As filed with the Securities and Exchange Commission on January 6, 2025.
Registration No. 333-
UNITED STATES
SECURITIES AND EXCHANGE COMMISSION
Washington, D.C. 20549
FORM S-1
REGISTRATION STATEMENT
UNDER
THE SECURITIES ACT OF 1933
Smithfield Foods, Inc.
(Exact name of registrant as specified in its charter)
| Virginia | 2013 | 52-0845861 | ||||||
| (State or other jurisdiction of incorporation or organization) | (Primary Standard Industrial Classification Code Number) | (I.R.S. Employer Identification No.) | ||||||
200 Commerce Street
Smithfield, Virginia 23430
(757) 365-3000
(Address, including zip code, and telephone number, including area code, of registrant’s principal executive offices)
C. Shane Smith
President and Chief Executive Officer
200 Commerce Street
Smithfield, Virginia 23430
(757) 365-3000
(Name, address, including zip code, and telephone number, including area code, of registrant’s agent for service)
With copies to:
Colin Diamond Brandon Bortner Alex Herman Paul Hastings LLP 200 Park Avenue New York, New York 10166 (212) 318-6000 | Andrew J. Pitts Ryan J. Patrone Cravath, Swaine & Moore LLP Two Manhattan West 375 Ninth Avenue New York, New York, 10001 (212) 474-1000 | |||||||
Approximate date of commencement of proposed sale to the public: As soon as practicable after this Registration Statement is declared effective.
If any of the securities being registered on this Form are to be offered on a delayed or continuous basis pursuant to Rule 415 under the Securities Act of 1933, check the following box: ☐
If this Form is filed to register additional securities for an offering pursuant to Rule 462(b) under the Securities Act, please check the following box and list the Securities Act registration statement number of the earlier effective registration statement for the same offering. ☐
If this Form is a post-effective amendment filed pursuant to Rule 462(c) under the Securities Act, check the following box and list the Securities Act registration statement number of the earlier effective registration statement for the same offering. ☐
If this Form is a post-effective amendment filed pursuant to Rule 462(d) under the Securities Act, check the following box and list the Securities Act registration statement number of the earlier effective registration statement for the same offering. ☐
Indicate by check mark whether the registrant is a large accelerated filer, an accelerated filer, a non-accelerated filer, a smaller reporting company or an emerging growth company. See the definitions of “large accelerated filer,” “accelerated filer” “smaller reporting company” and “emerging growth company” in Rule 12b-2 of the Exchange Act:
| Large accelerated filer | ☐ | Accelerated filer | o | ||||||||
| Non-accelerated filer | ☒ | Smaller reporting company | o | ||||||||
| Emerging growth company | o | ||||||||||
If an emerging growth company, indicate by check mark if the registrant has elected not to use the extended transition period for complying with any new or revised financial accounting standards provided pursuant to Section 7(a)(2)(B) of the Securities Act. ☐
The Registrant hereby amends this Registration Statement on such date or dates as may be necessary to delay its effective date until the Registrant shall file a further amendment which specifically states that this Registration Statement shall thereafter become effective in accordance with Section 8(a) of the Securities Act of 1933, as amended, or until this Registration Statement shall become effective on such date as the Securities and Exchange Commission, acting pursuant to said Section 8(a), may determine.
The information in this preliminary prospectus is not complete and may be changed. These securities may not be sold until the registration statement filed with the Securities and Exchange Commission is effective. This preliminary prospectus is not an offer to sell these securities nor a solicitation of an offer to buy these securities in any jurisdiction where the offer and sale is not permitted.
Preliminary Prospectus (Subject to completion, dated January 6, 2025)
Shares
Smithfield Foods, Inc.

Common Stock
This is the initial public offering of common stock of Smithfield Foods, Inc. We are offering shares of our common stock, and SFDS UK Holdings Limited (the “selling shareholder”), an indirect wholly owned subsidiary of our parent company, WH Group Limited (“WH Group”), is offering shares of our common stock. We will not receive any proceeds from the sale of stock by our selling shareholder.
There is currently no public market for shares of our common stock. We expect that the initial public offering price of our common stock will be between $ and $ per share. We have applied to list our common stock on the Nasdaq Global Select Market, under the symbol “SFD.” We will not consummate this offering of our common stock unless our common stock is approved for listing on the Nasdaq Global Select Market.
After the completion of this offering, WH Group will beneficially own approximately % of the voting power of our common stock (or approximately % if the underwriters exercise in full their option to purchase additional shares of our common stock). As a result, we will be a “controlled company” within the meaning of the corporate governance standards of The Nasdaq Stock Market LLC, or Nasdaq, and qualify for, and intend to rely on, exemptions from certain corporate governance requirements as described herein. See “Management—Controlled Company Exemption.” There is no single shareholder or group of shareholders which owns 50% or more of the voting power of WH Group as of the date of this prospectus. As a result, WH Group would not be considered a controlled company within the meaning of the corporate governance standards of Nasdaq.
Investing in our common stock involves risks. See “Risk Factors” beginning on page 31 to read about factors you should consider before buying shares of our common stock.
Neither the Securities and Exchange Commission, or the SEC, nor any state securities commission has approved or disapproved of these securities or passed upon the adequacy or accuracy of this prospectus. Any representation to the contrary is a criminal offense.
| Per Share | Total | ||||||||||
| Initial public offering price | $ | $ | |||||||||
Underwriting discounts and commissions (1) | $ | $ | |||||||||
| Proceeds, before expenses, to us | $ | $ | |||||||||
| Proceeds, before expenses, to selling shareholder | $ | $ | |||||||||
________________
(1)See “Underwriting” for additional information regarding underwriting compensation.
At our request, the underwriters have reserved up to 2% of the shares of our common stock offered by this prospectus for sale at the initial public offering price through a directed share program to our directors, officers and certain of our employees. See “Underwriting—Directed Share Program.”
The selling shareholder has granted the underwriters a 30-day option from the date of this prospectus to purchase up to additional shares of our common stock. Such shares are offered by the selling shareholder at the initial public offering price listed on the cover page of this prospectus, less underwriting discounts and commissions.
The underwriters expect to deliver the shares on or about , 2025 through the book-entry facilities of The Depository Trust Company.
| Morgan Stanley | BofA Securities | Goldman Sachs & Co. LLC | ||||||
| Barclays | Citigroup | UBS Investment Bank | ||||||
| BNP PARIBAS | HSBC | |||||||
The date of this prospectus , 2025.


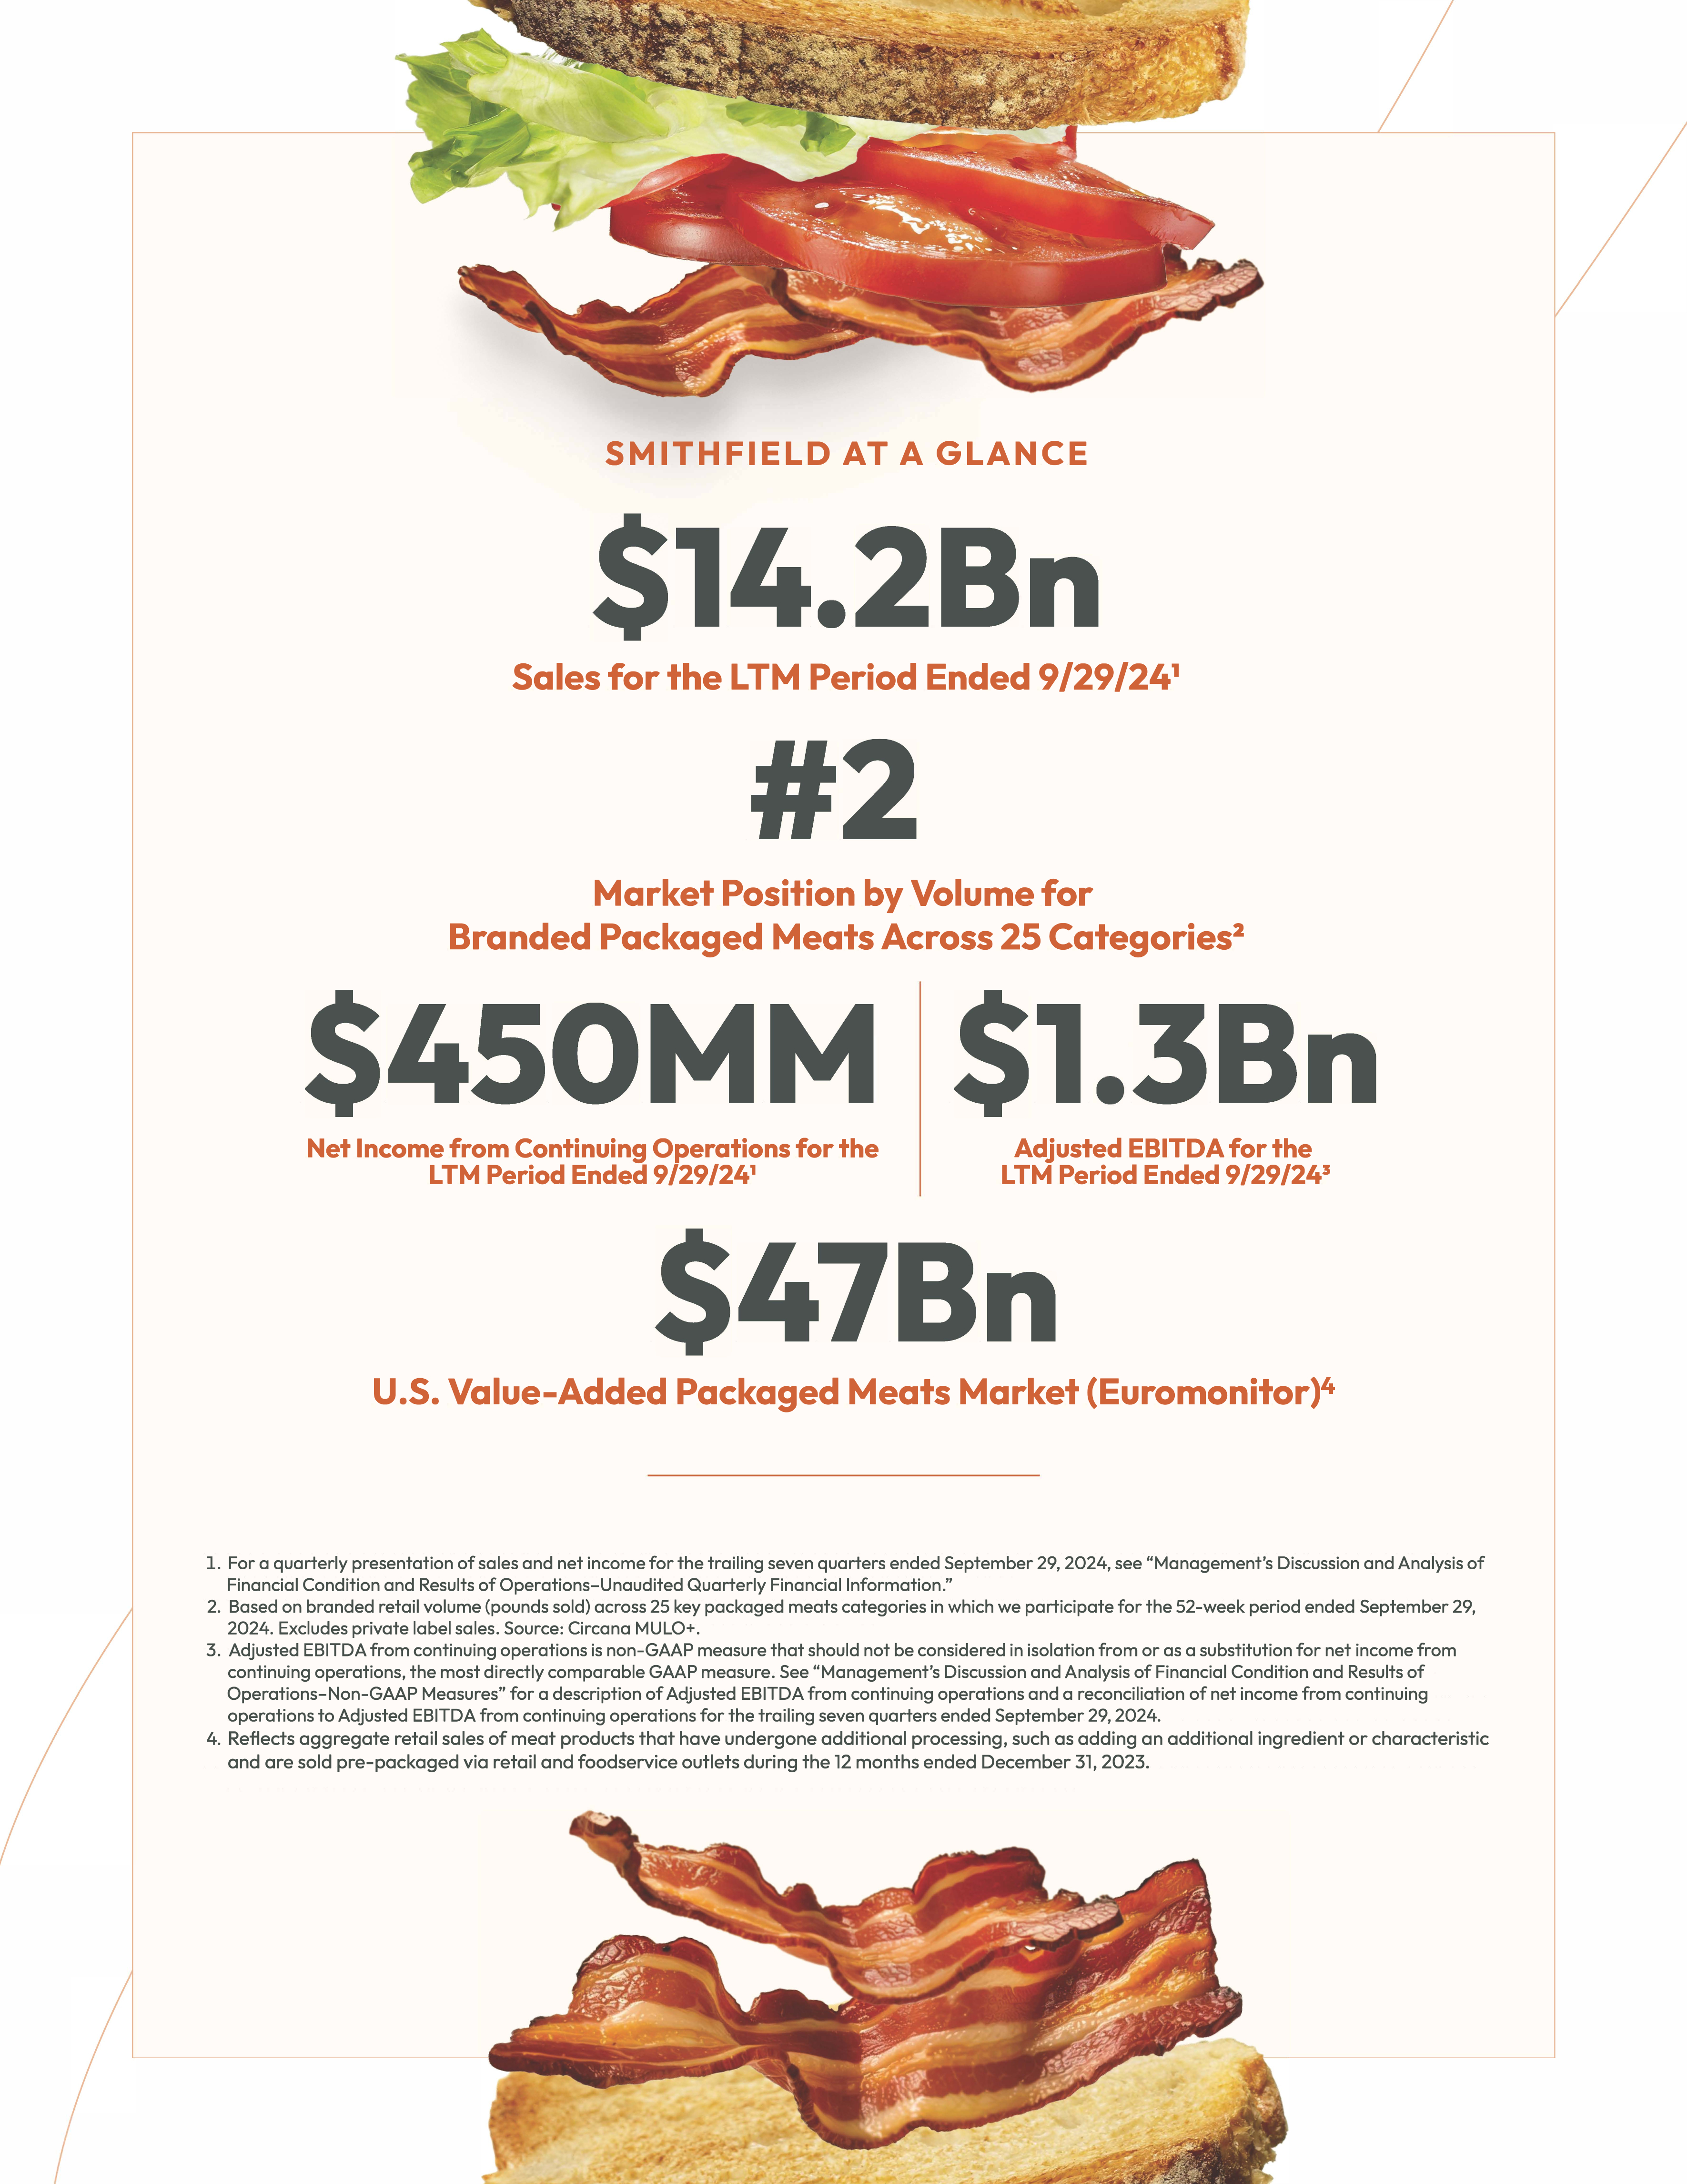
TABLE OF CONTENTS
| Page | |||||
i
We, the selling shareholder and the underwriters have not authorized anyone to provide any information or to make any representations other than those contained in this prospectus, any amendment or supplement to this prospectus or any free writing prospectus prepared by us or on our behalf. We, the selling shareholder and the underwriters take no responsibility for, and cannot assure you as to the reliability of, any other information that others may give you. This prospectus is an offer to sell only the shares of our common stock offered hereby, but only under circumstances and in jurisdictions where it is lawful to do so.
The information contained in this prospectus is current only as of the date of this prospectus, regardless of the time of delivery of this prospectus or of any sale of shares of our common stock. Our business, results of operations or financial condition may have changed since that date.
We, the selling shareholder and the underwriters have not done anything that would permit this offering or possession or distribution of this prospectus in any jurisdiction where action for that purpose is required, other than in the United States. Persons outside the United States who come into possession of this prospectus must inform themselves about, and observe any restrictions relating to, the offering of the shares of our common stock and the distribution of this prospectus outside the United States.
ii
ABOUT THIS PROSPECTUS
Unless otherwise indicated or the context otherwise requires, references in this prospectus to “Smithfield,” “our company,” “we,” “us” and “our” refer to Smithfield Foods, Inc., a Virginia corporation and its consolidated subsidiaries.
Prior to August 26, 2024, we conducted business operations in the United States, Mexico and Europe. On August 26, 2024, we completed the carve out of our European operations, or the European Carve-out, pursuant to which we transferred our operations in Europe to WH Group. Following the European Carve-out, we principally engage in operations in the United States and Mexico. Unless otherwise expressly stated or the context otherwise requires, the description of our business included in this prospectus reflects our business after giving effect to the European Carve-out. The results of operations, assets and liabilities, and cash flows of the European operations as presented in our consolidated financial statements have been condensed into separate line items and presented in the consolidated statements of income, the consolidated balance sheets and the consolidated statements of cash flows, respectively, as discontinued operations, and this treatment has been applied retrospectively to all periods presented. Unless otherwise expressly stated, the financial information of our company included in this prospectus reflects the historical financial statements of Smithfield (which has been an indirect, wholly owned subsidiary of WH Group), as retroactively adjusted to remove the impact of the discontinued operations.
Industry and Market Data
Within this prospectus, we reference information and statistics regarding the market for our products. We have obtained some of this information and statistics from various independent third-party sources, including government agencies, independent industry publications, reports by market research firms and other independent sources. Some data and other information contained in this prospectus are also based on management’s estimates and calculations, which are derived from our review and interpretation of internal surveys and independent sources. Data regarding the industries in which we compete and our market position and market share within these industries are inherently imprecise and are subject to significant business, economic and competitive uncertainties beyond our control, but we believe they generally indicate size, position and market share within this industry. In addition, assumptions and estimates of our and our industries’ future performance are necessarily subject to a high degree of uncertainty and risk due to a variety of factors. These and other factors could cause our future performance to differ materially from our assumptions and estimates. See “Forward-Looking Statements.”
The sources of certain statistical data, estimates and forecasts contained in this prospectus include the following independent industry publications or reports:
•Agriculture and Horticulture Development Board, “2022 pig cost of production in selected countries: Overview,” December 13, 2023;
•Business Research Insights, “Dry Sausage Market Size, Share, Growth, and Industry Analysis, By Type (Pork Dry Sausage, Beef Dry Sausage, Poultry Dry Sausage), By Application (Pizza, Ready to Eat Food, Meals), Regional Forecast to 2031,” last updated September 9, 2024;
•Circana Retail/Deli database, last accessed October 2024;
•Euromonitor International Limited, Global & U.S. Meat report;
•Euromonitor International Limited, Meat & Value-Added report;
•International Food Information Council, 2024 IFIC Food & Health Survey;
•Iowa State University forecasts – Study; Estimated Returns – Swine (Farrow to Finish) latest month data collected July 2024;
•Ipsos, “Nearly nine in ten Americans consume meat as part of their diet,” https://www.ipsos.com/en-us/news-polls/nearly-nine-ten-americans-consume-meat-part-their-diet, May 12, 2021;
iii
•Mintel Group – Reports:
•Protein and Protein Alternatives – US – 2024 (April 24, 2024);
•The Future of Foodservice – US – 2024 (January 31, 2024);
•Bacon and Lunchmeat – US – 2023 (September 30, 2023);
•Hot Dogs and Sausages – US – 2023;
•Protein and Protein Alternatives – US – 2022; and
•Grocery Retailing – US – 2024 (June 26, 2024);
•National Hog Farmer, “NHF Snapshot - Packer Capacity,” May/June 2024 Issue;
•Organization for Economic Co-operation and Development, “Indicators – Meat Consumption, OECD-FAO Agricultural Outlook,” 2023-2032;
•Progressive Grocer, “The PG 100: The Top Food Retailers in North America,” May 20, 2024;
•U.S. Department of Agriculture, “Interagency Agricultural Projections Committee,” October 2023; and
•U.S. Department of Agriculture, “USDA Agricultural Projects to 2033,” February 2024.
Trademarks, Trade Names, Service Marks and Copyrights
We own or have rights to use various trademarks, tradenames, service marks and copyrights, which are protected under applicable intellectual property laws, including, for example: Smithfield, Eckrich, Farmland, Armour, Farmer John, Kretschmar, John Morrell, Cook’s, Gwaltney, Carando, Margherita, Curly’s and Smithfield Culinary. This prospectus also contains trademarks, tradenames, service marks and copyrights of other companies, which are, to our knowledge, the property of their respective owners. Solely for convenience, certain trademarks, tradenames, service marks and copyrights referred to in this prospectus may appear without the ©, ®, and ™ symbols, but such references are not intended to indicate, in any way, that we will not assert, to the fullest extent under applicable law, our rights or the rights of the applicable licensors to these trademarks, tradenames, service marks and copyrights. We do not intend our use or display of other parties’ trademarks, tradenames, service marks or copyrights to imply, and such use or display should not be construed to imply a relationship with, or endorsement or sponsorship of us by, these other parties.
Presentation of Financial Information
Our fiscal year is the 52-week or 53-week period which ends on the Sunday nearest to December 31. Unless otherwise noted, all references to “2023”, “2022” and “2021” are to the 52-week periods ended December 31, 2023, January 1, 2023 and January 2, 2022, respectively.
The consolidated financial statements in this prospectus were prepared in accordance with accounting principles generally accepted in the United States of America, or GAAP, which requires us to make estimates and use assumptions that affect the amounts reported in the consolidated financial statements and the accompanying notes. It is possible that actual results could differ materially from those estimates. The information reflects all normal recurring adjustments that we believe are necessary to present fairly the financial position and results of operations for all periods included. Totals and percentages may be affected by rounding.
Non-GAAP Measures
This prospectus contains certain financial measures, including Adjusted Net Income and Adjusted Net Income Margin, EBITDA, Adjusted EBITDA and Adjusted EBITDA Margin, Net Debt, Ratio of Net Debt to Adjusted EBITDA, Adjusted Segment Profit, Adjusted Segment Profit Margin and Free Cash Flow that are not required by, or prepared in accordance with, GAAP. We refer to these measures as “non-GAAP” financial measures. See
iv
“Management’s Discussion and Analysis of Financial Condition and Results of Operations—Non-GAAP Measures” for our definitions of these non-GAAP measures, information about how and why we use these non-GAAP measures and a reconciliation of each of these non-GAAP measures to its most directly comparable financial measure calculated in accordance with GAAP. You should be aware that our presentation of these and other non-GAAP financial measures in this prospectus may not be comparable to similarly titled measures used by other companies.
v
PROSPECTUS SUMMARY
This summary highlights selected information contained elsewhere in this prospectus. This summary does not contain all of the information that you should consider before deciding to invest in our common stock. You should read the entire prospectus carefully, including “Risk Factors,” “Management’s Discussion and Analysis of Financial Condition and Results of Operations” and our consolidated financial statements and related notes included elsewhere in this prospectus, before making an investment decision.
Our Mission
Good food. Responsibly.® At Smithfield, we are helping to feed a world of nearly eight billion people. Our products are found on tables everywhere. We provide families with wholesome, safe and affordable food while finding new and innovative ways to care for our people, communities, animals and planet. It is our responsibility and our promise. We make more than good food. Good is what we do.
Our Company
Smithfield is an American food company and an industry leader in value-added packaged meats and fresh pork with over $14 billion in annual sales. We employ approximately 34,000 people in the United States and approximately 2,500 people in Mexico. We maintain high-quality standards, meeting demand through our strong relationships with thousands of U.S. family farmers and blue-chip global customers. We are a market leader due to our scale, diverse portfolio of strong brands and products and reputation as a trusted partner known for quality. We market our products under a leading portfolio of iconic brands including Smithfield, Eckrich and Nathan’s Famous, among many others.
Our ambition is to be the most trusted food and protein company in North America as we feed people in the United States and around the world, while embracing a culture of responsibility, operational excellence and innovation. We produce and distribute a wide variety of packaged meats and fresh pork products both domestically and abroad. We conduct our operations through three reportable segments: Packaged Meats, Fresh Pork and Hog Production. We are a leading provider of packaged meats in the United States, with the number two branded market position by volume across the 25 key packaged meats categories in which we compete, according to Circana. These 25 key packaged meats categories represent a total addressable market opportunity of $43 billion annually, of which we had an approximate 20% market share by volume (including our private label sales) as of September 2024. We are also the largest fresh pork processor in the United States with approximately 23% market share as of Fall 2023, according to National Hog Farmer. We sell our products across diverse channels including retail and foodservice, distributing in all 50 states in the United States, as well as export markets. We are a leading exporter of pork and pork products, with export sales representing 13% of our total sales for the nine months ended September 29, 2024.
Our Packaged Meats segment is the cornerstone of our business with a value-added product portfolio and profitability that has more than doubled since 2014. Alongside our Packaged Meats segment, our Fresh Pork and Hog Production segments remain integral parts of our business, providing significant scale and operational benefits in support of our product offerings and our ability to meet demand consistently across economic cycles. We believe our emphasis on value-added packaged meats, along with our commitment to food quality, strong financial position and steadfast devotion to our stated mission, will continue delivering value for our shareholders.
Smithfield’s supply chain includes company-owned and contract farms in the United States and Mexico, as well as long-standing relationships with more than 4,000 independent U.S. family farms who meet our animal care and quality standards. Our model offers a resilient supply chain, providing us with several competitive advantages, including an assured supply of consistent, high-quality protein, the ability to innovate and lead in areas such as group-housed pork and the ability to deliver differentiated products to meet customer specifications. We operate 39 facilities producing fresh pork and packaged meats in the United States and one fresh pork facility in Mexico, and we focus on continually optimizing our operations by identifying opportunities to reduce costs and increase flexibility to meet market demand. Additionally, we remain committed to investing in innovation across our products, packaging and manufacturing processes. We seek to be the supplier of choice to our customers and maintain our reputation for high-quality, safe and delicious products.
1
A New Smithfield in the Public Eye
Founded in 1936, we began as a pork processing operation named The Smithfield Packing Company. Through a series of acquisitions beginning in the 1980s, we became the largest fresh pork processor in the United States. In 2013, Smithfield was taken private and became a wholly owned subsidiary of Hong Kong-based WH Group, which is publicly traded on The Stock Exchange of Hong Kong Limited. WH Group is a limited liability company incorporated in the Cayman Islands, the shares of which have been listed on the Main Board of the Stock Exchange since August 2014. Through its subsidiaries, WH Group is principally engaged in the production and sale of packaged meats and pork.
Following the acquisition of Smithfield by WH Group, we focused on integrating our independent operating companies into a cohesive business. Our “One Smithfield” initiative unified our operations, brands and employees under one corporate umbrella, achieving synergies and enhancing profitability through disciplined cost management and balance sheet strength.
In recent years, we have transformed into a differentiated American food company with a leading position in value-added packaged meats and fresh pork, and our headquarters remains in our namesake town of Smithfield, Virginia.
In August 2024, we completed a carve-out of our European operations to focus our local management teams on the different market dynamics of North America and Europe. Pursuant to the European Carve-out, our operations in Europe were transferred to WH Group.

Led by growth in our Packaged Meats segment, our product portfolio has evolved to a higher concentration of value-added packaged meats offerings, significantly improving profitability. Additionally, we have reduced complexity and improved our cost structure in our plant operations by rationalizing our SKU count. Since 2019, we have reduced our Packaged Meats SKU count by over 40% and increased volume velocity (pounds/item) by over 60%.
The growth in our Packaged Meats segment has helped to increase our overall scale and profit margins and to stabilize our earnings and cash flows during volatile commodity cycles and economic downturns. This is the anchor of our strong financial position and fuels continued investment in our business. We have invested over $3 billion in capital expenditures since 2013, driving our organic growth strategy and improving our operations, including automating processes.
2
The following table sets forth certain metrics for our business for 2014 and 2023 and highlights our strategic growth and evolution led by our Packaged Meats segment.

______________
(1)Based on our historical financial statements for the year ended December 28, 2014, which are not included or incorporated by reference in this prospectus. We do not believe the adoption of accounting standards after that date would have a material effect on the financial measures presented. See “Management’s Discussion and Analysis of Financial Condition and Results of Operations—Non-GAAP Measures” for more information.
(2)Ratio of Net Debt to Adjusted EBITDA is defined as net debt divided by Adjusted EBITDA. Net debt is defined as long-term debt and finance lease obligations, including the current portion, minus cash and cash equivalents. Ratio of Net Debt to Adjusted EBITDA is a non-GAAP measure that should not be considered in isolation or as a substitute for other financial measures calculated and presented in accordance with GAAP. For additional information regarding Ratio of Net Debt to Adjusted EBITDA, including a reconciliation to ratio of debt to net income, the most directly comparable GAAP measure, see “Management’s Discussion and Analysis of our Financial Condition and Results of Operations – Non-GAAP Measures.”
Packaged Meats Segment
The Packaged Meats segment produces a wide variety of value-added products and sells them primarily in the United States. For the nine months ended September 29, 2024, the segment had $5.9 billion in sales, comprising 58% of our total sales, $855 million in segment profit, comprising 109% of our total operating profit and a 15% operating profit margin. For the year ended December 31, 2023, we sold approximately 2.9 billion pounds of packaged meats products. The segment has achieved strong growth with a fiscal year 2014 to fiscal year 2023 segment profit compound annual growth rate, or CAGR, of 9.8%.
Our Packaged Meats portfolio is diversified across product categories, brands and channels and spans all meal occasions. For the nine months ended September 29, 2024, 63% of the segment sales were conducted through the retail channel, 31% through the foodservice channel and 6% through the industrial channel (i.e., other protein processors) and other.
We serve 100% of the top 10 ranked national grocery retailers, as identified by Progressive Grocer based on 2023 annual sales, including blue-chip customers, such as Walmart, Sam’s Club, Costco, Kroger and Albertsons. In the foodservice industry, we serve approximately 70% of the top 50 ranked national foodservice chains, including McDonald’s, Subway, IHOP and Jersey Mike’s, as well as all of the top foodservice distributors, including Sysco, U.S. Foods and Performance Food Group. Within the foodservice industry, we leverage our reputation for high-
3
quality products through our Smithfield Culinary brand, and we are the most recognized pork processor by chefs and foodservice operators, with 49% unaided awareness based on a 2024 study by Datassential.
We produce a wide variety of packaged meats products, including bacon, sausage, hot dogs, deli and lunch meats, dry sausage products (such as pepperoni and genoa), ham products, ready-to-eat products and prepared foods (such as pre-cooked entrees, bacon and sausage). We address all dayparts, with our products featured during breakfast, weekday school lunches, football weekends, holiday dinners and at snack time. While pork is our primary protein offering, approximately 17% of the volume utilized in our Packaged Meats segment for the nine months ended September 29, 2024 was non-pork products made with other proteins—primarily poultry and beef.
Our Packaged Meats segment’s branded retail offerings generated $3.2 billion, or 22% of consolidated sales, in 2023. Our products are available at most major food retailers where we continue to drive penetration and have strong on-shelf performance with attractive dollar velocities for our largest categories relative to competition.
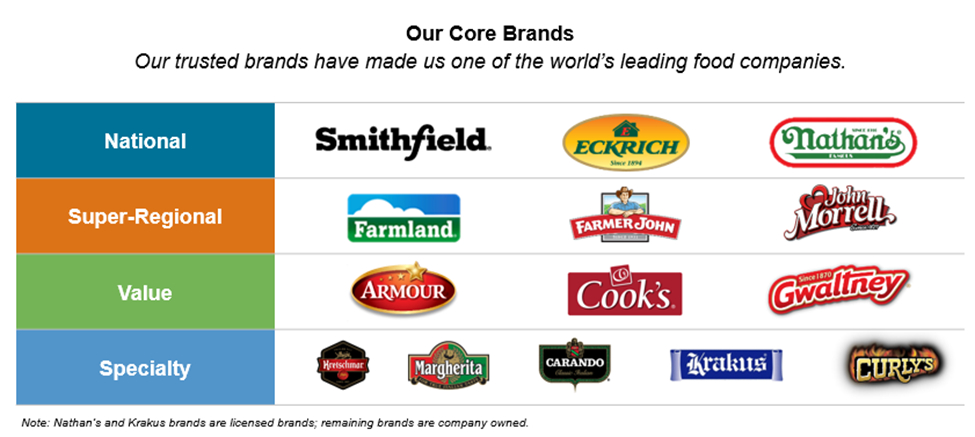
Led by our flagship Smithfield brand, our portfolio of brands has strong consumer recognition and robust brand equity, and we target on-trend product categories for growth. We market our domestic packaged meats products under a strategic set of core brands, including national, super-regional, value and specialty brands that deliver value to our ultimate consumers across a wide range of price points.
The following table illustrates the percentage of our Packaged Meats segment’s branded sales in the retail channel in 2023 for each of our top brands, along with the relevance these brands represent across dayparts:

Additionally, private label represented 38% of our packaged meats retail channel sales volume in 2023. Our private label products make our offerings more valuable to blue-chip retail customers by providing consumers quality selections up and down the value chain. In addition, our private label business helps to optimize our manufacturing footprint and increases the efficiency and profitability of our plants.
Fresh Pork Segment
As the largest fresh pork processor in the United States, our Fresh Pork segment produces a wide variety of primal, sub-primal and offal products, such as bellies, butts, hams, loins, picnics and ribs. Our Fresh Pork segment had $5.9 billion in sales for the nine months ended September 29, 2024, comprising 58% of our total sales, $196 million in segment profit, comprising 25% our total operating profit and a 3% operating profit margin. For the year ended December 31, 2023, we processed approximately 29 million head through the Fresh Pork segment. Approximately one-third of our fresh pork products, including the majority of hams, bellies and trimmings, is transferred to our Packaged Meats segment, providing it with approximately 80% of its raw material requirements for the nine months ended September 29, 2024.
4
Our strategy is to drive our Fresh Pork segment’s profitability to exceed commodity meat values by maximizing the use of our raw materials. This includes offering value-added products, such as marinated fresh pork, a category in which we hold the leading position, and case-ready fresh pork. The export strategy is particularly important to our ongoing initiative to maximize hog utilization by selling byproducts to drive profitability.
Vertically Integrated Supply Chain and Hog Production Segment
Our supply chain, supported by our upstream businesses, is differentiated from our competitors’ supply chains and provides benefits that we believe are hard to replicate. Nearly all of the Hog Production segment’s sales are intercompany sales of live hogs to our Fresh Pork segment. Our Fresh Pork segment sources hogs from a mix of company-owned and contract farms, which raise company-owned hogs, comprising our Hog Production segment. Our Fresh Pork segment further supplements our supply by sourcing hogs from independent farmers with whom we partner across the United States through multi-year agreements. Contract farms and independent farms are held to the same animal care and quality standards as our company-owned farms and thereby form a key part of our integrated supply chain.
We have unmatched scale in hog production, which enables us to consistently supply high-quality raw materials for our Fresh Pork segment and, ultimately, our Packaged Meats segment. Today, we internally supply approximately 50% of the raw material needs of our Fresh Pork segment. We believe that it is important to maintain a certain level of internal production to enable supply to our Fresh Pork processing facilities, particularly to support our East Coast processing operations. Our scale has also enabled us to be an early mover in group-housing for pregnant sows on company-owned farms with the result that these farms supply the majority of our group-housed pork needs which is a differentiated product for which our customers pay a premium.
Beyond scale, our internally supplied hog production is geographically diverse, with locations in the East Coast, Midwest, Missouri and Utah, whereas our largest competitors are located predominantly in the Midwest. Our geographic diversity reduces risk by mitigating the impact of a potential disease outbreak in one part of the country. In addition, our East Coast hog production operations provide an efficient supply to two of our largest Fresh Pork and Packaged Meats processing facilities co-located in North Carolina. Our East Coast location provides us with a significant strategic advantage in our ability to export to more than 30 countries, because it gives us close proximity to East Coast ports, unlike our competitors who need to transport product from the Midwest more than 1,000 miles to either the East or West Coast ports.
In recent years, we embarked on a strategy to optimize the size of our hog production operations and procure a larger percentage of hogs from independent suppliers under long-term, market-based supply agreements. Our Hog Production segment’s transformation strategy is integral to our ongoing objective to further transition our business toward an increased mix of value-added, high-margin products. This transformation allows us to reduce our capital investment and exposure to more volatile areas of the value chain. We plan to reduce the size of the segment’s production from approximately 50% of fresh pork supply today to approximately 30% in the medium term, which is still significantly higher than our competitors. We have made material progress in executing our strategy, reducing the size of our segment’s production from a peak of 17.6 million head in 2019, and we continue to further optimize production levels. In the year ended December 31, 2023, we produced approximately 15.8 million head through the Hog Production segment. We ended 2024 at 14.6 million head, and we expect to end 2025 at approximately 11.5 million head. We believe this strategy will maintain an appropriate supply of high-quality inputs to meet business needs and improve our cost structure while achieving flexibility in our retained hog production business. See also “Risk Factors—Risks Relating to Our Business and Operations—An inability to realize savings and efficiency gains could adversely affect profitability and we may be unable to achieve any or all of our financial and operational targets.”
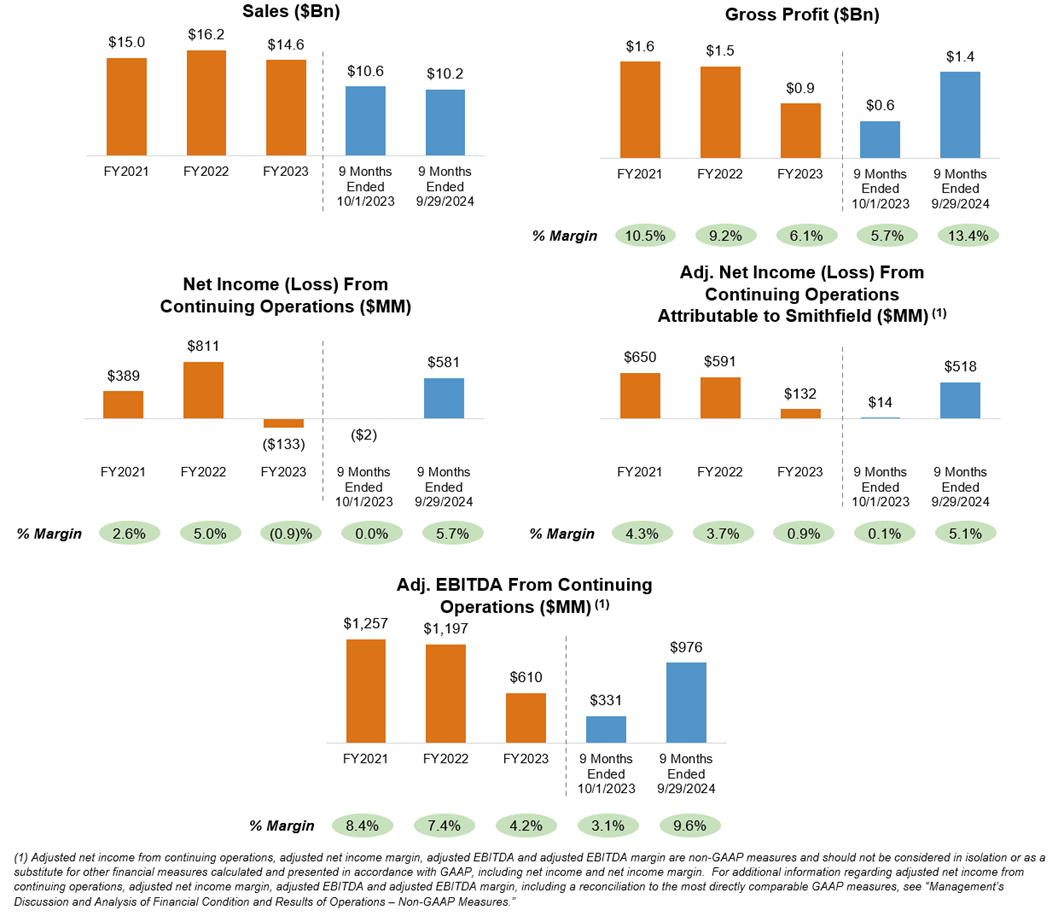
Our Financial Performance
We believe the rebound in our 2024 performance following a challenging year for our industry demonstrates the resilience of our business model, effectiveness of our strategy and operational discipline, while our stable cash flows and strong balance sheet allow us to invest in our continued operations and return value to shareholders.
5
The charts below depict our recent financial performance:
We believe maintaining a healthy financial position is critical to the execution of our strategy, efficiency of our operations and our ability to manage effectively through industry and macroeconomic headwinds. We are committed to maintaining investment-grade credit ratings and target the following metrics:
•Ratio of Net Debt to Adjusted EBITDA of 2.0x. As of , our Ratio of Net Debt to Adjusted EBITDA was x and our ratio of debt to net income from continuing operations was x. See “Management’s Discussion and Analysis of Financial Condition and Results of Operations—Non-GAAP Measures” for our definitions of Ratio of Net Debt to Adjusted EBITDA, information about how and why we use this non-GAAP measure and, for historical periods, a reconciliation of this non-GAAP measure to ratio of debt to net income from continuing operations, its most directly comparable financial measure calculated in accordance with GAAP.
•Minimum liquidity of $1.0 billion. As of , our liquidity was $ . We define liquidity as cash and cash equivalents plus available borrowing capacity under our credit facilities.
6
In addition, the charts below depict our segment profit over time:
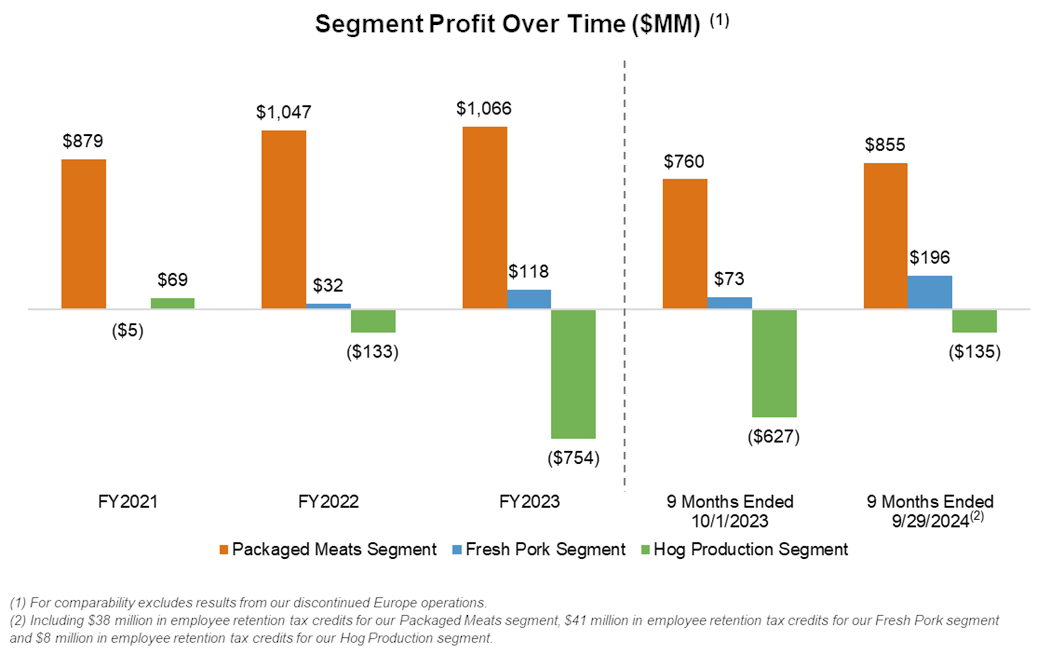
The evolution of our business to value-added products with higher margins supports stronger cash flow generation, which is allocated toward investment in growth and shareholder return. Our capital allocation strategy is focused on:
•Driving top-line growth and achieving operational efficiencies by allocating $400 million to $500 million annually towards capital expenditures.
•Returning excess capital to shareholders in the form of a regular dividend after funding investments in our strategic priorities. We initially expect to pay annual dividends in an amount equal to 50% of our net income, subject to the discretion of the board.
•Conducting opportunistic and financially disciplined acquisitions, primarily focused on growing our Packaged Meats segment, with assets and capabilities that complement our robust manufacturing platform and strong brands and product offerings.
7
Our Industry
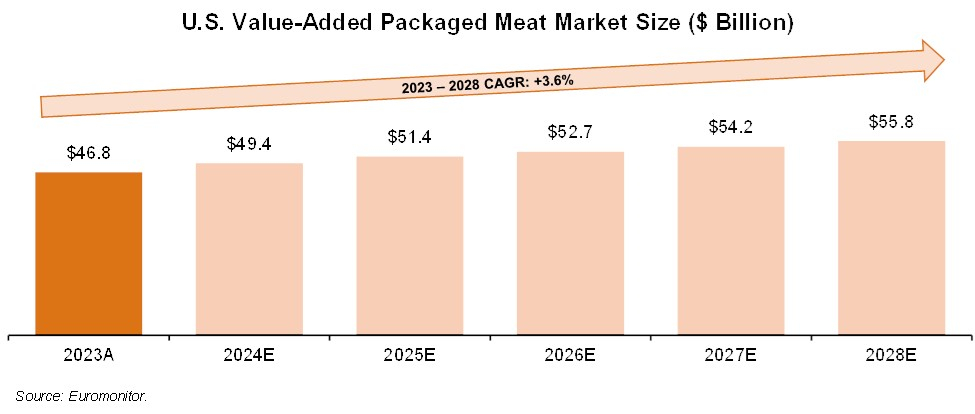
We operate in the large and growing global packaged and fresh meats market, which includes value-added fresh, refrigerated and frozen proteins. Our business operations are primarily concentrated in North America, but, as a leading exporter to major international markets, we also benefit from significant global demand for our products. According to Euromonitor, the global meat market reached $1.1 trillion in 2023 and is projected to grow at a 6.5% CAGR between 2023 and 2028. Per Euromonitor, U.S. value-added packaged meats represented a $47 billion market in 2023 and is forecasted to grow at a 3.6% CAGR between 2023 and 2028. Value-added packaged meats refers to the processed meats category as defined by Euromonitor and includes meat products that have undergone additional processing, such as adding an additional ingredient or characteristic, and are sold pre-packaged via retail and foodservice outlets.
The following table sets forth information about size of the U.S. value-added packaged meat market:
Consumer Trends in U.S. Packaged Meats and Fresh Pork
The U.S. packaged meats market is supported by long-term secular tailwinds, including consumer demand for high-protein diets, high-quality nutrition, product versatility and convenience. We expect these tailwinds to continue to drive increases in overall meat consumption. Consumers associate protein with healthiness and energy. A 2024 International Food Information Council consumer survey reported that a high-protein diet is the most popular diet type in the United States. According to market research firm Ipsos, 89% of Americans include animal protein in their diets as of 2021. Data from the Organization for Economic Co-operation and Development shows that pork represented 24% of all meat protein consumed in the United States in 2023.
According to Mintel, many packaged meats products are household staples for U.S. consumers, including bacon, lunch meat, hot dogs, fresh sausage and dry sausage. Mintel reports that, as of September 2023, U.S. bacon and lunch meat represented an estimated $27.0 billion market in 2023 that is expected to grow at a 4.2% CAGR between 2023 and 2028, and U.S. hot dogs and sausages were estimated to represent a $12.3 billion market in 2023 that is expected to grow at a 1.0% CAGR between 2023 and 2027. According to Business Research Insights, U.S. dry sausage for charcuterie, snacking, sandwiches, pizza toppings and other uses, typically higher margin products, represented a $4.7 billion market in 2023 that is expected to grow at a 3.9% CAGR between 2023 and 2030.
Mintel reports that 86% of U.S. consumers anticipate eating the same amount of pork or more pork in the coming year according to a survey conducted in February 2024, and pork consumption is distributed relatively equally across income groups. According to Mintel, packaged pork products benefit from growing demand for convenience, as consumers value marinated, ready-to-cook and ready-to-eat options. Mintel reports that pork is an affordable and convenient protein.
8
Pork is also a highly versatile protein, with a wide variety of cuts and flavor profiles. Use occasions for pork products benefit from strong daypart distribution, which is unique relative to all other meat proteins. Products like bacon, sausage and ham appear on tables at every meal. According to the National Pork Board, bacon is by far the most beloved packaged meats product, and pork is a highly snacked meat protein and the most popular pizza topping in the United States.
Additionally, increased U.S. demand for global cuisines supports the domestic pork market. Asian and Mexican cuisines, for which pork is a leading protein, continue to gain popularity with U.S. consumers, particularly among Generation Z (the generational cohort aged 12 to 27 years) and Millennials (the generational cohort aged 28 to 43 years). We believe that the continued growth of global cuisines in the United States introduces consumers to different pork preparations and flavor profiles and serves as an incremental long-term tailwind for pork.
According to Mintel, most U.S. consumers are concerned about the environmental impact of meat production, and health and nutrition are important factors to consumers of meat. Many cuts of pork offer lower levels of cholesterol and saturated fat relative to cuts of beef. Lean cuts of pork, including pork tenderloin, offer a superior nutritional profile to chicken breast. Additionally, relative to beef, pork production generally has a lower carbon footprint and lower rate of land usage. Nevertheless, changes in market trends and consumer preferences could adversely affect our results of operations. For more information, see “Risk Factors—Risks Relating to Our Business and Operations—Changes in consumer preferences and failure to maintain favorable consumer perception of our brands could negatively impact our business.”
Our Competitive Strengths
We attribute our track record of success to a combination of the following competitive strengths. We believe these strengths are central to our business model and position us well for long-term success.
Leader in Packaged Meats with Diverse Portfolio of Strong Brands
We have grown our Packaged Meats business to become a leading provider of value-added pork and other protein products for U.S. customers and consumers. Consumers choose our products for consistent high-quality and delicious taste, helping us achieve an 81% repeat purchase rate as of September 2024. Our Net Promoter Scores, a gauge of brand affinity, are superior to peers across key categories, including smoked ham, fresh pork, Italian specialty, hot dogs, everyday ham and bacon. We continue to see increasing loyalty and unaided awareness across our key brands and categories. Our longstanding commitment to our values and corporate heritage resonates with consumers who share our ideals, including our commitment to sustainability and American agriculture.
Our trusted brands have made us one of the country’s leading food companies. Led by our flagship Smithfield brand, we have a diverse portfolio of national, super-regional, value and specialty brands with strong customer loyalty. We complement our national brands with super-regional brands to capitalize on each brand’s history and strong consumer affinity. Our value brands offer consumers choices across price points, and our specialty brands address various on-trend categories such as dry sausage and convenient preparation items, including barbecue and meatballs.
9
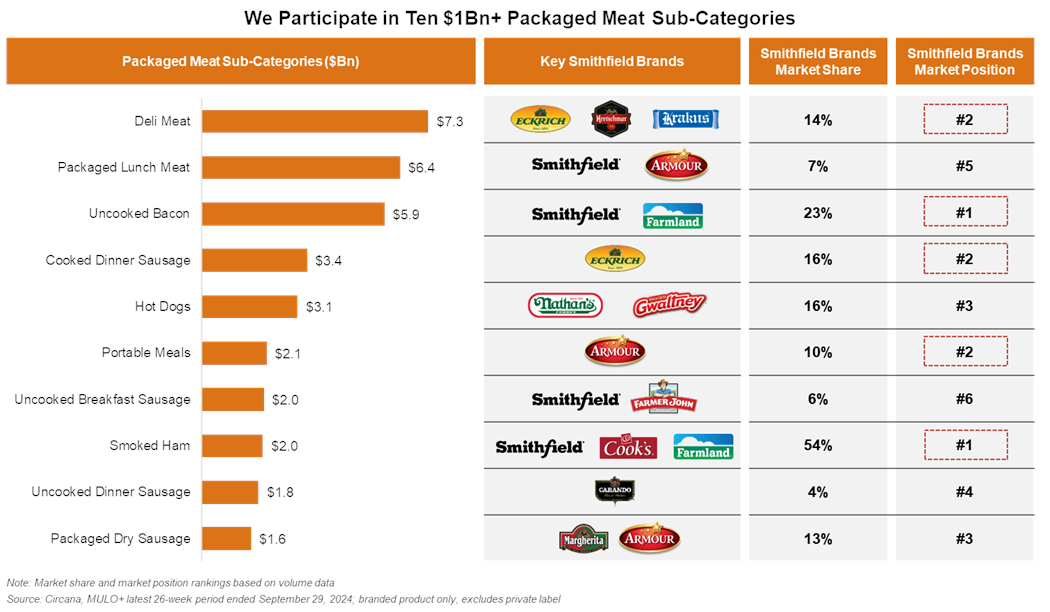
As a branded player across the United States, we have a leading position in 15 of the 25 key categories in which we compete. We have a significant presence in 10 categories each over $1 billion in size, including the number one or two position by volume in uncooked bacon, smoked ham, deli meat, cooked dinner sausage and portable meals as shown in the table below:
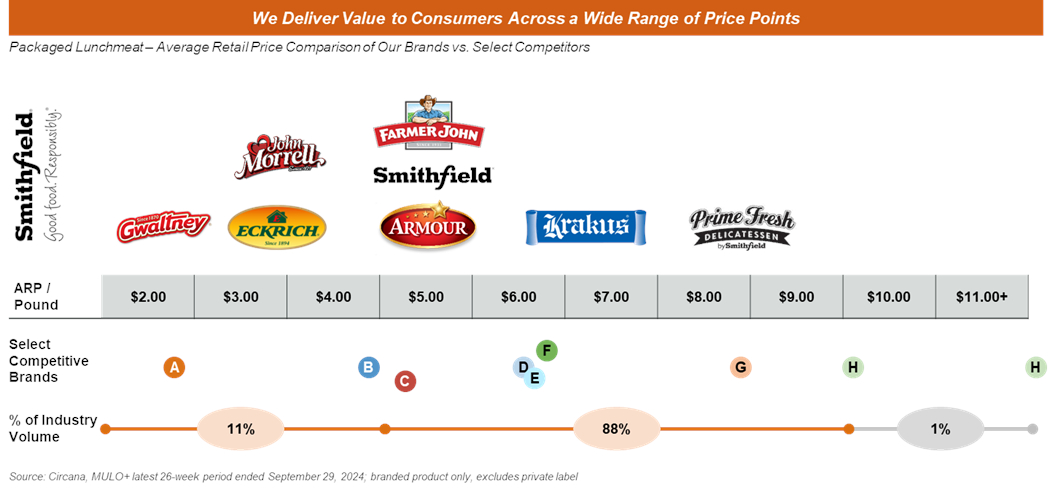
We market our products to customers and consumers across multiple categories and price points. We have a balanced sales mix with approximately 64% branded and 36% private label in the retail channel as of September 2024. Our participation in both branded and private label helps us attract and retain consumers as they move across the value spectrum, enabling us to meet shifting consumer preferences during periods of economic downturn and to capture wallet share when they trade up to premium brands.
10
For example, in the packaged lunch meat category, almost 98% of the volume is sold on average in the $2.00-$9.00 price per pound range. Our packaged lunch meat offering exemplifies how we cover a wide range of retail price points from our best value with Gwaltney (at approximately $2.50 average retail price per pound) to our premium Smithfield Prime Fresh (at approximately $8.50 average retail price per pound) as of September 2024.
While some of our competitors may choose to focus on consumers at only the high or low end of the value spectrum, our strategy enables us to meet consumer demand across various price points, as shown in the chart below:
For information about challenges we face in the highly-competitive food market, see “Risk Factors—Risks Relating to Our Business and Operations—The food industry in which we operate is highly competitive, and our inability to compete successfully, or the effects of such competition, could adversely affect our business, financial condition and results of operations.”
Trusted and Scaled Partner Known for Quality
We have a nearly 90-year history of providing great tasting, quality products across the United States and abroad. We pride ourselves on producing safe, wholesome and high-quality protein, and we continually train our team members in the latest animal welfare and food safety and quality best practices across our supply chain. Producing Good food. Responsibly.® is at the core of our purpose-driven culture. Consumers trust our high-quality brands and products, and we are a trusted partner to customers, suppliers and farmers across the value chain.
Through years of investment and growth, we have created an asset base that we believe would be hard to replicate. Our scale and integrated operating model enable us to reliably meet demand across economic cycles and offer a differentiated value proposition to our customers and consumers. We believe that we are a preferred supplier to our partners because we consistently provide comprehensive end-to-end support and reliably deliver high-quality products on time. Our commitment and reputation for high-quality products and service is evidenced by the numerous awards received from our retail and foodservice customers, recognizing Smithfield as a supplier of choice.
Leveraging our scale and global distribution channels, we are also a leading exporter of pork and pork products, with sales to export markets representing 13% of our total sales for the nine months ended September 29, 2024. Export markets promote whole hog utilization due to differentiated demand for parts of the animal across the globe, which helps us to operate sustainably while supporting American agriculture.
11
Strong Financial Profile Marked by Robust Growth and Profitability Metrics
We are focused on delivering long-term sustainable results and have built our business to generate resilient growth, profitability and cash flow. Our track record of sales and earnings growth reflects strong demand for our products and successful management of commodity volatility across economic cycles. In 2024, we demonstrated a strong rebound in our results after a challenging 2023 for our industry.
The resilience of our business model is underscored by our history of maintaining a strong balance sheet and moderate leverage. Sustaining a healthy financial position creates operational flexibility and helps to insulate us from industry and macroeconomic headwinds. We are committed to a target Ratio of Net Debt to Adjusted EBITDA of < 2.0x and a target minimum liquidity of $1.0 billion, as well as maintaining investment grade ratings.
We have a strong track record of disciplined capital allocation, generating higher profitability and cash flows by executing projects that drive organic growth and unlock operational efficiencies. While organic growth has been the backbone of our growth strategy over the past decade, we will continue to supplement our organic growth with a disciplined acquisition strategy. Our acquisition strategy primarily focuses on packaged meats assets and capabilities that complement our manufacturing platform, strong brands and product offerings.
Innovative Sustainability Initiatives
Sustainability has been a key focus for our business for over twenty years. Our strategy today is built around three objectives: being good stewards of the environment and our animals; doing good work in the communities where our employees live and work; and producing good food with a commitment to food safety, quality and nutrition. We have been at the forefront of the industry in achieving sustainability milestones, including becoming the first major protein company to adopt and publicly report a comprehensive sustainability program, to achieve International Standards Organization 14001 certification globally, to develop and adopt a comprehensive animal care management program, to begin reporting antibiotics usage in 2007 and to publish an online ingredient glossary.
We leverage on-the-ground resources to strive to achieve our sustainability goals. We co-founded Align RNG, LLC, or Align, as well as Monarch Bioenergy LLC, or Monarch, to advance developments in methane capture and manure-to-energy conversion. In 2022, TPG Rise Climate invested in Monarch, helping us to further scale the business.
Our sustainability activities have been recognized externally. We were awarded the prestigious “Profit with a Purpose” award by the World Sustainability Awards, or WSA, in 2021 for our innovative renewable natural gas programs. These programs convert methane from hog manure into clean energy, creating new income opportunities for family farmers. Additionally, we received a “Highly Commendable” mention in the WSA’s External Partnership category in 2021 for our collaboration with a leading environmental organization to implement sustainable farming practices within our supply chain.
We are consistently recognized as an employer of choice for U.S. veterans. We have a long history of supporting veterans and military families through monetary and food donations, employee volunteerism and partnerships. We honor the service and sacrifice of American veterans and their families through the Helping Our Heroes program, which focuses on hiring initiatives, career development and strengthening the community and family support systems veterans rely on every day.
Proven, Execution-Oriented Management Team and Culture
We are an iconic American food company with a management team based in Smithfield, Virginia. We employ approximately 34,000 people in the United States and approximately 2,500 people in Mexico. Our energetic and highly experienced management team, whose dedication and commitment to our mission permeates throughout our business, has made us one of the world’s foremost protein companies, sets the tone for our success and drives the agility necessary to continue to transform Smithfield into a leading packaged food company. We foster a culture of responsibility, operational excellence and innovation that serves as the foundation for the transformation in our business.
12
C. Shane Smith, President and Chief Executive Officer since 2021, is a veteran of our company and has served in a wide range of roles during his 21-year tenure. He previously served as President of Smithfield’s European operations and as our Chief Strategy Officer, and he has held other roles in finance and our Hog Production segment. He has been instrumental in overseeing the continued execution of our “One Smithfield” vision, fortifying our position as a leading food company and improving operational efficiency to enhance market competitiveness.
Mark L. Hall, our Chief Financial Officer, has 26 years of experience in the food industry and leads our finance, accounting, treasury, tax, mergers and acquisitions, data analytics and risk management functions. Since joining Smithfield in 2014, Mark has played a crucial role in developing and executing our strategy, including during his tenure as head of finance within the Packaged Meats segment.
Our senior leadership team has extensive food industry experience. Steven France, Donovan Owens and Kraig A. Westerbeek lead our Packaged Meats, Fresh Pork and Hog Production segments, respectively, and have nearly a century of combined industry experience, including over 80 years of experience at Smithfield. Our leadership, combined with our integrated operating structure, solid financial foundation and the support of over 36,000 employees, create a cohesive and coordinated platform to further Smithfield’s growth as a leading food company creating value for a range of stakeholders.
Our Growth Strategies
Since the last time we were a public company in 2013, we have grown sales to $14.6 billion while significantly improving our profitability and leverage position. The strategic initiatives we are executing across our segments are complemented and enabled by our strong balance sheet and ongoing operational investments, positioning us for future growth.
Drive Growth of Packaged Meats
Our Packaged Meats segment is core to our growth strategy and has been a major driver in transforming our business since 2014. We have methodically shifted our business mix to focus on this higher-margin segment over time. The segment contributed 58% of our sales and 109% of our overall operating profit for the nine months ended September 29, 2024.
We plan to accelerate the growth of our Packaged Meats segment through several strategic initiatives, including:
•continuing to shift our portfolio toward a higher mix of value-added and premium products, such as:
•converting one-time seasonal commodity bone-in ham purchase occasions to increased unit sales of everyday, convenient products such as quarter-weight ham, Anytime Favorites ham and Prime Fresh sliced lunch meat, which is underscored by our ability to generate a 19% increase in ham units sold from 2019 to 2023 while volume increased only by 2% for that same period; and
•increasing penetration of higher-margin dry sausage products through expanding distribution points and manufacturing capacity, as evidenced by a 29% increase in dry sausage units sold from 2019 to 2023 and the recent acquisition of a dry sausage plant;
•harnessing our powerful brands to continue to expand product offerings and drive awareness, loyalty and increased market share;
•leveraging the breadth of our platform and national and specialty brands to further penetrate dayparts and households;
•expanding in under-indexed geographical locations and moving into new categories;
•attracting new consumers, particularly younger demographics, through product and packaging innovation and effective and appealing marketing strategies while maintaining our promise to consumers to offer high-quality products for every budget; and
13
•deepening our presence across our distribution channels through our integrated sales force, which leverages our scale and breadth to provide a unified, reliable and consistent customer experience.
We believe that these proven strategies will drive profitable organic growth in our Packaged Meats segment. As an example, we see significant potential for our Packaged Meats segment to generate continued growth through our distribution expansion opportunities across brands to expand unit count within our existing product portfolio.

Further Enhance Fresh Pork
We continually seek greater efficiencies as we manufacture and market fresh pork products. Our capabilities and supply chain allow us to provide differentiated products and high service levels to our customers. We deliver a high-quality, consistently available supply to our Packaged Meats segment and maximize the value of our raw materials. We will seek to enhance the profitability of our Fresh Pork segment by:
•maximizing the value of each hog and expanding use of raw materials, including unprocessed fresh and value-added pork, snacks, pharmaceuticals and pet food treats and ingredients;
•capitalizing on export markets as an outlet for increasing the value of raw materials through whole-hog utilization, and appealing to differentiated, global tastes and preferences;
•leveraging our relationship with WH Group to inform product development opportunities for the Asian market and to benefit from WH Group’s distribution network; and
•appealing to ever-changing consumer preferences and demand for flavor enhancements through ongoing product innovation.
As we seek to grow our fresh pork business profitably, we remain committed to demonstrating that profitability can go hand-in-hand with sustainable operations. We will further our mission of producing good food the right way by seeking new and unique ways to use our raw materials.
Continue Investing in Innovation
We will continue to invest in product, packaging and operational innovations in our Packaged Meats and Fresh Pork segments to drive growth, enhance our profitability and expand our total addressable market. We are focused
14
on strengthening relationships with customers and consumers by being first-to-market with new products and solutions.
Within our branded packaged meats portfolio, we are introducing more value-added and premium innovations. We see a significant opportunity to increase distribution of our innovative Smithfield Prime Fresh packaged lunch meat offering. Smithfield Prime Fresh embodies the quality of bulk deli meat but is displayed in the packaged lunch meat section of the retail wall. This enables our retail partners to increase average revenue per pound and reduce in-store labor costs while providing a convenient lunch meat option for consumers.
In addition, our Smithfield Double Thick/Double Smoked bacon and Smithfield Maple Thick Cut bacon demonstrate our ability to introduce premium, higher-margin offerings with new cut and flavor characteristics. These products sell at a higher velocity than the category average.
In the Fresh Pork segment, we are investing in value-added products and adding new cuts and flavors, such as Sweet & Smokey BBQ, Chipotle and Lemon & Garlic marinated fresh pork loin filet.
Innovation does not stop with our products. In our plants, we are committed to advancing automation and strategically redeploying labor. On our farms, innovative approaches to animal nutrition are increasing feed conversion and lowering our cost basis. Byproducts that were once considered waste are now used to create renewable natural gas through our biogas joint ventures and lifesaving pharmaceuticals through our bioscience business.
Our culture of responsibility, operational excellence and innovation serves as a catalyst for our ongoing business transformation. We conduct company-wide competitions and recognition events for grassroots projects that drive innovation throughout our organization. By fostering this entrepreneurial spirit, we will seek to drive growth in our top- and bottom-line results and build on Smithfield’s competitive advantage.
Optimize Our Operations and Supply Chain to Decrease Our Cost Basis
We have implemented many initiatives over the past several years to reduce costs and realize operational efficiencies. These initiatives have enabled us to offset inflation and enhance margins across our entire business.
We continue to optimize the size of our company-owned hog production operations and procure a greater mix of hogs from independent suppliers with market-based supply agreements. Additionally, we continue to implement cost-saving initiatives in our retained hog production operations to improve our cost structure.
We employ automation in all of our plants to redeploy labor to higher value tasks, improve yields and drive efficiency by reducing complexity to lower our cost basis and help offset inflationary pressures.
In our logistics and distribution network, we have reduced transportation and warehousing costs through transportation efficiencies, maximizing utilization of our storage and trucking assets, improving supply and demand
15
planning and optimizing inventory levels. These actions increase profitability and improve customer service levels, which we believe is essential to being a supplier of choice.
We remain committed to optimizing our operations and supply chain through a series of targeted actions, which in the past have supported meaningful margin improvement:
| Hog Production | Packaged Meats & Fresh Pork | Logistics | ||||||
| “Reform and Rationalize” | “Best-In-Class Lean Manufacturing” | “Improve Service at Optimal Cost” | ||||||
•Optimize number of company-owned hogs •Improve herd health •Transform genetics •Drive procurement and nutrition savings | •Offset inflation with cost savings programs •Employ automation •Improve yields and maximize raw material usage •Reduce complexity | •Be the supplier of choice •Maximize assets (reduce transport miles, warehouse utilization) •Improve supply and demand planning •Optimize inventory levels | ||||||
Implementation of our growth strategies requires us, in particular, to continue to grow our Packaged Meats segment and to reduce our exposure to commodity price volatility through optimization and continued reduction of the size of our company-owned hog production operations. For information about challenges that we face in implementing this strategy and our other growth strategies, please see “Risk Factors—Risks Relating to Our Business and Operations—Our results of operations are cyclical and could be adversely affected by fluctuations in the commodity prices for meat, livestock (primarily hogs) and feed ingredients,” and “—Disruption of our supply chain could adversely affect our business, financial condition and results of operations.”
Execute Synergistic M&A in North America
We intend to execute opportunistic, complementary M&A to bolster our value-added product portfolio and production capacity in North America. While acquisitions are not a primary growth driver for us, our team is experienced in identifying strategic acquisition targets and integrating them successfully into our business. We believe our integration expertise allows us to capture both cost synergies and incremental revenue opportunities. We will remain disciplined in our acquisition approach and maintaining our investment grade ratings, while pursuing opportunities that we believe will prove accretive to earnings and enhance our operational profile. For example, we recently acquired a dry sausage plant in Nashville, Tennessee from Cargill Meat Solutions Corporation, or Cargill, which is strategically located and offers important capacity for some of our fast-growing, higher margin packaged meats products. This acquisition will help serve the growing demand for high-quality pepperoni, deli, charcuterie and other dry sausage products.
Recent Developments
Murphy Family Farms Investment
On December 27, 2024, we became a member of a North Carolina-based company, Murphy Family Farms LLC, by contributing $3 million in cash in exchange for a 25% minority interest. We additionally sold approximately 150,000 sows located on company-owned and contract farms in North Carolina to Murphy Family Farms. On December 30, 2024, we sold the commercial hog inventories associated with such sows to Murphy Family Farms. Murphy Family Farms is now a hog supplier to us and will supply approximately 3.2 million hogs annually. We will supply animal feed and provide certain support services to Murphy Family Farms.
VisionAg Hog Production Investment
On December 20, 2024, we entered into an agreement to become a member of a North Carolina-based company, VisionAg Hog Production, LLC, whereby we will contribute $450,000 in cash in exchange for a 9% minority interest in VisionAg Hog Production, with the existing owner retaining a 91% interest. As part of the agreement, we will sell to VisionAg Hog Production approximately 28,000 sows and the associated commercial hog
16
inventories located on certain company-owned and contract farms in North Carolina. VisionAg Hog Production will become a hog supplier to us, expected to supply approximately 600,000 hogs annually. In addition, we will supply animal feed and provide certain support services to VisionAg Hog Production. The transaction is expected to close during the first quarter of 2025. Closing of the transaction is subject to satisfaction of customary closing conditions.
Sale of Utah Hog Production Assets.
On December 17, 2024, we sold our hog production assets in Utah, excluding the live animals, for $58 million. The transaction resulted in a gain of $32 million, which was recognized in operating gains in the fourth quarter of fiscal year 2024. As part of the agreement, we will lease back certain farm and feed properties, which we will continue to operate.
Sale of Missouri Hog Farms
On November 26, 2024, we sold certain hog farms in Missouri, most of which were previously inactive, for $32 million. The transaction resulted in a loss of $4 million, which was recognized in cost of sales in the fourth quarter of fiscal year 2024.
Preliminary Results for the Three Months Ended December 29, 2024
We have set forth below our preliminary estimates of selected unaudited financial information for the three months ended December 29, 2024 and actual unaudited financial results for the three months ended December 31, 2023. We have provided estimates and ranges of certain preliminary results below because our closing procedures for the three months ended December 29, 2024 are not yet complete.
Our preliminary estimates of the financial results set forth below are based solely on information available to us as of the date of this prospectus and are inherently uncertain and subject to change. Our actual results for the three months ended December 29, 2024 remain subject to the completion of management’s final review and our other closing procedures as well as the effects of potential subsequent events. Accordingly, you should not place undue reliance on these preliminary financial results set out below, which may differ from actual results. See “Forward-Looking Statements,” “Management’s Discussion and Analysis of Financial Condition and Results of Operations” and the consolidated financial statements and accompanying notes included elsewhere in this prospectus.
The preliminary estimated unaudited financial results included in this prospectus have been prepared by, and are the responsibility of, our management. Our independent registered public accounting firm, Ernst & Young LLP, has not audited, reviewed, compiled or performed any procedures with respect to the preliminary financial results. Accordingly, Ernst & Young LLP does not express an opinion or any other form of assurance with respect thereto.
The preliminary estimates and actual results provided below do not represent a comprehensive statement of our financial results and should not be viewed as a substitute for full quarterly financial statements prepared in accordance with GAAP. In addition, the preliminary estimates and actual results provided below are not necessarily indicative of the results to be achieved in any future period. The unaudited actual results for the three months ended December 31, 2023 have been derived from the books and records of our company. For additional information regarding the presentation of our financial information, see “Note 1: Summary of Significant Accounting Policies—Basis of Presentation,” in the consolidated financial statements and accompanying notes included elsewhere in this prospectus.
Additionally, the estimates and actual results reported below include certain financial measures that are not required by, or presented in accordance with, GAAP. Management believes that investors’ understanding of our performance is enhanced by including these non-GAAP financial measures as a reasonable basis for comparing our ongoing results of operations. These non-GAAP financial measures have limitations as analytical tools, are not measurements of our performance under GAAP and should not be considered as alternatives to net income or any other performance measures derived in accordance with GAAP and should not be used by investors or other users of our financial statements in isolation for formulating decisions, as such non-GAAP measures exclude a number of important cash and non-cash charges. A reconciliation of EBITDA, Adjusted EBITDA and Adjusted EBITDA Margin to net income and net income margin is provided below. See also “Management’s Discussion and Analysis
17
of Financial Condition and Results of Operations—Non-GAAP Measures.” You should be aware that our presentation of these and other non-GAAP financial measures in this prospectus may not be comparable to similarly titled measures used by other companies.
The following table reflects certain preliminary results for the three months ended December 29, 2024 and actual results for the three months ended December 31, 2023:
| Three Months Ended | |||||||||||||||||
December 29, 2024 (estimated) | December 31, 2023 (actual) | ||||||||||||||||
| Low | High | ||||||||||||||||
| (in millions except margin data) | |||||||||||||||||
| Consolidated Statements of Income Data: | |||||||||||||||||
| Sales | $ | $ | $ | 3,998 | |||||||||||||
| Gross profit | 285 | ||||||||||||||||
| Operating profit (loss) | (116) | ||||||||||||||||
| Net income (loss) from continuing operations | $ | $ | (131) | ||||||||||||||
| Net income (loss) margin from continuing operations | % | % | (3.3) | % | |||||||||||||
| Consolidated Balance Sheet Data (at end of period): | |||||||||||||||||
| Cash and cash equivalents | $ | $ | $ | 687 | |||||||||||||
Working capital (1) | 2,470 | ||||||||||||||||
| Total assets | 13,317 | ||||||||||||||||
| Current portion of long-term debt and finance lease obligations | 27 | ||||||||||||||||
| Long-term debt and finance lease obligations | 2,006 | ||||||||||||||||
| Total shareholder’s equity | 7,241 | ||||||||||||||||
| Non-GAAP Financial Measures: | |||||||||||||||||
| EBITDA from continuing operations | $ | $ | $ | (24) | |||||||||||||
| Adjusted EBITDA from continuing operations | $ | $ | $ | 279 | |||||||||||||
| Adjusted EBITDA margin from continuing operations | % | % | 7.0 | % | |||||||||||||
________________
(1)We define working capital as current assets less current liabilities.
For the three months ended December 29, 2024, we estimate that our sales will range from $ million to $ million, as compared to $3,998 million for the three months ended December 31, 2023. Such was primarily due to .
For the three months ended December 29, 2024, we estimate that our gross profit will range from $ million to $ million, as compared to a gross profit of $285 million for the three months ended December 31, 2023. Such was primarily due to .
For the three months ended December 29, 2024, we estimate that our operating profit will range from $ million to $ million, as compared to an operating loss of $116 million for the three months ended December 31, 2023. Such was primarily due to .
For the three months ended December 29, 2024, we estimate that our net income (loss) from continuing operations will range from $ million to $ million, as compared to a net loss from continuing operations of $131 million for the three months ended December 31, 2023. Such was primarily due to .
18
The following table reflects certain preliminary segment results for the three months ended December 29, 2024 and actual results for the three months ended December 31, 2023:
| Three Months Ended | |||||||||||||||||
December 29, 2024 (estimated) | December 31, 2023 (actual) | ||||||||||||||||
| Low | High | ||||||||||||||||
| (in millions except margin data) | |||||||||||||||||
| Segment Sales: | |||||||||||||||||
| Packaged Meats | $ | $ | $ | 2,404 | |||||||||||||
| Fresh Pork | 1,836 | ||||||||||||||||
| Hog Production | 819 | ||||||||||||||||
Other (1) | 178 | ||||||||||||||||
| Intersegment | (1,240) | ||||||||||||||||
| Consolidated | $ | 3,998 | |||||||||||||||
| Segment Profit: | |||||||||||||||||
| Packaged Meats | $ | $ | $ | 306 | |||||||||||||
| Fresh Pork | 45 | ||||||||||||||||
| Hog Production | (127) | ||||||||||||||||
Other (1) | 13 | ||||||||||||||||
________________
(1)Consists of our Mexico and Bioscience operations.
Segment Sales
Packaged Meats sales for the three months ended December 29, 2024 by approximately $ million compared to the three months ended December 31, 2023, primarily attributable to .
Fresh Pork sales for the three months ended December 29, 2024 by approximately $ million compared to the three months ended December 31, 2023, primarily attributable to .
Hog Production sales for the three months ended December 29, 2024 by approximately $ million compared to the three months ended December 31, 2023, primarily attributable to .
Segment Profit
Packaged Meats segment profit for the three months ended December 29, 2024 by approximately $ million compared to the three months ended December 31, 2023, primarily attributable to .
Fresh Pork segment profit for the three months ended December 29, 2024 by approximately $ million compared to the three months ended December 31, 2023, primarily attributable to .
Hog Production segment profit for the three months ended December 29, 2024 by approximately $ million compared to the three months ended December 31, 2023, primarily attributable to .
Segment profit from our Other segment operations for the three months ended December 29, 2024 by approximately $ million compared to the three months ended December 31, 2023, primarily attributable to .
Non-GAAP Measures
EBITDA, Adjusted EBITDA and Adjusted EBITDA Margin are non-GAAP measures that should not be considered in isolation or as a substitute for other financial measures calculated and presented in accordance with
19
GAAP. For our definitions of EBITDA, Adjusted EBITDA and Adjusted EBITDA Margin and information about how and why we use these non-GAAP measures, see “Management’s Discussion and Analysis of Financial Condition and Results of Operations—Non-GAAP Measures.”
The following table provides a preliminary reconciliation of preliminary estimated net income, the most directly comparable financial measure calculated in accordance with GAAP, to preliminary estimated EBITDA, Adjusted EBITDA and Adjusted EBITDA Margin for the three months ended December 29, 2024, and a reconciliation of actual net income and actual net income margin to actual EBITDA, Adjusted EBITDA and Adjusted EBITDA Margin for the three months ended December 31, 2023:
| Three Months Ended | |||||||||||||||||
December 29, 2024 (estimated) | December 31, 2023 (actual) | ||||||||||||||||
| Low | High | ||||||||||||||||
| (in millions except margin data) | |||||||||||||||||
| Net income (loss) from continuing operations | $ | $ | $ | (131) | |||||||||||||
| Interest expense, net | 17 | ||||||||||||||||
| Income tax expense (benefit) | $ | (42) | |||||||||||||||
| Depreciation and amortization | 131 | ||||||||||||||||
| EBITDA from continuing operations | $ | $ | $ | (24) | |||||||||||||
Litigation Charges (1) | 196 | ||||||||||||||||
West Coast Exit and Hog Production Reform (2) | 106 | ||||||||||||||||
| Incremental costs from destruction of property | 2 | ||||||||||||||||
| Adjusted EBITDA from continuing operations | $ | $ | $ | 279 | |||||||||||||
| Net income (loss) margin from continuing operations | % | % | (3.3) | % | |||||||||||||
| Adjusted EBITDA margin from continuing operations | % | % | 7.0 | % | |||||||||||||
________________
(1)Consists of accruals for the antitrust price-fixing and antitrust wage-fixing litigation matters that are described in “Note 17: Regulation and Contingencies” in the consolidated financial statements and accompanying notes included elsewhere in this prospectus.
(2)Consists of costs related to the closure of our Vernon, California processing facility, the sale or closure of certain farms in Arizona, California, Missouri and Utah and certain residual operating and restructuring expenses, including the termination of a number of agreements with contract farmers workforce reduction, due to discontinuation of operations in the West Coast and efforts to improve the cost structure of our Hog Production segment.
Summary of Risk Factors
Investing in our common stock involves a high degree of risk. You should carefully consider the risks described in “Risk Factors” before making a decision to invest in our common stock. If any of these risks actually occurs, our business, consolidated results of operations and consolidated financial condition, including cash flows, may be materially adversely affected. In such case, the trading price of our common stock may decline and you may lose part or all of your investment. Below is a summary of some of the principal risks we face.
•Our results of operations are cyclical and could be adversely affected by fluctuations in the commodity prices for meat, livestock (primarily hogs) and feed ingredients.
•Disruption of our supply chain could adversely affect our business, financial condition and results of operations.
•An inability to realize savings and efficiency gains could adversely affect profitability and we may be unable to achieve any or all of our financial and operational targets.
20
•The food industry in which we operate is highly competitive, and our inability to compete successfully, or the effects of such competition, could adversely affect our business, financial condition and results of operations.
•Changes in consumer preferences and failure to maintain favorable consumer perception of our brands and products could negatively impact our business.
•Outbreaks of disease among or attributed to livestock can significantly affect production, the supply of raw materials, demand for our products and our business.
•Our operations are subject to the general risks associated with the food industry, including perceived or real health risks related to our products or the food industry generally and risks associated with government regulations.
•If our products become contaminated, we may be subject to product liability claims and product recalls. Such product liability claims or product recalls can adversely affect our business reputation, expose us to increased scrutiny by federal and state regulators and may not be covered by insurance.
•Any disruption of operations at one or more of our production facilities, distribution centers or cold storage facilities, including as a result of natural disasters, public health crises, political crises and instability, civil unrest and other catastrophic events or events outside of our control, could adversely affect our business, financial condition and results of operations.
•Our reliance on third-party service providers can have an adverse effect on our business.
•Due to seasonality or changes in our promotional activities, our revenue and operating results may vary from quarter to quarter.
•Significant increases in the cost of distribution could adversely affect our business, financial condition and results of operations.
•We are increasingly dependent on information technology, and our business and reputation could suffer if we are unable to protect our information technology systems against, or effectively respond to, cyberattacks, other cyber-incidents or security breaches or if our information technology systems are otherwise disrupted.
•We are subject to risks associated with our international sales.
•The consolidation of customers and/or the loss of our customers could adversely impact our business.
•We face risks associated with the long-term trend toward increased activism against companies in the food products industry.
•We are subject to extensive governmental regulations, which require significant compliance expenditures.
•Governmental authorities may take further action restricting our ability to produce and/or sell livestock or adopt new regulations impacting our production or processing operations, which could adversely affect our business.
•We are, and could become, subject to legal proceedings and regulatory investigations that may result in significant expenses, fines and reputational damage.
•Government antitrust and foreign investment policies and regulations may limit our strategic growth opportunities, including certain acquisitions and joint ventures.
•Climate change, or legal, regulatory, voluntary or market measures to address climate change, may negatively affect our business, operations or reputation.
21
•We will be a “controlled company” within the meaning of the rules of Nasdaq and, as a result, qualify for, and intend to rely on, exemptions from certain corporate governance requirements.
•You will not have the same protections afforded to shareholders of other companies that are subject to such requirements.
Corporate History
Smithfield Foods, based in Virginia since its founding in 1936, started as a pork processing operation called The Smithfield Packing Company. Through a series of acquisitions beginning in the 1980s, we have become the largest fresh pork processor in the United States. In 2013, we were acquired by Hong Kong-based Shuanghui International Holdings Limited, which subsequently changed its name to WH Group Limited, and we are currently its indirect wholly owned subsidiary. WH Group’s shares are publicly traded on The Stock Exchange of Hong Kong Limited.
Relationship with WH Group
Upon completion of this offering, WH Group will continue to own % of the total voting power of our outstanding shares of common stock (or % if the underwriters exercise in full their option to purchase additional shares). Accordingly, WH Group will generally be able to control, whether directly or indirectly through its ability to remove and elect directors, and subject to applicable law, substantially all matters affecting us. See “Risk Factors—Risks Relating to Our Relationship with WH Group—WH Group controls us, and their interests may conflict with ours or yours in the future” for more information.
Corporate Reorganization
Prior to August 26, 2024, we conducted business operations in the United States, Mexico and Europe. On August 26, 2024, we completed the European Carve-out, pursuant to which we transferred our operations in Europe to WH Group. Following the European Carve-out, we principally engage in operations in the United States and Mexico. Unless otherwise expressly stated or the context otherwise requires, the description of our business included in this prospectus reflects our business after giving effect to the European Carve-out. The results of operations, assets and liabilities, and cash flows of the European operations as presented in our consolidated financial statements have all been condensed into separate line items and presented in the consolidated statements of income, the consolidated balance sheets and the consolidated statements of cash flows as discontinued operations, and this treatment has been applied retrospectively to all periods presented. Unless otherwise expressly stated, the financial information of our company included in this prospectus reflect the historical financial statements of Smithfield Foods, which has been an indirect, wholly owned subsidiary of WH Group, as retroactively adjusted to remove the impact of the discontinued operations.
Corporate Information
Our principal offices are located at 200 Commerce Street, Smithfield, Virginia 23430. Our telephone number is 757-365-3000, and our corporate website address is www.smithfieldfoods.com. Upon completion of this offering, we are required to file annual, quarterly and current reports, proxy statements and other information with the SEC. You may obtain any of the documents filed by us with the SEC at no cost from the SEC’s website at http://www.sec.gov. Any information contained on, or that can be accessed through, our website or the SEC’s website is not incorporated by reference into, nor is it in any way part of this prospectus and should not be relied upon in connection with making any decision with respect to an investment in our securities.
22
THE OFFERING
Common stock offered by us | shares. | |||||||
Common stock offered by the selling shareholder | shares (or shares if the underwriters exercise in full their option to purchase additional shares of our common stock). | |||||||
Common stock to be held by the selling shareholder upon completion of this offering | shares (or shares if the underwriters exercise in full their option to purchase additional shares of our common stock). | |||||||
Option to purchase additional shares of common stock | The selling shareholder has granted the underwriters a 30-day option from the date of this prospectus to purchase up to additional shares of our common stock. Such shares are offered by the selling shareholder at the initial public offering price listed on the cover page of this prospectus, less underwriting discounts and commissions. | |||||||
Use of proceeds | We estimate that the net proceeds to us from this offering will be approximately $ based on an assumed initial public offering price of $ per share of our common stock, which is the midpoint of the estimated public offering price range set forth on the cover page of this prospectus, after deducting the underwriting discounts and commissions and estimated offering expenses payable by us. Certain of the shares of common stock offered by this prospectus are being sold by the selling shareholder. We will not receive any of the proceeds from the sale of shares by the selling shareholder in this offering, including any such proceeds received by the selling shareholder from any exercise by the underwriters of their option to purchase additional shares. For information about the selling shareholder, see “Principal and Selling Shareholders.” We intend to use the net proceeds to us from this offering for general corporate purposes, including capital investments in infrastructure, automation and capacity expansion. See “Use of Proceeds.” | |||||||
23
Controlled company | Upon completion of this offering, WH Group will own % of the voting power of our shares of common stock eligible to vote in the election of our directors (or % if the underwriters exercise in full their option to purchase additional shares of our common stock). As a result, we will be a “controlled company” as defined under the corporate governance rules of Nasdaq and, therefore, will qualify for, and intend to rely on, exemptions from certain corporate governance requirements of Nasdaq. See “Management—Controlled Company Exemption.” There is no single shareholder or group of shareholders which owns 50% or more of the voting power of WH Group as of the date of this prospectus. As a result, WH Group would not be considered a controlled company within the meaning of the corporate governance standards of Nasdaq. | |||||||
| As long as WH Group beneficially owns a majority of the voting power of our outstanding shares of common stock, WH Group will generally be able to control the outcome of matters submitted to our shareholders for approval, including the election of directors, without the approval of our other shareholders. See “Risk Factors—Risks Relating to Our Relationship with WH Group—WH Group controls us, and their interests may conflict with ours or yours in the future.” | ||||||||
Dividend policy | We have historically paid dividends to WH Group annually, along with special dividends in some years. We initially expect to pay annual dividends in an amount equal to 50% of our net income, subject to the discretion of the board. The payment of any dividends in the future to our shareholders, and the timing and amount thereof, will fall within the discretion of the board. The board’s decisions regarding the payment of dividends will depend on many factors, such as our financial condition, earnings, capital requirements, debt service obligations, restrictive covenants in the agreements governing our indebtedness, general economic business conditions, industry practice, legal requirements and other factors that the board may deem relevant. We cannot assure you that we will pay our anticipated dividend in the same amount or frequency, or at all, in the future. You should not purchase shares of our common stock with the expectation of receiving cash dividends. See “Risk Factors—Risks Relating to This Offering—We expect to continue paying regular dividends to our shareholders, but our ability to do so is subject to the discretion of our board and may be limited by our financial condition, our credit facilities, the indentures governing the notes we previously issued and applicable law” and “Dividend Policy.” | |||||||
24
Directed share program | At our request, the underwriters have reserved up to 2% of the shares of our common stock offered by this prospectus for sale, at the initial public offering price, to directors, officers and certain employees of our company. If purchased by our directors or officers, these shares will be subject to certain lock-up agreements. See “Underwriting” for a description of these lock-up agreements. The number of shares of our common stock available for sale to the general public will be reduced to the extent these individuals purchase such reserved shares. Any reserved shares that are not so purchased will be offered by the underwriters to the general public on the same basis as the other shares offered by this prospectus. Morgan Stanley will administer our directed share program. See “Underwriting—Directed Share Program.” | |||||||
Risk factors | Investing in shares of our common stock involves a high degree of risk. See “Risk Factors” for a discussion of factors you should carefully consider before investing in shares of our common stock. | |||||||
Trading symbol | We have applied to list our shares of common stock on the Nasdaq Global Select Market under the symbol “SFD”. | |||||||
Assured entitlement distribution | Pursuant to Practice Note 15 under The Rules Governing The Listing of Securities on The Stock Exchange of Hong Kong Limited, in connection with this offering, WH Group is required to make available to its shareholders an “assured entitlement” to a certain portion of shares of our common stock. WH Group intends to effect the “assured entitlement” by providing to its shareholders a “distribution in specie” of a certain portion of shares of our common stock held by WH Group, which we refer to as the Assured Entitlement Distribution. The distribution will be made without any consideration being paid by WH Group’s shareholders. WH Group’s shareholders who are entitled to fractional shares of our common stock who elect to receive cash in lieu of shares of our common stock, who are located in the United States or are U.S. persons, or are otherwise ineligible holders, will only receive cash in the Assured Entitlement Distribution. WH Group currently intends that the Assured Entitlement Distribution will represent approximately 0.35% to 0.45% of our outstanding shares following the completion of this offering. The Assured Entitlement Distribution will only be made if this offering is completed. The distribution in specie of shares of our common stock by WH Group is not part of this offering. | |||||||
Unless otherwise indicated or the context otherwise requires, references in this prospectus to the number and percentage of shares of our common stock to be outstanding upon completion of this offering are based on shares of
25
our common stock outstanding as of December 29, 2024. This amount, and, unless otherwise indicated, other information presented in this prospectus, exclude:
• shares of common stock reserved for issuance under our equity incentive plan under which no awards had been granted prior to the pricing of this offering; and
• shares of common stock reserved for issuance under our employee stock purchase plan.
In connection with the pricing of this offering, we intend to grant to certain of our employees and certain directors and employees of WH Group
•options to purchase shares with an exercise price equal to the initial public offering price; and
• restricted stock units.
Of these grants, our directors and executive officers will receive options to purchase shares and restricted stock units.
The foregoing numbers of options and restricted stock units to be granted are estimates calculated using the midpoint of the estimated public offering price range set forth on the cover of this prospectus as applied to the intended aggregate grant date value of the awards, and the final numbers to be granted will be calculated using the initial public offering price.
Unless otherwise indicated, the information presented in this prospectus:
•gives effect to a -for- stock split of our common stock effected on ;
•gives effect to the adoption of our amended and restated articles of incorporation and our amended and restated bylaws, which will be in effect prior to the completion of this offering and forms of which are filed as exhibits to the registration statement of which this prospectus is a part;
•assumes an initial public offering price of $ per share of our common stock, which is the midpoint of the estimated public offering price range set forth on the cover page of this prospectus;
•assumes no purchase of shares of our common stock in this offering, including pursuant to our directed share program, by our directors, officers or existing shareholder; and
•assumes no exercise of the underwriters’ option to purchase additional shares of our common stock.
26
SUMMARY HISTORICAL CONSOLIDATED FINANCIAL AND OTHER INFORMATION
The following tables set forth summary consolidated financial and other information as of and for the fiscal years ended December 31, 2023, January 1, 2023 and January 2, 2022. The summary consolidated financial information for the fiscal years ended December 31, 2023, January 1, 2023 and January 2, 2022, and as of December 31, 2023 and January 1, 2023 has been derived from our audited consolidated financial statements included in this prospectus. The summary consolidated unaudited financial information for the fiscal nine months ended September 29, 2024 and October 1, 2023 and the summary consolidated balance sheet data as of September 29, 2024 were derived from our unaudited financial statements included elsewhere in this prospectus.
The summary consolidated financial information below is only a summary and should be read in conjunction with “Management’s Discussion and Analysis of Financial Condition and Results of Operations” and our consolidated financial statements and related notes included in this offering memorandum. The summary financial information set forth below does not purport to indicate our financial condition or results of operations as of any future date or for any future period. Totals may be affected by rounding.
| Nine Months Ended (unaudited) | Fiscal Year Ended | ||||||||||||||||||||||||||||
September 29, 2024 | October 1, 2023 | December 31, 2023 | January 1, 2023 | January 2, 2022 | |||||||||||||||||||||||||
| (in millions except per share and share data) | |||||||||||||||||||||||||||||
| Consolidated Statements of Income Data: | |||||||||||||||||||||||||||||
| Sales | $ | 10,190 | $ | 10,642 | $ | 14,640 | $ | 16,199 | $ | 15,009 | |||||||||||||||||||
| Cost of sales | 8,826 | 10,038 | 13,751 | 14,704 | 13,437 | ||||||||||||||||||||||||
| Gross profit | 1,364 | 604 | 889 | 1,495 | 1,572 | ||||||||||||||||||||||||
| Selling, general and administrative expenses | 594 | 643 | 1,050 | 807 | 1,095 | ||||||||||||||||||||||||
| Operating gains | (12) | (99) | (105) | (429) | (44) | ||||||||||||||||||||||||
| Operating profit (loss) | 783 | 60 | (56) | 1,117 | 521 | ||||||||||||||||||||||||
| Interest expense, net | 52 | 59 | 76 | 87 | 93 | ||||||||||||||||||||||||
| Non-operating (gains) losses | (13) | 3 | (3) | (18) | (30) | ||||||||||||||||||||||||
| Income (loss) from continuing operations before income taxes | 745 | (2) | (129) | 1,047 | 458 | ||||||||||||||||||||||||
| Income tax expense (benefit) | 165 | — | (41) | 231 | 97 | ||||||||||||||||||||||||
| (Income) loss from equity method investments | (1) | — | 46 | 6 | (28) | ||||||||||||||||||||||||
| Net income (loss) from continuing operations | $ | 581 | $ | (2) | $ | (133) | $ | 811 | $ | 389 | |||||||||||||||||||
| Weighted average number of shares outstanding - basic and diluted | 1,000 | 1,000 | 1,000 | 1,000 | 1,000 | ||||||||||||||||||||||||
| Net income (loss) attributable to Smithfield per common share from continuing operations | $ | 572,076 | $ | 815 | $ | (138,176) | $ | 799,581 | $ | 387,402 | |||||||||||||||||||
27
| As of September 29, 2024 (unaudited) | As of Fiscal Year Ended | ||||||||||||||||
| December 31, 2023 | January 1, 2023 | ||||||||||||||||
As Adjusted (1) | Actual | ||||||||||||||||
| (in millions) | |||||||||||||||||
| Consolidated Balance Sheet Data: | |||||||||||||||||
| Cash and cash equivalents | $ | 278 | $ | 687 | $ | 547 | |||||||||||
Working capital (2) | 2,212 | 2,470 | 2,954 | ||||||||||||||
| Total assets | 10,650 | 13,317 | 13,847 | ||||||||||||||
| Long-term debt and finance lease obligations | 2,005 | 2,006 | 2,029 | ||||||||||||||
| Total shareholder’s equity | 5,601 | 7,241 | 7,374 | ||||||||||||||
________________
(1)As adjusted reflects the issuance and sale of shares of our common stock by us at an assumed initial public offering price of $ per share, which is the midpoint of the estimated price range set forth on the cover page of this prospectus, after deducting underwriting discounts and commissions and estimated offering expenses payable by us.
(2)We define working capital as current assets less current liabilities.
| Nine Months Ended (unaudited) | Fiscal Year Ended | ||||||||||||||||||||||||||||
September 29, 2024 | October 1, 2023 | December 31, 2023 | January 1, 2023 | January 2, 2022 | |||||||||||||||||||||||||
| (in millions) | |||||||||||||||||||||||||||||
| Consolidated Cash Flows Data: | |||||||||||||||||||||||||||||
| Net cash flows from operating activities of continuing operations | $ | 233 | $ | (6) | $ | 688 | $ | 521 | $ | 755 | |||||||||||||||||||
| Net cash flows from investing activities of continuing operations | (305) | (60) | (194) | 274 | (204) | ||||||||||||||||||||||||
| Net cash flows from financing activities of continuing operations | (290) | (270) | (353) | (567) | (434) | ||||||||||||||||||||||||
Non-GAAP Measures
The table below includes Adjusted Net Income, Adjusted Net Income Margin, EBITDA, Adjusted EBITDA, Adjusted EBITDA Margin, Net Debt, Ratio of Net Debt to Adjusted EBITDA, Adjusted Segment Profit, Adjusted Segment Profit Margin and Free Cash Flow, which are financial measures that are not required by, or prepared in accordance with, GAAP. We present Adjusted Net Income, Adjusted Net Income Margin, EBITDA, Adjusted EBITDA, Adjusted EBITDA Margin, Net Debt, Ratio of Net Debt to Adjusted EBITDA, Adjusted Segment Profit, Adjusted Segment Profit Margin and Free Cash Flow as we believe that the presentation of these non-GAAP financial measures enhances an investor’s understanding of our financial performance. We believe Adjusted Net Income is a useful measure for investors because it excludes the effects of discontinued operations, non-operating gains and losses, and other items that are unusual in nature, infrequent in occurrence or otherwise stem from strategic decisions to restructure our operations. We believe that Adjusted Net Income Margin is a useful measurement of operating profitability for investors for the same reasons we find Adjusted Net Income useful and also because it provides a period-to-period comparison of our after-tax operating performance. We believe EBITDA is a useful measure to our stakeholders because it excludes the effects of financing and investing activities by eliminating interest and depreciation costs to provide a comparable year-over-year analysis. We believe Adjusted EBITDA is a useful measure as it excludes the effect of discontinued operations, non-operating gains and losses, and other items that are unusual in nature, infrequent in occurrence or otherwise stem from strategic decisions to restructure our operations. We believe Adjusted EBITDA Margin is a useful measure as it evaluates overall operating performance, ability to pursue and service possible debt opportunities and possible future investment opportunities. We believe Net Debt is a useful measure as it helps to give investors a clear understanding of our financial position. Net Debt is also used to calculate certain leverage ratios. We believe Ratio of Net Debt to Adjusted EBITDA is a useful measure as it monitors the sustainability of our debt levels and our ability to take on additional debt against Adjusted EBITDA, which is used as an operating performance measure. We believe Adjusted Segment Profit is a useful measure because it provides a more complete understanding of underlying
28
operating results and trends of established, ongoing operations of our segments, excluding the impact of employee retention in tax credits, which were not applicable to periods before 2024. We believe Adjusted Segment Profit Margin is a useful measure for the same reasons we find Adjusted Segment Profit useful. We believe Free Cash Flow is a useful measure as it offers supplemental information and insight regarding the liquidity of our operations and our ability to generate sufficient cash flow to, among other things, repay debt and pursue business opportunities and investments. Although non-GAAP measures such as Adjusted Net Income, Adjusted Net Income Margin, EBITDA, Adjusted EBITDA, Adjusted EBITDA Margin, Net Debt, Ratio of Net Debt to Adjusted EBITDA, Adjusted Segment Profit, Adjusted Segment Profit Margin and Free Cash Flow are frequently used by investors and securities analysts in their evaluations of companies in industries similar to ours, these non-GAAP measures have limitations as analytical tools, are not measurements of our performance under GAAP and should not be considered as alternatives to operating profit, net income or operating cash flow or any other performance measures derived in accordance with GAAP and should not be used by investors or other users of our financial statements in isolation for formulating decisions, as such non-GAAP measures exclude a number of important cash and non-cash charges. A reconciliation of Adjusted Net Income, Adjusted Net Income Margin, EBITDA, Adjusted EBITDA and Adjusted EBITDA Margin to net income and net income margin, Ratio of Net Debt to Adjusted EBITDA to ratio of debt to net income, Net Debt to debt, Adjusted Segment Profit and Adjusted Segment Profit Margin to segment profit and segment profit margin and Free Cash Flow to net cash flows from operating activities is provided in “Management’s Discussion and Analysis of Financial Condition and Results of Operations—Non-GAAP Measures.” You should be aware that our presentation of these and other non-GAAP financial measures in this prospectus may not be comparable to similarly titled measures used by other companies.
| Nine Months Ended (unaudited) | Fiscal Year Ended | ||||||||||||||||||||||||||||
September 29, 2024 | October 1, 2023 | December 31, 2023 | January 1, 2023 | January 2, 2022 | |||||||||||||||||||||||||
| Consolidated GAAP and Non-GAAP Data: | (in millions except for percentages) | ||||||||||||||||||||||||||||
| Net income (loss) from continuing operations | $ | 581 | $ | (2) | $ | (133) | $ | 811 | $ | 389 | |||||||||||||||||||
| Net income (loss) margin from continuing operations | 5.7 | % | — | % | (0.9) | % | 5.0 | % | 2.6 | % | |||||||||||||||||||
| Adjusted net income from continuing operations attributable to Smithfield | $ | 518 | $ | 14 | $ | 132 | $ | 591 | $ | 650 | |||||||||||||||||||
| Adjusted net income margin from continuing operations attributable to Smithfield | 5.1 | % | 0.1 | % | 0.9 | % | 3.7 | % | 4.3 | % | |||||||||||||||||||
| EBITDA from continuing operations | $ | 1,050 | $ | 353 | $ | 329 | $ | 1,569 | $ | 910 | |||||||||||||||||||
| Adjusted EBITDA from continuing operations | $ | 976 | $ | 331 | $ | 610 | $ | 1,197 | $ | 1,257 | |||||||||||||||||||
| Adjusted EBITDA margin from continuing operations | 9.6 | % | 3.1 | % | 4.2 | % | 7.4 | % | 8.4 | % | |||||||||||||||||||
| Cash flows from operating activities from continuing operations | $ | 233 | $ | (6) | $ | 688 | $ | 521 | $ | 755 | |||||||||||||||||||
| Free cash flow from continuing operations | $ | (35) | $ | (249) | $ | 334 | $ | 183 | $ | 548 | |||||||||||||||||||
| Fiscal Year Ended | |||||||||||||||||||||||||||||
| December 31, 2023 | December 28, 2014 | ||||||||||||||||||||||||||||
| (in millions except for ratios) | |||||||||||||||||||||||||||||
| Net income (loss) from continuing operations | $ | (133) | $ | 437 | |||||||||||||||||||||||||
Debt (1) | $ | 2,033 | $ | 2,676 | |||||||||||||||||||||||||
| Cash and cash equivalents | (687) | (378) | |||||||||||||||||||||||||||
29
| Net debt | $ | 1,345 | $ | 2,298 | |||||||||||||||||||||||||
| Ratio of debt to net income (loss) from continuing operations | (15.3x) | 6.1x | |||||||||||||||||||||||||||
| Ratio of net debt to Adjusted EBITDA from continuing operations | 2.2 | x | 2.3x | ||||||||||||||||||||||||||
| Nine Months Ended (unaudited) | Fiscal Year Ended | ||||||||||||||||||||||||||||
September 29, 2024 | October 1, 2023 | December 31, 2023 | January 1, 2023 | January 2, 2022 | |||||||||||||||||||||||||
Segment Results (2) | (in millions) | ||||||||||||||||||||||||||||
| Segment Sales: | |||||||||||||||||||||||||||||
| Packaged Meats | $ | 5,861 | $ | 5,876 | $ | 8,280 | $ | 9,262 | $ | 8,515 | |||||||||||||||||||
| Fresh Pork | 5,871 | 5,996 | 7,832 | 9,190 | 9,145 | ||||||||||||||||||||||||
| Hog Production | 2,220 | 2,499 | 3,317 | 4,456 | 3,866 | ||||||||||||||||||||||||
| Other | 350 | 380 | 559 | 524 | 247 | ||||||||||||||||||||||||
| Intersegment | (4,111) | (4,108) | (5,348) | (7,234) | (6,765) | ||||||||||||||||||||||||
| Consolidated | $ | 10,190 | $ | 10,642 | $ | 14,640 | $ | 16,199 | $ | 15,009 | |||||||||||||||||||
| Segment Profit (Loss) | |||||||||||||||||||||||||||||
| Packaged Meats | $ | 855 | $ | 760 | $ | 1,066 | $ | 1,047 | $ | 879 | |||||||||||||||||||
| Fresh Pork | 196 | 73 | 118 | 32 | (5) | ||||||||||||||||||||||||
| Hog Production | (135) | (627) | (754) | (133) | 69 | ||||||||||||||||||||||||
Other (3) | 18 | (17) | (4) | 53 | 68 | ||||||||||||||||||||||||
| Nine Months Ended September 29, 2024 (unaudited) | Packaged Meats | Fresh Pork | Hog Production | ||||||||||||||||||||||||||
| (in millions except for percentages) | |||||||||||||||||||||||||||||
| Segment profit | $ | 855 | $ | 196 | $ | (135) | |||||||||||||||||||||||
| Employee retention tax credits | (38) | (41) | (8) | ||||||||||||||||||||||||||
| Adjusted segment profit | $ | 816 | $ | 156 | $ | (143) | |||||||||||||||||||||||
| Segment profit margin | 14.6 | % | 3.3 | % | (6.1) | % | |||||||||||||||||||||||
| Adjusted segment profit margin | 13.9 | % | 2.6 | % | (6.4) | % | |||||||||||||||||||||||
________________
(1)Debt is defined as long-term debt and finance lease obligations, including the current portion.
(2)Additional information about our reportable segments is included in “Note 2: Reportable Segments” in the consolidated financial statements and accompanying notes included elsewhere in this prospectus.
(3)Consists of our Mexico and Bioscience operations.
30
RISK FACTORS
Investing in our common stock involves a high degree of risk. You should carefully consider the risks and uncertainties described below, as well as the financial and other information set forth in this prospectus, before deciding to invest in our common stock. If any of the following risks actually occurs, our business, results of operations and financial condition may be materially adversely affected. In such case, the trading price of our common stock could decline, and you may lose all or part of your investment. The risks described below are not the only ones facing us. Additional risks and uncertainties of which we are unaware, or that we currently deem immaterial, also may become important factors that affect us.
Risks Relating to Our Business and Operations
Our results of operations are cyclical and could be adversely affected by fluctuations in the commodity prices for meat, livestock (primarily hogs) and feed ingredients.
We are significantly impacted by the cyclical nature of commodity prices for meat, livestock (primarily hogs) and feed ingredients such as grains, as well as the selling price of our products and competing animal protein products on the market (especially beef and chicken), all of which are determined by constantly changing and volatile market forces of supply and demand. These fluctuations can be significant, as shown in recent years, with average lean hog prices published by the Chicago Mercantile Exchange, Inc., or CME, decreasing from $98 per hundredweight in 2022 to $81 per hundredweight in 2023 and then increasing to $85 per hundredweight in the first nine months of 2024. Further, hog raising costs are largely dependent on the fluctuations of commodity prices for corn, grains, soybean meal, wheat and other feed ingredients. Our Hog Production segment generally generates higher profits when hog prices are high and feed ingredient prices are low, and lower profits (or losses) when hog prices are low and feed ingredient prices are high. When hog prices are lower than our hog production costs, our non-vertically integrated competitors (i.e., those without significant hog production operations) may have a cost advantage over us.
Other factors that may impact commodity prices and our results of operations include, but are not limited to:
•competing demand for feed ingredients, such as competing demand for corn for use in the manufacture of ethanol or other alternative fuels;
•environmental regulations;
•changes in governmental agricultural programs;
•tariffs and other import and export restrictions, such as trade barriers resulting from, among other things, developments in international relations and food safety concerns;
•transportation interruptions or increases in diesel fuel costs;
•an increase in pork processing capacity, adversely impacting fresh meat values;
•adverse weather conditions, including the impact of climate change and weather on our water supply and the availability and pricing of feed ingredients;
•energy prices, including the effect of changes in energy prices on our transportation costs and the cost of feed;
•contamination with mold or bacteria;
•the impact of COVID-19 pandemic and other similar disruptions in the future; and
•labor strikes, industrial accidents, occupational health and safety issues and animal welfare or food safety issues (including the real or perceived outbreak of food-borne illnesses or outbreaks of diseases among livestock).
31
Profitability in our industry is materially affected by the commodity prices of animal feed ingredients, such as grain, corn and soybean meal and wheat. The production of feed ingredients is positively or negatively affected due to various factors, primarily by the global level of supply inventories and demand for feed ingredients, the agricultural policies of the United States and other countries and weather patterns and climatic conditions throughout the world. Market prices for feed ingredients remain volatile. High prices for animal feed ingredients may have a material adverse effect on our operating results. A significant decrease in pork prices for a sustained period of time could have a material adverse effect on our consolidated sales.
Given the volatility of the commodity prices, we have sought to reduce our reliance and exposure to commodity markets by entering into supply contracts that offer price and supply stability and implementing cost-saving programs to offset rising commodity costs. For example, we have been reducing the number of hogs we own and raise and increasing the number of hogs we purchase from contract farmers under market agreements. However, if we are not able to continue to execute and maintain marketing and purchasing contracts with independent growers or supply contracts with our contract farmers on attractive terms, or if our counterparties are unable to perform their obligations under such agreements, our results of operations would be negatively affected.
We attempt to manage certain of these risks through the use of our risk management and hedging programs. However, we may not be effective in doing so and, in any case, these programs may also limit our ability to realize gains from favorable commodity fluctuations. Additionally, a portion of our commodity derivative contracts are marked-to-market, such that the unrealized gains and losses are reported in earnings as incurred. This accounting treatment may cause significant volatility in our earnings. See “Management’s Discussion and Analysis of Financial Condition and Results of Operations—Quantitative and Qualitative Disclosures About Market Risk” and “Note 7: Derivative Financial Instruments” in the consolidated financial statements and accompanying notes for the year ended December 31, 2023 included elsewhere in this prospectus for the effects of derivative instruments on our consolidated statements of income.
Furthermore, we may be unable to price our products to cover increased costs. Competitive considerations and customer resistance to price increases may delay or make us unable to adjust our selling prices. To the extent we are unable to either re-engineer or otherwise offset increased costs or are unwilling or unable to build price increases into a higher quoted price or negotiating higher prices, our margins will be negatively affected. Conversely, when raw materials prices decline, we may receive customer pressure to reduce our sales prices.
Disruption of our supply chain could adversely affect our business, financial condition and results of operations.
The primary raw materials used in our business are hogs, fresh pork, raw beef, poultry and animal feed ingredients, including corn, grains, soybean meal and wheat. Disruption to our raw material supply due to adverse weather conditions, climate change, crop conditions, natural disaster, fire, terrorism, pandemic or epidemic, changes in governmental agricultural programs, strikes, import restrictions, transportation interruptions, increases in diesel fuel costs, increases in handling and storage costs, cold chain market fluctuations, contamination with mold or bacteria, the real or perceived outbreak of food-borne illnesses or outbreak of diseases among livestock, water shortage, industrial accidents and other occupational health and safety issues or other events beyond our control could impair, and in some cases have impaired, our ability to produce and sell our products.
In addition, we rely on specific suppliers for the provision of certain ingredients and materials, including sodium for our hogs and sourcing of carbon dioxide. We purchase most of the seasonings for our Packaged Meats segment from a single company, Saratoga Food Specialties, LLC, or Saratoga, with which we have entered into an exclusivity agreement regarding such seasonings. Saratoga also has a right of first refusal to supply us with any new seasoning or sauce products we need. We believe that we carry sufficient inventory of finished product and seasonings to overcome an interruption in the supply of seasonings from Saratoga; however, this may not be the case if alternate sources are unavailable or inadequate.
Any disruption in supply of ingredients or materials could affect our ongoing operations and our ability to fulfill demand. A disruption in our supply chain may require significant costs and resources to restore and may also force us to buy material at higher prices, which can substantially increase our costs. We may not be able to pass on all or part of the increased costs to customers in the form of price increases, in a timely manner or at all. Even if we are
32
able to increase our selling prices, sustained price increases for our products may lead to sales declines and loss of market share, particularly if our competitors do not increase their prices.
An inability to realize savings and efficiency gains could adversely affect profitability and we may be unable to achieve any or all of our financial and operational targets.
We are currently implementing multiple savings opportunities across the areas of production, procurement, commercial and logistics, which we expect will deliver productivity savings and help us effectively manage margins and profitability. In addition, we have ongoing initiatives to improve profitability and efficiency gains of the Hog Production segment, including genetic transformation, herd health improvements, procurement and nutrition savings.
However, our cost-savings expectations are based upon several assumptions and estimates that are difficult to predict, necessarily speculative in nature and subject to significant business, operational, economic and competitive uncertainties and contingencies. A variety of factors could affect the realization of some or all of the expected cost savings and efficiency gains, including, but not limited to, our anticipated business strategies, our marketing strategies, our product development and licensing strategies, our ability to anticipate and react to business trends, general economic conditions, lack of sustainability in cost savings over time, unexpected costs associated with operating our business and other developments in our industry. The actual results of implementing the various cost savings and efficiency initiatives may differ materially from our current estimates. Moreover, we may not be able to identify or implement further cost savings and efficiency initiatives in the future. In addition, our continued efforts to implement cost savings and efficiency initiatives may divert management attention from the rest of our business and may preclude us from seeking attractive new product opportunities or pursuing other initiatives, any of which may materially and adversely affect our business. We may be unable to achieve or improve all of these cost savings and efficiency gains within the expected timeframe, or at all, and we may incur additional or unexpected costs in order to realize them.
The food industry in which we operate is highly competitive, and our inability to compete successfully, or the effects of such competition, could adversely affect our business, financial condition and results of operations.
The food industry in which we operate is highly competitive. Numerous brands and products compete for shelf space and sales, with competition in our Packaged Meats and Fresh Pork segments based primarily on taste, product quality, nutritional profile and dietary attributes, product availability, convenience, price, brand recognition and loyalty and the ability to identify and satisfy emerging consumer preferences. Our ability to compete effectively depends on our capacity to execute across these criteria.
Although we regularly conduct research and development activities to develop new products that meet our standards for quality and appeal to consumer preferences, the success of our innovation and product development efforts is affected by our ability to anticipate changes in consumer preferences, the technical capability of our employees in developing and testing product prototypes, our ability to comply with applicable governmental regulations, and the success of our management, sales and marketing teams in introducing and marketing new products, including through current and new product categories.
The protein industry is highly competitive. We compete with large multi-brand packaged foods businesses, as well as fresh meat companies, private, category-focused companies and pork processing companies. Our products compete with many other protein sources, including chicken, beef and seafood, but our principal competition comes from other pork processors. Additionally, we face competition for export sales from both domestic and international suppliers.
Some of our competitors have greater scale, marketing resources, name recognition, research and development capabilities and/or other resources (financial and otherwise) than we do, and some of the companies may be more innovative and able to bring new products to market faster and more quickly exploit and serve niche markets or new or burgeoning consumer preferences than us.
There can be no assurance that we will successfully develop and market new products or successfully introduce products in new categories. The development and introduction of new products requires substantial marketing
33
expenditures, which we may be unable to recoup if the new products do not gain widespread market acceptance. If we introduce new or improved products that ultimately do not meet objectives for such products, it could impact our growth, sales and profitability. Any failure to successfully develop, market and launch future products or successfully enter into new product categories may lead to decreased growth, sales and profitability.
Further, our competitors could increase their promotional spending or market and sell their products more successfully than we do. Our competitors could also offer lower prices to customers, which could pressure us to lower prices to our customers and to achieve additional cost savings to offset these reductions. We may be unable to change our cost structure and pricing practices rapidly enough or sufficiently to successfully compete in such an environment.
We may be unable to compete successfully with any or all of these companies. Competitive pressures or other factors could cause us to lose sales, which may require us to lower prices, increase the use of discounting or promotional programs, or increase marketing expenditures, each of which would adversely affect our margins and could result in a decrease in our operating results and profitability.
Changes in consumer preferences and failure to maintain favorable consumer perception of our brands and products could negatively impact our business.
The food industry in general is subject to changing consumer trends, demands and preferences. Trends within the food industry change often, and failure to identify and react to changes in these trends could lead to, among other things, reduced demand and price reductions for our brands and products. We strive to respond to consumer preferences and social expectations, but we may not be successful in our efforts.
We have a number of widely recognized brands with significant value. Maintaining and continually enhancing the value of these brands is critical to the success of our business. Brand value is based in large part on consumer perceptions. Success in promoting and enhancing brand value depends in large part on our ability to provide high-quality products. Brand value could diminish significantly due to a number of factors, including consumer perception that we have acted in an irresponsible manner, adverse publicity about our products (whether or not valid), our failure to maintain the safety and quality of our food products or ingredients (or the food safety system generally), the failure of our products to deliver consistently positive consumer experiences or the products becoming unavailable to consumers.
Prolonged negative perceptions concerning the health implications of certain food products or ingredients or loss of confidence in the food safety system generally could influence consumer preferences and acceptance of our products and marketing programs. Prolonged negative perceptions and failure to satisfy consumer preferences could materially and adversely affect our business, financial condition and results of operations.
The use of social and digital media by consumers has greatly increased the speed and extent that information or misinformation can be shared. Individuals and organizations have in the past used social media platforms to publicize information and perceptions about the food production industry in general and our company in particular. Such publications could damage our reputation. A negative perception by consumers of one or more of our brands or a shift in consumer preferences away from animal-based products may result in reduced sales of our products, which could have a material adverse effect on our business, results of operations and financial condition.
Outbreaks of disease among or attributed to livestock can significantly affect production, the supply of raw materials, demand for our products and our business.
We are subject to risks relating to our ability to maintain animal health and control diseases. Real or perceived livestock health problems could adversely impact our production, our supply of raw materials and consumer confidence in all of our operating segments.
From time to time, we have experienced outbreaks of livestock diseases, and we may experience additional occurrences of livestock disease in the future. For example, there have been recent outbreaks of both high- and low-pathogenic strains of avian influenza in the United States. The outbreaks of both high- and low-pathogenic strains of avian influenza are a fairly common occurrence in Mexico. Adverse publicity concerning any disease or health
34
concern could also cause customers to lose confidence in the safety and quality of our food products. Outbreaks of disease, including African Swine Fever, or ASF, Bovine Spongiform Encephalopathy, Foot and Mouth Disease and Highly Pathogenic Avian Influenza, or HPAI, can have a significant impact on our financial results. In recent years, ASF has impacted hog herds in Asia (including in China), Europe and the Caribbean; and, if an outbreak of ASF were to occur in the United States, our supply of hogs and pork could be materially impacted. In 2024, HPAI was detected in the United States in dairy cattle, wild birds, mammals, and farm workers directly exposed to infected dairy or poultry. The U.S. pork market was significantly impacted by the spreading of Porcine Epidemic Diarrhea Virus in 2014 and Porcine Reproductive and Respiratory Syndrome Virus in 2015, which affected our herds in several regions. The spread of these diseases in the United States reduced hog supplies, leading to higher meat prices. In 2015, the hog herds recovered and supply increase yielded lower market prices. Neither of these diseases or the corresponding fluctuations to market prices had a material adverse impact on our financial condition or results of operations. However, we cannot guarantee that the outbreak of any such diseases would not have a material adverse impact on our financial condition or results of operations in the future.
The outbreak of such diseases could adversely affect our supply of raw materials, increase the cost of production, reduce the number of livestock offspring produced, hamper the growth of livestock to finished size, result in expensive vaccination programs and require in some cases the destruction of infected livestock, any of which could adversely affect our operating margins. Additionally, the real or perceived outbreak of disease may hinder our ability to market and sell products both domestically and internationally. Any real or perceived outbreak of disease, including contamination of other livestock of our competitors, could also reduce consumer confidence in the meat products affected by the particular disease, generate adverse publicity, depress market conditions for our hogs internationally and/or domestically and result in the imposition of import or export restrictions.
Our operations are subject to the general risks associated with the food industry, including perceived or real health risks related to our products or the food industry generally and risks associated with government regulations.
We are subject to risks affecting the food industry generally, including risks posed by the following:
•food spoilage;
•food contamination;
•food allergens;
•consumer nutritional and health-related concerns;
•consumer product liability claims;
•product tampering;
•product labeling errors;
•the expense and possible unavailability of product liability insurance; and
•the potential cost and disruption of a product recall or withdrawal.
Adverse publicity concerning any perceived or real health risk associated with our brands or our products could cause customers to lose confidence in the safety and quality of our food products, which could adversely affect our reputation, business, financial condition and results of operation, particularly as we expand our branded products business. We could also be adversely affected by perceived or real health risks associated with similar products produced by others to the extent such risks cause customers to lose confidence in the safety and quality of such products generally and, therefore, lead customers to opt for other options that are perceived as safe.
Our manufacturing facilities and products, including the processing, packaging, storage, distribution, advertising and labeling of our products, are subject to extensive federal, state and foreign laws and regulations in the food safety area, including regular government inspections and governmental food processing controls. Loss of
35
or failure to obtain necessary permits and registrations could delay or prevent us from meeting current product demand, introducing new products, building new facilities or acquiring new businesses and could adversely affect operating results. If we are found to be out of compliance with applicable laws and regulations, particularly if it relates to or compromises food safety or animal welfare, we could be subject to civil remedies, including fines, injunctions, recalls or asset seizures, as well as potential criminal sanctions, any of which could have a material adverse effect on our business, financial condition, results of operations and prospects. In addition, future material changes in food safety and animal welfare regulations could result in increased operating costs or could be required to be implemented on schedules that cannot be met without interruptions in our operations.
Product liability claims or product recalls can adversely affect our business reputation, expose us to increased scrutiny by federal and state regulators and may not be covered by insurance.
Pork and poultry products may be subject to contamination by foreign materials, exposure to chemicals of concern from packaging or environmental exposure, or disease-producing organisms or pathogens, such as Listeria monocytogenes, Salmonella, Campylobacter and generic E.coli, Yersinia enterocolitica and Staphylococcus aureus. Because these pathogens are generally found in the environment, there is a risk that, as a result of food processing, they could be present in our products. We cannot assure you that our food safety monitoring systems, even when working effectively, will eliminate all such risks related to food safety. These risks cannot be eliminated entirely even with adherence to good manufacturing practices and finished product testing. We license our brand abroad and have little, if any control, over the products sold under such licenses. Any quality issues with such products could cause reputational damage to us. We also have little, if any, control over proper handling once the product has been shipped. Illness and death may result if the pathogens are not eliminated at the further processing, food service or consumer level. Even an inadvertent shipment of contaminated products is a violation of law and may lead to increased risk of exposure to product liability claims, product recalls and increased scrutiny by federal and state regulatory agencies and may have a material adverse effect on our business, reputation and/or prospects. The packaging, marketing and distribution of food products entail an inherent risk of product liability and product recall and the resultant adverse publicity. We may be subject to significant liability if the consumption of any of our products causes injury, illness or death.
We could be required, and in some instances have in the past been required to, recall certain products due to such products being mislabeled, contaminated, spoiled, tampered with or damaged, whether caused by us or someone in our supply chain. A widespread product recall or market withdrawal could result in significant losses due to the cost of a recall or withdrawal, the destruction of product inventory, potential customer claims, lost sales due to the unavailability of product for a period of time. The costs associated with product recalls could be exacerbated by issues encountered in tracing affected products either within our facilities or in the hands of third parties. In addition, such a product recall or withdrawal could also result in adverse publicity, damage to our reputation and a loss of consumer confidence in our products, which could have a material adverse effect on our business results. Any product contamination or mislabeling also could subject us to, and in some instances has subjected us to, product liability claims, adverse publicity or government scrutiny, investigation or intervention, resulting in increased costs and decreased sales as customers lose confidence in the safety and quality of our food products.
In addition, we purchase ingredients, commodities and other raw materials from third-party suppliers. If these materials are alleged or prove to include contaminants that affect the safety or quality of our products or are otherwise rumored to have adverse effects, we may need to find alternate materials for our products, delay production of our products, or discard or otherwise dispose of our products, which could adversely affect our results of operations. Additionally, if this occurs after the affected product has been distributed, we may need to withdraw or recall the affected product and we may experience adverse publicity or product liability claims. We cannot assure you that we will not be required to perform product recalls, or that product liability claims will not be asserted against us, in the future. Any claims that may be made may create adverse publicity that would have a material adverse effect on our ability to market our products successfully or on our business, reputation, prospects, financial condition and results of operations.
Moreover, claims or liabilities of this type might not be covered by our insurance or by any rights of indemnity or contribution that we may have against others. We do not currently maintain any product recall insurance and we
36
cannot be sure that we will not incur claims or liabilities for which we are not insured or that exceed the amount of our insurance coverage. A product liability judgment against us or a widespread product recall could have a material adverse effect on our business, financial condition, results of operations or liquidity. To date, product recalls have not had a material adverse impact on our financial condition or results of operations.
Any disruption of operations at one or more of our production facilities, distribution centers or cold storage facilities, including as a result of natural disasters, public health crises, political crises and instability, civil unrest and other catastrophic events or events outside of our control, could adversely affect our business, financial condition and results of operations.
Our production and distribution network consists of 39 processing plants and five distribution centers that are either company-owned or rented, and numerous third-party cold storage facilities in North America. Any disruption in, or the loss of operations at, one or more of these facilities, even on a short-term basis, could delay or postpone production or distribution of our products, which could adversely affect our business, financial condition and results of operations.
Natural disasters, such as fires, earthquakes, power shortages or outages, floods or monsoons, public health crises, such as pandemics and epidemics, political crises, such as terrorism, war, civil unrest, political instability or other conflict, or other events outside of our control have in the past, and may in the future, adversely impact our results of operations.
Such disruption could be caused by a number of different events, including:
•maintenance outages;
•regulatory actions;
•prolonged power failures;
•equipment or software failure;
•widespread contamination of our equipment;
•fires, floods, earthquakes or other natural disasters; or
•other events beyond our control.
Any material malfunction or prolonged disruption in the operations of any of our facilities, including our manufacturing facilities, farms, distribution facilities, stores of our wholesale partners or the facilities of our suppliers, distributors or any of our other third-party service providers, could prevent us from fulfilling orders to existing customers and could limit our ability to sell products to new customers. Any of these events could adversely affect our business, financial condition and results of operations.
A meaningful portion of our packaged meat and fresh pork products are distributed through our facility in Kansas and disruption to operations at this facility would require us to change our overall distribution activities which would likely have an adverse impact on our operations. We also utilize third-party warehouse and transportation providers through which a meaningful portion of our product is distributed. A disruption in storage or transportation services could be caused by a number of factors, including:
•labor issues;
•port and shipping capacity;
•failure to meet customer standards;
•acts of war;
•terrorism;
37
•fire, earthquakes, extreme temperatures, flooding or other natural disasters; or
•bankruptcy or other financial issues affecting the third-party providers of such services.
A disruption in storage or transportation services could result in an inability to supply materials to our facilities or finished products to our distribution centers or customers. Alternatives may not be available on short notice or could result in higher transportation costs. Any disruption in the distribution chain of our products or an increase in the cost of these services could have a material adverse effect on our business, financial condition and results of operations.
Our reliance on third-party service providers can have an adverse effect on our business.
We rely on third-party service providers for many areas of our business, including transportation and cold storage. Failure by these third parties, including independent growers, to meet their contractual, regulatory and other obligations to us, or our failure to adequately monitor their performance, have in the past resulted in and could in the future result in additional costs to remediate errors made by such service providers. Depending on the function involved, such errors have in the past led to and can in the future lead to business disruption, systems performance degradation, processing inefficiencies or other systems disruptions, the loss of or damage to intellectual property or sensitive data through security breaches or otherwise, incorrect or adverse effects on financial reporting, litigation or remediation costs, damage to our reputation, all of which can adversely affect our business. For example, should the refrigeration system fail at one of our third-party cold storage facilities, we could suffer the loss of some, or all, of our inventory. Should our contract manufacturers go out of business or suffer major equipment failure, we may lose the ability to produce sufficient quantities of our products for a period of time before establishing production with a new manufacturer. Any number of similar failures suffered by our service providers could prove damaging to our ongoing operations and our ability to fulfill demand.
Due to seasonality or changes in our promotional activities, our revenue and operating results may vary from quarter to quarter.
We have experienced, and expect to continue to experience, fluctuations in our quarterly results of operations due to the seasonal nature of our business. Hog supply and consumer purchasing patterns are impacted by seasonal factors, including weather and holidays. Seasonality could cause our results of operations for an interim financial period to fluctuate and not be indicative of our full-year results. Seasonality also impacts relative net sales and profitability of each quarter of the year, both on a quarter-to-quarter and year-over-year basis. If we fail to effectively manage our inventories or fluctuations in business as a result of promotional activities or other factors, seasonality could have a material adverse effect on our business, financial condition and results of operations.
Significant increases in the cost of distribution could adversely affect our business, financial condition and results of operations.
Our distribution costs primarily include freight and cold storage. Significant increases in these distribution costs could adversely affect our business, financial condition and results of operations. We use a core group of contract carriers that have established rates based on mileage to regions or destination states. A fuel surcharge addendum is a component of all rates to offset the fluctuating price of diesel fuel, primarily to limit the contract carrier’s exposure. If these surcharges rise significantly and we do not have effective hedges in place, or if we are unable to pass increased distribution costs on to our customers in the form of higher prices for our products, our business, financial condition and operating results could be adversely affected. In addition, if we increase prices to offset higher transportation and distribution costs, we could experience lower demand for our products, decreased ability to attract new customers and lower sales volumes.
We use in-house and third-party cold storage vendors to store our finished goods. A major component of cold storage operations expense is electricity cost. Any significant increase in electricity rates for the vendor are passed along to us in the form of higher storage rates. If our storage rates or electricity rates for in-house cold storage increase significantly, we may be unable to pass these costs on to our customers, which could adversely affect our business, financial condition and results of operations.
38
We are increasingly dependent on information technology, and our business and reputation could suffer if we are unable to protect our information technology systems against, or effectively respond to, cyberattacks, other cyber-incidents or security breaches or if our information technology systems are otherwise disrupted.
Information technology is an important part of our business operations, and we increasingly rely on information technology systems to manage business data and increase efficiencies in our production and distribution facilities and inventory management processes. We also use information technology to process financial information and results of operations and to comply with regulatory, legal and tax requirements. In addition, we depend on information technology for digital marketing and electronic communications among our facilities, personnel, customers and suppliers. Like other companies, our information technology systems are vulnerable to a variety of disruptions, including, but not limited to, the process of upgrading or replacing software, databases or components thereof, natural disasters, terrorist attacks, telecommunications failures, computer viruses, cyberattacks, hackers, unauthorized access attempts and other security issues. Cyberattacks and other cyber-incidents are occurring more frequently, constantly evolving in nature, becoming more sophisticated and being made by groups and individuals with a wide range of motives and expertise. Our security initiatives and disaster recovery plans to mitigate our exposure to these risks may not be adequate. Any significant failure of our systems, including failures that prevent our systems from functioning as intended or our failure to timely identify or appropriately respond to cyberattacks or other cyber-incidents, could cause transaction errors, processing inefficiencies, loss of customers and sales, have negative consequences on our employees and our business partners, have a negative impact on our operations and business reputation and expose us to liability, litigation and regulatory enforcement actions.
In addition, targeted cyberattacks or those that result from a security incident directed at a third-party vendor that we rely on have in the past created and can in the future create a risk of compromise to our internal systems, products and offerings, which have in the past resulted in and could in the future result in interruptions or delays that could disrupt our business operations. If our supply chain cybersecurity is compromised as a result of third-party action, employee error, malfeasance, stolen or fraudulently obtained log-in credentials or otherwise, our business may be harmed and we could incur significant liabilities. For example, we were informed by the third-party provider for our previously hosted consumer facing website that a security incident occurred on the third-party website hosting provider’s IT systems in which an unauthorized party obtained certain information about certain of our customers who made purchases on its websites.
The costs to address cybersecurity risks or risks on information technology failure, both before and after an incident, have in the past been and could in the future be significant, regardless of whether incidents result or resulted from an attack on us directly, or on third-party vendors upon which we rely. If we are unable to prevent security breaches, we may suffer financial and reputational damage or penalties because of the unauthorized disclosure of confidential information belonging to us or to our business partners, customers, consumers or suppliers. Finally, the disclosure of non-public information through external media channels could lead to the loss of intellectual property or damage our reputation and brand image. Any such incidents could subject us to government investigations and regulatory enforcement actions, litigation, potential liability, and damage to our brand and reputation or otherwise harm our business and operations.
Our operations are subject to the risks associated with acquisitions, investments in joint ventures and divestitures.
From time to time, we review opportunities for strategic growth through acquisitions. We have also pursued and may in the future pursue strategic growth through investment in joint ventures. These acquisitions and investments may involve large transactions or realignment of existing investments. These transactions present financial, managerial and operational challenges, including:
•diversion of management attention from managing our existing business;
•difficulty with integrating businesses, operations, personnel and financial and other systems;
•lack of experience in operating in the geographical or product markets of the acquired business;
•new or additional regulatory requirements;
39
•failure to realize any or all of the anticipated benefits, including cost synergies;
•increased levels of debt potentially leading to associated reduction in ratings of our debt securities and adverse impact on our various financial ratios;
•the requirement that we periodically review the value at which we carry our investments in joint ventures and, in the event we determine that the value at which we carry a joint venture investment has been impaired, the requirement to record a non-cash impairment charge, which charge could substantially affect our reported earnings in the period of such charge, would negatively impact our financial ratios and could limit our ability to obtain financing in the future;
•potential loss of key employees and customers of the acquired business;
•assumption of and exposure to unknown or contingent liabilities of acquired businesses;
•potential disputes with the sellers; and
•for our investments, potential lack of common business goals and strategies with, and cooperation of, our joint venture partners.
Product sales and our manufacturing facilities are subject to the U.S. Department of Agriculture, or the USDA, and the U.S. Food and Drug Administration, or the FDA, regulation in the United States and comparable regulatory requirements outside the United States. Failure to satisfy such regulatory requirements may impact our ability to manufacture and sell such products or may subject us to regulatory or judicial enforcement actions that could be costly and time consuming and could divert the attention of management, as well as negatively impact our reputation and brand. We may experience financial or other setbacks if any of the businesses that we have acquired or may acquire in the future have problems of which we are not aware or liabilities that exceed expectations.
Additionally, from time to time, we may divest businesses that do not meet our strategic objectives or do not meet our growth or profitability targets. We may not be able to complete desired or proposed divestitures on terms favorable to us. Gains or losses from the sales of, or lost operating profit from, those businesses may adversely affect our profitability and margins. Moreover, we may incur asset impairment charges related to divestitures that reduce our profitability. Our divestiture activities may present financial, managerial and operational risks, and could adversely affect our business, financial condition and results of operations.
We are subject to risks associated with our international sales.
We export our products to 35 countries, and we are engaged in a joint venture in Mexico. For the nine months ended September 29, 2024, U.S. export sales accounted for 13% of our total sales. Because of the growing market share of U.S. pork products in the international markets, U.S. exporters are increasingly being affected by measures taken by importing countries to protect local producers.
Our international sales and investments operations are subject to various risks related to economic or political uncertainties, including, but not limited to, the following risks:
•general economic and political conditions;
•imposition of tariffs, quotas, trade barriers and other trade protection measures by various countries;
•import or export licensing requirements imposed by various countries;
•the closing of borders by foreign countries to the import of our products due to, among other things, animal disease or other perceived health or safety issues;
•difficulties and costs associated with complying with, and enforcing remedies under, a wide variety of complex domestic and international laws, treaties and regulations, including anti-corruption laws, export controls and sanctions laws and anti-money laundering laws;
40
•the risk that the parties with which we do business, including parties that may resell our products in foreign countries, may not comply with all applicable laws, treaties and regulations, including import and export licensing requirements, anti-corruption laws (including, but not limited to, the U.S. Foreign Corrupt Practices Act, due to our operations in Mexico), sanctions laws, anti-bribery laws and anti-money laundering laws, and that any such non-compliance may have direct or indirect consequences on us, such as reputational harm and subjecting us to government investigations or penalties;
•different regulatory structures and unexpected changes in regulatory environments;
•tax rates that may exceed those in the United States and earnings that may be subject to withholding requirements and incremental taxes upon repatriation;
•potentially negative consequences from changes in tax laws;
•increased distribution costs, disruptions in shipping or reduced availability of freight transportation; and
•disruptions or halts in operations at ports in the United States.
Furthermore, our foreign operations are subject to the risks described above as well as additional risks and uncertainties including:
•fluctuations in currency values, which have affected, among other things, the costs of our investments in foreign operations;
•translation of foreign currencies into U.S. dollars;
•foreign currency exchange controls; and
•unstable political environments.
Negative consequences relating to these risks and uncertainties could jeopardize or limit our ability to export our products to one or more of those markets and could adversely affect our business, financial condition and results of operations.
We depend on availability of, and satisfactory relations with, our employees.
As of December 31, 2024, we had approximately 34,000 employees in the United States and approximately 2,500 in Mexico, with approximately 46% of our total workforce covered by collective bargaining agreements or are members of labor unions. Our operations depend on the availability, retention and relative costs of labor and maintaining satisfactory relations with employees and the labor unions. Further, employee shortages can and do occur, particularly in rural areas where some of our operations are located. Labor relations issues arise from time to time, including issues in connection with union efforts to represent employees at our plants and with the negotiation of new collective bargaining agreements. If we fail to maintain satisfactory relations with our employees or with the labor unions, we may experience labor strikes, work stoppages or other labor disputes. Negotiation of collective bargaining agreements also could result in higher ongoing labor costs.
Immigration reform continues to attract significant attention in the public arena and the U.S. Congress. If new immigration legislation is enacted, such laws may contain provisions that could increase our costs in recruiting, training and retaining employees, increase our costs of complying with federal law in reviewing employees’ immigration status and create employee shortages. Furthermore, increased enforcement efforts with respect to existing immigration laws by governmental authorities may disrupt a portion of our workforce or our operations. There can be no assurance that these activities or consequences will not adversely affect our business, financial condition or results of operations in the future.
We also rely on an adequate supply of skilled employees in the farming and corporate areas. Trained and experienced personnel in our industry are in high demand, and we have experienced high turnover and difficulty retaining employees with appropriate training and skills. We cannot predict whether we will be able to attract,
41
motivate and maintain an adequate skilled workforce necessary to operate our existing and future facilities efficiently, or that labor expenses will not increase as a result of a shortage in the supply of skilled personnel, thereby adversely impacting our financial performance. While our industry generally operates with high employee turnover, any material increases in employee turnover rates or any widespread employee dissatisfaction could also have a material adverse effect on our business, financial condition and results of operations.
We are subject to various risks relating to worker employment and health and safety.
Given the nature of our operations, the type of work performed by our employees and the number of plants and employees that we have, we are subject to various risks relating to employment eligibility and worker safety. We cannot assure you that no accidents will occur. Workplace accidents have previously resulted in lawsuits, regulatory or administrative investigations and inquiries and fines and penalties, and we may become subject to additional such lawsuits, investigations and inquiries, and fines and penalties in the future, and our business, financial condition and results of operations may be adversely affected.
Allegations or findings that we, our suppliers, third-party staffing agencies or other business partners are not complying with applicable workplace and labor laws, including child labor laws, or regarding illegal employment of foreign workers, could negatively affect our overall reputation and brand image, which in turn could have a negative impact on our relationships with customers, consumers and our brand license partners, as well as subject us to increased regulatory and political scrutiny. In addition, the discovery by us or governmental authorities of undocumented workers could result in our having to attempt to replace those workers, which could be disruptive to our operations or may be difficult to do. Moreover, failure or perceived failure to comply with legal or regulatory requirements applicable to our business could expose us to litigation, governmental inquiries and substantial fines and penalties, as well as costs and distractions, that could adversely affect our business, results of operations, financial condition and cash flows.
Following a 2023 investigation of our plant in St. James, the Minnesota Department of Labor and Industry alleged that we had employed 11 underage employees during the two-year audit period. During the hiring process, we use the federal E-Verify system and trained human resources professionals to scrutinize identity documents for I-9 purposes carefully, but our process may be circumvented by underage individuals with fake documentation. Since this investigation, we have put in place new risk-based measures designed to recognize identity fraud, including visual inspection protocols, internal auditing and enhanced I-9 training. In November 2024, we entered into a consent order with the Minnesota Department of Labor and Industry relating to these allegations. Although we did not admit liability in connection with this consent order, we are required to pay a $2 million administrative penalty. Under the consent order, we are required to conduct industry outreach related to underage labor compliance, contractually require underage labor compliance with our labor staffing agencies and sanitation contractors, and take other steps to enhance our compliance practices.
In addition, one of our sanitation contractors, Packers Sanitation Services Inc., was featured prominently in the news in 2022 and 2023 because of a federal investigation that found underage employees in its workforce. We have sought to address the risk of our contractors utilizing underage employees by increasing our efforts to monitor compliance by these third parties; however, we cannot provide any assurance that companies that provide services to us will comply with such laws and that our monitoring efforts will timely identify non-compliance, if any occurs. In addition, we cannot give any assurance that our reputation will not be adversely affected by non-compliance, governmental investigations or other inquiries in the future.
We depend upon the continued services of certain key members of our senior management team, without whom our business operations could be significantly disrupted.
Our success depends, in part, on the continued contributions of our executive leadership team and key members of our senior management. Our management team has significant industry experience, as well as in-depth knowledge of our company, and could be difficult to replace. Any loss or extended interruption in the service of one or more of our senior officers could adversely affect our business, financial condition and results of operations. In addition, we do not have key-man insurance on the life of any of our officers. The unexpected loss of the services of our key personnel could have a detrimental effect on us. Moreover, the market for qualified individuals may be
42
highly competitive and we may not be able to attract and retain qualified personnel to replace or succeed members of our senior management, should the need arise. In addition, our compensation arrangements may not always be successful in attracting new employees or retaining our existing team members.
The consolidation of customers and/or the loss of our customers could adversely impact our business.
Continued consolidation within the retail industry, including among supermarkets, warehouse clubs and food distributors, has resulted in an increasingly concentrated retail base and increased our exposure to loss of certain customers. These consolidations have produced large, sophisticated customers with increased buying power who are more capable of operating with reduced inventories, opposing price increases, and demanding lower pricing, increased promotional programs and specifically tailored products. These customers also may use shelf space currently used for our products for their own private label products. Because of these trends, our volume growth could slow or we may need to lower prices or increase promotional spending for our products, any of which could adversely affect our financial results. Additionally, these large customers may demand more favorable terms that may expose us to greater risks, including uncapped indemnification and no limitation of liability provisions. Such terms may obligate us to pay significant amounts in connection with potential losses arising from claims and related legal proceedings, and any such claims could also affect our reputation and our relationship with customers.
Our ten largest customers represented approximately 37% of net sales of fiscal year 2023. We generally do not have long-term sales agreements or other contractual assurances as to future sales to our customers, including these major customers. Our business could be materially adversely affected and suffer significant decreases in sales and operating profit from the loss of one or more of our larger customers or if our larger customers’ plans, markets, and/or financial condition should change significantly. For example, if our customers cannot access sufficient funds or financing, then they may delay, decrease, or cancel purchases of our products, or delay or fail to pay us for previous purchases. The loss of a significant customer or a material reduction in sales to, or adverse change to trade terms with, a significant customer could materially and adversely affect our product sales, financial condition and results of operations.
Impairment in the carrying value of goodwill or intangible assets could negatively impact our consolidated results of operations and net worth.
As of December 31, 2023, we had $2.9 billion of goodwill and intangible assets, which represented approximately 22% of total assets. Goodwill was allocated to our reporting units as follows: Packaged Meats, $1,503 million; Mexico, $83 million; Fresh Pork, $34 million; Hog Production, $4 million; and Bioscience, $4 million. Under GAAP, goodwill and identified intangible assets with indefinite lives must be evaluated for impairment annually or more frequently if events indicate it is warranted.
Goodwill is the excess amount of purchase consideration over the fair value of net assets acquired in a business combination. In evaluating the potential for impairment of goodwill, we make assumptions regarding future operating performance, business trends, and market and economic conditions. Such analyses further require us to make judgmental assumptions about sales, operating margins, growth rates, and discount rates. There are inherent uncertainties related to these factors and to management’s judgment in applying these factors to the assessment of goodwill recoverability. Goodwill reviews are prepared using estimates of the fair value of reporting units based on market multiples of EBITDA and/or on the estimated present value of future cash flows. For indefinite life intangible assets, an impairment loss is recognized if the carrying amount of an indefinite life intangible asset exceeds the estimated fair value of that intangible asset. Identified intangible assets with definite lives are tested for recoverability whenever events or changes in circumstances indicate that their carrying amount may not be recoverable.
Events and conditions that could result in impairment in the value of our goodwill and other intangible assets include changes in the industry in which we operate, particularly the impact of a downturn in the global economy or the economies of geographic regions or countries in which we operate, as well as competition, adverse changes in the regulatory environment, or other factors leading to reduction in expected long-term sales or profitability. We could be required to evaluate the recoverability of goodwill and indefinite life intangible assets prior to the annual
43
assessment if we experience disruptions to the business, unexpected significant declines in operating results, divestiture of a significant component of our business or market capitalization declines.
In addition, our equity investments in joint ventures, partnerships and other entities, both within and outside the United States, are periodically involved in modifying and amending their credit facilities and loan agreements. The ability of these entities to refinance or amend their facilities on a successful and satisfactory basis, and to comply with the covenants in their financing facilities, affects our assessment of the carrying value of any individual investment. As of December 31, 2023, none of our equity investments represented more than 5% of our total consolidated assets. If we determine in the future that an investment is impaired, we would be required to record a non-cash impairment charge, which could substantially affect our reported earnings in the period of such charge. In addition, any such impairment charge would negatively impact our financial ratios and could limit our ability to obtain financing in the future. See Note 8: “Equity Method Investments” in our annual audited consolidated financial statements, included in this prospectus, for a discussion of the accounting treatment of our equity investments.
The loss of any trademark or other intellectual property right could enable other companies to compete more effectively with us.
We utilize intellectual property in our business. Our registered and unregistered trademarks are valuable assets that reflect the goodwill of our brands and consumers’ favorable perception of our products. We have invested a significant amount of money in establishing, promoting and protecting our brands. We also rely on patented and unpatented proprietary methods, processes and techniques in our manufacturing operations and copyright protection in our sales and marketing materials to develop and maintain our competitive position. Our continued success depends, to a significant degree, upon our ability to protect and preserve our intellectual property rights. In certain jurisdictions, we receive access to third-party intellectual property. In particular, we have a license agreement with Nathan’s Famous for the exclusive right to manufacture, distribute, market and sell “Nathan’s Famous” branded hot dogs and sausages in refrigerated consumer packages to be resold through retail channels within the United States until March 2032. We cannot assure you that we will be able to maintain or renew the license agreement with Nathan’s Famous or enter into new license agreement with third-party owners of intellectual property on reasonable terms, or at all. We also license certain of our trademarks and other intellectual property for use by third parties. In an effort to preserve our trademark rights, we enter into license agreements with these third parties that govern the use of our trademarks and contain limitations on their use. We cannot assure you that our efforts to police the use of our trademarks by our licensees will be sufficient to ensure that our licensees abide by the terms of their licenses. In the event that our licensees fail to do so, our trademark rights could be diluted.
We rely primarily on confidentiality agreements and intellectual property law to protect our proprietary rights. Our confidentiality agreements with our employees and certain of our consultants, contract employees, suppliers, vendors and independent contractors, including some of our co-manufacturers who use our formulations to manufacture our products, generally require that all non-public information made known to them be kept strictly confidential. Further, some of our formulations have been developed by or with our suppliers and co-manufacturers. As a result, we may not hold exclusive rights to some formulations or be able to prevent others from using similar formulations.
We cannot be certain that the steps we have taken to protect our intellectual property rights are adequate, that our intellectual property rights can be successfully defended and asserted in the future or that third parties will not infringe upon, misappropriate or challenge any such rights. In addition, our trademark rights and related registrations may be challenged in the future and could be canceled or narrowed. Failure to protect our trademark rights could prevent us in the future from using certain brands or from challenging third parties who use names and logos similar to our trademarks, which may in turn cause consumer confusion or negatively affect consumers’ perception of our brands and products. We may not be successful in enforcing our trademarks or challenging confusingly similar trademarks used by third parties. Moreover, intellectual property disputes and proceedings and infringement claims may result in a significant distraction for management and significant expense, which may not be recoverable regardless of whether we are successful. Such proceedings may be protracted with no certainty of success, and an adverse outcome could subject us to liabilities, force us to cease use of certain trademarks or other intellectual
44
property, or force us to enter into licenses with others. Any one of these occurrences may have an adverse effect on our business, financial condition and results of operations.
Deterioration of economic conditions could negatively impact our business.
Our business and results of operations have in the past been and may continue in the future to be adversely affected by changes in national or global economic conditions, including inflation, interest rates, availability of and access to capital markets, volatility in financial markets, declining consumer spending rates, recessions, decreased energy availability and increased energy costs (including fuel surcharges), supply chain challenges, labor shortages, geopolitical conflicts (including the ongoing conflicts between Russia and Ukraine and Israel and Hamas), the negative impacts caused by pandemics, epidemics and public health crises and the effects of governmental initiatives to manage economic conditions.
Any such changes could adversely affect the demand for our products or the cost and availability of our needed raw materials, cooking ingredients and packaging materials, thereby negatively affecting our financial results. Disruptions and instability in credit and other financial markets and deterioration of national and global economic conditions, could, among other things:
•make it more difficult or costly for us to obtain financing for our operations or investments or to refinance our debt in the future;
•cause our lenders to depart from prior credit industry practice and make more difficult or expensive the granting of any technical or other waivers under our credit agreements to the extent we may seek them in the future;
•impair the financial condition of some of our customers, suppliers or counterparties to our derivative instruments, which could result in challenges in collecting accounts receivable or non-performance by suppliers;
•lead customers and consumers to delay or reduce purchases of our products as a result of unfavorable economic conditions;
•negatively impact global demand for our products, which could result in a reduction of sales, operating profit and cash flows;
•decrease the value of our investments in equity and debt securities, including our company-owned life insurance and pension plan assets, which could result in higher pension cost and statutorily mandated funding requirements; and
•impair the financial viability of our insurers.
Furthermore, inflation has and may continue to increase our operational costs, including labor costs and feed ingredient costs, and continued increases in interest rates in response to concerns about inflation may have the effect of further increasing economic uncertainty and heightening these risks. As a result, instability and weakness of the U.S. and global economies, and the negative effects on consumers’ spending, may materially negatively affect our business and results of operations. A prolonged period of reduced consumer spending could have an adverse effect on our business and our results of operations.
If tax laws change or we experience adverse outcomes resulting from examination of our tax returns or disagreements with taxing authorities, it could adversely affect our business, financial condition and results of operations.
We are subject to federal, state, and local tax laws and regulations in the United States. The application and interpretation of these laws in different jurisdictions affect our operations in complex ways and are subject to change, and some changes may be retroactively applied. Our future effective tax rates and the value of our deferred tax assets could be adversely affected by changes in tax laws, including impacts of the Tax Cuts and Jobs Act of Public Law No. 115-97, and the Coronavirus Aid, Relief and Economic Security Act. In addition, in August 2022,
45
the Inflation Reduction Act, or the IRA, was signed into law. The IRA, among other things, includes a 15% corporate minimum tax as well as a 1% excise tax on corporate stock repurchases, subject to certain exceptions. Furthermore, the European Carve-out may result in incremental tax liability to us. There have also been prior proposals in U.S. Congress to limit the recognition of losses resulting from certain transactions including, potentially, transactions such as European Carve-out. Any such proposals could, potentially, increase our tax obligations. The United States and U.S. states and localities are also actively considering changes to existing tax laws that, if enacted, could increase our tax obligations or require us to change the manner in which we operate our business.
In addition, we are subject to the examination of our income and other tax returns by the Internal Revenue Service and other tax authorities. We regularly assess the likelihood of adverse outcomes resulting from such examinations to determine the adequacy of our provision for income taxes. Although we believe we have made appropriate provisions for taxes in the jurisdictions in which we operate, changes in the tax laws, or challenges from tax authorities under existing tax laws could adversely affect our business, financial condition and results of operations.
We face risks associated with the long-term trend toward increased activism against companies in the food products industry.
The treatment of animals and related standards of care in the food products industry have been subject to increasing focus by animal rights groups. We and many of our customers face pressure from animal rights groups to operate our respective businesses in a manner that treats animals in conformity with certain standards developed or approved by these groups. Some of our customers also require us to comply with specified animal rights standards and audits of our facilities. Animal rights groups have also engaged in legislative efforts to ban any form of gestation crates in various states. Conforming to requirements imposed on our business by animal rights groups has caused us and may in the future cause us to incur increased costs.
Animal rights groups have in the past:
•used pressure tactics in an effort to generate adverse publicity regarding our company;
•trespassed on and otherwise damaged our properties; and
•sought to disrupt our business operations or those of our suppliers and customers through protests.
These groups have, and may continue to, coordinate their actions with other groups, threaten strikes or boycotts or enlist the support of well-known persons or organizations in order to increase the pressure on us to achieve their stated aims. Future activist actions could include one or more of the following:
•property damage;
•disruptions to our business operations;
•contamination of our hogs and food supply;
•outbreak of disease;
•cyberattacks;
•legal challenges or lawsuits;
•negative publicity about our business or the food products industry in general;
•reduction in demand for our products; and
•other adverse effects on our ability to develop our properties and expand our operations.
46
These actions could have a material adverse effect on our reputation and, in turn, our business, results of operations, financial condition and prospects. We may need to incur significant costs associated with responding to these or other initiatives, and there is no guarantee that our responses will produce favorable outcomes.
Risks Relating to Government Regulations
We are subject to extensive governmental regulations, which require significant compliance expenditures.
We are subject to extensive federal, state and local regulations. Our food processing facilities and products are subject to frequent inspection by the USDA, the FDA and various state and local health and agricultural agencies. Applicable statutes and regulations governing food products include rules for labeling the content of specific types of foods, the nutritional value of that food and its serving size, as well as rules that protect against contamination of products by food-borne pathogens. Many jurisdictions also require that food producers adhere to good production practices (the definition of which may vary by jurisdiction) with respect to production processes. Recently, the food safety practices and procedures in the meat processing industry have been subject to more intense scrutiny and oversight by the USDA and state authorities and future outbreaks of diseases among cattle, poultry or pigs could lead to further governmental regulation. In addition, our production facilities and distribution centers are subject to various federal, state and local laws and regulations relating to workplace safety and workplace health. Our exported products are often inspected by foreign food safety authorities, and any violation discovered during these inspections may result in a partial or total return of a shipment, partial or total destruction of the shipment and costs due to delays in product deliveries to our customers.
Our Bioscience operations are also subject to regulations from various government authorities, including the FDA, USDA and EPA. Compliance with these and other agency requirements, which are subject to change, affect our operations and may impact our results at one or more of our facilities. Additionally, the loss of or failure to obtain necessary permits or registrations, or failure to comply with these regulations, at any of our facilities could result in (i) the suspension or restriction of our heparin operations, (ii) administrative penalties and injunctive relief, (iii) civil penalties such as fines, injunctions and product recalls and/or (iv) negative publicity.
We seek to comply with applicable regulations through using internationally recognized management systems to manage our regulatory and compliance programs, employing data analytics to monitor food safety indicators and taking corrective action if necessary, and working with the USDA and the FDA on projects aimed at improving food safety and increasing consumer protection. Failure by us, our contract farms or our co-manufacturers to comply with applicable laws and regulations or maintain permits, licenses or registrations relating to our or our co-manufacturers’ operations could subject us to civil remedies or penalties, including fines, injunctions, recalls or seizures, warning letters, restrictions on the marketing or manufacturing of products, or refusals to permit the import or export of products, as well as potential criminal sanctions, which could result in increased operating costs resulting in a material effect on our operating results and business.
In addition, developments or changes in the regulatory environment may have a material impact on our business. For example, President Biden issued an executive order in July 2021 that, among other things, directed federal agencies to enforce antitrust laws more vigorously than past administrations, which may, among other things, make acquisition transactions more challenging. As a subsidiary of a public company based outside of the United States, we may also face heightened scrutiny in respect of potential acquisition transactions. See the section titled “Business—Quality Assurance and Food Safety—Regulation” for further information on the regulations to which we are subject.
Governmental authorities may take further action restricting our ability to produce and/or sell livestock or adopt new regulations impacting our production or processing operations, which could adversely affect our business.
A number of states have adopted legislation that prohibits or restricts the ability of meat packers, or in some cases corporations generally, from owning livestock or engaging in farming. In addition, the U.S. Congress has in the past considered federal legislation that would ban meat packers from owning livestock. We cannot assure you that such or similar legislation affecting our operations will not be adopted at the federal or state levels in the future. Such legislation, if adopted and applicable to our current operations and not successfully challenged or settled, could have a material adverse impact on our operations and our financial statements.
47
Other states have adopted legislation that prohibits or limits nonresident aliens, foreign business entities, or foreign governments from acquiring or owning an interest in private agricultural land within the boundaries of their state. We cannot assure you that such or similar legislation affecting our operations will not be adopted in additional states in the future. Such legislation, if adopted and applicable to our current operations and not successfully challenged or settled, could have a material adverse impact on our operations and our financial statements.
In addition, the State of California enacted the Farm Animal Confinement Initiative, or Proposition 12, which became enforceable on July 1, 2023. Proposition 12 prohibits the sale within the state of certain uncooked pork produced from breeding sows or their offspring unless the animals have been housed in confinement systems that meet certain minimum standards and other conditions are met. Similarly, Massachusetts Question 3 prohibits the sale of certain pork products within the State of Massachusetts, as well as the shipment of certain pork products through the state, unless the products came from animals that were also housed in confinement systems that meet certain minimum standards. The volume of such pork sold into California and into or through Massachusetts accounted for approximately 1% of our sales for the year ended December 31, 2023.
In fiscal year 2008, North Carolina enacted a permanent moratorium on the construction of new hog farms that use the lagoon and sprayfield system. The moratorium limits us from expanding our North Carolina hog production operations. This permanent moratorium replaced a 10-year moratorium on the construction of hog farms with more than 250 hogs or the expansion of existing large farms. This moratorium may over time lead to increased difficulties in our ability to contract with independent growers.
We are, and could become, subject to legal proceedings and regulatory investigations that may result in significant expenses, fines and reputational damage.
We are involved on an ongoing basis in litigation arising in the ordinary course of business or otherwise. For example, we have been named as one of 16 defendants in a series of purported class actions alleging antitrust violations in the pork industry. The plaintiffs in all of these cases also challenge the defendant pork producers’ use of benchmarking reports from defendant Agri Stats, Inc., alleging that the reports allowed the pork producers to share proprietary information and monitor each producer’s compliance with the supposed agreement to reduce supply. Payments in an aggregated amount of $194 million were made by us to settle all class claims against us by the direct purchasers, commercial and institutional indirect purchasers and consumer indirect purchasers. In addition to the class actions, we have been named as a defendant in similar claims and suits brought by a number of individual purchasers who opted out of their class and three states or commonwealths. We have entered into negotiations with many of these claimants and has settled certain of the pending non-class cases and related claims. Currently, 22 opt-out cases and one case by the State of New Mexico remain pending against us.
We intend to vigorously defend against these claims, but we cannot assure you that we will be successful or that additional similar claims will not arise in the future. We established a reserve for these claims, however we cannot assure you that the reserve will not have to be increased, as applicable.
Trends in litigation may include class actions involving consumers, shareholders, employees or injured persons and claims related to commercial, labor, employment, antitrust, securities or environmental matters. Moreover, the process of litigating cases, even if we are successful, may be costly, and may approximate the cost of damages sought. These actions could also expose us to adverse publicity, which might adversely affect our brands, reputation and/or customer preference for our products and distract management from other tasks. Litigation trends and expenses and the outcome of litigation cannot be predicted with certainty and adverse litigation trends, expenses and outcomes could adversely affect our business, financial condition and results of operations. See “—Risks Relating to Government Regulations—Environmental regulation and related litigation and commitments could have a material adverse effect on us” for further information regarding ligation involving environmental matters.
Government antitrust and foreign investment policies and regulations may limit our strategic growth opportunities, including certain acquisitions and joint ventures.
The United States and many non-U.S. jurisdictions have laws designed to protect national security or to restrict foreign direct investment. In the United States, the Committee on Foreign Investment in the United States, or CFIUS, has the authority to review transactions that afford foreign investors the ability to “control” a U.S. business,
48
as well as certain non-controlling investments. If CFIUS identifies a national security risk arising from a particular transaction, it can impose mitigation measures and can also intervene to prohibit the transaction or order a divestment if the transaction has already closed. Many non-U.S. jurisdictions restrict foreign investment in assets important to national security by taking steps including, but not limited to, placing limitations, restrictions or conditions on foreign equity investment, implementing investment screening or approval mechanisms and restricting the employment of foreigners as key personnel. These U.S. and foreign laws could limit our ability to invest in certain businesses or joint ventures or impose burdensome notification requirements, operational restrictions or delays in pursuing and consummating transactions.
Certain of our acquisitions or investments may be subject to review and approval by CFIUS or any non-U.S. equivalents thereof based on our ownership structure and scope of operations. This may have outsized impacts on transaction certainty, timing, feasibility and cost, and could prevent us from maintaining or pursuing acquisition or investment opportunities that we otherwise would have maintained or pursued. CFIUS or any non-U.S. equivalents thereof may seek to impose limitations, conditions or restrictions on or prohibit one or more of our acquisitions or investments, which may adversely affect our flexibility in structuring or financing certain acquisition transactions. In addition, CFIUS is actively pursuing transactions that were not notified to it voluntarily and may ask questions regarding, or impose restrictions, conditions or limitations on, transactions post-closing. Although CFIUS reviews (and in some cases mitigates) foreign investment originating from various countries, it has placed significant focus on reviews involving investors either directly or indirectly controlled by individuals or entities based in the People’s Republic of China, or the PRC. As a result, acquisitions or investments undertaken by us could be subject to heightened CFIUS scrutiny compared to acquisitions or investments made by other foreign investors. These risks have increased and may continue to increase due to geopolitical, policy or regulatory developments, particularly with regard to U.S.-PRC relations.
In addition, the U.S. Department of Justice Antitrust Division and the Federal Trade Commission, the two agencies responsible for enforcing federal antitrust and competition laws, issued new Merger Guidelines in December 2023, designed to invigorate enforcement of the antitrust and competition laws. These initiatives are expected to increase scrutiny of mergers and acquisitions subject to premerger review and those already consummated. As a result, the review process from U.S. antitrust agencies and other non-U.S. antitrust authorities for mergers and acquisitions undertaken by us is expected to become more challenging, more time consuming and more expensive. We may even be required to undergo investigations concerning previously closed transactions. If certain proposed acquisitions are delayed or rejected by antitrust enforcers, or if previously closed transactions are investigated, it could have an adverse impact on our business, as well as limit our opportunities for future strategic growth through acquisitions. In addition, competition rules from other U.S. federal agencies, including the USDA, as well as state competition laws could create additional hurdles.
Furthermore, complying with these laws imposes potentially significant costs and complex additional burdens, and any failure by us to comply with them could expose us to significant penalties, sanctions, loss of future investment opportunities, additional regulatory scrutiny and reputational harm.
Environmental regulation and related litigation and commitments could have a material adverse effect on us.
Our past and present business operations and properties are subject to extensive and increasingly stringent federal, state, local and foreign laws and regulations pertaining to protection of the environment, including:
•the treatment of hazardous materials and the discharge of such materials into the environment;
•the handling and disposition of manure and liquid and solid wastes; and
•air emissions.
We have incurred and expect to continue to incur significant costs complying with environmental laws and regulations. Failure to comply with, and liabilities under, these laws and regulations in the future may result in significant additional consequences to us, including administrative, civil and criminal penalties, cleanup and other environmental damages, negative publicity and increased compliance costs. Some requirements applicable to us, including the Clean Water Act and the Clean Air Act, may also be enforced by citizen groups or other third parties.
49
Natural disasters, such as flooding and hurricanes, can cause the discharge of effluents or other waste into the environment, which have in the past and may in the future result in litigation and governmental enforcement actions against us or new or additional governmental regulations applicable to our operations. See “Business—Quality Assurance and Food Safety—Regulation” for further discussion of regulatory compliance as it relates to environmental risk. We have incurred, and will continue to incur, significant capital and operating expenditures to comply with these laws and regulations.
We also face the risk of lawsuits even if we are operating in compliance with applicable regulations. For example, in recent years various nuisance suits were filed against us and our subsidiary Murphy-Brown LLC, or Murphy Brown, in North Carolina. Several of these lawsuits resulted in unfavorable outcomes to us. We resolved all then-existing filed cases in July 2019 pursuant to a settlement agreement, however we have since been involved in other pending and threatened nuisance suits and claims related to both farms and other facilities. We cannot assure you that additional or similar claims relating to our farming operations (whether sounding in nuisance or other torts or causes of action) will not arise in the future.
In addition, new environmental issues could arise that would cause currently unanticipated investigations, assessments or expenditures. U.S. federal, international, state and local authorities may, from time to time, adopt revisions to environmental rules and regulations with which we must comply. New or more stringent laws or regulations that impose additional requirements on our operations or on us could increase the cost of doing business for us. For example, in January 2024, the EPA published draft revised Effluent Limitations Guidelines, or ELGs, for wastewater discharges of meat and poultry facilities. The draft proposal includes a number of options for revised ELGs that the EPA is evaluating. For existing direct dischargers of wastewater, including meat processors such as us, the EPA’s preferred option is the imposition of more stringent effluent limitations for nitrogen and ammonia and, for the first time, limitations for phosphorus. This option would also establish, for the first time, pretreatment standards for oil and grease, total suspended solids and biochemical oxygen demand for these dischargers. In addition, the EPA is proposing an amendment to add E. coli bacteria limitations for direct dischargers. Another option the EPA is considering would extend the nitrogen and phosphorus limitations to indirect dischargers, which would also cover many of our facilities.
The EPA conducted a number of public hearings on the proposed ELGs in January and March 2024. It is unclear when the EPA will issue final ELGs or to what extent they will differ from what the EPA has proposed. In addition, the new U.S. administration may elect to change, or abandon, the ELGs. Significant upgrades related to our direct and indirect wastewater discharge streams, including to treatment systems at our Sioux City and Denison, Iowa, Sioux Falls, South Dakota and Tar Heel, North Carolina centers, would be required to meet the standards as proposed, which we estimate would require material capital expenditures in the aggregate.
Additionally, increased public interest in farm animal welfare could result in additional government regulation and additional or unplanned capital expenditures. Further, the regulation or taxation of carbon or other greenhouse gas, or GHG, emissions to address climate change concerns could result in increased compliance costs and capital expenditures and may also affect the prices of commodities, energy and other inputs to our business. It is not possible at this time to predict the complete structure or outcome of any future legislative or regulatory efforts to address GHG emissions and climate change or whether costs of compliance with such efforts will have a material adverse effect on our financial position or results of operations.
Climate change, or legal, regulatory, voluntary or market measures to address climate change, may negatively affect our business, operations or reputation.
There is growing concern that carbon dioxide and other GHGs in the atmosphere have an adverse impact on global temperatures, weather patterns, and the frequency and severity of extreme weather and natural disasters. In the event that climate change has a negative effect on agricultural productivity, we may be subject to decreased availability or less favorable pricing for certain commodities that are necessary for our products, such as grains. We may also be subject to decreased availability or less favorable pricing for water as a result of climate change, which could impact our farming, manufacturing and distribution operations. In addition, natural disasters and extreme weather conditions may disrupt the productivity of our facilities or the operation of our supply chain.
50
The increasing concern over climate change also has resulted and may continue to result in more regional, federal, and/or global legal and regulatory requirements including changes to energy policies, increased mandatory climate-related disclosure, carbon pricing regulations or carbon taxes. For example, in March 2024 the SEC published its final rules to enhance and standardize climate-related disclosures, requiring covered entities, including us, to disclose certain climate-related metrics and GHG emissions data, information about climate-related targets and goals and climate-related risks and obtain attestation requirements. The rules are currently stayed pending the resolution of litigation challenging the rules. At this time, we cannot predict the costs of implementation or any potential adverse impacts resulting from the new rules, should they become effective. However, we may incur increased costs relating to the assessment and disclosure of climate-related risks and targets. We may also be subject to increased litigation risks related to disclosures made pursuant to the new rules or voluntary climate-related reporting, which could materially and adversely affect our future results of operations and financial condition.
Collecting, measuring and analyzing information relating to our GHG emissions or impacts of climate change on our business is costly, time-consuming, dependent on third-party cooperation and such information may ultimately be unreliable. Furthermore, methodologies for measuring, tracking and reporting on such matters are evolving, and may be ambiguous and subject to rapid change, which may require our processes, benchmarks, baselines and controls for such data to evolve as well. Organizational changes may result in data recalculations. Quantifying GHG emissions within the boundaries of a business is a relatively nascent exercise, and we, like other companies in our industry, have refined and updated our methodologies following prior publication of data. For example, there have been inconsistent practices across many U.S. pork/poultry and dairy producers in quantifying our GHG emissions where biogas eligible for carbon reduction credits is also produced on farms. We have revised baselines and previously reported GHG emissions for our U.S. operations, as well as our carbon reduction goals, as a result of guidance clarifying the accounting of biogas credits in this context. Our GHG footprint has also changed as a result of closure or sale of plants, acquisition of new plants and reduction of farm operations. Furthermore, like many peer companies, our data collection, analysis and reporting capabilities have developed from a starting point with very limited established guidance or methodology. See “Business—Sustainability.” We have engaged a third-party consultant to conduct a review of the GHG emissions attributable to our worldwide businesses, our energy use and our value chain, and that analysis is ongoing. We expect additional changes to the methodologies to quantify our GHG emissions and possibly our climate-related goals as a result of this work.
Like many companies, our quantification of GHG emissions attributable to our business and our carbon reduction goals have been voluntary to date. The process of quantifying our GHG emissions and setting carbon reduction goals, as well as a perceived or actual lack of progress in these endeavors, can subject companies such as ours to criticism, investigations, regulatory enforcement, litigation and other risks. In addition, failure to achieve our GHG emissions reduction goals could harm our reputation, which could have a material adverse effect on our results of operations, financial condition and liquidity. We may also face increased pressure from customers, consumers, investors, activists and other stakeholders to modify our products or operations to exclude ingredients or activities that are considered to have a greater impact on climate change.
Our ability to achieve any of our climate-related strategies, expectations, goals and targets is also subject to factors and conditions that are outside of our control. Examples of such factors include, but are not limited to, evolving regulatory and other standards, processes and assumptions, the pace of scientific and technological developments, increased costs and the availability of requisite financing, market trends that may alter business opportunities, the conduct of third-party manufacturers and suppliers, constraints or disruptions to our supply chain and changes in carbon markets or carbon taxes. We may be required to expend significant resources in the near or long-term future to achieve these strategies and expectations, which could significantly increase our operational costs and, despite such efforts, may be unable to achieve such strategies or meet customer or investor expectations.
51
Risks Relating to our Capital Structure
We may require additional financing to achieve our goals, and the failure to obtain this necessary capital when needed on acceptable terms, or at all, may force us to delay, limit, reduce or terminate our product manufacturing and development, and other operations.
We have funded our operations primarily through equity financing, long-term senior unsecured notes, committed revolving credit facilities, commercial paper and sales of our products. We have incurred and expect to continue to incur significant capital expenditures related to the expansion and automation of our processing capacity and maintenance of our facilities. We believe that we will continue to expend substantial resources for the foreseeable future as we consider additional markets to pursue and other growth opportunities. In addition, our operating performance and cash flow may not be sufficient to meet all our debt service requirements, return value to shareholders such as through payment of dividends or repurchase of shares of our common stock, and achieve our target Ratio of Net Debt to Adjusted EBITDA or our target minimum liquidity.
Our operating plan may change because of factors currently unknown to us, and we may need to seek additional funds sooner than planned, through public or private equity or debt financing or other sources. We may also seek financing in connection with potential new product introductions or acquisitions or investments in businesses or technologies that we believe could offer growth opportunities. Such financing may result in dilution to shareholders, imposition of affirmative and negative covenants and debt repayment obligations, or other restrictions, any of which may adversely affect our business. In addition, we may seek additional capital due to favorable market conditions or strategic considerations even if we believe we have sufficient funds for our current or future operating plans.
Our affiliation with WH Group has historically provided us with higher credit ratings. The terms of additional financing we incur in the future after this offering may not be as favorable as those previously obtained prior to this offering. Our ability to access additional capital may further be affected by adverse or uncertain economic conditions. Weakness and volatility in the capital markets and the economy in general could make it more difficult to access the capital markets and could increase our cost of borrowing.
Our level of indebtedness and the terms of our indebtedness could adversely affect our business and liquidity position.
As of December 29, 2024, after giving effect to this offering and the application of the net proceeds therefrom, we would have had, on a consolidated basis, $ million of outstanding total debt and $ million of undrawn capacity including $ million under the Senior Revolving Credit Facility (as defined herein) and $ million under the Securitization Facility (as defined herein) (after giving effect to $ million of issued but undrawn letters of credit).
Because the borrowing capacity under the Securitization Facility depends, in part, on accounts receivable levels, which fluctuate from time to time, such amounts may not reflect actual borrowing capacity. The Senior Revolving Credit Facility is a fixed commitment facility and is not dependent on a borrowing base. In addition, on or before the maturity date of the Senior Revolving Credit Facility, we have the right, but not the obligation, to request an increase in the amount of commitments under the Senior Revolving Credit Facility in an aggregate amount not to exceed $500 million under customary terms and conditions.
Our indebtedness may increase from time to time for various reasons, including fluctuations in operating results, working capital needs, capital expenditures and potential acquisitions or joint ventures. In addition, due to the volatile nature of the commodities markets, we may need to borrow significant amounts to cover any margin calls under our risk management and hedging programs. During fiscal year 2024, margin deposits posted by us ranged from $(11) million to $97 million (negative amounts representing margin deposits we have received from our brokers). The average daily amount on deposit with our brokers during fiscal year 2024 was $27 million. As of December 29, 2024, our net amount of margin held on deposit was $60 million.
52
Our consolidated indebtedness level could significantly affect our business and the value of our common stock because:
•it may, together with the financial and other affirmative and negative covenants in the agreements governing our indebtedness, limit or impair our ability in the future to obtain financing, refinance any of our indebtedness, sell assets or raise equity or debt on commercially reasonable terms or at all, which could cause us to default on our obligations, materially impair our liquidity or otherwise adversely affect our business and the value of our common stock;
•a downgrade in our credit rating (including the loss of our investment grade credit ratings) could restrict or impede our ability to access capital markets at attractive rates and increase the cost of future borrowings;
•it may, through event of default provisions, limit our ability to enter into change of control transactions, which may impede our ability to enter into certain transactions;
•it may reduce our flexibility to respond to changing business and economic conditions or to take advantage of business opportunities that may arise;
•it may place us at a competitive disadvantage relative to some of our competitors that have less indebtedness than we do;
•a portion of our cash flow from operations must be dedicated to interest payments on our indebtedness and is not available for other purposes, which amount could increase if prevailing interest rates rise or if we incur additional indebtedness;
•substantially all of our accounts receivable in the United States secure the Securitization Facility, all of which could limit our ability to dispose of such assets or utilize the proceeds of such dispositions and, upon an event of default under any such secured indebtedness, the lender thereunder could foreclose upon our pledged assets; and
•it could make us more vulnerable to downturns in general economic or industry conditions or in our business.
Further, our debt agreements, under certain circumstances, currently and in the future may require us to maintain investment grade credit ratings and certain financial ratio covenants, and may limit additional borrowings, investments, the payment of dividends and other restricted payments, the acquisition or disposition of assets, mergers and consolidations, transactions with affiliates, the creation of liens, entrance into swap agreements, sale/leaseback transactions and the repayment of certain debt. We cannot assure you that any of these limitations will not hinder our ability to finance operations and capital needs and our ability to pursue business opportunities and activities that may be in our interest.
In addition, should market conditions deteriorate, or should our operating results otherwise be depressed in the future, we may have to request amendments or waivers to our covenants and restrictions under our debt agreements. There can be no assurance that we will be able to obtain such relief should it be needed in the future. A breach of any of these covenants or restrictions could result in a default that would permit our senior lenders, including lenders under the Senior Revolving Credit Facility (as defined herein) and the Securitization Facility (as defined herein) and the holders of our other debt financing facilities, as the case may be, to declare all amounts outstanding under the Senior Revolving Credit Facility, the Securitization Facility and our other debt financing facilities, as applicable, to be due and payable, together with accrued and unpaid interest, and the commitments of the relevant lenders to make further extensions of credit under the Senior Revolving Credit Facility and the Securitization Facility could be terminated. If we were unable to repay our secured indebtedness to our lenders, these lenders could proceed against the collateral securing that indebtedness, which could include substantially all of our accounts receivable assets in the United States.
Our future ability to comply with financial covenants and other conditions, make scheduled payments of principal and interest, or refinance existing borrowings depends on our future business performance which is subject
53
to economic, financial, competitive and other factors, including the other risks set forth in this section, and may be affected by events beyond our control. Any failure to comply with the covenants of our debt agreements could have a material adverse effect on our business, financial condition, results of operations and prospects.
Additionally, the repayment obligations under our outstanding debt may have the effect of discouraging, delaying or preventing a takeover of our company.
We may not be able to generate sufficient cash to service all of our indebtedness.
Our ability to make payments on and to refinance our indebtedness and to fund planned capital expenditures and other strategic investments will depend on our ability to generate cash in the future. This, to a certain extent, is subject to general economic, financial, competitive, legislative, regulatory and other factors that are beyond our control. We may not generate sufficient cash flow from operations, and we cannot assure you that future borrowings will be available to us in an amount sufficient to enable us to pay our indebtedness or to fund our other liquidity needs.
If we do not generate cash flow from operations sufficient to pay our debt service obligations, we may have to undertake alternative financing plans, such as refinancing or restructuring our debt, selling assets, reducing or delaying capital investments or seeking to raise additional capital. Our ability to refinance our debt will depend on the condition of the capital markets and our financial condition at that time. Any refinancing of our debt could be at higher interest rates and may require us to comply with more onerous covenants, which could further restrict our business operations.
In addition, we conduct our operations through our subsidiaries, certain of which are not, and in the future may not be, guarantors of our indebtedness. Accordingly, repayment of our indebtedness is dependent on the generation of cash flow by our subsidiaries and their ability to make such cash available to us, by dividend, intercompany transfer, debt repayment or otherwise. Due to the restrictive covenants under certain debt agreements, our subsidiaries may be restricted from distributing dividends to enable us to make payments in respect of our indebtedness. In addition, unless they are guarantors of our indebtedness, our subsidiaries do not have any obligation to pay amounts due on our indebtedness or to make funds available for that purpose.
If drawn upon, our current variable rate indebtedness would subject us to interest rate risk, which could cause our debt service obligations to increase.
Our undrawn revolving credit facility has, and indebtedness we incur in the future may have, variable interest rates. Market interest rates have increased over the past several years and may increase in the future as a result of action by the U.S. Federal Reserve and other factors, and as a result, variable-rate debt may create higher debt service requirements, which would adversely affect our cash flow. If we draw upon our variable rate indebtedness and interest rates increase, our debt service obligations on our variable rate indebtedness would increase even though the amount borrowed would remain the same.
In particular, our borrowings under the Senior Revolving Credit Facility (as defined herein) bear interest at the Secured Overnight Financing Rate, or SOFR, plus a margin ranging from 0.875% to 1.50% per annum, or, at our election, at a base rate plus a margin ranging from 0.00% to 0.50% per annum, in each case depending on our senior unsecured debt rating. To the extent we draw from our Senior Revolving Credit Facility, we may subject to interest rate risk which could cause our debt service obligations to increase. We may also enter into additional variable rate indebtedness in the future.
There can also be no assurance that SOFR will perform in the same way as the Senior Revolving Credit Facility’s original benchmark London interbank Offered Rates, or LIBOR, would have at any time, including as a result of changes in interest and yield rates in the market, market volatility or global or regional economic, financial, political, regulatory, judicial or other events.
54
Despite current indebtedness levels and restrictive covenants, we may incur additional indebtedness. This could further exacerbate the risks associated with our financial leverage.
Despite current indebtedness levels and restrictive covenants, we expect to incur additional indebtedness and may incur other indebtedness to finance our operations and other capital needs. Although the agreements governing our indebtedness contain restrictions on the incurrence of additional indebtedness, these restrictions are subject to a number of thresholds, qualifications and exceptions, and the additional indebtedness incurred in compliance with these restrictions could be substantial. If additional debt is incurred, the related risks that we now face as a result of our leverage would intensify.
Risks Relating to our Relationship with WH Group
We will be a “controlled company” within the meaning of the rules of Nasdaq and, as a result, qualify for, and intend to rely on, exemptions from certain corporate governance requirements. You will not have the same protections afforded to shareholders of other companies that are subject to such requirements.
After the completion of this offering, WH Group will collectively beneficially own approximately % of the voting power of our common stock (or approximately % if the underwriters exercise in full their option to purchase additional shares). As a result, we will be a “controlled company” within the meaning of the corporate governance standards of Nasdaq. Under these rules, a company of which more than 50% of the voting power is held by an individual, group or another company is a “controlled company” and may elect not to comply with certain corporate governance requirements, including requirements that:
•a majority of our board consist of “independent directors” as defined under the rules of Nasdaq;
•our director nominees be selected, or recommended for our board’s selection, by a nominating and governance committee comprised solely of independent directors;
•the compensation of our executive officers be determined, or recommended to our board for determination, by a compensation committee comprised solely of independent directors; and
•an annual performance evaluation of the nominating and governance and compensation committees be performed.
Following this offering, we intend to utilize these exemptions. Accordingly, you will not have the same protections afforded to shareholders of companies that are subject to all of the corporate governance requirements of Nasdaq. These exemptions do not modify the independence requirements for our audit committee, and we expect to satisfy the member independence requirement for the audit committee prior to the end of the transition period provided under Nasdaq’s listing standards and SEC rules and regulations for companies completing their initial public offering. See the section titled “Management—Committees of the Board of Directors—Audit Committee.” There is no single shareholder or group of shareholders which owns 50% or more of the voting power of WH Group as of the date of this prospectus. As a result, WH Group would not be considered a controlled company within the meaning of the corporate governance standards of Nasdaq.
WH Group controls us, and their interests may conflict with ours or yours in the future.
We have agreed to nominate to our board individuals designated by WH Group in accordance with our shareholders agreement with WH Group. For so long as WH Group beneficially owns more than 50% of our outstanding common stock, it will be entitled to nominate for election to our board a majority of the directors on our board and control the composition of our board and the approval of actions requiring shareholder approval through its voting power. Even when WH Group ceases to own a majority of our common stock, for so long as WH Group continues to own at least 10% of our outstanding common stock, it will be entitled to nominate for election to our board a number of the total number of directors entitled to serve on the board proportionate to the percentage of our outstanding common stock beneficially owned by WH Group, rounded up to the nearest whole number. In addition, at any time that WH Group (including its permitted transferees) owns at least a majority of the combined voting
55
power of our then-outstanding shares of common stock entitled to vote generally in director elections, shareholders are permitted to take action by written consent.
As a result, WH Group will generally be able to control, whether directly or indirectly through its ability to remove and elect directors, and subject to applicable law, substantially all matters affecting us, including:
•any determination with respect to our business direction and policies, including the election and removal or directors and the appointment and removal of officers;
•any determinations with respect to mergers, amalgamations, business combinations or disposition of assets;
•our financing and dividend policy, and the payment of dividends on our common stock, if any;
•compensation and benefit programs and other human resources policy decisions;
•changes to any other agreements that may adversely affect us; and
•determinations with respect to our tax returns and other tax matters.
In particular, for so long as WH Group continues to own a significant percentage of our common stock, WH Group will be able to cause or prevent a change of control of our company or a change in the composition of our board, and could preclude any unsolicited acquisition of our company. The concentration of ownership could deprive you of an opportunity to receive a premium for your common stock as part of a sale of our company and ultimately might affect the market price of our common stock.
If WH Group sells a controlling interest in our company to a third party in a private transaction, you may not realize any change of control premium on shares of our common stock and we may become subject to the control of a presently unknown third party.
Following the completion of this offering, WH Group will continue to own a controlling equity interest in our company. WH Group will have the ability, should it choose to do so, to sell some or all of its shares of our common stock in a privately negotiated transaction, which, if sufficient in size, could result in a change of control of our company.
The ability of WH Group to privately sell its shares of our common stock, with no requirement for a concurrent offer to be made to acquire all of the shares of our common stock that will be publicly traded hereafter, could prevent you from realizing any change of control premium on your shares of our common stock that may otherwise accrue to WH Group on its private sale of our common stock. Additionally, if WH Group privately sells its controlling interest in our company, we may become subject to the control of a presently unknown third party. Such third party may have interests that conflict with those of other shareholders.
After this offering, certain of our directors may have actual or potential conflicts of interest because of their equity interest in WH Group. Also, certain of WH Group’s current executive officers also serve as directors of our company, which may create conflicts of interest, or the appearance of conflicts of interest.
Because of their positions with WH Group, certain of our directors own equity interests in WH Group. Continuing ownership of shares of WH Group’s common stock and equity awards could create, or appear to create, potential conflicts of interest if we and WH Group face decisions that could have implications for both WH Group and us after this offering. In addition, certain of WH Group’s current executive officers also serve as directors of our company, and this could create, or appear to create, potential conflicts of interest when we and WH Group encounter opportunities or face decisions that could have implications for both companies following this offering or in connection with the allocation of such directors’ time between WH Group and us. These potential conflicts could arise, for example, over matters such as the desirability of changes in our business and operations, funding and capital matters, regulatory matters and other agreements with WH Group relating to the commercial arrangements in the future, employee retention or recruiting or our dividend policy.
56
While our board believes that, given its size and structure, such actual or potential conflicts of interest can be managed adequately, including that the independent members of our board may meet in the absence of senior executive officers or non-independent directors in respect of the relevant matter, the actual or perceived conflicts of interest that may arise could cause reputational or other harm.
In addition, we have, and expect to continue to be, engaged in related party transactions with WH Group and its affiliates. In all related party transactions, there is a risk that a related party’s influence may be such that the transaction terms could be viewed as favorable to that related party, even if we strive to reach arms-length transaction terms. The appearance of conflicts of interest created by related party transactions could impair the confidence of our investors. Furthermore, WH Group has certain non-compete arrangements with Henan Shuanghui Investment & Development Co., Ltd., or Shuanghui Development, which provide that there will be no competition between Shuanghui Development on the one hand, and WH Group and entities controlled by WH Group, on the other hand, regarding the operation of meat business in the PRC. Such undertaking by WH Group may restrict us from engaging in certain activities that would compete with Shuanghui Development and may limit our ability to pursue business opportunities in the manner that we desire, which could adversely affect our business, financial condition and results of operations.
After this offering, WH Group will indemnify us for certain liabilities. However, there can be no assurance that the indemnity will be sufficient to insure us against the full amount of such liabilities, or that WH Group’s ability to satisfy its indemnification obligation will not be impaired in the future.
Pursuant to the shareholders agreement and certain other agreements with WH Group, WH Group has agreed to indemnify us for certain liabilities as discussed further in “Certain Relationships and Related Party Transactions—Relationship with WH Group”. However, third parties could also seek to hold us responsible for any of the liabilities that WH Group has agreed to retain, and there can be no assurance that the indemnity from WH Group will be sufficient to protect us against the full amount of such liabilities, or that WH Group will be able to fully satisfy its indemnification obligations. In addition, WH Group’s insurance will not necessarily be available to us for liabilities associated with occurrences of indemnified liabilities prior to this offering, and in any event WH Group’s insurers may deny coverage to us for liabilities associated with certain occurrences of indemnified liabilities prior to this offering. Moreover, even if we ultimately succeed in recovering from WH Group or such insurance providers any amounts for which we are held liable, we may be temporarily required to bear these losses. Each of these risks could negatively affect our business, financial condition or results of operations.
Changes in relations between the United States and the PRC, or in U.S. regulations concerning the PRC, may adversely impact our business, financial condition, results of operations, our ability to raise capital or the market price of our common stock.
The U.S. government, including its agencies such as the SEC, has made statements and taken certain actions that have led to, and may in the future make statements or take actions that would lead to, changes in relations between the United States and the PRC, which statements and actions could impact companies, including us, with connections to the PRC. In particular, the United States may in the future impose policies on or increase scrutiny of companies having operations in the PRC, such as WH Group, or companies in the United States with significant PRC ownership. These could restrict or negatively impact our business or our ability to access the U.S. capital markets. More broadly, changes in political conditions in the PRC and changes in the state of U.S.-PRC relations, including any tensions relating to potential military conflict between the PRC and Taiwan, are difficult to predict and could lead to policies or regulations that adversely affect our business, financial condition or results of operations on account of our controlling shareholder’s ties to the PRC. Furthermore, continued or increased tension in U.S.-PRC relations or any deterioration in political or trade relations between the United States and the PRC may lead to negative investor sentiment towards companies controlled by shareholders with significant ties to the PRC, which could make our common stock less attractive to U.S. investors and affect the market price of our common stock.
57
Our controlling shareholder is required by the stock exchange on which its shares are listed to disclose and obtain approval from its board of directors or shareholders for certain corporate actions that we undertake.
WH Group is listed on The Stock Exchange of Hong Kong Limited and is therefore subject to the applicable Hong Kong laws and regulations, including but not limited to the Rules Governing the Listing of Securities on The Stock Exchange of Hong Kong Limited, or the HKEx Listing Rules. Under the HKEx Listing Rules, WH Group is obligated to obtain approval from its board of directors and/or shareholders for certain transactions in which we, as a subsidiary of WH Group, engage, such as the purchase or sale of assets, mergers and acquisitions, lending, leasing of assets, donation or acceptance of assets, debt restructuring, license agreements, research and development joint ventures, and transactions with connected persons (as defined under the HKEx Listing Rules) of WH Group, the value of which exceeds certain financial thresholds established by the applicable listing rules and/or otherwise not exempted under the applicable listing rules. In addition, the HKEx Listing Rules require our controlling shareholder to obtain shareholders’ approval for certain corporate actions that we undertake, including but not limited to (i) any issuance of shares by us that results in a reduction of WH Group’s equity interest in us in excess of certain dilution thresholds and (ii) the implementation of a share option and/or award scheme involving the issuance of new shares by us. This offering will constitute a “disposal” and a “deemed disposal” of the interest in a subsidiary of WH Group under the HKEx Listing Rules. Based on the proposed size of this offering, it is expected that this offering may constitute a “major transaction” of WH Group under the HKEx Listing Rules and would therefore be subject to the approval of the shareholders of WH Group under paragraph 3(e)(1) of Practice Note 15 and Chapter 14 of the HKEx Listing Rules. Accordingly, we received the requisite approval of the shareholders of WH Group for this offering prior to the date of this prospectus.
Additionally, under Practice Note 15 of the HKEx Listing Rules, this offering constitutes a “spin-off” transaction by WH Group, for which the approval of The Stock Exchange of Hong Kong Limited is required to be obtained by WH Group. On September 6, 2024, The Stock Exchange of Hong Kong Limited confirmed that WH Group may proceed with the “spin-off” transaction. The offering is not subject to the approval of any other regulatory authority on the part of WH Group.
There can be no assurance that WH Group will obtain the requisite approvals if we desire to enter into any of the transactions as required under the applicable listing rules, and a failure to do so would restrict our ability to engage in such transactions. Furthermore, regulators including The Stock Exchange of Hong Kong Limited and/or the Securities and Futures Commission of Hong Kong could impose additional restrictions or approval requirements that could impact our ability to undertake certain corporate actions. We cannot guarantee that our controlling shareholder will be able to successfully or timely obtain any of the approvals needed to permit us to undertake any of the corporate actions as required under the applicable listing rules, and the failure to do so may have a material adverse effect on our business, financial condition or results of operations.
Risks Relating to this Offering
We will incur increased costs and become subject to additional regulations and requirements as a result of becoming a public company, and our management will be required to devote substantial time to new compliance matters, which could lower our profits or make it more difficult to run our business.
As a public company, we will incur significant legal, regulatory, finance, accounting, investor relations, insurance and other expenses that we have not incurred as a private company, including costs associated with public company reporting requirements and costs of recruiting and retaining non-executive directors. We also have incurred and will incur costs associated with the Sarbanes-Oxley Act, the Dodd-Frank Wall Street Reform and Consumer Protection Act and related rules implemented by the SEC and the relevant stock exchange. The expenses incurred by public companies generally for reporting and corporate governance purposes have been increasing. We expect these rules and regulations to increase our compliance costs and to make some activities more time-consuming and costly, although we are currently unable to estimate these costs with any degree of certainty. Our management will need to devote a substantial amount of time to related compliance requirements, diverting the attention of management away from revenue-producing activities. These laws and regulations also could make it more difficult or costly for us to obtain certain types of insurance, including director and officer liability insurance, and we may be forced to accept reduced policy limits and coverage or incur substantially higher costs to obtain the
58
same or similar coverage. These laws and regulations could also make it more difficult for us to attract and retain qualified persons to serve on our board, our board committees or as our executive officers. Furthermore, if we are unable to satisfy our obligations as a public company, we could be subject to delisting of our common stock, fines, sanctions and other regulatory action, and civil litigation.
Failure to comply with requirements to design, implement, and maintain effective internal controls could have a material adverse effect on our business and stock price.
As a privately held company, we were not required to evaluate our internal control over financial reporting in a manner that meets the standards of publicly traded companies required by Section 404(a) of the Sarbanes-Oxley Act, or Section 404.
As a public company, we will have significant requirements for enhanced financial reporting and internal controls. The process of designing and implementing effective internal controls is a continuous effort that requires us to anticipate and react to changes in our business and the economic and regulatory environment, and to expend significant resources to maintain a system of internal controls that is adequate to satisfy our reporting obligations as a public company. If we are unable to establish or maintain appropriate internal financial reporting controls and procedures, it could cause us to fail to meet our reporting obligations on a timely basis, result in material misstatements in our consolidated financial statements, and harm our results of operations. In addition, we will be required, pursuant to Section 404, to furnish a report by management on, among other things, the effectiveness of our internal control over financial reporting in the second annual report following the completion of this offering. This assessment will need to include disclosure of any material weaknesses identified by our management in our internal control over financial reporting. The rules governing the standards that must be met for our management to assess our internal control over financial reporting are complex and require significant documentation, testing and possible remediation. Testing and maintaining internal controls may divert our management’s attention from other matters that are important to our business.
In connection with the implementation of the necessary procedures and practices related to internal control over financial reporting, we may identify deficiencies that we may not be able to remediate in time to meet the deadline imposed by the Sarbanes-Oxley Act for compliance with the requirements of Section 404. In addition, we may encounter problems or delays in completing the remediation of any deficiencies identified by us or our independent registered public accounting firm in connection with the issuance of their attestation report.
We may not be able to conclude on an ongoing basis that we have effective internal control over financial reporting in accordance with Section 404, or our independent registered public accounting firm may not issue an unqualified opinion. If either we are unable to conclude that we have effective internal control over financial reporting or our independent registered public accounting firm is unable to provide us with an unqualified report, investors could lose confidence in our reported financial information, which could have a material adverse effect on the trading price of our common stock.
In addition, the preparation of financial statements in conformity with GAAP requires us to make estimates and assumptions that affect the amounts reported in our combined financial statements. We base our estimates on historical experience and on various other assumptions that we believe to be reasonable under the circumstances, the results of which form the basis for making judgments about the carrying values of assets, liabilities, equity, net sales and expenses that are not readily apparent from other sources. If our assumptions change or if actual circumstances differ from our assumptions, our results of operations could be adversely affected.
There is currently no public market for our common stock and an active, liquid trading market for our common stock may not develop or continue following this offering.
There is currently no public market for our common stock. If an active and liquid trading market does not develop or continue, you may have difficulty selling your shares of our common stock at an attractive price or at all. The initial public offering price per share of common stock will be determined by agreement between us and the representative of the underwriters and may not be indicative of the price at which shares of our common stock will trade in the public market after this offering. An inactive market may also impair our ability to raise capital by
59
selling shares of our common stock and may impair our ability to acquire other companies by using our shares of common stock as consideration.
Our stock price may change significantly following this offering, and you may not be able to resell shares of our common stock at or above the price you paid or at all, and you could lose all or part of your investment as a result.
Even if a trading market develops, the market price of our common stock may be highly volatile and could be subject to wide fluctuations. You may not be able to resell your shares at or above the initial public offering price due to a number of factors such as those listed elsewhere in this “Risk Factors” section and the following:
•results of operations that vary from the expectations of securities analysts and investors;
•results of operations that vary from those of our competitors;
•changes in expectations as to our future financial performance, including financial estimates and investment recommendations by securities analysts and investors;
•changes in market valuations of, or earnings and other announcements by, companies in our industries;
•declines in the market prices of stocks generally, particularly those of companies in our industry;
•additions or departures of key management personnel;
•strategic actions by us or our competitors;
•announcements by us or our competitors of significant contracts, price reductions, new services, acquisitions, dispositions, joint marketing relationships, joint ventures, other strategic relationships or capital commitments;
•changes in our market share;
•an increase in our indebtedness or the interest rates applicable to our indebtedness;
•changes in general economic or market conditions or trends in our industries or the economy as a whole;
•changes in business or regulatory conditions;
•future sales of our common stock or other securities;
•actions by WH Group or other institutional shareholders;
•investor perceptions of or the investment opportunity associated with our common stock relative to other investment alternatives;
•changes in the way we are perceived in the marketplace, including due to negative publicity or campaigns on social media to boycott certain of our products, our business or our industries;
•the public’s response to press releases or other public announcements by us or third parties, including our filings with the SEC;
•changes or proposed changes in laws or regulations or differing interpretations or enforcement thereof affecting our business;
•announcements relating to litigation or governmental investigations;
•guidance, if any, that we provide to the public, any changes in this guidance or our failure to meet this guidance;
60
•the development and sustainability of an active trading market for our common stock;
•changes in accounting principles; and
•other events or factors, including those resulting from informational technology system failures and disruptions, epidemics, pandemics, natural disasters, war, acts of terrorism, civil unrest, or responses to these events.
Further, the global equity markets in general have recently experienced extreme price and volume fluctuations, including as a result of the COVID-19 pandemic, economic uncertainty and changes or anticipated changes in interest rates, inflation, and liquidity concerns at financial institutions that may be unrelated to our operating performance. Continued market fluctuations could result in extreme volatility in the price of our common stock, which could cause a decline in the value of our common stock. In addition, price volatility may be greater if the public float and trading volume of our common stock is low.
In the past, following periods of market volatility, shareholders have instituted securities class action litigation against various issuers. If we were to become involved in securities litigation, it could have a substantial cost and divert resources and the attention of executive management from our business regardless of the outcome of such litigation, which may adversely affect the market price of our common stock.
Investors in this offering will suffer immediate and substantial dilution.
The initial public offering price per share of common stock will be substantially higher than our as adjusted net tangible book value per share immediately after this offering. As a result, you will pay a price per share of common stock that substantially exceeds the per share book value of our tangible assets after subtracting our liabilities. Upon the issuance and sale of shares of our common stock by us at an assumed initial public offering price of $ per share, which is the midpoint of the estimated price range set forth on the cover page of this prospectus, you will incur immediate and substantial dilution in an amount of $ per share of common stock. If the underwriters exercise their option to purchase additional shares, you will experience additional dilution. See “Dilution.”
We expect to continue paying regular dividends to our shareholders, but our ability to do so is subject to the discretion of our board and may be limited by our financial condition, our credit facilities, the indentures governing the notes we previously issued and applicable law.
We have historically paid dividends to WH Group annually, along with special dividends in some years. We initially expect to pay annual dividends in an amount equal to 50% of our net income, subject to the discretion of the board. See “Dividend Policy.” However, the payment of dividends and other distributions is at the discretion of our board and our board may, in its discretion, increase, decrease or eliminate the payment of dividends. Our ability to pay dividends on our common stock depends on many factors, including our results of operations, financial condition, level of indebtedness, capital requirements, contractual restrictions, restrictions in our debt agreements and in any preferred stock, business prospects and other factors that our board may deem relevant. In particular, our ability to pay dividends on our common stock is limited by covenants in our credit facilities and the indentures governing the notes and may be further restricted by the terms of any future debt or preferred securities. Furthermore, Virginia law prohibits us from paying dividends or other distributions if, after giving effect to the dividend or other distribution, we would not be able to pay our debts as they become due in the usual course of business or our total assets would be less than the sum of our total liabilities plus the amount that would be needed, if we were to be dissolved at the time of the dividend or other distribution, to satisfy the preferential rights of any then outstanding shares of our preferred stock. While we do not currently believe that these restrictions will impair our ability to continue to pay regular quarterly cash dividends, there can be no assurance that we will not need to reduce or eliminate the payment of dividends on our common stock in the future.
Any shareholder whose principal currency is not the U.S. dollar will be subject to exchange rate fluctuations.
Our common stock will be traded in, and any cash dividends or other distributions to be declared in respect of them, if any, will be denominated in U.S. dollars. Shareholders whose principal currency is not the U.S. dollar will
61
be exposed to foreign currency exchange rate risk. Any depreciation of the U.S. dollar in relation to such foreign currency would reduce the value of our common stock held by such shareholders, whereas any appreciation of the U.S. dollar would increase their value in foreign currency terms. In addition, we will not offer our shareholders the option to elect to receive dividends, if any, in any other currency. Consequently, our shareholders may be required to arrange their own foreign currency exchange, either through a brokerage house or otherwise, which could incur additional commissions or expenses.
Future sales or issuances, or the perception of future sales or issuances, by us or our existing shareholders in the public market following this offering could cause the market price for our common stock to decline.
The sale or issuance of substantial amounts of shares of our common stock or other securities convertible or exchangeable into shares of our common stock in the public market, or the perception that such sales or issuances could occur, including sales by our existing shareholders, could harm the prevailing market price of shares of our common stock. These sales or issuances, or the possibility that these sales or issuances may occur, also might make it more difficult for us to sell equity securities in the future at a time and at a price that we deem appropriate.
Upon completion of this offering, we will have a total of shares of our common stock outstanding, or shares if the underwriters exercise in full their option to purchase additional shares of our common stock. All of the shares of our common stock sold in this offering will be freely tradable without restriction or further registration under the Securities Act, except that any shares held by WH Group or purchased by our directors and officers in this offering (including through our directed share program described under “Underwriting—Directed Share Program”) may be sold only in compliance with the limitations described in “Shares Eligible for Future Sale.” The shares of common stock held by WH Group after this offering, representing approximately % of the total outstanding shares of our common stock following this offering (or approximately % if the underwriters exercise in full their option to purchase additional shares), will be “restricted securities” within the meaning of Rule 144 of the Securities Act, or Rule 144, and subject to certain restrictions on resale. Restricted securities may be sold in the public market only if they are registered under the Securities Act or are sold pursuant to an exemption from registration such as Rule 144, as described in “Shares Eligible for Future Sale.”
We, our directors and our officers and WH Group will sign lock-up agreements with the underwriters that will, subject to certain customary exceptions, restrict the sale of the shares of our common stock and certain other securities held by them for 180 days following the date of this prospectus. The representative of the underwriters may, in their sole discretion and at any time without notice, release all or any portion of the shares or securities subject to any such lock-up agreements. See “Underwriting” for a description of these lock-up agreements.
Upon the expiration of the lock-up agreements described above, all of such shares will be eligible for resale in a public market pursuant to Rule 144, subject to our compliance with the public information requirement and, in the case of shares held by WH Group, subject to volume, manner of sale and other limitations under Rule 144.
In addition, pursuant to the registration rights agreement to be entered into between us and WH Group, WH Group has the right, subject to certain conditions, to require us to register the sale of their shares of our common stock under the Securities Act. See “Certain Relationships and Related Party Transactions—Registration Rights Agreement.” By exercising its registration rights and selling a large number of shares, WH Group could cause the prevailing market price of our common stock to decline. Following completion of this offering, the shares covered by registration rights would represent approximately % of our common stock outstanding (or approximately % if the underwriters exercise in full their option to purchase additional shares). Registration of any of these outstanding shares of common stock would result in such shares becoming freely tradable without compliance with Rule 144 upon effectiveness of the registration statement. See “Shares Eligible for Future Sale—Registration Rights.”
We intend to file one or more registration statements on Form S-8 under the Securities Act to register shares of our common stock or securities convertible into or exchangeable for shares of our common stock issued under the New Equity Awards, to be adopted in connection with this offering. Any such Form S-8 registration statements will automatically become effective upon filing. Accordingly, shares registered under such registration statements will be
62
available for sale in the open market. We expect that the initial registration statement on Form S-8 will cover shares of our common stock.
In the future, we may attempt to obtain financing or to further increase our capital resources by issuing additional shares of our common stock or by offering debt or other equity securities, including senior or subordinated notes, debt securities convertible into equity or shares of preferred stock. Our decision to issue securities in any future offering will depend on market conditions and other factors beyond our control, which may have a material adverse effect on the amount, timing or nature of our future offerings. Thus, holders of our common stock bear the risk that our future offerings may reduce the market price of our common stock and dilute their stockholdings in us.
As restrictions on resale end, or if the existing shareholders exercise their registration rights, or we register additional shares of our common stock or securities convertible into or exchangeable for shares of our common stock, or if the market anticipates any of the foregoing, the market price of our shares of common stock could drop significantly. These factors could also make it more difficult for us to raise additional funds through future offerings of our shares of common stock or other securities.
Our quarterly results of operations may fluctuate significantly and could fall below the expectations of securities analysts and investors due to seasonality and other factors, some of which are beyond our control, resulting in a decline in our stock price.
Our quarterly results of operations may fluctuate due to seasonal or other factors. Accordingly, results for any one quarter are not necessarily indicative of results to be expected for any other quarter or for any year. In addition, if we increase our marketing or promotional activity in certain periods, the seasonality of our business may be amplified. Typically, our third and fourth quarters have higher revenue due to weather and holidays. Fluctuations or changes in these seasonal patterns may adversely affect our business, financial condition and results of operations. As a result, it may be difficult to accurately forecast our results of operations and, if our forecasts are not accurate, we may fail to meet the expectations of investors and securities analysts, which could cause the trading price of our common stock to fall substantially and potentially subject us to costly lawsuits, including securities class action suits.
If securities analysts do not publish research or reports about our business or if they downgrade our stock or our sector, our stock price and trading volume could decline.
The trading market for our common stock will rely in part on the research and reports that industry or financial analysts publish about us or our business. We do not control these analysts. Furthermore, if one or more of the analysts who do cover us downgrade our stock or our industries, or the stock of any of our competitors, or publish inaccurate or unfavorable research about our business, or if our operating results do not meet their expectations, the price of our stock could decline. If one or more of these analysts ceases coverage of us or fails to publish reports on us regularly, we could lose visibility in the market, which in turn could cause our stock price or trading volume to decline.
Our management may spend the proceeds to our company from this offering in ways with which you may disagree or that may not be profitable.
Although we anticipate using the net proceeds to our company from this offering as described under “Use of Proceeds,” we will have broad discretion as to the application of the net proceeds received by us and could use them for purposes other than those contemplated by this offering. You may not agree with the manner in which our management chooses to allocate and spend the net proceeds. Our management may use the net proceeds for corporate purposes that may not increase our profitability or otherwise result in the creation of shareholder value. In addition, pending our use of the net proceeds, we may invest the net proceeds primarily in instruments that do not produce significant income or that may lose value.
63
Anti-takeover provisions in our organizational documents and provisions in existing and future debt agreements could delay or prevent a change of control.
Certain provisions of our amended and restated articles of incorporation and our amended and restated bylaws may have an anti-takeover effect and may delay, defer or prevent a merger, acquisition, tender offer, takeover attempt or other change of control transaction that a shareholder might consider to be in its best interest, including those attempts that might result in a premium over the market price for the shares held by our shareholders.
These provisions will provide for, among other things:
•a classified board of directors, as a result of which our board will be divided into three classes, with each class serving for staggered three-year terms;
•the ability of our board to issue one or more classes or series of preferred stock and to determine the preferences, rights and limitations of those shares without shareholder approval;
•advance notice requirements for nominations of directors and proposals of other business by shareholders to be considered at our annual or special meetings;
•at any time after WH Group (including its permitted transferees) ceases to own a majority of the combined voting power of our then-outstanding shares of common stock entitled to vote generally in director elections, or the WHG Trigger Event, our shareholders will not be able to act by less-than-unanimous written consent without a duly called annual or special meeting of our shareholders;
•at any time after the WHG Trigger Event, special meetings may only be called by the Chair of the board, the President or the board;
•from and after the WHG Trigger Event, our directors may only be removed for cause, by the affirmative vote of holders of a majority of the voting power of the shares of common stock outstanding and entitled to vote on the election of directors;
•restrictions on engaging in mergers, share exchanges, certain dispositions of corporate assets and other transactions with an interested shareholder (generally defined as any person, other than WH Group and its affiliates and permitted transferees, that acquires more than 10% of any class of our outstanding voting shares without the approval of a majority of our disinterested directors) unless the transaction is approved by a majority of our disinterested directors and holders of two-thirds of our voting shares (excluding shares owned by the interested shareholder); and
•that our amended and restated articles of incorporation and amended and restated bylaws may be amended by the affirmative vote of the holders of at least a majority of the total voting power of the outstanding shares of common stock entitled to vote.
These anti-takeover provisions could make it more difficult for a third party to acquire us, even if the third party’s offer may be considered beneficial by many of our shareholders. These provisions also may have the effect of preventing changes in our board and may make it more difficult to accomplish transactions that shareholders may otherwise deem to be in their best interests. As a result, our shareholders may be limited in their ability to obtain a premium for their shares. See “Description of Capital Stock.”
Our board will be authorized to issue and designate shares of our preferred stock in additional classes and series without shareholder approval.
Our amended and restated articles of incorporation will authorize our board, without the approval of our shareholders, to issue up to shares of our preferred stock, subject to limitations prescribed by applicable law and the provisions of our amended and restated articles of incorporation, as shares of preferred stock in one or more classes or series, to establish from time to time the number of shares to be included in each such class or series and to fix the preferences, rights and limitations of the shares of each such class or series. The preferences, rights and
64
limitations of these classes or series of preferred stock may be senior to or on parity with our common stock, which may reduce the value of our common stock.
Our amended and restated bylaws designate the U.S. District Court for the Eastern District of Virginia, Richmond Division (or if it does not have jurisdiction over certain action, the Circuit Court of Henrico County, Virginia) as the sole and exclusive forum for certain litigation that may be initiated by our shareholders, which could limit our shareholders’ ability to obtain a favorable judicial forum for disputes with us.
Pursuant to our amended and restated bylaws, unless we consent in writing to the selection of an alternative forum, the U.S. District Court for the Eastern District of Virginia, Richmond Division (or, if the U.S. District Court for the Eastern District of Virginia does not have jurisdiction over certain action, the Circuit Court of Henrico County) will be the sole and exclusive forum for (i) any derivative action or proceeding brought on behalf of our company, (ii) any action asserting a claim of breach of a duty owed by any of our directors, officers or shareholders to us or our shareholders, (iii) any action asserting a claim arising pursuant to the Virginia Stock Corporation Act, our amended and restated articles of incorporation or our amended and restated bylaws or (iv) any action asserting a claim governed by the internal affairs doctrine. Our amended and restated bylaws will provide that the foregoing provision will not apply to claims arising under the Securities Act or the Exchange Act or any other claim for which the federal courts have exclusive jurisdiction. In addition, our amended and restated bylaws will provide that, unless we consent in writing to the selection of an alternative forum, the federal district courts of the United States shall, to the fullest extent permitted by law, be the sole and exclusive forum for the resolution of any complaint asserting a cause of action arising under the Securities Act. There is no guarantee that a court will enforce such provisions. Section 22 of the Securities Act creates concurrent jurisdiction for federal and state courts over all claims brought to enforce any duty or liability created by the Securities Act or the rules and regulations thereunder. For the avoidance of doubt, our shareholders cannot waive compliance with U.S. federal securities laws and the rules and regulations thereunder. The forum selection clause in our amended and restated bylaws may have the effect of discouraging lawsuits against us or our directors, officers or shareholders.
Any person or entity purchasing or otherwise acquiring or holding any interest in shares of our capital stock will be deemed to have notice of and consented to the forum provisions in our amended and restated bylaws, except our shareholders will not be deemed to have waived (and cannot waive) compliance with the federal securities laws and the rules and regulations thereunder. This exclusive forum provision may limit a shareholder’s ability to bring a claim in a judicial forum that it finds favorable for disputes with us or any of our current or former directors, officers or shareholders. There is also a risk that this exclusive forum provision may result in increased costs for a shareholder to bring a claim. Alternatively, if a court were to find the exclusive forum provision contained in our amended and restated bylaws to be inapplicable or unenforceable in an action, we may incur additional costs associated with resolving such action in other jurisdictions, which could harm our business, financial condition and results of operations.
65
FORWARD-LOOKING STATEMENTS
This prospectus contains forward-looking statements about us and our industry that involve substantial risks and uncertainties. All statements other than statements of historical facts contained in this prospectus, including statements regarding our strategy, future financial condition, future operations, projected costs, prospects, plans, objectives of management, and expected market growth, are forward-looking statements. In some cases, you can identify forward-looking statements because they contain words, such as “may,” “might,” “will,” “shall,” “should,” “expects,” “plans,” “anticipates,” “could,” “intends,” “target,” “projects,” “contemplates,” “believes,” “estimates,” “predicts,” “potential,” “goal,” “objective,” “seeks,” “likely” or “continue” or the negative of these words or other similar terms or expressions that concern our expectations, strategy, plans, or intentions.
Forward-looking statements contained in this prospectus include, but are not limited to, statements about:
•our ability to capture synergies between our Packaged Meats and Fresh Pork segments;
•our ability to execute on our strategy to optimize the size of our hog production operations;
•our ability to anticipate and meet consumer trends and interests through production innovation;
•the size of our addressable markets, market share and market trends, including our ability to drive organic growth in our business through our Packaged Meats and Fresh Pork segments;
•anticipated trends, developments and challenges in our industry, business and the highly competitive markets in which we operate;
•our ability to mitigate higher input costs through productivity improvements in our operations (including analytics and task automation), various procurement strategies and the use of derivative instruments;
•our dependence on third-party suppliers and our ability to mitigate any disruption or inefficiency in our supply chain and/or operations;
•our expectations regarding our hog production transformation strategy and our ability to achieve segment production targets;
•fluctuations in our quarterly results of operations due to the seasonal nature of our business;
•our ability to attract and retain a diverse and inclusive workforce and maintain our corporate culture;
•our ability to prevent cyberattacks, other cyber-incidents, security breaches or other disruptions of our information technology systems;
•our ability to defend litigation brought against us successfully and the sufficiency of our accruals for related contingent losses;
•compliance with laws and regulations, including environmental, cybersecurity and tax laws and regulations, that currently apply or may become applicable to our business both in the United States and Mexico and our expectations regarding various laws and restrictions that relate to our business;
•our ability to capitalize on export markets;
•our ability to execute on acquisitions, joint ventures and divestitures;
•legal, regulatory, or market measures to address climate change and our ability to achieve our climate-related goals and strategies;
•future investments in our business, our anticipated capital expenditures and our estimates regarding our capital requirements;
66
•the sufficiency of our cash and cash equivalents and the availability of our committed credit facilities to meet our liquidity needs;
•our ability to achieve our financial and operational targets;
•our ability to maintain our investment grade ratings;
•our expectations regarding expenses, such as stock-based compensation expenses;
•fluctuations in the values of our open derivative contracts and pension obligations and related assets;
•impairment in the carrying value of our goodwill or intangible assets;
•our ability to achieve or maintain our targeted Ratio of Net Debt to Adjusted EBITDA and minimum liquidity levels;
•our dividend policy and our ability to pay dividends; and
•our intended use of the net proceeds from this offering.
We caution you that the foregoing list does not contain all of the forward-looking statements made in this prospectus.
You should not rely upon forward-looking statements as predictions of future events. We have based the forward-looking statements contained in this prospectus primarily on our current expectations, estimates, forecasts and projections about future events and trends that we believe may affect our business, results of operations, financial condition and prospects. Although we believe that we have a reasonable basis for each forward-looking statement contained in this prospectus, we cannot guarantee that the future results, levels of activity, performance or events and circumstances reflected in the forward-looking statements will be achieved or occur at all. The outcome of the events described in these forward-looking statements is subject to risks, uncertainties and other factors, including those described in the section titled “Risk Factors” and elsewhere in this prospectus. Moreover, we operate in a very competitive and rapidly changing environment. Additional risks and uncertainties of which we are unaware, or that we currently deem immaterial, also may become important factors that affect us. New risks and uncertainties emerge from time to time, and it is not possible for us to predict all risks and uncertainties that could have an impact on the forward-looking statements contained in this prospectus. The results, events and circumstances reflected in the forward-looking statements may not be achieved or occur, and actual results, events or circumstances could differ materially from those described in the forward-looking statements.
The forward-looking statements made in this prospectus relate only to events as of the date on which the statements are made. We undertake no obligation to update any forward-looking statements made in this prospectus to reflect events or circumstances after the date of this prospectus or to reflect new information or the occurrence of unanticipated events, except as required by law. We may not actually achieve the plans, intentions, or expectations disclosed in our forward-looking statements, and you should not place undue reliance on our forward-looking statements. Our forward-looking statements do not reflect the potential impact of any future acquisitions, mergers, dispositions, joint ventures, or investments we may make.
In addition, statements that “we believe” and similar statements reflect our beliefs and opinions on the relevant subject. These statements are based upon information available to us as of the date of this prospectus, and while we believe such information forms a reasonable basis for such statements, such information may be limited or incomplete, and our statements should not be read to indicate that we have conducted an exhaustive inquiry into, or review of, all potentially available relevant information. These statements are inherently uncertain, and you are cautioned not to unduly rely upon these statements.
You should read this prospectus and the documents that we reference in this prospectus and have filed as exhibits to the registration statement, of which this prospectus is a part, completely and with the understanding that our actual future results may be materially different from what we expect. We qualify all of the forward-looking statements in this prospectus by these cautionary statements.
67
USE OF PROCEEDS
We estimate that the net proceeds to us from this offering will be approximately $ based on an assumed initial public offering price of $ per share of our common stock, which is the midpoint of the estimated public offering price range set forth on the cover page of this prospectus, after deducting the underwriting discounts and commissions and estimated offering expenses payable by us.
Certain of the shares of common stock offered by this prospectus are being sold by the selling shareholder. The selling shareholder in this offering is SFDS UK Holdings Limited, an indirect wholly owned subsidiary of WH Group that holds WH Group’s interest in us. We will not receive any of the proceeds from the sale of shares by the selling shareholder in this offering, including from any exercise by the underwriters of their option to purchase additional shares. For information about the selling shareholder, see “Principal and Selling Shareholders.”
We intend to use the net proceeds to us from this offering for general corporate purposes, including capital investments in infrastructure, automation and capacity expansion.
Each $1.00 increase (decrease) in the assumed initial public offering price of $ per share of our common stock, which is the midpoint of the estimated public offering price range set forth on the cover page of this prospectus, would increase (decrease) the net proceeds to us from this offering by $ , assuming the number of shares of our common stock offered in this offering by us, as set forth on the cover page of this prospectus, remains the same and after deducting the underwriting discounts and commissions and estimated offering expenses payable by us. Similarly, an increase (decrease) of one million shares in the number of shares of our common stock sold in this offering by us would increase (decrease) the net proceeds to us from this offering by $ , assuming the initial public offering price of $ per share of our common stock, which is the midpoint of the estimated public offering price range set forth on the cover page of this prospectus, remains the same and after deducting the underwriting discounts and commissions and estimated offering expenses payable by us. The information discussed above is illustrative only and will adjust based on the actual initial public offering price and other terms of this offering determined at the time of the pricing of this offering.
The foregoing represents our current intentions with respect to the use of the net proceeds of this offering based upon our present plans and business condition. We cannot predict with certainty all of the particular uses for the net proceeds of this offering or the amounts that we will actually spend on such particular uses. Accordingly, our management will have broad discretion in applying the net proceeds of this offering. A change in our present plans or the occurrence of unforeseen events or changed business conditions could result in application of the net proceeds of this offering in a manner other than as described in this prospectus.
Pending their use, we intend to invest the net proceeds of this offering in a variety of capital-preservation investments, including short- and intermediate-term investments, interest-bearing investments, investment-grade securities, government securities and money market funds.
68
DIVIDEND POLICY
We have historically paid dividends to WH Group annually, along with special dividends in some years. We initially expect to pay annual dividends in an amount equal to 50% of our net income, subject to the discretion of the board.
The payment of any dividends or other distributions in the future to our shareholders, and the timing and amount thereof, will fall within the discretion of the board. The board’s decisions regarding the payment of dividends will depend on many factors, such as our financial condition, earnings, capital requirements, debt service obligations, restrictive covenants in the agreements governing our indebtedness, general economic business conditions, industry practice, legal requirements and other factors that the board may deem relevant.
We cannot assure you that we will pay our anticipated dividend in the same amount or frequency, or at all, in the future. You should not purchase shares of our common stock with the expectation of receiving cash dividends. See “Risk Factors—Risks Relating to This Offering—We expect to continue paying regular dividends to our shareholders, but our ability to do so is subject to the discretion of our board and may be limited by our financial condition, our credit facilities, the indentures governing the notes we previously issued and applicable law.”
69
CAPITALIZATION
The following table sets forth our cash and cash equivalents and capitalization as of September 29, 2024:
•on an actual basis as derived from our consolidated financial statements included elsewhere in this prospectus; and
•on an as adjusted basis after giving effect to the sale by us of shares of our common stock in this offering based on an assumed initial public offering price of $ per share of our common stock, which is the midpoint of the estimated price range set forth on the cover page of this prospectus, after deducting the underwriting discounts and commissions and estimated offering expenses payable by us.
The “as adjusted” information set forth below is illustrative only, and will be adjusted based on the actual initial public offering price and other terms of the offering determined at the pricing of this offering. You should read this table in conjunction with the information contained in “Summary Historical Consolidated Financial Information,” “Use of Proceeds,” and “Management’s Discussion and Analysis of Financial Condition and Results of Operations,” as well as our consolidated financial statements and related notes and our unaudited condensed consolidated financial statements and related notes, each included elsewhere in this prospectus.
| As of September 29, 2024 | |||||||||||
| Actual | As Adjusted (2) | ||||||||||
| (In millions, except par value and share data) | |||||||||||
| Cash and cash equivalents | $ | 278 | $ | ||||||||
Current portion of long-term debt and finance lease obligations (1) | 8 | $ | |||||||||
Long-term debt and finance lease obligations (1) | 2,005 | $ | |||||||||
Common stock, no par value, 1,000 shares authorized and 1,000 issued and outstanding, actual; shares authorized and shares issued and outstanding, as adjusted (2) | — | ||||||||||
| Additional paid-in capital | 2,967 | ||||||||||
| Preferred stock, no par value, no shares authorized, issued and outstanding, actual; shares authorized and shares issued and outstanding, as adjusted | — | ||||||||||
| Retained earnings | 2,997 | ||||||||||
| Accumulated other comprehensive loss | (363) | ||||||||||
| Total shareholder’s equity | 5,601 | ||||||||||
| Total capitalization | $ | 7,613 | $ | ||||||||
________________
(1)For a further description of our indebtedness, including our revolving credit facility, see “Note 10: Debt” and “Note 11: Lease Obligations, Commitments, and Guarantees” in the consolidated financial statements and accompanying notes included elsewhere in this prospectus.
(2)Each $1.00 increase (decrease) in the assumed initial public offering price of $ per share of our common stock, which is the midpoint of the estimated public offering price range set forth on the cover page of this prospectus, would increase (decrease) the net proceeds to us from this offering by $ , assuming the number of shares of our common stock offered in this offering by us, as set forth on the cover page of this prospectus, remains the same and after deducting the underwriting discounts and commissions and estimated offering expenses payable by us. Similarly, an increase (decrease) of one million shares in the number of shares of our common stock sold in this offering by us would increase (decrease) the net proceeds to us from this offering by $ , assuming the initial public offering price of $ per share of our common stock, which is the midpoint of the estimated public offering price range set forth on the cover page of this prospectus, remains the same and after deducting the underwriting discounts and commissions and estimated offering expenses payable by us. The information discussed above is illustrative only and will adjust based on the actual initial public offering price and other terms of this offering determined at the time of the pricing of this offering.
70
DILUTION
If you invest in our common stock in this offering, your ownership interest in us will be immediately diluted to the extent of the difference between the initial public offering price per share of our common stock and the as adjusted net tangible book value per share of our common stock after giving effect to this offering.
Our net tangible book value as of September 29, 2024 was approximately $3 billion, or $3 million per share of our common stock. We calculate net tangible book value per share by taking the amount of our total tangible assets, reduced by the amount of our total liabilities, and then dividing that amount by the total number of shares of common stock outstanding.
After giving effect to (i) the sale by us of shares of common stock in this offering at an assumed initial public offering price of $ per share, which is the midpoint of the estimated price range set forth on the cover page of this prospectus, and (ii) our receipt of the proceeds therefrom, after deducting the underwriting discounts and commissions and estimated offering expenses payable by us, our as adjusted net tangible book value as of , would have been $ , or $ per share of our common stock. This amount represents an immediate increase in net tangible book value of $ per share of common stock to our existing shareholders and an immediate and substantial dilution in net tangible book value of $ per share of common stock to new investors purchasing shares in this offering.
The following table illustrates this dilution on a per share of common stock basis:
| Assumed initial public offering price per share of our common stock | $ | ||||||||||
| Historical net tangible book value per share of our common stock | $ | ||||||||||
| Increase in net tangible book value per share of our common stock attributable to new investors purchasing shares of our common stock in this offering | |||||||||||
| Net tangible book value per share of our common stock after giving effect to this offering | |||||||||||
| Dilution in net tangible book value per share of our common stock to new investors purchasing shares of our common stock in this offering | $ | ||||||||||
Each $1.00 increase (decrease) in the assumed initial public offering price of $ per share of our common stock, which is the midpoint of the estimated public offering price range set forth on the cover page of this prospectus, would increase (decrease) the net proceeds to us from this offering by $ , assuming the number of shares of our common stock offered in this offering by us, as set forth on the cover page of this prospectus, remains the same and after deducting the underwriting discounts and commissions and estimated offering expenses payable by us. Similarly, an increase (decrease) of one million shares in the number of shares of our common stock sold in this offering by us would increase (decrease) the net proceeds to us from this offering by $ , assuming the initial public offering price of $ per share of our common stock, which is the midpoint of the estimated public offering price range set forth on the cover page of this prospectus, remains the same and after deducting the underwriting discounts and commissions and estimated offering expenses payable by us. The information discussed above is illustrative only and will adjust based on the actual initial public offering price and other terms of this offering determined at the time of the pricing of this offering.
The following table summarizes, on the same as adjusted basis as of September 29, 2024, the total number of shares of common stock purchased, the total cash consideration paid to us, and the average price per share of
71
common stock paid by our existing shareholders and by new investors purchasing shares of common stock in this offering:
| Shares Purchased | Total Consideration | Average Price Per Share | |||||||||||||||||||||||||||
| Number | Percent | Amount | Percent | ||||||||||||||||||||||||||
| (in millions except for percentages) | |||||||||||||||||||||||||||||
| Existing shareholders | % | $ | % | $ | |||||||||||||||||||||||||
| New investors in this offering | $ | ||||||||||||||||||||||||||||
| Total | 100.0 | % | $ | 100.0 | % | ||||||||||||||||||||||||
If the underwriters were to exercise in full their option to purchase additional shares of common stock in this offering, the percentage of shares of our common stock held by existing shareholders as of , 2025 would be % and the percentage of shares of our common stock held by new investors in this offering would be %.
72
MANAGEMENT’S DISCUSSION AND ANALYSIS OF FINANCIAL CONDITION AND RESULTS OF OPERATIONS
The following management’s discussion and analysis of our financial condition and results of operations should be read in conjunction with, and is qualified in its entirety by reference to the consolidated financial statements of Smithfield Foods, Inc. and the related notes included within this prospectus. For the purposes of this “Management’s Discussion and Analysis of Financial Condition and Results of Operations,” references to “we,” “our,” “us,” and “Smithfield” refer to Smithfield Foods, Inc. and its consolidated subsidiaries.
This discussion and analysis contains forward-looking statements that involve risks and uncertainties which could cause our actual results to differ materially from those anticipated in such forward-looking statements, including, risks and uncertainties discussed under the heading “Forward-Looking Statements,” “Risk Factors” and elsewhere in this prospectus. Additionally, our historical results are not necessarily indicative of the results that may be expected for any period in the future.
Our fiscal year is the 52-week or 53-week period that ends on the Sunday nearest to December 31. Unless otherwise noted, all references to “2023”, “2022” and “2021” are to the 52-week periods ended December 31, 2023, January 1, 2023 and January 2, 2022, respectively.
Overview
Smithfield is an American food company and an industry leader in value-added packaged meats and fresh pork with over $14 billion in annual sales. We produce and distribute a wide variety of packaged meats and fresh pork products both domestically and abroad. We market our products under a leading portfolio of iconic brands including Smithfield, Eckrich and Nathan’s Famous, among many others.
We conduct our operations through the following reportable segments:
•Packaged Meats: The Packaged Meats segment consists of our U.S. operations that process fresh meat into a wide variety of packaged meats products, including bacon, sausage, hot dogs, deli and lunch meats, dry sausage products (such as pepperoni and genoa), ham products, ready-to-eat products and prepared foods (such as pre-cooked entrees, bacon and sausage). Approximately 80% of the Packaged Meats segment’s raw materials are sourced from our Fresh Pork segment. We market our domestic packaged meats products under a strategic set of core brands, which include: Smithfield, Eckrich, Nathan’s Famous, Farmland, Armour, Farmer John, Kretschmar, Krakus, John Morrell, Cook’s, Gwaltney, Carando, Margherita, Curly’s and Smithfield Culinary. We also sell a sizeable portion of our packaged meats products as private label products. The majority of the Packaged Meats segment’s products are sold to retail and foodservice customers in the United States.
•Fresh Pork: The Fresh Pork segment consists of our U.S. operations that process live hogs into a wide variety of primal, sub-primal and offal products, such as bellies, butts, hams, loins, picnics and ribs. The Fresh Pork segment sources approximately half of its raw materials from our Hog Production segment and half from independent farmers with whom we partner across the United States. Approximately one-third of our fresh pork products, including the majority of hams, bellies and trimmings, is transferred to our Packaged Meats segment. Externally, we sell our fresh pork products to domestic retail, foodservice and industrial customers, as well as to export markets, including, among others, China, Mexico, Japan, South Korea and Canada.
•Hog Production: The Hog Production segment consists of our hog production operations in the United States, which produce and raise our hogs on numerous company-owned farms and farms that are owned and operated by third-party contract farmers. Nearly all of the hogs produced by this segment are processed by our Fresh Pork segment. The Hog Production segment also may sell grains to external customers.
We also have other operations that do not themselves constitute reportable segments and are included in our Other segments. These include our Mexico and Bioscience operations. Our Mexico operations include the raising of hogs and production of pork products that are sold primarily to customers in Mexico. Our Bioscience operations use
73
raw materials from hogs that we process to manufacture heparin products, including an active pharmaceutical ingredient that mitigates the risk of blood clots.
Prior to this offering, we have been an indirect wholly owned subsidiary of Hong Kong-based WH Group. WH Group is publicly traded on The Stock Exchange of Hong Kong Limited.
On August 26, 2024, we completed a carve-out and transfer of our European operations to WH Group. Accordingly, the results of operations, assets and liabilities, and cash flows of the European operations have been condensed and reported as discontinued operations in the consolidated financial statements for all periods presented.
Key Factors Affecting Our Results of Operations
The following are key factors that have influenced our results of operations in the past and may influence our results in the future.
Sales Drivers
We are focused on driving profitable growth through our Packaged Meats segment. Within the Packaged Meats segment, the primary factors impacting sales of our brands are household penetration, consumption levels, price point and product offerings. As a result, we have pursued strategies that we believe best align our products with consumer trends and behavior. We have shifted our portfolio towards a higher mix of value-added and margin accretive products while leveraging the breadth of our offerings to further penetrate across dayparts. We look to increase brand awareness and encourage consumer adoption of our products through product and packaging innovation and effective and appealing marketing strategies while maintaining our promise to consumers to offer high-quality products for every budget. We have also expanded to new categories and grown distribution of under-indexed brands in under-penetrated locations. In addition to the prior initiatives, we also seek to increase sales in packaged meats products by driving volumes of our private label and foodservice products, by expanding our customer relationships and by offering quality selections across the value chain. We will seek to continue to increase the overall contribution to our sales from our Packaged Meats segment.
In our Fresh Pork segment, the primary drivers of external sales are the consistent level of global pork consumption, our ability to maximize the value of each hog and our ability to leverage our different end markets including retail, foodservice, industrial and export channels. Through ongoing product innovation, we seek to appeal to ever-changing consumer preferences, including demand for convenience and smaller portion sizes as well as expanded interests in new and varied flavors. We also seek to capitalize on export markets as an outlet for increasing the value of raw materials through whole-hog utilization and by appealing to differentiated, global tastes and preferences.
Cost Factors
Our cost as a percentage of sales varies based on fluctuations of raw materials prices, as well as manufacturing, distribution and marketing costs. Raw materials are the largest component of our total cost of goods sold, with feed ingredients and hogs accounting for the majority share. Approximately 80% of the raw materials used in the Packaged Meats segment is sourced internally from our Fresh Pork segment, and about half of the hogs used in the Fresh Pork segment are supplied by our Hog Production segment. In the Hog Production segment, approximately 64% of cost of goods sold is from animal feed, which is derived primarily from corn and soybean meal. The price of feed ingredients, hogs and pork fluctuates based on market dynamics which can affect our margins. We enter into hedging transactions for these commodities when we determine conditions are appropriate to mitigate the inherent price risks. While this hedging may limit our ability to participate in gains from favorable commodity fluctuations, it also reduces the risk of loss from adverse changes in raw material prices.
We continue to optimize the size of our hog production operations and procure a greater mix of hogs from independent suppliers with market-based supply agreements in order to supply our Fresh Pork segment. We have reduced the size of our internal hog production from a peak of 17.6 million head in 2019 to closing 2024 at 14.6 million head, and we continue to explore opportunities for reduced internal production. We expect to end 2025 at approximately 11.5 million head.
74
We are pursuing best-in-class manufacturing principles in our plants by employing automation to redeploy labor to higher value tasks, increasing yields and driving efficiency by reducing complexity. In our logistics and distribution network, we have reduced transportation and warehousing costs by improving transportation carrier mix, maximizing utilization of our cold storage and trucking assets, improving supply and demand planning and optimizing inventory levels.
Our results of operations will continue to depend on our ability to (i) manage raw material cost movements through optimizing our hog production operations, hedging, forward purchasing, strategic sourcing negotiations and passing inflationary cost increases to customers, (ii) operate our manufacturing and logistics footprint efficiently and competitively and (iii) continue to attract and retain customers and consumers through effective sales and marketing spend.
Seasonality
Our business is somewhat seasonal. Traditionally, the periods of higher sales for hams are the holiday seasons such as Easter, Thanksgiving and Christmas, and the periods of higher sales for ribs, smoked sausages and hot dogs are the summer months.
In addition, hog prices tend to rise as hog supplies decrease during the summer, and hog prices tend to decline as hog supplies increase during the fall and winter. This tendency is due to lower farrowing performance during the winter and slower animal growth rates during the summer.
Seasonality impacts relative sales and profitability of each quarter of the year, both on a quarter-to-quarter and year-over-year basis, as well as our cash generation and use. Generally, our sales and profitability are higher in the fourth quarter due to the Thanksgiving and Christmas holidays. In addition, the timing of the Easter holiday can impact the comparability of our first and second quarters with prior periods. Our cash use is highest in the first quarter due to working capital needs related to payments to certain suppliers that are typically deferred in the fourth quarter.
Impact of Material Acquisitions, Investments and Dispositions on Our Results of Operations
The following transactions occurred during the last three fiscal years and impacted our results of operations during such periods:
West Coast Exit and Hog Production Reform. We have undertaken a number of steps to reduce our activities in California where high taxes, high utility costs and a challenging regulatory environment negatively impact our ability to operate efficiently and profitably. We also undertook a number of other actions in furtherance of our efforts to optimize the size of our Hog Production segment’s operations:
•West Coast Exit. In May 2022, we announced a decision to close our Vernon, California processing facility, exit farm operations in Arizona and California, and reduce our sow herd in Utah. Additionally, in December 2023, we made a decision to terminate a number of agreements with contract farmers and closed several company-owned nursery farms in Utah as a result of the Vernon, California facility closure in early 2023.
•Hog Production Reform. In May 2023, we made a decision to cease operations on a number of sow farms in Missouri. The decision was driven by persistent livestock disease issues, underperforming operations and shifting industry supply and demand dynamics. Additionally, during 2023 we terminated certain agreements with underperforming contract farmers in the eastern United States.
As a result of these decisions, we incurred various exit costs and disposal charges. We recognized charges totaling $195 million and $151 million in cost of sales in 2023 and 2022, respectively. Additionally, certain biogas assets owned by our joint venture, Align, were impaired due to our decision in December 2023 to terminate hog grower contracts and close farms in Utah. As a result, we recognized our share of the impairment totaling $35 million in (income) loss from equity method investments in the consolidated income statement in the fourth quarter of 2023. We also incurred $14 million in costs associated with biogas assets owned by our joint venture, Monarch,
75
in connection with the farms in Missouri that were closed. These costs were recognized in (income) loss from equity method investments in the consolidated statement of income in the fourth quarter of fiscal year 2023.
In the second quarter of 2023, we sold our Vernon, California facility for $205 million and recognized a gain of $86 million in operating gains in the consolidated statement of income.
Saratoga. On October 31, 2022, we closed on the sale of our Saratoga operation, which produced spices, seasonings and sauces for sale primarily to the foodservice industry and for use in our internal production of various packaged meats products. Saratoga continues to be a supplier of ours subsequent to the sale. Proceeds totaled $575 million, resulting in a $417 million gain on the disposal. The gain was recognized in operating gains in the consolidated statement of income in the fourth quarter of 2022. The carrying amount of assets disposed of included $47 million of allocated goodwill. We received $568 million of proceeds at closing. The remainder was received in the first quarter of 2023. Saratoga was accounted for in the Packaged Meats segment.
Altosano. On July 7, 2021, we acquired a controlling interest in Altosano in exchange for cash valued at $108 million, increasing our total ownership and voting rights in Altosano from 50% to 66%. We paid $1 million, net of $17 million in cash acquired, of the purchase consideration to our joint venture partner upon change in control. We paid an additional $55 million and $2 million in the third quarter of 2022 and the third quarter of 2023, respectively, with smaller amounts payable annually through 2028. Altosano consists of hog production and pork processing operations in Mexico, growing approximately 1.8 million hogs and processing approximately 1.5 million hogs per year, with approximately 2,600 employees. We historically recorded our share of earnings in Altosano using the equity method of accounting. Upon acquisition of the controlling interest, the accounts of Altosano were consolidated. See also “—Other Anticipated or Potential Cash Requirements—Altosano Redeemable Noncontrolling Interest.”
Recent Developments
Murphy Family Farms Investment
On December 27, 2024, we became a member of a North Carolina-based company, Murphy Family Farms LLC, by contributing $3 million in cash in exchange for a 25% minority interest. We additionally sold approximately 150,000 sows located on company-owned and contract farms in North Carolina to Murphy Family Farms. On December 30, 2024, we sold the commercial hog inventories associated with such sows to Murphy Family Farms. Murphy Family Farms is now a hog supplier to us and will supply approximately 3.2 million hogs annually. We will supply animal feed and provide certain support services to Murphy Family Farms.
VisionAg Hog Production Investment
On December 20, 2024, we entered into an agreement to become a member of a North Carolina-based company, VisionAg Hog Production, LLC, whereby we will contribute $450,000 in cash in exchange for a 9% minority interest in VisionAg Hog Production, with the existing owner retaining a 91% interest. As part of the agreement, we will sell to VisionAg Hog Production approximately 28,000 sows and the associated commercial hog inventories located on certain company-owned and contract farms in North Carolina. VisionAg Hog Production will become a hog supplier to us, expected to supply approximately 600,000 hogs annually. In addition, we will supply animal feed and provide certain support services to VisionAg Hog Production. The transaction is expected to close during the first quarter of 2025. Closing of the transaction is subject to satisfaction of customary closing conditions.
Sale of Utah Hog Production Assets
On December 17, 2024, we sold our hog production assets in Utah, excluding the live animals, for $58 million. The transaction resulted in a gain of $32 million, which was recognized in operating gains in the fourth quarter of fiscal year 2024. As part of the agreement, we will lease back certain farm and feed properties, which we will continue to operate.
76
Sale of Missouri Hog Farms
On November 26, 2024, we sold certain hog farms in Missouri, most of which were previously inactive, for $32 million. The transaction resulted in a loss of $4 million, which was recognized in cost of sales in the fourth quarter of fiscal year 2024.
Components of Our Results of Operations
Sales
Our sales are derived primarily from the delivery of our packaged meats and fresh pork products to customers. Sales fluctuate as a function of changes in volume, product mix and net price.
•Sales to customers are recorded at the transaction price, which is the amount of consideration we expect to receive in exchange for providing goods to customers. The net sales price reflects adjustments for estimates of known or expected variable consideration, including consumer incentives, trade promotions and other programs.
•Walmart accounted for approximately 11.8%, 11.5% and 11.3% of our consolidated sales in 2023, 2022 and 2021, respectively. No other customer accounted for 10% or more of our consolidated sales during 2023, 2022 and 2021. Cumulatively, our top ten customers accounted for 36.9%, 36.5% and 37.3% of our consolidated sales in 2023, 2022 and 2021, respectively.
•Sales to our customers located outside of the United States, including sales to WH Group and its affiliates, accounted for 15.9%, 14.2% and 17.7% of our consolidated sales in 2023, 2022 and 2021, respectively.
•Sales to WH Group and its affiliates accounted for 3.2%, 2.7% and 5.5% of our consolidated sales in 2023, 2022 and 2021, respectively.
Cost of Sales
Cost of sales consists primarily of costs directly related to the manufacture and distribution of our products. These costs include:
•Primary raw material costs, including costs for grains, hogs, other proteins (such as beef and poultry), corn and soybean meal. Prices for these raw materials are affected by the global level of supply and demand, the agricultural policies of the United States and other countries and weather patterns and climatic conditions throughout the world and can have a material impact on cost of sales.
•Secondary raw material costs, such as packaging and ingredients, which can be affected by inflation or other factors that impact the availability of supply.
•The cost of labor and overhead required to produce our products.
•Cold storage costs and freight and distribution costs, which are both impacted by changes in fuel costs.
•Asset write-downs and losses from the disposal of assets.
Cost of sales are impacted by fluctuations in commodity prices for hogs, fresh pork, corn, soybean meal and other proteins.
•Hogs. The lean hog price index published by the CME averaged $0.81 per pound, $0.98 per pound and $0.93 per pound in 2023, 2022 and 2021, respectively.
•Fresh Pork. Fresh pork cut-out values reported by the USDA averaged $0.90 per pound, $1.04 per pound and $1.04 per pound in 2023, 2022 and 2021, respectively.
77
•Corn and soybean meal. Nearby futures prices for corn reported by the CME averaged $5.58 per bushel, $6.87 per bushel and $5.74 per bushel in 2023, 2022 and 2021, respectively. Nearby futures prices for soybean meal averaged $432.33 per ton, $433.89 per ton and $381.01 per ton in 2023, 2022 and 2021, respectively. The prices paid for corn and soybean meal take approximately six months to be fully reflected in our results due to the hog growth period.
Selling, General and Administrative Expenses (SG&A)
SG&A expenses relate to sales and administrative functions that support our operations and other general corporate expenses. These expenses include:
•Sales and marketing expenses, including salaries, wages and incentives for our sales and marketing personnel, broker commissions, sales-related travel and entertainment expenses and other marketing and advertising expenses, such as costs relating to the execution of in-store product demonstrations, trade shows and samples provided to prospective customers;
•General and administrative expenses, including salaries, wages and incentives for our management and general administrative personnel, professional fees for service providers, depreciation of non-production property and equipment, amortization of intangible assets, information technology licensing and maintenance costs, insurance, travel and other operating expenses; and
•Accruals for litigation and defense costs.
In the future, we expect to incur stock-based compensation expenses related to restricted stock awards granted to employees and directors under our equity incentive plan to be adopted in connection with this offering.
Operating Gains
Operating gains primarily consists of gains on the sale of businesses and other assets, and certain insurance recoveries.
Interest Expense, Net
Interest expense, net consists of interest on our debt and the amortization of finance lease costs and debt issuance costs, premiums and discounts, net of interest earned on our cash and cash equivalents.
Non-Operating Gains
Non-operating gains consist primarily of the non-operating components of net pension and postretirement benefits cost (benefit), gains and losses on non-qualified retirement plan assets, gains and losses on the sale or dilution of equity method investments, and impairments of investments. The non-operating components of net pension and postretirement benefits cost (benefit) consist of interest cost, expected return on plan assets, amortization of actuarial gains/losses and prior service costs/credits, and curtailment gains.
(Income) Loss from Equity Method Investments
We account for investments in entities that we do not control, but over which we have the ability to exercise significant influence, using the equity accounting method. Our equity method investments consist primarily of biogas joint ventures, which produce renewable natural gas from methane gas captured on our hog farms. We record our share of the income or loss from these equity method investments in (income) loss from equity method investments.
78
Results of Operations
The following table summarizes the results of operations for our consolidated business.
| Nine Months Ended | Fiscal Year | % of Sales | |||||||||||||||||||||||||||||||||||||||||||||
September 29, 2024 | October 1, 2023 | 2023 | 2022 | 2021 | 2023 | 2022 | 2021 | ||||||||||||||||||||||||||||||||||||||||
| (in millions except for percentages) | |||||||||||||||||||||||||||||||||||||||||||||||
| Sales | $ | 10,190 | $ | 10,642 | $ | 14,640 | $ | 16,199 | $ | 15,009 | 100.0 | % | 100.0 | % | 100.0 | % | |||||||||||||||||||||||||||||||
| Cost of sales | 8,826 | 10,038 | 13,751 | 14,704 | 13,437 | 93.9 | % | 90.8 | % | 89.5 | % | ||||||||||||||||||||||||||||||||||||
| Gross profit | 1,364 | 604 | 889 | 1,495 | 1,572 | 6.1 | % | 9.2 | % | 10.5 | % | ||||||||||||||||||||||||||||||||||||
| Selling, general and administrative expenses | 594 | 643 | 1,050 | 807 | 1,095 | 7.2 | % | 5.0 | % | 7.3 | % | ||||||||||||||||||||||||||||||||||||
| Operating gains | (12) | (99) | (105) | (429) | (44) | (0.7) | % | (2.7) | % | (0.3) | % | ||||||||||||||||||||||||||||||||||||
| Operating profit (loss) | 783 | 60 | (56) | 1,117 | 521 | (0.4) | % | 6.9 | % | 3.5 | % | ||||||||||||||||||||||||||||||||||||
| Interest expense, net | 52 | 59 | 76 | 87 | 93 | 0.5 | % | 0.5 | % | 0.6 | % | ||||||||||||||||||||||||||||||||||||
| Non-operating (gains) losses | (13) | 3 | (3) | (18) | (30) | — | % | (0.1) | % | (0.2) | % | ||||||||||||||||||||||||||||||||||||
| Income (loss) from continuing operations before income taxes | 745 | (2) | (129) | 1,047 | 458 | (0.9) | % | 6.5 | % | 3.1 | % | ||||||||||||||||||||||||||||||||||||
| Income tax expense (benefit) | 165 | — | (41) | 231 | 97 | (0.3) | % | 1.4 | % | 0.6 | % | ||||||||||||||||||||||||||||||||||||
| (Income) loss from equity method investments | (1) | — | 46 | 6 | (28) | 0.3 | % | — | % | (0.2) | % | ||||||||||||||||||||||||||||||||||||
| Net income (loss) from continuing operations | $ | 581 | $ | (2) | $ | (133) | $ | 811 | $ | 389 | (0.9) | % | 5.0 | % | 2.6 | % | |||||||||||||||||||||||||||||||
79
Nine Months Ended September 29, 2024 compared with the Nine Months Ended October 1, 2023
Consolidated Results
| Nine Months Ended | |||||||||||||||||||||||
September 29, 2024 | October 1, 2023 | $ Change | % Change | ||||||||||||||||||||
| (in millions except for percentages) | |||||||||||||||||||||||
| Sales | $ | 10,190 | $ | 10,642 | $ | (452) | (4.2) | % | |||||||||||||||
| Cost of sales | 8,826 | 10,038 | (1,212) | (12.1) | % | ||||||||||||||||||
| Gross profit | 1,364 | 604 | 760 | 125.9 | % | ||||||||||||||||||
| Selling, general and administrative expenses | 594 | 643 | (50) | (7.7) | % | ||||||||||||||||||
| Operating gains | (12) | (99) | 87 | (87.7) | % | ||||||||||||||||||
| Operating profit | 783 | 60 | 723 | 1208.8 | % | ||||||||||||||||||
| Interest expense, net | 52 | 59 | (7) | (12.5) | % | ||||||||||||||||||
| Non-operating (gains) losses | (13) | 3 | (16) | NM | |||||||||||||||||||
| Income (loss) from continuing operations before income taxes | 745 | (2) | 747 | NM | |||||||||||||||||||
| Income tax expense | 165 | — | 165 | NM | |||||||||||||||||||
| Income from equity method investments | (1) | — | (1) | NM | |||||||||||||||||||
| Net income (loss) from continuing operations | $ | 581 | $ | (2) | $ | 583 | NM | ||||||||||||||||
Sales. Sales decreased by $452 million, or 4.2%, primarily due to the following factors:
•Lower volume in our Fresh Pork segment, which decreased sales by approximately $330 million, or 3.1%.
•Lower volume in our Packaged Meats segment primarily due to recently enacted group housing legislation in California and Massachusetts, which reduced sales by approximately $178 million, or 1.7%.
•A decrease in grain sales to external customers from our Hog Production segment, which reduced consolidated sales by $125 million, or 1.2%, year-over-year.
Higher average sales prices for fresh pork and packaged meats products partially offset the decline in sales. See “Segment Results” below for additional discussion of sales for each of our reportable segments.
Cost of sales. Cost of sales decreased by $1,212 million, or 12.1%, year-over-year primarily due to the following factors:
•A $761 million decrease in raw material costs primarily attributable to lower feed ingredient prices, fewer hogs produced in our Hog Production segment and a reduction in grain sales to external customers.
•A $285 million decrease in manufacturing costs primarily attributable to the recognition of $86 million in employee retention tax credits in the second quarter of 2024 and declines in production volume in each of our reportable segments.
•A $115 million decrease in distribution costs due in part to lower sales volumes in our Fresh Pork and Packaged Meats segments.
•An $81 million reduction in costs associated with our West Coast Exit and Hog Production Reform activities.
80
Selling, General and Administrative Expenses. SG&A decreased by $50 million, or 7.7%, primarily driven by cost reduction initiatives and a $17 million decrease in accruals for litigation matters described in “Note 18: Regulation and Contingencies” of the condensed consolidated interim financial statements and accompanying notes.
Operating gains. Operating gains for the first nine months of 2024 and 2023 includes a $5 million gain on the sale of a shuttered packaged meats facility located in Charlotte, North Carolina and an $86 million gain on the sale of our Vernon, California facility, respectively.
Interest expense, net. Interest expense, net decreased $7 million, or 12.5%, due to higher levels of cash and cash equivalents earning interest at higher rates for the nine months ended September 29, 2024 compared to the same period in the prior year, while interest rates on borrowings were largely fixed.
Non-operating (gains) losses. Non-operating (gains) losses consisted of the following items:
| Nine Months Ended | |||||||||||
September 29, 2024 | October 1, 2023 | ||||||||||
| (in millions) | |||||||||||
| Gain on nonqualified retirement plan assets | $ | (18) | $ | (6) | |||||||
| Net pension and postretirement benefits cost | 5 | 8 | |||||||||
| Other | (1) | 1 | |||||||||
| Non operating (gains) losses | $ | (13) | $ | 3 | |||||||
Income tax expense. Income tax expense increased by $165 million year-over-year primarily due to the higher amount of pre-tax income recognized in 2024.
Segment Results
The following tables present sales and profit (loss) for each of our reportable segments and other operating segments. Additional information about our reportable segments, including a reconciliation of the measure of our segments’ profit (loss) to consolidated income (loss) from continuing operations before income taxes, is included in “Note 2: Reportable Segments” in the condensed consolidated interim financial statements and accompanying notes included elsewhere in this prospectus.
| Nine Months Ended | ||||||||||||||||||||||||||
| Sales | September 29, 2024 | October 1, 2023 | $ Change | % Change | ||||||||||||||||||||||
| (in millions except for percentages) | ||||||||||||||||||||||||||
| Packaged Meats | $ | 5,861 | $ | 5,876 | $ | (15) | (0.3) | % | ||||||||||||||||||
| Fresh Pork | 5,871 | 5,996 | (125) | (2.1) | % | |||||||||||||||||||||
| Hog Production | 2,220 | 2,499 | (279) | (11.2) | % | |||||||||||||||||||||
Other (1) | 350 | 380 | (30) | (7.9) | % | |||||||||||||||||||||
| Intersegment | (4,111) | (4,108) | (3) | 0.1 | % | |||||||||||||||||||||
| Consolidated | $ | 10,190 | $ | 10,642 | ||||||||||||||||||||||
| Nine Months Ended | ||||||||||||||||||||||||||
| Segment profit (loss) | September 29, 2024 | October 1, 2023 | $ Change | % Change | ||||||||||||||||||||||
| (in millions except for percentages) | ||||||||||||||||||||||||||
| Packaged Meats | $ | 855 | $ | 760 | $ | 95 | 12.5 | % | ||||||||||||||||||
| Fresh Pork | 196 | 73 | 123 | 168.5 | % | |||||||||||||||||||||
| Hog Production | (135) | (627) | 492 | (78.5) | % | |||||||||||||||||||||
Other (1) | 18 | (17) | 35 | NM | ||||||||||||||||||||||
81
| Nine Months Ended | ||||||||||||||||||||||||||
Adjusted segment profit (loss) (1) | September 29, 2024 | October 1, 2023 | $ Change | % Change | ||||||||||||||||||||||
| (in millions except for percentages) | ||||||||||||||||||||||||||
| Packaged Meats | $ | 816 | $ | 760 | $ | 56 | 7.4 | % | ||||||||||||||||||
| Fresh Pork | 156 | 73 | 82 | 112.7 | % | |||||||||||||||||||||
| Hog Production | (143) | (627) | 484 | (77.2) | % | |||||||||||||||||||||
Other (2) | 18 | (17) | 35 | (208.0) | % | |||||||||||||||||||||
________________
(1)The nine months ended September 29, 2024 includes adjustments for the recognition of employee retention tax credits attributable to qualifying wages paid to employees during the COVID-19 pandemic. See “Management’s Discussion and Analysis of Financial Condition and Results of Operations—Non-GAAP Measures” for more information.
(2)Includes our Mexico and Bioscience operations. Our Mexico operations include the raising of hogs and production of pork products that are sold primarily to customers in Mexico. Our Bioscience operations use raw materials from hogs that we harvest to manufacture heparin products, including an active pharmaceutical ingredient that mitigates the risk of blood clots.
Packaged Meats
Sales
Packaged Meats segment sales for the first nine months of 2024 were relatively consistent with prior year as lower volume was largely offset by a higher average sales price. Sales volume declined by 3.0% year-over-year primarily due to recently enacted group housing legislation in California and Massachusetts, which requires pork producers nationwide to comply with certain production standards in order to sell pork products into these states. Our average sales price increased by 2.9%, primarily driven by higher raw material costs, which translated into higher sales prices of our packaged meats products.
Segment Profit
Packaged Meats segment profit increased by $95 million, or 12.5%, year-over-year. The first nine months of 2024 included $38 million of employee retention tax credits. Excluding these tax credits, Packaged Meats segment profit increased by $56 million, or 7.4%, year-over-year primarily driven by the following factors:
•A $49 million decrease in manufacturing and distribution costs primarily due to the decline in sales volume.
•A $28 million decrease in selling, general and administrative expenses.
Fresh Pork
Sales
Fresh Pork segment sales decreased by $125 million, or 2.1%, year-over-year driven by a 5.8% decrease in volume, partially offset by a 3.9% increase in average sales price. The increase in our average sales price reflects strong demand for U.S. pork, which was supported by higher relative prices for competing proteins and strength in export markets.
Segment Profit
Fresh Pork segment profit improved by $123 million, or 168.5%, year-over-year. The first nine months of 2024 included $41 million of employee retention tax credits. Excluding these tax credits, Fresh Pork segment profit
82
increased by $82 million, or 112.7%, year-over-year. The improvement in results was primarily driven by the following factors, which more than offset the decrease in sales:
•A $79 million decrease in raw material costs due to the decrease in sales volume, which was partially offset by the impact of higher market prices for live hogs.
•A $124 million decrease in manufacturing and distribution costs due primarily to the decline in sales volume.
Hog Production
Sales
Hog Production segment sales decreased by $279 million, or 11.2%, year-over-year driven by an 8.3% decrease in the number of hogs sold and a $125 million reduction in grain sales to external customers, partially offset by a 6.3% increase in our average hog sales price, including the effects of hedging. The decrease in the number of hogs sold by the segment was largely attributable to Hog Production Reform activities aimed at reducing the number of hogs we produce.
Segment Loss
Hog Production segment loss improved by $492 million year-over-year. The first nine months of 2024 included $8 million of employee retention tax credits. Excluding these tax credits, Hog Production segment loss improved by $484 million, or 77.2%, year-over-year primarily driven by the following factors, which more than offset the decrease in sales:
•A $612 million decrease in raw material feed costs due to lower market prices for feed ingredients, the decrease in sales volume and a reduction in grain sales to external customers.
•A $148 million decrease in hog raising costs largely attributable to the Hog Production Reform activities.
Other
The results from our other segment operations increased to a profit of $18 million in the first nine months of 2024 from a loss of $17 million in the same period a year ago. The results of our Mexico operations improved by $27 million year-over-year primarily due to significantly lower raw material costs. Results for our Bioscience operations improved by $8 million year-over-year largely due to the impact of a $16 million charge recognized in the third quarter of 2023 to write down inventories to their estimated net realizable values.
83
2023 compared with 2022
Consolidated Results
| Fiscal Year | |||||||||||||||||||||||
| 2023 | 2022 | $ Change | % Change | ||||||||||||||||||||
| (in millions except for percentages) | |||||||||||||||||||||||
| Sales | $ | 14,640 | $ | 16,199 | $ | (1,558) | (9.6) | % | |||||||||||||||
| Cost of sales | 13,751 | 14,704 | (953) | (6.5) | % | ||||||||||||||||||
| Gross profit | 889 | 1,495 | (606) | (40.5) | % | ||||||||||||||||||
| Selling, general and administrative expenses | 1,050 | 807 | 243 | 30.1 | % | ||||||||||||||||||
| Operating gains | (105) | (429) | 325 | (75.6) | % | ||||||||||||||||||
| Operating profit (loss) | (56) | 1,117 | (1,173) | (105.0) | % | ||||||||||||||||||
| Interest expense, net | 76 | 87 | (12) | (13.5) | % | ||||||||||||||||||
| Non-operating gains | (3) | (18) | 15 | (83.1) | % | ||||||||||||||||||
| Income (loss) from continuing operations before income taxes | (129) | 1,047 | (1,176) | (112.3) | % | ||||||||||||||||||
| Income tax expense (benefit) | (41) | 231 | (272) | (118.0) | % | ||||||||||||||||||
| Loss from equity method investments | 46 | 6 | 40 | 682.6 | % | ||||||||||||||||||
| Net income (loss) from continuing operations | $ | (133) | $ | 811 | $ | (943) | (116.4) | % | |||||||||||||||
Sales. Sales decreased by $1,558 million, or 9.6%, primarily due to the following factors:
•Lower volumes and average sales prices in our Packaged Meats and Fresh Pork segments attributable to softened consumer demand, which reduced sales by approximately $1,231 million, or 7.6%, year-over-year. Fresh pork cut-out values reported by the USDA, which is representative of the prices paid for individual fresh pork cuts in the market place and also impact the sales prices of our packaged meats products, decreased 13.4% year-over-year to an average of $0.90 per pound in 2023 from $1.04 per pound in 2022.
•A reduction in external grain sales from our Hog Production segment, which reduced consolidated sales by $193 million, or 1.2%, year-over-year.
•The sale of Saratoga operations in the fourth quarter of 2022 reduced sales by $167 million, or 1.0%, year-over-year.
See “Segment Results” below for additional discussion of sales for each of our reportable segments.
Cost of sales. Cost of sales decreased by $953 million, or 6.5%, primarily due to the following factors:
•A $472 million decrease in live hog raw material costs primarily attributable to lower market prices paid for hogs from outside producers, primarily driven by weakened demand and higher domestic hog supplies compared to the prior year. The lean hog price index published by the CME decreased by 17.1% year over year.
•A $478 million decrease in raw material feed costs primarily attributable to an 8.5% reduction in the number of hogs produced by our Hog Production segment, a reduction in grain sales to external customers and lower market prices for feed ingredients.
•The sale of Saratoga, which reduced cost of sales by approximately $145 million, or 1.0%, year-over-year.
Cost of sales also reflects an increase in costs associated with our West Coast Exit and other Hog Production Reform activities totaling $44 million.
84
Selling, General and Administrative Expenses. SG&A increased by $243 million, or 30.1%, primarily driven by an increase of $201 million in accruals for and/or settlement of litigation matters described in “Note 17: Regulation and Contingencies” of the consolidated financial statements and accompanying notes included elsewhere in this prospectus. After adjusting for the effect of these charges, SG&A increased by $41 million primarily due to the following factors:
•An increase of $12 million in employee costs.
•An increase of $12 million in professional services.
•Expenses of $12 million attributable to the discount on the sale of receivables under the Monetization Facility (as defined below in “—Liquidity and Capital Resources”).
•An increase of $7 million in government-mandated fees associated with funded status of our qualified pension plans.
Operating gains. Operating gains included an $86 million gain for the sale of our Vernon, California facility in 2023 and a $417 million gain on the sale of Saratoga in 2022.
Interest expense, net. Interest expense, net decreased $12 million, or 13.5%, due to higher levels of cash and cash equivalents earning interest at higher rates in 2023 while interest rates on borrowings were largely fixed.
Non-operating gains. Non-operating gains consisted of the following items:
| Fiscal Year | |||||||||||
| 2023 | 2022 | ||||||||||
| (in millions) | |||||||||||
| (Gain) loss on nonqualified retirement plan assets | $ | (15) | $ | 26 | |||||||
| Gain on the sale/dilution of equity method investments | — | (56) | |||||||||
| Net pension and postretirement benefits cost (benefit) | 10 | (28) | |||||||||
| Impairment of investment | — | 40 | |||||||||
| Other | 1 | 1 | |||||||||
| Total non-operating gains | $ | (3) | $ | (18) | |||||||
•Gain on the sale/dilution of equity method investments: in February 2022, our interest in Monarch was reduced from 50% to 33% upon the issuance of additional shares to a new investor, which transaction was accounted for as a partial sale of our investment resulting in a $52 million gain. Additionally, in the fourth quarter of 2022, we sold our investment in Norson Holding, S. de R.L. de C.V., or Norson, for $21 million and recognized a $4 million gain on the sale.
•Net pension and postretirement benefits cost (benefit): change from 2022 to 2023 was driven by higher interest cost and a smaller asset base at the beginning of 2023 as compared to 2022, which reduced the return on assets included in net periodic pension cost year-over-year.
•Impairment of investment: in the first quarter of 2022, we wrote down the value of our former investment in Norson, by $40 million to its estimated fair value.
Income tax expense (benefit). Income tax expense decreased from $231 million in 2022 to a benefit of $41 million in 2023 primarily due to the lower amount of pre-tax income recognized in 2023.
Loss from equity method investments. Loss from equity method investments increased $40 million primarily due to $49 million in charges and costs incurred in connection with the West Coast Exit and Hog Production Reform activities. These charges were partially offset by an increase in income generated by our equity method investments of $10 million.
85
Segment Results
The following tables present sales and profit (loss) for each of our reportable segments and other operating segments. Additional information about our reportable segments, including a reconciliation of the measure of our segments’ profit (loss) to consolidated income (loss) from continuing operations before income taxes, is included in “Note 2: Reportable Segments” in the consolidated financial statements and accompanying notes included elsewhere in this prospectus.
| Fiscal Year | ||||||||||||||||||||||||||
| Sales | 2023 | 2022 | $ Change | % Change | ||||||||||||||||||||||
| (in millions except for percentages) | ||||||||||||||||||||||||||
| Packaged Meats | $ | 8,280 | $ | 9,262 | $ | (982) | (10.6) | % | ||||||||||||||||||
| Fresh Pork | 7,832 | 9,190 | (1,358) | (14.8) | % | |||||||||||||||||||||
| Hog Production | 3,317 | 4,456 | (1,139) | (25.6) | % | |||||||||||||||||||||
Other (1) | 559 | 524 | 35 | 6.6 | % | |||||||||||||||||||||
| Intersegment | (5,348) | (7,234) | 1,886 | (26.1) | % | |||||||||||||||||||||
| Consolidated | $ | 14,640 | $ | 16,199 | ||||||||||||||||||||||
| Fiscal Year | ||||||||||||||||||||||||||
| Segment profit (loss) | 2023 | 2022 | $ Change | % Change | ||||||||||||||||||||||
| (in millions except for percentages) | ||||||||||||||||||||||||||
| Packaged Meats | $ | 1,066 | $ | 1,047 | $ | 19 | 1.8 | % | ||||||||||||||||||
| Fresh Pork | 118 | 32 | 86 | 270.7 | % | |||||||||||||||||||||
| Hog Production | (754) | (133) | (621) | 468.1 | % | |||||||||||||||||||||
Other (1) | (4) | 53 | (58) | (108.1) | % | |||||||||||||||||||||
________________
(1)Consists of our Mexico and Bioscience operations.
Packaged Meats
Sales
Packaged Meats segment sales declined by $982 million, or 10.6%, year-over-year driven by lower volume, a lower average unit selling price and the sale of Saratoga. Volume declined by 7.2% year-over-year as a result of softened consumer demand as well as a 2.7% reduction in volume due to the sale of Saratoga. Our average sales price decreased by 3.7% driven primarily by lower fresh pork market prices, which translated to lower sales prices for our packaged meats products. The sale of Saratoga reduced segment sales by $167 million, or 1.8% year-over-year.
Segment Profit
Packaged Meats segment profit increased by $19 million, or 1.8%, year-over-year driven primarily by the following factors, which offset the decline in sales:
•A $913 million decrease in raw material costs driven by lower fresh pork market prices, the decline in sales volume and the sale of Saratoga. The USDA fresh pork carcass cutout value decreased 13.4%, with components used by our Packaged Meats segment decreasing at an even higher rate. Accordingly, our average sales price decreased, but to a lesser degree, which improved profitability.
•A $92 million decrease in manufacturing and distribution costs attributable the decline in sales volume and the sale of Saratoga, partially offset by higher wage rates.
The sale of Saratoga had the effect of reducing segment profit by $24 million year-over-year.
86
Fresh Pork
Sales
Fresh Pork segment sales decreased by $1,358 million, or 14.8%, year-over-year primarily due to lower fresh pork market prices and sales volume. Our average sales price decreased by 10.5% due in part to softened consumer demand. Sales volume decreased by 4.8% largely due to the closure of our Vernon, California facility in early 2023.
Segment Profit
Fresh Pork segment profit improved by $86 million, or 270.7%. The improvement in results was driven primarily by a favorable spread between fresh pork market values and live hog market prices. Live hog market prices decreased by 17.1% while USDA fresh pork market values decreased 13.4% year-over-year, thereby improving fresh pork margins.
Hog Production
Sales
Hog Production segment sales decreased by $1,139 million or 25.6%, year-over-year driven by a 16.5% decrease in our average hog sales price, including the effects of hedging, and an 8.5% decrease in the number of hogs sold. The CME lean hog price index decreased by 17.1% over the same period. Additionally, lower grain sales to external customers reduced sales by $193 million, or 4.3%. The decrease in the number of hogs sold by the segment was largely attributable to the West Coast Exit and Hog Production Reform activities aimed at reducing the number of hogs we produce and improving our cost structure.
Segment Loss
Hog Production segment loss increased by $621 million year-over-year primarily due to lower market hog sales, which outweighed the benefit of lower raw material feed costs. Feed costs decreased by approximately $290 million, or 11.0%, primarily due to the decrease in the number of hogs produced and, to a lesser degree, lower feed prices.
Other
The results from our other segment operations declined to a loss of $4 million in 2023 from a profit of $53 million in 2022. The decline was largely attributable to our Bioscience operations driven by lower sales prices resulting from a global supply and demand imbalance for heparin, as well as higher raw material and manufacturing costs. We also recognized charges in the third and fourth quarters of 2023 totaling $17 million to write down inventories to their estimated net realizable values. Additionally, we experienced a $14 million decline in results from our Mexico operations largely due to higher manufacturing costs and lower selling prices.
87
2022 compared with 2021
Consolidated Results
| Fiscal Year | |||||||||||||||||||||||
| 2022 | 2021 | $ Change | % Change | ||||||||||||||||||||
| (in millions except for percentages) | |||||||||||||||||||||||
| Sales | $ | 16,199 | $ | 15,009 | $ | 1,189 | 7.9 | % | |||||||||||||||
| Cost of sales | 14,704 | 13,437 | 1,267 | 9.4 | % | ||||||||||||||||||
| Gross profit | 1,495 | 1,572 | (77) | (4.9) | % | ||||||||||||||||||
| Selling, general and administrative expenses | 807 | 1,095 | (288) | (26.3) | % | ||||||||||||||||||
| Operating gains | (429) | (44) | (386) | NM | |||||||||||||||||||
| Operating profit | 1,117 | 521 | 596 | 114.4 | % | ||||||||||||||||||
| Interest expense, net | 87 | 93 | (5) | (5.5) | % | ||||||||||||||||||
| Non-operating gains | (18) | (30) | 12 | (39.9) | % | ||||||||||||||||||
| Income from continuing operations before income taxes | 1,047 | 458 | 589 | 128.7 | % | ||||||||||||||||||
| Income tax expense | 231 | 97 | 134 | 138.4 | % | ||||||||||||||||||
| (Income) loss from equity method investments | 6 | (28) | 34 | (121.0) | % | ||||||||||||||||||
| Net income from continuing operations | $ | 811 | $ | 389 | 422 | 108.5 | % | ||||||||||||||||
________________
NM = not meaningful
Sales. Sales increased by $1,189 million, or 7.9%, primarily due to the following factors:
•Higher average sales prices in our Packaged Meats and Fresh Pork segments induced by broad-based inflationary cost pressures and a favorable shift in product mix that was supported by strong consumer demand.
•The consolidation of Altosano beginning in July 2021 after acquiring a controlling interest, which increased sales by $284 million, or 1.9%, year-over-year.
See “Segment Results” below for additional discussion of sales for each of our reportable segments.
Cost of sales. Cost of sales increased by $1,267 million, or 9.4%, primarily due to the following factors:
•A $688 million increase in raw material feed costs primarily attributable to higher market prices for feed ingredients and increased grain sales to external customers.
•A $446 million increase in manufacturing costs primarily resulting from broad-based inflation.
•The consolidation of Altosano in July 2021, which increased cost of sales year-over-year by $253 million, or 1.9%.
•Charges incurred in 2022 associated with our West Coast Exit and other Hog Production Reform activities totaling $151 million.
Selling, general and administrative expenses. SG&A decreased by $288 million, or 26.3%, primarily driven by a $341 million decrease in accruals for, and/or settlement of, litigation matters described in “Note 17: Regulation and Contingencies” of the consolidated financial statements and accompanying notes included elsewhere in this prospectus. After adjusting for the effects of these charges, SG&A increased by $53 million primarily due to the following factors:
•An increase of $33 million in employee costs, including $15 million for variable compensation programs.
88
•An increase of $11 million attributable to the consolidation of Altosano.
•An increase of $11 million in marketing and advertising expenses.
Operating gains. Operating gains included a $417 million gain on the sale of Saratoga in 2022 and $33 million in insurance recoveries in 2021.
Non-operating gains. Non-operating gains consist of the following items:
| Fiscal Year | |||||||||||
| 2022 | 2021 | ||||||||||
| (in millions) | |||||||||||
| Gain on the sale/dilution of equity method investments | $ | (56) | $ | — | |||||||
| Net pension and postretirement benefits cost (benefit) | (28) | (22) | |||||||||
| Impairment of investment | 40 | — | |||||||||
| (Gain) loss on nonqualified retirement plan assets | 26 | (18) | |||||||||
| Other | 1 | 11 | |||||||||
| Total non-operating gains | $ | (18) | $ | (30) | |||||||
•Gain on the sale/dilution of equity method investments: in February 2022, our interest in Monarch was reduced from 50% to 33% upon the issuance of additional shares to a new investor, which transaction accounted for as a partial sale of our investment, which resulted in a $52 million gain. Additionally, in the fourth quarter of 2022, we sold our investment in Norson for $21 million and recognized a $4 million gain on the sale.
•Net pension and postretirement benefits cost (benefit): in the second quarter of 2021, we amended our qualified pension plans to freeze the benefit accrual for all non-union participants as of June 30, 2021. The increase in benefit year-over-year was largely driven by lower amortization of actuarial losses in 2022. For more information, see “Note 13: Pension and Other Retirement Plans” in the consolidated financial statements and accompanying notes included elsewhere in this prospectus.
•Impairment of investment: in the first quarter of 2022, we wrote down the value of our former investment in Norson by $40 million to its estimated fair value.
Income tax expense. Our effective tax rate increased to 22.1% in 2022 compared to 21.2% in 2021 largely due to the impact of similar levels of tax credits in each year relative to higher pre-tax income in 2022 and the effect of certain permanent items that were favorable to the effective tax rate in 2021 and unfavorable in 2022.
(Income) loss from equity method investments. The results of our equity method investments decreased to a loss of $6 million in 2022 from income of $28 million in 2021 primarily driven by a reduction in profitability of our biogas joint ventures, losses incurred by Norson, which we sold to our joint venture partner in November 2022, and the purchase of a controlling interest in Altosano in July 2021, which resulted in the consolidation of Altosano and ceased accounting for the results of Altosano under the equity method of accounting at that point.
Segment Results
The following tables present sales and profit (loss) for each of our reportable segments and other operating segments. Additional information about our reportable segments, including a reconciliation of the measure of our segments’ profit (loss) to consolidated income (loss) from continuing operations before income taxes, is included in
89
“Note 2: Reportable Segments” in the consolidated financial statements and accompanying notes included elsewhere in this prospectus.
| Fiscal Year | ||||||||||||||||||||||||||
| Sales | 2022 | 2021 | $ Change | % Change | ||||||||||||||||||||||
| (in millions except for percentages) | ||||||||||||||||||||||||||
| Packaged Meats | $ | 9,262 | $ | 8,515 | $ | 746 | 8.8 | % | ||||||||||||||||||
| Fresh Pork | 9,190 | 9,145 | 45 | 0.5 | % | |||||||||||||||||||||
| Hog Production | 4,456 | 3,866 | 590 | 15.3 | % | |||||||||||||||||||||
Other (1) | 524 | 247 | 277 | 112.3 | % | |||||||||||||||||||||
| Intersegment | (7,234) | (6,765) | (469) | 6.9 | % | |||||||||||||||||||||
| Consolidated | $ | 16,199 | $ | 15,009 | ||||||||||||||||||||||
| Fiscal Year | ||||||||||||||||||||||||||
| Segment profit (loss) | 2022 | 2021 | $ Change | % Change | ||||||||||||||||||||||
| (in millions except for percentages) | ||||||||||||||||||||||||||
| Packaged Meats | $ | 1,047 | $ | 879 | $ | 168 | 19.2 | % | ||||||||||||||||||
| Fresh Pork | 32 | (5) | 37 | NM | ||||||||||||||||||||||
| Hog Production | (133) | 69 | (201) | (293.4) | % | |||||||||||||||||||||
Other (1) | 53 | 68 | (15) | (22.2) | % | |||||||||||||||||||||
________________
(1)Consists of our Mexico and Bioscience operations.
NM = not meaningful
Packaged Meats
Sales
Packaged Meats segment sales increased by $746 million, or 8.8% year-over-year, driven by a 9.6% increase in our average unit selling price, which partially offset a 0.8% decline in volume. The increase in the average sales price was driven by higher raw material costs and other broad-based inflationary cost pressures, including wage increases for our employees, which translated to higher sales prices of our packaged meats products, as well as a favorable shift in product mix to more value-added products.
Segment Profit
Packaged Meats segment profit improved by $168 million, or 19.2%, year-over-year primarily driven by the increase in sales, partially offset by the following factors:
•A $351 million increase in raw material costs driven primarily by higher USDA market prices for hams and general inflationary conditions.
•A $186 million increase in manufacturing and distribution costs driven by broad-based inflationary cost pressures, including wage increases for our employees.
•A $40 million increase in SG&A mainly due to higher variable compensation and marketing related expenditures.
Fresh Pork
Sales
Fresh Pork segment sales were largely unchanged year-over-year as a 6.9% increase in average sales price was nearly offset by a 6.0% decrease in volume. Our average sales price improved primarily due to a favorable change in
90
product mix and general inflationary conditions. Sales volume decreased as we processed fewer hogs after ceasing harvest operations in our Smithfield, Virginia plant in 2021.
Segment Profit (Loss)
Fresh Pork segment profit for 2022 was $32 million compared to a loss of $5 million in 2021. The improvement in results was primarily driven by the following factors:
•The increase in sales of $45 million.
•A $58 million decrease in raw material costs primarily attributable to the decrease in sales volume, which more than offset the impact of a 5.6% increase in live hog market prices.
•A $37 million decrease in distribution costs primarily attributable to the decrease in volume.
These improvements to profitability were partially offset by the following factors:
•An $87 million increase in manufacturing costs attributable to wage increases for our employees and broad-based inflationary conditions.
•A $14 million increase in SG&A primarily attributable to higher variable compensation and other employee related expenses.
Hog Production
Sales
Hog Production segment sales increased by $590 million, or 15.3%, year-over-year, driven by an 11.2% increase in our average live hog sales price, including the effects of hedging, and an increase in grain sales to external customers of $179 million. The number of hogs produced decreased by 1.4% year-over-year.
Segment Profit (Loss)
Hog Production segment results declined to a loss of $133 million in 2022 from a profit of $69 million in 2021 driven primarily by the following factors, which more than offset the increase in sales:
•A $670 million increase in raw material costs primarily attributable to higher market prices for raw material feed ingredients, which increased by 25% year-over-year, and an increase in grain sales to external customers.
•A $104 million increase in hog raising and delivery costs primarily attributable to higher prices for transportation fuel and energy as well as other broad-based inflation.
•A $16 million decrease in income from our biogas joint ventures primarily due to the reduction of our ownership in Monarch from 50% in 2021 to 33% in 2022 and a reduction in market prices for natural gas and related environmental attribute credits.
Other
The results of our Other segment operations decreased by $15 million, or 22.2%, due to lower results from our Bioscience operations, partially offset by an increase in results from our Mexico operations. Our Bioscience results decreased due to higher raw material costs and lower sales volume, partially offset by an increase in average sales price. The results from our Mexico operations increased largely due to a full year of consolidated results of Altosano as well as a higher average sales price, which outweighed the increase in manufacturing costs. The increase in sales
91
of our other operating segments was also driven largely by a full year of consolidated results of Altosano and higher sales prices in our Mexico operations.
Other Transactions
We have engaged in several transactions since the beginning of 2021 that we believe are helpful to understand our historical and future financial results:
Dry Sausage Facility Acquisition. On July 30, 2024, we acquired a dry sausage production facility located in Nashville, Tennessee from Cargill for $38 million. The acquisition is part of our strategy to grow our value-added packaged meats business and serve the growing demand for high-quality pepperoni, salami, charcuterie and other dry sausage products. This business will be accounted for in the Packaged Meats segment.
Norson. In the first quarter of 2022, our then 50% owned joint venture in Mexico, Norson breached a financial covenant under its debt agreement. As a result, Norson was unable to further borrow under the existing debt agreement. We evaluated our investment in Norson for impairment. Based on our evaluation, we determined that our investment was impaired and that the impairment was other than temporary. As such, we wrote down the value of our investment in Norson by $40 million to its estimated fair value in the first quarter of 2022. This impairment was recognized in non-operating gains in the consolidated statement of income. In November 2022, we sold our shares in Norson to our joint venture partner and recognized a $4 million gain on the sale in non-operating gains in the fourth quarter of 2022.
Unaudited Quarterly Financial Information
The following table sets forth certain financial information for each of our fiscal quarters beginning with the first quarter of 2023. We have prepared the following unaudited quarterly financial information on the same basis as our audited consolidated financial statements and have included all adjustments, consisting only of normal recurring adjustments that in our opinion are necessary to fairly state the financial information set forth in those statements. Our historical results are not necessarily indicative of the results that may be expected in the future. The results of a particular quarter or other interim period are not necessarily indicative of the results for a full fiscal year or any other
92
period. This information should be read in conjunction with the audited consolidated financial statements and related notes thereto included elsewhere in this prospectus.
| Three Months Ended (unaudited) | |||||||||||||||||||||||||||||||||||||||||
| September 29, 2024 | June 30, 2024 | March 31, 2024 | December 31, 2023 | October 1, 2023 | July 2, 2023 | April 2, 2023 | |||||||||||||||||||||||||||||||||||
| (in millions except for percentages) | |||||||||||||||||||||||||||||||||||||||||
| Sales | $ | 3,334 | $ | 3,412 | $ | 3,444 | $ | 3,998 | $ | 3,379 | $ | 3,490 | $ | 3,774 | |||||||||||||||||||||||||||
| Gross profit | 476 | 527 | 362 | 285 | 253 | 126 | 224 | ||||||||||||||||||||||||||||||||||
| Operating profit (loss) | 285 | 334 | 163 | (116) | 30 | 7 | 23 | ||||||||||||||||||||||||||||||||||
| Net income (loss) from continuing operations | $ | 209 | $ | 259 | $ | 112 | $ | (131) | $ | 10 | $ | (12) | $ | (1) | |||||||||||||||||||||||||||
| Segment Results | |||||||||||||||||||||||||||||||||||||||||
| Segment Sales: | |||||||||||||||||||||||||||||||||||||||||
| Packaged Meats | $ | 1,917 | $ | 1,945 | $ | 1,999 | $ | 2,404 | $ | 1,928 | $ | 1,872 | $ | 2,076 | |||||||||||||||||||||||||||
| Fresh Pork | 1,951 | 1,981 | 1,938 | 1,836 | 2,095 | 1,908 | 1,992 | ||||||||||||||||||||||||||||||||||
| Hog Production | 738 | 776 | 706 | 819 | 778 | 811 | 909 | ||||||||||||||||||||||||||||||||||
| Other | 117 | 119 | 114 | 178 | 127 | 116 | 137 | ||||||||||||||||||||||||||||||||||
| Intersegment | (1,389) | (1,408) | (1,314) | (1,240) | (1,550) | (1,217) | (1,341) | ||||||||||||||||||||||||||||||||||
| Consolidated | $ | 3,334 | $ | 3,412 | $ | 3,444 | $ | 3,998 | $ | 3,379 | $ | 3,490 | $ | 3,774 | |||||||||||||||||||||||||||
| Segment Profit (loss): | |||||||||||||||||||||||||||||||||||||||||
| Packaged Meats | $ | 239 | $ | 330 | $ | 286 | $ | 306 | $ | 184 | $ | 276 | $ | 301 | |||||||||||||||||||||||||||
| Fresh Pork | 28 | 58 | 110 | 45 | 22 | (7) | 58 | ||||||||||||||||||||||||||||||||||
| Hog Production | 43 | (3) | (175) | (127) | (90) | (252) | (284) | ||||||||||||||||||||||||||||||||||
| Other | 20 | 7 | (8) | 13 | (10) | (16) | 9 | ||||||||||||||||||||||||||||||||||
Selected GAAP and Non-GAAP Data (1) | |||||||||||||||||||||||||||||||||||||||||
| Net income (loss) from continuing operations | $ | 209 | $ | 259 | $ | 112 | $ | (131) | $ | 10 | $ | (12) | $ | (1) | |||||||||||||||||||||||||||
| EBITDA from continuing operations | $ | 382 | $ | 419 | $ | 249 | $ | (24) | $ | 123 | $ | 114 | $ | 117 | |||||||||||||||||||||||||||
| Adjusted EBITDA from continuing operations | $ | 383 | $ | 333 | $ | 261 | $ | 279 | $ | 150 | $ | 43 | $ | 138 | |||||||||||||||||||||||||||
| Net income (loss) margin from continuing operations | 6.3 | % | 7.6 | % | 3.3 | % | (3.3) | % | 0.3 | % | (0.3) | % | — | % | |||||||||||||||||||||||||||
| Adjusted EBITDA margin from continuing operations | 11.5 | % | 9.7 | % | 7.6 | % | 7.0 | % | 4.4 | % | 1.2 | % | 3.7 | % | |||||||||||||||||||||||||||
__________________
(1)EBITDA from continuing operations, Adjusted EBITDA from continuing operations and Adjusted EBITDA Margin from continuing operations are non-GAAP measures that should not be considered in isolation or as a substitute for other financial measures calculated and presented in accordance with GAAP. For additional information regarding these non-GAAP measures, including reconciliations of these non-GAAP measures to net income (loss) from continuing operations and net income (loss) margin from continuing operations, the respective most directly comparable GAAP measures, see “—Non-GAAP Measures.”
Liquidity and Capital Resources
Our sources of liquidity include cash and cash equivalents on hand together with availability under our committed revolving credit facilities. As of September 29, 2024, we had $2,569 million of available liquidity consisting of $278 million in cash and cash equivalents and $2,290 million of availability under our committed credit facilities. Availability under our committed credit facilities is reduced by the principal amount of our outstanding commercial paper. We believe that our current liquidity position is strong and that our cash flows from operations and availability under our credit facilities will be sufficient to meet our working capital needs and financial obligations and commitments for at least the next twelve months.
93
Description of Certain Indebtedness
Description of the Senior Unsecured Credit Facilities and Other Facilities
| September 29, 2024 | ||||||||||||||||||||||||||||||||||||||
| Facility | Capacity | Borrowing Base Adjustment | Outstanding Borrowings | Commercial Paper Borrowings | Outstanding Letters of Credit | Amount Available | ||||||||||||||||||||||||||||||||
| (in millions) | ||||||||||||||||||||||||||||||||||||||
| Senior unsecured revolving credit facility | $ | 2,100 | $ | — | $ | — | $ | — | $ | — | $ | 2,100 | ||||||||||||||||||||||||||
| Accounts receivable securitization facility | 275 | (61) | — | — | (23) | 190 | ||||||||||||||||||||||||||||||||
| Total credit facilities | $ | 2,375 | $ | (61) | $ | — | $ | — | $ | (23) | $ | 2,290 | ||||||||||||||||||||||||||
Senior Unsecured Revolving Credit Facility
In May 2023, we exercised an option to extend the maturity of our $2.1 billion senior unsecured revolving credit facility pursuant to that certain Amendment No. 1 to the Second Amended and Restated Credit Agreement, or the Senior Revolving Credit Facility, dated as of May 1, 2021 as amended by Amendment No. 1 dated as of May 19, 2023 and Amendment No. 2 dated as of June 28, 2024, by and among us and certain of our subsidiaries as borrowers, Bank of America, N.A., as administrative agent, swing line lender and letter of credit lender, and various other lenders, to May 21, 2027. The Senior Revolving Credit Facility bears interest at the Secured Overnight Financing Rate, or SOFR, plus a margin ranging from 0.875% to 1.50% per annum, or, at our election, at a base rate plus a margin ranging from 0.00% to 0.50% per annum, in each case depending on our senior unsecured debt ratings. The Senior Revolving Credit Facility also contains financial maintenance covenants requiring us to maintain a maximum total consolidated leverage ratio (ratio of consolidated funded debt to consolidated capitalization, each as defined in the Senior Revolving Credit Facility) of 0.50 to 1.00 (which we may elect to increase to 0.55 to 1.00 with respect to any fiscal quarter in which a material acquisition is consummated and the immediately following three consecutive fiscal quarters, subject to certain restrictions) and a minimum interest coverage ratio (ratio of Consolidated EBITDA to Consolidated Interest Expense, each as defined in the Senior Revolving Credit Facility) of 3.50 to 1.00. As of the date hereof, there are no borrowings outstanding under the Senior Revolving Credit Facility.
Our Senior Revolving Credit Facility contains customary covenants, including, but not limited to, restrictions on our ability and that of our subsidiaries to merge and consolidate with other companies, incur indebtedness, grant liens or security interests on assets subject to their security interest, make acquisitions, loans, advances or investments, pay dividends, sell or otherwise transfer assets, optionally prepay or modify terms of any junior indebtedness or enter into transactions with affiliates, each subject to certain exceptions as set forth therein. We are currently in compliance with the covenants under our Senior Debt Facility. We are currently in compliance with the covenants under our revolving credit facility.
We are currently evaluating the possibility of refinancing our revolving credit facility in order to extend its maturity and seek improved terms. There can be no assurance that we will enter into such a refinancing transaction.
Our commercial paper program, which is supported by the Senior Revolving Credit Facility, provides access to a low-cost source of borrowing to fund general corporate purposes, including working capital. The maximum issuance capacity under our commercial paper program is $1.75 billion. The maturity of commercial paper issued under the program varies but does not exceed 397 days from the date of issuance. Our ability to access the commercial paper market in the future is dependent on maintaining investment grade credit ratings and market conditions.
Accounts Receivable Securitization Facility
Our accounts receivable securitization facility, the Fifth Amended and Restated Credit and Security Agreement, dated as of December 22, 2022 as amended by the First Amendment dated as of November 22, 2024, by and among Smithfield Receivables Funding LLC, as borrower Smithfield, as servicer, certain lenders, letter of credit
94
participants and co-agents, Coöperatieve Rabobank U.A., New York Branch, as a letter of credit issuer, PNC Bank, National Association, as administrative agent and a letter of credit issuer and PNC Capital Markets LLC, as structuring agent, or the Securitization Facility, matures on November 22, 2027. As part of the Securitization Facility, certain accounts receivable of our major domestic meat processing subsidiaries are sold to a wholly owned “bankruptcy remote” special purpose vehicle, or the SPV. The SPV pledges all such accounts receivable not otherwise sold pursuant to the Monetization Facility (as defined below) as security for loans made, and letters of credit issued, by participating lenders under the Securitization Facility. The SPV is included in our consolidated financial statements and therefore the accounts receivable owned by it are included in our consolidated balance sheets. However, the accounts receivable owned by the SPV are separate and distinct from our other assets and are not available to our other creditors should we become insolvent. As of September 29, 2024, the SPV held $350 million of accounts receivable. We must maintain certain ratios related to the collection of our receivables as a condition of the Securitization Facility agreement. As of September 29, 2024, we had $23 million in letters of credit issued under the Securitization Facility. None of the letters of credit were drawn upon.
Under the Securitization Facility, we and the SPV, as applicable, are subject to certain customary covenants, including, but not limited to, restrictions on our ability to sell, assign or otherwise dispose of any collateral or assign any right to receive income with respect thereto, use proceeds for any purpose other than those set forth in the Securitization Facility, make certain payments on junior indebtedness, incur debt or merge or consolidate, subject to certain exceptions set forth therein. The SPV is also prohibited from issuing any LCR Security (as defined therein). We are currently in compliance with the covenants under our Securitization Facility.
Monetization Facility
In addition to the Securitization Facility, we maintain an uncommitted $250 million accounts receivable monetization facility, or the Monetization Facility, pursuant to the Master Receivables Purchase Agreement, dated as of December 22, 2022 as amended by the First Amendment dated as of November 22, 2024, by and among Smithfield Receivables Funding LLC, as borrower, Smithfield, as servicer, certain buyers and PNC Bank, National Association, as administrative agent. At our election and subject to the purchasing banks’ approval, certain accounts receivable may be sold by the SPV to purchasing banks, so long as the uncollected outstanding amount of accounts receivable sold pursuant to the Monetization Facility does not exceed $250 million in the aggregate at any time, among other limitations. In the event of a sale, the purchasing banks assume all credit risk related to the receivables while we maintain risk associated with customer disputes. We account for the sale of receivables to a purchasing bank by derecognizing the receivables from our consolidated balance sheet upon transfer of control to the purchasing bank, and recognizing a discount on the sale in SG&A in the consolidated statement of income. The proceeds from the sale of receivables are included in net cash flows from operating activities in the consolidated statement of cash flows. On behalf of the purchasing banks, we continue to service all receivables sold under the Monetization Facility. As of September 29, 2024, the uncollected balance of receivables that had been sold to purchasing banks was $221 million. We had no servicing asset or liability outstanding as of September 29, 2024.
In the first quarter of fiscal year 2023, we sold $227 million of accounts receivable at a discount and received proceeds totaling $225 million. Subsequently, we reinvested $3.4 billion of cash collections from customers in the revolving sale of receivables to purchasing banks through December 31, 2023. For the nine months ended September 29, 2024 and October 1, 2023, we reinvested $2.8 billion and $2.2 billion, respectively, of cash collections from customers. In the year ended December 31, 2023, we incurred charges of $12 million attributable to the discount on the sale of accounts receivable. In the nine months ended September 29, 2024 and October 1, 2023, we incurred charges totaling $10 million and $8 million, respectively, attributable to the discount on the sale of accounts receivable.
Debt Issuances and Repurchases of Senior Unsecured Notes
In February 2017, we issued $600 million aggregate principal amount of 4.250% senior unsecured notes due February 2027, or the 2027 Notes, pursuant to an indenture by and among us, certain of our subsidiaries and U.S. Bank National Association, as trustee, or the 2027 Notes Indenture. The 2027 Notes are jointly, severally, fully and unconditionally guaranteed by certain of our subsidiaries. The net proceeds from the issuance of the 2027 Notes
95
were used to refinance the Company’s existing senior notes. As of September 29, 2024 and December 31, 2023, we had $600 million principal amount of 2027 Notes outstanding.
In April 2019, we issued $400 million aggregate principal amount of 5.200% senior unsecured notes due April 2029, or the 2029 Notes, pursuant to an indenture by and among us, certain of our subsidiaries and U.S. Bank National Association, as trustee, or the 2029 Notes Indenture. The 2029 Notes are jointly, severally, fully and unconditionally guaranteed by certain of our subsidiaries. The net proceeds from the issuance of the 2029 Notes were used to repay outstanding borrowings under the Securitization Facility, to refinance a portion of our outstanding commercial paper and for general corporate purposes. As of September 29, 2024 and December 31, 2023, we had $400 million principal amount of 2029 Notes outstanding.
In September 2020, we issued $500 million aggregate principal amount of 3.000% senior unsecured notes due September 2030, or the 2030 Notes, pursuant to an indenture by and among us, certain of our subsidiaries and U.S. Bank National Association, as trustee, or the 2030 Notes Indenture. The 2030 Notes are jointly, severally, fully and unconditionally guaranteed by certain of our subsidiaries. The net proceeds from the issuance of the 2030 Notes were used to refinance a portion of the Company’s existing senior notes outstanding as of the date of such issuance. As of September 29, 2024 and December 31, 2023, we had $500 million principal amount of 2030 Notes outstanding.
In September 2021, we issued $500 million aggregate principal amount of 2.625% senior unsecured notes due September 2031, or the 2031 Notes, at a price equal to 98.681% of their face value pursuant to an indenture by and among us, certain of our subsidiaries and U.S. Bank National Association, as trustee, or the 2031 Notes Indenture, together with the 2027 Notes Indenture, the 2029 Notes Indenture and the 2030 Notes Indenture, the Indentures. The 2031 Notes are jointly, severally, fully and unconditionally guaranteed by certain of our subsidiaries. The net proceeds from the issuance of the 2031 Notes were used, in part, to fund an early redemption of our remaining outstanding 2.65% senior unsecured notes due October 2021 totaling $291 million and repay outstanding borrowings on our Senior Revolving Credit Facility. In October 2021, we executed an early redemption of our 3.35% senior unsecured notes due February 2022, repaying the outstanding balance of $296 million. As of September 29, 2024 and December 31, 2023, we had $500 million principal amount of 2031 Notes outstanding.
The Indentures contain customary covenants, including, but not limited to, restrictions on our ability and that of our subsidiaries to merge and consolidate with other companies, sell or otherwise transfer assets, effectuate a change of control and grant liens or security interests on assets, subject to exceptions and qualifications as set forth therein. We are currently in compliance with the covenants under our Indentures.
Cash Flows
| Nine Months Ended | Fiscal Year | ||||||||||||||||||||||||||||
September 29, 2024 | October 1, 2023 | 2023 | 2022 | 2021 | |||||||||||||||||||||||||
| (in millions) | |||||||||||||||||||||||||||||
| Cash (used in) provided by: | |||||||||||||||||||||||||||||
| Operating activities of continuing operations | $ | 233 | $ | (6) | $ | 688 | $ | 521 | $ | 755 | |||||||||||||||||||
| Investing activities of continuing operations | (305) | (60) | (194) | 274 | (204) | ||||||||||||||||||||||||
| Financing activities of continuing operations | (290) | (270) | (353) | (567) | (434) | ||||||||||||||||||||||||
Net cash used in operating activities
Net cash flows from operating activities of continuing operations increased by $239 million from a cash outflow of $6 million for the nine months ended October 1, 2023 to a cash inflow of $233 million for the nine months ended September 29, 2024 driven primarily by an increase in net income from continuing operations, partially offset by changes in working capital. Working capital was adversely impacted by changes in accounts receivable and inventories. Accounts receivable decreased by $281 million in the prior year primarily due to the monetization of
96
receivables under the Monetization Facility, which was initiated in the first quarter of 2023. Inventories increased by $102 million in the nine months ended September 29, 2024 while decreasing by $115 million for the same period in the prior year primarily attributable to changes in meat values.
Net cash flows from operating activities of continuing operations increased by $167 million from $521 million in 2022 to $688 million in 2023 driven primarily by positive changes in working capital, partially offset by a decrease in net income from continuing operations. The changes in working capital were driven primarily by decreases in inventories and accounts payable of $469 million and $215 million, respectively, in 2023 as a result of lower commodity prices for feed grains and meat, as well as lower inventory volumes attributable to the West Coast Exit and Hog Production Reform activities. Conversely, inventories and accounts payable increased by $307 million and $121 million, respectively, in 2022 due to higher prices for corn, soybean meal and wheat as well as increased meat inventory volumes. Additionally, accounts receivable decreased by $157 million in 2023 primarily due to the monetization of receivables under the Monetization Facility.
Net cash flows from operating activities of continuing operations decreased by $234 million from $755 million in 2021 to $521 million in 2022 driven primarily by higher levels of working capital, partially offset by an increase in net income from continuing operations. The changes in working capital were driven primarily by a larger increase in inventories in 2022 as compared to 2021 (from $307 million to $184 million) due to higher prices for feed grains in both years and higher meat inventory volumes in 2022. Accounts receivable increased by $33 million in 2022 primarily due to higher sales. Prepaid expenses and other current assets increased by $23 million in 2022 primarily due a payment made to settle certain class claims associated with antitrust price-fixing litigation, partially offset by decreases in income tax receivables and derivative assets. Accrued expenses and other current liabilities decreased by $24 million in 2022 mainly due to the settlement of certain class claims associated with the antitrust price-fixing litigation. Accrued expenses and other current liabilities increased in 2021 primarily due to accruals for contingent losses, partially offset by decreases in accruals for variable compensation and trade promotions.
Investing Activities
Net cash used in investing activities was $305 million for the nine months ended September 29, 2024, a decrease of $245 million, compared to $60 million for the nine months ended October 1, 2023. In the second quarter of 2023, we received $205 million in proceeds for the sale of our Vernon, California facility. Capital expenditures increased by $25 million year-over-year and consisted primarily of various plant expansion, automation and improvement projects.
Net cash used in investing activities was $194 million in 2023, a decrease of $469 million, compared to net cash provided by investing activities of $274 million in 2022. Our capital expenditures did not change significantly from 2022 to 2023, and consisted primarily of various plant expansion, automation and improvement projects. We used an additional $47 million in cash for breeding stock transactions in 2023 compared to 2022. In 2023, we received $205 million in proceeds for the sale of our Vernon, California facility. In 2022, we received proceeds of $568 million, $32 million and $5 million for the sales of Saratoga, certain hog farms in California and Arizona, and our subsidiary, Smithfield Foods de Mexico, S. de R.L. de C.V., respectively. In addition, in 2022 we sold our investment in Norson for $21 million. We made capital contributions totaling $21 million and $17 million to our biogas joint ventures in 2023 and 2022, respectively.
Net cash provided by investing activities was $274 million in 2022, an increase of $478 million, compared to net cash used in investing activities of $204 million in 2021. Our capital expenditures increased by $131 million in 2022 compared to 2021, and consisted primarily of various plant expansion, automation and improvement projects. In 2022, we received proceeds of $568 million, $32 million and $5 million for the sales of Saratoga, certain hog farms in California and Arizona and our subsidiary, Smithfield Foods de Mexico, S. de R.L. de C.V., respectively. In addition, we received $21 million from the sale of our investment in Norson. In 2022, we invested $17 million in our biogas venture, Align, and $5 million in other investments.
Financing Activities
Net cash used in financing activities increased by $20 million from $270 million for the nine months ended October 1, 2023 to $290 million for the nine months ended September 29, 2024. We paid an additional $8 million in
97
dividends in the nine months ended September 29, 2024 compared to the same period in 2023. Our dividend payments through the first three quarters of 2023 included a $100 million special dividend from the proceeds from the sale of our Vernon, California facility.
Net cash used in financing activities decreased by $214 million from $567 million in 2022 to $353 million in 2023. We paid an additional $173 million in dividends in 2022 compared to 2023. Our dividend payment in 2022 included $263 million of special dividends from the sale of Saratoga and in 2023 included a $100 million special dividend from the proceeds from the sale of our Vernon, California facility. In 2021, we acquired a controlling interest in Altosano, increasing our total ownership from 50% to 66%. We paid $2 million and $55 million of deferred consideration for the acquisition in 2023 and 2022, respectively.
Net cash used in financing activities increased by $133 million from $434 million in 2021 to $567 million in 2022. We paid an addition $304 million in dividends in 2022 compared to 2021. Our dividend payment in 2022 included $263 million of special dividends from the sale of Saratoga. In 2021, we repaid our 2.65% senior unsecured notes due October 2021 and our 3.35% senior unsecured notes due February 2022 totaling $310 million and $308 million, respectively. In September 2021, we issued $500 million aggregate principal amount of the 2031 Notes at a price equal to 98.681% of their face value. In 2021, we paid $55 million of deferred consideration for the acquisition of an additional 16% interest in Altosano.
Contractual Obligations and Commitments
Our cash requirements for long-term contractual obligations and commitments as of September 29, 2024 are presented in the following table:
| Due Date by Period | |||||||||||||||||||||||||||||||||||||||||
| 2024 | 2025 | 2026 | 2027 | 2028 | 2029 & thereafter | Total | |||||||||||||||||||||||||||||||||||
| (in millions) | |||||||||||||||||||||||||||||||||||||||||
Debt principal payments (1) | $ | 2 | $ | 5 | $ | 2 | $ | 599 | $ | — | $ | 1,383 | $ | 1,991 | |||||||||||||||||||||||||||
| Debt interest payments | 18 | 75 | 74 | 51 | 49 | 68 | 335 | ||||||||||||||||||||||||||||||||||
Guaranteed royalty payments (2) | 4 | 15 | 15 | 16 | 16 | 50 | 116 | ||||||||||||||||||||||||||||||||||
Lease obligations (3) | 22 | 72 | 58 | 46 | 35 | 244 | 477 | ||||||||||||||||||||||||||||||||||
Pension and other postretirement benefit obligations (4) | — | — | — | — | — | — | 287 | ||||||||||||||||||||||||||||||||||
Commitments to investees (5) | — | — | — | — | — | — | 150 | ||||||||||||||||||||||||||||||||||
| Purchase commitments: | |||||||||||||||||||||||||||||||||||||||||
Hog procurement (6) | 638 | 1,902 | 1,110 | 662 | 363 | — | 4,674 | ||||||||||||||||||||||||||||||||||
Contract hog growers (7) | 21 | 87 | 75 | 66 | 54 | 144 | 446 | ||||||||||||||||||||||||||||||||||
Grain procurement (8) | 102 | — | — | — | — | — | 102 | ||||||||||||||||||||||||||||||||||
| Other | 60 | 17 | 16 | 14 | 14 | 188 | 308 | ||||||||||||||||||||||||||||||||||
Other long-term liabilities (9) | — | — | — | — | — | — | 209 | ||||||||||||||||||||||||||||||||||
| Total | $ | 866 | $ | 2,172 | $ | 1,350 | $ | 1,453 | $ | 531 | $ | 2,078 | $ | 9,096 | |||||||||||||||||||||||||||
________________
(1)In the event of default on a payment, acceleration of principal payments could occur.
(2)Represents guaranteed royalty payments to license the Nathan’s Famous brand.
(3)Amounts presented for lease obligations represent the undiscounted contractual lease payments for our operating and finance lease obligations. For more information on leases, see “Note 11: Lease Obligations, Commitments and Guarantees” in the consolidated financial statements and accompanying notes included elsewhere in this prospectus.
(4)We historically provided the majority of our U.S. employees with pension benefits. In the second quarter of 2021, we amended our qualified pension plans to freeze the benefit accrual for all non-union participants. Funding requirements for our pension plans are determined based on the funded status measured at the end of each year. The values of our pension obligation and related assets may fluctuate significantly, which may in turn lead to a larger underfunded status in our pension plans and a higher funding requirement. The minimum funding requirement for 2024 was $37 million and was satisfied in September 2024. We are unable to reliably estimate the amount and timing of the remaining payments beyond 2024, therefore we have only the estimated total liability as of September 29, 2024 in the table above. For more information,
98
see “Note 13: Pension and Other Retirement Plans” in the consolidated financial statements and accompanying notes included elsewhere in this prospectus.
(5)We have committed to contribute up to $250 million through 2028 to Align to fund various projects as they are approved by Align’s board. As of September 29, 2024, we had contributed $113 million in capital toward this commitment. Additionally, we have committed to contribute up to $25 million to the TPG Rise Climate investment fund through July 2027. As of September 29, 2024, we had contributed $12 million in capital toward this commitment. We are unable to reliably estimate the time at which either commitment will be drawn upon.
(6)Through the Fresh Pork segment, we have purchase agreements with certain independent suppliers. Some of these arrangements obligate us to purchase all of the hogs produced by these suppliers. Other arrangements obligate us to purchase a fixed amount of hogs. Due to the uncertainty of the number of hogs that we are obligated to purchase and the uncertainty of market prices at the time of hog purchases, we have estimated our obligations under these arrangements. Future payments were estimated using current live hog market prices, available futures contract prices and internal projections adjusted for historical quality premiums.
(7)Through the Hog Production segment, we use contract farmers and their facilities to raise hogs produced from our breeding stock. Under multi-year contracts, the farmers provide the initial facility investment, labor and front-line management in exchange for a performance-based service fee payable upon delivery. We are obligated to pay this service fee for all hogs delivered. We have estimated our obligation based on expected hogs delivered from these farmers.
(8)Includes fixed-price forward grain purchase contracts totaling $77 million. Also includes unpriced forward grain purchase contracts which, if valued using market prices as of September 29, 2024, would be $25 million. These forward grain contracts are accounted for as normal purchases. As a result, they are not recorded in the balance sheet.
(9)Other long-term liabilities consist of long-term casualty insurance reserves, deferred compensation, contingent liabilities, and asset retirement obligations, among others. We are unable to estimate reliably the amount and timing of the remaining payments beyond September 29, 2024. Therefore, we have only included the total liability in the table above.
Other Anticipated or Potential Cash Requirements
Capital Expenditures
We believe that annual total capital expenditures in the near term are likely to be in the range of $400 million to $500 million inclusive of both repairs and maintenance and profit improvement projects. These expenditures are expected to be funded with cash flows from operations. Capital expenditures could be more in certain years to ensure continuity of production in our older assets. For additional information on how we intend to use the proceeds of this offering, see “Use of Proceeds.”
Dividends
In 2024, we paid dividends of $288 million to our parent company. For more information on dividends, see “Dividend Policy.”
Altosano Redeemable Noncontrolling Interest
After December 31, 2024, our noncontrolling interest (NCI) holders in Altosano have the right to exercise a put option that would obligate us to redeem 40% of their interest. After December 31, 2027 the NCI holders in Altosano have the right to exercise a put option for the remainder of their interest. The redemption value for the NCI is fair value. As of December 31, 2023, the value of the NCI on our consolidated balance sheet was $246 million.
Contingent Losses
Like other participants in our industry, we are subject to various laws and regulations administered by federal, state and other government entities, including the EPA and corresponding state agencies, as well as the Grain Inspection, Packers and Stockyard Administration, the USDA, the United States Occupational Safety and Health Administration, or OSHA, the Commodity Futures Trading Commission and similar agencies in foreign countries. We, from time to time, receive notices and inquiries from regulatory authorities and others asserting that we are not in compliance with such laws and regulations. In some instances, litigation ensues. In addition, individuals may initiate litigation against us.
The consolidated financial statements reflect accruals for contingent losses associated with various claims. These matters will not affect our profits or losses in future periods unless our accruals prove to be insufficient or excessive. It is reasonably possible that a change in our estimates may occur in the near term and that our accruals
99
could be insufficient. We are unable to estimate the amount of possible loss in excess of our accruals, which could be material. Additionally, legal expenses incurred in our and our subsidiaries’ defense of these claims and any payments made to plaintiffs through unfavorable verdicts or otherwise could negatively impact our cash flows and our liquidity position. For more information on contingencies, refer to “Note 17: Regulation and Contingencies” in the consolidated financial statements and accompanying notes included elsewhere in this prospectus.
Risk Management Activities
We are exposed to market risks primarily from changes in commodity prices, and to a lesser degree, interest rates and foreign exchange rates. To mitigate these risks, we utilize derivative instruments to hedge our exposure to changing prices and rates, as more fully described in “—Quantitative and Qualitative Disclosures About Market Risk” and “Note 7: Derivative Financial Instruments” in the consolidated financial statements and accompanying notes as of December 31, 2023 included elsewhere in this prospectus for the effects of derivative instruments on our consolidated statements of income.
Our liquidity position may be positively or negatively affected by changes in the value of our derivative portfolio. When the value of our open derivative contracts decreases, we may be required to post margin deposits with our brokers and counterparties to cover a portion of the decrease. Conversely, when the value of our open derivative contracts increases, our brokers may be required to deliver margin deposits to us for a portion of the increase. Over the past three fiscal years, the maximum amount of margin deposits held by our brokers and counterparties at any given time was $231 million.
The effects, positive or negative, on liquidity resulting from our risk management activities historically have tended to be mitigated by offsetting changes in cash prices in our core business. For example, in a period of rising grain prices, gains resulting from long grain derivative positions would generally be offset by higher cash prices paid to farmers and other suppliers in spot markets. These offsetting changes do not always occur, however, in the same amounts or in the same period, with lag times of as much as twelve months.
Guarantees
We and certain other joint venture partners in Monarch joint and severally guarantee Monarch’s debt, interest and fees. As of December 31, 2023, the maximum amount of loans that could be outstanding under Monarch’s debt agreements was $74 million and the loans mature in June 2025. Monarch’s outstanding debt was $49 million as of the end of 2023. The guarantee arrangement contains provisions that may reduce our obligations under the guarantee depending on Monarch’s debt to EBITDA ratio.
The guarantee involves elements of performance and credit risk and is not included in our consolidated balance sheets. We could become liable in connection with Monarch’s obligation depending on the ability of Monarch to perform on its obligation. If we consider it probable that we will become responsible for the obligation, we would record the liability on our consolidated balance sheet.
Non-GAAP Measures
Adjusted Net Income and Adjusted Net Income Margin
The following table provides a reconciliation of net income to Adjusted Net Income and Adjusted Net Income Margin, which relate to continuing operations attributable to Smithfield. Adjusted Net Income and Adjusted Net Income Margin are non-GAAP measures. We believe Adjusted Net Income is a useful measure for investors because it excludes the effects of discontinued operations, non-operating gains and losses and other items that are unusual in nature, infrequent in occurrence or otherwise stem from strategic decisions to restructure our operations. We believe that Adjusted Net Income Margin is a useful measurement of operating profitability for investors for the same reasons we find Adjusted Net Income useful and also because it provides a period-to-period comparison of our after-tax operating performance. Although we believe Adjusted Net Income and Adjusted Net Income Margin provide a better comparison of our year-over-year performance and are frequently used by investors and securities analysts in their evaluations of companies, Adjusted Net Income and Adjusted Net Income Margin have limitations as analytical tools. As such, Adjusted Net Income and Adjusted Net Income Margin are not intended to be
100
alternatives to net income or any other performance measures derived in accordance with GAAP and should not be used by investors or other users of our financial statements in isolation for formulating decisions as they exclude a number of important cash and non-cash charges.
In arriving at our presentation of non-GAAP financial measures, we exclude items that have an impact on our income statement that, in the judgment of our management, are items that, either as a result of their nature or size, could, were they not identified, potentially cause investors to extrapolate future performance from an improper base. While not all inclusive, examples of these items include:
•legal settlements (both gain or loss) and loss contingencies, due to the difficulty in predicting future events, their timing and size;
•transactions or events that are not part of our core business activities or are unusual in their nature (whether gains or losses); and
•the tax effects of the foregoing items.
| Nine Months Ended | Fiscal Year | ||||||||||||||||||||||||||||||||||
September 29, 2024 | October 1, 2023 | 2023 | 2022 | 2021 | Affected income statement account | ||||||||||||||||||||||||||||||
| (in millions except for percentages) | |||||||||||||||||||||||||||||||||||
| Net income (loss) from continuing operations | $ | 581 | $ | (2) | $ | (133) | $ | 811 | $ | 389 | |||||||||||||||||||||||||
Litigation charges (1) | — | 12 | 208 | — | 341 | SG&A | |||||||||||||||||||||||||||||
West Coast Exit and Hog Production Reform (2) | 13 | 95 | 195 | 151 | — | Cost of sales | |||||||||||||||||||||||||||||
West Coast Exit and Hog Production Reform (3) | — | — | 49 | — | — | (Income) loss from equity method investments | |||||||||||||||||||||||||||||
| Gain on sale of Vernon, California facility | — | (86) | (86) | — | — | Operating gains | |||||||||||||||||||||||||||||
| Gain on sale of Saratoga | — | — | — | (417) | — | Operating gains | |||||||||||||||||||||||||||||
| Incremental costs from destruction of property | 4 | 1 | 3 | — | 6 | Cost of sales | |||||||||||||||||||||||||||||
| Insurance recoveries | (4) | (4) | (5) | (6) | — | Operating gains | |||||||||||||||||||||||||||||
| Accelerated depreciation of Smithfield harvest and pet food assets | — | — | — | 8 | 6 | Cost of sales | |||||||||||||||||||||||||||||
| Impairment of Norson investment, net of gain on sale | — | — | — | 36 | — | Non-operating gains | |||||||||||||||||||||||||||||
| Gain on dilution of investment in Monarch | — | — | — | (52) | — | Non-operating gains | |||||||||||||||||||||||||||||
| Employee Retention Tax Credits | (86) | — | — | — | — | Cost of sales | |||||||||||||||||||||||||||||
| Employee Retention Tax Credits | (1) | — | — | — | — | SG&A | |||||||||||||||||||||||||||||
101
| Nine Months Ended | Fiscal Year | ||||||||||||||||||||||||||||||||||
September 29, 2024 | October 1, 2023 | 2023 | 2022 | 2021 | Affected income statement account | ||||||||||||||||||||||||||||||
| (in millions except for percentages) | |||||||||||||||||||||||||||||||||||
Income tax effect of non-GAAP adjustments (4) | 19 | (5) | (94) | 72 | (91) | Income tax expense (benefit) | |||||||||||||||||||||||||||||
| Adjusted net income from continuing operations | 526 | 11 | 137 | 602 | 651 | ||||||||||||||||||||||||||||||
| Less: Net income (loss) from continuing operations attributable to noncontrolling interests | 9 | (3) | 5 | 11 | 1 | ||||||||||||||||||||||||||||||
| Adjusted net income from continuing operations attributable to Smithfield | $ | 518 | $ | 14 | $ | 132 | $ | 591 | $ | 650 | |||||||||||||||||||||||||
| Net income (loss) margin from continuing operations | 5.7 | % | — | % | (0.9) | % | 5.0 | % | 2.6 | % | |||||||||||||||||||||||||
| Adjusted net income margin from continuing operations attributable to Smithfield | 5.1 | % | 0.1 | % | 0.9 | % | 3.7 | % | 4.3 | % | |||||||||||||||||||||||||
________________
(1)Consists of accruals for the antitrust price-fixing and antitrust wage-fixing litigation matters that are described in “Note 17: Regulation and Contingencies” in the consolidated financial statements and accompanying notes included elsewhere in this prospectus.
(2)Consists of costs related to the closure of our Vernon, California processing facility, the sale or closure of certain farms in Arizona, California, Missouri and Utah and certain residual operating and restructuring expenses, including the termination of a number of agreements with contract farmers, workforce reduction, and accelerated depreciation of machinery equipment with no future alternative use, due to discontinuation of operations in the West Coast and efforts to improve the cost structure of our Hog Production segment.
(3)Includes an impairment of certain biogas assets recognized by our joint venture, Align, and costs incurred in connection with the closure of certain farms in Missouri that impacted assets owned by our joint venture, Monarch.
(4)Represents the tax effects of the non-GAAP adjustments based on a statutory tax rate of 25.7%.
EBITDA, Adjusted EBITDA, Adjusted EBITDA Margin, Net Debt and Ratio of Net Debt to Adjusted EBITDA
The following table provides a reconciliation of net income to earnings before income tax, depreciation and amortization (EBITDA), Adjusted EBITDA, Adjusted EBITDA Margin, Net Debt and Ratio of Net Debt to Adjusted EBITDA. EBITDA, Adjusted EBITDA, Adjusted EBITDA Margin, Net Debt and Ratio of Net Debt to Adjusted EBITDA are non-GAAP measures. We believe EBITDA is a useful measure to our stakeholders because it excludes the effects of financing and investing activities by eliminating interest and depreciation costs to provide a comparable year-over-year analysis. We believe Adjusted EBITDA is a useful measure as it excludes the effect of discontinued operations, non-operating gains and losses, and other items that are unusual in nature, infrequent in occurrence or otherwise stem from strategic decisions to restructure our operations. We believe Adjusted EBITDA Margin is a useful measure as it evaluates overall operating performance, ability to pursue and service possible debt opportunities and possible future investment opportunities. We believe Net Debt is a useful measure as it helps to give investors a clear understanding of our financial position. Net Debt is also used to calculate certain leverage ratios. We believe Ratio of Net Debt to Adjusted EBITDA is a useful measure as it monitors the sustainability of our debt levels and our ability to take on additional debt against Adjusted EBITDA, which is used as an operating performance measure. We believe these non-GAAP measures provide a more comparable year-over-year analysis.
102
Although EBITDA, Adjusted EBITDA, Adjusted EBITDA Margin, Net Debt and Ratio of Net Debt to Adjusted EBITDA are frequently used by investors and securities analysts in their evaluations of companies, EBITDA, Adjusted EBITDA, Adjusted EBITDA Margin, Net Debt and Ratio of Net Debt to Adjusted EBITDA have limitations as analytical tools. As such, EBITDA, Adjusted EBITDA, Adjusted EBITDA Margin, Net Debt and Ratio of Net Debt to Adjusted EBITDA are not intended to be alternatives to net income, debt, ratio of debt to net income or any other performance measures derived in accordance with GAAP and should not be used by investors or other users of our financial statements in isolation for formulating decisions as they exclude a number of important cash and non-cash charges.
| Nine Months Ended (unaudited) | Fiscal Year | ||||||||||||||||||||||||||||||||||||||||
September 29, 2024 | October 1, 2023 | 2023 | 2022 | 2021 | 2014(6) | Affected income statement account | |||||||||||||||||||||||||||||||||||
| (in millions except for percentages) | |||||||||||||||||||||||||||||||||||||||||
| Net income (loss) from continuing operations | $ | 581 | $ | (2) | $ | (133) | $ | 811 | $ | 389 | $ | 437 | |||||||||||||||||||||||||||||
| Interest expense, net | 52 | 59 | 76 | 87 | 93 | 162 | |||||||||||||||||||||||||||||||||||
| Income tax expense (benefit) | 165 | — | (41) | 231 | 97 | 219 | |||||||||||||||||||||||||||||||||||
| Depreciation and amortization | 253 | 296 | 427 | 440 | 331 | 199 | |||||||||||||||||||||||||||||||||||
| EBITDA from continuing operations | $ | 1,050 | $ | 353 | $ | 329 | $ | 1,569 | $ | 910 | $ | 1,017 | |||||||||||||||||||||||||||||
Litigation charges (1) | — | 12 | 208 | — | 341 | — | SG&A | ||||||||||||||||||||||||||||||||||
West Coast Exit and Hog Production Reform (2) | 12 | 55 | 110 | 68 | — | — | Cost of sales | ||||||||||||||||||||||||||||||||||
| West Coast Exit and Hog Production Reform | — | — | 49 | — | — | — | (Income) loss from equity method investments | ||||||||||||||||||||||||||||||||||
| Gain on sale of Vernon, California facility | — | (86) | (86) | — | — | — | Operating gains | ||||||||||||||||||||||||||||||||||
| Gain on sale of Saratoga | — | — | — | (417) | — | — | Operating gains | ||||||||||||||||||||||||||||||||||
| Incremental costs from destruction of property | 4 | 1 | 3 | — | 6 | — | Cost of sales | ||||||||||||||||||||||||||||||||||
| Insurance recoveries | (4) | (4) | (5) | (6) | — | — | Operating gains | ||||||||||||||||||||||||||||||||||
| Impairment of Norson investment, net of gain on sale | — | — | — | 36 | — | — | Non-operating gains | ||||||||||||||||||||||||||||||||||
| Gain on dilution of investment in Monarch | — | — | — | (52) | — | — | Non-operating gains | ||||||||||||||||||||||||||||||||||
| Employee Retention Tax Credits | (86) | — | — | — | — | — | Cost of sales | ||||||||||||||||||||||||||||||||||
| Employee Retention Tax Credits | (1) | — | — | — | — | — | SG&A | ||||||||||||||||||||||||||||||||||
103
| Adjusted EBITDA from continuing operations | $ | 976 | $ | 331 | $ | 610 | $ | 1,197 | $ | 1,257 | $ | 1,017 | |||||||||||||||||||||||||||||
| Net income (loss) margin from continuing operations | 5.7 | % | — | % | (0.9) | % | 5.0 | % | 2.6 | % | 3.3 | % | |||||||||||||||||||||||||||||
| Adjusted EBITDA margin from continuing operations | 9.6 | % | 3.1 | % | 4.2 | % | 7.4 | % | 8.4 | % | 7.6 | % | |||||||||||||||||||||||||||||
| Fiscal Year Ended | |||||||||||||||||||||||||||||||||||||||||
| December 31, 2023 | December 28, 2014 | ||||||||||||||||||||||||||||||||||||||||
| (in millions except for ratios) | |||||||||||||||||||||||||||||||||||||||||
| Net income (loss) from continuing operations | $ | (133) | $ | 437 | |||||||||||||||||||||||||||||||||||||
| Current portion of long-term debt and capital lease | 27 | 28 | |||||||||||||||||||||||||||||||||||||||
| Long-term debt and finance lease obligations | 2,006 | 2,648 | |||||||||||||||||||||||||||||||||||||||
| Cash and cash equivalents | (687) | (378) | |||||||||||||||||||||||||||||||||||||||
| Net debt | 1,345 | 2,298 | |||||||||||||||||||||||||||||||||||||||
| Ratio of debt to net income (loss) from continuing operations | (15.3x) | 6.1x | |||||||||||||||||||||||||||||||||||||||
Ratio of net debt to adjusted EBITDA from continuing operations (3) | 2.2 | x | 2.3x | ||||||||||||||||||||||||||||||||||||||
(1)Consists of accruals for litigation matters that are described in “Note 17: Regulation and Contingencies” in the consolidated financial statements and accompanying notes included elsewhere in this prospectus.
(2)Excludes accelerated depreciation and amortization charges of $1 million, $42 million, $85 million and $83 million in the nine months ended September 29, 2024, the nine months ended 2023, fiscal year 2023 and fiscal year 2022, respectively, as the charges are included in the depreciation and amortization line.
(3)See “Prospectus Summary—A New Smithfield in the Public Eye” for more information. There were no adjustments to EBITDA made for fiscal year 2014.
104
Quarterly Reconciliations of EBITDA, Adjusted EBITDA, Adjusted EBITDA Margin to Net Income and Net Income Margin
| Three Months Ended (unaudited) | |||||||||||||||||||||||||||||||||||||||||
| September 29, 2024 | June 30, 2024 | March 31, 2024 | December 31, 2023 | October 1, 2023 | July 2, 2023 | April 2, 2023 | |||||||||||||||||||||||||||||||||||
| (in millions except for percentages) | |||||||||||||||||||||||||||||||||||||||||
| Net income (loss) from continuing operations | $ | 209 | $ | 259 | $ | 112 | $ | (131) | $ | 10 | $ | (12) | $ | (1) | |||||||||||||||||||||||||||
| Interest expense, net | 17 | 19 | 16 | 17 | 18 | 20 | 22 | ||||||||||||||||||||||||||||||||||
| Income tax expense (benefit) | 69 | 58 | 39 | (42) | 3 | (2) | — | ||||||||||||||||||||||||||||||||||
| Depreciation and amortization | 88 | 83 | 82 | 131 | 92 | 108 | 96 | ||||||||||||||||||||||||||||||||||
| EBITDA from continuing operations | $ | 382 | $ | 419 | $ | 249 | $ | (24) | $ | 123 | $ | 114 | $ | 117 | |||||||||||||||||||||||||||
Litigation charges (1) | — | — | — | 196 | 12 | — | — | ||||||||||||||||||||||||||||||||||
West Coast Exit and Hog Production Reform (2) | 3 | — | 10 | 106 | 14 | 20 | 21 | ||||||||||||||||||||||||||||||||||
| Gain on sale of Vernon, California facility | — | — | — | — | — | (86) | — | ||||||||||||||||||||||||||||||||||
| Incremental costs from destruction of property | — | 2 | 3 | 2 | 1 | — | — | ||||||||||||||||||||||||||||||||||
| Insurance recoveries | (3) | (1) | — | — | — | (4) | — | ||||||||||||||||||||||||||||||||||
| Employee Retention Tax Credits | — | (87) | — | — | — | — | — | ||||||||||||||||||||||||||||||||||
| Adjusted EBITDA from continuing operations | $ | 383 | $ | 333 | $ | 261 | $ | 279 | $ | 150 | $ | 43 | $ | 138 | |||||||||||||||||||||||||||
| Net income (loss) margin from continuing operations | 6.3 | % | 7.6 | % | 3.3 | % | (3.3) | % | 0.3 | % | (0.3) | % | — | % | |||||||||||||||||||||||||||
| Adjusted EBITDA margin from continuing operations | 11.5 | % | 9.7 | % | 7.6 | % | 7.0 | % | 4.4 | % | 1.2 | % | 3.7 | % | |||||||||||||||||||||||||||
________________
(1)Consists of accruals for the antitrust price-fixing and antitrust wage-fixing litigation matters that are described in “Note 17: Regulation and Contingencies” in the consolidated financial statements and accompanying notes included elsewhere in this prospectus.
(2)Consists of costs related to the closure of our Vernon, California processing facility, the sale or closure of certain farms in Arizona, California, Missouri and Utah and certain residual operating and restructuring expenses, including the termination of a number of agreements with contract farmers and workforce reduction, due to discontinuation of operations in the West Coast and efforts to improve the cost structure of our Hog Production segment.
Adjusted Segment Profit and Adjusted Segment Profit Margin
The following table provides a reconciliation of segment profit and segment profit margin to Adjusted Segment Profit and Adjusted Segment Profit Margin. Adjusted Segment Profit and Adjusted Segment Profit Margin are non-GAAP measures. We believe Adjusted Segment Profit is a useful measure because it provides a more complete understanding of underlying operating results and trends of established, ongoing operations of our segments, excluding the impact of employee retention in tax credits, which were not applicable to periods before 2024. We believe Adjusted Segment Profit Margin is a useful measure for the same reasons we find Adjusted Segment Profit useful.
Adjusted Segment Profit and Adjusted Segment Profit Margin are not intended to be alternatives to segment profit, segment profit margin or any other performance measures derived in accordance with GAAP and should not
105
be used by investors or other users of our financial statements in isolation for formulating decisions as they exclude a number of important cash and non-cash charges.
| Nine Months Ended September 29, 2024 (unaudited) | Packaged Meats | Fresh Pork | Hog Production | |||||||||||||||||
| (in millions except for percentages) | ||||||||||||||||||||
| Segment profit | $ | 855 | $ | 196 | $ | (135) | ||||||||||||||
| Employee retention tax credits | (38) | (41) | (8) | |||||||||||||||||
| Adjusted segment profit | $ | 816 | $ | 156 | $ | (143) | ||||||||||||||
| Segment profit margin | 14.6 | % | 3.3 | % | (6.1) | % | ||||||||||||||
| Adjusted segment profit margin | 13.9 | % | 2.6 | % | (6.4) | % | ||||||||||||||
Free Cash Flow
The following table provides a reconciliation of net cash flows from operating activities to Free Cash Flow. Free Cash Flow is a non-GAAP measure. We define Free Cash Flow as cash flow from operating activities less capital expenditures. We use Free Cash Flow as a measure of our liquidity. We believe Free Cash Flow is a useful measure as it offers supplemental information and insight regarding the liquidity of our operations and our ability to generate sufficient cash flow to, among other things, repay debt and pursue business opportunities and investments. Although Free Cash Flow is frequently used by investors and securities analysts in their evaluations of companies in industries similar to ours, Free Cash Flow has limitations as an analytical tool. As such, Free Cash Flow is not intended to be an alternative to operating cash flow or any other performance measures derived in accordance with GAAP and should not be used by investors or other users of our financial statements in isolation for formulating decisions as it excludes a number of important cash and non-cash charges.
| Nine Months Ended (unaudited) | Fiscal Year | ||||||||||||||||||||||||||||
September 29, 2024 | October 1, 2023 | 2023 | 2022 | 2021 | |||||||||||||||||||||||||
| (in millions) | |||||||||||||||||||||||||||||
| Net cash flows from operating activities of continuing operations | $ | 233 | $ | (6) | $ | 688 | $ | 521 | $ | 755 | |||||||||||||||||||
| Less: Capital expenditures | (268) | (242) | (353) | (338) | (207) | ||||||||||||||||||||||||
| Free cash flow from continuing operations | $ | (35) | $ | (249) | $ | 334 | $ | 183 | $ | 548 | |||||||||||||||||||
Quantitative and Qualitative Disclosures About Market Risk
We are exposed to market risks from changes in commodity prices, interest rates and foreign exchange rates, as well as risks from concentrations of credit. To mitigate these risks, we utilize derivative instruments to hedge our exposure to changing prices and rates.
We record all derivatives as either assets or liabilities at fair value on the balance sheet, with the exception of certain contracts for the purchase or sale of commodities that are expected to result in physical delivery. Accounting for changes in the fair value of a derivative depends on whether it qualifies and has been designated as part of a hedging relationship. For derivatives that qualify and have been designated as hedges for accounting purposes, changes in fair value have no impact on earnings, to the extent the derivative is perfectly effective in achieving offsetting changes in fair value or cash flows attributable to the risk being hedged, until the hedged item is recognized in earnings (commonly referred to as the “hedge accounting” method). For derivatives that do not qualify or are not designated as hedging instruments for accounting purposes, changes in fair value are recorded in current period earnings (commonly referred to as the “mark-to-market” method). We may elect either method of accounting for our derivative portfolio, assuming all the necessary requirements are met. We have in the past availed ourselves of either acceptable method and expect to do so in the future. We believe all of our derivative instruments represent economic hedges against changes in prices and rates, regardless of their designation for accounting purposes.
106
When available, we use quoted market prices or rates to determine the fair value of our derivative instruments. This may include prices or rates quoted on an exchange, such as the CME, quotes obtained from brokers, or independent valuations from external sources, such as banks. In some cases where market prices are not available, we make use of observable market-based inputs to calculate fair value.
The size and mix of our derivative portfolio vary from time to time based on our analysis of current and future market conditions. The following table presents the fair values of our open derivative financial instruments in the consolidated balance sheets:
September 29, 2024 | December 31, 2023 | January 1, 2023 | |||||||||||||||
| (in millions) | |||||||||||||||||
| Livestock | 15 | 27 | 3 | ||||||||||||||
| Grains | 5 | 1 | 2 | ||||||||||||||
Energy (1) | (9) | (21) | 24 | ||||||||||||||
________________
(1)Negative amount represents net liabilities.
See “Note 7: Derivative Financial Instruments” in the consolidated financial statements and accompanying notes included elsewhere in this prospectus for the effects of derivative instruments on our consolidated statements of income.
Commodities Risk
Our meat processing and hog production operations use various raw materials, primarily live hogs, corn, soybean meal and wheat, which are actively traded on commodity exchanges. These commodities are subject to significant price fluctuations. We enter into hedging transactions for these commodities when we determine conditions are appropriate to mitigate the inherent price risks. While this hedging may limit our ability to participate in gains from favorable commodity fluctuations, it also reduces the risk of loss from adverse changes in raw material prices.
We attempt to closely match the hedging instrument terms with the hedged item’s terms. Gains and losses resulting from our commodity derivative contracts are recorded in cost of sales except for lean hog contracts that are designated in cash flow hedging relationships, which are recorded in sales, and are generally offset by increases and decreases in cash prices for the underlying commodity (with such increases and decreases reflected in the same income statement line items). For example, in a period of rising grain prices, gains resulting from long grain derivative positions would generally be offset by higher cash prices paid to farmers and other suppliers in spot markets. However, under the “mark-to-market” method described above, these offsetting changes do not always occur in the same period, which could result in volatility in our results of operations.
The following table presents the sensitivity of the fair value of our open commodity derivative contracts to a hypothetical 10% change in market prices, as of September 29, 2024, December 31, 2023 and January 1, 2023:
| September 29, 2024 | December 31, 2023 | January 1, 2023 | |||||||||||||||
| (in millions) | |||||||||||||||||
| Grains | 8 | 3 | 12 | ||||||||||||||
| Livestock | 50 | 28 | 26 | ||||||||||||||
| Energy | 3 | 5 | 12 | ||||||||||||||
107
Interest Rate Risk
The following table presents the fair values and carrying values of our fixed-rate debt as of September 29, 2024, December 31, 2023 and January 1, 2023:
| September 29, 2024 | December 31, 2023 | January 1, 2023 | |||||||||||||||||||||||||||||||||
| Fair Value | Carrying Value | Fair Value | Carrying Value | Fair Value | Carrying Value | ||||||||||||||||||||||||||||||
| (in millions) | |||||||||||||||||||||||||||||||||||
| Debt | $ | 1,867 | $ | 1,982 | $ | 1,758 | $ | 1,979 | $ | 1,657 | $ | 1,976 | |||||||||||||||||||||||
We determine the fair value of fixed-rate debt using Level 2 inputs based on quoted market prices. The carrying amount of all other debt approximates fair value as those instruments are based on variable interest rates.
Changes in interest rates impact the fair value of our fixed-rate debt. A hypothetical 10% change in interest rates would impact the fair value of our fixed-rate debt by $40 million, $53 million and $64 million as of September 29, 2024, December 31, 2023 and January 1, 2023, respectively.
We periodically enter into interest rate swaps to hedge our exposure to changes in interest rates on certain financial instruments and to manage the overall mix of fixed rate and floating rate debt instruments. The fair values of interest rate swaps as of September 29, 2024, December 31, 2023 and January 1, 2023 were not material.
Foreign Currency Exchange Risk
Our revenues are primarily generated from transactions denominated in U.S. dollars. However, we also generate revenues from transactions denominated in Japanese yen, Canadian dollars and Australian dollars, among others. We employ foreign currency exchange forward contracts to manage the exposure to foreign currency exchange risk. The fair values of foreign currency exchange forward contracts as of September 29, 2024, December 31, 2023 and January 1, 2023 was not material.
Concentration of Credit Risk
Our financial instruments are exposed to concentrations of credit risk primarily through our cash and cash equivalents, accounts receivable and derivatives. From time to time, we may have bank deposits in excess of insurance limits of the Federal Deposit Insurance Corporation, or the FDIC. We have not experienced any losses in such accounts and believes it is not exposed to any significant credit risk related to its cash and cash equivalents.
Concentrations of credit risk with respect to accounts receivable are limited due to our large number of customers. As of September 29, 2024, December 31, 2023 and January 1, 2023, 13.1%, 12.5% and 9.9%, respectively, of our accounts receivable balance was due from Walmart. No other single customer or customer group represented 10% or greater of our accounts receivable.
With regards to derivatives used to hedge commodities, foreign exchange and interest rates, we bear risk of nonperformance by counterparties. Our trading relationships are governed by international swaps and derivatives agreements and we mitigate risk by diversifying counterparties and monitoring credit ratings.
An estimate of expected credit losses is recognized as a valuation allowance and adjusted each reporting period. The estimate is based on the current expected credit loss model and is determined based on the age of receivable balances, the financial health of the customer, historical experience, current economic conditions and expectations about future performance. The valuation allowance as of September 29, 2024, December 31, 2023 and January 1, 2023 was not material.
Critical Accounting Estimates
The preparation of consolidated financial statements requires us to make estimates and assumptions. These estimates and assumptions are based on our judgment, experience and our understanding of the current facts and circumstances. Actual results could differ from those estimates. Certain of our accounting estimates are considered critical as they are both important to the representation of our financial condition and results of operations and
108
require significant or complex judgment on the part of management. The following is a summary of certain accounting policies and estimates that we consider to be critical. Our accounting policies are more fully discussed in “Note 1: Summary of Significant Accounting Policies” in the consolidated financial statements and accompanying notes for the year ended December 31, 2023 included elsewhere in this prospectus.
Revenue Recognition
Our revenue (sales) is primarily derived from contracts with customers for the purchase of our products. Revenue is recognized at a point in time when our performance obligation has been satisfied and control of the promised goods is transferred to the customer, which generally occurs upon shipment or delivery to a customer based on the terms of the sale. The primary performance obligation in our contracts with customers is to provide meat products. Shipping and handling activities are considered part of the fulfillment of our promise to provide meat products and not a separate performance obligation. Shipping and handling costs are reported as a component of cost of sales.
Revenue is recorded at the amount of consideration we expect to receive in exchange for providing goods to customers. The transaction price may include estimates of variable consideration, including a variety of customer sales incentive programs, such as rebates, product returns and coupons redeemed by consumers. Our estimates of variable consideration are based on a number of factors including history with the respective customer, current performance and future projections. We sufficiently constrain estimates of variable consideration based on the likelihood and magnitude of a potential revenue reversal when the uncertainties associated with the variable consideration are subsequently resolved.
We review and update estimates of variable consideration regularly. We have not experienced any material reversals of revenue recognized in the past three fiscal years resulting from overestimation of variable consideration nor do we expect there will be a material change in our estimates of variable consideration that would result in a material reversal of revenue recognized in the consolidated statements of income. The effect of any reversal of revenue would be recognized in the period in which an adjustment to our estimate is identified.
Contingent Liabilities
We are subject to lawsuits, investigations and other claims related to the operation of our farms and facilities, labor, livestock procurement, securities, the environment, our products, taxes and other matters, and are required to assess the likelihood of any adverse judgments or outcomes to these matters, as well as potential ranges of loss. A determination of the amount of accruals and disclosures required, if any, are made after considerable analysis of each individual issue or claim.
We accrue for contingent liabilities, including future defense costs, when an assessment of the risk of loss is probable and can be reasonably estimated. We disclose contingent liabilities when the risk of loss is reasonably possible or probable.
Our contingent liabilities contain uncertainties because the eventual outcome will result from future events. Our determination of accruals requires estimates and judgments related to the possible outcomes, differing interpretations of the law, assessments of the amounts of potential damages, settlements or defense costs, and the effectiveness of strategies or other factors beyond our control.
The consolidated financial statements reflect accruals for estimated contingent losses associated with various claims. These matters will not affect our profits or losses in future periods unless our accruals prove to be insufficient or excessive. However, legal expenses incurred in our defense of legal matters and any payments made to plaintiffs through unfavorable verdicts or otherwise will negatively impact our cash flows and our liquidity position.
If actual results are not consistent with the estimates or assumptions used to develop our accruals for contingent losses, we may be exposed to gains or losses that could have a material effect on our future results of operations and cash flows.
109
Impairment of Goodwill and Indefinite-Lived Intangible Assets
Goodwill and non-amortizable intangible assets are tested for impairment annually in the fourth quarter, or sooner if impairment indicators arise. In the evaluation of goodwill for impairment, we may perform a qualitative assessment to determine if it is more likely than not that the fair value of a reporting unit is less than its carrying amount. If it is not, no further analysis is required. If it is, a quantitative goodwill impairment test is performed to measure the amount of goodwill impairment loss to be recognized for that reporting unit, if any.
To identify if an impairment exists, we compare the fair value of a reporting unit with its carrying amount, including goodwill. The fair value of a reporting unit is estimated by applying valuation multiples of earnings and/or estimating future discounted cash flows. If the fair value of a reporting unit exceeds its carrying amount, goodwill is not impaired. However, if the carrying amount of a reporting unit exceeds its fair value, an impairment loss is recognized in an amount equal to that excess.
For our other non-amortizable intangible assets, if the carrying value of the intangible asset exceeds its fair value, an impairment loss is recognized in an amount equal to that excess.
The selection of earnings multiples is dependent upon assumptions regarding future levels of operating performance as well as business trends and prospects, and industry, market and economic conditions. A discounted cash flow analysis requires us to make various judgmental assumptions about sales, operating margins, growth rates and discount rates. When estimating future discounted cash flows, we consider the assumptions that hypothetical marketplace participants would use in estimating future cash flows. In addition, where applicable, an appropriate discount rate is used, based on an industry-wide average cost of capital or location-specific economic factors. We consider all these factors to be level 3 inputs, as defined in “Note 15: Fair Value Measurements” in the consolidated financial statements and accompanying notes included elsewhere in this prospectus.
The fair values of our trademarks have been estimated using a royalty rate method. Assumptions about royalty rates are based on the rates at which similar brands and trademarks are licensed in the marketplace.
Our impairment analysis contains uncertainties due to uncontrollable events that could positively or negatively impact the anticipated future economic and operating conditions.
As of December 31, 2023, we had $1,627 million of goodwill and $1,274 million of non-amortizable intangible assets, consisting mainly of trademarks. Our goodwill is included in the following reporting units:
•Packaged Meats: $1,503 million;
•Mexico: $83 million;
•Fresh Pork: $34 million;
•Hog Production: $4 million; and
•Bioscience: $4 million.
We have not recognized an impairment of goodwill or other intangible assets in the past three fiscal years. A hypothetical 10% decrease in the estimated fair value of any of our reporting units would not result in an impairment. A hypothetical 10% decrease in the estimated fair value of our intangible assets also would not result in an impairment.
Income Taxes
We estimate total income tax expense based on statutory tax rates and tax planning opportunities available to us in various jurisdictions in which we earn income.
Federal income taxes include an estimate for taxes on earnings of foreign subsidiaries expected to be remitted to the United States and be taxable, but not for earnings considered indefinitely invested in the foreign subsidiary. We
110
account for the global intangible low-taxed income (GILTI) inclusion from foreign subsidiaries in the period in which it is incurred.
Deferred tax assets and liabilities are recognized for the estimated future tax consequences attributable to differences between the financial statement carrying amounts of assets and liabilities and their respective tax bases. Deferred tax assets and liabilities are measured using enacted tax rates in effect for the year in which those temporary differences are expected to be recovered or settled. The effect on deferred tax assets and liabilities of a change in tax rate is recognized in earnings in the period that includes the enactment date.
We record liabilities for uncertain tax positions based on our analysis of whether, and the extent to which, additional taxes will be due. We record these liabilities using a two-step process in which (1) we evaluate whether we believe it is more likely than not that the tax positions will be sustained on the basis of the technical merits of the position and (2) for those tax positions that meet the more-likely-than-not recognition threshold, we recognize the largest amount of tax benefit that is more than 50 percent likely to be realized upon ultimate settlement with the tax authority.
The determination of our provision for income taxes requires significant judgment, the use of estimates, and the interpretation and application of complex tax laws. Significant judgment is required in assessing the timing and amounts of deductible and taxable items. Changes in current tax laws and rates could affect recorded tax assets and liabilities in the future. In addition, changes in projected future earnings could affect the recorded valuation allowances in the future.
Our analysis of uncertain tax positions requires considerable judgment about the likelihood and amount of benefit that would be sustained upon examination by tax authorities.
Due to the complexity and inherent uncertainties surrounding income tax positions, the ultimate resolution may result in a payment that is materially different from the current estimate of the tax liabilities. To the extent we prevail in matters for which liabilities have been established, or are required to pay amounts in excess of our recorded liabilities, our effective tax rate in a given financial statement period could be materially affected. An unfavorable tax settlement would require use of cash and result in an increase in our effective tax rate in the period of resolution. A favorable tax settlement would be recognized as a reduction in our effective tax rate in the period of resolution.
Over the past three fiscal years, we have recognized $17 million of income tax expense subsequent to the initial recognition and measurement of an uncertain tax position and there have been no payments to tax authorities upon the ultimate resolution of uncertain tax positions.
See “Note 12: Income Taxes” in the consolidated financial statements and accompanying notes included elsewhere in this prospectus.
Pension Accounting
We historically provided the majority of our U.S. employees with pension benefits. In the second quarter of 2021, we amended our qualified pension plans to freeze the benefit accrual for all non-union participants as of June 30, 2021.
We recognize the funded status of our pension plans in our consolidated balance sheets and recognize, as a component of other comprehensive income (loss), the gains or losses and prior service costs or credits that arise during the period but are not recognized in net periodic benefit cost.
We use an independent third-party actuary to assist in the determination of our pension obligation and related costs. The measurement of our pension obligations and related costs is dependent on the use of assumptions and estimates. These assumptions include discount rates, expected returns on plan assets, salary growth rates and mortality rates. Changes in assumptions and future investment returns could potentially have a material impact on our expenses and related funding requirements.
111
The following weighted average assumptions were used to determine our benefit obligation and net benefit cost for 2023:
•5.58% – Discount rate to determine net benefit cost;
•5.57% – Discount rate to determine pension benefit obligation; and
•7.25% – Expected return on plan assets.
If actual results are not consistent with our estimates or assumptions, we may be exposed to gains or losses that could be material. The effects of actual results differing from these assumptions are accumulated and amortized over future periods and, therefore, generally affect our recognized expense in such future periods.
An additional 0.50% decrease in the discount rate used to measure our projected benefit obligation would have further reduced the funded status by $105 million as of December 31, 2023, and would have resulted in an additional $3 million in net pension cost for the twelve months ended December 31, 2023.
A 0.50% decrease in expected return on plan assets would have resulted in an additional $8 million in net pension cost for the twelve months ended December 31, 2023.
In addition to higher net pension cost, a significant decrease in the funded status of our pension plans caused by either a devaluation of plan assets or a decline in the discount rate would result in higher pension funding requirements.
See “Note 13: Pension and Other Retirement Plans” in the consolidated financial statements and accompanying notes included elsewhere in this prospectus for further information about our accounting for pension and retirement plans.
Derivative Accounting
We are exposed to market risks primarily from changes in commodity prices. To mitigate these risks, we utilize derivative instruments to hedge our exposure to changing prices. Our objective is to reduce the volatility of earnings and cash flows associated with fluctuations in commodity prices.
We record all derivatives as either assets or liabilities at fair value on the balance sheet, with the exception of contracts that qualify for the normal purchase and normal sale scope exception, which are expected to result in physical delivery. Accounting for changes in the fair value of a derivative depends on whether it qualifies and has been designated as part of a hedging relationship. For derivatives that qualify and have been designated as hedging instruments for accounting purposes, changes in fair value have no net impact on earnings, to the extent the derivative is considered perfectly effective in achieving offsetting changes in fair value attributable to the risk being hedged, until the hedged item is recognized in earnings (commonly referred to as the “hedge accounting” method). For derivatives that do not qualify or are not designated as hedging instruments for accounting purposes, changes in fair value are recorded in current period earnings (commonly referred to as the “mark-to-market” method).
We apply hedge accounting when the change in the market value of derivative contracts has historically been, and is expected to continue to be, highly effective at offsetting changes in price movements of the hedged item. If it is determined that the derivative instruments are no longer effective at offsetting changes in the price of the hedged items, then the mark-to-market method must be applied to account for the derivative instruments prospectively, which could increase volatility in our results of operations. We recognized $16 million, $(15) million and $(9) million in gains (losses) on derivatives accounted for under the mark-to-market method in 2023, 2022 and 2021, respectively.
For additional information on derivatives, refer to “Note 1: Summary of Significant Accounting Policies” and “Note 7: Derivative Financial Instruments” in the consolidated financial statements and accompanying notes for the year ended December 31, 2023 included elsewhere in this prospectus, which includes detailed discussions of our accounting for and use of derivative instruments.
112
Recently Issued Accounting Pronouncements
There have been no recently issued accounting pronouncements that have had, or are expected to have, a material impact on our results of operations, financial position and/or cash flows.
113
BUSINESS
Our Mission
Good food. Responsibly.® At Smithfield, we are helping to feed a world of nearly eight billion people. Our products are found on tables everywhere. We provide families with wholesome, safe and affordable food while finding new and innovative ways to care for our people, communities, animals and planet. It is our responsibility and our promise. We make more than good food. Good is what we do.
Our Company
Smithfield is an American food company and an industry leader in value-added packaged meats and fresh pork with over $14 billion in annual sales. We employ approximately 34,000 people in the United States and approximately 2,500 people in Mexico. We maintain high-quality standards, meeting demand through our strong relationships with thousands of U.S. family farmers and blue-chip global customers. We are a market leader due to our scale, diverse portfolio of strong brands and products and reputation as a trusted partner known for quality. We market our products under a leading portfolio of iconic brands including Smithfield, Eckrich and Nathan’s Famous, among many others.
Our ambition is to be the most trusted food and protein company in North America as we feed people in the United States and around the world, while embracing a culture of responsibility, operational excellence and innovation. We produce and distribute a wide variety of packaged meats and fresh pork products both domestically and abroad. We conduct our operations through three reportable segments: Packaged Meats, Fresh Pork and Hog Production. We are a leading provider of packaged meats in the United States, with the number two branded market position by volume across the 25 key packaged meats categories in which we compete, according to Circana. These 25 key packaged meats categories represent a total addressable market opportunity of $43 billion annually, of which we had an approximate 20% market share by volume (including our private label sales) as of September 2024. We are also the largest fresh pork processor in the United States with approximately 23% market share as of Fall 2023, according to National Hog Farmer. We sell our products across diverse channels including retail and foodservice, distributing in all 50 states in the United States, as well as export markets. We are a leading exporter of pork and pork products, with export sales representing 13% of our total sales for the nine months ended September 29, 2024.
Our Packaged Meats segment is the cornerstone of our business with a value-added product portfolio and profitability that has more than doubled since 2014. Alongside our Packaged Meats segment, our Fresh Pork and Hog Production segments remain integral parts of our business, providing significant scale and operational benefits in support of our product offerings and our ability to meet demand consistently across economic cycles. We believe our emphasis on value-added packaged meats, along with our commitment to food quality, strong financial position and steadfast devotion to our stated mission, will continue delivering value for our shareholders.
Smithfield’s supply chain includes company-owned and contract farms in the United States and Mexico, as well as long-standing relationships with more than 4,000 independent U.S. family farms who meet our animal care and quality standards. Our model offers a resilient supply chain, providing us with several competitive advantages, including an assured supply of consistent, high-quality protein, the ability to innovate and lead in areas such as group-housed pork and the ability to deliver differentiated products to meet customer specifications. We operate 39 facilities producing fresh pork and packaged meats in the United States and one fresh pork facility in Mexico, and we focus on continually optimizing our operations by identifying opportunities to reduce costs and increase flexibility to meet market demand. Additionally, we remain committed to investing in innovation across our products, packaging and manufacturing processes. We seek to be the supplier of choice to our customers and maintain our reputation for high-quality, safe and delicious products.
A New Smithfield in the Public Eye
Founded in 1936, we began as a pork processing operation named The Smithfield Packing Company. Through a series of acquisitions beginning in the 1980s, we became the largest fresh pork processor in the United States. In 2013, Smithfield was taken private and became a wholly owned subsidiary of Hong Kong-based WH Group, which is publicly traded on The Stock Exchange of Hong Kong Limited. WH Group is a limited liability company
114
incorporated in the Cayman Islands, the shares of which have been listed on the Main Board of the Stock Exchange since August 2014. Through its subsidiaries, WH Group is principally engaged in the production and sale of packaged meats and pork.
Following the acquisition of Smithfield by WH Group, we focused on integrating our independent operating companies into a cohesive business. Our “One Smithfield” initiative unified our operations, brands and employees under one corporate umbrella, achieving synergies and enhancing profitability through disciplined cost management and balance sheet strength.
In recent years, we have transformed into a differentiated American food company with a leading position in value-added packaged meats and fresh pork, and our headquarters remains in our namesake town of Smithfield, Virginia.
In August 2024, we completed a carve-out of our European operations to focus our local management teams on the different market dynamics of North America and Europe. Pursuant to the European Carve-out, our operations in Europe were transferred to WH Group.
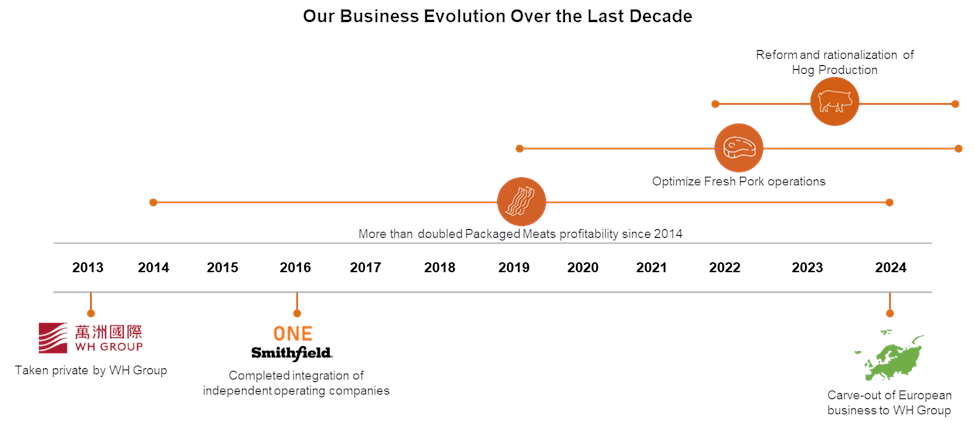
Led by growth in our Packaged Meats segment, our product portfolio has evolved to a higher concentration of value-added packaged meats offerings, significantly improving profitability. Additionally, we have reduced complexity and improved our cost structure in our plant operations by rationalizing our SKU count. Since 2019, we have reduced our Packaged Meats SKU count by over 40% and increased volume velocity (pounds/item) by over 60%.
The growth in our Packaged Meats segment has helped to increase our overall scale and profit margins and to stabilize our earnings and cash flows during volatile commodity cycles and economic downturns. This is the anchor of our strong financial position and fuels continued investment in our business. We have invested over $3 billion in capital expenditures since 2013, driving our organic growth strategy and improving our operations, including automating processes.
115
The following table sets forth certain metrics for our business for 2014 and 2023 and highlights our strategic growth and evolution led by our Packaged Meats segment.
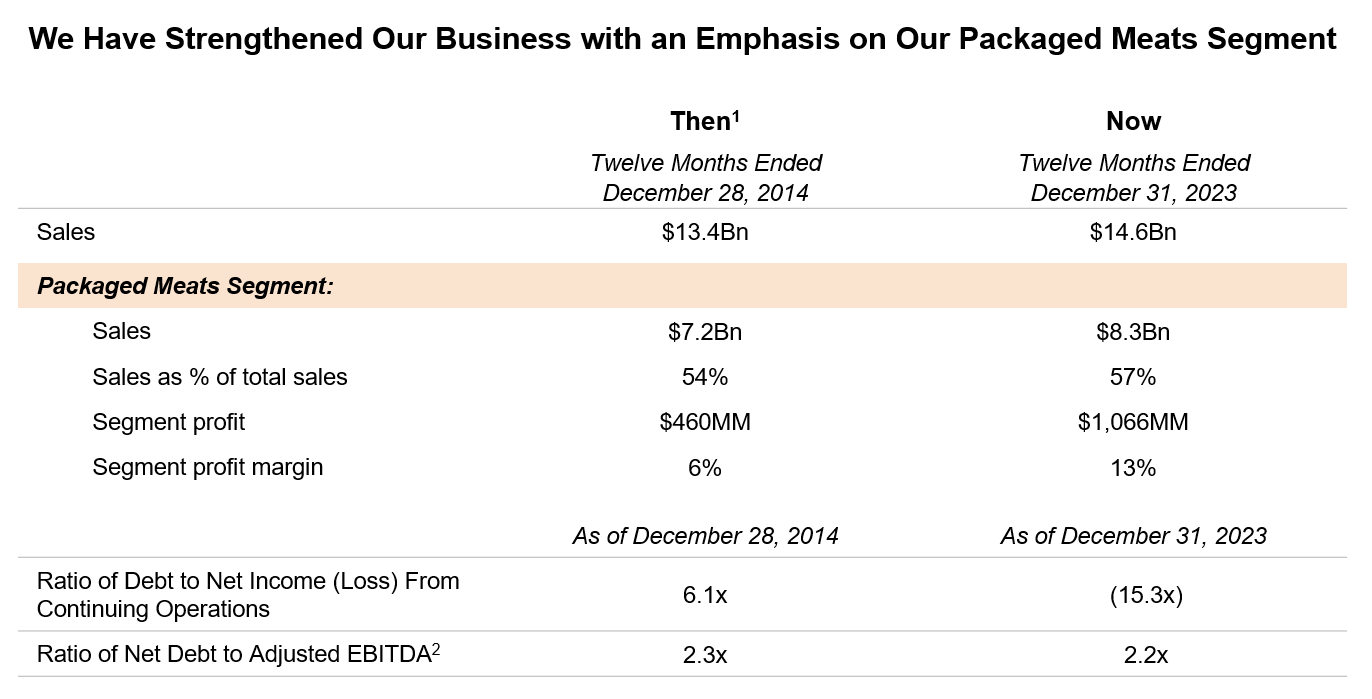
______________
(1)Based on our historical financial statements for the year ended December 28, 2014, which are not included or incorporated by reference in this prospectus. We do not believe the adoption of accounting standards after that date would have a material effect on the financial measures presented. See “Management’s Discussion and Analysis of Financial Condition and Results of Operations—Non-GAAP Measures” for more information.
(2)Ratio of Net Debt to Adjusted EBITDA is defined as net debt divided by Adjusted EBITDA. Net debt is defined as long-term debt and finance lease obligations, including the current portion, minus cash and cash equivalents. Ratio of Net Debt to Adjusted EBITDA is a non-GAAP measure that should not be considered in isolation or as a substitute for other financial measures calculated and presented in accordance with GAAP. For additional information regarding Ratio of Net Debt to Adjusted EBITDA, including a reconciliation to ratio of debt to net income, the most directly comparable GAAP measure, see “Management’s Discussion and Analysis of our Financial Condition and Results of Operations – Non-GAAP Measures.”
Our Industry
We operate in the large and growing global packaged and fresh meats market, which includes value-added fresh, refrigerated and frozen proteins. Our business operations are primarily concentrated in North America, but, as a leading exporter to major international markets, we also benefit from significant global demand for our products. According to Euromonitor, the global meat market reached $1.1 trillion in 2023 and is projected to grow at a 6.5% CAGR between 2023 and 2028. Per Euromonitor, U.S. value-added packaged meats represented a $47 billion market in 2023 and is forecasted to grow at a 3.6% CAGR between 2023 and 2028. Value-added packaged meats refers to the processed meats category as defined by Euromonitor and includes meat products that have undergone additional processing, such as adding an additional ingredient or characteristic, and are sold pre-packaged via retail and foodservice outlets.
116
The following table sets forth information about size of the U.S. value-added packaged meat market:

Consumer Trends in U.S. Packaged Meats and Fresh Pork
The U.S. packaged meats market is supported by long-term secular tailwinds, including consumer demand for high-protein diets, high-quality nutrition, product versatility and convenience. We expect these tailwinds to continue to drive increases in overall meat consumption. Consumers associate protein with healthiness and energy. A 2024 International Food Information Council consumer survey reported that a high-protein diet is the most popular diet type in the United States. According to market research firm Ipsos, 89% of Americans include animal protein in their diets as of 2021. Data from the Organization for Economic Co-operation and Development shows that pork represented 24% of all meat protein consumed in the United States in 2023.
According to Mintel, many packaged meats products are household staples for U.S. consumers, including bacon, lunch meat, hot dogs, fresh sausage and dry sausage. Mintel reports that, as of September 2023, U.S. bacon and lunch meat represented an estimated $27.0 billion market in 2023 that is expected to grow at a 4.2% CAGR between 2023 and 2028, and U.S. hot dogs and sausages were estimated to represent a $12.3 billion market in 2023 that is expected to grow at a 1.0% CAGR between 2023 and 2027. According to Business Research Insights, U.S. dry sausage for charcuterie, snacking, sandwiches, pizza toppings and other uses, typically higher margin products, represented a $4.7 billion market in 2023 that is expected to grow at a 3.9% CAGR between 2023 and 2030.
Mintel reports that 86% of U.S. consumers anticipate eating the same amount of pork or more pork in the coming year according to a survey conducted in February 2024, and pork consumption is distributed relatively equally across income groups. According to Mintel, packaged pork products benefit from growing demand for convenience, as consumers value marinated, ready-to-cook and ready-to-eat options. Mintel reports that pork is an affordable and convenient protein.
Pork is also a highly versatile protein, with a wide variety of cuts and flavor profiles. Use occasions for pork products benefit from strong daypart distribution, which is unique relative to all other meat proteins. Products like bacon, sausage and ham appear on tables at every meal. According to the National Pork Board, bacon is by far the most beloved packaged meats product, and pork is a highly snacked meat protein and the most popular pizza topping in the United States.
Additionally, increased U.S. demand for global cuisines supports the domestic pork market. Asian and Mexican cuisines, for which pork is a leading protein, continue to gain popularity with U.S. consumers, particularly among Generation Z (the generational cohort aged 12 to 27 years) and Millennials (the generational cohort aged 28 to 43 years). We believe that the continued growth of global cuisines in the United States introduces consumers to different pork preparations and flavor profiles and serves as an incremental long-term tailwind for pork.
117
According to Mintel, most U.S. consumers are concerned about the environmental impact of meat production, and health and nutrition are important factors to consumers of meat. Many cuts of pork offer lower levels of cholesterol and saturated fat relative to cuts of beef. Lean cuts of pork, including pork tenderloin, offer a superior nutritional profile to chicken breast. Additionally, relative to beef, pork production generally has a lower carbon footprint and lower rate of land usage. Nevertheless, changes in market trends and consumer preferences could adversely affect our results of operations. For more information, see “Risk Factors—Risks Relating to Our Business and Operations—Changes in consumer preferences and failure to maintain favorable consumer perception of our brands could negatively impact our business.”
The U.S. Pork Industry
The United States is a leading global producer and consumer of pork and pork products. According to the USDA, as of the end of 2023, the United States is the world’s third-largest producer of pork, behind China and the collective countries of the European Union. Pork is a growing industry in the United States. In 2023, the industry produced 27.3 billion pounds of pork. The USDA projects that total 2024 commercial pork production will be approximately 28 billion pounds, 3% higher than 2023, and will steadily increase year-over-year through 2033. The National Pork Producers Council, or NPPC, reported that the pork industry supported an estimated 573,000 U.S. jobs and was responsible for an estimated $63 billion of gross domestic product in 2023.
Pork processors sell fresh pork, value-added fresh pork and further processed or packaged pork to end markets such as food retailers and foodservice providers. Fresh pork includes cuts of fresh meat sold as commodity products and value-added products such as marinated or otherwise seasoned fresh pork. Value-added fresh pork is sold as both private label and branded products. Further processed or packaged pork includes value-added products across temperature classes, such as bacon, marinated ribs, dry sausage and smoked cuts, pre-cooked products, and also includes branded products.
According to Mintel, the U.S. foodservice channel represented an estimated $956 billion market in 2023 and is projected to grow at a 5.6% CAGR between 2023 and 2028. Private label remains important to the sector, representing 46% of total protein sales at U.S. food retailers as of February 2024, according to Mintel. Additionally, the U.S. grocery retail channel represented an estimated $873 billion market in 2023 and is projected to grow at a 2.4% CAGR at current prices, according to Mintel.
Growing U.S. Fresh Pork Export Market
Global demand for pork and pork products supports strong U.S. pork exports. According to the USDA, the U.S. share of the global pork export market increased to 26% in 2022 from 2% in 1990. While the European Union is currently the world’s largest pork exporter, the United States, at number two, is emerging as a more cost-effective alternative due to lower feed and labor costs, according to the Agriculture and Horticulture Development Board. The USDA projects that the United States will surpass the European Union as the world’s leading pork exporter in 2025 and forecasts that U.S. pork will exceed U.S. poultry broiler exports in the coming years for the first time since 1976. According to the USDA, the total value of U.S. pork product export volume was 3.1 million tons in 2023, and the market is expected to grow at a 3.3% CAGR between 2023 and 2033.
118
The following tables set forth information about U.S. pork production:
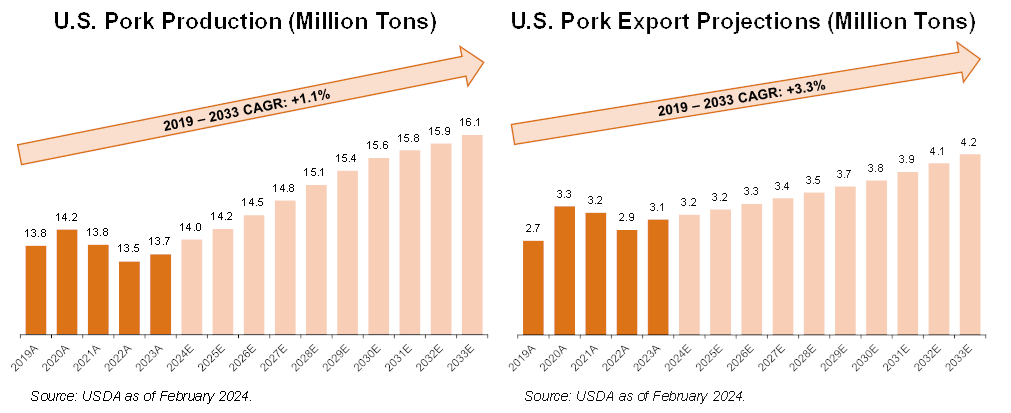
U.S. Hog Production Industry
The U.S. hog production industry is large and growing, representing a significant value-added activity in the agricultural economy. Like many agricultural sectors, the hog industry is cyclical in nature. The hog production process spans approximately ten months from insemination to harvest, creating peaks and troughs in hog inventories over time that result in a discrepancy between hog production costs and pricing. According to Iowa State University forecasts, 2023 represented the bottom of the trough in the current cycle due to low hog prices and high feed costs. According to the USDA, the U.S. pork sector continues to stabilize relative to 2023 due to consistent consumer demand for pork and lower feed prices.
Our Competitive Strengths
We attribute our track record of success to a combination of the following competitive strengths. We believe these strengths are central to our business model and position us well for long-term success.
Leader in Packaged Meats with Diverse Portfolio of Strong Brands
We have grown our Packaged Meats business to become a leading provider of value-added pork and other protein products for U.S. customers and consumers. Consumers choose our products for consistent high-quality and delicious taste, helping us achieve an 81% repeat purchase rate as of September 2024. Our Net Promoter Scores, a gauge of brand affinity, are superior to peers across key categories, including smoked ham, fresh pork, Italian specialty, hot dogs, everyday ham and bacon. We continue to see increasing loyalty and unaided awareness across our key brands and categories. Our longstanding commitment to our values and corporate heritage resonates with consumers who share our ideals, including our commitment to sustainability and American agriculture.
Our trusted brands have made us one of the country’s leading food companies. Led by our flagship Smithfield brand, we have a diverse portfolio of national, super-regional, value and specialty brands with strong customer loyalty. We complement our national brands with super-regional brands to capitalize on each brand’s history and strong consumer affinity. Our value brands offer consumers choices across price points, and our specialty brands
119
address various on-trend categories such as dry sausage and convenient preparation items, including barbecue and meatballs.
As a branded player across the United States, we have a leading position in 15 of the 25 key categories in which we compete. We have a significant presence in 10 categories each over $1 billion in size, including the number one or two position by volume in uncooked bacon, smoked ham, deli meat, cooked dinner sausage and portable meals as shown in the table below:

We market our products to customers and consumers across multiple categories and price points. We have a balanced sales mix with approximately 64% branded and 36% private label in the retail channel as of September 2024. Our participation in both branded and private label helps us attract and retain consumers as they move across
120
the value spectrum, enabling us to meet shifting consumer preferences during periods of economic downturn and to capture wallet share when they trade up to premium brands.
For example, in the packaged lunch meat category, almost 98% of the volume is sold on average in the $2.00-$9.00 price per pound range. Our packaged lunch meat offering exemplifies how we cover a wide range of retail price points from our best value with Gwaltney (at approximately $2.50 average retail price per pound) to our premium Smithfield Prime Fresh (at approximately $8.50 average retail price per pound) as of September 2024.
While some of our competitors may choose to focus on consumers at only the high or low end of the value spectrum, our strategy enables us to meet consumer demand across various price points, as shown in the chart below:

For information about challenges we face in the highly-competitive food market, see “Risk Factors—Risks Relating to Our Business and Operations—The food industry in which we operate is highly competitive, and our inability to compete successfully, or the effects of such competition, could adversely affect our business, financial condition and results of operations.”
Trusted and Scaled Partner Known for Quality
We have a nearly 90-year history of providing great tasting, quality products across the United States and abroad. We pride ourselves on producing safe, wholesome and high-quality protein, and we continually train our team members in the latest animal welfare and food safety and quality best practices across our supply chain. Producing Good food. Responsibly.® is at the core of our purpose-driven culture. Consumers trust our high-quality brands and products, and we are a trusted partner to customers, suppliers and farmers across the value chain.
Through years of investment and growth, we have created an asset base that we believe would be hard to replicate. Our scale and integrated operating model enable us to reliably meet demand across economic cycles and offer a differentiated value proposition to our customers and consumers. We believe that we are a preferred supplier to our partners because we consistently provide comprehensive end-to-end support and reliably deliver high-quality products on time. Our commitment and reputation for high-quality products and service is evidenced by the numerous awards received from our retail and foodservice customers, recognizing Smithfield as a supplier of choice.
Leveraging our scale and global distribution channels, we are also a leading exporter of pork and pork products, with sales to export markets representing 13% of our total sales for the nine months ended September 29, 2024. Export markets promote whole hog utilization due to differentiated demand for parts of the animal across the globe, which helps us to operate sustainably while supporting American agriculture.
121
Strong Financial Profile Marked by Robust Growth and Profitability Metrics
We are focused on delivering long-term sustainable results and have built our business to generate resilient growth, profitability and cash flow. Our track record of sales and earnings growth reflects strong demand for our products and successful management of commodity volatility across economic cycles. In 2024, we demonstrated a strong rebound in our results after a challenging 2023 for our industry.
The resilience of our business model is underscored by our history of maintaining a strong balance sheet and moderate leverage. Sustaining a healthy financial position creates operational flexibility and helps to insulate us from industry and macroeconomic headwinds. We are committed to a target Ratio of Net Debt to Adjusted EBITDA of <2.0x and a target minimum liquidity of $1.0 billion, as well as maintaining investment grade ratings.
We have a strong track record of disciplined capital allocation, generating higher profitability and cash flows by executing projects that drive organic growth and unlock operational efficiencies. While organic growth has been the backbone of our growth strategy over the past decade, we will continue to supplement our organic growth with a disciplined acquisition strategy. Our acquisition strategy primarily focuses on packaged meats assets and capabilities that complement our manufacturing platform, strong brands and product offerings.
Innovative Sustainability Initiatives
Sustainability has been a key focus for our business for over twenty years. Our strategy today is built around three objectives: being good stewards of the environment and our animals; doing good work in the communities where our employees live and work; and producing good food with a commitment to food safety, quality and nutrition. We have been at the forefront of the industry in achieving sustainability milestones, including becoming the first major protein company to adopt and publicly report a comprehensive sustainability program, to achieve International Standards Organization 14001 certification globally, to develop and adopt a comprehensive animal care management program, to begin reporting antibiotics usage in 2007 and to publish an online ingredient glossary.
We leverage on-the-ground resources to strive to achieve our sustainability goals. We co-founded Align as well as Monarch to advance developments in methane capture and manure-to-energy conversion. In 2022, TPG Rise Climate invested in Monarch, helping us to further scale the business.
Our sustainability activities have been recognized externally. We were awarded the prestigious “Profit with a Purpose” award by WSA in 2021 for our innovative renewable natural gas programs. These programs convert methane from hog manure into clean energy, creating new income opportunities for family farmers. Additionally, we received a “Highly Commendable” mention in the WSA’s External Partnership category in 2021 for our collaboration with a leading environmental organization to implement sustainable farming practices within our supply chain.
We are consistently recognized as an employer of choice for U.S. veterans. We have a long history of supporting veterans and military families through monetary and food donations, employee volunteerism and partnerships. We honor the service and sacrifice of American veterans and their families through the Helping Our Heroes program, which focuses on hiring initiatives, career development and strengthening the community and family support systems veterans rely on every day.
Proven, Execution-Oriented Management Team and Culture
We are an iconic American food company with a management team based in Smithfield, Virginia. We employ approximately 34,000 people in the United States and approximately 2,500 people in Mexico. Our energetic and highly experienced management team, whose dedication and commitment to our mission permeates throughout our business, has made us one of the world’s foremost protein companies, sets the tone for our success and drives the agility necessary to continue to transform Smithfield into a leading packaged food company. We foster a culture of responsibility, operational excellence and innovation that serves as the foundation for the transformation in our business.
122
C. Shane Smith, President and Chief Executive Officer since 2021, is a veteran of our company and has served in a wide range of roles during his 21-year tenure. He previously served as President of Smithfield’s European operations and as our Chief Strategy Officer, and he has held other roles in finance and our Hog Production segment. He has been instrumental in overseeing the continued execution of our “One Smithfield” vision, fortifying our position as a leading food company and improving operational efficiency to enhance market competitiveness.
Mark L. Hall, our Chief Financial Officer, has 26 years of experience in the food industry and leads our finance, accounting, treasury, tax, mergers and acquisitions, data analytics and risk management functions. Since joining Smithfield in 2014, Mark has played a crucial role in developing and executing our strategy, including during his tenure as head of finance within the Packaged Meats segment.
Our senior leadership team has extensive food industry experience. Steven France, Donovan Owens and Kraig A. Westerbeek lead our Packaged Meats, Fresh Pork and Hog Production segments, respectively, and have nearly a century of combined industry experience, including over 80 years of experience at Smithfield. Our leadership, combined with our integrated operating structure, solid financial foundation and the support of over 36,000 employees, create a cohesive and coordinated platform to further Smithfield’s growth as a leading food company creating value for a range of stakeholders.
Our Growth Strategies
Since the last time we were a public company in 2013, we have grown sales to $14.6 billion while significantly improving our profitability and leverage position. The strategic initiatives we are executing across our segments are complemented and enabled by our strong balance sheet and ongoing operational investments, positioning us for future growth.
Drive Growth of Packaged Meats
Our Packaged Meats segment is core to our growth strategy and has been a major driver in transforming our business since 2014. We have methodically shifted our business mix to focus on this higher-margin segment over time. The segment contributed 58% of our sales and 109% of our overall operating profit for the nine months ended September 29, 2024.
We plan to accelerate the growth of our Packaged Meats segment through several strategic initiatives, including:
•continuing to shift our portfolio toward a higher mix of value-added and premium products, such as:
•converting one-time seasonal commodity bone-in ham purchase occasions to increased unit sales of everyday, convenient products such as quarter-weight ham, Anytime Favorites ham and Prime Fresh sliced lunch meat, which is underscored by our ability to generate a 19% increase in ham units sold from 2019 to 2023 while volume increased only by 2% for that same period; and
•increasing penetration of higher-margin dry sausage products through expanding distribution points and manufacturing capacity, as evidenced by a 29% increase in dry sausage units sold from 2019 to 2023 and the recent acquisition of a dry sausage plant;
•harnessing our powerful brands to continue to expand product offerings and drive awareness, loyalty and increased market share;
•leveraging the breadth of our platform and national and specialty brands to further penetrate dayparts and households;
•expanding in under-indexed geographical locations and moving into new categories;
•attracting new consumers, particularly younger demographics, through product and packaging innovation and effective and appealing marketing strategies while maintaining our promise to consumers to offer high-quality products for every budget; and
123
•deepening our presence across our distribution channels through our integrated sales force, which leverages our scale and breadth to provide a unified, reliable and consistent customer experience.
We believe that these proven strategies will drive profitable organic growth in our Packaged Meats segment. As an example, we see significant potential for our Packaged Meats segment to generate continued growth through our distribution expansion opportunities across brands to expand unit count within our existing product portfolio.
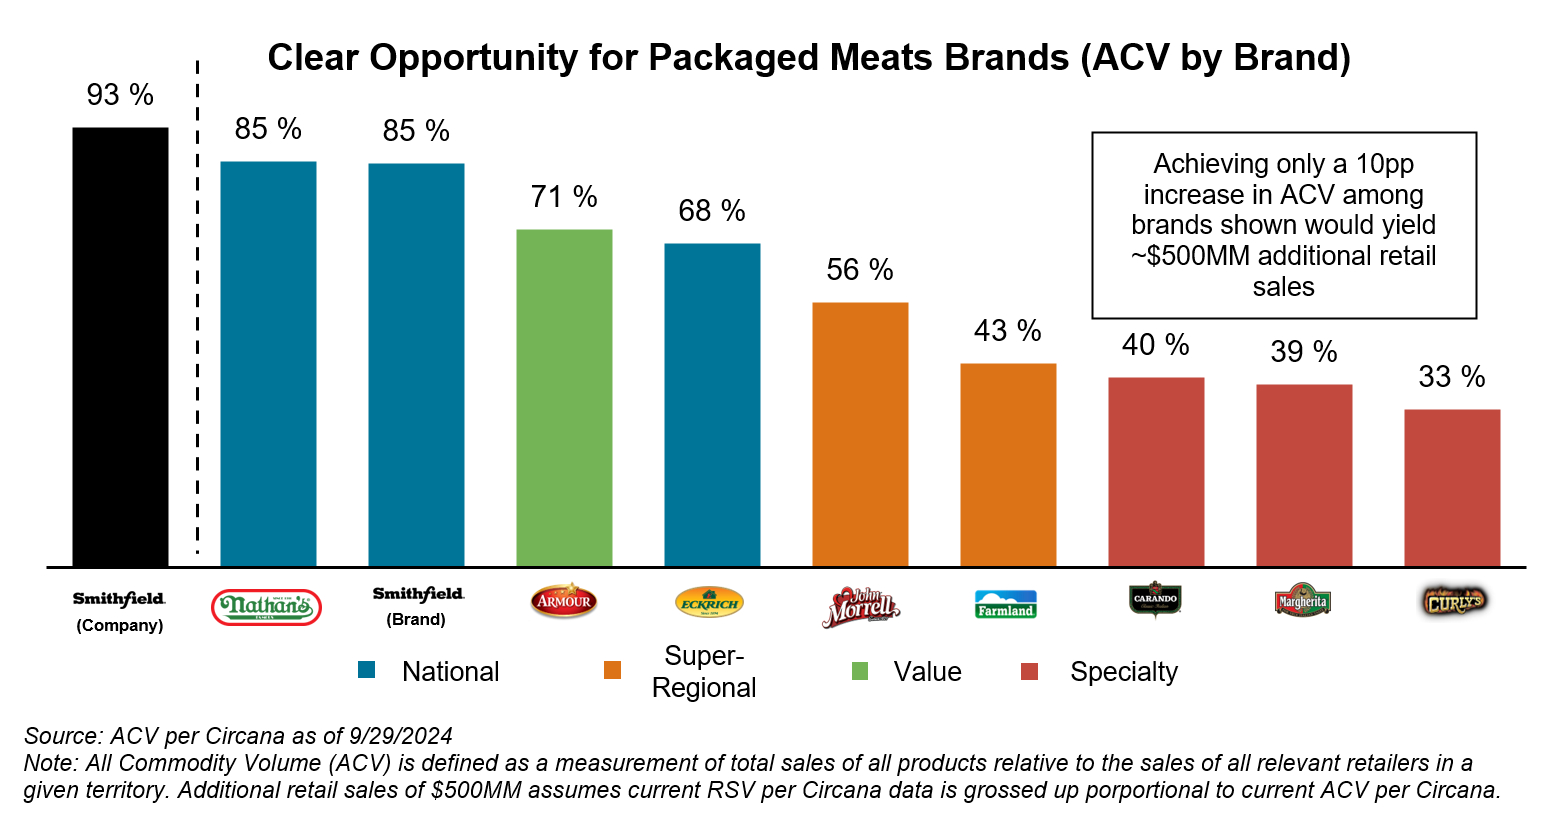
Further Enhance Fresh Pork
We continually seek greater efficiencies as we manufacture and market fresh pork products. Our capabilities and supply chain allow us to provide differentiated products and high service levels to our customers. We deliver a high-quality, consistently available supply to our Packaged Meats segment and maximize the value of our raw materials. We will seek to enhance the profitability of our Fresh Pork segment by:
•maximizing the value of each hog and expanding use of raw materials, including unprocessed fresh and value-added pork, snacks, pharmaceuticals and pet food treats and ingredients;
•capitalizing on export markets as an outlet for increasing the value of raw materials through whole-hog utilization, and appealing to differentiated, global tastes and preferences;
•leveraging our relationship with WH Group to inform product development opportunities for the Asian market and to benefit from WH Group’s distribution network; and
•appealing to ever-changing consumer preferences and demand for flavor enhancements through ongoing product innovation.
As we seek to grow our fresh pork business profitably, we remain committed to demonstrating that profitability can go hand-in-hand with sustainable operations. We will further our mission of producing good food the right way by seeking new and unique ways to use our raw materials.
Continue Investing in Innovation
We will continue to invest in product, packaging and operational innovations in our Packaged Meats and Fresh Pork segments to drive growth, enhance our profitability and expand our total addressable market. We are focused
124
on strengthening relationships with customers and consumers by being first-to-market with new products and solutions.
Within our branded packaged meats portfolio, we are introducing more value-added and premium innovations. We see a significant opportunity to increase distribution of our innovative Smithfield Prime Fresh packaged lunch meat offering. Smithfield Prime Fresh embodies the quality of bulk deli meat but is displayed in the packaged lunch meat section of the retail wall. This enables our retail partners to increase average revenue per pound and reduce in-store labor costs while providing a convenient lunch meat option for consumers.
In addition, our Smithfield Double Thick/Double Smoked bacon and Smithfield Maple Thick Cut bacon demonstrate our ability to introduce premium, higher-margin offerings with new cut and flavor characteristics. These products sell at a higher velocity than the category average.
In the Fresh Pork segment, we are investing in value-added products and adding new cuts and flavors, such as Sweet & Smokey BBQ, Chipotle and Lemon & Garlic marinated fresh pork loin filet.
Innovation does not stop with our products. In our plants, we are committed to advancing automation and strategically redeploying labor. On our farms, innovative approaches to animal nutrition are increasing feed conversion and lowering our cost basis. Byproducts that were once considered waste are now used to create renewable natural gas through our biogas joint ventures and lifesaving pharmaceuticals through our bioscience business.
Our culture of responsibility, operational excellence and innovation serves as a catalyst for our ongoing business transformation. We conduct company-wide competitions and recognition events for grassroots projects that drive innovation throughout our organization. By fostering this entrepreneurial spirit, we will seek to drive growth in our top- and bottom-line results and build on Smithfield’s competitive advantage.
Optimize Our Operations and Supply Chain to Decrease Our Cost Basis
We have implemented many initiatives over the past several years to reduce costs and realize operational efficiencies. These initiatives have enabled us to offset inflation and enhance margins across our entire business.
We continue to optimize the size of our company-owned hog production operations and procure a greater mix of hogs from independent suppliers with market-based supply agreements. Additionally, we continue to implement cost-saving initiatives in our retained hog production operations to improve our cost structure.
We employ automation in all of our plants to redeploy labor to higher value tasks, improve yields and drive efficiency by reducing complexity to lower our cost basis and help offset inflationary pressures.
In our logistics and distribution network, we have reduced transportation and warehousing costs through transportation efficiencies, maximizing utilization of our storage and trucking assets, improving supply and demand
125
planning and optimizing inventory levels. These actions increase profitability and improve customer service levels, which we believe is essential to being a supplier of choice.
We remain committed to optimizing our operations and supply chain through a series of targeted actions, which in the past have supported meaningful margin improvement:
| Hog Production | Packaged Meats & Fresh Pork | Logistics | ||||||
| “Reform and Rationalize” | “Best-In-Class Lean Manufacturing” | “Improve Service at Optimal Cost” | ||||||
•Optimize number of company-owned hogs •Improve herd health •Transform genetics •Drive procurement and nutrition savings | •Offset inflation with cost savings programs •Employ automation •Improve yields and maximize raw material usage •Reduce complexity | •Be the supplier of choice •Maximize assets (reduce transport miles, warehouse utilization) •Improve supply and demand planning •Optimize inventory levels | ||||||
Implementation of our growth strategies requires us, in particular, to continue to grow our Packaged Meats segment and to reduce our exposure to commodity price volatility through optimization and continued reduction of the size of our company-owned hog production operations. For information about challenges that we face in implementing this strategy and our other growth strategies, please see “Risk Factors—Risks Relating to Our Business and Operations—Our results of operations are cyclical and could be adversely affected by fluctuations in the commodity prices for meat, livestock (primarily hogs) and feed ingredients,” and “—Disruption of our supply chain could adversely affect our business, financial condition and results of operations.”
Execute Synergistic M&A in North America
We intend to execute opportunistic, complementary M&A to bolster our value-added product portfolio and production capacity in North America. While acquisitions are not a primary growth driver for us, our team is experienced in identifying strategic acquisition targets and integrating them successfully into our business. We believe our integration expertise allows us to capture both cost synergies and incremental revenue opportunities. We will remain disciplined in our acquisition approach and maintaining our investment grade ratings, while pursuing opportunities that we believe will prove accretive to earnings and enhance our operational profile. For example, we recently acquired a dry sausage plant in Nashville, Tennessee from Cargill, which is strategically located and offers important capacity for some of our fast-growing, higher margin packaged meats products. This acquisition will help serve the growing demand for high-quality pepperoni, deli, charcuterie and other dry sausage products.
Our Operations
Our “One Smithfield” initiative unifies the operations of our segments under a single corporate umbrella that enables us to realize synergies and create a consistent, go-to-market approach for customers and ultimate consumers of our products. In particular, we have leveraged the natural synergies across our Packaged Meats and Fresh Pork segments, focusing on cross-selling among our existing customer base and utilizing shared facilities. We intend to continue to capture synergies in manufacturing, distribution, product development, supply chain management and logistics, giving us two strong platforms for further expansion of our customer base.
Packaged Meats Segment
The Packaged Meats segment produces a wide variety of value-added products and sells them primarily in the United States. For the nine months ended September 29, 2024, the segment had $5.9 billion in sales, comprising 58% of our total sales, $855 million in segment profit, comprising 109% of our total operating profit and a 14.6% operating profit margin. For the year ended December 31, 2023, we sold approximately 2.9 billion pounds of packaged meats products. The segment has achieved strong growth with a fiscal year 2014 to fiscal year 2023 segment profit CAGR of 9.8%.
126
Our Packaged Meats portfolio is diversified across product categories, brands and channels and spans all meal occasions. For the nine months ended September 29, 2024, 63% of the segment sales were conducted through the retail channel, 31% through the foodservice channel and 6% through the industrial channel (i.e., other protein processors) and other.
We serve 100% of the top 10 ranked national grocery retailers, as identified by Progressive Grocer based on 2023 annual sales, including blue-chip customers, such as Walmart, Sam’s Club, Costco, Kroger and Albertsons. In the foodservice industry, we serve approximately 70% of the top 50 ranked national foodservice chains, including McDonald’s, Subway, IHOP and Jersey Mike’s, as well as all of the top foodservice distributors, including Sysco, U.S. Foods and Performance Food Group. Within the foodservice industry, we leverage our reputation for high-quality products through our Smithfield Culinary brand, and we are the most recognized pork processor by chefs and foodservice operators, with 49% unaided awareness based on a 2024 study by Datassential.
We produce a wide variety of packaged meats products, including bacon, sausage, hot dogs, deli and lunch meats, dry sausage products (such as pepperoni and genoa), ham products, ready-to-eat products and prepared foods (such as pre-cooked entrees, bacon and sausage). We address all dayparts, with our products featured during breakfast, weekday school lunches, football weekends, holiday dinners and at snack time. While pork is our primary protein offering, approximately 17% of the volume utilized in our Packaged Meats segment for the nine months ended September 29, 2024 was non-pork products made with other proteins—primarily, poultry and beef.
Our Packaged Meats segment’s branded retail offerings generated $3.2 billion, or 22% of consolidated sales, in 2023. Our products are available at most major food retailers, where we continue to drive penetration and have strong on-shelf performance with attractive dollar velocities for our largest categories relative to competition.
Led by our flagship Smithfield brand, our portfolio of brands has strong consumer recognition and robust brand equity, and we target on-trend product categories for growth. We market our domestic packaged meats products under a strategic set of core brands, including national, super-regional, value and specialty brands that deliver value to our ultimate consumers across a wide range of price points.
The following table illustrates the percentage of our Packaged Meats segment’s branded sales in the retail channel in 2023 for each of our top brands, along with the relevance these brands represent across dayparts:
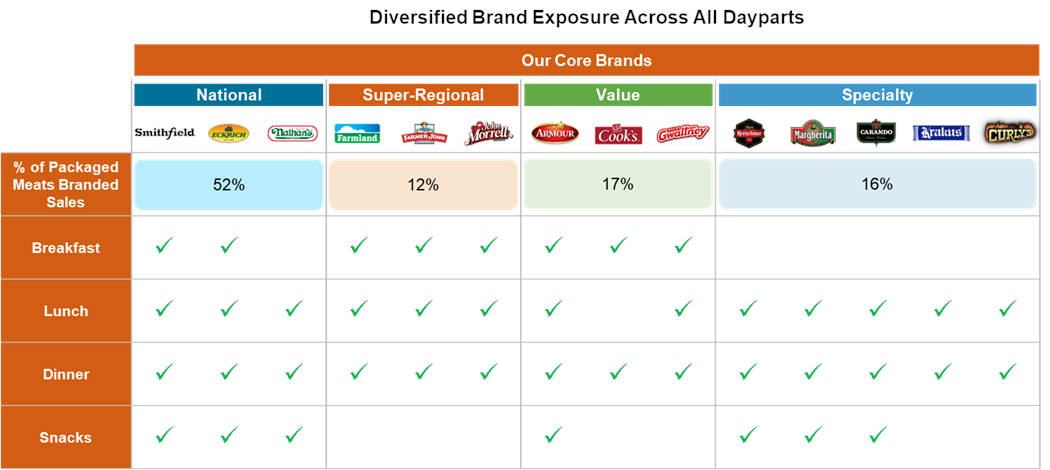
Additionally, private label represented 38% of our packaged meats retail channel sales volume in 2023. Our private label products make our offerings more valuable to blue-chip retail customers by providing consumers quality selections up and down the value chain. In addition, our private label business helps to optimize our manufacturing footprint and increases the efficiency and profitability of our plants.
127
Fresh Pork Segment
As the largest fresh pork processor in the United States, our Fresh Pork segment produces a wide variety of primal, sub-primal and offal products, such as bellies, butts, hams, loins, picnics and ribs. Our Fresh Pork segment had $5.9 billion in sales for the nine months ended September 29, 2024, comprising 58% of our total sales, $196 million in segment profit, comprising 25% our total operating profit and a 3% operating profit margin. For the year ended December 31, 2023, we processed approximately 29 million head through the Fresh Pork segment. Approximately one-third of our fresh pork products, including the majority of hams, bellies and trimmings, is transferred to our Packaged Meats segment, providing it with approximately 80% of its raw material requirements for the nine months ended September 29, 2024.
Our strategy is to drive our Fresh Pork segment’s profitability to exceed commodity meat values by maximizing the use of our raw materials. This includes offering value-added products, such as marinated fresh pork, a category in which we hold the leading position, and case-ready fresh pork. The export strategy is particularly important to our ongoing initiative to maximize hog utilization by selling byproducts to drive profitability.
Vertically Integrated Supply Chain and Hog Production Segment
Our supply chain, supported by our upstream businesses, is differentiated from our competitors’ supply chains and provides benefits that we believe are hard to replicate. Nearly all of the Hog Production segment’s sales are intercompany sales of live hogs to our Fresh Pork segment. Our Fresh Pork segment sources hogs from a mix of company-owned and contract farms, which raise company-owned hogs, comprising our Hog Production segment. Our Fresh Pork segment further supplements our supply by sourcing hogs from independent farmers with whom we partner across the United States through multi-year agreements. Contract farms and independent farms are held to the same animal care and quality standards as our company-owned farms and thereby form a key part of our integrated supply chain.
We have unmatched scale in hog production, which enables us to consistently supply high-quality raw materials for our Fresh Pork segment and, ultimately, our Packaged Meats segment. Today, we internally supply approximately 50% of the raw material needs of our Fresh Pork segment. We believe that it is important to maintain a certain level of internal production to enable supply to our Fresh Pork processing facilities, particularly to support our East Coast processing operations. Our scale has also enabled us to be an early mover in group-housing for pregnant sows on company-owned farms with the result that these farms supply the majority of our group-housed pork needs which is a differentiated product for which our customers pay a premium.
Beyond scale, our internally supplied hog production is geographically diverse, with locations in the East Coast, Midwest, Missouri and Utah, whereas our largest competitors are located predominantly in the Midwest. Our geographic diversity reduces risk by mitigating the impact of a potential disease outbreak in one part of the country. In addition, our East Coast hog production operations provide an efficient supply to two of our largest Fresh Pork and Packaged Meats processing facilities co-located in North Carolina. Our East Coast location provides us with a significant strategic advantage in our ability to export to more than 30 countries, because it gives us close proximity to East Coast ports, unlike our competitors who need to transport product from the Midwest more than 1,000 miles to either the East or West Coast ports.
In recent years, we embarked on a strategy to optimize the size of our hog production operations and procure a larger percentage of hogs from independent suppliers under long-term, market-based supply agreements. Our Hog Production segment’s transformation strategy is integral to our ongoing objective to further transition our business toward an increased mix of value-added, high-margin products. This transformation allows us to reduce our capital investment and exposure to more volatile areas of the value chain. We plan to reduce the size of the segment’s production from approximately 50% of fresh pork supply today to approximately 30% in the medium term, which is still significantly higher than our competitors. We have made material progress in executing our strategy, reducing the size of our segment’s production from a peak of 17.6 million head in 2019, and we continue to further optimize production levels. In the year ended December 31, 2023, we produced approximately 15.8 million head through the Hog Production segment. We ended 2024 at 14.6 million head, and we expect to end 2025 at approximately 11.5 million head. We believe this strategy will maintain an appropriate supply of high-quality inputs to meet business
128
needs and improve our cost structure while achieving flexibility in our retained hog production business. See also “Risk Factors—Risks Relating to Our Business and Operations—An inability to realize savings and efficiency gains could adversely affect profitability and we may be unable to achieve any or all of our financial and operational targets.”
Sales and Marketing
Our goal is to provide quality and value to the ultimate consumers of our packaged meats and fresh pork products. We sell our branded and private label packaged meats and fresh pork products through a variety of channels, including:
•national and regional retailers (primarily grocery supermarket chains, independent grocers and club stores);
•the foodservice industry, including foodservice distributors, fast food and other restaurants, hotel chains and other institutional customers;
•industrial customers who use our products as raw materials in their finished goods production, including prepared meals, byproducts for pharmaceutical production and pet food treats and ingredients; and
•export sales to international retailers and wholesale distributors, primarily in North American, Asian, Latin American and other emerging markets.
In the United States, our ultimate consumers span all age groups. Our three largest generational cohorts are Millennials, Generation X (the generational cohort aged 44 to 59) and Boomers (the generational cohort aged 60 to 78). While Boomers are our largest cohort, Generation Z is our fastest growing cohort. We address consumer trends and interests and seek to appeal to younger demographics through product innovation, including enhanced flavors and ready-to-eat and smaller package sizes, as well as charcuterie and snacking items.
We have implemented a strategy in our Fresh Pork segment to improve profitability by exporting certain parts of the hog, primarily offals, that are in higher demand and generate higher sales values in international markets. In 2023, export sales comprised 23% of the Fresh Pork segment’s volumes and 22% of the segment’s sales.
We use a variety of consumer advertising and trade promotion programs designed to build awareness and increase sales distribution and penetration. We also provide sales incentives to certain of our customers through rebates, such as those based on achievement of specified volume and/or growth in volume levels. We primarily use company-employed salespersons to sell our products, and we also engage independent brokers who work on a commission basis.
Customers
In 2023, we sold our products to more than 5,700 customers. Walmart is a customer of our Packaged Meats and Fresh Pork segments and accounted for approximately 12%, 12% and 11% of our consolidated sales in 2023, 2022 and 2021, respectively. Walmart has been our customer for multiple decades. No other customer accounted for 10% or more of our consolidated sales during 2023, 2022 and 2021. Cumulatively, our top ten customers accounted for 37%, 36% and 37% of our consolidated sales in 2023, 2022 and 2021. Sales to our customers located outside of the United States accounted for 16%, 14% and 18% of our consolidated sales in 2023, 2022 and 2021, respectively.
Manufacturing Facilities
We manufacture packaged meats, fresh pork and value-added items at 39 processing plants across 19 different states:
•Packaged meats. We produce packaged meats products across 31 processing plants in 18 states.
•Fresh pork. We process hogs at eight processing plants in six states, with the aggregate processing capacity of our collective processing plants of approximately 108,000 hogs per day.
129
•Value-added items. We operate six additional processing plants that use our fresh pork products to produce value-added items, such as case-ready products, process pork skins for snacking and pet food and treats.
Our processing plants are strategically located to access raw materials in a cost-effective manner and to service our diverse customer base. Six fresh pork facilities include our packaged meats operations, which improves our overall cost structure by reducing the cost of transporting fresh raw materials and leveraging shared fixed overheads.
We continue to optimize our operations by reconfiguring our manufacturing footprint, closing high-cost operating lines and creating greater agility across our facilities. Our facilities utilize modern, highly automated equipment to process and package our packaged meats and fresh pork products, aiding us in redeploying our team members to higher-value tasks. We believe that these expenditures have enhanced product quality, improved customer satisfaction and increased sales potential. Our economies of scale and network afford us significant supply chain transparency and substantial availability of high-quality raw material supply to our growing Packaged Meats segment. Our portfolio of production facilities requires routine capital investment for repairs and maintenance. We believe that annual total capital expenditures in the near term are likely to be in the range of $400 million to $500 million inclusive of both repairs and maintenance and profit improvement projects. Capital expenditures could be more in certain years to ensure continuity of production in our older assets. For additional information on how we intend to use the proceeds of this offering, see “Use of Proceeds.”
Our facilities are also designed to promote regulatory compliance and worker safety, as well as reduced waste and emissions, while seeking to comply with applicable environmental standards.
Our “Other” operating segment includes pharmaceutical operations, known as Smithfield Bioscience, and our Mexican operations. For Smithfield Bioscience, we have a manufacturing location in Ohio that processes raw materials from hogs that we process to manufacture heparin products, including Heparin Sodium, an active pharmaceutical ingredient, which mitigates the risk of blood clots. These intermediate products are sold to the healthcare industry for use in pharmaceutical drugs and medical devices. In Mexico, we own a 66% interest in Granjas Carroll de Mexico, S. de R.L. de C.V., or GCM or Altosano. Altosano produces 1.8 million hogs annually at 115 company-owned farms and processes 1.5 million hogs at one manufacturing plant, primarily for consumption in the local Mexican market. GCM sells branded products in Mexico under the Altosano brand.
Distribution and Transportation
We have integrated, centralized teams that coordinate supply and demand planning, customer service and logistics to service our packaged meats and fresh pork customer base. We use a combination of third-party shipping companies and our leased and owned fleet of tractor trailers to distribute meat products to our customers, as well as to move products between facilities. In the United States, we distribute products directly from some of our plants and from owned and leased distribution centers in Indiana, Kansas, Maryland, Nebraska and North Carolina. We use these distribution centers to consolidate products that are manufactured at different plants across our network to fulfill our customer orders efficiently. One of these distribution centers is operated by third-party logistics providers.
Due in part to the different demands of distribution for frozen and refrigerated products, as well as the seasonality of certain of our products, we use a network of over 45 third-party cold storage locations for storage, handling and other value-added services. These arrangements are generally contracted on an annual basis with either fixed or variable usage requirements. Access to these locations provides capacity to sell frozen and chilled product offerings to our export customer base. For export sales to overseas geographies, we contract with third-party international container shipping carriers to ship our products cost effectively to the destination ports of our customers.
Our distribution network enables us to enhance our customer reach and sell our products efficiently and cost effectively throughout the United States and the world. We continue to seek innovative solutions to accomplish this mission. We use automation in our distribution centers to pick and fulfill orders and thereby reduce labor costs. We coordinate deliveries and use backhauling to reduce overall transportation costs.
130
Raw Materials
Feed for Internally Sourced Hogs
The primary raw materials for hog production are corn, soybean meal and wheat. Hogs consume grain during the grow-out period from wean to finish, which takes six months on average. In 2023, feed costs accounted for approximately 64% of our production cost of hogs. We have over 50 locations used for feed production and feed storage in the United States, which are located near our farms, where we convert purchased grain into feed for our animals.
The profitability of hog production is related to the market price of hogs, the cost of feed grains and the efficiency of our farm operations. Hog production generally generates higher profits when hog prices are high and feed grain prices are low, and lower profits (or losses) when hog prices are low and feed grain prices are high. We seek to mitigate higher input costs through productivity initiatives to improve feed conversion, procurement initiatives and the use of derivative instruments to hedge a portion of forecasted future consumption economically. We seek to stabilize pricing generally by purchasing grains through forward purchase contracts.
Feed grains are readily available from numerous sources at competitive prices, and we believe such raw materials to be in adequate supply. We take an active role in the physical markets for grain and other feed ingredients throughout the world. These efforts range from buying lower-cost corn from local farmers near our feed mills to importing grain or soybean meal from South America from time to time.
Raw Materials for Fresh Pork Segment
Internally Sourced Hogs
We source approximately half of the hogs processed in our Fresh Pork segment’s facilities through our Hog Production segment, which includes more than 400 company-owned farms and more than 1,900 contract farms in the United States that raise our hogs for processing. Contract farmers provide the initial facility investment, labor and front-line management through a pre-determined economic and commercial arrangement, and we provide the animals and the feed. In the nine months ended September 29, 2024, we produced 10.8 million hogs from approximately 750,000 sows; and, in the year ended December 31, 2023, we produced 15.8 million hogs from approximately 770,000 sows. Nearly all of the Hog Production segment’s sales are intercompany sales to the Fresh Pork segment.
We develop breeding stock, optimize diets for our hogs at each stage of the growth process, feed our hogs and design hog containment facilities. From the process’s origin at the grain farms to the ultimate step of delivering hogs to our processing plants, we monitor the vertically integrated process at every juncture to ensure a premium level of product, assurance of supply and control of input costs. Whether our animals are raised on company-owned or contract farms, we seek to have a supply chain that meets our standards for quality and animal welfare practices.
At our company-owned and contract farms, we have ongoing initiatives to improve profitability, including genetic transformation, herd health improvements and procurement and nutrition savings. These ongoing initiatives are intended to improve the livability of our animals while reducing costs. We utilize our fleet of leased and owned tractor trailers to transport hogs between farm and production facilities.
Externally Sourced Hogs
We currently procure approximately half of the hogs that we process in our Fresh Pork segment through multi-year, market-based supply agreements with independent suppliers, which provide us with a stable supply of high-quality hogs at market-indexed prices. The loss of any one supplier would not materially impact our business or operations. We seek to stabilize pricing generally by purchasing hogs through forward purchase contracts.
Raw Materials for Packaged Meats Segment
We source approximately 80% of the raw materials used in our Packaged Meats segment from our Fresh Pork segment. We purchase beef and poultry from other meat processors to supplement our processing requirements. Our
131
third-party pork and beef purchases are made on a spot basis, while our third-party poultry purchases are booked through annual volume commitments.
Although the price of our raw materials fluctuates due to market dynamics, we believe that our supply of raw materials is adequate and generally available from numerous sources. We seek to mitigate higher input costs through productivity improvements in our operations, various procurement strategies and the use of derivative instruments to economically hedge a portion of forecasted future consumption.
Packaging Materials and Ingredients for Fresh Pork and Packaged Meats Segments
We have a centralized procurement function responsible for competitively sourcing packaging and ingredient raw materials from third-party suppliers. We purchase raw materials, including seasonings, sweeteners, cheese and antimicrobials from ingredient suppliers, commodity processors and other food companies located primarily in the United States. We also purchase packaging materials, including flexible resin-based packaging, corrugated boxes and folding cartons, foam trays and pads, labels and casings, from packaging manufacturers located primarily in the United States. We purchase the majority of our packaging materials under contracts with pricing formulas based on published raw material indices for the primary components of our packaging, which are typically resin and paperboard.
We purchase most of the seasonings for our Packaged Meats segment from Saratoga. We owned Saratoga until October 2022 when we sold it to Solina Group Holding. Shortly thereafter, we entered into a strategic sourcing purchase agreement with Saratoga pursuant to which we agreed to purchase certain seasonings exclusively from Saratoga. The sourcing agreement expires on October 31, 2025 but automatically renews for successive one-year terms unless terminated by either party with a 90-day notice. The prices at which we purchase seasonings are adjusted annually by agreement between us and Saratoga based on market information and operations data. Saratoga has a right of first refusal to supply us with any new seasoning or sauce products we need. We may terminate the exclusivity arrangement or terminate the sourcing agreement entirely if Saratoga does not satisfy certain key performance indicators. We believe that we carry sufficient inventory of finished product and seasonings to overcome an interruption in the supply of seasonings from Saratoga.
Seasonality
Our business is somewhat seasonal in that, traditionally, the periods of higher sales for hams are the holiday seasons such as Easter, Thanksgiving and Christmas, and the periods of higher sales for ribs, smoked sausages and hot dogs are the summer months. We typically build inventories of certain products in anticipation of seasonal demand fluctuations.
In addition, hog prices tend to rise as hog supplies decrease during the summer, and hog prices tend to decline as hog supplies increase during the fall and winter. This tendency is due to lower farrowing performance during the winter and slower animal growth rates during the summer.
Competition
In our business, we participate across the value chain — from farm to finished products. We believe our diverse branded and private label product offerings allow us to compete effectively across channels and customer price points.
In general, the primary competitive factors in our Packaged Meats and Fresh Pork segments are:
•taste;
•product quality;
•nutritional profile and dietary attributes;
•product availability;
132
•convenience;
•price;
•brand recognition and loyalty; and
•the ability to identify and satisfy emerging consumer preferences.
Our ability to compete effectively depends on our capacity to execute across these criteria. Competitive factors may vary by channel. In the U.S. retail channel, we believe that product quality, brand awareness, effective consumer advertising and promotional activities, relationships with key stakeholders for shelf space and customer service are the primary bases of competition. In the U.S. foodservice channel, we believe that competition is based on consistent quality, product development, service and price. As our hog production operation is mainly comprised of intracompany sales, our customers and ultimate consumers primarily interact with our Packaged Meats and Fresh Pork segments.
The protein industry is highly competitive. We compete with large multi-brand packaged foods businesses, as well as fresh meat companies, private, category-focused companies and pork processing companies. Competing large, multi-brand consumer packaged food companies include Tyson Foods, Hormel Foods, Kraft Heinz, Pilgrims Pride, Maple Leaf Foods, Premium Brands and Conagra. These competitors are scaled, multinational corporations with substantial financial, marketing, research and development and other resources. Private, category-focused companies that we compete with include Boar’s Head and Johnsonville. These private competitors may be more innovative and able to bring new products to market faster and more quickly exploit and serve niche markets or new or burgeoning consumer preferences. Pork processing companies with which we compete include Tyson Foods, Triumph Foods, JBS USA, Prestage Farms and Seaboard. Although pork is relatively inexpensive in comparison to other protein sources, we also compete indirectly with the producers of chicken, beef, seafood and meat alternatives since changes in the relative prices of these proteins may alter consumer buying patterns. Additionally, we face competition for export sales from both domestic and international suppliers.
As a leading food company, we believe that we effectively compete through our high-quality products, leading brands, expansive channel reach, scaled distribution network, our significant focus on controlling our input costs (including through internally sourced hogs) and our strong financial profile. Based on the strength of our longstanding relationships and proven, execution-oriented management team, we believe that we are a trusted partner to farmers, suppliers, customers and ultimate consumers across the value chain.
Our Properties
The table below summarizes information about our owned and leased properties:
| Number of Facilities | ||||||||||||||||||||||||||||||||||||||
| Segment/Type of Facilities | Owned | Leased | Total | State (5) | Capacity (in thousand) | Unit of Measurement | ||||||||||||||||||||||||||||||||
Packaged Meats (1) | ||||||||||||||||||||||||||||||||||||||
| Production | 29 | 2 | 31 | Georgia (1), Iowa (5), Illinois (2), Indiana (1), Kansas (2), Kentucky (2), Massachusetts (1), Minnesota (1), Missouri (2), North Carolina (3), Nebraska (3), New Jersey (1), Ohio (2), Pennsylvania (1) , South Dakota (1), Tennessee (1), Virginia (1), Wisconsin (1) | 13,100 | Daily production lbs. | ||||||||||||||||||||||||||||||||
Fresh Pork (1) | ||||||||||||||||||||||||||||||||||||||
| Processing | 8 | — | 8 | Iowa (2), Illinois (1), Missouri (1), Nebraska (1), North Carolina (2), South Dakota (1) | 107.9 | Head of hogs daily | ||||||||||||||||||||||||||||||||
133
| Number of Facilities | ||||||||||||||||||||||||||||||||||||||
| Segment/Type of Facilities | Owned | Leased | Total | State (5) | Capacity (in thousand) | Unit of Measurement | ||||||||||||||||||||||||||||||||
| Other | 5 | 1 | 6 | Iowa (2), North Carolina (2), Utah (1), Virginia (1) | 2,500 | Daily production lbs. | ||||||||||||||||||||||||||||||||
| Hog Production | ||||||||||||||||||||||||||||||||||||||
Farms (3) | 269 | 1,430 | (2) | 1,699 | Colorado (26), Iowa (410), Illinois (15), Missouri (204), North Carolina (930), Oklahoma (11), South Carolina (28), South Dakota (9), Utah (23), Virginia (43) | 11,562 | Hogs annually | |||||||||||||||||||||||||||||||
| Feed facilities | 27 | 24 | 51 | Colorado (1), Iowa (3), Indiana (1), Kansas (1), Missouri (9), North Carolina (26), Ohio (2), South Carolina (5), Utah (1), Virginia (2) | 708.4/32.9 | Capacity in tons of feed storage / daily feed production | ||||||||||||||||||||||||||||||||
| Distribution Network | ||||||||||||||||||||||||||||||||||||||
Distribution Centers (4) | 2 | 3 | 5 | Indiana (1), Kansas (1), Maryland (1), Nebraska (1), North Carolina (1) | 201.0 | Pallet capacity | ||||||||||||||||||||||||||||||||
| Direct-to-Store Delivery Facilities | 6 | 7 | 13 | Indiana (3), Kentucky (1), Michigan (2), Ohio (3), Pennsylvania (1), Texas (3) | 152.1 | Square feet | ||||||||||||||||||||||||||||||||
| Other | ||||||||||||||||||||||||||||||||||||||
| Mexico | ||||||||||||||||||||||||||||||||||||||
| Fresh Pork | 1 | — | 1 | Puebla, MX | 5.0 | Head of hogs daily | ||||||||||||||||||||||||||||||||
| Hog Production | 115 | 6 | (2) | 121 | Puebla (79), Veracruz (42), MX | 1,800 | Hogs annually | |||||||||||||||||||||||||||||||
| Corporate | 1 | Puebla, MX | 13.3 | Square feet | ||||||||||||||||||||||||||||||||||
| Bioscience | 1 | — | 1 | Ohio | 34.5 | Square feet | ||||||||||||||||||||||||||||||||
| U.S. Administrative | ||||||||||||||||||||||||||||||||||||||
| Headquarters | 1 | — | 1 | Virginia | 132.3 | Square feet | ||||||||||||||||||||||||||||||||
| Satellite offices | 1 | 3 | 4 | Illinois (1), Missouri (1), North Carolina (1), Virginia (1) | 135.2 | Square feet | ||||||||||||||||||||||||||||||||
| Sales offices | — | 5 | 0 | Idaho (1), Ohio (1), Michigan (1) California (1), Arkansas (1) | 32.0 | Square feet | ||||||||||||||||||||||||||||||||
________________
(1)Certain of our fresh pork facilities are co-located with packaged meats production facilities. They are counted separately under each segment heading. We operate a total of 39 facilities that process fresh pork and packaged meats in the United States.
(2)Consists of contract farms.
(3)Does not include a limited number of inactive farms.
(4)Distribution centers serve both our Packaged Meats and Fresh Pork segments. We also have access to over 45 cold storage locations via contractual arrangements with third parties. Our contracts are either pay-for-use or commit us to a specific annual amount irrespective of usage.
(5)Numbers in parentheses represent total number of facilities for each jurisdiction.
134
The map below shows the expansive footprint of our facilities and properties:
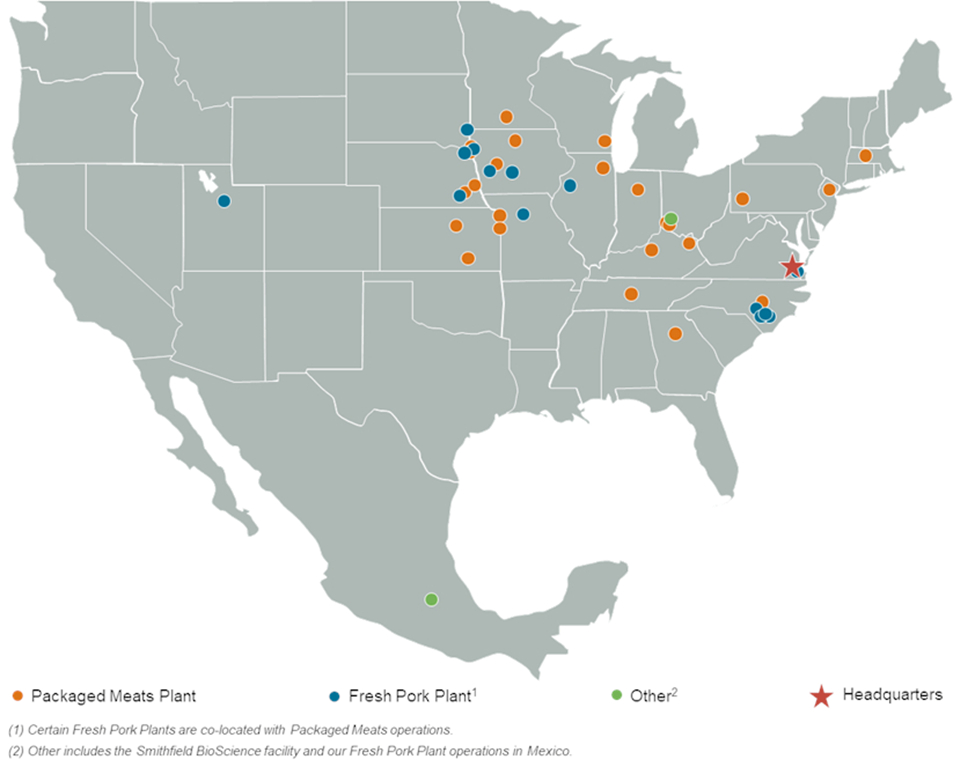
Research and Development
We conduct research and development activities to develop new and improved products for our customers, incorporate innovative ingredients, develop advanced pork processing equipment and methods and enhance the survival, health, growth and well-being of our animals.
Our in-house food science research and development team consists of approximately 35 professionals focused on developing new and improved products and enhancing plant productivity. In 2011, we opened Smithfield’s Innovation Center near our headquarters in Smithfield, Virginia. This technologically advanced facility is dedicated to developing new products, enhancing food safety and quality, exploring consumer insights and preferences and evaluating both our products and those of our competitors.
Our animal scientists conduct research at farms across the country to improve the performance and well-being of our animals. In addition, we conduct genetic and genomic research to advance the proprietary genetics of our animals and foster specific traits that improve their overall performance.
We incurred expenses for research and development activities of $175 million, $157 million and $157 million in 2023, 2022 and 2021, respectively.
135
Employees
As of December 31, 2024, we had approximately 34,000 employees in the United States and approximately 2,500 in Mexico.
As of January 1, 2023 (1) | As of December 31, 2023 (1) | As of December 31, 2024 (1) | |||||||||||||||
| Corporate | 2,533 | 2,406 | 2,149 | ||||||||||||||
| Facilities | 31,988 | 30,066 | 29,450 | ||||||||||||||
| Farms | 5,336 | 4,945 | 4,790 | ||||||||||||||
| Total | 39,857 | 37,417 | 36,389 | ||||||||||||||
________________
(1)Includes employees that are members of labor unions.
We have both unionized and nonunionized facilities in the United States. Approximately 46% of our employees are covered by collective bargaining agreements or are members of labor unions, and 8,359 of our employees are covered by collective bargaining agreements that will expire in 2025. Collective bargaining agreements covering our other employees expire over periods throughout the next several years. We believe that our relationship with our employees is satisfactory.
Workplace Safety
We require strict adherence to our rigorous health and safety policies from every team member and visitor at our facilities. We practice a “stop work authority” policy, which empowers all our team members to halt production, without fear of retribution, if they believe something is unsafe.
We have implemented our Smithfield Injury Prevention System, or SIPS, a comprehensive management system that outlines our safety and health policy requirements and includes rigorous validation of the management process. This validation process promotes compliance with SIPS, safeguarding team members and visitors at our facilities.
Adherence to local, state and federal regulatory compliance is critical for protecting our team, visitors and assets. SIPS is designed to provide the guidance needed to comply with regulatory standards, prevent injuries, manage risks and promote continuous improvement throughout our business. Performance is measured through various metrics, including internal improvement goals and external benchmarks, such as the annual U.S. Bureau of Labor Statistics Report. During 2023, we achieved safety incident rates below industry averages, with a Total Recordable Cases Rate of 2.42, a Total Days Away from Work, with Job Restrictions or Transfer rate of 1.68, and a Days Away from Work (With or Without Job Restriction or Transfer) rate of 0.43, each of which was more than 50% better than the meatpacking industry average.
Culture and Diversity
We are committed to attracting, training and retaining a diverse workforce that is reflective of the marketplace. We strive to implement a company culture that is inclusive, positive and performance oriented.
Our Equal Employment Opportunity Policy affirms our commitment to employing and supporting employees of all races, religions, colors, national origins, genders, sexual orientations, gender identities, ages and other characteristics. We continuously assess our progress in our efforts to promote a diverse and inclusive workforce. Our chief human resource officer is charged with creating and executing a comprehensive talent strategy that aligns Smithfield's business plan with our human resources function and leads our recruiting, retention, training and development and diversity, culture and engagement programs. We value and strive to promote diverse and inclusive representation at all levels across our business. We also continue to take steps to model our leadership team to reflect the diversity within our company and our supply chain.
136
Insurance
We maintain insurance policies for workers’ compensation and employers’ liability, property, directors and officers and vehicle and general liability on terms that we believe are customary for companies similarly situated. In addition, we maintain excess liability insurance where we reasonably believe it to be cost effective to do so. We are self-insured for certain levels of product recall insurance and employee medical and dental benefits. We believe that our insurance policies provide suitable coverage for the risks inherent to our operations, both in terms of the type of coverage and of the insured amounts.
Information Systems
We use a mix of proprietary and third-party SaaS applications to meet the specialized requirements of our business. These systems are designed to be scalable, enabling the seamless integration of newly acquired entities into our existing operations.
In 2021, we launched a digital strategy to enhance our technology infrastructure, focusing on IT security, cybersecurity, recoverability and scalability. A key investment was the modernization of our data management platform. This new technology has provided us with advanced analytics, offering improved business insights. Recent investments in our supply, demand and production planning systems have enabled us to further enhance our customer experience via improved forecasting accuracy and fulfillment efficiency. We have been continuously advancing our digital strategy by streamlining our applications footprint for greater efficiency and investing in technology improvements to refine our analytics and expand task automation.
We operate a single enterprise resource planning, or ERP, system covering the majority of our Fresh Pork and Packaged Meats segments’ facilities for operations, procurement, receiving, warehousing, inventory management and order processing. We also have an integrated suite of supporting financial, demand planning and material requirements planning software modules that are effectively integrated into our core ERP platform.
Cybersecurity
Cybersecurity and the protection of our information and the information of our customers is a top priority for us. Safeguarding the information of our employees, customers, and partners is critical to our operations, and we are committed to utilizing leading-edge technology to support our mission of producing good food the right way.
Through regular investment in state-of-the art tools and advanced analytics, our global cybersecurity team strives to:
•identify potential vulnerabilities and service disruptions proactively;
•monitor, test and secure key networks and services;
•enable prompt recovery of operations following cyber disruptions; and
•provide guidance and oversight for cyber resilience in critical business areas.
Our policies and procedures continue to evolve to promote compliance with the rapidly developing laws and regulations governing the privacy and protection of personal and corporate information. We are committed to expanding our cyber behavior management and training initiatives, which is a comprehensive program designed to enhance cyber awareness and equip our staff to become cyber-proficient digital citizens. These investments in cybersecurity have led to more comprehensive threat analysis, faster incident response and proactive risk mitigation.
Intellectual Property
We rely on a combination of intellectual property laws, internal procedures and policies and contractual provisions to protect our intellectual property and proprietary rights. We own and use numerous retail and foodservice brands, which are registered trademarks or are otherwise protected under applicable intellectual property laws, including, for example: Smithfield, Eckrich, Farmland, Armour, Farmer John, Kretschmar, John Morrell,
137
Cook’s, Gwaltney, Carando, Margherita, Curly’s and Smithfield Culinary. We pursue the registration of certain of our trademarks in the United States and in certain locations outside the United States to protect our brand names, products, and services around the world. Trademark registrations can generally be renewed as long as the trademarks are in use.
In December 2012, we entered into a license agreement with Nathan’s Famous. The agreement expires in March 2032. Pursuant to the agreement, we have the exclusive right and obligation within the United States, Canada and Sam’s Clubs in Mexico (i) to manufacture, distribute, market and sell “Nathan’s Famous” branded hot dogs, sausages and corned beef and certain other ancillary products through retail channel, and (ii) to manufacture and distribute “Nathan’s Famous” branded hot dog and sausage products in bulk for use in the food service industry. The agreement also grants us the non-exclusive right and obligation to supply “Nathan’s Famous” natural casing and skinless hot dogs in bulk for use in the “Nathan’s Famous” restaurant system within the United States and to supply to Nathan’s licensees in foreign territories, where importation is permitted. We pay an agreed royalty rate based on a percentage of net sales, subject to a minimum annual guaranteed royalties in the case of subparagraph (i) above. We do not have any patents, licenses, or franchises, other than the license agreement with Nathan’s Famous, that are material individually or in the aggregate to our business.
We believe that registered and licensed trademarks have been important to the success of our branded fresh pork and packaged meats products. We consider these marks and the accompanying goodwill and customer recognition valuable and material to our business. Our brands are among the leaders across several of the largest packaged meats product categories in the United States.
For information regarding additional trademark license agreements, see “Certain Relationships and Related Party Transactions—Historical Agreements with WH Group—European Carve-out—Trademark License Agreements and Related Agreements.”
In our hog production operations, we use genetic lines of breeding stock that we own, which are considered trade secrets, as well as genetic lines that we license from third parties. We also sublicense rights to some of our strategic hog production partners.
Sustainability
We maintain a strong commitment to sustainability, pursuing rigorous voluntary goals and setting long-term targets across a sustainability platform encompassing seven core pillars: animal care; diversity, equity and inclusion; environmental stewardship; food safety and quality; health and wellness; helping local communities and worker health and safety. We are working to meet the rising environmental and social challenges the protein sector faces. At the heart of our business is a goal to provide protein to a growing world population while maintaining responsible stewardship of the planet’s finite resources. Our culture of “Good Food. Responsibly.” pushes us to partner with many stakeholders to innovate and address these issues.
Respect for our animals, people, the environment and communities is at the core of how we operate. Since our inception, we have been committed to providing good food and dedicated to animal care, community support, employee safety, environmental stewardship and food safety and quality programs. More than 20 years ago, we started to develop a comprehensive animal care management system on our farms. We were also an early industry mover in group housing for pregnant sows on company-owned farms. To reduce our impact on the environment, we have invested in biogas joint ventures that capture and utilize methane produced on certain company-owned and contract farms as a renewable source of energy. We hold a one-third interest in Monarch, a joint venture that currently operates renewable natural gas, or RNG, projects at nine of our company-owned farms in Missouri. In 2022, TPG Rise Climate invested in Monarch, helping us to further scale the business. We also hold a 50% interest in Align, a joint venture that is developing RNG projects on at a total of six of our company-owned farms and contract farms in North Carolina and Virginia.
We continuously strive for transparency in our sustainability reporting and report in accordance with the Global Reporting Initiative and in consideration of the International Financial Reporting Standards Foundation SASB Standards.
138
The development and support of the communities where our employees live and work is a core value and component of our sustainability program. Over the last ten years, we have contributed more than $320 million in cash and in-kind donations to fight hunger, advance education and support the vitality of our local communities.
Quality Assurance and Food Safety
Producing safe, wholesome products for our customers and ultimate consumers is our focus, and we operate under programs and policies that promote regulatory compliance and food safety and quality at every step of our value chain.
Regulation
We are subject to extensive food safety regulation, including the Federal Meat Inspection Act of 1906, the U.S. Packers and Stockyards Act of 1921, the Food, Drug and Cosmetic Act of 1938, the Nutrition Labeling and Education Act of 1990, the USDA Pathogen Reduction: Hazard Analysis and Critical Control Point Systems Rule of 1996, the Public Health Security and Bioterrorism Preparedness & Response Act of 2002, the Food Safety Modernization Act of 2011 and other rules and regulations promulgated by the FDA, the USDA and the sub-branches of these regulatory bodies relating to the production and introduction of human foods to commerce. These comprehensive and evolving regulatory programs govern, among other things, the manufacturing, composition, ingredients, labeling, packaging and safety of food, including compliance with specific current good manufacturing practice regulations.
Our processing plants are subject to on-site examination, inspection and regulation by the USDA. The FDA inspects various of our processing plants that produce snacking foods, heparin products, and pet food and treats in the United States, as well as the production of our feed mills. We are subject to recalls of our meat products in the event of suspected contamination or adulteration that could constitute a food safety hazard. We maintain a rigorous program of interventions, inspections and testing to reduce the likelihood of food safety hazards.
Compliance with federal, state and local regulation is costly and time-consuming but remains one of our top priorities. Regulatory enforcement actions for violations of federal, state and local regulations may include seizure and condemnation of products, product recalls, cease and desist orders, injunctions and monetary, civil or criminal penalties.
Policies and Procedures
Our plants, as well as those of our hog suppliers, have all developed quality programs following the standards set in the USDA’s Process Verified Program, or PVP. Our PVP programs monitor aspects of traceability, country of origin and Transport Quality Assurance status of drivers. In addition, all of our applicable U.S. facilities are certified to a Global Food Safety Initiative, or GFSI benchmarked standard, and all of our food safety plans and policies meet the requirements of a GFSI benchmarked standard. We also require our ingredient suppliers to undergo annual food safety audits, the majority of which, to our knowledge, meet the requirements of a GFSI benchmarked standard.
To drive adherence to these programs and policies, we employ data analytics to monitor food safety indicators and take corrective action if necessary. As part of our quality and food safety program, our professionals continuously work with the applicable regulatory agencies, including the USDA’s Food Safety and Inspection Service, the FDA and industry associations on projects aimed at improving food safety and increasing consumer protection to stay informed of emerging issues and improve our quality and food safety program.
Animal Care
We are committed to proper animal care and have a moral and ethical obligation to the humane treatment of animals. We believe our hogs can and should be raised, transported and processed using procedures that are safe and free from cruelty and neglect.
139
Regulation
We are subject to regulations relating to animal treatment, including the Humane Methods of Slaughter Act of 1978 governing our processing plants. Our processing facilities are subject to regular on-site examination, inspection and regulation by the USDA, and regular internal and third-party audits are conducted throughout the year. We are also subject to state laws governing the care of livestock that is used in certain meat products sold within those states, including California Proposition 12 and Massachusetts Question 3.
We believe that we are in substantial compliance with all applicable laws and regulations relating to the operations of our facilities. In addition to complying with federal laws and regulations pertaining to hog production, we are also required to comply with local municipality (city and county), as well as state regulations, including the registration and licensing of our facilities, enforcement by state health agencies of various state standards and inspection of our facilities.
Policies and Procedures
Our comprehensive, systematic animal care management program to monitor and measure the well-being of our hogs on company-owned and contract farms was developed in consultation with experts in animal behavior and handling. The program guides the proper and humane care of our animals at every stage of their lives, from gestation to transport to our processing plants. All farm employees and contract farmers are required to employ the methods and techniques of the management system and verify their compliance.
Our Animal Care Policy underscores our commitments to provide:
•shelter that is designed, maintained and operated to meet the animals’ needs;
•access to adequate water and high-quality feed to meet nutritional requirements;
•humane treatment of animals that enhances their well-being and complies with all applicable laws and regulations;
•identification and appropriate treatment of animals in need of health care; and
•use of humane methods to euthanize sick or injured animals not responding to care and treatment.
Biosecurity, or procedures to prevent the spread of disease to our farms, is a critical element of our program to safeguard the health and well-being of our animals. Our standard operating procedure covers the animal production process at individual farms, as well as the movement of vehicles, animals, personnel and equipment between farms. For example, employees and visitors must “shower in” and change into clean clothing before entering all sow farms and must also “shower out” prior to leaving. In addition, equipment and supplies delivered to sow farms, as well as vehicles, must be disinfected prior to being allowed inside the farm complex.
Since 2009, all company-owned and contract farms have been certified by the National Pork Board’s Pork Quality Assurance Plus (PQA Plus®) program that are conducted every three years. Our company-owned and contract farms undergo on-farm site assessments every other year and are subject to random third-party audits.
In January 2014, we announced the recommendation that all our contract sow growers join with us in converting their facilities to group housing systems for pregnant sows. In December 2017, we completed a 10-year program to phase out individual gestation stalls at our company-owned sow farms and replace the gestation stalls with group pens for all pregnant sows at our U.S. company-owned farms. Altosano has also completed its conversion to group housing facilities for our Mexican hog production operations. We asked contract sow growers to convert by 2022 and offered a sliding scale of incentives to accelerate that timetable. Growers who commit to convert to group housing will receive contract extensions upon completion of the conversion.
140
Other Regulation
In addition to the various laws and regulations described above related to quality and food safety and animal care, we are subject to various laws and regulations administered by federal, state and other government entities in the United States and internationally, governing, among other things, environmental protection, worker safety, storage and transportation of our products, including governmental regulations issued by the EPA, OSHA, the Center for Disease Control and the state and local regulatory authorities relating to handling and discharge of waste water, storm water, air emissions, treatment, storage and disposal of agricultural and food processing wastes, handling of hazardous substances, remediation of contaminated soil, surface water and groundwater and the use and maintenance of refrigeration systems, including ammonia-based chillers, noise, odor and dust management, the operation of mechanized processing equipment and other operations.
We follow a number of other policies and protocols to reduce the impact of our hog production operations on the environment, including:
•the employment of environmental management systems;
•ongoing employee training regarding environmental controls;
•walk-around inspections at all sites by trained personnel;
•formal emergency response plans that are regularly updated; and
•collaboration with manufacturers regarding testing and developing new equipment.
Hog production facilities generate significant quantities of manure, which must be managed properly to protect public health and the environment. We track the best technologies available and economically feasible for the management of swine manure, which require permits under state law and, in some instances, federal law. These permits impose standards and conditions on the design and operation of the systems to protect public health and the environment and can also impose nutrient management planning requirements depending on the type of system utilized. In addition, our hog production facilities have been designed to meet or exceed all applicable zoning and other government regulations. These regulations require, among other things, maintenance of separation distances between farms and nearby residences, schools, churches, public use areas, businesses, rivers, streams and wells and adherence to required construction standards.
New or more stringent environmental laws or regulations that impose additional requirements on our operations or on us could increase the cost of doing business for us. For example, in January 2024, the EPA published draft revised Effluent Limitations Guidelines, or ELGs, for wastewater discharges of meat and poultry facilities. The draft proposal includes a number of options for revised ELGs that the EPA is evaluating. For existing direct dischargers of wastewater, including meat processors such as us, the EPA’s preferred option is the imposition of more stringent effluent limitations for nitrogen and ammonia and, for the first time, limitations for phosphorus. This option would also establish, for the first time, pretreatment standards for oil and grease, total suspended solids and biochemical oxygen demand for these dischargers. In addition, the EPA is proposing an amendment to add E. coli bacteria limitations for direct dischargers. Another option the EPA is considering would extend the nitrogen and phosphorus limitations to indirect dischargers, which would also cover many of our facilities.
It is unclear when the EPA will issue final ELGs or to what extent they will differ from what the EPA has proposed. Significant upgrades related to our direct and indirect wastewater discharge streams, including to treatment systems at our Sioux City and Denison, Iowa, Sioux Falls, South Dakota and Tar Heel, North Carolina centers, would be required to meet the standards as proposed, which we estimate would require material capital expenditures in the aggregate.
For more information regarding environmental regulation of our operations, see “Risk Factors—Risks Relating to Government Regulations—Governmental authorities may take further action restricting our ability to produce and/or sell livestock or adopt new regulations impacting our production or processing operations, which could adversely affect our business.”
141
Our Mexican operations also are subject to regulation by Mexican environmental authorities. The Mexican federal, state and local authorities may, from time to time, adopt revisions to environmental rules and regulations, and/or changes in the terms and conditions of our environmental permits, with which we must comply. Our Mexican processing plants are also subject to on-site examination, inspection and regulation by Mexican governmental agencies that perform functions similar to those performed by the USDA and the FDA. We believe that we are in substantial compliance with all applicable laws and regulations relating to the operations of our facilities.
It is our policy to comply with all applicable law in the jurisdictions in which we do business. We believe that we are in substantial compliance with applicable laws and regulations. We use internationally recognized management systems to manage many of our regulatory and compliance programs including, but not limited to, the International Organization for Standardization, or ISO, 14001:2004 standard to manage and optimize environmental performance. We were the first U.S. livestock and major international meat processor in industry to achieve ISO 14001:2004 certification for our hog production and processing facilities.
Legal and Regulatory Proceedings
From time to time, we are involved in various legal and/or administrative proceedings and subject to claims that arise in the ordinary course of business. We do not believe the ultimate liability, if any, for outstanding proceedings or claims, individually or in the aggregate, in excess of amounts already provided in our consolidated financial statements, will have a material adverse effect on our business, financial condition or results of operations. It is reasonably possible that an adverse determination might have an impact on a particular period. Regardless of the outcome, litigation has the potential to have an adverse impact on us because of defense and settlement costs, diversion of management resources, adverse reputational impact, and other factors. See “Risk Factors—Risks Relating to Government Regulations—We are, and could become, subject to legal proceedings and regulatory investigations that may result in significant expenses, fines and reputational damage.” and “Risk Factors—Risks Relating to Our Business and Operations—We are subject to various risks relating to worker employment and health and safety.”
Antitrust Price-Fixing Litigation
The company has been named as one of 16 defendants in a series of class actions filed in 2018 in the United States District Court for the District of Minnesota alleging antitrust violations in the pork industry. The class cases were filed by three different groups of plaintiffs. In all of these cases, the plaintiffs alleged that starting in 2009 and continuing through at least June of 2018, the defendant pork producers agreed to reduce the supply of hogs in the United States in order to raise the price of hogs and all pork products. The plaintiffs in all of these cases also challenged the defendant pork producers’ use of benchmarking reports from defendant Agri Stats, Inc., alleging that the reports allowed the pork producers to share proprietary information and monitor each producer’s compliance with the supposed agreement to reduce supply. Payments in the aggregate amount of $194 million were made by us to settle all class claims.
In addition to the class actions, the company has been named as a defendant in similar antitrust lawsuits and related claims brought by a number of individual parties who opted out of the classes. The plaintiffs in the non-class cases assert the same or similar antitrust claims as the plaintiffs in the class actions. The company has entered into negotiations with many of these claimants and has settled certain of these cases. Currently, 22 of these cases are pending against the company.
The Attorneys General for the states of New Mexico and Alaska and the Commonwealth of Puerto Rico have filed similar complaints on behalf of their respective states, territories, agencies and citizens. The company has settled with Puerto Rico and Alaska. The company intends to vigorously defend against the remaining claims.
Antitrust Wage-Fixing Litigation
On November 11, 2022, our company and our wholly owned subsidiary, Smithfield Packaged Meats Corp., were named as two of the numerous defendants in a purported class action complaint filed in the United States District Court for the District of Colorado alleging wage-fixing violations in the red meat industry. The plaintiffs allege that the defendants, most of whom operate beef or pork processing plants, conspired to suppress wages paid to
142
plant workers in the United States in violation of the antitrust laws. The plaintiffs sought damages on behalf of all employees of defendants and their subsidiaries from January 1, 2014, to the present. The plaintiffs also sought treble damages and attorneys’ fees. The defendants filed motions to dismiss the complaint, which were largely denied by the court on September 27, 2023. The plaintiffs subsequently amended their complaint adding additional defendants, including our wholly owned subsidiary, Murphy-Brown of Missouri, LLC (which has been dismissed voluntarily), and expanding the class period back to 2000.
Since the case was filed, several defendants have settled. On April 5, 2024, the remaining defendants moved to dismiss the amended complaint. We intend to vigorously defend against these claims.
Maxwell Foods Litigation
On August 13, 2020, Maxwell Foods, LLC, or Maxwell, filed a complaint against our company in the General Court of Justice, Superior Court Division for Wayne County, North Carolina. The complaint alleged that Smithfield breached the Production Sales Agreement, or the PSA, between the parties (as well as the duty of good faith and fair dealing): (i) by failing to provide Maxwell with the same pricing as other major hog suppliers in violation of a purported “Most-Favored-Nation Provision” found in a December 6, 1994 letter to Maxwell, (ii) by failing to comply with an implicit duty to negotiate the PSA to provide alternative pricing to Maxwell when the Iowa-Southern Minnesota market allegedly ceased to be viable; and (iii) by failing to purchase Maxwell’s entire output of hogs since April 2020.
We filed a notice of removal to the United States District Court of the Eastern District of North Carolina. We also filed a motion to dismiss several of Maxwell’s claims. On February 22, 2021, the U.S. District Court granted Maxwell’s motion to remand the case to the Superior Court of Wayne County and left Smithfield’s partial motion to dismiss the complaint for consideration by the state court in Wayne County.
On March 1, 2021, Maxwell filed an amended complaint, which added a claim under the North Carolina Unfair and Deceptive Trade Practices Act, or the UDTPA. We filed a notice of designation seeking assignment of the case to the North Carolina Business Court. Maxwell objected to such designation, and on April 13, 2021 the Business Court overruled Maxwell’s objection.
The Business Court also dismissed two of Maxwell’s claims: the implied duty to negotiate claim and the UDTPA claim. Maxwell subsequently filed another amended complaint adding a fraudulent concealment claim and a new breach of contract claim, as well as a request for punitive damages. The court dismissed the fraudulent concealment claim and the request for punitive damages. The three remaining claims, all for breach of contract, are: (1) the claim under the “Most-Favored-Nation Provision,” (2) the claim that we failed to purchase Maxwell’s entire output of hogs since April 2020, and (3) the claim that from time to time, we would calculate Maxwell’s payment for a delivery of hogs using an average of the preceding week’s weight rather than the actual weights of the hogs being delivered.
The parties filed cross-motions for summary judgment, and on December 30, 2024, the Business Court issued decisions on these motions. The rulings on the summary judgment motions remain under seal. We intend to vigorously defend against the remaining claims and do not believe that this matter will have a material adverse effect on our results of operations or financial condition.
Murphy-Brown Consent Decree
In March 2006, we entered into a consent decree that settled two citizen lawsuits alleging, among other things, violations of certain environmental laws relating to wastewater management practices. The consent decree provides, among other requirements, that our subsidiary, Murphy-Brown LLC, must undertake a series of measures designed to enhance the performance of the swine waste management systems on approximately 244 company-owned farms in North Carolina and thereby reduce the potential for surface water or groundwater contamination from these farms. We believe that Murphy-Brown has successfully completed a number of the measures required by the consent decree; Murphy-Brown expects to fulfill its remaining consent decree obligations, at which time it will move for termination of the decree.
143
Premium Standard Farms Consent Judgment and Decree
Prior to our acquisition of Premium Standard Farms, or PSF, PSF entered into a consent judgment with the State of Missouri and a consent decree with the federal government and a citizen group. The judgment and decree generally required that PSF pay penalties to settle past alleged regulatory violations, utilize new technologies to reduce nitrogen in the material that it applies to farm fields and research, develop and implement “Next Generation Technology” for environmental controls at certain of its Missouri farm operations. We successfully completed the measures called for in the state judgment and the state court terminated the judgment in the fall of 2012. We have also completed all but one of the measures called for in the federal consent decree, which we expect to complete by the end of 2024, but we are unable to predict at this time when the consent decree will be terminated.
North Carolina Voluntary Settlement
In July 2000, we voluntarily entered into an agreement with the Attorney General of North Carolina, or the NC AG Agreement, designed to enhance water quality in the State of North Carolina through a series of initiatives while protecting access to swine operations in North Carolina. One of the features of the NC AG Agreement required us to contribute a total of $50 million to the Attorney General of North Carolina who administers a program with our input and recommendations to allocate those funds to enhance the environment of the state, including eastern North Carolina, to obtain environmental easements, and to construct or maintain wetlands and such other environmental purposes. We began annual contributions of $2 million in 2001, deferred annual payments in 2011 and 2012 and re-started our annual $2 million payment in 2013. The final payment under the NC AG Agreement is scheduled to occur in 2026.
144
MANAGEMENT
Executive Officers
The following table sets forth the name, age and position of the individuals who are expected to continue to serve as our executive officers upon completion of this offering, followed by a biography of each executive officer.
| Name | Age | Position | ||||||||||||
| C. Shane Smith | 51 | President, Chief Executive Officer and Director | ||||||||||||
| Mark L. Hall | 55 | Chief Financial Officer | ||||||||||||
| Keller D. Watts | 53 | Chief Business Officer | ||||||||||||
| Doug Sutton | 54 | Chief Manufacturing Officer | ||||||||||||
| Steven France | 58 | President, Packaged Meats | ||||||||||||
| Donovan Owens | 53 | President, U.S. Fresh Pork | ||||||||||||
| Kraig A. Westerbeek | 53 | President, Hog Production | ||||||||||||
| I. Jay Bennett | 55 | Chief Human Resources Officer | ||||||||||||
| Tennille J. Checkovich | 48 | Chief Legal Officer | ||||||||||||
C. Shane Smith has served as President and Chief Executive Officer of Smithfield and as a member of the board of directors of WH Group and as a member of the board of directors of our company since July 2021. He joined our company in 2003 and has served in a variety of leadership roles for our U.S. and international operations since then. Mr. Smith has also served as an executive director at WH Group since August 2021. He served as our Chief Strategy Officer from January 2021 to July 2021. In that role, Mr. Smith was also responsible for our hog production operations, Smithfield Renewables and our European and Mexican operations. Prior to that, Mr. Smith served as Executive Vice President of our European operations from April 2019 to January 2021, President of our Romanian operations from November 2017 to April 2019 and Chief Financial Officer of our European operations from September 2012 to April 2019. Mr. Smith holds a Bachelor of Science in Accounting from Mount Olive College and a Master of Business Administration (MBA) from the College of William and Mary in Virginia.
Mark L. Hall has served as our Chief Financial Officer since January 2023. Mr. Hall joined our company in 2014 as the Vice President, Finance for the John Morrell Food Group. He served as Executive Vice President of Finance from December 2020 to January 2023, overseeing financial planning and analysis, mergers and acquisitions, operations, logistics, trade spend finance, data analytics and project and capital management in support of the U.S. business. He served as Senior Vice President, Finance, from 2019 to late 2020, where he oversaw financial operations for our fresh pork and packaged meats businesses. He served as the Vice President, Finance for our combined packaged meats businesses from 2015 to 2019. Mr. Hall has over 25 years of industry experience, serving in roles of increasing responsibility at The Quaker Oats Company and McCain Foods USA prior to joining our company in 2014. He began his career in public accounting at Arthur Andersen LLP and worked in Equity Research for Legg Mason Wood Walker, Inc. Mr. Hall holds a Bachelor of Business Administration from the University of Iowa and a Master of Business Administration (MBA) from the University of Maryland. Mr. Hall is a certified public accountant registered in the State of Illinois.
Keller D. Watts has served as our Chief Business Officer since January 2023. He has been with our company since 1994. He served as Smithfield Foods Executive Vice President, Packaged Business Management and Supply Planning from August 2021 to January 2023, Senior Vice President of Business Management Retail from May 2016 to August 2021, Senior Vice President, Packaged Business Development for Smithfield Farmland subsidiary from September 2014 to May 2016, Senior Vice President, Packaged Business Development for Smithfield Farmland from December 2008 to September 2014, Vice President, Packaged Meats from June 2006 to December 2008 and Vice President, Product Management for subsidiary Smithfield Packing from May 2001 to December 2008. Over the course of his career, Mr. Watts has held roles in sales, marketing, revenue management, supply chain, strategic sourcing, and R&D. Mr. Watts holds a Bachelor of Science in Marketing Management from Virginia Polytechnic Institute and State University and a Master of Business Administration (MBA) from Western Governors University.
145
Doug Sutton, Ph.D. has served as our Chief Manufacturing Officer since January 2023. He joined our company in 2001. He served as Executive Vice President, Manufacturing from August 2021 to January 2023, Vice President, Research and Development from January 2012 to August 2021 and Director, Research Development from January 2001 to January 2012. Dr. Sutton holds a Bachelor of Animal Science and a Master of Animal Science, each from Oklahoma State University, and a Ph.D. in Animal Science from University of Illinois Urbana-Champaign.
Steven France has served as our President of Packaged Meats since January 2023. Mr. France joined our company in 2002. He has experience spanning manufacturing, business management, transportation and warehousing, sales and marketing and customer service. He served as Executive Vice President, Packaged Meats from December 2020 to January 2023, Senior Vice President of Sales, Packaged Meats from December 2018 to December 2020 and Vice President, Deli Sales from February 2018 to December 2018. Mr. France began his career at Conagra Brands, Inc. and spent several years in various management roles at Michael Foods, Inc. Mr. France holds a Bachelor of Science from The Ohio State University.
Donovan Owens has served as our President of Fresh Pork since May 2023. He joined our company in 1993. He has experience in industrial engineering, fresh pork business management and fresh pork operations. Mr. Owens served as Executive Director of Support Operations for Smithfield Hog Production from May 2022 to April 2023. He led our Tar Heel, North Carolina facility for 12 years initially as Director of Operations from July 2010 to December 2017 and then as Complex Plant Manager from December 2017 to June 2022. He served in various other roles at our company between 1993 and 2010. Mr. Owens holds a Bachelor of Business Administration in Finance from Virginia Polytechnic Institute and State University.
Kraig A. Westerbeek has served as the President of Hog Production since February 2024. He joined our company in 1993. In July 2022, Mr. Westerbeek was named as the Chief Development Officer of Monarch. He served as Vice President, Smithfield Renewables and Hog Production Environmental Compliance from July 2017 to June 2022 and Vice President, Environment and Support Operations from June 2014 to June 2017. Mr. Westerbeek is a past member of the board of directors of the North Carolina Pork Council and NPPC and is a current member of NPPC’s environmental committee, which he previously chaired. Mr. Westerbeek holds a Bachelor of Science in Biological and Agricultural Engineering, Agriculture Systems from North Carolina State University.
I. Jay Bennett has served as our Chief Human Resources Officer since March 2023. Mr. Bennett was previously at Lockheed Martin Corporation where he served as Vice President, Human Resources RMS Lines of Business from February 2022 to March 2023. Prior to that, he was at Sikorsky Aircraft (acquired by Lockheed Martin in 2015) where he served as Vice President, Human Resources from October 2017 to February 2022 and Vice President Human Resources, Operations from July 2014 to October 2017. Prior to that, Mr. Bennett served in various managerial human resources roles at Rolls Royce plc from April 2009 to July 2014. Mr. Bennett previously served in various human resources roles at United Technologies Corporation and General Motors Company. Mr. Bennett holds a Bachelor of Arts in Political Science from DePauw University and a Juris Doctor (JD) from Indiana University Robert H. McKinney School of Law.
Tennille J. Checkovich has served as our Chief Legal Officer since December 2024. She joined our company in 2020 and served as General Counsel from March 2023 to December 2024 and Deputy General Counsel from October 2020 to March 2023. Prior to joining Smithfield, from September 2004 to October 2020, Ms. Checkovich worked at McGuireWoods LLP, where she was a partner in the business and securities litigation department, served on the firm’s Finance Committee and advised corporate clients, including our company, on a range of matters. She previously worked as an associate at Cravath, Swaine & Moore LLP. Early in her career, Ms. Checkovich was a law clerk to the Honorable Barbara S. Jones of the United States District Court for the Southern District of New York. She is the Vice Chair of the Board of the Alliance for the Chesapeake Bay, where she has served on the Governance Committee. Ms. Checkovich holds a Bachelor of Arts in economics from the University of Virginia and a Juris Doctor from Yale Law School.
146
Directors
The following table sets forth the name, age and position of our current directors and the individuals who are expected to serve as our directors upon completion of this offering, followed by a biography of each director.
| Name | Age | Position | ||||||||||||
Long Wan(3)(4)(5) | 84 | Chairman | ||||||||||||
C. Shane Smith(5) | 51 | Chief Executive Officer and Director | ||||||||||||
Hank Shenghua He(3)(4)(5) | 56 | Director | ||||||||||||
Lijun Guo(3)(5) | 53 | Director | ||||||||||||
| Hongwei Wan | 50 | Director Nominee | ||||||||||||
Xiaoming Zhou(3)(4)(5) | 38 | Director Nominee | ||||||||||||
Marie T. Gallagher(1)(2) | 65 | Director Nominee | ||||||||||||
Raymond A. Starling(1)(2)(4) | 48 | Director Nominee | ||||||||||||
John A. Quelch(1)(2)(3) | 73 | Director Nominee | ||||||||||||
________________
(1)Independent director under the rules of Nasdaq.
(2)Proposed member of our Audit Committee.
(3)Proposed member of our Compensation Committee.
(4)Proposed member of our Nominating and Governance Committee.
(5)Proposed member of our Executive Committee.
The biography of C. Shane Smith is set forth above in “—Executive Officers.”
Long Wan has served as a member of our board of directors since September 2013. Mr. Wan has served as a director of WH Group since October 2007, as the Chairman of the board of directors since November 2010 and as an Executive Director since December 2013. Mr. Wan has also served as a director of Shuanghui Development since August 2012. Mr. Wan also holds directorships in various subsidiaries of WH Group. He served as the Chief Executive Officer of WH Group from October 2013 to August 2021. He served as the Chairman of the board of directors of Shuanghui Development from August 2012 to August 2024. Mr. Wan has over 50 years of experience in the meat processing industry, and under his leadership, the business under WH Group has grown from a local state-owned enterprise in Henan Province, China into an international company with operations spanning various continents. He was appointed as an Executive Director of the China Meat Association from December 2006 to December 2011 and a senior consultant of the China Meat Association in 2001. Mr. Wan received his professional certificate in Business Management from the Henan University of Animal Husbandry and Economy (previously named the Henan Business College) and was awarded the senior economist professional qualification issued by the Henan Province Advanced Professional Titles Adjudication Committee (Economic Disciplines).
We believe Mr. Wan is qualified to serve as our director because of his extensive experience in the meat processing industry, outstanding accomplishments in the meat industry and his in-depth knowledge of our Company. Mr. Wan is the father of Mr. Hongwei Wan.
Hank Shenghua He has served as a member of our board of directors since January 2016. He has served as our Vice President and Chief Operation Coordinating Officer, among other roles, since January 2014. Mr. He has extensive experience in mechanical engineering and food industry operations. After our Company was acquired by WH Group in 2013, Mr. He played an important role in the post-acquisition transition. Prior to joining our Company, Mr. He served in various positions with Shuanghui Development for more than a decade, including as the assistant to the Chairman of Shuanghui Development from September 2012 to January 2014 and as the Vice President from June 2005 to August 2012. He also served as the manager of Shuanghui Group’s Commerce and Logistic Division from August 2008 to June 2011. Mr. He obtained his Bachelor’s Degree in Engineering from University of Chongqing in China.
We believe Mr. He is qualified to serve as our director because of his exceptional expertise in corporate strategy, communication and leadership.
147
Lijun Guo has served as a member of our board of directors since May 2015. Mr. Guo has served as an Executive Director of WH Group since December 2013 and as the Chief Executive Officer of WH Group since August 2021. Mr. Guo has also served as a director of Shuanghui Development since August 2021. He also holds directorships in various subsidiaries of WH Group. He also served as an Executive Vice President and the Chief Financial Officer of WH Group from April 2016 to August 2021. Prior to this, Mr. Guo was WH Group’s Vice President and Chief Financial Officer from January 2014 to March 2016 and served as the Deputy Chief Executive Officer from October 2013 to January 2014. Mr. Guo was the Executive Vice President of Shuanghui Development from August 2012 to October 2013. Prior to that, he held various positions in Shuanghui Group, including serving as deputy director, director of the finance department and Chief Financial Officer. Mr. Guo has over 30 years of experience overseeing the financial operations of various companies.
Mr. Guo obtained his adult higher education diploma in financial accounting from Henan Radio and Television University in July 1994 and obtained the completion certificate for the master of business administration program of the Graduate School of Renmin University of China in December 2004. Mr. Guo received his assistant accountant certificate awarded by the Ministry of Personnel of the People’s Republic of China in October 1994.
We believe Mr. Guo is qualified to serve as our director because of his substantial experience in accounting and financial operations and comprehensive knowledge of the industry.
Hongwei Wan will serve as a member of our board of directors upon the pricing of this offering. Mr. Wan Hongwei has served as an Executive Director and the Deputy Chairman of the board of directors of WH Group since August 2021. He has also served as a director of Shuanghui Development since August 2018 and the Chairman of the board of directors of Shuanghui Development since August 2024. He also holds directorships in various subsidiaries of the Group. Mr. Wan Hongwei served as an assistant to the Chief Executive Officer of WH Group from January 2014 to August 2021 and was in charge of WH Group’s public relations department. He served as the Vice Chairman of the board of directors of Shuanghui Development from August 2018 to August 2024. Prior to that, he served as the secretary to the Chairman of Shuanghui Group. Mr. Wan Hongwei holds a Bachelor of Arts from York University in Toronto, Ontario.
We believe Mr. Wan is qualified to serve as our director because of his exceptional expertise in the industry we operate in and comprehensive understanding of our company. Mr. Wan is the son of Mr. Long Wan.
Xiaoming Zhou will serve as a member of our board of directors upon the pricing of this offering. Mr. Zhou has served as the Vice President of WH Group since May 2023, responsible for investment management of WH Group. Mr. Zhou has more than 15 years of experience in investment banking and corporate finance. Prior to joining WH Group, Mr. Zhou worked in BofA Securities, Inc. from May 2015 to May 2023 and most recently served as Managing Director of Global Investment Banking, advising corporate clients on capital raising and merger and acquisition transactions. Prior to that, he served as Vice President of Morgan Stanley’s investment banking division. Mr. Zhou holds a Bachelor in Economics (major in finance) and Bachelor of Science (major in statistics), both from Peking University.
We believe Mr. Zhou is qualified to serve as our director because of his significant knowledge in corporate finance and capital raising, combined with his broad experience in investments in the industry in which we operate.
Marie T. Gallagher will serve as a director upon the pricing of this offering. Ms. Gallagher has spent nearly two decades at PepsiCo, Inc., where she has served as Senior Vice President and Controller since May 2011 after serving in various other roles at PepsiCo since 2005. As PepsiCo’s Chief Accounting Officer, Ms. Gallagher is responsible for PepsiCo’s global financial reporting and Sarbanes-Oxley processes and provides guidance on accounting and business issues, including strategic M&A activity in emerging markets and cybersecurity matters. Prior to joining PepsiCo, Ms. Gallagher served in various control roles of increasing responsibility at Altria Corporate Services, Inc. from 1992 to 2005, ending as Assistant Controller. Ms. Gallagher served as a director of Glatfelter Corporation (NYSE: GLT) from February 2020 to November 2024 where she served as a member of the Audit Committee from February 2020 to February 2021 and the Audit Committee chair and a member of the Nominating and Governance Committee from February 2021 to November 2024. She currently serves on the boards of various not-for-profit
148
companies. Ms. Gallagher is a Certified Public Accountant and holds a Bachelor’s Degree in Business Administration in Accounting from Pace University.
We believe Ms. Gallagher is qualified to serve as our director because of her significant knowledge in corporate finance, financial reporting and accounting, as well as her broad experience in the food and beverage industry.
Raymond A. Starling will serve as a director upon the pricing of this offering. Mr. Starling has served as General Counsel to the North Carolina Chamber of Commerce and President of the North Carolina Chamber Legal Institute since July 2019. He has also served as Executive Advisor for Aimpoint Research since July 2022. Prior to these roles, Mr. Starling served as Chief of Staff to the U.S. Secretary of Agriculture from June 2018 to June 2019. Mr. Starling also previously served as a principal agriculture advisor to the President of the United States at the White House from February 2017 to June 2018. Mr. Starling served in various roles for North Carolina Speaker of the House and later U.S. Senator Thom Tillis from November 2012 to February 2017, and Mr. Starling served as General Counsel for the North Carolina Department of Agriculture & Consumer Services from February 2007 to November 2012. Prior to his career in public service, Mr. Starling worked as an Associate for Hunton & Williams LLP from August 2003 to February 2007. Mr. Starling has taught several agricultural and food law courses at the University of North Carolina at Chapel Hill and Campbell University, taught a public lawyering course at Regent University and is currently a member of the extended faculty of High Point University School of Law. Mr. Starling holds a Bachelor of Science in Agricultural and Extension Education from North Carolina State University and a Juris Doctor (JD) from the University of North Carolina School of Law.
We believe Mr. Starling is qualified to serve as our director due to his substantial knowledge of the agriculture industry, as well as his broad government and private sector experience.
John A. Quelch will serve as a director effective upon the pricing of this offering. Mr. Quelch has served as the Executive Vice Chancellor of Duke Kunshan University since January 2024. Mr. Quelch has also held professorship positions at Duke Kunshnan University and Duke University Fuqua School of Business since January 2024. He also has served as Chairman of the consulting firm Globalpraxis since January 2023. Mr. Quelch served as Dean and Vice Provost for Executive Education and the Leonard M. Miller University Chair at the University of Miami from July 2017 to December 2023. Between 2013 and 2017, he served as a professor at both Harvard Business School and Harvard T.H. Chan School of Public Health. Mr. Quelch was a Harvard Business School professor between 1979 and 2013, except for serving as Dean, Vice President and Distinguished Professor of International Management of the China Europe International Business School from 2011 to 2013 and Dean of the London Business School from 1998 to 2001. Mr. Quelch has served as an independent director of several publicly traded and private companies in the United States and the United Kingdom, as well as in nonprofit and public agency boards, including as chairman of the Massachusetts Port Authority. Mr. Quelch holds a Bachelor of Arts in Modern History and a Master of Arts from Exeter College, Oxford University and a Master of Business Administration from the Wharton School of Business at the University of Pennsylvania. He also holds a Master of Science in Nutrition Science from T.H. Chan School of Public Health at Harvard University and a Doctor of Business Administration from Harvard Business School.
We believe Mr. Quelch is qualified to serve as our director due to his extensive experience as a director of various public reporting companies, as well as his academic and management expertise.
Composition of the Board of Directors
Our business and affairs are managed under the direction of our board. Upon completion of this offering, the board will consist of nine directors.
In accordance with our amended and restated articles of incorporation, which will become effective immediately prior to the completion of this offering, our board will be divided into three classes of directors, with staggered three-year terms, denominated as class I, class II and class III. As a result, approximately one-third of the board will be elected each year. The class I directors, whose terms will expire at the first annual meeting of our shareholders following the completion of this offering, will be Mr. Smith, Mr. Zhou and Mr. Quelch. The class II directors, whose terms will expire at the second annual meeting of our shareholders following the completion of this offering, will be Mr. Long Wan, Mr. He and Mr. Starling. The class III directors, whose terms will expire at the third
149
annual meeting of our shareholders following the completion of this offering, will be Mr. Guo, Mr. Hongwei Wan and Ms. Gallagher.
We expect that any additional directorships resulting from an increase in the number of directors will be distributed among the three classes so that, as nearly as possible, each class will consist of one-third of the directors. The division of our board into three classes with staggered three-year terms may delay or prevent a change of our management or a change of control. See “Description of Capital Stock—Election and Removal of Directors; Vacancies.”
We also have entered into a shareholders agreement with WH Group, which grants WH Group certain rights with respect to the composition of our board. For so long as WH Group beneficially owns more than 50% of our outstanding common stock, it will be entitled to nominate for election to our board a majority of the directors on our board and control the composition of our board and the approval of actions requiring shareholder approval through their voting power. If WH Group ceases to own a majority of our common stock, for so long as WH Group continues to own at least 10% of our outstanding common stock, it will be entitled to nominate for election to our board a number of the total number of directors entitled to serve on the board proportionate to the percentage of our outstanding common stock beneficially owned by WH Group, rounded up to the nearest whole number. Thereafter, WH Group will no longer have any right to nominate for election to our board directors to serve on the board under the shareholders agreement. See “Certain Relationships and Related Party Transactions—Relationship with WH Group Following this Offering.”
Controlled Company Exemption
Upon completion of this offering, WH Group will own % of the voting power of our shares of common stock eligible to vote in the election of our directors (or % if the underwriters exercise in full their option to purchase additional shares of our common stock). As a result, we will be a “controlled company” as defined under the corporate governance rules of Nasdaq and, therefore, will qualify for exemptions from certain corporate governance requirements of Nasdaq. Accordingly, we have elected not to comply with the requirements that:
•a majority of our board consists of independent directors;
•we have a nominating and corporate governance committee that is composed entirely of independent directors;
•we have a compensation committee that is composed entirely of independent directors; and
•we conduct an annual performance evaluation of the Nominating and Governance and Compensation committees.
The “controlled company” exemption does not modify the independence requirements for the Audit Committee, and we intend to comply with the applicable requirements of the Securities Exchange Act of 1934, as amended, or the Exchange Act, and the corporate governance requirements of Nasdaq within the applicable transition periods. As a result, we expect that the Audit Committee will be composed of (1) at least one independent director upon the listing of our common stock, (2) a majority of independent directors within 90 days of listing and (3) exclusively independent directors within one year of listing. Upon the completion of this offering, we expect the Audit Committee will be composed exclusively of independent directors. See “—Committees of the Board of Directors—Audit Committee.”
In the event that we cease to be a “controlled company,” we will be required to fully implement the corporate governance requirements of Nasdaq within the applicable transition periods specified in the rules of Nasdaq. There is no single shareholder or group of shareholders which owns 50% or more of the voting power of WH Group as of the date of this prospectus. As a result, WH Group would not be considered a controlled company within the meaning of the corporate governance standards of Nasdaq.
150
Director Independence
The board has undertaken a review of the independence of each of our directors. Based on information provided by our directors concerning their background, employment and affiliations, the board has determined that Ms. Gallagher, Mr. Starling and Mr. Quelch qualify as “independent” under the rules of Nasdaq. In assessing the independence of each of our directors, the board considered the relationships that each director has with us and with WH Group as well as all other facts and circumstances that the board deemed relevant to assess the independence of each of our directors.
The board will assess, at least annually, the independence of each of our directors and make a determination as to which of our directors are independent. To assist the board in making this determination, we have adopted Standards of Independence as part of our Corporate Governance Guidelines. The Standards of Independence conform to, or are stricter than, the independence standards of Nasdaq and identify, among other things, material business, charitable and other relationships that could interfere with a director’s ability to exercise independent judgment.
Committees of the Board of Directors
Effective immediately prior to the listing of our shares on the Nasdaq Global Select Market, the board will have the following standing committees: (1) the Audit Committee, (2) the Compensation Committee, (3) the Nominating and Governance Committee and (4) the Executive Committee. The board will adopt a written charter for each committee and these charters will be available on our website at www.smithfieldfoods.com. The information contained on, or that can be accessed through, our website is not part of, and is not incorporated into, this prospectus, and you should not rely on any such information in making an investment decision to purchase shares of our common stock.
Audit Committee
The initial members of the Audit Committee will be Ms. Gallagher, Mr. Starling and Mr. Quelch, and Ms. Gallagher will serve as Chair of the Audit Committee. The board has determined that each of the members of the Audit Committee is independent under the rules of Nasdaq and under Rule 10A-3 under the Exchange Act and that Ms. Gallagher is an “audit committee financial expert” as defined under the rules of the SEC. The responsibilities of the Audit Committee will include:
•reviewing the audit plans and findings of our independent registered public accounting firm and our internal audit and risk review staff, as well as the results of regulatory examinations, and tracking management’s corrective action plans where necessary;
•reviewing our combined financial statements, including any significant financial items and/or changes in accounting policies, with our senior management and independent registered public accounting firm;
•reviewing our financial risk and control procedures, compliance programs and significant tax, legal and regulatory matters;
•exercising the sole discretion to appoint annually our independent registered public accounting firm, evaluate its independence and performance and setting clear hiring policies for employees or former employees of the independent registered public accounting firm; and
•reviewing and approving in advance any proposed related person transactions.
Compensation Committee
The initial members of the Compensation Committee will be Mr. Long Wan, Mr. Guo, Mr. He, Mr. Zhou and Mr. Quelch, and Mr. Long Wan will serve as Chair of the Compensation Committee. The responsibilities of the Compensation Committee will include:
•establishing our executive compensation philosophy and principles;
151
•reviewing and approving the compensation for our executive officers;
•administering our equity incentive plans;
•overseeing the design and management of the various pension, long-term incentive, savings, health and benefit plans that cover our employees; and
•reviewing the compensation for our non-employee directors and recommending compensation for approval by the full board.
Nominating and Governance Committee
The initial members of the Nominating and Governance Committee will be Mr. Long Wan, Mr. He, Mr. Zhou and Mr. Starling, and Mr. Long Wan will serve as Chair of the Nominating and Governance Committee. The responsibilities of the Nominating and Governance Committee will include:
•identifying, evaluating, and recommending to our board individuals qualified to become new directors, consistent with criteria approved by our board;
•reviewing the qualifications of incumbent directors to determine whether to recommend them for reelection at our next annual meeting of the shareholders;
•identifying, evaluating, and recommending to our board to appoint those directors that are qualified to serve on any committee of our board;
•reviewing and recommending to our board corporate governance principles applicable to us; and
•overseeing the evaluation of our board.
Executive Committee
The initial members of the Executive Committee will be Mr. Long Wan, Mr. Guo, Mr. He, Mr. Smith and Mr. Zhou, and Mr. Guo will serve as Chair of the Executive Committee. The Executive Committee will be empowered to exercise the authority of the board between meetings in accordance with and subject to the limitations set forth in its written charter.
Compensation Committee Interlocks and Insider Participation
During 2024, we were not a standalone company, and we did not have a compensation committee or any other committee serving a similar function. Decisions with respect to the compensation for that fiscal year of the individuals who will serve as our executive officers upon completion of this offering were made by WH Group, as described in “Executive Compensation.”
Corporate Governance Guidelines
Effective immediately prior to the listing of our shares on the Nasdaq Global Select Market, the board will adopt Corporate Governance Guidelines to assist it in guiding our governance practices. Our Corporate Governance Guidelines are required to be reviewed annually by the Nominating and Governance Committee and may be amended by the board from time to time. Our Corporate Governance Guidelines will address a number of topics, including responsibilities of the board, director qualifications, rights of the board, rights of our shareholders, election of directors, board committees, board and board committee performance evaluations, director orientation, executive performance evaluations, succession planning and stock ownership guidelines. Our Corporate Governance Guidelines will be available on our website at www.smithfieldfoods.com. The information contained on, or that can be accessed through, our website is not part of, and is not incorporated into, this prospectus, and you should not rely on any such information in making an investment decision to purchase shares of our common stock.
152
Board of Directors Oversight of Risk Management
The board will be responsible for overseeing senior management’s execution of its risk management duties and for assessing its approach to risk management. The board’s oversight of risk is an integral element of its oversight responsibilities and seeks to ensure that senior management has processes in place to appropriately identify and manage risk. We expect that the board will actively engage with senior management to understand and oversee our most significant risks, including in the following ways:
•The board will review and discuss strategic, operational, financial and reporting risks as well as non-financial risks including strategic, operational, compliance, environmental, social, human capital management and cybersecurity risks.
•The board and its applicable committees will receive regular updates from management regarding various enterprise risk-management issues and risks related to our business segments, including risks related to litigation, product quality and safety, cybersecurity, reputation, human capital, diversity, equity and inclusion and environmental sustainability.
•Independent directors will hold regular executive sessions without any non-independent directors or members of management present to discuss risks facing us and our risk-management practices and, with respect to certain board committees, independent directors will also meet in private session with management and compliance leaders.
•The board will consult with external advisors, including outside counsel, consultants, auditors and industry experts, to ensure that it is well informed about the risks and opportunities facing us.
•The board will review feedback provided by shareholders to ensure that it understands shareholder perspectives and concerns.
Code of Ethics and Business Conduct
Effective immediately prior to the listing of our shares on the Nasdaq Global Select Market, we will adopt an amended Code of Ethics and Business Conduct that applies to all of our directors, officers and employees, including our chief executive officer, chief financial officer and chief accounting officer. Our Code of Ethics and Business Conduct is a “code of ethics,” as defined in Item 406(b) of Regulation S-K. We will make any legally required disclosures regarding amendments to, or waivers of, provisions of our code of ethics on our website.
Our amended Code of Ethics and Business Conduct will be available on our website at www.smithfieldfoods.com. The information contained on, or that can be accessed through, our website is not part of, and is not incorporated into, this prospectus, and you should not rely on any such information in making an investment decision to purchase shares of our common stock.
153
EXECUTIVE AND DIRECTOR COMPENSATION
Compensation Discussion and Analysis
Executive Summary
As a wholly owned subsidiary of WH Group, we have historically not had an independent board or compensation committee to determine the compensation of our named executive officers, or NEOs. Such determinations have historically been made by the board of directors of WH Group, based on recommendations from the Remuneration Committee of the board of directors of WH Group, or, if the executive served as a director or an executive officer of WH Group, the WH Group Remuneration Committee. The board of directors of WH Group has also historically approved the mix of compensation and performance metrics that determine the compensation of our senior management. After the completion of this offering, our executive compensation programs, policies, and practices for our executive officers will be subject to the review and approval of our board or the Compensation Committee. Our Compensation Committee will review our compensation philosophy and programs following the completion of this offering to ensure that they are appropriate for our status as a newly public company. Accordingly, our executive compensation programs, policies, and practices following the completion of this offering may not be the same as those discussed below.
For purposes of this Compensation Discussion and Analysis, or the CD&A, and the following executive compensation tables, our NEOs are:
•C. Shane Smith, Chief Executive Officer
•Mark Hall, Chief Financial Officer
•Steven J. France, President, Packaged Meats
•Keller Watts, Chief Business Officer
•Doug Sutton, Chief Manufacturing Officer
Prior to the completion of this offering, Mr. Smith and Mr. Hall each served as a director and an executive officer, respectively, of WH Group. The following sections of this CD&A describe our historical executive compensation philosophy and executive compensation plans, policies, and practices as part of WH Group, as well as certain aspects of our anticipated compensation structure following the completion of this offering.
Compensation Philosophy and Objectives
The compensation philosophy and objectives of WH Group pursuant to which our NEOs’ compensation has historically been determined prior to this offering have focused on aligning employee rewards with the goals, objectives, and financial performance of WH Group and motivating employees to continually improve operating performance. Our historical incentive programs have been structured as opportunities to earn compensation, and not as guarantees; they are designed to pay out when performance is strong and not to pay out when performance is weak.
The primary goal of WH Group’s executive compensation program is the same as its primary goal for operating our company—to maximize short-term and long-term corporate performance. To facilitate WH Group’s efforts to achieve this goal, our historical executive compensation program has been based on the following principles:
•Paying for performance. A significant portion of our executives’ compensation is subject to corporate, operating segment, and/or business-unit performance measures, and all of our NEOs have a portion of their compensation tied to our net income. Performance-based compensation has varied from year to year depending on our performance, which is impacted by, among other things, the volatile nature of our agricultural commodity-based industry and governmental food and energy policy. In recent years, average payouts of performance-based cash compensation ranged from 61% to 80% of our executives’ total cash
154
compensation. In fiscal year 2024, target performance-based cash compensation constituted on average approximately 80% of total target cash compensation of our NEOs.
•Alignment with the interests of shareholders. Many of our cash awards are tied to key financial performance measures that are expected to correlate with the creation of shareholder value.
•Attracting and retaining top talent. The compensation of our executives is designed to be competitive with the organizations with which we compete for talent so that we can attract and retain talented and experienced executives. Our NEOs have, on average, approximately 21 years of experience with Smithfield and its predecessors.
Each element of our compensation program is designed to further one or more of these principles. The structure of a particular executive’s compensation varies depending on the scope and level of that executive’s responsibilities. For an executive with corporate-level responsibilities, performance-based cash compensation is generally based on Smithfield’s net income. For an executive responsible for a business segment, performance-based cash compensation is also based on the performance of that segment. For example, performance-based cash compensation for an executive responsible for the Fresh Pork segment or an individual business unit within that group is generally based on the operating results of the Fresh Pork segment in addition to Smithfield’s net income, thus encouraging coordination of efforts among the individual business units within each operating segment in order to maximize the financial performance of the entire operating segment. An executive responsible for an individual business unit might occasionally receive performance-based cash compensation based on the operating results or other performance measures of that business unit, particularly if that unit operates more-or-less independently of other business units.
Compensation Process
Prior to the completion of this offering, the WH Group Remuneration Committee and senior management of WH Group were responsible for developing and administering the compensation program for our executive officers, including our NEOs, and other key employees.
In connection with this offering, we intend to establish, through our Compensation Committee, our own compensation strategy and philosophy that will inform the initial compensation determinations for our executive officers that will take effect following this offering. We have engaged Willis Towers Watson, a compensation consultant, to provide advice on executive compensation matters. Following the completion of this offering, the Compensation Committee will assume responsibility for determining our compensation philosophy, structuring our compensation and benefits programs, and determining appropriate payments and awards to our executive officers, including our NEOs.
Components of Executive Compensation
The components of executive compensation for our NEOs in fiscal year 2024, as described in more detail below, include (i) base salary, (ii) cash incentive awards, and (iii) benefits and perquisites.
Base Salary
Base salaries are intended to provide a level of compensation sufficient to attract and retain an effective management team when considered in combination with the performance-based and other components of our executive compensation program. The base salary levels for executive officers are designed to reflect each executive officer’s scope of responsibility and accountability within our company. Base salaries are reviewed annually to determine if they are equitably aligned within our company and are at sufficient levels to attract and retain top talent. Consistent with our greater emphasis on performance-based pay, base salaries for executives are not changed frequently.
155
Our NEOs’ base salaries for fiscal year 2024 were as follows:
| NEO | Salary | |||||||
| C. Shane Smith | $ | 1,500,000 | ||||||
| Mark Hall | $ | 1,000,000 | ||||||
| Steven J. France | $ | 1,000,000 | ||||||
| Keller Watts | $ | 1,000,000 | ||||||
| Doug Sutton | $ | 1,000,000 | ||||||
Annual Incentive Program
We have historically provided performance-based annual cash incentive opportunities to certain of our executives, including our NEOs. The performance criteria applied to such awards are designed to tie executives’ performance directly to the amount of incentive compensation earned, and to encourage executives to coordinate their management efforts among business units within the same operating segment, in addition to the company as a whole. Awards generally use formulas based on our net income or pre-tax profits—either company-wide or for a particular operating segment depending on the executive’s scope of responsibility. An executive who is responsible for an individual business unit may occasionally receive a cash incentive award that is based on the operating results or other performance measures of that business unit, particularly if that business unit operates to a significant degree independently of other business units. At the beginning of the year, the WH Group Remuneration Committee recommends the performance criteria and cash incentive award formulas for the year to the board of directors of WH Group. In making these recommendations, the WH Group Remuneration Committee considers the performance of our company and the respective segments and business units in recent years. The WH Group Remuneration Committee has the discretion to take into account additional criteria when evaluating bonus outcomes and award cash bonuses if targets are not met and additional cash bonuses if the executives out-perform their target criteria, or to reduce cash bonuses that would otherwise be earned even if targets are met.
Individual Target Annual Cash Incentive Opportunities
Each NEO’s annual incentive target, as a percentage of base salary, for fiscal year 2024 was as follows:
| NEO | Incentive Target | |||||||
| C. Shane Smith | 667 | % | ||||||
| Mark Hall | 400 | % | ||||||
| Steven J. France | 400 | % | ||||||
| Keller Watts | 400 | % | ||||||
| Doug Sutton | 300 | % | ||||||
Annual Cash Incentive Program Design for Fiscal Year 2024
For fiscal year 2024, the performance of C. Shane Smith, Mark Hall, Keller Watts, and Doug Sutton was measured against Net Income attributable to Smithfield, and the performance of Steven France was measured against Packaged Meats Segment Profit, Net Income attributable to Smithfield, and Packaged Meats Volume. For Mr. France, Packaged Meats Segment Profit made up 60% of his target opportunity, Net Income attributable to Smithfield made up 20% of his target opportunity, and Packaged Meats Volume made up 20% of his target opportunity.
For our NEOs, annual cash incentive payout opportunities were based on attaining a certain target (to receive a payout at target) or a stretch target (to receive a payout above target, with no maximum payout cap) for the relevant financial metrics pre-established by the WH Group Remuneration Committee at the beginning of the fiscal year. For our NEOs with respect to fiscal year 2024, the threshold, target and stretch performance and corresponding payout opportunities relating to Net Income attributable to Smithfield were as follows, with non-linear interpolation for performance between threshold and target payout levels:
156
Net Income attributable to Smithfield (in $ millions) (1) | Payout | ||||||||||
| Below Threshold | <600 | 0 | % | ||||||||
| Threshold | 600 | 36 | % | ||||||||
| Target | 1,000 | 100 | % | ||||||||
| Stretch | >1,000 | >100%(2) | |||||||||
________________
(1)After the completion of this offering, it is expected that this financial target will be changed to North America Net Income, which will be equivalent to Net Income attributable to Smithfield excluding Net Income from Europe.
(2)For performance above target, our NEOs receive a percentage of the amount in excess of the target of $1 billion as follows:
| NEO | Payout for Amount in Excess of Target | |||||||
| C. Shane Smith | 1.0 | % | ||||||
| Mark Hall | 0.4 | % | ||||||
| Steven J. France | 0.4 | % | ||||||
| Keller Watts | 0.4 | % | ||||||
| Doug Sutton | 0.3 | % | ||||||
For Packaged Meats Segment Profit, threshold begins at 76% achievement of plan with an approximately 4% target payout; 100% payout when plan is achieved at target; and for every 1.5% increase above the target, Mr. France will receive an additional 0.012% of the Packaged Meats Segment Profit result, with no maximum payout cap. For Packaged Meats Volume, threshold begins at approximately 91% achievement of plan with a 2.5% target payout; 100% payout when plan is achieved at target, and for every approximately 0.4% increase above the target, Mr. France will receive an additional $20,000, with no maximum payout cap. Award payouts are interpolated between the discrete percentages if performance is between the above stated levels.
SEC rules provide that we do not have to disclose confidential financial information if doing so would result in competitive harm to us. Packaged Meats Segment Profit targets and Packaged Meats Volume targets and Packaged Meats Volume results are competitively sensitive information that we maintain as confidential and proprietary information and do not publicly disclose (with respect to Packaged Meats Volume, we have not disclosed these results after fiscal year 2023). We believe disclosure of such information would result in competitive harm to us.
The target-level goals can be characterized as “strong performance,” meaning that based on historical performance, although attainment of this performance level is uncertain, it can be reasonably anticipated that target performance may be achieved, while the threshold goals are more likely to be achieved and the stretch targets represent more aggressive levels of performance.
The board of directors of WH Group, at the recommendation of the WH Group Remuneration Committee, and senior management of WH Group retain the ability to reduce or eliminate payouts for individual executives, including our NEOs, even if financial metrics are met, as well as to increase payouts based on individual performance or to award bonuses even if financial metrics are not met. In making these decisions, the board of directors of WH Group and senior management of WH Group may consider factors such as the performance of the individual executive against his or her individual objectives in support of strategic priorities or additional financial metrics applicable to the business or functional area for which the executive is responsible. In addition, when comparing results to the performance targets, the board of directors of WH Group also has the discretion to make adjustments to our results for unbudgeted items that are not considered part of our ordinary operations and other events that impacted performance. This ensures that our executives are not unfairly rewarded for or penalized by these types of events.
Our full-year financial and strategic results for fiscal year 2024, including the financial metrics discussed above, are not available as of the time of this filing, and accordingly, the bonus payouts for our NEOs for fiscal year 2024 cannot yet be determined. Our board of directors or Compensation Committee will certify the total payout based on achievement against the established financial targets for all NEOs in March 2025. Following this certification, the
157
financial targets and the actual achievement against these goals for fiscal year 2024, as well as the corresponding bonus payouts for our NEOs, will be disclosed by us in a Current Report on Form 8-K.
Other Compensation Elements
Retirement Plans. Our executive officers participate in the same tax-qualified retirement plans on the same terms as provided to most of our salaried employees. These plans consist of an employee-funded 401(k) savings plan (with employer match) and a company-funded pension plan, the Smithfield Foods Salaried Pension Plan, or the Salaried Pension Plan. We also maintain the Smithfield Foods Supplemental Pension Plan, or the Supplemental Plan, which is a non-qualified supplemental pension plan available to certain executives, including our NEOs. As of June 30, 2021, our company-funded tax-qualified pension plans were frozen for all non-union employees who were eligible for such plans, both for new participants and for future benefit accruals of existing participants. Any non-union employee hired after that date does not participate in such plans, and non-union employees hired before that date participate in those plans but are no longer accruing new benefits.
Our retirement plans are intended to provide an appropriate level of replacement income upon retirement. The Supplemental Plan allows us to provide pension benefits comparable to those that would be available under the Salaried Pension Plan if the federal income tax laws did not include limits on covered compensation and benefits. The Supplemental Plan uses the same benefit formulas as the Salaried Pension Plan and uses the same types of compensation to determine benefit amounts. Therefore, the Supplemental Plan allows eligible employees to receive a pension benefit that is approximately the same percentage of their earnings, except that the amount of compensation in any year that can be used in calculating benefits is capped at $5 million. For more information about our pension plans, please refer to the Pension Benefits table and related discussion below.
Participation in the 401(k) savings plan is voluntary. The amount of compensation deferred and the amount of our match therefore varies among employees, including the executives. However, the same formulas are used to determine benefits for all participants in this plan. Furthermore, the plan does not involve any above-market returns, as returns depend on actual investment results based on individual participant investment elections.
Perquisites and Other Benefits. We provide a limited number of perquisites to our executive officers. The Summary Compensation Table below contains an itemized disclosure of all perquisites to NEOs. We believe that these perquisites are reasonable and consistent with those paid to other executives in our industry. Providing these perquisites helps to keep our base compensation packages competitive.
We also provide certain benefits to substantially all salaried employees that are not included as perquisites in the Summary Compensation Table for the NEOs because they are broadly available. These include health and welfare benefits, disability and life insurance, education and tuition reimbursement, an employee assistance program, and a charitable gift matching program.
In addition, we sponsor a non-qualified deferred compensation plan, which we refer to as the Smithfield Foods, Inc. Executive Nonqualified Excess Plan, or the Deferred Compensation Plan, for eligible employees, including our NEOs, and we maintain an additional non-qualified deferred compensation plan, the John Morrell & Company Amended & Restated Deferred Compensation Plan, or the JM Deferred Compensation Plan, that has been frozen since 2016. For a description of the Deferred Compensation Plan and the JM Deferred Compensation Plan, see “—Non-Qualified Deferred Compensation—Discussion of Non-Qualified Deferred Compensation” below.
Employment Agreements
None of our NEOs is currently party to an employment agreement with us. However, we plan to adopt an Executive Severance Plan, or the Severance Plan, effective upon the completion of this offering, pursuant to which certain senior executive employees will be entitled to severance benefits in certain situations. See “—Future Compensation Programs—Executive Severance Plan” for a description of the Severance Plan.
158
Other Compensation Governance Practices
Following the completion of this offering, we intend to implement anti-pledging and anti-hedging policies for our senior executives and our non-employee directors. We also intend to implement a compensation recoupment policy that will apply to our executive officers.
Risk Assessment of Compensation Programs
We believe that our compensation arrangements, including financial performance measures used to determine incentive payout amounts, do not provide our executives with an incentive to engage in business activities or other behavior that would expose us or our shareholders to excessive risks that are reasonably likely to have a material adverse effect.
Tax and Accounting Implications
Tax Considerations of Executive Compensation
Section 162(m) of the Internal Revenue Code of 1986, as amended, or the Code, generally prohibits public companies from claiming a tax deduction for more than $1 million of annual compensation per person paid to certain current and former executive officers. Although the Compensation Committee will be mindful of the benefits of tax deductibility when determining executive compensation, it may approve compensation that will not be fully deductible in order to ensure competitive levels of total compensation for our executive officers.
Accounting for Stock-Based Compensation
Following the completion of this offering, we will account for stock-based payments in accordance with the requirements of FASB ASC Topic 718.
Summary Compensation Table for Fiscal Year 2024
The following table sets forth the compensation awarded to or paid to our NEOs for services rendered in all capacities during fiscal year 2024.
Name and Principal Position | Year | Salary ($) | Bonus ($) (1) | Non- Equity Incentive Plan Compensation ($) (1) | All Other Compensation ($) (2) | Total ($) | ||||||||||||||||||||||||||||||||
C. Shane Smith Chief Executive Officer | 2024 | 1,500,000 | — | — | 43,612 | 1,543,612 | ||||||||||||||||||||||||||||||||
Mark Hall Chief Financial Officer | 2024 | 1,000,000 | — | — | 40,647 | 1,040,647 | ||||||||||||||||||||||||||||||||
Steven J. France President, Packaged Meats | 2024 | 1,000,000 | — | — | 33,447 | 1,033,447 | ||||||||||||||||||||||||||||||||
Keller Watts Chief Business Officer | 2024 | 1,000,000 | — | — | 34,612 | 1,034,612 | ||||||||||||||||||||||||||||||||
Doug Sutton Chief Manufacturing Officer | 2024 | 1,000,000 | — | — | 28,843 | 1,028,843 | ||||||||||||||||||||||||||||||||
________________
(1)Our full-year financial and strategic results for fiscal year 2024, including the financial metrics discussed above, are not available as of the time of this filing, and accordingly, the bonus payouts for our NEOs for fiscal year 2024 cannot yet be determined. Our board of directors or Compensation Committee will certify the total payout based on our achievement against the established financial targets for all NEOs in March 2025. Following this certification, the financial targets and the actual achievement against these goals for fiscal year 2024, as well as the corresponding bonus payouts for our NEOs, will be disclosed by us in a Current Report on Form 8-K.
159
(2)The amounts shown in this column consist of the components set forth in the table below, which include the contributions made with respect to each NEO under our 401(k) plan and the Deferred Compensation Plan and perquisites provided to each NEO.
| Name | Year | 401(k) and non-qualified plan contributions ($) | Leased vehicle ($) | Life insurance premiums ($) | ||||||||||||||||||||||
| C. Shane Smith | 2024 | 23,000 | 19,800 | 812 | ||||||||||||||||||||||
| Mark Hall | 2024 | 21,835 | 18,000 | 812 | ||||||||||||||||||||||
| Steven J. France | 2024 | 21,835 | 10,800 | 812 | ||||||||||||||||||||||
| Keller Watts | 2024 | 23,000 | 10,800 | 812 | ||||||||||||||||||||||
| Doug Sutton | 2024 | 17,231 | 10,800 | 812 | ||||||||||||||||||||||
Grants of Plan-Based Awards
The following table provides information on the annual incentive awards granted to our NEOs in respect of fiscal year 2024. There were no grants of equity awards to our NEOs in fiscal year 2024.
| Estimated Possible Payouts Under Non-Equity Incentive Plan Awards | ||||||||||||||||||||
| Name | Threshold ($) | Target ($) | Maximum ($)(1) | |||||||||||||||||
| C. Shane Smith | 3,600,000 | 10,000,000 | — | |||||||||||||||||
| Mark Hall | 1,440,000 | 4,000,000 | — | |||||||||||||||||
| Steven J. France | 1,270,000 | 4,000,000 | — | |||||||||||||||||
| Keller Watts | 1,440,000 | 4,000,000 | — | |||||||||||||||||
| Doug Sutton | 1,080,000 | 3,000,000 | — | |||||||||||||||||
________________
(1)Our NEOs are not subject to a maximum cap with respect to their possible payouts. See “—Components of Executive
Compensation—Annual Incentive Program—Annual Cash Incentive Program Design for Fiscal Year 2024” above.
Outstanding Equity Awards at Fiscal Year-End
There were no outstanding equity awards held by our NEOs as of December 31, 2024.
Option Exercises and Stock Vested
We had no outstanding option awards or stock awards during fiscal year 2024. Accordingly, no option awards were exercised by, and no stock awards vested for, our NEOs in fiscal year 2024.
160
Pension Benefits
The following table shows the present value of accumulated benefits that our NEOs are entitled to under the Salaried Pension Plan and the Supplemental Plan.
| Name | Plan Name | Number of Years Credited Service (#) | Present Value of Accumulated Benefit ($) | ||||||||||||||||||||
| C. Shane Smith | Salaried Pension Plan | 18 | 337,148 | ||||||||||||||||||||
| Supplemental Plan | 21 | 11,220,836 | |||||||||||||||||||||
| Mark Hall | Salaried Pension Plan | 8 | 193,093 | ||||||||||||||||||||
| Supplemental Plan | 11 | 3,029,835 | |||||||||||||||||||||
| Steven J. France | Salaried Pension Plan | 15.24 | 456,040 | ||||||||||||||||||||
| Supplemental Plan | 18.24 | 6,325,958 | |||||||||||||||||||||
| Keller Watts | Salaried Pension Plan | 28 | 608,284 | ||||||||||||||||||||
| Supplemental Plan | 31 | 7,057,993 | |||||||||||||||||||||
| Doug Sutton | Salaried Pension Plan | 21 | 473,842 | ||||||||||||||||||||
| Supplemental Plan | 24 | 4,668,487 | |||||||||||||||||||||
Discussion of Pension Plans
We sponsor the Salaried Pension Plan, a tax-qualified pension plan covering substantially all of our salaried employees. Each of the NEOs participates in the Salaried Pension Plan and our non-qualified pension plan, the Supplemental Plan.
The Salaried Pension Plan provides for retirement benefits that generally are a function of the participant’s average compensation during the five consecutive calendar years during the last ten years of employment in which the participant’s compensation was the highest, or Final Average Earnings, and aggregate years of service. The Supplemental Plan provides a retirement benefit, which is the benefit calculated under the Salaried Pension Plan without application of compensation and benefit limits under federal tax laws, reduced by the benefit payable from the Salaried Pension Plan. The Supplemental Plan is maintained so that we can provide a retirement benefit for certain salaried employees that is approximately the same percentage of their earnings from the company.
The retirement benefit under the Salaried Pension Plan is a lifetime benefit payable at age 65 equal to the sum of (i) 0.8% of Final Average Earnings and (ii) 0.9% of Final Average Earnings in excess of Social Security Covered Compensation, with that sum multiplied by the years of service with the company. Social Security Covered Compensation is determined annually by the Internal Revenue Service and represents an average of the amount of wages subject to Social Security taxes over a period of years. Compensation for purposes of Final Average Earnings is the total compensation shown on the participant’s W-2 reduced by any income from the exercise of stock options. Total compensation includes salary, bonus, non-equity incentive plan payments, stock awards when vested, and taxable perquisites from the company. For NEOs, such compensation includes salary, bonus, and non-equity incentive plan compensation, each as shown in the Summary Compensation Table. For the Salaried Pension Plan, compensation for purposes of calculating accruals is limited to $345,000 for calendar year 2024 as set by the Internal Revenue Service. The Supplemental Plan limits yearly earnings for purposes of calculating accruals to $5,000,000.
If a participant does not commence receiving benefits by age 65, the participant is entitled to a late retirement benefit, which is the greater of the benefit calculated at the participant’s normal retirement date actuarially increased to the actual retirement date and the benefit calculated at actual retirement date. A participant is eligible for early retirement after age 55 with five years of vesting service (age 60 for the Supplemental Plan). The early retirement benefit payable is the accrued benefit payable at age 65 reduced by 0.5% for each month that the early retirement date precedes the normal retirement date.
161
The normal form of benefit for the Salaried Pension Plan and the Supplemental Plan is a single life annuity with monthly payments paid over the life of the participant. Married participants receive a joint and 50% survivor annuity with actuarially reduced monthly payments paid until the death of the participant and his or her spouse. The other optional forms of retirement benefit in the Salaried Pension Plan include joint and 66.67%, 75%, or 100% annuities, and a ten-year certain and continuous annuity with payments guaranteed for ten years even if the participant dies. The Supplemental Plan also includes a five-year installment payment option in which the lump-sum value of the single life annuity is calculated based on factors specified in the Supplemental Plan and mandated by the Internal Revenue Service and then paid in five annual principal installments with interest credited on the unpaid installments at the same interest rate that is used to calculate the lump-sum value (currently segmented rates of 5.50% for the first 5 years, 5.76% for the next 15 years, and 5.83% for 20 or more years).
As of June 30, 2021, our company-funded tax-qualified pension plans were frozen for all non-union employees who were eligible for such plans, both for new participants and for future benefit accruals of existing participants. Any non-union employee hired after that date does not participate in such plans, and non-union employees hired before that date participate in those plans but are no longer accruing new benefits.
In accordance with SEC rules, the present value of each NEO’s accumulated benefits under the pension plans, as shown in the table above, has been calculated in accordance with the benefit formulas described above and using the same assumptions as are used by us for financial reporting purposes under generally accepted accounting principles (except that retirement age is assumed to be the normal retirement age of 65). Those assumptions are incorporated herein by reference to Note 13, “Pension and Other Retirement Plans,” of the audited financial statements included as part of this Registration Statement.
Non-Qualified Deferred Compensation
The table below provides information on benefits available to the NEOs for fiscal year 2024 under the Deferred Compensation Plan and the JM Deferred Compensation Plan, as applicable.
| Name | Plan | Executive Contributions in Last Fiscal Year ($) (1) | Company Contributions in Last Fiscal Year ($) | Aggregate Earnings in Last Fiscal Year ($) | Aggregate Withdrawals/ Distributions ($) | Aggregate Balance at Last Fiscal Year-End ($) | ||||||||||||||||||||||||||||||||
| C. Shane Smith | N/A | — | — | — | — | — | ||||||||||||||||||||||||||||||||
| Mark Hall | JM Deferred Compensation Plan | — | — | 3,881 | — | 29,482 | ||||||||||||||||||||||||||||||||
| Steven J. France | Deferred Compensation Plan | — | — | 192,710 | — | 1,011,005 | ||||||||||||||||||||||||||||||||
| Keller Watts | Deferred Compensation Plan | 150,000 | — | 170,585 | — | 1,213,215 | ||||||||||||||||||||||||||||||||
| Doug Sutton | N/A | — | — | — | — | — | ||||||||||||||||||||||||||||||||
________________
(1)Amounts in this column are included in the “Salary” and/or “Non-Equity Incentive Plan Compensation” columns of the “Summary Compensation Table for Fiscal Year 2024” above.
Discussion of Non-Qualified Deferred Compensation
Deferred Compensation Plan
Pursuant to the Deferred Compensation Plan, eligible employees, including our NEOs, are entitled to defer up to 80% of their annual base salary and earned cash bonuses. We may also make discretionary contributions to participants’ deferral accounts under the Deferred Compensation Plan from time to time. The portion of a participant’s deferral account that is attributable to employer contributions vests generally based on the participant’s years of service with the company—with 20% vesting credit applied per year of service—and will vest earlier upon the first to occur of a change in control of the company and the participant’s 65th birthday, death, or disability. Each participant may choose to have his deferral account notionally invested in one or more investment options that we
162
make available from time to time, and deferral account values will track the investment performance of those deemed investment options selected by the participant.
The vested portion of a participant’s account under the Deferred Compensation Plan will be distributed to the participant upon a separation from service with the company, or if earlier and elected by the participant in connection with making a deferral election under the plan, upon the participant’s disability, a change in control of the company, or a fixed in-service date elected by the participant. Distributions will be made in a lump sum or, for distributions upon a separation from service and if elected by the participant in connection with making a deferral election under the plan, in up to ten annual installments. A participant may elect that in-service distributions be made in a lump sum or in up to four annual installments.
JM Deferred Compensation Plan
Pursuant to the JM Deferred Compensation Plan, which has been frozen to new contributions since 2016, eligible employees were entitled to defer up to 80% of their annual base salary and earned cash bonuses. Despite the JM Deferred Compensation Plan being frozen to new contributions, there is still opportunity for earnings on contributions made prior to the plan being frozen. Each participant may choose to have his deferral account notionally invested in one or more investment options that we make available from time to time, and deferral account values track the investment performance of those deemed investment options selected by the participant. Distributions from the participant’s account under the JM Deferred Compensation Plan will commence as of the first day of the month coinciding with or next following the date which is six months after such participant’s separation from service with the company, or if earlier upon the participant’s death or certain emergencies. Distributions will be made in a lump sum or, if elected by the participant in writing in connection with making a deferral election under the plan, in no less than 24 and no more than 120 monthly installments.
Our Chief Financial Officer, Mark Hall, had elected to defer a portion of his pay prior to the plan being frozen, and there have been earnings on the account in fiscal year 2024, as shown in the above table.
Potential Payments Upon Termination or Change in Control
There are currently no plans or arrangements between WH Group or our company and our NEOs that provide for any payment or benefit to our NEOs in connection with a change in control of our company or a termination of the NEO’s employment from our company, other than potential accelerated vesting of the employer-contribution portion of any deferral accounts under the Deferred Compensation Plan. All our NEOs are currently fully vested in their Deferred Compensation Plan accounts and, as a result, none of them is entitled to any vesting acceleration in connection with a change in control of our company.
We plan to adopt the Severance Plan effective upon the completion of this offering, pursuant to which certain senior executive employees will be entitled to severance benefits in certain situations. See “—Future Compensation Programs—Executive Severance Plan” for a description of the Severance Plan.
Future Compensation Program
Overview
We expect our Compensation Committee to establish a specific set of objectives and principles for our compensation programs following the completion of this offering, as described below. We believe that this offering will enable us to offer our key employees equity compensation directly linked to the performance of our business, which we expect will enhance our ability to attract, retain and motivate qualified personnel and serve the interests of our shareholders.
Post-Offering Compensation Philosophy and Objectives
We are committed to providing a fair and competitive executive compensation and benefits package that will attract, retain, and reward all members of our high-performing executive team. We are also committed to providing a total compensation package that ties personal earnings to the attainment of company milestones and the long-term achievement of our financial and operational goals. Consistent with such compensation philosophy, we plan to
163
recognize and reward both corporate and individual performance and recognize both short-term and long-term contributions to our company with a particular focus on sharing in annual company financial improvement and long-term company value gains. Our Compensation Committee will structure our compensation and benefits programs to be transparent, flexible, externally competitive, internally competitive and aligned with corporate and individual performance. Overall, we will aim to provide total annual cash compensation opportunities above the market median for similar positions based on industry benchmarks to be determined by our Compensation Committee, while targeting total target direct compensation in line with market.
Executive Severance Plan
We plan to adopt the Severance Plan effective upon the completion of this offering. Pursuant to the Severance Plan, certain senior executive employees will be entitled to severance benefits, or the Severance Benefits, upon a termination of employment by us without “cause” or a voluntary resignation for “good reason,” as such terms are defined in the Severance Plan, or a Qualifying Termination. Severance Benefits are contingent upon the executive’s (i) compliance with all restrictive covenants to which the executive is then subject and (ii) timely execution and delivery of an irrevocable general release of claims against our company and related parties. Participation in the Severance Plan is conditioned upon the executive’s agreeing to customary restrictive covenants in favor of our company and our affiliates, including covenants of non-disclosure, non-competition, non-solicitation, and non-disparagement (subject to any limitations under applicable local law). We may amend or terminate the Severance Plan at any time; however, no such action will become effective for 180 days, or if a change in control of our company has occurred prior to the effectiveness of such amendment or termination, until the 24-month anniversary of such change in control.
The Severance Benefits will consist of (i) base salary continuation for 18 months (or for the Chief Executive Officer, two years), (ii) a prorated bonus for the year of termination based on actual company performance through the separation date, and (iii) a company subsidy of COBRA insurance premiums under our health plans to provide the executive participation at the active-employee rate for the duration of COBRA coverage (up to 18 months). If the Qualifying Termination occurs within two months prior to a change in control of Smithfield, or within two years following a change in control, the prorated bonus will be based on the executive’s target bonus for the year of termination.
Smithfield Omnibus Incentive Plan
We plan to adopt an equity incentive plan, which we refer to as the Smithfield Foods, Inc. Omnibus Incentive Plan, or the 2025 Incentive Plan, which will permit us to grant cash and equity-based incentive awards to our NEOs and our other employees and service providers including our non-employee directors. The 2025 Incentive Plan is expected to become effective immediately prior to the pricing of this offering. The following summary describes the expected material terms of the 2025 Incentive Plan and is qualified in its entirety by reference to the 2025 Incentive Plan, the form of which is filed as an exhibit to the registration statement of which this prospectus forms a part.
Purpose. The purpose of the 2025 Incentive Plan is to promote the success of our business for the benefit of our shareholders by aligning employee and shareholder interests through the grant of cash and equity-based incentive awards to eligible individuals in order to attract, retain, and reward such individuals and strengthen the alignment of interests between such individuals and our shareholders.
The 2025 Incentive Plan provides for the grant of non-statutory stock options, or NSOs, stock appreciation rights, restricted stock awards, restricted stock unit awards, dividend equivalent rights, and other forms of awards to our employees, directors, and consultants who have been designated eligible by our board of directors and those of our affiliates. The 2025 Incentive Plan also provides for the grant of incentive stock options, or ISOs, within the meaning of Section 422 of the Code, to our employees and the employees of our parent and subsidiary corporations.
Authorized shares. Initially, the maximum aggregate number of shares of our common stock that may be issued under the 2025 Incentive Plan will not exceed shares, representing % of our shares outstanding immediately following this offering. The aggregate number of shares of our common stock that may be issued with respect to any ISO will not exceed shares.
164
The following shares of our common stock will not reduce the number of shares available for issuance under the 2025 Incentive Plan: (i) shares that are not issued pursuant to a stock-settled award because the award expires or is canceled, forfeited, or terminated, and (ii) shares withheld pursuant to an award to satisfy the exercise, strike, or purchase price of an award or to satisfy a tax withholding obligation. Further, if in connection with a future merger, consolidation, or acquisition, we grant awards pursuant to the 2025 Incentive Plan in substitution for canceled awards granted by the predecessor or acquired company, or the Substitute Awards, the shares underlying such Substitute Awards will not count against the shares available for issuance under the 2025 Incentive Plan; however, shares acquired by exercise of substitute ISOs will count against the maximum number of shares that may be issued pursuant to the exercise of ISOs under the 2025 Incentive Plan.
Plan administration. Our board of directors, or a duly authorized committee of our board of directors, which we refer to as the Incentive Plan Committee, will administer the 2025 Incentive Plan and may delegate its authority to one or more subcommittees of directors or to any of our officers, subject to certain limitations set forth in the 2025 Incentive Plan. We anticipate that our Compensation Committee will serve as the Incentive Plan Committee. Administrative authority under the 2025 Incentive Plan includes the authority to determine award recipients, how and when each award will be granted, the types of awards to be granted, grant dates, the number of shares subject to each award, the fair market value of our common stock, and the other terms and conditions of each award, including the period of exercisability and the vesting schedule applicable to an award. Under the 2025 Incentive Plan, our board of directors may not, without shareholder approval, reduce the exercise or strike price of an option or stock appreciation right (other than equitable adjustments relating to certain capitalization events or corporate transactions).
Stock options and stock appreciation rights. ISOs, NSOs, and stock appreciation rights will be granted under award agreements adopted by the Incentive Plan Committee. The Incentive Plan Committee will determine the exercise price for stock options and stock appreciation rights, which may not be less than 100% (or 110% in the case of ISOs granted to a person who owns or is deemed to own stock possessing more than 10% of our total combined voting power or that of any of our parent or subsidiary corporations, or a 10% shareholder) of the fair market value of our common stock on the date of grant (other than in the case of Substitute Awards). Options and stock appreciation rights granted under the 2025 Incentive Plan will vest at the rate, and subject to the conditions, specified in the applicable award agreement. The terms and conditions of separate options and stock appreciation rights need not be identical.
No option or stock appreciation right will be exercisable after the expiration of 10 years (or five years in the case of ISOs granted to a 10% shareholder) or such shorter period specified in the applicable award agreement. Unless the terms of the award specify otherwise, if a participant’s service relationship with us or any of our affiliates ceases for any reason other than disability, death, cause, or voluntary resignation, the participant may generally exercise any vested options and stock appreciation rights for a period of 90 days following the cessation of service. This period may be extended if exercise of the option is prohibited by applicable securities laws. Unless the terms of the award specify otherwise, if a participant’s service relationship with us or any of our affiliates ceases due to death or disability, the participant or a beneficiary may generally exercise any vested options and stock appreciation rights for a period of one year following such termination. Unless the terms of the award specify otherwise, if a participant’s service relationship with us or any of our affiliates ceases due to disability and the participant subsequently dies while the options or stock appreciation rights remain outstanding, the participant’s designated beneficiary may generally exercise such options and stock appreciation rights for a period of one year following his death. Upon a termination for cause, options and stock appreciation rights generally terminate immediately, whether or not vested. A participant may not exercise an option or stock appreciation right at any time that the issuance of shares upon such exercise would violate applicable law.
Acceptable consideration for the purchase of common stock issued upon the exercise of a stock option or a stock appreciation right will be determined by the Incentive Plan Committee and set forth in the applicable award agreement. Upon the exercise of a stock appreciation right the participant will be entitled to receive, for each stock appreciation right exercised, up to, but no more than, an amount in cash and/or shares (as chosen by the Incentive Plan Committee in its sole discretion) equal in value to the excess of the fair market value of one share on the date of exercise over the fair market value of one share on the grant date.
165
Tax limitations on ISOs. The aggregate fair market value, determined at the time of grant, of our common stock with respect to ISOs that are exercisable for the first time by any participant during any calendar year under all of our stock plans or plans of our affiliates may not exceed $100,000. Options or portions thereof that exceed such limit will generally be treated as NSOs.
Restricted stock unit awards. Subject to the terms of the 2025 Incentive Plan, each restricted stock unit award will have such terms and conditions as determined by the Incentive Plan Committee. A restricted stock unit award represents a participant’s right to be issued on a future date the number of shares that is equal to the number of restricted stock units subject to the award. Restricted stock unit awards granted under the 2025 Incentive Plan will vest at the rate, and subject to the conditions, specified in the applicable award agreement. The terms and conditions of separate restricted stock unit awards need not be identical. A participant will not have voting or any other rights as a shareholder with respect to any restricted stock unit award unless and until shares are actually issued in settlement of a vested restricted stock unit award. A restricted stock unit award will generally be granted in consideration for a participant’s services to us or an affiliate, such that the participant will not be required to make any payment to us with respect to the grant or vesting of the restricted stock unit award or the issuance of any shares pursuant to the restricted stock unit award. A restricted stock unit award may be settled by cash, delivery of shares (or any combination of our common stock and cash), or in any other form of consideration determined by the Incentive Plan Committee, as set forth in the applicable award agreement. At the time of grant, the Incentive Plan Committee may impose such restrictions or conditions on the award of restricted stock units that delay delivery to a date following the vesting of the award in a manner intended to comply with Section 409A of the Code, as applicable. Additionally, dividends or dividend equivalents may be paid or credited in respect of shares covered by a restricted stock unit award, subject to the same restrictions on transferability and forfeitability as the underlying award with respect to which such dividends or dividend equivalents are granted and subject to such other terms and conditions as determined by the Incentive Plan Committee and specified in the applicable award agreement. Except as otherwise provided in the applicable award agreement, restricted stock unit awards that have not vested will be forfeited once the participant’s continuous service ends for any reason.
Restricted stock awards. Restricted stock awards will be granted under award agreements adopted by the Incentive Plan Committee. A restricted stock award may be awarded in consideration for cash, past or future services to us or any of our affiliates, or any other form of legal consideration that may be acceptable to the Incentive Plan Committee. Restricted stock awards granted under the 2025 Incentive Plan will vest at the rate, and subject to the conditions, specified in the applicable award agreement. The terms and conditions of separate restricted stock awards need not be identical. Dividends or dividend equivalents may be paid or credited with respect to shares subject to a restricted stock award, subject to the same restrictions on transferability and forfeitability as the underlying award with respect to which such dividends or dividend equivalents are granted and subject to such other terms and conditions as determined by the Incentive Plan Committee and specified in the applicable award agreement. If the award-holder’s service relationship with us ends for any reason, we may receive any or all of the unvested shares then-held by the award-holder through a forfeiture condition or a repurchase right.
Other stock awards. The Incentive Plan Committee will be permitted to grant other awards, based in whole or in part by reference to, or otherwise based on, our common stock, either alone or in addition to other awards. Such awards may include fully vested shares awarded as a bonus, shares in payment of the amounts due under an incentive or performance plan sponsored by us, standalone dividend equivalent rights, and awards valued by reference to the book value of shares of our common stock.
Cash awards. The Incentive Plan Committee will also be permitted to grant cash awards. Cash awards may be granted subject to the satisfaction of vesting conditions or may be awarded as a bonus and not subject to any restrictions or conditions.
Non-employee director compensation limit. The aggregate value of all compensation granted or paid following the effective date of the 2025 Incentive Plan to any individual for service as a non-employee director with respect to any calendar year, including awards granted under the 2025 Incentive Plan (valued based on the grant date fair value for financial reporting purposes) and cash fees paid by us to such non-employee director, but not including the equity awards granted in connection with the consummation of this offering, will not exceed $750,000 in total value, except such amount may increase for (i) newly elected directors in their first year of service, (ii) special committee
166
appointments, (iii) any director serving as lead director or non-executive chair, and (iv) any director who does not participate in the decision to award such additional compensation or in other contemporaneous decisions involving compensation for non-employee directors.
Changes to capital structure. In connection with certain corporate transactions or changes to our capital structure, such as a stock split, reverse stock split, or recapitalization, the Incentive Plan Committee will adjust as it deems necessary, as applicable, (i) the class and maximum number of shares subject to the 2025 Incentive Plan and the awards thereunder and (ii) the class and number of shares and exercise price, strike price, or purchase price, if applicable, of all outstanding awards granted under the 2025 Incentive Plan. The 2025 Incentive Plan Committee may adjust the vesting terms applicable to any awards to reflect any unusual or non-recurring events and other extraordinary items, impact of charges for restructurings, discontinued operations, and the cumulative effects of accounting or tax changes, each as defined by generally accepted accounting principles or as identified in our financial statements, notes to the financial statements, management’s discussion and analysis, or other public filing.
Change in control provisions. In the event of a change in control (as defined below), awards outstanding under the 2025 Incentive Plan may be assumed, continued, or substituted for, in whole or in part, by any surviving or acquiring corporation (or its parent company), or settled for a cash amount based on the highest price per share of common stock paid in any transaction related to such change in control. The Incentive Plan Committee may terminate all awards subject to exercise by delivering at least 20 days’ advance notice to the award-holders to permit exercise in advance of, and contingent upon, such change in control. The Incentive Plan Committee may elect to accelerate the vesting of awards in connection with a change in control.
Under the 2025 Incentive Plan, a “change in control” means (i) the acquisition by any person or entity of 50% or more of the combined voting power of our then-outstanding voting securities, (ii) a merger, reorganization, or consolidation other than such a transaction after which our voting securities immediately before the transaction continue to represent more than 50% of the combined voting power of the surviving entity (or the parent of the surviving entity) and are held in substantially the same proportion by the holders of such voting securities immediately before the transaction, (iii) a complete dissolution or liquidation, (iv) a sale or disposition of all or substantially all of our assets other than to a person or persons who beneficially own more than 50% of the combined voting power of our outstanding voting securities immediately prior to such transaction, or (v) when, during any two-year period, a majority of our board of directors ceases to consist of individuals who were serving on our board of directors at the beginning of such period and individuals whose election or nomination to our board of directors was approved by a vote of at least two thirds of the directors then in office who were either directors on our board of directors at the beginning of such period or whose election or nomination was so approved. The 2025 Incentive Plan provides that a “change in control” will not be deemed to occur solely by virtue of a “spin-off” or distribution of shares owned by WH Group to its shareholders for no consideration in substantially the same proportions as their ownership of WH Group.
Transferability. Awards granted under the 2025 Incentive Plan are generally not transferrable or assignable by a participant. After the vested shares subject to an award have been issued, or in the case of a restricted stock award and similar awards, after the issued shares have vested, the holder of such shares is generally free to assign, hypothecate, donate, encumber, or otherwise dispose of any interest in such shares provided that any such actions are in compliance with the terms of our trading policy, any minimum ownership requirements that we may effect from time to time, and applicable law.
Clawback/Recovery. All awards granted under the 2025 Incentive Plan will be subject to recoupment in accordance with any clawback policy that we may adopt and maintain from time to time, to the extent applicable and permissible under applicable law. In addition, the Incentive Plan Committee may impose such other clawback, recovery or recoupment provisions in an award agreement as the Incentive Plan Committee may deem necessary or appropriate, including but not limited to a reacquisition right in respect of previously acquired shares or other cash or property upon the occurrence of cause. Acceptance of an award constitutes the participant’s acknowledgement of and consent to any applicable clawback policy in effect at the time of such clawback.
Amendment or termination. The Incentive Plan Committee may accelerate the time at which an award granted under the 2025 Incentive Plan may first be exercised or the time during which an award granted under the 2025
167
Incentive Plan or any part thereof will vest. The Incentive Plan Committee will have the authority to amend, suspend, or terminate the 2025 Incentive Plan at any time, provided that such action does not materially impair the existing rights of any participant without such participant’s consent. Certain material amendments will also require the approval of our shareholders. No award may be granted on or after the 10th anniversary of the date our board of directors adopts the 2025 Incentive Plan. No awards may be granted under the 2025 Incentive Plan while it is suspended or after it is terminated.
Smithfield Employee Stock Purchase Plan
We plan to adopt an employee stock purchase plan, which we refer to as the Smithfield Foods, Inc. Employee Stock Purchase Plan, or the 2025 ESPP. The following summary describes the expected material terms of the 2025 Employee Stock Purchase Plan and is qualified in its entirety by reference to the 2025 Employee Stock Purchase Plan, the form of which is filed as an exhibit to the registration statement of which this prospectus forms a part.
Purpose. The purpose of the 2025 ESPP is to provide an opportunity to our employees and employees of certain of our related companies to acquire a stock ownership interest in our company. The 2025 ESPP is designed to allow eligible employees to purchase our common stock in a manner that is intended to qualify for favorable tax treatment under Section 423 of the Code and will be construed in a manner that is consistent with the requirements of Section 423 of the Code. We intend (but make no undertaking or representation to maintain) for the 2025 ESPP to qualify as an employee stock purchase plan as defined in Section 423(b) of the Code.
Share reserve. The maximum number of shares of our common stock that may be issued under the 2025 ESPP will not exceed shares, representing 0.5% of our shares outstanding immediately following this offering. If any purchase right granted under the 2025 ESPP terminates without having been exercised in full, the shares not purchased under such purchase right will again become available for issuance under the 2025 ESPP.
Administration. Our board of directors, or a duly authorized committee of our board of directors, which we refer to as the ESPP Committee, will administer the 2025 ESPP and may delegate its authority to one or more subcommittees of directors or to any of our officers, subject to certain limitations set forth in the 2025 ESPP. We anticipate that our Compensation Committee will serve as the ESPP Committee. Administrative authority under the 2025 ESPP includes the authority to determine how and when purchase rights are granted and the provisions of each offering, to designate, from time to time, which of our related corporations will be eligible to participate in the ESPP, or which related corporations will be eligible to participate in each separate offering, to impose holding periods on participants, to construe and interpret the 2025 ESPP and purchase rights thereunder, and to establish, amend and revoke rules and regulations for the 2025 ESPP’s administration, to settle all controversies regarding the 2025 ESPP and purchase rights granted thereunder, to exercise such powers and to perform such acts as it deems necessary or expedient to promote the best interests of us and our related corporations and to carry out the intent of the 2025 ESPP to be treated as an employee stock purchase plan, and to adopt such rules, procedures, and sub-plans as are necessary or appropriate to permit or facilitate participation in the 2025 ESPP by employees who are foreign nationals or employed or located outside the United States. All determinations, interpretations, and constructions made by the ESPP Committee in good faith will not be subject to review by any person and will be final, binding, and conclusive on all persons.
Offerings. The ESPP Committee may grant, or provide for the grant of, purchase rights to eligible employees under an offering (consisting of one or more purchase periods) during an offering period that it selects. Each offering will be in the offering document and will contain those terms and conditions as the ESPP Committee deems appropriate, subject to the requirements of Section 423(b)(5) of the Code. The provisions of separate offering documents do not need to be identical, but each offering document will include an offering period during which the offering will be effective, which period will not exceed 27 months beginning with the offering date, and the substance of the applicable provisions contained in the 2025 ESPP.
Eligibility. Generally, purchase rights may be granted only to employees, including executive officers, employed by us (or by any of our affiliates or related corporations as designated by the ESPP Committee) on the first day of an offering period if such employee has been employed by us or by one of our designated affiliates or related corporations for such continuous period preceding such date as the ESPP Committee may require, but in no
168
event will the required period of continuous employment exceed two years. The ESPP Committee may (unless prohibited by applicable law) require that employees have to satisfy one or both of the following service requirements: (i) being customarily employed by us, or any of our related corporations or affiliates, for more than 20 hours per week and more than five months per calendar year and (ii) such other criteria as our board of directors may determine consistent with Section 423 of the Code. No employee will be eligible for the grant of any purchase rights under the 2025 ESPP if immediately after such rights are granted, such employee owns stock possessing five percent or more of the total combined voting power or value of all classes of our outstanding capital stock (or the stock of any related corporation) determined in accordance with the rules of Section 424(d) of the Code. An employee may be granted purchase rights only if such purchase rights, together with any other rights granted under all employee stock purchase plans of ours or any of our related corporations, do not permit such employee’s rights to purchase our stock or the stock of any of our related corporations to accrue at a rate that, when aggregated, exceeds $25,000 (based on the fair market value per share on the date on which the purchase right is granted) for each calendar year in which such purchase rights are outstanding at any time. The ESPP Committee may also exclude highly compensated employees, within the meaning of Section 423(b)(4)(D) of the Code, from participation in any offering period.
Purchase Rights; Purchase Price. On the first day of each offering period, each eligible employee, pursuant to the applicable offering document and the terms of the 2025 ESPP, will be granted a purchase right to purchase up to that number of shares purchasable with a percentage, as designated by the ESPP Committee in the subscription agreement for the offering period, which will not exceed 15% of such employee’s earnings. During each offering period that begins on the first day of the offering period (or such later date as the ESPP Committee determines for a particular offering) and ends on the date stated in the offering document, which date will be no later than the end of the offering period, an employee may decrease (but not increase) such percentage of earnings as designated in the offering document. The ESPP Committee will establish one or more purchase dates during an offering period on which purchase rights granted for that offering period will be exercised and shares will be purchased in accordance with the offering document. Each eligible employee may purchase up to shares in an offering period (or such lesser number of shares determined by the ESPP Committee prior to the start of the offering period).
The purchase price of shares acquired pursuant to purchase rights will not be less than 85% of the lesser of (i) the fair market value of a share on the first day of an offering period and (ii) the fair market value of a share on the date of purchase.
Participation; withdrawal; termination. An eligible employee may elect to participate in an offering and authorize payroll deductions as the means of making contributions by completing and delivering to us or our designee, within the time specified in the offering document, a subscription agreement in an enrollment form provided by us or our designee. The enrollment form will specify the amount of contributions not to exceed the maximum amount specified by the ESPP Committee. Each participant’s contributions will be credited to an account for the participant under the 2025 ESPP and will be maintained with our general funds except where applicable law requires that contributions be deposited with a third party. If permitted in the offering document, a participant may begin such contributions with the first payroll occurring on the first trading day of the applicable offering period (or, in the case of a payroll date that occurs after the end of the prior offering period but before the first day of the next new offering period, contributions from such payroll will be included in the new offering period). If permitted in the offering document, a participant may thereafter reduce (including to zero) his contributions. If required under applicable law or if specifically provided in the offering document, in addition to or instead of making contributions by payroll deductions, a participant may make contributions through payment by cash, check, or wire transfer prior to a purchase date.
During an offering period, a participant may cease making contributions and withdraw from the offering by delivering to us or our designee a written notice. We may impose a deadline before a purchase date for withdrawing. Upon such withdrawal, such participant’s purchase right in that offering period will immediately terminate, and we will distribute as soon as practicable to such participant all of his accumulated but unused contributions. A participant’s withdrawal from that offering period will have no effect upon his eligibility to participate in any other offering periods under the 2025 ESPP, but such participant will be required to deliver a new subscription agreement in an enrollment form to participate in subsequent offering periods.
169
Unless otherwise required by applicable law, purchase rights granted pursuant to any offering under the 2025 ESPP will terminate immediately if the participant is no longer an employee for any reason or for no reason (subject to any post-employment participation period required by applicable law) or is otherwise no longer eligible to participate. Upon termination from the 2025 ESPP, we will distribute to the individual his accumulated but unused contributions as soon as practicable.
Unless otherwise determined by the ESPP Committee, a participant whose employment transfers or whose employment terminates with an immediate rehire (with no break in service) by or between us and one of our subsidiaries designated to participate in an offering period (or between such designated subsidiaries) will not be treated as having terminated employment for purposes of participating in the 2025 ESPP or an offering period. The ESPP Committee may establish different and additional rules governing transfers between separate offerings. Unless specified otherwise in the offering document or as required by applicable law, we will have no obligation to pay interest on contributions.
Purchase of shares. On each purchase date, each participant’s accumulated contributions will be applied to the purchase of whole shares, up to the maximum number of shares permitted by the 2025 ESPP and the applicable offering document, at the purchase price specified in the offering document. Unless otherwise provided in the offering document, if any amount of accumulated contributions remains in a participant’s account after the purchase of shares on the final purchase date of an offering period, then such remaining amount will roll over to the next offering period, unless the participant elects not to participate in such subsequent offering period or withdraws from the 2025 ESPP. If the ESPP Committee determines that, on a given purchase date, the number of shares with respect to which rights are to be exercised may exceed either the number of shares available for issuance under the 2025 ESPP on the enrollment date of the offering period or the number of shares available for issuance under the 2025 ESPP on the purchase date, the ESPP Committee may in its sole discretion provide that we make a pro rata allocation of the shares available for purchase on such enrollment date or purchase date, as applicable, in as uniform a manner as practicable and as it determines in its sole discretion.
A participant will not be deemed to be the holder of, or to have any of the rights of a holder with respect to, shares subject to purchase rights unless and until the participant’s shares acquired upon exercise of purchase rights are recorded in our books (or the books of our transfer agent) or issued in certificated form.
Changes to capital structure and other adjustments. If the ESPP Committee determines that any dividend or other distribution (whether in the form of cash, common stock, other securities, or other property), change in control, reorganization, merger, amalgamation, consolidation, combination, repurchase, recapitalization, liquidation, dissolution, or sale, transfer, exchange, or other disposition of all or substantially all of the assets of our company, or sale or exchange of common stock or other securities of our company, issuance of warrants or other rights to purchase common stock or other securities of our company, or other similar corporate transaction or event affects the common stock such that an adjustment would be appropriate in order to prevent dilution or enlargement of the benefits or potential benefits intended by our company to be made available under the 2025 ESPP or with respect to any outstanding purchase rights under the 2025 ESPP, the ESPP Committee must make equitable adjustments, if any, to reflect such change with respect to the aggregate number, type, and class of shares (or other securities or property) that may be issued under the 2025 ESPP and the purchase price with respect to any outstanding rights.
If the ESPP Committee determines that any of the foregoing has occurred, or that any unusual or nonrecurring transactions or events affecting us, any affiliate of us, or the financial statements of us or any affiliate, or that changes in applicable law or accounting principles have occurred, then the ESPP Committee may take any one or more of the following actions whenever the ESPP Committee determines that such action is appropriate in order to prevent the dilution or enlargement of the benefits or potential benefits intended to be made available under the 2025 ESPP or with respect to any right under the 2025 ESPP, to facilitate such transactions or events or to give effect to such changes in laws, regulations, or principles: (i) terminating outstanding purchase rights in exchange for a cash payment, a replacement right, or property, (ii) providing for the assumption of, or substitution for, outstanding rights by a successor, (iii) adjusting the number and type of shares subject to, or the terms and conditions of, outstanding rights, (iv) shortening the then-outstanding offering periods, and (v) terminating outstanding rights without being exercised.
170
Transferability. During a participant’s lifetime, purchase rights will be exercisable only by a participant. Purchase rights are not transferable by a participant, except by will, by the laws of descent and distribution, or if permitted by us, by a beneficiary designation.
Tax withholding. Each participant must make arrangements satisfactory to us and any applicable related corporation to enable us or our related corporation to fulfill any withholding obligation for taxes arising out of or in relation to a participant’s participation in the 2025 ESPP.
Amendment, suspension, and termination. The ESPP Committee will have the authority to amend, suspend, or terminate the 2025 ESPP. Shareholder approval is required for any amendment to the 2025 ESPP if such approval is required by applicable law or listing requirements. Shareholder approval is required to amend the 2025 ESPP to increase the aggregate number, or change the type, of shares that may be sold pursuant to rights granted under the 2025 ESPP (other than permitted adjustments described above) or to change the 2025 ESPP in any manner that would be considered the adoption of a new plan within the meaning of Treasury Regulation Section 1.423-2(c)(4). No purchase rights may be granted under the 2025 ESPP while it is suspended or after it is terminated.
IPO Equity Awards
In connection with the pricing of this offering, we intend to grant equity awards to certain of our employees and certain directors and employees of WH Group who are expected to contribute significantly to the success of this offering and our business following the completion of this offering, including each of our NEOs. Each such award will be granted 50% in restricted stock units and 50% in stock options. Such restricted stock units and stock options will vest in equal annual installments over five years from the grant date.
Pursuant to such awards, we intend to grant options to purchase shares with an exercise price equal to the initial public offering price and restricted stock units. Of these grants, our NEOs will receive options to purchase shares and restricted stock units.
The foregoing numbers of options and restricted stock units to be granted are estimates calculated using the midpoint of the estimated public offering price range set forth on the cover of this prospectus as applied to the intended aggregate grant date value of the awards, and the final numbers to be granted will be calculated using the initial public offering price.
Director Compensation
We have not paid any director compensation for service on the board prior to this offering. In connection with the completion of this offering, we intend to adopt a director compensation program consisting of:
•an annual cash retainer of $110,000;
•an annual grant of restricted stock units with a grant value of $180,000; and
•an additional annual cash retainer for the chair of the Audit Committee of $25,000 and for the members of the Audit Committee of $10,000.
Cash retainers will be paid quarterly in arrears. Restricted stock units will generally be granted on the date that we hold our annual shareholder meeting, and will vest on the earlier of the subsequent annual shareholder meeting or one year after the grant date, except with respect to the initial grant. At the closing of this offering, our non-employee directors will receive their initial annual grant of restricted stock units, which will vest at our annual shareholder meeting in 2026.
Non-employee directors who join our board of directors between annual meetings will have their annual retainers for the term prorated. Directors who are also employees of the company or any of our affiliates will not receive any additional compensation for their service as directors.
Restricted stock units will be administered under the 2025 Incentive Plan. The preceding summary is qualified in its entirety by reference to the full text of the 2025 Incentive Plan.
171
In addition, we paid each of our independent directors approximately $25,000 in consulting fees related to advisory services provided to us in the month preceding the pricing of this offering.
172
CERTAIN RELATIONSHIPS AND RELATED PARTY TRANSACTIONS
In addition to the director, director nominee and executive officer compensation arrangements discussed above in the section entitled “Executive Compensation,” this section describes transactions, or series of related transactions, during our last three fiscal years or as currently proposed, to which we were a party or will be a party, in which:
•the amount involved exceeded or will exceed $120,000; and
•any of our directors, director nominees, executive officers or beneficial owners of more than 5% of any class of our capital stock, or any members of the immediate family of and any entity affiliated with any such person, had or will have a direct or indirect material interest.
Relationship with WH Group
We are a wholly owned subsidiary of WH Group. Following this offering, WH Group will continue to hold a majority of our outstanding common stock. We expect that WH Group will continue to consolidate our financial results in its consolidated financial statements at least until such time as WH Group ceases to own a majority of the combined voting power of our then-outstanding shares of common stock.
Historical Agreements with WH Group
Prior to this offering, we have operated as part of WH Group’s corporate organization rather than as a stand-alone public company. The previous transactions and arrangements we had with WH Group and/or other related persons are described below.
Transactions with WH Group
The table below sets forth our sales to and purchases from WH Group for the periods indicated:
| Fiscal Year | |||||||||||||||||
| 2023 | 2022 | 2021 | |||||||||||||||
| (in millions) | |||||||||||||||||
Sales to WH Group (1) | $ | 463 | $ | 442 | $ | 824 | |||||||||||
Purchases from WH Group (2) | 33 | 62 | 59 | ||||||||||||||
________________
(1)Sales to WH Group reflects our sale of pork products to subsidiaries of WH Group (other than our company and our company’s subsidiaries). Amounts for the periods presented exclude pre-European Carve-out sales by our European operations to subsidiaries of WH Group in the amount of $24 million, $29 million and $35 million during fiscal years 2023, 2022 and 2021, respectively. These amounts have been excluded because, as a result of the European Carve-out, our results of operations will not reflect such sales subsequent to August 26, 2024.
(2)As a result of the European Carve-out, our results of operations will not reflect transactions by our pre-European Carve-out European operations subsequent to August 26, 2024. However, we expect to continue to purchase Krakus-branded ham and deli meat products from the European operations of WH Group. As a result, Purchases from WH Group reflects purchases by us from our European operations prior to the European Carve-out, but excludes purchases by our European operations from subsidiaries of WH Group (other than our company and our company’s subsidiaries) prior to the European Carve-out in the amount of $5 million and $1 million during fiscal years 2023 and 2022, respectively. We have included purchases by us from our European operations prior to the European Carve-out because, subsequent to August 26, 2024, our results of operations will reflect purchases by us from our pre-European Carve-out European operations that are now the European operations of WH Group. We have excluded purchases by our pre-European Carve-out European operations from subsidiaries of WH Group (other than our company and our company’s subsidiaries) because, subsequent to August 26, 2024, our results of operations will not reflect such transactions.
We have entered into commercial arrangements with WH Group intended to formalize our historical sale to and purchases from WH Group detailed in the table above.
On August 15, 2024, we entered into a long-term distribution framework agreement, or the Distribution Agreement, with WH Group in relation to the exclusive rights for us to distribute Krakus-branded ham and deli meat
173
products in North America and South America. Pursuant to the terms of the distribution agreement, WH Group is required to make available and sell products to us in accordance with specified non-binding annual amounts mutually agreed upon. We are not restricted from selling similar or competing products. The pricing terms are set on an arm’s length basis based on a formula price that takes into account an index price for cooked ham and the prevailing exchange rates between the United States and Poland. Any price increases requested by WH Group must be validated by market information provided to us by WH Group. We expect the pricing under the Distribution Agreement to result in prices comparable to prevailing market prices for Polish ham sold by other manufacturers. We are required to purchase a minimum quantity of products annually to retain our exclusive distributor status. In addition, we are granted a non-transferable and non-exclusive license to use the trademark of “Krakus” and associated trade dress and logos. The distribution agreement will terminate on August 31, 2034 and will thereafter renew automatically for additional successive three-year terms unless either party provides a timely notice of its intent not to renew.
On January 1, 2024, Smithfield Fresh Meats Sales Corp, our wholly owned U.S. subsidiary, and Rotary Vortex Limited, or Vortex, a wholly owned Hong Kong subsidiary of WH Group, entered into a master sale and purchase agreement, or the Vortex Master Sale and Purchase Agreement, in relation to the sale by us of pork products to WH Group for a term of one year. Under the Vortex Master Sale and Purchase Agreement, WH Group is not required to procure, and we are not obliged to sell, any specific quantity of products at any specified price levels to one another, and WH Group could source from other suppliers and we could sell to other customers in China, at comparable prices. The relevant transaction prices for the pork products sold by us to WH Group are set on an arm’s length basis with reference to market prices including the pork cut-out values published by the USDA.
We may also periodically procure raw materials, such as bellies, ribs and other items from the European operations of WH Group to supplement the raw material supply for our downstream operations as and when needed. In addition, we also anticipate that the China operations of WH Group will purchase hog casing raw materials from us from time to time.
European Carve-out
We transferred our operations in Europe to WH Group on August 26, 2024.
Transitional Services Agreement
Pursuant to a transitional services agreement entered into at the time of the European Carve-out, we continue to provide the Europe Business of WH Group, on a cost plus basis, certain administrative services, including IT support services through December 2024, financial reporting services through March 2025 and tax advisory services through August 2025. The transitional services are intended to facilitate the organized transition of WH Group’s Europe Business to WH Group following the European Carve-out.
Trademark License Agreements and Related Agreements
On July 10, 2014, SF Investments, Inc., or SFII, a wholly owned U.S. subsidiary of our company, and Vortex entered into a trademark license agreement, or the 2014 Vortex Trademark License Agreement, pursuant to which SFII granted Vortex a perpetual, non-exclusive, royalty bearing right and license, in China, Hong Kong and Macau, to use Smithfield trademarks to import, manufacture, promote, distribute and sell meats, including pork and poultry. Pursuant to the terms of the 2014 Vortex Trademark License Agreement, Vortex (as the licensee) has the right to sublicense the foregoing rights solely to Shuanghui Development, a non-wholly owned subsidiary of WH Group, for a term beginning in July 2014 and ending until the 2014 Vortex Trademark License Agreement is terminated in accordance with the terms and conditions therein. On September 4, 2023, SFII and Vortex entered into a trademark license agreement, as amended on January 1, 2024, which we refer to as the 2023 Vortex Trademark License Agreement and, together with the 2014 Vortex Trademark License Agreement, the China Trademark License Agreements, in relation to the license of Smithfield trademarks, for an initial term from September 4, 2023 to December 31, 2028.
Pursuant to the terms of the China Trademark License Agreements, Vortex sublicensed the use of Smithfield trademarks to Shuanghui Development, which allows Shuanghui Development the use of Smithfield trademarks for
174
the production and sales of Smithfield brand products in China. Shuanghui Development would pay royalty fees to Vortex in return.
Relationship with WH Group Following this Offering
We have entered into a shareholders agreement and a registration rights agreement with the selling shareholder, establishing a framework for our relationship with WH Group after this offering. See “Principal and Selling Shareholders” for more information on WH Group.
Shareholders Agreement
The shareholders agreement governs certain aspects of the relationship between WH Group and us following this offering as set forth below.
WH Group Rights with Respect to Board and Committee Representation
The shareholders agreement entitles WH Group to have our board include in the candidates for director elections a specified number of directors nominated by WH Group based on its beneficial ownership of our common stock, as follows:
•until WH Group ceases to beneficially own more than 50% of our outstanding common stock, WH Group will be entitled to nominate for election to our board a majority of the directors on the board;
•thereafter, and until WH Group ceases to beneficially own at least 10% of our outstanding common stock, WH Group will be entitled to nominate for election to our board a number of the total number of directors entitled to serve on the board proportionate to the percentage of our outstanding common stock beneficially owned by WH Group, rounded up to the nearest whole number; and
•thereafter, WH Group will no longer have any right to nominate for election to our board directors to serve on the board under the shareholders agreement.
In connection with the foregoing, WH Group shall take the necessary actions to ensure that the composition of our board complies with the rules of Nasdaq with respect to the number of independent directors serving.
The shareholders agreement provides that, until WH Group ceases to beneficially own more than 50% of our outstanding common stock, (i) the Chairperson of the board will be a director designated by WH Group and (ii) WH Group’s consent will be required for (A) the election, appointment, designation or removal (other than for cause) of the Chairperson of the board and (B) any change to the number of directors on the board.
The shareholders agreement also provides that:
•at any time during which the board includes a director designated by WH Group who is also an independent director, at least one member of the audit committee of the board will be a director designated by WH Group, so long as the director meets certain standards for membership on the committee;
•until WH Group ceases to beneficially own at least 25% of our outstanding common stock, if the board has a compensation committee, WH Group will be entitled to designate a number of the total number of directors entitled to serve on the compensation committee proportionate to the percentage of our outstanding common stock beneficially owned by WH Group, rounded up to the nearest whole number, provided that following the date on which WH Group ceases to beneficially own more than 50% of our outstanding common stock, such directors must be independent directors;
•until WH Group ceases to beneficially own at least 25% of our outstanding common stock, if the board has a nominating and governance committee, WH Group will be entitled to designate a number of the total number of directors entitled to serve on the nominating and governance committee proportionate to the percentage of our outstanding common stock beneficially owned by WH Group, rounded up to the nearest
175
whole number, provided that following the date on which WH Group ceases to beneficially own more than 50% of our outstanding common stock, such directors must be independent directors; and
•until WH Group ceases to beneficially own more than 50% of our outstanding common stock, subject to certain exceptions, the compensation committee and the nominating and governance committee will only act with the consent of a majority of the members of the committee, which majority must include a director designated by WH Group.
Information Rights; Accounting and Financial Disclosure Matters
In addition, pursuant to the shareholders agreement, following the completion of this offering, we will comply with certain covenants relating to our financial reporting to account for WH Group’s investment in us under the principles of consolidation and the equity method of accounting, as applicable, or to complete a financial statement audit for any such period. These include covenants regarding:
•delivery or supply of monthly, quarterly and annual financial information, as applicable, and periodic budgets and financial projections to WH Group;
•provision to WH Group of reasonable access to our auditors and other professional advisors retained by us as well as certain books and records related to internal accounting controls or our company’s operations; and
•cooperation with WH Group to the extent reasonably requested by WH Group in the preparation of its public filings, tax filings and press releases.
The shareholders agreement also requires that we and WH Group provide each other with information reasonably necessary to comply with our respective reporting, disclosure, filing, notification or other requirements of any national securities exchange or governmental authority, for use in judicial, regulatory, administrative and other proceedings or to satisfy audit, accounting, regulatory, litigation and other similar requirements.
Releases; Indemnification
We and WH Group each agree to release the other party and its affiliates, successors and assigns and all persons that, at or prior to the completion of this offering, have been the other party’s shareholders, directors, officers, agents or employees, and their respective heirs, executors, administrators, successors and assigns, from any and all claims against any of them that arise out of or relate to events, circumstances or actions occurring or failing to occur or any conditions existing at or prior to the completion of this offering. These releases are subject to certain exceptions, including for any right to enforce the shareholders agreement or certain other agreements between the parties, in each case in accordance with their terms.
The shareholders agreement also provides for cross-indemnities that, except as otherwise provided in the shareholders agreement, are principally designed to place financial responsibility for the obligations and liabilities allocated to us under the shareholders agreement with us and financial responsibility for the obligations and liabilities allocated to WH Group under the shareholders agreement with WH Group. Specifically, each party will indemnify, defend and hold harmless the other party, its affiliates and subsidiaries and each of its officers, directors, employees and agents for any losses arising out of or due to:
•the liabilities or alleged liabilities for the operation of the indemnifying party’s business; or
•any untrue statement or alleged untrue statement of a material fact contained in any document filed with the SEC, or any omission or alleged omission to state a material fact required to be stated in any document filed with the SEC after this offering and to the extent such statement or omission was made based on information provided by the indemnifying party.
Each party’s aforementioned indemnification obligations are subject to reduction by any insurance proceeds (net of premium increases) received by the party being indemnified. The shareholders agreement also specifies procedures with respect to claims subject to indemnification and related matters. Generally speaking, except as
176
otherwise set forth in any other transaction agreement, absent fraud or willful misconduct by an indemnifying party, these indemnification provisions are the sole and exclusive remedy of an indemnitee for any monetary or compensatory damages or losses resulting from any breach of the shareholders agreement or any transaction agreement.
Dispute Resolution
The shareholders agreement contains provisions that govern the resolution of disputes or claims arising out of, relating to or in connection with the shareholders agreement. These provisions contemplate that if a dispute or claim cannot be resolved by senior officers of the parties, either party may submit the dispute or claim to non-binding mediation or, at any time before, during or following such non-binding mediation, binding arbitration, subject to the provisions of the shareholders agreement.
Registration Rights Agreement
We have entered into a registration rights agreement with the selling shareholder. Pursuant to that agreement, we have agreed to effect the registration under applicable federal securities laws of shares of our common stock held by WH Group following this offering.
Demand Registration
Pursuant to the registration rights agreement, WH Group and its permitted transferees may request that we register their shares and effect underwritten offerings following the completion of this offering. Such registrations may be effected pursuant to a shelf registration statement on Form S-3 once we are permitted to file such a registration statement, which will be no earlier than 12 full calendar months after the pricing of this offering. The registration rights agreement sets forth customary registration procedures, including an agreement by us to make our management reasonably available to participate in customary road show presentations in connection with any underwritten offerings.
Piggyback Registration
WH Group and its permitted transferees also have “piggyback” registration rights, such that WH Group and its permitted transferees may include their respective shares in any future registrations of our equity securities, whether or not that registration relates to a primary offering by us or a secondary offering by or on behalf of any of our shareholders.
Registration Expenses
We are responsible for all expenses incurred in connection with the performance of our obligations under the registration rights provisions under the registration rights agreement, as well as the fees and expenses of one counsel to the selling shareholder. The selling shareholder will be responsible for other expenses that it incurs and for any applicable underwriting discounts or commissions and any stock transfer taxes.
Indemnification
We will also agree to indemnify WH Group and its permitted transferees with respect to liabilities resulting from untrue statements or omissions in any registration statement used in any such registration, including in connection with this offering, other than untrue statements or omissions resulting from information furnished to us for use in a registration statement by WH Group or its permitted transferee.
Hong Kong Stock Exchange Matters of WH Group
Pursuant to Practice Note 15 of The Rules Governing the Listing of Securities of The Stock Exchange of Hong Kong Limited, this offering is deemed a “spin-off” transaction by WH Group for which WH Group requires approval by The Stock Exchange of Hong Kong Limited. On September 6, 2024, The Stock Exchange of Hong Kong Limited confirmed that WH Group may proceed with the “spin-off” transaction. Pursuant to Practice Note 15, WH Group is required to provide to its shareholders an “assured entitlement” to a certain portion of our shares.
177
WH Group intends to effect the Assured Entitlement Distribution by providing to its shareholders a “distribution in specie” of a certain portion of our common stock held by WH Group. The distribution will be made without any consideration being paid by WH Group’s shareholders. WH Group’s shareholders who are entitled to fractional shares of our common stock, who elect to receive cash in lieu of shares of our common stock, who are located in the United States or are U.S. persons, or are otherwise ineligible holders, will only receive cash in the Assured Entitlement Distribution.
WH Group currently intends that the Assured Entitlement Distribution will represent approximately 0.35% to 0.45% of our outstanding shares following the completion of this offering. The Assured Entitlement Distribution will only be made if this offering is completed. The distribution in specie of shares of our common stock by WH Group is not part of this offering.
Policies and Procedures for Related Person Transactions
Prior to the completion of this offering, our board will approve a written related person transaction policy that will set forth policies and procedures with respect to our review and approval of certain transactions between us and a “related person,” or a “related person transaction.” Pursuant to the terms of our related person transaction policy, our board, acting through our audit committee, will review and decide whether to approve or ratify any related person transaction. Any related person transaction is required to be reported to our legal department, which will then determine whether it should be submitted to our audit committee for consideration. Our audit committee must then review and decide whether to approve any related person transaction.
For the purposes of our related person transaction policy, a “related person transaction” is a transaction, arrangement or relationship (or any series of similar transactions, arrangements or relationships) in which we were, are or will be a participant and the amount involved exceeds $120,000, and in which any related person had, has or will have a direct or indirect interest.
A “related person,” as defined in our related person transaction policy, means any person who is, or at any time since the beginning of our last fiscal year was, a director or executive officer of our company or a nominee to become a director of our company; any person who is known to be the beneficial owner of more than five percent of our common stock; any immediate family member of any of the foregoing persons, including any child, stepchild, parent, stepparent, spouse, sibling, mother-in-law, father-in-law, son-in-law, daughter-in-law, brother-in-law or sister-in-law of the director, executive officer, nominee or more than five percent beneficial owner, and any person (other than a tenant or employee) sharing the household of such director, executive officer, nominee or more than five percent beneficial owner; and any firm, corporation or other entity in which any of the foregoing persons is a general partner or, for other ownership interests, a limited partner or other owner in which such person has a beneficial ownership interest of 10% or more.
Director Nominee Related Person Transactions
We purchase grain at spot market prices from each of the father and brother of our director nominee, Raymond Starling. In 2022, we purchased approximately $150,000 of grain from Mr. Starling’s father. Our purchases of grain from each of Mr. Starling’s father and brother did not otherwise exceed $120,000 in any other fiscal year during the last three fiscal years.
178
PRINCIPAL AND SELLING SHAREHOLDERS
The following table sets forth the number and percentage of shares of our common stock beneficially owned (1) immediately prior to the completion of this offering and (2) upon completion of this offering, by:
•each person known to us to beneficially own more than 5% of our shares of common stock (including the selling shareholder);
•each of our named executive officers and each person whom we anticipate will serve on the board upon completion of this offering; and
•all persons whom we anticipate will serve as our executive officers or on our board upon completion of this offering, collectively as a group.
Percentage of beneficial ownership in the following table is based on shares of our common stock outstanding immediately prior to the completion of this offering and shares of our common stock outstanding upon completion of this offering. In addition, the following table does not reflect any shares of our common stock that may be purchased in this offering, including through our directed share program described under “Underwriting—Directed Share Program.”
Beneficial ownership is determined in accordance with the rules of the SEC. These rules generally attribute beneficial ownership of securities to persons who possess sole or shared voting power or investment power with respect to those securities. A security holder is also deemed to be, as of any date, the beneficial owner of all securities that such security holder has the right to acquire within 60 days after such date through (1) the exercise of any option or warrant, (2) the conversion of a security, (3) the power to revoke a trust, discretionary account or similar arrangement or (4) the automatic termination of a trust, discretionary account or similar arrangement. Shares issuable pursuant to options are deemed to be outstanding for computing the beneficial ownership percentage of the person holding those options but are not deemed to be outstanding for computing the beneficial ownership percentage of any other person.
Unless otherwise indicated in the footnotes to the following table, to our knowledge all persons listed below have sole voting and investment power with respect to the shares of our common stock beneficially owned by them, subject to applicable community property laws. Unless otherwise indicated in the footnotes to the following table, the address for each shareholder listed below is c/o Smithfield Foods, Inc., 200 Commerce Street, Smithfield, Virginia 23430.
| Common stock beneficially owned prior to this offering | Common stock to be sold in this offering | Common stock beneficially owned after this offering (assuming the underwriters do not exercise their option to purchase additional shares) | Common stock beneficially owned after this offering (assuming the underwriters exercise in full their option to purchase additional shares) | ||||||||||||||||||||||||||||||||||||||
| Name of Beneficial Owner | Shares | % | Shares | Shares | % | Shares | % | ||||||||||||||||||||||||||||||||||
| 5% or Greater Shareholder: | |||||||||||||||||||||||||||||||||||||||||
SFDS UK Holdings Limited (1) | 100 | ||||||||||||||||||||||||||||||||||||||||
| Named Executive Officers: | |||||||||||||||||||||||||||||||||||||||||
| C. Shane Smith | — | ||||||||||||||||||||||||||||||||||||||||
| Mark L. Hall | — | ||||||||||||||||||||||||||||||||||||||||
| Steven France | — | ||||||||||||||||||||||||||||||||||||||||
| Keller D. Watts | — | ||||||||||||||||||||||||||||||||||||||||
| Doug Sutton | — | ||||||||||||||||||||||||||||||||||||||||
| Directors: | — | ||||||||||||||||||||||||||||||||||||||||
| Long Wan | — | ||||||||||||||||||||||||||||||||||||||||
179
| Lijun Guo | — | ||||||||||||||||||||||||||||||||||||||||
| Hongwei Wan | — | ||||||||||||||||||||||||||||||||||||||||
| Hank Shenghua He | — | ||||||||||||||||||||||||||||||||||||||||
| Xiaoming Zhou | — | ||||||||||||||||||||||||||||||||||||||||
| Executive officers and directors as a group ( persons) | — | ||||||||||||||||||||||||||||||||||||||||
________________
*Represents beneficial ownership or outstanding total voting power, as applicable of less than 1 percent.
(1)The address of SFDS UK Holdings Limited is 1 Chamberlain Square Cs, Birmingham, United Kingdom, B3 3AX.
180
DESCRIPTION OF CAPITAL STOCK
In connection with this offering, we will amend and restate our articles of incorporation and our bylaws. The following description summarizes the material terms of our amended and restated articles of incorporation and our amended and restated bylaws, which will be in effect prior to the completion of this offering, as well as the relevant sections of the Virginia Stock Corporation Act, or the VSCA. The following description is not complete and is qualified in its entirety by reference to the full text of our amended and restated articles of incorporation and our amended and restated bylaws, the forms of which are filed as exhibits to the registration statement of which this prospectus is a part, and to the VSCA.
General
Upon completion of this offering, our authorized capital stock will consist of shares of common stock, par value $ per share, and shares of preferred stock, par value $ per share. Upon completion of this offering, there will be shares of our common stock outstanding, and no shares of our preferred stock outstanding. As of December 29, 2024, all shares of our common stock outstanding are held by one shareholder: SFDS UK Holdings Limited.
Common Stock
Holders of shares of our common stock will be entitled to the rights set forth below.
Voting Rights
Each holder of shares of our common stock will be entitled to one vote per share of our common stock on all matters which may be submitted to the holders of shares of our common stock. At any meeting of our shareholders, the holders of a majority in voting power of the outstanding shares entitled to vote at such meeting must be present in person or represented by proxy in order to constitute a quorum.
At any meeting of our shareholders, action on a matter, except as otherwise expressly provided by statute, our amended and restated articles of incorporation or our amended and restated bylaws, will be determined by a majority of the votes properly cast for and against such matter. Except as otherwise required by law, a nominee for election as a director will be elected to the board by a plurality of the votes cast with respect to that director’s election.
Dividend Rights
Subject to any preferential rights of any outstanding shares of our preferred stock, each holder of shares of our common stock will be entitled to receive ratably dividends or other distributions, if any, as may be declared and paid or set apart for payment from time to time by our board out of any assets legally available for the payment of the dividends or other distributions, but only when and as declared by our board or any authorized committee thereof.
Liquidation, Dissolution and Winding-Up Rights
In the event of a liquidation, dissolution or winding-up of our company, each holder of shares of our common stock will be entitled to ratable distribution of our net assets that remain after the payment in full of all liabilities and the liquidation preferences of any outstanding shares of our preferred stock.
Other Rights
Holders of shares of our common stock will have no preemptive rights or conversion rights to purchase, subscribe for or otherwise acquire any shares of our common stock or preferred stock or any other securities. There are no redemption or sinking fund provisions applicable to the shares of our common stock. All of the outstanding shares of our common stock are, and the shares of our common stock to be issued pursuant to this offering will be, fully paid and non-assessable.
181
Preferred Stock
We do not currently have any preferred stock outstanding. However, our amended and restated articles of incorporation will authorize our board to classify or reclassify one or more classes, or series within a class of preferred stock (including convertible preferred stock), without shareholder action. Our board will be able to determine, with respect to any class or series of preferred stock, the number of shares and the terms, including the preferences, rights and limitations, of that class or series, including, without limitation, voting rights, preferences and the relative, participating, optional or other special rights of the shares of any such class or series and any qualifications, limitations and restrictions thereof.
We will be able to issue a class or series of preferred stock that could, depending on the terms of the class or series, impede or discourage an acquisition attempt or other transaction that some, or a majority, of the holders of our common stock might believe to be in their best interests or in which the holders of our common stock might receive a premium for their common stock over the market price of our common stock. In addition, the issuance of preferred stock may adversely affect the holders of our common stock by restricting the payment of dividends or other distributions on our common stock, diluting the voting power of our common stock or subordinating the rights of our common stock to any payment upon a liquidation, dissolution or winding up of our company or other event. The issuance of preferred stock could have the effect of delaying, deferring, impeding or preventing a change of control or other corporate action. As a result of these or other factors, the issuance of shares of one or more classes or series of our preferred stock may have an adverse impact on the market price of our common stock.
Election and Removal of Directors; Vacancies
Our amended and restated articles of incorporation will provide that our board will be divided into three classes of directors, with staggered three-year terms. As a result, approximately one-third of our board will be elected each year. Our amended and restated articles of incorporation will provide that any director may be removed for cause or without cause by the affirmative vote of holders of a majority of the voting power of the shares of common stock outstanding and entitled to vote on the election of directors. However, from and after such time when WH Group (including its permitted transferees) ceases to own a majority of the combined voting power of our then-outstanding shares of common stock entitled to vote generally in director elections, our directors may only be removed for cause, by the affirmative vote of holders of a majority of the voting power of the shares of common stock outstanding and entitled to vote on the election of directors.
Our amended and restated articles of incorporation will provide that any vacancies in our board, however created, will be filled by appointment made solely and exclusively by the affirmative vote of a majority of the directors remaining in office, even if less than a quorum of our board, and not by the shareholders. In addition, our amended and restated articles of incorporation will provide that any directorship to be filled by reason of an increase in the number of directors on our board may be filled by election by a majority of the directors then in office. Pursuant to the VSCA, any director appointed by our board to fill a vacancy must stand for election at the next meeting of our shareholders at which directors are elected.
Special Shareholder Meetings
Our amended and restated articles of incorporation will provide that a special meeting of our shareholders may be called at any time by (1) the Chair of our board, (2) the President, (3) our board acting pursuant to a resolution approved by the affirmative vote of a majority of the directors then in office or (4) WH Group, up to and until such time when WH Group (including its permitted transferees) ceases to own a majority of the combined voting power of our then-outstanding shares of common stock entitled to vote generally in director elections. Our amended and restated articles of incorporation will provide that our shareholders will otherwise not have the ability to call a special meeting.
Shareholder Action by Written Consent
Our amended and restated articles of incorporation will provide that (1) up to and until such time when WH Group (including its permitted transferees) ceases to own a majority of the combined voting power of our then-outstanding shares of common stock entitled to vote generally in director elections, any action required or permitted
182
to be taken at any annual or special meeting of our shareholders may be taken by written consent by holders of the requisite number of voting shares without a duly called annual or special meeting of our shareholders and (2) from and after such time when WH Group (including its permitted transferees) ceases to own a majority of the combined voting power of our then-outstanding shares of common stock entitled to vote generally in director elections, holders of shares of our common stock will not be able to act by less-than-unanimous written consent without a duly called annual or special meeting of our shareholders.
Requirements for Advance Notification of Shareholder Proposals
Our amended and restated bylaws will establish advance notice procedures for business (including any nominations for director) to be properly brought by a shareholder before an annual or special meeting of our shareholders. In general, any such notice must be received by us not less than 90 days nor more than 120 days prior to the first anniversary of the date of the preceding year’s annual meeting, or in the event that no annual meeting was held in the previous year, or the date of the annual meeting has been changed by more than 30 days from the first anniversary of the preceding year’s annual meeting, notice by the proposing shareholder to be timely must be received not later than the 10th day following the day on which public announcement of such meeting is first made.
In addition, our amended and restated bylaws will require that, in order to submit a nomination for director, a shareholder must also submit all information relating to such person that is required to be disclosed in solicitations of proxies, as well as comply with requirements regarding the form and content of a shareholder’s notice and provide other information that we require in connection with shareholder proposals, director nominations and solicitations of proxies.
No Cumulative Voting
The VSCA provides that shareholders of a company do not have the right to cumulate votes in the election of directors unless the articles of incorporation of the company provide otherwise. Our amended and restated articles of incorporation will not provide for cumulative voting.
Anti-Takeover Provisions
Our amended and restated articles of incorporation, our amended and restated bylaws and the VSCA contain provisions that may have the effect of impeding the acquisition of control of us by means of a tender offer, a proxy contest, open market purchases or otherwise in a transaction not approved by our board. These provisions may reduce, or have the effect of reducing, our vulnerability to coercive takeover practices and inadequate takeover bids.
The existence of these provisions could limit the price that investors might otherwise pay in the future for shares of common stock. In addition, these provisions may make it more difficult for our shareholders to remove our board or management, should they choose to do so.
Undesignated Preferred Stock
The authority that our board will possess to issue preferred stock, as described under “—Preferred Stock,” could potentially be used to discourage attempts by third parties to obtain control of us through a merger, tender offer or proxy contest or otherwise by making such attempts more difficult or more costly. Our board may be able to issue preferred stock with voting rights or conversion rights that, if exercised, could adversely affect the voting power of the holders of shares of our common stock.
183
Virginia Anti-takeover Statutes
Affiliated Transactions Statute
The VSCA contains provisions governing affiliated transactions. An affiliated transaction generally is defined as any of the following transactions:
•a merger, a share exchange, certain dispositions of corporate assets not in the ordinary course of business to or with an interested shareholder (defined as any holder of more than 10% of any class of outstanding voting shares), or any material guarantee of any indebtedness of any interested shareholder;
•certain sales or other dispositions of the corporation’s voting shares or any of the corporation’s subsidiaries having an aggregate fair market value greater than 5% of the aggregate fair market value of all outstanding voting shares;
•any dissolution, domestication or conversion of the corporation proposed by or on behalf of an interested shareholder; or
•any reclassification, including reverse stock splits, recapitalization, merger of the corporation with any of its subsidiaries, distribution or other transaction that increases the percentage of outstanding voting shares owned beneficially by any interested shareholder by more than 5%.
In general, these provisions prohibit a Virginia corporation from engaging in affiliated transactions with an interested shareholder for a period of three years following the date that such person became an interested shareholder unless:
•a majority of (but not fewer than two) disinterested directors of the corporation and the holders of two thirds of the voting shares, other than the shares beneficially owned by the interested shareholder, approve the affiliated transaction; or
•before the date the person became an interested shareholder, a majority of disinterested directors approved the transaction that resulted in the shareholder becoming an interested shareholder.
After three years, any such transaction must be at a “fair price,” as statutorily defined, or must be approved by the holders of two thirds of the voting shares, other than the shares beneficially owned by the interested shareholder or approved by a majority of the disinterested directors. For purposes of the affiliated transactions provisions, a “disinterested director” means (i) any member of the board who was a director before the applicable person became an interested shareholder and (ii) any member of the board who was recommended for election, or who was elected to fill a vacancy, by a majority of the disinterested directors then on the board.
The shareholders of a Virginia corporation may include a provision in the corporation’s articles of incorporation or bylaws opting out of the affiliated transactions provisions. Our amended and restated articles of incorporation will contain a provision opting out of the affiliated transactions provisions; however, our amended and restated articles of incorporation will also include a provision containing substantially similar restrictions as the affiliated transactions provisions, except that (i) WH Group (including its permitted transferees), (ii) its affiliates and successors and (iii) any “group,” and any member of any such group, to which any such persons described in clauses (i) or (ii) are a party under Rule 13d-5 of the Exchange Act will not be “interested shareholders.”
Control Share Acquisitions Statute
The VSCA also contains provisions relating to control share acquisitions, which are transactions causing the voting power of any person acquiring beneficial ownership of shares of a Virginia public corporation to meet or exceed certain threshold percentages (20 percent, 33 1/3 percent or more than 50 percent) of the total votes entitled to be cast for the election of directors. Shares acquired in a control share acquisition have no voting rights unless:
•the voting rights are granted by a majority of all the votes which could be cast on the election of directors, other than those held by the acquiring person or any officer or employee director of the corporation; or
184
•the articles of incorporation or bylaws of the corporation provide that these Virginia law provisions do not apply to acquisitions of its shares.
If requested by the acquiring person, the corporation shall call a special meeting of the shareholders to be held within 50 days of the corporation’s receipt of the acquiring person’s request to consider the grant of voting rights to the shares acquired in the control share acquisition. If authorized by the corporation’s articles of incorporation or bylaws and voting rights are not granted, the acquiring person’s shares may be repurchased by the corporation, at its option, at a price per share equal to the acquiring person’s cost. The VSCA law grants dissenters’ rights to any shareholder who objects to a control share acquisition that is approved by a vote of disinterested shareholders and that gives the acquiring person control of a majority of the corporation’s voting shares.
Our amended and restated articles of incorporation will contain a provision opting out of the control share acquisition provisions.
Classified Board
Under the classified board provisions, it would take at least two elections of directors for any individual or group to gain control of our board. Accordingly, these provisions could discourage a third party from initiating a proxy contest, making a tender offer or otherwise attempting to gain control of our company.
Amendment of the Articles of Incorporation
Our amended and restated articles of incorporation will provide that, subject to the rights of any preferred shares then outstanding or as otherwise required by applicable law, the affirmative vote of the holders of a majority of the total voting power of the outstanding shares of common stock of our company entitled to vote thereon shall be required to amend or alter our amended and restated articles of incorporation.
Amendment of Bylaws
Our amended and restated articles of incorporation will provide that our amended and restated bylaws may be amended or repealed by (1) the affirmative vote of a majority of our board, subject to certain limits set forth in the VSCA, or (2) the affirmative vote of the holders of a majority of the outstanding shares of capital stock.
Conflicts of Interest; Business Opportunities
In order to address potential conflicts of interest between us and WH Group, our amended and restated articles of incorporation will include provisions eliminating, to the fullest extent permitted by Virginia law, any duty of WH Group or its affiliates or any of our directors, officers and employees who are also directors, officers or employees of WH Group or its affiliates to offer us the right to have or participate in any business opportunities before they may pursue or take such business opportunity, in each case so long as such business opportunity was not expressly offered to such person solely in his or her capacity as our director, officer or employee. These provisions generally recognize that we and WH Group may engage in the same or similar business activities and lines of business or have an interest in the same areas of business opportunities and that we and WH Group will continue to have contractual and business relations with each other.
Limitation of Liability, Indemnification of Directors and Officers and Insurance
The VSCA authorizes corporations to include provisions in the articles of incorporation or a shareholder-approved bylaw that limit or eliminate the personal liability of directors or officers to corporations and their shareholders for monetary damages except for liability resulting from willful misconduct or a knowing violation of the criminal law or federal or state securities law. Our amended and restated articles of incorporation will eliminate director and officer liability to the fullest extent permitted by Virginia law. Our amended and restated articles of incorporation will include provisions that require us to indemnify our directors and officers who are or become a party to any threatened, pending or completed proceeding (including a derivative proceeding by or in the right of the company) due to their status as a director or officer of our company, or for serving at our request as a director or officer or another position at another corporation or enterprise, as the case may be, except to the extent they engaged in willful misconduct or a knowing violation of the criminal law. Our amended and restated articles of incorporation
185
will also provide that we must advance reasonable expenses to our directors and officers in connection with any threatened or pending proceeding, subject to certain exceptions and subject to our receipt of an undertaking from the indemnified party as may be required under the VSCA. Our amended and restated articles of incorporation will expressly authorize us to carry directors’ and officers’ insurance to protect us and our directors, officers and certain employees against some liabilities.
The limitation of liability, indemnification and expense advancement provisions that will be in our amended and restated articles of incorporation may discourage shareholders from bringing lawsuits against our directors and officers. These provisions may also have the effect of discouraging or reducing the likelihood of a derivative proceeding against our directors and officers, even though such a proceeding, if successful, might otherwise benefit us and our shareholders. However, the limitation of liability provisions will not limit or eliminate our rights, or those of any shareholder, to seek non-monetary relief such as injunction or rescission. The limitation of liability, indemnification and expense advancement provisions that will be in our amended and restated articles of incorporation will not alter the liability of directors and officers under the federal securities laws. In addition, your investment may be adversely affected to the extent that, in any lawsuit, we pay the costs of settlement and damage awards against directors and officers pursuant to these indemnification provisions. We intend to enter into separate indemnification agreements with each of our directors and executive officers pursuant to which we will agree to indemnify them to the fullest extent permitted by Virginia law.
There is currently no pending material litigation or proceeding against us or any of our directors, officers or employees for which indemnification is sought.
Exclusive Forum
Our amended and restated bylaws will provide, in all cases to the fullest extent permitted by law, that, unless we consent in writing to the selection of an alternative forum, the United States District Court for the Eastern District of Virginia, Richmond Division, will be the sole and exclusive forum for:
•any derivative action or proceeding brought on our behalf;
•any action asserting a claim of breach of a duty owed by any of our directors, officers or shareholders to us or our shareholders;
•any action asserting a claim arising pursuant to the VSCA, our amended and restated articles of incorporation or our amended and restated bylaws; or
•any action asserting a claim governed by the internal affairs doctrine.
However, if the United States District Court for the Eastern District of Virginia, Richmond Division, does not have jurisdiction over any such action, the action shall be brought instead in the Circuit Court of Henrico County, Virginia.
In addition, our amended and restated bylaws will provide that the foregoing provision will not apply to claims arising under the Securities Act or the Exchange Act or any other claim for which the federal courts have exclusive jurisdiction. Our amended and restated bylaws will provide that, unless we consent in writing to the selection of an alternative forum, the federal district courts of the United States will be the sole and exclusive forum for the resolution of any action asserting a claim arising under the Securities Act. There is uncertainty as to whether a court will enforce such provisions. Section 22 of the Securities Act creates concurrent jurisdiction for federal and state courts over all claims brought to enforce any duty or liability created by the Securities Act or the rules and regulations thereunder. Our shareholders cannot waive compliance with U.S. federal securities laws and the rules and regulations thereunder as a result of these exclusive forum provisions.
These exclusive forum provisions may impose additional costs on shareholders in pursuing any such claims, particularly if the shareholders do not reside in or near the Commonwealth of Virginia, or limit a shareholder’s ability to bring a claim in a judicial forum that such shareholder finds favorable for disputes with us or our current or
186
former directors, officers or shareholders, which in each case may discourage such lawsuits with respect to such claims.
Listing
We have applied to list our shares of common stock on the Nasdaq Global Select Market under the symbol “SFD.” We believe that upon the completion of this offering, we will meet the standards for listing on the Nasdaq Global Select Market, and the closing of this offering is contingent upon such listing.
Transfer Agent and Registrar
Upon the completion of this offering, the transfer agent and registrar for our common stock will be Computershare Trust Company, N.A. The transfer agent and registrar’s address is 150 Royall Street, Canton, Massachusetts 02021.
187
SHARES ELIGIBLE FOR FUTURE SALE
There is currently no public market for shares of our common stock, and we cannot predict with certainty the effect, if any, that market sales of shares of our common stock or the availability of shares of our common stock for sale will have on the market price of shares of our common stock prevailing from time to time. The sale or other availability of substantial amounts of shares of our common stock (including shares issued on the exercise of options, warrants or convertible securities, if any) in the public market, or the perception that such sales could occur, could adversely affect the prevailing market price of shares of our common stock and our ability to raise additional capital through a future sale of securities.
Upon completion of this offering, we will have shares of common stock outstanding. This includes shares of common stock (or shares if the underwriters exercise in full their option to purchase additional shares of our common stock) that we and the selling shareholder are offering to be sold in this offering, which shares will be freely tradable without restriction or further registration under the Securities Act, subject to the provisions of Rule 144 described below under “—Rule 144” and any contractual restrictions, including under the lock-up agreements described below under “—Lock-Up Agreements.”
The remaining shares of common stock not sold in this offering will be “restricted securities,” as that term is defined in Rule 144 under the Securities Act. These restricted securities are eligible for public sale only if they are registered under the Securities Act or if they qualify for an exemption from registration under Rule 144 or Rule 701 under the Securities Act, each of which is summarized below. We expect that substantially all of these shares will be subject to the 180-day lock-up period under the lock-up agreements described below.
Sale of Restricted Shares
Subject to any contractual restrictions, including under the lock-up agreements described below under “—Lock-Up Agreements,” all of the shares of our common stock to be sold in this offering will be freely tradable without restriction or further registration under the Securities Act, except that any shares purchased by or owned by our “affiliates,” as that term is defined in Rule 144 under the Securities Act, may generally only be sold publicly in compliance with the limitations of Rule 144 described below under “—Rule 144.” As defined in Rule 144, an affiliate of an issuer is a person that directly or indirectly, through one or more intermediaries, controls, or is controlled by or is under common control with, such issuer.
Upon completion of this offering, WH Group will own % of our outstanding shares of common stock (or % if the underwriters exercise in full their option to purchase additional shares of our common stock). These shares will be “restricted securities” as that term is defined in Rule 144. Subject to any contractual restrictions, including under the lock-up agreements described below under “—Lock-Up Agreements,” WH Group will be entitled to sell these shares in the public market only if the sale of such shares is registered with the SEC or if the sale of such shares qualifies for an exemption from registration under Rule 144 or any other applicable exemption under the Securities Act.
In addition, upon completion of this offering, WH Group will, subject to certain conditions, have registration rights with respect to all of the shares of our common stock that WH Group will own following the completion of this offering. See “—Registration Rights.” At such time as these restricted shares become unrestricted and available for sale, the sale of these restricted shares, whether pursuant to Rule 144 or otherwise, may have a negative effect on the prevailing market price of shares of our common stock.
Rule 144
In general, under Rule 144 as currently in effect, beginning 90 days after the date of the registration statement of which this prospectus is a part, a person who is not one of our affiliates and has not been one of our affiliates at any time during the preceding three months will be entitled to sell any shares of our common stock that such person has beneficially owned for at least six months, including the holding period of any prior owner other than one of our affiliates, without regard to volume limitations. Sales of shares of our common stock by any such person would be subject to the availability of current public information about us if the shares to be sold were beneficially owned by such person for less than one year. Beginning 90 days after the date of this prospectus, our affiliates who have
188
beneficially owned shares of our common stock for at least six months, including the holding period of any prior owner other than one of our affiliates, would be entitled to sell, within any three-month period, a number of shares of our common stock that does not exceed the greater of:
•1% of the number of shares of our common stock then outstanding; and
•the average weekly trading volume of shares of our common stock during the four calendar weeks preceding the filing of a notice on Form 144 with respect to the sale;
provided, in each case, that we are subject to the periodic reporting requirements of the Exchange Act for at least 90 days before the sale. Sales under Rule 144 by our affiliates are also subject to certain manner of sale provisions and notice requirements and to the availability of current public information about us.
Registration Statements on Form S-8
In connection with this offering, we intend to file a registration statement on Form S-8 under the Securities Act to register an aggregate of shares of our common stock that we expect to reserve for issuance under our proposed equity incentive plan. The registration statement will become effective automatically upon filing with the SEC, and shares of our common stock covered by the registration statement will be eligible for resale in the public market immediately after the effective date of the registration statement, subject to the lock-up agreements described below under “—Lock-Up Agreements.”
Lock-Up Agreements
We, our officers, directors and our selling shareholder, have agreed with the underwriters that for a period of 180 days, after the date of this prospectus, among other things and subject to certain exceptions, we or they will not offer, pledge, sell, contract to sell, sell any option or contract to purchase, purchase any option or contract to sell, grant any option, right or warrant to purchase, lend, or otherwise dispose of or transfer, directly or indirectly, any shares of common stock or any securities convertible into or exercisable or exchangeable for shares of common stock, request or demand that we file a registration statement related to our common stock or enter into any swap or other agreement that transfers to another, in whole or in part, directly or indirectly, the economic consequences of ownership of the common stock, or publicly declare an intention to do any of the foregoing. Upon expiration of the lock-up period, certain of our shareholders will have the right to require us to register their shares under the Securities Act. See the subsection titled “—Registration Rights” below and the section titled “Certain Relationships and Related Party Transactions—Registration Rights Agreement.”
Morgan Stanley & Co. LLC, BofA Securities, Inc. and Goldman Sachs & Co. LLC may, in their sole discretion and at any time or from time to time before the termination of the lock-up period, in certain cases without public notice, release all or any portion of the securities subject to lock-up agreements. See “Underwriting.” There are no existing agreements between the underwriters and any of our shareholders who will execute a lock-up agreement providing consent to the sale of shares prior to the expiration of the lock-up period.
Upon the expiration of the lock-up period, substantially all of the shares subject to such lock-up restrictions will become eligible for sale, subject to the limitations discussed above.
Rule 10b5-1 Trading Plans
Following the closing of this offering, certain of our officers, directors and significant shareholders may adopt written plans, known as Rule 10b5-1 trading plans, in which they will contract with a broker to buy or sell shares of our common stock on a periodic basis to diversify their assets and investments. Under these 10b5-1 trading plans, a broker may execute trades pursuant to parameters established by the officer, director or shareholder when entering into the plan, without further direction from such officer, director or shareholder. Such sales would not commence until the expiration of the applicable lock-up agreements entered into by such officer, director or shareholder in connection with this offering.
189
Registration Rights
Pursuant to a registration rights agreement that we will enter into with WH Group, WH Group will be able to require us to effect the registration under the Securities Act of shares of our common stock that WH Group will own following the completion of this offering. If the offer and sale of these shares is registered, these shares will become freely tradable without restriction under the Securities Act immediately upon the effectiveness of the registration, except for shares purchased by our affiliates. See “Certain Relationships and Related Party Transactions—Registration Rights Agreement.”
Rule 701
In general, under Rule 701 as currently in effect, any of our employees, directors, officers, consultants or advisors who received shares of our common stock from us in connection with a compensatory stock or option plan or other written agreement before the effective date of this offering are entitled to resell such shares 90 days after the effective date of this offering in reliance on Rule 144, in the case of affiliates, without having to comply with the holding period requirements of Rule 144 and, in the case of non-affiliates, without having to comply with the public information, holding period, volume limitation, or notice filing requirements of Rule 144.
190
MATERIAL U.S. FEDERAL INCOME TAX CONSEQUENCES TO NON-U.S. HOLDERS
The following is a summary of material U.S. federal income tax consequences to a non-U.S. holder (as defined below) of the ownership and disposition of our common stock as of the date hereof. This summary deals only with common stock that is held as a capital asset.
A “non-U.S. holder” means a beneficial owner of our common stock (other than an entity or arrangement treated as a partnership for U.S. federal income tax purposes) that is not, for U.S. federal income tax purposes, any of the following:
•an individual who is a citizen or resident of the United States;
•a corporation (or any other entity treated as a corporation for U.S. federal income tax purposes) created or organized in or under the laws of the United States, any state thereof or the District of Columbia;
•an estate the income of which is subject to U.S. federal income taxation regardless of its source; or
•a trust if it (1) is subject to the primary supervision of a court within the United States and one or more U.S. persons have the authority to control all substantial decisions of the trust or (2) has a valid election in effect under applicable U.S. Treasury regulations to be treated as a U.S. person.
This summary is based upon provisions of the Internal Revenue Code of 1986, as amended, or the Code, and the Treasury regulations promulgated thereunder, rulings, and judicial decisions as of the date hereof. Those authorities may be changed, perhaps retroactively, so as to result in U.S. federal income tax consequences different from those summarized below. This summary does not address all of the U.S. federal income tax consequences that may be relevant to you in light of your particular circumstances, nor does it address the Medicare tax on net investment income, United States federal estate and gift taxes, or the effects of any state, local or non-U.S. tax laws. In addition, it does not represent a detailed description of the U.S. federal income tax consequences applicable to you if you are subject to special treatment under the U.S. federal income tax laws (including if you are a U.S. expatriate, foreign pension fund, “controlled foreign corporation,” “passive foreign investment company,” or a partnership or other pass-through entity for U.S. federal income tax purposes). We cannot assure you that such a change in law will not alter significantly the tax considerations that we describe in this summary.
If a partnership (or other entity or arrangement treated as a partnership for U.S. federal income tax purposes) holds our common stock, the tax treatment of a partner generally will depend upon the status of the partner and the activities of the partnership. If you are a partnership or a partner of a partnership considering an investment in our common stock, you should consult your tax advisors.
If you are considering the purchase of our common stock, you should consult your own tax advisors concerning the particular U.S. federal income tax consequences to you of the ownership and disposition of our common stock, as well as the consequences to you arising under other U.S. federal tax laws and the laws of any other taxing jurisdiction.
Dividends
As discussed above under “Management’s Discussion and Analysis of Financial Condition and Results of Operations,” in 2024, we paid dividends of $288 million to our parent company. If we make distributions of cash or other property (other than certain pro rata distributions of our stock) in respect of our common stock, the distribution generally will be treated as a dividend for U.S. federal income tax purposes to the extent it is paid from our current or accumulated earnings and profits, as determined under U.S. federal income tax principles. Any portion of a distribution that exceeds our current and accumulated earnings and profits generally will be treated first as a tax-free return of capital, causing a reduction in the adjusted tax basis of a non-U.S. holder’s common stock, and to the extent the amount of the distribution exceeds a non-U.S. holder’s adjusted tax basis in our common stock, the excess will be treated as gain from the disposition of our common stock (the tax treatment of which is described below under described below under “—Gain on Disposition of Common Stock”).
191
Dividends paid to a non-U.S. holder of our common stock generally will be subject to withholding of U.S. federal income tax at a 30% rate or such lower rate as may be specified by an applicable income tax treaty. However, dividends that are effectively connected with the conduct of a trade or business by the non-U.S. holder within the United States (and, if required by an applicable income tax treaty, are attributable to a U.S. permanent establishment of the non-U.S. holder) are not subject to such withholding tax, provided certain certification and disclosure requirements are satisfied. Instead, such dividends are subject to U.S. federal income tax on a net income basis generally in the same manner as if the non-U.S. holder were a U.S. person as defined under the Code. Any such effectively connected dividends received by a foreign corporation may be subject to an additional “branch profits tax” at a 30% rate or such lower rate as may be specified by an applicable income tax treaty.
A non-U.S. holder of our common stock who wishes to claim the benefit of an applicable treaty rate and avoid backup withholding, as discussed below, for dividends will be required (a) to provide the applicable withholding agent with a properly executed Internal Revenue Service Form W-8BEN or Form W-8BEN-E (or other applicable form) certifying under penalty of perjury that such holder is not a U.S. person as defined under the Code and is eligible for treaty benefits or (b) if our common stock is held through certain foreign intermediaries, to satisfy the relevant certification requirements of applicable U.S. Treasury regulations. Special certification and other requirements apply to certain non-U.S. holders that are pass-through entities rather than corporations or individuals.
A non-U.S. holder of our common stock eligible for a reduced rate of U.S. federal withholding tax pursuant to an income tax treaty may obtain a refund of any excess amounts withheld by timely filing an appropriate claim for refund with the Internal Revenue Service.
Gain on Disposition of Common Stock
Subject to the discussion of backup withholding below, any gain realized by a non-U.S. holder on the sale or other taxable disposition of our common stock generally will not be subject to U.S. federal income tax unless:
•the gain is effectively connected with a trade or business of the non-U.S. holder in the United States (and, if required by an applicable income tax treaty, is attributable to a U.S. permanent establishment of the non-U.S. holder);
•the non-U.S. holder is an individual who is present in the United States for 183 days or more in the taxable year of the disposition, and certain other conditions are met; or
•we are or have been a “United States real property holding corporation” for U.S. federal income tax purposes and certain other conditions are met.
A non-U.S. holder described in the first bullet point immediately above will be subject to tax on the gain derived from the sale or other disposition in the same manner as if the non-U.S. holder were a U.S. person as defined under the Code. In addition, if any non-U.S. holder described in the first bullet point immediately above is a foreign corporation, the gain realized by such non-U.S. holder may be subject to an additional “branch profits tax” at a 30% rate (or such lower rate as may be specified by an applicable income tax treaty). An individual non-U.S. holder described in the second bullet point immediately above will be subject to a tax equal to 30% (or such lower rate as may be specified by an applicable income tax treaty) on the gain derived from the sale or other disposition, which gain may be offset by U.S. source capital losses, even though the individual is not considered a resident of the United States, provided that the non-U.S. holder has timely filed U.S. federal income tax returns with respect to such losses.
Generally, a corporation is a “United States real property holding corporation” if the fair market value of its United States real property interests equals or exceeds 50% of the sum of the fair market value of its worldwide real property interests and its other assets used or held for use in a trade or business (all as determined for U.S. federal income tax purposes). We believe we are not and do not anticipate becoming a “United States real property holding corporation” for U.S. federal income tax purposes.
192
Information Reporting and Backup Withholding
Distributions paid to a non-U.S. holder and the amount of any tax withheld with respect to such distributions generally will be reported to the Internal Revenue Service. Copies of the information returns reporting such distributions and any withholding may also be made available to the tax authorities in the country in which the non-U.S. holder resides under the provisions of an applicable income tax treaty or agreement for the exchange of information.
A non-U.S. holder will not be subject to backup withholding on distributions received if such holder certifies under penalty of perjury that it is a non-U.S. holder (and the payor does not have actual knowledge or reason to know that such holder is a U.S. person as defined under the Code), or such holder otherwise establishes an exemption.
Information reporting and, depending on the circumstances, backup withholding will apply to the proceeds of a sale or other disposition of our common stock made within the United States or conducted through certain U.S.- related financial intermediaries, unless the beneficial owner certifies under penalty of perjury that it is a non-U.S. holder (and the payor does not have actual knowledge or reason to know that the beneficial owner is a U.S. person as defined under the Code), or such owner otherwise establishes an exemption.
Backup withholding is not an additional tax and any amounts withheld under the backup withholding rules will be allowed as a refund or a credit against a non-U.S. holder’s U.S. federal income tax liability, provided the required information is timely furnished to the Internal Revenue Service.
Additional Withholding Requirements
Under Sections 1471 through 1474 of the Code (such Sections commonly referred to as “FATCA”), a 30% U.S. federal withholding tax may apply to any dividends paid on our common stock to (i) a “foreign financial institution” (as specifically defined in the Code, regardless of whether such foreign financial institution is the beneficial owner or an intermediary) which does not provide sufficient documentation, typically on IRS Form W-8BEN-E, evidencing either (x) an exemption from FATCA, or (y) its compliance (or deemed compliance) with FATCA (which may alternatively be in the form of compliance with an intergovernmental agreement with the United States) in a manner which avoids withholding, or (ii) a “non-financial foreign entity” (as specifically defined in the Code, regardless of whether such non-financial foreign entity is the beneficial owner or an intermediary) which does not provide sufficient documentation, typically on IRS Form W-8BEN-E, evidencing either (x) an exemption from FATCA, or (y) adequate information regarding certain substantial U.S. beneficial owners of such entity (if any). If a dividend payment is both subject to withholding under FATCA and subject to the withholding tax discussed above under “—Dividends,” an applicable withholding agent may credit the withholding under FATCA against, and therefore reduce, such other withholding tax. While withholding under FATCA would also have applied to payments of gross proceeds from the sale or other taxable disposition of our common stock, proposed U.S. Treasury regulations (upon which taxpayers may rely until final regulations are issued) eliminate FATCA withholding on payments of gross proceeds entirely. You should consult your own tax advisors regarding these requirements and whether they may be relevant to your ownership and disposition of our common stock. We will not pay additional amounts to a holder in circumstances in which FATCA withholding has applied.
193
UNDERWRITING
Under the terms and subject to the conditions in an underwriting agreement dated the date of this prospectus, the underwriters named below, for whom Morgan Stanley & Co. LLC, BofA Securities, Inc. and Goldman Sachs & Co. LLC are acting as representatives, have severally agreed to purchase, and we and the selling shareholder have agreed to sell to them, severally, the number of shares of common stock indicated below:
| Name | Number of Shares | |||||||
| Morgan Stanley & Co. LLC | ||||||||
| BofA Securities, Inc. | ||||||||
| Goldman Sachs & Co. LLC | ||||||||
| Barclays Capital Inc. | ||||||||
| Citigroup Global Markets Inc. | ||||||||
| UBS Securities LLC | ||||||||
| BNP Paribas Securities Corp. | ||||||||
| HSBC Securities (USA) Inc. | ||||||||
| Total: | ||||||||
The underwriters and the representatives are collectively referred to as the “underwriters” and the “representatives,” respectively. The underwriters are offering the shares of common stock subject to their acceptance of the shares from us and the selling shareholder and subject to prior sale. The underwriting agreement provides that the obligations of the several underwriters to pay for and accept delivery of the shares of common stock offered by this prospectus are subject to the approval of certain legal matters by their counsel and to certain other conditions. The underwriters are obligated to take and pay for all of the shares of common stock offered by this prospectus if any such shares are taken. However, the underwriters are not required to take or pay for the shares covered by the underwriters’ over-allotment option described below. The underwriters may offer and sell the shares of common stock through certain of their respective affiliates or other registered broker-dealers or selling agents.
The underwriters initially propose to offer part of the shares of common stock directly to the public at the offering price listed on the cover page of this prospectus and part to certain dealers at a price that represents a concession not in excess of $ per share under the public offering price. After the initial offering of the shares of common stock, the offering price and other selling terms may from time to time be varied by the representatives.
The selling shareholder has granted the underwriters a 30-day option from the date of this prospectus, to purchase up to additional shares of our common stock at the initial public offering price listed on the cover page of this prospectus, less underwriting discounts and commissions. The underwriters may exercise this option solely for the purpose of covering over-allotments, if any, made in connection with the offering of the shares of common stock offered by this prospectus. To the extent the option is exercised, each underwriter will become obligated, subject to certain conditions, to purchase about the same percentage of the additional shares of common stock as the number listed next to the underwriter’s name in the preceding table bears to the total number of shares of common stock listed next to the names of all underwriters in the preceding table.
194
The following table shows the per share and total public offering price, underwriting discounts and commissions, and proceeds before expenses to us and the selling shareholder. These amounts are shown assuming both no exercise and full exercise of the underwriters’ option to purchase up to an additional shares of common stock.
| Total | |||||||||||||||||
| Per Share | No Exercise | Full Exercise | |||||||||||||||
| Public offering price | $ | $ | $ | ||||||||||||||
| Underwriting discounts and commissions to be paid by: | |||||||||||||||||
| Us | $ | $ | $ | ||||||||||||||
| The selling shareholder | $ | $ | $ | ||||||||||||||
| Proceeds, before expenses, to us | $ | $ | $ | ||||||||||||||
| Proceeds, before expenses, to the selling shareholder | $ | $ | $ | ||||||||||||||
The estimated offering expenses payable by us, exclusive of the underwriting discounts and commissions, are approximately $ . We have agreed to reimburse the underwriters for expenses relating to clearance of this offering with the Financial Industry Regulatory Authority, or FINRA, in an amount up to $ .
The underwriters have informed us that they do not intend sales to discretionary accounts to exceed 5% of the total number of shares of common stock offered by them.
We have applied to list our shares of common stock on the Nasdaq Global Select Market under the symbol “SFD”.
We and all of our directors and officers and our selling shareholder, have agreed that, without the prior written consent of Morgan Stanley & Co. LLC, BofA Securities, Inc. and Goldman Sachs & Co. LLC, on behalf of the underwriters, we and they will not, and will not publicly disclose an intention to, during the period ending 180 days after the date of this prospectus, or the restricted period:
1.offer, pledge, sell, contract to sell, sell any option or contract to purchase, purchase any option or contract to sell, grant any option, right or warrant to purchase, lend or otherwise transfer or dispose of, directly or indirectly, any shares of our common stock or any securities convertible into or exercisable or exchangeable for shares of our common stock;
2.enter into any swap or other arrangement that transfers to another, in whole or in part, any of the economic consequences of ownership of our common stock;
whether any such transaction described in clauses (1) or (2) above is to be settled by delivery of our common stock or such other securities, in cash or otherwise;
3.in the case of us, file any registration statement with the SEC relating to the offering of any shares of our common stock or any securities convertible into or exercisable or exchangeable for our common stock; or
4.in the case of our directors and officers and our selling shareholder, make any demand for, or exercise any right with respect to, the registration of any shares of our common stock or any security convertible into or exercisable or exchangeable for our common stock.
With respect to us the restrictions described in the immediately preceding paragraph to do not apply to:
1.the sale of our common stock to the underwriters pursuant to the underwriting agreement;
2.the issuance by our company of shares of our common stock upon the exercise of an option or a warrant or the conversion of a security outstanding on the date of this prospectus as described in this prospectus;
3.the grant of stock options, stock awards, restricted stock, restricted stock units or other equity awards and the issuance of securities to employees, officers, directors, advisors or consultants of our company pursuant to the terms of an equity compensation plan in effect as of the completion of this offering and described in this prospectus, provided that it is a condition of any such grant that any such grantee executes a lock-up
195
agreement substantially in the form required by the underwriting agreement with respect to the remaining portion of the restricted period before receiving any shares of our common stock;
4.the sale or issuance of or entry into an agreement to sell or issue our common stock or any securities convertible into or exercisable or exchangeable for our common stock in connection with one or more mergers, acquisitions of securities, businesses, property or other assets, products or technologies, joint ventures, commercial relationships or other strategic corporate transactions or alliances; provided, that the aggregate amounts of our common stock or any securities convertible into or exercisable or exchangeable for our common stock (on an as-converted, as-exercised or as-exchanged basis) that we may sell or issue or agree to sell or issue pursuant to this clause (4) does not exceed 5% of the total number of shares of our common stock issued and outstanding immediately following the completion of this offering determined on a fully-diluted basis and all recipients of any such securities execute a lock-up agreement substantially in the form required by the underwriting agreement with respect to the remaining portion of the restricted period;
5.the filing of any registration statement on Form S-8 (including any resale registration statement on Form S-8) relating to securities granted, issued or to be granted or issued pursuant to any plan in effect as of the completion of this offering and described in this prospectus; or
6.the confidential submission to the SEC or FINRA of any registration statement under the Securities Act, provided, however, that such confidential submission may only be made seven days or more following written notice to Morgan Stanley & Co. LLC, BofA Securities, Inc. and Goldman Sachs & Co. LLC of the intention to make such submission.
With respect to our directors, our officers and our selling shareholder, the restrictions described above do not apply to:
1.the sale of our common stock by the selling shareholder to the underwriters pursuant to the underwriting agreement;
2.transactions relating to shares of our common stock or any securities convertible into or exercisable or exchangeable for our common stock acquired in open market transactions after the completion of this offering; provided that no filing under Section 16(a) of the Exchange Act is required or voluntarily made during the restricted period in connection with subsequent sales of our common stock or any securities convertible into or exercisable or exchangeable for our common stock acquired in such open market transactions;
3.transfers of shares of our common stock or any securities convertible into or exercisable or exchangeable for our common stock (i) as a bona fide gift or charitable contribution, or for bona fide estate planning purposes, (ii) upon death or by will, other testamentary document or intestate succession, (iii) to an immediate family member of the holder or to any trust for the direct or indirect benefit of the holder or the holder’s immediate family (“immediate family” means any spouse or domestic partner and relationship by blood, current or former marriage or adoption, not more remote than first cousin), (iv) if the holder is a trust, to a trustee or any beneficiary of the holder or the estate of any such beneficiary, (v) to a partnership, limited liability company, corporation or other entity of which the holder and the immediate family of the holder are the legal and beneficial owner of all of the outstanding equity securities or similar interests or (vi) to a nominee or custodian of a person or entity to whom a disposition or transfer would be permissible under clauses (i) through (v) above;
4.in the case of a corporation, partnership, limited liability company, trust, or other business entity, distributions, transfers or dispositions of shares of our common stock or any securities convertible into or exercisable or exchangeable for our common stock (i) to another corporation, partnership, limited liability company, trust or other business entity that is an affiliate of the holder, or to any investment fund or other entity controlled or managed by the undersigned or affiliates of the undersigned, (ii) to any investment fund or other entity controlling, controlled by, managing or managed by or under common control with the holder or its affiliates, (iii) as part of a distribution, transfer or disposition without consideration by the holder to its stockholders, current or former partners (general or limited), members, beneficiaries or other equity holders,
196
or to the estates of any such stockholders, partners, beneficiaries or other equity holders, (iv) to any wholly owned subsidiary of the holder or (v) any director or indirect partner, member, stockholder or equityholder of a holder referenced in clauses (i) to (iv) that is not a natural person;
5.(i) the receipt by the holder from our company of our common stock or any securities convertible into or exercisable or exchangeable for our common stock upon the exercise of options, settlement of restricted stock units or other equity awards or the exercise of warrants which are outstanding as of the date of this prospectus and are disclosed in this prospectus, or (ii) the transfer of shares of our common stock or any securities convertible into our common stock upon a vesting or settlement event of our restricted stock units, deferred stock units, restricted stock, or performance shares, or in connection with the “cashless” or “net exercise” of options or warrants or settlement of restricted stock units, deferred stock units, restricted stock, performance shares, or warrants to cover tax withholding to the extent permitted by the applicable instrument; provided (x) our common stock received upon such exercise or settlement is subject to the restrictions described herein, and (y) any public announcement or filing under Section 16(a) of the Exchange Act or any other public filing or disclosure clearly indicates that (A) the filing relates to the circumstances described in (i) or (ii), as the case may be, (B) no shares were sold by the reporting person and (C) our common stock or any securities convertible into or exercisable or exchangeable for our common stock retained by the holder after such “cashless” or “net exercise” are subject to a lock-up agreement with the underwriters;
6.the transfer of our common stock or any securities convertible into or exercisable or exchangeable for our common stock that occurs by operation of law pursuant to a qualified domestic order in connection with a divorce settlement, divorce decree, separation agreement or other order of a court or regulatory agency, provided that such transfer does not involve a disposition for value and that such transferee execute a lock-up agreement substantially in the form required by the underwriting agreement;
7.the transfer of our common stock or any securities convertible into or exercisable or exchangeable for our common stock in connection with a bona fide third-party tender offer, merger, consolidation or other similar transaction, that is approved by our board of directors, provided that if such transaction is not completed, all such securities would remain subject to the restrictions described herein;
8.the transfer of our common stock or any securities convertible into or exercisable or exchangeable for our common stock pursuant to arrangements under which we have the option to repurchase such securities or a right of first refusal with respect to such securities; or
9.in the case of the selling shareholder, the distribution by the selling shareholder or one of its affiliates of approximately 0.35% to 0.45% of our outstanding shares following the completion of this offering as part of the Assured Entitlement Distribution;
provided that, in the case of any transfer pursuant to clauses (3) or (4), such transfer does not involve a disposition for value, and (A) each transferee, donee or distributee signs and delivers a lock-up agreement to the underwriters substantially in the form of the lock-up signed and delivered by the donor or distributor and (B) any public announcement or filing under Section 16(a) of the Exchange Act, or any other public filing or disclosure reporting a reduction in beneficial ownership of shares of our common stock, clearly indicates that the shares of our common stock or any securities convertible into or exercisable or exchangeable for our common stock retained by the transferee, donee or distributee are subject to a lock-up agreement with the underwriters; provided further, in the case of any transfer pursuant to clauses (6) or (8), that no public announcement of filing under Section 16(a) of the Exchange Act, or any other public filing or disclosure is made during the restricted period, unless such filing is required and clearly indicates that the transfer is by operation of law, court order, or in connection with a divorce settlement, or a repurchase by our company, as the case may be.
Morgan Stanley & Co. LLC, BofA Securities, Inc. and Goldman Sachs & Co. LLC, in their sole discretion, may release the common stock and other securities subject to the lock-up agreements described above in whole or in part at any time.
In order to facilitate the offering of the common stock, the underwriters may engage in transactions that stabilize, maintain or otherwise affect the price of the common stock. Specifically, the underwriters may sell more shares than
197
they are obligated to purchase under the underwriting agreement, creating a short position. A short sale is covered if the short position is no greater than the number of shares available for purchase by the underwriters under the over-allotment option. The underwriters can close out a covered short sale by exercising the over-allotment option or purchasing shares in the open market. In determining the source of shares to close out a covered short sale, the underwriters will consider, among other things, the open market price of shares compared to the price available under the over-allotment option. The underwriters may also sell shares in excess of the over-allotment option, creating a naked short position. The underwriters must close out any naked short position by purchasing shares in the open market. A naked short position is more likely to be created if the underwriters are concerned that there may be downward pressure on the price of our common stock in the open market after pricing that could adversely affect investors who purchase in this offering. As an additional means of facilitating this offering, the underwriters may bid for, and purchase, shares of common stock in the open market to stabilize the price of our common stock. These activities may raise or maintain the market price of our common stock above independent market levels or prevent or retard a decline in the market price of our common stock. The underwriters are not required to engage in these activities and may end any of these activities at any time.
We, the selling shareholder and the underwriters have agreed to indemnify each other against certain liabilities, including liabilities under the Securities Act, or to contribute to payments we, the selling shareholder or the underwriters may be required to make in respect of those liabilities.
A prospectus in electronic format may be made available on websites maintained by one or more underwriters, or selling group members, if any, participating in this offering. The representatives may agree to allocate a number of shares of common stock to underwriters for sale to their online brokerage account holders. Internet distributions will be allocated by the representatives to underwriters that may make Internet distributions on the same basis as other allocations.
Other Relationships
The underwriters and their respective affiliates are full service financial institutions engaged in various activities, which may include securities trading, commercial and investment banking, financial advisory, investment management, investment research, principal investment, hedging, financing and brokerage activities. Certain of the underwriters and their respective affiliates have, from time to time, performed, and may in the future perform, various financial advisory and investment banking services for us and the selling shareholder, for which they received or will receive customary fees and expenses.
In addition, in the ordinary course of their various business activities, the underwriters and their respective affiliates may make or hold a broad array of investments and actively trade debt and equity securities (or related derivative securities) and financial instruments (including bank loans) for their own account and for the accounts of their customers and may at any time hold long and short positions in such securities and instruments. Such investment and securities activities may involve securities and instruments of ours, our affiliates or the selling shareholder. The underwriters and their respective affiliates may also make investment recommendations or publish or express independent research views in respect of such securities or instruments and may at any time hold, or recommend to clients that they acquire, long or short positions in such securities and instruments.
Certain affiliates of Morgan Stanley & Co. LLC, BofA Securities, Inc., Goldman Sachs & Co. LLC, Barclays Capital Inc., Citigroup Global Markets Inc. and HSBC Securities (USA) Inc. have preexisting lending relationships with us, including as agents, arrangers, bookrunners and/or lenders under our Senior Revolving Credit Facility.
Pricing of the Offering
There is currently no public market for shares of our common stock. The initial public offering price will be determined by negotiations among us, the selling shareholder and the representatives. Among the factors considered in determining the initial public offering price are our future prospects and those of our industry in general, our sales, earnings and certain other financial and operating information in recent periods, and the earnings multiples, market prices of securities, and certain financial and operating information of companies engaged in activities similar to ours.
198
Directed Share Program
At our request, the underwriters have reserved up to 2% of the shares of our common stock offered by this prospectus for sale, at the initial public offering price, to directors, officers and certain employees of our company. If purchased by our directors or officers, these shares will be subject to the lock-up agreement described above. The number of shares of our common stock available for sale to the general public will be reduced to the extent these individuals purchase such reserved shares. Any reserved shares that are not so purchased will be offered by the underwriters to the general public on the same basis as the other shares offered by this prospectus. Other than the underwriting discount described on the front cover of this prospectus, the underwriters will not be entitled to any commission with respect to shares of our common stock sold pursuant to the directed share program. Morgan Stanley will administer our directed share program. We will agree to indemnify Morgan Stanley and its affiliates against certain liabilities and expenses, including liabilities under the Securities Act, in connection with sales of the shares reserved for the directed share program.
Selling Restrictions
European Economic Area
In relation to each Member State of the European Economic Area (each, a “Relevant State”), no shares of our common stock have been offered or will be offered pursuant to the offering to the public in that Relevant State prior to the publication of a prospectus in relation to our common stock which has been approved by the competent authority in that Relevant State or, where appropriate, approved in another Relevant State and notified to the competent authority in that Relevant State, all in accordance with the Prospectus Regulation, except that offers of our common stock may be made to the public in that Relevant State at any time under the following exemptions under the Prospectus Regulation:
(a)to any legal entity which is a qualified investor as defined under Article 2 of the Prospectus Regulation;
(b)to fewer than 150 natural or legal persons (other than qualified investors as defined under Article 2 of the Prospectus Regulation), subject to obtaining the prior consent of the representatives for any such offer; or
(c)in any other circumstances falling within Article 1(4) of the Prospectus Regulation;
provided that no such offer of our common stock shall require us or any of the representatives to publish a prospectus pursuant to Article 3 of the Prospectus Regulation or supplement a prospectus pursuant to Article 23 of the Prospectus Regulation, and each person who initially acquires any shares of our common stock or to whom any offer is made will be deemed to have represented, acknowledged and agreed to and with each of the representatives and us that it is a “qualified investor” within the meaning of Article 2(e) in the Prospectus Regulation.
In the case of any shares being offered to a financial intermediary, as that term is used in Article 5 of the Prospectus Regulation, each such financial intermediary will be deemed to have represented, acknowledged, and agreed that the shares of our common stock acquired by it in the offer have not been acquired on a nondiscretionary basis on behalf of, nor have they been acquired with a view to their offer or resale to, persons in circumstances which may give rise to an offer of any shares of our common stock to the public other than their offer or resale in a Relevant State to qualified investors as so defined or in circumstances in which the prior consent of the representatives has been obtained to each such proposed offer or resale.
For the purposes of this provision, the expression an “offer to the public” in relation to any shares in any Relevant State means the communication in any form and by any means of sufficient information on the terms of the offer and the shares of our common stock to be offered so as to enable an investor to decide to purchase or subscribe for any shares of our common stock, and the expression “Prospectus Regulation” means Regulation (EU) 2017/1129 (as amended).
United Kingdom
No shares of our common stock have been offered or will be offered pursuant to the offering to the public in the United Kingdom, or the UK, prior to the publication of a prospectus in relation to the shares of common stock which
199
(i) has been approved by the Financial Conduct Authority or (ii) is to be treated as if it had been approved by the Financial Conduct Authority in accordance with the transitional provisions in Article 74 (transitional provisions) of the Prospectus Amendment etc. (EU Exit) Regulations 2019/1234, except that shares of our common stock may be offered to the public in the UK at any time under the following exemptions under the UK Prospectus Regulation:
(a)to any legal entity which is a qualified investor as defined under Article 2 of the UK Prospectus Regulation;
(b)to fewer than 150 natural or legal persons (other than qualified investors as defined under Article 2 of the UK Prospectus Regulation), subject to obtaining the prior consent of the underwriters for any such offer; or
(c)in any other circumstances falling within Section 86 of the Financial Services and Markets Act 2000, or FSMA,
provided that no such offer of shares of our common stock shall require us or any underwriter to publish a prospectus pursuant to Section 85 of the FSMA or supplement a prospectus pursuant to Article 23 of the UK Prospectus Regulation.
For the purposes of this provision, the expression an “offer to the public” in relation to the shares of our common stock in the UK means the communication in any form and by any means of sufficient information on the terms of the offer and any shares of our common stock to be offered so as to enable an investor to decide to purchase or subscribe for any shares of our common stock, and the expression “UK Prospectus Regulation” means Regulation (EU) 2017/1129 as it forms part of UK domestic law by virtue of the European Union (Withdrawal) Act 2018, as amended by the European Union, or Withdrawal Agreement, Act 2020.
In addition, in the UK, this document is being distributed only to, and is directed only at, and any offer subsequently made may only be directed at persons who are “qualified investors” (as defined in the Prospectus Regulation) (i) who have professional experience in matters relating to investments falling within Article 19(5) of the FSMA (Financial Promotion) Order 2005, as amended, or the Order, and/or (ii) who are high net worth companies (or persons to whom it may otherwise be lawfully communicated) falling within Article 49(2)(a) to (d) of the Order (all such persons together being referred to as “relevant persons”) or otherwise in circumstances which have not resulted and will not result in an offer to the public of the shares of our common stock in the UK within the meaning of the FSMA.
Any person in the UK that is not a relevant person should not act or rely on the information included in this document or use it as a basis for taking any action. In the UK, any investment or investment activity that this document relates to may be made or taken exclusively by relevant persons.
Japan
No registration pursuant to Article 4, paragraph 1 of the Financial Instruments and Exchange Law of Japan (Law No. 25 of 1948, as amended), or the FIEL, has been made or will be made with respect to the solicitation of the application for the acquisition of the shares of common stock.
Accordingly, the shares of common stock have not been, directly or indirectly, offered or sold and will not be, directly or indirectly, offered or sold in Japan or to, or for the benefit of, any resident of Japan (which term as used herein means any person resident in Japan, including any corporation or other entity organized under the laws of Japan) or to others for re-offering or re-sale, directly or indirectly, in Japan or to, or for the benefit of, any resident of Japan except pursuant to an exemption from the registration requirements, and otherwise in compliance with, the FIEL and the other applicable laws and regulations of Japan.
For Qualified Institutional Investors, or QII
Please note that the solicitation for newly-issued or secondary securities (each as described in Paragraph 2, Article 4 of the FIEL) in relation to the shares of common stock constitutes either a “QII only private placement” or a “QII only secondary distribution” (each as described in Paragraph 1, Article 23-13 of the FIEL). Disclosure regarding any such solicitation, as is otherwise prescribed in Paragraph 1, Article 4 of the FIEL, has not been made in relation to the shares of common stock. The shares of common stock may only be transferred to QIIs.
200
For Non-QII Investors
Please note that the solicitation for newly-issued or secondary securities (each as described in Paragraph 2, Article 4 of the FIEL) in relation to the shares of common stock constitutes either a “small number private placement” or a “small number private secondary distribution” (each as is described in Paragraph 4, Article 23-13 of the FIEL). Disclosure regarding any such solicitation, as is otherwise prescribed in Paragraph 1, Article 4 of the FIEL, has not been made in relation to the shares of common stock. The shares of common stock may only be transferred en bloc without subdivision to a single investor.
Notice to Prospective Investors in Canada
The shares of common stock may be sold only to purchasers purchasing, or deemed to be purchasing, as principal that are accredited investors, as defined in National Instrument 45-106 Prospectus Exemptions or subsection 73.3(1) of the Securities Act (Ontario), and are permitted clients, as defined in National Instrument 31-103 Registration Requirements, Exemptions and Ongoing Registrant Obligations. Any resale of the shares of common stock must be made in accordance with an exemption from, or in a transaction not subject to, the prospectus requirements of applicable securities laws.
Securities legislation in certain provinces or territories of Canada may provide a purchaser with remedies for rescission or damages if this prospectus (including any amendment thereto) contains a misrepresentation, provided that the remedies for rescission or damages are exercised by the purchaser within the time limit prescribed by the securities legislation of the purchaser’s province or territory. The purchaser should refer to any applicable provisions of the securities legislation of the purchaser’s province or territory for particulars of these rights or consult with a legal advisor.
Pursuant to section 3A.3 of National Instrument 33-105 Underwriting Conflicts, or NI 33-105, the underwriters are not required to comply with the disclosure requirements of NI 33-105 regarding underwriter conflicts of interest in connection with this offering.
Notice to Prospective Investors in Switzerland
The shares of common stock may not be publicly offered in Switzerland and will not be listed on the SIX Swiss Exchange, or SIX, or on any other stock exchange or regulated trading facility in Switzerland. This document does not constitute a prospectus within the meaning of, and has been prepared without regard to the disclosure standards for issuance prospectuses under art. 652a or art. 1156 of the Swiss Code of Obligations or the disclosure standards for listing prospectuses under art. 27 ff. of the SIX Listing Rules or the listing rules of any other stock exchange or regulated trading facility in Switzerland. Neither this document nor any other offering or marketing material relating to the shares of common stock, or the offering may be publicly distributed or otherwise made publicly available in Switzerland.
Neither this document nor any other offering or marketing material relating to the offering, our company or the shares of common stock have been or will be filed with or approved by any Swiss regulatory authority. In particular, this document will not be filed with, and the offer of shares of common stock will not be supervised by, the Swiss Financial Market Supervisory Authority, or FINMA, and the offer of shares of common stock has not been and will not be authorized under the Swiss Federal Act on Collective Investment Schemes, or CISA. The investor protection afforded to acquirers of interests in collective investment schemes under the CISA does not extend to acquirers of shares of common stock.
Notice to Prospective Investors in Australia
This prospectus:
(a)does not constitute a disclosure document or a prospectus under Chapter 6D.2 of the Corporations Act 2001 (Cth), or the Corporations Act;
201
(b)has not been, and will not be, lodged with the Australian Securities and Investments Commission, or ASIC, as a disclosure document for the purposes of the Corporations Act and does not purport to include the information required of a disclosure document for the purposes of the Corporations Act; and
(c)may only be provided in Australia to select investors who are able to demonstrate that they fall within one or more of the categories of investors, available under section 708 of the Corporations Act, or the Exempt Investors.
The shares of common stock may not be directly or indirectly offered for subscription or purchased or sold, and no invitations to subscribe for or buy the shares of common stock may be issued, and no draft or definitive offering memorandum, advertisement or other offering material relating to any shares of common stock may be distributed in Australia, except where disclosure to investors is not required under Chapter 6D of the Corporations Act or is otherwise in compliance with all applicable Australian laws and regulations. By submitting an application for the shares of common stock, you represent and warrant to us that you are an Exempt Investor.
As any offer of shares of common stock under this document will be made without disclosure in Australia under Chapter 6D.2 of the Corporations Act, the offer of those securities for resale in Australia within 12 months may, under section 707 of the Corporations Act, require disclosure to investors under Chapter 6D.2 if none of the exemptions in section 708 applies to that resale. By applying for the shares of common stock you undertake to us that you will not, for a period of 12 months from the date of issue of the shares of common stock, offer, transfer, assign or otherwise alienate those shares of common stock to investors in Australia except in circumstances where disclosure to investors is not required under Chapter 6D.2 of the Corporations Act or where a compliant disclosure document is prepared and lodged with ASIC.
Notice to Prospective Investors in Hong Kong
The shares of common stock have not been offered or sold and will not be offered or sold in Hong Kong, by means of any document, other than (a) to “professional investors” as defined in the Securities and Futures Ordinance (Cap. 571 of the Laws of Hong Kong), or SFO, of Hong Kong and any rules made thereunder; or (b) in other circumstances which do not result in the document being a “prospectus” as defined in the Companies (Winding Up and Miscellaneous Provisions) Ordinance (Cap. 32) of Hong Kong), or CO, or which do not constitute an offer to the public within the meaning of the CO. No advertisement, invitation or document relating to the shares of common stock has been or may be issued or has been or may be in the possession of any person for the purposes of issue, whether in Hong Kong or elsewhere, which is directed at, or the contents of which are likely to be accessed or read by, the public of Hong Kong (except if permitted to do so under the securities laws of Hong Kong) other than with respect to shares of common stock which are or are intended to be disposed of only to persons outside Hong Kong or only to “professional investors” as defined in the SFO and any rules made thereunder.
Notice to Prospective Investors in Singapore
Each joint book-running manager has acknowledged that this prospectus has not been registered as a prospectus with the Monetary Authority of Singapore. Accordingly, each joint book-running manager has represented and agreed that it has not offered or sold any shares of common stock or caused the shares of common stock to be made the subject of an invitation for subscription or purchase and will not offer or sell any shares of common stock or cause the shares of common stock to be made the subject of an invitation for subscription or purchase, and has not circulated or distributed, nor will it circulate or distribute, this prospectus or any other document or material in connection with the offer or sale, or invitation for subscription or purchase, of the shares of common stock, whether directly or indirectly, to any person in Singapore other than:
(a)to an institutional investor, (as defined in Section 4A of the Securities and Futures Act (Chapter 289) of Singapore, as modified or amended from time to time, or the SFA) pursuant to Section 274 of the SFA;
(b)to a relevant person (as defined in Section 275(2) of the SFA) pursuant to Section 275(1) of the SFA, or any person pursuant to Section 275(1A) of the SFA, and in accordance with the conditions specified in Section 275 of the SFA; or
202
(c)otherwise pursuant to, and in accordance with the conditions of, any other applicable provision of the SFA.
Where the shares of common stock are subscribed or purchased under Section 275 of the SFA by a relevant person which is:
(a)a corporation (which is not an accredited investor (as defined in Section 4A of the SFA)) the sole business of which is to hold investments and the entire share capital of which is owned by one or more individuals, each of whom is an accredited investor; or
(b)a trust (where the trustee is not an accredited investor) whose sole purpose is to hold investments and each beneficiary of the trust is an individual who is an accredited investor, securities or securities-based derivatives contracts (each term as defined in Section 2(1) of the SFA) of that corporation or the beneficiaries’ rights and interest (howsoever described) in that trust shall not be transferred within six months after that corporation or that trust has acquired the shares of common stock pursuant to an offer made under Section 275 of the SFA except:
(i)to an institutional investor or to a relevant person, or to any person arising from an offer referred to in Section 275(1A) or Section 276(4)(i)(B) of the SFA;
(ii)where no consideration is or will be given for the transfer;
(iii)where the transfer is by operation of law;
(iv)as specified in Section 276(7) of the SFA; or
(v)as specified in Regulation 37A of the Securities and Futures (Offers of Investments) (Securities and Securities-based Derivatives Contracts) Regulations 2018.
Singapore SFA Products Classification—In connection with Section 309B of the SFA and the CMP Regulations 2018, unless otherwise specified before an offer of shares of common stock, we have determined, and hereby notify all relevant persons (as defined in Section 309A(1) of the SFA), that the shares of common stock are ‘‘prescribed capital markets products’’ (as defined in the CMP Regulations 2018) and Excluded Investment Products (as defined in MAS Notice SFA 04-N12: Notice on the Sale of Investment Products and MAS Notice FAA-N16: Notice on Recommendations on Investment Products).
Notice to Prospective Investors in the United Arab Emirates
The shares of common stock have not been, and are not being, publicly offered, sold, promoted or advertised in the United Arab Emirates (including the Dubai International Financial Centre) other than in compliance with the laws of the United Arab Emirates (and the Dubai International Financial Centre) governing the issue, offering and sale of securities. Further, this prospectus does not constitute a public offer of securities in the United Arab Emirates (including the Dubai International Financial Centre) and is not intended to be a public offer. This prospectus has not been approved by or filed with the Central Bank of the United Arab Emirates, the Securities and Commodities Authority or the Dubai Financial Services Authority.
Notice to Prospective Investors in China
This prospectus will not be circulated or distributed in the PRC and the shares of common stock will not be offered or sold, and will not be offered or sold to any person for re-offering or resale directly or indirectly to any residents of the PRC except pursuant to any applicable laws and regulations of the PRC. Neither this prospectus nor any advertisement or other offering material may be distributed or published in the PRC, except under circumstances that will result in compliance with applicable laws and regulations.
Notice to Prospective Investors in Korea
The shares of common stock have not been and will not be registered under the Financial Investments Services and Capital Markets Act of Korea and the decrees and regulations thereunder, or the FSCMA, and the shares of
203
common stock have been and will be offered in Korea as a private placement under the FSCMA. None of the shares of common stock may be offered, sold or delivered directly or indirectly, or offered or sold to any person for re-offering or resale, directly or indirectly, in Korea or to any resident of Korea except pursuant to the applicable laws and regulations of Korea, including the FSCMA and the Foreign Exchange Transaction Law of Korea and the decrees and regulations thereunder, or the FETL. Furthermore, the purchaser of the shares of common stock shall comply with all applicable regulatory requirements (including but not limited to requirements under the FETL) in connection with the purchase of the shares of common stock. By the purchase of the shares of common stock, the relevant holder thereof will be deemed to represent and warrant that if it is in Korea or is a resident of Korea, it purchased the shares of common stock pursuant to the applicable laws and regulations of Korea.
Notice to Prospective Investors in Saudi Arabia
This document may not be distributed in the Kingdom of Saudi Arabia except to such persons as are permitted under the Offers of Securities Regulations as issued by the board of the Saudi Arabian Capital Market Authority, or the CMA, pursuant to resolution number 2-11-2004 dated 4 October 2004 as amended by resolution number 1-28-2008, as amended, or the CMA Regulations. The CMA does not make any representation as to the accuracy or completeness of this document and expressly disclaims any liability whatsoever for any loss arising from, or incurred in reliance upon, any part of this document. Prospective purchasers of the shares of common stock offered hereby should conduct their own due diligence on the accuracy of the information relating to the securities. If you do not understand the contents of this document, you should consult an authorized financial adviser.
Notice to Prospective Investors in the Dubai International Financial Centre, or the DIFC
This document relates to an Exempt Offer in accordance with the Markets Rules 2012 of the Dubai Financial Services Authority, or the DFSA. This document is intended for distribution only to persons of a type specified in the Markets Rules 2012 of the DFSA. It must not be delivered to, or relied on by, any other person. The DFSA has no responsibility for reviewing or verifying any documents in connection with Exempt Offers. The DFSA has not approved this prospectus nor taken steps to verify the information set forth herein and has no responsibility for this document. The shares of common stock to which this document relates may be illiquid and/or subject to restrictions on their resale. Prospective purchasers of the shares of common stock offered should conduct their own due diligence on the securities. If you do not understand the contents of this document, you should consult an authorized financial advisor.
In relation to its use in the DIFC, this document is strictly private and confidential and is being distributed to a limited number of investors and must not be provided to any person other than the original recipient, and may not be reproduced or used for any other purpose. The interests in the securities may not be offered or sold directly or indirectly to the public in the DIFC.
Notice to Prospective Investors in Bermuda
Shares of common stock may be offered or sold in Bermuda only in compliance with the provisions of the Investment Business Act of 2003 of Bermuda which regulates the sale of securities in Bermuda. Additionally, non-Bermudian persons (including companies) may not carry on or engage in any trade or business in Bermuda unless such persons are permitted to do so under applicable Bermuda legislation.
Notice to Prospective Investors in the British Virgin Islands
The shares of common stock are not being and may not be offered to the public or to any person in the British Virgin Islands for purchase or subscription by or on behalf of us. The shares of common stock may be offered to companies incorporated under the BVI Business Companies Act, 2004 (British Virgin Islands) (BVI Companies), but only where the offer will be made to, and received by, the relevant BVI Company entirely outside of the British Virgin Islands.
204
Notice to Prospective Investors in Taiwan
The shares of common stock have not been and will not be registered with the Financial Supervisory Commission of Taiwan pursuant to relevant securities laws and regulations and may not be sold, issued or offered within Taiwan through a public offering or in circumstances which constitutes an offer within the meaning of the Securities and Exchange Act of Taiwan that requires a registration or approval of the Financial Supervisory Commission of Taiwan. No person or entity in Taiwan has been authorized to offer, sell, give advice regarding or otherwise intermediate the offering and sale of the shares of common stock in Taiwan.
Notice to Prospective Investors in South Africa
Due to restrictions under the securities laws of South Africa, no “offer to the public” (as such term is defined in the South African Companies Act, No. 71 of 2008 (as amended or re-enacted) (the South African Companies Act), is being made in connection with the issue of the shares of common stock in South Africa. Accordingly, this document does not, nor is it intended to, constitute a “registered prospectus” (as that term is defined in the South African Companies Act) prepared and registered under the South African Companies Act and has not been approved by, and/or filed with, the South African Companies and Intellectual Property Commission or any other regulatory authority in South Africa. The shares of common stock are not offered, and the offer shall not be transferred, sold, renounced or delivered, in South Africa or to a person with an address in South Africa, unless one or other of the following exemptions stipulated in section 96 (1) applies:
Section 96(1)(a) the offer, transfer, sale renunciation or delivery is to:
(i)persons whose ordinary business, or part of whose ordinary business, is to deal in securities, as principal or agent;
(ii)the South African Public Investment Corporation;
(iii)persons or entities regulated by the Reserve Bank of South Africa;
(iv)authorized financial service providers under South African law;
(v)financial institutions recognized as such under South African law;
(vi)a wholly owned subsidiary of any person or entity contemplated in (iii), (iv) or (v), acting as agent in the capacity of an authorized portfolio manager for a pension fund, or as manager for a collective investment scheme (in each case duly registered as such under South African law); or
(vii)any combination of the person in (i) to (vi); or
Section 96(1)(b) the total contemplated acquisition cost of the shares of common stock, for any single addressee acting as principal is equal to or greater than ZAR1,000,000 or such higher amount as may be promulgated by notice in the Government Gazette of South Africa pursuant to section 96(2)(a) of the South African Companies Act.
Information made available in this prospectus should not be considered as “advice” as defined in the South African Financial Advisory and Intermediary Services Act, 2002.
Notice to Prospective Investors in Malaysia
No prospectus or other offering material or document in connection with the offer and sale of the shares of common stock has been or will be registered with the Securities Commission of Malaysia, or the Commission, for the Commission’s approval pursuant to the Capital Markets and Services Act 2007. Accordingly, this prospectus and any other document or material in connection with the offer or sale, or invitation for subscription or purchase, of the shares of common stock may not be circulated or distributed, nor may the shares of common stock be offered or sold, or be made the subject of an invitation for subscription or purchase, whether directly or indirectly, to persons in Malaysia other than (i) a closed end fund approved by the Commission; (ii) a holder of a Capital Markets Services License; (iii) a person who acquires the shares of common stock, as principal, if the offer is on terms that the shares of common
205
stock may only be acquired at a consideration of not less than RM250,000 (or its equivalent in foreign currencies) for each transaction; (iv) an individual whose total net personal assets or total net joint assets with his or her spouse exceeds RM3 million (or its equivalent in foreign currencies), excluding the value of the primary residence of the individual; (v) an individual who has a gross annual income exceeding RM300,000 (or its equivalent in foreign currencies) per annum in the preceding twelve months; (vi) an individual who, jointly with his or her spouse, has a gross annual income of RM400,000 (or its equivalent in foreign currencies), per annum in the preceding twelve months; (vii) a corporation with total net assets exceeding RM10 million (or its equivalent in a foreign currencies) based on the last audited accounts; (viii) a partnership with total net assets exceeding RM10 million (or its equivalent in foreign currencies); (ix) a bank licensee or insurance licensee as defined in the Labuan Financial Services and Securities Act 2010; (x) an Islamic bank licensee or takaful licensee as defined in the Labuan Financial Services and Securities Act 2010; and (xi) any other person as may be specified by the Commission; provided that, in the each of the preceding categories (i) to (xi), the distribution of the shares of common stock is made by a holder of a Capital Markets Services License who carries on the business of dealing in securities. The distribution in Malaysia of this prospectus is subject to Malaysian laws. This prospectus does not constitute and may not be used for the purpose of public offering or an issue, offer for subscription or purchase, invitation to subscribe for or purchase any securities requiring the registration of a prospectus with the Commission under the Capital Markets and Services Act 2007.
Notice to Prospective Investors in Qatar
The shares of common stock described in this prospectus have not been, and will not be, offered, sold or delivered, at any time, directly or indirectly in the State of Qatar in a manner that would constitute a public offering. This prospectus has not been, and will not be, registered with or approved by the Qatar Financial Markets Authority or Qatar Central Bank and may not be publicly distributed. This prospectus is intended for the original recipient only and must not be provided to any other person. It is not for general circulation in the State of Qatar and may not be reproduced or used for any other purpose.
Notice to Prospective Investors in Israel
In the State of Israel this prospectus shall not be regarded as an offer to the public to purchase shares of common stock under the Israeli Securities Law, 5728—1968, which requires a prospectus to be published and authorized by the Israel Securities Authority, if it complies with certain provisions of Section 15 of the Israeli Securities Law, 5728–1968, including, inter alia, if: (i) the offer is made, distributed or directed to not more than 35 investors, subject to certain conditions, or the Addressed Investors; or (ii) the offer is made, distributed or directed to certain qualified investors defined in the First Addendum of the Israeli Securities Law, 5728—1968, subject to certain conditions, or the “Qualified Investors.” The Qualified Investors shall not be taken into account in the count of the Addressed Investors and may be offered to purchase securities in addition to the 35 Addressed Investors. We have not and will not take any action that would require us to publish a prospectus in accordance with and subject to the Israeli Securities Law, 5728—1968. We have not and will not distribute this prospectus or make, distribute or direct an offer to subscribe for our shares of common stock to any person within the State of Israel, other than to Qualified Investors and up to 35 Addressed Investors.
Qualified Investors may have to submit written evidence that they meet the definitions set out in the First Addendum to the Israeli Securities Law, 5728—1968. In particular, we may request, as a condition to be offered shares of common stock, that Qualified Investors will each represent, warrant and certify to us and/or to anyone acting on our behalf: (i) that it is an investor falling within one of the categories listed in the First Addendum to the Israeli Securities Law, 5728—1968; (ii) which of the categories listed in the First Addendum to the Israeli Securities Law, 5728—1968 regarding Qualified Investors is applicable to it; (iii) that it will abide by all provisions set forth in the Israeli Securities Law, 5728—1968 and the regulations promulgated thereunder in connection with the offer to be issued shares of common stock; (iv) that the shares of common stock that it will be issued are, subject to exemptions available under the Israeli Securities Law, 5728—1968 (A) for its own account, (B) for investment purposes only, and (C) not issued with a view to resale within the State of Israel, other than in accordance with the provisions of the Israeli Securities Law, 5728—1968; and (v) that it is willing to provide further evidence of its Qualified Investor status. Addressed Investors may have to submit written evidence in respect of their identity and may have to sign and submit a declaration containing, inter alia, the Addressed Investor’s name, address and passport number or Israeli identification number.
206
Notice to Prospective Investors in Brazil
The offer and sale of the shares of common stock have not been and will not be registered with the Brazilian Securities Commission (Comissão de Valores Mobiliários, or CVM) and, therefore, will not be carried out by any means that would constitute a public offering in Brazil under CVM resolution No. 160, dated 13 July 2022, as amended, or the CVM Resolution 160, or unauthorized distribution under Brazilian laws and regulations. The shares of common stock may only be offered to Brazilian professional investors (as defined by applicable CVM regulation), who may only acquire the shares of common stock through a non-Brazilian account, with settlement outside Brazil in non-Brazilian currency. The trading of these shares of common stock on regulated securities markets in Brazil is prohibited.
207
LEGAL MATTERS
The validity of the shares of common stock offered by this prospectus will be passed upon for us by Hunton Andrews Kurth LLP, Richmond, Virginia. The underwriters have been represented by Cravath, Swaine & Moore LLP, New York, New York.
EXPERTS
The consolidated financial statements of Smithfield Foods, Inc. at December 31, 2023 and January 1, 2023, and for each of the three years in the period ended December 31, 2023, appearing in this prospectus and registration statement have been audited by Ernst & Young LLP, an independent registered public accounting firm, as set forth in their report thereon appearing elsewhere herein, and are included in reliance upon such report given on the authority of such firm as experts in accounting and auditing.
Following Smithfield Foods, Inc.’s acquisition of Argal Alimentacion, S.A., or Argal, on March 28, 2024, a member firm of Ernst & Young Global Limited in Spain, or EY Spain, continued to provide ongoing tax credit advisory services under a contingent fee arrangement to Argal and its wholly owned subsidiary related to the years ended December 31, 2023 and 2022. A related contingent-based fee of approximately $8,500 was collected by EY Spain in June 2024. While the service was permissible under the independence rules of the SEC and PCAOB (United States), the provision of such service under a contingent fee arrangement and collection of the contingent-based fee after Argal became an affiliate of Smithfield Foods, Inc. is inconsistent with the aforementioned independence rules. The contingent fee arrangement, which was not material to the respective parties, was terminated on August 1, 2024.
After careful consideration of the facts and circumstances and the applicable independence rules, EY, management and the board have concluded that (i) the aforementioned matter does not impair EY’s ability to exercise objective and impartial judgment in connection with EY’s audits of Smithfield Foods, Inc.’s consolidated financial statements and (ii) a reasonable investor with knowledge of all relevant facts and circumstances would reach the same conclusion.
WHERE YOU CAN FIND MORE INFORMATION
We have filed with the SEC a registration statement on Form S-1, of which this prospectus is a part, with respect to the shares of our common stock offered hereby. This prospectus, which constitutes part of the registration statement, does not contain all of the information included in the registration statement and the exhibits thereto. References in this prospectus to any of our contracts or other documents are not necessarily complete, and each such reference is qualified in all respects by reference to the full text of such contract or other document filed as an exhibit to the registration statement. For additional information about us and the shares of our common stock offered hereby, you should refer to the registration statement and the exhibits thereto, which are available on the internet website maintained by the SEC at www.sec.gov.
Upon completion of this offering, we will become subject to the reporting and information requirements of the Exchange Act and, in accordance with the Exchange Act, we will file periodic and current reports, proxy statements and other information with the SEC. We expect to make these reports and other information filed with or furnished to the SEC available, free of charge, through our website at www.smithfieldfoods.com as soon as reasonably practicable after the reports and other information are filed with or furnished to the SEC. Additionally, the SEC maintains an internet website that contains such reports and other information filed electronically with the SEC.
The information contained on, or that can be accessed through, the websites referenced in this prospectus is not part of, and is not incorporated into, this prospectus, and you should not rely on any such information in making an investment decision to purchase shares of our common stock. We have included the website addresses referenced in this prospectus only as inactive textual references and do not intend them to be active links to such website addresses.
208
INDEX TO FINANCIAL STATEMENTS
SMITHFIELD FOODS, INC. AND SUBSIDIARIES
| Page | |||||
Report of Independent Registered Public Accounting Firm (PCAOB ID: 42) | |||||
F-1
REPORT OF INDEPENDENT REGISTERED PUBLIC ACCOUNTING FIRM
To the Shareholder and the Board of Directors of Smithfield Foods, Inc.
Opinion on the Financial Statements
We have audited the accompanying consolidated balance sheets of Smithfield Foods, Inc. and subsidiaries (the Company) as of December 31, 2023 and January 1, 2023, the related consolidated statements of income, comprehensive income, shareholder’s equity and cash flows for each of the three years in the period ended December 31, 2023, and the related notes (collectively referred to as the “consolidated financial statements”). In our opinion, the consolidated financial statements present fairly, in all material respects, the financial position of the Company at December 31, 2023 and January 1, 2023, and the results of its operations and its cash flows for each of the three years in the period ended December 31, 2023, in conformity with U.S. generally accepted accounting principles.
Basis for Opinion
These financial statements are the responsibility of the Company's management. Our responsibility is to express an opinion on the Company’s financial statements based on our audits. We are a public accounting firm registered with the PCAOB and are required to be independent with respect to the Company in accordance with the U.S. federal securities laws and the applicable rules and regulations of the Securities and Exchange Commission and the PCAOB.
We conducted our audits in accordance with the standards of the PCAOB. Those standards require that we plan and perform the audit to obtain reasonable assurance about whether the financial statements are free of material misstatement, whether due to error or fraud. The Company is not required to have, nor were we engaged to perform, an audit of its internal control over financial reporting. As part of our audits, we are required to obtain an understanding of internal control over financial reporting but not for the purpose of expressing an opinion on the effectiveness of the Company's internal control over financial reporting. Accordingly, we express no such opinion.
Our audits included performing procedures to assess the risks of material misstatement of the financial statements, whether due to error or fraud, and performing procedures that respond to those risks. Such procedures included examining, on a test basis, evidence regarding the amounts and disclosures in the financial statements. Our audits also included evaluating the accounting principles used and significant estimates made by management, as well as evaluating the overall presentation of the financial statements. We believe that our audits provide a reasonable basis for our opinion.
Critical Audit Matters
The critical audit matters communicated below are matters arising from the current period audit of the financial statements that were communicated or required to be communicated to the audit committee and that: (1) relate to accounts or disclosures that are material to the financial statements and (2) involved our especially challenging, subjective or complex judgments. The communication of critical audit matters does not alter in any way our opinion on the consolidated financial statements, taken as a whole, and we are not, by communicating the critical audit matters below, providing separate opinions on the critical audit matters or on the accounts or disclosures to which they relate.
F-2
| Pension Accounting | ||||||||
| Description of the Matter | At December 31, 2023, the Company’s defined benefit pension obligation was $1.83 billion, offset by the fair value of plan assets totaling $1.55 billion. As discussed in Notes 1 and 13 of the consolidated financial statements, the Company, with the assistance of a third-party actuary, measures the defined benefit pension obligation at December 31, or upon a remeasurement event, using actuarial assumptions including discount rates. Auditing the defined benefit pension obligation was complex due to the significant estimation uncertainty in evaluating the discount rate used in the Company’s measurement process. | |||||||
| How We Addressed the Matter in Our Audit | To test the Company's accounting for the defined benefit pension obligation, we performed audit procedures that included, among others, evaluating the discount rate assumption with the assistance of our actuarial specialists. For example, we compared the discount rate used by management to historical trends, independently calculated an expected range for the discount rate based on the maturity and duration of the projected benefit payments, and compared the projected benefit payments to the historical benefits paid. | |||||||
| Contingent Liabilities | ||||||||
| Description of the Matter | As described in Note 17 of the consolidated financial statements, the Company is involved in antitrust price-fixing litigation with a number of individual parties. The Company recognizes a contingent liability, including future defense costs, when an assessment of the risk of loss is probable and can be reasonably estimated. For the antitrust price-fixing litigation, where a settlement agreement has not yet been reached with the claimant, judgment is required to determine the probability and estimate of the loss. Auditing management’s measurement and disclosure of the amount of contingent liabilities for antitrust price-fixing litigation was subjective and required more complex auditor judgment. For instance, auditing management's judgments related to the outcome of litigation with claimants where the matter has not yet been tried in court or where the Company has not otherwise agreed to a settlement with claimants was more complex due to the judgment applied in evaluating the likelihood of the outcomes. | |||||||
| How We Addressed the Matter in Our Audit | To test the Company's accounting for and disclosure of ongoing antitrust price-fixing litigation, our audit procedures included, among others, reviewing the initial complaint, testing the Company's evaluation of the probability of outcome through inspection of responses to inquiry letters to both internal and external counsel, evaluating relevant events up to the audit report date, and by obtaining written representations from executives of the Company. When applicable, we also compared the Company's evaluation of these matters with its relevant history for similar legal contingencies that have been settled or otherwise resolved by obtaining and evaluating settlement agreements. In addition, we evaluated the adequacy of the Company’s financial statement disclosures. | |||||||
/s/ Ernst & Young LLP
We have served as the Company’s auditor since 2017.
Richmond, VA
November 18, 2024
F-3
SMITHFIELD FOODS, INC. AND SUBSIDIARIES
CONSOLIDATED STATEMENTS OF INCOME
(in millions, except for share and per share data)
| Twelve Months Ended | |||||||||||||||||
| December 31, 2023 | January 1, 2023 | January 2, 2022 | |||||||||||||||
| Sales | $ | 14,640 | $ | 16,199 | $ | 15,009 | |||||||||||
| Cost of sales | 13,751 | 14,704 | 13,437 | ||||||||||||||
| Gross profit | 889 | 1,495 | 1,572 | ||||||||||||||
| Selling, general and administrative expenses | 1,050 | 807 | 1,095 | ||||||||||||||
| Operating gains | (105) | (429) | (44) | ||||||||||||||
| Operating profit (loss) | (56) | 1,117 | 521 | ||||||||||||||
| Interest expense, net | 76 | 87 | 93 | ||||||||||||||
| Non-operating gains | (3) | (18) | (30) | ||||||||||||||
| Income (loss) from continuing operations before income taxes | (129) | 1,047 | 458 | ||||||||||||||
| Income tax expense (benefit) | (41) | 231 | 97 | ||||||||||||||
| (Income) loss from equity method investments | 46 | 6 | (28) | ||||||||||||||
| Net income (loss) from continuing operations | (133) | 811 | 389 | ||||||||||||||
| Income from discontinued operations before income taxes | 185 | 97 | 115 | ||||||||||||||
| Income tax expense from discontinued operations | 30 | 27 | 30 | ||||||||||||||
| Net income from discontinued operations | 155 | 70 | 85 | ||||||||||||||
| Net income | 23 | 881 | 474 | ||||||||||||||
| Net income from continuing operations attributable to noncontrolling interests | 5 | 11 | 1 | ||||||||||||||
| Net income from discontinued operations attributable to noncontrolling interests | — | — | — | ||||||||||||||
| Net income attributable to Smithfield | $ | 17 | $ | 870 | $ | 472 | |||||||||||
| Net income (loss) per common share attributable to Smithfield: | |||||||||||||||||
| Basic and diluted | |||||||||||||||||
| Continuing operations | $ | (138,176) | $ | 799,581 | $ | 387,402 | |||||||||||
| Discontinued operations | 155,467 | 70,065 | 85,016 | ||||||||||||||
| Total | $ | 17,291 | $ | 869,646 | $ | 472,417 | |||||||||||
| Weighted average shares outstanding | |||||||||||||||||
| Basic | 1,000 | 1,000 | 1,000 | ||||||||||||||
| Diluted | 1,000 | 1,000 | 1,000 | ||||||||||||||
See Notes to Consolidated Financial Statements
F-4
SMITHFIELD FOODS, INC. AND SUBSIDIARIES
CONSOLIDATED STATEMENTS OF COMPREHENSIVE INCOME
(in millions)
| Twelve Months Ended | |||||||||||||||||
| December 31, 2023 | January 1, 2023 | January 2, 2022 | |||||||||||||||
| Net income | $ | 23 | $ | 881 | $ | 474 | |||||||||||
| Other comprehensive income (loss), net of tax: | |||||||||||||||||
| Foreign currency translation | 219 | (59) | (101) | ||||||||||||||
| Pension accounting | 16 | 44 | 136 | ||||||||||||||
| Hedge accounting | (1) | (27) | (29) | ||||||||||||||
| Total other comprehensive income (loss) | 234 | (41) | 6 | ||||||||||||||
| Comprehensive income | 256 | 839 | 480 | ||||||||||||||
| Comprehensive income (loss) attributable to noncontrolling interest | 31 | 22 | (3) | ||||||||||||||
| Comprehensive income attributable to Smithfield | $ | 226 | $ | 818 | $ | 483 | |||||||||||
See Notes to Consolidated Financial Statements
F-5
SMITHFIELD FOODS, INC. AND SUBSIDIARIES
CONSOLIDATED BALANCE SHEETS
(in millions, except share data)
| December 31, 2023 | January 1, 2023 | ||||||||||
| ASSETS | |||||||||||
| Current assets: | |||||||||||
| Cash and cash equivalents | $ | 687 | $ | 547 | |||||||
| Accounts receivable, net | 577 | 756 | |||||||||
| Inventories, net | 2,536 | 2,934 | |||||||||
| Current assets of discontinued operations | 958 | 969 | |||||||||
| Prepaid expenses and other current assets | 163 | 337 | |||||||||
| Total current assets | 4,921 | 5,543 | |||||||||
| Property, plant and equipment, net | 3,347 | 3,367 | |||||||||
| Goodwill | 1,627 | 1,617 | |||||||||
| Long-term assets of discontinued operations | 1,347 | 1,181 | |||||||||
| Intangible assets, net | 1,274 | 1,282 | |||||||||
| Operating lease assets | 381 | 418 | |||||||||
| Equity method investments | 191 | 224 | |||||||||
| Other assets | 230 | 216 | |||||||||
| Total assets | $ | 13,317 | $ | 13,847 | |||||||
| LIABILITIES AND EQUITY | |||||||||||
| Current liabilities: | |||||||||||
| Accounts payable | 789 | 1,015 | |||||||||
| Current portion of long-term debt and finance lease obligations | 27 | 9 | |||||||||
| Current portion of operating lease obligations | 63 | 72 | |||||||||
| Current liabilities of discontinued operations | 406 | 408 | |||||||||
| Accrued expenses and other current liabilities | 1,166 | 1,085 | |||||||||
| Total current liabilities | 2,450 | 2,589 | |||||||||
| Long-term debt and finance lease obligations | 2,006 | 2,029 | |||||||||
| Long-term operating lease obligations | 325 | 359 | |||||||||
| Deferred income taxes, net | 474 | 588 | |||||||||
| Net long-term pension obligation | 255 | 276 | |||||||||
| Long-term liabilities of discontinued operations | 86 | 238 | |||||||||
| Other liabilities | 235 | 197 | |||||||||
| Redeemable noncontrolling interests | 246 | 197 | |||||||||
| Commitments and contingencies (Note 17) | |||||||||||
| Equity: | |||||||||||
| Shareholder’s equity: | |||||||||||
| Common stock, no par value, 1,000 shares authorized; 1,000 issued and outstanding | — | — | |||||||||
F-6
| Additional paid-in capital | 4,152 | 4,188 | |||||||||
| Retained earnings | 3,588 | 3,894 | |||||||||
| Accumulated other comprehensive loss | (500) | (708) | |||||||||
| Total shareholder’s equity | 7,241 | 7,374 | |||||||||
| Noncontrolling interests | — | — | |||||||||
| Total equity | 7,241 | 7,374 | |||||||||
| Total liabilities and equity | $ | 13,317 | $ | 13,847 | |||||||
See Notes to Consolidated Financial Statements
F-7
SMITHFIELD FOODS, INC. AND SUBSIDIARIES
CONSOLIDATED STATEMENTS OF CASH FLOWS
(in millions)
| Twelve Months Ended | |||||||||||||||||
| December 31, 2023 | January 1, 2023 | January 2, 2022 | |||||||||||||||
| Cash flows from operating activities: | |||||||||||||||||
| Net income | $ | 23 | $ | 881 | $ | 474 | |||||||||||
| Less: Net income from discontinued operations | (155) | (70) | (85) | ||||||||||||||
| Net income (loss) from continuing operations | $ | (133) | $ | 811 | $ | 389 | |||||||||||
| Adjustments to reconcile net income from continuing operations to net cash flows from operating activities of continuing operations: | |||||||||||||||||
| Depreciation and amortization | 427 | 440 | 331 | ||||||||||||||
| Impairment of assets | 1 | 40 | 1 | ||||||||||||||
| (Income) loss from equity method investments | 46 | 6 | (28) | ||||||||||||||
| Deferred income taxes | (130) | 2 | 32 | ||||||||||||||
| Gain on sale/dilution of equity method investments | — | (56) | — | ||||||||||||||
| Gain on sale of businesses and other assets | (74) | (414) | — | ||||||||||||||
| Accounts receivable | 157 | (33) | (2) | ||||||||||||||
| Inventories | 469 | (307) | (184) | ||||||||||||||
| Prepaid expenses and other current assets | 57 | (23) | 13 | ||||||||||||||
| Accounts payable | (215) | 121 | 188 | ||||||||||||||
| Accrued expenses and other current liabilities | 80 | (24) | 70 | ||||||||||||||
| Other | 3 | (41) | (55) | ||||||||||||||
| Net cash flows from operating activities of continuing operations | 688 | 521 | 755 | ||||||||||||||
| Cash flows from investing activities: | |||||||||||||||||
| Capital expenditures | (353) | (338) | (207) | ||||||||||||||
| Net expenditures from breeding stock transactions | (48) | (1) | (6) | ||||||||||||||
| Proceeds from the sale of investments | (27) | (22) | — | ||||||||||||||
| Business acquisitions, net of cash acquired | — | — | (1) | ||||||||||||||
| Investments in partnerships and other assets | — | 21 | — | ||||||||||||||
| Business dispositions | 13 | 606 | — | ||||||||||||||
| Proceeds from sale of property, plant and equipment and other assets | 219 | 8 | 6 | ||||||||||||||
| Other | 3 | 1 | 4 | ||||||||||||||
| Net cash flows from investing activities of continuing operations | (194) | 274 | (204) | ||||||||||||||
| Cash flows from financing activities: | |||||||||||||||||
| Payment of dividends | (323) | (496) | (192) | ||||||||||||||
| Repayments of Securitization Facility | (226) | (785) | (430) | ||||||||||||||
| Proceeds from Securitization Facility | 226 | 785 | 430 | ||||||||||||||
| Purchase of redeemable noncontrolling interest | (15) | — | — | ||||||||||||||
| Net proceeds from (repayments of) revolving credit facilities | (7) | (13) | (70) | ||||||||||||||
F-8
| Principal payments on long-term debt and finance lease obligations | (4) | (3) | (653) | ||||||||||||||
| Payment of deferred purchase consideration for acquisition | (2) | (55) | — | ||||||||||||||
| Proceeds from the issuance of debt | — | — | 493 | ||||||||||||||
| Other | (2) | — | (12) | ||||||||||||||
| Net cash flows from financing activities of continuing operations | (353) | (567) | (434) | ||||||||||||||
| Effect of foreign exchange rate changes on cash from continuing operations | 3 | 8 | 1 | ||||||||||||||
| Cash flows from discontinued operations | |||||||||||||||||
| Net cash flows from operating activities of discontinued operations | 346 | (4) | 31 | ||||||||||||||
| Net cash flows from investing activities of discontinued operations | (128) | (81) | (126) | ||||||||||||||
| Net cash flows from financing activities of discontinued operations | (180) | 90 | 97 | ||||||||||||||
| Effect of foreign exchange rate changes on cash from discontinued operations | — | 4 | (4) | ||||||||||||||
| Net change in cash and cash equivalents of discontinued operations | 38 | 8 | (1) | ||||||||||||||
| Net change in cash, cash equivalents and restricted cash | 181 | 245 | 117 | ||||||||||||||
| Cash, cash equivalents and restricted cash at beginning of period | 570 | 325 | 208 | ||||||||||||||
| Cash, cash equivalents and restricted cash at end of period | 751 | 570 | 325 | ||||||||||||||
| Less: Cash, cash equivalents and restricted cash for discontinued operations at end of period | (64) | (23) | (14) | ||||||||||||||
| Cash, cash equivalents and restricted cash at end of period | $ | 687 | $ | 547 | $ | 311 | |||||||||||
See Notes to Consolidated Financial Statements
F-9
SMITHFIELD FOODS, INC. AND SUBSIDIARIES
CONSOLIDATED STATEMENTS OF SHAREHOLDER’S EQUITY
(in millions)
Additional Paid-in Capital | Retained Earnings | Accumulated Other Comprehensive Loss | Total Shareholder’s Equity | Noncontrolling Interests | Total Equity | ||||||||||||||||||||||||||||||
| Balance, January 3, 2021 | $ | 4,190 | $ | 3,122 | $ | (667) | $ | 6,644 | $ | 1 | $ | 6,645 | |||||||||||||||||||||||
| Dividends | — | (73) | — | (73) | — | (73) | |||||||||||||||||||||||||||||
| Comprehensive income: | |||||||||||||||||||||||||||||||||||
| Net income | — | 472 | — | 472 | — | 472 | |||||||||||||||||||||||||||||
| Other comprehensive income, net of tax | — | — | 10 | 10 | — | 10 | |||||||||||||||||||||||||||||
| Effect of change in accounting principle | — | (1) | 1 | — | — | — | |||||||||||||||||||||||||||||
| Balance, January 2, 2022 | 4,190 | 3,521 | (656) | 7,054 | — | 7,054 | |||||||||||||||||||||||||||||
| Dividends | — | (496) | — | (496) | — | (496) | |||||||||||||||||||||||||||||
| Adjustment to redeemable noncontrolling interests | (2) | — | — | (2) | — | (2) | |||||||||||||||||||||||||||||
| Comprehensive income: | |||||||||||||||||||||||||||||||||||
| Net income | — | 870 | — | 870 | — | 870 | |||||||||||||||||||||||||||||
| Other comprehensive loss, net of tax | — | — | (52) | (52) | — | (52) | |||||||||||||||||||||||||||||
| Balance, January 1, 2023 | 4,188 | 3,894 | (708) | 7,374 | — | 7,374 | |||||||||||||||||||||||||||||
| Dividends | — | (323) | — | (323) | — | (323) | |||||||||||||||||||||||||||||
| Adjustment to redeemable noncontrolling interests | (36) | — | — | (36) | — | (36) | |||||||||||||||||||||||||||||
| Comprehensive income: | |||||||||||||||||||||||||||||||||||
| Net income | — | 17 | — | 17 | — | 17 | |||||||||||||||||||||||||||||
| Other comprehensive income, net of tax | — | — | 208 | 208 | — | 208 | |||||||||||||||||||||||||||||
| Balance, December 31, 2023 | $ | 4,152 | $ | 3,588 | $ | (500) | $ | 7,241 | $ | — | $ | 7,241 | |||||||||||||||||||||||
See Notes to Consolidated Financial Statements
F-10
SMITHFIELD FOODS, INC. AND SUBSIDIARIES
NOTES TO CONSOLIDATED FINANCIAL STATEMENTS
NOTE 1: SUMMARY OF SIGNIFICANT ACCOUNTING POLICIES
Organization
Smithfield Foods, Inc., together with its subsidiaries (“Smithfield,” “the Company,” “we,” “us” or “our”) produces a wide variety of fresh pork and packaged meats products primarily in the United States and markets them both domestically and internationally. We operate in a cyclical industry and our results are significantly affected by fluctuations in commodity prices for meat, livestock (primarily hogs) and grains. Smithfield is an indirect, wholly owned subsidiary of Hong Kong-based WH Group Limited (“WH Group”).
Basis of Presentation
The accompanying consolidated financial statements have been prepared in accordance with accounting principles generally accepted in the United States (“GAAP”), which require us to make estimates and use assumptions that affect the amounts reported in the consolidated financial statements and accompanying notes. It is possible that actual results could differ materially from those estimates. The information reflects all normal recurring adjustments which we believe are necessary to present fairly the financial position and results of operations for all periods included. Totals and percentages may be affected by rounding.
Our elected fiscal year is the 52-week or 53-week period which ends on the Sunday nearest to December 31. Fiscal years 2023, 2022 and 2021 each consisted of 52-weeks.
Principles of Consolidation
The consolidated financial statements include the accounts of all wholly owned subsidiaries, as well as all majority-owned subsidiaries and other entities for which we have a controlling financial interest. We evaluate contractual, equity and other variable interests in entities that may be deemed variable interest entities (“VIE”). We consolidate a VIE if we determine that we are the VIE’s primary beneficiary. A VIE’s primary beneficiary has both (1) the power to direct the activities of the VIE that most significantly impact the VIE’s economic performance and (2) the obligation to absorb losses or the right to receive benefits from the VIE that could potentially be significant to the VIE. All intercompany transactions and accounts have been eliminated.
The functional currency of our 66% owned subsidiary, Granjas Carroll de Mexico, S. de R.L. de C.V., (“Altosano”) is the Mexican Peso. The assets and liabilities of Altosano are translated into U.S. dollars using the exchange rates in effect at the balance sheet dates. The income and cash flows of Altosano are translated into U.S. dollars using the average exchange rates over the course of the year. The net effect of translating the accounts of Altosano into U.S. dollars is included as a component of shareholder’s equity in accumulated other comprehensive loss.
Gains and losses that arise from exchange rate fluctuations on transactions denominated in a currency other than the functional currency are recognized in earnings as incurred and included in selling, general and administrative expenses (“SG&A”) for operating transactions or non-operating gains for non-operating transactions.
Cash and Cash Equivalents
We consider all highly liquid investments with original maturities of 90 days or less to be cash equivalents. The majority of our cash is concentrated in demand deposit accounts or money market funds. The carrying value of cash and cash equivalents approximates fair value.
Accounts Receivable, Net
Accounts receivable, net is comprised of both receivables from contracts with customers and other receivables. We monitor the credit risk associated with our accounts receivable and establish an allowance for credit losses
F-11
expected to be incurred over the life of the receivable, which is recorded net of this allowance. We calculate this allowance based on our history of write-offs, future economic conditions, level of past due accounts, the financial health of our customers and historical experience. Our allowance for credit losses was not material for the periods presented.
Inventories, Net
Inventories, net consist of the following:
| December 31, 2023 | January 1, 2023 | ||||||||||
| (in millions) | |||||||||||
| Livestock | $ | 1,036 | $ | 1,233 | |||||||
| Fresh and packaged meats | 943 | 1,117 | |||||||||
| Grains | 307 | 350 | |||||||||
| Manufacturing supplies | 123 | 124 | |||||||||
| Other | 127 | 110 | |||||||||
| Inventories, net | $ | 2,536 | $ | 2,934 | |||||||
Inventories are generally valued at the lower of historical average cost or net realizable value. The cost of livestock includes feed, medications, contract grower fees and other production expenses. Fresh pork in the United States is valued based on U.S. Department of Agriculture (“USDA”) published market prices and adjusted for the cost of further processing. Costs for fresh and packaged meats include meat, labor, supplies and overhead. Manufacturing supplies principally consist of ingredients and packaging materials. Other consists primarily of maintenance parts. We primarily use batch-specific costing to record the cost of inventories sold, which approximates the first-in, first-out (“FIFO”) method.
Derivative Financial Instruments and Hedging Activities
We record all derivatives as either assets or liabilities at fair value on the balance sheet, with the exception of contracts that qualify for the normal purchase and normal sale scope exception, which are expected to result in physical delivery. Accounting for changes in the fair value of a derivative depends on whether it qualifies and has been designated as part of a hedging relationship. For derivatives that qualify and have been designated as hedging instruments for accounting purposes, changes in fair value have no net impact on earnings, to the extent the derivative is considered perfectly effective in achieving offsetting changes in fair value attributable to the risk being hedged, until the hedged item is recognized in earnings (commonly referred to as the “hedge accounting” method). For derivatives that do not qualify or are not designated as hedging instruments for accounting purposes, changes in fair value are recorded in current period earnings (commonly referred to as the “mark-to-market” method). We may elect either method of accounting for our derivative portfolio, assuming all the necessary requirements are met. We have, in the past, availed ourselves of either acceptable method and expect to do so in the future. We believe all of our derivative instruments represent economic hedges against changes in prices and rates, regardless of their designation for accounting purposes.
When cash flow hedge accounting is applied, derivative gains or losses are recognized as a component of other comprehensive income (loss) and reclassified into earnings in the same period or periods during which the hedged transactions affect earnings. The initial fair value of hedge components excluded from the assessment of effectiveness is recognized in earnings on a straight-line basis over the life of the hedging instrument and is presented in the same income statement line item as the hedged item. Any difference between the change in fair value of the hedge components excluded from the assessment of effectiveness and the amounts recognized in earnings is recorded as a component of other comprehensive income (loss).
When fair value hedge accounting is applied, derivative gains and losses are recognized in earnings concurrently with the change in fair value of the hedged item attributable to the risk being hedged.
F-12
A portion of our derivatives are exchange traded futures contracts held with brokers, subject to netting arrangements that are enforceable during the ordinary course of business. Additionally, we have a portfolio of over-the-counter derivatives that are held by counterparties under netting arrangements found in typical master netting agreements. These agreements legally allow for net settlement in the event of bankruptcy. We offset the fair values of derivative assets and liabilities, along with the related cash collateral, that are executed with the same counterparty under these arrangements in the consolidated balance sheets.
The cash flows associated with derivative instruments are reported in net cash flows from operating activities in the consolidated statements of cash flows.
Property, Plant and Equipment, Net
Property, plant and equipment, net, (“PP&E”) consists of the following:
| Useful Life | December 31, 2023 | January 1, 2023 | |||||||||||||||
| (in Years) | (in millions) | ||||||||||||||||
| Machinery and equipment | 5-20 | $ | 2,735 | $ | 2,526 | ||||||||||||
| Buildings and improvements | 15-40 | 1,561 | 1,441 | ||||||||||||||
| Land and improvements | 3+ | 686 | 660 | ||||||||||||||
| Computer hardware and software | 3-15 | 229 | 240 | ||||||||||||||
| Breeding stock | 2 | 207 | 221 | ||||||||||||||
| Vehicles | 2-7 | 110 | 94 | ||||||||||||||
| Construction in progress | 225 | 290 | |||||||||||||||
| Property, plant and equipment, gross | 5,753 | 5,472 | |||||||||||||||
| Accumulated depreciation | (2,431) | (2,151) | |||||||||||||||
| Finance leases | 25 | 47 | |||||||||||||||
| Property, plant and equipment, net | $ | 3,347 | $ | 3,367 | |||||||||||||
PP&E is generally stated at historical cost and depreciated on a straight-line basis over the estimated useful lives of the assets. Assets held under finance leases are classified in property, plant and equipment, net and depreciated over the lease term or, in the instance where title transfers to us at the end of the lease term, the estimated useful lives of the assets. The depreciation of assets held under finance leases is included in depreciation expense. Depreciation expense is included in either cost of sales or SG&A, as applicable. Accelerated depreciation of assets resulting from decisions to dispose of assets prior to the end of their previously estimated useful lives is included in cost of sales. Depreciation expense totaled $395 million, $421 million and $320 million in fiscal years 2023, 2022 and 2021, respectively.
During the construction period of significant assets, the associated interest costs are capitalized. Capitalized interest was not material for any of the fiscal years presented.
F-13
Goodwill
Goodwill represents the excess of the purchase price of a business over the fair value of identifiable net assets. The changes in goodwill allocated to each of our reportable segments (1) for fiscal years 2023 and 2022 is presented in the following table.
| Fresh Pork | Hog Production | Packaged Meats | Other (2) | Consolidated | |||||||||||||||||||||||||
| (in millions) | |||||||||||||||||||||||||||||
| Balance, January 2, 2022 | $ | 34 | $ | 4 | $ | 1,549 | $ | 80 | $ | 1,667 | |||||||||||||||||||
| Dispositions | — | — | (47) | $ | — | (47) | |||||||||||||||||||||||
| Measurement period adjustments | — | — | — | $ | (8) | (8) | |||||||||||||||||||||||
| Foreign currency translation | — | — | — | $ | 4 | 4 | |||||||||||||||||||||||
| Balance, January 1, 2023 | 34 | 4 | 1,503 | 77 | 1,617 | ||||||||||||||||||||||||
| Foreign currency translation | — | — | — | 10 | 10 | ||||||||||||||||||||||||
| Balance, December 31, 2023 | 34 | 4 | 1,503 | 87 | 1,627 | ||||||||||||||||||||||||
__________________
(1)See “Note 2: Reportable Segments” for further information about our reportable segments.
(2)Includes our Mexico and Bioscience operations.
Goodwill for each reporting unit is tested for impairment annually in the fourth quarter, or sooner if impairment indicators arise. Goodwill is considered to be impaired if the carrying amount of a reporting unit exceeds its fair value, in which case an impairment loss would be recognized in an amount equal to that excess. We may perform a qualitative assessment to determine if it is more likely than not that the carrying amount of a reporting unit exceeds its fair value. If it is not, no further analysis is required. If it is, a quantitative goodwill impairment test is performed to estimate the fair value of the reporting unit and measure the amount of goodwill impairment loss to be recognized, if any.
The fair value of a reporting unit is estimated by applying valuation multiples and/or estimating future discounted cash flows. The selection of multiples is dependent upon assumptions regarding future operating performance as well as business trends and prospects, and industry, market and economic conditions. When estimating future discounted cash flows, we consider the assumptions that hypothetical marketplace participants would use in estimating future cash flows. In addition, where applicable, an appropriate discount rate is used, based on an industry-wide average cost of capital or location-specific economic factors. We consider all these factors to be level 3 inputs, as defined in “Note 15: Fair Value Measurements.”
Based on the results of our annual goodwill impairment tests, as of our testing date, we have determined that no impairments existed for any of the fiscal years presented.
F-14
Intangible Assets, Net
Intangible assets, net consists of the following:
| Useful Life | December 31, 2023 | January 1, 2023 | |||||||||||||||
| (in Years) | (in millions) | ||||||||||||||||
| Amortized intangible assets: | |||||||||||||||||
| Customer relationships | 14-20 | $ | 82 | $ | 82 | ||||||||||||
| Contractual relationships | 17-22 | 40 | 40 | ||||||||||||||
| Rights and customer lists | 5-25 | 5 | 5 | ||||||||||||||
| Amortized intangible assets, gross | 127 | 127 | |||||||||||||||
| Accumulated amortization | (70) | (62) | |||||||||||||||
| Amortized intangible assets, net | 58 | 66 | |||||||||||||||
| Non-amortized intangible assets: | |||||||||||||||||
| Trademarks | Indefinite | 1,216 | 1,216 | ||||||||||||||
| Intangible assets, net | $ | 1,274 | $ | 1,282 | |||||||||||||
Intangible assets with finite lives are amortized over their estimated useful lives and tested for recoverability when indicators of impairment are present using estimated future undiscounted cash flows related to those assets. The useful life of an intangible asset is the period over which the asset is expected to contribute directly or indirectly to future cash flows. Amortization expense for intangible assets was $8 million in each of fiscal years 2023, 2022 and 2021. The estimated amortization expense associated with our intangible assets for each of the next five years is as follows:
| Year | (in millions) | |||||||
| 2024 | $ | 8 | ||||||
| 2025 | 7 | |||||||
| 2026 | 7 | |||||||
| 2027 | 7 | |||||||
| 2028 | 4 | |||||||
Indefinite-lived trademarks are tested for impairment annually in the fourth quarter, or sooner if impairment indicators arise. If the carrying amount of our trademarks exceed their estimated fair value, an impairment loss is recognized in an amount equal to that excess. The fair values of trademarks are calculated using a royalty rate method. Assumptions about royalty rates are based on the rates at which similar brands and trademarks are licensed in the marketplace.
We have determined that no impairments of our intangible assets existed for any of the fiscal years presented.
Investments
We account for investments in entities that we do not control, but over which we have the ability to exercise significant influence, using the equity accounting method. These investments are recorded in equity method investments on the consolidated balance sheet. We record our share of earnings and losses from our equity method investments in (income) loss from equity method investments in the consolidated statements of income. The majority of our equity method investments are reported on a one-month lag, which does not materially impact our consolidated financial statements.
We account for investments in entities that we do not control and do not have the ability to exercise significant influence at fair value if fair value is readily determinable. For investments that do not have readily determinable fair values, we account for the investment at cost minus impairment, if any, plus or minus changes resulting from orderly
F-15
transactions for the identical or a similar investment of the same issuer. These investments are recorded in other assets on the consolidated balance sheets.
We consider whether the fair value of an investment has declined below its carrying amount whenever adverse events or changes in circumstances indicate that recorded values may not be recoverable. If we consider any such decline to be other than temporary (based on various factors, including historical financial results, product development activities and the overall health of the affiliate’s industry), then a write-down of the investment would be recorded to its estimated fair value.
Leases
At inception, we determine whether a contract is or contains a lease based on whether we have the right to control the use of an identified asset for a period of time, which includes the right to (1) obtain substantially all of the economic benefits from the use of the identified asset and (2) direct the use of the identified asset. Our lease assets and obligations are initially measured at the present value of the future lease payments over the term of the lease, adjusted for any prepayments. The lease term consists of the noncancellable period of the lease, plus any period covered by an option to extend the lease that is either controlled by the lessor or is reasonably certain to be exercised by the Company. The value of the future lease payments is discounted at the interest rate implicit in our lease contracts, if readily determinable. Otherwise, we utilize the appropriate incremental borrowing rate, which is the rate incurred to borrow on a collateralized basis over a similar term and economic environment to that of the lease. Our lease assets and obligations do not contain any leases with a term of 12 months or less.
Our lease agreements contain both lease and non-lease components. We allocate the consideration in our lease agreements to each component based on the standalone values of each component. The non-lease components are excluded from the measurement of our lease assets and obligations.
Operating lease cost is recognized on a straight-line basis in earnings over the term of the lease. Finance lease cost is amortized into earnings using the effective interest method over the lease term or, in the instance where title transfers to us at the end of the lease term, the estimated useful lives of the assets. The interest component of finance lease cost is included in interest expense.
Debt Issuance Costs, Premiums and Discounts
Debt issuance costs, premiums and discounts are amortized into interest expense over the terms of the related loan agreements using the effective interest method. Debt issuance costs are generally recorded as a reduction of the associated debt instrument and classified in long-term debt and finance lease obligations in the consolidated balance sheets. Costs to enter into and/or refinance credit facilities are classified in other assets on the consolidated balance sheets and reclassified to current assets as the credit facilities approach expiration.
Income Taxes
Smithfield is included in its parent’s (United Global Foods Holdings, Inc.) consolidated federal income tax group and consolidated income tax return. The members of the consolidated group have elected to allocate income taxes among the members of the group by the separate return method, under which the parent company credits the subsidiary for income tax reductions resulting from the subsidiary’ inclusion in the consolidated return, or the parent charges the subsidiary for its allocated share of the consolidated income tax liability.
We estimate total income tax expense, including interest and penalties, based on statutory tax rates and tax planning opportunities available to us in various jurisdictions in which we earn income. Federal income taxes include an estimate for taxes on earnings of foreign subsidiaries expected to be remitted to the United States and be taxable, but not for earnings considered indefinitely invested in the foreign subsidiary.
We account for the global intangible low-taxed income (“GILTI”) inclusion from foreign subsidiaries in the period in which it is incurred.
Deferred tax assets and liabilities are recognized for the estimated future tax consequences attributable to differences between the financial statement carrying amounts of assets and liabilities and their respective tax bases.
F-16
Deferred tax assets and liabilities are measured using enacted tax rates in effect for the year in which those temporary differences are expected to be recovered or settled. The effect on deferred tax assets and liabilities of a change in tax rate is recognized in earnings in the period that includes the enactment date. Valuation allowances are established when necessary to reduce deferred tax assets to amounts more likely than not to be realized.
The determination of our provision for income taxes requires significant judgment, the use of estimates, and the interpretation and application of complex tax laws. Significant judgment is required in assessing the timing and amounts of deductible and taxable items.
We record liabilities for uncertain tax positions based on our analysis of whether, and the extent to which, additional taxes will be due. We record these liabilities using a two-step process in which (1) we evaluate whether we believe it is more likely than not that the tax positions will be sustained on the basis of the technical merits of the position and (2) for those tax positions that meet the more-likely-than-not recognition threshold, we recognize the largest amount of tax benefit that is more than 50 percent likely to be realized upon ultimate settlement with the tax authority. We recognize accrued interest and penalties related to unrecognized tax benefits in income tax expense.
Pension Accounting
We recognize the funded status of our defined benefit pension plans in the consolidated balance sheets. We measure our pension and other postretirement benefit plan obligations and related plan assets as of December 31. The measurement of our pension obligations and related costs is dependent on the use of assumptions and estimates. These assumptions include discount rates, salary growth, mortality rates and expected returns on plan assets. Changes in assumptions and future investment returns could potentially have a material impact on our expenses and related funding requirements.
We recognize in other comprehensive income (loss), the gains or losses and prior service costs or credits that arise during the period. Prior to the freeze of our qualified pension plans for all non-union participants in the second quarter of 2021, these amounts were amortized into net periodic benefit cost over the average remaining service period of active plan participants. Subsequent to the plan freeze, these amounts are amortized over the average remaining life expectancy of the plan participants.
Self-Insurance Programs
We are self-insured for certain levels of workers’ compensation claims, health care coverage, product recall, vehicle, property, and general liability. The cost of these self-insurance programs is accrued based upon estimated settlements for known and anticipated claims. Any resulting adjustments to previously recorded reserves are reflected in current period earnings.
Asset Retirement Obligations
We record an asset retirement obligation (“ARO”) related to PP&E when a legal obligation is incurred and the fair value of the obligation can be estimated. AROs are initially recorded as a liability at fair value and capitalized in property, plant and equipment, net on the consolidated balance sheet. We estimate the fair value of AROs based on the projected discounted future cash outflows required to settle the liability. Such an estimate requires assumptions and judgments regarding the amount and timing of cash outflows required to settle the liability, which are level 3 inputs, as defined in “Note 15: Fair Value Measurements.” If the fair value of the recorded ARO changes, a revision is recorded to both the ARO and the related asset. The cost of the ARO is depreciated into earnings on a straight-line basis over the remaining useful life of the related asset. Accretion of the liability due to the passage of time is recognized as an expense in current period earnings. As of December 31, 2023 and January 1, 2023, the balance of our AROs was $29 million, and $20 million, respectively.
Contingent Liabilities
We are subject to lawsuits, investigations and other claims related to the operation of our farms and facilities, labor, livestock procurement, securities, environmental, our products, taxes and other matters, and are required to assess the likelihood of any adverse judgments or outcomes to these matters, as well as potential ranges of loss. A
F-17
determination of the amount of accruals and disclosures required, if any, for these contingencies is made after considerable analysis of each individual issue.
We accrue for contingent liabilities, including future defense costs, when an assessment of the risk of loss is probable and can be reasonably estimated. We disclose contingent liabilities when the risk of material loss is at least reasonably possible. We reevaluate our accruals when facts and circumstances change, which could warrant an adjustment to the amount that is recorded.
Our contingent liabilities contain uncertainties because the eventual outcome will result from future events. Our determination of accruals and any reasonably possible losses in excess of those accruals require estimates and judgments related to the possible outcomes, differing interpretations of the law, assessments of the amount of potential damages, settlements or defense costs, and the effectiveness of strategies or other factors beyond our control. If actual results are not consistent with our estimates or assumptions, we may be exposed to gains or losses that could have a material effect on our future results of operations and cash flows.
Redeemable Noncontrolling Interests
Certain noncontrolling interest holders have the right to exercise a put option that would obligate us to redeem a portion or all of their interest. These noncontrolling interests are classified as redeemable noncontrolling interests outside of equity in our consolidated balance sheets. At the end of each period we adjust the value of redeemable noncontrolling interests, if necessary, to the redemption value (as defined in the subsidiary’s operating agreement) through additional paid-in capital. See “Note 15: Fair Value Measurements” for a discussion of the assessment of redemption value. The following table presents the changes in redeemable noncontrolling interests for the periods presented:
| Twelve Months Ended | |||||||||||||||||||||||||||||
| December 31, 2023 | January 1, 2023 | January 2, 2022 | |||||||||||||||||||||||||||
| (in millions) | |||||||||||||||||||||||||||||
| Beginning balance | $ | 197 | $ | 174 | $ | 11 | |||||||||||||||||||||||
| Attribution of net income | 5 | 11 | 1 | ||||||||||||||||||||||||||
| Attribution of comprehensive income (loss) | 25 | 11 | (5) | ||||||||||||||||||||||||||
| Dividends | (2) | (1) | (2) | ||||||||||||||||||||||||||
| Acquisition | — | — | 169 | ||||||||||||||||||||||||||
| Redemption | (15) | — | — | ||||||||||||||||||||||||||
| Adjustment to redemption value | 36 | 2 | — | ||||||||||||||||||||||||||
| Ending balance | $ | 246 | $ | 197 | $ | 174 | |||||||||||||||||||||||
Revenue Recognition
Our revenue (sales) is primarily derived from contracts with customers for the purchase of our products. Revenue is recognized at a point in time when our performance obligation has been satisfied and control of the promised goods is transferred to the customer, which generally occurs upon shipment or delivery to a customer based on terms of the sale. The primary performance obligation in our contracts with customers is to provide meat products. Shipping and handling activities are considered part of the fulfillment of our promise to provide meat products and not a separate performance obligation. Shipping and handling costs are reported as a component of cost of sales.
Revenue is recorded at the transaction price, which is the amount of consideration we expect to receive in exchange for providing goods to customers. The transaction price may be adjusted for estimates of known or expected variable consideration, including consumer incentives, trade promotions and other programs. Our estimates of variable consideration are based on a number of factors including history with the respective customer, current performance, and future projections. Additionally, in determining whether an estimate of variable consideration is
F-18
constrained, we consider the likelihood and magnitude of a potential revenue reversal. We review and update these estimates regularly until the incentives or product returns are realized. The impact of any adjustment is recognized in the period in which the adjustment is identified. Payment terms vary per contract. However, payment is typically received within a few weeks of the invoice date.
The balances for receivables from contracts with customers and deferred revenue are presented in the following table:
| December 31, 2023 | January 1, 2023 | January 2, 2022 | |||||||||||||||
| (in millions) | |||||||||||||||||
| Receivables from contracts with customers | $ | 475 | $ | 700 | $ | 703 | |||||||||||
| Deferred revenue | 9 | 13 | 23 | ||||||||||||||
Advertising and Promotional Expenses
Advertising and promotional expenses are recognized as incurred except for certain production expenses, which are expensed upon the first airing of the advertisement. Promotional sponsorship expenses are recognized as the promotional events occur. Advertising expenses totaled $123 million, $127 million and $116 million in fiscal years 2023, 2022 and 2021, respectively, and are included in SG&A in the consolidated statements of income.
Research and Development Expenses
Research and development expenses are recognized as incurred. Research and development expenses totaled $175 million, $157 million and $157 million in fiscal years 2023, 2022 and 2021, respectively, and are included in cost of sales in the consolidated statements of income.
Government Assistance
We may receive government assistance (government grants) from time to time, primarily in the form of refundable tax credits. Government grants typically specify conditions that must be met in order for the government grants to be earned. Our policy is to recognize government grants when they are reasonably assured of receipt. We did not recognize any government grants during any of the fiscal years presented.
Recently Issued Accounting Pronouncements
There have been no recently issued accounting pronouncements that have had, or are expected to have, a material impact on our consolidated financial statements.
NOTE 2: REPORTABLE SEGMENTS
Our reportable segments are determined on the basis of our organizational structure and information that is regularly reviewed by our Chief Operating Decision Maker (“CODM”) for the purpose of making operating and resource allocation decisions and assessing the performance of the operating segments of our business. Our CODM is our Chief Executive Officer.
Following the carve-out and distribution of our European operations, we conduct our operations through three reportable segments: Packaged Meats, Fresh Pork and Hog Production.
Packaged Meats
The Packaged Meats segment consists of our U.S. operations that process fresh meat into a wide variety of packaged meats products, including bacon, sausage, hot dogs, deli and lunch meats, dry sausage products (such as pepperoni and genoa), ham products, ready-to-eat products and prepared foods (such as pre-cooked entrees, bacon and sausage). Approximately 80% of the Packaged Meats segment’s raw materials are sourced from our Fresh Pork segment. We market our domestic packaged meats products under a strategic set of core brands, which include: Smithfield, Eckrich, Nathan’s Famous, Farmland, Armour, Farmer John, Kretschmar, Krakus, John Morrell, Cook’s,
F-19
Gwaltney, Carando, Margherita, Curly’s and Smithfield Culinary. We also sell a sizeable portion of our packaged meats products as private label products. The majority of the Packaged Meats segment’s products are sold to retail and foodservice customers in the United States.
Fresh Pork
The Fresh Pork segment consists of our U.S. operations that process live hogs into a wide variety of primal, sub-primal and offal products, such as bellies, butts, hams, loins, picnics and ribs. The Fresh Pork segment sources approximately half of its raw materials from our Hog Production segment and half from independent farmers with whom we partner across the United States. Approximately one-third of our fresh pork products, including the majority of hams, bellies and trimmings, is transferred to our Packaged Meats segment. Externally, we sell our fresh pork products to domestic retail, foodservice and industrial customers, as well as to export markets, including, among others, China, Mexico, Japan, South Korea and Canada.
Hog Production
The Hog Production segment consists of our hog production operations in the United States, which produce and raise our hogs on numerous company-owned farms and farms that are owned and operated by third-party contract farmers. Nearly all of the hogs produced by this segment are processed by our Fresh Pork segment. The Hog Production segment also may sell grains to external customers.
Our CODM reviews assets at a consolidated level; not by reportable segment. Therefore, we do not disclose assets by reportable segment.
The following table provides certain financial information by reportable segment for the fiscal years presented with a reconciliation to consolidated totals.
| Packaged Meats | Fresh Pork | Hog Production | Other (1) | Unallocated | Intersegment | Consolidated | |||||||||||||||||||||||||||||||||||
| (in millions) | |||||||||||||||||||||||||||||||||||||||||
| 2023 | |||||||||||||||||||||||||||||||||||||||||
| Sales | 8,280 | 7,832 | 3,317 | 559 | — | (5,348) | $ | 14,640 | |||||||||||||||||||||||||||||||||
| Depreciation and amortization | 124 | 121 | 144 | 38 | — | — | 427 | ||||||||||||||||||||||||||||||||||
| (Income) loss from equity method investments | — | (1) | (2) | — | 49 | — | 46 | ||||||||||||||||||||||||||||||||||
| Capital expenditures | 154 | 123 | 40 | 36 | — | — | 353 | ||||||||||||||||||||||||||||||||||
| Reconciliation of segment profit to loss from continuing operations before income taxes: | |||||||||||||||||||||||||||||||||||||||||
| Segment profit | 1,066 | 118 | (754) | (4) | — | — | 426 | ||||||||||||||||||||||||||||||||||
Unallocated expenses (2) | — | — | — | — | (371) | — | (371) | ||||||||||||||||||||||||||||||||||
Corporate expenses (3) | — | — | — | — | (107) | — | (107) | ||||||||||||||||||||||||||||||||||
| Interest expense | — | — | — | — | (76) | — | (76) | ||||||||||||||||||||||||||||||||||
| Non-operating gains | — | — | — | — | 3 | — | 3 | ||||||||||||||||||||||||||||||||||
| Allocated income from equity method investments | — | (1) | (2) | — | — | — | (4) | ||||||||||||||||||||||||||||||||||
| Loss from continuing operations before income taxes | (129) | ||||||||||||||||||||||||||||||||||||||||
F-20
| Packaged Meats | Fresh Pork | Hog Production | Other (1) | Unallocated | Intersegment | Consolidated | |||||||||||||||||||||||||||||||||||
| 2022 | |||||||||||||||||||||||||||||||||||||||||
| Sales | $ | 9,262 | $ | 9,190 | $ | 4,456 | $ | 524 | — | $ | (7,234) | $ | 16,199 | ||||||||||||||||||||||||||||
| Depreciation and amortization | 138 | 139 | 130 | 33 | — | — | 440 | ||||||||||||||||||||||||||||||||||
| (Income) loss from equity method investments | — | (1) | (1) | 8 | — | — | 6 | ||||||||||||||||||||||||||||||||||
| Capital expenditures | 99 | 148 | 79 | 13 | — | — | 338 | ||||||||||||||||||||||||||||||||||
| Reconciliation of segment profit to income from continuing operations before income taxes: | |||||||||||||||||||||||||||||||||||||||||
| Segment profit | 1,047 | 32 | (133) | 53 | — | — | 999 | ||||||||||||||||||||||||||||||||||
Unallocated gains (2) | 229 | 229 | |||||||||||||||||||||||||||||||||||||||
Corporate expenses (3) | — | — | — | — | (118) | — | (118) | ||||||||||||||||||||||||||||||||||
| Interest expense | — | — | — | — | (87) | — | (87) | ||||||||||||||||||||||||||||||||||
| Non-operating gains | — | — | — | — | 18 | — | 18 | ||||||||||||||||||||||||||||||||||
| (Income) loss from equity method investments | — | (1) | (1) | 8 | — | — | 6 | ||||||||||||||||||||||||||||||||||
| Income from continuing operations before income taxes | 1,047 | ||||||||||||||||||||||||||||||||||||||||
| 2021 | |||||||||||||||||||||||||||||||||||||||||
| Sales | $ | 8,515 | $ | 9,145 | $ | 3,866 | $ | 247 | — | $ | (6,765) | $ | 15,009 | ||||||||||||||||||||||||||||
| Depreciation and amortization | 125 | 122 | 71 | 13 | — | — | 331 | ||||||||||||||||||||||||||||||||||
| Income from equity method investments | — | (4) | (17) | (7) | — | — | (28) | ||||||||||||||||||||||||||||||||||
| Capital expenditures | 75 | 88 | 44 | 1 | — | — | 207 | ||||||||||||||||||||||||||||||||||
| Reconciliation of segment profit to income from continuing operations before income taxes: | |||||||||||||||||||||||||||||||||||||||||
| Segment profit | 879 | (5) | 69 | 68 | — | — | 1,011 | ||||||||||||||||||||||||||||||||||
Unallocated expenses (2) | (343) | (343) | |||||||||||||||||||||||||||||||||||||||
Corporate expenses (3) | — | — | — | — | (119) | — | (119) | ||||||||||||||||||||||||||||||||||
| Interest expense | — | — | — | — | (93) | — | (93) | ||||||||||||||||||||||||||||||||||
| Non-operating gains | — | — | — | — | 30 | — | 30 | ||||||||||||||||||||||||||||||||||
| Income from equity method investments | — | (4) | (17) | (7) | — | — | (28) | ||||||||||||||||||||||||||||||||||
| Income from continuing operations before income taxes | 458 | ||||||||||||||||||||||||||||||||||||||||
________________
(1)Includes our Mexico and Bioscience operations. Our Mexico operations include the raising of hogs and production of pork products that are sold primarily to customers in Mexico. Our Bioscience operations use raw materials from hogs that we harvest to manufacture heparin products, including an active pharmaceutical ingredient that mitigates the risk of blood clots.
(2)Includes certain costs of sales, SG&A and operating gains that we do not allocate to our segments.
(3)Represents general corporate expenses for management and administration of the business.
F-21
The following table disaggregates our sales by reportable segment to customers by major distribution channel:
Retail (1) | Foodservice (2) | Exports (3) | Industrial (4) | Other / Unallocated (5) | Total External Sales (6) | Intersegment | Consolidated (7) | ||||||||||||||||||||||||||||||||||||||||
| (in millions) | |||||||||||||||||||||||||||||||||||||||||||||||
| 2023 | |||||||||||||||||||||||||||||||||||||||||||||||
| Packaged Meats | $ | 5,265 | $ | 2,420 | $ | 126 | $ | 449 | $ | 20 | $ | 8,280 | $ | — | $ | 8,280 | |||||||||||||||||||||||||||||||
| Fresh Pork | 2,007 | 246 | 1,731 | 1,142 | 12 | 5,138 | 2,694 | 7,832 | |||||||||||||||||||||||||||||||||||||||
| Hog Production | — | — | — | — | 671 | 671 | 2,646 | 3,317 | |||||||||||||||||||||||||||||||||||||||
Other (8) | — | — | — | — | 552 | 552 | 7 | 559 | |||||||||||||||||||||||||||||||||||||||
| Intersegment | — | — | — | — | — | — | (5,348) | (5,348) | |||||||||||||||||||||||||||||||||||||||
| Total | $ | 7,272 | $ | 2,667 | $ | 1,857 | $ | 1,591 | $ | 1,254 | $ | 14,640 | $ | — | $ | 14,640 | |||||||||||||||||||||||||||||||
| 2022 | |||||||||||||||||||||||||||||||||||||||||||||||
| Packaged Meats | $ | 5,624 | $ | 2,749 | $ | 194 | $ | 516 | $ | 178 | $ | 9,261 | $ | — | $ | 9,262 | |||||||||||||||||||||||||||||||
| Fresh Pork | 2,233 | 322 | 1,683 | 1,303 | 14 | 5,555 | 3,635 | 9,190 | |||||||||||||||||||||||||||||||||||||||
| Hog Production | — | — | — | — | 862 | 862 | 3,594 | 4,456 | |||||||||||||||||||||||||||||||||||||||
Other (8) | — | — | — | — | 520 | 520 | 4 | 524 | |||||||||||||||||||||||||||||||||||||||
| Intersegment | — | — | — | — | — | — | (7,234) | (7,234) | |||||||||||||||||||||||||||||||||||||||
| Total | $ | 7,857 | $ | 3,071 | $ | 1,877 | $ | 1,819 | $ | 1,575 | $ | 16,199 | $ | — | $ | 16,199 | |||||||||||||||||||||||||||||||
| 2021 | |||||||||||||||||||||||||||||||||||||||||||||||
| Packaged Meats | $ | 5,161 | $ | 2,507 | $ | 203 | $ | 473 | $ | 171 | $ | 8,515 | $ | — | $ | 8,515 | |||||||||||||||||||||||||||||||
| Fresh Pork | 2,007 | 312 | 2,291 | 1,070 | 63 | 5,744 | 3,401 | 9,145 | |||||||||||||||||||||||||||||||||||||||
| Hog Production | — | — | — | — | 503 | 503 | 3,363 | 3,866 | |||||||||||||||||||||||||||||||||||||||
Other (8) | — | — | — | — | 247 | 247 | — | 247 | |||||||||||||||||||||||||||||||||||||||
| Intersegment | — | — | — | — | — | — | (6,765) | (6,765) | |||||||||||||||||||||||||||||||||||||||
| Total | $ | 7,169 | $ | 2,819 | $ | 2,494 | $ | 1,543 | $ | 985 | $ | 15,009 | $ | — | $ | 15,009 | |||||||||||||||||||||||||||||||
________________
(1)Includes national and regional retailers in the United States such as grocery supermarket chains, independent grocers and club stores.
(2)Includes foodservice distributors, fast food and other restaurant operators, hotel chains and other institutional customers in the United States.
(3)Includes exports from the United States to international retailers and wholesale distributors primarily in North America, Asia, Latin America and other emerging markets.
(4)Includes sales to industrial customers who use our raw materials in their finished goods production, including prepared meals, pharmaceutical production and pet food.
(5)Includes sales of grain, oilseeds, breeding stock and market hogs, among others, in addition to external sales from our Mexico and Bioscience operations.
(6)Includes external sales from our Mexico operations of $515 million, $444 million, and $160 million in fiscal years 2023, 2022 and 2021, respectively. All other external sales are sourced from our U.S. operations.
(7)Our largest customer, Walmart Inc., (Walmart) accounted for 12%, 12% and 11% of consolidated sales in fiscal years 2023, 2022 and 2021, respectively. Sales to Walmart were included in our Packaged Meats and Fresh Pork segments. Any extended discontinuance of sales to this customer could, if not replaced, have a material impact on our results of operations.
(8)Includes our Mexico and Bioscience operations.
NOTE 3: DISCONTINUED OPERATIONS
On August 26, 2024, we completed a carve-out and distribution of our European operations to WH Group. The European carve-out represents a strategic shift in our geographical footprint. Accordingly, the results of operations, assets and liabilities, and cash flows of the European operations have been condensed into separate line items and presented in the consolidated statements of income, the consolidated balance sheets and the consolidated statements of cash flows as discontinued operations and this treatment has been applied retrospectively to all periods presented.
F-22
The following table presents the major components of net income from discontinued operations included in the consolidated statements of income.
| Fiscal Year | |||||||||||||||||
| 2023 | 2022 | 2021 | |||||||||||||||
| (in millions) | |||||||||||||||||
| Sales | $ | 3,337 | $ | 2,872 | $ | 2,628 | |||||||||||
| Cost of sales | 2,980 | 2,623 | 2,383 | ||||||||||||||
| Gross profit | 357 | 250 | 244 | ||||||||||||||
| Selling, general and administrative expenses | 164 | 144 | 129 | ||||||||||||||
| Operating gains | (7) | (2) | (2) | ||||||||||||||
| Operating profit | 199 | 108 | 117 | ||||||||||||||
| Interest expense | 11 | 9 | (1) | ||||||||||||||
| Non-operating losses | 3 | 2 | 2 | ||||||||||||||
| Income from discontinued operations before income taxes | 185 | 97 | 115 | ||||||||||||||
| Income tax on discontinued operations | 30 | 27 | 30 | ||||||||||||||
| Net income from discontinued operations | 155 | 70 | 85 | ||||||||||||||
The following tables present the carrying amounts of the major classes of assets and liabilities of the discontinued operations included in the consolidated balance sheets.
Assets
| December 31, 2023 | January 1, 2023 | ||||||||||
| (in millions) | |||||||||||
| Current assets: | |||||||||||
| Cash and cash equivalents | $ | 61 | $ | 21 | |||||||
| Accounts receivable, net | 412 | 430 | |||||||||
| Inventories, net | 460 | 492 | |||||||||
| Prepaid expenses and other current assets | 25 | 26 | |||||||||
| Total current assets | 958 | 969 | |||||||||
| Property, plant and equipment, net | 911 | 771 | |||||||||
| Goodwill | 253 | 205 | |||||||||
| Intangible assets, net | 114 | 105 | |||||||||
| Other assets | 69 | 99 | |||||||||
| Total long-term assets | 1,347 | 1,181 | |||||||||
F-23
Liabilities
| December 31, 2023 | January 1, 2023 | ||||||||||
| (in millions) | |||||||||||
| Current liabilities: | |||||||||||
| Accounts payable | $ | 182 | $ | 193 | |||||||
| Current portion of long-term debt and finance lease obligations | 68 | 88 | |||||||||
| Accrued expenses and other current liabilities | 156 | 127 | |||||||||
| Total current liabilities | 406 | 408 | |||||||||
| Deferred income taxes, net | 30 | 20 | |||||||||
| Long-term debt and finance lease obligations | 8 | 148 | |||||||||
| Other liabilities | 48 | 70 | |||||||||
| Total long-term liabilities | 86 | 238 | |||||||||
Acquisitions within our Discontinued Operations
Prior to the carve-out and distribution of our European operations, we completed several acquisitions, which are included in discontinued operations.
Mecom
On June 17, 2021, we acquired Mecom Group s.r.o., Schneider Food, s.r.o., and Kaiser Food kft. (collectively referred to as “Mecom”) for €48 million ($57 million). Mecom has two meat processing plants in Slovakia and two in Hungary which produce salami and other packaged meats products. Mecom employs more than 1,400 people.
Goodies
On February 28, 2023, we purchased Goodies Meat Production S.R.L. (“Goodies”), a Romanian producer of private label packaged meats products, for consideration valued at €29 million ($31 million). We paid €24 million ($26 million) including post-closing adjustments. The consideration includes contingent payments of €5 million, which are payable upon the achievement of certain earnings targets over a two-year period. Goodies operates a production facility in Ceptura de Jos, Romania and employs 320 people. Their portfolio of products includes salami, ham, bacon, bologna and other meat specialties. The acquisition of Goodies strengthens and expands the packaged meats business in Europe.
DeVeris
On May 31, 2023, we acquired an 80% interest in DeVeris Polska Sp. z o.o. (“DeVeris”), a Polish processor of poultry by-products, for 48 million zł ($11 million). DeVeris operates a production facility in Turek, Poland. The acquisition of DeVeris expanded the vertically integrated business in Poland by enabling further processing of both pork and poultry by-products.
Continuing Involvement
In connection with the carve out of our European operations (“Morliny Foods”), we entered into a transition services agreement that governs certain services Smithfield will provide to Morliny Foods for up to a year subsequent to the carve out. These services include information technology support, including access and license fees, tax advisory services and financial reporting services, none of which are material to Smithfield. In addition, Smithfield will continue to purchase certain products from Morliny Foods for distribution in the U.S. market. Purchases of these products from Morliny Foods were $33 million, $62 million and $59 million in fiscal years 2023, 2022 and 2021, respectively.
F-24
NOTE 4: ACQUISITIONS AND DISPOSITIONS
Acquisitions
Altosano
On July 7, 2021, we acquired a controlling interest in Altosano in exchange for cash valued at $108 million, increasing our total ownership and voting rights in Altosano from 50% to 66%. We paid $1 million, net of $17 million in cash acquired, of the purchase consideration to our joint venture partner upon change in control. We paid an additional $55 million and $2 million in the third quarter of fiscal year 2022 and the third quarter of fiscal year 2023, respectively, with smaller amounts payable annually through 2028. Altosano consists of hog production and pork processing operations in Mexico, growing approximately 1.8 million hogs and processing approximately 1.5 million hogs per year, with approximately 2,600 employees. We historically recorded our share of earnings in Altosano using the equity method of accounting. Upon acquisition of the controlling interest, the accounts of Altosano were consolidated.
American Skin
On December 28, 2023, we acquired the remaining 15% interest in American Skin Food Group, LLC for $15 million.
Dispositions
Saratoga
On October 31, 2022 we closed on the sale of our Saratoga Specialty Foods operation (“Saratoga”), which produced spices, seasonings and sauces for sale primarily to the foodservice industry and for use in our internal production of various packaged meats products. Saratoga continues to be a supplier of ours subsequent to the sale. Proceeds totaled $575 million, resulting in a $417 million gain on the disposal. The gain was recognized in operating gains in the consolidated statement of income in the fourth quarter of 2022. The carrying amount of assets disposed of included $47 million of allocated goodwill. We received $568 million of proceeds at closing. The remainder was received in the first quarter of fiscal year 2023. Saratoga was accounted for in the Packaged Meats segment.
F-25
NOTE 5: OPERATING GAINS AND NON-OPERATING GAINS
The following table provides details of operating gains and non-operating gains.
| Fiscal Year | |||||||||||||||||
| 2023 | 2022 | 2021 | |||||||||||||||
| (in millions) | |||||||||||||||||
| Operating gains: | |||||||||||||||||
Gain on disposal of assets (1) | $ | (88) | $ | — | $ | — | |||||||||||
| Insurance recoveries | (5) | (6) | (33) | ||||||||||||||
Gain on sale of businesses (2) | (1) | (417) | — | ||||||||||||||
| Other | (11) | (6) | (11) | ||||||||||||||
| Total operating gains | $ | (105) | $ | (429) | $ | (44) | |||||||||||
| Non-operating gains: | |||||||||||||||||
| (Gain) loss on nonqualified retirement plan assets | $ | (15) | $ | 26 | $ | (18) | |||||||||||
Gain on the sale/dilution of equity method investments (3) | — | (56) | — | ||||||||||||||
Impairment of investment (4) | — | 40 | — | ||||||||||||||
Net pension and postretirement benefits cost (benefit) (5) | 10 | (28) | (22) | ||||||||||||||
| Other | 1 | 1 | 11 | ||||||||||||||
| Total non-operating gains | $ | (3) | $ | (18) | $ | (30) | |||||||||||
________________
(1)Includes an $86 million gain on the sale of our Vernon, California plant. See “Note 6: Restructuring” for further information.
(2)Fiscal year 2022 includes the $417 million gain on the sale of Saratoga.
(3)In February 2022, our interest in Monarch Bioenergy LLC (“Monarch”), was reduced from 50% to 33% upon the issuance of additional shares to a new investor. The transaction was accounted for as a partial sale of our investment, which resulted in a $52 million gain. In addition, in November 2022, we sold our shares in Norson Holding, S. de R.L. de C.V. (“Norson”) to our joint venture partner and recognized a $4 million gain on the sale in non-operating gains in the fourth quarter of 2022.
(4)In the first quarter of fiscal year 2022, we wrote down the value of our former investment in Norson by $40 million to its estimated fair value.
(5)Includes the components of net pension and postretirement benefits cost other than service cost, which is included in operating profit. These components consist of interest cost, expected return on plan assets, amortization of actuarial gains/losses and prior service costs/credits, and curtailment gains.
NOTE 6: RESTRUCTURING
In May 2022, we announced a decision to close our Vernon, California processing facility, exit farm operations in Arizona and California and reduce our sow herd in Utah. The decision to permanently close our Vernon facility was based on increasingly difficult business conditions in California, where high taxes, high utility costs and a challenging regulatory environment negatively impact our ability to operate efficiently and profitably.
In May 2023, we made a decision to cease operations on a number of sow farms in Missouri. The decision was driven by persistent livestock disease issues, underperforming operations and shifting industry supply and demand dynamics.
In December 2023, we made a decision to terminate a number of third-party hog grower contracts and close several company-owned nursery farms in Utah as a result of the Vernon facility closure in early 2023.
F-26
As a result of these decisions, we incurred various exit costs and disposal charges, which have been, or will be, recorded in cost of sales in our consolidated statements of income. The following table details the charges by major type of cost.
| Fiscal Year | Cumulative | Estimated remaining charges expected to be incurred | |||||||||||||||||||||
| 2023 | 2022 | ||||||||||||||||||||||
| (in millions) | |||||||||||||||||||||||
Accelerated depreciation (1) | $ | 85 | $ | 83 | $ | 168 | $ | — | |||||||||||||||
| Contract termination costs | 42 | 6 | 47 | 15 | |||||||||||||||||||
| Employee termination benefits | 3 | 28 | 31 | 1 | |||||||||||||||||||
| Loss on asset disposals | 2 | 3 | 5 | — | |||||||||||||||||||
| Other exit costs | 64 | 31 | 95 | 1 | |||||||||||||||||||
| Total | $ | 195 | $ | 151 | $ | 346 | $ | 18 | |||||||||||||||
________________
(1)Accelerated depreciation includes $11 million and $20 million for AROs in fiscal years 2023 and 2022, respectively, which were recorded in connection with the decisions to close certain Company-owned farms in accordance with our general permit for concentrated animal feeding operations in the State of Utah.
We also incurred $14 million in costs associated with biogas assets owned by our joint venture, Monarch, in connection with the farms in Missouri that were closed. These costs were recognized in (income) loss from equity method investments in the consolidated statement of income in the fourth quarter of fiscal year 2023.
Additionally, certain biogas assets owned by our joint venture, Align RNG, LLC (“Align”), were impaired as a result of our decision in December 2023 to terminate hog grower contracts and close farms in Utah. As a result, we recognized our share of the impairment totaling $35 million in (income) loss from equity method investments in the consolidated income statement in the fourth quarter of fiscal year 2023.
In the second quarter of fiscal year 2023, we sold our Vernon, California facility for $205 million and recognized a gain of $86 million in operating gains in other operating gains in the consolidated statement of income.
The following table reconciles the beginning and ending liability balances associated with these restructuring activities.
| Balance, January 2, 2022 | Additions | Payments | Balance, January 1, 2023 | Additions | Payments | Balance, December 31, 2023 | |||||||||||||||||||||||||||||||||||
| (in millions) | |||||||||||||||||||||||||||||||||||||||||
| Contract termination costs | $ | — | $ | 6 | $ | — | $ | 5 | $ | 42 | $ | (5) | $ | 42 | |||||||||||||||||||||||||||
| Employee termination benefits | — | 28 | (1) | 27 | 3 | (28) | 2 | ||||||||||||||||||||||||||||||||||
| Other exit costs | — | — | — | — | 64 | (56) | 8 | ||||||||||||||||||||||||||||||||||
| Total | $ | — | $ | 34 | $ | (1) | $ | 33 | $ | 108 | $ | (89) | $ | 52 | |||||||||||||||||||||||||||
NOTE 7: DERIVATIVE FINANCIAL INSTRUMENTS
Our pork production operations use various raw materials, primarily live hogs, corn, soybean meal and wheat, which are actively traded on commodity exchanges. We also use fuel and other energy commodities in our operations. We hedge these commodities when we determine conditions are appropriate to mitigate price risk. While this hedging may limit our ability to participate in gains from favorable commodity fluctuations, it also reduces the risk of loss from adverse changes in raw material prices. We attempt to closely match the commodity contract terms with the hedged item. We also periodically enter into interest rate swaps to hedge exposure to changes in interest rates on certain financial instruments and foreign exchange forward contracts to hedge certain exposures to fluctuating foreign currency rates.
F-27
Changes in commodity prices could have a significant impact on cash deposit requirements under our broker and counterparty agreements. Additionally, certain of our derivative contracts contain credit risk-related contingent features, which would require us to post additional cash collateral to cover net losses on open derivative instruments if our credit rating were sufficiently downgraded. As of December 31, 2023, the net liability position of our open derivative instruments that are subject to credit risk-related contingent features was not material.
Although our counterparties primarily consist of financial institutions that are investment grade, we would be exposed to losses in the event of nonperformance or nonpayment by our counterparties. However, a portion of our financial instruments are exchange traded derivative contracts held with brokers and counterparties with whom we maintain margin accounts that are settled on a daily basis, thereby limiting our credit exposure to non-exchange traded derivatives. Determination of the credit quality of our counterparties is based upon a number of factors, including credit ratings and our evaluation of their financial condition. As of December 31, 2023, we had gross credit exposure of $16 million on non-exchange traded derivative contracts. After taking into account the effect of netting arrangements, we had no credit exposure on non-exchange traded derivative contracts.
The size and mix of our derivative portfolio vary from time to time based upon our analysis of current and future market conditions. The following table presents the fair values of our open derivative financial instruments on a gross basis.
| Assets | Liabilities | |||||||||||||||||||||||||
| December 31, 2023 | January 1, 2023 | December 31, 2023 | January 1, 2023 | |||||||||||||||||||||||
| (in millions) | (in millions) | |||||||||||||||||||||||||
| Derivatives using the “hedge accounting” method: | ||||||||||||||||||||||||||
| Commodity contracts | $ | 37 | $ | 21 | $ | 29 | $ | 13 | ||||||||||||||||||
Foreign exchange contracts (1) | 1 | 1 | — | — | ||||||||||||||||||||||
| Total | 38 | 23 | 29 | 13 | ||||||||||||||||||||||
| Derivatives using the “mark-to-market” method: | ||||||||||||||||||||||||||
| Commodity contracts | 13 | 31 | 13 | 12 | ||||||||||||||||||||||
| Total fair value of derivative instruments | $ | 51 | $ | 54 | $ | 42 | $ | 25 | ||||||||||||||||||
________________
(1)Amounts relate to our discontinued operations. See “Note 3: Discontinued Operations” for further information about our discontinued operations.
The following tables reconcile the gross amounts of derivative assets and liabilities to the net amounts presented in our consolidated balance sheets and the related effects of cash collateral under netting arrangements that provide a legal right of offset of assets and liabilities.
| December 31, 2023 | |||||||||||||||||||||||||||||
| Gross Amount of Derivative Assets/ Liabilities | Netting of Derivative Assets/ Liabilities | Net Derivative Assets/Liabilities | Netting of Derivative and Cash Collateral | Net Amount Presented in the Consolidated Balance Sheet (1) | |||||||||||||||||||||||||
| (in millions) | |||||||||||||||||||||||||||||
| Assets: | |||||||||||||||||||||||||||||
| Commodities | $ | 50 | $ | (25) | $ | 25 | $ | (1) | $ | 24 | |||||||||||||||||||
Foreign exchange contracts (2) | 1 | — | 1 | — | 1 | ||||||||||||||||||||||||
| Total | $ | 51 | $ | (25) | $ | 26 | $ | (1) | $ | 26 | |||||||||||||||||||
| Liabilities: | |||||||||||||||||||||||||||||
| Commodities | 42 | (25) | 18 | 1 | 19 | ||||||||||||||||||||||||
F-28
________________
(1)$25 million of net assets are included in prepaid expenses and other current assets with the remaining $1 million in current assets of discontinued operations. $14 million of the net liabilities are included in accrued expenses and other current liabilities with the remaining $5 million in other liabilities.
(2)Amounts relate to our discontinued operations.
| January 1, 2023 | |||||||||||||||||||||||||||||
| Gross Amount of Derivative Assets/ Liabilities | Netting of Derivative Assets/ Liabilities | Net Derivative Assets/Liabilities | Netting of Derivative and Cash Collateral | Net Amount Presented in the Consolidated Balance Sheet (1) | |||||||||||||||||||||||||
| (in millions) | |||||||||||||||||||||||||||||
| Assets: | |||||||||||||||||||||||||||||
| Commodities | $ | 53 | $ | (18) | $ | 35 | $ | 25 | $ | 61 | |||||||||||||||||||
Foreign exchange contracts (2) | 1 | — | 1 | — | 1 | ||||||||||||||||||||||||
| Total | $ | 54 | $ | (18) | $ | 36 | $ | 25 | $ | 62 | |||||||||||||||||||
| Liabilities: | |||||||||||||||||||||||||||||
| Commodities | 24 | (18) | 7 | (3) | 4 | ||||||||||||||||||||||||
________________
(1)We recorded $59 million of the net assets in prepaid expenses and other current assets, $2 million in other assets and the remaining $1 million in current liabilities of discontinued operations. We recorded $3 million of the net liabilities in accrued expenses and other current liabilities with the remaining $1 million in other liabilities.
(2)Amounts relate to our discontinued operations.
See “Note 15: Fair Value Measurements” for additional information about the fair value of our derivatives.
Hedge Accounting Method
Cash Flow Hedges
We enter into derivative instruments, such as futures, swaps and options contracts, to manage our exposure to the variability in expected future cash flows attributable to commodity price risk associated with the forecasted sale of fresh pork and the forecasted purchase of grains, hogs, and energy. In addition, we enter into interest rate swaps to manage our exposure to changes in interest rates associated with our variable interest rate debt and the forecasted issuance of fixed rate debt. Lastly, we enter into foreign exchange contracts to manage our exposure to the variability in expected future cash flows attributable to changes in foreign exchange rates associated with the forecasted purchase or sale of assets denominated in foreign currencies. As of December 31, 2023, substantially all of our commodity-related cash flow hedges were for transactions forecasted through December 2024.
As of December 31, 2023, the notional volumes associated with open derivative instruments designated in cash flow hedging relationships were as follows:
| Volume | Metric | ||||||||||
| Commodities: | |||||||||||
| Lean hogs | 712,467,000 | Pounds | |||||||||
| Corn | 22,907,000 | Bushels | |||||||||
| Soybean meal | 59,000 | Tons | |||||||||
| Natural Gas | 12,940,000 | Million BTU | |||||||||
Foreign currency (1) | 19,452,483 | U.S. Dollars | |||||||||
________________
(1)Amounts relate to our discontinued operations and represent the U.S. Dollar equivalent of various foreign currency contracts.
F-29
The following table presents the effects on our consolidated financial statements of pre-tax gains and losses on derivative instruments designated in cash flow hedging relationships for the periods indicated:
| Gains (Losses) Recognized in Other Comprehensive Income (Loss) on Derivative | Gains (Losses) Reclassified from Accumulated Other Comprehensive Loss into Earnings | ||||||||||||||||||||||||||||||||||||||||||||||||||||
| Fiscal Year | Fiscal Year | ||||||||||||||||||||||||||||||||||||||||||||||||||||
| 2023 | 2022 | 2021 | 2023 | 2022 | 2021 | ||||||||||||||||||||||||||||||||||||||||||||||||
| (in millions) | (in millions) | ||||||||||||||||||||||||||||||||||||||||||||||||||||
| Commodity contracts | $ | 10 | $ | 58 | $ | (49) | 13 | 97 | (7) | ||||||||||||||||||||||||||||||||||||||||||||
| Interest rate swaps | — | — | 2 | (2) | (1) | (1) | |||||||||||||||||||||||||||||||||||||||||||||||
Foreign exchange contracts (1) | 2 | — | (1) | 1 | (1) | (1) | |||||||||||||||||||||||||||||||||||||||||||||||
| Total | $ | 11 | $ | 58 | $ | (48) | $ | 13 | $ | 94 | $ | (9) | |||||||||||||||||||||||||||||||||||||||||
________________
(1)Amounts relate to our discontinued operations.
In fiscal year 2023, we recognized a total of $53 million in expenses for option premiums, which are excluded from the assessment of hedge effectiveness. As of December 31, 2023, accumulated other comprehensive income included $29 million of net gains associated with options for which the underlying hedged transactions had not yet impacted earnings. This amount represents the difference between the change in the fair value of the options and the amount of option premiums amortized through earnings. The amounts associated with option contracts as of and for the years ended December 31, 2023 and January 1, 2023 were not material.
We expect to reclassify $9 million ($7 million net of tax) of deferred gains on closed commodity and interest rate contracts into earnings within the next twelve months. We are unable to estimate the amount of unrealized gains or losses to be reclassified into earnings within the next twelve months related to open contracts as their values are subject to change.
Fair Value Hedges
We enter into derivative instruments (primarily futures contracts) that are designed to hedge changes in the fair value of firm commitments to buy grains and hogs. As of December 31, 2023, the notional volumes associated with open derivative instruments designated in fair value hedging relationships were as follows:
| Volume | Metric | ||||||||||
| Lean hogs | 4,080,000 | Pounds | |||||||||
| Corn | 1,440,000 | Bushels | |||||||||
| Soybeans | 45,000 | Bushels | |||||||||
The following amounts were recorded in the consolidated balance sheets related to fair value hedges:
| Balance Sheet Classification | Carrying Amount of Hedged Assets | Fair Value Hedging Adjustment Included in the Carrying Amount of Hedged Assets | |||||||||||||||||||||||||||||||||||||||
| December 31, 2023 | January 1, 2023 | December 31, 2023 | January 1, 2023 | ||||||||||||||||||||||||||||||||||||||
| (in millions) | (in millions) | ||||||||||||||||||||||||||||||||||||||||
Prepaid expenses and other current assets (1) | $ | — | $ | 1 | $ | — | $ | 1 | |||||||||||||||||||||||||||||||||
| Accrued expenses and other current liabilities | 1 | — | 1 | — | |||||||||||||||||||||||||||||||||||||
| Total | $ | 1 | $ | 1 | $ | 1 | $ | 1 | |||||||||||||||||||||||||||||||||
________________
(1)Changes in the fair value of firm commitments to buy grains and hogs that are designated in fair value hedge relationships are recorded in the consolidated balance sheets in prepaid expenses and other current assets. When the underlying grains or hogs are acquired, the hedge relationship is discontinued and the fair value hedge adjustment is reclassified to inventories.
F-30
The fair value hedge adjustment remaining in inventories for which hedge accounting has been discontinued was a gain of $7 million and a loss of $4 million as of December 31, 2023 and January 1, 2023, respectively.
Mark-to-Market Method
As of December 31, 2023, the notional volumes associated with open derivative instruments using the “mark-to-market” method, including delta-adjusted options, were as follows:
| Volume | Metric | ||||||||||
| Commodities: | |||||||||||
| Lean hogs | 107,015,000 | Pounds | |||||||||
| Corn | 19,757,000 | Bushels | |||||||||
| Soybean meal | 39,000 | Tons | |||||||||
| Soybeans | 452,000 | Bushels | |||||||||
| Wheat | 45,000 | Bushels | |||||||||
| Natural gas | 2,420,000 | Million BTU | |||||||||
| Crude oil | 9,000 | Barrels | |||||||||
| Foreign currency | 13,567,973 | U.S. Dollars | |||||||||
F-31
Derivative Impact on the Consolidated Statements of Income
The following table presents the effect of derivatives on the consolidated statements of income for the periods indicated:
| Fiscal Year | |||||||||||||||||
| 2023 | 2022 | 2021 | |||||||||||||||
| (in millions) | |||||||||||||||||
| Sales | |||||||||||||||||
| Cash flow hedging - commodity contracts | $ | 12 | $ | (30) | $ | (177) | |||||||||||
| Mark to market - commodity contracts | 30 | (35) | — | ||||||||||||||
| Total derivative gain (loss) recognized sales | 42 | (65) | (177) | ||||||||||||||
| Cost of Sales | |||||||||||||||||
| Cash flow hedging - commodity contracts | — | 127 | 170 | ||||||||||||||
| Fair value hedging - commodity contracts | |||||||||||||||||
| Change in fair value of open derivatives | 17 | (24) | (27) | ||||||||||||||
| Change in fair value of related hedged items | (17) | 24 | 27 | ||||||||||||||
Gain (loss) on closed derivatives (1) | 5 | (28) | (30) | ||||||||||||||
| Mark to market - commodity contracts | (14) | 20 | (9) | ||||||||||||||
| Total derivative gain (loss) recognized in cost of sales | (9) | 119 | 131 | ||||||||||||||
| Selling, general and administrative expenses | |||||||||||||||||
| Mark to market - foreign exchange contracts | — | 1 | 1 | ||||||||||||||
| Interest expense | |||||||||||||||||
| Cash flow hedging - interest rate contracts | (2) | (1) | (1) | ||||||||||||||
| Discontinued operations | |||||||||||||||||
| Cash flow hedging - foreign exchange contracts | 1 | (1) | (1) | ||||||||||||||
| Mark to market - foreign exchange contracts | 2 | 4 | (2) | ||||||||||||||
| Total derivative gain (loss) recognized in discontinued operations | 3 | 3 | (3) | ||||||||||||||
| Total derivative gain (loss) | $ | 36 | $ | 56 | $ | (50) | |||||||||||
________________
(1)Represents the amount of fair value hedge adjustment applied to the carrying amount of hedged assets that is recognized in cost of sales as the underlying hedged assets are relieved from inventories and charged to cost of sales.
F-32
NOTE 8: EQUITY METHOD INVESTMENTS
Equity method investments consist of the following:
| Equity Investments | % Owned | December 31, 2023 | January 1, 2023 | |||||||||||||||||
| (in millions) | ||||||||||||||||||||
| Align | 50% | $ | 75 | $ | 99 | |||||||||||||||
| Monarch | 33% | 93 | 90 | |||||||||||||||||
| Viceroy | 50% | 6 | 18 | |||||||||||||||||
| All other equity method investments | 50% | 18 | 17 | |||||||||||||||||
| Total investments | $ | 191 | $ | 224 | ||||||||||||||||
Align, Monarch and Viceroy Bio Energy, LLC (“Viceroy”) operate renewable natural gas facilities and are included in our Hog Production segment. These facilities refine methane gas that is captured from our Company-owned and contract grower hog farms into renewable natural gas. All significant operating decisions are made jointly between us and our investment partners, and therefore, we do not consolidate these entities.
NOTE 9: ACCRUED EXPENSES AND OTHER CURRENT LIABILITIES
Accrued expenses and other current liabilities consist of the following:
| December 31, 2023 | January 1, 2023 | ||||||||||
| (in millions) | |||||||||||
| Payroll and related benefits | $ | 361 | $ | 391 | |||||||
| Litigation contingencies | 315 | 244 | |||||||||
| Accrued customer incentives and marketing | 136 | 142 | |||||||||
| Accrued exit and disposal costs | 49 | 6 | |||||||||
| Amounts owed to purchasing banks pursuant to the Monetization Facility | 42 | — | |||||||||
| Accrued contract grower services | 36 | 40 | |||||||||
| Accrued self-insurance | 30 | 33 | |||||||||
| Accrued interest | 23 | 23 | |||||||||
| Accrued pension and other post-employment benefits | 23 | 24 | |||||||||
Payables to related parties (1) | 16 | 27 | |||||||||
| Derivative instruments and broker deposits | 13 | 3 | |||||||||
| Other | 123 | 151 | |||||||||
| Total accrued expenses and other current liabilities | $ | 1,166 | $ | 1,085 | |||||||
________________
(1)See “Note 16: Related Party Transactions” for related party transactions.
F-33
NOTE 10: DEBT
Long-term debt consists of the following:
| December 31, 2023 | January 1, 2023 | ||||||||||
| (in millions) | |||||||||||
| 4.25% senior unsecured notes, due February 2027, net of unamortized debt issuance costs and discounts totaling $2 million and $3 million as of December 31, 2023 and January 1, 2023, respectively | $ | 598 | $ | 597 | |||||||
| 2.625% senior unsecured notes, due September 2031, net of unamortized debt issuance costs and discounts totaling $8 million and $9 million as of December 31, 2023 and January 1, 2023, respectively | 492 | 491 | |||||||||
| 3.00% senior unsecured notes, due October 2030, net of unamortized debt issuance costs and discounts totaling $8 million and $9 million as of December 31, 2023 and January 1, 2023, respectively | 492 | 491 | |||||||||
| 5.20% senior unsecured notes, due April 2029, net of unamortized debt issuance costs and discounts totaling $3 million and $4 million as of December 31, 2023 and January 1, 2023, respectively | 397 | 396 | |||||||||
| Bank borrowings at 6.43% due March 2026. | 12 | 17 | |||||||||
| Total debt | 1,991 | 1,992 | |||||||||
| Current portion | (5) | (5) | |||||||||
| Total long-term debt | $ | 1,986 | $ | 1,988 | |||||||
Scheduled principal payments on debt for the next five years are as follows:
| Year | (in millions) | |||||||
| 2024 | $ | 5 | ||||||
| 2025 | 5 | |||||||
| 2026 | 2 | |||||||
| 2027 | 600 | |||||||
| 2028 | — | |||||||
Credit Facilities
| December 31, 2023 | ||||||||||||||||||||||||||||||||||||||
| Facility | Capacity | Borrowing Base Adjustment | Outstanding Borrowings | Commercial Paper Borrowings | Outstanding Letters of Credit | Amount Available | ||||||||||||||||||||||||||||||||
| (in millions) | ||||||||||||||||||||||||||||||||||||||
| Senior unsecured revolving credit facility | $ | 2,100 | $ | — | $ | — | $ | — | $ | — | $ | 2,100 | ||||||||||||||||||||||||||
| Accounts receivable securitization facility | 275 | — | — | — | (23) | 252 | ||||||||||||||||||||||||||||||||
| Total credit facilities | $ | 2,375 | $ | — | $ | — | $ | — | $ | (23) | $ | 2,352 | ||||||||||||||||||||||||||
Senior Unsecured Revolving Credit Facility
In May 2023, we exercised an option to extend the maturity of our $2.1 billion senior unsecured revolving credit facility pursuant to that certain Amendment No. 1 to the Second Amended and Restated Credit Agreement, dated as of May 1, 2021, by and among us and certain of our subsidiaries as borrowers, Bank of America, N.A., as administrative agent, swing line lender and letter of credit lender, and various other lenders (“Senior Revolving Credit Facility”) to May 21, 2027. The Senior Revolving Credit Facility bears interest at the Secured Overnight Financing Rate (“SOFR”) plus a margin ranging from 0.875% to 1.50% per annum, or, at our election, at a base rate
F-34
plus a margin ranging from 0.00% to 0.50% per annum, in each case depending on our senior unsecured debt ratings. The Senior Revolving Credit Facility also contains financial maintenance covenants requiring us to maintain a maximum total consolidated leverage ratio (ratio of consolidated funded debt to consolidated capitalization, each as defined in the Senior Revolving Credit Facility) of 0.50 to 1.00 (which we may elect to increase to 0.55 to 1.00 with respect to any fiscal quarter in which a material acquisition is consummated and the immediately following three consecutive fiscal quarters, subject to certain restrictions) and a minimum interest coverage ratio (“ratio of Consolidated EBITDA to Consolidated Interest Expense, each as defined in the Senior Revolving Credit Facility”) of 3.50 to 1.00.
Our Senior Revolving Credit Facility contains customary covenants, including, but not limited to, restrictions on our ability and that of our subsidiaries to merge and consolidate with other companies, incur indebtedness, grant liens or security interests on assets subject to their security interest, make acquisitions, loans, advances or investments, pay dividends, sell or otherwise transfer assets, optionally prepay or modify terms of any junior indebtedness or enter into transactions with affiliates, each subject to certain exceptions as set forth therein. We are currently in compliance with the covenants under our Senior Debt Facility. We are currently in compliance with the covenants under our revolving credit facilities.
Our commercial paper program, which is supported by the Senior Revolving Credit Facility, provides access to a low-cost source of borrowing to fund general corporate purposes, including working capital. The maximum issuance capacity under our commercial paper program is $1.75 billion. The maturity of commercial paper issued under the program varies but does not exceed 397 days from the date of issuance. Our ability to access the commercial paper market in the future is dependent on maintaining investment grade credit ratings and market conditions.
Accounts Receivable Securitization Facility
Our accounts receivable securitization facility the Fifth Amended and Restated Credit and Security Agreement, dated as of December 22, 2022, by and among Smithfield Receivables Funding LLC, as borrower Smithfield, as servicer, certain lenders, letter of credit participants and co-agents, Coöperatieve Rabobank U.A., New York Branch, as a letter of credit issuer, PNC Bank, National Association, as administrative agent and a letter of credit issuer and PNC Capital Markets LLC, as structuring agent (“Securitization Facility”) matures on December 22, 2025. As part of the Securitization Facility, certain accounts receivable of our major domestic meat processing subsidiaries are sold to a wholly owned “bankruptcy remote” special purpose vehicle (“SPV”). The SPV pledges all such accounts receivable not otherwise sold pursuant to the Monetization Facility (as defined below) as security for loans made, and letters of credit issued, by participating lenders under the Securitization Facility. The SPV is included in our consolidated financial statements and therefore the accounts receivable owned by it are included in our consolidated balance sheets. However, the accounts receivable owned by the SPV are separate and distinct from our other assets and are not available to our other creditors should we become insolvent. As of December 31, 2023, the SPV held $370 million of accounts receivable. We must maintain certain ratios related to the collection of our receivables as a condition of the Securitization Facility agreement. As of December 31, 2023, we had $23 million in letters of credit issued under the Securitization Facility. None of the letters of credit were drawn upon.
Under the Securitization Facility, we and the SPV, as applicable, are subject to certain customary covenants, including, but not limited to, restrictions on our ability to sell, assign or otherwise dispose of any collateral or assign any right to receive income with respect thereto, use proceeds for any purpose other than those set forth in the Securitization Facility, make certain payments on junior indebtedness, incur debt or merge or consolidate, subject to certain exceptions set forth therein. The SPV is also prohibited from issuing any LCR Security (as defined therein). We are currently in compliance with the covenants under our Securitization Facility.
Monetization Facility
In addition to the Securitization Facility, we maintain an uncommitted $250 million accounts receivable monetization facility (“Monetization Facility”) pursuant to the Master Receivables Purchase Agreement, dated as of December 22, 2022, by and among SPV, as borrower, Smithfield, as servicer, certain buyers and PNC Bank, National Association, as administrative agent. At Smithfield’s election and subject to the purchasing banks’
F-35
approval, certain accounts receivable may be sold by the SPV to purchasing banks, so long as the uncollected outstanding amount of accounts receivable sold pursuant to the Monetization Facility does not exceed $250 million in the aggregate at any time, among other limitations. In the event of a sale, the purchasing banks assume all credit risk related to the receivables while we maintain risk associated with customer disputes. We account for the sale of receivables to a purchasing bank by derecognizing the receivables from our consolidated balance sheet upon transfer of control to the purchasing bank, and recognizing a discount on the sale in SG&A in the consolidated statement of income. The proceeds from the sale of receivables are included in net cash flows from operating activities in the consolidated statement of cash flows. On behalf of the purchasing banks, we continue to service all receivables sold under the Monetization Facility. As of December 31, 2023, the uncollected balance of receivables that had been sold to purchasing banks was $201 million. We had no servicing asset or liability outstanding as of December 31, 2023.
In the first quarter of fiscal year 2023, we sold $227 million of accounts receivable at a discount and received proceeds totaling $225 million. Subsequently, we reinvested $3.4 billion of cash collections from customers in the revolving sale of accounts receivable to purchasing banks through December 31, 2023. We recognized charges totaling $12 million attributable to the discount on the sale of accounts receivable in SG&A in the consolidated statement of income in fiscal year 2023.
NOTE 11: LEASE OBLIGATIONS, COMMITMENTS, AND GUARANTEES
Lease Obligations
We lease real estate, vehicles, machinery and other equipment. Additionally, we have contracts with independent farmers to raise our hogs that include a lease component for the use of the farmers’ facilities. Our leases may include options to extend or terminate the lease, variable lease payments based on usage of the underlying assets and residual value guarantees.
The following table presents the maturities of our lease obligations as of December 31, 2023:
| Operating Leases | Finance Leases | Total | |||||||||||||||
| (in millions) | |||||||||||||||||
| 2024 | $ | 79 | $ | 22 | $ | 102 | |||||||||||
| 2025 | 65 | 3 | 67 | ||||||||||||||
| 2026 | 51 | 3 | 53 | ||||||||||||||
| 2027 | 40 | 2 | 42 | ||||||||||||||
| 2028 | 32 | 1 | 34 | ||||||||||||||
| After 2028 | 233 | 10 | 244 | ||||||||||||||
| Total lease payments | $ | 500 | $ | 42 | $ | 542 | |||||||||||
| Present value discount | (112) | — | (113) | ||||||||||||||
| Present value of lease obligations | $ | 388 | $ | 41 | $ | 429 | |||||||||||
The following table presents the weighted-average lease term and discount rate for our finance and operating leases:
| December 31, 2023 | January 1, 2023 | ||||||||||
| Weighted-average remaining lease term (years): | |||||||||||
| Finance leases | 10 | 13 | |||||||||
| Operating leases | 11 | 11 | |||||||||
| Weighted-average discount rate: | |||||||||||
| Finance leases | 2.7 | % | 3.0 | % | |||||||
| Operating leases | 4.7 | % | 4.4 | % | |||||||
F-36
The components of total lease cost included in the consolidated statements of income are presented in the following table:
| Fiscal Year | |||||||||||||||||
| 2023 | 2022 | 2021 | |||||||||||||||
| (in millions) | |||||||||||||||||
| Operating lease cost | $ | 90 | $ | 123 | $ | 128 | |||||||||||
| Finance lease cost: | |||||||||||||||||
| Amortization of leased assets | 23 | 3 | 2 | ||||||||||||||
| Interest on lease obligations | 1 | — | — | ||||||||||||||
Short-term lease cost (1) | 96 | 71 | 59 | ||||||||||||||
Variable lease cost (2) | 23 | 21 | 16 | ||||||||||||||
| Total lease cost | $ | 234 | $ | 218 | $ | 205 | |||||||||||
________________
(1)Represents the expense for leases with terms of one year or less, which are not included in the lease obligation
(2)Represents the expense associated with lease payments that vary based on usage or changes in other circumstances, which are not included in the lease obligation.
The following table presents the classification of lease payments associated with our lease obligations in the statements of cash flows, as well as new, or modifications to existing, lease obligations entered into during the periods presented:
| Fiscal Year | |||||||||||||||||
| 2023 | 2022 | 2021 | |||||||||||||||
| (in millions) | |||||||||||||||||
| Classification of lease payments: | |||||||||||||||||
Operating cash flows - finance leases (1) | $ | 1 | $ | — | $ | — | |||||||||||
| Operating cash flows - operating leases | 97 | 120 | 130 | ||||||||||||||
| Financing cash flows - finance leases | 4 | 3 | 3 | ||||||||||||||
| New, or modifications to existing, finance lease obligations | 1 | 25 | 3 | ||||||||||||||
| New, or modifications to existing, operating lease obligations | 42 | 159 | 83 | ||||||||||||||
________________
(1)Represents the interest component of our payments on finance leases.
Commitments
We have purchase commitments with certain livestock producers that obligate us to purchase all the livestock that these producers deliver. Other arrangements obligate us to purchase a fixed amount of livestock. We have purchase commitments under forward grain contracts that obligate us to purchase a fixed amount of grain. We also have contractual commitments to independent farmers who raise our hogs in exchange for a performance-based service fee payable upon delivery. We estimate the future obligations under these commitments based on the amounts that are fixed and determinable in the related contracts. There are additional variable components of these
F-37
contracts not included in our estimates that are based on quantities delivered and performance. Our estimated future obligations under these and other commitments are as follows:
| Year | (in millions) | |||||||
| 2024 | $ | 2,298 | ||||||
| 2025 | 1,326 | |||||||
| 2026 | 603 | |||||||
| 2027 | 117 | |||||||
| 2028 | 69 | |||||||
All minimum purchase commitments under these contracts were fulfilled in each of fiscal years 2023, 2022 and 2021.
We have committed to contribute up to $250 million through 2028 to Align to fund various projects as they are approved by Align’s board. As of December 31, 2023, we had contributed $109 million in capital toward this commitment.
We have committed to contribute up to $25 million to the TPG Rise Climate investment fund through July 2027. As of December 31, 2023, we had contributed $12 million in capital toward this commitment.
We had $91 million of committed funds related to approved capital expenditure projects as of December 31, 2023. These projects are expected to be funded with cash flows from operations and/or borrowings under credit facilities.
Guarantees
Smithfield and certain other joint venture partners in Monarch joint and severally guarantee Monarch’s debt, interest and fees. As of December 31, 2023, the maximum amount of loans that could be outstanding under Monarch’s debt agreements was $74 million and the loans mature in June 2025. Monarch’s outstanding debt was $49 million as of the end of fiscal year 2023. The guarantee arrangement contains provisions that may reduce our obligations under the guarantee depending on Monarch’s debt to earnings before interest, taxes, depreciation and amortization (“EBITDA”) ratio.
The guarantee involves elements of performance and credit risk and is not included in the consolidated balance sheets. We could become liable in connection with Monarch’s obligation depending on the ability of Monarch to perform on its obligation. If we consider it probable that we will become responsible for the obligation, we would record the liability on our consolidated balance sheet.
F-38
NOTE 12: INCOME TAXES
Income (loss) from continuing operations before income taxes consists of the following:
| Fiscal Year | |||||||||||||||||
| 2023 | 2022 | 2021 | |||||||||||||||
| (in millions) | |||||||||||||||||
| United States | (134) | 1,059 | 453 | ||||||||||||||
| Foreign | 5 | (12) | 5 | ||||||||||||||
| Total income (loss) from continuing operations before income taxes | (129) | 1,047 | 458 | ||||||||||||||
Income Tax Expense
Income tax expense (benefit) from continuing operations consists of the following:
| Fiscal Year | |||||||||||||||||
| 2023 | 2022 | 2021 | |||||||||||||||
| (in millions) | |||||||||||||||||
| Current income tax expense: | |||||||||||||||||
| Federal | 55 | 206 | 57 | ||||||||||||||
| State | 33 | 23 | 8 | ||||||||||||||
| Foreign | — | — | — | ||||||||||||||
| 89 | 229 | 65 | |||||||||||||||
| Deferred income tax expense (benefit): | |||||||||||||||||
| Federal | (120) | (6) | 24 | ||||||||||||||
| State | (6) | 4 | 7 | ||||||||||||||
| Foreign | (4) | 4 | 1 | ||||||||||||||
| (130) | 2 | 32 | |||||||||||||||
| Total income tax expense (benefit) | $ | (41) | $ | 231 | $ | 97 | |||||||||||
Effective Tax Rate Reconciliation
The following table reconciles the federal statutory income tax rate to our effective tax rate:
| Fiscal Year | |||||||||||||||||
| 2023 | 2022 | 2021 | |||||||||||||||
| Federal income taxes at statutory rate | 21.0 | % | 21.0 | % | 21.0 | % | |||||||||||
Tax credits (1) | 13.0 | (1.3) | (2.5) | ||||||||||||||
Equity method investments (2) | 7.4 | (0.1) | 1.3 | ||||||||||||||
| Foreign income taxes | 4.3 | — | 0.2 | ||||||||||||||
| Officers’ life insurance | 2.9 | 0.5 | (0.8) | ||||||||||||||
| Impact of foreign operations | 0.1 | (1.0) | (0.6) | ||||||||||||||
| State income taxes, net of federal tax benefit | (16.5) | 2.6 | 3.0 | ||||||||||||||
| Other | — | 0.4 | (0.4) | ||||||||||||||
| Effective tax rate | 32.2 | % | 22.1 | % | 21.2 | % | |||||||||||
________________
(1)We recognized federal tax credits of $17 million, $13 million and $12 million in 2023, 2022 and 2021, respectively.
F-39
(2)The results of our equity method investments are excluded from income (loss) from continuing operations before income taxes. However, the income taxes on our equity method investments are included in income tax expense (benefit), which can have significant impact on our computed effective tax rate.
The impact of the reconciling items between the federal statutory rate and our effective tax rate were magnified in fiscal year 2023 largely due to the pre-tax loss and decrease in earnings in fiscal year 2023 compared to pre-tax income in fiscal year 2022.
Income Taxes Receivable and Payable
We classified current income taxes receivable of $27 million and $2 million as of December 31, 2023 and January 1, 2023, respectively, in prepaid expenses and other current assets, long-term income taxes receivable of $13 million and $12 million as of December 31, 2023 and January 1, 2023, respectively, in other assets, and current taxes payable of $30 million as of January 1, 2023 in other current liabilities on our consolidated balance sheets. The current taxes payable amount does not include amounts payable to our immediate parent for income taxes.
Deferred Tax Assets and Liabilities
The tax effects of temporary differences between the tax basis and book basis of our assets and liabilities are presented in the table below:
| December 31, 2023 | January 1, 2023 | ||||||||||
| (in millions) | |||||||||||
| Deferred tax assets: | |||||||||||
| Accrued expenses and other current liabilities | $ | 101 | $ | 86 | |||||||
| Research and development expenses | 98 | 70 | |||||||||
| Operating lease obligations | 92 | 106 | |||||||||
| Pension and other retirement liabilities | 67 | 72 | |||||||||
Tax credits, carryforwards and net operating losses (1) | 38 | 36 | |||||||||
| Deferred payroll taxes | 24 | 24 | |||||||||
| Employee benefits | 18 | 17 | |||||||||
| Other | 21 | 9 | |||||||||
| 458 | 418 | ||||||||||
Valuation allowance (2) | (12) | (7) | |||||||||
| Total deferred tax asset | $ | 446 | $ | 411 | |||||||
| Deferred tax liabilities: | |||||||||||
| Property, plant and equipment | 425 | 483 | |||||||||
| Intangible assets | 309 | 305 | |||||||||
| Operating lease assets | 90 | 103 | |||||||||
| Inventory | 56 | 52 | |||||||||
| Investments | 25 | 38 | |||||||||
| Other | 15 | 18 | |||||||||
| Total deferred tax liability | $ | 920 | $ | 999 | |||||||
| Net deferred tax liability | $ | 474 | $ | 588 | |||||||
________________
(1)We have $28 million of gross foreign net operating losses that will expire between 2030 and 2032. We have $728 million of gross state net operating losses, $93 million of which have no expiration, and $635 million that will expire between 2024 and 2043. We have $3 million of state tax credits that will expire between 2024 and 2037.
F-40
(2)Valuation allowances are established if the Company’s deferred tax assets are not more likely than not to be realized. The valuation allowance primarily relates to state credits and state net operating loss carryforwards.
Unrecognized Tax Benefits
A reconciliation of the beginning and ending liability for unrecognized tax benefits is as follows:
| (in millions) | |||||
| Balance, January 3, 2021 | $ | 15 | |||
| Additions for tax positions taken in fiscal 2021 | 7 | ||||
| Lapse of statute of limitations | (1) | ||||
| Balance, January 2, 2022 | 21 | ||||
| Additions for tax positions taken in fiscal 2022 | 11 | ||||
| Lapse of statute of limitations | (3) | ||||
| Balance, January 1, 2023 | 28 | ||||
| Additions for tax positions taken in fiscal 2023 | 1 | ||||
| Additions for tax positions taken in prior years | 17 | ||||
| Lapse of statute of limitations | (1) | ||||
| Balance, December 31, 2023 | $ | 45 | |||
During fiscal years 2023, 2022 and 2021, we recognized interest and penalties of $4 million, $(2) million, and $1 million, respectively, within income tax expense (benefit). The unrecognized tax benefits, if recognized, would affect income tax expense by $39 million, $25 million, and $19 million in fiscal years 2023, 2022 and 2021, respectively. We do not expect any significant changes to unrecognized tax benefits within the next 12 months of the reporting date.
We operate in multiple taxing jurisdictions, both within the United States and outside of the United States, and are subject to examination from various tax authorities. The liability for unrecognized tax benefits included $9 million and $4 million of accrued interest as of December 31, 2023 and January 1, 2023, respectively.
We are currently being audited in several tax jurisdictions and remain subject to examination until the statute of limitations expires for the respective tax jurisdiction. Within the United States and Mexico, we may be subject to audit by various tax authorities, and our subsidiaries operating within each country may be subject to different statute of limitations expiration dates. We have concluded all U.S. federal income tax matters through the tax year ended January 1, 2017. We are currently under U.S federal examination for all subsequent tax years through December 31, 2023. We are also subject to examination from tax authorities in Mexico and certain U.S. states for the tax years ended December 29, 2019 through December 31, 2023.
We consider the earnings of our foreign subsidiaries to be indefinitely reinvested as we intend to use these earnings in our foreign operations. The amount of foreign subsidiary net earnings that was considered indefinitely reinvested was $141 million and $150 million as of December 31, 2023 and January 1, 2023, respectively, which is considered previously taxed income. The determination of any unrecorded deferred tax asset or liability on the remaining excess carrying amount of our investments over their respective tax bases is not practicable due to the uncertainty of how these investments would be recovered and such differences are not expected to be recognized in the foreseeable future.
NOTE 13: PENSION AND OTHER RETIREMENT PLANS
Company Sponsored Defined Benefit Pension Plans
We have historically provided the majority of our U.S. employees with pension benefits. In the second quarter of fiscal year 2021, we amended our qualified pension plans to freeze the benefit accrual for all non-union participants as of June 30, 2021. As a result of this amendment, we performed an interim remeasurement of our plan
F-41
obligations and assets in the second quarter of fiscal year 2021. The remeasurement resulted in a curtailment gain of $110 million, of which $105 million was recognized in other comprehensive income (loss), and the remainder in non-operating gains.
The following table presents a reconciliation of the pension benefit obligation, plan assets and the funded status of our pension plans:
| December 31, 2023 | January 1, 2023 | ||||||||||
| (in millions) | |||||||||||
| Change in benefit obligation: | |||||||||||
| Benefit obligation at beginning of year | $ | 1,815 | $ | 2,574 | |||||||
| Service cost | 13 | 23 | |||||||||
| Interest cost | 98 | 77 | |||||||||
| Benefits paid | (118) | (123) | |||||||||
| Actuarial (gain) loss | 21 | (736) | |||||||||
| Benefit obligation at end of year | 1,829 | 1,815 | |||||||||
Change in plan assets: (1) | |||||||||||
| Fair value of plan assets at beginning of year | 1,518 | 2,194 | |||||||||
| Actual return on plan assets | 129 | (574) | |||||||||
| Employer contributions | 22 | 21 | |||||||||
| Benefits paid | (118) | (123) | |||||||||
| Fair value of plan assets at end of year | 1,551 | 1,518 | |||||||||
| Funded status | $ | 278 | $ | 297 | |||||||
| Amounts recognized in the consolidated balance sheets: | |||||||||||
| Net long-term pension liability | 255 | 276 | |||||||||
| Accrued expenses and other current liabilities | 22 | 22 | |||||||||
| Net amount recognized at end of year | $ | 278 | $ | 297 | |||||||
________________
(1)Excludes the assets and related activity of our non-qualified defined benefit pension plans. The fair value of assets related to our non-qualified plans was $128 million and $119 million as of December 31, 2023 and January 1, 2023, respectively. These assets are recorded in prepaid expenses and other current assets, and other assets within the consolidated balance sheets.
The accumulated benefit obligation for all defined benefit pension plans was $1,807 million as of December 31, 2023 and January 1, 2023. The accumulated benefit obligation exceeded plan assets for all defined benefit plans as of December 31, 2023 and January 1, 2023, respectively.
The following table presents the pre-tax unrecognized items included as components of accumulated other comprehensive loss related to our defined benefit pension plans as of the dates indicated:
| December 31, 2023 | January 1, 2023 | ||||||||||
| (in millions) | |||||||||||
| Unrecognized actuarial loss | $ | (489) | $ | (508) | |||||||
| Unrecognized prior service cost | (3) | (4) | |||||||||
F-42
The following table presents the components of the net periodic pension cost (benefit) for the periods indicated:
| Fiscal Year | |||||||||||||||||
| 2023 | 2022 | 2021 | |||||||||||||||
| (in millions) | |||||||||||||||||
| Service cost | $ | 13 | $ | 23 | $ | 53 | |||||||||||
| Interest cost | 98 | 77 | 76 | ||||||||||||||
| Expected return on plan assets | (107) | (128) | (128) | ||||||||||||||
| Net amortization | 18 | 22 | 34 | ||||||||||||||
| Curtailment gain | — | — | (4) | ||||||||||||||
| Net periodic pension cost (benefit) | $ | 22 | $ | (7) | $ | 30 | |||||||||||
The following table shows our weighted average assumptions for the periods indicated:
| Fiscal Year | |||||||||||||||||
| 2023 | 2022 | 2021 | |||||||||||||||
| Discount rate to determine net periodic pension cost (benefit) | 5.58 | % | 3.07 | % | 3.16 | % | |||||||||||
| Discount rate to determine benefit obligation | 5.57 | 5.57 | 3.06 | ||||||||||||||
| Expected long-term rate of return on plan assets | 7.25 | 6.00 | 6.25 | ||||||||||||||
| Rate of compensation increase | 4.00 | 4.00 | 4.00 | ||||||||||||||
We use an independent third-party actuary to assist in the determination of assumptions used and the measurement of our pension obligation and related costs. We review and select the discount rate to be used in connection with our pension obligation annually. In determining the discount rate, a hypothetical bond portfolio is constructed based on bonds (with an AA rating or better) whose cash flows from coupons and maturities match the year-by-year projected benefit payments from defined benefit pension plans. We use the resulting yield of this portfolio to determine the discount rate applicable to our obligation. A similar methodology is used to develop the discount rate applicable to service cost.
To determine the expected long-term return on plan assets, we consider the current and anticipated asset allocations, as well as historical and estimated returns on various categories of plan assets. Long-term trends are evaluated relative to market factors such as inflation, interest rates and fiscal and monetary policies in order to assess the capital market assumptions. Actual results that differ from our assumptions are recorded in accumulated other comprehensive loss and amortized over future periods and, therefore, affect expense in future periods.
Pension plan assets may be invested in cash and cash equivalents, equities, commingled funds, debt securities and alternative investments. Our investment policy for the pension plans is to balance risk and return through a diversified portfolio of high-quality equity and fixed income securities. Maturity for fixed income securities is managed such that sufficient liquidity exists to meet near-term benefit payment obligations. The plans retain outside investment advisors to manage plan investments within parameters established by our plan trustees.
F-43
The following table presents the fair value of our qualified pension plan assets by major asset category. The allocation of our pension plan assets is based on the target range presented in the following table.
| Asset category: | December 31, 2023 | January 1, 2023 | Target Range | |||||||||||||||||
| (in millions) | ||||||||||||||||||||
| Cash and cash equivalents, net of unsettled transactions | $ | 159 | $ | 157 | 0-10% | |||||||||||||||
| Equity securities | 508 | 539 | 30-50% | |||||||||||||||||
| Debt securities | 582 | 521 | 35-55% | |||||||||||||||||
| Alternative assets | 302 | 301 | 2-25% | |||||||||||||||||
| Total plan assets | $ | 1,551 | $ | 1,518 | ||||||||||||||||
See “Note 15: Fair Value Measurements” for additional information about the fair value of our pension assets.
The minimum funding requirement for our qualified pension plans in fiscal year 2024 is $37 million.
Expected future benefit payments for our defined benefit pension plans are as follows:
| Fiscal Year | (in millions) | |||||||
| 2024 | $ | 118 | ||||||
| 2025 | 123 | |||||||
| 2026 | 120 | |||||||
| 2027 | 123 | |||||||
| 2028 | 125 | |||||||
| 2029 - 2033 | 640 | |||||||
Multiemployer Defined Benefit Pension Plans
In addition to our Company sponsored defined benefit pension plans, we contribute to several multiemployer defined benefit pension plans under collective bargaining agreements that cover certain of our union-represented employees. The risks of participating in such plans are different from the risks of single-employer plans, in the following respects:
•Assets contributed to a multiemployer plan by one employer may be used to provide benefits to employees of other participating employers.
•If a participating employer ceases to contribute to a multiemployer plan, the unfunded obligation of the plan may be borne by the remaining participating employers.
•If we were to withdraw from a multiemployer plan, we may be required to pay the plan an amount based on the underfunded status of the plan and on the history of our participation in the plan prior to withdrawal. This is referred to as a withdrawal liability.
Each multiemployer plan in which we participate has a certified zone status as currently defined by the Pension Protection Act of 2006. The zone status is based on information provided by each plan and is certified by the plan's actuary. The following are descriptions of the zone status types based on criteria established under the Internal Revenue Code (“IRC”):
•“Red” Zone—Plan has been determined to be in “critical status” and is generally less than 65% funded. A rehabilitation plan, as required under the IRC, must be adopted by plans in the “red” zone. Plan participants may be responsible for the payment of surcharges, in addition to the contribution rate specified in the applicable collective bargaining agreement, for a plan in “critical status,” in accordance with the requirements of the IRC.
F-44
•“Yellow” Zone—Plan has been determined to be in “endangered status” and is generally less than 80% funded. A funding improvement plan, as required under the IRC, must be adopted.
•“Green” Zone—Plan has been determined to be neither in “critical status” nor in “endangered status,” and is generally at least 80% funded.
The IAM National Pension Fund National Pension Plan was in the “red” zone, and all other plans in which we participate were in the “green” zone for the two most recent benefit plan years that have been certified.
The following table summarizes information about the multiemployer plans in which we participate, including our contributions to the plans (1).
| Fiscal Years | ||||||||||||||||||||||||||||||||
| Plan | EIN / PN (2) | 2023 | 2022 | 2021 | Expiration Dates of Collective Bargaining Agreements | |||||||||||||||||||||||||||
| (in millions) | ||||||||||||||||||||||||||||||||
| United Food and Commercial Workers International Union Industry Pension Fund | 51-6055922 / 001 | $ | 1 | $ | 1 | $ | 1 | Multiple (3) | ||||||||||||||||||||||||
| Central Pension Fund of the International Union of Operating Engineers and Participating Employers | 36-6052390 / 001 | — | — | — | October 2028 | |||||||||||||||||||||||||||
| IAM National Pension Fund National Pension Plan | 51-6031295 / 002 | — | — | — | February 2026 | |||||||||||||||||||||||||||
| Total contributions to multiemployer plans | $ | 2 | $ | 2 | $ | 2 | ||||||||||||||||||||||||||
________________
(1)Contributions represent the amounts we contributed to the plans. Our contributions to the Central Pension Fund of the International Union of Operating Engineers and Participating Employers exceeded 5% of total plan contributions for the plan years ended January 31, 2023 and January 31, 2022. Our contributions to each other plan did not exceed 5% of total plan contributions for any plan year presented.
(2)Represents the Employer Identification Number and the three-digit plan number assigned to a plan by the Internal Revenue Service.
(3)We have multiple collective bargaining agreements associated with the United Food and Commercial Workers International Union Industry Pension Fund. These agreements are currently scheduled to expire between September 2024 and May 2028.
Other Post-Employment Benefit Plans
We sponsor defined contribution plans (401(k) plans) covering substantially all U.S. employees. Our contributions vary depending on the plan but are based primarily on each participant’s level of contribution and cannot exceed the maximum allowable for tax purposes. Coinciding with the freeze of our pension plans in 2021, we increased the rate of employer contributions to our 401(k) plans for affected employees from a 50% match on up to 4% of employee earnings to a 100% match on up to 7% of employee earnings. Total Company contributions were $67 million, $68 million, and $47 million, in fiscal years 2023, 2022 and 2021, respectively.
We also provide health care and life insurance benefits for certain retired employees. These plans are unfunded and generally pay covered costs reduced by retiree premium contributions, co-payments and deductibles. We retain the right to modify or eliminate these benefits. We consider disclosures related to these plans immaterial to the consolidated financial statements and related notes.
NOTE 14: EQUITY
Common Stock
The Company has 1,000 shares of no par value common stock authorized and outstanding. All shares are owned by a wholly owned subsidiary of WH Group. There are no other outstanding shares of stock in the Company.
F-45
Stock-Based Compensation
During 2014, WH Group adopted a share incentive plan to provide incentives to various executives and management of WH Group and its subsidiaries, including Smithfield (the WH Group Incentive Plan). Stock options granted under the WH Group Incentive Plan were subject to graded vesting over five years and valued in five separate tranches, according to the expected life of each tranche. All options granted under the WH Group Incentive Plan were fully vested in 2019. No stock compensation expense was recognized in any period presented.
The following table summarizes stock option activity for Smithfield employees under the WH Group Incentive Plan as of December 31, 2023, and changes during the year then ended:
| Number of Shares | Weighted Average Exercise Price (HKD) | Weighted Average Exercise Price (USD) | Weighted Average Remaining Contractual Term (Years) | Aggregate Intrinsic Value (HKD) | Aggregate Intrinsic Value (USD) | ||||||||||||||||||||||||||||||
| (in millions) | |||||||||||||||||||||||||||||||||||
| Outstanding as of January 1, 2023 | 90,041,929 | $ | 6.20 | $ | 0.80 | ||||||||||||||||||||||||||||||
| Forfeited | (2,384,000) | $ | 6.20 | $ | 0.80 | ||||||||||||||||||||||||||||||
| Outstanding as of December 31, 2023 | 87,657,929 | $ | 6.20 | $ | 0.80 | 0.6 | $ | — | $ | — | |||||||||||||||||||||||||
| Exercisable as of December 31, 2023 | 87,657,929 | $ | 6.20 | $ | 0.80 | 0.6 | $ | — | $ | — | |||||||||||||||||||||||||
Accumulated Other Comprehensive Loss
Accumulated other comprehensive loss consists of the following (net of tax):
| Fiscal Year | |||||||||||||||||
| 2023 | 2022 | 2021 | |||||||||||||||
| (in millions) | |||||||||||||||||
| Foreign currency translation | $ | (134) | $ | (327) | $ | (258) | |||||||||||
| Pension accounting | (373) | (389) | (434) | ||||||||||||||
| Hedge accounting | 8 | 8 | 35 | ||||||||||||||
| Accumulated other comprehensive loss | $ | (500) | $ | (708) | $ | (656) | |||||||||||
Other Comprehensive Income (Loss)
The following table presents changes in the balances for each component of accumulated other comprehensive loss and the related effects on net income of amounts reclassified therefrom.
| Fiscal Year | ||||||||||||||||||||||||||||||||||||||||||||||||||||||||
| 2023 | 2022 | 2021 | ||||||||||||||||||||||||||||||||||||||||||||||||||||||
| Before Tax | Tax | After Tax | Before Tax | Tax | After Tax | Before Tax | Tax | After Tax | ||||||||||||||||||||||||||||||||||||||||||||||||
| (in millions) | ||||||||||||||||||||||||||||||||||||||||||||||||||||||||
| Continuing operations: | ||||||||||||||||||||||||||||||||||||||||||||||||||||||||
| Foreign currency translation: | ||||||||||||||||||||||||||||||||||||||||||||||||||||||||
Translation gains (losses) (1) | $ | 75 | $ | — | $ | 75 | $ | 33 | $ | — | $ | 33 | $ | (16) | $ | 1 | $ | (15) | ||||||||||||||||||||||||||||||||||||||
| Translation losses reclassified to non-operating gains | — | — | — | 16 | — | 16 | 35 | — | 35 | |||||||||||||||||||||||||||||||||||||||||||||||
| Retirement benefits: | ||||||||||||||||||||||||||||||||||||||||||||||||||||||||
| Actuarial gains | 2 | — | 1 | 36 | (8) | 27 | 68 | (22) | 47 | |||||||||||||||||||||||||||||||||||||||||||||||
F-46
| Curtailment gain arising during the period | — | — | — | — | — | — | 105 | (33) | 72 | |||||||||||||||||||||||||||||||||||||||||||||||
| Prior service cost | — | — | — | — | — | — | (5) | 2 | (3) | |||||||||||||||||||||||||||||||||||||||||||||||
| Amortization of actuarial losses, prior service credits and curtailment gains reclassified to non-operating gains | 18 | (4) | 14 | 23 | (6) | 18 | 31 | (10) | 21 | |||||||||||||||||||||||||||||||||||||||||||||||
| Derivatives: | ||||||||||||||||||||||||||||||||||||||||||||||||||||||||
| Gains (losses) arising during the period | 10 | (2) | 7 | 58 | (15) | 43 | (48) | 12 | (36) | |||||||||||||||||||||||||||||||||||||||||||||||
| (Gains) losses reclassified to sales | (12) | 3 | (9) | 30 | (8) | 23 | 177 | (46) | 131 | |||||||||||||||||||||||||||||||||||||||||||||||
| Gains reclassified to cost of sales | — | — | — | (127) | 33 | (95) | (170) | 44 | (126) | |||||||||||||||||||||||||||||||||||||||||||||||
| Losses reclassified to interest expense | 2 | — | 1 | 1 | — | 1 | 1 | — | 1 | |||||||||||||||||||||||||||||||||||||||||||||||
| Effect of change in accounting principle | — | — | — | — | — | — | 1 | — | 1 | |||||||||||||||||||||||||||||||||||||||||||||||
| Total other comprehensive income from continuing operations | $ | 93 | $ | (4) | $ | 88 | $ | 70 | $ | (4) | $ | 66 | $ | 179 | $ | (52) | $ | 127 | ||||||||||||||||||||||||||||||||||||||
| Discontinued operations: | ||||||||||||||||||||||||||||||||||||||||||||||||||||||||
| Foreign currency translation: | ||||||||||||||||||||||||||||||||||||||||||||||||||||||||
Translation gains (losses) (1) | 144 | — | 144 | (107) | (1) | (108) | (122) | 2 | (121) | |||||||||||||||||||||||||||||||||||||||||||||||
| Retirement benefits: | ||||||||||||||||||||||||||||||||||||||||||||||||||||||||
| Amortization of actuarial losses, prior service credits and curtailment gains reclassified to non-operating gains | 1 | — | 1 | (1) | — | (1) | (1) | — | — | |||||||||||||||||||||||||||||||||||||||||||||||
| Derivatives: | ||||||||||||||||||||||||||||||||||||||||||||||||||||||||
| Derivative gains (losses) arising during the period | 2 | — | 2 | — | — | — | (1) | — | (1) | |||||||||||||||||||||||||||||||||||||||||||||||
| Derivative (gains) losses reclassified to sales | (1) | — | (1) | 1 | — | 1 | 1 | — | 1 | |||||||||||||||||||||||||||||||||||||||||||||||
| Total other comprehensive income from discontinued operations | $ | 145 | $ | — | $ | 145 | $ | (106) | $ | (1) | $ | (107) | $ | (123) | $ | 2 | $ | (121) | ||||||||||||||||||||||||||||||||||||||
| Total other comprehensive income (loss) | $ | 238 | $ | (5) | $ | 234 | $ | (37) | $ | (5) | $ | (41) | $ | 56 | $ | (50) | $ | 6 | ||||||||||||||||||||||||||||||||||||||
| Other comprehensive income attributable to noncontrolling interest | 25 | — | 25 | 11 | — | 11 | — | — | — | |||||||||||||||||||||||||||||||||||||||||||||||
| Other comprehensive income (loss) attributable to Smithfield | $ | 213 | $ | (5) | $ | 208 | $ | (47) | $ | (5) | $ | (52) | $ | 56 | $ | (50) | $ | 6 | ||||||||||||||||||||||||||||||||||||||
________________
(1)We consider the earnings in our non-U.S. subsidiaries, including the subsidiaries within our discontinued operations, to be indefinitely reinvested, and accordingly, record no deferred income taxes on such amounts.
NOTE 15: FAIR VALUE MEASUREMENTS
Fair value is defined as the price that would be received to sell an asset or paid to transfer a liability in an orderly transaction between market participants at the measurement date. We are required to consider and reflect the assumptions of market participants in fair value calculations. These factors include nonperformance risk (the risk
F-47
that an obligation will not be fulfilled) and credit risk, both of the reporting entity (for liabilities) and of the counterparty (for assets).
We use, as appropriate, a market approach (generally, data from market transactions), an income approach (generally, present value techniques), and/or a cost approach (generally, replacement cost) to measure the fair value of an asset or liability. These valuation approaches incorporate inputs, such as observable, independent market data, that we believe are predicated on the assumptions market participants would use to price an asset or liability. These inputs may incorporate, as applicable, certain risks such as nonperformance risk, which includes credit risk.
The Financial Accounting Standards Board (“FASB”) has established a three-level fair value hierarchy that prioritizes the inputs used to measure fair value. The fair value hierarchy gives the highest priority to quoted market prices (Level 1) and the lowest priority to unobservable inputs (Level 3). The three levels of inputs used to measure fair value are as follows:
•Level 1—Quoted prices in active markets for identical assets or liabilities accessible by the reporting entity.
•Level 2—Observable inputs other than quoted prices included in Level 1, such as quoted prices for similar assets and liabilities in active markets; quoted prices for identical or similar assets and liabilities in markets that are not active; or other inputs that are observable or can be corroborated by observable market data.
•Level 3—Unobservable for an asset or liability. Unobservable inputs should only be used to the extent observable inputs are not available.
We have classified assets and liabilities measured at fair value based on the lowest level of input that is significant to the fair value measurement. For the periods presented, we had no transfers of assets or liabilities between levels within the fair value hierarchy. The timing of any such transfers would be determined at the end of each reporting period.
Assets and Liabilities Measured at Fair Value on a Recurring Basis
The following tables set forth, by level within the fair value hierarchy, our financial assets and liabilities, including assets held in a rabbi trust used to fund our non-qualified defined benefit plan, that were measured at fair value on a recurring basis:
| December 31, 2023 | January 1, 2023 | |||||||||||||||||||||||||||||||||||||||||||||||||
| Level 1 | Level 2 | Level 3 | Total | Level 1 | Level 2 | Level 3 | Total | |||||||||||||||||||||||||||||||||||||||||||
| (in millions) | ||||||||||||||||||||||||||||||||||||||||||||||||||
| Assets | ||||||||||||||||||||||||||||||||||||||||||||||||||
| Derivatives: | ||||||||||||||||||||||||||||||||||||||||||||||||||
| Commodity contracts | $ | 34 | $ | 16 | $ | — | $ | 50 | $ | 20 | $ | 12 | $ | 21 | $ | 53 | ||||||||||||||||||||||||||||||||||
Foreign exchange contracts (1) | — | 1 | — | 1 | — | 1 | — | 1 | ||||||||||||||||||||||||||||||||||||||||||
Mutual funds (2) | 33 | — | — | 44 | 38 | — | — | 50 | ||||||||||||||||||||||||||||||||||||||||||
| Insurance contracts | — | 129 | — | 129 | — | 112 | — | 112 | ||||||||||||||||||||||||||||||||||||||||||
| Total | $ | 67 | $ | 146 | $ | — | $ | 224 | $ | 57 | $ | 125 | $ | 21 | $ | 216 | ||||||||||||||||||||||||||||||||||
| Liabilities | ||||||||||||||||||||||||||||||||||||||||||||||||||
| Derivatives: | ||||||||||||||||||||||||||||||||||||||||||||||||||
| Commodity contracts | 17 | 26 | — | 42 | 12 | 12 | — | 24 | ||||||||||||||||||||||||||||||||||||||||||
| Total | $ | 17 | $ | 26 | $ | — | $ | 42 | $ | 12 | $ | 13 | $ | — | $ | 25 | ||||||||||||||||||||||||||||||||||
__________________
(1)Amounts relate to our discontinued operations. See “Note 3: Discontinued Operations” for further information about our discontinued operations.
(2)Institutional funds that are not publicly traded are estimated at fair value using the net asset value (“NAV”) per share of the investment as a practical expedient and are not categorized in the fair value hierarchy. Therefore, the sum of the values categorized in the fair value hierarchy above do not agree to the total.
F-48
The following are descriptions of the valuation methodologies and key inputs used to measure financial assets and liabilities recorded at fair value on a recurring basis:
•Derivatives—Derivatives classified within Level 1 are valued using quoted market prices. In some cases where quoted market prices are not available, we value the derivatives using market-based pricing models that utilize the net present value of estimated future cash flows to calculate fair value, in which case the measurements are classified within Level 2. These valuation models make use of market-based observable inputs, including exchange traded prices and rates, yield curves, credit curves and measures of volatility. Level 3 derivatives are valued based on diesel fuel prices and use both observable and unobservable inputs. There is a lack of price transparency with respect to forward prices for diesel fuel. Such unobservable inputs are significant to the diesel fuel derivative contract valuation methodology.
•Mutual funds—Mutual funds consist of publicly traded funds and other institutional funds that are not publicly traded. Publicly traded mutual funds are measured at fair value using quoted market prices and are categorized in Level 1 within the fair value hierarchy.
•Insurance contracts—Insurance contracts are valued at their cash surrender value using the daily asset unit value which is based on the quoted market price of the underlying securities and classified within Level 2.
Assets and Liabilities Measured at Fair Value on a Nonrecurring Basis
Certain assets and liabilities are measured at fair value on a nonrecurring basis after initial recognition; that is, the assets and liabilities are not measured at fair value on an ongoing basis but are subject to fair value adjustments in certain circumstances, for example, when there is evidence of impairment. As of December 31, 2023, we had no significant assets or liabilities that were measured and recorded at fair value on a nonrecurring basis after initial recognition.
We recorded charges of $1 million, $40 million and $1 million in fiscal years 2023, 2022 and 2021, respectively, to write down certain assets to their estimated fair values. Fair value was estimated using a variety of fair value techniques, including an income approach and a market approach based on the relevant information available, which consisted of level 3 inputs. The charges for fiscal year 2023 and fiscal year 2021 were recorded in cost of sales in the consolidated statements of income. The charge for fiscal year 2022 was recorded in non-operating gains and represents the impairment of our investment in Norson. The fair value of these assets at the time of remeasurement was not material.
Redeemable Noncontrolling Interest
The redemption value for the noncontrolling interest in Granjas Carroll de Mexico, S. de R.L. de C.V. (“Altosano”) is fair value. We estimate the redemption value of Altosano using an income and a market approach. Under the income approach, fair value is determined by using the projected discounted cash flows. Under the market approach, the fair value is determined by reference to guideline companies that are reasonably comparable; the fair value is estimated based on the valuation multiples of EBITDA. The significant unobservable inputs used in the determination of the fair value have an inherent measurement uncertainty that if changed could result in higher or lower fair value measurements as of the reporting date. The following table provides the significant unobservable level 3 inputs used in the valuation:
| Unobservable Inputs | December 31, 2023 | January 1, 2023 | ||||||||||||
| Weighted average cost of capital | 11 | % | 10 | % | ||||||||||
| Growth rate | 3 | % | 3 | % | ||||||||||
| EBITDA Multiple | 12x | 8x | ||||||||||||
| Control premium | 25 | % | 25 | % | ||||||||||
F-49
Pension Plan Assets
The following table summarizes our qualified pension plan assets measured at fair value on a recurring basis (at least annually):
| December 31, 2023 | January 1, 2023 | ||||||||||||||||||||||||||||||||||||||||||||||
| Level 1 | Level 2 | Level 3 | Total | Level 1 | Level 2 | Level 3 | Total | ||||||||||||||||||||||||||||||||||||||||
| (in millions) | |||||||||||||||||||||||||||||||||||||||||||||||
| Cash and cash equivalents | $ | 176 | $ | — | $ | — | $ | 176 | $ | 113 | $ | — | $ | — | $ | 113 | |||||||||||||||||||||||||||||||
| Equity securities: | |||||||||||||||||||||||||||||||||||||||||||||||
| U.S. common stock: | |||||||||||||||||||||||||||||||||||||||||||||||
| Health care | 3 | — | — | 3 | 5 | — | — | 5 | |||||||||||||||||||||||||||||||||||||||
| Financial services | 9 | 1 | — | 10 | 17 | (1) | — | 16 | |||||||||||||||||||||||||||||||||||||||
| Retail and consumer products | 6 | — | — | 6 | 9 | — | — | 9 | |||||||||||||||||||||||||||||||||||||||
| Energy | 1 | — | — | 1 | 4 | — | — | 4 | |||||||||||||||||||||||||||||||||||||||
| Information technology | 16 | — | — | 16 | 12 | — | — | 12 | |||||||||||||||||||||||||||||||||||||||
| Manufacturing and industrials | 8 | — | — | 8 | 12 | — | — | 12 | |||||||||||||||||||||||||||||||||||||||
| Telecommunications | 1 | — | — | 1 | 1 | — | — | 1 | |||||||||||||||||||||||||||||||||||||||
| International common stock | 14 | — | — | 14 | 23 | — | — | 23 | |||||||||||||||||||||||||||||||||||||||
Commingled funds: (1) | |||||||||||||||||||||||||||||||||||||||||||||||
| Global equity | — | — | — | 449 | — | — | — | 457 | |||||||||||||||||||||||||||||||||||||||
| Corporate debt securities | — | — | — | 157 | — | — | — | 155 | |||||||||||||||||||||||||||||||||||||||
| Fixed income: | |||||||||||||||||||||||||||||||||||||||||||||||
| Corporate debt securities | 252 | 2 | — | 253 | 239 | 1 | — | 240 | |||||||||||||||||||||||||||||||||||||||
| Government debt securities | 125 | 46 | — | 171 | 140 | (14) | — | 126 | |||||||||||||||||||||||||||||||||||||||
| Alternative investments: | |||||||||||||||||||||||||||||||||||||||||||||||
Diversified investment funds (1) | — | — | — | 4 | — | — | — | 5 | |||||||||||||||||||||||||||||||||||||||
Limited partnerships (1) | — | — | — | 298 | — | — | — | 296 | |||||||||||||||||||||||||||||||||||||||
| Total fair value | $ | 611 | $ | 49 | $ | — | 1,568 | $ | 574 | $ | (14) | $ | — | 1,473 | |||||||||||||||||||||||||||||||||
| Unsettled transactions, net | (17) | 45 | |||||||||||||||||||||||||||||||||||||||||||||
| Total plan assets | $ | 1,551 | $ | 1,518 | |||||||||||||||||||||||||||||||||||||||||||
__________________
(1)Assets that are measured at fair value using NAV per share as a practical expedient have not been categorized in the fair value hierarchy.
The following are descriptions of the valuation methodologies and key inputs used to measure pension plan assets recorded at fair value:
•Cash and cash equivalents—Cash equivalents include highly liquid investments with original maturities of three months or less. Due to their short-term nature, the carrying amount of these instruments approximates the estimated fair value. Actively traded money market funds are classified as Level 1 and included in cash and cash equivalents.
•Equity securities—The fair value of equity securities is based on quoted prices in active markets and classified as Level 1. Level 1 financial instruments include highly liquid instruments with quoted prices, such as equities and mutual funds traded in active markets.
F-50
•Commingled funds—The fair value of commingled funds is measured using the NAV per share practical expedient and have not been categorized in the fair value hierarchy. The NAV per share is based on the fair value of the underlying assets owned by the funds, minus its liabilities then divided by the total number of shares outstanding. Underlying assets of commingled funds primarily consist of liquid equity and fixed income securities with quoted prices in active markets.
•Fixed income—When available, the fair value of fixed income securities is based on quoted prices in active markets and classified as Level 1. Level 1 financial instruments include highly liquid instruments with quoted prices, such as equities and mutual funds traded in active markets.
If quoted prices are not available, fair values of fixed income instruments are obtained from pricing services, broker quotes or other model-based valuation techniques with observable inputs and classified as Level 2. The nature of these fixed income instruments include instruments for which quoted prices are available but traded less frequently, instruments whose fair value has been derived using a model where inputs to the model are directly observable in the market, or can be derived principally from or corroborated by observable market data and securities that are valued using other financial instruments, the parameters of which can be directly observed. Level 2 fixed income instruments include corporate debt securities.
•Alternative investments—The fair value of alternative investments is measured using the net asset value per share practical expedient and have not been categorized in the fair value hierarchy. The net asset value per share is based on the fair value of the underlying assets owned by the alternative investment funds, minus its liabilities then divided by the total number of shares outstanding.
•Limited partnerships—The fair value of limited partnerships is measured using the NAV practical expedient and has not been categorized in the fair value hierarchy. The NAV is based on the fair value of the underlying assets owned by the partnership, minus its liabilities then multiplied by the ownership percentage of the pension plans.
Other Financial Instruments
We determine the fair value of fixed-rate debt using Level 2 inputs based on quoted market prices. The carrying amount of all other debt approximates fair value as those instruments are based on variable interest rates. The following table presents the fair value and carrying value of total debt as of December 31, 2023 and January 1, 2023:
| December 31, 2023 | January 1, 2023 | ||||||||||||||||||||||
| Fair Value | Carrying Value | Fair Value | Carrying Value | ||||||||||||||||||||
| (in millions) | |||||||||||||||||||||||
| Debt | $ | 1,770 | $ | 1,991 | $ | 1,673 | $ | 1,992 | |||||||||||||||
The carrying amounts of cash and cash equivalents, accounts receivable, notes payable and accounts payable approximate their fair values because of the relatively short-term maturity of these instruments.
NOTE 16: RELATED PARTY TRANSACTIONS
The following tables present amounts of related party transactions and balances owed from and to related parties:
| December 31, 2023 | January 1, 2023 | ||||||||||
| (in millions) | |||||||||||
Receivables from related parties (1) | $ | 35 | $ | 29 | |||||||
Payables to and other current liabilities with related parties (2) | 31 | 42 | |||||||||
F-51
________________
(1)Includes receivables from WH Group and its subsidiaries of $34 million and $27 million as of December 31, 2023 and January 1, 2023, respectively. These balances are recorded in accounts receivable, net and prepaid expenses and other current assets on the consolidated balance sheets.
(2)Includes amounts due to our immediate parent company of $16 million and $27 million as of December 31, 2023 and January 1, 2023, which includes $8 million and $20 million related to income taxes, respectively. These amounts are recorded in accrued expenses and other current liabilities on the consolidated balance sheets. The remaining balances are recorded in accounts payable.
| Fiscal Year | |||||||||||||||||
| 2023 | 2022 | 2021 | |||||||||||||||
| (in millions) | |||||||||||||||||
Sales to related parties (1) | $ | 501 | $ | 492 | $ | 887 | |||||||||||
Payments to related parties (2) | 540 | 732 | 405 | ||||||||||||||
________________
(1)Sales to related parties includes $487 million, $471 million and $860 million in sales to subsidiaries of WH Group, and $4 million, $20 million and $27 million in sales to certain equity method investees in fiscal years 2023, 2022 and 2021, respectively.
(2)Payments to related parties includes $350 million, $520 million and $221 million in payments to our immediate parent company in fiscal years 2023, 2022 and 2021, respectively, which primarily consist of dividends. Payments also include $183 million, $209 million and $180 million to certain equity method investees in fiscal years 2023, 2022 and 2021, respectively, primarily for raw materials used in our hog production operations and cold storage fees.
NOTE 17: REGULATION AND CONTINGENCIES
Like other participants in our industry, we are subject to various laws and regulations administered by federal, state and other government entities, including the United States Environmental Protection Agency and corresponding state agencies, as well as the United States Department of Agriculture, the Grain Inspection, Packers and Stockyard Administration, the United States Food and Drug Administration, the United States Occupational Safety and Health Administration, the Commodity and Futures Trading Commission and similar agencies in foreign countries.
We, from time-to-time, receive notices and inquiries from regulatory authorities and others asserting that we are not in compliance with such laws and regulations. In some instances, litigation ensues. In addition, individuals may initiate litigation against us.
Our policy for establishing accruals and disclosures for contingent liabilities is contained in “Note 1: Summary of Significant Accounting Policies.” As of December 31, 2023 and January 1, 2023, we had recorded $315 million and $244 million in accrued expenses and other current liabilities on the consolidated balance sheets, respectively, related to litigation matters, including those described below. We recorded charges of $213 million, $12 million and $353 million in 2023, 2022 and 2021, respectively, for litigation matters, including those described below, in SG&A in the consolidated statements of income. These matters will not affect our profits or losses in future periods unless our accruals prove to be insufficient or excessive. It is reasonably possible that a change in our estimates may occur in the near term and that our accruals could be insufficient. We are unable to estimate the amount of possible loss in excess of our accruals, which could be material. Additionally, legal expenses incurred in our and our subsidiaries’ defense of these claims and any payments made to plaintiffs through unfavorable verdicts or otherwise could negatively impact our cash flows and our liquidity position.
Antitrust Price-Fixing Litigation
The Company has been named as one of 16 defendants in a series of class actions filed in 2018 in the United States District Court for the District of Minnesota alleging antitrust violations in the pork industry. The class cases were filed by three different groups of plaintiffs. In all of these cases, the plaintiffs alleged that starting in 2009 and continuing through at least June of 2018, the defendant pork producers agreed to reduce the supply of hogs in the United States in order to raise the price of hogs and all pork products. The plaintiffs in all of these cases also challenged the defendant pork producers’ use of benchmarking reports from defendant Agri Stats, Inc., alleging that
F-52
the reports allowed the pork producers to share proprietary information and monitor each producer’s compliance with the supposed agreement to reduce supply. Payments in the aggregate amount of $194 million were made by us to settle all class claims.
In addition to the class actions, the Company has been named as a defendant in similar antitrust lawsuits and related claims brought by a number of individual parties who opted out of the classes. The plaintiffs in the non-class cases assert the same or similar antitrust claims as the plaintiffs in the class actions. The Company has entered into negotiations with many of these claimants and has settled certain of these cases. Currently, 29 of these cases are pending against the Company.
The Attorneys General for the states of New Mexico and Alaska and the Commonwealth of Puerto Rico have filed similar complaints on behalf of their respective states, territories, agencies and citizens. The Company has settled with Puerto Rico and Alaska. The Company intends to vigorously defend against the remaining claims.
Antitrust Wage-Fixing Litigation
On November 11, 2022, Smithfield Foods, Inc. and our wholly owned subsidiary, Smithfield Packaged Meats Corp., were named as two of the numerous defendants in a purported class action complaint filed in the United States District Court for the District of Colorado alleging wage-fixing violations in the red meat industry. The plaintiffs allege that the defendants, most of whom operate beef or pork processing plants, conspired to suppress wages paid to plant workers in the United States in violation of the antitrust laws. The plaintiffs sought damages on behalf of all employees of defendants and their subsidiaries from January 1, 2014, to the present. The plaintiffs also sought treble damages and attorneys’ fees. The defendants filed motions to dismiss the complaint, which were largely denied by the court on September 27, 2023. The plaintiffs subsequently amended their complaint adding additional defendants, including our wholly owned subsidiary, Murphy-Brown of Missouri, LLC (which has been dismissed voluntarily), and expanding the class period back to 2000.
Since the case was filed, several defendants have settled. On April 5, 2024, the remaining defendants moved to dismiss the amended complaint. We intend to vigorously defend against these claims.
Maxwell Foods Litigation
On August 13, 2020, Maxwell Foods, LLC (“Maxwell”) filed a complaint against Smithfield Foods, Inc. in the General Court of Justice, Superior Court Division for Wayne County, North Carolina. The complaint alleged that Smithfield breached the Production Sales Agreement (“PSA”) between the parties (as well as the duty of good faith and fair dealing): (i) by failing to provide Maxwell with the same pricing as other major hog suppliers in violation of a purported “Most-Favored-Nation Provision” found in a December 6, 1994 letter to Maxwell, (ii) by failing to comply with an implicit duty to negotiate the PSA to provide alternative pricing to Maxwell when the Iowa-Southern Minnesota market allegedly ceased to be viable; and (iii) by failing to purchase Maxwell’s entire output of hogs since April 2020.
Smithfield filed a notice of removal to the United States District Court of the Eastern District of North Carolina. Smithfield also filed a motion to dismiss several of Maxwell’s claims. On February 22, 2021, the U.S. District Court granted Maxwell’s motion to remand the case to the Superior Court of Wayne County and left Smithfield’s partial motion to dismiss the complaint for consideration by the state court in Wayne County.
On March 1, 2021, Maxwell filed an amended complaint, which added a claim under the North Carolina Unfair and Deceptive Trade Practices Act (“UDTPA”). Smithfield filed a notice of designation seeking assignment of the case to the North Carolina Business Court. Maxwell objected to such designation, and on April 13, 2021 the Business Court overruled Maxwell’s objection.
The Business Court also dismissed two of Maxwell’s claims: the implied duty to negotiate claim and the UDTPA claim. Maxwell subsequently filed another amended complaint adding a fraudulent concealment claim and a new breach of contract claim, as well as a request for punitive damages. The court dismissed the fraudulent concealment claim and the request for punitive damages. The three remaining claims, all for breach of contract, are: (1) the claim under the “Most-Favored-Nation Provision,” (2) the claim that Smithfield failed to purchase Maxwell’s
F-53
entire output of hogs since April 2020, and (3) the claim that from time to time, Smithfield would calculate Maxwell’s payment for a delivery of hogs using an average of the preceding week’s weight rather than the actual weights of the hogs being delivered.
The parties filed cross-motions for summary judgment and related motions to exclude expert testimony, which were fully briefed on November 17, 2023. The Company intends to vigorously defend against the remaining claims.
Insurance Claims
A fire at one of our pork processing facilities in North Carolina in 2021 damaged or destroyed assets and disrupted our business. Additionally, we have claims against certain of our insurance carriers for losses we incurred in connection with nuisance litigation in the State of North Carolina. We maintain comprehensive general liability and property insurance, including business interruption insurance, with loss limits that we believe will provide substantial and broad coverage for the losses arising from these events.
In connection with our claims associated with these matters, we received insurance proceeds totaling $3 million, $6 million and $30 million in fiscal years 2023, 2022 and 2021, respectively. We recognized $2 million of the proceeds in each of fiscal years 2023 and 2022 in investing activities in the consolidated statements of cash flows. All other proceeds were recognized in operating activities in the consolidated statements of cash flows. The insurance recoveries were recognized in operating gains in the consolidated statements of income.
Any additional insurance recoveries from these claims will be recognized if and when the claims are settled.
NOTE 18: SUPPLEMENTAL CASH FLOW INFORMATION
| Fiscal Year | |||||||||||||||||
| 2023 | 2022 | 2021 | |||||||||||||||
| Supplemental disclosures of cash flow information: | (in millions) | ||||||||||||||||
| Interest paid | 81 | 84 | 90 | ||||||||||||||
Income taxes paid (1) | 108 | 152 | (3) | ||||||||||||||
_______________
(1)Does not include amounts paid to our immediate parent company for income taxes.
NOTE 19: SUBSEQUENT EVENTS
We evaluated subsequent events from January 1, 2024 through November 18, 2024, the date these consolidated financial statements were available to be issued.
Sale of Utah Hog Production Assets
On September 26, 2024, we entered into an agreement for the sale of our hog production assets in Utah, excluding the live animals. As part of the agreement, we will lease back certain farm and feed properties, which we will continue to operate. The transaction is expected to close in the fourth quarter of fiscal year 2024, subject to the resolution of certain closing conditions.
Dry Sausage Facility Acquisition
On July 30, 2024, we acquired a dry sausage production facility located in Nashville, Tennessee from Cargill Meat Solutions Corporation for $38 million. The acquisition is part of our strategy to grow our value-added packaged meats business and serve the growing demand for high-quality pepperoni, deli, charcuterie and other dry sausage products.
Altoona, Iowa Facility Closure
On August 30, 2024, we closed our Altoona, Iowa ham boning facility and consolidated production volume into other locations to improve manufacturing efficiencies. Costs associated with closing the plant primarily include
F-54
operating lease assets and equipment that we disposed of prior to the expiration of the lease term or end of the asset’s useful life. The charges associated with the closing were not material.
Antitrust Price-Fixing Litigation
Additional information regarding the antitrust price-fixing litigation matter described in “Note 17: Regulations and Contingencies” arose subsequent to the end of fiscal year 2023 and warranted an increase to our accrual. The increase in accrual was recognized in the fiscal year 2023 financial statements.
Except for these events, there were no subsequent events that would require recognition or disclosure in the consolidated financial statements.
Discontinued Operations
On March 28, 2024, we purchased a 50.1% stake in Argal Alimentacíon, S.A. (“Argal”), a Spanish producer of packaged meats products with approximately 1,480 employees, for €91 million ($98 million), subject to post-closing adjustments. We paid €82 million ($88 million) at closing with the remaining balance due upon finalization of the purchase price. In August 2024, we paid an additional €8 million ($9 million), which resulted in a final purchase price of €90 million ($97 million). Argal is included in our discontinued European operations.
On August 26, 2024, we completed a carve-out and distribution of our European operations to WH Group, which is further described in “Note 3: Discontinued Operations.”
F-55
SMITHFIELD FOODS, INC. AND SUBSIDIARIES
CONDENSED CONSOLIDATED STATEMENTS OF INCOME
(in millions, except for share and per share data)
| Nine Months Ended | |||||||||||||||||||||||
| September 29, 2024 | October 1, 2023 | ||||||||||||||||||||||
| Sales | $ | 10,190 | $ | 10,642 | |||||||||||||||||||
| Cost of sales | 8,826 | 10,038 | |||||||||||||||||||||
| Gross profit | 1,364 | 604 | |||||||||||||||||||||
| Selling, general and administrative expenses | 594 | 643 | |||||||||||||||||||||
| Operating gains | (12) | (99) | |||||||||||||||||||||
| Operating profit | 783 | 60 | |||||||||||||||||||||
| Interest expense, net | 52 | 59 | |||||||||||||||||||||
| Non-operating (gains) losses | (13) | 3 | |||||||||||||||||||||
| Income (loss) from continuing operations before income taxes | 745 | (2) | |||||||||||||||||||||
| Income tax expense | 165 | — | |||||||||||||||||||||
| Income from equity method investments | (1) | — | |||||||||||||||||||||
| Net income (loss) from continuing operations | 581 | (2) | |||||||||||||||||||||
| Income from discontinued operations before income taxes | 187 | 132 | |||||||||||||||||||||
| Income tax expense from discontinued operations | 8 | 20 | |||||||||||||||||||||
| Net income from discontinued operations | 179 | 112 | |||||||||||||||||||||
| Net income | 760 | 110 | |||||||||||||||||||||
| Net income (loss) from continuing operations attributable to noncontrolling interests | 9 | (3) | |||||||||||||||||||||
| Net income from discontinued operations attributable to noncontrolling interests | 2 | — | |||||||||||||||||||||
| Net income attributable to Smithfield | $ | 749 | $ | 113 | |||||||||||||||||||
| Net income attributable to Smithfield per common share: | |||||||||||||||||||||||
| Basic and diluted | |||||||||||||||||||||||
| Continuing operations | $ | 572,076 | $ | 815 | |||||||||||||||||||
| Discontinued operations | 176,449 | 112,017 | |||||||||||||||||||||
| Total | $ | 748,524 | $ | 112,832 | |||||||||||||||||||
| Weighted average shares outstanding | |||||||||||||||||||||||
| Basic | 1,000 | 1,000 | |||||||||||||||||||||
| Diluted | 1,000 | 1,000 | |||||||||||||||||||||
See Notes to Condensed Consolidated Financial Statements
F-56
SMITHFIELD FOODS, INC. AND SUBSIDIARIES
CONDENSED CONSOLIDATED STATEMENTS OF COMPREHENSIVE INCOME
(in millions)
| Nine Months Ended | |||||||||||||||||||||||
| September 29, 2024 | October 1, 2023 | ||||||||||||||||||||||
| Net income | $ | 760 | $ | 110 | |||||||||||||||||||
| Other comprehensive income (loss), net of tax: | |||||||||||||||||||||||
| Foreign currency translation | (35) | 77 | |||||||||||||||||||||
| Pension accounting | 10 | 11 | |||||||||||||||||||||
| Hedge accounting | (10) | 6 | |||||||||||||||||||||
| Total other comprehensive income (loss) | (36) | 94 | |||||||||||||||||||||
| Comprehensive income | 724 | 203 | |||||||||||||||||||||
| Comprehensive income (loss) attributable to noncontrolling interests | (18) | 25 | |||||||||||||||||||||
| Comprehensive income attributable to Smithfield | $ | 742 | $ | 179 | |||||||||||||||||||
See Notes to Condensed Consolidated Financial Statements
F-57
SMITHFIELD FOODS, INC. AND SUBSIDIARIES
CONDENSED CONSOLIDATED BALANCE SHEETS
(in millions, except share data)
| September 29, 2024 | December 31, 2023 | ||||||||||
| ASSETS | |||||||||||
| Current assets: | |||||||||||
| Cash and cash equivalents | $ | 278 | $ | 687 | |||||||
| Accounts receivable, net | 540 | 577 | |||||||||
| Inventories, net | 2,655 | 2,536 | |||||||||
| Current assets of discontinued operations | — | 958 | |||||||||
| Prepaid expenses and other current assets | 250 | 163 | |||||||||
| Total current assets | 3,724 | 4,921 | |||||||||
| Property, plant and equipment, net | 3,248 | 3,347 | |||||||||
| Goodwill | 1,616 | 1,627 | |||||||||
| Long-term assets of discontinued operations | — | 1,347 | |||||||||
| Intangible assets, net | 1,268 | 1,274 | |||||||||
| Operating lease assets | 346 | 381 | |||||||||
| Equity method investments | 192 | 191 | |||||||||
| Other assets | 257 | 230 | |||||||||
| Total assets | $ | 10,650 | $ | 13,317 | |||||||
| LIABILITIES AND EQUITY | |||||||||||
| Current liabilities: | |||||||||||
| Accounts payable | 566 | 789 | |||||||||
| Current portion of long-term debt and finance lease obligations | 8 | 27 | |||||||||
| Current portion of operating lease obligations | 58 | 63 | |||||||||
| Current liabilities of discontinued operations | — | 406 | |||||||||
| Accrued expenses and other current liabilities | 881 | 1,166 | |||||||||
| Total current liabilities | 1,512 | 2,450 | |||||||||
| Long-term debt and finance lease obligations | 2,005 | 2,006 | |||||||||
| Long-term operating lease obligations | 295 | 325 | |||||||||
| Deferred income taxes, net | 533 | 474 | |||||||||
| Long-term liabilities of discontinued operations | — | 86 | |||||||||
| Other liabilities | 422 | 490 | |||||||||
| Redeemable noncontrolling interests | 282 | 246 | |||||||||
| Commitments and contingencies (Note 18) | |||||||||||
| Equity: | |||||||||||
| Shareholder’s equity: | |||||||||||
F-58
| Common stock, no par value, 1,000 shares authorized; 1,000 issued and outstanding | — | — | |||||||||
| Additional paid-in capital | 2,967 | 4,152 | |||||||||
| Retained earnings | 2,997 | 3,588 | |||||||||
| Accumulated other comprehensive loss | (363) | (500) | |||||||||
| Total shareholder’s equity | 5,601 | 7,241 | |||||||||
| Noncontrolling interests | — | — | |||||||||
| Total equity | 5,601 | 7,241 | |||||||||
| Total liabilities and equity | $ | 10,650 | $ | 13,317 | |||||||
See Notes to Condensed Consolidated Financial Statements
F-59
SMITHFIELD FOODS, INC. AND SUBSIDIARIES
CONDENSED CONSOLIDATED STATEMENTS OF CASH FLOWS
(in millions)
| Nine Months Ended | ||||||||||||||
| September 29, 2024 | October 1, 2023 | |||||||||||||
| Cash flows from operating activities: | ||||||||||||||
| Net income | $ | 760 | $ | 110 | ||||||||||
| Less: Net income from discontinued operations | (179) | (112) | ||||||||||||
| Net income (loss) from continuing operations | $ | 581 | $ | (2) | ||||||||||
| Adjustments to reconcile net income from continuing operations to net cash flows from operating activities of continuing operations: | ||||||||||||||
| Depreciation and amortization | 253 | 296 | ||||||||||||
| (Gain) loss on sale of assets | 6 | (79) | ||||||||||||
| Changes in operating and other assets and liabilities, net | (615) | (198) | ||||||||||||
| Other, net | 8 | (23) | ||||||||||||
| Net cash flows from operating activities | 233 | (6) | ||||||||||||
| Cash flows from investing activities: | ||||||||||||||
| Capital expenditures | (268) | (242) | ||||||||||||
| Net expenditures from breeding stock transactions | (42) | (35) | ||||||||||||
| Investment in partnerships and other assets | (5) | (9) | ||||||||||||
| Proceeds from sale of property, plant and equipment and other assets | 8 | 216 | ||||||||||||
| Other | 2 | 10 | ||||||||||||
| Net cash flows from investing activities | (305) | (60) | ||||||||||||
| Cash flows from financing activities: | ||||||||||||||
| Payment of dividends | (270) | (262) | ||||||||||||
| Principal payments on long-term debt and finance lease obligations | (20) | (2) | ||||||||||||
| Repayments of Securitization Facility | (14) | (226) | ||||||||||||
| Proceeds from Securitization Facility | 14 | 226 | ||||||||||||
| Net repayments of revolving credit facilities | (1) | (4) | ||||||||||||
| Other | 1 | (2) | ||||||||||||
| Net cash flows from financing activities | (290) | (270) | ||||||||||||
| Effect of foreign exchange rate changes on cash from continuing operations | (12) | 10 | ||||||||||||
| Cash flows from discontinued operations | ||||||||||||||
| Net cash flows from operating activities of discontinued operations | 221 | 194 | ||||||||||||
| Net cash flows from investing activities of discontinued operations | (171) | (99) | ||||||||||||
| Net cash flows from financing activities of discontinued operations | (143) | (198) | ||||||||||||
| Effect of foreign exchange rate changes on cash from discontinued operations | (5) | (13) | ||||||||||||
| Net change in cash and cash equivalents of discontinued operations | (98) | (117) | ||||||||||||
F-60
| Net change in cash, cash equivalents and restricted cash | (472) | (443) | ||||||||||||
| Cash, cash equivalents and restricted cash at beginning of period | 751 | 570 | ||||||||||||
| Cash, cash equivalents and restricted cash at end of period | 278 | 126 | ||||||||||||
| Less: cash, cash equivalents and restricted cash of discontinued operations | — | 33 | ||||||||||||
| Cash, cash equivalents and restricted cash at end of period | $ | 278 | $ | 94 | ||||||||||
See Notes to Condensed Consolidated Financial Statements
F-61
SMITHFIELD FOODS, INC. AND SUBSIDIARIES
CONDENSED CONSOLIDATED STATEMENTS OF SHAREHOLDER’S EQUITY
(in millions)
| Nine Months Ended September 29, 2024 | |||||||||||||||||||||||||||||||||||
| Additional Paid-in Capital | Retained Earnings | Accumulated Other Comprehensive Loss | Total Shareholder’s Equity | Noncontrolling Interests | Total Equity | ||||||||||||||||||||||||||||||
| Balance, December 31, 2023 | $ | 4,152 | $ | 3,588 | $ | (500) | $ | 7,241 | $ | — | $ | 7,241 | |||||||||||||||||||||||
| Dividends | — | (269) | — | (269) | — | (269) | |||||||||||||||||||||||||||||
| European operations carve-out | (1,125) | (1,071) | 143 | (2,054) | — | (2,054) | |||||||||||||||||||||||||||||
| Adjustment to redeemable noncontrolling interests | (58) | — | — | (58) | — | (58) | |||||||||||||||||||||||||||||
| Other | (1) | — | — | (1) | — | (1) | |||||||||||||||||||||||||||||
| Comprehensive income: | |||||||||||||||||||||||||||||||||||
| Net income | — | 749 | — | 749 | — | 749 | |||||||||||||||||||||||||||||
| Other comprehensive loss, net of tax | — | — | (6) | (6) | — | (6) | |||||||||||||||||||||||||||||
| Balance, September 29, 2024 | $ | 2,967 | $ | 2,997 | $ | (363) | $ | 5,601 | $ | — | $ | 5,601 | |||||||||||||||||||||||
| Nine Months Ended October 1, 2023 | |||||||||||||||||||||||||||||||||||
| Additional Paid-in Capital | Retained Earnings | Accumulated Other Comprehensive Loss | Total Shareholder’s Equity | Noncontrolling Interests | Total Equity | ||||||||||||||||||||||||||||||
| Balance, January 1, 2023 | $ | 4,188 | $ | 3,894 | $ | (708) | $ | 7,374 | $ | — | $ | 7,374 | |||||||||||||||||||||||
| Dividends | — | (262) | — | (262) | — | (262) | |||||||||||||||||||||||||||||
| Comprehensive income: | |||||||||||||||||||||||||||||||||||
| Net income | — | 113 | — | 113 | — | 113 | |||||||||||||||||||||||||||||
| Other comprehensive income, net of tax | — | — | 66 | 66 | — | 66 | |||||||||||||||||||||||||||||
| Balance, October 1, 2023 | $ | 4,188 | $ | 3,744 | $ | (642) | $ | 7,290 | $ | — | $ | 7,290 | |||||||||||||||||||||||
See Notes to Condensed Consolidated Financial Statements
F-62
SMITHFIELD FOODS, INC. AND SUBSIDIARIES
NOTES TO CONDENSED CONSOLIDATED FINANCIAL STATEMENTS
(unaudited)
NOTE 1: SUMMARY OF SIGNIFICANT ACCOUNTING POLICIES
Organization
Smithfield Foods, Inc., together with its subsidiaries (“Smithfield,” “the Company,” “we,” “us” or “our”) produces a wide variety of fresh pork and packaged meats products primarily in the United States and markets them both domestically and internationally. We operate in a cyclical industry and our results are significantly affected by fluctuations in commodity prices for meat, livestock (primarily hogs) and grains. Smithfield is an indirect, wholly owned subsidiary of Hong Kong-based WH Group Limited (“WH Group”).
Sales and profitability as well as cash flow generation and use are impacted on a quarterly basis by the seasonal nature of our business. Generally, our sales and profitability are higher in the fourth quarter due to the Thanksgiving and Christmas holidays. In addition, the timing of the Easter holiday can impact the comparability of our first and second quarters both on a quarter-to-quarter and year-over-year basis. Our cash use is highest in the first quarter due to working capital needs related to payments to certain suppliers that are typically deferred in the fourth quarter.
Basis of Presentation
The accompanying condensed consolidated financial statements have been prepared in accordance with accounting principles generally accepted in the United States (“GAAP”), which require us to make estimates and use assumptions that affect the amounts reported in the condensed consolidated financial statements and accompanying notes. It is possible that actual results could differ materially from those estimates. The information reflects all normal recurring adjustments which we believe are necessary to present fairly the financial position and results of operations for all periods included. Totals and percentages may be affected by rounding.
These statements and notes should be read in conjunction with the audited consolidated financial statements and related notes for the year ended December 31, 2023, which include a comprehensive description of our significant accounting policies and other information that is not required to be disclosed in our interim condensed consolidated financial statements.
Our elected fiscal year is the 52-week or 53-week period which ends on the Sunday nearest to December 31. Unless otherwise noted, all references to the nine months ended September 29, 2024 and October 1, 2023 are to the 39-week periods ended September 29, 2024 and October 1, 2023, respectively.
Recently Issued Accounting Pronouncements
There have been no recently issued accounting pronouncements that have had, or are expected to have, a material impact on our condensed consolidated financial statements.
NOTE 2: REPORTABLE SEGMENTS
Our reportable segments are determined on the basis of our organizational structure and information that is regularly reviewed by our Chief Operating Decision Maker (“CODM”) for the purpose of making operating and resource allocation decisions and assessing the performance of the operating segments of our business. Our CODM is our Chief Executive Officer.
Following the carve-out and distribution of our European operations, we conduct our operations through three reportable segments: Packaged Meats, Fresh Pork and Hog Production.
F-63
Packaged Meats
The Packaged Meats segment consists of our U.S. operations that process fresh meat into a wide variety of packaged meats products, including bacon, sausage, hot dogs, deli and lunch meats, dry sausage products (such as pepperoni and genoa), ham products, ready-to-eat products and prepared foods (such as pre-cooked entrees, bacon and sausage). Approximately 80% of the Packaged Meats segment’s raw materials are sourced from our Fresh Pork segment. We market our domestic packaged meats products under a strategic set of core brands, which include: Smithfield, Eckrich, Nathan’s Famous, Farmland, Armour, Farmer John, Kretschmar, Krakus, John Morrell, Cook’s, Gwaltney, Carando, Margherita, Curly’s and Smithfield Culinary. We also sell a sizeable portion of our packaged meats products as private label products. The majority of the Packaged Meats segment’s products are sold to retail and foodservice customers in the United States.
Fresh Pork
The Fresh Pork segment consists of our U.S. operations that process live hogs into a wide variety of primal, sub-primal and offal products, such as bellies, butts, hams, loins, picnics and ribs. The Fresh Pork segment sources approximately half of its raw materials from our Hog Production segment and half from independent farmers with whom we partner across the United States. Approximately one-third of our fresh pork products, including the majority of hams, bellies and trimmings, is transferred to our Packaged Meats segment. Externally, we sell our fresh pork products to domestic retail, foodservice and industrial customers, as well as to export markets, including, among others, China, Mexico, Japan, South Korea and Canada.
Hog Production
The Hog Production segment consists of our hog production operations in the United States, which produce and raise our hogs on numerous company-owned farms and farms that are owned and operated by third-party contract farmers. Nearly all of the hogs produced by this segment are processed by our Fresh Pork segment. The Hog Production segment also may sell grains to external customers.
Our CODM reviews assets at a consolidated level; not by reportable segment. Therefore, we do not disclose assets by reportable segment.
F-64
The following table provides certain financial information by reportable segment for the fiscal years presented with a reconciliation to consolidated totals.
| Nine Months Ended September 29, 2024 | |||||||||||||||||||||||||||||||||||||||||
| Packaged Meats | Fresh Pork | Hog Production | Other (1) | Unallocated | Intersegment | Consolidated | |||||||||||||||||||||||||||||||||||
| (in millions) | |||||||||||||||||||||||||||||||||||||||||
| Sales | $ | 5,861 | $ | 5,871 | $ | 2,220 | $ | 350 | $ | — | $ | (4,111) | $ | 10,190 | |||||||||||||||||||||||||||
| Reconciliation of segment profit to loss from continuing operations before income taxes: | |||||||||||||||||||||||||||||||||||||||||
| Segment profit | 855 | 196 | (135) | 18 | — | — | 935 | ||||||||||||||||||||||||||||||||||
Unallocated expenses (2) | — | — | — | — | (59) | — | (59) | ||||||||||||||||||||||||||||||||||
Corporate expenses (3) | — | — | — | — | (92) | — | (92) | ||||||||||||||||||||||||||||||||||
| Interest expense | — | — | — | — | (52) | — | (52) | ||||||||||||||||||||||||||||||||||
| Non-operating gains | — | — | — | — | 13 | — | 13 | ||||||||||||||||||||||||||||||||||
| Income from equity method investments | — | (1) | (1) | — | — | — | $ | (1) | |||||||||||||||||||||||||||||||||
| Income from continuing operations before income taxes | $ | 745 | |||||||||||||||||||||||||||||||||||||||
| Nine Months Ended October 1, 2023 | |||||||||||||||||||||||||||||||||||||||||
| Packaged Meats | Fresh Pork | Hog Production | Other (1) | Unallocated | Intersegment | Consolidated | |||||||||||||||||||||||||||||||||||
| (in millions) | |||||||||||||||||||||||||||||||||||||||||
| Sales | $ | 5,876 | $ | 5,996 | $ | 2,499 | $ | 380 | $ | — | $ | (4,108) | $ | 10,642 | |||||||||||||||||||||||||||
| Reconciliation of segment profit to income from continuing operations before income taxes: | |||||||||||||||||||||||||||||||||||||||||
| Segment profit | 760 | 73 | (627) | (17) | — | — | 190 | ||||||||||||||||||||||||||||||||||
Unallocated expenses (2) | (47) | — | (47) | ||||||||||||||||||||||||||||||||||||||
Corporate expenses (3) | — | — | — | — | (82) | — | (82) | ||||||||||||||||||||||||||||||||||
| Interest expense | — | — | — | — | (59) | — | (59) | ||||||||||||||||||||||||||||||||||
| Non-operating losses | — | — | — | — | (3) | — | (3) | ||||||||||||||||||||||||||||||||||
| (Income) loss from equity method investments | — | (1) | 1 | — | — | — | — | ||||||||||||||||||||||||||||||||||
| Loss from continuing operations before income taxes | $ | (2) | |||||||||||||||||||||||||||||||||||||||
(1)Includes our Mexico and Bioscience operations. Our Mexico operations include the raising of hogs and production of pork products that are sold primarily to customers in Mexico. Our Bioscience operations use raw materials from hogs that we harvest to manufacture heparin products, including an active pharmaceutical ingredient that mitigates the risk of blood clots.
(2)Includes certain costs of sales, SG&A and operating gains that we do not allocate to our segments.
(3)Represents general corporate expenses for management and administration of the business.
F-65
The following table disaggregates our sales by reportable segment to customers by major distribution channel:
| Nine Months Ended September 29, 2024 | |||||||||||||||||||||||||||||||||||||||||||||||
Retail (1) | Foodservice (2) | Exports (3) | Industrial (4) | Other / Unallocated (5) | Total External Sales | Intersegment | Consolidated | ||||||||||||||||||||||||||||||||||||||||
| (in millions) | |||||||||||||||||||||||||||||||||||||||||||||||
| Packaged Meats | $ | 3,681 | $ | 1,804 | $ | 65 | $ | 300 | $ | 11 | $ | 5,861 | $ | — | $ | 5,861 | |||||||||||||||||||||||||||||||
| Fresh Pork | 1,464 | 173 | 1,224 | 774 | — | 3,635 | 2,236 | 5,871 | |||||||||||||||||||||||||||||||||||||||
| Hog Production | — | — | — | — | 345 | 345 | 1,874 | 2,220 | |||||||||||||||||||||||||||||||||||||||
Other (6) | — | — | — | — | 349 | 349 | 1 | 350 | |||||||||||||||||||||||||||||||||||||||
| Intersegment | — | — | — | — | — | — | (4,111) | (4,111) | |||||||||||||||||||||||||||||||||||||||
| Total | $ | 5,145 | $ | 1,977 | $ | 1,289 | $ | 1,074 | $ | 705 | $ | 10,190 | $ | — | $ | 10,190 | |||||||||||||||||||||||||||||||
| Nine Months Ended October 1, 2023 | |||||||||||||||||||||||||||||||||||||||||||||||
Retail (1) | Foodservice (2) | Exports (3) | Industrial (4) | Other / Unallocated (5) | Total External Sales | Intersegment | Consolidated | ||||||||||||||||||||||||||||||||||||||||
| (in millions) | |||||||||||||||||||||||||||||||||||||||||||||||
| Packaged Meats | $ | 3,648 | $ | 1,838 | $ | 87 | $ | 291 | $ | 12 | $ | 5,876 | $ | — | $ | 5,876 | |||||||||||||||||||||||||||||||
| Fresh Pork | 1,535 | 195 | 1,298 | 880 | 10 | 3,918 | 2,078 | 5,996 | |||||||||||||||||||||||||||||||||||||||
| Hog Production | — | — | — | — | 473 | 473 | 2,025 | 2,499 | |||||||||||||||||||||||||||||||||||||||
Other (6) | — | — | — | — | 375 | 375 | 5 | 380 | |||||||||||||||||||||||||||||||||||||||
| Intersegment | — | — | — | — | — | — | (4,108) | (4,108) | |||||||||||||||||||||||||||||||||||||||
| Total | $ | 5,182 | $ | 2,032 | $ | 1,385 | $ | 1,171 | $ | 871 | $ | 10,642 | $ | — | $ | 10,642 | |||||||||||||||||||||||||||||||
(1)Includes national and regional retailers in the United States such as grocery supermarket chains, independent grocers and club stores.
(2)Includes foodservice distributors, fast food and other restaurant operators, hotel chains and other institutional customers in the United States.
(3)Includes exports from the United States to international retailers and wholesale distributors primarily in North America, Asia, Latin America and other emerging markets.
(4)Includes sales to industrial customers who use our raw materials in their finished goods production, including prepared meals, pharmaceutical production and pet food.
(5)Includes sales of grain, oilseeds, breeding stock and market hogs, among others, in addition to external sales from our Mexico and Bioscience operations.
(6)Includes our Mexico and Bioscience operations.
NOTE 3: DISCONTINUED OPERATIONS
On August 26, 2024, we completed a carve-out and distribution of our European operations to WH Group. The European carve-out represents a strategic shift in our geographical footprint. Accordingly, the historical results of operations, assets and liabilities, and cash flows of the European operations have been condensed into separate line items and presented in the condensed consolidated statements of income, the condensed consolidated balance sheets and the condensed consolidated statements of cash flows as discontinued operations.
F-66
The following table presents the major components of net income from discontinued operations included in the condensed consolidated statements of income.
| Nine Months Ended | ||||||||||||||||||||
| September 29, 2024 | October 1, 2023 | |||||||||||||||||||
| (in millions) | ||||||||||||||||||||
| Sales | $ | 2,362 | $ | 2,495 | ||||||||||||||||
| Cost of sales | 2,037 | 2,245 | ||||||||||||||||||
| Gross profit | 325 | 250 | ||||||||||||||||||
| Selling, general and administrative expenses | 149 | 112 | ||||||||||||||||||
| Operating gains | (15) | (5) | ||||||||||||||||||
| Operating profit | 190 | 142 | ||||||||||||||||||
| Interest expense | 4 | 10 | ||||||||||||||||||
| Income from discontinued operations before income taxes | 187 | 132 | ||||||||||||||||||
Income tax expense from discontinued operations (1) | 8 | 20 | ||||||||||||||||||
| Net income from discontinued operations | $ | 179 | $ | 112 | ||||||||||||||||
________________
(1)Income tax expense (benefit) from discontinued operations for 2024 includes a $27 million income tax benefit recognized as a result of the carve-out of our European operations.
The following tables present the carrying amounts of the major classes of assets and liabilities of the discontinued operations included in the condensed consolidated balance sheets.
Assets
| December 31, 2023 | ||||||||
| (in millions) | ||||||||
| Current assets: | ||||||||
| Cash and cash equivalents | $ | 61 | ||||||
| Accounts receivable, net | 412 | |||||||
| Inventories, net | 460 | |||||||
| Prepaid expenses and other current assets | 25 | |||||||
| Total current assets | 958 | |||||||
| Property, plant and equipment, net | 911 | |||||||
| Goodwill | 253 | |||||||
| Intangible assets, net | 114 | |||||||
| Other assets | 69 | |||||||
| Total long-term assets | 1,347 | |||||||
F-67
Liabilities
| December 31, 2023 | ||||||||
| (in millions) | ||||||||
| Current liabilities: | ||||||||
| Accounts payable | $ | 182 | ||||||
| Current portion of long-term debt and finance lease obligations | 68 | |||||||
| Accrued expenses and other current liabilities | 156 | |||||||
| Total current liabilities | 406 | |||||||
| Deferred income taxes, net | 30 | |||||||
| Long-term debt and finance lease obligations | 8 | |||||||
| Other liabilities | 48 | |||||||
| Total long-term liabilities | 86 | |||||||
Argal Acquisition
On March 28, 2024, our former European operation purchased a 50.1% stake in Argal Alimentacíon, S.A. (“Argal”), a Spanish producer of packaged meats products with approximately 1,480 employees, for €91 million ($98 million), subject to post-closing adjustments. The Company paid €82 million ($88 million) at closing with the remaining balance due upon finalization of the purchase price. In August 2024, the Company paid an additional €8 million ($9 million), which resulted in a final purchase price of €90 million ($97 million). Argal is included in our discontinued European operations.
Continuing Involvement
In connection with the carve out of our European operations (“Morliny Foods”), we entered into a transition services agreement that governs certain services Smithfield will provide to Morliny Foods for up to a year subsequent to the carve out. These services include information technology support, including access and license fees, tax advisory services and financial reporting services, none of which are material to Smithfield. In addition, Smithfield will continue to purchase certain products from Morliny Foods for distribution in the U.S. market. Purchases of these products from Morliny Foods were $32 million for the nine months ended September 29, 2024. Subsequent to the carve-out transaction, Morliny Foods became, and WH Group remains, a related party.
NOTE 4: ACQUISITION AND DISPOSITIONS
Acquisition
Dry Sausage Facility
On July 30, 2024, we acquired a dry sausage production facility located in Nashville, Tennessee from Cargill Meat Solutions Corporation for $38 million. The acquisition is part of our strategy to grow our value-added packaged meats business and serve the growing demand for high-quality pepperoni, deli, charcuterie and other dry sausage products. The total cost of the asset acquisition was allocated based on the relative fair value of the assets acquired. The allocated fair values of the assets acquired are as follows: equipment valued at $17 million, building valued at $11 million, inventory valued at $5 million and land valued at $5 million.
Dispositions
Altoona, Iowa Facility Closure
On August 30, 2024, we closed our Altoona, Iowa ham boning facility and consolidated production volume into other locations to improve manufacturing efficiencies. Costs associated with closing the plant primarily include
F-68
operating lease assets and equipment that we disposed of prior to the expiration of the lease term or end of the asset’s useful life. The charges associated with the closing were not material.
NOTE 5: OPERATING GAINS AND NON-OPERATING (GAINS) LOSSES
The following table provides details of operating gains and non-operating (gains) losses.
| Nine Months Ended | ||||||||||||||||||||
| September 29, 2024 | October 1, 2023 | |||||||||||||||||||
| (in millions) | ||||||||||||||||||||
| Operating gains: | ||||||||||||||||||||
Gain on disposal of assets (1) | $ | (5) | $ | (88) | ||||||||||||||||
| Insurance recoveries | (4) | (4) | ||||||||||||||||||
| Other | (3) | (7) | ||||||||||||||||||
| Total operating gains | $ | (12) | $ | (99) | ||||||||||||||||
| Non-operating (gains) losses: | ||||||||||||||||||||
| Gain on nonqualified retirement plan assets | $ | (18) | $ | (6) | ||||||||||||||||
Net pension and postretirement benefits cost (2) | 5 | 8 | ||||||||||||||||||
| Other | (1) | 1 | ||||||||||||||||||
| Total non-operating (gains) losses | $ | (13) | $ | 3 | ||||||||||||||||
________________
(1)Includes an $86 million gain on the sale of our Vernon, California plant. See “Note 6: Restructuring” for further information.
(2)Includes the components of net pension and postretirement benefits cost other than service cost, which is included in operating profit. These components consist of interest cost, expected return on plan assets, amortization of actuarial gains/losses and prior service costs/credits, and curtailment gains.
NOTE 6: RESTRUCTURING
In May 2022, we announced a decision to close our Vernon, California processing facility, exit farm operations in Arizona and California and reduce our sow herd in Utah. The decision to permanently close our Vernon facility was based on increasingly difficult business conditions in California, where high taxes, high utility costs and a challenging regulatory environment negatively impact our ability to operate efficiently and profitably.
In May 2023, we made a decision to cease operations on a number of sow farms in Missouri. The decision was driven by persistent livestock disease issues, underperforming operations and shifting industry supply and demand dynamics.
In December 2023, we made a decision to terminate a number of third-party hog grower contracts and close several company-owned nursery farms in Utah as a result of the Vernon facility closure in early 2023.
F-69
As a result of these decisions, we incurred various exit costs and disposal charges, which have been, or will be, recorded in cost of sales in our condensed consolidated statements of income. The following table details the charges by major type of cost.
| Nine Months Ended | Cumulative | ||||||||||||||||||||||||||||||||||
| September 29, 2024 | October 1, 2023 | ||||||||||||||||||||||||||||||||||
| (in millions) | |||||||||||||||||||||||||||||||||||
| Accelerated depreciation | $ | — | $ | 42 | $ | 168 | |||||||||||||||||||||||||||||
| Contract termination costs | 8 | — | 56 | ||||||||||||||||||||||||||||||||
| Employee termination benefits | 2 | 1 | 33 | ||||||||||||||||||||||||||||||||
| Loss on asset disposals | — | 2 | 5 | ||||||||||||||||||||||||||||||||
| Other exit costs | 4 | 49 | 99 | ||||||||||||||||||||||||||||||||
| Total | $ | 13 | $ | 94 | $ | 359 | |||||||||||||||||||||||||||||
In the second quarter of fiscal year 2023, we sold our Vernon, California facility for $205 million and recognized a gain of $86 million in operating gains in the condensed consolidated statement of income.
The following table reconciles the beginning and ending liability balances associated with these restructuring activities.
| Balance, December 31, 2023 | Additions | Payments | Balance, September 29, 2024 | ||||||||||||||||||||||||||||||||||||||
| (in millions) | |||||||||||||||||||||||||||||||||||||||||
| Contract termination costs | $ | 42 | $ | 8 | $ | (50) | $ | — | |||||||||||||||||||||||||||||||||
| Employee termination benefits | 2 | 2 | (3) | 1 | |||||||||||||||||||||||||||||||||||||
| Other exit costs | 8 | 4 | (6) | 5 | |||||||||||||||||||||||||||||||||||||
| Total | $ | 51 | $ | 13 | $ | (58) | $ | 6 | |||||||||||||||||||||||||||||||||
On September 26, 2024, we entered into an agreement for the sale of our hog production assets in Utah, excluding the live animals. As part of the agreement, we will lease back certain farm and feed properties, which we will continue to operate. The transaction is expected to close in the fourth quarter of fiscal year 2024, subject to the resolution of certain closing conditions. We reclassified $52 million of property, plant and equipment and $24 million of asset retirement obligations to prepaids and other current assets and accrued expenses and other current liabilities, respectively, in our condensed consolidated balance sheet as of September 29, 2024.
NOTE 7: EMPLOYEE RETENTION TAX CREDITS
In 2020, the World Health Organization publicly characterized COVID-19 as a pandemic. The Company recognized a substantial amount of incremental costs during the pandemic, including costs to compensate employees who were not able to work due to facility closures, reduced work schedules or health related reasons.
The Coronavirus Aid, Relief, and Economic Security Act was signed into law in March 2020, which provided, among other things, an employee retention credit to eligible employers who paid qualified wages to employees during the pandemic. The employee retention credit represents a government grant. Our policy is to recognize government grants when they are reasonably assured of receipt. In the second quarter of 2024, we concluded the recognition threshold had been met and therefore, recognized $86 million and $1 million of employee retention credits in cost of sales and SG&A, respectively, in the condensed consolidated statement of income.
F-70
NOTE 8: ACCOUNTS RECEIVABLE
Accounts receivable, net is comprised of both receivables from contracts with customers and other receivables. Our receivables from contracts with customers were $454 million and $475 million as of September 29, 2024 and December 31, 2023, respectively.
We monitor the credit risk associated with our accounts receivable and establish an allowance for credit losses expected to be incurred over the life of the receivable, which is recorded net of this allowance. We calculate this allowance based on our history of write-offs, future economic conditions, level of past due accounts, the financial health of our customers and historical experience. Our allowance for credit losses was not material for the periods presented.
NOTE 9: INVENTORIES
Inventories, net consist of the following:
| September 29, 2024 | December 31, 2023 | ||||||||||
| (in millions) | |||||||||||
| Fresh and packaged meats | $ | 1,321 | $ | 943 | |||||||
| Livestock | 953 | 1,036 | |||||||||
| Grains | 135 | 307 | |||||||||
| Manufacturing supplies | 114 | 123 | |||||||||
| Other | 132 | 127 | |||||||||
| Inventories, net | $ | 2,655 | $ | 2,536 | |||||||
NOTE 10: DERIVATIVE FINANCIAL INSTRUMENTS
Our pork production operations use various raw materials, primarily live hogs, corn, soybean meal and wheat, which are actively traded on commodity exchanges. We also use fuel and other energy commodities in our operations. We hedge these commodities when we determine conditions are appropriate to mitigate price risk. While this hedging may limit our ability to participate in gains from favorable commodity fluctuations, it also reduces the risk of loss from adverse changes in raw material prices. We attempt to closely match the commodity contract terms with the hedged item. We also periodically enter into interest rate swaps to hedge exposure to changes in interest rates on certain financial instruments and foreign exchange forward contracts to hedge certain exposures to fluctuating foreign currency rates.
We record all derivatives as either assets or liabilities at fair value on the condensed consolidated balance sheet, with the exception of contracts that qualify for the normal purchase and normal sale scope exception, which are expected to result in physical delivery. Accounting for changes in the fair value of a derivative depends on whether it qualifies and has been designated as part of a hedging relationship. For derivatives that qualify and have been designated as hedging instruments for accounting purposes, changes in fair value have no net impact on earnings, to the extent the derivative is considered perfectly effective in achieving offsetting changes in fair value attributable to the risk being hedged, until the hedged item is recognized in earnings (commonly referred to as the “hedge accounting” method). For derivatives that do not qualify or are not designated as hedging instruments for accounting purposes, changes in fair value are recorded in current period earnings (commonly referred to as the “mark-to-market” method). We may elect either method of accounting for our derivative portfolio, assuming all the necessary requirements are met. We have, in the past, availed ourselves of either acceptable method and expect to do so in the future. We believe all of our derivative instruments represent economic hedges against changes in prices and rates, regardless of their designation for accounting purposes.
When cash flow hedge accounting is applied, derivative gains or losses are recognized as a component of other comprehensive income (loss) and reclassified into earnings in the same period or periods during which the hedged transactions affect earnings. The initial fair value of hedge components excluded from the assessment of effectiveness is recognized in earnings on a straight-line basis over the life of the hedging instrument and is
F-71
presented in the same income statement line item as the hedged item. Any difference between the change in fair value of the hedge components excluded from the assessment of effectiveness and the amounts recognized in earnings is recorded as a component of other comprehensive income (loss).
When fair value hedge accounting is applied, derivative gains and losses are recognized in earnings concurrently with the change in fair value of the hedged item attributable to the risk being hedged.
Changes in commodity prices could have a significant impact on cash deposit requirements under our broker and counterparty agreements. Additionally, certain of our derivative contracts contain credit risk-related contingent features, which would require us to post additional cash collateral to cover net losses on open derivative instruments if our credit rating were sufficiently downgraded. As of September 29, 2024, the net liability position of our open derivative instruments that are subject to credit risk-related contingent features was not material.
Although our counterparties primarily consist of financial institutions that are investment grade, we would be exposed to losses in the event of nonperformance or nonpayment by our counterparties. However, a portion of our financial instruments are exchange traded derivative contracts held with brokers and counterparties with whom we maintain margin accounts that are settled on a daily basis, thereby limiting our credit exposure to non-exchange traded derivatives. Additionally, we have a portfolio of over-the-counter derivatives that are held by counterparties under netting arrangements found in typical master netting agreements. These agreements legally allow for net settlement in the event of bankruptcy. We offset the fair values of derivative assets and liabilities, along with the related cash collateral, that are executed with the same counterparty under these arrangements in the condensed consolidated balance sheets. Determination of the credit quality of our counterparties is based upon a number of factors, including credit ratings and our evaluation of their financial condition. As of September 29, 2024, we had gross credit exposure of $10 million on non-exchange traded derivative contracts. After taking into account the effect of netting arrangements, we had no credit exposure on non-exchange traded derivative contracts.
The size and mix of our derivative portfolio vary from time to time based upon our analysis of current and future market conditions. The following table presents the fair values of our open derivative financial instruments on a gross basis.
| Assets | Liabilities | ||||||||||||||||||||||
| September 29, 2024 | December 31, 2023 | September 29, 2024 | December 31, 2023 | ||||||||||||||||||||
| (in millions) | (in millions) | ||||||||||||||||||||||
| Derivatives using the “hedge accounting” method: | |||||||||||||||||||||||
| Commodity contracts | $ | 35 | $ | 37 | $ | 18 | $ | 29 | |||||||||||||||
| Foreign exchange contracts | — | 1 | — | — | |||||||||||||||||||
| Total | 35 | 38 | 18 | 29 | |||||||||||||||||||
| Derivatives using the “mark-to-market” method: | |||||||||||||||||||||||
| Commodity contracts | 5 | 13 | 11 | 13 | |||||||||||||||||||
| Total fair value of derivative instruments | $ | 39 | $ | 51 | $ | 28 | $ | 42 | |||||||||||||||
F-72
The following tables reconcile the gross amounts of derivative assets and liabilities to the net amounts presented in our condensed consolidated balance sheets and the related effects of cash collateral under netting arrangements that provide a legal right of offset of assets and liabilities.
| September 29, 2024 | |||||||||||||||||||||||||||||
| Gross Amount of Derivative Assets/ Liabilities | Netting of Derivative Assets/ Liabilities | Net Derivative Assets/Liabilities | Netting of Derivative and Cash Collateral | Net Amount Presented in the Condensed Consolidated Balance Sheet (1) | |||||||||||||||||||||||||
| (in millions) | |||||||||||||||||||||||||||||
| Assets: | |||||||||||||||||||||||||||||
| Commodities | $ | 39 | $ | (22) | $ | 18 | $ | 13 | $ | 31 | |||||||||||||||||||
| Liabilities: | |||||||||||||||||||||||||||||
| Commodities | 28 | (22) | 6 | — | 6 | ||||||||||||||||||||||||
________________
(1)Net derivative assets are recorded in prepaid expenses and other current assets. Net derivative liabilities are recorded in accrued expenses and other current liabilities. Cash collateral balances were not material.
| December 31, 2023 | |||||||||||||||||||||||||||||
| Gross Amount of Derivative Assets/ Liabilities | Netting of Derivative Assets/ Liabilities | Net Derivative Assets/Liabilities | Netting of Derivative and Cash Collateral | Net Amount Presented in the Condensed Consolidated Balance Sheet (1) | |||||||||||||||||||||||||
| (in millions) | |||||||||||||||||||||||||||||
| Assets: | |||||||||||||||||||||||||||||
| Commodities | $ | 50 | $ | (25) | $ | 25 | $ | (1) | $ | 24 | |||||||||||||||||||
| Foreign exchange contracts | 1 | — | 1 | — | 1 | ||||||||||||||||||||||||
| Total | $ | 51 | $ | (25) | $ | 26 | $ | (1) | $ | 26 | |||||||||||||||||||
| Liabilities: | |||||||||||||||||||||||||||||
| Commodities | 42 | (25) | 18 | 1 | 19 | ||||||||||||||||||||||||
________________
(1)We recorded $25 million of the net assets in prepaid expenses and other current assets with the remaining $1 million in current assets of discontinued operations. We recorded $14 million of the net liabilities in accrued expenses and other current liabilities with the remaining $5 million in other liabilities.
See “Note 16: Fair Value Measurements” for additional information about the fair value of our derivatives.
Hedge Accounting Method
Cash Flow Hedges
We enter into derivative instruments, such as futures, swaps and options contracts, to manage our exposure to the variability in expected future cash flows attributable to commodity price risk associated with the forecasted sale of fresh pork and the forecasted purchase of grains, hogs, and energy. In addition, we enter into interest rate swaps to manage our exposure to changes in interest rates associated with our variable interest rate debt and the forecasted issuance of fixed rate debt. Lastly, we enter into foreign exchange contracts to manage our exposure to the variability in expected future cash flows attributable to changes in foreign exchange rates associated with the forecasted purchase or sale of assets denominated in foreign currencies. As of September 29, 2024, substantially all of our commodity-related cash flow hedges were for transactions forecasted through April 2025.
F-73
As of September 29, 2024, the notional volumes associated with open derivative instruments designated in cash flow hedging relationships were as follows:
| Volume | Metric | ||||||||||
| Commodities: | |||||||||||
| Lean hogs | 663,565,000 | Pounds | |||||||||
| Corn | 44,195,000 | Bushels | |||||||||
| Soybean meal | 321,000 | Tons | |||||||||
| Natural Gas | 7,900,000 | Million BTU | |||||||||
| Diesel | 1,050,000 | Gallons | |||||||||
The following table presents the effects on our condensed consolidated financial statements of pre-tax gains and losses on derivative instruments designated in cash flow hedging relationships for the periods indicated:
| Gains (Losses) Recognized in Other Comprehensive Income (Loss) on Derivative | Gains (Losses) Reclassified from Accumulated Other Comprehensive Loss into Earnings | ||||||||||||||||||||||||||||||||||||||||||||||
| Nine Months Ended | Nine Months Ended | ||||||||||||||||||||||||||||||||||||||||||||||
| September 29, 2024 | October 1, 2023 | September 29, 2024 | October 1, 2023 | ||||||||||||||||||||||||||||||||||||||||||||
| (in millions) | (in millions) | ||||||||||||||||||||||||||||||||||||||||||||||
| Commodity contracts | $ | (3) | $ | 6 | $ | 11 | $ | (2) | |||||||||||||||||||||||||||||||||||||||
| Interest rate swaps | — | — | (1) | (1) | |||||||||||||||||||||||||||||||||||||||||||
| Foreign exchange contracts | 1 | — | 1 | 1 | |||||||||||||||||||||||||||||||||||||||||||
| Total | $ | (2) | $ | 6 | $ | 11 | $ | (2) | |||||||||||||||||||||||||||||||||||||||
We recognized $48 million in expenses for option premiums, which are excluded from the assessment of hedge effectiveness, in the nine months ended September 29, 2024 and $34 million in the nine months ended October 1, 2023. Accumulated other comprehensive income included $4 million of net gains associated with options for which the underlying hedged transactions had not yet impacted earnings as of September 29, 2024. This amount represents the difference between the change in the fair value of the options and the amount of option premiums amortized through earnings.
We expect to reclassify $14 million ($10 million net of tax) of deferred gains on closed commodity and interest rate contracts into earnings within the next twelve months. We are unable to estimate the amount of unrealized gains or losses to be reclassified into earnings within the next twelve months related to open contracts as their values are subject to change.
Fair Value Hedges
We enter into derivative instruments (primarily futures contracts) that are designed to hedge changes in the fair value of firm commitments to buy grains and hogs. As of September 29, 2024, the notional volumes associated with open derivative instruments designated in fair value hedging relationships were as follows:
| Volume | Metric | ||||||||||
| Lean hogs | 3,880,000 | Pounds | |||||||||
| Corn | 2,610,000 | Bushels | |||||||||
| Soybeans | 205,000 | Bushels | |||||||||
The carrying values of hedged firm commitments designated in fair value hedge relationships as of September 29, 2024 and December 31, 2023 were not material. When the underlying inventories are acquired, the hedge relationship is discontinued and the fair value hedge adjustments is reclassified to inventories. The amount of fair
F-74
value hedge gains remaining in inventories for which hedge accounting has been discontinued was $4 million and $7 million as of September 29, 2024 and December 31, 2023, respectively.
Mark-to-Market Method
As of September 29, 2024, the notional volumes associated with open derivative instruments using the “mark-to-market” method, including delta-adjusted options, were as follows:
| Volume | Metric | ||||||||||
| Commodities: | |||||||||||
| Lean hogs | 139,556,000 | Pounds | |||||||||
| Corn | 23,865,000 | Bushels | |||||||||
| Soybean meal | 106,000 | Tons | |||||||||
| Soybeans | 845,000 | Bushels | |||||||||
| Natural gas | 370,000 | Million BTU | |||||||||
| Foreign currency | 15,178,000 | U.S. Dollars | |||||||||
Derivative Impact on the Condensed Consolidated Statements of Income
The following table presents the effect of derivatives on the condensed consolidated statements of income for the periods indicated:
| Nine Months Ended | |||||||||||||||||||||||
| September 29, 2024 | October 1, 2023 | ||||||||||||||||||||||
| (in millions) | |||||||||||||||||||||||
| Sales | |||||||||||||||||||||||
| Cash flow hedging - commodity contracts | $ | 34 | $ | (4) | |||||||||||||||||||
| Mark to market - commodity contracts | (7) | 10 | |||||||||||||||||||||
| Total derivative gain (loss) recognized sales | 27 | 6 | |||||||||||||||||||||
| Cost of Sales | |||||||||||||||||||||||
| Cash flow hedging - commodity contracts | (23) | 2 | |||||||||||||||||||||
| Fair value hedging - commodity contracts | |||||||||||||||||||||||
| Change in fair value of open derivatives | 5 | 17 | |||||||||||||||||||||
| Change in fair value of related hedged items | (5) | (17) | |||||||||||||||||||||
Gain (loss) on closed derivatives (1) | 8 | — | |||||||||||||||||||||
| Mark to market - commodity contracts | (8) | (11) | |||||||||||||||||||||
| Total derivative gain (loss) recognized in cost of sales | (23) | (8) | |||||||||||||||||||||
| Selling, general and administrative expenses | |||||||||||||||||||||||
| Mark to market - foreign exchange contracts | 1 | 1 | |||||||||||||||||||||
| Interest expense | |||||||||||||||||||||||
| Cash flow hedging - interest rate contracts | (1) | (1) | |||||||||||||||||||||
F-75
| Discontinued operations | |||||||||||||||||||||||
| Cash flow hedging - foreign exchange contracts | 1 | 1 | |||||||||||||||||||||
| Mark to market - foreign exchange contracts | 3 | — | |||||||||||||||||||||
| Total derivative gain (loss) recognized in discontinued operations | 4 | 1 | |||||||||||||||||||||
| Total derivative gain (loss) | $ | 9 | $ | (2) | |||||||||||||||||||
________________
(1)Represents the amount of fair value hedge adjustment applied to the carrying amount of hedged assets that is recognized in cost of sales as the underlying hedged assets are relieved from inventories and charged to cost of sales.
NOTE 11: ACCOUNTS RECEIVABLE SECURITIZATION
We maintain a $275 million accounts receivable securitization facility (“Securitization Facility”), which matures on December 22, 2025. As part of the Securitization Facility, certain accounts receivable of our major domestic meat processing subsidiaries are sold to a wholly owned “bankruptcy remote” special purpose vehicle (“SPV”). The SPV pledges all such accounts receivable not otherwise sold pursuant to the Monetization Facility (as defined below) as security for loans made, and letters of credit issued, by participating lenders under the Securitization Facility. The SPV is included in our condensed consolidated financial statements and therefore the accounts receivable owned by it are included in our condensed consolidated balance sheets. However, the accounts receivable owned by the SPV are separate and distinct from our other assets and are not available to our other creditors should we become insolvent. As of September 29, 2024, the SPV held $350 million of accounts receivable. We must maintain certain ratios related to the collection of our receivables as a condition of the Securitization Facility agreement. As of September 29, 2024, we had $23 million in letters of credit issued under the Securitization Facility. None of the letters of credit were drawn upon.
In addition to the Securitization Facility, we maintain an uncommitted $250 million accounts receivable monetization facility (“Monetization Facility”) pursuant to the Master Receivables Purchase Agreement, dated as of December 22, 2022, by and among SPV, as borrower, Smithfield, as servicer, certain buyers and PNC Bank, National Association, as administrative agent. At Smithfield’s election and subject to the purchasing banks’ approval, certain accounts receivable may be sold by the SPV to purchasing banks, so long as the uncollected outstanding amount of accounts receivable sold pursuant to the Monetization Facility does not exceed $250 million in the aggregate at any time, among other limitations. In the event of a sale, the purchasing banks assume all credit risk related to the receivables while we maintain risk associated with customer disputes. We account for the sale of receivables to a purchasing bank by derecognizing the receivables from our condensed consolidated balance sheet upon transfer of control to the purchasing bank, and recognizing a discount on the sale in selling, general and administrative expenses in the condensed consolidated statement of income. The proceeds from the sale of receivables are included in net cash flows from operating activities in the condensed consolidated statement of cash flows. On behalf of the purchasing banks, we continue to service all receivables sold under the Monetization Facility. As of September 29, 2024, the uncollected balance of receivables that had been sold to purchasing banks was $221 million. We had no servicing asset or liability outstanding as of September 29, 2024.
In the first quarter of 2023, we sold $227 million of accounts receivable at a discount and received proceeds totaling $225 million. We reinvested $2,836 million and $2,201 million in the nine months ended September 29, 2024 and October 1, 2023, respectively. We recognized charges totaling $10 million and $8 million in the nine months ended September 29, 2024 and October 1, 2023, respectively, attributable to the discount on the sale of accounts receivable in SG&A in the condensed consolidated statements of income.
NOTE 12: INCOME TAXES
The Company’s effective tax rate attributable to continuing operations for the nine months ended September 29, 2024 was 22.2%, compared to 14.8%, for the corresponding periods a year ago. The change in the effective tax rate is attributable to the mix between foreign and domestic earnings. The Company benefited from tax credits in both of these periods.
F-76
NOTE 13: PENSION AND OTHER RETIREMENT PLANS
The following table presents the components of the net periodic pension cost for the periods indicated:
| Nine Months Ended | |||||||||||||||||||||||
| September 29, 2024 | October 1, 2023 | ||||||||||||||||||||||
| (in millions) | |||||||||||||||||||||||
| Service cost | $ | 9 | $ | 9 | |||||||||||||||||||
| Interest cost | 74 | 73 | |||||||||||||||||||||
| Expected return on plan assets | (83) | (80) | |||||||||||||||||||||
| Net amortization | 14 | 14 | |||||||||||||||||||||
Net periodic pension cost (1) | $ | 14 | $ | 17 | |||||||||||||||||||
(1)The components of net periodic pension cost other than service cost, which is included in operating profit, are included in non operating (gains) losses in the condensed consolidated statements of income.
NOTE 14: REDEEMABLE NONCONTROLLING INTERESTS
Certain noncontrolling interest holders have the right to exercise a put option that would obligate us to redeem a portion or all of their interest. These noncontrolling interests are classified as redeemable noncontrolling interests outside of equity in our condensed consolidated balance sheets. At the end of each period we adjust the value of redeemable noncontrolling interests, if necessary, to the redemption value (as defined in the subsidiary’s operating agreement) through additional paid-in capital. See “Note 16: Fair Value Measurements” for a discussion of the assessment of redemption value. The following table presents the changes in redeemable noncontrolling interests for the periods presented:
| Nine months ended | |||||||||||
| September 29, 2024 | October 1, 2023 | ||||||||||
| (in millions) | |||||||||||
| Beginning balance | $ | 246 | $ | 197 | |||||||
| Attribution of net income (loss) | 9 | (3) | |||||||||
| Attribution of comprehensive income (loss) | (29) | 28 | |||||||||
| Dividends | (1) | (2) | |||||||||
| Adjustment to redemption value | 58 | — | |||||||||
| Ending balance | $ | 282 | $ | 220 | |||||||
F-77
NOTE 15: EQUITY
Accumulated Other Comprehensive Loss
The following table presents the charges in each component of accumulated other comprehensive loss for the nine months ended and September 29, 2024 and October 1, 2023 , respectively.
| Nine Months Ended September 29, 2024 | |||||||||||||||||||||||
| Foreign Currency Translation | Pension Accounting | Hedge Accounting | Accumulated Other Comprehensive Loss | ||||||||||||||||||||
| (in millions) | |||||||||||||||||||||||
| Balance, December 31, 2023 | $ | (134) | $ | (373) | $ | 8 | $ | (500) | |||||||||||||||
| Other comprehensive loss, net of tax | (6) | 10 | (10) | (6) | |||||||||||||||||||
European operations carve-out (1) | 143 | — | (1) | 143 | |||||||||||||||||||
| Balance, September 29, 2024 | $ | 3 | $ | (363) | $ | (3) | $ | (363) | |||||||||||||||
| Nine Months Ended October 1, 2023 | |||||||||||||||||||||||
| (in millions) | |||||||||||||||||||||||
| Balance, January 1, 2023 | $ | (327) | $ | (389) | $ | 8 | $ | (708) | |||||||||||||||
| Other comprehensive income, net of tax | 49 | 11 | 6 | 66 | |||||||||||||||||||
| Balance, October 1, 2023 | $ | (278) | $ | (379) | $ | 15 | $ | (642) | |||||||||||||||
(1)The tax effects were not material.
Other Comprehensive Income (Loss)
The following table presents the details of other comprehensive income (loss).
F-78
| Nine Months Ended | |||||||||||||||||||||||||||||||||||
| September 29, 2024 | October 1, 2023 | ||||||||||||||||||||||||||||||||||
| Before Tax | Tax | After Tax | Before Tax | Tax | After Tax | ||||||||||||||||||||||||||||||
| (in millions) | |||||||||||||||||||||||||||||||||||
| Continuing operations: | |||||||||||||||||||||||||||||||||||
| Foreign currency translation: | |||||||||||||||||||||||||||||||||||
Translation gains (losses) (1) | $ | (113) | $ | — | $ | (113) | $ | 82 | $ | — | $ | 82 | |||||||||||||||||||||||
| Retirement benefits: | |||||||||||||||||||||||||||||||||||
| Amortization of actuarial losses, prior service credits and curtailment gains reclassified to non-operating (gains) losses | 13 | (3) | 10 | 13 | (3) | 10 | |||||||||||||||||||||||||||||
| Derivatives: | |||||||||||||||||||||||||||||||||||
| Gains (losses) arising during the period | (3) | 1 | (2) | 6 | (2) | 5 | |||||||||||||||||||||||||||||
| (Gains) losses reclassified to sales | (34) | 9 | (25) | 4 | (1) | 3 | |||||||||||||||||||||||||||||
| (Gains) losses reclassified to cost of sales | 23 | (6) | 17 | (2) | 1 | (1) | |||||||||||||||||||||||||||||
| Losses reclassified to interest expense | 1 | — | 1 | 1 | — | 1 | |||||||||||||||||||||||||||||
| Total other comprehensive income (loss) from continuing operations | $ | (112) | $ | — | $ | (112) | $ | 104 | $ | (6) | $ | 99 | |||||||||||||||||||||||
| Discontinued operations: | |||||||||||||||||||||||||||||||||||
| Foreign currency translation: | |||||||||||||||||||||||||||||||||||
Translation gains (losses) (1) | 77 | — | 77 | (5) | — | (5) | |||||||||||||||||||||||||||||
| Retirement benefits: | |||||||||||||||||||||||||||||||||||
| Amortization of actuarial losses, prior service credits and curtailment gains reclassified to non-operating (gains) losses | — | — | — | 1 | — | 1 | |||||||||||||||||||||||||||||
| Derivatives: | |||||||||||||||||||||||||||||||||||
| Derivative gains arising during the period | 1 | — | 1 | — | — | — | |||||||||||||||||||||||||||||
| Derivative gains reclassified to sales | (1) | — | (1) | (1) | — | (1) | |||||||||||||||||||||||||||||
| Total other comprehensive income (loss) from discontinued operations | $ | 76 | $ | — | $ | 76 | $ | (5) | $ | — | $ | (5) | |||||||||||||||||||||||
| Total other comprehensive income (loss) | $ | (36) | $ | — | $ | (36) | $ | 99 | $ | (6) | $ | 94 | |||||||||||||||||||||||
| Other comprehensive income (loss) attributable to noncontrolling interest | (29) | — | (29) | 28 | — | 28 | |||||||||||||||||||||||||||||
| Other comprehensive income (loss) attributable to Smithfield | $ | (6) | $ | — | $ | (6) | $ | 72 | $ | (6) | $ | 66 | |||||||||||||||||||||||
(1)We consider the earnings in our non-U.S. subsidiaries, including our former European operations, to be indefinitely reinvested, and accordingly, record no deferred income taxes on such amounts.
F-79
NOTE 16: FAIR VALUE MEASUREMENTS
Fair value is defined as the price that would be received to sell an asset or paid to transfer a liability in an orderly transaction between market participants at the measurement date. We are required to consider and reflect the assumptions of market participants in fair value calculations. These factors include nonperformance risk (the risk that an obligation will not be fulfilled) and credit risk, both of the reporting entity (for liabilities) and of the counterparty (for assets).
We use, as appropriate, a market approach (generally, data from market transactions), an income approach (generally, present value techniques), and/or a cost approach (generally, replacement cost) to measure the fair value of an asset or liability. These valuation approaches incorporate inputs, such as observable, independent market data, that we believe are predicated on the assumptions market participants would use to price an asset or liability. These inputs may incorporate, as applicable, certain risks such as nonperformance risk, which includes credit risk.
The Financial Accounting Standards Board (“FASB”) has established a three-level fair value hierarchy that prioritizes the inputs used to measure fair value. The fair value hierarchy gives the highest priority to quoted market prices (Level 1) and the lowest priority to unobservable inputs (Level 3). The three levels of inputs used to measure fair value are as follows:
•Level 1—Quoted prices in active markets for identical assets or liabilities accessible by the reporting entity.
•Level 2—Observable inputs other than quoted prices included in Level 1, such as quoted prices for similar assets and liabilities in active markets; quoted prices for identical or similar assets and liabilities in markets that are not active; or other inputs that are observable or can be corroborated by observable market data.
•Level 3—Unobservable for an asset or liability. Unobservable inputs should only be used to the extent observable inputs are not available.
We have classified assets and liabilities measured at fair value based on the lowest level of input that is significant to the fair value measurement. For the periods presented, we had no transfers of assets or liabilities between levels within the fair value hierarchy. The timing of any such transfers would be determined at the end of each reporting period.
F-80
Assets and Liabilities Measured at Fair Value on a Recurring Basis
The following tables set forth, by level within the fair value hierarchy, our financial assets and liabilities, including assets held in a rabbi trust used to fund our non-qualified defined benefit plan, that were measured at fair value on a recurring basis:
| September 29, 2024 | December 31, 2023 | |||||||||||||||||||||||||||||||||||||||||||||||||
| Level 1 | Level 2 | Level 3 | Total | Level 1 | Level 2 | Level 3 | Total | |||||||||||||||||||||||||||||||||||||||||||
| (in millions) | ||||||||||||||||||||||||||||||||||||||||||||||||||
| Assets | ||||||||||||||||||||||||||||||||||||||||||||||||||
| Derivatives: | ||||||||||||||||||||||||||||||||||||||||||||||||||
| Commodity contracts | $ | 28 | $ | 11 | $ | — | $ | 39 | $ | 34 | $ | 16 | $ | — | $ | 50 | ||||||||||||||||||||||||||||||||||
| Foreign exchange contracts | — | — | — | — | — | 1 | — | 1 | ||||||||||||||||||||||||||||||||||||||||||
Mutual funds (1) | 76 | — | — | 87 | 33 | — | — | 44 | ||||||||||||||||||||||||||||||||||||||||||
| Insurance contracts | — | 105 | — | 105 | — | 129 | — | 129 | ||||||||||||||||||||||||||||||||||||||||||
| Total | $ | 105 | $ | 116 | $ | — | $ | 231 | $ | 67 | $ | 146 | $ | — | $ | 224 | ||||||||||||||||||||||||||||||||||
| Liabilities | ||||||||||||||||||||||||||||||||||||||||||||||||||
| Derivatives: | ||||||||||||||||||||||||||||||||||||||||||||||||||
| Commodity contracts | 15 | 13 | 1 | 28 | 17 | 26 | — | 42 | ||||||||||||||||||||||||||||||||||||||||||
| Total | $ | 15 | $ | 13 | $ | 1 | $ | 28 | $ | 17 | $ | 26 | $ | — | $ | 42 | ||||||||||||||||||||||||||||||||||
__________________
(1)Institutional funds that are not publicly traded are estimated at fair value using the net asset value (“NAV”) per share of the investment as a practical expedient and are not categorized in the fair value hierarchy. Therefore, the sum of the values categorized in the fair value hierarchy above do not agree to the total.
The following are descriptions of the valuation methodologies and key inputs used to measure financial assets and liabilities recorded at fair value on a recurring basis:
•Derivatives—Derivatives classified within Level 1 are valued using quoted market prices. In some cases where quoted market prices are not available, we value the derivatives using market-based pricing models that utilize the net present value of estimated future cash flows to calculate fair value, in which case the measurements are classified within Level 2. These valuation models make use of market-based observable inputs, including exchange traded prices and rates, yield curves, credit curves and measures of volatility. Level 3 derivatives are valued based on diesel fuel prices and use both observable and unobservable inputs. There is a lack of price transparency with respect to forward prices for diesel fuel. Such unobservable inputs are significant to the diesel fuel derivative contract valuation methodology.
•Mutual funds—Mutual funds consist of publicly traded funds and other institutional funds that are not publicly traded. Publicly traded mutual funds are measured at fair value using quoted market prices and are categorized in Level 1 within the fair value hierarchy.
•Insurance contracts—Insurance contracts are valued at their cash surrender value using the daily asset unit value which is based on the quoted market price of the underlying securities and classified within Level 2.
Assets and Liabilities Measured at Fair Value on a Nonrecurring Basis
Certain assets and liabilities are measured at fair value on a nonrecurring basis after initial recognition; that is, the assets and liabilities are not measured at fair value on an ongoing basis but are subject to fair value adjustments in certain circumstances, for example, when there is evidence of impairment. For the nine months ended September 29, 2024 and October 1, 2023, we had no significant assets or liabilities that were measured and recorded at fair value on a nonrecurring basis after initial recognition.
F-81
Redeemable Noncontrolling Interest
The redemption value for the noncontrolling interest in Granjas Carroll de Mexico, S. de R.L. de C.V. (“Altosano”) is fair value. We estimate the redemption value of Altosano using an income and a market approach. Under the income approach, fair value is determined by using the projected discounted cash flows. Under the market approach, the fair value is determined by reference to guideline public companies that are reasonably comparable; the fair value is estimated based on the valuation multiples of earnings before interest, taxes, depreciation and amortization (“EBITDA”). The significant unobservable inputs used in the determination of the fair value have an inherent measurement uncertainty that if changed could result in higher or lower fair value measurements as of the reporting date. The following table provides the significant unobservable level 3 inputs used in the valuation:
| Unobservable Inputs | September 29, 2024 | December 31, 2023 | ||||||||||||
| Weighted average cost of capital | 10 | % | 11 | % | ||||||||||
| Growth rate | 3 | % | 3 | % | ||||||||||
| EBITDA Multiple | 11x | 12x | ||||||||||||
| Control premium | 25 | % | 25 | % | ||||||||||
Other Financial Instruments
We determine the fair value of fixed-rate debt using Level 2 inputs based on quoted market prices. The carrying amount of all other debt approximates fair value as those instruments are based on variable interest rates. The following table presents the fair value and carrying value of total debt as of September 29, 2024 and December 31, 2023:
| September 29, 2024 | December 31, 2023 | ||||||||||||||||||||||
| Fair Value | Carrying Value | Fair Value | Carrying Value | ||||||||||||||||||||
| (in millions) | |||||||||||||||||||||||
| Debt | $ | 1,876 | $ | 1,991 | $ | 1,770 | $ | 1,991 | |||||||||||||||
The carrying amounts of cash and cash equivalents, accounts receivable, notes payable and accounts payable approximate their fair values because of the relatively short-term maturity of these instruments.
NOTE 17: GUARANTEES
Smithfield and certain other joint venture partners in Monarch joint and severally guarantee Monarch’s debt, interest and fees. As of September 29, 2024, the maximum amount of loans that could be outstanding under Monarch’s debt agreements was $61 million and the loans mature in June 2025. Monarch’s outstanding debt was $43 million as of September 29, 2024. The guarantee arrangement contains provisions that may reduce our obligations under the guarantee depending on Monarch’s debt to EBITDA ratio.
The guarantee involves elements of performance and credit risk and is not included in the condensed consolidated balance sheets. We could become liable in connection with Monarch’s obligation depending on the ability of Monarch to perform on its obligation. If we consider it probable that we will become responsible for the obligation, we would record the liability on our condensed consolidated balance sheet.
NOTE 18: REGULATION AND CONTINGENCIES
Like other participants in our industry, we are subject to various laws and regulations administered by federal, state and other government entities, including the United States Environmental Protection Agency and corresponding state agencies, as well as the United States Department of Agriculture, the Grain Inspection, Packers and Stockyard Administration, the United States Food and Drug Administration, the United States Occupational Safety and Health Administration, the Commodity and Futures Trading Commission and similar agencies in foreign countries.
F-82
We, from time-to-time, receive notices and inquiries from regulatory authorities and others asserting that we are not in compliance with such laws and regulations. In some instances, litigation ensues. In addition, individuals may initiate litigation against us.
We accrue for contingent liabilities, including future defense costs, when an assessment of the risk of loss is probable and can be reasonably estimated. We evaluate our accruals when facts and circumstances change regarding the litigation which could warrant an adjustment to the amount that is recorded. As of September 29, 2024 and December 31, 2023, we had recorded $172 million and $315 million in accrued expenses and other current liabilities on the condensed consolidated balance sheets, respectively, related to litigation matters, including those described below. We recorded charges of $17 million in the nine months ended October 1, 2023, for litigation matters, including those described below, in SG&A in the condensed consolidated statements of income. Charges recorded for litigation matters in the nine months ended September 29, 2024 were not material. These matters will not affect our profits or losses in future periods unless our accruals prove to be insufficient or excessive. It is reasonably possible that a change in our estimates may occur in the near term and that our accruals could be insufficient. We are unable to estimate the amount of possible loss in excess of our accruals, which could be material. Additionally, legal expenses incurred in our and our subsidiaries’ defense of these claims and any payments made to plaintiffs through unfavorable verdicts or otherwise could negatively impact our cash flows and our liquidity position.
Antitrust Price-Fixing Litigation
The Company has been named as one of 16 defendants in a series of class actions filed in 2018 in the United States District Court for the District of Minnesota alleging antitrust violations in the pork industry. The class cases were filed by three different groups of plaintiffs. In all of these cases, the plaintiffs alleged that starting in 2009 and continuing through at least June of 2018, the defendant pork producers agreed to reduce the supply of hogs in the United States in order to raise the price of hogs and all pork products. The plaintiffs in all of these cases also challenged the defendant pork producers’ use of benchmarking reports from defendant Agri Stats, Inc., alleging that the reports allowed the pork producers to share proprietary information and monitor each producer’s compliance with the supposed agreement to reduce supply. Payments in the aggregate amount of $194 million were made by us to settle all class claims.
In addition to the class actions, the Company has been named as a defendant in similar antitrust lawsuits and related claims brought by a number of individual parties who opted out of the classes. The plaintiffs in the non-class cases assert the same or similar antitrust claims as the plaintiffs in the class actions. The Company has entered into negotiations with many of these claimants and has settled certain of these cases. Currently, 29 of these cases are pending against the Company.
The Attorneys General for the states of New Mexico and Alaska and the Commonwealth of Puerto Rico have filed similar complaints on behalf of their respective states, territories, agencies and citizens. The Company has settled with Puerto Rico and Alaska. The Company intends to vigorously defend against the remaining claims.
Antitrust Wage-Fixing Litigation
On November 11, 2022, Smithfield Foods, Inc. and our wholly owned subsidiary, Smithfield Packaged Meats Corp., were named as two of the numerous defendants in a purported class action complaint filed in the United States District Court for the District of Colorado alleging wage-fixing violations in the red meat industry. The plaintiffs allege that the defendants, most of whom operate beef or pork processing plants, conspired to suppress wages paid to plant workers in the United States in violation of the antitrust laws. The plaintiffs sought damages on behalf of all employees of defendants and their subsidiaries from January 1, 2014, to the present. The plaintiffs also sought treble damages and attorneys’ fees. The defendants filed motions to dismiss the complaint, which were largely denied by the court on September 27, 2023. The plaintiffs subsequently amended their complaint adding additional defendants, including our wholly owned subsidiary, Murphy-Brown of Missouri, LLC (which has been dismissed voluntarily), and expanding the class period back to 2000.
Since the case was filed, several defendants have settled. On April 5, 2024, the remaining defendants moved to dismiss the amended complaint. We intend to vigorously defend against these claims.
F-83
Maxwell Foods Litigation
On August 13, 2020, Maxwell Foods, LLC (“Maxwell”) filed a complaint against Smithfield Foods, Inc. in the General Court of Justice, Superior Court Division for Wayne County, North Carolina. The complaint alleged that Smithfield breached the Production Sales Agreement (“PSA”) between the parties (as well as the duty of good faith and fair dealing): (i) by failing to provide Maxwell with the same pricing as other major hog suppliers in violation of a purported “Most-Favored-Nation Provision” found in a December 6, 1994 letter to Maxwell, (ii) by failing to comply with an implicit duty to negotiate the PSA to provide alternative pricing to Maxwell when the Iowa-Southern Minnesota market allegedly ceased to be viable; and (iii) by failing to purchase Maxwell’s entire output of hogs since April 2020.
Smithfield filed a notice of removal to the United States District Court of the Eastern District of North Carolina. Smithfield also filed a motion to dismiss several of Maxwell’s claims. On February 22, 2021, the U.S. District Court granted Maxwell’s motion to remand the case to the Superior Court of Wayne County and left Smithfield’s partial motion to dismiss the complaint for consideration by the state court in Wayne County.
On March 1, 2021, Maxwell filed an amended complaint, which added a claim under the North Carolina Unfair and Deceptive Trade Practices Act (“UDTPA”). Smithfield filed a notice of designation seeking assignment of the case to the North Carolina Business Court. Maxwell objected to such designation, and on April 13, 2021 the Business Court overruled Maxwell’s objection.
The Business Court also dismissed two of Maxwell’s claims: the implied duty to negotiate claim and the UDTPA claim. Maxwell subsequently filed another amended complaint adding a fraudulent concealment claim and a new breach of contract claim, as well as a request for punitive damages. The court dismissed the fraudulent concealment claim and the request for punitive damages. The three remaining claims, all for breach of contract, are: (1) the claim under the “Most-Favored-Nation Provision,” (2) the claim that Smithfield failed to purchase Maxwell’s entire output of hogs since April 2020, and (3) the claim that from time to time, Smithfield would calculate Maxwell’s payment for a delivery of hogs using an average of the preceding week’s weight rather than the actual weights of the hogs being delivered.
The parties filed cross-motions for summary judgment and related motions to exclude expert testimony, which were fully briefed on November 17, 2023. The Company intends to vigorously defend against the remaining claims.
NOTE 19: SUBSEQUENT EVENTS
We evaluated subsequent events from September 30, 2024 through November 18, 2024, the date these condensed consolidated financial statements were available to be issued. There were no subsequent events that would require recognition or disclosure in the condensed consolidated financial statements.
F-84
Shares
Smithfield Foods, Inc.
Common Stock
PROSPECTUS
| Morgan Stanley | BofA Securities | Goldman Sachs & Co. LLC | ||||||
| Barclays | Citigroup | UBS Investment Bank | ||||||
| BNP PARIBAS | HSBC | |||||||
, 2025
Through and including , 2025 (25 days after the date of this prospectus), all dealers that effect transactions in these securities, whether or not participating in this offering, may be required to deliver a prospectus. This is in addition to the dealers’ obligation to deliver a prospectus when acting as underwriters and with respect to their unsold allotments or subscriptions.
PART II
INFORMATION NOT REQUIRED IN PROSPECTUS
Item 13. Other Expenses of Issuance and Distribution
The following table sets forth the various expenses, other than the underwriting discounts and commissions, payable by us in connection with the sale of our common stock being registered hereby. All amounts shown are estimates except the SEC registration fee, the FINRA filing fee and the exchange listing fee.
| ($ in thousands) | ||||||||
| SEC registration fee | $ | * | ||||||
| FINRA filing fee | * | |||||||
| Nasdaq listing fee | * | |||||||
| Printing fees and expenses | * | |||||||
| Legal fees and expenses | * | |||||||
| Accounting fees and expenses | * | |||||||
| Transfer agent and registrar fees and expenses | * | |||||||
| Miscellaneous | * | |||||||
| Total | $ | * | ||||||
________________
*To be completed by amendment.
Item 14. Indemnification of Directors and Officers
We expect to adopt amended and restated articles of incorporation, which will become effective immediately prior to the completion of the offering and will contain provisions authorized by the VSCA. The VSCA permits indemnification of a corporation’s directors and officers in a variety of circumstances, which may include indemnification for liabilities under the Securities Act. Sections 13.1-696 through 13.1-704 of the VSCA generally authorize a Virginia corporation to indemnify its directors and officers in civil, criminal, administrative and investigative actions if they acted in good faith and believed their conduct to be in the best interests of the corporation if acting in their official capacity with the corporation or, in all other cases, at least not opposed to its best interests, and, in the case of any criminal action, had no reasonable cause to believe that the conduct was unlawful. Additionally, Section 13.1-704 of the VSCA provides that a Virginia corporation has the power to make any further indemnity to any director or officer, including in a proceeding brought by or in the right of the corporation, if authorized by its articles of incorporation or any bylaw or resolution adopted by the shareholders, except an indemnity against their willful misconduct or a knowing violation of the criminal law. Our amended and restated articles of incorporation will require us to indemnify our directors and officers to the full extent permitted by the VSCA.
Our amended and restated articles of incorporation will also provide that, to the full extent that the VSCA permits the limitation or elimination of the liability of directors and officers, no director or officer of our company shall be liable in any proceeding brought by or in the right of our company or by or on behalf of our shareholders for monetary damages arising out of any transaction, occurrence or course of conduct. Section 13.1-692.1 of the VSCA permits the elimination of liability of directors and officers in any proceeding brought by or in the right of a corporation or brought by or on behalf of shareholders of a corporation, except for liability resulting from such persons having engaged in willful misconduct or a knowing violation of the criminal law or any federal or state securities law, including, without limitation, any unlawful insider trading or manipulation of the market for any security.
We have or will enter into indemnification agreements with each of our directors and executive officers pursuant to which we agree to indemnify, including advancing expenses to, each of them against any liabilities that they may incur as a result of their service as a director or executive officer of our company to the fullest extent permitted by Virginia law and our amended and restated articles of incorporation.
II-1
We will carry insurance on behalf of our directors, officers, employees or agents that may cover liabilities under the Securities Act.
The form of underwriting agreement, the form of which will be filed as an exhibit to this registration statement, will provide for indemnification by the underwriters named in this registration statement of our executive officers, directors and us, and by us of the underwriters named in the registration statement, for certain liabilities, including liabilities arising under the Securities Act, in connection with matters specifically provided in writing for inclusion in this registration statement. Insofar as indemnification for liabilities arising under the Securities Act may be permitted to directors, officers or persons controlling us pursuant to the foregoing provisions, we have been informed that in the opinion of the SEC, such indemnification is against public policy as expressed in the Securities Act and is therefore unenforceable.
Item 15. Recent Sales of Unregistered Securities
We have not sold any securities, registered or otherwise, within the past three years.
Item 16. Exhibits and Financial Statement Schedules
(a)Exhibits. See the Exhibit Index immediately preceding the signature page hereto, which is incorporated by reference as if fully set forth herein.
(b)Financial Statement Schedules. Schedules are omitted because they are not required or because the information is provided elsewhere in the financial statements included in this registration statement.
Item 17. Undertakings.
Insofar as indemnification for liabilities arising under the Securities Act may be permitted to directors, officers and controlling persons of the Registrant pursuant to the foregoing provisions, or otherwise, the Registrant has been advised that in the opinion of the SEC such indemnification is against public policy as expressed in the Securities Act and is, therefore, unenforceable. In the event that a claim for indemnification against such liabilities (other than the payment by the Registrant of expenses incurred or paid by a director, officer or controlling person of the Registrant in the successful defense of any action, suit or proceeding) is asserted by such director, officer or controlling person in connection with the securities being registered, the Registrant will, unless in the opinion of its counsel the matter has been settled by controlling precedent, submit to a court of appropriate jurisdiction the question of whether such indemnification by it is against public policy as expressed in the Securities Act and will be governed by the final adjudication of such issue.
The undersigned Registrant hereby undertakes that:
(A)For purposes of determining any liability under the Securities Act, the information omitted from the form of prospectus filed as part of this registration statement in reliance upon Rule 430A and contained in a form of prospectus filed by the Registrant pursuant to Rule 424(b)(1) or (4) or 497(h) under the Securities Act shall be deemed to be part of this registration statement as of the time it was declared effective.
(B)For the purpose of determining any liability under the Securities Act, each post-effective amendment that contains a form of prospectus shall be deemed to be a new registration statement relating to the securities offered therein, and the offering of such securities at that time shall be deemed to be the initial bona fide offering thereof.
II-2
EXHIBIT INDEX
In reviewing the agreements included as exhibits to this registration statement, please remember that they are included to provide you with information regarding their terms and are not intended to provide any other factual or disclosure information about our company, subsidiaries or affiliates or the other parties to the agreements. The agreements contain representations and warranties by each of the parties to the applicable agreement. These representations and warranties have been made solely for the benefit of the other parties to the applicable agreement and (i) should not in all instances be treated as categorical statements of fact, but rather as a way of allocating the risk to one of the parties if those statements prove to be inaccurate; (ii) have been qualified by disclosures that were made to the other party in connection with the negotiation of the applicable agreement, which disclosures are not necessarily reflected in the agreement; (iii) may apply standards of materiality in a way that is different from what may be viewed as material to investors; and (iv) were made only as of the date of the applicable agreement or such other date or dates as may be specified in the agreement and are subject to more recent developments. Accordingly, these representations and warranties may not describe the actual state of affairs as of the date they were made or at any other time. Additional information about our company, subsidiaries and affiliates may be found elsewhere in this registration statement.
| Exhibit Number | Description of Exhibit | |||||||
| 1.1* | Form of Underwriting Agreement. | |||||||
| 3.1* | Form of Amended and Restated Articles of Incorporation of the Registrant. | |||||||
| 3.2* | Form of Amended and Restated Bylaws of the Registrant. | |||||||
| 4.1 | ||||||||
| 4.2 | ||||||||
| 4.3 | ||||||||
| 4.4 | ||||||||
| 4.5* | Registration Rights Agreement, by and between the Registrant and SFDS UK Holdings Limited. | |||||||
| 4.6* | Shareholders Agreement, by and between the Registrant and WH Group Limited. | |||||||
| 4.7* | Specimen Common Stock Certificate of the Registrant. | |||||||
| 5.1* | Opinion of Hunton Andrews Kurth LLP. | |||||||
| 10.1 | ||||||||
| 10.2 | ||||||||
| 10.3 | ||||||||
| 10.4 | ||||||||
| 10.5 | ||||||||
II-3
| Exhibit Number | Description of Exhibit | |||||||
| 10.6 | Fifth Amended and Restated Receivables Sale Agreement, dated as of December 22, 2022, among the Registrant, SFFC, Inc., Smithfield Support Services Corp., Smithfield Fresh Meats Sales Corp., Smithfield Fresh Meats Corp., Smithfield Direct, LLC, Smithfield Bioscience, Inc., Smithfield Packaged Meats Sales Corp. and Smithfield Receivables Funding LLC. | |||||||
| 10.7 | ||||||||
| 10.8* | Form of Indemnification Agreement among the Registrant and its directors and executive officers. | |||||||
| 10.9*† | Form of Smithfield Foods, Inc. Omnibus Incentive Plan. | |||||||
| 10.10*† | Form of Smithfield Foods, Inc. Employee Stock Purchase Plan. | |||||||
| 10.11*† | Form of Option Award Agreement. | |||||||
| 10.12*† | Form of Restricted Stock Unit Award Agreement. | |||||||
| 10.13*† | Smithfield Foods, Inc. Executive Nonqualified Excess Plan. | |||||||
| 10.14*† | John Morrell & Company Amended & Restated Deferred Compensation Plan. | |||||||
| 10.15*† | Smithfield Foods, Inc. Executive Severance Plan. | |||||||
| 21.1 | ||||||||
| 23.1 | ||||||||
| 23.2* | Consent of Hunton Andrews Kurth LLP (included as part of Exhibit 5.1). | |||||||
| 24.1 | ||||||||
| 99.1 | ||||||||
| 99.2 | ||||||||
| 99.3 | ||||||||
| 99.4 | ||||||||
| 99.5 | ||||||||
| 107 | ||||||||
________________
*To be filed by amendment.
†Compensatory arrangements for director(s) and/or executive officer(s).
II-4
SIGNATURES
Pursuant to the requirements of the Securities Act of 1933, as amended, the Registrant has duly caused this registration statement to be signed on its behalf by the undersigned, thereunto duly authorized, in Smithfield, Virginia, on January 6, 2025.
| Smithfield Foods, Inc. | ||||||||
| By: | /s/ C. Shane Smith | |||||||
| Name: C. Shane Smith | ||||||||
| Title: President and Chief Executive Officer | ||||||||
POWER OF ATTORNEY
Each of the undersigned officers and directors of Smithfield Foods, Inc. hereby severally constitutes and appoints and C. Shane Smith, Mark L. Hall and Tennille J. Checkovich, and each of them acting alone, as such person’s true and lawful attorneys-in-fact and agents, with full power of substitution and resubstitution, for such person and in such person’s name, place and stead, and in any and all capacities, to sign any and all amendments (including post-effective amendments) to this registration statement and any subsequent registration statement filed pursuant to Rule 462 under the Securities Act, and to file the same, with all exhibits thereto and other documents in connection therewith, with the SEC and any applicable securities exchange or securities self-regulatory body, granting unto said attorneys-in-fact and agents, and each of them, full power and authority to do and perform each and every act and thing requisite and necessary to be done in and about the premises, as fully to all intents and purposes as such person might or could do in person, hereby ratifying and confirming all that said attorneys-in-fact and agents, or either of them individually, or their or such person’s substitute or substitutes, may lawfully do or cause to be done by virtue hereof.
Pursuant to the requirements of the Securities Act of 1933, this registration statement has been signed by the following persons in the capacities and on the dates indicated.
| Signature | Title | Date | ||||||||||||
| /s/ C. Shane Smith | C. Shane Smith (Principal Executive Officer and Director) | January 6, 2025 | ||||||||||||
| C. Shane Smith | ||||||||||||||
| /s/ Mark L. Hall | Mark L. Hall (Principal Financial Officer) | January 6, 2025 | ||||||||||||
| Mark L. Hall | ||||||||||||||
| /s/ R. Allen Brobst, Jr. | R. Allen Brobst, Jr. (Principal Accounting Officer) | January 6, 2025 | ||||||||||||
| R. Allen Brobst, Jr. | ||||||||||||||
| /s/ Long Wan | Long Wan (Chairman) | January 6, 2025 | ||||||||||||
| Long Wan | ||||||||||||||
| /s/ Hank Shenghua He | Hank Shenghua He (Director) | January 6, 2025 | ||||||||||||
| Hank Shenghua He | ||||||||||||||
| /s/ Lijun Guo | Lijun Guo (Director) | January 6, 2025 | ||||||||||||
| Lijun Guo | ||||||||||||||
II-5