Exhibit 99.1
The Irreplaceable CornerTM Company
Institutional Quality Real Estate
Operating Platform Approaching $1 Billion
Invested in Three of the Top Six Employment Growth Markets in U.S.
Creating Value for a Quarter of a Century
The Irreplaceable Corner™ Company
Disclosure
Additional Information and Where to Find It
In connection with the proposed merger, the Company has filed but not yet distributed to shareholders a proxy statement with the Securities and Exchange Commission. The proxy statement distributed to shareholders will contain information about the Company, the proposed merger and related matters. SHAREHOLDERS ARE URGED TO READ THE PROXY STATEMENT CAREFULLY WHEN IT IS AVAILABLE, AS IT WILL CONTAIN IMPORTANT INFORMATION THAT SHAREHOLDERS SHOULD CONSIDER BEFORE MAKING A DECISION ABOUT THE MERGER. In addition to receiving the proxy statement from the Company by mail, shareholders will be able to obtain the proxy statement, as well as other filings containing information about the Company, without charge, from the Securities and Exchange Commission’s website (http://www.sec.gov) or, without charge, from the Company at http://www.amreit.com or by directing such request to AmREIT, 8 Greenway Plaza, Suite 1000, Houston, TX 77046, Attention: Investor Relations.
Participants in the Solicitation
The Company and its directors and executive officers and other members of management and employees may be deemed to be participants in the solicitation of proxies in respect of the merger. Information about the Company’s directors and executive officers and their ownership of the Company’s common stock is set forth in the proxy statement related to the merger, as well as the proxy statement for the Company’s 2009 Annual Meeting of Shareholders, which was filed with the SEC on April 7, 2007, and the Company’s Annual Report on Form 10-K, which was filed with the SEC on March 31, 2009. Shareholders may obtain additional information regarding the interests of the Company and its directors and executive officers in the merger, which may be different than those of the Company’s shareholders generally, by reading the proxy statement and other relevant documents regarding the merger, when filed with the SEC.
Cautionary Statement Regarding Forward-Looking Statements
The Company has made forward-looking statements in these materials which are subject to risks and uncertainties. These statements are based on the beliefs and assumptions of the Company, and on the information currently available to the Company.
When used or referred to in these materials, these forward-looking statements may be preceded by, followed by or otherwise include the words “believes,” “expects,” “anticipates,” “intends,” “plans,” “estimates,” “projects” or similar expressions, or statements that certain events or conditions “will” or “may” occur. These forward-looking statements are subject to a number of factors and uncertainties that could cause actual results to differ materially from those described in the forward-looking statements. The following factors, among others, could cause actual results to differ materially from those described in the forward-looking statements:
cost savings expected from the merger may not be fully realized;
Revenue of the combined company following the merger may be lower than expected
Occupancy rates from the Company’s properties may deteriorate or fail to recover as predicted;
The Company may not be able to sustain the rental rate increases upon lease renewals that it has recently experienced;
The Company may experience tenant defaults due to recessionary conditions, as well as tenant bankruptcies and abandonments of leases;
General economic conditions, either internationally or nationally or in the jurisdictions in which REITPlus or AmREIT are doing business, may be less favorable than expected;
Legislative or regulatory changes, including changes in environmental regulation, may adversely affect the businesses in which REITPlus and AmREIT are engaged;
There may be environmental risks and liability under federal, state and foreign environmental laws and regulations; and
Changes may occur in the securities or capital markets.
Except for its ongoing obligations to disclose material information as required by the federal securities laws, the Company has no intention or obligation to update these forward-looking statements after it distributes these materials.
www.amreit.com
2
Vision 2010 - Phases
Phase I:
Business Model – changes to reach greater efficiency and reduce volatility
of earnings. This phase includes the elimination of the general contracting
business and IBD Securities business. Estimated G&A Savings of $4 -
$4.5 million per year. Phase I was executed during the 3rd and 4th quarters
of 2008.
Phase II:
Capital Structure – changes to reach greater efficiency and reduce
volatility of earnings. This will include the simplification of AmREIT’s equity
capitalization into one Class of stock, the consolidation of AmREIT into
REITPlus and the privatization of the Company. Phase II will be executed
during 2009.
Phase III:
Growth & Liquidity – made possible by Phase I and II as we pursue our
goal to grow our platform within seven of the top growth markets of the U.S.
and to provide shareholders liquidity through an IPO of our shares or a
recapitalization with institutional investors as capital markets thaw and the
economic markets move from recession to recovery.
www.amreit.com
3
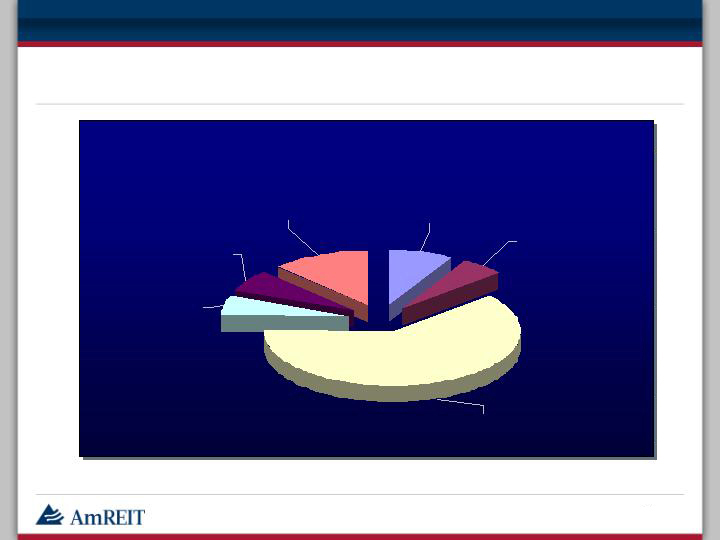
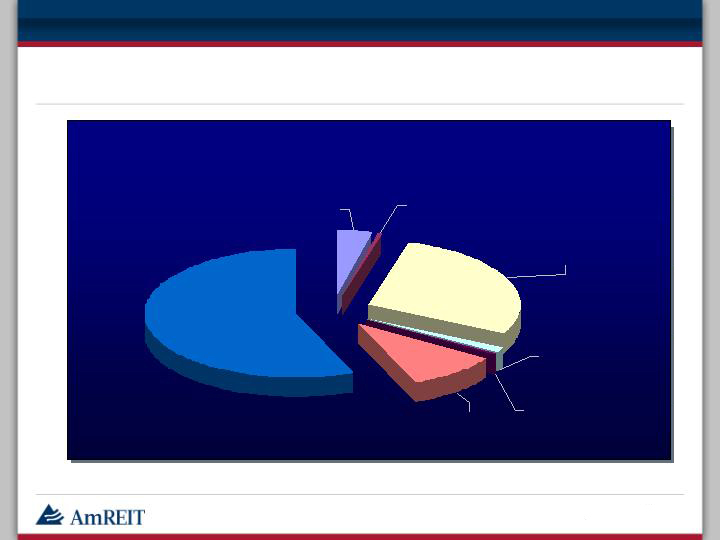
Expense Management – Pre-Vision 2010 Phase I
2008 Expenses ($15.9 mm)
Conferences and
Seminars
5%
Legal and
Professional
8%
Other G
&
A
12%
Marketing
7%
Travel and
Entertainment
5%
Salary
&
Benefits
63%
4
www.amreit.com
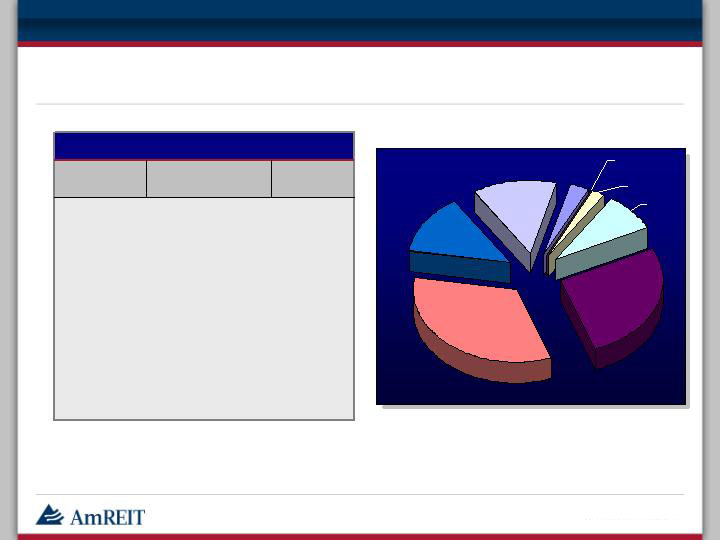
Expense Management – Post Vision 2010 Phase I
2009 Estimated Expenses ($6.9 mm)
Conferences and
Seminars
0%
Legal and
Professional
4%
Marketing
1%
Travel and
Entertainment
1%
Other G&A
10%
Salary
&
Benefits
28%
Cost Savings
56%
Includes:
Salaries - $5.3 mm
Marketing - $945,000
Conference - $784,000
Legal - $707,000
Other G & A - $1.1 mm
5
www.amreit.com

Vision 2010 - Phases
Phase I:
Business Model – changes to reach greater efficiency and reduce volatility of earnings. This phase includes the elimination of the general contracting business and IBD Securities business. Estimated G&A Savings of $4 -
$4.5 million per year. Phase I was executed during the 3rd and 4th quarters of 2008.
Phase II:
Capital Structure – changes to reach greater efficiency and reduce volatility of earnings. This will include the simplification of AmREIT’s equity capitalization into one Class of stock, the consolidation of AmREIT into REITPlus and the privatization of the Company. Phase II will be executed during 2009.
Phase III:
Growth & Liquidity– made possible by Phase I and II as we pursue our goal to grow our platform within seven of the top growth markets of the U.S. and to provide shareholders liquidity through an IPO of our shares or a recapitalization with institutional investors as capital markets thaw and the economic markets move from recession to recovery.
6
www.amreit.com
AmREIT
$450 Million
$8 Million
New
Company
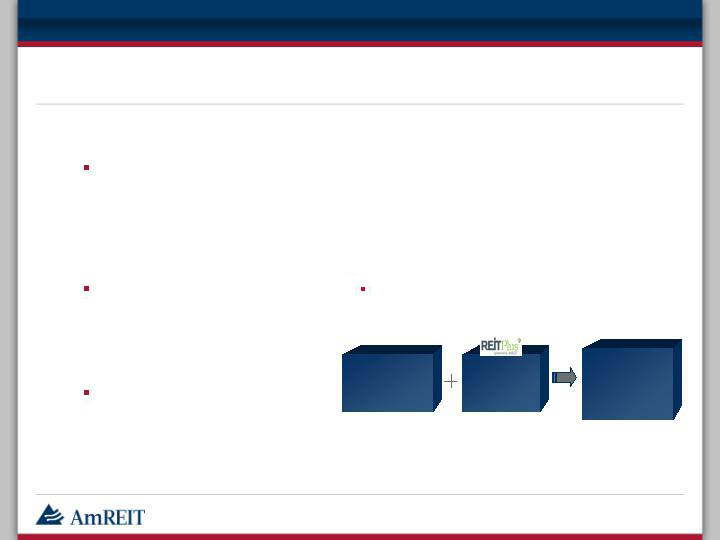
Phase II – Capital Structure (Three Step Combination)
Step One:
Privatization through
voluntary De-listing of Class
A Shares from trading on
NYX
Step Two:
Re-domicile AmREIT from
Texas to Maryland,
positioning us for Step Three
Step Three:
Reverse merger of AmREIT
into REITPlus
Of the Shareholders who voted, 93% voted “yes”
7
www.amreit.com
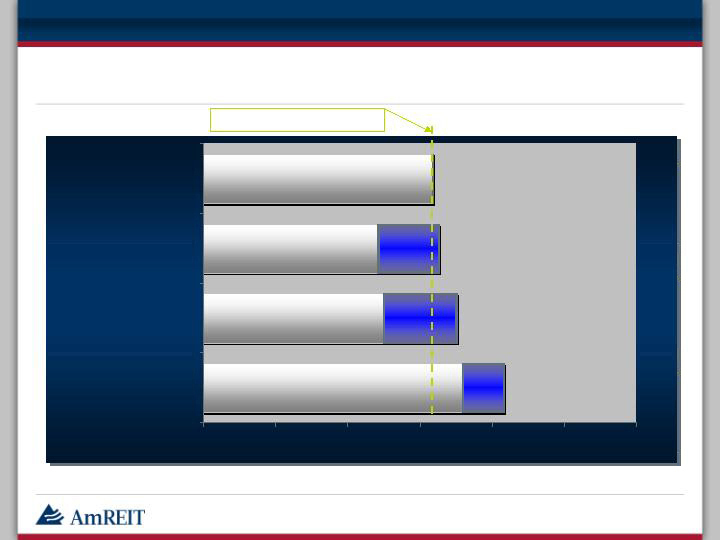
AmREIT Valuation
$0.00
$3.00
$6.00
$9.00
$12.00
$15.00
$18.00
Net Asset Value
Discounted Cash Flow
Analysis
Retail REIT Public Comps-
LTM Cap Rate
Price Per Share
Class A Share Price - $9.50
Source: KeyBanc Capital Markets
$9.50
$7.25 to $9.75
$7.50 to $10.75
$10.75 to $11.75
8
www.amreit.com
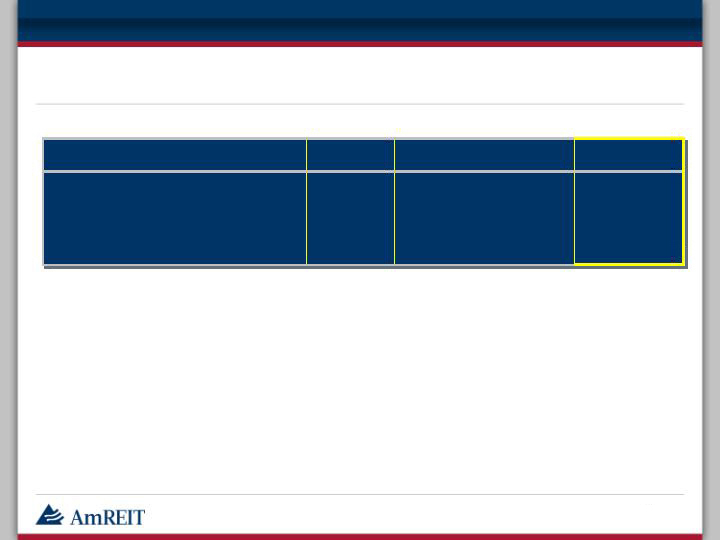
AmREIT – Exchange Ratio
Initial
Anticipated
Anticipated
REITPlus
Exchange
Actual
Investment
Premium
(1)
Consideration
Share Value
Ratio
Consideration
(2)
Class C
10.00
$
1.00
$
11.00
$
9.50
$
1.16
11.00
$
Class D
10.00
$
0.55
$
10.55
$
9.50
$
1.11
10.55
$
Class D - Drip
9.50
$
-
$
9.50
$
9.50
$
1.00
9.50
$
(1)
The Anticipated Premium represents the conversion premium. For Class C, this is stated as 10%, for Class D, this is stated as a total of 7.7%, amortized 1.1% per year. For Class D, we have used a five-year holding period. The Class D Drip shares do not receive a conversion premium.
(2)
Calculated by multiplying the Exchange Ratio by the REITPlus Share Value.
9
www.amreit.com
AmREIT Dividend Exchange Analysis
5.2%
5.8%
6.1%
5.2%
5.2%
Pro-forma Dividend
Rate
($150.00)
($100.00)
($120.00)
$ -
$200.00
Annual Difference per
1,000 shares
$0.50
$0.55
$0.58
$0.50
$0.50
Per Annum
$0.0416
$0.0458
$0.0483
$0.0416
$0.0416
Per Month
Dividend Post Merger on
Exchange of Value
$0.65
$0.65
$0.70
$0.50
$0.30
Per Year
$0.0541
$0.0541
$0.0583
$0.0416
$0.025
Per Month
Dividend Pre Merger
Class D
Drip Stock
Class D
Stock
Class C
Stock
Class A
Stock
REITPlus
10
www.amreit.com

Vision 2010 - Phases
Phase I:
Business Model – changes to reach greater efficiency and reduce volatility of earnings. This phase includes the elimination of the general contracting business and IBD Securities business. Estimated G&A Savings of $4 - $4.5 million per year. Phase I was executed during the 3rd and 4th quarters of 2008.
Phase II:
Capital Structure – changes to reach greater efficiency and reduce volatility of earnings. This will include the simplification of AmREIT’s equity capitalization into one Class of stock, the consolidation of AmREIT into REITPlus and the privatization of the Company. Phase II will be executed during 2009.
Phase III:
Growth & Liquidity – made possible by Phase I and II as we pursue our goal to grow our platform within seven of the top growth markets of the U.S. and to provide shareholders liquidity through an IPO of our shares or a recapitalization with institutional investors as capital markets thaw and the economic markets move from recession to recovery.
11
www.amreit.com
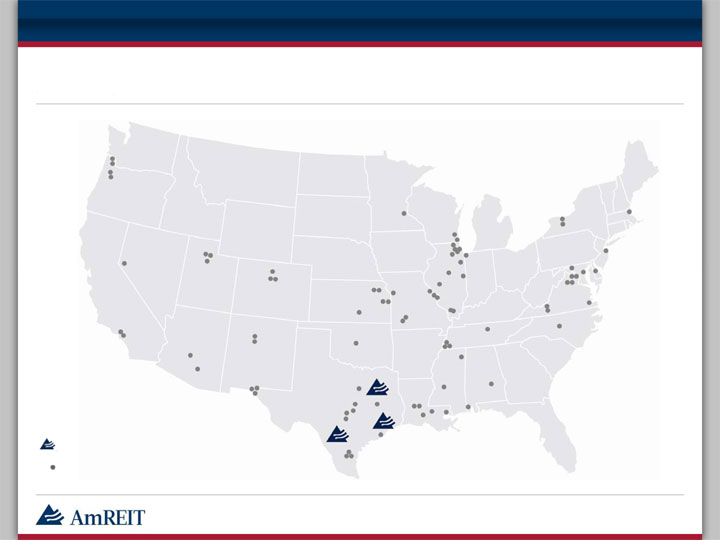
Investing in Three of the Top Six U.S. Growth Markets
Three Top U.S. Growth Markets
Prior/Non-core Holdings
12
www.amreit.com
AmREIT’s Markets
Rank
Metropolitan Statistacal Area
Increase from
2007 to 2008
%
Increase
1
Dallas-Fort Worth-Arlington, TX
146,532
2.4%
2
Houston-Sugar Land-Baytown, TX
130,185
2.3%
3
Phoenix-Mesa-Scottsdale, AZ
115,978
2.8%
4
Atlanta-Sandy Springs-Marietta, GA
114,989
2.2%
5
Austin-Round Rock-San Antonio, TX
106,536
3.0%
6
Los Angeles-Long Beach-Santa Ana, CA
88,196
0.7%
7
New York-Northern New Jersey-Long Island, NY-NJ-PA
84,227
0.4%
8
Chicago-Naperville-Joliet, IL-IN-WI
72,771
0.8%
9
San Francisco-Oakland-Fremont, CA
58,406
1.4%
10
Washington-Arlington-Alexandria, DC-VA-MD-WV
55,835
1.1%
Top 10 U.S. Population Growth Markets: 2007-2008
Employment Growth in 10 Largest U.S. Metros: LTM Sep 2008
AmREIT’s core portfolio of
Irreplaceable Corners TM are corner
properties located in top United States
growth markets.
Currently, the Company’s properties
are located in 3 of the top 6 population
and employment growth markets in the
U.S. (Houston, Dallas, and San
Antonio.
Rank
Metropolitan Statistacal Area
LTM
Sep 2008
1
Houston-Sugar Land-Baytown, TX
55,700
2
Dallas-FortWorth-Arlington, TX
54,300
3
Washington-Arlington-Alexandria, DC-VA-MD-WV
40,700
4
Seattle-Tacoma-Bellevue, WA
33,900
5
New York-Northern New Jersey-Long Island, NY_NJ-PA
20,200
5a.
Austin-Round Rock-San Antonio, TX
32,000
6
Boston-Cambridge-Quincy, MA
19,300
7
San Antonio, TX
17,400
8
Virginia Beach-Norfolk-Newport News, VA-NC
17,000
9
Austin-Round Rock, TX
14,600
10
Charleston-North Charleston-Summerville, SC
13,500
13
www.amreit.com
AmREIT’s Markets
Rank
Metropolitan Statistacal Area
Rate
1
New Orleans-Metairie-Kenner, LA
5.3%
2
Oklahoma City, OK
5.6%
3
San Antonio, TX
5.9%
4
Washington-Arlington-Alexandria, DC-VA-MD-WV
5.9%
5
Austin-Round Rock-San Antonio, TX
6.2%
6
Houston-Sugar Land-Baytown, TX
6.5%
7
Virginia Beach-Norfolk-Newport News, VA-NC
6.9%
8
Dallas-Fort Worth-Arlington, TX
7.0%
9
Phoenix-Mesa-Scottsdale, AZ
7.2%
10
Baltimore-Towson, MD
7.4%
Rank
Metropolitan Statistacal Area
GLA
(SQ FT)
% of
Total
1
Houston-Sugar Land-Baytown, TX
656,538
59.1%
2
Dallas-Fort Worth-Arlington, TX
271,221
24.4%
3
San Antonio, TX
65,932
5.9%
Top Three Total
993,691
89.4%
Other
118,038
10.6%
Total Portfolio
1,111,729
100.0%
AmREIT Real Estate Portfolio
Top 10 Lowest U.S. Unemployment Rate: March 2009
14
www.amreit.com
AmREIT – Debt Maturities as of March 31, 2009
13%
$ 19,900
2017
13%
$ 20,000
2016
33%
$ 49,000
2015
27%
$ 39,614
2013
9.1%
$ 12,812
2012
2%
$ 3,075
2011
0%
$ -
2010
3.1%
$ 4,567
2009
Percent of
Total
Outstanding
Amount
Year
Secured Debt Maturities
As of 9/30/08, AmREIT’s Unsecured Revolving Credit Facility Balance is $27,880,000.
2013
27%
2015
33%
2016
13%
2017
13%
2011
2%
2009
3%
2010
0%
2012
9%
15
www.amreit.com
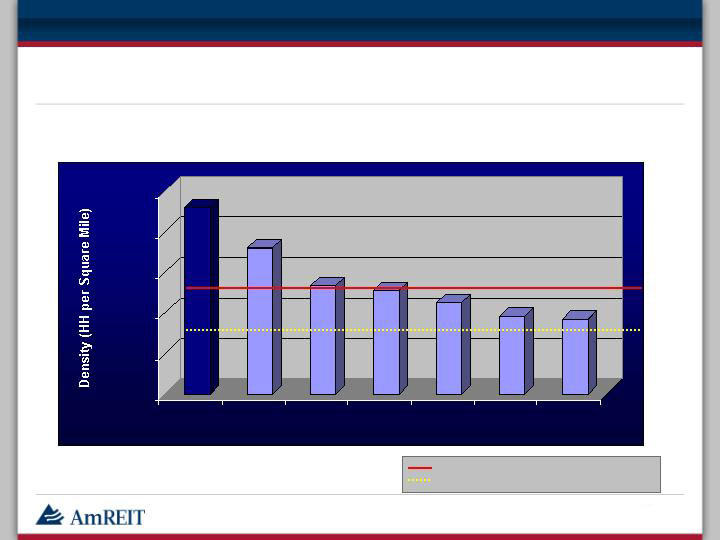
2,300
1,794
1,326
1,268
1,121
962
919
0
500
1,000
1,500
2,000
2,500
AMY
FRT
WRI
KIM
REG
EQY
DDR
AmREIT Portfolio - Household Population Density Comparison
Shopping Center REIT Average: 1,232
National Average: 800
Source: Merrill Lynch Research, as of September 2007.
AmREIT’s portfolio population density is 87% greater than the shopping center sample
group and 188% greater than the national average.
16
www.amreit.com
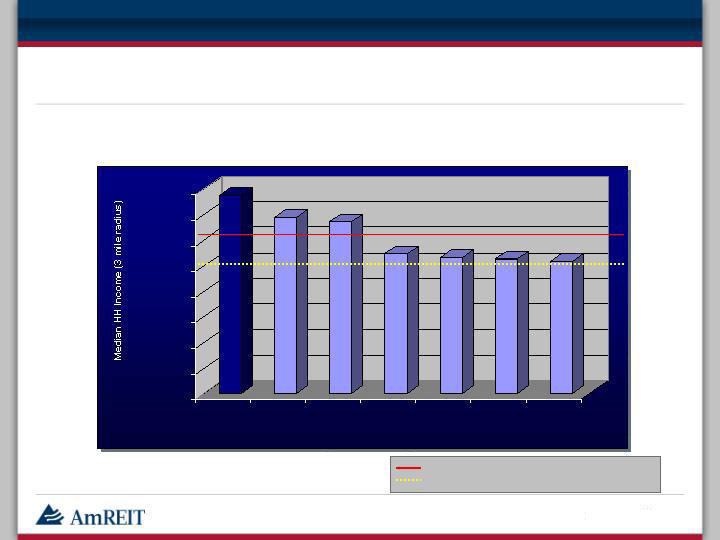
$77,556
$68,828
$67,381
$54,670
$53,489
$52,864
$51,683
$0
$10,000
$20,000
$30,000
$40,000
$50,000
$60,000
$70,000
$80,000
AMY
FRT
REG
KIM
DDR
EQY
WRI
Peer Group REITs
AmREIT Portfolio - Household Income Comparison
Shopping Center REIT Average: $58,153
National Average: $48,775
Source: Merrill Lynch Research, as of September 2007.
AmREIT’s median household income is 34% greater than the shopping center
sample group and 60% higher than the national average.
17
www.amreit.com
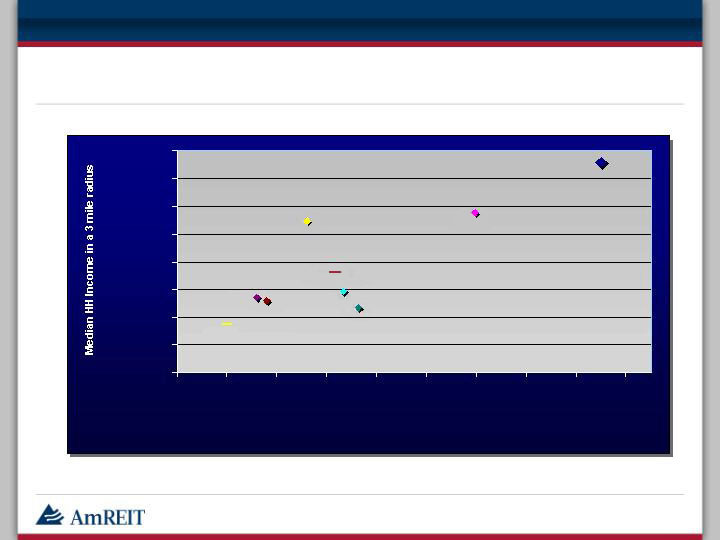
AmREIT Portfolio - REIT Demographic Positioning
Source: Merrill Lynch Research, as of September 2007.
AMY
FRT
REG
EQY
WRI
National Avg
KIM
DDR
Shopping Center Avg
$40,000
$45,000
$50,000
$55,000
$60,000
$65,000
$70,000
$75,000
$80,000
600
800
1,000
1,200
1,400
1,600
1,800
2,000
2,200
2,400
Households per Square Mile
18
www.amreit.com
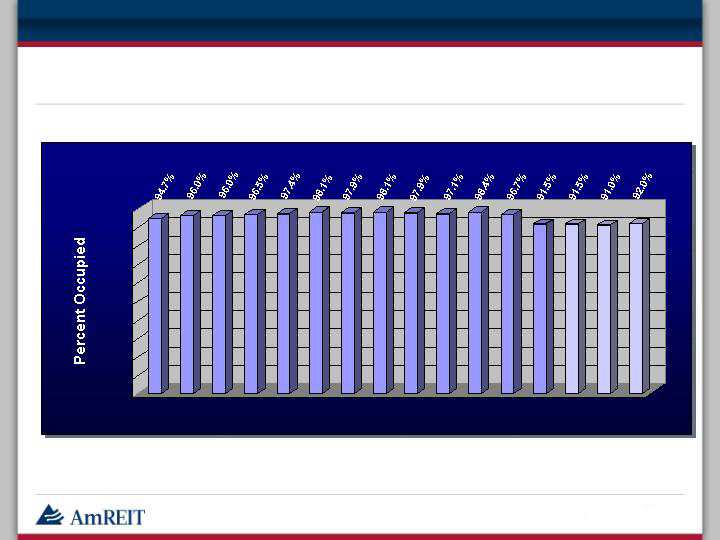
AmREIT Portfolio – Three Year Portfolio Occupancy
0%
10%
20%
30%
40%
50%
60%
70%
80%
90%
100%
1Q
2006
2Q
2006
3Q
2006
4Q
2006
1Q
2007
2Q
2007
3Q
2007
4Q
2007
1Q
2008
2Q
2008
3Q
2008
4Q
2008
1Q
2009
2Q
2009
3Q
2009
4Q
2009
Portfolio Occupancy
19
www.amreit.com
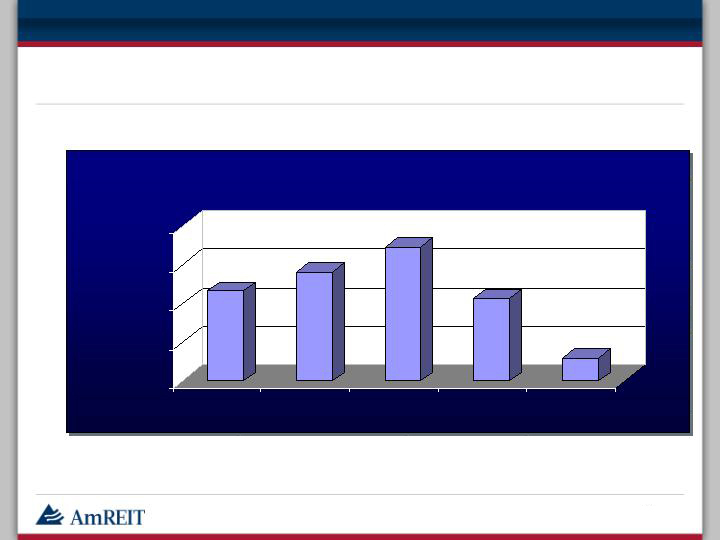
AmREIT Portfolio – Rental Rate Increase Upon Renewal
11.69%
14.16%
17.33%
10.70%
3.00%
0.00%
5.00%
10.00%
15.00%
20.00%
2006
2007
2008
1Q09A
2009E
Rental Rate Increase Upon Renewal
20
www.amreit.com
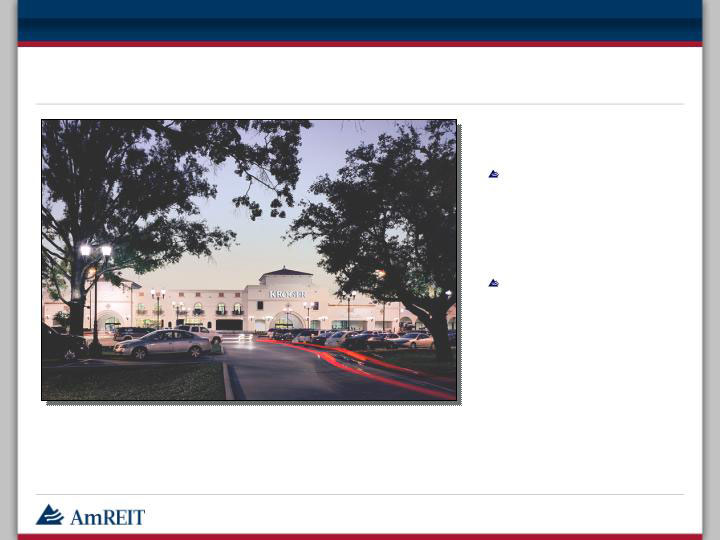
Plaza in the Park; Houston, Texas
Center is anchored by the
top grossing Kroger in
Texas and the #4 store in
the country (out of
approximately 2,500 stores
nationwide).
Entrance to the affluent
West University submarket.
3 Miles 5 Miles
Estimated Population: 148,619 410,882
Estimated Ave. HHI: $110,381 $83,529
Year Acquired: 2004
Retail SF: 344,623 SF
21
www.amreit.com
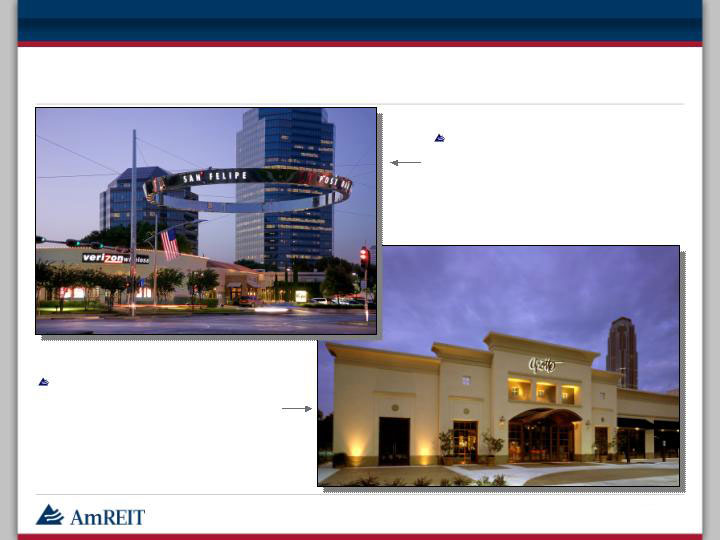
Courtyard on Post Oak; Houston, Texas
Uptown Plaza; Houston, Texas
Capitalized Income Value (at
6.5%) is approximately $7.7
million. Land value (at $150/s.f.)
is over $10 million.
Capitalized Income Value (at
6.5%) is approximately $17.7
million. Land value (at $175/s.f.)
is over $20 million.
22
www.amreit.com
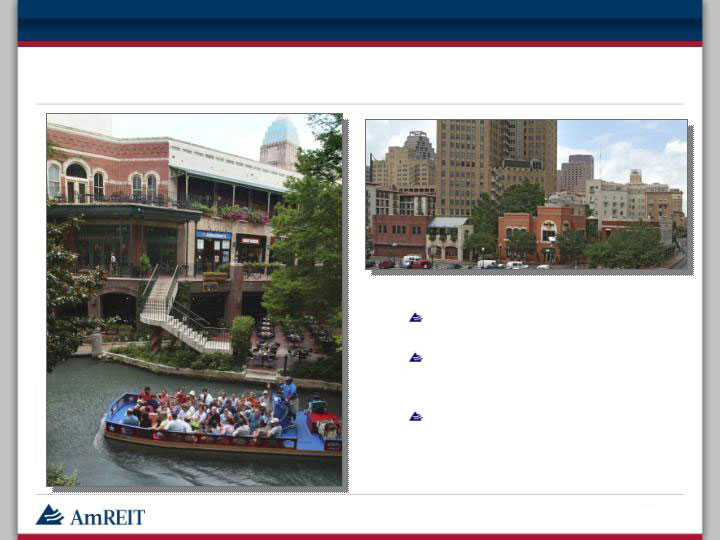
South Bank on the Riverwalk; San Antonio, TX
The Alamo and Riverwalk are the #1
and #2 tourist destinations in Texas.
Due to percentage rent, NOI was
$190,000 more than the original
projection upon acquisition.
Tenant sales have increased consistently for over 10 years.
23
www.amreit.com
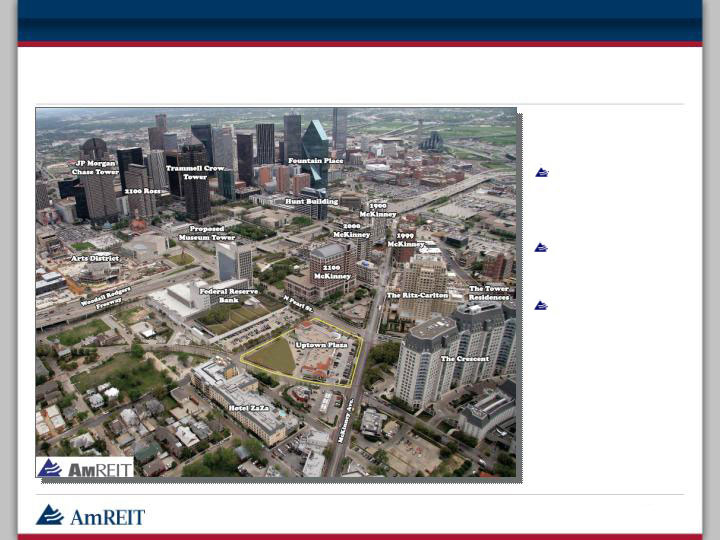
Uptown Plaza; Dallas, TX
Across from the
prestigious Crescent
Court and the Ritz
Carlton.
Assembled two
properties to control
city block.
0.9 acre development
tract under contract
with option to invest in
the development.
24
www.amreit.com
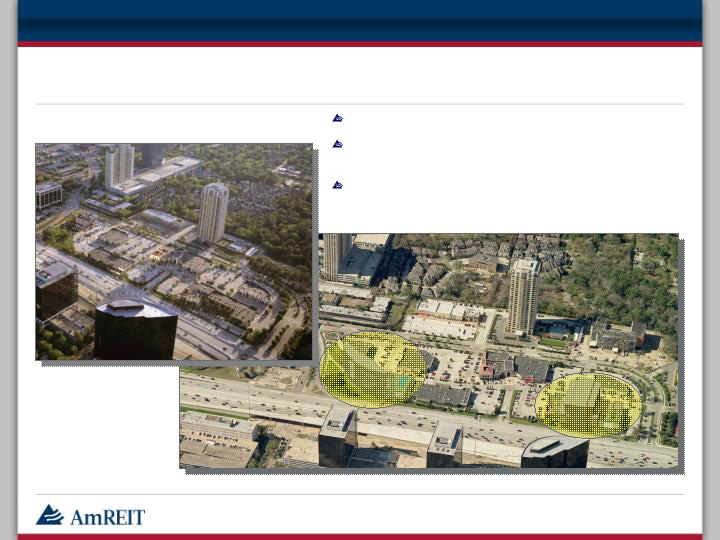
Uptown Park; Houston, TX – Future Development Potential
Uptown Park Houston TX - June 2005
Urban Context Conceptual Rendering
Demographics better than Buckhead and Beverly Hills.
Development potential for 200 room hotel and 200,000
s.f. office.
Market rents have increased from high $20’s to low
$40’s with NOI exceeding initial underwriting by
$800,000.
25
www.amreit.com

Independent Board of Directors
AmREIT Board of Directors
REITPlus Board of Directors
Mack D. Pridgen, III
Attorney with tax and audit experience and top executive of Highwoods (NYSE) while they grew from $250 million to $4.5 Billion.
Scot J. Luther
CEO and founder of retail real estate development company.
Brent M. Longnecker
Former national partner with Deloitte Touche, author of eight books on governance and compensation and CEO of national consulting organization.
H.L. “Hank” Rush, Jr.
CEO Star of Hope. Formerly top executive of BMC Software and Stewart Title.
Phillip Taggart
President and Chief Executive Officer of Taggart Financial Group, Inc. and co-author of “Taking Your Company Public”.
Robert S. Cartwright, Jr.
Graduate of Harvard (BA) and Stanford (PHD). Distinguished professor of Rice University.
26
www.amreit.com