Exhibit 99.2
|
|
|
|
|
|
|
|
|
|
|
|
|
|
|
|
|
|
|
|
|
|
|
|
|

|
|
|
|
|
|
|
|
|
|
|
|
|
|
|
|
|
|
|
|
|
|
|
|
|

|
|
|
|
|
|
|
|
|
|
|
|
|
|
|
|
|
|
|
|
|
|
|
|
|
| ++ Earnings Webcast ++ |
AMY:06 | 2nd Quarter 2006 |
| August 8, 2006 |
Forward Looking Statement
In addition to historical information, this presentation contains forward-looking statements under the federal securities law. These statements are based on current expectations, estimates and projections about the industry and markets in which AmREIT operates, and beliefs and assumptions made by management. Past performance is not indicative of future returns. Forward-looking statements are not guarantees of future performance and involve certain risks and uncertainties, which are difficult to predict. The estimated 2006 amounts included herein are based solely on management’s 2006 forecast and do not represent historical results of operations or financial condition.
2
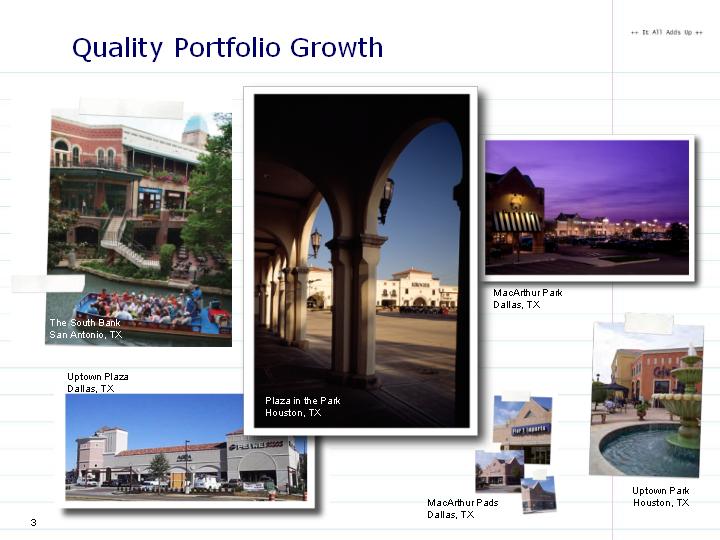
Quality Portfolio Growth
[GRAPHICS APPEAR HERE]
3
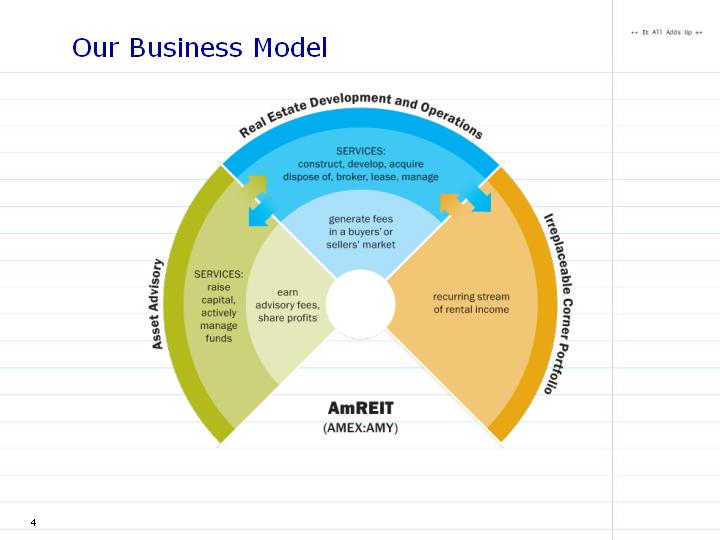
Our Business Model
[CHART APPEARS HERE]
4
YTD (6/30/06) Financial Update
• | Total Assets by $16 Million to $331 Million | |
|
|
|
• | Capital Under Management in Advisory Group by $24 Million to $85 million | |
|
| |
| • | On track to reach $120 million by yearend |
|
| |
• | Generated $0.14 in FFO per Class A Share | |
|
| |
| • | On track to reach annual guidance of $0.71 - $0.77 per share |
5
[GRAPHIC APPEARS HERE]
Real Estate Development and Operating Business
2nd Quarter Financial Update
• | $1.3 Million in Revenues | |
|
|
|
| • | $112,000 – development fees |
|
|
|
| • | $718,000 – leasing & brokerage commissions |
|
|
|
| • | $333,000 – construction fees (net of expense) |
|
|
|
| • | $80,000 – property management fees |
|
|
|
• | $1.7 Million in Expenses | |
|
|
|
| • | Primarily commissions, salary, and G&A |
|
|
|
• | Net Loss = $363,000 OR ($0.06) in FFO/share | |
|
|
|
• | Started development on 200,000 square feet for advisory business | |
|
|
|
• | Projected to contribute $0.13 - $0.15 in FFO for 2006 | |
6
[GRAPHIC APPEARS HERE]
Asset Advisory Business
2nd Quarter Financial Update
• | Raised $11.3 Million for Funds | |
|
|
|
| • | $85 million in total assets under management |
|
|
|
• | $1.7 Million in Revenues | |
|
|
|
| • | $1,400,000 – securities commission income |
|
|
|
| • | $186,000 – recurring asset management fee income |
|
|
|
| • | $165,000 – general partner back-end interest from AOF* |
|
|
|
• | $1.8 Million in Expenses | |
|
|
|
| • | Primarily commissions, salary, and G&A |
|
|
|
• | Net Loss = $74,000 OR ($0.01) in FFO/share | |
|
|
|
• | Projected to contribute $0.02 - $0.03 in FFO for 2006 | |
|
| |
* AmREIT Opportunity Fund | ||
7
[GRAPHIC APPEARS HERE]
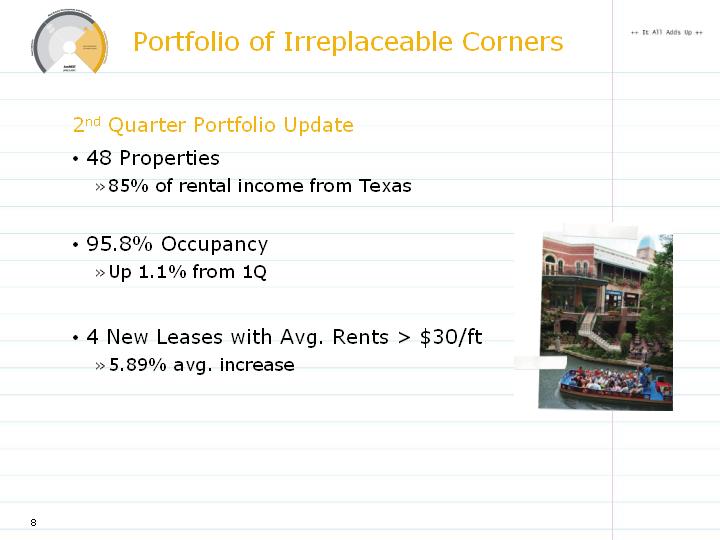
Portfolio of Irreplaceable Corners
2nd Quarter Portfolio Update
• | 48 Properties | |
|
| |
| • | 85% of rental income from Texas |
|
|
|
• | 95.8% Occupancy | |
|
| |
| • | Up 1.1% from 1Q |
|
|
|
• | 4 New Leases with Avg. Rents > $30/ft | |
|
| |
| • | 5.89% avg. increase |
[GRAPHIC APPEARS HERE]
8
[GRAPHIC APPEARS HERE]
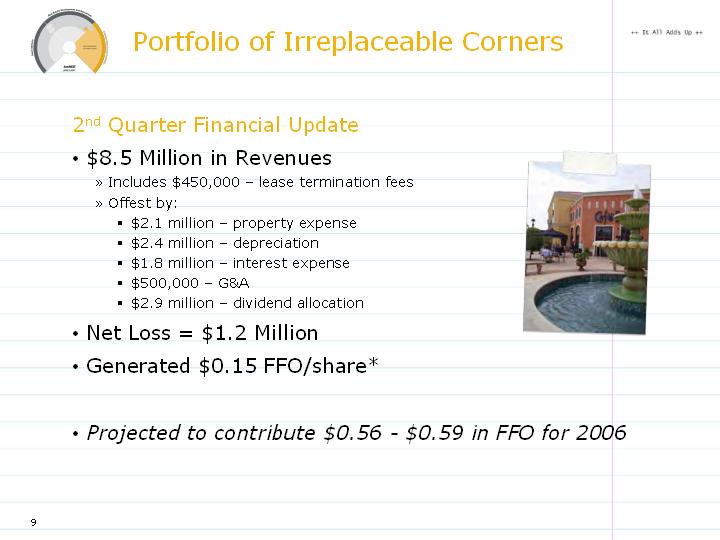
Portfolio of Irreplaceable Corners
2nd Quarter Financial Update
• | $8.5 Million in Revenues | ||
|
| ||
| • | Includes $450,000 – lease termination fees | |
|
|
| |
| • | Offest by: | |
|
|
| |
|
| • | $2.1 million – property expense |
|
|
|
|
|
| • | $2.4 million – depreciation |
|
|
|
|
|
| • | $1.8 million – interest expense |
|
|
|
|
|
| • | $500,000 – G&A |
|
|
|
|
|
| • | $2.9 million – dividend allocation |
|
|
|
|
• | Net Loss = $1.2 Million | ||
|
|
|
|
• | Generated $0.15 FFO/share* | ||
|
|
|
|
• | Projected to contribute $0.56 - $0.59 in FFO for 2006 | ||
[GRAPHIC APPEARS HERE]
9
Additional Updates
• | Stock Buy-Back | ||
|
|
|
|
| • | Initiated program in December 2005 | |
|
|
|
|
| • | As of July 31, 2006 | |
|
|
|
|
|
| • | 311,600 share purchased |
|
|
|
|
|
| • | $7.12 average price |
|
|
|
|
• | $0.71 to $0.77 2006 FFO Guidance | ||
|
|
|
|
| • | Increases in transactional activity forecasted for 3rd and 4th quarter will fuel the growth in FFO for the year | |
|
|
|
|
| • | $0.18 - $0.22 FFO/share projected for 3rd quarter | |
10
[GRAPHIC APPEARS HERE]
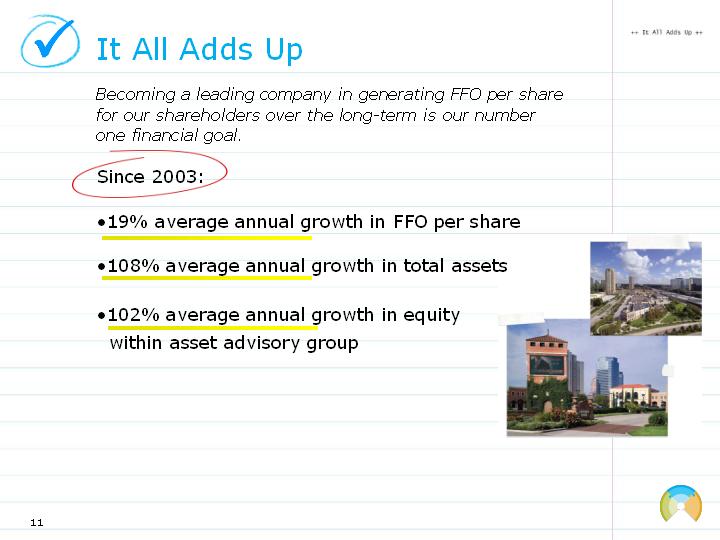
It All Adds Up
Becoming a leading company in generating FFO per share for our shareholders over the long-term is our number one financial goal.
Since 2003:
• 19% average annual growth in FFO per share
• 108% average annual growth in total assets
• 102% average annual growth in equity within asset advisory group
[GRAPHICS APPEAR HERE]
11
Focus Areas For Near Future
1. | Simplify Balance Sheet |
|
|
2. | More Aggressively Spread the AmREIT Story |
|
|
3. | Build Upon Our Development and Repositioning Expertise |
[GRAPHICS APPEAR HERE]
12
[GRAPHIC APPEARS HERE]
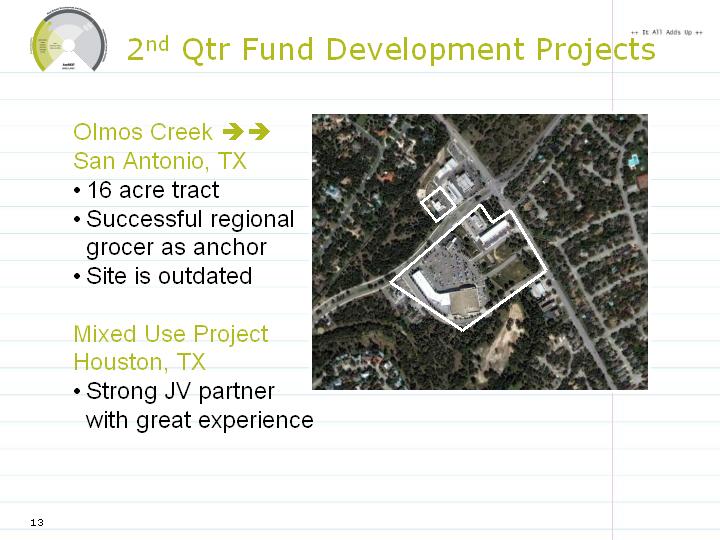
2nd Qtr Fund Development Projects
Olmos Creek ->-> San Antonio, TX | |
|
|
• | 16 acre tract |
|
|
• | Successful regional grocer as anchor |
|
|
• | Site is outdated |
|
|
Mixed Use Project Houston, TX | |
|
|
• | Strong JV partner with great experience |
13
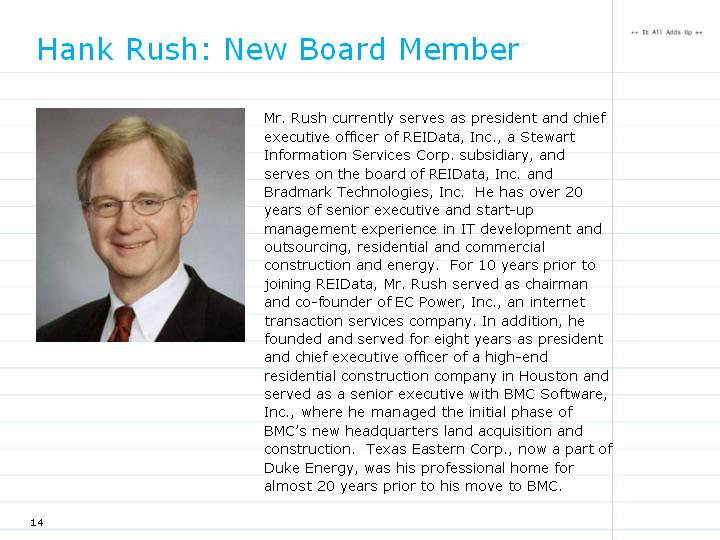
Hank Rush: New Board Member
[GRAPHIC APPEARS HERE]
Mr. Rush currently serves as president and chief executive officer of REIData, Inc., a Stewart Information Services Corp. subsidiary, and serves on the board of REIData, Inc. and Bradmark Technologies, Inc. He has over 20 years of senior executive and start-up management experience in IT development and outsourcing, residential and commercial construction and energy. For 10 years prior to joining REIData, Mr. Rush served as chairman and co-founder of EC Power, Inc., an internet transaction services company. In addition, he founded and served for eight years as president and chief executive officer of a high-end residential construction company in Houston and served as a senior executive with BMC Software, Inc., where he managed the initial phase of BMC’s new headquarters land acquisition and construction. Texas Eastern Corp., now a part of Duke Energy, was his professional home for almost 20 years prior to his move to BMC.
14
USEFUL INFORMATION
Contact Names: | Debbie Lucas, |
|
|
| VP Corporate Communications | Date: | August 8, 2006 |
|
|
|
|
| Chad Braun, |
|
|
| Chief Financial Officer | Phone: | 1-800-888-4400 |
|
|
|
|
Company: | AmREIT | Website: | www.amreit.com |
| 8 Greenway Plaza, Suite 1000 |
|
|
| Houston, TX 77046 |
|
|
[GRAPHICS APPEAR HERE]
DISCLAIMERS
Unless otherwise stated, all references to funds from operations (FFO) or FFO per share throughout this presentation represent amounts available to Class A shareholders.
All references to FFO within this presentation represent amounts available to Class A shareholders. References to 2003 and 2004 FFO have been adjusted for certain non-cash changes such as deferred merger charges and asset impairment charges.
15