UNITED STATES
SECURITIES AND EXCHANGE COMMISSION
Washington, D.C. 20549
FORM 8-K
CURRENT REPORT
Pursuant to Section 13 or 15(d) of the
Securities Exchange Act of 1934
Date of Report (Date of Earliest Event Reported)
October 20, 2003
THE SHAW GROUP INC.
(Exact name of registrant as specified in its charter)
| Louisiana | 1-12227 | 72-1106167 | ||
| (State or other jurisdiction of incorporation) | (Commission File Number) | (IRS Employer Identification No.) |
4171 Essen Lane, Baton Rouge, Louisiana 70809
(Address of principal executive offices and zip code)
(225) 932-2500
(Registrant’s telephone number, including area code)
Not Applicable
(Former name or former address, if changed since last report)
Item 7(c). Exhibits
99.1 Slide show accompanying the series of presentations.
Item 9. Regulation FD Disclosure
In accordance with General Instruction B.2. of Form 8-K, the following information will not be deemed “filed” for purposes of Section 18 of the Securities Act of 1934, as amended, nor shall it be deemed incorporated by reference in any filing under the Securities Act of 1933, as amended, except as expressly set forth by specific reference in a filing.
Representatives of The Shaw Group Inc. (“Shaw”) will make a series of presentations in connection with its recently announced public offering. The slides for those presentations give an overview of Shaw—including financial position, industry fundamentals, and business plan—and are furnished herewith as Exhibit 99.1.
SIGNATURES
Pursuant to the requirements of the Securities Exchange Act of 1934, the registrant has duly caused this report to be signed on its behalf by the undersigned hereunto duly authorized.
THE SHAW GROUP INC.
(Registrant)
Date: October 20, 2003
By:/s/ Robert L. Belk
Robert L. Belk, Executive Vice President
and Chief Financial Officer
2

The Shaw Group Inc.
Add-on Common Stock Offering
October 2003

Forward Looking Statement &
Regulation G Disclosure
Any statements in this presentation which express a belief, expectation or intention, as well as
those which are not historical fact, are forward looking and are protected under the safe harbor
of the Private Securities Litigation Reform Act. They involve a number of risks and
uncertainties, which may cause the Company’s actual results to differ materially from such
forward-looking statements. These risks and uncertainties include factors detailed in the
Company’s filings with the Securities and Exchange Commission, including its Form 10-K for
the year ended August 31, 2003 and on the Company’s web site under the heading “Forward
Looking Statement”.
During today’s presentation, we will use certain financial measures which are considered non-
GAAP, such as EBITDA, Net Debt and Net Capitalization. As required by the recently issued
SEC Regulation G, a reconciliation of these measures to their most comparable GAAP
measures is available either in this presentation or on our website at www.shawgrp.com in the
Investor Relations section under Regulation G Disclosures.

Current Offering
Credit Suisse First Boston
Merrill Lynch & Co.
Joint book-running managers:
Launch: October 17
Roadshow: October 20 – 23
Pricing: October 23
Transaction timing:
Fund a portion of tender for
~$250 MM of LYONs
Use of Proceeds:
20 million share add-on common
stock offering
15% (3.0 MM share) over-
allotment option
Offering Size:
SGR/NYSE
Ticker/Exchange:

Roadshow/Management Team
J.M. Bernhard, Jr.
Founder, Chairman and CEO
Under Mr. Bernhard's leadership, Shaw has grown intrinsically and through
a series of strategic acquisitions to over $3 billion in revenues and is one of
the youngest companies to be named to the Fortune 500.
Robert L. Belk
Executive Vice President and CFO
Robert L. Belk joined Shaw in 1998 as EVP, CFO and Treasurer.
Previously, Mr. Belk was with Ocean Energy, Inc., where he served as
Executive Vice President and Chief Financial Officer. Prior to joining Ocean
Energy, Inc., Mr. Belk was engaged in public accounting with national and
local firms and as a sole-practitioner.
T.A. Barfield, Jr.
President and COO
Since joining Shaw in 1994, Mr. Barfield has served in several strategic
positions. Most recently, Mr. Barfield served as President of Shaw
Environmental and Infrastructure, Inc. where he successfully led the
integration of The IT Group into Shaw's business portfolio.

Company Overview
Jim Bernhard
Founder, Chairman & CEO

Proven growth strategy through exploiting market leadership
positions
Diversified backlog with highly visible recurring revenue
Predominantly cost-plus contract profile
Positioned for expansion/recovery across power business lines
Diverse service, end market, customer and contract portfolio
Strong pro forma financial position
Investment Highlights

Leading Market Positions
Environmental & Infrastructure (“E&I”)
Environmental – Ranked #2 in construction/remediation and #5 in
hazardous waste and Top 10 in 8 of 12 service categories in ENR Rankings
Infrastructure – Blue chip clients, including NASA, DoD, DoE and Los
Alamos National Laboratory
Engineering, Construction & Maintenance Services (“ECM”)
Power: Ranked #3 in ENR’s overall power category
Fossil Fuel Power: Ranked #2 by ENR; designed and/or constructed
110 power plants
Nuclear Power: Ranked #3 in ENR’s nuclear power category; provided
services to 95% of domestic nuclear fleet; currently working on the only
2 active restarts in North America
Ethylene and Downstream Processing Technologies (Fluid Catalytic
Cracking, Ethyl Benzene, Cumene, Styrene) – Designed and/or
constructed over 120 plants; 40% of worldwide incremental capacity based
on proprietary technology
Fabrication, Manufacturing & Distribution
Piping Fabrication – Leading market share worldwide; industry’s most
advanced induction bending technology
* Source: Engineering News Record 2002 Rankings.

Growth Strategy
Expand E&I’s market share in rapidly growing federal services
platforms (Privatization, Facilities Management)
Expand federal business by bringing complete portfolio of Shaw’s
capabilities to DOE, DOD, DHS and other agencies
Leverage global market leadership position to capture power,
transmission and distribution opportunities
Cross-sell broad range of services to established multinational,
industrial customer base
Continue to expand maintenance operations
Grow international presence across all business lines
Pursue strategic alliances
Selectively pursue strategic acquisitions

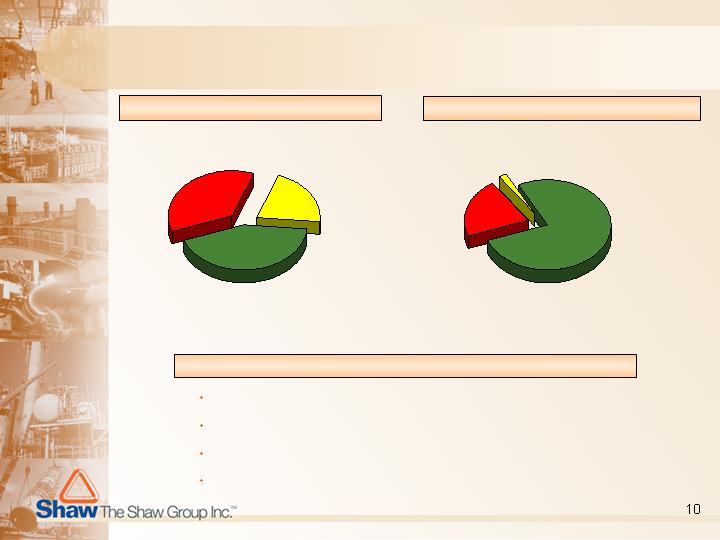
Diversification of Backlog
Infrastructure
15%
Process
Industries
11%
Other
Industries
1%
Fossil-Fuel
EPC
4%
Nuclear
Power
23%
Other Power
2%
Process
Industries
16%
Other
Industries
1%
Fossil-Fuel
EPC
53%
Nuclear Power
10%
Other Power
20%
Backlog at 8/31/01
$4.3 Billion
Backlog at 8/31/03
$4.8 Billion
Environmental
43%
Greater than 52% of backlog
from federal contracts
Announced projects since
8/31/03 of approximately
$1 billion
Highly Visible Recurring Revenue
Over 1,500 active contracts
77% of backlog is cost-plus
$2.5 billion in Federal Contracts in backlog
Demonstrated ability to redistribute resources to areas of growth
Backlog Conversion at 8/31/03
Highlights
Contract Mix at 8/31/03
Fixed-Price
21%
Unit-Price
2%
Cost-Plus
77%
Next 12 months
36%
13-24
months
21%
Greater than
24 months
43%

Top Ten Contracts in Backlog
Company
Contract Type
Customer
Unsecured
Credit Rating
Services Contracted
Backlog
8/31/03
($ MM)
1.
TVA -Browns Ferry Unit 1
Cost-plus
AAA
Nuclear Restart
$374
2.
TVA
Cost-plus
AAA
Nuclear Maintenance
317
3.
BASF-SINOPEC
Negotiated
Fixed-price
BBB
Ethylene Plant EPC
189
4.
DOE LANL (Los Alamos)
Cost-plus
U.S. Government
Maintenance Services
186
5.
Entergy
Cost-plus
BBB
Nuclear Maintenance
171
6.
Exelon
Cost-plus
BBB+
Nuclear Maintenance
169
7.
USACE Omaha-FPRI
Fixed-plus
U.S. Government
Environmental Remediation
1
50
8.
USACE Omaha TERC V
Cost-plus
U.S. Government
Environmental Remediation
137
9.
USACE -KC TERC
Cost-plus
U.S. Government
Environmental Remediation
135
10.
USACE -SAC TERC II
Cost-plus
U.S. Government
Environmental Remediation
133
Top Ten
Total
$1,961
% of
Total
Backlog
41%

Announced Projects Since August 31, 2003
Astoria power project in New York City (fossil fuel)
Marathon Ashland Clean Fuels project (process)
Entergy Nuclear Northeast maintenance and modifications work
(nuclear maintenance - not currently under contract)
U.S. Army Corps of Engineers Rapid Response contract
(environmental)
Total Estimated Project Value of Approximately $1 Billion
* Not in backlog at August 31, 2003.
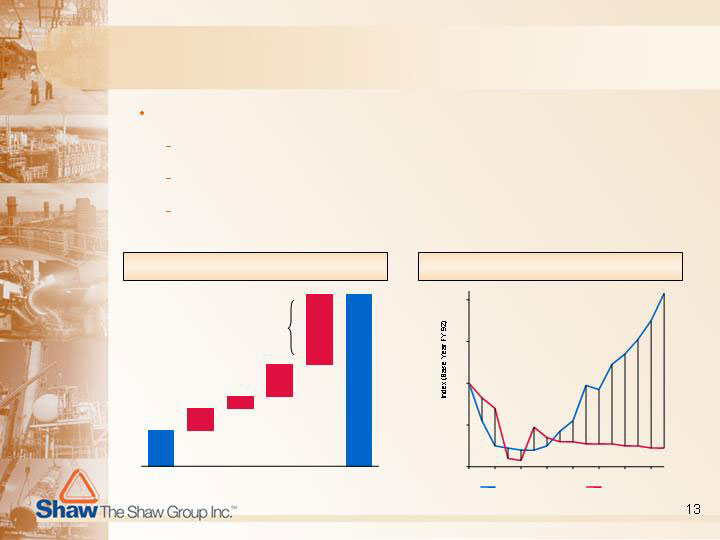
Attractive Government Services Opportunities
The Government Services Industry is experiencing robust growth:
Increased outsourcing opportunities
Increased service requirements driven by aging base of equipment
Increased overall defense spending with focus on homeland
defense initiatives
($ in billions)
Shaw
Core
Competency
Increased O&M Spending
Increased O&M Spending
FY 01
R&D
Procurement
Personnel
O&M
FY 03
Source: OSD, CSP.
$296
$13
$7
$19
$42
$377
60
80
100
120
140
FY 92
FY 94
FY 96
FY 98
FY 00
FY 02
FY 04
FY 06
DoD Procurement Budget
DoD Headcount
Source: OSD, CSP.
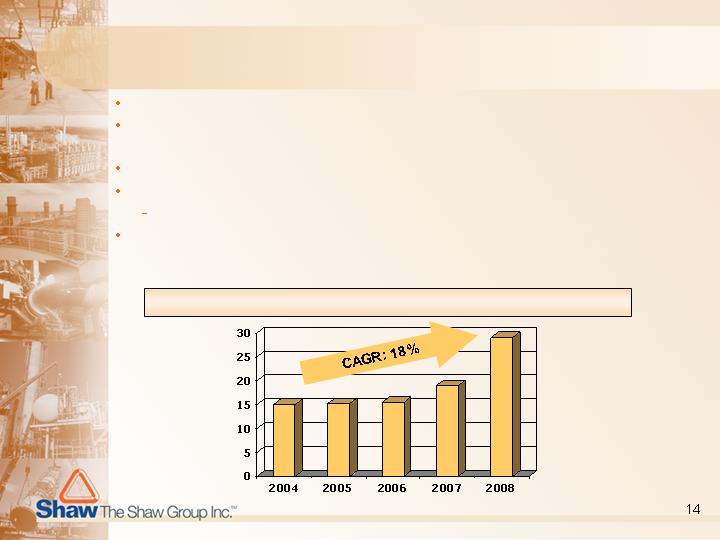
Expected U.S. Power Market Recovery
Near-term power shortage in the New York City area
Other known capacity constrained regions (Western U.S., Carolinas,
Florida)
Constrained transmission pockets which present shortages in local areas
U.S. generation added in last 3 years: ~140 GW
Significant cancellations and suspended construction
Clean Air market estimated to grow from $1 billion in 2004 to over $4
billion in 2007, pending passage of Clear Skies bill (Source: McIlvaine
Company)
Projected U.S. Generation Additions (GW added)
* Sources: Platts and Shaw Group.

Environmental & Infrastructure
2003 Revenues
$1.2 billion
Services Provided
Toxic waste remediation and
lifecycle management of solid
waste
Vulnerability assessment and
biological agent detection and
response
Facilities management and other
O&M services to military bases
Infrastructure planning,
engineering and maintenance
Federal Housing and Utility
Privatization
Significant Customers
U.S. Department of Defense
U.S. Environmental Protection Agency
U.S. Department of Energy
South Florida Water Management
ExxonMobil
Opportunities
Military housing privatization
Federal facilities management
Homeland security initiatives
Transportation and water
Coastal restoration
Environmental regulation
Chemical weapons demilitarization
Unexploded ordnance and explosives
International expansion
Commercial expansion

Engineering, Construction & Maintenance
2003 Revenues
$1.8 billion
Services Provided
Consulting and feasibility studies
Engineering and design,
procurement and construction
Turnarounds, restarts,
decommissioning, retrofitting and
maintenance
Project and construction
management
Refining and Petrochemical
technologies
Modularization
Reduces field man-hours
No onsite fabrication needed
Full control of construction -
no subcontractors
Significant Customers
Tennessee Valley Authority
Duke Energy
BASF
Entergy
Opportunities
Power Plant Retrofitting from Clean
Air Act Standards (scrubbers)
Clean Fuels
Power Plant Upgrades and Re-
powerings
Transmission & Distribution
Outsourcing of Maintenance
Operations
International Expansion
Marathon
KeySpan
Exelon
FPL

Fabrication, Manufacturing & Distribution
2003 Revenues
$263 million
Services Provided
Leading supplier of pre-fabricated piping systems for power plants and process
facilities worldwide
Leading manufacturer and master distributor of specialty pipe fittings
Industry leader in engineered pipe supports and fabricated structural steel
products for power, petrochemical and other industries
Industry’s most advanced induction bending technology
Significant Customers
Dow Chemical
Fluor
Bechtel
GE
TVA
Opportunities
Capital and maintenance projects in
petrochemical and power sectors
Nuclear maintenance and upgrades
Desalination projects
Clean fuel initiatives driven by Clean Air
Act
International expansion - China facility

Financial Overview
Bob Belk
Executive Vice President and CFO
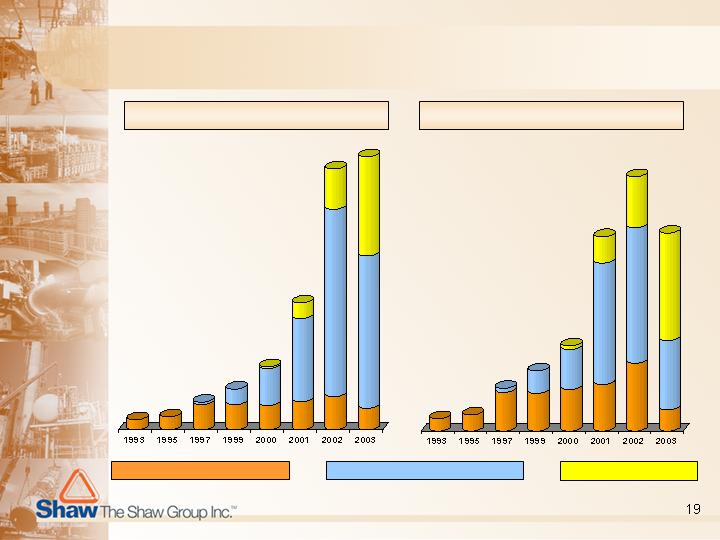
Historical Financial Performance
$121
$157
$338
$494
$1,539
$3,171
$763
$10
$13
$34
$48
$155
$70
Historical Revenue
Historical EBITDA
$203
Fabrication, Manufacturing & Distribution
Engineering, Construction & Maintenance
Environmental & Infrastructure
Fiscal Year Ended 8/31
($ in millions)
Fiscal Year Ended 8/31
($ in millions)
$3,307
$158*
* 2003 EBITDA of $158 million excludes a $30.0 million charge related to NEG and a $12.4 million charge related to
Orion and other receivables. See the Reconciliation of Non-GAAP Financial Measures slide herein for further details.

Fiscal 2004 Guidance
Guidance on fiscal 2004 operating performance was reconfirmed to the public
markets on October 16, 2003.
The guidance above does not include the application of the proceeds from this
offering and cash on hand to tender for approximately $250 million of
outstanding LYONs ($373 million face amount)
Transaction quantifies dilution and eliminates “overhang” from otherwise
potential conversion of remaining ~$250 million of LYONs in May 2004
Eliminates any near term liquidity events, allowing management to focus
on business operations
* Based on previously provided guidance of $1.15 - $1.25 per share and 38.3 million shares outstanding.
($ in millions)
Forecasted Financial Data
Fiscal 2004
Revenue
$
2,400
-
$
2,800
EBITDA
$140
-
$150
Net Income
*
$
44
-
$
48

Pro Forma Capitalization
Substantial liquidity from unrestricted cash balances and availability under
amended credit facility provides for LC and other growth and operating
flexibility
Substantially improved leverage statistics
Financial flexibility to pursue new business and other strategic opportunities
* Pro forma available liquidity reflects $50 million upsizing of revolver.
($ in millions)
Status Quo
Transaction
Pro Forma
8/31/2003
Adjustments
8/31/2003
Capitalization:
Unrestricted Cash & Equivalents
$184.9
($53.2)
$131.7
Restricted Cash
58.0
--
58.0
Total Cash & Equivalents
$243.0
($53.2)
$189.8
Revolving Credit Facility
$0.0
--
$0.0
10.75% Senior Notes
250.1
--
250.1
LYONs
251.5
($251.5)
0.0
Other Debt
11.5
--
11.5
Total Debt
$513.2
($251.5)
$261.7
Shareholders' Equity
$661.6
$198.0
$859.6
Total Capitalization
$1,174.7
($53.5)
$1,121.3
LTM Credit Statistics:
Available Liquidity*
$188.6
$271.7
Total Debt / Total Capitalization
43.7%
23.3%
Net Debt / Net Capitalization
33.2%
13.1%

Proven growth strategy through exploiting market leadership
positions
Diversified backlog with highly visible recurring revenue
Predominantly cost-plus contract profile
Positioned for expansion/recovery across power business lines
Diverse service, end market, customer and contract portfolio
Strong pro forma financial position
Investment Highlights

Reconciliation of Non-GAAP Financial Measures
* Other charges excluded from 2003 EBITDA are comprised of a $30.0 million charge related to NEG and a $12.4 million
charge related to Orion and other receivables.
($ in millions)
Fiscal Year Ended August 31,
1993
1995
1997
1999
2000
2001
2002
2003
Net Income
$4.2
$4.4
$14.0
$18.1
$29.5
$61.0
$98.4
$20.9
Add (deduct):
Interest
2.2
3.5
6.8
8.6
8.0
15.7
23.0
32.0
Income taxes
2.4
2.0
6.1
8.6
16.4
38.4
54.3
11.7
Depreciation and amortization
1.1
3.0
7.4
13.3
16.8
39.7
28.6
44.8
Extraordinary (gains) losses,
net of taxes
- -
(0.5)
- -
- -
0.6
0.2
- -
- -
(Earnings) losses from
unconsolidated entities
(0.3)
0.6
(0.4)
(0.7)
(1.2)
0.3
(1.7)
3.0
Discontinued Operations, net of
taxes
- -
- -
0.3
- -
- -
- -
- -
- -
Cumulative effect of accounting
change, net of taxes
- -
- -
- -
- -
0.3
- -
- -
- -
Acquired EBITDA (Badger)
- -
- -
- -
- -
- -
- -
- -
2.7
Other excluded charges
- -
- -
- -
- -
- -
- -
- -
42.4
EBITDA
$9.7
$13.0
$34.1
$48.0
$70.4
$155.3
$202.6
$157.5