| UNITED STATES SECURITIES AND EXCHANGE COMMISSION | ||
| Washington, D.C. 20549 | ||
FORM N-CSR | ||
| CERTIFIED SHAREHOLDER REPORT OF REGISTERED MANAGEMENT INVESTMENT COMPANIES | ||
| Investment Company Act file number: | (811-07121) |
| Exact name of registrant as specified in charter: | Putnam Asset Allocation Funds |
| Address of principal executive offices: | 100 Federal Street, Boston, Massachusetts 02110 |
| Name and address of agent for service: | Stephen Tate, Vice President 100 Federal Street Boston, Massachusetts 02110 |
| Copy to: | Bryan Chegwidden, Esq. Ropes & Gray LLP 1211 Avenue of the Americas New York, New York 10036 |
| Registrant’s telephone number, including area code: | (617) 292-1000 |
| Date of fiscal year end: | September 30, 2021 |
| Date of reporting period: | October 1, 2020 – September 30, 2021 |
Item 1. Report to Stockholders: |
| The following is a copy of the report transmitted to stockholders pursuant to Rule 30e-1 under the Investment Company Act of 1940: | |||
Putnam Dynamic
Asset Allocation
Conservative Fund
Annual report
9 | 30 | 21
Message from the Trustees
November 10, 2021
Dear Fellow Shareholder:
In the final months of the year, markets may be at a crossroads. The Federal Reserve is poised to begin reducing its monthly purchases of Treasury and mortgage-backed bonds, a program that has been in place since early 2020. Congress is considering major legislation to support infrastructure projects, which may include both higher tax rates and borrowing. Also of note, companies continue to respond creatively to the evolving challenges of the Covid-19 pandemic.
The investment landscape could change in the months ahead, as often occurs in a dynamic economy. Be assured that Putnam’s research teams will actively analyze new opportunities and risks that might emerge. They will work to uncover investment potential others may miss as they select securities for your fund.
Thank you for investing with Putnam.


Putnam Dynamic Asset Allocation Conservative Fund is designed for investors seeking total return consistent with preservation of capital. The fund’s target mix of 70% bonds and 30% stocks has been developed to pursue this goal while moderating investment volatility.
The managers believe that spreading fund holdings across a variety of asset classes can help to smooth performance compared with the more extreme market ups and downs that can happen when investing in only one type of asset.
Active global research guides our portfolio decisions
Today, trends can spread quickly from one part of the world to affect markets everywhere. The portfolio managers of Putnam’s Global Asset Allocation group have extensive experience analyzing how opportunities and risks are connected across borders. They follow a disciplined process to adjust the portfolio as market conditions change.

| 2 Dynamic Asset Allocation Conservative Fund |
Diversification can help to reduce volatility over time
With today’s market volatility, investors should consider evaluating the effectiveness of a portfolio over a full market cycle. Recent history has demonstrated that a more diversified portfolio can outperform in the long run.

| Dynamic Asset Allocation Conservative Fund 3 |
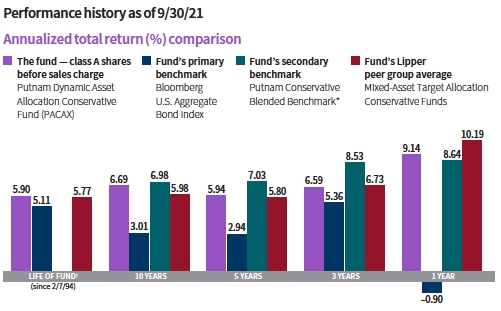
Current performance may be lower or higher than the quoted past performance, which cannot guarantee future results. Share price, principal value, and return will fluctuate, and you may have a gain or a loss when you sell your shares. Performance of class A shares assumes reinvestment of distributions and does not account for taxes. Fund returns in the bar chart do not reflect a sales charge of 5.75%; had they, returns would have been lower. See below and pages 10–12 for additional performance information. For a portion of the periods, the fund had expense limitations, without which returns would have been lower. To obtain the most recent month-end performance, visit putnam.com.
All Bloomberg indices provided by Bloomberg Index Services Limited.
Lipper peer group average provided by Lipper, a Refinitiv company.
* Putnam Conservative Blended Benchmark is a blended benchmark administered by Putnam Management and comprises 65% the Bloomberg U.S. Aggregate Bond Index, 25% the Russell 3000 Index, 5% the MSCI EAFE Index (ND), and 5% the JPMorgan Developed High Yield Index.
† The fund’s secondary benchmark, the Putnam Conservative Blended Benchmark, was introduced on 12/31/94, which post-dates the inception of the fund’s class A shares.
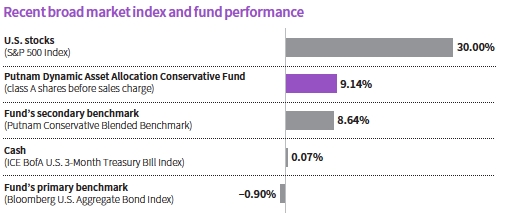
This comparison shows your fund’s performance in the context of broad market indexes for the 12 months ended 9/30/21. See above and pages 10–12 for additional fund performance information. Index descriptions can be found on page 16.
All Bloomberg indices provided by Bloomberg Index Services Limited.
| 4 Dynamic Asset Allocation Conservative Fund |


How did stocks perform during the reporting period?
Major stock indexes advanced for much of the period. After a shaky start in September and October 2020, the introduction of the first Covid-19 vaccines, additional fiscal stimulus, and signs of economic recovery helped lift investor sentiment. After finishing calendar-year 2020 strong, stocks faced challenges in the new year. Vaccine shortages delayed economic reopenings, particularly outside the United States. A sell-off in global technology stocks and a spike in new Covid-19 cases, largely from the highly contagious Delta variant, also curbed investor enthusiasm.
By March 2021, U.S. President Biden’s $1.9 trillion relief bill helped buoy stock markets. As the economic recovery picked up speed, investors grew concerned over rising inflation and a potential wind down of the Federal Reserve’s asset-purchase program. Despite these headwinds, U.S. stocks rose a remarkable 30.00%, as measured by the S&P 500 Index, for the 12-month reporting period. Non-U.S. stocks in developed markets, as measured by the MSCI EAFE Index [ND], gained 25.73% for the period.
| Dynamic Asset Allocation Conservative Fund 5 |

Allocations are shown as a percentage of the fund’s net assets as of 9/30/21. Cash and net other assets, if any, represent the market value weights of cash, derivatives, short-term securities, and other unclassified assets in the portfolio. Summary information may differ from the portfolio schedule included in the financial statements due to the inclusion of derivative securities, any interest accruals, the exclusion of as-of trades, if any, the use of different classifications of securities for presentation purposes, and rounding. Holdings and allocations may vary over time.
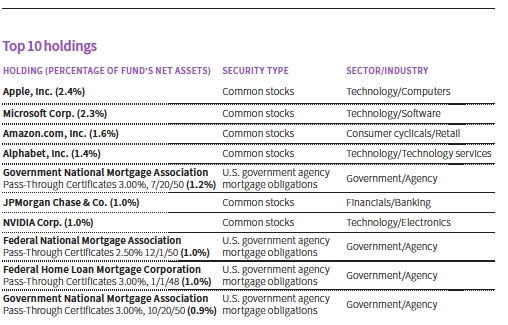
This table shows the fund’s top 10 individual holdings and the percentage of the fund’s net assets that each represented as of 9/30/21. Short-term investments, to-be-announced (TBA) commitments, and derivatives, if any, are excluded. Holdings may vary over time.
| 6 Dynamic Asset Allocation Conservative Fund |
How did bonds perform during the reporting period?
During the period, the Fed continued to purchase billions of dollars’ worth of U.S. Treasuries and mortgage-backed bonds as well as corporate bonds and exchange-traded funds, helping to keep interest rates low. In the first quarter of calendar-year 2021, stimulus-fueled growth and inflation expectations drove yields on all but very short-term government debt higher and bond prices lower. Investors feared that inflationary pressures would eventually lead the Fed to raise short-term rates. In late September 2021, the Fed indicated it was ready to scale back asset purchases as soon as November 2021 and could lift interest rates in 2022. The European Central Bank also said it would conduct bond purchases under its emergency program at a “moderately lower pace” over the next three months.
The yield on the benchmark 10-year U.S. Treasury note, which helps set borrowing costs on everything from mortgages to corporate debt, rose from 0.68% at the start of the period to 1.52% at period-end. The Bloomberg U.S. Aggregate Bond Index, a measure of investment-grade fixed income securities, posted a loss of 0.90%. High-yield bonds, as measured by the JPMorgan Developed High Yield Index, closed the period at 11.94%, reflecting tightening credit spreads. [Spreads are the yield advantage credit-sensitive bonds offer over comparable-maturity U.S. Treasuries. Bond prices fall as spreads widen and rise as spreads tighten.]
How did the fund perform for the reporting period?
The fund’s class A shares returned 9.14%, outperforming its primary benchmark, the Bloomberg U.S. Aggregate Bond Index, which posted a loss of 0.90% for the period. The fund also outperformed its secondary benchmark, the Putnam Conservative Blended Benchmark, which returned 8.64% for the period. This custom benchmark comprises 65% the Bloomberg U.S. Aggregate Bond Index, 25% the Russell 3000 Index, 5% the MSCI EAFE Index [ND], and 5% the JPMorgan Developed High Yield Index.
What strategies affected fund performance relative to the custom benchmark during the reporting period?
Our asset allocation decisions benefited fund results. Due to political and pandemic uncertainties, we actively adjusted our allocation mix. The largest boost to fund performance came from our equity allocation decisions. Our equity position ranged from moderately overweight to overweight, which helped results as stocks soared over the period. We moved the position to neutral at the end of August 2021.
An out-of-benchmark long position to commodity risk, implemented at the beginning of calendar-year 2021, also was a notable contributor. We anticipated that vaccine rollouts, fiscal support, and easy monetary conditions would stimulate significant global demand for commodities in 2021. We eliminated this position in mid-August 2021. In fixed income, our interest-rate risk and credit risk positions remained close to the weightings of the custom benchmark and did not have a material impact on fund performance over the period.
Our active implementation decisions detracted from performance, primarily driven by underperformance from our strategic global macroeconomic trades. Our fundamental U.S. large-cap growth strategy also weighed on results, but to a lesser extent. Implementation losses were slightly mitigated by positive contributions from our quantitative U.S. large-cap equity and international developed equity strategies. In quantitative strategies, our team analyzes stock market history to identify characteristics of stocks [factors] that have excess risk-adjusted returns. Over the recent past, many factor-based
| Dynamic Asset Allocation Conservative Fund 7 |
quantitative models, particularly those that emphasize value factors, have struggled. Performance in these factors and in our quantitative strategies improved compared with prior periods. Selection within our fundamental U.S. large-cap value and opportunistic fixed income sleeves also helped lift fund performance.
How did the fund use derivatives for the period?
The fund used futures to help manage exposure to market risk, gain exposure to interest rates, hedge prepayment and interest-rate risks, and equitize cash.
How was the fund positioned relative to the custom benchmark at the start of its new fiscal year on October 1, 2021?
The portfolio was positioned close to the custom benchmark as of October 1, 2021. We had a slightly underweight position to interest-rate risk and neutral positions to equity risk and credit risk. We also made several changes to positioning near the end of the reporting period. As previously mentioned, we eliminated our out-of-benchmark long position to commodity risk. We also reduced our equity position from overweight to neutral. Lastly, we decreased our credit position from slightly overweight to neutral. This change was supported by an expected ramp-up in investment-grade and high-yield issuance and a confluence of policy and geopolitical risks.
What is your outlook for financial markets?
Despite investor concerns around central bank asset-purchase tapering, inflation, and surging Covid-19 cases, markets have recovered significantly year to date. The stimulative monetary and fiscal policy backdrop among the Group of Ten [G10] advanced countries, historically strong earnings, positive economic data, and ample liquidity fueled the performance of financial markets during the period. While we remain optimistic about the recovery, we anticipate more volatility ahead as investors weigh the impact of a widely expected shift in central bank policy and end to more stimulus. The Fed’s rate-setting committee indicated in September 2021 that it could start to taper its $120 billion in monthly asset purchases as soon as its next scheduled meeting in early

This chart shows how the fund’s top weightings have changed over the past six months. Allocations are shown as a percentage of the fund’s net assets. Current period summary information may differ from the portfolio schedule included in the financial statements due to the inclusion of derivative securities, any interest accruals, the exclusion of as-of trades, if any, the use of different classifications of securities for presentation purposes, and rounding. Holdings and allocations may vary over time.
| 8 Dynamic Asset Allocation Conservative Fund |
November 2021. New projections released at the end of the Fed’s two-day policy meeting showed that half of 18 Fed officials expected to raise interest rates by the end of 2022.
Given the current environment, our outlook on equities is neutral. This view is supported by a combination of factors, including our expectations for seasonally increased volatility, a move past peak earnings growth, and a shift in central bank policy. While we maintain a positive disposition toward equities, we feel risks have become more balanced.
In fixed income, our outlook on credit is neutral. Given that spreads have been hovering at the tight end of their recent range, and volatility and defaults are extremely low relative to historical levels, we expect an uptick in volatility and thus a lower risk-adjusted return as opposed to a substantial widening in spreads. Our outlook on interest-rate-sensitive fixed income is slightly bearish, as we believe risks are skewed to higher yields given the expectations for continued economic momentum and inflation spikes. We expect asset-purchase tapering and a shift in rate policy by the Fed to put upward pressure on yields. Against this backdrop, we continue to have conviction in our investment strategies based on their strong, long-term results.
Thank you, Jason, for your time and insights today.
The views expressed in this report are exclusively those of Putnam Management and are subject to change. They are not meant as investment advice.
Please note that the holdings discussed in this report may not have been held by the fund for the entire period. Portfolio composition is subject to review in accordance with the fund’s investment strategy and may vary in the future. Current and future portfolio holdings are subject to risk.
Of special interest
Effective February 2021, the monthly dividend rate for the fund’s class A shares declined from $0.014 to $0.013 per share. This change was the result of falling interest rates and lower dividend payments made by companies held in the portfolio. Similar decreases were made to other share classes.
ABOUT DERIVATIVES
Derivatives are an increasingly common type of investment instrument, the performance of which is derived from an underlying security, index, currency, or other area of the capital markets. Derivatives employed by the fund’s managers generally serve one of two main purposes: to implement a strategy that may be difficult or more expensive to invest in through traditional securities, or to hedge unwanted risk associated with a particular position.
For example, the fund’s managers might use currency forward contracts to capitalize on an anticipated change in exchange rates between two currencies. This approach would require a significantly smaller outlay of capital than purchasing traditional bonds denominated in the underlying currencies. In another example, the managers may identify a bond that they believe is undervalued relative to its risk of default, but may seek to reduce the interest-rate risk of that bond by using interest-rate swaps, a derivative through which two parties “swap” payments based on the movement of certain rates. In other examples, the managers may use options and futures contracts to hedge against a variety of risks by establishing a combination of long and short exposures to specific equity markets or sectors.
Like any other investment, derivatives may not appreciate in value and may lose money. Derivatives may amplify traditional investment risks through the creation of leverage and may be less liquid than traditional securities. And because derivatives typically represent contractual agreements between two financial institutions, derivatives entail “counterparty risk,” which is the risk that the other party is unable or unwilling to pay. Putnam monitors the counterparty risks we assume. For example, Putnam often enters into collateral agreements that require the counterparties to post collateral on a regular basis to cover their obligations to the fund. Counterparty risk for exchange-traded futures and centrally cleared swaps is mitigated by the daily exchange of margin and other safeguards against default through their respective clearinghouses.
| Dynamic Asset Allocation Conservative Fund 9 |
Your fund’s performance
This section shows your fund’s performance, price, and distribution information for periods ended September 30, 2021, the end of its most recent fiscal year. In accordance with regulatory requirements for mutual funds, we also include expense information taken from the fund’s current prospectus. Performance should always be considered in light of a fund’s investment strategy. Data represent past performance. Past performance does not guarantee future results. More recent returns may be less or more than those shown. Investment return and principal value will fluctuate, and you may have a gain or a loss when you sell your shares. Performance information does not reflect any deduction for taxes a shareholder may owe on fund distributions or on the redemption of fund shares. For the most recent month-end performance, please visit the Individual Investors section at putnam.com or call Putnam at 1-800-225-1581. Class P, R, R5, R6, and Y shares are not available to all investors. See the Terms and definitions section in this report for definitions of the share classes offered by your fund.
Fund performance Total return for periods ended 9/30/21
| Annual | ||||||||
| average | Annual | Annual | Annual | |||||
| (life of fund) | 10 years | average | 5 years | average | 3 years | average | 1 year | |
| Class A (2/7/94) | ||||||||
| Before sales charge | 5.90% | 91.13% | 6.69% | 33.45% | 5.94% | 21.09% | 6.59% | 9.14% |
| After sales charge | 5.68 | 80.14 | 6.06 | 25.77 | 4.69 | 14.13 | 4.50 | 2.86 |
| Class B (2/18/94) | ||||||||
| Before CDSC | 5.67 | 80.06 | 6.06 | 28.61 | 5.16 | 18.38 | 5.79 | 8.31 |
| After CDSC | 5.67 | 80.06 | 6.06 | 26.61 | 4.83 | 15.38 | 4.88 | 3.31 |
| Class C (9/1/94) | ||||||||
| Before CDSC | 5.67 | 79.91 | 6.05 | 28.61 | 5.16 | 18.52 | 5.83 | 8.36 |
| After CDSC | 5.67 | 79.91 | 6.05 | 28.61 | 5.16 | 18.52 | 5.83 | 7.36 |
| Class P (8/31/16) | ||||||||
| Net asset value | 6.21 | 97.24 | 7.03 | 36.19 | 6.37 | 22.65 | 7.04 | 9.61 |
| Class R (1/21/03) | ||||||||
| Net asset value | 5.71 | 86.39 | 6.42 | 31.80 | 5.68 | 20.18 | 6.32 | 8.82 |
| Class R5 (7/2/12) | ||||||||
| Net asset value | 6.19 | 96.68 | 7.00 | 35.42 | 6.25 | 22.14 | 6.90 | 9.49 |
| Class R6 (7/2/12) | ||||||||
| Net asset value | 6.22 | 97.80 | 7.06 | 35.91 | 6.33 | 22.42 | 6.98 | 9.54 |
| Class Y (7/14/94) | ||||||||
| Net asset value | 6.18 | 95.80 | 6.95 | 35.20 | 6.22 | 22.05 | 6.87 | 9.45 |
Current performance may be lower or higher than the quoted past performance, which cannot guarantee future results. After-sales-charge returns for class A shares reflect the deduction of the maximum 5.75% sales charge levied at the time of purchase. Class B share returns after contingent deferred sales charge (CDSC) reflect the applicable CDSC, which is 5% in the first year, declining over time to 1% in the sixth year, and is eliminated thereafter. Class C share returns after CDSC reflect a 1% CDSC for the first year that is eliminated thereafter. Class P, R, R5, R6, and Y shares have no initial sales charge or CDSC. Performance for class B, C, R, and Y shares before their inception is derived from the historical performance of class A shares, adjusted for the applicable sales charge (or CDSC) and the higher operating expenses for such shares, except for class Y shares, for which 12b-1 fees are not applicable. Performance for class P, R5, and R6 shares prior to their inception is derived from the historical performance of class Y shares and has not been adjusted for the lower investor servicing fees applicable to class P, R5, and R6 shares; had it, returns would have been higher.
| 10 Dynamic Asset Allocation Conservative Fund |
For a portion of the periods, the fund had expense limitations, without which returns would have been lower.
Class B and C share performance reflects conversion to class A shares after eight years.
Comparative index returns For periods ended 9/30/21
| Annual | ||||||||
| average | Annual | Annual | Annual | |||||
| (life of fund) | 10 years | average | 5 years | average | 3 years | average | 1 year | |
| Bloomberg U.S. | ||||||||
| Aggregate Bond Index | 5.11% | 34.55% | 3.01% | 15.61% | 2.94% | 16.94% | 5.36% | –0.90% |
| Putnam Conservative | ||||||||
| Blended Benchmark* | —† | 96.26 | 6.98 | 40.44 | 7.03 | 27.85 | 8.53 | 8.64 |
| Lipper Mixed-Asset Target | ||||||||
| Allocation Conservative | 5.77 | 79.73 | 5.98 | 32.74 | 5.80 | 21.66 | 6.73 | 10.19 |
| Funds category average‡ |
Index and Lipper results should be compared with fund performance before sales charge, before CDSC, or at net asset value.
All Bloomberg indices provided by Bloomberg Index Services Limited.
Lipper peer group average provided by Lipper, a Refinitiv company.
* Putnam Conservative Blended Benchmark is a blended benchmark administered by Putnam Management and comprises 65% the Bloomberg U.S. Aggregate Bond Index, 25% the Russell 3000 Index, 5% the MSCI EAFE Index (ND), and 5% the JPMorgan Developed High Yield Index.
† The fund’s secondary benchmark, the Putnam Conservative Blended Benchmark, was introduced on 12/31/94, which post-dates the inception of the fund’s class A shares.
‡ Over the 1-year, 3-year, 5-year, 10-year, and life-of-fund periods ended 9/30/21, there were 327, 298, 281, 193, and 8 funds, respectively, in this Lipper category.

Past performance does not indicate future results. At the end of the same time period, a $10,000 investment in the fund’s class B and C shares would have been valued at $18,006 and $17,991, respectively, and no contingent deferred sales charges would apply. A $10,000 investment in the fund’s class P, R, R5, R6, and Y shares would have been valued at $19,724, $18,639, $19,668, $19,780, and $19,580, respectively.
| Dynamic Asset Allocation Conservative Fund 11 |
Fund price and distribution information For the 12-month period ended 9/30/21
| Distributions | Class A | Class B | Class C | Class P | Class R | Class R5 | Class R6 | Class Y | |
| Number | 12 | 12 | 12 | 12 | 12 | 12 | 12 | 12 | |
| Income | $0.160 | $0.073 | $0.073 | $0.204 | $0.127 | $0.192 | $0.198 | $0.188 | |
| Capital gains | |||||||||
| Long-term gains | 0.130 | 0.130 | 0.130 | 0.130 | 0.130 | 0.130 | 0.130 | 0.130 | |
| Short-term gains | 0.110 | 0.110 | 0.110 | 0.110 | 0.110 | 0.110 | 0.110 | 0.110 | |
| Total | $0.400 | $0.313 | $0.313 | $0.444 | $0.367 | $0.432 | $0.438 | $0.428 | |
| Before | After | Net | Net | Net | Net | Net | Net | Net | |
| sales | sales | asset | asset | asset | asset | asset | asset | asset | |
| Share value | charge | charge | value | value | value | value | value | value | value |
| 9/30/20 | $11.22 | $11.90 | $11.12 | $11.06 | $11.26 | $11.57 | $11.26 | $11.27 | $11.27 |
| 9/30/21 | 11.83 | 12.55 | 11.72 | 11.66 | 11.88 | 12.21 | 11.88 | 11.89 | 11.89 |
The classification of distributions, if any, is an estimate. Before-sales-charge share value and current dividend rate for class A shares, if applicable, do not take into account any sales charge levied at the time of purchase. After-sales-charge share value, current dividend rate, and current 30-day SEC yield, if applicable, are calculated assuming that the maximum sales charge (5.75% for class A shares) was levied at the time of purchase. Final distribution information will appear on your year-end tax forms.
As a mutual fund investor, you pay ongoing expenses, such as management fees, distribution fees (12b-1 fees), and other expenses. Using the following information, you can estimate how these expenses affect your investment and compare them with the expenses of other funds. You may also pay one-time transaction expenses, including sales charges (loads) and redemption fees, which are not shown in this section and would have resulted in higher total expenses. For more information, see your fund’s prospectus or talk to your financial representative.
Expense ratios
| Class A | Class B | Class C | Class P | Class R | Class R5 | Class R6 | Class Y | |
| Total annual operating | ||||||||
| expenses for the fiscal year | ||||||||
| ended 9/30/20 | 0.99% | 1.74% | 1.74% | 0.60% | 1.24% | 0.71% | 0.64% | 0.74% |
| Annualized expense ratio | ||||||||
| for the six-month period | ||||||||
| ended 9/30/21* | 0.97% | 1.72% | 1.72% | 0.59% | 1.22% | 0.70% | 0.63% | 0.72% |
Fiscal year expense information in this table is taken from the most recent prospectus, is subject to change, and may differ from that shown for the annualized expense ratio and in the financial highlights of this report.
Expenses are shown as a percentage of average net assets.
* Expense ratios for each class are for the fund’s most recent fiscal half year. As a result of this, ratios may differ from expense ratios based on one-year data in the financial highlights.
| 12 Dynamic Asset Allocation Conservative Fund |
Expenses per $1,000
The following table shows the expenses you would have paid on a $1,000 investment in each class of the fund from 4/1/21 to 9/30/21. It also shows how much a $1,000 investment would be worth at the close of the period, assuming actual returns and expenses.
| Class A | Class B | Class C | Class P | Class R | Class R5 | Class R6 | Class Y | |
| Expenses paid per $1,000*† | $4.96 | $8.78 | $8.79 | $3.02 | $6.24 | $3.59 | $3.23 | $3.69 |
| Ending value (after expenses) | $1,041.80 | $1,037.40 | $1,038.50 | $1,044.60 | $1,040.80 | $1,043.10 | $1,043.30 | $1,043.80 |
* Expenses for each share class are calculated using the fund’s annualized expense ratio for each class, which represents the ongoing expenses as a percentage of average net assets for the six months ended 9/30/21. The expense ratio may differ for each share class.
† Expenses are calculated by multiplying the expense ratio by the average account value for the period; then multiplying the result by the number of days in the period (183); and then dividing that result by the number of days in the year (365).
Estimate the expenses you paid
To estimate the ongoing expenses you paid for the six months ended 9/30/21, use the following calculation method. To find the value of your investment on 4/1/21, call Putnam at 1-800-225-1581.

Compare expenses using the SEC’s method
The Securities and Exchange Commission (SEC) has established guidelines to help investors assess fund expenses. Per these guidelines, the following table shows your fund’s expenses based on a $1,000 investment, assuming a hypothetical 5% annualized return. You can use this information to compare the ongoing expenses (but not transaction expenses or total costs) of investing in the fund with those of other funds. All mutual fund shareholder reports will provide this information to help you make this comparison. Please note that you cannot use this information to estimate your actual ending account balance and expenses paid during the period.
| Class A | Class B | Class C | Class P | Class R | Class R5 | Class R6 | Class Y | |
| Expenses paid per $1,000*† | $4.91 | $8.69 | $8.69 | $2.99 | $6.17 | $3.55 | $3.19 | $3.65 |
| Ending value (after expenses) | $1,020.21 | $1,016.44 | $1,016.44 | $1,022.11 | $1,018.95 | $1,021.56 | $1,021.91 | $1,021.46 |
* Expenses for each share class are calculated using the fund’s annualized expense ratio for each class, which represents the ongoing expenses as a percentage of average net assets for the six months ended 9/30/21. The expense ratio may differ for each share class.
† Expenses are calculated by multiplying the expense ratio by the average account value for the six-month period; then multiplying the result by the number of days in the six-month period (183); and then dividing that result by the number of days in the year (365).
| Dynamic Asset Allocation Conservative Fund 13 |
Consider these risks before investing
Allocation of assets among asset classes may hurt performance. The value of investments in the fund’s portfolio may fall or fail to rise over extended periods of time for a variety of reasons, including general economic, political, or financial market conditions; investor sentiment and market perceptions; government actions; geopolitical events or changes; and factors related to a specific issuer, asset class, geography, industry, or sector. These and other factors may lead to increased volatility and reduced liquidity in the fund’s portfolio holdings.
International investing involves currency, economic, and political risks. Emerging market securities carry illiquidity and volatility risks. Investments in small and/or midsize companies increase the risk of greater price fluctuations. Growth stocks may be more susceptible to earnings disappointments, and value stocks may fail to rebound. Funds that invest in government securities are not guaranteed. Mortgage-backed investments, unlike traditional debt investments, are also subject to prepayment risk, which means that they may increase in value less than other bonds when interest rates decline and decline in value more than other bonds when interest rates rise. Bond investments are subject to interest-rate risk (the risk of bond prices falling if interest rates rise) and credit risk (the risk of an issuer defaulting on interest or principal payments). Default risk is generally higher for non-qualified mortgages. Interest-rate risk is generally greater for longer-term bonds, and credit risk is generally greater for below-investment-grade bonds. Unlike bonds, funds that invest in bonds have fees and expenses. The use of derivatives may increase these risks by increasing investment exposure (which may be considered leverage) or, in the case of over-the-counter instruments, because of the potential inability to terminate or sell derivatives positions and the potential failure of the other party to the instrument to meet its obligations.
Our investment techniques, analyses, and judgments may not produce the outcome we intend. The investments we select for the fund may not perform as well as other securities that we do not select for the fund. We, or the fund’s other service providers, may experience disruptions or operating errors that could have a negative effect on the fund. You can lose money by investing in the fund.
| 14 Dynamic Asset Allocation Conservative Fund |
Terms and definitions
Important terms
Total return shows how the value of the fund’s shares changed over time, assuming you held the shares through the entire period and reinvested all distributions in the fund.
Before sales charge, or net asset value, is the price, or value, of one share of a mutual fund, without a sales charge. Before-sales-charge figures fluctuate with market conditions, and are calculated by dividing the net assets of each class of shares by the number of outstanding shares in the class.
After sales charge is the price of a mutual fund share plus the maximum sales charge levied at the time of purchase. After-sales-charge performance figures shown here assume the 5.75% maximum sales charge for class A shares.
Contingent deferred sales charge (CDSC) is generally a charge applied at the time of the redemption of class B or C shares and assumes redemption at the end of the period. Your fund’s class B CDSC declines over time from a 5% maximum during the first year to 1% during the sixth year. After the sixth year, the CDSC no longer applies. The CDSC for class C shares is 1% for one year after purchase.
Share classes
Class A shares are generally subject to an initial sales charge and no CDSC (except on certain redemptions of shares bought without an initial sales charge).
Class B shares are closed to new investments and are only available by exchange from another Putnam fund or through dividend and/or capital gains reinvestment. They are not subject to an initial sales charge and may be subject to a CDSC.
Class C shares are not subject to an initial sales charge and are subject to a CDSC only if the shares are redeemed during the first year.
Class P shares require no minimum initial investment amount and no minimum subsequent investment amount. There is no initial or deferred sales charge. They are available only to other Putnam funds and other accounts managed by Putnam Management or its affiliates.
Class R shares are not subject to an initial sales charge or CDSC and are only available to employer-sponsored retirement plans.
Class R5 shares are not subject to an initial sales charge or CDSC and carry no 12b-1 fee. They are only available to employer-sponsored retirement plans.
Class R6 shares are not subject to an initial sales charge or CDSC and carry no 12b-1 fee. They are generally only available to employer-sponsored retirement plans, corporate and institutional clients, and clients in other approved programs.
Class Y shares are not subject to an initial sales charge or CDSC and carry no 12b-1 fee. They are generally only available to corporate and institutional clients and clients in other approved programs.
Fixed-income terms
Current rate is the annual rate of return earned from dividends or interest of an investment. Current rate is expressed as a percentage of the price of a security, fund share, or principal investment.
Mortgage-backed security (MBS), also known as a mortgage “pass-through,” is a type of asset-backed security that is secured by a mortgage or collection of mortgages. The following are types of MBSs:
• Agency “pass-through” has its principal and interest backed by a U.S. government agency, such as the Federal National Mortgage Association (Fannie Mae), Government National Mortgage Association (Ginnie Mae), and Federal Home Loan Mortgage Corporation (Freddie Mac).
| Dynamic Asset Allocation Conservative Fund 15 |
• Collateralized mortgage obligation (CMO) represents claims to specific cash flows from pools of home mortgages. The streams of principal and interest payments on the mortgages are distributed to the different classes of CMO interests in “tranches.” Each tranche may have different principal balances, coupon rates, prepayment risks, and maturity dates. A CMO is highly sensitive to changes in interest rates and any resulting change in the rate at which homeowners sell their properties, refinance, or otherwise prepay loans. CMOs are subject to prepayment, market, and liquidity risks.
°Interest-only (IO) security is a type of CMO in which the underlying asset is the interest portion of mortgage, Treasury, or bond payments.
• Non-agency residential mortgage-backed security (RMBS) is an MBS not backed by Fannie Mae, Ginnie Mae, or Freddie Mac. One type of RMBS is an Alt-A mortgage-backed security.
• Commercial mortgage-backed security (CMBS) is secured by the loan on a commercial property.
Yield curve is a graph that plots the yields of bonds with equal credit quality against their differing maturity dates, ranging from shortest to longest. It is used as a benchmark for other debt, such as mortgage or bank lending rates.
Comparative indexes
Bloomberg U.S. Aggregate Bond Index is an unmanaged index of U.S. investment-grade fixed-income securities.
ICE BofA (Intercontinental Exchange Bank of America) U.S. 3-Month Treasury Bill Index is an unmanaged index that seeks to measure the performance of U.S. Treasury bills available in the marketplace.
JPMorgan Developed High Yield Index is an unmanaged index of high-yield fixed-income securities issued in developed countries.
MSCI EAFE Index (ND) is a free float-adjusted market capitalization index that is designed to measure the equity performance of large-and mid-cap markets in developed countries, excluding the U.S. and Canada. Calculated with net dividends (ND), this total return index reflects the reinvestment of dividends after the deduction of withholding taxes, using a tax rate applicable to non-resident institutional investors who do not benefit from double taxation treaties.
Putnam Conservative Blended Benchmark is a benchmark administered by Putnam Management, comprising 65% the Bloomberg U.S. Aggregate Bond Index, 25% the Russell 3000® Index, 5% the MSCI EAFE Index (ND), and 5% the JPMorgan Developed High Yield Index.
Russell 3000® Index is an unmanaged index of the 3,000 largest U.S. companies.
S&P 500® Index is an unmanaged index of common stock performance.
Indexes assume reinvestment of all distributions and do not account for fees. Securities and performance of a fund and an index will differ. You cannot invest directly in an index.
BLOOMBERG® is a trademark and service mark of Bloomberg Finance L.P. and its affiliates (collectively “Bloomberg”). Bloomberg or Bloomberg’s licensors own all proprietary rights in the Bloomberg Indices. Neither Bloomberg nor Bloomberg’s licensors approve or endorse this material, or guarantee the accuracy or completeness of any information herein, or make any warranty, express or implied, as to the results to be obtained therefrom, and to the maximum extent allowed by law, neither shall have any liability or responsibility for injury or damages arising in connection therewith.
ICE Data Indices, LLC (“ICE BofA”), used with permission. ICE BofA permits use of the ICE BofA indices and related data on an “as is” basis; makes no warranties regarding same; does not guarantee the suitability, quality, accuracy, timeliness, and/or completeness of the ICE BofA indices or any data included in, related to, or derived therefrom; assumes no liability in connection with the use of the foregoing; and does not sponsor, endorse, or recommend Putnam Investments, or any of its products or services.
Frank Russell Company is the source and owner of the trademarks, service marks, and copyrights related to the Russell Indexes. Russell® is a trademark of Frank Russell Company.
| 16 Dynamic Asset Allocation Conservative Fund |
Lipper, a Refinitiv company, is a third-party industry-ranking entity that ranks mutual funds. Its rankings do not reflect sales charges. Lipper rankings are based on total return at net asset value relative to other funds that have similar current investment styles or objectives as determined by Lipper. Lipper may change a fund’s category assignment at its discretion. Lipper category averages reflect performance trends for funds within a category.
Other information for shareholders
Proxy voting
Putnam is committed to managing our mutual funds in the best interests of our shareholders. The Putnam funds’ proxy voting guidelines and procedures, as well as information regarding how your fund voted proxies relating to portfolio securities during the 12-month period ended June 30, 2021, are available in the Individual Investors section of putnam.com and on the Securities and Exchange Commission (SEC) website, www.sec.gov. If you have questions about finding forms on the SEC’s website, you may call the SEC at 1-800-SEC-0330. You may also obtain the Putnam funds’ proxy voting guidelines and procedures at no charge by calling Putnam’s Shareholder Services at 1-800-225-1581.
Fund portfolio holdings
The fund will file a complete schedule of its portfolio holdings with the SEC for the first and third quarters of each fiscal year on Form N-PORT within 60 days of the end of such fiscal quarter. Shareholders may obtain the fund’s Form N-PORT on the SEC’s website at www.sec.gov.
Prior to its use of Form N-PORT, the fund filed its complete schedule of its portfolio holdings with the SEC on Form N-Q, which is available online at www.sec.gov.
Trustee and employee fund ownership
Putnam employees and members of the Board of Trustees place their faith, confidence, and, most importantly, investment dollars in Putnam mutual funds. As of September 30, 2021, Putnam employees had approximately $562,000,000 and the Trustees had approximately $79,000,000 invested in Putnam mutual funds. These amounts include investments by the Trustees’ and employees’ immediate family members as well as investments through retirement and deferred compensation plans.
Liquidity risk management program
Putnam, as the administrator of the fund’s liquidity risk management program (appointed by the Board of Trustees), presented the most recent annual report on the program to the Trustees in April 2021. The report covered the structure of the program, including the program documents and related policies and procedures adopted to comply with Rule 22e-4 under the Investment Company Act of 1940, and reviewed the operation of the program from January 2020 through December 2020. The report included a description of the annual liquidity assessment of the fund that Putnam performed in November 2020. The report noted that there were no material compliance exceptions identified under Rule 22e-4 during the period. The report included a review of the governance of the program and the methodology for classification of the fund’s investments. The report also included a discussion of liquidity monitoring during the period, including during the market liquidity challenges caused by the Covid-19 pandemic, and the impact those challenges had on the liquidity of the fund’s investments. Putnam concluded that the program has been operating effectively and adequately to ensure compliance with Rule 22e-4.
| Dynamic Asset Allocation Conservative Fund 17 |
Important notice regarding Putnam’s privacy policy
In order to conduct business with our shareholders, we must obtain certain personal information such as account holders’ names, addresses, Social Security numbers, and dates of birth. Using this information, we are able to maintain accurate records of accounts and transactions.
It is our policy to protect the confidentiality of our shareholder information, whether or not a shareholder currently owns shares of our funds. In particular, it is our policy not to sell information about you or your accounts to outside marketing firms. We have safeguards in place designed to prevent unauthorized access to our computer systems and procedures to protect personal information from unauthorized use.
Under certain circumstances, we must share account information with outside vendors who provide services to us, such as mailings and proxy solicitations. In these cases, the service providers enter into confidentiality agreements with us, and we provide only the information necessary to process transactions and perform other services related to your account. Finally, it is our policy to share account information with your financial representative, if you’ve listed one on your Putnam account.
| 18 Dynamic Asset Allocation Conservative Fund |
Trustee approval of management contract
General conclusions
The Board of Trustees of The Putnam Funds oversees the management of each fund and, as required by law, determines annually whether to approve the continuance of your fund’s management contract with Putnam Investment Management, LLC (“Putnam Management”), the sub-management contract with respect to your fund between Putnam Management and its affiliate, Putnam Investments Limited (“PIL”), and the sub-advisory contract among Putnam Management, PIL, and another affiliate, The Putnam Advisory Company (“PAC”). The Board, with the assistance of its Contract Committee, requests and evaluates all information it deems reasonably necessary under the circumstances in connection with its annual contract review. The Contract Committee consists solely of Trustees who are not “interested persons” (as this term is defined in the Investment Company Act of 1940, as amended (the “1940 Act”)) of The Putnam Funds (“Independent Trustees”).
At the outset of the review process, members of the Board’s independent staff and independent legal counsel considered any possible changes to the annual contract review materials furnished to the Contract Committee during the course of the previous year’s review and, as applicable, identified those changes to Putnam Management. Following these discussions and in consultation with the Contract Committee, the Independent Trustees’ independent legal counsel requested that Putnam Management and its affiliates furnish specified information, together with any additional information that Putnam Management considered relevant, to the Contract Committee. Over the course of several months ending in June 2021, the Contract Committee met on a number of occasions with representatives of Putnam Management, and separately in executive session, to consider the information that Putnam Management provided. Throughout this process, the Contract Committee was assisted by the members of the Board’s independent staff and by independent legal counsel for The Putnam Funds and the Independent Trustees.
In May 2021, the Contract Committee met in executive session to discuss and consider its recommendations with respect to the continuance of the contracts. At the Trustees’ June 2021 meeting, the Contract Committee met in executive session with the other Independent Trustees to review a summary of the key financial, performance and other data that the Contract Committee considered in the course of its review. The Contract Committee then presented its written report, which summarized the key factors that the Committee had considered and set forth its recommendations. The Contract Committee recommended, and the Independent Trustees approved, the continuance of your fund’s management, sub-management and sub-advisory contracts, effective July 1, 2021. (Because PIL and PAC are affiliates of Putnam Management and Putnam Management remains fully responsible for all services provided by PIL and PAC, the Trustees have not attempted to evaluate PIL or PAC as separate entities, and all subsequent references to Putnam Management below should be deemed to include reference to PIL and PAC as necessary or appropriate in the context.)
The Independent Trustees’ approval was based on the following conclusions:
• That the fee schedule in effect for your fund represented reasonable compensation in light of the nature and quality of the services being provided to the fund, the fees paid by competitive funds, the costs incurred by Putnam Management in providing services to the fund and the application of certain reductions and waivers noted below; and
• That the fee schedule in effect for your fund represented an appropriate sharing between fund shareholders and Putnam Management of any economies of scale as may exist in the management of the fund at current asset levels.
These conclusions were based on a comprehensive consideration of all information provided to the Trustees and were not the result of any single factor. Some of the factors that figured particularly in the Trustees’ deliberations and how the Trustees considered these factors are described below, although individual Trustees may have evaluated the information presented differently, giving different weights to various factors. It is also important to recognize that the management arrangements for your fund and the other Putnam funds are the result of many years of review and discussion between the Independent Trustees and Putnam Management, that some aspects of the arrangements may receive greater scrutiny in some years than others and that the Trustees’ conclusions
| Dynamic Asset Allocation Conservative Fund 19 |
may be based, in part, on their consideration of fee arrangements in previous years. For example, with certain exceptions primarily involving newly launched or repositioned funds, the current fee arrangements under the vast majority of the funds’ management contracts were first implemented at the beginning of 2010 following extensive review by the Contract Committee and discussions with representatives of Putnam Management, as well as approval by shareholders.
Management fee schedules and total expenses
The Trustees reviewed the management fee schedules in effect for all Putnam funds, including fee levels and breakpoints. Under its management contract, your fund has the benefit of breakpoints in its management fee schedule that provide shareholders with reduced fee levels as assets under management in the Putnam family of funds increase. The Trustees also reviewed the total expenses of each Putnam fund, recognizing that in most cases management fees represented the major, but not the sole, determinant of total costs to fund shareholders. (Two funds have implemented so-called “all-in” management fees covering substantially all routine fund operating costs.)
In reviewing fees and expenses, the Trustees generally focus their attention on material changes in circumstances — for example, changes in assets under management, changes in a fund’s investment strategy, changes in Putnam Management’s operating costs or profitability, or changes in competitive practices in the mutual fund industry — that suggest that consideration of fee changes might be warranted. The Trustees concluded that the circumstances did not indicate that changes to the management fee schedule for your fund would be appropriate at this time.
As in the past, the Trustees also focused on the competitiveness of each fund’s total expense ratio. The Trustees and Putnam Management and the funds’ investor servicing agent, Putnam Investor Services, Inc. (“PSERV”), have implemented expense limitations that were in effect during your fund’s fiscal year ending in 2020. These expense limitations were: (i) a contractual expense limitation applicable to specified open-end funds, including your fund, of 25 basis points on investor servicing fees and expenses and (ii) a contractual expense limitation applicable to specified open-end funds, including your fund, of 20 basis points on so-called “other expenses” (i.e., all expenses exclusive of management fees, distribution fees, investor servicing fees, investment-related expenses, interest, taxes, brokerage commissions, acquired fund fees and expenses and extraordinary expenses). These expense limitations attempt to maintain competitive expense levels for the funds. Most funds, including your fund, had sufficiently low expenses that these expense limitations were not operative during their fiscal years ending in 2020. Putnam Management and PSERV have agreed to maintain these expense limitations until at least January 30, 2023. Putnam Management and PSERV’s commitment to these expense limitation arrangements, which were intended to support an effort to have fund expenses meet competitive standards, was an important factor in the Trustees’ decision to approve the continuance of your fund’s management, sub-management and sub-advisory contracts.
The Trustees reviewed comparative fee and expense information for a custom group of competitive funds selected by Broadridge Financial Solutions, Inc. (“Broadridge”). This comparative information included your fund’s percentile ranking for effective management fees and total expenses (excluding any applicable 12b-1 fees), which provides a general indication of your fund’s relative standing. In the custom peer group, your fund ranked in the second quintile in effective management fees (determined for your fund and the other funds in the custom peer group based on fund asset size and the applicable contractual management fee schedule) and in the third quintile in total expenses (excluding any applicable 12b-1 fees) as of December 31, 2020. The first quintile represents the least expensive funds and the fifth quintile the most expensive funds. The fee and expense data reported by Broadridge as of December 31, 2020 reflected the most recent fiscal year-end data available in Broadridge’s database at that time.
In connection with their review of fund management fees and total expenses, the Trustees also reviewed the costs of the services provided and the profits realized by Putnam Management and its affiliates from their contractual relationships with the funds. This information included trends in revenues, expenses and profitability of Putnam Management and its affiliates relating to the investment management, investor servicing and distribution services provided to the funds. In this regard, the Trustees also reviewed an analysis of the revenues, expenses and profitability of Putnam Management and its affiliates, allocated
| 20 Dynamic Asset Allocation Conservative Fund |
on a fund-by-fund basis, with respect to the funds’ management, distribution and investor servicing contracts. For each fund, the analysis presented information about revenues, expenses and profitability for each of the agreements separately and for the agreements taken together on a combined basis. The Trustees concluded that, at current asset levels, the fee schedules in place for the Putnam funds, including the fee schedule for your fund, represented reasonable compensation for the services being provided and represented an appropriate sharing between fund shareholders and Putnam Management of any economies of scale as may exist in the management of the Putnam funds at that time.
The information examined by the Trustees in connection with their annual contract review for the Putnam funds included information regarding services provided and fees charged by Putnam Management and its affiliates to other clients, including defined benefit pension and profit-sharing plans, sub-advised mutual funds, private funds sponsored by affiliates of Putnam Management, model-only separately managed accounts and Putnam Management’s newly launched exchange-traded funds. This information included, in cases where a product’s investment strategy corresponds with a fund’s strategy, comparisons of those fees with fees charged to the Putnam funds, as well as an assessment of the differences in the services provided to these clients as compared to the services provided to the Putnam funds. The Trustees observed that the differences in fee rates between these clients and the Putnam funds are by no means uniform when examined by individual asset sectors, suggesting that differences in the pricing of investment management services to these types of clients may reflect, among other things, historical competitive forces operating in separate marketplaces. The Trustees considered the fact that in many cases fee rates across different asset classes are higher on average for mutual funds than for other clients, and the Trustees also considered the differences between the services that Putnam Management provides to the Putnam funds and those that it provides to its other clients. The Trustees did not rely on these comparisons to any significant extent in concluding that the management fees paid by your fund are reasonable.
Investment performance
The quality of the investment process provided by Putnam Management represented a major factor in the Trustees’ evaluation of the quality of services provided by Putnam Management under your fund’s management contract. The Trustees were assisted in their review of Putnam Management’s investment process and performance by the work of the investment oversight committees of the Trustees and the full Board of Trustees, which meet on a regular basis with individual portfolio managers and with senior management of Putnam Management’s Investment Division throughout the year. The Trustees concluded that Putnam Management generally provides a high-quality investment process — based on the experience and skills of the individuals assigned to the management of fund portfolios, the resources made available to them and in general Putnam Management’s ability to attract and retain high-quality personnel — but also recognized that this does not guarantee favorable investment results for every fund in every time period.
The Trustees considered that, in the aggregate, The Putnam Funds generally performed well in 2020, which Putnam Management characterized as a challenging year with significant volatility and varied market dynamics. On an asset-weighted basis, the Putnam funds ranked in the second quartile of their peers as determined by Lipper Inc. (“Lipper”) for the year ended December 31, 2020 and, on an asset-weighted-basis, delivered a gross return that was 2.3% ahead of their benchmarks in 2020. In addition to the performance of the individual Putnam funds, the Trustees considered, as they had in prior years, the performance of The Putnam Fund complex versus competitor fund complexes. In this regard, the Trustees observed that The Putnam Funds’ relative performance, as reported in the Barron’s/Lipper Fund Families survey, continued to be exceptionally strong over the long term, with The Putnam Funds ranking as the 3rd best performing mutual fund complex out of 44 complexes for the ten-year period, with 2020 marking the fourth consecutive year that The Putnam Funds have ranked in the top ten fund complexes for the ten-year period. The Trustees noted that The Putnam Funds’ performance was solid over the one- and five-year periods, with The Putnam Funds ranking 22nd out of 53 complexes and 14th out of 50 complexes, respectively. In addition to the Barron’s/Lipper Fund Families Survey, the Trustees also considered the funds’ ratings assigned by Morningstar Inc., noting that 26 of the funds were four- or five-star rated at the end of 2020 (representing an increase of four funds year-over-year) and that this included seven funds
| Dynamic Asset Allocation Conservative Fund 21 |
that had achieved a five-star rating (representing an increase of two funds year-over-year). They also noted, however, the disappointing investment performance of some funds for periods ended December 31, 2020 and considered information provided by Putnam Management regarding the factors contributing to the underperformance and actions being taken to improve the performance of these particular funds. The Trustees indicated their intention to continue to monitor closely the performance of those funds and evaluate whether additional actions to address areas of underperformance may be warranted.
For purposes of the Trustees’ evaluation of the Putnam funds’ investment performance, the Trustees generally focus on a competitive industry ranking of each fund’s total net return over a one-year, three-year and five-year period. For a number of Putnam funds with relatively unique investment mandates for which Putnam Management informed the Trustees that meaningful competitive performance rankings are not considered to be available, the Trustees evaluated performance based on their total gross and net returns and comparisons of those returns to the returns of selected investment benchmarks. In the case of your fund, the Trustees considered that its class A share cumulative total return performance at net asset value was in the following quartiles of its Lipper peer group (Lipper Mixed-Asset Target Allocation Conservative Funds) for the one-year, three-year and five-year periods ended December 31, 2020 (the first quartile representing the best-performing funds and the fourth quartile the worst-performing funds):
| One-year period | 2nd |
| Three-year period | 3rd |
| Five-year period | 3rd |
Over the one-year, three-year and five-year periods ended December 31, 2020, there were 305, 293 and 270 funds, respectively, in your fund’s Lipper peer group. (When considering performance information, shareholders should be mindful that past performance is not a guarantee of future results.)
The Trustees considered Putnam Management’s continued efforts to support fund performance through certain initiatives, including structuring compensation for portfolio managers to enhance accountability for fund performance, emphasizing accountability in the portfolio management process and affirming its commitment to a fundamental-driven approach to investing. The Trustees noted further that Putnam Management had made selective hires and internal promotions in 2020 to strengthen its investment team.
Brokerage and soft-dollar allocations; investor servicing
The Trustees considered various potential benefits that Putnam Management may receive in connection with the services it provides under the management contract with your fund. These include benefits related to brokerage allocation and the use of soft dollars, whereby a portion of the commissions paid by a fund for brokerage may be used to acquire research services that are expected to be useful to Putnam Management in managing the assets of the fund and of other clients. Subject to policies established by the Trustees, soft dollars generated by these means are used predominantly to acquire brokerage and research services (including third-party research and market data) that enhance Putnam Management’s investment capabilities and supplement Putnam Management’s internal research efforts. The Trustees indicated their continued intent to monitor regulatory and industry developments in this area with the assistance of their Brokerage Committee. In addition, with the assistance of their Brokerage Committee, the Trustees indicated their continued intent to monitor the allocation of the Putnam funds’ brokerage in order to ensure that the principle of seeking best price and execution remains paramount in the portfolio trading process.
Putnam Management may also receive benefits from payments that the funds make to Putnam Management’s affiliates for investor or distribution services. In conjunction with the annual review of your fund’s management, sub-management and sub-advisory contracts, the Trustees reviewed your fund’s investor servicing agreement with PSERV and its distributor’s contract and distribution plans with Putnam Retail Management Limited Partnership (“PRM”), both of which are affiliates of Putnam Management. The Trustees concluded that the fees payable by the funds to PSERV and PRM, as applicable, for such services are fair and reasonable in relation to the nature and quality of such services, the fees paid by competitive funds and the costs incurred by PSERV and PRM, as applicable, in providing such services. Furthermore, the Trustees were of the view that the investor services provided by PSERV were required for the operation of the funds, and that they were of a quality at least equal to those provided by other providers.
| 22 Dynamic Asset Allocation Conservative Fund |
Audited financial statements
These sections of the report, as well as the accompanying Notes, preceded by the Report of Independent Registered Public Accounting Firm, constitute the fund’s audited financial statements.
The fund’s portfolio lists all the fund’s investments and their values as of the last day of the reporting period. Holdings are organized by asset type and industry sector, country, or state to show areas of concentration and diversification.
Statement of assets and liabilities shows how the fund’s net assets and share price are determined. All investment and non-investment assets are added together. Any unpaid expenses and other liabilities are subtracted from this total. The result is divided by the number of shares to determine the net asset value per share, which is calculated separately for each class of shares. (For funds with preferred shares, the amount subtracted from total assets includes the liquidation preference of preferred shares.)
Statement of operations shows the fund’s net investment gain or loss. This is done by first adding up all the fund’s earnings — from dividends and interest income — and subtracting its operating expenses to determine net investment income (or loss). Then, any net gain or loss the fund realized on the sales of its holdings — as well as any unrealized gains or losses over the period — is added to or subtracted from the net investment result to determine the fund’s net gain or loss for the fiscal period.
Statement of changes in net assets shows how the fund’s net assets were affected by the fund’s net investment gain or loss, by distributions to shareholders, and by changes in the number of the fund’s shares. It lists distributions and their sources (net investment income or realized capital gains) over the current reporting period and the most recent fiscal year-end. The distributions listed here may not match the sources listed in the Statement of operations because the distributions are determined on a tax basis and may be paid in a different period from the one in which they were earned.
Financial highlights provide an overview of the fund’s investment results, per-share distributions, expense ratios, net investment income ratios, and portfolio turnover in one summary table, reflecting the five most recent reporting periods. In a semiannual report, the highlights table also includes the current reporting period.
| Dynamic Asset Allocation Conservative Fund 23 |
Report of Independent Registered Public Accounting Firm
To the Board of Trustees of Putnam Asset Allocation Funds and Shareholders of
Putnam Dynamic Asset Allocation Conservative Fund:
Opinion on the Financial Statements
We have audited the accompanying statement of assets and liabilities, including the fund’s portfolio, of Putnam Dynamic Asset Allocation Conservative Fund (one of the funds constituting Putnam Asset Allocation Funds, referred to hereafter as the “Fund”) as of September 30, 2021, the related statement of operations for the year ended September 30, 2021, the statement of changes in net assets for each of the two years in the period ended September 30, 2021, including the related notes, and the financial highlights for each of the five years in the period ended September 30, 2021 (collectively referred to as the “financial statements”). In our opinion, the financial statements present fairly, in all material respects, the financial position of the Fund as of September 30, 2021, the results of its operations for the year then ended, the changes in its net assets for each of the two years in the period ended September 30, 2021, and the financial highlights for each of the five years in the period ended September 30, 2021, in conformity with accounting principles generally accepted in the United States of America.
Basis for Opinion
These financial statements are the responsibility of the Fund’s management. Our responsibility is to express an opinion on the Fund’s financial statements based on our audits. We are a public accounting firm registered with the Public Company Accounting Oversight Board (United States) (“PCAOB”) and are required to be independent with respect to the Fund in accordance with the U.S. federal securities laws and the applicable rules and regulations of the Securities and Exchange Commission and the PCAOB.
We conducted our audits of these financial statements in accordance with the standards of the PCAOB. Those standards require that we plan and perform the audit to obtain reasonable assurance about whether the financial statements are free of material misstatement, whether due to error or fraud.
Our audits included performing procedures to assess the risks of material misstatement of the financial statements, whether due to error or fraud, and performing procedures that respond to those risks. Such procedures included examining, on a test basis, evidence regarding the amounts and disclosures in the financial statements. Our audits also included evaluating the accounting principles used and significant estimates made by management, as well as evaluating the overall presentation of the financial statements. Our procedures included confirmation of securities owned as of September 30, 2021, by correspondence with the custodian, transfer agent, agent banks and brokers; when replies were not received from brokers, we performed other auditing procedures. We believe that our audits provide a reasonable basis for our opinion.
PricewaterhouseCoopers LLP
Boston, Massachusetts
November 10, 2021
We have served as the auditor of one or more investment companies in the Putnam Investments family of funds since at least 1957. We have not been able to determine the specific year we began serving as auditor.
| 24 Dynamic Asset Allocation Conservative Fund |
| The fund’s portfolio 9/30/21 | ||
| COMMON STOCKS (53.9%)* | Shares | Value |
| Basic materials (2.2%) | ||
| Akzo Nobel NV (Netherlands) | 4,130 | $449,719 |
| Anglo American PLC (United Kingdom) | 15,368 | 530,117 |
| Arkema SA (France) | 1,797 | 237,713 |
| Axalta Coating Systems, Ltd. † | 18,000 | 525,420 |
| BHP Group PLC (United Kingdom) | 21,069 | 525,109 |
| BlueScope Steel, Ltd. (Australia) | 20,443 | 296,578 |
| Brenntag AG (Germany) | 8,134 | 758,759 |
| CF Industries Holdings, Inc. | 6,400 | 357,248 |
| Compagnie De Saint-Gobain (France) | 18,648 | 1,255,981 |
| Corteva, Inc. | 36,594 | 1,539,876 |
| Covestro AG (Germany) | 8,247 | 566,416 |
| CRH PLC (Ireland) | 47,596 | 2,220,162 |
| Dow, Inc. | 28,407 | 1,635,107 |
| DuPont de Nemours, Inc. | 40,696 | 2,766,921 |
| Eastman Chemical Co. | 6,700 | 674,958 |
| Eiffage SA (France) | 2,393 | 241,410 |
| Fortune Brands Home & Security, Inc. | 8,121 | 726,180 |
| Freeport-McMoRan, Inc. (Indonesia) | 51,649 | 1,680,142 |
| Holcim, Ltd. (Switzerland) | 8,906 | 428,472 |
| International Paper Co. | 5,000 | 279,600 |
| LANXESS AG (Germany) | 1,922 | 130,696 |
| LG Chem, Ltd. (South Korea) | 300 | 195,959 |
| Linde PLC | 1,996 | 593,471 |
| Nitto Denko Corp. (Japan) | 1,500 | 106,892 |
| Rio Tinto PLC (United Kingdom) | 10,564 | 697,500 |
| Sherwin-Williams Co. (The) | 5,543 | 1,550,543 |
| Shin-Etsu Chemical Co., Ltd. (Japan) | 2,400 | 404,795 |
| SIG Combibloc Group AG (Switzerland) | 18,266 | 484,454 |
| WestRock Co. | 6,000 | 298,980 |
| Weyerhaeuser Co. R | 49,600 | 1,764,272 |
| 23,923,450 | ||
| Capital goods (2.9%) | ||
| ABB, Ltd. (Switzerland) | 17,826 | 594,179 |
| AGCO Corp. | 6,400 | 784,192 |
| Allegion PLC (Ireland) | 6,200 | 819,516 |
| Allison Transmission Holdings, Inc. | 7,500 | 264,900 |
| Atlas Copco AB Class A (Sweden) | 1,680 | 101,909 |
| Avery Dennison Corp. | 1,400 | 290,094 |
| Caterpillar, Inc. | 1,400 | 268,758 |
| Clean Harbors, Inc. † | 2,600 | 270,062 |
| CNH Industrial NV (United Kingdom) | 58,319 | 987,471 |
| Crown Holdings, Inc. | 6,300 | 634,914 |
| Cummins, Inc. | 7,500 | 1,684,200 |
| Daikin Industries, Ltd. (Japan) | 2,400 | 516,213 |
| Deere & Co. | 8,739 | 2,928,177 |
| Dover Corp. | 1,700 | 264,350 |
| Eaton Corp. PLC | 7,908 | 1,180,743 |
| GEA Group AG (Germany) | 2,565 | 117,550 |
Dynamic Asset Allocation Conservative Fund 25 | |
| COMMON STOCKS (53.9%)* cont. | Shares | Value |
| Capital goods cont. | ||
| Gentex Corp. | 11,800 | $389,164 |
| Honeywell International, Inc. | 9,411 | 1,997,767 |
| Johnson Controls International PLC | 43,644 | 2,971,283 |
| Koito Manufacturing Co., Ltd. (Japan) | 4,900 | 294,632 |
| Legrand SA (France) | 5,817 | 623,893 |
| Lockheed Martin Corp. | 10,300 | 3,554,530 |
| Northrop Grumman Corp. | 6,008 | 2,163,781 |
| Oshkosh Corp. | 3,200 | 327,584 |
| Otis Worldwide Corp. | 7,617 | 626,727 |
| Parker Hannifin Corp. | 7,500 | 2,097,150 |
| Raytheon Technologies Corp. | 12,931 | 1,111,549 |
| Republic Services, Inc. | 4,500 | 540,270 |
| Sandvik AB (Sweden) | 24,512 | 559,416 |
| Schneider Electric SA (France) | 3,463 | 575,759 |
| Textron, Inc. | 8,000 | 558,480 |
| Toro Co. (The) | 3,200 | 311,712 |
| TransDigm Group, Inc. † | 900 | 562,113 |
| Waste Management, Inc. | 7,800 | 1,165,008 |
| 32,138,046 | ||
| Communication services (1.7%) | ||
| American Tower Corp. R | 9,824 | 2,607,388 |
| AT&T, Inc. | 27,000 | 729,270 |
| Charter Communications, Inc. Class A † S | 4,105 | 2,986,634 |
| Comcast Corp. Class A | 55,580 | 3,108,589 |
| Crown Castle International Corp. R | 1,500 | 259,980 |
| Deutsche Telekom AG (Germany) | 38,725 | 780,780 |
| KDDI Corp. (Japan) | 41,500 | 1,371,472 |
| Koninklijke KPN NV (Netherlands) | 99,376 | 311,651 |
| Liberty Global PLC Class C (United Kingdom) † | 25,455 | 749,904 |
| SK Telecom Co., Ltd. (South Korea) | 2,216 | 604,268 |
| T-Mobile US, Inc. † | 6,784 | 866,724 |
| Verizon Communications, Inc. | 79,732 | 4,306,325 |
| 18,682,985 | ||
| Computers (3.5%) | ||
| Apple, Inc. | 188,655 | 26,694,683 |
| Check Point Software Technologies, Ltd. (Israel) † | 1,400 | 158,256 |
| Cisco Systems, Inc./California | 56,400 | 3,069,852 |
| Dynatrace, Inc. † | 11,919 | 845,891 |
| Fortinet, Inc. † | 9,800 | 2,861,992 |
| Fujitsu, Ltd. (Japan) | 3,000 | 544,832 |
| Logitech International SA (Switzerland) | 1,793 | 158,795 |
| ServiceNow, Inc. † | 3,272 | 2,036,067 |
| Synopsys, Inc. † | 4,100 | 1,227,581 |
| Twilio, Inc. Class A † | 3,045 | 971,507 |
| 38,569,456 | ||
| Conglomerates (0.2%) | ||
| 3M Co. | 4,900 | 859,558 |
| AMETEK, Inc. | 6,500 | 806,065 |
| General Electric Co. | 2,221 | 228,830 |
| 1,894,453 |
26 Dynamic Asset Allocation Conservative Fund | |
| COMMON STOCKS (53.9%)* cont. | Shares | Value |
| Consumer cyclicals (9.0%) | ||
| Adecco Group AG (Switzerland) | 1,102 | $55,189 |
| Adyen NV (Netherlands) † | 113 | 314,203 |
| Allfunds Group PLC (United Kingdom) † | 22,579 | 434,208 |
| Amadeus IT Holding SA Class A (Spain) † | 5,588 | 367,090 |
| Amazon.com, Inc. † | 5,476 | 17,988,879 |
| Aramark | 20,909 | 687,070 |
| Aristocrat Leisure, Ltd. (Australia) | 11,660 | 390,312 |
| Berkeley Group Holdings PLC (The) (United Kingdom) | 2,397 | 140,408 |
| BJ’s Wholesale Club Holdings, Inc. † | 29,167 | 1,601,852 |
| Brambles, Ltd. (Australia) | 33,882 | 263,532 |
| Brunswick Corp. | 6,400 | 609,728 |
| CIE Generale Des Etablissements Michelin SCA (France) | 4,683 | 718,703 |
| CK Hutchison Holdings, Ltd. (Hong Kong) | 27,500 | 182,361 |
| CoStar Group, Inc. † | 16,457 | 1,416,289 |
| Daiwa House Industry Co., Ltd. (Japan) | 12,200 | 407,438 |
| DraftKings, Inc. Class A † S | 19,209 | 925,105 |
| Evolution AB (Sweden) | 996 | 151,400 |
| FleetCor Technologies, Inc. † | 1,100 | 287,397 |
| Flutter Entertainment PLC (Ireland) † | 2,877 | 564,789 |
| Ford Motor Co. † | 257,700 | 3,649,032 |
| Gartner, Inc. † | 5,900 | 1,792,892 |
| General Motors Co. † | 38,686 | 2,039,139 |
| Genting Intl. Public Ltd., Co. (Singapore) | 203,400 | 107,135 |
| GVC Holdings PLC (United Kingdom) † | 17,376 | 497,405 |
| Hermes International (France) | 481 | 664,779 |
| Hilton Worldwide Holdings, Inc. † | 8,923 | 1,178,818 |
| Home Depot, Inc. (The) | 3,475 | 1,140,704 |
| iHeartMedia, Inc. Class A † | 577 | 14,437 |
| Industria de Diseno Textil SA (Inditex) (Spain) | 6,519 | 237,178 |
| Interpublic Group of Cos., Inc. (The) | 24,800 | 909,416 |
| Kingfisher PLC (United Kingdom) | 61,424 | 277,898 |
| Kohl’s Corp. | 27,100 | 1,276,139 |
| La Francaise des Jeux SAEM (France) | 2,246 | 115,535 |
| Live Nation Entertainment, Inc. † | 13,923 | 1,268,803 |
| lululemon athletica, Inc. (Canada) † | 3,283 | 1,328,630 |
| LVMH Moet Hennessy Louis Vuitton SA (France) | 322 | 230,251 |
| Marriott International, Inc./MD Class A † | 15,900 | 2,354,631 |
| Mastercard, Inc. Class A | 7,907 | 2,749,106 |
| Moncler SpA (Italy) | 4,706 | 287,823 |
| Nexi SpA (Italy) † | 30,086 | 561,307 |
| Nielsen Holdings PLC | 17,000 | 326,230 |
| Nike, Inc. Class B | 12,741 | 1,850,375 |
| Nintendo Co., Ltd. (Japan) | 1,500 | 729,688 |
| Nitori Holdings Co., Ltd. (Japan) | 3,100 | 609,870 |
| O’Reilly Automotive, Inc. † | 7,609 | 4,649,556 |
| Omnicom Group, Inc. | 4,100 | 297,086 |
| OPAP SA (Greece) | 26,281 | 405,395 |
| Owens Corning | 3,100 | 265,050 |
| Pandora A/S (Denmark) | 2,460 | 298,324 |
Dynamic Asset Allocation Conservative Fund 27 | |
| COMMON STOCKS (53.9%)* cont. | Shares | Value |
| Consumer cyclicals cont. | ||
| PayPal Holdings, Inc. † | 18,724 | $4,872,172 |
| Polaris, Inc. S | 3,500 | 418,810 |
| Porsche Automobil Holding SE (Preference) (Germany) | 4,186 | 417,152 |
| Publicis Groupe SA (France) | 2,806 | 188,966 |
| PulteGroup, Inc. | 27,097 | 1,244,294 |
| Ross Stores, Inc. | 3,000 | 326,550 |
| S&P Global, Inc. | 2,850 | 1,210,937 |
| SEB SA (France) | 723 | 101,946 |
| SGS SA (Switzerland) | 135 | 392,548 |
| Sofina SA (Belgium) | 192 | 76,169 |
| Sony Group Corp. (Japan) | 17,600 | 1,959,961 |
| Square, Inc. Class A † | 1,878 | 450,420 |
| Stellantis NV (Italy) | 36,536 | 699,050 |
| TABCORP Holdings, Ltd. (Australia) | 43,225 | 152,993 |
| Target Corp. | 18,639 | 4,264,044 |
| Tempur Sealy International, Inc. | 14,500 | 672,945 |
| Tesla, Inc. † | 3,071 | 2,381,499 |
| Thomson Reuters Corp. (Canada) | 3,192 | 352,945 |
| TJX Cos., Inc. (The) | 72,445 | 4,779,921 |
| Toyota Motor Corp. (Japan) | 3,000 | 53,665 |
| TransUnion | 2,600 | 292,006 |
| Travel + Leisure Co. | 6,200 | 338,086 |
| United Rentals, Inc. † | 4,817 | 1,690,430 |
| Universal Music Group NV (Netherlands) † | 16,112 | 431,403 |
| Volkswagen AG (Preference) (Germany) | 609 | 136,425 |
| Volvo AB (Sweden) | 25,646 | 576,197 |
| Walmart, Inc. | 47,114 | 6,566,749 |
| Walt Disney Co. (The) † | 6,507 | 1,100,789 |
| Wesfarmers, Ltd. (Australia) | 17,324 | 697,160 |
| Whirlpool Corp. | 1,300 | 265,018 |
| Wyndham Hotels & Resorts, Inc. | 4,300 | 331,917 |
| Yamaha Motor Co., Ltd. (Japan) | 25,000 | 696,119 |
| 97,757,871 | ||
| Consumer staples (3.6%) | ||
| Airbnb, Inc. Class A † | 8,529 | 1,430,740 |
| Asahi Group Holdings, Ltd. (Japan) | 11,600 | 561,927 |
| Auto1 Group SE 144A (Germany) † | 5,237 | 191,466 |
| Carlsberg A/S Class B (Denmark) | 2,822 | 459,070 |
| Chipotle Mexican Grill, Inc. † | 655 | 1,190,476 |
| Coca-Cola Co. (The) | 6,100 | 320,067 |
| Coca-Cola Europacific Partners PLC (United Kingdom) | 10,341 | 571,753 |
| Coca-Cola HBC AG (Switzerland) | 20,061 | 644,797 |
| Coles Group, Ltd. (Australia) | 40,970 | 499,995 |
| Colgate-Palmolive Co. | 34,300 | 2,592,394 |
| Constellation Brands, Inc. Class A | 6,800 | 1,432,692 |
| Darden Restaurants, Inc. | 6,500 | 984,555 |
| Diageo PLC (United Kingdom) | 18,343 | 883,822 |
| Endeavour Group, Ltd./Australia (Australia) | 22,257 | 111,763 |
| Estee Lauder Cos., Inc. (The) Class A | 4,136 | 1,240,510 |
28 Dynamic Asset Allocation Conservative Fund | |
| COMMON STOCKS (53.9%)* cont. | Shares | Value |
| Consumer staples cont. | ||
| Ferguson PLC (United Kingdom) | 4,571 | $633,645 |
| Imperial Brands PLC (United Kingdom) | 22,935 | 478,639 |
| ITOCHU Corp. (Japan) | 22,400 | 656,130 |
| Keurig Dr Pepper, Inc. | 20,985 | 716,848 |
| Koninklijke Ahold Delhaize NV (Netherlands) | 21,349 | 707,790 |
| Kraft Heinz Co. (The) | 4,300 | 158,326 |
| L’Oreal SA (France) | 2,160 | 891,480 |
| ManpowerGroup, Inc. | 3,700 | 400,636 |
| McDonald’s Corp. | 10,400 | 2,507,544 |
| MercadoLibre, Inc. (Argentina) † | 400 | 671,760 |
| Mondelez International, Inc. Class A | 22,000 | 1,279,960 |
| Nestle SA (Switzerland) | 6,043 | 727,087 |
| Netflix, Inc. † | 1,050 | 640,857 |
| NH Foods, Ltd. (Japan) | 3,600 | 136,179 |
| PepsiCo, Inc. | 26,222 | 3,944,051 |
| Philip Morris International, Inc. | 4,700 | 445,513 |
| Procter & Gamble Co. (The) | 31,109 | 4,349,038 |
| Starbucks Corp. | 10,100 | 1,114,131 |
| Swedish Match AB | 33,602 | 294,693 |
| Sysco Corp. | 14,300 | 1,122,550 |
| Chocoladefabriken Lindt & Spruengli AG (Switzerland) | 1 | 117,425 |
| Tyson Foods, Inc. Class A | 4,200 | 331,548 |
| Uber Technologies, Inc. † | 31,824 | 1,425,715 |
| Unilever PLC (United Kingdom) | 2,429 | 131,307 |
| Yakult Honsha Co., Ltd. (Japan) | 4,400 | 223,082 |
| Yum! Brands, Inc. | 2,200 | 269,082 |
| Zalando SE (Germany) † | 4,513 | 414,716 |
| ZOZO, Inc. (Japan) | 26,500 | 992,278 |
| 38,898,037 | ||
| Electronics (2.5%) | ||
| Advanced Micro Devices, Inc. † | 11,904 | 1,224,922 |
| Brother Industries, Ltd. (Japan) | 7,700 | 169,421 |
| Cirrus Logic, Inc. † | 3,800 | 312,930 |
| Garmin, Ltd. | 2,200 | 342,012 |
| Hoya Corp. (Japan) | 9,900 | 1,548,339 |
| Intel Corp. | 5,500 | 293,040 |
| Marvell Technology, Inc. | 7,230 | 436,041 |
| MinebeaMitsumi, Inc. (Japan) | 24,500 | 625,589 |
| nVent Electric PLC (United Kingdom) | 5,500 | 177,815 |
| NVIDIA Corp. | 54,332 | 11,255,417 |
| NXP Semiconductors NV | 3,719 | 728,441 |
| Omron Corp. (Japan) | 3,300 | 327,088 |
| Qualcomm, Inc. | 51,216 | 6,605,840 |
| Samsung Electronics Co., Ltd. (Preference) (South Korea) | 9,728 | 569,405 |
| Shimadzu Corp. (Japan) | 6,200 | 272,343 |
| Texas Instruments, Inc. | 4,421 | 849,760 |
| Thales SA (France) | 6,713 | 648,291 |
| Vontier Corp. | 25,765 | 865,704 |
| 27,252,398 |
Dynamic Asset Allocation Conservative Fund 29 | |
| COMMON STOCKS (53.9%)* cont. | Shares | Value |
| Energy (1.6%) | ||
| BP PLC (United Kingdom) | 131,464 | $595,538 |
| Cenovus Energy, Inc. (Canada) | 20,534 | 207,026 |
| Chevron Corp. | 12,200 | 1,237,690 |
| ConocoPhillips | 27,980 | 1,896,205 |
| DCC PLC (Ireland) | 1,376 | 113,890 |
| Enterprise Products Partners LP | 30,822 | 666,988 |
| EOG Resources, Inc. | 4,418 | 354,633 |
| Equinor ASA (Norway) | 29,469 | 750,970 |
| Exxon Mobil Corp. | 17,974 | 1,057,231 |
| Halliburton Co. | 98,839 | 2,136,899 |
| Marathon Petroleum Corp. | 17,200 | 1,063,132 |
| MWO Holdings, LLC (Units) F | 42 | 107 |
| Oasis Petroleum, Inc. | 1,773 | 176,272 |
| Orsted AS (Denmark) | 3,196 | 421,682 |
| Reliance Industries, Ltd. 144A (India) | 11,457 | 774,443 |
| Royal Dutch Shell PLC Class A (Amsterdam Exchange) (United Kingdom) | 65,025 | 1,448,246 |
| Royal Dutch Shell PLC Class B (United Kingdom) | 88,316 | 1,956,581 |
| Schlumberger, Ltd. | 5,500 | 163,020 |
| Targa Resources Corp. | 15,100 | 743,071 |
| Valero Energy Corp. | 19,340 | 1,364,824 |
| 17,128,448 | ||
| Financials (7.8%) | ||
| 3i Group PLC (United Kingdom) | 19,558 | 336,885 |
| Aflac, Inc. | 13,200 | 688,116 |
| AIA Group, Ltd. (Hong Kong) | 98,600 | 1,135,294 |
| Alliance Data Systems Corp. | 3,300 | 332,937 |
| Allianz SE (Germany) | 3,661 | 825,716 |
| Allstate Corp. (The) S | 6,600 | 840,246 |
| Ally Financial, Inc. | 29,400 | 1,500,870 |
| American International Group, Inc. | 18,848 | 1,034,567 |
| Ameriprise Financial, Inc. | 6,300 | 1,663,956 |
| Apollo Global Management, Inc. | 14,958 | 921,263 |
| Assured Guaranty, Ltd. | 27,487 | 1,286,666 |
| Athene Holding, Ltd. Class A † | 9,000 | 619,830 |
| AvalonBay Communities, Inc. R | 1,300 | 288,132 |
| Aviva PLC (United Kingdom) | 94,034 | 500,490 |
| AXA SA (France) | 56,828 | 1,580,954 |
| Banco Bilbao Vizcaya Argenta (Spain) | 105,249 | 694,276 |
| Bank Leumi Le-Israel BM (Israel) | 55,755 | 473,277 |
| Bank of America Corp. | 92,977 | 3,946,874 |
| Bank of Ireland Group PLC (Ireland) † | 100,781 | 594,020 |
| BNP Paribas SA (France) | 11,302 | 723,954 |
| BOC Hong Kong Holdings, Ltd. (Hong Kong) | 76,500 | 229,181 |
| Boston Properties, Inc. R | 9,986 | 1,081,983 |
| Brixmor Property Group, Inc. R | 13,000 | 287,430 |
| CaixaBank SA (Spain) | 178,145 | 552,404 |
| Capital One Financial Corp. | 8,674 | 1,404,928 |
| CBRE Group, Inc. Class A † | 13,300 | 1,294,888 |
| Citigroup, Inc. | 122,185 | 8,574,943 |
30 Dynamic Asset Allocation Conservative Fund | |
| COMMON STOCKS (53.9%)* cont. | Shares | Value |
| Financials cont. | ||
| CK Asset Holdings, Ltd. (Hong Kong) | 94,616 | $543,776 |
| Commonwealth Bank of Australia (Australia) | 4,252 | 316,857 |
| Dai-ichi Life Holdings, Inc. (Japan) | 16,500 | 359,271 |
| DBS Group Holdings, Ltd. (Singapore) | 31,800 | 706,148 |
| Deutsche Boerse AG (Germany) | 3,086 | 502,359 |
| Dexus Property Group (Australia) R | 23,211 | 179,593 |
| Direct Line Insurance Group PLC (United Kingdom) | 59,366 | 231,622 |
| Discover Financial Services | 2,700 | 331,695 |
| Duke Realty Corp. R | 6,000 | 287,220 |
| Equitable Holdings, Inc. | 28,000 | 829,920 |
| Equity Lifestyle Properties, Inc. R | 3,700 | 288,970 |
| Fidelity National Financial, Inc. | 6,700 | 303,778 |
| First Industrial Realty Trust, Inc. R | 5,600 | 291,648 |
| Gaming and Leisure Properties, Inc. R | 39,889 | 1,847,659 |
| Gjensidige Forsikring ASA (Norway) | 3,836 | 84,950 |
| Goldman Sachs Group, Inc. (The) | 18,204 | 6,881,658 |
| Goodman Group (Australia) R | 40,962 | 635,869 |
| Hana Financial Group, Inc. (South Korea) | 17,381 | 670,886 |
| Investor AB Class B (Sweden) | 25,563 | 547,348 |
| Invitation Homes, Inc. R | 7,400 | 283,642 |
| Israel Discount Bank, Ltd. Class A (Israel) † | 43,231 | 228,249 |
| Jones Lang LaSalle, Inc. † | 2,900 | 719,461 |
| JPMorgan Chase & Co. | 69,042 | 11,301,485 |
| KeyCorp | 25,238 | 545,646 |
| Lamar Advertising Co. Class A R | 4,300 | 487,835 |
| Lincoln National Corp. | 4,700 | 323,125 |
| Link REIT (The) (Hong Kong) R | 5,500 | 47,004 |
| London Stock Exchange Group PLC (United Kingdom) | 6,975 | 696,855 |
| Medical Properties Trust, Inc. R | 24,000 | 481,680 |
| MetLife, Inc. | 48,400 | 2,987,732 |
| Mitsubishi UFJ Financial Group, Inc. (Japan) | 128,600 | 750,824 |
| Morgan Stanley | 8,000 | 778,480 |
| Network International Holdings PLC (United Arab Emirates) † | 90,646 | 443,456 |
| NN Group NV (Netherlands) | 1,184 | 61,790 |
| OneMain Holdings, Inc. | 6,500 | 359,645 |
| Partners Group Holding AG (Switzerland) | 415 | 646,035 |
| Persimmon PLC (United Kingdom) | 3,999 | 142,500 |
| PNC Financial Services Group, Inc. (The) | 8,564 | 1,675,461 |
| Principal Financial Group, Inc. | 11,100 | 714,840 |
| Prologis, Inc. R | 1,200 | 150,516 |
| Prudential PLC (United Kingdom) | 26,138 | 507,408 |
| Public Storage R | 900 | 267,390 |
| Radian Group, Inc. | 41,232 | 936,791 |
| Raymond James Financial, Inc. | 1,500 | 138,420 |
| Sberbank of Russia PJSC ADR (Russia) | 23,764 | 441,541 |
| SEI Investments Co. | 4,000 | 237,200 |
| Simon Property Group, Inc. R | 1,500 | 194,955 |
| Skandinaviska Enskilda Banken AB (Sweden) | 28,569 | 402,541 |
| SLM Corp. | 31,200 | 549,120 |
Dynamic Asset Allocation Conservative Fund 31 | |
| COMMON STOCKS (53.9%)* cont. | Shares | Value |
| Financials cont. | ||
| State Street Corp. | 9,100 | $770,952 |
| Sumitomo Mitsui Financial Group, Inc. (Japan) | 20,093 | 702,961 |
| Sumitomo Mitsui Trust Holdings, Inc. (Japan) | 7,400 | 253,433 |
| Sumitomo Realty & Development Co., Ltd. (Japan) | 2,800 | 102,173 |
| Sun Hung Kai Properties, Ltd. (Hong Kong) | 15,500 | 192,624 |
| Synchrony Financial | 38,700 | 1,891,656 |
| United Overseas Bank, Ltd. (Singapore) | 17,400 | 329,098 |
| Unum Group | 13,400 | 335,804 |
| Visa, Inc. Class A | 13,606 | 3,030,737 |
| Zurich Insurance Group AG (Switzerland) | 444 | 181,040 |
| 84,547,412 | ||
| Government (—%) | ||
| Poste Italiane SpA (Italy) | 11,192 | 154,034 |
| 154,034 | ||
| Healthcare (7.0%) | ||
| 10x Genomics, Inc. Class A † | 6,300 | 917,154 |
| Abbott Laboratories | 19,400 | 2,291,722 |
| AbbVie, Inc. | 27,349 | 2,950,136 |
| Abcam PLC (United Kingdom) † | 17,931 | 356,586 |
| Align Technology, Inc. † | 4,600 | 3,060,978 |
| AmerisourceBergen Corp. | 7,000 | 836,150 |
| Amgen, Inc. | 1,200 | 255,180 |
| Anthem, Inc. | 12,736 | 4,747,981 |
| AstraZeneca PLC (United Kingdom) | 7,540 | 907,700 |
| AstraZeneca PLC ADR (United Kingdom) | 29,387 | 1,764,983 |
| Biogen, Inc. † | 6,200 | 1,754,538 |
| Boston Scientific Corp. † | 6,500 | 282,035 |
| Bristol-Myers Squibb Co. | 79,800 | 4,721,766 |
| Danaher Corp. | 9,623 | 2,929,627 |
| DexCom, Inc. † | 2,269 | 1,240,825 |
| Edwards Lifesciences Corp. † | 22,900 | 2,592,509 |
| Eli Lilly and Co. | 7,327 | 1,692,903 |
| Eurofins Scientific (Luxembourg) | 2,527 | 324,055 |
| Fisher & Paykel Healthcare Corp., Ltd. (New Zealand) | 4,318 | 94,945 |
| Ginkgo Bioworks Holdings, Inc. † S | 17,983 | 208,423 |
| GlaxoSmithKline PLC (United Kingdom) | 15,044 | 283,963 |
| HCA Healthcare, Inc. | 5,582 | 1,354,863 |
| Hikma Pharmaceuticals PLC (United Kingdom) | 5,860 | 192,784 |
| ICON PLC (Ireland) † | 1,483 | 388,576 |
| IDEXX Laboratories, Inc. † | 1,900 | 1,181,610 |
| Incyte Corp. † | 8,000 | 550,240 |
| Ipsen SA (France) | 1,869 | 178,428 |
| IQVIA Holdings, Inc. † | 6,990 | 1,674,385 |
| Johnson & Johnson | 19,100 | 3,084,650 |
| Laboratory Corp. of America Holdings † | 1,000 | 281,440 |
| Lonza Group AG (Switzerland) | 2,521 | 1,888,710 |
| McKesson Corp. | 18,159 | 3,620,541 |
| Medtronic PLC | 16,800 | 2,105,880 |
| Merck & Co., Inc. | 60,973 | 4,579,682 |
32 Dynamic Asset Allocation Conservative Fund | |
| COMMON STOCKS (53.9%)* cont. | Shares | Value |
| Healthcare cont. | ||
| Merck KGaA (Germany) | 6,229 | $1,354,552 |
| Moderna, Inc. † | 7,077 | 2,723,654 |
| Molina Healthcare, Inc. † | 2,700 | 732,537 |
| Novartis AG (Switzerland) | 13,870 | 1,137,898 |
| Novo Nordisk A/S Class B (Denmark) | 11,523 | 1,108,341 |
| Ono Pharmaceutical Co., Ltd. (Japan) | 5,500 | 125,441 |
| Organon & Co. | 1,587 | 52,038 |
| Oxford Nanopore Technologies PLC (United Kingdom) † | 9,486 | 78,299 |
| Pfizer, Inc. | 12,480 | 536,765 |
| Recordati SpA (Italy) | 2,436 | 141,697 |
| Regeneron Pharmaceuticals, Inc. † | 5,523 | 3,342,409 |
| Roche Holding AG (Switzerland) | 4,786 | 1,746,429 |
| Sanofi (France) | 10,114 | 973,620 |
| Sartorius Stedim Biotech (France) | 580 | 323,746 |
| Seagen, Inc. † | 1,900 | 322,620 |
| Service Corp. International | 4,500 | 271,170 |
| Sonic Healthcare, Ltd. (Australia) | 15,486 | 454,665 |
| Sonova Holding AG (Switzerland) | 1,591 | 600,044 |
| Thermo Fisher Scientific, Inc. | 2,356 | 1,346,053 |
| UnitedHealth Group, Inc. | 3,343 | 1,306,244 |
| Vertex Pharmaceuticals, Inc. † | 12,600 | 2,285,514 |
| 76,259,684 | ||
| Semiconductor (0.3%) | ||
| Applied Materials, Inc. | 9,903 | 1,274,813 |
| ASML Holding NV (Netherlands) | 1,328 | 979,629 |
| Renesas Electronics Corp. (Japan) † | 59,600 | 735,390 |
| Taiwan Semiconductor Manufacturing Co., Ltd. (Taiwan) | 20,000 | 412,421 |
| Tokyo Electron, Ltd. (Japan) | 700 | 308,562 |
| 3,710,815 | ||
| Software (4.8%) | ||
| Activision Blizzard, Inc. | 18,209 | 1,409,195 |
| Adobe, Inc. † | 14,051 | 8,089,442 |
| Atlassian Corp PLC Class A (Australia) † | 900 | 352,278 |
| Autodesk, Inc. † | 4,500 | 1,283,265 |
| Cadence Design Systems, Inc. † | 22,610 | 3,424,058 |
| Capcom Co., Ltd. (Japan) | 8,400 | 233,314 |
| Electronic Arts, Inc. | 2,100 | 298,725 |
| Intuit, Inc. | 13,515 | 7,291,478 |
| Manhattan Associates, Inc. † | 3,000 | 459,090 |
| Microsoft Corp. | 88,542 | 24,961,661 |
| Oracle Corp. | 15,102 | 1,315,837 |
| Oracle Corp. (Japan) | 3,100 | 272,758 |
| Sage Group PLC (The) (United Kingdom) | 37,120 | 354,287 |
| Tata Consultancy Services, Ltd. (India) | 13,025 | 659,548 |
| Veeva Systems, Inc. Class A † | 7,400 | 2,132,458 |
| Workday, Inc. Class A † | 1,300 | 324,857 |
| 52,862,251 | ||
| Technology (—%) | ||
| SoftBank Group Corp. (Japan) | 8,400 | 485,414 |
| 485,414 |
Dynamic Asset Allocation Conservative Fund 33 | |
| COMMON STOCKS (53.9%)* cont. | Shares | Value |
| Technology services (4.4%) | ||
| Accenture PLC Class A | 15,400 | $4,926,768 |
| Alibaba Group Holding, Ltd. (China) † | 19,900 | 370,140 |
| Alphabet, Inc. Class A † | 5,671 | 15,161,532 |
| Alphabet, Inc. Class C † | 2,518 | 6,711,251 |
| Capgemini SE (France) | 2,041 | 424,467 |
| Cognizant Technology Solutions Corp. Class A | 9,400 | 697,574 |
| DocuSign, Inc. † | 9,692 | 2,495,012 |
| Facebook, Inc. Class A † | 17,136 | 5,815,787 |
| Fidelity National Information Services, Inc. | 24,773 | 3,014,379 |
| Genpact, Ltd. | 6,300 | 299,313 |
| GoDaddy, Inc. Class A † | 13,300 | 927,010 |
| IBM Corp. | 2,100 | 291,753 |
| Nomura Research Institute, Ltd. (Japan) | 13,500 | 497,536 |
| Palo Alto Networks, Inc. † | 800 | 383,200 |
| Pinterest, Inc. Class A † | 54,900 | 2,797,155 |
| Roku, Inc. † | 7,500 | 2,350,125 |
| Salesforce.com, Inc. † | 901 | 244,369 |
| SCSK Corp. (Japan) | 5,100 | 107,847 |
| Zebra Technologies Corp. Class A † | 2,000 | 1,030,840 |
| 48,546,058 | ||
| Transportation (1.0%) | ||
| A. P. Moeller-Maersck A/S Class B (Denmark) | 58 | 156,888 |
| CSX Corp. | 73,300 | 2,179,942 |
| Deutsche Post AG (Germany) | 23,548 | 1,484,148 |
| Nippon Express Co., Ltd. (Japan) | 1,100 | 75,787 |
| Nippon Yusen KK (Japan) | 7,100 | 534,051 |
| Norfolk Southern Corp. | 1,100 | 263,175 |
| Ryder System, Inc. | 4,100 | 339,111 |
| Southwest Airlines Co. † | 35,166 | 1,808,587 |
| Union Pacific Corp. | 17,808 | 3,490,546 |
| United Parcel Service, Inc. Class B | 2,800 | 509,880 |
| Yamato Holdings Co., Ltd. (Japan) | 9,100 | 230,701 |
| 11,072,816 | ||
| Utilities and power (1.4%) | ||
| AES Corp. (The) | 11,800 | 269,394 |
| Ameren Corp. | 8,539 | 691,659 |
| American Electric Power Co., Inc. | 29,528 | 2,397,083 |
| CLP Holdings, Ltd. (Hong Kong) | 43,500 | 418,397 |
| E.ON SE (Germany) | 10,929 | 133,710 |
| Edison International | 13,400 | 743,298 |
| Electricite De France SA (France) | 23,541 | 295,624 |
| Energias de Portugal (EDP) SA (Portugal) | 125,904 | 660,454 |
| Exelon Corp. | 66,695 | 3,224,036 |
| FirstEnergy Corp. | 7,700 | 274,274 |
| Fortum OYJ (Finland) | 15,937 | 484,678 |
| Kinder Morgan, Inc. | 49,000 | 819,770 |
| NRG Energy, Inc. | 42,438 | 1,732,744 |
| Osaka Gas Co., Ltd. (Japan) | 9,300 | 170,940 |
| Public Service Enterprise Group, Inc. | 4,500 | 274,050 |
34 Dynamic Asset Allocation Conservative Fund | |
| COMMON STOCKS (53.9%)* cont. | Shares | Value |
| Utilities and power cont. | ||
| Southern Co. (The) | 32,300 | $2,001,631 |
| SSE PLC (United Kingdom) | 23,665 | 496,930 |
| Texas Competitive Electric Holdings Co., LLC/TCEH Finance, Inc. (Rights) | 2,297 | 2,986 |
| Tokyo Gas Co., Ltd. (Japan) | 8,800 | 163,882 |
| 15,255,540 | ||
| Total common stocks (cost $407,055,321) | $589,139,168 | |
| U.S. GOVERNMENT AND AGENCY MORTGAGE OBLIGATIONS (23.4%)* | Principal amount | Value |
| U.S. Government Guaranteed Mortgage Obligations (4.8%) | ||
| Government National Mortgage Association Pass-Through Certificates | ||
| 6.00%, with due dates from 12/20/48 to 4/20/49 | $522,553 | $578,095 |
| 5.00%, 5/20/49 | 19,520 | 21,604 |
| 4.70%, with due dates from 5/20/67 to 8/20/67 | 173,497 | 190,021 |
| 4.642%, 6/20/67 | 72,521 | 80,162 |
| 4.50%, 5/20/49 | 24,772 | 27,144 |
| 4.48%, 3/20/67 | 86,484 | 95,777 |
| 3.00%, TBA, 10/1/51 | 20,000,000 | 20,897,888 |
| 3.00%, with due dates from 7/20/50 to 10/20/50 | 29,303,177 | 30,589,505 |
| 52,480,196 | ||
| U.S. Government Agency Mortgage Obligations (18.6%) | ||
| Federal Home Loan Mortgage Corporation Pass-Through Certificates | ||
| 4.00%, 9/1/45 | 194,222 | 213,771 |
| 3.00%, with due dates from 2/1/47 to 1/1/48 | 11,093,241 | 11,672,987 |
| 2.50%, with due dates from 5/1/51 to 8/1/51 | 3,977,468 | 4,126,640 |
| Federal National Mortgage Association Pass-Through Certificates | ||
| 4.00%, 1/1/57 | 528,347 | 587,223 |
| 4.00%, with due dates from 6/1/48 to 4/1/49 | 8,928,298 | 9,567,700 |
| 3.50%, 6/1/56 | 559,768 | 613,014 |
| 3.00%, with due dates from 4/1/46 to 11/1/48 | 11,286,073 | 11,927,868 |
| 2.50%, with due dates from 7/1/50 to 8/1/51 | 30,586,688 | 31,599,672 |
| Uniform Mortgage-Backed Securities | ||
| 6.00%, TBA, 10/1/51 | 8,000,000 | 8,947,946 |
| 4.50%, TBA, 10/1/51 | 1,000,000 | 1,081,445 |
| 4.00%, TBA, 10/1/51 | 4,000,000 | 4,286,094 |
| 3.50%, TBA, 10/1/51 | 33,000,000 | 34,921,979 |
| 2.50%, TBA, 11/1/51 | 24,000,000 | 24,698,438 |
| 2.50%, TBA, 10/1/51 | 24,000,000 | 24,747,190 |
| 2.50%, TBA, 10/1/36 | 33,000,000 | 34,381,859 |
| 203,373,826 | ||
| Total U.S. government and agency mortgage obligations (cost $254,780,284) | $255,854,022 | |
| U.S. TREASURY OBLIGATIONS (—%)* | Principal amount | Value |
| U.S. Treasury Bonds 1.375%, 11/15/40 i | $128,000 | $115,685 |
| U.S. Treasury Notes | ||
| 2.75%, 2/15/24 i | 104,000 | 110,217 |
| 0.50%, 3/15/23 i | 10,000 | 10,049 |
| 0.375%, 12/31/25 i | 178,000 | 174,572 |
| Total U.S. treasury obligations (cost $410,523) | $410,523 | |
Dynamic Asset Allocation Conservative Fund 35 | |
| CORPORATE BONDS AND NOTES (22.5%)* | Principal amount | Value | |
| Basic materials (1.0%) | |||
| Allegheny Technologies, Inc. sr. unsec. unsub. notes 7.875%, 8/15/23 | $110,000 | $123,750 | |
| ArcelorMittal SA sr. unsec. unsub. notes 7.00%, 10/15/39 (France) | 120,000 | 169,350 | |
| Beacon Roofing Supply, Inc. 144A company guaranty sr. notes 4.50%, 11/15/26 | 35,000 | 36,400 | |
| Beacon Roofing Supply, Inc. 144A sr. unsec. unsub. notes 4.125%, 5/15/29 | 40,000 | 39,750 | |
| Big River Steel, LLC/BRS Finance Corp. 144A sr. notes 6.625%, 1/31/29 | 84,000 | 90,825 | |
| Boise Cascade Co. 144A company guaranty sr. unsec. notes 4.875%, 7/1/30 | 75,000 | 80,063 | |
| Builders FirstSource, Inc. 144A company guaranty sr. unsec. bonds 4.25%, 2/1/32 | 50,000 | 51,125 | |
| Builders FirstSource, Inc. 144A sr. notes 6.75%, 6/1/27 | 74,000 | 78,440 | |
| BWAY Holding Co. 144A sr. unsec. notes 7.25%, 4/15/25 | 90,000 | 89,451 | |
| Celanese US Holdings, LLC company guaranty sr. unsec. notes 1.40%, 8/5/26 (Germany) | 255,000 | 253,159 | |
| CF Industries, Inc. company guaranty sr. unsec. bonds 4.95%, 6/1/43 | 110,000 | 132,550 | |
| CF Industries, Inc. 144A company guaranty sr. notes 4.50%, 12/1/26 | 797,000 | 908,714 | |
| Coeur Mining, Inc. 144A company guaranty sr. unsec. notes 5.125%, 2/15/29 | 75,000 | 72,004 | |
| Compass Minerals International, Inc. 144A company guaranty sr. unsec. notes 6.75%, 12/1/27 | 155,000 | 164,494 | |
| Compass Minerals International, Inc. 144A company guaranty sr. unsec. notes 4.875%, 7/15/24 | 40,000 | 41,700 | |
| CP Atlas Buyer, Inc. 144A sr. unsec. notes 7.00%, 12/1/28 | 45,000 | 45,113 | |
| CVR Partners LP/CVR Nitrogen Finance Corp. 144A company guaranty sr. notes 6.125%, 6/15/28 | 20,000 | 20,975 | |
| Diamond BC BV 144A sr. unsec. unsub. notes 4.625%, 10/1/29 (Netherlands) | 30,000 | 30,338 | |
| First Quantum Minerals, Ltd. 144A company guaranty sr. unsec. notes 6.875%, 3/1/26 (Canada) | 200,000 | 208,000 | |
| Freeport-McMoRan, Inc. company guaranty sr. unsec. bonds 4.625%, 8/1/30 (Indonesia) | 50,000 | 54,063 | |
| Freeport-McMoRan, Inc. company guaranty sr. unsec. notes 4.375%, 8/1/28 (Indonesia) | 115,000 | 120,319 | |
| Freeport-McMoRan, Inc. company guaranty sr. unsec. unsub. notes 5.45%, 3/15/43 (Indonesia) | 65,000 | 80,031 | |
| GCP Applied Technologies, Inc. 144A sr. unsec. notes 5.50%, 4/15/26 | 215,000 | 219,838 | |
| Glencore Funding, LLC 144A company guaranty sr. unsec. notes 2.50%, 9/1/30 | 744,000 | 728,359 | |
| Graphic Packaging International, LLC 144A company guaranty sr. unsec. notes 3.50%, 3/1/29 | 65,000 | 64,675 | |
| HudBay Minerals, Inc. 144A company guaranty sr. unsec. notes 4.50%, 4/1/26 (Canada) | 40,000 | 39,650 | |
| HudBay Minerals, Inc. 144A company guaranty sr. unsec. notes 6.125%, 4/1/29 (Canada) | 25,000 | 26,184 | |
| Huntsman International, LLC sr. unsec. bonds 2.95%, 6/15/31 | 200,000 | 204,828 | |
36 Dynamic Asset Allocation Conservative Fund | |
| CORPORATE BONDS AND NOTES (22.5%)* cont. | Principal amount | Value | |
| Basic materials cont. | |||
| Huntsman International, LLC sr. unsec. notes 4.50%, 5/1/29 | $266,000 | $301,443 | |
| Ingevity Corp. 144A company guaranty sr. unsec. notes 3.875%, 11/1/28 | 85,000 | 84,788 | |
| Intelligent Packaging Holdco Issuer LP 144A sr. unsec. notes 9.00%, 1/15/26 (Canada) ‡‡ | 60,000 | 62,850 | |
| Intelligent Packaging, Ltd., Finco, Inc./Intelligent Packaging, Ltd. Co-Issuer, LLC 144A sr. notes 6.00%, 9/15/28 (Canada) | 85,000 | 89,101 | |
| International Flavors & Fragrances, Inc. sr. unsec. notes 4.45%, 9/26/28 | 362,000 | 417,515 | |
| International Flavors & Fragrances, Inc. 144A company guaranty sr. unsec. bonds 3.468%, 12/1/50 | 78,000 | 81,859 | |
| International Flavors & Fragrances, Inc. 144A sr. unsec. notes 2.30%, 11/1/30 | 137,000 | 135,831 | |
| Kraton Polymers, LLC 144A company guaranty sr. unsec. notes 4.25%, 12/15/25 | 115,000 | 120,175 | |
| Louisiana-Pacific Corp. 144A sr. unsec. notes 3.625%, 3/15/29 | 100,000 | 100,625 | |
| Mauser Packaging Solutions Holding Co. 144A sr. notes 8.50%, 4/15/24 | 35,000 | 36,225 | |
| Mauser Packaging Solutions Holding Co. 144A sr. notes 5.50%, 4/15/24 | 25,000 | 25,219 | |
| Mercer International, Inc. sr. unsec. notes 5.50%, 1/15/26 (Canada) | 105,000 | 107,231 | |
| Mercer International, Inc. sr. unsec. notes 5.125%, 2/1/29 (Canada) | 85,000 | 86,806 | |
| NOVA Chemicals Corp. 144A sr. unsec. sub. notes 4.25%, 5/15/29 (Canada) | 50,000 | 50,000 | |
| Novelis Corp. 144A company guaranty sr. unsec. bonds 3.875%, 8/15/31 | 20,000 | 19,781 | |
| Novelis Corp. 144A company guaranty sr. unsec. notes 4.75%, 1/30/30 | 70,000 | 73,689 | |
| Novelis Corp. 144A company guaranty sr. unsec. notes 3.25%, 11/15/26 | 20,000 | 20,284 | |
| Nutrien, Ltd. sr. unsec. bonds 5.25%, 1/15/45 (Canada) | 120,000 | 157,913 | |
| Nutrien, Ltd. sr. unsec. bonds 4.125%, 3/15/35 (Canada) | 520,000 | 589,222 | |
| Nutrien, Ltd. sr. unsec. sub. bonds 4.20%, 4/1/29 (Canada) | 122,000 | 138,937 | |
| Olympus Water US Holding Corp. 144A sr. unsec. notes 6.25%, 10/1/29 | 200,000 | 198,190 | |
| Packaging Corp. of America sr. unsec. unsub. notes 4.50%, 11/1/23 | 225,000 | 240,865 | |
| Pactiv Evergreen Group Issuer, LLC/Pactiv Evergreen Group Issuer, Inc. 144A sr. notes 4.375%, 10/15/28 | 20,000 | 20,075 | |
| SCIH Salt Holdings, Inc. 144A sr. notes 4.875%, 5/1/28 | 40,000 | 40,200 | |
| SCIH Salt Holdings, Inc. 144A sr. unsec. notes 6.625%, 5/1/29 | 80,000 | 76,800 | |
| Sherwin-Williams Co. (The) sr. unsec. unsub. bonds 3.45%, 6/1/27 | 455,000 | 499,638 | |
| Sherwin-Williams Co. (The) sr. unsec. unsub. notes 2.75%, 6/1/22 | 11,000 | 11,150 | |
| Taseko Mines, Ltd. 144A company guaranty sr. notes 7.00%, 2/15/26 (Canada) | 95,000 | 96,306 | |
| TMS International Holding Corp. 144A sr. unsec. notes 6.25%, 4/15/29 | 125,000 | 130,625 | |
| TopBuild Corp. 144A company guaranty sr. unsec. bonds 4.125%, 2/15/32 ## | 35,000 | 35,350 | |
| Trinseo Materials Operating SCA/Trinseo Materials Finance, Inc. 144A company guaranty sr. unsec. notes 5.125%, 4/1/29 (Luxembourg) | 120,000 | 120,900 | |
Dynamic Asset Allocation Conservative Fund 37 | |
| CORPORATE BONDS AND NOTES (22.5%)* cont. | Principal amount | Value | |
| Basic materials cont. | |||
| Tronox, Inc. 144A company guaranty sr. unsec. notes 4.625%, 3/15/29 | $80,000 | $79,600 | |
| United States Steel Corp. sr. unsec. notes 6.875%, 3/1/29 | 105,000 | 111,953 | |
| Univar Solutions USA, Inc. 144A company guaranty sr. unsec. notes 5.125%, 12/1/27 | 120,000 | 125,994 | |
| Westlake Chemical Corp. sr. unsec. bonds 3.125%, 8/15/51 | 1,094,000 | 1,032,052 | |
| Westlake Chemical Corp. sr. unsec. bonds 2.875%, 8/15/41 | 546,000 | 522,190 | |
| WestRock MWV, LLC company guaranty sr. unsec. unsub. notes 8.20%, 1/15/30 | 515,000 | 721,577 | |
| WestRock MWV, LLC company guaranty sr. unsec. unsub. notes 7.95%, 2/15/31 | 110,000 | 156,298 | |
| Weyerhaeuser Co. sr. unsec. unsub. notes 7.375%, 3/15/32 R | 86,000 | 122,466 | |
| WR Grace Holdings, LLC 144A company guaranty sr. notes 5.625%, 10/1/24 | 90,000 | 98,550 | |
| WR Grace Holdings, LLC 144A company guaranty sr. notes 4.875%, 6/15/27 | 70,000 | 72,013 | |
| WR Grace Holdings, LLC 144A sr. unsec. notes 5.625%, 8/15/29 | 70,000 | 72,101 | |
| 11,458,535 | |||
| Capital goods (1.1%) | |||
| Allison Transmission, Inc. 144A company guaranty sr. unsec. bonds 3.75%, 1/30/31 | 55,000 | 53,488 | |
| Allison Transmission, Inc. 144A company guaranty sr. unsec. notes 4.75%, 10/1/27 | 150,000 | 156,000 | |
| Amsted Industries, Inc. 144A company guaranty sr. unsec. sub. notes 5.625%, 7/1/27 | 70,000 | 73,046 | |
| Amsted Industries, Inc. 144A sr. unsec. bonds 4.625%, 5/15/30 | 75,000 | 77,063 | |
| ARD Finance SA 144A sr. notes Ser. REGS, 6.50%, 6/30/27 (Luxembourg) ‡‡ | 200,000 | 212,470 | |
| Berry Global, Inc. 144A company guaranty sr. notes 1.65%, 1/15/27 | 167,000 | 164,897 | |
| Berry Global, Inc. 144A company guaranty sr. unsub. notes 1.57%, 1/15/26 | 749,000 | 748,805 | |
| Boeing Co. (The) sr. unsec. bonds 5.93%, 5/1/60 | 564,000 | 770,466 | |
| Bombardier, Inc. 144A sr. unsec. notes 7.875%, 4/15/27 (Canada) | 155,000 | 160,692 | |
| Bombardier, Inc. 144A sr. unsec. notes 7.50%, 12/1/24 (Canada) | 10,000 | 10,400 | |
| Bombardier, Inc. 144A sr. unsec. notes 7.125%, 6/15/26 (Canada) | 65,000 | 68,250 | |
| Bombardier, Inc. 144A sr. unsec. notes 6.00%, 2/15/28 (Canada) | 40,000 | 40,450 | |
| Clarios Global LP 144A company guaranty sr. notes 6.75%, 5/15/25 | 63,000 | 66,465 | |
| Crown Cork & Seal Co., Inc. company guaranty sr. unsec. bonds 7.375%, 12/15/26 | 65,000 | 80,275 | |
| Deere & Co. sr. unsec. unsub. notes 2.60%, 6/8/22 | 570,000 | 575,953 | |
| General Dynamics Corp. company guaranty sr. unsec. unsub. notes 2.25%, 11/15/22 | 160,000 | 162,650 | |
| GFL Environmental, Inc. 144A company guaranty sr. notes 3.50%, 9/1/28 (Canada) | 75,000 | 75,469 | |
| GFL Environmental, Inc. 144A company guaranty sr. unsec. notes 4.75%, 6/15/29 (Canada) | 30,000 | 30,750 | |
| GFL Environmental, Inc. 144A company guaranty sr. unsec. notes 4.00%, 8/1/28 (Canada) | 25,000 | 24,813 | |
| GFL Environmental, Inc. 144A sr. notes 5.125%, 12/15/26 (Canada) | 100,000 | 105,011 | |
| Granite US Holdings Corp. 144A company guaranty sr. unsec. notes 11.00%, 10/1/27 | 100,000 | 109,500 | |
38 Dynamic Asset Allocation Conservative Fund | |
| CORPORATE BONDS AND NOTES (22.5%)* cont. | Principal amount | Value | |
| Capital goods cont. | |||
| Great Lakes Dredge & Dock Corp. 144A company guaranty sr. unsec. notes 5.25%, 6/1/29 | $70,000 | $72,450 | |
| Honeywell International, Inc. sr. unsec. bonds 3.812%, 11/21/47 | 255,000 | 301,348 | |
| Howmet Aerospace, Inc. sr. unsec. unsub. notes 3.00%, 1/15/29 | 325,000 | 327,795 | |
| Husky III Holding, Ltd. 144A sr. unsec. notes 13.00%, 2/15/25 (Canada) ‡‡ | 130,000 | 138,125 | |
| Johnson Controls International PLC sr. unsec. bonds 4.95%, 7/2/64 | 405,000 | 534,274 | |
| Johnson Controls International PLC sr. unsec. unsub. bonds 4.50%, 2/15/47 | 190,000 | 233,972 | |
| L3Harris Technologies, Inc. sr. unsec. bonds 1.80%, 1/15/31 | 170,000 | 164,048 | |
| L3Harris Technologies, Inc. sr. unsec. notes 3.85%, 12/15/26 | 418,000 | 462,231 | |
| L3Harris Technologies, Inc. sr. unsec. sub. notes 4.40%, 6/15/28 | 312,000 | 356,025 | |
| LSF11 A5 HoldCo., LLC 144A sr. unsec. notes 6.625%, 10/15/29 | 80,000 | 80,000 | |
| Madison IAQ, LLC 144A sr. notes 4.125%, 6/30/28 | 55,000 | 55,000 | |
| Madison IAQ, LLC 144A sr. unsec. notes 5.875%, 6/30/29 | 110,000 | 110,825 | |
| MajorDrive Holdings IV, LLC 144A sr. unsec. notes 6.375%, 6/1/29 | 280,000 | 270,610 | |
| Northrop Grumman Corp. sr. unsec. unsub. notes 3.25%, 1/15/28 | 860,000 | 930,431 | |
| Oshkosh Corp. sr. unsec. sub. notes 4.60%, 5/15/28 | 140,000 | 160,283 | |
| Otis Worldwide Corp. sr. unsec. notes 2.565%, 2/15/30 | 235,000 | 241,253 | |
| Panther BF Aggregator 2 LP/Panther Finance Co., Inc. 144A company guaranty sr. unsec. notes 8.50%, 5/15/27 | 105,000 | 111,694 | |
| Park-Ohio Industries, Inc. company guaranty sr. unsec. notes 6.625%, 4/15/27 | 155,000 | 154,806 | |
| Raytheon Technologies Corp. sr. unsec. bonds 4.875%, 10/15/40 (acquired 6/8/20, cost $237,986) ∆∆ | 195,000 | 249,758 | |
| Raytheon Technologies Corp. sr. unsec. unsub. notes 4.125%, 11/16/28 | 745,000 | 847,948 | |
| RBS Global, Inc./Rexnord, LLC 144A sr. unsec. notes 4.875%, 12/15/25 | 110,000 | 112,682 | |
| Roller Bearing Co. of America, Inc. 144A sr. notes 4.375%, 10/15/29 | 35,000 | 35,875 | |
| Sensata Technologies BV 144A company guaranty sr. unsec. notes 4.00%, 4/15/29 | 110,000 | 111,650 | |
| Staples, Inc. 144A sr. notes 7.50%, 4/15/26 | 225,000 | 228,201 | |
| Stevens Holding Co, Inc. 144A company guaranty sr. unsec. notes 6.125%, 10/1/26 | 145,000 | 156,419 | |
| Terex Corp. 144A company guaranty sr. unsec. notes 5.00%, 5/15/29 | 55,000 | 56,994 | |
| Titan Acquisition, Ltd./Titan Co-Borrower, LLC 144A sr. unsec. notes 7.75%, 4/15/26 (Canada) | 15,000 | 15,326 | |
| TransDigm, Inc. company guaranty sr. unsec. sub. notes 6.375%, 6/15/26 | 75,000 | 77,375 | |
| TransDigm, Inc. company guaranty sr. unsec. sub. notes 4.875%, 5/1/29 | 110,000 | 110,205 | |
| TransDigm, Inc. company guaranty sr. unsec. sub. notes 4.625%, 1/15/29 | 70,000 | 69,878 | |
| TransDigm, Inc. company guaranty sr. unsec. sub. notes 5.50%, 11/15/27 | 135,000 | 138,713 | |
| TransDigm, Inc. 144A company guaranty sr. notes 6.25%, 3/15/26 | 235,000 | 244,988 | |
| Waste Connections, Inc. sr. unsec. sub. bonds 3.50%, 5/1/29 | 430,000 | 471,338 | |
Dynamic Asset Allocation Conservative Fund 39 | |
| CORPORATE BONDS AND NOTES (22.5%)* cont. | Principal amount | Value | |
| Capital goods cont. | |||
| Waste Pro USA, Inc. 144A sr. unsec. notes 5.50%, 2/15/26 | $195,000 | $196,950 | |
| WESCO Distribution, Inc. 144A company guaranty sr. unsec. unsub. notes 7.25%, 6/15/28 | 100,000 | 110,750 | |
| 11,707,133 | |||
| Communication services (2.9%) | |||
| American Tower Corp. sr. unsec. bonds 2.70%, 4/15/31 R | 1,083,000 | 1,107,405 | |
| American Tower Corp. sr. unsec. notes 2.90%, 1/15/30 R | 339,000 | 352,922 | |
| American Tower Corp. sr. unsec. sub. notes 2.75%, 1/15/27 R | 735,000 | 771,738 | |
| AT&T, Inc. sr. unsec. bonds 3.55%, 9/15/55 | 1,914,000 | 1,887,479 | |
| AT&T, Inc. sr. unsec. unsub. bonds 2.55%, 12/1/33 | 2,419,000 | 2,379,856 | |
| AT&T, Inc. sr. unsec. unsub. bonds 2.25%, 2/1/32 | 91,000 | 88,603 | |
| AT&T, Inc. sr. unsec. unsub. notes 4.75%, 5/15/46 | 567,000 | 678,215 | |
| CCO Holdings, LLC/CCO Holdings Capital Corp. sr. unsec. bonds 4.50%, 5/1/32 | 70,000 | 72,100 | |
| CCO Holdings, LLC/CCO Holdings Capital Corp. 144A company guaranty sr. unsec. bonds 5.50%, 5/1/26 | 70,000 | 72,190 | |
| CCO Holdings, LLC/CCO Holdings Capital Corp. 144A sr. unsec. bonds 5.375%, 6/1/29 | 875,000 | 945,000 | |
| CCO Holdings, LLC/CCO Holdings Capital Corp. 144A sr. unsec. bonds 4.75%, 3/1/30 | 80,000 | 83,638 | |
| CCO Holdings, LLC/CCO Holdings Capital Corp. 144A sr. unsec. bonds 4.50%, 8/15/30 | 50,000 | 51,586 | |
| Charter Communications Operating, LLC/Charter Communications Operating Capital Corp. company guaranty sr. notes 3.75%, 2/15/28 | 275,000 | 301,167 | |
| Charter Communications Operating, LLC/Charter Communications Operating Capital Corp. company guaranty sr. notes 2.25%, 1/15/29 | 210,000 | 209,835 | |
| Charter Communications Operating, LLC/Charter Communications Operating Capital Corp. company guaranty sr. sub. bonds 6.484%, 10/23/45 | 694,000 | 943,549 | |
| Charter Communications Operating, LLC/Charter Communications Operating Capital Corp. company guaranty sr. sub. bonds 4.80%, 3/1/50 | 590,000 | 662,101 | |
| Charter Communications Operating, LLC/Charter Communications Operating Capital Corp. sr. bonds 3.70%, 4/1/51 | 330,000 | 321,296 | |
| Charter Communications Operating, LLC/Charter Communications Operating Capital Corp. company guaranty sr. sub. bonds 5.375%, 5/1/47 | 52,000 | 62,259 | |
| Comcast Corp. company guaranty sr. unsec. unsub. bonds 4.049%, 11/1/52 | 150,999 | 175,674 | |
| Comcast Corp. company guaranty sr. unsec. unsub. bonds 3.999%, 11/1/49 | 263,000 | 304,598 | |
| Comcast Corp. company guaranty sr. unsec. unsub. bonds 3.969%, 11/1/47 | 780,000 | 889,319 | |
| Comcast Corp. company guaranty sr. unsec. unsub. bonds 2.35%, 1/15/27 | 720,000 | 755,180 | |
| Comcast Corp. company guaranty sr. unsec. unsub. notes 6.50%, 11/15/35 | 17,000 | 24,399 | |
| Comcast Corp. company guaranty sr. unsec. unsub. notes 3.15%, 3/1/26 | 25,000 | 27,015 | |
40 Dynamic Asset Allocation Conservative Fund | |
| CORPORATE BONDS AND NOTES (22.5%)* cont. | Principal amount | Value | |
| Communication services cont. | |||
| Comcast Corp. sr. unsec. bonds 3.45%, 2/1/50 | $1,050,000 | $1,113,530 | |
| Comcast Corp. 144A company guaranty sr. unsec. bonds 2.987%, 11/1/63 | 173,001 | 162,118 | |
| Comcast Corp. 144A company guaranty sr. unsec. bonds 2.887%, 11/1/51 | 82,000 | 78,653 | |
| CommScope Technologies, LLC 144A company guaranty sr. unsec. notes 6.00%, 6/15/25 | 40,000 | 40,500 | |
| Cox Communications, Inc. 144A company guaranty sr. unsec. bonds 2.95%, 10/1/50 | 404,000 | 379,875 | |
| Cox Communications, Inc. 144A sr. unsec. bonds 3.50%, 8/15/27 | 340,000 | 372,292 | |
| Crown Castle International Corp. sr. unsec. bonds 3.80%, 2/15/28 R | 395,000 | 434,373 | |
| Crown Castle International Corp. sr. unsec. bonds 3.65%, 9/1/27 R | 557,000 | 612,406 | |
| Crown Castle International Corp. sr. unsec. unsub. bonds 3.70%, 6/15/26 R | 455,000 | 496,370 | |
| CSC Holdings, LLC sr. unsec. unsub. bonds 5.25%, 6/1/24 | 202,000 | 216,378 | |
| CSC Holdings, LLC sr. unsec. unsub. notes 6.75%, 11/15/21 | 90,000 | 90,225 | |
| CSC Holdings, LLC 144A sr. unsec. unsub. notes 7.50%, 4/1/28 | 260,000 | 281,002 | |
| Deutsche Telekom International Finance BV company guaranty sr. unsec. unsub. bonds 8.75%, 6/15/30 (Netherlands) | 163,000 | 243,015 | |
| DISH DBS Corp. company guaranty sr. unsec. notes 7.75%, 7/1/26 | 125,000 | 141,153 | |
| DISH DBS Corp. company guaranty sr. unsec. unsub. notes 5.875%, 11/15/24 | 75,000 | 80,646 | |
| DISH DBS Corp. company guaranty sr. unsec. unsub. notes 5.125%, 6/1/29 | 110,000 | 107,777 | |
| Embarq Corp. sr. unsec. unsub. bonds 7.995%, 6/1/36 | 130,000 | 139,411 | |
| Equinix, Inc. sr. unsec. sub. notes 3.20%, 11/18/29 R | 140,000 | 148,531 | |
| Equinix, Inc. sr. unsec. sub. notes 2.90%, 11/18/26 R | 1,380,000 | 1,463,472 | |
| Frontier Communications Corp. 144A company guaranty sr. notes 5.875%, 10/15/27 | 55,000 | 58,438 | |
| Frontier Communications Corp. 144A notes 6.75%, 5/1/29 | 155,000 | 163,331 | |
| Intelsat Jackson Holdings SA 144A sr. unsec. notes 9.75%, 7/15/25 (Luxembourg) (In default) † | 115,000 | 64,400 | |
| Level 3 Financing, Inc. 144A company guaranty sr. unsec. notes 4.625%, 9/15/27 | 75,000 | 77,160 | |
| Level 3 Financing, Inc. 144A company guaranty sr. unsec. notes 4.25%, 7/1/28 | 105,000 | 105,812 | |
| Level 3 Financing, Inc. 144A company guaranty sr. unsec. unsub. notes 3.625%, 1/15/29 | 50,000 | 48,438 | |
| Quebecor Media, Inc. sr. unsec. unsub. notes 5.75%, 1/15/23 (Canada) | 19,000 | 20,093 | |
| Rogers Communications, Inc. company guaranty sr. unsec. unsub. notes 4.50%, 3/15/43 (Canada) | 410,000 | 468,343 | |
| Sprint Capital Corp. company guaranty sr. unsec. unsub. notes 6.875%, 11/15/28 | 552,000 | 706,560 | |
| Sprint Corp. company guaranty sr. unsec. notes 7.625%, 3/1/26 | 110,000 | 133,290 | |
| Sprint Corp. company guaranty sr. unsec. sub. notes 7.875%, 9/15/23 | 380,000 | 424,593 | |
| T-Mobile USA, Inc. company guaranty sr. bonds 2.25%, 11/15/31 | 1,035,000 | 1,014,919 | |
| T-Mobile USA, Inc. company guaranty sr. notes 3.875%, 4/15/30 | 64,000 | 70,666 | |
| T-Mobile USA, Inc. company guaranty sr. notes 3.75%, 4/15/27 | 792,000 | 872,539 | |
| T-Mobile USA, Inc. company guaranty sr. notes 2.55%, 2/15/31 | 267,000 | 267,951 | |
Dynamic Asset Allocation Conservative Fund 41 | |
| CORPORATE BONDS AND NOTES (22.5%)* cont. | Principal amount | Value | |
| Communication services cont. | |||
| T-Mobile USA, Inc. company guaranty sr. unsec. bonds 2.875%, 2/15/31 | $70,000 | $70,595 | |
| T-Mobile USA, Inc. company guaranty sr. unsec. notes 5.375%, 4/15/27 | 10,000 | 10,505 | |
| T-Mobile USA, Inc. company guaranty sr. unsec. notes 4.00%, 4/15/22 | 30,000 | 30,350 | |
| T-Mobile USA, Inc. company guaranty sr. unsec. notes 2.625%, 2/15/29 | 50,000 | 50,528 | |
| T-Mobile USA, Inc. company guaranty sr. unsec. unsub. bonds 4.75%, 2/1/28 | 110,000 | 116,875 | |
| TCI Communications, Inc. sr. unsec. unsub. notes 7.125%, 2/15/28 | 365,000 | 481,899 | |
| Telefonica Emisiones SA company guaranty sr. unsec. bonds 4.895%, 3/6/48 (Spain) | 1,085,000 | 1,304,423 | |
| Verizon Communications, Inc. sr. unsec. bonds 3.70%, 3/22/61 | 924,000 | 975,678 | |
| Verizon Communications, Inc. sr. unsec. bonds 1.75%, 1/20/31 | 290,000 | 275,642 | |
| Verizon Communications, Inc. sr. unsec. notes 2.55%, 3/21/31 | 461,000 | 466,666 | |
| Verizon Communications, Inc. sr. unsec. unsub. bonds 5.25%, 3/16/37 | 505,000 | 653,100 | |
| Verizon Communications, Inc. sr. unsec. unsub. notes 4.40%, 11/1/34 | 775,000 | 913,226 | |
| Verizon Communications, Inc. sr. unsec. unsub. notes 4.329%, 9/21/28 | 1,337,000 | 1,536,918 | |
| Videotron, Ltd./Videotron Ltee. 144A sr. unsec. notes 5.125%, 4/15/27 (Canada) | 219,000 | 226,665 | |
| Videotron, Ltd./Videotron Ltee. 144A sr. unsec. notes 3.625%, 6/15/29 (Canada) | 90,000 | 91,238 | |
| 31,469,692 | |||
| Conglomerates (—%) | |||
| General Electric Co. jr. unsec. sub. FRN (BBA LIBOR USD 3 Month + 3.33%), 3.446%, perpetual maturity | 127,000 | 124,301 | |
| 124,301 | |||
| Consumer cyclicals (2.7%) | |||
| ADT Security Corp. 144A sr. notes 4.125%, 8/1/29 | 95,000 | 94,420 | |
| Alimentation Couche-Tard, Inc. 144A company guaranty sr. unsec. notes 3.55%, 7/26/27 (Canada) | 415,000 | 455,981 | |
| Alimentation Couche-Tard, Inc. 144A sr. unsec. notes 2.95%, 1/25/30 (Canada) | 239,000 | 248,635 | |
| Amazon.com, Inc. sr. unsec. notes 3.15%, 8/22/27 | 1,225,000 | 1,346,898 | |
| Amazon.com, Inc. sr. unsec. notes 2.50%, 11/29/22 | 430,000 | 438,523 | |
| Amazon.com, Inc. sr. unsec. unsub. notes 1.50%, 6/3/30 | 215,000 | 209,104 | |
| AMC Entertainment Holdings, Inc. 144A company guaranty sr. notes 10.50%, 4/15/25 | 40,000 | 42,800 | |
| American Builders & Contractors Supply Co., Inc. 144A sr. notes 4.00%, 1/15/28 | 50,000 | 51,063 | |
| American Builders & Contractors Supply Co., Inc. 144A sr. unsec. notes 3.875%, 11/15/29 | 50,000 | 49,625 | |
| Autonation, Inc. sr. unsec. bonds 2.40%, 8/1/31 | 236,000 | 230,004 | |
| BCPE Ulysses Intermediate, Inc. 144A sr. unsec. notes 7.75%, 4/1/27 ‡‡ | 160,000 | 158,800 | |
| Beasley Mezzanine Holdings, LLC 144A company guaranty sr. notes 8.625%, 2/1/26 | 165,000 | 168,300 | |
42 Dynamic Asset Allocation Conservative Fund | |
| CORPORATE BONDS AND NOTES (22.5%)* cont. | Principal amount | Value | |
| Consumer cyclicals cont. | |||
| BMW US Capital, LLC 144A company guaranty sr. unsec. notes 3.95%, 8/14/28 | $405,000 | $457,320 | |
| Boyd Gaming Corp. company guaranty sr. unsec. notes 4.75%, 12/1/27 | 50,000 | 51,535 | |
| Boyd Gaming Corp. 144A sr. unsec. bonds 4.75%, 6/15/31 | 110,000 | 113,438 | |
| Boyd Gaming Corp. 144A sr. unsec. notes 8.625%, 6/1/25 | 45,000 | 48,769 | |
| Brookfield Residential Properties, Inc./Brookfield Residential US Corp. 144A company guaranty sr. unsec. notes 6.25%, 9/15/27 (Canada) | 105,000 | 110,383 | |
| Brookfield Residential Properties, Inc./Brookfield Residential US Corp. 144A sr. unsec. notes 5.00%, 6/15/29 (Canada) | 110,000 | 112,481 | |
| Caesars Entertainment, Inc. 144A sr. unsec. notes 4.625%, 10/15/29 | 40,000 | 40,500 | |
| Carriage Services, Inc. 144A company guaranty sr. unsec. notes 4.25%, 5/15/29 | 50,000 | 50,055 | |
| Cengage Learning, Inc. 144A sr. unsec. unsub. notes 9.50%, 6/15/24 | 130,000 | 133,034 | |
| Cinemark USA, Inc. 144A company guaranty sr. notes 8.75%, 5/1/25 | 20,000 | 21,450 | |
| Cinemark USA, Inc. 144A company guaranty sr. unsec. notes 5.875%, 3/15/26 | 120,000 | 121,200 | |
| Cinemark USA, Inc. 144A company guaranty sr. unsec. notes 5.25%, 7/15/28 | 115,000 | 113,275 | |
| Clear Channel Outdoor Holdings, Inc. 144A company guaranty sr. notes 5.125%, 8/15/27 | 70,000 | 72,437 | |
| Clear Channel Outdoor Holdings, Inc. 144A company guaranty sr. unsec. sub. notes 7.75%, 4/15/28 | 80,000 | 84,200 | |
| Clear Channel Outdoor Holdings, Inc. 144A sr. unsec. notes 7.50%, 6/1/29 | 85,000 | 88,400 | |
| Constellation Merger Sub, Inc. 144A sr. unsec. notes 8.50%, 9/15/25 | 160,000 | 155,200 | |
| D.R. Horton, Inc. company guaranty sr. unsec. unsub. notes 1.30%, 10/15/26 | 905,000 | 894,802 | |
| Diamond Sports Group, LLC/Diamond Sports Finance Co. 144A sr. notes 5.375%, 8/15/26 | 120,000 | 79,200 | |
| Diamond Sports Group, LLC/Diamond Sports Finance Co. 144A sr. unsec. notes 6.625%, 8/15/27 | 90,000 | 39,375 | |
| DIRECTV Holdings, LLC/DIRECTV Financing Co., Inc. 144A sr. notes 5.875%, 8/15/27 | 85,000 | 88,719 | |
| Dollar General Corp. sr. unsec. sub. notes 3.25%, 4/15/23 | 400,000 | 414,735 | |
| Ecolab, Inc. sr. unsec. unsub. bonds 2.70%, 11/1/26 | 1,390,000 | 1,481,336 | |
| Entercom Media Corp. 144A company guaranty notes 6.75%, 3/31/29 | 110,000 | 110,871 | |
| Entercom Media Corp. 144A company guaranty notes 6.50%, 5/1/27 | 75,000 | 76,713 | |
| Ford Motor Co. sr. unsec. unsub. notes 9.00%, 4/22/25 | 140,000 | 168,354 | |
| Ford Motor Credit Co., LLC sr. unsec. unsub. notes 5.125%, 6/16/25 | 400,000 | 434,500 | |
| Ford Motor Credit Co., LLC sr. unsec. unsub. notes 4.00%, 11/13/30 | 285,000 | 296,400 | |
| Full House Resorts, Inc. 144A company guaranty sr. notes 8.25%, 2/15/28 | 90,000 | 96,750 | |
| Garda World Security Corp. 144A sr. unsec. notes 6.00%, 6/1/29 (Canada) | 80,000 | 78,386 | |
| Gartner, Inc. 144A company guaranty sr. unsec. bonds 3.75%, 10/1/30 | 110,000 | 113,300 | |
Dynamic Asset Allocation Conservative Fund 43 | |
| CORPORATE BONDS AND NOTES (22.5%)* cont. | Principal amount | Value | |
| Consumer cyclicals cont. | |||
| Gartner, Inc. 144A company guaranty sr. unsec. notes 3.625%, 6/15/29 | $30,000 | $30,228 | |
| General Motors Co. sr. unsec. bonds 5.95%, 4/1/49 | 163,000 | 214,821 | |
| General Motors Co. sr. unsec. bonds 5.20%, 4/1/45 | 50,000 | 60,887 | |
| General Motors Financial Co., Inc. company guaranty sr. unsec. notes 4.00%, 10/6/26 | 1,082,000 | 1,191,589 | |
| General Motors Financial Co., Inc. company guaranty sr. unsec. unsub. notes 4.30%, 7/13/25 | 200,000 | 219,463 | |
| General Motors Financial Co., Inc. company guaranty sr. unsec. unsub. notes 4.00%, 1/15/25 | 85,000 | 92,020 | |
| Global Payments, Inc. sr. unsec. notes 2.90%, 5/15/30 | 140,000 | 144,449 | |
| Global Payments, Inc. sr. unsec. unsub. notes 4.00%, 6/1/23 | 810,000 | 854,004 | |
| GW B-CR Security Corp. 144A sr. unsec. notes 9.50%, 11/1/27 (Canada) | 135,000 | 146,117 | |
| Hanesbrands, Inc. 144A company guaranty sr. unsec. notes 5.375%, 5/15/25 | 40,000 | 41,875 | |
| Hanesbrands, Inc. 144A company guaranty sr. unsec. unsub. notes 4.625%, 5/15/24 | 60,000 | 63,257 | |
| Hilton Worldwide Finance, LLC/Hilton Worldwide Finance Corp. company guaranty sr. unsec. notes 4.875%, 4/1/27 | 80,000 | 82,702 | |
| Home Depot, Inc. (The) sr. unsec. unsub. notes 5.95%, 4/1/41 | 300,000 | 428,643 | |
| Home Depot, Inc. (The) sr. unsec. unsub. notes 2.625%, 6/1/22 | 475,000 | 481,637 | |
| Hyatt Hotels Corp. sr. unsec. unsub. notes 4.85%, 3/15/26 | 576,000 | 637,167 | |
| iHeartCommunications, Inc. company guaranty sr. notes 6.375%, 5/1/26 | 83,261 | 87,853 | |
| iHeartCommunications, Inc. company guaranty sr. unsec. notes 8.375%, 5/1/27 | 190,911 | 203,797 | |
| IHS Markit, Ltd. sr. unsec. sub. bonds 4.75%, 8/1/28 (United Kingdom) | 50,000 | 58,625 | |
| IHS Markit, Ltd. 144A company guaranty notes 4.75%, 2/15/25 (United Kingdom) | 1,201,000 | 1,325,604 | |
| Interpublic Group of Cos., Inc. (The) sr. unsec. sub. bonds 4.65%, 10/1/28 | 944,000 | 1,099,950 | |
| Iron Mountain, Inc. 144A company guaranty sr. unsec. bonds 5.25%, 3/15/28 R | 45,000 | 47,025 | |
| JELD-WEN, Inc. 144A company guaranty sr. unsec. notes 4.875%, 12/15/27 | 50,000 | 52,102 | |
| JELD-WEN, Inc. 144A sr. notes 6.25%, 5/15/25 | 45,000 | 47,531 | |
| L Brands, Inc. company guaranty sr. unsec. bonds 6.75%, perpetual maturity | 55,000 | 68,200 | |
| L Brands, Inc. company guaranty sr. unsec. notes 7.50%, perpetual maturity | 110,000 | 124,988 | |
| L Brands, Inc. 144A company guaranty sr. unsec. notes 9.375%, 7/1/25 | 12,000 | 15,225 | |
| L Brands, Inc. 144A company guaranty sr. unsec. unsub. bonds 6.625%, 10/1/30 | 50,000 | 56,750 | |
| LBM Acquisition, LLC 144A company guaranty sr. unsec. notes 6.25%, 1/15/29 | 80,000 | 79,960 | |
| Lennar Corp. company guaranty sr. unsec. unsub. notes 4.75%, 11/29/27 | 599,000 | 694,061 | |
| Levi Strauss & Co. 144A sr. unsec. sub. bonds 3.50%, 3/1/31 | 125,000 | 126,250 | |
44 Dynamic Asset Allocation Conservative Fund | |
| CORPORATE BONDS AND NOTES (22.5%)* cont. | Principal amount | Value | |
| Consumer cyclicals cont. | |||
| Lions Gate Capital Holdings, LLC 144A company guaranty sr. unsec. notes 5.50%, 4/15/29 | $150,000 | $155,066 | |
| Live Nation Entertainment, Inc. 144A company guaranty sr. unsec. notes 4.875%, 11/1/24 | 40,000 | 40,447 | |
| Live Nation Entertainment, Inc. 144A company guaranty sr. unsec. sub. notes 5.625%, 3/15/26 | 65,000 | 67,275 | |
| Live Nation Entertainment, Inc. 144A sr. notes 6.50%, 5/15/27 | 50,000 | 55,000 | |
| Masonite International Corp. 144A company guaranty sr. unsec. notes 5.375%, 2/1/28 | 40,000 | 42,120 | |
| Masonite International Corp. 144A company guaranty sr. unsec. notes 3.50%, 2/15/30 | 50,000 | 49,625 | |
| Mattamy Group Corp. 144A sr. unsec. notes 5.25%, 12/15/27 (Canada) | 140,000 | 146,300 | |
| Mattamy Group Corp. 144A sr. unsec. notes 4.625%, 3/1/30 (Canada) | 110,000 | 112,404 | |
| Mattel, Inc. 144A company guaranty sr. unsec. notes 3.75%, 4/1/29 | 80,000 | 83,400 | |
| Mattel, Inc. 144A company guaranty sr. unsec. notes 3.375%, 4/1/26 | 20,000 | 20,622 | |
| Mav Acquisition Corp. 144A sr. notes 5.75%, 8/1/28 | 110,000 | 108,075 | |
| Mav Acquisition Corp. 144A sr. unsec. notes 8.00%, 8/1/29 | 115,000 | 109,857 | |
| Meredith Corp. company guaranty sr. notes 6.50%, 7/1/25 | 50,000 | 53,500 | |
| Meredith Corp. company guaranty sr. unsec. notes 6.875%, 2/1/26 | 86,000 | 88,903 | |
| Moody’s Corp. sr. unsec. bonds 2.55%, 8/18/60 | 335,000 | 293,206 | |
| Moody’s Corp. sr. unsec. notes 2.00%, 8/19/31 | 755,000 | 738,801 | |
| NESCO Holdings II, Inc. 144A company guaranty notes 5.50%, 4/15/29 | 105,000 | 108,906 | |
| News Corp. 144A sr. unsec. notes 3.875%, 5/15/29 | 80,000 | 82,200 | |
| Nexstar Broadcasting, Inc. 144A sr. unsec. notes 4.75%, 11/1/28 | 55,000 | 57,055 | |
| Nexstar Escrow, Inc. 144A sr. unsec. notes 5.625%, 7/15/27 | 50,000 | 52,899 | |
| Nielsen Co. Luxembourg SARL (The) 144A company guaranty sr. unsec. notes 5.00%, 2/1/25 (Luxembourg) | 80,000 | 81,900 | |
| Nielsen Finance, LLC/Nielsen Finance Co. 144A company guaranty sr. unsec. notes 5.625%, 10/1/28 | 75,000 | 77,813 | |
| Nielsen Finance, LLC/Nielsen Finance Co. 144A company guaranty sr. unsec. notes 4.50%, 7/15/29 | 60,000 | 58,668 | |
| Nielsen Finance, LLC/Nielsen Finance Co. 144A sr. unsec. bonds 4.75%, 7/15/31 | 60,000 | 58,366 | |
| Omnicom Group, Inc. company guaranty sr. unsec. unsub. notes 3.60%, 4/15/26 | 660,000 | 722,101 | |
| Penn National Gaming, Inc. 144A sr. unsec. notes 5.625%, 1/15/27 | 120,000 | 123,600 | |
| PM General Purchaser, LLC 144A sr. notes 9.50%, 10/1/28 | 165,000 | 174,177 | |
| Prime Security Services Borrower, LLC/Prime Finance, Inc. 144A company guaranty sr. notes 3.375%, 8/31/27 | 50,000 | 47,969 | |
| Prime Security Services Borrower, LLC/Prime Finance, Inc. 144A notes 6.25%, 1/15/28 | 100,000 | 103,378 | |
| PulteGroup, Inc. company guaranty sr. unsec. unsub. notes 7.875%, 6/15/32 | 132,000 | 189,420 | |
| QVC, Inc. company guaranty sr. notes 4.85%, 4/1/24 | 98,000 | 105,840 | |
| Raptor Acquisition Corp./Raptor Co-Issuer, LLC 144A sr. notes 4.875%, 11/1/26 | 35,000 | 35,744 | |
Dynamic Asset Allocation Conservative Fund 45 | |
| CORPORATE BONDS AND NOTES (22.5%)* cont. | Principal amount | Value | |
| Consumer cyclicals cont. | |||
| Realogy Group, LLC/Realogy Co-Issuer Corp. 144A company guaranty sr. unsec. notes 5.75%, 1/15/29 | $90,000 | $93,353 | |
| S&P Global, Inc. company guaranty sr. unsec. bonds 2.50%, 12/1/29 | 90,000 | 94,032 | |
| S&P Global, Inc. company guaranty sr. unsec. notes 1.25%, 8/15/30 | 152,000 | 143,061 | |
| Sabre GLBL, Inc. 144A company guaranty sr. notes 9.25%, 4/15/25 | 125,000 | 144,474 | |
| Scientific Games International, Inc. 144A company guaranty sr. unsec. notes 7.25%, 11/15/29 | 160,000 | 179,782 | |
| Scientific Games International, Inc. 144A sr. unsec. notes 7.00%, 5/15/28 | 50,000 | 53,938 | |
| Scotts Miracle-Gro Co. (The) 144A company guaranty sr. unsec. bonds 4.375%, 2/1/32 | 55,000 | 55,447 | |
| Scotts Miracle-Gro Co. (The) company guaranty sr. unsec. notes 4.50%, 10/15/29 | 150,000 | 156,750 | |
| Scripps Escrow II, Inc. 144A sr. notes 3.875%, 1/15/29 | 60,000 | 60,209 | |
| Scripps Escrow II, Inc. 144A sr. unsec. bonds 5.375%, 1/15/31 | 65,000 | 63,905 | |
| Shift4 Payments, LLC/Shift4 Payments Finance Sub, Inc. 144A company guaranty sr. unsec. notes 4.625%, 11/1/26 | 110,000 | 114,813 | |
| Sinclair Television Group, Inc. 144A company guaranty sr. unsec. bonds 5.50%, 3/1/30 | 100,000 | 99,190 | |
| Sinclair Television Group, Inc. 144A sr. bonds 4.125%, 12/1/30 | 55,000 | 53,763 | |
| Sirius XM Radio, Inc. 144A company guaranty sr. unsec. bonds 3.875%, 9/1/31 | 535,000 | 522,628 | |
| Sirius XM Radio, Inc. 144A company guaranty sr. unsec. notes 4.00%, 7/15/28 | 170,000 | 172,869 | |
| Sirius XM Radio, Inc. 144A sr. unsec. bonds 5.00%, 8/1/27 | 700,000 | 728,000 | |
| Six Flags Entertainment Corp. 144A company guaranty sr. unsec. bonds 5.50%, 4/15/27 | 65,000 | 67,113 | |
| Six Flags Theme Parks, Inc. 144A company guaranty sr. notes 7.00%, 7/1/25 | 105,000 | 111,825 | |
| Spanish Broadcasting System, Inc. 144A sr. notes 9.75%, 3/1/26 | 85,000 | 88,780 | |
| Spectrum Brands, Inc. 144A company guaranty sr. unsec. bonds 5.00%, 10/1/29 | 50,000 | 53,750 | |
| Spectrum Brands, Inc. 144A company guaranty sr. unsec. bonds 3.875%, 3/15/31 | 100,000 | 101,040 | |
| Square, Inc. 144A sr. unsec. bonds 3.50%, 6/1/31 | 425,000 | 435,936 | |
| Standard Industries, Inc. 144A sr. unsec. bonds 3.375%, 1/15/31 | 40,000 | 38,068 | |
| Standard Industries, Inc. 144A sr. unsec. notes 5.00%, 2/15/27 | 70,000 | 72,188 | |
| Standard Industries, Inc. 144A sr. unsec. notes 4.75%, 1/15/28 | 10,000 | 10,375 | |
| Station Casinos, LLC 144A sr. unsec. notes 4.50%, 2/15/28 | 100,000 | 101,585 | |
| Stellantis Finance US, Inc. 144A company guaranty sr. unsec. notes 2.691%, 9/15/31 | 575,000 | 570,226 | |
| SugarHouse HSP Gaming Prop. Mezz LP/SugarHouse HSP Gaming Finance Corp. 144A company guaranty sr. unsub. notes 5.875%, 5/15/25 | 90,000 | 90,000 | |
| Taylor Morrison Communities, Inc. 144A sr. unsec. bonds 5.125%, 8/1/30 | 20,000 | 21,525 | |
| Taylor Morrison Communities, Inc. 144A sr. unsec. notes 5.75%, 1/15/28 | 50,000 | 55,700 | |
| Terrier Media Buyer, Inc. 144A company guaranty sr. unsec. notes 8.875%, 12/15/27 | 155,000 | 163,894 | |
46 Dynamic Asset Allocation Conservative Fund | |
| CORPORATE BONDS AND NOTES (22.5%)* cont. | Principal amount | Value | |
| Consumer cyclicals cont. | |||
| Townsquare Media, Inc. 144A sr. notes 6.875%, 2/1/26 | $185,000 | $194,076 | |
| TRI Pointe Group, Inc./TRI Pointe Homes, Inc. company guaranty sr. unsec. unsub. notes 5.875%, 6/15/24 | 50,000 | 55,000 | |
| Univision Communications, Inc. 144A company guaranty sr. notes 9.50%, 5/1/25 | 55,000 | 59,675 | |
| Univision Communications, Inc. 144A company guaranty sr. notes 6.625%, 6/1/27 | 100,000 | 108,625 | |
| Univision Communications, Inc. 144A company guaranty sr. notes 4.50%, 5/1/29 | 55,000 | 55,894 | |
| Urban One, Inc. 144A company guaranty sr. notes 7.375%, 2/1/28 | 80,000 | 85,773 | |
| Valvoline, Inc. 144A company guaranty sr. unsec. unsub. notes 4.25%, 2/15/30 | 65,000 | 67,392 | |
| ViacomCBS, Inc. company guaranty sr. unsec. bonds 4.20%, 6/1/29 | 324,000 | 369,168 | |
| ViacomCBS, Inc. company guaranty sr. unsec. unsub. bonds 2.90%, 1/15/27 | 298,000 | 316,589 | |
| ViacomCBS, Inc. company guaranty sr. unsec. unsub. notes 4.00%, 1/15/26 | 136,000 | 150,322 | |
| Victoria’s Secret & Co. 144A sr. unsec. notes 4.625%, 7/15/29 | 70,000 | 70,875 | |
| Walt Disney Co. (The) company guaranty sr. unsec. bonds 7.75%, 12/1/45 | 281,000 | 494,575 | |
| Werner FinCo LP/Werner FinCo, Inc. 144A company guaranty sr. unsec. notes 8.75%, 7/15/25 | 130,000 | 135,444 | |
| White Cap Buyer, LLC 144A sr. unsec. notes 6.875%, 10/15/28 | 95,000 | 100,225 | |
| Wolverine World Wide, Inc. 144A company guaranty sr. unsec. notes 4.00%, 8/15/29 | 85,000 | 85,850 | |
| Wynn Las Vegas, LLC/Wynn Las Vegas Capital Corp. 144A company guaranty sr. unsec. sub. notes 5.25%, 5/15/27 | 130,000 | 131,297 | |
| Wynn Resorts Finance, LLC/Wynn Resorts Capital Corp. 144A sr. unsec. bonds 5.125%, 10/1/29 | 125,000 | 125,938 | |
| Wynn Resorts Finance, LLC/Wynn Resorts Capital Corp. 144A sr. unsec. notes 7.75%, 4/15/25 | 30,000 | 31,651 | |
| 30,019,276 | |||
| Consumer staples (1.1%) | |||
| 1011778 BC ULC/New Red Finance, Inc. 144A bonds 4.00%, 10/15/30 (Canada) | 70,000 | 69,300 | |
| 1011778 BC ULC/New Red Finance, Inc. 144A company guaranty notes 4.375%, 1/15/28 (Canada) | 70,000 | 71,065 | |
| 1011778 BC ULC/New Red Finance, Inc. 144A company guaranty sr. notes 3.875%, 1/15/28 (Canada) | 90,000 | 90,563 | |
| Albertsons Cos., Inc./Safeway, Inc./New Albertsons LP/Albertsons, LLC 144A company guaranty sr. unsec. notes 4.875%, 2/15/30 | 30,000 | 32,325 | |
| Albertsons Cos., Inc./Safeway, Inc./New Albertsons LP/Albertsons, LLC 144A company guaranty sr. unsec. notes 4.625%, 1/15/27 | 130,000 | 136,374 | |
| Albertsons Cos., LLC/Safeway, Inc./New Albertsons LP/Albertsons, LLC 144A company guaranty sr. unsec. notes 7.50%, 3/15/26 | 90,000 | 97,200 | |
| Anheuser-Busch InBev Worldwide, Inc. company guaranty sr. unsec. unsub. bonds 5.55%, 1/23/49 | 338,000 | 457,767 | |
| Anheuser-Busch InBev Worldwide, Inc. company guaranty sr. unsec. unsub. bonds 4.60%, 4/15/48 | 810,000 | 966,998 | |
Dynamic Asset Allocation Conservative Fund 47 | |
| CORPORATE BONDS AND NOTES (22.5%)* cont. | Principal amount | Value | |
| Consumer staples cont. | |||
| Anheuser-Busch InBev Worldwide, Inc. company guaranty sr. unsec. unsub. notes 4.75%, 1/23/29 | $404,000 | $475,620 | |
| Ascend Learning, LLC 144A sr. unsec. notes 6.875%, 8/1/25 | 125,000 | 127,031 | |
| Ascend Learning, LLC 144A sr. unsec. notes 6.875%, 8/1/25 | 55,000 | 56,049 | |
| Ashtead Capital, Inc. 144A company guaranty sr. unsec. notes 2.45%, 8/12/31 | 405,000 | 398,129 | |
| Ashtead Capital, Inc. 144A notes 4.375%, 8/15/27 | 685,000 | 717,866 | |
| Brand Energy & Infrastructure Services, Inc. 144A sr. unsec. notes 8.50%, 7/15/25 | 40,000 | 40,150 | |
| CDW, LLC/CDW Finance Corp. company guaranty sr. unsec. notes 3.25%, 2/15/29 | 15,000 | 15,375 | |
| CVS Pass-Through Trust sr. notes 6.036%, 12/10/28 | 33,377 | 38,186 | |
| ERAC USA Finance, LLC 144A company guaranty sr. unsec. bonds 4.50%, 2/15/45 | 230,000 | 278,613 | |
| ERAC USA Finance, LLC 144A company guaranty sr. unsec. notes 7.00%, 10/15/37 | 300,000 | 445,762 | |
| ERAC USA Finance, LLC 144A company guaranty sr. unsec. notes 5.625%, 3/15/42 | 363,000 | 496,206 | |
| Fresh Market, Inc. (The) 144A company guaranty sr. notes 9.75%, 5/1/23 | 165,000 | 169,950 | |
| Golden Nugget, Inc. 144A company guaranty sr. unsec. sub. notes 8.75%, 10/1/25 | 85,000 | 88,825 | |
| Golden Nugget, Inc. 144A sr. unsec. notes 6.75%, 10/15/24 | 170,000 | 170,221 | |
| IRB Holding Corp. 144A company guaranty sr. notes 7.00%, 6/15/25 | 50,000 | 53,086 | |
| JDE Peet’s NV 144A company guaranty sr. unsec. notes 1.375%, 1/15/27 (Netherlands) | 535,000 | 527,831 | |
| Keurig Dr Pepper, Inc. company guaranty sr. unsec. notes 2.25%, 3/15/31 | 869,000 | 870,360 | |
| Keurig Dr Pepper, Inc. company guaranty sr. unsec. unsub. notes 4.597%, 5/25/28 | 303,000 | 351,761 | |
| KFC Holding Co./Pizza Hut Holdings, LLC/Taco Bell of America, LLC 144A company guaranty sr. unsec. notes 4.75%, 6/1/27 | 60,000 | 62,641 | |
| Kraft Heinz Foods Co. company guaranty sr. unsec. bonds 4.375%, 6/1/46 | 175,000 | 199,118 | |
| Kraft Heinz Foods Co. company guaranty sr. unsec. notes 5.00%, 7/15/35 | 135,000 | 166,018 | |
| Kraft Heinz Foods Co. company guaranty sr. unsec. notes 3.00%, 6/1/26 | 89,000 | 93,747 | |
| Kraft Heinz Foods Co. company guaranty sr. unsec. sub. notes 4.875%, 10/1/49 | 335,000 | 407,727 | |
| Lamb Weston Holdings, Inc. 144A company guaranty sr. unsec. notes 4.875%, 5/15/28 | 75,000 | 82,444 | |
| Lamb Weston Holdings, Inc. 144A company guaranty sr. unsec. unsub. notes 4.875%, 11/1/26 | 382,000 | 391,366 | |
| Lamb Weston Holdings, Inc. 144A company guaranty sr. unsec. unsub. notes 4.625%, 11/1/24 | 25,000 | 25,427 | |
| Match Group Holdings II, LLC 144A sr. unsec. bonds 5.00%, 12/15/27 | 54,000 | 56,523 | |
| Match Group Holdings II, LLC 144A sr. unsec. bonds 3.625%, 10/1/31 | 45,000 | 44,466 | |
| Match Group Holdings II, LLC 144A sr. unsec. notes 4.125%, 8/1/30 | 25,000 | 26,031 | |
48 Dynamic Asset Allocation Conservative Fund | |
| CORPORATE BONDS AND NOTES (22.5%)* cont. | Principal amount | Value | |
| Consumer staples cont. | |||
| Match Group Holdings II, LLC 144A sr. unsec. unsub. notes 4.625%, 6/1/28 | $415,000 | $433,872 | |
| Millennium Escrow Corp. 144A sr. notes 6.625%, 8/1/26 | 70,000 | 72,097 | |
| Mondelez International Holdings Netherlands BV 144A company guaranty sr. unsec. notes 2.125%, 9/19/22 (Netherlands) | 425,000 | 432,673 | |
| Nestle Holdings, Inc. 144A company guaranty sr. unsec. notes 0.375%, 1/15/24 | 850,000 | 846,756 | |
| Netflix, Inc. sr. unsec. notes 4.875%, 4/15/28 | 90,000 | 103,725 | |
| Netflix, Inc. sr. unsec. unsub. notes 5.875%, 11/15/28 | 160,000 | 196,064 | |
| Netflix, Inc. sr. unsec. unsub. notes 4.375%, 11/15/26 | 480,000 | 536,400 | |
| Netflix, Inc. 144A sr. unsec. bonds 5.375%, 11/15/29 | 55,000 | 66,619 | |
| Netflix, Inc. 144A sr. unsec. bonds 4.875%, 6/15/30 | 30,000 | 35,325 | |
| Newell Brands, Inc. sr. unsec. notes 4.875%, 6/1/25 | 55,000 | 60,704 | |
| Newell Brands, Inc. sr. unsec. unsub. notes 4.70%, 4/1/26 | 90,000 | 99,228 | |
| Rite Aid Corp. 144A company guaranty sr. notes 8.00%, 11/15/26 | 86,000 | 86,649 | |
| Rite Aid Corp. 144A company guaranty sr. unsec. sub. notes 7.50%, 7/1/25 | 58,000 | 57,987 | |
| TripAdvisor, Inc. 144A company guaranty sr. unsec. notes 7.00%, 7/15/25 | 90,000 | 95,400 | |
| VM Consolidated, Inc. 144A company guaranty sr. unsec. notes 5.50%, 4/15/29 | 110,000 | 111,856 | |
| Yum! Brands, Inc. sr. unsec. sub. bonds 3.625%, 3/15/31 | 50,000 | 50,267 | |
| Yum! Brands, Inc. 144A sr. unsec. bonds 4.75%, 1/15/30 | 50,000 | 54,191 | |
| 12,137,934 | |||
| Energy (1.3%) | |||
| Antero Midstream Partners LP/Antero Midstream Finance Corp. 144A company guaranty sr. unsec. notes 7.875%, 5/15/26 | 60,000 | 65,607 | |
| Antero Resources Corp. 144A company guaranty sr. unsec. notes 8.375%, 7/15/26 | 45,000 | 50,973 | |
| Antero Resources Corp. 144A company guaranty sr. unsec. notes 7.625%, 2/1/29 | 60,000 | 67,080 | |
| Antero Resources Corp. 144A sr. unsec. notes 5.375%, 3/1/30 | 55,000 | 57,923 | |
| Apache Corp. sr. unsec. unsub. notes 5.10%, 9/1/40 | 55,000 | 61,599 | |
| Apache Corp. sr. unsec. unsub. notes 4.875%, 11/15/27 | 45,000 | 49,073 | |
| Apache Corp. sr. unsec. unsub. notes 4.625%, 11/15/25 | 40,000 | 43,000 | |
| Apache Corp. sr. unsec. unsub. notes 4.375%, 10/15/28 | 65,000 | 70,281 | |
| Baytex Energy Corp. 144A company guaranty sr. unsec. sub. notes 5.625%, 6/1/24 (Canada) | 25,000 | 25,140 | |
| BP Capital Markets America, Inc. company guaranty sr. unsec. notes 3.119%, 5/4/26 | 445,000 | 481,205 | |
| BP Capital Markets PLC company guaranty sr. unsec. unsub. notes 3.279%, 9/19/27 (United Kingdom) | 715,000 | 783,057 | |
| Callon Petroleum Co. company guaranty sr. unsec. notes 6.125%, 10/1/24 | 130,000 | 127,755 | |
| Callon Petroleum Co. 144A company guaranty notes 9.00%, 4/1/25 | 50,000 | 54,065 | |
| Callon Petroleum Co. 144A company guaranty sr. unsec. notes 8.00%, 8/1/28 | 65,000 | 64,188 | |
| Cenovus Energy, Inc. sr. unsec. bonds 6.75%, 11/15/39 (Canada) | 80,000 | 108,700 | |
| Centennial Resource Production, LLC 144A company guaranty sr. unsec. notes 6.875%, 4/1/27 | 130,000 | 132,436 | |
Dynamic Asset Allocation Conservative Fund 49 | |
| CORPORATE BONDS AND NOTES (22.5%)* cont. | Principal amount | Value | |
| Energy cont. | |||
| Centennial Resource Production, LLC 144A company guaranty sr. unsec. notes 5.375%, 1/15/26 | $120,000 | $117,756 | |
| ChampionX Corp. company guaranty sr. unsec. notes 6.375%, 5/1/26 | 57,000 | 59,280 | |
| Cheniere Corpus Christi Holdings, LLC company guaranty sr. notes 5.125%, 6/30/27 | 120,000 | 138,733 | |
| Cheniere Energy Partners LP 144A company guaranty sr. unsec. bonds 4.00%, 3/1/31 | 80,000 | 83,776 | |
| Cheniere Energy Partners LP 144A company guaranty sr. unsec. unsub. bonds 3.25%, 1/31/32 | 96,000 | 96,240 | |
| Comstock Resources, Inc. 144A company guaranty sr. unsec. notes 7.50%, 5/15/25 | 24,000 | 24,950 | |
| Comstock Resources, Inc. 144A company guaranty sr. unsec. notes 5.875%, 1/15/30 | 110,000 | 114,400 | |
| Comstock Resources, Inc. 144A sr. unsec. notes 6.75%, 3/1/29 | 95,000 | 102,600 | |
| ConocoPhillips 144A company guaranty sr. unsec. notes 3.75%, 10/1/27 | 55,000 | 61,426 | |
| Continental Resources, Inc. company guaranty sr. unsec. bonds 4.90%, 6/1/44 | 80,000 | 89,400 | |
| Continental Resources, Inc. company guaranty sr. unsec. notes 4.375%, 1/15/28 | 95,000 | 105,094 | |
| Continental Resources, Inc. company guaranty sr. unsec. unsub. notes 4.50%, 4/15/23 | 135,000 | 139,894 | |
| Continental Resources, Inc. 144A company guaranty sr. unsec. bonds 5.75%, 1/15/31 | 110,000 | 132,963 | |
| CrownRock LP/CrownRock Finance, Inc. 144A sr. unsec. notes 5.00%, 5/1/29 | 95,000 | 99,190 | |
| DCP Midstream Operating LP company guaranty sr. unsec. notes 5.625%, 7/15/27 | 50,000 | 56,875 | |
| DCP Midstream Operating LP 144A company guaranty sr. unsec. unsub. bonds 6.75%, 9/15/37 | 135,000 | 176,850 | |
| Devon Energy Corp. sr. unsec. unsub. bonds 7.95%, 4/15/32 | 75,000 | 106,314 | |
| Devon Energy Corp. sr. unsec. unsub. bonds 7.875%, 9/30/31 | 50,000 | 70,750 | |
| Devon Energy Corp. sr. unsec. unsub. bonds 5.60%, 7/15/41 | 40,000 | 49,842 | |
| Devon Energy Corp. 144A sr. unsec. notes 5.25%, 10/15/27 | 312,000 | 331,626 | |
| Diamondback Energy, Inc. company guaranty sr. unsec. notes 3.25%, 12/1/26 | 290,000 | 310,546 | |
| DT Midstream, Inc. 144A sr. unsec. bonds 4.375%, 6/15/31 | 45,000 | 46,350 | |
| DT Midstream, Inc. 144A sr. unsec. notes 4.125%, 6/15/29 | 35,000 | 35,492 | |
| Encino Acquisition Partners Holdings, LLC 144A company guaranty sr. unsec. notes 8.50%, 5/1/28 | 135,000 | 138,038 | |
| Endeavor Energy Resources LP/EER Finance, Inc. 144A sr. unsec. bonds 5.75%, 1/30/28 | 555,000 | 584,138 | |
| Endeavor Energy Resources LP/EER Finance, Inc. 144A sr. unsec. notes 6.625%, 7/15/25 | 100,000 | 105,375 | |
| EnLink Midstream, LLC 144A company guaranty sr. unsec. notes 5.625%, 1/15/28 | 140,000 | 149,064 | |
| EOG Resources, Inc. sr. unsec. unsub. notes 2.625%, 3/15/23 | 690,000 | 708,630 | |
| EQT Corp. sr. unsec. notes 7.50%, 2/1/30 | 55,000 | 70,796 | |
| EQT Corp. sr. unsec. notes 5.00%, 1/15/29 | 10,000 | 11,260 | |
50 Dynamic Asset Allocation Conservative Fund | |
| CORPORATE BONDS AND NOTES (22.5%)* cont. | Principal amount | Value | |
| Energy cont. | |||
| Equinor ASA company guaranty sr. unsec. notes 5.10%, 8/17/40 (Norway) | $170,000 | $225,168 | |
| Global Partners LP/GLP Finance Corp. company guaranty sr. unsec. notes 6.875%, 1/15/29 | 15,000 | 15,570 | |
| Hess Midstream Operations LP 144A company guaranty sr. unsec. notes 5.125%, 6/15/28 | 95,000 | 99,232 | |
| Hess Midstream Operations LP 144A company guaranty sr. unsec. notes 4.25%, 2/15/30 | 45,000 | 45,506 | |
| Hess Midstream Operations LP 144A company guaranty sr. unsec. sub. notes 5.625%, 2/15/26 | 355,000 | 368,313 | |
| Hilcorp Energy I LP/Hilcorp Finance Co. 144A sr. unsec. bonds 6.00%, 2/1/31 | 25,000 | 25,688 | |
| Hilcorp Energy I LP/Hilcorp Finance Co. 144A sr. unsec. notes 5.75%, 2/1/29 | 25,000 | 25,688 | |
| Holly Energy Partners LP/Holly Energy Finance Corp. 144A company guaranty sr. unsec. notes 5.00%, 2/1/28 | 150,000 | 152,100 | |
| ITT Holdings, LLC 144A sr. unsec. notes 6.50%, 8/1/29 | 125,000 | 126,094 | |
| MEG Energy Corp. 144A company guaranty sr. unsec. notes 5.875%, 2/1/29 (Canada) | 15,000 | 15,319 | |
| MEG Energy Corp. 144A notes 6.50%, 1/15/25 (Canada) | 53,000 | 54,535 | |
| Nabors Industries, Inc. company guaranty sr. unsec. notes 5.75%, 2/1/25 | 60,000 | 55,440 | |
| Nabors Industries, Inc. 144A company guaranty sr. unsec. notes 9.00%, 2/1/25 | 35,000 | 36,225 | |
| Nabors Industries, Ltd. 144A company guaranty sr. unsec. notes 7.25%, 1/15/26 | 45,000 | 43,767 | |
| Northriver Midstream Finance LP 144A sr. notes 5.625%, 2/15/26 (Canada) | 80,000 | 83,200 | |
| Oasis Petroleum, Inc. 144A company guaranty sr. unsec. notes 6.375%, 6/1/26 | 55,000 | 57,613 | |
| Occidental Petroleum Corp. sr. unsec. bonds 6.625%, 9/1/30 | 70,000 | 86,275 | |
| Occidental Petroleum Corp. sr. unsec. bonds 6.125%, 1/1/31 | 25,000 | 30,012 | |
| Occidental Petroleum Corp. sr. unsec. sub. bonds 6.20%, 3/15/40 | 140,000 | 164,878 | |
| Occidental Petroleum Corp. sr. unsec. sub. notes 6.45%, 9/15/36 | 175,000 | 220,172 | |
| Ovintiv, Inc. company guaranty sr. unsec. bonds 6.50%, 8/15/34 | 35,000 | 47,204 | |
| Ovintiv, Inc. company guaranty sr. unsec. unsub. bonds 7.375%, 11/1/31 | 95,000 | 128,863 | |
| Ovintiv, Inc. company guaranty sr. unsec. unsub. bonds 6.625%, 8/15/37 | 35,000 | 48,001 | |
| Ovintiv, Inc. company guaranty sr. unsec. unsub. notes 8.125%, 9/15/30 | 30,000 | 41,273 | |
| PBF Holding Co., LLC/PBF Finance Corp. 144A company guaranty sr. notes 9.25%, 5/15/25 | 100,000 | 94,750 | |
| Pertamina Persero PT 144A sr. unsec. unsub. notes 4.30%, 5/20/23 (Indonesia) | 200,000 | 210,252 | |
| Petrobras Global Finance BV company guaranty sr. unsec. unsub. notes 6.25%, 3/17/24 (Brazil) | 146,000 | 162,608 | |
| Petrobras Global Finance BV company guaranty sr. unsec. unsub. notes 5.60%, 1/3/31 (Brazil) | 274,000 | 297,427 | |
| Petroleos de Venezuela SA company guaranty sr. unsec. bonds Ser. REGS, 6.00%, 11/15/26 (Venezuela) (In default) † | 270,000 | 14,850 | |
Dynamic Asset Allocation Conservative Fund 51 | |
| CORPORATE BONDS AND NOTES (22.5%)* cont. | Principal amount | Value | |
| Energy cont. | |||
| Petroleos Mexicanos company guaranty sr. unsec. unsub. FRB 7.69%, 1/23/50 (Mexico) | $159,000 | $150,557 | |
| Petroleos Mexicanos company guaranty sr. unsec. unsub. notes 6.84%, 1/23/30 (Mexico) | 902,000 | 931,667 | |
| Precision Drilling Corp. 144A company guaranty sr. unsec. notes 7.125%, 1/15/26 (Canada) | 140,000 | 143,500 | |
| Precision Drilling Corp. 144A company guaranty sr. unsec. notes 6.875%, 1/15/29 (Canada) | 25,000 | 26,111 | |
| Rattler Midstream LP 144A company guaranty sr. unsec. notes 5.625%, 7/15/25 | 70,000 | 72,891 | |
| Regency Energy Partners LP/Regency Energy Finance Corp. company guaranty sr. unsec. unsub. notes 4.50%, 11/1/23 | 24,000 | 25,500 | |
| Renewable Energy Group, Inc. 144A company guaranty sr. notes 5.875%, 6/1/28 | 35,000 | 36,181 | |
| Rockcliff Energy II, LLC 144A sr. unsec. notes 5.50%, 10/15/29 | 35,000 | 35,525 | |
| Sabine Pass Liquefaction, LLC sr. bonds 4.20%, 3/15/28 | 174,000 | 194,270 | |
| Sabine Pass Liquefaction, LLC sr. notes 5.75%, 5/15/24 | 120,000 | 133,645 | |
| Sabine Pass Liquefaction, LLC sr. notes 5.00%, 3/15/27 | 52,000 | 59,780 | |
| Shell International Finance BV company guaranty sr. unsec. unsub. notes 2.875%, 5/10/26 (Netherlands) | 980,000 | 1,056,005 | |
| SM Energy Co. sr. unsec. notes 6.625%, 1/15/27 | 40,000 | 41,017 | |
| SM Energy Co. sr. unsec. unsub. notes 6.75%, 9/15/26 | 85,000 | 86,810 | |
| SM Energy Co. sr. unsec. unsub. notes 6.50%, 7/15/28 | 95,000 | 98,355 | |
| SM Energy Co. 144A company guaranty notes 10.00%, 1/15/25 | 45,000 | 50,192 | |
| Southwestern Energy Co. company guaranty sr. unsec. notes 5.375%, 3/15/30 | 110,000 | 118,715 | |
| Southwestern Energy Co. 144A company guaranty sr. unsec. unsub. notes 5.375%, 2/1/29 | 205,000 | 219,350 | |
| Spectra Energy Partners LP sr. unsec. notes 3.375%, 10/15/26 | 340,000 | 368,403 | |
| Tallgrass Energy Partners LP/Tallgrass Energy Finance Corp. 144A company guaranty sr. unsec. notes 7.50%, 10/1/25 | 25,000 | 27,000 | |
| Tallgrass Energy Partners LP/Tallgrass Energy Finance Corp. 144A company guaranty sr. unsec. notes 6.00%, 12/31/30 | 95,000 | 97,328 | |
| Tallgrass Energy Partners LP/Tallgrass Energy Finance Corp. 144A company guaranty sr. unsec. notes 5.50%, 1/15/28 | 120,000 | 122,400 | |
| Targa Resources Partners LP/Targa Resources Partners Finance Corp. company guaranty sr. unsec. notes 6.875%, 1/15/29 | 30,000 | 33,614 | |
| Targa Resources Partners LP/Targa Resources Partners Finance Corp. company guaranty sr. unsec. notes 6.50%, 7/15/27 | 50,000 | 53,912 | |
| Targa Resources Partners LP/Targa Resources Partners Finance Corp. company guaranty sr. unsec. notes 5.50%, 3/1/30 | 30,000 | 32,803 | |
| Targa Resources Partners LP/Targa Resources Partners Finance Corp. company guaranty sr. unsec. unsub. notes 5.00%, 1/15/28 | 55,000 | 57,750 | |
| Transcanada Trust company guaranty jr. unsec. sub. FRB 5.30%, 3/15/77 (Canada) | 227,000 | 243,741 | |
| Transocean Pontus, Ltd. 144A company guaranty sr. notes 6.125%, 8/1/25 (Cayman Islands) | 43,550 | 43,550 | |
| Transocean Poseidon, Ltd. 144A company guaranty sr. notes 6.875%, 2/1/27 | 75,000 | 74,620 | |
| Transocean, Inc. 144A company guaranty sr. unsec. notes 11.50%, 1/30/27 | 90,000 | 92,700 | |
52 Dynamic Asset Allocation Conservative Fund | |
| CORPORATE BONDS AND NOTES (22.5%)* cont. | Principal amount | Value | |
| Energy cont. | |||
| USA Compression Partners LP/USA Compression Finance Corp. company guaranty sr. unsec. notes 6.875%, 4/1/26 | $100,000 | $104,120 | |
| USA Compression Partners LP/USA Compression Finance Corp. company guaranty sr. unsec. unsub. notes 6.875%, 9/1/27 | 50,000 | 52,930 | |
| Viper Energy Partners LP 144A company guaranty sr. unsec. notes 5.375%, 11/1/27 | 30,000 | 31,275 | |
| 14,451,970 | |||
| Financials (6.3%) | |||
| AG Issuer, LLC 144A sr. notes 6.25%, 3/1/28 | 90,000 | 94,365 | |
| Air Lease Corp. sr. unsec. notes 2.10%, 9/1/28 | 240,000 | 232,999 | |
| Air Lease Corp. sr. unsec. sub. bonds 4.625%, 10/1/28 | 279,000 | 313,379 | |
| Air Lease Corp. sr. unsec. sub. notes 3.25%, 10/1/29 | 972,000 | 1,011,229 | |
| Alliant Holdings Intermediate, LLC/Alliant Holdings Co-Issuer 144A sr. unsec. notes 6.75%, 10/15/27 | 130,000 | 134,550 | |
| Ally Financial, Inc. company guaranty sr. unsec. notes 8.00%, 11/1/31 | 105,000 | 151,445 | |
| American Express Co. sr. unsec. notes 2.65%, 12/2/22 | 404,000 | 414,936 | |
| AmWINS Group, Inc. 144A sr. unsec. notes 4.875%, 6/30/29 | 45,000 | 45,632 | |
| ANZ New Zealand Int’l, Ltd./London 144A company guaranty sr. unsec. notes 2.875%, 1/25/22 (United Kingdom) | 1,400,000 | 1,411,718 | |
| Ares Capital Corp. sr. unsec. sub. notes 3.875%, 1/15/26 | 204,000 | 218,163 | |
| Aretec Escrow Issuer, Inc. 144A sr. unsec. notes 7.50%, 4/1/29 | 130,000 | 133,900 | |
| Athene Global Funding 144A notes 1.985%, 8/19/28 | 660,000 | 651,469 | |
| Australia & New Zealand Banking Group, Ltd./United Kingdom 144A jr. unsec. sub. FRB 6.75%, perpetual maturity (United Kingdom) | 200,000 | 233,322 | |
| Banco Santander SA sr. unsec. unsub. notes 4.379%, 4/12/28 (Spain) | 200,000 | 227,128 | |
| Banco Santander SA unsec. sub. notes 5.179%, 11/19/25 (Spain) | 200,000 | 227,221 | |
| Bank of America Corp. jr. unsec. sub. FRN Ser. AA, 6.10%, perpetual maturity | 204,000 | 227,205 | |
| Bank of America Corp. jr. unsec. sub. FRN Ser. Z, 6.50%, perpetual maturity | 10,000 | 11,190 | |
| Bank of America Corp. sr. unsec. FRN Ser. MTN, 2.496%, 2/13/31 | 735,000 | 743,813 | |
| Bank of America Corp. sr. unsec. unsub. bonds Ser. MTN, 3.248%, 10/21/27 | 2,355,000 | 2,542,832 | |
| Bank of America Corp. unsec. sub. FRN (BBA LIBOR USD 3 Month + 0.76%), 0.876%, 9/15/26 | 100,000 | 99,887 | |
| Bank of America Corp. unsec. sub. notes 6.11%, 1/29/37 | 870,000 | 1,173,590 | |
| Bank of Nova Scotia (The) sr. unsec. notes 2.00%, 11/15/22 (Canada) | 267,000 | 272,237 | |
| Bank of Nova Scotia (The) sr. unsec. unsub. notes 2.70%, 3/7/22 (Canada) | 230,000 | 232,302 | |
| Berkshire Hathaway Finance Corp. company guaranty sr. unsec. bonds 2.85%, 10/15/50 | 635,000 | 625,774 | |
| Berkshire Hathaway Finance Corp. company guaranty sr. unsec. notes 4.30%, 5/15/43 | 151,000 | 184,208 | |
| Blackstone Holdings Finance Co., LLC 144A company guaranty sr. unsec. unsub. bonds 1.60%, 3/30/31 | 205,000 | 193,650 | |
| Blackstone Mortgage Trust, Inc. 144A sr. notes 3.75%, 1/15/27 R | 65,000 | 64,431 | |
| BNP Paribas SA 144A unsec. sub. FRB 2.588%, 8/12/35 (France) | 485,000 | 470,314 | |
Dynamic Asset Allocation Conservative Fund 53 | |
| CORPORATE BONDS AND NOTES (22.5%)* cont. | Principal amount | Value | |
| Financials cont. | |||
| BPCE SA 144A unsec. sub. notes 5.15%, 7/21/24 (France) | $200,000 | $219,069 | |
| BPCE SA 144A unsec. sub. notes 4.50%, 3/15/25 (France) | 295,000 | 323,956 | |
| Camden Property Trust sr. unsec. unsub. notes 4.875%, 6/15/23 R | 140,000 | 148,582 | |
| Cantor Fitzgerald LP 144A unsec. notes 6.50%, 6/17/22 | 136,000 | 141,535 | |
| Capital One Financial Corp. unsec. sub. FRB 2.359%, 7/29/32 | 1,420,000 | 1,390,223 | |
| CIT Group, Inc. sr. unsec. sub. notes 5.00%, 8/1/23 | 47,000 | 50,114 | |
| CIT Group, Inc. sr. unsec. unsub. notes 5.25%, 3/7/25 | 466,000 | 519,008 | |
| CIT Group, Inc. sr. unsec. unsub. notes 5.00%, 8/15/22 | 45,000 | 46,575 | |
| Citigroup, Inc. jr. unsec. sub. FRN 3.875%, perpetual maturity | 374,000 | 381,480 | |
| Citigroup, Inc. sr. unsec. FRB 3.668%, 7/24/28 | 2,519,000 | 2,767,885 | |
| Citigroup, Inc. sr. unsec. unsub. FRB 3.887%, 1/10/28 | 576,000 | 636,497 | |
| Citigroup, Inc. sr. unsec. unsub. notes 4.50%, 1/14/22 | 387,000 | 391,539 | |
| Citigroup, Inc. sr. unsec. unsub. notes 2.90%, 12/8/21 | 234,000 | 234,597 | |
| Citigroup, Inc. unsec. sub. bonds 4.75%, 5/18/46 | 275,000 | 345,318 | |
| Citigroup, Inc. unsec. sub. bonds 4.45%, 9/29/27 | 385,000 | 437,818 | |
| Citigroup, Inc. unsec. sub. notes 4.60%, 3/9/26 | 340,000 | 384,007 | |
| CNO Financial Group, Inc. sr. unsec. notes 5.25%, 5/30/29 | 90,000 | 105,469 | |
| CNO Financial Group, Inc. sr. unsec. unsub. notes 5.25%, 5/30/25 | 80,000 | 90,038 | |
| Cobra AcquisitionCo., LLC 144A company guaranty sr. unsec. notes 6.375%, 11/1/29 | 90,000 | 90,000 | |
| Coinbase Global, Inc. 144A company guaranty sr. unsec. unsub. bonds 3.625%, 10/1/31 | 55,000 | 52,284 | |
| Coinbase Global, Inc. 144A company guaranty sr. unsec. unsub. notes 3.375%, 10/1/28 | 55,000 | 53,075 | |
| Commonwealth Bank of Australia 144A sr. unsec. notes 3.15%, 9/19/27 (Australia) | 1,010,000 | 1,102,282 | |
| Commonwealth Bank of Australia 144A unsec. sub. notes 2.688%, 3/11/31 (Australia) | 200,000 | 199,372 | |
| Credit Agricole SA 144A unsec. sub. FRN 4.00%, 1/10/33 (France) | 250,000 | 269,688 | |
| Credit Suisse AG/New York, NY sr. unsec. notes 2.80%, 4/8/22 | 550,000 | 557,405 | |
| Credit Suisse Group AG 144A jr. unsec. sub. FRN 6.25%, perpetual maturity (Switzerland) | 225,000 | 242,438 | |
| Credit Suisse Group AG 144A sr. unsec. bonds 3.869%, 1/12/29 (Switzerland) | 311,000 | 339,436 | |
| Credit Suisse Group AG 144A sr. unsec. FRN 2.193%, 6/5/26 (Switzerland) | 1,090,000 | 1,105,976 | |
| Danske Bank A/S 144A sr. unsec. notes 2.70%, 3/2/22 (Denmark) | 1,275,000 | 1,287,642 | |
| Deutsche Bank AG sr. unsec. unsub. notes 1.686%, 3/19/26 (Germany) | 1,315,000 | 1,322,473 | |
| Deutsche Bank AG unsec. sub. FRB 3.729%, 1/14/32 (Germany) | 425,000 | 438,806 | |
| Digital Realty Trust LP company guaranty sr. unsec. bonds 4.45%, 7/15/28 R | 204,000 | 233,923 | |
| Digital Realty Trust LP company guaranty sr. unsec. notes 4.75%, 10/1/25 R | 990,000 | 1,114,611 | |
| Diversified Healthcare Trust company guaranty sr. unsec. notes 9.75%, 6/15/25 R | 210,000 | 229,688 | |
| DNB Bank ASA 144A sr. unsec. notes 2.15%, 12/2/22 (Norway) | 970,000 | 992,189 | |
| Empire Communities Corp. 144A sr. unsec. notes 7.00%, 12/15/25 (Canada) | 40,000 | 41,900 | |
54 Dynamic Asset Allocation Conservative Fund | |
| CORPORATE BONDS AND NOTES (22.5%)* cont. | Principal amount | Value | |
| Financials cont. | |||
| Fairfax Financial Holdings, Ltd. sr. unsec. notes 4.85%, 4/17/28 (Canada) | $714,000 | $814,909 | |
| Fairfax US, Inc. 144A company guaranty sr. unsec. notes 4.875%, 8/13/24 | 190,000 | 206,803 | |
| Fifth Third Bancorp jr. unsec. sub. FRB 5.10%, perpetual maturity | 51,000 | 52,505 | |
| Five Corners Funding Trust 144A sr. unsec. bonds 4.419%, 11/15/23 | 345,000 | 372,780 | |
| Freedom Mortgage Corp. 144A sr. unsec. notes 8.25%, 4/15/25 | 67,000 | 68,340 | |
| Freedom Mortgage Corp. 144A sr. unsec. notes 8.125%, 11/15/24 | 80,000 | 81,100 | |
| Freedom Mortgage Corp. 144A sr. unsec. notes 6.625%, 1/15/27 | 55,000 | 53,488 | |
| GLP Capital LP/GLP Financing II, Inc. company guaranty sr. unsec. notes 5.25%, 6/1/25 | 85,000 | 94,782 | |
| goeasy, Ltd. 144A company guaranty sr. unsec. notes 5.375%, 12/1/24 (Canada) | 30,000 | 30,900 | |
| goeasy, Ltd. 144A company guaranty sr. unsec. notes 4.375%, 5/1/26 (Canada) | 60,000 | 61,650 | |
| Goldman Sachs Group, Inc. (The) jr. unsec. sub. FRN 3.65%, 7/28/51 | 189,000 | 189,567 | |
| Goldman Sachs Group, Inc. (The) sr. unsec. FRB 4.223%, 5/1/29 | 916,000 | 1,035,191 | |
| Goldman Sachs Group, Inc. (The) sr. unsec. unsub. notes 5.75%, 1/24/22 | 95,000 | 96,607 | |
| Goldman Sachs Group, Inc. (The) sr. unsec. unsub. notes 3.85%, 1/26/27 | 2,035,000 | 2,235,917 | |
| Goldman Sachs Group, Inc. (The) sr. unsec. unsub. notes 2.60%, 2/7/30 | 289,000 | 297,420 | |
| Home Point Capital, Inc. 144A company guaranty sr. unsec. notes 5.00%, 2/1/26 | 50,000 | 45,250 | |
| HUB International, Ltd. 144A sr. unsec. notes 7.00%, 5/1/26 | 130,000 | 134,388 | |
| Huntington Bancshares, Inc. 144A unsec. sub. FRB 2.487%, 8/15/36 | 592,000 | 582,914 | |
| Icahn Enterprises LP/Icahn Enterprises Finance Corp. company guaranty sr. unsec. notes 6.75%, 2/1/24 | 65,000 | 65,813 | |
| Icahn Enterprises LP/Icahn Enterprises Finance Corp. company guaranty sr. unsec. notes 6.25%, 5/15/26 | 95,000 | 99,275 | |
| Icahn Enterprises LP/Icahn Enterprises Finance Corp. company guaranty sr. unsec. notes 5.25%, 5/15/27 | 85,000 | 88,188 | |
| Icahn Enterprises LP/Icahn Enterprises Finance Corp. company guaranty sr. unsec. sub. notes 4.375%, 2/1/29 | 50,000 | 49,938 | |
| Intercontinental Exchange, Inc. sr. unsec. bonds 2.65%, 9/15/40 | 599,000 | 572,897 | |
| Intercontinental Exchange, Inc. sr. unsec. bonds 1.85%, 9/15/32 | 300,000 | 282,320 | |
| International Lease Finance Corp. sr. unsec. unsub. notes 5.875%, 8/15/22 | 44,000 | 46,033 | |
| Intesa Sanpaolo SpA 144A unsec. sub. bonds 4.198%, 6/1/32 (Italy) | 465,000 | 476,685 | |
| iStar, Inc. sr. unsec. notes 5.50%, 2/15/26 R | 85,000 | 88,825 | |
| iStar, Inc. sr. unsec. notes 4.75%, 10/1/24 R | 135,000 | 142,763 | |
| iStar, Inc. sr. unsec. notes 4.25%, 8/1/25 R | 110,000 | 114,260 | |
| JPMorgan Chase & Co. jr. unsec. bonds 6.10%, perpetual maturity | 43,000 | 46,732 | |
| JPMorgan Chase & Co. jr. unsec. sub. FRB Ser. HH, 4.60%, perpetual maturity | 252,000 | 257,670 | |
| JPMorgan Chase & Co. jr. unsec. sub. FRB Ser. W, (BBA LIBOR USD 3 Month + 1.00%), 1.125%, 5/15/47 | 293,000 | 260,717 | |
| JPMorgan Chase & Co. sr. unsec. unsub. FRB 3.964%, 11/15/48 | 2,495,000 | 2,892,177 | |
| JPMorgan Chase & Co. unsec. sub. bonds 3.625%, 12/1/27 | 2,650,000 | 2,894,592 | |
Dynamic Asset Allocation Conservative Fund 55 | |
| CORPORATE BONDS AND NOTES (22.5%)* cont. | Principal amount | Value | |
| Financials cont. | |||
| JPMorgan Chase & Co. unsec. sub. FRB 2.956%, 5/13/31 | $80,000 | $83,229 | |
| JPMorgan Chase & Co. unsec. sub. notes 3.375%, 5/1/23 | 1,053,000 | 1,101,207 | |
| KKR Group Finance Co. III, LLC 144A company guaranty sr. unsec. unsub. bonds 5.125%, 6/1/44 | 250,000 | 323,182 | |
| Ladder Capital Finance Holdings, LLLP/Ladder Capital Finance Corp. 144A company guaranty sr. unsec. notes 4.75%, 6/15/29 R | 55,000 | 54,612 | |
| Ladder Capital Finance Holdings, LLLP/Ladder Capital Finance Corp. 144A company guaranty sr. unsec. unsub. notes 5.25%, 10/1/25 R | 30,000 | 30,373 | |
| Ladder Capital Finance Holdings, LLLP/Ladder Capital Finance Corp. 144A sr. unsec. notes 4.25%, 2/1/27 R | 100,000 | 99,250 | |
| Lloyds Banking Group PLC unsec. sub. notes 4.65%, 3/24/26 (United Kingdom) | 295,000 | 331,548 | |
| Marsh & McLennan Cos., Inc. sr. unsec. sub. bonds 4.90%, 3/15/49 | 305,000 | 410,622 | |
| Marsh & McLennan Cos., Inc. sr. unsec. sub. notes 4.375%, 3/15/29 | 344,000 | 399,434 | |
| MetLife Capital Trust IV 144A jr. unsec. sub. notes 7.875%, 12/15/37 | 385,000 | 535,115 | |
| Metropolitan Life Global Funding I 144A notes 2.40%, 6/17/22 | 300,000 | 304,743 | |
| Metropolitan Life Global Funding I 144A notes 1.95%, 1/13/23 | 420,000 | 428,547 | |
| Mitsubishi UFJ Financial Group, Inc. sr. unsec. unsub. notes 3.85%, 3/1/26 (Japan) | 425,000 | 469,264 | |
| Morgan Stanley sr. unsec. unsub. FRN Ser. GMTN, 3.772%, 1/24/29 | 2,470,000 | 2,733,094 | |
| Morgan Stanley sr. unsec. unsub. notes 4.375%, 1/22/47 | 715,000 | 891,316 | |
| Morgan Stanley sr. unsec. unsub. notes Ser. GMTN, 3.125%, 1/23/23 | 1,324,000 | 1,370,314 | |
| National Australia Bank, Ltd./New York, NY sr. unsec. notes 2.80%, 1/10/22 (Australia) | 430,000 | 433,068 | |
| Nationstar Mortgage Holdings, Inc. 144A company guaranty sr. unsec. notes 6.00%, 1/15/27 | 50,000 | 52,340 | |
| Nationstar Mortgage Holdings, Inc. 144A company guaranty sr. unsec. notes 5.50%, 8/15/28 | 85,000 | 87,550 | |
| Nationstar Mortgage Holdings, Inc. 144A company guaranty sr. unsec. notes 5.125%, 12/15/30 | 30,000 | 30,066 | |
| NatWest Group PLC sr. unsec. unsub. FRB 4.892%, 5/18/29 (United Kingdom) | 200,000 | 233,010 | |
| Neuberger Berman Group, LLC/Neuberger Berman Finance Corp. 144A sr. unsec. notes 4.875%, 4/15/45 | 225,000 | 258,994 | |
| New York Life Global Funding 144A notes 1.10%, 5/5/23 | 1,176,000 | 1,190,467 | |
| OneMain Finance Corp. company guaranty sr. unsec. notes 8.875%, 6/1/25 | 25,000 | 27,125 | |
| OneMain Finance Corp. company guaranty sr. unsec. notes 4.00%, 9/15/30 | 55,000 | 54,725 | |
| OneMain Finance Corp. company guaranty sr. unsec. sub. notes 7.125%, 3/15/26 | 45,000 | 52,144 | |
| OneMain Finance Corp. company guaranty sr. unsec. sub. notes 6.625%, 1/15/28 | 50,000 | 57,500 | |
| OneMain Finance Corp. company guaranty sr. unsec. unsub. notes 6.875%, 3/15/25 | 75,000 | 84,281 | |
| OneMain Finance Corp. company guaranty sr. unsec. unsub. notes 5.375%, 11/15/29 | 105,000 | 113,804 | |
| PennyMac Financial Services, Inc. 144A company guaranty sr. unsec. notes 5.75%, 9/15/31 | 50,000 | 49,925 | |
56 Dynamic Asset Allocation Conservative Fund | |
| CORPORATE BONDS AND NOTES (22.5%)* cont. | Principal amount | Value | |
| Financials cont. | |||
| PennyMac Financial Services, Inc. 144A company guaranty sr. unsec. notes 5.375%, 10/15/25 | $100,000 | $102,845 | |
| PHH Mortgage Corp. 144A company guaranty sr. notes 7.875%, 3/15/26 | 165,000 | 167,888 | |
| PNC Bank NA sr. unsec. FRN 2.028%, 12/9/22 | 580,000 | 581,784 | |
| PNC Financial Services Group, Inc. (The) sr. unsec. notes 3.30%, 3/8/22 | 122,000 | 123,314 | |
| Prologis LP sr. unsec. unsub. notes 2.25%, 4/15/30 R | 192,000 | 195,448 | |
| Prologis LP sr. unsec. unsub. notes 2.125%, 4/15/27 R | 80,000 | 82,801 | |
| Provident Funding Associates LP/PFG Finance Corp. 144A sr. unsec. notes 6.375%, 6/15/25 | 125,000 | 127,188 | |
| Prudential Financial, Inc. jr. unsec. sub. FRN 5.20%, 3/15/44 | 100,000 | 107,500 | |
| Royal Bank of Canada unsec. sub. notes Ser. GMTN, 4.65%, 1/27/26 (Canada) | 440,000 | 499,244 | |
| Santander UK Group Holdings PLC 144A unsec. sub. notes 4.75%, 9/15/25 (United Kingdom) | 430,000 | 479,033 | |
| Service Properties Trust company guaranty sr. unsec. unsub. notes 7.50%, 9/15/25 R | 35,000 | 39,296 | |
| Societe Generale SA 144A jr. unsec. sub. notes 5.375%, perpetual maturity (France) | 390,000 | 419,500 | |
| Starwood Property Trust, Inc. sr. unsec. notes 4.75%, 3/15/25 R | 80,000 | 84,200 | |
| Sumitomo Mitsui Trust Bank, Ltd. 144A sr. unsec. notes 0.80%, 9/12/23 (Japan) | 755,000 | 759,580 | |
| Swiss Re Treasury US Corp. 144A company guaranty sr. unsec. notes 4.25%, 12/6/42 | 435,000 | 529,818 | |
| Toronto-Dominion Bank (The) sr. unsec. unsub. notes Ser. MTN, 1.90%, 12/1/22 (Canada) | 925,000 | 941,954 | |
| Toronto-Dominion Bank (The) unsec. sub. FRB 3.625%, 9/15/31 (Canada) | 760,000 | 834,992 | |
| Truist Bank unsec. sub. FRN Ser. BKNT, 2.636%, 9/17/29 | 390,000 | 407,694 | |
| Truist Financial Corp. jr. unsec. sub. FRB Ser. N, 4.80%, 9/1/24 | 141,000 | 148,555 | |
| U.S. Bancorp sr. unsec. unsub. notes Ser. V, 2.625%, 1/24/22 | 431,000 | 433,333 | |
| U.S. Bancorp unsec. sub. notes unsec. sub. notes Ser. MTN, 2.95%, 7/15/22 | 204,000 | 207,964 | |
| UBS AG/London 144A sr. unsec. notes 1.75%, 4/21/22 (United Kingdom) | 380,000 | 382,719 | |
| UBS Group AG 144A sr. unsec. notes 3.491%, 5/23/23 (Switzerland) | 1,960,000 | 1,996,832 | |
| UBS Group Funding Jersey, Ltd. 144A company guaranty sr. unsec. notes 4.125%, 4/15/26 (Switzerland) | 233,000 | 259,692 | |
| UBS Group Funding Switzerland AG company guaranty jr. unsec. sub. FRN Ser. REGS, 6.875%, perpetual maturity (Switzerland) | 589,000 | 669,248 | |
| USIS Merger Sub, Inc. 144A sr. unsec. notes 6.875%, 5/1/25 | 105,000 | 106,861 | |
| Wells Fargo & Co. jr. unsec. sub. FRB Ser. U, 5.875%, perpetual maturity | 127,000 | 142,399 | |
| Wells Fargo & Co. jr. unsec. sub. FRN 3.90%, perpetual maturity | 98,000 | 101,063 | |
| Westpac Banking Corp. unsec. sub. bonds 2.963%, 11/16/40 (Australia) | 298,000 | 295,100 | |
| 68,981,877 | |||
| Healthcare (2.4%) | |||
| AbbVie, Inc. sr. unsec. notes 3.20%, 11/21/29 | 2,640,000 | 2,844,629 | |
| AbbVie, Inc. sr. unsec. sub. notes 3.80%, 3/15/25 | 525,000 | 570,073 | |
Dynamic Asset Allocation Conservative Fund 57 | |
| CORPORATE BONDS AND NOTES (22.5%)* cont. | Principal amount | Value | |
| Healthcare cont. | |||
| Air Methods Corp. 144A sr. unsec. notes 8.00%, 5/15/25 | $110,000 | $105,050 | |
| Amgen, Inc. sr. unsec. bonds 4.663%, 6/15/51 | 495,000 | 624,546 | |
| Amgen, Inc. sr. unsec. unsub. notes 2.60%, 8/19/26 | 710,000 | 751,073 | |
| Bausch Health Americas, Inc. 144A sr. unsec. notes 8.50%, 1/31/27 | 110,000 | 117,975 | |
| Bausch Health Cos., Inc. 144A company guaranty sr. unsec. notes 7.25%, 5/30/29 | 90,000 | 92,237 | |
| Bausch Health Cos., Inc. 144A company guaranty sr. unsec. notes 7.00%, 1/15/28 | 45,000 | 46,112 | |
| Bausch Health Cos., Inc. 144A company guaranty sr. unsec. notes 6.25%, 2/15/29 | 75,000 | 74,214 | |
| Bausch Health Cos., Inc. 144A company guaranty sr. unsec. notes 6.125%, 4/15/25 | 106,000 | 108,189 | |
| Bausch Health Cos., Inc. 144A company guaranty sr. unsec. notes 5.00%, 2/15/29 | 40,000 | 37,250 | |
| Bausch Health Cos., Inc. 144A sr. notes 4.875%, 6/1/28 | 90,000 | 93,263 | |
| Becton Dickinson and Co. sr. unsec. notes 2.823%, 5/20/30 | 94,000 | 98,495 | |
| Becton Dickinson and Co. sr. unsec. sub. bonds 1.957%, 2/11/31 | 795,000 | 773,144 | |
| Biogen, Inc. sr. unsec. sub. notes 3.625%, 9/15/22 | 705,000 | 727,070 | |
| Bristol-Myers Squibb Co. sr. unsec. notes 3.25%, 2/20/23 | 712,000 | 739,036 | |
| Bristol-Myers Squibb Co. sr. unsec. notes 3.25%, 8/15/22 | 473,000 | 485,170 | |
| Bristol-Myers Squibb Co. sr. unsec. notes 2.90%, 7/26/24 | 808,000 | 857,886 | |
| Bristol-Myers Squibb Co. sr. unsec. notes 1.45%, 11/13/30 | 540,000 | 517,764 | |
| Bristol-Myers Squibb Co. sr. unsec. sub. notes 3.40%, 7/26/29 | 299,000 | 331,391 | |
| Centene Corp. sr. unsec. bonds 3.00%, 10/15/30 | 50,000 | 51,250 | |
| Centene Corp. sr. unsec. notes 4.625%, 12/15/29 | 225,000 | 244,969 | |
| Charles River Laboratories International, Inc. 144A company guaranty sr. unsec. notes 4.00%, 3/15/31 | 50,000 | 52,375 | |
| Charles River Laboratories International, Inc. 144A company guaranty sr. unsec. notes 3.75%, 3/15/29 | 45,000 | 46,069 | |
| CHS/Community Health Systems, Inc. 144A company guaranty sr. notes 8.00%, 3/15/26 | 45,000 | 47,721 | |
| CHS/Community Health Systems, Inc. 144A company guaranty sr. notes 6.00%, 1/15/29 | 10,000 | 10,625 | |
| CHS/Community Health Systems, Inc. 144A company guaranty sr. notes 5.625%, 3/15/27 | 40,000 | 41,950 | |
| CHS/Community Health Systems, Inc. 144A company guaranty sr. unsec. sub. notes 6.875%, 4/1/28 | 75,000 | 72,094 | |
| CHS/Community Health Systems, Inc. 144A jr. notes 6.875%, 4/15/29 | 105,000 | 105,247 | |
| CHS/Community Health Systems, Inc. 144A sr. notes 6.625%, 2/15/25 | 100,000 | 104,625 | |
| Cigna Corp. company guaranty sr. unsec. unsub. notes 3.75%, 7/15/23 | 391,000 | 413,291 | |
| CVS Health Corp. sr. unsec. unsub. notes 4.78%, 3/25/38 | 1,768,000 | 2,167,819 | |
| CVS Health Corp. sr. unsec. unsub. notes 3.70%, 3/9/23 | 56,000 | 58,477 | |
| CVS Pass-Through Trust 144A sr. mtge. notes 4.704%, 1/10/36 | 205,341 | 232,901 | |
| DH Europe Finance II Sarl company guaranty sr. unsec. bonds 3.40%, 11/15/49 (Luxembourg) | 265,000 | 286,269 | |
| Elanco Animal Health, Inc. sr. unsec. notes Ser. WI, 5.90%, 8/28/28 | 115,000 | 134,550 | |
| Endo Luxembourg Finance Co. I Sarl/Endo US, Inc. 144A company guaranty sr. notes 6.125%, 4/1/29 (Luxembourg) | 40,000 | 40,000 | |
58 Dynamic Asset Allocation Conservative Fund | |
| CORPORATE BONDS AND NOTES (22.5%)* cont. | Principal amount | Value | |
| Healthcare cont. | |||
| Global Medical Response, Inc. 144A sr. notes 6.50%, 10/1/25 | $55,000 | $56,856 | |
| HCA, Inc. company guaranty sr. bonds 3.50%, 7/15/51 | 651,000 | 645,325 | |
| HCA, Inc. company guaranty sr. notes 4.125%, 6/15/29 | 86,000 | 96,064 | |
| HCA, Inc. company guaranty sr. sub. bonds 5.50%, 6/15/47 | 88,000 | 114,114 | |
| HCA, Inc. company guaranty sr. unsec. notes 5.375%, 9/1/26 | 105,000 | 120,136 | |
| HCA, Inc. company guaranty sr. unsec. notes 3.50%, 9/1/30 | 50,000 | 52,970 | |
| Jazz Securities DAC 144A company guaranty sr. unsub. notes 4.375%, 1/15/29 (Ireland) | 200,000 | 207,260 | |
| Mallinckrodt International Finance SA/Mallinckrodt CB, LLC 144A company guaranty sub. notes 10.00%, 4/15/25 (Luxembourg) | 107,000 | 103,790 | |
| Merck & Co., Inc. sr. unsec. notes 2.90%, 3/7/24 | 28,000 | 29,674 | |
| Merck & Co., Inc. sr. unsec. unsub. notes 3.70%, 2/10/45 | 685,000 | 787,406 | |
| Merck & Co., Inc. sr. unsec. unsub. notes 2.75%, 2/10/25 | 172,000 | 182,100 | |
| Mozart Debt Merger Sub, Inc. 144A sr. unsec. notes 5.25%, 10/1/29 | 90,000 | 90,000 | |
| Novartis Capital Corp. company guaranty sr. unsec. unsub. bonds 4.00%, 11/20/45 | 1,130,000 | 1,364,031 | |
| Ortho-Clinical Diagnostics, Inc./Ortho-Clinical Diagnostics SA 144A sr. unsec. notes 7.375%, 6/1/25 | 24,000 | 25,320 | |
| Owens & Minor, Inc. 144A sr. unsec. notes 4.50%, 3/31/29 | 120,000 | 121,200 | |
| Pfizer, Inc. sr. unsec. unsub. notes 3.00%, 12/15/26 | 530,000 | 579,400 | |
| Roche Holdings, Inc. 144A company guaranty sr. unsec. bonds 4.00%, 11/28/44 (Switzerland) | 955,000 | 1,160,620 | |
| Service Corp. International sr. unsec. bonds 5.125%, 6/1/29 | 135,000 | 146,765 | |
| Service Corp. International sr. unsec. notes 4.625%, 12/15/27 | 123,000 | 128,996 | |
| Service Corp. International sr. unsec. notes 3.375%, 8/15/30 | 95,000 | 94,808 | |
| Service Corp. International sr. unsec. sub. notes 4.00%, 5/15/31 | 55,000 | 56,856 | |
| Tenet Healthcare Corp. company guaranty sr. notes 4.625%, 7/15/24 | 25,000 | 25,375 | |
| Tenet Healthcare Corp. 144A company guaranty notes 6.25%, 2/1/27 | 25,000 | 25,938 | |
| Tenet Healthcare Corp. 144A company guaranty sr. notes 7.50%, 4/1/25 | 25,000 | 26,531 | |
| Tenet Healthcare Corp. 144A company guaranty sr. notes 5.125%, 11/1/27 | 200,000 | 208,500 | |
| Tenet Healthcare Corp. 144A company guaranty sr. notes 4.875%, 1/1/26 | 805,000 | 833,111 | |
| Tenet Healthcare Corp. 144A company guaranty sr. notes 4.25%, 6/1/29 | 135,000 | 137,025 | |
| Teva Pharmaceutical Finance Netherlands III BV company guaranty sr. unsec. notes 6.75%, 3/1/28 (Israel) | 200,000 | 228,500 | |
| UnitedHealth Group, Inc. sr. unsec. unsub. notes 3.95%, 10/15/42 | 540,000 | 631,465 | |
| UnitedHealth Group, Inc. sr. unsec. unsub. notes 3.85%, 6/15/28 | 1,455,000 | 1,646,167 | |
| UnitedHealth Group, Inc. sr. unsec. unsub. notes 2.875%, 3/15/22 | 200,000 | 201,042 | |
| UnitedHealth Group, Inc. sr. unsec. unsub. notes 2.75%, 2/15/23 | 535,000 | 549,530 | |
| UnitedHealth Group, Inc. sr. unsec. unsub. notes 2.00%, 5/15/30 | 75,000 | 75,209 | |
| Viatris, Inc. 144A company guaranty sr. unsec. notes 2.30%, 6/22/27 | 459,000 | 468,675 | |
| Zoetis, Inc. sr. unsec. notes 3.90%, 8/20/28 | 540,000 | 606,806 | |
| Zoetis, Inc. sr. unsec. sub. notes 2.00%, 5/15/30 | 147,000 | 145,638 | |
| 26,078,002 | |||
Dynamic Asset Allocation Conservative Fund 59 | |
| CORPORATE BONDS AND NOTES (22.5%)* cont. | Principal amount | Value | |
| Technology (2.1%) | |||
| Ahead DB Holdings, LLC 144A company guaranty sr. unsec. notes 6.625%, 5/1/28 | $120,000 | $120,900 | |
| Alphabet, Inc. sr. unsec. bonds 2.25%, 8/15/60 | 520,000 | 454,341 | |
| Alphabet, Inc. sr. unsec. notes 1.998%, 8/15/26 | 505,000 | 527,786 | |
| Analog Devices, Inc. sr. unsec. unsub. notes 3.90%, 12/15/25 | 450,000 | 499,398 | |
| Apple, Inc. sr. unsec. bonds 4.25%, 2/9/47 | 1,420,000 | 1,762,428 | |
| Apple, Inc. sr. unsec. bonds 2.80%, 2/8/61 | 310,000 | 296,076 | |
| Apple, Inc. sr. unsec. notes 2.85%, 5/11/24 | 175,000 | 184,665 | |
| Apple, Inc. sr. unsec. notes 0.75%, 5/11/23 | 901,000 | 907,573 | |
| Apple, Inc. sr. unsec. unsub. notes 4.375%, 5/13/45 | 350,000 | 440,950 | |
| Apple, Inc. sr. unsec. unsub. notes 3.85%, 5/4/43 | 453,000 | 529,143 | |
| Arches Buyer, Inc. 144A sr. notes 4.25%, 6/1/28 | 55,000 | 55,764 | |
| Arches Buyer, Inc. 144A sr. unsec. notes 6.125%, 12/1/28 | 55,000 | 56,055 | |
| Black Knight InfoServ, LLC 144A company guaranty sr. unsec. notes 3.625%, 9/1/28 | 85,000 | 85,425 | |
| Boxer Parent Co., Inc. 144A company guaranty sr. notes 7.125%, 10/2/25 | 30,000 | 32,021 | |
| Boxer Parent Co., Inc. 144A notes 9.125%, 3/1/26 | 85,000 | 89,128 | |
| Broadcom Corp./Broadcom Cayman Finance, Ltd. company guaranty sr. unsec. unsub. notes 3.50%, 1/15/28 | 1,225,000 | 1,330,790 | |
| Broadcom, Inc. company guaranty sr. unsec. bonds 4.15%, 11/15/30 | 434,000 | 480,860 | |
| Broadcom, Inc. 144A company guaranty sr. unsec. bonds 3.75%, 2/15/51 | 153,000 | 152,678 | |
| Cisco Systems, Inc./California sr. unsec. unsub. bonds 5.90%, 2/15/39 | 315,000 | 454,995 | |
| Cisco Systems, Inc./California sr. unsec. unsub. notes 2.50%, 9/20/26 | 520,000 | 555,184 | |
| Clarivate Science Holdings Corp. 144A sr. unsec. notes 4.875%, 7/1/29 | 115,000 | 115,224 | |
| CommScope Finance, LLC 144A sr. notes 6.00%, 3/1/26 | 45,000 | 46,725 | |
| CommScope, Inc. 144A company guaranty sr. unsec. notes 8.25%, 3/1/27 | 75,000 | 78,504 | |
| Crowdstrike Holdings, Inc. company guaranty sr. unsec. notes 3.00%, 2/15/29 | 100,000 | 99,665 | |
| Dell International, LLC/EMC Corp. company guaranty sr. bonds 8.35%, 7/15/46 | 80,000 | 129,749 | |
| Dell International, LLC/EMC Corp. company guaranty sr. notes 6.02%, 6/15/26 | 137,000 | 162,965 | |
| Diamond 1 Finance Corp./Diamond 2 Finance Corp. 144A company guaranty sr. unsec. notes 7.125%, 6/15/24 | 35,000 | 35,788 | |
| Diebold Nixdorf, Inc. company guaranty sr. unsec. sub. notes 8.50%, 4/15/24 | 110,000 | 112,338 | |
| Diebold Nixdorf, Inc. 144A company guaranty sr. notes 9.375%, 7/15/25 | 50,000 | 54,719 | |
| Fidelity National Information Services, Inc. sr. unsec. bonds 2.25%, 3/1/31 | 180,000 | 178,667 | |
| Fiserv, Inc. sr. unsec. bonds 3.50%, 7/1/29 | 330,000 | 359,352 | |
| Fiserv, Inc. sr. unsec. sub. bonds 4.20%, 10/1/28 | 820,000 | 933,382 | |
| Google, LLC sr. unsec. notes 3.375%, 2/25/24 | 540,000 | 577,148 | |
| IBM Corp. sr. unsec. unsub. notes 1.875%, 8/1/22 | 675,000 | 684,341 | |
60 Dynamic Asset Allocation Conservative Fund | |
| CORPORATE BONDS AND NOTES (22.5%)* cont. | Principal amount | Value | |
| Technology cont. | |||
| Imola Merger Corp. 144A sr. notes 4.75%, 5/15/29 | $185,000 | $191,386 | |
| Microchip Technology, Inc. company guaranty sr. notes 4.333%, 6/1/23 | 270,000 | 285,367 | |
| Microchip Technology, Inc. company guaranty sr. unsec. notes 4.25%, 9/1/25 | 105,000 | 109,802 | |
| Microsoft Corp. sr. unsec. unsub. bonds 2.921%, 3/17/52 | 1,170,000 | 1,209,543 | |
| Microsoft Corp. sr. unsec. unsub. bonds 2.40%, 8/8/26 | 1,800,000 | 1,912,105 | |
| Microsoft Corp. sr. unsec. unsub. notes 2.40%, 2/6/22 | 124,000 | 124,693 | |
| Oracle Corp. sr. unsec. bonds 3.65%, 3/25/41 | 510,000 | 527,462 | |
| Oracle Corp. sr. unsec. notes 2.50%, 5/15/22 | 550,000 | 555,509 | |
| Oracle Corp. sr. unsec. unsub. bonds 4.00%, 11/15/47 | 1,105,000 | 1,179,999 | |
| Oracle Corp. sr. unsec. unsub. notes 5.375%, 7/15/40 | 310,000 | 390,589 | |
| Oracle Corp. sr. unsec. unsub. notes 2.50%, 10/15/22 | 832,000 | 850,824 | |
| Plantronics, Inc. 144A company guaranty sr. unsec. notes 4.75%, 3/1/29 | 120,000 | 112,360 | |
| Qorvo, Inc. 144A company guaranty sr. unsec. bonds 3.375%, 4/1/31 | 85,000 | 89,624 | |
| Rocket Software, Inc. 144A sr. unsec. notes 6.50%, 2/15/29 | 140,000 | 138,600 | |
| Salesforce.com, Inc. sr. unsec. bonds 3.05%, 7/15/61 | 490,000 | 495,705 | |
| Salesforce.com, Inc. sr. unsec. bonds 2.90%, 7/15/51 | 490,000 | 488,771 | |
| Sensata Technologies, Inc. 144A company guaranty sr. unsec. notes 3.75%, 2/15/31 | 385,000 | 387,633 | |
| ServiceNow, Inc. sr. unsec. notes 1.40%, 9/1/30 | 545,000 | 511,167 | |
| Tempo Acquisition, LLC/Tempo Acquisition Finance Corp. 144A company guaranty sr. notes 5.75%, 6/1/25 | 40,000 | 42,000 | |
| TTM Technologies, Inc. 144A company guaranty sr. unsec. notes 4.00%, 3/1/29 | 80,000 | 80,200 | |
| Twilio, Inc. company guaranty sr. unsec. notes 3.875%, 3/15/31 | 55,000 | 56,310 | |
| Twilio, Inc. company guaranty sr. unsec. notes 3.625%, 3/15/29 | 105,000 | 107,415 | |
| VMware, Inc. sr. unsec. unsub. bonds 2.20%, 8/15/31 | 282,000 | 275,731 | |
| Western Digital Corp. company guaranty sr. unsec. notes 4.75%, 2/15/26 | 55,000 | 60,914 | |
| ZoomInfo Technologies LLC/ZoomInfo Finance Corp. 144A company guaranty sr. unsec. notes 3.875%, 2/1/29 | 165,000 | 164,175 | |
| 22,932,611 | |||
| Transportation (0.2%) | |||
| Air Canada 144A sr. notes 3.875%, 8/15/26 (Canada) | 10,000 | 10,038 | |
| American Airlines, Inc./AAdvantage Loyalty IP, Ltd. 144A company guaranty sr. notes 5.75%, 4/20/29 | 105,000 | 113,138 | |
| American Airlines, Inc./AAdvantage Loyalty IP, Ltd. 144A company guaranty sr. notes 5.50%, 4/20/26 | 105,000 | 110,381 | |
| CSX Corp. sr. unsec. unsub. notes 4.10%, 3/15/44 | 370,000 | 429,755 | |
| Delta Air Lines, Inc./SkyMiles IP, Ltd. 144A company guaranty sr. notes 4.75%, 10/20/28 | 155,000 | 172,825 | |
| Penske Truck Leasing Co. LP/PTL Finance Corp. 144A sr. unsec. bonds 3.40%, 11/15/26 | 210,000 | 228,037 | |
| Penske Truck Leasing Co. LP/PTL Finance Corp. 144A sr. unsec. notes 3.90%, 2/1/24 | 315,000 | 335,784 | |
| United Airlines, Inc. 144A company guaranty sr. notes 4.625%, 4/15/29 | 40,000 | 41,338 | |
Dynamic Asset Allocation Conservative Fund 61 | |
| CORPORATE BONDS AND NOTES (22.5%)* cont. | Principal amount | Value | |
| Transportation cont. | |||
| United Airlines, Inc. 144A company guaranty sr. notes 4.375%, 4/15/26 | $40,000 | $41,050 | |
| Watco Cos LLC/Watco Finance Corp. 144A sr. unsec. notes 6.50%, 6/15/27 | 270,000 | 288,900 | |
| 1,771,246 | |||
| Utilities and power (1.4%) | |||
| AES Corp. (The) sr. unsec. unsub. notes 2.45%, 1/15/31 | 592,000 | 583,857 | |
| American Electric Power Co., Inc. sr. unsec. unsub. notes Ser. J, 4.30%, 12/1/28 | 575,000 | 652,640 | |
| Buckeye Partners LP sr. unsec. bonds 5.85%, 11/15/43 | 45,000 | 45,041 | |
| Buckeye Partners LP sr. unsec. notes 3.95%, 12/1/26 | 25,000 | 25,500 | |
| Buckeye Partners LP 144A sr. unsec. notes 4.50%, 3/1/28 | 40,000 | 40,600 | |
| Calpine Corp. 144A company guaranty sr. notes 5.25%, 6/1/26 | 41,000 | 42,178 | |
| Calpine Corp. 144A company guaranty sr. notes 4.50%, 2/15/28 | 150,000 | 153,000 | |
| Calpine Corp. 144A sr. unsec. notes 5.00%, 2/1/31 | 20,000 | 20,000 | |
| Calpine Corp. 144A sr. unsec. notes 4.625%, 2/1/29 | 10,000 | 9,850 | |
| Commonwealth Edison Co. 1st mtge. bonds 5.90%, 3/15/36 | 208,000 | 290,597 | |
| Consolidated Edison Co. of New York, Inc. sr. unsec. unsub. notes 4.20%, 3/15/42 | 205,000 | 235,530 | |
| Duke Energy Corp. sr. unsec. bonds 4.20%, 6/15/49 | 570,000 | 648,885 | |
| Duke Energy Corp. sr. unsec. notes 3.15%, 8/15/27 | 775,000 | 834,659 | |
| Duke Energy Indiana LLC sr. bonds 6.45%, 4/1/39 | 255,000 | 369,910 | |
| Duke Energy Ohio, Inc. sr. bonds 3.65%, 2/1/29 | 585,000 | 641,950 | |
| Duke Energy Progress, LLC sr. notes 3.375%, 9/1/23 | 164,000 | 172,591 | |
| Enbridge, Inc. company guaranty sr. unsec. unsub. bonds 4.50%, 6/10/44 (Canada) | 495,000 | 576,466 | |
| Enbridge, Inc. sr. unsec. unsub. bonds 4.25%, 12/1/26 (Canada) | 395,000 | 442,803 | |
| Energy Transfer LP jr. unsec. sub. FRN 6.625%, perpetual maturity | 935,000 | 909,288 | |
| Energy Transfer LP company guaranty sr. unsec. bonds 3.75%, 5/15/30 | 1,080,000 | 1,167,005 | |
| Energy Transfer LP company guaranty sr. unsec. notes 5.875%, 1/15/24 | 174,000 | 191,230 | |
| Energy Transfer LP company guaranty sr. unsec. notes 2.90%, 5/15/25 | 78,000 | 81,759 | |
| Energy Transfer LP sr. unsec. unsub. bonds 6.125%, 12/15/45 | 66,000 | 83,979 | |
| Enterprise Products Operating, LLC company guaranty sr. unsec. notes 2.80%, 1/31/30 | 286,000 | 298,817 | |
| Enterprise Products Operating, LLC company guaranty sr. unsec. unsub. bonds 4.25%, 2/15/48 | 1,310,000 | 1,483,990 | |
| IPALCO Enterprises, Inc. sr. notes 4.25%, 5/1/30 | 125,000 | 140,216 | |
| IPALCO Enterprises, Inc. sr. sub. notes 3.70%, 9/1/24 | 68,000 | 72,637 | |
| Kinder Morgan Energy Partners LP company guaranty sr. unsec. unsub. notes 3.45%, 2/15/23 | 210,000 | 217,183 | |
| Kinder Morgan, Inc./DE company guaranty sr. unsec. notes Ser. GMTN, 7.75%, 1/15/32 | 17,000 | 24,390 | |
| NRG Energy, Inc. company guaranty sr. unsec. notes 6.625%, 1/15/27 | 14,000 | 14,503 | |
| NRG Energy, Inc. 144A company guaranty sr. bonds 4.45%, 6/15/29 | 65,000 | 71,915 | |
| NRG Energy, Inc. 144A company guaranty sr. notes 3.75%, 6/15/24 | 249,000 | 265,652 | |
| NRG Energy, Inc. 144A company guaranty sr. unsec. bonds 3.875%, 2/15/32 | 120,000 | 118,650 | |
62 Dynamic Asset Allocation Conservative Fund | |
| CORPORATE BONDS AND NOTES (22.5%)* cont. | Principal amount | Value | |
| Utilities and power cont. | |||
| NRG Energy, Inc. 144A sr. unsec. bonds 5.25%, 6/15/29 | $40,000 | $42,550 | |
| NSTAR Electric Co. sr. unsec. unsub. notes 2.375%, 10/15/22 (Canada) | 350,000 | 354,775 | |
| Oncor Electric Delivery Co., LLC sr. notes 5.30%, 6/1/42 | 110,000 | 149,970 | |
| Oncor Electric Delivery Co., LLC sr. notes 3.75%, 4/1/45 | 560,000 | 637,029 | |
| Pacific Gas and Electric Co. company guaranty sr. unsec. unsub. notes 2.95%, 3/1/26 | 95,000 | 97,528 | |
| Pacific Gas and Electric Co. notes 2.10%, 8/1/27 | 85,000 | 82,952 | |
| Pacific Gas and Electric Co. sr. notes 3.30%, 3/15/27 | 25,000 | 25,949 | |
| Pacific Gas and Electric Co. sr. notes 1.367%, 3/10/23 | 1,645,000 | 1,639,256 | |
| Public Service Electric & Gas Co. sr. notes Ser. MTN, 5.50%, 3/1/40 | 215,000 | 291,628 | |
| Vistra Operations Co., LLC 144A company guaranty sr. notes 4.30%, 7/15/29 | 311,000 | 331,450 | |
| Vistra Operations Co., LLC 144A company guaranty sr. notes 3.55%, 7/15/24 | 300,000 | 315,548 | |
| Vistra Operations Co., LLC 144A company guaranty sr. unsec. notes 5.625%, 2/15/27 | 55,000 | 56,928 | |
| Vistra Operations Co., LLC 144A company guaranty sr. unsec. notes 5.50%, 9/1/26 | 125,000 | 128,431 | |
| Vistra Operations Co., LLC 144A company guaranty sr. unsec. sub. notes 5.00%, 7/31/27 | 65,000 | 67,113 | |
| 15,148,378 | |||
| Total corporate bonds and notes (cost $231,458,146) | $246,280,955 | ||
| MORTGAGE-BACKED SECURITIES (6.4%)* | Principal amount | Value | |
| Agency collateralized mortgage obligations (1.8%) | |||
| Federal Home Loan Mortgage Corporation | |||
| REMICs IFB Ser. 3408, Class EK, ((-4.024 x 1 Month US LIBOR) + 25.79%), 25.456%, 4/15/37 | $41,890 | $74,643 | |
| REMICs IFB Ser. 3065, Class DC, ((-3 x 1 Month US LIBOR) + 19.86%), 19.609%, 3/15/35 | 77,639 | 103,609 | |
| REMICs IFB Ser. 2990, Class LB, ((-2.556 x 1 Month US LIBOR) + 16.95%), 16.732%, 6/15/34 | 29,261 | 34,236 | |
| REMICs IFB Ser. 4326, Class GS, IO, ((-1 x 1 Month US LIBOR) + 6.05%), 5.966%, 4/15/44 | 4,658,279 | 809,775 | |
| REMICs Ser. 5079, Class BI, IO, 5.50%, 2/25/51 | 2,982,243 | 627,017 | |
| REMICs Ser. 5117, Class CI, IO, 5.00%, 6/25/51 | 7,313,520 | 1,380,427 | |
| REMICs Ser. 5024, Class HI, IO, 4.50%, 10/25/50 | 4,455,724 | 736,173 | |
| REMICs Ser. 5138, Class YI, IO, 4.50%, 12/25/49 | 5,016,613 | 890,050 | |
| REMICs Ser. 5121, Class KI, IO, 4.00%, 6/25/51 | 4,216,683 | 736,518 | |
| REMICs Ser. 5080, Class DI, IO, 4.00%, 3/25/51 | 6,938,065 | 1,314,303 | |
| REMICs Ser. 5036, Class IK, IO, 4.00%, 4/25/50 | 4,122,086 | 699,930 | |
| REMICs Ser. 5152, Class IE, IO, 3.50%, 10/25/51 | 5,817,000 | 773,431 | |
| REMICs Ser. 5010, Class IA, IO, 3.50%, 9/25/50 | 2,706,154 | 462,629 | |
| REMICs Ser. 5127, Class AI, IO, 3.00%, 6/25/51 | 5,806,072 | 840,849 | |
| REMICs Ser. 5094, Class AI, IO, 3.00%, 4/25/41 | 7,668,783 | 846,090 | |
| REMICs Ser. 3391, PO, zero %, 4/15/37 | 3,632 | 3,350 | |
Dynamic Asset Allocation Conservative Fund 63 | |
| MORTGAGE-BACKED SECURITIES (6.4%)* cont. | Principal amount | Value | |
| Agency collateralized mortgage obligations cont. | |||
| Federal National Mortgage Association | |||
| REMICs IFB Ser. 06-62, Class PS, ((-6 x 1 Month US LIBOR) + 39.90%), 39.384%, 7/25/36 | $12,783 | $24,933 | |
| REMICs IFB Ser. 06-8, Class HP, ((-3.667 x 1 Month US LIBOR) + 24.57%), 24.251%, 3/25/36 | 48,257 | 79,052 | |
| REMICs IFB Ser. 05-106, Class JC, ((-3.101 x 1 Month US LIBOR) + 20.12%), 19.857%, 12/25/35 | 22,823 | 34,234 | |
| REMICs IFB Ser. 17-69, Class SG, IO, ((-1 x 1 Month US LIBOR) + 6.15%), 6.064%, 9/25/47 | 3,926,200 | 720,556 | |
| REMICs IFB Ser. 19-43, Class SC, IO, ((-1 x 1 Month US LIBOR) + 6.10%), 6.014%, 8/25/49 | 3,209,895 | 663,550 | |
| REMICs Ser. 21-67, Class DI, IO, 4.00%, 10/25/51 | 6,592,000 | 998,068 | |
| REMICs Ser. 21-28, Class GI, IO, 4.00%, 5/25/51 | 4,280,650 | 756,492 | |
| REMICs Ser. 20-67, Class JI, IO, 4.00%, 9/25/50 | 4,494,807 | 848,918 | |
| REMICs Ser. 21-65, Class LI, IO, 3.50%, 10/25/51 | 3,223,000 | 434,098 | |
| REMICs Ser. 20-96, Class JI, IO, 3.00%, 1/25/51 | 5,578,192 | 655,757 | |
| REMICs Ser. 21-28, Class NI, IO, 3.00%, 5/25/41 | 6,217,928 | 596,532 | |
| REMICs Ser. 21-45, Class MI, IO, 2.50%, 2/25/49 | 4,391,729 | 591,169 | |
| REMICs Ser. 07-14, Class KO, PO, zero %, 3/25/37 | 10,038 | 9,235 | |
| REMICs Ser. 06-125, Class OX, PO, zero %, 1/25/37 | 947 | 861 | |
| REMICs Ser. 06-84, Class OT, PO, zero %, 9/25/36 | 1,414 | 1,329 | |
| Government National Mortgage Association | |||
| Ser. 17-162, Class QI, IO, 5.00%, 10/20/47 | 683,166 | 135,659 | |
| Ser. 10-9, Class UI, IO, 5.00%, 1/20/40 | 127,492 | 24,224 | |
| Ser. 10-9, Class QI, IO, 4.50%, 1/20/40 | 25,160 | 4,174 | |
| Ser. 14-116, Class IL, IO, 4.00%, 8/20/44 | 1,202,111 | 150,685 | |
| Ser. 16-123, Class LI, IO, 3.50%, 3/20/44 | 1,285,571 | 96,983 | |
| Ser. 13-14, IO, 3.50%, 12/20/42 | 252,942 | 23,911 | |
| Ser. 21-117, Class MI, IO, 3.50%, 5/20/42 | 5,811,907 | 766,474 | |
| Ser. 12-141, Class WI, IO, 3.50%, 11/20/41 | 101,442 | 558 | |
| Ser. 15-124, Class NI, IO, 3.50%, 6/20/39 | 84,100 | 303 | |
| Ser. 20-138, Class AI, IO, 3.00%, 9/20/50 | 2,653,361 | 386,762 | |
| Ser. 16-H16, Class EI, IO, 2.194%, 6/20/66 W | 2,363,360 | 166,144 | |
| FRB Ser. 16-H16, Class LI, IO, 2.104%, 7/20/66 W | 10,320,377 | 730,489 | |
| Ser. 15-H25, Class BI, IO, 1.875%, 10/20/65 W | 2,096,842 | 144,263 | |
| Ser. 15-H26, Class EI, IO, 1.721%, 10/20/65 W | 1,227,783 | 74,035 | |
| 19,452,478 | |||
| Commercial mortgage-backed securities (2.5%) | |||
| Arbor Multifamily Mortgage Securities Trust 144A FRB Ser. 20-MF1, Class XA, IO, 1.086%, 5/15/53 W | 3,185,242 | 220,379 | |
| AREIT CRE Trust 144A FRB Ser. 21-CRE5, Class A, 1.18%, 7/17/26 | 379,000 | 379,000 | |
| BANK | |||
| FRB Ser. 17-BNK8, Class B, 4.062%, 11/15/50 W | 275,000 | 299,561 | |
| FRB Ser. 19-BN22, Class C, 3.577%, 11/15/62 W | 382,000 | 403,067 | |
| FRB Ser. 19-BN20, Class XA, IO, 0.958%, 9/15/62 W | 4,158,724 | 236,862 | |
| Barclays Commercial Mortgage Trust Ser. 19-C5, Class AS, 3.366%, 11/15/52 W | 420,000 | 450,738 | |
| BBCMS Mortgage Trust 144A Ser. 21-C11, Class D, 2.00%, 9/15/54 | 274,000 | 231,088 | |
| Bear Stearns Commercial Mortgage Securities Trust 144A FRB Ser. 06-PW14, Class X1, IO, 0.763%, 12/11/38 W | 94,622 | 331 | |
64 Dynamic Asset Allocation Conservative Fund | |
| MORTGAGE-BACKED SECURITIES (6.4%)* cont. | Principal amount | Value | |
| Commercial mortgage-backed securities cont. | |||
| Benchmark Mortgage Trust | |||
| Ser. 18-B8, Class AS, 4.532%, 1/15/52 W | $173,000 | $199,826 | |
| Ser. 19-B11, Class AS, 3.784%, 5/15/52 | 181,000 | 200,714 | |
| BXMT, Ltd. 144A FRB Ser. 21-FL4, Class A, 1.134%, 5/15/38 (Cayman Islands) | 399,000 | 399,182 | |
| CD Commercial Mortgage Trust FRB Ser. 17-CD6, Class AM, 3.709%, 11/13/50 W | 330,000 | 358,591 | |
| CFCRE Commercial Mortgage Trust FRB Ser. 17-C8, Class B, 4.199%, 6/15/50 W | 179,000 | 193,201 | |
| CFCRE Commercial Mortgage Trust 144A | |||
| FRB Ser. 11-C2, Class D, 5.887%, 12/15/47 W | 129,000 | 130,419 | |
| FRB Ser. 11-C2, Class E, 5.887%, 12/15/47 W | 411,000 | 408,325 | |
| Citigroup Commercial Mortgage Trust Ser. 14-GC21, Class AS, 4.026%, 5/10/47 | 291,000 | 308,754 | |
| Citigroup Commercial Mortgage Trust 144A | |||
| FRB Ser. 14-GC19, Class D, 5.26%, 3/10/47 W | 266,000 | 282,393 | |
| FRB Ser. 06-C5, Class XC, IO, 0.607%, 10/15/49 W | 3,699,075 | 39 | |
| COMM Mortgage Trust | |||
| FRB Ser. 13-CR13, Class C, 5.045%, 11/10/46 W | 468,000 | 496,890 | |
| FRB Ser. 14-CR18, Class C, 4.914%, 7/15/47 W | 246,000 | 250,908 | |
| Ser. 13-CR11, Class AM, 4.715%, 8/10/50 W | 233,000 | 248,112 | |
| Ser. 14-LC15, Class B, 4.599%, 4/10/47 W | 190,000 | 200,304 | |
| FRB Ser. 15-LC21, Class B, 4.478%, 7/10/48 W | 289,000 | 315,588 | |
| Ser. 13-CR13, Class AM, 4.449%, 11/10/46 W | 351,000 | 374,761 | |
| Ser. 14-LC15, Class AM, 4.198%, 4/10/47 | 286,000 | 305,452 | |
| Ser. 15-DC1, Class AM, 3.724%, 2/10/48 | 280,000 | 298,297 | |
| FRB Ser. 14-UBS4, Class XA, IO, 1.253%, 8/10/47 W | 3,516,790 | 87,733 | |
| FRB Ser. 13-LC13, Class XA, IO, 1.178%, 8/10/46 W | 3,803,927 | 59,994 | |
| FRB Ser. 14-CR18, Class XA, IO, 1.165%, 7/15/47 W | 1,133,687 | 26,245 | |
| FRB Ser. 14-CR17, Class XA, IO, 1.122%, 5/10/47 W | 3,587,234 | 75,002 | |
| FRB Ser. 14-UBS6, Class XA, IO, 1.025%, 12/10/47 W | 4,062,189 | 89,311 | |
| FRB Ser. 14-CR14, Class XA, IO, 0.696%, 2/10/47 W | 11,694,989 | 133,639 | |
| COMM Mortgage Trust 144A | |||
| FRB Ser. 10-C1, Class D, 5.985%, 7/10/46 W | 606,000 | 609,313 | |
| FRB Ser. 13-CR9, Class D, 4.412%, 7/10/45 W | 215,000 | 144,467 | |
| CSAIL Commercial Mortgage Trust | |||
| Ser. 19-C15, Class B, 4.476%, 3/15/52 | 201,000 | 225,649 | |
| FRB Ser. 15-C1, Class C, 4.404%, 4/15/50 W | 708,000 | 677,949 | |
| Ser. 19-C17, Class AS, 3.278%, 9/15/52 | 277,000 | 296,491 | |
| FRB Ser. 20-C19, Class XA, IO, 1.237%, 3/15/53 W | 5,774,046 | 443,077 | |
| DBUBS Mortgage Trust 144A FRB Ser. 11-LC3A, Class D, 5.545%, 8/10/44 W | 930,000 | 927,210 | |
| Federal Home Loan Mortgage Corporation | |||
| Multifamily Structured Pass-Through Certificates FRB Ser. K099, Class X1, IO, 1.005%, 9/25/29 W | 5,570,801 | 345,482 | |
| Multifamily Structured Pass-Through Certificates FRB Ser. K740, Class X1, IO, 0.845%, 9/25/27 W | 4,670,812 | 189,547 | |
Dynamic Asset Allocation Conservative Fund 65 | |
| MORTGAGE-BACKED SECURITIES (6.4%)* cont. | Principal amount | Value | |
| Commercial mortgage-backed securities cont. | |||
| Federal Home Loan Mortgage Corporation | |||
| Multifamily Structured Pass-Through Certificates Ser. KW10, Class X1, IO, 0.773%, 9/25/29 W | $4,086,240 | $177,682 | |
| Multifamily Structured Pass-Through Certificates FRB Ser. K131, Class X1, IO, 0.729%, 7/25/31 W | 6,282,000 | 401,420 | |
| GS Mortgage Securities Corp., II FRB Ser. 13-GC10, Class XA, IO, 1.625%, 2/10/46 W | 5,540,933 | 85,203 | |
| GS Mortgage Securities Trust | |||
| FRB Ser. 14-GC22, Class C, 4.845%, 6/10/47 W | 895,000 | 931,005 | |
| Ser. 15-GC32, Class AS, 4.018%, 7/10/48 W | 395,000 | 428,645 | |
| Ser. 17-GS7, Class AS, 3.663%, 8/10/50 | 311,000 | 335,756 | |
| GS Mortgage Securities Trust 144A | |||
| FRB Ser. 10-C1, Class D, 6.187%, 8/10/43 W | 435,000 | 321,229 | |
| Ser. 12-GC6, Class AS, 4.948%, 1/10/45 | 147,682 | 148,122 | |
| FRB Ser. 13-GC14, Class B, 4.897%, 8/10/46 W | 219,000 | 231,459 | |
| Ser. 12-GCJ9, Class C, 4.448%, 11/10/45 W | 373,000 | 378,598 | |
| JPMBB Commercial Mortgage Securities Trust | |||
| FRB Ser. 14-C19, Class C, 4.811%, 4/15/47 W | 268,000 | 284,081 | |
| FRB Ser. 14-C22, Class C, 4.705%, 9/15/47 W | 204,000 | 200,989 | |
| FRB Ser. 13-C12, Class B, 4.235%, 7/15/45 W | 235,000 | 241,510 | |
| FRB Ser. 13-C12, Class C, 4.235%, 7/15/45 W | 378,000 | 386,841 | |
| FRB Ser. 14-C25, Class XA, IO, 0.98%, 11/15/47 W | 3,250,074 | 71,365 | |
| FRB Ser. 14-C19, Class XA, IO, 0.814%, 4/15/47 W | 3,668,897 | 49,886 | |
| JPMorgan Chase Commercial Mortgage Securities Trust | |||
| FRB Ser. 13-C16, Class C, 5.189%, 12/15/46 W | 202,000 | 214,277 | |
| Ser. 14-C20, Class AS, 4.043%, 7/15/47 | 320,000 | 341,000 | |
| FRB Ser. 13-LC11, Class XA, IO, 1.376%, 4/15/46 W | 2,710,770 | 38,612 | |
| FRB Ser. 06-LDP8, Class X, IO, 0.23%, 5/15/45 W | 80,787 | 1 | |
| JPMorgan Chase Commercial Mortgage Securities Trust 144A | |||
| FRB Ser. 10-C2, Class C2, 5.872%, 11/15/43 W | 168,493 | 166,977 | |
| FRB Ser. 12-C6, Class E, 5.31%, 5/15/45 W | 253,000 | 192,131 | |
| LSTAR Commercial Mortgage Trust 144A FRB Ser. 15-3, Class B, 3.317%, 4/20/48 W | 739,000 | 755,384 | |
| Mezz Cap Commercial Mortgage Trust 144A | |||
| FRB Ser. 07-C5, Class X, IO, 7.004%, 12/15/49 W | 10,238 | — | |
| FRB Ser. 06-C4, Class X, IO, 6.11%, 7/15/45 W | 15,713 | — | |
| Morgan Stanley Bank of America Merrill Lynch Trust | |||
| FRB Ser. 14-C14, Class C, 5.218%, 2/15/47 W | 295,000 | 316,003 | |
| FRB Ser. 14-C17, Class C, 4.637%, 8/15/47 W | 322,000 | 321,270 | |
| Ser. 14-C15, Class B, 4.565%, 4/15/47 W | 215,000 | 230,159 | |
| FRB Ser. 15-C24, Class B, 4.488%, 5/15/48 W | 193,000 | 208,537 | |
| Ser. 13-C8, Class B, 3.659%, 12/15/48 W | 294,000 | 300,968 | |
| FRB Ser. 14-C17, Class XA, IO, 1.214%, 8/15/47 W | 2,691,849 | 55,864 | |
| Morgan Stanley Bank of America Merrill Lynch Trust 144A | |||
| FRB Ser. 12-C5, Class E, 4.813%, 8/15/45 W | 414,000 | 417,389 | |
| FRB Ser. 12-C6, Class D, 4.757%, 11/15/45 W | 265,000 | 263,531 | |
| Morgan Stanley Capital I Trust Ser. 16-UB12, Class AS, 3.778%, 12/15/49 W | 193,000 | 204,800 | |
66 Dynamic Asset Allocation Conservative Fund | |
| MORTGAGE-BACKED SECURITIES (6.4%)* cont. | Principal amount | Value | |
| Commercial mortgage-backed securities cont. | |||
| Morgan Stanley Capital I Trust 144A | |||
| FRB Ser. 07-IQ15, Class C, 6.382%, 6/11/49 W | $637,399 | $647,381 | |
| FRB Ser. 11-C3, Class D, 5.467%, 7/15/49 W | 206,000 | 205,485 | |
| TIAA Real Estate CDO, Ltd. 144A Ser. 03-1A, Class E, 8.00%, 12/28/38 (In default) † | 357,873 | 4 | |
| UBS Commercial Mortgage Trust | |||
| FRB Ser. 17-C7, Class XA, IO, 1.172%, 12/15/50 W | 3,226,043 | 154,418 | |
| FRB Ser. 18-C8, Class XA, IO, 1.022%, 2/15/51 W | 4,004,289 | 181,708 | |
| UBS Commercial Mortgage Trust 144A FRB Ser. 12-C1, Class C, 5.734%, 5/10/45 W | 576,000 | 585,582 | |
| UBS-Barclays Commercial Mortgage Trust 144A | |||
| FRB Ser. 12-C2, Class D, 5.043%, 5/10/63 W | 319,000 | 159,500 | |
| FRB Ser. 12-C4, Class XA, IO, 1.728%, 12/10/45 W | 846,186 | 9,452 | |
| FRB Ser. 12-C2, Class XA, IO, 1.43%, 5/10/63 W | 11,804,467 | 68,706 | |
| VMC Finance, LLC 144A FRB Ser. 21-FL4, Class A, 1.187%, 6/16/36 | 183,894 | 183,894 | |
| Wells Fargo Commercial Mortgage Trust | |||
| FRB Ser. 13-LC12, Class AS, 4.443%, 7/15/46 W | 251,000 | 254,185 | |
| FRB Ser. 13-LC12, Class C, 4.443%, 7/15/46 W | 409,000 | 364,225 | |
| Ser. 19-C49, Class AS, 4.244%, 3/15/52 | 244,000 | 276,509 | |
| FRB Ser. 16-LC25, Class AS, 4.093%, 12/15/59 W | 263,000 | 289,449 | |
| Ser. 15-NXS3, Class AS, 3.972%, 9/15/57 W | 208,000 | 224,873 | |
| FRB Ser. 19-C52, Class XA, IO, 1.741%, 8/15/52 W | 2,443,215 | 229,276 | |
| FRB Ser. 14-LC16, Class XA, IO, 1.243%, 8/15/50 W | 4,684,814 | 109,154 | |
| FRB Ser. 16-LC25, Class XA, IO, 1.106%, 12/15/59 W | 4,315,384 | 152,622 | |
| Wells Fargo Commercial Mortgage Trust 144A FRB Ser. 13-LC12, Class D, 4.443%, 7/15/46 W | 507,000 | 233,290 | |
| WF-RBS Commercial Mortgage Trust | |||
| Ser. 13-C18, Class AS, 4.387%, 12/15/46 W | 629,000 | 666,520 | |
| FRB Ser. 13-C11, Class C, 4.325%, 3/15/45 W | 303,000 | 311,955 | |
| Ser. 12-C8, Class AS, 3.66%, 8/15/45 | 509,000 | 516,901 | |
| Ser. 13-C11, Class AS, 3.311%, 3/15/45 | 290,000 | 297,157 | |
| WF-RBS Commercial Mortgage Trust 144A | |||
| FRB Ser. 11-C5, Class D, 5.965%, 11/15/44 W | 357,000 | 355,936 | |
| FRB Ser. 11-C3, Class D, 5.513%, 3/15/44 W | 639,172 | 312,172 | |
| Ser. 11-C4, Class E, 5.023%, 6/15/44 W | 123,000 | 89,666 | |
| FRB Ser. 12-C9, Class D, 4.969%, 11/15/45 W | 291,000 | 286,395 | |
| FRB Ser. 13-C15, Class D, 4.65%, 8/15/46 W | 153,000 | 87,520 | |
| FRB Ser. 12-C10, Class XA, IO, 1.635%, 12/15/45 W | 2,009,410 | 21,997 | |
| FRB Ser. 12-C9, Class XB, IO, 0.873%, 11/15/45 W | 6,676,000 | 40,056 | |
| 27,540,573 | |||
| Residential mortgage-backed securities (non-agency) (2.1%) | |||
| American Home Mortgage Investment Trust FRB Ser. 07-1, Class GA1C, (1 Month US LIBOR + 0.19%), 0.276%, 5/25/47 | 516,092 | 301,850 | |
| Arroyo Mortgage Trust 144A | |||
| Ser. 19-1, Class A3, 4.055%, 1/25/49 W | 83,413 | 84,589 | |
| Ser. 19-3, Class A3, 3.416%, 10/25/48 W | 137,588 | 139,293 | |
| Banc of America Funding Trust FRB Ser. 05-B, Class 3M1, (1 Month US LIBOR + 0.68%), 0.762%, 4/20/35 | 93,857 | 93,438 | |
| BankUnited Trust FRB Ser. 05-1, Class 1A1, (1 Month US LIBOR + 0.60%), 0.686%, 9/25/45 | 82,281 | 79,401 | |
Dynamic Asset Allocation Conservative Fund 67 | |
| MORTGAGE-BACKED SECURITIES (6.4%)* cont. | Principal amount | Value | |
| Residential mortgage-backed securities (non-agency) cont. | |||
| Bellemeade Re, Ltd. 144A FRB Ser. 19-4A, Class M1C, (1 Month US LIBOR + 2.50%), 2.586%, 10/25/29 (Bermuda) | $471,000 | $473,902 | |
| BRAVO Residential Funding Trust 144A Ser. 21-C, Class A1, 1.62%, 3/1/61 | 336,000 | 336,013 | |
| Bunker Hill Loan Depositary Trust 144A Ser. 20-1, Class A2, 2.60%, 2/25/55 W | 250,000 | 255,681 | |
| Citigroup Mortgage Loan Trust, Inc. FRB Ser. 05-2, Class 1A2A, 2.751%, 5/25/35 W | 174,087 | 177,292 | |
| COLT Mortgage Loan Trust 144A Ser. 20-2, Class A1, 1.853%, 3/25/65 W | 61,455 | 61,824 | |
| Countrywide Alternative Loan Trust | |||
| FRB Ser. 06-OA7, Class 1A2, (1 Month US LIBOR + 0.94%), 1.032%, 6/25/46 | 311,328 | 286,401 | |
| FRB Ser. 05-59, Class 1A1, (1 Month US LIBOR + 0.66%), 0.744%, 11/20/35 | 309,283 | 296,127 | |
| FRB Ser. 06-OA10, Class 4A1, (1 Month US LIBOR + 0.38%), 0.466%, 8/25/46 | 454,471 | 411,766 | |
| FRB Ser. 06-OA19, Class A1, (1 Month US LIBOR + 0.18%), 0.267%, 2/20/47 | 277,638 | 216,854 | |
| Credit Suisse Mortgage Trust 144A Ser. 21-RPL4, Class A1, 1.796%, 12/27/60 W | 189,672 | 190,027 | |
| CSMC Trust 144A Ser. 21-RPL7, Class A1, 1.926%, 9/1/51 | 200,000 | 200,000 | |
| Deephaven Residential Mortgage Trust 144A Ser. 20-2, Class A1, 1.692%, 5/25/65 | 73,728 | 73,993 | |
| Eagle Re, Ltd. 144A FRB Ser. 18-1, Class M1, (1 Month US LIBOR + 1.70%), 1.786%, 11/25/28 (Bermuda) | 189,271 | 189,917 | |
| Federal Home Loan Mortgage Corporation | |||
| Structured Agency Credit Risk Debt FRN Ser. 16-HQA1, Class M3, (1 Month US LIBOR + 6.35%), 6.436%, 9/25/28 | 211,600 | 222,565 | |
| Structured Agency Credit Risk Debt FRN Ser. 16-DNA1, Class M3, (1 Month US LIBOR + 5.55%), 5.634%, 7/25/28 | 451,009 | 473,041 | |
| Structured Agency Credit Risk Debt FRN Ser. 16-HQA2, Class M3, (1 Month US LIBOR + 5.15%), 5.236%, 11/25/28 | 217,863 | 224,896 | |
| Structured Agency Credit Risk Debt FRN Ser. 16-DNA3, Class M3, (1 Month US LIBOR + 5.00%), 5.086%, 12/25/28 | 449,109 | 471,074 | |
| Structured Agency Credit Risk Debt FRN Ser. 14-HQ3, Class M3, (1 Month US LIBOR + 4.75%), 4.836%, 10/25/24 | 19,547 | 19,692 | |
| Structured Agency Credit Risk Debt FRN Ser. 16-DNA2, Class M3, (1 Month US LIBOR + 4.65%), 4.736%, 10/25/28 | 1,437,555 | 1,489,619 | |
| Structured Agency Credit Risk Debt FRN Ser. 17-DNA2, Class M2, (1 Month US LIBOR + 3.45%), 3.536%, 10/25/29 | 282,000 | 292,151 | |
| Structured Agency Credit Risk Debt FRN Ser. 17-DNA2, Class M1, (1 Month US LIBOR + 1.20%), 1.286%, 10/25/29 | 94,163 | 94,194 | |
| Federal Home Loan Mortgage Corporation 144A | |||
| Structured Agency Credit Risk Trust FRB Ser. 19-DNA1, Class M2, (1 Month US LIBOR + 2.65%), 2.736%, 1/25/49 | 117,930 | 119,504 | |
| Structured Agency Credit Risk Trust FRB Ser. 19-DNA2, Class M2, (1 Month US LIBOR + 2.45%), 2.536%, 3/25/49 | 11,147 | 11,300 | |
| Structured Agency Credit Risk Trust FRB Ser. 18-HRP2, Class M3, (1 Month US LIBOR + 2.40%), 2.486%, 2/25/47 | 311,000 | 317,026 | |
| Structured Agency Credit Risk Trust FRB Ser. 19-HQA1, Class M2, (1 Month US LIBOR + 2.35%), 2.436%, 2/25/49 | 95,557 | 96,243 | |
68 Dynamic Asset Allocation Conservative Fund | |
| MORTGAGE-BACKED SECURITIES (6.4%)* cont. | Principal amount | Value | |
| Residential mortgage-backed securities (non-agency) cont. | |||
| Federal Home Loan Mortgage Corporation 144A | |||
| Structured Agency Credit Risk Trust FRB Ser. 18-HQA2, Class M2, (1 Month US LIBOR + 2.30%), 2.386%, 10/25/48 | $66,200 | $67,065 | |
| Structured Agency Credit Risk Debt FRN Ser. 21-DNA2, Class M2, (US 30 Day Average SOFR + 2.30%), 2.35%, 8/25/33 | 440,000 | 450,769 | |
| Structured Agency Credit Risk Trust FRB Ser. 18-DNA3, Class M2, (1 Month US LIBOR + 2.10%), 2.186%, 9/25/48 | 324,000 | 328,860 | |
| Structured Agency Credit Risk Trust REMICs FRB Ser. 20-HQA1, Class M2, (1 Month US LIBOR + 1.90%), 1.986%, 1/25/50 | 99,289 | 99,595 | |
| Structured Agency Credit Risk Trust FRB Ser. 18-HRP2, Class M3AS, (1 Month US LIBOR + 1.00%), 1.086%, 2/25/47 | 772,000 | 772,965 | |
| Structured Agency Credit Risk Trust REMICs FRB Ser. 21-HQA3, Class M1, (US 30 Day Average SOFR + 0.85%), 0.90%, 9/25/41 | 79,000 | 79,055 | |
| Federal National Mortgage Association | |||
| Connecticut Avenue Securities FRB Ser. 16-C01, Class 2M2, (1 Month US LIBOR + 6.95%), 7.036%, 8/25/28 | 251,248 | 266,154 | |
| Connecticut Avenue Securities FRB Ser. 16-C01, Class 1M2, (1 Month US LIBOR + 6.75%), 6.836%, 8/25/28 | 722,495 | 763,512 | |
| Connecticut Avenue Securities FRB Ser. 16-C02, Class 1M2, (1 Month US LIBOR + 6.00%), 6.086%, 9/25/28 | 509,216 | 533,085 | |
| Connecticut Avenue Securities FRB Ser. 16-C03, Class 2M2, (1 Month US LIBOR + 5.90%), 5.986%, 10/25/28 | 332,032 | 348,308 | |
| Connecticut Avenue Securities FRB Ser. 15-C04, Class 1M2, (1 Month US LIBOR + 5.70%), 5.786%, 4/25/28 | 678,625 | 716,127 | |
| Connecticut Avenue Securities FRB Ser. 15-C04, Class 2M2, (1 Month US LIBOR + 5.55%), 5.636%, 4/25/28 | 706,942 | 741,185 | |
| Connecticut Avenue Securities FRB Ser. 15-C03, Class 2M2, (1 Month US LIBOR + 5.00%), 5.086%, 7/25/25 | 47,344 | 47,736 | |
| Connecticut Avenue Securities FRB Ser. 14-C04, Class 2M2, (1 Month US LIBOR + 5.00%), 5.086%, 11/25/24 | 26,144 | 26,654 | |
| Connecticut Avenue Securities FRB Ser. 14-C04, Class 1M2, (1 Month US LIBOR + 4.90%), 4.986%, 11/25/24 | 93,767 | 97,265 | |
| Connecticut Avenue Securities FRB Ser. 16-C05, Class 2M2, (1 Month US LIBOR + 4.45%), 4.536%, 1/25/29 | 500,731 | 519,488 | |
| Connecticut Avenue Securities FRB Ser. 16-C07, Class 2M2, (1 Month US LIBOR + 4.35%), 4.436%, 5/25/29 | 196,120 | 204,242 | |
| Connecticut Avenue Securities FRB Ser. 15-C01, Class 1M2, (1 Month US LIBOR + 4.30%), 4.386%, 2/25/25 | 37,394 | 38,060 | |
| Connecticut Avenue Securities FRB Ser. 16-C06, Class 1M2, (1 Month US LIBOR + 4.25%), 4.336%, 4/25/29 | 245,265 | 254,479 | |
| Connecticut Avenue Securities FRB Ser. 16-C04, Class 1M2, (1 Month US LIBOR + 4.25%), 4.336%, 1/25/29 | 1,038,657 | 1,076,504 | |
| Connecticut Avenue Securities FRB Ser. 15-C02, Class 1M2, (1 Month US LIBOR + 4.00%), 4.086%, 5/25/25 | 44,120 | 44,893 | |
| Connecticut Avenue Securities FRB Ser. 15-C02, Class 2M2, (1 Month US LIBOR + 4.00%), 4.086%, 5/25/25 | 36,439 | 36,698 | |
| Connecticut Avenue Securities FRB Ser. 17-C01, Class 1M2, (1 Month US LIBOR + 3.55%), 3.636%, 7/25/29 | 690,248 | 710,440 | |
| Connecticut Avenue Securities FRB Ser. 14-C03, Class 2M2, (1 Month US LIBOR + 2.90%), 2.986%, 7/25/24 | 79,005 | 80,261 | |
| Connecticut Avenue Securities FRB Ser. 18-C04, Class 2M2, (1 Month US LIBOR + 2.55%), 2.636%, 12/25/30 | 224,485 | 228,213 | |
Dynamic Asset Allocation Conservative Fund 69 | |
| MORTGAGE-BACKED SECURITIES (6.4%)* cont. | Principal amount | Value | |
| Residential mortgage-backed securities (non-agency) cont. | |||
| Federal National Mortgage Association | |||
| Connecticut Avenue Securities FRB Ser. 18-C05, Class 1M2, (1 Month US LIBOR + 2.35%), 2.436%, 1/25/31 | $384,546 | $389,593 | |
| Connecticut Avenue Securities FRB Ser. 17-C05, Class 1M2A, (1 Month US LIBOR + 2.20%), 2.286%, 1/25/30 | 17,692 | 17,692 | |
| Connecticut Avenue Securities FRB Ser. 17-C01, Class 1EB1, (1 Month US LIBOR + 1.25%), 1.336%, 7/25/29 | 160,000 | 160,500 | |
| Federal National Mortgage Association 144A | |||
| Connecticut Avenue Securities Trust FRB Ser. 19-R01, Class 2M2, (1 Month US LIBOR + 2.45%), 2.536%, 7/25/31 | 35,838 | 36,040 | |
| Connecticut Avenue Securities Trust FRB Ser. 19-HRP1, Class M2, (1 Month US LIBOR + 2.15%), 2.236%, 11/25/39 | 166,314 | 167,150 | |
| Connecticut Avenue Securities Trust FRB Ser. 20-R01, Class 1M2, (1 Month US LIBOR + 2.05%), 2.136%, 1/25/40 | 447,831 | 450,158 | |
| Home Re, Ltd. 144A FRB Ser. 18-1, Class M1, (1 Month US LIBOR + 1.60%), 1.686%, 10/25/28 (Bermuda) | 84,046 | 84,211 | |
| Legacy Mortgage Asset Trust 144A | |||
| Ser. 20-GS5, Class A1, 3.25%, 6/25/60 | 404,624 | 411,701 | |
| FRB Ser. 19-GS7, Class A1, 3.25%, 11/25/59 | 273,047 | 274,958 | |
| FRB Ser. 20-GS1, Class A1, 2.882%, 10/25/59 | 258,899 | 260,967 | |
| Long Beach Mortgage Loan Trust FRB Ser. 04-1, Class A2, (1 Month US LIBOR + 0.80%), 0.886%, 2/25/34 | 360,542 | 360,564 | |
| Merrill Lynch Mortgage Investors Trust FRB Ser. 05-A2, Class A2, 2.824%, 2/25/35 W | 82,861 | 84,222 | |
| Morgan Stanley ABS Capital I, Inc. Trust FRB Ser. 04-HE6, Class M1, (1 Month US LIBOR + 0.83%), 0.911%, 8/25/34 | 95,429 | 94,721 | |
| Morgan Stanley Resecuritization Trust 144A Ser. 15-R4, Class CB1, 0.91%, 8/26/47 W | 100,000 | 96,524 | |
| OSW Structured Asset Trust 144A FRB Ser. 20-RPL1, Class A1, 3.072%, 12/26/59 | 241,969 | 242,835 | |
| Park Place Securities, Inc. Asset-Backed Pass-Through Certificates FRB Ser. 04-WCW2, Class M3, (1 Month US LIBOR + 1.05%), 1.136%, 10/25/34 | 290,000 | 288,184 | |
| Residential Mortgage Loan Trust 144A Ser. 20-2, Class A2, 2.508%, 5/25/60 W | 209,000 | 209,919 | |
| Starwood Mortgage Residential Trust 144A | |||
| Ser. 20-2, Class M1E, 3.00%, 4/25/60 | 493,000 | 501,928 | |
| Ser. 20-3, Class A3, 2.591%, 4/25/65 W | 403,000 | 402,999 | |
| Structured Asset Mortgage Investments II Trust | |||
| FRB Ser. 07-AR7, Class 1A1, (1 Month US LIBOR + 0.85%), 0.936%, 5/25/47 | 404,426 | 358,526 | |
| FRB Ser. 07-AR1, Class 2A1, (1 Month US LIBOR + 0.18%), 0.266%, 1/25/37 | 100,164 | 96,571 | |
| Towd Point Mortgage Trust 144A Ser. 16-5, Class M2, 3.375%, 10/25/56 W | 174,000 | 181,830 | |
| Triangle Re, Ltd. 144A FRB Ser. 21-2, Class M1A, (1 Month US LIBOR + 2.05%), 2.136%, 10/25/33 (Bermuda) | 164,000 | 165,465 | |
| WaMu Mortgage Pass-Through Certificates Trust | |||
| FRB Ser. 05-AR12, Class 1A8, 2.808%, 10/25/35 W | 294,823 | 291,178 | |
| FRB Ser. 04-AR3, Class A2, 2.577%, 6/25/34 W | 138,794 | 143,596 | |
70 Dynamic Asset Allocation Conservative Fund | |
| MORTGAGE-BACKED SECURITIES (6.4%)* cont. | Principal amount | Value | |
| Residential mortgage-backed securities (non-agency) cont. | |||
| WaMu Mortgage Pass-Through Certificates Trust | |||
| FRB Ser. 05-AR9, Class A1C3, (1 Month US LIBOR + 0.96%), 1.046%, 7/25/45 | $133,292 | $127,081 | |
| FRB Ser. 04-AR13, Class A2B, (1 Month US LIBOR + 0.88%), 0.966%, 11/25/34 | 163,477 | 159,712 | |
| FRB Ser. 05-AR11, Class A1B3, (1 Month US LIBOR + 0.80%), 0.886%, 8/25/45 | 166,435 | 166,622 | |
| 22,456,733 | |||
| Total mortgage-backed securities (cost $70,760,590) | $69,449,784 | ||
| COLLATERALIZED LOAN OBLIGATIONS (1.6%)* | Principal amount | Value | |
| 522 Funding CLO, Ltd. 144A FRB Ser. 19-5A, Class A1, (BBA LIBOR USD 3 Month + 1.39%), 1.516%, 1/15/33 (Cayman Islands) | $534,000 | $534,682 | |
| 522 Funding CLO, Ltd. 144A FRB Ser. 21-7A, Class A, (BBA LIBOR USD 3 Month + 1.07%), 1.27%, 4/23/34 (Cayman Islands) | 250,000 | 250,234 | |
| AB BSL CLO 1, Ltd. 144A FRB Ser. 20-1A, Class A1A, (BBA LIBOR USD 3 Month + 1.50%), 1.626%, 1/15/33 (Cayman Islands) | 534,000 | 534,780 | |
| AB BSL CLO 2, Ltd. 144A FRB Ser. 21-2A, Class A, (BBA LIBOR USD 3 Month + 1.10%), 1.23%, 4/15/34 (Cayman Islands) | 250,000 | 250,113 | |
| AGL CLO 13, Ltd. 144A FRB Ser. 21-13A, Class A1, (BBA LIBOR USD 3 Month + 1.16%), 1.292%, 10/20/34 (Cayman Islands) ## | 350,000 | 350,000 | |
| AGL CLO 6, Ltd. 144A FRB Ser. 21-6A, Class AR, (BBA LIBOR USD 3 Month + 1.20%), 1.334%, 7/20/34 (Cayman Islands) | 100,000 | 100,054 | |
| Aimco CLO 14, Ltd. 144A FRB Ser. 21-14A, Class A, (BBA LIBOR USD 3 Month + 0.99%), 1.188%, 4/20/34 (Cayman Islands) | 250,000 | 250,077 | |
| Apidos CLO XXIII 144A FRB Ser. 20-23A, Class AR, (BBA LIBOR USD 3 Month + 1.22%), 1.346%, 4/15/33 | 600,000 | 601,013 | |
| Apidos CLO XXXV 144A FRB Ser. 21-35A, Class A, (BBA LIBOR USD 3 Month + 1.05%), 1.249%, 4/20/34 (Cayman Islands) | 250,000 | 250,233 | |
| Ares LX CLO, Ltd. 144A FRB Ser. 21-60A, Class A, (BBA LIBOR USD 3 Month + 1.12%), 1.255%, 7/18/34 (Cayman Islands) | 250,000 | 250,179 | |
| Ares XLI CLO, Ltd. 144A FRB Ser. 21-41A, Class AR2, (BBA LIBOR USD 3 Month + 1.07%), 1.196%, 4/15/34 (Cayman Islands) | 500,000 | 500,232 | |
| Balboa Bay Loan Funding, Ltd. 144A FRB Ser. 20-1A, Class A, (BBA LIBOR USD 3 Month + 1.35%), 1.484%, 1/20/32 | 534,000 | 535,975 | |
| Benefit Street Partners CLO V-B, Ltd. 144A FRB Ser. 18-5BA, Class A1A, (BBA LIBOR USD 3 Month + 1.09%), 1.224%, 4/20/31 | 250,000 | 249,775 | |
| Canyon Capital CLO, Ltd. 144A FRB Ser. 19-2A, Class A, (BBA LIBOR USD 3 Month + 1.37%), 1.496%, 10/15/32 | 250,000 | 250,077 | |
| Carlyle C17 CLO, Ltd. 144A FRB Ser. C17A, Class A1AR, (BBA LIBOR USD 3 Month + 1.03%), 1.159%, 4/30/31 | 363,000 | 363,266 | |
| Carlyle US CLO, Ltd. 144A FRB Ser. 21-1A, Class A1R, (BBA LIBOR USD 3 Month + 1.00%), 1.134%, 4/20/31 | 250,000 | 250,081 | |
| CarVal CLO II, Ltd. 144A FRB Ser. 21-1A, Class ANR, (BBA LIBOR USD 3 Month + 1.11%), 1.244%, 4/20/32 (Cayman Islands) | 250,000 | 250,279 | |
| Cedar Funding II CLO, Ltd. 144A FRB Ser. 21-1A, Class ARR, (BBA LIBOR USD 3 Month + 1.08%), 1.214%, 4/20/34 | 453,000 | 453,423 | |
| Columbia Cent CLO 29, Ltd. 144A FRB Ser. 20-29A, Class A1N, (BBA LIBOR USD 3 Month + 1.70%), 1.834%, 7/20/31 | 105,000 | 105,231 | |
Dynamic Asset Allocation Conservative Fund 71 | |
| COLLATERALIZED LOAN OBLIGATIONS (1.6%)* cont. | Principal amount | Value | |
| Crestline Denali CLO XVII, Ltd. 144A FRB Ser. 21-1A, Class AR, (BBA LIBOR USD 3 Month + 1.06%), 1.186%, 10/15/31 (Cayman Islands) | $252,000 | $252,013 | |
| Elevation CLO, Ltd. 144A FRB Ser. 17-2A, Class A1R, (BBA LIBOR USD 3 Month + 1.23%), 1.356%, 10/15/29 | 450,000 | 450,016 | |
| Elmwood CLO II, Ltd. 144A FRB Ser. 21-2A, Class AR, (BBA LIBOR USD 3 Month + 1.15%), 1.284%, 4/20/34 | 265,000 | 265,288 | |
| Elmwood CLO IV, Ltd. 144A FRB Ser. 20-1A, Class A, (BBA LIBOR USD 3 Month + 1.24%), 1.366%, 4/15/33 (Cayman Islands) | 350,000 | 350,935 | |
| Elmwood CLO V, Ltd. 144A FRB Ser. 21-2A, Class AR, (BBA LIBOR USD 3 Month + 1.15%), 1.267%, 10/20/34 (Cayman Islands) | 250,000 | 250,874 | |
| Galaxy XXII CLO, Ltd. 144A FRB Ser. 21-22A, Class ARR, (BBA LIBOR USD 3 Month + 1.20%), 1.326%, 4/16/34 (Cayman Islands) | 350,000 | 350,758 | |
| GoldenTree Loan Management US CLO 5, Ltd. 144A FRB Ser. 19-5A, Class A, (BBA LIBOR USD 3 Month + 1.30%), 1.434%, 10/20/32 | 250,000 | 250,000 | |
| Golub Capital Partners 48 LP 144A FRB Ser. 20-48A, Class A1, (BBA LIBOR USD 3 Month + 1.31%), 1.444%, 4/17/33 | 250,000 | 250,331 | |
| Greywolf CLO V, Ltd. 144A FRB Ser. 18-1A, Class A1R, (BBA LIBOR USD 3 Month + 1.16%), 1.285%, 1/27/31 (Cayman Islands) | 459,000 | 459,111 | |
| Guggenheim 1828 CLO, Ltd. 144A FRB Ser. 18-1A, Class A1S1, (BBA LIBOR USD 3 Month + 1.23%), 1.356%, 10/15/31 (Cayman Islands) | 249,053 | 248,951 | |
| HalseyPoint CLO 3, Ltd. 144A FRB Ser. 20-3A, Class A1A, (BBA LIBOR USD 3 Month + 1.45%), 1.579%, 11/30/32 (Cayman Islands) | 501,000 | 502,642 | |
| Kayne CLO 6, Ltd. 144A FRB Ser. 19-6A, Class A1, (BBA LIBOR USD 3 Month + 1.38%), 1.514%, 1/20/33 | 250,000 | 250,186 | |
| Madison Park Funding, Ltd. 144A FRB Ser. 18-30A, Class A, (BBA LIBOR USD 3 Month + 0.75%), 0.876%, 4/15/29 | 301,131 | 301,142 | |
| Nassau, Ltd. 144A FRB Ser. 21-IA, Class ANAR, (BBA LIBOR USD 3 Month + 1.35%), 1.482%, 4/15/31 (Cayman Islands) | 250,000 | 249,997 | |
| Northwoods Capital XVII, Ltd. 144A FRB Ser. 18-17A, Class A, (BBA LIBOR USD 3 Month + 1.06%), 1.198%, 4/22/31 (Cayman Islands) | 250,000 | 249,512 | |
| Oaktree CLO, Ltd. 144A FRB Ser. 21-1A, Class A1, (BBA LIBOR USD 3 Month + 1.16%), 1.292%, 7/15/34 (Cayman Islands) | 258,000 | 258,185 | |
| OCP CLO, Ltd. 144A FRB Ser. 21-19A, Class AR, (BBA LIBOR USD 3 Month + 1.15%), 1.284%, 10/20/34 (Cayman Islands) | 250,000 | 250,730 | |
| OZLM IX, Ltd. 144A FRB Ser. 18-9A, Class A1AR, (BBA LIBOR USD 3 Month + 1.28%), 1.414%, 10/20/31 (Cayman Islands) | 479,773 | 479,773 | |
| OZLM XI, Ltd. 144A FRB Ser. 17-11A, Class A1R, (BBA LIBOR USD 3 Month + 1.25%), 1.379%, 10/30/30 | 247,297 | 247,355 | |
| Palmer Square Loan Funding, Ltd. 144A FRB Ser. 21-4A, Class A1, (BBA LIBOR USD 3 Month + 0.80%), 0.928%, 10/15/29 (Cayman Islands) ## | 356,000 | 356,000 | |
| Regatta XVIII Funding, Ltd. 144A FRB Ser. 21-1A, Class A1, (BBA LIBOR USD 3 Month + 1.10%), 1.226%, 1/15/34 | 274,000 | 274,424 | |
| Riserva CLO, Ltd. 144A FRB Ser. 21-3A, Class ARR, (BBA LIBOR USD 3 Month + 1.06%), 1.194%, 1/18/34 (Cayman Islands) | 250,000 | 249,624 | |
| RR, Ltd. 144A FRB Ser. 20-12A, Class AAR2, (BBA LIBOR USD 3 Month + 1.36%), 1.486%, 1/15/36 | 319,000 | 319,955 | |
| Shackleton CLO, Ltd. 144A FRB Ser. 20-11A, Class AR, (BBA LIBOR USD 3 Month + 1.09%), 1.215%, 8/15/30 (Cayman Islands) | 286,000 | 286,134 | |
72 Dynamic Asset Allocation Conservative Fund | |
| COLLATERALIZED LOAN OBLIGATIONS (1.6%)* cont. | Principal amount | Value | |
| Signal Peak CLO 8, Ltd. 144A FRB Ser. 20-8A, Class A, (BBA LIBOR USD 3 Month + 1.27%), 1.404%, 4/20/33 (Cayman Islands) | $316,000 | $316,670 | |
| Sound Point CLO II, Ltd. 144A FRB Ser. 18-1A, Class A1R, (BBA LIBOR USD 3 Month + 1.07%), 1.195%, 1/26/31 (Cayman Islands) | 272,000 | 272,168 | |
| Sound Point CLO XXIX, Ltd. 144A FRB Ser. 21-1A, Class A, (BBA LIBOR USD 3 Month + 1.07%), 1.21%, 4/25/34 (Cayman Islands) | 300,000 | 300,187 | |
| Sound Point CLO XXVI, Ltd. 144A FRB Ser. 21-1A, Class AR, (BBA LIBOR USD 3 Month + 1.17%), 1.298%, 7/20/34 (Cayman Islands) | 258,000 | 258,092 | |
| Trinitas CLO XVI, Ltd. 144A FRB Ser. 21-16A, Class A1, (BBA LIBOR USD 3 Month + 1.18%), 1.314%, 7/20/34 (Cayman Islands) | 701,000 | 702,534 | |
| Vibrant CLO VIII, Ltd. 144A FRB Ser. 18-8A, Class A1A, (BBA LIBOR USD 3 Month + 1.14%), 1.274%, 1/20/31 (Cayman Islands) | 400,000 | 400,001 | |
| Voya CLO, Ltd. 144A FRB Ser. 13-2A, Class A1R, (BBA LIBOR USD 3 Month + 0.97%), 1.095%, 4/25/31 | 250,000 | 250,295 | |
| Wellfleet CLO, Ltd. 144A FRB Ser. 18-2A, Class A1, (BBA LIBOR USD 3 Month + 1.20%), 1.334%, 10/20/31 (Cayman Islands) | 250,000 | 250,009 | |
| York CLO-4, Ltd. 144A FRB Ser. 20-2A, Class A1R, (BBA LIBOR USD 3 Month + 1.09%), 1.224%, 4/20/32 (Cayman Islands) | 350,000 | 350,175 | |
| ZAIS CLO, Ltd. 144A FRB Ser. 19-13A, Class A1A, (BBA LIBOR USD 3 Month + 1.49%), 1.616%, 7/15/32 | 468,000 | 468,593 | |
| Total collateralized loan obligations (cost $17,314,985) | $17,302,364 | ||
| ASSET-BACKED SECURITIES (0.8%)* | Principal amount | Value | |
| 1Sharpe Mortgage Trust 144A FRB Ser. 20-1, Class NOTE, (BBA LIBOR USD 3 Month + 2.90%), 3.025%, 7/25/24 | $443,000 | $443,576 | |
| Mello Warehouse Securitization Trust 144A | |||
| FRB Ser. 20-1, Class A, (1 Month US LIBOR + 0.90%), 0.986%, 10/25/53 | 217,000 | 217,000 | |
| FRB Ser. 20-2, Class A, (1 Month US LIBOR + 0.80%), 0.886%, 11/25/53 | 131,000 | 131,000 | |
| FRB Ser. 21-2, Class A, (1 Month US LIBOR + 0.75%), 0.836%, 4/25/55 | 338,000 | 338,000 | |
| MRA Issuance Trust 144A | |||
| FRB Ser. 21-EBO4, Class A1X, (1 Month US LIBOR + 1.75%), 1.836%, 2/16/22 | 570,000 | 570,000 | |
| FRB Ser. 21-EBO1, Class A1X, (1 Month US LIBOR + 1.75%), 1.834%, 2/16/22 | 437,000 | 437,000 | |
| FRB Ser. 20-11, Class A1X, (1 Month US LIBOR + 1.70%), 1.784%, 4/22/22 | 498,000 | 498,000 | |
| FRB Ser. 21-NA1, Class A1X, (1 Month US LIBOR + 1.50%), 1.586%, 3/8/22 | 492,000 | 492,000 | |
| FRB Ser. 20-2, Class A2, (1 Month US LIBOR + 1.45%), 1.286%, 8/15/22 | 783,000 | 783,000 | |
| FRB Ser. 21-14, Class A1X, (1 Month US LIBOR + 1.25%), 1.243%, 2/15/22 | 558,000 | 558,000 | |
| FRB Ser. 21-8, Class A1X, (1 Month US LIBOR + 1.15%), 1.236%, 10/15/21 | 777,000 | 777,000 | |
| FRB Ser. 21-11, Class A1X, (1 Month US LIBOR + 1.15%), 1.234%, 1/25/22 | 570,000 | 571,138 | |
Dynamic Asset Allocation Conservative Fund 73 | |
| ASSET-BACKED SECURITIES (0.8%)* cont. | Principal amount | Value | |
| MSG III Securitization Trust 144A FRB Ser. 21-1, Class A, (1 Month US LIBOR + 0.75%), 0.836%, 6/25/54 | $131,000 | $131,000 | |
| NewRez Warehouse Securitization Trust 144A FRB Ser. 21-1, Class A, (1 Month US LIBOR + 0.75%), 0.836%, 5/25/55 | 188,000 | 188,225 | |
| Provident Funding Mortgage Warehouse Securitization Trust 144A FRB Ser. 21-1, Class A, (1 Month US LIBOR + 0.70%), 0.786%, 2/25/55 | 241,000 | 241,000 | |
| RMF Buyout Issuance Trust 144A Ser. 20-HB1, Class A1, 1.719%, 10/25/50 W | 167,964 | 168,384 | |
| Station Place Securitization Trust 144A | |||
| FRB Ser. 21-6, Class A, (1 Month US LIBOR + 0.80%), 0.883%, 4/25/22 | 574,000 | 574,000 | |
| FRB Ser. 21-10, Class A, (1 Month US LIBOR + 0.75%), 0.854%, 8/8/22 | 574,000 | 574,000 | |
| FRB Ser. 21-WL2, Class A, (1 Month US LIBOR + 0.70%), 0.786%, 3/25/54 | 353,000 | 353,000 | |
| FRB Ser. 21-WL1, Class A, (1 Month US LIBOR + 0.65%), 0.736%, 1/26/54 | 353,000 | 353,000 | |
| Toorak Mortgage Corp., Ltd. 144A Ser. 19-1, Class A1, 4.535%, 3/25/22 W | 185,679 | 186,341 | |
| Towd Point Asset Trust 144A FRB Ser. 18-SL1, Class A, (1 Month US LIBOR + 0.60%), 0.686%, 1/25/46 | 368,767 | 368,325 | |
| Total asset-backed securities (cost $8,948,927) | $8,952,989 | ||
| FOREIGN GOVERNMENT AND AGENCY BONDS AND NOTES (0.8%)* | Principal amount | Value | |
| Bahrain (Kingdom of) sr. unsec. bonds Ser. REGS, 5.25%, 1/25/33 (Bahrain) | $300,000 | $284,616 | |
| Colombia (Republic of) sr. unsec. notes 3.875%, 4/25/27 (Colombia) | 390,000 | 403,162 | |
| Dominican (Republic of) sr. unsec. unsub. bonds Ser. REGS, 6.40%, 6/5/49 (Dominican Republic) | 250,000 | 265,625 | |
| Dominican (Republic of) sr. unsec. unsub. notes Ser. REGS, 5.95%, 1/25/27 (Dominican Republic) | 491,000 | 552,375 | |
| Indonesia (Republic of) sr. unsec. unsub. notes Ser. REGS, 4.75%, 1/8/26 (Indonesia) | 800,000 | 908,008 | |
| Indonesia (Republic of) 144A sr. unsec. unsub. notes 4.35%, 1/8/27 (Indonesia) | 825,000 | 930,175 | |
| Ivory Coast (Republic of) sr. unsec. unsub. bonds Ser. REGS, 6.125%, 6/15/33 (Ivory Coast) | 1,005,000 | 1,061,531 | |
| Kazakhstan (Republic of) sr. unsec. unsub. bonds Ser. REGS, 4.875%, 10/14/44 (Kazakhstan) | 470,000 | 575,727 | |
| Kazakhstan (Republic of) sr. unsec. unsub. notes Ser. REGS, 5.125%, 7/21/25 (Kazakhstan) | 290,000 | 333,116 | |
| Mexico (Government of) sr. unsec. bonds 5.55%, 1/21/45 (Mexico) | 862,000 | 1,007,730 | |
| Paraguay (Republic of) sr. unsec. notes Ser. REGS, 4.95%, 4/28/31 (Paraguay) | 200,000 | 225,250 | |
| Paraguay (Republic of) sr. unsec. unsub. notes Ser. REGS, 4.70%, 3/27/27 (Paraguay) | 200,000 | 221,502 | |
| Saudi Arabia (Kingdom of) sr. unsec. notes Ser. REGS, 2.90%, 10/22/25 (Saudi Arabia) | 330,000 | 351,140 | |
| Senegal (Republic of) unsec. bonds Ser. REGS, 6.25%, 5/23/33 (Senegal) | 785,000 | 819,344 | |
74 Dynamic Asset Allocation Conservative Fund | |
| FOREIGN GOVERNMENT AND AGENCY BONDS AND NOTES (0.8%)* cont. | Principal amount | Value | |
| South Africa (Republic of) sr. unsec. unsub. notes 4.85%, 9/27/27 (South Africa) | $300,000 | $314,255 | |
| United Mexican States sr. unsec. bonds 2.659%, 5/24/31 (Mexico) | 243,000 | 234,429 | |
| Uruguay (Oriental Republic of) sr. unsec. unsub. bonds 7.625%, 3/21/36 (Uruguay) | 210,000 | 313,643 | |
| Venezuela (Republic of) sr. unsec. notes 9.00%, 5/7/23 (Venezuela) (In default) † | 340,000 | 36,550 | |
| Venezuela (Republic of) sr. unsec. unsub. notes 8.25%, 10/13/24 (Venezuela) (In default) † | 550,000 | 59,125 | |
| Total foreign government and agency bonds and notes (cost $8,586,361) | $8,897,303 | ||
| SENIOR LOANS (0.4%)*c | Principal amount | Value | |
| Adient US, LLC bank term loan FRN Ser. B, (BBA LIBOR USD 3 Month + 3.50%), 3.584%, 4/1/28 | $79,800 | $79,766 | |
| Alpha 3 BV bank term loan FRN (BBA LIBOR USD 3 Month + 2.50%), 3.00%, 3/5/28 | 59,850 | 59,763 | |
| AMC Entertainment Holdings, Inc. bank term loan FRN Ser. B, (BBA LIBOR USD 3 Month + 3.00%), 3.083%, 4/22/26 | 99,351 | 91,955 | |
| American Airlines, Inc. bank term loan FRN (BBA LIBOR USD 3 Month + 4.75%), 5.50%, 4/20/28 | 50,000 | 51,674 | |
| AppleCaramel Buyer, LLC bank term loan FRN (BBA LIBOR USD 3 Month + 4.00%), 4.50%, 10/19/27 | 84,363 | 84,554 | |
| Arches Buyer, Inc. bank term loan FRN (BBA LIBOR USD 3 Month + 3.25%), 3.75%, 12/6/27 | 148,875 | 148,038 | |
| Asurion, LLC bank term loan FRN (BBA LIBOR USD 3 Month + 5.25%), 5.334%, 1/30/29 | 65,000 | 64,659 | |
| Asurion, LLC bank term loan FRN Ser. B9, (BBA LIBOR USD 3 Month + 3.25%), 3.334%, 7/31/27 | 44,887 | 44,203 | |
| Blackstone CQP Holdco LP bank term loan FRN Ser. B, (BBA LIBOR USD 3 Month + 3.75%), 4.25%, 6/4/28 | 129,675 | 129,243 | |
| Brand Industrial Services, Inc. bank term loan FRN (BBA LIBOR USD 3 Month + 4.25%), 5.25%, 6/21/24 | 177,138 | 175,446 | |
| BWAY Corp. bank term loan FRN Ser. B, (BBA LIBOR USD 3 Month + 3.25%), 3.334%, 4/3/24 | 68,393 | 66,929 | |
| CP Atlas Buyer, Inc. bank term loan FRN Ser. B1, (BBA LIBOR USD 3 Month + 3.75%), 4.25%, 11/23/27 | 178,105 | 177,437 | |
| CPG International, Inc. bank term loan FRN (BBA LIBOR USD 3 Month + 2.50%), 3.25%, 5/5/24 | 41,744 | 41,737 | |
| DIRECTV Financing, LLC bank term loan FRN (BBA LIBOR USD 3 Month + 5.00%), 5.75%, 7/22/27 | 110,000 | 110,034 | |
| Epicor Software Corp. bank term loan FRN (BBA LIBOR USD 3 Month + 7.75%), 8.75%, 7/30/28 | 50,000 | 51,313 | |
| Epicor Software Corp. bank term loan FRN Ser. B, (BBA LIBOR USD 3 Month + 3.25%), 4.00%, 7/30/27 | 480,150 | 479,934 | |
| Global Medical Response, Inc. bank term loan FRN (BBA LIBOR USD 3 Month + 4.75%), 5.75%, 10/5/25 | 217,684 | 218,337 | |
| Greeneden US Holdings II, LLC bank term loan FRN (BBA LIBOR USD 3 Month + 4.00%), 4.75%, 12/1/27 | 84,575 | 84,832 | |
| iHeartCommunications, Inc. bank term loan FRN (BBA LIBOR USD 3 Month + 3.25%), 3.75%, 5/1/26 | 66,870 | 66,837 | |
Dynamic Asset Allocation Conservative Fund 75 | |
| SENIOR LOANS (0.4%)*c cont. | Principal amount | Value | |
| IRB Holding Corp. bank term loan FRN Ser. B, (BBA LIBOR USD 3 Month + 3.25%), 4.25%, 12/15/27 | $39,700 | $39,750 | |
| Jazz Financing Lux Sarl bank term loan FRN Ser. B, (BBA LIBOR USD 3 Month + 3.50%), 4.00%, 5/31/28 | 114,713 | 114,842 | |
| Klockner-Pentaplast of America, Inc. bank term loan FRN (BBA LIBOR USD 3 Month + 4.75%), 5.25%, 2/4/26 | 69,650 | 69,781 | |
| MajorDrive Holdings IV, LLC bank term loan FRN (BBA LIBOR USD 3 Month + 4.00%), 4.50%, 6/1/28 | 189,525 | 189,821 | |
| One Call Corp. bank term loan FRN Ser. B, (1 Month US LIBOR + 5.50%), 6.25%, 4/22/27 | 124,688 | 125,623 | |
| Ortho-Clinical Diagnostics, Inc. bank term loan FRN Ser. B, (BBA LIBOR USD 3 Month + 3.00%), 3.083%, 6/30/25 | 86,996 | 86,888 | |
| Polaris Newco, LLC bank term loan FRN Ser. B, (BBA LIBOR USD 3 Month + 4.00%), 4.50%, 6/3/28 | 130,000 | 130,244 | |
| Quorum Health Corp. bank term loan FRN (BBA LIBOR USD 3 Month + 7.00%), 8.00%, 4/29/25 | 161,039 | 161,141 | |
| Robertshaw Holdings Corp. bank term loan FRN (BBA LIBOR USD 3 Month + 8.00%), 9.00%, 2/28/26 | 75,000 | 64,688 | |
| Robertshaw Holdings Corp. bank term loan FRN (BBA LIBOR USD 3 Month + 3.50%), 4.50%, 2/28/25 | 52,645 | 50,934 | |
| Rocket Software, Inc. bank term loan FRN (BBA LIBOR USD 3 Month + 4.25%), 4.75%, 11/28/25 | 59,850 | 59,576 | |
| SCIH Salt Holdings, Inc. bank term loan FRN Ser. B, (BBA LIBOR USD 3 Month + 4.00%), 4.75%, 3/16/27 | 102,738 | 102,787 | |
| Solenis International, LLC bank term loan FRN (BBA LIBOR USD 3 Month + 8.50%), 8.584%, 6/26/26 | 65,000 | 64,878 | |
| Solenis International, LLC bank term loan FRN (BBA LIBOR USD 3 Month + 4.00%), 4.084%, 6/26/25 | 180,919 | 180,825 | |
| Starfruit US Holdco, LLC bank term loan FRN Ser. B, (BBA LIBOR USD 3 Month + 3.00%), 2.832%, 10/1/25 | 70,860 | 70,346 | |
| Terrier Media Buyer, Inc. bank term loan FRN (BBA LIBOR USD 3 Month + 3.50%), 3.584%, 12/17/26 | 405,900 | 404,885 | |
| Titan Acquisition, Ltd. (United Kingdom) bank term loan FRN Ser. B, (BBA LIBOR USD 3 Month + 3.00%), 3.167%, 3/28/25 | 139,633 | 136,999 | |
| TK Elevator US Newco, Inc. bank term loan FRN Ser. B, (BBA LIBOR USD 3 Month + 3.50%), 4.00%, 7/31/27 | 55,000 | 55,076 | |
| United Airlines, Inc. bank term loan FRN Ser. B, (BBA LIBOR USD 3 Month + 3.75%), 4.50%, 4/21/28 | 104,475 | 105,116 | |
| Vertiv Group Corp. bank term loan FRN Ser. B, (BBA LIBOR USD 3 Month + 2.75%), 2.833%, 3/2/27 | 295,517 | 293,546 | |
| Total senior loans (cost $4,704,814) | $4,734,437 | ||
| CONVERTIBLE PREFERRED STOCKS (0.2%)* | Shares | Value |
| Danaher Corp. 5.00% cv. pfd. | 489 | $791,227 |
| T-Mobile US, Inc. 144A 5.25% cv. pfd. † | 787 | 889,916 |
| Total convertible preferred stocks (cost $1,314,207) | $1,681,143 | |
76 Dynamic Asset Allocation Conservative Fund | |
| PURCHASED OPTIONS OUTSTANDING (—%)* Counterparty | Expiration date/strike price | Notional amount | Contract amount | Value | |
| Bank of America N.A. | |||||
| GBP/USD (Put) | Nov-21/$1.33 | $17,442,228 | GBP | 12,945,100 | $102,334 |
| Goldman Sachs International | |||||
| EUR/USD (Put) | Nov-21/1.16 | 17,511,009 | EUR | 15,117,200 | 99,252 |
| JPMorgan Chase Bank N.A. | |||||
| EUR/USD (Put) | Oct-21/1.16 | 17,511,009 | EUR | 15,117,200 | 116,466 |
| UBS AG | |||||
| NZD/USD (Put) | Nov-21/0.68 | 13,048,305 | NZD | 18,901,000 | 88,898 |
| Total purchased options outstanding (cost $386,402) | $406,950 | ||||
| CONVERTIBLE BONDS AND NOTES (—%)* | Principal amount | Value | |
| DISH Network Corp. cv. sr. unsec. notes 3.375%, 8/15/26 | $55,000 | $57,173 | |
| fuboTV, Inc. 144A cv. sr. unsec. notes 3.25%, 2/15/26 | 50,000 | 45,252 | |
| Nabors Industries, Inc. company guaranty cv. sr. unsec. notes 0.75%, 1/15/24 | 130,000 | 115,050 | |
| Transocean, Inc. cv. company guaranty sr. unsec. sub. notes 0.50%, 1/30/23 | 49,000 | 41,566 | |
| Total convertible bonds and notes (cost $231,756) | $259,041 | ||
| WARRANTS (—%)* † | Expiration date | Strike price | Warrants | Value |
| Occidental Petroleum Corp. | 8/3/27 | $22.00 | 401 | $4,752 |
| Total warrants (cost $1,987) | $4,752 | |||
| PREFERRED STOCKS (—%)* | Shares | Value |
| GMAC Capital Trust I Ser. 2, $1.91 cum. ARP | $148 | $3,736 |
| Total preferred stocks (cost $3,700) | $3,736 | |
| SHORT-TERM INVESTMENTS (3.5%)* | Principal amount/ shares | Value | |
| Putnam Cash Collateral Pool, LLC 0.09% d | Shares | 4,673,015 | $4,673,015 |
| Putnam Short Term Investment Fund Class P 0.08% L | Shares | 4,239,484 | 4,239,484 |
| State Street Institutional U.S. Government Money Market Fund, Premier Class 0.03% P | Shares | 575,000 | 575,000 |
| U.S. Treasury Bills 0.048%, 3/24/22 ∆ | $1,000,000 | 999,770 | |
| U.S. Treasury Bills 0.042%, 10/7/21 # ∆ § | 2,000,000 | 1,999,988 | |
| U.S. Treasury Bills 0.042%, 2/17/22 # ∆ § | 8,595,000 | 8,593,423 | |
| U.S. Treasury Bills 0.042%, 3/17/22 # | 4,400,000 | 4,399,030 | |
| U.S. Treasury Bills 0.041%, 4/21/22 # ∆ § | 9,000,000 | 8,997,475 | |
| U.S. Treasury Bills 0.043%, 10/14/21 # ∆ § | 1,614,000 | 1,613,984 | |
| U.S. Treasury Bills 0.023%, 10/5/21 # § | 2,001,000 | 2,000,996 | |
| Total short-term investments (cost $38,092,992) | $38,092,165 | ||
| TOTAL INVESTMENTS | ||
| Total investments (cost $1,044,050,995) | $1,241,469,332 | |
Dynamic Asset Allocation Conservative Fund 77 | |
| Key to holding’s currency abbreviations | ||
| EUR | Euro | |
| GBP | British Pound | |
| NZD | New Zealand Dollar | |
| Key to holding’s abbreviations | ||
| ADR | American Depository Receipts: represents ownership of foreign securities on deposit with a custodian bank | |
| ARP | Adjustable Rate Preferred Stock: the rate shown is the current interest rate at the close of the reporting period | |
| BKNT | Bank Note | |
| bp | Basis Points | |
| CVR | Contingent Value Rights | |
| DAC | Designated Activity Company | |
| FRB | Floating Rate Bonds: the rate shown is the current interest rate at the close of the reporting period. Rates may be subject to a cap or floor. For certain securities, the rate may represent a fixed rate currently in place at the close of the reporting period. | |
| FRN | Floating Rate Notes: the rate shown is the current interest rate or yield at the close of the reporting period. Rates may be subject to a cap or floor. For certain securities, the rate may represent a fixed rate currently in place at the close of the reporting period. | |
| GMTN | Global Medium Term Notes | |
| IFB | Inverse Floating Rate Bonds, which are securities that pay interest rates that vary inversely to changes in the market interest rates. As interest rates rise, inverse floaters produce less current income. The rate shown is the current interest rate at the close of the reporting period. Rates may be subject to a cap or floor. | |
| IO | Interest Only | |
| MTN | Medium Term Notes | |
| OTC | Over-the-counter | |
| PJSC | Public Joint Stock Company | |
| PO | Principal Only | |
| REGS | Securities sold under Regulation S may not be offered, sold or delivered within the United States except pursuant to an exemption from, or in a transaction not subject to, the registration requirements of the Securities Act of 1933. | |
| TBA | To Be Announced Commitments | |
| Notes to the fund’s portfolio | |||
| Unless noted otherwise, the notes to the fund’s portfolio are for the close of the fund’s reporting period, which ran from October 1, 2020 through September 30, 2021 (the reporting period). Within the following notes to the portfolio, references to “Putnam Management” represent Putnam Investment Management, LLC, the fund’s manager, an indirect wholly-owned subsidiary of Putnam Investments, LLC, references to “the SEC” represent the Securities and Exchange Commission and references to “ASC 820” represent Accounting Standards Codification 820 Fair Value Measurements and Disclosures. | |||
| * | Percentages indicated are based on net assets of $1,093,261,408. | ||
| † | This security is non-income-producing. | ||
| ∆∆ | This security is restricted with regard to public resale. The total fair value of this security and any other restricted securities (excluding 144A securities), if any, held at the close of the reporting period was $249,758, or less than 0.1% of net assets. | ||
| ‡‡ | Income may be received in cash or additional securities at the discretion of the issuer. The rate shown in parenthesis is the rate paid in kind, if applicable. | ||
| # | This security, in part or in entirety, was pledged and segregated with the broker to cover margin requirements for futures contracts at the close of the reporting period. Collateral at period end totaled $19,060,525 and is included in Investments in securities on the Statement of assets and liabilities (Notes 1 and 9). | ||
| ∆ | This security, in part or in entirety, was pledged and segregated with the custodian for collateral on certain derivative contracts at the close of the reporting period. Collateral at period end totaled $1,714,782 and is included in Investments in securities on the Statement of assets and liabilities (Notes 1 and 9). | ||
78 Dynamic Asset Allocation Conservative Fund | |
| § | This security, in part or in entirety, was pledged and segregated with the custodian for collateral on the initial margin on certain centrally cleared derivative contracts at the close of the reporting period. Collateral at period end totaled $7,692,225 and is included in Investments in securities on the Statement of assets and liabilities (Notes 1 and 9). | ||
| ## | Forward commitment, in part or in entirety (Note 1). | ||
| c | Senior loans are exempt from registration under the Securities Act of 1933, as amended, but contain certain restrictions on resale and cannot be sold publicly. These loans pay interest at rates which adjust periodically. The interest rates shown for senior loans are the current interest rates at the close of the reporting period. Senior loans are also subject to mandatory and/or optional prepayment which cannot be predicted. As a result, the remaining maturity may be substantially less than the stated maturity shown (Notes 1 and 7). | ||
| d | Affiliated company. See Notes 1 and 5 to the financial statements regarding securities lending. The rate quoted in the security description is the annualized 7-day yield of the fund at the close of the reporting period. | ||
| F | This security is valued by Putnam Management at fair value following procedures approved by the Trustees. Securities are classified as Level 3 for ASC 820 based on the securities’ valuation inputs. At the close of the reporting period, fair value pricing was also used for certain foreign securities in the portfolio (Note 1). | ||
| i | This security was pledged, or purchased with cash that was pledged, to the fund for collateral on certain derivative contracts (Note 1). | ||
| L | Affiliated company (Note 5). The rate quoted in the security description is the annualized 7-day yield of the fund at the close of the reporting period. | ||
| P | This security was pledged, or purchased with cash that was pledged, to the fund for collateral on certain derivative contracts and TBA commitments. The rate quoted in the security description is the annualized 7-day yield of the fund at the close of the reporting period. | ||
| R | Real Estate Investment Trust. | ||
| S | Security on loan, in part or in entirety, at the close of the reporting period (Note 1). | ||
| W | The rate shown represents the weighted average coupon associated with the underlying mortgage pools. Rates may be subject to a cap or floor. | ||
| At the close of the reporting period, the fund maintained liquid assets totaling $272,137,705 to cover certain derivative contracts and delayed delivery securities. | |||
| Unless otherwise noted, the rates quoted in Short-term investments security descriptions represent the weighted average yield to maturity. | |||
| Debt obligations are considered secured unless otherwise indicated. | |||
| 144A after the name of an issuer represents securities exempt from registration under Rule 144A of the Securities Act of 1933, as amended. These securities may be resold in transactions exempt from registration, normally to qualified institutional buyers. | |||
| See Note 1 to the financial statements regarding TBA commitments. | |||
| The dates shown on debt obligations are the original maturity dates. | |||
| FORWARD CURRENCY CONTRACTS at 9/30/21 (aggregate face value $262,576,108) | ||||||
| Counterparty | Currency | Contract type* | Delivery date | Value | Aggregate face value | Unrealized appreciation/ (depreciation) |
| Bank of America N.A. | ||||||
| Australian Dollar | Sell | 10/20/21 | $2,179,471 | $2,112,227 | $(67,244) | |
| British Pound | Buy | 12/15/21 | 1,807,317 | 1,857,728 | (50,411) | |
| Canadian Dollar | Sell | 10/20/21 | 603,646 | 604,305 | 659 | |
| Euro | Buy | 12/15/21 | 2,694,365 | 2,770,390 | (76,025) | |
| Hong Kong Dollar | Sell | 11/17/21 | 20,851 | 20,859 | 8 | |
| Japanese Yen | Buy | 11/17/21 | 2,020,666 | 2,043,115 | (22,449) | |
| New Zealand Dollar | Sell | 10/20/21 | 3,067,587 | 3,094,655 | 27,068 | |
| Swedish Krona | Buy | 12/15/21 | 427,150 | 440,131 | (12,981) | |
| Swiss Franc | Sell | 12/15/21 | 3,870 | 13,515 | 9,645 | |
Dynamic Asset Allocation Conservative Fund 79 | |
| FORWARD CURRENCY CONTRACTS at 9/30/21 (aggregate face value $262,576,108) cont. | ||||||
| Counterparty | Currency | Contract type* | Delivery date | Value | Aggregate face value | Unrealized appreciation/ (depreciation) |
| Barclays Bank PLC | ||||||
| Australian Dollar | Sell | 10/20/21 | $1,723,550 | $1,741,628 | $18,078 | |
| British Pound | Buy | 12/15/21 | 593,456 | 595,738 | (2,282) | |
| Canadian Dollar | Sell | 10/20/21 | 471,642 | 476,915 | 5,273 | |
| Euro | Sell | 12/15/21 | 532,470 | 524,821 | (7,649) | |
| Hong Kong Dollar | Buy | 11/17/21 | 266,609 | 266,712 | (103) | |
| Japanese Yen | Buy | 11/17/21 | 1,062,160 | 1,061,999 | 161 | |
| New Zealand Dollar | Sell | 10/20/21 | 1,142,985 | 1,151,038 | 8,053 | |
| Swedish Krona | Buy | 12/15/21 | 1,062,799 | 1,082,341 | (19,542) | |
| Swiss Franc | Sell | 12/15/21 | 3,296,111 | 3,347,849 | 51,738 | |
| Citibank, N.A. | ||||||
| Australian Dollar | Sell | 10/20/21 | 111,848 | 76,796 | (35,052) | |
| British Pound | Buy | 12/15/21 | 1,581,470 | 1,619,873 | (38,403) | |
| Canadian Dollar | Buy | 10/20/21 | 2,094,995 | 2,102,731 | (7,736) | |
| Danish Krone | Sell | 12/15/21 | 344,218 | 352,360 | 8,142 | |
| Euro | Buy | 12/15/21 | 988,607 | 1,010,245 | (21,638) | |
| Japanese Yen | Buy | 11/17/21 | 61,146 | 56,193 | 4,953 | |
| New Zealand Dollar | Sell | 10/20/21 | 2,543,240 | 2,559,853 | 16,613 | |
| Swiss Franc | Sell | 12/15/21 | 3,172,595 | 3,217,110 | 44,515 | |
| Credit Suisse International | ||||||
| Australian Dollar | Buy | 10/20/21 | 21,329 | 18,661 | 2,668 | |
| British Pound | Sell | 12/15/21 | 1,248,763 | 1,282,050 | 33,287 | |
| Canadian Dollar | Sell | 10/20/21 | 723,964 | 732,001 | 8,037 | |
| Euro | Sell | 12/15/21 | 1,265,978 | 1,296,464 | 30,486 | |
| New Zealand Dollar | Buy | 10/20/21 | 1,104,604 | 1,126,211 | (21,607) | |
| Goldman Sachs International | ||||||
| Australian Dollar | Sell | 10/20/21 | 3,959,920 | 4,149,712 | 189,792 | |
| British Pound | Buy | 12/15/21 | 7,343,945 | 7,590,052 | (246,107) | |
| Canadian Dollar | Buy | 10/20/21 | 6,663,864 | 6,645,711 | 18,153 | |
| Chinese Yuan (Offshore) | Buy | 11/17/21 | 7,030,682 | 6,981,089 | 49,593 | |
| Euro | Buy | 12/15/21 | 9,866,695 | 10,081,281 | (214,586) | |
| Hong Kong Dollar | Sell | 11/17/21 | 210,902 | 210,981 | 79 | |
| Japanese Yen | Buy | 11/17/21 | 2,436,771 | 2,540,348 | (103,577) | |
| New Zealand Dollar | Sell | 10/20/21 | 2,130,101 | 2,130,932 | 831 | |
| Norwegian Krone | Sell | 12/15/21 | 3,808,770 | 3,844,038 | 35,268 | |
| Swedish Krona | Buy | 12/15/21 | 4,089,217 | 4,164,420 | (75,203) | |
| Swiss Franc | Buy | 12/15/21 | 143,725 | 127,647 | 16,078 | |
| HSBC Bank USA, National Association | ||||||
| Australian Dollar | Sell | 10/20/21 | 1,327,420 | 1,340,876 | 13,456 | |
| British Pound | Sell | 12/15/21 | 1,207,124 | 1,241,285 | 34,161 | |
| Canadian Dollar | Sell | 10/20/21 | 224,294 | 215,792 | (8,502) | |
| Euro | Buy | 12/15/21 | 2,394,953 | 2,453,845 | (58,892) | |
| Hong Kong Dollar | Sell | 11/17/21 | 994,360 | 994,715 | 355 | |
| Japanese Yen | Sell | 11/17/21 | 426,434 | 429,977 | 3,543 | |
80 Dynamic Asset Allocation Conservative Fund | |
| FORWARD CURRENCY CONTRACTS at 9/30/21 (aggregate face value $262,576,108) cont. | ||||||
| Counterparty | Currency | Contract type* | Delivery date | Value | Aggregate face value | Unrealized appreciation/ (depreciation) |
| HSBC Bank USA, National Association cont. | ||||||
| New Zealand Dollar | Sell | 10/20/21 | $1,131,802 | $1,139,693 | $7,891 | |
| Swiss Franc | Sell | 12/15/21 | 1,262,029 | 1,286,293 | 24,264 | |
| JPMorgan Chase Bank N.A. | ||||||
| Australian Dollar | Buy | 10/20/21 | 3,568,852 | 3,643,159 | (74,307) | |
| British Pound | Buy | 12/15/21 | 481,744 | 540,809 | (59,065) | |
| Canadian Dollar | Buy | 10/20/21 | 1,857,042 | 1,867,233 | (10,191) | |
| Euro | Sell | 12/15/21 | 2,826,148 | 2,904,541 | 78,393 | |
| Japanese Yen | Sell | 11/17/21 | 4,571,010 | 4,603,704 | 32,694 | |
| New Zealand Dollar | Buy | 10/20/21 | 8,646,452 | 8,715,426 | (68,974) | |
| Norwegian Krone | Buy | 12/15/21 | 620,264 | 633,667 | (13,403) | |
| Singapore Dollar | Buy | 11/17/21 | 178,361 | 179,198 | (837) | |
| South Korean Won | Sell | 11/17/21 | 3,964,474 | 4,093,773 | 129,299 | |
| Swedish Krona | Sell | 12/15/21 | 113,491 | 127,492 | 14,001 | |
| Swiss Franc | Sell | 12/15/21 | 2,126,852 | 2,167,345 | 40,493 | |
| Morgan Stanley & Co. International PLC | ||||||
| Australian Dollar | Buy | 10/20/21 | 5,731,621 | 5,811,118 | (79,497) | |
| British Pound | Buy | 12/15/21 | 4,991,549 | 5,116,902 | (125,353) | |
| Canadian Dollar | Sell | 10/20/21 | 1,080,104 | 1,097,261 | 17,157 | |
| Euro | Sell | 12/15/21 | 231,665 | 233,232 | 1,567 | |
| Japanese Yen | Buy | 11/17/21 | 4,299,581 | 4,340,570 | (40,989) | |
| New Zealand Dollar | Sell | 10/20/21 | 4,403,094 | 4,390,627 | (12,467) | |
| Norwegian Krone | Buy | 12/15/21 | 2,463,348 | 2,465,557 | (2,209) | |
| Swedish Krona | Buy | 12/15/21 | 5,986,437 | 6,101,340 | (114,903) | |
| Swiss Franc | Sell | 12/15/21 | 290,783 | 293,125 | 2,342 | |
| NatWest Markets PLC | ||||||
| Australian Dollar | Buy | 10/20/21 | 1,719,067 | 1,694,709 | 24,358 | |
| British Pound | Sell | 12/15/21 | 2,243,380 | 2,308,480 | 65,100 | |
| Canadian Dollar | Buy | 10/20/21 | 835,914 | 845,794 | (9,880) | |
| Euro | Sell | 12/15/21 | 238,045 | 243,808 | 5,763 | |
| Hong Kong Dollar | Sell | 11/17/21 | 210,607 | 210,683 | 76 | |
| Japanese Yen | Sell | 11/17/21 | 536,624 | 541,046 | 4,422 | |
| New Zealand Dollar | Sell | 10/20/21 | 5,708,227 | 5,775,663 | 67,436 | |
| Norwegian Krone | Buy | 12/15/21 | 1,230,262 | 1,230,726 | (464) | |
| Swedish Krona | Buy | 12/15/21 | 531,577 | 541,436 | (9,859) | |
| Swiss Franc | Buy | 12/15/21 | 2,456,979 | 2,504,054 | (47,075) | |
| State Street Bank and Trust Co. | ||||||
| Australian Dollar | Sell | 10/20/21 | 2,314,093 | 2,319,725 | 5,632 | |
| British Pound | Sell | 12/15/21 | 4,161,870 | 4,232,482 | 70,612 | |
| Canadian Dollar | Buy | 10/20/21 | 4,213,123 | 4,171,802 | 41,321 | |
| Euro | Buy | 12/15/21 | 1,972,458 | 2,066,279 | (93,821) | |
| Hong Kong Dollar | Sell | 11/17/21 | 3,277,980 | 3,279,032 | 1,052 | |
| Japanese Yen | Sell | 11/17/21 | 13,502,086 | 13,543,004 | 40,918 | |
| New Zealand Dollar | Buy | 10/20/21 | 393,190 | 352,123 | 41,067 | |
| Norwegian Krone | Sell | 12/15/21 | 1,762,987 | 1,775,578 | 12,591 | |
Dynamic Asset Allocation Conservative Fund 81 | |
| FORWARD CURRENCY CONTRACTS at 9/30/21 (aggregate face value $262,576,108) cont. | ||||||
| Counterparty | Currency | Contract type* | Delivery date | Value | Aggregate face value | Unrealized appreciation/ (depreciation) |
| State Street Bank and Trust Co. cont. | ||||||
| Swedish Krona | Sell | 12/15/21 | $1,003,247 | $1,021,713 | $18,466 | |
| Swiss Franc | Sell | 12/15/21 | 182,855 | 199,691 | 16,836 | |
| Toronto-Dominion Bank | ||||||
| Australian Dollar | Buy | 10/20/21 | 1,139,442 | 1,162,526 | (23,084) | |
| British Pound | Sell | 12/15/21 | 218,436 | 251,452 | 33,016 | |
| Canadian Dollar | Buy | 10/20/21 | 120,714 | 127,357 | (6,643) | |
| Chinese Yuan (Offshore) | Sell | 11/17/21 | 7,788,774 | 7,712,287 | (76,487) | |
| Euro | Sell | 12/15/21 | 527,481 | 540,202 | 12,721 | |
| Japanese Yen | Buy | 11/17/21 | 4,132,521 | 4,166,833 | (34,312) | |
| New Zealand Dollar | Sell | 10/20/21 | 1,935,992 | 1,956,413 | 20,421 | |
| Norwegian Krone | Buy | 12/15/21 | 3,698,846 | 3,736,384 | (37,538) | |
| Swedish Krona | Sell | 12/15/21 | 700,333 | 698,786 | (1,547) | |
| UBS AG | ||||||
| Australian Dollar | Buy | 10/20/21 | 2,954,667 | 3,029,644 | (74,977) | |
| British Pound | Sell | 12/15/21 | 3,731,331 | 3,809,396 | 78,065 | |
| Canadian Dollar | Buy | 10/20/21 | 3,097,018 | 3,093,041 | 3,977 | |
| Euro | Buy | 12/15/21 | 6,891,246 | 7,047,917 | (156,671) | |
| Hong Kong Dollar | Sell | 11/17/21 | 1,707,030 | 1,707,647 | 617 | |
| Japanese Yen | Buy | 11/17/21 | 5,147,768 | 5,218,175 | (70,407) | |
| New Zealand Dollar | Sell | 10/20/21 | 2,896,463 | 2,906,227 | 9,764 | |
| Norwegian Krone | Sell | 12/15/21 | 2,231,723 | 2,250,017 | 18,294 | |
| Swedish Krona | Buy | 12/15/21 | 816,842 | 830,162 | (13,320) | |
| Swiss Franc | Sell | 12/15/21 | 3,596,891 | 3,660,125 | 63,234 | |
| WestPac Banking Corp. | ||||||
| British Pound | Sell | 12/15/21 | 352,112 | 361,481 | 9,369 | |
| Canadian Dollar | Sell | 10/20/21 | 196,662 | 198,867 | 2,205 | |
| Euro | Sell | 12/15/21 | 188,394 | 192,961 | 4,567 | |
| Japanese Yen | Buy | 11/17/21 | 2,531,131 | 2,551,946 | (20,815) | |
| New Zealand Dollar | Sell | 10/20/21 | 951,498 | 957,154 | 5,656 | |
| Unrealized appreciation | 1,656,350 | |||||
| Unrealized (depreciation) | (2,369,084) | |||||
| Total | $(712,734) | |||||
| * The exchange currency for all contracts listed is the United States Dollar. | ||||||
| FUTURES CONTRACTS OUTSTANDING at 9/30/21 | ||||||
| Number of contracts | Notional amount | Value | Expiration date | Unrealized appreciation/ (depreciation) | ||
| MSCI EAFE Index (Long) | 42 | $4,790,707 | $4,760,700 | Dec-21 | $(211,089) | |
| MSCI EAFE Index (Short) | 365 | 41,633,524 | 41,372,750 | Dec-21 | 1,897,722 | |
| MSCI Emerging Markets Index (Long) | 37 | 2,318,229 | 2,304,360 | Dec-21 | (97,265) | |
| NASDAQ 100 Index E-Mini (Long) | 17 | 4,992,050 | 4,992,050 | Dec-21 | (315,762) | |
| Russell 2000 Index E-Mini (Long) | 216 | 23,807,218 | 23,768,640 | Dec-21 | (479,344) | |
| S&P 500 Index E-Mini (Long) | 8 | 1,723,016 | 1,719,100 | Dec-21 | (82,237) | |
82 Dynamic Asset Allocation Conservative Fund | |
| FUTURES CONTRACTS OUTSTANDING at 9/30/21 cont. | ||||||
| Number of contracts | Notional amount | Value | Expiration date | Unrealized appreciation/ (depreciation) | ||
| S&P 500 Index E-Mini (Short) | 1,235 | $265,990,595 | $265,386,063 | Dec-21 | $12,673,160 | |
| S&P Mid Cap 400 Index E-Mini (Long) | 1 | 264,054 | 263,320 | Dec-21 | (7,831) | |
| S&P Mid Cap 400 Index E-Mini (Short) | 64 | 16,899,456 | 16,852,480 | Dec-21 | 500,182 | |
| U.S. Treasury Bond 30 yr (Long) | 148 | 23,564,375 | 23,564,375 | Dec-21 | (457,763) | |
| U.S. Treasury Bond Ultra 30 yr (Long) | 255 | 48,720,938 | 48,720,938 | Dec-21 | (1,333,100) | |
| U.S. Treasury Bond Ultra 30 yr (Short) | 3 | 573,188 | 573,188 | Dec-21 | 15,723 | |
| U.S. Treasury Note 2 yr (Long) | 426 | 93,743,297 | 93,743,297 | Dec-21 | (62,177) | |
| U.S. Treasury Note 2 yr (Short) | 219 | 48,191,977 | 48,191,977 | Dec-21 | 26,882 | |
| U.S. Treasury Note 5 yr (Long) | 729 | 89,479,055 | 89,479,055 | Dec-21 | (432,398) | |
| U.S. Treasury Note 5 yr (Short) | 759 | 93,161,321 | 93,161,321 | Dec-21 | 450,292 | |
| U.S. Treasury Note 10 yr (Long) | 334 | 43,957,531 | 43,957,532 | Dec-21 | (475,501) | |
| U.S. Treasury Note Ultra 10 yr (Short) | 253 | 36,748,250 | 36,748,250 | Dec-21 | 511,893 | |
| Unrealized appreciation | 16,075,854 | |||||
| Unrealized (depreciation) | (3,954,467) | |||||
| Total | $12,121,387 | |||||
| WRITTEN OPTIONS OUTSTANDING at 9/30/21 (premiums $112,750) | |||||
| Counterparty | Expiration date/strike price | Notional amount | Contract amount | Value | |
| Bank of America N.A. | |||||
| GBP/USD (Put) | Nov-21/$1.30 | $17,442,228 | GBP | 12,945,100 | $27,192 |
| Goldman Sachs International | |||||
| EUR/USD (Put) | Nov-21/1.14 | 17,511,009 | EUR | 15,117,200 | 25,899 |
| JPMorgan Chase Bank N.A. | |||||
| EUR/USD (Put) | Oct-21/1.15 | 17,511,009 | EUR | 15,117,200 | 42,832 |
| UBS AG | |||||
| NZD/USD (Put) | Nov-21/0.66 | 13,048,305 | NZD | 18,901,000 | 29,163 |
| Total | ||6|| | ||||
| TBA SALE COMMITMENTS OUTSTANDING at 9/30/21 (proceeds receivable $69,636,875) | |||
| Agency | Principal amount | Settlement date | Value |
| Uniform Mortgage-Backed Securities, 3.00%, 10/1/51 | $2,000,000 | 10/14/21 | $2,093,045 |
| Uniform Mortgage-Backed Securities, 2.50%, 10/1/51 | 40,000,000 | 10/14/21 | 41,245,316 |
| Uniform Mortgage-Backed Securities, 2.00%, 11/1/51 | 10,000,000 | 11/10/21 | 10,007,265 |
| Uniform Mortgage-Backed Securities, 2.00%, 10/1/51 | 16,000,000 | 10/14/21 | 16,041,000 |
| Total | $69,386,626 | ||
Dynamic Asset Allocation Conservative Fund 83 | |
| CENTRALLY CLEARED INTEREST RATE SWAP CONTRACTS OUTSTANDING at 9/30/21 | |||||||
| Notional amount | Value | Upfront premium received (paid) | Termination date | Payments made by fund | Payments received by fund | Unrealized appreciation/ (depreciation) | |
| $26,309,000 | $157,328 | $31,257 | 4/20/31 | 1.57% — Semiannually | 3 month USD-LIBOR-BBA — Quarterly | $(294,456) | |
| 34,569,000 | 319,072 E | (372,732) | 12/15/26 | 0.95% — Semiannually | 3 month USD-LIBOR-BBA — Quarterly | (53,660) | |
| 14,740,000 | 136,050 E | 158,799 | 12/15/26 | 3 month USD-LIBOR-BBA — Quarterly | 0.95% — Semiannually | 22,749 | |
| 53,783,000 | 91,431 E | 95,555 | 12/15/23 | 3 month USD-LIBOR-BBA — Quarterly | 0.40% — Semiannually | 4,125 | |
| 67,680,000 | 1,426,694 E | 1,642,353 | 12/15/31 | 3 month USD-LIBOR-BBA — Quarterly | 1.35% — Semiannually | 215,658 | |
| 3,489,000 | 160,913 E | (154,906) | 12/15/51 | 1.65% — Semiannually | 3 month USD-LIBOR-BBA — Quarterly | 6,006 | |
| 11,343,000 | 523,139 E | 503,541 | 12/15/51 | 3 month USD-LIBOR-BBA — Quarterly | 1.65% — Semiannually | (19,599) | |
| 1,209,000 | 1,294 | (16) | 10/1/31 | 3 month USD-LIBOR-BBA — Quarterly | 1.542% — Semiannually | 1,278 | |
| Total | $1,903,851 | $(117,899) | |||||
| E Extended effective date. | |||||||
| OTC TOTAL RETURN SWAP CONTRACTS OUTSTANDING at 9/30/21 | |||||||
| Swap counterparty/ Notional amount | Value | Upfront premium received (paid) | Termination date | Payments received (paid) by fund | Total return received by or paid by fund | Unrealized appreciation/ (depreciation) | |
| Goldman Sachs International | |||||||
| $24,050,787 | $24,050,787 | $— | 12/15/25 | (1 month USD-LIBOR-BBA plus 0.50%) — Monthly | A basket (GSGLPWDL) of common stocks — Monthly* | $(184) | |
| 23,487,578 | 23,487,578 | — | 12/15/25 | 1 month USD-LIBOR-BBA minus 0.15% — Monthly | A basket (GSGLPWDS) of common stocks — Monthly* | (4,644) | |
| 351,330 | 351,656 | — | 12/15/25 | (1 month USD-LIBOR-BBA plus 0.35%) — Monthly | Abbvie Inc. — Monthly | 267 | |
| 787,964 | 714,241 | — | 12/15/25 | (1 month USD-LIBOR-BBA plus 0.35%) — Monthly | Agilent Technologies, Inc. — Monthly | (73,856) | |
| 196,753 | 191,810 | — | 12/15/25 | (1 month USD-LIBOR-BBA plus 0.35%) — Monthly | Amgen Inc — Monthly | (4,976) | |
84 Dynamic Asset Allocation Conservative Fund | |
| OTC TOTAL RETURN SWAP CONTRACTS OUTSTANDING at 9/30/21 cont. | |||||||
| Swap counterparty/ Notional amount | Value | Upfront premium received (paid) | Termination date | Payments received (paid) by fund | Total return received by or paid by fund | Unrealized appreciation/ (depreciation) | |
| Goldman Sachs International cont. | |||||||
| $85,993 | $83,317 | $— | 12/15/25 | (1 month USD-LIBOR-BBA plus 0.40%) — Monthly | Astellas Pharma Inc. — Monthly | $(1,672) | |
| 335,765 | 357,237 | — | 12/15/25 | (1 month USD-LIBOR-BBA) — Monthly | AstraZeneca PLC — Monthly | 21,461 | |
| 263,486 | 282,302 | — | 12/15/25 | (1 month USD-LIBOR-BBA plus 0.35%) — Monthly | Astrazeneca Plc — Monthly | 18,772 | |
| 264,003 | 268,292 | — | 12/15/25 | (1 month USD-LIBOR-BBA plus 0.35%) — Monthly | Bayer AG- Reg — Monthly | 4,244 | |
| 297,116 | 281,009 | — | 12/15/25 | (1 month USD-LIBOR-BBA plus 0.35%) — Monthly | Biogen Inc. — Monthly | (16,157) | |
| 263,314 | 251,295 | — | 12/15/25 | (1 month USD-LIBOR-BBA plus 0.35%) — Monthly | Bristol-Myers Squibb Co. — Monthly | (9,982) | |
| 254,866 | 240,611 | — | 12/15/25 | (1 month USD-LIBOR-BBA plus 0.30%) — Monthly | CSL Ltd. — Monthly | (12,946) | |
| 26,140 | 27,985 | — | 12/15/25 | (1 month USD-LIBOR-BBA plus 0.40%) — Monthly | Dajichi Sankyo Co Ltd. — Monthly | 1,955 | |
| 132,787 | 131,107 | — | 12/15/25 | (1 month USD-LIBOR-BBA plus 0.40%) — Monthly | Eisai Co Ltd. — Monthly | (581) | |
| 204,981 | 202,631 | — | 12/15/25 | (1 month USD-LIBOR-BBA plus 0.35%) — Monthly | Eli Lilly & Co. — Monthly | (2,385) | |
| 79,066 | 69,633 | — | 12/15/25 | (1 month USD-LIBOR-BBA plus 0.35%) — Monthly | Eurofins Scientific — Monthly | (9,447) | |
| 77,322 | 72,881 | — | 12/15/25 | (1 month USD-LIBOR-BBA plus 0.35%) — Monthly | Galapagos NV — Monthly | (4,454) | |
| 224,322 | 218,351 | — | 12/15/25 | (1 month USD-LIBOR-BBA plus 0.35%) — Monthly | Gilead Sciences Inc — Monthly | (3,789) | |
| 373,038 | 364,316 | — | 12/15/25 | (1 month USD-LIBOR-BBA plus 0.35%) — Monthly | Glaxosmithkline Plc — Monthly | (3,740) | |
| 49,247 | 48,449 | — | 12/15/25 | (1 month USD-LIBOR-BBA plus 0.35%) — Monthly | Grifols Sa — Monthly | (806) | |
| 72,365 | 72,750 | — | 12/15/25 | (1 month USD-LIBOR-BBA plus 0.35%) — Monthly | H Lundbeck A/S — Monthly | 373 | |
Dynamic Asset Allocation Conservative Fund 85 | |
| OTC TOTAL RETURN SWAP CONTRACTS OUTSTANDING at 9/30/21 cont. | |||||||
| Swap counterparty/ Notional amount | Value | Upfront premium received (paid) | Termination date | Payments received (paid) by fund | Total return received by or paid by fund | Unrealized appreciation/ (depreciation) | |
| Goldman Sachs International cont. | |||||||
| $106,749 | $103,696 | $— | 12/15/25 | (1 month USD-LIBOR-BBA plus 0.35%) — Monthly | Hikma Pharmaceuticals PLC — Monthly | $(2,505) | |
| 122,304 | 115,239 | — | 12/15/25 | (1 month USD-LIBOR-BBA plus 0.40%) — Monthly | Hisamitsu Pharmaceutical Co — Monthly | (6,042) | |
| 496,218 | 447,388 | — | 12/15/25 | (1 month USD-LIBOR-BBA plus 0.35%) — Monthly | Illumina Inc — Monthly | (48,914) | |
| 53,611 | 50,209 | — | 12/15/25 | (1 month USD-LIBOR-BBA plus 0.35%) — Monthly | Incyte Corp — Monthly | (3,411) | |
| 464,385 | 462,633 | — | 12/15/25 | (1 month USD-LIBOR-BBA plus 0.35%) — Monthly | Ipsen — Monthly | (1,830) | |
| 746,692 | 691,792 | — | 12/15/25 | (1 month USD-LIBOR-BBA plus 0.35%) — Monthly | IQVIA Holdings, Inc. — Monthly | (55,027) | |
| 401,144 | 391,638 | — | 12/15/25 | (1 month USD-LIBOR-BBA plus 0.35%) — Monthly | Johnson & Johnson — Monthly | (9,574) | |
| 382,107 | 394,177 | — | 12/15/25 | (1 month USD-LIBOR-BBA plus 0.35%) — Monthly | Merck & Co. Inc. — Monthly | 15,417 | |
| 812,170 | 757,192 | — | 12/15/25 | (1 month USD-LIBOR-BBA plus 0.35%) — Monthly | Merck Kgaa — Monthly | (55,115) | |
| 791,503 | 698,322 | — | 12/15/25 | (1 month USD-LIBOR-BBA plus 0.35%) — Monthly | Mettler-Toledo International — Monthly | (93,315) | |
| 32,776 | 31,585 | — | 12/15/25 | (1 month USD-LIBOR-BBA plus 0.35%) — Monthly | Novartis Ag-Reg — Monthly | (1,196) | |
| 17,703 | 17,215 | — | 12/15/25 | (1 month USD-LIBOR-BBA plus 0.35%) — Monthly | Organon & Co. — Monthly | (491) | |
| 12,711 | 12,389 | — | 12/15/25 | (1 month USD-LIBOR-BBA plus 0.35%) — Monthly | Orion Oyj-Class B — Monthly | (324) | |
| 762,307 | 707,023 | — | 12/15/25 | (1 month USD-LIBOR-BBA plus 0.35%) — Monthly | Perkinelmer Inc. — Monthly | (55,413) | |
| 322,439 | 338,457 | — | 12/15/25 | (1 month USD-LIBOR-BBA plus 0.35%) — Monthly | Perrigo Co Plc — Monthly | 17,680 | |
| 552,954 | 531,217 | — | 12/15/25 | (1 month USD-LIBOR-BBA plus 0.35%) — Monthly | Pfizer, Inc. — Monthly | (21,831) | |
86 Dynamic Asset Allocation Conservative Fund | |
| OTC TOTAL RETURN SWAP CONTRACTS OUTSTANDING at 9/30/21 cont. | |||||||
| Swap counterparty/ Notional amount | Value | Upfront premium received (paid) | Termination date | Payments received (paid) by fund | Total return received by or paid by fund | Unrealized appreciation/ (depreciation) | |
| Goldman Sachs International cont. | |||||||
| $18,239 | $17,567 | $— | 12/15/25 | (1 month USD-LIBOR-BBA plus 0.35%) — Monthly | Recordati Industria Chemica — Monthly | $(676) | |
| 45,640 | 42,363 | — | 12/15/25 | (1 month USD-LIBOR-BBA plus 0.35%) — Monthly | Regeneron Pharmaceuticals — Monthly | (3,285) | |
| 334,882 | 335,290 | — | 12/15/25 | (1 month USD-LIBOR-BBA plus 0.35%) — Monthly | Sanofi — Monthly | 351 | |
| 412,331 | 367,284 | — | 12/15/25 | (1 month USD-LIBOR-BBA plus 0.35%) — Monthly | Sartorius Stedim Biotech — Monthly | (45,117) | |
| 142,115 | 141,875 | — | 12/15/25 | (1 month USD-LIBOR-BBA plus 0.40%) — Monthly | Shionogi & Co Ltd — Monthly | 652 | |
| 351,618 | 334,449 | — | 12/15/25 | (1 month USD-LIBOR-BBA plus 0.40%) — Monthly | Sumitomo Dajnippon Pharma Co. — Monthly | (15,119) | |
| 270,015 | 262,230 | — | 12/15/25 | (1 month USD-LIBOR-BBA plus 0.40%) — Monthly | Taisho Pharmaceutical Holdin — Monthly | (6,026) | |
| 147,053 | 143,099 | — | 12/15/25 | (1 month USD-LIBOR-BBA plus 0.40%) — Monthly | Takeda Pharmaceutical Co Ltd — Monthly | (845) | |
| 197,618 | 214,582 | — | 12/15/25 | (1 month USD-LIBOR-BBA plus 0.35%) — Monthly | Teva Pharmaceutical-Sp Adr — Monthly | 16,931 | |
| 638,397 | 647,888 | — | 12/15/25 | (1 month USD-LIBOR-BBA plus 0.35%) — Monthly | Thermo Fisher Scientific Inc — Monthly | 9,679 | |
| 72,813 | 75,994 | — | 12/15/25 | (1 month USD-LIBOR-BBA plus 0.35%) — Monthly | Ucb Sa — Monthly | 3,169 | |
| 10,010 | 9,614 | — | 12/15/25 | (1 month USD-LIBOR-BBA plus 0.35%) — Monthly | Vertex Pharmaceuticals Inc — Monthly | (398) | |
| 319,044 | 314,861 | — | 12/15/25 | (1 month USD-LIBOR-BBA plus 0.35%) — Monthly | Viatris, Inc. — Monthly | (4,237) | |
| 172,215 | 165,087 | — | 12/15/25 | (1 month USD-LIBOR-BBA plus 0.35%) — Monthly | Vifor Pharma AG — Monthly | (7,157) | |
| 893,861 | 779,271 | — | 12/15/25 | (1 month USD-LIBOR-BBA plus 0.35%) — Monthly | Waters Corp. — Monthly | (114,741) | |
| 597,807 | 569,024 | — | 12/15/25 | (1 month USD-LIBOR-BBA plus 0.35%) — Monthly | Zoetis, Inc. — Monthly | (28,883) | |
Dynamic Asset Allocation Conservative Fund 87 | |
| OTC TOTAL RETURN SWAP CONTRACTS OUTSTANDING at 9/30/21 cont. | |||||||
| Swap counterparty/ Notional amount | Value | Upfront premium received (paid) | Termination date | Payments received (paid) by fund | Total return received by or paid by fund | Unrealized appreciation/ (depreciation) | |
| JPMorgan Chase Bank N.A. | |||||||
| $13,815,355 | $13,411,939 | — | 2/5/22 | (1 month USD-LIBOR-BBA plus 0.35%) — Monthly | Russell 1000 Value Total Return Index — Monthly | $(378,347) | |
| Upfront premium received | — | Unrealized appreciation | 110,951 | ||||
| Upfront premium (paid) | — | Unrealized (depreciation) | (1,109,438) | ||||
| Total | $— | Total | $(998,487) | ||||
| * The 50 largest components, and any individual component greater than 1% of basket value, are shown below. | |||||||
| A BASKET (GSGLPWDL) OF COMMON STOCKS | ||||
| Common stocks | Sector | Shares | Value | Percentage value |
| Sonic Healthcare, Ltd. (Australia) | Health care | 3,995 | $117,430 | 0.49% |
| Electronic Arts, Inc. | Technology | 815 | 115,923 | 0.48% |
| Roku, Inc. | Technology | 370 | 115,921 | 0.48% |
| Nintendo Co., Ltd. (Japan) | Consumer cyclicals | 237 | 115,876 | 0.48% |
| Aristocrat Leisure, Ltd. (Australia) | Consumer cyclicals | 3,402 | 115,462 | 0.48% |
| Marubeni Corp. (Japan) (Japan) | Conglomerates | 13,743 | 115,233 | 0.48% |
| Take-Two Interactive Software, Inc. | Technology | 745 | 114,798 | 0.48% |
| Veeva Systems, Inc. Class A | Technology | 398 | 114,734 | 0.48% |
| AtoS SE (France) | Technology | 2,146 | 114,717 | 0.48% |
| Roche Holding AG (Switzerland) | Health care | 312 | 114,515 | 0.48% |
| Recruit Holdings Co., Ltd. (Japan) | Consumer staples | 1,858 | 114,080 | 0.47% |
| CyberAgent, Inc. (Japan) | Consumer cyclicals | 5,860 | 114,052 | 0.47% |
| Nitori Holdings Co., Ltd. (Japan) | Consumer cyclicals | 574 | 114,046 | 0.47% |
| Netflix, Inc. | Consumer staples | 187 | 114,032 | 0.47% |
| Merck & Co., Inc. | Health care | 1,517 | 113,961 | 0.47% |
| Newcrest Mining, Ltd. (Australia) | Basic materials | 6,945 | 113,668 | 0.47% |
| Aegon NV (Netherlands) | Financials | 21,954 | 113,596 | 0.47% |
| Bank Leumi Le-Israel BM (Israel) | Financials | 13,321 | 113,586 | 0.47% |
| MSCI, Inc. | Technology | 187 | 113,537 | 0.47% |
| Royal Dutch Shell PLC Class A (United Kingdom) | Energy | 5,091 | 113,530 | 0.47% |
| DSV A/S (Denmark) | Transportation | 473 | 113,527 | 0.47% |
| Brenntag AG (Germany) | Basic materials | 1,215 | 113,414 | 0.47% |
| Bank Hapoalim MB (Israel) | Financials | 12,823 | 113,353 | 0.47% |
| Kirin Holdings Co., Ltd. (Japan) | Consumer staples | 6,079 | 113,333 | 0.47% |
| Repsol SA (Spain) | Energy | 8,648 | 113,176 | 0.47% |
| GlaxoSmithKline PLC (United Kingdom) | Health care | 5,983 | 113,157 | 0.47% |
| FactSet Research Systems, Inc. | Consumer cyclicals | 287 | 113,139 | 0.47% |
| Valeo (France) (France) | Consumer cyclicals | 4,027 | 113,122 | 0.47% |
| Shopify, Inc. Class A (Canada) | Technology | 83 | 113,006 | 0.47% |
| Pinterest, Inc. Class A | Technology | 2,217 | 112,964 | 0.47% |
| CoStar Group, Inc. | Consumer cyclicals | 1,311 | 112,853 | 0.47% |
88 Dynamic Asset Allocation Conservative Fund | |
| A BASKET (GSGLPWDL) OF COMMON STOCKS cont. | ||||
| Common stocks | Sector | Shares | Value | Percentage value |
| Moncler SpA (Italy) | Consumer cyclicals | 1,837 | $112,825 | 0.47% |
| Airbnb, Inc. Class A | Consumer staples | 672 | 112,761 | 0.47% |
| Namco Bandai Holdings, Inc. (Japan) | Consumer cyclicals | 1,491 | 112,522 | 0.47% |
| Magna International, Inc. (Canada) | Consumer cyclicals | 1,494 | 112,466 | 0.47% |
| Sumitomo Chemical Co., Ltd. (Japan) | Basic materials | 21,389 | 112,426 | 0.47% |
| Thales SA (France) | Technology | 1,152 | 112,282 | 0.47% |
| Eiffage SA (France) | Basic materials | 1,105 | 112,269 | 0.47% |
| Fairfax Financial Holdings, Ltd. (Canada) | Financials | 278 | 112,267 | 0.47% |
| Dropbox, Inc. Class A | Technology | 3,841 | 112,239 | 0.47% |
| Segro PLC (United Kingdom) | Financials | 6,971 | 112,237 | 0.47% |
| Royal Bank of Canada (Canada) | Financials | 1,127 | 112,161 | 0.47% |
| Activision Blizzard, Inc. | Technology | 1,449 | 112,143 | 0.47% |
| eBay, Inc. | Technology | 1,609 | 112,128 | 0.47% |
| Athene Holding, Ltd. Class A | Financials | 1,628 | 112,112 | 0.47% |
| Cadence Design Systems, Inc. | Technology | 740 | 112,098 | 0.47% |
| DoorDash, Inc. Class A | Consumer staples | 544 | 112,095 | 0.47% |
| Pfizer, Inc. | Health care | 2,606 | 112,085 | 0.47% |
| Hologic, Inc. | Health care | 1,518 | 112,072 | 0.47% |
| IAC/InterActiveCorp | Technology | 860 | 111,988 | 0.47% |
| A BASKET (GSGLPWDS) OF COMMON STOCKS | ||||
| Common stocks | Sector | Shares | Value | Percentage value |
| AMC Entertainment Holdings, Inc. Class A | Consumer cyclicals | 3,069 | $116,803 | 0.50% |
| Sunrun, Inc. | Energy | 2,650 | 116,591 | 0.50% |
| Trade Desk, Inc. (The) Class A | Consumer cyclicals | 1,630 | 114,576 | 0.49% |
| Takeda Pharmaceutical Co., Ltd. (Japan) | Health care | 3,410 | 113,339 | 0.48% |
| Argenx SE (Netherlands) | Health care | 376 | 112,891 | 0.48% |
| Tokio Marine Holdings, Inc. (Japan) | Financials | 2,086 | 112,879 | 0.48% |
| Trend Micro, Inc. (Japan) | Technology | 2,012 | 112,438 | 0.48% |
| Shimano, Inc. (Japan) | Consumer cyclicals | 380 | 112,279 | 0.48% |
| Cheniere Energy, Inc. | Energy | 1,148 | 112,110 | 0.48% |
| AGC, Inc. (Japan) | Consumer cyclicals | 2,155 | 111,909 | 0.48% |
| Canopy Growth Corp. (Canada) | Health care | 8,066 | 111,759 | 0.48% |
| Silver Wheaton Corp. (Canada) | Basic materials | 2,966 | 111,659 | 0.48% |
| Chugai Pharmaceutical Co., Ltd. (Japan) | Health care | 3,027 | 111,606 | 0.48% |
| Veolia Environnement SA (France) | Utilities and power | 3,641 | 111,600 | 0.48% |
| AXA SA (France) | Financials | 3,995 | 111,469 | 0.47% |
| Nippon Paint Holdings Co., Ltd. (Japan) | Basic materials | 10,191 | 111,441 | 0.47% |
| Valero Energy Corp. | Energy | 1,579 | 111,431 | 0.47% |
| Realestate.com.au, Ltd. (Australia) | Technology | 970 | 111,398 | 0.47% |
Dynamic Asset Allocation Conservative Fund 89 | |
| A BASKET (GSGLPWDS) OF COMMON STOCKS cont. | ||||
| Common stocks | Sector | Shares | Value | Percentage value |
| CyberArk Software, Ltd. (Israel) | Technology | 705 | $111,309 | 0.47% |
| Heineken NV (Netherlands) | Consumer staples | 1,065 | 111,266 | 0.47% |
| Boston Beer Co., Inc. Class A | Consumer staples | 218 | 111,176 | 0.47% |
| Imperial Brands PLC (United Kingdom) | Consumer staples | 5,294 | 111,173 | 0.47% |
| Chewy, Inc. Class A | Consumer staples | 1,632 | 111,170 | 0.47% |
| Avantor, Inc. | Health care | 2,716 | 111,095 | 0.47% |
| Black Knight, Inc. | Technology | 1,543 | 111,081 | 0.47% |
| PPD, Inc. | Health care | 2,373 | 111,032 | 0.47% |
| Essity AB Class B (Sweden) | Consumer staples | 3,572 | 110,997 | 0.47% |
| Ceridian HCM Holding, Inc. | Technology | 985 | 110,952 | 0.47% |
| M3, Inc. (Japan) | Health care | 1,544 | 110,842 | 0.47% |
| Clarivate PLC (United Kingdom) | Technology | 5,058 | 110,770 | 0.47% |
| Konami Holdings Corp. (Japan) | Technology | 1,754 | 110,770 | 0.47% |
| Live Nation Entertainment, Inc. | Consumer cyclicals | 1,215 | 110,753 | 0.47% |
| Credit Suisse Group AG (Switzerland) | Financials | 11,100 | 110,693 | 0.47% |
| Nice, Ltd. (Israel) | Communication services | 396 | 110,646 | 0.47% |
| Atmos Energy Corp. | Utilities and power | 1,254 | 110,645 | 0.47% |
| Royalty Pharma PLC Class A | Health care | 3,061 | 110,636 | 0.47% |
| Hess Corp. | Energy | 1,416 | 110,604 | 0.47% |
| Sumco Corp. (Japan) | Technology | 5,468 | 110,586 | 0.47% |
| Kubota Corp. (Japan) | Capital goods | 5,149 | 110,536 | 0.47% |
| Nutrien, Ltd. (Canada) | Basic materials | 1,699 | 110,254 | 0.47% |
| CIE Generale Des Etablissements Michelin SCA (France) | Consumer cyclicals | 716 | 110,136 | 0.47% |
| FedEx Corp. | Transportation | 502 | 110,060 | 0.47% |
| Devon Energy Corp. | Energy | 3,098 | 109,997 | 0.47% |
| Naturgy Energy Group SA (Spain) | Utilities and power | 4,366 | 109,990 | 0.47% |
| Charter Communications, Inc. Class A | Communication services | 151 | 109,941 | 0.47% |
| MarketAxess Holdings, Inc. | Consumer cyclicals | 261 | 109,915 | 0.47% |
| ORIX Corp. (Japan) | Financials | 5,796 | 109,893 | 0.47% |
| Catalent, Inc. | Health care | 826 | 109,876 | 0.47% |
| Sumitomo Electric Industries, Ltd. (Japan) | Conglomerates | 8,164 | 109,735 | 0.47% |
| Broadridge Financial Solutions, Inc. | Financials | 658 | 109,698 | 0.47% |
| CENTRALLY CLEARED TOTAL RETURN SWAP CONTRACTS OUTSTANDING at 9/30/21 | |||||||
| Notional amount | Value | Upfront premium received (paid) | Termination date | Payments received (paid) by fund | Total return received by or paid by fund | Unrealized appreciation/ (depreciation) | |
| $69,154,000 | $117,562 | $29,190 | 9/13/26 | 2.7375% — At maturity | USA Non-revised Consumer Price Index-Urban (CPI-U) — At maturity | $(88,373) | |
90 Dynamic Asset Allocation Conservative Fund | |
| CENTRALLY CLEARED TOTAL RETURN SWAP CONTRACTS OUTSTANDING at 9/30/21 cont. | |||||||
| Notional amount | Value | Upfront premium received (paid) | Termination date | Payments received (paid) by fund | Total return received by or paid by fund | Unrealized appreciation/ (depreciation) | |
| $21,874,000 | $123,807 | $70,777 | 1/15/32 | 2.78% — At maturity | USA Non-revised Consumer Price Index-Urban (CPI-U) — At maturity | $(53,029) | |
| Total | $99,967 | $(141,402) | |||||
| OTC CREDIT DEFAULT CONTRACTS OUTSTANDING — PROTECTION SOLD at 9/30/21 | ||||||||
| Swap counterparty/ Referenced debt* | Rating*** | Upfront premium received (paid)** | Notional amount | Value | Termi- nation date | Payments received by fund | Unrealized appreciation/ (depreciation) | |
| Bank of America N.A. | ||||||||
| CMBX NA BBB−.6 Index | B+/P | $957 | $14,000 | $3,983 | 5/11/63 | 300 bp — Monthly | $(3,019) | |
| CMBX NA BBB−.6 Index | B+/P | 1,868 | 31,000 | 8,820 | 5/11/63 | 300 bp — Monthly | (6,936) | |
| CMBX NA BBB−.6 Index | B+/P | 3,828 | 62,000 | 17,639 | 5/11/63 | 300 bp — Monthly | (13,780) | |
| Citigroup Global Markets, Inc. | ||||||||
| CMBX NA BB.11 Index | BB−/P | 23,165 | 41,000 | 3,452 | 11/18/54 | 500 bp — Monthly | 19,747 | |
| CMBX NA BB.6 Index | B-/P | 27,399 | 184,133 | 82,823 | 5/11/63 | 500 bp — Monthly | (55,270) | |
| CMBX NA BB.7 Index | B/P | 21,179 | 415,000 | 139,897 | 1/17/47 | 500 bp — Monthly | (118,372) | |
| CMBX NA BB.9 Index | B+/P | 814 | 4,000 | 828 | 9/17/58 | 500 bp — Monthly | (11) | |
| CMBX NA BB.9 Index | B+/P | 8,577 | 42,000 | 8,698 | 9/17/58 | 500 bp — Monthly | (86) | |
| CMBX NA BBB−.10 Index | BB+/P | 4,255 | 39,000 | 3,413 | 11/17/59 | 300 bp — Monthly | 862 | |
| CMBX NA BBB−.12 Index | BBB−/P | 626 | 15,000 | 693 | 8/17/61 | 300 bp — Monthly | (60) | |
| CMBX NA BBB−.12 Index | BBB−/P | 6,600 | 112,000 | 5,174 | 8/17/61 | 300 bp — Monthly | 1,482 | |
| Credit Suisse International | ||||||||
| CMBX NA BB.7 Index | B/P | 9,898 | 74,000 | 24,945 | 1/17/47 | 500 bp — Monthly | (14,985) | |
| CMBX NA BBB−.7 Index | BB−/P | 11,936 | 151,000 | 27,286 | 1/17/47 | 300 bp — Monthly | (15,275) | |
| Goldman Sachs International | ||||||||
| CMBX NA A.6 Index | BBB+/P | 192 | 3,000 | 314 | 5/11/63 | 200 bp — Monthly | (120) | |
| CMBX NA A.6 Index | BBB+/P | 305 | 6,000 | 628 | 5/11/63 | 200 bp — Monthly | (320) | |
| CMBX NA A.6 Index | BBB+/P | 1,900 | 16,000 | 1,674 | 5/11/63 | 200 bp — Monthly | 232 | |
Dynamic Asset Allocation Conservative Fund 91 | |
| OTC CREDIT DEFAULT CONTRACTS OUTSTANDING — PROTECTION SOLD at 9/30/21 cont. | ||||||||
| Swap counterparty/ Referenced debt* | Rating*** | Upfront premium received (paid)** | Notional amount | Value | Termi- nation date | Payments received by fund | Unrealized appreciation/ (depreciation) | |
| Goldman Sachs International cont. | ||||||||
| CMBX NA A.6 Index | BBB+/P | $2,674 | $23,000 | $2,406 | 5/11/63 | 200 bp — Monthly | $276 | |
| CMBX NA A.6 Index | BBB+/P | (65) | 36,000 | 3,766 | 5/11/63 | 200 bp — Monthly | (3,819) | |
| CMBX NA A.6 Index | BBB+/P | (378) | 47,000 | 4,916 | 5/11/63 | 200 bp — Monthly | (5,278) | |
| CMBX NA A.6 Index | BBB+/P | 1,584 | 52,000 | 5,439 | 5/11/63 | 200 bp — Monthly | (3,838) | |
| CMBX NA A.6 Index | BBB+/P | 2,767 | 56,000 | 5,858 | 5/11/63 | 200 bp — Monthly | (3,072) | |
| CMBX NA A.6 Index | BBB+/P | 1,851 | 59,000 | 6,171 | 5/11/63 | 200 bp — Monthly | (4,301) | |
| CMBX NA A.6 Index | BBB+/P | (113) | 59,000 | 6,171 | 5/11/63 | 200 bp — Monthly | (6,264) | |
| CMBX NA A.6 Index | BBB+/P | 444 | 59,000 | 6,171 | 5/11/63 | 200 bp — Monthly | (5,708) | |
| CMBX NA A.6 Index | BBB+/P | 7,383 | 63,000 | 6,590 | 5/11/63 | 200 bp — Monthly | 814 | |
| CMBX NA A.6 Index | BBB+/P | 4,269 | 65,000 | 6,799 | 5/11/63 | 200 bp — Monthly | (2,509) | |
| CMBX NA A.6 Index | BBB+/P | 6,251 | 73,000 | 7,636 | 5/11/63 | 200 bp — Monthly | (1,361) | |
| CMBX NA A.6 Index | BBB+/P | 4,533 | 88,000 | 9,205 | 5/11/63 | 200 bp — Monthly | (4,642) | |
| CMBX NA A.6 Index | BBB+/P | (92) | 151,000 | 15,795 | 5/11/63 | 200 bp — Monthly | (15,836) | |
| CMBX NA A.6 Index | BBB+/P | 4,120 | 178,000 | 18,619 | 5/11/63 | 200 bp — Monthly | (14,439) | |
| CMBX NA A.7 Index | BBB+/P | 1,462 | 29,000 | 1,401 | 1/17/47 | 200 bp — Monthly | 71 | |
| CMBX NA BBB−.14 Index | BBB−/P | 450 | 10,000 | 343 | 12/16/72 | 300 bp — Monthly | 112 | |
| CMBX NA BBB−.6 Index | B+/P | 545 | 8,000 | 2,276 | 5/11/63 | 300 bp — Monthly | (1,727) | |
| CMBX NA BBB−.6 Index | B+/P | 678 | 13,000 | 3,699 | 5/11/63 | 300 bp — Monthly | (3,014) | |
| CMBX NA BBB−.6 Index | B+/P | 1,727 | 20,000 | 5,690 | 5/11/63 | 300 bp — Monthly | (3,953) | |
| CMBX NA BBB−.6 Index | B+/P | 1,064 | 22,000 | 6,259 | 5/11/63 | 300 bp — Monthly | (5,184) | |
| CMBX NA BBB−.6 Index | B+/P | 4,641 | 55,000 | 15,648 | 5/11/63 | 300 bp — Monthly | (10,979) | |
| CMBX NA BBB−.6 Index | B+/P | 5,992 | 71,000 | 20,200 | 5/11/63 | 300 bp — Monthly | (14,172) | |
| CMBX NA BBB−.6 Index | B+/P | 18,758 | 200,000 | 56,900 | 5/11/63 | 300 bp — Monthly | (38,042) | |
92 Dynamic Asset Allocation Conservative Fund | |
| OTC CREDIT DEFAULT CONTRACTS OUTSTANDING — PROTECTION SOLD at 9/30/21 cont. | ||||||||
| Swap counterparty/ Referenced debt* | Rating*** | Upfront premium received (paid)** | Notional amount | Value | Termi- nation date | Payments received by fund | Unrealized appreciation/ (depreciation) | |
| Goldman Sachs International cont. | ||||||||
| CMBX NA BBB−.6 Index | B+/P | $15,560 | $207,000 | $58,892 | 5/11/63 | 300 bp — Monthly | $(41,190) | |
| CMBX NA BBB−.7 Index | BB−/P | 5,300 | 62,000 | 11,203 | 1/17/47 | 300 bp — Monthly | (5,873) | |
| CMBX NA BBB−.7 Index | BB−/P | 5,793 | 68,000 | 12,288 | 1/17/47 | 300 bp — Monthly | (6,461) | |
| CMBX NA BBB−.7 Index | BB−/P | 19,769 | 251,000 | 45,356 | 1/17/47 | 300 bp — Monthly | (25,462) | |
| JPMorgan Securities LLC | ||||||||
| CMBX NA A.13 Index | A-/P | (473) | 90,000 | 1,332 | 12/16/72 | 200 bp — Monthly | 889 | |
| CMBX NA A.7 Index | BBB+/P | 11,139 | 254,000 | 12,268 | 1/17/47 | 200 bp — Monthly | (1,045) | |
| CMBX NA BB.10 Index | B+/P | 4,092 | 51,000 | 11,914 | 5/11/63 | 500 bp — Monthly | (7,779) | |
| CMBX NA BB.7 Index | B/P | 112,621 | 230,000 | 77,533 | 1/17/47 | 500 bp — Monthly | 35,279 | |
| Morgan Stanley & Co. International PLC | ||||||||
| CMBX NA A.13 Index | A-/P | (10,349) | 694,000 | 10,271 | 12/16/72 | 200 bp — Monthly | 154 | |
| CMBX NA A.6 Index | BBB+/P | 2,840 | 32,000 | 3,347 | 5/11/63 | 200 bp — Monthly | (497) | |
| CMBX NA BB.6 Index | B-/P | 17,681 | 69,411 | 31,221 | 5/11/63 | 500 bp — Monthly | (13,482) | |
| CMBX NA BB.6 Index | B-/P | 33,265 | 130,146 | 58,540 | 5/11/63 | 500 bp — Monthly | (25,166) | |
| CMBX NA BBB−.12 Index | BBB−/P | 2,711 | 46,000 | 2,125 | 8/17/61 | 300 bp — Monthly | 609 | |
| CMBX NA BBB−.12 Index | BBB−/P | 2,576 | 60,000 | 2,772 | 8/17/61 | 300 bp — Monthly | (166) | |
| Upfront premium received | 428,039 | Unrealized appreciation | 60,527 | |||||
| Upfront premium (paid) | (11,470) | Unrealized (depreciation) | (503,493) | |||||
| Total | $416,569 | Total | $(442,966) | |||||
| * Payments related to the referenced debt are made upon a credit default event. | ||||||||
| ** Upfront premium is based on the difference between the original spread on issue and the market spread on day of execution. | ||||||||
| *** Ratings for an underlying index represent the average of the ratings of all the securities included in that index. The Moody’s, Standard & Poor’s or Fitch ratings are believed to be the most recent ratings available at September 30, 2021. Securities rated by Fitch are indicated by “/F.” Securities rated by Putnam are indicated by “/P.” The Putnam rating categories are comparable to the Standard & Poor’s classifications. | ||||||||
Dynamic Asset Allocation Conservative Fund 93 | |
| OTC CREDIT DEFAULT CONTRACTS OUTSTANDING — PROTECTION PURCHASED at 9/30/21 | ||||||||
| Swap counterparty/ Referenced debt* | Upfront premium received (paid)** | Notional amount | Value | Termi- nation date | Payments (paid) by fund | Unrealized appreciation/ (depreciation) | ||
| Citigroup Global Markets, Inc. | ||||||||
| CMBX NA A.7 Index | $(1,357) | $183,000 | $8,839 | 1/17/47 | (200 bp) — Monthly | $7,421 | ||
| CMBX NA BB.10 Index | (30,138) | 125,000 | 29,200 | 11/17/59 | (500 bp) — Monthly | (1,054) | ||
| CMBX NA BB.10 Index | (13,515) | 53,000 | 12,381 | 11/17/59 | (500 bp) — Monthly | (1,178) | ||
| CMBX NA BB.10 Index | (4,696) | 45,000 | 10,512 | 11/17/59 | (500 bp) — Monthly | 5,778 | ||
| CMBX NA BB.10 Index | (4,167) | 38,000 | 8,877 | 11/17/59 | (500 bp) — Monthly | 4,678 | ||
| CMBX NA BB.11 Index | (1,787) | 26,000 | 2,189 | 11/18/54 | (500 bp) — Monthly | 380 | ||
| CMBX NA BB.11 Index | (1,296) | 10,000 | 842 | 11/18/54 | (500 bp) — Monthly | (462) | ||
| CMBX NA BB.11 Index | (259) | 5,000 | 421 | 11/18/54 | (500 bp) — Monthly | 157 | ||
| CMBX NA BB.8 Index | (12,404) | 34,787 | 12,404 | 10/17/57 | (500 bp) — Monthly | — | ||
| CMBX NA BB.8 Index | (3,725) | 28,989 | 10,254 | 10/17/57 | (500 bp) — Monthly | 6,505 | ||
| CMBX NA BB.9 Index | (4,232) | 41,000 | 8,491 | 9/17/58 | (500 bp) — Monthly | 4,225 | ||
| CMBX NA BB.9 Index | (1,492) | 37,000 | 7,663 | 9/17/58 | (500 bp) — Monthly | 6,140 | ||
| CMBX NA BB.9 Index | (589) | 15,000 | 3,107 | 9/17/58 | (500 bp) — Monthly | 2,505 | ||
| CMBX NA BB.9 Index | (109) | 3,000 | 621 | 9/17/58 | (500 bp) — Monthly | 498 | ||
| CMBX NA BBB− .10 Index | (5,726) | 24,000 | 2,100 | 11/17/59 | (300 bp) — Monthly | (3,638) | ||
| CMBX NA BBB− .10 Index | (4,183) | 17,000 | 1,488 | 11/17/59 | (300 bp) — Monthly | (2,704) | ||
| CMBX NA BBB− .12 Index | (5,415) | 24,000 | 1,109 | 8/17/61 | (300 bp) — Monthly | (4,319) | ||
| CMBX NA BBB−.10 Index | (16,982) | 57,000 | 4,988 | 11/17/59 | (300 bp) — Monthly | (12,023) | ||
| CMBX NA BBB−.10 Index | (4,972) | 39,000 | 3,413 | 11/17/59 | (300 bp) — Monthly | (1,579) | ||
| CMBX NA BBB−.12 Index | (61,189) | 194,000 | 8,963 | 8/17/61 | (300 bp) — Monthly | (52,323) | ||
| CMBX NA BBB−.12 Index | (14,363) | 43,000 | 1,987 | 8/17/61 | (300 bp) — Monthly | (12,398) | ||
| CMBX NA BBB−.12 Index | (15,115) | 43,000 | 1,987 | 8/17/61 | (300 bp) — Monthly | (13,150) | ||
| CMBX NA BBB−.12 Index | (13,039) | 37,000 | 1,709 | 8/17/61 | (300 bp) — Monthly | (11,348) | ||
94 Dynamic Asset Allocation Conservative Fund | |
| OTC CREDIT DEFAULT CONTRACTS OUTSTANDING — PROTECTION PURCHASED at 9/30/21 cont. | ||||||||
| Swap counterparty/ Referenced debt* | Upfront premium received (paid)** | Notional amount | Value | Termi- nation date | Payments (paid) by fund | Unrealized appreciation/ (depreciation) | ||
| Citigroup Global Markets, Inc. cont. | ||||||||
| CMBX NA BBB−.12 Index | $(6,849) | $36,000 | $1,663 | 8/17/61 | (300 bp) — Monthly | $(5,204) | ||
| CMBX NA BBB−.12 Index | (6,349) | 19,000 | 878 | 8/17/61 | (300 bp) — Monthly | (5,480) | ||
| CMBX NA BBB−.12 Index | (847) | 5,000 | 231 | 8/17/61 | (300 bp) — Monthly | (618) | ||
| CMBX NA BBB−.8 Index | (17,500) | 112,000 | 14,538 | 10/17/57 | (300 bp) — Monthly | (3,018) | ||
| CMBX NA BBB−.8 Index | (8,061) | 51,000 | 6,620 | 10/17/57 | (300 bp) — Monthly | (1,467) | ||
| CMBX NA BBB−.8 Index | (8,093) | 51,000 | 6,620 | 10/17/57 | (300 bp) — Monthly | (1,499) | ||
| CMBX NA BBB−.8 Index | (3,292) | 23,000 | 2,985 | 10/17/57 | (300 bp) — Monthly | (318) | ||
| CMBX NA BBB−.9 Index | (4,495) | 19,000 | 1,469 | 9/17/58 | (300 bp) — Monthly | (3,036) | ||
| Credit Suisse International | ||||||||
| CMBX NA BB.10 Index | (11,178) | 94,000 | 21,958 | 11/17/59 | (500 bp) — Monthly | 10,702 | ||
| CMBX NA BB.10 Index | (12,542) | 94,000 | 21,958 | 11/17/59 | (500 bp) — Monthly | 9,338 | ||
| CMBX NA BB.10 Index | (6,091) | 49,000 | 11,446 | 11/17/59 | (500 bp) — Monthly | 5,315 | ||
| CMBX NA BB.7 Index | (53,129) | 323,000 | 108,883 | 1/17/47 | (500 bp) — Monthly | 55,485 | ||
| CMBX NA BB.7 Index | (31,728) | 172,000 | 57,981 | 1/17/47 | (500 bp) — Monthly | 26,110 | ||
| CMBX NA BB.7 Index | (2,136) | 116,650 | 52,469 | 5/11/63 | (500 bp) — Monthly | 50,236 | ||
| CMBX NA BB.8 Index | (2,804) | 15,461 | 5,469 | 10/17/57 | (500 bp) — Monthly | 2,652 | ||
| CMBX NA BB.9 Index | (5,714) | 57,000 | 11,805 | 9/17/58 | (500 bp) — Monthly | 6,043 | ||
| Goldman Sachs International | ||||||||
| CMBX NA BB.6 Index | (8,695) | 81,944 | 36,858 | 5/11/63 | (500 bp) — Monthly | 28,095 | ||
| CMBX NA BB.7 Index | (3,481) | 23,000 | 7,753 | 1/17/47 | (500 bp) — Monthly | 4,254 | ||
| CMBX NA BB.10 Index | (2,941) | 13,000 | 3,037 | 11/17/59 | (500 bp) — Monthly | 85 | ||
| CMBX NA BB.6 Index | (18,117) | 119,542 | 53,770 | 5/11/63 | (500 bp) — Monthly | 35,553 | ||
| CMBX NA BB.7 Index | (48,016) | 284,000 | 95,736 | 1/17/47 | (500 bp) — Monthly | 47,484 | ||
| CMBX NA BB.7 Index | (50,559) | 249,000 | 83,938 | 1/17/47 | (500 bp) — Monthly | 33,171 | ||
Dynamic Asset Allocation Conservative Fund 95 | |
| OTC CREDIT DEFAULT CONTRACTS OUTSTANDING — PROTECTION PURCHASED at 9/30/21 cont. | ||||||||
| Swap counterparty/ Referenced debt* | Upfront premium received (paid)** | Notional amount | Value | Termi- nation date | Payments (paid) by fund | Unrealized appreciation/ (depreciation) | ||
| Goldman Sachs International cont. | ||||||||
| CMBX NA BB.7 Index | $(2,949) | $18,000 | $6,068 | 1/17/47 | (500 bp) — Monthly | $3,104 | ||
| CMBX NA BB.8 Index | (13,670) | 37,686 | 13,330 | 10/17/57 | (500 bp) — Monthly | (372) | ||
| CMBX NA BB.8 Index | (13,694) | 37,686 | 13,330 | 10/17/57 | (500 bp) — Monthly | (396) | ||
| CMBX NA BB.8 Index | (11,909) | 33,821 | 11,962 | 10/17/57 | (500 bp) — Monthly | 25 | ||
| CMBX NA BB.8 Index | (1,699) | 14,495 | 5,127 | 10/17/57 | (500 bp) — Monthly | 3,415 | ||
| CMBX NA BB.9 Index | (595) | 5,000 | 1,036 | 9/17/58 | (500 bp) — Monthly | 436 | ||
| CMBX NA BB.9 Index | (602) | 5,000 | 1,036 | 9/17/58 | (500 bp) — Monthly | 430 | ||
| CMBX NA BBB−.12 Index | (1,351) | 4,000 | 185 | 8/17/61 | (300 bp) — Monthly | (1,168) | ||
| CMBX NA BBB−.6 Index | (41,148) | 151,000 | 42,960 | 5/11/63 | (300 bp) — Monthly | 1,737 | ||
| CMBX NA BBB−.6 Index | (6,354) | 127,000 | 36,132 | 5/11/63 | (300 bp) — Monthly | 29,714 | ||
| JPMorgan Securities LLC | ||||||||
| CMBX NA BB.11 Index | (26,255) | 49,166 | 22,115 | 5/11/63 | (500 bp) — Monthly | (4,181) | ||
| CMBX NA BB.8 Index | (3,965) | 7,731 | 2,734 | 10/17/57 | (500 bp) — Monthly | (1,237) | ||
| CMBX NA BBB− .10 Index | (4,123) | 25,000 | 2,188 | 11/17/59 | (300 bp) — Monthly | (1,948) | ||
| CMBX NA BBB−.10 Index | (18,860) | 166,000 | 14,525 | 11/17/59 | (300 bp) — Monthly | (4,418) | ||
| CMBX NA BBB−.10 Index | (13,804) | 49,000 | 4,288 | 11/17/59 | (300 bp) — Monthly | (9,541) | ||
| CMBX NA BBB−.10 Index | (13,109) | 44,000 | 3,850 | 11/17/59 | (300 bp) — Monthly | (9,281) | ||
| CMBX NA BBB−.12 Index | (2,654) | 8,000 | 370 | 8/17/61 | (300 bp) — Monthly | (2,289) | ||
| CMBX NA BBB−.6 Index | (63,940) | 200,000 | 56,900 | 5/11/63 | (300 bp) — Monthly | (7,140) | ||
| CMBX NA BBB−.7 Index | (98,131) | 418,000 | 75,533 | 1/17/47 | (300 bp) — Monthly | (22,807) | ||
| Merrill Lynch International | ||||||||
| CMBX NA BB.10 Index | (5,121) | 90,000 | 21,024 | 11/17/59 | (500 bp) — Monthly | 15,828 | ||
| CMBX NA BB.9 Index | (1,364) | 35,000 | 7,249 | 9/17/58 | (500 bp) — Monthly | 5,856 | ||
| CMBX NA BBB− .10 Index | (10,400) | 48,000 | 4,200 | 11/17/59 | (300 bp) — Monthly | (6,224) | ||
96 Dynamic Asset Allocation Conservative Fund | |
| OTC CREDIT DEFAULT CONTRACTS OUTSTANDING — PROTECTION PURCHASED at 9/30/21 cont. | ||||||||
| Swap counterparty/ Referenced debt* | Upfront premium received (paid)** | Notional amount | Value | Termi- nation date | Payments (paid) by fund | Unrealized appreciation/ (depreciation) | ||
| Merrill Lynch International cont. | ||||||||
| CMBX NA BBB−.7 Index | $(2,376) | $29,000 | $5,240 | 1/17/47 | (300 bp) — Monthly | $2,849 | ||
| CMBX NA BBB−.9 Index | (5,928) | 32,000 | 2,474 | 9/17/58 | (300 bp) — Monthly | (3,470) | ||
| CMBX NA BBB−.9 Index | (2,964) | 16,000 | 1,237 | 9/17/58 | (300 bp) — Monthly | (1,735) | ||
| Morgan Stanley & Co. International PLC | ||||||||
| CMBX NA BBB−.7 Index | (7,030) | 69,000 | 12,468 | 1/17/47 | (300 bp) — Monthly | 5,403 | ||
| CMBX NA BB.10 Index | (4,719) | 45,000 | 10,512 | 11/17/59 | (500 bp) — Monthly | 5,755 | ||
| CMBX NA BB.10 Index | (8,924) | 38,000 | 8,877 | 11/17/59 | (500 bp) — Monthly | (79) | ||
| CMBX NA BB.7 Index | (5,206) | 27,000 | 9,102 | 1/17/47 | (500 bp) — Monthly | 3,873 | ||
| CMBX NA BB.8 Index | (6,671) | 18,360 | 6,494 | 10/17/57 | (500 bp) — Monthly | (193) | ||
| CMBX NA BB.8 Index | (4,944) | 9,663 | 3,418 | 10/17/57 | (500 bp) — Monthly | (1,534) | ||
| CMBX NA BB.9 Index | (1,758) | 20,000 | 4,142 | 9/17/58 | (500 bp) — Monthly | 2,367 | ||
| CMBX NA BB.9 Index | (547) | 14,000 | 2,899 | 9/17/58 | (500 bp) — Monthly | 2,340 | ||
| CMBX NA BB.9 Index | (1,213) | 10,000 | 2,071 | 9/17/58 | (500 bp) — Monthly | 850 | ||
| CMBX NA BB.9 Index | (362) | 9,000 | 1,864 | 9/17/58 | (500 bp) — Monthly | 1,495 | ||
| CMBX NA BB.9 Index | (606) | 5,000 | 1,036 | 9/17/58 | (500 bp) — Monthly | 425 | ||
| CMBX NA BB.9 Index | (243) | 4,000 | 828 | 9/17/58 | (500 bp) — Monthly | 582 | ||
| CMBX NA BB.9 Index | (246) | 4,000 | 828 | 9/17/58 | (500 bp) — Monthly | 579 | ||
| CMBX NA BB.9 Index | (225) | 3,000 | 621 | 9/17/58 | (500 bp) — Monthly | 393 | ||
| CMBX NA BB.9 Index | (50) | 1,000 | 207 | 9/17/58 | (500 bp) — Monthly | 157 | ||
| CMBX NA BBB− .10 Index | (8,045) | 33,000 | 2,888 | 11/17/59 | (300 bp) — Monthly | (5,174) | ||
| CMBX NA BBB− .10 Index | (3,903) | 18,000 | 1,575 | 11/17/59 | (300 bp) — Monthly | (2,337) | ||
| CMBX NA BBB− .10 Index | (4,021) | 17,000 | 1,488 | 11/17/59 | (300 bp) — Monthly | (2,542) | ||
| CMBX NA BBB− .10 Index | (3,460) | 16,000 | 1,400 | 11/17/59 | (300 bp) — Monthly | (2,068) | ||
| CMBX NA BBB− .10 Index | (2,296) | 10,000 | 875 | 11/17/59 | (300 bp) — Monthly | (1,426) | ||
Dynamic Asset Allocation Conservative Fund 97 | |
| OTC CREDIT DEFAULT CONTRACTS OUTSTANDING — PROTECTION PURCHASED at 9/30/21 cont. | ||||||||
| Swap counterparty/ Referenced debt* | Upfront premium received (paid)** | Notional amount | Value | Termi- nation date | Payments (paid) by fund | Unrealized appreciation/ (depreciation) | ||
| Morgan Stanley & Co. International PLC cont. | ||||||||
| CMBX NA BBB− .12 Index | $(3,339) | $16,000 | $739 | 8/17/61 | (300 bp) — Monthly | $(2,608) | ||
| CMBX NA BBB−.10 Index | (6,722) | 53,000 | 4,638 | 11/17/59 | (300 bp) — Monthly | (2,111) | ||
| CMBX NA BBB−.10 Index | (3,637) | 42,000 | 3,675 | 11/17/59 | (300 bp) — Monthly | 17 | ||
| CMBX NA BBB−.12 Index | (1,994) | 6,000 | 277 | 8/17/61 | (300 bp) — Monthly | (1,720) | ||
| CMBX NA BBB−.6 Index | (55,775) | 230,000 | 65,435 | 5/11/63 | (300 bp) — Monthly | 9,545 | ||
| CMBX NA BBB−.8 Index | (6,344) | 50,000 | 6,490 | 10/17/57 | (300 bp) — Monthly | 121 | ||
| CMBX NA BBB−.8 Index | (6,359) | 50,000 | 6,490 | 10/17/57 | (300 bp) — Monthly | 106 | ||
| CMBX NA BBB−.8 Index | (7,282) | 47,000 | 6,101 | 10/17/57 | (300 bp) — Monthly | (1,205) | ||
| CMBX NA BBB−.8 Index | (7,188) | 46,000 | 5,971 | 10/17/57 | (300 bp) — Monthly | (1,240) | ||
| CMBX NA BBB−.8 Index | (5,725) | 40,000 | 5,192 | 10/17/57 | (300 bp) — Monthly | (553) | ||
| Upfront premium received | — | Unrealized appreciation | 450,212 | |||||
| Upfront premium (paid) | (1,069,166) | Unrealized (depreciation) | (237,813) | |||||
| Total | $(1,069,166) | Total | $212,399 | |||||
| * Payments related to the referenced debt are made upon a credit default event. | ||||||||
| ** Upfront premium is based on the difference between the original spread on issue and the market spread on day of execution. | ||||||||
| CENTRALLY CLEARED CREDIT DEFAULT CONTRACTS OUTSTANDING — PROTECTION SOLD at 9/30/21 | ||||||||
| Referenced debt* | Rating*** | Upfront premium received (paid)** | Notional amount | Value | Termi- nation date | Payments received by fund | Unrealized appreciation/ (depreciation) | |
| NA HY Series 37 Index | B+/P | $(493,165) | $5,220,000 | $479,718 | 12/20/26 | 500 bp — Quarterly | $(12,722) | |
| NA IG Series 37 Index | BBB+/P | (2,145,776) | 85,200,000 | 2,026,056 | 12/20/26 | 100 bp — Quarterly | (103,153) | |
| Total | $(2,638,941) | $(115,875) | ||||||
| * Payments related to the referenced debt are made upon a credit default event. | ||||||||
| ** Upfront premium is based on the difference between the original spread on issue and the market spread on day of execution. | ||||||||
| *** Ratings for an underlying index represent the average of the ratings of all the securities included in that index. The Moody’s, Standard & Poor’s or Fitch ratings are believed to be the most recent ratings available at September 30, 2021. Securities rated by Fitch are indicated by “/F.” Securities rated by Putnam are indicated by “/P.” The Putnam rating categories are comparable to the Standard & Poor’s classifications. | ||||||||
98 Dynamic Asset Allocation Conservative Fund | |
Level 1: Valuations based on quoted prices for identical securities in active markets.
Level 2: Valuations based on quoted prices in markets that are not active or for which all significant inputs are observable, either directly or indirectly.
Level 3: Valuations based on inputs that are unobservable and significant to the fair value measurement.
| Valuation inputs | |||
| Investments in securities: | Level 1 | Level 2 | Level 3 |
| Common stocks*: | |||
| Basic materials | $13,799,247 | $10,124,203 | $— |
| Capital goods | 27,767,024 | 4,371,022 | — |
| Communication services | 15,614,814 | 3,068,171 | — |
| Conglomerates | 1,894,453 | — | — |
| Consumer cyclicals | 82,597,299 | 15,160,572 | — |
| Consumer staples | 29,140,746 | 9,757,291 | — |
| Energy | 11,066,991 | 6,061,350 | 107 |
| Financials | 65,992,750 | 18,554,662 | — |
| Government | — | 154,034 | — |
| Healthcare | 64,066,080 | 12,193,604 | — |
| Technology | 160,720,976 | 10,705,416 | — |
| Transportation | 8,591,241 | 2,481,575 | — |
| Utilities and power | 12,427,939 | 2,827,601 | — |
| Total common stocks | 493,679,560 | 95,459,501 | 107 |
| Asset-backed securities | — | 7,228,413 | 1,724,576 |
| Collateralized loan obligations | — | 17,302,364 | — |
| Convertible bonds and notes | — | 259,041 | — |
| Convertible preferred stocks | — | 1,681,143 | — |
| Corporate bonds and notes | — | 246,280,955 | — |
| Foreign government and agency bonds and notes | — | 8,897,303 | — |
| Mortgage-backed securities | — | 69,449,784 | — |
| Preferred stocks | — | 3,736 | — |
| Purchased options outstanding | — | 406,950 | — |
| Senior loans | — | 4,734,437 | — |
| U.S. government and agency mortgage obligations | — | 255,854,022 | — |
| U.S. treasury obligations | — | 410,523 | — |
| Warrants | 4,752 | — | — |
| Short-term investments | 575,000 | 37,517,165 | — |
| Totals by level | $494,259,312 | $745,485,337 | $1,724,683 |
Dynamic Asset Allocation Conservative Fund 99 | |
| Valuation inputs | |||
| Other financial instruments: | Level 1 | Level 2 | Level 3 |
| Forward currency contracts | $— | $(712,734) | $— |
| Futures contracts | 12,121,387 | — | — |
| Written options outstanding | — | (125,086) | — |
| TBA sale commitments | — | (69,386,626) | — |
| Interest rate swap contracts | — | (2,021,750) | — |
| Total return swap contracts | — | (1,239,856) | — |
| Credit default contracts | — | 2,945,096 | — |
| Totals by level | $12,121,387 | $(70,540,956) | $— |
| * Common stock classifications are presented at the sector level, which may differ from the fund’s portfolio presentation. | |||
| At the start and close of the reporting period, Level 3 investments in securities represented less than 1% of the fund’s net assets and were not considered a significant portion of the fund’s portfolio. | |||
The accompanying notes are an integral part of these financial statements.
100 Dynamic Asset Allocation Conservative Fund | |
Statement of assets and liabilities 9/30/21
| ASSETS | |
| Investment in securities, at value, including $4,520,258 of securities on loan (Notes 1 and 9): | |
| Unaffiliated issuers (identified cost $1,035,138,496) | $1,232,556,833 |
| Affiliated issuers (identified cost $8,912,499) (Note 5) | 8,912,499 |
| Cash | 84,015 |
| Foreign currency (cost $172,284) (Note 1) | 170,929 |
| Dividends, interest and other receivables | 4,067,129 |
| Foreign tax reclaim | 282,112 |
| Receivable for shares of the fund sold | 4,713,213 |
| Receivable for investments sold | 12,462,920 |
| Receivable for sales of TBA securities (Note 1) | 67,617,012 |
| Receivable for variation margin on futures contracts (Note 1) | 3,794,280 |
| Receivable for variation margin on centrally cleared swap contracts (Note 1) | 115,937 |
| Unrealized appreciation on forward currency contracts (Note 1) | 1,656,350 |
| Unrealized appreciation on OTC swap contracts (Note 1) | 621,690 |
| Premium paid on OTC swap contracts (Note 1) | 1,080,636 |
| Prepaid assets | 37,267 |
| Total assets | 1,338,172,822 |
| LIABILITIES | |
| Payable for investments purchased | 6,900,288 |
| Payable for purchases of delayed delivery securities (Note 1) | 927,089 |
| Payable for purchases of TBA securities (Note 1) | 152,311,123 |
| Payable for shares of the fund repurchased | 2,896,738 |
| Payable for compensation of Manager (Note 2) | 465,797 |
| Payable for custodian fees (Note 2) | 47,012 |
| Payable for investor servicing fees (Note 2) | 195,879 |
| Payable for Trustee compensation and expenses (Note 2) | 201,218 |
| Payable for administrative services (Note 2) | 3,298 |
| Payable for distribution fees (Note 2) | 396,072 |
| Payable for variation margin on futures contracts (Note 1) | 446,935 |
| Payable for variation margin on centrally cleared swap contracts (Note 1) | 96,515 |
| Unrealized depreciation on OTC swap contracts (Note 1) | 1,850,744 |
| Premium received on OTC swap contracts (Note 1) | 428,039 |
| Unrealized depreciation on forward currency contracts (Note 1) | 2,369,084 |
| Written options outstanding, at value (premiums $112,750) (Note 1) | 125,086 |
| TBA sale commitments, at value (proceeds receivable $69,636,875) (Note 1) | 69,386,626 |
| Collateral on securities loaned, at value (Note 1) | 4,673,015 |
| Collateral on certain derivative contracts and TBA commitments, at value (Notes 1 and 9) | 985,523 |
| Other accrued expenses | 205,333 |
| Total liabilities | 244,911,414 |
| Net assets | $1,093,261,408 |
(Continued on next page)
| Dynamic Asset Allocation Conservative Fund 101 |
Statement of assets and liabilities cont.
| REPRESENTED BY | |
| Paid-in capital (Unlimited shares authorized) (Notes 1 and 4) | $892,731,103 |
| Total distributable earnings (Note 1) | 200,530,305 |
| Total — Representing net assets applicable to capital shares outstanding | 1,093,261,408 |
| COMPUTATION OF NET ASSET VALUE AND OFFERING PRICE | |
| Net asset value and redemption price per class A share | |
| ($461,749,139 divided by 39,028,615 shares) | $11.83 |
| Offering price per class A share (100/94.25 of $11.83)* | $12.55 |
| Net asset value and offering price per class B share ($6,996,545 divided by 596,811 shares)** | $11.72 |
| Net asset value and offering price per class C share ($99,034,164 divided by 8,495,466 shares)** | $11.66 |
| Net asset value, offering price and redemption price per class P share | |
| ($180,543,518 divided by 15,201,692 shares) | $11.88 |
| Net asset value, offering price and redemption price per class R share | |
| ($8,115,025 divided by 664,430 shares) | $12.21 |
| Net asset value, offering price and redemption price per class R5 share | |
| ($4,958,736 divided by 417,447 shares) | $11.88 |
| Net asset value, offering price and redemption price per class R6 share | |
| ($112,853,228 divided by 9,489,249 shares) | $11.89 |
| Net asset value, offering price and redemption price per class Y share | |
| ($219,011,053 divided by 18,424,804 shares) | $11.89 |
* On single retail sales of less than $50,000. On sales of $50,000 or more the offering price is reduced.
** Redemption price per share is equal to net asset value less any applicable contingent deferred sales charge.
The accompanying notes are an integral part of these financial statements.
| 102 Dynamic Asset Allocation Conservative Fund |
Statement of operations Year ended 9/30/21
| INVESTMENT INCOME | |
| Interest (including interest income of $89,567 from investments in affiliated issuers) (Note 5) | $14,430,107 |
| Dividends (net of foreign tax of $249,898) | 9,776,049 |
| Securities lending (net of expenses) (Notes 1 and 5) | 31,515 |
| Total investment income | 24,237,671 |
| EXPENSES | |
| Compensation of Manager (Note 2) | 5,671,343 |
| Investor servicing fees (Note 2) | 1,222,856 |
| Custodian fees (Note 2) | 196,181 |
| Trustee compensation and expenses (Note 2) | 46,806 |
| Distribution fees (Note 2) | 2,290,411 |
| Administrative services (Note 2) | 28,239 |
| Other | 489,645 |
| Total expenses | 9,945,481 |
| Expense reduction (Note 2) | (1,512) |
| Net expenses | 9,943,969 |
| Net investment income | 14,293,702 |
| REALIZED AND UNREALIZED GAIN (LOSS) | |
| Net realized gain (loss) on: | |
| Securities from unaffiliated issuers (Notes 1 and 3) | 75,155,169 |
| Foreign currency transactions (Note 1) | (20,089) |
| Forward currency contracts (Note 1) | (772,166) |
| Futures contracts (Note 1) | (71,379,636) |
| Swap contracts (Note 1) | 554,770 |
| Written options (Note 1) | (48,331) |
| Net increase from payments by affiliates (Note 2) | 3,047 |
| Total net realized gain | 3,492,764 |
| Change in net unrealized appreciation (depreciation) on: | |
| Securities from unaffiliated issuers and TBA sale commitments | 69,960,406 |
| Assets and liabilities in foreign currencies | (527) |
| Forward currency contracts | (993,298) |
| Futures contracts | 12,439,335 |
| Swap contracts | (683,418) |
| Written options | (261,604) |
| Total change in net unrealized appreciation | 80,460,894 |
| Net gain on investments | 83,953,658 |
| Net increase in net assets resulting from operations | $98,247,360 |
The accompanying notes are an integral part of these financial statements.
| Dynamic Asset Allocation Conservative Fund 103 |
Statement of changes in net assets
| DECREASE IN NET ASSETS | Year ended 9/30/21 | Year ended 9/30/20 |
| Operations | ||
| Net investment income | $14,293,702 | $16,921,078 |
| Net realized gain on investments | ||
| and foreign currency transactions | 3,492,764 | 9,697,158 |
| Change in net unrealized appreciation of investments | ||
| and assets and liabilities in foreign currencies | 80,460,894 | 44,187,885 |
| Net increase in net assets resulting from operations | 98,247,360 | 70,806,121 |
| Distributions to shareholders (Note 1): | ||
| From ordinary income | ||
| Net investment income | ||
| Class A | (6,273,433) | (8,916,664) |
| Class B | (51,945) | (129,587) |
| Class C | (649,536) | (1,349,241) |
| Class M | — | (22,344) |
| Class P | (3,080,291) | (3,667,103) |
| Class R | (93,570) | (173,642) |
| Class R5 | (79,114) | (120,094) |
| Class R6 | (2,043,634) | (3,040,562) |
| Class Y | (3,667,006) | (5,240,388) |
| Net realized short-term gain on investments | ||
| Class A | (4,238,205) | — |
| Class B | (84,218) | — |
| Class C | (1,006,425) | — |
| Class P | (1,628,221) | — |
| Class R | (86,443) | — |
| Class R5 | (44,063) | — |
| Class R6 | (1,152,922) | — |
| Class Y | (2,412,103) | — |
| From net realized long-term gain on investments | ||
| Class A | (5,008,786) | (1,364,560) |
| Class B | (99,530) | (31,987) |
| Class C | (1,189,411) | (311,911) |
| Class P | (1,924,261) | (424,679) |
| Class R | (102,159) | (29,750) |
| Class R5 | (52,075) | (16,121) |
| Class R6 | (1,362,544) | (390,705) |
| Class Y | (2,850,668) | (647,620) |
| Decrease from capital share transactions (Note 4) | (64,881,948) | (47,802,203) |
| Total decrease in net assets | (5,815,151) | (2,873,040) |
| NET ASSETS | ||
| Beginning of year | 1,099,076,559 | 1,101,949,599 |
| End of year | $1,093,261,408 | $1,099,076,559 |
The accompanying notes are an integral part of these financial statements.
| 104 Dynamic Asset Allocation Conservative Fund |
| This page left blank intentionally. |
| Dynamic Asset Allocation Conservative Fund 105 |
Financial highlights (For a common share outstanding throughout the period)
| INVESTMENT OPERATIONS | LESS DISTRIBUTIONS | RATIOS AND SUPPLEMENTAL DATA | |||||||||||
| Ratio of net | |||||||||||||
| Net asset | Net realized | Ratio | investment | ||||||||||
| value, | and unrealized | Total from | From net | From net | Net asset | Total return | Net assets, | of expenses | income (loss) | Portfolio | |||
| beginning | Net investment | gain (loss) | investment | investment | realized gain | Total | value, end | at net asset | end of period | to average | to average | turnover | |
| Period ended | of period | income (loss)a | on investments | operations | income | on investments | distributions | of period | value (%)b | (in thousands) | net assets (%)c | net assets (%) | (%)d |
| Class A | |||||||||||||
| September 30, 2021 | $11.22 | .14 | .87 | 1.01 | (.16) | (.24) | (.40) | $11.83 | 9.14 | $461,749 | .97 | 1.21 | 380 |
| September 30, 2020 | 10.76 | .16 | .55 | .71 | (.22) | (.03) | (.25) | 11.22 | 6.70 | 447,803 | .98 | 1.47 | 395 |
| September 30, 2019 | 10.86 | .22 | .18 | .40 | (.22) | (.28) | (.50) | 10.76 | 3.98 | 472,811 | 1.00 | 2.07 | 173 |
| September 30, 2018 | 10.79 | .21 | .13 | .34 | (.19) | (.08) | (.27) | 10.86 | 3.17 | 485,387 | .99 | 1.95 | 166 |
| September 30, 2017 | 10.32 | .18 | .52 | .70 | (.17) | (.06) | (.23) | 10.79 | 6.82 | 490,389 | 1.01 | 1.74 | 327 |
| Class B | |||||||||||||
| September 30, 2021 | $11.12 | .05 | .86 | .91 | (.07) | (.24) | (.31) | $11.72 | 8.31 | $6,997 | 1.72 | .45 | 380 |
| September 30, 2020 | 10.67 | .08 | .54 | .62 | (.14) | (.03) | (.17) | 11.12 | 5.87 | 9,047 | 1.73 | .72 | 395 |
| September 30, 2019 | 10.77 | .14 | .18 | .32 | (.14) | (.28) | (.42) | 10.67 | 3.24 | 11,609 | 1.75 | 1.31 | 173 |
| September 30, 2018 | 10.71 | .13 | .12 | .25 | (.11) | (.08) | (.19) | 10.77 | 2.33 | 15,589 | 1.74 | 1.18 | 166 |
| September 30, 2017 | 10.23 | .10 | .53 | .63 | (.09) | (.06) | (.15) | 10.71 | 6.17 | 19,195 | 1.76 | .98 | 327 |
| Class C | |||||||||||||
| September 30, 2021 | $11.06 | .05 | .86 | .91 | (.07) | (.24) | (.31) | $11.66 | 8.36 | $99,034 | 1.72 | .47 | 380 |
| September 30, 2020 | 10.61 | .08 | .54 | .62 | (.14) | (.03) | (.17) | 11.06 | 5.92 | 101,750 | 1.73 | .73 | 395 |
| September 30, 2019 | 10.71 | .14 | .18 | .32 | (.14) | (.28) | (.42) | 10.61 | 3.27 | 108,582 | 1.75 | 1.32 | 173 |
| September 30, 2018 | 10.66 | .13 | .11 | .24 | (.11) | (.08) | (.19) | 10.71 | 2.25 | 117,639 | 1.74 | 1.19 | 166 |
| September 30, 2017 | 10.19 | .10 | .52 | .62 | (.09) | (.06) | (.15) | 10.66 | 6.12 | 133,084 | 1.76 | 1.00 | 327 |
| Class P | |||||||||||||
| September 30, 2021 | $11.26 | .19 | .87 | 1.06 | (.20) | (.24) | (.44) | $11.88 | 9.61 | $180,544 | .59 | 1.60 | 380 |
| September 30, 2020 | 10.80 | .20 | .55 | .75 | (.26) | (.03) | (.29) | 11.26 | 7.10 | 170,539 | .59 | 1.86 | 395 |
| September 30, 2019 | 10.89 | .26 | .19 | .45 | (.26) | (.28) | (.54) | 10.80 | 4.48 | 144,175 | .60 | 2.47 | 173 |
| September 30, 2018 | 10.83 | .25 | .13 | .38 | (.24) | (.08) | (.32) | 10.89 | 3.47 | 120,496 | .60 | 2.35 | 166 |
| September 30, 2017 | 10.35 | .23 | .52 | .75 | (.21) | (.06) | (.27) | 10.83 | 7.31 | 102,483 | .61 | 2.19 | 327 |
| Class R | |||||||||||||
| September 30, 2021 | $11.57 | .12 | .89 | 1.01 | (.13) | (.24) | (.37) | $12.21 | 8.82 | $8,115 | 1.22 | .97 | 380 |
| September 30, 2020 | 11.08 | .14 | .57 | .71 | (.19) | (.03) | (.22) | 11.57 | 6.51 | 9,223 | 1.23 | 1.23 | 395 |
| September 30, 2019 | 11.17 | .20 | .18 | .38 | (.19) | (.28) | (.47) | 11.08 | 3.69 | 10,451 | 1.25 | 1.82 | 173 |
| September 30, 2018 | 11.09 | .19 | .14 | .33 | (.17) | (.08) | (.25) | 11.17 | 2.91 | 10,407 | 1.24 | 1.69 | 166 |
| September 30, 2017 | 10.60 | .16 | .53 | .69 | (.14) | (.06) | (.20) | 11.09 | 6.57 | 12,207 | 1.26 | 1.52 | 327 |
| Class R5 | |||||||||||||
| September 30, 2021 | $11.26 | .17 | .88 | 1.05 | (.19) | (.24) | (.43) | $11.88 | 9.49 | $4,959 | .70 | 1.49 | 380 |
| September 30, 2020 | 10.80 | .19 | .55 | .74 | (.25) | (.03) | (.28) | 11.26 | 6.99 | 4,664 | .70 | 1.77 | 395 |
| September 30, 2019 | 10.90 | .25 | .18 | .43 | (.25) | (.28) | (.53) | 10.80 | 4.26 | 5,781 | .71 | 2.36 | 173 |
| September 30, 2018 | 10.83 | .24 | .14 | .38 | (.23) | (.08) | (.31) | 10.90 | 3.45 | 5,651 | .71 | 2.24 | 166 |
| September 30, 2017 | 10.35 | .19 | .54 | .73 | (.19) | (.06) | (.25) | 10.83 | 7.17 | 105 | .72 | 1.84 | 327 |
See notes to financial highlights at the end of this section.
The accompanying notes are an integral part of these financial statements.
| 106 Dynamic Asset Allocation Conservative Fund | Dynamic Asset Allocation Conservative Fund 107 |
Financial highlights cont.
| INVESTMENT OPERATIONS | LESS DISTRIBUTIONS | RATIOS AND SUPPLEMENTAL DATA | |||||||||||
| Ratio of net | |||||||||||||
| Net asset | Net realized | Ratio | investment | ||||||||||
| value, | and unrealized | Total from | From net | From net | Net asset | Total return | Net assets, | of expenses | income (loss) | Portfolio | |||
| beginning | Net investment | gain (loss) | investment | investment | realized gain | Total | value, end | at net asset | end of period | to average | to average | turnover | |
| Period ended | of period | income (loss)a | on investments | operations | income | on investments | distributions | of period | value (%)b | (in thousands) | net assets (%)c | net assets (%) | (%)d |
| Class R6 | |||||||||||||
| September 30, 2021 | $11.27 | .18 | .88 | 1.06 | (.20) | (.24) | (.44) | $11.89 | 9.54 | $112,853 | .63 | 1.57 | 380 |
| September 30, 2020 | 10.81 | .20 | .55 | .75 | (.26) | (.03) | (.29) | 11.27 | 7.04 | 119,654 | .63 | 1.84 | 395 |
| September 30, 2019 | 10.90 | .26 | .19 | .45 | (.26) | (.28) | (.54) | 10.81 | 4.42 | 116,456 | .64 | 2.43 | 173 |
| September 30, 2018 | 10.84 | .25 | .12 | .37 | (.23) | (.08) | (.31) | 10.90 | 3.40 | 106,430 | .64 | 2.31 | 166 |
| September 30, 2017 | 10.35 | .23 | .52 | .75 | (.20) | (.06) | (.26) | 10.84 | 7.36 | 113,578 | .65 | 2.16 | 327 |
| Class Y | |||||||||||||
| September 30, 2021 | $11.27 | .17 | .88 | 1.05 | (.19) | (.24) | (.43) | $11.89 | 9.45 | $219,011 | .72 | 1.46 | 380 |
| September 30, 2020 | 10.80 | .19 | .55 | .74 | (.24) | (.03) | (.27) | 11.27 | 7.02 | 236,396 | .73 | 1.73 | 395 |
| September 30, 2019 | 10.90 | .24 | .18 | .42 | (.24) | (.28) | (.52) | 10.80 | 4.20 | 224,159 | .75 | 2.32 | 173 |
| September 30, 2018 | 10.83 | .24 | .13 | .37 | (.22) | (.08) | (.30) | 10.90 | 3.39 | 230,196 | .74 | 2.20 | 166 |
| September 30, 2017 | 10.35 | .21 | .52 | .73 | (.19) | (.06) | (.25) | 10.83 | 7.14 | 244,376 | .76 | 2.04 | 327 |
a Per share net investment income (loss) has been determined on the basis of the weighted average number of shares outstanding during the period.
b Total return assumes dividend reinvestment and does not reflect the effect of sales charges.
c Includes amounts paid through expense offset and/or brokerage service arrangements, if any (Note 2). Also excludes acquired fund fees and expenses, if any.
d Portfolio turnover includes TBA purchase and sale commitments.
The accompanying notes are an integral part of these financial statements.
| 108 Dynamic Asset Allocation Conservative Fund | Dynamic Asset Allocation Conservative Fund 109 |
Notes to financial statements 9/30/21
Within the following Notes to financial statements, references to “State Street” represent State Street Bank and Trust Company, references to “the SEC” represent the Securities and Exchange Commission, references to “Putnam Management” represent Putnam Investment Management, LLC, the fund’s manager, an indirect wholly-owned subsidiary of Putnam Investments, LLC and references to “OTC”, if any, represent over-the-counter. Unless otherwise noted, the “reporting period” represents the period from October 1, 2020 through September 30, 2021.
Putnam Dynamic Asset Allocation Conservative Fund (the fund) is a diversified series of Putnam Asset Allocation Funds (the Trust), a Massachusetts business trust registered under the Investment Company Act of 1940, as amended, as an open-end management investment company. The goal of the fund is to seek total return consistent with preservation of capital. Total return is composed of capital appreciation and income. The fund is one of three Putnam Dynamic Asset Allocation Funds, each of which has a unique strategic, or typical, allocation between equity and fixed-income investments. Using qualitative analysis and quantitative techniques, Putnam Management adjusts portfolio allocations from time to time within a certain range for the fund to try to optimize the fund’s performance consistent with its goal. The fund invests mainly in fixed-income investments, including U.S. and foreign government obligations, corporate obligations and securitized debt instruments (such as mortgage-backed investments). Putnam Management may consider, among other factors, credit, interest rate and prepayment risks, as well as general market conditions, when deciding whether to buy or sell fixed-income investments. The fund also invests, to a lesser extent, in equity securities (growth or value stocks or both) of U.S. and foreign companies of any size. Putnam Management may consider, among other factors, a company’s valuation, financial strength, growth potential, competitive position in its industry, projected future earnings, cash flows and dividends when deciding whether to buy or sell equity investments. Putnam Management may also select other investments that do not fall within these asset classes. The fund typically uses to a significant extent derivatives, such as futures, options, certain foreign currency transactions, warrants and swap contracts, for both hedging and non-hedging purposes.
The fund offers class A, class B, class C, class P, class R, class R5, class R6 and class Y shares. Purchases of class B shares are closed to new and existing investors except by exchange from class B shares of another Putnam fund or through dividend and/or capital gains reinvestment. Class A shares are sold with a maximum front-end sales charge of 5.75%. Class A shares generally are not subject to a contingent deferred sales charge, and class P, class R, class R5, class R6 and class Y shares are not subject to a contingent deferred sales charge. Class B shares, which convert to class A shares after approximately eight years, are not subject to a front-end sales charge and are subject to a contingent deferred sales charge if those shares are redeemed within six years of purchase. Class C shares are subject to a one-year 1.00% contingent deferred sales charge and generally convert to class A shares after approximately eight years. Prior to March 1, 2021, class C shares generally converted to class A shares after approximately ten years. Class R shares, which are not available to all investors, are sold at net asset value. The expenses for class A, class B, class C and class R shares may differ based on the distribution fee of each class, which is identified in Note 2. Class P, class R5, class R6 and class Y shares, which are sold at net asset value, are generally subject to the same expenses as class A, class B, class C and class R shares, but do not bear a distribution fee, and in the case of class P, class R5 and class R6 shares, bear a lower investor servicing fee, which is identified in Note 2. Class P shares are only available to other Putnam funds and other accounts managed by Putnam Management or its affiliates. Class R5, class R6 and class Y shares are not available to all investors.
In the normal course of business, the fund enters into contracts that may include agreements to indemnify another party under given circumstances. The fund’s maximum exposure under these arrangements is unknown as this would involve future claims that may be, but have not yet been, made against the fund. However, the fund’s management team expects the risk of material loss to be remote.
The fund has entered into contractual arrangements with an investment adviser, administrator, distributor, shareholder servicing agent and custodian, who each provide services to the fund. Unless expressly stated otherwise, shareholders are not parties to, or intended beneficiaries of these contractual arrangements, and these contractual arrangements are not intended to create any shareholder right to enforce them against the service providers or to seek any remedy under them against the service providers, either directly or on behalf of the fund.
Under the fund’s Amended and Restated Agreement and Declaration of Trust, any claims asserted against or on behalf of the Putnam Funds, including claims against Trustees and Officers, must be brought in state and federal courts located within the Commonwealth of Massachusetts.
| 110 Dynamic Asset Allocation Conservative Fund |
Note 1: Significant accounting policies
The following is a summary of significant accounting policies consistently followed by the fund in the preparation of its financial statements. The preparation of financial statements is in conformity with accounting principles generally accepted in the United States of America and requires management to make estimates and assumptions that affect the reported amounts of assets and liabilities in the financial statements and the reported amounts of increases and decreases in net assets from operations. Actual results could differ from those estimates. Subsequent events after the Statement of assets and liabilities date through the date that the financial statements were issued have been evaluated in the preparation of the financial statements.
Investment income, realized and unrealized gains and losses and expenses of the fund are borne pro-rata based on the relative net assets of each class to the total net assets of the fund, except that each class bears expenses unique to that class (including the distribution fees applicable to such classes). Each class votes as a class only with respect to its own distribution plan or other matters on which a class vote is required by law or determined by the Trustees. If the fund were liquidated, shares of each class would receive their pro-rata share of the net assets of the fund. In addition, the Trustees declare separate dividends on each class of shares.
Security valuation Portfolio securities and other investments are valued using policies and procedures adopted by the Board of Trustees. The Trustees have formed a Pricing Committee to oversee the implementation of these procedures and have delegated responsibility for valuing the fund’s assets in accordance with these procedures to Putnam Management. Putnam Management has established an internal Valuation Committee that is responsible for making fair value determinations, evaluating the effectiveness of the pricing policies of the fund and reporting to the Pricing Committee.
Investments for which market quotations are readily available are valued at the last reported sales price on their principal exchange, or official closing price for certain markets, and are classified as Level 1 securities under Accounting Standards Codification 820 Fair Value Measurements and Disclosures (ASC 820). If no sales are reported, as in the case of some securities that are traded OTC, a security is valued at its last reported bid price and is generally categorized as a Level 2 security.
Investments in open-end investment companies (excluding exchange-traded funds), if any, which can be classified as Level 1 or Level 2 securities, are valued based on their net asset value. The net asset value of such investment companies equals the total value of their assets less their liabilities and divided by the number of their outstanding shares.
Market quotations are not considered to be readily available for certain debt obligations (including short-term investments with remaining maturities of 60 days or less) and other investments; such investments are valued on the basis of valuations furnished by an independent pricing service approved by the Trustees or dealers selected by Putnam Management. Such services or dealers determine valuations for normal institutional-size trading units of such securities using methods based on market transactions for comparable securities and various relationships, generally recognized by institutional traders, between securities (which consider such factors as security prices, yields, maturities and ratings). These securities will generally be categorized as Level 2.
Many securities markets and exchanges outside the U.S. close prior to the scheduled close of the New York Stock Exchange and therefore the closing prices for securities in such markets or on such exchanges may not fully reflect events that occur after such close but before the scheduled close of the New York Stock Exchange. Accordingly, on certain days, the fund will fair value certain foreign equity securities and total return swaps taking into account multiple factors including movements in the U.S. securities markets, currency valuations and comparisons to the valuation of American Depository Receipts, exchange-traded funds and futures contracts. The foreign equity securities, which would generally be classified as Level 1 securities, will be transferred to Level 2 of the fair value hierarchy when they are valued at fair value. The number of days on which fair value prices will be used will depend on market activity and it is possible that fair value prices will be used by the fund to a significant extent. At the close of the reporting period, fair value pricing was used for certain foreign securities and total return swaps in the portfolio. Securities quoted in foreign currencies, if any, are translated into U.S. dollars at the current exchange rate.
To the extent a pricing service or dealer is unable to value a security or provides a valuation that Putnam Management does not believe accurately reflects the security’s fair value, the security will be valued at fair value by Putnam Management in accordance with policies and procedures approved by the Trustees. Certain investments, including certain restricted and illiquid securities and derivatives, are also valued at fair value following procedures approved by the Trustees. These valuations consider such factors as significant market or specific security events such as interest rate or credit quality changes, various relationships with other securities, discount rates, U.S. Treasury, U.S. swap and credit yields, index levels, convexity exposures, recovery rates, sales and other
| Dynamic Asset Allocation Conservative Fund 111 |
multiples and resale restrictions. These securities are classified as Level 2 or as Level 3 depending on the priority of the significant inputs.
To assess the continuing appropriateness of fair valuations, the Valuation Committee reviews and affirms the reasonableness of such valuations on a regular basis after considering all relevant information that is reasonably available. Such valuations and procedures are reviewed periodically by the Trustees. Certain securities may be valued on the basis of a price provided by a single source. The fair value of securities is generally determined as the amount that the fund could reasonably expect to realize from an orderly disposition of such securities over a reasonable period of time. By its nature, a fair value price is a good faith estimate of the value of a security in a current sale and does not reflect an actual market price, which may be different by a material amount.
Security transactions and related investment income Security transactions are recorded on the trade date (the date the order to buy or sell is executed). Gains or losses on securities sold are determined on the identified cost basis.
Interest income, net of any applicable withholding taxes, if any, and including amortization and accretion of premiums and discounts on debt securities, is recorded on the accrual basis. Dividend income, net of any applicable withholding taxes, is recognized on the ex-dividend date except that certain dividends from foreign securities, if any, are recognized as soon as the fund is informed of the ex-dividend date. Non-cash dividends, if any, are recorded at the fair value of the securities received. Dividends representing a return of capital or capital gains, if any, are reflected as a reduction of cost and/or as a realized gain.
The fund may have earned certain fees in connection with its senior loan purchasing activities. These fees, if any, are treated as market discount and are amortized into income in the Statement of operations.
Securities purchased or sold on a forward commitment or delayed delivery basis may be settled at a future date beyond customary settlement time; interest income is accrued based on the terms of the securities. Losses may arise due to changes in the fair value of the underlying securities or if the counterparty does not perform under the contract.
Stripped securities The fund may invest in stripped securities which represent a participation in securities that may be structured in classes with rights to receive different portions of the interest and principal. Interest-only securities receive all of the interest and principal-only securities receive all of the principal. If the interest-only securities experience greater than anticipated prepayments of principal, the fund may fail to recoup fully its initial investment in these securities. Conversely, principal-only securities increase in value if prepayments are greater than anticipated and decline if prepayments are slower than anticipated. The fair value of these securities is highly sensitive to changes in interest rates.
Foreign currency translation The accounting records of the fund are maintained in U.S. dollars. The fair value of foreign securities, currency holdings, and other assets and liabilities is recorded in the books and records of the fund after translation to U.S. dollars based on the exchange rates on that day. The cost of each security is determined using historical exchange rates. Income and withholding taxes are translated at prevailing exchange rates when earned or incurred. The fund does not isolate that portion of realized or unrealized gains or losses resulting from changes in the foreign exchange rate on investments from fluctuations arising from changes in the market prices of the securities. Such gains and losses are included with the net realized and unrealized gain or loss on investments. Net realized gains and losses on foreign currency transactions represent net realized exchange gains or losses on disposition of foreign currencies, currency gains and losses realized between the trade and settlement dates on securities transactions and the difference between the amount of investment income and foreign withholding taxes recorded on the fund’s books and the U.S. dollar equivalent amounts actually received or paid. Net unrealized appreciation and depreciation of assets and liabilities in foreign currencies arise from changes in the value of assets and liabilities other than investments at the period end, resulting from changes in the exchange rate.
Options contracts The fund uses options contracts to hedge against changes in values of securities it owns, owned or expects to own.
The potential risk to the fund is that the change in value of options contracts may not correspond to the change in value of the hedged instruments. In addition, losses may arise from changes in the value of the underlying instruments if there is an illiquid secondary market for the contracts, if interest or exchange rates move unexpectedly or if the counterparty to the contract is unable to perform. Realized gains and losses on purchased options are included in realized gains and losses on investment securities. If a written call option is exercised, the premium originally received is recorded as an addition to sales proceeds. If a written put option is exercised, the premium originally received is recorded as a reduction to the cost of investments.
| 112 Dynamic Asset Allocation Conservative Fund |
Exchange-traded options are valued at the last sale price or, if no sales are reported, the last bid price for purchased options and the last ask price for written options. OTC traded options are valued using prices supplied by dealers.
Options on swaps are similar to options on securities except that the premium paid or received is to buy or grant the right to enter into a previously agreed upon interest rate or credit default contract. Forward premium swap option contracts include premiums that have extended settlement dates. The delayed settlement of the premiums is factored into the daily valuation of the option contracts. In the case of interest rate cap and floor contracts, in return for a premium, ongoing payments between two parties are based on interest rates exceeding a specified rate, in the case of a cap contract, or falling below a specified rate in the case of a floor contract.
Written option contracts outstanding at period end, if any, are listed after the fund’s portfolio.
Futures contracts The fund uses futures contracts to manage exposure to market risk, to hedge prepayment risk, to hedge interest rate risk, to gain exposure to interest rates and to equitize cash.
The potential risk to the fund is that the change in value of futures contracts may not correspond to the change in value of the hedged instruments. In addition, losses may arise from changes in the value of the underlying instruments, if there is an illiquid secondary market for the contracts, if interest or exchange rates move unexpectedly or if the counterparty to the contract is unable to perform. With futures, there is minimal counterparty credit risk to the fund since futures are exchange traded and the exchange’s clearinghouse, as counterparty to all exchange traded futures, guarantees the futures against default. Risks may exceed amounts recognized on the Statement of assets and liabilities. When the contract is closed, the fund records a realized gain or loss equal to the difference between the value of the contract at the time it was opened and the value at the time it was closed.
Futures contracts are valued at the quoted daily settlement prices established by the exchange on which they trade. The fund and the broker agree to exchange an amount of cash equal to the daily fluctuation in the value of the futures contract. Such receipts or payments are known as “variation margin.”
Futures contracts outstanding at period end, if any, are listed after the fund’s portfolio.
Forward currency contracts The fund buys and sells forward currency contracts, which are agreements between two parties to buy and sell currencies at a set price on a future date. These contracts are used to hedge foreign exchange risk and to gain exposure to currencies.
The U.S. dollar value of forward currency contracts is determined using current forward currency exchange rates supplied by a quotation service. The fair value of the contract will fluctuate with changes in currency exchange rates. The contract is marked to market daily and the change in fair value is recorded as an unrealized gain or loss. The fund records a realized gain or loss equal to the difference between the value of the contract at the time it was opened and the value at the time it was closed when the contract matures or by delivery of the currency. The fund could be exposed to risk if the value of the currency changes unfavorably, if the counterparties to the contracts are unable to meet the terms of their contracts or if the fund is unable to enter into a closing position. Risks may exceed amounts recognized on the Statement of assets and liabilities.
Forward currency contracts outstanding at period end, if any, are listed after the fund’s portfolio.
Interest rate swap contracts The fund entered into OTC and/or centrally cleared interest rate swap contracts, which are arrangements between two parties to exchange cash flows based on a notional principal amount, to hedge interest rate risk, to gain exposure on interest rates and to hedge prepayment risk.
An OTC and centrally cleared interest rate swap can be purchased or sold with an upfront premium. For OTC interest rate swap contracts, an upfront payment received by the fund is recorded as a liability on the fund’s books. An upfront payment made by the fund is recorded as an asset on the fund’s books. OTC and centrally cleared interest rate swap contracts are marked to market daily based upon quotations from an independent pricing service or market makers. Any change is recorded as an unrealized gain or loss on OTC interest rate swaps. Daily fluctuations in the value of centrally cleared interest rate swaps are settled through a central clearing agent and are recorded in variation margin on the Statement of assets and liabilities and recorded as unrealized gain or loss. Payments, including upfront premiums, received or made are recorded as realized gains or losses at the reset date or the closing of the contract. Certain OTC and centrally cleared interest rate swap contracts may include extended effective dates. Payments related to these swap contracts are accrued based on the terms of the contract.
The fund could be exposed to credit or market risk due to unfavorable changes in the fluctuation of interest rates or if the counterparty defaults, in the case of OTC interest rate contracts, or the central clearing agency or a
| Dynamic Asset Allocation Conservative Fund 113 |
clearing member defaults, in the case of centrally cleared interest rate swap contracts, on its respective obligation to perform under the contract. The fund’s maximum risk of loss from counterparty risk or central clearing risk is the fair value of the contract. This risk may be mitigated for OTC interest rate swap contracts by having a master netting arrangement between the fund and the counterparty and for centrally cleared interest rate swap contracts through the daily exchange of variation margin. There is minimal counterparty risk with respect to centrally cleared interest rate swap contracts due to the clearinghouse guarantee fund and other resources that are available in the event of a clearing member default. Risk of loss may exceed amounts recognized on the Statement of assets and liabilities.
OTC and centrally cleared interest rate swap contracts outstanding, including their respective notional amounts at period end, if any, are listed after the fund’s portfolio.
Total return swap contracts The fund entered into OTC and/or centrally cleared total return swap contracts, which are arrangements to exchange a market-linked return for a periodic payment, both based on a notional principal amount, to hedge sector exposure, to manage exposure to specific sectors or industries, to manage exposure to specific securities, to gain exposure to a basket of securities, to gain exposure to specific markets or countries and to gain exposure to specific sectors or industries.
To the extent that the total return of the security, index or other financial measure underlying the transaction exceeds or falls short of the offsetting interest rate obligation, the fund will receive a payment from or make a payment to the counterparty. OTC and/or centrally cleared total return swap contracts are marked to market daily based upon quotations from an independent pricing service or market maker. Any change is recorded as an unrealized gain or loss on OTC total return swaps. Daily fluctuations in the value of centrally cleared total return swaps are settled through a central clearing agent and are recorded in variation margin on the Statement of assets and liabilities and recorded as unrealized gain or loss. Payments received or made are recorded as realized gains or losses. Certain OTC and/or centrally cleared total return swap contracts may include extended effective dates. Payments related to these swap contracts are accrued based on the terms of the contract. The fund could be exposed to credit or market risk due to unfavorable changes in the fluctuation of interest rates or in the price of the underlying security or index, the possibility that there is no liquid market for these agreements or that the counterparty may default on its obligation to perform. The fund’s maximum risk of loss from counterparty risk or central clearing risk is the fair value of the contract. This risk may be mitigated for OTC total return swap contracts by having a master netting arrangement between the fund and the counterparty and for centrally cleared total return swap contracts through the daily exchange of variation margin. There is minimal counterparty risk with respect to centrally cleared total return swap contracts due to the clearinghouse guarantee fund and other resources that are available in the event of a clearing member default. Risk of loss may exceed amounts recognized on the Statement of assets and liabilities.
OTC and/or centrally cleared total return swap contracts outstanding, including their respective notional amounts at period end, if any, are listed after the fund’s portfolio.
Credit default contracts The fund entered into OTC and/or centrally cleared credit default contracts to hedge credit risk, to hedge market risk and to gain exposure on individual names and/or baskets of securities.
In OTC and centrally cleared credit default contracts, the protection buyer typically makes a periodic stream of payments to a counterparty, the protection seller, in exchange for the right to receive a contingent payment upon the occurrence of a credit event on the reference obligation or all other equally ranked obligations of the reference entity. Credit events are contract specific but may include bankruptcy, failure to pay, restructuring and obligation acceleration. For OTC credit default contracts, an upfront payment received by the fund is recorded as a liability on the fund’s books. An upfront payment made by the fund is recorded as an asset on the fund’s books. Centrally cleared credit default contracts provide the same rights to the protection buyer and seller except the payments between parties, including upfront premiums, are settled through a central clearing agent through variation margin payments. Upfront and periodic payments received or paid by the fund for OTC and centrally cleared credit default contracts are recorded as realized gains or losses at the reset date or close of the contract. The OTC and centrally cleared credit default contracts are marked to market daily based upon quotations from an independent pricing service or market makers. Any change in value of OTC credit default contracts is recorded as an unrealized gain or loss. Daily fluctuations in the value of centrally cleared credit default contracts are recorded in variation margin on the Statement of assets and liabilities and recorded as unrealized gain or loss. Upon the occurrence of a credit event, the difference between the par value and fair value of the reference obligation, net of any proportional amount of the upfront payment, is recorded as a realized gain or loss.
In addition to bearing the risk that the credit event will occur, the fund could be exposed to market risk due to unfavorable changes in interest rates or in the price of the underlying security or index or the possibility that
| 114 Dynamic Asset Allocation Conservative Fund |
the fund may be unable to close out its position at the same time or at the same price as if it had purchased the underlying reference obligations. In certain circumstances, the fund may enter into offsetting OTC and centrally cleared credit default contracts which would mitigate its risk of loss. Risks of loss may exceed amounts recognized on the Statement of assets and liabilities. The fund’s maximum risk of loss from counterparty risk, either as the protection seller or as the protection buyer, is the fair value of the contract. This risk may be mitigated for OTC credit default contracts by having a master netting arrangement between the fund and the counterparty and for centrally cleared credit default contracts through the daily exchange of variation margin. Counterparty risk is further mitigated with respect to centrally cleared credit default swap contracts due to the clearinghouse guarantee fund and other resources that are available in the event of a clearing member default. Where the fund is a seller of protection, the maximum potential amount of future payments the fund may be required to make is equal to the notional amount.
OTC and centrally cleared credit default contracts outstanding, including their respective notional amounts at period end, if any, are listed after the fund’s portfolio.
TBA commitments The fund may enter into TBA (to be announced) commitments to purchase securities for a fixed unit price at a future date beyond customary settlement time. Although the unit price and par amount have been established, the actual securities have not been specified. However, it is anticipated that the amount of the commitments will not significantly differ from the principal amount. The fund holds, and maintains until settlement date, cash or high-grade debt obligations in an amount sufficient to meet the purchase price, or the fund may enter into offsetting contracts for the forward sale of other securities it owns. Income on the securities will not be earned until settlement date.
The fund may also enter into TBA sale commitments to hedge its portfolio positions, to sell mortgage-backed securities it owns under delayed delivery arrangements or to take a short position in mortgage-backed securities. Proceeds of TBA sale commitments are not received until the contractual settlement date. During the time a TBA sale commitment is outstanding, either equivalent deliverable securities or an offsetting TBA purchase commitment deliverable on or before the sale commitment date are held as “cover” for the transaction, or other liquid assets in an amount equal to the notional value of the TBA sale commitment are segregated. If the TBA sale commitment is closed through the acquisition of an offsetting TBA purchase commitment, the fund realizes a gain or loss. If the fund delivers securities under the commitment, the fund realizes a gain or a loss from the sale of the securities based upon the unit price established at the date the commitment was entered into.
TBA commitments, which are accounted for as purchase and sale transactions, may be considered securities themselves, and involve a risk of loss due to changes in the value of the security prior to the settlement date as well as the risk that the counterparty to the transaction will not perform its obligations. Counterparty risk is mitigated by having a master agreement between the fund and the counterparty.
Unsettled TBA commitments are valued at their fair value according to the procedures described under “Security valuation” above. The contract is marked to market daily and the change in fair value is recorded by the fund as an unrealized gain or loss. Based on market circumstances, Putnam Management will determine whether to take delivery of the underlying securities or to dispose of the TBA commitments prior to settlement.
TBA purchase commitments outstanding at period end, if any, are listed within the fund’s portfolio and TBA sale commitments outstanding at period end, if any, are listed after the fund’s portfolio.
Master agreements The fund is a party to ISDA (International Swaps and Derivatives Association, Inc.) Master Agreements that govern OTC derivative and foreign exchange contracts and Master Securities Forward Transaction Agreements that govern transactions involving mortgage-backed and other asset-backed securities that may result in delayed delivery (Master Agreements) with certain counterparties entered into from time to time. The Master Agreements may contain provisions regarding, among other things, the parties’ general obligations, representations, agreements, collateral requirements, events of default and early termination. With respect to certain counterparties, in accordance with the terms of the Master Agreements, collateral pledged to the fund is held in a segregated account by the fund’s custodian and, with respect to those amounts which can be sold or repledged, are presented in the fund’s portfolio.
Collateral pledged by the fund is segregated by the fund’s custodian and identified in the fund’s portfolio. Collateral can be in the form of cash or debt securities issued by the U.S. Government or related agencies or other securities as agreed to by the fund and the applicable counterparty. Collateral requirements are determined based on the fund’s net position with each counterparty.
With respect to ISDA Master Agreements, termination events applicable to the fund may occur upon a decline in the fund’s net assets below a specified threshold over a certain period of time. Termination events applicable
| Dynamic Asset Allocation Conservative Fund 115 |
to counterparties may occur upon a decline in the counterparty’s long-term or short-term credit ratings below a specified level. In each case, upon occurrence, the other party may elect to terminate early and cause settlement of all derivative and foreign exchange contracts outstanding, including the payment of any losses and costs resulting from such early termination, as reasonably determined by the terminating party. Any decision by one or more of the fund’s counterparties to elect early termination could impact the fund’s future derivative activity.
At the close of the reporting period, the fund had a net liability position of $1,748,064 on open derivative contracts subject to the Master Agreements. Collateral pledged by the fund at period end for these agreements totaled $1,714,782 and may include amounts related to unsettled agreements.
Securities lending The fund may lend securities, through its agent, to qualified borrowers in order to earn additional income. The loans are collateralized by cash in an amount at least equal to the fair value of the securities loaned. The fair value of securities loaned is determined daily and any additional required collateral is allocated to the fund on the next business day. The remaining maturities of the securities lending transactions are considered overnight and continuous. The risk of borrower default will be borne by the fund’s agent; the fund will bear the risk of loss with respect to the investment of the cash collateral. Income from securities lending, net of expenses, is included in investment income on the Statement of operations. Cash collateral is invested in Putnam Cash Collateral Pool, LLC, a limited liability company managed by an affiliate of Putnam Management. Investments in Putnam Cash Collateral Pool, LLC are valued at its closing net asset value each business day. There are no management fees charged to Putnam Cash Collateral Pool, LLC. At the close of the reporting period, the fund received cash collateral of $4,673,015 and the value of securities loaned amounted to $4,520,258.
Interfund lending The fund, along with other Putnam funds, may participate in an interfund lending program pursuant to an exemptive order issued by the SEC. This program allows the fund to borrow from or lend to other Putnam funds that permit such transactions. Interfund lending transactions are subject to each fund’s investment policies and borrowing and lending limits. Interest earned or paid on the interfund lending transaction will be based on the average of certain current market rates. During the reporting period, the fund did not utilize the program.
Lines of credit The fund participates, along with other Putnam funds, in a $317.5 million unsecured committed line of credit and a $235.5 million unsecured uncommitted line of credit, both provided by State Street. Borrowings may be made for temporary or emergency purposes, including the funding of shareholder redemption requests and trade settlements. Interest is charged to the fund based on the fund’s borrowing at a rate equal to 1.25% plus the higher of (1) the Federal Funds rate and (2) the Overnight Bank Funding Rate for the committed line of credit and 1.30% plus the higher of (1) the Federal Funds rate and (2) the Overnight Bank Funding Rate for the uncommitted line of credit. A closing fee equal to 0.04% of the committed line of credit and 0.04% of the uncommitted line of credit has been paid by the participating funds. In addition, a commitment fee of 0.21% per annum on any unutilized portion of the committed line of credit is allocated to the participating funds based on their relative net assets and paid quarterly. During the reporting period, the fund had no borrowings against these arrangements.
Federal taxes It is the policy of the fund to distribute all of its taxable income within the prescribed time period and otherwise comply with the provisions of the Internal Revenue Code of 1986, as amended (the Code), applicable to regulated investment companies. It is also the intention of the fund to distribute an amount sufficient to avoid imposition of any excise tax under Section 4982 of the Code.
The fund is subject to the provisions of Accounting Standards Codification 740 Income Taxes (ASC 740). ASC 740 sets forth a minimum threshold for financial statement recognition of the benefit of a tax position taken or expected to be taken in a tax return. The fund did not have a liability to record for any unrecognized tax benefits in the accompanying financial statements. No provision has been made for federal taxes on income, capital gains or unrealized appreciation on securities held nor for excise tax on income and capital gains. Each of the fund’s federal tax returns for the prior three fiscal years remains subject to examination by the Internal Revenue Service.
The fund may also be subject to taxes imposed by governments of countries in which it invests. Such taxes are generally based on either income or gains earned or repatriated. The fund accrues and applies such taxes to net investment income, net realized gains and net unrealized gains as income and/or capital gains are earned. In some cases, the fund may be entitled to reclaim all or a portion of such taxes, and such reclaim amounts, if any, are reflected as an asset on the fund’s books. In many cases, however, the fund may not receive such amounts for an extended period of time, depending on the country of investment.
Distributions to shareholders Distributions to shareholders from net investment income are recorded by the fund on the ex-dividend date. Distributions from capital gains, if any, are recorded on the ex-dividend date and
| 116 Dynamic Asset Allocation Conservative Fund |
paid at least annually. The amount and character of income and gains to be distributed are determined in accordance with income tax regulations, which may differ from generally accepted accounting principles. These differences include temporary and/or permanent differences from losses on wash sale transactions, foreign currency gains and losses, unrealized gains and losses on certain futures contracts, straddle loss deferrals, income on swap contracts and interest-only securities. Reclassifications are made to the fund’s capital accounts to reflect income and gains available for distribution (or available capital loss carryovers) under income tax regulations. At the close of the reporting period, the fund reclassified $5,814,563 to increase undistributed net investment income, $65 to decrease paid-in capital and $5,814,498 to increase accumulated net realized loss.
Tax cost of investments includes adjustments to net unrealized appreciation (depreciation) which may not necessarily be final tax cost basis adjustments, but closely approximate the tax basis unrealized gains and losses that may be realized and distributed to shareholders. The tax basis components of distributable earnings and the federal tax cost as of the close of the reporting period were as follows:
| Unrealized appreciation | $185,925,144 |
| Unrealized depreciation | (23,206,198) |
| Net unrealized appreciation | 162,718,946 |
| Undistributed ordinary income | 7,482,147 |
| Undistributed long-term gains | 12,437,820 |
| Undistributed short-term gains | 18,199,926 |
| Cost for federal income tax purposes | $1,020,331,283 |
Expenses of the Trust Expenses directly charged or attributable to any fund will be paid from the assets of that fund. Generally, expenses of the Trust will be allocated among and charged to the assets of each fund on a basis that the Trustees deem fair and equitable, which may be based on the relative assets of each fund or the nature of the services performed and relative applicability to each fund.
Note 2: Management fee, administrative services and other transactions
The fund pays Putnam Management a management fee (based on the fund’s average net assets and computed and paid monthly) at annual rates that may vary based on the average of the aggregate net assets of all open-end mutual funds sponsored by Putnam Management (excluding net assets of funds that are invested in, or that are invested in by, other Putnam funds to the extent necessary to avoid “double counting” of those assets). Such annual rates may vary as follows:
| 0.680% | of the first $5 billion, | 0.480% | of the next $50 billion, | |
| 0.630% | of the next $5 billion, | 0.460% | of the next $50 billion, | |
| 0.580% | of the next $10 billion, | 0.450% | of the next $100 billion and | |
| 0.530% | of the next $10 billion, | 0.445% | of any excess thereafter. |
For the reporting period, the management fee represented an effective rate (excluding the impact from any expense waivers in effect) of 0.512% of the fund’s average net assets.
Putnam Management has contractually agreed, through January 30, 2023, to waive fees and/or reimburse the fund’s expenses to the extent necessary to limit the cumulative expenses of the fund, exclusive of brokerage, interest, taxes, investment-related expenses, extraordinary expenses, acquired fund fees and expenses and payments under the fund’s investor servicing contract, investment management contract and distribution plans, on a fiscal year-to-date basis to an annual rate of 0.20% of the fund’s average net assets over such fiscal year-to-date period. During the reporting period, the fund’s expenses were not reduced as a result of this limit.
Putnam Investments Limited (PIL), an affiliate of Putnam Management, is authorized by the Trustees to manage a separate portion of the assets of the fund as determined by Putnam Management from time to time. Putnam Management pays a quarterly sub-management fee to PIL for its services at an annual rate of 0.35% of the average net assets of the portion of the fund managed by PIL.
The Putnam Advisory Company, LLC (PAC), an affiliate of Putnam Management, is authorized by the Trustees to manage a separate portion of the assets of the fund, as designated from time to time by Putnam Management or PIL. PAC did not manage any portion of the assets of the fund during the reporting period. If Putnam Management or PIL were to engage the services of PAC, Putnam Management or PIL, as applicable, would pay a quarterly
| Dynamic Asset Allocation Conservative Fund 117 |
sub-advisory fee to PAC for its services at the annual rate of 0.35% of the average net assets of the portion of the fund’s assets for which PAC is engaged as sub-adviser.
Putnam Management voluntarily reimbursed the fund $3,047 for a trading error which occurred during the reporting period. The effect of the loss incurred and the reimbursement by Putnam Management of such amounts had no material impact on total return.
The fund reimburses Putnam Management an allocated amount for the compensation and related expenses of certain officers of the fund and their staff who provide administrative services to the fund. The aggregate amount of all such reimbursements is determined annually by the Trustees.
Custodial functions for the fund’s assets are provided by State Street. Custody fees are based on the fund’s asset level, the number of its security holdings and transaction volumes.
Putnam Investor Services, Inc., an affiliate of Putnam Management, provides investor servicing agent functions to the fund. Putnam Investor Services, Inc. received fees for investor servicing for class A, class B, class C, class R and class Y shares that included (1) a per account fee for each direct and underlying non-defined contribution account (retail account) of the fund; (2) a specified rate of the fund’s assets attributable to defined contribution plan accounts; and (3) a specified rate based on the average net assets in retail accounts. Putnam Investor Services, Inc. has agreed that the aggregate investor servicing fees for each fund’s retail and defined contribution accounts for these share classes will not exceed an annual rate of 0.25% of the fund’s average assets attributable to such accounts.
Class P shares paid a monthly fee based on the average net assets of class P shares at an annual rate of 0.01%.
Class R5 shares paid a monthly fee based on the average net assets of class R5 shares at an annual rate of 0.12%.
Class R6 shares paid a monthly fee based on the average net assets of class R6 shares at an annual rate of 0.05%.
During the reporting period, the expenses for each class of shares related to investor servicing fees were as follows:
| Class A | $647,032 | Class R | 12,552 | |
| Class B | 11,603 | Class R5 | 5,791 | |
| Class C | 144,686 | Class R6 | 60,560 | |
| Class P | 17,694 | Class Y | 322,938 | |
| Total | $1,222,856 |
The fund has entered into expense offset arrangements with Putnam Investor Services, Inc. and State Street whereby Putnam Investor Services, Inc.’s and State Street’s fees are reduced by credits allowed on cash balances. For the reporting period, the fund’s expenses were reduced by $1,512 under the expense offset arrangements.
Each Independent Trustee of the fund receives an annual Trustee fee, of which $724, as a quarterly retainer, has been allocated to the fund, and an additional fee for each Trustees meeting attended. Trustees also are reimbursed for expenses they incur relating to their services as Trustees.
The fund has adopted a Trustee Fee Deferral Plan (the Deferral Plan) which allows the Trustees to defer the receipt of all or a portion of Trustees fees payable on or after July 1, 1995. The deferred fees remain invested in certain Putnam funds until distribution in accordance with the Deferral Plan.
The fund has adopted an unfunded noncontributory defined benefit pension plan (the Pension Plan) covering all Trustees of the fund who have served as a Trustee for at least five years and were first elected prior to 2004. Benefits under the Pension Plan are equal to 50% of the Trustee’s average annual attendance and retainer fees for the three years ended December 31, 2005. The retirement benefit is payable during a Trustee’s lifetime, beginning the year following retirement, for the number of years of service through December 31, 2006. Pension expense for the fund is included in Trustee compensation and expenses in the Statement of operations. Accrued pension liability is included in Payable for Trustee compensation and expenses in the Statement of assets and liabilities. The Trustees have terminated the Pension Plan with respect to any Trustee first elected after 2003.
The fund has adopted distribution plans (the Plans) with respect to the following share classes pursuant to Rule 12b–1 under the Investment Company Act of 1940. The purpose of the Plans is to compensate Putnam Retail Management Limited Partnership, an indirect wholly-owned subsidiary of Putnam Investments, LLC, for services provided and expenses incurred in distributing shares of the fund. The Plans provide payments by the fund to
| 118 Dynamic Asset Allocation Conservative Fund |
Putnam Retail Management Limited Partnership at an annual rate of up to the following amounts (Maximum %) of the average net assets attributable to each class. The Trustees have approved payment by the fund at the following annual rate (Approved %) of the average net assets attributable to each class. During the reporting period, the class-specific expenses related to distribution fees were as follows:
| Maximum % | Approved % | Amount | |
| Class A | 0.35% | 0.25% | $1,143,387 |
| Class B | 1.00% | 1.00% | 81,628 |
| Class C | 1.00% | 1.00% | 1,021,190 |
| Class R | 1.00% | 0.50% | 44,206 |
| Total | $2,290,411 |
For the reporting period, Putnam Retail Management Limited Partnership, acting as underwriter, received net commissions of $79,518 from the sale of class A shares and received $1,379 and $1,682 in contingent deferred sales charges from redemptions of class B and class C shares, respectively.
A deferred sales charge of up to 1.00% is assessed on certain redemptions of class A shares. For the reporting period, Putnam Retail Management Limited Partnership, acting as underwriter, received $234 on class A redemptions.
Note 3: Purchases and sales of securities
During the reporting period, the cost of purchases and the proceeds from sales, excluding short-term investments, were as follows:
| Cost of purchases | Proceeds from sales | |
| Investments in securities, including TBA commitments (Long-term) | $4,275,535,944 | $4,374,660,020 |
| U.S. government securities (Long-term) | — | — |
| Total | $4,275,535,944 | $4,374,660,020 |
The fund may purchase or sell investments from or to other Putnam funds in the ordinary course of business, which can reduce the fund’s transaction costs, at prices determined in accordance with SEC requirements and policies approved by the Trustees. During the reporting period, purchases or sales of long-term securities from or to other Putnam funds, if any, did not represent more than 5% of the fund’s total cost of purchases and/or total proceeds from sales.
Note 4: Capital shares
At the close of the reporting period, there were an unlimited number of shares of beneficial interest authorized. Transactions, including, if applicable, direct exchanges pursuant to share conversions, in capital shares were as follows:
| YEAR ENDED 9/30/21 | YEAR ENDED 9/30/20 | |||
| Class A | Shares | Amount | Shares | Amount |
| Shares sold | 5,553,212 | $64,472,706 | 6,639,226 | $72,074,146 |
| Shares issued in connection with | ||||
| reinvestment of distributions | 1,296,126 | 14,920,438 | 918,566 | 9,921,588 |
| 6,849,338 | 79,393,144 | 7,557,792 | 81,995,734 | |
| Shares repurchased | (7,735,673) | (89,529,313) | (11,588,070) | (125,091,264) |
| Net decrease | (886,335) | $(10,136,169) | (4,030,278) | $(43,095,530) |
| Dynamic Asset Allocation Conservative Fund 119 |
| YEAR ENDED 9/30/21 | YEAR ENDED 9/30/20 | |||
| Class B | Shares | Amount | Shares | Amount |
| Shares sold | 50,778 | $577,845 | 47,005 | $511,921 |
| Shares issued in connection with | ||||
| reinvestment of distributions | 17,980 | 204,364 | 13,330 | 142,519 |
| 68,758 | 782,209 | 60,335 | 654,440 | |
| Shares repurchased | (285,458) | (3,292,754) | (335,254) | (3,611,675) |
| Net decrease | (216,700) | $(2,510,545) | (274,919) | $(2,957,235) |
| YEAR ENDED 9/30/21 | YEAR ENDED 9/30/20 | |||
| Class C | Shares | Amount | Shares | Amount |
| Shares sold | 1,472,043 | $16,876,257 | 1,493,794 | $15,960,590 |
| Shares issued in connection with | ||||
| reinvestment of distributions | 245,648 | 2,776,537 | 150,113 | 1,597,686 |
| 1,717,691 | 19,652,794 | 1,643,907 | 17,558,276 | |
| Shares repurchased | (2,422,920) | (27,717,478) | (2,677,181) | (28,470,753) |
| Net decrease | (705,229) | $(8,064,684) | (1,033,274) | $(10,912,477) |
| YEAR ENDED 9/30/20* | ||||
| Class M | Shares | Amount | ||
| Shares sold | 1,842 | $19,564 | ||
| Shares issued in connection with | ||||
| reinvestment of distributions | 2,074 | 22,039 | ||
| 3,916 | 41,603 | |||
| Shares repurchased | (749,684) | (8,021,268) | ||
| Net decrease | (745,768) | $(7,979,665) | ||
| YEAR ENDED 9/30/21 | YEAR ENDED 9/30/20 | |||
| Class P | Shares | Amount | Shares | Amount |
| Shares sold | 25,009,573 | $285,742,261 | 6,716,194 | $73,397,737 |
| Shares issued in connection with | ||||
| reinvestment of distributions | 573,458 | 6,632,773 | 377,448 | 4,091,782 |
| 25,583,031 | 292,375,034 | 7,093,642 | 77,489,519 | |
| Shares repurchased | (25,526,022) | (291,740,978) | (5,299,782) | (57,677,250) |
| Net increase | 57,009 | $634,056 | 1,793,860 | $19,812,269 |
| YEAR ENDED 9/30/21 | YEAR ENDED 9/30/20 | |||
| Class R | Shares | Amount | Shares | Amount |
| Shares sold | 95,286 | $1,145,646 | 199,225 | $2,230,485 |
| Shares issued in connection with | ||||
| reinvestment of distributions | 23,201 | 275,018 | 17,430 | 193,941 |
| 118,487 | 1,420,664 | 216,655 | 2,424,426 | |
| Shares repurchased | (251,499) | (3,014,990) | (362,193) | (4,095,628) |
| Net decrease | (133,012) | $(1,594,326) | (145,538) | $(1,671,202) |
| 120 Dynamic Asset Allocation Conservative Fund |
| YEAR ENDED 9/30/21 | YEAR ENDED 9/30/20 | |||
| Class R5 | Shares | Amount | Shares | Amount |
| Shares sold | 31,132 | $363,017 | 45,875 | $499,997 |
| Shares issued in connection with | ||||
| reinvestment of distributions | 15,152 | 175,252 | 12,572 | 136,215 |
| 46,284 | 538,269 | 58,447 | 636,212 | |
| Shares repurchased | (42,919) | (494,533) | (179,559) | (1,942,061) |
| Net increase (decrease) | 3,365 | $43,736 | (121,112) | $(1,305,849) |
| YEAR ENDED 9/30/21 | YEAR ENDED 9/30/20 | |||
| Class R6 | Shares | Amount | Shares | Amount |
| Shares sold | 2,010,460 | $23,339,093 | 4,666,484 | $50,488,104 |
| Shares issued in connection with | ||||
| reinvestment of distributions | 394,022 | 4,559,100 | 316,522 | 3,431,267 |
| 2,404,482 | 27,898,193 | 4,983,006 | 53,919,371 | |
| Shares repurchased | (3,528,758) | (41,347,746) | (5,143,839) | (55,804,971) |
| Net decrease | (1,124,276) | $(13,449,553) | (160,833) | $(1,885,600) |
| YEAR ENDED 9/30/21 | YEAR ENDED 9/30/20 | |||
| Class Y | Shares | Amount | Shares | Amount |
| Shares sold | 5,155,735 | $59,844,904 | 8,679,853 | $94,145,871 |
| Shares issued in connection with | ||||
| reinvestment of distributions | 719,057 | 8,311,041 | 507,796 | 5,508,996 |
| 5,874,792 | 68,155,945 | 9,187,649 | 99,654,867 | |
| Shares repurchased | (8,426,724) | (97,960,408) | (8,957,209) | (97,461,781) |
| Net increase (decrease) | (2,551,932) | $(29,804,463) | 230,440 | $2,193,086 |
* Effective November 25, 2019, the fund converted all of its class M shares to class A shares and class M shares were no longer able to be purchased.
At the close of the reporting period, the Putnam RetirementReady Funds owned 15.5% of the outstanding shares of the fund.
| Dynamic Asset Allocation Conservative Fund 121 |
Note 5: Affiliated transactions
Transactions during the reporting period with any company which is under common ownership or control were as follows:
| Shares | |||||
| outstanding | |||||
| and fair | |||||
| Fair value as | Purchase | Sale | Investment | value as | |
| Name of affiliate | of 9/30/20 | cost | proceeds | income | of 9/30/21 |
| Short-term investments | |||||
| Putnam Cash Collateral | |||||
| Pool, LLC* | $4,149,590 | $68,510,103 | $67,986,678 | $6,567 | $4,673,015 |
| Putnam Short Term | |||||
| Investment Fund** | 157,023,383 | 271,547,841 | 424,331,740 | 89,567 | 4,239,484 |
| Total Short-term | |||||
| investments | $161,172,973 | $340,057,944 | $492,318,418 | $96,134 | $8,912,499 |
* No management fees are charged to Putnam Cash Collateral Pool, LLC (Note 1).Investment income shown is included in securities lending income on the Statement of operations. There were no realized or unrealized gains or losses during the period.
** Management fees charged to Putnam Short Term Investment Fund have been waived by Putnam Management. There were no realized or unrealized gains or losses during the period.
Note 6: Market, credit and other risks
In the normal course of business, the fund trades financial instruments and enters into financial transactions where risk of potential loss exists due to changes in the market (market risk) or failure of the contracting party to the transaction to perform (credit risk). The fund may be exposed to additional credit risk that an institution or other entity with which the fund has unsettled or open transactions will default. Investments in foreign securities involve certain risks, including those related to economic instability, unfavorable political developments, and currency fluctuations. The fund may invest in higher-yielding, lower-rated bonds that may have a higher rate of default. The fund may invest a significant portion of its assets in securitized debt instruments, including mortgage-backed and asset-backed investments. The yields and values of these investments are sensitive to changes in interest rates, the rate of principal payments on the underlying assets and the market’s perception of the issuers. The market for these investments may be volatile and limited, which may make them difficult to buy or sell.
On July 27, 2017, the United Kingdom’s Financial Conduct Authority (“FCA”), which regulates LIBOR, announced a desire to phase out the use of LIBOR by the end of 2021. On March 5, 2021, the FCA and LIBOR’s administrator, ICE Benchmark Administration, announced that most LIBOR settings will no longer be published after the end of 2021 and a majority of U.S. dollar LIBOR settings will no longer be published after June 30, 2023. LIBOR has historically been a common benchmark interest rate index used to make adjustments to variable-rate loans. It is used throughout global banking and financial industries to determine interest rates for a variety of financial instruments and borrowing arrangements. The transition process might lead to increased volatility and illiquidity in markets that currently rely on LIBOR to determine interest rates. It could also lead to a reduction in the value of some LIBOR-based investments and reduce the effectiveness of new hedges placed against existing LIBOR-based investments. While some LIBOR-based instruments may contemplate a scenario where LIBOR is no longer available by providing for an alternative rate-setting methodology, not all may have such provisions and there may be significant uncertainty regarding the effectiveness of any such alternative methodologies. Since the usefulness of LIBOR as a benchmark could deteriorate during the transition period, these effects could occur prior to the date on which the applicable rate ceases to be published.
Beginning in January 2020, global financial markets have experienced, and may continue to experience, significant volatility resulting from the spread of a virus known as Covid–19. The outbreak of Covid–19 has resulted in travel and border restrictions, quarantines, supply chain disruptions, lower consumer demand, and general market uncertainty. The effects of Covid–19 have adversely affected, and may continue to adversely affect, the global economy, the economies of certain nations, and individual issuers, all of which may negatively impact the fund’s performance.
| 122 Dynamic Asset Allocation Conservative Fund |
Note 7: Senior loan commitments
Senior loans are purchased or sold on a when-issued or delayed delivery basis and may be settled a month or more after the trade date, which from time to time can delay the actual investment of available cash balances; interest income is accrued based on the terms of the securities. Senior loans can be acquired through an agent, by assignment from another holder of the loan, or as a participation interest in another holder’s portion of the loan. When the fund invests in a loan or participation, the fund is subject to the risk that an intermediate participant between the fund and the borrower will fail to meet its obligations to the fund, in addition to the risk that the borrower under the loan may default on its obligations.
Note 8: Summary of derivative activity
The volume of activity for the reporting period for any derivative type that was held during the period is listed below and was based on an average of the holdings at the end of each fiscal quarter:
| Purchased equity option contracts (contract amount) | $1,000 |
| Purchased currency option contracts (contract amount) | $28,200,000 |
| Written equity option contracts (contract amount) | $1,000 |
| Written currency option contracts (contract amount) | $28,200,000 |
| Futures contracts (number of contracts) | 5,000 |
| Forward currency contracts (contract amount) | $384,600,000 |
| Centrally cleared interest rate swap contracts (notional) | $210,300,000 |
| OTC total return swap contracts (notional) | $83,600,000 |
| Centrally cleared total return swap contracts (notional) | $77,200,000 |
| OTC credit default contracts (notional) | $11,700,000 |
| Centrally cleared credit default contracts (notional) | $115,400,000 |
| Warrants (number of warrants) | 400 |
The following is a summary of the fair value of derivative instruments as of the close of the reporting period:
| Fair value of derivative instruments as of the close of the reporting period | ||||
| ASSET DERIVATIVES | LIABILITY DERIVATIVES | |||
| Derivatives not | ||||
| accounted for as | Statement of | Statement of | ||
| hedging instruments | assets and | assets and | ||
| under ASC 815 | liabilities location | Fair value | liabilities location | Fair value |
| Receivables, Net | ||||
| assets — Unrealized | ||||
| Credit contracts | appreciation | $3,816,496* | Payables | $871,400 |
| Foreign exchange | ||||
| contracts | Investments, Receivables | 2,063,300 | Payables | 2,494,170 |
| Investments, | ||||
| Receivables, Net | ||||
| assets — Unrealized | Payables, Net assets — | |||
| Equity contracts | appreciation | 15,186,767* | Unrealized depreciation | 2,302,966* |
| Receivables, Net | ||||
| assets — Unrealized | Payables, Net assets — | |||
| Interest rate contracts | appreciation | 1,486,068* | Unrealized depreciation | 5,505,336* |
| Total | $22,552,631 | $11,173,872 | ||
* Includes cumulative appreciation/depreciation of futures contracts and/or centrally cleared swaps as reported in the fund’s portfolio. Only current day’s variation margin is reported within the Statement of assets and liabilities.
| Dynamic Asset Allocation Conservative Fund 123 |
The following is a summary of realized and change in unrealized gains or losses of derivative instruments in the Statement of operations for the reporting period (Note 1):
| Amount of realized gain or (loss) on derivatives recognized in net gain or (loss) on investments | ||||||
| Derivatives not | ||||||
| accounted for as | ||||||
| hedging | Forward | |||||
| instruments under | currency | |||||
| ASC 815 | Warrants | Options | Futures | contracts | Swaps | Total |
| Credit contracts | $— | $— | $— | $— | $2,706,851 | $2,706,851 |
| Foreign exchange | ||||||
| contracts | — | 78,489 | — | (772,166) | — | $(693,677) |
| Equity contracts | — | 313,010 | (63,414,717) | — | 4,873,132 | $(58,228,575) |
| Interest rate | ||||||
| contracts | — | — | (7,964,919) | — | (7,025,213) | $(14,990,132) |
| Total | $— | $391,499 | $(71,379,636) | $(772,166) | $554,770 | $(71,205,533) |
| Change in unrealized appreciation or (depreciation) on derivatives recognized in net gain or (loss) | ||||||
| on investments | ||||||
| Derivatives not | ||||||
| accounted for as | ||||||
| hedging | Forward | |||||
| instruments under | currency | |||||
| ASC 815 | Warrants | Options | Futures | contracts | Swaps | Total |
| Credit contracts | $— | $— | $— | $— | $82,523 | $82,523 |
| Foreign exchange | ||||||
| contracts | — | 134,634 | — | (993,298) | — | $(858,664) |
| Equity contracts | 3,549 | — | 14,155,834 | — | (666,923) | $13,492,460 |
| Interest rate | ||||||
| contracts | — | — | (1,716,499) | — | (99,018) | $(1,815,517) |
| Total | $3,549 | $134,634 | $12,439,335 | $(993,298) | $(683,418) | $10,900,802 |
| 124 Dynamic Asset Allocation Conservative Fund |
| This page left blank intentionally. |
| Dynamic Asset Allocation Conservative Fund 125 |
Note 9: Offsetting of financial and derivative assets and liabilities
The following table summarizes any derivatives, repurchase agreements and reverse repurchase agreements, at the end of the reporting period, that are subject to an enforceable master netting agreement or similar agreement. For securities lending transactions or borrowing transactions associated with securities sold short, if any, see Note 1. For financial reporting purposes, the fund does not offset financial assets and financial liabilities that are subject to the master netting agreements in the Statement of assets and liabilities.
| Bank of America N.A. | Barclays Bank PLC | Barclays Capital, Inc. (clearing broker) | BofA Securities, Inc. | Citibank, N.A. | Citigroup Globa lMarkets, Inc. | Credit Suisse International | Goldman Sachs International | HSBC Bank USA, National Association | JPMorgan Chase Bank N.A. | JPMorgan Securities LLC | Merrill Lynch International | Morgan Stanley & Co. International PLC | NatWest Markets PLC | State Street Bank and Trust Co. | Toronto- Dominion Bank | UBS AG | WestPac Banking Corp. | Total | |
| Assets: | |||||||||||||||||||
| Centrally cleared interest rate | |||||||||||||||||||
| swap contracts§ | $ — | $ — | $73,900 | $ — | $ — | $ — | $ — | $ — | $ — | $ — | $ — | $ — | $ — | $ — | $ — | $ — | $ — | $ — | $73,900 |
| OTC Total return | |||||||||||||||||||
| swap contracts*# | — | — | — | — | — | — | — | 110,951 | — | — | — | — | — | — | — | — | — | — | 110,951 |
| Centrally cleared total return | |||||||||||||||||||
| swap contracts§ | — | — | 42,037 | — | — | — | — | — | — | — | — | — | — | — | — | — | — | — | 42,037 |
| OTC Credit default | |||||||||||||||||||
| contracts — protection sold*# | — | — | — | — | — | — | — | — | — | — | 1,362 | — | 10,503 | — | — | — | — | — | 11,865 |
| OTC Credit default | |||||||||||||||||||
| contracts — protection | |||||||||||||||||||
| purchased*# | — | — | — | — | — | 177,707 | 291,203 | 411,347 | — | — | 181,999 | 41,257 | 178,052 | — | — | — | — | — | 1,281,565 |
| Centrally cleared credit | |||||||||||||||||||
| default contracts§ | — | — | — | — | — | — | — | — | — | — | — | — | — | — | — | — | — | — | — |
| Futures contracts§ | — | — | — | 3,649,021 | — | — | — | — | — | — | 145,259 | — | — | — | — | — | — | — | 3,794,280 |
| Forward currency contracts# | 37,380 | 83,303 | — | — | 74,223 | — | 74,478 | 309,794 | 83,670 | 294,880 | — | — | 21,066 | 167,155 | 248,495 | 66,158 | 173,951 | 21,797 | 1,656,350 |
| Purchased options**# | 102,334 | — | — | — | — | — | — | 99,252 | — | 116,466 | — | — | — | — | — | — | 88,898 | — | 406,950 |
| Total Assets | $139,714 | $83,303 | $115,937 | $3,649,021 | $74,223 | $177,707 | $365,681 | $931,344 | $83,670 | $411,346 | $328,620 | $41,257 | $209,621 | $167,155 | $248,495 | $66,158 | $262,849 | $21,797 | $7,377,898 |
| Liabilities: | |||||||||||||||||||
| Centrally cleared interest rate | |||||||||||||||||||
| swap contracts§ | — | — | 38,728 | — | — | — | — | — | — | — | — | — | — | — | — | — | — | — | 38,728 |
| OTC Total return | |||||||||||||||||||
| swap contracts*# | — | — | — | — | — | — | — | 731,091 | — | 378,347 | — | — | — | — | — | — | — | — | 1,109,438 |
| Centrally cleared total return | |||||||||||||||||||
| swap contracts§ | — | — | — | — | — | — | — | — | — | — | — | — | — | — | — | — | — | — | — |
| OTC Credit default | |||||||||||||||||||
| contracts — protection sold*# | 30,388 | — | — | — | — | 244,323 | 52,094 | 345,423 | — | — | 101,397 | — | 97,775 | — | — | — | — | — | 871,400 |
| OTC Credit default | |||||||||||||||||||
| contracts — protection | |||||||||||||||||||
| purchased*# | — | — | — | — | — | — | — | — | — | — | — | — | — | — | — | — | — | — | — |
| Centrally cleared credit | |||||||||||||||||||
| default contracts§ | — | — | 57,787 | — | — | — | — | — | — | — | — | — | — | — | — | — | — | — | 57,787 |
| Futures contracts§ | — | — | — | 289,825 | — | — | — | — | — | — | 157,110 | — | — | — | — | — | — | — | 446,935 |
| Forward currency contracts# | 229,110 | 29,576 | — | — | 102,829 | — | 21,607 | 639,473 | 67,394 | 226,777 | — | — | 375,418 | 67,278 | 93,821 | 179,611 | 315,375 | 20,815 | 2,369,084 |
| Written options# | 27,192 | — | — | — | — | — | — | 25,899 | — | 42,832 | — | — | — | — | — | — | 29,163 | — | 125,086 |
| Total Liabilities | $286,690 | $29,576 | $96,515 | $289,825 | $102,829 | $244,323�� | $73,701 | $1,741,886 | $67,394 | $647,956 | $258,507 | $— | $473,193 | $67,278 | $93,821 | $179,611 | $344,538 | $20,815 | $5,018,458 |
| 126 Dynamic Asset Allocation Conservative Fund | Dynamic Asset Allocation Conservative Fund 127 |
| Bank of America N.A. | Barclays Bank PLC | Barclays Capital, Inc. (clearing broker) | BofA Securities, Inc. | Citibank, N.A. | Citigroup Global Markets, Inc. | Credit Suisse International | Goldman Sachs International | HSBC Bank USA, National Association | JPMorgan Chase Bank N.A. | JPMorgan Securities LLC | Merrill Lynch International | Morgan Stanley & Co. International PLC | NatWest Markets PLC | State Street Bank and Trust Co. | Toronto- Dominion Bank | UBS AG | WestPac Banking Corp. | Total | |
| Total Financial and Derivative | |||||||||||||||||||
| Net Assets | $(146,976) | $53,727 | $19,422 | $3,359,196 | $(28,606) | $(66,616) | $291,980 | $(810,542) | $16,276 | $(236,610) | $70,113 | $41,257 | $(263,572) | $99,877 | $154,674 | $(113,453) | $(81,689) | $982 | $2,359,440 |
| Total collateral | |||||||||||||||||||
| received (pledged)†## | $(121,000) | $— | $— | $— | $(28,606) | $— | $291,980 | $(810,542) | $— | $(110,978) | $70,113 | $41,257 | $(251,981) | $99,877 | $154,674 | $— | $(81,689) | $— | |
| Net amount | $(25,976) | $53,727 | $19,422 | $3,359,196 | $— | $(66,616) | $— | $— | $16,276 | $(125,632) | $— | $— | $(11,591) | $— | $— | $(113,453) | $— | $982 | |
| Controlled collateral received | |||||||||||||||||||
| (including TBA commitments)** | $— | $— | $— | $104,000 | $— | $— | $360,000 | $— | $— | $— | $111,000 | $120,266 | $— | $115,685 | $174,572 | $— | $— | $— | $985,523 |
| Uncontrolled collateral received | $— | $— | $— | $— | $— | $— | $— | $— | $— | $— | $— | $— | $— | $— | $— | $— | $— | $— | $— |
| Collateral (pledged) (including | |||||||||||||||||||
| TBA commitments)** | $(121,000) | $— | $— | $— | $(49,990) | $— | $— | $(1,059,840) | $— | $(110,978) | $— | $— | $(251,981) | $— | $— | $— | $(120,993) | $— | $(1,714,782) |
* Excludes premiums, if any. Included in unrealized appreciation and depreciation on OTC swap contracts on the Statement of assets and liabilities.
** Included with Investments in securities on the Statement of assets and liabilities.
† Additional collateral may be required from certain brokers based on individual agreements.
# Covered by master netting agreement (Note 1).
## Any over-collateralization of total financial and derivative net assets is not shown. Collateral may include amounts related to unsettled agreements.
§ Includes current day’s variation margin only as reported on the Statement of assets and liabilities, which is not collateralized. Cumulative appreciation/(depreciation) for futures contracts and centrally cleared swap contracts is represented in the tables listed after the fund’s portfolio. Collateral pledged for initial margin on futures contracts and centrally cleared swap contracts, which is not included in the table above, amounted to $19,060,525 and $7,692,225, respectively.
Note 10: New accounting pronouncements
In March 2020, the Financial Accounting Standards Board (FASB) issued Accounting Standards Update (ASU) 2020–04, Reference Rate Reform (Topic 848) — Facilitation of the Effects of Reference Rate Reform on Financial Reporting. The amendments in ASU 2020–04 provide optional temporary financial reporting relief from the effect of certain types of contract modifications due to the planned discontinuation of LIBOR and other interbank-offered based reference rates as of the end of 2021. The discontinuation of LIBOR was subsequently extended to June 30, 2023. ASU 2020–04 is effective for certain reference rate-related contract modifications that occur during the period March 12, 2020 through December 31, 2022. Management is currently evaluating the impact, if any, of applying this provision.
Federal tax information (Unaudited)
Pursuant to §852 of the Internal Revenue Code, as amended, the fund hereby designates $13,766,023 as a capital gain dividend with respect to the taxable year ended September 30, 2021, or, if subsequently determined to be different, the net capital gain of such year.
The fund designated 13.54% of ordinary income distributions as qualifying for the dividends received deduction for corporations.
For the reporting period, the fund hereby designates 21.28%, or the maximum amount allowable, of its taxable ordinary income distributions as qualified dividends taxed at the individual net capital gain rates.
For the reporting period, pursuant to §871(k) of the Internal Revenue Code, the fund hereby designates $8,887,905 of distributions paid as qualifying to be taxed as interest-related dividends, and $10,652,599 to be taxed as short-term capital gain dividends for nonresident alien shareholders.
The Form 1099 that will be mailed to you in January 2022 will show the tax status of all distributions paid to your account in calendar 2021.
| 128 Dynamic Asset Allocation Conservative Fund | Dynamic Asset Allocation Conservative Fund 129 |

| 130 Dynamic Asset Allocation Conservative Fund |

* Mr. Reynolds is an “interested person” (as defined in the Investment Company Act of 1940) of the fund and Putnam Investments. He is President and Chief Executive Officer of Putnam Investments, as well as the President of your fund and each of the other Putnam funds.
The address of each Trustee is 100 Federal Street, Boston, MA 02110.
As of September 30, 2021, there were 100 Putnam funds. All Trustees serve as Trustees of all Putnam funds.
Each Trustee serves for an indefinite term, until his or her resignation, retirement at age 75, removal, or death.
| Dynamic Asset Allocation Conservative Fund 131 |
Officers
In addition to Robert L. Reynolds, the other officers of the fund are shown below:
| James F. Clark (Born 1974) | Susan G. Malloy (Born 1957) |
| Vice President and Chief Compliance Officer | Vice President and Assistant Treasurer |
| Since 2016 | Since 2007 |
| Chief Compliance Officer and Chief Risk Officer, | Head of Accounting and Middle Office Services, |
| Putnam Investments, and Chief Compliance Officer, | Putnam Investments and Putnam Management |
| Putnam Management | |
| Denere P. Poulack (Born 1968) | |
| Nancy E. Florek (Born 1957) | Assistant Vice President, Assistant Clerk, |
| Vice President, Director of Proxy Voting and Corporate | and Assistant Treasurer |
| Governance, Assistant Clerk, and Assistant Treasurer | Since 2004 |
| Since 2000 | |
| Janet C. Smith (Born 1965) | |
| Michael J. Higgins (Born 1976) | Vice President, Principal Financial Officer, Principal |
| Vice President, Treasurer, and Clerk | Accounting Officer, and Assistant Treasurer |
| Since 2010 | Since 2007 |
| Head of Fund Administration Services, | |
| Jonathan S. Horwitz (Born 1955) | Putnam Investments and Putnam Management |
| Executive Vice President, Principal Executive Officer, | |
| and Compliance Liaison | Stephen J. Tate (Born 1974) |
| Since 2004 | Vice President and Chief Legal Officer |
| Since 2021 | |
| Richard T. Kircher (Born 1962) | General Counsel, Putnam Investments, |
| Vice President and BSA Compliance Officer | Putnam Management, and Putnam Retail Management |
| Since 2019 | |
| Assistant Director, Operational Compliance, Putnam | Mark C. Trenchard (Born 1962) |
| Investments and Putnam Retail Management | Vice President |
| Since 2002 | |
| Director of Operational Compliance, Putnam | |
| Investments and Putnam Retail Management |
The principal occupations of the officers for the past five years have been with the employers as shown above, although in some cases they have held different positions with such employers. The address of each officer is 100 Federal Street, Boston, MA 02110.
| 132 Dynamic Asset Allocation Conservative Fund |
Fund information
Founded over 80 years ago, Putnam Investments was built around the concept that a balance between risk and reward is the hallmark of a well-rounded financial program. We manage over funds across income, value, blend, growth, sustainable, asset allocation, absolute return, and global sector categories.
| Investment Manager | Trustees | Jonathan S. Horwitz |
| Putnam Investment | Kenneth R. Leibler, Chair | Executive Vice President, |
| Management, LLC | Liaquat Ahamed | Principal Executive Officer, |
| 100 Federal Street | Ravi Akhoury | and Compliance Liaison |
| Boston, MA 02110 | Barbara M. Baumann | |
| Katinka Domotorffy | Richard T. Kircher | |
| Investment Sub-Advisors | Catharine Bond Hill | Vice President and BSA |
| Putnam Investments Limited | Paul L. Joskow | Compliance Officer |
| 16 St James’s Street | George Putnam, III | |
| London, England SW1A 1ER | Robert L. Reynolds | Susan G. Malloy |
| Manoj P. Singh | Vice President and | |
| The Putnam Advisory Company, LLC | Mona K. Sutphen | Assistant Treasurer |
| 100 Federal Street | ||
| Boston, MA 02110 | Officers | Denere P. Poulack |
| Robert L. Reynolds | Assistant Vice President, | |
| Marketing Services | President | Assistant Clerk, and |
| Putnam Retail Management | Assistant Treasurer | |
| Limited Partnership | James F. Clark | |
| 100 Federal Street | Vice President, Chief Compliance | Janet C. Smith |
| Boston, MA 02110 | Officer, and Chief Risk Officer | Vice President, |
| Principal Financial Officer, | ||
| Custodian | Nancy E. Florek | Principal Accounting Officer, |
| State Street Bank | Vice President, Director of | and Assistant Treasurer |
| and Trust Company | Proxy Voting and Corporate | |
| Governance, Assistant Clerk, | Stephen J. Tate | |
| Legal Counsel | and Assistant Treasurer | Vice President and |
| Ropes & Gray LLP | Chief Legal Officer | |
| Michael J. Higgins | ||
| Independent Registered | Vice President, Treasurer, | Mark C. Trenchard |
| Public Accounting Firm | and Clerk | Vice President |
| PricewaterhouseCoopers LLP |
This report is for the information of shareholders of Putnam Dynamic Asset Allocation Conservative Fund. It may also be used as sales literature when preceded or accompanied by the current prospectus, the most recent copy of Putnam’s Quarterly Performance Summary, and Putnam’s Quarterly Ranking Summary. For more recent performance, please visit putnam.com. Investors should carefully consider the investment objectives, risks, charges, and expenses of a fund, which are described in its prospectus. For this and other information or to request a prospectus or summary prospectus, call 1-800-225-1581 toll free. Please read the prospectus carefully before investing. The fund’s Statement of Additional Information contains additional information about the fund’s Trustees and is available without charge upon request by calling 1-800-225-1581.

| Item 2. Code of Ethics: |
| (a) The fund’s principal executive, financial and accounting officers are employees of Putnam Investment Management, LLC, the Fund’s investment manager. As such they are subject to a comprehensive Code of Ethics adopted and administered by Putnam Investments which is designed to protect the interests of the firm and its clients. The Fund has adopted a Code of Ethics which incorporates the Code of Ethics of Putnam Investments with respect to all of its officers and Trustees who are employees of Putnam Investment Management, LLC. For this reason, the Fund has not adopted a separate code of ethics governing its principal executive, financial and accounting officers. |
| (c) In April 2021, the Code of Ethics of Putnam Investments was amended. The key changes to the Code of Ethics are as follows: (i) Employees may invest in the Putnam Exchange Traded Funds (ETFs) with preclearing requirements for certain individuals (ii) All employees must hold Putnam ETFs in an approved Putnam broker (iii) All access persons must report Putnam ETF trades or holdings in the quarterly transaction report or annual holdings report. |
| Item 3. Audit Committee Financial Expert: |
| The Funds’ Audit, Compliance and Risk Committee is comprised solely of Trustees who are “independent” (as such term has been defined by the Securities and Exchange Commission (“SEC”) in regulations implementing Section 407 of the Sarbanes-Oxley Act (the “Regulations”)). The Trustees believe that each member of the Audit, Compliance and Risk Committee also possesses a combination of knowledge and experience with respect to financial accounting matters, as well as other attributes, that qualifies him or her for service on the Committee. In addition, the Trustees have determined that each of Dr. Hill, Dr. Joskow, and Mr. Singh qualifies as an “audit committee financial expert” (as such term has been defined by the Regulations) based on their review of his or her pertinent experience and education; in the case of Dr. Joskow, including his experience serving on the audit committees of several public companies and institutions and his education and experience as an economist who studies companies and industries, routinely using public company financial statements in his research. The SEC has stated, and the funds’ amended and restated agreement and Declaration of Trust provides, that the designation or identification of a person as an audit committee financial expert pursuant to this Item 3 of Form N-CSR does not impose on such person any duties, obligations or liability that are greater than the duties, obligations and liability imposed on such person as a member of the Audit, Compliance and Risk Committee and the Board of Trustees in the absence of such designation or identification. |
| Item 4. Principal Accountant Fees and Services: |
| The following table presents fees billed in each of the last two fiscal years for services rendered to the fund by the fund’s independent auditor: |
| Fiscal year ended | Audit Fees | Audit-Related Fees | Tax Fees | All Other Fees | |
| September 30, 2021 | $154,852 | $ — | $22,542 | $ — | |
| September 30, 2020 | $140,713 | $ — | $17,704 | $ — | |
| For the fiscal years ended September 30, 2021 and September 30, 2020, the fund’s independent auditor billed aggregate non-audit fees in the amounts of $287,441 and $363,546 respectively, to the fund, Putnam Management and any entity controlling, controlled by or under common control with Putnam Management that provides ongoing services to the fund. |
| Audit Fees represent fees billed for the fund’s last two fiscal years relating to the audit and review of the financial statements included in annual reports and registration statements, and other services that are normally provided in connection with statutory and regulatory filings or engagements. |
| Audit-Related Fees represent fees billed in the fund’s last two fiscal years for services traditionally performed by the fund’s auditor, including accounting consultation for proposed transactions or concerning financial accounting and reporting standards and other audit or attest services not required by statute or regulation. |
| Tax Fees represent fees billed in the fund’s last two fiscal years for tax compliance, tax planning and tax advice services. Tax planning and tax advice services include assistance with tax audits, employee benefit plans and requests for rulings or technical advice from taxing authorities. |
| Pre-Approval Policies of the Audit, Compliance and Risk Committee. The Audit, Compliance and Risk Committee of the Putnam funds has determined that, as a matter of policy, all work performed for the funds by the funds’ independent auditors will be pre-approved by the Committee itself and thus will generally not be subject to pre-approval procedures. |
| The Audit, Compliance and Risk Committee also has adopted a policy to pre-approve the engagement by Putnam Management and certain of its affiliates of the funds’ independent auditors, even in circumstances where pre-approval is not required by applicable law. Any such requests by Putnam Management or certain of its affiliates are typically submitted in writing to the Committee and explain, among other things, the nature of the proposed engagement, the estimated fees, and why this work should be performed by that particular audit firm as opposed to another one. In reviewing such requests, the Committee considers, among other things, whether the provision of such services by the audit firm are compatible with the independence of the audit firm. |
| The following table presents fees billed by the fund’s independent auditor for services required to be approved pursuant to paragraph (c)(7)(ii) of Rule 2–01 of Regulation S-X. |
| Fiscal year ended | Audit-Related Fees | Tax Fees | All Other Fees | Total Non-Audit Fees | |
| September 30, 2021 | $ — | $264,899 | $ — | $ — | |
| September 30, 2020 | $ — | $345,842 | $ — | $ — | |
| Item 5. Audit Committee of Listed Registrants |
| Not applicable |
| Item 6. Schedule of Investments: |
| The registrant’s schedule of investments in unaffiliated issuers is included in the report to shareholders in Item 1 above. |
| Item 7. Disclosure of Proxy Voting Policies and Procedures For Closed-End Management Investment Companies: |
| Not applicable |
| Item 8. Portfolio Managers of Closed-End Investment Companies |
| Not Applicable |
| Item 9. Purchases of Equity Securities by Closed-End Management Investment Companies and Affiliated Purchasers: |
| Not applicable |
| Item 10. Submission of Matters to a Vote of Security Holders: |
| Not applicable |
| Item 11. Controls and Procedures: |
| (a) The registrant’s principal executive officer and principal financial officer have concluded, based on their evaluation of the effectiveness of the design and operation of the registrant’s disclosure controls and procedures as of a date within 180 days of the filing date of this report, that the design and operation of such procedures are generally effective to provide reasonable assurance that information required to be disclosed by the registrant in this report is recorded, processed, summarized and reported within the time periods specified in the Commission’s rules and forms. |
| (b) Changes in internal control over financial reporting: Not applicable |
| Item 12. Disclosures of Securities Lending Activities for Closed-End Management Investment Companies: |
| Not Applicable |
| Item 13. Exhibits: |
| (a)(1) The Code of Ethics of The Putnam Funds, which incorporates the Code of Ethics of Putnam Investments, is filed herewith |
| (b) The certifications required by Rule 30a-2(b) under the Investment Company Act of 1940, as amended, are filed herewith. |
| SIGNATURES |
| Pursuant to the requirements of the Securities Exchange Act of 1934 and the Investment Company Act of 1940, the registrant has duly caused this report to be signed on its behalf by the undersigned, thereunto duly authorized. |
| Putnam Asset Allocation Funds |
| By (Signature and Title): |
| /s/ Janet C. Smith Janet C. Smith Principal Accounting Officer |
| Date: November 24, 2021 |
| Pursuant to the requirements of the Securities Exchange Act of 1934 and the Investment Company Act of 1940, this report has been signed below by the following persons on behalf of the registrant and in the capacities and on the dates indicated. |
| By (Signature and Title): |
| /s/ Jonathan S. Horwitz Jonathan S. Horwitz Principal Executive Officer |
| Date: November 24, 2021 |
| By (Signature and Title): |
| /s/ Janet C. Smith Janet C. Smith Principal Financial Officer |
| Date: November 24, 2021 |