UNITED STATES
SECURITIES AND EXCHANGE COMMISSION
Washington, D.C. 20549
FORM N-CSR
CERTIFIED SHAREHOLDER REPORT OF REGISTERED MANAGEMENT
INVESTMENT COMPANIES
Investment Company Act file number 811-08104
Touchstone Funds Group Trust
(Exact name of registrant as specified in charter)
303 Broadway, Suite 1100
Cincinnati, Ohio 45202-4203
(Address of principal executive offices) (Zip code)
E. Blake Moore Jr.
303 Broadway, Suite 1100
Cincinnati, Ohio 45202-4203
(Name and address of agent for service)
Registrant's telephone number, including area code: 800-638-8194
Date of fiscal year end: September 30
Date of reporting period: September 30, 2022
Form N-CSR is to be used by management investment companies to file reports with the Commission not later than 10 days after the transmission to stockholders of any report that is required to be transmitted to stockholders under Rule 30e-1 under the Investment Company Act of 1940 (17 CFR 270.30e-1). The Commission may use the information provided on Form N-CSR in its regulatory, disclosure review, inspection, and policymaking roles.
A registrant is required to disclose the information specified by Form N-CSR, and the Commission will make this information public. A registrant is not required to respond to the collection of information contained in Form N-CSR unless the Form displays a currently valid Office of Management and Budget ("OMB") control number. Please direct comments concerning the accuracy of the information collection burden estimate and any suggestions for reducing the burden to Secretary, Securities and Exchange Commission, 450 Fifth Street, NW, Washington, DC 20549-0609. The OMB has reviewed this collection of information under the clearance requirements of 44 U.S.C. § 3507.
Item 1. Reports to Stockholders.
| (a) | The Report to Shareholders is attached herewith. |
| Touchstone Funds Group Trust |
| Touchstone Active Bond Fund |
| Touchstone Anti-Benchmark® International Core Equity Fund |
| Touchstone Ares Credit Opportunities Fund (formerly Touchstone Credit Opportunities Fund) |
| Touchstone Dividend Equity Fund |
| Touchstone High Yield Fund |
| Touchstone Impact Bond Fund |
| Touchstone International ESG Equity Fund |
| Touchstone Mid Cap Fund |
| Touchstone Mid Cap Value Fund |
| Touchstone Sands Capital Select Growth Fund |
| Touchstone Small Cap Fund |
| Touchstone Small Cap Value Fund |
| Touchstone Ultra Short Duration Fixed Income Fund |


President
Touchstone Funds Group Trust
| Average Annual Total Returns** | |||
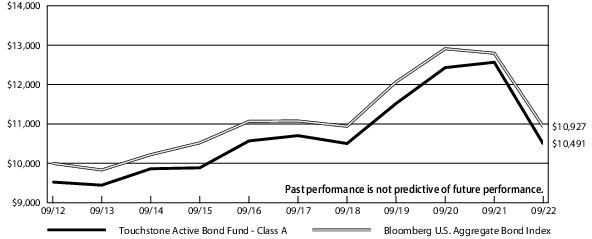
| Touchstone Active Bond Fund | 1 Year | 5 Years | 10 Years |
| Class A | -19.21% | -1.36% | 0.48% |
| Class C | -17.98% | -1.15% | 0.36% |
| Class Y | -16.32% | -0.15% | 1.22% |
| Institutional Class | -16.26% | -0.07% | 1.30% |
| Bloomberg U.S. Aggregate Bond Index | -14.60% | -0.27% | 0.89% |
| * | The chart above represents performance of Class A shares only, which will vary from the performance of Class C shares, Class Y shares and Institutional Class shares based on the differences in sales loads and fees paid by shareholders in the different classes. |
| ** | The average annual total returns shown above are adjusted for maximum sales loads and fees, if applicable. The maximum offering price per share of Class A shares is equal to the net asset value (“NAV”) per share plus a sales load equal to 3.36% of the NAV (or 3.25% of the offering price). Class C shares are subject to a contingent deferred sales charge (“CDSC”) of 1.00%. The CDSC will be assessed on an amount equal to the lesser of (1) the NAV at the time of purchase of the shares being redeemed or (2) the NAV of such shares being redeemed, if redeemed within a one-year period from the date of purchase. Class Y shares and Institutional Class shares are not subject to sales charges. |
| Average Annual Total Returns | ||
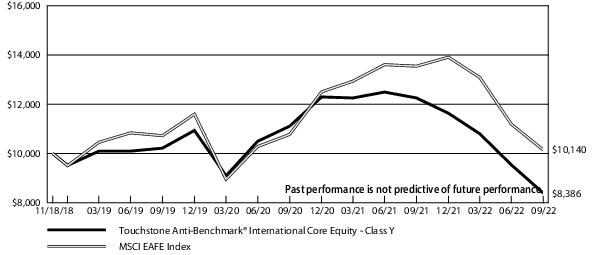
| Touchstone Anti-Benchmark® International Core Equity Fund | 1 Year | Since Inception* |
| Class Y | -31.55% | -4.45% |
| Institutional Class | -31.26% | -4.26% |
| MSCI EAFE Index | -25.13% | 0.36% |
| * | The chart above represents performance of Class Y shares only, which will vary from the performance of Institutional Class shares based on the difference in fees paid by the shareholders in the different classes. The inception date of the Fund was November 19, 2018. The returns of the index listed above are based on the inception date of the Fund. |

| Average Annual Total Returns** | |||
| Touchstone Ares Credit Opportunities Fund | 1 Year | 5 Years | Since Inception* |
| Class A | -13.50% | 1.39% | 3.00% |
| Class C | -11.84% | 1.89% | 3.19% |
| Class Y | -10.47% | 2.82% | 4.10% |
| Institutional Class | -10.39% | 2.92% | 4.20% |
| ICE BofA 3-Month U.S. Treasury Bill Index | 0.62% | 1.15% | 0.94% |
| * | The chart above represents performance of Class A shares only, which will vary from the performance of Class C shares, Class Y shares and Institutional Class shares based on the differences in sales loads and fees paid by shareholders in the different classes. The inception date of the Fund was August 31, 2015. The returns of the index listed above are based on the inception date of the Fund. |
| ** | The average annual total returns shown above are adjusted for maximum sales loads and fees, if applicable. The maximum offering price per share of Class A shares is equal to the net asset value (“NAV”) per share plus a sales load equal to 3.36% of the NAV (or 3.25% of the offering price). Class C shares are subject to a contingent deferred sales charge (“CDSC”) of 1.00%. The CDSC will be assessed on an amount equal to the lesser of (1) the NAV at the time of purchase of the shares being redeemed or (2) the NAV of such shares being redeemed, if redeemed within a one-year period from the date of purchase. Class Y shares and Institutional Class shares are not subject to sales charges. |
| Average Annual Total Returns** | ||||
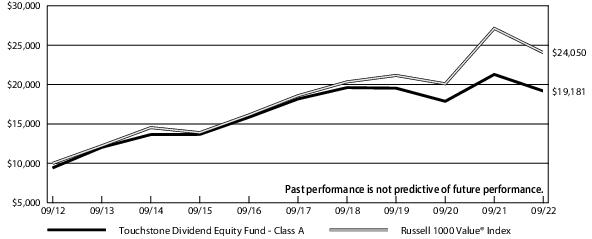
| Touchstone Dividend Equity Fund* | 1 Year | 5 Years | 10 Years | Since Inception |
| Class A* | -14.41% | -0.11% | 6.73% | 5.99% |
| Class C* | -11.41% | 0.41% | 6.66% | 5.55% |
| Class Y* | -9.69% | 1.29% | — | 6.02% |
| Institutional Class* | -9.62% | — | — | -8.51% |
| Class R6* | -9.56% | — | — | -10.21% |
| Russell 1000® Value Index | -11.36% | 5.29% | 9.17% | 6.42% |
| * | The chart above represents performance of Class A shares only, which will vary from the performance of Class C shares, Class Y shares, Class R6 shares and Institutional Class shares based on the differences in sales loads and fees paid by shareholders in the different classes. Effective July 17, 2021, the AIG Focused Dividend Strategy Fund and the AIG Select Dividend Growth Fund merged into the Fund. The Fund adopted the performance and accounting history of the AIG Focused Dividend Strategy Fund (the "Predecessor Fund"). Prior to July 17, 2021, the Fund's performance history is that of the Predecessor Fund. The inception date of Class A, Class C, Class Y, Class R6 and Institutional Class shares was June 8, 1998, June 8, 1998, May 14, 2013, August 2, 2021 and July 19, 2021, respectively. The returns of the Index are based on the inception date of the Fund. |
| ** | The average annual total returns shown above are adjusted for maximum sales loads and fees, if applicable. The maximum offering price per share of Class A shares is equal to the net asset value (“NAV”) per share plus a sales load equal to 5.26% of the NAV (or 5.00% of the offering price). Class C shares are subject to a contingent deferred sales charge (“CDSC”) of 1.00%. The CDSC will be assessed on an amount equal to the lesser of (1) the NAV at the time of purchase of the shares being redeemed or (2) the NAV of such shares being redeemed, if redeemed within a one-year period from the date of purchase. Class Y shares, Class R6 shares and Institutional Class shares are not subject to sales charges. |
| Average Annual Total Returns** | |||
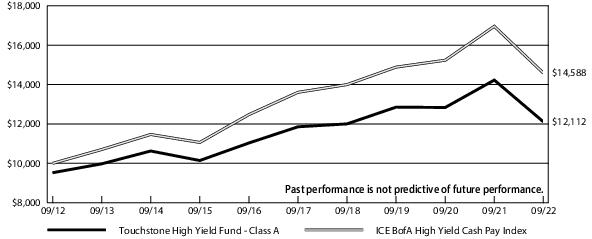
| Touchstone High Yield Fund | 1 Year | 5 Years | 10 Years |
| Class A | -17.64% | -0.55% | 1.93% |
| Class C | -16.36% | -0.32% | 1.81% |
| Class Y | -14.70% | 0.68% | 2.70% |
| Institutional Class | -14.63% | 0.78% | 2.78% |
| ICE BofA High Yield Cash Pay Index | -13.98% | 1.40% | 3.85% |
| * | The chart above represents performance of Class A shares only, which will vary from the performance of Class C shares, Class Y shares and Institutional Class shares based on the differences in sales loads and fees paid by shareholders in the different classes. |
| ** | The average annual total returns shown above are adjusted for maximum sales loads and fees, if applicable. The maximum offering price per share of Class A shares is equal to the net asset value (“NAV”) per share plus a sales load equal to 3.36% of the NAV (or 3.25% of the offering price). Class C shares are subject to a contingent deferred sales charge (“CDSC”) of 1.00%. The CDSC will be assessed on an amount equal to the lesser of (1) the NAV at the time of purchase of the shares being redeemed or (2) the NAV of such shares being redeemed, if redeemed within a one-year period from the date of purchase. Class Y shares and Institutional Class shares are not subject to sales charges. |
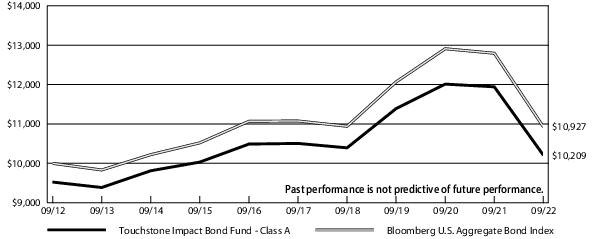
| Average Annual Total Returns** | |||
| Touchstone Impact Bond Fund | 1 Year | 5 Years | 10 Years |
| Class A | -17.34% | -1.54% | 0.21% |
| Class C | -16.02% | -1.32% | 0.09% |
| Class Y | -14.37% | -0.34% | 0.94% |
| Institutional Class | -14.29% | -0.22% | 1.06% |
| Class R6* | -14.27% | -0.32% | 0.95% |
| Bloomberg U.S. Aggregate Bond Index | -14.60% | -0.27% | 0.89% |
| * | The chart above represents performance of Class A shares only, which will vary from the performance of Class C shares, Class Y shares and Institutional Class shares based on the differences in sales loads and fees paid by shareholders in the different classes. The inception date of Class R6 shares was November 22, 2021. Class R6 shares’ performance was calculated using the historical performance of Class Y shares for the periods prior to November 22, 2021. The returns have been restated for sales loads and fees applicable to Class R6 shares. |
| ** | The average annual total returns shown above are adjusted for maximum sales loads and fees, if applicable. The maximum offering price per share of Class A shares is equal to the net asset value (“NAV”) per share plus a sales load equal to 3.36% of the NAV (or 3.25% of the offering price). Class C shares are subject to a contingent deferred sales charge (“CDSC”) of 1.00%. The CDSC will be assessed on an amount equal to the lesser of (1) the NAV at the time of purchase of the shares being redeemed or (2) the NAV of such shares being redeemed, if redeemed within a one-year period from the date of purchase. Class Y shares, Class R6 shares and Institutional Class shares are not subject to sales charges. |
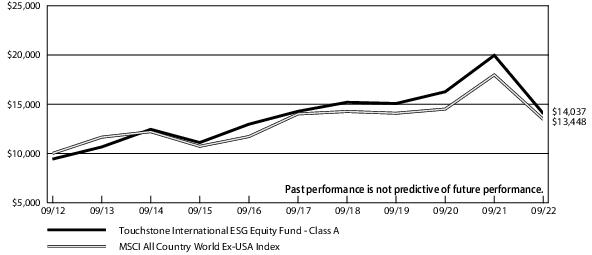
| Average Annual Total Returns** | |||
| Touchstone International ESG Equity Fund | 1 Year | 5 Years | 10 Years |
| Class A | -33.20% | -1.50% | 3.45% |
| Class C | -30.82% | -1.05% | 3.45% |
| Class Y | -29.43% | -0.06% | 4.33% |
| Institutional Class* | -29.41% | -0.03% | 4.34% |
| MSCI All Country World Ex-USA Index | -25.17% | -0.81% | 3.01% |
| * | The chart above represents performance of Class A shares only, which will vary from the performance of Class C shares, Class Y shares and Institutional Class shares based on the differences in sales loads and fees paid by shareholders in the different classes. The inception date of Institutional Class shares was August 23, 2019. Institutional Class shares’ performance was calculated using the historical performance of Class A shares for the periods prior to August 23, 2019. The returns have been restated for sales loads and fees applicable to Institutional Class shares. |
| ** | The average annual total returns shown above are adjusted for maximum sales loads and fees, if applicable. The maximum offering price per share of Class A shares is equal to the net asset value (“NAV”) per share plus a sales load equal to 5.26% of the NAV (or 5.00% of the offering price). Class C shares are subject to a contingent deferred sales charge (“CDSC”) of 1.00%. The CDSC will be assessed on an amount equal to the lesser of (1) the NAV at the time of purchase of the shares being redeemed or (2) the NAV of such shares being redeemed, if redeemed within a one-year period from the date of purchase. Class Y shares and Institutional Class shares are not subject to sales charges. |
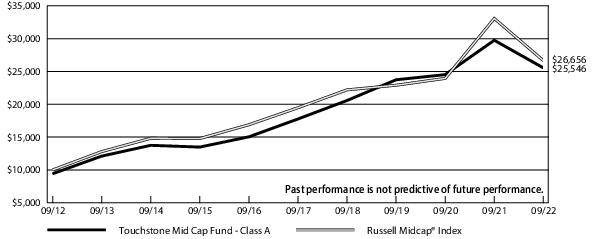
| Average Annual Total Returns** | |||
| Touchstone Mid Cap Fund | 1 Year | 5 Years | 10 Years |
| Class A | -18.43% | 6.27% | 9.83% |
| Class C | -15.54% | 6.75% | 9.82% |
| Class Y | -13.87% | 7.81% | 10.77% |
| Class Z | -14.12% | 7.53% | 10.48% |
| Institutional Class | -13.82% | 7.90% | 10.85% |
| Class R6* | -13.76% | 7.86% | 10.79% |
| Russell Midcap® Index | -19.39% | 6.48% | 10.30% |
| * | The chart above represents performance of Class A shares only, which will vary from the performance of Class C shares, Class Y shares, Class Z shares, Institutional Class shares and Class R6 shares based on the differences in sales loads and fees paid by shareholders in the different classes. The inception date of Class R6 shares was February 22, 2021. Class R6 shares performance was calculated using the historical performance of Class Y shares for the periods prior to February 22, 2021. The returns have been restated for sales loads and fees applicable to Class R6 shares. |
| ** | The average annual total returns shown above are adjusted for maximum sales loads and fees, if applicable. The maximum offering price per share of Class A shares is equal to the net asset value (“NAV”) per share plus a sales load equal to 5.26% of the NAV (or 5.00% of the offering price). Class C shares are subject to a contingent deferred sales charge (“CDSC”) of 1.00%. The CDSC will be assessed on an amount equal to the lesser of (1) the NAV at the time of purchase of the shares being redeemed or (2) the NAV of such shares being redeemed, if redeemed within a one-year period from the date of purchase. Class Y shares, Class Z shares, Institutional Class shares and Class R6 shares are not subject to sales charges. |
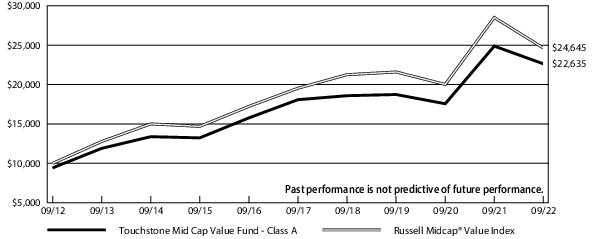
| Average Annual Total Returns** | |||
| Touchstone Mid Cap Value Fund | 1 Year | 5 Years | 10 Years |
| Class A | -13.57% | 3.36% | 8.51% |
| Class C | -10.58% | 3.82% | 8.50% |
| Class Y | -8.81% | 4.85% | 9.42% |
| Institutional Class | -8.68% | 5.00% | 9.57% |
| Russell Midcap® Value Index | -13.56% | 4.76% | 9.44% |
| * | The chart above represents performance of Class A shares only, which will vary from the performance of Class C shares, Class Y shares and Institutional Class shares based on the differences in sales loads and fees paid by shareholders in the different classes. |
| ** | The average annual total returns shown above are adjusted for maximum sales loads and fees, if applicable. The maximum offering price per share of Class A shares is equal to the net asset value (“NAV”) per share plus a sales load equal to 5.26% of the NAV (or 5.00% of the offering price). Class C shares are subject to a contingent deferred sales charge (“CDSC”) of 1.00%. The CDSC will be assessed on an amount equal to the lesser of (1) the NAV at the time of purchase of the shares being redeemed or (2) the NAV of such shares being redeemed, if redeemed within a one-year period from the date of purchase. Class Y shares and Institutional Class shares are not subject to sales charges. |
| Average Annual Total Returns** | |||
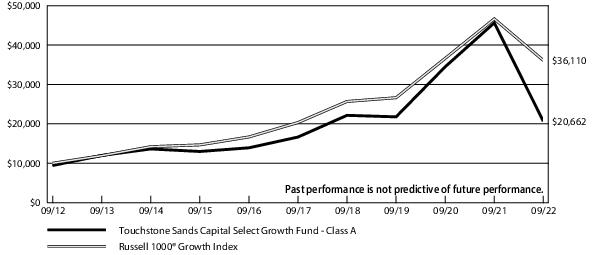
| Touchstone Sands Capital Select Growth Fund | 1 Year | 5 Years | 10 Years |
| Class A | -56.99% | 3.18% | 7.53% |
| Class C | -55.41% | 3.63% | 7.52% |
| Class Y | -54.59% | 4.68% | 8.44% |
| Class Z | -54.73% | 4.40% | 8.16% |
| Institutional Class* | -54.58% | 4.55% | 8.24% |
| Class R6* | -54.58% | 4.55% | 8.24% |
| Russell 1000® Growth Index | -22.59% | 12.17% | 13.70% |
| * | The chart above represents performance of Class A shares only, which will vary from the performance of Class C shares, Class Y shares, Class Z shares, Institutional Class shares and Class R6 shares based on the differences in sales loads and fees paid by shareholders in the different classes. The inception date of Institutional Class shares and Class R6 shares was September 1, 2020. Institutional Class shares' and Class R6 shares' performance was calculated using the historical performance of Class Z shares for the periods prior to September 1, 2020. The returns have been restated for sales loads and fees applicable to Institutional Class and Class R6 shares. |
| ** | The average annual total returns shown above are adjusted for maximum sales loads and fees, if applicable. The maximum offering price per share of Class A shares is equal to the net asset value (“NAV”) per share plus a sales load equal to 5.26% of the NAV (or 5.00% of the offering price). Class C shares are subject to a contingent deferred sales charge (“CDSC”) of 1.00%. The CDSC will be assessed on an amount equal to the lesser of (1) the NAV at the time of purchase of the shares being redeemed or (2) the NAV of such shares being redeemed, if redeemed within a one-year period from the date of purchase. Class Y shares, Class Z shares, Institutional Class shares and Class R6 shares are not subject to sales charges. |
| Average Annual Total Returns** | |||
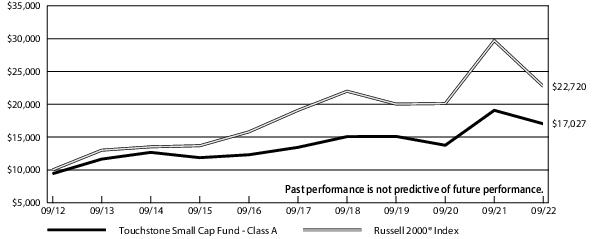
| Touchstone Small Cap Fund | 1 Year | 5 Years | 10 Years |
| Class A | -15.22% | 3.61% | 5.47% |
| Class C | -12.22% | 4.08% | 5.48% |
| Class Y | -10.58% | 5.10% | 6.37% |
| Institutional Class | -10.52% | 5.20% | 6.46% |
| Russell 2000® Index | -23.50% | 3.55% | 8.55% |
| * | The chart above represents performance of Class A shares only, which will vary from the performance of Class C shares, Class Y shares and Institutional Class shares based on the differences in sales loads and fees paid by shareholders in the different classes. |
| ** | The average annual total returns shown above are adjusted for maximum sales loads and fees, if applicable. The maximum offering price per share of Class A shares is equal to the net asset value (“NAV”) per share plus a sales load equal to 5.26% of the NAV (or 5.00% of the offering price). Class C shares are subject to a contingent deferred sales charge (“CDSC”) of 1.00%. The CDSC will be assessed on an amount equal to the lesser of (1) the NAV at the time of purchase of the shares being redeemed or (2) the NAV of such shares being redeemed, if redeemed within a one-year period from the date of purchase. Class Y shares and Institutional Class shares are not subject to sales charges. |
| Average Annual Total Returns** | |||
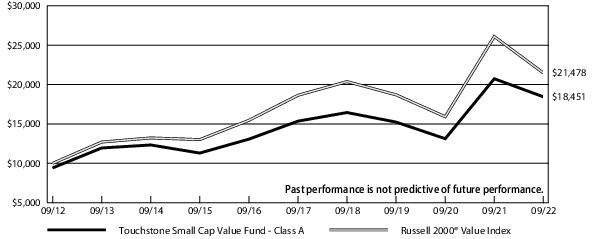
| Touchstone Small Cap Value Fund | 1 Year | 5 Years | 10 Years |
| Class A | -15.49% | 2.52% | 6.32% |
| Class C | -12.61% | 2.96% | 6.31% |
| Class Y | -10.81% | 4.00% | 7.22% |
| Institutional Class | -10.67% | 4.17% | 7.38% |
| Russell 2000® Value Index | -17.69% | 2.87% | 7.94% |
| * | The chart above represents performance of Class A shares only, which will vary from the performance of Class C shares, Class Y shares and Institutional Class shares based on the differences in sales loads and fees paid by shareholders in the different classes. |
| ** | The average annual total returns shown above are adjusted for maximum sales loads and fees, if applicable. The maximum offering price per share of Class A shares is equal to the net asset value (“NAV”) per share plus a sales load equal to 5.26% of the NAV (or 5.00% of the offering price). Class C shares are subject to a contingent deferred sales charge (“CDSC”) of 1.00%. The CDSC will be assessed on an amount equal to the lesser of (1) the NAV at the time of purchase of the shares being redeemed or (2) the NAV of such shares being redeemed, if redeemed within a one-year period from the date of purchase. Class Y shares and Institutional Class shares are not subject to sales charges. |
| Average Annual Total Returns** | |||
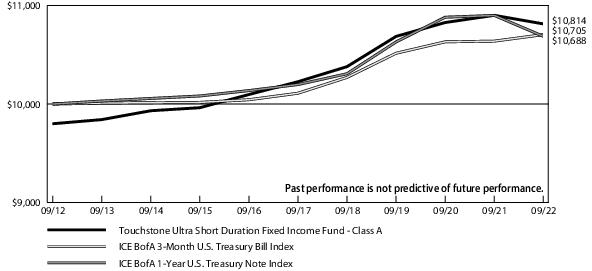
| Touchstone Ultra Short Duration Fixed Income Fund | 1 Year | 5 Years | 10 Years |
| Class A | -2.80% | 0.71% | 0.78% |
| Class C | -2.16% | 0.64% | 0.60% |
| Class S* | -1.05% | 0.87% | 0.74% |
| Class Y | -0.55% | 1.37% | 1.25% |
| Class Z | -0.80% | 1.12% | 1.00% |
| Institutional Class | -0.50% | 1.42% | 1.29% |
| ICE BofA 3-Month U.S. Treasury Bill Index | 0.62% | 1.15% | 0.68% |
| ICE BofA 1-Year U.S. Treasury Note Index | -1.95% | 0.94% | 0.67% |
| * | The chart above represents performance of Class A shares only, which will vary from the performance of Class C shares, Class S shares, Class Y shares, Institutional Class shares and Class Z shares based on the differences in sales loads and fees paid by shareholders in the different classes. The inception date of Class S shares was October 27, 2017. Class S shares' performance was calculated using the historical performance of Class Z shares for the periods prior to October 27, 2017. The returns have been restated for sales loads and fees applicable to Class S shares. |
| ** | The average annual total returns shown above are adjusted for maximum sales loads and fees, if applicable. The maximum offering price per share of Class A shares is equal to the net asset value (“NAV”) per share plus a sales load equal to 2.04% of the NAV (or 2.00% of the offering price). Class C shares are subject to a contingent deferred sales charge (“CDSC”) of 1.00%. The CDSC will be assessed on an amount equal to the lesser of (1) the NAV at the time of purchase of the shares being redeemed or (2) the NAV of such shares being redeemed, if redeemed within a one-year period from the date of purchase. Class S shares, Class Y shares, Class Z shares and Institutional Class shares are not subject to sales charges. |
| Credit Quality*(% of Fixed Income Securities) | |
| AAA/Aaa | 40.4% |
| AA/Aa | 7.5 |
| A/A | 15.2 |
| BBB/Baa | 27.6 |
| BB/Ba | 2.0 |
| B/B | 1.8 |
| CCC | 0.4 |
| CC | 0.1 |
| C or Lower | 0.0 |
| Not Rated | 4.6 |
| Cash Equivalents | 0.4 |
| Total | 100.0% |
| Geographic Allocation(% of Net Assets) | |
| Common Stocks | |
| Japan | 31.5% |
| Hong Kong | 8.8 |
| United Kingdom | 8.1 |
| Switzerland | 5.3 |
| Spain | 4.4 |
| France | 4.4 |
| Israel | 4.0 |
| Netherlands | 3.9 |
| Denmark | 3.7 |
| China | 3.7 |
| Australia | 3.4 |
| Finland | 2.7 |
| Norway | 2.0 |
| Portugal | 2.0 |
| Belgium | 1.8 |
| Germany | 1.6 |
| United States | 1.3 |
| Sweden | 1.3 |
| Ireland | 1.3 |
| Luxembourg | 1.0 |
| Singapore | 1.0 |
| New Zealand | 0.6 |
| Austria | 0.4 |
| United Arab Emirates | 0.0 |
| Short-Term Investment Funds | 2.4 |
| Other Assets/Liabilities (Net) | (0.6) |
| Total | 100.0% |
be used. Where no rating has been assigned, it may be for reasons unrelated to the creditworthiness of the issuer.
| Credit Quality*(% of Fixed Income Securities) | |
| BBB/Baa | 5.1% |
| BB/Ba | 39.6 |
| B/B | 32.4 |
| CCC | 13.4 |
| Not Rated | 6.4 |
| Cash Equivalents | 3.1 |
| Total | 100.0% |
| Sector Allocation**(% of Net Assets) | |
| Long Positions | |
| Corporate Bonds | |
| Energy | 11.7% |
| Consumer Discretionary | 9.9 |
| Communication Services | 9.3 |
| Industrials | 8.0 |
| Financials | 5.8 |
| Consumer Staples | 5.6 |
| Materials | 4.3 |
| Real Estate | 4.0 |
| Health Care | 3.8 |
| Information Technology | 2.5 |
| Utilities | 1.8 |
| Bank Loans | 17.8 |
| Asset-Backed Securities | 9.5 |
| Common Stocks | |
| Energy | 1.2 |
| Health Care | 0.5 |
| Industrials | 0.1 |
| Exchange-Traded Fund | 0.4 |
| Warrants | 0.0 |
| Short-Term Investment Funds | 6.4 |
| Other Assets/Liabilities (Net) | (1.8) |
| 100.8% | |
| Short Positions | |
| Corporate Bonds | (0.8) |
| Total | 100.0% |
| Sector Allocation**(% of Net Assets) | |
| Information Technology | 23.2% |
| Health Care | 13.7 |
| Financials | 13.7 |
| Consumer Discretionary | 10.7 |
| Industrials | 9.0 |
| Communication Services | 7.2 |
| Consumer Staples | 7.0 |
| Energy | 5.6 |
| Utilities | 3.9 |
| Materials | 3.0 |
| Real Estate | 2.8 |
| Short-Term Investment Fund | 0.4 |
| Other Assets/Liabilities (Net) | (0.2) |
| Total | 100.0% |
| Credit Quality*(% of Fixed Income Securities) | |
| A/A | 0.5% |
| BBB/Baa | 6.5 |
| BB/Ba | 60.9 |
| B/B | 25.0 |
| CCC | 3.0 |
| Not Rated | 2.0 |
| Cash Equivalents | 2.1 |
| Total | 100.0% |
| Credit Quality*(% of Fixed Income Securities) | |
| AAA/Aaa | 68.1% |
| AA/Aa | 11.0 |
| A/A | 11.5 |
| BBB/Baa | 7.9 |
| BB/Ba | 0.3 |
| Cash Equivalents | 1.2 |
| Total | 100.0% |
| Geographic Allocation(% of Net Assets) | |
| Common Stocks | |
| Japan | 18.0% |
| France | 14.5 |
| United Kingdom | 11.0 |
| Sweden | 8.9 |
| South Korea | 7.5 |
| Singapore | 6.2 |
| Switzerland | 5.6 |
| India | 4.7 |
| China | 4.2 |
| Canada | 4.0 |
| Taiwan | 3.5 |
| Germany | 2.9 |
| Thailand | 2.0 |
| Netherlands | 1.9 |
| Denmark | 1.2 |
| Preferred Stocks | 2.6 |
| Short-Term Investment Funds | 3.9 |
| Other Assets/Liabilities (Net) | (2.6) |
| Total | 100.0% |
| Sector Allocation*(% of Net Assets) | |
| Industrials | 26.2% |
| Information Technology | 16.7 |
| Consumer Discretionary | 12.8 |
| Financials | 12.1 |
| Consumer Staples | 12.0 |
| Materials | 10.8 |
| Health Care | 5.5 |
| Real Estate | 2.7 |
| Short-Term Investment Fund | 1.3 |
| Other Assets/Liabilities (Net) | (0.1) |
| Total | 100.0% |
| Sector Allocation*(% of Net Assets) | |
| Financials | 18.2% |
| Industrials | 14.8 |
| Consumer Staples | 11.1 |
| Utilities | 10.2 |
| Health Care | 9.1 |
| Consumer Discretionary | 8.5 |
| Materials | 8.4 |
| Energy | 7.1 |
| Information Technology | 6.7 |
| Real Estate | 5.0 |
| Short-Term Investment Fund | 1.3 |
| Other Assets/Liabilities (Net) | (0.4) |
| Total | 100.0% |
| Sector Allocation*(% of Net Assets) | |
| Information Technology | 45.7% |
| Communication Services | 15.9 |
| Consumer Discretionary | 14.4 |
| Health Care | 14.0 |
| Industrials | 8.6 |
| Short-Term Investment Fund | 1.0 |
| Other Assets/Liabilities (Net) | 0.4 |
| Total | 100.0% |
| Sector Allocation*(% of Net Assets) | |
| Industrials | 23.9% |
| Consumer Discretionary | 18.3 |
| Financials | 16.0 |
| Information Technology | 12.7 |
| Materials | 7.3 |
| Real Estate | 6.9 |
| Consumer Staples | 5.0 |
| Health Care | 3.9 |
| Energy | 0.9 |
| Short-Term Investment Funds | 7.8 |
| Other Assets/Liabilities (Net) | (2.7) |
| Total | 100.0% |
| Sector Allocation*(% of Net Assets) | |
| Industrials | 24.2% |
| Financials | 19.5 |
| Information Technology | 8.6 |
| Health Care | 8.2 |
| Materials | 7.9 |
| Consumer Staples | 7.8 |
| Consumer Discretionary | 6.9 |
| Utilities | 5.1 |
| Real Estate | 4.7 |
| Energy | 4.4 |
| Communication Services | 0.7 |
| Exchange-Traded Fund | 1.0 |
| Short-Term Investment Funds | 1.1 |
| Other Assets/Liabilities (Net) | (0.1) |
| Total | 100.0% |
| Credit Quality**(% of Fixed Income Securities) | |
| AAA/Aaa | 53.6% |
| AA/Aa | 12.0 |
| A/A | 13.3 |
| BBB/Baa | 13.7 |
| Not Rated | 0.3 |
| Cash Equivalents | 7.1 |
| Total | 100.0% |
| Principal Amount | Market Value | |||
| Corporate Bonds — 40.7% | ||||
| Financials — 12.2% | ||||
| $ 1,304,000 | AerCap Ireland Capital DAC / AerCap Global Aviation Trust (Ireland), 2.450%, 10/29/26 | $ 1,100,499 | ||
| 661,000 | Allstate Corp. (The), 1.450%, 12/15/30 | 499,022 | ||
| 308,000 | Allstate Corp. (The), Ser B, 5.750%, 8/15/53 | 283,570 | ||
| 724,000 | American Financial Group, Inc., 5.250%, 4/2/30 | 693,980 | ||
| 1,057,000 | Ares Capital Corp., 3.250%, 7/15/25 | 965,630 | ||
| 200,000 | Banco Nacional de Panama (Panama), 144a, 2.500%, 8/11/30 | 146,761 | ||
| 1,007,000 | Bank of America Corp., 2.687%, 4/22/32 | 784,386 | ||
| 759,000 | Bank of America Corp., 3.705%, 4/24/28 | 690,951 | ||
| 1,007,000 | Bank of America Corp., MTN, 4.000%, 1/22/25 | 974,794 | ||
| 903,000 | Bank of Montreal (Canada), 3.803%, 12/15/32 | 783,406 | ||
| 1,363,000 | Bank of Nova Scotia (The) (Canada), 3.625%, 10/27/81 | 988,175 | ||
| 1,282,000 | Barclays PLC (United Kingdom), 2.894%, 11/24/32 | 926,410 | ||
| 617,000 | Berkshire Hathaway Finance Corp., 4.250%, 1/15/49 | 512,833 | ||
| 437,000 | BNP Paribas SA (France), 144a, 4.625%, 3/13/27 | 403,970 | ||
| 733,000 | Charles Schwab Corp. (The), 5.000%(A) | 658,784 | ||
| 1,122,000 | Citigroup, Inc., 0.981%, 5/1/25 | 1,039,820 | ||
| 670,000 | Citigroup, Inc., 3.200%, 10/21/26 | 614,013 | ||
| 430,000 | Citigroup, Inc., 4.750%, 5/18/46 | 342,722 | ||
| 1,026,000 | Citizens Bank NA, 4.575%, 8/9/28 | 976,878 | ||
| 1,032,000 | Cooperatieve Rabobank UA (Netherlands), 144a, 1.106%, 2/24/27 | 883,754 | ||
| 1,457,000 | Corestates Capital III, 144a, (3M LIBOR +0.570%), 3.475%, 2/15/27(B) | 1,373,223 | ||
| 899,000 | Credit Suisse AG (Switzerland), 3.700%, 2/21/25 | 843,942 | ||
| 1,197,000 | Goldman Sachs Group, Inc. (The), 2.615%, 4/22/32 | 928,998 | ||
| 1,865,000 | Goldman Sachs Group, Inc. (The), 3.615%, 3/15/28 | 1,697,985 | ||
| 529,000 | Goldman Sachs Group, Inc. (The), 3.691%, 6/5/28 | 479,197 | ||
| 724,000 | HSBC Holdings PLC (United Kingdom), 3.900%, 5/25/26 | 678,791 | ||
| 1,154,000 | Huntington Bancshares, Inc., 2.550%, 2/4/30 | 931,327 | ||
| 200,000 | Jababeka International BV (Indonesia), 6.500%, 10/5/23 | 110,000 | ||
| 1,258,000 | JPMorgan Chase & Co., 2.956%, 5/13/31 | 995,963 | ||
| 968,000 | JPMorgan Chase & Co., 3.509%, 1/23/29 | 856,675 | ||
| 898,000 | JPMorgan Chase & Co., 5.717%, 9/14/33 | 848,604 | ||
| 930,000 | Lloyds Banking Group PLC (United Kingdom), 3.574%, 11/7/28 | 816,006 | ||
| 1,226,000 | Mastercard, Inc., 2.000%, 11/18/31 | 969,618 | ||
| 962,000 | Morgan Stanley, 3.950%, 4/23/27 | 894,368 | ||
| 820,000 | Morgan Stanley, 5.297%, 4/20/37 | 735,385 | ||
| 1,190,292 | Northwestern Mutual Life Insurance Co. (The), 144a, 3.850%, 9/30/47 | 896,902 | ||
| 1,193,000 | PNC Capital Trust, (3M LIBOR +0.570%), 3.652%, 6/1/28(B) | 1,109,551 | ||
| 1,098,000 | Prudential Financial, Inc., 5.125%, 3/1/52 | 951,900 | ||
| 1,877,000 | Truist Bank, Ser A, (3M LIBOR +0.670%), 3.580%, 5/15/27(B) | 1,740,919 | ||
| 32,129,712 | ||||
| Consumer Discretionary — 4.9% | ||||
| 1,298,000 | BAT Capital Corp. (United Kingdom), 3.557%, 8/15/27 | 1,139,587 | ||
| 697,000 | Brunswick Corp., 4.400%, 9/15/32 | 563,433 | ||
| 239,000 | Expedia Group, Inc., 2.950%, 3/15/31 | 185,331 | ||
| 664,000 | Ford Motor Co., 3.250%, 2/12/32 | 476,752 | ||
| 535,000 | Ford Motor Credit Co. LLC, 3.664%, 9/8/24 | 502,226 | ||
| 300,000 | GEMS MENASA Cayman Ltd. / GEMS Education Delaware LLC (United Arab Emirates), 7.125%, 7/31/26 | 281,338 | ||
| 1,630,000 | General Motors Financial Co., Inc., 3.100%, 1/12/32 | 1,228,828 | ||
| 459,000 | General Motors Financial Co., Inc., 5.650%, 1/17/29 | 433,915 | ||
| 200,000 | Genm Capital Labuan Ltd. (Malaysia), 144a, 3.882%, 4/19/31 | 136,879 | ||
| Principal Amount | Market Value | |||
| Consumer Discretionary — (Continued) | ||||
| $ 561,000 | Home Depot, Inc. (The), 5.950%, 4/1/41 | $ 584,278 | ||
| 929,000 | Hyundai Capital America, 144a, 2.650%, 2/10/25 | 865,804 | ||
| 740,000 | Imperial Brands Finance PLC (United Kingdom), 144a, 6.125%, 7/27/27 | 729,493 | ||
| 1,410,000 | JBS USA LUX SA / JBS USA Food Co. / JBS USA Finance, Inc., 144a, 2.500%, 1/15/27 | 1,208,483 | ||
| 447,000 | JBS USA LUX SA / JBS USA Food Co. / JBS USA Finance, Inc., 144a, 4.375%, 2/2/52 | 299,606 | ||
| 1,108,000 | Lowe's Cos., Inc., 4.500%, 4/15/30 | 1,034,452 | ||
| 1,602,000 | Procter & Gamble Co. (The), 1.200%, 10/29/30 | 1,235,851 | ||
| 200,000 | Prosus NV (China), 144a, 3.257%, 1/19/27 | 167,499 | ||
| 1,153,000 | Toll Brothers Finance Corp., 3.800%, 11/1/29 | 933,000 | ||
| 689,000 | Warnermedia Holdings, Inc., 144a, 4.279%, 3/15/32 | 566,720 | ||
| 689,000 | Warnermedia Holdings, Inc., 144a, 5.141%, 3/15/52 | 499,904 | ||
| 13,073,379 | ||||
| Industrials — 4.0% | ||||
| 200,000 | Aeropuerto Internacional de Tocumen SA (Panama), 144a, 4.000%, 8/11/41 | 147,642 | ||
| 1,228,000 | Amcor Flexibles North America, Inc., 2.630%, 6/19/30 | 986,017 | ||
| 650,000 | Boeing Co. (The), 5.805%, 5/1/50 | 566,167 | ||
| 782,000 | Burlington Northern Santa Fe LLC, 5.750%, 5/1/40 | 790,495 | ||
| 200,000 | Canpack SA / Canpack US LLC (Poland), 144a, 3.125%, 11/1/25 | 173,935 | ||
| 635,000 | Carrier Global Corp., 3.577%, 4/5/50 | 439,787 | ||
| 1,237,000 | CNH Industrial Capital LLC, 1.450%, 7/15/26 | 1,070,562 | ||
| 320,000 | DAE Funding LLC (United Arab Emirates), 3.375%, 3/20/28 | 271,060 | ||
| 899,000 | FedEx Corp., 5.100%, 1/15/44 | 759,780 | ||
| 977,000 | John Deere Capital Corp., MTN, 2.450%, 1/9/30 | 824,339 | ||
| 300,000 | Misc Capital Two Labuan Ltd. (Malaysia), 144a, 3.625%, 4/6/25 | 286,824 | ||
| 890,000 | Mohawk Industries, Inc., 3.625%, 5/15/30 | 740,252 | ||
| 803,000 | Norfolk Southern Corp., 4.837%, 10/1/41 | 714,798 | ||
| 1,068,000 | Parker-Hannifin Corp., 4.250%, 9/15/27 | 1,017,706 | ||
| 691,000 | Roper Technologies, Inc., 2.950%, 9/15/29 | 581,505 | ||
| 1,381,000 | Weir Group PLC (The) (United Kingdom), 144a, 2.200%, 5/13/26 | 1,160,681 | ||
| 10,531,550 | ||||
| Energy — 4.0% | ||||
| 878,000 | Boardwalk Pipelines LP, 4.800%, 5/3/29 | 806,025 | ||
| 619,000 | Canadian Natural Resources Ltd. (Canada), 6.250%, 3/15/38 | 597,080 | ||
| 723,000 | Cenovus Energy, Inc. (Canada), 5.250%, 6/15/37 | 633,056 | ||
| 655,000 | Continental Resources, Inc., 144a, 5.750%, 1/15/31 | 592,027 | ||
| 320,000 | Ecopetrol SA (Colombia), 6.875%, 4/29/30 | 268,837 | ||
| 300,000 | EIG Pearl Holdings Sarl (Saudi Arabia), 144a, 3.545%, 8/31/36 | 239,170 | ||
| 200,000 | EIG Pearl Holdings Sarl (Saudi Arabia), 144a, 4.387%, 11/30/46 | 141,058 | ||
| 1,103,000 | Energy Transfer LP, 4.150%, 9/15/29 | 962,593 | ||
| 200,000 | FS Luxembourg Sarl (Brazil), 144a, 10.000%, 12/15/25 | 201,947 | ||
| 150,000 | Heritage Petroleum Co. Ltd. (Trinidad and Tobago), 144a, 9.000%, 8/12/29 | 156,924 | ||
| 300,000 | KazMunayGas National Co. JSC (Kazakhstan), 144a, 4.750%, 4/19/27 | 250,815 | ||
| 200,000 | KazMunayGas National Co. JSC (Kazakhstan), 144a, 5.750%, 4/19/47 | 133,073 | ||
| 601,000 | MC Brazil Downstream Trading SARL (Brazil), 144a, 7.250%, 6/30/31 | 452,252 | ||
| 793,000 | Midwest Connector Capital Co. LLC, 144a, 3.900%, 4/1/24 | 766,250 | ||
| Principal Amount | Market Value | |||
| Corporate Bonds — 40.7% (Continued) | ||||
| Energy — (Continued) | ||||
| $ 801,000 | MPLX LP, 4.950%, 3/14/52 | $ 626,924 | ||
| 969,000 | NGPL PipeCo LLC, 144a, 7.768%, 12/15/37 | 978,893 | ||
| 300,000 | Oil and Gas Holding Co. BSCC (The) (Bahrain), 144a, 7.500%, 10/25/27 | 291,589 | ||
| 200,000 | Petroleos del Peru SA (Peru), 144a, 4.750%, 6/19/32 | 140,701 | ||
| 200,000 | Petroleos del Peru SA (Peru), 144a, 5.625%, 6/19/47 | 120,080 | ||
| 375,000 | Petroleos Mexicanos (Mexico), 6.625%, 6/15/35 | 239,625 | ||
| 403,000 | Petroleos Mexicanos (Mexico), 6.700%, 2/16/32 | 283,914 | ||
| 250,000 | Petroleos Mexicanos (Mexico), 6.750%, 9/21/47 | 139,505 | ||
| 501,000 | Petroleos Mexicanos (Mexico), 7.690%, 1/23/50 | 308,866 | ||
| 380,000 | Petronas Capital Ltd. (Malaysia), 144a, 2.480%, 1/28/32 | 311,599 | ||
| 400,000 | Qatar Petroleum (Qatar), 144a, 3.125%, 7/12/41 | 291,714 | ||
| 250,000 | SA Global Sukuk Ltd. (Saudi Arabia), 144a, 2.694%, 6/17/31 | 210,932 | ||
| 200,000 | Sinopec Group Overseas Development 2018 Ltd. (China), 144a, 3.350%, 5/13/50 | 142,438 | ||
| 350,000 | YPF, SA (Argentina), 144a, 6.950%, 7/21/27 | 201,775 | ||
| 10,489,662 | ||||
| Utilities — 3.1% | ||||
| 199,271 | Alfa Desarrollo SpA (Chile), 144a, 4.550%, 9/27/51 | 131,519 | ||
| 1,002,000 | CMS Energy Corp., 4.750%, 6/1/50 | 846,690 | ||
| 717,000 | Duke Energy Progress LLC, 4.150%, 12/1/44 | 578,302 | ||
| 712,000 | Edison International, 4.125%, 3/15/28 | 635,535 | ||
| 929,000 | Electricite de France SA (France), 144a, 4.875%, 9/21/38 | 763,136 | ||
| 200,000 | Eskom Holdings SOC Ltd. (South Africa), 144a, 7.125%, 2/11/25 | 177,100 | ||
| 903,000 | FirstEnergy Transmission LLC, 144a, 5.450%, 7/15/44 | 816,751 | ||
| 250,000 | Minejesa Capital BV (Indonesia), 4.625%, 8/10/30 | 204,375 | ||
| 200,000 | NPC Ukrenergo (Ukraine), 144a, 6.875%, 11/9/28* | 38,278 | ||
| 1,114,000 | Ohio Power Co., Ser R, 2.900%, 10/1/51 | 696,195 | ||
| 1,225,000 | Pacific Gas and Electric Co., 3.500%, 8/1/50 | 745,594 | ||
| 859,000 | PacifiCorp., 5.750%, 4/1/37 | 816,235 | ||
| 200,000 | Perusahaan Listrik Negara PT (Indonesia), 144a, 4.875%, 7/17/49 | 139,268 | ||
| 1,860,000 | WEC Energy Group, Inc., (3M LIBOR +2.112%), 5.018%, 5/15/67(B) | 1,543,800 | ||
| 8,132,778 | ||||
| Health Care — 2.5% | ||||
| 806,000 | AbbVie, Inc., 4.450%, 5/14/46 | 655,121 | ||
| 903,000 | Alcon Finance Corp. (Switzerland), 144a, 3.800%, 9/23/49 | 646,666 | ||
| 744,000 | Becton Dickinson and Co., 4.685%, 12/15/44 | 635,493 | ||
| 840,000 | CommonSpirit Health, 4.187%, 10/1/49 | 628,377 | ||
| 768,000 | CVS Health Corp., 5.125%, 7/20/45 | 672,431 | ||
| 1,026,000 | DH Europe Finance II Sarl, 3.250%, 11/15/39 | 777,974 | ||
| 1,045,000 | HCA Inc., 5.375%, 9/1/26 | 1,012,780 | ||
| 906,000 | Mylan, Inc., 4.550%, 4/15/28 | 800,672 | ||
| 1,056,000 | UnitedHealth Group, Inc., 3.500%, 8/15/39 | 830,449 | ||
| 6,659,963 | ||||
| Communication Services — 2.4% | ||||
| 609,000 | AT&T, Inc., 4.500%, 5/15/35 | 526,434 | ||
| 1,165,000 | British Telecommunications PLC (United Kingdom), 144a, 3.250%, 11/8/29 | 950,020 | ||
| 940,000 | Charter Communications Operating LLC / Charter Communications Operating Capital, 6.484%, 10/23/45 | 826,188 | ||
| 782,000 | Comcast Corp., 4.000%, 3/1/48 | 597,937 | ||
| 1,380,000 | Netflix, Inc., 6.375%, 5/15/29 | 1,369,670 | ||
| 445,000 | Paramount Global, 4.950%, 5/19/50 | 316,279 | ||
| Principal Amount | Market Value | |||
| Communication Services — (Continued) | ||||
| $ 1,152,000 | T-Mobile USA, Inc., 3.875%, 4/15/30 | $ 1,021,450 | ||
| 1,083,000 | Verizon Communications, Inc., 2.987%, 10/30/56 | 643,868 | ||
| 6,251,846 | ||||
| Information Technology — 2.2% | ||||
| 634,000 | Apple, Inc., 4.650%, 2/23/46 | 588,341 | ||
| 1,381,000 | Broadcom, Inc., 4.150%, 11/15/30 | 1,194,836 | ||
| 1,175,000 | Microchip Technology, Inc., 0.983%, 9/1/24 | 1,081,865 | ||
| 658,000 | Micron Technology, Inc., 2.703%, 4/15/32 | 477,898 | ||
| 465,000 | Microsoft Corp., 3.500%, 2/12/35 | 417,560 | ||
| 858,000 | NXP BV / NXP Funding LLC (China), 5.350%, 3/1/26 | 847,601 | ||
| 386,000 | Oracle Corp., 3.600%, 4/1/40 | 262,019 | ||
| 309,000 | Oracle Corp., 4.300%, 7/8/34 | 251,714 | ||
| 629,000 | Visa, Inc., 4.150%, 12/14/35 | 572,676 | ||
| 5,694,510 | ||||
| Real Estate — 2.1% | ||||
| 973,000 | Crown Castle International Corp. REIT, 3.650%, 9/1/27 | 880,993 | ||
| 830,000 | Equinix, Inc. REIT, 2.900%, 11/18/26 | 744,978 | ||
| 1,082,000 | Host Hotels & Resorts LP REIT, Ser F, 4.500%, 2/1/26 | 1,027,795 | ||
| 1,000,000 | Invitation Homes Operating Partnership LP REIT, 4.150%, 4/15/32 | 844,678 | ||
| 200,000 | Logan Group Co. Ltd. (China), 5.250%, 2/23/23 | 31,900 | ||
| 457,000 | Mid-America Apartments LP REIT, 3.750%, 6/15/24 | 446,924 | ||
| 696,000 | Sabra Health Care LP REIT, 5.125%, 8/15/26 | 653,237 | ||
| 353,000 | STORE Capital Corp. REIT, 4.500%, 3/15/28 | 336,249 | ||
| 720,000 | STORE Capital Corp. REIT, 4.625%, 3/15/29 | 688,109 | ||
| 5,654,863 | ||||
| Consumer Staples — 1.9% | ||||
| 1,218,000 | 7-Eleven, Inc., 144a, 0.950%, 2/10/26 | 1,050,812 | ||
| 1,181,000 | Anheuser-Busch Cos. LLC / Anheuser-Busch InBev Worldwide, Inc. (Belgium), 4.900%, 2/1/46 | 1,023,520 | ||
| 978,000 | Ashtead Capital, Inc. (United Kingdom), 144a, 4.000%, 5/1/28 | 855,051 | ||
| 200,000 | Coruripe Netherlands BV (Brazil), 144a, 10.000%, 2/10/27 | 171,000 | ||
| 623,000 | Kroger Co. (The), 5.000%, 4/15/42 | 549,841 | ||
| 926,000 | Mars, Inc., 144a, 3.875%, 4/1/39 | 763,698 | ||
| 657,000 | Starbucks Corp., 3.350%, 3/12/50 | 447,996 | ||
| 400,000 | Ulker Biskuvi Sanayi AS (Turkey), 144a, 6.950%, 10/30/25 | 273,360 | ||
| 5,135,278 | ||||
| Materials — 1.4% | ||||
| 672,000 | Braskem America Finance Co. (Brazil), 144a, 7.125%, 7/22/41 | 588,285 | ||
| 200,000 | Braskem Idesa SAPI (Mexico), 144a, 6.990%, 2/20/32 | 134,000 | ||
| 200,000 | Braskem Netherlands Finance BV (Brazil), 144a, 4.500%, 1/31/30 | 161,640 | ||
| 421,000 | Braskem Netherlands Finance BV (Brazil), 144a, 5.875%, 1/31/50 | 298,279 | ||
| 1,054,000 | Celanese US Holdings LLC, 6.165%, 7/15/27 | 994,403 | ||
| 200,000 | Freeport Indonesia PT (Indonesia), 144a, 4.763%, 4/14/27 | 180,058 | ||
| 200,000 | Freeport Indonesia PT (Indonesia), 144a, 5.315%, 4/14/32 | 165,500 | ||
| 200,000 | Indonesia Asahan Aluminium Persero PT (Indonesia), 144a, 5.800%, 5/15/50 | 150,610 | ||
| 200,000 | Metinvest BV (Ukraine), 144a, 7.750%, 10/17/29 | 87,760 | ||
| 200,000 | OCP SA (Morocco), 144a, 5.125%, 6/23/51 | 127,000 | ||
| Principal Amount | Market Value | |||
| Corporate Bonds — 40.7% (Continued) | ||||
| Materials — (Continued) | ||||
| $ 795,000 | Sherwin-Williams Co. (The), 4.500%, 6/1/47 | $ 644,931 | ||
| 200,000 | Stillwater Mining Co. (South Africa), 144a, 4.500%, 11/16/29 | 147,656 | ||
| 3,680,122 | ||||
| Total Corporate Bonds | $107,433,663 | |||
| U.S. Treasury Obligations — 22.2% | ||||
| 4,345,000 | U.S. Treasury Bond, 1.750%, 8/15/41 | 2,972,252 | ||
| 3,039,000 | U.S. Treasury Bond, 2.250%, 2/15/52 | 2,207,549 | ||
| 1,035,000 | U.S. Treasury Bond, 2.375%, 2/15/42 | 793,230 | ||
| 2,905,000 | U.S. Treasury Bond, 2.875%, 5/15/52 | 2,436,569 | ||
| 2,000,000 | U.S. Treasury Bond, 3.000%, 5/15/42 | 1,701,953 | ||
| 6,595,000 | U.S. Treasury Bond, 3.250%, 5/15/42 | 5,854,093 | ||
| 24,505,000 | U.S. Treasury Note, 0.750%, 5/31/26 | 21,647,679 | ||
| 22,885,000 | U.S. Treasury Note, 2.750%, 8/15/32 | 20,914,744 | ||
| Total U.S. Treasury Obligations | $58,528,069 | |||
| Commercial Mortgage-Backed Securities — 8.6% | ||||
| 1,000,000 | Austin Fairmont Hotel Trust, Ser 2019-FAIR, Class C, 144a, (1M LIBOR +1.450%), 4.268%, 9/15/32(B) | 957,262 | ||
| 500,000 | BANK, Ser 2018-BN14, Class A3, 3.966%, 9/15/60 | 466,244 | ||
| 970,000 | BANK, Ser 2020-BN26, Class A4, 2.403%, 3/15/63 | 799,401 | ||
| 1,230,000 | BANK, Ser 2022-BNK39, Class A4, 2.928%, 2/15/55 | 1,023,501 | ||
| 930,000 | BBCMS Mortgage Trust, Ser 2021-C11, Class A5, 2.322%, 9/15/54 | 739,291 | ||
| 2,745,000 | BBCMS Mortgage Trust, Ser 2021-C12, Class A5, 2.689%, 11/15/54 | 2,244,181 | ||
| 720,000 | BBCMS Mortgage Trust, Ser 2022-C14, Class A5, 2.946%, 2/15/55 | 600,455 | ||
| 1,000,000 | BPR Trust, Ser 2021-KEN, Class B, 144a, (1M LIBOR +1.950%), 4.768%, 2/15/29(B) | 969,794 | ||
| 830,000 | Citigroup Commercial Mortgage Trust, Ser 2020-GC46, Class A5, 2.717%, 2/15/53 | 695,833 | ||
| 1,234,572 | COMM Mortgage Trust, Ser 2014-CR14, Class A2, 3.147%, 2/10/47 | 1,221,187 | ||
| 1,600,000 | CSMC, Ser 2021-B33, Class A1, 144a, 3.052%, 10/10/43 | 1,376,392 | ||
| 580,000 | DBUBS Mortgage Trust, Ser 2017-BRBK, Class B, 144a, 3.648%, 10/10/34(B)(C) | 544,007 | ||
| 550,000 | Eleven Madison Trust Mortgage Trust, Ser 2015-11MD, Class C, 144a, 3.673%, 9/10/35(B)(C) | 493,028 | ||
| 595,000 | GS Mortgage Securities Corp. II, Ser 2017-SLP, Class B, 144a, 3.772%, 10/10/32 | 594,047 | ||
| 750,000 | GS Mortgage Securities Corp. Trust, Ser 2020-UPTN, Class E, 144a, 3.354%, 2/10/37 | 647,452 | ||
| 1,750,000 | GS Mortgage Securities Trust, Ser 2017-FARM, Class B, 144a, 3.659%, 1/10/43(B)(C) | 1,492,292 | ||
| 1,325,000 | GS Mortgage Securities Trust, Ser 2020-GC47, Class A5, 2.377%, 5/12/53 | 1,083,754 | ||
| 765,000 | HONO Mortgage Trust, Ser 2021-LULU, Class B, 144a, (1M LIBOR +1.450%), 4.268%, 10/15/36(B) | 726,757 | ||
| 528,000 | JP Morgan Chase Commercial Mortgage Securities Trust, Ser 2016-NINE, Class B, 144a, 2.949%, 9/6/38(B)(C) | 452,805 | ||
| 755,000 | JP Morgan Chase Commercial Mortgage Securities Trust, Ser 2017-JP7, Class A5, 3.454%, 9/15/50 | 695,233 | ||
| 1,200,000 | JPMorgan Chase Commercial Mortgage Securities Trust, Ser 2018-MINN, Class A, 144a, (1M LIBOR +1.27%), 4.088%, 11/15/35(B) | 1,150,640 | ||
| 1,210,000 | Morgan Stanley Capital I Trust, Ser 2018-H3, Class AS, 4.177%, 7/15/51 | 1,137,688 | ||
| Principal Amount | Market Value | |||
| Commercial Mortgage-Backed Securities — 8.6% (Continued) | ||||
| $ 2,380,000 | Wells Fargo Commercial Mortgage Trust, Ser 2019-C53, Class A4, 3.040%, 10/15/52 | $ 2,051,531 | ||
| 695,000 | WFRBS Commercial Mortgage Trust, Ser 2013-C12, Class B, 3.863%, 3/15/48(B)(C) | 686,085 | ||
| Total Commercial Mortgage-Backed Securities | $22,848,860 | |||
| U.S. Government Mortgage-Backed Obligations — 7.7% | ||||
| 49,293 | FHLMC, Pool #1Q0339, (12M LIBOR +1.889%), 2.769%, 4/1/37(B) | 49,720 | ||
| 7,228 | FHLMC, Pool #A12886, 5.000%, 8/1/33 | 7,256 | ||
| 47,004 | FHLMC, Pool #A13842, 6.000%, 9/1/33 | 47,852 | ||
| 4,837 | FHLMC, Pool #A21415, 5.000%, 5/1/34 | 4,879 | ||
| 10,389 | FHLMC, Pool #A35682, 5.000%, 7/1/35 | 10,417 | ||
| 4,141 | FHLMC, Pool #A36523, 5.000%, 8/1/35 | 4,072 | ||
| 19,093 | FHLMC, Pool #A46590, 5.000%, 8/1/35 | 18,666 | ||
| 2,572 | FHLMC, Pool #A64971, 5.500%, 8/1/37 | 2,662 | ||
| 1,556,159 | FHLMC, Pool #A89148, 4.000%, 10/1/39 | 1,485,355 | ||
| 42,092 | FHLMC, Pool #A96485, 4.500%, 1/1/41 | 41,185 | ||
| 271,740 | FHLMC, Pool #A97897, 4.500%, 4/1/41 | 266,586 | ||
| 14,204 | FHLMC, Pool #C62740, 7.000%, 1/1/32 | 14,542 | ||
| 8,199 | FHLMC, Pool #C72254, 6.500%, 7/1/32 | 8,456 | ||
| 14,268 | FHLMC, Pool #C90986, 7.000%, 6/1/26 | 14,399 | ||
| 8,119 | FHLMC, Pool #G02184, 5.000%, 4/1/36 | 8,202 | ||
| 1,400,576 | FHLMC, Pool #G05624, 4.500%, 9/1/39 | 1,374,461 | ||
| 131,015 | FHLMC, Pool #G05733, 5.000%, 11/1/39 | 132,365 | ||
| 33,030 | FHLMC, Pool #J13584, 3.500%, 11/1/25 | 31,406 | ||
| 877,281 | FHLMC REMIC, Pool #SD1436, 4.500%, 8/1/52 | 838,359 | ||
| 840,000 | FHLMC REMIC, Pool #SD1620, 5.000%, 9/1/52 | 820,194 | ||
| 13,967 | FNMA, Pool #255628, 5.500%, 2/1/25 | 13,911 | ||
| 5,256 | FNMA, Pool #426830, 8.000%, 11/1/24 | 5,266 | ||
| 4,378 | FNMA, Pool #540040, 7.500%, 6/1/28 | 4,377 | ||
| 7,588 | FNMA, Pool #561741, 7.500%, 1/1/31 | 7,842 | ||
| 14,950 | FNMA, Pool #640291, 7.000%, 8/1/32 | 14,941 | ||
| 14,135 | FNMA, Pool #670402, 6.500%, 6/1/32 | 14,732 | ||
| 79,540 | FNMA, Pool #745257, 6.000%, 1/1/36 | 83,540 | ||
| 51,645 | FNMA, Pool #748895, 6.000%, 12/1/33 | 51,814 | ||
| 23,016 | FNMA, Pool #758564, 6.000%, 9/1/24 | 23,388 | ||
| 33,366 | FNMA, Pool #810049, 5.500%, 3/1/35 | 33,244 | ||
| 30,681 | FNMA, Pool #819297, 6.000%, 9/1/35 | 31,963 | ||
| 549,253 | FNMA, Pool #881279, 5.000%, 11/1/36 | 548,883 | ||
| 17,346 | FNMA, Pool #889060, 6.000%, 1/1/38 | 18,712 | ||
| 42,930 | FNMA, Pool #889061, 6.000%, 1/1/38 | 45,091 | ||
| 3,561 | FNMA, Pool #895657, 6.500%, 8/1/36 | 3,625 | ||
| 59,879 | FNMA, Pool #905049, 5.500%, 11/1/36 | 59,633 | ||
| 219,438 | FNMA, Pool #928553, 5.500%, 8/1/37 | 221,289 | ||
| 114,614 | FNMA, Pool #931535, 5.500%, 7/1/39 | 114,492 | ||
| 93,818 | FNMA, Pool #AA3467, 4.500%, 4/1/39 | 92,013 | ||
| 155,450 | FNMA, Pool #AA4584, 4.500%, 4/1/39 | 152,475 | ||
| 36,448 | FNMA, Pool #AB1800, 4.000%, 11/1/40 | 34,752 | ||
| 54,759 | FNMA, Pool #AB2452, 4.000%, 3/1/26 | 53,079 | ||
| 14,265 | FNMA, Pool #AD3775, 4.500%, 3/1/25 | 14,030 | ||
| 24,463 | FNMA, Pool #AD6193, 5.000%, 6/1/40 | 24,318 | ||
| 49,770 | FNMA, Pool #AE1568, 4.000%, 9/1/40 | 47,460 | ||
| 290,932 | FNMA, Pool #AE2497, 4.500%, 9/1/40 | 285,091 | ||
| 32,203 | FNMA, Pool #AE5441, 5.000%, 10/1/40 | 32,391 | ||
| 93,923 | FNMA, Pool #AH1135, 5.000%, 1/1/41 | 94,773 | ||
| 34,626 | FNMA, Pool #AH3671, 4.000%, 2/1/26 | 33,579 | ||
| 283,401 | FNMA, Pool #AH6622, 4.000%, 3/1/41 | 270,200 | ||
| 262,922 | FNMA, Pool #AL0150, 4.000%, 2/1/41 | 250,692 | ||
| 46,922 | FNMA, Pool #AL0211, 5.000%, 4/1/41 | 47,348 | ||
| 310,626 | FNMA, Pool #AS0779, 4.000%, 10/1/43 | 295,269 | ||
| 2,125,943 | FNMA, Pool #BT7156, 2.000%, 8/1/51 | 1,729,273 | ||
| 1,531,790 | FNMA, Pool #FM4660, 2.000%, 10/1/35 | 1,355,147 | ||
| Principal Amount | Market Value | |||
| U.S. Government Mortgage-Backed Obligations — 7.7% (Continued) | ||||
| $ 1,535,002 | FNMA, Pool #FM4702, 2.500%, 10/1/50 | $ 1,301,626 | ||
| 2,231,495 | FNMA, Pool #FM5085, 2.000%, 12/1/50 | 1,819,541 | ||
| 1,062,725 | FNMA, Pool #FM8360, 2.500%, 8/1/51 | 900,470 | ||
| 1,049,301 | FNMA, Pool #FM8361, 2.500%, 8/1/51 | 887,059 | ||
| 1,150,991 | FNMA, Pool #FM9905, 2.500%, 12/1/51 | 971,697 | ||
| 1,152,230 | FNMA, Pool #FM9907, 2.500%, 12/1/51 | 972,883 | ||
| 840,000 | FNMA, Pool #FS2906, 5.000%, 9/1/52 | 821,231 | ||
| 930,537 | FNMA, Pool #MA4128, 2.000%, 9/1/40 | 780,635 | ||
| 661,801 | GNMA, Pool #4424, 5.000%, 4/20/39 | 673,106 | ||
| Total U.S. Government Mortgage-Backed Obligations | $20,417,915 | |||
| Asset-Backed Securities — 6.1% | ||||
| 1,100,000 | AB BSL CLO 2 Ltd. (Cayman Islands), Ser 2021-2A, Class B1, 144a, (3M LIBOR +1.650%), 4.162%, 4/15/34(B) | 1,025,452 | ||
| 1,982,199 | Adams Outdoor Advertising LP, Ser 2018-1, Class A, 144a, 4.810%, 11/15/48 | 1,875,584 | ||
| 1,400,000 | Aimco CLO 11 Ltd. (Cayman Islands), Ser 2020-11A, Class AR, 144a, (3M LIBOR +1.130%), 3.870%, 10/17/34(B) | 1,335,228 | ||
| 966,529 | CF Hippolyta Issuer LLC, Ser 2020-1, Class A1, 144a, 1.690%, 7/15/60 | 858,697 | ||
| 1,523 | CIT Home Equity Loan Trust, Ser 2002-1, Class AF5, 6.941%, 2/25/33(B)(C) | 1,398 | ||
| 1,326,500 | Coinstar Funding LLC, Ser 2017-1A, Class A2, 144a, 5.216%, 4/25/47 | 1,236,057 | ||
| 1,265,438 | Driven Brands Funding LLC, Ser 2021-1A, Class A2, 144a, 2.791%, 10/20/51 | 999,257 | ||
| 107,291 | FHLMC Structured Pass Through Securities, Ser T-20, Class A5, 8.370%, 12/25/29(B)(C) | 112,993 | ||
| 5,976 | FNMA REMIC Trust, Ser 2001-W2, Class AF6, 6.089%, 10/25/31(B)(C) | 6,065 | ||
| 1,138,500 | Jack in the Box Funding LLC, Ser 2022-1A, Class A2I, 144a, 3.445%, 2/26/52 | 989,208 | ||
| 962,725 | Jersey Mike's Funding, Ser 2019-1A, Class A2, 144a, 4.433%, 2/15/50 | 875,095 | ||
| 1,425,000 | Madison Park Funding XLIX Ltd. (Cayman Islands), Ser 2021-49A, Class B1, 144a, (3M LIBOR +1.700%), 4.438%, 10/19/34(B) | 1,339,359 | ||
| 556,099 | Mid-State Capital Corp. Trust, Ser 2005-1, Class M2, 7.079%, 1/15/40 | 553,958 | ||
| 947,979 | Mill City Mortgage Loan Trust, Ser 2018-3, Class M3, 144a, 3.250%, 8/25/58(B)(C) | 789,022 | ||
| 1,185,000 | Neighborly Issuer LLC, Ser 2021-1A, Class A2, 144a, 3.584%, 4/30/51 | 983,266 | ||
| 53,395 | Orange Lake Timeshare Trust, Ser 2016-A, Class A, 144a, 2.610%, 3/8/29 | 51,343 | ||
| 1,119,375 | Planet Fitness Master Issuer LLC, Ser 2022-1A, Class A2I, 144a, 3.251%, 12/5/51 | 976,308 | ||
| 1,027,000 | TAL Advantage VII LLC, Ser 2020-1A, Class A, 144a, 2.050%, 9/20/45 | 899,629 | ||
| 1,580,000 | Wendy's Funding LLC, Ser 2021-1A, Class A2II, 144a, 2.775%, 6/15/51 | 1,242,758 | ||
| Total Asset-Backed Securities | $16,150,677 | |||
| Non-Agency Collateralized Mortgage Obligations — 5.5% | ||||
| 1,407 | Adjustable Rate Mortgage Trust, Ser 2004-4, Class 3A1, 3.010%, 3/25/35(B)(C) | 1,393 | ||
| 1,234,036 | Agate Bay Mortgage Trust, Ser 2015-7, Class B1, 144a, 3.651%, 10/25/45(B)(C) | 1,121,367 | ||
| 1,923,173 | Agate Bay Mortgage Trust, Ser 2015-7, Class B2, 144a, 3.651%, 10/25/45(B)(C) | 1,744,211 | ||
| Principal Amount | Market Value | |||
| Non-Agency Collateralized Mortgage Obligations — 5.5% (Continued) | ||||
| $ 442,799 | CSMC Trust, Ser 2013-7, Class B3, 144a, 3.544%, 8/25/43(B)(C) | $ 401,484 | ||
| 516,819 | CSMC Trust, Ser 2014-OAK1, Class B4, 144a, 3.633%, 11/25/44(B)(C) | 482,266 | ||
| 921,658 | CSMC Trust, Ser 2015-1, Class B3, 144a, 3.914%, 1/25/45(B)(C) | 848,380 | ||
| 969,985 | CSMC Trust, Ser 2015-2, Class B4, 144a, 3.902%, 2/25/45(B)(C) | 879,903 | ||
| 862,875 | CSMC Trust, Ser 2015-WIN1, Class B3, 144a, 3.781%, 12/25/44(B)(C) | 795,086 | ||
| 1,245,843 | Deephaven Residential Mortgage Trust, Ser 2022-2, Class A1, 144a, 4.300%, 3/25/67 | 1,182,592 | ||
| 1,220,631 | EverBank Mortgage Loan Trust, Ser 2018-1, Class B2, 144a, 3.577%, 2/25/48 | 1,029,867 | ||
| 34,141 | Galton Funding Mortgage Trust, Ser 2019-1, Class A22, 144a, 4.000%, 2/25/59(B)(C) | 33,048 | ||
| 330,115 | GS Mortgage-Backed Securities Corp. Trust, Ser 2020-PJ3, Class A14, 144a, 3.000%, 10/25/50(B)(C) | 278,664 | ||
| 18,745 | JP Morgan Mortgage Trust, Ser 2005-A1, Class 2A1, 2.545%, 2/25/35(B)(C) | 18,411 | ||
| 7,082 | JP Morgan Mortgage Trust, Ser 2005-A2, Class 7CB1, 2.781%, 4/25/35(B)(C) | 7,076 | ||
| 17,714 | JP Morgan Mortgage Trust, Ser 2006-A4, Class 2A2, 2.741%, 6/25/36(B)(C) | 13,365 | ||
| 491,991 | JP Morgan Mortgage Trust, Ser 2015-IVR2, Class B3, 144a, 3.780%, 1/25/45(B)(C) | 473,380 | ||
| 1,601,155 | JP Morgan Mortgage Trust, Ser 2017-1, Class B2, 144a, 3.450%, 1/25/47(B)(C) | 1,341,447 | ||
| 305,305 | JP Morgan Mortgage Trust, Ser 2019-INV1, Class A15, 144a, 4.000%, 10/25/49(B)(C) | 290,915 | ||
| 18,033 | MASTR Alternative Loan Trust, Ser 2004-7, Class 10A1, 6.000%, 6/25/34 | 16,007 | ||
| 1,100,000 | Mill City Mortgage Loan Trust, Ser 2016-1, Class B2, 144a, 3.578%, 4/25/57 | 1,004,159 | ||
| 136,230 | Residential Asset Securitization Trust, Ser 2006-A1, Class 1A3, 6.000%, 4/25/36 | 67,322 | ||
| 131,527 | Sequoia Mortgage Trust, Ser 2013-10, Class B2, 144a, 3.532%, 8/25/43(B)(C) | 124,159 | ||
| 132,255 | Sequoia Mortgage Trust, Ser 2013-5, Class B1, 144a, 3.497%, 5/25/43(B)(C) | 123,070 | ||
| 631,132 | Sequoia Mortgage Trust, Ser 2017-2, Class A1, 144a, 3.500%, 2/25/47(B)(C) | 554,524 | ||
| 69,199 | Sequoia Mortgage Trust, Ser 2018-CH4, Class A13, 144a, 4.500%, 10/25/48(B)(C) | 68,436 | ||
| 1,000,000 | Towd Point Mortgage Trust, Ser 2017-1, Class B1, 144a, 3.779%, 10/25/56 | 875,210 | ||
| 800,000 | Towd Point Mortgage Trust, Ser 2019-4, Class A2, 144a, 3.250%, 10/25/59 | 693,116 | ||
| 45,558 | Washington Mutual Mortgage Pass-Through Certificates, Ser 2005-9, Class 2A4, 5.500%, 11/25/35 | 40,127 | ||
| Total Non-Agency Collateralized Mortgage Obligations | $14,508,985 | |||
| Agency Collateralized Mortgage Obligations — 4.7% | ||||
| 2,085,000 | FHLMC REMIC, Ser 4991, Class HB, 2.000%, 7/25/50 | 1,516,415 | ||
| 2,850,000 | FHLMC REMIC, Ser 5178, Class CV, 2.000%, 11/25/40 | 2,132,849 | ||
| 121,017 | FNMA REMIC, Ser 2003-32, Class BZ, 6.000%, 11/25/32 | 124,772 | ||
| 12,308 | FNMA REMIC, Ser 2015-51, Class KC, 3.000%, 6/25/45 | 11,515 | ||
| 377,454 | FNMA REMIC, Ser 2017-90, Class KA, 3.000%, 11/25/47 | 352,681 | ||
| Principal Amount | Market Value | |||
| Agency Collateralized Mortgage Obligations — 4.7% (Continued) | ||||
| $ 1,800,000 | FNMA REMIC, Ser 2019-35, Class KB, 3.000%, 7/25/49 | $ 1,462,776 | ||
| 2,500,000 | FNMA REMIC, Ser 2022-16, Class KB, 2.500%, 11/25/49 | 1,886,695 | ||
| 2,550,000 | FNMA REMIC, Ser 2022-17, Class UV, 3.000%, 7/25/42 | 2,090,868 | ||
| 45,775 | FNMA Trust, Ser 2004-W15, Class 2AF, (1M LIBOR +0.250%), 3.334%, 8/25/44(B) | 45,574 | ||
| 855,373 | GNMA, Ser 2010-169, Class AW, 4.500%, 12/20/40 | 847,635 | ||
| 4,276,402 | GNMA, Ser 2012-147, Class IO, 0.553%, 4/16/54(B)(C)(D) | 58,899 | ||
| 1,484,864 | GNMA, Ser 2016-113, Class IO, 1.182%, 2/16/58(B)(C)(D) | 80,359 | ||
| 8,612,474 | GNMA, Ser 2016-140, Class IO, 0.751%, 5/16/58(B)(C)(D) | 323,785 | ||
| 1,700,000 | GNMA, Ser 2022-50, Class KV, 3.000%, 6/20/42 | 1,365,725 | ||
| Total Agency Collateralized Mortgage Obligations | $12,300,548 | |||
| Sovereign Government Obligations — 4.0% | ||||
| 200,000 | Angolan Government International Bond, 144a, 8.750%, 4/14/32 | 147,900 | ||
| 275,000 | Angolan Government International Bond, 144a, 8.250%, 5/9/28 | 216,233 | ||
| 12,043 | Argentine Republic Government International Bond, 1.000%, 7/9/29 | 2,330 | ||
| 242,500 | Argentine Republic Government International Bond, 1.500%, 7/9/35(B)(C) | 44,119 | ||
| 382,000 | Bahamas Government International Bond, 144a, 6.000%, 11/21/28 | 229,206 | ||
| 100,000 | Bahamas Government International Bond, 144a, 8.950%, 10/15/32 | 58,001 | ||
| 200,000 | Bahamas Government International Bond, 144a, 9.000%, 6/16/29 | 138,742 | ||
| 50,000 | Banque Centrale de Tunisie International Bond, 8.250%, 9/19/27 | 30,610 | ||
| 368,000 | Chile Government International Bond, 3.100%, 5/7/41 | 250,098 | ||
| 811,000 | Chile Government International Bond, 3.100%, 1/22/61 | 473,813 | ||
| 200,000 | Chile Government International Bond, 3.500%, 1/31/34 | 163,435 | ||
| 300,000 | Chile Government International Bond, 4.000%, 1/31/52 | 219,194 | ||
| 375,000 | Colombia Government International Bond, 3.250%, 4/22/32 | 253,437 | ||
| 200,000 | Colombia Government International Bond, 4.125%, 5/15/51 | 107,383 | ||
| 200,000 | Colombia Government International Bond, 5.200%, 5/15/49 | 123,447 | ||
| 250,000 | Colombia Government International Bond, 6.125%, 1/18/41 | 183,818 | ||
| 200,000 | Dominican Republic International Bond, 144a, 5.500%, 2/22/29 | 172,222 | ||
| 200,000 | Dominican Republic International Bond, 144a, 4.875%, 9/23/32 | 150,371 | ||
| 150,000 | Dominican Republic International Bond, 144a, 5.950%, 1/25/27 | 139,398 | ||
| 100,000 | Dominican Republic International Bond, 144a, 6.850%, 1/27/45 | 77,713 | ||
| 247,150 | Ecuador Government International Bond, 144a, 1.500%, 7/31/40(B)(C) | 72,291 | ||
| 372,885 | Ecuador Government International Bond, 144a, 2.500%, 7/31/35(B)(C) | 122,717 | ||
| Principal Amount | Market Value | |||
| Sovereign Government Obligations — 4.0% (Continued) | ||||
| $ 631,050 | Ecuador Government International Bond, 144a, 5.500%, 7/31/30(B)(C) | $ 297,109 | ||
| 585,000 | Egypt Government International Bond, 144a, 7.625%, 5/29/32 | 351,990 | ||
| 200,000 | Egypt Government International Bond, 144a, 8.875%, 5/29/50 | 110,808 | ||
| 350,000 | Egypt Government International Bond, 144a, 5.750%, 5/29/24 | 309,719 | ||
| 200,000 | Egypt Government International Bond, 144a, 5.800%, 9/30/27 | 139,993 | ||
| 200,000 | Egypt Government International Bond, 144a, 7.500%, 1/31/27 | 154,046 | ||
| 200,000 | Egypt Government International Bond, 144a, 8.150%, 11/20/59 | 107,520 | ||
| 100,000 | El Salvador Government International Bond, 144a, 6.375%, 1/18/27 | 36,980 | ||
| 100,000 | El Salvador Government International Bond, 144a, 7.650%, 6/15/35 | 33,131 | ||
| 75,000 | El Salvador Government International Bond, 144a, 8.625%, 2/28/29 | 27,038 | ||
| 585,000 | Ghana Government International Bond, 144a, 7.625%, 5/16/29 | 222,300 | ||
| 200,000 | Ghana Government International Bond, 144a, 8.950%, 3/26/51 | 73,400 | ||
| 200,000 | Guatemala Government Bond, 144a, 5.250%, 8/10/29 | 179,725 | ||
| 200,000 | Guatemala Government Bond, 144a, 6.125%, 6/1/50 | 163,947 | ||
| 200,000 | Hungary Government International Bond, 144a, 5.500%, 6/16/34 | 168,670 | ||
| 300,000 | Hungary Government International Bond, 144a, 3.125%, 9/21/51 | 158,570 | ||
| 500,000 | Indonesia Government International Bond, 5.450%, 9/20/52 | 461,265 | ||
| 200,000 | Lebanese Republic Government International Bond, MTN, 6.650%, 2/26/30 | 11,500 | ||
| 1,020,000 | Mexico Government International Bond, 3.771%, 5/24/61 | 602,706 | ||
| 225,000 | Mexico Government International Bond, 4.280%, 8/14/41 | 163,784 | ||
| 200,000 | Mexico Government International Bond, 4.875%, 5/19/33 | 175,916 | ||
| 200,000 | Mongolia Government International Bond, 144a, 5.625%, 5/1/23 | 188,500 | ||
| 200,000 | Morocco Government International Bond, 144a, 5.500%, 12/11/42 | 147,000 | ||
| 370,000 | Nigeria Government International Bond, 144a, 7.625%, 11/28/47 | 205,350 | ||
| 200,000 | Nigeria Government International Bond, 144a, 6.125%, 9/28/28 | 132,260 | ||
| 200,000 | Nigeria Government International Bond, 144a, 7.875%, 2/16/32 | 128,052 | ||
| 200,000 | Oman Government International Bond, 144a, 6.000%, 8/1/29 | 186,141 | ||
| 200,000 | Oman Government International Bond, 144a, 6.500%, 3/8/47 | 156,369 | ||
| 200,000 | Oman Government International Bond, 144a, 5.375%, 3/8/27 | 187,819 | ||
| 300,000 | Pakistan Government International Bond, 144a, 7.875%, 3/31/36 | 108,132 | ||
| 200,000 | Papua New Guinea Government International Bond, 8.375%, 10/4/28 | 161,770 | ||
| 216,000 | Paraguay Government International Bond, 144a, 2.739%, 1/29/33 | 155,136 | ||
| Principal Amount | Market Value | |||
| Sovereign Government Obligations — 4.0% (Continued) | ||||
| $ 100,000 | Paraguay Government International Bond, 144a, 5.600%, 3/13/48 | $ 75,075 | ||
| 200,000 | Republic of Belarus International Bond, 144a, 6.875%, 2/28/23 | 64,000 | ||
| 200,000 | Republic of South Africa Government International Bond, 5.750%, 9/30/49 | 128,300 | ||
| 360,000 | Republic of Uzbekistan International Bond, 144a, 3.700%, 11/25/30 | 256,738 | ||
| 200,000 | Romanian Government International Bond, 4.375%, 8/22/23 | 198,726 | ||
| 200,000 | Sri Lanka Government International Bond, 144a, 6.125%, 6/3/25 | 53,686 | ||
| 200,000 | Third Pakistan International Sukuk Co. Ltd. (The), 5.625%, 12/5/22 | 169,732 | ||
| 350,000 | Turkey Government International Bond, 4.875%, 4/16/43 | 197,050 | ||
| 200,000 | Turkey Government International Bond, 5.750%, 5/11/47 | 119,820 | ||
| 200,000 | Ukraine Government International Bond, 7.750%, 9/1/28* | 40,572 | ||
| 400,000 | Ukraine Government International Bond, 144a, 7.375%, 9/25/34* | 73,754 | ||
| Total Sovereign Government Obligations | $10,460,577 | |||
| Shares | ||||
| Preferred Stocks — 0.2% | ||||
| Financials — 0.2% | ||||
| 4,604 | Bank of America Corp., Ser NN, 4.375%(A) | 84,161 | ||
| 4,105 | US Bancorp, Ser L, 3.750%(A) | 65,967 | ||
| 8,981 | Wells Fargo & Co., Ser AA, 4.700%(A) | 166,418 | ||
| 13,426 | Wells Fargo & Co., Ser DD, 4.250%(A) | 230,793 | ||
| Total Preferred Stocks | $547,339 | |||
| Short-Term Investment Fund — 1.0% | ||||
| 2,774,825 | Dreyfus Government Cash Management, Institutional Shares, 2.75%∞Ω | 2,774,825 | ||
| Total Investment Securities—100.7% (Cost $307,622,850) | $265,971,458 | |||
| Liabilities in Excess of Other Assets — (0.7%) | (1,902,359) | |||
| Net Assets — 100.0% | $264,069,099 | |||
| (A) | Perpetual Bond - A bond or preferred stock with no definite maturity date. |
| (B) | Variable rate security - Rate reflected is the rate in effect as of September 30, 2022. |
| (C) | Certain variable rate securities are not based on a published reference rate and spread but are determined by the issuer or agent and are based on current market conditions. These securities do not indicate a reference rate and spread in their description. |
| (D) | Interest only security - This type of security represents the right to receive the monthly interest payments on an underlying pool of mortgages. Payments of principal on the pool reduce the value of the “interest only” holding. |
| * | Non-income producing security. |
| ∞ | Open-End Fund. |
| Ω | Represents the 7-Day SEC yield as of September 30, 2022. |
| Portfolio Abbreviations: |
| CLO – Collateralized Loan Obligation |
| DAC – Designated Activity Company |
| FHLMC – Federal Home Loan Mortgage Corporation |
| FNMA – Federal National Mortgage Association |
| GNMA – Government National Mortgage Association |
| IO – Interest Only |
| JSC – Joint Stock Company |
| LIBOR – London Interbank Offered Rate |
| LLC – Limited Liability Company |
| LP – Limited Partnership |
| MTN – Medium Term Note |
| PLC – Public Limited Company |
| REIT – Real Estate Investment Trust |
| REMIC – Real Estate Mortgage Investment Conduit |
| SOC – State-Owned Company |
| 144a - This is a restricted security that was sold in a transaction qualifying for the exemption under Rule 144a of the Securities Act of 1933. This security may be sold in transactions exempt from registration, normally to qualified institutional buyers. At September 30, 2022, these securities were valued at $69,792,539 or 26.4% of net assets. These securities were deemed liquid pursuant to procedures approved by the Board of Trustees. |
| Valuation Inputs at Reporting Date: | ||||
| Description | Level 1 | Level 2 | Level 3 | Total |
| Assets: | ||||
| Corporate Bonds | $— | $107,433,663 | $— | $107,433,663 |
| U.S. Treasury Obligations | — | 58,528,069 | — | 58,528,069 |
| Commercial Mortgage-Backed Securities | — | 22,848,860 | — | 22,848,860 |
| U.S. Government Mortgage-Backed Obligations | — | 20,417,915 | — | 20,417,915 |
| Asset-Backed Securities | — | 16,150,677 | — | 16,150,677 |
| Non-Agency Collateralized Mortgage Obligations | — | 14,508,985 | — | 14,508,985 |
| Agency Collateralized Mortgage Obligations | — | 12,300,548 | — | 12,300,548 |
| Sovereign Government Obligations | — | 10,460,577 | — | 10,460,577 |
| Preferred Stocks | 547,339 | — | — | 547,339 |
| Short-Term Investment Fund | 2,774,825 | — | — | 2,774,825 |
| Other Financial Instruments | ||||
| Futures | ||||
| Interest rate contracts | 174,948 | — | — | 174,948 |
| Total Assets | $3,497,112 | $262,649,294 | $— | $266,146,406 |
| Liabilities: | ||||
| Other Financial Instruments | ||||
| Futures | ||||
| Interest rate contracts | $(165,904) | $— | $— | $(165,904) |
| Total Liabilities | $(165,904) | $— | $— | $(165,904) |
| Total | $3,331,208 | $262,649,294 | $— | $265,980,502 |
| Description | Expiration Date | Number of Contracts | Notional Value | Unrealized Appreciation/ (Depreciation) |
| Short Futures: | ||||
| 30-Year U.S. Ultra Long Term Treasury Bond | 12/20/2022 | 29 | $4,147,948 | $174,948 |
| Long Futures: | ||||
| 2-Year U.S. Treasury Note | 12/30/2022 | 172 | 35,493,091 | (165,904) |
| $9,044 |
| Shares | Market Value | |||
| Common Stocks — 98.2% | ||||
| Japan — 31.5% | ||||
| Communication Services — 1.8% | ||||
| 4,100 | Nexon Co. Ltd. | $ 72,438 | ||
| 1,900 | Square Enix Holdings Co. Ltd. | 81,892 | ||
| Consumer Discretionary — 4.9% | ||||
| 5,700 | Mitsubishi Motors Corp.* | 20,463 | ||
| 6,600 | Pan Pacific International Holdings Corp. | 116,429 | ||
| 1,600 | Shimamura Co. Ltd. | 135,405 | ||
| 2,900 | Skylark Holdings Co. Ltd.* | 30,903 | ||
| 36,700 | Yamada Holdings Co. Ltd. | 120,766 | ||
| Consumer Staples — 12.1% | ||||
| 1,400 | Calbee, Inc. | 29,987 | ||
| 1,900 | Kobayashi Pharmaceutical Co. Ltd. | 111,345 | ||
| 12,100 | Lion Corp. | 136,735 | ||
| 1,500 | MatsukiyoCocokara & Co. | 64,340 | ||
| 1,800 | MEIJI Holdings Co. Ltd.† | 79,970 | ||
| 1,700 | Nissin Foods Holdings Co. Ltd. | 118,282 | ||
| 7,900 | Pigeon Corp. | 115,491 | ||
| 4,000 | Sundrug Co. Ltd. | 97,333 | ||
| 1,100 | Toyo Suisan Kaisha Ltd. | 45,362 | ||
| 5,000 | Welcia Holdings Co. Ltd. | 105,512 | ||
| 12,000 | Yamazaki Baking Co. Ltd. | 137,884 | ||
| Energy — 2.2% | ||||
| 900 | Cosmo Energy Holdings Co. Ltd. | 23,220 | ||
| 2,100 | Idemitsu Kosan Co. Ltd. | 45,640 | ||
| 10,000 | Inpex Corp. | 93,271 | ||
| 700 | Iwatani Corp. | 26,359 | ||
| Financials — 1.4% | ||||
| 8,100 | Shinsei Bank Ltd. | 116,335 | ||
| Health Care — 2.4% | ||||
| 700 | Daiichi Sankyo Co. Ltd. | 19,566 | ||
| 2,800 | Eisai Co. Ltd. | 150,245 | ||
| 1,200 | Medipal Holdings Corp. | 15,261 | ||
| 700 | Ono Pharmaceutical Co. Ltd. | 16,351 | ||
| Industrials — 1.0% | ||||
| 1,400 | Kyushu Railway Co. | 30,218 | ||
| 800 | West Japan Railway Co. | 30,579 | ||
| 1,800 | Yamato Holdings Co. Ltd. | 27,031 | ||
| Information Technology — 1.0% | ||||
| 2,500 | Alps Alpine Co. Ltd. | 18,072 | ||
| 9,600 | Ricoh Co. Ltd. | 70,293 | ||
| Real Estate — 2.0% | ||||
| 55 | GLP J-Reit | 60,998 | ||
| 50 | Nippon Prologis REIT, Inc. | 109,621 | ||
| Utilities — 2.7% | ||||
| 5,100 | Toho Gas Co. Ltd. | 101,201 | ||
| 19,700 | Tokyo Electric Power Co. Holdings, Inc.* | 62,974 | ||
| 4,100 | Tokyo Gas Co. Ltd. | 69,212 | ||
| Total Japan | 2,706,984 | |||
| Hong Kong — 8.8% | ||||
| Consumer Staples — 0.6% | ||||
| 77,000 | WH Group Ltd., 144a | 48,428 | ||
| Financials — 1.6% | ||||
| 7,500 | Hang Seng Bank Ltd. | 113,944 | ||
| 700 | Hong Kong Exchanges & Clearing Ltd. | 23,928 | ||
| Industrials — 2.4% | ||||
| 2,300 | Jardine Matheson Holdings Ltd. | 116,283 | ||
| Shares | Market Value | |||
| Hong Kong — (Continued) | ||||
| Industrials — (Continued) | ||||
| 5,500 | MTR Corp. Ltd. | $ 25,228 | ||
| 133,000 | Pacific Basin Shipping Ltd. | 41,068 | ||
| 19,000 | Xinyi Glass Holdings, Ltd. | 27,478 | ||
| Information Technology — 0.9% | ||||
| 12,800 | ASMPT Ltd. | 77,593 | ||
| Real Estate — 1.6% | ||||
| 11,000 | Henderson Land Development Co. Ltd. | 30,802 | ||
| 15,400 | Link REIT | 107,500 | ||
| Utilities — 1.7% | ||||
| 11,000 | CK Infrastructure Holdings Ltd. | 56,104 | ||
| 97,000 | Hong Kong & China Gas Co. Ltd. | 85,442 | ||
| Total Hong Kong | 753,798 | |||
| United Kingdom — 8.1% | ||||
| Communication Services — 2.0% | ||||
| 50,347 | BT Group PLC | 67,681 | ||
| 10,989 | Pearson PLC | 104,941 | ||
| Consumer Staples — 3.8% | ||||
| 57,469 | J Sainsbury PLC | 111,293 | ||
| 6,580 | Ocado Group PLC* | 34,147 | ||
| 1,212 | Reckitt Benckiser Group PLC | 80,333 | ||
| 2,301 | Unilever PLC | 101,106 | ||
| Energy — 0.1% | ||||
| 2,592 | Harbour Energy PLC | 12,869 | ||
| Financials — 0.6% | ||||
| 4,820 | Hiscox Ltd. | 47,489 | ||
| Health Care — 1.2% | ||||
| 43,560 | ConvaTec Group PLC, 144a | 98,993 | ||
| Industrials — 0.3% | ||||
| 13,108 | Royal Mail PLC | 26,682 | ||
| Information Technology — 0.1% | ||||
| 115 | Endava PLC ADR* | 9,272 | ||
| Total United Kingdom | 694,806 | |||
| Switzerland — 5.3% | ||||
| Communication Services — 1.5% | ||||
| 277 | Swisscom AG | 129,703 | ||
| Consumer Staples — 1.0% | ||||
| 9 | Chocoladefabriken Lindt & Spruengli AG | 86,979 | ||
| Health Care — 2.1% | ||||
| 601 | Novartis AG | 45,818 | ||
| 410 | Roche Holding AG | 133,469 | ||
| Real Estate — 0.7% | ||||
| 594 | PSP Swiss Property AG | 59,377 | ||
| Total Switzerland | 455,346 | |||
| Spain — 4.4% | ||||
| Communication Services — 1.5% | ||||
| 2,183 | Cellnex Telecom SA, 144a | 67,338 | ||
| 18,036 | Telefonica SA | 59,625 | ||
| Financials — 1.8% | ||||
| 60,069 | Banco de Sabadell SA | 40,058 | ||
| 17,389 | Bankinter SA | 97,637 | ||
| 4,816 | CaixaBank SA | 15,512 | ||
| Health Care — 0.8% | ||||
| 8,315 | Grifols SA* | 71,836 | ||
| Shares | Market Value | |||
| Common Stocks — 98.2% (Continued) | ||||
| Spain — (Continued) | ||||
| Utilities — 0.3% | ||||
| 413 | Naturgy Energy Group SA | $ 9,554 | ||
| 1,197 | Red Electrica Corp. SA | 18,369 | ||
| Total Spain | 379,929 | |||
| France — 4.4% | ||||
| Communication Services — 0.4% | ||||
| 2,594 | Orange SA | 23,462 | ||
| 1,540 | Vivendi SE | 11,945 | ||
| Consumer Staples — 1.4% | ||||
| 8,494 | Carrefour SA | 117,804 | ||
| Energy — 0.2% | ||||
| 168 | Gaztransport Et Technigaz SA | 18,524 | ||
| Financials — 0.1% | ||||
| 731 | SCOR SE | 10,568 | ||
| Health Care — 1.5% | ||||
| 979 | BioMerieux | 77,439 | ||
| 177 | Ipsen SA | 16,381 | ||
| 397 | Sanofi | 30,230 | ||
| Industrials — 0.1% | ||||
| 86 | Aeroports de Paris* | 9,938 | ||
| Real Estate — 0.7% | ||||
| 440 | Covivio REIT | 21,197 | ||
| 2,137 | Klepierre SA REIT | 37,152 | ||
| Total France | 374,640 | |||
| Israel — 4.0% | ||||
| Communication Services — 0.3% | ||||
| 14,416 | Bezeq The Israeli Telecommunication Corp. Ltd. | 23,566 | ||
| Financials — 1.0% | ||||
| 10,719 | Bank Hapoalim BM | 90,484 | ||
| Health Care — 0.8% | ||||
| 8,844 | Teva Pharmaceutical Industries Ltd.* | 70,571 | ||
| Information Technology — 0.8% | ||||
| 348 | Nice Ltd.* | 65,484 | ||
| Materials — 1.1% | ||||
| 11,702 | ICL Group Ltd. | 93,785 | ||
| Total Israel | 343,890 | |||
| Netherlands — 3.9% | ||||
| Communication Services — 1.4% | ||||
| 44,541 | Koninklijke KPN NV | 120,544 | ||
| Consumer Staples — 1.2% | ||||
| 3,936 | Koninklijke Ahold Delhaize NV | 100,256 | ||
| Financials — 0.2% | ||||
| 341 | Euronext NV, 144a | 21,581 | ||
| Health Care — 0.4% | ||||
| 93 | Argenx SE* | 33,096 | ||
| Materials — 0.7% | ||||
| 1,607 | OCI NV | 58,835 | ||
| Total Netherlands | 334,312 | |||
| Denmark — 3.7% | ||||
| Health Care — 1.0% | ||||
| 847 | Ascendis Pharma A/S ADR* | 87,461 | ||
| Industrials — 0.5% | ||||
| 2,568 | Vestas Wind Systems A/S | 47,284 | ||
| Shares | Market Value | |||
| Denmark — (Continued) | ||||
| Materials — 1.3% | ||||
| 2,191 | Chr Hansen Holding A/S | $ 107,927 | ||
| Utilities — 0.9% | ||||
| 991 | Orsted AS, 144a | 78,984 | ||
| Total Denmark | 321,656 | |||
| China — 3.7% | ||||
| Consumer Discretionary — 1.0% | ||||
| 46,200 | Chow Tai Fook Jewellery Group Ltd. | 86,827 | ||
| Consumer Staples — 1.4% | ||||
| 45,900 | Budweiser Brewing Co. APAC Ltd., 144a | 119,526 | ||
| Industrials — 1.1% | ||||
| 18,000 | SITC International Holdings Co., Ltd. | 33,011 | ||
| 82,300 | Yangzijiang Shipbuilding Holdings Ltd. | 58,755 | ||
| Real Estate — 0.2% | ||||
| 5,000 | Wharf Holdings Ltd. (The) | 15,990 | ||
| Total China | 314,109 | |||
| Australia — 3.4% | ||||
| Consumer Discretionary — 0.8% | ||||
| 2,118 | Domino's Pizza Enterprises Ltd. | 69,781 | ||
| Consumer Staples — 1.1% | ||||
| 11,488 | Treasury Wine Estates Ltd. | 92,436 | ||
| Health Care — 0.3% | ||||
| 1,685 | Ansell Ltd. | 27,112 | ||
| Materials — 1.2% | ||||
| 54,361 | Evolution Mining Ltd. | 70,918 | ||
| 3,273 | Newcrest Mining Ltd. | 35,935 | ||
| Total Australia | 296,182 | |||
| Finland — 2.7% | ||||
| Communication Services — 1.2% | ||||
| 2,347 | Elisa Oyj | 106,340 | ||
| Health Care — 1.5% | ||||
| 3,010 | Orion Oyj - Class B | 126,744 | ||
| Total Finland | 233,084 | |||
| Norway — 2.0% | ||||
| Energy — 2.0% | ||||
| 2,656 | Aker BP ASA | 76,239 | ||
| 2,892 | Equinor ASA | 95,375 | ||
| Total Norway | 171,614 | |||
| Portugal — 2.0% | ||||
| Consumer Staples — 1.3% | ||||
| 6,185 | Jeronimo Martins SGPS SA | 115,186 | ||
| Energy — 0.5% | ||||
| 4,366 | Galp Energia SGPS SA | 42,007 | ||
| Utilities — 0.2% | ||||
| 3,232 | EDP - Energias de Portugal SA | 14,027 | ||
| Total Portugal | 171,220 | |||
| Belgium — 1.8% | ||||
| Health Care — 1.3% | ||||
| 1,648 | UCB SA | 114,368 | ||
| Materials — 0.4% | ||||
| 1,206 | Umicore SA | 35,405 | ||
| Shares | Market Value | |||
| Common Stocks — 98.2% (Continued) | ||||
| Belgium — (Continued) | ||||
| Utilities — 0.1% | ||||
| 66 | Elia Group SA | $ 7,766 | ||
| Total Belgium | 157,539 | |||
| Germany — 1.6% | ||||
| Health Care — 0.8% | ||||
| 2,294 | Fresenius Medical Care AG & Co. KGaA | 64,629 | ||
| Materials — 0.8% | ||||
| 3,744 | K+S AG | 70,900 | ||
| Total Germany | 135,529 | |||
| United States — 1.3% | ||||
| Energy — 0.1% | ||||
| 1,019 | Tenaris SA | 13,185 | ||
| Health Care — 1.2% | ||||
| 2,419 | QIAGEN NV* | 100,738 | ||
| Total United States | 113,923 | |||
| Sweden — 1.3% | ||||
| Consumer Staples — 1.0% | ||||
| 4,194 | Essity AB | 82,860 | ||
| Industrials — 0.3% | ||||
| 886 | Saab AB | 27,605 | ||
| Total Sweden | 110,465 | |||
| Ireland — 1.3% | ||||
| Consumer Staples — 1.3% | ||||
| 1,231 | Kerry Group PLC - Class A | 109,722 | ||
| Luxembourg — 1.0% | ||||
| Health Care — 1.0% | ||||
| 1,447 | Eurofins Scientific SE | 85,900 | ||
| Singapore — 1.0% | ||||
| Real Estate — 1.0% | ||||
| 78,500 | Suntec Real Estate Investment Trust REIT | 83,476 | ||
| New Zealand — 0.6% | ||||
| Health Care — 0.6% | ||||
| 5,368 | Fisher & Paykel Healthcare Corp. Ltd. | 55,639 | ||
| Austria — 0.4% | ||||
| Utilities — 0.4% | ||||
| 456 | Verbund AG | 38,932 | ||
| United Arab Emirates — 0.0% | ||||
| Health Care — 0.0% | ||||
| 15,156 | NMC Health PLC(A) | 0 | ||
| Total Common Stocks | $8,442,695 | |||
| Shares | Market Value | |||
| Short-Term Investment Funds — 2.4% | ||||
| 124,204 | Dreyfus Government Cash Management, Institutional Shares, 2.75%∞Ω | $ 124,204 | ||
| 83,219 | Invesco Government & Agency Portfolio, Institutional Class, 2.88%∞Ω** | 83,219 | ||
| Total Short-Term Investment Funds | $207,423 | |||
| Total Investment Securities — 100.6% (Cost $10,224,244) | $8,650,118 | |||
| Liabilities in Excess of Other Assets — (0.6)% | (54,794) | |||
| Net Assets — 100.0% | $8,595,324 | |||
| (A) | Level 3- For more information on valuation inputs, and their aggregation into the levels used in the table below, please refer to the security valuation section in the accompanying Notes to Financial Statements. |
| * | Non-income producing security. |
| ** | Represents collateral for securities loaned. |
| † | All or a portion of the security is on loan. The total market value of the securities on loan as of September 30, 2022 was $79,170. |
| ∞ | Open-End Fund. |
| Ω | Represents the 7-Day SEC yield as of September 30, 2022. |
| Portfolio Abbreviations: |
| ADR – American Depositary Receipt |
| PLC – Public Limited Company |
| REIT – Real Estate Investment Trust |
| 144a - This is a restricted security that was sold in a transaction qualifying for the exemption under Rule 144a of the Securities Act of 1933. This security may be sold in transactions exempt from registration, normally to qualified institutional buyers. At September 30, 2022, these securities were valued at $434,850 or 5.1% of net assets. These securities were deemed liquid pursuant to procedures approved by the Board of Trustees. |
| Valuation inputs at Reporting Date: | ||||
| Description | Level 1 | Level 2 | Level 3 | Total |
| Common Stocks | ||||
| Japan | $366,123 | $2,340,861 | $— | $2,706,984 |
| Hong Kong | — | 753,798 | — | 753,798 |
| United Kingdom | 56,761 | 638,045 | — | 694,806 |
| Switzerland | — | 455,346 | — | 455,346 |
| Spain | — | 379,929 | — | 379,929 |
| France | — | 374,640 | — | 374,640 |
| Israel | — | 343,890 | — | 343,890 |
| Netherlands | — | 334,312 | — | 334,312 |
| Denmark | 87,461 | 234,195 | — | 321,656 |
| China | — | 314,109 | — | 314,109 |
| Australia | — | 296,182 | — | 296,182 |
| Finland | — | 233,084 | — | 233,084 |
| Norway | — | 171,614 | — | 171,614 |
| Portugal | — | 171,220 | — | 171,220 |
| Belgium | — | 157,539 | — | 157,539 |
| Germany | — | 135,529 | — | 135,529 |
| United States | — | 113,923 | — | 113,923 |
| Sweden | — | 110,465 | — | 110,465 |
| Ireland | — | 109,722 | — | 109,722 |
| Luxembourg | — | 85,900 | — | 85,900 |
| Singapore | — | 83,476 | — | 83,476 |
| New Zealand | — | 55,639 | — | 55,639 |
| Austria | — | 38,932 | — | 38,932 |
| United Arab Emirates | — | — | 0 | 0 |
| Short-Term Investment Funds | 207,423 | — | — | 207,423 |
| Total | $717,768 | $7,932,350 | $0 | $8,650,118 |
| Measurements Using Unobservable Inputs (Level 3) | |
| Assets | Common Stocks |
| Beginning balance, September 30, 2021 | $0 |
| Change in unrealized appreciation (depreciation) | — |
| Ending balance, September 30, 2022 | $0 |
| Net Change in Unrealized Appreciation/Depreciation for Investments in Securities still held at September 30, 2022 | $— |
| Principal Amount | Market Value | |||
| Corporate Bonds — 66.7% | ||||
| Energy — 11.7% | ||||
| $ 2,867,000 | Apache Corp., 5.100%, 9/1/40(A) | $ 2,333,021 | ||
| 2,609,000 | Archrock Partners LP / Archrock Partners Finance Corp., 144a, 6.250%, 4/1/28 | 2,293,298 | ||
| 252,000 | Ascent Resources Utica Holdings LLC / ARU Finance Corp., 144a, 5.875%, 6/30/29 | 224,280 | ||
| 1,229,000 | Ascent Resources Utica Holdings LLC / ARU Finance Corp., 144a, 7.000%, 11/1/26 | 1,184,922 | ||
| 187,000 | Ascent Resources Utica Holdings LLC / ARU Finance Corp., 144a, 8.250%, 12/31/28 | 179,686 | ||
| 2,399,000 | Blue Racer Midstream LLC / Blue Racer Finance Corp., 144a, 7.625%, 12/15/25 | 2,303,040 | ||
| 160,000 | Cheniere Energy Partners LP, 3.250%, 1/31/32 | 124,285 | ||
| 239,000 | Cheniere Energy Partners LP, 4.000%, 3/1/31 | 200,163 | ||
| 382,000 | Cheniere Energy Partners LP, 4.500%, 10/1/29 | 337,115 | ||
| 1,722,000 | Citgo Holding, Inc., 144a, 9.250%, 8/1/24† | 1,709,429 | ||
| 1,210,000 | CITGO Petroleum Corp., 144a, 6.375%, 6/15/26 | 1,129,549 | ||
| 320,000 | Cullinan Holdco Scsp (Luxembourg), 4.625%, 10/15/26 | 262,842 | ||
| 480,000 | Cullinan Holdco Scsp (Luxembourg), 144a, 4.625%, 10/15/26 | 394,262 | ||
| 1,065,000 | EnLink Midstream LLC, 5.375%, 6/1/29 | 974,475 | ||
| 489,000 | Enviva Partners LP / Enviva Partners Finance Corp., 144a, 6.500%, 1/15/26 | 462,281 | ||
| 2,835,000 | EQM Midstream Partners LP, 6.500%, 7/15/48 | 2,162,254 | ||
| 810,000 | EQT Corp., 7.000%, 2/1/30 | 835,839 | ||
| 2,754,000 | ITT Holdings LLC, 144a, 6.500%, 8/1/29 | 2,136,432 | ||
| 1,904,000 | Moss Creek Resources Holdings, Inc., 144a, 7.500%, 1/15/26 | 1,661,240 | ||
| 36,000 | Moss Creek Resources Holdings, Inc., 144a, 10.500%, 5/15/27 | 33,491 | ||
| 2,402,000 | New Fortress Energy, Inc., 144a, 6.500%, 9/30/26 | 2,219,208 | ||
| 715,000 | NGL Energy Partners LP / NGL Energy Finance Corp., 6.125%, 3/1/25† | 569,127 | ||
| 1,665,000 | NGL Energy Partners LP / NGL Energy Finance Corp., 7.500%, 11/1/23† | 1,613,718 | ||
| 1,420,426 | Rockcliff Energy II LLC, 144a, 5.500%, 10/15/29 | 1,243,893 | ||
| 679,000 | Summit Midstream Holdings LLC / Summit Midstream Finance Corp., 5.750%, 4/15/25 | 551,687 | ||
| 924,000 | Tallgrass Energy Partners LP / Tallgrass Energy Finance Corp., 144a, 6.000%, 12/31/30 | 785,502 | ||
| 645,000 | Tallgrass Energy Partners LP / Tallgrass Energy Finance Corp., 144a, 6.000%, 9/1/31 | 545,025 | ||
| 1,957,000 | TerraForm Power Operating LLC, 144a, 5.000%, 1/31/28 | 1,722,056 | ||
| 2,050,000 | Western Midstream Operating LP, 5.500%, 2/1/50 | 1,655,375 | ||
| 31,847,495 | ||||
| Consumer Discretionary — 9.9% | ||||
| 565,000 | Asbury Automotive Group, Inc., 4.500%, 3/1/28 | 477,425 | ||
| 1,255,000 | Asbury Automotive Group, Inc., 144a, 4.625%, 11/15/29 | 1,003,209 | ||
| 1,291,000 | Ashton Woods USA LLC / Ashton Woods Finance Co., 144a, 4.625%, 8/1/29 | 937,334 | ||
| 763,000 | Ashton Woods USA LLC / Ashton Woods Finance Co., 144a, 6.625%, 1/15/28 | 638,761 | ||
| 28,000 | Bath & Body Works, Inc., 6.694%, 1/15/27 | 26,131 | ||
| 300,000 | Bath & Body Works, Inc., 6.750%, 7/1/36 | 247,197 | ||
| 961,000 | Bath & Body Works, Inc., 6.875%, 11/1/35 | 802,800 | ||
| 92,000 | Bath & Body Works, Inc., 7.500%, 6/15/29 | 84,180 | ||
| 772,000 | Boyne USA, Inc., 144a, 4.750%, 5/15/29 | 646,687 | ||
| 1,292,000 | Caesars Entertainment, Inc., 144a, 8.125%, 7/1/27 | 1,233,970 | ||
| 970,000 | Carvana Co., 144a, 4.875%, 9/1/29 | 470,450 | ||
| 608,000 | Carvana Co., 144a, 5.500%, 4/15/27 | 331,360 | ||
| 500,000 | Carvana Co., 144a, 5.625%, 10/1/25 | 351,762 | ||
| 233,000 | Carvana Co., 144a, 5.875%, 10/1/28 | 118,156 | ||
| Principal Amount | Market Value | |||
| Consumer Discretionary — (Continued) | ||||
| $ 55,000 | Carvana Co., 144a, 10.250%, 5/1/30 | $ 36,713 | ||
| 463,000 | Century Communities, Inc., 144a, 3.875%, 8/15/29 | 355,352 | ||
| 179,000 | Century Communities, Inc., 6.750%, 6/1/27 | 167,071 | ||
| 125,000 | Clarios Global LP, 144a, 6.750%, 5/15/25 | 122,404 | ||
| 837,000 | Clarios Global LP / Clarios US Finance Co., 144a, 8.500%, 5/15/27 | 794,409 | ||
| 227,000 | Clarios Global LP / Clarios US Finance Co., 144a, 6.250%, 5/15/26 | 216,785 | ||
| 147,000 | Dana, Inc., 5.375%, 11/15/27 | 124,582 | ||
| 333,000 | Dana, Inc., 5.625%, 6/15/28 | 274,263 | ||
| 11,000 | Ford Motor Credit Co. LLC, 3.810%, 1/9/24 | 10,643 | ||
| 610,000 | Ford Motor Credit Co. LLC, 3.815%, 11/2/27 | 512,400 | ||
| 2,077,000 | Ford Motor Credit Co. LLC, 4.063%, 11/1/24 | 1,949,576 | ||
| 462,000 | Ford Motor Credit Co. LLC, 4.125%, 8/17/27 | 398,059 | ||
| 55,000 | Ford Motor Credit Co. LLC, 5.125%, 6/16/25 | 51,895 | ||
| 1,500,000 | Hanesbrands Finance Luxembourg SCA, 144a, 3.500%, 6/15/24 | 1,356,144 | ||
| 983,000 | Hanesbrands, Inc., 144a, 4.625%, 5/15/24 | 937,290 | ||
| 1,601,231 | Hawaiian Brand Intellectual Property Ltd. / HawaiianMiles Loyalty Ltd., 144a, 5.750%, 1/20/26 | 1,412,270 | ||
| 1,000,000 | House of HR (Belgium), 144a, 7.500%, 1/15/27 | 988,024 | ||
| 320,000 | Lithia Motors, Inc., 144a, 3.875%, 6/1/29 | 256,800 | ||
| 1,041,000 | Lithia Motors, Inc., 144a, 4.375%, 1/15/31 | 852,350 | ||
| 934,000 | Live Nation Entertainment, Inc., 144a, 4.750%, 10/15/27 | 810,885 | ||
| 217,000 | Live Nation Entertainment, Inc., 144a, 4.875%, 11/1/24 | 209,513 | ||
| 204,000 | Live Nation Entertainment, Inc., 144a, 5.625%, 3/15/26 | 193,889 | ||
| 622,000 | Meritage Homes Corp., 144a, 3.875%, 4/15/29 | 494,490 | ||
| 534,850 | Mileage Plus Holdings LLC / Mileage Plus Intellectual Property Assets Ltd., 144a, 6.500%, 6/20/27 | 521,701 | ||
| 1,797,000 | Peninsula Pacific Entertainment LLC / Peninsula Pacific Entertainment Finance In, 144a, 8.500%, 11/15/27 | 1,934,021 | ||
| 2,446,000 | Six Flags Entertainment Corp., 144a, 4.875%, 7/31/24 | 2,329,962 | ||
| 59,000 | Six Flags Theme Parks, Inc., 144a, 7.000%, 7/1/25 | 59,010 | ||
| 610,000 | SRS Distribution, Inc., 144a, 6.000%, 12/1/29 | 486,487 | ||
| 833,000 | Station Casinos LLC, 144a, 4.500%, 2/15/28 | 683,752 | ||
| 845,000 | United Airlines, Inc., 144a, 4.375%, 4/15/26(A) | 754,162 | ||
| 208,000 | United Airlines, Inc., 144a, 4.625%, 4/15/29 | 172,640 | ||
| 26,836,964 | ||||
| Communication Services — 9.3% | ||||
| 2,682,000 | Altice Financing SA (Luxembourg), 144a, 5.000%, 1/15/28 | 2,065,891 | ||
| 1,586,000 | Altice France Holding SA (Luxembourg), 144a, 10.500%, 5/15/27 | 1,242,243 | ||
| 1,354,000 | ANGI Group LLC, 144a, 3.875%, 8/15/28 | 954,800 | ||
| 2,968,000 | Avaya, Inc., 144a, 6.125%, 9/15/28 | 1,476,580 | ||
| 72,000 | Belo Corp., 7.250%, 9/15/27 | 70,380 | ||
| 500,000 | Belo Corp., 7.750%, 6/1/27 | 490,000 | ||
| 675,000 | CCO Holdings LLC / CCO Holdings Capital Corp., 144a, 4.250%, 2/1/31 | 516,609 | ||
| 310,000 | CCO Holdings LLC / CCO Holdings Capital Corp., 144a, 5.000%, 2/1/28 | 271,963 | ||
| 2,085,000 | CCO Holdings LLC / CCO Holdings Capital Corp., 144a, 4.500%, 8/15/30(A) | 1,648,901 | ||
| 460,000 | CCO Holdings LLC / CCO Holdings Capital Corp., 144a, 5.125%, 5/1/27 | 416,461 | ||
| 1,656,000 | CommScope, Inc., 144a, 8.250%, 3/1/27 | 1,368,270 | ||
| 310,000 | CommScope, Inc., 144a, 6.000%, 3/1/26(A) | 285,423 | ||
| 205,000 | CSC Holdings LLC, 144a, 3.375%, 2/15/31 | 144,525 | ||
| 76,000 | CSC Holdings LLC, 144a, 4.500%, 11/15/31 | 57,090 | ||
| 430,000 | CSC Holdings LLC, 144a, 4.625%, 12/1/30 | 291,906 | ||
| 890,000 | CSC Holdings LLC, 144a, 5.750%, 1/15/30 | 632,581 | ||
| Principal Amount | Market Value | |||
| Corporate Bonds — 66.7% (Continued) | ||||
| Communication Services — (Continued) | ||||
| $ 2,891,000 | Diamond Sports Group LLC / Diamond Sports Finance Co., 144a, 5.375%, 8/15/26 | $ 568,082 | ||
| 1,000,000 | Diamond Sports Group LLC/Diamond Sports Finance Co., 144a, 6.625%, 8/15/27 | 70,000 | ||
| 1,085,000 | DISH DBS Corp., 5.125%, 6/1/29 | 637,437 | ||
| 496,000 | DISH DBS Corp., 7.750%, 7/1/26 | 376,960 | ||
| 250,000 | DKT Finance ApS (Denmark), 7.000%, 6/17/23 | 238,887 | ||
| 650,000 | DKT Finance ApS (Denmark), 144a, 7.000%, 6/17/23 | 621,107 | ||
| 1,114,000 | Gray Television, Inc., 144a, 4.750%, 10/15/30 | 834,879 | ||
| 600,000 | Level 3 Financing, Inc., 144a, 3.625%, 1/15/29 | 444,234 | ||
| 273,000 | Level 3 Financing, Inc., 144a, 4.250%, 7/1/28 | 213,044 | ||
| 411,000 | Level 3 Financing, Inc., 144a, 4.625%, 9/15/27(A) | 344,295 | ||
| 416,000 | Lumen Technologies, Inc., 144a, 5.125%, 12/15/26 | 357,931 | ||
| 1,781,000 | Nexstar Media, Inc., 144a, 4.750%, 11/1/28 | 1,523,271 | ||
| 1,580,000 | Scripps Escrow II, Inc., 144a, 3.875%, 1/15/29 | 1,269,356 | ||
| 1,197,000 | Sirius XM Radio, Inc., 144a, 4.000%, 7/15/28 | 1,018,144 | ||
| 934,000 | Sirius XM Radio, Inc., 144a, 4.125%, 7/1/30 | 759,193 | ||
| 20,000 | Sirius XM Radio, Inc., 144a, 5.000%, 8/1/27 | 18,350 | ||
| 240,000 | Sirius XM Radio, Inc., 144a, 5.500%, 7/1/29 | 215,876 | ||
| 397,000 | TEGNA, Inc., 4.625%, 3/15/28 | 366,531 | ||
| 1,400,000 | Telenet Finance Luxembourg Notes Sarl (Belgium), 144a, 5.500%, 3/1/28 | 1,214,178 | ||
| 1,755,000 | Telesat Canada / Telesat LLC (Canada), 144a, 5.625%, 12/6/26 | 838,539 | ||
| 338,000 | Virgin Media Finance PLC (United Kingdom), 144a, 5.000%, 7/15/30 | 253,659 | ||
| 131,000 | Virgin Media Secured Finance PLC (United Kingdom), 144a, 4.500%, 8/15/30 | 102,239 | ||
| 910,000 | Virgin Media Vendor Financing Notes IV DAC (Ireland), 144a, 5.000%, 7/15/28 | 735,962 | ||
| 400,000 | Vmed O2 UK Financing I PLC (United Kingdom), 144a, 4.250%, 1/31/31 | 302,392 | ||
| 25,258,169 | ||||
| Industrials — 8.0% | ||||
| 1,511,000 | Ardagh Packaging Finance PLC / Ardagh Holdings USA, Inc., 144a, 4.125%, 8/15/26 | 1,246,575 | ||
| 767,000 | Ardagh Packaging Finance PLC / Ardagh Holdings USA, Inc., 144a, 5.250%, 4/30/25 | 717,609 | ||
| 2,292,983 | Artera Services LLC, 144a, 9.033%, 12/4/25 | 1,845,851 | ||
| 1,235,000 | Cargo Aircraft Management, Inc., 144a, 4.750%, 2/1/28(A) | 1,062,977 | ||
| 3,042,676 | CP Atlas Buyer, Inc., 144a, 7.000%, 12/1/28† | 2,259,065 | ||
| 958,000 | GFL Environmental, Inc. (Canada), 144a, 3.500%, 9/1/28 | 807,891 | ||
| 142,000 | GFL Environmental, Inc. (Canada), 144a, 3.750%, 8/1/25 | 129,930 | ||
| 2,192,271 | GFL Environmental, Inc. (Canada), 144a, 4.375%, 8/15/29 | 1,827,872 | ||
| 3,234,000 | H&E Equipment Services, Inc., 144a, 3.875%, 12/15/28 | 2,538,690 | ||
| 2,614,000 | Mauser Packaging Solutions Holding Co., 144a, 7.250%, 4/15/25 | 2,299,457 | ||
| 1,818,000 | OI European Group BV, 144a, 4.750%, 2/15/30 | 1,445,310 | ||
| 529,000 | Owens-Brockway Glass Container, Inc., 144a, 5.375%, 1/15/25 | 488,003 | ||
| 51,000 | Owens-Brockway Glass Container, Inc., 144a, 6.625%, 5/13/27 | 46,264 | ||
| 1,000,000 | Schenck Process Holding GmbH/Darmstadt (Germany), 144a, 5.375%, 6/15/23 | 954,324 | ||
| 602,000 | Summit Materials LLC / Summit Materials Finance Corp., 144a, 5.250%, 1/15/29 | 529,760 | ||
| 1,000,000 | TransDigm, Inc., 144a, 6.250%, 3/15/26 | 970,000 | ||
| 175,000 | TransDigm, Inc., 144a, 8.000%, 12/15/25 | 177,487 | ||
| Principal Amount | Market Value | |||
| Industrials — (Continued) | ||||
| $ 453,000 | Trident TPI Holdings, Inc., 144a, 9.250%, 8/1/24 | $ 415,697 | ||
| 2,404,000 | Tutor Perini Corp., 144a, 6.875%, 5/1/25 | 1,798,768 | ||
| 21,561,530 | ||||
| Financials — 5.8% | ||||
| 1,431,000 | Acrisure LLC / Acrisure Finance, Inc., 144a, 4.250%, 2/15/29 | 1,103,701 | ||
| 666,000 | Acrisure LLC / Acrisure Finance, Inc., 144a, 10.125%, 8/1/26 | 641,025 | ||
| 1,254,000 | Alliant Holdings Intermediate LLC / Alliant Holdings Co-Issuer, 144a, 6.750%, 10/15/27 | 1,080,683 | ||
| 1,616,000 | Blackstone Private Credit Fund, 2.625%, 12/15/26 | 1,327,145 | ||
| 479,000 | LPL Holdings, Inc., 144a, 4.375%, 5/15/31 | 396,289 | ||
| 2,126,000 | LPL Holdings, Inc., 144a, 4.625%, 11/15/27 | 1,927,533 | ||
| 657,441 | Midcap Financial Issuer Trust, 144a, 5.625%, 1/15/30 | 503,422 | ||
| 1,915,000 | Midcap Financial Issuer Trust, 144a, 6.500%, 5/1/28 | 1,636,463 | ||
| 300,000 | Navient Corp., 4.875%, 3/15/28 | 229,152 | ||
| 1,394,000 | Navient Corp., 5.000%, 3/15/27 | 1,140,125 | ||
| 599,000 | OneMain Finance Corp., 3.500%, 1/15/27 | 466,605 | ||
| 392,000 | OneMain Finance Corp., 3.875%, 9/15/28 | 288,614 | ||
| 1,690,000 | OneMain Finance Corp., 4.000%, 9/15/30 | 1,185,890 | ||
| 2,771,000 | Rocket Mortgage LLC / Rocket Mortgage Co-Issuer, Inc., 144a, 3.625%, 3/1/29 | 2,119,815 | ||
| 2,152,000 | VistaJet Malta Finance PLC / XO Management Holding, Inc. (Switzerland), 144a, 6.375%, 2/1/30 | 1,759,260 | ||
| 15,805,722 | ||||
| Consumer Staples — 5.6% | ||||
| 405,000 | Bath & Body Works, Inc., 144a, 6.625%, 10/1/30 | 352,350 | ||
| 687,000 | BCPE Ulysses Intermediate, Inc., 144a, 7.750%, 4/1/27(B) | 467,406 | ||
| 219,000 | Chobani LLC / Chobani Finance Corp., Inc., 144a, 4.625%, 11/15/28 | 186,268 | ||
| 1,248,000 | Chobani LLC / Chobani Finance Corp., Inc., 144a, 7.500%, 4/15/25 | 1,145,252 | ||
| 2,018,000 | eG Global Finance PLC (United Kingdom), 144a, 6.750%, 2/7/25 | 1,820,276 | ||
| 385,455 | eG Global Finance PLC (United Kingdom), 144a, 8.500%, 10/30/25 | 337,099 | ||
| 663,000 | JBS USA LUX SA / JBS USA Food Co. / JBS USA Finance, Inc., 144a, 5.500%, 1/15/30 | 610,968 | ||
| 2,570,000 | Korn Ferry, 144a, 4.625%, 12/15/27 | 2,274,450 | ||
| 1,881,000 | LBM Acquisition LLC, 144a, 6.250%, 1/15/29 | 1,274,378 | ||
| 1,407,000 | LCM Investments Holdings II LLC, 144a, 4.875%, 5/1/29 | 1,089,533 | ||
| 894,000 | Legacy LifePoint Health LLC, 144a, 4.375%, 2/15/27 | 738,751 | ||
| 2,173,000 | Specialty Building Products Holdings LLC / SBP Finance Corp., 144a, 6.375%, 9/30/26 | 1,802,537 | ||
| 411,000 | SRS Distribution, Inc., 144a, 6.125%, 7/1/29 | 329,152 | ||
| 2,024,000 | Team Health Holdings, Inc., 144a, 6.375%, 2/1/25 | 1,499,211 | ||
| 1,505,000 | Wolverine World Wide, Inc., 144a, 4.000%, 8/15/29 | 1,148,104 | ||
| 15,075,735 | ||||
| Materials — 4.3% | ||||
| 1,289,636 | ASP Unifrax Holdings, Inc., 144a, 5.250%, 9/30/28 | 980,162 | ||
| 515,000 | CF Industries, Inc., 5.150%, 3/15/34 | 462,715 | ||
| 1,200,000 | Chemours Co. (The), 144a, 5.750%, 11/15/28 | 981,504 | ||
| 272,000 | First Quantum Minerals Ltd. (Zambia), 144a, 7.500%, 4/1/25 | 261,781 | ||
| 1,760,000 | First Quantum Minerals Ltd. (Zambia), 144a, 6.500%, 3/1/24 | 1,724,800 | ||
| 417,000 | Freeport-McMoRan, Inc., 4.625%, 8/1/30 | 365,530 | ||
| 300,000 | Freeport-McMoRan, Inc., 5.000%, 9/1/27 | 290,373 | ||
| 822,000 | Freeport-McMoRan, Inc., 5.400%, 11/14/34(A) | 730,602 | ||
| 63,000 | Freeport-McMoRan, Inc., 5.450%, 3/15/43(A) | 52,561 | ||
| Principal Amount | Market Value | |||
| Corporate Bonds — 66.7% (Continued) | ||||
| Materials — (Continued) | ||||
| $ 213,000 | Hudbay Minerals, Inc. (Canada), 144a, 4.500%, 4/1/26 | $ 177,084 | ||
| 601,000 | SCIH Salt Holdings, Inc., 144a, 4.875%, 5/1/28 | 490,189 | ||
| 2,031,000 | SCIH Salt Holdings, Inc., 144a, 6.625%, 5/1/29† | 1,561,203 | ||
| 2,187,000 | Tronox, Inc., 144a, 4.625%, 3/15/29 | 1,618,380 | ||
| 2,480,000 | Venator Finance Sarl / Venator Materials LLC, 144a, 5.750%, 7/15/25 | 1,674,000 | ||
| 215,000 | Venator Finance Sarl / Venator Materials LLC, 144a, 9.500%, 7/1/25 | 205,863 | ||
| 11,576,747 | ||||
| Real Estate — 4.0% | ||||
| 2,467,000 | Brookfield Property REIT, Inc. / BPR Cumulus LLC / BPR Nimbus LLC / GGSI Sellco LL, 144a, 4.500%, 4/1/27 | 2,022,766 | ||
| 215,000 | Brookfield Property REIT, Inc. / BPR Cumulus LLC / BPR Nimbus LLC / GGSI Sellco LL, 144a, 5.750%, 5/15/26 | 194,190 | ||
| 834,000 | HAT Holdings I LLC / HAT Holdings II LLC REIT, 144a, 3.375%, 6/15/26 | 669,285 | ||
| 939,000 | HAT Holdings I LLC / HAT Holdings II LLC REIT, 144a, 3.750%, 9/15/30 | 682,841 | ||
| 1,386,000 | HAT Holdings I LLC / HAT Holdings II LLC REIT, 144a, 6.000%, 4/15/25 | 1,300,823 | ||
| 855,000 | Iron Mountain, Inc. REIT, 144a, 4.875%, 9/15/29(A) | 702,374 | ||
| 531,000 | Iron Mountain, Inc. REIT, 144a, 5.250%, 3/15/28 | 465,756 | ||
| 1,105,000 | Iron Mountain, Inc. REIT, 144a, 5.250%, 7/15/30 | 914,354 | ||
| 1,676,000 | Ladder Capital Finance Holdings LLLP / Ladder Capital Finance Corp. REIT, 144a, 4.250%, 2/1/27 | 1,349,528 | ||
| 963,000 | Ladder Capital Finance Holdings LLLP / Ladder Capital Finance Corp. REIT, 144a, 4.750%, 6/15/29 | 720,950 | ||
| 1,810,000 | VICI Properties LP / VICI Note Co., Inc. REIT, 144a, 3.750%, 2/15/27 | 1,585,307 | ||
| 201,000 | VICI Properties LP / VICI Note Co., Inc. REIT, 144a, 4.125%, 8/15/30 | 167,879 | ||
| 46,000 | VICI Properties LP / VICI Note Co., Inc. REIT, 144a, 4.625%, 12/1/29 | 39,956 | ||
| 10,816,009 | ||||
| Health Care — 3.8% | ||||
| 2,242,000 | Acadia Healthcare Co., Inc., 144a, 5.000%, 4/15/29 | 1,985,507 | ||
| 2,639,000 | Air Methods Corp., 144a, 8.000%, 5/15/25 | 1,327,177 | ||
| 2,935,000 | Global Medical Response, Inc., 144a, 6.500%, 10/1/25 | 2,461,731 | ||
| 1,000,000 | IQVIA, Inc., 144a, 2.875%, 6/15/28 | 796,291 | ||
| 1,144,000 | LifePoint Health, Inc., 144a, 5.375%, 1/15/29 | 797,604 | ||
| 1,506,000 | Molina Healthcare, Inc., 144a, 4.375%, 6/15/28 | 1,359,165 | ||
| 1,881,000 | Syneos Health, Inc., 144a, 3.625%, 1/15/29 | 1,497,803 | ||
| 10,225,278 | ||||
| Information Technology — 2.5% | ||||
| 2,707,000 | Ahead DB Holdings LLC, 144a, 6.625%, 5/1/28 | 2,307,402 | ||
| 751,000 | Condor Merger Sub, Inc., 144a, 7.375%, 2/15/30 | 604,555 | ||
| 500,000 | Entegris, Inc., 144a, 3.625%, 5/1/29 | 395,720 | ||
| 1,225,000 | II-VI, Inc., 144a, 5.000%, 12/15/29 | 1,013,320 | ||
| 382,000 | Picard Midco, Inc., 144a, 6.500%, 3/31/29 | 324,582 | ||
| 440,000 | Seagate HDD Cayman, 3.125%, 7/15/29 | 322,401 | ||
| 746,000 | Seagate HDD Cayman, 3.375%, 7/15/31 | 520,866 | ||
| 1,663,000 | Synaptics, Inc., 144a, 4.000%, 6/15/29 | 1,338,808 | ||
| 6,827,654 | ||||
| Utilities — 1.8% | ||||
| 1,492,000 | NRG Energy, Inc., 144a, 3.625%, 2/15/31(A) | 1,163,760 | ||
| 160,000 | NRG Energy, Inc., 144a, 3.875%, 2/15/32 | 124,807 | ||
| 1,260,000 | Pattern Energy Operations LP / Pattern Energy Operations, Inc., 144a, 4.500%, 8/15/28 | 1,092,357 | ||
| 1,000,000 | Vistra Operations Co. LLC, 144a, 5.000%, 7/31/27 | 903,250 | ||
| Principal Amount | Market Value | |||
| Utilities — (Continued) | ||||
| $ 1,350,000 | Vistra Operations Co. LLC, 144a, 5.625%, 2/15/27 | $ 1,266,253 | ||
| 466,000 | Vistra Operations Co. LLC, 144a, 4.300%, 7/15/29(A) | 397,651 | ||
| 4,948,078 | ||||
| Total Corporate Bonds | $180,779,381 | |||
| Bank Loans — 17.8%(C) | ||||
| Consumer Discretionary — 3.7% | ||||
| 850,951 | Alpha Topco Limited - Delta 2 (Lux) Sarl, 2018 Incremental New Facility B3 Loan, (1M LIBOR + 2.500%), 5.615%, 2/01/24 | 839,250 | ||
| 505,000 | American Airlines Inc., Initial Term Loan, (3M LIBOR + 4.750%), 7.460%, 4/20/28 | 488,335 | ||
| 596,904 | Aramark Services Inc., US Term B-3 Loan, (1M LIBOR + 1.750%), 4.865%, 3/11/25 | 576,012 | ||
| 978,730 | Brightview Landscapes LLC, Initial Term Loan, 6.284%, 4/20/29 | 938,358 | ||
| 1,039,928 | Caesars Resort Collection LLC, Term B Loan, (1M LIBOR + 2.750%), 5.865%, 12/23/24 | 1,014,034 | ||
| 473,669 | Caesars Resort Collection LLC, Term B-1 Loan, (1M LIBOR + 3.500%), 6.615%, 7/21/25 | 466,020 | ||
| 2,259,912 | ClubCorp Holdings Inc., First Lien Term B Loan , 6.424%, 9/18/24(D) | 2,072,068 | ||
| 635,000 | Delta Air Lines Inc., Initial Term Loan, (3M LIBOR + 3.750%), 6.460%, 10/20/27 | 635,495 | ||
| 570,731 | LBM Acquisition LLC, First Lien Initial Term Loan, (1M LIBOR + 3.750%), 7.121%, 12/17/27 | 496,822 | ||
| 398,391 | Station Casinos LLC, Term B-1 Facility Loan, (1M LIBOR + 2.250%), 5.370%, 2/08/27 | 380,380 | ||
| 970,225 | United AirLines, Inc., Class B Term Loan, (1M LIBOR + 3.750%), 6.533%, 4/21/28 | 924,275 | ||
| 871,095 | Whatabrands LLC, Initial Term B Loan, (1M LIBOR + 3.250%), 6.365%, 8/03/28 | 804,238 | ||
| 352,614 | William Morris Endeavor Entertainment LLC, New Term Loan B-1, (1M LIBOR + 2.750%), 5.280%, 5/18/25 | 335,716 | ||
| 9,971,003 | ||||
| Communication Services — 3.1% | ||||
| 602,375 | Cable One Inc., Incremental Term B-4 Loan, (1M LIBOR + 2.000%), 5.115%, 5/03/28 | 590,707 | ||
| 186,230 | Charter Communications Operating LLC, Term Loan B2, (1M LIBOR + 1.750%), 4.870%, 2/01/27 | 178,936 | ||
| 483,817 | CSC Holdings LLC, 2017 Refinancing Term Loan, (1M LIBOR + 2.250%), 5.068%, 7/17/25 | 459,931 | ||
| 896,443 | Delta TopCo Inc., Second Lien Initial Term Loan, (6M LIBOR + 7.250%), 9.336%, 12/01/28 | 784,388 | ||
| 617,696 | E.W. Scripps Company, The, Tranche B-2 Term Loan, (1M LIBOR + 2.563%), 5.678%, 5/01/26 | 595,867 | ||
| 383,552 | Go Daddy Operating Company, LLC (GD Finance Co, Inc.), Tranche B-2 Term Loan, (1M LIBOR + 1.750%), 4.274%, 2/15/24 | 378,949 | ||
| 1,007,627 | Gray Television Inc., Term C Loan, (1M LIBOR + 2.500%), 5.064%, 1/02/26 | 974,627 | ||
| 464,753 | MH Sub I, LLC, 2020 June New Term Loan, (1M LIBOR + 3.750%), 6.865%, 9/13/24 | 441,748 | ||
| 509,272 | NEP Group Inc., First Lien Initial Dollar Term Loan, (1M LIBOR + 3.250%), 5.774%, 10/20/25 | 468,530 | ||
| 325,349 | Nexstar Broadcasting Inc., Term B-4 Loan, (1M LIBOR + 2.500%), 5.615%, 9/18/26 | 320,352 | ||
| 972,302 | Numericable U.S. LLC, USD TLB-12 Term Loan, (3M LIBOR + 3.688%), 6.200%, 1/31/26 | 879,933 | ||
| 903,175 | Proofpoint Inc., Initial Term Loan, 6.320%, 8/31/28 | 846,347 | ||
| 370,000 | Telenet Financing USD LLC, Term Loan AR Facility, (1M LIBOR + 2.000%), 4.818%, 4/28/28 | 350,113 | ||
| Principal Amount | Market Value | |||
| Bank Loans — 17.8%(C) (Continued) | ||||
| Communication Services — (Continued) | ||||
| $ 715,000 | UPC Financing Partnership, Facility AX, (1M LIBOR + 3.000%), 5.391%, 1/31/29 | $ 681,037 | ||
| 480,000 | Virgin Media Bristol LLC, Facility Q Advance, (1M LIBOR + 3.250%), 6.068%, 1/31/29 | 463,800 | ||
| 8,415,265 | ||||
| Health Care — 3.0% | ||||
| 985,000 | AlixPartners LLP, Initial Dollar Term Loan, (1M LIBOR + 2.750%), 5.865%, 2/04/28 | 944,191 | ||
| 542,998 | Avantor Funding Inc., Incremental B-5 Dollar Term Loan, (1M LIBOR + 2.250%), 5.365%, 11/08/27 | 527,474 | ||
| 577,500 | Belron Finance US LLC, First Incremental Loan, (3M LIBOR + 2.250%), 5.188%, 11/13/25 | 561,619 | ||
| 807,907 | Change Healthcare Holdings LLC, Closing Date Term Loan, (3M LIBOR + 2.500%), 7.750%, 3/01/24 | 804,764 | ||
| 724,142 | Elanco Animal Health Inc., Term Loan, (1M LIBOR + 1.750%), 4.314%, 8/01/27 | 687,486 | ||
| 635,375 | Froneri US Inc., Facility B2, (1M LIBOR + 2.250%), 5.365%, 1/29/27 | 598,364 | ||
| 683,428 | Gainwell Acquisition Corp, Term B Loan, (3M LIBOR + 4.000%), 6.250%, 10/01/27 | 649,770 | ||
| 870,329 | Organon & Co, Senior Secured Dollar Term Loan, (3M LIBOR + 3.000%), 6.188%, 6/02/28 | 848,571 | ||
| 374,300 | Packaging Coordinators Midco Inc., First Lien Term B Loan, (3M LIBOR + 3.750%), 7.424%, 11/30/27 | 354,960 | ||
| 975,150 | Sunshine Luxembourg VII SARL, Term Loan B3 (USD), (3M LIBOR + 3.750%), 7.424%, 10/01/26 | 904,998 | ||
| 703,394 | Surgery Center Holdings, Inc., 2021 New Term Loan, (1M LIBOR + 3.750%), 6.510%, 8/31/26 | 666,466 | ||
| 265,000 | Team Health Holdings Inc., Initial Term Loan, (LIBOR + 2.750%), 5.274%, 2/06/24(D) | 240,901 | ||
| 402,163 | Trans Union LLC, Term B-5 Loan, (1M LIBOR + 1.750%), 4.865%, 11/16/26 | 387,283 | ||
| 8,176,847 | ||||
| Information Technology — 2.7% | ||||
| 1,879,731 | Applied Systems Inc., Term B Loan, (1M LIBOR + 3.250%), 6.674%, 9/19/24(D) | 1,830,633 | ||
| 956,350 | Dun & Bradstreet Corporation (The), Term Loan B, (1M LIBOR + 3.250%), 6.330%, 2/06/26 | 923,116 | ||
| 376,702 | Epicor Software Corporation, Term C Loan, (1M LIBOR + 3.250%), 5.774%, 7/30/27 | 352,100 | ||
| 1,393,101 | Hyland Software Inc., 2018 Refinancing Term Loan, (1M LIBOR + 3.500%), 6.024%, 7/01/24 | 1,345,917 | ||
| 470,800 | Hyland Software Inc., 2021-1 Incremental Term Facility, (1M LIBOR + 6.250%), 9.365%, 7/07/25 | 461,384 | ||
| 483,108 | Quest Software, Inc., Second Lien Initial Term Loan, (3M SOFR + 7.650%), 10.227%, 2/01/30 | 277,183 | ||
| 230,323 | SS&C Technologies Inc., Term B-3 Loan, (1M LIBOR + 1.750%), 4.865%, 4/16/25 | 222,467 | ||
| 186,975 | SS&C Technologies Inc., Term B-4 Loan, (1M LIBOR + 1.750%), 4.865%, 4/16/25 | 180,597 | ||
| 727,679 | SS&C Technologies Inc., Term B-5 Loan, (1M LIBOR + 1.750%), 4.865%, 4/16/25 | 702,858 | ||
| 956,032 | Tempo Acquisition LLC, Additional Initial Term B-1 Loan, 6.034%, 8/31/28 | 929,502 | ||
| 7,225,757 | ||||
| Financials — 2.1% | ||||
| 539,126 | Deerfield Dakota Holding LLC, First Lien Initial Dollar Term Loan, (1M LIBOR + 3.750%), 6.784%, 4/09/27 | 507,679 | ||
| 280,315 | Focus Financial Partners LLC, Tranche B-3 Term Loan, 5.115%, 7/03/24(D) | 272,996 | ||
| Principal Amount | Market Value | |||
| Financials — (Continued) | ||||
| $ 943,138 | HUB International Ltd, Initial Term Loan, (3M LIBOR + 3.000%), 5.766%, 4/25/25 | $ 905,610 | ||
| 656,525 | NFP Corp, Closing Date Term Loan, (1M LIBOR + 3.250%), 6.365%, 2/15/27 | 615,492 | ||
| 1,129,095 | Sedgwick Claims Management Services Inc., Term Loan, (1M LIBOR + 3.250%), 6.365%, 12/31/25 | 1,066,995 | ||
| 2,305,871 | USI Inc., Term Loan B, (3M LIBOR + 3.000%), 6.424%, 5/16/24 | 2,240,546 | ||
| 5,609,318 | ||||
| Energy — 1.5% | ||||
| 2,546,685 | Gulf Finance, LLC, Term Loan, (1M LIBOR + 6.750%), 9.390%, 8/25/26 | 2,000,064 | ||
| 852,145 | PES Holdings LLC, Tranche C Loan Non-PIK, (3M PRIME + 6.990%), 11.000%, 12/31/22 | 23,434 | ||
| 2,164,682 | Traverse Midstream Partners LLC, (3M Term SOFR + 4.250%), 5.950%, 9/27/24 | 2,110,565 | ||
| 4,134,063 | ||||
| Industrials — 1.0% | ||||
| 438,442 | CP Atlas Buyer Inc., Term B Loan, (3M LIBOR + 3.750%), 6.274%, 11/23/27 | 380,129 | ||
| 843,798 | Transdigm Inc., Tranche F Refinancing Term Loan, (1M LIBOR + 2.250%), 5.924%, 12/09/25 | 807,127 | ||
| 710,626 | Vertical Midco Gmbh, Term Loan B, (3M LIBOR + 3.500%), 6.871%, 7/30/27 | 679,835 | ||
| 1,012,793 | Wilsonart LLC, Tranche E Term Loan, (3M LIBOR + 3.250%), 5.510%, 12/31/26(D) | 922,279 | ||
| 2,789,370 | ||||
| Materials — 0.4% | ||||
| 497,453 | BWay Holding Company, Initial Term Loan, (3M LIBOR + 3.250%), 5.814%, 4/03/24 | 462,323 | ||
| 452,464 | Tronox Finance LLC, First Lien Term Loan B, (3M LIBOR + 2.250%), 5.365%, 3/10/28 | 428,823 | ||
| 256,523 | Venator Materials LLC, Initial Term Loan, (1M LIBOR + 3.000%), 6.115%, 8/08/24 | 222,213 | ||
| 1,113,359 | ||||
| Consumer Staples — 0.3% | ||||
| 955,941 | IRB Holding Corp, Term B Loan, (1M LIBOR + 2.750%), 5.865%, 2/05/25(D) | 922,330 | ||
| Total Bank Loans | $48,357,312 | |||
| Asset-Backed Securities — 9.5% | ||||
| 1,000,000 | Aimco CLO 11 Ltd. (Cayman Islands), Ser 2020-11A, Class ER, 144a, (3M LIBOR +6.200%), 8.940%, 10/17/34(E) | 864,225 | ||
| 575,000 | AIMCO CLO 16 Ltd. (Cayman Islands), Ser 2021-16A, Class SUB, 144a, 1/17/35(E)(F) | 443,449 | ||
| 325,000 | Atrium XIII (Cayman Islands), Ser 13A, Class E, 144a, (3M LIBOR +6.050%), 8.833%, 11/21/30(E) | 276,547 | ||
| 340,000 | Atrium XV (Cayman Islands), Ser 15A, Class SUB, 144a, 1/23/31(E)(F) | 197,465 | ||
| 1,250,000 | Bain Capital Credit CLO Ltd. (Cayman Islands), Ser 2019-2A, Class ER, 144a, (3M LIBOR +6.320%), 9.060%, 10/17/32(E) | 1,009,157 | ||
| 620,000 | Bain Capital Credit CLO Ltd. (Cayman Islands), Ser 2021-2A, Class SUB, 144a, 7/16/34(E)(F) | 396,546 | ||
| 850,000 | Bain Capital Credit CLO Ltd. (Cayman Islands), Ser 2022-1A, Class SUB, 144a, 4/18/35(E)(F) | 752,099 | ||
| 1,000,000 | Carlyle US CLO Ltd. (Cayman Islands), Ser 2021-10A, Class E, 144a, (3M LIBOR +6.500%), 9.210%, 10/20/34(E) | 871,216 | ||
| Principal Amount | Market Value | |||
| Asset-Backed Securities — 9.5% (Continued) | ||||
| $ 1,000,000 | Carlyle US CLO Ltd. (Cayman Islands), Ser 2021-11A, Class E, 144a, (3M LIBOR +6.400%), 9.183%, 1/25/33(E) | $ 871,636 | ||
| 500,000 | Cedar Funding IV CLO Ltd. (Cayman Islands), Ser 2014-4A, Class ERR, 144a, (3M LIBOR +6.610%), 9.393%, 7/23/34(E) | 417,977 | ||
| 714,286 | Cedar Funding XIV CLO Ltd. (Cayman Islands), Ser 2021-14A, Class E, 144a, (3M LIBOR +6.340%), 8.852%, 7/15/33(E) | 583,526 | ||
| 1,500,000 | CIFC Funding Ltd. (Cayman Islands), Ser 2015-4A, Class SUB, 144a, 4/20/34(E)(F) | 562,563 | ||
| 1,000,000 | CIFC Funding Ltd., Ser 2019-4A, Class DR, 144a, (3M LIBOR +6.600%), 9.112%, 10/15/34(E) | 877,047 | ||
| 500,000 | CIFC Funding Ltd. (Cayman Islands), Ser 2020-3A, Class SUB, 144a, 10/20/34(E)(F) | 398,773 | ||
| 1,000,000 | CIFC Funding Ltd. (Cayman Islands), Ser 2021-7A, Class E, 144a, (3M LIBOR +6.350%), 9.133%, 1/23/35(E) | 861,510 | ||
| 250,000 | Dryden 45 Senior Loan Fund (Cayman Islands), Ser 2016-45A, Class ER, 144a, (3M LIBOR +5.850%), 8.362%, 10/15/30(E) | 204,146 | ||
| 250,000 | Dryden 57 CLO Ltd. (Cayman Islands), Ser 2018-57A, Class E, 144a, (3M LIBOR +5.200%), 8.105%, 5/15/31(E) | 200,994 | ||
| 1,000,000 | Dryden 76 CLO Ltd. (Cayman Islands), Ser 2019-76A, Class ER, 144a, (3M LIBOR +6.500%), 9.210%, 10/20/34(E) | 846,022 | ||
| 250,000 | Dryden 78 CLO Ltd. (Cayman Islands), Ser 2020-78A, Class SUB, 144a, 4/17/33(E)(F) | 178,075 | ||
| 650,000 | Dryden 98 CLO Ltd. (Cayman Islands), Ser 2022-98X, Class SUB, 4/20/35(F) | 611,146 | ||
| 250,000 | Elmwood CLO VIII Ltd. (Cayman Islands), Ser 2021-1A, Class F1, 144a, (3M LIBOR +8.000%), 10.710%, 1/20/34(E) | 210,373 | ||
| 588,235 | Elmwood CLO VIII Ltd. (Cayman Islands), Ser 2021-1A, Class SUB, 144a, 1/20/34(E)(F) | 445,951 | ||
| 1,000,000 | Fillmore Park CLO Ltd. (Cayman Islands), Ser 2018-1A, Class E, 144a, (3M LIBOR +5.400%), 7.912%, 7/15/30(E) | 828,762 | ||
| 1,000,000 | ICG US CLO Ltd. (Cayman Islands), Ser 2021-1A, Class SUB, 144a, 4/17/34(E)(F) | 655,094 | ||
| 750,000 | Invesco CLO Ltd. (Cayman Islands), Ser 2021-3A, Class SUB, 144a, 10/22/34(E)(F) | 469,115 | ||
| 75,000 | Invesco CLO Ltd. (Cayman Islands), Ser 2021-3A, Class Y, 144a, 10/22/34(E)(F) | 22,688 | ||
| 625,000 | Madison Park Funding LIII Ltd. (Cayman Islands), Ser 2022-53A, Class SUB, 144a, 4/21/35(E)(F) | 501,174 | ||
| 1,000,000 | Madison Park Funding LIX Ltd. (Cayman Islands), Ser 2021-59X, Class SUB, 1/18/34(E)(F) | 809,837 | ||
| 300,000 | Madison Park Funding XII Ltd. (Cayman Islands), Ser 2014-12A, Class SUB, 144a, 7/20/26(E)(F) | 8,100 | ||
| 500,000 | Madison Park Funding XXII Ltd. (Cayman Islands), Ser 2016-22A, Class ER, 144a, (3M LIBOR +6.700%), 9.212%, 1/15/33(E) | 430,019 | ||
| 1,000,000 | Madison Park Funding XXII Ltd. (Cayman Islands), Ser 2016-22A, Class SUB, 144a, 1/15/33(E)(F) | 554,640 | ||
| 500,000 | Madison Park Funding XXVIII Ltd. (Cayman Islands), Ser 2018-28A, Class SUB, 144a, 7/15/30(E)(F) | 294,410 | ||
| 250,000 | Madison Park Funding XXXI Ltd. (Cayman Islands), Ser 2018-31A, Class SUB, 144a, 1/23/48(E)(F) | 164,357 | ||
| 540,000 | Madison Park Funding XXXVII Ltd. (Cayman Islands), Ser 2019-37A, Class SUB, 144a, 7/15/49(E)(F) | 452,215 | ||
| Principal Amount | Market Value | |||
| Asset-Backed Securities — 9.5% (Continued) | ||||
| $ 1,000,000 | Magnetite XXIII Ltd. (Cayman Islands), Ser 2019-23A, Class ER, 144a, (3M LIBOR +6.300%), 9.083%, 1/25/35(E) | $ 861,606 | ||
| 250,000 | Niagara Park CLO Ltd. (Cayman Islands), Ser 2019-1A, Class ER, 144a, (3M LIBOR +5.950%), 8.690%, 7/17/32(E) | 210,027 | ||
| 250,000 | Oaktree CLO Ltd. (Cayman Islands), Ser 2019-2A, Class D, 144a, (3M LIBOR +6.770%), 9.282%, 4/15/31(E) | ��� 203,370 | ||
| 250,000 | Oaktree CLO Ltd. (Cayman Islands), Ser 2022-2A, Class E, 144a, (3M Term SOFR +8.340%), 11.165%, 7/15/33(E) | 228,490 | ||
| 250,000 | Octagon Loan Funding Ltd. (Cayman Islands), Ser 2014-1A, Class DRR, 144a, (3M LIBOR +2.900%), 5.861%, 11/18/31(E) | 214,920 | ||
| 825,000 | OHA Credit Funding 4 Ltd. (Cayman Islands), Ser 2019-4A, Class ER, 144a, (3M LIBOR +6.400%), 9.159%, 10/22/36(E) | 711,947 | ||
| 350,000 | OHA Loan Funding Ltd. (Cayman Islands), Ser 2016-1A, Class SUB, 144a, 1/20/33(E)(F) | 224,325 | ||
| 1,000,000 | REESE PARK CLO Ltd. (Cayman Islands), Ser 2020-1A, Class M2, 144a, 10/15/34(E)(F) | 43,696 | ||
| 1,000,000 | REESE PARK CLO Ltd. (Cayman Islands), Ser 2020-1A, Class SUB, 144a, 10/15/34(E)(F) | 610,840 | ||
| 750,000 | Rockland Park CLO Ltd. (Cayman Islands), Ser 2021-1A, Class M1, 144a, 4/20/34(E)(F) | 2,925 | ||
| 750,000 | Rockland Park CLO Ltd. (Cayman Islands), Ser 2021-1A, Class M2, 144a, 4/20/34(E)(F) | 6,750 | ||
| 750,000 | Rockland Park CLO Ltd. (Cayman Islands), Ser 2021-1A, Class SUB, 144a, 4/20/34(E)(F) | 500,866 | ||
| 500,000 | RR 6 Ltd. (Cayman Islands), Ser 2019-6A, Class SUB, 144a, 4/15/36(E)(F) | 415,532 | ||
| 500,000 | Steele Creek CLO Ltd. (Cayman Islands), Ser 2019-2A, Class E, 144a, (3M LIBOR +7.700%), 10.212%, 7/15/32(E) | 397,417 | ||
| 250,000 | TCI-Flatiron CLO Ltd. (Cayman Islands), Ser 2017-1A, Class D, 144a, (3M LIBOR +2.750%), 5.692%, 11/18/30(E) | 224,338 | ||
| 500,000 | Thompson Park CLO Ltd. (Cayman Islands), Ser 2021-1A, Class E, 144a, (3M LIBOR +6.310%), 8.822%, 4/15/34(E) | 431,630 | ||
| 525,000 | Thompson Park CLO Ltd. (Cayman Islands), Ser 2021-1A, Class SUB, 144a, 4/15/34(F) | 471,415 | ||
| 300,000 | TICP CLO XII Ltd. (Cayman Islands), Ser 2018-12A, Class ER, 144a, (3M LIBOR +6.250%), 8.762%, 7/15/34(E) | 255,918 | ||
| 250,000 | Voya CLO Ltd. (Cayman Islands), Ser 2019-4X, Class ER, (3M LIBOR +6.710%), 9.222%, 1/15/35(E) | 206,874 | ||
| 1,000,000 | Voya CLO Ltd., Ser 2020-3A, Class ER, 144a, (3M LIBOR +6.400%), 9.110%, 10/20/34(E) | 824,911 | ||
| 850,000 | Voya CLO Ltd. (Cayman Islands), Ser 2021-1A, Class E, 144a, (3M LIBOR +6.350%), 8.862%, 7/15/34(E) | 699,620 | ||
| 250,000 | Wellfleet CLO Ltd. (Cayman Islands), Ser 2018-3A, Class D, 144a, (3M LIBOR +6.250%), 8.960%, 1/20/32(E) | 193,785 | ||
| 250,000 | Wellfleet CLO Ltd. (Cayman Islands), Ser 2018-3A, Class SUB, 144a, 1/20/32(E)(F) | 90,214 | ||
| 250,000 | Wellfleet CLO Ltd. (Cayman Islands), Ser 2019-1A, Class D, 144a, (3M LIBOR +6.900%), 9.610%, 7/20/32(E) | 200,864 | ||
| 280,000 | Wellfleet CLO Ltd. (Cayman Islands), Ser 2020-1A, Class SUB, 144a, 4/15/33(E)(F) | 160,860 | ||
| Total Asset-Backed Securities | $25,663,994 | |||
| Shares | MarketValue | |||
| Common Stocks — 1.8% | ||||
| Energy — 1.2% | ||||
| 14,309 | AFG Holdings, Inc. | $ 7,154 | ||
| 55,000 | Antero Resources Corp.* | 1,679,150 | ||
| 187,384 | Ascent Resources Marcellus Holdings, LLC | 0 | ||
| 10,000 | Chesapeake Energy Corp. | 942,100 | ||
| 45,000 | Summit Midstream Partners LP* | 675,900 | ||
| 3,304,304 | ||||
| Health Care — 0.5% | ||||
| 184,286 | Bausch Health Cos., Inc.*† | 1,269,731 | ||
| Industrials — 0.1% | ||||
| 28,087 | Tutor Perini Corp.* | 155,040 | ||
| Total Common Stocks | $4,729,075 | |||
| Exchange-Traded Fund — 0.4% | ||||
| 32,000 | Alerian MLP ETF† | 1,169,920 | ||
| Warrants — 0.0% | ||||
| Energy — 0.0% | ||||
| 48,515 | Ascent Resources Marcellus Holdings, LLC, Exp 3/30/23, Price 0.00* | 0 | ||
| Total Warrants | $0 | |||
| Short-Term Investment Funds — 6.4% | ||||
| 8,102,499 | Dreyfus Government Cash Management, Institutional Shares, 2.75%∞Ω | 8,102,499 | ||
| 9,255,865 | Invesco Government & Agency Portfolio, Institutional Class, 2.88%∞Ω** | 9,255,865 | ||
| Total Short-Term Investment Funds | $17,358,364 | |||
| Total Long Positions—102.6% (Cost $319,184,965) | $278,058,046 | |||
| Securities Sold Short — (0.8)% | ||||
| Principal Amount | ||||
| Corporate Bonds — (0.8)% | ||||
| Energy — (0.2)% | ||||
| $ (675,000) | Chesapeake Energy Corp., 6.750%, 4/15/29 | (644,795) | ||
| Consumer Staples — (0.6)% | ||||
| (2,000,000) | QVC, Inc., 4.750%, 2/15/27 | (1,497,641) | ||
| Total Corporate Bonds | $(2,142,436) | |||
| Total Securities Sold Short (Proceeds $2,340,328) | $(2,142,436) | |||
| Total Investment Securities—101.8% | $275,915,610 | |||
| Liabilities in Excess of Other Assets — (1.8%) | (4,826,046) | |||
| Net Assets — 100.0% | $271,089,564 | |||
| (A) | All or a portion of these securities are pledged as collateral for securities sold short. The total value of the securities pledged as collateral as of September 30, 2022 was $4,372,014. |
| (B) | Represents a payment-in-kind (“PIK”) security, which may pay interest in additional principal amounts. |
| (C) | Bank loans pay interest at rates which adjust periodically unless otherwise indicated. The interest rates shown are the current interest rates as of September 30, 2022. |
| (D) | All or a portion of this position has not settled. Full contract rates do not take effect until settlement date. |
| (E) | Variable rate security - Rate reflected is the rate in effect as of September 30, 2022. |
| (F) | Security has no stated coupon and is considered an equity position in the collateralized loan obligation (“CLO”). CLO equity investments are entitled to recurring distributions which are generally equal to the excess cash flow generated from the underlying investments after payment of the contractual payments to debt holders and fund expenses. |
| * | Non-income producing security. |
| ** | Represents collateral for securities loaned. |
| † | All or a portion of the security is on loan. The total market value of the securities on loan as of September 30, 2022 was $8,891,937. |
| ∞ | Open-End Fund. |
| Ω | Represents the 7-Day SEC yield as of September 30, 2022. |
| Portfolio Abbreviations: |
| CLO – Collateralized Loan Obligation |
| DAC – Designated Activity Company |
| ETF – Exchange-Traded Fund |
| EUR – Euro |
| GBP – Great Britain Pound |
| ICE – Intercontinental Exchange, Inc. |
| LIBOR – London Interbank Offered Rate |
| LLC – Limited Liability Company |
| LLLP – Limited Liability Limited Partnership |
| LP – Limited Partnership |
| MLP – Master Limited Partnership |
| PIK – Payment In Kind |
| PLC – Public Limited Company |
| REIT – Real Estate Investment Trust |
| SOFR – Secured Overnight Financing Rate |
| USD – United States Dollar |
| 144a - This is a restricted security that was sold in a transaction qualifying for the exemption under Rule 144a of the Securities Act of 1933. This security may be sold in transactions exempt from registration, normally to qualified institutional buyers. At September 30, 2022, these securities were valued at $177,861,826 or 65.6% of net assets. These securities were deemed liquid pursuant to procedures approved by the Board of Trustees. |
| Valuation Inputs at Reporting Date: | ||||
| Description | Level 1 | Level 2 | Level 3 | Total |
| Assets: | ||||
| Corporate Bonds | $— | $180,779,381 | $— | $180,779,381 |
| Bank Loans | — | 48,357,312 | — | 48,357,312 |
| Asset-Backed Securities | — | 25,663,994 | — | 25,663,994 |
| Common Stocks | 4,721,921 | 7,154 | — | 4,729,075 |
| Exchange-Traded Fund | 1,169,920 | — | — | 1,169,920 |
| Warrants | — | 0 | — | 0 |
| Short-Term Investment Funds | 17,358,364 | — | — | 17,358,364 |
| Other Financial Instruments | ||||
| Swap Agreements | ||||
| Credit contracts | — | 40,777 | — | 40,777 |
| Total Assets | $23,250,205 | $254,848,618 | $— | $278,098,823 |
| Liabilities: | ||||
| Securities Sold Short | ||||
| Corporate Bonds | $— | $(2,142,436) | $— | $(2,142,436) |
| Other Financial Instruments | ||||
| Foreign currency exchange contracts | — | (133,467) | — | (133,467) |
| Total Liabilities | $— | $(2,275,903) | $— | $(2,275,903) |
| Total | $23,250,205 | $252,572,715 | $— | $275,822,920 |
| Measurements Using Unobservable Inputs (Level 3) | |
| Assets | |
| Beginning balance, September 30, 2021 | $1 |
| Transfer out of Level 3 | (494,023) |
| Purchases and Sales | 562,499 |
| Change in unrealized appreciation (depreciation) | (68,477) |
| Ending balance, September 30, 2022 | $— |
| Net Change in Unrealized Appreciation/Depreciation for Investments in Securities still held at September 30, 2022 | $— |
| Counterparty | Termination Date | Notional Amount(2) | Pay Fixed Rate | Clearinghouse | Underlying Bond | Value(3) | Premiums (Received) | Unrealized Appreciation |
| Wells Fargo | 6/20/25 | $(500,000) | 5.000% | ICE | American Axle & Manufacturing Inc. USD SR 5Y D14 | $4,385 | $(2,278) | $4,385 |
| Wells Fargo | 12/20/25 | $(568,538) | 5.000% | ICE | Markit CDX North America High Yield Series 35 5Y Index | $36,392 | $(38,397) | $36,392 |
| $40,777 |
| (1) | If the Fund is a buyer of protection and a credit event occurs, as defined under the terms of that particular swap agreement, the Fund will either (i) receive from the seller of protection an amount equal to the notional amount of the swap and deliver the referenced obligation or underlying investments comprising the referenced index or (ii) receive a net settlement amount in the form of cash or investments equal to the notional amount of the swap less the recovery value of the referenced obligation or underlying investments comprising the referenced index. |
| (2) | The maximum potential amount the Fund could be required to pay as a seller of credit protection or receive as a buyer of credit protection if a credit event occurs as defined under the terms of that particular swap agreement. |
| (3) | The quoted market prices and resulting values for credit default swap agreements on the underlying bond serve as an indicator of the current status of the payment/performance risk and represent the likelihood of an expected liability (or profit) for the credit derivative had the notional amount of the swap agreement been closed/sold as of the period end. Decreasing market values (sell protection) or increasing market values (buy protection) when compared to the notional amount of the swap, represent a deterioration of the referenced entity's credit soundness and a greater likelihood or risk of default or other credit event occurring as defined under the terms of the agreement. |
| Contract to | ||||||
| Counterparty | Expiration Date | Receive | Deliver | Unrealized Depreciation | ||
| Wells Fargo | 10/28/2022 | USD | 7,149,141 | EUR | 7,393,114 | $(110,435) |
| Wells Fargo | 10/28/2022 | USD | 663,555 | GBP | 614,545 | (23,032) |
| $(133,467) | ||||||
| Shares | Market Value | |||
| Common Stocks — 99.8% | ||||
| Information Technology — 23.2% | ||||
| 158,927 | Analog Devices, Inc. | $ 22,144,888 | ||
| 350,565 | Apple, Inc. | 48,448,083 | ||
| 159,678 | Automatic Data Processing, Inc. | 36,117,567 | ||
| 91,304 | Broadcom, Inc. | 40,539,889 | ||
| 1,055,074 | Cisco Systems, Inc. | 42,202,960 | ||
| 1,138,323 | Intel Corp. | 29,334,584 | ||
| 397,446 | International Business Machines Corp. | 47,220,559 | ||
| 149,266 | KLA Corp. | 45,172,370 | ||
| 373,406 | Microsoft Corp. | 86,966,257 | ||
| 820,395 | Oracle Corp. | 50,101,523 | ||
| 316,292 | Paychex, Inc. | 35,491,125 | ||
| 306,261 | QUALCOMM, Inc. | 34,601,368 | ||
| 256,606 | Texas Instruments, Inc. | 39,717,477 | ||
| 308,954 | Visa, Inc. - Class A | 54,885,678 | ||
| 612,944,328 | ||||
| Health Care — 13.7% | ||||
| 160,873 | AbbVie, Inc. | 21,590,765 | ||
| 174,272 | AmerisourceBergen Corp. | 23,584,230 | ||
| 483,442 | Bristol-Myers Squibb Co. | 34,367,892 | ||
| 409,169 | CVS Health Corp. | 39,022,447 | ||
| 265,968 | Gilead Sciences, Inc. | 16,407,566 | ||
| 349,977 | Johnson & Johnson | 57,172,243 | ||
| 551,695 | Medtronic PLC | 44,549,371 | ||
| 535,152 | Merck & Co., Inc. | 46,087,290 | ||
| 646,597 | Pfizer, Inc. | 28,295,085 | ||
| 103,090 | UnitedHealth Group, Inc. | 52,064,574 | ||
| 363,141,463 | ||||
| Financials — 13.7% | ||||
| 148,273 | Arthur J Gallagher & Co. | 25,387,303 | ||
| 1,366,951 | Bank of America Corp. | 41,281,920 | ||
| 85,475 | BlackRock, Inc. | 47,035,183 | ||
| 166,279 | Goldman Sachs Group, Inc. (The) | 48,728,061 | ||
| 2,461,800 | Huntington Bancshares, Inc. | 32,446,524 | ||
| 250,545 | JPMorgan Chase & Co. | 26,181,952 | ||
| 325,310 | Principal Financial Group, Inc. | 23,471,116 | ||
| 352,084 | Prudential Financial, Inc. | 30,201,766 | ||
| 136,847 | T Rowe Price Group, Inc. | 14,370,303 | ||
| 418,053 | Truist Financial Corp. | 18,202,028 | ||
| 408,383 | US Bancorp | 16,466,003 | ||
| 973,523 | Wells Fargo & Co. | 39,155,095 | ||
| 362,927,254 | ||||
| Consumer Discretionary — 10.7% | ||||
| 180,574 | Dollar General Corp. | 43,312,480 | ||
| 149,868 | Home Depot, Inc. (The) | 41,354,576 | ||
| 147,065 | McDonald's Corp. | 33,933,778 | ||
| 601,380 | Starbucks Corp. | 50,672,279 | ||
| 183,536 | Target Corp. | 27,234,907 | ||
| 555,468 | VF Corp. | 16,614,048 | ||
| 153,381 | Whirlpool Corp. | 20,677,292 | ||
| 452,383 | Yum! Brands, Inc. | 48,106,408 | ||
| 281,905,768 | ||||
| Industrials — 9.0% | ||||
| 259,941 | 3M Co. | 28,723,480 | ||
| 174,471 | Caterpillar, Inc. | 28,627,202 | ||
| 78,717 | Cummins, Inc. | 16,019,696 | ||
| 68,328 | Deere & Co. | 22,814,036 | ||
| 173,263 | Eaton Corp. PLC | 23,106,354 | ||
| 99,293 | Lockheed Martin Corp. | 38,355,893 | ||
| Shares | Market Value | |||
| Industrials — (Continued) | ||||
| 496,530 | Raytheon Technologies Corp. | $ 40,645,946 | ||
| 543,494 | Stanley Black & Decker, Inc. | 40,876,184 | ||
| 239,168,791 | ||||
| Communication Services — 7.2% | ||||
| 1,985,582 | AT&T, Inc. | 30,458,828 | ||
| 1,257,419 | Comcast Corp. - Class A | 36,880,099 | ||
| 822,283 | Fox Corp. - Class A | 25,227,643 | ||
| 989,372 | Interpublic Group of Cos., Inc. (The) | 25,327,923 | ||
| 423,110 | Omnicom Group, Inc. | 26,694,010 | ||
| 1,052,254 | Verizon Communications, Inc. | 39,954,084 | ||
| 480,346 | Warner Bros Discovery, Inc.* | 5,523,979 | ||
| 190,066,566 | ||||
| Consumer Staples — 7.0% | ||||
| 649,993 | Coca-Cola Co. (The) | 36,412,608 | ||
| 246,994 | PepsiCo, Inc. | 40,324,240 | ||
| 548,311 | Philip Morris International, Inc. | 45,515,296 | ||
| 415,325 | Sysco Corp. | 29,367,631 | ||
| 266,031 | Walmart, Inc. | 34,504,221 | ||
| 186,123,996 | ||||
| Energy — 5.6% | ||||
| 265,368 | Chevron Corp. | 38,125,421 | ||
| 429,349 | Exxon Mobil Corp. | 37,486,461 | ||
| 446,188 | Phillips 66 | 36,016,295 | ||
| 347,437 | Valero Energy Corp. | 37,123,644 | ||
| 148,751,821 | ||||
| Utilities — 3.9% | ||||
| 460,521 | Dominion Energy, Inc. | 31,826,606 | ||
| 346,230 | Duke Energy Corp. | 32,206,315 | ||
| 492,677 | NextEra Energy, Inc. | 38,630,803 | ||
| 102,663,724 | ||||
| Materials — 3.0% | ||||
| 151,927 | Air Products & Chemicals, Inc. | 35,357,971 | ||
| 857,156 | DuPont de Nemours, Inc. | 43,200,662 | ||
| 78,558,633 | ||||
| Real Estate — 2.8% | ||||
| 188,701 | Alexandria Real Estate Equities, Inc. REIT | 26,453,993 | ||
| 134,756 | American Tower Corp. REIT | 28,932,113 | ||
| 199,193 | Simon Property Group, Inc. REIT | 17,877,572 | ||
| 73,263,678 | ||||
| Total Common Stocks | $2,639,516,022 | |||
| Short-Term Investment Fund — 0.4% | ||||
| 9,205,055 | Dreyfus Government Cash Management, Institutional Shares, 2.75%∞Ω | 9,205,055 | ||
| Total Investment Securities—100.2% (Cost $3,011,521,844) | $2,648,721,077 | |||
| Liabilities in Excess of Other Assets — (0.2%) | (4,007,597) | |||
| Net Assets — 100.0% | $2,644,713,480 | |||
| * | Non-income producing security. |
| ∞ | Open-End Fund. |
| Ω | Represents the 7-Day SEC yield as of September 30, 2022. |
| Portfolio Abbreviations: |
| PLC – Public Limited Company |
| REIT – Real Estate Investment Trust |
| Valuation Inputs at Reporting Date: | ||||
| Description | Level 1 | Level 2 | Level 3 | Total |
| Common Stocks | $2,639,516,022 | $— | $— | $2,639,516,022 |
| Short-Term Investment Fund | 9,205,055 | — | — | 9,205,055 |
| Total | $2,648,721,077 | $— | $— | $2,648,721,077 |
| Principal Amount | Market Value | |||
| Corporate Bonds — 94.8% | ||||
| Communication Services — 17.3% | ||||
| $ 666,000 | Altice Financing SA (Luxembourg), 144a, 5.750%, 8/15/29 | $ ��� 509,636 | ||
| 483,000 | Altice Financing SA (Luxembourg), 144a, 5.000%, 1/15/28 | 372,045 | ||
| 540,000 | Altice France Holding SA (Luxembourg), 144a, 10.500%, 5/15/27 | 422,958 | ||
| 514,000 | Altice France SA (France), 144a, 5.125%, 7/15/29 | 384,015 | ||
| 446,000 | Altice France SA (France), 144a, 5.500%, 10/15/29 | 335,567 | ||
| 506,000 | Belo Corp., 7.250%, 9/15/27 | 494,615 | ||
| 316,000 | C&W Senior Financing DAC (Ireland), 144a, 6.875%, 9/15/27 | 256,217 | ||
| 434,000 | Cars.com, Inc., 144a, 6.375%, 11/1/28 | 369,985 | ||
| 1,418,000 | CCO Holdings LLC / CCO Holdings Capital Corp., 144a, 4.250%, 2/1/31 | 1,085,261 | ||
| 641,000 | CCO Holdings LLC / CCO Holdings Capital Corp., 144a, 6.375%, 9/1/29 | 588,502 | ||
| 836,000 | Connect Finco SARL / Connect US Finco LLC (United Kingdom), 144a, 6.750%, 10/1/26 | 731,356 | ||
| 360,000 | CSC Holdings LLC, 144a, 3.375%, 2/15/31 | 253,800 | ||
| 1,268,000 | CSC Holdings LLC, 144a, 4.625%, 12/1/30 | 860,782 | ||
| 1,073,000 | CSC Holdings LLC, 144a, 5.750%, 1/15/30 | 762,651 | ||
| 312,000 | Directv Financing LLC / Directv Financing Co-Obligor, Inc., 144a, 5.875%, 8/15/27 | 268,978 | ||
| 607,000 | DISH DBS Corp., 144a, 5.250%, 12/1/26 | 497,046 | ||
| 574,000 | DISH DBS Corp., 7.750%, 7/1/26 | 436,240 | ||
| 500,000 | Frontier Communications Holdings LLC, 144a, 8.750%, 5/15/30 | 500,320 | ||
| 351,000 | Go Daddy Operating Co. LLC / GD Finance Co., Inc., 144a, 3.500%, 3/1/29 | 287,076 | ||
| 909,000 | GoTo Group Inc., 144a, 5.500%, 9/1/27 | 557,481 | ||
| 1,175,000 | Gray Escrow II, Inc., 144a, 5.375%, 11/15/31 | 921,699 | ||
| 330,000 | Gray Television, Inc., 144a, 7.000%, 5/15/27 | 310,365 | ||
| 245,000 | LCPR Senior Secured Financing DAC, 144a, 5.125%, 7/15/29 | 184,501 | ||
| 400,000 | LCPR Senior Secured Financing DAC, 144a, 6.750%, 10/15/27 | 332,000 | ||
| 136,000 | Netflix, Inc., 144a, 5.375%, 11/15/29 | 127,840 | ||
| 240,000 | Nexstar Media, Inc., 144a, 4.750%, 11/1/28 | 205,270 | ||
| 608,000 | Northwest Fiber LLC / Northwest Fiber Finance Sub, Inc., 144a, 4.750%, 4/30/27 | 528,960 | ||
| 455,000 | Outfront Media Capital LLC / Outfront Media Capital Corp., 144a, 4.250%, 1/15/29 | 357,402 | ||
| 345,000 | Photo Holdings Merger Sub, Inc., 144a, 8.500%, 10/1/26 | 220,023 | ||
| 408,000 | Sprint Capital Corp., 6.875%, 11/15/28 | 419,220 | ||
| 1,543,000 | Stagwell Global, 144a, 5.625%, 8/15/29 | 1,269,225 | ||
| 612,000 | Station Casinos LLC, 144a, 4.625%, 12/1/31 | 462,234 | ||
| 472,000 | TEGNA, Inc., 5.000%, 9/15/29 | 433,905 | ||
| 230,000 | Telecom Italia Capital SA (Italy), 6.000%, 9/30/34 | 171,401 | ||
| 562,000 | Telecom Italia Capital SA (Italy), 6.375%, 11/15/33 | 436,916 | ||
| 923,000 | Videotron Ltd. (Canada), 144a, 5.125%, 4/15/27 | 847,171 | ||
| 376,000 | Vmed O2 UK Financing I PLC (United Kingdom), 144a, 4.250%, 1/31/31 | 284,249 | ||
| 324,000 | VZ Secured Financing BV (Netherlands), 144a, 5.000%, 1/15/32 | 242,059 | ||
| 17,728,971 | ||||
| Industrials — 15.4% | ||||
| 457,000 | Air Canada (Canada), 144a, 3.875%, 8/15/26 | 392,449 | ||
| 79,000 | American Axle & Manufacturing, Inc., 6.250%, 3/15/26 | 72,459 | ||
| 862,000 | American Axle & Manufacturing, Inc., 6.500%, 4/1/27 | 730,545 | ||
| Principal Amount | Market Value | |||
| Industrials — (Continued) | ||||
| $ 683,000 | American Builders & Contractors Supply Co., Inc., 144a, 3.875%, 11/15/29 | $ 535,095 | ||
| 206,000 | Ardagh Metal Packaging Finance USA LLC / Ardagh Metal Packaging Finance PLC, 144a, 6.000%, 6/15/27 | 193,991 | ||
| 388,000 | Bombardier, Inc. (Canada), 144a, 7.875%, 4/15/27 | 356,960 | ||
| 486,000 | BWX Technologies, Inc., 144a, 4.125%, 6/30/28 | 424,463 | ||
| 214,000 | Canpack SA / Canpack US LLC (Poland), 144a, 3.125%, 11/1/25 | 186,111 | ||
| 697,000 | Canpack SA / Canpack US LLC (Poland), 144a, 3.875%, 11/15/29 | 544,496 | ||
| 296,000 | Cascades, Inc./Cascades USA, Inc. (Canada), 144a, 5.375%, 1/15/28 | 250,383 | ||
| 1,382,000 | Cimpress PLC (Ireland), 144a, 7.000%, 6/15/26 | 939,760 | ||
| 293,000 | Covanta Holding Corp., 144a, 4.875%, 12/1/29 | 236,820 | ||
| 415,000 | Delta Air Lines, Inc., 3.750%, 10/28/29† | 322,276 | ||
| 748,000 | Dycom Industries, Inc., 144a, 4.500%, 4/15/29 | 630,319 | ||
| 460,000 | Fortress Transportation & Infrastructure Investors LLC, 144a, 6.500%, 10/1/25 | 432,130 | ||
| 348,000 | GFL Environmental, Inc. (Canada), 144a, 3.500%, 9/1/28 | 293,472 | ||
| 1,413,000 | Granite US Holdings Corp., 144a, 11.000%, 10/1/27 | 1,332,046 | ||
| 937,000 | H&E Equipment Services, Inc., 144a, 3.875%, 12/15/28 | 735,545 | ||
| 467,000 | Howmet Aerospace, Inc., 3.000%, 1/15/29 | 381,520 | ||
| 86,000 | Howmet Aerospace, Inc., 5.950%, 2/1/37 | 77,945 | ||
| 214,000 | Howmet Aerospace, Inc., 6.750%, 1/15/28 | 212,883 | ||
| 1,165,000 | Imola Merger Corp., 144a, 4.750%, 5/15/29 | 982,852 | ||
| 684,000 | MIWD Holdco II LLC / MIWD Finance Corp., 144a, 5.500%, 2/1/30 | 499,202 | ||
| 606,000 | Moog, Inc., 144a, 4.250%, 12/15/27 | 536,607 | ||
| 652,000 | New Enterprise Stone & Lime Co., Inc., 144a, 5.250%, 7/15/28 | 534,255 | ||
| 221,000 | OI European Group BV, 144a, 4.750%, 2/15/30 | 175,695 | ||
| 364,000 | Owens-Brockway Glass Container, Inc., 144a, 6.625%, 5/13/27 | 330,199 | ||
| 799,000 | Pactiv Evergreen Group Issuer, Inc. / Pactiv Evergreen Group Issuer LLC, 144a, 4.000%, 10/15/27 | 669,880 | ||
| 700,000 | PECF USS Intermediate Holding III Corp., 144a, 8.000%, 11/15/29 | 510,463 | ||
| 479,000 | Seaspan Corp. (Hong Kong), 144a, 5.500%, 8/1/29 | 368,862 | ||
| 412,000 | Standard Industries, Inc., 144a, 3.375%, 1/15/31 | 290,275 | ||
| 193,000 | Standard Industries, Inc., 144a, 5.000%, 2/15/27 | 170,859 | ||
| 319,000 | Stericycle, Inc., 144a, 3.875%, 1/15/29 | 264,172 | ||
| 495,000 | TK Elevator US Newco, Inc. (Germany), 144a, 5.250%, 7/15/27 | 420,854 | ||
| 1,000,000 | TransDigm, Inc., 4.625%, 1/15/29 | 805,030 | ||
| 15,840,873 | ||||
| Energy — 15.4% | ||||
| 130,000 | Antero Resources Corp., 144a, 7.625%, 2/1/29 | 130,000 | ||
| 1,026,000 | Blue Racer Midstream LLC / Blue Racer Finance Corp., 144a, 6.625%, 7/15/26 | 956,745 | ||
| 458,000 | Blue Racer Midstream LLC / Blue Racer Finance Corp., 144a, 7.625%, 12/15/25 | 439,680 | ||
| 297,000 | Bristow Group, Inc., 144a, 6.875%, 3/1/28 | 261,553 | ||
| 346,000 | California Resources Corp., 144a, 7.125%, 2/1/26 | 325,240 | ||
| 830,000 | Civitas Resources, Inc., 144a, 5.000%, 10/15/26 | 754,038 | ||
| 549,000 | CNX Resources Corp., 144a, 7.375%, 1/15/31 | 538,563 | ||
| 1,662,000 | CQP Holdco LP / BIP-V Chinook Holdco LLC, 144a, 5.500%, 6/15/31 | 1,407,257 | ||
| 610,000 | Crescent Energy Finance LLC, 144a, 7.250%, 5/1/26 | 548,036 | ||
| 467,000 | CVR Energy, Inc., 144a, 5.250%, 2/15/25 | 420,356 | ||
| 632,000 | DCP Midstream Operating LP, 144a, 5.850%, 5/21/43 | 605,614 | ||
| 625,000 | Earthstone Energy Holdings LLC, 144a, 8.000%, 4/15/27 | 582,662 | ||
| Principal Amount | Market Value | |||
| Corporate Bonds — 94.8% (Continued) | ||||
| Energy — (Continued) | ||||
| $ 67,000 | EQM Midstream Partners LP, 144a, 7.500%, 6/1/27 | $ 63,859 | ||
| 1,277,000 | Genesis Energy LP / Genesis Energy Finance Corp., 5.625%, 6/15/24 | 1,200,398 | ||
| 414,000 | Hilcorp Energy I LP / Hilcorp Finance Co., 144a, 5.750%, 2/1/29 | 362,256 | ||
| 201,000 | Hilcorp Energy I LP / Hilcorp Finance Co., 144a, 6.000%, 4/15/30 | 175,160 | ||
| 534,000 | Hilcorp Energy I LP / Hilcorp Finance Co., 144a, 6.250%, 11/1/28 | 492,711 | ||
| 268,000 | Holly Energy Partners LP / Holly Energy Finance Corp., 144a, 6.375%, 4/15/27 | 255,841 | ||
| 274,000 | Kinetik Holdings LP, 144a, 5.875%, 6/15/30 | 250,891 | ||
| 1,067,000 | Murphy Oil Corp., 6.375%, 7/15/28 | 1,008,315 | ||
| 424,000 | Nabors Industries, Inc., 144a, 7.375%, 5/15/27 | 391,331 | ||
| 861,000 | NuStar Logistics LP, 5.625%, 4/28/27 | 750,653 | ||
| 531,000 | NuStar Logistics LP, 6.000%, 6/1/26 | 486,069 | ||
| 923,000 | Parkland Corp. (Canada), 144a, 4.500%, 10/1/29 | 745,196 | ||
| 888,000 | Precision Drilling Corp. (Canada), 144a, 6.875%, 1/15/29 | 784,020 | ||
| 76,000 | Rockies Express Pipeline LLC, 144a, 4.800%, 5/15/30 | 62,320 | ||
| 245,000 | Rockies Express Pipeline LLC, 144a, 4.950%, 7/15/29 | 210,160 | ||
| 165,000 | Tallgrass Energy Partners LP / Tallgrass Energy Finance Corp., 144a, 5.500%, 1/15/28 | 140,837 | ||
| 782,000 | Tallgrass Energy Partners LP / Tallgrass Energy Finance Corp., 144a, 6.000%, 12/31/30 | 664,786 | ||
| 584,000 | TerraForm Power Operating LLC, 144a, 5.000%, 1/31/28 | 513,889 | ||
| 331,000 | Vermilion Energy, Inc. (Canada), 144a, 6.875%, 5/1/30 | 304,520 | ||
| 15,832,956 | ||||
| Consumer Discretionary — 11.4% | ||||
| 617,000 | Adient Global Holdings Ltd., 144a, 4.875%, 8/15/26 | 540,757 | ||
| 415,000 | Bath & Body Works, Inc., 5.250%, 2/1/28 | 359,748 | ||
| 829,000 | Carnival Corp., 144a, 6.000%, 5/1/29 | 559,575 | ||
| 532,000 | Carnival Corp., 144a, 9.875%, 8/1/27 | 522,690 | ||
| 449,000 | Carriage Services, Inc., 144a, 4.250%, 5/15/29 | 355,080 | ||
| 755,000 | Coty, Inc. / HFC Prestige Products, Inc. / HFC Prestige International US LLC, 144a, 4.750%, 1/15/29 | 646,582 | ||
| 423,000 | Dana, Inc., 4.250%, 9/1/30 | 309,827 | ||
| 1,318,000 | Ford Motor Credit Co. LLC, 2.900%, 2/10/29 | 998,385 | ||
| 372,000 | Hilton Domestic Operating Co., Inc., 144a, 3.625%, 2/15/32 | 284,712 | ||
| 445,000 | International Game Technology PLC, 144a, 6.250%, 1/15/27 | 431,370 | ||
| 692,000 | JB Poindexter & Co., Inc., 144a, 7.125%, 4/15/26 | 640,100 | ||
| 617,000 | KB Home, 4.000%, 6/15/31 | 453,051 | ||
| 403,000 | Newell Brands, Inc., 6.375%, 9/15/27 | 399,063 | ||
| 298,000 | Royal Caribbean Cruises Ltd., 144a, 5.375%, 7/15/27 | 219,191 | ||
| 172,000 | Royal Caribbean Cruises Ltd., 7.500%, 10/15/27 | 134,755 | ||
| 133,000 | Royal Caribbean Cruises Ltd., 144a, 8.250%, 1/15/29 | 129,509 | ||
| 483,000 | Royal Caribbean Cruises Ltd., 144a, 11.625%, 8/15/27 | 439,540 | ||
| 973,000 | Sands China Ltd. (Macao), 5.625%, 8/8/25 | 881,470 | ||
| 706,000 | Sonic Automotive, Inc., 144a, 4.625%, 11/15/29 | 554,210 | ||
| 733,000 | Speedway Motorsports LLC / Speedway Funding II, Inc., 144a, 4.875%, 11/1/27 | 637,283 | ||
| 485,000 | Tempur Sealy International, Inc., 144a, 3.875%, 10/15/31 | 355,262 | ||
| 671,000 | Thor Industries, Inc., 144a, 4.000%, 10/15/29 | 497,369 | ||
| 340,000 | United Airlines, Inc., 144a, 4.625%, 4/15/29 | 282,200 | ||
| 238,000 | WW International, Inc., 144a, 4.500%, 4/15/29 | 124,479 | ||
| 1,108,000 | Wynn Macau Ltd. (Macao), 144a, 4.875%, 10/1/24 | 889,170 | ||
| 11,645,378 | ||||
| Financials — 8.3% | ||||
| 580,000 | Allstate Corp. (The), Ser B, 5.750%, 8/15/53 | 533,996 | ||
| Principal Amount | Market Value | |||
| Financials — (Continued) | ||||
| $ 504,000 | Deutsche Bank AG (Germany), 4.296%, 5/24/28 | $ 449,523 | ||
| 440,000 | FirstCash, Inc., 144a, 4.625%, 9/1/28 | 368,500 | ||
| 328,000 | FirstCash, Inc., 144a, 5.625%, 1/1/30 | 280,233 | ||
| 611,000 | Icahn Enterprises LP / Icahn Enterprises Finance Corp., 5.250%, 5/15/27 | 536,183 | ||
| 807,000 | Jane Street Group / JSG Finance, Inc., 144a, 4.500%, 11/15/29 | 694,020 | ||
| 400,000 | MGIC Investment Corp., 5.250%, 8/15/28 | 357,352 | ||
| 559,000 | National Rural Utilities Cooperative Finance Corp., 4.750%, 4/30/43 | 508,558 | ||
| 692,000 | Navient Corp., 5.875%, 10/25/24 | 655,663 | ||
| 430,000 | Navient Corp., 6.750%, 6/25/25 | 402,549 | ||
| 382,000 | Nielsen Finance LLC / Nielsen Finance Co., 144a, 4.750%, 7/15/31 | 374,505 | ||
| 315,000 | OneMain Finance Corp., 3.875%, 9/15/28 | 231,922 | ||
| 228,000 | OneMain Finance Corp., 4.000%, 9/15/30 | 159,990 | ||
| 399,000 | OneMain Finance Corp., 6.625%, 1/15/28 | 342,342 | ||
| 89,000 | PennyMac Financial Services, Inc., 144a, 4.250%, 2/15/29 | 63,395 | ||
| 273,000 | PennyMac Financial Services, Inc., 144a, 5.375%, 10/15/25 | 233,404 | ||
| 414,000 | PennyMac Financial Services, Inc., 144a, 5.750%, 9/15/31 | 296,749 | ||
| 1,035,000 | Prime Security Services Borrower LLC / Prime Finance, Inc., 144a, 5.750%, 4/15/26 | 973,873 | ||
| 718,000 | Rocket Mortgage LLC / Rocket Mortgage Co.-Issuer, Inc., 144a, 2.875%, 10/15/26 | 588,760 | ||
| 661,000 | Rocket Mortgage LLC / Rocket Mortgage Co.-Issuer, Inc., 144a, 3.875%, 3/1/31 | 479,129 | ||
| 8,530,646 | ||||
| Consumer Staples — 7.7% | ||||
| 580,000 | 1011778 BC ULC / New Red Finance, Inc. (Canada), 144a, 4.000%, 10/15/30 | 456,796 | ||
| 446,000 | ACCO Brands Corp., 144a, 4.250%, 3/15/29 | 335,519 | ||
| 407,000 | AHP Health Partners, Inc., 144a, 5.750%, 7/15/29 | 315,425 | ||
| 1,163,000 | Albertsons Cos., Inc. / Safeway, Inc. / New Albertsons LP / Albertsons LLC, 144a, 5.875%, 2/15/28 | 1,072,868 | ||
| 352,000 | Ashtead Capital, Inc. (United Kingdom), 144a, 5.500%, 8/11/32 | 324,170 | ||
| 328,000 | Avis Budget Car Rental LLC / Avis Budget Finance, Inc., 144a, 5.750%, 7/15/27 | 287,694 | ||
| 1,075,000 | BellRing Brands, Inc., 144a, 7.000%, 3/15/30 | 983,303 | ||
| 699,000 | Gap, Inc. (The), 144a, 3.875%, 10/1/31 | 443,866 | ||
| 280,000 | Macy's Retail Holdings LLC, 144a, 5.875%, 4/1/29 | 228,368 | ||
| 368,000 | Performance Food Group, Inc., 144a, 4.250%, 8/1/29 | 306,397 | ||
| 314,000 | Post Holdings, Inc., 144a, 4.625%, 4/15/30 | 256,828 | ||
| 908,000 | Primo Water Holdings, Inc. (Canada), 144a, 4.375%, 4/30/29 | 738,595 | ||
| 684,000 | QVC, Inc., 4.375%, 9/1/28 | 463,779 | ||
| 448,000 | QVC, Inc., 4.750%, 2/15/27 | 335,472 | ||
| 61,000 | SEG Holding LLC / SEG Finance Corp., 144a, 5.625%, 10/15/28 | 55,967 | ||
| 1,374,000 | Turning Point Brands, Inc., 144a, 5.625%, 2/15/26 | 1,191,945 | ||
| 147,000 | Wolverine World Wide, Inc., 144a, 4.000%, 8/15/29 | 112,140 | ||
| 7,909,132 | ||||
| Health Care — 6.5% | ||||
| 592,000 | AdaptHealth LLC, 144a, 4.625%, 8/1/29 | 474,458 | ||
| 293,000 | AdaptHealth LLC, 144a, 5.125%, 3/1/30 | 241,586 | ||
| 349,000 | Avantor Funding, Inc., 144a, 3.875%, 11/1/29 | 286,181 | ||
| 339,000 | CHS / Community Health Systems, Inc., 144a, 5.250%, 5/15/30 | 236,029 | ||
| Principal Amount | Market Value | |||
| Corporate Bonds — 94.8% (Continued) | ||||
| Health Care — (Continued) | ||||
| $ 300,000 | Herbalife Nutrition Ltd. / HLF Financing, Inc., 144a, 7.875%, 9/1/25 | $ 269,298 | ||
| 400,000 | HLF Financing Sarl LLC / Herbalife International, Inc., 144a, 4.875%, 6/1/29 | 285,458 | ||
| 413,000 | Medline Borrower LP, 144a, 3.875%, 4/1/29 | 331,433 | ||
| 412,000 | Medline Borrower LP, 144a, 5.250%, 10/1/29 | 311,274 | ||
| 1,105,000 | MEDNAX, Inc., 144a, 5.375%, 2/15/30 | 915,773 | ||
| 330,000 | ModivCare, Inc., 144a, 5.875%, 11/15/25 | 304,562 | ||
| 432,000 | Molina Healthcare, Inc., 144a, 3.875%, 5/15/32 | 353,870 | ||
| 522,000 | Option Care Health, Inc., 144a, 4.375%, 10/31/29 | 441,090 | ||
| 444,000 | Tenet Healthcare Corp., 144a, 4.250%, 6/1/29 | 367,743 | ||
| 730,000 | Tenet Healthcare Corp., 144a, 4.375%, 1/15/30 | 609,331 | ||
| 266,000 | Tenet Healthcare Corp., 144a, 6.125%, 6/15/30 | 244,308 | ||
| 729,000 | Teva Pharmaceutical Finance Netherlands III BV (Israel), 3.150%, 10/1/26 | 598,145 | ||
| 452,000 | Teva Pharmaceutical Finance Netherlands III BV (Israel), 4.750%, 5/9/27 | 383,888 | ||
| 6,654,427 | ||||
| Materials — 4.9% | ||||
| 355,000 | Arconic Corp., 144a, 6.125%, 2/15/28 | 313,582 | ||
| 44,000 | Avient Corp., 144a, 7.125%, 8/1/30 | 40,609 | ||
| 520,000 | Celanese US Holdings LLC, 6.379%, 7/15/32 | 482,600 | ||
| 938,000 | Clearwater Paper Corp., 144a, 4.750%, 8/15/28 | 821,335 | ||
| 650,000 | Cleveland-Cliffs, Inc., 144a, 4.875%, 3/1/31† | 536,861 | ||
| 233,000 | Hudbay Minerals, Inc. (Canada), 144a, 4.500%, 4/1/26 | 193,712 | ||
| 356,000 | Hudbay Minerals, Inc. (Canada), 144a, 6.125%, 4/1/29 | 286,840 | ||
| 275,000 | INEOS Quattro Finance 2 PLC (United Kingdom), 144a, 3.375%, 1/15/26 | 228,937 | ||
| 443,000 | Kaiser Aluminum Corp., 144a, 4.500%, 6/1/31 | 324,161 | ||
| 243,000 | Kaiser Aluminum Corp., 144a, 4.625%, 3/1/28 | 198,268 | ||
| 705,000 | Mineral Resources Ltd. (Australia), 144a, 8.000%, 11/1/27 | 678,196 | ||
| 636,000 | NOVA Chemicals Corp. (Canada), 144a, 4.250%, 5/15/29 | 493,624 | ||
| 596,000 | Tronox, Inc., 144a, 4.625%, 3/15/29 | 441,040 | ||
| 5,039,765 | ||||
| Information Technology — 3.0% | ||||
| 482,000 | Booz Allen Hamilton, Inc., 144a, 4.000%, 7/1/29 | 412,154 | ||
| 587,000 | Clarivate Science Holdings Corp., 144a, 4.875%, 7/1/29 | 459,621 | ||
| 555,000 | Consensus Cloud Solutions, Inc., 144a, 6.000%, 10/15/26 | 489,063 | ||
| 145,000 | NCR Corp., 144a, 5.125%, 4/15/29 | 108,753 | ||
| 299,000 | NCR Corp., 144a, 5.750%, 9/1/27 | 270,888 | ||
| 448,000 | Open Text Corp. (Canada), 144a, 3.875%, 12/1/29 | 345,063 | ||
| 560,000 | Open Text Corp. (Canada), 144a, 3.875%, 2/15/28 | 463,131 | ||
| 291,000 | SS&C Technologies, Inc., 144a, 5.500%, 9/30/27 | 265,448 | ||
| 361,000 | Ziff Davis, Inc., 144a, 4.625%, 10/15/30 | 295,013 | ||
| 3,109,134 | ||||
| Real Estate — 3.0% | ||||
| 450,000 | CTR Partnership LP / CareTrust Capital Corp. REIT, 144a, 3.875%, 6/30/28 | 370,223 | ||
| 535,000 | Diversified Healthcare Trust REIT, 4.750%, 2/15/28 | 337,050 | ||
| 325,000 | Howard Hughes Corp. (The), 144a, 4.375%, 2/1/31 | 233,449 | ||
| 132,000 | Iron Mountain, Inc. REIT, 144a, 4.500%, 2/15/31 | 102,060 | ||
| 674,000 | Iron Mountain, Inc. REIT, 144a, 4.875%, 9/15/29 | 553,684 | ||
| 112,000 | Iron Mountain, Inc. REIT, 144a, 5.250%, 3/15/28 | 98,239 | ||
| 660,000 | Iron Mountain, Inc. REIT, 144a, 5.250%, 7/15/30 | 546,130 | ||
| 515,000 | RHP Hotel Properties LP / RHP Finance Corp. REIT, 144a, 4.500%, 2/15/29 | 427,107 | ||
| 420,000 | Service Properties Trust REIT, 4.650%, 3/15/24 | 388,500 | ||
| 3,056,442 | ||||
| Principal Amount | Market Value | |||
| Utilities — 1.9% | ||||
| $ 331,000 | Calpine Corp., 144a, 5.125%, 3/15/28 | $ 284,388 | ||
| 814,000 | Edison International, Ser B, 5.000%(A) | 643,060 | ||
| 592,000 | NRG Energy, Inc., 5.750%, 1/15/28 | 547,432 | ||
| 561,000 | Vistra Operations Co. LLC, 144a, 4.375%, 5/1/29 | 467,032 | ||
| 1,941,912 | ||||
| Total Corporate Bonds | $97,289,636 | |||
| Shares | ||||
| Common Stocks — 2.1% | ||||
| Energy — 2.1% | ||||
| 39,372 | Unit Corp.* | 2,097,347 | ||
| Short-Term Investment Funds — 3.0% | ||||
| 2,254,561 | Dreyfus Government Cash Management, Institutional Shares, 2.75%∞Ω | 2,254,561 | ||
| 881,725 | Invesco Government & Agency Portfolio, Institutional Class, 2.88%∞Ω** | 881,725 | ||
| Total Short-Term Investment Funds | $3,136,286 | |||
| Total Investment Securities—99.9% (Cost $120,990,945) | $102,523,269 | |||
| Other Assets in Excess of Liabilities — 0.1% | 70,964 | |||
| Net Assets — 100.0% | $102,594,233 | |||
| (A) | Perpetual Bond - A bond or preferred stock with no definite maturity date. |
| * | Non-income producing security. |
| ** | Represents collateral for securities loaned. |
| † | All or a portion of the security is on loan. The total market value of the securities on loan as of September 30, 2022 was $849,473. |
| ∞ | Open-End Fund. |
| Ω | Represents the 7-Day SEC yield as of September 30, 2022. |
| Portfolio Abbreviations: |
| DAC – Designated Activity Company |
| LLC – Limited Liability Company |
| LP – Limited Partnership |
| PLC – Public Limited Company |
| REIT – Real Estate Investment Trust |
| 144a - This is a restricted security that was sold in a transaction qualifying for the exemption under Rule 144a of the Securities Act of 1933. This security may be sold in transactions exempt from registration, normally to qualified institutional buyers. At September 30, 2022, these securities were valued at $76,954,943 or 75.0% of net assets. These securities were deemed liquid pursuant to procedures approved by the Board of Trustees. |
| Valuation Inputs at Reporting Date: | ||||
| Description | Level 1 | Level 2 | Level 3 | Total |
| Corporate Bonds | $— | $97,289,636 | $— | $97,289,636 |
| Common Stocks | 2,097,347 | — | — | 2,097,347 |
| Short-Term Investment Funds | 3,136,286 | — | — | 3,136,286 |
| Total | $5,233,633 | $97,289,636 | $— | $102,523,269 |
| Principal Amount | Market Value | |||
| Corporate Bonds — 29.5% | ||||
| Financials — 9.8% | ||||
| $ 2,444,000 | Aflac, Inc., 3.250%, 3/17/25 | $ 2,441,035 | ||
| 3,000,000 | American Express Co., 4.050%, 5/3/29 | 2,752,640 | ||
| 1,374,947 | Fishers Lane Associates LLC, 144a, 3.666%, 8/5/30 | 1,330,577 | ||
| 710,000 | Fishers Lane Associates LLC, 144a, 5.477%, 8/5/40 | 712,481 | ||
| 2,599,000 | Globe Life, Inc., 4.550%, 9/15/28 | 2,445,892 | ||
| 2,400,000 | KeyBank NA, 4.150%, 8/8/25 | 2,326,657 | ||
| 2,000,000 | MassMutual Global Funding II, 144a, 0.850%, 6/9/23 | 1,948,692 | ||
| 1,500,000 | Metropolitan Life Global Funding I, 144a, 3.050%, 6/17/29 | 1,313,745 | ||
| 2,000,000 | Metropolitan Life Global Funding I, 144a, 4.300%, 8/25/29 | 1,863,475 | ||
| 2,386,000 | National Rural Utilities Cooperative Finance Corp., 3.400%, 11/15/23 | 2,352,328 | ||
| 1,500,000 | Nationwide Mutual Insurance Co., 144a, 4.350%, 4/30/50 | 1,116,067 | ||
| 1,334,000 | Nationwide Mutual Insurance Co., 144a, 9.375%, 8/15/39 | 1,693,910 | ||
| 1,300,000 | New York Life Global Funding, 144a, 1.450%, 1/14/25 | 1,202,611 | ||
| 1,000,000 | Northwestern Mutual Global Funding, 144a, 0.600%, 3/25/24 | 940,530 | ||
| 2,350,000 | Northwestern Mutual Life Insurance Co. (The), 144a, 3.625%, 9/30/59 | 1,583,826 | ||
| 3,500,000 | Pacific Life Global Funding II, 144a, 1.375%, 4/14/26 | 3,067,809 | ||
| 3,500,000 | PNC Bank NA, 2.700%, 10/22/29 | 2,875,868 | ||
| 1,500,000 | Progressive Corp. (The), 4.200%, 3/15/48 | 1,251,997 | ||
| 3,500,000 | Protective Life Global Funding, 144a, 1.170%, 7/15/25 | 3,128,174 | ||
| 2,610,000 | Reliance Standard Life Global Funding II, 144a, 2.750%, 1/21/27 | 2,344,563 | ||
| 1,550,000 | SBA Tower Trust REIT, 144a, 1.884%, 1/15/26 | 1,363,146 | ||
| 1,500,000 | SBA Tower Trust REIT, 144a, 2.836%, 1/15/25 | 1,403,715 | ||
| 2,802,000 | Teachers Insurance & Annuity Association of America, 144a, 4.900%, 9/15/44 | 2,455,742 | ||
| 1,100,000 | Unum Group, 7.190%, 2/1/28 | 1,144,553 | ||
| 844,000 | Unum Group, 7.250%, 3/15/28 | 860,424 | ||
| 2,000,000 | USB Capital IX, (3M LIBOR +1.020%), 3.532%(A)(B) | 1,518,100 | ||
| 47,438,557 | ||||
| Utilities — 7.0% | ||||
| 3,000,000 | American Water Capital Corp., 2.950%, 9/1/27 | 2,724,177 | ||
| 2,250,000 | Avista Corp., 4.350%, 6/1/48 | 1,896,454 | ||
| 1,623,000 | California Water Service Co., 5.500%, 12/1/40 | 1,596,733 | ||
| 3,270,000 | Cleco Securitization I LLC, Ser A-2, 4.646%, 9/1/42 | 3,082,073 | ||
| 2,008,000 | Commonwealth Edison Co., 5.900%, 3/15/36 | 2,057,729 | ||
| 2,163,000 | Dominion Energy South Carolina, Inc., 4.600%, 6/15/43 | 1,872,290 | ||
| 1,750,000 | Duke Energy Florida Project Finance LLC, Ser 2032, 2.858%, 3/1/33 | 1,465,268 | ||
| 2,328,000 | Duke Energy Progress LLC, 6.300%, 4/1/38 | 2,453,378 | ||
| 2,532,000 | Entergy Louisiana LLC, 4.440%, 1/15/26 | 2,456,795 | ||
| 3,000,000 | Essential Utilities, Inc., 4.276%, 5/1/49 | 2,330,881 | ||
| 1,642,000 | Georgia Power Co., 4.750%, 9/1/40 | 1,380,576 | ||
| 2,085,000 | Kentucky Utilities Co., 5.125%, 11/1/40 | 1,920,147 | ||
| 2,000,000 | NextEra Energy Capital Holdings, Inc., (3M LIBOR +2.067%), 5.810%, 10/1/66(B) | 1,658,448 | ||
| 2,080,000 | PG&E Wildfire Recovery Funding LLC, Ser A-5, 5.099%, 6/1/52 | 1,979,420 | ||
| 2,750,000 | SCE Recovery Funding LLC, Ser A-2, 2.943%, 11/15/42 | 2,128,913 | ||
| 1,020,000 | Sierra Pacific Power Co., 2.600%, 5/1/26 | 942,074 | ||
| 2,024,023 | Southaven Combined Cycle Generation LLC, 3.846%, 8/15/33 | 1,844,421 | ||
| 33,789,777 | ||||
| Principal Amount | Market Value | |||
| Industrials — 5.2% | ||||
| $ 6,665 | Burlington Northern and Santa Fe Railway Co. 2005-3 Pass Through Trust, 4.830%, 1/15/23 | $ 6,651 | ||
| 161,997 | Burlington Northern and Santa Fe Railway Co. 2005-4 Pass Through Trust, 4.967%, 4/1/23 | 160,897 | ||
| 2,355,000 | Burlington Northern Santa Fe LLC, 6.700%, 8/1/28 | 2,531,817 | ||
| 1,000,000 | CSX Corp., 6.150%, 5/1/37 | 1,031,606 | ||
| 1,347,391 | CSX Transportation, Inc., 6.251%, 1/15/23 | 1,353,167 | ||
| 2,174,588 | FedEx Corp. 2020-1 Class AA Pass Through Trust, 1.875%, 2/20/34 | 1,788,134 | ||
| 1,075,000 | GATX Corp., 1.900%, 6/1/31 | 775,877 | ||
| 2,823,000 | GATX Corp., 3.250%, 3/30/25 | 2,670,690 | ||
| 1,180,000 | Kansas City Southern, 3.000%, 5/15/23 | 1,166,516 | ||
| 1,625,000 | Kansas City Southern, 3.125%, 6/1/26 | 1,517,089 | ||
| 1,941,000 | Norfolk Southern Corp., 2.903%, 2/15/23 | 1,926,407 | ||
| 2,750,000 | Republic Services, Inc., 2.300%, 3/1/30 | 2,257,144 | ||
| 667,000 | TOTE Maritime Alaska LLC, 6.365%, 4/15/28 | 689,458 | ||
| 2,386,000 | Tote Shipholdings LLC, 3.400%, 10/16/40 | 2,134,751 | ||
| 1,960,000 | Union Pacific Corp., 2.891%, 4/6/36 | 1,489,763 | ||
| 53,822 | Union Pacific Railroad Co. 2003 Pass Through Trust, 4.698%, 1/2/24 | 53,712 | ||
| 559,508 | Union Pacific Railroad Co. 2006 Pass Through Trust, 5.866%, 7/2/30 | 579,344 | ||
| 1,209,696 | Union Pacific Railroad Co. 2014-1 Pass Through Trust, 3.227%, 5/14/26 | 1,151,850 | ||
| 2,100,000 | Waste Management, Inc., 3.900%, 3/1/35 | 1,785,324 | ||
| 25,070,197 | ||||
| Consumer Discretionary — 2.4% | ||||
| 3,733,938 | American Airlines 2016-3 Class AA Pass Through Trust, 3.000%, 10/15/28 | 3,224,987 | ||
| 583,190 | Continental Airlines 2012-2 Class A Pass Through Trust, 4.000%, 10/29/24 | 550,946 | ||
| 3,900,000 | Delta Air Lines 2019-1 Class AA Pass Through Trust, 3.204%, 4/25/24 | 3,769,279 | ||
| 1,785,000 | PulteGroup, Inc., 7.875%, 6/15/32 | 1,843,766 | ||
| 2,570,000 | Smithsonian Institution, 2.645%, 9/1/39 | 1,894,378 | ||
| 597,503 | United Airlines, Inc. Pass-Through Trust, 2.875%, 10/7/28 | 512,213 | ||
| 11,795,569 | ||||
| Real Estate — 1.7% | ||||
| 2,500,000 | American Tower Corp. REIT, 3.125%, 1/15/27 | 2,246,540 | ||
| 3,225,000 | American Tower Trust #1 REIT, Ser 13, Class 2A, 144a, 3.070%, 3/15/48 | 3,202,983 | ||
| 2,000,000 | Crown Castle International Corp. REIT, 4.300%, 2/15/29 | 1,833,972 | ||
| 805,000 | SBA Tower Trust REIT, 144a, 1.631%, 11/15/26 | 686,440 | ||
| 7,969,935 | ||||
| Health Care — 1.3% | ||||
| 978,906 | CVS Pass Through Trust Series 2013, 144a, 4.704%, 1/10/36 | 891,229 | ||
| 2,237,360 | CVS Pass-Through Trust, 6.036%, 12/10/28 | 2,222,199 | ||
| 3,405,000 | HCA, Inc., 5.250%, 4/15/25 | 3,335,693 | ||
| 6,449,121 | ||||
| Consumer Staples — 0.8% | ||||
| 1,000,000 | Kroger Co. (The), 4.500%, 1/15/29 | 947,812 | ||
| 1,265,000 | Kroger Co. (The), Ser B, 7.700%, 6/1/29 | 1,385,903 | ||
| 1,600,000 | United Rentals North America, Inc., 4.875%, 1/15/28 | 1,466,944 | ||
| 3,800,659 | ||||
| Communication Services — 0.7% | ||||
| 1,500,000 | AT&T, Inc., 4.850%, 7/15/45 | 1,245,525 | ||
| Principal Amount | Market Value | |||
| Corporate Bonds — 29.5% (Continued) | ||||
| Communication Services — (Continued) | ||||
| $ 1,200,000 | Verizon Communications, Inc., 2.100%, 3/22/28 | $ 1,012,982 | ||
| 1,185,000 | Verizon Communications, Inc., 4.862%, 8/21/46 | 1,022,178 | ||
| 3,280,685 | ||||
| Information Technology — 0.3% | ||||
| 1,900,000 | Lam Research Corp., 1.900%, 6/15/30 | 1,504,961 | ||
| Energy — 0.3% | ||||
| 1,405,000 | Texas Eastern Transmission LP, 7.000%, 7/15/32 | 1,479,139 | ||
| Total Corporate Bonds | $142,578,600 | |||
| U.S. Government Agency Obligations — 22.2% | ||||
| 2,125,600 | Canal Barge Co., Inc., 4.500%, 11/12/34 | 2,037,988 | ||
| 539,628 | Export-Import Bank of the United States, 1.581%, 11/16/24 | 522,495 | ||
| 1,442,701 | Helios Leasing I LLC, 1.734%, 7/24/24 | 1,406,885 | ||
| 892,000 | Matson Navigation Co., Inc., 5.337%, 9/4/28 | 895,450 | ||
| 825,000 | Petroleos Mexicanos (Mexico), 2.290%, 2/15/24 | 810,202 | ||
| 1,752,579 | Reliance Industries Ltd. (India), 1.870%, 1/15/26 | 1,663,789 | ||
| 1,273,169 | SBA Small Business Investment Cos, Ser 2017-10A, Class 1, 2.845%, 3/10/27 | 1,204,631 | ||
| 1,913,566 | SBA Small Business Investment Cos, Ser 2017-10B, Class 1, 2.518%, 9/10/27 | 1,771,245 | ||
| 2,608 | Small Business Administration Participation Certificates, Ser 2003-20D, Class 1, 4.760%, 4/1/23 | 2,607 | ||
| 18,933 | Small Business Administration Participation Certificates, Ser 2004-20D, Class 1, 4.770%, 4/1/24 | 18,732 | ||
| 44,981 | Small Business Administration Participation Certificates, Ser 2004-20K, Class 1, 4.880%, 11/1/24 | 44,404 | ||
| 36,185 | Small Business Administration Participation Certificates, Ser 2005-20H, Class 1, 5.110%, 8/1/25 | 35,886 | ||
| 73,435 | Small Business Administration Participation Certificates, Ser 2006-20H, Class 1, 5.700%, 8/1/26 | 73,046 | ||
| 91,188 | Small Business Administration Participation Certificates, Ser 2006-20K, Class 1, 5.360%, 11/1/26 | 89,447 | ||
| 169,419 | Small Business Administration Participation Certificates, Ser 2006-20L, Class 1, 5.120%, 12/1/26 | 165,070 | ||
| 162,674 | Small Business Administration Participation Certificates, Ser 2007-20A, Class 1, 5.320%, 1/1/27 | 159,700 | ||
| 206,325 | Small Business Administration Participation Certificates, Ser 2007-20E, Class 1, 5.310%, 5/1/27 | 203,520 | ||
| 423,377 | Small Business Administration Participation Certificates, Ser 2007-20F, Class 1, 5.710%, 6/1/27 | 419,462 | ||
| 425,846 | Small Business Administration Participation Certificates, Ser 2007-20L, Class 1, 5.290%, 12/1/27 | 423,513 | ||
| 149,007 | Small Business Administration Participation Certificates, Ser 2008-20A, Class 1, 5.170%, 1/1/28 | 146,852 | ||
| 208,510 | Small Business Administration Participation Certificates, Ser 2008-20K, Class 1, 6.770%, 11/1/28 | 209,079 | ||
| 375,205 | Small Business Administration Participation Certificates, Ser 2009-20C, Class 1, 4.660%, 3/1/29 | 369,182 | ||
| 241,810 | Small Business Administration Participation Certificates, Ser 2009-20D, Class 1, 4.310%, 4/1/29 | 237,218 | ||
| 504,831 | Small Business Administration Participation Certificates, Ser 2009-20E, Class 1, 4.430%, 5/1/29 | 489,408 | ||
| 202,451 | Small Business Administration Participation Certificates, Ser 2009-20F, Class 1, 4.950%, 6/1/29 | 197,423 | ||
| Principal Amount | Market Value | |||
| U.S. Government Agency Obligations — 22.2% (Continued) | ||||
| $ 529,288 | Small Business Administration Participation Certificates, Ser 2009-20J, Class 1, 3.920%, 10/1/29 | $ 511,350 | ||
| 851,377 | Small Business Administration Participation Certificates, Ser 2010-20F, Class 1, 3.880%, 6/1/30 | 829,651 | ||
| 1,587,930 | Small Business Administration Participation Certificates, Ser 2010-20I, Class 1, 3.210%, 9/1/30 | 1,485,220 | ||
| 3,772,429 | Small Business Administration Participation Certificates, Ser 2013-20C, Class 1, 2.220%, 3/1/33 | 3,393,496 | ||
| 3,047,645 | Small Business Administration Participation Certificates, Ser 2013-20E, Class 1, 2.070%, 5/1/33 | 2,747,716 | ||
| 1,577,077 | Small Business Administration Participation Certificates, Ser 2013-20G, Class 1, 3.150%, 7/1/33 | 1,484,557 | ||
| 2,130,869 | Small Business Administration Participation Certificates, Ser 2014-20H, Class 1, 2.880%, 8/1/34 | 1,967,129 | ||
| 3,078,010 | Small Business Administration Participation Certificates, Ser 2014-20I, Class 1, 2.920%, 9/1/34 | 2,879,240 | ||
| 2,655,122 | Small Business Administration Participation Certificates, Ser 2014-20K, Class 1, 2.800%, 11/1/34 | 2,451,835 | ||
| 1,553,048 | Small Business Administration Participation Certificates, Ser 2015-20I, Class 1, 2.820%, 9/1/35 | 1,423,862 | ||
| 2,020,629 | Small Business Administration Participation Certificates, Ser 2016-20A, Class 1, 2.780%, 1/1/36 | 1,872,117 | ||
| 2,788,553 | Small Business Administration Participation Certificates, Ser 2016-20B, Class 1, 2.270%, 2/1/36 | 2,523,208 | ||
| 3,459,938 | Small Business Administration Participation Certificates, Ser 2016-20F, Class 1, 2.180%, 6/1/36 | 3,104,572 | ||
| 3,794,700 | Small Business Administration Participation Certificates, Ser 2017-20E, Class 1, 2.880%, 5/1/37 | 3,502,253 | ||
| 3,062,724 | Small Business Administration Participation Certificates, Ser 2017-20F, Class 1, 2.810%, 6/1/37 | 2,807,273 | ||
| 4,127,676 | Small Business Administration Participation Certificates, Ser 2017-20K, Class 1, 2.790%, 11/1/37 | 3,777,041 | ||
| 2,012,751 | Small Business Administration Participation Certificates, Ser 2017-20L, Class 1, 2.780%, 12/1/37 | 1,844,896 | ||
| 4,721,676 | Small Business Administration Participation Certificates, Ser 2018-20A, Class 1, 2.920%, 1/1/38 | 4,340,370 | ||
| 4,419,850 | Small Business Administration Participation Certificates, Ser 2018-20C, Class 1, 3.200%, 3/1/38 | 4,160,843 | ||
| 3,631,827 | Small Business Administration Participation Certificates, Ser 2018-20K, Class 1, 3.870%, 11/1/38 | 3,484,818 | ||
| 1,882,760 | Small Business Administration Participation Certificates, Ser 2018-25D, Class 1, 3.890%, 10/1/43 | 1,804,334 | ||
| 2,061,123 | Small Business Administration Participation Certificates, Ser 2019-25B, Class 1, 3.450%, 2/1/44 | 1,912,751 | ||
| 2,545,961 | Small Business Administration Participation Certificates, Ser 2019-25E, Class 1, 3.070%, 5/1/44 | 2,360,484 | ||
| 3,812,499 | Small Business Administration Participation Certificates, Ser 2020-25I, Class 1, 1.150%, 9/1/45 | 3,091,839 | ||
| 3,437,962 | Small Business Administration Participation Certificates, Ser 2022-25C, Class 1, 2.750%, 3/1/47 | 3,060,839 | ||
| 2,250,000 | Small Business Administration Participation Certificates, Ser 2022-25D, Class 1, 3.500%, 4/1/47 | 2,091,894 | ||
| 3,000,000 | Small Business Administration Participation Certificates, Ser 2022-25G, Class 1, 3.930%, 7/1/47 | 2,863,270 | ||
| 3,000,000 | Small Business Administration Participation Certificates, Ser 2022-25H, Class 1, 3.800%, 8/1/47 | 2,826,766 | ||
| 9,640,000 | Small Business Administration Participation Certificates, Ser 2022-25I, Class 1, 4.260%, 9/1/47 | 9,392,760 | ||
| Principal Amount | Market Value | |||
| U.S. Government Agency Obligations — 22.2% (Continued) | ||||
| $ 2,482,000 | Tennessee Valley Auth., 4.650%, 6/15/35 | $ 2,489,957 | ||
| 2,312,359 | United States International Development Finance Corp., 1.870%, 11/20/37 | 1,870,043 | ||
| 5,308,519 | United States of America Executive Branch, Ser 2021-25L, Class 1, 1.850%, 12/1/46 | 4,418,789 | ||
| 1,931,211 | United States Small Business Administration, Ser 2019-20A, Class 1, 3.370%, 1/1/39 | 1,813,501 | ||
| 3,124,000 | Vessel Management Services, Inc., 5.125%, 4/16/35 | 3,091,382 | ||
| Total U.S. Government Agency Obligations | $107,277,290 | |||
| Agency Collateralized Mortgage Obligations — 13.3% | ||||
| 2,324,142 | Fannie Mae-Aces, Ser 2017-M15, Class ATS2, 3.209%, 11/25/27(B)(C) | 2,189,548 | ||
| 3,325,000 | FHLMC Multifamily Structured Pass Through Certificates, Ser K-1511, Class A3, 3.542%, 3/25/34 | 2,977,499 | ||
| 3,760,000 | FHLMC Multifamily Structured Pass Through Certificates, Ser KG02, Class A2, 2.412%, 8/25/29 | 3,292,094 | ||
| 2,959,235 | FHLMC Multifamily Structured Pass Through Certificates, Ser KG03, Class A1, 0.704%, 4/25/29(B)(C) | 2,558,451 | ||
| 2,727,000 | FHLMC Multifamily Structured Pass Through Certificates, Ser KSG1, Class A2, 1.503%, 9/25/30 | 2,189,189 | ||
| 1,650,000 | FHLMC Multifamily Structured Pass Through Certificates, Ser KSG2, Class A2, 2.091%, 11/25/31(B)(C) | 1,352,593 | ||
| 2,384,740 | FHLMC Multifamily Structured Pass Through Certificates, Ser KW03, Class A1, 2.617%, 12/25/26 | 2,316,355 | ||
| 3,060,000 | FHLMC Multifamily Structured Pass-Through Certificates, Ser K-1513, Class A3, 2.797%, 8/25/34 | 2,544,536 | ||
| 2,600,000 | FREMF Mortgage Trust, Ser 2013-K30, Class B, 144a, 3.670%, 6/25/45(B)(C) | 2,572,399 | ||
| 1,650,000 | FREMF Mortgage Trust, Ser 2014-K38, Class B, 144a, 4.375%, 6/25/47(B)(C) | 1,620,020 | ||
| 1,765,000 | FREMF Mortgage Trust, Ser 2014-K40, Class B, 144a, 4.210%, 11/25/47(B)(C) | 1,717,851 | ||
| 2,000,000 | FREMF Mortgage Trust, Ser 2014-K41, Class B, 144a, 3.964%, 11/25/47(B)(C) | 1,937,834 | ||
| 2,180,000 | FREMF Mortgage Trust, Ser 2015-K49, Class B, 144a, 3.852%, 10/25/48(B)(C) | 2,072,652 | ||
| 2,200,000 | FREMF Mortgage Trust, Ser 2017-K61, Class B, 144a, 3.818%, 12/25/49(B)(C) | 2,033,796 | ||
| 750,000 | FREMF Mortgage Trust, Ser 2018-K74, Class B, 144a, 4.228%, 2/25/51(B)(C) | 695,591 | ||
| 783,458 | FRESB Mortgage Trust, Ser 2015-SB9, Class A5, (1M LIBOR +0.700%), 3.253%, 11/25/35(B) | 781,431 | ||
| 212,473 | FRESB Mortgage Trust, Ser 2016-SB17, Class A5H, (1M LIBOR +0.700%), 3.253%, 5/25/36(B) | 211,817 | ||
| 838,463 | FRESB Mortgage Trust, Ser 2017-SB27, Class A10F, 3.090%, 1/25/27(B)(C) | 791,404 | ||
| 1,580,657 | FRESB Mortgage Trust, Ser 2018-SB46, Class A10F, 3.300%, 12/25/27(B)(C) | 1,477,884 | ||
| 2,321,544 | FRESB Mortgage Trust, Ser 2018-SB54, Class A10F, 3.520%, 5/25/28 | 2,205,566 | ||
| 2,885,908 | FRESB Mortgage Trust, Ser 2018-SB55, Class A10F, 3.770%, 9/25/28 | 2,741,052 | ||
| 2,069,492 | GNMA, Pool #785631, 4.660%, 5/20/67(B)(C) | 2,060,114 | ||
| 181,994 | GNMA, Ser 2011-142, Class B, 3.373%, 2/16/44(B)(C) | 181,222 | ||
| 955,316 | GNMA, Ser 2012-46, Class C, 3.176%, 5/16/50(B)(C) | 930,709 | ||
| 23,060 | GNMA, Ser 2012-53, Class AC, 2.381%, 12/16/43 | 22,965 | ||
| 989,279 | GNMA, Ser 2013-121, Class AB, 2.875%, 8/16/44(B)(C) | 934,791 | ||
| 293,753 | GNMA, Ser 2013-40, Class AC, 1.584%, 1/16/46 | 281,653 | ||
| 20,373 | GNMA, Ser 2013-59, Class A, 1.750%, 7/16/45 | 19,388 | ||
| 2,540,000 | GNMA, Ser 2015-32, Class HG, 3.000%, 9/16/49(B)(C) | 2,136,641 | ||
| 741,045 | GNMA, Ser 2015-37, Class AD, 2.600%, 11/16/55 | 694,595 | ||
| Principal Amount | Market Value | |||
| Agency Collateralized Mortgage Obligations — 13.3% (Continued) | ||||
| $ 1,678,035 | GNMA, Ser 2015-73, Class B, 2.700%, 10/16/55(B)(C) | $ 1,550,002 | ||
| 1,008,141 | GNMA, Ser 2017-46, Class AB, 2.600%, 1/16/52 | 892,336 | ||
| 1,057,784 | GNMA, Ser 2017-H11, Class FV, (1M LIBOR +0.500%), 2.857%, 5/20/67(B) | 1,046,672 | ||
| 1,200,811 | GNMA, Ser 2019-H15, Class GA, 2.250%, 8/20/69 | 1,140,065 | ||
| 3,883,022 | GNMA, Ser 2020-113, Class AF, 2.000%, 10/1/62 | 3,012,111 | ||
| 4,977,748 | GNMA, Ser 2020-118, Class AB, 2.250%, 4/16/62 | 4,303,959 | ||
| 2,336,655 | GNMA, Ser 2021-21, Class AF, 1.750%, 6/16/63 | 1,737,508 | ||
| 3,778,752 | GNMA, Ser 2021-22, Class AD, 1.350%, 10/16/62 | 3,096,593 | ||
| Total Agency Collateralized Mortgage Obligations | $64,320,886 | |||
| Municipal Bonds — 8.9% | ||||
| California — 3.7% | ||||
| 1,000,000 | California Health Facilities Financing Authority, 2.704%, 6/1/30 | 849,326 | ||
| 2,000,000 | California Health Facilities Financing Authority, 2.229%, 6/1/32 | 1,549,546 | ||
| 875,000 | California Health Facilities Financing Authority, 4.140%, 6/1/34 | 781,872 | ||
| 1,585,000 | California Municipal Finance Authority, Revenue, 2.519%, 10/1/35 | 1,107,527 | ||
| 1,465,000 | City of San Francisco Public Utilities Commission Water Revenue, Build America Bonds, 6.950%, 11/1/50 | 1,804,825 | ||
| 2,345,000 | East Bay Municipal Utility District Water System Revenue, Build America Bonds Sub, 5.874%, 6/1/40 | 2,569,765 | ||
| 2,010,000 | Los Angeles Department of Water & Power Water System Revenue, Revenue, Build America Bonds, 6.008%, 7/1/39 | 2,143,026 | ||
| 3,500,000 | Los Angeles Unified School District, Build America Bonds Ser RY, UTGO, 6.758%, 7/1/34 | 3,861,115 | ||
| 2,500,000 | State of California, Build America Bonds, UTGO, 7.300%, 10/1/39 | 2,992,248 | ||
| 17,659,250 | ||||
| Texas — 1.1% | ||||
| 1,770,000 | Dallas Area Rapid Transit, Revenue, Build America Bonds, 5.999%, 12/1/44 | 1,942,976 | ||
| 2,640,000 | Texas State Transportation Commission Highway Authority, Build America Bonds, 5.178%, 4/1/30 | 2,672,914 | ||
| 1,281,000 | Travis County Housing Finance Corp, Revenue, 2.550%, 7/1/42 | 887,297 | ||
| 5,503,187 | ||||
| Virginia — 0.7% | ||||
| 1,131,963 | Virginia Housing Development Authority, 2.950%, 10/25/49 | 999,589 | ||
| 2,734,089 | Virginia Housing Development Authority, 2.125%, 7/25/51 | 2,272,649 | ||
| 3,272,238 | ||||
| Minnesota — 0.6% | ||||
| 3,652,754 | Minnesota Housing Finance Agency, Revenue, 1.580%, 2/1/51 | 3,056,204 | ||
| Indiana — 0.6% | ||||
| 2,750,000 | Indianapolis Local Public Improvement Bond Bank, Build America Bonds, 6.116%, 1/15/40 | 2,951,360 | ||
| Oklahoma — 0.6% | ||||
| 3,000,000 | Oklahoma Development Finance Auth., Revenue, 5.087%, 2/1/52 | 2,849,639 | ||
| Principal Amount | Market Value | |||
| Municipal Bonds — 8.9% (Continued) | ||||
| New York — 0.5% | ||||
| $ 1,135,000 | Port Authority of New York & New Jersey, 4.960%, 8/1/46 | $ 1,087,618 | ||
| 1,400,000 | Port Authority of New York and New Jersey, Cons One Hundred Sixty-Eight, 4.926%, 10/1/51 | 1,340,661 | ||
| 2,428,279 | ||||
| Nevada — 0.4% | ||||
| 2,053,493 | Nevada Housing Division, Revenue, 1.900%, 11/1/44 | 1,873,625 | ||
| Washington — 0.3% | ||||
| 1,600,000 | State of Washington, Build America Bonds, UTGO, 5.481%, 8/1/39 | 1,635,515 | ||
| Ohio — 0.2% | ||||
| 825,000 | Ohio State HFA, Revenue, 2.650%, 11/1/41 | 783,376 | ||
| Louisiana — 0.2% | ||||
| 741,360 | Louisiana Housing Corp., 2.875%, 11/1/38 | 699,507 | ||
| Total Municipal Bonds | $42,712,180 | |||
| U.S. Government Mortgage-Backed Obligations — 8.8% | ||||
| 1,322,292 | FHLMC, Pool #SD8186, 3.500%, 11/1/51 | 1,193,812 | ||
| 771,331 | FHLMC, Pool #W30008, 7.645%, 5/1/25 | 785,981 | ||
| 560,598 | FNMA, Pool #888829, 5.888%, 6/1/37(B)(C) | 557,468 | ||
| 531,650 | FNMA, Pool #AH8854, 4.500%, 4/1/41 | 519,604 | ||
| 4,000,000 | FNMA, Pool #AM9682, 3.810%, 8/1/45 | 3,438,420 | ||
| 2,871,355 | FNMA, Pool #AN0897, 3.440%, 2/1/32 | 2,659,335 | ||
| 3,000,000 | FNMA, Pool #AN8089, 3.330%, 1/1/38 | 2,442,078 | ||
| 1,485,080 | FNMA, Pool #AS8650, 3.000%, 1/1/47 | 1,314,652 | ||
| 197,756 | FNMA, Pool #AT0924, 2.000%, 3/1/28 | 180,372 | ||
| 533,313 | FNMA, Pool #BC0153, 4.000%, 1/1/46 | 504,041 | ||
| 3,860,363 | FNMA, Pool #BL3622, 2.600%, 8/1/26 | 3,711,556 | ||
| 3,488,729 | FNMA, Pool #BS5630, 3.790%, 11/1/32 | 3,279,134 | ||
| 3,381,916 | FNMA, Pool #CB0455, 2.500%, 5/1/51 | 2,859,181 | ||
| 1,645,471 | FNMA, Pool #FM3442, 3.000%, 6/1/50 | 1,445,248 | ||
| 8,096,275 | FNMA, Pool #FS1887, 3.000%, 5/1/47 | 7,082,607 | ||
| 4,321,336 | FNMA, Pool #MA4269, 2.500%, 2/1/41 | 3,670,574 | ||
| 1,586,717 | FNMA, Pool #MA4416, 3.500%, 9/1/51 | 1,432,359 | ||
| 5,290,600 | FNMA, Pool #MA4709, 5.000%, 7/1/52 | 5,165,934 | ||
| Total U.S. Government Mortgage-Backed Obligations | $42,242,356 | |||
| U.S. Treasury Obligations — 7.2% | ||||
| 7,870,000 | U.S. Treasury Bond, 1.375%, 11/15/40 | 5,088,447 | ||
| 4,850,000 | U.S. Treasury Bond, 1.875%, 2/15/51 | 3,211,231 | ||
| 9,227,000 | U.S. Treasury Bond, 2.875%, 5/15/52 | 7,739,146 | ||
| 12,500,000 | U.S. Treasury Note, 2.875%, 6/15/25 | 12,058,594 | ||
| 10,429,000 | U.S. Treasury Strip, Principal, 5/15/43(D) | 4,449,482 | ||
| 5,379,000 | U.S. Treasury Strip, Principal, 5/15/45(D) | 2,131,535 | ||
| Total U.S. Treasury Obligations | $34,678,435 | |||
| Asset-Backed Securities — 4.4% | ||||
| 898,063 | 321 Henderson Receivables I LLC, Ser 2012-1A, Class A, 144a, 4.210%, 2/16/65 | 833,250 | ||
| 1,101,490 | 321 Henderson Receivables I LLC, Ser 2012-2A, Class A, 144a, 3.840%, 10/15/59 | 999,494 | ||
| 1,591,504 | 321 Henderson Receivables I LLC, Ser 2015-2A, Class A, 144a, 3.870%, 3/15/58 | 1,417,069 | ||
| 2,355,322 | CF Hippolyta Issuer LLC, Ser 2021-1A, Class A1, 144a, 1.530%, 3/15/61 | 2,026,658 | ||
| 2,487,854 | JG Wentworth XLII LLC, Ser 2018-2A, Class A, 144a, 3.960%, 10/15/75 | 2,191,888 | ||
| 453,217 | JGWPT XXXIV LLC, Ser 2015-1A, Class A, 144a, 3.260%, 9/15/72 | 386,576 | ||
| Principal Amount | Market Value | |||
| Asset-Backed Securities — 4.4% (Continued) | ||||
| $ 4,445,000 | Louisiana Local Government Environmental Fac. & Community Development Auth, Ser 2022-ELL, Class A2, 4.145%, 2/1/33 | $ 4,218,755 | ||
| 1,000,000 | Oklahoma Development Finance Authority, Ser 2022-ONG, Class A1, 3.877%, 5/1/37 | 955,977 | ||
| 3,993,090 | Small Business Administration Participation Certificates, Ser 2021-10B, Class 1, 1.304%, 9/10/31 | 3,444,979 | ||
| 4,500,254 | Small Business Administration Participation Certificates, Ser 2021-25I, Class 1, 1.560%, 9/1/46 | 3,754,516 | ||
| 765,321 | Tesla Auto Lease Trust, Ser 2021-A, Class A2, 144a, 0.360%, 3/20/25 | 755,150 | ||
| 290,000 | Tesla Auto Lease Trust, Ser 2021-B, Class A4, 144a, 0.630%, 9/22/25 | 269,829 | ||
| Total Asset-Backed Securities | $21,254,141 | |||
| Commercial Mortgage-Backed Securities — 3.5% | ||||
| 20,887 | CD Mortgage Trust, Ser 2006-CD3, Class AJ, 5.688%, 10/15/48 | 18,261 | ||
| 2,979,161 | Citigroup Commercial Mortgage Trust, Ser 2020-555, Class A, 144a, 2.647%, 12/10/41 | 2,446,813 | ||
| 2,300,000 | COMM Mortgage Trust, Ser 2020-SBX, Class A, 144a, 1.670%, 1/10/38 | 2,016,835 | ||
| 2,440,000 | DOLP Trust, Ser 2021-NYC, Class A, 144a, 2.956%, 5/10/41 | 1,957,656 | ||
| 2,000,000 | FREMF Mortgage Trust, Ser 2015-K45, Class B, 144a, 3.734%, 4/25/48 | 1,919,965 | ||
| 2,500,000 | FREMF Mortgage Trust, Ser 2015-K50, Class B, 144a, 3.909%, 10/25/48 | 2,380,676 | ||
| 245,000 | FREMF Mortgage Trust, Ser 2015-K51, Class B, 144a, 4.087%, 10/25/48 | 234,818 | ||
| 2,623,031 | Logistics 1 MI TN VA Senior Notes CTL Pass-Through Trust, 144a, 2.654%, 10/10/42 | 2,055,671 | ||
| 2,550,000 | MKT Mortgage Trust, Ser 2020-525M, Class A, 144a, 2.694%, 2/12/40 | 2,040,442 | ||
| 2,125,000 | SLG Office Trust, Ser 2021-OVA, Class A, 144a, 2.585%, 7/15/41 | 1,702,565 | ||
| Total Commercial Mortgage-Backed Securities | $16,773,702 | |||
| Non-Agency Collateralized Mortgage Obligations — 0.1% | ||||
| 478,469 | Virginia Housing Development Authority, Ser 2013-B, Class A, 2.750%, 4/25/42 | 453,198 | ||
| Shares | ||||
| Short-Term Investment Fund — 1.2% | ||||
| 5,796,451 | Dreyfus Government Cash Management, Institutional Shares, 2.75%∞Ω | 5,796,450 | ||
| Total Investment Securities—99.1% (Cost $543,304,092) | $478,087,238 | |||
| Other Assets in Excess of Liabilities — 0.9% | 4,465,510 | |||
| Net Assets — 100.0% | $482,552,748 | |||
| (A) | Perpetual Bond - A bond or preferred stock with no definite maturity date. |
| (B) | Variable rate security - Rate reflected is the rate in effect as of September 30, 2022. |
| (C) | Certain variable rate securities are not based on a published reference rate and spread but are determined by the issuer or agent and are based on current market conditions. These securities do not indicate a reference rate and spread in their description. |
| (D) | Strip Security- Separate trading of Registered Interest and Principal. Holders of a principal strip security are entitled to the portion of the payment representing principal only. |
| ∞ | Open-End Fund. |
| Ω | Represents the 7-Day SEC yield as of September 30, 2022. |
| Portfolio Abbreviations: |
| FHLMC – Federal Home Loan Mortgage Corporation |
| FNMA – Federal National Mortgage Association |
| FREMF – Freddie Mac Multifamily Securitization |
| FRESB – Freddie Mac Multifamily Securitization Small Balance Loan |
| GNMA – Government National Mortgage Association |
| HFA – Housing Finance Authority/Agency |
| LIBOR – London Interbank Offered Rate |
| LLC – Limited Liability Company |
| LP – Limited Partnership |
| REIT – Real Estate Investment Trust |
| UTGO – Unlimited Tax General Obligation |
| 144a - This is a restricted security that was sold in a transaction qualifying for the exemption under Rule 144a of the Securities Act of 1933. This security may be sold in transactions exempt from registration, normally to qualified institutional buyers. At September 30, 2022, these securities were valued at $70,535,213 or 14.6% of net assets. These securities were deemed liquid pursuant to procedures approved by the Board of Trustees. |
| Valuation Inputs at Reporting Date: | ||||
| Description | Level 1 | Level 2 | Level 3 | Total |
| Corporate Bonds | $— | $142,578,600 | $— | $142,578,600 |
| U.S. Government Agency Obligations | — | 107,277,290 | — | 107,277,290 |
| Agency Collateralized Mortgage Obligations | — | 64,320,886 | — | 64,320,886 |
| Municipal Bonds | — | 42,712,180 | — | 42,712,180 |
| U.S. Government Mortgage-Backed Obligations | — | 42,242,356 | — | 42,242,356 |
| U.S. Treasury Obligations | — | 34,678,435 | — | 34,678,435 |
| Asset-Backed Securities | — | 21,254,141 | — | 21,254,141 |
| Commercial Mortgage-Backed Securities | — | 16,773,702 | — | 16,773,702 |
| Non-Agency Collateralized Mortgage Obligations | — | 453,198 | — | 453,198 |
| Short-Term Investment Fund | 5,796,450 | — | — | 5,796,450 |
| Total | $5,796,450 | $472,290,788 | $— | $478,087,238 |
| Measurements Using Unobservable Inputs (Level 3) | |
| Assets | Corporate Bonds |
| Beginning balance, September 30, 2021 | $2,330,817 |
| Transfer out of Level 3 | (2,330,817) |
| Change in unrealized appreciation (depreciation) | — |
| Ending balance, September 30, 2022 | $— |
| Net Change in Unrealized Appreciation/Depreciation for Investments in Securities still held at September 30, 2022 | $— |
| Shares | Market Value | |||
| Common Stocks — 96.1% | ||||
| Japan — 18.0% | ||||
| Communication Services — 2.7% | ||||
| 19,000 | Nintendo Co. Ltd. | $ 766,352 | ||
| Consumer Discretionary — 8.4% | ||||
| 12,800 | Denso Corp. | 585,257 | ||
| 100,400 | Panasonic Corp. | 705,013 | ||
| 16,700 | Sony Group Corp. | 1,075,721 | ||
| Industrials — 4.6% | ||||
| 22,500 | Hitachi Ltd. | 957,512 | ||
| 23,400 | Kubota Corp. | 325,187 | ||
| Information Technology — 2.3% | ||||
| 2,600 | Tokyo Electron Ltd. | 640,627 | ||
| Total Japan | 5,055,669 | |||
| France — 14.5% | ||||
| Energy — 5.1% | ||||
| 30,984 | TotalEnergies SE ADR | 1,441,376 | ||
| Industrials — 5.8% | ||||
| 20,440 | Cie de Saint-Gobain | 730,845 | ||
| 7,870 | Schneider Electric SE | 888,922 | ||
| Materials — 3.6% | ||||
| 8,862 | Air Liquide SA | 1,012,919 | ||
| Total France | 4,074,062 | |||
| United Kingdom — 11.0% | ||||
| Financials — 6.3% | ||||
| 2,340,950 | Lloyds Banking Group PLC | 1,058,082 | ||
| 8,483 | London Stock Exchange Group PLC | 716,380 | ||
| Industrials — 4.7% | ||||
| 12,140 | Ashtead Group PLC | 545,205 | ||
| 32,111 | RELX PLC | 784,657 | ||
| Total United Kingdom | 3,104,324 | |||
| Sweden — 8.9% | ||||
| Financials — 6.0% | ||||
| 94,978 | Svenska Handelsbanken AB - Class A | 779,674 | ||
| 68,971 | Swedbank AB - Class A | 905,297 | ||
| Industrials — 2.9% | ||||
| 56,584 | Epiroc AB - Class A | 809,462 | ||
| Total Sweden | 2,494,433 | |||
| South Korea — 7.5% | ||||
| Communication Services — 4.2% | ||||
| 30,719 | KT Corp. ADR | 375,386 | ||
| 31,636 | KT Corp. | 795,250 | ||
| Financials — 2.6% | ||||
| 24,260 | KB Financial Group, Inc. | 732,617 | ||
| Information Technology — 0.7% | ||||
| 536 | Samsung SDI Co. Ltd. | 201,613 | ||
| Total South Korea | 2,104,866 | |||
| Singapore — 6.2% | ||||
| Financials — 3.9% | ||||
| 134,600 | Oversea-Chinese Banking Corp. Ltd. | 1,102,897 | ||
| Real Estate — 2.3% | ||||
| 494,300 | CapitaLand Integrated Commercial Trust REIT | 657,510 | ||
| Total Singapore | 1,760,407 | |||
| Shares | Market Value | |||
| Switzerland — 5.6% | ||||
| Health Care — 3.1% | ||||
| 2,663 | Roche Holding AG | $ 866,894 | ||
| Industrials — 2.5% | ||||
| 28,210 | ABB Ltd. ADR† | 723,868 | ||
| Total Switzerland | 1,590,762 | |||
| India — 4.7% | ||||
| Financials — 4.7% | ||||
| 62,901 | ICICI Bank Ltd. ADR | 1,319,034 | ||
| China — 4.2% | ||||
| Communication Services — 2.2% | ||||
| 18,500 | Tencent Holdings Ltd. | 624,862 | ||
| Consumer Discretionary — 2.0% | ||||
| 6,972 | Alibaba Group Holding Ltd. ADR* | 557,690 | ||
| Total China | 1,182,552 | |||
| Canada — 4.0% | ||||
| Financials — 4.0% | ||||
| 7,935 | Intact Financial Corp. | 1,122,969 | ||
| Taiwan — 3.5% | ||||
| Information Technology — 3.5% | ||||
| 14,517 | Taiwan Semiconductor Manufacturing Co. Ltd. ADR | 995,286 | ||
| Germany — 2.9% | ||||
| Industrials — 2.9% | ||||
| 26,880 | Deutsche Post AG | 810,154 | ||
| Thailand — 2.0% | ||||
| Industrials — 2.0% | ||||
| 289,800 | Airports of Thailand PCL* | 555,083 | ||
| Netherlands — 1.9% | ||||
| Health Care — 1.9% | ||||
| 33,878 | Koninklijke Philips NV | 521,603 | ||
| Denmark — 1.2% | ||||
| Industrials — 1.2% | ||||
| 18,715 | Vestas Wind Systems A/S | 344,597 | ||
| Total Common Stocks | $27,035,801 | |||
| Preferred Stocks — 2.6% | ||||
| Germany — 2.6% | ||||
| Consumer Discretionary — 2.6% | ||||
| 6,043 | Volkswagen AG, 5.796%(A) | 738,406 | ||
| Short-Term Investment Funds — 3.9% | ||||
| 361,606 | Dreyfus Government Cash Management, Institutional Shares, 2.75%∞Ω | 361,606 | ||
| 738,513 | Invesco Government & Agency Portfolio, Institutional Class, 2.88%∞Ω** | 738,513 | ||
| Total Short-Term Investment Funds | $1,100,119 | |||
| Total Investment Securities — 102.6% (Cost $33,628,554) | $28,874,326 | |||
| Liabilities in Excess of Other Assets — (2.6)% | (719,560) | |||
| Net Assets — 100.0% | $28,154,766 | |||
| (A) | Perpetual Bond - A bond or preferred stock with no definite maturity date. |
| * | Non-income producing security. |
| ** | Represents collateral for securities loaned. |
| † | All or a portion of the security is on loan. The total market value of the securities on loan as of September 30, 2022 was $715,914. |
| ∞ | Open-End Fund. |
| Ω | Represents the 7-Day SEC yield as of September 30, 2022. |
| Portfolio Abbreviations: |
| ADR – American Depositary Receipt |
| PCL – Public Company Limited |
| PLC – Public Limited Company |
| REIT – Real Estate Investment Trust |
| Valuation inputs at Reporting Date: | ||||
| Description | Level 1 | Level 2 | Level 3 | Total |
| Common Stocks | ||||
| Japan | $— | $5,055,669 | $— | $5,055,669 |
| France | 1,441,376 | 2,632,686 | — | 4,074,062 |
| United Kingdom | — | 3,104,324 | — | 3,104,324 |
| Sweden | — | 2,494,433 | — | 2,494,433 |
| South Korea | 375,386 | 1,729,480 | — | 2,104,866 |
| Singapore | — | 1,760,407 | — | 1,760,407 |
| Switzerland | 723,868 | 866,894 | — | 1,590,762 |
| India | 1,319,034 | — | — | 1,319,034 |
| China | 557,690 | 624,862 | — | 1,182,552 |
| Canada | 1,122,969 | — | — | 1,122,969 |
| Taiwan | 995,286 | — | — | 995,286 |
| Germany | — | 810,154 | — | 810,154 |
| Thailand | — | 555,083 | — | 555,083 |
| Netherlands | — | 521,603 | — | 521,603 |
| Denmark | — | 344,597 | — | 344,597 |
| Preferred Stocks | — | 738,406 | — | 738,406 |
| Short-Term Investment Funds | 1,100,119 | — | — | 1,100,119 |
| Total | $7,635,728 | $21,238,598 | $— | $28,874,326 |
| Shares | Market Value | |||
| Common Stocks — 98.8% | ||||
| Industrials — 26.2% | ||||
| 3,244,013 | AerCap Holdings N.V. (Ireland)* | $ 137,319,070 | ||
| 2,408,795 | Allison Transmission Holdings, Inc. | 81,320,919 | ||
| 1,694,223 | Armstrong World Industries, Inc. | 134,233,288 | ||
| 1,658,474 | Copart, Inc. * | 176,461,634 | ||
| 654,897 | Lennox International, Inc. | 145,825,915 | ||
| 530,465 | Old Dominion Freight Line, Inc. | 131,963,778 | ||
| 2,114,945 | Otis Worldwide Corp. | 134,933,491 | ||
| 645,439 | UniFirst Corp. | 108,582,203 | ||
| 1,050,640,298 | ||||
| Information Technology — 16.7% | ||||
| 1,498,687 | Amphenol Corp. - Class A | 100,352,082 | ||
| 1,785,831 | Black Knight, Inc.* | 115,596,841 | ||
| 1,127,593 | Citrix Systems, Inc. | 117,269,672 | ||
| 2,289,768 | Entegris, Inc. | 190,096,539 | ||
| 1,699,946 | Skyworks Solutions, Inc. | 144,954,395 | ||
| 668,269,529 | ||||
| Consumer Discretionary — 12.8% | ||||
| 1,499,657 | CarMax, Inc.* | 99,007,355 | ||
| 601,954 | Churchill Downs, Inc. | 110,849,829 | ||
| 1,260,682 | Dollar Tree, Inc.* | 171,578,820 | ||
| 1,934,168 | Hasbro, Inc. | 130,401,607 | ||
| 511,837,611 | ||||
| Financials — 12.1% | ||||
| 198,428 | Alleghany Corp.* | 166,554,510 | ||
| 774,151 | Cincinnati Financial Corp. | 69,340,705 | ||
| 919,635 | M&T Bank Corp. | 162,150,043 | ||
| 2,571,891 | Moelis & Co. - Class A | 86,955,635 | ||
| 485,000,893 | ||||
| Consumer Staples — 12.0% | ||||
| 2,227,047 | BellRing Brands, Inc.* | 45,899,439 | ||
| 1,372,295 | Brown-Forman Corp. - Class B | 91,353,678 | ||
| 2,568,540 | Lamb Weston Holdings, Inc. | 198,753,625 | ||
| 1,756,735 | Post Holdings, Inc.* | 143,894,164 | ||
| 479,900,906 | ||||
| Materials — 10.8% | ||||
| 1,044,593 | AptarGroup, Inc. | 99,267,673 | ||
| 1,534,865 | Ball Corp. | 74,164,677 | ||
| 308,612 | NewMarket Corp. | 92,839,748 | ||
| 1,066,065 | Vulcan Materials Co. | 168,129,111 | ||
| 434,401,209 | ||||
| Shares | Market Value | |||
| Health Care — 5.5% | ||||
| 2,255,178 | Perrigo Co. PLC | $ 80,419,648 | ||
| 849,650 | STERIS PLC | 141,279,802 | ||
| 221,699,450 | ||||
| Real Estate — 2.7% | ||||
| 3,465,290 | STORE Capital Corp. REIT | 108,567,536 | ||
| Total Common Stocks | $3,960,317,432 | |||
| Short-Term Investment Fund — 1.3% | ||||
| 49,226,916 | Dreyfus Government Cash Management, Institutional Shares, 2.75%∞Ω | 49,226,916 | ||
| Total Investment Securities—100.1% (Cost $3,800,697,083) | $4,009,544,348 | |||
| Liabilities in Excess of Other Assets — (0.1%) | (2,252,867) | |||
| Net Assets — 100.0% | $4,007,291,481 | |||
| * | Non-income producing security. |
| ∞ | Open-End Fund. |
| Ω | Represents the 7-Day SEC yield as of September 30, 2022. |
| Portfolio Abbreviations: |
| PLC – Public Limited Company |
| REIT – Real Estate Investment Trust |
| Valuation Inputs at Reporting Date: | ||||
| Description | Level 1 | Level 2 | Level 3 | Total |
| Common Stocks | $3,843,047,760 | $117,269,672 | $— | $3,960,317,432 |
| Short-Term Investment Fund | 49,226,916 | — | — | 49,226,916 |
| Total | $3,892,274,676 | $117,269,672 | $— | $4,009,544,348 |
| Shares | Market Value | |||
| Common Stocks — 99.1% | ||||
| Financials — 18.2% | ||||
| 242,948 | American International Group, Inc. | $ 11,535,171 | ||
| 67,366 | Ameriprise Financial, Inc. | 16,972,864 | ||
| 361,940 | Arch Capital Group Ltd.* | 16,482,748 | ||
| 914,248 | Chimera Investment Corp. REIT | 4,772,375 | ||
| 108,267 | Pinnacle Financial Partners, Inc. | 8,780,454 | ||
| 150,620 | Progressive Corp. (The) | 17,503,550 | ||
| 142,150 | Reinsurance Group of America, Inc. | 17,883,891 | ||
| 87,014 | Signature Bank | 13,139,114 | ||
| 63,265 | The Allstate Corp. | 7,878,390 | ||
| 182,796 | Webster Financial Corp. | 8,262,379 | ||
| 229,765 | Western Alliance Bancorp | 15,104,751 | ||
| 138,315,687 | ||||
| Industrials — 14.8% | ||||
| 180,042 | AerCap Holdings N.V. (Ireland)* | 7,621,178 | ||
| 163,554 | Clean Harbors, Inc. * | 17,987,669 | ||
| 113,429 | Dover Corp. | 13,223,553 | ||
| 178,489 | Hexcel Corp. | 9,231,451 | ||
| 25,964 | Huntington Ingalls Industries, Inc. | 5,751,026 | ||
| 85,109 | Leidos Holdings, Inc. | 7,444,484 | ||
| 33,182 | Parker-Hannifin Corp. | 8,040,330 | ||
| 159,693 | Regal Rexnord Corp. | 22,414,510 | ||
| 53,482 | Snap-on, Inc. | 10,768,601 | ||
| 129,017 | Westinghouse Air Brake Technologies Corp. | 10,495,533 | ||
| 112,978,335 | ||||
| Consumer Staples — 11.1% | ||||
| 47,015 | Casey's General Stores, Inc. | 9,521,478 | ||
| 51,025 | Constellation Brands, Inc. - Class A | 11,719,422 | ||
| 269,272 | Darling Ingredients, Inc.* | 17,812,343 | ||
| 168,765 | Hain Celestial Group, Inc. (The)* | 2,848,753 | ||
| 199,140 | Ingredion, Inc. | 16,034,753 | ||
| 158,741 | Lamb Weston Holdings, Inc. | 12,283,378 | ||
| 346,602 | TreeHouse Foods, Inc.* | 14,702,857 | ||
| 84,922,984 | ||||
| Utilities — 10.2% | ||||
| 532,996 | CenterPoint Energy, Inc. | 15,019,828 | ||
| 104,685 | DTE Energy Co. | 12,044,009 | ||
| 121,243 | Entergy Corp. | 12,200,683 | ||
| 207,110 | Evergy, Inc. | 12,302,334 | ||
| 483,990 | NiSource, Inc. | 12,191,708 | ||
| 153,202 | WEC Energy Group, Inc. | 13,700,855 | ||
| 77,459,417 | ||||
| Health Care — 9.1% | ||||
| 89,019 | AmerisourceBergen Corp. | 12,046,941 | ||
| 221,667 | Centene Corp.* | 17,247,909 | ||
| 269,128 | Encompass Health Corp. | 12,172,660 | ||
| 266,154 | Envista Holdings Corp.* | 8,732,513 | ||
| 51,877 | Laboratory Corp. of America Holdings | 10,624,928 | ||
| 85,159 | Zimmer Biomet Holdings, Inc. | 8,903,374 | ||
| 69,728,325 | ||||
| Consumer Discretionary — 8.5% | ||||
| 2,954 | AutoZone, Inc.* | 6,327,261 | ||
| 294,023 | BorgWarner, Inc. | 9,232,322 | ||
| 80,448 | Carter's, Inc. | 5,271,757 | ||
| 114,281 | Columbia Sportswear Co. | 7,691,111 | ||
| 101,377 | Dollar Tree, Inc.* | 13,797,410 | ||
| 128,667 | Hasbro, Inc. | 8,674,729 | ||
| 294,023 | LKQ Corp. | 13,863,185 | ||
| 64,857,775 | ||||
| Shares | Market Value | |||
| Materials — 8.4% | ||||
| 446,949 | Axalta Coating Systems Ltd. * | $ 9,412,746 | ||
| 221,043 | Berry Global Group, Inc.* | 10,285,131 | ||
| 145,257 | FMC Corp. | 15,353,665 | ||
| 63,583 | International Flavors & Fragrances, Inc. | 5,775,244 | ||
| 396,348 | Livent Corp.* | 12,148,066 | ||
| 57,291 | Scotts Miracle-Gro Co. (The) | 2,449,190 | ||
| 345,253 | Valvoline, Inc. | 8,748,711 | ||
| 64,172,753 | ||||
| Energy — 7.1% | ||||
| 400,485 | ChampionX Corp. | 7,837,492 | ||
| 637,167 | Coterra Energy, Inc. | 16,642,802 | ||
| 90,472 | Pioneer Natural Resources | 19,589,902 | ||
| 92,378 | Valero Energy Corp. | 9,870,589 | ||
| 53,940,785 | ||||
| Information Technology — 6.7% | ||||
| 136,836 | Akamai Technologies, Inc.* | 10,990,667 | ||
| 81,405 | F5 Networks, Inc.* | 11,781,746 | ||
| 110,622 | Global Payments, Inc. | 11,952,707 | ||
| 80,448 | PTC, Inc.* | 8,414,861 | ||
| 99,244 | Qorvo, Inc.* | 7,880,966 | ||
| 51,020,947 | ||||
| Real Estate — 5.0% | ||||
| 83,605 | Alexandria Real Estate Equities, Inc. REIT | 11,720,585 | ||
| 73,581 | Boston Properties, Inc. REIT | 5,516,367 | ||
| 53,231 | Digital Realty Trust, Inc. REIT | 5,279,451 | ||
| 38,495 | Essex Property Trust, Inc. REIT | 9,324,644 | ||
| 388,856 | Host Hotels & Resorts, Inc. REIT | 6,175,033 | ||
| 38,016,080 | ||||
| Total Common Stocks | $755,413,088 | |||
| Short-Term Investment Fund — 1.3% | ||||
| 9,751,474 | Dreyfus Government Cash Management, Institutional Shares, 2.75%∞Ω | 9,751,474 | ||
| Total Investment Securities—100.4% (Cost $655,134,963) | $765,164,562 | |||
| Liabilities in Excess of Other Assets — (0.4%) | (3,260,071) | |||
| Net Assets — 100.0% | $761,904,491 | |||
| * | Non-income producing security. |
| ∞ | Open-End Fund. |
| Ω | Represents the 7-Day SEC yield as of September 30, 2022. |
| Portfolio Abbreviations: |
| REIT – Real Estate Investment Trust |
| Valuation Inputs at Reporting Date: | ||||
| Description | Level 1 | Level 2 | Level 3 | Total |
| Common Stocks | $755,413,088 | $— | $— | $755,413,088 |
| Short-Term Investment Fund | 9,751,474 | — | — | 9,751,474 |
| Total | $765,164,562 | $— | $— | $765,164,562 |
| Shares | Market Value | |||
| Common Stocks — 98.6% | ||||
| Information Technology — 45.7% | ||||
| 594,214 | Atlassian Corp. PLC - Class A* | $ 125,135,526 | ||
| 1,834,810 | Block, Inc.* | 100,896,202 | ||
| 1,361,366 | Cloudflare, Inc. - Class A* | 75,297,153 | ||
| 576,479 | Datadog, Inc.* | 51,179,806 | ||
| 247,759 | Intuit, Inc. | 95,962,016 | ||
| 167,030 | Lam Research Corp. | 61,132,980 | ||
| 317,673 | NVIDIA Corp. | 38,562,325 | ||
| 448,708 | ServiceNow, Inc.* | 169,436,628 | ||
| 1,941,588 | Shopify, Inc. (Canada) - Class A* | 52,306,381 | ||
| 496,402 | Snowflake, Inc. - Class A* | 84,368,484 | ||
| 1,024,526 | Visa, Inc. - Class A | 182,007,044 | ||
| 1,036,284,545 | ||||
| Communication Services — 15.9% | ||||
| 98,442 | Charter Communications, Inc. - Class A* | 29,862,381 | ||
| 1,312,009 | Match Group, Inc.* | 62,648,430 | ||
| 298,373 | Meta Platforms, Inc. - Class A* | 40,483,249 | ||
| 371,128 | Netflix, Inc.* | 87,378,376 | ||
| 1,577,850 | Sea Ltd. (Taiwan) ADR* | 88,438,492 | ||
| 2,208,489 | Warner Music Group Corp. - Class A | 51,259,030 | ||
| 360,069,958 | ||||
| Consumer Discretionary — 14.4% | ||||
| 477,715 | Airbnb, Inc. - Class A* | 50,179,183 | ||
| 1,659,905 | Amazon.com, Inc.* | 187,569,265 | ||
| 703,516 | DoorDash, Inc. - Class A* | 34,788,866 | ||
| 786,449 | Floor & Decor Holdings, Inc. - Class A* | 55,255,907 | ||
| 327,793,221 | ||||
| Health Care — 14.0% | ||||
| 685,432 | 10X Genomics, Inc. - Class A* | 19,521,103 | ||
| 179,855 | Align Technology, Inc.* | 37,249,769 | ||
| 1,771,331 | DexCom, Inc.* | 142,662,999 | ||
| 779,996 | Edwards Lifesciences Corp.* | 64,451,070 | ||
| 488,356 | Sarepta Therapeutics, Inc.* | 53,982,872 | ||
| 317,867,813 | ||||
| Shares | Market Value | |||
| Industrials — 8.6% | ||||
| 1,593,545 | CoStar Group, Inc.* | $ 110,990,409 | ||
| 3,140,390 | Uber Technologies, Inc.* | 83,220,335 | ||
| 194,210,744 | ||||
| Total Common Stocks | $2,236,226,281 | |||
| Short-Term Investment Fund — 1.0% | ||||
| 22,434,313 | Dreyfus Government Cash Management, Institutional Shares, 2.75%∞Ω | 22,434,313 | ||
| Total Investment Securities—99.6% (Cost $2,088,344,020) | $2,258,660,594 | |||
| Other Assets in Excess of Liabilities — 0.4% | 8,513,266 | |||
| Net Assets — 100.0% | $2,267,173,860 | |||
| * | Non-income producing security. |
| ∞ | Open-End Fund. |
| Ω | Represents the 7-Day SEC yield as of September 30, 2022. |
| Portfolio Abbreviations: |
| ADR – American Depositary Receipt |
| PLC – Public Limited Company |
| Valuation Inputs at Reporting Date: | ||||
| Description | Level 1 | Level 2 | Level 3 | Total |
| Common Stocks | $2,236,226,281 | $— | $— | $2,236,226,281 |
| Short-Term Investment Fund | 22,434,313 | — | — | 22,434,313 |
| Total | $2,258,660,594 | $— | $— | $2,258,660,594 |
| Shares | Market Value | |||
| Common Stocks — 94.9% | ||||
| Industrials — 23.9% | ||||
| 34,305 | Armstrong World Industries, Inc. | $ 2,717,985 | ||
| 97,016 | Evoqua Water Technologies Corp.* | 3,208,319 | ||
| 72,482 | IAA, Inc.* | 2,308,552 | ||
| 32,679 | Landstar System, Inc. | 4,717,867 | ||
| 52,947 | Masonite International Corp. * | 3,774,591 | ||
| 46,417 | Matson, Inc. | 2,855,574 | ||
| 12,195 | UniFirst Corp. | 2,051,565 | ||
| 21,634,453 | ||||
| Consumer Discretionary — 18.3% | ||||
| 62,645 | Acushnet Holdings Corp. | 2,724,431 | ||
| 3,684 | Graham Holdings Co. - Class B | 1,981,918 | ||
| 40,394 | Malibu Boats, Inc. - Class A* | 1,938,508 | ||
| 11,970 | Murphy USA, Inc. | 3,290,673 | ||
| 23,619 | Penske Automotive Group, Inc. | 2,324,818 | ||
| 176,710 | Tempur Sealy International, Inc. | 4,265,780 | ||
| 16,526,128 | ||||
| Financials — 16.0% | ||||
| 70,012 | Atlantic Union Bankshares Corp. | 2,126,965 | ||
| 89,259 | Cannae Holdings, Inc.* | 1,844,091 | ||
| 22,412 | Hanover Insurance Group, Inc. (The) | 2,871,874 | ||
| 82,224 | Moelis & Co. - Class A | 2,779,993 | ||
| 3,725 | White Mountains Insurance Group Ltd.† | 4,853,749 | ||
| 14,476,672 | ||||
| Information Technology — 12.7% | ||||
| 86,729 | ACI Worldwide, Inc.* | 1,812,636 | ||
| 82,722 | CTS Corp. | 3,445,371 | ||
| 29,385 | Qualys, Inc.* | 4,095,975 | ||
| 127,023 | Vontier Corp. | 2,122,555 | ||
| 11,476,537 | ||||
| Materials — 7.3% | ||||
| 53,469 | Ingevity Corp.* | 3,241,825 | ||
| 10,014 | NewMarket Corp. | 3,012,512 | ||
| 41,531 | Tredegar Corp. | 392,053 | ||
| 6,646,390 | ||||
| Real Estate — 6.9% | ||||
| 121,050 | Alexander & Baldwin, Inc. REIT | 2,007,009 | ||
| 127,466 | Essential Properties Realty Trust, Inc. REIT | 2,479,214 | ||
| 39,556 | First Industrial Realty Trust, Inc. REIT | 1,772,504 | ||
| 6,258,727 | ||||
| Consumer Staples — 5.0% | ||||
| 18,832 | Lancaster Colony Corp. | 2,830,073 | ||
| 28,962 | PriceSmart, Inc. | 1,667,922 | ||
| 4,497,995 | ||||
| Shares | Market Value | |||
| Health Care — 3.9% | ||||
| 24,781 | Haemonetics Corp.* | $ 1,834,537 | ||
| 32,936 | LivaNova PLC* | 1,672,161 | ||
| 3,506,698 | ||||
| Energy — 0.9% | ||||
| 42,842 | Dril-Quip, Inc. * | 836,276 | ||
| Total Common Stocks | $85,859,876 | |||
| Short-Term Investment Funds — 7.8% | ||||
| 4,585,720 | Dreyfus Government Cash Management, Institutional Shares, 2.75%∞Ω | 4,585,720 | ||
| 2,475,674 | Invesco Government & Agency Portfolio, Institutional Class, 2.88%∞Ω** | 2,475,674 | ||
| Total Short-Term Investment Funds | $7,061,394 | |||
| Total Investment Securities—102.7% (Cost $85,623,269) | $92,921,270 | |||
| Liabilities in Excess of Other Assets — (2.7%) | (2,418,548) | |||
| Net Assets — 100.0% | $90,502,722 | |||
| * | Non-income producing security. |
| ** | Represents collateral for securities loaned. |
| † | All or a portion of the security is on loan. The total market value of the securities on loan as of September 30, 2022 was $2,453,587. |
| ∞ | Open-End Fund. |
| Ω | Represents the 7-Day SEC yield as of September 30, 2022. |
| Portfolio Abbreviations: |
| PLC – Public Limited Company |
| REIT – Real Estate Investment Trust |
| Valuation Inputs at Reporting Date: | ||||
| Description | Level 1 | Level 2 | Level 3 | Total |
| Common Stocks | $85,859,876 | $— | $— | $85,859,876 |
| Short-Term Investment Funds | 7,061,394 | — | — | 7,061,394 |
| Total | $92,921,270 | $— | $— | $92,921,270 |
| Shares | Market Value | |||
| Common Stocks — 98.0% | ||||
| Industrials — 24.2% | ||||
| 23,463 | Altra Industrial Motion Corp. | $ 788,826 | ||
| 26,861 | AZEK Co., Inc. (The)* | 446,430 | ||
| 17,379 | BWX Technologies, Inc. | 875,380 | ||
| 3,540 | CACI International, Inc. - Class A* | 924,152 | ||
| 19,706 | CIRCOR International, Inc. * | 324,952 | ||
| 11,576 | Clean Harbors, Inc. * | 1,273,128 | ||
| 6,531 | EMCOR Group, Inc. | 754,200 | ||
| 18,010 | Enerpac Tool Group Corp. | 321,118 | ||
| 9,317 | EnPro Industries, Inc. | 791,759 | ||
| 43,812 | Gates Industrial Corp. PLC* | 427,605 | ||
| 28,165 | Harsco Corp.* | 105,337 | ||
| 11,751 | Hexcel Corp. | 607,762 | ||
| 7,805 | Hillenbrand, Inc. | 286,600 | ||
| 24,302 | Huron Consulting Group, Inc.* | 1,610,007 | ||
| 13,327 | ITT, Inc. | 870,786 | ||
| 19,201 | Kelly Services, Inc. - Class A | 260,942 | ||
| 14,964 | Korn/Ferry International | 702,560 | ||
| 8,778 | Masonite International Corp. * | 625,784 | ||
| 11,826 | Regal Rexnord Corp. | 1,659,897 | ||
| 7,918 | Standex International Corp. | 646,505 | ||
| 3,521 | Valmont Industries, Inc. | 945,811 | ||
| 15,249,541 | ||||
| Financials — 19.5% | ||||
| 31,925 | Bank of NT Butterfield & Son Ltd. (The) (Bermuda) | 1,036,285 | ||
| 35,781 | BankUnited, Inc. | 1,222,637 | ||
| 94,229 | Chimera Investment Corp. REIT | 491,876 | ||
| 39,408 | First Interstate BancSystem, Inc. - Class A | 1,590,113 | ||
| 52,078 | MGIC Investment Corp. | 667,640 | ||
| 26,365 | NMI Holdings, Inc. - Class A* | 537,055 | ||
| 24,009 | PacWest Bancorp | 542,603 | ||
| 14,376 | Pinnacle Financial Partners, Inc. | 1,165,894 | ||
| 5,234 | Primerica, Inc. | 646,137 | ||
| 70,007 | Umpqua Holdings Corp. | 1,196,420 | ||
| 24,288 | Univest Financial Corp. | 570,282 | ||
| 18,832 | Western Alliance Bancorp | 1,238,016 | ||
| 16,578 | Wintrust Financial Corp. | 1,351,936 | ||
| 12,256,894 | ||||
| Information Technology — 8.6% | ||||
| 10,775 | Belden, Inc. | 646,715 | ||
| 5,454 | ExlService Holdings, Inc.* | 803,701 | ||
| 75,543 | Harmonic, Inc.* | 987,347 | ||
| 11,068 | Lumentum Holdings, Inc.* | 758,933 | ||
| 7,816 | MACOM Technology Solutions Holdings, Inc.* | 404,791 | ||
| 21,516 | National Instruments Corp. | 812,014 | ||
| 74,492 | Viavi Solutions, Inc.* | 972,121 | ||
| 5,385,622 | ||||
| Health Care — 8.2% | ||||
| 7,424 | Amedisys, Inc.* | 718,569 | ||
| 21,582 | Encompass Health Corp. | 976,154 | ||
| 21,996 | Envista Holdings Corp.* | 721,689 | ||
| 19,080 | Integra LifeSciences Holdings Corp.* | 808,229 | ||
| 12,202 | NuVasive, Inc.* | 534,570 | ||
| 28,092 | Prestige Consumer Healthcare, Inc.* | 1,399,824 | ||
| 5,159,035 | ||||
| Materials — 7.9% | ||||
| 24,139 | Axalta Coating Systems Ltd. * | 508,367 | ||
| 7,030 | Cabot Corp. | 449,147 | ||
| 10,229 | Ingevity Corp.* | 620,184 | ||
| 5,201 | Innospec, Inc. | 445,570 | ||
| Shares | Market Value | |||
| Materials — (Continued) | ||||
| 34,113 | Livent Corp.* | $ 1,045,563 | ||
| 70,888 | O-I Glass, Inc.* | 918,000 | ||
| 8,168 | Silgan Holdings, Inc. | 343,383 | ||
| 24,713 | Valvoline, Inc. | 626,227 | ||
| 4,956,441 | ||||
| Consumer Staples — 7.8% | ||||
| 13,244 | Hain Celestial Group, Inc. (The)* | 223,559 | ||
| 40,880 | Hostess Brands, Inc.* | 950,051 | ||
| 12,365 | Ingredion, Inc. | 995,630 | ||
| 3,811 | Lancaster Colony Corp. | 572,717 | ||
| 5,695 | MGP Ingredients, Inc. | 604,581 | ||
| 10,623 | Performance Food Group Co.* | 456,258 | ||
| 25,772 | TreeHouse Foods, Inc.* | 1,093,248 | ||
| 4,896,044 | ||||
| Consumer Discretionary — 6.9% | ||||
| 38,300 | American Eagle Outfitters, Inc.† | 372,659 | ||
| 3,719 | Carter's, Inc. | 243,706 | ||
| 5,739 | Dorman Products, Inc.* | 471,287 | ||
| 38,349 | Goodyear Tire & Rubber Co. (The)* | 386,941 | ||
| 3,868 | Murphy USA, Inc. | 1,063,352 | ||
| 3,696 | Oxford Industries, Inc. | 331,827 | ||
| 11,767 | Steven Madden Ltd. | 313,826 | ||
| 27,931 | Topgolf Callaway Brands Corp.* | 537,951 | ||
| 19,402 | Urban Outfitters, Inc.* | 381,249 | ||
| 7,469 | YETI Holdings, Inc.* | 213,016 | ||
| 4,315,814 | ||||
| Utilities — 5.1% | ||||
| 10,193 | Black Hills Corp. | 690,372 | ||
| 8,204 | IDACORP, Inc. | 812,278 | ||
| 28,163 | Portland General Electric Co. | 1,223,964 | ||
| 7,412 | Spire, Inc. | 461,990 | ||
| 3,188,604 | ||||
| Real Estate — 4.7% | ||||
| 27,894 | Corporate Office Properties Trust REIT | 647,978 | ||
| 20,047 | National Storage Affiliates Trust REIT | 833,554 | ||
| 67,186 | Newmark Group, Inc. - Class A | 541,519 | ||
| 32,428 | STAG Industrial, Inc. REIT | 921,928 | ||
| 2,944,979 | ||||
| Energy — 4.4% | ||||
| 17,114 | Cactus, Inc. - Class A | 657,691 | ||
| 29,902 | ChampionX Corp. | 585,182 | ||
| 11,947 | Helmerich & Payne, Inc. | 441,680 | ||
| 16,573 | PDC Energy, Inc. | 957,754 | ||
| 21,502 | Select Energy Services, Inc. - Class A* | 149,869 | ||
| 2,792,176 | ||||
| Communication Services — 0.7% | ||||
| 20,299 | TEGNA, Inc. | 419,783 | ||
| Total Common Stocks | $61,564,933 | |||
| Exchange-Traded Fund — 1.0% | ||||
| 4,868 | iShares Russell 2000 Value ETF | 627,631 | ||
| Shares | Market Value | |||
| Short-Term Investment Funds — 1.1% | ||||
| 692,011 | Dreyfus Government Cash Management, Institutional Shares, 2.75%∞Ω | $ 692,011 | ||
| 666 | Invesco Government & Agency Portfolio, Institutional Class, 2.88%∞Ω** | 666 | ||
| Total Short-Term Investment Funds | $692,677 | |||
| Total Investment Securities—100.1% (Cost $54,949,768) | $62,885,241 | |||
| Liabilities in Excess of Other Assets — (0.1%) | (34,253) | |||
| Net Assets — 100.0% | $62,850,988 | |||
| * | Non-income producing security. |
| ** | Represents collateral for securities loaned. |
| † | All or a portion of the security is on loan. The total market value of the securities on loan as of September 30, 2022 was $632. |
| ∞ | Open-End Fund. |
| Ω | Represents the 7-Day SEC yield as of September 30, 2022. |
| Portfolio Abbreviations: |
| ETF – Exchange-Traded Fund |
| PLC – Public Limited Company |
| REIT – Real Estate Investment Trust |
| Valuation Inputs at Reporting Date: | ||||
| Description | Level 1 | Level 2 | Level 3 | Total |
| Common Stocks | $61,564,933 | $— | $— | $61,564,933 |
| Exchange-Traded Fund | 627,631 | — | — | 627,631 |
| Short-Term Investment Funds | 692,677 | — | — | 692,677 |
| Total | $62,885,241 | $— | $— | $62,885,241 |
| Principal Amount | Market Value | |||
| Asset-Backed Securities — 37.7% | ||||
| $ 2,674,784 | ACC Auto Trust, Ser 2021-A, Class A, 144a, 1.080%, 4/15/27 | $ 2,631,365 | ||
| 26,874 | Aegis Asset Backed Securities Trust Mortgage Pass-Through Certificate, Ser 2005-4, Class M1, (1M LIBOR +0.675%), 3.759%, 10/25/35(A) | 26,847 | ||
| 7,000,000 | AGL Static CLO 18 Ltd. (Cayman Islands), Ser 2022-18A, Class A1, 144a, (TSFR3M +1.320%), 2.438%, 4/21/31(A) | 6,887,993 | ||
| 9,500,000 | American Credit Acceptance Receivables Trust, Ser 2018-4, Class E, 144a, 5.380%, 1/13/25 | 9,505,956 | ||
| 3,123,021 | American Credit Acceptance Receivables Trust, Ser 2019-1, Class D, 144a, 3.810%, 4/14/25 | 3,122,289 | ||
| 659,218 | American Credit Acceptance Receivables Trust, Ser 2020-1, Class C, 144a, 2.190%, 3/13/26 | 658,763 | ||
| 8,250,000 | Anchorage Capital CLO Ltd. (Cayman Islands), Ser 2013-1A, Class A1R, 144a, (3M LIBOR +1.250%), 3.705%, 10/13/30(A) | 8,089,323 | ||
| 5,544,619 | Ares XL CLO Ltd. (Cayman Islands), Ser 2016-40A, Class A1RR, 144a, (3M LIBOR +0.870%), 3.382%, 1/15/29(A) | 5,445,221 | ||
| 4,242,158 | Asset Backed Securities Corp. Home Equity Loan Trust Series OOMC, Ser 2006-HE3, Class A5, (1M LIBOR +0.540%), 2.897%, 3/25/36(A) | 4,081,329 | ||
| 1,507,928 | Avid Automobile Receivables Trust, Ser 2021-1, Class A, 144a, 0.610%, 1/15/25 | 1,497,732 | ||
| 3,750,000 | Barings CLO Ltd. (Cayman Islands), Ser 2013-IA, Class BR, 144a, (3M LIBOR +1.250%), 3.960%, 1/20/28(A) | 3,637,961 | ||
| 6,048,000 | BDS Ltd. (Cayman Islands), Ser 2020-FL5, Class B, 144a, (SOFR30A +1.914%), 4.933%, 2/16/37(A) | 5,926,877 | ||
| 349,712 | Bear Stearns Asset Backed Securities Trust, Ser 2006-SD2, Class M1, (1M LIBOR +0.825%), 3.909%, 6/25/36(A) | 349,056 | ||
| 6,258,969 | Black Diamond CLO Ltd. (Cayman Islands), Ser 2017-1A, Class A1AR, 144a, (3M LIBOR +1.050%), 3.833%, 4/24/29(A) | 6,151,640 | ||
| 126,482 | BSPRT Issuer Ltd. (Cayman Islands), Ser 2019-FL5, Class A, 144a, (1M LIBOR +1.150%), 3.968%, 5/15/29(A) | 126,053 | ||
| 276,369 | CarNow Auto Receivables Trust, Ser 2021-2A, Class A, 144a, 0.730%, 9/15/23 | 276,216 | ||
| 1,975,000 | CarNow Auto Receivables Trust, Ser 2021-2A, Class B, 144a, 1.300%, 1/15/26 | 1,930,751 | ||
| 2,927,044 | CIFC Funding Ltd. (Cayman Islands), Ser 2012-2RA, Class A1, 144a, (3M LIBOR +0.800%), 3.510%, 1/20/28(A) | 2,888,430 | ||
| 1,512,641 | Conn's Receivables Funding LLC, Ser 2021-A, Class A, 144a, 1.050%, 5/15/26 | 1,505,764 | ||
| 331,960 | CPS Auto Receivables Trust, Ser 2018-C, Class D, 144a, 4.400%, 6/17/24 | 332,033 | ||
| 4,337,313 | CPS Auto Receivables Trust, Ser 2019-A, Class D, 144a, 4.350%, 12/16/24 | 4,338,150 | ||
| 1,403,919 | Crossroads Asset Trust, Ser 2021-A, Class A2, 144a, 0.820%, 3/20/24 | 1,389,277 | ||
| 10,750,000 | Dewolf Park CLO Ltd. (Cayman Islands), Ser 2017-1A, Class AR, 144a, (3M LIBOR +0.920%), 3.432%, 10/15/30(A) | 10,475,047 | ||
| 2,422,483 | DT Auto Owner Trust, Ser 2018-3A, Class D, 144a, 4.190%, 7/15/24 | 2,423,289 | ||
| 5,620,000 | DT Auto Owner Trust, Ser 2019-1A, Class E, 144a, 4.940%, 2/17/26 | 5,620,308 | ||
| 5,854,655 | DT Auto Owner Trust, Ser 2020-1A, Class C, 144a, 2.290%, 11/17/25 | 5,824,774 | ||
| Principal Amount | Market Value | |||
| Asset-Backed Securities — 37.7% (Continued) | ||||
| $ 172,335 | DT Auto Owner Trust, Ser 2021-1A, Class A, 144a, 0.350%, 1/15/25 | $ 172,073 | ||
| 1,668,743 | Elara HGV Timeshare Issuer LLC, Ser 2016-A, Class A, 144a, 2.730%, 4/25/28 | 1,640,618 | ||
| 1,025,769 | Exeter Automobile Receivables Trust, Ser 2018-2A, Class D, 144a, 4.040%, 3/15/24 | 1,024,293 | ||
| 6,450,000 | Exeter Automobile Receivables Trust, Ser 2018-4A, Class E, 144a, 5.380%, 7/15/25 | 6,446,213 | ||
| 1,096,332 | Exeter Automobile Receivables Trust, Ser 2019-1A, Class D, 144a, 4.130%, 12/16/24 | 1,095,982 | ||
| 899,967 | Exeter Automobile Receivables Trust, Ser 2020-1A, Class C, 144a, 2.490%, 1/15/25 | 898,982 | ||
| 7,200,000 | Exeter Automobile Receivables Trust, Ser 2021-3A, Class B, 0.690%, 1/15/26 | 7,062,021 | ||
| 3,445,793 | FCI Funding LLC, Ser 2021-1A, Class A, 144a, 1.130%, 4/15/33 | 3,341,877 | ||
| 4,265,775 | Flagship Credit Auto Trust, Ser 2019-1, Class C, 144a, 3.600%, 2/18/25 | 4,263,137 | ||
| 2,760,977 | FNA VI LLC, Ser 2021-1A, Class A, 144a, 1.350%, 1/10/32 | 2,524,265 | ||
| 133,501 | FNMA REMIC Trust, Ser 2001-W4, Class AF5, 5.614%, 2/25/32(A)(B) | 135,395 | ||
| 588,961 | GLS Auto Receivables Issuer Trust, Ser 2019-4A, Class B, 144a, 2.780%, 9/16/24 | 588,365 | ||
| 2,600,000 | GLS Auto Receivables Issuer Trust, Ser 2020-4A, Class C, 144a, 1.140%, 11/17/25 | 2,546,869 | ||
| 5,025,161 | LAD Auto Receivables Trust, Ser 2021-1A, Class A, 144a, 1.300%, 8/17/26 | 4,844,872 | ||
| 3,358,776 | Madison Park Funding XI Ltd. (Cayman Islands), Ser 2013-11A, Class AR2, 144a, (3M LIBOR +0.900%), 3.683%, 7/23/29(A) | 3,297,569 | ||
| 2,506,926 | Magnetite XVI Ltd. (Cayman Islands), Ser 2015-16A, Class AR, 144a, (3M LIBOR +0.800%), 3.540%, 1/18/28(A) | 2,471,977 | ||
| 5,195,601 | MF1 Ltd. (Cayman Islands), Ser 2020-FL4, Class A, 144a, (SOFR30A +1.814%), 4.660%, 11/15/35(A) | 5,170,660 | ||
| 4,000,000 | MF1 Ltd. (Cayman Islands), Ser 2020-FL4, Class AS, 144a, (SOFR30A +2.214%), 5.060%, 11/15/35(A) | 3,964,626 | ||
| 10,219,000 | MF1 Ltd. (Cayman Islands), Ser 2020-FL4, Class C, 144a, (SOFR30A +3.714%), 6.560%, 11/15/35(A) | 10,024,307 | ||
| 5,353,267 | Monroe Capital Mml CLO Ltd. (Cayman Islands), Ser 2017-1A, Class AR, 144a, (3M LIBOR +1.300%), 4.059%, 4/22/29(A) | 5,267,433 | ||
| 6,250,000 | Neuberger Berman CLO XV (Cayman Islands), Ser 2013-15A, Class A1R2, 144a, (3M LIBOR +0.920%), 3.432%, 10/15/29(A) | 6,125,362 | ||
| 1,705,011 | Palmer Square Loan Funding Ltd. (Cayman Islands), Ser 2020-1A, Class A1, 144a, (3M LIBOR +1.025%), 3.784%, 2/20/28(A) | 1,684,682 | ||
| 9,139,777 | Palmer Square Loan Funding Ltd. (Cayman Islands), Ser 2021-4A, Class A1, 144a, (3M LIBOR +0.800%), 3.312%, 10/15/29(A) | 8,934,205 | ||
| 2,927,098 | Peaks CLO 1 Ltd. (Cayman Islands), Ser 2014-1A, Class A2R, 144a, (3M LIBOR +1.410%), 4.193%, 7/25/30(A) | 2,850,701 | ||
| 1,937,127 | Prestige Auto Receivables Trust, Ser 2018-1A, Class D, 144a, 4.140%, 10/15/24 | 1,933,347 | ||
| 9,020,000 | Prestige Auto Receivables Trust, Ser 2019-1A, Class D, 144a, 3.010%, 8/15/25 | 8,933,612 | ||
| 1,640,000 | Prestige Auto Receivables Trust, Ser 2020-1A, Class D, 144a, 1.620%, 11/16/26 | 1,601,350 | ||
| 9,700,000 | Progress Residential Trust, Ser 2019-SFR3, Class B, 144a, 2.571%, 9/17/36 | 9,197,630 | ||
| Principal Amount | Market Value | |||
| Asset-Backed Securities — 37.7% (Continued) | ||||
| $ 756,338 | RAMP Series Trust, Ser 2005-RS6, Class M4, (1M LIBOR +0.975%), 4.059%, 6/25/35(A) | $ 753,453 | ||
| 294,955 | RAMP Trust, Ser 2005-RS5, Class M4, (1M LIBOR +0.640%), 4.044%, 5/25/35(A) | 294,709 | ||
| 2,381,647 | Sierra Timeshare Receivables Funding LLC, Ser 2018-2A, Class B, 144a, 3.650%, 6/20/35 | 2,341,128 | ||
| 351,750 | Sierra Timeshare Receivables Funding LLC, Ser 2019-1A, Class B, 144a, 3.420%, 1/20/36 | 340,520 | ||
| 670,246 | Symphony CLO XIV Ltd. (Cayman Islands), Ser 2014-14A, Class AR, 144a, (3M LIBOR +0.950%), 3.433%, 7/14/26(A) | 668,345 | ||
| 8,036,070 | Symphony Static CLO I Ltd. (Cayman Islands), Ser 2021-1A, Class A, 144a, (3M LIBOR +0.830%), 3.613%, 10/25/29(A) | 7,834,220 | ||
| 6,406,625 | TICP CLO III-2 Ltd. (Cayman Islands), Ser 2018-3R, Class A, 144a, (3M LIBOR +0.840%), 3.550%, 4/20/28(A) | 6,340,745 | ||
| 3,792,769 | Towd Point Mortgage Trust, Ser 2015-5, Class M1, 144a, 3.500%, 5/25/55(A)(B) | 3,755,814 | ||
| 2,306,245 | Towd Point Mortgage Trust, Ser 2017-1, Class A1, 144a, 2.750%, 10/25/56(A)(B) | 2,271,449 | ||
| 5,063,210 | Towd Point Mortgage Trust, Ser 2017-5, Class A1, 144a, (1M LIBOR +0.600%), 3.684%, 2/25/57(A) | 5,007,380 | ||
| 2,494,259 | Towd Point Mortgage Trust, Ser 2019-HY1, Class A1, 144a, (1M LIBOR +1.000%), 4.084%, 10/25/48(A) | 2,460,101 | ||
| 1,344,680 | Towd Point Mortgage Trust, Ser 2019-MH1, Class A1, 144a, 3.000%, 11/25/58(A)(B) | 1,318,160 | ||
| 4,728,930 | Tricon American Homes Trust, Ser 2017-SFR2, Class A, 144a, 2.928%, 1/17/36 | 4,617,033 | ||
| 3,800,000 | Tricon American Homes Trust, Ser 2017-SFR2, Class D, 144a, 3.672%, 1/17/36 | 3,691,423 | ||
| 6,000,000 | United Auto Credit Securitization Trust, Ser 2022-1, Class B, 144a, 2.100%, 3/10/25 | 5,853,226 | ||
| 8,200,000 | Westlake Automobile Receivables Trust, Ser 2019-1A, Class E, 144a, 4.490%, 7/15/24 | 8,204,430 | ||
| 6,464,811 | Westlake Automobile Receivables Trust, Ser 2019-2A, Class D, 144a, 3.200%, 11/15/24 | 6,452,141 | ||
| Total Asset-Backed Securities | $265,389,144 | |||
| Commercial Mortgage-Backed Securities — 20.1% | ||||
| 216,714 | AREIT Trust, Ser 2019-CRE3, Class A, 144a, (SOFR30A +1.384%), 4.306%, 9/14/36(A) | 214,655 | ||
| 10,793,000 | AREIT Trust, Ser 2020-CRE4, Class C, 144a, (SOFR30A +3.222%), 5.507%, 4/15/37(A) | 10,671,638 | ||
| 4,800,000 | Austin Fairmont Hotel Trust, Ser 2019-FAIR, Class C, 144a, (1M LIBOR +1.450%), 4.268%, 9/15/32(A) | 4,594,857 | ||
| 8,145,000 | BHMS, Ser 2018-ATLS, Class A, 144a, (1M LIBOR +1.250%), 4.068%, 7/15/35(A) | 7,864,249 | ||
| 977,000 | BPR Trust, Ser 2021-KEN, Class A, 144a, (1M LIBOR +1.250%), 4.068%, 2/15/29(A) | 948,102 | ||
| 8,900,000 | BPR Trust, Ser 2021-KEN, Class B, 144a, (1M LIBOR +1.950%), 4.768%, 2/15/29(A) | 8,631,166 | ||
| 5,669,472 | BX Commercial Mortgage Trust, Ser 2019-XL, Class A, 144a, (1M LIBOR +0.920%), 3.738%, 10/15/36(A) | 5,583,929 | ||
| 1,526,628 | BX Trust, Ser 2019-RP, Class A, 144a, (1M LIBOR +1.045%), 3.863%, 6/15/34(A) | 1,500,756 | ||
| 8,495,000 | BXMT LTD (Cayman Islands), Ser 2020-FL2, Class AS, 144a, (SOFR30A +1.264%), 4.186%, 2/15/38(A) | 8,318,158 | ||
| 6,494,000 | BXMT Ltd. (Cayman Islands), Ser 2020-FL2, Class A, 144a, (SOFR30A +1.014%), 3.936%, 2/15/38(A) | 6,396,550 | ||
| Principal Amount | Market Value | |||
| Commercial Mortgage-Backed Securities — 20.1% (Continued) | ||||
| $ 7,200,000 | BXP Trust, Ser 2017-CQHP, Class A, 144a, (1M LIBOR +0.850%), 3.668%, 11/15/34(A) | $ 6,942,187 | ||
| 2,700,000 | CAMB Commercial Mortgage Trust, Ser 2019-LIFE, Class C, 144a, (1M LIBOR +1.450%), 4.268%, 12/15/37(A) | 2,605,267 | ||
| 308,242 | Citigroup Commercial Mortgage Trust, Ser 2013-GC11, Class AAB, 2.690%, 4/10/46 | 307,763 | ||
| 1,026,729 | Citigroup Commercial Mortgage Trust, Ser 2015-GC35, Class A2, 3.063%, 11/10/48 | 964,100 | ||
| 56,000,000 | Citigroup Commercial Mortgage Trust, Ser 2021-PRM2, Class XCP, 144a, 0.720%, 10/15/36(A)(B)(C) | 16,828 | ||
| 7,500,000 | COMM Mortgage Trust, Ser 2013-CR8, Class B, 144a, 4.048%, 6/10/46 | 7,377,939 | ||
| 2,808,985 | COMM Mortgage Trust, Ser 2013-LC6, Class AM, 3.282%, 1/10/46 | 2,796,495 | ||
| 34,090,911 | COMM Mortgage Trust, Ser 2014-UBS3, Class XA, 1.217%, 6/10/47(A)(B)(C) | 426,419 | ||
| 2,680,000 | CSMC Trust, Ser 2017-CHOP, Class A, 144a, (1M LIBOR +0.750%), 3.568%, 7/15/32(A) | 2,522,530 | ||
| 6,080,000 | CSMC Trust, Ser 2017-PFHP, Class A, 144a, (1M LIBOR +0.950%), 3.768%, 12/15/30(A) | 6,027,603 | ||
| 10,020,322 | DBGS Mortgage Trust, Ser 2018-BIOD, Class B, 144a, (1M LIBOR +0.888%), 3.593%, 5/15/35(A) | 9,768,358 | ||
| 118,906,000 | GS Mortgage Securities Corp. II, Ser 2017-SLP, Class XA, 144a, 1.325%, 10/10/32(A)(B)(C) | 509,845 | ||
| 705,000 | GS Mortgage Securities Corp. Trust, Ser 2017-GPTX, Class A, 144a, 2.856%, 5/10/34 | 666,218 | ||
| 4,279,000 | GS Mortgage Securities Trust, Ser 2018-HART, Class A, 144a, (1M LIBOR +1.090%), 3.910%, 10/15/31(A) | 4,234,091 | ||
| 94,257,000 | HONO Mortgage Trust, Ser 2021-LULU, Class XCP, 144a, 0.508%, 10/15/36(A)(B)(C) | 14,063 | ||
| 3,000,000 | JP Morgan Chase Commercial Mortgage Securities Trust, Ser 2012-LC9, Class AS, 144a, 3.353%, 12/15/47 | 2,990,086 | ||
| 2,361,000 | JP Morgan Chase Commercial Mortgage Securities Trust, Ser 2013-LC11, Class AS, 3.216%, 4/15/46 | 2,321,157 | ||
| 1,300,000 | JP Morgan Chase Commercial Mortgage Securities Trust, Ser 2018-WPT, Class BFX, 144a, 4.549%, 7/5/33 | 1,272,340 | ||
| 2,750,000 | JP Morgan Chase Commercial Mortgage Securities Trust, Ser 2019-MFP, Class C, 144a, (1M LIBOR +1.360%), 4.178%, 7/15/36(A) | 2,665,718 | ||
| 412,833 | JPMBB Commercial Mortgage Securities Trust, Ser 2014-C24, Class A2, 2.940%, 11/15/47 | 397,802 | ||
| 468,380 | Morgan Stanley Bank of America Merrill Lynch Trust, Ser 2013-C10, Class A3FL, 144a, (1M LIBOR +1.000%), 3.939%, 7/15/46(A) | 468,473 | ||
| 138,052 | Morgan Stanley Bank of America Merrill Lynch Trust, Ser 2013-C8, Class ASB, 2.699%, 12/15/48 | 137,763 | ||
| 1,411,000 | Morgan Stanley Capital I Trust, Ser 2017-CLS, Class A, 144a, (1M LIBOR +0.700%), 3.518%, 11/15/34(A) | 1,402,197 | ||
| 9,140,000 | Morgan Stanley Capital I Trust, Ser 2017-CLS, Class B, 144a, (1M LIBOR +0.850%), 3.668%, 11/15/34(A) | 9,077,283 | ||
| 7,191,263 | Morgan Stanley Capital I Trust, Ser 2018-BOP, Class A, 144a, (1M LIBOR +0.850%), 3.668%, 8/15/33(A) | 7,103,303 | ||
| 478,270 | ReadyCap Commercial Mortgage Trust, Ser 2018-4, Class A, 144a, 3.390%, 2/27/51 | 457,108 | ||
| Principal Amount | Market Value | |||
| Commercial Mortgage-Backed Securities — 20.1% (Continued) | ||||
| $ 3,442,841 | Tharaldson Hotel Portfolio Trust, Ser 2018-THL, Class A, 144a, (1M LIBOR +1.050%), 3.693%, 11/11/34(A) | $ 3,347,400 | ||
| 10,450,000 | WFRBS Commercial Mortgage Trust, Ser 2013-C12, Class D, 144a, 4.530%, 3/15/48(A)(B) | 10,132,016 | ||
| Total Commercial Mortgage-Backed Securities | $141,676,412 | |||
| Corporate Bonds — 19.5% | ||||
| Utilities — 6.0% | ||||
| 4,000,000 | American Electric Power Co., Inc., 2.031%, 3/15/24 | 3,829,071 | ||
| 4,596,000 | CenterPoint Energy Resources Corp., (3M LIBOR +0.500%), 3.600%, 3/2/23(A) | 4,585,315 | ||
| 7,225,000 | Dominion Energy, Inc., (3M LIBOR +0.530%), 3.823%, 9/15/23(A) | 7,191,316 | ||
| 6,595,000 | Edison International, 3.125%, 11/15/22 | 6,583,455 | ||
| 6,000,000 | Metropolitan Edison Co., 144a, 4.000%, 4/15/25 | 5,693,314 | ||
| 10,000,000 | NextEra Energy Capital Holdings, Inc., (3M LIBOR +0.270%), 3.254%, 2/22/23(A) | 9,970,992 | ||
| 1,500,000 | Pacific Gas and Electric Co., (SOFR + 1.150%), 3.803%, 11/14/22(A) | 1,496,722 | ||
| 3,000,000 | Southern California Gas Co., (3M LIBOR +0.350%), 3.620%, 9/14/23(A) | 2,989,534 | ||
| 42,339,719 | ||||
| Financials — 3.0% | ||||
| 4,367,000 | Comerica, Inc., 3.700%, 7/31/23 | 4,329,374 | ||
| 4,000,000 | FNB Corp., 2.200%, 2/24/23 | 3,944,176 | ||
| 3,800,000 | Mitsubishi UFJ Financial Group, Inc. (Japan), 0.848%, 9/15/24 | 3,625,116 | ||
| 2,800,000 | Sumitomo Mitsui Trust Bank Ltd. (Japan), 144a, 0.800%, 9/12/23 | 2,686,772 | ||
| 2,500,000 | Synovus Financial Corp., 5.200%, 8/11/25 | 2,452,956 | ||
| 4,000,000 | UBS Group AG (Switzerland), 144a, 1.008%, 7/30/24 | 3,859,673 | ||
| 20,898,067 | ||||
| Consumer Discretionary — 2.2% | ||||
| 3,500,000 | American Honda Finance Corp., MTN, 0.875%, 7/7/23 | 3,401,694 | ||
| 5,000,000 | Hyundai Capital America, 144a, 0.800%, 1/8/24 | 4,704,680 | ||
| 2,500,000 | Hyundai Capital America, 144a, 2.375%, 2/10/23 | 2,478,000 | ||
| 5,000,000 | Toyota Motor Corp. (Japan), 0.681%, 3/25/24 | 4,717,377 | ||
| 15,301,751 | ||||
| Industrials — 2.0% | ||||
| 5,000,000 | Air Lease Corp., 2.750%, 1/15/23 | 4,971,249 | ||
| 1,450,000 | CNH Industrial NV (United Kingdom), 4.500%, 8/15/23 | 1,441,314 | ||
| 8,380,000 | Huntington Ingalls Industries, Inc., 0.670%, 8/16/23 | 8,080,292 | ||
| 14,492,855 | ||||
| Consumer Staples — 1.7% | ||||
| 2,500,000 | Coca-Cola Europacific Partners PLC (United Kingdom), 144a, 0.500%, 5/5/23 | 2,435,450 | ||
| 5,500,000 | Nestle Holdings, Inc., 144a, 0.375%, 1/15/24 | 5,202,855 | ||
| 4,500,000 | Triton Container International Ltd. (Bermuda), 144a, 0.800%, 8/1/23 | 4,293,859 | ||
| 11,932,164 | ||||
| Health Care — 1.4% | ||||
| 7,225,000 | Dignity Health, 3.125%, 11/1/22 | 7,217,076 | ||
| 2,625,000 | Elevance Health, Inc., 0.450%, 3/15/23 | 2,578,839 | ||
| 9,795,915 | ||||
| Information Technology — 1.2% | ||||
| 4,000,000 | Microchip Technology, Inc., 4.250%, 9/1/25 | 3,863,780 | ||
| 5,000,000 | SK Hynix, Inc. (South Korea), 144a, 1.000%, 1/19/24 | 4,725,100 | ||
| 8,588,880 | ||||
| Principal Amount | Market Value | |||
| Energy — 1.0% | ||||
| $ 2,225,000 | Canadian Natural Resources Ltd. (Canada), 2.950%, 1/15/23 | $ 2,213,970 | ||
| 5,000,000 | Energy Transfer Partners LP / Regency Energy Finance Corp., 4.500%, 11/1/23 | 4,956,938 | ||
| 7,170,908 | ||||
| Materials — 0.7% | ||||
| 5,000,000 | Nutrien Ltd. (Canada), 1.900%, 5/13/23 | 4,908,378 | ||
| Real Estate — 0.3% | ||||
| 2,000,000 | American Tower Trust #1 REIT, Ser 13, Class 2A, 144a, 3.070%, 3/15/48 | 1,986,346 | ||
| Total Corporate Bonds | $137,414,983 | |||
| Non-Agency Collateralized Mortgage Obligations — 11.2% | ||||
| 619,208 | Bear Stearns ARM Trust, Ser 2003-1, Class 5A1, 2.844%, 4/25/33(A)(B)†† | 620,524 | ||
| 112,713 | Bear Stearns Asset Backed Securities Trust, Ser 2003-AC7, Class A2, 5.750%, 1/25/34(A)(B)†† | 94,900 | ||
| 11,227,313 | Cascade Funding Mortgage Trust, Ser 2021-HB6, Class A, 144a, 0.898%, 6/25/36(A)(B) | 10,662,258 | ||
| 3,669,359 | CFMT LLC, Ser 2020-HB4, Class A, 144a, 0.946%, 12/26/30(A)(B) | 3,558,840 | ||
| 4,841,131 | CFMT LLC, Ser 2021-EBO1, Class A, 144a, 0.985%, 11/25/50(A)(B) | 4,618,159 | ||
| 5,288,698 | CFMT LLC, Ser 2021-HB7, Class A, 144a, 1.151%, 10/27/31(A)(B) | 4,971,101 | ||
| 1,581,040 | CIM Trust, Ser 2018-R3, Class A1, 144a, 5.000%, 12/25/57 | 1,558,759 | ||
| 6,672 | Community Program Loan Trust, Ser 1987-A, Class A5, 4.500%, 4/1/29 | 6,438 | ||
| 10,781,655 | CSMC Trust, Ser 2018-RPL9, Class A1, 144a, 3.850%, 9/25/57(A)(B) | 10,438,882 | ||
| 1,244,039 | GSR Mortgage Loan Trust, Ser 2003-13, Class 1A1, 4.077%, 10/25/33(A)(B) | 1,243,527 | ||
| 55,799 | JP Morgan Mortgage Trust, Ser 2006-A4, Class 2A2, 2.741%, 6/25/36(A)(B) | 42,099 | ||
| 2,857,098 | JP Morgan Mortgage Trust, Ser 2019-HYB1, Class A5A, 144a, 3.000%, 10/25/49(A)(B) | 2,612,957 | ||
| 36,615 | Merrill Lynch Mortgage Investors Trust, Ser 2004-1, Class 1A, 2.850%, 12/25/34(A)(B) | 35,030 | ||
| 15,775 | Merrill Lynch Mortgage Investors Trust, Ser 2003-A1, Class 2A, (12M LIBOR +1.625%), 5.785%, 12/25/32(A) | 14,905 | ||
| 823,080 | Mill City Mortgage Loan Trust, Ser 2018-2, Class A1, 144a, 3.500%, 5/25/58(A)(B) | 809,731 | ||
| 242,595 | RFMSI Trust, Ser 2007-SA1, Class 1A1, 3.082%, 2/25/37(A)(B) | 197,658 | ||
| 8,524,038 | RMF Proprietary Issuance Trust, Ser 2019-1, Class A, 144a, 2.750%, 10/25/63(A)(B) | 8,254,736 | ||
| 1,906,934 | Sequoia Mortgage Trust, Ser 2013-7, Class B2, 3.504%, 6/25/43(A)(B) | 1,787,777 | ||
| 222,813 | Sequoia Mortgage Trust, Ser 2018-CH4, Class A13, 144a, 4.500%, 10/25/48(A)(B) | 220,354 | ||
| 1,409,375 | Sequoia Mortgage Trust, Ser 2019-CH3, Class A13, 144a, 4.000%, 9/25/49(A)(B) | 1,340,767 | ||
| 7,660,691 | Starwood Mortgage Residential Trust, Ser 2020-3, Class A1, 144a, 1.486%, 4/25/65(A)(B) | 7,364,940 | ||
| 4,590,673 | Towd Point HE Trust, Ser 2021-HE1, Class A1, 144a, 0.918%, 2/25/63(A)(B) | 4,312,865 | ||
| Principal Amount | Market Value | |||
| Non-Agency Collateralized Mortgage Obligations — 11.2% (Continued) | ||||
| $ 8,033,659 | Towd Point Mortgage Trust, Ser 2018-2, Class A1, 144a, 3.250%, 3/25/58(A)(B) | $ 7,793,643 | ||
| 6,729,439 | Towd Point Mortgage Trust, Ser 2021-SJ2, Class A1A, 144a, 2.250%, 12/25/61(A)(B) | 6,257,486 | ||
| Total Non-Agency Collateralized Mortgage Obligations | $78,818,336 | |||
| Commercial Paper — 5.1% | ||||
| 16,000,000 | Black Hills Co., 3.301%, 10/3/22(D) | 15,995,572 | ||
| 2,000,000 | Ingredion, Inc., 3.372%, 10/4/22(D) | 1,999,262 | ||
| 18,000,000 | Monatana-Dakota, 3.401%, 10/3/22(D) | 17,995,028 | ||
| Total Commercial Paper | $35,989,862 | |||
| U.S. Government Agency Obligations — 3.0% | ||||
| 2,396 | Small Business Administration Participation Certificates, Ser 2003-20E, Class 1, 4.640%, 5/1/23 | 2,391 | ||
| 48,550 | Small Business Administration Pools, Pool #508374, (Prime Rate -2.500%), 2.250%, 4/25/28(A) | 47,978 | ||
| 1,650,000 | United States International Development Finance Corp., 3.120%, 5/15/26(A)(B) | 1,650,000 | ||
| 4,282,800 | United States International Development Finance Corp., 3.170%, 7/5/38(A)(B) | 4,282,800 | ||
| 5,575,800 | United States International Development Finance Corp., 3.250%, 4/20/35(A)(B) | 5,575,800 | ||
| 9,090,909 | United States International Development Finance Corp., 3.410%, 9/30/27(A)(B) | 9,090,909 | ||
| Total U.S. Government Agency Obligations | $20,649,878 | |||
| Municipal Bonds — 1.9% | ||||
| Other Territory — 1.8% | ||||
| 2,645,000 | Taxable Municipal Funding Trust, Rev., 144a, 3.300%, 11/1/24(A)(B) | 2,645,000 | ||
| 840,000 | Taxable Municipal Funding Trust, Rev., 144a, 3.300%, 5/15/56(A)(B) | 840,000 | ||
| 4,549,000 | Taxable Municipal Funding Trust, Rev., 144a, 3.300%, 12/15/25(A)(B) | 4,549,000 | ||
| 4,300,000 | Taxable Municipal Funding Trust, Txbl Floaters Ser 2020 11, (LOC - Barclays Bank PLC), 144a, 3.300%, 9/1/30(A)(B) | 4,300,000 | ||
| 12,334,000 | ||||
| California — 0.1% | ||||
| 815,000 | CA St Enterprise Dev Authority, Txbl Variable J Harris Indl Wt, (LOC - City National Bank), 144a, 3.500%, 9/1/41(A)(B) | 815,000 | ||
| Total Municipal Bonds | $13,149,000 | |||
| U.S. Government Mortgage-Backed Obligations — 0.7% | ||||
| 103,953 | FHLMC, Pool #1B7189, (12M LIBOR +2.470%), 3.340%, 3/1/36(A) | 106,190 | ||
| 96,457 | FHLMC, Pool #1H1354, (1 Year CMT Rate +2.250%), 2.540%, 11/1/36(A) | 98,871 | ||
| 31,739 | FHLMC, Pool #1J1813, (12M LIBOR +1.925%), 4.175%, 8/1/37(A) | 32,501 | ||
| 84,853 | FHLMC, Pool #1L0147, (1 Year CMT Rate +2.290%), 4.290%, 7/1/35(A) | 83,662 | ||
| 36,970 | FHLMC, Pool #1Q0080, (12M LIBOR +1.648%), 3.248%, 1/1/36(A) | 37,456 | ||
| 98,331 | FHLMC, Pool #1Q0119, (12M LIBOR +1.853%), 3.959%, 9/1/36(A) | 100,671 | ||
| 64,766 | FHLMC, Pool #1Q0187, (12M LIBOR +1.756%), 2.038%, 12/1/36(A) | 64,697 | ||
| Principal Amount | Market Value | |||
| U.S. Government Mortgage-Backed Obligations — 0.7% (Continued) | ||||
| $ 44,229 | FHLMC, Pool #1Q0339, (12M LIBOR +1.889%), 2.769%, 4/1/37(A) | $ 44,612 | ||
| 82,051 | FHLMC, Pool #1Q1303, (1 Year CMT Rate +2.250%), 2.612%, 11/1/36(A) | 83,431 | ||
| 139,925 | FHLMC, Pool #781515, (1 Year CMT Rate +2.250%), 2.854%, 4/1/34(A) | 141,813 | ||
| 52,567 | FHLMC, Pool #782760, (1 Year CMT Rate +2.250%), 3.402%, 11/1/36(A) | 53,992 | ||
| 68,840 | FHLMC, Pool #847795, (1 Year CMT Rate +2.279%), 2.726%, 4/1/35(A) | 67,762 | ||
| 181,684 | FHLMC, Pool #848539, (1 Year CMT Rate +2.293%), 2.828%, 4/1/37(A) | 184,566 | ||
| 376,456 | FHLMC, Pool #848583, (1 Year CMT Rate +2.315%), 2.885%, 1/1/36(A) | 383,388 | ||
| 4,643 | FHLMC, Pool #A92646, 5.500%, 6/1/40 | 4,788 | ||
| 5,783 | FHLMC, Pool #C03505, 5.500%, 6/1/40 | 5,971 | ||
| 33 | FHLMC, Pool #G00100, 8.000%, 2/1/23 | 34 | ||
| 16,717 | FHLMC, Pool #G01840, 5.000%, 7/1/35 | 16,887 | ||
| 51,229 | FNMA, Pool #254868, 5.000%, 9/1/33 | 50,931 | ||
| 16,324 | FNMA, Pool #256272, 5.500%, 6/1/26 | 16,258 | ||
| 33,712 | FNMA, Pool #256852, 6.000%, 8/1/27 | 34,257 | ||
| 8,772 | FNMA, Pool #323832, 7.500%, 7/1/29 | 9,118 | ||
| 159 | FNMA, Pool #334593, 7.000%, 5/1/24 | 159 | ||
| 18,936 | FNMA, Pool #665773, 7.500%, 6/1/31 | 18,931 | ||
| 70,121 | FNMA, Pool #679742, (1 Year CMT Rate +2.584%), 2.975%, 1/1/40(A) | 68,435 | ||
| 61,238 | FNMA, Pool #725424, 5.500%, 4/1/34 | 62,206 | ||
| 209,015 | FNMA, Pool #725490, (12M LIBOR +1.597%), 2.738%, 4/1/34(A) | 209,226 | ||
| 9,621 | FNMA, Pool #735484, 5.000%, 5/1/35 | 9,708 | ||
| 69,152 | FNMA, Pool #813170, (12M LIBOR +1.575%), 2.004%, 1/1/35(A) | 69,213 | ||
| 205,478 | FNMA, Pool #815323, (6M LIBOR +1.532%), 3.343%, 1/1/35(A) | 209,410 | ||
| 67,027 | FNMA, Pool #820364, (12M LIBOR +0.827%), 2.202%, 4/1/35(A) | 66,341 | ||
| 79,060 | FNMA, Pool #827787, (6M LIBOR +1.550%), 2.839%, 5/1/35(A) | 80,590 | ||
| 34,692 | FNMA, Pool #889060, 6.000%, 1/1/38 | 37,425 | ||
| 38,088 | FNMA, Pool #889061, 6.000%, 1/1/38 | 40,006 | ||
| 2,333 | FNMA, Pool #889382, 5.500%, 4/1/38 | 2,412 | ||
| 81,073 | FNMA, Pool #922674, (12M LIBOR +1.905%), 2.646%, 4/1/36(A) | 82,614 | ||
| 22,551 | FNMA, Pool #960376, 5.500%, 12/1/37 | 23,316 | ||
| 84,984 | FNMA, Pool #995405, 5.500%, 10/1/23 | 85,105 | ||
| 3,808 | FNMA, Pool #AD0941, 5.500%, 4/1/40 | 3,937 | ||
| 27,411 | FNMA, Pool #AE0363, 5.000%, 7/1/37 | 27,645 | ||
| 32,203 | FNMA, Pool #AE5441, 5.000%, 10/1/40 | 32,391 | ||
| 30,273 | FNMA, Pool #AI6588, 4.000%, 7/1/26 | 29,404 | ||
| 46,821 | FNMA, Pool #AI8506, 4.000%, 8/1/26 | 45,472 | ||
| 46,922 | FNMA, Pool #AL0211, 5.000%, 4/1/41 | 47,348 | ||
| 992 | FNMA, Pool #AL0302, 5.000%, 4/1/24 | 995 | ||
| 243,524 | FNMA, Pool #AL0478, (12M LIBOR +1.764%), 2.494%, 4/1/36(A) | 247,955 | ||
| 96,282 | FNMA, Pool #AL0543, 5.000%, 7/1/41 | 97,162 | ||
| 41,824 | FNMA, Pool #AL1105, 4.500%, 12/1/40 | 40,988 | ||
| 10,746 | FNMA, Pool #AL2591, 5.500%, 5/1/38 | 10,781 | ||
| 220,678 | FNMA, Pool #AL5275, (6M LIBOR +1.508%), 2.551%, 9/1/37(A) | 222,028 | ||
| 633,563 | FNMA, Pool #AL7396, (6M LIBOR +1.528%), 2.723%, 2/1/37(A) | 645,034 | ||
| 224 | GNMA, Pool #344233, 8.000%, 2/15/23 | 224 | ||
| Principal Amount | Market Value | |||
| U.S. Government Mortgage-Backed Obligations — 0.7% (Continued) | ||||
| $ 3,533 | GNMA, Pool #345123, 8.000%, 12/15/23 | $ 3,537 | ||
| 164,715 | GNMA, Pool #80826, (1 Year CMT Rate +1.500%), 2.625%, 2/20/34(A) | 163,450 | ||
| 70,230 | GNMA, Pool #80889, (1 Year CMT Rate +1.500%), 2.875%, 4/20/34(A) | 69,735 | ||
| 150,491 | GNMA, Pool #81016, (1 Year CMT Rate +1.500%), 1.625%, 8/20/34(A) | 147,882 | ||
| 160,740 | GNMA, Pool #82760, (1 Year CMT Rate +1.500%), 2.625%, 3/20/41(A) | 160,517 | ||
| 27,542 | GNMA, Pool #MA2392, (1 Year CMT Rate +1.500%), 1.750%, 11/20/44(A) | 27,130 | ||
| 221,871 | GNMA, Pool #MA2466, (1 Year CMT Rate +1.500%), 1.750%, 12/20/44(A) | 218,435 | ||
| Total U.S. Government Mortgage-Backed Obligations | $4,929,003 | |||
| Agency Collateralized Mortgage Obligations — 0.5% | ||||
| 134,211,403 | FHLMC Multifamily Structured Pass Through Certificates, Ser K038, Class X1, 1.238%, 3/25/24(A)(B)(C) | 1,607,625 | ||
| 60,365,539 | FHLMC Multifamily Structured Pass Through Certificates, Ser K040, Class X1, 0.835%, 9/25/24(A)(B)(C) | 620,359 | ||
| 136,525 | FHLMC REMIC, Ser 2770, Class FH, (1M LIBOR +0.400%), 3.218%, 3/15/34(A) | 135,386 | ||
| 629,268 | FHLMC REMIC, Ser 4238, Class TL, 1.250%, 8/15/27 | 589,507 | ||
| 3,894 | FNMA REMIC, Ser 2003-119, Class PU, 4.000%, 11/25/33 | 3,887 | ||
| 27,169 | FNMA REMIC, Ser 2003-33, Class AM, 4.250%, 5/25/33 | 26,446 | ||
| 16,948 | FNMA REMIC, Ser 2003-42, Class CA, 4.000%, 5/25/33 | 16,757 | ||
| 95,451 | FNMA REMIC, Ser 2003-81, Class FE, (1M LIBOR +0.500%), 3.584%, 9/25/33(A) | 95,039 | ||
| 236,554 | FNMA REMIC, Ser 2009-32, Class BH, 5.250%, 5/25/39 | 231,116 | ||
| 59 | FNMA REMIC, Ser 2011-15, Class HC, 2.500%, 3/25/26 | 58 | ||
| 39,990 | FNMA REMIC, Ser 2012-102, Class NA, 1.500%, 9/25/27 | 38,095 | ||
| 332,251 | FREMF Mortgage Trust, Ser 2013-K25, Class B, 144a, 3.746%, 11/25/45(A)(B) | 331,139 | ||
| 38,310 | GNMA, Ser 2002-72, Class AB, 4.500%, 10/20/32 | 38,256 | ||
| 13,183 | GNMA, Ser 2011-57, Class BA, 3.000%, 5/20/40 | 12,967 | ||
| Total Agency Collateralized Mortgage Obligations | $3,746,637 | |||
| Shares | ||||
| Short-Term Investment Fund — 0.1% | ||||
| 522,721 | Dreyfus Government Cash Management, Institutional Shares, 2.75%∞Ω | 522,721 | ||
| Total Investment Securities—99.8% (Cost $718,178,811) | $702,285,976 | |||
| Other Assets in Excess of Liabilities — 0.2% | 1,385,066 | |||
| Net Assets — 100.0% | $703,671,042 | |||
| (A) | Variable rate security - Rate reflected is the rate in effect as of September 30, 2022. |
| (B) | Certain variable rate securities are not based on a published reference rate and spread but are determined by the issuer or agent and are based on current market conditions. These securities do not indicate a reference rate and spread in their description. |
| (C) | Interest only security - This type of security represents the right to receive the monthly interest payments on an underlying pool of mortgages. Payments of principal on the pool reduce the value of the “interest only” holding. |
| (D) | Rate reflects yield at the time of purchase. |
| †† | The issuers and/or sponsors of certain mortgage-backed securities may no longer exist; however, the securities held by the Fund are separate legal entities organized as trusts and publicly traded. The Fund receives principal and interest payments directly from these trusts. |
| ∞ | Open-End Fund. |
| Ω | Represents the 7-Day SEC yield as of September 30, 2022. |
| Portfolio Abbreviations: |
| ARM – Adjustable Rate Mortgage |
| CLO – Collateralized Loan Obligation |
| CMT – Constant Maturity Treasury |
| FHLMC – Federal Home Loan Mortgage Corporation |
| FNMA – Federal National Mortgage Association |
| FREMF – Freddie Mac Multifamily Securitization |
| GNMA – Government National Mortgage Association |
| LIBOR – London Interbank Offered Rate |
| LLC – Limited Liability Company |
| LOC – Letter of Credit |
| LP – Limited Partnership |
| MTN – Medium Term Note |
| PLC – Public Limited Company |
| REIT – Real Estate Investment Trust |
| REMIC – Real Estate Mortgage Investment Conduit |
| SOFR – Secured Overnight Financing Rate |
| SOFR30A – Secured Overnight Financing Rate 30 Day Average |
| TSFR3M – Three Month Term Secured Overnight Financing Rate |
| 144a - This is a restricted security that was sold in a transaction qualifying for the exemption under Rule 144a of the Securities Act of 1933. This security may be sold in transactions exempt from registration, normally to qualified institutional buyers. At September 30, 2022, these securities were valued at $513,332,913 or 73.0% of net assets. These securities were deemed liquid pursuant to procedures approved by the Board of Trustees. |
| Valuation Inputs at Reporting Date: | ||||
| Description | Level 1 | Level 2 | Level 3 | Total |
| Asset-Backed Securities | $— | $265,389,144 | $— | $265,389,144 |
| Commercial Mortgage-Backed Securities | — | 141,676,412 | — | 141,676,412 |
| Corporate Bonds | — | 137,414,983 | — | 137,414,983 |
| Non-Agency Collateralized Mortgage Obligations | — | 78,818,336 | — | 78,818,336 |
| Commercial Paper | — | 35,989,862 | — | 35,989,862 |
| U.S. Government Agency Obligations | — | 20,649,878 | — | 20,649,878 |
| Municipal Bonds | — | 13,149,000 | — | 13,149,000 |
| U.S. Government Mortgage-Backed Obligations | — | 4,929,003 | — | 4,929,003 |
| Agency Collateralized Mortgage Obligations | — | 3,746,637 | — | 3,746,637 |
| Short-Term Investment Fund | 522,721 | — | — | 522,721 |
| Total | $522,721 | $701,763,255 | $— | $702,285,976 |
| Touchstone Active Bond Fund | Touchstone Anti- Benchmark® International Core Equity Fund | Touchstone Ares Credit Opportunities Fund | Touchstone Dividend Equity Fund | Touchstone High Yield Fund | Touchstone Impact Bond Fund | |
| Assets | ||||||
| Investments, at cost | $307,622,850 | $10,224,244 | $319,184,965 | $3,011,521,844 | $120,990,945 | $543,304,092 |
| Investments, at market value * | $265,971,458 | $8,650,118 | $278,058,046 | $2,648,721,077 | $102,523,269 | $478,087,238 |
| Cash | — | — | 2,389 | 71 | 43,514 | 194 |
| Cash deposits held at prime broker (A) | 268,663 | — | 1,703,098 | — | — | — |
| Foreign currency † | 33 | 17,164 | 1,021,462 | — | — | — |
| Dividends and interest receivable | 2,116,455 | 15,892 | 3,934,690 | 3,312,604 | 1,754,906 | 3,549,855 |
| Receivable for capital shares sold | 314,450 | — | 214,596 | 413,485 | 5,349 | 2,813,664 |
| Receivable for investments sold | 246 | — | 5,137,100 | — | — | — |
| Receivable for variation margin on futures contracts | 42,103 | — | — | — | — | — |
| Receivable for variation margin on swap agreements | — | — | 120,260 | — | — | — |
| Receivable for securities lending income | 384 | 27 | 12,182 | 78,231 | 757 | — |
| Receivable from Investment Advisor | — | 12,818 | — | — | — | — |
| Tax reclaim receivable | — | 53,451 | 1,921 | 107,039 | — | — |
| Other assets | 18,970 | 1,483 | 26,906 | 47,009 | 11,813 | 26,744 |
| Total Assets | 268,732,762 | 8,750,953 | 290,232,650 | 2,652,679,516 | 104,339,608 | 484,477,695 |
| Liabilities | ||||||
| Bank overdrafts | 6,493 | — | — | — | — | — |
| Unrealized depreciation on forward foreign currency contracts | — | — | 133,467 | — | — | — |
| Dividends payable | — | — | — | — | — | — |
| Securities sold short** | — | — | 2,142,436 | — | — | — |
| Dividend and interest payable on securities sold short | — | — | 32,321 | — | — | — |
| Payable for return of collateral for securities on loan | — | 83,219 | 9,255,865 | — | 881,725 | — |
| Payable for capital shares redeemed | 2,524,652 | 1,346 | 1,403,937 | 4,555,647 | 555,186 | 1,593,819 |
| Payable for investments purchased | 1,825,054 | — | 5,765,437 | — | 176,573 | — |
| Payable to Investment Advisor | 74,901 | 3,385 | 118,195 | 1,221,736 | 42,484 | 89,867 |
| Payable to other affiliates | 54,258 | 1,605 | 40,101 | 984,034 | 13,669 | 59,190 |
| Payable to Trustees | 13,553 | 13,553 | 13,553 | 13,553 | 13,553 | 13,553 |
| Payable for professional services | 37,834 | 33,871 | 52,651 | 91,337 | 30,489 | 38,875 |
| Payable for reports to shareholders | 7,811 | 1,970 | 10,886 | 75,595 | 4,700 | 8,297 |
| Payable for transfer agent services | 109,086 | 125 | 113,485 | 1,008,589 | 20,185 | 115,477 |
| Other accrued expenses and liabilities | 10,021 | 16,555 | 60,752 | 15,545 | 6,811 | 5,869 |
| Total Liabilities | 4,663,663 | 155,629 | 19,143,086 | 7,966,036 | 1,745,375 | 1,924,947 |
| Net Assets | $264,069,099 | $8,595,324 | $271,089,564 | $2,644,713,480 | $102,594,233 | $482,552,748 |
| Net assets consist of: | ||||||
| Par value | 293,058 | 12,060 | 311,906 | 1,804,955 | 147,495 | 544,615 |
| Paid-in capital | 412,843,133 | 11,703,621 | 376,144,677 | 2,904,681,792 | 136,712,208 | 555,067,093 |
| Distributable earnings (deficit) | (149,067,092) | (3,120,357) | (105,367,019) | (261,773,267) | (34,265,470) | (73,058,960) |
| Net Assets | $264,069,099 | $8,595,324 | $271,089,564 | $2,644,713,480 | $102,594,233 | $482,552,748 |
| *Includes market value of securities on loan of: | $— | $79,170 | $8,891,937 | $— | $849,473 | $— |
| †Cost of foreign currency: | $40 | $17,476 | $991,627 | $— | $— | $— |
| **Proceeds received for securities sold short: | $— | $— | $2,340,328 | $— | $— | $— |
| (A) | Represents segregated cash for futures contracts, swap agreements and/or securities sold short. |
| Touchstone International ESG Equity Fund | Touchstone Mid Cap Fund | Touchstone Mid Cap Value Fund | Touchstone Sands Capital Select Growth Fund | Touchstone Small Cap Fund | Touchstone Small Cap Value Fund | Touchstone Ultra Short Duration Fixed Income Fund |
| $33,628,554 | $3,800,697,083 | $655,134,963 | $2,088,344,020 | $85,623,269 | $54,949,768 | $718,178,811 |
| $28,874,326 | $4,009,544,348 | $765,164,562 | $2,258,660,594 | $92,921,270 | $62,885,241 | $702,285,976 |
| — | — | — | 124 | — | — | — |
| — | — | — | — | — | — | — |
| 15 | — | — | — | — | — | — |
| 75,573 | 3,169,417 | 886,872 | 191,825 | 102,453 | 71,252 | 2,672,991 |
| 26,058 | 8,988,974 | 1,037,903 | 5,904,780 | 171,253 | 37,564 | 3,312,088 |
| — | — | — | 43,705,544 | — | — | 475,688 |
| — | — | — | — | — | — | — |
| — | — | — | — | — | — | — |
| 47 | — | — | — | 214 | — | — |
| — | — | — | — | — | — | — |
| 44,283 | — | — | — | — | — | — |
| 12,121 | 84,777 | 29,193 | 52,171 | 14,855 | 15,273 | 34,092 |
| 29,032,423 | 4,021,787,516 | 767,118,530 | 2,308,515,038 | 93,210,045 | 63,009,330 | 708,780,835 |
| — | — | — | — | — | — | 510,361 |
| — | — | — | — | — | — | — |
| — | — | — | — | — | — | 184,609 |
| — | — | — | — | — | — | — |
| — | — | — | — | — | — | — |
| 738,513 | — | — | — | 2,475,674 | 666 | — |
| 56,160 | 9,847,779 | 4,303,697 | 8,177,255 | 95,845 | 32,919 | 3,882,450 |
| — | — | — | 29,982,738 | — | — | — |
| 8,951 | 2,501,769 | 393,642 | 1,273,293 | 53,036 | 42,017 | 132,643 |
| 4,639 | 593,888 | 99,375 | 605,758 | 11,392 | 9,651 | 133,604 |
| 13,553 | 13,553 | 13,553 | 13,553 | 13,553 | 13,553 | 13,553 |
| 31,207 | 121,011 | 40,255 | 79,850 | 24,418 | 24,908 | 46,746 |
| 4,837 | 114,493 | 43,405 | 57,295 | 6,022 | 5,381 | 12,585 |
| 13,128 | 1,232,954 | 311,496 | 742,933 | 23,437 | 23,500 | 182,926 |
| 6,669 | 70,588 | 8,616 | 408,503 | 3,946 | 5,747 | 10,316 |
| 877,657 | 14,496,035 | 5,214,039 | 41,341,178 | 2,707,323 | 158,342 | 5,109,793 |
| $28,154,766 | $4,007,291,481 | $761,904,491 | $2,267,173,860 | $90,502,722 | $62,850,988 | $703,671,042 |
| 47,062 | 1,015,789 | 377,124 | 2,505,473 | 80,700 | 21,754 | 781,089 |
| 33,495,286 | 3,800,669,073 | 622,639,275 | 2,697,087,222 | 81,900,700 | 63,412,339 | 828,693,388 |
| (5,387,582) | 205,606,619 | 138,888,092 | (432,418,835) | 8,521,322 | (583,105) | (125,803,435) |
| $28,154,766 | $4,007,291,481 | $761,904,491 | $2,267,173,860 | $90,502,722 | $62,850,988 | $703,671,042 |
| $715,914 | $— | $— | $— | $2,453,587 | $632 | $— |
| $17 | $— | $— | $— | $— | $— | $— |
| $— | $— | $— | $— | $— | $— | $— |
| Touchstone Active Bond Fund | Touchstone Anti- Benchmark® International Core Equity Fund | Touchstone Ares Credit Opportunities Fund | Touchstone Dividend Equity Fund | Touchstone High Yield Fund | Touchstone Impact Bond Fund | |
| Pricing of Class A Shares | ||||||
| Net assets applicable to Class A shares | $135,000,030 | $— | $115,483,216 | $1,398,059,126 | $11,823,758 | $11,777,068 |
| Shares of beneficial interest outstanding (unlimited number of shares authorized, $0.01 par value) | 14,951,242 | — | 13,360,121 | 95,226,127 | 1,745,698 | 1,330,967 |
| Net asset value price per share* | $9.03 | $— | $8.64 | $14.68 | $6.77 | $8.85 |
| Maximum sales charge - Class A shares | 3.25% | — | 3.25% | 5.00% | 3.25% | 3.25% |
| Maximum offering price per share (100%/(100%-maximum sales charge) of net asset value adjusted to the nearest cent) - Class A shares | $9.33 | $— | $8.93 | $15.45 | $7.00 | $9.15 |
| Pricing of Class C Shares | ||||||
| Net assets applicable to Class C shares | $4,667,251 | $— | $17,574,693 | $471,272,543 | $700,317 | $1,414,903 |
| Shares of beneficial interest outstanding (unlimited number of shares authorized, $0.01 par value) | 566,166 | — | 2,104,823 | 32,361,573 | 103,771 | 160,060 |
| Net asset value and offering price per share** | $8.24 | $— | $8.35 | $14.56 | $6.75 | $8.84 |
| Pricing of Class S Shares | ||||||
| Net assets applicable to Class S shares | $— | $— | $— | $— | $— | $— |
| Shares of beneficial interest outstanding (unlimited number of shares authorized, $0.01 par value) | — | — | — | — | — | — |
| Net asset value, offering price and redemption price per share | $— | $— | $— | $— | $— | $— |
| Pricing of Class Y Shares | ||||||
| Net assets applicable to Class Y shares | $56,002,958 | $155,087 | $135,892,395 | $772,986,510 | $22,994,171 | $225,456,690 |
| Shares of beneficial interest outstanding (unlimited number of shares authorized, $0.01 par value) | 6,206,811 | 21,669 | 15,483,602 | 52,744,353 | 3,292,098 | 25,443,394 |
| Net asset value, offering price and redemption price per share | $9.02 | $7.16 | $8.78 | $14.66 | $6.98 | $8.86 |
| Pricing of Class Z Shares | ||||||
| Net assets applicable to Class Z shares | $— | $— | $— | $— | $— | $— |
| Shares of beneficial interest outstanding (unlimited number of shares authorized, $0.01 par value) | — | — | — | — | — | — |
| Net asset value, offering price and redemption price per share | $— | $— | $— | $— | $— | $— |
| Pricing of Institutional Class Shares | ||||||
| Net assets applicable to Institutional Class shares | $68,398,860 | $8,440,237 | $2,139,260 | $885,198 | $67,075,987 | $243,901,929 |
| Shares of beneficial interest outstanding (unlimited number of shares authorized, $0.01 par value) | 7,581,581 | 1,184,338 | 242,102 | 60,424 | 9,607,893 | 27,526,860 |
| Net asset value, offering price and redemption price per share | $9.02 | $7.13 | $8.84 | $14.65 | $6.98 | $8.86 |
| Pricing of Class R6 Shares | ||||||
| Net assets applicable to Class R6 shares | $— | $— | $— | $1,510,103 | $— | $2,158 |
| Shares of beneficial interest outstanding (unlimited number of shares authorized, $0.01 par value) | — | — | — | 103,068 | — | 243 |
| Net asset value, offering price and redemption price per share | $— | $— | $— | $14.65 | $— | $8.86 |
| * | There is no sales load on subscriptions of $1 million or more for all funds except for Active Bond Fund, Ares Credit Opportunities Fund, High Yield Fund, Impact Bond Fund and Ultra Short Duration Fixed Income Fund. There is no sales load on subscriptions of $500,000 or more for Active Bond Fund, Ares Credit Opportunities Fund, High Yield Fund, Impact Bond Fund and Ultra Short Duration Fixed Income Fund. Redemptions that were part of a $500,000 or $1million or more subscription, as applicable, may be subject to a contingent deferred sales load if redeemed within a one-year period from the date of purchase. |
| ** | Redemption price per share varies by length of time shares are held due to the terms of the contingent deferred sales charge. |
| ^ | The Shares of beneficial interest outstanding and Net asset value and offering price per share were updated to reflect the effect of a 1 for 0.796098 reverse stock split for Class C shares on October 14, 2022 (See Note 10 in the Notes to Financial Statements). |
| Touchstone International ESG Equity Fund | Touchstone Mid Cap Fund | Touchstone Mid Cap Value Fund | Touchstone Sands Capital Select Growth Fund^ | Touchstone Small Cap Fund | Touchstone Small Cap Value Fund | Touchstone Ultra Short Duration Fixed Income Fund |
| $6,595,379 | $109,652,886 | $12,949,607 | $319,960,482 | $4,022,418 | $21,033,654 | $125,115,471 |
| 1,104,207 | 2,826,289 | 646,506 | 38,546,713 | 365,121 | 730,307 | 13,888,950 |
| $5.97 | $38.80 | $20.03 | $8.30 | $11.02 | $28.80 | $9.01 |
| 5.00% | 5.00% | 5.00% | 5.00% | 5.00% | 5.00% | 2.00% |
| $6.28 | $40.84 | $21.08 | $8.74 | $11.60 | $30.32 | $9.19 |
| $1,086,124 | $65,811,598 | $4,012,731 | $20,623,091 | $161,525 | $272,107 | $5,012,563 |
| 182,596 | 1,846,712 | 208,543 | 2,485,869 | 16,581 | 9,937 | 555,909 |
| $5.95 | $35.64 | $19.24 | $8.30 | $9.74 | $27.38 | $9.02 |
| $— | $— | $— | $— | $— | $— | $42,708,609 |
| — | — | — | — | — | — | 4,738,639 |
| $— | $— | $— | $— | $— | $— | $9.01 |
| $14,560,025 | $2,789,007,944 | $349,755,519 | $613,010,439 | $53,484,561 | $34,156,407 | $250,472,849 |
| 2,430,091 | 70,598,497 | 17,359,359 | 65,571,102 | 4,756,840 | 1,180,215 | 27,789,478 |
| $5.99 | $39.51 | $20.15 | $9.35 | $11.24 | $28.94 | $9.01 |
| $— | $37,449,451 | $— | $203,619,755 | $— | $— | $50,208,669 |
| — | 972,484 | — | 24,503,393 | — | — | 5,571,768 |
| $— | $38.51 | $— | $8.31 | $— | $— | $9.01 |
| $5,913,238 | $407,131,613 | $395,186,634 | $839,598,658 | $32,834,218 | $7,388,820 | $230,152,881 |
| 989,310 | 10,265,396 | 19,497,981 | 89,673,564 | 2,931,442 | 254,897 | 25,564,153 |
| $5.98 | $39.66 | $20.27 | $9.36 | $11.20 | $28.99 | $9.00 |
| $— | $598,237,989 | $— | $270,361,435 | $— | $— | $— |
| — | 15,069,569 | — | 28,863,966 | — | — | — |
| $— | $39.70 | $— | $9.37 | $— | $— | $— |
| Touchstone Active Bond Fund | Touchstone Anti- Benchmark® International Core Equity Fund | Touchstone Ares Credit Opportunities Fund | Touchstone Dividend Equity Fund | |
| Investment Income | ||||
| Dividends* | $129,649 | $442,987 | $— | $89,314,216 |
| Interest** | 10,176,361 | — | 17,533,957 | — |
| Income from securities loaned | 5,259 | 1,539 | 104,483 | 78,689 |
| Total Investment Income | 10,311,269 | 444,526 | 17,638,440 | 89,392,905 |
| Expenses | ||||
| Investment advisory fees | 1,221,208 | 80,153 | 1,782,683 | 17,462,840 |
| Administration fees | 447,318 | 23,173 | 394,000 | 4,485,940 |
| Compliance fees and expenses | 3,293 | 3,293 | 3,293 | 3,293 |
| Custody fees | 50,996 | 38,592 | 76,470 | 41,411 |
| Professional fees | 51,158 | 56,834 | 131,594 | 142,960 |
| Transfer Agent fees, Class A | 159,787 | — | 123,437 | 1,450,343 |
| Transfer Agent fees, Class C | 7,294 | — | 22,837 | 579,974 |
| Transfer Agent fees, Class S | — | — | — | — |
| Transfer Agent fees, Class Y | 68,408 | 295 | 130,124 | 798,450 |
| Transfer Agent fees, Class Z | — | — | — | — |
| Transfer Agent fees, Institutional Class | 9,129 | 43 | 444 | 416 |
| Transfer Agent fees, Class R6 | — | — | — | 27 |
| Pricing expense | 10,408 | 17,259 | 10,886 | — |
| Registration Fees, Class A | 18,691 | — | 17,928 | 31,368 |
| Registration Fees, Class C | 12,734 | — | 12,363 | 20,268 |
| Registration Fees, Class S | — | — | — | — |
| Registration Fees, Class Y | 14,125 | 4,172 | 31,716 | 18,958 |
| Registration Fees, Class Z | — | — | — | — |
| Registration Fees, Institutional Class | 12,296 | 5,588 | 6,603 | 6,075 |
| Registration Fees, Class R6 | — | — | — | 5,381 |
| Dividend expense on securities sold short | — | — | 17,108 | — |
| Interest expense on securities sold short | — | — | 95,274 | — |
| Reports to Shareholders, Class A | 15,516 | — | 13,424 | 99,298 |
| Reports to Shareholders, Class C | 2,372 | — | 3,316 | 45,277 |
| Reports to Shareholders, Class S | — | — | — | — |
| Reports to Shareholders, Class Y | 4,429 | 1,709 | 12,859 | 47,773 |
| Reports to Shareholders, Class Z | — | — | — | — |
| Reports to Shareholders, Institutional Class | 2,486 | 2,153 | 1,818 | 1,662 |
| Reports to Shareholders, Class R6 | — | — | — | 1,585 |
| Shareholder servicing fees, Class Z | — | — | — | — |
| Distribution and shareholder servicing expenses, Class A | 409,743 | — | 331,423 | 4,238,275 |
| Distribution and shareholder servicing expenses, Class C | 68,728 | — | 246,975 | 6,691,666 |
| Distribution expenses, Class S | — | — | — | — |
| Trustee fees | 27,891 | 27,891 | 27,891 | 27,891 |
| Other expenses | 105,105 | 14,929 | 109,426 | 238,338 |
| Total Expenses | 2,723,115 | 276,084 | 3,603,892 | 36,439,469 |
| Fees waived and/or reimbursed by the Advisor and/or Affiliates(A) | (289,666) | (170,789) | (615,648) | (692,784) |
| Fees eligible for recoupment by the Advisor(A) | — | — | — | — |
| Net Expenses | 2,433,449 | 105,295 | 2,988,244 | 35,746,685 |
| Net Investment Income (Loss) | 7,877,820 | 339,231 | 14,650,196 | 53,646,220 |
| Realized and Unrealized Gains (Losses) on Investments | ||||
| Net realized gains (losses) on investments(B) | (15,530,586) | (1,134,452) | (8,077,915) | 129,178,514 |
| Net realized gains on securities sold short | — | — | 534,216 | — |
| Net realized gains on written options | — | — | 259,459 | — |
| Net realized gains on futures contracts | 223,242 | — | — | — |
| Net realized gains (losses) on swap agreements | 153,741 | — | (71,238) | — |
| Net realized gains on forward foreign currency contracts | — | — | 1,363,203 | — |
| Net realized gains (losses) on foreign currency transactions | — | 20,472 | (377,131) | — |
| Net change in unrealized appreciation (depreciation) on investments | (50,653,841) | (4,687,304) | (42,238,298) | (443,882,482) |
| Net change in unrealized appreciation (depreciation) on securities sold short | — | — | 190,642 | — |
| Net change in unrealized appreciation (depreciation) on written options | — | — | (1,022) | — |
| Net change in unrealized appreciation (depreciation) on futures contracts | 9,044 | — | — | — |
| Net change in unrealized appreciation (depreciation) on swap agreements | — | — | 97,446 | — |
| Net change in unrealized appreciation (depreciation) on forward foreign currency contracts | — | — | (236,311) | — |
| Net change in unrealized appreciation (depreciation) on foreign currency transactions | (6) | (8,299) | (75,162) | — |
| Net Realized and Unrealized Gains (Losses) on Investments | (65,798,406) | (5,809,583) | (48,632,111) | (314,703,968) |
| Change in Net Assets Resulting from Operations | $(57,920,586) | $(5,470,352) | $(33,981,915) | $(261,057,748) |
| *Net of foreign tax withholding of: | $— | $43,420 | $— | $— |
| **Net of foreign tax withholding of: | $— | $— | $16,120 | $— |
| (A) | See Note 4 in Notes to Financial Statements. |
| (B) | For the year ended September 30, 2022, Mid Cap Fund, Sands Capital Select Growth Fund and Small Cap Fund had redemptions-in-kind of securities in the amount of $389,883,890, $711,270,580, and $5,450,274, respectively. Net realized gains (losses) on investments includes the realized gain on the transactions of $151,809,197, $331,351,035, and $1,922,232, respectively, which will not be realized by the Fund for tax purposes. |
| Touchstone High Yield Fund | Touchstone Impact Bond Fund | Touchstone International ESG Equity Fund | Touchstone Mid Cap Fund | Touchstone Mid Cap Value Fund | Touchstone Sands Capital Select Growth Fund | Touchstone Small Cap Fund | Touchstone Small Cap Value Fund | Touchstone Ultra Short Duration Fixed Income Fund |
| $16,085 | $— | $1,095,280 | $51,477,551 | $16,171,123 | $6,350,619 | $1,143,996 | $1,021,682 | $— |
| 6,349,161 | 11,577,542 | — | 4,276 | — | 2,174 | — | — | 13,593,632 |
| 9,679 | 1,181 | 14,551 | 1,044 | 1,009 | 11,970 | 214 | 479 | — |
| 6,374,925 | 11,578,723 | 1,109,831 | 51,482,871 | 16,172,132 | 6,364,763 | 1,144,210 | 1,022,161 | 13,593,632 |
| 642,001 | 1,171,029 | 231,741 | 30,158,825 | 6,688,388 | 25,650,413 | 814,603 | 636,789 | 2,262,694 |
| 156,637 | 602,065 | 47,256 | 6,102,935 | 1,181,159 | 5,581,697 | 127,020 | 99,157 | 1,194,812 |
| 3,293 | 3,293 | 3,293 | 3,293 | 3,293 | 3,293 | 3,293 | 3,293 | 3,293 |
| 40,492 | 14,478 | 12,481 | 55,253 | 23,015 | 55,201 | 9,051 | 26,513 | 87,502 |
| 36,219 | 91,086 | 39,813 | 216,941 | 69,663 | 184,064 | 26,839 | 36,806 | 67,142 |
| 17,520 | 19,109 | 9,051 | 188,534 | 18,871 | 470,411 | 6,878 | 21,799 | 93,044 |
| 1,024 | 1,417 | 1,670 | 69,711 | 3,167 | 42,638 | 383 | 647 | 2,238 |
| — | — | — | — | — | — | — | — | 23,091 |
| 30,871 | 144,873 | 22,618 | 3,367,049 | 946,326 | 866,307 | 52,632 | 32,462 | 208,781 |
| — | — | — | 72,743 | — | 546,292 | — | — | 66,249 |
| 812 | 110,768 | 25 | 233,221 | 141,043 | 682,584 | 7,329 | 1,231 | 128,056 |
| — | 23 | — | 314 | — | 158 | — | — | — |
| 5,814 | 5,923 | 4,585 | — | — | — | — | — | 7,549 |
| 9,691 | 14,822 | 12,549 | 19,830 | 14,404 | 25,216 | 11,890 | 15,991 | 15,924 |
| 6,542 | 9,021 | 8,876 | 14,595 | 9,436 | 15,097 | 6,933 | 6,486 | 8,719 |
| — | — | — | — | — | — | — | — | 13,340 |
| 14,078 | 24,324 | 16,644 | 129,391 | 26,477 | 74,181 | 18,690 | 16,046 | 30,214 |
| — | — | — | 14,821 | — | 24,109 | — | — | 14,858 |
| 16,037 | 19,418 | 3,339 | 29,187 | 30,080 | 78,245 | 11,456 | 6,866 | 32,043 |
| — | 2,974 | — | 3,084 | — | 14,817 | — | — | — |
| — | — | — | — | — | — | — | — | — |
| — | — | — | — | — | — | — | — | — |
| 3,109 | 3,528 | 1,915 | 11,879 | 8,790 | 41,160 | 2,765 | 3,839 | 5,695 |
| 1,758 | 2,005 | 1,815 | 7,384 | 1,985 | 5,342 | 1,746 | 1,772 | 1,860 |
| — | — | — | — | — | — | — | — | 2,014 |
| 2,423 | 9,750 | 3,703 | 256,454 | 66,792 | 68,103 | 6,511 | 4,163 | 9,970 |
| — | — | — | 4,098 | — | 27,469 | — | — | 7,078 |
| 2,300 | 5,862 | 1,729 | 13,900 | 33,692 | 31,242 | 1,907 | 2,053 | 3,336 |
| — | 1,771 | — | 16,844 | — | 8,072 | — | — | — |
| — | — | — | 119,099 | — | 892,278 | — | — | 165,134 |
| 35,092 | 37,785 | 22,928 | 342,285 | 36,604 | 1,401,595 | 12,254 | 60,962 | 347,263 |
| 9,172 | 15,087 | 19,142 | 814,033 | 41,155 | 427,427 | 1,916 | 4,315 | 30,132 |
| — | — | — | — | — | — | — | — | 233,801 |
| 27,891 | 27,891 | 27,891 | 27,891 | 27,891 | 27,891 | 27,891 | 27,891 | 27,891 |
| 34,232 | 34,636 | 17,546 | 1,101,714 | 45,580 | 1,944,563 | 28,012 | 26,827 | 71,458 |
| 1,097,008 | 2,372,938 | 510,610 | 43,395,308 | 9,417,811 | 39,189,865 | 1,179,999 | 1,035,908 | 5,165,181 |
| (163,758) | (236,402) | (145,313) | (77,736) | (1,293,131) | (482,237) | (238,087) | (137,571) | (586,749) |
| — | — | — | 198,256 | — | — | — | — | — |
| 933,250 | 2,136,536 | 365,297 | 43,515,828 | 8,124,680 | 38,707,628 | 941,912 | 898,337 | 4,578,432 |
| 5,441,675 | 9,442,187 | 744,534 | 7,967,043 | 8,047,452 | (32,342,865) | 202,298 | 123,824 | 9,015,200 |
| (2,307,010) | (1,804,552) | (1,283,197) | 210,920,205 | 46,743,638 | (272,720,741) | 4,588,403 | 6,334,093 | (566,755) |
| — | — | — | — | — | — | — | — | — |
| — | — | — | — | — | — | — | — | — |
| — | — | — | — | — | — | — | — | — |
| — | — | — | — | — | — | — | — | — |
| — | — | — | — | — | — | — | — | — |
| — | — | (12,942) | — | — | — | — | — | — |
| (21,160,954) | (78,265,539) | (11,942,602) | (859,804,305) | (127,460,280) | (2,963,008,595) | (15,184,808) | (14,047,386) | (14,699,448) |
| — | — | — | — | — | — | — | — | — |
| — | — | — | — | — | — | — | — | — |
| — | — | — | — | — | — | — | — | — |
| — | — | — | — | — | — | — | — | — |
| — | — | — | — | — | — | — | — | — |
| — | 1 | (4,210) | — | — | — | — | — | — |
| (23,467,964) | (80,070,090) | (13,242,951) | (648,884,100) | (80,716,642) | (3,235,729,336) | (10,596,405) | (7,713,293) | (15,266,203) |
| $(18,026,289) | $(70,627,903) | $(12,498,417) | $(640,917,057) | $(72,669,190) | $(3,268,072,201) | $(10,394,107) | $(7,589,469) | $(6,251,003) |
| $— | $— | $162,650 | $— | $— | $— | $— | $— | $— |
| $— | $— | $— | $— | $— | $— | $— | $— | $— |
| Touchstone Active Bond Fund | Touchstone Anti- Benchmark® International Core Equity Fund | Touchstone Ares Credit Opportunities Fund | ||||
| For the Year Ended September 30, 2022 | For the Year Ended September 30, 2021 | For the Year Ended September 30, 2022 | For the Year Ended September 30, 2021 | For the Year Ended September 30, 2022 | For the Year Ended September 30, 2021 | |
| From Operations | ||||||
| Net investment income | $7,877,820 | $7,992,609 | $339,231 | $577,520 | $14,650,196 | $6,422,974 |
| Net realized gains (losses) on investments, securities sold short, written options, futures contracts, swap agreements, forward foreign currency contracts and foreign currency transactions | (15,153,603) | 11,402,813 | (1,113,980) | 3,576,770 | (6,369,406) | 14,169,305 |
| Net change in unrealized appreciation (depreciation) on investments, securities sold short, written options, futures contracts, swap agreements, forward foreign currency contracts and foreign currency transactions | (50,644,803) | (14,784,211) | (4,695,603) | (285,194) | (42,262,705) | (426,231) |
| Change in Net Assets from Operations | (57,920,586) | 4,611,211 | (5,470,352) | 3,869,096 | (33,981,915) | 20,166,048 |
| Distributions to Shareholders: | ||||||
| Distributed earnings, Class A | (4,486,138) | (2,854,355) | — | — | (10,184,185) | (2,010,075) |
| Distributed earnings, Class B | — | — | — | — | — | — |
| Distributed earnings, Class C | (155,959) | (91,900) | — | — | (1,894,704) | (375,656) |
| Distributed earnings, Class Y | (2,209,120) | (2,291,191) | (27,448) | (4,532) | (10,225,969) | (3,026,554) |
| Distributed earnings, Institutional Class | (2,857,397) | (3,052,478) | (3,622,949) | (714,426) | (296,585) | (1,962,020) |
| Distributed earnings, Class R6 | — | — | — | — | — | — |
| Return of capital, Class A | — | — | — | — | (208,087) | — |
| Return of capital, Class C | — | — | — | — | (38,713) | — |
| Return of capital, Class Y | — | — | — | — | (208,942) | — |
| Return of capital, Institutional Class | — | — | — | — | (6,060) | — |
| Total Distributions | (9,708,614) | (8,289,924) | (3,650,397) | (718,958) | (23,063,245) | (7,374,305) |
| Change in Net Assets from Share Transactions(B) | (56,833,680) | 33,611,918 | (21,781,747) | (771,211) | 50,868,017 | 177,091,677 |
| Total Increase (Decrease) in Net Assets | (124,462,880) | 29,933,205 | (30,902,496) | 2,378,927 | (6,177,143) | 189,883,420 |
| Net Assets | ||||||
| Beginning of period | 388,531,979 | 358,598,774 | 39,497,820 | 37,118,893 | 277,266,707 | 87,383,287 |
| End of period | $264,069,099 | $388,531,979 | $8,595,324 | $39,497,820 | $271,089,564 | $277,266,707 |
| (A) | The Fund changed its fiscal year end from October 31 to September 30. |
| (B) | For details on share transactions by class, see Statements of Changes in Net Assets - Capital Stock Activity on pages 96-98. |
| Touchstone Dividend Equity Fund | Touchstone High Yield Fund | Touchstone Impact Bond Fund | ||||
| For the Year Ended September 30, 2022 | For the Eleven Months Ended September 30, 2021(A) | For the Year Ended October 31, 2020 | For the Year Ended September 30, 2022 | For the Year Ended September 30, 2021 | For the Year Ended September 30, 2022 | For the Year Ended September 30, 2021 |
| $53,646,220 | $74,658,477 | $231,627,728 | $5,441,675 | $8,786,402 | $9,442,187 | $7,077,303 |
| 129,178,514 | 693,404,709 | (637,360,833) | (2,307,010) | 7,075,942 | (1,804,552) | 1,304,822 |
| (443,882,482) | 199,414,510 | (532,491,386) | (21,160,954) | 4,489,032 | (78,265,538) | (9,914,205) |
| (261,057,748) | 967,477,696 | (938,224,491) | (18,026,289) | 20,351,376 | (70,627,903) | (1,532,080) |
| (60,517,485) | (37,578,649) | (151,258,569) | (635,363) | (682,278) | (308,245) | (294,184) |
| — | (2,109,055) | (17,797,190) | — | — | — | — |
| (20,012,156) | (14,593,990) | (138,592,258) | (35,370) | (36,797) | (19,672) | (14,442) |
| (39,811,139) | (34,302,130) | (242,410,378) | (1,361,171) | (1,574,315) | (4,857,585) | (3,080,885) |
| (26,606) | (1,422) | — | (3,489,266) | (6,593,545) | (5,592,885) | (4,314,437) |
| (18,155) | (11) | — | — | — | (54) | — |
| — | — | — | — | — | — | — |
| — | — | — | — | — | — | — |
| — | — | — | — | — | — | — |
| — | — | — | — | — | — | — |
| (120,385,541) | (88,585,257) | (550,058,395) | (5,521,170) | (8,886,935) | (10,778,441) | (7,703,948) |
| (680,140,322) | (1,822,939,395) | (3,062,747,155) | (13,278,170) | (57,540,644) | 128,133,121 | 53,261,500 |
| (1,061,583,611) | (944,046,956) | (4,551,030,041) | (36,825,629) | (46,076,203) | 46,726,777 | 44,025,472 |
| 3,706,297,091 | 4,650,344,047 | 9,201,374,088 | 139,419,862 | 185,496,065 | 435,825,971 | 391,800,499 |
| $2,644,713,480 | $3,706,297,091 | $4,650,344,047 | $102,594,233 | $139,419,862 | $482,552,748 | $435,825,971 |
| Touchstone International ESG Equity Fund | Touchstone Mid Cap Fund | Touchstone Mid Cap Value Fund | ||||
| For the Year Ended September 30, 2022 | For the Year Ended September 30, 2021 | For the Year Ended September 30, 2022 | For the Year Ended September 30, 2021 | For the Year Ended September 30, 2022 | For the Year Ended September 30, 2021 | |
| From Operations | ||||||
| Net investment income (loss) | $744,534 | $362,539 | $7,967,043 | $5,125,933 | $8,047,452 | $3,143,017 |
| Net realized gains (losses) on investments and foreign currency transactions | (1,296,139) | 3,095,868 | 210,920,205 | 249,118,292 | 46,743,638 | 91,266,526 |
| Net change in unrealized appreciation (depreciation) on investments and foreign currency transactions | (11,946,812) | 2,792,476 | (859,804,305) | 621,005,091 | (127,460,280) | 179,982,199 |
| Change in Net Assets from Operations | (12,498,417) | 6,250,883 | (640,917,057) | 875,249,316 | (72,669,190) | 274,391,742 |
| Distributions to Shareholders: | ||||||
| Distributed earnings, Class A | (698,433) | (48,775) | (4,115,987) | (2,210,139) | (1,024,882) | (17,884) |
| Distributed earnings, Class C | (136,481) | — | (2,578,283) | (1,691,858) | (262,128) | — |
| Distributed earnings, Class S | — | — | — | — | — | — |
| Distributed earnings, Class Y | (1,412,733) | (80,193) | (94,122,984) | (57,465,241) | (29,429,809) | (1,153,819) |
| Distributed earnings, Class Z | — | — | (1,548,497) | (1,244,341) | — | — |
| Distributed earnings, Institutional Class | (251) | (19) | (17,280,598) | (25,311,010) | (34,105,495) | (1,848,019) |
| Distributed earnings, Class R6 | — | — | (18,048,845) | — | — | — |
| Return of capital, Class A | — | — | — | — | — | — |
| Return of capital, Class C | — | — | — | — | — | — |
| Return of capital, Class Y | — | — | — | — | — | — |
| Return of capital, Institutional Class | — | — | — | — | — | — |
| Total Distributions | (2,247,898) | (128,987) | (137,695,194) | (87,922,589) | (64,822,314) | (3,019,722) |
| Change in Net Assets from Share Transactions(A) | 9,517,569 | (76,211) | (44,043,632) | 196,604,803 | 24,201,005 | (79,179,049) |
| Total Increase (Decrease) in Net Assets | (5,228,746) | 6,045,685 | (822,655,883) | 983,931,530 | (113,290,499) | 192,192,971 |
| Net Assets | ||||||
| Beginning of period | 33,383,512 | 27,337,827 | 4,829,947,364 | 3,846,015,834 | 875,194,990 | 683,002,019 |
| End of period | $28,154,766 | $33,383,512 | $4,007,291,481 | $4,829,947,364 | $761,904,491 | $875,194,990 |
| (A) | For details on share transactions by class, see Statements of Changes in Net Assets - Capital Stock Activity on pages 99-102. |
| Touchstone Sands Capital Select Growth Fund | Touchstone Small Cap Fund | Touchstone Small Cap Value Fund | Touchstone Ultra Short Duration Fixed Income Fund | ||||
| For the Year Ended September 30, 2022 | For the Year Ended September 30, 2021 | For the Year Ended September 30, 2022 | For the Year Ended September 30, 2021 | For the Year Ended September 30, 2022 | For the Year Ended September 30, 2021 | For the Year Ended September 30, 2022 | For the Year Ended September 30, 2021 |
| $(32,342,865) | $(38,393,633) | $202,298 | $613,344 | $123,824 | $115,710 | $9,015,200 | $6,477,833 |
| (272,720,741) | 1,041,558,717 | 4,588,403 | 17,883,246 | 6,334,093 | 5,693,285 | (566,755) | 175,982 |
| (2,963,008,595) | 141,728,022 | (15,184,808) | 9,656,923 | (14,047,386) | 24,049,244 | (14,699,448) | 2,532,844 |
| (3,268,072,201) | 1,144,893,106 | (10,394,107) | 28,153,513 | (7,589,469) | 29,858,239 | (6,251,003) | 9,186,659 |
| (87,728,652) | (17,693,260) | (678,527) | (76,369) | (40,652) | (32,691) | (1,908,884) | (1,191,026) |
| (8,735,300) | (4,115,544) | (28,748) | (5,189) | (365) | (461) | (34,489) | (19,141) |
| — | — | — | — | — | — | (521,248) | (371,847) |
| (165,283,847) | (152,873,291) | (6,589,242) | (1,040,101) | (93,549) | (63,554) | (4,538,648) | (3,531,075) |
| (59,112,671) | (52,230,135) | — | — | — | — | (887,969) | (732,118) |
| (241,831,240) | (8,474) | (4,725,275) | (1,003,459) | (25,873) | (17,628) | (5,753,399) | (5,902,220) |
| (49,261,002) | (102,763) | — | — | — | — | — | — |
| — | — | — | — | (53,341) | (30,163) | — | — |
| — | — | — | — | (480) | (425) | — | — |
| — | — | — | — | (122,749) | (58,641) | — | — |
| — | — | — | — | (33,949) | (16,265) | — | — |
| (611,952,712) | (227,023,467) | (12,021,792) | (2,125,118) | (370,958) | (219,828) | (13,644,637) | (11,747,427) |
| (204,998,792) | 3,177,487,521 | 17,957,994 | (4,449,869) | (5,338,603) | (6,753,764) | (349,436,215) | 88,853,009 |
| (4,085,023,705) | 4,095,357,160 | (4,457,905) | 21,578,526 | (13,299,030) | 22,884,647 | (369,331,855) | 86,292,241 |
| 6,352,197,565 | 2,256,840,405 | 94,960,627 | 73,382,101 | 76,150,018 | 53,265,371 | 1,073,002,897 | 986,710,656 |
| $2,267,173,860 | $6,352,197,565 | $90,502,722 | $94,960,627 | $62,850,988 | $76,150,018 | $703,671,042 | $1,073,002,897 |
| Touchstone Active Bond Fund | Touchstone Anti- Benchmark® International Core Equity Fund | |||||||
| For the Year Ended September 30, 2022 | For the Year Ended September 30, 2021 | For the Year Ended September 30, 2022 | For the Year Ended September 30, 2021 | |||||
| Shares | Dollars | Shares | Dollars | Shares | Dollars | Shares | Dollars | |
| Class A(C) | ||||||||
| Proceeds from Shares issued | 957,583 | $9,919,979 | 1,581,041 | $17,746,223 | — | $— | — | $— |
| Proceeds from Shares issued in connection with reorganization | — | — | 9,794,843 | 110,186,140 | — | — | — | — |
| Reinvestment of distributions | 395,728 | 4,046,156 | 224,230 | 2,513,018 | — | — | — | — |
| Cost of Shares redeemed | (3,202,683) | (32,795,091) | (6,207,410) | (69,966,791) | — | — | — | — |
| Shares issued (reacquired) upon automatic conversion | — | — | — | — | — | — | — | — |
| Change from Class A Share Transactions | (1,849,372) | (18,828,956) | 5,392,704 | 60,478,590 | — | — | — | — |
| Class B(C) | ||||||||
| Proceeds from Shares issued | — | — | — | — | — | — | — | — |
| Reinvestment of distributions | — | — | — | — | — | — | — | — |
| Share conversion in connection with reorganization | — | — | — | — | — | — | — | — |
| Cost of Shares redeemed | — | — | — | — | — | — | — | — |
| Shares issued (reacquired) upon automatic conversion | — | — | — | — | — | — | — | — |
| Change from Class B Share Transactions | — | — | — | — | — | — | — | — |
| Class C | ||||||||
| Proceeds from Shares issued | 79,703 | 743,810 | 79,533 | 820,532 | — | — | — | — |
| Proceeds from Shares issued in connection with reorganization | — | — | 628,710 | 6,476,580 | — | — | — | — |
| Reinvestment of distributions | 16,301 | 153,510 | 8,702 | 89,500 | — | — | — | — |
| Cost of Shares redeemed | (436,459) | (4,114,643) | (355,656) | (3,662,936) | — | — | — | — |
| Shares issued (reacquired) upon automatic conversion | — | — | — | — | — | — | — | — |
| Change from Class C Share Transactions | (340,455) | (3,217,323) | 361,289 | 3,723,676 | — | — | — | — |
| Class Y(D) | ||||||||
| Proceeds from Shares issued | 855,970 | 8,911,215 | 2,054,376 | 23,130,318 | 211 | 1,975 | 360 | 4,282 |
| Proceeds from Shares issued in connection with reorganization | — | — | — | — | — | — | — | — |
| Reinvestment of distributions | 190,004 | 1,942,507 | 172,216 | 1,928,699 | 2,678 | 27,448 | 382 | 4,531 |
| Cost of Shares redeemed | (3,198,427) | (33,186,132) | (1,909,973) | (21,405,317) | (4,336) | (45,901) | — | — |
| Change from Class Y Share Transactions | (2,152,453) | (22,332,410) | 316,619 | 3,653,700 | (1,447) | (16,478) | 742 | 8,813 |
| Institutional Class | ||||||||
| Proceeds from Shares issued | 2,468,132 | 25,699,815 | 1,734,665 | 19,494,859 | 91,092 | 936,175 | 26,082 | 312,372 |
| Reinvestment of distributions | 244,595 | 2,496,364 | 242,823 | 2,719,478 | 351,924 | 3,622,949 | 60,238 | 714,426 |
| Cost of Shares redeemed | (4,095,927) | (40,651,170) | (5,014,127) | (56,458,385) | (2,582,071) | (26,324,393) | (152,975) | (1,806,822) |
| Change from Institutional Class Share Transactions | (1,383,200) | (12,454,991) | (3,036,639) | (34,244,048) | (2,139,055) | (21,765,269) | (66,655) | (780,024) |
| Class R6 | ||||||||
| Proceeds from Shares issued | — | — | — | — | — | — | — | — |
| Reinvestment of distributions | — | — | — | — | — | — | — | — |
| Cost of Shares redeemed | — | — | — | — | — | — | — | — |
| Change from Class R6 Share Transactions | — | — | — | — | — | — | — | — |
| Change from Share Transactions | (5,725,480) | $(56,833,680) | 3,033,973 | $33,611,918 | (2,140,502) | $(21,781,747) | (65,913) | $(771,211) |
| (A) | Represents the period from commencement of operations (July 19, 2021 and August 2, 2021) through September 30, 2021 for Institutional Class shares and Class R6 shares, respectively. |
| (B) | The Fund changed its fiscal year end from October 31 to September 30. |
| (C) | Effective July 16, 2021, Class B shares of the AIG Focused Dividend Strategy Fund were reorganized into Class A shares of the Touchstone Dividend Equity Fund. |
| (D) | Effective July 16, 2021, Class W shares of the AIG Senior Floating Rate Fund and the AIG Focused Dividend Strategy Fund were reorganized into Class Y shares of the Touchstone Ares Credit Opportunities Fund and the Touchstone Dividend Equity Fund, respectively. |
| Touchstone Ares Credit Opportunities Fund | Touchstone Dividend Equity Fund | ||||||||
| For the Year Ended September 30, 2022 | For the Year Ended September 30, 2021 | For the Year Ended September 30, 2022 | For the Eleven Months Ended September 30, 2021(A) (B) | For the Year Ended October 31, 2020 | |||||
| Shares | Dollars | Shares | Dollars | Shares | Dollars | Shares | Dollars | Shares | Dollars |
| 2,639,584 | $25,845,071 | 953,296 | $9,677,433 | 11,750,580 | $203,025,882 | 18,284,009 | $305,544,840 | 32,491,602 | $486,460,585 |
| — | — | 13,726,507 | 141,260,445 | — | — | 11,403,748 | 196,261,607 | — | — |
| 921,673 | 8,914,419 | 169,953 | 1,734,106 | 2,841,172 | 48,934,804 | 1,811,037 | 30,101,529 | 8,170,831 | 127,355,567 |
| (3,723,221) | (35,720,836) | (1,919,910) | (19,609,644) | (22,337,515) | (384,510,078) | (46,557,495) | (778,744,677) | (62,833,118) | (942,900,578) |
| — | — | — | — | — | — | — | — | 1,460,932 | 21,639,786 |
| (161,964) | (961,346) | 12,929,846 | 133,062,340 | (7,745,763) | (132,549,392) | (15,058,701) | (246,836,701) | (20,709,753) | (307,444,640) |
| — | — | — | — | — | — | 136,950 | 2,217,290 | 635,537 | 9,704,526 |
| — | — | — | — | — | — | 111,727 | 1,822,664 | 980,773 | 15,306,408 |
| — | — | — | — | — | — | (9,181,258) | (156,710,795) | — | — |
| — | — | — | — | — | — | (3,577,145) | (58,419,158) | (6,740,251) | (99,688,786) |
| — | — | — | — | — | — | — | — | (211,231) | (3,035,073) |
| — | — | — | — | — | — | (12,509,726) | (211,089,999) | (5,335,172) | (77,712,925) |
| 401,575 | 3,728,162 | 198,200 | 1,956,744 | 537,535 | 9,218,520 | 1,335,140 | 21,782,502 | 4,570,086 | 69,249,503 |
| — | — | 3,149,581 | 31,321,283 | — | — | 264,762 | 4,518,475 | — | — |
| 195,986 | 1,843,314 | 36,177 | 356,730 | 1,099,871 | 18,952,270 | 827,808 | 13,554,365 | 7,429,473 | 116,019,169 |
| (1,613,128) | (14,997,904) | (508,343) | (5,019,285) | (17,454,612) | (298,835,024) | (34,119,489) | (562,501,490) | (73,315,974) | (1,083,852,691) |
| — | — | — | — | — | — | — | — | (1,263,663) | (18,604,713) |
| (1,015,567) | (9,426,428) | 2,875,615 | 28,615,472 | (15,817,206) | (270,664,234) | (31,691,779) | (522,646,148) | (62,580,078) | (917,188,732) |
| 13,774,144 | 135,923,029 | 5,664,582 | 58,278,512 | 4,261,170 | 73,385,940 | 10,482,598 | 173,072,737 | 27,504,922 | 416,610,757 |
| — | — | 1,935,037 | 20,196,958 | — | — | 2,988,813 | 51,352,080 | — | — |
| 1,067,587 | 10,399,285 | 294,373 | 3,005,542 | 1,816,271 | 31,267,102 | 1,599,069 | 26,426,043 | 12,165,668 | 190,671,524 |
| (8,938,113) | (85,234,791) | (2,133,266) | (21,900,451) | (22,291,593) | (384,019,103) | (66,132,757) | (1,093,538,113) | (158,495,499) | (2,367,683,139) |
| 5,903,618 | 61,087,523 | 5,760,726 | 59,580,561 | (16,214,152) | (279,366,061) | (51,062,277) | (842,687,253) | (118,824,909) | (1,760,400,858) |
| 262,123 | 2,736,235 | 154,880 | 1,589,436 | 74,586 | 1,304,989 | 43,758 | 746,709 | — | — |
| 30,343 | 302,575 | 165,580 | 1,665,750 | 1,580 | 26,607 | 84 | 1,422 | — | — |
| (296,440) | (2,870,542) | (4,536,711) | (47,421,882) | (34,338) | (595,734) | (25,246) | (429,936) | — | — |
| (3,974) | 168,268 | (4,216,251) | (44,166,696) | 41,828 | 735,862 | 18,596 | 318,195 | — | — |
| — | — | — | — | 109,749 | 1,818,544 | 144 | 2,500 | — | — |
| — | — | — | — | 1,165 | 18,155 | 1 | 11 | — | — |
| — | — | — | — | (7,991) | (133,196) | — | — | — | — |
| — | — | — | — | 102,923 | 1,703,503 | 145 | 2,511 | — | — |
| 4,722,113 | $50,868,017 | 17,349,936 | $177,091,677 | (39,632,370) | $(680,140,322) | (110,303,742) | $(1,822,939,395) | (207,449,912) | $(3,062,747,155) |
| Touchstone High Yield Fund | Touchstone Impact Bond Fund | |||||||
| For the Year Ended September 30, 2022 | For the Year Ended September 30, 2021 | For the Year Ended September 30, 2022(A) | For the Year Ended September 30, 2021 | |||||
| Shares | Dollars | Shares | Dollars | Shares | Dollars | Shares | Dollars | |
| Class A | ||||||||
| Proceeds from Shares issued | 1,703,585 | $13,262,426 | 1,566,811 | $12,966,425 | 377,375 | $3,620,779 | 901,622 | $9,649,457 |
| Reinvestment of distributions | 72,853 | 555,192 | 73,113 | 599,939 | 18,750 | 184,581 | 22,409 | 239,040 |
| Cost of Shares redeemed | (1,841,082) | (14,290,976) | (1,684,115) | (13,909,317) | (767,068) | (7,359,721) | (750,021) | (8,017,527) |
| Change from Class A Share Transactions | (64,644) | (473,358) | (44,191) | (342,953) | (370,943) | (3,554,361) | 174,010 | 1,870,970 |
| Class C | ||||||||
| Proceeds from Shares issued | 81,683 | 676,334 | 6,419 | 52,516 | 44,867 | 420,512 | 47,117 | 503,565 |
| Reinvestment of distributions | 2,706 | 20,722 | 4,205 | 34,328 | 1,705 | 16,769 | 1,104 | 11,798 |
| Cost of Shares redeemed | (81,164) | (647,943) | (69,525) | (567,351) | (41,260) | (395,172) | (54,392) | (576,886) |
| Change from Class C Share Transactions | 3,225 | 49,113 | (58,901) | (480,507) | 5,312 | 42,109 | (6,171) | (61,523) |
| Class Y | ||||||||
| Proceeds from Shares issued | 286,693 | 2,317,767 | 927,706 | 7,935,403 | 12,496,494 | 119,881,821 | 10,483,459 | 112,124,601 |
| Reinvestment of distributions | 171,525 | 1,351,066 | 184,449 | 1,558,178 | 473,335 | 4,616,308 | 265,494 | 2,835,648 |
| Cost of Shares redeemed | (1,414,473) | (11,332,097) | (1,027,444) | (8,666,870) | (6,343,321) | (61,579,622) | (5,408,326) | (57,650,536) |
| Change from Class Y Share Transactions | (956,255) | (7,663,264) | 84,711 | 826,711 | 6,626,508 | 62,918,507 | 5,340,627 | 57,309,713 |
| Class Z | ||||||||
| Proceeds from Shares issued | — | — | — | — | — | — | — | — |
| Reinvestment of distributions | — | — | — | — | — | — | — | — |
| Cost of Shares redeemed | — | — | — | — | — | — | — | — |
| Change from Class Z Share Transactions | — | — | — | — | — | — | — | — |
| Institutional Class | ||||||||
| Proceeds from Shares issued | 1,854,683 | 14,764,264 | 9,988,999 | 84,709,298 | 12,052,534 | 116,919,483 | 4,823,496 | 51,565,488 |
| Reinvestment of distributions | 441,962 | 3,460,147 | 773,258 | 6,527,173 | 478,417 | 4,684,703 | 347,131 | 3,707,296 |
| Cost of Shares redeemed | (2,839,482) | (23,415,072) | (17,418,797) | (148,780,366) | (5,487,283) | (52,879,874) | (5,736,474) | (61,130,444) |
| Change from Institutional Class Share Transactions | (542,837) | (5,190,661) | (6,656,540) | (57,543,895) | 7,043,668 | 68,724,312 | (565,847) | (5,857,660) |
| Class R6 | ||||||||
| Proceeds from Shares issued | — | — | — | — | 237 | 2,500 | — | — |
| Reinvestment of distributions | — | — | — | — | 6 | 54 | — | — |
| Cost of Shares redeemed | — | — | — | — | — | — | — | — |
| Change from Class R6 Share Transactions | — | — | — | — | 243 | 2,554 | — | — |
| Change from Share Transactions | (1,560,511) | $(13,278,170) | (6,674,921) | $(57,540,644) | 13,304,788 | $128,133,121 | 4,942,619 | $53,261,500 |
| (A) | Represents the period from commencement of operations (November 22, 2021) through September 30, 2022 for Class R6 shares. |
| (B) | Represents the period from commencement of operations (February 22, 2021) through September 30, 2021 for Class R6 shares. |
| Touchstone International ESG Equity Fund | Touchstone Mid Cap Fund | ||||||
| For the Year Ended September 30, 2022 | For the Year Ended September 30, 2021 | For the Year Ended September 30, 2022 | For the Year Ended September 30, 2021(B) | ||||
| Shares | Dollars | Shares | Dollars | Shares | Dollars | Shares | Dollars |
| 116,562 | $954,882 | 392,101 | $3,253,480 | 806,631 | $36,571,813 | 1,056,622 | $48,021,108 |
| 73,968 | 649,137 | 5,449 | 46,211 | 71,397 | 3,424,450 | 43,425 | 1,864,324 |
| (209,255) | (1,607,984) | (849,981) | (7,474,932) | (1,010,446) | (44,572,673) | (804,599) | (36,519,129) |
| (18,725) | (3,965) | (452,431) | (4,175,241) | (132,418) | (4,576,410) | 295,448 | 13,366,303 |
| 8,247 | 68,824 | 3,336 | 29,600 | 231,373 | 9,571,863 | 527,048 | 22,032,167 |
| 15,724 | 136,482 | — | — | 54,254 | 2,397,489 | 39,173 | 1,562,270 |
| (144,085) | (1,170,984) | (250,238) | (2,163,270) | (540,733) | (22,486,612) | (634,832) | (26,906,601) |
| (120,114) | (965,678) | (246,902) | (2,133,670) | (255,106) | (10,517,260) | (68,611) | (3,312,164) |
| 882,406 | 6,984,426 | 1,040,078 | 9,287,340 | 22,336,268 | 1,015,673,212 | 29,528,367 | 1,339,183,765 |
| 157,788 | 1,385,068 | 9,218 | 77,978 | 1,751,887 | 85,423,942 | 1,191,861 | 51,892,782 |
| (856,963) | (6,436,665) | (356,297) | (3,132,637) | (22,546,804) | (1,030,111,093) | (23,432,626) | (1,086,466,153) |
| 183,231 | 1,932,829 | 692,999 | 6,232,681 | 1,541,351 | 70,986,061 | 7,287,602 | 304,610,394 |
| — | — | — | — | 130,091 | 5,766,393 | 294,301 | 13,056,057 |
| — | — | — | — | 32,503 | 1,546,815 | 29,122 | 1,240,929 |
| — | — | — | — | (368,822) | (16,442,723) | (1,136,353) | (49,001,380) |
| — | — | — | — | (206,228) | (9,129,515) | (812,930) | (34,704,394) |
| 1,100,440 | 9,428,318 | — | — | 11,899,790 | 549,099,520 | 11,851,354 | 551,714,234 |
| 29 | 251 | 2 | 19 | 284,657 | 13,929,716 | 305,343 | 13,325,183 |
| (111,545) | (874,186) | — | — | (16,217,258) | (752,215,758) | (26,681,385) | (1,270,666,182) |
| 988,924 | 8,554,383 | 2 | 19 | (4,032,811) | (189,186,522) | (14,524,688) | (705,626,765) |
| — | — | — | — | 4,712,206 | 214,624,639 | 13,812,160 | 664,476,348 |
| — | — | — | — | 44,138 | 2,160,530 | — | — |
| — | — | — | — | (2,621,084) | (118,405,155) | (877,851) | (42,204,919) |
| — | — | — | — | 2,135,260 | 98,380,014 | 12,934,309 | 622,271,429 |
| 1,033,316 | $9,517,569 | (6,332) | $(76,211) | (949,952) | $(44,043,632) | 5,111,130 | $196,604,803 |
| Touchstone Mid Cap Value Fund | Touchstone Sands Capital Select Growth Fund^ | |||||||
| For the Year Ended September 30, 2022 | For the Year Ended September 30, 2021 | For the Year Ended September 30, 2022 | For the Year Ended September 30, 2021 | |||||
| Shares | Dollars | Shares | Dollars | Shares | Dollars | Shares | Dollars | |
| Class A | ||||||||
| Proceeds from Shares issued | 178,116 | $4,123,820 | 179,118 | $3,742,466 | 3,523,376 | $53,585,937 | 4,489,061 | $85,327,200 |
| Proceeds from Shares issued in connection with reorganization | — | — | — | — | — | — | 31,777,096 | 621,944,594 |
| Reinvestment of distributions | 37,968 | 887,520 | 777 | 15,458 | 4,519,112 | 78,722,927 | 726,547 | 12,765,441 |
| Cost of Shares redeemed | (145,632) | (3,318,663) | (194,259) | (4,301,475) | (10,318,484) | (133,480,712) | (5,675,525) | (109,088,540) |
| Change from Class A Share Transactions | 70,452 | 1,692,677 | (14,364) | (543,551) | (2,275,996) | (1,171,848) | 31,317,179 | 610,948,695 |
| Class C | ||||||||
| Proceeds from Shares issued | 67,979 | 1,494,741 | 44,231 | 975,312 | 251,663 | 3,430,566 | 444,102 | 8,806,047 |
| Proceeds from Shares issued in connection with reorganization | — | — | — | — | — | — | 2,407,486 | 48,772,136 |
| Reinvestment of distributions | 11,605 | 260,768 | — | — | 490,793 | 8,587,815 | 223,106 | 4,077,626 |
| Cost of Shares redeemed | (54,422) | (1,197,286) | (64,635) | (1,390,188) | (1,782,102) | (25,452,609) | (1,520,323) | (30,198,698) |
| Change from Class C Share Transactions | 25,162 | 558,223 | (20,404) | (414,876) | (1,039,646) | (13,434,228) | 1,554,371 | 31,457,111 |
| Class Y(A) | ||||||||
| Proceeds from Shares issued | 3,289,801 | 76,964,313 | 4,976,510 | 107,646,472 | 22,865,882 | 333,989,648 | 26,427,558 | 552,879,177 |
| Proceeds from Shares issued in connection with reorganization | — | — | — | — | — | — | 2,050,915 | 44,517,985 |
| Reinvestment of distributions | 1,239,623 | 29,116,578 | 53,819 | 1,141,546 | 7,425,758 | 145,396,335 | 6,900,842 | 134,290,391 |
| Cost of Shares redeemed | (4,051,666) | (93,632,765) | (6,000,984) | (128,777,432) | (42,774,802) | (610,441,703) | (40,208,134) | (869,420,564) |
| Change from Class Y Share Transactions | 477,758 | 12,448,126 | (970,655) | (19,989,414) | (12,483,162) | (131,055,720) | (4,828,819) | (137,733,011) |
| Class Z | ||||||||
| Proceeds from Shares issued | — | — | — | — | 1,962,538 | 26,430,355 | 2,349,120 | 44,465,418 |
| Reinvestment of distributions | — | — | — | — | 3,380,155 | 58,949,906 | 2,953,208 | 51,976,461 |
| Cost of Shares redeemed | — | — | — | — | (8,475,809) | (107,741,495) | (6,168,500) | (116,963,273) |
| Change from Class Z Share Transactions | — | — | — | — | (3,133,116) | (22,361,234) | (866,172) | (20,521,394) |
| Institutional Class | ||||||||
| Proceeds from Shares issued | 4,801,311 | 112,469,588 | 7,159,517 | 157,885,918 | 91,188,349 | 1,146,837,317 | 34,707,619 | 738,829,312 |
| Proceeds from Shares issued in connection with reorganization | — | — | — | — | — | — | 128,604,796 | 2,547,803,595 |
| Reinvestment of distributions | 1,156,963 | 27,326,336 | 73,904 | 1,599,620 | 11,423,614 | 223,902,843 | 435 | 8,474 |
| Cost of Shares redeemed | (5,581,086) | (130,293,945) | (10,054,747) | (217,716,746) | (125,778,987) | (1,548,133,917) | (50,472,388) | (1,076,340,071) |
| Change from Institutional Class Share Transactions | 377,188 | 9,501,979 | (2,821,326) | (58,231,208) | (23,167,024) | (177,393,757) | 112,840,462 | 2,210,301,310 |
| Class R6 | ||||||||
| Proceeds from Shares issued | — | — | — | — | 19,742,464 | 266,770,160 | 23,160,816 | 511,629,011 |
| Reinvestment of distributions | — | — | — | — | 2,425,351 | 47,536,886 | 5,281 | 102,763 |
| Cost of Shares redeemed | — | — | — | — | (15,112,322) | (173,889,051) | (1,357,750) | (28,696,964) |
| Change from Class R6 Share Transactions | — | — | — | — | 7,055,493 | 140,417,995 | 21,808,347 | 483,034,810 |
| Change from Share Transactions | 950,560 | $24,201,005 | (3,826,749) | $(79,179,049) | (35,043,451) | $(204,998,792) | 161,825,368 | $3,177,487,521 |
| ^ | The September 30, 2022 and September 30, 2021 Class C share amounts relating to Proceeds from Shares issued, Proceeds from Shares issued in connection with reorganization, Reinvestment of distributions, Cost of Shares redeemed, and Change from Class C Share Transactions as well as Change from Share transactions were updated to reflect the effect of a 1 for 0.796098 reverse stock split for Class C shares on October 14, 2022 (See Note 10 in the Notes to Financial Statements). |
| (A) | Effective July 16, 2021, Class W shares of the AIG Focused Growth Fund were reorganized into Class Y shares of the Touchstone Sands Capital Select Growth Fund. |
| Touchstone Small Cap Fund | Touchstone Small Cap Value Fund | ||||||
| For the Year Ended September 30, 2022 | For the Year Ended September 30, 2021 | For the Year Ended September 30, 2022 | For the Year Ended September 30, 2021 | ||||
| Shares | Dollars | Shares | Dollars | Shares | Dollars | Shares | Dollars |
| 29,607 | $398,907 | 43,246 | $590,663 | 24,852 | $818,331 | 42,845 | $1,116,437 |
| — | — | — | — | — | — | — | — |
| 47,532 | 622,960 | 5,640 | 70,614 | 2,627 | 91,456 | 2,306 | 60,923 |
| (86,799) | (1,094,775) | (93,218) | (1,222,383) | (54,906) | (1,801,263) | (89,797) | (2,685,709) |
| (9,660) | (72,908) | (44,332) | (561,106) | (27,427) | (891,476) | (44,646) | (1,508,349) |
| 9,171 | 104,830 | 38,275 | 492,935 | 981 | 30,476 | 4,097 | 116,576 |
| — | — | — | — | — | — | — | — |
| 2,469 | 28,748 | 381 | 4,341 | 25 | 845 | 32 | 817 |
| (10,560) | (116,965) | (54,615) | (663,938) | (9,147) | (285,716) | (8,879) | (252,956) |
| 1,080 | 16,613 | (15,959) | (166,662) | (8,141) | (254,395) | (4,750) | (135,563) |
| 1,316,326 | 16,731,539 | 746,342 | 10,272,999 | 211,395 | 6,709,161 | 129,975 | 3,908,356 |
| — | — | — | — | — | — | — | — |
| 488,405 | 6,524,237 | 79,888 | 1,025,095 | 6,268 | 214,254 | 4,571 | 120,978 |
| (537,971) | (6,903,222) | (717,298) | (9,747,622) | (318,952) | (10,279,221) | (228,926) | (6,501,791) |
| 1,266,760 | 16,352,554 | 108,932 | 1,550,472 | (101,289) | (3,355,806) | (94,380) | (2,472,457) |
| — | — | — | — | — | — | — | — |
| — | — | — | — | — | — | — | — |
| — | — | — | — | — | — | — | — |
| — | — | — | — | — | — | — | — |
| 674,179 | 8,378,000 | 1,174,009 | 15,984,215 | 38,296 | 1,271,519 | 42,781 | 1,285,210 |
| — | — | — | — | — | — | — | — |
| 355,283 | 4,724,892 | 78,422 | 1,002,693 | 700 | 23,622 | 495 | 13,106 |
| (885,718) | (11,441,157) | (1,630,878) | (22,259,481) | (64,963) | (2,132,067) | (140,813) | (3,935,711) |
| 143,744 | 1,661,735 | (378,447) | (5,272,573) | (25,967) | (836,926) | (97,537) | (2,637,395) |
| — | — | — | — | — | — | — | — |
| — | — | — | — | — | — | — | — |
| — | — | — | — | — | — | — | — |
| — | — | — | — | — | — | — | — |
| 1,401,924 | $17,957,994 | (329,806) | $(4,449,869) | (162,824) | $(5,338,603) | (241,313) | $(6,753,764) |
| Touchstone Ultra Short Duration Fixed Income Fund | ||||
| For the Year Ended September 30, 2022 | For the Year Ended September 30, 2021 | |||
| Shares | Dollars | Shares | Dollars | |
| Class A | ||||
| Proceeds from Shares issued | 4,600,658 | $41,866,137 | 4,686,457 | $43,241,421 |
| Reinvestment of distributions | 200,685 | 1,821,816 | 123,448 | 1,139,270 |
| Cost of Shares redeemed | (6,573,211) | (59,713,757) | (2,612,393) | (24,114,385) |
| Change from Class A Share Transactions | (1,771,868) | (16,025,804) | 2,197,512 | 20,266,306 |
| Class C | ||||
| Proceeds from Shares issued | 443,252 | 4,024,638 | 133,907 | 1,237,687 |
| Reinvestment of distributions | 2,359 | 21,374 | 810 | 7,479 |
| Cost of Shares redeemed | (350,793) | (3,188,945) | (244,873) | (2,263,008) |
| Change from Class C Share Transactions | 94,818 | 857,067 | (110,156) | (1,017,842) |
| Class S | ||||
| Proceeds from Shares issued | 14,097 | 128,000 | 1,605,257 | 14,831,783 |
| Reinvestment of distributions | 55,818 | 506,788 | 38,145 | 352,177 |
| Cost of Shares redeemed | (1,026,930) | (9,373,454) | (2,605,972) | (24,063,147) |
| Change from Class S Share Transactions | (957,015) | (8,738,666) | (962,570) | (8,879,187) |
| Class Y | ||||
| Proceeds from Shares issued | 23,384,051 | 213,007,246 | 17,600,835 | 162,587,751 |
| Reinvestment of distributions | 398,408 | 3,620,579 | 291,545 | 2,691,868 |
| Cost of Shares redeemed | (28,167,532) | (256,261,950) | (17,423,646) | (160,851,675) |
| Change from Class Y Share Transactions | (4,385,073) | (39,634,125) | 468,734 | 4,427,944 |
| Class Z | ||||
| Proceeds from Shares issued | 1,547,953 | 14,110,958 | 2,629,137 | 24,264,471 |
| Reinvestment of distributions | 97,336 | 884,392 | 78,837 | 727,666 |
| Cost of Shares redeemed | (4,224,808) | (38,428,153) | (3,875,990) | (35,793,520) |
| Change from Class Z Share Transactions | (2,579,519) | (23,432,803) | (1,168,016) | (10,801,383) |
| Institutional Class | ||||
| Proceeds from Shares issued | 12,899,131 | 118,098,349 | 41,003,304 | 378,229,514 |
| Reinvestment of distributions | 575,348 | 5,232,249 | 597,097 | 5,507,609 |
| Cost of Shares redeemed | (42,326,295) | (385,792,482) | (32,400,298) | (298,879,952) |
| Change from Institutional Class Share Transactions | (28,851,816) | (262,461,884) | 9,200,103 | 84,857,171 |
| Change from Share Transactions | (38,450,473) | $(349,436,215) | 9,625,607 | $88,853,009 |
| Touchstone Active Bond Fund | ||||||||||||||||||||||||||||
| Period ended | Net asset value at beginning of period | Net investment income | Net realized and unrealized gains (losses) on investments | Total from investment operations | Distributions from net investment income | Distributions from realized capital gains | Total distributions | Net asset value at end of period | Total return(1) | Net assets at end of period (000's) | Ratio of net expenses to average net assets | Ratio of gross expenses to average net assets | Ratio of net investment income (loss) to average net assets | Portfolio turnover rate | ||||||||||||||
| Class A | ||||||||||||||||||||||||||||
| 09/30/18 | $10.47 | $0.23 | $(0.43) | $(0.20) | $(0.26) | $ — (2) | $(0.26) | $10.01 | (1.87)% | $133,083 | 0.90% | 0.97% | 2.34% | 448%(3) | ||||||||||||||
| 09/30/19 | 10.01 | 0.27 | 0.68 | 0.95 | (0.28) | — | (0.28) | 10.68 | 9.68 | 127,502 | 0.90 | 1.00 | 2.68 | 235 | ||||||||||||||
| 09/30/20 | 10.68 | 0.28(4) | 0.55 | 0.83 | (0.28) | — | (0.28) | 11.23 | 7.91 | 128,086 | 0.90 | 0.95 | 2.54 | 261 | ||||||||||||||
| 09/30/21 | 11.23 | 0.22(4) | (0.10) | 0.12 | (0.23) | — | (0.23) | 11.12 | 1.10 | 186,813 | 0.90 | 0.93 | 1.99 | 144(5) | ||||||||||||||
| 09/30/22 | 11.12 | 0.23(4) | (2.04) | (1.81) | (0.25) | (0.03) | (0.28) | 9.03 | (16.52) | 135,000 | 0.85 | 0.93 | 2.20 | 159 | ||||||||||||||
| Class C | ||||||||||||||||||||||||||||
| 09/30/18 | $9.68 | $0.20 | $(0.46) | $(0.26) | $(0.19) | $ — (2) | $(0.19) | $9.23 | (2.64)% | $23,807 | 1.65% | 1.79% | 1.59% | 448%(3) | ||||||||||||||
| 09/30/19 | 9.23 | 0.12 | 0.68 | 0.80 | (0.21) | — | (0.21) | 9.82 | 8.83 | 11,743 | 1.65 | 1.85 | 1.93 | 235 | ||||||||||||||
| 09/30/20 | 9.82 | 0.18(4) | 0.51 | 0.69 | (0.21) | — | (0.21) | 10.30 | 7.11 | 5,618 | 1.65 | 1.93 | 1.79 | 261 | ||||||||||||||
| 09/30/21 | 10.30 | 0.13(4) | (0.09) | 0.04 | (0.16) | — | (0.16) | 10.18 | 0.39 | 9,229 | 1.64 | 1.93 | 1.25 | 144(5) | ||||||||||||||
| 09/30/22 | 10.18 | 0.14(4) | (1.87) | (1.73) | (0.18) | (0.03) | (0.21) | 8.24 | (17.17) | 4,667 | 1.58 | 1.89 | 1.46 | 159 | ||||||||||||||
| Class Y | ||||||||||||||||||||||||||||
| 09/30/18 | $10.46 | $0.26 | $(0.43) | $(0.17) | $(0.29) | $ — (2) | $(0.29) | $10.00 | (1.62)% | $165,937 | 0.65% | 0.70% | 2.59% | 448%(3) | ||||||||||||||
| 09/30/19 | 10.00 | 0.31 | 0.67 | 0.98 | (0.31) | — | (0.31) | 10.67 | 9.96 | 90,336 | 0.65 | 0.73 | 2.93 | 235 | ||||||||||||||
| 09/30/20 | 10.67 | 0.30(4) | 0.56 | 0.86 | (0.31) | — | (0.31) | 11.22 | 8.18 | 90,235 | 0.65 | 0.73 | 2.79 | 261 | ||||||||||||||
| 09/30/21 | 11.22 | 0.25(4) | (0.10) | 0.15 | (0.26) | — | (0.26) | 11.11 | 1.35 | 92,882 | 0.65 | 0.70 | 2.24 | 144(5) | ||||||||||||||
| 09/30/22 | 11.11 | 0.25(4) | (2.03) | (1.78) | (0.28) | (0.03) | (0.31) | 9.02 | (16.32) | 56,003 | 0.60 | 0.68 | 2.44 | 159 | ||||||||||||||
| Institutional Class | ||||||||||||||||||||||||||||
| 09/30/18 | $10.46 | $0.27 | $(0.43) | $(0.16) | $(0.30) | $ — (2) | $(0.30) | $10.00 | (1.54)% | $38,715 | 0.57% | 0.66% | 2.67% | 448%(3) | ||||||||||||||
| 09/30/19 | 10.00 | 0.30 | 0.69 | 0.99 | (0.32) | — | (0.32) | 10.67 | 10.06 | 96,477 | 0.57 | 0.66 | 3.01 | 235 | ||||||||||||||
| 09/30/20 | 10.67 | 0.31(4) | 0.56 | 0.87 | (0.32) | — | (0.32) | 11.22 | 8.23 | 134,659 | 0.57 | 0.63 | 2.87 | 261 | ||||||||||||||
| 09/30/21 | 11.22 | 0.26(4) | (0.10) | 0.16 | (0.27) | — | (0.27) | 11.11 | 1.43 | 99,607 | 0.57 | 0.61 | 2.32 | 144(5) | ||||||||||||||
| 09/30/22 | 11.11 | 0.26(4) | (2.04) | (1.78) | (0.28) | (0.03) | (0.31) | 9.02 | (16.26) | 68,399 | 0.52 | 0.59 | 2.53 | 159 | ||||||||||||||
| (1) | Total returns shown exclude the effect of applicable sales loads and fees. If these charges were included, the returns would be lower. |
| (2) | Less than $0.005 per share. |
| (3) | Portfolio turnover excludes the purchases and sales of securities by the Sentinel Government Securities Fund and Sentinel Total Return Bond Fund acquired on October 27, 2017. If these transactions were included, portfolio turnover would have been higher. |
| (4) | The net investment income per share was based on average shares outstanding for the period. |
| (5) | Portfolio turnover excludes the purchases and sales of securities of the AIG U.S. Government Securities Fund acquired on July 16, 2021. If these transactions were included, portfolio turnover would have been higher. |
| Touchstone Anti-Benchmark® International Core Equity Fund | ||||||||||||||||||||||||||||
| Period ended | Net asset value at beginning of period | Net investment income | Net realized and unrealized gains (losses) on investments | Total from investment operations | Distributions from net investment income | Distributions from realized capital gains | Total distributions | Net asset value at end of period | Total return | Net assets at end of period (000's) | Ratio of net expenses to average net assets | Ratio of gross expenses to average net assets | Ratio of net investment income (loss) to average net assets | Portfolio turnover rate | ||||||||||||||
| Class Y | ||||||||||||||||||||||||||||
| 09/30/19(1) | $10.00 | $0.24 | $(0.03) | $0.21 | $(0.01) | $ — | $(0.01) | $10.20 | 2.13%(2) | $3 | 0.69%(3) | 373.97%(3) | 2.74%(3) | 117%(2)(4) | ||||||||||||||
| 09/30/20 | 10.20 | 0.08 | 0.81 | 0.89 | (0.23) | — | (0.23) | 10.86 | 8.74 | 243 | 0.69 | 9.11 | 1.43 | 79 | ||||||||||||||
| 09/30/21 | 10.86 | 0.16 | 0.96 | 1.12 | (0.20) | — | (0.20) | 11.78 | 10.32 | 272 | 0.69 | 3.40 | 1.34 | 62 | ||||||||||||||
| 09/30/22 | 11.78 | 0.17(5) | (3.53) | (3.36) | (0.35) | (0.91) | (1.26) | 7.16 | (31.55) | 155 | 0.69 | 4.49 | 1.81 | 84 | ||||||||||||||
| Institutional Class | ||||||||||||||||||||||||||||
| 09/30/19(1) | $10.00 | $0.21 | $— | $0.21 | $(0.01) | $ — | $(0.01) | $10.20 | 2.14%(2) | $36,710 | 0.59%(3) | 1.13%(3) | 2.84%(3) | 117%(2)(4) | ||||||||||||||
| 09/30/20 | 10.20 | 0.17 | 0.75 | 0.92 | (0.24) | — | (0.24) | 10.88 | 9.00 | 36,876 | 0.59 | 0.96 | 1.53 | 79 | ||||||||||||||
| 09/30/21 | 10.88 | 0.18 | 0.96 | 1.14 | (0.22) | — | (0.22) | 11.80 | 10.43 | 39,225 | 0.59 | 0.97 | 1.44 | 62 | ||||||||||||||
| 09/30/22 | 11.80 | 0.19(5) | (3.49) | (3.30) | (0.46) | (0.91) | (1.37) | 7.13 | (31.26) | 8,440 | 0.59 | 1.52 | 1.91 | 84 | ||||||||||||||
| (1) | Represents the period from commencement of operations (November 19, 2018) through September 30, 2019. |
| (2) | Not annualized. |
| (3) | Annualized. |
| (4) | Portfolio turnover excludes securities received from processing a subscription-in-kind. |
| (5) | The net investment income per share was based on average shares outstanding for the period. |
| Touchstone Ares Credit Opportunities Fund | ||||||||||||||||||||||||||||||
| Period ended | Net asset value at beginning of period | Net investment income | Net realized and unrealized gains (losses) on investments | Total from investment operations | Distributions from net investment income | Distributions from realized capital gains | Return of capital | Total distributions | Net asset value at end of period | Total return(1) | Net assets at end of period (000's) | Ratio of net expenses to average net assets(2) | Ratio of gross expenses to average net assets(3) | Ratio of net investment income (loss) to average net assets | Portfolio turnover rate | |||||||||||||||
| Class A | ||||||||||||||||||||||||||||||
| 06/30/18 | $10.41 | $0.49 | $(0.13) | $0.36 | $(0.53) | $ (0.28) | $ — | $(0.81) | $9.96 | 3.50% | $153 | 1.76% | 10.00% | 5.00% | 70% | |||||||||||||||
| 06/30/19 | 9.96 | 0.52 | 0.12 | 0.64 | (0.54) | (0.11) | — | (0.65) | 9.95 | 6.69 | 226 | 1.55 | 7.56 | 5.46 | 94 | |||||||||||||||
| 09/30/19(4) | 9.95 | 0.20 | 0.04 | 0.24 | (0.12) | (0.04) | — | (0.16) | 10.03 | 1.40(5) | 7,239 | 1.18(6) | 2.55(6) | 5.43(6) | 28(5)(7) | |||||||||||||||
| 09/30/20 | 10.03 | 0.57 | (0.61) | (0.04) | (0.54) | — | — | (0.54) | 9.45 | (0.29) | 5,597 | 1.18 | 1.61 | 5.90 | 115 | |||||||||||||||
| 09/30/21 | 9.45 | 0.47(8) | 1.07 | 1.54 | (0.53) | — | — | (0.53) | 10.46 | 16.67 | 141,422 | 1.09 | 1.32 | 4.45 | 135(9) | |||||||||||||||
| 09/30/22 | 10.46 | 0.47(8) | (1.53) | (1.06) | (0.43) | (0.32) | (0.01) | (0.76) | 8.64 | (10.60) | 115,483 | 1.07 | 1.26 | 4.87 | 72 | |||||||||||||||
| Class C | ||||||||||||||||||||||||||||||
| 06/30/18 | $10.44 | $0.44 | $(0.15) | $0.29 | $(0.45) | $ (0.28) | $ — | $(0.73) | $10.00 | 2.69% | $22 | 2.51% | 34.60% | 4.25% | 70% | |||||||||||||||
| 06/30/19 | 10.00 | 0.43 | 0.14 | 0.57 | (0.48) | (0.11) | — | (0.59) | 9.98 | 5.97 | 127 | 2.26 | 11.81 | 4.75 | 94 | |||||||||||||||
| 09/30/19(4) | 9.98 | 0.19 | (0.27) | (0.08) | (0.11) | (0.04) | — | (0.15) | 9.75 | 1.15(5) | 4,538 | 1.93(6) | 3.62(6) | 4.68(6) | 28(5)(7) | |||||||||||||||
| 09/30/20 | 9.75 | 0.52 | (0.62) | (0.10) | (0.47) | — | — | (0.47) | 9.18 | (0.98) | 2,246 | 1.93 | 2.61 | 5.15 | 115 | |||||||||||||||
| 09/30/21 | 9.18 | 0.40(8) | 1.02 | 1.42 | (0.47) | — | — | (0.47) | 10.13 | 15.79 | 31,605 | 1.56 | 2.17 | 3.98 | 135(9) | |||||||||||||||
| 09/30/22 | 10.13 | 0.42(8) | (1.47) | (1.05) | (0.40) | (0.32) | (0.01) | (0.73) | 8.35 | (11.01) | 17,575 | 1.47 | 2.05 | 4.47 | 72 | |||||||||||||||
| Class Y | ||||||||||||||||||||||||||||||
| 06/30/18 | $10.41 | $0.50 | $(0.12) | $0.38 | $(0.55) | $ (0.28) | $ — | $(0.83) | $9.96 | 3.73% | $444 | 1.51% | 4.29% | 5.25% | 70% | |||||||||||||||
| 06/30/19 | 9.96 | 0.60 | 0.06 | 0.66 | (0.56) | (0.11) | — | (0.67) | 9.95 | 7.05 | 11,356 | 1.09 | 1.71 | 5.93 | 94 | |||||||||||||||
| 09/30/19(4) | 9.95 | 0.17 | 0.21 | 0.38 | (0.13) | (0.04) | — | (0.17) | 10.16 | 1.54(5) | 47,483 | 0.93(6) | 1.60(6) | 5.68(6) | 28(5)(7) | |||||||||||||||
| 09/30/20 | 10.16 | 0.59 | (0.62) | (0.03) | (0.56) | — | — | (0.56) | 9.57 | (0.13) | 36,558 | 0.93 | 1.20 | 6.15 | 115 | |||||||||||||||
| 09/30/21 | 9.57 | 0.48(8) | 1.11 | 1.59 | (0.55) | — | — | (0.55) | 10.61 | 16.98 | 101,613 | 0.88 | 1.07 | 4.66 | 135(9) | |||||||||||||||
| 09/30/22 | 10.61 | 0.49(8) | (1.54) | (1.05) | (0.45) | (0.32) | (0.01) | (0.78) | 8.78 | (10.47) | 135,892 | 0.87 | 1.02 | 5.07 | 72 | |||||||||||||||
| Institutional Class | ||||||||||||||||||||||||||||||
| 06/30/18 | $10.41 | $0.55 | $(0.16) | $0.39 | $(0.56) | $ (0.28) | $ — | $(0.84) | $9.96 | 3.85% | $51,715 | 1.41% | 1.59% | 5.35% | 70% | |||||||||||||||
| 06/30/19 | 9.96 | 0.58 | 0.09 | 0.67 | (0.57) | (0.11) | — | (0.68) | 9.95 | 7.04 | 47,531 | 1.24 | 1.50 | 5.78 | 94 | |||||||||||||||
| 09/30/19(4) | 9.95 | 0.15 | 0.29 | 0.44 | (0.13) | (0.04) | — | (0.17) | 10.22 | 1.57(5) | 48,158 | 0.83(6) | 1.36(6) | 5.78(6) | 28(5)(7) | |||||||||||||||
| 09/30/20 | 10.22 | 0.61 | (0.63) | (0.02) | (0.57) | — | — | (0.57) | 9.63 | (0.02) | 42,982 | 0.83 | 1.06 | 6.25 | 115 | |||||||||||||||
| 09/30/21 | 9.63 | 0.49(8) | 1.12 | 1.61 | (0.56) | — | — | (0.56) | 10.68 | 17.07 | 2,627 | 0.78 | 0.97 | 4.76 | 135(9) | |||||||||||||||
| 09/30/22 | 10.68 | 0.51(8) | (1.56) | (1.05) | (0.46) | (0.32) | (0.01) | (0.79) | 8.84 | (10.39) | 2,139 | 0.77 | 1.15 | 5.17 | 72 | |||||||||||||||
| (1) | Total returns shown exclude the effect of applicable sales loads and fees. If these charges were included, the returns would be lower. |
| (2) | The ratio of net expenses to average net assets excluding dividend and interest expense on securities sold short for Class A was 1.03%, 1.04%, 1.08%, 1.08%, 1.45% and 1.69%, for Class C was 1.43%, 1.51%, 1.83%, 1.83%, 2.16% and 2.44%, for Class Y was 0.83%, 0.83%, 0.83%, 0.83%, 0.99% and 1.44%, and for Institutional Class was 0.73% 0.73%, 0.73%, 0.73%, 1.14% and 1.34% for the years ended September 30, 2022, 2021 and 2020, for the period ended September 30, 2019, and the years ended June 30, 2019 and 2018, respectively. |
| (3) | The ratio of gross expenses to average net assets excluding dividend and interest expense on securities sold short for Class A was 1.22%, 1.27%, 1.51%, 2.45%, 7.46% and 9.93%, for Class C was 2.01%, 2.12%, 2.51%, 3.52%, 11.71% and 34.53%, for Class Y was 0.98%, 1.02%, 1.10%, 1.50%, 1.61% and 4.22%, and for Institutional Class was 1.11%, 0.92%, 0.96%, 1.26%, 1.40% and 1.52% for the years ended September 30, 2022, 2021 and 2020, for the period ended September 30, 2019, and the years ended June 30, 2019 and 2018, respectively. |
| (4) | The Fund changed its fiscal year end from June 30 to September 30. |
| (5) | Not annualized. |
| (6) | Annualized. |
| (7) | Portfolio turnover excludes the purchases and sales of securities by the Touchstone Ares Credit Opportunities Fund acquired on September 6, 2019. If these transactions were included, portfolio turnover would have been higher. |
| (8) | The net investment income per share was based on average shares outstanding for the period. |
| (9) | Portfolio turnover excludes the purchases and sales of securities by the Touchstone Dynamic Diversified Income Fund and the AIG Senior Floating Rate Fund acquired on June 25, 2021 and July 16, 2021, respectively. If these transactions were included, portfolio turnover would have been higher. |
| Touchstone Dividend Equity Fund | ||||||||||||||||||||||||||||
| Period ended | Net asset value at beginning of period | Net investment income(1) | Net realized and unrealized gains (losses) on investments | Total from investment operations | Distributions from net investment income | Distributions from realized capital gains | Total distributions | Net asset value at end of period | Total return(2) | Net assets at end of period (000's) | Ratio of net expenses to average net assets | Ratio of gross expenses to average net assets | Ratio of net investment income (loss) to average net assets | Portfolio turnover rate | ||||||||||||||
| Class A | ||||||||||||||||||||||||||||
| 10/31/17 | $16.66 | $0.45 | $2.28 | $2.73 | $(0.54) | $ (0.04) | $(0.58) | $18.81 | 16.57% | $4,598,192 | 1.04% | 1.04% | 2.52% | 45% | ||||||||||||||
| 10/31/18 | 18.81 | 0.47 | 0.15 | 0.62 | (0.44) | (1.44) | (1.88) | 17.55 | 3.03 | 3,570,189 | 1.04 | 1.04 | 2.57 | 38 | ||||||||||||||
| 10/31/19 | 17.55 | 0.50 | 0.39 | 0.89 | (0.49) | (0.78) | (1.27) | 17.17 | 5.42 | 2,381,987 | 1.05 | 1.05 | 2.90 | 37 | ||||||||||||||
| 10/31/20 | 17.17 | 0.55 | (2.42) | (1.87) | (0.60) | (0.58) | (1.18) | 14.12 | (11.33) | 1,666,379 | 1.09 | 1.09 | 3.60 | 68 | ||||||||||||||
| 09/30/21(3) | 14.12 | 0.29 | 2.83 | 3.12 | (0.36) | — | (0.36) | 16.88 | 22.13(4) | 1,737,804 | 1.09(5) | 1.09(5) | 1.91(5) | 83(4)(6) | ||||||||||||||
| 09/30/22 | 16.88 | 0.28 | (1.87) | (1.59) | (0.30) | (0.31) | (0.61) | 14.68 | (9.90) | 1,398,059 | 0.99 | 1.00 | 1.64 | 12 | ||||||||||||||
| Class C | ||||||||||||||||||||||||||||
| 10/31/17 | $16.53 | $0.33 | $2.26 | $2.59 | $(0.43) | $ (0.04) | $(0.47) | $18.65 | 15.80% | $3,682,928 | 1.69% | 1.69% | 1.87% | 45% | ||||||||||||||
| 10/31/18 | 18.65 | 0.35 | 0.14 | 0.49 | (0.32) | (1.44) | (1.76) | 17.38 | 2.31 | 3,142,587 | 1.69 | 1.69 | 1.92 | 38 | ||||||||||||||
| 10/31/19 | 17.38 | 0.38 | 0.39 | 0.77 | (0.37) | (0.78) | (1.15) | 17.00 | 4.78 | 2,421,728 | 1.70 | 1.70 | 2.27 | 37 | ||||||||||||||
| 10/31/20 | 17.00 | 0.47 | (2.40) | (1.93) | (0.50) | (0.58) | (1.08) | 13.99 | (11.89) | 1,117,141 | 1.74 | 1.74 | 2.99 | 68 | ||||||||||||||
| 09/30/21(3) | 13.99 | 0.19 | 2.80 | 2.99 | (0.24) | — | (0.24) | 16.74 | 21.38(4) | 806,336 | 1.75(5) | 1.77(5) | 1.27(5) | 83(4)(6) | ||||||||||||||
| 09/30/22 | 16.74 | 0.16 | (1.86) | (1.70) | (0.17) | (0.31) | (0.48) | 14.56 | (10.54) | 471,273 | 1.69 | 1.76 | 0.94 | 12 | ||||||||||||||
| Class Y | ||||||||||||||||||||||||||||
| 10/31/17 | $16.65 | $0.47 | $2.29 | $2.76 | $(0.58) | $ (0.04) | $(0.62) | $18.79 | 16.80% | $5,499,586 | 0.84% | 0.84% | 2.67% | 45% | ||||||||||||||
| 10/31/18 | 18.79 | 0.51 | 0.15 | 0.66 | (0.49) | (1.44) | (1.93) | 17.52 | 3.21 | 5,289,972 | 0.84 | 0.84 | 2.77 | 38 | ||||||||||||||
| 10/31/19 | 17.52 | 0.53 | 0.39 | 0.92 | (0.52) | (0.78) | (1.30) | 17.14 | 5.66 | 4,094,116 | 0.85 | 0.85 | 3.13 | 37 | ||||||||||||||
| 10/31/20 | 17.14 | 0.61 | (2.44) | (1.83) | (0.63) | (0.58) | (1.21) | 14.10 | (11.11) | 1,691,794 | 0.88 | 0.88 | 3.83 | 68 | ||||||||||||||
| 09/30/21(3)(7) | 14.10 | 0.33 | 2.81 | 3.14 | (0.39) | — | (0.39) | 16.85 | 22.33(4) | 1,161,841 | 0.88(5) | 0.88(5) | 2.14(5) | 83(4)(6) | ||||||||||||||
| 09/30/22 | 16.85 | 0.32 | (1.86) | (1.54) | (0.34) | (0.31) | (0.65) | 14.66 | (9.69) | 772,987 | 0.74 | 0.74 | 1.89 | 12 | ||||||||||||||
| Institutional Class | ||||||||||||||||||||||||||||
| 09/30/21(3)(8) | $17.02 | $0.07 | $(0.17) | $(0.10) | $(0.08) | $ — | $(0.08) | $16.84 | (0.61)%(4) | $313 | 0.67%(5) | 3.37%(5) | 2.01%(5) | 83%(4)(6) | ||||||||||||||
| 09/30/22 | 16.84 | 0.33 | (1.85) | (1.52) | (0.36) | (0.31) | (0.67) | 14.65 | (9.62) | 885 | 0.67 | 1.80 | 1.97 | 12 | ||||||||||||||
| Class R6 | ||||||||||||||||||||||||||||
| 09/30/21(3)(9) | $17.34 | $0.06 | $(0.48) | $(0.42) | $(0.08) | $ — | $(0.08) | $16.84 | (2.44)%(4) | $2 | 0.65%(5) | 359.78%(5) | 2.26%(5) | 83%(4)(6) | ||||||||||||||
| 09/30/22 | 16.84 | 0.32 | (1.84) | (1.52) | (0.36) | (0.31) | (0.67) | 14.65 | (9.56) | 1,510 | 0.65 | 1.76 | 1.99 | 12 | ||||||||||||||
| (1) | The net investment income per share was based on average shares outstanding for the period. |
| (2) | Total returns shown exclude the effect of applicable sales loads and fees. If these charges were included, the returns would be lower. |
| (3) | The Fund changed its fiscal year end from October 31 to September 30. |
| (4) | Not annualized. |
| (5) | Annualized. |
| (6) | Portfolio turnover excludes the purchases and sales of securities by the AIG Select Dividend Growth Fund acquired on July 16, 2021. If these transactions were included, portfolio turnover would have been higher. |
| (7) | Effective July 16, 2021, Class W shares of the AIG Focused Dividend Strategy Fund were reorganized into Class Y shares of the Fund. |
| (8) | Represents the period from commencement of operations (July 19, 2021) through September 30, 2021. |
| (9) | Represents the period from commencement of operations (August 2, 2021) through September 30, 2021. |
| Touchstone High Yield Fund | ||||||||||||||||||||||||||
| Period ended | Net asset value at beginning of period | Net investment income | Net realized and unrealized gains (losses) on investments | Total from investment operations | Distributions from net investment income | Total distributions | Net asset value at end of period | Total return(1) | Net assets at end of period (000's) | Ratio of net expenses to average net assets | Ratio of gross expenses to average net assets | Ratio of net investment income (loss) to average net assets | Portfolio turnover rate | |||||||||||||
| Class A | ||||||||||||||||||||||||||
| 09/30/18 | $8.43 | $0.41 | $(0.31) | $0.10 | $(0.41) | $(0.41) | $8.12 | 1.24% | $12,457 | 1.05% | 1.29% | 4.76% | 59% | |||||||||||||
| 09/30/19 | 8.12 | 0.40 | 0.16 | 0.56 | (0.41) | (0.41) | 8.27 | 7.08 | 14,642 | 1.05 | 1.28 | 4.95 | 63 | |||||||||||||
| 09/30/20 | 8.27 | 0.39 | (0.41) | (0.02) | (0.39) | (0.39) | 7.86 | (0.13) | 14,578 | 1.05 | 1.25 | 4.84 | 89 | |||||||||||||
| 09/30/21 | 7.86 | 0.36 | 0.48 | 0.84 | (0.37) | (0.37) | 8.33 | 10.84 | 15,081 | 1.05 | 1.21 | 4.35 | 96 | |||||||||||||
| 09/30/22 | 8.33 | 0.33 | (1.54) | (1.21) | (0.35) | (0.35) | 6.77 | (14.88) | 11,824 | 1.05 | 1.26 | 4.33 | 57 | |||||||||||||
| Class C | ||||||||||||||||||||||||||
| 09/30/18 | $8.41 | $0.34 | $(0.30) | $0.04 | $(0.35) | $(0.35) | $8.10 | 0.50% | $9,444 | 1.80% | 2.00% | 4.01% | 59% | |||||||||||||
| 09/30/19 | 8.10 | 0.34 | 0.16 | 0.50 | (0.35) | (0.35) | 8.25 | 6.31 | 4,582 | 1.80 | 2.10 | 4.20 | 63 | |||||||||||||
| 09/30/20 | 8.25 | 0.29 | (0.37) | (0.08) | (0.33) | (0.33) | 7.84 | (0.89) | 1,250 | 1.80 | 2.35 | 4.09 | 89 | |||||||||||||
| 09/30/21 | 7.84 | 0.26 | 0.52 | 0.78 | (0.31) | (0.31) | 8.31 | 10.07 | 835 | 1.80 | 2.83 | 3.60 | 96 | |||||||||||||
| 09/30/22 | 8.31 | 0.28 | (1.54) | (1.26) | (0.30) | (0.30) | 6.75 | (15.55) | 700 | 1.80 | 2.82 | 3.58 | 57 | |||||||||||||
| Class Y | ||||||||||||||||||||||||||
| 09/30/18 | $8.67 | $0.44 | $(0.32) | $0.12 | $(0.44) | $(0.44) | $8.35 | 1.44% | $63,983 | 0.80% | 0.88% | 5.01% | 59% | |||||||||||||
| 09/30/19 | 8.35 | 0.47 | 0.14 | 0.61 | (0.44) | (0.44) | 8.52 | 7.52 | 44,030 | 0.80 | 0.91 | 5.20 | 63 | |||||||||||||
| 09/30/20 | 8.52 | 0.44 | (0.45) | (0.01) | (0.42) | (0.42) | 8.09 | 0.02 | 33,694 | 0.80 | 0.89 | 5.09 | 89 | |||||||||||||
| 09/30/21 | 8.09 | 0.39 | 0.50 | 0.89 | (0.40) | (0.40) | 8.58 | 11.18 | 36,447 | 0.80 | 0.89 | 4.60 | 96 | |||||||||||||
| 09/30/22 | 8.58 | 0.39 | (1.62) | (1.23) | (0.37) | (0.37) | 6.98 | (14.70) | 22,994 | 0.80 | 0.96 | 4.58 | 57 | |||||||||||||
| Institutional Class | ||||||||||||||||||||||||||
| 09/30/18 | $8.66 | $0.44 | $(0.30) | $0.14 | $(0.45) | $(0.45) | $8.35 | 1.63% | $111,705 | 0.72% | 0.76% | 5.09% | 59% | |||||||||||||
| 09/30/19 | 8.35 | 0.44 | 0.16 | 0.60 | (0.44) | (0.44) | 8.51 | 7.47 | 135,328 | 0.72 | 0.77 | 5.28 | 63 | |||||||||||||
| 09/30/20 | 8.51 | 0.43 | (0.42) | 0.01 | (0.43) | (0.43) | 8.09 | 0.21 | 135,974 | 0.72 | 0.75 | 5.17 | 89 | |||||||||||||
| 09/30/21 | 8.09 | 0.40 | 0.50 | 0.90 | (0.41) | (0.41) | 8.58 | 11.27 | 87,056 | 0.72 | 0.75 | 4.68 | 96 | |||||||||||||
| 09/30/22 | 8.58 | 0.37 | (1.59) | (1.22) | (0.38) | (0.38) | 6.98 | (14.63) | 67,076 | 0.72 | 0.82 | 4.66 | 57 | |||||||||||||
| (1) | Total returns shown exclude the effect of applicable sales loads and fees. If these charges were included, the returns would be lower. |
| Touchstone Impact Bond Fund | ||||||||||||||||||||||||||
| Period ended | Net asset value at beginning of period | Net investment income | Net realized and unrealized gains (losses) on investments | Total from investment operations | Distributions from net investment income | Total distributions | Net asset value at end of period | Total return(1) | Net assets at end of period (000's) | Ratio of net expenses to average net assets | Ratio of gross expenses to average net assets | Ratio of net investment income (loss) to average net assets | Portfolio turnover rate | |||||||||||||
| Class A | ||||||||||||||||||||||||||
| 09/30/18 | $10.13 | $0.22 | $(0.33) | $(0.11) | $(0.25) | $(0.25) | $9.77 | (1.07)% | $5,697 | 0.85% | 1.30% | 2.25% | 40% | |||||||||||||
| 09/30/19 | 9.77 | 0.23 | 0.69 | 0.92 | (0.25) | (0.25) | 10.44 | 9.59 | 10,083 | 0.85 | 1.19 | 2.28 | 22 | |||||||||||||
| 09/30/20 | 10.44 | 0.19 | 0.37 | 0.56 | (0.20) | (0.20) | 10.80 | 5.46 | 16,509 | 0.85 | 1.03 | 1.83 | 21 | |||||||||||||
| 09/30/21 | 10.80 | 0.15 | (0.21) | (0.06) | (0.17) | (0.17) | 10.57 | (0.57) | 17,997 | 0.84 | 0.93 | 1.43 | 24 | |||||||||||||
| 09/30/22 | 10.57 | 0.18 | (1.70) | (1.52) | (0.20) | (0.20) | 8.85 | (14.52) | 11,777 | 0.76 | 0.93 | 1.79 | 19 | |||||||||||||
| Class C | ||||||||||||||||||||||||||
| 09/30/18 | $10.12 | $0.16 | $(0.35) | $(0.19) | $(0.18) | $(0.18) | $9.75 | (1.94)% | $1,087 | 1.60% | 2.78% | 1.50% | 40% | |||||||||||||
| 09/30/19 | 9.75 | 0.16 | 0.70 | 0.86 | (0.18) | (0.18) | 10.43 | 8.89 | 1,475 | 1.60 | 2.94 | 1.53 | 22 | |||||||||||||
| 09/30/20 | 10.43 | 0.12 | 0.37 | 0.49 | (0.13) | (0.13) | 10.79 | 4.69 | 1,737 | 1.60 | 2.55 | 1.08 | 21 | |||||||||||||
| 09/30/21 | 10.79 | 0.07 | (0.21) | (0.14) | (0.09) | (0.09) | 10.56 | (1.32) | 1,635 | 1.59 | 2.37 | 0.68 | 24 | |||||||||||||
| 09/30/22 | 10.56 | 0.10 | (1.69) | (1.59) | (0.13) | (0.13) | 8.84 | (15.18) | 1,415 | 1.51 | 2.25 | 1.04 | 19 | |||||||||||||
| Class Y | ||||||||||||||||||||||||||
| 09/30/18 | $10.15 | $0.24 | $(0.33) | $(0.09) | $(0.28) | $(0.28) | $9.78 | (0.92)% | $54,895 | 0.60% | 0.67% | 2.50% | 40% | |||||||||||||
| 09/30/19 | 9.78 | 0.26 | 0.69 | 0.95 | (0.28) | (0.28) | 10.45 | 9.84 | 95,218 | 0.60 | 0.68 | 2.53 | 22 | |||||||||||||
| 09/30/20 | 10.45 | 0.22 | 0.38 | 0.60 | (0.23) | (0.23) | 10.82 | 5.81 | 145,821 | 0.60 | 0.64 | 2.08 | 21 | |||||||||||||
| 09/30/21 | 10.82 | 0.19 | (0.22) | (0.03) | (0.20) | (0.20) | 10.59 | (0.32) | 199,280 | 0.59 | 0.60 | 1.68 | 24 | |||||||||||||
| 09/30/22 | 10.59 | 0.20 | (1.70) | (1.50) | (0.23) | (0.23) | 8.86 | (14.37) | 225,457 | 0.51 | 0.52 | 2.04 | 19 | |||||||||||||
| Institutional Class | ||||||||||||||||||||||||||
| 09/30/18 | $10.14 | $0.26 | $(0.33) | $(0.07) | $(0.29) | $(0.29) | $9.78 | (0.72)% | $191,224 | 0.50% | 0.60% | 2.60% | 40% | |||||||||||||
| 09/30/19 | 9.78 | 0.27 | 0.69 | 0.96 | (0.29) | (0.29) | 10.45 | 9.95 | 207,462 | 0.50 | 0.60 | 2.63 | 22 | |||||||||||||
| 09/30/20 | 10.45 | 0.23 | 0.38 | 0.61 | (0.24) | (0.24) | 10.82 | 5.92 | 227,734 | 0.50 | 0.59 | 2.18 | 21 | |||||||||||||
| 09/30/21 | 10.82 | 0.19 | (0.21) | (0.02) | (0.21) | (0.21) | 10.59 | (0.22) | 216,914 | 0.49 | 0.57 | 1.78 | 24 | |||||||||||||
| 09/30/22 | 10.59 | 0.21 | (1.70) | (1.49) | (0.24) | (0.24) | 8.86 | (14.29) | 243,902 | 0.41 | 0.49 | 2.14 | 19 | |||||||||||||
| Class R6 | ||||||||||||||||||||||||||
| 09/30/22(2) | $10.51 | $0.19 | $(1.61) | $(1.42) | $(0.23) | $(0.23) | $8.86 | (13.72)%(3) | $2 | 0.37%(4) | 238.46%(4) | 2.18%(4) | 19% | |||||||||||||
| (1) | Total returns shown exclude the effect of applicable sales loads and fees. If these charges were included, the returns would be lower. |
| (2) | Represents the period from commencement of operations (November 22, 2021) through September 30, 2022. |
| (3) | Not annualized. |
| (4) | Annualized. |
| Touchstone International ESG Equity Fund | ||||||||||||||||||||||||||||
| Period ended | Net asset value at beginning of period | Net investment income (loss) | Net realized and unrealized gains (losses) on investments | Total from investment operations | Distributions from net investment income | Distributions from realized capital gains | Total distributions | Net asset value at end of period | Total return(1) | Net assets at end of period (000's) | Ratio of net expenses to average net assets | Ratio of gross expenses to average net assets | Ratio of net investment income (loss) to average net assets | Portfolio turnover rate | ||||||||||||||
| Class A | ||||||||||||||||||||||||||||
| 09/30/18 | $9.40 | $0.24 | $0.35 | $0.59 | $(0.23) | $ (0.18) | $(0.41) | $9.58 | 6.41% | $11,984 | 1.20% | 1.41% | 2.16% | 68% | ||||||||||||||
| 09/30/19 | 9.58 | 0.15 | (0.29) | (0.14) | (0.17) | (0.77) | (0.94) | 8.50 | (0.81) | 10,333 | 1.20 | 1.52 | 1.71 | 123 | ||||||||||||||
| 09/30/20 | 8.50 | 0.03 | 0.62 | 0.65 | (0.02) | (1.69) | (1.71) | 7.44 | 7.93 | 11,719 | 1.17 | 1.81 | 0.68 | 80 | ||||||||||||||
| 09/30/21 | 7.44 | 0.12 | 1.57 | 1.69 | (0.03) | — | (0.03) | 9.10 | 22.73 | 10,218 | 1.17 | 1.64 | 1.06 | 52 | ||||||||||||||
| 09/30/22 | 9.10 | 0.15 | (2.66) | (2.51) | (0.12) | (0.50) | (0.62) | 5.97 | (29.67) | 6,595 | 1.17 | 1.59 | 1.94 | 32 | ||||||||||||||
| Class C | ||||||||||||||||||||||||||||
| 09/30/18 | $9.39 | $0.14 | $0.38 | $0.52 | $(0.16) | $ (0.18) | $(0.34) | $9.57 | 5.62% | $19,455 | 1.95% | 2.07% | 1.41% | 68% | ||||||||||||||
| 09/30/19 | 9.57 | 0.09 | (0.30) | (0.21) | (0.11) | (0.77) | (0.88) | 8.48 | (1.61) | 10,691 | 1.95 | 2.16 | 1.05 | 123 | ||||||||||||||
| 09/30/20 | 8.48 | (0.03) | 0.64 | 0.61 | (—)(2) | (1.69) | (1.69) | 7.40 | 7.35 | 4,066 | 1.95 | 2.56 | (0.10) | 80 | ||||||||||||||
| 09/30/21 | 7.40 | — | 1.61 | 1.61 | — | — | — | 9.01 | 21.76 | 2,727 | 1.95 | 2.56 | 0.28 | 52 | ||||||||||||||
| 09/30/22 | 9.01 | 0.08 | (2.64) | (2.56) | — | (0.50) | (0.50) | 5.95 | (30.16) | 1,086 | 1.95 | 2.72 | 1.16 | 32 | ||||||||||||||
| Class Y | ||||||||||||||||||||||||||||
| 09/30/18 | $9.38 | $0.23 | $0.37 | $0.60 | $(0.25) | $ (0.18) | $(0.43) | $9.55 | 6.59% | $56,185 | 0.95% | 0.99% | 2.41% | 68% | ||||||||||||||
| 09/30/19 | 9.55 | 0.18 | (0.30) | (0.12) | (0.19) | (0.77) | (0.96) | 8.47 | (0.57) | 16,554 | 0.95 | 1.09 | 2.17 | 123 | ||||||||||||||
| 09/30/20 | 8.47 | 0.07 | 0.61 | 0.68 | (0.03) | (1.69) | (1.72) | 7.43 | 8.32 | 11,550 | 0.90 | 1.49 | 0.95 | 80 | ||||||||||||||
| 09/30/21 | 7.43 | 0.10 | 1.61 | 1.71 | (0.05) | — | (0.05) | 9.09 | 23.07 | 20,434 | 0.90 | 1.34 | 1.33 | 52 | ||||||||||||||
| 09/30/22 | 9.09 | 0.18 | (2.66) | (2.48) | (0.12) | (0.50) | (0.62) | 5.99 | (29.43) | 14,560 | 0.90 | 1.30 | 2.21 | 32 | ||||||||||||||
| Institutional Class | ||||||||||||||||||||||||||||
| 09/30/19(3) | $8.05(4) | $(0.01) | $0.45 | $0.44 | $(0.01) | $ — | $(0.01) | $8.48 | 5.46%(5) | $3 | 0.89%(6) | 2,643.52%(6) | (0.97)%(6) | 123% | ||||||||||||||
| 09/30/20 | 8.48 | 0.07 | 0.60 | 0.67 | (0.03) | (1.69) | (1.72) | 7.43 | 8.30 | 3 | 0.89 | 314.41 | 0.96 | 80 | ||||||||||||||
| 09/30/21 | 7.43 | 0.12 | 1.60 | 1.72 | (0.05) | — | (0.05) | 9.10 | 23.21 | 4 | 0.89 | 255.65 | 1.34 | 52 | ||||||||||||||
| 09/30/22 | 9.10 | 0.22 | (2.70) | (2.48) | (0.14) | (0.50) | (0.64) | 5.98 | (29.41) | 5,913 | 0.89 | 1.18 | 2.22 | 32 | ||||||||||||||
| (1) | Total returns shown exclude the effect of applicable sales loads and fees. If these charges were included, the returns would be lower. |
| (2) | Less than $0.005 per share. |
| (3) | Represents the period from commencement of operations (August 23, 2019) through September 30, 2019. |
| (4) | Net asset value at the beginning of period is based on the net asset value of Class Y shares on August 23, 2019. |
| (5) | Not annualized. |
| (6) | Annualized. |
| Touchstone Mid Cap Fund | ||||||||||||||||||||||||||||
| Period ended | Net asset value at beginning of period | Net investment income (loss) | Net realized and unrealized gains (losses) on investments | Total from investment operations | Distributions from net investment income | Distributions from realized capital gains | Total distributions | Net asset value at end of period | Total return(1) | Net assets at end of period (000's) | Ratio of net expenses to average net assets(2) | Ratio of gross expenses to average net assets(3) | Ratio of net investment income (loss) to average net assets | Portfolio turnover rate | ||||||||||||||
| Class A | ||||||||||||||||||||||||||||
| 09/30/18 | $30.50 | $0.01(4) | $4.79 | $4.80 | $— | $ (0.31) | $(0.31) | $34.99 | 15.83% | $36,824 | 1.24% | 1.35% | 0.04% | 46% | ||||||||||||||
| 09/30/19 | 34.99 | 0.05 | 5.00 | 5.05 | (0.02) | (1.15) | (1.17) | 38.87 | 15.34 | 61,772 | 1.23 | 1.36 | 0.19 | 25 | ||||||||||||||
| 09/30/20 | 38.87 | 0.03(4) | 1.27 | 1.30 | (0.24) | (0.89) | (1.13) | 39.04 | 3.32 | 103,964 | 1.21 | 1.29 | 0.08 | 18 | ||||||||||||||
| 09/30/21 | 39.04 | (0.07)(4) | 8.33 | 8.26 | (0.13) | (0.70) | (0.83) | 46.47 | 21.34 | 137,477 | 1.22 | 1.23 | (0.15) | 21(6) | ||||||||||||||
| 09/30/22 | 46.47 | (0.05)(4) | (6.26) | (6.31) | (0.15) | (1.21) | (1.36) | 38.80 | (14.13) | 109,653 | 1.23 | 1.23 | (0.11) | 15(6) | ||||||||||||||
| Class C | ||||||||||||||||||||||||||||
| 09/30/18 | $29.02 | $(0.22)(4) | $4.52 | $4.30 | $— | $ (0.31) | $(0.31) | $33.01 | 14.91% | $56,274 | 1.99% | 2.08% | (0.71)% | 46% | ||||||||||||||
| 09/30/19 | 33.01 | (0.17) | 4.65 | 4.48 | — | (1.15) | (1.15) | 36.34 | 14.48 | 66,855 | 1.98 | 2.07 | (0.56) | 25 | ||||||||||||||
| 09/30/20 | 36.34 | (0.23)(4) | 1.16 | 0.93 | — | (0.89) | (0.89) | 36.38 | 2.54 | 78,959 | 1.96 | 2.00 | (0.67) | 18 | ||||||||||||||
| 09/30/21 | 36.38 | (0.36)(4) | 7.74 | 7.38 | (0.06) | (0.70) | (0.76) | 43.00 | 20.47 | 90,388 | 1.93 | 1.93 | (0.86) | 21(6) | ||||||||||||||
| 09/30/22 | 43.00 | (0.34)(4) | (5.74) | (6.08) | (0.07) | (1.21) | (1.28) | 35.64 | (14.71) | 65,812 | 1.93 | 1.93 | (0.81) | 15(6) | ||||||||||||||
| Class Y | ||||||||||||||||||||||||||||
| 09/30/18 | $30.77 | $0.10(4) | $4.82 | $4.92 | $(0.05) | $ (0.31) | $(0.36) | $35.33 | 16.09% | $712,578 | 0.99% | 1.05% | 0.29% | 46% | ||||||||||||||
| 09/30/19 | 35.33 | 0.14 | 5.05 | 5.19 | (0.04) | (1.15) | (1.19) | 39.33 | 15.62 | 1,194,001 | 0.98 | 1.07 | 0.44 | 25 | ||||||||||||||
| 09/30/20 | 39.33 | 0.12(4) | 1.28 | 1.40 | (0.29) | (0.89) | (1.18) | 39.55 | 3.57 | 2,443,232 | 0.96 | 1.00 | 0.33 | 18 | ||||||||||||||
| 09/30/21 | 39.55 | 0.05(4) | 8.44 | 8.49 | (0.16) | (0.70) | (0.86) | 47.18 | 21.64 | 3,258,367 | 0.97(7) | 0.93 | 0.10 | 21(6) | ||||||||||||||
| 09/30/22 | 47.18 | 0.08(4) | (6.36) | (6.28) | (0.18) | (1.21) | (1.39) | 39.51 | (13.87) | 2,789,008 | 0.94(7) | 0.95 | 0.17 | 15(6) | ||||||||||||||
| Class Z | ||||||||||||||||||||||||||||
| 09/30/18 | $30.32 | $0.01(4) | $4.76 | $4.77 | $— | $ (0.31) | $(0.31) | $34.78 | 15.83% | $20,464 | 1.24% | 1.40% | 0.04% | 46% | ||||||||||||||
| 09/30/19 | 34.78 | 0.05 | 4.96 | 5.01 | (0.02) | (1.15) | (1.17) | 38.62 | 15.32 | 61,657 | 1.22 | 1.37 | 0.19 | 25 | ||||||||||||||
| 09/30/20 | 38.62 | 0.03(4) | 1.25 | 1.28 | (0.26) | (0.89) | (1.15) | 38.75 | 3.30 | 77,184 | 1.21 | 1.30 | 0.08 | 18 | ||||||||||||||
| 09/30/21 | 38.75 | (—)(4) | 8.20 | 8.20 | (0.13) | (0.70) | (0.83) | 46.12 | 21.33 | 54,368 | 1.22 | 1.25 | (0.15) | 21(6) | ||||||||||||||
| 09/30/22 | 46.12 | (0.05)(4) | (6.21) | (6.26) | (0.14) | (1.21) | (1.35) | 38.51 | (14.12) | 37,449 | 1.23 | 1.26 | (0.11) | 15(6) | ||||||||||||||
| Institutional Class | ||||||||||||||||||||||||||||
| 09/30/18 | $30.81 | $0.12(4) | $4.83 | $4.95 | $(0.07) | $ (0.31) | $(0.38) | $35.38 | 16.18% | $129,284 | 0.92% | 0.97% | 0.36% | 46% | ||||||||||||||
| 09/30/19 | 35.38 | 0.15 | 5.08 | 5.23 | (0.05) | (1.15) | (1.20) | 39.41 | 15.71 | 245,418 | 0.91 | 0.97 | 0.51 | 25 | ||||||||||||||
| 09/30/20 | 39.41 | 0.15(4) | 1.29 | 1.44 | (0.32) | (0.89) | (1.21) | 39.64 | 3.64 | 1,142,677 | 0.89(7) | 0.89 | 0.40 | 18 | ||||||||||||||
| 09/30/21 | 39.64 | 0.10(4) | 8.46 | 8.56 | (0.16) | (0.70) | (0.86) | 47.34 | 21.80 | 676,846 | 0.85(7) | 0.84 | 0.22 | 21(6) | ||||||||||||||
| 09/30/22 | 47.34 | 0.11(4) | (6.39) | (6.28) | (0.19) | (1.21) | (1.40) | 39.66 | (13.82) | 407,132 | 0.87 | 0.87 | 0.25 | 15(6) | ||||||||||||||
| Class R6 | ||||||||||||||||||||||||||||
| 09/30/21(8) | $45.92 | $0.07(4) | $1.36 | $1.43 | $— | $ — | $— | $47.35 | 3.11%(9) | $612,500 | 0.80%(5) | 0.82%(5) | 0.27%(5) | 21%(6) | ||||||||||||||
| 09/30/22 | 47.35 | 0.14(4) | (6.39) | (6.25) | (0.19) | (1.21) | (1.40) | 39.70 | (13.76) | 598,238 | 0.81 | 0.82 | 0.31 | 15(6) | ||||||||||||||
| (1) | Total returns shown exclude the effect of applicable sales loads and fees. If these charges were included, the returns would be lower. |
| (2) | The ratio of net expenses to average net assets excluding liquidity provider expenses for Class A was 1.21% and 1.21%, for Class C was 1.91% and 1.92%, for Class Y was 0.92% and 0.96%, for Class Z was 1.21% and 1.21%, for Institutional Class was 0.85% and 0.84% and for Class R6 was 0.79%, and 0.79% for the years ended September 30, 2022 and 2021. |
| (3) | The ratio of gross expenses to average net assets excluding liquidity provider expenses for Class A was 1.21% and 1.22%, for Class C was 1.91% and 1.92%, for Class Y was 0.93% and 0.92%, for Class Z was 1.24% and 1.24%, for Institutional Class was and 0.85% and 0.83% and for Class R6 was 0.80% and 0.81% for the years ended September 30, 2022, and 2021. |
| (4) | The net investment income per share was based on average shares outstanding for the period. |
| (5) | Annualized. |
| (6) | Portfolio turnover excludes securities delivered from processing redemptions-in-kind. |
| (7) | Net expenses include amounts recouped by the Advisor. |
| (8) | Represents the period from commencement of operations (February 22, 2021) through September 30, 2021. |
| (9) | Not annualized. |
| Touchstone Mid Cap Value Fund | ||||||||||||||||||||||||||||
| Period ended | Net asset value at beginning of period | Net investment income (loss) | Net realized and unrealized gains (losses) on investments | Total from investment operations | Distributions from net investment income | Distributions from realized capital gains | Total distributions | Net asset value at end of period | Total return(1) | Net assets at end of period (000's) | Ratio of net expenses to average net assets(2) | Ratio of gross expenses to average net assets(3) | Ratio of net investment income (loss) to average net assets | Portfolio turnover rate | ||||||||||||||
| Class A | ||||||||||||||||||||||||||||
| 09/30/18 | $19.36 | $0.07 | $0.48 | $0.55 | $(0.06) | $ (1.14) | $(1.20) | $18.71 | 2.80% | $17,217 | 1.25% | 1.48% | 0.32% | 31% | ||||||||||||||
| 09/30/19 | 18.71 | 0.12 | (0.06) | 0.06 | (0.10) | (0.76) | (0.86) | 17.91 | 0.81 | 10,866 | 1.22 | 1.53 | 0.59 | 34 | ||||||||||||||
| 09/30/20 | 17.91 | 0.09 | (1.20) | (1.11) | (0.09) | — | (0.09) | 16.71 | (6.20) | 9,864 | 1.22 | 1.59 | 0.50 | 37 | ||||||||||||||
| 09/30/21 | 16.71 | 0.01(4) | 6.93 | 6.94 | (0.03) | — | (0.03) | 23.62 | 41.59 | 13,605 | 1.23 | 1.55 | 0.06 | 33(5) | ||||||||||||||
| 09/30/22 | 23.62 | 0.14(4) | (2.05) | (1.91) | (0.19) | (1.49) | (1.68) | 20.03 | (9.04) | 12,950 | 1.22 | 1.44 | 0.59 | 27 | ||||||||||||||
| Class C | ||||||||||||||||||||||||||||
| 09/30/18 | $18.94 | $(0.13) | $0.53 | $0.40 | $— | $ (1.14) | $(1.14) | $18.20 | 2.04% | $7,755 | 2.01% | 2.31% | (0.43)% | 31% | ||||||||||||||
| 09/30/19 | 18.20 | (0.12) | 0.05 | (0.07) | — | (0.76) | (0.76) | 17.37 | 0.06 | 5,378 | 1.97 | 2.40 | (0.17) | 34 | ||||||||||||||
| 09/30/20 | 17.37 | (0.24) | (0.96) | (1.20) | — | — | — | 16.17 | (6.91) | 3,296 | 1.97 | 2.57 | (0.25) | 37 | ||||||||||||||
| 09/30/21 | 16.17 | (0.15)(4) | 6.71 | 6.56 | — | — | — | 22.73 | 40.57 | 4,167 | 1.98 | 2.36 | (0.69) | 33(5) | ||||||||||||||
| 09/30/22 | 22.73 | (0.03)(4) | (1.97) | (2.00) | — | (1.49) | (1.49) | 19.24 | (9.73) | 4,013 | 1.97 | 2.26 | (0.16) | 27 | ||||||||||||||
| Class Y | ||||||||||||||||||||||||||||
| 09/30/18 | $19.45 | $0.11 | $0.48 | $0.59 | $(0.11) | $ (1.14) | $(1.25) | $18.79 | 3.00% | $337,247 | 1.00% | 1.05% | 0.57% | 31% | ||||||||||||||
| 09/30/19 | 18.79 | 0.14 | (0.04) | 0.10 | (0.14) | (0.76) | (0.90) | 17.99 | 1.08 | 286,407 | 0.97 | 1.19 | 0.84 | 34 | ||||||||||||||
| 09/30/20 | 17.99 | 0.12 | (1.20) | (1.08) | (0.13) | — | (0.13) | 16.78 | (5.97) | 299,596 | 0.97 | 1.22 | 0.75 | 37 | ||||||||||||||
| 09/30/21 | 16.78 | 0.07(4) | 6.96 | 7.03 | (0.06) | — | (0.06) | 23.75 | 41.97 | 400,865 | 0.98 | 1.16 | 0.31 | 33(5) | ||||||||||||||
| 09/30/22 | 23.75 | 0.20(4) | (2.06) | (1.86) | (0.25) | (1.49) | (1.74) | 20.15 | (8.81) | 349,756 | 0.97 | 1.16 | 0.84 | 27 | ||||||||||||||
| Institutional Class | ||||||||||||||||||||||||||||
| 09/30/18 | $19.54 | $0.12 | $0.50 | $0.62 | $(0.13) | $ (1.14) | $(1.27) | $18.89 | 3.17% | $431,412 | 0.87% | 0.99% | 0.70% | 31% | ||||||||||||||
| 09/30/19 | 18.89 | 0.17 | (0.04) | 0.13 | (0.17) | (0.76) | (0.93) | 18.09 | 1.20 | 453,198 | 0.84 | 0.97 | 0.97 | 34 | ||||||||||||||
| 09/30/20 | 18.09 | 0.15 | (1.22) | (1.07) | (0.15) | — | (0.15) | 16.87 | (5.86) | 370,247 | 0.84 | 0.98 | 0.88 | 37 | ||||||||||||||
| 09/30/21 | 16.87 | 0.10(4) | 7.00 | 7.10 | (0.09) | — | (0.09) | 23.88 | 42.16 | 456,557 | 0.85 | 0.97 | 0.44 | 33(5) | ||||||||||||||
| 09/30/22 | 23.88 | 0.23(4) | (2.07) | (1.84) | (0.28) | (1.49) | (1.77) | 20.27 | (8.68) | 395,187 | 0.84 | 0.95 | 0.97 | 27 | ||||||||||||||
| (1) | Total returns shown exclude the effect of applicable sales loads and fees. If these charges were included, the returns would be lower. |
| (2) | The ratio of net expenses to average net assets excluding liquidity provider expenses for Class A was 1.22%, for Class C was 1.97%, for Class Y was 0.97% and for Institutional Class was 0.84% for the year ended September 30, 2021 . |
| (3) | The ratio of gross expenses to average net assets excluding liquidity provider expenses for Class A was 1.54%, for Class C was 2.35%, for Class Y was 1.15% and for Institutional Class was 0.96% for the year ended September 30, 2021. |
| (4) | The net investment income per share was based on average shares outstanding for the period. |
| (5) | Portfolio turnover excludes securities delivered from processing redemptions-in-kind. |
| Touchstone Sands Capital Select Growth Fund | ||||||||||||||||||||||||||
| Period ended | Net asset value at beginning of period | Net investment loss | Net realized and unrealized gains (losses) on investments | Total from investment operations | Distributions from realized capital gains | Total distributions | Net asset value at end of period | Total return(1) | Net assets at end of period (000's) | Ratio of net expenses to average net assets(2) | Ratio of gross expenses to average net assets(3) | Ratio of net investment income (loss) to average net assets | Portfolio turnover rate | |||||||||||||
| Class A | ||||||||||||||||||||||||||
| 09/30/18 | $16.58 | $(0.21) | $4.72 | $4.51 | $ (3.36) | $(3.36) | $17.73 | 33.03% | $97,583 | 1.43% | 1.43% | (1.28)% | 21%(4) | |||||||||||||
| 09/30/19 | 17.73 | (0.06) | (0.72) | (0.78) | (3.83) | (3.83) | 13.12 | (1.75) | 89,299 | 1.44 | 1.44 | (1.23) | 25(4) | |||||||||||||
| 09/30/20 | 13.12 | (0.11)(5) | 6.58 | 6.47 | (2.37) | (2.37) | 17.22 | 58.43 | 163,697 | 1.25(6) | 1.24 | (0.85) | 41(4) | |||||||||||||
| 09/30/21 | 17.22 | (0.19)(5) | 5.43 | 5.24 | (1.85) | (1.85) | 20.61 | 32.30 | 841,243 | 1.06(6) | 1.06 | (0.96) | 35(4)(7) | |||||||||||||
| 09/30/22 | 20.61 | (0.13)(5) | (10.02) | (10.15) | (2.16) | (2.16) | 8.30 | (54.73) | 319,960 | 1.13 | 1.13 | (0.98) | 45(4) | |||||||||||||
| Class C | ||||||||||||||||||||||||||
| 09/30/18^ | $19.48 | $(0.30) | $5.39 | $5.09 | $ (4.22) | $(4.22) | $20.35 | 32.11% | $80,444 | 2.18% | 2.19% | (2.03)% | 21%(4) | |||||||||||||
| 09/30/19^ | 20.35 | (0.64) | (0.43) | (1.07) | (4.81) | (4.81) | 14.47 | (2.44) | 50,079 | 2.19 | 2.21 | (1.98) | 25(4) | |||||||||||||
| 09/30/20^ | 14.47 | (0.23)(5) | 7.03 | 6.80 | (2.98) | (2.98) | 18.29 | 57.27 | 36,065 | 2.01 | 2.04 | (1.56) | 41(4) | |||||||||||||
| 09/30/21^ | 18.29 | (0.35)(5) | 5.67 | 5.32 | (2.32) | (2.32) | 21.29 | 31.14 | 75,082 | 1.86 | 1.87 | (1.75) | 35(4)(7) | |||||||||||||
| 09/30/22^ | 21.29 | (0.23)(5) | (10.05) | (10.28) | (2.71) | (2.71) | 8.30 | (55.02) | 20,623 | 1.78 | 1.94 | (1.63) | 45(4) | |||||||||||||
| Class Y | ||||||||||||||||||||||||||
| 09/30/18 | $17.29 | $(0.18) | $4.98 | $4.80 | $ (3.36) | $(3.36) | $18.73 | 33.36% | $1,556,324 | 1.18%(6) | 1.17% | (1.03)% | 21%(4) | |||||||||||||
| 09/30/19 | 18.73 | (0.14) | (0.62) | (0.76) | (3.83) | (3.83) | 14.14 | (1.45) | 1,089,979 | 1.19(6) | 1.18 | (0.98) | 25(4) | |||||||||||||
| 09/30/20 | 14.14 | (0.09)(5) | 7.21 | 7.12 | (2.37) | (2.37) | 18.89 | 58.86 | 1,565,333 | 1.00(6) | 0.99 | (0.58) | 41(4) | |||||||||||||
| 09/30/21 | 18.89 | (0.16)(5) | 5.98 | 5.82 | (1.85) | (1.85) | 22.86 | 32.53 | 1,784,643 | 0.85 | 0.85 | (0.74) | 35(4)(7) | |||||||||||||
| 09/30/22 | 22.86 | (0.11)(5) | (11.24) | (11.35) | (2.16) | (2.16) | 9.35 | (54.59) | 613,010 | 0.88 | 0.88 | (0.72) | 45(4) | |||||||||||||
| Class Z | ||||||||||||||||||||||||||
| 09/30/18 | $16.58 | $(0.20) | $4.73 | $4.53 | $ (3.36) | $(3.36) | $17.75 | 33.10% | $611,071 | 1.42% | 1.47% | (1.27)% | 21%(4) | |||||||||||||
| 09/30/19 | 17.75 | (0.17) | (0.61) | (0.78) | (3.83) | (3.83) | 13.14 | (1.69) | 458,996 | 1.43 | 1.49 | (1.22) | 25(4) | |||||||||||||
| 09/30/20 | 13.14 | (0.11)(5) | 6.59 | 6.48 | (2.37) | (2.37) | 17.25 | 58.42 | 491,741 | 1.24 | 1.31 | (0.82) | 41(4) | |||||||||||||
| 09/30/21 | 17.25 | (0.20)(5) | 5.43 | 5.23 | (1.85) | (1.85) | 20.63 | 32.17 | 570,206 | 1.16(6) | 1.16 | (1.05) | 35(4)(7) | |||||||||||||
| 09/30/22 | 20.63 | (0.14)(5) | (10.02) | (10.16) | (2.16) | (2.16) | 8.31 | (54.73) | 203,620 | 1.18 | 1.19 | (1.03) | 45(4) | |||||||||||||
| Institutional Class | ||||||||||||||||||||||||||
| 09/30/20(8) | $19.81(9) | $(0.01)(5) | $(0.91) | $(0.92) | $ — | $— | $18.89 | (4.64)%(10) | $2 | 0.81%(11) | 1,344.66%(11) | (0.81)%(11) | 41%(4) | |||||||||||||
| 09/30/21 | 18.89 | (0.15)(5) | 5.99 | 5.84 | (1.85) | (1.85) | 22.88 | 32.65 | 2,582,030 | 0.79(6) | 0.79 | (0.69) | 35(4)(7) | |||||||||||||
| 09/30/22 | 22.88 | (0.10)(5) | (11.26) | (11.36) | (2.16) | (2.16) | 9.36 | (54.58) | 839,599 | 0.82 | 0.83 | (0.67) | 45 | |||||||||||||
| Class R6 | ||||||||||||||||||||||||||
| 09/30/20(8) | $19.81(9) | $(0.01)(5) | $(0.91) | $(0.92) | $ — | $— | $18.89 | (4.64)%(10) | $2 | 0.75%(11) | 3.55%(11) | (0.73)%(11) | 41%(4) | |||||||||||||
| 09/30/21 | 18.89 | (0.14)(5) | 5.98 | 5.84 | (1.85) | (1.85) | 22.88 | 32.65 | 498,994 | 0.74 | 0.75 | (0.65) | 35(4)(7) | |||||||||||||
| 09/30/22 | 22.88 | (0.09)(5) | (11.26) | (11.35) | (2.16) | (2.16) | 9.37 | (54.58) | 270,361 | 0.76 | 0.79 | (0.61) | 45(4) | |||||||||||||
| ^ | Updated to reflect the effect of a 1 for 0.796098 reverse stock split for Class C shares on October 14, 2022 (See Note 10 in the Notes to Financial Statements). All historical per share information has been retroactively adjusted to reflect this reverse stock split. |
| (1) | Total returns shown exclude the effect of applicable sales loads and fees. If these charges were included, the returns would be lower. |
| (2) | The ratio of net expenses to average net assets excluding liquidity provider expenses for Class A was 1.09%, 1.04%, 1.22%, 1.40% and 1.42%, for Class C was 1.74%, 1.84%, 1.98%, 2.15% and 2.17%, for Class Y was 0.84%, 0.83%, 0.97%, 1.15% and 1.17% and for Class Z was 1.14%, 1.14%, 1.21%, 1.39% and 1.41% for the years ended September 30, 2022, 2021, 2020, 2019 and 2018, respectively. The ratio of net expenses to average net assets excluding liquidity provider expenses for Institutional Class was 0.78%, 0.77% and 0.78% and for Class R6 was 0.72%, 0.72% and 0.72% for the years ended September 30, 2022, 2021 and 2020, respectively. |
| (3) | The ratio of gross expenses to average net assets excluding liquidity provider expenses for Class A was 1.09%, 1.04%, 1.21%, 1.40% and 1.42%, for Class C was 1.90%, 1.85%, 2.01%, 2.17% and 2.18%, for Class Y was 0.84%, 0.83%, 0.96%, 1.14% and 1.16% and for Class Z was 1.15%, 1.14%, 1.28%, 1.45% and 1.46% for the years ended September 30, 2022, 2021, 2020, 2019 and 2018, respectively. The ratio of gross expenses to average net assets excluding liquidity provider expenses for Institutional Class was 0.78%, 0.77% and 0.78% and for Class R6 was 0.72%, 0.72% and 0.72% for the years ended September 30, 2022, 2021 and 2020, respectively. |
| (4) | Portfolio turnover excludes securities delivered from processing redemptions-in-kind. |
| (5) | The net investment income per share was based on average shares outstanding for the period. |
| (6) | Net expenses include amounts recouped by the Advisor. |
| (7) | Portfolio turnover excludes the purchases and sales of securities by the Touchstone Sands Capital Institutional Growth Fund and the AIG Focused Growth Fund acquired on December 11, 2020 and July 16, 2021, respectively. If these transactions were included, portfolio turnover would have been higher. |
| (8) | Represents the period from commencement of operations (September 1, 2020) through September 30, 2020. |
| (9) | Net asset value at the beginning of period is based on the net asset value of Class Y shares on September 1, 2020. |
| (10) | Not annualized. |
| (11) | Annualized. |
| Touchstone Small Cap Fund | ||||||||||||||||||||||||||||
| Period ended | Net asset value at beginning of period | Net investment income (loss) | Net realized and unrealized gains (losses) on investments | Total from investment operations | Distributions from net investment income | Distributions from realized capital gains | Total distributions | Net asset value at end of period | Total return(1) | Net assets at end of period (000's) | Ratio of net expenses to average net assets(2) | Ratio of gross expenses to average net assets(3) | Ratio of net investment income (loss) to average net assets | Portfolio turnover rate | ||||||||||||||
| Class A | ||||||||||||||||||||||||||||
| 09/30/18 | $17.73 | $0.32(4)(5) | $1.52 | $1.84 | $(0.34) | $ (2.99) | $(3.33) | $16.24 | 12.14% | $8,142 | 1.39% | 1.65% | 1.99%(5) | 29%(6) | ||||||||||||||
| 09/30/19 | 16.24 | —(7) | (0.49) | (0.49) | — | (3.40) | (3.40) | 12.35 | 0.22 | 3,750 | 1.39 | 2.01 | 0.02 | 17(6) | ||||||||||||||
| 09/30/20 | 12.35 | 0.01(4) | (0.98) | (0.97) | — | (1.09) | (1.09) | 10.29 | (8.92) | 4,313 | 1.27 | 2.09 | 0.08 | 22(6) | ||||||||||||||
| 09/30/21 | 10.29 | 0.05(4) | 3.91 | 3.96 | — | (0.20) | (0.20) | 14.05 | 38.68 | 5,266 | 1.27 | 1.78 | 0.39 | 33(6) | ||||||||||||||
| 09/30/22 | 14.05 | (0.01)(4) | (1.21) | (1.22) | (0.03) | (1.78) | (1.81) | 11.02 | (10.75) | 4,022 | 1.25 | 1.77 | (0.05) | 18(6) | ||||||||||||||
| Class C | ||||||||||||||||||||||||||||
| 09/30/18 | $16.94 | $0.19(4)(5) | $1.45 | $1.64 | $(0.19) | $ (2.99) | $(3.18) | $15.40 | 11.33% | $6,299 | 2.14% | 2.40% | 1.24%(5) | 29%(6) | ||||||||||||||
| 09/30/19 | 15.40 | (0.10) | (0.49) | (0.59) | — | (3.40) | (3.40) | 11.41 | (0.58) | 3,356 | 2.14 | 2.64 | (0.73) | 17(6) | ||||||||||||||
| 09/30/20 | 11.41 | (0.07)(4) | (0.87) | (0.94) | — | (1.09) | (1.09) | 9.38 | (9.43) | 295 | 2.02 | 3.10 | (0.68) | 22(6) | ||||||||||||||
| 09/30/21 | 9.38 | (0.04)(4) | 3.55 | 3.51 | — | (0.20) | (0.20) | 12.69 | 37.62 | 197 | 2.02 | 4.51 | (0.36) | 33(6) | ||||||||||||||
| 09/30/22 | 12.69 | (0.09)(4) | (1.07) | (1.16) | (0.01) | (1.78) | (1.79) | 9.74 | (11.45) | 162 | 2.00 | 6.81 | (0.80) | 18(6) | ||||||||||||||
| Class Y | ||||||||||||||||||||||||||||
| 09/30/18 | $17.94 | $0.37(4)(5) | $1.53 | $1.90 | $(0.40) | $ (2.99) | $(3.39) | $16.45 | 12.44% | $51,218 | 1.14% | 1.17% | 2.24%(5) | 29%(6) | ||||||||||||||
| 09/30/19 | 16.45 | 0.04 | (0.50) | (0.46) | — | (3.40) | (3.40) | 12.59 | 0.44 | 34,709 | 1.14 | 1.31 | 0.27 | 17(6) | ||||||||||||||
| 09/30/20 | 12.59 | 0.04(4) | (1.00) | (0.96) | (0.02) | (1.09) | (1.11) | 10.52 | (8.65) | 35,573 | 1.02 | 1.32 | 0.33 | 22(6) | ||||||||||||||
| 09/30/21 | 10.52 | 0.09(4) | 3.98 | 4.07 | (0.11) | (0.20) | (0.31) | 14.28 | 39.02 | 49,842 | 1.02 | 1.25 | 0.64 | 33(6) | ||||||||||||||
| 09/30/22 | 14.28 | 0.02(4) | (1.24) | (1.22) | (0.04) | (1.78) | (1.82) | 11.24 | (10.58) | 53,485 | 1.00 | 1.23 | 0.20 | 18(6) | ||||||||||||||
| Institutional Class | ||||||||||||||||||||||||||||
| 09/30/18 | $17.93 | $0.38(4)(5) | $1.53 | $1.91 | $(0.45) | $ (2.99) | $(3.44) | $16.40 | 12.52% | $93,636 | 1.06% | 1.10% | 2.32%(5) | 29%(6) | ||||||||||||||
| 09/30/19 | 16.40 | 0.06 | (0.51) | (0.45) | — | (3.40) | (3.40) | 12.55 | 0.54 | 36,691 | 1.06 | 1.20 | 0.35 | 17(6) | ||||||||||||||
| 09/30/20 | 12.55 | 0.04(4) | (0.97) | (0.93) | (0.04) | (1.09) | (1.13) | 10.49 | (8.57) | 33,201 | 0.94 | 1.21 | 0.41 | 22(6) | ||||||||||||||
| 09/30/21 | 10.49 | 0.10(4) | 3.97 | 4.07 | (0.13) | (0.20) | (0.33) | 14.23 | 39.13 | 39,656 | 0.94 | 1.16 | 0.72 | 33(6) | ||||||||||||||
| 09/30/22 | 14.23 | 0.04(4) | (1.25) | (1.21) | (0.04) | (1.78) | (1.82) | 11.20 | (10.52) | 32,834 | 0.92 | 1.14 | 0.28 | 18(6) | ||||||||||||||
| (1) | Total returns shown exclude the effect of applicable sales loads and fees. If these charges were included, the returns would be lower. |
| (2) | The ratio of net expenses to average net assets excluding liquidity provider expenses for Class A was 1.24%, 1.24%, 1.24%, 1.34% and 1.38%, for Class C was 1.99%, 1.99%, 1.99%, 2.09% and 2.13%, for Class Y was 0.99%, 0.99%, 0.99%, 1.09% and 1.13% and for Institutional Class was 0.91%, 0.91%, 0.91%, 1.01% and 1.05% for the years ended September 30, 2022, 2021, 2020, 2019 and 2018, respectively. |
| (3) | The ratio of gross expenses to average net assets excluding liquidity provider expenses for Class A was 1.76%, 1.75%, 2.06%, 1.96% and 1.64%, for Class C was 6.80%, 4.48%, 3.07%, 2.59% and 2.39%, for CLass Y was 1.22%, 1.22%, 1.29%, 1.26% and 1.16% and for Institutional Class was 1.12% 1.13%, 1.18%, 1.15% and 1.09% for the years ended September 30, 2022, 2021, 2020, 2019 and 2018, respectively. |
| (4) | The net investment income per share was based on average shares outstanding for the period. |
| (5) | Includes impact of special dividend from Alexander & Baldwin Inc. in January, 2018 as part of the company's conversion to a real estate investment trust. This special dividend enhanced the net investment income per share and ratio of net investment income by $0.34 and 2.10%, respectively, for Class A, Class Y and Institutional Class and by $0.32 and 2.10%, respectively, for Class C. |
| (6) | Portfolio turnover excludes securities delivered from processing redemptions-in-kind. |
| (7) | Less than $0.005 per share. |
| Touchstone Small Cap Value Fund | ||||||||||||||||||||||||||||||
| Period ended | Net asset value at beginning of period | Net investment income (loss) | Net realized and unrealized gains (losses) on investments | Total from investment operations | Distributions from net investment income | Distributions from realized capital gains | Return of capital | Total distributions | Net asset value at end of period | Total return(1) | Net assets at end of period (000's) | Ratio of net expenses to average net assets | Ratio of gross expenses to average net assets | Ratio of net investment income (loss) to average net assets | Portfolio turnover rate | |||||||||||||||
| Class A | ||||||||||||||||||||||||||||||
| 09/30/18 | $26.06 | $0.02 | $1.83 | $1.85 | $—(3) | $ — | $ — | $—(3) | $27.91 | 7.12% | $83,139 | 1.38% | 1.75% | 0.09% | 49%(2)(4) | |||||||||||||||
| 09/30/19 | 27.91 | 0.11 | (2.29) | (2.18) | (0.03) | (1.70) | — | (1.73) | 24.00 | (7.37) | 24,389 | 1.38 | 1.68 | 0.19 | 28 | |||||||||||||||
| 09/30/20 | 24.00 | 0.03(5) | (3.34) | (3.31) | (0.04) | — | (0.02) | (0.06) | 20.63 | (13.83) | 16,552 | 1.38 | 1.58 | 0.12 | 41 | |||||||||||||||
| 09/30/21 | 20.63 | (—)(5) | 11.98 | 11.98 | (0.08) | — | (0.04) | (0.12) | 32.49 | 57.95 | 24,620 | 1.38 | 1.55 | (0.02) | 29 | |||||||||||||||
| 09/30/22 | 32.49 | (0.01)(5) | (3.55) | (3.56) | (0.06) | — | (0.07) | (0.13) | 28.80 | (11.04) | 21,034 | 1.38 | 1.57 | (0.02) | 35 | |||||||||||||||
| Class C | ||||||||||||||||||||||||||||||
| 09/30/18 | $25.60 | $(0.11) | $1.73 | $1.62 | $— | $ — | $ — | $— | $27.22 | 6.29% | $1,433 | 2.13% | 3.66% | (0.66)% | 49%(2)(4) | |||||||||||||||
| 09/30/19 | 27.22 | (0.41) | (1.90) | (2.31) | — | (1.70) | — | (1.70) | 23.21 | (8.07) | 788 | 2.13 | 3.57 | (0.56) | 28 | |||||||||||||||
| 09/30/20 | 23.21 | (0.13)(5) | (3.22) | (3.35) | (0.02) | — | — (3) | (0.02) | 19.84 | (14.46) | 453 | 2.13 | 4.50 | (0.63) | 41 | |||||||||||||||
| 09/30/21 | 19.84 | (0.22)(5) | 11.50 | 11.28 | (0.04) | — | (0.02) | (0.06) | 31.06 | 56.81 | 562 | 2.13 | 3.71 | (0.77) | 29 | |||||||||||||||
| 09/30/22 | 31.06 | (0.24)(5) | (3.38) | (3.62) | (0.03) | — | (0.03) | (0.06) | 27.38 | (11.73) | 272 | 2.13 | 4.21 | (0.77) | 35 | |||||||||||||||
| Class Y | ||||||||||||||||||||||||||||||
| 09/30/18 | $26.14 | $0.15 | $1.78 | $1.93 | $(0.11) | $ — | $ — | $(0.11) | $27.96 | 7.41% | $41,365 | 1.13% | 1.71% | 0.34% | 49%(2)(4) | |||||||||||||||
| 09/30/19 | 27.96 | 0.10 | (2.23) | (2.13) | (0.08) | (1.70) | — | (1.78) | 24.05 | (7.16) | 24,921 | 1.13 | 1.30 | 0.44 | 28 | |||||||||||||||
| 09/30/20 | 24.05 | 0.08(5) | (3.34) | (3.26) | (0.09) | — | (0.03) | (0.12) | 20.67 | (13.60) | 28,435 | 1.13 | 1.31 | 0.37 | 41 | |||||||||||||||
| 09/30/21 | 20.67 | 0.07(5) | 12.01 | 12.08 | (0.09) | — | (0.05) | (0.14) | 32.61 | 58.32 | 41,793 | 1.13 | 1.26 | 0.23 | 29 | |||||||||||||||
| 09/30/22 | 32.61 | 0.08(5) | (3.58) | (3.50) | (0.07) | — | (0.10) | (0.17) | 28.94 | (10.81) | 34,156 | 1.13 | 1.27 | 0.23 | 35 | |||||||||||||||
| Institutional Class | ||||||||||||||||||||||||||||||
| 09/30/18 | $26.14 | $0.28 | $1.69 | $1.97 | $(0.17) | $ — | $ — | $(0.17) | $27.94 | 7.53% | $29,279 | 0.98% | 1.27% | 0.49% | 49%(2)(4) | |||||||||||||||
| 09/30/19 | 27.94 | 0.18 | (2.27) | (2.09) | (0.11) | (1.70) | — | (1.81) | 24.04 | (6.98) | 40,104 | 0.98 | 1.17 | 0.59 | 28 | |||||||||||||||
| 09/30/20 | 24.04 | 0.12(5) | (3.33) | (3.21) | (0.11) | — | (0.04) | (0.15) | 20.68 | (13.42) | 7,825 | 0.98 | 1.19 | 0.52 | 41 | |||||||||||||||
| 09/30/21 | 20.68 | 0.11(5) | 12.03 | 12.14 | (0.10) | — | (0.05) | (0.15) | 32.67 | 58.59 | 9,176 | 0.98 | 1.25 | 0.38 | 29 | |||||||||||||||
| 09/30/22 | 32.67 | 0.13(5) | (3.59) | (3.46) | (0.10) | — | (0.12) | (0.22) | 28.99 | (10.67) | 7,389 | 0.98 | 1.26 | 0.38 | 35 | |||||||||||||||
| (1) | Total returns shown exclude the effect of applicable sales loads and fees. If these charges were included, the returns would be lower. |
| (2) | Portfolio turnover excludes securities delivered from processing redemptions-in-kind. |
| (3) | Less than $0.005 per share. |
| (4) | Portfolio turnover excludes the purchases and sales of securities of the Touchstone Small Cap Value Opportunities Fund acquired on September 21, 2018. If these transactions were included, portfolio turnover would have been higher. |
| (5) | The net investment income per share was based on average shares outstanding for the period. |
| Touchstone Ultra Short Duration Fixed Income Fund | ||||||||||||||||||||||||||
| Period ended | Net asset value at beginning of period | Net investment income (loss) | Net realized and unrealized gains (losses) on investments | Total from investment operations | Distributions from net investment income | Total distributions | Net asset value at end of period | Total return(1) | Net assets at end of period (000's) | Ratio of net expenses to average net assets | Ratio of gross expenses to average net assets | Ratio of net investment income (loss) to average net assets | Portfolio turnover rate | |||||||||||||
| Class A | ||||||||||||||||||||||||||
| 09/30/18 | $9.29 | $0.16 | $(0.01) | $0.15 | $(0.19) | $(0.19) | $9.25 | 1.50% | $76,623 | 0.69% | 0.81% | 1.88% | 143%(2) | |||||||||||||
| 09/30/19 | 9.25 | 0.23 | 0.04 | 0.27 | (0.23) | (0.23) | 9.29 | 2.95 | 71,684 | 0.69 | 0.80 | 2.43 | 91 | |||||||||||||
| 09/30/20 | 9.29 | 0.18 | (0.06) | 0.12 | (0.18) | (0.18) | 9.23 | 1.32 | 124,233 | 0.69 | 0.80 | 1.84 | 72 | |||||||||||||
| 09/30/21 | 9.23 | 0.04 | 0.02 | 0.06 | (0.08) | (0.08) | 9.21 | 0.67 | 144,172 | 0.69 | 0.74 | 0.40 | 113 | |||||||||||||
| 09/30/22 | 9.21 | 0.08 | (0.15) | (0.07) | (0.13) | (0.13) | 9.01 | (0.80) | 125,115 | 0.69 | 0.74 | 0.81 | 52 | |||||||||||||
| Class C | ||||||||||||||||||||||||||
| 09/30/18 | $9.29 | $0.13 | $(0.03) | $0.10 | $(0.14) | $(0.14) | $9.25 | 1.00% | $4,492 | 1.19% | 1.67% | 1.38% | 143%(2) | |||||||||||||
| 09/30/19 | 9.25 | 0.18 | 0.04 | 0.22 | (0.18) | (0.18) | 9.29 | 2.45 | 4,225 | 1.19 | 1.71 | 1.93 | 91 | |||||||||||||
| 09/30/20 | 9.29 | 0.12 | (0.04) | 0.08 | (0.13) | (0.13) | 9.24 | 0.93 | 5,276 | 1.19 | 1.60 | 1.33 | 72 | |||||||||||||
| 09/30/21 | 9.24 | (0.01) | 0.02 | 0.01 | (0.04) | (0.04) | 9.21 | 0.07 | 4,249 | 1.19 | 1.47 | (0.10) | 113 | |||||||||||||
| 09/30/22 | 9.21 | 0.03 | (0.14) | (0.11) | (0.08) | (0.08) | 9.02 | (1.18) | 5,013 | 1.19 | 1.48 | 0.31 | 52 | |||||||||||||
| Class S | ||||||||||||||||||||||||||
| 09/30/18(3) | $9.29 | $0.13 | $(0.02) | $0.11 | $(0.15) | $(0.15) | $9.25 | 1.24%(4) | $141,918 | 0.94%(5) | 0.99%(5) | 1.63%(5) | 143%(2) | |||||||||||||
| 09/30/19 | 9.25 | 0.21 | 0.03 | 0.24 | (0.21) | (0.21) | 9.28 | 2.59 | 135,565 | 0.94 | 0.99 | 2.18 | 91 | |||||||||||||
| 09/30/20 | 9.28 | 0.12 | (0.01) | 0.11 | (0.16) | (0.16) | 9.23 | 1.18 | 61,464 | 0.94 | 0.99 | 1.58 | 72 | |||||||||||||
| 09/30/21 | 9.23 | 0.01 | 0.03 | 0.04 | (0.06) | (0.06) | 9.21 | 0.42 | 52,456 | 0.94 | 0.99 | 0.15 | 113 | |||||||||||||
| 09/30/22 | 9.21 | 0.05 | (0.15) | (0.10) | (0.10) | (0.10) | 9.01 | (1.05) | 42,709 | 0.94 | 0.99 | 0.56 | 52 | |||||||||||||
| Class Y | ||||||||||||||||||||||||||
| 09/30/18 | $9.29 | $0.20 | $(0.03) | $0.17 | $(0.21) | $(0.21) | $9.25 | 1.75% | $262,571 | 0.44% | 0.50% | 2.13% | 143%(2) | |||||||||||||
| 09/30/19 | 9.25 | 0.25 | 0.04 | 0.29 | (0.25) | (0.25) | 9.29 | 3.21 | 305,997 | 0.44 | 0.51 | 2.68 | 91 | |||||||||||||
| 09/30/20 | 9.29 | 0.19 | (0.05) | 0.14 | (0.20) | (0.20) | 9.23 | 1.57 | 292,708 | 0.44 | 0.51 | 2.09 | 72 | |||||||||||||
| 09/30/21 | 9.23 | 0.06 | 0.03 | 0.09 | (0.11) | (0.11) | 9.21 | 0.92 | 296,363 | 0.44 | 0.50 | 0.65 | 113 | |||||||||||||
| 09/30/22 | 9.21 | 0.10 | (0.15) | (0.05) | (0.15) | (0.15) | 9.01 | (0.55) | 250,473 | 0.44 | 0.50 | 1.06 | 52 | |||||||||||||
| Class Z | ||||||||||||||||||||||||||
| 09/30/18 | $9.29 | $0.18 | $(0.03) | $0.15 | $(0.19) | $(0.19) | $9.25 | 1.50% | $163,898 | 0.69% | 0.78% | 1.88% | 143%(2) | |||||||||||||
| 09/30/19 | 9.25 | 0.23 | 0.04 | 0.27 | (0.23) | (0.23) | 9.29 | 2.95 | 128,199 | 0.69 | 0.77 | 2.43 | 91 | |||||||||||||
| 09/30/20 | 9.29 | 0.17 | (0.05) | 0.12 | (0.18) | (0.18) | 9.23 | 1.32 | 86,018 | 0.69 | 0.79 | 1.83 | 72 | |||||||||||||
| 09/30/21 | 9.23 | 0.03 | 0.03 | 0.06 | (0.08) | (0.08) | 9.21 | 0.68 | 75,058 | 0.69 | 0.78 | 0.40 | 113 | |||||||||||||
| 09/30/22 | 9.21 | 0.10 | (0.17) | (0.07) | (0.13) | (0.13) | 9.01 | (0.80) | 50,209 | 0.69 | 0.79 | 0.81 | 52 | |||||||||||||
| Institutional Class | ||||||||||||||||||||||||||
| 09/30/18 | $9.29 | $0.21 | $(0.03) | $0.18 | $(0.22) | $(0.22) | $9.25 | 1.80% | $275,561 | 0.39% | 0.46% | 2.18% | 143%(2) | |||||||||||||
| 09/30/19 | 9.25 | 0.26 | 0.03 | 0.29 | (0.26) | (0.26) | 9.28 | 3.17 | 362,921 | 0.39 | 0.46 | 2.73 | 91 | |||||||||||||
| 09/30/20 | 9.28 | 0.20 | (0.05) | 0.15 | (0.21) | (0.21) | 9.22 | 1.63 | 417,011 | 0.39 | 0.46 | 2.13 | 72 | |||||||||||||
| 09/30/21 | 9.22 | 0.07 | 0.02 | 0.09 | (0.11) | (0.11) | 9.20 | 0.98 | 500,705 | 0.39 | 0.45 | 0.70 | 113 | |||||||||||||
| 09/30/22 | 9.20 | 0.13 | (0.18) | (0.05) | (0.15) | (0.15) | 9.00 | (0.50) | 230,153 | 0.39 | 0.46 | 1.11 | 52 | |||||||||||||
| (1) | Total returns shown exclude the effect of applicable sales loads and fees. If these charges were included, the returns would be lower. |
| (2) | Portfolio turnover excludes the purchases and sales of securities of the Sentinel Low Duration Bond Fund acquired on October 27, 2017. If these transactions were included, portfolio turnover would have been higher. |
| (3) | Represents the period from commencement of operations (October 27, 2017) through September 30, 2018. |
| (4) | Not annualized. |
| (5) | Annualized. |
| Touchstone Active Bond Fund ("Active Bond Fund”) |
| Touchstone Anti-Benchmark® International Core Equity Fund ("Anti-Benchmark® International Core Equity Fund”) |
| Touchstone Ares Credit Opportunities Fund (formerly Touchstone Credit Opportunities Fund) ("Ares Credit Opportunities Fund”) |
| Touchstone Dividend Equity Fund ("Dividend Equity Fund”) |
| Touchstone High Yield Fund ("High Yield Fund”) |
| Touchstone Impact Bond Fund ("Impact Bond Fund”) |
| Touchstone International ESG Equity Fund ("International ESG Equity Fund”) |
| Touchstone Mid Cap Fund ("Mid Cap Fund”) |
| Touchstone Mid Cap Value Fund ("Mid Cap Value Fund”) |
| Touchstone Sands Capital Select Growth Fund ("Sands Capital Select Growth Fund”) |
| Touchstone Small Cap Fund ("Small Cap Fund”) |
| Touchstone Small Cap Value Fund ("Small Cap Value Fund”) |
| Touchstone Ultra Short Duration Fixed Income Fund ("Ultra Short Duration Fixed Income Fund”) |
| Class A | Class C | Class S | Class Y | Class Z | Institutional Class | Class R6 | |
| Active Bond Fund | X | X | X | X | |||
| Anti-Benchmark® International Core Equity Fund | X | X | |||||
| Ares Credit Opportunities Fund | X | X | X | X | |||
| Dividend Equity Fund | X | X | X | X | X | ||
| High Yield Fund | X | X | X | X | |||
| Impact Bond Fund | X | X | X | X | X | ||
| International ESG Equity Fund | X | X | X | X | |||
| Mid Cap Fund | X | X | X | X | X | X | |
| Mid Cap Value Fund | X | X | X | X | |||
| Sands Capital Select Growth Fund | X | X | X | X | X | X | |
| Small Cap Fund | X | X | X | X | |||
| Small Cap Value Fund | X | X | X | X | |||
| Ultra Short Duration Fixed Income Fund | X | X | X | X | X | X |
| (1) | market value of investment securities, assets and liabilities at the current rate of exchange on the valuation date; and |
| (2) | purchases and sales of investment securities, income, and expenses at the relevant rates of exchange prevailing on the respective dates of such transactions. |
| Assets | Liabilities | ||
| Ares Credit Opportunities Fund | |||
| Forwards - Foreign Currency Contracts | $— | $133,467 | |
| Total | $— | $133,467 |
| Counterparty | Derivative Type | Gross Amount of Recognized Liabilities | Gross Amount Available for Offset in Statement of Assets and Liabilities | Non-Cash Collateral Received | Cash Collateral Received | Net Amount(A) |
| Wells Fargo | Forward-Foreign Currency Contracts | $(133,467) | $— | $— | $— | $(133,467) |
| (A) | Net amount represents the net amount payable to the counterparty in the event of default. |
| Fund | Derivatives not accounted for as hedging instruments under ASC 815 | Asset Derivatives | Liability Derivatives |
| Active Bond Fund | Futures Contracts - Interest Rate Contracts* | $174,948 | $165,904 |
| Ares Credit Opportunities Fund | Forwards - Foreign Currency Contracts** | — | 133,467 |
| Swap Agreements - Credit Contracts*** | 40,777 | — |
| * | Statements of Assets and Liabilities Location: Receivable for variation margin on futures contracts. Only current day’s variation margin is reported within the payable/receivable on the Statement of Assets and Liabilities. Includes cumulative appreciation/(depreciation) on futures contracts as reported on the Portfolio of Investments and within the components of net assets section of the Statement of Assets and Liabilities. |
| ** | Statements of Assets and Liabilities Location: Unrealized depreciation on forward foreign currency contracts. |
| *** | Statements of Assets and Liabilities Location: Receivable for variation margin on swap agreements. Variation margin reported in the Portfolio of Investments and other tables in the Notes to the Financial Statements is the cumulative unrealized appreciation (depreciation). |
| Fund | Derivatives not accounted for as hedging instruments under ASC 815 | Realized Gains (Losses) on Derivatives | Change in Unrealized Appreciation (Depreciation) on Derivatives |
| Active Bond Fund | Futures - Interest Rate Contracts* | $223,242 | $9,044 |
| Swap Agreements - Credit Contracts** | 153,741 | — | |
| Ares Credit Opportunities Fund | Purchased Options - Equity Contracts*** | (834,230) | (1,516) |
| Written Options - Equity Contracts**** | 259,459 | (1,022) | |
| Forwards - Foreign Currency Exchange Contracts***** | 1,363,203 | (236,311) | |
| Swap Agreements - Credit Contracts** | (71,238) | 97,446 |
| * | Statements of Operations Location: Net realized gains on futures contracts and net change in unrealized appreciation (depreciation) on futures contracts, respectively. |
| ** | Statements of Operations Location: Net realized gains (losses) on swap agreements and net change in unrealized appreciation (depreciation) on swap agreements, respectively. |
| *** | Statements of Operations Location: Net realized gains (losses) on investments and net change in unrealized appreciation (depreciation) on investments, respectively. |
| **** | Statements of Operations Location: Net realized gains on written options and net change in unrealized appreciation (depreciation) on written options, respectively. |
| ***** | Statements of Operations Location: Net realized gains on forward foreign currency contracts and net change in unrealized appreciation (depreciation) on forward foreign currency contracts, respectively. |
| Active Bond Fund | Ares Credit Opportunities Fund | |
| Equity Contracts: | ||
| Purchased Options - Cost | $— | $147,989 |
| Written Options - Premiums received | — | 4,014 |
| Credit Contracts: | ||
| Credit Default Swaps - Notional value | — | 1,245,140 |
| Forward currency exchange contracts: | ||
| U.S. dollar amount delivered | — | 7,685 |
| U.S. dollar amount received | — | 5,965,464 |
| Interest Rate Contracts: | ||
| Futures Contracts - Notional Value | 19,678,660 | — |
| Fund | Security Type | Market Value of Securities Loaned* | Market Value of Collateral Received** | Net Amount*** |
| Anti-Benchmark® International Core Equity Fund | Common Stocks | $79,170 | $83,219 | $4,049 |
| Ares Credit Opportunities Fund | Corporate Bonds | 6,803,566 | 7,118,869 | 315,303 |
| Common Stocks | 2,088,371 | 2,136,996 | 48,625 | |
| Total Ares Credit Opportunities Fund | 8,891,937 | 9,255,865 | 363,928 | |
| High Yield Fund | Corporate Bonds | 849,473 | 881,725 | 32,252 |
| International ESG Equity Fund | Common Stocks | 715,914 | 738,513 | 22,599 |
| Small Cap Fund | Common Stocks | 2,453,587 | 2,475,674 | 22,087 |
| Small Cap Value Fund | Common Stocks | 632 | 666 | 34 |
| * | The remaining contractual maturity is overnight for all securities. |
| ** | Gross amount of recognized liabilities for securities lending included in the Statements of Assets and Liabilities. |
| *** | Net amount represents the net amount payable due to (received from) the borrower in the event of default. |
| Active Bond Fund | Anti- Benchmark® International Core Equity Fund | Ares Credit Opportunities Fund | Dividend Equity Fund | High Yield Fund | |
| Purchases of investment securities | $110,996,084 | $14,626,593 | $254,660,562 | $384,959,920 | $65,807,136 |
| Proceeds from sales and maturities | $117,870,371 | $39,349,777 | $201,987,657 | $1,133,991,340 | $83,273,816 |
| Impact Bond Fund | International ESG Equity Fund | Mid Cap Fund* | Mid Cap Value Fund | Sands Capital Select Growth Fund* | |
| Purchases of investment securities | $104,999,789 | $19,123,531 | $1,005,795,977 | $234,021,658 | $1,879,409,309 |
| Proceeds from sales and maturities | $23,317,295 | $11,152,344 | $658,902,999 | $265,033,684 | $1,928,280,989 |
| Small Cap Fund* | Small Cap Value Fund | Ultra Short Duration Fixed Income Fund | |
| Purchases of investment securities | $27,687,333 | $25,536,575 | $425,791,001 |
| Proceeds from sales and maturities | $16,814,902 | $30,605,539 | $709,580,612 |
| * | Mid Cap Fund, Sands Capital Select Growth Fund and Small Cap Fund had redemptions-in-kind out of the Fund of $460,557,327, $771,319,894 and $6,931,783, respectively. The redemptions were comprised of securities in the amount of $389,883,890, $711,270,580 and $5,450,274, which is excluded from the proceeds from sales and maturities, and cash in the amount of $70,673,437, $60,049,314 and $1,481,509 for the Mid Cap Fund, Sands Capital Select Growth Fund and Small Cap Fund, respectively. |
| Active Bond Fund* | 0.38% on the first $200 million 0.30% on such assets over $200 million |
| Anti-Benchmark® International Core Equity Fund | 0.45% on the first $1 billion 0.40% on such assets over $1 billion |
| Ares Credit Opportunities Fund | 0.60% |
| Dividend Equity Fund | 0.55% on the first $1 billion 0.50% on such assets over $1 billion |
| High Yield Fund | 0.60% on the first $50 million 0.50% on the next $250 million 0.45% on such assets over $300 million |
| Impact Bond Fund | 0.30% on the first $200 million 0.225% on such assets over $200 million |
| International ESG Equity Fund | 0.65% on the first $1 billion 0.60% on such assets over $1 billion |
| Mid Cap Fund | 0.80% on the first $1 billion 0.70% on the next $500 million 0.60% on such assets over $1.5 billion |
| Mid Cap Value Fund | 0.75% |
| Sands Capital Select Growth Fund | 0.70% on the first $1 billion 0.65% on the next $500 million 0.60% on the next $500 million 0.55% on such assets over $2 billion |
| Small Cap Fund | 0.85% on the first $250 million 0.80% on the next $250 million 0.70% on such assets over $500 million |
| Small Cap Value Fund | 0.85% |
| Ultra Short Duration Fixed Income Fund | 0.25% |
| Ares Capital Management II LLC | The London Company |
| Ares Credit Opportunities Fund | Mid Cap Fund |
| EARNEST Partners LLC | Small Cap Fund |
| Impact Bond Fund | Rockefeller & Co. LLC |
| Fort Washington Investment Advisors, Inc.* | International ESG Equity Fund |
| Active Bond Fund | Sands Capital Management, LLC |
| Dividend Equity Fund | Sands Capital Select Growth Fund |
| High Yield Fund | TOBAM S.A.S. |
| Ultra Short Duration Fixed Income Fund | Anti-Benchmark® International Core Equity Fund |
| Leeward Investments, LLC** | |
| Mid Cap Value Fund | |
| Small Cap Value Fund |
| Class A | Class C | Class S | Class Y | Class Z | Institutional Class | Class R6 | Termination Date | |
| Active Bond Fund* | 0.83% | 1.56% | — | 0.58% | — | 0.50% | — | July 29, 2023 |
| Anti-Benchmark® International Core Equity Fund | — | — | — | 0.69% | — | 0.59% | — | January 29, 2023 |
| Ares Credit Opportunities Fund | 1.03% | 1.43% | — | 0.83% | — | 0.73% | — | July 29, 2023 |
| Dividend Equity Fund | 0.99% | 1.69% | — | 0.77% | — | 0.67% | 0.65% | July 29, 2023 |
| High Yield Fund | 1.05% | 1.80% | — | 0.80% | — | 0.72% | — | January 29, 2023 |
| Impact Bond Fund | 0.76% | 1.51% | — | 0.51% | — | 0.41% | 0.37% | January 29, 2023 |
| International ESG Equity Fund | 1.17% | 1.95% | — | 0.90% | — | 0.89% | — | January 29, 2023 |
| Mid Cap Fund | 1.21% | 1.96% | — | 0.96% | 1.21% | 0.89% | 0.79% | January 29, 2023 |
| Mid Cap Value Fund | 1.22% | 1.97% | — | 0.97% | — | 0.84% | — | January 29, 2023 |
| Sands Capital Select Growth Fund | 1.13% | 1.74% | — | 0.90% | 1.14% | 0.78% | 0.72% | July 29, 2023 |
| Small Cap Fund | 1.24% | 1.99% | — | 0.99% | — | 0.91% | — | January 29, 2023 |
| Small Cap Value Fund | 1.38% | 2.13% | — | 1.13% | — | 0.98% | — | January 29, 2023 |
| Ultra Short Duration Fixed Income Fund | 0.69% | 1.19% | 0.94% | 0.44% | 0.69% | 0.39% | — | January 29, 2023 |
| * | Prior to January 1, 2022, the expense limitation for Class A shares was 0.90%, Class C shares was 1.63%, Class Y shares was 0.65% and Institutional Class was 0.57%. |
| Fund | Investment Advisory Fees Waived | Administration Fees Waived | Other Operating Expenses Reimbursed/ Waived | Total |
| Active Bond Fund | $— | $44,481 | $245,185 | $289,666 |
| Anti-Benchmark® International Core Equity Fund | 13,662 | 23,173 | 133,954 | 170,789 |
| Ares Credit Opportunities Fund | — | 36,779 | 578,869 | 615,648 |
| Dividend Equity Fund | — | 69 | 692,715 | 692,784 |
| High Yield Fund | — | 58,224 | 105,534 | 163,758 |
| Impact Bond Fund | — | 45,840 | 190,562 | 236,402 |
| International ESG Equity Fund | — | 32,563 | 112,750 | 145,313 |
| Mid Cap Fund | — | 43,651 | 34,085 | 77,736 |
| Mid Cap Value Fund | — | 285,210 | 1,007,921 | 1,293,131 |
| Sands Capital Select Growth Fund | — | 112,083 | 370,154 | 482,237 |
| Small Cap Fund | — | 93,615 | 144,472 | 238,087 |
| Small Cap Value Fund | — | 17,758 | 119,813 | 137,571 |
| Ultra Short Duration Fixed Income Fund | — | 72,892 | 513,857 | 586,749 |
| Fund | Expires on or before September 30, 2023 | Expires on or before September 30, 2024 | Expires on or before September 30, 2025 | Total |
| Active Bond Fund | $170,804 | $91,314 | $129,291 | $391,409 |
| Anti-Benchmark® International Core Equity Fund | 141,795 | 157,113 | 170,789 | 469,697 |
| Ares Credit Opportunities Fund | 229,289 | 179,639 | 220,343 | 629,271 |
| Dividend Equity Fund | — | 2,947 | 15,147 | 18,094 |
| High Yield Fund | 85,080 | 72,946 | 124,409 | 282,435 |
| Impact Bond Fund | 247,247 | 185,879 | 199,976 | 633,102 |
| International ESG Equity Fund | 141,782 | 110,488 | 107,560 | 359,830 |
| Mid Cap Fund | 85,991 | 7,225 | 77,736 | 170,952 |
| Mid Cap Value Fund | 1,340,628 | 1,228,808 | 1,249,338 | 3,818,774 |
| Sands Capital Select Growth Fund | 290,944 | 17,026 | 415,611 | 723,581 |
| Small Cap Fund | 218,366 | 217,704 | 223,917 | 659,987 |
| Small Cap Value Fund | 142,724 | 78,571 | 88,081 | 309,376 |
| Ultra Short Duration Fixed Income Fund | 615,640 | 480,103 | 473,831 | 1,569,574 |
| Fund | Amount |
| Active Bond Fund | $ 10,612 |
| Ares Credit Opportunities Fund | 5,827 |
| Dividend Equity Fund | 29,915 |
| High Yield Fund | 1,724 |
| Impact Bond Fund | 780 |
| International ESG Equity Fund | 1,226 |
| Mid Cap Fund | 11,614 |
| Mid Cap Value Fund | 1,929 |
| Sands Capital Select Growth Fund | 25,019 |
| Small Cap Fund | 922 |
| Small Cap Value Fund | 795 |
| Ultra Short Duration Fixed Income Fund | 2,028 |
| Fund | Class A | Class C |
| Active Bond Fund | $ 2,523 | $ 195 |
| Ares Credit Opportunities Fund | — | 374 |
| Dividend Equity Fund | 20 | 2,251 |
| Mid Cap Fund | 20 | 369 |
| Mid Cap Value Fund | — | 54 |
| Sands Capital Select Growth Fund | 142 | 3,097 |
| Ultra Short Duration Fixed Income Fund | — | 347 |
| Fund | Shares ReFlow Subscribed to | Redemptions-in-kind |
| Mid Cap Fund | 9,862,620 | $ 389,883,890 |
| Sands Capital Select Growth Fund | 64,403,324 | 711,270,580 |
| Small Cap Fund | 330,089 | 5,450,274 |
| Fund | Daily Average Amount Loaned | Weighted Average Interest Rate | Interest Income* |
| Mid Cap Fund | $ 448,971 | 1.11% | $ 4,276 |
| Sands Capital Select Growth Fund | $ 317,641 | 0.68% | $ 2,174 |
| * | Included in Interest in the Statements of Operations. |
| Fund | Daily Average Amount Borrowed | Weighted Average Interest Rate | Interest Expense* |
| Active Bond Fund | $ 16,354 | 1.39% | $ 212 |
| Ares Credit Opportunities Fund | $ 16,247 | 0.68% | $ 111 |
| Dividend Equity Fund | $ 14,740 | 1.13% | $ 176 |
| High Yield Fund | $ 84,263 | 1.29% | $ 826 |
| Mid Cap Value Fund | $ 14,404 | 0.89% | $ 130 |
| * | Included in Other expenses in the Statements of Operations. |
| Active Bond Fund | Anti-Benchmark® International Core Equity Fund | Ares Credit Opportunities Fund | ||||
| Year Ended September 30, 2022 | Year Ended September 30, 2021 | Year Ended September 30, 2022 | Year Ended September 30, 2021 | Year Ended September 30, 2022 | Year Ended September 30, 2021 | |
| From ordinary income | $9,708,614 | $8,289,924 | $1,160,407 | $718,958 | $22,601,443 | $7,374,305 |
| From long-term capital gains | — | — | 2,489,990 | — | — | — |
| From return of capital | — | — | — | — | 461,802 | — |
| Total distributions | $9,708,614 | $8,289,924 | $3,650,397 | $718,958 | $23,063,245 | $7,374,305 |
| Dividend Equity Fund | |||
| Year Ended September 30, 2022 | Eleven Months Ended September 30, 2021 | Year Ended October 31, 2020 | |
| From ordinary income | $62,270,650 | $87,137,356 | $550,058,395 |
| From long-term capital gains | 58,114,891 | 1,447,901 | — |
| Total distributions | $120,385,541 | $88,585,257 | $550,058,395 |
| High Yield Fund | Impact Bond Fund | International ESG Equity Fund | ||||
| Year Ended September 30, 2022 | Year Ended September 30, 2021 | Year Ended September 30, 2022 | Year Ended September 30, 2021 | Year Ended September 30, 2022 | Year Ended September 30, 2021 | |
| From ordinary income | $5,521,170 | $8,886,935 | $10,778,441 | $7,703,948 | $422,795 | $128,987 |
| From long-term capital gains | — | — | — | — | 1,825,103 | — |
| Total distributions | $5,521,170 | $8,886,935 | $10,778,441 | $7,703,948 | $2,247,898 | $128,987 |
| Mid Cap Fund | Mid Cap Value Fund | Sands Capital Select Growth Fund | ||||
| Year Ended September 30, 2022 | Year Ended September 30, 2021 | Year Ended September 30, 2022 | Year Ended September 30, 2021 | Year Ended September 30, 2022 | Year Ended September 30, 2021 | |
| From ordinary income | $78,196,511 | $51,726,485 | $18,385,395 | $3,019,722 | $59,079,674 | $— |
| From long-term capital gains | 59,498,683 | 36,196,104 | 46,436,919 | — | 552,873,038 | 227,023,467 |
| Total distributions | $137,695,194 | $87,922,589 | $64,822,314 | $3,019,722 | $611,952,712 | $227,023,467 |
| Small Cap Fund | Small Cap Value Fund | Ultra Short Duration Fixed Income Fund | ||||
| Year Ended September 30, 2022 | Year Ended September 30, 2021 | Year Ended September 30, 2022 | Year Ended September 30, 2021 | Year Ended September 30, 2022 | Year Ended September 30, 2021 | |
| From ordinary income | $1,344,611 | $807,183 | $160,439 | $114,334 | $13,644,637 | $11,769,916 |
| From long-term capital gains | 10,677,181 | 1,317,935 | — | — | — | — |
| From return of capital | — | — | 210,519 | 105,494 | — | — |
| Total distributions | $12,021,792 | $2,125,118 | $370,958 | $219,828 | $13,644,637 | $11,769,916 |
| Active Bond Fund | Anti-Benchmark® International Core Equity Fund | Ares Credit Opportunities Fund | Dividend Equity Fund | |
| Tax cost of portfolio investments | $308,319,392 | $10,648,520 | $320,043,483 | $3,011,865,719 |
| Gross unrealized appreciation on investments | 500,418 | 621,448 | 1,321,437 | 153,368,605 |
| Gross unrealized depreciation on investments | (42,848,352) | (2,619,850) | (43,306,874) | (516,513,247) |
| Net unrealized appreciation (depreciation) on investments | (42,347,934) | (1,998,402) | (41,985,437) | (363,144,642) |
| Gross unrealized appreciation on short sales, derivatives and foreign currency transactions | — | 12 | 227,727 | — |
| Gross unrealized depreciation on derivatives and foreign currency transactions | (7) | (8,690) | (134,303) | — |
| Net unrealized appreciation (depreciation) on short sales and foreign currency transactions | (7) | (8,678) | 93,424 | — |
| Capital loss carryforwards | (107,111,541) | — | (63,475,006) | — |
| Qualified late year losses | — | (1,380,592) | — | — |
| Undistributed ordinary income | 395,445 | 267,315 | — | 75,002,463 |
| Undistributed capital gains | — | — | — | 26,368,912 |
| Other temporary differences | (3,055) | — | — | — |
| Accumulated earnings (deficit) | $(149,067,092) | $(3,120,357) | $(105,367,019) | $(261,773,267) |
| High Yield Fund | Impact Bond Fund | International ESG Equity Fund | Mid Cap Fund | |
| Tax cost of portfolio investments | $121,153,260 | $543,421,983 | $33,729,349 | $3,805,759,773 |
| Gross unrealized appreciation on investments | 125,934 | 72,029 | 2,842,177 | 548,112,972 |
| Gross unrealized depreciation on investments | (18,755,925) | (65,406,774) | (7,697,200) | (344,328,397) |
| Net unrealized appreciation (depreciation) on investments | (18,629,991) | (65,334,745) | (4,855,023) | 203,784,575 |
| Gross unrealized appreciation on foreign currency transactions | — | 1 | — | — |
| Gross unrealized depreciation on foreign currency transactions | — | — | (3,986) | — |
| Net unrealized appreciation (depreciation) on foreign currency transactions | — | 1 | (3,986) | — |
| Capital loss carryforwards | (15,689,200) | (8,542,672) | (1,250,666) | — |
| Undistributed ordinary income | 53,721 | 818,456 | 722,093 | — |
| Undistributed capital gains | — | — | — | 1,822,044 |
| Accumulated earnings (deficit) | $(34,265,470) | $(73,058,960) | $(5,387,582) | $205,606,619 |
| Mid Cap Value Fund | Sands Capital Select Growth Fund | Small Cap Fund | Small Cap Value Fund | |
| Tax cost of portfolio investments | $662,106,684 | $2,119,629,746 | $86,134,332 | $55,903,989 |
| Gross unrealized appreciation on investments | 167,799,186 | 525,682,972 | 16,130,692 | 13,154,806 |
| Gross unrealized depreciation on investments | (64,741,308) | (386,652,124) | (9,343,754) | (6,173,554) |
| Net unrealized appreciation (depreciation) on investments | 103,057,878 | 139,030,848 | 6,786,938 | 6,981,252 |
| Capital loss carryforwards | — | — | — | (7,564,357) |
| Qualified late year losses | — | (571,449,683) | — | — |
| Undistributed ordinary income | 118,923 | — | 493,679 | — |
| Undistributed capital gains | 35,711,291 | — | 1,240,705 | — |
| Accumulated earnings (deficit) | $138,888,092 | $(432,418,835) | $8,521,322 | $(583,105) |
| Ultra Short Duration Fixed Income Fund | |
| Tax cost of portfolio investments | $718,233,045 |
| Gross unrealized appreciation on investments | 587,590 |
| Gross unrealized depreciation on investments | (16,534,659) |
| Net unrealized appreciation (depreciation) on investments | (15,947,069) |
| Capital loss carryforwards | (110,201,636) |
| Undistributed ordinary income | 529,879 |
| Other temporary differences | (184,609) |
| Accumulated earnings (deficit) | $(125,803,435) |
| Fund | No Expiration Short Term | No Expiration Long Term | Total |
| Active Bond Fund* | $ 60,739,139 | $ 46,372,402 | $ 107,111,541 |
| Ares Credit Opportunities Fund* | 9,747,722 | 53,727,284 | 63,475,006 |
| High Yield Fund | 1,273,520 | 14,415,680 | 15,689,200 |
| Impact Bond Fund | 565,256 | 7,977,416 | 8,542,672 |
| International ESG Equity Fund | 849,977 | 400,689 | 1,250,666 |
| Small Cap Value Fund | 6,261,517 | 1,302,840 | 7,564,357 |
| Ultra Short Duration Fixed Income Fund* | 36,923,149 | 73,278,487 | 110,201,636 |
| * | Future utilization is limited under current tax law. |
| Fund | Utilized |
| Small Cap Value Fund | $ 6,234,265 |
| Fund | Paid-In Capital | Distributable Earnings |
| Ares Credit Opportunities Fund | $ 38,748 | $ (38,748) |
| Dividend Equity Fund | 15,088,554 | (15,088,554) |
| Mid Cap Fund | 199,558,731 | (199,558,731) |
| Mid Cap Value Fund | 5,714,886 | (5,714,886) |
| Sands Capital Select Growth Fund | 289,802,360 | (289,802,360) |
| Small Cap Fund | 2,278,446 | (2,278,446) |
| Small Cap Value Fund | (36,615) | 36,615 |
| Funds comprising the Touchstone Funds Group Trust | Statement of operations | Statements of changes in net assets | Financial highlights |
| Touchstone Active Bond Fund Touchstone High Yield Fund Touchstone Impact Bond Fund Touchstone International ESG Equity Fund Touchstone Mid Cap Fund Touchstone Mid Cap Value Fund Touchstone Sands Capital Select Growth Fund Touchstone Small Cap Fund Touchstone Small Cap Value Fund Touchstone Ultra Short Duration Fixed Income Fund | For the year ended September 30, 2022 | For each of the two years in the period ended September 30, 2022 | For each of the five years in the period ended September 30, 2022 |
| Touchstone Ares Credit Opportunities Fund (formerly, Touchstone Credit Opportunities Fund) | For the year ended September 30, 2022 | For each of the two years in the period ended September 30, 2022 | For each of the three years in the period ended September 30, 2022, the period from July 1, 2019 through September 30, 2019 and each of the two years in the period ended June 30, 2019 |
| Touchstone Anti-Benchmark® International Core Equity Fund | For the year ended September 30, 2022 | For each of the two years in the period ended September 30, 2022 | For each of the three years in the period ended September 30, 2022 and the period from November 19, 2018 (commencement of operations) through September 30, 2019 |
| Touchstone Dividend Equity Fund | For the year ended September 30, 2022 | ||

| Anti-Benchmark® International Core Equity Fund | 83.95 % |
| Dividend Equity Fund | 63.32 % |
| International ESG Equity Fund | 100.00 % |
| Mid Cap Fund | 100.00 % |
| Mid Cap Value Fund | 100.00 % |
| Sands Capital Select Growth Fund | 100.00 % |
| Small Cap Fund | 63.54 % |
| Small Cap Value Fund | 100.00 % |
| Dividend Equity Fund | 61.83 % |
| Mid Cap Fund | 100.00 % |
| Mid Cap Value Fund | 100.00 % |
| Sands Capital Select Growth Fund | 100.00 % |
| Small Cap Fund | 65.12 % |
| Small Cap Value Fund | 100.00 % |
| Anti-Benchmark® International Core Equity Fund | $ 2,489,990 |
| Dividend Equity Fund | $ 73,203,445 |
| International ESG Equity Fund | $ 1,825,103 |
| Mid Cap Fund | $ 108,988,351 |
| Mid Cap Value Fund | $ 52,845,128 |
| Sands Capital Select Growth Fund | $ 552,873,038 |
| Small Cap Fund | $ 11,222,410 |
| Net Expense Ratio Annualized September 30, 2022 | Beginning Account Value April 1, 2022 | Ending Account Value September 30, 2022 | Expenses Paid During the Six Months Ended September 30, 2022* | ||
| Active Bond Fund | |||||
| Class A | Actual | 0.83% | $1,000.00 | $890.90 | $3.93 |
| Class A | Hypothetical | 0.83% | $1,000.00 | $1,020.91 | $4.20 |
| Class C | Actual | 1.56% | $1,000.00 | $887.00 | $7.38 |
| Class C | Hypothetical | 1.56% | $1,000.00 | $1,017.25 | $7.89 |
| Class Y | Actual | 0.58% | $1,000.00 | $891.90 | $2.75 |
| Class Y | Hypothetical | 0.58% | $1,000.00 | $1,022.16 | $2.94 |
| Institutional Class | Actual | 0.50% | $1,000.00 | $892.30 | $2.37 |
| Institutional Class | Hypothetical | 0.50% | $1,000.00 | $1,022.56 | $2.54 |
| Anti-Benchmark® International Core Equity Fund | |||||
| Class Y | Actual | 0.69% | $1,000.00 | $776.60 | $3.07 |
| Class Y | Hypothetical | 0.69% | $1,000.00 | $1,021.61 | $3.50 |
| Institutional Class | Actual | 0.59% | $1,000.00 | $778.40 | $2.63 |
| Institutional Class | Hypothetical | 0.59% | $1,000.00 | $1,022.11 | $2.99 |
| Ares Credit Opportunities Fund | |||||
| Class A | Actual | 1.03% | $1,000.00 | $916.20 | $4.95** |
| Class A | Hypothetical | 1.03% | $1,000.00 | $1,019.90 | $5.22** |
| Class C | Actual | 1.43% | $1,000.00 | $913.60 | $6.86** |
| Class C | Hypothetical | 1.43% | $1,000.00 | $1,017.90 | $7.23** |
| Class Y | Actual | 0.83% | $1,000.00 | $916.30 | $3.99** |
| Class Y | Hypothetical | 0.83% | $1,000.00 | $1,020.91 | $4.20** |
| Institutional Class | Actual | 0.73% | $1,000.00 | $917.40 | $3.51** |
| Institutional Class | Hypothetical | 0.73% | $1,000.00 | $1,021.41 | $3.70** |
| Dividend Equity Fund | |||||
| Class A | Actual | 0.99% | $1,000.00 | $837.20 | $4.56 |
| Net Expense Ratio Annualized September 30, 2022 | Beginning Account Value April 1, 2022 | Ending Account Value September 30, 2022 | Expenses Paid During the Six Months Ended September 30, 2022* | ||
| Class A | Hypothetical | 0.99% | $1,000.00 | $1,020.10 | $5.01 |
| Class C | Actual | 1.69% | $1,000.00 | $834.20 | $7.77 |
| Class C | Hypothetical | 1.69% | $1,000.00 | $1,016.60 | $8.54 |
| Class Y | Actual | 0.74% | $1,000.00 | $838.00 | $3.41 |
| Class Y | Hypothetical | 0.74% | $1,000.00 | $1,021.36 | $3.75 |
| Institutional Class | Actual | 0.67% | $1,000.00 | $838.80 | $3.09 |
| Institutional Class | Hypothetical | 0.67% | $1,000.00 | $1,021.71 | $3.40 |
| Class R6 | Actual | 0.65% | $1,000.00 | $838.90 | $3.00 |
| Class R6 | Hypothetical | 0.65% | $1,000.00 | $1,021.81 | $3.29 |
| High Yield Fund | |||||
| Class A | Actual | 1.05% | $1,000.00 | $884.80 | $4.96 |
| Class A | Hypothetical | 1.05% | $1,000.00 | $1,019.80 | $5.32 |
| Class C | Actual | 1.80% | $1,000.00 | $881.20 | $8.49 |
| Class C | Hypothetical | 1.80% | $1,000.00 | $1,016.04 | $9.10 |
| Class Y | Actual | 0.80% | $1,000.00 | $884.60 | $3.78 |
| Class Y | Hypothetical | 0.80% | $1,000.00 | $1,021.06 | $4.05 |
| Institutional Class | Actual | 0.72% | $1,000.00 | $886.00 | $3.40 |
| Institutional Class | Hypothetical | 0.72% | $1,000.00 | $1,021.46 | $3.65 |
| Impact Bond Fund | |||||
| Class A | Actual | 0.76% | $1,000.00 | $911.40 | $3.64 |
| Class A | Hypothetical | 0.76% | $1,000.00 | $1,021.26 | $3.85 |
| Class C | Actual | 1.51% | $1,000.00 | $907.80 | $7.22 |
| Class C | Hypothetical | 1.51% | $1,000.00 | $1,017.50 | $7.64 |
| Class Y | Actual | 0.51% | $1,000.00 | $912.70 | $2.45 |
| Class Y | Hypothetical | 0.51% | $1,000.00 | $1,022.51 | $2.59 |
| Institutional Class | Actual | 0.41% | $1,000.00 | $913.10 | $1.97 |
| Institutional Class | Hypothetical | 0.41% | $1,000.00 | $1,023.01 | $2.08 |
| Class R6 | Actual | 0.37% | $1,000.00 | $913.30 | $1.77 |
| Class R6 | Hypothetical | 0.37% | $1,000.00 | $1,023.21 | $1.88 |
| International ESG Equity Fund | |||||
| Class A | Actual | 1.17% | $1,000.00 | $751.90 | $5.14 |
| Class A | Hypothetical | 1.17% | $1,000.00 | $1,019.20 | $5.92 |
| Class C | Actual | 1.95% | $1,000.00 | $749.40 | $8.55 |
| Class C | Hypothetical | 1.95% | $1,000.00 | $1,015.29 | $9.85 |
| Class Y | Actual | 0.90% | $1,000.00 | $753.50 | $3.96 |
| Class Y | Hypothetical | 0.90% | $1,000.00 | $1,020.56 | $4.56 |
| Institutional Class | Actual | 0.89% | $1,000.00 | $754.10 | $3.91 |
| Institutional Class | Hypothetical | 0.89% | $1,000.00 | $1,020.61 | $4.51 |
| Mid Cap Fund | |||||
| Class A | Actual | 1.25% | $1,000.00 | $864.70 | $5.84*** |
| Class A | Hypothetical | 1.25% | $1,000.00 | $1,018.80 | $6.33*** |
| Class C | Actual | 1.93% | $1,000.00 | $861.70 | $9.01*** |
| Class C | Hypothetical | 1.93% | $1,000.00 | $1,015.39 | $9.75*** |
| Class Y | Actual | 0.94% | $1,000.00 | $866.10 | $4.40*** |
| Class Y | Hypothetical | 0.94% | $1,000.00 | $1,020.36 | $4.76*** |
| Class Z | Actual | 1.22% | $1,000.00 | $864.80 | $5.70*** |
| Class Z | Hypothetical | 1.22% | $1,000.00 | $1,018.95 | $6.17*** |
| Institutional Class | Actual | 0.86% | $1,000.00 | $866.30 | $4.02*** |
| Institutional Class | Hypothetical | 0.86% | $1,000.00 | $1,020.76 | $4.36*** |
| Class R6 | Actual | 0.81% | $1,000.00 | $866.60 | $3.79*** |
| Class R6 | Hypothetical | 0.81% | $1,000.00 | $1,021.01 | $4.10*** |
| Mid Cap Value Fund | |||||
| Class A | Actual | 1.22% | $1,000.00 | $846.20 | $5.65 |
| Class A | Hypothetical | 1.22% | $1,000.00 | $1,018.95 | $6.17 |
| Class C | Actual | 1.97% | $1,000.00 | $843.10 | $9.10 |
| Class C | Hypothetical | 1.97% | $1,000.00 | $1,015.19 | $9.95 |
| Class Y | Actual | 0.97% | $1,000.00 | $847.40 | $4.49 |
| Class Y | Hypothetical | 0.97% | $1,000.00 | $1,020.21 | $4.91 |
| Institutional Class | Actual | 0.84% | $1,000.00 | $848.10 | $3.89 |
| Institutional Class | Hypothetical | 0.84% | $1,000.00 | $1,020.86 | $4.26 |
| Sands Capital Select Growth Fund | |||||
| Class A | Actual | 1.25% | $1,000.00 | $623.10 | $5.09**** |
| Class A | Hypothetical | 1.25% | $1,000.00 | $1,018.80 | $6.33**** |
| Class C | Actual | 1.81% | $1,000.00 | $621.50 | $7.36**** |
| Class C | Hypothetical | 1.81% | $1,000.00 | $1,015.99 | $9.15**** |
| Net Expense Ratio Annualized September 30, 2022 | Beginning Account Value April 1, 2022 | Ending Account Value September 30, 2022 | Expenses Paid During the Six Months Ended September 30, 2022* | ||
| Class Y | Actual | 0.93% | $1,000.00 | $624.60 | $3.79**** |
| Class Y | Hypothetical | 0.93% | $1,000.00 | $1,020.41 | $4.71**** |
| Class Z | Actual | 1.21% | $1,000.00 | $623.40 | $4.92**** |
| Class Z | Hypothetical | 1.21% | $1,000.00 | $1,019.00 | $6.12**** |
| Institutional Class | Actual | 0.86% | $1,000.00 | $624.40 | $3.50**** |
| Institutional Class | Hypothetical | 0.86% | $1,000.00 | $1,020.76 | $4.36**** |
| Class R6 | Actual | 0.78% | $1,000.00 | $624.40 | $3.18**** |
| Class R6 | Hypothetical | 0.78% | $1,000.00 | $1,021.16 | $3.95**** |
| Small Cap Fund | |||||
| Class A | Actual | 1.25% | $1,000.00 | $886.60 | $5.91***** |
| Class A | Hypothetical | 1.25% | $1,000.00 | $1,018.80 | $6.33***** |
| Class C | Actual | 2.00% | $1,000.00 | $883.00 | $9.44***** |
| Class C | Hypothetical | 2.00% | $1,000.00 | $1,015.04 | $10.10***** |
| Class Y | Actual | 1.00% | $1,000.00 | $887.10 | $4.73***** |
| Class Y | Hypothetical | 1.00% | $1,000.00 | $1,020.05 | $5.06***** |
| Institutional Class | Actual | 0.92% | $1,000.00 | $887.50 | $4.35***** |
| Institutional Class | Hypothetical | 0.92% | $1,000.00 | $1,020.46 | $4.66***** |
| Small Cap Value Fund | |||||
| Class A | Actual | 1.38% | $1,000.00 | $863.00 | $6.44 |
| Class A | Hypothetical | 1.38% | $1,000.00 | $1,018.15 | $6.98 |
| Class C | Actual | 2.13% | $1,000.00 | $859.60 | $9.93 |
| Class C | Hypothetical | 2.13% | $1,000.00 | $1,014.39 | $10.76 |
| Class Y | Actual | 1.13% | $1,000.00 | $864.30 | $5.28 |
| Class Y | Hypothetical | 1.13% | $1,000.00 | $1,019.40 | $5.72 |
| Institutional Class | Actual | 0.98% | $1,000.00 | $864.80 | $4.58 |
| Institutional Class | Hypothetical | 0.98% | $1,000.00 | $1,020.16 | $4.96 |
| Ultra Short Duration Fixed Income Fund | |||||
| Class A | Actual | 0.69% | $1,000.00 | $999.10 | $3.46 |
| Class A | Hypothetical | 0.69% | $1,000.00 | $1,021.61 | $3.50 |
| Class C | Actual | 1.19% | $1,000.00 | $997.70 | $5.96 |
| Class C | Hypothetical | 1.19% | $1,000.00 | $1,019.10 | $6.02 |
| Class S | Actual | 0.94% | $1,000.00 | $997.80 | $4.71 |
| Class S | Hypothetical | 0.94% | $1,000.00 | $1,020.36 | $4.76 |
| Class Y | Actual | 0.44% | $1,000.00 | $1,000.30 | $2.21 |
| Class Y | Hypothetical | 0.44% | $1,000.00 | $1,022.86 | $2.23 |
| Class Z | Actual | 0.69% | $1,000.00 | $999.10 | $3.46 |
| Class Z | Hypothetical | 0.69% | $1,000.00 | $1,021.61 | $3.50 |
| Institutional Class | Actual | 0.39% | $1,000.00 | $1,000.60 | $1.96 |
| Institutional Class | Hypothetical | 0.39% | $1,000.00 | $1,023.11 | $1.98 |
| * | Expenses are equal to the Fund’s annualized expense ratio, multiplied by the average account value over the period, multiplied by 183/365 (to reflect one-half year period). |
| ** | Excluding interest and dividend expenses on securities sold short, your actual cost of investment in Class A, Class C, Class Y and Institutional Class would be $4.95, $6.86, $3.99 and $3.51, respectively, and your hypothetical cost of investment in Class A, Class C, Class Y and Institutional Class would be $5.22, $7.23, $4.20 and $3.70, respectively. |
| *** | Excluding liquidity provider expenses, your actual cost of investment in Class A, Class C, Class Y, Class Z, Institutional Class and Class R6 would be $5.80, $8.96, $4.35, $5.66, $3.98 and $3.74, respectively, and your hypothetical cost of investment in Class A, Class C, Class Y, Class Z, Institutional Class and Class R6 would be $,6.28 $9.70, $4.71, $6.12, $4.31 and $4.05, respectively. |
| **** | Excluding liquidity provider expenses, your actual cost of investment in Class A, Class C, Class Y, Class Z, Institutional Class and Class R6 would be $4.80, $7.07, $3.50, $4.64, $3.22 and $2.89, respectively, and your hypothetical cost of investment in Class A, Class C, Class Y, Class Z, Institutional Class and Class R6 would be $5.97, $8.79, $4.36, $5.77, $4.00 and $3.60, respectively. |
| ***** | Excluding liquidity provider expenses, your actual cost of investment in Class A, Class C, Class Y and Institutional Class would be $5.86, $9.39, $4.68 and $4.31, respectively, and your hypothetical cost of investment in Class A, Class C, Class Y and Institutional Class would be $6.28, $10.05, $5.01 and $4.61, respectively. |
| Interested Trustees1: | |||||
| Name Address Year of Birth | Position(s) Held with Trust | Term of Office And Length of Time Served | Principal Occupation(s) During Past 5 Years | Number of Funds Overseen in the Touchstone Fund Complex2 | Other Directorships Held During Past 5 Years3 |
| Jill T. McGruder Touchstone Advisors, Inc. 303 Broadway Suite 1100 Cincinnati, Ohio 45202 Year of Birth: 1955 | Trustee | Until retirement at age 75 or until she resigns or is removed Trustee since 1999 | President of Touchstone Funds from 1999 to 2020; Director and CEO of IFS Financial Services, Inc. (a holding company) since 1999; and Senior Vice President and Chief Marketing Officer of Western & Southern Financial Group, Inc. (a financial services company) since 2016. | 40 | Director, Integrity Life Insurance Co. and National Integrity Life Insurance Co. since 2005; Director, Touchstone Securities (the Distributor) since 1999; Director, Touchstone Advisors (the Advisor) since 1999; Director, W&S Brokerage Services, Inc. since 1999; Director, W&S Financial Group Distributors, Inc. since 1999; Director, Insurance Profillment Solutions LLC since 2014; Director, Columbus Life Insurance Co. since 2016; Director, The Lafayette Life Insurance Co. since 2016; Director, Gerber Life Insurance Company since 2019; Director, Western & Southern Agency, Inc. since 2018; and Director, LL Global, Inc. (not-for-profit trade organization with operating divisions LIMRA and LOMA) since 2016. |
| E. Blake Moore, Jr. Touchstone Advisors, Inc. 303 Broadway Suite 1100 Cincinnati, Ohio 45202 Year of Birth: 1958 | President and Trustee | Until retirement at age 75 or until he resigns or is removed Trustee since 2021 | President, Touchstone Funds since 2021; Chief Executive Officer of Touchstone Advisors, Inc. and Touchstone Securities, Inc. since 2020; President, Foresters Investment Management Company, Inc. from 2018 to 2020; President, North American Asset Management at Foresters Financial from 2018 to 2020; Managing Director, Head of Americas at UBS Asset Management from 2015 to 2017; and Executive Vice President, Head of Distribution at Mackenzie Investments from 2011 to 2014. | 40 | Trustee, College of Wooster since 2008; and Director, UBS Funds from 2015 to 2017. |
| Independent Trustees: | |||||
| Karen Carnahan c/o Touchstone Advisors, Inc. 303 Broadway Suite 1100 Cincinnati, Ohio 45202 Year of Birth: 1954 | Trustee | Until retirement at age 75 or until she resigns or is removed Trustee since 2019 | Retired; formerly Chief Operating Officer of Shred-it (a business services company) from 2014 to 2015; formerly President & Chief Operating Officer of the document management division of Cintas Corporation (a business services company) from 2008 to 2014. | 40 | Director, Cintas Corporation since 2019; Director, Boys & Girls Club of West Chester/Liberty since 2016; and Board of Advisors, Best Upon Request from 2020 to 2021. |
| William C. Gale c/o Touchstone Advisors, Inc. 303 Broadway Suite 1100 Cincinnati, Ohio 45202 Year of Birth: 1952 | Trustee | Until retirement at age 75 or until he resigns or is removed Trustee since 2013 | Retired; formerly Senior Vice President and Chief Financial Officer of Cintas Corporation (a business services company) from 1995 to 2015. | 40 | None. |
| Independent Trustees (Continued): | |||||
| Name Address Year of Birth | Position(s) Held with Trust | Term of Office And Length of Time Served | Principal Occupation(s) During Past 5 Years | Number of Funds Overseen in the Touchstone Fund Complex2 | Other Directorships Held During Past 5 Years3 |
| Susan J. Hickenlooper, CFA4 c/o Touchstone Advisors, Inc. 303 Broadway Suite 1100 Cincinnati, Ohio 45202 Year of Birth: 1946 | Trustee | Until retirement at age 75 or until she resigns or is removed Trustee since 2009 | Retired from investment management. | 40 | Trustee, Episcopal Diocese of Southern Ohio from 2014 to 2018. |
| Susan M. King c/o Touchstone Advisors, Inc. 303 Broadway Suite 1100 Cincinnati, Ohio 45202 Year of Birth: 1963 | Trustee | Until retirement at age 75 or until she resigns or is removed Trustee since 2021 | Formerly, Partner of ID Fund LLC (2020 to 2021); formerly, Senior Vice President, Head of Product and Marketing Strategy of Foresters Financial (2018 to 2020); formerly, Managing Director, Head of Sales Strategy and Marketing, Americas of UBS Asset Management (2015 to 2017); formerly, Director, Allianz Funds, Allianz Funds Multi-Strategy Trust and AllianzGI Institutional Multi-Series Trust (2014 to 2015); and formerly, Director, Alliance Capital Cash Management Offshore Funds (2003 to 2005). | 40 | Trustee, Claremont McKenna College since 2017; Trustee, Israel Cancer Research Fund since 2019; and Board Member of WHAM! (Women's Health Access Matters) since 2021. |
| Kevin A. Robie c/o Touchstone Advisors, Inc. 303 Broadway Suite 1100 Cincinnati, Ohio 45202 Year of Birth: 1956 | Trustee | Until retirement at age 75 or until he resigns or is removed Trustee since 2013 | Retired; formerly Vice President of Portfolio Management at Soin LLC (private multinational holding company and family office) from 2004 to 2020. | 40 | Director, SaverSystems, Inc. since 2015; Director, Buckeye EcoCare, Inc. from 2013 to 2018; Director, Turner Property Services Group, Inc. since 2017; Trustee, Dayton Region New Market Fund, LLC (private fund) since 2010; and Trustee, Entrepreneurs Center, Inc. (business incubator) since 2006. |
| William H. Zimmer III c/o Touchstone Advisors, Inc. 303 Broadway Suite 1100 Cincinnati, Ohio 45202 Year of Birth: 1953 | Trustee | Until retirement at age 75 or until he resigns or is removed Trustee since 2019 | Independent Treasury Consultant since 2014. | 40 | Director, Deaconess Associations, Inc. (healthcare) since 2001; Trustee, Huntington Funds (mutual funds) from 2006 to 2015; and Director, National Association of Corporate Treasurers from 2011 to 2015. |
| Principal Officers: | |||
| Name Address Year of Birth | Position(s) Held with Trust1 | Term of Office And Length of Time Served | Principal Occupation(s) During Past 5 Years |
| E. Blake Moore, Jr. Touchstone Advisors, Inc. 303 Broadway Suite 1100 Cincinnati, Ohio 45202 Year of Birth: 1958 | President and Trustee | Until resignation, removal or disqualification President since January 2021 | See biography above. |
| Timothy D. Paulin Touchstone Advisors, Inc. 303 Broadway Suite 1100 Cincinnati, Ohio 45202 Year of Birth: 1963 | Vice President | Until resignation, removal or disqualification Vice President since 2010 | Senior Vice President of Investment Research and Product Management of Touchstone Advisors, Inc. |
| Timothy S. Stearns Touchstone Advisors, Inc. 303 Broadway Suite 1100 Cincinnati, Ohio 45202 Year of Birth: 1963 | Chief Compliance Officer | Until resignation, removal or disqualification Chief Compliance Officer since 2013 | Chief Compliance Officer of Touchstone Advisors, Inc. and Touchstone Securities, Inc. |
| Terrie A. Wiedenheft Touchstone Advisors, Inc. 303 Broadway Suite 1100 Cincinnati, Ohio 45202 Year of Birth: 1962 | Controller and Treasurer | Until resignation, removal or disqualification Controller and Treasurer since 2006 | Senior Vice President and Chief Administration Officer within the Office of the Chief Marketing Officer of Western & Southern Financial Group (since 2021); and Senior Vice President, Chief Financial Officer, and Chief Operations Officer of IFS Financial Services, Inc. (a holding company). |
| Meredyth A. Whitford-Schultz Western & Southern Financial Group 400 Broadway Cincinnati, Ohio 45202 Year of Birth: 1981 | Secretary | Until resignation, removal or disqualification Secretary since 2018 | Senior Counsel - Securities/Mutual Funds of Western & Southern Financial Group (2015 to present); Associate at Morgan Lewis & Bockius LLP (law firm) (2014 to 2015); Associate at Bingham McCutchen LLP (law firm) (2008 to 2014). |


303 Broadway
Cincinnati, Ohio 45202-4203
800.638.8194
www.touchstoneinvestments.com
303 Broadway
Cincinnati, Ohio 45202-4203
4400 Computer Drive
Westborough, Massachusetts 01581
| (b) | Not applicable. |
Item 2. Code of Ethics.
| (a) | The registrant, as of the end of the period covered by this report, has adopted a code of ethics that applies to the registrant’s principal executive officer, principal financial officer, principal accounting officer or controller, or persons performing similar functions, regardless of whether these individuals are employed by the registrant or a third party. |
| (c) | There have been no amendments, during the period covered by this report, to a provision of the code of ethics that applies to the registrant’s principal executive officer, principal financial officer, principal accounting officer or controller, or persons performing similar functions, regardless of whether these individuals are employed by the registrant or a third party, and that relates to any element of the code of ethics description. |
| (d) | The registrant has not granted any waivers, including an implicit waiver, from a provision of the code of ethics that applies to the registrant’s principal executive officer, principal financial officer, principal accounting officer or controller, or persons performing similar functions, regardless of whether these individuals are employed by the registrant or a third party, that relates to one or more of the items set forth in paragraph (b) of this item’s instructions. |
| (e) | Not applicable. |
| (f) | A copy of the code of ethics is attached hereto as Exhibit 13(a)(1). |
Item 3. Audit Committee Financial Expert.
The registrant’s Board of Trustees has determined that the registrant has at least one audit committee financial expert serving on its audit committee. Ms. Karen Carnahan is the registrant’s audit committee financial expert and is an independent trustee within the meaning of the Investment Company Act of 1940, as amended (the “1940 Act”).
Item 4. Principal Accountant Fees and Services.
Audit Fees
| (a) | Audit fees for Touchstone Funds Group Trust totaled $279,200 and $267,300 for the fiscal years ended September 30, 2022 and September 30, 2021, respectively, including fees associated with the annual audits and filings of Form N-1A and Form N-CEN. |
Audit-Related Fees
| (b) | The aggregate fees billed in each of the last two fiscal years for assurance and related services by the principal accountant that are reasonably related to the performance of the audit of the registrant's financial statements and are not reported under paragraph (a) of this Item are $45,700 and $56,550 for the fiscal years ended September 30, 2022 and September 30, 2021, respectively. The fees for 2022 and 2021 relate to review of N-1A, N-14 filings and out of scope audit procedures. |
Tax Fees
| (c) | The aggregate fees billed in each of the last two fiscal years for professional services rendered by the principal accountant for tax compliance, tax advice, and tax planning were $91,510 and $74,950 for the fiscal years ended September 30, 2022 and September 30, 2021, respectively. The fees relate to the preparation of federal income and excise tax returns, review of capital gains distribution calculations, and out of scope tax services. |
All Other Fees
| (d) | The aggregate fees billed in each of the last two fiscal years for products and services provided by the principal accountant, other than the services reported in paragraphs (a) through (c) of this Item are $33,651 and $25,567 for the fiscal years ended September 30, 2022 and September 2021, respectively. The fees relate to the PFIC analyzer and Global Withholding Tax Reporter subscriptions. |
| (e)(1) | Disclose the audit committee's pre-approval policies and procedures described in paragraph (c)(7) of Rule 2-01 of Regulation S-X. |
The Audit Committee’s pre-approval policies describe the types of audit, audit-related, tax and other services that have the general pre-approval of the Audit Committee. The pre-approval policies provide that annual audit service fees, tax services not specifically granted pre-approval, services exceeding pre-approved cost levels and other services that have not received general pre-approval will be subject to specific pre-approval by the Audit Committee. The pre-approval policies further provide that the Committee may grant general pre-approval to other audit services (statutory audits and services associated with SEC registration statements, periodic reports and other documents filed with the SEC or other documents issued in connection with securities offerings), audit-related services (accounting consultations related to accounting, financial reporting or disclosure matters not classified as “audit services,” assistance with understanding and implementing new accounting and financial reporting guidance from rulemaking authorities, agreed-upon or expanded audit procedures related to accounting and/or billing records required to respond to or comply with financial, accounting or regulatory reporting matters and assistance with internal control reporting requirements under Form N-CSR), tax services that have historically been provided by the auditor that the Committee believes would not impair the independence of the auditor and are consistent with the SEC’s rules on auditor independence and permissible non-audit services classified as “all other services” that are routine and recurring services.
| (e)(2) | All of the services described in paragraphs (b) through (d) of Item 4 were approved by the Audit Committee. |
| (f) | The percentage of hours expended on the principal accountant's engagement to audit the registrant's financial statements for the most recent fiscal year that were attributed to work performed by persons other than the principal accountant's full-time, permanent employees was less than fifty percent. |
| (g) | The aggregate non-audit fees for Touchstone Funds Group Trust and certain entities*, totaled approximately $605,095 and $465,691 for the fiscal years ended September 30, 2022 and September 30, 2021, respectively. |
| * | These include the advisors (excluding non-affiliated sub-advisors) and any entity controlling, controlled by or under common control with the advisors that provides ongoing services to the registrant (Funds). |
| (h) | The registrant's audit committee of the board of trustees has considered whether the provision of non-audit services that were rendered to the registrant's investment adviser (not including any sub-adviser whose role is primarily portfolio management and is subcontracted with or overseen by another investment adviser), and any entity controlling, controlled by, or under common control with the investment adviser that provides ongoing services to the registrant that were not pre-approved pursuant to paragraph (c)(7)(ii) of Rule 2-01 of Regulation S-X is compatible with maintaining the principal accountant's independence. |
| (i) | Not applicable. |
| (j) | Not applicable. |
Item 5. Audit Committee of Listed Registrants.
Not applicable.
Item 6. Investments.
| (a) | Schedule of Investments in securities of unaffiliated issuers as of the close of the reporting period is included as part of the report to shareholders filed under Item 1 of this form. | |
| (b) | Not applicable. |
Item 7. Disclosure of Proxy Voting Policies and Procedures for Closed-End Management Investment Companies.
Not applicable.
Item 8. Portfolio Managers of Closed-End Management Investment Companies.
Not applicable.
Item 9. Purchases of Equity Securities by Closed-End Management Investment Company and Affiliated Purchasers.
Not applicable.
Item 10. Submission of Matters to a Vote of Security Holders.
There have been no material changes to the procedures by which the shareholders may recommend nominees to the registrant’s board of trustees, where those changes were implemented after the registrant last provided disclosure in response to the requirements of Item 407(c)(2)(iv) of Regulation S-K (17 CFR 229.407) (as required by Item 22(b)(15) of Schedule 14A (17 CFR 240.14a-101)), or this Item.
Item 11. Controls and Procedures.
| (a) | The registrant’s principal executive and principal financial officers, or persons performing similar functions, have concluded that the registrant’s disclosure controls and procedures (as defined in Rule 30a-3(c) under the Investment Company Act of 1940, as amended (the “1940 Act”) (17 CFR 270.30a-3(c))) are effective, as of a date within 90 days of the filing date of the report that includes the disclosure required by this paragraph, based on their evaluation of these controls and procedures required by Rule 30a-3(b) under the 1940 Act (17 CFR 270.30a-3(b)) and Rules 13a-15(b) or 15d-15(b) under the Securities Exchange Act of 1934, as amended (17 CFR 240.13a-15(b) or 240.15d-15(b)). |
| (b) | There were no changes in the registrant’s internal control over financial reporting (as defined in Rule 30a-3(d) under the 1940 Act (17 CFR 270.30a-3(d))) that occurred during the period covered by this report that has materially affected, or is reasonably likely to materially affect, the registrant’s internal control over financial reporting. |
Item 12. Disclosure of Securities Lending Activities for Closed-End Management Investment Companies.
Not applicable.
Item 13. Exhibits.
| (a)(1) | Code of ethics, and any amendment thereto, that is the subject of disclosure required by Item 2 is attached hereto. |
| (a)(2) | Certifications pursuant to Rule 30a-2(a) under the 1940 Act and Section 302 of the Sarbanes-Oxley Act of 2002 are attached hereto. |
| (a)(2)(1) | Not applicable |
| (a)(2)(2) | Letter from former accountant pursuant to Item 304(a) under Regulation S-K is attached hereto. |
| (b) | Certifications pursuant to Rule 30a-2(b) under the 1940 Act and Section 906 of the Sarbanes-Oxley Act of 2002 are attached hereto. |
SIGNATURES
Pursuant to the requirements of the Securities Exchange Act of 1934 and the Investment Company Act of 1940, the registrant has duly caused this report to be signed on its behalf by the undersigned, thereunto duly authorized.
| (Registrant) | Touchstone Funds Group Trust |
| By (Signature and Title)* | /s/ E. Blake Moore, Jr. | |
| E. Blake Moore Jr., President | ||
| (principal executive officer) |
| Date | November 30, 2022 |
Pursuant to the requirements of the Securities Exchange Act of 1934 and the Investment Company Act of 1940, this report has been signed below by the following persons on behalf of the registrant and in the capacities and on the dates indicated.
| By (Signature and Title)* | /s/ E. Blake Moore, Jr. | |
| E. Blake Moore Jr., President | ||
| (principal executive officer) |
| Date | November 30, 2022 |
| By (Signature and Title)* | /s/ Terrie A. Wiedenheft | |
| Terrie A. Wiedenheft, Controller and Treasurer | ||
| (principal financial officer) |
| Date | November 30, 2022 |
* Print the name and title of each signing officer under his or her signature.