Cincinnati, Ohio 45202-4203
Item 1: Reports to Shareholders.
(a) The Report to Shareholders is attached herewith.

| Class | Costs of a $10,000 investment | Costs paid as a percentage of a $10,000 investment |
| Class A | $ 88 | 0.83 % |
| Factor | Performance Impact | Observations |
| Interest Rate Management | Positive | Interest rates have been extremely volatile but have declined materially over the past 12 months. This contributed to both absolute and relative performance, through tactical interest rate management, and positioning for a steeper yield curve. |
| Sector Allocation | Positive | Over the past 12 months the Fund had overweight allocations to Investment Grade Corporate Credit and Emerging Markets debt, which both outperformed and contributed to relative performance. |
| Security Selection | Positive | Security selection within Investment Grade Corporates and securitized debt contributed to relative outperformance. |
| High Yield Credit Protection | Negative | The Fund maintained credit risk protection on high yield credit which underperformed as spreads tightened over the year. |
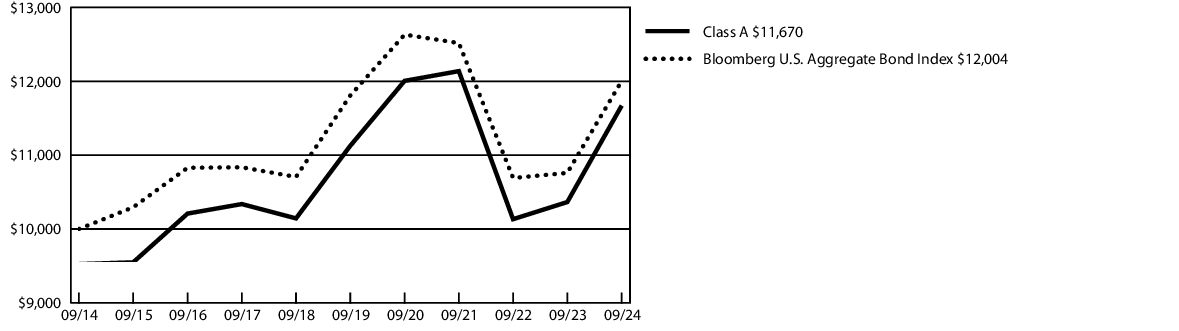
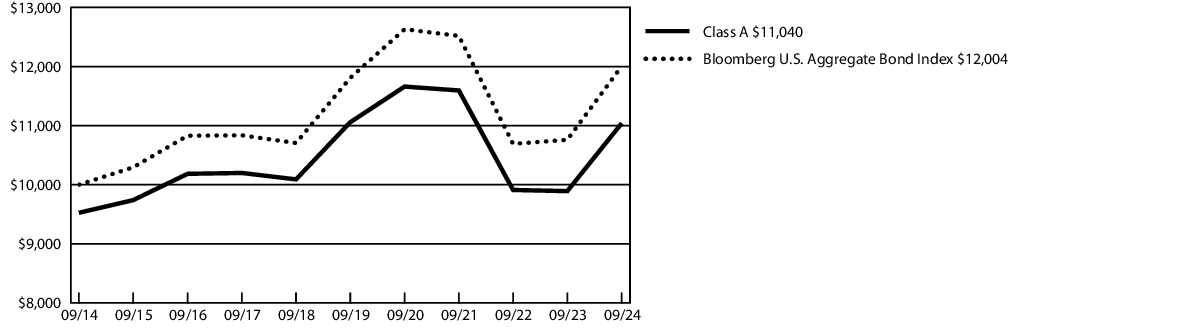
| AVERAGE ANNUAL TOTAL RETURNS | 1 Year | 5 Years | 10 Years |
| Class A | 8.92 % | 0.55 % | 1.56 % |
| Class A - excluding sales load | 12.60 % | 0.96 % | 2.05 % |
| Bloomberg U.S. Aggregate Bond Index | 11.57 % | 0.33 % | 1.84 % |
| Fund net assets | $ 263,555,634 |
| Total number of portfolio holdings | 319 |
| Total advisory fees paid | $ 914,151 |
| Portfolio turnover rate | 172 % |
| Corporate Bonds | 39.1 % |
| U.S. Treasury Obligations | 21.2 % |
| Non-Agency Collateralized Mortgage Obligations | 8.6 % |
| U.S. Government Mortgage-Backed Obligations | 7.4 % |
| Agency Collateralized Mortgage Obligations | 6.6 % |
| Commercial Mortgage-Backed Securities | 6.5 % |
| Asset-Backed Securities | 5.3 % |
| Sovereign Government Obligations | 1.1 % |
| Short-Term Investment Fund | 3.6 % |
| Other Assets/Liabilities (Net) | 0.6 % |
| Total | 100.0 % |
| AAA/Aaa | 43.7 % |
| AA/Aa | 7.3 % |
| A/A | 14.1 % |
| BBB/Baa | 26.7 % |
| BB/Ba | 0.6 % |
| B/B | 0.5 % |
| CC | 0.1 % |
| Not Rated | 7.0 % |
| Total | 100.0 % |

| Class | Costs of a $10,000 investment | Costs paid as a percentage of a $10,000 investment |
| Class C | $ 165 | 1.56 % |
| Factor | Performance Impact | Observations |
| Interest Rate Management | Positive | Interest rates have been extremely volatile but have declined materially over the past 12 months. This contributed to both absolute and relative performance, through tactical interest rate management, and positioning for a steeper yield curve. |
| Sector Allocation | Positive | Over the past 12 months the Fund had overweight allocations to Investment Grade Corporate Credit and Emerging Markets debt, which both outperformed and contributed to relative performance. |
| Security Selection | Positive | Security selection within Investment Grade Corporates and securitized debt contributed to relative outperformance. |
| High Yield Credit Protection | Negative | The Fund maintained credit risk protection on high yield credit which underperformed as spreads tightened over the year. |
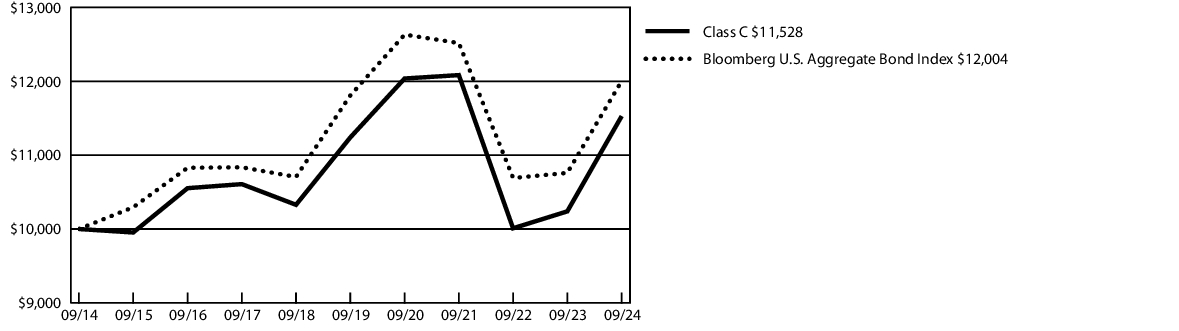
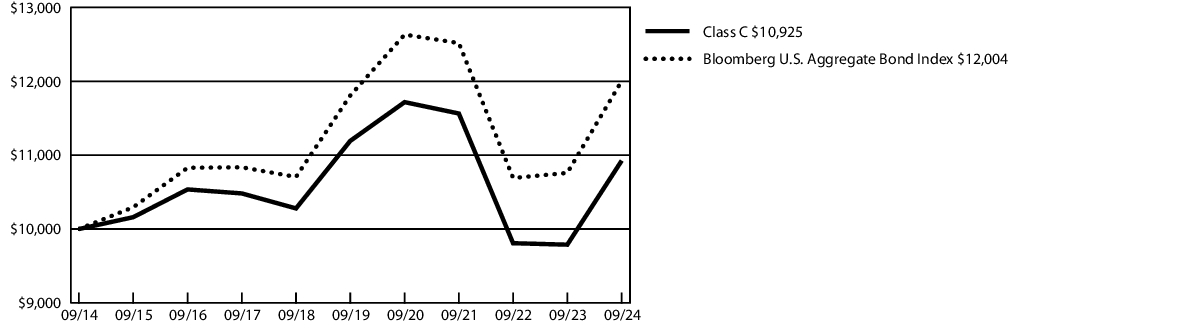
| AVERAGE ANNUAL TOTAL RETURNS | 1 Year | 5 Years | 10 Years |
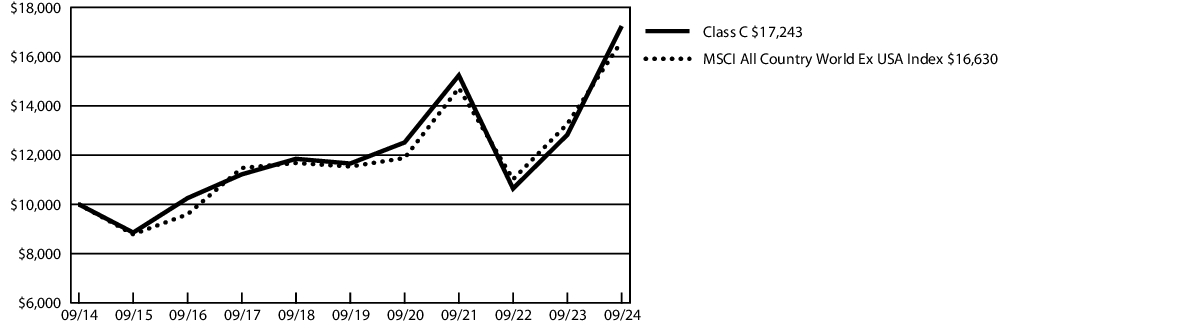
| Class C | 10.69 % | 0.22 % | 1.43 % |
| Class C - excluding sales load | 11.69 % | 0.22 % | 1.43 % |
| Bloomberg U.S. Aggregate Bond Index | 11.57 % | 0.33 % | 1.84 % |
| Fund net assets | $ 263,555,634 |
| Total number of portfolio holdings | 319 |
| Total advisory fees paid | $ 914,151 |
| Portfolio turnover rate | 172 % |
| Corporate Bonds | 39.1 % |
| U.S. Treasury Obligations | 21.2 % |
| Non-Agency Collateralized Mortgage Obligations | 8.6 % |
| U.S. Government Mortgage-Backed Obligations | 7.4 % |
| Agency Collateralized Mortgage Obligations | 6.6 % |
| Commercial Mortgage-Backed Securities | 6.5 % |
| Asset-Backed Securities | 5.3 % |
| Sovereign Government Obligations | 1.1 % |
| Short-Term Investment Fund | 3.6 % |
| Other Assets/Liabilities (Net) | 0.6 % |
| Total | 100.0 % |
| AAA/Aaa | 43.7 % |
| AA/Aa | 7.3 % |
| A/A | 14.1 % |
| BBB/Baa | 26.7 % |
| BB/Ba | 0.6 % |
| B/B | 0.5 % |
| CC | 0.1 % |
| Not Rated | 7.0 % |
| Total | 100.0 % |
| Class | Costs of a $10,000 investment | Costs paid as a percentage of a $10,000 investment |
| Class Y | $ 62 | 0.58 % |
| Factor | Performance Impact | Observations |
| Interest Rate Management | Positive | Interest rates have been extremely volatile but have declined materially over the past 12 months. This contributed to both absolute and relative performance, through tactical interest rate management, and positioning for a steeper yield curve. |
| Sector Allocation | Positive | Over the past 12 months the Fund had overweight allocations to Investment Grade Corporate Credit and Emerging Markets debt, which both outperformed and contributed to relative performance. |
| Security Selection | Positive | Security selection within Investment Grade Corporates and securitized debt contributed to relative outperformance. |
| High Yield Credit Protection | Negative | The Fund maintained credit risk protection on high yield credit which underperformed as spreads tightened over the year. |
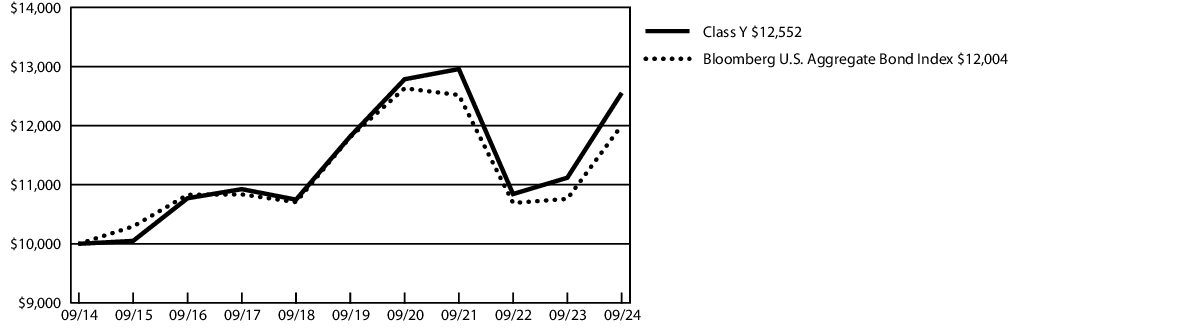
| AVERAGE ANNUAL TOTAL RETURNS | 1 Year | 5 Years | 10 Years |
| Class Y | 12.89 % | 1.21 % | 2.30 % |
| Bloomberg U.S. Aggregate Bond Index | 11.57 % | 0.33 % | 1.84 % |
| Fund net assets | $ 263,555,634 |
| Total number of portfolio holdings | 319 |
| Total advisory fees paid | $ 914,151 |
| Portfolio turnover rate | 172 % |
| Corporate Bonds | 39.1 % |
| U.S. Treasury Obligations | 21.2 % |
| Non-Agency Collateralized Mortgage Obligations | 8.6 % |
| U.S. Government Mortgage-Backed Obligations | 7.4 % |
| Agency Collateralized Mortgage Obligations | 6.6 % |
| Commercial Mortgage-Backed Securities | 6.5 % |
| Asset-Backed Securities | 5.3 % |
| Sovereign Government Obligations | 1.1 % |
| Short-Term Investment Fund | 3.6 % |
| Other Assets/Liabilities (Net) | 0.6 % |
| Total | 100.0 % |
| AAA/Aaa | 43.7 % |
| AA/Aa | 7.3 % |
| A/A | 14.1 % |
| BBB/Baa | 26.7 % |
| BB/Ba | 0.6 % |
| B/B | 0.5 % |
| CC | 0.1 % |
| Not Rated | 7.0 % |
| Total | 100.0 % |
| Class | Costs of a $10,000 investment | Costs paid as a percentage of a $10,000 investment |
| Institutional Class | $ 53 | 0.50 % |
| Factor | Performance Impact | Observations |
| Interest Rate Management | Positive | Interest rates have been extremely volatile but have declined materially over the past 12 months. This contributed to both absolute and relative performance, through tactical interest rate management, and positioning for a steeper yield curve. |
| Sector Allocation | Positive | Over the past 12 months the Fund had overweight allocations to Investment Grade Corporate Credit and Emerging Markets debt, which both outperformed and contributed to relative performance. |
| Security Selection | Positive | Security selection within Investment Grade Corporates and securitized debt contributed to relative outperformance. |
| High Yield Credit Protection | Negative | The Fund maintained credit risk protection on high yield credit which underperformed as spreads tightened over the year. |
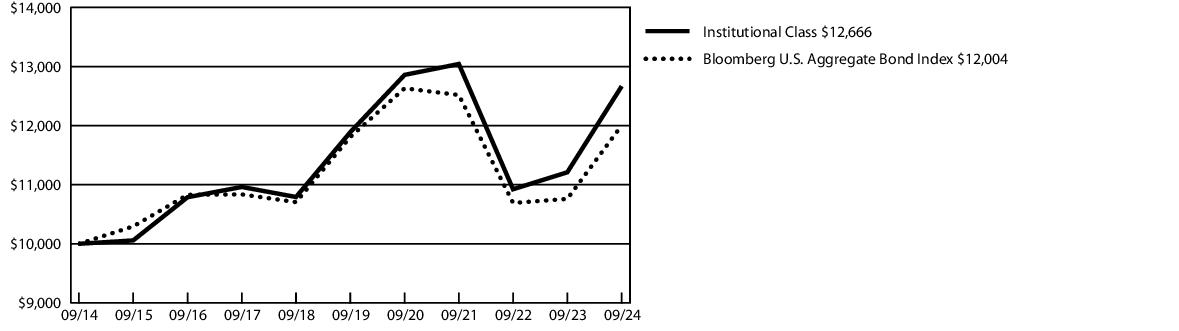
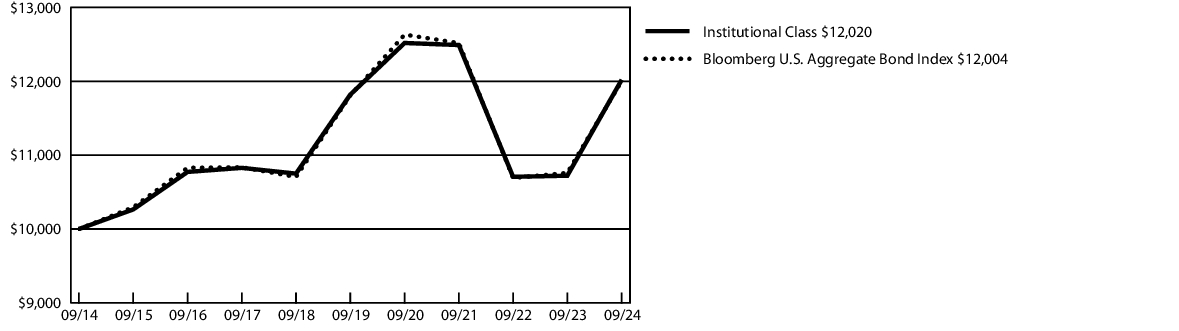
| AVERAGE ANNUAL TOTAL RETURNS | 1 Year | 5 Years | 10 Years |
| Institutional Class | 12.98 % | 1.27 % | 2.39 % |
| Bloomberg U.S. Aggregate Bond Index | 11.57 % | 0.33 % | 1.84 % |
| Fund net assets | $ 263,555,634 |
| Total number of portfolio holdings | 319 |
| Total advisory fees paid | $ 914,151 |
| Portfolio turnover rate | 172 % |
| Corporate Bonds | 39.1 % |
| U.S. Treasury Obligations | 21.2 % |
| Non-Agency Collateralized Mortgage Obligations | 8.6 % |
| U.S. Government Mortgage-Backed Obligations | 7.4 % |
| Agency Collateralized Mortgage Obligations | 6.6 % |
| Commercial Mortgage-Backed Securities | 6.5 % |
| Asset-Backed Securities | 5.3 % |
| Sovereign Government Obligations | 1.1 % |
| Short-Term Investment Fund | 3.6 % |
| Other Assets/Liabilities (Net) | 0.6 % |
| Total | 100.0 % |
| AAA/Aaa | 43.7 % |
| AA/Aa | 7.3 % |
| A/A | 14.1 % |
| BBB/Baa | 26.7 % |
| BB/Ba | 0.6 % |
| B/B | 0.5 % |
| CC | 0.1 % |
| Not Rated | 7.0 % |
| Total | 100.0 % |
| Class | Costs of a $10,000 investment | Costs paid as a percentage of a $10,000 investment |
| Class A | $ 111 | 1.04 % |
| Factor | Performance Impact | Observations |
| Sector Allocation | Positive | Allocations to off-benchmark sectors such as Collateralized Loan Obligation securities and post-reorganization equities were a source of high current income and price appreciation. |
| Trading | Positive | Benefitted from discounted secondary market prices. |
| Bank Loans | Negative | The allocation to bank loans was a headwind to relative performance as the asset class underperformed high yield bonds. |
| AVERAGE ANNUAL TOTAL RETURNS | 1 Year | 5 Years | Since Inception 1 |
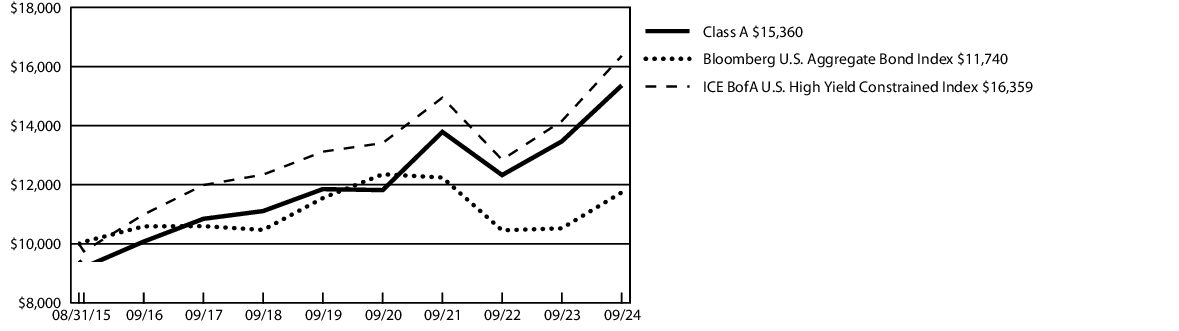
| Class A | 10.41 % | 4.24 % | 4.84 % |
| Class A - excluding sales load | 14.07 % | 5.32 % | 5.52 % |
| Bloomberg U.S. Aggregate Bond Index | 11.57 % | 0.33 % | 1.78 % |
| ICE BofA U.S. High Yield Constrained Index | 15.67 % | 4.53 % | 5.58 % |
1 | The inception date of the Fund was August 31, 2015. The returns of the indexes listed above are based on the inception date of the Fund. |
| Fund net assets | $ 623,356,953 |
| Total number of portfolio holdings | 374 |
| Total advisory fees paid | $ 2,769,725 |
| Portfolio turnover rate | 49 % |
| Corporate Bonds | 79.4 % |
| Bank Loans | 11.9 % |
| Asset-Backed Securities | 3.9 % |
| Common Stocks | 0.6 % |
| Warrants | 0.1 % |
| Trade Claim | 0.0 % |
| Purchased Options | 0.0 % |
| Short-Term Investment Funds | 6.0 % |
| Other Assets/Liabilities (Net) | (1.9 ) % |
| Total | 100.0 % |
| BBB/Baa | 9.7 % |
| BB/Ba | 40.5 % |
| B/B | 36.4 % |
| CCC | 9.0 % |
| CC | 0.1 % |
| Not Rated | 4.3 % |
| Total | 100.0 % |
| Class | Costs of a $10,000 investment | Costs paid as a percentage of a $10,000 investment |
| Class C | $ 154 | 1.44 % |
| Factor | Performance Impact | Observations |
| Sector Allocation | Positive | Allocations to off-benchmark sectors such as Collateralized Loan Obligation securities and post-reorganization equities were a source of high current income and price appreciation. |
| Trading | Positive | Benefitted from discounted secondary market prices. |
| Bank Loans | Negative | The allocation to bank loans was a headwind to relative performance as the asset class underperformed high yield bonds. |
| AVERAGE ANNUAL TOTAL RETURNS | 1 Year | 5 Years | Since Inception 1 |
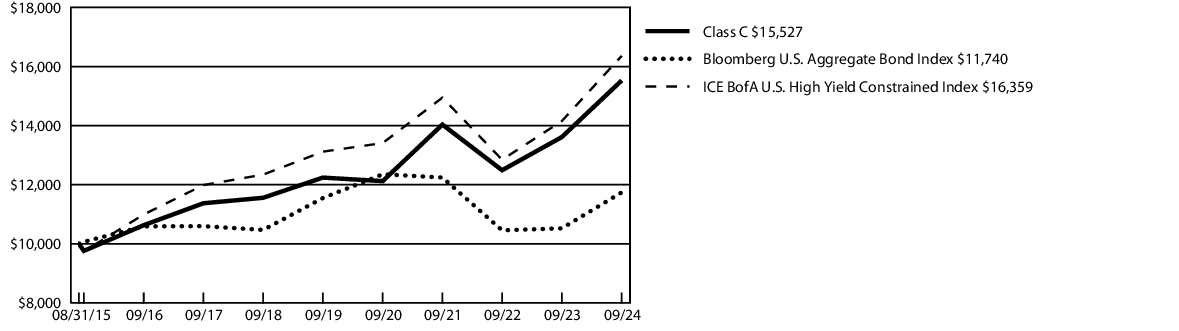
| Class C | 12.57 % | 4.77 % | 4.96 % |
| Class C - excluding sales load | 13.57 % | 4.77 % | 4.96 % |
| Bloomberg U.S. Aggregate Bond Index | 11.57 % | 0.33 % | 1.78 % |
| ICE BofA U.S. High Yield Constrained Index | 15.67 % | 4.53 % | 5.58 % |
1 | The inception date of the Fund was August 31, 2015. The returns of the indexes listed above are based on the inception date of the Fund. |
| Fund net assets | $ 623,356,953 |
| Total number of portfolio holdings | 374 |
| Total advisory fees paid | $ 2,769,725 |
| Portfolio turnover rate | 49 % |
| Corporate Bonds | 79.4 % |
| Bank Loans | 11.9 % |
| Asset-Backed Securities | 3.9 % |
| Common Stocks | 0.6 % |
| Warrants | 0.1 % |
| Trade Claim | 0.0 % |
| Purchased Options | 0.0 % |
| Short-Term Investment Funds | 6.0 % |
| Other Assets/Liabilities (Net) | (1.9 ) % |
| Total | 100.0 % |
| BBB/Baa | 9.7 % |
| BB/Ba | 40.5 % |
| B/B | 36.4 % |
| CCC | 9.0 % |
| CC | 0.1 % |
| Not Rated | 4.3 % |
| Total | 100.0 % |
| Class | Costs of a $10,000 investment | Costs paid as a percentage of a $10,000 investment |
| Class Y | $ 90 | 0.84 % |
| Factor | Performance Impact | Observations |
| Sector Allocation | Positive | Allocations to off-benchmark sectors such as Collateralized Loan Obligation securities and post-reorganization equities were a source of high current income and price appreciation. |
| Trading | Positive | Benefitted from discounted secondary market prices. |
| Bank Loans | Negative | The allocation to bank loans was a headwind to relative performance as the asset class underperformed high yield bonds. |

| AVERAGE ANNUAL TOTAL RETURNS | 1 Year | 5 Years | Since Inception 1 |
| Class Y | 14.16 % | 5.52 % | 5.76 % |
| Bloomberg U.S. Aggregate Bond Index | 11.57 % | 0.33 % | 1.78 % |
| ICE BofA U.S. High Yield Constrained Index | 15.67 % | 4.53 % | 5.58 % |
1 | The inception date of the Fund was August 31, 2015. The returns of the indexes listed above are based on the inception date of the Fund. |
| Fund net assets | $ 623,356,953 |
| Total number of portfolio holdings | 374 |
| Total advisory fees paid | $ 2,769,725 |
| Portfolio turnover rate | 49 % |
| Corporate Bonds | 79.4 % |
| Bank Loans | 11.9 % |
| Asset-Backed Securities | 3.9 % |
| Common Stocks | 0.6 % |
| Warrants | 0.1 % |
| Trade Claim | 0.0 % |
| Purchased Options | 0.0 % |
| Short-Term Investment Funds | 6.0 % |
| Other Assets/Liabilities (Net) | (1.9 ) % |
| Total | 100.0 % |
| BBB/Baa | 9.7 % |
| BB/Ba | 40.5 % |
| B/B | 36.4 % |
| CCC | 9.0 % |
| CC | 0.1 % |
| Not Rated | 4.3 % |
| Total | 100.0 % |
| Class | Costs of a $10,000 investment | Costs paid as a percentageof a $10,000 investment |
| Institutional Class | $ 79 | 0.74 % |
| Factor | Performance Impact | Observations |
| Sector Allocation | Positive | Allocations to off-benchmark sectors such as Collateralized Loan Obligation securities and post-reorganization equities were a source of high current income and price appreciation. |
| Trading | Positive | Benefitted from discounted secondary market prices. |
| Bank Loans | Negative | The allocation to bank loans was a headwind to relative performance as the asset class underperformed high yield bonds. |
| AVERAGE ANNUAL TOTAL RETURNS | 1 Year | 5 Years | Since Inception 1 |
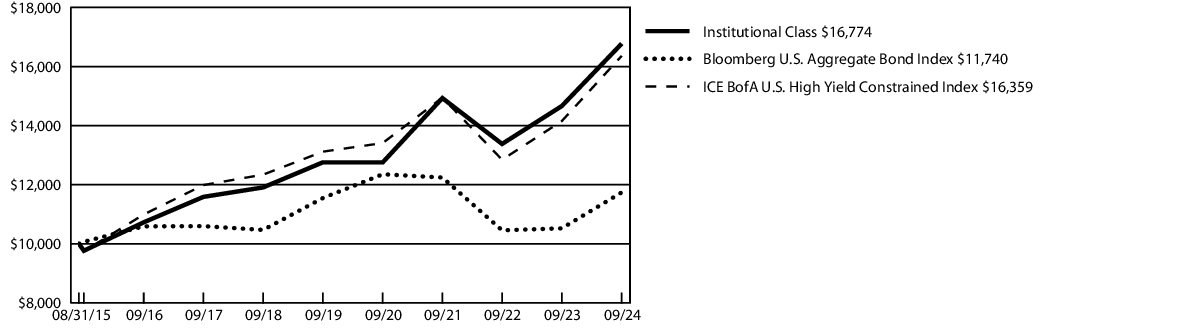
| Institutional Class | 14.40 % | 5.63 % | 5.86 % |
| Bloomberg U.S. Aggregate Bond Index | 11.57 % | 0.33 % | 1.78 % |
| ICE BofA U.S. High Yield Constrained Index | 15.67 % | 4.53 % | 5.58 % |
1 | The inception date of the Fund was August 31, 2015. The returns of the indexes listed above are based on the inception date of the Fund. |
| Fund net assets | $ 623,356,953 |
| Total number of portfolio holdings | 374 |
| Total advisory fees paid | $ 2,769,725 |
| Portfolio turnover rate | 49 % |
| Corporate Bonds | 79.4 % |
| Bank Loans | 11.9 % |
| Asset-Backed Securities | 3.9 % |
| Common Stocks | 0.6 % |
| Warrants | 0.1 % |
| Trade Claim | 0.0 % |
| Purchased Options | 0.0 % |
| Short-Term Investment Funds | 6.0 % |
| Other Assets/Liabilities (Net) | (1.9 ) % |
| Total | 100.0 % |
| BBB/Baa | 9.7 % |
| BB/Ba | 40.5 % |
| B/B | 36.4 % |
| CCC | 9.0 % |
| CC | 0.1 % |
| Not Rated | 4.3 % |
| Total | 100.0 % |
| Class | Costs of a $10,000 investment | Costs paid as a percentage of a $10,000 investment |
| Class A | $ 113 | 0.99 % |
| Factor | Performance Impact | Observations |
| Security Selection | Positive | Stock selection, primarily within Information Technology, was the main driver of relative outperformance. |
| Sector Allocation | Negative | Underweight exposure to Financials and Industrials detracted from relative performance as the sectors outperformed. |
| Dividend Style | Negative | High dividend paying stocks underperformed low dividend yielding stocks. |
| AVERAGE ANNUAL TOTAL RETURNS | 1 Year | 5 Years | 10 Years |
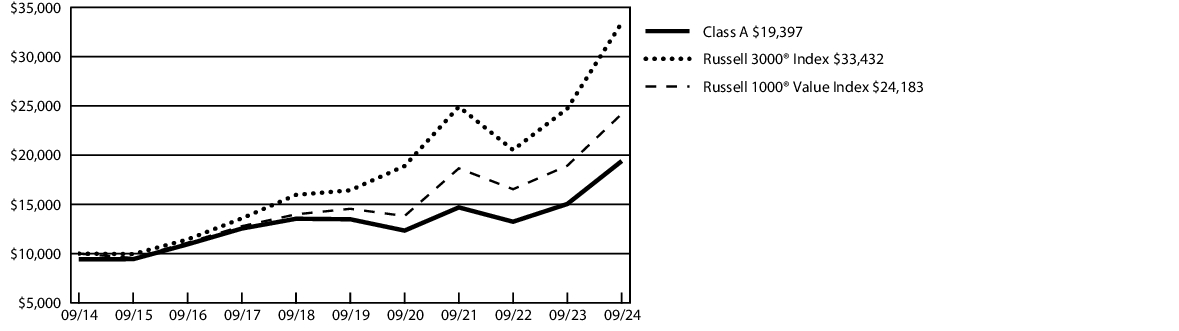
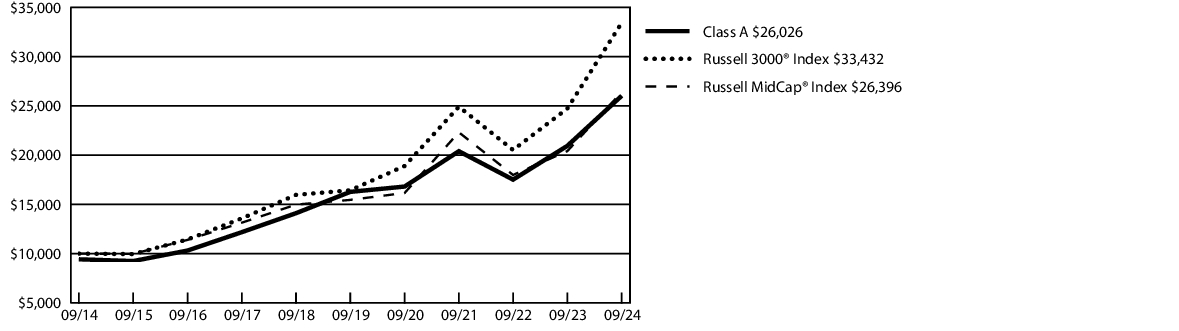
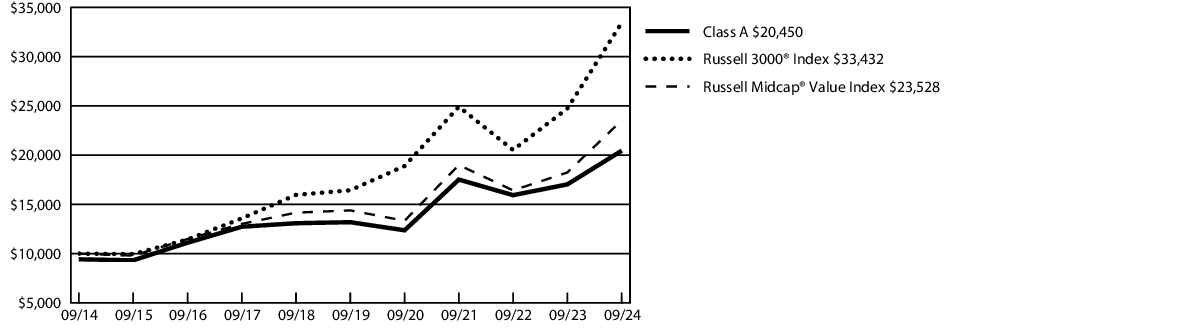
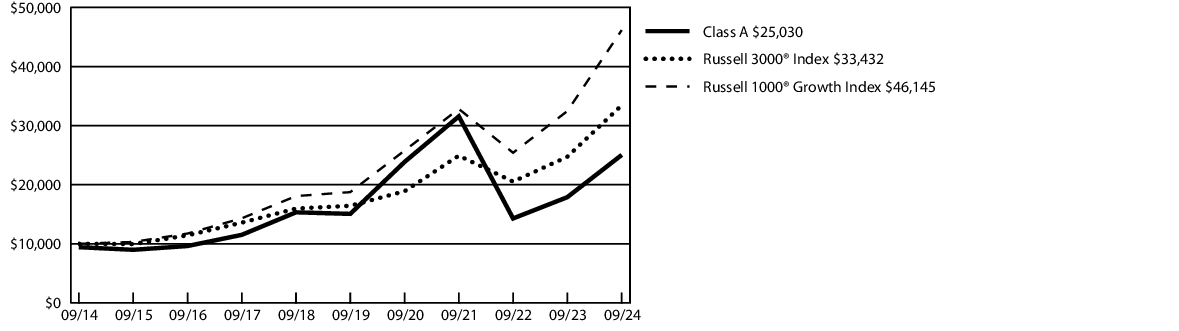
| Class A | 22.55 % | 6.27 % | 6.85 % |
| Class A - excluding sales load | 28.97 % | 7.53 % | 7.49 % |
| Russell 3000 ® Index | 35.19 % | 15.26 % | 12.83 % |
| Russell 1000 ® Value Index | 27.76 % | 10.69 % | 9.23 % |
| Fund net assets | $ 2,526,043,646 |
| Total number of portfolio holdings | 87 |
| Total advisory fees paid | $ 12,787,406 |
| Portfolio turnover rate | 10 % |
| Information Technology | 21.3 % |
| Financials | 14.8 % |
| Health Care | 13.9 % |
| Industrials | 10.3 % |
| Consumer Discretionary | 8.5 % |
| Communication Services | 8.0 % |
| Consumer Staples | 6.8 % |
| Energy | 4.5 % |
| Utilities | 4.3 % |
| Materials | 3.5 % |
| Real Estate | 3.3 % |
| Short-Term Investment Fund | 0.9 % |
| Other Assets/Liabilities (Net) | (0.1 ) % |
| Total | 100.0 % |
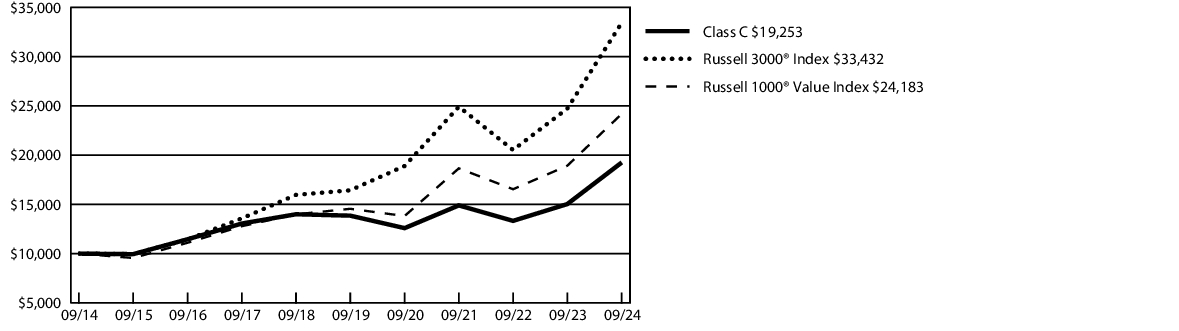
| Class | Costs of a $10,000 investment | Costs paid as a percentage of a $10,000 investment |
| Class C | $ 193 | 1.69 % |
| Factor | Performance Impact | Observations |
| Security Selection | Positive | Stock selection, primarily within Information Technology, was the main driver of relative outperformance. |
| Sector Allocation | Negative | Underweight exposure to Financials and Industrials detracted from relative performance as the sectors outperformed. |
| Dividend Style | Negative | High dividend paying stocks underperformed low dividend yielding stocks. |
| AVERAGE ANNUAL TOTAL RETURNS | 1 Year | 5 Years | 10 Years |
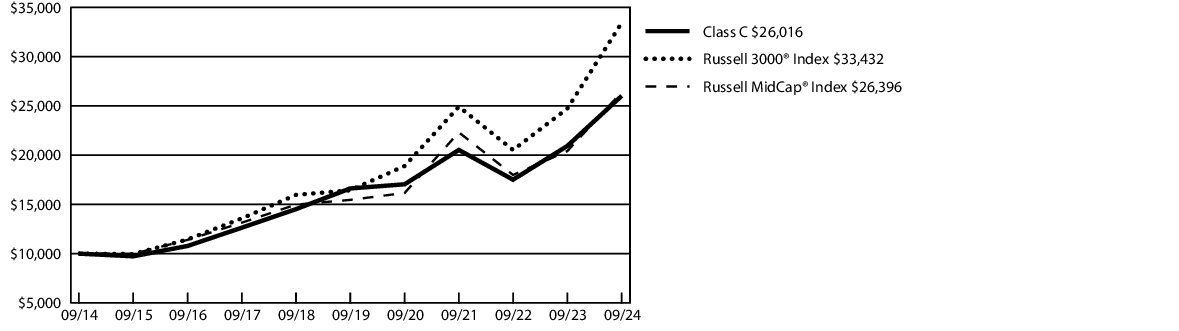
| Class C | 27.08 % | 6.80 % | 6.77 % |
| Class C - excluding sales load | 28.08 % | 6.80 % | 6.77 % |
| Russell 3000 ® Index | 35.19 % | 15.26 % | 12.83 % |
| Russell 1000 ® Value Index | 27.76 % | 10.69 % | 9.23 % |
| Fund net assets | $ 2,526,043,646 |
| Total number of portfolio holdings | 87 |
| Total advisory fees paid | $ 12,787,406 |
| Portfolio turnover rate | 10 % |
| Information Technology | 21.3 % |
| Financials | 14.8 % |
| Health Care | 13.9 % |
| Industrials | 10.3 % |
| Consumer Discretionary | 8.5 % |
| Communication Services | 8.0 % |
| Consumer Staples | 6.8 % |
| Energy | 4.5 % |
| Utilities | 4.3 % |
| Materials | 3.5 % |
| Real Estate | 3.3 % |
| Short-Term Investment Fund | 0.9 % |
| Other Assets/Liabilities (Net) | (0.1 ) % |
| Total | 100.0 % |
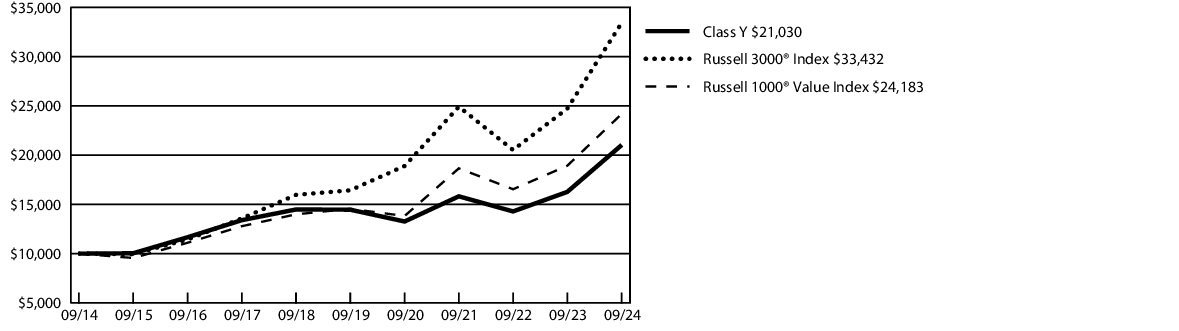
| Class | Costs of a $10,000 investment | Costs paid as a percentage of a $10,000 investment |
| Class Y | $ 87 | 0.76 % |
| Factor | Performance Impact | Observations |
| Security Selection | Positive | Stock selection, primarily within Information Technology, was the main driver of relative outperformance. |
| Sector Allocation | Negative | Underweight exposure to Financials and Industrials detracted from relative performance as the sectors outperformed. |
| Dividend Style | Negative | High dividend paying stocks underperformed low dividend yielding stocks. |
| AVERAGE ANNUAL TOTAL RETURNS | 1 Year | 5 Years | 10 Years |
| Class Y | 29.25 % | 7.77 % | 7.72 % |
| Russell 3000 ® Index | 35.19 % | 15.26 % | 12.83 % |
| Russell 1000 ® Value Index | 27.76 % | 10.69 % | 9.23 % |
| Fund net assets | $ 2,526,043,646 |
| Total number of portfolio holdings | 87 |
| Total advisory fees paid | $ 12,787,406 |
| Portfolio turnover rate | 10 % |
| Information Technology | 21.3 % |
| Financials | 14.8 % |
| Health Care | 13.9 % |
| Industrials | 10.3 % |
| Consumer Discretionary | 8.5 % |
| Communication Services | 8.0 % |
| Consumer Staples | 6.8 % |
| Energy | 4.5 % |
| Utilities | 4.3 % |
| Materials | 3.5 % |
| Real Estate | 3.3 % |
| Short-Term Investment Fund | 0.9 % |
| Other Assets/Liabilities (Net) | (0.1 ) % |
| Total | 100.0 % |
| Class | Costs of a $10,000 investment | Costs paid as a percentage of a $10,000 investment |
| Institutional Class | $ 77 | 0.67 % |
| Factor | Performance Impact | Observations |
| Security Selection | Positive | Stock selection, primarily within Information Technology, was the main driver of relative outperformance. |
| Sector Allocation | Negative | Underweight exposure to Financials and Industrials detracted from relative performance as the sectors outperformed. |
| Dividend Style | Negative | High dividend paying stocks underperformed low dividend yielding stocks. |
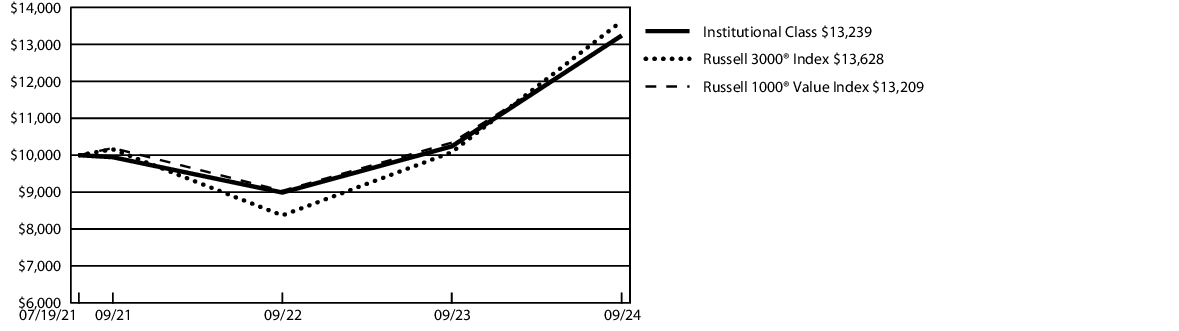
| AVERAGE ANNUAL TOTAL RETURNS | 1 Year | Since Inception 1 |
| Institutional Class | 29.31 % | 9.17 % |
| Russell 3000 ® Index | 35.19 % | 10.15 % |
| Russell 1000 ® Value Index | 27.76 % | 9.09 % |
1 | The inception date was July 19, 2021. The returns of the indexes listed above are based on the inception date of the Class. |
| Fund net assets | $ 2,526,043,646 |
| Total number of portfolio holdings | 87 |
| Total advisory fees paid | $ 12,787,406 |
| Portfolio turnover rate | 10 % |
| Information Technology | 21.3 % |
| Financials | 14.8 % |
| Health Care | 13.9 % |
| Industrials | 10.3 % |
| Consumer Discretionary | 8.5 % |
| Communication Services | 8.0 % |
| Consumer Staples | 6.8 % |
| Energy | 4.5 % |
| Utilities | 4.3 % |
| Materials | 3.5 % |
| Real Estate | 3.3 % |
| Short-Term Investment Fund | 0.9 % |
| Other Assets/Liabilities (Net) | (0.1 ) % |
| Total | 100.0 % |
| Class | Costs of a $10,000 investment | Costs paid as a percentage of a $10,000 investment |
| Class R6 | $ 75 | 0.65 % |
| Factor | Performance Impact | Observations |
| Security Selection | Positive | Stock selection, primarily within Information Technology, was the main driver of relative outperformance. |
| Sector Allocation | Negative | Underweight exposure to Financials and Industrials detracted from relative performance as the sectors outperformed. |
| Dividend Style | Negative | High dividend paying stocks underperformed low dividend yielding stocks. |
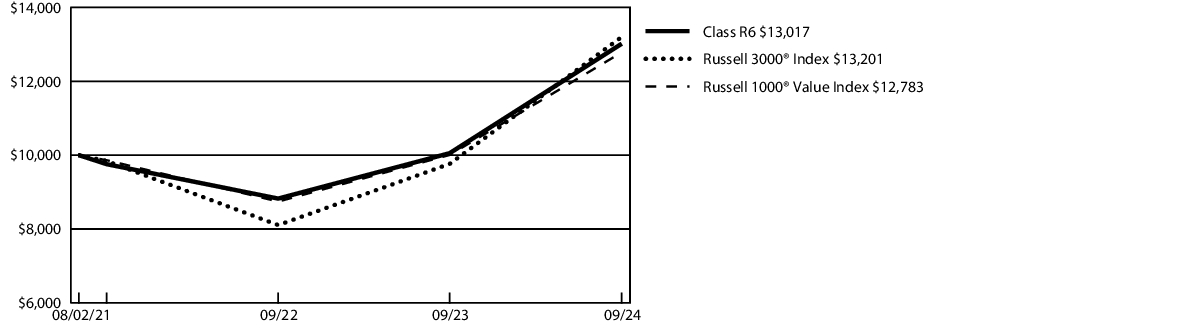
| AVERAGE ANNUAL TOTAL RETURNS | 1 Year | Since Inception 1 |
| Class R6 | 29.47 % | 8.70 % |
| Russell 3000 ® Index | 35.19 % | 9.18 % |
| Russell 1000 ® Value Index | 27.76 % | 8.08 % |
1 | The inception date was August 2, 2021. The returns of the indexes listed above are based on the inception date of the Class. |
| Fund net assets | $ 2,526,043,646 |
| Total number of portfolio holdings | 87 |
| Total advisory fees paid | $ 12,787,406 |
| Portfolio turnover rate | 10 % |
| Information Technology | 21.3 % |
| Financials | 14.8 % |
| Health Care | 13.9 % |
| Industrials | 10.3 % |
| Consumer Discretionary | 8.5 % |
| Communication Services | 8.0 % |
| Consumer Staples | 6.8 % |
| Energy | 4.5 % |
| Utilities | 4.3 % |
| Materials | 3.5 % |
| Real Estate | 3.3 % |
| Short-Term Investment Fund | 0.9 % |
| Other Assets/Liabilities (Net) | (0.1 ) % |
| Total | 100.0 % |
| Class | Costs of a $10,000 investment | Costs paid as a percentage of a $10,000 investment |
| Class A | $ 112 | 1.05 % |
| Factor | Performance Impact | Observations |
| Overweight to Media Entertainment Industry | Positive | Strong credit selection among multiple credits led to high sector specific performance. |
| Overweight to QVC Inc. issue | Positive | A significant overweight to the retailer was positive as it recovered from previous lows by reducing debt and extending its maturities. |
| Underweight to CCCs | Negative | The Fund was underweight risk relative to the market in anticipation of financial stress in the lower quality segments of the high yield market due to higher interest rates. |
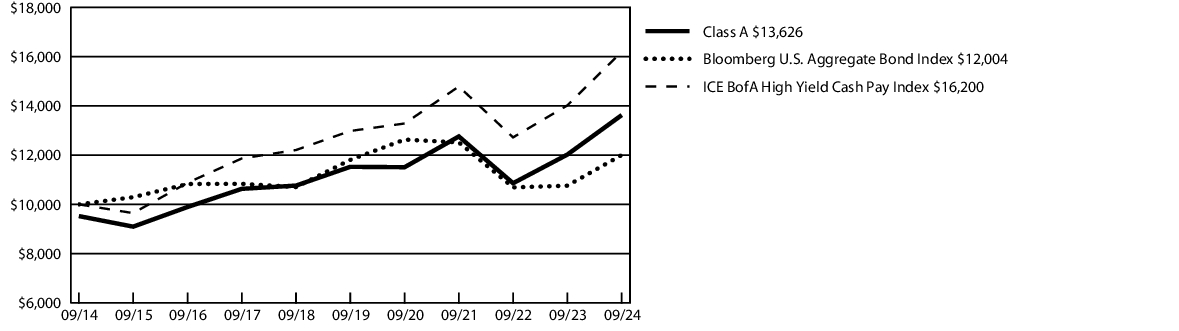
| AVERAGE ANNUAL TOTAL RETURNS | 1 Year | 5 Years | 10 Years |
| Class A | 9.62 % | 2.98 % | 3.14 % |
| Class A - excluding sales load | 13.34 % | 3.40 % | 3.64 % |
| Bloomberg U.S. Aggregate Bond Index | 11.57 % | 0.33 % | 1.84 % |
| ICE BofA High Yield Cash Pay Index | 15.55 % | 4.53 % | 4.94 % |
| Fund net assets | $ 106,625,654 |
| Total number of portfolio holdings | 152 |
| Total advisory fees paid | $ 572,741 |
| Portfolio turnover rate | 49 % |
| Corporate Bonds | 97.7 % |
| Short-Term Investment Funds | 4.6 % |
| Other Assets/Liabilities (Net) | (2.3 ) % |
| Total | 100.0 % |
| A/A | 0.7 % |
| BBB/Baa | 10.3 % |
| BB/Ba | 58.8 % |
| B/B | 25.4 % |
| CCC | 4.1 % |
| Not Rated | 0.7 % |
| Total | 100.0 % |
| Class | Costs of a $10,000 investment | Costs paid as a percentage of a $10,000 investment |
| Class C | $ 191 | 1.80 % |
| Factor | Performance Impact | Observations |
| Overweight to Media Entertainment Industry | Positive | Strong credit selection among multiple credits led to high sector specific performance. |
| Overweight to QVC Inc. issue | Positive | A significant overweight to the retailer was positive as it recovered from previous lows by reducing debt and extending its maturities. |
| Underweight to CCCs | Negative | The Fund was underweight risk relative to the market in anticipation of financial stress in the lower quality segments of the high yield market due to higher interest rates. |
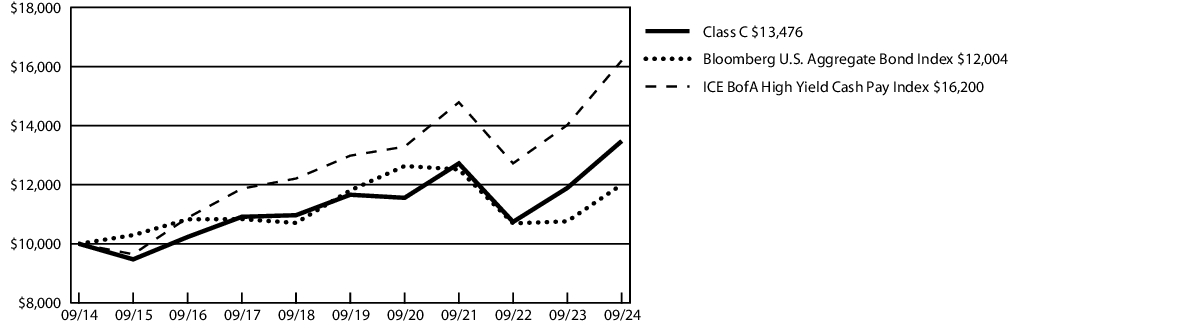
| AVERAGE ANNUAL TOTAL RETURNS | 1 Year | 5 Years | 10 Years |
| Class C | 11.55 % | 2.62 % | 3.03 % |
| Class C - excluding sales load | 12.55 % | 2.62 % | 3.03 % |
| Bloomberg U.S. Aggregate Bond Index | 11.57 % | 0.33 % | 1.84 % |
| ICE BofA High Yield Cash Pay Index | 15.55 % | 4.53 % | 4.94 % |
| Fund net assets | $ 106,625,654 |
| Total number of portfolio holdings | 152 |
| Total advisory fees paid | $ 572,741 |
| Portfolio turnover rate | 49 % |
| Corporate Bonds | 97.7 % |
| Short-Term Investment Funds | 4.6 % |
| Other Assets/Liabilities (Net) | (2.3 ) % |
| Total | 100.0 % |
| A/A | 0.7 % |
| BBB/Baa | 10.3 % |
| BB/Ba | 58.8 % |
| B/B | 25.4 % |
| CCC | 4.1 % |
| Not Rated | 0.7 % |
| Total | 100.0 % |
| Class | Costs of a $10,000 investment | Costs paid as a percentage of a $10,000 investment |
| Class Y | $ 85 | 0.80 % |
| Factor | Performance Impact | Observations |
| Overweight to Media Entertainment Industry | Positive | Strong credit selection among multiple credits led to high sector specific performance. |
| Overweight to QVC Inc. issue | Positive | A significant overweight to the retailer was positive as it recovered from previous lows by reducing debt and extending its maturities. |
| Underweight to CCCs | Negative | The Fund was underweight risk relative to the market in anticipation of financial stress in the lower quality segments of the high yield market due to higher interest rates. |
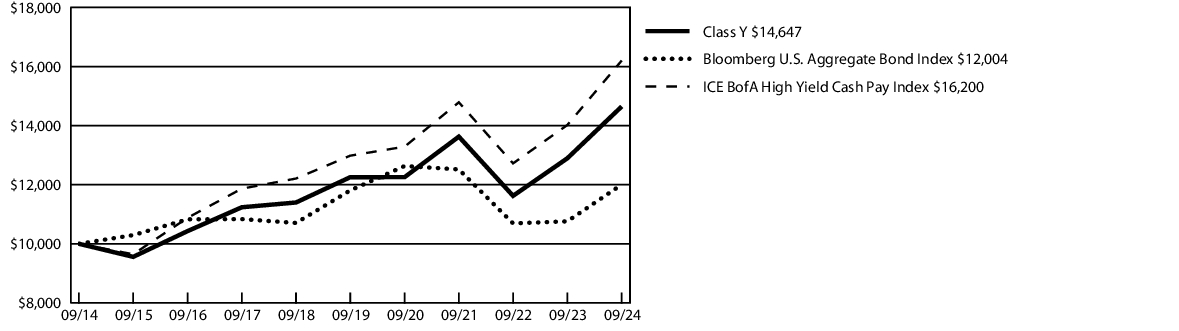
| AVERAGE ANNUAL TOTAL RETURNS | 1 Year | 5 Years | 10 Years |
| Class Y | 13.60 % | 3.63 % | 3.89 % |
| Bloomberg U.S. Aggregate Bond Index | 11.57 % | 0.33 % | 1.84 % |
| ICE BofA High Yield Cash Pay Index | 15.55 % | 4.53 % | 4.94 % |
| Fund net assets | $ 106,625,654 |
| Total number of portfolio holdings | 152 |
| Total advisory fees paid | $ 572,741 |
| Portfolio turnover rate | 49 % |
| Corporate Bonds | 97.7 % |
| Short-Term Investment Funds | 4.6 % |
| Other Assets/Liabilities (Net) | (2.3 ) % |
| Total | 100.0 % |
| A/A | 0.7 % |
| BBB/Baa | 10.3 % |
| BB/Ba | 58.8 % |
| B/B | 25.4 % |
| CCC | 4.1 % |
| Not Rated | 0.7 % |
| Total | 100.0 % |
| Class | Costs of a $10,000 investment | Costs paid as a percentage of a $10,000 investment |
| Institutional Class | $ 77 | 0.72 % |
| Factor | Performance Impact | Observations |
| Overweight to Media Entertainment Industry | Positive | Strong credit selection among multiple credits led to high sector specific performance. |
| Overweight to QVC Inc. issue | Positive | A significant overweight to the retailer was positive as it recovered from previous lows by reducing debt and extending its maturities. |
| Underweight to CCCs | Negative | The Fund was underweight risk relative to the market in anticipation of financial stress in the lower quality segments of the high yield market due to higher interest rates. |
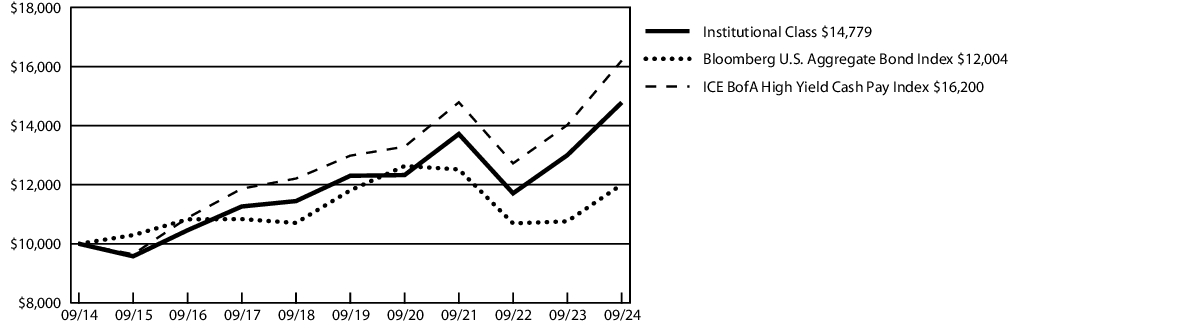
| AVERAGE ANNUAL TOTAL RETURNS | 1 Year | 5 Years | 10 Years |
| Institutional Class | 13.70 % | 3.74 % | 3.98 % |
| Bloomberg U.S. Aggregate Bond Index | 11.57 % | 0.33 % | 1.84 % |
| ICE BofA High Yield Cash Pay Index | 15.55 % | 4.53 % | 4.94 % |
| Fund net assets | $ 106,625,654 |
| Total number of portfolio holdings | 152 |
| Total advisory fees paid | $ 572,741 |
| Portfolio turnover rate | 49 % |
| Corporate Bonds | 97.7 % |
| Short-Term Investment Funds | 4.6 % |
| Other Assets/Liabilities (Net) | (2.3 ) % |
| Total | 100.0 % |
| A/A | 0.7 % |
| BBB/Baa | 10.3 % |
| BB/Ba | 58.8 % |
| B/B | 25.4 % |
| CCC | 4.1 % |
| Not Rated | 0.7 % |
| Total | 100.0 % |
| Class | Costs of a $10,000 investment | Costs paid as a percentage of a $10,000 investment |
| Class A | $ 80 | 0.76 % |
| Factor | Performance Impact | Observations |
| Sector | Positive | Overweight to spread sectors (offset by an underweight to Treasuries) added carry and price performance as spreads tightened. |
| Quality | Negative | An underweight to BBB rated bonds weighed on performance as investors drove spreads relatively tighter in lower rated bonds. |
| Security Selection | Positive | Security selection in Mortgage Pass Thru securities and U.S. Agencies benefitted the Fund. |
| AVERAGE ANNUAL TOTAL RETURNS | 1 Year | 5 Years | 10 Years |
| Class A | 7.96 % | -0.43 % | 0.99 % |
| Class A - excluding sales load | 11.61 % | -0.03 % | 1.49 % |
| Bloomberg U.S. Aggregate Bond Index | 11.57 % | 0.33 % | 1.84 % |
| Fund net assets | $ 601,104,958 |
| Total number of portfolio holdings | 271 |
| Total advisory fees paid | $ 1,409,356 |
| Portfolio turnover rate | 20 % |
| Corporate Bonds | 28.6 % |
| U.S. Government Agency Obligations | 20.9 % |
| U.S. Government Mortgage-Backed Obligations | 16.9 % |
| Agency Collateralized Mortgage Obligations | 8.4 % |
| U.S. Treasury Obligations | 7.0 % |
| Asset-Backed Securities | 6.7 % |
| Municipal Bonds | 6.2 % |
| Commercial Mortgage-Backed Securities | 3.8 % |
| Non-Agency Collateralized Mortgage Obligations | 0.1 % |
| Short-Term Investment Fund | 0.7 % |
| Other Assets/Liabilities (Net) | 0.7 % |
| Total | 100.0 % |
| AAA/Aaa | 69.7 % |
| AA/Aa | 11.7 % |
| A/A | 11.4 % |
| BBB/Baa | 7.0 % |
| BB/Ba | 0.2 % |
| Total | 100.0 % |
| Class | Costs of a $10,000 investment | Costs paid as a percentage of a $10,000 investment |
| Class C | $ 159 | 1.51 % |
| Factor | Performance Impact | Observations |
| Sector | Positive | Overweight to spread sectors (offset by an underweight to Treasuries) added carry and price performance as spreads tightened. |
| Quality | Negative | An underweight to BBB rated bonds weighed on performance as investors drove spreads relatively tighter in lower rated bonds. |
| Security Selection | Positive | Security selection in Mortgage Pass Thru securities and U.S. Agencies benefitted the Fund. |
| AVERAGE ANNUAL TOTAL RETURNS | 1 Year | 5 Years | 10 Years |
| Class C | 9.77 % | -0.77 % | 0.89 % |
| Class C - excluding sales load | 10.77 % | -0.77 % | 0.89 % |
| Bloomberg U.S. Aggregate Bond Index | 11.57 % | 0.33 % | 1.84 % |
| Fund net assets | $ 601,104,958 |
| Total number of portfolio holdings | 271 |
| Total advisory fees paid | $ 1,409,356 |
| Portfolio turnover rate | 20 % |
| Corporate Bonds | 28.6 % |
| U.S. Government Agency Obligations | 20.9 % |
| U.S. Government Mortgage-Backed Obligations | 16.9 % |
| Agency Collateralized Mortgage Obligations | 8.4 % |
| U.S. Treasury Obligations | 7.0 % |
| Asset-Backed Securities | 6.7 % |
| Municipal Bonds | 6.2 % |
| Commercial Mortgage-Backed Securities | 3.8 % |
| Non-Agency Collateralized Mortgage Obligations | 0.1 % |
| Short-Term Investment Fund | 0.7 % |
| Other Assets/Liabilities (Net) | 0.7 % |
| Total | 100.0 % |
| AAA/Aaa | 69.7 % |
| AA/Aa | 11.7 % |
| A/A | 11.4 % |
| BBB/Baa | 7.0 % |
| BB/Ba | 0.2 % |
| Total | 100.0 % |
| Class | Costs of a $10,000 investment | Costs paid as a percentage of a $10,000 investment |
| Class Y | $ 54 | 0.51 % |
| Factor | Performance Impact | Observations |
| Sector | Positive | Overweight to spread sectors (offset by an underweight to Treasuries) added carry and price performance as spreads tightened. |
| Quality | Negative | An underweight to BBB rated bonds weighed on performance as investors drove spreads relatively tighter in lower rated bonds. |
| Security Selection | Positive | Security selection in Mortgage Pass Thru securities and U.S. Agencies benefitted the Fund. |

| AVERAGE ANNUAL TOTAL RETURNS | 1 Year | 5 Years | 10 Years |
| Class Y | 12.00 % | 0.24 % | 1.75 % |
| Bloomberg U.S. Aggregate Bond Index | 11.57 % | 0.33 % | 1.84 % |
| Fund net assets | $ 601,104,958 |
| Total number of portfolio holdings | 271 |
| Total advisory fees paid | $ 1,409,356 |
| Portfolio turnover rate | 20 % |
| Corporate Bonds | 28.6 % |
| U.S. Government Agency Obligations | 20.9 % |
| U.S. Government Mortgage-Backed Obligations | 16.9 % |
| Agency Collateralized Mortgage Obligations | 8.4 % |
| U.S. Treasury Obligations | 7.0 % |
| Asset-Backed Securities | 6.7 % |
| Municipal Bonds | 6.2 % |
| Commercial Mortgage-Backed Securities | 3.8 % |
| Non-Agency Collateralized Mortgage Obligations | 0.1 % |
| Short-Term Investment Fund | 0.7 % |
| Other Assets/Liabilities (Net) | 0.7 % |
| Total | 100.0 % |
| AAA/Aaa | 69.7 % |
| AA/Aa | 11.7 % |
| A/A | 11.4 % |
| BBB/Baa | 7.0 % |
| BB/Ba | 0.2 % |
| Total | 100.0 % |
| Class | Costs of a $10,000 investment | Costs paid as a percentage of a $10,000 investment |
| Institutional Class | $ 43 | 0.41 % |
| Factor | Performance Impact | Observations |
| Sector | Positive | Overweight to spread sectors (offset by an underweight to Treasuries) added carry and price performance as spreads tightened. |
| Quality | Negative | An underweight to BBB rated bonds weighed on performance as investors drove spreads relatively tighter in lower rated bonds. |
| Security Selection | Positive | Security selection in Mortgage Pass Thru securities and U.S. Agencies benefitted the Fund. |
| AVERAGE ANNUAL TOTAL RETURNS | 1 Year | 5 Years | 10 Years |
| Institutional Class | 12.10 % | 0.34 % | 1.86 % |
| Bloomberg U.S. Aggregate Bond Index | 11.57 % | 0.33 % | 1.84 % |
| Fund net assets | $ 601,104,958 |
| Total number of portfolio holdings | 271 |
| Total advisory fees paid | $ 1,409,356 |
| Portfolio turnover rate | 20 % |
| Corporate Bonds | 28.6 % |
| U.S. Government Agency Obligations | 20.9 % |
| U.S. Government Mortgage-Backed Obligations | 16.9 % |
| Agency Collateralized Mortgage Obligations | 8.4 % |
| U.S. Treasury Obligations | 7.0 % |
| Asset-Backed Securities | 6.7 % |
| Municipal Bonds | 6.2 % |
| Commercial Mortgage-Backed Securities | 3.8 % |
| Non-Agency Collateralized Mortgage Obligations | 0.1 % |
| Short-Term Investment Fund | 0.7 % |
| Other Assets/Liabilities (Net) | 0.7 % |
| Total | 100.0 % |
| AAA/Aaa | 69.7 % |
| AA/Aa | 11.7 % |
| A/A | 11.4 % |
| BBB/Baa | 7.0 % |
| BB/Ba | 0.2 % |
| Total | 100.0 % |
| Class | Costs of a $10,000 investment | Costs paid as a percentage of a $10,000 investment |
| Class R6 | $ 39 | 0.37 % |
| Factor | Performance Impact | Observations |
| Sector | Positive | Overweight to spread sectors (offset by an underweight to Treasuries) added carry and price performance as spreads tightened. |
| Quality | Negative | An underweight to BBB rated bonds weighed on performance as investors drove spreads relatively tighter in lower rated bonds. |
| Security Selection | Positive | Security selection in Mortgage Pass Thru securities and U.S. Agencies benefitted the Fund. |
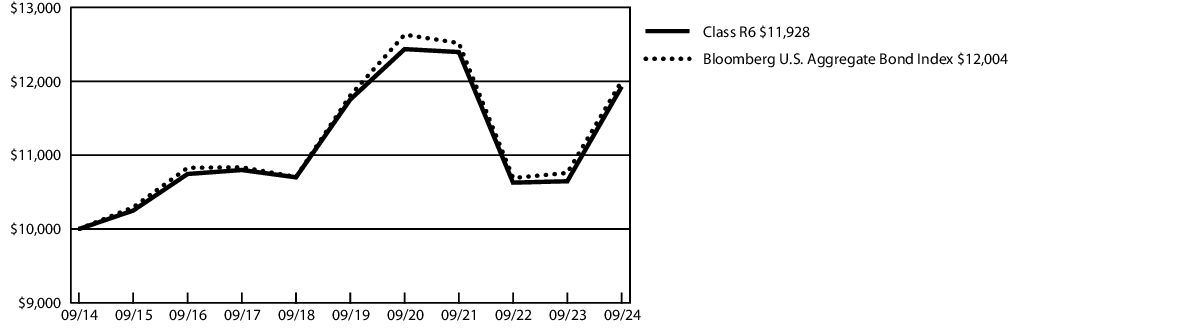
| AVERAGE ANNUAL TOTAL RETURNS | 1 Year | 5 Years | 10 Years |
| Class R6 1 | 12.02 % | 0.29 % | 1.78 % |
| Bloomberg U.S. Aggregate Bond Index | 11.57 % | 0.33 % | 1.84 % |
1 | The inception date was November 22, 2021. Performance information was calculated using the historical performance of Class Y shares for the periods prior to November 22, 2021. |
| Fund net assets | $ 601,104,958 |
| Total number of portfolio holdings | 271 |
| Total advisory fees paid | $ 1,409,356 |
| Portfolio turnover rate | 20 % |
| Corporate Bonds | 28.6 % |
| U.S. Government Agency Obligations | 20.9 % |
| U.S. Government Mortgage-Backed Obligations | 16.9 % |
| Agency Collateralized Mortgage Obligations | 8.4 % |
| U.S. Treasury Obligations | 7.0 % |
| Asset-Backed Securities | 6.7 % |
| Municipal Bonds | 6.2 % |
| Commercial Mortgage-Backed Securities | 3.8 % |
| Non-Agency Collateralized Mortgage Obligations | 0.1 % |
| Short-Term Investment Fund | 0.7 % |
| Other Assets/Liabilities (Net) | 0.7 % |
| Total | 100.0 % |
| AAA/Aaa | 69.7 % |
| AA/Aa | 11.7 % |
| A/A | 11.4 % |
| BBB/Baa | 7.0 % |
| BB/Ba | 0.2 % |
| Total | 100.0 % |
| Class | Costs of a $10,000 investment | Costs paid as a percentage of a $10,000 investment |
| Class A | $ 131 | 1.17 % |
| Factor | Performance Impact | Observations |
| Consumer Staples and Utilities Sectors | Negative | We were overweight Consumer Staples and underweight Utilities which detracted from relative performance. |
| Energy and Industrials Sectors | Positive | While sector allocation overall was negative, our underweight position in Energy and our overweight position in Industrials added to relative performance. |
| Materials and Industrials Stocks | Positive | Strong performance from Materials and Industrials sector stocks in the portfolio was a positive contributor to performance. |
| Consumer Discretionary and Consumer Staples Stocks | Negative | Weak performance from Consumer Discretionary and Consumer Staples sector stocks in the portfolio was the main driver of relative underperformance. |
| Quality, Yield and Growth exposures | Negative | We were generally overweight Quality and Yield (shareholder yield) factors and underweight Growth factors which detracted from relative performance. |
| AVERAGE ANNUAL TOTAL RETURNS | 1 Year | 5 Years | 10 Years |
| Class A | 18.07 % | 8.73 % | 10.04 % |
| Class A - excluding sales load | 24.28 % | 9.85 % | 10.69 % |
| Russell 3000 ® Index | 35.19 % | 15.26 % | 12.83 % |
| Russell Midcap ® Index | 29.33 % | 11.30 % | 10.19 % |
| Fund net assets | $ 6,085,137,125 |
| Total number of portfolio holdings | 35 |
| Total advisory fees paid | $ 34,583,103 |
| Portfolio turnover rate | 13 % |
| Industrials | 26.4 % |
| Information Technology | 12.9 % |
| Financials | 12.6 % |
| Consumer Discretionary | 12.0 % |
| Materials | 10.1 % |
| Consumer Staples | 9.8 % |
| Health Care | 8.0 % |
| Real Estate | 6.5 % |
| Short-Term Investment Fund | 1.7 % |
| Other Assets/Liabilities (Net) | (0.0 ) % |
| Total | 100.0 % |
| Class | Costs of a $10,000 investment | Costs paid as a percentage of a $10,000 investment |
| Class C | $ 213 | 1.91 % |
| Factor | Performance Impact | Observations |
| Consumer Staples and Utilities Sectors | Negative | We were overweight Consumer Staples and underweight Utilities which detracted from relative performance. |
| Energy and Industrials Sectors | Positive | While sector allocation overall was negative, our underweight position in Energy and our overweight position in Industrials added to relative performance. |
| Materials and Industrials Stocks | Positive | Strong performance from Materials and Industrials sector stocks in the portfolio was a positive contributor to performance. |
| Consumer Discretionary and Consumer Staples Stocks | Negative | Weak performance from Consumer Discretionary and Consumer Staples sector stocks in the portfolio was the main driver of relative underperformance. |
| Quality, Yield and Growth exposures | Negative | We were generally overweight Quality and Yield (shareholder yield) factors and underweight Growth factors which detracted from relative performance. |
| AVERAGE ANNUAL TOTAL RETURNS | 1 Year | 5 Years | 10 Years |
| Class C | 22.38 % | 9.06 % | 10.03 % |
| Class C - excluding sales load | 23.38 % | 9.06 % | 10.03 % |
| Russell 3000 ® Index | 35.19 % | 15.26 % | 12.83 % |
| Russell Midcap ® Index | 29.33 % | 11.30 % | 10.19 % |
| Fund net assets | $ 6,085,137,125 |
| Total number of portfolio holdings | 35 |
| Total advisory fees paid | $ 34,583,103 |
| Portfolio turnover rate | 13 % |
| Industrials | 26.4 % |
| Information Technology | 12.9 % |
| Financials | 12.6 % |
| Consumer Discretionary | 12.0 % |
| Materials | 10.1 % |
| Consumer Staples | 9.8 % |
| Health Care | 8.0 % |
| Real Estate | 6.5 % |
| Short-Term Investment Fund | 1.7 % |
| Other Assets/Liabilities (Net) | (0.0 ) % |
| Total | 100.0 % |
| Class | Costs of a $10,000 investment | Costs paid as a percentage of a $10,000 investment |
| Class Y | $ 101 | 0.90 % |
| Factor | Performance Impact | Observations |
| Consumer Staples and Utilities Sectors | Negative | We were overweight Consumer Staples and underweight Utilities which detracted from relative performance. |
| Energy and Industrials Sectors | Positive | While sector allocation overall was negative, our underweight position in Energy and our overweight position in Industrials added to relative performance. |
| Materials and Industrials Stocks | Positive | Strong performance from Materials and Industrials sector stocks in the portfolio was a positive contributor to performance. |
| Consumer Discretionary and Consumer Staples Stocks | Negative | Weak performance from Consumer Discretionary and Consumer Staples sector stocks in the portfolio was the main driver of relative underperformance. |
| Quality, Yield and Growth exposures | Negative | We were generally overweight Quality and Yield (shareholder yield) factors and underweight Growth factors which detracted from relative performance. |

| AVERAGE ANNUAL TOTAL RETURNS | 1 Year | 5 Years | 10 Years |
| Class Y | 24.61 % | 10.15 % | 10.98 % |
| Russell 3000 ® Index | 35.19 % | 15.26 % | 12.83 % |
| Russell Midcap ® Index | 29.33 % | 11.30 % | 10.19 % |
| Fund net assets | $ 6,085,137,125 |
| Total number of portfolio holdings | 35 |
| Total advisory fees paid | $ 34,583,103 |
| Portfolio turnover rate | 13 % |
| Industrials | 26.4 % |
| Information Technology | 12.9 % |
| Financials | 12.6 % |
| Consumer Discretionary | 12.0 % |
| Materials | 10.1 % |
| Consumer Staples | 9.8 % |
| Health Care | 8.0 % |
| Real Estate | 6.5 % |
| Short-Term Investment Fund | 1.7 % |
| Other Assets/Liabilities (Net) | (0.0 ) % |
| Total | 100.0 % |
| Class | Costs of a $10,000 investment | Costs paid as a percentage of a $10,000 investment |
| Class Z | $ 136 | 1.21 % |
| Factor | Performance Impact | Observations |
| Consumer Staples and Utilities Sectors | Negative | We were overweight Consumer Staples and underweight Utilities which detracted from relative performance. |
| Energy and Industrials Sectors | Positive | While sector allocation overall was negative, our underweight position in Energy and our overweight position in Industrials added to relative performance. |
| Materials and Industrials Stocks | Positive | Strong performance from Materials and Industrials sector stocks in the portfolio was a positive contributor to performance. |
| Consumer Discretionary and Consumer Staples Stocks | Negative | Weak performance from Consumer Discretionary and Consumer Staples sector stocks in the portfolio was the main driver of relative underperformance. |
| Quality, Yield and Growth exposures | Negative | We were generally overweight Quality and Yield (shareholder yield) factors and underweight Growth factors which detracted from relative performance. |
| AVERAGE ANNUAL TOTAL RETURNS | 1 Year | 5 Years | 10 Years |
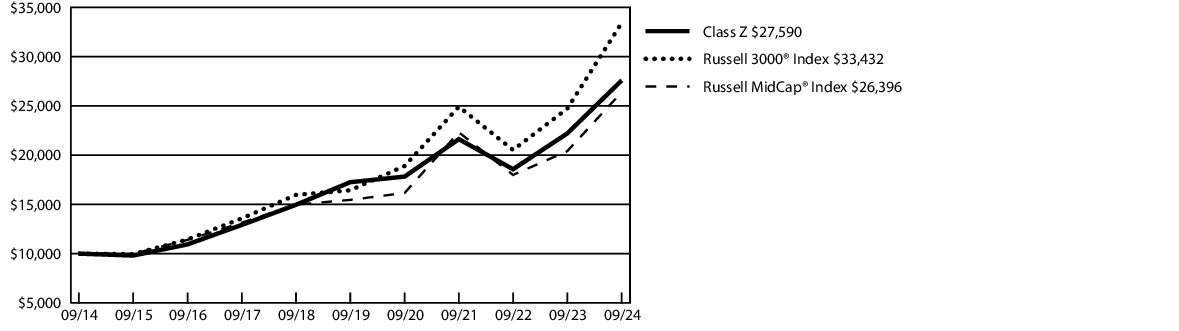
| Class Z | 24.24 % | 9.84 % | 10.68 % |
| Russell 3000 ® Index | 35.19 % | 15.26 % | 12.83 % |
| Russell Midcap ® Index | 29.33 % | 11.30 % | 10.19 % |
| Fund net assets | $ 6,085,137,125 |
| Total number of portfolio holdings | 35 |
| Total advisory fees paid | $ 34,583,103 |
| Portfolio turnover rate | 13 % |
| Industrials | 26.4 % |
| Information Technology | 12.9 % |
| Financials | 12.6 % |
| Consumer Discretionary | 12.0 % |
| Materials | 10.1 % |
| Consumer Staples | 9.8 % |
| Health Care | 8.0 % |
| Real Estate | 6.5 % |
| Short-Term Investment Fund | 1.7 % |
| Other Assets/Liabilities (Net) | (0.0 ) % |
| Total | 100.0 % |
| Class | Costs of a $10,000 investment | Costs paid as a percentage of a $10,000 investment |
| Institutional Class | $ 95 | 0.85 % |
| Factor | Performance Impact | Observations |
| Consumer Staples and Utilities Sectors | Negative | We were overweight Consumer Staples and underweight Utilities which detracted from relative performance. |
| Energy and Industrials Sectors | Positive | While sector allocation overall was negative, our underweight position in Energy and our overweight position in Industrials added to relative performance. |
| Materials and Industrials Stocks | Positive | Strong performance from Materials and Industrials sector stocks in the portfolio was a positive contributor to performance. |
| Consumer Discretionary and Consumer Staples Stocks | Negative | Weak performance from Consumer Discretionary and Consumer Staples sector stocks in the portfolio was the main driver of relative underperformance. |
| Quality, Yield and Growth exposures | Negative | We were generally overweight Quality and Yield (shareholder yield) factors and underweight Growth factors which detracted from relative performance. |
| AVERAGE ANNUAL TOTAL RETURNS | 1 Year | 5 Years | 10 Years |
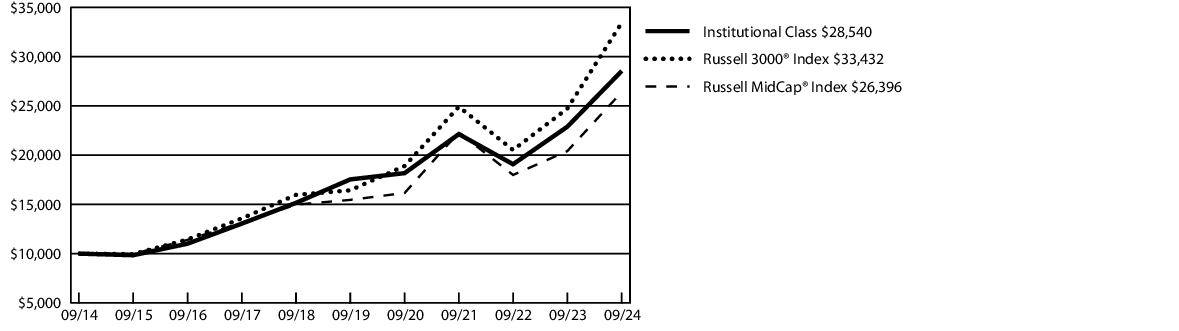
| Institutional Class | 24.70 % | 10.23 % | 11.06 % |
| Russell 3000 ® Index | 35.19 % | 15.26 % | 12.83 % |
| Russell Midcap ® Index | 29.33 % | 11.30 % | 10.19 % |
| Fund net assets | $ 6,085,137,125 |
| Total number of portfolio holdings | 35 |
| Total advisory fees paid | $ 34,583,103 |
| Portfolio turnover rate | 13 % |
| Industrials | 26.4 % |
| Information Technology | 12.9 % |
| Financials | 12.6 % |
| Consumer Discretionary | 12.0 % |
| Materials | 10.1 % |
| Consumer Staples | 9.8 % |
| Health Care | 8.0 % |
| Real Estate | 6.5 % |
| Short-Term Investment Fund | 1.7 % |
| Other Assets/Liabilities (Net) | (0.0 ) % |
| Total | 100.0 % |
| Class | Costs of a $10,000 investment | Costs paid as a percentage of a $10,000 investment |
| Class R6 | $ 89 | 0.79 % |
| Factor | Performance Impact | Observations |
| Consumer Staples and Utilities Sectors | Negative | We were overweight Consumer Staples and underweight Utilities which detracted from relative performance. |
| Energy and Industrials Sectors | Positive | While sector allocation overall was negative, our underweight position in Energy and our overweight position in Industrials added to relative performance. |
| Materials and Industrials Stocks | Positive | Strong performance from Materials and Industrials sector stocks in the portfolio was a positive contributor to performance. |
| Consumer Discretionary and Consumer Staples Stocks | Negative | Weak performance from Consumer Discretionary and Consumer Staples sector stocks in the portfolio was the main driver of relative underperformance. |
| Quality, Yield and Growth exposures | Negative | We were generally overweight Quality and Yield (shareholder yield) factors and underweight Growth factors which detracted from relative performance. |

| AVERAGE ANNUAL TOTAL RETURNS | 1 Year | 5 Years | 10 Years |
| Class R6 1 | 24.76 % | 10.25 % | 11.03 % |
| Russell 3000 ® Index | 35.19 % | 15.26 % | 12.83 % |
| Russell Midcap ® Index | 29.33 % | 11.30 % | 10.19 % |
1 | The inception date was February 22, 2021. Performance information was calculated using the historical performance of Class Y shares for the periods prior to February 22, 2021. |
| Fund net assets | $ 6,085,137,125 |
| Total number of portfolio holdings | 35 |
| Total advisory fees paid | $ 34,583,103 |
| Portfolio turnover rate | 13 % |
| Industrials | 26.4 % |
| Information Technology | 12.9 % |
| Financials | 12.6 % |
| Consumer Discretionary | 12.0 % |
| Materials | 10.1 % |
| Consumer Staples | 9.8 % |
| Health Care | 8.0 % |
| Real Estate | 6.5 % |
| Short-Term Investment Fund | 1.7 % |
| Other Assets/Liabilities (Net) | (0.0 ) % |
| Total | 100.0 % |
| Class | Costs of a $10,000 investment | Costs paid as a percentage of a $10,000 investment |
| Class A | $ 136 | 1.24 % |
| Factor | Performance Impact | Observations |
| Communication Services sector | Positive | No exposure to the sector, which underperformed the benchmark. |
| Insurance Industry | Positive | The Allstate Corporation, The Progressive Corporation, and Reinsurance Group of America, Incorporated (“RGA”) all outperformed on margin expansion driven by cost controls and positive pricing. Allstate’s sale of its voluntary benefits business simplified the asset mix while providing capital for growth and buybacks. RGA traded higher as its new CEO raised return targets for the business from prior management’s expectations. |
| Consumer Discretionary sector | Negative | Weakness in LKQ Corp, which experienced several transitory issues during the period, including a worker strike, tax law changes, and dilution from an acquisition. Later in the period, the company underperformed as consumers elected to delay repair work on their vehicles. |
| Consumer Staples sector | Negative | Darling Ingredients Inc., a global rendering company, declined to provide guidance on a 2024 earnings report as volatility in fat prices clouded the near-term outlook. French fry producer Lamb Weston Holdings Inc. continued to suffer from the impacts of a botched enterprise resource planning implementation in 2024. The company lost market share due to its inability to meet customer demand in the face of a volume slowdown at its quick service customers, resulting in excess capacity and low utilization rates. |
| AVERAGE ANNUAL TOTAL RETURNS | 1 Year | 5 Years | 10 Years |
| Class A | 14.06 % | 8.05 % | 7.42 % |
| Class A - excluding sales load | 20.08 % | 9.16 % | 8.05 % |
| Russell 3000 ® Index | 35.19 % | 15.26 % | 12.83 % |
| Russell Midcap ® Value Index | 29.01 % | 10.33 % | 8.93 % |
| Fund net assets | $ 612,944,224 |
| Total number of portfolio holdings | 73 |
| Total advisory fees paid | $ 5,465,195 |
| Portfolio turnover rate | 29 % |
| Industrials | 20.5 % |
| Financials | 16.3 % |
| Health Care | 10.6 % |
| Consumer Staples | 9.5 % |
| Utilities | 9.1 % |
| Consumer Discretionary | 8.2 % |
| Information Technology | 8.1 % |
| Materials | 6.0 % |
| Real Estate | 5.8 % |
| Energy | 5.0 % |
| Short-Term Investment Fund | 0.9 % |
| Other Assets/Liabilities (Net) | 0.0 % |
| Total | 100.0 % |
| Class | Costs of a $10,000 investment | Costs paid as a percentage of a $10,000 investment |
| Class C | $ 218 | 1.99 % |
| Factor | Performance Impact | Observations |
| Communication Services sector | Positive | No exposure to the sector, which underperformed the benchmark. |
| Insurance Industry | Positive | The Allstate Corporation, The Progressive Corporation, and Reinsurance Group of America, Incorporated (“RGA”) all outperformed on margin expansion driven by cost controls and positive pricing. Allstate’s sale of its voluntary benefits business simplified the asset mix while providing capital for growth and buybacks. RGA traded higher as its new CEO raised return targets for the business from prior management’s expectations. |
| Consumer Discretionary sector | Negative | Weakness in LKQ Corp, which experienced several transitory issues during the period, including a worker strike, tax law changes, and dilution from an acquisition. Later in the period, the company underperformed as consumers elected to delay repair work on their vehicles. |
| Consumer Staples sector | Negative | Darling Ingredients Inc., a global rendering company, declined to provide guidance on a 2024 earnings report as volatility in fat prices clouded the near-term outlook. French fry producer Lamb Weston Holdings Inc. continued to suffer from the impacts of a botched enterprise resource planning implementation in 2024. The company lost market share due to its inability to meet customer demand in the face of a volume slowdown at its quick service customers, resulting in excess capacity and low utilization rates. |

| AVERAGE ANNUAL TOTAL RETURNS | 1 Year | 5 Years | 10 Years |
| Class C | 18.16 % | 8.35 % | 7.41 % |
| Class C - excluding sales load | 19.16 % | 8.35 % | 7.41 % |
| Russell 3000 ® Index | 35.19 % | 15.26 % | 12.83 % |
| Russell Midcap ® Value Index | 29.01 % | 10.33 % | 8.93 % |
| Fund net assets | $ 612,944,224 |
| Total number of portfolio holdings | 73 |
| Total advisory fees paid | $ 5,465,195 |
| Portfolio turnover rate | 29 % |
| Industrials | 20.5 % |
| Financials | 16.3 % |
| Health Care | 10.6 % |
| Consumer Staples | 9.5 % |
| Utilities | 9.1 % |
| Consumer Discretionary | 8.2 % |
| Information Technology | 8.1 % |
| Materials | 6.0 % |
| Real Estate | 5.8 % |
| Energy | 5.0 % |
| Short-Term Investment Fund | 0.9 % |
| Other Assets/Liabilities (Net) | 0.0 % |
| Total | 100.0 % |
| Class | Costs of a $10,000 investment | Costs paid as a percentage of a $10,000 investment |
| Class Y | $ 109 | 0.99 % |
| Factor | Performance Impact | Observations |
| Communication Services sector | Positive | No exposure to the sector, which underperformed the benchmark. |
| Insurance Industry | Positive | The Allstate Corporation, The Progressive Corporation, and Reinsurance Group of America, Incorporated (“RGA”) all outperformed on margin expansion driven by cost controls and positive pricing. Allstate’s sale of its voluntary benefits business simplified the asset mix while providing capital for growth and buybacks. RGA traded higher as its new CEO raised return targets for the business from prior management’s expectations. |
| Consumer Discretionary sector | Negative | Weakness in LKQ Corp, which experienced several transitory issues during the period, including a worker strike, tax law changes, and dilution from an acquisition. Later in the period, the company underperformed as consumers elected to delay repair work on their vehicles. |
| Consumer Staples sector | Negative | Darling Ingredients Inc., a global rendering company, declined to provide guidance on a 2024 earnings report as volatility in fat prices clouded the near-term outlook. French fry producer Lamb Weston Holdings Inc. continued to suffer from the impacts of a botched enterprise resource planning implementation in 2024. The company lost market share due to its inability to meet customer demand in the face of a volume slowdown at its quick service customers, resulting in excess capacity and low utilization rates. |
| AVERAGE ANNUAL TOTAL RETURNS | 1 Year | 5 Years | 10 Years |
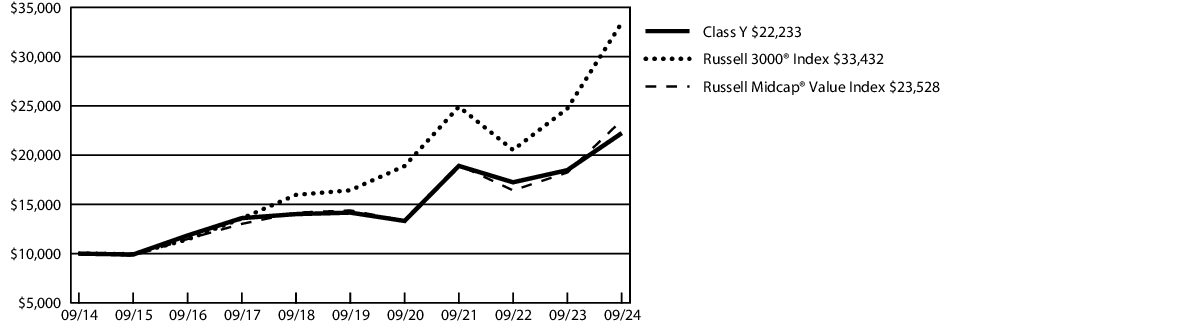
| Class Y | 20.33 % | 9.43 % | 8.32 % |
| Russell 3000 ® Index | 35.19 % | 15.26 % | 12.83 % |
| Russell Midcap ® Value Index | 29.01 % | 10.33 % | 8.93 % |
| Fund net assets | $ 612,944,224 |
| Total number of portfolio holdings | 73 |
| Total advisory fees paid | $ 5,465,195 |
| Portfolio turnover rate | 29 % |
| Industrials | 20.5 % |
| Financials | 16.3 % |
| Health Care | 10.6 % |
| Consumer Staples | 9.5 % |
| Utilities | 9.1 % |
| Consumer Discretionary | 8.2 % |
| Information Technology | 8.1 % |
| Materials | 6.0 % |
| Real Estate | 5.8 % |
| Energy | 5.0 % |
| Short-Term Investment Fund | 0.9 % |
| Other Assets/Liabilities (Net) | 0.0 % |
| Total | 100.0 % |
| Class | Costs of a $10,000 investment | Costs paid as a percentage of a $10,000 investment |
| Institutional Class | $ 95 | 0.86 % |
| Factor | Performance Impact | Observations |
| Communication Services sector | Positive | No exposure to the sector, which underperformed the benchmark. |
| Insurance Industry | Positive | The Allstate Corporation, The Progressive Corporation, and Reinsurance Group of America, Incorporated (“RGA”) all outperformed on margin expansion driven by cost controls and positive pricing. Allstate’s sale of its voluntary benefits business simplified the asset mix while providing capital for growth and buybacks. RGA traded higher as its new CEO raised return targets for the business from prior management’s expectations. |
| Consumer Discretionary sector | Negative | Weakness in LKQ Corp, which experienced several transitory issues during the period, including a worker strike, tax law changes, and dilution from an acquisition. Later in the period, the company underperformed as consumers elected to delay repair work on their vehicles. |
| Consumer Staples sector | Negative | Darling Ingredients Inc., a global rendering company, declined to provide guidance on a 2024 earnings report as volatility in fat prices clouded the near-term outlook. French fry producer Lamb Weston Holdings Inc. continued to suffer from the impacts of a botched enterprise resource planning implementation in 2024. The company lost market share due to its inability to meet customer demand in the face of a volume slowdown at its quick service customers, resulting in excess capacity and low utilization rates. |
| AVERAGE ANNUAL TOTAL RETURNS | 1 Year | 5 Years | 10 Years |
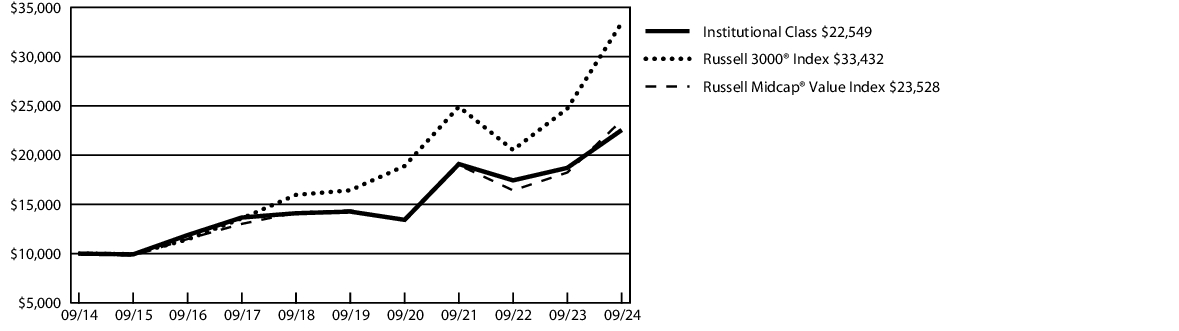
| Institutional Class | 20.51 % | 9.58 % | 8.47 % |
| Russell 3000 ® Index | 35.19 % | 15.26 % | 12.83 % |
| Russell Midcap ® Value Index | 29.01 % | 10.33 % | 8.93 % |
| Fund net assets | $ 612,944,224 |
| Total number of portfolio holdings | 73 |
| Total advisory fees paid | $ 5,465,195 |
| Portfolio turnover rate | 29 % |
| Industrials | 20.5 % |
| Financials | 16.3 % |
| Health Care | 10.6 % |
| Consumer Staples | 9.5 % |
| Utilities | 9.1 % |
| Consumer Discretionary | 8.2 % |
| Information Technology | 8.1 % |
| Materials | 6.0 % |
| Real Estate | 5.8 % |
| Energy | 5.0 % |
| Short-Term Investment Fund | 0.9 % |
| Other Assets/Liabilities (Net) | 0.0 % |
| Total | 100.0 % |
| Class | Costs of a $10,000 investment | Costs paid as a percentage of a $10,000 investment |
| Class A | $ 138 | 1.18 % |
| Factor | Performance Impact | Observations |
| Western Europe | Positive | European equities performed strongly during the period. Stock selection for the Fund within the region was particularly driven by Adyen N.V. and CTS Eventim AG & Co. |
| Information Technology | Positive | Increased demand for semiconductors for artificial intelligence, in addition to other end-markets. |
| Growth | Positive | Growth equities rallied as central banks globally cut rates. Through September, 2024 was already the third largest year for policy rate cuts ever. |
| Health Care | Negative | The industry continues to face an unprecedented overlapping of headwinds including rapid demand declines for COVID-19 vaccines, lower levels of biotech funding, and a volatile Chinese macroeconomic environment. |
| AVERAGE ANNUAL TOTAL RETURNS | 1 Year | 5 Years | 10 Years |
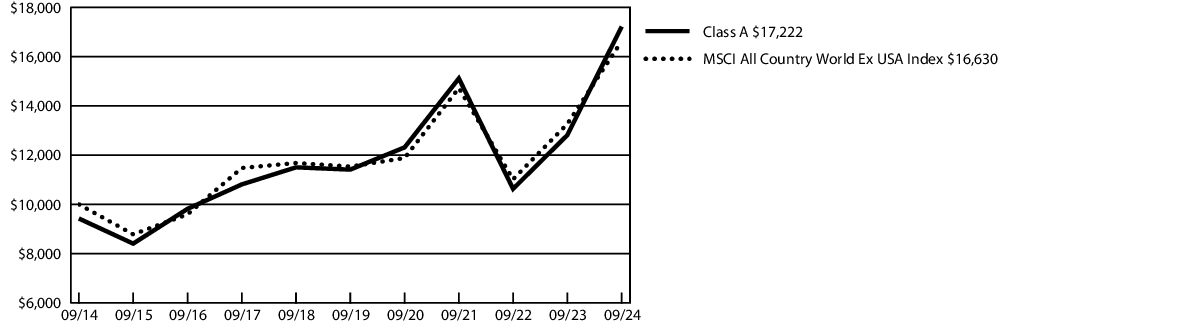
| Class A | 27.71 % | 7.46 % | 5.59 % |
| Class A - excluding sales load | 34.43 % | 8.58 % | 6.22 % |
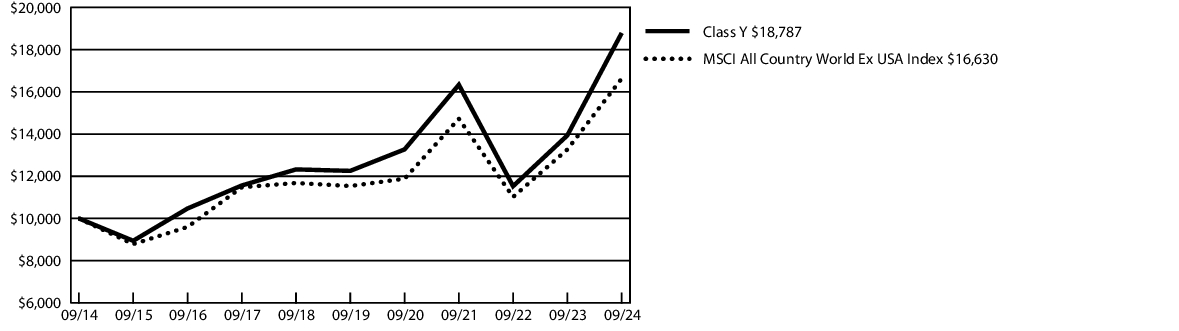
| MSCI All Country World Ex USA Index | 25.35 % | 7.59 % | 5.22 % |
| Fund net assets | $ 109,051,618 |
| Total number of portfolio holdings | 32 |
| Total advisory fees paid | $ 378,368 |
| Portfolio turnover rate | 117 % |
| Information Technology | 24.1 % |
| Consumer Discretionary | 20.3 % |
| Industrials | 19.0 % |
| Communication Services | 10.9 % |
| Financials | 9.4 % |
| Health Care | 6.1 % |
| Consumer Staples | 4.2 % |
| Materials | 3.5 % |
| Short-Term Investment Fund | 2.8 % |
| Other Assets/Liabilities (Net) | (0.3 ) % |
| Total | 100.0 % |
| Common Stocks | |
| Japan | 12.6 % |
| Netherlands | 11.9 % |
| Switzerland | 9.3 % |
| Brazil | 9.2 % |
| Canada | 8.8 % |
| India | 7.5 % |
| Germany | 6.6 % |
| Sweden | 6.6 % |
| Italy | 5.0 % |
| Taiwan | 4.7 % |
| Singapore | 4.1 % |
| Denmark | 3.6 % |
| United Kingdom | 3.0 % |
| Other Countries | 4.6 % |
| Short-Term Investment Fund | 2.8 % |
| Other Assets/Liabilities (Net) | (0.3 ) % |
| Total | 100.0 % |
| Class | Costs of a $10,000 investment | Costs paid as a percentage of a $10,000 investment |
| Class C | $ 229 | 1.96 % |
| Factor | Performance Impact | Observations |
| Western Europe | Positive | European equities performed strongly during the period. Stock selection for the Fund within the region was particularly driven by Adyen N.V. and CTS Eventim AG & Co. |
| Information Technology | Positive | Increased demand for semiconductors for artificial intelligence, in addition to other end-markets. |
| Growth | Positive | Growth equities rallied as central banks globally cut rates. Through September, 2024 was already the third largest year for policy rate cuts ever. |
| Health Care | Negative | The industry continues to face an unprecedented overlapping of headwinds including rapid demand declines for COVID-19 vaccines, lower levels of biotech funding, and a volatile Chinese macroeconomic environment. |
| AVERAGE ANNUAL TOTAL RETURNS | 1 Year | 5 Years | 10 Years |
| Class C | 32.48 % | 7.80 % | 5.60 % |
| Class C - excluding sales load | 33.48 % | 7.80 % | 5.60 % |
| MSCI All Country World Ex USA Index | 25.35 % | 7.59 % | 5.22 % |
| Fund net assets | $ 109,051,618 |
| Total number of portfolio holdings | 32 |
| Total advisory fees paid | $ 378,368 |
| Portfolio turnover rate | 117 % |
| Information Technology | 24.1 % |
| Consumer Discretionary | 20.3 % |
| Industrials | 19.0 % |
| Communication Services | 10.9 % |
| Financials | 9.4 % |
| Health Care | 6.1 % |
| Consumer Staples | 4.2 % |
| Materials | 3.5 % |
| Short-Term Investment Fund | 2.8 % |
| Other Assets/Liabilities (Net) | (0.3 ) % |
| Total | 100.0 % |
| Common Stocks | |
| Japan | 12.6 % |
| Netherlands | 11.9 % |
| Switzerland | 9.3 % |
| Brazil | 9.2 % |
| Canada | 8.8 % |
| India | 7.5 % |
| Germany | 6.6 % |
| Sweden | 6.6 % |
| Italy | 5.0 % |
| Taiwan | 4.7 % |
| Singapore | 4.1 % |
| Denmark | 3.6 % |
| United Kingdom | 3.0 % |
| Other Countries | 4.6 % |
| Short-Term Investment Fund | 2.8 % |
| Other Assets/Liabilities (Net) | (0.3 ) % |
| Total | 100.0 % |
| Class | Costs of a $10,000 investment | Costs paid as a percentage of a $10,000 investment |
| Class Y | $ 107 | 0.91 % |
| Factor | Performance Impact | Observations |
| Western Europe | Positive | European equities performed strongly during the period. Stock selection for the Fund within the region was particularly driven by Adyen N.V. and CTS Eventim AG & Co. |
| Information Technology | Positive | Increased demand for semiconductors for artificial intelligence, in addition to other end-markets. |
| Growth | Positive | Growth equities rallied as central banks globally cut rates. Through September, 2024 was already the third largest year for policy rate cuts ever. |
| Health Care | Negative | The industry continues to face an unprecedented overlapping of headwinds including rapid demand declines for COVID-19 vaccines, lower levels of biotech funding, and a volatile Chinese macroeconomic environment. |
| AVERAGE ANNUAL TOTAL RETURNS | 1 Year | 5 Years | 10 Years |
| Class Y | 34.82 % | 8.92 % | 6.51 % |
| MSCI All Country World Ex USA Index | 25.35 % | 7.59 % | 5.22 % |
| Fund net assets | $ 109,051,618 |
| Total number of portfolio holdings | 32 |
| Total advisory fees paid | $ 378,368 |
| Portfolio turnover rate | 117 % |
| Information Technology | 24.1 % |
| Consumer Discretionary | 20.3 % |
| Industrials | 19.0 % |
| Communication Services | 10.9 % |
| Financials | 9.4 % |
| Health Care | 6.1 % |
| Consumer Staples | 4.2 % |
| Materials | 3.5 % |
| Short-Term Investment Fund | 2.8 % |
| Other Assets/Liabilities (Net) | (0.3 ) % |
| Total | 100.0 % |
| Common Stocks | |
| Japan | 12.6 % |
| Netherlands | 11.9 % |
| Switzerland | 9.3 % |
| Brazil | 9.2 % |
| Canada | 8.8 % |
| India | 7.5 % |
| Germany | 6.6 % |
| Sweden | 6.6 % |
| Italy | 5.0 % |
| Taiwan | 4.7 % |
| Singapore | 4.1 % |
| Denmark | 3.6 % |
| United Kingdom | 3.0 % |
| Other Countries | 4.6 % |
| Short-Term Investment Fund | 2.8 % |
| Other Assets/Liabilities (Net) | (0.3 ) % |
| Total | 100.0 % |
| Class | Costs of a $10,000 investment | Costs paid as a percentage of a $10,000 investment |
| Institutional Class | $ 102 | 0.87 % |
| Factor | Performance Impact | Observations |
| Western Europe | Positive | European equities performed strongly during the period. Stock selection for the Fund within the region was particularly driven by Adyen N.V. and CTS Eventim AG & Co. |
| Information Technology | Positive | Increased demand for semiconductors for artificial intelligence, in addition to other end-markets. |
| Growth | Positive | Growth equities rallied as central banks globally cut rates. Through September, 2024 was already the third largest year for policy rate cuts ever. |
| Health Care | Negative | The industry continues to face an unprecedented overlapping of headwinds including rapid demand declines for COVID-19 vaccines, lower levels of biotech funding, and a volatile Chinese macroeconomic environment. |
| AVERAGE ANNUAL TOTAL RETURNS | 1 Year | 5 Years | 10 Years |
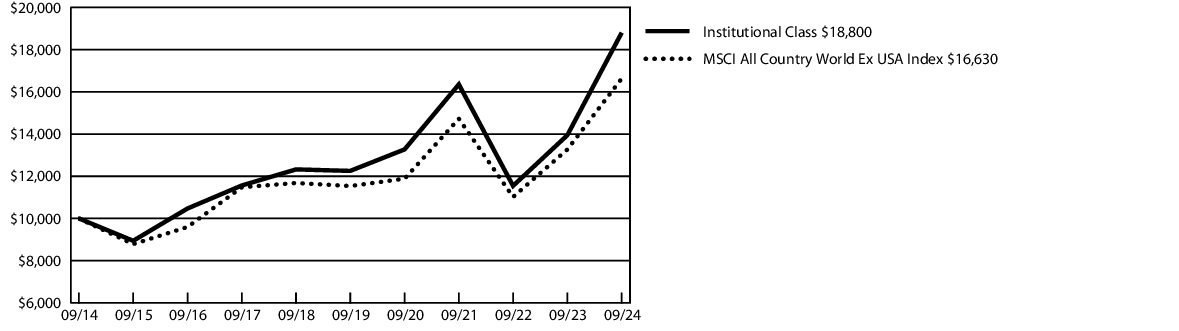
| Institutional Class 1 | 34.81 % | 8.94 % | 6.52 % |
| MSCI All Country World Ex USA Index | 25.35 % | 7.59 % | 5.22 % |
1 | The inception date was August 23, 2019. Performance information was calculated using the historical performance of Class Y shares for the periods prior to August 23, 2019. |
| Fund net assets | $ 109,051,618 |
| Total number of portfolio holdings | 32 |
| Total advisory fees paid | $ 378,368 |
| Portfolio turnover rate | 117 % |
| Information Technology | 24.1 % |
| Consumer Discretionary | 20.3 % |
| Industrials | 19.0 % |
| Communication Services | 10.9 % |
| Financials | 9.4 % |
| Health Care | 6.1 % |
| Consumer Staples | 4.2 % |
| Materials | 3.5 % |
| Short-Term Investment Fund | 2.8 % |
| Other Assets/Liabilities (Net) | (0.3 ) % |
| Total | 100.0 % |
| Common Stocks | |
| Japan | 12.6 % |
| Netherlands | 11.9 % |
| Switzerland | 9.3 % |
| Brazil | 9.2 % |
| Canada | 8.8 % |
| India | 7.5 % |
| Germany | 6.6 % |
| Sweden | 6.6 % |
| Italy | 5.0 % |
| Taiwan | 4.7 % |
| Singapore | 4.1 % |
| Denmark | 3.6 % |
| United Kingdom | 3.0 % |
| Other Countries | 4.6 % |
| Short-Term Investment Fund | 2.8 % |
| Other Assets/Liabilities (Net) | (0.3 ) % |
| Total | 100.0 % |
| Class | Costs of a $10,000 investment | Costs paid as a percentage of a $10,000 investment |
| Class R6 | $ 96 | 0.82 % |
| Factor | Performance Impact | Observations |
| Western Europe | Positive | European equities performed strongly during the period. Stock selection for the Fund within the region was particularly driven by Adyen N.V. and CTS Eventim AG & Co. |
| Information Technology | Positive | Increased demand for semiconductors for artificial intelligence, in addition to other end-markets. |
| Growth | Positive | Growth equities rallied as central banks globally cut rates. Through September, 2024 was already the third largest year for policy rate cuts ever. |
| Health Care | Negative | The industry continues to face an unprecedented overlapping of headwinds including rapid demand declines for COVID-19 vaccines, lower levels of biotech funding, and a volatile Chinese macroeconomic environment. |
| AVERAGE ANNUAL TOTAL RETURNS | 1 Year | 5 Years | 10 Years |
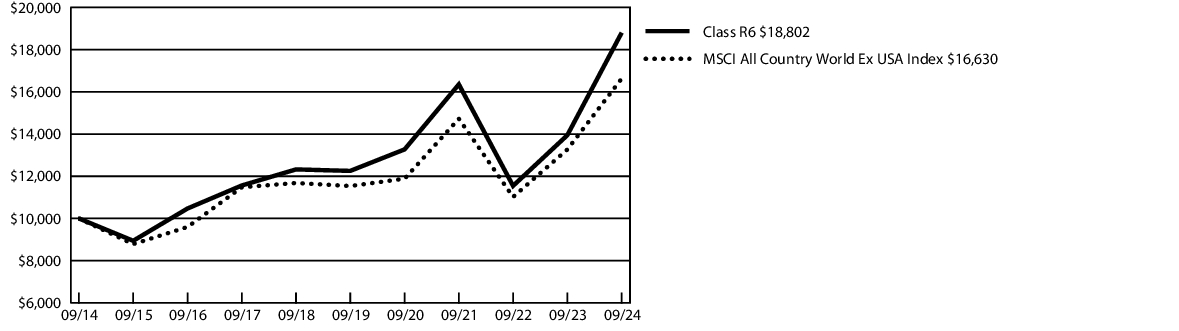
| Class R6 1 | 34.83 % | 8.94 % | 6.52 % |
| MSCI All Country World Ex USA Index | 25.35 % | 7.59 % | 5.22 % |
1 | The inception date was August 31, 2023 . Performance information was calculated using the historical performance of Institutional Class shares for the periods prior to August 31, 2023. |
| Fund net assets | $ 109,051,618 |
| Total number of portfolio holdings | 32 |
| Total advisory fees paid | $ 378,368 |
| Portfolio turnover rate | 117 % |
| Information Technology | 24.1 % |
| Consumer Discretionary | 20.3 % |
| Industrials | 19.0 % |
| Communication Services | 10.9 % |
| Financials | 9.4 % |
| Health Care | 6.1 % |
| Consumer Staples | 4.2 % |
| Materials | 3.5 % |
| Short-Term Investment Fund | 2.8 % |
| Other Assets/Liabilities (Net) | (0.3 ) % |
| Total | 100.0 % |
| Common Stocks | |
| Japan | 12.6 % |
| Netherlands | 11.9 % |
| Switzerland | 9.3 % |
| Brazil | 9.2 % |
| Canada | 8.8 % |
| India | 7.5 % |
| Germany | 6.6 % |
| Sweden | 6.6 % |
| Italy | 5.0 % |
| Taiwan | 4.7 % |
| Singapore | 4.1 % |
| Denmark | 3.6 % |
| United Kingdom | 3.0 % |
| Other Countries | 4.6 % |
| Short-Term Investment Fund | 2.8 % |
| Other Assets/Liabilities (Net) | (0.3 ) % |
| Total | 100.0 % |
| Class | Costs of a $10,000 investment | Costs paid as a percentage of a $10,000 investment |
| Class A | $ 139 | 1.16 % |
| Factor | Performance Impact | Observations |
| Information Technology stock performance | Negative | The Fund’s positions in stocks in the Information Technology sector underperformed. |
| Health Care stock performance | Negative | The Fund’s positions in stocks in the Health Care sector underperformed. |
| Style Factor exposure | Negative | The strategy benefitted from its overweight to Growth, Momentum, and residual Volatility; however, this was offset by the portfolio’s underweight to the Quality, Size and Dividend Yield factors. |
| AVERAGE ANNUAL TOTAL RETURNS | 1 Year | 5 Years | 10 Years |
| Class A | 32.91 % | 9.57 % | 9.61 % |
| Class A - excluding sales load | 39.94 % | 10.70 % | 10.26 % |
| Russell 3000 ® Index | 35.19 % | 15.26 % | 12.83 % |
| Russell 1000 ® Growth Index | 42.19 % | 19.74 % | 16.52 % |
| Fund net assets | $ 2,458,129,714 |
| Total number of portfolio holdings | 31 |
| Total advisory fees paid | $ 16,349,661 |
| Portfolio turnover rate | 37 % |
| Information Technology | 53.4 % |
| Communication Services | 15.6 % |
| Consumer Discretionary | 12.4 % |
| Financials | 10.1 % |
| Health Care | 6.2 % |
| Industrials | 1.6 % |
| Short-Term Investment Fund | 1.0 % |
| Other Assets/Liabilities (Net) | (0.3 ) % |
| Total | 100.0 % |
| Class | Costs of a $10,000 investment | Costs paid as a percentage of a $10,000 investment |
| Class C | $ 212 | 1.77 % |
| Factor | Performance Impact | Observations |
| Information Technology stock performance | Negative | The Fund’s positions in stocks in the Information Technology sector underperformed. |
| Health Care stock performance | Negative | The Fund’s positions in stocks in the Health Care sector underperformed. |
| Style Factor exposure | Negative | The strategy benefitted from its overweight to Growth, Momentum, and residual Volatility; however, this was offset by the portfolio’s underweight to the Quality, Size and Dividend Yield factors. |

| AVERAGE ANNUAL TOTAL RETURNS | 1 Year | 5 Years | 10 Years |
| Class C | 38.15 % | 9.97 % | 9.61 % |
| Class C - excluding sales load | 39.15 % | 9.97 % | 9.61 % |
| Russell 3000 ® Index | 35.19 % | 15.26 % | 12.83 % |
| Russell 1000 ® Growth Index | 42.19 % | 19.74 % | 16.52 % |
| Fund net assets | $ 2,458,129,714 |
| Total number of portfolio holdings | 31 |
| Total advisory fees paid | $ 16,349,661 |
| Portfolio turnover rate | 37 % |
| Information Technology | 53.4 % |
| Communication Services | 15.6 % |
| Consumer Discretionary | 12.4 % |
| Financials | 10.1 % |
| Health Care | 6.2 % |
| Industrials | 1.6 % |
| Short-Term Investment Fund | 1.0 % |
| Other Assets/Liabilities (Net) | (0.3 ) % |
| Total | 100.0 % |
| Class | Costs of a $10,000 investment | Costs paid as a percentage of a $10,000 investment |
| Class Y | $ 108 | 0.90 % |
| Factor | Performance Impact | Observations |
| Information Technology stock performance | Negative | The Fund’s positions in stocks in the Information Technology sector underperformed. |
| Health Care stock performance | Negative | The Fund’s positions in stocks in the Health Care sector underperformed. |
| Style Factor exposure | Negative | The strategy benefitted from its overweight to Growth, Momentum, and residual Volatility; however, this was offset by the portfolio’s underweight to the Quality, Size and Dividend Yield factors. |

| AVERAGE ANNUAL TOTAL RETURNS | 1 Year | 5 Years | 10 Years |
| Class Y | 40.32 % | 10.98 % | 10.54 % |
| Russell 3000 ® Index | 35.19 % | 15.26 % | 12.83 % |
| Russell 1000 ® Growth Index | 42.19 % | 19.74 % | 16.52 % |
| Fund net assets | $ 2,458,129,714 |
| Total number of portfolio holdings | 31 |
| Total advisory fees paid | $ 16,349,661 |
| Portfolio turnover rate | 37 % |
| Information Technology | 53.4 % |
| Communication Services | 15.6 % |
| Consumer Discretionary | 12.4 % |
| Financials | 10.1 % |
| Health Care | 6.2 % |
| Industrials | 1.6 % |
| Short-Term Investment Fund | 1.0 % |
| Other Assets/Liabilities (Net) | (0.3 ) % |
| Total | 100.0 % |
| Class | Costs of a $10,000 investment | Costs paid as a percentage of a $10,000 investment |
| Class Z | $ 140 | 1.17 % |
| Factor | Performance Impact | Observations |
| Information Technology stock performance | Negative | The Fund’s positions in stocks in the Information Technology sector underperformed. |
| Health Care stock performance | Negative | The Fund’s positions in stocks in the Health Care sector underperformed. |
| Style Factor exposure | Negative | The strategy benefitted from its overweight to Growth, Momentum, and residual Volatility; however, this was offset by the portfolio’s underweight to the Quality, Size and Dividend Yield factors. |

AVERAGE ANNUAL TOTAL RETURNS | 1 Year | 5 Years | 10 Years |
| Class Z | 40.00 % | 10.68 % | 10.26 % |
| Russell 3000 ® Index | 35.19 % | 15.26 % | 12.83 % |
| Russell 1000 ® Growth Index | 42.19 % | 19.74 % | 16.52 % |
| Fund net assets | $ 2,458,129,714 |
| Total number of portfolio holdings | 31 |
| Total advisory fees paid | $ 16,349,661 |
| Portfolio turnover rate | 37 % |
| Information Technology | 53.4 % |
| Communication Services | 15.6 % |
| Consumer Discretionary | 12.4 % |
| Financials | 10.1 % |
| Health Care | 6.2 % |
| Industrials | 1.6 % |
| Short-Term Investment Fund | 1.0 % |
| Other Assets/Liabilities (Net) | (0.3 ) % |
| Total | 100.0 % |
| Class | Costs of a $10,000 investment | Costs paid as a percentage of a $10,000 investment |
| Institutional Class | $ 97 | 0.81 % |
| Factor | Performance Impact | Observations |
| Information Technology stock performance | Negative | The Fund’s positions in stocks in the Information Technology sector underperformed. |
| Health Care stock performance | Negative | The Fund’s positions in stocks in the Health Care sector underperformed. |
| Style Factor exposure | Negative | The strategy benefitted from its overweight to Growth, Momentum, and residual Volatility; however, this was offset by the portfolio’s underweight to the Quality, Size and Dividend Yield factors. |
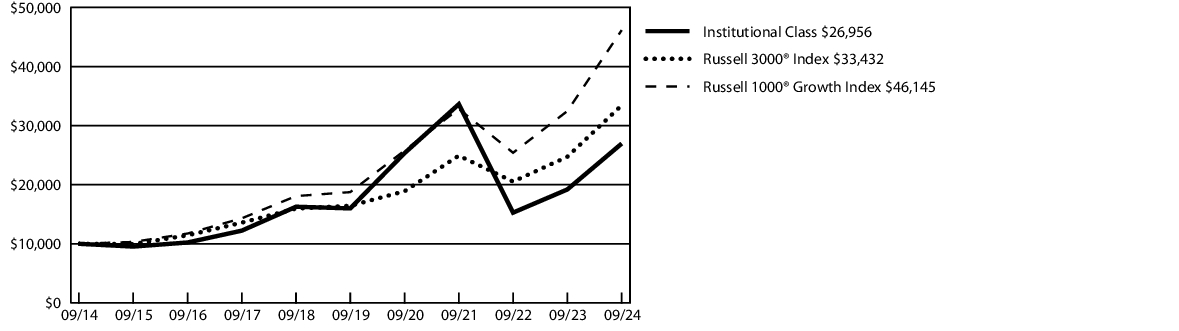
| AVERAGE ANNUAL TOTAL RETURNS | 1 Year | 5 Years | 10 Years |
| Institutional Class 1 | 40.48 % | 11.00 % | 10.42 % |
| Russell 3000 ® Index | 35.19 % | 15.26 % | 12.83 % |
| Russell 1000 ® Growth Index | 42.19 % | 19.74 % | 16.52 % |
1 | The inception date was September 1, 2020. Performance information was calculated using the historical performance of Class Z shares for the periods prior to September 1, 2020. |
| Fund net assets | $ 2,458,129,714 |
| Total number of portfolio holdings | 31 |
| Total advisory fees paid | $ 16,349,661 |
| Portfolio turnover rate | 37 % |
| Information Technology | 53.4 % |
| Communication Services | 15.6 % |
| Consumer Discretionary | 12.4 % |
| Financials | 10.1 % |
| Health Care | 6.2 % |
| Industrials | 1.6 % |
| Short-Term Investment Fund | 1.0 % |
| Other Assets/Liabilities (Net) | (0.3 ) % |
| Total | 100.0 % |
| Class | Costs of a $10,000 investment | Costs paid as a percentage of a $10,000 investment |
| Class R6 | $ 90 | 0.75 % |
| Factor | Performance Impact | Observations |
| Information Technology stock performance | Negative | The Fund’s positions in stocks in the Information Technology sector underperformed. |
| Health Care stock performance | Negative | The Fund’s positions in stocks in the Health Care sector underperformed. |
| Style Factor exposure | Negative | The strategy benefitted from its overweight to Growth, Momentum, and residual Volatility; however, this was offset by the portfolio’s underweight to the Quality, Size and Dividend Yield factors. |
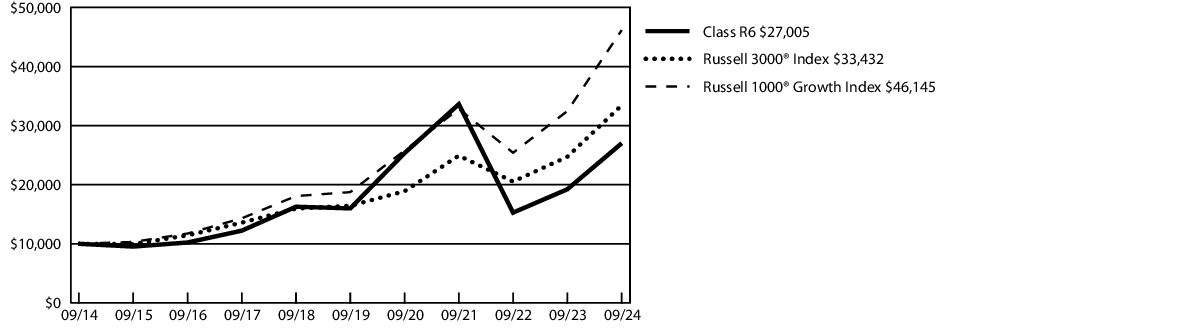
| AVERAGE ANNUAL TOTAL RETURNS | 1 Year | 5 Years | 10 Years |
| Class R6 1 | 40.49 % | 11.04 % | 10.44 % |
| Russell 3000 ® Index | 35.19 % | 15.26 % | 12.83 % |
| Russell 1000 ® Growth Index | 42.19 % | 19.74 % | 16.52 % |
1 | The inception date was September 1, 2020. Performance information was calculated using the historical performance of Class Z shares for the periods prior to September 1, 2020. |
| Fund net assets | $ 2,458,129,714 |
| Total number of portfolio holdings | 31 |
| Total advisory fees paid | $ 16,349,661 |
| Portfolio turnover rate | 37 % |
| Information Technology | 53.4 % |
| Communication Services | 15.6 % |
| Consumer Discretionary | 12.4 % |
| Financials | 10.1 % |
| Health Care | 6.2 % |
| Industrials | 1.6 % |
| Short-Term Investment Fund | 1.0 % |
| Other Assets/Liabilities (Net) | (0.3 ) % |
| Total | 100.0 % |
| Class | Costs of a $10,000 investment | Costs paid as a percentage of a $10,000 investment |
| Class A | $ 138 | 1.25 % |
| Factor | Performance Impact | Observations |
| Health Care and Communication Services Stocks | Negative | Overall, stock selection detracted from performance over the 12 month period. Weak performance from Health Care and Communication Services sector stocks in the portfolio was the main driver of relative underperformance. |
| Industrials and Consumer Discretionary Stocks | Positive | Strong performance from Industrials and Consumer Discretionary sector stocks in the portfolio was a positive contributor to performance. |
| Energy and Utilities Sectors | Positive | Our underweight position in Energy and Utilities sectors added to relative performance. |
| Health Care and Information Technology Sectors | Negative | While sector allocation overall was positive, our underweight position in Health Care and our overweight position in Information Technology detracted from relative performance. |
| Quality, Yield and Growth Exposures | Negative | We were generally overweight Quality and Yield (shareholder yield) factors and underweight Growth factors which detracted from relative performance. |
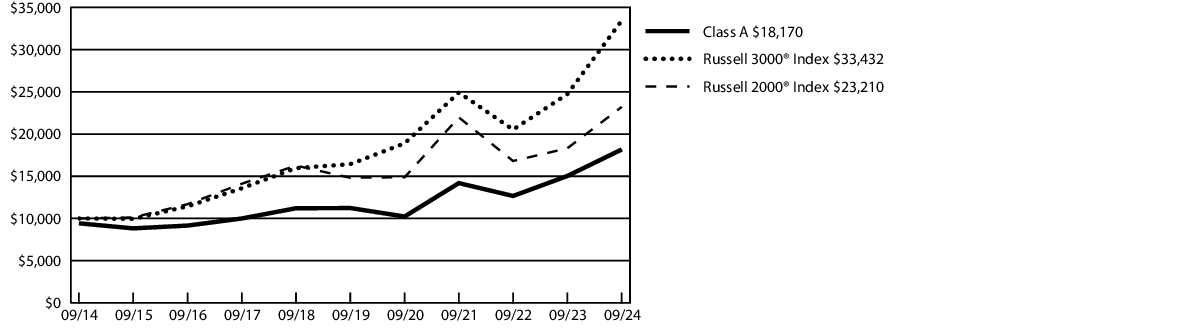
| AVERAGE ANNUAL TOTAL RETURNS | 1 Year | 5 Years | 10 Years |
| Class A | 14.83 % | 8.97 % | 6.15 % |
| Class A - excluding sales load | 20.91 % | 10.09 % | 6.78 % |
| Russell 3000 ® Index | 35.19 % | 15.26 % | 12.83 % |
| Russell 2000 ® Index | 26.76 % | 9.39 % | 8.78 % |
| Fund net assets | $ 276,297,761 |
| Total number of portfolio holdings | 37 |
| Total advisory fees paid | $ 1,854,357 |
| Portfolio turnover rate | 16 % |
| Industrials | 22.4 % |
| Information Technology | 18.6 % |
| Financials | 17.3 % |
| Consumer Discretionary | 15.9 % |
| Real Estate | 7.6 % |
| Health Care | 6.8 % |
| Materials | 5.0 % |
| Consumer Staples | 4.6 % |
| Communication Services | 1.4 % |
| Energy | 0.5 % |
| Short-Term Investment Fund | 2.7 % |
| Other Assets/Liabilities (Net) | (2.8 ) % |
| Total | 100.0 % |
| Class | Costs of a $1 0,0 00investment | Costs paid as a percentage of a $10,000 investment |
| Class C | $ 220 | 2.00 % |
| Factor | Performance Impact | Observations |
| Health Care and Communication Services Stocks | Negative | Overall, stock selection detracted from performance over the 12 month period. Weak performance from Health Care and Communication Services sector stocks in the portfolio was the main driver of relative underperformance. |
| Industrials and Consumer Discretionary Stocks | Positive | Strong performance from Industrials and Consumer Discretionary sector stocks in the portfolio was a positive contributor to performance. |
| Energy and Utilities Sectors | Positive | Our underweight position in Energy and Utilities sectors added to relative performance. |
| Health Care and Information Technology Sectors | Negative | While sector allocation overall was positive, our underweight position in Health Care and our overweight position in Information Technology detracted from relative performance. |
| Quality, Yield and Growth Exposures | Negative | We were generally overweight Quality and Yield (shareholder yield) factors and underweight Growth factors which detracted from relative performance. |
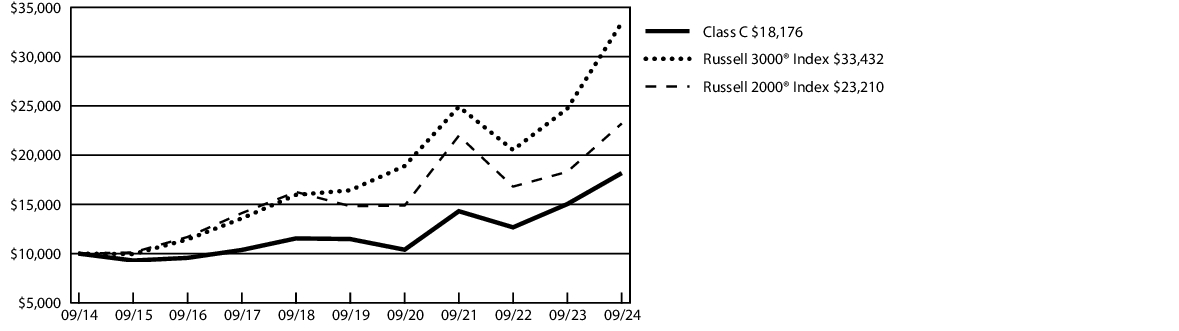
| AVERAGE ANNUAL TOTAL RETURNS | 1 Year | 5 Years | 10 Years |
| Class C | 19.08 % | 9.31 % | 6.16 % |
| Class C - excluding sales load | 20.08 % | 9.31 % | 6.16 % |
| Russell 3000 ® Index | 35.19 % | 15.26 % | 12.83 % |
| Russell 2000 ® Index | 26.76 % | 9.39 % | 8.78 % |
| Fund net assets | $ 276,297,761 |
| Total number of portfolio holdings | 37 |
| Total advisory fees paid | $ 1,854,357 |
| Portfolio turnover rate | 16 % |
| Industrials | 22.4 % |
| Information Technology | 18.6 % |
| Financials | 17.3 % |
| Consumer Discretionary | 15.9 % |
| Real Estate | 7.6 % |
| Health Care | 6.8 % |
| Materials | 5.0 % |
| Consumer Staples | 4.6 % |
| Communication Services | 1.4 % |
| Energy | 0.5 % |
| Short-Term Investment Fund | 2.7 % |
| Other Assets/Liabilities (Net) | (2.8 ) % |
| Total | 100.0 % |
| Class | Costs of a $10,000 investment | Costs paid as a percentage of a $10,000 investment |
| Class Y | $ 111 | 1.00 % |
| Factor | Performance Impact | Observations |
| Health Care and Communication Services Stocks | Negative | Overall, stock selection detracted from performance over the 12 month period. Weak performance from Health Care and Communication Services sector stocks in the portfolio was the main driver of relative underperformance. |
| Industrials and Consumer Discretionary Stocks | Positive | Strong performance from Industrials and Consumer Discretionary sector stocks in the portfolio was a positive contributor to performance. |
| Energy and Utilities Sectors | Positive | Our underweight position in Energy and Utilities sectors added to relative performance. |
| Health Care and Information Technology Sectors | Negative | While sector allocation overall was positive, our underweight position in Health Care and our overweight position in Information Technology detracted from relative performance. |
| Quality, Yield and Growth Exposures | Negative | We were generally overweight Quality and Yield (shareholder yield) factors and underweight Growth factors which detracted from relative performance. |

| AVERAGE ANNUAL TOTAL RETURNS | 1 Year | 5 Years | 10 Years |
| Class Y | 21.28 % | 10.38 % | 7.06 % |
| Russell 3000 ® Index | 35.19 % | 15.26 % | 12.83 % |
| Russell 2000 ® Index | 26.76 % | 9.39 % | 8.78 % |
| Fund net assets | $ 276,297,761 |
| Total number of portfolio holdings | 37 |
| Total advisory fees paid | $ 1,854,357 |
| Portfolio turnover rate | 16 % |
| Industrials | 22.4 % |
| Information Technology | 18.6 % |
| Financials | 17.3 % |
| Consumer Discretionary | 15.9 % |
| Real Estate | 7.6 % |
| Health Care | 6.8 % |
| Materials | 5.0 % |
| Consumer Staples | 4.6 % |
| Communication Services | 1.4 % |
| Energy | 0.5 % |
| Short-Term Investment Fund | 2.7 % |
| Other Assets/Liabilities (Net) | (2.8 ) % |
| Total | 100.0 % |
| Class | Costs of a $10,000 investment | Costs paid as a percentage of a $10,000 investment |
| Institutional Class | $ 102 | 0.92 % |
| Factor | Performance Impact | Observations |
| Health Care and Communication Services Stocks | Negative | Overall, stock selection detracted from performance over the 12 month period. Weak performance from Health Care and Communication Services sector stocks in the portfolio was the main driver of relative underperformance. |
| Industrials and Consumer Discretionary Stocks | Positive | Strong performance from Industrials and Consumer Discretionary sector stocks in the portfolio was a positive contributor to performance. |
| Energy and Utilities Sectors | Positive | Our underweight position in Energy and Utilities sectors added to relative performance. |
| Health Care and Information Technology Sectors | Negative | While sector allocation overall was positive, our underweight position in Health Care and our overweight position in Information Technology detracted from relative performance. |
| Quality, Yield and Growth Exposures | Negative | We were generally overweight Quality and Yield (shareholder yield) factors and underweight Growth factors which detracted from relative performance. |
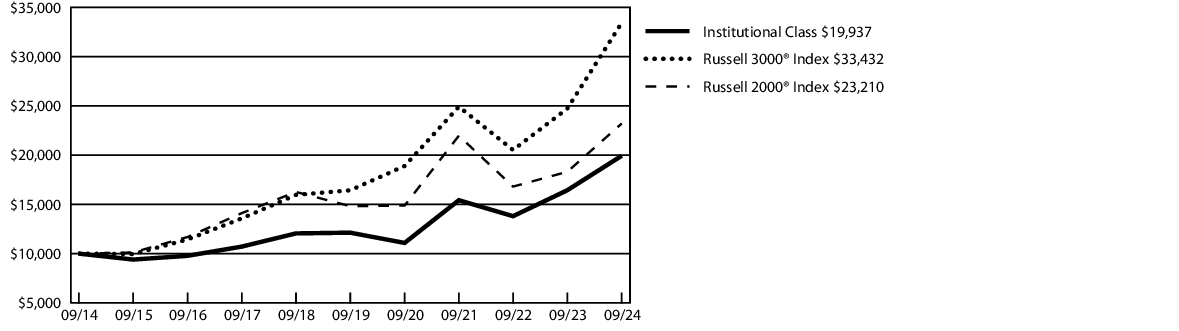
| AVERAGE ANNUAL TOTAL RETURNS | 1 Year | 5 Years | 10 Years |
| Institutional Class | 21.29 % | 10.45 % | 7.14 % |
| Russell 3000 ® Index | 35.19 % | 15.26 % | 12.83 % |
| Russell 2000 ® Index | 26.76 % | 9.39 % | 8.78 % |
| Fund net assets | $ 276,297,761 |
| Total number of portfolio holdings | 37 |
| Total advisory fees paid | $ 1,854,357 |
| Portfolio turnover rate | 16 % |
| Industrials | 22.4 % |
| Information Technology | 18.6 % |
| Financials | 17.3 % |
| Consumer Discretionary | 15.9 % |
| Real Estate | 7.6 % |
| Health Care | 6.8 % |
| Materials | 5.0 % |
| Consumer Staples | 4.6 % |
| Communication Services | 1.4 % |
| Energy | 0.5 % |
| Short-Term Investment Fund | 2.7 % |
| Other Assets/Liabilities (Net) | (2.8 ) % |
| Total | 100.0 % |
| Class | Costs of a $10,000 investment | Costs paid as a percentage of a $10,000 investment |
| Class A | $ 154 | 1.39 % |
| Factor | Performance Impact | Observations |
| Industrials sector | Positive | Led by EMCOR Group Inc. and CACI International Inc. EMCOR, an engineering and construction company, reported strong results leading to margin and multiple expansion while CACI beat earnings expectations and raised forward guidance on continued positive bookings. |
| Real Estate sector | Positive | Concentrated in the Fund’s position in Newmark Group, Inc.; a turn in the commercial real estate markets as interest rate decreases should drive better demand for its real estate service offerings. |
| Health Care sector | Negative | Medical device company Integra LifeSciences Holdings Corporation continues to experience execution issues related to compliance which has led to reduced earnings expectations. QuidelOrtho Corporation, a medical testing company, experienced lower flu and COVID-related volumes resulting in reduced guidance for the year. The resignation of the CEO also impacted investor sentiment, although the stock has recovered more recently as investors gained confidence in the new CEO’s strategy to streamline operations and reduce their debt load. |
| Materials sector | Negative | Arcadium Lithium plc, a company formed by the merger of Livent Corporation and Allkem Ltd., underperformed as the shareholder base consolidated and lithium prices experienced an accelerated decline in early 2024. |
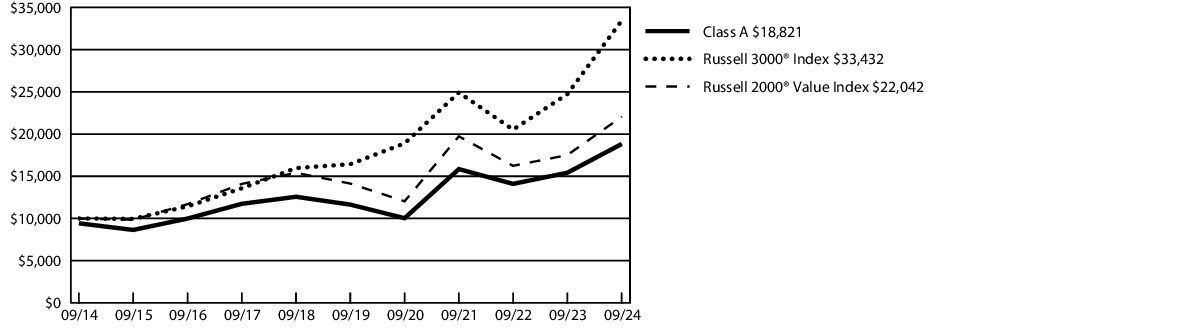
| AVERAGE ANNUAL TOTAL RETURNS | 1 Year | 5 Years | 10 Years |
| Class A | 15.96 % | 8.96 % | 6.53 % |
| Class A - excluding sales load | 22.07 % | 10.08 % | 7.16 % |
| Russell 3000 ® Index | 35.19 % | 15.26 % | 12.83 % |
| Russell 2000 ® Value Index | 25.88 % | 9.29 % | 8.22 % |
| Fund net assets | $ 216,872,292 |
| Total number of portfolio holdings | 90 |
| Total advisory fees paid | $ 1,316,077 |
| Portfolio turnover rate | 17 % |
| Financials | 22.2 % |
| Industrials | 21.5 % |
| Consumer Discretionary | 10.6 % |
| Real Estate | 8.5 % |
| Health Care | 8.2 % |
| Information Technology | 7.0 % |
| Energy | 5.6 % |
| Consumer Staples | 5.3 % |
| Materials | 5.1 % |
| Utilities | 4.2 % |
| Short-Term Investment Funds | 2.4 % |
| Other Assets/Liabilities (Net) | (0.6 ) % |
| Total | 100.0 % |
| Class | Costs of a $10,000 investment | Costs paid as a percentage of a $10,000 investment |
| Class C | $ 237 | 2.14 % |
| Factor | Performance Impact | Observations |
| Industrials sector | Positive | Led by EMCOR Group Inc. and CACI International Inc. EMCOR, an engineering and construction company, reported strong results leading to margin and multiple expansion while CACI beat earnings expectations and raised forward guidance on continued positive bookings. |
| Real Estate sector | Positive | Concentrated in the Fund’s position in Newmark Group, Inc.; a turn in the commercial real estate markets as interest rate decreases should drive better demand for its real estate service offerings. |
| Health Care sector | Negative | Medical device company Integra LifeSciences Holdings Corporation continues to experience execution issues related to compliance which has led to reduced earnings expectations. QuidelOrtho Corporation, a medical testing company, experienced lower flu and COVID-related volumes resulting in reduced guidance for the year. The resignation of the CEO also impacted investor sentiment, although the stock has recovered more recently as investors gained confidence in the new CEO’s strategy to streamline operations and reduce their debt load. |
| Materials sector | Negative | Arcadium Lithium plc, a company formed by the merger of Livent Corporation and Allkem Ltd., underperformed as the shareholder base consolidated and lithium prices experienced an accelerated decline in early 2024. |
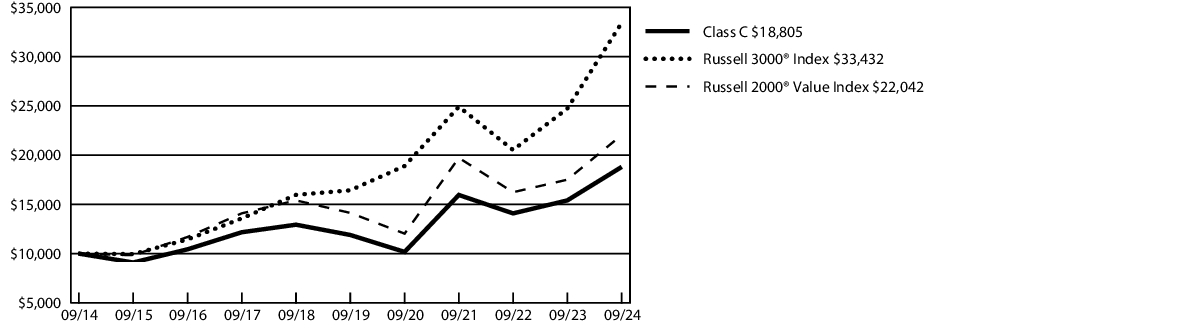
| AVERAGE ANNUAL TOTAL RETURNS | 1 Year | 5 Years | 10 Years |
| Class C | 20.12 % | 9.27 % | 6.52 % |
| Class C - excluding sales load | 21.12 % | 9.27 % | 6.52 % |
| Russell 3000 ® Index | 35.19 % | 15.26 % | 12.83 % |
| Russell 2000 ® Value Index | 25.88 % | 9.29 % | 8.22 % |
| Fund net assets | $ 216,872,292 |
| Total number of portfolio holdings | 90 |
| Total advisory fees paid | $ 1,316,077 |
| Portfolio turnover rate | 17 % |
| Financials | 22.2 % |
| Industrials | 21.5 % |
| Consumer Discretionary | 10.6 % |
| Real Estate | 8.5 % |
| Health Care | 8.2 % |
| Information Technology | 7.0 % |
| Energy | 5.6 % |
| Consumer Staples | 5.3 % |
| Materials | 5.1 % |
| Utilities | 4.2 % |
| Short-Term Investment Funds | 2.4 % |
| Other Assets/Liabilities (Net) | (0.6) % |
| Total | 100.0 % |
| Class | Costs of a $10,000 investment | Costs paid as a percentage of a $10,000 investment |
| Class Y | $ 127 | 1.14 % |
| Factor | Performance Impact | Observations |
| Industrials sector | Positive | Led by EMCOR Group Inc. and CACI International Inc. EMCOR, an engineering and construction company, reported strong results leading to margin and multiple expansion while CACI beat earnings expectations and raised forward guidance on continued positive bookings. |
| Real Estate sector | Positive | Concentrated in the Fund’s position in Newmark Group, Inc.; a turn in the commercial real estate markets as interest rate decreases should drive better demand for its real estate service offerings. |
| Health Care sector | Negative | Medical device company Integra LifeSciences Holdings Corporation continues to experience execution issues related to compliance which has led to reduced earnings expectations. QuidelOrtho Corporation, a medical testing company, experienced lower flu and COVID-related volumes resulting in reduced guidance for the year. The resignation of the CEO also impacted investor sentiment, although the stock has recovered more recently as investors gained confidence in the new CEO’s strategy to streamline operations and reduce their debt load. |
| Materials sector | Negative | Arcadium Lithium plc, a company formed by the merger of Livent Corporation and Allkem Ltd., underperformed as the shareholder base consolidated and lithium prices experienced an accelerated decline in early 2024. |
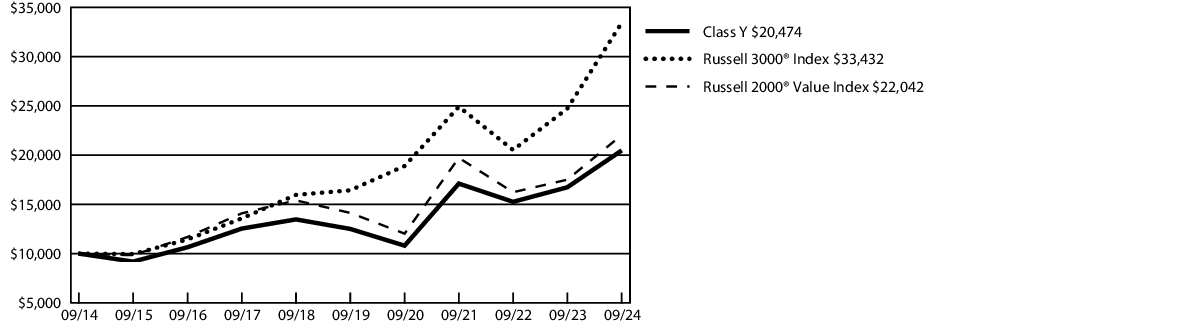
| AVERAGE ANNUAL TOTAL RETURNS | 1 Year | 5 Years | 10 Years |
| Class Y | 22.33 % | 10.35 % | 7.43 % |
| Russell 3000® Index | 35.19 % | 15.26 % | 12.83 % |
| Russell 2000® Value Index | 25.88 % | 9.29 % | 8.22 % |
| Fund net assets | $ 216,872,292 |
| Total number of portfolio holdings | 90 |
| Total advisory fees paid | $ 1,316,077 |
| Portfolio turnover rate | 17 % |
| Financials | 22.2 % |
| Industrials | 21.5 % |
| Consumer Discretionary | 10.6 % |
| Real Estate | 8.5 % |
| Health Care | 8.2 % |
| Information Technology | 7.0 % |
| Energy | 5.6 % |
| Consumer Staples | 5.3 % |
| Materials | 5.1 % |
| Utilities | 4.2 % |
| Short-Term Investment Funds | 2.4 % |
| Other Assets/Liabilities (Net) | (0.6 ) % |
| Total | 100.0 % |
| Class | Costs of a $10,000 investment | Costs paid as a percentage of a $10,000 investment |
| Institutional Class | $ 110 | 0.99 % |
| Factor | Performance Impact | Observations |
| Industrials sector | Positive | Led by EMCOR Group Inc. and CACI International Inc. EMCOR, an engineering and construction company, reported strong results leading to margin and multiple expansion while CACI beat earnings expectations and raised forward guidance on continued positive bookings. |
| Real Estate sector | Positive | Concentrated in the Fund’s position in Newmark Group, Inc.; a turn in the commercial real estate markets as interest rate decreases should drive better demand for its real estate service offerings. |
| Health Care sector | Negative | Medical device company Integra LifeSciences Holdings Corporation continues to experience execution issues related to compliance which has led to reduced earnings expectations. QuidelOrtho Corporation, a medical testing company, experienced lower flu and COVID-related volumes resulting in reduced guidance for the year. The resignation of the CEO also impacted investor sentiment, although the stock has recovered more recently as investors gained confidence in the new CEO’s strategy to streamline operations and reduce their debt load. |
| Materials sector | Negative | Arcadium Lithium plc, a company formed by the merger of Livent Corporation and Allkem Ltd., underperformed as the shareholder base consolidated and lithium prices experienced an accelerated decline in early 2024. |
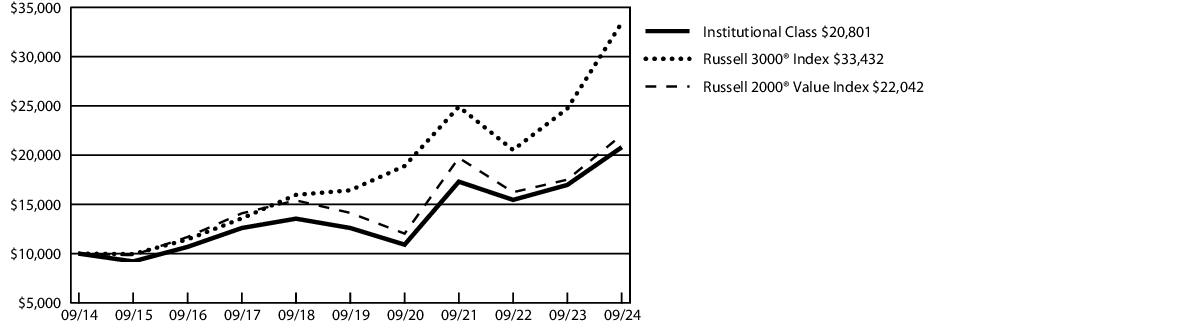
| AVERAGE ANNUAL TOTAL RETURNS | 1 Year | 5 Years | 10 Years |
| Institutional Class | 22.53 % | 10.54 % | 7.60 % |
| Russell 3000 ® Index | 35.19 % | 15.26 % | 12.83 % |
| Russell 2000 ® Value Index | 25.88 % | 9.29 % | 8.22 % |
| Fund net assets | $ 216,872,292 |
| Total number of portfolio holdings | 90 |
| Total advisory fees paid | $ 1,316,077 |
| Portfolio turnover rate | 17 % |
| Financials | 22.2 % |
| Industrials | 21.5 % |
| Consumer Discretionary | 10.6 % |
| Real Estate | 8.5 % |
| Health Care | 8.2 % |
| Information Technology | 7.0 % |
| Energy | 5.6 % |
| Consumer Staples | 5.3 % |
| Materials | 5.1 % |
| Utilities | 4.2 % |
| Short-Term Investment Funds | 2.4 % |
| Other Assets/Liabilities (Net) | (0.6 ) % |
| Total | 100.0 % |
| Class | Costs of a $10,000 investment | Costs paid as a percentage of a $10,000 investment |
| Class A | $ 67 | 0.65 % |
| Factor | Performance Impact | Observations |
| Interest Rates | Positive | Interest rates in the front end of the curve (2 years and in) moved 50 to 145 basis points (“bps”) lower over the past year. This was a tailwind for performance in the Fund – particularly the longer fixed rate exposures in the 1–2-year part of the curve. |
| Spreads | Positive | Spreads on short duration assets compressed meaningfully over the reporting period. Fund option-adjusted spread compressed from 185bps to 148bps over the reporting period, with the most significant sector spread tightening in its Collateralized Loan Obligation (“CLO”) exposure (75bps tighter), Residential Mortgage Backed Securities (“RMBS”) (68bps tighter), and Commercial Mortgage Backed Securities (“CMBS”) (34bps tighter). |
| Carry | Positive | Portfolio yield was a significant driver of performance over the reporting period. Portfolio yield to call as of September 30, 2023 was 7.23%, which provided a significant level of income as a base for total return performance over the 12-month period that followed. |
| Asset Allocation | Positive | Fund management maintained a significant overweight to securitized subsectors over the past year, versus Investment Grade (“IG”) Credit. This was a positive contributor to performance, given the securitized sectors’ trailing 12-month gross returns ranging from 7.36% for CLOs to 10.78% for RMBS, comparing favorably versus the Fund’s IG Credit return of 6.86% over the same time period. |
| Cash | Negative | The Fund maintained an oversized position in Cash & Equivalents to start the fiscal year, as a conservative positioning during a period where redemption activity had been abnormally high. This emphasis on liquidity created a cash drag on assets that could have otherwise been more fully invested in higher yielding sectors. |
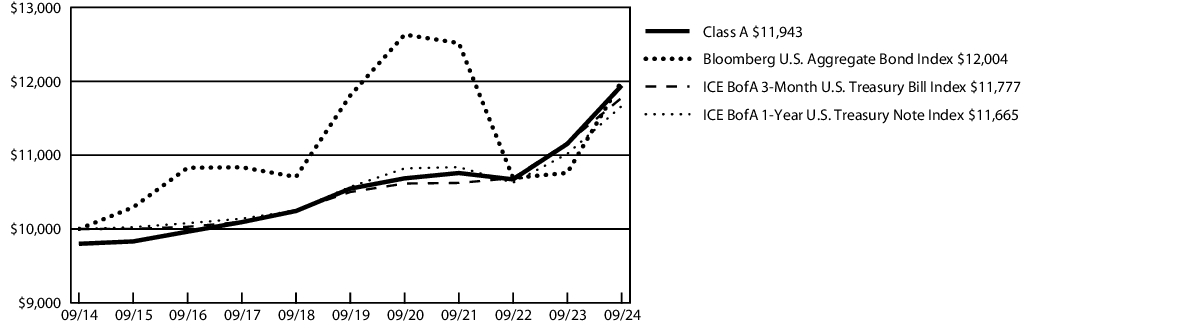
| AVERAGE ANNUAL TOTAL RETURNS | 1 Year | 5 Years | 10 Years |
| Class A | 4.89 % | 2.10 % | 1.79 % |
| Class A - excluding sales load | 7.09 % | 2.52 % | 2.00 % |
| Bloomberg U.S. Aggregate Bond Index | 11.57 % | 0.33 % | 1.84 % |
| ICE BofA 3-Month U.S. Treasury Bill Index | 5.46 % | 2.32 % | 1.65 % |
| ICE BofA 1-Year U.S. Treasury Note Index | 5.87 % | 1.99 % | 1.55 % |
| Fund net assets | $ 518,112,946 |
| Total number of portfolio holdings | 216 |
| Total advisory fees paid | $ 882,614 |
| Portfolio turnover rate | 78 % |
| Asset-Backed Securities | 47.1 % |
| Corporate Bonds | 18.2 % |
| Commercial Mortgage-Backed Securities | 18.2 % |
| Non-Agency Collateralized Mortgage Obligations | 8.5 % |
| Commercial Paper | 5.7 % |
| Municipal Bonds | 1.0 % |
| U.S. Government Mortgage-Backed Obligations | 0.7 % |
| Agency Collateralized Mortgage Obligations | 0.1 % |
| U.S. Government Agency Obligations | 0.0 % |
| Short-Term Investment Fund | 0.0 % |
| Other Assets/Liabilities (Net) | 0.5 % |
| Total | 100.0 % |
| AAA/Aaa | 55.8 % |
| AA/Aa | 16.1 % |
| A/A | 14.5 % |
| BBB/Baa | 13.3 % |
| Not Rated | 0.3 % |
| Total | 100.0 % |
| Class | Costs of a $10,000 investment | Costs paid as a percentage of a $10,000 investment |
| Class C | $ 119 | 1.15 % |
| Factor | Performance Impact | Observations |
| Interest Rates | Positive | Interest rates in the front end of the curve (2 years and in) moved 50 to 145 basis points (“bps”) lower over the past year. This was a tailwind for performance in the Fund – particularly the longer fixed rate exposures in the 1–2-year part of the curve. |
| Spreads | Positive | Spreads on short duration assets compressed meaningfully over the reporting period. Fund option-adjusted spread compressed from 185bps to 148bps over the reporting period, with the most significant sector spread tightening in its Collateralized Loan Obligation (“CLO”) exposure (75bps tighter), Residential Mortgage Backed Securities (“RMBS”) (68bps tighter), and Commercial Mortgage Backed Securities (“CMBS”) (34bps tighter). |
| Carry | Positive | Portfolio yield was a significant driver of performance over the reporting period. Portfolio yield to call as of September 30, 2023 was 7.23%, which provided a significant level of income as a base for total return performance over the 12-month period that followed. |
| Asset Allocation | Positive | Fund management maintained a significant overweight to securitized subsectors over the past year, versus Investment Grade (“IG”) Credit. This was a positive contributor to performance, given the securitized sectors’ trailing 12-month gross returns ranging from 7.36% for CLOs to 10.78% for RMBS, comparing favorably versus the Fund’s IG Credit return of 6.86% over the same time period. |
| Cash | Negative | The Fund maintained an oversized position in Cash & Equivalents to start the fiscal year, as a conservative positioning during a period where redemption activity had been abnormally high. This emphasis on liquidity created a cash drag on assets that could have otherwise been more fully invested in higher yielding sectors. |
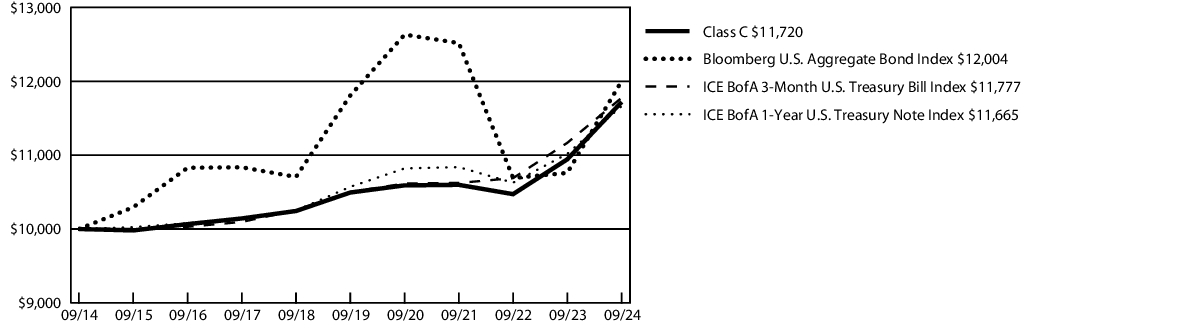
| AVERAGE ANNUAL TOTAL RETURNS | 1 Year | 5 Years | 10 Years |
| Class C | 5.55 % | 2.03 % | 1.60 % |
| Class C - excluding sales load | 6.55 % | 2.03 % | 1.60 % |
| Bloomberg U.S. Aggregate Bond Index | 11.57 % | 0.33 % | 1.84 % |
| ICE BofA 3-Month U.S. Treasury Bill Index | 5.46 % | 2.32 % | 1.65 % |
| ICE BofA 1-Year U.S. Treasury Note Index | 5.87 % | 1.99 % | 1.55 % |
| Fund net assets | $ 518,112,946 |
| Total number of portfolio holdings | 216 |
| Total advisory fees paid | $ 882,614 |
| Portfolio turnover rate | 78 % |
| Asset-Backed Securities | 47.1 % |
| Corporate Bonds | 18.2 % |
| Commercial Mortgage-Backed Securities | 18.2 % |
| Non-Agency Collateralized Mortgage Obligations | 8.5 % |
| Commercial Paper | 5.7 % |
| Municipal Bonds | 1.0 % |
| U.S. Government Mortgage-Backed Obligations | 0.7 % |
| Agency Collateralized Mortgage Obligations | 0.1 % |
| U.S. Government Agency Obligations | 0.0 % |
| Short-Term Investment Fund | 0.0 % |
| Other Assets/Liabilities (Net) | 0.5 % |
| Total | 100.0 % |
| AAA/Aaa | 55.8 % |
| AA/Aa | 16.1 % |
| A/A | 14.5 % |
| BBB/Baa | 13.3 % |
| Not Rated | 0.3 % |
| Total | 100.0 % |
| Class | Costs of a $10,000 investment | Costs paid as a percentage of a $10,000 investment |
| Class S | $ 93 | 0.90 % |
| Factor | Performance Impact | Observations |
| Interest Rates | Positive | Interest rates in the front end of the curve (2 years and in) moved 50 to 145 basis points (“bps”) lower over the past year. This was a tailwind for performance in the Fund – particularly the longer fixed rate exposures in the 1–2-year part of the curve. |
| Spreads | Positive | Spreads on short duration assets compressed meaningfully over the reporting period. Fund option-adjusted spread compressed from 185bps to 148bps over the reporting period, with the most significant sector spread tightening in its Collateralized Loan Obligation (“CLO”) exposure (75bps tighter), Residential Mortgage Backed Securities (“RMBS”) (68bps tighter), and Commercial Mortgage Backed Securities (“CMBS”) (34bps tighter). |
| Carry | Positive | Portfolio yield was a significant driver of performance over the reporting period. Portfolio yield to call as of September 30, 2023 was 7.23%, which provided a significant level of income as a base for total return performance over the 12-month period that followed. |
| Asset Allocation | Positive | Fund management maintained a significant overweight to securitized subsectors over the past year, versus Investment Grade (“IG”) Credit. This was a positive contributor to performance, given the securitized sectors’ trailing 12-month gross returns ranging from 7.36% for CLOs to 10.78% for RMBS, comparing favorably versus the Fund’s IG Credit return of 6.86% over the same time period. |
| Cash | Negative | The Fund maintained an oversized position in Cash & Equivalents to start the fiscal year, as a conservative positioning during a period where redemption activity had been abnormally high. This emphasis on liquidity created a cash drag on assets that could have otherwise been more fully invested in higher yielding sectors. |
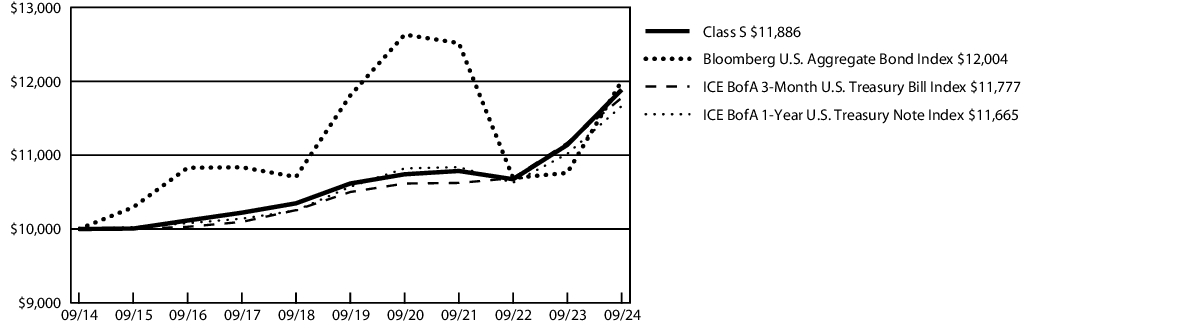
| AVERAGE ANNUAL TOTAL RETURNS | 1 Year | 5 Years | 10 Years |
| Class S 1 | 6.81 % | 2.29 % | 1.74 % |
| Bloomberg U.S. Aggregate Bond Index | 11.57 % | 0.33 % | 1.84 % |
| ICE BofA 3-Month U.S. Treasury Bill Index | 5.46 % | 2.32 % | 1.65 % |
| ICE BofA 1-Year U.S. Treasury Note Index | 5.87 % | 1.99 % | 1.55 % |
1 | The inception date was October 27, 2017. Performance information was calculated using the historical performance of Class Z shares for the periods prior to October 27, 2017. |
| Fund net assets | $ 518,112,946 |
| Total number of portfolio holdings | 216 |
| Total advisory fees paid | $ 882,614 |
| Portfolio turnover rate | 78 % |
| Asset-Backed Securities | 47.1 % |
| Corporate Bonds | 18.2 % |
| Commercial Mortgage-Backed Securities | 18.2 % |
| Non-Agency Collateralized Mortgage Obligations | 8.5 % |
| Commercial Paper | 5.7 % |
| Municipal Bonds | 1.0 % |
| U.S. Government Mortgage-Backed Obligations | 0.7 % |
| Agency Collateralized Mortgage Obligations | 0.1 % |
| U.S. Government Agency Obligations | 0.0 % |
| Short-Term Investment Fund | 0.0 % |
| Other Assets/Liabilities (Net) | 0.5 % |
| Total | 100.0 % |
| AAA/Aaa | 55.8 % |
| AA/Aa | 16.1 % |
| A/A | 14.5 % |
| BBB/Baa | 13.3 % |
| Not Rated | 0.3 % |
| Total | 100.0 % |
| Class | Costs of a $10,000 investment | Costs paid as a percentage of a $10,000 investment |
| Class Y | $ 41 | 0.40 % |
| Factor | Performance Impact | Observations |
| Interest Rates | Positive | Interest rates in the front end of the curve (2 years and in) moved 50 to 145 basis points (“bps”) lower over the past year. This was a tailwind for performance in the Fund – particularly the longer fixed rate exposures in the 1–2-year part of the curve. |
| Spreads | Positive | Spreads on short duration assets compressed meaningfully over the reporting period. Fund option-adjusted spread compressed from 185bps to 148bps over the reporting period, with the most significant sector spread tightening in its Collateralized Loan Obligation (“CLO”) exposure (75bps tighter), Residential Mortgage Backed Securities (“RMBS”) (68bps tighter), and Commercial Mortgage Backed Securities (“CMBS”) (34bps tighter). |
| Carry | Positive | Portfolio yield was a significant driver of performance over the reporting period. Portfolio yield to call as of September 30, 2023 was 7.23%, which provided a significant level of income as a base for total return performance over the 12-month period that followed. |
| Asset Allocation | Positive | Fund management maintained a significant overweight to securitized subsectors over the past year, versus Investment Grade (“IG”) Credit. This was a positive contributor to performance, given the securitized sectors’ trailing 12-month gross returns ranging from 7.36% for CLOs to 10.78% for RMBS, comparing favorably versus the Fund’s IG Credit return of 6.86% over the same time period. |
| Cash | Negative | The Fund maintained an oversized position in Cash & Equivalents to start the fiscal year, as a conservative positioning during a period where redemption activity had been abnormally high. This emphasis on liquidity created a cash drag on assets that could have otherwise been more fully invested in higher yielding sectors. |
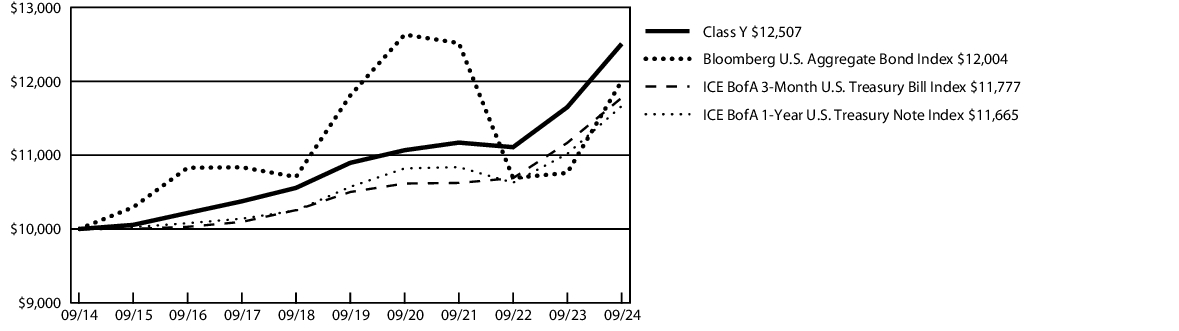
| AVERAGE ANNUAL TOTAL RETURNS | 1 Year | 5 Years | 10 Years |
| Class Y | 7.35 % | 2.80 % | 2.26 % |
| Bloomberg U.S. Aggregate Bond Index | 11.57 % | 0.33 % | 1.84 % |
| ICE BofA 3-Month U.S. Treasury Bill Index | 5.46 % | 2.32 % | 1.65 % |
| ICE BofA 1-Year U.S. Treasury Note Index | 5.87 % | 1.99 % | 1.55 % |
| Fund net assets | $ 518,112,946 |
| Total number of portfolio holdings | 216 |
| Total advisory fees paid | $ 882,614 |
| Portfolio turnover rate | 78 % |
| Asset-Backed Securities | 47.1 % |
| Corporate Bonds | 18.2 % |
| Commercial Mortgage-Backed Securities | 18.2 % |
| Non-Agency Collateralized Mortgage Obligations | 8.5 % |
| Commercial Paper | 5.7 % |
| Municipal Bonds | 1.0 % |
| U.S. Government Mortgage-Backed Obligations | 0.7 % |
| Agency Collateralized Mortgage Obligations | 0.1 % |
| U.S. Government Agency Obligations | 0.0 % |
| Short-Term Investment Fund | 0.0 % |
| Other Assets/Liabilities (Net) | 0.5 % |
| Total | 100.0 % |
| AAA/Aaa | 55.8 % |
| AA/Aa | 16.1 % |
| A/A | 14.5 % |
| BBB/Baa | 13.3 % |
| Not Rated | 0.3 % |
| Total | 100.0 % |
| Class | Costs of a $10,000 investment | Costs paid as a percentage of a $10,000 investment |
| Class Z | $ 67 | 0.65 % |
| Factor | Performance Impact | Observations |
| Interest Rates | Positive | Interest rates in the front end of the curve (2 years and in) moved 50 to 145 basis points (“bps”) lower over the past year. This was a tailwind for performance in the Fund – particularly the longer fixed rate exposures in the 1–2-year part of the curve. |
| Spreads | Positive | Spreads on short duration assets compressed meaningfully over the reporting period. Fund option-adjusted spread compressed from 185bps to 148bps over the reporting period, with the most significant sector spread tightening in its Collateralized Loan Obligation (“CLO”) exposure (75bps tighter), Residential Mortgage Backed Securities (“RMBS”) (68bps tighter), and Commercial Mortgage Backed Securities (“CMBS”) (34bps tighter). |
| Carry | Positive | Portfolio yield was a significant driver of performance over the reporting period. Portfolio yield to call as of September 30, 2023 was 7.23%, which provided a significant level of income as a base for total return performance over the 12-month period that followed. |
| Asset Allocation | Positive | Fund management maintained a significant overweight to securitized subsectors over the past year, versus Investment Grade (“IG”) Credit. This was a positive contributor to performance, given the securitized sectors’ trailing 12-month gross returns ranging from 7.36% for CLOs to 10.78% for RMBS, comparing favorably versus the Fund’s IG Credit return of 6.86% over the same time period. |
| Cash | Negative | The Fund maintained an oversized position in Cash & Equivalents to start the fiscal year, as a conservative positioning during a period where redemption activity had been abnormally high. This emphasis on liquidity created a cash drag on assets that could have otherwise been more fully invested in higher yielding sectors. |
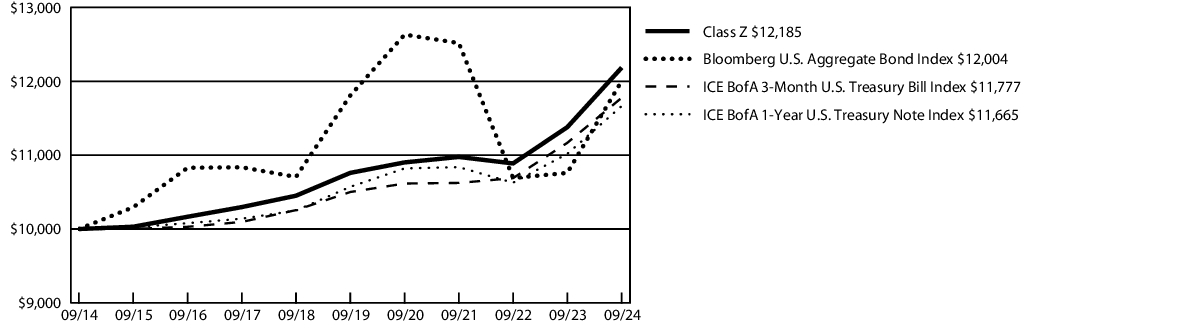
| AVERAGE ANNUAL TOTAL RETURNS | 1 Year | 5 Years | 10 Years |
| Class Z | 7.09 % | 2.52 % | 2.00 % |
| Bloomberg U.S. Aggregate Bond Index | 11.57 % | 0.33 % | 1.84 % |
| ICE BofA 3-Month U.S. Treasury Bill Index | 5.46 % | 2.32 % | 1.65 % |
| ICE BofA 1-Year U.S. Treasury Note Index | 5.87 % | 1.99 % | 1.55 % |
| Fund net assets | $ 518,112,946 |
| Total number of portfolio holdings | 216 |
| Total advisory fees paid | $ 882,614 |
| Portfolio turnover rate | 78 % |
| Asset-Backed Securities | 47.1 % |
| Corporate Bonds | 18.2 % |
| Commercial Mortgage-Backed Securities | 18.2 % |
| Non-Agency Collateralized Mortgage Obligations | 8.5 % |
| Commercial Paper | 5.7 % |
| Municipal Bonds | 1.0 % |
| U.S. Government Mortgage-Backed Obligations | 0.7 % |
| Agency Collateralized Mortgage Obligations | 0.1 % |
| U.S. Government Agency Obligations | 0.0 % |
| Short-Term Investment Fund | 0.0 % |
| Other Assets/Liabilities (Net) | 0.5 % |
| Total | 100.0 % |
| AAA/Aaa | 55.8 % |
| AA/Aa | 16.1 % |
| A/A | 14.5 % |
| BBB/Baa | 13.3 % |
| Not Rated | 0.3 % |
| Total | 100.0 % |
| Class | Costs of a $10,000 investment | Costs paid as a percentage of a $10,000 investment |
| Institutional Class | $ 36 | 0.35 % |
| Factor | Performance Impact | Observations |
| Interest Rates | Positive | Interest rates in the front end of the curve (2 years and in) moved 50 to 145 basis points (“bps”) lower over the past year. This was a tailwind for performance in the Fund – particularly the longer fixed rate exposures in the 1–2-year part of the curve. |
| Spreads | Positive | Spreads on short duration assets compressed meaningfully over the reporting period. Fund option-adjusted spread compressed from 185bps to 148bps over the reporting period, with the most significant sector spread tightening in its Collateralized Loan Obligation (“CLO”) exposure (75bps tighter), Residential Mortgage Backed Securities (“RMBS”) (68bps tighter), and Commercial Mortgage Backed Securities (“CMBS”) (34bps tighter). |
| Carry | Positive | Portfolio yield was a significant driver of performance over the reporting period. Portfolio yield to call as of September 30, 2023 was 7.23%, which provided a significant level of income as a base for total return performance over the 12-month period that followed. |
| Asset Allocation | Positive | Fund management maintained a significant overweight to securitized subsectors over the past year, versus Investment Grade (“IG”) Credit. This was a positive contributor to performance, given the securitized sectors’ trailing 12-month gross returns ranging from 7.36% for CLOs to 10.78% for RMBS, comparing favorably versus the Fund’s IG Credit return of 6.86% over the same time period. |
| Cash | Negative | The Fund maintained an oversized position in Cash & Equivalents to start the fiscal year, as a conservative positioning during a period where redemption activity had been abnormally high. This emphasis on liquidity created a cash drag on assets that could have otherwise been more fully invested in higher yielding sectors. |
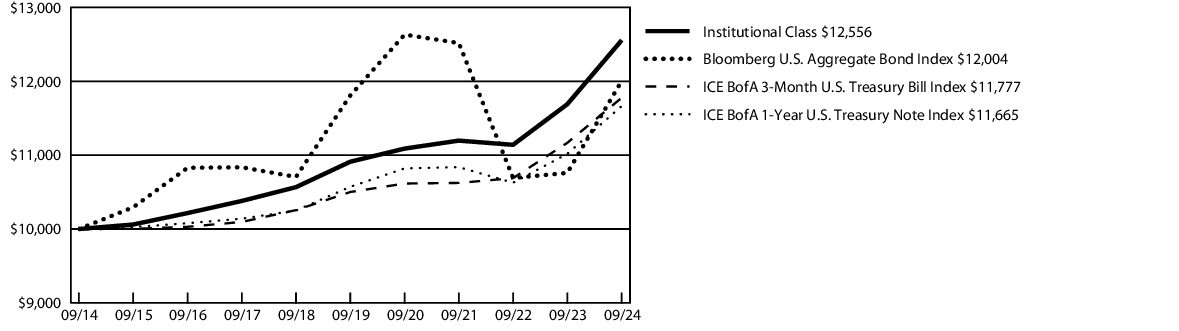
| AVERAGE ANNUAL TOTAL RETURNS | 1 Year | 5 Years | 10 Years |
| Institutional Class | 7.41 % | 2.85 % | 2.30 % |
| Bloomberg U.S. Aggregate Bond Index | 11.57 % | 0.33 % | 1.84 % |
| ICE BofA 3-Month U.S. Treasury Bill Index | 5.46 % | 2.32 % | 1.65 % |
| ICE BofA 1-Year U.S. Treasury Note Index | 5.87 % | 1.99 % | 1.55 % |
| Fund net assets | $ 518,112,946 |
| Total number of portfolio holdings | 216 |
| Total advisory fees paid | $ 882,614 |
| Portfolio turnover rate | 78 % |
| Asset-Backed Securities | 47.1 % |
| Corporate Bonds | 18.2 % |
| Commercial Mortgage-Backed Securities | 18.2 % |
| Non-Agency Collateralized Mortgage Obligations | 8.5 % |
| Commercial Paper | 5.7 % |
| Municipal Bonds | 1.0 % |
| U.S. Government Mortgage-Backed Obligations | 0.7 % |
| Agency Collateralized Mortgage Obligations | 0.1 % |
| U.S. Government Agency Obligations | 0.0 % |
| Short-Term Investment Fund | 0.0 % |
| Other Assets/Liabilities (Net) | 0.5 % |
| Total | 100.0 % |
| AAA/Aaa | 55.8 % |
| AA/Aa | 16.1 % |
| A/A | 14.5 % |
| BBB/Baa | 13.3 % |
| Not Rated | 0.3 % |
| Total | 100.0 % |
| (b) | Not applicable. |
Item 2. Code of Ethics.
| (a) | The registrant, as of the end of the period covered by this report, has adopted a code of ethics that applies to the registrant’s principal executive officer, principal financial officer, principal accounting officer or controller, or persons performing similar functions, regardless of whether these individuals are employed by the registrant or a third party. |
| (c) | There have been no amendments, during the period covered by this report, to a provision of the code of ethics that applies to the registrant’s principal executive officer, principal financial officer, principal accounting officer or controller, or persons performing similar functions, regardless of whether these individuals are employed by the registrant or a third party, and that relates to any element of the code of ethics description. |
| (d) | The registrant has not granted any waivers, including an implicit waiver, from a provision of the code of ethics that applies to the registrant’s principal executive officer, principal financial officer, principal accounting officer or controller, or persons performing similar functions, regardless of whether these individuals are employed by the registrant or a third party, that relates to one or more of the items set forth in paragraph (b) of this item’s instructions. |
| (e) | Not applicable. |
| (f) | A copy of the code of ethics is attached hereto as Exhibit 19(a)(1). |
Item 3. Audit Committee Financial Expert.
The registrant’s Board of Trustees has determined that the registrant has at least one audit committee financial expert serving on its audit committee. Ms. Karen Carnahan is the registrant’s audit committee financial expert and is an independent trustee within the meaning of the Investment Company Act of 1940, as amended (the “1940 Act”).
Item 4. Principal Accountant Fees and Services.
Audit Fees
| (a) | Audit fees for Touchstone Funds Group Trust totaled $264,400 and $258,900 for the fiscal years ended September 30, 2024 and September 30, 2023, respectively, including fees associated with the annual audits and filings of Form N-1A and Form N-CEN. |
Audit-Related Fees
| (b) | The aggregate fees billed in each of the last two fiscal years for assurance and related services by the principal accountant that are reasonably related to the performance of the audit of the registrant's financial statements and are not reported under paragraph (a) of this Item are $17,675 and $27,170 for the fiscal years ended September 30, 2024 and September 30, 2023, respectively. The fees for 2024 relate to the review of N-14 and N-1A filings and 2023 relate to review of N-1A filings and out of scope audit procedures. |
Tax Fees
| (c) | The aggregate fees billed in each of the last two fiscal years for professional services rendered by the principal accountant for tax compliance, tax advice, and tax planning were $76,847 and $80,260 for the fiscal years ended September 30, 2024 and September 30, 2023, respectively. The fees relate to the preparation of federal income and excise tax returns and review of capital gains distribution calculations. |
All Other Fees
| (d) | The aggregate fees billed in each of the last two fiscal years for products and services provided by the principal accountant, other than the services reported in paragraphs (a) through (c) of this Item are $19,650 and $19,025 for the fiscal years ended September 30, 2024 and September 2023, respectively. The fees relate to the PFIC analyzer, Rapid Security Analyzer and Global Withholding Tax Reporter subscriptions. |
| (e)(1) | The Audit Committee’s pre-approval policies describe the types of audit, audit-related, tax and other services that have the general pre-approval of the Audit Committee. The pre-approval policies provide that annual audit service fees, tax services not specifically granted pre-approval, services exceeding pre-approved cost levels and other services that have not received general pre-approval will be subject to specific pre-approval by the Audit Committee. The pre-approval policies further provide that the Committee may grant general pre-approval to other audit services (statutory audits and services associated with SEC registration statements, periodic reports and other documents filed with the SEC or other documents issued in connection with securities offerings), audit-related services (accounting consultations related to accounting, financial reporting or disclosure matters not classified as “audit services,” assistance with understanding and implementing new accounting and financial reporting guidance from rulemaking authorities, agreed-upon or expanded audit procedures related to accounting and/or billing records required to respond to or comply with financial, accounting or regulatory reporting matters and assistance with internal control reporting requirements under Form N-CSR), tax services that have historically been provided by the auditor that the Committee believes would not impair the independence of the auditor and are consistent with the SEC’s rules on auditor independence and permissible non-audit services classified as “all other services” that are routine and recurring services. |
| (e)(2) | All of the services described in paragraphs (b) through (d) of Item 4 were approved by the Audit Committee. |
| (f) | The percentage of hours expended on the principal accountant's engagement to audit the registrant's financial statements for the most recent fiscal year that were attributed to work performed by persons other than the principal accountant's full-time, permanent employees was less than fifty percent. |
| (g) | The aggregate non-audit fees billed by the registrant's accountant for services rendered to the registrant, and rendered to the registrant's investment adviser (not including any sub-adviser whose role is primarily portfolio management and is subcontracted with or overseen by another investment adviser), and any entity controlling, controlled by, or under common control with the adviser that provides ongoing services to the registrant for each of the last two fiscal years of the registrant was $1,670,149 for 2024 and $1,154,817 for 2023. |
| (h) | The registrant’s audit committee of the Board of Trustees has considered whether the provision of non-audit services that were rendered to the registrant's investment adviser (not including any sub-adviser whose role is primarily portfolio management and is subcontracted with or overseen by another investment adviser), and any entity controlling, controlled by, or under common control with the investment adviser that provides ongoing services to the registrant that were not pre-approved pursuant to paragraph (c)(7)(ii) of Rule 2-01 of Regulation S-X is compatible with maintaining the principal accountant's independence. |
| (i) | Not applicable. |
| (j) | Not applicable. |
Item 5. Audit Committee of Listed Registrants.
Not applicable.
Item 6. Investments.
| (a) | Schedule of Investments in securities of unaffiliated issuers as of the close of the reporting period is included as part of the report to shareholders filed under Item 7 of this form. |
| (b) | Not applicable. |
Item 7. Financial Statements and Financial Highlights for Open-End Management Investment Companies.
The financial statements including the financial highlights are attached herewith.
| Touchstone Funds Group Trust |
| Touchstone Active Bond Fund |
| Touchstone Ares Credit Opportunities Fund |
| Touchstone Dividend Equity Fund |
| Touchstone High Yield Fund |
| Touchstone Impact Bond Fund |
| Touchstone Mid Cap Fund |
| Touchstone Mid Cap Value Fund |
| Touchstone Sands Capital International Growth Equity Fund |
| Touchstone Sands Capital Select Growth Fund |
| Touchstone Small Cap Fund |
| Touchstone Small Cap Value Fund |
| Touchstone Ultra Short Duration Fixed Income Fund |

| Principal Amount | Market Value | |||
| Corporate Bonds — 39.1% | ||||
| Financials — 10.4% | ||||
| $ 783,000 | AerCap Ireland Capital DAC / AerCap Global Aviation Trust (Ireland), 3.000%, 10/29/28 | $ 739,192 | ||
| 1,107,000 | American Express Co., 5.282%, 7/27/29 | 1,146,151 | ||
| 876,000 | American Tower Corp. REIT, 5.900%, 11/15/33 | 940,514 | ||
| 905,000 | Ares Capital Corp., 3.250%, 7/15/25 | 891,471 | ||
| 897,000 | Bank of America Corp., 2.687%, 4/22/32 | 799,278 | ||
| 647,000 | Bank of America Corp., 3.705%, 4/24/28 | 637,473 | ||
| 775,000 | Bank of Montreal (Canada), 3.803%, 12/15/32 | 752,924 | ||
| 862,000 | Bank of New York Mellon Corp. (The), 5.834%, 10/25/33 | 932,725 | ||
| 853,000 | Bank of Nova Scotia (The) (Canada), 3.625%, 10/27/81 | 767,651 | ||
| 1,282,000 | Barclays PLC (United Kingdom), 2.894%, 11/24/32 | 1,123,346 | ||
| 522,000 | Berkshire Hathaway Finance Corp., 4.250%, 1/15/49 | 482,478 | ||
| 1,505,000 | Citigroup, Inc., 4.542%, 9/19/30 | 1,505,670 | ||
| 550,000 | Citigroup, Inc., 6.174%, 5/25/34 | 586,350 | ||
| 883,000 | Citizens Bank NA, 4.575%, 8/9/28 | 881,704 | ||
| 1,172,000 | Corestates Capital III, 144a, (TSFR3M + 0.832%), 5.950%, 2/15/27(A) | 1,155,154 | ||
| 1,031,000 | Goldman Sachs Group, Inc. (The), 2.615%, 4/22/32 | 910,514 | ||
| 454,000 | Goldman Sachs Group, Inc. (The), 3.691%, 6/5/28 | 446,693 | ||
| 1,083,000 | JPMorgan Chase & Co., 2.956%, 5/13/31 | 995,347 | ||
| 831,000 | JPMorgan Chase & Co., 3.509%, 1/23/29 | 811,082 | ||
| 1,047,000 | Macquarie Airfinance Holdings Ltd. (United Kingdom), 144a, 6.400%, 3/26/29 | 1,091,370 | ||
| 1,055,000 | Mastercard, Inc., 2.000%, 11/18/31 | 910,766 | ||
| 813,000 | Morgan Stanley, 3.950%, 4/23/27 | 804,671 | ||
| 705,000 | Morgan Stanley, 5.297%, 4/20/37 | 708,986 | ||
| 802,000 | New York Life Global Funding, 144a, 4.550%, 1/28/33 | 804,600 | ||
| 1,022,292 | Northwestern Mutual Life Insurance Co. (The), 144a, 3.850%, 9/30/47 | 823,172 | ||
| 1,392,000 | PNC Capital Trust, (TSFR3M + 0.832%), 5.847%, 6/1/28(A) | 1,354,918 | ||
| 940,000 | Royal Bank of Canada (Canada), MTN, 4.969%, 8/2/30 | 963,738 | ||
| 1,364,000 | State Street Corp., (TSFR3M + 1.262%), 6.208%, 6/15/47(A) | 1,183,122 | ||
| 1,625,000 | Truist Bank, Ser A, (TSFR3M + 0.932%), 6.050%, 5/15/27(A) | 1,604,668 | ||
| 684,000 | US Bancorp, 4.967%, 7/22/33 | 682,035 | ||
| 27,437,763 | ||||
| Consumer Discretionary — 4.6% | ||||
| 1,534,000 | 7-Eleven, Inc., 144a, 1.800%, 2/10/31 | 1,291,876 | ||
| 1,016,000 | Delta Air Lines, Inc. / SkyMiles IP Ltd., 144a, 4.750%, 10/20/28 | 1,014,363 | ||
| 782,000 | Ford Motor Credit Co. LLC, 5.303%, 9/6/29 | 779,609 | ||
| 1,933,000 | General Motors Financial Co., Inc., 3.100%, 1/12/32 | 1,689,675 | ||
| 481,000 | Home Depot, Inc. (The), 5.950%, 4/1/41 | 539,891 | ||
| 847,000 | Hyundai Capital America, 144a, 5.350%, 3/19/29 | 872,058 | ||
| 1,017,000 | Imperial Brands Finance PLC (United Kingdom), 144a, 6.125%, 7/27/27 | 1,057,468 | ||
| 953,000 | Lowe's Cos., Inc., 4.500%, 4/15/30 | 964,375 | ||
| 748,000 | Mattel, Inc., 5.450%, 11/1/41 | 714,745 | ||
| 1,238,000 | Meritage Homes Corp., 144a, 3.875%, 4/15/29 | 1,182,979 | ||
| 992,000 | Toll Brothers Finance Corp., 3.800%, 11/1/29 | 961,929 | ||
| 1,329,000 | Warnermedia Holdings, Inc., 5.141%, 3/15/52 | 1,025,203 | ||
| 12,094,171 | ||||
| Industrials — 4.4% | ||||
| 1,057,000 | Amcor Flexibles North America, Inc., 2.630%, 6/19/30 | 950,045 | ||
| 853,000 | Burlington Northern Santa Fe LLC, 5.750%, 5/1/40 | 930,859 | ||
| 771,000 | FedEx Corp., 5.100%, 1/15/44 | 750,611 | ||
| 1,085,000 | Ingersoll Rand, Inc., 5.176%, 6/15/29 | 1,121,759 | ||
| 1,214,000 | John Deere Capital Corp., MTN, 5.100%, 4/11/34 | 1,271,530 | ||
| 692,000 | Norfolk Southern Corp., 4.837%, 10/1/41 | 676,695 | ||
| Principal Amount | Market Value | |||
| Corporate Bonds — 39.1% (Continued) | ||||
| Industrials — 4.4% (Continued) | ||||
| $ 580,000 | Penske Truck Leasing Co. LP / PTL Finance Corp., 144a, 5.350%, 1/12/27 | $ 590,953 | ||
| 1,478,000 | Textron Financial Corp., 144a, (TSFR3M + 1.997%), 7.115%, 2/15/42(A) | 1,325,233 | ||
| 752,000 | Timken Co. (The), 4.500%, 12/15/28 | 749,977 | ||
| 1,110,000 | Waste Management, Inc., 4.875%, 2/15/34 | 1,143,572 | ||
| 1,574,000 | Weir Group PLC (The) (United Kingdom), 144a, 2.200%, 5/13/26 | 1,513,796 | ||
| 570,000 | WestRock MWV LLC, 8.200%, 1/15/30 | 665,046 | ||
| 11,690,076 | ||||
| Consumer Staples — 3.9% | ||||
| 617,000 | Anheuser-Busch Cos. LLC / Anheuser-Busch InBev Worldwide, Inc. (Belgium), 4.900%, 2/1/46 | 606,949 | ||
| 367,000 | Archer-Daniels-Midland Co., 5.375%, 9/15/35 | 391,323 | ||
| 84,000 | Archer-Daniels-Midland Co., 5.935%, 10/1/32 | 92,449 | ||
| 1,052,000 | Ashtead Capital, Inc. (United Kingdom), 144a, 4.000%, 5/1/28 | 1,024,399 | ||
| 938,000 | BAT Capital Corp. (United Kingdom), 2.259%, 3/25/28 | 872,345 | ||
| 1,617,000 | Coca-Cola Co. (The), 2.500%, 3/15/51 | 1,057,026 | ||
| 200,000 | Coruripe Netherlands BV (Brazil), 144a, 10.000%, 2/10/27 | 189,174 | ||
| 536,000 | Kroger Co. (The), 5.000%, 4/15/42 | 519,741 | ||
| 326,000 | Kroger Co. (The), 5.650%, 9/15/64 | 327,438 | ||
| 795,000 | Mars, Inc., 144a, 3.875%, 4/1/39 | 711,768 | ||
| 1,668,000 | Pernod Ricard International Finance LLC, 144a, 1.625%, 4/1/31 | 1,390,264 | ||
| 1,149,000 | Philip Morris International, Inc., 5.375%, 2/15/33 | 1,200,639 | ||
| 568,000 | Starbucks Corp., 3.350%, 3/12/50 | 417,216 | ||
| 133,739 | TransJamaican Highway Ltd. (Jamaica), 5.750%, 10/10/36 | 123,040 | ||
| 687,000 | Tyson Foods, Inc., 5.400%, 3/15/29 | 712,997 | ||
| 686,000 | Walmart, Inc., 4.500%, 9/9/52 | 665,797 | ||
| 10,302,565 | ||||
| Energy — 3.5% | ||||
| 200,000 | 3R Lux Sarl (Brazil), 144a, 9.750%, 2/5/31 | 210,742 | ||
| 1,070,000 | Aker BP ASA (Norway), 144a, 5.125%, 10/1/34 | 1,056,336 | ||
| 954,000 | Cheniere Energy Partners LP, 3.250%, 1/31/32 | 853,124 | ||
| 300,000 | Cheniere Energy Partners LP, 4.000%, 3/1/31 | 283,965 | ||
| 1,054,000 | DCP Midstream Operating LP, 144a, 6.750%, 9/15/37 | 1,165,522 | ||
| 1,011,000 | HF Sinclair Corp., 5.000%, 2/1/28 | 1,005,793 | ||
| 562,413 | MC Brazil Downstream Trading SARL (Brazil), 144a, 7.250%, 6/30/31 | 481,267 | ||
| 988,000 | Midwest Connector Capital Co. LLC, 144a, 4.625%, 4/1/29 | 981,672 | ||
| 1,052,000 | NGPL PipeCo LLC, 144a, 7.768%, 12/15/37 | 1,244,185 | ||
| 887,000 | Occidental Petroleum Corp., 7.950%, 6/15/39 | 1,062,326 | ||
| 100,000 | Petroleos del Peru SA (Peru), 144a, 4.750%, 6/19/32 | 78,690 | ||
| 100,000 | Petroleos del Peru SA (Peru), 144a, 5.625%, 6/19/47 | 68,192 | ||
| 827,000 | Western Midstream Operating LP, 5.250%, 2/1/50 | 750,540 | ||
| 35,000 | YPF SA (Argentina), 144a, 6.950%, 7/21/27 | 34,050 | ||
| 9,276,404 | ||||
| Health Care — 3.0% | ||||
| 692,000 | AbbVie, Inc., 4.450%, 5/14/46 | 645,323 | ||
| 777,000 | Alcon Finance Corp. (Switzerland), 144a, 3.800%, 9/23/49 | 628,535 | ||
| 910,000 | Amgen, Inc., 5.150%, 3/2/28 | 937,058 | ||
| 654,000 | Becton Dickinson & Co., 4.685%, 12/15/44 | 610,662 | ||
| 723,000 | CommonSpirit Health, 4.187%, 10/1/49 | 614,915 | ||
| 661,000 | CVS Health Corp., 5.125%, 7/20/45 | 615,271 | ||
| 884,000 | DH Europe Finance II Sarl, 3.250%, 11/15/39 | 744,962 | ||
| Principal Amount | Market Value | |||
| Corporate Bonds — 39.1% (Continued) | ||||
| Health Care — 3.0% (Continued) | ||||
| $ 795,000 | Elevance Health, Inc., 4.750%, 2/15/33 | $ 803,479 | ||
| 708,000 | Thermo Fisher Scientific, Inc., 5.404%, 8/10/43 | 752,684 | ||
| 911,000 | UnitedHealth Group, Inc., 3.500%, 8/15/39 | 784,113 | ||
| 922,000 | Viatris, Inc., 2.700%, 6/22/30 | 818,724 | ||
| 7,955,726 | ||||
| Communication Services — 2.9% | ||||
| 677,000 | AT&T, Inc., 3.800%, 12/1/57 | 511,259 | ||
| 536,000 | AT&T, Inc., 4.500%, 5/15/35 | 520,345 | ||
| 432,000 | Charter Communications Operating LLC / Charter Communications Operating Capital, 6.384%, 10/23/35 | 440,543 | ||
| 602,000 | Charter Communications Operating LLC / Charter Communications Operating Capital, 6.484%, 10/23/45 | 580,549 | ||
| 673,000 | Comcast Corp., 4.000%, 3/1/48 | 563,215 | ||
| 328,000 | Paramount Global, 4.200%, 5/19/32 | 290,615 | ||
| 1,148,000 | Rogers Communications, Inc. (Canada), 5.300%, 2/15/34 | 1,166,738 | ||
| 991,000 | T-Mobile USA, Inc., 3.875%, 4/15/30 | 963,373 | ||
| 472,000 | T-Mobile USA, Inc., 5.750%, 1/15/54 | 501,119 | ||
| 932,000 | Verizon Communications, Inc., 2.987%, 10/30/56 | 610,329 | ||
| 1,404,000 | Videotron Ltd. (Canada), 144a, 3.625%, 6/15/29 | 1,340,424 | ||
| 7,488,509 | ||||
| Information Technology — 2.2% | ||||
| 1,203,000 | Apple, Inc., 4.650%, 2/23/46 | 1,193,020 | ||
| 1,265,000 | Broadcom, Inc., 144a, 3.419%, 4/15/33 | 1,148,154 | ||
| 126,000 | Cisco Systems, Inc., 4.850%, 2/26/29 | 130,259 | ||
| 1,098,000 | Marvell Technology, Inc., 2.950%, 4/15/31 | 990,947 | ||
| 566,000 | Micron Technology, Inc., 2.703%, 4/15/32 | 493,969 | ||
| 236,000 | Micron Technology, Inc., 6.750%, 11/1/29 | 259,151 | ||
| 1,482,000 | Microsoft Corp., 2.525%, 6/1/50 | 1,015,748 | ||
| 332,000 | Oracle Corp., 3.600%, 4/1/40 | 275,704 | ||
| 266,000 | Oracle Corp., 4.300%, 7/8/34 | 257,271 | ||
| 5,764,223 | ||||
| Utilities — 2.0% | ||||
| 1,297,000 | CMS Energy Corp., 4.750%, 6/1/50 | 1,251,570 | ||
| 616,000 | Duke Energy Progress LLC, 4.150%, 12/1/44 | 539,838 | ||
| 614,000 | Edison International, 4.125%, 3/15/28 | 608,311 | ||
| 763,000 | Electricite de France SA (France), 144a, 4.875%, 9/21/38 | 730,778 | ||
| 959,000 | Ohio Power Co., Ser R, 2.900%, 10/1/51 | 629,269 | ||
| 1,054,000 | Pacific Gas and Electric Co., 3.500%, 8/1/50 | 761,188 | ||
| 738,000 | PacifiCorp., 5.750%, 4/1/37 | 781,349 | ||
| 5,302,303 | ||||
| Real Estate — 1.3% | ||||
| 837,000 | Crown Castle International Corp. REIT, 3.650%, 9/1/27 | 820,379 | ||
| 1,017,000 | Invitation Homes Operating Partnership LP REIT, 4.150%, 4/15/32 | 970,680 | ||
| 595,000 | Sabra Health Care LP REIT, 5.125%, 8/15/26 | 598,337 | ||
| 374,000 | Store Capital LLC REIT, 2.700%, 12/1/31 | 317,482 | ||
| 116,000 | Store Capital LLC REIT, 2.750%, 11/18/30 | 101,378 | ||
| 635,000 | Store Capital LLC REIT, 4.625%, 3/15/29 | 622,071 | ||
| 3,430,327 | ||||
| Materials — 0.9% | ||||
| 421,000 | Braskem America Finance Co. (Brazil), 144a, 7.125%, 7/22/41 | 405,236 | ||
| 120,000 | Braskem Idesa SAPI (Mexico), 144a, 6.990%, 2/20/32 | 94,566 | ||
| 886,000 | Celanese US Holdings LLC, 6.379%, 7/15/32 | 946,423 | ||
| Principal Amount | Market Value | |||
| Corporate Bonds — 39.1% (Continued) | ||||
| Materials — 0.9% (Continued) | ||||
| $ 683,000 | Sherwin-Williams Co. (The), 4.500%, 6/1/47 | $ 622,305 | ||
| 200,000 | WE Soda Investments Holding PLC (Turkey), 144a, 9.500%, 10/6/28 | 207,818 | ||
| 2,276,348 | ||||
| Total Corporate Bonds | $103,018,415 | |||
| U.S. Treasury Obligations — 21.2% | ||||
| 2,180,000 | U.S. Treasury Bond, 2.250%, 2/15/52 | 1,484,273 | ||
| 1,730,000 | U.S. Treasury Bond, 2.875%, 5/15/52 | 1,352,779 | ||
| 1,995,000 | U.S. Treasury Bond, 4.125%, 8/15/44 | 1,977,232 | ||
| 1,150,000 | U.S. Treasury Bond, 4.250%, 2/15/54 | 1,170,305 | ||
| 2,430,000 | U.S. Treasury Bond, 4.250%, 8/15/54 | 2,478,220 | ||
| 2,900,000 | U.S. Treasury Note, 3.375%, 5/15/33 | 2,816,965 | ||
| 839,000 | U.S. Treasury Note, 3.875%, 8/15/34 | 843,982 | ||
| 6,765,000 | U.S. Treasury Note, 4.000%, 8/31/26 | 6,774,249 | ||
| 7,830,000 | U.S. Treasury Note, 4.000%, 1/31/29 | 7,958,461 | ||
| 105,000 | U.S. Treasury Note, 4.000%, 2/15/34 | 106,690 | ||
| 5,265,000 | U.S. Treasury Note, 4.375%, 7/31/26 | 5,327,933 | ||
| 4,750,000 | U.S. Treasury Note, 4.375%, 11/30/28 | 4,893,057 | ||
| 5,360,000 | U.S. Treasury Note, 4.375%, 5/15/34 | 5,607,062 | ||
| 10,590,000 | U.S. Treasury Note, 4.625%, 4/30/29 | 11,051,658 | ||
| 2,155,000 | U.S. Treasury Note, 4.875%, 5/31/26 | 2,194,396 | ||
| Total U.S. Treasury Obligations | $56,037,262 | |||
| Non-Agency Collateralized Mortgage Obligations — 8.6% | ||||
| 826 | Adjustable Rate Mortgage Trust, Ser 2004-4, Class 3A1, 4.888%, 3/25/35(A)(B) | 812 | ||
| 975,761 | Agate Bay Mortgage Trust, Ser 2015-7, Class B1, 144a, 3.642%, 10/25/45(A)(B) | 925,167 | ||
| 1,520,666 | Agate Bay Mortgage Trust, Ser 2015-7, Class B2, 144a, 3.642%, 10/25/45(A)(B) | 1,439,314 | ||
| 729,326 | Angel Oak Mortgage Trust, Ser 2024-1, Class A1, 144a, 5.210%, 8/25/68(A)(B) | 733,021 | ||
| 795,873 | AOMT, Ser 2024-6, Class A1, 144a, 4.650%, 11/25/67(A)(B) | 787,816 | ||
| 505,944 | COLT Mortgage Loan Trust, Ser 2022-6, Class A1, 144a, 4.650%, 6/27/67(A)(B) | 502,047 | ||
| 327,197 | CSMC Trust, Ser 2013-7, Class B3, 144a, 3.545%, 8/25/43(A)(B) | 305,864 | ||
| 362,933 | CSMC Trust, Ser 2014-OAK1, Class B4, 144a, 3.640%, 11/25/44(A)(B) | 349,340 | ||
| 689,065 | CSMC Trust, Ser 2015-1, Class B3, 144a, 3.895%, 1/25/45(A)(B) | 660,228 | ||
| 755,293 | CSMC Trust, Ser 2015-2, Class B4, 144a, 3.884%, 2/25/45(A)(B) | 715,792 | ||
| 655,943 | CSMC Trust, Ser 2015-WIN1, Class B3, 144a, 3.768%, 12/25/44(A)(B) | 628,245 | ||
| 748,618 | CSMC Trust, Ser 2018-J1, Class B2, 144a, 3.578%, 2/25/48(A)(B) | 693,924 | ||
| 973,166 | Deephaven Residential Mortgage Trust, Ser 2022-2, Class A1, 144a, 4.300%, 3/25/67(A)(B) | 951,286 | ||
| 1,115,810 | EverBank Mortgage Loan Trust, Ser 2018-1, Class B2, 144a, 3.574%, 2/25/48(A)(B) | 1,017,830 | ||
| 1,021,804 | EverBank Mortgage Loan Trust, Ser 2018-1, Class B3, 144a, 3.574%, 2/25/48(A)(B) | 928,837 | ||
| 20,561 | Galton Funding Mortgage Trust, Ser 2019-1, Class A22, 144a, 4.000%, 2/25/59(A)(B) | 19,782 | ||
| 1,026,943 | GCAT Trust, Ser 2022-NQM2, Class A1, 144a, 4.210%, 2/25/67(A)(B) | 1,015,109 | ||
| 272,262 | GS Mortgage-Backed Securities Corp. Trust, Ser 2020-PJ3, Class A14, 144a, 3.000%, 10/25/50(A)(B) | 239,971 | ||
| 681,487 | GS Mortgage-Backed Securities Trust, Ser 2022-PJ1, Class A8, 144a, 2.500%, 5/28/52(A)(B) | 604,927 | ||
| Principal Amount | Market Value | |||
| Non-Agency Collateralized Mortgage Obligations — 8.6% (Continued) | ||||
| $ 13,826 | JP Morgan Mortgage Trust, Ser 2005-A1, Class 2A1, 6.185%, 2/25/35(A)(B) | $ 13,619 | ||
| 1,487 | JP Morgan Mortgage Trust, Ser 2005-A2, Class 7CB1, 5.502%, 4/25/35(A)(B) | 1,506 | ||
| 14,492 | JP Morgan Mortgage Trust, Ser 2006-A4, Class 2A2, 5.822%, 6/25/36(A)(B) | 10,297 | ||
| 368,422 | JP Morgan Mortgage Trust, Ser 2015-IVR2, Class B3, 144a, 6.925%, 1/25/45(A)(B) | 369,855 | ||
| 1,421,312 | JP Morgan Mortgage Trust, Ser 2017-1, Class B2, 144a, 3.448%, 1/25/47(A)(B) | 1,293,738 | ||
| 180,690 | JP Morgan Mortgage Trust, Ser 2019-INV1, Class A15, 144a, 4.000%, 10/25/49(A)(B) | 173,001 | ||
| 1,122,565 | JP Morgan Mortgage Trust, Ser 2021-11, Class A3, 144a, 2.500%, 1/25/52(A)(B) | 944,386 | ||
| 15,151 | MASTR Alternative Loan Trust, Ser 2004-7, Class 10A1, 6.000%, 6/25/34 | 15,126 | ||
| 730,474 | Mello Mortgage Capital Acceptance, Ser 2022-INV2, Class A15, 144a, 3.000%, 4/25/52(A)(B) | 632,174 | ||
| 1,100,000 | Mill City Mortgage Loan Trust, Ser 2016-1, Class B2, 144a, 3.933%, 4/25/57(A)(B) | 1,043,556 | ||
| 947,979 | Mill City Mortgage Loan Trust, Ser 2018-3, Class M3, 144a, 3.250%, 8/25/58(A)(B) | 847,879 | ||
| 134,842 | Residential Asset Securitization Trust, Ser 2006-A1, Class 1A3, 6.000%, 4/25/36 | 58,828 | ||
| 80,877 | Sequoia Mortgage Trust, Ser 2013-10, Class B2, 144a, 3.534%, 8/25/43(A)(B) | 78,573 | ||
| 85,036 | Sequoia Mortgage Trust, Ser 2013-5, Class B1, 144a, 3.491%, 5/25/43(A)(B) | 82,596 | ||
| 517,823 | Sequoia Mortgage Trust, Ser 2017-2, Class A1, 144a, 3.500%, 2/25/47(A)(B) | 476,680 | ||
| 1,000,000 | Towd Point Mortgage Trust, Ser 2017-1, Class B1, 144a, 3.852%, 10/25/56(A)(B) | 939,151 | ||
| 800,000 | Towd Point Mortgage Trust, Ser 2017-4, Class B1, 144a, 3.638%, 6/25/57(A)(B) | 710,371 | ||
| 800,000 | Towd Point Mortgage Trust, Ser 2019-4, Class A2, 144a, 3.250%, 10/25/59(A)(B) | 730,562 | ||
| 823,238 | Verus Securitization Trust, Ser 2022-3, Class A1, 144a, 4.130%, 2/25/67(A)(B) | 793,666 | ||
| 39,854 | Washington Mutual Mortgage Pass-Through Certificates, Ser 2005-9, Class 2A4, 5.500%, 11/25/35 | 35,715 | ||
| 887,300 | Wells Fargo Mortgage Backed Securities Trust, Ser 2021-RR1, Class A3, 144a, 2.500%, 12/25/50(A)(B) | 799,264 | ||
| Total Non-Agency Collateralized Mortgage Obligations | $22,569,855 | |||
| U.S. Government Mortgage-Backed Obligations — 7.4% | ||||
| 34,338 | FHLMC, Pool #1Q0339, (RFUCCT1Y + 1.889%), 6.655%, 4/1/37(A) | 34,889 | ||
| 5,525 | FHLMC, Pool #A12886, 5.000%, 8/1/33 | 5,613 | ||
| 40,204 | FHLMC, Pool #A13842, 6.000%, 9/1/33 | 41,682 | ||
| 3,392 | FHLMC, Pool #A21415, 5.000%, 5/1/34 | 3,481 | ||
| 8,340 | FHLMC, Pool #A35682, 5.000%, 7/1/35 | 8,519 | ||
| 3,651 | FHLMC, Pool #A36523, 5.000%, 8/1/35 | 3,732 | ||
| 16,919 | FHLMC, Pool #A46590, 5.000%, 8/1/35 | 17,397 | ||
| 1,868 | FHLMC, Pool #A64971, 5.500%, 8/1/37 | 1,928 | ||
| 1,262,346 | FHLMC, Pool #A89148, 4.000%, 10/1/39 | 1,248,685 | ||
| 32,240 | FHLMC, Pool #A96485, 4.500%, 1/1/41 | 32,634 | ||
| 206,935 | FHLMC, Pool #A97897, 4.500%, 4/1/41 | 209,467 | ||
| 9,536 | FHLMC, Pool #C62740, 7.000%, 1/1/32 | 9,909 | ||
| 6,831 | FHLMC, Pool #C72254, 6.500%, 7/1/32 | 7,062 | ||
| 2,451 | FHLMC, Pool #C90986, 7.000%, 6/1/26 | 2,546 | ||
| 6,081 | FHLMC, Pool #G02184, 5.000%, 4/1/36 | 6,240 | ||
| Principal Amount | Market Value | |||
| U.S. Government Mortgage-Backed Obligations — 7.4% (Continued) | ||||
| $ 1,068,988 | FHLMC, Pool #G05624, 4.500%, 9/1/39 | $ 1,082,056 | ||
| 97,560 | FHLMC, Pool #G05733, 5.000%, 11/1/39 | 100,583 | ||
| 6,831 | FHLMC, Pool #J13584, 3.500%, 11/1/25 | 6,778 | ||
| 795,136 | FHLMC REMIC, Pool #SD1436, 4.500%, 8/1/52 | 782,859 | ||
| 705,170 | FHLMC REMIC, Pool #SD1620, 5.000%, 9/1/52 | 706,218 | ||
| 712 | FNMA, Pool #255628, 5.500%, 2/1/25 | 721 | ||
| 1,335 | FNMA, Pool #540040, 7.500%, 6/1/28 | 1,332 | ||
| 5,647 | FNMA, Pool #561741, 7.500%, 1/1/31 | 5,831 | ||
| 9,462 | FNMA, Pool #640291, 7.000%, 8/1/32 | 9,823 | ||
| 8,430 | FNMA, Pool #670402, 6.500%, 6/1/32 | 8,731 | ||
| 60,920 | FNMA, Pool #745257, 6.000%, 1/1/36 | 64,229 | ||
| 40,527 | FNMA, Pool #748895, 6.000%, 12/1/33 | 40,770 | ||
| 28,647 | FNMA, Pool #810049, 5.500%, 3/1/35 | 29,600 | ||
| 20,869 | FNMA, Pool #819297, 6.000%, 9/1/35 | 21,933 | ||
| 437,312 | FNMA, Pool #881279, 5.000%, 11/1/36 | 450,353 | ||
| 13,510 | FNMA, Pool #889060, 6.000%, 1/1/38 | 14,585 | ||
| 30,420 | FNMA, Pool #889061, 6.000%, 1/1/38 | 32,068 | ||
| 981 | FNMA, Pool #895657, 6.500%, 8/1/36 | 991 | ||
| 53,686 | FNMA, Pool #905049, 5.500%, 11/1/36 | 55,875 | ||
| 146,015 | FNMA, Pool #928553, 5.500%, 8/1/37 | 151,965 | ||
| 105,632 | FNMA, Pool #931535, 5.500%, 7/1/39 | 106,320 | ||
| 75,137 | FNMA, Pool #AA3467, 4.500%, 4/1/39 | 75,972 | ||
| 118,608 | FNMA, Pool #AA4584, 4.500%, 4/1/39 | 119,927 | ||
| 27,882 | FNMA, Pool #AB1800, 4.000%, 11/1/40 | 27,550 | ||
| 15,353 | FNMA, Pool #AB2452, 4.000%, 3/1/26 | 15,246 | ||
| 1,377 | FNMA, Pool #AD3775, 4.500%, 3/1/25 | 1,380 | ||
| 22,001 | FNMA, Pool #AD6193, 5.000%, 6/1/40 | 22,183 | ||
| 41,565 | FNMA, Pool #AE1568, 4.000%, 9/1/40 | 41,070 | ||
| 220,485 | FNMA, Pool #AE2497, 4.500%, 9/1/40 | 222,939 | ||
| 27,376 | FNMA, Pool #AE5441, 5.000%, 10/1/40 | 28,193 | ||
| 71,374 | FNMA, Pool #AH1135, 5.000%, 1/1/41 | 73,503 | ||
| 8,112 | FNMA, Pool #AH3671, 4.000%, 2/1/26 | 8,056 | ||
| 218,293 | FNMA, Pool #AH6622, 4.000%, 3/1/41 | 215,693 | ||
| 212,895 | FNMA, Pool #AL0150, 4.000%, 2/1/41 | 210,360 | ||
| 37,585 | FNMA, Pool #AL0211, 5.000%, 4/1/41 | 38,707 | ||
| 257,947 | FNMA, Pool #AS0779, 4.000%, 10/1/43 | 255,082 | ||
| 1,813,301 | FNMA, Pool #BT7156, 2.000%, 8/1/51 | 1,518,217 | ||
| 703,947 | FNMA, Pool #BW2258, 4.500%, 7/1/52 | 692,338 | ||
| 1,230,640 | FNMA, Pool #FM4660, 2.000%, 10/1/35 | 1,133,982 | ||
| 1,223,690 | FNMA, Pool #FM4702, 2.500%, 10/1/50 | 1,073,246 | ||
| 1,846,699 | FNMA, Pool #FM5085, 2.000%, 12/1/50 | 1,542,791 | ||
| 863,792 | FNMA, Pool #FM8360, 2.500%, 8/1/51 | 758,475 | ||
| 840,722 | FNMA, Pool #FM8361, 2.500%, 8/1/51 | 735,058 | ||
| 1,056,788 | FNMA, Pool #FM9905, 2.500%, 12/1/51 | 917,555 | ||
| 906,468 | FNMA, Pool #FM9907, 2.500%, 12/1/51 | 787,897 | ||
| 701,986 | FNMA, Pool #FS2906, 5.000%, 9/1/52 | 702,343 | ||
| 1,691,419 | FNMA, Pool #FS7278, 5.000%, 11/1/53 | 1,689,883 | ||
| 783,941 | FNMA, Pool #MA4128, 2.000%, 9/1/40 | 689,036 | ||
| 521,502 | GNMA, Pool #4424, 5.000%, 4/20/39 | 535,900 | ||
| Total U.S. Government Mortgage-Backed Obligations | $19,439,987 | |||
| Agency Collateralized Mortgage Obligations — 6.6% | ||||
| 2,085,000 | FHLMC REMIC, Ser 4991, Class HB, 2.000%, 7/25/50 | 1,537,216 | ||
| 2,850,000 | FHLMC REMIC, Ser 5178, Class CV, 2.000%, 11/25/40 | 2,149,472 | ||
| 76,672 | FNMA REMIC, Ser 2003-32, Class BZ, 6.000%, 11/25/32 | 79,419 | ||
| 6,918 | FNMA REMIC, Ser 2015-51, Class KC, 3.000%, 6/25/45 | 6,656 | ||
| 1,420,000 | FNMA REMIC, Ser 2017-37, Class AY, 3.000%, 5/25/47 | 1,153,687 | ||
| Principal Amount | Market Value | |||
| Agency Collateralized Mortgage Obligations — 6.6% (Continued) | ||||
| $ 287,670 | FNMA REMIC, Ser 2017-90, Class KA, 3.000%, 11/25/47 | $ 273,514 | ||
| 1,800,000 | FNMA REMIC, Ser 2019-35, Class KB, 3.000%, 7/25/49 | 1,479,682 | ||
| 2,500,000 | FNMA REMIC, Ser 2022-16, Class KB, 2.500%, 11/25/49 | 1,978,354 | ||
| 2,550,000 | FNMA REMIC, Ser 2022-17, Class UV, 3.000%, 7/25/42 | 2,197,682 | ||
| 510,011 | FNMA REMIC, Ser 2023-9, Class BZ, 4.500%, 3/25/53 | 468,379 | ||
| 30,464 | FNMA Trust, Ser 2004-W15, Class 2AF, (SOFR30A + 0.364%), 5.645%, 8/25/44(A) | 30,160 | ||
| 522,061 | GNMA, Ser 2010-169, Class AW, 4.500%, 12/20/40 | 524,427 | ||
| 3,728,139 | GNMA, Ser 2012-147, Class IO, 0.539%, 4/16/54(A)(B)(C) | 38,783 | ||
| 1,348,612 | GNMA, Ser 2016-113, Class IO, 1.169%, 2/16/58(A)(B)(C) | 65,890 | ||
| 7,187,637 | GNMA, Ser 2016-140, Class IO, 0.736%, 5/16/58(A)(B)(C) | 258,659 | ||
| 1,650,000 | GNMA, Ser 2016-83, Class PB, 3.000%, 6/20/46 | 1,353,606 | ||
| 2,500,000 | GNMA, Ser 2018-112, Class YC, 3.500%, 8/20/48 | 2,111,029 | ||
| 350,000 | GNMA, Ser 2022-200, Class PL, 5.500%, 9/20/52 | 368,354 | ||
| 1,700,000 | GNMA, Ser 2022-50, Class KV, 3.000%, 6/20/42 | 1,441,083 | ||
| Total Agency Collateralized Mortgage Obligations | $17,516,052 | |||
| Commercial Mortgage-Backed Securities — 6.5% | ||||
| 500,000 | BANK, Ser 2018-BN14, Class A3, 3.966%, 9/15/60 | 492,142 | ||
| 970,000 | BANK, Ser 2020-BN26, Class A4, 2.403%, 3/15/63 | 864,817 | ||
| 1,230,000 | BANK, Ser 2022-BNK39, Class A4, 2.928%, 2/15/55(A)(B) | 1,103,667 | ||
| 525,000 | BBCMS Mortgage Trust, Ser 2024-5C27, Class AS, 6.410%, 7/15/57(A)(B) | 552,797 | ||
| 305,000 | Citigroup Commercial Mortgage Trust, Ser 2017-P8, Class AS, 3.789%, 9/15/50(A)(B) | 291,411 | ||
| 830,000 | Citigroup Commercial Mortgage Trust, Ser 2020-GC46, Class A5, 2.717%, 2/15/53 | 756,164 | ||
| 1,600,000 | CSMC, Ser 2021-B33, Class A1, 144a, 3.053%, 10/10/43 | 1,507,247 | ||
| 550,000 | Eleven Madison Trust Mortgage Trust, Ser 2015-11MD, Class C, 144a, 3.673%, 9/10/35(A)(B) | 519,800 | ||
| 750,000 | GS Mortgage Securities Corp. Trust, Ser 2020-UPTN, Class E, 144a, 3.354%, 2/10/37(A)(B) | 713,402 | ||
| 1,750,000 | GS Mortgage Securities Trust, Ser 2017-FARM, Class B, 144a, 3.659%, 1/10/43(A)(B) | 1,513,342 | ||
| 1,325,000 | GS Mortgage Securities Trust, Ser 2020-GC47, Class A5, 2.377%, 5/12/53 | 1,176,930 | ||
| 765,000 | HONO Mortgage Trust, Ser 2021-LULU, Class B, 144a, (TSFR1M + 1.564%), 6.661%, 10/15/36(A) | 735,327 | ||
| 528,000 | JP Morgan Chase Commercial Mortgage Securities Trust, Ser 2016-NINE, Class B, 144a, 2.949%, 9/6/38(A)(B) | 498,480 | ||
| 755,000 | JP Morgan Chase Commercial Mortgage Securities Trust, Ser 2017-JP7, Class A5, 3.454%, 9/15/50 | 722,822 | ||
| 515,000 | JPMBB Commercial Mortgage Securities Trust, Ser 2014-C25, Class AS, 4.065%, 11/15/47 | 489,730 | ||
| 1,200,000 | JPMorgan Chase Commercial Mortgage Securities Trust, Ser 2018-MINN, Class A, 144a, (TSFR1M + 1.317%), 6.414%, 11/15/35(A) | 1,115,420 | ||
| 1,210,000 | Morgan Stanley Capital I Trust, Ser 2018-H3, Class A5, 4.177%, 7/15/51 | 1,189,608 | ||
| 340,000 | UBS Commercial Mortgage Trust, Ser 2017-C1, Class AS, 3.724%, 6/15/50 | 323,310 | ||
| Principal Amount | Market Value | |||
| Commercial Mortgage-Backed Securities — 6.5% (Continued) | ||||
| $ 385,000 | Wells Fargo Commercial Mortgage Trust, Ser 2015-P2, Class AS, 4.013%, 12/15/48 | $ 379,338 | ||
| 2,380,000 | Wells Fargo Commercial Mortgage Trust, Ser 2019-C53, Class A4, 3.040%, 10/15/52 | 2,217,169 | ||
| Total Commercial Mortgage-Backed Securities | $17,162,923 | |||
| Asset-Backed Securities — 5.3% | ||||
| 1,100,000 | AB BSL CLO 2 Ltd. (Cayman Islands), Ser 2021-2A, Class B1, 144a, (TSFR3M + 1.912%), 7.213%, 4/15/34(A) | 1,100,986 | ||
| 944,425 | CF Hippolyta Issuer LLC, Ser 2020-1, Class A1, 144a, 1.690%, 7/15/60 | 913,836 | ||
| 783 | CIT Home Equity Loan Trust, Ser 2002-1, Class AF5, 7.210%, 2/25/33(A)(B) | 787 | ||
| 1,298,500 | Coinstar Funding LLC, Ser 2017-1A, Class A2, 144a, 5.216%, 4/25/47 | 1,150,825 | ||
| 1,239,938 | Driven Brands Funding LLC, Ser 2021-1A, Class A2, 144a, 2.791%, 10/20/51 | 1,124,817 | ||
| 85,510 | FHLMC Structured Pass Through Securities, Ser T-20, Class A5, 8.370%, 12/25/29(A)(B) | 90,034 | ||
| 1,524 | FNMA REMIC Trust, Ser 2001-W2, Class AF6, 6.089%, 10/25/31(A)(B) | 1,535 | ||
| 1,092,500 | Jack in the Box Funding LLC, Ser 2022-1A, Class A2I, 144a, 3.445%, 2/26/52 | 1,043,854 | ||
| 962,725 | Jersey Mike's Funding LLC, Ser 2019-1A, Class A2, 144a, 4.433%, 2/15/50 | 946,164 | ||
| 1,425,000 | Madison Park Funding XLIX Ltd. (Cayman Islands), Ser 2021-49A, Class B1, 144a, (TSFR3M + 1.962%), 7.241%, 10/19/34(A) | 1,427,262 | ||
| 268,953 | Mid-State Capital Corp. Trust, Ser 2005-1, Class M2, 7.079%, 1/15/40 | 271,904 | ||
| 1,161,000 | Neighborly Issuer LLC, Ser 2021-1A, Class A2, 144a, 3.584%, 4/30/51 | 1,075,348 | ||
| 1,096,875 | Planet Fitness Master Issuer LLC, Ser 2022-1A, Class A2I, 144a, 3.251%, 12/5/51 | 1,055,559 | ||
| 754,000 | TAL Advantage VII LLC, Ser 2020-1A, Class A, 144a, 2.050%, 9/20/45 | 704,793 | ||
| 950,000 | Trimaran Cavu Ltd. (Cayman Islands), Ser 2019-1A, Class C2, 144a, 5.539%, 7/20/32 | 930,927 | ||
| 800,000 | Verdelite Static CLO Ltd. (Jersey), Ser 2024-1A, Class B, 144a, (TSFR3M + 1.650%), 6.944%, 7/20/32(A) | 801,068 | ||
| 1,547,994 | Wendy's Funding LLC, Ser 2021-1A, Class A2II, 144a, 2.775%, 6/15/51 | 1,350,090 | ||
| Total Asset-Backed Securities | $13,989,789 | |||
| Sovereign Government Obligations — 1.1% | ||||
| 382,000 | Bahamas Government International Bond, 144a, 6.000%, 11/21/28 | 358,067 | ||
| 697,000 | Chile Government International Bond, 3.100%, 1/22/61 | 463,554 | ||
| 200,000 | Egypt Government International Bond, 144a, 5.800%, 9/30/27 | 188,863 | ||
| 200,000 | Egypt Government International Bond, 144a, 8.150%, 11/20/59 | 154,542 | ||
| 200,000 | Ghana Government International Bond, 144a, 7.625%, 5/16/29 | 104,250 | ||
| 200,000 | Ghana Government International Bond, 144a, 8.950%, 3/26/51 | 106,400 | ||
| 878,000 | Mexico Government International Bond, 3.771%, 5/24/61 | 573,458 | ||
| Principal Amount | Market Value | |||
| Sovereign Government Obligations — 1.1% (Continued) | ||||
| $ 200,000 | Nigeria Government International Bond, 8.250%, 9/28/51 | $ 159,500 | ||
| 736,000 | Republic of Poland Government International Bond, 5.500%, 3/18/54 | 751,736 | ||
| Total Sovereign Government Obligations | $2,860,370 | |||
| Shares | ||||
| Short-Term Investment Fund — 3.6% | ||||
| 9,334,152 | Dreyfus Government Cash Management, Institutional Shares, 4.80%∞Ω | 9,334,152 | ||
| Total Investment Securities—99.4% (Cost $269,487,905) | $261,928,805 | |||
| Other Assets in Excess of Liabilities — 0.6% | 1,626,829 | |||
| Net Assets — 100.0% | $263,555,634 | |||
| (A) | Variable rate security - Rate reflected is the rate in effect as of September 30, 2024. |
| (B) | Certain variable rate securities are not based on a published reference rate and spread but are determined by the issuer or agent and are based on current market conditions. These securities do not indicate a reference rate and spread in their description. |
| (C) | Interest only security - This type of security represents the right to receive the monthly interest payments on an underlying pool of mortgages. Payments of principal on the pool reduce the value of the “interest only” holding. |
| ∞ | Open-End Fund. |
| Ω | Represents the 7-Day SEC yield as of September 30, 2024. |
| Portfolio Abbreviations: |
| CLO – Collateralized Loan Obligation |
| DAC – Designated Activity Company |
| FHLMC – Federal Home Loan Mortgage Corporation |
| FNMA – Federal National Mortgage Association |
| GNMA – Government National Mortgage Association |
| ICE – Intercontinental Exchange, Inc. |
| IO – Interest Only |
| LLC – Limited Liability Company |
| LP – Limited Partnership |
| MTN – Medium Term Note |
| PLC – Public Limited Company |
| REIT – Real Estate Investment Trust |
| REMIC – Real Estate Mortgage Investment Conduit |
| RFUCCT1Y – FTSE USD IBOR Consumer Cash Fallbacks Term One year |
| SOFR30A – Secured Overnight Financing Rate 30 Day Average |
| TSFR1M – One Month Term Secured Overnight Financing Rate |
| TSFR3M – Three Month Term Secured Overnight Financing Rate |
| 144a - This is a restricted security that was sold in a transaction qualifying for the exemption under Rule 144a of the Securities Act of 1933. This security may be sold in transactions exempt from registration, normally to qualified institutional buyers. At September 30, 2024, these securities were valued at $69,489,415 or 26.4% of net assets. These securities were deemed liquid pursuant to procedures approved by the Board of Trustees. |
| Valuation Inputs at Reporting Date: | ||||
| Description | Level 1 | Level 2 | Level 3 | Total |
| Corporate Bonds | $— | $103,018,415 | $— | $103,018,415 |
| U.S. Treasury Obligations | — | 56,037,262 | — | 56,037,262 |
| Non-Agency Collateralized Mortgage Obligations | — | 22,569,855 | — | 22,569,855 |
| U.S. Government Mortgage-Backed Obligations | — | 19,439,987 | — | 19,439,987 |
| Agency Collateralized Mortgage Obligations | — | 17,516,052 | — | 17,516,052 |
| Commercial Mortgage-Backed Securities | — | 17,162,923 | — | 17,162,923 |
| Asset-Backed Securities | — | 13,989,789 | — | 13,989,789 |
| Sovereign Government Obligations | — | 2,860,370 | — | 2,860,370 |
| Short-Term Investment Fund | 9,334,152 | — | — | 9,334,152 |
| Other Financial Instruments | ||||
| Swap Agreements | ||||
| Credit contracts | — | 151 | — | 151 |
| Total | $9,334,152 | $252,594,804 | $— | $261,928,956 |
| Counterparty | Termination Date | Notional Amount(2) | Pay Fixed Rate | Clearinghouse | Underlying Bond | Value(3) | Premiums Paid/ (Received) | Unrealized Appreciation |
| Buy Protection: | ||||||||
| Wells Fargo | 12/20/29 | $10,460,000 | 5.000% | ICE | Markit CDX North America High Yield Series 43 5Y Index | $(763,284) | $(763,435) | $151 |
| (1) | If the Fund is a buyer of protection and a credit event occurs, as defined under the terms of that particular swap agreement, the Fund will either (i) receive from the seller of protection an amount equal to the notional amount of the swap and deliver the referenced obligation or underlying investments comprising the referenced index or (ii) receive a net settlement amount in the form of cash or investments equal to the notional amount of the swap less the recovery value of the referenced obligation or underlying investments comprising the referenced index. |
| (2) | The maximum potential amount the Fund could be required to pay as a seller of credit protection or receive as a buyer of credit protection if a credit event occurs as defined under the terms of that particular swap agreement. |
| (3) | The quoted market prices and resulting values for credit default swap agreements on the underlying bond serve as an indicator of the current status of the payment/performance risk and represent the likelihood of an expected liability (or profit) for the credit derivative had the notional amount of the swap agreement been closed/sold as of the period end. Decreasing market values (sell protection) or increasing market values (buy protection) when compared to the notional amount of the swap, represent a deterioration of the referenced entity's credit soundness and a greater likelihood or risk of default or other credit event occurring as defined under the terms of the agreement. |
| Principal Amount | Market Value | |||
| Corporate Bonds — 79.4% | ||||
| Communication Services — 13.0% | ||||
| $ 5,361,000 | Altice Financing SA (Luxembourg), 144a, 5.000%, 1/15/28 | $ 4,534,130 | ||
| 1,363,000 | Altice France Holding SA (Luxembourg), 144a, 10.500%, 5/15/27 | 470,271 | ||
| 1,659,000 | Altice France SA (France), 144a, 5.500%, 1/15/28 | 1,207,348 | ||
| 4,430,000 | ANGI Group LLC, 144a, 3.875%, 8/15/28 | 4,062,506 | ||
| 72,000 | Belo Corp., 7.250%, 9/15/27 | 74,365 | ||
| 675,000 | CCO Holdings LLC / CCO Holdings Capital Corp., 144a, 4.250%, 2/1/31 | 595,461 | ||
| 4,584,000 | CCO Holdings LLC / CCO Holdings Capital Corp., 144a, 5.000%, 2/1/28 | 4,459,199 | ||
| 6,580,000 | CCO Holdings LLC / CCO Holdings Capital Corp., 144a, 4.500%, 8/15/30(A) | 5,958,462 | ||
| 1,961,000 | CommScope LLC, 144a, 6.000%, 3/1/26(A) | 1,907,072 | ||
| 4,410,000 | CommScope LLC, 144a, 4.750%, 9/1/29 | 3,704,400 | ||
| 205,000 | CSC Holdings LLC, 144a, 3.375%, 2/15/31 | 145,540 | ||
| 76,000 | CSC Holdings LLC, 144a, 4.500%, 11/15/31 | 55,327 | ||
| 1,129,000 | CSC Holdings LLC, 144a, 6.500%, 2/1/29 | 935,299 | ||
| 1,315,000 | CSC Holdings LLC, 144a, 4.625%, 12/1/30 | 667,555 | ||
| 5,215,000 | CSC Holdings LLC, 144a, 5.750%, 1/15/30 | 2,699,183 | ||
| 416,000 | CSC Holdings LLC, 144a, 4.125%, 12/1/30 | 303,162 | ||
| 1,761,000 | DISH DBS Corp., 144a, 5.250%, 12/1/26 | 1,627,381 | ||
| 1,213,000 | DISH DBS Corp., 7.750%, 7/1/26 | 1,058,037 | ||
| 1,842,000 | DISH DBS Corp., 144a, 5.750%, 12/1/28 | 1,609,394 | ||
| 4,587,000 | Go Daddy Operating Co. LLC / GD Finance Co., Inc., 144a, 3.500%, 3/1/29 | 4,303,994 | ||
| 5,202,000 | Gray Television, Inc., 144a, 4.750%, 10/15/30 | 3,308,725 | ||
| 508,000 | Gray Television, Inc., 144a, 10.500%, 7/15/29 | 530,564 | ||
| 5,898,000 | Level 3 Financing, Inc., 144a, 4.875%, 6/15/29 | 4,954,320 | ||
| 1,586,000 | Level 3 Financing, Inc., 144a, 11.000%, 11/15/29 | 1,757,248 | ||
| 2,399,000 | Nexstar Media, Inc., 144a, 4.750%, 11/1/28 | 2,288,282 | ||
| 128,000 | Nexstar Media, Inc., 144a, 5.625%, 7/15/27 | 126,795 | ||
| 6,575,000 | Scripps Escrow II, Inc., 144a, 3.875%, 1/15/29 | 4,906,980 | ||
| 1,800,000 | Sirius XM Radio, Inc., 144a, 3.125%, 9/1/26 | 1,738,178 | ||
| 749,000 | Sirius XM Radio, Inc., 144a, 4.125%, 7/1/30 | 679,418 | ||
| 526,000 | Sirius XM Radio, Inc., 144a, 5.000%, 8/1/27 | 517,475 | ||
| 240,000 | Sirius XM Radio, Inc., 144a, 5.500%, 7/1/29 | 234,549 | ||
| 990,000 | Station Casinos LLC, 144a, 4.625%, 12/1/31 | 918,265 | ||
| 1,500,000 | Summer BC Holdco B SARL (Luxembourg), 144a, 5.750%, 10/31/26 | 1,669,725 | ||
| 2,794,000 | TEGNA, Inc., 4.625%, 3/15/28 | 2,666,092 | ||
| 1,200,000 | Telenet Finance Luxembourg Notes Sarl (Belgium), 144a, 5.500%, 3/1/28 | 1,173,000 | ||
| 3,051,000 | Telesat Canada / Telesat LLC (Canada), 144a, 5.625%, 12/6/26 | 1,452,082 | ||
| 1,000,000 | United Group BV (Slovenia), 144a, 3.625%, 2/15/28 | 1,064,706 | ||
| 1,036,000 | Univision Communications, Inc., 144a, 4.500%, 5/1/29 | 928,546 | ||
| 338,000 | Virgin Media Finance PLC (United Kingdom), 144a, 5.000%, 7/15/30 | 297,060 | ||
| 1,460,000 | Virgin Media Secured Finance PLC (United Kingdom), 144a, 4.500%, 8/15/30 | 1,298,791 | ||
| 3,127,000 | Virgin Media Vendor Financing Notes IV DAC (United Kingdom), 144a, 5.000%, 7/15/28 | 3,013,785 | ||
| 400,000 | Vmed O2 UK Financing I PLC (United Kingdom), 144a, 4.250%, 1/31/31 | 354,159 | ||
| 5,225,000 | Zayo Group Holdings, Inc., 144a, 4.000%, 3/1/27 | 4,672,850 | ||
| 80,929,681 | ||||
| Industrials — 10.0% | ||||
| 728,000 | Amsted Industries, Inc., 144a, 4.625%, 5/15/30 | 695,292 | ||
| 2,038,000 | ARD Finance SA (Luxembourg), 144a, 6.500%, 6/30/27(B) | 458,287 | ||
| Principal Amount | Market Value | |||
| Corporate Bonds — 79.4% (Continued) | ||||
| Industrials — 10.0% (Continued) | ||||
| $ 2,260,000 | Ardagh Packaging Finance PLC / Ardagh Holdings USA, Inc., 144a, 4.125%, 8/15/26† | $ 2,033,751 | ||
| 2,324,000 | Ardagh Packaging Finance PLC / Ardagh Holdings USA, Inc., 144a, 5.250%, 8/15/27 | 1,733,334 | ||
| 3,959,000 | Ardagh Packaging Finance PLC / Ardagh Holdings USA, Inc., 144a, 5.250%, 8/15/27 | 2,952,784 | ||
| 1,000,000 | BCP V Modular Services Finance II PLC (United Kingdom), 144a, 4.750%, 11/30/28 | 1,082,538 | ||
| 2,297,000 | Builders FirstSource, Inc., 144a, 6.375%, 3/1/34 | 2,385,136 | ||
| 1,440,000 | BWX Technologies, Inc., 144a, 4.125%, 4/15/29 | 1,383,700 | ||
| 2,620,000 | BWX Technologies, Inc., 144a, 4.125%, 6/30/28 | 2,526,932 | ||
| 2,589,000 | Chart Industries, Inc., 144a, 9.500%, 1/1/31 | 2,822,536 | ||
| 2,750,000 | Clean Harbors, Inc., 144a, 4.875%, 7/15/27 | 2,712,587 | ||
| 3,389,676 | CP Atlas Buyer, Inc., 144a, 7.000%, 12/1/28† | 3,138,286 | ||
| 3,079,000 | EMRLD Borrower LP / Emerald Co-Issuer, Inc., 144a, 6.625%, 12/15/30 | 3,174,991 | ||
| 1,465,000 | Gates Corp., 144a, 6.875%, 7/1/29 | 1,517,492 | ||
| 2,008,000 | GFL Environmental, Inc., 144a, 3.500%, 9/1/28 | 1,913,017 | ||
| 1,742,000 | GFL Environmental, Inc., 144a, 3.750%, 8/1/25 | 1,728,364 | ||
| 713,271 | GFL Environmental, Inc., 144a, 4.375%, 8/15/29 | 683,797 | ||
| 1,250,000 | Graphic Packaging International LLC, 144a, 3.750%, 2/1/30 | 1,170,538 | ||
| 4,434,000 | H&E Equipment Services, Inc., 144a, 3.875%, 12/15/28 | 4,162,852 | ||
| 450,000 | LABL, Inc., 144a, 8.625%, 10/1/31 | 447,976 | ||
| 451,000 | LABL, Inc., 144a, 10.500%, 7/15/27 | 451,782 | ||
| 2,866,000 | Madison IAQ LLC, 144a, 4.125%, 6/30/28 | 2,765,500 | ||
| 2,728,000 | OI European Group BV, 144a, 4.750%, 2/15/30 | 2,579,956 | ||
| 51,000 | Owens-Brockway Glass Container, Inc., 144a, 6.625%, 5/13/27 | 51,240 | ||
| 4,243,000 | Sealed Air Corp/Sealed Air Corp. US, 144a, 6.125%, 2/1/28 | 4,312,893 | ||
| 2,849,000 | Sensata Technologies BV, 144a, 4.000%, 4/15/29 | 2,715,731 | ||
| 535,000 | Sensata Technologies, Inc., 144a, 6.625%, 7/15/32 | 557,925 | ||
| 3,343,000 | Standard Industries, Inc., 144a, 4.375%, 7/15/30 | 3,164,438 | ||
| 450,000 | Summit Materials LLC / Summit Materials Finance Corp., 144a, 5.250%, 1/15/29 | 445,087 | ||
| 1,234,000 | Summit Materials LLC / Summit Materials Finance Corp., 144a, 7.250%, 1/15/31 | 1,305,813 | ||
| 160,000 | TransDigm, Inc., 144a, 6.750%, 8/15/28 | 164,653 | ||
| 1,967,000 | Trident TPI Holdings, Inc., 144a, 12.750%, 12/31/28 | 2,183,518 | ||
| 2,973,000 | Wilsonart LLC, 144a, 11.000%, 8/15/32 | 2,973,098 | ||
| 62,395,824 | ||||
| Energy — 10.0% | ||||
| 4,218,000 | Apache Corp., 5.100%, 9/1/40(A) | 3,753,743 | ||
| 1,577,000 | Archrock Partners LP / Archrock Partners Finance Corp., 144a, 6.250%, 4/1/28 | 1,584,298 | ||
| 1,436,000 | Archrock Partners LP / Archrock Partners Finance Corp., 144a, 6.625%, 9/1/32 | 1,472,532 | ||
| 111,000 | Ascent Resources Utica Holdings LLC / ARU Finance Corp., 144a, 5.875%, 6/30/29 | 109,665 | ||
| 2,527,000 | Ascent Resources Utica Holdings LLC / ARU Finance Corp., 144a, 7.000%, 11/1/26 | 2,529,416 | ||
| 187,000 | Ascent Resources Utica Holdings LLC / ARU Finance Corp., 144a, 8.250%, 12/31/28 | 191,566 | ||
| 2,560,000 | Cheniere Energy Partners LP, 3.250%, 1/31/32 | 2,289,306 | ||
| 239,000 | Cheniere Energy Partners LP, 4.000%, 3/1/31 | 226,225 | ||
| 4,741,000 | CITGO Petroleum Corp., 144a, 6.375%, 6/15/26 | 4,742,238 | ||
| 680,000 | Cullinan Holdco Scsp (Luxembourg), 144a, 4.625%, 10/15/26 | 669,364 | ||
| 900,000 | Cullinan Holdco Scsp (Luxembourg), 144a, (EUR003M + 4.750%), 8.435%, 10/15/26(C) | 911,770 | ||
| Principal Amount | Market Value | |||
| Corporate Bonds — 79.4% (Continued) | ||||
| Energy — 10.0% (Continued) | ||||
| $ 928,000 | EnLink Midstream LLC, 5.375%, 6/1/29 | $ 951,468 | ||
| 4,234,000 | EnLink Midstream Partners LP, 5.450%, 6/1/47 | 4,002,359 | ||
| 208,000 | EnLink Midstream Partners LP, 5.600%, 4/1/44 | 198,754 | ||
| 5,880,000 | Enviva Partners LP / Enviva Partners Finance Corp., 144a, 6.500%, 1/15/26 | 249,900 | ||
| 4,785,000 | EQM Midstream Partners LP, 6.500%, 7/15/48 | 4,947,250 | ||
| 4,356,000 | ITT Holdings LLC, 144a, 6.500%, 8/1/29 | 4,129,132 | ||
| 860,000 | Kodiak Gas Services LLC, 144a, 7.250%, 2/15/29 | 890,147 | ||
| 2,205,000 | Moss Creek Resources Holdings, Inc., 144a, 8.250%, 9/1/31 | 2,174,671 | ||
| 955,000 | NuStar Logistics LP, 5.625%, 4/28/27 | 959,278 | ||
| 2,110,000 | Summit Midstream Holdings LLC, 144a, 8.625%, 10/31/29 | 2,206,507 | ||
| 1,220,000 | Sunoco LP, 144a, 7.250%, 5/1/32 | 1,293,245 | ||
| 2,779,000 | Tallgrass Energy Partners LP / Tallgrass Energy Finance Corp., 144a, 6.000%, 12/31/30 | 2,640,043 | ||
| 1,045,000 | Tallgrass Energy Partners LP / Tallgrass Energy Finance Corp., 144a, 6.000%, 9/1/31 | 989,841 | ||
| 1,000,000 | Tallgrass Energy Partners LP / Tallgrass Energy Finance Corp., 144a, 7.375%, 2/15/29 | 1,012,568 | ||
| 2,582,000 | TerraForm Power Operating LLC, 144a, 5.000%, 1/31/28 | 2,555,231 | ||
| 1,750,000 | TerraForm Power Operating LLC, 144a, 4.750%, 1/15/30 | 1,674,854 | ||
| 4,734,426 | TGNR Intermediate Holdings LLC, 144a, 5.500%, 10/15/29 | 4,497,709 | ||
| 5,080,000 | Transocean, Inc., 6.800%, 3/15/38 | 4,146,528 | ||
| 4,308,000 | Western Midstream Operating LP, 5.250%, 2/1/50 | 3,909,706 | ||
| 61,909,314 | ||||
| Consumer Discretionary — 9.8% | ||||
| 3,795,000 | Allison Transmission, Inc., 144a, 4.750%, 10/1/27 | 3,733,800 | ||
| 480,000 | Asbury Automotive Group, Inc., 4.500%, 3/1/28 | 467,301 | ||
| 2,340,000 | Asbury Automotive Group, Inc., 144a, 4.625%, 11/15/29 | 2,231,828 | ||
| 1,025,000 | Ashton Woods USA LLC / Ashton Woods Finance Co., 144a, 6.625%, 1/15/28 | 1,034,014 | ||
| 2,120,000 | Bath & Body Works, Inc., 6.750%, 7/1/36 | 2,185,018 | ||
| 2,711,000 | Bath & Body Works, Inc., 6.875%, 11/1/35 | 2,824,996 | ||
| 92,000 | Bath & Body Works, Inc., 7.500%, 6/15/29 | 95,105 | ||
| 2,801,000 | Boyne USA, Inc., 144a, 4.750%, 5/15/29 | 2,692,177 | ||
| 1,882,000 | Caesars Entertainment, Inc., 144a, 4.625%, 10/15/29 | 1,789,976 | ||
| 780,000 | Caesars Entertainment, Inc., 144a, 7.000%, 2/15/30 | 814,665 | ||
| 957,000 | Caesars Entertainment, Inc., 144a, 8.125%, 7/1/27 | 976,623 | ||
| 0 | Carvana Co., 144a, 12.000%, 12/1/28(B) | 0 | ||
| 0 | Carvana Co., 144a, 13.000%, 6/1/30(B) | 0 | ||
| 1,588,000 | Churchill Downs, Inc., 144a, 4.750%, 1/15/28 | 1,557,012 | ||
| 1,200,000 | Churchill Downs, Inc., 144a, 5.500%, 4/1/27 | 1,195,661 | ||
| 837,000 | Clarios Global LP / Clarios US Finance Co., 144a, 8.500%, 5/15/27 | 839,468 | ||
| 1,227,000 | Clarios Global LP / Clarios US Finance Co., 144a, 6.250%, 5/15/26 | 1,226,698 | ||
| 1,146,000 | Cougar JV Subsidiary LLC, 144a, 8.000%, 5/15/32 | 1,211,619 | ||
| 1,000,000 | Ford Motor Co., 4.750%, 1/15/43 | 828,011 | ||
| 610,000 | Ford Motor Credit Co. LLC, 3.815%, 11/2/27 | 587,779 | ||
| 462,000 | Ford Motor Credit Co. LLC, 4.125%, 8/17/27(A) | 449,841 | ||
| 55,000 | Ford Motor Credit Co. LLC, 5.125%, 6/16/25 | 54,985 | ||
| 1,266,000 | Gap, Inc. (The), 144a, 3.625%, 10/1/29 | 1,145,176 | ||
| 4,531,000 | Hilton Domestic Operating Co., Inc., 144a, 3.750%, 5/1/29 | 4,298,057 | ||
| 129,000 | Lithia Motors, Inc., 144a, 3.875%, 6/1/29 | 120,386 | ||
| 1,222,000 | Lithia Motors, Inc., 144a, 4.375%, 1/15/31 | 1,137,281 | ||
| 1,803,000 | Live Nation Entertainment, Inc., 144a, 4.750%, 10/15/27(A) | 1,775,979 | ||
| 1,125,000 | Live Nation Entertainment, Inc., 144a, 6.500%, 5/15/27 | 1,147,459 | ||
| Principal Amount | Market Value | |||
| Corporate Bonds — 79.4% (Continued) | ||||
| Consumer Discretionary — 9.8% (Continued) | ||||
| $ 3,449,000 | MGM Resorts International, 4.750%, 10/15/28 | $ 3,379,812 | ||
| 2,006,000 | MGM Resorts International, 6.500%, 4/15/32 | 2,044,067 | ||
| 1,110,000 | Nissan Motor Co. Ltd. (Japan), 144a, 4.345%, 9/17/27 | 1,081,927 | ||
| 2,130,000 | Service Corp. International, 5.750%, 10/15/32 | 2,144,232 | ||
| 2,492,000 | Spirit Loyalty Cayman Ltd. / Spirit IP Cayman Ltd., 144a, 8.000%, 9/20/25 | 1,369,997 | ||
| 2,052,000 | Spirit Loyalty Cayman Ltd. / Spirit IP Cayman Ltd., 144a, 8.000%, 9/20/25 | 1,128,104 | ||
| 512,000 | United Airlines, Inc., 144a, 4.375%, 4/15/26(A) | 504,203 | ||
| 208,000 | United Airlines, Inc., 144a, 4.625%, 4/15/29 | 200,901 | ||
| 3,940,000 | Victoria's Secret & Co., 144a, 4.625%, 7/15/29 | 3,477,927 | ||
| 2,973,000 | Viking Cruises Ltd., 144a, 5.875%, 9/15/27 | 2,970,960 | ||
| 2,030,000 | Viking Ocean Cruises Ship VII Ltd., 144a, 5.625%, 2/15/29 | 2,025,852 | ||
| 909,000 | VistaJet Malta Finance PLC / Vista Management Holding, Inc. (Switzerland), 144a, 9.500%, 6/1/28 | 887,044 | ||
| 3,606,000 | Wynn Las Vegas LLC / Wynn Las Vegas Capital Corp., 144a, 5.250%, 5/15/27 | 3,608,434 | ||
| 61,244,375 | ||||
| Materials — 7.2% | ||||
| 1,015,000 | Avient Corp., 144a, 6.250%, 11/1/31 | 1,040,645 | ||
| 1,114,000 | Axalta Coating Systems LLC, 144a, 3.375%, 2/15/29 | 1,043,067 | ||
| 1,944,000 | Axalta Coating Systems LLC / Axalta Coating Systems Dutch Holding B BV, 144a, 4.750%, 6/15/27 | 1,927,522 | ||
| 4,864,000 | Ball Corp., 2.875%, 8/15/30 | 4,328,960 | ||
| 2,362,000 | CF Industries, Inc., 5.150%, 3/15/34 | 2,387,116 | ||
| 1,379,000 | Chemours Co. (The), 144a, 4.625%, 11/15/29 | 1,234,742 | ||
| 3,277,000 | Chemours Co. (The), 144a, 5.750%, 11/15/28 | 3,112,935 | ||
| 1,535,000 | Compass Minerals International, Inc., 144a, 6.750%, 12/1/27 | 1,530,160 | ||
| 2,371,000 | Constellium SE, 144a, 3.750%, 4/15/29 | 2,214,113 | ||
| 1,446,000 | FMG Resources August 2006 Pty Ltd. (Australia), 144a, 4.375%, 4/1/31 | 1,350,789 | ||
| 1,202,000 | FMG Resources August 2006 Pty Ltd. (Australia), 144a, 4.500%, 9/15/27 | 1,182,652 | ||
| 2,174,000 | Freeport-McMoRan, Inc., 5.400%, 11/14/34(A) | 2,255,368 | ||
| 2,330,000 | Freeport-McMoRan, Inc., 5.450%, 3/15/43(A) | 2,344,572 | ||
| 1,994,000 | Novelis Corp., 144a, 3.250%, 11/15/26 | 1,924,098 | ||
| 881,000 | Novelis Corp., 144a, 4.750%, 1/30/30 | 854,725 | ||
| 740,000 | OCI NV (Netherlands), 144a, 4.625%, 10/15/25 | 738,998 | ||
| 3,280,000 | OCI NV (Netherlands), 144a, 6.700%, 3/16/33 | 3,434,171 | ||
| 3,072,000 | SCIH Salt Holdings, Inc., 144a, 4.875%, 5/1/28 | 2,961,410 | ||
| 1,648,000 | SCIH Salt Holdings, Inc., 144a, 6.625%, 5/1/29 | 1,584,236 | ||
| 3,806,000 | Tronox, Inc., 144a, 4.625%, 3/15/29 | 3,555,018 | ||
| 3,107,000 | WR Grace Holdings LLC, 144a, 5.625%, 8/15/29 | 2,918,332 | ||
| 1,100,000 | WR Grace Holdings LLC, 144a, 4.875%, 6/15/27 | 1,084,025 | ||
| 45,007,654 | ||||
| Financials — 7.1% | ||||
| 2,292,000 | Acrisure LLC / Acrisure Finance, Inc., 144a, 7.500%, 11/6/30 | 2,358,718 | ||
| 500,000 | Alliant Holdings Intermediate LLC / Alliant Holdings Co-Issuer, 144a, 4.250%, 10/15/27 | 478,725 | ||
| 3,451,000 | Alliant Holdings Intermediate LLC / Alliant Holdings Co-Issuer, 144a, 7.000%, 1/15/31 | 3,546,945 | ||
| 1,689,000 | Ally Financial, Inc., 4.750%, 6/9/27 | 1,686,489 | ||
| 4,079,000 | Blackstone Private Credit Fund, 2.625%, 12/15/26 | 3,856,436 | ||
| 3,104,000 | Blue Owl Capital Corp., 3.400%, 7/15/26 | 3,004,462 | ||
| 1,695,000 | Focus Financial Partners LLC, 144a, 6.750%, 9/15/31 | 1,708,752 | ||
| 3,497,000 | GGAM Finance Ltd. (Ireland), 144a, 6.875%, 4/15/29 | 3,639,762 | ||
| Principal Amount | Market Value | |||
| Corporate Bonds — 79.4% (Continued) | ||||
| Financials — 7.1% (Continued) | ||||
| $ 3,435,000 | Howden UK Refinance PLC / Howden UK Refinance 2 PLC / Howden US Refinance LLC (United Kingdom), 144a, 7.250%, 2/15/31 | $ 3,564,427 | ||
| 1,052,000 | Ladder Capital Finance Holdings LLLP / Ladder Capital Finance Corp. REIT, 144a, 5.250%, 10/1/25 | 1,048,852 | ||
| 1,601,000 | LPL Holdings, Inc., 144a, 4.625%, 11/15/27 | 1,588,304 | ||
| 341,000 | Macquarie Airfinance Holdings Ltd. (United Kingdom), 144a, 6.400%, 3/26/29 | 355,451 | ||
| 341,000 | Macquarie Airfinance Holdings Ltd. (United Kingdom), 144a, 6.500%, 3/26/31 | 360,959 | ||
| 657,441 | Midcap Financial Issuer Trust, 144a, 5.625%, 1/15/30 | 605,874 | ||
| 3,566,000 | Midcap Financial Issuer Trust, 144a, 6.500%, 5/1/28 | 3,455,390 | ||
| 4,006,000 | Nationstar Mortgage Holdings, Inc., 144a, 5.500%, 8/15/28 | 3,965,315 | ||
| 1,349,000 | OneMain Finance Corp., 3.500%, 1/15/27 | 1,289,422 | ||
| 392,000 | OneMain Finance Corp., 3.875%, 9/15/28 | 363,403 | ||
| 2,684,000 | OneMain Finance Corp., 4.000%, 9/15/30 | 2,390,511 | ||
| 441,000 | OneMain Finance Corp., 9.000%, 1/15/29 | 467,321 | ||
| 1,242,000 | Rocket Mortgage LLC / Rocket Mortgage Co-Issuer, Inc., 144a, 3.625%, 3/1/29 | 1,168,282 | ||
| 373,000 | United Wholesale Mortgage LLC, 144a, 5.500%, 11/15/25 | 372,335 | ||
| 3,467,000 | VistaJet Malta Finance PLC / XO Management Holding, Inc. (Switzerland), 144a, 6.375%, 2/1/30 | 2,977,757 | ||
| 44,253,892 | ||||
| Consumer Staples — 6.9% | ||||
| 2,165,000 | American Builders & Contractors Supply Co., Inc., 144a, 4.000%, 1/15/28 | 2,083,510 | ||
| 1,115,000 | Aramark Services, Inc., 144a, 5.000%, 4/1/25 | 1,112,666 | ||
| 405,000 | Bath & Body Works, Inc., 144a, 6.625%, 10/1/30 | 412,796 | ||
| 500,000 | BCP V Modular Services Finance PLC (United Kingdom), 144a, 6.750%, 11/30/29 | 489,786 | ||
| 2,500,000 | Chobani LLC / Chobani Finance Corp., Inc., 144a, 4.625%, 11/15/28 | 2,434,889 | ||
| 3,787,000 | Fertitta Entertainment LLC / Fertitta Entertainment Finance Co., Inc., 144a, 4.625%, 1/15/29 | 3,615,265 | ||
| 1,200,000 | Iceland Bondco PLC (United Kingdom), 144a, 4.375%, 5/15/28 | 1,463,960 | ||
| 3,548,000 | Korn Ferry, 144a, 4.625%, 12/15/27 | 3,469,482 | ||
| 3,976,000 | Lamb Weston Holdings, Inc., 144a, 4.125%, 1/31/30 | 3,729,400 | ||
| 3,057,000 | LBM Acquisition LLC, 144a, 6.250%, 1/15/29 | 2,890,780 | ||
| 4,143,000 | LCM Investments Holdings II LLC, 144a, 4.875%, 5/1/29 | 3,980,637 | ||
| 1,865,000 | Legacy LifePoint Health LLC, 144a, 4.375%, 2/15/27 | 1,828,284 | ||
| 1,274,000 | Papa John's International, Inc., 144a, 3.875%, 9/15/29 | 1,178,999 | ||
| 2,334,000 | Performance Food Group, Inc., 144a, 4.250%, 8/1/29 | 2,220,240 | ||
| 1,000,000 | Performance Food Group, Inc., 144a, 6.125%, 9/15/32 | 1,022,769 | ||
| 3,436,000 | Simmons Foods, Inc. / Simmons Prepared Foods, Inc. / Simmons Pet Food, Inc. / Simmons Feed, 144a, 4.625%, 3/1/29 | 3,255,223 | ||
| 4,447,000 | Specialty Building Products Holdings LLC / SBP Finance Corp., 144a, 6.375%, 9/30/26 | 4,430,125 | ||
| 4,044,000 | Wolverine World Wide, Inc., 144a, 4.000%, 8/15/29 | 3,568,762 | ||
| 43,187,573 | ||||
| Information Technology — 5.2% | ||||
| 1,109,000 | Ahead DB Holdings LLC, 144a, 6.625%, 5/1/28 | 1,073,097 | ||
| 1,077,000 | Amentum Escrow Corp., 144a, 7.250%, 8/1/32 | 1,123,821 | ||
| 745,000 | Cloud Software Group, Inc., 144a, 6.500%, 3/31/29 | 740,079 | ||
| 464,000 | Cloud Software Group, Inc., 144a, 8.250%, 6/30/32 | 484,820 | ||
| 1,217,000 | Coherent Corp., 144a, 5.000%, 12/15/29 | 1,190,008 | ||
| 2,643,000 | Elastic NV, 144a, 4.125%, 7/15/29 | 2,468,880 | ||
| 500,000 | Entegris, Inc., 144a, 3.625%, 5/1/29 | 467,225 | ||
| Principal Amount | Market Value | |||
| Corporate Bonds — 79.4% (Continued) | ||||
| Information Technology — 5.2% (Continued) | ||||
| $ 2,275,000 | Entegris, Inc., 144a, 4.750%, 4/15/29 | $ 2,242,255 | ||
| 3,414,000 | McAfee Corp., 144a, 7.375%, 2/15/30 | 3,329,653 | ||
| 4,204,000 | ON Semiconductor Corp., 144a, 3.875%, 9/1/28 | 4,008,941 | ||
| 4,227,000 | Open Text Holdings, Inc. (Canada), 144a, 4.125%, 2/15/30 | 3,963,584 | ||
| 3,298,000 | PTC, Inc., 144a, 4.000%, 2/15/28 | 3,199,028 | ||
| 440,000 | Seagate HDD Cayman, 3.125%, 7/15/29 | 396,671 | ||
| 2,467,000 | Seagate HDD Cayman, 3.375%, 7/15/31 | 2,108,545 | ||
| 1,332,000 | SS&C Technologies, Inc., 144a, 6.500%, 6/1/32 | 1,376,880 | ||
| 4,327,000 | Synaptics, Inc., 144a, 4.000%, 6/15/29 | 4,099,155 | ||
| 32,272,642 | ||||
| Health Care — 4.0% | ||||
| 3,669,000 | Charles River Laboratories International, Inc., 144a, 4.250%, 5/1/28 | 3,568,225 | ||
| 5,175,000 | CHS/Community Health Systems, Inc., 144a, 5.625%, 3/15/27 | 5,092,647 | ||
| 2,078,000 | Fortrea Holdings, Inc., 144a, 7.500%, 7/1/30† | 2,094,780 | ||
| 1,961,000 | Grifols Escrow Issuer SA (Spain), 144a, 4.750%, 10/15/28† | 1,838,068 | ||
| 953,000 | HCA, Inc., 3.500%, 9/1/30 | 897,204 | ||
| 1,000,000 | IQVIA, Inc., 144a, 2.875%, 6/15/28 | 1,080,479 | ||
| 1,509,000 | LifePoint Health, Inc., 144a, 9.875%, 8/15/30 | 1,660,544 | ||
| 2,236,000 | Medline Borrower LP, 144a, 3.875%, 4/1/29 | 2,116,815 | ||
| 3,856,000 | Molina Healthcare, Inc., 144a, 4.375%, 6/15/28 | 3,748,775 | ||
| 3,055,000 | Option Care Health, Inc., 144a, 4.375%, 10/31/29 | 2,905,409 | ||
| 25,002,946 | ||||
| Real Estate — 3.5% | ||||
| 5,084,000 | Brookfield Property REIT, Inc. / BPR Cumulus LLC / BPR Nimbus LLC / GGSI Sellco LL, 144a, 4.500%, 4/1/27 | 4,947,347 | ||
| 35,000 | Brookfield Property REIT, Inc. / BPR Cumulus LLC / BPR Nimbus LLC / GGSI Sellco LL, 144a, 5.750%, 5/15/26 | 34,843 | ||
| 293,000 | HAT Holdings I LLC / HAT Holdings II LLC, 144a, 8.000%, 6/15/27 | 310,455 | ||
| 2,374,000 | HAT Holdings I LLC / HAT Holdings II LLC REIT, 144a, 3.375%, 6/15/26 | 2,298,864 | ||
| 688,000 | HAT Holdings I LLC / HAT Holdings II LLC REIT, 144a, 3.750%, 9/15/30 | 621,197 | ||
| 250,000 | Iron Mountain UK PLC REIT, 144a, 3.875%, 11/15/25 | 329,642 | ||
| 700,000 | Iron Mountain, Inc. REIT, 144a, 4.500%, 2/15/31 | 664,007 | ||
| 4,621,000 | Iron Mountain, Inc. REIT, 144a, 4.875%, 9/15/29(A) | 4,525,225 | ||
| 1,505,000 | Iron Mountain, Inc. REIT, 144a, 5.250%, 7/15/30 | 1,485,453 | ||
| 2,156,000 | Ladder Capital Finance Holdings LLLP / Ladder Capital Finance Corp. REIT, 144a, 4.250%, 2/1/27 | 2,102,937 | ||
| 450,000 | RLJ Lodging Trust LP REIT, 144a, 3.750%, 7/1/26 | 439,740 | ||
| 793,000 | RLJ Lodging Trust LP REIT, 144a, 4.000%, 9/15/29 | 730,214 | ||
| 1,810,000 | VICI Properties LP / VICI Note Co., Inc. REIT, 144a, 3.750%, 2/15/27 | 1,765,502 | ||
| 1,801,000 | VICI Properties LP / VICI Note Co., Inc. REIT, 144a, 4.125%, 8/15/30 | 1,711,080 | ||
| 46,000 | VICI Properties LP / VICI Note Co., Inc. REIT, 144a, 4.625%, 12/1/29 | 45,130 | ||
| 22,011,636 | ||||
| Utilities — 2.7% | ||||
| 1,106,000 | Alpha Generation LLC, 144a, 6.750%, 10/15/32 | 1,122,633 | ||
| 1,076,000 | Calpine Corp., 144a, 4.625%, 2/1/29 | 1,039,820 | ||
| 4,200,000 | Calpine Corp., 144a, 4.500%, 2/15/28 | 4,098,407 | ||
| 3,671,000 | NRG Energy, Inc., 144a, 3.625%, 2/15/31 | 3,326,584 | ||
| 15,000 | NRG Energy, Inc., 144a, 3.875%, 2/15/32 | 13,665 | ||
| 645,000 | NRG Energy, Inc., 144a, 7.000%, 3/15/33 | 716,614 | ||
| Principal Amount | Market Value | |||
| Corporate Bonds — 79.4% (Continued) | ||||
| Utilities — 2.7% (Continued) | ||||
| $ 2,703,000 | Pattern Energy Operations LP / Pattern Energy Operations, Inc., 144a, 4.500%, 8/15/28 | $ 2,613,666 | ||
| 2,200,000 | Vistra Operations Co. LLC, 144a, 5.000%, 7/31/27 | 2,189,409 | ||
| 1,350,000 | Vistra Operations Co. LLC, 144a, 5.625%, 2/15/27 | 1,347,854 | ||
| 466,000 | Vistra Operations Co. LLC, 144a, 4.300%, 7/15/29(A) | 456,844 | ||
| 16,925,496 | ||||
| Total Corporate Bonds | $495,141,033 | |||
| Bank Loans — 11.9%(D) | ||||
| Information Technology — 3.6% | ||||
| 3,268,920 | Access CIG LLC, 2023 Refinancing Term Loan, (3M SOFR + 5.000%), 10.388%, 8/18/28 | 3,278,269 | ||
| 1,465,075 | Avaya Inc., Exit Term Loan, 7.000%, 8/01/28(E) | 1,287,698 | ||
| 1,473,639 | Cloud Software Group Inc., Term Loan B, (1M SOFR + 4.000%), 9.322%, 3/30/29 | 1,466,418 | ||
| 1,750,000 | Cloud Software Group Inc., Third Amendment Term Loan, (3M SOFR + 4.500%), 9.929%, 3/19/31 | 1,753,640 | ||
| 3,482,500 | Dun & Bradstreet Corporation (The), Incremental Term B-2, (1M SOFR + 2.750%), 8.082%, 1/18/29 | 3,478,391 | ||
| 1,293,500 | Genesys Cloud Services Holdings II LLC (f/k/a Greeneden US Holdings II LLC), 2024 Incremental Dollar Term Loans, (1M SOFR + 3.864%), 9.191%, 12/01/27 | 1,293,668 | ||
| 3,501,281 | Quest Software US Holdings Inc., First Lien Initial Term Loan, (3M SOFR + 4.400%), 9.783%, 2/01/29 | 2,328,352 | ||
| 2,168,250 | Thunder Generation Funding LLC, Term Loan B, 3.000%, 10/14/31(E) | 2,165,540 | ||
| 3,839,256 | VeriFone Systems Inc., First Lien Initial Term Loan, (3M SOFR + 4.262%), 9.653%, 8/20/25 | 3,509,732 | ||
| 1,912,382 | Whitebridge Pet Brands LLC, Term B-2 Loans, (1M SOFR + 2.750%), 8.067%, 9/28/29 | 1,910,260 | ||
| 22,471,968 | ||||
| Health Care — 2.2% | ||||
| 2,842,951 | Curia Global Inc., Term Loan, (3M SOFR + 3.850%), 9.233%, 8/30/26 | 2,698,132 | ||
| 3,226,054 | eResearch Technology Inc., Tranche B-1 Term Loan, (1M SOFR + 4.000%), 9.322%, 2/04/27 | 3,238,829 | ||
| 226,450 | Gainwell Acquisition Corp., Term B Loan, (3M SOFR + 4.100%), 9.490%, 10/01/27 | 215,032 | ||
| 2,853,196 | Grifols Worldwide Operations USA Inc., Dollar Tranche B Term Loan, (3M SOFR + 2.150%), 7.538%, 11/15/27 | 2,768,941 | ||
| 1,500,000 | Home VI, Additional Senior Facility B3, 8.636%, 10/31/29(E) | 1,628,850 | ||
| 1,152,626 | Medline Borrower LP, Term Loan B, (1M SOFR + 2.750%), 8.082%, 10/23/28 | 1,152,511 | ||
| 889,376 | Packaging Coordinators Midco Inc., 2024 Replacement Term Loan, (3M SOFR + 3.250%), 8.575%, 11/30/27 | 888,540 | ||
| 991,446 | Team Health Holdings Inc., Extended Term Loan, (3M SOFR + 5.250%), 10.576%, 3/02/27 | 946,057 | ||
| 13,536,892 | ||||
| Consumer Discretionary — 1.6% | ||||
| 1,200,000 | Armorica Lux Sarl, Facility B Loan, (3M EURIBOR + 4.925%), 8.837%, 7/28/28 | 1,261,203 | ||
| 4,659,812 | AVSC Holding Corp, Term Loan B1, (1M SOFR + 3.600%), 0.250%, 3/03/25 | 4,632,646 | ||
| 140,412 | AVSC Holding Corp., Term Loan B2, (1M SOFR + 5.600%), 1.000%, 10/15/26 | 140,369 | ||
| 1,512,400 | Caesars Entertainment Inc., Incremental Term B-1 Loan, (3M SOFR + 2.750%), 8.040%, 2/06/31 | 1,510,509 | ||
| 1,363,021 | ClubCorp Holdings Inc., Term Loan, (2M SOFR + 5.262%), 10.649%, 9/18/26 | 1,363,757 | ||
| Principal Amount | Market Value | |||
| Bank Loans — 11.9%(D) (Continued) | ||||
| Consumer Discretionary — (Continued) | ||||
| $ 622,375 | Froneri US Inc., Facility B2, (1M SOFR + 2.350%), 7.666%, 1/29/27 | $ 620,663 | ||
| 879,808 | Johnstone Supply LLC, Initial Term Loans, (1M SOFR + 3.000%), 8.328%, 6/09/31 | 876,984 | ||
| 10,406,131 | ||||
| Industrials — 1.5% | ||||
| 1,387,816 | Coherent Corp (f/k/a II-VI Inc.), Term Loan B-1, (1M SOFR + 2.500%), 7.829%, 7/02/29 | 1,386,511 | ||
| 1,523,479 | CP Atlas Buyer Inc., Term B Loan, (1M SOFR + 3.850%), 9.183%, 11/23/27 | 1,501,587 | ||
| 2,484,473 | LABL Inc., Initial Dollar Term Loan, (1M SOFR + 5.100%), 10.433%, 10/29/28 | 2,423,653 | ||
| 965,000 | Ovation Parent Inc., Initial Term Loan, (3M SOFR + 3.500%), 8.827%, 4/21/31 | 967,818 | ||
| 2,641,617 | Pretium PKG Holdings Inc., Initial Third Amendment Tranche A-1 Term Loan (First Lien), (3M SOFR + 4.600%), 9.995%, 10/02/28 | 2,105,580 | ||
| 833,229 | Transdigm Inc., Tranche J Term Loan, (3M SOFR + 2.500%), 7.843%, 2/28/31 | 829,729 | ||
| 9,214,878 | ||||
| Materials — 0.8% | ||||
| 585,159 | Aruba Investments Holdings LLC, First Lien Initial Dollar Term Loan, (1M SOFR + 4.100%), 9.430%, 11/24/27 | 581,098 | ||
| 2,249,776 | Flexsys Holdings Inc., Initial Term Loan, 10.846%, 11/01/28(E) | 1,888,417 | ||
| 3,231,463 | Schenectady International Group Inc., Initial Term Loan, (3M SOFR + 4.850%), 10.244%, 10/15/25 | 2,520,541 | ||
| 4,990,056 | ||||
| Energy — 0.8% | ||||
| 850,667 | Enviva Partners LP, Revolving Loan, 12.250%, 6/30/27(E) | 850,667 | ||
| 391,440 | Enviva Partners LP, Term Loan A, (3M SOFR + 8.000%), 13.325%, 12/13/24 | 442,327 | ||
| 260,960 | Enviva Partners LP, Term Loan A1 Ddtl, 4.000%, 12/13/24(E) | 294,884 | ||
| 260,960 | Enviva Partners LP, Term Loan B1 Ddtl, 4.000%, 12/13/24(E) | 263,134 | ||
| 2,676,165 | Freeport LNG Investments, LLP, Tla Term Loan, (3M SOFR + 3.262%), 8.588%, 11/16/26 | 2,661,446 | ||
| 880,158 | PES Holdings LLC, Tranche C Loan, (1M SOFR + 2.000%), 6.990%, 12/31/24 | 4,401 | ||
| 290,510 | Prairie ECI Acquiror LP, Initial Term Loan B-2, (1M SOFR + 4.750%), 10.071%, 8/01/29 | 289,783 | ||
| 4,806,642 | ||||
| Communication Services — 0.7% | ||||
| 751,062 | NEP Group Inc., First Lien Initial Dollar Term Loan, (1M SOFR + 3.364%), 4.500%, 10/20/25 | 718,203 | ||
| 3,422,429 | NEP Group Inc., Term Loan PIK, 3.250%, 8/19/26(E) | 3,272,697 | ||
| 370,000 | Telenet Financing USD LLC, Term Loan AR Facility, (1M SOFR + 2.114%), 7.447%, 4/30/28 | 356,125 | ||
| 480,000 | Virgin Media Bristol LLC, Facility Q Advance, (1M SOFR + 3.364%), 8.697%, 1/31/29 | 458,669 | ||
| 4,805,694 | ||||
| Financials — 0.7% | ||||
| 2,490,466 | CHPPR Midco Inc. (f/k/a Air Methods Corporation), Amendment No. 1 Term Loan, (3M SOFR + 8.750%), 14.095%, 12/31/29 | 2,506,031 | ||
| 1,769,825 | Wec US Holdings Ltd., Initial Term Loan, (1M SOFR + 2.750%), 8.076%, 1/27/31 | 1,768,781 | ||
| 4,274,812 | ||||
| Total Bank Loans | $74,507,073 | |||
| Principal Amount | Market Value | |||
| Asset-Backed Securities — 3.9% | ||||
| $ 603,924 | Aimco CLO 16 Ltd. (Cayman Islands), Ser 2021-16A, Class SUB, 144a, 7/17/37(C)(F) | $ 481,118 | ||
| 340,000 | Atrium XV (Cayman Islands), Ser 15A, Class SUB, 144a, 1/23/31(C)(F) | 179,259 | ||
| 520,638 | Bain Capital Credit CLO Ltd. (Cayman Islands), Ser 2017-2A, Class SUB, 144a, 7/25/37(C)(F) | 294,537 | ||
| 1,250,000 | Bain Capital Credit CLO Ltd. (Cayman Islands), Ser 2019-2A, Class ER, 144a, (TSFR3M + 6.582%), 11.867%, 10/17/32(C) | 1,195,359 | ||
| 620,000 | Bain Capital Credit CLO Ltd. (Cayman Islands), Ser 2021-2A, Class SUB, 144a, 7/16/34(C)(F) | 269,717 | ||
| 850,000 | Bain Capital Credit CLO Ltd. (Cayman Islands), Ser 2022-1A, Class SUB, 144a, 4/18/35(C)(F) | 436,230 | ||
| 1,000,000 | Carlyle US CLO Ltd. (Cayman Islands), Ser 2021-10A, Class E, 144a, (TSFR3M + 6.762%), 12.044%, 10/20/34(C) | 993,769 | ||
| 750,000 | Carlyle US CLO Ltd. (Cayman Islands), Ser 2021-5A, Class SUB, 144a, 7/20/34(C)(F) | 407,097 | ||
| 1,000,000 | CARLYLE US CLO Ltd. (Cayman Islands), Ser 2021-4A, Class SUB, 144a, 4/20/34(C)(F) | 651,929 | ||
| 500,000 | Cedar Funding IV CLO Ltd. (Cayman Islands), Ser 2014-4A, Class ERR, 144a, (TSFR3M + 6.872%), 12.155%, 7/23/34(C) | 496,725 | ||
| 1,500,000 | CIFC Funding Ltd. (Cayman Islands), Ser 2015-4A, Class SUB, 144a, 4/20/34(C)(F) | 506,535 | ||
| 1,000,000 | CIFC Funding Ltd. (Cayman Islands), Ser 2019-4A, Class DR, 144a, (TSFR3M + 6.862%), 12.163%, 10/15/34(C) | 1,003,767 | ||
| 500,000 | CIFC Funding Ltd. (Cayman Islands), Ser 2020-3A, Class SUB, 144a, 10/20/34(C)(F) | 372,499 | ||
| 1,046,139 | CIFC Funding Ltd. (Cayman Islands), Ser 2021-7A, Class E, 144a, (TSFR3M + 6.612%), 11.895%, 1/23/35(C) | 1,049,068 | ||
| 500,000 | Dryden 106 CLO Ltd. (Cayman Islands), Ser 2022-106A, Class E, 144a, (TSFR3M + 8.870%), 14.171%, 10/15/35(C) | 503,537 | ||
| 650,000 | Dryden 98 CLO Ltd. (Cayman Islands), Ser 2022-98X, Class SUB, 4/20/35(C)(F) | 392,925 | ||
| 250,000 | Elmwood CLO 22 Ltd. (Cayman Islands), Ser 2023-1A, Class E, 144a, (TSFR3M + 7.650%), 12.936%, 4/17/36(C) | 255,157 | ||
| 250,000 | Elmwood CLO 23 Ltd. (Cayman Islands), Ser 2023-2A, Class E, 144a, (TSFR3M + 8.000%), 13.286%, 4/16/36(C) | 254,818 | ||
| 555,000 | Elmwood CLO 24 Ltd. (Cayman Islands), Ser 2023-3A, Class E, 144a, (TSFR3M +7.570%), 12.856%, 12/11/33(C) | 560,200 | ||
| 1,945,000 | Elmwood CLO 24 Ltd. (Cayman Islands), Ser 2023-3A, Class SUB, 144a, 12/11/33(C)(F) | 1,588,789 | ||
| 588,235 | Elmwood CLO VIII Ltd. (Cayman Islands), Ser 2021-1A, Class SUB, 144a, 1/20/34(C)(F) | 374,235 | ||
| 750,000 | Invesco CLO Ltd. (Cayman Islands), Ser 2021-3A, Class SUB, 144a, 10/22/34(C)(F) | 365,425 | ||
| 75,000 | Invesco CLO Ltd. (Cayman Islands), Ser 2021-3A, Class Y, 144a, 10/22/34(C)(F) | 18,757 | ||
| 250,000 | Invesco US CLO Ltd. (Jersey), Ser 2023-2A, Class E, 144a, (TSFR3M + 7.83%), 13.112%, 4/21/36(C) | 254,878 | ||
| 625,000 | Madison Park Funding LIII Ltd. (Cayman Islands), Ser 2022-53A, Class SUB, 144a, 4/21/35(C)(F) | 428,695 | ||
| 227,540 | Madison Park Funding LIX Ltd. (Cayman Islands), Ser 2021-59A, Class SUB, 144a, 4/18/37(C)(F) | 169,462 | ||
| 1,000,000 | Madison Park Funding LIX Ltd. (Cayman Islands), Ser 2021-59X, Class SUB, 4/18/37(C)(F) | 744,757 | ||
| Principal Amount | Market Value | |||
| Asset-Backed Securities — 3.9% (Continued) | ||||
| $ 300,000 | Madison Park Funding XII Ltd. (Cayman Islands), Ser 2014-12A, Class SUB, 144a, 7/20/26(C)(F) | $ 144 | ||
| 1,500,000 | Madison Park Funding XXII Ltd. (Cayman Islands), Ser 2016-22A, Class SUB, 144a, 1/15/33(C)(F) | 766,285 | ||
| 250,000 | Madison Park Funding XXXI Ltd. (Cayman Islands), Ser 2018-31A, Class SUB, 144a, 7/23/37(C)(F) | 142,917 | ||
| 606,936 | Madison Park Funding XXXVII Ltd. (Cayman Islands), Ser 2019-37A, Class SUB, 144a, 4/15/37(C)(F) | 363,861 | ||
| 500,000 | Madison Park Funding XXXVIII Ltd. (Cayman Islands), Ser 2021-38A, Class SUB, 144a, 7/17/34(C)(F) | 329,232 | ||
| 1,000,000 | Magnetite XXIII Ltd. (Cayman Islands), Ser 2019-23A, Class ER, 144a, (TSFR3M + 6.562%), 11.846%, 1/25/35(C) | 1,001,729 | ||
| 250,000 | Niagara Park CLO Ltd. (Cayman Islands), Ser 2019-1A, Class ER, 144a, (TSFR3M + 6.212%), 11.497%, 7/17/32(C) | 250,435 | ||
| 250,000 | Oaktree CLO Ltd. (Cayman Islands), Ser 2022-2A, Class ER, 144a, (TSFR3M +7.750%), 13.051%, 7/15/33(C) | 250,143 | ||
| 250,000 | Octagon Loan Funding Ltd. (Cayman Islands), Ser 2014-1A, Class DRR, 144a, (TSFR3M + 3.162%), 8.263%, 11/18/31(C) | 250,023 | ||
| 825,000 | OHA Credit Funding 4 Ltd. (Cayman Islands), Ser 2019-4A, Class ER, 144a, (TSFR3M + 6.662%), 11.944%, 10/22/36(C) | 830,037 | ||
| 389,058 | OHA Loan Funding Ltd. (Cayman Islands), Ser 2016-1A, Class SUB, 144a, 7/20/37(C)(F) | 296,810 | ||
| 1,000,000 | REESE PARK CLO Ltd. (Cayman Islands), Ser 2020-1A, Class M2, 144a, 10/15/34(C)(F) | 30,880 | ||
| 1,000,000 | REESE PARK CLO Ltd. (Cayman Islands), Ser 2020-1A, Class SUB, 144a, 10/15/34(C)(F) | 546,485 | ||
| 750,000 | Rockland Park CLO Ltd. (Cayman Islands), Ser 2021-1A, Class M1, 144a, 4/20/34(C)(F) | 4,957 | ||
| 750,000 | Rockland Park CLO Ltd. (Cayman Islands), Ser 2021-1A, Class M2, 144a, 4/20/34(C)(F) | 11,565 | ||
| 750,000 | Rockland Park CLO Ltd. (Cayman Islands), Ser 2021-1A, Class SUB, 144a, 4/20/34(C)(F) | 452,395 | ||
| 3,999,999 | RR 26 Ltd. (Cayman Islands), Ser 2023-26A, Class SUB, 144a, 4/15/38(C)(F) | 2,952,531 | ||
| 500,000 | RR 6 Ltd. (Cayman Islands), Ser 2019-6A, Class SUB, 144a, 4/15/36(C)(F) | 326,472 | ||
| 500,000 | Steele Creek CLO Ltd. (Cayman Islands), Ser 2019-2A, Class E, 144a, (TSFR3M + 7.962%), 13.263%, 7/15/32(C) | 493,530 | ||
| 500,000 | Thompson Park CLO Ltd. (Cayman Islands), Ser 2021-1A, Class E, 144a, (TSFR3M + 6.572%), 11.873%, 4/15/34(C) | 501,815 | ||
| 280,000 | Wellfleet CLO Ltd. (Cayman Islands), Ser 2020-1A, Class SUB, 144a, 4/15/33(C)(F) | 105,711 | ||
| Total Asset-Backed Securities | $24,157,201 | |||
| Shares | ||||
| Common Stocks — 0.6% | ||||
| Information Technology — 0.4% | ||||
| 398,969 | Avaya Holdings Corp.* | 2,593,298 | ||
| 3,406 | Avaya Holdings Corp., A shares(G)* | 22,139 | ||
| 8,415 | Avaya Holdings Corp., Reg S shares(G)* | 54,698 | ||
| 2,670,135 | ||||
| Energy — 0.1% | ||||
| 14,309 | AFG Holdings, Inc.* | 143 | ||
| Shares | MarketValue | |||
| Common Stocks — 0.6% (Continued) | ||||
| Energy — 0.1% (Continued) | ||||
| 187,384 | Ascent Resources Marcellus Holdings, LLC(G)* | $ 46,846 | ||
| 23,001 | Summit Midstream Corp.* | 805,725 | ||
| 852,714 | ||||
| Health Care — 0.1% | ||||
| 7,180 | CHPPR Holdings, Inc.* | 233,350 | ||
| Total Common Stocks | $3,756,199 | |||
| Warrants — 0.1% | ||||
| Health Care — 0.1% | ||||
| 11,649 | CHPPR Holdings, Inc. 4(A)(2)DOT Warrant* | 378,593 | ||
| 2,622 | CHPPR Holdings, Inc. 1145 DOT Warrant* | 85,215 | ||
| 9,949 | CHPPR Holdings, Inc., Class B, Exp 6/28/29* | 497 | ||
| 4,713 | CHPPR Holdings, Inc., Class A, Exp 6/28/29* | 47 | ||
| Total Warrants | $464,352 | |||
| Principal Amount | ||||
| Trade Claim — 0.0% | ||||
| $ 1,000,000 | Enviva, Inc. , 9/1/26(G) | 55,000 | ||
| Number of Contracts | Notional Amount | |||
| Purchased Options — 0.0% | ||||
| Purchased Put Options — 0.0% | ||||
| 7,499 | iShares iBoxx $ High Yield Corporate Bond ETF, Strike @77.00, Exp 10/24 | $749,900 | 52,493 | |
| Total Purchased Options | $52,493 | |||
| Shares | ||||
| Short-Term Investment Funds — 6.0% | ||||
| 29,473,686 | Dreyfus Government Cash Management, Institutional Shares, 4.80%∞Ω | 29,473,686 | ||
| 7,685,520 | Invesco Government & Agency Portfolio, Institutional Class, 4.84%∞Ω** | 7,685,520 | ||
| Total Short-Term Investment Funds | $37,159,206 | |||
| Total Investment Securities—101.9% (Cost $631,515,319) | $635,292,557 | |||
| Liabilities in Excess of Other Assets — (1.9%) | (11,935,604) | |||
| Net Assets — 100.0% | $623,356,953 | |||
| (A) | All or a portion of these securities are pledged as collateral for securities sold short. The total value of the securities pledged as collateral as of September 30, 2024 was $7,379,028. |
| (B) | Represents a payment-in-kind (“PIK”) security, which may pay interest in additional principal amounts. |
| (C) | Variable rate security - Rate reflected is the rate in effect as of September 30, 2024. |
| (D) | Bank loans pay interest at rates which adjust periodically unless otherwise indicated. The interest rates shown are the current interest rates as of September 30, 2024. |
| (E) | All or a portion of this position has not settled. Full contract rates do not take effect until settlement date. |
| (F) | Security has no stated coupon and is considered an equity position in the collateralized loan obligation (“CLO”). CLO equity investments are entitled to recurring distributions which are generally equal to the excess cash flow generated from the underlying investments after payment of the contractual payments to debt holders and fund expenses. |
| (G) | Level 3- For more information on valuation inputs, and their aggregation into the levels used in the table below, please refer to the security valuation section in the accompanying Notes to Financial Statements. |
| * | Non-income producing security. |
| ** | Represents collateral for securities loaned. |
| † | All or a portion of the security is on loan. The total market value of the securities on loan as of September 30, 2024 was $7,379,028. |
| ∞ | Open-End Fund. |
| Ω | Represents the 7-Day SEC yield as of September 30, 2024. |
| Portfolio Abbreviations: |
| CLO – Collateralized Loan Obligation |
| DAC – Designated Activity Company |
| ETF – Exchange-Traded Fund |
| EUR – Euro |
| EURIBOR – Euro Interbank Offered Rate |
| GBP – Great Britain Pound |
| ICE – Intercontinental Exchange, Inc. |
| LLC – Limited Liability Company |
| LLLP – Limited Liability Limited Partnership |
| LP – Limited Partnership |
| PIK – Payment In Kind |
| PLC – Public Limited Company |
| REIT – Real Estate Investment Trust |
| SOFR – Secured Overnight Financing Rate |
| TSFR3M – Three Month Term Secured Overnight Financing Rate |
| USD – United States Dollar |
| 144a - This is a restricted security that was sold in a transaction qualifying for the exemption under Rule 144a of the Securities Act of 1933. This security may be sold in transactions exempt from registration, normally to qualified institutional buyers. At September 30, 2024, these securities were valued at $446,139,814 or 71.6% of net assets. These securities were deemed liquid pursuant to procedures approved by the Board of Trustees. |
| Valuation Inputs at Reporting Date: | ||||
| Description | Level 1 | Level 2 | Level 3 | Total |
| Assets: | ||||
| Corporate Bonds | $— | $495,141,033 | $— | $495,141,033 |
| Bank Loans | — | 74,507,073 | — | 74,507,073 |
| Asset-Backed Securities | — | 24,157,201 | — | 24,157,201 |
| Common Stocks | 805,725 | 2,826,791 | 123,683 | 3,756,199 |
| Warrants | — | 464,352 | — | 464,352 |
| Trade Claim | — | — | 55,000 | 55,000 |
| Purchased Put Options | ||||
| Equity contracts | 52,493 | — | — | 52,493 |
| Short-Term Investment Funds | 37,159,206 | — | — | 37,159,206 |
| Total Assets | $38,017,424 | $597,096,450 | $178,683 | $635,292,557 |
| Liabilities: | ||||
| Other Financial Instruments | ||||
| Swap Agreements | ||||
| Credit contracts | $— | $(14,952) | $— | $(14,952) |
| Foreign currency exchange contracts | — | (103,915) | — | (103,915) |
| Total Liabilities | $— | $(118,867) | $— | $(118,867) |
| Total | $38,017,424 | $596,977,583 | $178,683 | $635,173,690 |
| Counterparty | Termination Date | Notional Amount(2) | Pay Fixed Rate | Clearinghouse | Underlying Bond | Value(3) | Premiums Paid/ (Received) | Unrealized Depreciation |
| Buy Protection: | ||||||||
| Wells Fargo | 12/20/28 | $569,250 | 5.000% | ICE | Markit CDX North America High Yield Series 41 5Y Index | $(43,876) | $(28,924) | $(14,952) |
| (1) | If the Fund is a buyer of protection and a credit event occurs, as defined under the terms of that particular swap agreement, the Fund will either (i) receive from the seller of protection an amount equal to the notional amount of the swap and deliver the referenced obligation or underlying investments comprising the referenced index or (ii) receive a net settlement amount in the form of cash or investments equal to the notional amount of the swap less the recovery value of the referenced obligation or underlying investments comprising the referenced index. |
| (2) | The maximum potential amount the Fund could be required to pay as a seller of credit protection or receive as a buyer of credit protection if a credit event occurs as defined under the terms of that particular swap agreement. |
| (3) | The quoted market prices and resulting values for credit default swap agreements on the underlying bond serve as an indicator of the current status of the payment/performance risk and represent the likelihood of an expected liability (or profit) for the credit derivative had the notional amount of the swap agreement been closed/sold as of the period end. Decreasing market values (sell protection) or increasing market values (buy protection) when compared to the notional amount of the swap, represent a deterioration of the referenced entity's credit soundness and a greater likelihood or risk of default or other credit event occurring as defined under the terms of the agreement. |
| Contract to | ||||||
| Counterparty | Expiration Date | Receive | Deliver | Unrealized Depreciation | ||
| Wells Fargo | 10/15/2024 | USD | 8,565,610 | EUR | 7,747,266 | $(63,776) |
| Wells Fargo | 10/15/2024 | USD | 1,858,676 | GBP | 1,420,268 | (40,139) |
| $(103,915) | ||||||
| Shares | Market Value | |||
| Common Stocks — 99.2% | ||||
| Information Technology — 21.3% | ||||
| 67,702 | Accenture PLC - Class A | $ 23,931,303 | ||
| 131,226 | Analog Devices, Inc. | 30,204,288 | ||
| 219,075 | Apple, Inc. | 51,044,475 | ||
| 317,835 | Broadcom, Inc. | 54,826,538 | ||
| 684,877 | Cisco Systems, Inc. | 36,449,154 | ||
| 762,664 | Intel Corp. | 17,892,097 | ||
| 159,257 | International Business Machines Corp. | 35,208,538 | ||
| 42,718 | KLA Corp. | 33,081,246 | ||
| 133,272 | Microchip Technology, Inc. | 10,700,409 | ||
| 243,114 | Micron Technology, Inc. | 25,213,353 | ||
| 207,191 | Microsoft Corp. | 89,154,287 | ||
| 248,039 | Oracle Corp. | 42,265,846 | ||
| 173,669 | QUALCOMM, Inc. | 29,532,413 | ||
| 71,218 | Salesforce, Inc. | 19,493,079 | ||
| 183,352 | Texas Instruments, Inc. | 37,875,023 | ||
| 536,872,049 | ||||
| Financials — 14.8% | ||||
| 101,976 | Arthur J Gallagher & Co. | 28,692,987 | ||
| 897,632 | Bank of America Corp. | 35,618,038 | ||
| 50,972 | BlackRock, Inc. | 48,398,424 | ||
| 384,976 | Charles Schwab Corp. (The) | 24,950,294 | ||
| 69,890 | Goldman Sachs Group, Inc. (The) | 34,603,238 | ||
| 68,356 | JPMorgan Chase & Co. | 14,413,546 | ||
| 231,001 | Principal Financial Group, Inc. | 19,842,986 | ||
| 183,738 | Prudential Financial, Inc. | 22,250,672 | ||
| 136,847 | T Rowe Price Group, Inc. | 14,906,744 | ||
| 705,714 | Truist Financial Corp. | 30,183,388 | ||
| 822,567 | US Bancorp | 37,615,989 | ||
| 96,989 | Visa, Inc. - Class A | 26,667,125 | ||
| 605,196 | Wells Fargo & Co. | 34,187,522 | ||
| 372,330,953 | ||||
| Health Care — 13.9% | ||||
| 143,084 | AbbVie, Inc. | 28,256,228 | ||
| 40,227 | Amgen, Inc. | 12,961,542 | ||
| 130,742 | Becton Dickinson & Co. | 31,521,896 | ||
| 484,450 | Bristol-Myers Squibb Co. | 25,065,443 | ||
| 54,903 | Cencora, Inc. | 12,357,567 | ||
| 508,605 | CVS Health Corp. | 31,981,083 | ||
| 198,968 | Gilead Sciences, Inc. | 16,681,477 | ||
| 265,117 | Johnson & Johnson | 42,964,861 | ||
| 544,672 | Medtronic PLC | 49,036,820 | ||
| 262,516 | Merck & Co., Inc. | 29,811,317 | ||
| 975,294 | Pfizer, Inc. | 28,225,008 | ||
| 69,658 | UnitedHealth Group, Inc. | 40,727,640 | ||
| 349,590,882 | ||||
| Industrials — 10.3% | ||||
| 212,062 | 3M Co. | 28,988,875 | ||
| 71,594 | Automatic Data Processing, Inc. | 19,812,208 | ||
| 84,376 | Caterpillar, Inc. | 33,001,141 | ||
| 57,282 | Lockheed Martin Corp. | 33,484,766 | ||
| 169,544 | Paychex, Inc. | 22,751,109 | ||
| 293,684 | RTX Corp. | 35,582,754 | ||
| 803,806 | Southwest Airlines Co. | 23,816,772 | ||
| 406,480 | Stanley Black & Decker, Inc. | 44,765,642 | ||
| 76,110 | Union Pacific Corp. | 18,759,593 | ||
| 260,962,860 | ||||
| Consumer Discretionary — 8.5% | ||||
| 4,831 | Booking Holdings, Inc. | 20,348,752 | ||
| 103,598 | Home Depot, Inc. (The) | 41,977,909 | ||
| Shares | Market Value | |||
| Common Stocks — 99.2% (Continued) | ||||
| Consumer Discretionary — 8.5% (Continued) | ||||
| 458,164 | Las Vegas Sands Corp. | $ 23,063,976 | ||
| 90,021 | McDonald's Corp. | 27,412,295 | ||
| 179,062 | NIKE, Inc. - Class B | 15,829,081 | ||
| 336,066 | Starbucks Corp. | 32,763,074 | ||
| 555,468 | VF Corp. | 11,081,586 | ||
| 105,078 | Whirlpool Corp. | 11,243,346 | ||
| 223,173 | Yum! Brands, Inc. | 31,179,500 | ||
| 214,899,519 | ||||
| Communication Services — 8.0% | ||||
| 1,505,150 | AT&T, Inc. | 33,113,300 | ||
| 788,916 | Comcast Corp. - Class A | 32,953,021 | ||
| 423,322 | Fox Corp. - Class A | 17,919,220 | ||
| 599,746 | Interpublic Group of Cos., Inc. (The) | 18,969,966 | ||
| 52,733 | Meta Platforms, Inc. - Class A | 30,186,479 | ||
| 193,492 | Omnicom Group, Inc. | 20,005,138 | ||
| 800,820 | Verizon Communications, Inc. | 35,964,826 | ||
| 135,308 | Walt Disney Co. (The) | 13,015,277 | ||
| 202,127,227 | ||||
| Consumer Staples — 6.8% | ||||
| 112,634 | Constellation Brands, Inc. - Class A | 29,024,655 | ||
| 146,835 | Dollar General Corp. | 12,417,836 | ||
| 177,371 | PepsiCo, Inc. | 30,161,939 | ||
| 341,394 | Philip Morris International, Inc. | 41,445,232 | ||
| 415,325 | Sysco Corp. | 32,420,269 | ||
| 161,101 | Target Corp. | 25,109,202 | ||
| 170,579,133 | ||||
| Energy — 4.5% | ||||
| 226,803 | Chevron Corp. | 33,401,278 | ||
| 302,142 | Exxon Mobil Corp. | 35,417,085 | ||
| 883,172 | Kinder Morgan, Inc. | 19,509,269 | ||
| 111,240 | Phillips 66 | 14,622,498 | ||
| 85,995 | Valero Energy Corp. | 11,611,905 | ||
| 114,562,035 | ||||
| Utilities — 4.3% | ||||
| 296,070 | Duke Energy Corp. | 34,136,871 | ||
| 286,677 | Entergy Corp. | 37,729,560 | ||
| 443,033 | NextEra Energy, Inc. | 37,449,579 | ||
| 109,316,010 | ||||
| Materials — 3.5% | ||||
| 96,227 | Air Products & Chemicals, Inc. | 28,650,627 | ||
| 306,622 | DuPont de Nemours, Inc. | 27,323,087 | ||
| 313,726 | International Flavors & Fragrances, Inc. | 32,919,269 | ||
| 88,892,983 | ||||
| Real Estate — 3.3% | ||||
| 257,500 | Alexandria Real Estate Equities, Inc. REIT | 30,578,125 | ||
| 170,466 | American Tower Corp. REIT | 39,643,573 | ||
| 82,108 | Simon Property Group, Inc. REIT | 13,877,894 | ||
| 84,099,592 | ||||
| Total Common Stocks | $2,504,233,243 | |||
| Shares | Market Value | |||
| Short-Term Investment Fund — 0.9% | ||||
| 23,591,166 | Dreyfus Government Cash Management, Institutional Shares, 4.80%∞Ω | $ 23,591,166 | ||
| Total Investment Securities—100.1% (Cost $2,190,602,962) | $2,527,824,409 | |||
| Liabilities in Excess of Other Assets — (0.1%) | (1,780,763) | |||
| Net Assets — 100.0% | $2,526,043,646 | |||
| ∞ | Open-End Fund. |
| Ω | Represents the 7-Day SEC yield as of September 30, 2024. |
| Portfolio Abbreviations: |
| PLC – Public Limited Company |
| REIT – Real Estate Investment Trust |
| Valuation Inputs at Reporting Date: | ||||
| Description | Level 1 | Level 2 | Level 3 | Total |
| Common Stocks | $2,504,233,243 | $— | $— | $2,504,233,243 |
| Short-Term Investment Fund | 23,591,166 | — | — | 23,591,166 |
| Total | $2,527,824,409 | $— | $— | $2,527,824,409 |
| Principal Amount | Market Value | |||
| Corporate Bonds — 97.7% | ||||
| Energy — 17.8% | ||||
| $ 950,000 | Baytex Energy Corp. (Canada), 144a, 8.500%, 4/30/30 | $ 984,911 | ||
| 1,026,000 | Blue Racer Midstream LLC / Blue Racer Finance Corp., 144a, 6.625%, 7/15/26 | 1,024,881 | ||
| 259,000 | Blue Racer Midstream LLC / Blue Racer Finance Corp., 144a, 7.000%, 7/15/29 | 269,228 | ||
| 187,000 | Blue Racer Midstream LLC / Blue Racer Finance Corp., 144a, 7.250%, 7/15/32 | 196,230 | ||
| 477,000 | Civitas Resources, Inc., 144a, 8.375%, 7/1/28 | 495,917 | ||
| 308,000 | Civitas Resources, Inc., 144a, 8.625%, 11/1/30 | 326,306 | ||
| 1,957,000 | CQP Holdco LP / BIP-V Chinook Holdco LLC, 144a, 5.500%, 6/15/31 | 1,918,913 | ||
| 361,000 | Crescent Energy Finance LLC, 144a, 9.250%, 2/15/28 | 376,540 | ||
| 478,000 | Crescent Energy Finance LLC, 144a, 7.625%, 4/1/32 | 478,136 | ||
| 1,030,000 | Enbridge, Inc. (Canada), Ser NC5, 8.250%, 1/15/84 | 1,091,437 | ||
| 1,000,000 | Energy Transfer LP, (TSFR3M + 3.279%), 8.527%, 11/1/66(A) | 948,579 | ||
| 1,143,000 | EQM Midstream Partners LP, 144a, 4.500%, 1/15/29 | 1,118,156 | ||
| 242,000 | Genesis Energy LP / Genesis Energy Finance Corp., 7.875%, 5/15/32 | 246,303 | ||
| 445,000 | Genesis Energy LP / Genesis Energy Finance Corp., 8.875%, 4/15/30 | 467,865 | ||
| 414,000 | Hilcorp Energy I LP / Hilcorp Finance Co., 144a, 5.750%, 2/1/29 | 402,792 | ||
| 201,000 | Hilcorp Energy I LP / Hilcorp Finance Co., 144a, 6.000%, 4/15/30 | 195,895 | ||
| 534,000 | Hilcorp Energy I LP / Hilcorp Finance Co., 144a, 6.250%, 11/1/28 | 533,048 | ||
| 243,000 | Hilcorp Energy I LP / Hilcorp Finance Co., 144a, 6.875%, 5/15/34 | 242,202 | ||
| 750,000 | Murphy Oil Corp., 6.000%, 10/1/32 | 740,638 | ||
| 1,062,000 | Nabors Industries Ltd., 144a, 7.500%, 1/15/28 | 995,091 | ||
| 923,000 | Parkland Corp. (Canada), 144a, 4.500%, 10/1/29 | 873,874 | ||
| 242,000 | Prairie Acquiror LP, 144a, 9.000%, 8/1/29 | 249,841 | ||
| 1,031,000 | Precision Drilling Corp. (Canada), 144a, 6.875%, 1/15/29 | 1,027,930 | ||
| 524,000 | SM Energy Co., 144a, 7.000%, 8/1/32 | 525,985 | ||
| 809,000 | Tallgrass Energy Partners LP / Tallgrass Energy Finance Corp., 144a, 7.375%, 2/15/29 | 819,168 | ||
| 993,000 | Valaris Ltd., 144a, 8.375%, 4/30/30 | 1,023,036 | ||
| 347,000 | Venture Global LNG, Inc., 144a, 9.000%(B) | 351,803 | ||
| 1,064,000 | Vermilion Energy, Inc. (Canada), 144a, 6.875%, 5/1/30 | 1,063,761 | ||
| 18,988,466 | ||||
| Communication Services — 14.1% | ||||
| 666,000 | Altice Financing SA (Luxembourg), 144a, 5.750%, 8/15/29 | 536,565 | ||
| 483,000 | Altice Financing SA (Luxembourg), 144a, 5.000%, 1/15/28 | 408,503 | ||
| 540,000 | Altice France Holding SA (Luxembourg), 144a, 10.500%, 5/15/27 | 186,314 | ||
| 514,000 | Altice France SA (France), 144a, 5.125%, 7/15/29 | 361,454 | ||
| 446,000 | Altice France SA (France), 144a, 5.500%, 10/15/29 | 312,351 | ||
| 518,000 | AMC Networks, Inc., 144a, 10.250%, 1/15/29 | 532,323 | ||
| 192,000 | Belo Corp., 7.250%, 9/15/27 | 198,307 | ||
| 1,010,000 | Cable One, Inc., 1.125%, 3/15/28 | 812,676 | ||
| 1,898,000 | CCO Holdings LLC / CCO Holdings Capital Corp., 144a, 4.250%, 2/1/31 | 1,674,347 | ||
| 641,000 | CCO Holdings LLC / CCO Holdings Capital Corp., 144a, 6.375%, 9/1/29 | 640,948 | ||
| 315,000 | CCO Holdings LLC / CCO Holdings Capital Corp., 144a, 7.375%, 3/1/31† | 322,645 | ||
| 360,000 | CSC Holdings LLC, 144a, 3.375%, 2/15/31 | 255,582 | ||
| 256,000 | CSC Holdings LLC, 144a, 11.250%, 5/15/28 | 247,103 | ||
| Principal Amount | Market Value | |||
| Corporate Bonds — 97.7% (Continued) | ||||
| Communication Services — 14.1% (Continued) | ||||
| $1,268,000 | CSC Holdings LLC, 144a, 4.625%, 12/1/30 | $ 643,695 | ||
| 1,073,000 | CSC Holdings LLC, 144a, 5.750%, 1/15/30 | 555,364 | ||
| 200,000 | CSC Holdings LLC, 144a, 11.750%, 1/31/29 | 193,318 | ||
| 906,000 | Gray Television, Inc., 144a, 5.375%, 11/15/31 | 569,842 | ||
| 570,000 | LCPR Senior Secured Financing DAC, 144a, 6.750%, 10/15/27 | 521,435 | ||
| 528,000 | Sable International Finance Ltd. (Chile), 144a, 7.125%, 10/15/32 | 529,679 | ||
| 1 | Shutterfly Finance LLC, 144a, 8.500%, 10/1/27(C) | 1 | ||
| 1 | Shutterfly Finance LLC, 144a, 9.750%, 10/1/27 | 1 | ||
| 1,217,000 | Sirius XM Radio, Inc., 144a, 4.000%, 7/15/28 | 1,148,249 | ||
| 1,643,000 | Stagwell Global LLC, 144a, 5.625%, 8/15/29 | 1,594,236 | ||
| 612,000 | Station Casinos LLC, 144a, 4.625%, 12/1/31 | 567,655 | ||
| 523,000 | Univision Communications, Inc., 144a, 8.000%, 8/15/28 | 534,791 | ||
| 552,000 | Virgin Media Secured Finance PLC (United Kingdom), 144a, 5.500%, 5/15/29 | 529,328 | ||
| 1,060,000 | Zegona Finance PLC (United Kingdom), 144a, 8.625%, 7/15/29 | 1,131,550 | ||
| 15,008,262 | ||||
| Industrials — 13.5% | ||||
| 580,000 | Bombardier, Inc. (Canada), 144a, 7.250%, 7/1/31 | 613,182 | ||
| 1,132,000 | BWX Technologies, Inc., 144a, 4.125%, 6/30/28 | 1,091,789 | ||
| 578,000 | Canpack SA / Canpack US LLC (Poland), 144a, 3.125%, 11/1/25 | 563,990 | ||
| 697,000 | Canpack SA / Canpack US LLC (Poland), 144a, 3.875%, 11/15/29 | 652,715 | ||
| 616,000 | EMRLD Borrower LP / Emerald Co-Issuer, Inc., 144a, 6.625%, 12/15/30 | 635,204 | ||
| 641,000 | Fortress Transportation and Infrastructure Investors LLC, 144a, 7.000%, 5/1/31 | 674,664 | ||
| 308,000 | Fortress Transportation and Infrastructure Investors LLC, 144a, 7.000%, 6/15/32 | 323,370 | ||
| 937,000 | H&E Equipment Services, Inc., 144a, 3.875%, 12/15/28 | 879,700 | ||
| 1,165,000 | Imola Merger Corp., 144a, 4.750%, 5/15/29 | 1,137,697 | ||
| 1,049,000 | Manitowoc Co., Inc. (The), 144a, 9.250%, 10/1/31 | 1,075,225 | ||
| 923,000 | Owens-Brockway Glass Container, Inc., 144a, 7.250%, 5/15/31† | 948,173 | ||
| 799,000 | Pactiv Evergreen Group Issuer, Inc./Pactiv Evergreen Group Issuer LLC, 144a, 4.000%, 10/15/27 | 768,187 | ||
| 856,000 | Stanley Black & Decker, Inc., 4.000%, 3/15/60 | 809,736 | ||
| 1,093,000 | Stericycle, Inc., 144a, 3.875%, 1/15/29 | 1,088,878 | ||
| 1,110,000 | TK Elevator US Newco, Inc. (Germany), 144a, 5.250%, 7/15/27 | 1,098,345 | ||
| 1,000,000 | TransDigm, Inc., 4.625%, 1/15/29 | 965,549 | ||
| 519,000 | TransDigm, Inc., 144a, 6.375%, 3/1/29 | 536,220 | ||
| 507,000 | TransDigm, Inc., 144a, 6.625%, 3/1/32 | 528,201 | ||
| 14,390,825 | ||||
| Financials — 12.5% | ||||
| 1,337,000 | Boost Newco Borrower LLC, 144a, 7.500%, 1/15/31 | 1,434,751 | ||
| 946,000 | Credit Acceptance Corp., 144a, 9.250%, 12/15/28 | 1,011,556 | ||
| 742,000 | Encore Capital Group, Inc., 144a, 8.500%, 5/15/30 | 782,014 | ||
| 604,000 | Equitable Holdings, Inc., Ser B, 4.950%(B) | 598,260 | ||
| 328,000 | FirstCash, Inc., 144a, 5.625%, 1/1/30 | 325,035 | ||
| 311,000 | FirstCash, Inc., 144a, 6.875%, 3/1/32 | 320,087 | ||
| 760,000 | Freedom Mortgage Holdings LLC, 144a, 9.250%, 2/1/29 | 790,653 | ||
| 922,000 | goeasy Ltd. (Canada), 144a, 9.250%, 12/1/28 | 994,602 | ||
| 767,000 | HUB International Ltd., 144a, 7.375%, 1/31/32 | 792,067 | ||
| 815,000 | Icahn Enterprises LP / Icahn Enterprises Finance Corp., 5.250%, 5/15/27 | 781,024 | ||
| 660,000 | Jane Street Group / JSG Finance, Inc., 144a, 4.500%, 11/15/29 | 634,718 | ||
| Principal Amount | Market Value | |||
| Corporate Bonds — 97.7% (Continued) | ||||
| Financials — 12.5% (Continued) | ||||
| $ 420,000 | National Rural Utilities Cooperative Finance Corp., (TSFR3M + 3.172%), 8.427%, 4/30/43(A) | $ 420,208 | ||
| 1,028,000 | Nationstar Mortgage Holdings, Inc., 144a, 7.125%, 2/1/32 | 1,073,646 | ||
| 707,000 | Navient Corp., 5.000%, 3/15/27 | 700,835 | ||
| 315,000 | OneMain Finance Corp., 3.875%, 9/15/28 | 292,020 | ||
| 228,000 | OneMain Finance Corp., 4.000%, 9/15/30 | 203,069 | ||
| 394,000 | OneMain Finance Corp., 7.500%, 5/15/31 | 405,454 | ||
| 370,000 | PennyMac Financial Services, Inc., 144a, 4.250%, 2/15/29 | 353,002 | ||
| 273,000 | PennyMac Financial Services, Inc., 144a, 5.375%, 10/15/25 | 272,527 | ||
| 414,000 | PennyMac Financial Services, Inc., 144a, 5.750%, 9/15/31 | 406,245 | ||
| 198,000 | PennyMac Financial Services, Inc., 144a, 7.875%, 12/15/29 | 211,128 | ||
| 518,000 | Prime Security Services Borrower LLC / Prime Finance, Inc., 144a, 5.750%, 4/15/26 | 520,409 | ||
| 13,323,310 | ||||
| Consumer Discretionary — 12.4% | ||||
| 341,385 | American Airlines Group, Inc. Pass-Through Trust, Ser 2013-1, A, 3.950%, 11/15/25 | 337,012 | ||
| 1,239,000 | Carriage Services, Inc., 144a, 4.250%, 5/15/29 | 1,147,953 | ||
| 1,013,000 | Cimpress PLC (Ireland), 144a, 7.375%, 9/15/32 | 1,024,351 | ||
| 678,000 | Dana, Inc., 4.250%, 9/1/30 | 611,554 | ||
| 523,000 | Dana, Inc., 5.625%, 6/15/28 | 512,855 | ||
| 1,111,000 | Ford Motor Credit Co. LLC, 3.375%, 11/13/25 | 1,089,741 | ||
| 1,142,000 | Forestar Group, Inc., 144a, 3.850%, 5/15/26 | 1,116,617 | ||
| 623,000 | Gap, Inc. (The), 144a, 3.625%, 10/1/29 | 563,543 | ||
| 1,357,000 | Goodyear Tire & Rubber Co. (The), 5.625%, 4/30/33 | 1,197,499 | ||
| 710,000 | JB Poindexter & Co., Inc., 144a, 8.750%, 12/15/31 | 751,326 | ||
| 919,000 | Michaels Cos., Inc. (The), 144a, 5.250%, 5/1/28 | 688,637 | ||
| 356,000 | Michaels Cos., Inc. (The), 144a, 7.875%, 5/1/29 | 209,186 | ||
| 61,000 | Royal Caribbean Cruises Ltd., 144a, 5.625%, 9/30/31 | 61,894 | ||
| 773,000 | Sands China Ltd. (Macao), 5.125%, 8/8/25 | 771,017 | ||
| 500,000 | Sands China Ltd. (Macao), 5.400%, 8/8/28 | 505,044 | ||
| 1,100,000 | Speedway Motorsports LLC / Speedway Funding II, Inc., 144a, 4.875%, 11/1/27 | 1,081,772 | ||
| 1,610,000 | Wynn Macau Ltd. (Macao), 144a, 4.875%, 10/1/24 | 1,610,000 | ||
| 13,280,001 | ||||
| Consumer Staples — 7.8% | ||||
| 1,229,000 | AHP Health Partners, Inc., 144a, 5.750%, 7/15/29 | 1,201,006 | ||
| 1,039,000 | Allied Universal Holdco LLC, 144a, 7.875%, 2/15/31 | 1,061,545 | ||
| 575,000 | Avis Budget Car Rental LLC / Avis Budget Finance, Inc., 144a, 5.375%, 3/1/29 | 537,446 | ||
| 183,000 | Avis Budget Car Rental LLC / Avis Budget Finance, Inc., 144a, 8.250%, 1/15/30† | 187,348 | ||
| 1,155,000 | Gap, Inc. (The), 144a, 3.875%, 10/1/31 | 1,009,717 | ||
| 1,075,000 | PetSmart, Inc. / PetSmart Finance Corp., 144a, 7.750%, 2/15/29 | 1,061,215 | ||
| 279,000 | S&S Holdings LLC, 144a, 8.375%, 10/1/31 | 281,118 | ||
| 1,185,000 | Simmons Foods, Inc. / Simmons Prepared Foods, Inc. / Simmons Pet Food, Inc. / Simmons Feed, 144a, 4.625%, 3/1/29 | 1,122,654 | ||
| 1,029,000 | Turning Point Brands, Inc., 144a, 5.625%, 2/15/26 | 1,025,840 | ||
| 742,000 | VT Topco, Inc., 144a, 8.500%, 8/15/30 | 792,128 | ||
| 8,280,017 | ||||
| Health Care — 4.8% | ||||
| 592,000 | AdaptHealth LLC, 144a, 4.625%, 8/1/29 | 548,296 | ||
| 293,000 | AdaptHealth LLC, 144a, 5.125%, 3/1/30 | 274,294 | ||
| Principal Amount | Market Value | |||
| Corporate Bonds — 97.7% (Continued) | ||||
| Health Care — 4.8% (Continued) | ||||
| $ 330,000 | AdaptHealth LLC, 144a, 6.125%, 8/1/28† | $ 330,327 | ||
| 993,000 | Fortrea Holdings, Inc., 144a, 7.500%, 7/1/30† | 1,001,019 | ||
| 683,000 | Herbalife Nutrition Ltd. / HLF Financing, Inc., 144a, 7.875%, 9/1/25 | 681,073 | ||
| 777,000 | Medline Borrower LP, 144a, 3.875%, 4/1/29 | 735,584 | ||
| 1,123,000 | Pediatrix Medical Group, Inc., 144a, 5.375%, 2/15/30 | 1,087,775 | ||
| 452,000 | Teva Pharmaceutical Finance Netherlands III BV (Israel), 4.750%, 5/9/27 | 445,717 | ||
| 5,104,085 | ||||
| Materials — 4.5% | ||||
| 998,000 | Celanese US Holdings LLC, 6.379%, 7/15/32 | 1,066,061 | ||
| 739,000 | Cerdia Finanz GmbH (Germany), 144a, 9.375%, 10/3/31 | 751,932 | ||
| 938,000 | Clearwater Paper Corp., 144a, 4.750%, 8/15/28 | 883,026 | ||
| 1,041,000 | INEOS Finance PLC (Luxembourg), 144a, 6.750%, 5/15/28 | 1,051,754 | ||
| 1,138,000 | Novelis Corp., 144a, 4.750%, 1/30/30 | 1,104,061 | ||
| 4,856,834 | ||||
| Utilities — 4.5% | ||||
| 1,178,000 | Algonquin Power & Utilities Corp. (Canada), 4.750%, 1/18/82 | 1,100,702 | ||
| 1,033,000 | Edison International, Ser B, 5.000%(B) | 1,009,467 | ||
| 345,000 | PG&E Corp., 7.375%, 3/15/55 | 362,357 | ||
| 1,283,000 | South Jersey Industries, Inc., 5.020%, 4/15/31 | 1,045,476 | ||
| 1,223,000 | Vistra Corp., 144a, 8.000%(B) | 1,281,453 | ||
| 4,799,455 | ||||
| Information Technology — 3.7% | ||||
| 1,025,000 | Central Parent, Inc. / CDK Global, Inc., 144a, 7.250%, 6/15/29 | 1,048,059 | ||
| 1,133,000 | Consensus Cloud Solutions, Inc., 144a, 6.000%, 10/15/26 | 1,127,797 | ||
| 448,000 | Open Text Corp. (Canada), 144a, 3.875%, 12/1/29 | 416,407 | ||
| 560,000 | Open Text Corp. (Canada), 144a, 3.875%, 2/15/28 | 534,704 | ||
| 873,000 | Ziff Davis, Inc., 144a, 4.625%, 10/15/30 | 819,895 | ||
| 3,946,862 | ||||
| Real Estate — 2.1% | ||||
| 1,202,000 | CTR Partnership LP / CareTrust Capital Corp. REIT, 144a, 3.875%, 6/30/28 | 1,146,262 | ||
| 188,000 | HAT Holdings I LLC / HAT Holdings II LLC, 144a, 8.000%, 6/15/27 | 199,199 | ||
| 132,000 | Iron Mountain, Inc. REIT, 144a, 4.500%, 2/15/31 | 125,213 | ||
| 112,000 | Iron Mountain, Inc. REIT, 144a, 5.250%, 3/15/28 | 111,557 | ||
| 660,000 | Iron Mountain, Inc. REIT, 144a, 5.250%, 7/15/30 | 651,428 | ||
| 2,233,659 | ||||
| Total Corporate Bonds | $104,211,776 | |||
| Shares | ||||
| Short-Term Investment Funds — 4.6% | ||||
| 3,146,790 | Dreyfus Government Cash Management, Institutional Shares, 4.80%∞Ω | 3,146,790 | ||
| 1,735,517 | Invesco Government & Agency Portfolio, Institutional Class, 4.84%∞Ω** | 1,735,517 | ||
| Total Short-Term Investment Funds | $4,882,307 | |||
| Total Investment Securities—102.3% (Cost $109,983,128) | $109,094,083 | |||
| Liabilities in Excess of Other Assets — (2.3%) | (2,468,429) | |||
| Net Assets — 100.0% | $106,625,654 | |||
| (A) | Variable rate security - Rate reflected is the rate in effect as of September 30, 2024. |
| (B) | Perpetual Bond - A bond or preferred stock with no definite maturity date. |
| (C) | Represents a payment-in-kind (“PIK”) security, which may pay interest in additional principal amounts. |
| ** | Represents collateral for securities loaned. |
| † | All or a portion of the security is on loan. The total market value of the securities on loan as of September 30, 2024 was $1,678,204. |
| ∞ | Open-End Fund. |
| Ω | Represents the 7-Day SEC yield as of September 30, 2024. |
| Portfolio Abbreviations: |
| DAC – Designated Activity Company |
| LLC – Limited Liability Company |
| LP – Limited Partnership |
| PLC – Public Limited Company |
| REIT – Real Estate Investment Trust |
| TSFR3M – Three Month Term Secured Overnight Financing Rate |
| 144a - This is a restricted security that was sold in a transaction qualifying for the exemption under Rule 144a of the Securities Act of 1933. This security may be sold in transactions exempt from registration, normally to qualified institutional buyers. At September 30, 2024, these securities were valued at $84,475,314 or 79.2% of net assets. These securities were deemed liquid pursuant to procedures approved by the Board of Trustees. |
| Valuation Inputs at Reporting Date: | ||||
| Description | Level 1 | Level 2 | Level 3 | Total |
| Corporate Bonds | $— | $104,211,776 | $— | $104,211,776 |
| Short-Term Investment Funds | 4,882,307 | — | — | 4,882,307 |
| Total | $4,882,307 | $104,211,776 | $— | $109,094,083 |
| Principal Amount | Market Value | |||
| Corporate Bonds — 28.6% | ||||
| Financials — 9.9% | ||||
| $ 4,000,000 | Bank of America Corp., 6.204%, 11/10/28 | $ 4,220,995 | ||
| 2,000,000 | Fifth Third Bancorp, 5.631%, 1/29/32 | 2,087,799 | ||
| 1,000,000 | Fifth Third Bancorp, 6.339%, 7/27/29 | 1,062,299 | ||
| 1,064,336 | Fishers Lane Associates LLC, 144a, 3.666%, 8/5/30 | 1,029,026 | ||
| 940,000 | Fishers Lane Associates LLC, 144a, 5.477%, 8/5/40 | 974,400 | ||
| 2,599,000 | Globe Life, Inc., 4.550%, 9/15/28 | 2,594,379 | ||
| 5,000,000 | JPMorgan Chase & Co., 2.580%, 4/22/32 | 4,454,481 | ||
| 2,400,000 | KeyBank NA, 4.150%, 8/8/25 | 2,382,026 | ||
| 1,500,000 | KeyCorp, 2.550%, 10/1/29 | 1,358,352 | ||
| 1,500,000 | Metropolitan Life Global Funding I, 144a, 3.050%, 6/17/29 | 1,421,137 | ||
| 2,000,000 | Metropolitan Life Global Funding I, 144a, 4.300%, 8/25/29 | 2,005,321 | ||
| 1,000,000 | National Rural Utilities Cooperative Finance Corp., 5.800%, 1/15/33 | 1,082,377 | ||
| 1,500,000 | Nationwide Mutual Insurance Co., 144a, 4.350%, 4/30/50 | 1,213,606 | ||
| 1,919,000 | Nationwide Mutual Insurance Co., 144a, 9.375%, 8/15/39 | 2,578,778 | ||
| 2,350,000 | Northwestern Mutual Life Insurance Co. (The), 144a, 3.625%, 9/30/59 | 1,742,608 | ||
| 3,605,000 | Pacific Life Global Funding II, 144a, 1.375%, 4/14/26 | 3,453,130 | ||
| 3,500,000 | PNC Bank NA, 2.700%, 10/22/29 | 3,204,426 | ||
| 1,335,000 | Progressive Corp. (The), 4.200%, 3/15/48 | 1,182,727 | ||
| 1,274,000 | Protective Life Corp., 8.450%, 10/15/39 | 1,645,024 | ||
| 3,500,000 | Protective Life Global Funding, 144a, 1.170%, 7/15/25 | 3,407,138 | ||
| 1,075,000 | Reliance Standard Life Global Funding II, 144a, 5.243%, 2/2/26 | 1,080,074 | ||
| 2,610,000 | Reliance Standard Life Global Funding II, 144a, 2.750%, 1/21/27 | 2,486,305 | ||
| 1,885,000 | SBA Tower Trust REIT, 144a, 1.884%, 1/15/26 | 1,819,167 | ||
| 1,500,000 | SBA Tower Trust REIT, 144a, 2.836%, 1/15/25 | 1,489,201 | ||
| 2,802,000 | Teachers Insurance & Annuity Association of America, 144a, 4.900%, 9/15/44 | 2,674,597 | ||
| 1,100,000 | Unum Group, 7.190%, 2/1/28 | 1,180,840 | ||
| 2,292,000 | Unum Group, 7.250%, 3/15/28 | 2,471,220 | ||
| 1,405,000 | US Bancorp, 5.727%, 10/21/26 | 1,422,346 | ||
| 1,500,000 | US Bancorp, 5.850%, 10/21/33 | 1,598,356 | ||
| 59,322,135 | ||||
| Utilities — 7.5% | ||||
| 3,600,000 | American Water Capital Corp., 2.950%, 9/1/27 | 3,494,541 | ||
| 2,686,674 | Atmos Energy Kansas Securitization I LLC, 5.155%, 3/1/33 | 2,755,929 | ||
| 3,250,000 | Avista Corp., 4.350%, 6/1/48 | 2,845,608 | ||
| 1,500,000 | Brazos Securitization LLC, 144a, 5.243%, 9/1/40 | 1,538,035 | ||
| 1,623,000 | California Water Service Co., 5.500%, 12/1/40 | 1,631,284 | ||
| 3,270,000 | Cleco Securitization I LLC, Ser A-2, 4.646%, 9/1/42 | 3,267,236 | ||
| 2,008,000 | Commonwealth Edison Co., 5.900%, 3/15/36 | 2,208,839 | ||
| 2,163,000 | Dominion Energy South Carolina, Inc., 4.600%, 6/15/43 | 2,003,991 | ||
| 1,900,000 | Duke Energy Florida Project Finance LLC, Ser 2032, 2.858%, 3/1/33 | 1,704,807 | ||
| 2,328,000 | Duke Energy Progress LLC, 6.300%, 4/1/38 | 2,627,068 | ||
| 2,500,000 | Empire District Bondco LLC, Ser A-1, 4.943%, 1/1/33 | 2,547,697 | ||
| 2,532,000 | Entergy Louisiana LLC, 4.440%, 1/15/26 | 2,531,966 | ||
| 3,000,000 | Essential Utilities, Inc., 4.276%, 5/1/49 | 2,557,029 | ||
| 1,642,000 | Georgia Power Co., 4.750%, 9/1/40 | 1,597,781 | ||
| 3,828,000 | Idaho Power Co., MTN, 5.500%, 3/15/53 | 3,949,240 | ||
| 3,415,000 | Kentucky Utilities Co., 5.125%, 11/1/40 | 3,425,510 | ||
| 2,080,000 | PG&E Wildfire Recovery Funding LLC, Ser A-5, 5.099%, 6/1/52 | 2,104,778 | ||
| Principal Amount | Market Value | |||
| Corporate Bonds — 28.6% (Continued) | ||||
| Utilities — 7.5% (Continued) | ||||
| $ 1,110,000 | Sierra Pacific Power Co., 2.600%, 5/1/26 | $ 1,082,469 | ||
| 1,663,689 | Southaven Combined Cycle Generation LLC, 3.846%, 8/15/33 | 1,593,169 | ||
| 45,466,977 | ||||
| Industrials — 3.5% | ||||
| 641,637 | BNSF Railway Co. Pass-Through Trust, 144a, 3.442%, 6/16/28 | 618,682 | ||
| 2,355,000 | Burlington Northern Santa Fe LLC, 6.700%, 8/1/28 | 2,548,017 | ||
| 1,625,000 | Canadian Pacific Railway Co. (Canada), 3.125%, 6/1/26 | 1,588,981 | ||
| 1,500,000 | CSX Corp., 6.150%, 5/1/37 | 1,690,946 | ||
| 1,914,177 | FedEx Corp. Pass-Through Trust, 1.875%, 2/20/34 | 1,662,332 | ||
| 1,075,000 | GATX Corp., 1.900%, 6/1/31 | 894,946 | ||
| 2,823,000 | GATX Corp., 3.250%, 3/30/25 | 2,795,159 | ||
| 2,750,000 | Republic Services, Inc., 2.300%, 3/1/30 | 2,492,442 | ||
| 474,000 | TOTE Maritime Alaska LLC, 6.365%, 4/15/28 | 490,128 | ||
| 2,129,000 | Tote Shipholdings LLC, 3.400%, 10/16/40 | 1,874,529 | ||
| 1,000,000 | Union Pacific Corp., 4.850%, 6/15/44 | 923,608 | ||
| 1,094,869 | Union Pacific Railroad Co. Pass-Through Trust, 3.227%, 5/14/26 | 1,074,637 | ||
| 334,057 | Union Pacific Railroad Co. Pass-Through Trust, 5.866%, 7/2/30 | 344,467 | ||
| 2,225,000 | Waste Management, Inc., 3.900%, 3/1/35 | 2,112,034 | ||
| 21,110,908 | ||||
| Health Care — 2.1% | ||||
| 3,500,000 | Banner Health, 2.480%, 1/1/32 | 3,017,678 | ||
| 1,060,355 | CVS Pass Through Trust Series 2013, 144a, 4.704%, 1/10/36 | 992,267 | ||
| 1,613,418 | CVS Pass-Through Trust, 6.036%, 12/10/28 | 1,640,526 | ||
| 3,405,000 | HCA, Inc., 5.250%, 4/15/25 | 3,409,073 | ||
| 3,955,000 | Piedmont Healthcare, Inc., 2.044%, 1/1/32 | 3,346,772 | ||
| 12,406,316 | ||||
| Consumer Discretionary — 1.9% | ||||
| 3,237,896 | American Airlines 2016-3 Class AA Pass Through Trust, 3.000%, 10/15/28 | 3,045,863 | ||
| 483,596 | Continental Airlines 2012-2 Class A Pass Through Trust, 4.000%, 10/29/24 | 483,073 | ||
| 1,785,000 | PulteGroup, Inc., 7.875%, 6/15/32 | 2,132,565 | ||
| 2,570,000 | Smithsonian Institution, 2.645%, 9/1/39 | 2,077,833 | ||
| 535,819 | United Airlines, Inc. Pass-Through Trust, 2.875%, 10/7/28 | 501,003 | ||
| 2,932,971 | United Airlines, Inc. Pass-Through Trust, Ser 2023-1, A, 5.800%, 1/15/36 | 3,075,582 | ||
| 11,315,919 | ||||
| Real Estate — 1.2% | ||||
| 2,500,000 | American Tower Corp. REIT, 3.125%, 1/15/27 | 2,432,929 | ||
| 3,000,000 | Crown Castle International Corp. REIT, 4.300%, 2/15/29 | 2,971,002 | ||
| 2,050,000 | SBA Tower Trust REIT, 144a, 1.631%, 11/15/26 | 1,919,137 | ||
| 7,323,068 | ||||
| Communication Services — 1.2% | ||||
| 1,500,000 | AT&T, Inc., 4.850%, 7/15/45 | 1,412,945 | ||
| 1,000,000 | AT&T, Inc., 6.250%, 3/29/41 | 1,079,673 | ||
| 1,025,000 | Crown Castle Towers LLC, 144a, 4.241%, 7/15/28 | 1,003,646 | ||
| 4,000,000 | T-Mobile USA, Inc., 4.375%, 4/15/40 | 3,685,170 | ||
| 7,181,434 | ||||
| Consumer Staples — 1.0% | ||||
| 1,000,000 | Kroger Co. (The), 4.500%, 1/15/29 | 1,009,707 | ||
| 2,000,000 | Kroger Co. (The), Ser B, 7.700%, 6/1/29 | 2,267,150 | ||
| Principal Amount | Market Value | |||
| Corporate Bonds — 28.6% (Continued) | ||||
| Consumer Staples — 1.0% (Continued) | ||||
| $ 1,600,000 | United Rentals North America, Inc., 4.875%, 1/15/28 | $ 1,588,121 | ||
| 1,300,000 | United Rentals North America, Inc., 144a, 6.000%, 12/15/29 | 1,341,757 | ||
| 6,206,735 | ||||
| Energy — 0.3% | ||||
| 1,405,000 | Texas Eastern Transmission LP, 7.000%, 7/15/32 | 1,590,637 | ||
| Total Corporate Bonds | $171,924,129 | |||
| U.S. Government Agency Obligations — 20.9% | ||||
| 1,786,000 | Canal Barge Co., Inc., 4.500%, 11/12/34 | 1,779,509 | ||
| 60,981 | Export-Import Bank of the United States, 1.581%, 11/16/24 | 60,716 | ||
| 751,105 | Reliance Industries Ltd. (India), 1.870%, 1/15/26 | 736,089 | ||
| 6,514 | Small Business Administration Participation Certificates, Ser 2004-20K, Class 1, 4.880%, 11/1/24 | 6,506 | ||
| 9,160 | Small Business Administration Participation Certificates, Ser 2005-20H, Class 1, 5.110%, 8/1/25 | 9,132 | ||
| 73,666 | Small Business Administration Participation Certificates, Ser 2006-20H, Class 1, 5.700%, 8/1/26 | 73,783 | ||
| 41,635 | Small Business Administration Participation Certificates, Ser 2006-20K, Class 1, 5.360%, 11/1/26 | 41,663 | ||
| 65,352 | Small Business Administration Participation Certificates, Ser 2006-20L, Class 1, 5.120%, 12/1/26 | 65,426 | ||
| 62,785 | Small Business Administration Participation Certificates, Ser 2007-20A, Class 1, 5.320%, 1/1/27 | 62,845 | ||
| 117,002 | Small Business Administration Participation Certificates, Ser 2007-20E, Class 1, 5.310%, 5/1/27 | 116,583 | ||
| 236,163 | Small Business Administration Participation Certificates, Ser 2007-20F, Class 1, 5.710%, 6/1/27 | 238,077 | ||
| 228,919 | Small Business Administration Participation Certificates, Ser 2007-20L, Class 1, 5.290%, 12/1/27 | 229,553 | ||
| 85,928 | Small Business Administration Participation Certificates, Ser 2008-20A, Class 1, 5.170%, 1/1/28 | 85,757 | ||
| 107,539 | Small Business Administration Participation Certificates, Ser 2008-20K, Class 1, 6.770%, 11/1/28 | 110,878 | ||
| 241,972 | Small Business Administration Participation Certificates, Ser 2009-20C, Class 1, 4.660%, 3/1/29 | 242,291 | ||
| 127,877 | Small Business Administration Participation Certificates, Ser 2009-20D, Class 1, 4.310%, 4/1/29 | 126,797 | ||
| 291,038 | Small Business Administration Participation Certificates, Ser 2009-20E, Class 1, 4.430%, 5/1/29 | 291,184 | ||
| 128,824 | Small Business Administration Participation Certificates, Ser 2009-20F, Class 1, 4.950%, 6/1/29 | 129,536 | ||
| 300,999 | Small Business Administration Participation Certificates, Ser 2009-20J, Class 1, 3.920%, 10/1/29 | 297,227 | ||
| 510,974 | Small Business Administration Participation Certificates, Ser 2010-20F, Class 1, 3.880%, 6/1/30 | 508,191 | ||
| 1,027,813 | Small Business Administration Participation Certificates, Ser 2010-20I, Class 1, 3.210%, 9/1/30 | 1,001,231 | ||
| 2,628,941 | Small Business Administration Participation Certificates, Ser 2013-20C, Class 1, 2.220%, 3/1/33 | 2,430,433 | ||
| 2,059,433 | Small Business Administration Participation Certificates, Ser 2013-20E, Class 1, 2.070%, 5/1/33 | 1,912,525 | ||
| 1,081,208 | Small Business Administration Participation Certificates, Ser 2013-20G, Class 1, 3.150%, 7/1/33 | 1,039,653 | ||
| 1,440,641 | Small Business Administration Participation Certificates, Ser 2014-20H, Class 1, 2.880%, 8/1/34 | 1,364,344 | ||
| Principal Amount | Market Value | |||
| U.S. Government Agency Obligations — 20.9% (Continued) | ||||
| $ 2,101,176 | Small Business Administration Participation Certificates, Ser 2014-20I, Class 1, 2.920%, 9/1/34 | $ 1,991,602 | ||
| 2,547,756 | Small Business Administration Participation Certificates, Ser 2014-20K, Class 1, 2.800%, 11/1/34 | 2,412,228 | ||
| 1,310,755 | Small Business Administration Participation Certificates, Ser 2015-20I, Class 1, 2.820%, 9/1/35 | 1,235,477 | ||
| 2,346,226 | Small Business Administration Participation Certificates, Ser 2016-20A, Class 1, 2.780%, 1/1/36 | 2,210,750 | ||
| 2,182,118 | Small Business Administration Participation Certificates, Ser 2016-20B, Class 1, 2.270%, 2/1/36 | 1,988,782 | ||
| 2,397,612 | Small Business Administration Participation Certificates, Ser 2016-20E, Class 1, 2.270%, 5/1/36 | 2,212,822 | ||
| 2,469,319 | Small Business Administration Participation Certificates, Ser 2016-20F, Class 1, 2.180%, 6/1/36 | 2,262,643 | ||
| 3,887,951 | Small Business Administration Participation Certificates, Ser 2016-20L, Class 1, 2.810%, 12/1/36 | 3,641,705 | ||
| 625,710 | Small Business Administration Participation Certificates, Ser 2017-10A, Class 1, 2.845%, 3/10/27 | 602,944 | ||
| 1,084,945 | Small Business Administration Participation Certificates, Ser 2017-10B, Class 1, 2.518%, 9/10/27 | 1,038,861 | ||
| 2,938,014 | Small Business Administration Participation Certificates, Ser 2017-20E, Class 1, 2.880%, 5/1/37 | 2,756,200 | ||
| 2,914,313 | Small Business Administration Participation Certificates, Ser 2017-20F, Class 1, 2.810%, 6/1/37 | 2,647,920 | ||
| 3,386,670 | Small Business Administration Participation Certificates, Ser 2017-20K, Class 1, 2.790%, 11/1/37 | 3,157,239 | ||
| 1,578,152 | Small Business Administration Participation Certificates, Ser 2017-20L, Class 1, 2.780%, 12/1/37 | 1,474,690 | ||
| 3,417,834 | Small Business Administration Participation Certificates, Ser 2018-20A, Class 1, 2.920%, 1/1/38 | 3,220,493 | ||
| 3,536,137 | Small Business Administration Participation Certificates, Ser 2018-20C, Class 1, 3.200%, 3/1/38 | 3,360,127 | ||
| 2,883,008 | Small Business Administration Participation Certificates, Ser 2018-20K, Class 1, 3.870%, 11/1/38 | 2,822,868 | ||
| 1,546,336 | Small Business Administration Participation Certificates, Ser 2018-25D, Class 1, 3.890%, 10/1/43 | 1,484,366 | ||
| 1,709,243 | Small Business Administration Participation Certificates, Ser 2019-20A, Class 1, 3.370%, 1/1/39 | 1,618,264 | ||
| 1,761,095 | Small Business Administration Participation Certificates, Ser 2019-25B, Class 1, 3.450%, 2/1/44 | 1,639,901 | ||
| 2,210,497 | Small Business Administration Participation Certificates, Ser 2019-25E, Class 1, 3.070%, 5/1/44 | 2,045,076 | ||
| 3,199,312 | Small Business Administration Participation Certificates, Ser 2020-25I, Class 1, 1.150%, 9/1/45 | 2,572,018 | ||
| 5,009,686 | Small Business Administration Participation Certificates, Ser 2021-25L, Class 1, 1.850%, 12/1/46 | 4,256,542 | ||
| 3,079,862 | Small Business Administration Participation Certificates, Ser 2022-25C, Class 1, 2.750%, 3/1/47 | 2,734,166 | ||
| 2,252,247 | Small Business Administration Participation Certificates, Ser 2022-25D, Class 1, 3.500%, 4/1/47 | 2,116,732 | ||
| 3,020,239 | Small Business Administration Participation Certificates, Ser 2022-25G, Class 1, 3.930%, 7/1/47 | 2,913,761 | ||
| 3,755,014 | Small Business Administration Participation Certificates, Ser 2022-25H, Class 1, 3.800%, 8/1/47 | 3,597,135 | ||
| Principal Amount | Market Value | |||
| U.S. Government Agency Obligations — 20.9% (Continued) | ||||
| $ 8,918,273 | Small Business Administration Participation Certificates, Ser 2022-25I, Class 1, 4.260%, 9/1/47 | $ 8,774,911 | ||
| 4,707,224 | Small Business Administration Participation Certificates, Ser 2023-10A, Class 1, 5.168%, 3/10/33 | 4,814,524 | ||
| 2,440,858 | Small Business Administration Participation Certificates, Ser 2023-20E, Class 1, 4.600%, 5/1/43 | 2,460,688 | ||
| 2,237,531 | Small Business Administration Participation Certificates, Ser 2023-25C, Class 1, 4.930%, 3/1/48 | 2,271,871 | ||
| 5,821,465 | Small Business Administration Participation Certificates, Ser 2023-25F, Class 1, 4.930%, 6/1/48 | 5,988,186 | ||
| 2,567,436 | Small Business Administration Participation Certificates, Ser 2024-10A, Class 1, 5.035%, 3/10/34 | 2,621,376 | ||
| 5,195,000 | Small Business Administration Participation Certificates, Ser 2024-10B, Class 1, 4.380%, 9/10/34 | 5,186,481 | ||
| 5,912,704 | Small Business Administration Participation Certificates, Ser 2024-25A, Class 1, 5.050%, 1/1/49 | 6,105,189 | ||
| 5,387,381 | Small Business Administration Participation Certificates, Ser 2024-25B, Class 1, 5.070%, 2/1/49 | 5,540,623 | ||
| 3,000,000 | Small Business Administration Participation Certificates, Ser 2024-25I, Class 1, 4.450%, 9/1/49 | 2,993,410 | ||
| 2,146,661 | United States International Development Finance Corp., 1.870%, 11/20/37 | 1,813,601 | ||
| Total U.S. Government Agency Obligations | $125,546,101 | |||
| U.S. Government Mortgage-Backed Obligations — 16.9% | ||||
| 1,022,327 | FHLMC, Pool #SD8186, 3.500%, 11/1/51 | 958,316 | ||
| 5,496,103 | FHLMC, Pool #SD8257, 4.500%, 10/1/52 | 5,401,043 | ||
| 208,598 | FHLMC, Pool #W30008, 7.645%, 5/1/25 | 209,560 | ||
| 3,358,000 | FHLMC, Pool #WN2314, 4.650%, 1/1/33 | 3,383,044 | ||
| 5,378,428 | FHLMC REMIC, Pool #RA8086, 5.000%, 10/1/52 | 5,432,968 | ||
| 2,000,000 | FHLMC REMIC, Pool #WN2381, 4.450%, 4/1/30 | 2,013,329 | ||
| 510,656 | FNMA, Pool #888829, 5.888%, 6/1/37(A)(B) | 508,861 | ||
| 414,705 | FNMA, Pool #AH8854, 4.500%, 4/1/41 | 419,322 | ||
| 4,000,000 | FNMA, Pool #AM9682, 3.810%, 8/1/45 | 3,635,229 | ||
| 2,779,526 | FNMA, Pool #AN0897, 3.440%, 2/1/32 | 2,662,086 | ||
| 1,402,384 | FNMA, Pool #AN6828, 3.060%, 9/1/32 | 1,351,609 | ||
| 3,000,000 | FNMA, Pool #AN8089, 3.330%, 1/1/38 | 2,605,420 | ||
| 129,585 | FNMA, Pool #AT0924, 2.000%, 3/1/28 | 124,772 | ||
| 3,860,363 | FNMA, Pool #BL3622, 2.600%, 8/1/26 | 3,746,761 | ||
| 3,411,138 | FNMA, Pool #BS5630, 3.790%, 11/1/32 | 3,313,513 | ||
| 2,986,436 | FNMA, Pool #BZ0544, 5.380%, 12/1/31 | 3,148,182 | ||
| 2,930,768 | FNMA, Pool #CB0455, 2.500%, 5/1/51 | 2,552,584 | ||
| 1,354,269 | FNMA, Pool #FM3442, 3.000%, 6/1/50 | 1,236,769 | ||
| 7,026,945 | FNMA, Pool #FS1887, 3.000%, 5/1/47 | 6,387,371 | ||
| 2,961,076 | FNMA, Pool #FS7798, 6.000%, 6/1/54 | 3,045,472 | ||
| 3,515,666 | FNMA, Pool #MA4269, 2.500%, 2/1/41 | 3,184,157 | ||
| 1,234,776 | FNMA, Pool #MA4416, 3.500%, 9/1/51 | 1,156,460 | ||
| 3,332,658 | FNMA, Pool #MA4624, 3.000%, 6/1/52 | 2,994,581 | ||
| 5,260,940 | FNMA, Pool #MA4654, 3.500%, 7/1/52 | 4,896,973 | ||
| 4,510,808 | FNMA, Pool #MA4709, 5.000%, 7/1/52 | 4,512,470 | ||
| 5,656,713 | FNMA, Pool #MA4784, 4.500%, 10/1/52 | 5,561,395 | ||
| 4,860,475 | FNMA, Pool #MA5073, 6.000%, 7/1/53 | 4,975,573 | ||
| 2,453,050 | FNMA, Pool #MA5106, 5.000%, 8/1/53 | 2,450,632 | ||
| 3,649,407 | FNMA, Pool #MA5107, 5.500%, 8/1/53 | 3,693,662 | ||
| 6,222,007 | GNMA, Pool #MA8795, 2.500%, 4/20/53 | 5,485,707 | ||
| 2,721,424 | GNMA, Pool #MA9012, 3.000%, 7/20/53 | 2,487,909 | ||
| 5,705,206 | GNMA, Pool #MA9171, 5.500%, 9/20/53 | 5,767,878 | ||
| 2,792,910 | GNMA, Pool #MA9418, 3.000%, 1/20/54 | 2,553,255 | ||
| Total U.S. Government Mortgage-Backed Obligations | $101,856,863 | |||
| Principal Amount | Market Value | |||
| Agency Collateralized Mortgage Obligations — 8.4% | ||||
| $ 2,245,931 | Fannie Mae-Aces, Ser 2017-M15, Class ATS2, 3.206%, 11/25/27(A)(B) | $ 2,195,693 | ||
| 3,325,000 | FHLMC Multifamily Structured Pass Through Certificates, Ser K-1511, Class A3, 3.542%, 3/25/34 | 3,127,792 | ||
| 1,650,000 | FHLMC Multifamily Structured Pass Through Certificates, Ser KSG2, Class A2, 2.091%, 11/25/31(A)(B) | 1,447,100 | ||
| 473,318 | FHLMC Multifamily Structured Pass Through Certificates, Ser KW03, Class A1, 2.617%, 12/25/26 | 464,951 | ||
| 3,060,000 | FHLMC Multifamily Structured Pass-Through Certificates, Ser K-1513, Class A3, 2.797%, 8/25/34 | 2,697,804 | ||
| 6,072,821 | Freddie Mac Multiclass Certificates Series, Ser 2024-P015, Class A, 4.449%, 1/25/33(A)(B) | 5,978,199 | ||
| 2,000,000 | FREMF Mortgage Trust, Ser 2014-K41, Class B, 144a, 3.977%, 11/25/47(A)(B) | 1,992,434 | ||
| 2,600,000 | FREMF Mortgage Trust, Ser 2015-K49, Class B, 144a, 3.849%, 10/25/48(A)(B) | 2,571,646 | ||
| 2,450,000 | FREMF Mortgage Trust, Ser 2017-K61, Class B, 144a, 3.822%, 12/25/49(A)(B) | 2,395,717 | ||
| 1,200,000 | FREMF Mortgage Trust, Ser 2018-K74, Class B, 144a, 4.231%, 2/25/51(A)(B) | 1,180,624 | ||
| 615,347 | FRESB Mortgage Trust, Ser 2015-SB9, Class A5, (SOFR30A + 0.814%), 6.161%, 11/25/35(A) | 609,816 | ||
| 92,111 | FRESB Mortgage Trust, Ser 2016-SB17, Class A5H, (SOFR30A + 0.814%), 6.161%, 5/25/36(A) | 91,771 | ||
| 396,468 | FRESB Mortgage Trust, Ser 2017-SB27, Class A10F, 3.090%, 1/25/27(A)(B) | 388,819 | ||
| 2,063,996 | FRESB Mortgage Trust, Ser 2018-SB46, Class A10F, 3.300%, 12/25/27(A)(B) | 2,020,430 | ||
| 2,340,631 | FRESB Mortgage Trust, Ser 2018-SB54, Class A10F, 3.520%, 5/25/28(A)(B) | 2,277,469 | ||
| 2,623,136 | FRESB Mortgage Trust, Ser 2018-SB55, Class A10F, 3.770%, 9/25/28(A)(B) | 2,594,559 | ||
| 585,005 | GNMA, Pool #785631, 4.646%, 5/20/67(A)(B) | 579,721 | ||
| 373,342 | GNMA, Ser 2012-46, Class C, 3.176%, 5/16/50(A)(B) | 366,842 | ||
| 779,282 | GNMA, Ser 2013-121, Class AB, 2.955%, 8/16/44(A)(B) | 736,562 | ||
| 139,686 | GNMA, Ser 2013-40, Class AC, 1.584%, 1/16/46 | 134,218 | ||
| 17,473 | GNMA, Ser 2013-59, Class A, 1.750%, 7/16/45 | 16,387 | ||
| 2,540,000 | GNMA, Ser 2015-32, Class HG, 3.000%, 9/16/49(A)(B) | 2,167,786 | ||
| 371,158 | GNMA, Ser 2015-37, Class AD, 2.600%, 11/16/55 | 351,286 | ||
| 1,287,810 | GNMA, Ser 2015-73, Class B, 2.700%, 10/16/55(A)(B) | 1,188,952 | ||
| 799,272 | GNMA, Ser 2017-46, Class AB, 2.600%, 1/16/52 | 698,825 | ||
| 763,654 | GNMA, Ser 2017-H11, Class FV, (TSFR1M + 0.614%), 5.967%, 5/20/67(A) | 762,487 | ||
| 680,188 | GNMA, Ser 2019-H15, Class GA, 2.250%, 8/20/69 | 657,573 | ||
| 3,758,008 | GNMA, Ser 2020-113, Class AF, 2.000%, 10/16/62 | 2,635,093 | ||
| 4,823,407 | GNMA, Ser 2020-118, Class AB, 2.250%, 4/16/62 | 4,004,541 | ||
| 2,179,167 | GNMA, Ser 2021-21, Class AF, 1.750%, 6/16/63 | 1,580,169 | ||
| 3,586,494 | GNMA, Ser 2021-22, Class AD, 1.350%, 10/16/62 | 2,742,985 | ||
| Total Agency Collateralized Mortgage Obligations | $50,658,251 | |||
| U.S. Treasury Obligations — 7.0% | ||||
| 9,150,000 | U.S. Treasury Bond, 1.875%, 2/15/51 | 5,723,754 | ||
| 18,140,000 | U.S. Treasury Bond, 2.875%, 5/15/52 | 14,184,630 | ||
| 21,540,000 | U.S. Treasury Strip, Principal, 5/15/43(C) | 9,857,712 | ||
| 19,894,000 | U.S. Treasury Strip, Principal, 5/15/45(C) | 8,303,767 | ||
| 11,500,000 | U.S. Treasury Strip, Principal, 2/15/51(C) | 3,790,864 | ||
| Total U.S. Treasury Obligations | $41,860,727 | |||
| Asset-Backed Securities — 6.7% | ||||
| 1,788,466 | 321 Henderson Receivables I LLC, Ser 2012-1A, Class A, 144a, 4.210%, 2/16/65 | 1,739,402 | ||
| 888,657 | 321 Henderson Receivables I LLC, Ser 2012-2A, Class A, 144a, 3.840%, 10/15/59 | 839,555 | ||
| Principal Amount | Market Value | |||
| Asset-Backed Securities — 6.7% (Continued) | ||||
| $ 2,736,088 | 321 Henderson Receivables I LLC, Ser 2015-2A, Class A, 144a, 3.870%, 3/15/58 | $ 2,567,510 | ||
| 2,301,457 | CF Hippolyta Issuer LLC, Ser 2021-1A, Class A1, 144a, 1.530%, 3/15/61 | 2,162,099 | ||
| 3,065,457 | JG Wentworth XLII LLC, Ser 2018-2A, Class A, 144a, 3.960%, 10/15/75 | 2,899,524 | ||
| 1,379,876 | JGWPT XXVII LLC, Ser 2012-3A, Class A, 144a, 3.220%, 9/15/65 | 1,274,474 | ||
| 1,388,403 | JGWPT XXXI LLC, Ser 2014-1A, Class A, 144a, 3.960%, 3/15/63 | 1,319,667 | ||
| 1,038,881 | JGWPT XXXIV LLC, Ser 2015-1A, Class A, 144a, 3.260%, 9/15/72 | 934,221 | ||
| 4,445,000 | Louisiana Local Government Environmental Fac. & Community Development Auth, Revenue, Ser 2022-ELL, Class A2, 4.145%, 2/1/33 | 4,429,526 | ||
| 1,017,531 | Oklahoma Development Finance Auth., Ser 2022-ONG, Class A1, 3.877%, 5/1/37 | 997,210 | ||
| 3,960,275 | Small Business Administration Participation Certificates, Ser 2021-10B, Class 1, 1.304%, 9/10/31 | 3,493,350 | ||
| 4,605,182 | Small Business Administration Participation Certificates, Ser 2021-25I, Class 1, 1.560%, 9/1/46 | 3,779,064 | ||
| 2,541,408 | Small Business Administration Participation Certificates, Ser 2023-10B, Class 1, 5.688%, 9/10/33 | 2,624,303 | ||
| 3,478,154 | Small Business Administration Participation Certificates, Ser 2023-25G, Class 1, 5.180%, 7/1/48 | 3,619,236 | ||
| 3,041,583 | Small Business Administration Participation Certificates, Ser 2023-25H, Class 1, 5.150%, 8/1/48 | 3,157,193 | ||
| 469,446 | Sunnova Hestia I Issuer LLC, Ser 2023-GRID1, Class 1A, 144a, 5.750%, 12/20/50 | 483,766 | ||
| 2,750,423 | Sunnova Hestia II Issuer LLC, Ser 2024-GRID1, Class 1A, 144a, 5.630%, 7/20/51 | 2,829,301 | ||
| 1,027,302 | Tesla Auto Lease Trust, Ser 2023-A, Class A2, 144a, 5.860%, 8/20/25 | 1,028,303 | ||
| Total Asset-Backed Securities | $40,177,704 | |||
| Municipal Bonds — 6.2% | ||||
| California — 2.5% | ||||
| 1,000,000 | California Health Facilities Financing Authority, 2.704%, 6/1/30 | 930,724 | ||
| 2,000,000 | California Health Facilities Financing Authority, 2.229%, 6/1/32 | 1,737,307 | ||
| 875,000 | California Health Facilities Financing Authority, 4.140%, 6/1/34 | 853,192 | ||
| 1,540,000 | California Municipal Finance Authority, Revenue, 2.519%, 10/1/35 | 1,182,563 | ||
| 1,465,000 | City of San Francisco Public Utilities Commission Water Revenue, Build America Bonds, 6.950%, 11/1/50 | 1,758,487 | ||
| 2,345,000 | East Bay Municipal Utility District Water System Revenue, Build America Bonds Sub, 5.874%, 6/1/40 | 2,554,269 | ||
| 2,675,000 | State of California, Build America Bonds, UTGO, 7.300%, 10/1/39 | 3,220,508 | ||
| 2,540,000 | Tuolumne Wind Project Auth., Build America Bonds, Revenue, 6.918%, 1/1/34 | 2,836,637 | ||
| 15,073,687 | ||||
| Texas — 0.9% | ||||
| 1,770,000 | Dallas Area Rapid Transit, Revenue, Build America Bonds, 5.999%, 12/1/44 | 1,923,946 | ||
| Principal Amount | Market Value | |||
| Municipal Bonds — 6.2% (Continued) | ||||
| Texas — (Continued) | ||||
| $ 2,640,000 | Texas Department of Transportation State Highway Fund, Build America Bonds, Revenue, 5.178%, 4/1/30 | $ 2,713,510 | ||
| 1,281,000 | Travis County Housing Finance Corp, Revenue, 2.550%, 7/1/42 | 895,442 | ||
| 5,532,898 | ||||
| Oklahoma — 0.5% | ||||
| 3,000,000 | Oklahoma Development Finance Auth., Revenue, 5.087%, 2/1/52 | 3,119,619 | ||
| Indiana — 0.5% | ||||
| 2,750,000 | Indianapolis Local Public Improvement Bond Bank, Build America Bonds, 6.116%, 1/15/40 | 2,978,209 | ||
| Virginia — 0.4% | ||||
| 931,462 | Virginia Housing Development Authority, 2.950%, 10/25/49 | 825,371 | ||
| 2,369,105 | Virginia Housing Development Authority, 2.125%, 7/25/51 | 1,887,941 | ||
| 2,713,312 | ||||
| New York — 0.4% | ||||
| 1,135,000 | Port Authority of New York & New Jersey, 4.960%, 8/1/46 | 1,150,465 | ||
| 1,400,000 | Port Authority of New York and New Jersey, Cons One Hundred Sixty-Eight, 4.926%, 10/1/51 | 1,405,298 | ||
| 2,555,763 | ||||
| Minnesota — 0.4% | ||||
| 3,153,076 | Minnesota Housing Finance Agency, Revenue, 1.580%, 2/1/51 | 2,492,513 | ||
| Nevada — 0.3% | ||||
| 1,674,339 | Nevada Housing Division, Revenue, 1.900%, 11/1/44 | 1,547,962 | ||
| Ohio — 0.2% | ||||
| 1,348,000 | Ohio State HFA, Revenue, 2.650%, 11/1/41 | 1,156,176 | ||
| Louisiana — 0.1% | ||||
| 479,501 | Louisiana Housing Corp., 2.875%, 11/1/38 | 432,522 | ||
| Total Municipal Bonds | $37,602,661 | |||
| Commercial Mortgage-Backed Securities — 3.8% | ||||
| 17,094 | CD Mortgage Trust, Ser 2006-CD3, Class AJ, 5.688%, 10/15/48 | 15,986 | ||
| 2,979,161 | Citigroup Commercial Mortgage Trust, Ser 2020-555, Class A, 144a, 2.647%, 12/10/41 | 2,627,759 | ||
| 2,300,000 | COMM Mortgage Trust, Ser 2020-SBX, Class A, 144a, 1.670%, 1/10/38 | 2,025,438 | ||
| 2,440,000 | DOLP Trust, Ser 2021-NYC, Class A, 144a, 2.956%, 5/10/41 | 2,170,700 | ||
| 3,550,000 | FREMF Mortgage Trust, Ser 2015-K45, Class B, 144a, 3.723%, 4/25/48(A)(B) | 3,522,901 | ||
| 500,000 | FREMF Mortgage Trust, Ser 2015-K48, Class B, 144a, 3.771%, 8/25/48(A)(B) | 493,975 | ||
| 2,500,000 | FREMF Mortgage Trust, Ser 2015-K50, Class B, 144a, 3.906%, 10/25/48(A)(B) | 2,467,709 | ||
| 245,000 | FREMF Mortgage Trust, Ser 2015-K51, Class B, 144a, 4.090%, 10/25/48(A)(B) | 242,324 | ||
| 1,725,000 | FREMF Mortgage Trust, Ser 2016-K52, Class B, 144a, 4.068%, 1/25/49(A)(B) | 1,703,958 | ||
| 1,450,000 | FREMF Mortgage Trust, Ser 2017-K65, Class B, 144a, 4.221%, 7/25/50(A)(B) | 1,429,033 | ||
| 2,461,489 | Logistics 1 MI TN VA Senior Notes CTL Pass-Through Trust, 144a, 2.654%, 10/10/42 | 2,058,932 | ||
| Principal Amount | Market Value | |||
| Commercial Mortgage-Backed Securities — 3.8% (Continued) | ||||
| $ 2,550,000 | MKT Mortgage Trust, Ser 2020-525M, Class A, 144a, 2.694%, 2/12/40 | $ 2,186,023 | ||
| 2,185,000 | SLG Office Trust, Ser 2021-OVA, Class A, 144a, 2.585%, 7/15/41 | 1,895,843 | ||
| Total Commercial Mortgage-Backed Securities | $22,840,581 | |||
| Non-Agency Collateralized Mortgage Obligations — 0.1% | ||||
| 378,299 | Virginia Housing Development Auth., Ser 2013-B, Class A, 2.750%, 4/25/42 | 346,456 | ||
| Shares | ||||
| Short-Term Investment Fund — 0.7% | ||||
| 4,070,943 | Dreyfus Government Cash Management, Institutional Shares, 4.80%∞Ω | 4,070,943 | ||
| Total Investment Securities—99.3% (Cost $626,674,644) | $596,884,416 | |||
| Other Assets in Excess of Liabilities — 0.7% | 4,220,542 | |||
| Net Assets — 100.0% | $601,104,958 | |||
| (A) | Variable rate security - Rate reflected is the rate in effect as of September 30, 2024. |
| (B) | Certain variable rate securities are not based on a published reference rate and spread but are determined by the issuer or agent and are based on current market conditions. These securities do not indicate a reference rate and spread in their description. |
| (C) | Strip Security- Separate trading of Registered Interest and Principal. Holders of a principal strip security are entitled to the portion of the payment representing principal only. |
| ∞ | Open-End Fund. |
| Ω | Represents the 7-Day SEC yield as of September 30, 2024. |
| Portfolio Abbreviations: |
| FHLMC – Federal Home Loan Mortgage Corporation |
| FNMA – Federal National Mortgage Association |
| FREMF – Freddie Mac Multifamily Securitization |
| FRESB – Freddie Mac Multifamily Securitization Small Balance Loan |
| GNMA – Government National Mortgage Association |
| HFA – Housing Finance Authority/Agency |
| LLC – Limited Liability Company |
| LP – Limited Partnership |
| MTN – Medium Term Note |
| REIT – Real Estate Investment Trust |
| REMIC – Real Estate Mortgage Investment Conduit |
| SOFR30A – Secured Overnight Financing Rate 30 Day Average |
| TSFR1M – One Month Term Secured Overnight Financing Rate |
| UTGO – Unlimited Tax General Obligation |
| 144a - This is a restricted security that was sold in a transaction qualifying for the exemption under Rule 144a of the Securities Act of 1933. This security may be sold in transactions exempt from registration, normally to qualified institutional buyers. At September 30, 2024, these securities were valued at $83,830,850 or 13.9% of net assets. These securities were deemed liquid pursuant to procedures approved by the Board of Trustees. |
| Valuation Inputs at Reporting Date: | ||||
| Description | Level 1 | Level 2 | Level 3 | Total |
| Corporate Bonds | $— | $171,924,129 | $— | $171,924,129 |
| U.S. Government Agency Obligations | — | 125,546,101 | — | 125,546,101 |
| U.S. Government Mortgage-Backed Obligations | — | 101,856,863 | — | 101,856,863 |
| Agency Collateralized Mortgage Obligations | — | 50,658,251 | — | 50,658,251 |
| U.S. Treasury Obligations | — | 41,860,727 | — | 41,860,727 |
| Asset-Backed Securities | — | 40,177,704 | — | 40,177,704 |
| Municipal Bonds | — | 37,602,661 | — | 37,602,661 |
| Commercial Mortgage-Backed Securities | — | 22,840,581 | — | 22,840,581 |
| Non-Agency Collateralized Mortgage Obligations | — | 346,456 | — | 346,456 |
| Short-Term Investment Fund | 4,070,943 | — | — | 4,070,943 |
| Total | $4,070,943 | $592,813,473 | $— | $596,884,416 |
| Shares | Market Value | |||
| Common Stocks — 98.3% | ||||
| Industrials — 26.4% | ||||
| 2,502,417 | AerCap Holdings NV (Ireland) | $ 237,028,938 | ||
| 2,400,847 | Allison Transmission Holdings, Inc. | 230,649,371 | ||
| 1,874,023 | Armstrong World Industries, Inc. | 246,302,843 | ||
| 3,451,148 | Copart, Inc.* | 180,840,155 | ||
| 362,192 | Lennox International, Inc. | 218,869,004 | ||
| 659,648 | Old Dominion Freight Line, Inc. | 131,032,479 | ||
| 2,107,857 | Otis Worldwide Corp. | 219,090,657 | ||
| 714,897 | UniFirst Corp. | 142,014,289 | ||
| 1,605,827,736 | ||||
| Information Technology — 12.9% | ||||
| 2,986,828 | Amphenol Corp. - Class A | 194,621,712 | ||
| 2,282,535 | Entegris, Inc. | 256,853,664 | ||
| 1,048,627 | Keysight Technologies, Inc.* | 166,658,289 | ||
| 1,694,323 | Skyworks Solutions, Inc. | 167,348,283 | ||
| 785,481,948 | ||||
| Financials — 12.6% | ||||
| 1,026,862 | Cincinnati Financial Corp. | 139,776,455 | ||
| 2,746,297 | Fidelity National Information Services, Inc. | 230,002,374 | ||
| 1,115,597 | M&T Bank Corp. | 198,710,138 | ||
| 2,864,051 | Moelis & Co. - Class A | 196,216,134 | ||
| 764,705,101 | ||||
| Consumer Discretionary — 12.0% | ||||
| 1,607,262 | Churchill Downs, Inc. | 217,317,895 | ||
| 1,927,598 | Hasbro, Inc. | 139,403,887 | ||
| 504,502 | Pool Corp. | 190,096,354 | ||
| 3,377,483 | Tempur Sealy International, Inc. | 184,410,572 | ||
| 731,228,708 | ||||
| Materials — 10.1% | ||||
| 1,040,814 | AptarGroup, Inc. | 166,727,995 | ||
| 1,772,453 | Ball Corp. | 120,367,283 | ||
| 260,622 | NewMarket Corp. | 143,834,675 | ||
| 734,988 | Vulcan Materials Co. | 184,063,045 | ||
| 614,992,998 | ||||
| Consumer Staples — 9.8% | ||||
| 1,243,955 | BellRing Brands, Inc.* | 75,532,948 | ||
| 1,367,847 | Brown-Forman Corp. - Class B | 67,298,072 | ||
| 1,838,864 | Dollar Tree, Inc.* | 129,308,917 | ||
| 1,877,930 | Lamb Weston Holdings, Inc. | 121,577,188 | ||
| 1,750,688 | Post Holdings, Inc.* | 202,642,136 | ||
| 596,359,261 | ||||
| Shares | Market Value | |||
| Common Stocks — 98.3% (Continued) | ||||
| Health Care — 8.0% | ||||
| 1,752,362 | Bruker Corp. | $ 121,018,120 | ||
| 846,603 | STERIS PLC | 205,335,092 | ||
| 443,114 | Waters Corp.* | 159,472,297 | ||
| 485,825,509 | ||||
| Real Estate — 6.5% | ||||
| 1,661,954 | CBRE Group, Inc. - Class A* | 206,880,034 | ||
| 1,603,355 | Crown Castle, Inc. REIT | 190,206,003 | ||
| 397,086,037 | ||||
| Total Common Stocks | $5,981,507,298 | |||
| Short-Term Investment Fund — 1.7% | ||||
| 103,824,165 | Dreyfus Government Cash Management, Institutional Shares, 4.80%∞Ω | 103,824,165 | ||
| Total Investment Securities—100.0% (Cost $4,351,519,155) | $6,085,331,463 | |||
| Liabilities in Excess of Other Assets — (0.0%) | (194,338) | |||
| Net Assets — 100.0% | $6,085,137,125 | |||
| * | Non-income producing security. |
| ∞ | Open-End Fund. |
| Ω | Represents the 7-Day SEC yield as of September 30, 2024. |
| Portfolio Abbreviations: |
| PLC – Public Limited Company |
| REIT – Real Estate Investment Trust |
| Valuation Inputs at Reporting Date: | ||||
| Description | Level 1 | Level 2 | Level 3 | Total |
| Common Stocks | $5,981,507,298 | $— | $— | $5,981,507,298 |
| Short-Term Investment Fund | 103,824,165 | — | — | 103,824,165 |
| Total | $6,085,331,463 | $— | $— | $6,085,331,463 |
| Shares | Market Value | |||
| Common Stocks — 99.1% | ||||
| Industrials — 20.5% | ||||
| 110,927 | AerCap Holdings NV (Ireland) | $ 10,507,005 | ||
| 73,817 | Clean Harbors, Inc.* | 17,842,307 | ||
| 47,127 | Dover Corp. | 9,036,131 | ||
| 233,723 | Genpact Ltd. | 9,164,279 | ||
| 94,355 | Hexcel Corp. | 5,833,970 | ||
| 27,124 | L3Harris Technologies, Inc. | 6,451,986 | ||
| 100,277 | Leidos Holdings, Inc. | 16,345,151 | ||
| 15,587 | Parker-Hannifin Corp. | 9,848,178 | ||
| 95,340 | Regal Rexnord Corp. | 15,814,999 | ||
| 16,413 | Snap-on, Inc. | 4,755,010 | ||
| 68,214 | WESCO International, Inc. | 11,458,588 | ||
| 47,132 | Westinghouse Air Brake Technologies Corp. | 8,567,184 | ||
| 125,624,788 | ||||
| Financials — 16.3% | ||||
| 92,915 | Allstate Corp. (The) | 17,621,330 | ||
| 140,884 | American International Group, Inc. | 10,316,935 | ||
| 14,597 | Ameriprise Financial, Inc. | 6,857,817 | ||
| 218,166 | Chimera Investment Corp. REIT | 3,453,568 | ||
| 61,235 | Discover Financial Services | 8,590,658 | ||
| 598,506 | First Horizon Corp. | 9,294,798 | ||
| 89,569 | Global Payments, Inc. | 9,173,657 | ||
| 69,621 | Pinnacle Financial Partners, Inc. | 6,820,769 | ||
| 55,773 | Reinsurance Group of America, Inc. | 12,151,264 | ||
| 118,116 | Webster Financial Corp. | 5,505,387 | ||
| 34,176 | Willis Towers Watson PLC | 10,065,857 | ||
| 99,852,040 | ||||
| Health Care — 10.6% | ||||
| 44,821 | Cencora, Inc. | 10,088,311 | ||
| 147,387 | Encompass Health Corp. | 14,243,479 | ||
| 172,616 | Envista Holdings Corp.* | 3,410,892 | ||
| 112,882 | Hologic, Inc.* | 9,195,368 | ||
| 28,091 | Humana, Inc. | 8,897,543 | ||
| 46,564 | Labcorp Holdings, Inc. | 10,406,123 | ||
| 79,600 | Zimmer Biomet Holdings, Inc. | 8,592,820 | ||
| 64,834,536 | ||||
| Consumer Staples — 9.5% | ||||
| 15,724 | Casey's General Stores, Inc. | 5,907,664 | ||
| 29,387 | Constellation Brands, Inc. - Class A | 7,572,736 | ||
| 189,451 | Darling Ingredients, Inc.* | 7,039,999 | ||
| 49,834 | Dollar Tree, Inc.* | 3,504,327 | ||
| 70,610 | Ingredion, Inc. | 9,703,932 | ||
| 87,830 | Lamb Weston Holdings, Inc. | 5,686,114 | ||
| 182,718 | TreeHouse Foods, Inc.* | 7,670,502 | ||
| 188,190 | Tyson Foods, Inc. - Class A | 11,208,597 | ||
| 58,293,871 | ||||
| Utilities — 9.1% | ||||
| 166,623 | CenterPoint Energy, Inc. | 4,902,049 | ||
| 80,993 | DTE Energy Co. | 10,400,311 | ||
| 91,869 | Entergy Corp. | 12,090,879 | ||
| 103,465 | Evergy, Inc. | 6,415,865 | ||
| 313,920 | NiSource, Inc. | 10,877,328 | ||
| 116,717 | WEC Energy Group, Inc. | 11,225,841 | ||
| 55,912,273 | ||||
| Consumer Discretionary — 8.2% | ||||
| 32,571 | Advance Auto Parts, Inc. | 1,269,943 | ||
| 171,647 | Aramark | 6,647,888 | ||
| 119,951 | BorgWarner, Inc. | 4,353,022 | ||
| 85,633 | Columbia Sportswear Co. | 7,123,809 | ||
| 208,123 | Gentex Corp. | 6,179,172 | ||
| Shares | Market Value | |||
| Common Stocks — 99.1% (Continued) | ||||
| Consumer Discretionary — 8.2% (Continued) | ||||
| 122,393 | Hasbro, Inc. | $ 8,851,462 | ||
| 201,137 | LKQ Corp. | 8,029,389 | ||
| 194,220 | Valvoline, Inc.* | 8,128,107 | ||
| 50,582,792 | ||||
| Information Technology — 8.1% | ||||
| 100,106 | Akamai Technologies, Inc.* | 10,105,701 | ||
| 41,427 | F5, Inc.* | 9,122,225 | ||
| 71,355 | Keysight Technologies, Inc.* | 11,340,450 | ||
| 53,396 | PTC, Inc.* | 9,646,521 | ||
| 93,079 | Qorvo, Inc.* | 9,615,061 | ||
| 49,829,958 | ||||
| Materials — 6.0% | ||||
| 788,359 | Arcadium Lithium PLC (Jersey)* | 2,246,823 | ||
| 163,112 | Axalta Coating Systems Ltd.* | 5,903,023 | ||
| 104,969 | Berry Global Group, Inc. | 7,135,793 | ||
| 149,043 | FMC Corp. | 9,827,895 | ||
| 79,950 | International Flavors & Fragrances, Inc. | 8,389,154 | ||
| 37,136 | Scotts Miracle-Gro Co. (The) | 3,219,691 | ||
| 36,722,379 | ||||
| Real Estate — 5.8% | ||||
| 136,153 | Agree Realty Corp. REIT | 10,256,405 | ||
| 65,342 | Alexandria Real Estate Equities, Inc. REIT | 7,759,363 | ||
| 24,946 | Essex Property Trust, Inc. REIT | 7,369,547 | ||
| 199,468 | Host Hotels & Resorts, Inc. REIT | 3,510,637 | ||
| 42,001 | Mid-America Apartment Communities, Inc. REIT | 6,673,959 | ||
| 35,569,911 | ||||
| Energy — 5.0% | ||||
| 302,530 | ChampionX Corp. | 9,121,279 | ||
| 292,721 | Coterra Energy, Inc. | 7,010,668 | ||
| 43,124 | Diamondback Energy, Inc. | 7,434,578 | ||
| 503,978 | Permian Resources Corp. | 6,859,141 | ||
| 30,425,666 | ||||
| Total Common Stocks | $607,648,214 | |||
| Short-Term Investment Fund — 0.9% | ||||
| 5,234,062 | Dreyfus Government Cash Management, Institutional Shares, 4.80%∞Ω | 5,234,062 | ||
| Total Investment Securities—100.0% (Cost $449,143,474) | $612,882,276 | |||
| Other Assets in Excess of Liabilities — 0.0% | 61,948 | |||
| Net Assets — 100.0% | $612,944,224 | |||
| * | Non-income producing security. |
| ∞ | Open-End Fund. |
| Ω | Represents the 7-Day SEC yield as of September 30, 2024. |
| Portfolio Abbreviations: |
| PLC – Public Limited Company |
| REIT – Real Estate Investment Trust |
| Valuation Inputs at Reporting Date: | ||||
| Description | Level 1 | Level 2 | Level 3 | Total |
| Common Stocks | $607,648,214 | $— | $— | $607,648,214 |
| Short-Term Investment Fund | 5,234,062 | — | — | 5,234,062 |
| Total | $612,882,276 | $— | $— | $612,882,276 |
| Shares | Market Value | |||
| Common Stocks — 97.5% | ||||
| Japan — 12.6% | ||||
| Consumer Staples — 2.1% | ||||
| 60,300 | Ajinomoto Co., Inc. | $ 2,333,725 | ||
| Industrials — 6.1% | ||||
| 74,700 | Recruit Holdings Co. Ltd. | 4,538,205 | ||
| 4,600 | SMC Corp. | 2,057,215 | ||
| Information Technology — 4.4% | ||||
| 10,100 | Keyence Corp. | 4,840,548 | ||
| Total Japan | 13,769,693 | |||
| Netherlands — 11.9% | ||||
| Financials — 4.1% | ||||
| 2,854 | Adyen NV, 144a* | 4,468,280 | ||
| Industrials — 2.9% | ||||
| 18,171 | IMCD NV | 3,156,575 | ||
| Information Technology — 4.9% | ||||
| 6,395 | ASML Holding NV | 5,328,633 | ||
| Total Netherlands | 12,953,488 | |||
| Switzerland — 9.3% | ||||
| Health Care — 2.7% | ||||
| 4,705 | Lonza Group AG | 2,985,716 | ||
| Industrials — 3.1% | ||||
| 6,728 | VAT Group AG, 144a | 3,440,691 | ||
| Materials — 3.5% | ||||
| 11,387 | Sika AG | 3,774,398 | ||
| Total Switzerland | 10,200,805 | |||
| Brazil — 9.2% | ||||
| Consumer Discretionary — 6.1% | ||||
| 3,235 | MercadoLibre, Inc.* | 6,638,091 | ||
| Industrials — 3.1% | ||||
| 333,700 | WEG SA | 3,345,759 | ||
| Total Brazil | 9,983,850 | |||
| Canada — 8.8% | ||||
| Consumer Discretionary — 1.5% | ||||
| 16,614 | Dollarama, Inc. | 1,701,877 | ||
| Information Technology — 7.3% | ||||
| 1,276 | Constellation Software, Inc. | 4,137,516 | ||
| 47,482 | Shopify, Inc. - Class A* | 3,805,207 | ||
| Total Canada | 9,644,600 | |||
| India — 7.5% | ||||
| Consumer Discretionary — 2.2% | ||||
| 53,047 | Titan Co. Ltd. | 2,419,238 | ||
| Financials — 5.3% | ||||
| 26,093 | Bajaj Finance Ltd. | 2,397,371 | ||
| 165,044 | HDFC Bank Ltd. | 3,398,970 | ||
| Total India | 8,215,579 | |||
| Germany — 6.6% | ||||
| Communication Services — 4.3% | ||||
| 44,701 | CTS Eventim AG & Co. KGaA | 4,654,522 | ||
| Consumer Discretionary — 2.3% | ||||
| 78,039 | Zalando SE, 144a* | 2,579,339 | ||
| Total Germany | 7,233,861 | |||
| Sweden — 6.6% | ||||
| Industrials — 3.8% | ||||
| 139,598 | AddTech AB - Class B | 4,185,017 | ||
| Shares | Market Value | |||
| Common Stocks — 97.5% (Continued) | ||||
| Sweden — (Continued) | ||||
| Information Technology — 2.8% | ||||
| 282,709 | Hexagon AB - Class B | $ 3,045,079 | ||
| Total Sweden | 7,230,096 | |||
| Italy — 5.0% | ||||
| Consumer Discretionary — 3.2% | ||||
| 7,359 | Ferrari NV | 3,459,539 | ||
| Health Care — 1.8% | ||||
| 97,322 | Stevanato Group SpA | 1,946,440 | ||
| Total Italy | 5,405,979 | |||
| Taiwan — 4.7% | ||||
| Information Technology — 4.7% | ||||
| 29,249 | Taiwan Semiconductor Manufacturing Co. Ltd. ADR | 5,079,674 | ||
| Singapore — 4.1% | ||||
| Communication Services — 4.1% | ||||
| 47,003 | Sea Ltd. ADR* | 4,431,443 | ||
| Denmark — 3.6% | ||||
| Consumer Discretionary — 2.0% | ||||
| 13,006 | Pandora A/S | 2,143,624 | ||
| Health Care — 1.6% | ||||
| 7,345 | Genmab A/S* | 1,780,676 | ||
| Total Denmark | 3,924,300 | |||
| United Kingdom — 3.0% | ||||
| Consumer Discretionary — 3.0% | ||||
| 13,997 | Flutter Entertainment PLC* | 3,321,208 | ||
| United States — 2.5% | ||||
| Communication Services — 2.5% | ||||
| 34,679 | Liberty Media Corp.-Liberty Formula One - Class C* | 2,685,195 | ||
| Poland — 2.1% | ||||
| Consumer Staples — 2.1% | ||||
| 24,871 | Dino Polska SA, 144a* | 2,266,111 | ||
| Total Common Stocks | $106,345,882 | |||
| Short-Term Investment Fund — 2.8% | ||||
| 3,047,271 | Dreyfus Government Cash Management, Institutional Shares, 4.80%∞Ω | 3,047,271 | ||
| Total Investment Securities — 100.3% (Cost $91,725,133) | $109,393,153 | |||
| Liabilities in Excess of Other Assets — (0.3)% | (341,535) | |||
| Net Assets — 100.0% | $109,051,618 | |||
| * | Non-income producing security. |
| ∞ | Open-End Fund. |
| Ω | Represents the 7-Day SEC yield as of September 30, 2024. |
| Portfolio Abbreviations: |
| ADR – American Depositary Receipt |
| PLC – Public Limited Company |
| 144a - This is a restricted security that was sold in a transaction qualifying for the exemption under Rule 144a of the Securities Act of 1933. This security may be sold in transactions exempt from registration, normally to qualified institutional buyers. At September 30, 2024, these securities were valued at $12,754,421 or 11.7% of net assets. These securities were deemed liquid pursuant to procedures approved by the Board of Trustees. |
| Valuation inputs at Reporting Date: | ||||
| Description | Level 1 | Level 2 | Level 3 | Total |
| Common Stocks | ||||
| Japan | $— | $13,769,693 | $— | $13,769,693 |
| Netherlands | 5,328,633 | 7,624,855 | — | 12,953,488 |
| Switzerland | — | 10,200,805 | — | 10,200,805 |
| Brazil | 9,983,850 | — | — | 9,983,850 |
| Canada | 9,644,600 | — | — | 9,644,600 |
| India | — | 8,215,579 | — | 8,215,579 |
| Germany | — | 7,233,861 | — | 7,233,861 |
| Sweden | — | 7,230,096 | — | 7,230,096 |
| Italy | 5,405,979 | — | — | 5,405,979 |
| Taiwan | 5,079,674 | — | — | 5,079,674 |
| Singapore | 4,431,443 | — | — | 4,431,443 |
| Denmark | — | 3,924,300 | — | 3,924,300 |
| United Kingdom | 3,321,208 | — | — | 3,321,208 |
| United States | 2,685,195 | — | — | 2,685,195 |
| Poland | 2,266,111 | — | — | 2,266,111 |
| Short-Term Investment Fund | 3,047,271 | — | — | 3,047,271 |
| Total | $51,193,964 | $58,199,189 | $— | $109,393,153 |
| Shares | Market Value | |||
| Common Stocks — 99.3% | ||||
| Information Technology — 53.4% | ||||
| 466,373 | Apple, Inc. | $ 108,664,909 | ||
| 107,832 | ASML Holding NV (Netherlands) | 89,851,014 | ||
| 402,946 | Atlassian Corp. - Class A* | 63,991,854 | ||
| 282,484 | Cloudflare, Inc. - Class A* | 22,850,131 | ||
| 767,276 | Datadog, Inc. - Class A* | 88,282,777 | ||
| 544,039 | Entegris, Inc. | 61,220,709 | ||
| 42,336 | Lam Research Corp. | 34,549,563 | ||
| 460,329 | Microsoft Corp. | 198,079,569 | ||
| 2,063,441 | NVIDIA Corp. | 250,584,275 | ||
| 688,898 | Okta, Inc.* | 51,212,677 | ||
| 1,340,498 | Samsara, Inc. - Class A* | 64,504,764 | ||
| 167,727 | ServiceNow, Inc.* | 150,013,351 | ||
| 1,254,396 | Shopify, Inc. (Canada) - Class A* | 100,527,295 | ||
| 249,019 | Snowflake, Inc. - Class A* | 28,602,322 | ||
| 1,312,935,210 | ||||
| Communication Services — 15.6% | ||||
| 230,331 | Meta Platforms, Inc. - Class A | 131,850,678 | ||
| 87,883 | Netflix, Inc.* | 62,332,776 | ||
| 756,988 | ROBLOX Corp. - Class A* | 33,504,289 | ||
| 907,369 | Sea Ltd. (Singapore) ADR* | 85,546,749 | ||
| 192,980 | Spotify Technology SA* | 71,118,919 | ||
| 384,353,411 | ||||
| Consumer Discretionary — 12.4% | ||||
| 1,106,489 | Amazon.com, Inc.* | 206,172,095 | ||
| 368,470 | DoorDash, Inc. - Class A* | 52,591,723 | ||
| 361,705 | Floor & Decor Holdings, Inc. - Class A* | 44,912,910 | ||
| 303,676,728 | ||||
| Financials — 10.1% | ||||
| 991,343 | Block, Inc.* | 66,548,856 | ||
| 312,165 | Intercontinental Exchange, Inc. | 50,146,186 | ||
| 6,039,150 | NU Holdings Ltd. (Brazil) - Class A* | 82,434,397 | ||
| 175,804 | Visa, Inc. - Class A | 48,337,310 | ||
| 247,466,749 | ||||
| Health Care — 6.2% | ||||
| 835,064 | DexCom, Inc.* | 55,982,690 | ||
| Shares | Market Value | |||
| Common Stocks — 99.3% (Continued) | ||||
| Health Care — 6.2% (Continued) | ||||
| 616,482 | Edwards Lifesciences Corp.* | $ 40,681,647 | ||
| 1,010,592 | Ultragenyx Pharmaceutical, Inc.* | 56,138,386 | ||
| 152,802,723 | ||||
| Industrials — 1.6% | ||||
| 515,337 | Uber Technologies, Inc.* | 38,732,729 | ||
| Total Common Stocks | $2,439,967,550 | |||
| Short-Term Investment Fund — 1.0% | ||||
| 25,354,020 | Dreyfus Government Cash Management, Institutional Shares, 4.80%∞Ω | 25,354,020 | ||
| Total Investment Securities—100.3% (Cost $1,642,839,965) | $2,465,321,570 | |||
| Liabilities in Excess of Other Assets — (0.3%) | (7,191,856) | |||
| Net Assets — 100.0% | $2,458,129,714 | |||
| * | Non-income producing security. |
| ∞ | Open-End Fund. |
| Ω | Represents the 7-Day SEC yield as of September 30, 2024. |
| Portfolio Abbreviations: |
| ADR – American Depositary Receipt |
| Valuation Inputs at Reporting Date: | ||||
| Description | Level 1 | Level 2 | Level 3 | Total |
| Common Stocks | $2,439,967,550 | $— | $— | $2,439,967,550 |
| Short-Term Investment Fund | 25,354,020 | — | — | 25,354,020 |
| Total | $2,465,321,570 | $— | $— | $2,465,321,570 |
| Shares | Market Value | |||
| Common Stocks — 100.1% | ||||
| Industrials — 22.4% | ||||
| 89,286 | Armstrong World Industries, Inc. | $ 11,734,859 | ||
| 76,133 | Casella Waste Systems, Inc. - Class A* | 7,574,472 | ||
| 453,762 | Gates Industrial Corp. PLC* | 7,963,523 | ||
| 69,954 | Landstar System, Inc. | 13,212,212 | ||
| 295,275 | Marten Transport Ltd. | 5,226,367 | ||
| 77,390 | Matson, Inc. | 11,037,362 | ||
| 26,118 | UniFirst Corp. | 5,188,341 | ||
| 61,937,136 | ||||
| Information Technology — 18.6% | ||||
| 269,555 | ACI Worldwide, Inc.* | 13,720,350 | ||
| 177,064 | CTS Corp. | 8,566,356 | ||
| 277,891 | DoubleVerify Holdings, Inc.* | 4,679,684 | ||
| 90,166 | ePlus, Inc.* | 8,866,924 | ||
| 49,869 | Qualys, Inc.* | 6,406,172 | ||
| 271,377 | Vontier Corp. | 9,156,260 | ||
| 51,395,746 | ||||
| Financials — 17.3% | ||||
| 271,293 | Atlantic Union Bankshares Corp. | 10,219,607 | ||
| 257,512 | Cannae Holdings, Inc. | 4,908,179 | ||
| 48,088 | Hanover Insurance Group, Inc. (The) | 7,122,314 | ||
| 175,996 | Moelis & Co. - Class A | 12,057,486 | ||
| 7,980 | White Mountains Insurance Group Ltd. | 13,535,676 | ||
| 47,843,262 | ||||
| Consumer Discretionary — 15.9% | ||||
| 134,107 | Acushnet Holdings Corp. | 8,549,321 | ||
| 7,875 | Graham Holdings Co. - Class B | 6,471,045 | ||
| 18,976 | Murphy USA, Inc. | 9,352,701 | ||
| 337,394 | Revolve Group, Inc.* | 8,360,624 | ||
| 204,397 | Tempur Sealy International, Inc. | 11,160,076 | ||
| 43,893,767 | ||||
| Real Estate — 7.6% | ||||
| 259,104 | Alexander & Baldwin, Inc. REIT | 4,974,797 | ||
| 326,273 | Essential Properties Realty Trust, Inc. REIT | 11,142,223 | ||
| 84,678 | First Industrial Realty Trust, Inc. REIT | 4,740,274 | ||
| 20,857,294 | ||||
| Health Care — 6.8% | ||||
| 484,676 | Certara, Inc.* | 5,675,556 | ||
| 144,412 | Enovis Corp.* | 6,216,936 | ||
| 85,328 | Haemonetics Corp.* | 6,858,665 | ||
| 18,751,157 | ||||
| Materials — 5.0% | ||||
| 114,461 | Ingevity Corp.* | 4,463,979 | ||
| Shares | Market Value | |||
| Common Stocks — 100.1% (Continued) | ||||
| Materials — 5.0% (Continued) | ||||
| 15,478 | NewMarket Corp. | $ 8,542,153 | ||
| 88,909 | Tredegar Corp.* | 648,147 | ||
| 13,654,279 | ||||
| Consumer Staples — 4.6% | ||||
| 40,297 | Lancaster Colony Corp. | 7,115,241 | ||
| 61,996 | PriceSmart, Inc. | 5,689,993 | ||
| 12,805,234 | ||||
| Communication Services — 1.4% | ||||
| 11,331 | Cable One, Inc. | 3,963,471 | ||
| Energy — 0.5% | ||||
| 91,716 | Innovex International, Inc.* | 1,346,391 | ||
| Total Common Stocks | $276,447,737 | |||
| Short-Term Investment Fund — 2.7% | ||||
| 7,546,823 | Dreyfus Government Cash Management, Institutional Shares, 4.80%∞Ω | 7,546,823 | ||
| Total Investment Securities—102.8% (Cost $235,081,866) | $283,994,560 | |||
| Liabilities in Excess of Other Assets — (2.8%) | (7,696,799) | |||
| Net Assets — 100.0% | $276,297,761 | |||
| * | Non-income producing security. |
| ∞ | Open-End Fund. |
| Ω | Represents the 7-Day SEC yield as of September 30, 2024. |
| Portfolio Abbreviations: |
| PLC – Public Limited Company |
| REIT – Real Estate Investment Trust |
| Valuation Inputs at Reporting Date: | ||||
| Description | Level 1 | Level 2 | Level 3 | Total |
| Common Stocks | $276,447,737 | $— | $— | $276,447,737 |
| Short-Term Investment Fund | 7,546,823 | — | — | 7,546,823 |
| Total | $283,994,560 | $— | $— | $283,994,560 |
| Shares | Market Value | |||
| Common Stocks — 98.2% | ||||
| Financials — 22.2% | ||||
| 89,803 | Chimera Investment Corp. REIT | $ 1,421,581 | ||
| 13,600 | City Holding Co. | 1,596,504 | ||
| 166,081 | Columbia Banking System, Inc. | 4,336,375 | ||
| 35,439 | First American Financial Corp. | 2,339,328 | ||
| 194,544 | First Horizon Corp. | 3,021,268 | ||
| 100,613 | First Interstate BancSystem, Inc. - Class A | 3,086,807 | ||
| 23,506 | Hanover Insurance Group, Inc. (The) | 3,481,474 | ||
| 28,639 | Independent Bank Corp. | 1,693,424 | ||
| 106,778 | MGIC Investment Corp. | 2,733,517 | ||
| 57,416 | National Bank Holdings Corp. - Class A | 2,417,214 | ||
| 46,947 | NMI Holdings, Inc. - Class A* | 1,933,747 | ||
| 170,821 | Old National Bancorp | 3,187,520 | ||
| 36,704 | Pinnacle Financial Partners, Inc. | 3,595,891 | ||
| 62,011 | Univest Financial Corp. | 1,744,989 | ||
| 290,372 | Valley National Bancorp | 2,630,770 | ||
| 37,245 | Voya Financial, Inc. | 2,950,549 | ||
| 26,109 | Westamerica BanCorp | 1,290,307 | ||
| 42,324 | Wintrust Financial Corp. | 4,593,424 | ||
| 48,054,689 | ||||
| Industrials — 21.5% | ||||
| 27,563 | AZEK Co., Inc. (The)* | 1,289,948 | ||
| 18,567 | BWX Technologies, Inc. | 2,018,233 | ||
| 7,825 | CACI International, Inc. - Class A* | 3,948,182 | ||
| 17,511 | Clean Harbors, Inc.* | 4,232,584 | ||
| 2,641 | EMCOR Group, Inc. | 1,137,030 | ||
| 45,982 | Enerpac Tool Group Corp. | 1,926,186 | ||
| 20,376 | Enpro, Inc. | 3,304,580 | ||
| 139,288 | Enviri Corp.* | 1,440,238 | ||
| 55,798 | ExlService Holdings, Inc.* | 2,128,694 | ||
| 205,018 | Gates Industrial Corp. PLC* | 3,598,066 | ||
| 30,211 | Hexcel Corp. | 1,867,946 | ||
| 34,035 | Huron Consulting Group, Inc.* | 3,699,604 | ||
| 29,993 | ITT, Inc. | 4,484,253 | ||
| 38,207 | Korn Ferry | 2,874,695 | ||
| 14,025 | Regal Rexnord Corp. | 2,326,467 | ||
| 20,217 | Standex International Corp. | 3,695,263 | ||
| 9,401 | Valmont Industries, Inc. | 2,725,820 | ||
| 46,697,789 | ||||
| Consumer Discretionary — 10.6% | ||||
| 24,328 | American Eagle Outfitters, Inc. | 544,704 | ||
| 9,498 | Carter's, Inc. | 617,180 | ||
| 35,261 | Cheesecake Factory, Inc. (The) | 1,429,833 | ||
| 21,409 | Dorman Products, Inc.* | 2,421,786 | ||
| 70,739 | Gentex Corp. | 2,100,241 | ||
| 72,383 | Goodyear Tire & Rubber Co. (The)* | 640,590 | ||
| 11,209 | Installed Building Products, Inc. | 2,760,440 | ||
| 8,688 | Murphy USA, Inc. | 4,282,055 | ||
| 9,436 | Oxford Industries, Inc. | 818,667 | ||
| 47,818 | Steven Madden Ltd. | 2,342,604 | ||
| 49,536 | Urban Outfitters, Inc.* | 1,897,724 | ||
| 55,489 | Valvoline, Inc.* | 2,322,215 | ||
| 19,074 | YETI Holdings, Inc.* | 782,606 | ||
| 22,960,645 | ||||
| Real Estate — 8.5% | ||||
| 50,496 | Agree Realty Corp. REIT | 3,803,864 | ||
| 89,186 | COPT Defense Properties REIT | 2,705,012 | ||
| 52,168 | Healthpeak Properties, Inc. REIT | 1,193,082 | ||
| 63,395 | National Storage Affiliates Trust REIT | 3,055,639 | ||
| Shares | Market Value | |||
| Common Stocks — 98.2% (Continued) | ||||
| Real Estate — 8.5% (Continued) | ||||
| 291,578 | Newmark Group, Inc. - Class A | $ 4,528,206 | ||
| 82,788 | STAG Industrial, Inc. REIT | 3,236,183 | ||
| 18,521,986 | ||||
| Health Care — 8.2% | ||||
| 49,393 | Encompass Health Corp. | 4,773,340 | ||
| 56,161 | Envista Holdings Corp.* | 1,109,741 | ||
| 35,884 | Globus Medical, Inc. - Class A* | 2,567,142 | ||
| 67,019 | Integra LifeSciences Holdings Corp.* | 1,217,735 | ||
| 66,367 | Option Care Health, Inc.* | 2,077,287 | ||
| 62,093 | Prestige Consumer Healthcare, Inc.* | 4,476,905 | ||
| 35,247 | QuidelOrtho Corp.* | 1,607,263 | ||
| 17,829,413 | ||||
| Information Technology — 7.0% | ||||
| 11,190 | Belden, Inc. | 1,310,685 | ||
| 302,161 | Harmonic, Inc.* | 4,402,486 | ||
| 57,681 | Lumentum Holdings, Inc.* | 3,655,822 | ||
| 17,615 | Rogers Corp.* | 1,990,671 | ||
| 13,682 | Silicon Laboratories, Inc.* | 1,581,229 | ||
| 261,669 | Viavi Solutions, Inc.* | 2,360,254 | ||
| 15,301,147 | ||||
| Energy — 5.6% | ||||
| 43,694 | Cactus, Inc. - Class A | 2,607,221 | ||
| 108,265 | ChampionX Corp. | 3,264,190 | ||
| 57,928 | Civitas Resources, Inc. | 2,935,212 | ||
| 239,468 | Permian Resources Corp. | 3,259,159 | ||
| 12,065,782 | ||||
| Consumer Staples — 5.3% | ||||
| 63,498 | Hain Celestial Group, Inc. (The)* | 547,988 | ||
| 21,272 | Ingredion, Inc. | 2,923,411 | ||
| 7,949 | Lancaster Colony Corp. | 1,403,555 | ||
| 12,915 | MGP Ingredients, Inc.† | 1,075,174 | ||
| 38,077 | Performance Food Group Co.* | 2,984,094 | ||
| 60,573 | TreeHouse Foods, Inc.* | 2,542,854 | ||
| 11,477,076 | ||||
| Materials — 5.1% | ||||
| 327,356 | Arcadium Lithium PLC (Jersey)* | 932,965 | ||
| 48,933 | Axalta Coating Systems Ltd.* | 1,770,885 | ||
| 26,410 | Cabot Corp. | 2,951,846 | ||
| 31,240 | Ingevity Corp.* | 1,218,360 | ||
| 13,175 | Innospec, Inc. | 1,489,961 | ||
| 100,537 | O-I Glass, Inc.* | 1,319,045 | ||
| 26,417 | Silgan Holdings, Inc. | 1,386,892 | ||
| 11,069,954 | ||||
| Utilities — 4.2% | ||||
| 26,027 | Black Hills Corp. | 1,590,770 | ||
| 20,952 | IDACORP, Inc. | 2,159,942 | ||
| 84,650 | Portland General Electric Co. | 4,054,735 | ||
| 18,923 | Spire, Inc. | 1,273,329 | ||
| 9,078,776 | ||||
| Total Common Stocks | $213,057,257 | |||
| Shares | Market Value | |||
| Short-Term Investment Funds — 2.4% | ||||
| 4,111,779 | Dreyfus Government Cash Management, Institutional Shares, 4.80%∞Ω | $ 4,111,779 | ||
| 969,335 | Invesco Government & Agency Portfolio, Institutional Class, 4.84%∞Ω** | 969,335 | ||
| Total Short-Term Investment Funds | $5,081,114 | |||
| Total Investment Securities—100.6% (Cost $185,953,572) | $218,138,371 | |||
| Liabilities in Excess of Other Assets — (0.6%) | (1,266,079) | |||
| Net Assets — 100.0% | $216,872,292 | |||
| * | Non-income producing security. |
| ** | Represents collateral for securities loaned. |
| † | All or a portion of the security is on loan. The total market value of the securities on loan as of September 30, 2024 was $957,375. |
| ∞ | Open-End Fund. |
| Ω | Represents the 7-Day SEC yield as of September 30, 2024. |
| Portfolio Abbreviations: |
| PLC – Public Limited Company |
| REIT – Real Estate Investment Trust |
| Valuation Inputs at Reporting Date: | ||||
| Description | Level 1 | Level 2 | Level 3 | Total |
| Common Stocks | $213,057,257 | $— | $— | $213,057,257 |
| Short-Term Investment Funds | 5,081,114 | — | — | 5,081,114 |
| Total | $218,138,371 | $— | $— | $218,138,371 |
| Principal Amount | Market Value | |||
| Asset-Backed Securities — 47.1% | ||||
| $ 7,730,000 | American Credit Acceptance Receivables Trust, Ser 2021-3, Class E, 144a, 2.560%, 11/15/27 | $ 7,614,607 | ||
| 2,155,000 | American Credit Acceptance Receivables Trust, Ser 2023-1, Class C, 144a, 5.590%, 4/12/29 | 2,163,353 | ||
| 2,566,234 | American Credit Acceptance Receivables Trust, Ser 2024-2, Class A, 144a, 5.900%, 2/12/27 | 2,574,156 | ||
| 785,000 | AmeriCredit Automobile Receivables Trust, Ser 2020-2, Class D, 2.130%, 3/18/26 | 783,808 | ||
| 5,200,000 | AmeriCredit Automobile Receivables Trust, Ser 2021-2, Class C, 1.010%, 1/19/27 | 5,043,425 | ||
| 4,042,853 | AmeriCredit Automobile Receivables Trust, Ser 2023-2, Class A2, 6.190%, 4/19/27 | 4,067,638 | ||
| 2,919,592 | Asset Backed Securities Corp. Home Equity Loan Trust Series OOMC, Ser 2006-HE3, Class A5, (TSFR1M + 0.654%), 2.891%, 3/25/36(A) | 2,848,161 | ||
| 2,743,774 | AUF Funding LLC, Ser 2022-1A, Class A1LN, 144a, (TSFR3M + 2.500%), 7.782%, 1/20/31(A) | 2,746,128 | ||
| 5,230,000 | Avis Budget Rental Car Funding AESOP LLC, Ser 2020-2A, Class A, 144a, 2.020%, 2/20/27 | 5,068,243 | ||
| 5,790,000 | Bain Capital Credit CLO (Cayman Islands), Ser 2018-2A, Class A1R, 144a, (TSFR3M + 1.080%), 6.359%, 7/19/31(A) | 5,793,636 | ||
| 240,181 | Black Diamond CLO Ltd. (Cayman Islands), Ser 2017-1A, Class A1AR, 144a, (TSFR3M + 1.312%), 6.595%, 4/24/29(A) | 240,215 | ||
| 6,180,000 | Carlyle Global Market Strategies CLO Ltd., Ser 2012-4A, Class A1R4, 144a, (TSFR3M + 1.120%), 5.972%, 4/22/32(A) | 6,181,304 | ||
| 3,440,827 | CIFC Funding Ltd. (Cayman Islands), Ser 2017-2A, Class AR, 144a, (TSFR3M + 1.212%), 6.494%, 4/20/30(A) | 3,445,166 | ||
| 4,914,405 | CPS Auto Receivables Trust, Ser 2020-C, Class E, 144a, 4.220%, 5/17/27 | 4,897,108 | ||
| 1,500,000 | Credit Acceptance Auto Loan Trust, Ser 2022-3A, Class A, 144a, 6.570%, 10/15/32 | 1,510,469 | ||
| 5,000,000 | Credit Acceptance Auto Loan Trust, Ser 2023-1A, Class A, 144a, 6.480%, 3/15/33 | 5,084,571 | ||
| 4,860,000 | Credit Acceptance Auto Loan Trust, Ser 2023-2A, Class A, 144a, 5.920%, 5/16/33 | 4,910,835 | ||
| 5,773,150 | DB Master Finance LLC, Ser 2019-1A, Class A2II, 144a, 4.021%, 5/20/49 | 5,700,738 | ||
| 536,598 | Dell Equipment Finance Trust, Ser 2022-2, Class A3, 144a, 4.140%, 7/22/27 | 535,631 | ||
| 2,705,000 | Dell Equipment Finance Trust, Ser 2022-2, Class B, 144a, 4.400%, 7/22/27 | 2,698,770 | ||
| 4,700,000 | Dell Equipment Finance Trust, Ser 2022-2, Class C, 144a, 4.740%, 7/22/27 | 4,695,531 | ||
| 3,204,247 | Dewolf Park CLO Ltd., Ser 2017-1A, Class AR, 144a, (TSFR3M + 1.182%), 6.483%, 10/15/30(A) | 3,207,502 | ||
| 8,254,750 | Domino's Pizza Master Issuer LLC, Ser 2015-1A, Class A2II, 144a, 4.474%, 10/25/45 | 8,213,897 | ||
| 3,332,172 | DT Auto Owner Trust, Ser 2020-2A, Class E, 144a, 7.170%, 6/15/27 | 3,334,556 | ||
| 4,612,929 | DT Auto Owner Trust, Ser 2021-4A, Class C, 144a, 1.500%, 9/15/27 | 4,562,981 | ||
| 6,215,000 | Exeter Automobile Receivables Trust, Ser 2021-3A, Class D, 1.550%, 6/15/27 | 6,017,347 | ||
| 1,330,000 | Exeter Automobile Receivables Trust, Ser 2022-1A, Class D, 3.020%, 6/15/28 | 1,302,918 | ||
| 8,160,000 | Exeter Automobile Receivables Trust, Ser 2022-4A, Class C, 4.920%, 12/15/28 | 8,153,909 | ||
| 1,568,555 | FNA VI LLC, Ser 2021-1A, Class A, 144a, 1.350%, 1/10/32 | 1,469,324 | ||
| Principal Amount | Market Value | |||
| Asset-Backed Securities — 47.1% (Continued) | ||||
| $ 99,900 | FNMA REMIC Trust, Ser 2001-W4, Class AF5, 5.614%, 2/25/32(A)(B) | $ 101,290 | ||
| 3,436,487 | Foursight Capital Automobile Receivables Trust, Ser 2023-2, Class A2, 144a, 5.990%, 5/15/28 | 3,459,284 | ||
| 5,051,632 | Galaxy XXVI CLO Ltd. (Cayman Islands), Ser 2018-26A, Class AR, 144a, (TSFR3M + 1.170%), 6.291%, 11/22/31(A) | 5,054,860 | ||
| 7,374,850 | GLS Auto Receivables Issuer Trust, Ser 2020-3A, Class E, 144a, 4.310%, 7/15/27 | 7,354,778 | ||
| 3,713,230 | GLS Auto Receivables Issuer Trust, Ser 2021-1A, Class D, 144a, 1.680%, 1/15/27 | 3,666,102 | ||
| 5,000,000 | GLS Auto Receivables Issuer Trust, Ser 2022-3A, Class D, 144a, 6.420%, 6/15/28 | 5,095,319 | ||
| 5,100,000 | GLS Auto Select Receivables Trust, Ser 2024-3A, Class A2, 144a, 5.590%, 10/15/29 | 5,180,737 | ||
| 4,850,000 | GreatAmerica Leasing Receivables Funding LLC Series, Ser 2022-1, Class C, 144a, 5.980%, 7/15/30 | 4,982,680 | ||
| 1,286,039 | Hilton Grand Vacations Trust, Ser 2018-AA, Class A, 144a, 3.540%, 2/25/32 | 1,273,748 | ||
| 970,396 | Hilton Grand Vacations Trust, Ser 2020-AA, Class A, 144a, 2.740%, 2/25/39 | 942,330 | ||
| 1,212,995 | Hilton Grand Vacations Trust, Ser 2020-AA, Class B, 144a, 4.220%, 2/25/39 | 1,198,703 | ||
| 3,000,000 | Hpefs Equipment Trust, Ser 2022-2A, Class D, 144a, 4.940%, 3/20/30 | 3,002,370 | ||
| 5,100,000 | Hpefs Equipment Trust, Ser 2022-3A, Class C, 144a, 6.130%, 8/20/29 | 5,150,776 | ||
| 5,150,000 | M&T Equipment Notes, Ser 2024-1A, Class A2, 144a, 4.990%, 8/18/31 | 5,179,191 | ||
| 3,538,738 | Madison Park Funding XXIV Ltd. (Cayman Islands), Ser 2016-24A, Class AR2, 144a, (TSFR3M + 1.120%), 6.402%, 10/20/29(A) | 3,541,520 | ||
| 1,943,874 | MF1 Ltd. (Cayman Islands), Ser 2020-FL4, Class A, 144a, (TSFR1M + 1.814%), 6.897%, 12/15/35(A) | 1,941,447 | ||
| 5,219,000 | MF1 Ltd. (Cayman Islands), Ser 2020-FL4, Class C, 144a, (TSFR1M + 3.714%), 8.797%, 12/15/35(A) | 5,186,800 | ||
| 2,550,620 | OCP CLO Ltd. (Cayman Islands), Ser 2014-6A, Class A1R2, 144a, (TSFR3M + 1.150%), 6.436%, 10/17/30(A) | 2,551,857 | ||
| 2,736,122 | OneMain Direct Auto Receivables Trust, Ser 2019-1A, Class A, 144a, 3.630%, 9/14/27 | 2,717,156 | ||
| 4,455,000 | OneMain Financial Issuance Trust, Ser 2022-2A, Class A, 144a, 4.890%, 10/14/34 | 4,454,250 | ||
| 3,000,000 | OneMain Financial Issuance Trust, Ser 2022-3A, Class A, 144a, 5.940%, 5/15/34 | 3,032,972 | ||
| 5,680,422 | OZLM IX Ltd. (Cayman Islands), Ser 2014-9A, Class A1A4, 144a, (TSFR3M + 1.200%), 6.482%, 10/20/31(A) | 5,683,575 | ||
| 3,297,424 | Palmer Square Loan Funding Ltd. (Cayman Islands), Ser 2021-4A, Class A1, 144a, (TSFR3M + 1.062%), 6.363%, 10/15/29(A) | 3,299,185 | ||
| 149,170 | Prestige Auto Receivables Trust, Ser 2020-1A, Class D, 144a, 1.620%, 11/16/26 | 148,942 | ||
| 4,645,260 | Regatta XIV Funding Ltd. (Cayman Islands), Ser 2018-3A, Class AR, 144a, (TSFR3M + 1.100%), 6.385%, 10/25/31(A) | 4,644,331 | ||
| 1,212,393 | Romark WM-R Ltd. (Cayman Islands), Ser 2018-1A, Class A1, 144a, (TSFR3M +1.292%), 6.574%, 4/20/31(A) | 1,213,427 | ||
| 5,000,000 | Santander Drive Auto Receivables Trust, Ser 2022-7, Class B, 5.950%, 1/17/28 | 5,037,666 | ||
| 1,010,000 | SBA Tower Trust, Ser 2014-2A, Class C, 144a, 3.869%, 10/15/49(A)(B) | 1,009,303 | ||
| Principal Amount | Market Value | |||
| Asset-Backed Securities — 47.1% (Continued) | ||||
| $ 3,825,000 | SCF Equipment Leasing LLC, Ser 2024-1A, Class A2, 144a, 5.880%, 11/20/29 | $ 3,860,703 | ||
| 3,972,984 | Symphony Static CLO I Ltd. (Cayman Islands), Ser 2021-1A, Class A, 144a, (TSFR3M + 1.092%), 6.376%, 10/25/29(A) | 3,974,164 | ||
| 333,195 | TCI-Flatiron CLO Ltd. (Cayman Islands), Ser 2017-1A, Class AR, 144a, (TSFR3M + 1.222%), 6.323%, 11/18/30(A) | 333,474 | ||
| 1,371,067 | Towd Point Mortgage Trust, Ser 2017-5, Class A1, 144a, (TSFR1M + 0.714%), 5.569%, 2/25/57(A) | 1,411,696 | ||
| 1,558,734 | Towd Point Mortgage Trust, Ser 2019-HY1, Class A1, 144a, (TSFR1M + 1.114%), 5.969%, 10/25/48(A) | 1,582,638 | ||
| 2,478,278 | Westgate Resorts LLC, Ser 2022-1A, Class A, 144a, 1.788%, 8/20/36 | 2,410,271 | ||
| 5,325,000 | Westlake Automobile Receivables Trust, Ser 2021-1A, Class E, 144a, 2.330%, 8/17/26 | 5,248,201 | ||
| 4,295,000 | Westlake Automobile Receivables Trust, Ser 2021-2A, Class E, 144a, 2.380%, 3/15/27 | 4,198,643 | ||
| 4,900,000 | Westlake Automobile Receivables Trust, Ser 2022-3A, Class D, 144a, 6.680%, 4/17/28 | 5,023,717 | ||
| 5,000,000 | Westlake Automobile Receivables Trust, Ser 2023-1A, Class B, 144a, 5.410%, 1/18/28 | 5,024,774 | ||
| Total Asset-Backed Securities | $244,038,807 | |||
| Corporate Bonds — 18.2% | ||||
| Financials — 4.8% | ||||
| 3,950,000 | Citibank NA, (SOFR + 0.708%), 5.833%, 8/6/26(A) | 3,960,823 | ||
| 1,500,000 | Huntington National Bank (The), 5.699%, 11/18/25 | 1,500,109 | ||
| 2,982,000 | JPMorgan Chase & Co., Ser b, (TSFR3M + 0.762%), 6.009%, 2/1/27(A) | 2,929,526 | ||
| 6,050,000 | SBA Tower Trust REIT, 144a, 2.836%, 1/15/25 | 6,006,444 | ||
| 2,500,000 | Synovus Financial Corp., 5.200%, 8/11/25 | 2,501,134 | ||
| 8,000,000 | Toronto-Dominion Bank (The) (Canada), MTN, (SOFR + 0.480%), 5.748%, 10/10/25(A) | 8,007,047 | ||
| 24,905,083 | ||||
| Consumer Discretionary — 4.8% | ||||
| 7,500,000 | Daimler Truck Finance North America LLC (Germany), 144a, 5.600%, 8/8/25 | 7,561,245 | ||
| 5,350,000 | Hyundai Capital America, 144a, 5.250%, 1/8/27 | 5,444,058 | ||
| 4,780,000 | Mercedes-Benz Finance North America LLC (Germany), 144a, (SOFR + 0.630%), 5.808%, 7/31/26(A) | 4,777,467 | ||
| 6,997,122 | United Airlines, Inc. Pass-Through Trust, Ser 2013-1 A, 4.300%, 8/15/25 | 6,924,376 | ||
| 24,707,146 | ||||
| Energy — 3.2% | ||||
| 1,000,000 | Boardwalk Pipelines LP, 4.950%, 12/15/24 | 998,822 | ||
| 7,500,000 | Columbia Pipeline Group, Inc., 4.500%, 6/1/25 | 7,478,448 | ||
| 2,308,000 | Florida Gas Transmission Co. LLC, 144a, 4.350%, 7/15/25 | 2,294,061 | ||
| 1,000,000 | HF Sinclair Corp., 6.375%, 4/15/27 | 1,013,593 | ||
| 2,096,000 | Plains All American Pipeline LP / PAA Finance Corp., 3.600%, 11/1/24 | 2,092,901 | ||
| 3,041,000 | Western Midstream Operating LP, 3.100%, 2/1/25 | 3,015,595 | ||
| 16,893,420 | ||||
| Utilities — 1.5% | ||||
| 6,000,000 | FirstEnergy Pennsylvania Electric Co., 144a, 4.000%, 4/15/25 | 5,957,558 | ||
| 2,000,000 | Vistra Operations Co. LLC, 144a, 5.125%, 5/13/25 | 1,995,871 | ||
| 7,953,429 | ||||
| Real Estate — 1.1% | ||||
| 5,500,000 | Public Storage Operating Co. REIT, (SOFR + 0.700%), 5.950%, 4/16/27(A) | 5,523,480 | ||
| Principal Amount | Market Value | |||
| Corporate Bonds — 18.2% (Continued) | ||||
| Industrials — 1.0% | ||||
| $ 1,000,000 | Element Fleet Management Corp. (Canada), 144a, 3.850%, 6/15/25 | $ 990,373 | ||
| 4,250,000 | L3Harris Technologies, Inc., 5.400%, 1/15/27 | 4,361,075 | ||
| 5,351,448 | ||||
| Health Care — 1.0% | ||||
| 5,045,000 | UnitedHealth Group, Inc., (SOFR + 0.500%), 5.733%, 7/15/26(A) | 5,060,407 | ||
| Information Technology — 0.8% | ||||
| 4,000,000 | Microchip Technology, Inc., 4.250%, 9/1/25 | 3,982,055 | ||
| Total Corporate Bonds | $94,376,468 | |||
| Commercial Mortgage-Backed Securities — 18.2% | ||||
| 6,450,000 | BAMLL Commercial Mortgage Securities Trust, Ser 2017-SCH, Class AF, 144a, (TSFR1M + 1.047%), 6.144%, 11/15/33(A) | 6,440,513 | ||
| 8,145,000 | BHMS, Ser 2018-ATLS, Class A, 144a, (TSFR1M + 1.547%), 6.644%, 7/15/35(A) | 8,142,557 | ||
| 2,868,569 | BXMT Ltd. (Cayman Islands), Ser 2020-FL2, Class A, 144a, (TSFR1M + 1.014%), 6.097%, 2/15/38(A) | 2,802,172 | ||
| 8,495,000 | BXMT Ltd. (Cayman Islands), Ser 2020-FL2, Class AS, 144a, (TSFR1M + 1.264%), 6.347%, 2/15/38(A) | 8,046,739 | ||
| 7,200,000 | BXP Trust, Ser 2017-CQHP, Class A, 144a, (TSFR1M + 0.897%), 5.994%, 11/15/34(A) | 6,741,337 | ||
| 4,190,000 | CAMB Commercial Mortgage Trust, Ser 2019-LIFE, Class A, 144a, (TSFR1M + 1.367%), 6.464%, 12/15/37(A) | 4,187,381 | ||
| 2,700,000 | CAMB Commercial Mortgage Trust, Ser 2019-LIFE, Class C, 144a, (TSFR1M + 1.497%), 6.844%, 12/15/37(A) | 2,696,625 | ||
| 579,064 | Citigroup Commercial Mortgage Trust, Ser 2015-GC35, Class A2, 3.063%, 11/10/48 | 569,623 | ||
| 56,000,000 | Citigroup Commercial Mortgage Trust, Ser 2021-PRM2, Class XCP, 144a, 10/15/22(A)(B)(C) | 0 | ||
| 1,830,175 | COMM Mortgage Trust, Ser 2013-CR8, Class B, 144a, 3.637%, 6/10/46(A)(B) | 1,821,024 | ||
| 2,450,000 | COMM Mortgage Trust, Ser 2014-CR21, Class AM, 3.987%, 12/10/47 | 2,425,292 | ||
| 2,588,546 | COMM Mortgage Trust, Ser 2014-UBS3, Class XA, 0.780%, 6/10/47(A)(B)(C) | 44 | ||
| 4,250,000 | COMM Mortgage Trust, Ser 2015-CR22, Class A5, 3.309%, 3/10/48 | 4,220,310 | ||
| 1,874,000 | COMM Mortgage Trust, Ser 2015-CR27, Class A4, 3.612%, 10/10/48 | 1,849,134 | ||
| 1,000,000 | COMM Mortgage Trust, Ser 2015-PC1, Class A5, 3.902%, 7/10/50 | 993,390 | ||
| 1,248,721 | CSMC, Ser 2020-NET, Class A, 144a, 2.257%, 8/15/37 | 1,203,449 | ||
| 638,069 | CSMC Trust, Ser 2017-CHOP, Class A, 144a, (Prime Rate -2.306%), 6.194%, 7/15/32(A) | 624,275 | ||
| 6,080,000 | CSMC Trust, Ser 2017-PFHP, Class A, 144a, (TSFR1M + 0.997%), 6.094%, 12/15/30(A) | 5,860,774 | ||
| 4,474,500 | DBGS Mortgage Trust, Ser 2018-BIOD, Class B, 144a, (TSFR1M + 1.184%), 6.281%, 5/15/35(A) | 4,443,738 | ||
| 2,895,865 | Extended Stay America Trust, Ser 2021-ESH, Class B, 144a, (TSFR1M + 1.494%), 6.591%, 7/15/38(A) | 2,889,530 | ||
| 598,221 | GS Mortgage Securities Corp. Trust, Ser 2017-GPTX, Class A, 144a, 2.856%, 5/10/34 | 511,319 | ||
| 4,707,000 | GS Mortgage Securities Corp. Trust, Ser 2022-GTWY, Class A, 144a, (TSFR1M + 3.400%), 8.497%, 8/15/39(A) | 4,707,000 | ||
| 2,365,000 | GS Mortgage Securities Trust, Ser 2015-GC28, Class B, 3.980%, 2/10/48 | 2,338,445 | ||
| Principal Amount | Market Value | |||
| Commercial Mortgage-Backed Securities — 18.2% (Continued) | ||||
| $ 809,731 | GS Mortgage Securities Trust, Ser 2015-GC34, Class AAB, 3.278%, 10/10/48 | $ 801,070 | ||
| 914,420 | HPLY Trust, Ser 2019-HIT, Class A, 144a, (TSFR1M + 1.114%), 6.232%, 11/15/36(A) | 913,563 | ||
| 605,093 | JP Morgan Chase Commercial Mortgage Securities Trust, Ser 2013-LC11, Class AS, 3.216%, 4/15/46 | 552,771 | ||
| 1,300,000 | JP Morgan Chase Commercial Mortgage Securities Trust, Ser 2018-WPT, Class BFX, 144a, 4.549%, 7/5/33 | 1,067,820 | ||
| 5,350,000 | JP Morgan Chase Commercial Mortgage Securities Trust, Ser 2020-ACE, Class A, 144a, 3.287%, 1/10/37 | 5,306,784 | ||
| 4,567,420 | LUXE Trust, Ser 2021-TRIP, Class B, 144a, (TSFR1M + 1.514%), 6.614%, 10/15/38(A) | 4,544,828 | ||
| 2,807,570 | Morgan Stanley Bank of America Merrill Lynch Trust, Ser 2015-C20, Class A4, 3.249%, 2/15/48 | 2,793,974 | ||
| 5,661,653 | Morgan Stanley Capital I Trust, Ser 2018-BOP, Class A, 144a, (TSFR1M + 0.897%), 5.994%, 8/15/33(A) | 4,621,608 | ||
| 36,825 | ReadyCap Commercial Mortgage Trust, Ser 2018-4, Class A, 144a, 3.390%, 2/27/51 | 36,550 | ||
| Total Commercial Mortgage-Backed Securities | $94,153,639 | |||
| Non-Agency Collateralized Mortgage Obligations — 8.5% | ||||
| 443,719 | Bear Stearns ARM Trust, Ser 2003-1, Class 5A1, 6.900%, 4/25/33(A)(B)†† | 446,234 | ||
| 97,614 | Bear Stearns Asset Backed Securities Trust, Ser 2003-AC7, Class A2, 5.750%, 1/25/34(A)(B)†† | 82,358 | ||
| 476,353 | CIM Trust, Ser 2018-R3, Class A1, 144a, 5.000%, 12/25/57(A)(B) | 473,232 | ||
| 1,290 | Community Program Loan Trust, Ser 1987-A, Class A5, 4.500%, 4/1/29 | 1,285 | ||
| 7,191,015 | CSMC Trust, Ser 2018-RPL9, Class A1, 144a, 3.850%, 9/25/57(A)(B) | 7,086,010 | ||
| 1,058,789 | GSR Mortgage Loan Trust, Ser 2003-13, Class 1A1, 6.395%, 10/25/33(A)(B) | 1,059,784 | ||
| 45,650 | JP Morgan Mortgage Trust, Ser 2006-A4, Class 2A2, 5.822%, 6/25/36(A)(B) | 32,436 | ||
| 1,899,271 | JP Morgan Mortgage Trust, Ser 2019-HYB1, Class A5A, 144a, 3.000%, 10/25/49(A)(B) | 1,868,249 | ||
| 17,974 | Merrill Lynch Mortgage Investors Trust, Ser 2004-1, Class 1A, 6.957%, 12/25/34(A)(B) | 17,452 | ||
| 10,629 | Merrill Lynch Mortgage Investors Trust, Ser 2003-A1, Class 2A, (TSFR12M + 2.340%), 6.537%, 12/25/32(A) | 10,601 | ||
| 211,728 | Mill City Mortgage Loan Trust, Ser 2018-2, Class A1, 144a, 3.500%, 5/25/58(A)(B) | 209,967 | ||
| 185,733 | RFMSI Trust, Ser 2007-SA1, Class 1A1, 3.200%, 2/25/37(A)(B) | 156,872 | ||
| 6,512,445 | RMF Proprietary Issuance Trust, Ser 2019-1, Class A, 144a, 2.750%, 10/25/63(A)(B) | 5,840,742 | ||
| 1,205,441 | Sequoia Mortgage Trust, Ser 2013-7, Class B2, 3.506%, 6/25/43(A)(B) | 1,158,721 | ||
| 1,017,030 | Sequoia Mortgage Trust, Ser 2019-CH3, Class A13, 144a, 4.000%, 9/25/49(A)(B) | 972,161 | ||
| 4,402,260 | Starwood Mortgage Residential Trust, Ser 2020-3, Class A1, 144a, 1.486%, 4/25/65(A)(B) | 4,255,040 | ||
| 6,879,359 | Towd Point HE Trust, Ser 2021-HE1, Class A1, 144a, 0.918%, 2/25/63(A)(B) | 6,670,177 | ||
| 365,465 | Towd Point Mortgage Trust, Ser 2015-2, Class 1M2, 144a, 3.761%, 11/25/60(A)(B) | 363,808 | ||
| 2,795,808 | Towd Point Mortgage Trust, Ser 2015-6, Class M1, 144a, 3.750%, 4/25/55(A)(B) | 2,772,081 | ||
| 5,175,000 | Towd Point Mortgage Trust, Ser 2016-1, Class M2, 144a, 3.500%, 2/25/55(A)(B) | 5,070,126 | ||
| Principal Amount | Market Value | |||
| Non-Agency Collateralized Mortgage Obligations — 8.5% (Continued) | ||||
| $ 1,939,745 | Towd Point Mortgage Trust, Ser 2017-1, Class A2, 144a, 3.500%, 10/25/56(A)(B) | $ 1,916,132 | ||
| 3,553,515 | Towd Point Mortgage Trust, Ser 2021-SJ2, Class A1A, 144a, 2.250%, 12/25/61(A)(B) | 3,430,620 | ||
| Total Non-Agency Collateralized Mortgage Obligations | $43,894,088 | |||
| Commercial Paper — 5.7% | ||||
| 12,100,000 | BAT International Finance PLC, 4.921%, 10/1/24(D) | 12,098,349 | ||
| 6,600,000 | Canadian Tire Corp Ltd., 5.025%, 10/17/24(D) | 6,584,540 | ||
| 10,000,000 | Sonoco Products Company, 4.901%, 10/1/24(D) | 9,998,635 | ||
| 1,000,000 | Washington Gas Light Company, 4.905%, 10/1/24(D) | 999,867 | ||
| Total Commercial Paper | $29,681,391 | |||
| Municipal Bonds — 1.0% | ||||
| Other Territory — 1.0% | ||||
| 835,000 | Taxable Municipal Funding Trust, Rev., 144a, 5.150%, 5/15/56(A)(B) | 835,000 | ||
| 1,945,000 | Taxable Municipal Funding Trust, Rev., 144a, 5.150%, 12/15/25(A)(B) | 1,945,000 | ||
| 1,000,000 | Taxable Municipal Funding Trust, Rev., 144a, 5.150%, 6/30/28(A)(B) | 1,000,000 | ||
| 1,200,000 | Taxable Municipal Funding Trust, Txbl Floaters Ser 2020 11, (LOC - Barclays Bank PLC), 144a, 5.150%, 9/1/30(A)(B) | 1,200,000 | ||
| 4,980,000 | ||||
| California — 0.0% | ||||
| 235,000 | CA St Enterprise Dev Authority, Txbl Variable J Harris Indl Wt, (LOC - City National Bank), 144a, 5.280%, 9/1/41(A)(B) | 235,000 | ||
| Total Municipal Bonds | $5,215,000 | |||
| U.S. Government Mortgage-Backed Obligations — 0.7% | ||||
| 83,127 | FHLMC, Pool #1B7189, (RFUCCT1Y + 2.470%), 7.208%, 3/1/36(A) | 85,196 | ||
| 71,032 | FHLMC, Pool #1H1354, (1 Year CMT Rate +2.250%), 6.499%, 11/1/36(A) | 73,307 | ||
| 25,962 | FHLMC, Pool #1J1813, (RFUCCT1Y + 1.925%), 7.675%, 8/1/37(A) | 26,587 | ||
| 75,514 | FHLMC, Pool #1L0147, (1 Year CMT Rate +2.290%), 7.415%, 7/1/35(A) | 77,692 | ||
| 28,843 | FHLMC, Pool #1Q0080, (RFUCCT1Y + 1.661%), 6.938%, 1/1/36(A) | 29,801 | ||
| 73,351 | FHLMC, Pool #1Q0119, (RFUCCT1Y + 1.850%), 7.499%, 9/1/36(A) | 75,917 | ||
| 58,213 | FHLMC, Pool #1Q0187, (RFUCCT1Y + 1.789%), 6.038%, 12/1/36(A) | 58,981 | ||
| 30,810 | FHLMC, Pool #1Q0339, (RFUCCT1Y + 1.889%), 6.655%, 4/1/37(A) | 31,304 | ||
| 49,762 | FHLMC, Pool #1Q1303, (1 Year CMT Rate +2.250%), 6.571%, 11/1/36(A) | 51,343 | ||
| 80,654 | FHLMC, Pool #781515, (1 Year CMT Rate +2.250%), 6.708%, 4/1/34(A) | 83,343 | ||
| 32,735 | FHLMC, Pool #782760, (1 Year CMT Rate +2.250%), 7.023%, 11/1/36(A) | 34,145 | ||
| 44,316 | FHLMC, Pool #847795, (1 Year CMT Rate +2.275%), 6.640%, 4/1/35(A) | 45,307 | ||
| 112,591 | FHLMC, Pool #848539, (1 Year CMT Rate +2.288%), 6.747%, 4/1/37(A) | 115,835 | ||
| 231,032 | FHLMC, Pool #848583, (1 Year CMT Rate +2.303%), 6.753%, 1/1/36(A) | 239,860 | ||
| 3,371 | FHLMC, Pool #A92646, 5.500%, 6/1/40 | 3,503 | ||
| 4,660 | FHLMC, Pool #C03505, 5.500%, 6/1/40 | 4,802 | ||
| Principal Amount | Market Value | |||
| U.S. Government Mortgage-Backed Obligations — 0.7% (Continued) | ||||
| $ 12,100 | FHLMC, Pool #G01840, 5.000%, 7/1/35 | $ 12,417 | ||
| 35,322 | FNMA, Pool #254868, 5.000%, 9/1/33 | 36,190 | ||
| 4,507 | FNMA, Pool #256272, 5.500%, 6/1/26 | 4,561 | ||
| 14,640 | FNMA, Pool #256852, 6.000%, 8/1/27 | 14,963 | ||
| 3,985 | FNMA, Pool #323832, 7.500%, 7/1/29 | 4,089 | ||
| 11,838 | FNMA, Pool #665773, 7.500%, 6/1/31 | 11,850 | ||
| 40,407 | FNMA, Pool #679742, (1 Year CMT Rate +2.480%), 6.944%, 1/1/40(A) | 40,720 | ||
| 43,783 | FNMA, Pool #725424, 5.500%, 4/1/34 | 45,165 | ||
| 179,988 | FNMA, Pool #725490, (RFUCCT1Y + 1.597%), 6.739%, 4/1/34(A) | 181,537 | ||
| 6,887 | FNMA, Pool #735484, 5.000%, 5/1/35 | 7,059 | ||
| 36,608 | FNMA, Pool #813170, (RFUCCT1Y + 1.575%), 6.039%, 1/1/35(A) | 37,000 | ||
| 127,621 | FNMA, Pool #815323, (RFUCCT6M + 1.529%), 7.258%, 1/1/35(A) | 129,460 | ||
| 48,162 | FNMA, Pool #820364, (RFUCCT1Y + 0.827%), 6.202%, 4/1/35(A) | 47,857 | ||
| 52,543 | FNMA, Pool #827787, (RFUCCT6M + 1.55%), 7.175%, 5/1/35(A) | 53,400 | ||
| 27,020 | FNMA, Pool #889060, 6.000%, 1/1/38 | 29,171 | ||
| 26,989 | FNMA, Pool #889061, 6.000%, 1/1/38 | 28,452 | ||
| 1,755 | FNMA, Pool #889382, 5.500%, 4/1/38 | 1,821 | ||
| 51,711 | FNMA, Pool #922674, (RFUCCT1Y + 1.905%), 6.632%, 4/1/36(A) | 53,372 | ||
| 17,523 | FNMA, Pool #960376, 5.500%, 12/1/37 | 18,045 | ||
| 2,782 | FNMA, Pool #AD0941, 5.500%, 4/1/40 | 2,895 | ||
| 19,315 | FNMA, Pool #AE0363, 5.000%, 7/1/37 | 19,800 | ||
| 27,376 | FNMA, Pool #AE5441, 5.000%, 10/1/40 | 28,193 | ||
| 8,772 | FNMA, Pool #AI6588, 4.000%, 7/1/26 | 8,711 | ||
| 18,518 | FNMA, Pool #AI8506, 4.000%, 8/1/26 | 18,389 | ||
| 37,585 | FNMA, Pool #AL0211, 5.000%, 4/1/41 | 38,707 | ||
| 167,290 | FNMA, Pool #AL0478, (RFUCCT1Y + 1.777%), 6.533%, 4/1/36(A) | 173,840 | ||
| 79,432 | FNMA, Pool #AL0543, 5.000%, 7/1/41 | 81,804 | ||
| 33,645 | FNMA, Pool #AL1105, 4.500%, 12/1/40 | 34,019 | ||
| 8,078 | FNMA, Pool #AL2591, 5.500%, 5/1/38 | 8,134 | ||
| 174,139 | FNMA, Pool #AL5275, (RFUCCT6M + 1.505%), 6.539%, 9/1/37(A) | 177,300 | ||
| 446,583 | FNMA, Pool #AL7396, (RFUCCT6M + 1.532%), 7.175%, 2/1/37(A) | 454,735 | ||
| 119,914 | GNMA, Pool #80826, (1 Year CMT Rate +1.500%), 4.625%, 2/20/34(A) | 120,529 | ||
| 52,932 | GNMA, Pool #80889, (1 Year CMT Rate +1.500%), 4.875%, 4/20/34(A) | 53,150 | ||
| 114,846 | GNMA, Pool #81016, (1 Year CMT Rate +1.500%), 3.625%, 8/20/34(A) | 115,682 | ||
| 124,331 | GNMA, Pool #82760, (1 Year CMT Rate +1.500%), 4.625%, 3/20/41(A) | 125,230 | ||
| 16,005 | GNMA, Pool #MA2392, (1 Year CMT Rate +1.500%), 3.750%, 11/20/44(A) | 16,026 | ||
| 172,210 | GNMA, Pool #MA2466, (1 Year CMT Rate +1.500%), 3.750%, 12/20/44(A) | 173,620 | ||
| Total U.S. Government Mortgage-Backed Obligations | $3,444,816 | |||
| Agency Collateralized Mortgage Obligations — 0.1% | ||||
| 91,435 | FHLMC REMIC, Ser 2770, Class FH, (SOFR30A + 0.514%), 5.857%, 3/15/34(A) | 90,911 | ||
| 202,427 | FHLMC REMIC, Ser 4238, Class TL, 1.250%, 8/15/27 | 194,937 | ||
| 17,991 | FNMA REMIC, Ser 2003-33, Class AM, 4.250%, 5/25/33 | 17,693 | ||
| Principal Amount | Market Value | |||
| Agency Collateralized Mortgage Obligations — 0.1% (Continued) | ||||
| $ 7,152 | FNMA REMIC, Ser 2003-42, Class CA, 4.000%, 5/25/33 | $ 7,063 | ||
| 66,631 | FNMA REMIC, Ser 2003-81, Class FE, (SOFR30A + 0.614%), 5.895%, 9/25/33(A) | 66,462 | ||
| 145,911 | FNMA REMIC, Ser 2009-32, Class BH, 5.250%, 5/25/39 | 150,422 | ||
| 12,049 | FNMA REMIC, Ser 2012-102, Class NA, 1.500%, 9/25/27 | 11,728 | ||
| 4,308 | GNMA, Ser 2011-57, Class BA, 3.000%, 5/20/40 | 4,263 | ||
| Total Agency Collateralized Mortgage Obligations | $543,479 | |||
| U.S. Government Agency Obligations — 0.0% | ||||
| 26,173 | Small Business Administration Pools, Pool #508374, (Prime Rate -2.500%), 6.000%, 4/25/28(A) | 26,000 | ||
| Shares | ||||
| Short-Term Investment Fund — 0.0% | ||||
| 18,748 | Dreyfus Government Cash Management, Institutional Shares, 4.80%∞Ω | 18,748 | ||
| Total Investment Securities—99.5% (Cost $517,350,212) | $515,392,436 | |||
| Other Assets in Excess of Liabilities — 0.5% | 2,720,510 | |||
| Net Assets — 100.0% | $518,112,946 | |||
| (A) | Variable rate security - Rate reflected is the rate in effect as of September 30, 2024. |
| (B) | Certain variable rate securities are not based on a published reference rate and spread but are determined by the issuer or agent and are based on current market conditions. These securities do not indicate a reference rate and spread in their description. |
| (C) | Interest only security - This type of security represents the right to receive the monthly interest payments on an underlying pool of mortgages. Payments of principal on the pool reduce the value of the “interest only” holding. |
| (D) | Rate reflects yield at the time of purchase. |
| †† | The issuers and/or sponsors of certain mortgage-backed securities may no longer exist; however, the securities held by the Fund are separate legal entities organized as trusts and publicly traded. The Fund receives principal and interest payments directly from these trusts. |
| ∞ | Open-End Fund. |
| Ω | Represents the 7-Day SEC yield as of September 30, 2024. |
| Portfolio Abbreviations: |
| ARM – Adjustable Rate Mortgage |
| CLO – Collateralized Loan Obligation |
| CMT – Constant Maturity Treasury |
| FHLMC – Federal Home Loan Mortgage Corporation |
| FNMA – Federal National Mortgage Association |
| GNMA – Government National Mortgage Association |
| LLC – Limited Liability Company |
| LOC – Letter of Credit |
| LP – Limited Partnership |
| MTN – Medium Term Note |
| PLC – Public Limited Company |
| REIT – Real Estate Investment Trust |
| REMIC – Real Estate Mortgage Investment Conduit |
| RFUCCT1Y – FTSE USD IBOR Consumer Cash Fallbacks Term One year |
| RFUCCT6M – FTSE USD IBOR Consumer Cash Fallbacks Term Six months |
| SOFR – Secured Overnight Financing Rate |
| SOFR30A – Secured Overnight Financing Rate 30 Day Average |
| TSFR12M – Twelve Month Term Secured Overnight Financing Rate |
| TSFR1M – One Month Term Secured Overnight Financing Rate |
| TSFR3M – Three Month Term Secured Overnight Financing Rate |
| 144a - This is a restricted security that was sold in a transaction qualifying for the exemption under Rule 144a of the Securities Act of 1933. This security may be sold in transactions exempt from registration, normally to qualified institutional buyers. At September 30, 2024, these securities were valued at $369,462,653 or 71.3% of net assets. These securities were deemed liquid pursuant to procedures approved by the Board of Trustees. |
| Valuation Inputs at Reporting Date: | ||||
| Description | Level 1 | Level 2 | Level 3 | Total |
| Asset-Backed Securities | $— | $244,038,807 | $— | $244,038,807 |
| Corporate Bonds | — | 94,376,468 | — | 94,376,468 |
| Commercial Mortgage-Backed Securities | — | 94,153,639 | — | 94,153,639 |
| Non-Agency Collateralized Mortgage Obligations | — | 43,894,088 | — | 43,894,088 |
| Commercial Paper | — | 29,681,391 | — | 29,681,391 |
| Municipal Bonds | — | 5,215,000 | — | 5,215,000 |
| U.S. Government Mortgage-Backed Obligations | — | 3,444,816 | — | 3,444,816 |
| Agency Collateralized Mortgage Obligations | — | 543,479 | — | 543,479 |
| U.S. Government Agency Obligations | — | 26,000 | — | 26,000 |
| Short-Term Investment Fund | 18,748 | — | — | 18,748 |
| Total | $18,748 | $515,373,688 | $— | $515,392,436 |
| Touchstone Active Bond Fund | Touchstone Ares Credit Opportunities Fund | Touchstone Dividend Equity Fund | Touchstone High Yield Fund | Touchstone Impact Bond Fund | Touchstone Mid Cap Fund | |
| Assets | ||||||
| Investments, at cost | $269,487,905 | $631,515,319 | $2,190,602,962 | $109,983,128 | $626,674,644 | $4,351,519,155 |
| Investments, at market value * | $261,928,805 | $635,292,557 | $2,527,824,409 | $109,094,083 | $596,884,416 | $6,085,331,463 |
| Cash | — | — | — | — | — | 20,575 |
| Cash deposits held at prime broker (A) | 1,301,365 | 74,009 | — | — | — | — |
| Foreign currency † | 137 | 434,979 | — | — | — | — |
| Dividends and interest receivable | 2,166,406 | 7,238,531 | 2,246,229 | 1,639,822 | 4,367,392 | 2,661,984 |
| Receivable for capital shares sold | 1,361,757 | 3,301,313 | 189,848 | 4,091 | 829,710 | 10,352,869 |
| Receivable for investments sold | 388,424 | 4,752,511 | — | 249,044 | — | — |
| Receivable for securities lending income | — | 17,818 | — | 153 | 3 | — |
| Tax reclaim receivable | 12,973 | 6,601 | 107,040 | 9,674 | — | — |
| Unrealized appreciation on unfunded commitments | — | 14,590 | — | — | — | — |
| Total Assets | 267,159,867 | 651,132,909 | 2,530,367,526 | 110,996,867 | 602,081,521 | 6,098,366,891 |
| Liabilities | ||||||
| Due to custodian | 922,360 | 8,794 | — | — | 43,430 | — |
| Due to prime broker(A) | — | 691,831 | — | — | — | — |
| Unrealized depreciation on forward foreign currency contracts | — | 103,915 | — | — | — | — |
| Dividends payable | — | 289 | 616 | 611 | 160 | — |
| Payable for return of collateral for securities on loan | — | 7,685,520 | — | 1,735,517 | — | — |
| Deferred foreign capital gains tax | — | — | — | — | — | — |
| Payable for capital shares redeemed | 251,505 | 1,679,833 | 1,987,141 | 31,805 | 485,817 | 8,304,198 |
| Payable for investments purchased | 1,421,464 | 16,989,401 | — | 2,486,880 | 119,339 | — |
| Payable to Investment Adviser | 57,520 | 242,062 | 1,053,267 | 27,745 | 128,719 | 3,095,991 |
| Payable to other affiliates | 38,795 | 85,033 | 740,220 | 13,052 | 67,931 | 773,988 |
| Payable to Trustees | 15,375 | 15,375 | 15,375 | 15,375 | 15,375 | 15,375 |
| Payable for professional services | 32,340 | 49,058 | 36,684 | 28,564 | 31,228 | 54,095 |
| Payable for reports to shareholders | 14,035 | 17,201 | 64,168 | 8,967 | 14,246 | 123,930 |
| Payable for transfer agent services | 56,095 | 86,136 | 410,700 | 10,327 | 59,400 | 804,858 |
| Payable for variation margin on swap agreements | 763,284 | 43,876 | — | — | — | — |
| Other accrued expenses and liabilities | 31,460 | 77,632 | 15,709 | 12,370 | 10,918 | 57,331 |
| Total Liabilities | 3,604,233 | 27,775,956 | 4,323,880 | 4,371,213 | 976,563 | 13,229,766 |
| Net Assets | $263,555,634 | $623,356,953 | $2,526,043,646 | $106,625,654 | $601,104,958 | $6,085,137,125 |
| Net assets consist of: | ||||||
| Par value | 273,656 | 669,209 | 1,297,981 | 137,039 | 648,735 | 1,056,461 |
| Paid-in capital | 395,828,305 | 703,027,564 | 2,075,631,032 | 129,108,361 | 648,045,125 | 4,221,267,857 |
| Distributable earnings (deficit) | (132,546,327) | (80,339,820) | 449,114,633 | (22,619,746) | (47,588,902) | 1,862,812,807 |
| Net Assets | $263,555,634 | $623,356,953 | $2,526,043,646 | $106,625,654 | $601,104,958 | $6,085,137,125 |
| *Includes market value of securities on loan of: | $— | $7,379,028 | $— | $1,678,204 | $— | $— |
| †Cost of foreign currency: | $142 | $431,737 | $— | $— | $— | $— |
| (A) | Represents segregated cash for futures contracts, swap agreement, and/or securities sold short. |
| Touchstone Mid Cap Value Fund | Touchstone Sands Capital International Growth Equity Fund | Touchstone Sands Capital Select Growth Fund | Touchstone Small Cap Fund | Touchstone Small Cap Value Fund | Touchstone Ultra Short Duration Fixed Income Fund |
| $449,143,474 | $91,725,133 | $1,642,839,965 | $235,081,866 | $185,953,572 | $517,350,212 |
| $612,882,276 | $109,393,153 | $2,465,321,570 | $283,994,560 | $218,138,371 | $515,392,436 |
| — | 24 | 30 | 3 | 1 | — |
| — | — | — | — | — | — |
| — | 14,540 | — | — | — | — |
| 787,360 | 137,710 | 118,950 | 226,988 | 242,366 | 2,430,917 |
| 243,045 | 66,438 | 2,212,610 | 3,470,290 | 91,158 | 3,680,566 |
| 938,831 | — | — | — | 218,628 | 21,177 |
| — | 621 | — | — | 56 | — |
| — | 39,126 | — | — | — | — |
| — | — | — | — | — | — |
| 614,851,512 | 109,651,612 | 2,467,653,160 | 287,691,841 | 218,690,580 | 521,525,096 |
| — | — | — | — | — | 4,957 |
| — | — | — | — | — | — |
| — | — | — | — | — | — |
| — | 3 | — | — | — | 188,620 |
| — | — | — | — | 969,335 | — |
| — | 132,285 | — | — | — | — |
| 1,322,966 | 300,983 | 7,330,731 | 8,203,970 | 608,267 | 2,947,954 |
| — | — | — | 2,921,967 | — | — |
| 352,262 | 6,259 | 1,233,203 | 130,453 | 129,265 | 35,489 |
| 67,940 | 13,092 | 465,452 | 31,452 | 28,092 | 85,445 |
| 15,375 | 15,375 | 15,375 | 15,375 | 15,375 | 15,375 |
| 24,964 | 31,520 | 33,905 | 23,731 | 25,042 | 32,531 |
| 45,058 | 11,068 | 48,751 | 11,926 | 12,224 | 19,048 |
| 56,224 | 20,941 | 339,169 | 40,900 | 21,403 | 62,099 |
| — | — | — | — | — | — |
| 22,499 | 68,468 | 56,860 | 14,306 | 9,285 | 20,632 |
| 1,907,288 | 599,994 | 9,523,446 | 11,394,080 | 1,818,288 | 3,412,150 |
| $612,944,224 | $109,051,618 | $2,458,129,714 | $276,297,761 | $216,872,292 | $518,112,946 |
| 252,535 | 119,851 | 1,541,945 | 180,053 | 56,131 | 560,567 |
| 423,204,501 | 91,356,818 | 1,873,057,246 | 224,295,487 | 188,547,235 | 630,716,195 |
| 189,487,188 | 17,574,949 | 583,530,523 | 51,822,221 | 28,268,926 | (113,163,816) |
| $612,944,224 | $109,051,618 | $2,458,129,714 | $276,297,761 | $216,872,292 | $518,112,946 |
| $— | $— | $— | $— | $957,375 | $— |
| $— | $14,431 | $— | $— | $— | $— |
| Touchstone Active Bond Fund | Touchstone Ares Credit Opportunities Fund | Touchstone Dividend Equity Fund | Touchstone High Yield Fund | Touchstone Impact Bond Fund | Touchstone Mid Cap Fund | |
| Pricing of Class A Shares | ||||||
| Net assets applicable to Class A shares | $119,251,220 | $120,100,903 | $1,579,520,821 | $11,896,125 | $18,995,077 | $171,045,651 |
| Shares of beneficial interest outstanding (unlimited number of shares authorized, $0.01 par value) | 12,363,497 | 13,056,864 | 81,059,664 | 1,575,708 | 2,052,773 | 3,028,739 |
| Net asset value price per share* | $9.65 | $9.20 | $19.49 | $7.55 | $9.25 | $56.47 |
| Maximum sales charge - Class A shares | 3.25% | 3.25% | 5.00% | 3.25% | 3.25% | 5.00% |
| Maximum offering price per share (100%/(100%-maximum sales charge) of net asset value adjusted to the nearest cent) - Class A shares | $9.97 | $9.51 | $20.52 | $7.80 | $9.56 | $59.44 |
| Pricing of Class C Shares | ||||||
| Net assets applicable to Class C shares | $2,594,955 | $28,086,102 | $221,857,934 | $398,683 | $1,426,460 | $82,284,339 |
| Shares of beneficial interest outstanding (unlimited number of shares authorized, $0.01 par value) | 296,949 | 3,181,051 | 11,477,458 | 53,032 | 154,251 | 1,607,770 |
| Net asset value and offering price per share** | $8.74 | $8.83 | $19.33 | $7.52 | $9.25 | $51.18 |
| Pricing of Class S Shares | ||||||
| Net assets applicable to Class S shares | $— | $— | $— | $— | $— | $— |
| Shares of beneficial interest outstanding (unlimited number of shares authorized, $0.01 par value) | — | — | — | — | — | — |
| Net asset value, offering price and redemption price per share | $— | $— | $— | $— | $— | $— |
| Pricing of Class Y Shares | ||||||
| Net assets applicable to Class Y shares | $43,896,204 | $406,335,678 | $711,338,772 | $19,263,366 | $279,531,944 | $4,288,653,858 |
| Shares of beneficial interest outstanding (unlimited number of shares authorized, $0.01 par value) | 4,554,791 | 43,392,497 | 36,575,603 | 2,465,204 | 30,166,453 | 74,364,213 |
| Net asset value, offering price and redemption price per share | $9.64 | $9.36 | $19.45 | $7.81 | $9.27 | $57.67 |
| Pricing of Class Z Shares | ||||||
| Net assets applicable to Class Z shares | $— | $— | $— | $— | $— | $45,834,613 |
| Shares of beneficial interest outstanding (unlimited number of shares authorized, $0.01 par value) | — | — | — | — | — | 817,947 |
| Net asset value, offering price and redemption price per share | $— | $— | $— | $— | $— | $56.04 |
| Pricing of Institutional Class Shares | ||||||
| Net assets applicable to Institutional Class shares | $97,813,255 | $68,834,270 | $2,988,713 | $75,067,480 | $274,926,469 | $734,205,703 |
| Shares of beneficial interest outstanding (unlimited number of shares authorized, $0.01 par value) | 10,150,346 | 7,290,527 | 153,789 | 9,609,964 | 29,669,338 | 12,674,195 |
| Net asset value, offering price and redemption price per share | $9.64 | $9.44 | $19.43 | $7.81 | $9.27 | $57.93 |
| Pricing of Class R6 Shares | ||||||
| Net assets applicable to Class R6 shares | $— | $— | $10,337,406 | $— | $26,225,008 | $763,112,961 |
| Shares of beneficial interest outstanding (unlimited number of shares authorized, $0.01 par value) | — | — | 531,610 | — | 2,830,658 | 13,153,275 |
| Net asset value, offering price and redemption price per share | $— | $— | $19.45 | $— | $9.26 | $58.02 |
| * | There is no sales load on subscriptions of $1 million or more for all funds except for Active Bond Fund, Ares Credit Opportunities Fund, High Yield Fund, Impact Bond Fund and Ultra Short Duration Fixed Income Fund. There is no sales load on subscriptions of $500,000 or more for Active Bond Fund, Ares Credit Opportunities Fund, High Yield Fund, Impact Bond Fund and Ultra Short Duration Fixed Income Fund. Redemptions that were part of a $500,000 or $1million or more subscription, as applicable, may be subject to a contingent deferred sales load if redeemed within a one-year period from the date of purchase. |
| ** | Redemption price per share varies by length of time shares are held due to the terms of the contingent deferred sales charge. |
| Touchstone Mid Cap Value Fund | Touchstone Sands Capital International Growth Equity Fund | Touchstone Sands Capital Select Growth Fund | Touchstone Small Cap Fund | Touchstone Small Cap Value Fund | Touchstone Ultra Short Duration Fixed Income Fund |
| $16,052,735 | $9,246,866 | $393,678,886 | $27,889,781 | $25,639,405 | $81,750,672 |
| 671,644 | 1,019,525 | 27,068,594 | 1,855,362 | 670,479 | 8,847,081 |
| $23.90 | $9.07 | $14.54 | $15.03 | $38.24 | $9.24 |
| 5.00% | 5.00% | 5.00% | 5.00% | 5.00% | 2.00% |
| $25.16 | $9.55 | $15.31 | $15.82 | $40.25 | $9.43 |
| $1,788,933 | $1,031,146 | $18,051,105 | $1,435,697 | $465,105 | $4,265,812 |
| 79,046 | 111,501 | 1,257,114 | 110,188 | 12,965 | 461,263 |
| $22.63 | $9.25 | $14.36 | $13.03 | $35.87 | $9.25 |
| $— | $— | $— | $— | $— | $30,581,272 |
| — | — | — | — | — | 3,307,915 |
| $— | $— | $— | $— | $— | $9.24 |
| $172,791,414 | $76,260,119 | $624,311,388 | $208,328,687 | $42,121,358 | $252,342,402 |
| 7,157,681 | 8,382,719 | 37,921,798 | 13,522,891 | 1,091,989 | 27,293,542 |
| $24.14 | $9.10 | $16.46 | $15.41 | $38.57 | $9.25 |
| $— | $— | $232,611,290 | $— | $— | $38,879,164 |
| — | — | 15,978,742 | — | — | 4,206,221 |
| $— | $— | $14.56 | $— | $— | $9.24 |
| $422,311,142 | $2,973,120 | $851,055,894 | $38,643,596 | $148,646,424 | $110,293,624 |
| 17,345,150 | 326,253 | 51,517,445 | 2,516,907 | 3,837,637 | 11,940,652 |
| $24.35 | $9.11 | $16.52 | $15.35 | $38.73 | $9.24 |
| $— | $19,540,367 | $338,421,151 | $— | $— | $— |
| — | 2,145,095 | 20,450,796 | — | — | — |
| $— | $9.11 | $16.55 | $— | $— | $— |
| Touchstone Active Bond Fund | Touchstone Ares Credit Opportunities Fund | Touchstone Dividend Equity Fund | Touchstone High Yield Fund | |
| Investment Income | ||||
| Dividends* | $250,584 | $1,382,906 | $69,219,375 | $162,697 |
| Interest** | 11,532,801 | 40,420,211 | — | 6,917,841 |
| Income from securities loaned | 639 | 202,293 | — | 5,808 |
| Total Investment Income | 11,784,024 | 42,005,410 | 69,219,375 | 7,086,346 |
| Expenses | ||||
| Investment advisory fees | 914,151 | 2,769,725 | 12,787,406 | 572,741 |
| Administration fees | 341,091 | 625,270 | 3,334,266 | 141,843 |
| Compliance fees and expenses | 4,181 | 4,181 | 4,180 | 4,181 |
| Custody fees | 44,050 | 66,153 | 31,226 | 34,295 |
| Professional fees | 43,418 | 90,762 | 88,042 | 34,004 |
| Transfer Agent fees, Class A | 125,031 | 103,142 | 1,238,132 | 16,387 |
| Transfer Agent fees, Class C | 3,346 | 18,237 | 247,345 | 582 |
| Transfer Agent fees, Class S | — | — | — | — |
| Transfer Agent fees, Class Y | 42,787 | 225,833 | 547,742 | 25,055 |
| Transfer Agent fees, Class Z | — | — | — | — |
| Transfer Agent fees, Institutional Class | 12,195 | 18,782 | 540 | 616 |
| Transfer Agent fees, Class R6 | — | — | 430 | — |
| Registration fees, Class A | 21,391 | 21,270 | 33,747 | 14,855 |
| Registration fees, Class C | 16,640 | 18,399 | 24,923 | 8,115 |
| Registration fees, Class S | — | — | — | — |
| Registration fees, Class Y | 17,538 | 54,188 | 25,134 | 15,914 |
| Registration fees, Class Z | — | — | — | — |
| Registration fees, Institutional Class | 16,381 | 14,058 | 4,971 | 15,232 |
| Registration fees, Class R6 | — | — | 6,236 | — |
| Interest expense on securities sold short | — | 47,080 | — | — |
| Reports to Shareholders, Class A | 17,163 | 18,203 | 89,243 | 5,616 |
| Reports to Shareholders, Class C | 4,371 | 5,182 | 23,851 | 4,174 |
| Reports to Shareholders, Class S | — | — | — | — |
| Reports to Shareholders, Class Y | 7,329 | 24,349 | 36,485 | 4,631 |
| Reports to Shareholders, Class Z | — | — | — | — |
| Reports to Shareholders, Institutional Class | 4,840 | 4,699 | 4,029 | 4,456 |
| Reports to Shareholders, Class R6 | — | — | 4,089 | — |
| Shareholder servicing fees, Class Z | — | — | — | — |
| Distribution and shareholder servicing expenses, Class A | 295,752 | 283,761 | 3,698,184 | 30,116 |
| Distribution and shareholder servicing expenses, Class C | 28,157 | 220,200 | 2,817,690 | 4,513 |
| Distribution expenses, Class S | — | — | — | — |
| Trustee fees | 32,641 | 32,641 | 32,641 | 32,641 |
| Other expenses | 116,329 | 126,762 | 335,241 | 45,819 |
| Total Expenses | 2,108,782 | 4,792,877 | 25,415,773 | 1,015,786 |
| Fees waived and/or reimbursed by the Adviser and/or Affiliates(A) | (393,645) | (590,261) | (635,885) | (202,859) |
| Fees recouped by the Adviser | — | — | — | — |
| Net Expenses | 1,715,137 | 4,202,616 | 24,779,888 | 812,927 |
| Net Investment Income (Loss) | 10,068,887 | 37,802,794 | 44,439,487 | 6,273,419 |
| Realized and Unrealized Gains (Losses) on Investments | ||||
| Net realized gains (losses) on investments(B) | (4,789,017) | (7,160,638) | 130,992,842 | (65,630) |
| Net realized losses on securities sold short | — | (127,853) | — | — |
| Net realized losses on written options | — | (42,128) | — | — |
| Net realized gains on futures contracts | 72,196 | — | — | — |
| Net realized losses on swap agreements | (1,152,098) | (25,000) | — | — |
| Net realized losses on forward foreign currency contracts | — | (211,303) | — | — |
| Net realized gains on foreign currency transactions | — | 43,341 | — | — |
| Net change in unrealized appreciation (depreciation) on investments†(C) | 26,008,163 | 30,333,002 | 448,769,236 | 7,099,725 |
| Net change in unrealized appreciation (depreciation) on securities sold short | — | (19,760) | — | — |
| Net change in unrealized appreciation (depreciation) on written options | — | (1,600) | — | — |
| Net change in unrealized appreciation (depreciation) on futures contracts | (105,839) | — | — | — |
| Net change in unrealized appreciation (depreciation) on swap agreements | 31,925 | (22,889) | — | — |
| Net change in unrealized appreciation (depreciation) on forward foreign currency contracts | — | (237,320) | — | — |
| Net change in unrealized appreciation (depreciation) on foreign currency transactions | 6 | (42,155) | — | — |
| Net change in unrealized appreciation (depreciation) on unfunded commitments | — | 14,590 | — | — |
| Net Realized and Unrealized Gains (Losses) on Investments | 20,065,336 | 22,500,287 | 579,762,078 | 7,034,095 |
| Change in Net Assets Resulting from Operations | $30,134,223 | $60,303,081 | $624,201,565 | $13,307,514 |
| *Net of foreign tax withholding of: | $— | $314 | $— | $— |
| **Net of foreign tax withholding of: | $597 | $— | $— | $— |
| †Includes increase in deferred foreign capital gains tax of: | $— | $— | $— | $— |
| (A) | See Note 4 in Notes to Financial Statements. |
| (B) | Net realized gains on investments includes the realized gains of $32,202,117, $38,243,998, $245,337,181, $1,961,653 and $2,702,482 for the Mid Cap Fund, the Mid Cap Value Fund, the Sand Capital Select Growth Fund, the Small Cap Fund and the Small Cap Value Fund, respectively, for redemption-in-kind activity, which will not be recognized by the Fund for tax purposes. |
| (C) | Change in unrealized appreciation (depreciation) does not include net appreciation of $15,751,916, for the Sands Capital International Growth Equity Fund in connection with the Fund's reorganization. See Note 9 in the Notes to Financial Statements. |
| Touchstone Impact Bond Fund | Touchstone Mid Cap Fund | Touchstone Mid Cap Value Fund | Touchstone Sands Capital International Growth Equity Fund | Touchstone Sands Capital Select Growth Fund | Touchstone Small Cap Fund | Touchstone Small Cap Value Fund | Touchstone Ultra Short Duration Fixed Income Fund |
| $277,927 | $63,504,432 | $13,000,872 | $421,508 | $6,535,483 | $2,757,269 | $2,804,217 | $63,162 |
| 22,202,506 | 42,378 | — | — | 1,519 | — | — | 28,208,322 |
| 3 | — | 7,992 | 3,298 | — | 1,240 | 1,628 | — |
| 22,480,436 | 63,546,810 | 13,008,864 | 424,806 | 6,537,002 | 2,758,509 | 2,805,845 | 28,271,484 |
| 1,409,356 | 34,583,103 | 5,465,195 | 378,368 | 16,349,661 | 1,854,357 | 1,316,077 | 882,614 |
| 759,219 | 7,249,572 | 988,544 | 78,748 | 3,477,499 | 295,856 | 209,657 | 665,848 |
| 4,180 | 4,181 | 4,181 | 4,181 | 4,181 | 4,181 | 4,181 | 4,181 |
| 18,627 | 37,921 | 33,343 | 26,050 | 25,552 | 8,042 | 13,733 | 89,507 |
| 45,406 | 160,104 | 40,599 | 86,980 | 87,217 | 27,828 | 27,947 | 46,565 |
| 17,264 | 170,258 | 22,220 | 7,714 | 433,554 | 23,658 | 19,285 | 62,590 |
| 1,293 | 64,238 | 2,269 | 903 | 21,567 | 1,211 | 454 | 2,220 |
| — | — | — | — | — | — | — | 18,545 |
| 167,281 | 3,774,329 | 785,740 | 38,043 | 453,256 | 168,777 | 30,912 | 143,207 |
| — | 59,251 | — | — | 310,687 | — | — | 39,065 |
| 123,652 | 286,176 | 120,980 | 102 | 311,457 | 9,192 | 31,695 | 35,953 |
| 70 | 3,173 | — | 21 | 210 | — | — | — |
| 18,982 | 21,103 | 18,086 | 17,388 | 25,479 | 25,476 | 17,430 | 20,913 |
| 10,341 | 18,886 | 13,232 | 10,055 | 16,365 | 8,628 | 7,774 | 11,319 |
| — | — | — | — | — | — | — | 16,201 |
| 35,835 | 142,298 | 29,300 | 30,455 | 35,268 | 44,711 | 21,111 | 41,916 |
| — | 24,056 | — | — | 21,096 | — | — | 18,064 |
| 24,906 | 27,440 | 28,767 | 4,094 | 26,069 | 16,609 | 23,215 | 17,449 |
| 10,400 | 34,918 | — | 3,664 | 35,059 | — | — | — |
| — | — | — | — | — | — | — | — |
| 6,265 | 11,189 | 10,362 | 6,073 | 32,858 | 13,969 | 7,989 | 8,365 |
| 4,017 | 8,767 | 4,323 | 5,132 | 5,321 | 4,212 | 4,183 | 3,912 |
| — | — | — | — | — | — | — | 6,862 |
| 11,441 | 280,948 | 69,443 | 6,405 | 35,579 | 27,399 | 6,496 | 13,149 |
| — | 6,455 | — | — | 19,497 | — | — | 6,609 |
| 6,239 | 15,392 | 35,444 | 5,058 | 19,637 | 4,484 | 13,987 | 4,862 |
| 4,000 | 48,132 | — | 3,636 | 6,594 | — | — | — |
| — | 111,814 | — | — | 580,541 | — | — | 100,722 |
| 39,351 | 383,017 | 39,008 | 19,805 | 995,141 | 43,180 | 59,261 | 197,677 |
| 14,617 | 760,747 | 22,816 | 5,837 | 199,041 | 8,620 | 3,844 | 26,698 |
| — | — | — | — | — | — | — | 163,649 |
| 32,641 | 32,641 | 32,641 | 32,641 | 32,641 | 32,641 | 32,641 | 32,641 |
| 66,236 | 411,602 | 211,784 | 41,162 | 986,936 | 40,650 | 60,418 | 110,453 |
| 2,831,619 | 48,731,711 | 7,978,277 | 812,515 | 24,547,963 | 2,663,681 | 1,912,290 | 2,791,756 |
| (241,541) | (100,707) | (1,209,699) | (274,285) | (1,020,958) | (466,642) | (223,235) | (395,977) |
| 24,190 | — | — | — | — | — | — | — |
| 2,614,268 | 48,631,004 | 6,768,578 | 538,230 | 23,527,005 | 2,197,039 | 1,689,055 | 2,395,779 |
| 19,866,168 | 14,915,806 | 6,240,286 | (113,424) | (16,990,003) | 561,470 | 1,116,790 | 25,875,705 |
| (6,212,149) | 184,440,434 | 84,218,718 | 13,021,554 | 495,208,316 | 5,832,294 | 5,901,416 | 35,796 |
| — | — | — | — | — | — | — | — |
| — | — | — | — | — | — | — | — |
| — | — | — | — | — | — | — | — |
| — | — | — | — | — | — | — | — |
| — | — | — | — | — | — | — | — |
| — | — | — | 5,543 | — | — | — | — |
| 49,507,098 | 954,801,639 | 43,415,431 | 4,263,988 | 369,768,902 | 29,610,226 | 24,985,942 | 8,513,230 |
| — | — | — | — | — | — | — | — |
| — | — | — | — | — | — | — | — |
| — | — | — | — | — | — | — | — |
| — | — | — | — | — | — | — | — |
| — | — | — | — | — | — | — | — |
| — | — | — | 2,266 | — | — | — | — |
| — | — | — | — | — | — | — | — |
| 43,294,949 | 1,139,242,073 | 127,634,149 | 17,293,351 | 864,977,218 | 35,442,520 | 30,887,358 | 8,549,026 |
| $63,161,117 | $1,154,157,879 | $133,874,435 | $17,179,927 | $847,987,215 | $36,003,990 | $32,004,148 | $34,424,731 |
| $— | $— | $374 | $52,484 | $62,409 | $— | $17 | $— |
| $— | $— | $— | $— | $— | $— | $— | $1,980 |
| $— | $— | $— | $132,285 | $— | $— | $— | $— |
| Touchstone Active Bond Fund | Touchstone Ares Credit Opportunities Fund | Touchstone Dividend Equity Fund | ||||
| For the Year Ended September 30, 2024 | For the Year Ended September 30, 2023 | For the Year Ended September 30, 2024 | For the Year Ended September 30, 2023 | For the Year Ended September 30, 2024 | For the Year Ended September 30, 2023 | |
| From Operations | ||||||
| Net investment income | $10,068,887 | $9,719,592 | $37,802,794 | $22,075,288 | $44,439,487 | $49,643,111 |
| Net realized gains (losses) on investments, securities sold short, written options, futures contracts, swap agreements, forward foreign currency contracts and foreign currency transactions | (5,868,919) | (11,755,686) | (7,523,581) | (11,886,997) | 130,992,842 | 65,622,199 |
| Net change in unrealized appreciation (depreciation) on investments, securities sold short, written options, futures contracts, swap agreements, forward foreign currency contracts and foreign currency transactions | 25,934,255 | 8,149,145 | 30,023,868 | 14,731,238 | 448,769,236 | 251,252,978 |
| Change in Net Assets from Operations | 30,134,223 | 6,113,051 | 60,303,081 | 24,919,529 | 624,201,565 | 366,518,288 |
| Distributions to Shareholders: | ||||||
| Distributed earnings, Class A | (4,459,357) | (4,845,457) | (9,246,400) | (8,742,821) | (68,723,644) | (78,944,932) |
| Distributed earnings, Class C | (97,190) | (128,800) | (1,782,625) | (1,355,946) | (12,360,172) | (21,219,539) |
| Distributed earnings, Class Y | (1,895,734) | (2,051,260) | (23,953,726) | (11,913,987) | (34,119,389) | (43,345,420) |
| Distributed earnings, Class Z | — | — | — | — | — | — |
| Distributed earnings, Institutional Class | (3,431,408) | (2,817,303) | (2,983,154) | (266,808) | (105,264) | (156,753) |
| Distributed earnings, Class R6 | — | — | — | — | (134,254) | (86,001) |
| Total Distributions | (9,883,689) | (9,842,820) | (37,965,905) | (22,279,562) | (115,442,723) | (143,752,645) |
| Change in Net Assets from Share Transactions(A) | (8,295,198) | (8,739,032) | 255,423,069 | 71,867,177 | (388,991,315) | (461,203,004) |
| Total Increase (Decrease) in Net Assets | 11,955,336 | (12,468,801) | 277,760,245 | 74,507,144 | 119,767,527 | (238,437,361) |
| Net Assets | ||||||
| Beginning of period | 251,600,298 | 264,069,099 | 345,596,708 | 271,089,564 | 2,406,276,119 | 2,644,713,480 |
| End of period | $263,555,634 | $251,600,298 | $623,356,953 | $345,596,708 | $2,526,043,646 | $2,406,276,119 |
| (A) | For details on share transactions by class, see Statements of Changes in Net Assets - Capital Stock Activity. |
| Touchstone High Yield Fund | Touchstone Impact Bond Fund | Touchstone Mid Cap Fund | Touchstone Mid Cap Value Fund | ||||
| For the Year Ended September 30, 2024 | For the Year Ended September 30, 2023 | For the Year Ended September 30, 2024 | For the Year Ended September 30, 2023 | For the Year Ended September 30, 2024 | For the Year Ended September 30, 2023 | For the Year Ended September 30, 2024 | For the Year Ended September 30, 2023 |
| $6,273,419 | $6,087,145 | $19,866,168 | $15,982,211 | $14,915,806 | $14,559,362 | $6,240,286 | $7,474,745 |
| (65,630) | (5,774,897) | (6,212,149) | (2,239,646) | 184,440,434 | 190,084,208 | 84,218,718 | 36,760,330 |
| 7,099,725 | 10,478,906 | 49,507,098 | (14,080,473) | 954,801,639 | 570,163,404 | 43,415,431 | 10,293,772 |
| 13,307,514 | 10,791,154 | 63,161,117 | (337,908) | 1,154,157,879 | 774,806,974 | 133,874,435 | 54,528,847 |
| (707,448) | (697,795) | (535,441) | (342,282) | (1,041,503) | (1,555,315) | (265,672) | (815,662) |
| (23,596) | (35,389) | (37,638) | (35,048) | (488,588) | (876,818) | (44,228) | (235,497) |
| (1,168,613) | (1,321,672) | (9,267,380) | (7,568,779) | (33,202,497) | (41,788,857) | (6,087,273) | (21,489,426) |
| — | — | — | — | (304,095) | (529,661) | — | — |
| (4,417,000) | (4,081,431) | (9,610,376) | (8,476,076) | (5,518,854) | (6,240,039) | (6,531,520) | (20,979,995) |
| — | — | (968,242) | (511,889) | (7,734,788) | (9,120,342) | — | — |
| (6,316,657) | (6,136,287) | (20,419,077) | (16,934,074) | (48,290,325) | (60,111,032) | (12,928,693) | (43,520,580) |
| (1,039,081) | (6,575,222) | 38,090,671 | 54,991,481 | 435,390,499 | (178,108,351) | (205,369,656) | (75,544,620) |
| 5,951,776 | (1,920,355) | 80,832,711 | 37,719,499 | 1,541,258,053 | 536,587,591 | (84,423,914) | (64,536,353) |
| 100,673,878 | 102,594,233 | 520,272,247 | 482,552,748 | 4,543,879,072 | 4,007,291,481 | 697,368,138 | 761,904,491 |
| $106,625,654 | $100,673,878 | $601,104,958 | $520,272,247 | $6,085,137,125 | $4,543,879,072 | $612,944,224 | $697,368,138 |
| Touchstone Sands Capital International Growth Equity Fund | Touchstone Sands Capital Select Growth Fund | Touchstone Small Cap Fund | ||||
| For the Year Ended September 30, 2024 | For the Year Ended September 30, 2023 | For the Year Ended September 30, 2024 | For the Year Ended September 30, 2023 | For the Year Ended September 30, 2024 | For the Year Ended September 30, 2023 | |
| From Operations | ||||||
| Net investment income (loss) | $(113,424) | $595,023 | $(16,990,003) | $(13,882,480) | $561,470 | $401,392 |
| Net realized gains on investments and foreign currency transactions | 13,027,097 | 2,364,001 | 495,208,316 | 258,369,602 | 5,832,294 | 5,144,859 |
| Net change in unrealized appreciation on investments and foreign currency transactions | 4,266,254 | 2,278,193 | 369,768,902 | 282,396,129 | 29,610,226 | 12,004,467 |
| Change in Net Assets from Operations | 17,179,927 | 5,237,217 | 847,987,215 | 526,883,251 | 36,003,990 | 17,550,718 |
| Distributions to Shareholders: | ||||||
| Distributed earnings, Class A | (303,567) | (165,048) | — | — | (336,428) | (78,224) |
| Distributed earnings, Class C | (11,058) | — | — | — | (9,828) | (3,981) |
| Distributed earnings, Class S | — | — | — | — | — | — |
| Distributed earnings, Class Y | (670,405) | (393,842) | — | — | (3,207,156) | (1,085,775) |
| Distributed earnings, Class Z | — | — | — | — | — | — |
| Distributed earnings, Institutional Class | (142) | (163,206) | — | — | (1,293,778) | (672,297) |
| Distributed earnings, Class R6 | (688,890) | — | — | — | — | — |
| Total Distributions | (1,674,062) | (722,096) | — | — | (4,847,190) | (1,840,277) |
| Change in Net Assets from Share Transactions(A) | 57,608,911 | 3,266,955 | (688,966,686) | (494,947,926) | 114,871,848 | 24,055,950 |
| Total Increase (Decrease) in Net Assets | 73,114,776 | 7,782,076 | 159,020,529 | 31,935,325 | 146,028,648 | 39,766,391 |
| Net Assets | ||||||
| Beginning of period | 35,936,842 | 28,154,766 | 2,299,109,185 | 2,267,173,860 | 130,269,113 | 90,502,722 |
| End of period | $109,051,618 | $35,936,842 | $2,458,129,714 | $2,299,109,185 | $276,297,761 | $130,269,113 |
| (A) | For details on share transactions by class, see Statements of Changes in Net Assets - Capital Stock Activity. |
| Touchstone Small Cap Value Fund | Touchstone Ultra Short Duration Fixed Income Fund | ||
| For the Year Ended September 30, 2024 | For the Year Ended September 30, 2023 | For the Year Ended September 30, 2024 | For the Year Ended September 30, 2023 |
| $1,116,790 | $661,459 | $25,875,705 | $22,070,958 |
| 5,901,416 | 3,803,428 | 35,796 | (1,029,657) |
| 24,985,942 | (736,616) | 8,513,230 | 5,421,829 |
| 32,004,148 | 3,728,271 | 34,424,731 | 26,463,130 |
| (127,358) | (4,121) | (3,949,251) | (3,631,172) |
| (1,388) | — | (160,379) | (123,431) |
| — | — | (1,550,310) | (1,338,680) |
| (222,106) | (30,685) | (11,746,112) | (9,003,755) |
| — | — | (2,009,557) | (1,688,907) |
| (354,784) | (70,904) | (5,905,532) | (7,141,156) |
| — | — | — | — |
| (705,636) | (105,710) | (25,321,141) | (22,927,101) |
| 73,261,045 | 45,839,186 | 22,269,748 | (220,467,463) |
| 104,559,557 | 49,461,747 | 31,373,338 | (216,931,434) |
| 112,312,735 | 62,850,988 | 486,739,608 | 703,671,042 |
| $216,872,292 | $112,312,735 | $518,112,946 | $486,739,608 |
| Touchstone Active Bond Fund | Touchstone Ares Credit Opportunities Fund | |||||||
| For the Year Ended September 30, 2024 | For the Year Ended September 30, 2023 | For the Year Ended September 30, 2024 | For the Year Ended September 30, 2023 | |||||
| Shares | Dollars | Shares | Dollars | Shares | Dollars | Shares | Dollars | |
| Class A | ||||||||
| Proceeds from Shares issued | 678,984 | $6,303,026 | 701,985 | $6,482,853 | 1,846,354 | $16,633,390 | 1,048,381 | $9,244,118 |
| Reinvestment of distributions | 437,608 | 4,048,880 | 477,923 | 4,391,995 | 919,894 | 8,247,638 | 870,945 | 7,647,604 |
| Cost of Shares redeemed | (2,284,827) | (21,057,071) | (2,599,418) | (23,908,984) | (2,450,577) | (21,945,240) | (2,538,254) | (22,362,163) |
| Change from Class A Share Transactions | (1,168,235) | (10,705,165) | (1,419,510) | (13,034,136) | 315,671 | 2,935,788 | (618,928) | (5,470,441) |
| Class C | ||||||||
| Proceeds from Shares issued | 61,954 | 523,807 | 33,062 | 279,528 | 1,536,650 | 13,266,615 | 613,812 | 5,232,276 |
| Reinvestment of distributions | 11,541 | 96,807 | 15,191 | 127,251 | 200,217 | 1,727,300 | 154,389 | 1,307,591 |
| Cost of Shares redeemed | (182,890) | (1,520,689) | (208,075) | (1,755,105) | (641,468) | (5,509,999) | (787,372) | (6,697,572) |
| Change from Class C Share Transactions | (109,395) | (900,075) | (159,822) | (1,348,326) | 1,095,399 | 9,483,916 | (19,171) | (157,705) |
| Class Y | ||||||||
| Proceeds from Shares issued | 959,038 | 8,828,524 | 1,110,746 | 10,282,846 | 30,205,410 | 276,673,694 | 14,458,165 | 129,795,693 |
| Reinvestment of distributions | 199,704 | 1,845,784 | 211,257 | 1,939,470 | 2,615,812 | 23,894,780 | 1,326,671 | 11,841,076 |
| Cost of Shares redeemed | (2,105,874) | (19,389,099) | (2,026,891) | (18,739,214) | (13,131,818) | (119,197,235) | (7,565,345) | (67,640,669) |
| Change from Class Y Share Transactions | (947,132) | (8,714,791) | (704,888) | (6,516,898) | 19,689,404 | 181,371,239 | 8,219,491 | 73,996,100 |
| Institutional Class | ||||||||
| Proceeds from Shares issued | 3,901,465 | 35,954,776 | 3,674,786 | 34,110,952 | 6,747,572 | 62,470,117 | 551,587 | 4,977,060 |
| Reinvestment of distributions | 338,451 | 3,131,114 | 284,519 | 2,610,512 | 323,065 | 2,983,042 | 29,674 | 266,705 |
| Cost of Shares redeemed | (2,967,031) | (27,061,057) | (2,663,425) | (24,561,136) | (409,826) | (3,821,033) | (193,647) | (1,744,542) |
| Change from Institutional Class Share Transactions | 1,272,885 | 12,024,833 | 1,295,880 | 12,160,328 | 6,660,811 | 61,632,126 | 387,614 | 3,499,223 |
| Class R6 | ||||||||
| Proceeds from Shares issued | — | — | — | — | — | — | — | — |
| Reinvestment of distributions | — | — | — | — | — | — | — | — |
| Cost of Shares redeemed | — | — | — | — | — | — | — | — |
| Change from Class R6 Share Transactions | — | — | — | — | — | — | — | — |
| Change from Share Transactions | (951,877) | $(8,295,198) | (988,340) | $(8,739,032) | 27,761,285 | $255,423,069 | 7,969,006 | $71,867,177 |
| Touchstone Dividend Equity Fund | Touchstone High Yield Fund | ||||||
| For the Year Ended September 30, 2024 | For the Year Ended September 30, 2023 | For the Year Ended September 30, 2024 | For the Year Ended September 30, 2023 | ||||
| Shares | Dollars | Shares | Dollars | Shares | Dollars | Shares | Dollars |
| 8,925,262 | $155,570,756 | 9,133,770 | $149,424,859 | 649,688 | $4,770,576 | 960,683 | $6,804,663 |
| 3,301,241 | 57,549,923 | 3,968,436 | 64,495,430 | 87,356 | 641,411 | 88,296 | 626,553 |
| (18,898,577) | (329,539,414) | (20,596,595) | (337,257,289) | (762,483) | (5,606,590) | (1,193,530) | (8,470,386) |
| (6,672,074) | (116,418,735) | (7,494,389) | (123,337,000) | (25,439) | (194,603) | (144,551) | (1,039,170) |
| 245,772 | 4,282,780 | 375,934 | 6,095,130 | 3,790 | 27,487 | 20,211 | 142,797 |
| 697,120 | 11,897,105 | 1,258,395 | 20,312,459 | 2,533 | 18,519 | 2,946 | 20,841 |
| (11,067,075) | (190,895,162) | (12,394,261) | (200,934,264) | (37,539) | (270,822) | (42,680) | (303,663) |
| (10,124,183) | (174,715,277) | (10,759,932) | (174,526,675) | (31,216) | (224,816) | (19,523) | (140,025) |
| 3,001,739 | 52,088,617 | 3,630,133 | 59,307,296 | 759,211 | 5,783,556 | 1,325,741 | 9,704,717 |
| 1,557,419 | 27,125,354 | 2,108,464 | 34,206,319 | 152,884 | 1,160,546 | 179,191 | 1,311,911 |
| (10,718,919) | (185,956,940) | (15,747,586) | (257,199,586) | (1,065,064) | (8,119,251) | (2,178,857) | (15,989,945) |
| (6,159,761) | (106,742,969) | (10,008,989) | (163,685,971) | (152,969) | (1,175,149) | (673,925) | (4,973,317) |
| 49,079 | 909,302 | 3,205,037 | 52,232,159 | 303,250 | 2,305,316 | 205,109 | 1,515,683 |
| 3,910 | 68,175 | 4,606 | 74,646 | 581,429 | 4,412,663 | 554,680 | 4,060,544 |
| (26,679) | (460,354) | (3,142,588) | (51,282,405) | (810,773) | (6,162,492) | (831,624) | (5,998,937) |
| 26,310 | 517,123 | 67,055 | 1,024,400 | 73,906 | 555,487 | (71,835) | (422,710) |
| 514,750 | 9,149,376 | 10,123 | 165,596 | — | — | — | — |
| 5,772 | 104,697 | 5,282 | 85,743 | — | — | — | — |
| (50,557) | (885,530) | (56,828) | (929,097) | — | — | — | — |
| 469,965 | 8,368,543 | (41,423) | (677,758) | — | — | — | — |
| (22,459,743) | $(388,991,315) | (28,237,678) | $(461,203,004) | (135,718) | $(1,039,081) | (909,834) | $(6,575,222) |
| Touchstone Impact Bond Fund | Touchstone Mid Cap Fund | |||||||
| For the Year Ended September 30, 2024 | For the Year Ended September 30, 2023 | For the Year Ended September 30, 2024 | For the Year Ended September 30, 2023 | |||||
| Shares | Dollars | Shares | Dollars | Shares | Dollars | Shares | Dollars | |
| Class A | ||||||||
| Proceeds from Shares issued | 1,029,938 | $9,185,312 | 210,089 | $1,872,361 | 760,684 | $39,113,589 | 649,060 | $28,826,970 |
| Proceeds from Shares issued in connection with merger(B) | — | — | — | — | — | — | — | — |
| Reinvestment of distributions | 46,873 | 419,243 | 27,227 | 241,722 | 17,917 | 900,468 | 32,166 | 1,324,422 |
| Cost of Shares redeemed | (301,361) | (2,677,661) | (290,960) | (2,585,064) | (609,166) | (31,546,483) | (648,211) | (28,358,687) |
| Change from Class A Share Transactions | 775,450 | 6,926,894 | (53,644) | (470,981) | 169,435 | 8,467,574 | 33,015 | 1,792,705 |
| Class C | ||||||||
| Proceeds from Shares issued | 9,419 | 83,570 | 27,502 | 246,250 | 322,608 | 15,232,706 | 262,542 | 10,711,065 |
| Proceeds from Shares issued in connection with merger(B) | — | — | — | — | — | — | — | — |
| Reinvestment of distributions | 3,999 | 35,633 | 3,612 | 32,028 | 10,095 | 460,113 | 21,600 | 818,513 |
| Cost of Shares redeemed | (31,843) | (282,048) | (18,498) | (163,584) | (402,970) | (18,605,831) | (452,817) | (18,059,531) |
| Change from Class C Share Transactions | (18,425) | (162,845) | 12,616 | 114,694 | (70,267) | (2,913,012) | (168,675) | (6,529,953) |
| Class Y | ||||||||
| Proceeds from Shares issued | 8,983,839 | 80,096,075 | 8,716,760 | 78,032,049 | 21,155,459 | 1,110,332,388 | 18,711,876 | 837,891,526 |
| Proceeds from Shares issued in connection with merger(B) | — | — | — | — | — | — | — | — |
| Reinvestment of distributions | 1,002,835 | 8,954,764 | 825,222 | 7,335,072 | 597,357 | 30,830,297 | 924,879 | 38,740,907 |
| Cost of Shares redeemed | (7,061,017) | (63,128,519) | (7,744,580) | (69,165,993) | (15,439,210) | (809,672,304) | (22,184,645) | (986,903,115) |
| Change from Class Y Share Transactions | 2,925,657 | 25,922,320 | 1,797,402 | 16,201,128 | 6,313,606 | 331,490,381 | (2,547,890) | (110,270,682) |
| Class Z | ||||||||
| Proceeds from Shares issued | — | — | — | — | 152,557 | 7,753,135 | 121,238 | 5,343,875 |
| Reinvestment of distributions | — | — | — | — | 6,046 | 301,347 | 12,847 | 525,007 |
| Cost of Shares redeemed | — | — | — | — | (227,043) | (11,698,050) | (220,182) | (9,632,951) |
| Change from Class Z Share Transactions | — | — | — | — | (68,440) | (3,643,568) | (86,097) | (3,764,069) |
| Institutional Class | ||||||||
| Proceeds from Shares issued | 6,657,723 | 59,126,666 | 9,007,849 | 80,101,204 | 7,625,494 | 407,961,351 | 10,157,506 | 452,106,954 |
| Proceeds from Shares issued in connection with merger(B) | — | — | — | — | — | — | — | — |
| Reinvestment of distributions | 867,782 | 7,746,984 | 720,494 | 6,403,344 | 96,043 | 4,982,269 | 131,954 | 5,549,935 |
| Cost of Shares redeemed | (7,051,293) | (62,357,972) | (8,060,077) | (71,717,690) | (4,991,936) | (264,305,385) | (10,610,262) | (468,696,627) |
| Change from Institutional Class Share Transactions | 474,212 | 4,515,678 | 1,668,266 | 14,786,858 | 2,729,601 | 148,638,235 | (320,802) | (11,039,738) |
| Class R6 | ||||||||
| Proceeds from Shares issued | 1,038,539 | 9,233,952 | 2,968,049 | 26,523,017 | 3,214,864 | 168,633,597 | 3,316,011 | 149,069,605 |
| Reinvestment of distributions | 23,859 | 213,574 | 15,496 | 137,717 | 28,590 | 1,486,549 | 30,863 | 1,299,019 |
| Cost of Shares redeemed | (958,545) | (8,558,902) | (256,983) | (2,300,952) | (4,089,648) | (216,769,257) | (4,416,974) | (198,665,238) |
| Change from Class R6 Share Transactions | 103,853 | 888,624 | 2,726,562 | 24,359,782 | (846,194) | (46,649,111) | (1,070,100) | (48,296,614) |
| Change from Share Transactions | 4,260,747 | $38,090,671 | 6,151,202 | $54,991,481 | 8,227,741 | $435,390,499 | (4,160,549) | $(178,108,351) |
| (A) | Represents the period from commencement of operations (August 31, 2023) through September 30, 2023 for Class R6 shares. |
| (B) | See Note 9 in Notes to Financial Statements |
| Touchstone Mid Cap Value Fund | Touchstone Sands Capital International Growth Equity Fund | ||||||
| For the Year Ended September 30, 2024 | For the Year Ended September 30, 2023 | For the Year Ended September 30, 2024 | For the Year Ended September 30, 2023(A) | ||||
| Shares | Dollars | Shares | Dollars | Shares | Dollars | Shares | Dollars |
| 105,472 | $2,310,648 | 237,934 | $5,073,860 | 166,173 | $1,377,317 | 110,039 | $812,323 |
| — | — | — | — | 148,255 | 1,228,773 | — | — |
| 10,515 | 228,631 | 34,260 | 711,225 | 35,641 | 284,067 | 22,885 | 154,471 |
| (165,024) | (3,612,114) | (198,019) | (4,164,561) | (351,006) | (2,780,595) | (216,669) | (1,569,311) |
| (49,037) | (1,072,835) | 74,175 | 1,620,524 | (937) | 109,562 | (83,745) | (602,517) |
| 7,026 | 143,254 | 28,244 | 572,306 | 2,572 | 22,340 | 3,174 | 20,838 |
| — | — | — | — | 76,681 | 649,218 | — | — |
| 2,086 | 43,134 | 11,712 | 232,769 | 1,386 | 11,058 | — | — |
| (83,597) | (1,735,108) | (94,968) | (1,917,691) | (25,078) | (211,960) | (129,830) | (969,135) |
| (74,485) | (1,548,720) | (55,012) | (1,112,616) | 55,561 | 470,656 | (126,656) | (948,297) |
| 1,531,310 | 33,772,314 | 3,528,173 | 74,591,975 | 1,370,815 | 11,328,244 | 255,485 | 1,846,988 |
| — | — | — | — | 6,283,683 | 52,177,854 | — | — |
| 275,686 | 6,045,932 | 1,019,703 | 21,305,963 | 82,239 | 657,103 | 57,249 | 386,433 |
| (10,636,684) | (244,840,863) | (5,919,866) | (123,438,369) | (1,321,512) | (10,539,535) | (775,331) | (5,466,599) |
| (8,829,688) | (205,022,617) | (1,371,990) | (27,540,431) | 6,415,225 | 53,623,666 | (462,597) | (3,233,178) |
| — | — | — | — | — | — | — | — |
| — | — | — | — | — | — | — | — |
| — | — | — | — | — | — | — | — |
| — | — | — | — | — | — | — | — |
| 9,671,326 | 214,763,056 | 6,143,322 | 130,109,089 | 48,385 | 409,551 | 697,797 | 5,086,978 |
| — | — | — | — | 288,369 | 2,398,020 | — | — |
| 250,359 | 5,531,892 | 815,809 | 17,149,947 | 18 | 142 | 24,215 | 163,206 |
| (9,759,836) | (218,020,432) | (9,273,811) | (195,771,133) | (10,945) | (91,587) | (1,710,896) | (12,784,237) |
| 161,849 | 2,274,516 | (2,314,680) | (48,512,097) | 325,827 | 2,716,126 | (988,884) | (7,534,053) |
| — | — | — | — | — | 11 | 2,058,781 | 15,585,000 |
| — | — | — | — | 86,314 | 688,890 | — | — |
| — | — | — | — | — | — | — | — |
| — | — | — | — | 86,314 | 688,901 | 2,058,781 | 15,585,000 |
| (8,791,361) | $(205,369,656) | (3,667,507) | $(75,544,620) | 6,881,990 | $57,608,911 | 396,899 | $3,266,955 |
| Touchstone Sands Capital Select Growth Fund^ | Touchstone Small Cap Fund | |||||||
| For the Year Ended September 30, 2024 | For the Year Ended September 30, 2023 | For the Year Ended September 30, 2024 | For the Year Ended September 30, 2023 | |||||
| Shares | Dollars | Shares | Dollars | Shares | Dollars | Shares | Dollars | |
| Class A | ||||||||
| Proceeds from Shares issued | 1,377,788 | $18,567,086 | 1,817,428 | $17,756,652 | 1,654,399 | $23,564,732 | 282,898 | $3,741,430 |
| Reinvestment of distributions | — | — | — | — | 23,746 | 322,069 | 5,950 | 71,156 |
| Cost of Shares redeemed | (7,439,907) | (97,929,768) | (7,233,428) | (69,188,926) | (385,389) | (5,639,071) | (91,363) | (1,150,402) |
| Change from Class A Share Transactions | (6,062,119) | (79,362,682) | (5,416,000) | (51,432,274) | 1,292,756 | 18,247,730 | 197,485 | 2,662,184 |
| Class C | ||||||||
| Proceeds from Shares issued | 75,841 | 966,190 | 133,400 | 1,305,737 | 91,933 | 1,155,623 | 11,810 | 130,998 |
| Reinvestment of distributions | — | — | — | — | 832 | 9,829 | 378 | 3,981 |
| Cost of Shares redeemed | (588,184) | (7,807,387) | (849,812) | (8,113,817) | (6,878) | (84,916) | (4,468) | (50,099) |
| Change from Class C Share Transactions | (512,343) | (6,841,197) | (716,412) | (6,808,080) | 85,887 | 1,080,536 | 7,720 | 84,880 |
| Class S | ||||||||
| Proceeds from Shares issued | — | — | — | — | — | — | — | — |
| Reinvestment of distributions | — | — | — | — | — | — | — | — |
| Cost of Shares redeemed | — | — | — | — | — | — | — | — |
| Change from Class S Share Transactions | — | — | — | — | — | — | — | — |
| Class Y | ||||||||
| Proceeds from Shares issued | 3,951,462 | 58,999,137 | 10,684,298 | 113,318,127 | 8,687,498 | 125,057,195 | 2,942,642 | 38,124,552 |
| Reinvestment of distributions | — | — | — | — | 227,584 | 3,165,014 | 88,365 | 1,078,094 |
| Cost of Shares redeemed | (17,212,486) | (262,260,275) | (25,072,578) | (268,598,210) | (2,149,788) | (31,219,510) | (1,030,250) | (13,477,272) |
| Change from Class Y Share Transactions | (13,261,024) | (203,261,138) | (14,388,280) | (155,280,083) | 6,765,294 | 97,002,699 | 2,000,757 | 25,725,374 |
| Class Z | ||||||||
| Proceeds from Shares issued | 956,907 | 12,075,378 | 453,854 | 4,430,287 | — | — | — | — |
| Reinvestment of distributions | — | — | — | — | — | — | — | — |
| Cost of Shares redeemed | (4,267,290) | (57,306,038) | (5,668,122) | (53,642,802) | — | — | — | — |
| Change from Class Z Share Transactions | (3,310,383) | (45,230,660) | (5,214,268) | (49,212,515) | — | — | — | — |
| Institutional Class | ||||||||
| Proceeds from Shares issued | 43,854,917 | 669,537,156 | 48,862,372 | 525,452,758 | 918,596 | 13,055,275 | 318,407 | 3,953,747 |
| Reinvestment of distributions | — | — | — | — | 93,132 | 1,292,343 | 55,124 | 670,169 |
| Cost of Shares redeemed | (58,948,228) | (871,875,849) | (71,925,180) | (767,936,700) | (1,094,412) | (15,806,735) | (705,382) | (9,040,404) |
| Change from Institutional Class Share Transactions | (15,093,311) | (202,338,693) | (23,062,808) | (242,483,942) | (82,684) | (1,459,117) | (331,851) | (4,416,488) |
| Class R6 | ||||||||
| Proceeds from Shares issued | 3,094,371 | 45,982,684 | 8,081,234 | 89,264,784 | — | — | — | — |
| Reinvestment of distributions | — | — | — | — | — | — | — | — |
| Cost of Shares redeemed | (12,488,536) | (197,915,000) | (7,100,239) | (78,995,816) | — | — | — | — |
| Change from Class R6 Share Transactions | (9,394,165) | (151,932,316) | 980,995 | 10,268,968 | — | — | — | — |
| Change from Share Transactions | (47,633,345) | $(688,966,686) | (47,816,773) | $(494,947,926) | 8,061,253 | $114,871,848 | 1,874,111 | $24,055,950 |
| ^ | The September 30, 2023 Class C share amounts relating to Proceeds from Shares issued, Reinvestment of distributions, Cost of Shares redeemed, and Change from Class C Share Transactions as well as Change from Share transactions were updated to reflect the effect of a 1 for 0.796098 reverse stock split for Class C shares on October 14, 2022. |
| Touchstone Small Cap Value Fund | Touchstone Ultra Short Duration Fixed Income Fund | ||||||
| For the Year Ended September 30, 2024 | For the Year Ended September 30, 2023 | For the Year Ended September 30, 2024 | For the Year Ended September 30, 2023 | ||||
| Shares | Dollars | Shares | Dollars | Shares | Dollars | Shares | Dollars |
| 7,142 | $250,074 | 14,025 | $456,553 | 2,309,160 | $21,138,198 | 2,255,294 | $20,324,438 |
| 3,544 | 124,284 | 129 | 4,019 | 407,619 | 3,738,183 | 382,000 | 3,445,484 |
| (45,553) | (1,568,701) | (39,115) | (1,258,663) | (2,197,810) | (20,142,896) | (8,198,132) | (73,903,505) |
| (34,867) | (1,194,343) | (24,961) | (798,091) | 518,969 | 4,733,485 | (5,560,838) | (50,133,583) |
| 2,529 | 83,541 | 3,244 | 98,563 | 285,039 | 2,613,314 | 173,382 | 1,563,481 |
| 42 | 1,388 | — | — | 13,789 | 126,625 | 10,468 | 94,530 |
| (452) | (15,102) | (2,335) | (71,329) | (200,165) | (1,833,623) | (377,159) | (3,399,049) |
| 2,119 | 69,827 | 909 | 27,234 | 98,663 | 906,316 | (193,309) | (1,741,038) |
| — | — | — | — | 7,240 | 65,925 | 15,966 | 143,784 |
| — | — | — | — | 164,548 | 1,509,024 | 143,348 | 1,294,155 |
| — | — | — | — | (786,731) | (7,203,412) | (975,095) | (8,791,629) |
| — | — | — | — | (614,943) | (5,628,463) | (815,781) | (7,353,690) |
| 85,279 | 2,948,781 | 119,524 | 3,902,207 | 24,872,688 | 228,242,074 | 15,457,511 | 139,351,355 |
| 6,245 | 220,390 | 970 | 30,495 | 1,196,254 | 10,979,703 | 887,509 | 8,012,776 |
| (113,798) | (3,863,532) | (186,446) | (6,060,333) | (20,116,043) | (184,668,395) | (22,793,855) | (205,592,385) |
| (22,274) | (694,361) | (65,952) | (2,127,631) | 5,952,899 | 54,553,382 | (6,448,835) | (58,228,254) |
| — | — | — | — | 294,479 | 2,697,107 | 311,298 | 2,810,054 |
| — | — | — | — | 218,947 | 2,007,883 | 185,731 | 1,676,437 |
| — | — | — | — | (914,159) | (8,375,950) | (1,461,843) | (13,182,828) |
| — | — | — | — | (400,733) | (3,670,960) | (964,814) | (8,696,337) |
| 3,036,182 | 106,960,171 | 2,744,901 | 91,191,122 | 2,912,044 | 26,704,684 | 5,200,345 | 46,884,763 |
| 9,443 | 334,285 | 2,085 | 65,643 | 506,003 | 4,635,835 | 669,285 | 6,034,088 |
| (920,272) | (32,214,534) | (1,289,599) | (42,519,091) | (6,569,651) | (59,964,531) | (16,341,527) | (147,233,412) |
| 2,125,353 | 75,079,922 | 1,457,387 | 48,737,674 | (3,151,604) | (28,624,012) | (10,471,897) | (94,314,561) |
| — | — | — | — | — | — | — | — |
| — | — | — | — | — | — | — | — |
| — | — | — | — | — | — | — | — |
| — | — | — | — | — | — | — | — |
| 2,070,331 | $73,261,045 | 1,367,383 | $45,839,186 | 2,403,251 | $22,269,748 | (24,455,474) | $(220,467,463) |
| Touchstone Active Bond Fund | ||||||||||||||||||||||||||||
| Period ended | Net asset value at beginning of period | Net investment income(1) | Net realized and unrealized gains (losses) on investments | Total from investment operations | Distributions from net investment income | Distributions from realized capital gains | Total distributions | Net asset value at end of period | Total return(2) | Net assets at end of period (000's) | Ratio of net expenses to average net assets | Ratio of gross expenses to average net assets | Ratio of net investment income (loss) to average net assets | Portfolio turnover rate | ||||||||||||||
| Class A | ||||||||||||||||||||||||||||
| 09/30/20 | $10.68 | $0.28 | $0.55 | $0.83 | $(0.28) | $ — | $(0.28) | $11.23 | 7.91% | $128,086 | 0.90% | 0.95% | 2.54% | 261% | ||||||||||||||
| 09/30/21 | 11.23 | 0.22 | (0.10) | 0.12 | (0.23) | — | (0.23) | 11.12 | 1.10 | 186,813 | 0.90 | 0.93 | 1.99 | 144(3) | ||||||||||||||
| 09/30/22 | 11.12 | 0.23 | (2.04) | (1.81) | (0.25) | (0.03) | (0.28) | 9.03 | (16.52) | 135,000 | 0.85 | 0.93 | 2.20 | 159 | ||||||||||||||
| 09/30/23 | 9.03 | 0.34 | (0.13) | 0.21 | (0.34) | — | (0.34) | 8.90 | 2.29 | 120,437 | 0.83 | 0.97 | 3.66 | 146 | ||||||||||||||
| 09/30/24 | 8.90 | 0.36 | 0.74 | 1.10 | (0.35) | — | (0.35) | 9.65 | 12.60 | 119,251 | 0.83 | 0.98 | 3.86 | 172 | ||||||||||||||
| Class C | ||||||||||||||||||||||||||||
| 09/30/20 | $9.82 | $0.18 | $0.51 | $0.69 | $(0.21) | $ — | $(0.21) | $10.30 | 7.11% | $5,618 | 1.65% | 1.93% | 1.79% | 261% | ||||||||||||||
| 09/30/21 | 10.30 | 0.13 | (0.09) | 0.04 | (0.16) | — | (0.16) | 10.18 | 0.39 | 9,229 | 1.64 | 1.93 | 1.25 | 144(3) | ||||||||||||||
| 09/30/22 | 10.18 | 0.14 | (1.87) | (1.73) | (0.18) | (0.03) | (0.21) | 8.24 | (17.17) | 4,667 | 1.58 | 1.89 | 1.46 | 159 | ||||||||||||||
| 09/30/23 | 8.24 | 0.25 | (0.11) | 0.14 | (0.28) | — | (0.28) | 8.10 | 1.65 | 3,290 | 1.56 | 2.15 | 2.93 | 146 | ||||||||||||||
| 09/30/24 | 8.10 | 0.26 | 0.67 | 0.93 | (0.29) | — | (0.29) | 8.74 | 11.69 | 2,595 | 1.56 | 2.46 | 3.13 | 172 | ||||||||||||||
| Class Y | ||||||||||||||||||||||||||||
| 09/30/20 | $10.67 | $0.30 | $0.56 | $0.86 | $(0.31) | $ — | $(0.31) | $11.22 | 8.18% | $90,235 | 0.65% | 0.73% | 2.79% | 261% | ||||||||||||||
| 09/30/21 | 11.22 | 0.25 | (0.10) | 0.15 | (0.26) | — | (0.26) | 11.11 | 1.35 | 92,882 | 0.65 | 0.70 | 2.24 | 144(3) | ||||||||||||||
| 09/30/22 | 11.11 | 0.25 | (2.03) | (1.78) | (0.28) | (0.03) | (0.31) | 9.02 | (16.32) | 56,003 | 0.60 | 0.68 | 2.44 | 159 | ||||||||||||||
| 09/30/23 | 9.02 | 0.36 | (0.13) | 0.23 | (0.36) | — | (0.36) | 8.89 | 2.55 | 48,931 | 0.58 | 0.72 | 3.91 | 146 | ||||||||||||||
| 09/30/24 | 8.89 | 0.38 | 0.74 | 1.12 | (0.37) | — | (0.37) | 9.64 | 12.89 | 43,896 | 0.58 | 0.74 | 4.11 | 172 | ||||||||||||||
| Institutional Class | ||||||||||||||||||||||||||||
| 09/30/20 | $10.67 | $0.31 | $0.56 | $0.87 | $(0.32) | $ — | $(0.32) | $11.22 | 8.23% | $134,659 | 0.57% | 0.63% | 2.87% | 261% | ||||||||||||||
| 09/30/21 | 11.22 | 0.26 | (0.10) | 0.16 | (0.27) | — | (0.27) | 11.11 | 1.43 | 99,607 | 0.57 | 0.61 | 2.32 | 144(3) | ||||||||||||||
| 09/30/22 | 11.11 | 0.26 | (2.04) | (1.78) | (0.28) | (0.03) | (0.31) | 9.02 | (16.26) | 68,399 | 0.52 | 0.59 | 2.53 | 159 | ||||||||||||||
| 09/30/23 | 9.02 | 0.37 | (0.13) | 0.24 | (0.37) | — | (0.37) | 8.89 | 2.63 | 78,943 | 0.50 | 0.63 | 3.99 | 146 | ||||||||||||||
| 09/30/24 | 8.89 | 0.39 | 0.74 | 1.13 | (0.38) | — | (0.38) | 9.64 | 12.98 | 97,813 | 0.50 | 0.64 | 4.19 | 172 | ||||||||||||||
| (1) | The net investment income per share was based on average shares outstanding for the period. |
| (2) | Total returns shown exclude the effect of applicable sales loads and fees. If these charges were included, the returns would be lower. |
| (3) | Portfolio turnover excludes the purchases and sales of securities of the AIG U.S. Government Securities Fund acquired on July 16, 2021. If these transactions were included, portfolio turnover would have been higher. |
| Touchstone Ares Credit Opportunities Fund | ||||||||||||||||||||||||||||||
| Period ended | Net asset value at beginning of period | Net investment income | Net realized and unrealized gains (losses) on investments | Total from investment operations | Distributions from net investment income | Distributions from realized capital gains | Return of capital | Total distributions | Net asset value at end of period | Total return(1) | Net assets at end of period (000's) | Ratio of net expenses to average net assets(2) | Ratio of gross expenses to average net assets(2) | Ratio of net investment income (loss) to average net assets | Portfolio turnover rate | |||||||||||||||
| Class A | ||||||||||||||||||||||||||||||
| 09/30/20 | $10.03 | $0.57 | $(0.61) | $(0.04) | $(0.54) | $ — | $— | $(0.54) | $9.45 | (0.29)% | $5,597 | 1.18% | 1.61% | 5.90% | 115% | |||||||||||||||
| 09/30/21 | 9.45 | 0.47(3) | 1.07 | 1.54 | (0.53) | — | — | (0.53) | 10.46 | 16.67 | 141,422 | 1.09 | 1.32 | 4.45 | 135(4) | |||||||||||||||
| 09/30/22 | 10.46 | 0.47(3) | (1.53) | (1.06) | (0.43) | (0.32) | (0.01) | (0.76) | 8.64 | (10.60) | 115,483 | 1.07 | 1.26 | 4.87 | 72 | |||||||||||||||
| 09/30/23 | 8.64 | 0.67(3) | 0.12 | 0.79 | (0.68) | — | — | (0.68) | 8.75 | 9.31 | 111,502 | 1.07 | 1.26 | 7.59 | 54 | |||||||||||||||
| 09/30/24 | 8.75 | 0.72(3) | 0.46 | 1.18 | (0.73) | — | — | (0.73) | 9.20 | 14.07 | 120,101 | 1.04 | 1.19 | 8.06 | 49 | |||||||||||||||
| Class C | ||||||||||||||||||||||||||||||
| 09/30/20 | $9.75 | $0.52 | $(0.62) | $(0.10) | $(0.47) | $ — | $— | $(0.47) | $9.18 | (0.98)% | $2,246 | 1.93% | 2.61% | 5.15% | 115% | |||||||||||||||
| 09/30/21 | 9.18 | 0.40(3) | 1.02 | 1.42 | (0.47) | — | — | (0.47) | 10.13 | 15.79 | 31,605 | 1.56 | 2.17 | 3.98 | 135(4) | |||||||||||||||
| 09/30/22 | 10.13 | 0.42(3) | (1.47) | (1.05) | (0.40) | (0.32) | (0.01) | (0.73) | 8.35 | (11.01) | 17,575 | 1.47 | 2.05 | 4.47 | 72 | |||||||||||||||
| 09/30/23 | 8.35 | 0.61(3) | 0.11 | 0.72 | (0.64) | — | — | (0.64) | 8.43 | 8.91 | 17,580 | 1.47 | 2.07 | 7.19 | 54 | |||||||||||||||
| 09/30/24 | 8.43 | 0.66(3) | 0.44 | 1.10 | (0.70) | — | — | (0.70) | 8.83 | 13.57 | 28,086 | 1.44 | 2.00 | 7.66 | 49 | |||||||||||||||
| Class Y | ||||||||||||||||||||||||||||||
| 09/30/20 | $10.16 | $0.59 | $(0.62) | $(0.03) | $(0.56) | $ — | $— | $(0.56) | $9.57 | (0.13)% | $36,558 | 0.93% | 1.20% | 6.15% | 115% | |||||||||||||||
| 09/30/21 | 9.57 | 0.48(3) | 1.11 | 1.59 | (0.55) | — | — | (0.55) | 10.61 | 16.98 | 101,613 | 0.88 | 1.07 | 4.66 | 135(4) | |||||||||||||||
| 09/30/22 | 10.61 | 0.49(3) | (1.54) | (1.05) | (0.45) | (0.32) | (0.01) | (0.78) | 8.78 | (10.47) | 135,892 | 0.87 | 1.02 | 5.07 | 72 | |||||||||||||||
| 09/30/23 | 8.78 | 0.70(3) | 0.12 | 0.82 | (0.70) | — | — | (0.70) | 8.90 | 9.55 | 210,871 | 0.87 | 1.00 | 7.79 | 54 | |||||||||||||||
| 09/30/24 | 8.90 | 0.75(3) | 0.46 | 1.21 | (0.75) | — | — | (0.75) | 9.36 | 14.16 | 406,336 | 0.84 | 0.92 | 8.26 | 49 | |||||||||||||||
| Institutional Class | ||||||||||||||||||||||||||||||
| 09/30/20 | $10.22 | $0.61 | $(0.63) | $(0.02) | $(0.57) | $ — | $— | $(0.57) | $9.63 | (0.02)% | $42,982 | 0.83% | 1.06% | 6.25% | 115% | |||||||||||||||
| 09/30/21 | 9.63 | 0.49(3) | 1.12 | 1.61 | (0.56) | — | — | (0.56) | 10.68 | 17.07 | 2,627 | 0.78 | 0.97 | 4.76 | 135(4) | |||||||||||||||
| 09/30/22 | 10.68 | 0.51(3) | (1.56) | (1.05) | (0.46) | (0.32) | (0.01) | (0.79) | 8.84 | (10.39) | 2,139 | 0.77 | 1.15 | 5.17 | 72 | |||||||||||||||
| 09/30/23 | 8.84 | 0.71(3) | 0.11 | 0.82 | (0.70) | — | — | (0.70) | 8.96 | 9.59 | 5,644 | 0.77 | 1.21 | 7.89 | 54 | |||||||||||||||
| 09/30/24 | 8.96 | 0.77(3) | 0.47 | 1.24 | (0.76) | — | — | (0.76) | 9.44 | 14.40 | 68,834 | 0.74 | 0.92 | 8.36 | 49 | |||||||||||||||
| (1) | Total returns shown exclude the effect of applicable sales loads and fees. If these charges were included, the returns would be lower. |
| (2) | The ratio of net and gross expenses to average net assets excluding dividend and interest expense on securities sold short would have been lower by 0.01%, 0.04%, 0.04%, 0.05% and 0.10% for the years ended September 30, 2024, 2023, 2022, 2021 and 2020, respectively. |
| (3) | The net investment income per share was based on average shares outstanding for the period. |
| (4) | Portfolio turnover excludes the purchases and sales of securities by the Touchstone Dynamic Diversified Income Fund and the AIG Senior Floating Rate Fund acquired on June 25, 2021 and July 16, 2021, respectively. If these transactions were included, portfolio turnover would have been higher. |
| Touchstone Dividend Equity Fund | ||||||||||||||||||||||||||||
| Period ended | Net asset value at beginning of period | Net investment income(1) | Net realized and unrealized gains (losses) on investments | Total from investment operations | Distributions from net investment income | Distributions from realized capital gains | Total distributions | Net asset value at end of period | Total return(2) | Net assets at end of period (000's) | Ratio of net expenses to average net assets | Ratio of gross expenses to average net assets | Ratio of net investment income (loss) to average net assets | Portfolio turnover rate | ||||||||||||||
| Class A | ||||||||||||||||||||||||||||
| 10/31/19 | $17.55 | $0.50 | $0.39 | $0.89 | $(0.49) | $ (0.78) | $(1.27) | $17.17 | 5.42% | $2,381,987 | 1.05% | 1.05% | 2.90% | 37% | ||||||||||||||
| 10/31/20 | 17.17 | 0.55 | (2.42) | (1.87) | (0.60) | (0.58) | (1.18) | 14.12 | (11.33) | 1,666,379 | 1.09 | 1.09 | 3.60 | 68 | ||||||||||||||
| 09/30/21(3) | 14.12 | 0.29 | 2.83 | 3.12 | (0.36) | — | (0.36) | 16.88 | 22.13(4) | 1,737,804 | 1.09(5) | 1.09(5) | 1.91(5) | 83(4)(6) | ||||||||||||||
| 09/30/22 | 16.88 | 0.28 | (1.87) | (1.59) | (0.30) | (0.31) | (0.61) | 14.68 | (9.90) | 1,398,059 | 0.99 | 1.00 | 1.64 | 12 | ||||||||||||||
| 09/30/23 | 14.68 | 0.31 | 1.70 | 2.01 | (0.27) | (0.59) | (0.86) | 15.83 | 13.59 | 1,388,830 | 0.99 | 1.02 | 1.87 | 13(7) | ||||||||||||||
| 09/30/24 | 15.83 | 0.32 | 4.15 | 4.47 | (0.38) | (0.43) | (0.81) | 19.49 | 28.97 | 1,579,521 | 0.99 | 1.01 | 1.82 | 10 | ||||||||||||||
| Class C | ||||||||||||||||||||||||||||
| 10/31/19 | $17.38 | $0.38 | $0.39 | $0.77 | $(0.37) | $ (0.78) | $(1.15) | $17.00 | 4.78% | $2,421,728 | 1.70% | 1.70% | 2.27% | 37% | ||||||||||||||
| 10/31/20 | 17.00 | 0.47 | (2.40) | (1.93) | (0.50) | (0.58) | (1.08) | 13.99 | (11.89) | 1,117,141 | 1.74 | 1.74 | 2.99 | 68 | ||||||||||||||
| 09/30/21(3) | 13.99 | 0.19 | 2.80 | 2.99 | (0.24) | — | (0.24) | 16.74 | 21.38(4) | 806,336 | 1.75(5) | 1.77(5) | 1.27(5) | 83(4)(6) | ||||||||||||||
| 09/30/22 | 16.74 | 0.16 | (1.86) | (1.70) | (0.17) | (0.31) | (0.48) | 14.56 | (10.54) | 471,273 | 1.69 | 1.76 | 0.94 | 12 | ||||||||||||||
| 09/30/23 | 14.56 | 0.19 | 1.69 | 1.88 | (0.15) | (0.59) | (0.74) | 15.70 | 12.79 | 339,231 | 1.69 | 1.78 | 1.17 | 13(7) | ||||||||||||||
| 09/30/24 | 15.70 | 0.19 | 4.12 | 4.31 | (0.25) | (0.43) | (0.68) | 19.33 | 28.08 | 221,858 | 1.69 | 1.78 | 1.12 | 10 | ||||||||||||||
| Class Y | ||||||||||||||||||||||||||||
| 10/31/19 | $17.52 | $0.53 | $0.39 | $0.92 | $(0.52) | $ (0.78) | $(1.30) | $17.14 | 5.66% | $4,094,116 | 0.85% | 0.85% | 3.13% | 37% | ||||||||||||||
| 10/31/20 | 17.14 | 0.61 | (2.44) | (1.83) | (0.63) | (0.58) | (1.21) | 14.10 | (11.11) | 1,691,794 | 0.88 | 0.88 | 3.83 | 68 | ||||||||||||||
| 09/30/21(3)(8) | 14.10 | 0.33 | 2.81 | 3.14 | (0.39) | — | (0.39) | 16.85 | 22.33(4) | 1,161,841 | 0.88(5) | 0.88(5) | 2.14(5) | 83(4)(6) | ||||||||||||||
| 09/30/22 | 16.85 | 0.32 | (1.86) | (1.54) | (0.34) | (0.31) | (0.65) | 14.66 | (9.69) | 772,987 | 0.74 | 0.74 | 1.89 | 12 | ||||||||||||||
| 09/30/23 | 14.66 | 0.34 | 1.70 | 2.04 | (0.31) | (0.59) | (0.90) | 15.80 | 13.89 | 675,229 | 0.76 | 0.76 | 2.10 | 13(7) | ||||||||||||||
| 09/30/24 | 15.80 | 0.36 | 4.14 | 4.50 | (0.42) | (0.43) | (0.85) | 19.45 | 29.25 | 711,339 | 0.76 | 0.76 | 2.05 | 10 | ||||||||||||||
| Institutional Class | ||||||||||||||||||||||||||||
| 09/30/21(3)(9) | $17.02 | $0.07 | $(0.17) | $(0.10) | $(0.08) | $ — | $(0.08) | $16.84 | (0.61)%(4) | $313 | 0.67%(5) | 3.37%(5) | 2.01%(5) | 83%(4)(6) | ||||||||||||||
| 09/30/22 | 16.84 | 0.33 | (1.85) | (1.52) | (0.36) | (0.31) | (0.67) | 14.65 | (9.62) | 885 | 0.67 | 1.80 | 1.97 | 12 | ||||||||||||||
| 09/30/23 | 14.65 | 0.35 | 1.70 | 2.05 | (0.32) | (0.59) | (0.91) | 15.79 | 13.91 | 2,013 | 0.67 | 0.96 | 2.19 | 13(7) | ||||||||||||||
| 09/30/24 | 15.79 | 0.37 | 4.14 | 4.51 | (0.44) | (0.43) | (0.87) | 19.43 | 29.31 | 2,989 | 0.67 | 1.12 | 2.14 | 10 | ||||||||||||||
| Class R6 | ||||||||||||||||||||||||||||
| 09/30/21(3)(10) | $17.34 | $0.06 | $(0.48) | $(0.42) | $(0.08) | $ — | $(0.08) | $16.84 | (2.44)%(4) | $2 | 0.65%(5) | 359.78%(5) | 2.26%(5) | 83%(4)(6) | ||||||||||||||
| 09/30/22 | 16.84 | 0.32 | (1.84) | (1.52) | (0.36) | (0.31) | (0.67) | 14.65 | (9.56) | 1,510 | 0.65 | 1.76 | 1.99 | 12 | ||||||||||||||
| 09/30/23 | 14.65 | 0.36 | 1.70 | 2.06 | (0.33) | (0.59) | (0.92) | 15.79 | 13.94 | 974 | 0.65 | 1.39 | 2.20 | 13(7) | ||||||||||||||
| 09/30/24 | 15.79 | 0.39 | 4.14 | 4.53 | (0.44) | (0.43) | (0.87) | 19.45 | 29.47 | 10,337 | 0.65 | 0.92 | 2.16 | 10 | ||||||||||||||
| (1) | The net investment income per share was based on average shares outstanding for the period. |
| (2) | Total returns shown exclude the effect of applicable sales loads and fees. If these charges were included, the returns would be lower. |
| (3) | The Fund changed its fiscal year end from October 31 to September 30. |
| (4) | Not annualized. |
| (5) | Annualized. |
| (6) | Portfolio turnover excludes the purchases and sales of securities by the AIG Select Dividend Growth Fund acquired on July 16, 2021. If these transactions were included, portfolio turnover would have been higher. |
| (7) | Portfolio turnover excludes securities delivered from processing redemptions-in-kind. |
| (8) | Effective July 16, 2021, Class W shares of the AIG Focused Dividend Strategy Fund were reorganized into Class Y shares of the Fund. |
| (9) | Represents the period from commencement of operations (July 19, 2021) through September 30, 2021. |
| (10) | Represents the period from commencement of operations (August 2, 2021) through September 30, 2021. |
| Touchstone High Yield Fund | ||||||||||||||||||||||||||
| Period ended | Net asset value at beginning of period | Net investment income | Net realized and unrealized gains (losses) on investments | Total from investment operations | Distributions from net investment income | Total distributions | Net asset value at end of period | Total return(1) | Net assets at end of period (000's) | Ratio of net expenses to average net assets | Ratio of gross expenses to average net assets | Ratio of net investment income (loss) to average net assets | Portfolio turnover rate | |||||||||||||
| Class A | ||||||||||||||||||||||||||
| 09/30/20 | $8.27 | $0.39 | $(0.41) | $(0.02) | $(0.39) | $(0.39) | $7.86 | (0.13)% | $14,578 | 1.05% | 1.25% | 4.84% | 89% | |||||||||||||
| 09/30/21 | 7.86 | 0.36 | 0.48 | 0.84 | (0.37) | (0.37) | 8.33 | 10.84 | 15,081 | 1.05 | 1.21 | 4.35 | 96 | |||||||||||||
| 09/30/22 | 8.33 | 0.33 | (1.54) | (1.21) | (0.35) | (0.35) | 6.77 | (14.88) | 11,824 | 1.05 | 1.26 | 4.33 | 57 | |||||||||||||
| 09/30/23 | 6.77 | 0.40(2) | 0.31 | 0.71 | (0.41) | (0.41) | 7.07 | 10.69 | 11,322 | 1.05 | 1.35 | 5.60 | 70 | |||||||||||||
| 09/30/24 | 7.07 | 0.42(2) | 0.50 | 0.92 | (0.44) | (0.44) | 7.55 | 13.34 | 11,896 | 1.05 | 1.38 | 5.73 | 49 | |||||||||||||
| Class C | ||||||||||||||||||||||||||
| 09/30/20 | $8.25 | $0.29 | $(0.37) | $(0.08) | $(0.33) | $(0.33) | $7.84 | (0.89)% | $1,250 | 1.80% | 2.35% | 4.09% | 89% | |||||||||||||
| 09/30/21 | 7.84 | 0.26 | 0.52 | 0.78 | (0.31) | (0.31) | 8.31 | 10.07 | 835 | 1.80 | 2.83 | 3.60 | 96 | |||||||||||||
| 09/30/22 | 8.31 | 0.28 | (1.54) | (1.26) | (0.30) | (0.30) | 6.75 | (15.55) | 700 | 1.80 | 2.82 | 3.58 | 57 | |||||||||||||
| 09/30/23 | 6.75 | 0.34(2) | 0.31 | 0.65 | (0.36) | (0.36) | 7.04 | 9.74 | 593 | 1.80 | 3.26 | 4.85 | 70 | |||||||||||||
| 09/30/24 | 7.04 | 0.36(2) | 0.50 | 0.86 | (0.38) | (0.38) | 7.52 | 12.55 | 399 | 1.80 | 4.68 | 4.98 | 49 | |||||||||||||
| Class Y | ||||||||||||||||||||||||||
| 09/30/20 | $8.52 | $0.44 | $(0.45) | $(0.01) | $(0.42) | $(0.42) | $8.09 | 0.02% | $33,694 | 0.80% | 0.89% | 5.09% | 89% | |||||||||||||
| 09/30/21 | 8.09 | 0.39 | 0.50 | 0.89 | (0.40) | (0.40) | 8.58 | 11.18 | 36,447 | 0.80 | 0.89 | 4.60 | 96 | |||||||||||||
| 09/30/22 | 8.58 | 0.39 | (1.62) | (1.23) | (0.37) | (0.37) | 6.98 | (14.70) | 22,994 | 0.80 | 0.96 | 4.58 | 57 | |||||||||||||
| 09/30/23 | 6.98 | 0.43(2) | 0.32 | 0.75 | (0.43) | (0.43) | 7.30 | 10.92 | 19,125 | 0.80 | 0.99 | 5.85 | 70 | |||||||||||||
| 09/30/24 | 7.30 | 0.45(2) | 0.52 | 0.97 | (0.46) | (0.46) | 7.81 | 13.60 | 19,263 | 0.80 | 1.06 | 5.98 | 49 | |||||||||||||
| Institutional Class | ||||||||||||||||||||||||||
| 09/30/20 | $8.51 | $0.43 | $(0.42) | $0.01 | $(0.43) | $(0.43) | $8.09 | 0.21% | $135,974 | 0.72% | 0.75% | 5.17% | 89% | |||||||||||||
| 09/30/21 | 8.09 | 0.40 | 0.50 | 0.90 | (0.41) | (0.41) | 8.58 | 11.27 | 87,056 | 0.72 | 0.75 | 4.68 | 96 | |||||||||||||
| 09/30/22 | 8.58 | 0.37 | (1.59) | (1.22) | (0.38) | (0.38) | 6.98 | (14.63) | 67,076 | 0.72 | 0.82 | 4.66 | 57 | |||||||||||||
| 09/30/23 | 6.98 | 0.43(2) | 0.33 | 0.76 | (0.44) | (0.44) | 7.30 | 11.01 | 69,633 | 0.72 | 0.85 | 5.93 | 70 | |||||||||||||
| 09/30/24 | 7.30 | 0.46(2) | 0.51 | 0.97 | (0.46) | (0.46) | 7.81 | 13.70 | 75,067 | 0.72 | 0.86 | 6.06 | 49 | |||||||||||||
| (1) | Total returns shown exclude the effect of applicable sales loads and fees. If these charges were included, the returns would be lower. |
| (2) | The net investment income per share was based on average shares outstanding for the period. |
| Touchstone Impact Bond Fund | ||||||||||||||||||||||||||
| Period ended | Net asset value at beginning of period | Net investment income | Net realized and unrealized gains (losses) on investments | Total from investment operations | Distributions from net investment income | Total distributions | Net asset value at end of period | Total return(1) | Net assets at end of period (000's) | Ratio of net expenses to average net assets | Ratio of gross expenses to average net assets | Ratio of net investment income (loss) to average net assets | Portfolio turnover rate | |||||||||||||
| Class A | ||||||||||||||||||||||||||
| 09/30/20 | $10.44 | $0.19 | $0.37 | $0.56 | $(0.20) | $(0.20) | $10.80 | 5.46% | $16,509 | 0.85% | 1.03% | 1.83% | 21% | |||||||||||||
| 09/30/21 | 10.80 | 0.15 | (0.21) | (0.06) | (0.17) | (0.17) | 10.57 | (0.57) | 17,997 | 0.84 | 0.93 | 1.43 | 24 | |||||||||||||
| 09/30/22 | 10.57 | 0.18 | (1.70) | (1.52) | (0.20) | (0.20) | 8.85 | (14.52) | 11,777 | 0.76 | 0.93 | 1.79 | 19 | |||||||||||||
| 09/30/23 | 8.85 | 0.26 | (0.27) | (0.01) | (0.27) | (0.27) | 8.57 | (0.20) | 10,949 | 0.76 | 0.96 | 2.82 | 15 | |||||||||||||
| 09/30/24 | 8.57 | 0.29(2) | 0.69 | 0.98 | (0.30) | (0.30) | 9.25 | 11.61 | 18,995 | 0.76 | 0.94 | 3.26 | 20 | |||||||||||||
| Class C | ||||||||||||||||||||||||||
| 09/30/20 | $10.43 | $0.12 | $0.37 | $0.49 | $(0.13) | $(0.13) | $10.79 | 4.69% | $1,737 | 1.60% | 2.55% | 1.08% | 21% | |||||||||||||
| 09/30/21 | 10.79 | 0.07 | (0.21) | (0.14) | (0.09) | (0.09) | 10.56 | (1.32) | 1,635 | 1.59 | 2.37 | 0.68 | 24 | |||||||||||||
| 09/30/22 | 10.56 | 0.10 | (1.69) | (1.59) | (0.13) | (0.13) | 8.84 | (15.18) | 1,415 | 1.51 | 2.25 | 1.04 | 19 | |||||||||||||
| 09/30/23 | 8.84 | 0.18 | (0.25) | (0.07) | (0.20) | (0.20) | 8.57 | (0.87) | 1,479 | 1.51 | 2.25 | 2.07 | 15 | |||||||||||||
| 09/30/24 | 8.57 | 0.22(2) | 0.69 | 0.91 | (0.23) | (0.23) | 9.25 | 10.77 | 1,426 | 1.51 | 2.49 | 2.51 | 20 | |||||||||||||
| Class Y | ||||||||||||||||||||||||||
| 09/30/20 | $10.45 | $0.22 | $0.38 | $0.60 | $(0.23) | $(0.23) | $10.82 | 5.81% | $145,821 | 0.60% | 0.64% | 2.08% | 21% | |||||||||||||
| 09/30/21 | 10.82 | 0.19 | (0.22) | (0.03) | (0.20) | (0.20) | 10.59 | (0.32) | 199,280 | 0.59 | 0.60 | 1.68 | 24 | |||||||||||||
| 09/30/22 | 10.59 | 0.20 | (1.70) | (1.50) | (0.23) | (0.23) | 8.86 | (14.37) | 225,457 | 0.51 | 0.52 | 2.04 | 19 | |||||||||||||
| 09/30/23 | 8.86 | 0.27 | (0.26) | 0.01 | (0.29) | (0.29) | 8.58 | 0.05 | 233,839 | 0.51 | 0.51 | 3.07 | 15 | |||||||||||||
| 09/30/24 | 8.58 | 0.31(2) | 0.70 | 1.01 | (0.32) | (0.32) | 9.27 | 12.00 | 279,532 | 0.51(3) | 0.50 | 3.51 | 20 | |||||||||||||
| Institutional Class | ||||||||||||||||||||||||||
| 09/30/20 | $10.45 | $0.23 | $0.38 | $0.61 | $(0.24) | $(0.24) | $10.82 | 5.92% | $227,734 | 0.50% | 0.59% | 2.18% | 21% | |||||||||||||
| 09/30/21 | 10.82 | 0.19 | (0.21) | (0.02) | (0.21) | (0.21) | 10.59 | (0.22) | 216,914 | 0.49 | 0.57 | 1.78 | 24 | |||||||||||||
| 09/30/22 | 10.59 | 0.21 | (1.70) | (1.49) | (0.24) | (0.24) | 8.86 | (14.29) | 243,902 | 0.41 | 0.49 | 2.14 | 19 | |||||||||||||
| 09/30/23 | 8.86 | 0.28 | (0.26) | 0.02 | (0.30) | (0.30) | 8.58 | 0.15 | 250,604 | 0.41 | 0.48 | 3.17 | 15 | |||||||||||||
| 09/30/24 | 8.58 | 0.32(2) | 0.70 | 1.02 | (0.33) | (0.33) | 9.27 | 12.10 | 274,926 | 0.41 | 0.48 | 3.60 | 20 | |||||||||||||
| Class R6 | ||||||||||||||||||||||||||
| 09/30/22(4) | $10.51 | $0.19 | $(1.61) | $(1.42) | $(0.23) | $(0.23) | $8.86 | (13.72)%(5) | $2 | 0.37%(6) | 238.46%(6) | 2.18%(6) | 19% | |||||||||||||
| 09/30/23 | 8.86 | 0.26 | (0.24) | 0.02 | (0.30) | (0.30) | 8.58 | 0.18 | 23,402 | 0.37 | 0.46 | 3.21 | 15 | |||||||||||||
| 09/30/24 | 8.58 | 0.33(2) | 0.68 | 1.01 | (0.33) | (0.33) | 9.26 | 12.02 | 26,225 | 0.37 | 0.47 | 3.65 | 20 | |||||||||||||
| (1) | Total returns shown exclude the effect of applicable sales loads and fees. If these charges were included, the returns would be lower. |
| (2) | The net investment income per share was based on average shares outstanding for the period. |
| (3) | Net expenses include amounts recouped by the Adviser. |
| (4) | Represents the period from commencement of operations (November 22, 2021) through September 30, 2022. |
| (5) | Not annualized. |
| (6) | Annualized. |
| Touchstone Mid Cap Fund | ||||||||||||||||||||||||||||
| Period ended | Net asset value at beginning of period | Net investment income (loss)(1) | Net realized and unrealized gains (losses) on investments | Total from investment operations | Distributions from net investment income | Distributions from realized capital gains | Total distributions | Net asset value at end of period | Total return(2) | Net assets at end of period (000's) | Ratio of net expenses to average net assets(3) | Ratio of gross expenses to average net assets(3) | Ratio of net investment income (loss) to average net assets | Portfolio turnover rate | ||||||||||||||
| Class A | ||||||||||||||||||||||||||||
| 09/30/20 | $38.87 | $0.03 | $1.27 | $1.30 | $(0.24) | $ (0.89) | $(1.13) | $39.04 | 3.32% | $103,964 | 1.21% | 1.29% | 0.08% | 18% | ||||||||||||||
| 09/30/21 | 39.04 | (0.07) | 8.33 | 8.26 | (0.13) | (0.70) | (0.83) | 46.47 | 21.34 | 137,477 | 1.22 | 1.23 | (0.15) | 21(4) | ||||||||||||||
| 09/30/22 | 46.47 | (0.05) | (6.26) | (6.31) | (0.15) | (1.21) | (1.36) | 38.80 | (14.13) | 109,653 | 1.23 | 1.23 | (0.11) | 15(4) | ||||||||||||||
| 09/30/23 | 38.80 | 0.02 | 7.50 | 7.52 | (0.12) | (0.44) | (0.56) | 45.76 | 19.55 | 130,846 | 1.22 | 1.23 | 0.04 | 18(4) | ||||||||||||||
| 09/30/24 | 45.76 | 0.01 | 11.06 | 11.07 | (0.05) | (0.31) | (0.36) | 56.47 | 24.28 | 171,046 | 1.17 | 1.17 | 0.01 | 13(4) | ||||||||||||||
| Class C | ||||||||||||||||||||||||||||
| 09/30/20 | $36.34 | $(0.23) | $1.16 | $0.93 | $— | $ (0.89) | $(0.89) | $36.38 | 2.54% | $78,959 | 1.96% | 2.00% | (0.67)% | 18% | ||||||||||||||
| 09/30/21 | 36.38 | (0.36) | 7.74 | 7.38 | (0.06) | (0.70) | (0.76) | 43.00 | 20.47 | 90,388 | 1.93 | 1.93 | (0.86) | 21(4) | ||||||||||||||
| 09/30/22 | 43.00 | (0.34) | (5.74) | (6.08) | (0.07) | (1.21) | (1.28) | 35.64 | (14.71) | 65,812 | 1.93 | 1.93 | (0.81) | 15(4) | ||||||||||||||
| 09/30/23 | 35.64 | (0.27) | 6.88 | 6.61 | (0.05) | (0.44) | (0.49) | 41.76 | 18.70 | 70,076 | 1.94 | 1.94 | (0.67) | 18(4) | ||||||||||||||
| 09/30/24 | 41.76 | (0.34) | 10.07 | 9.73 | — | (0.31) | (0.31) | 51.18 | 23.38 | 82,284 | 1.91 | 1.91 | (0.73) | 13(4) | ||||||||||||||
| Class Y | ||||||||||||||||||||||||||||
| 09/30/20 | $39.33 | $0.12 | $1.28 | $1.40 | $(0.29) | $ (0.89) | $(1.18) | $39.55 | 3.57% | $2,443,232 | 0.96% | 1.00% | 0.33% | 18% | ||||||||||||||
| 09/30/21 | 39.55 | 0.05 | 8.44 | 8.49 | (0.16) | (0.70) | (0.86) | 47.18 | 21.64 | 3,258,367 | 0.97(5) | 0.93 | 0.10 | 21(4) | ||||||||||||||
| 09/30/22 | 47.18 | 0.08 | (6.36) | (6.28) | (0.18) | (1.21) | (1.39) | 39.51 | (13.87) | 2,789,008 | 0.94(5) | 0.95 | 0.17 | 15(4) | ||||||||||||||
| 09/30/23 | 39.51 | 0.15 | 7.64 | 7.79 | (0.15) | (0.44) | (0.59) | 46.71 | 19.90 | 3,178,397 | 0.94 | 0.94 | 0.33 | 18(4) | ||||||||||||||
| 09/30/24 | 46.71 | 0.15 | 11.29 | 11.44 | (0.17) | (0.31) | (0.48) | 57.67 | 24.61 | 4,288,654 | 0.90 | 0.90 | 0.28 | 13(4) | ||||||||||||||
| Class Z | ||||||||||||||||||||||||||||
| 09/30/20 | $38.62 | $0.03 | $1.25 | $1.28 | $(0.26) | $ (0.89) | $(1.15) | $38.75 | 3.30% | $77,184 | 1.21% | 1.30% | 0.08% | 18% | ||||||||||||||
| 09/30/21 | 38.75 | (—)(6) | 8.20 | 8.20 | (0.13) | (0.70) | (0.83) | 46.12 | 21.33 | 54,368 | 1.22 | 1.25 | (0.15) | 21(4) | ||||||||||||||
| 09/30/22 | 46.12 | (0.05) | (6.21) | (6.26) | (0.14) | (1.21) | (1.35) | 38.51 | (14.12) | 37,449 | 1.23 | 1.26 | (0.11) | 15(4) | ||||||||||||||
| 09/30/23 | 38.51 | 0.02 | 7.45 | 7.47 | (0.12) | (0.44) | (0.56) | 45.42 | 19.56 | 40,257 | 1.22 | 1.26 | 0.04 | 18(4) | ||||||||||||||
| 09/30/24 | 45.42 | (0.01) | 10.98 | 10.97 | (0.04) | (0.31) | (0.35) | 56.04 | 24.24 | 45,835 | 1.21 | 1.24 | (0.03) | 13(4) | ||||||||||||||
| Institutional Class | ||||||||||||||||||||||||||||
| 09/30/20 | $39.41 | $0.15 | $1.29 | $1.44 | $(0.32) | $ (0.89) | $(1.21) | $39.64 | 3.64% | $1,142,677 | 0.89%(5) | 0.89% | 0.40% | 18% | ||||||||||||||
| 09/30/21 | 39.64 | 0.10 | 8.46 | 8.56 | (0.16) | (0.70) | (0.86) | 47.34 | 21.80 | 676,846 | 0.85(5) | 0.84 | 0.22 | 21(4) | ||||||||||||||
| 09/30/22 | 47.34 | 0.11 | (6.39) | (6.28) | (0.19) | (1.21) | (1.40) | 39.66 | (13.82) | 407,132 | 0.87 | 0.87 | 0.25 | 15(4) | ||||||||||||||
| 09/30/23 | 39.66 | 0.17 | 7.67 | 7.84 | (0.15) | (0.44) | (0.59) | 46.91 | 19.96 | 466,528 | 0.88 | 0.88 | 0.38 | 18(4) | ||||||||||||||
| 09/30/24 | 46.91 | 0.18 | 11.35 | 11.53 | (0.20) | (0.31) | (0.51) | 57.93 | 24.70 | 734,206 | 0.85 | 0.85 | 0.34 | 13(4) | ||||||||||||||
| Class R6 | ||||||||||||||||||||||||||||
| 09/30/21(7) | $45.92 | $0.07 | $1.36 | $1.43 | $— | $ — | $— | $47.35 | 3.11%(8) | $612,500 | 0.80%(9) | 0.82%(9) | 0.27%(9) | 21%(4) | ||||||||||||||
| 09/30/22 | 47.35 | 0.14 | (6.39) | (6.25) | (0.19) | (1.21) | (1.40) | 39.70 | (13.76) | 598,238 | 0.81 | 0.82 | 0.31 | 15(4) | ||||||||||||||
| 09/30/23 | 39.70 | 0.21 | 7.68 | 7.89 | (0.16) | (0.44) | (0.60) | 46.99 | 20.07 | 657,775 | 0.80 | 0.83 | 0.46 | 18(4) | ||||||||||||||
| 09/30/24 | 46.99 | 0.21 | 11.37 | 11.58 | (0.24) | (0.31) | (0.55) | 58.02 | 24.76 | 763,113 | 0.79 | 0.80 | 0.39 | 13(4) | ||||||||||||||
| (1) | The net investment income per share was based on average shares outstanding for the period. |
| (2) | Total returns shown exclude the effect of applicable sales loads and fees. If these charges were included, the returns would be lower. |
| (3) | The ratio of net and gross expenses to average net assets excluding liquidity provider expenses would have been lower by 0.01%, 0.02% and 0.01% for the years ended September 30, 2023, 2022 and 2021, respectively. |
| (4) | Portfolio turnover excludes securities delivered from processing redemptions-in-kind. |
| (5) | Net expenses include amounts recouped by the Adviser. |
| (6) | Less than $0.005 per share. |
| (7) | Represents the period from commencement of operations (February 22, 2021) through September 30, 2021. |
| (8) | Not annualized. |
| (9) | Annualized. |
| Touchstone Mid Cap Value Fund | ||||||||||||||||||||||||||||
| Period ended | Net asset value at beginning of period | Net investment income (loss) | Net realized and unrealized gains (losses) on investments | Total from investment operations | Distributions from net investment income | Distributions from realized capital gains | Total distributions | Net asset value at end of period | Total return(1) | Net assets at end of period (000's) | Ratio of net expenses to average net assets(2) | Ratio of gross expenses to average net assets(2) | Ratio of net investment income (loss) to average net assets | Portfolio turnover rate | ||||||||||||||
| Class A | ||||||||||||||||||||||||||||
| 09/30/20 | $17.91 | $0.09 | $(1.20) | $(1.11) | $(0.09) | $ — | $(0.09) | $16.71 | (6.20)% | $9,864 | 1.22% | 1.59% | 0.50% | 37% | ||||||||||||||
| 09/30/21 | 16.71 | 0.01(3) | 6.93 | 6.94 | (0.03) | — | (0.03) | 23.62 | 41.59 | 13,605 | 1.23 | 1.55 | 0.06 | 33(4) | ||||||||||||||
| 09/30/22 | 23.62 | 0.14(3) | (2.05) | (1.91) | (0.19) | (1.49) | (1.68) | 20.03 | (9.04) | 12,950 | 1.22 | 1.44 | 0.59 | 27 | ||||||||||||||
| 09/30/23 | 20.03 | 0.14(3) | 1.26 | 1.40 | (0.06) | (1.12) | (1.18) | 20.25 | 6.86 | 14,596 | 1.24 | 1.51 | 0.66 | 21(4) | ||||||||||||||
| 09/30/24 | 20.25 | 0.12(3) | 3.91 | 4.03 | (0.20) | (0.18) | (0.38) | 23.90 | 20.08 | 16,053 | 1.24 | 1.50 | 0.54 | 29(4) | ||||||||||||||
| Class C | ||||||||||||||||||||||||||||
| 09/30/20 | $17.37 | $(0.24) | $(0.96) | $(1.20) | $— | $ — | $— | $16.17 | (6.91)% | $3,296 | 1.97% | 2.57% | (0.25)% | 37% | ||||||||||||||
| 09/30/21 | 16.17 | (0.15)(3) | 6.71 | 6.56 | — | — | — | 22.73 | 40.57 | 4,167 | 1.98 | 2.36 | (0.69) | 33(4) | ||||||||||||||
| 09/30/22 | 22.73 | (0.03)(3) | (1.97) | (2.00) | — | (1.49) | (1.49) | 19.24 | (9.73) | 4,013 | 1.97 | 2.26 | (0.16) | 27 | ||||||||||||||
| 09/30/23 | 19.24 | (0.02)(3) | 1.22 | 1.20 | (0.02) | (1.12) | (1.14) | 19.30 | 6.08 | 2,963 | 1.99 | 2.38 | (0.09) | 21(4) | ||||||||||||||
| 09/30/24 | 19.30 | (0.04)(3) | 3.71 | 3.67 | (0.16) | (0.18) | (0.34) | 22.63 | 19.16 | 1,789 | 1.99 | 2.80 | (0.21) | 29(4) | ||||||||||||||
| Class Y | ||||||||||||||||||||||||||||
| 09/30/20 | $17.99 | $0.12 | $(1.20) | $(1.08) | $(0.13) | $ — | $(0.13) | $16.78 | (5.97)% | $299,596 | 0.97% | 1.22% | 0.75% | 37% | ||||||||||||||
| 09/30/21 | 16.78 | 0.07(3) | 6.96 | 7.03 | (0.06) | — | (0.06) | 23.75 | 41.97 | 400,865 | 0.98 | 1.16 | 0.31 | 33(4) | ||||||||||||||
| 09/30/22 | 23.75 | 0.20(3) | (2.06) | (1.86) | (0.25) | (1.49) | (1.74) | 20.15 | (8.81) | 349,756 | 0.97 | 1.16 | 0.84 | 27 | ||||||||||||||
| 09/30/23 | 20.15 | 0.19(3) | 1.27 | 1.46 | (0.07) | (1.12) | (1.19) | 20.42 | 7.14 | 326,424 | 0.99 | 1.20 | 0.91 | 21(4) | ||||||||||||||
| 09/30/24 | 20.42 | 0.18(3) | 3.93 | 4.11 | (0.21) | (0.18) | (0.39) | 24.14 | 20.33 | 172,791 | 0.99 | 1.21 | 0.79 | 29(4) | ||||||||||||||
| Institutional Class | ||||||||||||||||||||||||||||
| 09/30/20 | $18.09 | $0.15 | $(1.22) | $(1.07) | $(0.15) | $ — | $(0.15) | $16.87 | (5.86)% | $370,247 | 0.84% | 0.98% | 0.88% | 37% | ||||||||||||||
| 09/30/21 | 16.87 | 0.10(3) | 7.00 | 7.10 | (0.09) | — | (0.09) | 23.88 | 42.16 | 456,557 | 0.85 | 0.97 | 0.44 | 33(4) | ||||||||||||||
| 09/30/22 | 23.88 | 0.23(3) | (2.07) | (1.84) | (0.28) | (1.49) | (1.77) | 20.27 | (8.68) | 395,187 | 0.84 | 0.95 | 0.97 | 27 | ||||||||||||||
| 09/30/23 | 20.27 | 0.22(3) | 1.28 | 1.50 | (0.08) | (1.12) | (1.20) | 20.57 | 7.29 | 353,386 | 0.86 | 0.97 | 1.04 | 21(4) | ||||||||||||||
| 09/30/24 | 20.57 | 0.21(3) | 3.97 | 4.18 | (0.22) | (0.18) | (0.40) | 24.35 | 20.51 | 422,311 | 0.86 | 0.98 | 0.92 | 29(4) | ||||||||||||||
| (1) | Total returns shown exclude the effect of applicable sales loads and fees. If these charges were included, the returns would be lower. |
| (2) | The ratio of net and gross expenses to average net assets excluding liquidity provider expenses would have been lower by 0.02%, 0.02% and 0.01% for the years ended September 30, 2024, 2023 and 2021, respectively. |
| (3) | The net investment income per share was based on average shares outstanding for the period. |
| (4) | Portfolio turnover excludes securities delivered from processing redemptions-in-kind. |
| Touchstone Sands Capital International Growth Equity Fund | ||||||||||||||||||||||||||||
| Period ended | Net asset value at beginning of period | Net investment income (loss) | Net realized and unrealized gains (losses) on investments | Total from investment operations | Distributions from net investment income | Distributions from realized capital gains | Total distributions | Net asset value at end of period | Total return(1) | Net assets at end of period (000's) | Ratio of net expenses to average net assets(2) | Ratio of gross expenses to average net assets(2) | Ratio of net investment income (loss) to average net assets | Portfolio turnover rate | ||||||||||||||
| Class A | ||||||||||||||||||||||||||||
| 09/30/20 | $8.50 | $0.03 | $0.62 | $0.65 | $(0.02) | $ (1.69) | $(1.71) | $7.44 | 7.93% | $11,719 | 1.17% | 1.81% | 0.68% | 80% | ||||||||||||||
| 09/30/21 | 7.44 | 0.12 | 1.57 | 1.69 | (0.03) | — | (0.03) | 9.10 | 22.73 | 10,218 | 1.17 | 1.64 | 1.06 | 52 | ||||||||||||||
| 09/30/22 | 9.10 | 0.15 | (2.66) | (2.51) | (0.12) | (0.50) | (0.62) | 5.97 | (29.67) | 6,595 | 1.17 | 1.59 | 1.94 | 32 | ||||||||||||||
| 09/30/23 | 5.97 | 0.14(3) | 1.08 | 1.22 | (0.16) | — | (0.16) | 7.03 | 20.50 | 7,177 | 1.17 | 1.79 | 1.93 | 171 | ||||||||||||||
| 09/30/24 | 7.03 | (0.04)(3) | 2.41 | 2.37 | (0.12) | (0.21) | (0.33) | 9.07 | 34.43 | 9,247 | 1.18 | 1.76 | (0.45) | 117 | ||||||||||||||
| Class C | ||||||||||||||||||||||||||||
| 09/30/20 | $8.48 | $(0.03) | $0.64 | $0.61 | $(—)(4) | $ (1.69) | $(1.69) | $7.40 | 7.35% | $4,066 | 1.95% | 2.56% | (0.10)% | 80% | ||||||||||||||
| 09/30/21 | 7.40 | — | 1.61 | 1.61 | — | — | — | 9.01 | 21.76 | 2,727 | 1.95 | 2.56 | 0.28 | 52 | ||||||||||||||
| 09/30/22 | 9.01 | 0.08 | (2.64) | (2.56) | — | (0.50) | (0.50) | 5.95 | (30.16) | 1,086 | 1.95 | 2.72 | 1.16 | 32 | ||||||||||||||
| 09/30/23 | 5.95 | 0.08(3) | 1.08 | 1.16 | — | — | — | 7.11 | 19.50 | 398 | 1.95 | 3.62 | 1.15 | 171 | ||||||||||||||
| 09/30/24 | 7.11 | (0.10)(3) | 2.45 | 2.35 | — | (0.21) | (0.21) | 9.25 | 33.48 | 1,031 | 1.96 | 4.87 | (1.23) | 117 | ||||||||||||||
| Class Y | ||||||||||||||||||||||||||||
| 09/30/20 | $8.47 | $0.07 | $0.61 | $0.68 | $(0.03) | $ (1.69) | $(1.72) | $7.43 | 8.32% | $11,550 | 0.90% | 1.49% | 0.95% | 80% | ||||||||||||||
| 09/30/21 | 7.43 | 0.10 | 1.61 | 1.71 | (0.05) | — | (0.05) | 9.09 | 23.07 | 20,434 | 0.90 | 1.34 | 1.33 | 52 | ||||||||||||||
| 09/30/22 | 9.09 | 0.18 | (2.66) | (2.48) | (0.12) | (0.50) | (0.62) | 5.99 | (29.43) | 14,560 | 0.90 | 1.30 | 2.21 | 32 | ||||||||||||||
| 09/30/23 | 5.99 | 0.16(3) | 1.08 | 1.24 | (0.18) | — | (0.18) | 7.05 | 20.86 | 13,870 | 0.90 | 1.46 | 2.20 | 171 | ||||||||||||||
| 09/30/24 | 7.05 | (0.01)(3) | 2.41 | 2.40 | (0.14) | (0.21) | (0.35) | 9.10 | 34.82 | 76,260 | 0.91 | 1.36 | (0.18) | 117 | ||||||||||||||
| Institutional Class | ||||||||||||||||||||||||||||
| 09/30/20 | $8.48 | $0.07 | $0.60 | $0.67 | $(0.03) | $ (1.69) | $(1.72) | $7.43 | 8.30% | $3 | 0.89% | 314.41% | 0.96% | 80% | ||||||||||||||
| 09/30/21 | 7.43 | 0.12 | 1.60 | 1.72 | (0.05) | — | (0.05) | 9.10 | 23.21 | 4 | 0.89 | 255.65 | 1.34 | 52 | ||||||||||||||
| 09/30/22 | 9.10 | 0.22 | (2.70) | (2.48) | (0.14) | (0.50) | (0.64) | 5.98 | (29.41) | 5,913 | 0.89 | 1.18 | 2.22 | 32 | ||||||||||||||
| 09/30/23 | 5.98 | 0.16(3) | 1.08 | 1.24 | (0.18) | — | (0.18) | 7.04 | 20.79 | 3 | 0.89 | 1.27 | 2.17 | 171 | ||||||||||||||
| 09/30/24 | 7.04 | (0.01)(3) | 2.41 | 2.40 | (0.12) | (0.21) | (0.33) | 9.11 | 34.81 | 2,973 | 0.87 | 2.28 | (0.14) | 117 | ||||||||||||||
| Class R6 | ||||||||||||||||||||||||||||
| 09/30/23(5) | $7.66(6) | $0.01(3) | $(0.63) | $(0.62) | $— | $ — | $— | $7.04 | (8.09)%(7) | $14,490 | 0.82%(8) | 1.56%(8) | 2.27%(8) | 171% | ||||||||||||||
| 09/30/24 | 7.04 | (0.01)(3) | 2.41 | 2.40 | (0.12) | (0.21) | (0.33) | 9.11 | 34.83 | 19,540 | 0.82 | 1.16 | (0.08) | 117 | ||||||||||||||
| (1) | Total returns shown exclude the effect of applicable sales loads and fees. If these charges were included, the returns would be lower. |
| (2) | The ratio of net and gross expenses to average net assets excluding liquidity provider expenses would have been lower by 0.01% for the year ended September 30, 2024. |
| (3) | The net investment income per share was based on average shares outstanding for the period. |
| (4) | Less than $0.005 per share. |
| (5) | Represents the period from commencement of operations (August 31, 2023) through September 30, 2023. |
| (6) | Net asset value at the beginning of period is based on the net asset value of Institutional Class shares on August 31, 2023. |
| (7) | Not annualized. |
| (8) | Annualized. |
| Touchstone Sands Capital Select Growth Fund | ||||||||||||||||||||||||||
| Period ended | Net asset value at beginning of period | Net investment loss(1) | Net realized and unrealized gains (losses) on investments | Total from investment operations | Distributions from realized capital gains | Total distributions | Net asset value at end of period | Total return(2) | Net assets at end of period (000's) | Ratio of net expenses to average net assets(3) | Ratio of gross expenses to average net assets(3) | Ratio of net investment income (loss) to average net assets | Portfolio turnover rate | |||||||||||||
| Class A | ||||||||||||||||||||||||||
| 09/30/20 | $13.12 | $(0.11) | $6.58 | $6.47 | $ (2.37) | $(2.37) | $17.22 | 58.43% | $163,697 | 1.25%(5) | 1.24% | (0.85)% | 41%(4) | |||||||||||||
| 09/30/21 | 17.22 | (0.19) | 5.43 | 5.24 | (1.85) | (1.85) | 20.61 | 32.30 | 841,243 | 1.06(5) | 1.06 | (0.96) | 35(4)(6) | |||||||||||||
| 09/30/22 | 20.61 | (0.13) | (10.02) | (10.15) | (2.16) | (2.16) | 8.30 | (54.73) | 319,960 | 1.13 | 1.13 | (0.98) | 45(4) | |||||||||||||
| 09/30/23 | 8.30 | (0.08) | 2.17 | 2.09 | — | — | 10.39 | 25.18 | 344,359 | 1.16 | 1.20 | (0.83) | 27(4) | |||||||||||||
| 09/30/24 | 10.39 | (0.12) | 4.27 | 4.15 | — | — | 14.54 | 39.94 | 393,679 | 1.16 | 1.19 | (0.90) | 37(4) | |||||||||||||
| Class C | ||||||||||||||||||||||||||
| 09/30/20^ | $14.47 | $(0.23) | $7.03 | $6.80 | $ (2.98) | $(2.98) | $18.29 | 57.27% | $36,065 | 2.01% | 2.04% | (1.56)% | 41%(4) | |||||||||||||
| 09/30/21^ | 18.29 | (0.35) | 5.67 | 5.32 | (2.32) | (2.32) | 21.29 | 31.14 | 75,082 | 1.86 | 1.87 | (1.75) | 35(4)(6) | |||||||||||||
| 09/30/22^ | 21.29 | (0.23) | (10.05) | (10.28) | (2.71) | (2.71) | 8.30 | (55.02) | 20,623 | 1.78 | 1.94 | (1.63) | 45(4) | |||||||||||||
| 09/30/23^ | 8.30 | (0.14) | 2.16 | 2.02 | — | — | 10.32 | 24.48 | 18,269 | 1.77 | 2.05 | (1.44) | 27(4) | |||||||||||||
| 09/30/24 | 10.32 | (0.20) | 4.24 | 4.04 | — | — | 14.36 | 39.15 | 18,051 | 1.77 | 2.04 | (1.51) | 37(4) | |||||||||||||
| Class Y | ||||||||||||||||||||||||||
| 09/30/20 | $14.14 | $(0.09) | $7.21 | $7.12 | $ (2.37) | $(2.37) | $18.89 | 58.86% | $1,565,333 | 1.00%(5) | 0.99% | (0.58)% | 41%(4) | |||||||||||||
| 09/30/21 | 18.89 | (0.16) | 5.98 | 5.82 | (1.85) | (1.85) | 22.86 | 32.53 | 1,784,643 | 0.85 | 0.85 | (0.74) | 35(4)(6) | |||||||||||||
| 09/30/22 | 22.86 | (0.11) | (11.24) | (11.35) | (2.16) | (2.16) | 9.35 | (54.59) | 613,010 | 0.88 | 0.88 | (0.72) | 45(4) | |||||||||||||
| 09/30/23 | 9.35 | (0.06) | 2.44 | 2.38 | — | — | 11.73 | 25.46 | 600,614 | 0.92 | 0.92 | (0.58) | 27(4) | |||||||||||||
| 09/30/24 | 11.73 | (0.10) | 4.83 | 4.73 | — | — | 16.46 | 40.32 | 624,311 | 0.90 | 0.90 | (0.64) | 37(4) | |||||||||||||
| Class Z | ||||||||||||||||||||||||||
| 09/30/20 | $13.14 | $(0.11) | $6.59 | $6.48 | $ (2.37) | $(2.37) | $17.25 | 58.42% | $491,741 | 1.24% | 1.31% | (0.82)% | 41%(4) | |||||||||||||
| 09/30/21 | 17.25 | (0.20) | 5.43 | 5.23 | (1.85) | (1.85) | 20.63 | 32.17 | 570,206 | 1.16(5) | 1.16 | (1.05) | 35(4)(6) | |||||||||||||
| 09/30/22 | 20.63 | (0.14) | (10.02) | (10.16) | (2.16) | (2.16) | 8.31 | (54.73) | 203,620 | 1.18 | 1.19 | (1.03) | 45(4) | |||||||||||||
| 09/30/23 | 8.31 | (0.08) | 2.17 | 2.09 | — | — | 10.40 | 25.15 | 200,700 | 1.17 | 1.25 | (0.84) | 27(4) | |||||||||||||
| 09/30/24 | 10.40 | (0.12) | 4.28 | 4.16 | — | — | 14.56 | 40.00 | 232,611 | 1.17 | 1.21 | (0.91) | 37(4) | |||||||||||||
| Institutional Class | ||||||||||||||||||||||||||
| 09/30/20(7) | $19.81(8) | $(0.01) | $(0.91) | $(0.92) | $ — | $— | $18.89 | (4.64)%(9) | $2 | 0.81%(10) | 1,344.66%(10) | (0.81)%(10) | 41%(4) | |||||||||||||
| 09/30/21 | 18.89 | (0.15) | 5.99 | 5.84 | (1.85) | (1.85) | 22.88 | 32.65 | 2,582,030 | 0.79(5) | 0.79 | (0.69) | 35(4)(6) | |||||||||||||
| 09/30/22 | 22.88 | (0.10) | (11.26) | (11.36) | (2.16) | (2.16) | 9.36 | (54.58) | 839,599 | 0.82 | 0.83 | (0.67) | 45(4) | |||||||||||||
| 09/30/23 | 9.36 | (0.05) | 2.45 | 2.40 | — | — | 11.76 | 25.64 | 783,666 | 0.81 | 0.88 | (0.48) | 27(4) | |||||||||||||
| 09/30/24 | 11.76 | (0.08) | 4.84 | 4.76 | — | — | 16.52 | 40.48 | 851,056 | 0.81 | 0.86 | (0.55) | 37(4) | |||||||||||||
| Class R6 | ||||||||||||||||||||||||||
| 09/30/20(7) | $19.81(8) | $(0.01) | $(0.91) | $(0.92) | $ — | $— | $18.89 | (4.64)%(9) | $2 | 0.75%(10) | 3.55%(10) | (0.73)%(10) | 41%(4) | |||||||||||||
| 09/30/21 | 18.89 | (0.14) | 5.98 | 5.84 | (1.85) | (1.85) | 22.88 | 32.65 | 498,994 | 0.74 | 0.75 | (0.65) | 35(4)(6) | |||||||||||||
| 09/30/22 | 22.88 | (0.09) | (11.26) | (11.35) | (2.16) | (2.16) | 9.37 | (54.58) | 270,361 | 0.76 | 0.79 | (0.61) | 45(4) | |||||||||||||
| 09/30/23 | 9.37 | (0.05) | 2.46 | 2.41 | — | — | 11.78 | 25.76 | 351,501 | 0.75 | 0.84 | (0.42) | 27(4) | |||||||||||||
| 09/30/24 | 11.78 | (0.07) | 4.84 | 4.77 | — | — | 16.55 | 40.49 | 338,421 | 0.75 | 0.83 | (0.49) | 37(4) | |||||||||||||
| ^ | Updated to reflect the effect of a 1 for 0.796098 reverse stock split for Class C shares on October 14, 2022. All historical per share information has been retroactively adjusted to reflect this reverse stock split. |
| (1) | The net investment income per share was based on average shares outstanding for the period. |
| (2) | Total returns shown exclude the effect of applicable sales loads and fees. If these charges were included, the returns would be lower. |
| (3) | The ratio of net and gross expenses to average net assets excluding liquidity provider expenses would have been lower by 0.03%, 0.03%, 0.04%, 0.02% and 0.03% for the years ended September 30, 2024, 2023, 2022, 2021 and 2020, respectively. |
| (4) | Portfolio turnover excludes securities delivered from processing redemptions-in-kind. |
| (5) | Net expenses include amounts recouped by the Adviser. |
| (6) | Portfolio turnover excludes the purchases and sales of securities by the Touchstone Sands Capital Institutional Growth Fund and the AIG Focused Growth Fund acquired on December 11, 2020 and July 16, 2021, respectively. If these transactions were included, portfolio turnover would have been higher. |
| (7) | Represents the period from commencement of operations (September 1, 2020) through September 30, 2020. |
| (8) | Net asset value at the beginning of period is based on the net asset value of Class Y shares on September 1, 2020. |
| (9) | Not annualized. |
| (10) | Annualized. |
| Touchstone Small Cap Fund | ||||||||||||||||||||||||||||
| Period ended | Net asset value at beginning of period | Net investment income (loss)(1) | Net realized and unrealized gains (losses) on investments | Total from investment operations | Distributions from net investment income | Distributions from realized capital gains | Total distributions | Net asset value at end of period | Total return(2) | Net assets at end of period (000's) | Ratio of net expenses to average net assets(3) | Ratio of gross expenses to average net assets(3) | Ratio of net investment income (loss) to average net assets | Portfolio turnover rate | ||||||||||||||
| Class A | ||||||||||||||||||||||||||||
| 09/30/20 | $12.35 | $0.01 | $(0.98) | $(0.97) | $— | $ (1.09) | $(1.09) | $10.29 | (8.92)% | $4,313 | 1.27% | 2.09% | 0.08% | 22%(4) | ||||||||||||||
| 09/30/21 | 10.29 | 0.05 | 3.91 | 3.96 | — | (0.20) | (0.20) | 14.05 | 38.68 | 5,266 | 1.27 | 1.78 | 0.39 | 33(4) | ||||||||||||||
| 09/30/22 | 14.05 | (0.01) | (1.21) | (1.22) | (0.03) | (1.78) | (1.81) | 11.02 | (10.75) | 4,022 | 1.25 | 1.77 | (0.05) | 18(4) | ||||||||||||||
| 09/30/23 | 11.02 | 0.01 | 2.03 | 2.04 | (0.01) | (0.21) | (0.22) | 12.84 | 18.65 | 7,223 | 1.24 | 1.82 | 0.08 | 14(4) | ||||||||||||||
| 09/30/24 | 12.84 | —(5) | 2.63 | 2.63 | (0.01) | (0.43) | (0.44) | 15.03 | 20.91 | 27,890 | 1.25 | 1.66 | 0.02 | 16(4) | ||||||||||||||
| Class C | ||||||||||||||||||||||||||||
| 09/30/20 | $11.41 | $(0.07) | $(0.87) | $(0.94) | $— | $ (1.09) | $(1.09) | $9.38 | (9.43)% | $295 | 2.02% | 3.10% | (0.68)% | 22%(4) | ||||||||||||||
| 09/30/21 | 9.38 | (0.04) | 3.55 | 3.51 | — | (0.20) | (0.20) | 12.69 | 37.62 | 197 | 2.02 | 4.51 | (0.36) | 33(4) | ||||||||||||||
| 09/30/22 | 12.69 | (0.09) | (1.07) | (1.16) | (0.01) | (1.78) | (1.79) | 9.74 | (11.45) | 162 | 2.00 | 6.81 | (0.80) | 18(4) | ||||||||||||||
| 09/30/23 | 9.74 | (0.07) | 1.79 | 1.72 | — | (0.21) | (0.21) | 11.25 | 17.78 | 273 | 1.99 | 6.48 | (0.67) | 14(4) | ||||||||||||||
| 09/30/24 | 11.25 | (0.09) | 2.30 | 2.21 | — | (0.43) | (0.43) | 13.03 | 20.08 | 1,436 | 2.00 | 3.67 | (0.73) | 16(4) | ||||||||||||||
| Class Y | ||||||||||||||||||||||||||||
| 09/30/20 | $12.59 | $0.04 | $(1.00) | $(0.96) | $(0.02) | $ (1.09) | $(1.11) | $10.52 | (8.65)% | $35,573 | 1.02% | 1.32% | 0.33% | 22%(4) | ||||||||||||||
| 09/30/21 | 10.52 | 0.09 | 3.98 | 4.07 | (0.11) | (0.20) | (0.31) | 14.28 | 39.02 | 49,842 | 1.02 | 1.25 | 0.64 | 33(4) | ||||||||||||||
| 09/30/22 | 14.28 | 0.02 | (1.24) | (1.22) | (0.04) | (1.78) | (1.82) | 11.24 | (10.58) | 53,485 | 1.00 | 1.23 | 0.20 | 18(4) | ||||||||||||||
| 09/30/23 | 11.24 | 0.04 | 2.08 | 2.12 | (0.02) | (0.21) | (0.23) | 13.13 | 18.99 | 88,745 | 0.99 | 1.21 | 0.33 | 14(4) | ||||||||||||||
| 09/30/24 | 13.13 | 0.04 | 2.70 | 2.74 | (0.03) | (0.43) | (0.46) | 15.41 | 21.28 | 208,329 | 1.00 | 1.19 | 0.27 | 16(4) | ||||||||||||||
| Institutional Class | ||||||||||||||||||||||||||||
| 09/30/20 | $12.55 | $0.04 | $(0.97) | $(0.93) | $(0.04) | $ (1.09) | $(1.13) | $10.49 | (8.57)% | $33,201 | 0.94% | 1.21% | 0.41% | 22%(4) | ||||||||||||||
| 09/30/21 | 10.49 | 0.10 | 3.97 | 4.07 | (0.13) | (0.20) | (0.33) | 14.23 | 39.13 | 39,656 | 0.94 | 1.16 | 0.72 | 33(4) | ||||||||||||||
| 09/30/22 | 14.23 | 0.04 | (1.25) | (1.21) | (0.04) | (1.78) | (1.82) | 11.20 | (10.52) | 32,834 | 0.92 | 1.14 | 0.28 | 18(4) | ||||||||||||||
| 09/30/23 | 11.20 | 0.05 | 2.07 | 2.12 | (0.02) | (0.21) | (0.23) | 13.09 | 19.08 | 34,027 | 0.91 | 1.13 | 0.41 | 14(4) | ||||||||||||||
| 09/30/24 | 13.09 | 0.05 | 2.68 | 2.73 | (0.04) | (0.43) | (0.47) | 15.35 | 21.29 | 38,644 | 0.92 | 1.12 | 0.35 | 16(4) | ||||||||||||||
| (1) | The net investment income per share was based on average shares outstanding for the period. |
| (2) | Total returns shown exclude the effect of applicable sales loads and fees. If these charges were included, the returns would be lower. |
| (3) | The ratio of net and gross expenses to average net assets excluding liquidity provider expenses would have been lower by 0.01%, 0.01%, 0.03% and 0.03% for the years ended September 30, 2024, 2022, 2021 and 2020, respectively. |
| (4) | Portfolio turnover excludes securities delivered from processing redemptions-in-kind. |
| (5) | Less than $0.005 per share. |
| Touchstone Small Cap Value Fund | ||||||||||||||||||||||||||||
| Period ended | Net asset value at beginning of period | Net investment income (loss)(1) | Net realized and unrealized gains (losses) on investments | Total from investment operations | Distributions from net investment income | Return of capital | Total distributions | Net asset value at end of period | Total return(2) | Net assets at end of period (000's) | Ratio of net expenses to average net assets(3) | Ratio of gross expenses to average net assets(3) | Ratio of net investment income (loss) to average net assets | Portfolio turnover rate | ||||||||||||||
| Class A | ||||||||||||||||||||||||||||
| 09/30/20 | $24.00 | $0.03 | $(3.34) | $(3.31) | $(0.04) | $(0.02) | $(0.06) | $20.63 | (13.83)% | $16,552 | 1.38% | 1.58% | 0.12% | 41% | ||||||||||||||
| 09/30/21 | 20.63 | (—) | 11.98 | 11.98 | (0.08) | (0.04) | (0.12) | 32.49 | 57.95 | 24,620 | 1.38 | 1.55 | (0.02) | 29 | ||||||||||||||
| 09/30/22 | 32.49 | (0.01) | (3.55) | (3.56) | (0.06) | (0.07) | (0.13) | 28.80 | (11.04) | 21,034 | 1.38 | 1.57 | (0.02) | 35 | ||||||||||||||
| 09/30/23 | 28.80 | 0.09 | 2.61 | 2.70 | (0.01) | — | (0.01) | 31.49 | 9.36 | 22,214 | 1.40 | 1.53 | 0.29 | 31(4) | ||||||||||||||
| 09/30/24 | 31.49 | 0.15 | 6.78 | 6.93 | (0.18) | — | (0.18) | 38.24 | 22.07 | 25,639 | 1.39 | 1.51 | 0.42 | 17(4) | ||||||||||||||
| Class C | ||||||||||||||||||||||||||||
| 09/30/20 | $23.21 | $(0.13) | $(3.22) | $(3.35) | $(0.02) | $—(5) | $(0.02) | $19.84 | (14.46)% | $453 | 2.13% | 4.50% | (0.63)% | 41% | ||||||||||||||
| 09/30/21 | 19.84 | (0.22) | 11.50 | 11.28 | (0.04) | (0.02) | (0.06) | 31.06 | 56.81 | 562 | 2.13 | 3.71 | (0.77) | 29 | ||||||||||||||
| 09/30/22 | 31.06 | (0.24) | (3.38) | (3.62) | (0.03) | (0.03) | (0.06) | 27.38 | (11.73) | 272 | 2.13 | 4.21 | (0.77) | 35 | ||||||||||||||
| 09/30/23 | 27.38 | (0.14) | 2.49 | 2.35 | — | — | — | 29.73 | 8.58 | 322 | 2.15 | 5.19 | (0.46) | 31(4) | ||||||||||||||
| 09/30/24 | 29.73 | (0.11) | 6.38 | 6.27 | (0.13) | — | (0.13) | 35.87 | 21.12 | 465 | 2.14 | 5.30 | (0.33) | 17(4) | ||||||||||||||
| Class Y | ||||||||||||||||||||||||||||
| 09/30/20 | $24.05 | $0.08 | $(3.34) | $(3.26) | $(0.09) | $(0.03) | $(0.12) | $20.67 | (13.60)% | $28,435 | 1.13% | 1.31% | 0.37% | 41% | ||||||||||||||
| 09/30/21 | 20.67 | 0.07 | 12.01 | 12.08 | (0.09) | (0.05) | (0.14) | 32.61 | 58.32 | 41,793 | 1.13 | 1.26 | 0.23 | 29 | ||||||||||||||
| 09/30/22 | 32.61 | 0.08 | (3.58) | (3.50) | (0.07) | (0.10) | (0.17) | 28.94 | (10.81) | 34,156 | 1.13 | 1.27 | 0.23 | 35 | ||||||||||||||
| 09/30/23 | 28.94 | 0.17 | 2.63 | 2.80 | (0.03) | — | (0.03) | 31.71 | 9.66 | 35,328 | 1.15 | 1.26 | 0.54 | 31(4) | ||||||||||||||
| 09/30/24 | 31.71 | 0.23 | 6.83 | 7.06 | (0.20) | — | (0.20) | 38.57 | 22.33 | 42,121 | 1.14 | 1.23 | 0.67 | 17(4) | ||||||||||||||
| Institutional Class | ||||||||||||||||||||||||||||
| 09/30/20 | $24.04 | $0.12 | $(3.33) | $(3.21) | $(0.11) | $(0.04) | $(0.15) | $20.68 | (13.42)% | $7,825 | 0.98% | 1.19% | 0.52% | 41% | ||||||||||||||
| 09/30/21 | 20.68 | 0.11 | 12.03 | 12.14 | (0.10) | (0.05) | (0.15) | 32.67 | 58.59 | 9,176 | 0.98 | 1.25 | 0.38 | 29 | ||||||||||||||
| 09/30/22 | 32.67 | 0.13 | (3.59) | (3.46) | (0.10) | (0.12) | (0.22) | 28.99 | (10.67) | 7,389 | 0.98 | 1.26 | 0.38 | 35 | ||||||||||||||
| 09/30/23 | 28.99 | 0.22 | 2.62 | 2.84 | (0.03) | — | (0.03) | 31.80 | 9.81 | 54,449 | 1.00 | 1.20 | 0.69 | 31(4) | ||||||||||||||
| 09/30/24 | 31.80 | 0.29 | 6.86 | 7.15 | (0.22) | — | (0.22) | 38.73 | 22.53 | 148,646 | 0.99 | 1.15 | 0.82 | 17(4) | ||||||||||||||
| (1) | The net investment income per share was based on average shares outstanding for the period. |
| (2) | Total returns shown exclude the effect of applicable sales loads and fees. If these charges were included, the returns would be lower. |
| (3) | The ratio of net and gross expenses to average net assets excluding liquidity provider expenses would have been lower by 0.01% and 0.02% for the years ended September 30, 2024 and 2023, respectively. |
| (4) | Portfolio turnover excludes securities delivered from processing redemptions-in-kind. |
| (5) | Less than $0.005 per share. |
| Touchstone Ultra Short Duration Fixed Income Fund | ||||||||||||||||||||||||||
| Period ended | Net asset value at beginning of period | Net investment income (loss) | Net realized and unrealized gains (losses) on investments | Total from investment operations | Distributions from net investment income | Total distributions | Net asset value at end of period | Total return(1) | Net assets at end of period (000's) | Ratio of net expenses to average net assets | Ratio of gross expenses to average net assets | Ratio of net investment income (loss) to average net assets | Portfolio turnover rate | |||||||||||||
| Class A | ||||||||||||||||||||||||||
| 09/30/20 | $9.29 | $0.18 | $(0.06) | $0.12 | $(0.18) | $(0.18) | $9.23 | 1.32% | $124,233 | 0.69% | 0.80% | 1.84% | 72% | |||||||||||||
| 09/30/21 | 9.23 | 0.04 | 0.02 | 0.06 | (0.08) | (0.08) | 9.21 | 0.67 | 144,172 | 0.69 | 0.74 | 0.40 | 113 | |||||||||||||
| 09/30/22 | 9.21 | 0.08 | (0.15) | (0.07) | (0.13) | (0.13) | 9.01 | (0.80) | 125,115 | 0.69 | 0.74 | 0.81 | 52 | |||||||||||||
| 09/30/23 | 9.01 | 0.33 | 0.07 | 0.40 | (0.34) | (0.34) | 9.07 | 4.51 | 75,540 | 0.69 | 0.76 | 3.57 | 29 | |||||||||||||
| 09/30/24 | 9.07 | 0.47(2) | 0.16 | 0.63 | (0.46) | (0.46) | 9.24 | 7.09 | 81,751 | 0.65 | 0.74 | 5.11 | 78 | |||||||||||||
| Class C | ||||||||||||||||||||||||||
| 09/30/20 | $9.29 | $0.12 | $(0.04) | $0.08 | $(0.13) | $(0.13) | $9.24 | 0.93% | $5,276 | 1.19% | 1.60% | 1.33% | 72% | |||||||||||||
| 09/30/21 | 9.24 | (0.01) | 0.02 | 0.01 | (0.04) | (0.04) | 9.21 | 0.07 | 4,249 | 1.19 | 1.47 | (0.10) | 113 | |||||||||||||
| 09/30/22 | 9.21 | 0.03 | (0.14) | (0.11) | (0.08) | (0.08) | 9.02 | (1.18) | 5,013 | 1.19 | 1.48 | 0.31 | 52 | |||||||||||||
| 09/30/23 | 9.02 | 0.28 | 0.07 | 0.35 | (0.29) | (0.29) | 9.08 | 3.99 | 3,292 | 1.19 | 1.61 | 3.07 | 29 | |||||||||||||
| 09/30/24 | 9.08 | 0.42(2) | 0.16 | 0.58 | (0.41) | (0.41) | 9.25 | 6.55 | 4,266 | 1.15 | 1.61 | 4.61 | 78 | |||||||||||||
| Class S | ||||||||||||||||||||||||||
| 09/30/20 | $9.28 | $0.12 | $(0.01) | $0.11 | $(0.16) | $(0.16) | $9.23 | 1.18% | $61,464 | 0.94% | 0.99% | 1.58% | 72% | |||||||||||||
| 09/30/21 | 9.23 | 0.01 | 0.03 | 0.04 | (0.06) | (0.06) | 9.21 | 0.42 | 52,456 | 0.94 | 0.99 | 0.15 | 113 | |||||||||||||
| 09/30/22 | 9.21 | 0.05 | (0.15) | (0.10) | (0.10) | (0.10) | 9.01 | (1.05) | 42,709 | 0.94 | 0.99 | 0.56 | 52 | |||||||||||||
| 09/30/23 | 9.01 | 0.30 | 0.08 | 0.38 | (0.32) | (0.32) | 9.07 | 4.28 | 35,599 | 0.94 | 1.04 | 3.32 | 29 | |||||||||||||
| 09/30/24 | 9.07 | 0.45(2) | 0.16 | 0.61 | (0.44) | (0.44) | 9.24 | 6.81 | 30,581 | 0.90 | 1.00 | 4.86 | 78 | |||||||||||||
| Class Y | ||||||||||||||||||||||||||
| 09/30/20 | $9.29 | $0.19 | $(0.05) | $0.14 | $(0.20) | $(0.20) | $9.23 | 1.57% | $292,708 | 0.44% | 0.51% | 2.09% | 72% | |||||||||||||
| 09/30/21 | 9.23 | 0.06 | 0.03 | 0.09 | (0.11) | (0.11) | 9.21 | 0.92 | 296,363 | 0.44 | 0.50 | 0.65 | 113 | |||||||||||||
| 09/30/22 | 9.21 | 0.10 | (0.15) | (0.05) | (0.15) | (0.15) | 9.01 | (0.55) | 250,473 | 0.44 | 0.50 | 1.06 | 52 | |||||||||||||
| 09/30/23 | 9.01 | 0.35 | 0.08 | 0.43 | (0.36) | (0.36) | 9.08 | 4.88 | 193,680 | 0.44 | 0.52 | 3.82 | 29 | |||||||||||||
| 09/30/24 | 9.08 | 0.49(2) | 0.16 | 0.65 | (0.48) | (0.48) | 9.25 | 7.35 | 252,342 | 0.40 | 0.46 | 5.36 | 78 | |||||||||||||
| Class Z | ||||||||||||||||||||||||||
| 09/30/20 | $9.29 | $0.17 | $(0.05) | $0.12 | $(0.18) | $(0.18) | $9.23 | 1.32% | $86,018 | 0.69% | 0.79% | 1.83% | 72% | |||||||||||||
| 09/30/21 | 9.23 | 0.03 | 0.03 | 0.06 | (0.08) | (0.08) | 9.21 | 0.68 | 75,058 | 0.69 | 0.78 | 0.40 | 113 | |||||||||||||
| 09/30/22 | 9.21 | 0.10 | (0.17) | (0.07) | (0.13) | (0.13) | 9.01 | (0.80) | 50,209 | 0.69 | 0.79 | 0.81 | 52 | |||||||||||||
| 09/30/23 | 9.01 | 0.32 | 0.08 | 0.40 | (0.34) | (0.34) | 9.07 | 4.51 | 41,800 | 0.69 | 0.81 | 3.57 | 29 | |||||||||||||
| 09/30/24 | 9.07 | 0.47(2) | 0.16 | 0.63 | (0.46) | (0.46) | 9.24 | 7.09 | 38,879 | 0.65 | 0.78 | 5.11 | 78 | |||||||||||||
| Institutional Class | ||||||||||||||||||||||||||
| 09/30/20 | $9.28 | $0.20 | $(0.05) | $0.15 | $(0.21) | $(0.21) | $9.22 | 1.63% | $417,011 | 0.39% | 0.46% | 2.13% | 72% | |||||||||||||
| 09/30/21 | 9.22 | 0.07 | 0.02 | 0.09 | (0.11) | (0.11) | 9.20 | 0.98 | 500,705 | 0.39 | 0.45 | 0.70 | 113 | |||||||||||||
| 09/30/22 | 9.20 | 0.13 | (0.18) | (0.05) | (0.15) | (0.15) | 9.00 | (0.50) | 230,153 | 0.39 | 0.46 | 1.11 | 52 | |||||||||||||
| 09/30/23 | 9.00 | 0.36 | 0.08 | 0.44 | (0.37) | (0.37) | 9.07 | 4.94 | 136,828 | 0.39 | 0.47 | 3.87 | 29 | |||||||||||||
| 09/30/24 | 9.07 | 0.50(2) | 0.16 | 0.66 | (0.49) | (0.49) | 9.24 | 7.41 | 110,294 | 0.35 | 0.43 | 5.41 | 78 | |||||||||||||
| (1) | Total returns shown exclude the effect of applicable sales loads and fees. If these charges were included, the returns would be lower. |
| (2) | The net investment income per share was based on average shares outstanding for the period. |
| Touchstone Active Bond Fund ("Active Bond Fund”) |
| Touchstone Ares Credit Opportunities Fund ("Ares Credit Opportunities Fund”) |
| Touchstone Dividend Equity Fund ("Dividend Equity Fund”) |
| Touchstone High Yield Fund ("High Yield Fund”) |
| Touchstone Impact Bond Fund ("Impact Bond Fund”) |
| Touchstone Mid Cap Fund ("Mid Cap Fund”) |
| Touchstone Mid Cap Value Fund ("Mid Cap Value Fund”) |
| Touchstone Sands Capital International Growth Equity Fund ("Sands Capital International Growth Equity Fund”) |
| Touchstone Sands Capital Select Growth Fund ("Sands Capital Select Growth Fund”) |
| Touchstone Small Cap Fund ("Small Cap Fund”) |
| Touchstone Small Cap Value Fund ("Small Cap Value Fund”) |
| Touchstone Ultra Short Duration Fixed Income Fund ("Ultra Short Duration Fixed Income Fund”) |
| Class A | Class C | Class S | Class Y | Class Z | Institutional Class | Class R6 | |
| Active Bond Fund | X | X | X | X | |||
| Ares Credit Opportunities Fund | X | X | X | X | |||
| Dividend Equity Fund | X | X | X | X | X | ||
| High Yield Fund | X | X | X | X | |||
| Impact Bond Fund | X | X | X | X | X | ||
| Mid Cap Fund | X | X | X | X | X | X | |
| Mid Cap Value Fund | X | X | X | X | |||
| Sands Capital International Growth Equity Fund | X | X | X | X | X | ||
| Sands Capital Select Growth Fund | X | X | X | X | X | X | |
| Small Cap Fund | X | X | X | X | |||
| Small Cap Value Fund | X | X | X | X | |||
| Ultra Short Duration Fixed Income Fund | X | X | X | X | X | X |
| (1) | market value of investment securities, assets and liabilities at the current rate of exchange on the valuation date; and |
| (2) | purchases and sales of investment securities, income, and expenses at the relevant rates of exchange prevailing on the respective dates of such transactions. |
| Assets | Liabilities | ||
| Ares Credit Opportunities Fund | |||
| Forwards - Foreign Currency Contracts | $— | $103,915 | |
| Total | $— | $103,915 |
| Counterparty | Derivative Type | Gross Amount of Recognized Liabilities | Gross Amount Available for Offset in Statement of Assets and Liabilities | Non-Cash Collateral Pledged | Cash Collateral Pledged | Net Amount(A) |
| Wells Fargo | Forward-Foreign Currency Contracts | $103,915 | $— | $— | $— | $103,915 |
| (A) | Net amount represents the net amount payable to the counterparty in the event of default. |
| Fund | Derivatives not accounted for as hedging instruments under ASC 815 | Asset Derivatives | Liability Derivatives |
| Active Bond Fund | Swap Agreements - Credit Contracts* | $151 | $— |
| Ares Credit Opportunities Fund | Purchased Options - Equity Contracts** | 52,493 | — |
| Forwards - Foreign Currency Contracts*** | — | 103,915 | |
| Swap Agreements - Credit Contracts* | — | 14,952 |
| * | Statements of Assets and Liabilities Location: Payable for variation margin on swap agreements. Variation margin reported in the Portfolio of Investments and other tables in the Notes to the Financial Statements is the cumulative unrealized appreciation (depreciation). |
| ** | Statements of Assets and Liabilities Location: Investments, at market value. |
| *** | Statements of Assets and Liabilities Location: Unrealized appreciation (depreciation) on forward foreign currency contracts. |
| Fund | Derivatives not accounted for as hedging instruments under ASC 815 | Realized Gains (Losses) on Derivatives | Change in Unrealized Appreciation (Depreciation) on Derivatives |
| Active Bond Fund | Futures - Interest Rate Contracts* | $72,196 | $(105,839) |
| Swap Agreements - Credit Contracts** | (1,152,098) | 31,925 | |
| Ares Credit Opportunities Fund | Purchased Options - Equity Contracts*** | 64,090 | — |
| Written Options - Equity Contracts**** | (42,128) | (1,600) | |
| Forwards - Foreign Currency Exchange Contracts***** | (211,303) | (237,320) | |
| Swap Agreements - Credit Contracts** | (25,000) | (22,889) |
| * | Statements of Operations Location: Net realized gains on futures contracts and Net change in unrealized appreciation (depreciation) on futures contracts, respectively. |
| ** | Statements of Operations Location: Net realized losses on swap agreements and Net change in unrealized appreciation (depreciation) on swap agreements, respectively. |
| *** | Statements of Operations Location: Net realized gains (losses) on investments and Net change in unrealized appreciation (depreciation) on investments, respectively. |
| **** | Statements of Operations Location: Net realized losses on written options and Net change in unrealized appreciation (depreciation) on written options, respectively. |
| ***** | Statements of Operations Location: Net realized losses on forward foreign currency contracts and Net change in unrealized appreciation (depreciation) on forward foreign currency contracts, respectively. |
| Active Bond Fund | Ares Credit Opportunities Fund | |
| Equity Contracts: | ||
| Purchased Options - Cost | $— | $75,969 |
| Written Options - Premiums received | — | 2,560 |
| Credit Contracts: | ||
| Credit Default Swaps (buy protection) - Notional value | 10,223,140 | 565,520 |
| Forward currency exchange contracts: | ||
| U.S. dollar amount received | — | 11,060,987 |
| Interest Rate Contracts: | ||
| Futures Contracts (long) - Notional Value | 44,218,012 | — |
| Futures Contracts (short) - Notional Value | 7,916,044 | — |
| Fund | Security Type | Market Value of Securities Loaned* | Market Value of Collateral Received** | Net Amount*** |
| Ares Credit Opportunities Fund | Corporate Bonds | $7,379,028 | $7,685,520 | $306,492 |
| High Yield Fund | Corporate Bonds | 1,678,204 | 1,735,517 | 57,313 |
| Small Cap Value Fund | Common Stocks | 957,375 | 969,335 | 11,960 |
| * | The remaining contractual maturity is overnight for all securities. |
| ** | Gross amount of recognized liabilities for securities lending included in the Statements of Assets and Liabilities. |
| *** | Net amount represents the net amount payable due to (received from) the borrower in the event of default. |
| Active Bond Fund | Ares Credit Opportunities Fund | Dividend Equity Fund | High Yield Fund | Impact Bond Fund | Mid Cap Fund* | |
| Purchases of investment securities | $53,874,405 | $446,519,441 | $250,121,969 | $48,730,127 | $36,806,971 | $1,202,788,189 |
| Proceeds from sales and maturities | $64,179,995 | $218,224,038 | $726,100,202 | $49,028,458 | $57,131,744 | $685,640,506 |
| Mid Cap Value Fund* | Sands Capital International Growth Equity Fund | Sands Capital Select Growth Fund* | Small Cap Fund* | Small Cap Value Fund* | Ultra Short Duration Fixed Income Fund | |
| Purchases of investment securities | $203,639,610 | $70,511,673 | $925,396,900 | $153,465,795 | $108,618,077 | $379,500,326 |
| Proceeds from sales and maturities | $314,667,000 | $68,014,543 | $1,086,069,397 | $33,477,862 | $26,610,372 | $325,123,355 |
| * | The Mid Cap Fund, the Mid Cap Value Fund, the Sands Capital Select Growth Fund, the Small Cap Fund and the Small Cap Value Fund had redemption-in-kinds out of the Fund of $82,227,974, $96,421,081, $518,343,761, $5,040,446 and $8,489,843, respectively, which are excluded from the proceeds from sales and maturities. |
| Active Bond Fund | 0.38% on the first $200 million 0.30% on such assets over $200 million |
| Ares Credit Opportunities Fund | 0.60% on all assets |
| Dividend Equity Fund | 0.55% on the first $1 billion 0.50% on such assets over $1 billion |
| High Yield Fund | 0.60% on the first $50 million 0.50% on the next $250 million 0.45% on such assets over $300 million |
| Impact Bond Fund | 0.30% on the first $200 million 0.225% on such assets over $200 million |
| Mid Cap Fund | 0.80% on the first $1 billion 0.70% on the next $500 million 0.60% on such assets over $1.5 billion |
| Mid Cap Value Fund | 0.75% on all assets |
| Sands Capital International Growth Equity Fund | 0.65% on the first $1 billion 0.60% on such assets over $1 billion |
| Sands Capital Select Growth Fund* | 0.675% on the first $1 billion 0.60% on the next $1 billion 0.55% on the next $2 billion 0.52% on such assets over $4 billion |
| Small Cap Fund | 0.85% on the first $250 million 0.80% on the next $250 million 0.70% on such assets over $500 million |
| Small Cap Value Fund | 0.85% on all assets |
| Ultra Short Duration Fixed Income Fund | 0.18% on the first $500 million 0.16% on such assets over $500 million |
| Ares Capital Management II LLC | The London Company |
| Ares Credit Opportunities Fund | Mid Cap Fund |
| EARNEST Partners LLC | Small Cap Fund |
| Impact Bond Fund | Sands Capital Management, LLC |
| Fort Washington Investment Advisors, Inc.* | Sands Capital International Growth Equity Fund |
| Active Bond Fund | Sands Capital Select Growth Fund |
| Dividend Equity Fund | |
| High Yield Fund | |
| Ultra Short Duration Fixed Income Fund | |
| Leeward Investments, LLC | |
| Mid Cap Value Fund | |
| Small Cap Value Fund |
| Class A | Class C | Class S | Class Y | Class Z | Institutional Class | Class R6 | Termination Date | |
| Active Bond Fund | 0.83% | 1.56% | — | 0.58% | — | 0.50% | — | January 29, 2025 |
| Ares Credit Opportunities Fund | 1.03% | 1.43% | — | 0.83% | — | 0.73% | — | January 29, 2025 |
| Dividend Equity Fund | 0.99% | 1.69% | — | 0.77% | — | 0.67% | 0.65% | January 29, 2025 |
| High Yield Fund | 1.05% | 1.80% | — | 0.80% | — | 0.72% | — | January 29, 2025 |
| Impact Bond Fund | 0.76% | 1.51% | — | 0.51% | — | 0.41% | 0.37% | January 29, 2025 |
| Mid Cap Fund | 1.21% | 1.96% | — | 0.96% | 1.21% | 0.89% | 0.79% | January 29, 2025 |
| Mid Cap Value Fund | 1.22% | 1.97% | — | 0.97% | — | 0.84% | — | January 29, 2025 |
| Sands Capital International Growth Equity Fund* | 1.17% | 1.95% | — | 0.90% | — | 0.86% | 0.78% | June 29, 2025 |
| Sands Capital Select Growth Fund** | 1.13% | 1.74% | — | 0.84% | 1.13% | 0.76% | 0.65% | September 30, 2025 |
| Small Cap Fund | 1.24% | 1.99% | — | 0.99% | — | 0.91% | — | January 29, 2025 |
| Small Cap Value Fund | 1.38% | 2.13% | — | 1.13% | — | 0.98% | — | January 29, 2025 |
| Ultra Short Duration Fixed Income Fund | 0.65% | 1.15% | 0.90% | 0.40% | 0.65% | 0.35% | — | January 29, 2025 |
| * | Prior to June 21, 2024, the expense limitation for Class R6 shares was 0.82%. |
| ** | Prior to September 30, 2024, the expense limitations for Classes Y, Z, R6 and Institutional Class shares were 0.90%, 1.14%, 0.72% and 0.78%, respectively. |
| Fund | Investment Advisory Fees Waived | Administration Fees Waived | Other Operating Expenses Reimbursed/ Waived | Total |
| Active Bond Fund | $— | $86,000 | $307,645 | $393,645 |
| Ares Credit Opportunities Fund | — | 26,257 | 564,004 | 590,261 |
| Dividend Equity Fund | — | 1,041 | 634,844 | 635,885 |
| High Yield Fund | — | 83,744 | 119,115 | 202,859 |
| Impact Bond Fund | — | 30,134 | 211,407 | 241,541 |
| Mid Cap Fund | — | 712 | 99,995 | 100,707 |
| Mid Cap Value Fund | — | 272,787 | 936,912 | 1,209,699 |
| Sands Capital International Growth Equity Fund | — | 67,241 | 207,044 | 274,285 |
| Sands Capital Select Growth Fund | — | 345,580 | 675,378 | 1,020,958 |
| Small Cap Fund | — | 111,109 | 355,533 | 466,642 |
| Small Cap Value Fund | — | 78,971 | 144,264 | 223,235 |
| Ultra Short Duration Fixed Income Fund | — | 26,027 | 369,950 | 395,977 |
| Fund | Expires on or before September 30, 2025 | Expires on or before September 30, 2026 | Expires on or before September 30, 2027 | Total |
| Active Bond Fund | $129,291 | $163,390 | $187,070 | $479,751 |
| Ares Credit Opportunities Fund | 220,343 | 209,014 | 295,053 | 724,410 |
| Dividend Equity Fund | 15,147 | 17,239 | 21,336 | 53,722 |
| High Yield Fund | 124,409 | 138,443 | 168,231 | 431,083 |
| Impact Bond Fund | 192,790 | 188,451 | 199,402 | 580,643 |
| Mid Cap Fund | 77,736 | 191,897 | 100,707 | 370,340 |
| Mid Cap Value Fund | 1,249,338 | 1,215,259 | 1,152,268 | 3,616,865 |
| Fund | Expires on or before September 30, 2025 | Expires on or before September 30, 2026 | Expires on or before September 30, 2027 | Total |
| Sands Capital International Growth Equity Fund | $107,560 | $138,906 | $248,643 | $495,109 |
| Sands Capital Select Growth Fund | 415,611 | 1,015,554 | 842,429 | 2,273,594 |
| Small Cap Fund | 223,917 | 267,374 | 414,842 | 906,133 |
| Small Cap Value Fund | 88,081 | 163,082 | 190,056 | 441,219 |
| Ultra Short Duration Fixed Income Fund | 473,831 | 405,681 | 223,111 | 1,102,623 |
| Fund | Amount |
| Active Bond Fund | $ 5,316 |
| Ares Credit Opportunities Fund | 9,813 |
| Dividend Equity Fund | 18,747 |
| High Yield Fund | 1,827 |
| Impact Bond Fund | 946 |
| Mid Cap Fund | 20,511 |
| Mid Cap Value Fund | 928 |
| Sands Capital International Growth Equity Fund | 120 |
| Sands Capital Select Growth Fund | 11,488 |
| Small Cap Fund | 1,639 |
| Small Cap Value Fund | 128 |
| Ultra Short Duration Fixed Income Fund | 4,105 |
| Fund | Class A | Class C |
| Active Bond Fund | $ 79 | $ 55 |
| Ares Credit Opportunities Fund | 48 | 460 |
| Dividend Equity Fund | 9 | 1,064 |
| Impact Bond Fund | 958 | — |
| Mid Cap Fund | — | 788 |
| Mid Cap Value Fund | — | 90 |
| Sands Capital Select Growth Fund | 10 | 197 |
| Ultra Short Duration Fixed Income Fund | — | 449 |
| Fund | Shares ReFlow Subscribed to | Redemptions-in-kind |
| Mid Cap Fund | 3,033,007 | $ 82,227,974 |
| Mid Cap Value Fund | 4,522,285 | 96,421,081 |
| Sands Capital Select Growth Fund | 34,974,058 | 518,343,761 |
| Small Cap Fund | 606,188 | 5,040,446 |
| Small Cap Value Fund | 309,435 | 8,489,843 |
| Fund | Daily Average Amount Loaned | Weighted Average Interest Rate | Interest Income* |
| Mid Cap Fund | $ 710,095 | 5.89% | $ 42,378 |
| Sands Capital Select Growth Fund | $ 25,452 | 5.89% | $ 1,519 |
| * | Included in Interest in the Statements of Operations. |
| Fund | Daily Average Amount Borrowed | Weighted Average Interest Rate | Interest Expense* |
| Active Bond Fund | $ 5,550 | 5.90% | $ 332 |
| Dividend Equity Fund | $ 1,328,477 | 5.89% | $ 79,285 |
| Impact Bond Fund | $ 37,380 | 5.90% | $ 2,236 |
| Mid Cap Value Fund | $ 215,799 | 5.89% | $ 12,876 |
| Sands Capital International Growth Equity Fund | $ 51,134 | 5.89% | $ 3,051 |
| Sands Capital Select Growth Fund | $ 263,166 | 5.89% | $ 15,700 |
| * | Included in Other expenses in the Statements of Operations. |
| Active Bond Fund | Ares Credit Opportunities Fund | Dividend Equity Fund | ||||
| Year Ended September 30, 2024 | Year Ended September 30, 2023 | Year Ended September 30, 2024 | Year Ended September 30, 2023 | Year Ended September 30, 2024 | Year Ended September 30, 2023 | |
| From ordinary income | $9,883,689 | $9,842,820 | $37,965,905 | $22,279,562 | $54,629,657 | $117,383,591 |
| From long-term capital gains | — | — | — | — | 60,813,066 | 26,369,054 |
| Total distributions | $9,883,689 | $9,842,820 | $37,965,905 | $22,279,562 | $115,442,723 | $143,752,645 |
| High Yield Fund | Impact Bond Fund | Mid Cap Fund | ||||
| Year Ended September 30, 2024 | Year Ended September 30, 2023 | Year Ended September 30, 2024 | Year Ended September 30, 2023 | Year Ended September 30, 2024 | Year Ended September 30, 2023 | |
| From ordinary income | $6,316,657 | $6,136,287 | $20,419,077 | $16,934,074 | $34,387,780 | $14,955,024 |
| From long-term capital gains | — | — | — | — | 13,902,545 | 45,156,008 |
| Total distributions | $6,316,657 | $6,136,287 | $20,419,077 | $16,934,074 | $48,290,325 | $60,111,032 |
| Mid Cap Value Fund | Sands Capital International Growth Equity Fund | Sands Capital Select Growth Fund | ||||
| Year Ended September 30, 2024 | Year Ended September 30, 2023 | Year Ended September 30, 2024 | Year Ended September 30, 2023 | Year Ended September 30, 2024 | Year Ended September 30, 2023 | |
| From ordinary income | $7,061,535 | $2,817,232 | $656,191 | $722,096 | $— | $— |
| From long-term capital gains | 5,867,158 | 40,703,348 | 1,017,871 | — | — | — |
| Total distributions | $12,928,693 | $43,520,580 | $1,674,062 | $722,096 | $— | $— |
| Small Cap Fund | Small Cap Value Fund | Ultra Short Duration Fixed Income Fund | ||||
| Year Ended September 30, 2024 | Year Ended September 30, 2023 | Year Ended September 30, 2024 | Year Ended September 30, 2023 | Year Ended September 30, 2024 | Year Ended September 30, 2023 | |
| From ordinary income | $815,292 | $599,565 | $705,636 | $105,710 | $25,321,141 | $22,927,101 |
| From long-term capital gains | 4,031,898 | 1,240,712 | — | — | — | — |
| Total distributions | $4,847,190 | $1,840,277 | $705,636 | $105,710 | $25,321,141 | $22,927,101 |
| Active Bond Fund | Ares Credit Opportunities Fund | Dividend Equity Fund | High Yield Fund | |
| Tax cost of portfolio investments | $270,208,784 | $633,345,940 | $2,191,906,197 | $110,069,811 |
| Gross unrealized appreciation on investments | 4,259,546 | 18,927,977 | 524,650,172 | 2,226,790 |
| Gross unrealized depreciation on investments | (12,539,525) | (16,981,361) | (188,731,960) | (3,202,518) |
| Net unrealized appreciation (depreciation) on investments | (8,279,979) | 1,946,616 | 335,918,212 | (975,728) |
| Gross unrealized appreciation on derivatives and foreign currency transactions | — | 17,832 | — | — |
| Gross unrealized depreciation on derivatives and foreign currency transactions | (5) | (100,775) | — | — |
| Net unrealized appreciation (depreciation) on derivatives and foreign currency transactions | (5) | (82,943) | — | — |
| Capital loss carryforwards | (123,365,709) | (83,177,121) | — | (21,654,629) |
| Undistributed ordinary income | 237,661 | 973,917 | 4,355,884 | 11,222 |
| Undistributed capital gains | — | — | 108,841,153 | — |
| Other temporary differences | (1,138,295) | (289) | (616) | (611) |
| Accumulated earnings (deficit) | $(132,546,327) | $(80,339,820) | $449,114,633 | $(22,619,746) |
| Impact Bond Fund | Mid Cap Fund | Mid Cap Value Fund | Sands Capital International Growth Equity Fund | |
| Tax cost of portfolio investments | $626,741,742 | $4,354,593,354 | $454,446,284 | $92,138,321 |
| Gross unrealized appreciation on investments | 6,032,141 | 1,845,175,684 | 179,035,333 | 19,855,460 |
| Gross unrealized depreciation on investments | (35,889,467) | (114,437,575) | (20,599,341) | (2,600,628) |
| Net unrealized appreciation (depreciation) on investments | (29,857,326) | 1,730,738,109 | 158,435,992 | 17,254,832 |
| Gross unrealized appreciation on foreign currency transactions | — | — | — | 2,414 |
| Gross unrealized depreciation on foreign currency transactions and deferred foreign capital gains tax | — | — | — | (132,286) |
| Net unrealized appreciation (depreciation) on foreign currency transactions and deferred foreign capital gains tax | — | — | — | (129,872) |
| Capital loss carryforwards | (18,078,594) | — | — | (9,100,217) |
| Qualified late year losses | — | — | — | (23,348) |
| Undistributed ordinary income | 347,178 | 7,395,551 | 9,225,082 | — |
| Undistributed capital gains | — | 124,679,147 | 21,826,114 | 9,573,557 |
| Other temporary differences | (160) | — | — | (3) |
| Accumulated earnings (deficit) | $(47,588,902) | $1,862,812,807 | $189,487,188 | $17,574,949 |
| Sands Capital Select Growth Fund | Small Cap Fund | Small Cap Value Fund | Ultra Short Duration Fixed Income Fund | |
| Tax cost of portfolio investments | $1,667,225,591 | $235,865,681 | $186,508,810 | $517,386,005 |
| Gross unrealized appreciation on investments | 945,625,994 | 63,113,707 | 40,174,964 | 2,566,889 |
| Gross unrealized depreciation on investments | (147,530,015) | (14,984,828) | (8,545,401) | (4,560,458) |
| Net unrealized appreciation (depreciation) on investments | 798,095,979 | 48,128,879 | 31,629,563 | (1,993,569) |
| Capital loss carryforwards | (201,446,158) | — | (4,308,879) | (112,668,297) |
| Qualified late year losses | (13,119,298) | — | — | — |
| Undistributed ordinary income | — | 2,267,159 | 948,242 | 1,686,670 |
| Undistributed capital gains | — | 1,426,183 | — | — |
| Other temporary differences | — | — | — | (188,620) |
| Accumulated earnings (deficit) | $583,530,523 | $51,822,221 | $28,268,926 | $(113,163,816) |
| Fund | No Expiration Short Term | No Expiration Long Term | Total |
| Active Bond Fund* | $ 62,157,195 | $ 61,208,514 | $ 123,365,709 |
| Ares Credit Opportunities Fund* | 9,942,740 | 73,234,381 | 83,177,121 |
| High Yield Fund | 1,677,980 | 19,976,649 | 21,654,629 |
| Impact Bond Fund | 1,239,848 | 16,838,746 | 18,078,594 |
| Sands Capital International Growth Equity Fund* | 4,830,010 | 4,270,207 | 9,100,217 |
| Sands Capital Select Growth Fund | 201,446,158 | — | 201,446,158 |
| Small Cap Value Fund | 4,308,879 | — | 4,308,879 |
| Ultra Short Duration Fixed Income Fund* | 37,072,467 | 75,595,830 | 112,668,297 |
| * | Future utilization may be limited under current tax laws. |
| Fund | Utilized |
| Sands Capital International Growth Equity Fund | $ 3,599,093 |
| Sands Capital Select Growth Fund | 251,005,207 |
| Small Cap Value Fund | 3,288,567 |
| Fund | Realized Capital Losses | Ordinary Losses | Total |
| Sands Capital International Growth Equity Fund | $ — | $ 23,348 | $ 23,348 |
| Sands Capital Select Growth Fund | — | 13,119,298 | 13,119,298 |
| Fund | Paid-In Capital | Distributable Earnings |
| Ares Credit Opportunities Fund | $ (26,142) | $ 26,142 |
| Dividend Equity Fund | 15,154,933 | (15,154,933) |
| Mid Cap Fund | 52,094,414 | (52,094,414) |
| Mid Cap Value Fund | 56,676,926 | (56,676,926) |
| Sands Capital International Growth Equity Fund | 12,789,876 | (12,789,876) |
| Sands Capital Select Growth Fund | 222,991,048 | (222,991,048) |
| Small Cap Fund | 2,490,972 | (2,490,972) |
| Small Cap Value Fund | 2,653,268 | (2,653,268) |
| Before Reorganization | After Reorganization | ||
| Touchstone International Growth Fund | Touchstone Sands Capital International Growth Equity Fund | Touchstone Sands Capital International Growth Equity Fund | |
| Class A | |||
| Shares | 148,255(A) | 901,064 | 1,049,319 |
| Net Assets | $1,228,773 | $7,468,184 | $8,696,957 |
| Net Assets Value | $8.29(A) | $8.29 | $8.29 |
| Class C | |||
| Shares | 76,681(B) | 44,746 | 121,427 |
| Net Assets | $649,218 | $378,843 | $1,028,061 |
| Net Asset Value | $8.47(B) | $8.47 | $8.47 |
| Class Y | |||
| Shares | 6,283,683(C) | 2,264,767 | 8,548,450 |
| Net Assets | $52,177,854 | $18,805,952 | $70,983,806 |
| Net Asset Value | $8.30(C) | $8.30 | $8.30 |
| Institutional Class | |||
| Shares | 288,369(D) | 44,474 | 332,843 |
| Net Assets | $2,398,020 | $369,836 | $2,767,856 |
| Net Asset Value | $8.32(D) | $8.32 | $8.32 |
| Fund Total | |||
| Shares Outstanding | 6,796,988 | 3,255,051 | 10,052,039 |
| Net Assets | $56,453,865 | $27,022,815 | $83,476,680 |
| Unrealized Appreciation (Depreciation) | $15,751,916 | $5,422,458 | $21,174,374 |
| (A) | Reflects a 1.6380:1 stock split which occurred on the date of the reorganization, June 21, 2024. |
| (B) | Reflects a 1.5184:1 stock split which occurred on the date of the reorganization, June 21, 2024. |
| (C) | Reflects a 1.6861:1 stock split which occurred on the date of the reorganization, June 21, 2024. |
| (D) | Reflects a 1.6989:1 stock split which occurred on the date of the reorganization, June 21, 2024. |
| Net investment income | $118,427 |
| Net realized and unrealized gain(loss) on investments | $32,867,472 |
| Net increase in net assets resulting from operations | $32,985,899 |
| Funds comprising the Touchstone Funds Group Trust | Statement of operations | Statements of changes in net assets | Financial highlights |
| Touchstone Active Bond Fund Touchstone Ares Credit Opportunities Fund Touchstone High Yield Fund Touchstone Impact Bond Fund Touchstone Mid Cap Fund Touchstone Mid Cap Value Fund Touchstone Sands Capital International Growth Equity Fund Touchstone Sands Capital Select Growth Fund Touchstone Small Cap Fund Touchstone Small Cap Value Fund Touchstone Ultra Short Duration Fixed Income Fund | For the year ended September 30, 2024 | For each of the two years in the period ended September 30, 2024 | For each of the five years in the period ended September 30, 2024 |
| Touchstone Dividend Equity Fund | For the year ended September 30, 2024 | For each of the two years in the period ended September 30, 2024 | For each of the three years in the period ended September 30, 2024 |

| Dividend Equity Fund | 100.00 % |
| Mid Cap Fund | 100.00 % |
| Mid Cap Value Fund | 95.83 % |
| Small Cap Fund | 75.65 % |
| Small Cap Value Fund | 100.00 % |
| Dividend Equity Fund | 100.00 % |
| Mid Cap Fund | 100.00 % |
| Mid Cap Value Fund | 97.53 % |
| Small Cap Fund | 76.54 % |
| Small Cap Value Fund | 100.00 % |
| Dividend Equity Fund | $ 125,487,401 |
| Mid Cap Fund | $ 144,780,917 |
| Mid Cap Value Fund | $ 42,577,002 |
| Sands Capital International Growth Equity Fund | $ 9,573,588 |
| Small Cap Fund | $ 4,587,193 |

303 Broadway
Cincinnati, Ohio 45202-4203
800.638.8194
www.touchstoneinvestments.com
303 Broadway
Cincinnati, Ohio 45202-4203
P.O. Box 534467
Pittsburgh, PA 15253-4467
Item 8. Changes in and Disagreements with Accountants for Open-End Management Investment Companies.
Not applicable.
Item 9. Proxy Disclosures for Open-End Management Investment Companies.
Not applicable.
Item 10. Remuneration Paid to Directors, Officers, and Others of Open-End Management Investment Companies.
The information is included as part of the material filed under Item 7 of this Form.
Item 11. Statement Regarding Basis for Approval of Investment Advisory Contract.
Not applicable.
Item 12. Disclosure of Proxy Voting Policies and Procedures for Closed-End Management Investment Companies.
Not applicable.
Item 13. Portfolio Managers of Closed-End Management Investment Companies.
Not applicable.
Item 14. Purchases of Equity Securities by Closed-End Management Investment Company and Affiliated Purchasers.
Not applicable.
Item 15. Submission of Matters to a Vote of Security Holders.
There have been no material changes to the procedures by which the shareholders may recommend nominees to the registrant’s board of trustees, where those changes were implemented after the registrant last provided disclosure in response to the requirements of Item 407(c)(2)(iv) of Regulation S-K (17 CFR 229.407) (as required by Item 22(b)(15) of Schedule 14A (17 CFR 240.14a-101)), or this Item.
Item 16. Controls and Procedures.
| (a) | The registrant’s principal executive and principal financial officers, or persons performing similar functions, have concluded that the registrant’s disclosure controls and procedures (as defined in Rule 30a-3(c) under the 1940 Act (17 CFR 270.30a-3(c))) are effective, as of a date within 90 days of the filing date of the report that includes the disclosure required by this paragraph, based on their evaluation of these controls and procedures required by Rule 30a-3(b) under the 1940 Act (17 CFR 270.30a-3(b)) and Rules 13a-15(b) or 15d-15(b) under the Securities Exchange Act of 1934, as amended (17 CFR 240.13a-15(b) or 240.15d-15(b)). |
| (b) | There were no changes in the registrant’s internal control over financial reporting (as defined in Rule 30a-3(d) under the 1940 Act (17 CFR 270.30a-3(d))) that occurred during the period covered by this report that have materially affected, or are reasonably likely to materially affect, the registrant’s internal control over financial reporting. |
Item 17. Disclosure of Securities Lending Activities for Closed-End Management Investment Companies.
Not applicable.
Item 18. Recovery of Erroneously Awarded Compensation.
Not Applicable.
Item 19. Exhibits.
| (a)(2) | Not applicable. |
| (a)(3) | Certifications pursuant to Rule 30a-2(a) under the 1940 Act and Section 302 of the Sarbanes-Oxley Act of 2002 are attached hereto. |
| (a)(3)(1) | There were no written solicitations to purchase securities under Rule 23c-1 under the Act sent or given during the period covered by the report by or on behalf of the Registrant to 10 or more persons. |
| (a)(3)(2) | There was no change in the Registrant’s independent public accountant during the period covered by the report. |
| (b) | Certifications pursuant to Rule 30a-2(b) under the 1940 Act and Section 906 of the Sarbanes-Oxley Act of 2002 are attached hereto. |
SIGNATURES
Pursuant to the requirements of the Securities Exchange Act of 1934 and the Investment Company Act of 1940, the registrant has duly caused this report to be signed on its behalf by the undersigned, thereunto duly authorized.
(Registrant) Touchstone Funds Group Trust
| By (Signature and Title)* | /s/ E. Blake Moore, Jr. | |
| E. Blake Moore, Jr., President | ||
| (principal executive officer) |
| Date | December 3, 2024 |
Pursuant to the requirements of the Securities Exchange Act of 1934 and the Investment Company Act of 1940, this report has been signed below by the following persons on behalf of the registrant and in the capacities and on the dates indicated.
| By (Signature and Title)* | /s/ E. Blake Moore, Jr. | |
| E. Blake Moore, Jr., President | ||
| (principal executive officer) |
| Date | December 3, 2024 |
| By (Signature and Title)* | /s/ Terrie A. Wiedenheft | |
| Terrie A. Wiedenheft, Controller and Treasurer | ||
| (principal financial officer) |
| Date | December 3, 2024 |
* Print the name and title of each signing officer under his or her signature.