UNITED STATES
SECURITIES AND EXCHANGE COMMISSION
Washington, D.C. 20549
FORM N-CSR
CERTIFIED SHAREHOLDER REPORT OF REGISTERED MANAGEMENT INVESTMENT COMPANIES
Investment Company Act file number 811-08104
Touchstone Funds Group Trust
(Exact name of registrant as specified in charter)
303 Broadway, Suite 1100
Cincinnati, Ohio 45202-4203
(Address of principal executive offices) (Zip code)
Jill T. McGruder
303 Broadway, Suite 1100
Cincinnati, Ohio 45202-4203
(Name and address of agent for service)
Registrant's telephone number, including area code: 800-638-8194
Date of fiscal year end: September 30
Date of reporting period: September 30, 2012
Form N-CSR is to be used by management investment companies to file reports with the Commission not later than 10 days after the transmission to stockholders of any report that is required to be transmitted to stockholders under Rule 30e-1 under the Investment Company Act of 1940 (17 CFR 270.30e-1). The Commission may use the information provided on Form N-CSR in its regulatory, disclosure review, inspection, and policymaking roles.
A registrant is required to disclose the information specified by Form N-CSR, and the Commission will make this information public. A registrant is not required to respond to the collection of information contained in Form N-CSR unless the Form displays a currently valid Office of Management and Budget ("OMB") control number. Please direct comments concerning the accuracy of the information collection burden estimate and any suggestions for reducing the burden to Secretary, Securities and Exchange Commission, 100 F Street, NE, Washington, DC 20549. The OMB has reviewed this collection of information under the clearance requirements of 44 U.S.C. § 3507.
Item 1. Reports to Stockholders.
The Report to Shareholders is attached herewith.
September 30, 2012
Annual Report
Touchstone Funds Group Trust
Touchstone Emerging Markets Equity Fund
Touchstone Focused Equity Fund
Touchstone Global Equity Fund
Touchstone Global Real Estate Fund
Touchstone International Fixed Income Fund
Touchstone Large Cap Relative Value Fund
Touchstone Market Neutral Equity Fund
Touchstone Merger Arbitrage Fund
Touchstone Mid Cap Fund
Touchstone Mid Cap Value Fund
Touchstone Premium Yield Equity Fund
Touchstone Sands Capital Select Growth Fund
Touchstone Short Duration Fixed Income Fund
Touchstone Small Cap Core Fund
Touchstone Small Cap Value Fund
Touchstone Total Return Bond Fund
Touchstone Ultra Short Duration Fixed Income Fund

Table of Contents
| Page | |
| Letter from the President | 3 |
| Management's Discussion of Fund Performance (Unaudited) | 4 - 57 |
| Tabular Presentation of Portfolios of Investments (Unaudited) | 58 - 62 |
| Portfolio Investments: | |
| Touchstone Emerging Markets Equity Fund | 63 |
| Touchstone Focused Equity Fund | 66 |
| Touchstone Global Equity Fund | 68 |
| Touchstone Global Real Estate Fund | 70 |
| Touchstone International Fixed Income Fund | 72 |
| Touchstone Large Cap Relative Value Fund | 76 |
| Touchstone Market Neutral Equity Fund | 78 |
| Touchstone Merger Arbitrage Fund | 82 |
| Touchstone Mid Cap Fund | 86 |
| Touchstone Mid Cap Value Fund | 87 |
| Touchstone Premium Yield Equity Fund | 89 |
| Touchstone Sands Capital Select Growth Fund | 90 |
| Touchstone Short Duration Fixed Income Fund | 91 |
| Touchstone Small Cap Core Fund | 98 |
| Touchstone Small Cap Value Fund | 99 |
| Touchstone Total Return Bond Fund | 101 |
| Touchstone Ultra Short Duration Fixed Income Fund | 106 |
| Statements of Assets and Liabilities | 116 - 123 |
| Statements of Operations | 124 - 127 |
| Statement of Changes in Net Assets | 128 - 135 |
| Statements of Changes in Net Assets - Capital Stock Activity | 136 - 147 |
| Financial Highlights | 148 - 186 |
| Notes to Financial Statements | 187 - 210 |
| Report of Independent Registered Public Accounting Firm | 211 |
| Other Items (Unaudited) | 212 - 218 |
| Management of the Trust (Unaudited) | 219 - 222 |
| Privacy Protection Policy | 223 |
| 2 |
Letter from the President
Dear Shareholder:
We are pleased to provide you with the Touchstone Funds Group Trust Annual Report. Inside you will find key financial information, as well as manager commentaries for the Funds, for the 12 months ended September 30, 2012.
The U.S. equity markets had a strong year, outperforming the bond market. From an investment style and market capitalization perspective, U.S. value equities slightly outperformed their growth counterparts, with small cap leading the way, followed closely by large cap. The U.S. equity markets outperformed both the developed and emerging international markets for the year. High yield bonds outperformed Treasuries and the overall bond market.
Global economic concerns continued to be in the forefront over the past year. An acceleration of the European debt crisis led the European Central Bank (ECB) to take more proactive measures to strengthen the currency bloc. Concerns over China’s ability to maintain a strong growth rate became greater during the year. U.S. economic growth waned and led to additional stimulus action by the Federal Reserve (Fed). Despite all the economic uncertainty, global capital markets generated strong performance. In the U.S., the S&P 500 Index gained significantly on strong earnings growth. International equities generated positive results over the period. Non-U.S. developed markets have been constrained by the ongoing pressures of dealing with unsustainable fiscal liabilities. Emerging markets also had positive gains over the past year as they continue to enjoy relatively high economic growth. The combination of continued Fed action and a flight to the perceived safety of U.S. Treasuries pushed interest rates to all-time lows and was a strong tailwind for bond investors.
There is much uncertainty going forward. The U.S. is faced with overcoming a large fiscal cliff of tax increases and spending cuts which risks weakening the U.S. economic recovery. Traditional income investors have benefited from strong bond returns but the low yields now available from fixed income may continue to influence investors to seek yield from other areas, including equities. U.S. and international equities are facing a slow growth environment that will create challenges in the year ahead.
Touchstone Investments helps investors achieve their financial goals by providing access to a distinctive selection of institutional asset managers who are known and respected for proficiency in their specific area of expertise. Recognizing that the mastery of all investment disciplines is beyond the scope of any one firm, the use of sub-advisors allows Touchstone to offer an array of strategically focused mutual funds across styles and asset classes. Touchstone employs a rigorous due-diligence process in sub-advisor selection and performs robust oversight and monitoring of its current sub-advisors.
When we examine where the financial markets may be headed in the year to come, we continue to believe that diversification is essential to balancing risk and return. We recommend that you continue to work with your financial professional on a sound asset allocation strategy to help keep your financial goals on course.
We greatly appreciate your continued support. Thank you for including Touchstone as part of your investment plan.
Sincerely,

Jill T. McGruder
President
Touchstone Funds Group Trust
| 3 |
Management's Discussion of Fund Performance (Unaudited)
Touchstone Emerging Markets Equity Fund
Sub-Advised by AGF Investments America, Inc.
Investment Philosophy
The Touchstone Emerging Markets Equity Fund seeks capital appreciation by primarily investing in equity securities of companies in emerging markets. It seeks to invest in businesses believed to be mispriced by the market and that are expected to generate positive and sustainable earnings growth.
Fund Performance
The Touchstone Emerging Markets Equity Fund (Class A Shares) slightly underperformed its benchmark, the MSCI Emerging Markets Index for the 12-month period ended September 30, 2012. The Fund’s total return was 16.71 percent (calculated excluding the maximum sales charge) while the total return of the benchmark was 16.93 percent.
Market Environment
Emerging markets were volatile but ended the period on a high note, as developments in Europe’s sovereign fiscal predicament swayed equity markets. European governments provided liquidity to prevent further escalation of the funding crisis, lifting markets. This short-term liquidity held off a decline, but an escalation of issues in Greece and Spain threw more uncertainty into the mix, leading to questions surrounding the long-term credibility of the European Union (EU). Most recently, substantial policy measures and long-term plans for stability helped markets, particularly the European Central Bank’s (ECB) Outright Monetary Transactions (OMTs) and the U.S. Federal Reserve’s third round of Quantitative Easing (QE3). Growth among developed markets remained constrained but the U.S. continued its modest recovery, particularly its housing industry.
In the Europe, Middle East and Africa (EMEA) regions, returns were mixed, although the stock markets in the larger economies of South Africa, Turkey and Russia posted double-digit returns. South African economic growth recovered after declining in the first quarter of 2012, with manufacturing production also declining as strikes affected the sector. Most recently, a series of labor-related issues have impacted mining firms and caused output disruptions. Turkish policymakers kept the benchmark repurchase rate stable throughout the 12-month period, as inflation continued to remain a concern. However, on a positive note, both consumer and producer price inflation have come down recently, and unemployment has also declined. The Fund had no exposure to Russia.
The smaller regional economies of Thailand and the Philippines led gains in Asia. China exhibited resilience after making cuts to its benchmark lending and deposit rates, with its manufacturing sector activity remaining relatively stable. Retail sales growth continues to remain strong, although it is slowing. Thailand recovered faster than expected from the disastrous flooding to post strong gains. In Taiwan, growth projections were revised downward due to weaker international trade. India’s growth slowed during the period, although the government has recently moved to implement a series of pro-investment policies as well as infrastructure spending to spur domestic growth. Economic growth in South Korea has trended downward during the past 12 months, but unemployment has remained at multi-year lows.
For the period, Latin America gained, with Mexico and Peru’s markets rising significantly. Brazil’s market was largely flat, as it saw a slowdown in economic growth. However, the government put into place broad economic reforms to stimulate growth, and successively cut the benchmark SELIC rate (Brazil’s central bank’s overnight rate) to record lows as well. Peru and Mexico maintained most of their growth momentum, with Mexico posting solid growth despite slowing demand from the United States. Inflationary pressures in the region have remained
| 4 |
Management's Discussion of Fund Performance (Unaudited) (Continued)
minimal, which is conducive for growth or further easing. Peru saw declining consumer prices, and the country’s central bank kept its reference rate at 4.25 percent, as the labor market remains relatively healthy with declining unemployment.
Portfolio Review
For the period, the Financials, Consumer Discretionary and Energy sectors contributed to Fund performance, while the Industrials sector detracted from performance. Exposure to the Financials sector contributed significantly toward returns, although an underweight to the sector slightly detracted. Thai bank KasiKornbank Public Company Ltd. showed rising net interest and non-interest income. Corporate tax reductions for 2012 also helped results improve, resulting in rising earnings on a per-share basis. Non-performing loan ratios as well as their related coverage ratios have improved. China Overseas Land & Investment Ltd. contributed to performance after revising its sales target for 2012 substantially upward, with further landbank acquisitions likely ahead. Mexican Grupo Financiero Banorte S.A. de C.V. contributed to performance, as net income rose strongly, partially assisted by the bank’s merger with Ixe Grupo Financiero S.A. de C.V. The Wharf (Holdings) Ltd. also contributed to the Fund’s performance. Wharf’s earnings rose as it continued to expand its operations into China. The firm looks to increase its portfolio of investment properties, and has already met its annual sales target in China. Credicorp Ltd. continued to show solid growth, growing its loan book and its retail business.
Improving wages for South African consumers and an increase in gross margins helped drive earnings higher for Woolworths Holdings Ltd. Operating margins increased, allowing profits before tax and total dividends to increase as well. The Foschini Group Ltd. also benefited from the improving consumer environment in South Africa. Retail turnover and earnings-per-share rose in double digits, resulting in an increase to dividends per share as well. The largest bicycle manufacturer in the world by revenue, Giant Manufacturing Company Ltd. contributed to performance. Sales continue to be regionally well-diversified with its global sales network of over 10,000 shops. In Brazil, Lojas Renner S.A. and Lojas Americanas S.A. contributed positively to performance, after each saw increases to same store sales, generating solid net income.
Security selection contributed to the Fund’s performance in the Energy sector. Thai company PTT Exploration & Production PCL showed that net income increased. The company benefited from a reduced corporate tax rate, and acquired Cove Energy PLC. PTT Exploration & Production beat out Shell PLC to control Cove’s share of a substantial gas discovery. Steel pipe manufacturer for the oil and gas industry, Tenaris S.A., saw growing demand for piping in more complex applications, with lower material costs and improved efficiency. Thai Oil PCL saw strong domestic demand. Demand for bitumen rose due to flood reconstruction activity, and refinery utilization remained high. No exposure to OGX Petroleo e Gas Participacoes S.A. also contributed to performance.
Security selection in the Industrials sector detracted from Fund performance. Turkish glass manufacturer Trakya Cam Sanayii AS was affected by rising costs that included higher natural gas pricing. However, we believe growing structural demand for automobile glass and construction activity, as well as the company’s regional expansion, look positive for the long term. In China, softer manufacturing activity resulted in poor performance for Weichai Power Company Ltd., which affected sales of heavy-duty trucks. However, the company continues to be an industry-leader, and we believe is likely to benefit from improvements in economic growth. Indian power plant equipment manufacturer Bharat Heavy Electricals Ltd. was affected by slowing economic growth in India, as well as a depreciating rupee and competitive pressures. South Africa’s economic slowdown and delays in the government’s infrastructure program negatively affected Aveng Ltd.’s businesses, although its mining and manufacturing operations improved.
For the twelve-month period from a regional perspective, the Fund’s exposure to Brazil, Argentina, Mexico and Peru contributed in Latin America. In Asia, holdings in India and South Korea detracted from performance,
| 5 |
Management's Discussion of Fund Performance (Unaudited) (Continued)
while exposure to Taiwan and Thailand contributed. China/Hong Kong contributed to performance somewhat. In the EMEA region, exposure to South Africa contributed, while Turkey detracted.
During the twelve-month period, the Fund’s position in Consorcio ARA S.A.B. de C.V., the fourth largest homebuilder in Mexico, was removed from the Fund’s portfolio. As the demand for housing, particularly in the lower income segment is expected to continue to grow, Consorcio’s track record of managing growth and maintaining a healthy balance sheet since the mid-1990s, positioned the company well to benefit from this secular trend. Despite generally rising affordability in the population, the recent growth in mortgage lending among lending institutions has been lower than expected, creating challenges for the company’s top line growth. With rising costs adding pressure to existing earnings margins, rising inventory levels, and a substantial deterioration in its working capital ratio through the addition of leverage, the company faced increasing headwinds to future incremental growth which would raise the company’s overall cost of capital, thus eroding the cash flow return on investment (CFROI) track record that is emphasized in the Fund’s process. The Fund also exited the position in Infosys Ltd., due to weakening fundamentals and earnings visibility, as well as rising pricing pressure.
Outlook
Global economies have decelerated, with developed markets in Europe showing severe levels of unemployment. The U.S. labor market is another cause for concern, although economic growth has been more resilient. In light of these conditions, as well as rising costs, emerging markets have seen earnings significantly revised downward. Consequently, emerging market policymakers have focused on cultivating domestic growth, either through government spending or expansionary monetary policy to boost domestic investment. In particular, we believe China retains significant potential to spur growth, with healthy balance sheets and minor inflationary risks, once leadership changes hands. Although earnings have come under pressure in emerging markets and profit margins have declined in some sectors, we believe long-term, emerging markets remain structurally sound.
While the short-term credibility of the euro has been positively addressed by the ECB’s OMT plans, long-term viability of the European Union continues to remain a concern and could easily disrupt financial markets if political issues arise. On a more optimistic note though, politicians and policymakers are working toward increased fiscal and political integration, which we believe would help reduce sovereign yields and improve global liquidity.
The U.S. elections and fiscal cliff will also pose some uncertainty going forward, and changes in Europe and the U.S. will impact emerging market growth. While developed markets work out their structural issues, emerging markets are experiencing faster improvements in demographics, rising incomes and healthier government finances. We believe these factors will most likely play out positively for long-term investors in these regions. Given their history as key sources of growth, current capacity and future propensity for growth, emerging markets will likely continue to do well.
We seek to identify companies that have created substantial economic value-add in the past and are believed to have the potential to continue doing so going forward. While security selection is key, uneven regional growth will play a role in determining which companies will benefit most, especially as policymakers take action to either preserve or enhance growth. We believe that companies with the ability to create value in light of these regional differences should be in the best position to reward the Fund’s shareholders over the long term.
| 6 |
Management's Discussion of Fund Performance (Unaudited) (Continued)
Comparison of the Change in Value of a $10,000 Investment in the Touchstone Emerging Markets Equity Fund - Class A* and the MSCI Emerging Markets Index
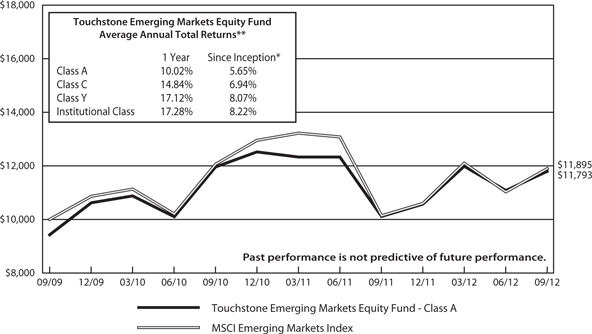
| * | The chart above represents performance for Class A shares only, which will vary from the performance of Class C shares, Class Y shares and Institutional Class shares based on the differences in loads and fees paid by shareholders in the different classes. The Fund commenced operations on September 30, 2009. |
| ** | The average annual total returns shown above are adjusted for maximum applicable sales charges, if applicable. |
The performance of the above Fund does not reflect the deduction of taxes that a shareholder would pay on Fund distributions or the redemption of Fund shares. Past performance is not predictive of future performance.
| 7 |
Management's Discussion of Fund Performance (Unaudited)
Touchstone Focused Equity Fund
Sub-Advised by Fort Washington Investment Advisors, Inc.
Investment Philosophy
The Touchstone Focused Equity Fund seeks capital appreciation by investing in equity securities of companies of any size.
Fund Performance
The Touchstone Focused Equity Fund (Class A Shares) underperformed its benchmark, the Russell 3000® Index for the 12-month period ended September 30, 2012. The Fund’s total return was 26.46 percent (calculated excluding the maximum sales charge) while the total return of the benchmark was 30.20 percent.
The Fund underperformed its benchmark over the past 12 months as the market was driven by a small subset of large capitalization, high quality companies that paid a significant dividend. The Fund had an underweight in those types of businesses as we did not find valuations to be attractive within our process.
Market Environment
For the one year ending September 30, 2012, investor optimism increased as the U.S. and European Central Bank (ECB) took action to support their economies. The positive move in the market was broadly based with the Consumer Discretionary, Telecommunication Services, and Financials sectors providing the leadership. The Utilities, Consumer Staples, and Energy sectors underperformed the Index.
Portfolio Review
Sectors that outperformed their respective peers included Industrials, Financials, Materials, Consumer Staples and Consumer Discretionary. Underperforming sectors included Information Technology, Health Care, Telecommunication Services, and Energy. The performance in each sector was driven by stock selection.
Stocks adding the most to performance were Allstate Corp. (Financials sector), Universal Forest Products Inc. (Industrials sector),Time Warner Cable Inc. (Consumer Discretionary sector), Oshkosh Corporation Inc. (Industrials sector) and Cemex S.A.B. de C.V. (Materials sector). This outperformance was driven by a combination of strong fundamentals and attractive valuation. Stocks detracting from performance included WellPoint Inc. (Health Care sector), Nokia and Hewlett-Packard Co. (Information Technology sector), Alliant Techsystems Inc. (Industrials sector) and North American Energy Partners Inc. (Energy sector).
During the past 12 months, the Fund’s weight in the Consumer Discretionary, Consumer Staples and Energy sectors increased. The Fund’s cash position also increased to almost 5% of fund assets. The Fund’s weight in the Information Technology, Financials and Materials sectors was reduced. The Fund’s weight in international companies has dramatically decreased.
In general, as the market moved higher over the past 12 months, more opportunities in businesses that have been able to consistently earn high returns on capital that also enjoy higher barriers to entry were found. Those types of businesses have increased from about 10% of Fund holdings to nearly 40% over the past 12 months.
Outlook
Markets do not largely go up after issues are solved. Rather, they rise as issues begin to improve. By the time issues are solved it is generally too late to invest heavily in equities as the market has already climbed the “wall of worry.” There is still more climbing to do with worries over third quarter of 2012 earnings, China, Europe and the U.S. fiscal cliff. Notably, earnings estimates for the domestically-oriented companies are, on balance, increasing which means the drag is global in nature on the earnings front. Importantly, at this juncture credit
| 8 |
Management's Discussion of Fund Performance (Unaudited) (Continued)
conditions have improved since late last year in the U.S. and global PMIs (Purchasing Manager Indices) are moving upward. Moreover, Europe was priced nearly at replacement cost in mid-2012 and European markets are improving as Mario Draghi, President of the ECB pledged to use the full force of the ECB’s balance sheet to suppress European bond yields; and the U.S. markets are priced for the most likely scenario of a 1.5% drag with regard to the “fiscal cliff,” which implies that a reasonable real Gross Domestic Product (GDP) forecast for 2013 is approximately 2%. With China, there are signs that the economy may have bottomed out based on infrastructure investments, new housing starts, real retail sales, manufacturing PMI, and construction machinery sales. The point is, things are either moving in the right direction, or the market is priced for a “most likely” scenario in the case of the U.S. fiscal cliff situation.
That said, we continue to believe that fair value for the U.S. market is north of current prices as the S&P 500 is not yet priced for long-term Earnings per Share (EPS) growth of 7%, which is the trend-line since the late 1920s. Beyond this, credit cycles drive things in the shorter-term to a point where inflation stops the bull-market-we are not there yet. Typically, markets hit the bottom based on fears of deflation and reach the top based on expectations of higher inflation. Inflation rising through 4% resulted in material corrections in equity prices in 1968, 1973, 1987, 2000 and 2007. The “wall of worry” is climbed as inflation expectations go from 0 to approximately 4%. This must be kept in the context of what drives things longer term, which is demographics (i.e. labor force growth), and productivity, which drives economic growth which in turn drives revenues for companies.
As a result of our view that the market is still not at fair value and the belief that we still have some deeper value opportunities that have not reached their full potential, the Fund is still tilted toward a scenario where we believe it should outperform as the “value” style does well. However, we added several higher return on capital type businesses during the last two quarters. At this juncture, 100% of the Fund is in businesses that we believe have a barrier to entry. In addition, the weighted average return on capital of the businesses in the Fund is the highest it has ever been at well north of our calculation of the cost of capital.
| 9 |
Management's Discussion of Fund Performance (Unaudited) (Continued)
Comparison of the Change in Value of a $10,000 Investment in the Touchstone Focused Equity Fund - Class A* and the Russell 3000® Index
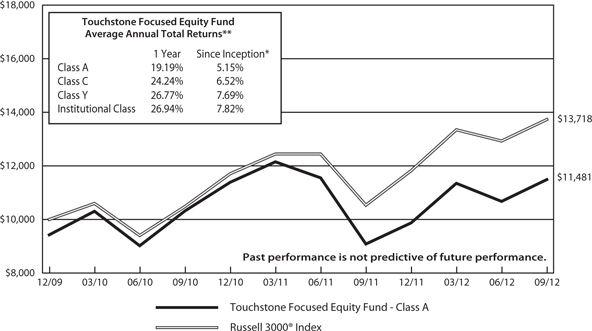
| * | The chart above represents performance for Class A shares only, which will vary from the performance of Class C shares, Class Y shares and Institutional Class shares based on the differences in loads and fees paid by shareholders in the different classes. The Fund commenced operations on December 31, 2009. |
| ** | The average annual total returns shown above are adjusted for maximum applicable sales charges, if applicable. |
The performance of the above Fund does not reflect the deduction of taxes that a shareholder would pay on Fund distributions or the redemption of Fund shares. Past performance is not predictive of future performance.
| 10 |
Management's Discussion of Fund Performance (Unaudited)
Touchstone Global Equity Fund
Sub-Advised by Bedlam Asset Management plc
Investment Philosophy
The Touchstone Global Equity Fund seeks capital appreciation by primarily investing in U.S. and foreign equity securities including those of emerging market countries regardless of market capitalization, sector or country with reasonable sector limitations.
Fund Performance
The Touchstone Global Equity Fund (Class A Shares) underperformed its benchmark, the MSCI All Country World Index for the 12-month period ended September 30, 2012. The Fund’s total return was 17.17 percent (calculated excluding the maximum sales charge) while the total return of the benchmark was 20.98 percent.
Market Environment
Strong gains in the equity markets were driven by the massive, unlimited, monetary stimulus packages by central banks globally. These were provoked by a deteriorating macroeconomic backdrop, with Gross Domestic Product (GDP) growth slowing and several major countries returning to recession in the second and third quarters of the year. Moreover, the eurozone crisis rumbled on, plaguing credit markets in Spain and Italy, and sent Greece into a spiral of contraction. The Federal Reserve’s (the Fed) third Quantitative Easing (QE3) program was the most aggressive yet. In contrast to QE1 and QE2, this time it is unlimited in size, open ended in nature, and has an overriding objective of reducing unemployment to a lower level. In addition to “Operation Twist,” the Fed will start buying $40 billion per month of Mortgage-Backed Securities (MBS) until the U.S. job market substantially improves. The aim is to drive down long-term rates, thereby increasing the value of homes, stocks and other financial assets. The hope is that it will push households and businesses into spending, investing and hiring.
Portfolio Review
For the 12-month period, gains were spread across all but two sectors, with two of the largest relative overweight sectors, Consumer Staples and Health Care, providing the largest contributions to performance. In the case of Consumer Staples, several stocks were sold as valuations hit their target prices. Sara Lee Corp. was broken up into its constituent parts, DE Masterblenders 1753 NV and Hillshire Brands Co. and, as we believed their value was unlocked; both of these stocks were sold. Cott Corp. saw a boost to margins from easing input costs and bounced upward from its November lows. Henkel AG & Co. performed well as management raised its revenue and growth targets for household products and adhesives. Estimates were revised up and the Fund took some profits as the stock progressed towards the target price. Treasury Wine Estates Ltd. was sold after rising when it was spun out of Foster Group Ltd. in 2011.
The Fund’s Health Care sector holdings performed well for a variety of reasons. Celgene Corp. benefited from positive trial results for its psoriasis drug, Aprimelast, and buoyant sales growth for its main product in the market, Revlimid. Pfizer Inc. was the best performer, benefiting from the disposal of its nutrition business and ongoing restructuring actions. The sector gains came in spite of a disappointment for Bristol Myers Squibb Co., which fell on the announcement that it had suspended the trial of a Hepatitis-C drug. Unlike Consumer Staples companies, we believe Health Care companies generally remain undervalued.
The Fund’s bias leans towards “undervalued growth” and, although it had a negligible weight in the Financials sector during the year, it was unable to keep pace with its benchmark, as it was more heavily weighted towards financial and cyclical sectors, which benefited from the aggressive quantitative easing.
| 11 |
Management's Discussion of Fund Performance (Unaudited) (Continued)
The main detractors to Fund performance were in the Energy and Financials sectors. The Fund remains positioned with a bias towards natural gas over oil in the Energy sector, due to the large discount at which this commodity trades versus its history, and versus oil. While this meant that U.S. gas stocks, Ultra Gas Inc. and Southwestern Energy Co., came under pressure as gas prices neared all-time lows, they benefited from a sharp correction, which we expect to continue as supply becomes increasingly constrained by reduced drilling. The Fund continued to avoid mainstream Financials stocks, as deleveraging continued in the developed world and interest margins remained compressed by the abysmal central bank funding rates. The two Financials stocks held in the period had mixed results. F&C Asset Management PLC saw some gains as its institutional funds performed well, but was sold when it became clear that a large proportion of its assets under management were likely to disappear after lock-up periods ended. SBI Holdings Ltd., the Japanese retail brokerage, continued to suffer from low trading volumes and market volatility, which we believe should eventually reverse and provide a welcome boost. At the stock level, two of the top three contributors to performance were gold miners, Yamana Gold Inc. and Fresnillo PLC. After a precipitous fall in the gold price in December of 2011, the stocks rebounded strongly, nearing all-time highs, and some subsequent profit-taking made sense.
Outlook
Given the continued backdrop of low growth and rising inflationary pressures, we believe the ability of companies to gain market share and pass on cost inflation will remain crucial in sustaining profitability. As such, the quality of company management is imperative. The Fund’s investment strategy will remain focused on undervalued companies that have sustainable franchises and identifiable earnings catalysts that can drive earnings growth without excessive debt. While we believe equity markets will remain highly volatile, we believe the basic tenets of investing remain unchanged – valuations still matter.
If, as we expect, Quantitative Easing doesn’t stimulate global growth, then the preferred commodities will be precious metals and those where we believe supply is being constrained (agriculture and U.S. natural gas). We believe the likely fallout from continued large commodity price swings will need to be closely monitored; for example, consider the grain market. We believe the huge price spikes will force bread and meat prices upwards in 2013. This will more than likely compress disposable income, most notably in emerging countries such as China. Increasing cost inflation is happening at the same time as growth is slowing across many big emerging market economies (e.g. Brazil, China and India). Not surprisingly, the Fund continues to find cheaper and often better managed exposure to emerging markets through companies listed in developed markets. Consequently, the Fund’s portfolio has just an 8 percent exposure to emerging markets based on where companies are listed, but 36 percent when evaluated on where companies generate their profits.
| 12 |
Management's Discussion of Fund Performance (Unaudited) (Continued)
Comparison of the Change in Value of a $10,000 Investment in the Touchstone Global Equity Fund - Class A* and the MSCI All Country World Index
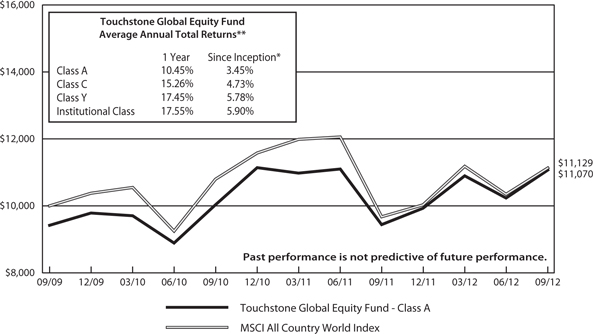
| * | The chart above represents performance for Class A shares only, which will vary from the performance of Class C shares, Class Y shares and Institutional Class shares based on the differences in loads and fees paid by shareholders in the different classes. The Fund commenced operations on September 30, 2009. |
| ** | The average annual total returns shown above are adjusted for maximum applicable sales charges, if applicable. |
The performance of the above Fund does not reflect the deduction of taxes that a shareholder would pay on Fund distributions or the redemption of Fund shares. Past performance is not predictive of future performance.
| 13 |
Management's Discussion of Fund Performance (Unaudited)
Touchstone Global Real Estate Fund
Sub-Advised by Cornerstone Real Estate Advisers LLC
Investment Philosophy
The Touchstone Global Real Estate Fund seeks capital appreciation by primarily investing in common stocks and other equity securities of U.S. and foreign real estate companies. Fund management utilizes a core research approach that combines top-down macroeconomic, capital and property market analysis with bottom-up understanding of local real estate and operational capacity to evaluate both property sectors and individual companies.
Fund Performance
The Touchstone Global Real Estate Fund (Class A Shares) slightly underperformed its benchmark, the FTSE EPRA/NAREIT Developed Total Return Index, for the 12-month period ended September 30, 2012. The Fund returned 29.15 percent (calculated excluding the maximum sales charge) while the total return of the benchmark was 29.65 percent.
Market Environment
Global equity markets were volatile during the period as market sentiment shifted continuously on macroeconomic fundamentals, the sovereign debt crisis in Europe, and the timing of central bank actions globally. Ultimately, global equity markets ended up strongly on the back of continued central bank actions to provide liquidity.
Global real estate securities were able to display their unique characteristic as dividend payers with a growth component during the period. In an upward trending market supported by improved macroeconomic outlook and global central bank actions, the sector was able to keep up with other global equity indices. Economic growth can be reflected in rising rents while increased liquidity/lower interest rates serve to reduce funding cost for this capital intensive business, which is favorable. These factors may contribute to yield compression and higher valuations. On the other hand, in a downward trending market, the sector may exhibit defensive characteristics due to its dividends.
Within the global real estate securities benchmark (“Index”), Asia was the strongest region followed by North America. Within Asia, Hong Kong and Singapore were strong performers. In North America, both the U.S. and Canada had strong returns. As expected, Europe significantly underperformed as no European country outperformed the Index.
Portfolio Review
For the period, the Fund benefited from a strong overall contribution from Singapore as well as stock selection in the U.S., Japan, and the U.K.
The Fund consistently held an overweight position in Singapore based on its market maturity as well as the solid fundamentals and healthy dividends offered by the country’s property stocks. During the period, Singapore significantly outperformed the Index. In terms of stock selection in Singapore, Fortune REIT stands out as the top contributor. Fortune REIT is a Hong Kong retail company with dual listing in both Hong Kong and Singapore, with shopping centers largely located in residential neighborhoods catering to daily necessities. We invested in this out-of-index holding due to its yields, stable business, and potential for yield accretion from asset enhancements. In the U.S., an overweight position in Extra Space Storage, Inc. contributed substantially as the stock benefited from solid earnings and guidance. Japan’s contribution came mainly from an overweight position in the developers as the sector rallied due to reflation hopes on the back of the Bank of Japan’s introduction of an inflation target. The Fund’s relative weight in the two largest Japanese Real Estate Investment Trusts (JREITs), Japan Real Estate Investment (overweight) and Nippon Building Fund, Inc. (underweight) also contributed positively to performance. In the U.K., Derwent London PLC and Great Portland Estates PLC were among
| 14 |
Management's Discussion of Fund Performance (Unaudited) (Continued)
the top performers. These two companies focus on the London West End office market, which is probably one of the strongest global real estate markets as there is healthy demand for space and for investment property with limited new supply due to development constraints. Both companies profited from the attractive characteristics of this underlying market. With their development pipelines they offer high quality space to tenants and investors in a constrained market. We also believe these companies have strong management teams and solid balance sheets, thus adding to our conviction.
Some detractors to performance were overall decisions in Hong Kong/China, stock selection in Germany, and an allocation decision in the Netherlands. In Hong Kong/China, performance was impacted by an unforeseen corporate governance event at Sun Hung Kai Properties in Hong Kong earlier in the period and an underweight position in the lower quality Hong Kong developers, which rallied later in the period. However, an overweight position in the high quality China Overseas Land & Investment Ltd. contributed significantly to performance, erasing a good portion of the stock selection struggles in Hong Kong/China. Negative performance in Germany was driven primarily by one stock, alstria Office REIT. This name worked well when it was initially made an investment in the fourth quarter of 2011 as a good defensive play in a negative, sentiment-driven market. Alstria was negatively impacted by profit taking following strong 2011 performance as well as an equity deal to finance the acquisition of a German office portfolio. As for the Netherlands, the Fund was overweight the country partly due to a quality bias in the region but it underperformed the Index significantly, which detracted from performance.
During the fiscal year, we shifted the Fund’s portfolio allocations proactively based on our macro fundamental views as well as valuation levels. Earlier in the period, we became comfortable with the improving global macro fundamental outlook as well as limited downside from global central bank backstop and shifted the Fund to a pro-cyclical tilt favoring Asia. As the period progressed, the global macro outlook began to deteriorate, particularly in the U.S. and China, and there were ongoing concerns about Europe and the effectiveness of global monetary easing. While recognizing the global central banks’ willingness to provide liquidity and support the economy, the Fund’s portfolio was gradually “de-risked.”
Outlook
Despite the recent weakness in the global economic outlook, we believe the coming year has the potential for slow but steady growth. Central banks around the globe have acted to provide necessary liquidity to support the global economy, which should slowly work its way into the system. An improving U.S. housing market could also be a catalyst into 2013. This environment is conducive for continued steady demand for commercial real estate. Modest economic growth rate should keep financing costs low for quite some time. These factors combined with limited new supply in most global real estate markets should lead to solid cash flow growth and provide valuation support for global real estate securities companies.
We believe the positive catalysts present in the markets should support equity valuations in the medium term, but we continue to closely monitor a number of significant risks ranging from slowing global growth, U.S. fiscal challenges, deterioration in the European sovereign debt issues, a hard landing in China, and instability in the Middle East, any one of which could impact equity markets in the near term.
The Fund has taken a marginal defensive characteristic to weather the short-term volatility. We believe the Fund is still positioned to capture the positive medium term catalysts seen in real estate fundamentals.
| 15 |
Management's Discussion of Fund Performance (Unaudited) (Continued)
Comparison of the Change in Value of a $10,000 Investment in the Touchstone Global Real Estate Fund - Class A* and the FTSE EPRA/NAREIT Developed Index
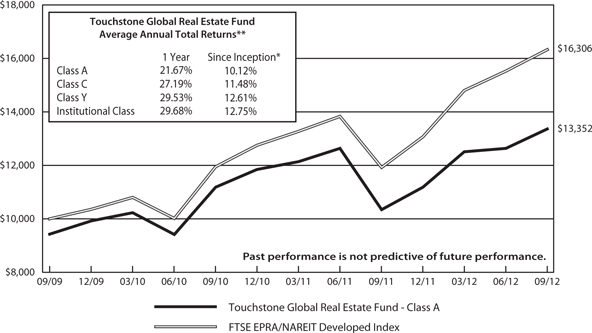
| * | The chart above represents performance for Class A shares only, which will vary from the performance of Class C shares, Class Y shares and Institutional Class shares based on the differences in loads and fees paid by shareholders in the different classes. The Fund commenced operations on September 30, 2009. |
| ** | The average annual total returns shown above are adjusted for maximum applicable sales charges, if applicable. |
The performance of the above Fund does not reflect the deduction of taxes that a shareholder would pay on Fund distributions or the redemption of Fund shares. Past performance is not predictive of future performance.
| 16 |
Management's Discussion of Fund Performance (Unaudited)
Touchstone International Fixed Income Fund
Sub-Advised by GAM International Management Ltd.
Investment Philosophy
The Touchstone International Fixed Income Fund seeks total return by investing primarily in fixed income securities of issuers located outside the United States. Fund management selects foreign country and currency compositions based on an evaluation of various macroeconomic factors including relative interest rates, exchange rates, monetary and fiscal policies, economic growth, employment, trade and current account balances. Management invests core holdings in developed market government bonds and currencies with tactical allocations to alpha-generating sectors: investment grade corporate bonds, emerging market bonds, high yield bonds and convertible bonds. Currencies are actively managed in order to manage risk and enhance returns.
Fund Performance
The Touchstone International Fixed Income Fund (Class A Shares) outperformed its benchmark, the Citigroup World Government Bond Index ex-U.S. for the year ended September 30, 2012. The Fund’s total return was 6.24 percent (calculated excluding the maximum sales charge) while the total return of the benchmark was 3.46 percent.
Market Environment
Over the past twelve months the market entered a period of heightened volatility as a result of significant changes in economic sentiment. Risk assets had a very strong start to the New Year, including lower-grade credit and convertibles, which benefited from strong risk appetite. This appetite spread to sovereign names that had near-pariah status last year, notably Ireland and Italy.
Within the global bond markets the major features during the first quarter of 2012 were weakness of U.S. Treasuries, a strong recovery in Italian debt prices and continuing excess returns from credit. Inflation-protected bonds performed well as hopes for economic recovery and high energy prices drove demand. Economic developments during the second quarter continued the pattern of mixed data with a moderate negative bias. Uncertainties over the outlook for the eurozone currency bloc continue to undermine sentiment amongst households and businesses. Up until the end of the second quarter there was a flight to quality from a ‘risk-off’ backdrop. The third quarter was again shaped by politics from both sides of the Atlantic. In July, core government bonds rallied through the month as concerns mounted over the level of yields in Spain and Italy. However, European Central Bank (ECB) President Mario Draghi’s unexpectedly firm commitment to do “whatever it takes to preserve the euro,” together with better U.S. economic data, led to a reversal in performance. This statement continued to boost peripheral European debt in August. Conversely, France, Austria and the Netherlands posted the worst returns among the region’s sovereign markets. Promises of further Quantitative Easing (QE3) measures from the Federal Reserve (the Fed) and an extension of the low interest rate policy saw risk assets rally strongly during September, including corporate and high-yield debt. This boosted currencies like the Euro at the expense of the U.S. dollar, as well as helped peripheral bonds for most of the third quarter. The Fund held overweight positions in the Mexican Peso, Korean Won, Sterling and some Scandinavian countries during the period.
Portfolio Review
The key drivers of the Fund’s outperformance versus the benchmark during this period were the spread contraction and Forex Index overlay, each factor contributing handsomely. In addition, the overweight, long maturity to Italy, the allocation to Convertible bonds and allocations to Latin American Emerging Market currencies out of the Yen contributed to performance as well. The recovery in Norwegian export credit insurer Eksportfinans ASA’s bonds, which were junked following the decision by the companies’ owners to put the organization into run-off, also contributed to the positive performance. Factors that also contributed to the Fund’s performance,
| 17 |
Management's Discussion of Fund Performance (Unaudited) (Continued)
in addition to the safe haven block (U.S., U.K. and Germany), were the underweights to France, Italy and Spain, although a higher duration in safe haven currencies would have helped. The continuation of the European debt crisis led to a strengthening of the U.S. Dollar (USD), which created a headwind for the Fund. It was positioned for stronger global economic growth that was beneficial in the first and third quarters of 2012, but led to weaker results in the second quarter, which detracted from Fund performance for the period.
Outlook
We believe the range of possible outcomes for the European Union (EU) and the Euro, for Iran and Israel, for China economic growth and U.S. politics/fiscal outcomes remains as diverse as ever. The European Central Bank’s new Outright Monetary Transactions (OMT) program can provide a floor for the performance of the up-until-now distressed bonds, and their rally has already begun. The optimism that the ECB sovereign support program initially created has come increasingly into question, as Spain dithers over whether to request a formal program and the fiscally responsible northern European countries seek to impose increased conditionality to avoid inflationary monetary financing. While we accept that pragmatism rather than strict adherence to legal obligations has become a hallmark of official policy actions in many countries since the global financial crisis broke, we remain concerned that markets are not fully discounting the significant tail risks which Europe presents.
Investment grade credit appears, at best, fairly valued, while many parts of the market formerly known as high yield now seem to be merely junk bonds with a modest spread. We remain deeply skeptical of the current fashion for emerging market corporate issuance. Looking forward we expect bond yields to re-converge – higher yields in core and lower yields in periphery – creating what we believe to be relative value opportunities. Further, we believe the spotlight will switch away from Europe, for once, onto the U.S. elections that will take place in November of 2012.
| 18 |
Management's Discussion of Fund Performance (Unaudited) (Continued)
Comparison of the Change in Value of a $10,000 Investment in the Touchstone International Fixed Income Fund - Class A* and the Citigroup World Government Bond Index ex-US
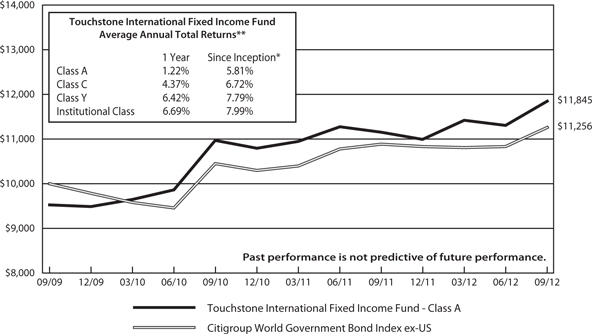
| * | The chart above represents performance for Class A shares only, which will vary from the performance of Class C shares, Class Y shares and Institutional Class shares based on the differences in loads and fees paid by shareholders in the different classes. The Fund commenced operations on September 30, 2009. |
| ** | The average annual total returns shown above are adjusted for maximum applicable sales charges, if applicable. |
The performance of the above Fund does not reflect the deduction of taxes that a shareholder would pay on Fund distributions or the redemption of Fund shares. Past performance is not predictive of future performance.
| 19 |
Management's Discussion of Fund Performance (Unaudited)
Touchstone Large Cap Relative Value Fund
Sub-Advised by EARNEST Partners LLC
Investment Philosophy
TheTouchstone Large Cap Relative Value Fund seeks capital appreciation by investing in stocks of large capitalization companies. The Fund seeks to identify stocks based on their financial characteristics and current environment including valuation measures, market trends, operating trends, growth measures and profitability measures.
Fund Performance
The Touchstone Large Cap Relative Value Fund (Class A Shares) underperformed its benchmark, the Russell 1000® Value Index for the 12-month period ended September 30, 2012. The Fund’s total return was 24.28 percent (calculated excluding the maximum sales charge) while the total return of the benchmark was 30.92 percent.
Market Environment
Despite ongoing volatility, global equity markets posted strong returns for the 12-month period ending September 30, 2012. The first half of the year was a reversal from what had been experienced for the previous 12 months. Overall sentiment was positive again as economic indicators in the U.S. came in better than expected, U.S. unemployment fell to 8.2 percent and the European Union (EU) formulated additional plans to help at-risk nations avoid default and provided liquidity to the region. In Europe, coordinated efforts to provide liquidity support to the global financial system by making it easier to exchange currencies was announced. The European Central Bank (ECB) also announced that it would lend over €500 billion to financial institutions in the region, further reducing liquidity risk for the eurozone banks and, in March, Greece moved forward with a debt restructuring that paved the way for additional international aid. The restructuring provided some immediate relief as the country continued the task of bringing its budget back into balance.
Then, as we reached the mid-point of the period, the progress in Europe was short-lived. Continued political disagreements, along with the Greek government’s inability to elect a government in early May, raised the likelihood that rescue efforts would not be enough and Greece might ultimately leave the eurozone, which led to a significant decline in global equity markets. A second election in mid-June, though, seated a pro-Euro government, easing those concerns for the time being. However, investor worries shifted to the impact these events would have on Spain and Italy. In response to the escalation of the crisis in Europe, EU member nations proposed a $125 billion aid package to Spain, and the ECB moved to accept a wider range of collateral to aid in bank funding. In late June, officials at the EU Summit agreed to allow bailouts to come directly from the jointly funded European Stability Mechanism (ESM) and that the aid would be subordinate to existing bond holders – which resulted in an immediate reduction in yield on both Spanish and Italian debt. Towards the end of the period market performance again turned positive as moderating fears regarding the European debt crisis and continued monetary support within the U.S. and Europe took hold. The ECB made clear that it would take whatever steps necessary to keep the Euro intact. The ECB’s new framework for buying sovereign debt of member nations gained traction once Germany provided its support. German chancellor Angela Merkel, with further affirmation by the German constitutional court, approved the plan at the end of the period.
In the U.S., the economy continued to post sluggish growth, but the housing market has been a relative bright spot with improving sales of new and existing homes, and prices beginning to show year-over-year increases after years of decline. The unemployment rate remains near 8 percent. The Federal Reserve (the Fed) announced plans for another round of Quantitative Easing (QE3) consisting of monthly purchases of $40 billion in Mortgage-Backed Securities (MBS), without a definitive termination date, in order to keep mortgage and other borrowing rates low. The Fed also pledged to keep its target fed funds rate at current levels until mid-2015,
| 20 |
Management's Discussion of Fund Performance (Unaudited) (Continued)
an extension from the previous target of 2014. Despite pricing pressures, the U.S. inflation rate, as measured by the Consumer Price Index (CPI), remains a low 1.7 percent, below the long-term average and well within the Fed’s comfort zone.
Portfolio Review
The market was volatile for the period as investors balanced negative data (the European Financial Crisis, slower growth in the Emerging Markets, and a still-weak employment environment in the U.S.) with more positive data (Chinese government stimulus activity, strengthening U.S. housing, and the Federal Reserve’s additional Quantitative Easing, QE3). Because of the fluctuating investor sentiment throughout the year, consistent trends have been elusive.Two notable exceptions included the Energy sector (Oil and Gas Refineries) andTelecommunication Services (Wireless). Information Technology was one of the weakest sectors for the year.
The Fund’s overweight positions in the Information Technology and Energy sectors, and its underweight positions in one of the strongest performing industries, Wireless (Telecommunication Services sector), detracted from the relative performance of the Fund. Stock selection in the Energy sector also detracted from relative performance. The Fund was underweight Telecommunication Services, which traded higher as investors sought dividends and bid shares up to historically high valuations. The group is now trading both above the broader market and its historical average, while earnings growth is slowing given the mature, highly penetrated nature of the U.S. wireless market. Oil and Gas Refineries are similarly trading above their historical average due to short-term pricing issues. Because U.S. crude is trading at a discount to global crude, U.S. refineries are able to produce diesel fuel at a relatively lower cost than their global competitors, and then export that refined product overseas and sell it at the higher price. We believe these mispricings are temporary in nature, and current valuations do not reflect the likely fall-off in earnings over time.
Absolute returns in the Fund benefited from strong stock performance in a number of sectors. Consumer Discretionary holding Comcast Corp., one of the leading cable providers in the U.S., continued to post strong quarterly earnings despite the seasonality of its business. The company reiterated its commitment to return cash to shareholders and we believe investors continued to get comfortable with the value of the cable network and the possible threat of Over-The-Top (OTT) video disintermediation. We continue to see benefits of investing in the company as we believe its high speed broadband deployments continue to give it a competitive advantage overTelecommunication Services companies. Although the market continues to worry about the impact of OTT on the video business, we believe this high-margin business should continue to be a growth driver, even as OTT video gains traction. In addition, Comcast continues to come up with innovative products such as cloud based navigation, DVR enhancements, and second screen experiences. Comcast trades at an attractive valuation and continues to return cash to shareholders aggressively. Materials sector holding, Freeport McMoRan Copper & Gold Inc. also contributed to Fund performance. It is the world’s largest publicly traded producer of copper and a significant producer of gold and molybdenum. It has a geographically diverse portfolio of long-lived, low cost mines in North and South America, Africa, and Asia. We believe copper’s wide variety of industrial and commercial uses that include building construction and power generation and transmission should drive growth going forward, particularly in developing geographies. Shares rose over the year on higher copper prices related to a supply/demand imbalance. New supply remains constrained due to declining ore grades at existing mines and the time and capital needed to develop world-class greenfield mines.
| 21 |
Management's Discussion of Fund Performance (Unaudited) (Continued)
During the year, a position in Boston Properties was initiated. It is regarded as the best in class operator in the office industry, with a bulk of property in the New York, Boston and Washington, DC markets. Boston Properties’ properties are at the top end of the quality spectrum and are located in the high demand markets where quality tenants are based. The Fund exited its position in Yum!Brands Inc. (Consumer Discretionary), an operator of quick service restaurants around the globe. Its brands include KFC, Pizza Hut, and Taco Bell. We saw the opportunity for Yum!Brands to expand in international markets such as China, and the market has recognized that growth. As the market is now giving Yum!Brands credit for sustained store growth and its longer-term opportunities in emerging markets, it was decided to exit the stock.
Outlook
As a bottom-up, fundamental manager, market and economic forecasts are not an integral part of our investment process. We continue to focus on owning fundamentally sound companies that are well capitalized and well positioned to take market share from weaker competitors. These higher quality companies have outperformed historically, and we believe will outperform over the longer term. Our investment philosophy is focused on the long term. The Fund is diversified across sectors and industries with relative over- and underweights reflective of where we believe we are finding the best opportunities.
| 22 |
Management's Discussion of Fund Performance (Unaudited) (Continued)
Comparison of the Change in Value of a $10,000 Investment in the Touchstone Large Cap Relative Value Fund - Class A* and the Russell 1000® Value Index
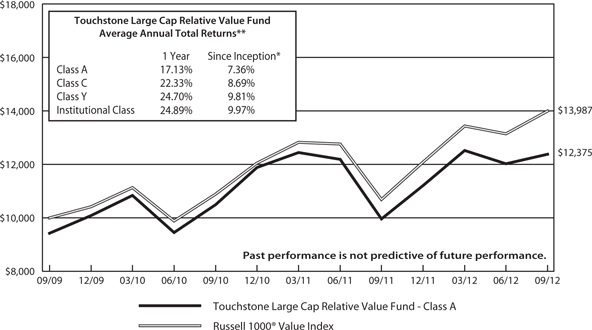
| * | The chart above represents performance for Class A shares only, which will vary from the performance of Class C shares, Class Y shares and Institutional Class shares based on the differences in loads and fees paid by shareholders in the different classes. The Fund commenced operations on September 30, 2009. |
| ** | The average annual total returns shown above are adjusted for maximum applicable sales charges, if applicable. |
The performance of the above Fund does not reflect the deduction of taxes that a shareholder would pay on Fund distributions or the redemption of Fund shares. Past performance is not predictive of future performance.
| 23 |
Management's Discussion of Fund Performance (Unaudited)
Touchstone Market Neutral Equity Fund
Sub-Advised by Aronson Johnson Ortiz
Investment Philosophy
The Touchstone Market Neutral Equity Fund seeks to achieve long-term capital appreciation and to provide positive returns regardless of the direction of the stock markets by investing long in equity securities believed to be undervalued, and taking short positions in securities believed to be overvalued.
Fund Performance
The Touchstone Market Neutral Equity Fund (Class A Shares) underperformed its benchmark, the Citigroup 3-Month Treasury Bill Index, for the 12-month period ended September 30, 2012. The Fund’s total return was -4.85 percent (calculated excluding the maximum sales charge) while the total return of the benchmark was 0.05 percent.
Market Environment
A respectable month of September capped off a solid trailing 12 months in the broad U.S. equity market. Value indices managed a slight edge over growth, and stocks of small capitalization companies outperformed those of large capitalization companies.
Portfolio Review
The Touchstone Market Neutral Equity Fund is always sector-neutral long versus short, with only limited industry bets, driven solely by the Fund’s bottom-up stock selection. Since our stock-picking is, in turn, guided by our multi-factor valuation model, we look to the measures underlying our model to explain what worked during the period.
Long holdings within the Energy sector were the largest contributors to performance, followed by positions in the Materials and Services sectors. Names like Tesoro Corp. and Valero Energy Corp. had a significantly positive impact on performance. We were challenged most by the Funds’ holdings in the Technology sector, particularly among short positions in the Software industry like NetSuite, Inc., SuccessFactors, and The Ultimate Software Group, Inc. In aggregate, our stock picking efforts were rewarded across all three broad pillars of attractiveness we use to evaluate stocks — value, management, and momentum — although our evaluation of management as represented by return on assets and earnings quality detracted from performance.
There were no significant changes in the Fund’s positioning. The Fund remained sector-neutral long versus short and invests solely in U.S. equities. Since individual positions are limited to 1.2% of the Fund, no individual stock change is considered significant.
Outlook
We remain firm in our conviction that results can be achieved through a consistent, systematic approach that focuses on low-priced companies with strong management and earnings power. Outperformance will continue to require patience and discipline — two virtues that are part of our investment process. As such, we do not allow the economic outlook — ours or anyone else’s — to shift our portfolio construction and structure. The Fund remains fully invested, well diversified, and sector-neutral, long versus short.
| 24 |
Management's Discussion of Fund Performance (Unaudited) (Continued)
Comparison of the Change in Value of a $10,000 Investment in the Touchstone Market Neutral Equity Fund - Class A* and the Citigroup 3-Month Treasury Bill Index
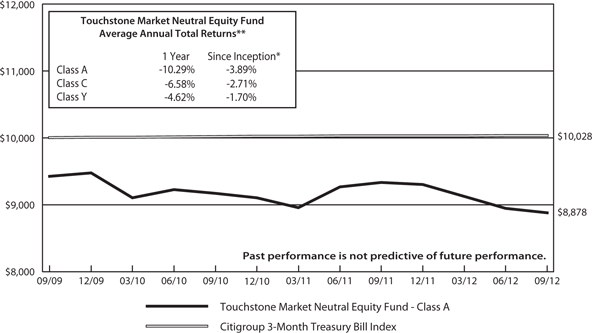
| * | The chart above represents performance for Class A shares only, which will vary from the performance of Class C shares, Class Y shares and Institutional Class shares based on the differences in loads and fees paid by shareholders in the different classes. The Fund commenced operations on September 30, 2009. |
| ** | The average annual total returns shown above are adjusted for maximum applicable sales charges, if applicable. |
The performance of the above Fund does not reflect the deduction of taxes that a shareholder would pay on Fund distributions or the redemption of Fund shares. Past performance is not predictive of future performance.
| 25 |
Management's Discussion of Fund Performance (Unaudited)
Touchstone Merger Arbitrage Fund
Sub-Advised by Longfellow Investment Management Co.
Investment Philosophy
The Touchstone Merger Arbitrage Fund seeks to achieve positive absolute returns regardless of market conditions over the long term by investing primarily in securities of companies that are involved in publicly announced mergers and other corporate reorganizations. Merger arbitrage is an investment strategy that seeks to capture the “arbitrage spread” represented by the difference between the market price of the securities of the company that is being purchased and the value that is offered for these securities by the acquiring company. The Fund emphasizes risk management via a thorough understanding of proposed financing terms, the size of the transaction, anti-trust concerns, regulatory approvals, and shareholder voting requirements. The Fund also limits assets under management in an effort to meaningfully invest in the entire market-capitalization spectrum, with an emphasis on small- and mid-sized deals.
Fund Performance
The Touchstone Merger Arbitrage Fund (Class A Shares) outperformed its benchmark, the BofA Merrill Lynch 3-Month U.S. Treasury Bill Index, for the 12-month period ended September 30, 2012. The Fund’s total return was 6.35 percent (calculated excluding the maximum sales charge) while the total return of the benchmark was 0.07 percent.
Market Environment
The market events during the past 12 months can be summed up in one word: unpredictable. The uncertainty has been driven by many factors: global economic problems, Euro debt crisis, the pending U.S. Presidential election, the fiscal “cliff ” and worldwide austerity packages are the obvious culprits. The S&P 500 Index rallied in the third quarter and returned 30% for the trailing twelve months. On the fixed income side, after much speculation, the Federal Reserve (the Fed) announced a new policy of Quantitative Easing (QE3) in mid-September 2012, which underscored its commitment to maintaining low interest rates until mid 2015 and emphasized its willingness to accept higher inflation in order to ensure job growth was on a sustainable path. We believe the program to buy Agency Mortgage Pass-through securities monthly will continue to pressure yield spreads tighter.
As for merger arbitrage, it continued on a steadier path than other markets. Headlines continued to paint a picture of declining global merger activity, primarily due to the decline in European transactions. The Fed’s effort to encourage investors to take more risk has proven successful in narrowing spreads across all asset classes, with merger arbitrage no exception.
Portfolio Review
During the period, the Fund has grown significantly. Despite the rapid increase in assets, we did not experience any significant challenges in putting the money to work. During this period, the Fund invested primarily in tender and merger related deals (70-80%) with a fixed income complement of about 10%. Cash fluctuated between 0 - 30%, with the average over the last two quarters approximately 12%. Health Care, Industrials, Information Technology, and Financials were prominently held sectors, with 90% of the deals invested in the U.S. The Fund’s non-U.S. deal holdings were primarily located in Canada.
The Fund continued to experience a high completion rate over the past year. The Fund invested in over 150 definitive merger arbitrage transactions with only one unsuccessful completion. This was partly a function of buyers taking more time to structure deals, as well as sellers being careful to ensure that agreements were solid, in addition to rigorous screening and analysis on our part. The number of successful deals positively impacted
| 26 |
Management's Discussion of Fund Performance (Unaudited) (Continued)
performance as the Fund was able to experience small gains on many deals. In addition, the Fund had a handful of proposals which became definitive, contributing positively to returns.
Some notable transactions included Great Wolf Resorts and Dollar Thrifty Automotive Group. Great Wolf Resorts was more successful than originally planned as another bidder emerged and started a bidding war which ended with the final price over 50 percent greater than the initial price. Hertz Global Holdings, Inc., which had been in discussions for over two years with Dollar Thrifty Automotive Group, eventually came to terms, but at a much higher offer price. The Fund opportunistically participated in the Medco Health Solutions, Inc. merger with Express Scripts Holding Company towards the end of the transaction after the deal spread had widened significantly. The Fund also successfully exited the NYSE Euronext, Inc. transaction with Deutsche Boerse AG prior to the deal being terminated.
The Fund’s investment in Pep Boys was a detractor during the Fund’s fiscal year. Gores Group, a private equity buyer, decided to exercise its right to pay a termination fee and break the transaction after Pep Boys reported significantly lower than expected earnings for the quarter. This transaction was the only broken deal during the period.
Outlook
Much of the global decline in merger arbitrage deal activity was due to the reduction in European transactions. Any improved confidence overseas could translate into more activity both in overseas and cross-border deal making. Additionally, we continue to expect that merger & acquisition activity will be dominated by middle market deals, particularly deals under $1 billion in market capitalization.
The global economic problems, the fiscal cliff scenarios facing the U.S., and the Euro debt crisis could escalate into a larger market crisis which, while not expected, could reduce deal flow and opportunities going forward. In addition, the strategy has enjoyed an unusually high completion rate. Any increase in deal failures, combined with narrowing arbitrage spreads, would present a challenge moving forward. With risk appetite increasing during the past 12 months, merger arbitrage annualized returns have compressed. Merger arbitrage spreads are not immune to this pressure and have now declined.
Technical indicators remain healthy for the merger arbitrage environment, albeit with lower expected annualized returns. The Fund continues to be well diversified by position size with a modest allocation to non-deal sectors. We will continue to be focused on announced transactions with a signed definitive merger agreement. With continued steady deal flow and high completion rates, we believe that the Fund represents an attractive alternative and a good diversification vehicle.
| 27 |
Management's Discussion of Fund Performance (Unaudited) (Continued)
Comparison of the Change in Value of a $10,000 Investment in the Touchstone Merger Arbitrage Fund - Class A* and the BofA Merrill Lynch 3-Month U.S. Treasury Bill Index
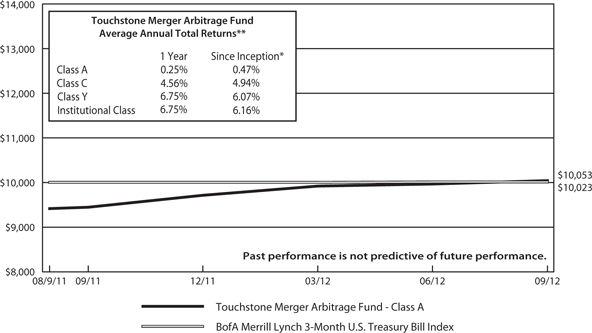
| * | The chart above represents performance for Class A shares only, which will vary from the performance of Class C shares, Class Y shares and Institutional Class shares based on the differences in loads and fees paid by shareholders in the different classes. The Fund commenced operations on August 9, 2011. |
| ** | The average annual total returns shown above are adjusted for maximum applicable sales charges, if applicable. |
The performance of the above Fund does not reflect the deduction of taxes that a shareholder would pay on Fund distributions or the redemption of Fund shares. Past performance is not predictive of future performance.
| 28 |
Management's Discussion of Fund Performance (Unaudited)
Touchstone Mid Cap Fund
Sub-Advised by The London Company
Investment Philosophy
The Touchstone Mid Cap Fund seeks long-term capital growth by investing primarily in common stocks of mid-cap U.S. companies. The Fund utilizes a bottom-up security selection process that screens potential investments against a proprietary quantitative model for return on capital, earnings to value ratio, free cash flow and return on equity. Its goal is to purchase generally profitable, financially stable companies that consistently generate high returns on unleveraged operating capital, are run by shareholder-oriented managements, and are trading at a discount to their private market value.
Fund Performance
Effective December 14, 2011, The London Company was named sub-advisor to the Touchstone Mid Cap Fund.
The Touchstone Mid Cap Fund (Class A Shares) underperformed its benchmark, the Russell Midcap® Index for the 12-month period ended September 30, 2012. The Fund’s total return was 25.95 percent, (calculated excluding the maximum sales charge) while the total return of the benchmark was 28.03 percent.
Market Environment
Equity markets reacted favorably to the Federal Reserve’s efforts to double-down on keeping short-term interest rates low and unchanged during the last year. Its “Operation Twist” program sold short-term U.S. Treasuries to purchase longer maturities, and its third round of Quantitative Easing (QE3) furthered efforts to keep interest rates at historically low levels. Both actions contributed to positive returns in equities.
Portfolio Review
Generally more economically sensitive stocks performed best over the past 12 months while defensive stocks lagged. This presented a headwind due to the Fund’s defensive nature.
For the 12-month period, the Fund added value through positive stock selection within the Energy, Health Care, Information Technology and Financials sectors. However, these gains were negated due primarily to an overweight in the Consumer Staples sector. An underweight in the Health Care sector, along with stock selection in the Consumer Staples and Materials sectors, also detracted from performance.
The Fund’s top performing stocks during the period included Consumer Discretionary companies, Cabela’s, Inc. and Whirlpool Corporation. Outdoor equipment retailer Cabela’s Inc. saw strong yearly results with better same-store sales comparisons and excellent cost control. Merchandise margins have continued to increase as a function of increasing Cabela’s branded merchandise and the company is benefiting from continued strong gun sales. Appliance maker Whirlpool Corporation rallied following strong earnings growth with significant margin improvement due to higher pricing and some improvement in the housing market. Additional top performers included Financials companies, Eaton Vance Corp. and M&T Bank Corp. Investment manager Eaton Vance Corp. benefited from a rising equity market which contributed to growth in assets under management. Commercial banker M&T Bank Corp. has a consistent track record in the banking industry with an attractive return on equity and very conservative and shareholder friendly management team. Also a top performer was Industrials company, Cintas Corporation, supplier of specialized services to businesses, which experienced increasing sales and profitability throughout the period, resulting in a higher share price.
The largest detractors from Fund performance over the past 12 months included Consumer Staples companies, Staples, Inc., Smithfield Foods, and Nu Skin Enterprises. Office supplier Staples, Inc. experienced weak performance as spending on office supply goods lessened and investors worried about an abundance of retail locations in
| 29 |
Management's Discussion of Fund Performance (Unaudited) (Continued)
the U.S. Global food retailer Smithfield Foods experienced poor performance due to swings in commodity prices and high margin costs. Nu Skin Enterprises, maker of anti-aging products, traded into weaker territory after a report questioning the company’s operations in China was circulated. We believe the report’s allegations are without merit as the company recently announced expansion plans in China. An additional detractor to performance was Consumer Discretionary company, CarMax, Inc. The used car retailer witnessed poor performance due to declining auto sales during the period.
Outlook
Our investment focus is at a company-specific level and not a top-down approach. As prudent managers of capital, we focus on fundamental facts and guard against speculation. While there are many headline concerns and fears – elections, fiscal cliffs, slowing Gross Domestic Product (GDP) growth, European sovereign debt, and Middle East angst – are already well known. It is the out-of-left-field events that usually catch the markets off guard.
Positive attributes in the market include visible progress in housing and services, underleveraged corporate balance sheets, attractive valuations, and healthy merger premiums. We believe dividend growth, stock buybacks, and premiums from acquisitions will lead equity returns and the spread to 10-year U.S. Treasuries remains low. Equity risk premiums have rarely been greater, cause and effect of the continuing outflow from stock funds to bond funds and the low allocation to U.S. equities by all types of investors.
Looking forward, it is our view that confidence, not credit, is what needs to be increased. Confidence comes from having stable and transparent tax policy and regulatory rules. With policy certainty, we believe that corporations should part with their excess cash to hire and expand. Bull markets always begin with maximum fear and uncertainty, and this year appears to be no different with the solid performance in the broad markets to date. We believe equity returns should continue to outpace inflation and the returns of other mainstream, liquid asset classes given reasonable valuations and investor demand for income and, more importantly, growth in income. Dividends continue to grow and will remain, we believe, a key determinant of outperformance in a low interest rate world.
| 30 |
Management's Discussion of Fund Performance (Unaudited) (Continued)
Comparison of the Change in Value of a $10,000 Investment in the Touchstone Mid Cap Fund - Class A* and the Russell Midcap® Index
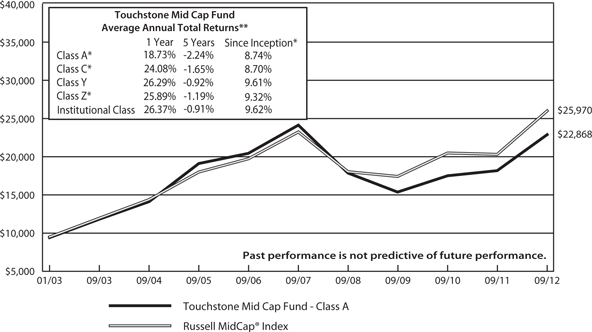
| * | The chart above represents performance for the Class A shares only, which will vary from the performance of Class C shares, Class Y shares and Class Z shares based on the differences in loads and fees paid by shareholders in the different classes. The initial public offering of the Class Y shares commenced on January 2, 2003. The initial public offering of Class A shares and Class C commenced on May 14, 2007 and the initial public offering of Class Z shares commenced on April 24, 2006. Class A and Class C shares performance information is calculated using the historical performance of Class Y shares for the periods prior to May 14, 2007 and Class Z shares performance information is calculated using the historical performance of Y shares for the periods prior to April 24, 2006. The returns have been restated for sales charges and for fees applicable to Class A, Class C and Class Z shares. |
| ** | The average annual total returns shown above are adjusted for maximum applicable sales charges, if applicable. |
The performance of the above Fund does not reflect the deduction of taxes that a shareholder would pay on Fund distributions or the redemption of Fund shares. Past performance is not predictive of future performance.
| 31 |
Management's Discussion of Fund Performance (Unaudited)
Touchstone Mid Cap Value Fund
Sub-Advised by Lee Munder Capital Group LLC
Investment Philosophy
The Touchstone Mid Cap Value Fund seeks capital appreciation by investing primarily in common stocks of mid-cap companies. The Fund seeks to identify companies believed to be selling at a discount to their inherent value utilizing a classic value approach.
Fund Performance
The Touchstone Mid Cap Value Fund (Class A Shares) underperformed its benchmark, the Russell Midcap® Value Index for the 12-month period ended September 30, 2012. The Fund’s total return was 27.55 percent (calculated excluding the maximum sales charge) while the total return of the benchmark was 29.28 percent.
Market Environment
Macro uncertainties, investor psychology, and the headlines have driven the market at different points during the 12-month period ended September 30, 2012. Fears of the debt crises in Italy, Greece, and Spain across the Continent enveloped the market all year long, while day-to-day news about central bank intervention - both its likelihood and its potential effectiveness - moved key market indices to wide, mostly short-lived, swings in both directions. With the exception of housing data, which showed steady improvement for the year, key economic indicators were generally unable to find a trend during the period, with employment numbers, manufacturing, and consumer spending numbers all holding in early in the year before trailing off later. Corporate earnings growth was uneven throughout the period as well, and we continued to see individual stock prices drop on earnings releases offering no visibility into future quarters.
While volatility can create opportunities, generally a market focused away from company fundamentals and away from valuation is not the preferred environment for the Fund’s strategy. In more recent months, stocks have reacted well to clearer commitments from the Central Banks in supporting the eurozone and from the Federal Reserve (the Fed) in holding rates low in the U.S., perhaps setting a backdrop that puts the focus back on individual companies and stock fundamentals.
Portfolio Review
Across market sectors, the Fund’s strongest performance in the past 12 months was in the Information Technology, Consumer Discretionary, and Health Care sectors, and the Fund’s weakest performance was in the Materials, Energy, and Industrials sectors.
A key driver of positive performance in the Information Technology sector was networking solutions and storage provider Brocade Communications Systems Inc. Brocade rallied as a result of improved operational performance and take-over speculation. Fidelity National Information Services Inc., which develops banking and payment servicing technologies, was another important contributor for the year.
Stock selection was strong in the Consumer Discretionary sector, led by Newell Rubbermaid Inc., Scripps Networks Interactive Inc., and American Eagle Outfitters. Newell Rubbermaid contributed substantially to performance, as the stock continued to rise on sales and margin growth news quarter over quarter. Scripps Networks Interactive, a media company that includes the cable channel HGTV, significantly outperformed.
As a consequence of the rich valuations being paid for REITs (Real Estate Investment Trusts) and Utilities, the Fund has searched for other defensive areas of the market that trade at more attractive valuation levels. The budget impasse last year provided an opportunity to find some bargains in the Health Care sector. HealthSouth Corp., the largest inpatient rehab facility provider, rallied on a strong earnings report coupled with the market
| 32 |
Management's Discussion of Fund Performance (Unaudited) (Continued)
more appropriately discounting upcoming reimbursement cuts related to Sequestration. The Fund has begun to reduce the Health Care overweight, due to outperformance and the growing risk that the market is likely to turn its attention to the election - and ultimately, the potential reimbursement risk from any political deal struck to avoid the fiscal cliff.
On the negative side, most of the Fund’s underperformance in the Materials sector was concentrated in Allegheny Technologies Inc., a specialty metal company largely tied to the aerospace industry. Allegheny Technologies has traded down with the more commodity metal players on concerns of a global slowdown. In the Energy sector, Newfield Exploration Co. contributed to underperformance. Missed earnings expectations, changes to the portfolio mix and a backlog in production continued to weigh on the stock. We believe these are transitory issues and continued to hold the position.
Towers Watson & Co. and Republic Services Inc., in the Industrials sector, detracted from performance for the year. Towers Watson, an employee benefits and financial services consulting company, had begun to improve through the first and second quarters of 2012, but was hit more recently as acquisition expenses skewed earnings reports. Republic Services has struggled as a heightened competitive environment and higher costs have squeezed margins and restricted profitability.
There were no significant changes to the Fund’s positioning made during the year; however, the combination of the Russell reconstitution in the second quarter of 2012 with modest changes to the Fund did impact some of the relative industry weights. In addition to reducing the Fund’s overweight to the Health Care sector, we increased the Fund’s overweight to the Consumer Staples sector.
Outlook
In 2011, the market craved earnings visibility regardless of valuation. Beginning in the fourth quarter of 2011 but especially in the first quarter of 2012, the market rewarded the riskiest parts of the market. In the second quarter of 2012, the quarter flipped back once again to rewarding visibility. While both tails of the market do not currently exhibit particularly attractive risk/reward opportunities, we continue to find favorable investment opportunities between the tails in the core of the market. Frankly, we believe a more normal environment that doesn’t reward the extremes offers a favorable backdrop for the Fund’s strategy.
In addition, the Fund’s strategy has historically outperformed when the market rewards higher return on capital businesses with accurate valuations. In this type of environment, the market has been willing to look past transitory difficulties and focus on the underlying, long-term, earnings power of the company and the inherent value of the franchise. This can happen in a market that slowly trends up or down or moves sideways. We seek strong balance sheets and good cash flow, so the Fund’s stocks have the potential to be relatively insulated from severe downturns in the market.
Our greatest concern, on a relative basis, is that the market continues to flip from one extreme of wanting risk to the other extreme of wanting visibility regardless of valuation. The Fund’s strategy participates in “risk-on” markets but historically has not outperformed. We believe the Fund’s emphasis on downside protection may help performance in “risk-off ” markets. However, as investors have sought perceived safety, they have focused on higher dividend payers and companies offering near term business and earnings visibility. Companies with these characteristics have been bid up to extreme valuation levels. This can be observed in the stretched relative valuations of Utilities and REITs. Historically, when markets have gone “risk-off,” companies with attractive relative valuations (on measures other than solely yield) have outperformed the market. However, this has not been the case over the past year. This flight to visibility regardless of valuation has been a headwind relative to the benchmark.
| 33 |
Management's Discussion of Fund Performance (Unaudited) (Continued)
We continue to find what we believe to be attractively valued investment opportunities with favorable risk/reward profiles. While we don’t believe in making short-term projections, we believe these investments should outperform the market longer term.
The Touchstone Mid Cap Value strategy utilizes a classic value-driven philosophy based on the belief that leading businesses selling at a discount to fair value have the potential to generate excess returns. The strategy focuses on stocks that are temporarily out of favor in the market; specifically, companies with higher returns on capital, free cash flow and strong balance sheets. Emphasis is placed on those companies having the cash flow characteristics as well as the balance sheet strength necessary to buffer the company from any prolonged weakness. The Fund’s companies often dominate a particular industry niche and generally have significant barriers to entry. As a result, the Fund’s holdings are able to perpetuate a higher return on capital over time. The entire process utilizes fundamental bottom-up security selection, while risk control measures insure security and sector diversification.
| 34 |
Management's Discussion of Fund Performance (Unaudited) (Continued)
Comparison of the Change in Value of a $10,000 Investment in the Touchstone Mid Cap Value Fund - Class A* and the Russell Midcap® Value Index
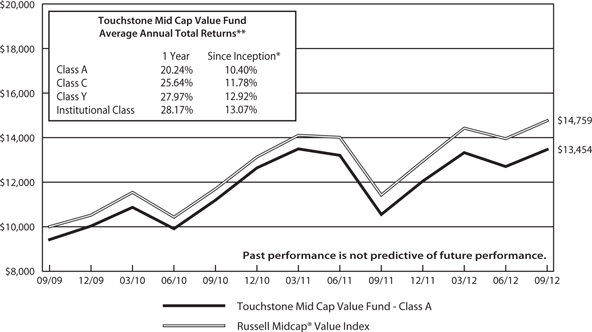
| * | The chart above represents performance for Class A shares only, which will vary from the performance of Class C shares, Class Y shares and Institutional Class shares based on the differences in loads and fees paid by shareholders in the different classes. The Fund commenced operations on September 30, 2009. |
| ** | The average annual total returns shown above are adjusted for maximum applicable sales charges, if applicable. |
The performance of the above Fund does not reflect the deduction of taxes that a shareholder would pay on Fund distributions or the redemption of Fund shares. Past performance is not predictive of future performance.
| 35 |
Management's Discussion of Fund Performance (Unaudited)
Touchstone Premium Yield Equity Fund
Sub-Advised by Miller/Howard Investments, Inc.
Investment Philosophy
The Touchtone Premium Yield Equity Fund seeks long-term growth of capital and high current income by focusing on dividend-paying equity securities of U.S. companies believed to possess attractive long-term return potential primarily due to lower than average valuations and improving business outlooks.
Fund Performance
The Touchstone Premium Yield Equity Fund (Class A Shares) underperformed both of its benchmarks, the Russell 3000® Value Index and the Dow Jones U.S. Select Dividend Index. The Fund’s total return was 23.98 percent (calculated excluding the maximum sales charge) while the total returns of its benchmarks were 31.05 percent and 24.42 percent, respectively.
While the Touchstone Premium Yield Equity Fund has the Russell 3000® Value Index as its assigned benchmark, that does not mean it is fully appropriate as a means to gauge fund performance. In fact, there may not be one index that is suitable for the Touchstone Premium Yield Equity Fund. Here are the main reasons why: 1) The Fund seeks to invest in high quality companies with recurring business models that can pay their dividend and have the capacity to grow their dividend. The analysis of a company begins with the question “Is the Dividend Safe and Will It Grow?” That makes for a style, cap, and sector agnostic approach. 2) The Fund’s underlying portfolio has a relatively high yield relative to the Russell 3000®Value Index. 3) Many of the companies in which the Fund is invested reside in the Energy and Utilities sectors. As an example, for the year ended September 30, 2012, the Fund was more than double the weight of the Index in both the Energy and Utilities sectors. 4) In the current environment, it should be noted that due to the nature of the Fund’s discipline, the number of candidates in the Financials sector can be limited. For the year ended September 30, 2012, the Fund was approximately half the weight of the Index in the Financials sector. More specifically, the Fund’s quality requirements preclude it from owning many banks.
Market Environment
The world of finance includes many pundits fighting for attention, and to get attention they need something to say. Recently the media has tired of quoting expert managers who suggest that higher yielding equities are a good place to be in a low/no yield environment, and have started to take the opposite tack. We can’t say this makes us uncomfortable, as we’d rather not have the whole world pumping up what we do, but the recent comments are not really based on the facts. We suggest that many “stories” are based on a view of sectors—an asset allocator’s view—rather than the specifics of the actual stocks in which one might want to invest.
While the market has risen from levels a year ago, there is still a level of uncertainty going forward. We will continue to seek companies with stable business models that produce recurring cash flow streams.
Portfolio Review
Strong stock selection in the Materials sector helped boost Fund performance.
The Fund’s overweight in the Information Technology sector as well as the sector’s underperformance, coupled with weaker stock selection, detracted from performance. Weak stock selection in the Financials sector detracted from Fund performance.
Stocks that contributed to performance for the 12 month period included Kinder Morgan, Inc., Williams Companies Inc., and Seadrill Ltd. (Energy sector), ONEKOK , Inc. (Utilities sector), and Abbott Laboratories (Health Care sector). Kinder Morgan benefited from growing payouts from limited partnerships and an attractive
| 36 |
Management's Discussion of Fund Performance (Unaudited) (Continued)
takeover of El Paso Corp. In addition, the company announced three dividend increases during the period. Williams Companies Inc. restructured the company to separate Exploration & Production (E&P) business from more stable cash flows of its midstream business. The company announced three dividend increases during the period. Seadrill Ltd.’s continued strengthening of its off-shore rig day rates coupled with a growing fleet of rigs translated to excellent earnings growth, four dividend increases and one special dividend. ONEOK, Inc. exhibited strong earnings growth, primarily from ONEOK Partners’ natural gas liquids business, which caused management to raise its dividend twice. Abbott Laboratories continued better than expected Earnings Per Share (EPS) reports and continued to have good news on several new drugs under development. The company also plans to restructure into separate pharmaceutical and medical products companies to unlock shareholder value.
Stocks that detracted from performance over the 12 month period included Enerplus Corp. (Energy sector), Telefonia SA and Windstream Corp. (Telecommunication Services sector), R.R. Donnelley & Sons Company (Industrials sector), and Annaly Capital Management Inc. (Financials sector). Enerplus Corp. was hurt by weak natural gas prices which depressed cash flows and endangered dividend levels. The stock was sold in June of 2012. Telefonica SA was affected by European economic woes coupled with new weakness in the Latin American telecommunications markets which hurt earnings and cash flow. Management guided dividend expectations down. The stock was sold in May of 2012. Windstream Corp. was hurt by market concerns about the company’s rural telephone company business and its transition towards increasing business customers and services. R.R. Donnelley & Sons was affected by market concerns about the future of the printing industry and the company’s lack of organic growth opportunities. Annaly Capital Management was affected by pass-through mortgage REIT spreads being squeezed by the Fed’s “Operation Twist.” The stock was sold in November of 2011.
Outlook
We think there is a much higher level of uncertainty and fear about future growth potential, government/currency stability, and even solvency. Whereas once investors felt that they could count on a limitless trajectory of economic growth punctuated by occasional backtracking that was soon healed in the “business cycle” process, now the “fiscal cliff ” image is a broader and more potent metaphor than a simple concern over congressional action by year-end. There is a reduction in faith among investors, a wavering of optimism. Since faith represents the emotional content of stock pricing (the rational content would be the actual facts), values and valuation have lost some shine. This will be how it is until something changes. Investors have been expecting change and recovery for many quarters now, and it’s hardly happened. Something is new and different. Something is interfering with the famed business cycle. We won’t pretend that we can define this “something” as discussed above. But we do know that people need energy, and food, and water, and healthcare, and shelter, and phone, and internet, the basics of life. We believe these areas of fundamental necessities will continue to provide opportunities for investment and return on investment for both companies and their shareholders. Clearly, this is where investors’ attention needs to remain focused.
This year has shown that the Fund can keep up with a “risk-on” market (as long as it is not one-sided and radical) and that its defense can be quite strong when risk appetites are sated. The most difficult scenario for the Fund, relative to the broad market, would be a sudden resolution of all problems and a great economic boom. We’re not too worried about that.
We continue to seek to invest in what are believed to be high quality companies with recurring business models that can pay their dividend and have the capacity to grow their dividend.
| 37 |
Management's Discussion of Fund Performance (Unaudited) (Continued)
Comparison of the Change in Value of a $10,000 Investment in the Touchstone Premium Yield Equity Fund - Class A* , the Russell 3000® Value Index and the Dow Jones U.S. Select Dividend Index
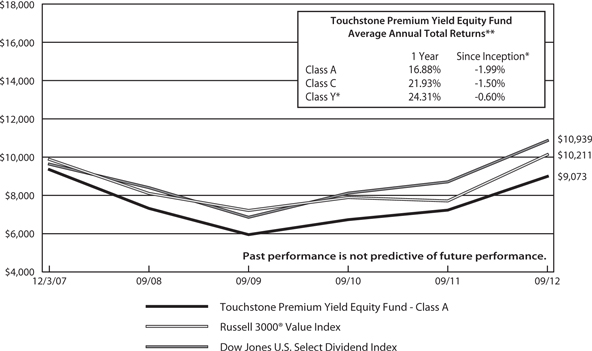
| * | The chart above represents performance for Class A shares only, which will vary from the performance of Class C shares and Class Y shares based on the differences in loads and fees paid by shareholders in the different classes. The initial public offering of Class A shares and Class C shares commenced on December 3, 2007. The initial public offering of Class Y shares commenced on August 12, 2008. The Class Y performance information is calculated using the historical performance of Class A for periods prior to August 12, 2008. The returns have been restated for sales charges and for fees applicable to Class Y shares. |
| ** | The average annual total returns shown above are adjusted for maximum applicable sales charges, if applicable. |
The performance of the above Fund does not reflect the deduction of taxes that a shareholder would pay on Fund distributions or the redemption of Fund shares. Past performance is not predictive of future performance.
| 38 |
Management's Discussion of Fund Performance (Unaudited)
Touchstone Sands Capital Select Growth Fund
Sub-Advised by Sands Capital Management, LLC
Investment Philosophy
The Touchstone Sands Capital Select Growth Fund primarily invests in common stocks of large capitalization U.S. companies that are believed to have above-average potential for revenue or earnings growth. The Fund invests in 25 to 30 companies that are generally high-quality seasoned and growing businesses, spread across an array of attractive and growing industries. Sands Capital generally seeks stocks with sustainable above average earnings growth and capital appreciation potential. In addition, Sands Capital looks for companies that have a significant competitive advantage, a leadership position or proprietary niche, a clear mission in an understandable business, financial strength, and are valued rationally in relation to comparable companies, the market, and the business prospects for that particular company.
Fund Performance
The Touchstone Sands Capital Select Growth Fund (Class A Shares) outperformed its benchmark, the Russell 1000® Growth Index, for the 12-month period ended September 30, 2012. The Fund’s total return was 34.72% (calculated excluding the maximum sales charge) while the total return of the benchmark was 29.19 percent.
Market Environment
While the U.S. and indeed the world do seem to be facing a period of slower overall growth, this does not mean that Growth Investors have to struggle. At its core, Growth Investing is about finding businesses that are either driving or benefiting from “change.” This never-ending cycle of creative destruction governs both economic and non-economic drivers of the global business landscape. We believe there will always be opportunities for diligent and selective growth investors to identify quality investments, whether a region is experiencing accelerating or decelerating growth.
What we will do to find the special businesses that can succeed in a period of depressed growth is continue to focus on what has worked for Sands Capital over the previous two decades. Despite the broad global economic malaise, our experience, deep fundamental research, and long-term concentrated approach should continue to position us to find leading growth businesses and achieve our mission of adding value.
Portfolio Review
On a relative basis, the top five contributors to performance for the period were Visa, Inc., Regeneron Pharmaceuticals, Inc., Alexion Pharmaceuticals, Inc., Salesforce.com, Inc., and National Oilwell Varco, Inc. National Oilwell Varco, a leading provider of critical drilling rig equipment, recently reported strong results, with revenues and operating income reaching record levels. The company benefits from both ongoing expansion of the global deepwater rig fleet, as well as from refurbishment of land and shallow-water rigs.
The top five relative detractors from performance were Netflix, Inc., Facebook, Inc., OpenTable, Inc., Coach, Inc., and Cerner Corporation. We originally purchased OpenTable because we believed there was opportunity for the company to take advantage of the shift to online restaurant reservations, potential for new products, and expansion opportunities outside of the U.S. We sold OpenTable in the first quarter of 2012 after observing several negative developments that lowered our conviction in the company’s ability to capitalize on these opportunities. These developments included senior level management changes, disappointing new product development, and increasing competition.
We initiated positions in four companies over the past year: Coach, Inc., athenahealth, Inc., Cerner Corporation, and Facebook, Inc. Coach is a leader in the $28 billion global premium handbags and accessories market. Through its “affordable luxury” value proposition, Coach has achieved the leading market share in the U.S.
| 39 |
Management's Discussion of Fund Performance (Unaudited) (Continued)
and the number two position in Japan. We believe Coach is uniquely positioned to capitalize on global growth opportunities due to its brand strength, strong financial position, and execution-driven management team. We think there is plenty of room for growth in the U.S., and see an even longer runway for continued expansion into overseas markets.
Athenahealth is a leading “software-enabled-service” provider in healthcare information technology. The company offers a subscription-based integrated suite of services to physician practices. The services include a web-based practice management system, a service for outsourcing back office billing, and a proprietary “live” payer rules database for reimbursement. We view this database as the company’s key asset, as it is currently the most comprehensive tool available to physician practices to ensure that insurance claims are submitted properly. The database has been developed over the past decade, is continuously updated, and we believe will be very difficult to replicate. In addition, athenahealth recently launched an electronic medical records platform and we anticipate a significant cross-selling opportunity. The company’s attractive business model scales well, and we believe it will generate long-term earnings growth.
Cerner is a leading global provider of integrated clinical information systems. We believe Cerner’s flagship product, the Cerner Millennium software suite, provides the most comprehensive set of clinical applications designed to improve safety, quality, and efficiency in the hospital setting. Furthermore, Cerner provides a variety of value-added services around its core Millennium offering. These services include off-site hosting capabilities, operational management, and revenue cycle management, which should provide a solid recurring revenue stream and opportunities to deepen relationships with current clients. We expect Cerner to capture a disproportionate share of new contract wins across multiple geographies, cross-sell additional modules/services to its large installed base, and continue to improve operating margins.
Facebook is the clear leader in social networking with over 900 million active users and accounts for more time spent online than any other destination on the web. Facebook’s broad application for users—e.g., communicating with friends, sharing news, photos, organizing events, etc.—creates a platform that captures unparalleled knowledge of human connections (i.e., the “social graph”). We think this platform is building the foundation to revolutionize online advertising by allowing marketers to mine its data to more effectively target and engage with brand advocates in ways previously not possible. As online advertising continues to evolve, Facebook’s platform offers significant optionality as its competitive advantages should allow it to develop a number of important revenue generating opportunities in the future.
We eliminated four Fund positions over the past 12 months: C.H. Robinson Worldwide, Inc., Illumina, Inc., OpenTable, Inc., and Netflix, Inc. We sold C.H. Robinson during the first quarter of 2012. While we believe C.H. Robinson remains the leading provider of third party logistics services in the U.S., we no longer have confidence in its ability to generate sustainable above average earnings growth over time.
Illumina is a global leader in the fast-growing genomic research tools space. Genetics are accountable for a significant component of human disease, but due to previous technological limitations scientists and researchers currently possess a very small fraction of this relevant genetic information. Newer genetic research tools are enabling scientists to efficiently narrow this information gap, fueling a revolution in scientific understanding and ultimately enabling the potential development of targeted therapies to address the root cause of many diseases. In particular, next-generation sequencing, where Illumina has a first-mover advantage with what we believe is the best-in-class platform, is delivering high-throughput genetic analysis at exponentially decreasing cost, essentially democratizing genetic research which should enable significant market expansion.
Roche, which is a global leader in clinical diagnostics, has made a bid to acquire Illumina, recognizing the importance of sequencing technology for the future of medical diagnostics and Illumina’s leadership in this space. While Illumina continues to dominate high-throughput sequencing, the market continues to evolve rapidly, with new competitors putting incremental pressure on overall market share and pricing for instruments
| 40 |
Management's Discussion of Fund Performance (Unaudited) (Continued)
and reagents. While there may be the potential for Roche to increase its bid price, we believe that significant further stock appreciation is limited, and chose to sell the Fund’s position in Illumina and reallocate those funds to what we believe are more attractive long-term investments.
The Fund exited its position in Netflix during the third quarter of 2012 because we no longer had conviction that the business met our investment criteria. Specifically, we had concerns with management’s ability to execute, the company’s ultimate growth potential, and the durability of its competitive advantages. In our view, several actions taken by Netflix’s management have been poorly executed, most notably the major change to its pricing plans and the announcement and subsequent reversal of Qwikster, a short-lived idea to spin off the DVD business.
Outlook
As long-term investors in business enterprises, not traders of stocks, Sands Capital does not actively ‘reposition’ portfolios on an ongoing basis. Clearly macro challenges persist–China’s slowdown, the European recession, continued deleveraging, geopolitical risks, and U.S. election uncertainty−but as a group, Fund companies continue to execute and deliver solid business results.
We diligently monitor and continually evaluate the long-term growth prospects for Fund companies while simultaneously seeking opportunities to add compelling new businesses to the Fund.
History has shown that in the long run, companies generating sustainable above-average earnings growth have been rewarded with significant stock price appreciation. This is why our process is predicated on using our six key investment criteria to 1) identify companies with business models that generate above-average earnings growth (typically companies with significant competitive advantages, strong leadership positions in attractive business spaces, and solid balance sheets); and 2) purchase these companies at rational valuations. While we acknowledge that over shorter-term periods there may be disconnects between stock prices and business fundamentals, we believe that our patient, disciplined and consistent investment philosophy will result in above-average returns over time.
| 41 |
Management's Discussion of Fund Performance (Unaudited) (Continued)
Comparison of the Change in Value of a $10,000 Investment in the Touchstone Sands Capital Select Growth Fund - Class A* and the Russell 1000® Growth Index
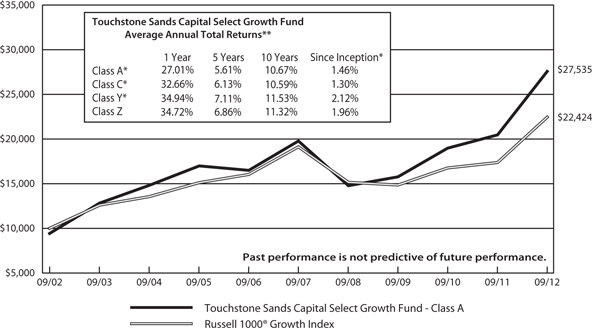
| * | The chart above represents performance for the Class A shares only, which will vary from the performance of Class C shares, Class Y shares and Class Z shares based on the differences in loads and fees paid by shareholders in the different classes. The initial public offering of the Class Z shares commenced on August 11, 2000. The initial public offering of Class Y shares commenced operations on August 27, 2004 and the initial public offering of Class A shares and Class C commenced on November 15, 2010. Class A and Class C shares performance information is calculated using the historical performance of Class Z shares for the periods prior to November 15, 2010 and Class Y shares performance information is calculated using the historical performance of Z shares for the periods prior to August 27, 2004. The returns have been restated for sales charges and for fees applicable to Class A, Class C and Class Y shares. |
| ** | The average annual total returns shown above are adjusted for maximum applicable sales charges, if applicable. |
The performance of the above Fund does not reflect the deduction of taxes that a shareholder would pay on Fund distributions or the redemption of Fund shares. Past performance is not predictive of future performance.
| 42 |
Management's Discussion of Fund Performance (Unaudited)
Touchstone Short Duration Fixed Income Fund
Sub-Advised by Longfellow Investment Management Co.
Investment Philosophy
TheTouchstone Short Duration Fixed Income Fund seeks to provide above market income, liquidity and risk-adjusted total return. Fund management targets these goals using a low risk approach, selecting a core group of securities from better yielding sectors within the government and corporate markets, and enhancing liquidity and yield by combining very short maturities with fixed rate issues in a barbell structure. The Fund invests in a diversified portfolio of fixed income securities of different maturities while seeking to maintain an effective duration between one and three years.
Fund Performance
The Touchstone Short Duration Fixed Income Fund (Class Z Shares) outperformed its benchmark, the Barclays 1-3 Year U.S. Treasury Index, for the 12-month period ended September 30, 2012. The Fund’s total return was 2.34 percent while the total return of the benchmark was 0.56 percent.
Market Environment
The economy seemed to stagger toward the finish line over the past year with periods of positive economic news followed quickly by negative data. Overall, we saw a choppy environment with sub-par growth and continued high unemployment. Overlaying this was slowing global growth and problems in Europe along with the approaching U.S. elections and the need to deal with the tax and fiscal issues before year-end (fiscal cliff ). In September of 2012, the Federal Reserve (the Fed) took action in the form of its third round of Quantitative Easing (QE3) which included a provision to: purchase agency mortgage securities for an indefinite time, continue with Operation Twist, which swaps shorter duration maturities for longer U.S Treasury securities, and extended their forecast for low short-term rates until 2015. Exhibiting its commitment to reduce unemployment, the Fed stated that it is willing to accept some higher inflation.
While there were periods of “risk-off,” for most of the year, particularly in April and May of 2012, the mood of the market was mostly “risk-on” which meant the spread sectors did well, particularly Commercial Mortgage-Backed Securities (CMBS). Corporate bonds, particularly Financials, Asset-Backed Securities (ABS) and Agency Pass-through securities also contributed to performance, but did not have a significant impact.
Portfolio Review
Over the year, the Funds’ allocations to agency securities and Small Business Administration (SBA) securities were reduced as they became fully priced in the scramble for high quality securities. The Fund’s allocation to credit cards was also reduced as new issuance was minimal and spreads tightened significantly. The Fund’s Collateralized Mortgage Obligation (CMO) allocation was trimmed as its holdings continued to pay down - when the mortgage loan’s principal value is reduced. The Fund added to auto, equipment and other esoteric ABS such as tax liens and whole business securitizations. During the year we also found value in CMBS and corporate bonds.
| 43 |
Management's Discussion of Fund Performance (Unaudited) (Continued)
Outlook
Given that the Fed has put interest rates on hold for the next several years, investors have been given a “free pass” to find the highest yielding securities consistent with their risk parameters. For the foreseeable future, fixed income spread product is destined to grind relentlessly tighter.
Any events which might stabilize the domestic and global economic situation such that the Fed would have to change course and be less accommodative would definitely be a major surprise to the market. Conversely, U.S. election results, failure to deal with the fiscal crisis, deepening Euro debt problems or slowing global growth could give rise to increased volatility and spread widening.
Given the Fed’s monetary stance, short-term rates should not move significantly and this will not be a significant contributor or detractor on performance. We will continue to use the Fund’s smaller size to identify opportunities which have the potential to provide an attractive return, although the opportunity set continues to get smaller as the demand for short maturity, high quality securities seems insatiable.
| 44 |
Management's Discussion of Fund Performance (Unaudited) (Continued)
Comparison of the Change in Value of a $10,000 Investment in the Touchstone Short Duration Fixed Income Fund - Class Z* and the Barclays Capital 1-3 Year U.S. Treasury Index
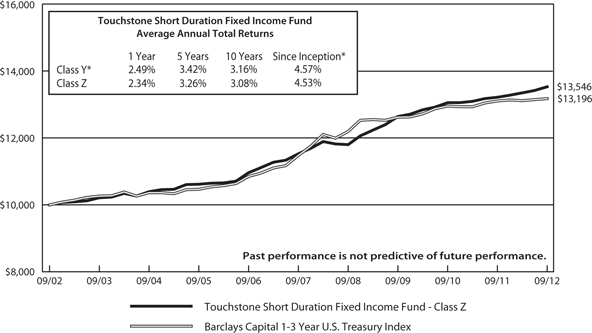
| * | The initial public offering of Class Z shares commenced on March 1, 1994 and the public offering of Class Y shares commenced on May 4, 2009. Class Y performance information is calculated using the historical performance of Class Z, for periods prior to May 4, 2009. |
The performance of the above Fund does not reflect the deduction of taxes that a shareholder would pay on Fund distributions or the redemption of Fund shares. Past performance is not predictive of future performance.
| 45 |
Management's Discussion of Fund Performance (Unaudited)
Touchstone Small Cap Core Fund
Sub-Advised by The London Company
Investment Philosophy
The Touchstone Small Cap Core Fund seeks long-term capital appreciation by investing primarily in common stocks of companies with small market capitalizations. The Fund utilizes a bottom-up security selection process that screens potential investments against a proprietary quantitative model for return on capital, earnings to value ratio, free cash flow and return on equity. The goal is to purchase generally profitable, financially stable companies that consistently generate high returns on unleveraged operating capital, are run by shareholder-oriented management, and are trading at a discount to their private market value.
Fund Performance
The Touchstone Small Cap Core Fund (Class A Shares) outperformed its benchmark, the Russell 2000® Index for the 12-month period ended September 30, 2012. The Fund’s total return was 35.86 percent (calculated excluding the maximum sales charge) while the total return of the benchmark was 31.91 percent.
Market Environment
Equity markets reacted favorably to the Federal Reserve’s efforts to double-down on keeping short-term interest rates low and unchanged during the last year. Its “Operation Twist” program sold short-term U.S. Treasuries to purchase longer maturities, and its third round of Quantitative Easing (QE3) furthered efforts to keep interest rates at historically low levels. Both actions contributed to positive returns in equities.
The best performing sectors for the market were the Health Care, Consumer Discretionary, and Financials sectors. The worst performing sectors were Utilities, Energy, and Consumer Staples sectors.
Portfolio Review
Generally more economically sensitive stocks performed best over the past 12 months while defensive stocks lagged. This presented a headwind due to the Fund’s defensive nature. However, portfolio construction has often allowed the Fund to outperform in periods when we wouldn’t necessarily expect that to have been the case. The combination of portfolio construction and strong stock selection contributed to the Fund’s performance.
Stock selection in the Consumer Discretionary, Materials, and Industrials sectors contributed to performance while stock selection in the Financials, Information Technology, and Consumer Staples sectors detracted from performance over the 12-month period.
The Fund’s top performing stocks during this period included Consumer Discretionary companies, Cabela’s Inc., Sturm, Ruger & Company and Service Corporation of America. Outdoor equipment retailer Cabela’s Inc. saw strong yearly results with better same-store sales comparisons and excellent cost controls. Merchandise margins have continued to increase as a function of increasing Cabela’s branded merchandise and the company is benefiting from continued strong gun sales. Sturm, Ruger & Company, manufacturer of high-quality firearms, benefited from increased sales due to successful new product generation, as well as safety concerns and fear among some consumers about potential changes in gun laws. Service Corp., provider of funeral, cremation and cemetery services, proved recession resistant. Management raised its guidance for the year due to solid financials and stronger-than-expected earnings. Additional top performers were Materials company, NewMarket Corporation, and Industrials company, Old Dominion Freight Lines. NewMarket Corporation, a fuel technologies provider, was driven by strong margins even though volume was down year-over-year. Industrials company, Old Dominion Freight Lines, a regional, inter-regional and national logistics services provider, continued to
| 46 |
Management's Discussion of Fund Performance (Unaudited) (Continued)
execute and improve upon its industry leading operating margins.The company’s premium pricing and non-unionized workforce led to significantly higher margins versus its competitors.
The largest detractors to performance during the past 12 months included Energy company, World Fuel Services Corporation. Provider of global fuel logistics and land fuel products and services, World Fuel Services Corporation was purchased by the Fund during the second quarter of 2012. The company’s unique business model experienced tremendous growth over the full trailing year, however we believe the results were not reflective of the broad market rally that occurred during the period. Additional detractors included Industrials companies, Ritchie Brothers Auctioneers, Inc. and Knoll, Inc. The world’s largest industrial auctioneer, Ritchie Brothers Auctioneers was added to the Fund during the third quarter of 2012. Despite the company’s competitive advantages, it underperformed the market rally during the period, though we forecast its free cash flow and return on invested capital to improve over the next few years. Knoll, Inc., designer and manufacturer of branded office furniture products and textiles, experienced a drop in sales and profits due to decreased industry demand. Consumer Staples company Nu Skin Enterprises, Inc. and Health Care company, Owens & Minor, Inc. were the bottom performing stocks. Nu Skin Enterprises, maker of anti-aging products, traded into weaker territory after a report questioning the company’s operations in China was circulated. We believe the report’s allegations are without merit as the company recently announced expansion plans in China. Owens & Minor, Inc., distributor of national name-brand medical and surgical supplies, announced plans to acquire a health-care third-party logistics business in Europe during the second quarter. Despite the announcement and the company’s stable earnings throughout the period, the company’s concentrated customer base, regulatory hurdles and margin limitations each contributed to underperformance.
Over the past 12 months, the Fund purchased or added to positions in Albemarle Corp. and World Fuel Services Corporation and sold or trimmed positions in Cabela’s, Inc., Capella Education Company, PriceSmart, Inc. and Sturm, Ruger & Co., Inc. Knoll, Inc. and Owens & Minor, Inc. were sold. All of these changes were bottom-up driven.
Outlook
Our investment focus is at a company-specific level and not a top-down approach. As prudent managers of capital, we focus on fundamental facts and guard against speculation. While there are many headline concerns and fears – elections, fiscal cliffs, slowing Gross Domestic Product (GDP) growth, European sovereign debt, and Middle East angst – are already well known. It is the out-of-left-field events that usually catch the markets off guard.
Positive attributes in the market include visible progress in housing and services, underleveraged corporate balance sheets, attractive valuations, and healthy merger premiums. We believe dividend growth, stock buybacks, and premiums from acquisitions will lead equity returns and that the spread to 10-year U.S. Treasuries remains low. Equity risk premiums have rarely been greater, cause and effect of the continuing outflow from stock funds to bond funds and the low allocation to U.S. equities by all types of investors.
Looking forward, it is our view that confidence, not credit, is what needs to be increased. Confidence comes from having stable and transparent tax policy and regulatory rules. With policy certainty, we believe that corporations should part with their excess cash to hire and expand. Bull markets always begin with maximum fear and uncertainty, and this year appears to be no different with the solid performance in the broad markets to date. We believe equity returns should continue to outpace inflation and the returns of other mainstream, liquid asset classes given reasonable valuations and investor demand for income and, more importantly, growth in income. Dividends continue to grow and will remain, we believe, a key determinant of outperformance in a low interest rate world.
| 47 |
Management's Discussion of Fund Performance (Unaudited) (Continued)
Comparison of the Change in Value of a $10,000 Investment in the Touchstone Small Cap Core Fund - Class A* and the Russell 2000® Index
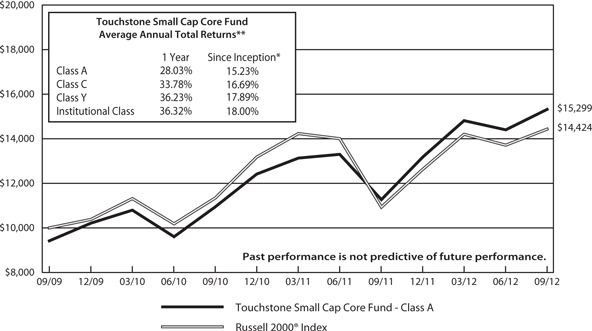
| * | The chart above represents performance for Class A shares only, which will vary from the performance of Class C shares, Class Y shares and Institutional Class shares based on the differences in loads and fees paid by shareholders in the different classes. The Fund commenced operations on September 30, 2009. |
** The average annual total returns shown above are adjusted for maximum applicable sales charges, if applicable.
The performance of the above Fund does not reflect the deduction of taxes that a shareholder would pay on Fund distributions or the redemption of Fund shares. Past performance is not predictive of future performance.
| 48 |
Management's Discussion of Fund Performance (Unaudited)
Touchstone Small Cap Value Fund
Sub-Advised by DePrince, Race & Zollo, Inc.
Investment Philosophy
The Touchstone Small Cap Value Fund seeks long-term capital appreciation by investing primarily in common stocks of small-cap companies that appear to be trading below their perceived value. The Fund utilizes a bottom-up security selection process that consists of three factors: dividend yield, low valuation, and a fundamental catalyst.
Fund Performance
The Touchstone Small Cap Value Fund (Class A Shares) outperformed its benchmark, the Russell 2000® Value Index for the 12-month period ended September 30, 2012. The Fund’s total return was 34.87 percent (calculated excluding the maximum sales charge) while the total return of the benchmark was 32.63 percent.
Market Environment
Stocks of small-capitalization companies returned more than 30% over the period despite the persistent tug-of-war between positive fundamentals and macroeconomic concerns. European leaders continued negotiations over plans to solve their sovereign debt crisis, the U.S. economy saw fits and starts but continued to show signs of improvement, and the consumer remained resilient as the housing and job markets gradually improved, providing additional confidence going forward.
Portfolio Review
The Fund’s performance over the period validated our relative valuation work and bottom-up research, which led to the Fund’s repositioning into more economically-sensitive companies in the second half of 2011. This cyclical exposure drove performance in the year. Stock selection and overweights in the Industrials, Materials and Consumer Discretionary sectors were the largest contributors to the Fund’s relative performance. Strong earnings results and positive outlooks boosted many of the Fund’s holdings. Eight of the top ten contributing stocks were within these sectors including Eagle Materials, Inc., H.B. Fuller Co., and PolyOne Corp. (Materials sector), Meredith Corp., Cooper Tire & Rubber Co., and Jones Group Inc. (Consumer Discretionary sector), and Lennox International Inc. and Apogee Enterprises (Industrials sector).
Over the period, the Fund’s Materials sector holdings surged, while the holdings in the Index also increased, but to a lesser degree. Eagle Materials was the top performing stock in the Fund; we exited the Fund’s position in April of 2012 after it reached its relative valuation target. This cement and wallboard manufacturer rose after management announced a 35% price increase for their wallboard products that dramatically improved profitability in 2012. It also benefited from improved housing and construction optimism, in addition to expanding capacity for specialized cement, which has seen increasingly strong demand. Chemical companies, H.B. Fuller and Polyone, outperformed on firming industrial order trends. Polyone is also successfully growing its mix of specialty chemicals, which may improve margins. Cooper Tire & Rubber Co. posted market share gains, and benefited from lower raw material costs. Apogee Enterprises, a manufacturer of value-added commercial glass coatings, outperformed on an improved order book and better pricing. Both of these stocks reached the Fund’s relative valuation targets and exited the Fund in August of 2012. Meredith Corp., a diversified media company, was rewarded after the company raised the dividend 50% and benefited from a strong election year. The retail industry performed well this period due to stronger than expected sales and earnings results. Jones Group benefited from improving margins and effectively-managed inventory levels. Trends within their core women’s business and positive feedback on their upcoming Fall product line increased expectations for its 2012 results.
| 49 |
Management's Discussion of Fund Performance (Unaudited) (Continued)
While the Fund’s underweight in the Financials sector detracted from performance, several of the Fund’s Financials holdings were solid performers. Greenhill & Co. Inc., a Mergers & Acquisitions (M&A) advisory firm, was a top ten contributing stock as M&A activity accelerated. We saw the Fund’s first takeover of the period in August of 2012. Flagstone Reinsurance Holdings agreed to a takeover bid by Validus Holdings for a 20% premium. This also boosted shares of Greenhill and Evercore Partners Inc., who are direct beneficiaries of improving M&A trends.
The Fund’s larger positions within the Information Technology sector underperformed due to concerns of a cyclical slowdown. Adtran Inc., a high-speed digital transmission provider, traded lower after management provided disappointing guidance due to uncertainty surrounding capital expenditure budgets among its telecom customers. We believe the spending environment will improve in future quarters and the company is beginning to realize synergies from their recent international acquisition. Brooks Automation Inc. and Intersil Corp. also traded lower on technology spending concerns. Brooks continues to grow their Life Sciences business which we believe should improve margins and create more stable earnings. We also remain confident in Intersil and are pleased with management’s recent announcement of a $50 million share buyback program. A rebound in semiconductor capital equipment spending going forward should also improve results.
Dividend paying stocks were clearly in favor in the last six months of 2011 as investors searched for income and safety in the more defensive, dividend-rich sectors of Utilities, Consumer Staples and Health Care. As markets sold off in the third quarter of 2011, our relative valuation work indicated that many of the defensive stocks became overvalued in the third quarter of 2011. Consequently, we were presented with the opportunity to invest in a wide variety of high quality, above-average yielding stocks in the more economically-sensitive sectors of Materials, Consumer Discretionary and Industrials. This portfolio transition in late third quarter of 2011 into early fourth quarter of 2011, driven by the Fund’s bottom-up stock selection process, proved beneficial for absolute and relative returns. As markets sold off in the second quarter of 2012, when Gross Domestic Product (GDP) estimates were lowered, we materially added to the Fund’s Energy sector positions. This proved rewarding in the third quarter of 2012 as those holdings drove the Fund’s quarterly outperformance. Portfolio activity and the consistent execution of buy/sell discipline also contributed to outperformance. During the market gyrations of the period, subsequent valuation opportunities presented themselves. As stocks approached their valuation targets, we sold them and moved into stocks with more attractive risk/reward perspectives.
Outlook
Through our bottom-up stock selection process, we continue to find what we believe are the greatest opportunities in cyclical sectors with attractive valuations and fundamental catalysts. We believe improving economic data on housing, employment, and manufacturing should provide a positive backdrop for the Fund’s economically-sensitive holdings. Increased M&A activity should also benefit several of the Fund’s Financials holdings.
Uncertainty continues to plague investor confidence despite incremental improvements in the economy. We are paying close attention to the potential impacts of the November election, GDP uncertainty around the globe, slower earnings growth with tougher earnings comparisons ahead, tax policy uncertainty, and the impending fiscal cliff.
We believe that the Fund’s current income from dividends and low relative valuations should become more attractive in this low-growth, income-starved environment. We are pleased to see several of the Fund’s holdings, such as Ryder System Inc. and Steris Corp., use their strong balance sheets and cash generation to return more cash to shareholders in the form of dividends.
The Fund maintains a cyclical bias with overweights in the Industrials, Energy, and Materials sectors. We continue to find opportunities in sectors leveraged to economic activity with near-term fundamental catalysts versus the more defensive sectors, which continue to trade at/near relative historical high valuations.
| 50 |
Management's Discussion of Fund Performance (Unaudited) (Continued)
Comparison of the Change in Value of a $10,000 Investment in the Touchstone Small Cap Value Fund - Class A* and the Russell 2000® Value Index
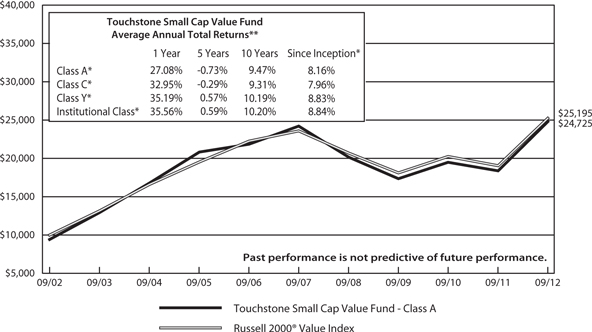
| * | The chart above represents performance for the Class A shares only, which will vary from the performance of Class C shares, Class Y shares and Institutional Class shares based on the differences in loads and fees paid by shareholders in the different classes. The initial public offering of Class Z shares commenced on March 4, 2002. On June 10, 2011, Class Z shares were converted to Class A shares and performance for periods prior to the date of conversion represents the performance of Class Z shares. The initial public offering of the Class C, Class Y, and Institutional Class shares commenced on March 1, 2011. The Class A shares performance information is calculated using the historical performance of Class Z shares for periods prior to June 1, 2011 and Class C, Class Y and Institutional Class shares performance information is calculated using the historical performance of Class Z shares for periods prior to March 1, 2011. The returns have been stated for sales charges and for fees applicable for Class A, Class C, Class Y and Institutional Class shares. |
| ** | The average annual total returns shown above are adjusted for maximum applicable sales charges, if applicable. |
The performance of the above Fund does not reflect the deduction of taxes that a shareholder would pay on Fund distributions or the redemption of Fund shares. Past performance is not predictive of future performance.
| 51 |
Management's Discussion of Fund Performance (Unaudited)
Touchstone Total Return Bond Fund
Sub-Advised by EARNEST Partners LLC
Investment Philosophy
The Touchstone Total Return Bond Fund seeks current income. Capital appreciation is a secondary goal. The Fund invests primarily in fixed income securities or sectors that are considered undervalued for their risk characteristics.
Fund Performance
The Touchstone Total Return Bond Fund (Class A Shares) outperformed its benchmark, the Barclays U.S. Aggregate Bond Index for the 12-month period ended September 30, 2012. The Fund’s total return was 6.42 percent (calculated excluding the maximum sales charge) while the total return of the benchmark was 5.16 percent.
Market Environment
The past twelve months were mixed, with continuing volatility and heightened uncertainty. A year ago the markets endured a tough third quarter driven by the Euro crisis and the U.S. debt ceiling debacle and subsequent U.S. downgrade by Standard & Poor’s. The first quarter of the trailing year saw an aftershock but, as the New Year opened, investors began a hunt for yield. The end result was a 0.28 percent drop in the yield of the ten-year Treasury note and a solid collapse in spreads in all sectors. The demand for perceived “safe” assets remained high at a time when the supply is constrained. While the U.S. Treasury is issuing bonds, many spread sectors are shrinking. The demand for “safe” assets has little to do with asset allocation if one remembers that many investors such as banks and insurance companies need debt. The hunt for yield is on. The Federal Reserve (the Fed) continues to be the world’s largest bond fund, buying agency Mortgage-Backed Securities (MBS) seemingly without care for valuation.
Portfolio Review
Focus on the Fund’s duration neutrality and spread during the period contributed to performance. As investors searched for yield, the Fund’s underweight of Treasuries was helpful with spreads coming down across the board. The Fund’s higher spread sectors like Commercial Mortgage-Backed Securities (CMBS) and Corporate Finance issues performed well. Anchors like Small Business Administration Development Company Participation Certificates (SBA DCPC) and Title XI Ship Financing debt obligations contributed as well. Sector selection, quality allocation and security selection were additive to overall performance as well. Utility Asset-Backed Securities (ABS) issues were added back to the Fund, as well as structured settlement ABS and Freddie Mac multi-family subordinated issues. The Fund’s U.S. Government weight was reduced from 70 percent to 60 percent, which is about as low as the strategy for the Fund wants to go. Selective credit was added. The Fund’s portfolio is currently 110 percent of the benchmark duration, a tolerance within which the Fund’s strategy wants to remain. During the past 12 months, duration’s attribution effect subtracted slightly from performance; however, the attribution effect from the yield curve added slightly to Fund performance for the 12-month period.
| 52 |
Management's Discussion of Fund Performance (Unaudited) (Continued)
Outlook
We believe that investors must deal with the U.S. election and the fiscal cliff immediately. Four years into the credit crisis, massive governmental involvement is showing no signs of coming to an end. If nothing else, we believe the markets will not return to normal until the Federal Reserve ceases its massive investing activities. We remain cautious on the outlook for single-family MBS and see no value in U.S. Treasuries. The supply of securities in sectors like SBA DCPC and U.S. agency multi-family debt remains strong. U.S. corporations are generally in good shape which, we believe, is precisely why investors should be wary. If growth slows, corporate management may sacrifice credit quality for equity performance. We believe stockholders will win over bondholders with increased dividends and stock buybacks. We believe the Fund’s focus on yield should drive performance in the next year and its focus on quality, while underweighting Treasuries, should help the Fund’s performance under the widest array of outcomes, which is the goal of its process. The Fund remains fully invested and interest rate forecast agnostic.
| 53 |
Management's Discussion of Fund Performance (Unaudited) (Continued)
Comparison of the Change in Value of a $10,000 Investment in the Touchstone Total Return Bond Fund - Class A* and the Barclays U.S. Aggregate Bond Index
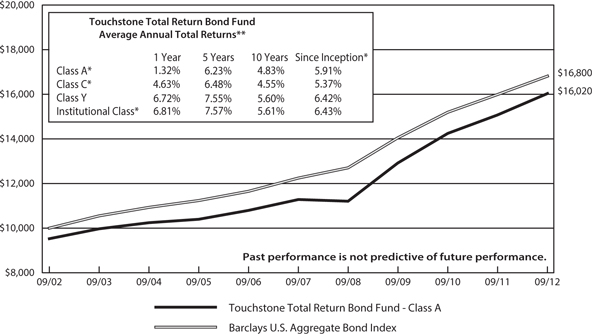
| * | The chart above represents performance for Class A shares only, which will vary from the performance of Class C shares, Class Y shares and Institutional Class shares based on the differences in loads and fees paid by shareholders in the different classes. Class Y shares began operations on November 15, 1991, Class A shares began operations on August 16, 2010, and Class C and Institutional Class shares began operations on August 1, 2011. The Class A shares performance information is calculated using the historical performance of Class Y for periods prior to August 16, 2010 and Class C and Institutional Class shares performance information is calculated using the historical performance of Class Y for periods prior to August 1, 2011. The returns have been restated for sales charges and for fees applicable to Class A, Class C and Institutional Class shares. |
| ** | The average annual total returns shown above are adjusted for maximum applicable sales charges, if applicable. |
The performance of the above Fund does not reflect the deduction of taxes that a shareholder would pay on Fund distributions or the redemption of Fund shares. Past performance is not predictive of future performance.
| 54 |
Management's Discussion of Fund Performance (Unaudited)
Touchstone Ultra Short Duration Fixed Income Fund
Sub-Advised by Fort Washington Investment Advisors, Inc.
Investment Philosophy
The Fund seeks maximum total return consistent with the preservation of capital by primarily investing in a diversified portfolio of fixed income securities of different maturities, including U.S. Treasury securities, U.S. government agency and U.S. government-sponsored enterprise securities, corporate bonds, mortgage-backed securities, commercial mortgage-backed securities, asset-backed securities, and municipal bonds. While the Fund may invest in securities of any maturity or duration, interest rate risk is managed by maintaining an effective duration of one year or less under normal market conditions.
Fund Performance
The Touchstone Ultra Short Duration Fixed Income Fund (Class Z Shares) outperformed its benchmarks, the BofA Merrill Lynch 3-Month U.S. Treasury Bill Index and the BofA Merrill Lynch 1-Year U.S. Treasury Note Index. The Fund’s total return was 2.10 percent for 12-month period ended September 30, 2012 while the total returns of its benchmarks were 0.07 percent and 0.26 percent, respectively.
Market Environment
Throughout the 12-month period, financial markets exceeded investors’ expectations, despite disappointing economic news and ongoing worries about Europe. The S&P 500 Index posted positive returns for the trailing 12 months, with strong results in three of the past four quarters. At the same time, credit markets continued to advance with positive trailing one-year returns for Investment Grade bonds (represented by the Barclays U.S. Credit Index) and High Yield bonds (represented by the BofA Merrill Lynch High Yield Cash Pay Index).
The catalysts for these market moves were precedent setting actions by the European Central Bank (ECB) and the Federal Reserve (the Fed). To calm fears about a collapsing eurozone, the ECB oversaw a region-wide supervisory banking structure and also purchased the debt of countries such as Spain and Italy in the secondary markets. These developments bolstered the authority of the ECB by granting it powers that the Fed and other central banks already possess. For its part, the Fed exceeded expectations when it announced that the third round of Quantitative Easing (QE3) would be maintained as long as unemployment remained unacceptably high, and that the period of unusually low interest rates would be extended to mid-2015.
Given this backdrop, it is not surprising that investors sought riskier fixed income assets. Low nominal yields were the norm, and just about any security that offered a meaningful pickup in yield over U.S. Treasury securities performed well in the “risk-on” market. U.S. Treasury yields declined modestly during the year. The bigger story (and driver of returns) was the decline in risk premiums for all non-U.S. Treasury securities — the move was impressive given the already low nominal yields. As one would expect those sectors with the widest spreads performed best. During the period, all short duration (0-3 year) fixed income subsectors posted positive performance, paced by Commercial Mortgage-Backed Securities (CMBS), Corporate Bonds and Asset-Backed Securities (ABS), which underscored the rally in spreads.
There was no meaningful change in the shape of the front end of the yield curve. Low nominal short-term rates drove investors into intermediate maturity bonds. So, while the curve did not contribute meaningfully to returns during the period, many investors took on more duration risk (“reaching for yield”) which could become problematic in the future.
Portfolio Review
The Fund’s sector allocations saw moderate changes, mostly in the latter half of the period. The most significant change in sector exposure was in CMBS which declined. Exposure to Corporate Bonds and ABS each increased
| 55 |
Management's Discussion of Fund Performance (Unaudited) (Continued)
as we believed that these sectors offered the most compelling opportunities. Exposure to Agency MBS (adjustable rate mortgages, pass-throughs and collateralized mortgage obligations) held steady at approximately 20% of Fund assets, a historically low level for the Fund.
Portfolio duration at period-end was 0.73 years, in line with the target duration of 0.75 years. Interest rate risk was not the primary driver of performance during the period as short-term interest rates did not move much. The significant narrowing of spreads, (or risk premiums) made “spread duration” the more relevant driver of return.
Outlook
We believe the Fund’s approach tends to perform well in a range-bound, or moderately rising, interest rate environment. The Fund focuses on the income component of return by acquiring higher yielding, structured securities with a stable cash flow profile that tend to produce competitive relative returns in an economic environment characterized by moderately improving credit fundamentals.
Given the flat relative value landscape, producing outperformance relative to the Fund’s benchmark through sector allocation becomes increasingly difficult. In this environment, we believe opportunistic investing utilizing a bottom-up approach will be the key to generating competitive returns. We believe that the CMBS and ABS sectors currently offer the greatest opportunity. The agency MBS sectors, especially agency adjustable rate mortgages, are at risk of underperforming, and we will continue to reduce exposure to these sectors. Agency MBS are trading at historically high prices at a time when mortgage rates are at historically low levels. As capacity is added in the mortgage origination business, prepayment speeds are likely to increase, potentially putting pressure on MBS prices.
Risk premiums have contracted to extremely low levels in most sectors. So much so, that in some sectors the risk/return tradeoff is heavily skewed toward risk. It is hard to imagine security prices appreciating materially from current levels, but not impossible. We believe that the global slowdown, combined with the U.S. elections and a potential “fiscal cliff,” should increase investor focus on credit risk and that volatility will increase as the markets continue to ebb and flow.
Our outlook is for a generally weak recovery with baseline growth in the 2% range. Rates are likely to remain range-bound well into 2014 and possibly longer (the Fed is reaffirming low short-term rates into 2015).
With volatility currently at cycle lows and economic and political headwinds looming, we have adopted a somewhat more defensive posture. Duration is down slightly during the previous 12 months while cash equivalents have increased, potentially reducing the Fund’s overall risk profile. With many sectors appearing fully valued and volatility likely to increase, we believe there will be an opportunity to deploy cash at more attractive prices in the future.
| 56 |
Management's Discussion of Fund Performance (Unaudited) (Continued)
Comparison of the Change in Value of a $10,000 Investment in the Touchstone Ultra Short Duration Fixed Income Fund - Class A*, the BofA Merrill Lynch 3-Month U.S. Treasury Bill Index and the BofA Merrill Lynch 1-Year U.S. Treasury Note Index
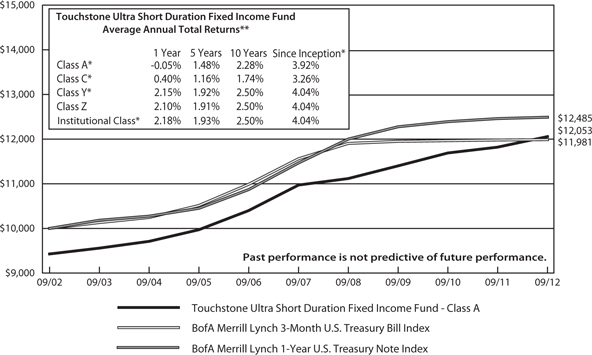
| * | The chart above represents performance for the Class A shares only, which will vary from the performance of Class C shares, Class Y shares, Institutional Class shares and Class Z shares based on the differences in loads and fees paid by shareholders in the different classes. The initial public offering of the Class Z shares commenced on March 1, 1994. The initial public offering of Class A, Class C , Class Y and Institutional Class shares commenced on April 16, 2012. Class A, Class C, Class Y and Institutional Class shares performance information is calculated using the historical performance of Class Z shares for the periods prior to April 16, 2012. The returns have been restated for sales charges and for fees applicable to Class A, Class C, Class Y and Institutional Class. |
| ** | The average annual total returns shown above are adjusted for maximum applicable sales charges, if applicable. |
The performance of the above Fund does not reflect the deduction of taxes that a shareholder would pay on Fund distributions or the redemption of Fund shares. Past performance is not predictive of future performance.
| 57 |
Tabular Presentation of Portfolios of Investments (Unaudited)
September 30, 2012
| Touchstone Emerging Markets Equity Fund | ||||
| Sector Allocation* | (% of Net Assets) | |||
| Financials | 21.0 | % | ||
| Consumer Discretionary | 15.9 | |||
| Materials | 13.3 | |||
| Consumer Staples | 11.2 | |||
| Energy | 11.1 | |||
| Information Technology | 9.9 | |||
| Telecommunication Services | 6.8 | |||
| Industrials | 4.7 | |||
| Utilities | 3.4 | |||
| Health Care | 1.2 | |||
| Investment Funds | 4.2 | |||
| Other Assets/Liabilities(Net) | (2.7 | ) | ||
| Total | 100.0 | % | ||
| Touchstone Focused Equity Fund | ||||
| Sector Allocation* | (% of Net Assets) | |||
| Financials | 20.2 | % | ||
| Consumer Discretionary | 15.3 | |||
| Information Technology | 14.8 | |||
| Industrials | 14.8 | |||
| Energy | 9.8 | |||
| Telecommunication Services | 7.2 | |||
| Health Care | 6.6 | |||
| Consumer Staples | 5.6 | |||
| Investment Funds | 7.3 | |||
| Other Assets/Liabilities (Net) | (1.6 | ) | ||
| Total | 100.0 | % | ||
| Touchstone Global Equity Fund | ||||
| Sector Allocation* | (% of Net Assets) | |||
| Materials | 20.5 | % | ||
| Health Care | 19.2 | |||
| Consumer Discretionary | 9.4 | |||
| Industrials | 8.6 | |||
| Energy | 8.4 | |||
| Information Technology | 8.4 | |||
| Consumer Staples | 8.3 | |||
| Telecommunication Services | 7.3 | |||
| Financials | 5.7 | |||
| Investment Funds | 8.4 | |||
| Other Assets/Liabilities(Net) | (4.2 | ) | ||
| Total | 100.0 | % | ||
* Sector Classifications are based upon the Global Industry Classification Standard (GICS®).
| 58 |
Tabular Presentation of Portfolios of Investments (Unaudited) (Continued)
| Touchstone Global Real Estate Fund | ||||
| Sector Allocation* | (% of Net Assets) | |||
| Retail | 27.9 | % | ||
| Specialized | 16.7 | |||
| Office | 15.1 | |||
| Diversified Real Estate Activities | 13.1 | |||
| Residential | 8.4 | |||
| Diversified REIT | 6.5 | |||
| Industrials | 3.9 | |||
| Real Estate Operating Companies | 2.6 | |||
| Real Estate Development | 2.5 | |||
| Mortgage | 0.8 | |||
| Hotels, Resorts & Cruise Lines | 0.6 | |||
| Investment Funds | 4.7 | |||
| Other Assets/Liabilities (Net) | (2.8 | ) | ||
| Total | 100.0 | % | ||
| Touchstone International Fixed Income Fund | ||||
| Credit Quality** | (% of Investment Securities) | |||
| AAA/Aaa | 44.8 | % | ||
| AA/Aa | 12.8 | |||
| A/A | 10.7 | |||
| BBB/Baa | 15.5 | |||
| BB/Ba | 5.0 | |||
| B/B | 1.6 | |||
| NR | 9.6 | |||
| Total | 100.0 | % | ||
| Touchstone Large Cap Relative Value Fund | ||||
| Sector Allocation* | (% of Net Assets) | |||
| Financials | 26.7 | % | ||
| Consumer Discretionary | 15.5 | |||
| Energy | 13.8 | |||
| Information Technology | 12.9 | |||
| Industrials | 11.5 | |||
| Health Care | 7.8 | |||
| Utilities | 4.4 | |||
| Materials | 2.8 | |||
| Consumer Staples | 1.9 | |||
| Investment Fund | 2.7 | |||
| Other Assets/Liabilities (Net) | 0.0 | |||
| Total | 100.0 | % | ||
* Sector Classifications are based upon the Global Industry Classification Standard (GICS®).
** Composite of Standard and Poors, Moody's and Fitch ratings
| 59 |
Tabular Presentation of Portfolios of Investments (Unaudited) (Continued)
| Touchstone Market Neutral Equity Fund | ||||
| Sector Allocation* | (% of Net Assets) | |||
| Long Positions | ||||
| Information Technology | 22.7 | % | ||
| Consumer Discretionary | 16.2 | |||
| Health Care | 13.2 | |||
| Energy | 12.5 | |||
| Financials | 11.6 | |||
| Industrials | 9.9 | |||
| Materials | 7.3 | |||
| Telecommunication Services | 0.9 | |||
| Utilities | 0.7 | |||
| Consumer Staples | 0.7 | |||
| Investment Fund | 1.9 | |||
| Cash Collateral for Securities Sold Short | 98.7 | |||
| Other Assets/Liabilities (Net) | (0.7 | ) | ||
| 195.6 | ||||
| Short Positions | ||||
| Information Technology | (19.4 | ) | ||
| Consumer Discretionary | (17.2 | ) | ||
| Health Care | (13.5 | ) | ||
| Financials | (12.3 | ) | ||
| Energy | (12.3 | ) | ||
| Industrials | (10.8 | ) | ||
| Materials | (7.0 | ) | ||
| Consumer Staples | (1.3 | ) | ||
| Utilities | (1.1 | ) | ||
| Telecommunication Services | (0.7 | ) | ||
| (95.6 | ) | |||
| Total | 100.0 | % | ||
| Touchstone Merger Arbitrage Fund | ||||
| Sector Allocation* | (% of Net Assets) | |||
| Long Positions | ||||
| Financials | 19.1 | % | ||
| Information Technology | 15.6 | |||
| Health Care | 14.3 | |||
| Industrials | 13.0 | |||
| Consumer Staples | 8.1 | |||
| Consumer Discretionary | 7.1 | |||
| Energy | 6.1 | |||
| Utilities | 3.5 | |||
| Materials | 2.6 | |||
| Other | 3.6 | |||
| Investment Funds | 4.1 | |||
| Cash Collateral for Securities Sold Short | 13.8 | |||
| Other Assets/Liabilities (Net) | 5.5 | |||
| 116.4 | ||||
| Short Positions | ||||
| Financials | (3.6 | ) | ||
| Consumer Staples | (2.9 | ) | ||
| Consumer Discretionary | (2.6 | ) | ||
| Utilities | (2.2 | ) | ||
| Industrials | (1.8 | ) | ||
| Energy | (1.2 | ) | ||
| Health Care | (1.2 | ) | ||
| Information Technology | (0.9 | ) | ||
| (16.4 | ) | |||
| Total | 100.0 | % | ||
* Sector Classifications are based upon the Global Industry Classification Standard (GICS®).
| 60 |
Tabular Presentation of Portfolios of Investments (Unaudited) (Continued)
| Touchstone Mid Cap Fund | ||||
| Sector Allocation* | (% of Net Assets) | |||
| Financials | 21.6 | % | ||
| Consumer Discretionary | 20.5 | |||
| Consumer Staples | 17.1 | |||
| Materials | 15.1 | |||
| Industrials | 7.6 | |||
| Information Technology | 7.4 | |||
| Energy | 5.7 | |||
| Health Care | 2.5 | |||
| Investment Funds | 6.2 | |||
| Other Assets/Liabilities (Net) | (3.7 | ) | ||
| Total | 100.0 | % | ||
| Touchstone Mid Cap Value Fund | ||||
| Sector Allocation* | (% of Net Assets) | |||
| Financials | 20.8 | % | ||
| Information Technology | 11.6 | |||
| Industrials | 10.6 | |||
| Consumer Staples | 9.8 | |||
| Consumer Discretionary | 9.7 | |||
| Utilities | 9.4 | |||
| Materials | 9.2 | |||
| Health Care | 8.7 | |||
| Energy | 7.1 | |||
| Exchange Traded Fund | 1.0 | |||
| Investment Fund | 1.8 | |||
| Other Assets/Liabilities (Net) | 0.3 | |||
| Total | 100.0 | % | ||
| Touchstone Premium Yield Equity Fund | ||||
| Sector Allocation* | (% of Net Assets) | |||
| Energy | 22.5 | % | ||
| Health Care | 18.1 | |||
| Utilities | 15.8 | |||
| Financials | 12.3 | |||
| Information Technology | 8.4 | |||
| Telecommunication Services | 7.9 | |||
| Industrials | 5.2 | |||
| Materials | 3.9 | |||
| Consumer Staples | 1.8 | |||
| Investment Fund | 13.8 | |||
| Other Assets/Liabilities (Net) | (9.7 | ) | ||
| Total | 100.0 | % | ||
| Touchstone Sands Capital Select Growth Fund | ||||
| Sector Allocation* | (% of Net Assets) | |||
| Information Technology | 42.2 | % | ||
| Consumer Discretionary | 21.7 | |||
| Health Care | 16.3 | |||
| Energy | 10.2 | |||
| Industrials | 2.8 | |||
| Materials | 2.7 | |||
| Financials | 2.3 | |||
| Investment Funds | 4.9 | |||
| Other Assets/Liabilities (Net) | (3.1 | ) | ||
| Total | 100.0 | % | ||
* Sector Classifications are based upon the Global Industry Classification Standard (GICS®).
| 61 |
Tabular Presentation of Portfolios of Investments (Unaudited) (Continued)
| Touchstone Short Duration Fixed Income Fund | ||||
| Credit Quality** | (% of Investment Securities) | |||
| AAA | 74.3 | % | ||
| AA | 5.3 | |||
| A | 9.6 | |||
| BBB | 10.8 | |||
| Total | 100.0 | % | ||
| Touchstone Small Cap Core Fund | ||||
| Sector Allocation* | (% of Net Assets) | |||
| Financials | 23.4 | % | ||
| Industrials | 16.8 | |||
| Consumer Discretionary | 15.5 | |||
| Materials | 12.5 | |||
| Consumer Staples | 9.6 | |||
| Energy | 8.5 | |||
| Information Technology | 8.1 | |||
| Health Care | 3.0 | |||
| Investment Funds | 12.5 | |||
| Other Assets/Liabilities (Net) | (9.9 | ) | ||
| Total | 100.0 | % | ||
| Touchstone Small Cap Value Fund | ||||
| Sector Allocation* | (% of Net Assets) | |||
| Financials | 24.2 | % | ||
| Industrials | 20.3 | |||
| Consumer Discretionary | 11.2 | |||
| Materials | 10.8 | |||
| Information Technology | 10.3 | |||
| Energy | 9.6 | |||
| Health Care | 4.9 | |||
| Consumer Staples | 4.8 | |||
| Utilities | 2.4 | |||
| Investment Funds | 13.0 | |||
| Other Assets/Liabilities (Net) | (11.5 | ) | ||
| Total | 100.0 | % | ||
| Touchstone Total Return Bond Fund | ||||
| Credit Quality** | (% of Investment Securities) | |||
| Aaa | 65.1 | % | ||
| Aa | 2.9 | |||
| A | 13.3 | |||
| Baa | 12.1 | |||
| Ba | 3.2 | |||
| B | 1.8 | |||
| N/R | 1.6 | |||
| Total | 100.0 | % | ||
| Touchstone Ultra Short Duration Fixed Income Fund | ||||
| Credit Quality** | (% of Investment Securities) | |||
| AAA | 40.0 | % | ||
| AA | 17.1 | |||
| A | 12.9 | |||
| BBB | 20.8 | |||
| N/A | 9.2 | |||
| Total | 100.0 | % | ||
* Sector Classifications are based upon the Global Industry Classification Standard (GICS®).
** Composite of Standard and Poors, Moody's and Fitch ratings
| 62 |
Portfolio of Investments
Touchstone Emerging Markets Equity Fund – September 30, 2012
| Market | ||||||||
| Shares | Value | |||||||
| Common Stocks — 98.5% | ||||||||
| Brazil — 10.9% | ||||||||
| All America Latina Logistica SA | 970,553 | $ | 3,988,017 | |||||
| Banco Bradesco SA (Preference) | 481,594 | 7,718,332 | ||||||
| Cia Energetica de Minas Gerais (Preference) | 441,996 | 5,363,467 | ||||||
| Gerdau SA (Preference) | 590,531 | 5,589,981 | ||||||
| Lojas Americanas SA (Preference) | 1,051,533 | 8,174,696 | ||||||
| Lojas Renner SA | 371,573 | 12,335,362 | ||||||
| Petroleo Brasileiro SA (Preference) | 736,359 | 8,118,201 | ||||||
| Vale SA ADR | 176,873 | 3,166,027 | ||||||
| Vale SA (Preference) | 201,075 | 3,494,326 | ||||||
| 57,948,409 | ||||||||
| South Africa — 8.8% | ||||||||
| Aveng Ltd. | 1,351,017 | 5,079,097 | ||||||
| Foschini Group Ltd. | 679,305 | 10,325,469 | ||||||
| Impala Platinum Holdings Ltd. | 220,234 | 3,678,064 | ||||||
| JD Group Ltd. | 762,648 | 4,260,859 | ||||||
| Massmart Holdings Ltd. | 177,734 | 3,564,290 | ||||||
| MTN Group Ltd. | 378,318 | 7,282,269 | ||||||
| Woolworths Holdings Ltd. | 1,712,141 | 12,505,233 | ||||||
| 46,695,281 | ||||||||
| India — 8.3% | ||||||||
| Bharat Forge Ltd. | 916,716 | 5,310,505 | ||||||
| Bharat Heavy Electricals Ltd. | 1,012,322 | 4,739,651 | ||||||
| Bharti Airtel Ltd. | 1,427,568 | 7,184,528 | ||||||
| ITC Ltd. | 1,863,793 | 9,625,504 | ||||||
| Mahindra & Mahindra Ltd. | 379,966 | 6,229,152 | ||||||
| Oil & Natural Gas Corp. Ltd. | 1,126,870 | 6,000,217 | ||||||
| Reliance Industries Ltd. | 272,788 | 4,329,853 | ||||||
| Reliance Industries Ltd. GDR, 144a | 13,890 | 437,257 | ||||||
| 43,856,667 | ||||||||
| Mexico — 6.6% | ||||||||
| America Movil SAB de CV, Series L ADR | 247,944 | 6,307,695 | ||||||
| Fomento Economico Mexicano SAB de CV ADR | 60,643 | 5,577,943 | ||||||
| Grupo Financiero Banorte SAB de CV - Class O | 1,422,920 | 8,042,219 | ||||||
| Kimberly-Clark de Mexico SAB de CV - Class A | 3,338,097 | 7,971,962 | ||||||
| Wal-Mart de Mexico SAB de CV - Class A | 2,435,559 | 6,859,131 | ||||||
| 34,758,950 | ||||||||
| Cayman Islands — 5.8% | ||||||||
| ASM Pacific Technology Ltd.† | 1,050,281 | 12,427,477 | ||||||
| Daphne International Holdings Ltd. | 9,006,245 | 9,036,386 | ||||||
| Tingyi Cayman Islands Holding Corp. | 3,141,810 | 9,461,025 | ||||||
| 30,924,888 | ||||||||
| Thailand — 5.7% | ||||||||
| Kasikornbank PCL | 1,947,216 | 11,545,384 | ||||||
| PTT Exploration & Production PCL | 1,265,770 | 6,682,509 | ||||||
| Siam Cement PCL | 251,214 | 3,248,316 | ||||||
| Siam Cement PCL (Non-Voting) | 316,525 | 3,588,929 | ||||||
| Thai Oil PCL | 2,476,323 | 5,249,515 | ||||||
| 30,314,653 | ||||||||
| Bermuda — 5.7% | ||||||||
| Credicorp Ltd. | 68,001 | 8,519,165 | ||||||
| First Pacific Co. Ltd. | 8,626,867 | 9,378,904 | ||||||
| Ports Design Ltd. | 46 | 36 | ||||||
| VTech Holdings Ltd.† | 989,352 | 12,121,206 | ||||||
| 30,019,311 | ||||||||
| Hong Kong — 5.2% | ||||||||
| China Overseas Land & Investment Ltd. | 3,653,461 | 9,291,435 | ||||||
| CNOOC Ltd. | 4,002,577 | 8,207,450 | ||||||
| Wharf Holdings Ltd. | 1,413,327 | 9,815,214 | ||||||
| 27,314,099 | ||||||||
| Taiwan — 4.9% | ||||||||
| Giant Manufacturing Co. Ltd. | 1,706,230 | 9,051,078 | ||||||
| Taiwan Semiconductor Manufacturing Co. Ltd. | 3,537,155 | 10,835,844 | ||||||
| Tripod Technology Corp. | 2,529,208 | 6,212,256 | ||||||
| 26,099,178 | ||||||||
| China — 4.6% | ||||||||
| China BlueChemical Ltd. | 8,839,568 | 5,232,571 | ||||||
| Industrial & Commercial Bank of China - Class H | 14,078,661 | 8,315,689 | ||||||
| PetroChina Co. Ltd. - Class H | 4,060,145 | 5,319,939 | ||||||
| Weichai Power Co. Ltd. - Class H† | 1,859,279 | 5,694,816 | ||||||
| 24,563,015 | ||||||||
| Korea — 4.4% | ||||||||
| BS Financial Group, Inc. | 529,727 | 5,719,436 | ||||||
| POSCO | 9,314 | 3,062,975 | ||||||
| Samsung Electronics Co. Ltd. | 8,804 | 10,662,154 | ||||||
| Shinhan Financial Group Co. Ltd. | 120,166 | 4,103,111 | ||||||
| 23,547,676 | ||||||||
| Turkey — 4.4% | ||||||||
| Akbank TAS | 1,119,280 | 4,421,693 | ||||||
| Trakya Cam Sanayi AS* | 4,604,745 | 5,201,076 | ||||||
| Tupras Turkiye Petrol Rafine | 233,712 | 5,331,585 | ||||||
| Turkcell Iletisim Hizmetleri AS* | 977,074 | 5,952,962 | ||||||
| Turkiye Garanti Bankasi AS | 591,982 | 2,470,366 | ||||||
| 23,377,682 | ||||||||
| Indonesia — 3.5% | ||||||||
| Bank Mandiri Tbk PT | 10,910,902 | 9,348,944 | ||||||
| Telekomunikasi Indonesia Tbk PT | 9,387,870 | 9,270,154 | ||||||
| 18,619,098 | ||||||||
| United Kingdom — 3.4% | ||||||||
| Fresnillo PLC | 310,562 | 9,292,741 | ||||||
| SABMiller PLC | 203,402 | 8,933,964 | ||||||
| 18,226,705 | ||||||||
| Malaysia — 2.5% | ||||||||
| British American Tobacco Malaysia Bhd | 368,903 | 7,289,953 | ||||||
| 63 |
Touchstone Emerging Markets Equity Fund (Continued)
| Market | ||||||||
| Shares | Value | |||||||
| Common Stocks — 98.5% (Continued) | ||||||||
| Malaysia — (Continued) | ||||||||
| CIMB Group Holdings Bhd | 2,434,293 | $ | 5,973,237 | |||||
| 13,263,190 | ||||||||
| Canada — 2.3% | ||||||||
| Eldorado Gold Corp.† | 465,212 | 7,093,406 | ||||||
| Yamana Gold, Inc. | 276,453 | 5,281,037 | ||||||
| 12,374,443 | ||||||||
| Jersey — 2.1% | ||||||||
| Randgold Resources Ltd. ADR | 90,764 | 11,163,971 | ||||||
| Luxembourg — 1.8% | ||||||||
| Tenaris SA ADR† | 230,028 | 9,378,242 | ||||||
| South Korea — 1.4% | ||||||||
| Hankook Tire Co. Ltd.± | 194,973 | 7,297,728 | ||||||
| Singapore — 1.3% | ||||||||
| Keppel Land Ltd. | 2,287,589 | 6,617,455 | ||||||
| Czech Republic — 1.3% | ||||||||
| CEZ AS* | 177,078 | 6,607,209 | ||||||
| Israel — 1.2% | ||||||||
| Teva Pharmaceutical Industries Ltd. ADR | 155,196 | 6,426,666 | ||||||
| Peru — 1.2% | ||||||||
| Cia de Minas Buenaventura SA ADR | 164,441 | 6,406,621 | ||||||
| Chile — 1.1% | ||||||||
| Enersis SA | 18,538,207 | 6,054,863 | ||||||
| United States — 0.1% | ||||||||
| Southern Copper Corp. | 9,925 | 341,022 | ||||||
| Total Common Stocks | $ | 522,197,022 | ||||||
| Investment Funds — 4.2% | ||||||||
| Invesco Government & Agency Portfolio** | 22,265,716 | 22,265,716 | ||||||
| Touchstone Institutional Money Market Fund^ | 603 | 603 | ||||||
| Total Investment Funds | $ | 22,266,319 | ||||||
| Total Investment Securities —102.7% | ||||||||
| (Cost $543,691,061) | $ | 544,463,341 | ||||||
| Liabilities in Excess of Other Assets — (2.7%) | (14,288,357 | ) | ||||||
| Net Assets — 100.0% | $ | 530,174,984 | ||||||
| † | All or a portion of the security is on loan. The total value of the securities on loan as of September 30, 2012 was $21,181,186. |
| * | Non-income producing security. |
| ** | Represents collateral for securities loaned. |
| ^ | Affiliated Fund. See Note 4 in Notes to Financial Statements. |
| ± | Fair valued security by Fund's Investment Advisor. |
Portfolio Abbreviations:
ADR - American Depositary Receipt
GDR - Global Depositary Receipt
PCL - Public Company Limited
PLC - Public Limited Company
144A - This is a restricted security that was sold in a transaction exempt from Rule 144A of the Securities Act of 1933. This security may be sold in transactions exempt from registration, normally to qualified institutional buyers. At September 30, 2012, these securities were valued at $437,257 or 0.08% of net assets. These securities were deemed liquid pursuant to procedures approved by the Board of Trustees.
Other Information:
The inputs or methodology used for valuing securities may not be an indication of the risk associated with investing in those securities. For more information on valuation inputs, and their aggregation into the levels used in the table below, please refer to the security valuation section in the accompanying Notes to Financial Statements.
| 64 |
Touchstone Emerging Markets Equity Fund (Continued)
Valuation inputs at Reporting Date:
| Description | Level 1 | Level 2 | Level 3 | Total | ||||||||||||
| Common Stocks | ||||||||||||||||
| Brazil | $ | 57,948,409 | $ | — | $ | — | $ | 57,948,409 | ||||||||
| South Africa | 46,695,281 | — | — | 46,695,281 | ||||||||||||
| India | 43,856,667 | — | — | 43,856,667 | ||||||||||||
| Mexico | 34,758,950 | — | — | 34,758,950 | ||||||||||||
| Cayman Islands | 30,924,888 | — | — | 30,924,888 | ||||||||||||
| Thailand | 30,314,653 | — | — | 30,314,653 | ||||||||||||
| Bermuda | 30,019,311 | — | — | 30,019,311 | ||||||||||||
| Hong Kong | 27,314,099 | — | — | 27,314,099 | ||||||||||||
| Taiwan | 26,099,178 | — | — | 26,099,178 | ||||||||||||
| China | 24,563,015 | — | — | 24,563,015 | ||||||||||||
| Korea | 23,547,676 | — | — | 23,547,676 | ||||||||||||
| Turkey | 23,377,682 | — | — | 23,377,682 | ||||||||||||
| Indonesia | 18,619,098 | — | — | 18,619,098 | ||||||||||||
| United Kingdom | 18,226,705 | — | — | 18,226,705 | ||||||||||||
| Malaysia | 13,263,190 | — | — | 13,263,190 | ||||||||||||
| Canada | 12,374,443 | — | — | 12,374,443 | ||||||||||||
| Jersey | 11,163,971 | — | — | 11,163,971 | ||||||||||||
| Luxembourg | 9,378,242 | — | — | 9,378,242 | ||||||||||||
| South Korea | — | — | 7,297,728 | 7,297,728 | ||||||||||||
| Singapore | 6,617,455 | — | — | 6,617,455 | ||||||||||||
| Czech Republic | 6,607,209 | — | — | 6,607,209 | ||||||||||||
| Israel | 6,426,666 | — | — | 6,426,666 | ||||||||||||
| Peru | 6,406,621 | — | — | 6,406,621 | ||||||||||||
| Chile | 6,054,863 | — | — | 6,054,863 | ||||||||||||
| United States | 341,022 | — | — | 341,022 | ||||||||||||
| Investment Funds | 22,266,319 | — | — | 22,266,319 | ||||||||||||
| $ | 544,463,341 | |||||||||||||||
At September 30, 2012 securities valued at $120,295,762 were transferred from Level 2 to Level 1 pursuant to the Fund's fair valuation policy.
Level 3 Rollforward Disclosure
The following is a rollforward of the Fund's investments that were valued using unobservable inputs for the year ended September 30, 2012:
Measurements Using Unobservable Inputs (Level 3)
| Common Stock | ||||||||
| South | ||||||||
| Assets | Korea | Total | ||||||
| Beginning balance | $ | — | $ | — | ||||
| Gross transfers into Level 3 | 7,297,728 | (a) | 7,297,728 | |||||
| Ending balance | $ | 7,297,728 | $ | 7,297,728 | ||||
The change in unrealized appreciation/depreciation relating to the Level 3 investments held at September 30, 2012 was ($529,048).
(a)Transferred from Level 1 to Level 3 due to lack of observable valuation inputs.
| Valuation | Unobservable | |||||||||
| Common Stocks | Fair Value | Technique | Input | |||||||
| Hankook Tire Co. Ltd | $ | 7,297,728 | Last sales price | Company Restructuring | ||||||
See accompanying Notes to Financial Statements.
| 65 |
Portfolio of Investments
Touchstone Focused Equity Fund – September 30, 2012
| Market | ||||||||
| Shares | Value | |||||||
| Common Stocks — 94.3% | ||||||||
| Financials — 20.2% | ||||||||
| Allstate Corp. (The) | 155,399 | $ | 6,155,354 | |||||
| Bank of America Corp. | 599,353 | 5,292,288 | ||||||
| Bank of New York Mellon Corp. (The) | 142,209 | 3,216,768 | ||||||
| Fidelity National Financial, Inc. - Class A | 108,497 | 2,320,751 | ||||||
| Goldman Sachs Group, Inc. (The) | 39,103 | 4,445,229 | ||||||
| 21,430,390 | ||||||||
| Consumer Discretionary — 15.3% | ||||||||
| Carnival Corp. | 73,794 | 2,689,053 | ||||||
| International Speedway Corp. - Class A | 57,276 | 1,624,920 | ||||||
| Lowe's Cos, Inc. | 58,110 | 1,757,246 | ||||||
| Royal Caribbean Cruises Ltd. | 61,133 | 1,846,828 | ||||||
| Sotheby's | 23,855 | 751,432 | ||||||
| Speedway Motorsports, Inc. | 107,360 | 1,653,344 | ||||||
| Time Warner Cable, Inc. | 62,096 | 5,902,846 | ||||||
| 16,225,669 | ||||||||
| Information Technology — 14.8% | ||||||||
| Adobe Systems, Inc.* | 68,043 | 2,208,676 | ||||||
| Apple, Inc. | 6,194 | 4,133,008 | ||||||
| Arrow Electronics, Inc.* | 61,881 | 2,086,009 | ||||||
| Google, Inc. - Class A* | 5,099 | 3,847,196 | ||||||
| Hewlett-Packard Co. | 107,821 | 1,839,426 | ||||||
| Microsoft Corp. | 55,036 | 1,638,972 | ||||||
| 15,753,287 | ||||||||
| Industrials — 14.8% | ||||||||
| Alliant Techsystems, Inc. | 85,106 | 4,264,662 | ||||||
| Gardner Denver, Inc. | 33,467 | 2,021,741 | ||||||
| Kennametal, Inc. | 26,546 | 984,326 | ||||||
| Oshkosh Corp.* | 122,005 | 3,346,597 | ||||||
| Universal Forest Products, Inc. | 122,029 | 5,069,085 | ||||||
| 15,686,411 | ||||||||
| Energy — 9.8% | ||||||||
| Devon Energy Corp. | 39,693 | 2,401,426 | ||||||
| Exxon Mobil Corp. | 33,085 | 3,025,623 | ||||||
| Halliburton Co. | 45,436 | 1,530,739 | ||||||
| National Oilwell Varco., Inc. | 22,507 | 1,803,036 | ||||||
| World Fuel Services Corp. | 45,423 | 1,617,513 | ||||||
| 10,378,337 | ||||||||
| Telecommunication Services — 7.2% | ||||||||
| France Telecom SA ADR† | 198,985 | 2,431,597 | ||||||
| KDDI Corp. ADR | 269,735 | 5,219,372 | ||||||
| 7,650,969 | ||||||||
| Health Care — 6.6% | ||||||||
| Owens & Minor, Inc. | 84,658 | 2,529,581 | ||||||
| WellPoint, Inc. | 77,237 | 4,480,518 | ||||||
| 7,010,099 | ||||||||
| Consumer Staples — 5.6% | ||||||||
| Energizer Holdings, Inc. | 15,273 | 1,139,519 | ||||||
| Sysco Corp. | 107,201 | 3,352,175 | ||||||
| TESCO PLC ADR | 88,564 | 1,432,966 | ||||||
| 5,924,660 | ||||||||
| Total Common Stocks | $ | 100,059,822 | ||||||
| Investment Funds — 7.3% | ||||||||
| Invesco Government & Agency Portfolio** | 2,541,236 | 2,541,236 | ||||||
| Touchstone Institutional Money Market Fund^ | 5,180,604 | 5,180,604 | ||||||
| Total Investment Funds | $ | 7,721,840 | ||||||
| Total Investment Securities —101.6% | ||||||||
| (Cost $106,243,292) | $ | 107,781,662 | ||||||
| Liabilities in Excess of Other Assets — (1.6%) | (1,681,754 | ) | ||||||
| Net Assets — 100.0% | $ | 106,099,908 | ||||||
| † | All or a portion of the security is on loan. The total value of the securities on loan as of September 30, 2012 was $2,407,279. |
| * | Non-income producing security. |
| ** | Represents collateral for securities loaned. |
| ^ | Affiliated Fund. See Note 4 in Notes to Financial Statements. |
Portfolio Abbreviations:
ADR - American Depositary Receipt
PLC - Public Limited Company
| 66 |
Touchstone Focused Equity Fund (Continued)
Other Information:
The inputs or methodology used for valuing securities may not be an indication of the risk associated with investing in those securities. For more information on valuation inputs, and their aggregation into the levels used in the table below, please refer to the security valuation section in the accompanying Notes to Financial Statements.
Valuation inputs at Reporting Date:
| Description | Level 1 | Level 2 | Level 3 | Total | ||||||||||||
| Common Stocks | $ | 100,059,822 | $ | — | $ | — | $ | 100,059,822 | ||||||||
| Investment Funds | 7,721,840 | — | — | 7,721,840 | ||||||||||||
| $ | 107,781,662 | |||||||||||||||
See accompanying Notes to Financial Statements.
| 67 |
Portfolio of Investments
Touchstone Global Equity Fund – September 30, 2012
| Market | ||||||||
| Shares | Value | |||||||
| Preferred Stocks — 1.5% | ||||||||
| Germany — 1.5% | ||||||||
| Henkel AG & Co. KGaA | 3,868 | $ | 307,629 | |||||
| Common Stocks — 94.3% | ||||||||
| United States — 25.6% | ||||||||
| AGCO Corp.* | 9,624 | 456,948 | ||||||
| Bristol-Myers Squibb Co. | 19,072 | 643,680 | ||||||
| Celgene Corp.* | 8,553 | 653,449 | ||||||
| DreamWorks Animation SKG, Inc. - Class A†* | 18,030 | 346,717 | ||||||
| Medtronic, Inc. | 12,797 | 551,807 | ||||||
| Mosaic Co. (The) | 8,841 | 509,330 | ||||||
| Pfizer, Inc. | 26,482 | 658,078 | ||||||
| Shuffle Master, Inc.* | 21,756 | 343,962 | ||||||
| Southwestern Energy Co.* | 12,491 | 434,437 | ||||||
| Ultra Petroleum Corp.†* | 19,326 | 424,785 | ||||||
| Wolverine World Wide, Inc. | 7,182 | 318,665 | ||||||
| 5,341,858 | ||||||||
| Japan — 12.6% | ||||||||
| Konami Corp. | 18,300 | 415,760 | ||||||
| Mitsubishi Estate Co. Ltd. | 22,500 | 430,741 | ||||||
| Otsuka Corp. | 3,600 | 322,911 | ||||||
| SBI Holdings, Inc. | 50,720 | 326,911 | ||||||
| Softbank Corp. | 13,600 | 550,692 | ||||||
| Yahoo! Japan Corp. | 1,528 | 582,105 | ||||||
| 2,629,120 | ||||||||
| United Kingdom — 12.1% | ||||||||
| BG Group PLC | 24,266 | 489,811 | ||||||
| Cairn Energy PLC | 91,982 | 408,615 | ||||||
| Fresnillo PLC | 29,004 | 867,867 | ||||||
| Rexam PLC | 62,003 | 435,434 | ||||||
| Smith & Nephew PLC | 29,058 | 320,719 | ||||||
| 2,522,446 | ||||||||
| Switzerland — 7.9% | ||||||||
| Lonza Group AG | 8,691 | 454,556 | ||||||
| Syngenta AG | 1,477 | 552,010 | ||||||
| Tyco International Ltd. | 11,493 | 646,596 | ||||||
| 1,653,162 | ||||||||
| France — 6.8% | ||||||||
| Nexans SA | 8,505 | 399,358 | ||||||
| Saft Groupe SA | 12,744 | 295,190 | ||||||
| Sanofi | 8,504 | 725,077 | ||||||
| 1,419,625 | ||||||||
| Canada — 5.1% | ||||||||
| Goldcorp, Inc. | 11,758 | 539,104 | ||||||
| Yamana Gold, Inc.† | 28,040 | 535,844 | ||||||
| 1,074,948 | ||||||||
| Taiwan — 4.3% | ||||||||
| Far EasTone Telecommunications Co. Ltd. | 187,000 | 462,500 | ||||||
| Giant Manufacturing Co. Ltd. | 83,000 | 440,292 | ||||||
| 902,792 | ||||||||
| Germany — 2.9% | ||||||||
| Gerry Weber International AG | 7,047 | 291,233 | ||||||
| Symrise AG | 9,417 | 318,870 | ||||||
| 610,103 | ||||||||
| Hong Kong — 2.5% | ||||||||
| Hutchison Telecommunications Hong Kong Holdings Ltd. | 1,176,000 | 520,204 | ||||||
| Denmark — 2.5% | ||||||||
| Carlsberg A/S - Class B | 5,849 | 518,208 | ||||||
| Norway — 2.5% | ||||||||
| Yara International ASA | 10,302 | 516,098 | ||||||
| Sweden — 2.1% | ||||||||
| Kinnevik Investment AB - Class B | 20,658 | 428,960 | ||||||
| Israel — 2.1% | ||||||||
| Check Point Software Technologies Ltd.* | 8,897 | 428,480 | ||||||
| Netherlands — 2.0% | ||||||||
| Koninklijke Ahold NV | 32,908 | 412,185 | ||||||
| Luxembourg — 1.4% | ||||||||
| Oriflame Cosmetics SA-SDR | 8,840 | 302,660 | ||||||
| Cambodia — 1.0% | ||||||||
| NagaCorp Ltd. | 390,637 | 219,146 | ||||||
| Australia — 0.9% | ||||||||
| Australian Agricultural Co. Ltd.* | 145,720 | 193,479 | ||||||
| Total Common Stocks | $ | 19,693,474 | ||||||
| Investment Funds — 8.4% | ||||||||
| Invesco Government & Agency Portfolio** | 970,747 | 970,747 | ||||||
| Touchstone Institutional Money Market Fund^ | 778,516 | 778,516 | ||||||
| Total Investment Funds | $ | 1,749,263 | ||||||
| Total Investment Securities —104.2% | ||||||||
| (Cost $21,281,276) | $ | 21,750,366 | ||||||
| Liabilities in Excess of Other Assets — (4.2%) | (877,066 | ) | ||||||
| Net Assets — 100.0% | $ | 20,873,300 | ||||||
| † | All or a portion of the security is on loan. The total value of the securities on loan as of September 30, 2012 was $949,161. |
| * | Non-income producing security. |
| 68 |
Touchstone Global Equity Fund (Continued)
| ** | Represents collateral for securities loaned. |
| ^ | Affiliated Fund. See Note 4 in Notes to Financial Statements. |
Portfolio Abbreviations:
ADR - American Depositary Receipt
PLC - Public Limited Company
SDR - Stockholm Depository Receipt
Other Information:
The inputs or methodology used for valuing securities may not be an indication of the risk associated with investing in those securities. For more information on valuation inputs, and their aggregation into the levels used in the table below, please refer to the security valuation section in the accompanying Notes to Financial Statements.
Valuation inputs at Reporting Date:
| Description | Level 1 | Level 2 | Level 3 | Total | ||||||||||||
| Common Stocks | $ | 19,693,474 | $ | — | $ | — | $ | 19,693,474 | ||||||||
| Preferred Stocks | 307,629 | — | — | 307,629 | ||||||||||||
| Investment Funds | 1,749,263 | — | — | 1,749,263 | ||||||||||||
| $ | 21,750,366 | |||||||||||||||
At September 30,2012 securities valued at $7,612,766 were transferred from Level 2 to Level 1 pursuant to Fund's fair valuation policy.
See accompanying Notes to Financial Statements.
| 69 |
Portfolio of Investments
Touchstone Global Real Estate Fund – September 30, 2012
| Market | ||||||||
| Shares | Value | |||||||
| Common Stocks — 98.1% | ||||||||
| United States — 48.3% | ||||||||
| Acadia Realty Trust REIT | 8,710 | $ | 216,182 | |||||
| American Capital Agency Corp. REIT | 5,310 | 183,673 | ||||||
| Apartment Investment & Management Co. REIT | 12,050 | 313,180 | ||||||
| AvalonBay Communities, Inc. REIT | 2,610 | 354,934 | ||||||
| Boston Properties, Inc. REIT | 5,275 | 583,468 | ||||||
| Camden Property Trust REIT | 6,440 | 415,316 | ||||||
| Coresite Realty Corp. REIT | 4,580 | 123,385 | ||||||
| DDR Corp. REIT | 17,560 | 269,722 | ||||||
| Digital Realty Trust, Inc. REIT | 1,750 | 122,238 | ||||||
| Douglas Emmett, Inc. REIT | 21,260 | 490,468 | ||||||
| Extra Space Storage, Inc. REIT | 28,560 | 949,620 | ||||||
| First Industrial Realty Trust, Inc. REIT* | 7,850 | 103,149 | ||||||
| General Growth Properties, Inc. REIT | 13,800 | 268,824 | ||||||
| HCP, Inc. REIT | 11,650 | 518,192 | ||||||
| Health Care REIT, Inc. | 7,380 | 426,195 | ||||||
| Home Properties, Inc. REIT | 5,750 | 352,302 | ||||||
| Host Hotels & Resorts, Inc. REIT | 6,643 | 106,620 | ||||||
| Kimco Realty Corp. REIT | 14,105 | 285,908 | ||||||
| Macerich Co. (The) REIT | 4,444 | 254,330 | ||||||
| Post Properties, Inc. REIT | 5,540 | 265,698 | ||||||
| ProLogis, Inc. REIT | 9,838 | 344,625 | ||||||
| Public Storage REIT | 4,515 | 628,353 | ||||||
| Rayonier, Inc. REIT | 5,270 | 258,283 | ||||||
| Simon Property Group, Inc. REIT | 9,436 | 1,432,479 | ||||||
| SL Green Realty Corp. REIT | 9,790 | 783,885 | ||||||
| Starwood Hotels & Resorts Worldwide, Inc. | 2,350 | 136,206 | ||||||
| Strategic Hotels & Resorts, Inc. REIT* | 30,730 | 184,687 | ||||||
| Sunstone Hotel Investors, Inc. REIT* | 19,760 | 217,360 | ||||||
| Ventas, Inc. REIT | 11,842 | 737,164 | ||||||
| Weingarten Realty Investors REIT | 10,270 | 288,690 | ||||||
| 11,615,136 | ||||||||
| Hong Kong — 11.7% | ||||||||
| Champion REIT | 541,000 | 246,986 | ||||||
| Cheung Kong Holdings Ltd. | 20,100 | 294,732 | ||||||
| China Overseas Land & Investment Ltd. | 40,600 | 103,253 | ||||||
| Hang Lung Properties Ltd. | 139,200 | 475,726 | ||||||
| Hongkong Land Holdings Ltd. | 21,065 | 126,601 | ||||||
| Link REIT (The) | 60,800 | 288,159 | ||||||
| Sun Hung Kai Properties Ltd. | 51,380 | 752,738 | ||||||
| Wharf Holdings Ltd. | 51,199 | 355,565 | ||||||
| Yuexiu Real Estate Investment Trust REIT | 361,000 | 176,448 | ||||||
| 2,820,208 | ||||||||
| Japan — 9.1% | ||||||||
| Frontier Real Estate Investment Corp. REIT | 14 | 122,527 | ||||||
| Japan Real Estate Investment Corp. REIT | 26 | 261,866 | ||||||
| Japan Retail Fund Investment Corp. REIT | 128 | 228,806 | ||||||
| Kenedix Realty Investment Corp. | 41 | 147,787 | ||||||
| Mitsubishi Estate Co., Ltd. | 28,600 | 547,519 | ||||||
| Mitsui Fudosan Co., Ltd. | 22,650 | 453,639 | ||||||
| Mori Trust Sogo REIT, Inc. | 13 | 116,440 | ||||||
| Nippon Building Fund, Inc. REIT | 12 | 129,318 | ||||||
| Sumitomo Realty & Development Co., Ltd. | 7,100 | 188,508 | ||||||
| 2,196,410 | ||||||||
| Singapore — 6.9% | ||||||||
| Ascendas Real Estate Investment Trust REIT | 112,800 | 221,519 | ||||||
| CapitaLand Ltd. | 143,300 | 371,328 | ||||||
| CapitaMall Trust REIT | 201,000 | 330,851 | ||||||
| Global Logistic Properties Ltd. | 135,250 | 276,628 | ||||||
| Keppel Land Ltd. | 75,000 | 216,957 | ||||||
| Suntec Real Estate Investment Trust REIT | 207,000 | 250,485 | ||||||
| 1,667,768 | ||||||||
| Australia — 5.6% | ||||||||
| Charter Hall Retail REIT | 35,700 | 127,019 | ||||||
| Goodman Group REIT | 68,236 | 280,294 | ||||||
| Stockland REIT | 69,700 | 241,482 | ||||||
| Westfield Group REIT | 66,920 | 705,268 | ||||||
| 1,354,063 | ||||||||
| United Kingdom — 5.6% | ||||||||
| British Land Co. PLC REIT | 43,572 | 367,281 | ||||||
| Derwent London PLC REIT | 9,120 | 288,061 | ||||||
| Development Securities PLC | 14,400 | 39,065 | ||||||
| Great Portland Estates PLC REIT | 22,740 | 165,573 | ||||||
| Hammerson PLC REIT | 24,120 | 175,660 | ||||||
| Land Securities Group PLC REIT | 25,480 | 313,321 | ||||||
| 1,348,961 | ||||||||
| Canada — 4.0% | ||||||||
| Canadian Apartment Properties REIT† | 12,789 | 323,530 | ||||||
| Canadian Real Estate Investment Trust REIT | 5,547 | 237,092 | ||||||
| Morguard Real Estate Investment Trust REIT | 10,727 | 195,096 | ||||||
| RioCan Real Estate Investment Trust REIT | 7,184 | 202,198 | ||||||
| 957,916 | ||||||||
| France — 3.6% | ||||||||
| Klepierre REIT | 5,829 | 204,417 | ||||||
| Unibail-Rodamco SE REIT | 3,350 | 667,693 | ||||||
| 872,110 | ||||||||
| Germany — 1.3% | ||||||||
| Alstria Office REIT-AG | 26,825 | 314,070 | ||||||
| Netherlands — 1.2% | ||||||||
| Corio NV REIT | 2,712 | 115,303 | ||||||
| Eurocommercial Properties NV REIT | 2,058 | 77,990 | ||||||
| Vastned Retail NV REIT | 1,883 | 79,949 | ||||||
| 273,242 | ||||||||
| Sweden — 0.8% | ||||||||
| Hufvudstaden AB - Class A | 14,483 | 179,582 | ||||||
| Total Common Stocks | $ | 23,599,466 | ||||||
| 70 |
Touchstone Global Real Estate Fund (Continued)
| Market | ||||||||
| Shares | Value | |||||||
| Investment Funds — 4.7% | ||||||||
| Invesco Government & Agency Portfolio** | 333,900 | $ | 333,900 | |||||
| Touchstone Institutional Money Market Fund^ | 808,114 | 808,114 | ||||||
| Total Investment Funds | $ | 1,142,014 | ||||||
| Total Investment Securities —102.8% | ||||||||
| (Cost $24,233,223) | $ | 24,741,480 | ||||||
| Liabilities in Excess of Other Assets — (2.8%) | (680,567 | ) | ||||||
| Net Assets — 100.0% | $ | 24,060,913 | ||||||
| † | All or a portion of the security is on loan. The total value of the securities on loan as of September 30, 2012 was $318,749. |
| * | Non-income producing security. |
| ** | Represents collateral for securities loaned. |
| ^ | Affiliated Fund. See Note 4 in Notes to Financial Statements. |
Portfolio Abbreviations:
ADR - American Depositary Receipt
PLC - Public Limited Company
REIT - Real Estate Investment Trust
Other Information:
The inputs or methodology used for valuing securities may not be an indication of the risk associated with investing in those securities. For more information on valuation inputs, and their aggregation into the levels used in the table below, please refer to the security valuation section in the accompanying Notes to Financial Statements.
Valuation inputs at Reporting Date:
| Description | Level 1 | Level 2 | Level 3 | Total | ||||||||||||
| Common Stocks | $ | 23,599,466 | $ | — | $ | — | $ | 23,599,466 | ||||||||
| Investment Funds | 1,142,014 | — | — | 1,142,014 | ||||||||||||
| $ | 24,741,480 | |||||||||||||||
At September 30, 2012 securities valued at $8,256,347 were transferred from Level 2 to Level 1 pursuant to the Fund's fair valuation policy.
See accompanying Notes to Financial Statements.
| 71 |
Portfolio of Investments
Touchstone International Fixed Income Fund – September 30, 2012
| Principal | Market | |||||||
| Amount(A) | Value | |||||||
| Corporate Bonds — 47.2% | ||||||||
| Financials — 40.8% | ||||||||
| $ | 70,000,000 | Asian Development Bank (JPY), | ||||||
| 2.350%, 6/21/27 | $ | 1,030,560 | ||||||
| 300,000 | Asian Development Bank MTN (NOK) | |||||||
| MTN, 2.000%, 8/29/17 | 52,153 | |||||||
| 200,000 | Barclays Bank PLC, 5.200%, 7/10/14 | 212,860 | ||||||
| 41,000,000 | Bayerische Landesbank (JPY), | |||||||
| 1.400%, 4/22/13 | 527,867 | |||||||
| 200,000 | Danske Bank A/S, 144A, | |||||||
| 3.875%, 4/14/16 | 206,229 | |||||||
| 200,000 | Derwent London Capital Jersey Ltd. | |||||||
| (GBP), 2.750%, 7/15/16 | 351,059 | |||||||
| 400,000 | Dexia Credit Local SA (GBP), | |||||||
| 1.289%, 4/1/14(B) | 630,814 | |||||||
| 50,000,000 | Dexia Municipal Agency SA (JPY), | |||||||
| 1.800%, 5/9/17 | 612,542 | |||||||
| 38,000,000 | Eksportfinans ASA (JPY), | |||||||
| 1.600%, 3/20/14 | 473,154 | |||||||
| 450,000 | European Financial Stability Facility | |||||||
| (EUR), 2.750%, 7/18/16 | 620,552 | |||||||
| 150,000 | European Investment Bank (GBP), | |||||||
| 6.000%, 12/7/28 | 327,497 | |||||||
| 40,000,000 | European Investment Bank (JPY), | |||||||
| 1.900%, 1/26/26 | 538,746 | |||||||
| 50,000,000 | European Investment Bank (JPY), | |||||||
| 2.150%, 1/18/27 | 686,442 | |||||||
| 500,000 | European Union (EUR), | |||||||
| 2.750%, 9/21/21 | 691,434 | |||||||
| 85,000 | European Union (EUR), 3.500%, 6/4/21 | 124,358 | ||||||
| 300,000 | German Postal Pensions Securitisation | |||||||
| PLC (EUR), 3.375%, 1/18/16 | 417,970 | |||||||
| 200,000 | ING Bank N.V., 144A, 3.750%, 3/7/17 | 210,741 | ||||||
| 300,000 | Kreditanstalt fuer Wiederaufbau (EUR), | |||||||
| 1.500%, 7/30/14 | 457,414 | |||||||
| 500,000 | Kreditanstalt fuer Wiederaufbau (EUR), | |||||||
| 3.375%, 1/18/21 | 732,841 | |||||||
| 30,000,000 | Kreditanstalt fuer Wiederaufbau (JPY), | |||||||
| 2.600%, 6/20/37 | 447,098 | |||||||
| 70,000,000 | Landwirtschaftliche Rentenbank (JPY), | |||||||
| 1.375%, 4/25/13 | 902,749 | |||||||
| 300,000 | LCR Finance PLC (GBP), | |||||||
| 4.500%, 12/7/28 | 589,904 | |||||||
| 400,000 | Merrill Lynch & Co., Inc. (EUR), | |||||||
| 0.973%, 5/30/14(B) | 505,426 | |||||||
| 2,200,000 | Nordic Investment Bank (NOK), | |||||||
| 2.125%, 8/9/17 | 383,340 | |||||||
| 300,000 | Northern Rock Asset Management | |||||||
| PLC (EUR), 3.875%, 11/16/20 | 415,725 | |||||||
| 250,000 | Northern Rock Asset Management | |||||||
| PLC (EUR), 4.125%, 3/27/17 | 354,049 | |||||||
| 200,000 | Oschadbank Via SSB #1 PLC, | |||||||
| 8.250%, 3/10/16 | 190,999 | |||||||
| 1,000,000 | Stadshypotek AB, Ser 1576 (SEK), | |||||||
| 6.000%, 3/18/15 | 168,178 | |||||||
| 50,000 | Swedbank Hypotek AB (EUR), | |||||||
| 2.500%, 1/21/13 | 64,676 | |||||||
| 250,000 | Temasek Financial III Pte Ltd. (SGD), | |||||||
| 0.000%, 10/24/14 | 207,729 | |||||||
| 13,135,106 | ||||||||
| Communications — 3.4% | ||||||||
| 150,000 | ITV PLC (GBP), 4.000%, 11/9/16 | 359,577 | ||||||
| 300,000 | WPP PLC (GBP), 5.750%, 5/19/14 | 714,309 | ||||||
| 1,073,886 | ||||||||
| Industrials — 1.9% | ||||||||
| 150,000 | Industrivarden AB (EUR), | |||||||
| 2.500%, 2/27/15 | 225,526 | |||||||
| 100,000 | Rexel SA (EUR), 7.000%, 12/17/18 | 138,785 | ||||||
| 200,000 | Xefin Lux SCA (EUR), 8.000%, 6/1/18 | 254,440 | ||||||
| 618,751 | ||||||||
| Information Technology — 0.7% | ||||||||
| 429,200 | Cap Gemini SA (EUR), 0.000%, 1/1/14 | 216,646 | ||||||
| Telecommunication Services — 0.2% | ||||||||
| 50,000 | Ziggo Finance BV (EUR), | |||||||
| 6.125%, 11/15/17 | 68,590 | |||||||
| Materials — 0.2% | ||||||||
| 50,000 | Smurfit Kappa Funding PLC (EUR), | |||||||
| 7.750%, 4/1/15 | 65,056 | |||||||
| Total Corporate Bonds | $ | 15,178,035 | ||||||
| Sovereign Government Obligations — 46.8% | ||||||||
| 1,000,000 | Belgium Government Bond, Ser 56 | |||||||
| (EUR), 3.500%, 3/28/15 | 1,380,465 | |||||||
| 740,000 | Bundesobligation (EUR), | |||||||
| 0.500%, 4/7/17 | 955,330 | |||||||
| 500,000 | Bundesrepublik Deutschland (EUR), | |||||||
| 2.250%, 9/4/20 | 699,131 | |||||||
| 500,000 | Bundesrepublik Deutschland (EUR), | |||||||
| 4.000%, 1/4/18 | 757,023 | |||||||
| 580,000 | Canadian Government Bond (CAD), | |||||||
| 4.000%, 6/1/16 | 648,850 | |||||||
| 570,000 | Canadian Government Bond (CAD), | |||||||
| 5.000%, 6/1/14 | 617,213 | |||||||
| 100,000,000 | Development Bank of Japan (JPY), | |||||||
| 1.700%, 9/20/22 | 1,405,755 | |||||||
| 440,000 | France Government Bond OAT (EUR), | |||||||
| 4.250%, 10/25/23 | 667,085 | |||||||
| 500,000 | France Government Bond OAT (EUR), | |||||||
| 5.000%, 10/25/16 | 753,746 | |||||||
| 500,000 | Italy Buoni Poliennali del Tesoro (EUR), | |||||||
| 3.750%, 3/1/21 | 600,568 | |||||||
| 500,000 | Italy Buoni Poliennali Del Tesoro (EUR), | |||||||
| 4.750%, 8/1/23 | 626,385 | |||||||
| 1,000,000 | Italy Buoni Poliennali Del Tesoro | |||||||
| Coupon Strip (EUR), 0.000%, 5/1/29 | 478,289 | |||||||
| 60,000,000 | Japan Finance Organization For | |||||||
| Municipalities (JPY), 2.000%, 5/9/16 | 821,481 | |||||||
| 72 |
Touchstone International Fixed Income Fund (Continued)
| Principal | Market | |||||||
| Amount(A) | Value | |||||||
| Sovereign Government Obligations — 46.8% (Continued) | ||||||||
| $ | 1,900,000 | Mexican Bonos, Ser M10 (MXN), | ||||||
| 7.750%, 12/14/17(C) | $ | 166,115 | ||||||
| 5,000,000 | Mexican Bonos, Ser M20 (MXN), | |||||||
| 8.000%, 12/7/23(C) | 471,967 | |||||||
| 3,000,000 | Mexican Bonos, Ser M20 (MXN), | |||||||
| 10.000%, 12/5/24(C) | 327,779 | |||||||
| 500,000 | Portugal Obrigacoes do Tesouro OT | |||||||
| (EUR), 4.200%, 10/15/16 | 592,973 | |||||||
| 1,400,000 | South Africa Government Bond (ZAR), | |||||||
| 7.250%, 1/15/20 | 175,929 | |||||||
| 1,500,000 | South Africa Government Bond, Ser | |||||||
| R207 (ZAR), 7.250%, 1/15/20 | 188,496 | |||||||
| 2,000,000 | Spain Government Bond Principal | |||||||
| Strip (EUR), 0.000%, 1/31/37 | 478,810 | |||||||
| 4,500,000 | Sweden Government Bond, Ser 1049 | |||||||
| (SEK), 4.500%, 8/12/15 | 756,303 | |||||||
| 500,000 | United Kingdom Gilt (GBP), | |||||||
| 4.250%, 12/7/40 | 991,936 | |||||||
| 250,000 | United Kingdom Gilt (GBP), | |||||||
| 8.000%, 12/7/15 | 502,858 | |||||||
| Total Sovereign Government Obligations | $ | 15,064,487 | ||||||
| Shares | ||||||||
| Investment Fund — 6.4% | ||||||||
| 2,061,388 | Touchstone Institutional Money Market Fund^ | $ | 2,061,388 | |||||
| Total Investment Securities —100.4% | ||||||||
| (Cost $31,778,604) | $ | 32,303,910 | ||||||
| Liabilities in Excess of Other Assets — (0.4%) | (123,850 | ) | ||||||
| Net Assets — 100.0% | $ | 32,180,060 | ||||||
| (A) | Principal amount stated in U.S. dollars unless otherwise noted. |
| (B) | Variable rate security - the rate reflected is the rate in effect as of September 30, 2012. |
| (C) | Amount shown represents units. One unit represents a principal amount of 100. |
| ^ | Affiliated Fund. See Note 4 in Notes to Financial Statements. |
Portfolio Abbreviations:
| AUD - Australian Dollar | MTN - Medium Term Note |
| CAD - Canadian Dollar | MXN - Mexican Peso |
| CHF - Swiss Franc | NOK - Norwegian krone |
| EUR - Euro | NZD - New Zealand Dollar |
| GBP - British Pound | PLC - Public Limited Company |
| HKD - Hong Kong Dollar | PLN - Polish Zloty |
| IDR - Indonesian Rupiah | SEK - Swedish krona |
| INR - Indian Rupee | SGD - Singapore dollar |
| JPY - Japanese Yen | TRY - Turkey Lira |
| KRW - South Korean Won | ZAR - South African Rand |
144A - This is a restricted security that was sold in a transaction exempt from Rule 144A of the securities Act of 1933. This security may be sold in transactions exempt from registration, normally to qualified institutional buyers. At September 30, 2012, these securities were valued at $416,970 or 1.29% of net assets. These securities were deemed liquid pursuant to procedures approved by the Board of Trustees.
Other Information:
The inputs or methodology used for valuing securities may not be an indication of the risk associated with investing in those securities. For more information on valuation inputs, and their aggregation into the levels used in the table below, please refer to the security valuation section in the accompanying Notes to Financial Statements.
Valuation inputs at Reporting Date:
| Description | Level 1 | Level 2 | Level 3 | Total | ||||||||||||
| Assets: | ||||||||||||||||
| Corporate Bonds | $ | — | $ | 15,178,035 | $ | — | $ | 15,178,035 | ||||||||
| Sovereign Government Obligations | — | 15,064,487 | — | 15,064,487 | ||||||||||||
| Investment Fund | 2,061,388 | — | — | 2,061,388 | ||||||||||||
| $ | 32,303,910 | |||||||||||||||
| 73 |
Touchstone International Fixed Income Fund (Continued)
| Level 1 | Level 2 | Level 3 | Total | |||||||||||||
| Other Financial Instruments* | ||||||||||||||||
| Assets: | ||||||||||||||||
| Forward Currency Contracts | $ | — | $ | 197,149 | $ | — | $ | 197,149 | ||||||||
| Liabilities: | ||||||||||||||||
| Forward Currency Contracts | $ | — | $ | (210,331 | ) | $ | — | $ | (210,331 | ) | ||||||
* Other Financial Instruments are derivative instruments not reflected in total investments. Amounts shown represent unrealized appreciation (depreciation).
Forward Foreign Currency Exchange Contracts
| Unrealized | ||||||||||||||||||||||||
| Contract to | Appreciation/ | |||||||||||||||||||||||
| Counterparty | Value Date | Receive | Deliver | (Depreciation) | ||||||||||||||||||||
| Brown Brothers Harriman | 10/04/2012 | CAD | 189,000 | USD | 192,083 | $ | 141 | |||||||||||||||||
| Brown Brothers Harriman | 10/04/2012 | EUR | 702,000 | USD | 903,123 | (963 | ) | |||||||||||||||||
| Brown Brothers Harriman | 10/04/2012 | GBP | 381,500 | USD | 616,046 | (10 | ) | |||||||||||||||||
| Brown Brothers Harriman | 10/04/2012 | USD | 191,402 | CAD | 189,000 | (822 | ) | |||||||||||||||||
| Brown Brothers Harriman | 10/04/2012 | USD | 885,103 | EUR | 702,000 | (17,058 | ) | |||||||||||||||||
| Brown Brothers Harriman | 10/04/2012 | USD | 605,889 | GBP | 381,500 | (10,147 | ) | |||||||||||||||||
| Brown Brothers Harriman | 10/04/2012 | USD | 174,935 | ZAR | 1,480,000 | (2,734 | ) | |||||||||||||||||
| Brown Brothers Harriman | 10/04/2012 | ZAR | 1,480,000 | USD | 179,369 | (1,700 | ) | |||||||||||||||||
| Brown Brothers Harriman | 10/11/2012 | AUD | 226,000 | CAD | 234,249 | (4,075 | ) | |||||||||||||||||
| Brown Brothers Harriman | 10/11/2012 | AUD | 260,000 | GBP | 168,350 | (2,484 | ) | |||||||||||||||||
| Brown Brothers Harriman | 10/11/2012 | CAD | 200,000 | CHF | 186,540 | 4,989 | ||||||||||||||||||
| Brown Brothers Harriman | 10/11/2012 | CHF | 100,000 | EUR | 83,378 | (806 | ) | |||||||||||||||||
| Brown Brothers Harriman | 10/11/2012 | CHF | 170,000 | JPY | 14,142,300 | (437 | ) | |||||||||||||||||
| Brown Brothers Harriman | 10/11/2012 | EUR | 379,578 | NZD | 600,000 | (9,006 | ) | |||||||||||||||||
| Brown Brothers Harriman | 10/11/2012 | EUR | 1,450,000 | USD | 1,826,783 | 36,788 | ||||||||||||||||||
| Brown Brothers Harriman | 10/11/2012 | GBP | 401,775 | EUR | 500,000 | 6,150 | ||||||||||||||||||
| Brown Brothers Harriman | 10/11/2012 | GBP | 125,000 | SEK | 1,363,287 | (5,616 | ) | |||||||||||||||||
| Brown Brothers Harriman | 10/11/2012 | HKD | 1,500,000 | EUR | 153,513 | (3,852 | ) | |||||||||||||||||
| Brown Brothers Harriman | 10/11/2012 | HKD | 1,594,000 | USD | 205,545 | 26 | ||||||||||||||||||
| Brown Brothers Harriman | 10/11/2012 | INR | 11,000,000 | JPY | 15,433,000 | 10,173 | ||||||||||||||||||
| Brown Brothers Harriman | 10/11/2012 | JPY | 39,074,400 | AUD | 486,000 | (2,739 | ) | |||||||||||||||||
| Brown Brothers Harriman | 10/11/2012 | JPY | 48,627,500 | EUR | 500,000 | (19,432 | ) | |||||||||||||||||
| Brown Brothers Harriman | 10/11/2012 | JPY | 7,326,325 | GBP | 59,000 | (1,380 | ) | |||||||||||||||||
| Brown Brothers Harriman | 10/11/2012 | JPY | 33,000,000 | SEK | 2,897,914 | (18,083 | ) | |||||||||||||||||
| Brown Brothers Harriman | 10/11/2012 | JPY | 266,946,125 | USD | 3,370,000 | 51,009 | ||||||||||||||||||
| Brown Brothers Harriman | 10/11/2012 | KRW | 167,000,000 | USD | 145,407 | 4,745 | ||||||||||||||||||
| Brown Brothers Harriman | 10/11/2012 | MXN | 5,000,000 | JPY | 29,260,000 | 12,904 | ||||||||||||||||||
| Brown Brothers Harriman | 10/11/2012 | MXN | 230,018 | USD | 17,000 | 844 | ||||||||||||||||||
| Brown Brothers Harriman | 10/11/2012 | NZD | 376,340 | USD | 300,000 | 11,641 | ||||||||||||||||||
| 74 |
Touchstone International Fixed Income Fund (Continued)
| Unrealized | ||||||||||||||||||||||||
| Contract to | Appreciation/ | |||||||||||||||||||||||
| Counterparty | Value Date | Receive | Deliver | (Depreciation) | ||||||||||||||||||||
| Brown Brothers Harriman | 10/11/2012 | PLN | 853,380 | EUR | 200,000 | $ | 8,892 | |||||||||||||||||
| Brown Brothers Harriman | 10/11/2012 | TRY | 696,957 | SEK | 2,600,000 | (8,576 | ) | |||||||||||||||||
| Brown Brothers Harriman | 10/11/2012 | USD | 2,225,361 | EUR | 1,710,500 | 26,989 | ||||||||||||||||||
| Brown Brothers Harriman | 10/11/2012 | USD | 868,349 | EUR | 675,500 | 182 | ||||||||||||||||||
| Brown Brothers Harriman | 10/11/2012 | USD | 1,600,000 | GBP | 1,021,554 | (49,542 | ) | |||||||||||||||||
| Brown Brothers Harriman | 10/11/2012 | USD | 639,653 | GBP | 395,000 | 1,832 | ||||||||||||||||||
| Brown Brothers Harriman | 10/11/2012 | USD | 553,404 | GBP | 340,500 | 3,586 | ||||||||||||||||||
| Brown Brothers Harriman | 10/11/2012 | USD | 398,006 | GBP | 246,500 | (26 | ) | |||||||||||||||||
| Brown Brothers Harriman | 10/11/2012 | USD | 1,200,000 | JPY | 95,361,000 | (22,085 | ) | |||||||||||||||||
| Brown Brothers Harriman | 10/11/2012 | USD | 700,000 | JPY | 54,530,700 | 1,170 | ||||||||||||||||||
| Brown Brothers Harriman | 10/11/2012 | ZAR | 2,463,900 | USD | 300,000 | (4,512 | ) | |||||||||||||||||
| Brown Brothers Harriman | 11/05/2012 | USD | 191,946 | CAD | 189,000 | (140 | ) | |||||||||||||||||
| Brown Brothers Harriman | 11/05/2012 | USD | 903,397 | EUR | 702,000 | 936 | ||||||||||||||||||
| Brown Brothers Harriman | 11/05/2012 | USD | 615,979 | GBP | 381,500 | 6 | ||||||||||||||||||
| Brown Brothers Harriman | 11/05/2012 | USD | 178,581 | ZAR | 1,480,000 | 1,717 | ||||||||||||||||||
| Brown Brothers Harriman | 02/14/2013 | EUR | 1,300,000 | USD | 1,690,728 | (17,574 | ) | |||||||||||||||||
| Brown Brothers Harriman | 02/14/2013 | JPY | 400,000,000 | USD | 5,120,983 | 12,429 | ||||||||||||||||||
| Brown Brothers Harriman | 02/14/2013 | ZAR | 5,423,400 | GBP | 400,000 | (6,532 | ) | |||||||||||||||||
| $ | (13,182 | ) | ||||||||||||||||||||||
See accompanying Notes to Financial Statements.
| 75 |
Portfolio of Investments
Touchstone Large Cap Relative Value Fund – September 30, 2012
| Market | ||||||||
| Shares | Value | |||||||
| Common Stocks — 97.3% | ||||||||
| Financials — 26.7% | ||||||||
| Aflac, Inc. | 11,000 | $ | 526,680 | |||||
| American Tower Corp. REIT | 13,700 | 978,043 | ||||||
| Bank of America Corp. | 38,200 | 337,306 | ||||||
| Boston Properties, Inc. REIT | 6,200 | 685,782 | ||||||
| CBRE Group, Inc. - Class A* | 30,300 | 557,823 | ||||||
| Chubb Corp. (The) | 11,400 | 869,592 | ||||||
| Goldman Sachs Group, Inc. (The) | 6,700 | 761,656 | ||||||
| IntercontinentalExchange, Inc.* | 3,800 | 506,958 | ||||||
| JPMorgan Chase & Co. | 18,200 | 736,736 | ||||||
| Morgan Stanley | 38,200 | 639,468 | ||||||
| Northern Trust Corp. | 15,600 | 724,074 | ||||||
| Travelers Cos, Inc. (The) | 12,900 | 880,554 | ||||||
| Wells Fargo & Co. | 28,200 | 973,746 | ||||||
| 9,178,418 | ||||||||
| Consumer Discretionary — 15.5% | ||||||||
| Carnival Corp. | 10,800 | 393,552 | ||||||
| Comcast Corp. - Class A | 23,300 | 833,441 | ||||||
| Darden Restaurants, Inc. | 17,100 | 953,325 | ||||||
| Johnson Controls, Inc. | 21,800 | 597,320 | ||||||
| Target Corp. | 7,900 | 501,413 | ||||||
| TJX Cos, Inc. | 26,800 | 1,200,372 | ||||||
| Walt Disney Co. (The) | 16,200 | 846,936 | ||||||
| 5,326,359 | ||||||||
| Energy — 13.8% | ||||||||
| Apache Corp. | 5,300 | 458,291 | ||||||
| Devon Energy Corp. | 9,400 | 568,700 | ||||||
| Exxon Mobil Corp. | 11,664 | 1,066,673 | ||||||
| Newfield Exploration Co.* | 7,200 | 225,504 | ||||||
| Occidental Petroleum Corp. | 12,800 | 1,101,568 | ||||||
| Schlumberger Ltd. | 8,900 | 643,737 | ||||||
| Transocean Ltd. (Switzerland) | 15,200 | 682,328 | ||||||
| 4,746,801 | ||||||||
| Information Technology — 12.9% | ||||||||
| Automatic Data Processing, Inc. | 11,700 | 686,322 | ||||||
| Corning, Inc. | 36,800 | 483,920 | ||||||
| Flextronics International Ltd. (Singapore) | 108,100 | 648,600 | ||||||
| Intel Corp. | 41,400 | 938,952 | ||||||
| International Business Machines Corp. | 6,000 | 1,244,700 | ||||||
| Xerox Corp. | 60,100 | 441,134 | ||||||
| 4,443,628 | ||||||||
| Industrials — 11.5% | ||||||||
| Boeing Co. (The) | 9,800 | 682,276 | ||||||
| Cummins, Inc. | 10,700 | 986,647 | ||||||
| General Dynamics Corp. | 11,200 | 740,544 | ||||||
| Norfolk Southern Corp. | 10,600 | 674,478 | ||||||
| Union Pacific Corp. | 7,300 | 866,510 | ||||||
| 3,950,455 | ||||||||
| Health Care — 7.8% | ||||||||
| CR Bard, Inc. | 3,600 | 376,740 | ||||||
| Express Scripts Holding Co.* | 16,700 | 1,046,589 | ||||||
| UnitedHealth Group, Inc. | 12,700 | 703,707 | ||||||
| WellPoint, Inc. | 9,300 | 539,493 | ||||||
| 2,666,529 | ||||||||
| Utilities — 4.4% | ||||||||
| Duke Energy Corp. | 6,100 | 395,280 | ||||||
| Exelon Corp. | 11,600 | 412,728 | ||||||
| Southern Co. (The) | 15,300 | 705,177 | ||||||
| 1,513,185 | ||||||||
| Materials — 2.8% | ||||||||
| Freeport-McMoRan Copper & Gold, Inc. | 24,400 | 965,752 | ||||||
| Consumer Staples — 1.9% | ||||||||
| Kimberly-Clark Corp. | 7,700 | 660,506 | ||||||
| Total Common Stocks | $ | 33,451,633 | ||||||
| Investment Fund — 2.7% | ||||||||
| Touchstone Institutional Money Market Fund^ | 943,001 | 943,001 | ||||||
| Total Investment Securities —100.0% | ||||||||
| (Cost $34,215,800) | $ | 34,394,634 | ||||||
| Liabilities in Excess of Other Assets — 0.0% | (6,346 | ) | ||||||
| Net Assets — 100.0% | $ | 34,388,288 | ||||||
* Non-income producing security.
^ Affiliated Fund. See Note 4 in Notes to Financial Statements.
Portfolio Abbreviations:
REIT - Real Estate Investment Trust
| 76 |
Touchstone Large Cap Relative Value Fund (Continued)
Other Information:
The inputs or methodology used for valuing securities may not be an indication of the risk associated with investing in those securities. For more information on valuation inputs, and their aggregation into the levels used in the table below, please refer to the security valuation section in the accompanying Notes to Financial Statements.
Valuation inputs at Reporting Date:
| Description | Level 1 | Level 2 | Level 3 | Total | ||||||||||||
| Common Stocks | $ | 33,451,633 | $ | — | $ | — | $ | 33,451,633 | ||||||||
| Investment Fund | 943,001 | — | — | 943,001 | ||||||||||||
| $ | 34,394,634 | |||||||||||||||
See accompanying Notes to Financial Statements.
| 77 |
Portfolio of Investments
Touchstone Market Neutral Equity Fund – September 30, 2012
| Market | ||||||||
| Shares | Value | |||||||
| Common Stocks — 95.7% | ||||||||
| Information Technology — 22.7% | ||||||||
| Accenture PLC - Class A | 5,000 | $ | 350,151 | |||||
| Actuate Corp.* | 23,800 | 167,314 | ||||||
| Amdocs Ltd. | 12,900 | 425,571 | ||||||
| Amtech Systems, Inc.* | 10,900 | 35,752 | ||||||
| Ancestry.com, Inc.* | 8,000 | 240,640 | ||||||
| Arris Group, Inc.* | 12,900 | 164,991 | ||||||
| BMC Software, Inc.* | 3,800 | 157,662 | ||||||
| CA, Inc. | 16,400 | 422,546 | ||||||
| CACI International, Inc. - Class A* | 7,300 | 378,067 | ||||||
| Computer Sciences Corp. | 6,500 | 209,365 | ||||||
| Comtech TeleCommunications Corp. | 4,400 | 121,616 | ||||||
| CoreLogic, Inc.* | 8,400 | 222,852 | ||||||
| CSG Systems International, Inc.* | 6,600 | 148,434 | ||||||
| Dice Holdings, Inc.* | 25,200 | 212,184 | ||||||
| Ebix, Inc. | 10,100 | 238,461 | ||||||
| F5 Networks, Inc.* | 1,500 | 157,050 | ||||||
| Fair Isaac Corp. | 4,600 | 203,596 | ||||||
| IAC/InterActiveCorp. | 3,400 | 177,004 | ||||||
| Intuit, Inc. | 6,900 | 406,272 | ||||||
| j2 Global, Inc. | 4,900 | 160,818 | ||||||
| Kulicke & Soffa Industries, Inc.* | 17,000 | 176,800 | ||||||
| Lender Processing Services, Inc. | 5,600 | 156,184 | ||||||
| LSI Corp.* | 41,400 | 286,074 | ||||||
| MIPS Technologies, Inc.* | 26,100 | 192,879 | ||||||
| Motorola Solutions, Inc. | 5,900 | 298,245 | ||||||
| Net 1 UEPS Technologies, Inc.* | 24,100 | 218,105 | ||||||
| NeuStar, Inc. - Class A* | 9,900 | 396,297 | ||||||
| Oplink Communications, Inc.* | 7,400 | 122,396 | ||||||
| Plantronics, Inc. | 4,500 | 158,985 | ||||||
| SAIC, Inc. | 34,500 | 415,380 | ||||||
| Symantec Corp.* | 14,500 | 261,000 | ||||||
| Total System Services, Inc. | 14,600 | 346,020 | ||||||
| Unisys Corp.* | 13,700 | 285,234 | ||||||
| United Online, Inc. | 75,900 | 418,968 | ||||||
| VeriSign, Inc.* | 4,600 | 223,974 | ||||||
| Websense, Inc.* | 23,100 | 361,515 | ||||||
| XO Group, Inc.* | 26,500 | 221,275 | ||||||
| 9,139,677 | ||||||||
| Consumer Discretionary — 16.2% | ||||||||
| Aaron's, Inc.* | 6,800 | 189,109 | ||||||
| ANN, Inc.* | 6,100 | 230,153 | ||||||
| Apollo Group, Inc. - Class A* | 4,400 | 127,820 | ||||||
| Arbitron, Inc. | 3,200 | 121,280 | ||||||
| Arctic Cat, Inc.* | 8,100 | 335,826 | ||||||
| Best Buy Co., Inc. | 8,700 | 149,553 | ||||||
| Capella Education Co.* | 8,900 | 312,034 | ||||||
| CBS Corp. - Class B | 3,500 | 127,155 | ||||||
| Coach, Inc. | 2,200 | 123,244 | ||||||
| CTC Media, Inc. | 20,300 | 184,933 | ||||||
| DIRECTV* | 8,200 | 430,172 | ||||||
| Francesca's Holdings Corp.* | 7,600 | 233,548 | ||||||
| Gap, Inc. (The) | 9,800 | 350,644 | ||||||
| H&R Block, Inc. | 7,300 | 126,509 | ||||||
| Hot Topic, Inc. | 13,900 | 120,930 | ||||||
| Interpublic Group of Cos, Inc. (The) | 28,900 | 321,368 | ||||||
| Interval Leisure Group, Inc. | 15,000 | 283,950 | ||||||
| Lululemon Athletica, Inc.* | 4,100 | 303,154 | ||||||
| Newell Rubbermaid, Inc. | 13,800 | 263,442 | ||||||
| Oxford Industries, Inc. | 3,000 | 169,350 | ||||||
| Papa John's International, Inc.* | 7,500 | 400,575 | ||||||
| PetMed Express, Inc. | 40,000 | 401,600 | ||||||
| Smith & Wesson Holding Corp.* | 12,700 | 139,827 | ||||||
| Texas Roadhouse, Inc. | 12,300 | 210,330 | ||||||
| TJX Cos, Inc. | 5,100 | 228,429 | ||||||
| Tupperware Brands Corp. | 2,700 | 144,693 | ||||||
| Urban Outfitters, Inc.* | 3,600 | 135,216 | ||||||
| Wyndham Worldwide Corp. | 6,800 | 356,864 | ||||||
| 6,521,708 | ||||||||
| Health Care — 13.2% | ||||||||
| Aetna, Inc. | 11,400 | 451,440 | ||||||
| AMAG Pharmaceuticals, Inc.* | 13,100 | 232,394 | ||||||
| Amedisys, Inc.* | 13,400 | 185,054 | ||||||
| AmerisourceBergen Corp. | 4,100 | 158,711 | ||||||
| Biogen Idec, Inc.* | 1,100 | 164,153 | ||||||
| Boston Scientific Corp.* | 26,900 | 154,406 | ||||||
| Charles River Laboratories International, Inc.* | 7,800 | 308,880 | ||||||
| Community Health Systems, Inc.* | 10,800 | 314,712 | ||||||
| Cyberonics, Inc.* | 3,100 | 162,502 | ||||||
| Gentiva Health Services, Inc.* | 10,800 | 122,256 | ||||||
| HCA Holdings, Inc. | 5,400 | 179,550 | ||||||
| Healthways, Inc.* | 12,100 | 141,691 | ||||||
| Hill-Rom Holdings, Inc. | 4,900 | 142,394 | ||||||
| Magellan Health Services, Inc.* | 8,100 | 418,041 | ||||||
| McKesson Corp. | 2,500 | 215,075 | ||||||
| Myriad Genetics, Inc.* | 7,800 | 210,522 | ||||||
| Natus Medical, Inc.* | 14,400 | 188,208 | ||||||
| PDL BioPharma, Inc. | 29,500 | 226,855 | ||||||
| Sun Healthcare Group, Inc.* | 28,200 | 238,713 | ||||||
| Tenet Healthcare Corp.* | 26,100 | 163,647 | ||||||
| Thoratec Corp.* | 4,500 | 155,700 | ||||||
| Triple-S Management Corp. - Class B* | 8,500 | 177,650 | ||||||
| UnitedHealth Group, Inc. | 3,300 | 182,853 | ||||||
| Warner Chilcott PLC - Class A | 13,600 | 183,600 | ||||||
| WellPoint, Inc. | 4,100 | 237,841 | ||||||
| 5,316,848 | ||||||||
| Energy — 12.5% | ||||||||
| Chevron Corp. | 1,300 | 151,528 | ||||||
| ConocoPhillips | 3,500 | 200,130 | ||||||
| Dresser-Rand Group, Inc.* | 5,100 | 281,061 | ||||||
| Exxon Mobil Corp. | 2,000 | 182,900 | ||||||
| Gran Tierra Energy, Inc.* | 43,600 | 225,412 | ||||||
| Gulf Island Fabrication, Inc. | 5,300 | 147,711 | ||||||
| Helix Energy Solutions Group, Inc.* | 8,400 | 153,468 | ||||||
| Hess Corp. | 4,100 | 220,252 | ||||||
| Marathon Oil Corp. | 6,300 | 186,291 | ||||||
| Marathon Petroleum Corp. | 8,300 | 453,097 | ||||||
| Matrix Service Co.* | 11,700 | 123,669 | ||||||
| Murphy Oil Corp. | 8,700 | 467,103 | ||||||
| Oceaneering International, Inc. | 3,800 | 209,950 | ||||||
| 78 |
Touchstone Market Neutral Equity Fund (Continued)
| Market | ||||||||
| Shares | Value | |||||||
| Common Stocks — 95.7% (Continued) | ||||||||
| Energy — (Continued) | ||||||||
| Patterson-UTI Energy, Inc. | 15,400 | $ | 243,936 | |||||
| Phillips 66 | 1,750 | 81,148 | ||||||
| RPC, Inc. | 9,900 | 117,711 | ||||||
| SEACOR Holdings, Inc.* | 2,500 | 208,400 | ||||||
| Tesoro Corp. | 8,300 | 347,770 | ||||||
| Unit Corp* | 6,100 | 253,150 | ||||||
| Vaalco Energy, Inc.* | 22,400 | 191,520 | ||||||
| Valero Energy Corp. | 13,100 | 415,008 | ||||||
| Western Refining, Inc. | 5,700 | 149,226 | ||||||
| 5,010,441 | ||||||||
| Financials — 11.6% | ||||||||
| Banco Latinoamericano De Comerico Exterior SA - Class E | 18,700 | 413,083 | ||||||
| CapitalSource, Inc. | 21,000 | 159,180 | ||||||
| Capitol Federal Financial, Inc. | 9,000 | 107,640 | ||||||
| CBOE Holdings, Inc. | 9,300 | 273,606 | ||||||
| Erie Indemnity Co. - Class A | 2,400 | 154,248 | ||||||
| Fifth Third Bancorp. | 14,800 | 229,548 | ||||||
| First Citizens BancShares, Inc. - Class A | 400 | 65,160 | ||||||
| FirstMerit Corp. | 10,500 | 154,665 | ||||||
| Huntington Bancshares, Inc. | 66,700 | 460,230 | ||||||
| KeyCorp | 49,500 | 432,630 | ||||||
| M&T Bank Corp. | 1,500 | 142,740 | ||||||
| Montpelier Re Holdings Ltd. | 13,800 | 305,394 | ||||||
| Moody's Corp. | 3,600 | 159,012 | ||||||
| National Health Investors, Inc. REIT | 3,900 | 200,616 | ||||||
| Netspend Holdings, Inc.* | 25,400 | 249,682 | ||||||
| Oritani Financial Corp. | 18,200 | 273,910 | ||||||
| Public Storage REIT | 1,300 | 180,921 | ||||||
| Renaissancere Holdings Ltd. | 3,800 | 292,752 | ||||||
| T Rowe Price Group, Inc. | 4,300 | 272,190 | ||||||
| Washington Federal, Inc. | 7,900 | 131,772 | ||||||
| 4,658,979 | ||||||||
| Industrials — 9.9% | ||||||||
| Alliant Techsystems, Inc. | 4,100 | 205,451 | ||||||
| Chicago Bridge & Iron Co. NV | 8,800 | 335,192 | ||||||
| Copart, Inc.* | 5,200 | 144,196 | ||||||
| Corporate Executive Board Co. (The) | 8,200 | 439,766 | ||||||
| Delta Air Lines, Inc.* | 15,200 | 139,232 | ||||||
| Equifax, Inc. | 4,000 | 186,320 | ||||||
| Exponent, Inc.* | 5,100 | 291,159 | ||||||
| JB Hunt Transport Services, Inc. | 2,600 | 135,304 | ||||||
| Lennox International, Inc. | 7,200 | 348,192 | ||||||
| Lockheed Martin Corp. | 1,600 | 149,408 | ||||||
| Meritor, Inc.* | 26,400 | 111,936 | ||||||
| Northrop Grumman Corp. | 2,800 | 186,004 | ||||||
| Oshkosh Corp.* | 6,300 | 172,809 | ||||||
| Progressive Waste Solutions Ltd. | 11,400 | 234,498 | ||||||
| Resources Connection, Inc. | 12,300 | 161,253 | ||||||
| Toro Co. | 11,000 | 437,580 | ||||||
| WABCO Holdings, Inc.* | 4,900 | 282,583 | ||||||
| 3,960,883 | ||||||||
| Materials — 7.3% | ||||||||
| Agrium, Inc. | 4,500 | 465,570 | ||||||
| Boise, Inc. | 16,300 | 142,788 | ||||||
| CF Industries Holdings, Inc. | 1,400 | 311,136 | ||||||
| Domtar Corp. | 2,000 | 156,580 | ||||||
| Freeport-McMoRan Copper & Gold, Inc. | 4,300 | 170,194 | ||||||
| Minerals Technologies, Inc. | 4,800 | 340,464 | ||||||
| Packaging Corp. of America | 7,400 | 268,620 | ||||||
| PPG Industries, Inc. | 1,900 | 218,196 | ||||||
| Schweitzer-Mauduit International, Inc. | 4,800 | 158,352 | ||||||
| Sherwin-Williams Co. (The) | 1,700 | 253,147 | ||||||
| Valspar Corp. | 7,700 | 431,970 | ||||||
| 2,917,017 | ||||||||
| Telecommunication Services — 0.9% | ||||||||
| Cbeyond, Inc.* | 23,600 | 232,696 | ||||||
| Neutral Tandem, Inc.* | 15,600 | 146,328 | ||||||
| 379,024 | ||||||||
| Utilities — 0.7% | ||||||||
| Entergy Corp. | 4,000 | 277,200 | ||||||
| Consumer Staples — 0.7% | ||||||||
| Dean Foods Co.* | 8,500 | 138,975 | ||||||
| Medifast, Inc.* | 4,900 | 128,135 | ||||||
| 267,110 | ||||||||
| Total Common Stocks | $ | 38,448,887 | ||||||
| Investment Fund — 1.9% | ||||||||
| Touchstone Institutional Money Market Fund^ | 778,325 | 778,325 | ||||||
| Total Long Positions | ||||||||
| (Cost $34,897,100) | $ | 39,227,212 | ||||||
| Securities Sold Short — (95.6%) | ||||||||
| Common Stocks — (95.6%) | ||||||||
| Information Technology — (19.4%) | ||||||||
| Bottomline Technologies, Inc.* | (11,800 | ) | (291,342 | ) | ||||
| BroadSoft, Inc.* | (4,500 | ) | (184,590 | ) | ||||
| Cavium, Inc.* | (7,300 | ) | (243,309 | ) | ||||
| comScore, Inc.* | (13,100 | ) | (199,775 | ) | ||||
| Concur Technologies, Inc.* | (2,500 | ) | (184,325 | ) | ||||
| Constant Contact, Inc.* | (10,300 | ) | (179,220 | ) | ||||
| DealerTrack Holdings, Inc.* | (5,600 | ) | (155,960 | ) | ||||
| EchoStar Corp. - Class A* | (5,100 | ) | (146,166 | ) | ||||
| Equinix, Inc.* | (2,100 | ) | (432,705 | ) | ||||
| FleetCor Technologies, Inc.* | (7,600 | ) | (340,480 | ) | ||||
| Fortinet, Inc.* | (5,400 | ) | (130,356 | ) | ||||
| Limelight Networks, Inc.* | (50,800 | ) | (118,872 | ) | ||||
| Linkedin Corp. - Class A* | (3,600 | ) | (433,440 | ) | ||||
| Liquidity Services, Inc.* | (2,500 | ) | (125,525 | ) | ||||
| LogMeIn, Inc.* | (6,400 | ) | (143,552 | ) | ||||
| Maxwell Technologies, Inc.* | (29,900 | ) | (242,788 | ) | ||||
| Microchip Technology, Inc. | (13,600 | ) | (445,264 | ) | ||||
| NetSuite, Inc.* | (4,500 | ) | (287,100 | ) | ||||
| Opnet Technologies, Inc. | (4,000 | ) | (136,280 | ) | ||||
| 79 |
Touchstone Market Neutral Equity Fund (Continued)
| Market | ||||||||
| Shares | Value | |||||||
| Common Stocks — (95.6%) (Continued) | ||||||||
| Information Technology — (Continued) | ||||||||
| Pegasystems, Inc. | (4,400 | ) | $ | (127,776 | ) | |||
| QLIK Technologies, Inc.* | (6,500 | ) | (145,665 | ) | ||||
| QLogic Corp.* | (26,600 | ) | (303,772 | ) | ||||
| Rackspace Hosting, Inc.* | (3,500 | ) | (231,315 | ) | ||||
| RealPage, Inc.* | (7,100 | ) | (160,460 | ) | ||||
| Rosetta Stone, Inc.* | (12,500 | ) | (159,375 | ) | ||||
| Salesforce.com, Inc.* | (2,900 | ) | (442,801 | ) | ||||
| ServiceSource International, Inc.* | (35,400 | ) | (363,204 | ) | ||||
| Sourcefire, Inc.* | (2,600 | ) | (127,478 | ) | ||||
| TiVo, Inc.* | (13,700 | ) | (142,891 | ) | ||||
| Ultimate Software Group, Inc.* | (2,800 | ) | (285,880 | ) | ||||
| Viasat, Inc.* | (11,800 | ) | (441,084 | ) | ||||
| VMware, Inc. - Class A* | (1,600 | ) | (154,784 | ) | ||||
| WebMD Health Corp.* | (20,200 | ) | (283,406 | ) | ||||
| (7,790,940 | ) | |||||||
| Consumer Discretionary — (17.2%) | ||||||||
| Arcos Dorados Holdings, Inc. | (10,800 | ) | (166,644 | ) | ||||
| Body Central Corp.* | (14,400 | ) | (150,480 | ) | ||||
| Callaway Golf Co. | (22,000 | ) | (135,080 | ) | ||||
| CarMax, Inc.* | (13,300 | ) | (376,390 | ) | ||||
| Carnival Corp. | (11,700 | ) | (426,348 | ) | ||||
| Darden Restaurants, Inc. | (2,700 | ) | (150,525 | ) | ||||
| DR Horton, Inc. | (7,200 | ) | (148,608 | ) | ||||
| DreamWorks Animation SKG, Inc. - Class A - Class A* | (23,700 | ) | (455,751 | ) | ||||
| Gentex Corp. | (9,600 | ) | (163,296 | ) | ||||
| Hanesbrands, Inc.* | (4,700 | ) | (149,836 | ) | ||||
| Hyatt Hotels Corp. - Class A* | (10,900 | ) | (437,635 | ) | ||||
| Iconix Brand Group, Inc.* | (6,200 | ) | (113,088 | ) | ||||
| JC Penney Co., Inc. | (14,500 | ) | (352,205 | ) | ||||
| K12, Inc.* | (13,900 | ) | (280,780 | ) | ||||
| KB Home | (11,900 | ) | (170,765 | ) | ||||
| Life Time Fitness, Inc.* | (3,000 | ) | (137,220 | ) | ||||
| LKQ Corp.* | (8,400 | ) | (155,400 | ) | ||||
| Monro Muffler Brake, Inc. | (11,500 | ) | (404,685 | ) | ||||
| Orient-Express Hotels Ltd. - Class A* | (22,300 | ) | (198,470 | ) | ||||
| Pep Boys-Manny Moe & Jack (The) | (26,600 | ) | (270,788 | ) | ||||
| Quiksilver, Inc.* | (33,200 | ) | (110,224 | ) | ||||
| Royal Caribbean Cruises Ltd. | (6,300 | ) | (190,323 | ) | ||||
| Ruby Tuesday, Inc.* | (19,800 | ) | (143,550 | ) | ||||
| Shaw Communications, Inc. - Class B | (22,200 | ) | (455,100 | ) | ||||
| Skechers U.S.A., Inc. - Class A* | (5,900 | ) | (120,360 | ) | ||||
| Standard Pacific Corp.* | (26,800 | ) | (181,168 | ) | ||||
| Tiffany & Co. | (6,900 | ) | (426,972 | ) | ||||
| Vail Resorts, Inc. | (7,800 | ) | (449,670 | ) | ||||
| (6,921,361 | ) | |||||||
| Health Care — (13.5%) | ||||||||
| Accretive Health, Inc.* | (21,500 | ) | (239,940 | ) | ||||
| Achillion Pharmaceuticals, Inc.* | (19,200 | ) | (199,872 | ) | ||||
| Antares Pharma, Inc.* | (35,800 | ) | (156,088 | ) | ||||
| AVEO Pharmaceuticals, Inc.* | (12,000 | ) | (124,920 | ) | ||||
| Becton Dickinson and Co. | (2,900 | ) | (227,824 | ) | ||||
| Brookdale Senior Living, Inc.* | (20,200 | ) | (469,044 | ) | ||||
| Centene Corp.* | (4,000 | ) | (149,640 | ) | ||||
| Cerner Corp.* | (5,400 | ) | (418,014 | ) | ||||
| DENTSPLY International, Inc. | (11,800 | ) | (450,052 | ) | ||||
| Emeritus Corp.* | (8,900 | ) | (186,366 | ) | ||||
| HealthStream, Inc.* | (10,900 | ) | (310,214 | ) | ||||
| HeartWare International, Inc.* | (2,500 | ) | (236,225 | ) | ||||
| HMS Holdings Corp.* | (10,600 | ) | (354,358 | ) | ||||
| IPC Hospitalist Co., Inc. (The)* | (3,700 | ) | (169,090 | ) | ||||
| Landauer, Inc. | (4,000 | ) | (238,880 | ) | ||||
| Medidata Solutions, Inc.* | (10,000 | ) | (415,000 | ) | ||||
| MEDNAX, Inc.* | (5,400 | ) | (402,030 | ) | ||||
| OraSure Technologies, Inc.* | (13,500 | ) | (150,120 | ) | ||||
| Perrigo Co. | (1,300 | ) | (151,021 | ) | ||||
| PSS World Medical, Inc.* | (10,900 | ) | (248,302 | ) | ||||
| Theravance, Inc.* | (5,000 | ) | (129,550 | ) | ||||
| (5,426,550 | ) | |||||||
| Financials — (12.3%) | ||||||||
| Alexander & Baldwin, Inc.* | (4,700 | ) | (138,791 | ) | ||||
| Bank of America Corp. | (21,600 | ) | (190,728 | ) | ||||
| Brookfield Asset Management, Inc. - Class A | (4,300 | ) | (148,393 | ) | ||||
| Cincinnati Financial Corp. | (7,200 | ) | (272,808 | ) | ||||
| Community Bank System, Inc. | (12,600 | ) | (355,194 | ) | ||||
| First Horizon National Corp. | (28,500 | ) | (274,455 | ) | ||||
| FNB Corp. | (15,400 | ) | (172,634 | ) | ||||
| Green Dot Corp. - Class A* | (18,200 | ) | (222,586 | ) | ||||
| Morgan Stanley | (21,100 | ) | (353,214 | ) | ||||
| National Retail Properties, Inc., REIT | (7,400 | ) | (225,700 | ) | ||||
| Old Republic International Corp. | (24,300 | ) | (225,990 | ) | ||||
| Plum Creek Timber Co., Inc., REIT | (6,100 | ) | (267,424 | ) | ||||
| Progressive Corp. (The) | (16,600 | ) | (344,284 | ) | ||||
| Radian Group, Inc. | (37,900 | ) | (164,486 | ) | ||||
| S&T Bancorp, Inc. | (16,500 | ) | (290,565 | ) | ||||
| TCF Financial Corp. | (37,100 | ) | (442,974 | ) | ||||
| United Bankshares, Inc. | (6,500 | ) | (161,915 | ) | ||||
| Valley National Bancorp | (42,630 | ) | (427,153 | ) | ||||
| Westamerica Bancorporation | (5,800 | ) | (272,890 | ) | ||||
| (4,952,184 | ) | |||||||
| Energy — (12.3%) | ||||||||
| Abraxas Petroleum Corp.* | (27,600 | ) | (63,480 | ) | ||||
| Approach Resources, Inc.* | (4,600 | ) | (138,598 | ) | ||||
| Arch Coal, Inc. | (17,000 | ) | (107,610 | ) | ||||
| Carrizo Oil & Gas, Inc.* | (11,300 | ) | (282,613 | ) | ||||
| Cheniere Energy, Inc.* | (8,500 | ) | (132,175 | ) | ||||
| Chesapeake Energy Corp. | (13,500 | ) | (254,745 | ) | ||||
| Devon Energy Corp. | (5,100 | ) | (308,550 | ) | ||||
| Enbridge, Inc. | (11,800 | ) | (460,554 | ) | ||||
| EQT Corp. | (4,600 | ) | (271,400 | ) | ||||
| EXCO Resources, Inc. | (17,700 | ) | (141,777 | ) | ||||
| Forest Oil Corp.* | (16,700 | ) | (141,115 | ) | ||||
| Golar Lng Ltd. | (4,500 | ) | (173,655 | ) | ||||
| Gulfport Energy Corp.* | (4,100 | ) | (128,166 | ) | ||||
| Magnum Hunter Resources Corp.* | (38,200 | ) | (169,608 | ) | ||||
| Pioneer Natural Resources Co. | (1,600 | ) | (167,040 | ) | ||||
| Range Resources Corp. | (6,100 | ) | (426,207 | ) | ||||
| Resolute Energy Corp.* | (44,400 | ) | (393,828 | ) | ||||
| 80 |
Touchstone Market Neutral Equity Fund (Continued)
| Market | ||||||||
| Shares | Value | |||||||
| Common Stocks — (95.6%) (Continued) | ||||||||
| Energy — (Continued) | ||||||||
| SandRidge Energy, Inc.* | (16,100 | ) | $ | (112,217 | ) | |||
| Seadrill Ltd. | (10,600 | ) | (415,732 | ) | ||||
| Spectra Energy Corp. | (6,800 | ) | (199,648 | ) | ||||
| TransCanada Corp. | (10,000 | ) | (455,000 | ) | ||||
| (4,943,718 | ) | |||||||
| Industrials — (10.8%) | ||||||||
| ADA-ES, Inc.* | (7,500 | ) | (177,075 | ) | ||||
| Advisory Board Co. (The)* | (5,000 | ) | (239,150 | ) | ||||
| Clean Harbors, Inc.* | (2,900 | ) | (141,665 | ) | ||||
| FTI Consulting, Inc.* | (8,900 | ) | (237,452 | ) | ||||
| General Electric Co. | (5,500 | ) | (124,905 | ) | ||||
| IHS, Inc. - Class A* | (2,900 | ) | (282,315 | ) | ||||
| Interface, Inc. | (9,700 | ) | (128,137 | ) | ||||
| Kirby Corp.* | (2,300 | ) | (127,144 | ) | ||||
| Matson, Inc. | (4,700 | ) | (98,277 | ) | ||||
| McGrath RentCorp | (12,600 | ) | (328,734 | ) | ||||
| Mobile Mini, Inc.* | (23,100 | ) | (386,001 | ) | ||||
| Nielsen Holdings N.V. | (8,400 | ) | (251,832 | ) | ||||
| Pall Corp. | (5,100 | ) | (323,799 | ) | ||||
| Ritchie Bros Auctioneers, Inc. | (8,400 | ) | (161,532 | ) | ||||
| Rush Enterprises, Inc. - Class A* | (13,300 | ) | (256,158 | ) | ||||
| Titan Machinery, Inc.* | (8,000 | ) | (162,240 | ) | ||||
| TransDigm Group, Inc.* | (1,800 | ) | (255,366 | ) | ||||
| Waste Connections, Inc. | (14,400 | ) | (435,600 | ) | ||||
| Waste Management, Inc. | (7,600 | ) | (243,808 | ) | ||||
| (4,361,190 | ) | |||||||
| Materials — (7.0%) | ||||||||
| Compass Minerals International, Inc. | (6,300 | ) | (469,917 | ) | ||||
| Ecolab, Inc. | (6,400 | ) | (414,784 | ) | ||||
| Martin Marietta Materials, Inc. | (5,400 | ) | (447,498 | ) | ||||
| Methanex Corp. | (4,800 | ) | (136,992 | ) | ||||
| Potash Corp. of Saskatchewan, Inc. | (3,100 | ) | (134,602 | ) | ||||
| Praxair, Inc. | (1,100 | ) | (114,268 | ) | ||||
| Sealed Air Corp. | (23,900 | ) | (369,494 | ) | ||||
| Sigma-Aldrich Corp. | (6,300 | ) | (453,411 | ) | ||||
| Texas Industries, Inc.* | (3,100 | ) | (126,015 | ) | ||||
| Turquoise Hill Resources Ltd.* | (15,900 | ) | (134,832 | ) | ||||
| (2,801,813 | ) | |||||||
| Consumer Staples — (1.3%) | ||||||||
| Bunge Ltd. | (2,100 | ) | (140,805 | ) | ||||
| Chiquita Brands International, Inc.* | (15,200 | ) | (116,128 | ) | ||||
| Dole Food Co., Inc.* | (18,800 | ) | (263,764 | ) | ||||
| (520,697 | ) | |||||||
| Utilities — (1.1%) | ||||||||
| Atlantic Power Corp.* | (29,400 | ) | (439,824 | ) | ||||
| Telecommunication Services — (0.7%) | ||||||||
| NII Holdings, Inc.* | (35,600 | ) | (279,460 | ) | ||||
| Total Common Stocks | $ | (38,437,737 | ) | |||||
| Total Securities Sold Short | ||||||||
| (Proceeds $(34,953,412)) | $ | (38,437,737 | ) | |||||
| Total Investment Securities —2.0% | ||||||||
| (Cost $(56,312)) | $ | 789,475 | ||||||
| Cash Collateral for Securities Sold Short— 98.7% | 39,685,494 | |||||||
| Liabilities in Excess of Other Assets — (0.7%) | (272,508 | ) | ||||||
| Net Assets — 100.0% | $ | 40,202,461 | ||||||
| * | Non-income producing security. |
| ^ | Affiliated Fund. See Note 4 in Notes to Financial Statements. |
Portfolio Abbreviations:
REIT - Real Estate Investment Trust
Other Information:
The inputs or methodology used for valuing securities may not be an indication of the risk associated with investing in those securities. For more information on valuation inputs, and their aggregation into the levels used in the table below, please refer to the security valuation section in the accompanying Notes to Financial Statements.
Valuation inputs at Reporting Date:
| Description | Level 1 | Level 2 | Level 3 | Total | ||||||||||||
| Assets: | ||||||||||||||||
| Common Stocks | $ | 38,448,887 | $ | — | $ | — | $ | 38,448,887 | ||||||||
| Investment Fund | 778,325 | — | — | 778,325 | ||||||||||||
| $ | 39,227,212 | |||||||||||||||
| Liabilities: | ||||||||||||||||
| Securities Sold Short | ||||||||||||||||
| Common Stocks | $ | (38,437,737 | ) | $ | — | $ | — | $ | (38,437,737 | ) | ||||||
See accompanying Notes to Financial Statements.
| 81 |
Portfolio of Investments
Touchstone Merger Arbitrage Fund – September 30, 2012
| Market | ||||||||
| Shares | Value | |||||||
| Common Stocks — 83.9% | ||||||||
| Information Technology — 15.6% | ||||||||
| Ariba, Inc.* | 222,700 | $ | 9,976,960 | |||||
| Brightpoint, Inc.* | 1,156,100 | 10,381,778 | ||||||
| FSI International, Inc.* | 1,262,092 | 7,824,970 | ||||||
| Kenexa Corp.* | 229,000 | 10,495,070 | ||||||
| LML Payment Systems, Inc.* | 1,278,700 | 4,347,580 | ||||||
| PLX Technology, Inc.* | 1,056,995 | 6,098,861 | ||||||
| Ramtron International Corp.* | 1,561,572 | 4,809,642 | ||||||
| 53,934,861 | ||||||||
| Financials — 15.4% | ||||||||
| American Realty Capital Trust, Inc. REIT | 655,400 | 7,687,843 | ||||||
| Beacon Federal Bancorp, Inc. | 290,600 | 5,974,736 | ||||||
| Brooklyn Federal BanCorp, Inc.± | 134,865 | 6,743 | ||||||
| Citizens Republic Bancorp, Inc.* | 346,400 | 6,702,840 | ||||||
| Eaton Vance Senior Income Trust | 482,244 | 3,665,054 | ||||||
| Fidelity Bancorp, Inc. PA | 137,300 | 2,887,419 | ||||||
| First California Financial Group, Inc.* | 500,900 | 3,486,264 | ||||||
| Pacific Capital Bancorp NA* | 179,691 | 8,247,817 | ||||||
| Presidential Life Corp. | 525,477 | 7,319,895 | ||||||
| SeaBright Holdings, Inc. | 664,100 | 7,305,100 | ||||||
| 53,283,711 | ||||||||
| Health Care — 14.3% | ||||||||
| American Medical Corp. | 21,600 | — | ||||||
| AMERIGROUP Corp.* | 80,400 | 7,350,972 | ||||||
| China Kanghui Holdings ADR* | 177,100 | 5,374,985 | ||||||
| Coventry Health Care, Inc. | 260,900 | 10,876,921 | ||||||
| Medicis Pharmaceutical Corp. - Class A | 197,900 | 8,563,133 | ||||||
| Par Pharmaceutical Cos., Inc.* | 65,500 | 3,273,690 | ||||||
| Sun Healthcare Group, Inc.* | 804,000 | 6,805,860 | ||||||
| Sunrise Senior Living, Inc.* | 513,200 | 7,323,364 | ||||||
| 49,568,925 | ||||||||
| Industrials — 13.0% | ||||||||
| Cooper Industries PLC | 148,600 | 11,153,916 | ||||||
| Dollar Thrifty Automotive Group, Inc.* | 102,200 | 8,884,246 | ||||||
| Exelis, Inc. | 61,950 | 640,563 | ||||||
| ITT Corp. | 30,975 | 624,146 | ||||||
| Robbins & Myers, Inc. | 173,200 | 10,322,720 | ||||||
| Shaw Group, Inc. (The)* | 173,900 | 7,585,518 | ||||||
| US Home Systems, Inc. | 344,759 | 4,299,145 | ||||||
| Xylem, Inc. | 62,000 | 1,559,300 | ||||||
| 45,069,554 | ||||||||
| Consumer Staples — 8.1% | ||||||||
| Grupo Modelo S.A. de C.V. | 1,070,100 | 9,609,498 | ||||||
| Kraft Foods, Inc. - Class A | 239,700 | 9,911,595 | ||||||
| Physicians Formula Holdings, Inc.* | 637,800 | 3,106,086 | ||||||
| Viterra, Inc. | 320,000 | 5,243,821 | ||||||
| 27,871,000 | ||||||||
| Consumer Discretionary — 6.5% | ||||||||
| Collective Brands, Inc.* | 225,500 | 4,895,605 | ||||||
| Comcast Corp. - Class A | 124,871 | 4,345,511 | ||||||
| Lowe's Cos, Inc. | 154,500 | 4,672,080 | ||||||
| Peet's Coffee & Tea, Inc.* | 49,200 | 3,608,328 | ||||||
| Sealy Corp.* | 2,241,625 | 4,886,742 | ||||||
| 22,408,266 | ||||||||
| Energy — 6.1% | ||||||||
| Nexen, Inc. | 259,700 | 6,580,798 | ||||||
| Progress Energy Resources Corp. | 250,000 | 5,569,118 | ||||||
| Sunoco., Inc. | 186,958 | 8,755,243 | ||||||
| 20,905,159 | ||||||||
| Utilities — 3.2% | ||||||||
| CH Energy Group, Inc. | 55,845 | 3,641,652 | ||||||
| GenOn Energy, Inc.* | 2,894,300 | 7,322,579 | ||||||
| 10,964,231 | ||||||||
| Materials — 1.7% | ||||||||
| Talison Lithium Ltd.* | 900,000 | 5,923,100 | ||||||
| Total Common Stocks | $ | 289,928,807 | ||||||
| Preferred Stocks — 3.3% | ||||||||
| Financials — 3.3% | ||||||||
| Countrywide Capital V, 7.00% | 136,000 | 3,425,840 | ||||||
| GMAC Capital Trust I, 8.13%(A) | 173,100 | 4,346,541 | ||||||
| Goldman Sachs Group, Inc. (The), 6.13% | 142,200 | 3,739,860 | ||||||
| Total Preferred Stocks | $ | 11,512,241 | ||||||
| Principal | ||||||||
| Amount | ||||||||
| Corporate Bonds — 2.2% | ||||||||
| Materials — 0.9% | ||||||||
| $ | 2,950,000 | ArcelorMittal, 5.375%, 6/1/13 | 3,025,331 | |||||
| Consumer Discretionary — 0.6% | ||||||||
| 1,935,000 | Peninsula Gaming LLC / Peninsula | |||||||
| Gaming Corp., 10.750%, 8/15/17 | 2,186,550 | |||||||
| Financials — 0.4% | ||||||||
| 1,150,000 | Leucadia National Corp., | |||||||
| 8.125%, 9/15/15 | 1,296,625 | |||||||
| Utilities — 0.3% | ||||||||
| 1,085,000 | AES Corp. (The), 8.000%, 10/15/17 | 1,253,175 | ||||||
| Total Corporate Bonds | $ | 7,761,681 | ||||||
| Commercial Mortgage-Backed Security — 0.9% | ||||||||
| 2,950,000 | Banc of America Merrill Lynch | |||||||
| Commercial Mortgage, Inc., Ser | ||||||||
| 2007-2, Class AM, | ||||||||
| 5.813%, 4/10/49(A) | 3,161,161 | |||||||
| Asset-Backed Securities — 1.6% | ||||||||
| 2,481,250 | Dominos Pizza Master Issuer LLC, Ser | |||||||
| 2012-1A, Class A2, 144a, | ||||||||
| 5.216%, 1/25/42 | 2,766,101 | |||||||
| 82 |
Touchstone Merger Arbitrage Fund (Continued)
| Principal | Market | |||||||
| Amount | Value | |||||||
| Asset-Backed Securities — 1.6% (Continued) | ||||||||
| $ | 2,400,000 | Sonic Capital LLC, Ser 2011-1A, Class | ||||||
| A2, 144a, 5.438%, 5/20/41 | $ | 2,674,303 | ||||||
| Total Asset-Backed Securities | $ | 5,440,404 | ||||||
| Number | ||||||||
| of | ||||||||
| Rights | ||||||||
| Rights — 1.1% | ||||||||
| Allos Therapeutics Contingent Value Rights, 0.00%± | 4,131,971 | $ | — | |||||
| Sanofi Contingent Value Rights, 0.00% | 2,262,409 | 3,800,847 | ||||||
| XO Holdings, Inc. Class O, 0.00% | 40,500 | — | ||||||
| Total Rights | $ | 3,800,847 | ||||||
| Shares | ||||||||
| Investment Funds — 4.1% | ||||||||
| Blackrock Credit Allocation Income Trust III, Inc. | 284,400 | $ | 3,444,084 | |||||
| Touchstone Institutional Money Market Fund^ | 10,751,954 | 10,751,954 | ||||||
| Total Investment Funds | $ | 14,196,038 | ||||||
| Total Long Positions | ||||||||
| (Cost $331,361,235) | $ | 335,801,179 | ||||||
| Securities Sold Short — (16.4%) | ||||||||
| Common Stocks — (16.4%) | ||||||||
| Financials — (3.6%) | ||||||||
| Berkshire Hills Bancorp, Inc. | (133,576 | ) | $ | (3,056,219 | ) | |||
| FirstMerit Corp. | (474,568 | ) | (6,990,387 | ) | ||||
| WesBanco, Inc. | (113,550 | ) | (2,351,620 | ) | ||||
| (12,398,226 | ) | |||||||
| Consumer Staples — (2.9%) | ||||||||
| Kraft Foods Group, Inc.*# | (79,899 | ) | (3,567,490 | ) | ||||
| Kraft Foods, Inc.*# | (239,700 | ) | (6,364,035 | ) | ||||
| (9,931,525 | ) | |||||||
| Consumer Discretionary — (2.6%) | ||||||||
| Comcast Corp. - Class A | (124,871 | ) | (4,466,636 | ) | ||||
| Home Depot, Inc. | (77,250 | ) | (4,663,582 | ) | ||||
| (9,130,218 | ) | |||||||
| Utilities — (2.2%) | ||||||||
| NRG Energy, Inc. | (352,123 | ) | (7,531,910 | ) | ||||
| Industrials — (1.8%) | ||||||||
| Chicago Bridge & Iron Co. N.V. | (21,696 | ) | (826,401 | ) | ||||
| Eaton Corp. | (115,138 | ) | (5,441,422 | ) | ||||
| (6,267,823 | ) | |||||||
| Energy — (1.2%) | ||||||||
| Energy Transfer Partners LP | (98,612 | ) | (4,197,913 | ) | ||||
| Health Care — (1.2%) | ||||||||
| Aetna, Inc. | (101,362 | ) | (4,013,936 | ) | ||||
| Information Technology — (0.9%) | ||||||||
| Integrated Device Technology, Inc.* | (554,777 | ) | (3,262,089 | ) | ||||
| Total Common Stocks | $ | (56,733,640 | ) | |||||
| Total Securities Sold Short | ||||||||
| (Proceeds $(55,104,957)) | $ | (56,733,640 | ) | |||||
| Total Investment Securities —80.7% | ||||||||
| (Cost $276,256,278) | 279,067,539 | |||||||
| Cash Collateral for Securities Sold Short— 13.8% | 47,882,314 | |||||||
| Other Assets in Excess of Liabilities — 5.5% | 18,842,310 | |||||||
| Net Assets — 100.0% | $ | 345,792,163 | ||||||
| (A) | Variable rate security - the rate reflected is the rate in effect as of September 30, 2012. |
| * | Non-income producing security. |
| ^ | Affiliated Fund. See Note 4 in Notes to Financial Statements. |
| # | When issued or delayed delivery security. See Note 2 in Notes to Financial Statements. |
| ± | Fair valued security by Fund's Investment Advisor. |
Portfolio Abbreviations:
ADR - American Depositary Receipt
CAD - Canadian Dollar
LLC - Limited Liability Company
LP - Limited Partnership
LTD - Limited
PLC - Public Limited Company
| 83 |
Touchstone Merger Arbitrage Fund (Continued)
144A - This is a restricted security that was sold in a transaction exempt from Rule 144A of the Securities Act of 1933. This security may be sold in transactions exempt from registration, normally to qualified institutional buyers. At September 30, 2012, these securities were valued at $5,440,404 or 1.6% of net assets. These securities were deemed liquid pursuant to procedures approved by the Board of Trustees.
Other Information:
The inputs or methodology used for valuing securities may not be an indication of the risk associated with investing in those securities. For more information on valuation inputs, and their aggregation into the levels used in the table below, please refer to the security valuation section in the accompanying Notes to Financial Statements.
Valuation inputs at Reporting Date:
| Description | Level 1 | Level 2 | Level 3 | Total | ||||||||||||
| Assets: | ||||||||||||||||
| Common Stocks | ||||||||||||||||
| Information Technology | $ | 53,934,861 | $ | — | $ | — | $ | 53,934,861 | ||||||||
| Financials | 53,276,968 | — | 6,743 | 53,283,711 | ||||||||||||
| Health Care | 49,568,925 | — | — | 49,568,925 | ||||||||||||
| Industrials | 45,069,554 | — | — | 45,069,554 | ||||||||||||
| Consumer Staples | 27,871,000 | — | — | 27,871,000 | ||||||||||||
| Consumer Discretionary | 22,408,266 | — | — | 22,408,266 | ||||||||||||
| Energy | 20,905,159 | — | — | 20,905,159 | ||||||||||||
| Utilities | 10,964,231 | — | — | 10,964,231 | ||||||||||||
| Materials | 5,923,100 | — | — | 5,923,100 | ||||||||||||
| Preferred Stocks | 11,512,241 | — | — | 11,512,241 | ||||||||||||
| Corporate Bonds | — | 7,761,681 | — | 7,761,681 | ||||||||||||
| Commercial Mortgage-Backed Security | — | 3,161,161 | — | 3,161,161 | ||||||||||||
| Asset-Backed Securities | — | 5,440,404 | — | 5,440,404 | ||||||||||||
| Rights | 3,800,847 | — | — | 3,800,847 | ||||||||||||
| Investment Funds | 14,196,038 | — | — | 14,196,038 | ||||||||||||
| $ | 335,801,179 | |||||||||||||||
| Liabilities: | ||||||||||||||||
| Securities Sold Short | ||||||||||||||||
| Common Stocks | (56,733,640 | ) | — | — | (56,733,640 | ) | ||||||||||
Valuation inputs at Reporting Date:
| Description | Level 1 | Level 2 | Level 3 | Total | ||||||||||||
| Other Financial Instruments** | ||||||||||||||||
| Assets: | ||||||||||||||||
| Forward Currency Contracts | $ | — | $ | 45,577 | $ | — | $ | 45,577 | ||||||||
| Liabilities: | ||||||||||||||||
| Forward Currency Contract | — | (69,877 | ) | — | (69,877 | ) | ||||||||||
** Other Financial Instruments are derivative instruments not reflected in total investments. Amounts shown represent unrealized appreciation (depreciation).
At September 30, 2012 securities valued at $1,790,578 were transferred from Level 1 to Level 2 pursuant to the Fund's fair valuation policy.
Level 3 Rollforward Disclosure
The following is a rollforward of the Fund's investments that were valued using unobservable inputs for the year ended September 30, 2012:
Measurements Using Unobservable Inputs (Level 3)
| Common Stock | ||||||||
| United | ||||||||
| Assets | States | Total | ||||||
| Beginning balance | $ | — | $ | — | ||||
| Gross transfers into Level 3 | 6,743 | (a) | 6,743 | |||||
| Ending balance | $ | 6,743 | $ | 6,743 | ||||
The change in unrealized appreciation/depreciation relating to the Level 3 investments held at September 30, 2012 was ($6,743).
| (a) | Transferred from Level 1 to Level 3 due to lack of observable valuation inputs. |
| 84 |
Touchstone Merger Arbitrage Fund (Continued)
Forward Foreign Currency Exchange Contract
| Unrealized | ||||||||||||||
| Contract to | Appreciation/ | |||||||||||||
| Counterparty | Value Date | Receive | Deliver | (Depreciation) | ||||||||||
| Brown Brothers Harriman | 10/05/2012 | USD | 5,333,607 | CAD | 5,200,000 | $ | 45,018 | |||||||
| Brown Brothers Harriman | 10/12/2012 | USD | 5,593,410 | CAD | 5,500,000 | 559 | ||||||||
| Brown Brothers Harriman | 11/16/2012 | USD | 5,874,084 | CAD | 5,850,000 | (69,877 | ) | |||||||
| $ | (24,300 | ) | ||||||||||||
See accompanying Notes to Financial Statements.
| 85 |
Portfolio of Investments
Touchstone Mid Cap Fund – September 30, 2012
| Market | ||||||||
| Shares | Value | |||||||
| Common Stocks — 97.5% | ||||||||
| Financials — 21.6% | ||||||||
| Alexander & Baldwin, Inc.* | 25,542 | $ | 754,255 | |||||
| Alleghany Corp.* | 3,820 | 1,317,671 | ||||||
| Eaton Vance Corp. | 93,356 | 2,703,590 | ||||||
| Hatteras Financial Corp. REIT | 66,033 | 1,861,470 | ||||||
| M&T Bank Corp.† | 30,003 | 2,855,085 | ||||||
| MBIA, Inc.* | 97,021 | 982,823 | ||||||
| UDR, Inc. REIT | 45,773 | 1,136,086 | ||||||
| White Mountains Insurance Group Ltd. | 3,419 | 1,755,109 | ||||||
| 13,366,089 | ||||||||
| Consumer Discretionary — 20.5% | ||||||||
| Cabela's, Inc.* | 43,756 | 2,392,578 | ||||||
| CarMax, Inc.* | 87,899 | 2,487,542 | ||||||
| Hasbro, Inc. | 59,595 | 2,274,741 | ||||||
| Service Corp. International | 168,911 | 2,273,542 | ||||||
| Staples, Inc. | 119,922 | 1,381,501 | ||||||
| Whirlpool Corp. | 22,003 | 1,824,269 | ||||||
| 12,634,173 | ||||||||
| Consumer Staples — 17.1% | ||||||||
| Brown-Forman Corp. - Class B | 30,564 | 1,994,268 | ||||||
| Energizer Holdings, Inc. | 31,966 | 2,384,983 | ||||||
| Hershey Co. (The) | 27,871 | 1,975,775 | ||||||
| Lorillard, Inc. | 15,028 | 1,750,011 | ||||||
| Nu Skin Enterprises, Inc. Class A | 33,465 | 1,299,447 | ||||||
| Pricesmart, Inc. | 15,467 | 1,171,161 | ||||||
| 10,575,645 | ||||||||
| Materials — 15.1% | ||||||||
| Albemarle Corp. | 45,951 | 2,420,699 | ||||||
| MeadWestvaco. Corp. | 91,941 | 2,813,395 | ||||||
| NewMarket Corp. | 10,442 | 2,573,744 | ||||||
| Vulcan Materials Co. | 32,643 | 1,544,014 | ||||||
| 9,351,852 | ||||||||
| Industrials — 7.6% | ||||||||
| Cintas Corp | 71,394 | 2,959,281 | ||||||
| Matson, Inc. | 24,450 | 511,250 | ||||||
| Old Dominion Freight Line, Inc.* | 39,357 | 1,187,007 | ||||||
| 4,657,538 | ||||||||
| Information Technology — 7.4% | ||||||||
| Amphenol Corp. - Class A | 36,540 | 2,151,475 | ||||||
| Paychex, Inc. | 73,010 | 2,430,503 | ||||||
| 4,581,978 | ||||||||
| Energy — 5.7% | ||||||||
| Atwood Oceanics, Inc.* | 63,482 | 2,885,257 | ||||||
| Kinder Morgan Management LLC* | 8,584 | 655,791 | ||||||
| 3,541,048 | ||||||||
| Health Care — 2.5% | ||||||||
| Tenet Healthcare Corp.* | 246,129 | 1,543,229 | ||||||
| Total Common Stocks | $ | 60,251,552 | ||||||
| Investment Funds — 6.2% | ||||||||
| Invesco Government & Agency Portfolio** | 2,855,721 | 2,855,721 | ||||||
| Touchstone Institutional Money Market Fund^ | 938,052 | 938,052 | ||||||
| Total Investment Funds | $ | 3,793,773 | ||||||
| Total Investment Securities —103.7% | ||||||||
| (Cost $57,102,367) | $ | 64,045,325 | ||||||
| Liabilities in Excess of Other Assets — (3.7%) | (2,260,414 | ) | ||||||
| Net Assets — 100.0% | $ | 61,784,911 | ||||||
| † | All or a portion of the security is on loan. The total value of the securities on loan as of September 30, 2012 was $2,818,354. |
| * | Non-income producing security. |
| ** | Represents collateral for securities loaned. |
| ^ | Affiliated Fund. See Note 4 in Notes to Financial Statements. |
Portfolio Abbreviations:
LLC - Limited Liability Company
REIT - Real Estate Investment Trust
Other Information:
The inputs or methodology used for valuing securities may not be an indication of the risk associated with investing in those securities. For more information on valuation inputs, and their aggregation into the levels used in the table below, please refer to the security valuation section in the accompanying Notes to Financial Statements.
Valuation inputs at Reporting Date:
| Description | Level 1 | Level 2 | Level 3 | Total | ||||||||||||
| Common Stocks | $ | 60,251,552 | $ | — | $ | — | $ | 60,251,552 | ||||||||
| Investment Funds | 3,793,773 | — | — | 3,793,773 | ||||||||||||
| $ | 64,045,325 | |||||||||||||||
See accompanying Notes to Financial Statements.
| 86 |
Portfolio of Investments
Touchstone Mid Cap Value Fund – September 30, 2012
| Market | ||||||||
| Shares | Value | |||||||
| Common Stocks — 96.8% | ||||||||
| Financials — 20.8% | ||||||||
| Allstate Corp. (The) | 40,507 | $ | 1,604,482 | |||||
| Ameriprise Financial, Inc. | 23,672 | 1,341,966 | ||||||
| Comerica, Inc. | 34,997 | 1,086,657 | ||||||
| Digital Realty Trust, Inc., REIT | 18,982 | 1,325,893 | ||||||
| Endurance Speciality Holdings Ltd. | 17,475 | 672,788 | ||||||
| Fifth Third BanCorp. | 109,585 | 1,699,663 | ||||||
| Host Hotels & Resorts, Inc., REIT | 77,059 | 1,236,798 | ||||||
| Liberty Property Trust, REIT | 39,823 | 1,443,186 | ||||||
| PartnerRe Ltd. | 18,158 | 1,348,776 | ||||||
| Reinsurance Group of America, Inc. | 23,510 | 1,360,524 | ||||||
| SunTrust Banks, Inc. | 49,792 | 1,407,620 | ||||||
| TCF Financial Corp. | 70,211 | 838,319 | ||||||
| Unum Group | 66,064 | 1,269,750 | ||||||
| Willis Group Holdings PLC | 33,178 | 1,224,932 | ||||||
| Zions Bancorporation | 70,083 | 1,447,564 | ||||||
| 19,308,918 | ||||||||
| Information Technology — 11.6% | ||||||||
| Adobe Systems, Inc.* | 36,953 | 1,199,494 | ||||||
| Analog Devices, Inc. | 25,617 | 1,003,930 | ||||||
| Diebold, Inc. | 30,025 | 1,012,143 | ||||||
| Fidelity National Information Services, Inc. | 44,297 | 1,382,952 | ||||||
| Juniper Networks, Inc.* | 61,883 | 1,058,818 | ||||||
| Molex, Inc. | 36,268 | 953,123 | ||||||
| Symantec Corp.* | 86,196 | 1,551,528 | ||||||
| Synopsys, Inc.* | 59,172 | 1,953,859 | ||||||
| Vishay Intertechnology, Inc.* | 68,952 | 677,798 | ||||||
| 10,793,645 | ||||||||
| Industrials — 10.6% | ||||||||
| Cintas Corp. | 30,279 | 1,255,065 | ||||||
| Dover Corp. | 19,708 | 1,172,429 | ||||||
| Flowserve Corp. | 9,252 | 1,181,850 | ||||||
| Fluor Corp. | 20,288 | 1,141,809 | ||||||
| Republic Services, Inc. | 57,822 | 1,590,683 | ||||||
| Spirit Aerosystems Holdings, Inc. - Class A* | 41,770 | 927,712 | ||||||
| Stanley Black & Decker, Inc. | 19,550 | 1,490,688 | ||||||
| Towers Watson & Co. - Class A | 19,710 | 1,045,616 | ||||||
| 9,805,852 | ||||||||
| Consumer Staples — 9.8% | ||||||||
| Coca-Cola Enterprises, Inc. | 31,857 | 996,168 | ||||||
| Constellation Brands, Inc.-Class A* | 32,609 | 1,054,901 | ||||||
| Energizer Holdings, Inc. | 16,015 | 1,194,879 | ||||||
| JM Smucker Co. (The) | 12,089 | 1,043,643 | ||||||
| Kroger Co. (The) | 58,822 | 1,384,670 | ||||||
| Molson Coors Brewing Co.-Class B | 26,900 | 1,211,845 | ||||||
| Sysco Corp. | 40,933 | 1,279,975 | ||||||
| Tyson Foods, Inc. - Class A | 56,550 | 905,931 | ||||||
| 9,072,012 | ||||||||
| Consumer Discretionary — 9.7% | ||||||||
| Harley-Davidson, Inc. | 25,252 | 1,069,927 | ||||||
| Hasbro, Inc. | 38,203 | 1,458,209 | ||||||
| Interpublic Group of Cos, Inc. (The) | 92,718 | 1,031,024 | ||||||
| Newell Rubbermaid, Inc. | 76,325 | 1,457,044 | ||||||
| Royal Caribbean Cruises Ltd. | 36,686 | 1,108,284 | ||||||
| Scripps Networks Interactive, Inc. - Class A | 16,731 | 1,024,439 | ||||||
| Urban Outfitters, Inc.* | 24,382 | 915,789 | ||||||
| WMS Industries, Inc.* | 55,256 | 905,093 | ||||||
| 8,969,809 | ||||||||
| Utilities — 9.3% | ||||||||
| AGL Resources, Inc. | 37,460 | 1,532,489 | ||||||
| Edison International | 20,650 | 943,498 | ||||||
| Great Plains Energy, Inc. | 80,311 | 1,787,723 | ||||||
| Portland General Electric Co. | 28,361 | 766,881 | ||||||
| SCANA Corp. | 26,462 | 1,277,321 | ||||||
| TECO Energy, Inc. | 69,457 | 1,232,167 | ||||||
| Xcel Energy, Inc. | 40,495 | 1,122,116 | ||||||
| 8,662,195 | ||||||||
| Materials — 9.2% | ||||||||
| Allegheny Technologies, Inc. | 51,819 | 1,653,026 | ||||||
| Compass Minerals International, Inc. | 13,375 | 997,641 | ||||||
| Greif, Inc. - Class A | 28,430 | 1,256,037 | ||||||
| Huntsman Corp. | 60,411 | 901,936 | ||||||
| Nucor Corp. | 27,427 | 1,049,357 | ||||||
| Owens-Illinois, Inc.* | 63,685 | 1,194,731 | ||||||
| Packaging Corp. of America | 40,171 | 1,458,207 | ||||||
| 8,510,935 | ||||||||
| Health Care — 8.7% | ||||||||
| AmerisourceBergen Corp. | 21,795 | 843,684 | ||||||
| CareFusion Corp.* | 50,861 | 1,443,944 | ||||||
| HealthSouth Corp.* | 36,798 | 885,360 | ||||||
| MEDNAX, Inc.* | 19,469 | 1,449,467 | ||||||
| Patterson Co., Inc. | 25,640 | 877,914 | ||||||
| Quest Diagnostics, Inc. | 20,877 | 1,324,228 | ||||||
| Teleflex, Inc. | 17,472 | 1,202,772 | ||||||
| 8,027,369 | ||||||||
| Energy — 7.1% | ||||||||
| EQT Corp. | 14,284 | 842,756 | ||||||
| McDermott International, Inc.* | 50,200 | 613,444 | ||||||
| Murphy Oil Corp. | 12,524 | 672,414 | ||||||
| Nabors Industries Ltd.* | 41,023 | 575,553 | ||||||
| Newfield Exploration Co.* | 40,995 | 1,283,963 | ||||||
| Pioneer Natural Resources Co. | 14,669 | 1,531,444 | ||||||
| Range Resources Corp. | 15,664 | 1,094,444 | ||||||
| 6,614,018 | ||||||||
| Total Common Stocks | $ | 89,764,753 | ||||||
| Exchange Traded Fund — 1.0% | ||||||||
| iShares Russell Midcap Value Index Fund | 19,546 | 952,281 | ||||||
| Investment Fund — 1.8% | ||||||||
| Touchstone Institutional Money Market Fund^ | 1,677,943 | 1,677,943 | ||||||
| 87 |
Touchstone Mid Cap Value Fund (Continued)
| Market | ||||
| Value | ||||
| Total Investment Securities —99.6% | ||||
| (Cost $86,322,248) | $ | 92,394,977 | ||
| Other Assets in Excess of Liabilities — 0.4% | 331,730 | |||
| Net Assets — 100.0% | $ | 92,726,707 | ||
Portfolio Abbreviations:
PLC - Public Limited Company
REIT - Real Estate Investment Trust
| * | Non-income producing security. |
| ^ | Affiliated Fund. See Note 4 in Notes to Financial Statements. |
Other Information:
The inputs or methodology used for valuing securities may not be an indication of the risk associated with investing in those securities. For more information on valuation inputs, and their aggregation into the levels used in the table below, please refer to the security valuation section in the accompanying Notes to Financial Statements.
Valuation inputs at Reporting Date:
| Description | Level 1 | Level 2 | Level 3 | Total | ||||||||||||
| Common Stocks | $ | 89,764,753 | $ | — | $ | — | $ | 89,764,753 | ||||||||
| Exchanged Traded Fund | 952,281 | — | — | 952,281 | ||||||||||||
| Investment Fund | 1,677,943 | — | — | 1,677,943 | ||||||||||||
| $ | 92,394,977 | |||||||||||||||
See accompanying Notes to Financial Statements.
| 88 |
Portfolio of Investments
Touchstone Premium Yield Equity Fund – September 30, 2012
| Market | ||||||||
| Shares | Value | |||||||
| Common Stocks — 95.9% | ||||||||
| Energy — 22.5% | ||||||||
| Kinder Morgan Management LLC* | 3 | $ | 207 | |||||
| Kinder Morgan, Inc. | 236,376 | 8,396,076 | ||||||
| Pembina Pipeline Corp. (Canada) | 46,953 | 1,319,379 | ||||||
| Seadrill Ltd. | 97,064 | 3,806,850 | ||||||
| Spectra Energy Corp. | 109,822 | 3,224,374 | ||||||
| Statoil ASA, ADR | 113,767 | 2,934,051 | ||||||
| Total SA, ADR | 48,531 | 2,431,403 | ||||||
| Williams Co, Inc. (The) | 125,078 | 4,373,978 | ||||||
| 26,486,318 | ||||||||
| Health Care — 18.1% | ||||||||
| Abbott Laboratories | 80,974 | 5,551,577 | ||||||
| Baxter International, Inc. | 39,327 | 2,369,845 | ||||||
| Eli Lilly & Co. | 49,980 | 2,369,552 | ||||||
| GlaxoSmithKline PLC ADR | 72,469 | 3,350,967 | ||||||
| Johnson & Johnson | 46,032 | 3,172,065 | ||||||
| Merck & Co., Inc. | 50,375 | 2,271,912 | ||||||
| Pfizer, Inc. | 90,753 | 2,255,212 | ||||||
| 21,341,130 | ||||||||
| Utilities — 15.8% | ||||||||
| American Water Works Co., Inc. | 119,291 | 4,420,924 | ||||||
| National Grid PLC ADR | 53,923 | 2,985,177 | ||||||
| NiSource, Inc. | 219,653 | 5,596,758 | ||||||
| ONEOK, Inc. | 115,491 | 5,579,370 | ||||||
| 18,582,229 | ||||||||
| Financials — 12.3% | ||||||||
| Bank of Montreal | 23,017 | 1,358,924 | ||||||
| Cincinnati Financial Corp. | 63,132 | 2,392,071 | ||||||
| CME Group, Inc. | 38,801 | 2,223,297 | ||||||
| Digital Realty Trust, Inc. REIT | 34,853 | 2,434,482 | ||||||
| HCP, Inc. REIT | 53,268 | 2,369,361 | ||||||
| Hospitality Properties Trust REIT | 107,850 | 2,564,673 | ||||||
| Valley National Bancorp | 115,744 | 1,159,755 | ||||||
| 14,502,563 | ||||||||
| Information Technology — 8.4% | ||||||||
| CA, Inc. | 86,281 | 2,223,031 | ||||||
| Intel Corp. | 138,099 | 3,132,085 | ||||||
| Maxim Integrated Products, Inc. | 77,074 | 2,051,710 | ||||||
| Microchip Technology, Inc. | 73,654 | 2,411,432 | ||||||
| 9,818,258 | ||||||||
| Telecommunication Services — 7.9% | ||||||||
| AT&T, Inc. | 79,571 | 2,999,827 | ||||||
| BCE, Inc. (Canada) | 28,936 | 1,271,448 | ||||||
| Vodafone Group PLC ADR | 116,266 | 3,313,000 | ||||||
| Windstream Corp. | 169,010 | 1,708,691 | ||||||
| 9,292,966 | ||||||||
| Industrials — 5.2% | ||||||||
| ACCO Brands Corp.* | 80 | 519 | ||||||
| General Electric Co. | 197,416 | 4,483,317 | ||||||
| R.R. Donnelley & Sons Co. | 153,358 | 1,625,595 | ||||||
| 6,109,431 | ||||||||
| Materials — 3.9% | ||||||||
| International Paper Co. | 71,023 | 2,579,555 | ||||||
| MeadWestvaco. Corp. | 66,684 | 2,040,531 | ||||||
| 4,620,086 | ||||||||
| Consumer Staples — 1.8% | ||||||||
| H.J. Heinz Co. | 37,222 | 2,082,571 | ||||||
| Total Common Stocks | $ | 112,835,552 | ||||||
| Investment Fund — 13.8% | ||||||||
| Touchstone Institutional Money Market Fund^ | 16,172,313 | 16,172,313 | ||||||
| Total Investment Securities —109.7% | ||||||||
| (Cost $115,627,837) | $ | 129,007,865 | ||||||
| Liabilities in Excess of Other Assets — (9.7)% | (11,363,410 | ) | ||||||
| Net Assets — 100.0% | $ | 117,644,455 | ||||||
Portfolio Abbreviations:
ADR - American Depositary Receipt
LLC - Limited Liability Company
PLC - Public Limited Company
REIT - Real Estate Investment Trust
| * | Non-income producing security. |
| ^ | Affiliated Fund. See Note 4 in Notes to Financial Statements. |
Other Information:
The inputs or methodology used for valuing securities may not be an indication of the risk associated with investing in those securities. For more information on valuation inputs, and their aggregation into the levels used in the table below, please refer to the security valuation section in the accompanying Notes to Financial Statements.
Valuation inputs at Reporting Date:
| Description | Level 1 | Level 2 | Level 3 | Total | ||||||||||||
| Common Stocks | $ | 112,835,552 | $ | — | $ | — | $ | 112,835,552 | ||||||||
| Investment Fund | 16,172,313 | — | — | 16,172,313 | ||||||||||||
| $ | 129,007,865 | |||||||||||||||
See accompanying Notes to Financial Statements.
| 89 |
Portfolio of Investments
Touchstone Sands Capital Select Growth Fund – September 30, 2012
| Market | ||||||||
| Shares | Value | |||||||
| Common Stocks — 98.2% | ||||||||
| Information Technology — 42.2% | ||||||||
| Apple, Inc. | 480,000 | $ | 320,284,800 | |||||
| ASML Holding NV (Netherlands) | 1,784,000 | 95,765,120 | ||||||
| F5 Networks, Inc.* | 705,000 | 73,813,500 | ||||||
| Facebook, Inc. - Class A†* | 2,200,976 | 47,651,130 | ||||||
| Google, Inc. - Class A* | 333,000 | 251,248,500 | ||||||
| Qualcomm, Inc. | 2,502,000 | 156,349,980 | ||||||
| Salesforce.com, Inc.* | 1,389,000 | 212,086,410 | ||||||
| Visa, Inc. - Class A | 1,837,000 | 246,672,360 | ||||||
| 1,403,871,800 | ||||||||
| Consumer Discretionary — 21.7% | ||||||||
| Amazon.Com, Inc.* | 1,020,000 | 259,406,400 | ||||||
| Coach, Inc. | 1,572,000 | 88,063,440 | ||||||
| Las Vegas Sands Corp. | 2,249,000 | 104,286,130 | ||||||
| NIKE, Inc. - Class B | 939,000 | 89,120,490 | ||||||
| Priceline.com, Inc.* | 167,000 | 103,327,910 | ||||||
| Starbucks Corp. | 1,558,000 | 79,068,500 | ||||||
| 723,272,870 | ||||||||
| Health Care — 16.3% | ||||||||
| Alexion Pharmaceuticals, Inc.* | 1,176,000 | 134,534,400 | ||||||
| Allergan, Inc./United States | 1,337,522 | 122,490,265 | ||||||
| athenahealth, Inc.†* | 472,000 | 43,315,439 | ||||||
| Cerner Corp.* | 1,112,275 | 86,101,208 | ||||||
| Intuitive Surgical, Inc.* | 141,000 | 69,883,830 | ||||||
| Regeneron Pharmaceuticals, Inc.* | 563,000 | 85,947,580 | ||||||
| 542,272,722 | ||||||||
| Energy — 10.2% | ||||||||
| FMC Technologies, Inc.* | 1,683,000 | 77,922,900 | ||||||
| National Oilwell Varco., Inc. | 1,166,000 | 93,408,260 | ||||||
| Schlumberger Ltd. | 1,525,000 | 110,303,250 | ||||||
| Southwestern Energy Co.* | 1,611,000 | 56,030,580 | ||||||
| 337,664,990 | ||||||||
| Industrials — 2.8% | ||||||||
| W.W. Grainger, Inc. | 445,000 | 92,724,650 | ||||||
| Materials — 2.7% | ||||||||
| Praxair, Inc. | 879,000 | 91,310,520 | ||||||
| Financials — 2.3% | ||||||||
| Intercontinental Exchange, Inc.* | 581,000 | 77,511,210 | ||||||
| Total Common Stocks | $ | 3,268,628,762 | ||||||
| Investment Funds — 4.9% | ||||||||
| Invesco Government & Agency Portfolio** | 79,587,866 | 79,587,866 | ||||||
| Touchstone Institutional Money Market Fund^ | 83,047,789 | 83,047,789 | ||||||
| Total Investment Funds | $ | 162,635,655 | ||||||
| Total Investment Securities —103.1% | ||||||||
| (Cost $2,680,454,621) | $ | 3,431,264,417 | ||||||
| Liabilities in Excess of Other Assets — (3.1%) | (103,869,373 | ) | ||||||
| Net Assets — 100.0% | $ | 3,327,395,044 | ||||||
| † | All or a portion of the security is on loan. The total value of the securities on loan as of September 30, 2012 was $80,652,124. |
| * | Non-income producing security. |
| ** | Represents collateral for securities loaned. |
| ^ | Affiliated Fund. See Note 4 in Notes to Financial Statements. |
Other Information:
The inputs or methodology used for valuing securities may not be an indication of the risk associated with investing in those securities. For more information on valuation inputs, and their aggregation into the levels used in the table below, please refer to the security valuation section in the accompanying Notes to Financial Statements.
Valuation inputs at Reporting Date:
| Description | Level 1 | Level 2 | Level 3 | Total | ||||||||||||
| Common Stocks | $ | 3,268,628,762 | $ | — | $ | — | $ | 3,268,628,762 | ||||||||
| Investment Funds | 162,635,655 | — | — | 162,635,655 | ||||||||||||
| $ | 3,431,264,417 | |||||||||||||||
See accompanying Notes to Financial Statements.
| 90 |
Portfolio of Investments
Touchstone Short Duration Fixed Income Fund – September 30, 2012
| Principal | Market | |||||||
| Amount | Value | |||||||
| Asset-Backed Securities — 28.4% | ||||||||
| $ | 310,000 | American Express Credit Account | ||||||
| Master Trust, Ser 2010-1, Class A, | ||||||||
| 0.471%, 11/16/15(A) | $ | 310,389 | ||||||
| 253,009 | AmeriCredit Automobile Receivables | |||||||
| Trust, Ser 2009-1, Class B, | ||||||||
| 9.790%, 4/15/14 | 260,700 | |||||||
| 365,000 | AmeriCredit Automobile Receivables | |||||||
| Trust, Ser 2010-2, Class C, | ||||||||
| 4.520%, 10/8/15 | 379,205 | |||||||
| 290,234 | AmeriCredit Automobile Receivables | |||||||
| Trust, Ser 2010-3, Class A3, | ||||||||
| 1.140%, 4/8/15 | 291,018 | |||||||
| 325,000 | AmeriCredit Automobile Receivables | |||||||
| Trust, Ser 2011-3, Class B, | ||||||||
| 2.280%, 6/8/16 | 333,783 | |||||||
| 385,000 | AmeriCredit Automobile Receivables | |||||||
| Trust, Ser 2011-4, Class A3, | ||||||||
| 1.170%, 5/9/16 | 388,293 | |||||||
| 285,000 | AmeriCredit Automobile Receivables | |||||||
| Trust, Ser 2012-1, Class B, | ||||||||
| 1.730%, 2/8/17 | 288,673 | |||||||
| 220,000 | AmeriCredit Automobile Receivables | |||||||
| Trust, Ser 2012-2, Class B, | ||||||||
| 1.780%, 3/8/17 | 223,106 | |||||||
| 700,000 | AmeriCredit Automobile Receivables | |||||||
| Trust, Ser 2012-3, Class A3, | ||||||||
| 0.960%, 1/9/17 | 704,444 | |||||||
| 580,000 | AmeriCredit Automobile Receivables | |||||||
| Trust, Ser 2012-4, Class A3, | ||||||||
| 0.670%, 6/8/17 | 580,288 | |||||||
| 365,000 | Capital One Multi-Asset Execution | |||||||
| Trust, Ser 2007-A7, Class A7, | ||||||||
| 5.750%, 7/15/20 | 447,889 | |||||||
| 225,000 | CarMax Auto Owner Trust, Ser 2012-1, | |||||||
| Class A3, 0.890%, 9/15/16 | 226,668 | |||||||
| 800,000 | Citibank Omni Master Trust, Ser | |||||||
| 2009-A13, Class A13, 144a, | ||||||||
| 5.350%, 8/15/18 | 870,948 | |||||||
| 1,115,000 | Citibank Omni Master Trust, Ser | |||||||
| 2009-A17, Class A17, 144a, | ||||||||
| 4.900%, 11/15/18 | 1,215,360 | |||||||
| 209,572 | CNH Equipment Trust, Ser 2010-A, | |||||||
| Class A4, 2.490%, 1/15/16 | 212,283 | |||||||
| 425,000 | CNH Equipment Trust, Ser 2011-C, | |||||||
| Class A3, 1.190%, 12/15/16 | 429,694 | |||||||
| 164,380 | College & University Facility Loan | |||||||
| Trust, Ser -2, Class D, 4.000%, 6/1/18 | 164,380 | |||||||
| 550,000 | Cronos Containers Program Ltd., Ser | |||||||
| 2012-2A, Class A, 144a, | ||||||||
| 3.810%, 9/18/27 | 550,495 | |||||||
| 312,638 | Dominos Pizza Master Issuer LLC, Ser | |||||||
| 2012-1A, Class A2, 144a, | ||||||||
| 5.216%, 1/25/42 | 348,529 | |||||||
| 209,105 | DT Auto Owner Trust, Ser 2012-2A, | |||||||
| Class A, 144a, 0.910%, 11/16/15 | 209,229 | |||||||
| 465,000 | Ford Credit Auto Lease Trust, Ser | |||||||
| 2012-A, Class A3, 0.850%, 1/15/15 | 467,059 | |||||||
| 102,082 | Ford Credit Auto Owner Trust, Ser | |||||||
| 2009-B, Class A4, 4.500%, 7/15/14 | 103,597 | |||||||
| 430,000 | GE Capital Credit Card Master Note | |||||||
| Trust, Ser 2012-1, Class A, | ||||||||
| 1.030%, 1/15/18 | 434,380 | |||||||
| 71,725 | GE Equipment Midticket LLC, Ser | |||||||
| 2010-1, Class A3, 144a, | ||||||||
| 0.940%, 7/14/14 | 71,762 | |||||||
| 900,000 | GE Equipment Midticket LLC, Ser | |||||||
| 2012-1, Class A4, 0.780%, 9/22/20 | 901,035 | |||||||
| 440,000 | GE Equipment Small Ticket LLC, Ser | |||||||
| 2011-1A, Class A3, 144a, | ||||||||
| 1.450%, 1/21/18 | 442,581 | |||||||
| 275,000 | GE Equipment Small Ticket LLC, Ser | |||||||
| 2011-2A, Class A3, 144a, | ||||||||
| 1.370%, 6/22/15 | 276,715 | |||||||
| 265,000 | GE Equipment Transportation LLC, Ser | |||||||
| 2011-1, Class A4, 1.330%, 5/20/19 | 267,342 | |||||||
| 630,000 | GE Equipment Transportation LLC, Ser | |||||||
| 2012-1, Class A4, 1.230%, 1/22/20 | 637,917 | |||||||
| 274,647 | Great America Leasing Receivables, | |||||||
| Ser 2009-1, Class A4, 144a, | ||||||||
| 3.190%, 12/15/13 | 276,422 | |||||||
| 394,419 | Great America Leasing Receivables, | |||||||
| Ser 2011-1, Class A3, 144a, | ||||||||
| 1.690%, 2/15/14 | 395,460 | |||||||
| 275,000 | Harley-Davidson Motorcycle Trust, Ser | |||||||
| 2010-1, Class A4, 1.530%, 9/15/15 | 277,720 | |||||||
| 360,000 | Harley-Davidson Motorcycle Trust, Ser | |||||||
| 2011-1, Class A3, 0.960%, 5/16/16 | 361,295 | |||||||
| 430,000 | Harley-Davidson Motorcycle Trust, Ser | |||||||
| 2011-1, Class A4, 1.310%, 3/15/17 | 433,839 | |||||||
| 367,562 | Mid-State Trust, Ser 2004-1, Class A, | |||||||
| 6.005%, 8/15/37 | 390,445 | |||||||
| 168,909 | MMAF Equipment Finance LLC, Ser | |||||||
| 2009-AA, Class A3, 144a, | ||||||||
| 2.370%, 11/15/13 | 169,281 | |||||||
| 875,000 | MMAF Equipment Finance LLC, Ser | |||||||
| 2009-AA, Class A4, 144a, | ||||||||
| 3.510%, 1/15/30 | 908,835 | |||||||
| 400,000 | MMAF Equipment Finance LLC, Ser | |||||||
| 2011-AA, Class A4, 144a, | ||||||||
| 2.100%, 7/15/17 | 411,805 | |||||||
| 450,000 | MMAF Equipment Finance LLC, Ser | |||||||
| 2012-AA, Class A4, 144a, | ||||||||
| 1.350%, 10/10/18 | 454,663 | |||||||
| 425,000 | Nissan Auto Lease Trust, Ser 2012-A, | |||||||
| Class A3, 0.980%, 5/15/15 | 429,473 | |||||||
| 17,427 | RSB Bondco. LLC, Ser 2007-A, Class A1, | |||||||
| 5.470%, 10/1/14 | 17,434 | |||||||
| 380,049 | Santander Consumer Acquired | |||||||
| Receivables Trust, Ser 2011-WO, | ||||||||
| Class A3, 144a, 1.400%, 10/15/14 | 380,813 | |||||||
| 458,587 | Santander Drive Auto Receivables | |||||||
| Trust, Ser 2010-1, Class A3, | ||||||||
| 1.840%, 11/17/14 | 463,089 | |||||||
| 91 |
Touchstone Short Duration Fixed Income Fund (Continued)
| Principal | Market | |||||||
| Amount | Value | |||||||
| Asset-Backed Securities — 28.4% (Continued) | ||||||||
| $ | 325,000 | Santander Drive Auto Receivables | ||||||
| Trust, Ser 2011-1, Class A3, | ||||||||
| 1.280%, 1/15/15 | $ | 326,821 | ||||||
| 490,000 | Santander Drive Auto Receivables | |||||||
| Trust, Ser 2011-2, Class A3, | ||||||||
| 1.290%, 2/16/15 | 493,063 | |||||||
| 315,000 | Santander Drive Auto Receivables | |||||||
| Trust, Ser 2011-2, Class B, | ||||||||
| 2.660%, 1/15/16 | 320,016 | |||||||
| 240,000 | Santander Drive Auto Receivables | |||||||
| Trust, Ser 2012-1, Class A3, | ||||||||
| 1.490%, 10/15/15 | 242,830 | |||||||
| 635,000 | Santander Drive Auto Receivables | |||||||
| Trust, Ser 2012-2, Class A3, | ||||||||
| 1.220%, 12/15/15 | 640,329 | |||||||
| 390,000 | Santander Drive Auto Receivables | |||||||
| Trust, Ser 2012-2, Class B, | ||||||||
| 2.090%, 8/15/16 | 393,827 | |||||||
| 750,000 | Santander Drive Auto Receivables | |||||||
| Trust, Ser 2012-3, Class A3, | ||||||||
| 1.080%, 4/15/16 | 754,891 | |||||||
| 161,528 | Small Business Administration | |||||||
| Participation Certificates, Ser | ||||||||
| 2003-20E, Class 1, 4.640%, 5/1/23 | 177,941 | |||||||
| 179,172 | Small Business Administration | |||||||
| Participation Certificates, Ser | ||||||||
| 2004-20B, Class 1, 4.720%, 2/1/24 | 196,657 | |||||||
| 178,538 | Small Business Administration | |||||||
| Participation Certificates, Ser | ||||||||
| 2005-20G, Class 1, 4.750%, 7/1/25 | 198,987 | |||||||
| 143,444 | Small Business Administration | |||||||
| Participation Certificates, Ser | ||||||||
| 2007-10E, Class 1, 5.250%, 9/1/17 | 153,215 | |||||||
| 662,400 | Sonic Capital LLC, Ser 2011-1A, Class | |||||||
| A2, 144a, 5.438%, 5/20/41 | 738,108 | |||||||
| 20,758 | Tax Liens Securitization Trust, Ser | |||||||
| 2010-1A, Class 1A2, 144a, | ||||||||
| 2.000%, 4/15/18 | 20,783 | |||||||
| 8,924 | Tax Liens Securitization Trust, Ser | |||||||
| 2010-1A, Class 2A2, 144a, | ||||||||
| 2.000%, 4/15/18 | 8,935 | |||||||
| 231,875 | Textainer Marine Containers Ltd., Ser | |||||||
| 2011-1A, Class A, 144a, | ||||||||
| 4.700%, 6/15/26 | 243,740 | |||||||
| 63,802 | United States Small Business Adminis- | |||||||
| tration, Ser 2005-P10A, Class 1, | ||||||||
| 4.638%, 2/10/15 | 67,593 | |||||||
| 102,628 | United States Small Business Adminis- | |||||||
| tration, Ser 2006-P10A, Class 1, | ||||||||
| 5.408%, 2/10/16 | 109,150 | |||||||
| 186,397 | United States Small Business Adminis- | |||||||
| tration, Ser 2007-P10B, Class 1, | ||||||||
| 5.788%, 8/10/17 | 208,054 | |||||||
| 215,000 | Volkswagen Auto Lease Trust, Ser | |||||||
| 2011-A, Class A3, 1.200%, 10/20/14 | 217,363 | |||||||
| 350,000 | Volvo Financial Equipment LLC, Ser | |||||||
| 2012-1A, Class A4, 144a, | ||||||||
| 1.090%, 8/15/17 | 352,887 | |||||||
| 345,419 | Westlake Automobile Receivables | |||||||
| Trust, Ser 2011-1A, Class A3, 144a, | ||||||||
| 1.490%, 6/16/14 | 345,949 | |||||||
| 500,000 | Westlake Automobile Receivables | |||||||
| Trust, Ser 2012-1A, Class A2, 144a, | ||||||||
| 1.030%, 3/15/16 | 500,099 | |||||||
| 370,000 | World Financial Network Credit Card | |||||||
| Master Trust, Ser 2009-D, Class A, | ||||||||
| 4.660%, 5/15/17 | 381,478 | |||||||
| 685,000 | World Financial Network Credit Card | |||||||
| Master Trust, Ser 2010-A, Class A, | ||||||||
| 3.960%, 4/15/19 | 740,807 | |||||||
| 900,000 | World Financial Network Credit Card | |||||||
| Master Trust, Ser 2011-A, Class A, | ||||||||
| 1.680%, 8/15/18 | 918,389 | |||||||
| Total Asset-Backed Securities | $ | 26,160,248 | ||||||
| Corporate Bonds — 22.6% | ||||||||
| Financials — 10.8% | ||||||||
| 375,453 | Ahold Lease Series 2001-A-1 Pass | |||||||
| Through Trust, 7.820%, 1/2/20(B) | 428,016 | |||||||
| 625,000 | American Express Co., | |||||||
| 6.800%, 9/1/66(A) | 668,750 | |||||||
| 250,000 | American International Group, Inc., | |||||||
| 3.000%, 3/20/15 | 258,869 | |||||||
| 290,000 | American International Group, Inc., | |||||||
| 4.250%, 5/15/13 | 295,867 | |||||||
| 500,000 | Bank of America NA, 5.300%, 3/15/17 | 555,222 | ||||||
| 315,000 | Bank of New York Mellon Corp. MTN, | |||||||
| 4.950%, 11/1/12 | 316,230 | |||||||
| 215,000 | Barclays Bank PLC, 2.500%, 1/23/13 | 216,334 | ||||||
| 500,000 | Barclays Bank PLC, 5.200%, 7/10/14 | 533,718 | ||||||
| 250,000 | Citigroup, Inc., 5.000%, 9/15/14 | 263,679 | ||||||
| 296,000 | Citigroup, Inc., 6.500%, 8/19/13 | 310,711 | ||||||
| 195,000 | CME Group, Inc., 5.750%, 2/15/14 | 208,480 | ||||||
| 305,000 | Credit Suisse/New York NY MTN, | |||||||
| 5.000%, 5/15/13 | 313,150 | |||||||
| 335,000 | FMR LLC, 144a, 4.750%, 3/1/13 | 340,060 | ||||||
| 502,000 | General Electric Capital Corp. MTN, | |||||||
| 1.875%, 9/16/13 | 509,114 | |||||||
| 525,000 | Hartford Financial Services Group, Inc., | |||||||
| 5.500%, 10/15/16 | 582,680 | |||||||
| 500,000 | HSBC Finance Corp., 5.500%, 1/19/16 | 552,779 | ||||||
| 400,000 | JPMorgan Chase & Co., 4.750%, 3/1/15 | 434,962 | ||||||
| 250,000 | Morgan Stanley, 4.750%, 4/1/14 | 258,798 | ||||||
| 205,000 | Morgan Stanley, 5.300%, 3/1/13 | 208,609 | ||||||
| 215,000 | National Australia Bank Ltd., 144a, | |||||||
| 1.700%, 12/10/13 | 217,943 | |||||||
| 185,000 | New York Life Global Funding, 144a, | |||||||
| 5.250%, 10/16/12 | 185,334 | |||||||
| 92 |
Touchstone Short Duration Fixed Income Fund (Continued)
| Principal | Market | |||||||
| Amount | Value | |||||||
| Corporate Bonds — 22.6% (Continued) | ||||||||
| Financials — (Continued) | ||||||||
| $ | 300,000 | Provident Bank of Maryland, | ||||||
| 9.500%, 5/1/18 | $ | 318,087 | ||||||
| 300,000 | Rio Tinto Finance USA Ltd., | |||||||
| 8.950%, 5/1/14 | 337,949 | |||||||
| 500,000 | SunTrust Bank/Atlanta GA, | |||||||
| 0.761%, 4/1/15(A) | 486,605 | |||||||
| 300,000 | TD Ameritrade Holding Corp., | |||||||
| 2.950%, 12/1/12 | 301,234 | |||||||
| 500,000 | UBS AG/Stamford CT, 3.875%, 1/15/15 | 529,935 | ||||||
| 343,918 | WHC-IRS Trust, 6.980%, 5/15/15 | 370,813 | ||||||
| 10,003,928 | ||||||||
| Industrials — 3.6% | ||||||||
| 225,000 | Cooper US, Inc., 5.250%, 11/15/12 | 226,260 | ||||||
| 167,896 | CSX Transportation, Inc., | |||||||
| 8.375%, 10/15/14 | 189,259 | |||||||
| 300,000 | Equifax, Inc., 4.450%, 12/1/14 | 317,492 | ||||||
| 95,217 | Federal Express Corp. 1995 Pass | |||||||
| Through Trust, 7.110%, 1/2/14 | 99,978 | |||||||
| 215,000 | Federal Express Corp. 2012 Pass | |||||||
| Through Trust, 144a, | ||||||||
| 2.625%, 1/15/18 | 217,129 | |||||||
| 262,111 | GATX Corp. 2008-2 Pass Through Trust, | |||||||
| 9.000%, 11/15/13 | 281,599 | |||||||
| 450,000 | Joy Global, Inc., 6.000%, 11/15/16 | 518,624 | ||||||
| 90,007 | Petrodrill Five Ltd., 4.390%, 4/15/16 | 94,483 | ||||||
| 102,093 | Petrodrill Four Ltd., 4.240%, 1/15/16 | 105,932 | ||||||
| 500,000 | Potash Corp. of Saskatchewan, Inc., | |||||||
| 5.250%, 5/15/14 | 537,455 | |||||||
| 265,000 | Roper Industries, Inc., 6.625%, 8/15/13 | 278,347 | ||||||
| 400,000 | Ryder System, Inc. MTN, | |||||||
| 7.200%, 9/1/15 | 463,979 | |||||||
| 3,330,537 | ||||||||
| Energy — 1.6% | ||||||||
| 400,000 | BP Capital Markets PLC, | |||||||
| 5.250%, 11/7/13 | 420,709 | |||||||
| 307,440 | Maritimes & Northeast Pipeline LLC, | |||||||
| 144a, 7.500%, 5/31/14 | 326,953 | |||||||
| 350,000 | Noble Corp., 5.875%, 6/1/13 | 361,777 | ||||||
| 315,000 | Noble Energy, Inc., 5.250%, 4/15/14 | 332,394 | ||||||
| 1,441,833 | ||||||||
| Consumer Staples — 1.5% | ||||||||
| 520,000 | Coca-Cola Bottling Co. Consolidated, | |||||||
| 5.000%, 11/15/12 | 522,667 | |||||||
| 495,000 | Coca-Cola Refreshments USA, Inc., | |||||||
| 7.375%, 3/3/14 | 542,680 | |||||||
| 273,790 | CVS Pass-Through Trust, 144a, | |||||||
| 6.117%, 1/10/13 | 277,897 | |||||||
| 1,343,244 | ||||||||
| Consumer Discretionary — 1.1% | ||||||||
| 465,000 | Staples, Inc., 7.375%, 10/1/12 | 464,999 | ||||||
| 500,000 | Staples, Inc., 9.750%, 1/15/14 | 553,170 | ||||||
| 1,018,169 | ||||||||
| Information Technology — 1.0% | ||||||||
| 505,000 | Amphenol Corp., 4.750%, 11/15/14 | 541,911 | ||||||
| 150,000 | Analog Devices, Inc., 5.000%, 7/1/14 | 161,900 | ||||||
| 250,000 | Comcast Cable Holdings LLC, | |||||||
| 7.875%, 8/1/13 | 264,970 | |||||||
| 968,781 | ||||||||
| Transportation — 0.9% | ||||||||
| 706,923 | Union Pacific Railroad Co. 1998 Pass | |||||||
| Through Trust, 6.330%, 1/2/20 | 807,735 | |||||||
| Materials — 0.8% | ||||||||
| 335,000 | Dow Chemical Co. (The), | |||||||
| 7.600%, 5/15/14 | 370,134 | |||||||
| 325,000 | Westvaco Corp., 7.650%, 3/15/27 | 369,782 | ||||||
| 739,916 | ||||||||
| Utilities — 0.8% | ||||||||
| 371,978 | Great River Energy, 144a, | |||||||
| 5.829%, 7/1/17 | 402,756 | |||||||
| 298,000 | Monongahela Power Co., Inc., 144a, | |||||||
| 7.950%, 12/15/13 | 321,548 | |||||||
| 724,304 | ||||||||
| Telecommunication Services — 0.5% | ||||||||
| 137,280 | BellSouth Telecommunications, Inc., | |||||||
| 6.300%, 12/15/15 | 144,293 | |||||||
| 350,000 | SBA Tower Trust, 144a, | |||||||
| 4.254%, 4/15/15 | 368,678 | |||||||
| 512,971 | ||||||||
| Total Corporate Bonds | $ | 20,891,418 | ||||||
| Commercial Mortgage-Backed Securities — 11.5% | ||||||||
| 135,000 | American Tower Trust, Ser 2007-1A, | |||||||
| Class AFX, 144a, 5.420%, 4/15/37 | 142,067 | |||||||
| 375,000 | Banc of America Merrill Lynch | |||||||
| Commercial Mortgage, Inc., Ser | ||||||||
| 2005-1, Class A4, | ||||||||
| 5.247%, 11/10/42(A) | 383,066 | |||||||
| 545,000 | Banc of America Merrill Lynch | |||||||
| Commercial Mortgage, Inc., Ser | ||||||||
| 2005-6, Class A4, 5.364%, 9/10/47(A) | 613,827 | |||||||
| 565,000 | Banc of America Merrill Lynch | |||||||
| Commercial Mortgage, Inc., Ser | ||||||||
| 2006-4, Class A4, 5.634%, 7/10/46 | 651,339 | |||||||
| 275,000 | Banc of America Merrill Lynch | |||||||
| Commercial Mortgage, Inc., Ser | ||||||||
| 2007-2, Class AM, | ||||||||
| 5.813%, 4/10/49(A) | 294,684 | |||||||
| 415,000 | Bear Stearns Commercial Mortgage | |||||||
| Securities, Ser 2005-PWR8, Class A4, | ||||||||
| 4.674%, 6/11/41†† | 452,950 | |||||||
| 400,000 | Citigroup/Deutsche Bank Commercial | |||||||
| Mortgage Trust, Ser 2006-CD3, | ||||||||
| Class A4, 5.658%, 10/15/48 | 414,859 | |||||||
| 93 |
Touchstone Short Duration Fixed Income Fund (Continued)
| Principal | Market | |||||||
| Amount | Value | |||||||
| Commercial Mortgage-Backed Securities — 11.5% (Continued) | ||||||||
| $ | 620,000 | Citigroup/Deutsche Bank Commercial | ||||||
| Mortgage Trust, Ser 2007-CD5, | ||||||||
| Class A4, 5.886%, 11/15/44(A) | $ | 733,629 | ||||||
| 83,463 | Commercial Mortgage Asset Trust, Ser | |||||||
| 1999-C1, Class A4, | ||||||||
| 6.975%, 1/17/32(A) | 84,998 | |||||||
| 391,220 | Commercial Mortgage Pass Through | |||||||
| Certificates, Ser 2004-LB2A, Class | ||||||||
| A4, 4.715%, 3/10/39 | 409,224 | |||||||
| 350,000 | Commercial Mortgage Pass Through | |||||||
| Certificates, Ser 2012-9W57, Class A, | ||||||||
| 144a, 2.365%, 2/10/29 | 367,308 | |||||||
| 390,000 | Credit Suisse Mortgage Capital | |||||||
| Certificates, Ser 2006-C3, Class A3, | ||||||||
| 6.000%, 6/15/38(A) | 449,369 | |||||||
| 132,013 | FDIC Structured Sale Guaranteed | |||||||
| Notes, Ser 2010-C1, Class A, 144a, | ||||||||
| 2.980%, 12/6/20 | 138,741 | |||||||
| 320,000 | Fontainebleau Miami Beach Trust, Ser | |||||||
| 2012-FBLU, Class A, 144a, | ||||||||
| 2.887%, 5/5/27 | 331,903 | |||||||
| 163,477 | GE Capital Commercial Mortgage | |||||||
| Corp., Ser 2003-C2, Class A4, | ||||||||
| 5.145%, 7/10/37 | 166,492 | |||||||
| 212,408 | GMAC Commercial Mortgage | |||||||
| Securities, Inc., Ser 2003-C1, Class | ||||||||
| A2, 4.079%, 5/10/36 | 214,514 | |||||||
| 235,000 | GMAC Commercial Mortgage | |||||||
| Securities, Inc., Ser 2003-C2, Class | ||||||||
| A2, 5.640%, 5/10/40(A) | 242,353 | |||||||
| 210,000 | Greenwich Capital Commercial | |||||||
| Funding Corp., Ser 2004-GG1, Class | ||||||||
| A7, 5.317%, 6/10/36(A) | 221,728 | |||||||
| 319,256 | JP Morgan Chase Commercial | |||||||
| Mortgage Securities Corp., Ser | ||||||||
| 2003-CB6, Class A2, | ||||||||
| 5.255%, 7/12/37(A) | 327,012 | |||||||
| 76,969 | JP Morgan Chase Commercial | |||||||
| Mortgage Securities Corp., Ser | ||||||||
| 2005-LDP3, Class A3, | ||||||||
| 4.959%, 8/15/42 | 77,995 | |||||||
| 805,000 | JP Morgan Chase Commercial | |||||||
| Mortgage Securities Corp., Ser | ||||||||
| 2007-CB18, Class A4, | ||||||||
| 5.440%, 6/12/47 | 927,193 | |||||||
| 32,155 | LB-UBS Commercial Mortgage Trust, | |||||||
| Ser 2003-C5, Class A3, | ||||||||
| 4.254%, 7/15/27†† | 32,546 | |||||||
| 173,631 | LB-UBS Commercial Mortgage Trust, | |||||||
| Ser 2003-C7, Class A3, | ||||||||
| 4.559%, 9/15/27(A)†† | 173,746 | |||||||
| 715,000 | LB-UBS Commercial Mortgage Trust, | |||||||
| Ser 2006-C1, Class A4, | ||||||||
| 5.156%, 2/15/31†† | 801,775 | |||||||
| 280,000 | LB-UBS Commercial Mortgage Trust, | |||||||
| Ser 2006-C1, Class AM, | ||||||||
| 5.217%, 2/15/31(A)†† | 308,827 | |||||||
| 182,266 | Merrill Lynch Mortgage Investors, Inc., | |||||||
| Ser 1998-C1, Class A3, | ||||||||
| 6.720%, 11/15/26(A) | 201,598 | |||||||
| 335,000 | Morgan Stanley Capital I, Ser | |||||||
| 2004-IQ7, Class A4, | ||||||||
| 5.532%, 6/15/38(A) | 353,996 | |||||||
| 181,393 | Wachovia Bank Commercial Mortgage | |||||||
| Trust, Ser 2003-C3, Class A2, | ||||||||
| 4.867%, 2/15/35 | 182,606 | |||||||
| 450,000 | Wachovia Bank Commercial Mortgage | |||||||
| Trust, Ser 2005-C20, Class A7, | ||||||||
| 5.118%, 7/15/42(A) | 499,935 | |||||||
| 325,979 | Wachovia Bank Commercial Mortgage | |||||||
| Trust, Ser 2005-C21, Class A4, | ||||||||
| 5.413%, 10/15/44(A) | 365,209 | |||||||
| Total Commercial Mortgage-Backed Securities | $ | 10,565,489 | ||||||
| U.S. Treasury Obligations — 10.8% | ||||||||
| 2,500,000 | U.S. Treasury Bill, 0.048%, 10/11/12(C) | 2,499,965 | ||||||
| 2,500,000 | U.S. Treasury Bill, 0.069%, 11/8/12(C) | 2,499,808 | ||||||
| 1,725,000 | U.S. Treasury Note, 1.500%, 6/30/16 | 1,793,731 | ||||||
| 700,000 | U.S. Treasury Note, 1.750%, 7/31/15 | 728,438 | ||||||
| 1,700,000 | U.S. Treasury Note, 2.750%, 11/30/16 | 1,858,312 | ||||||
| 525,000 | U.S. Treasury Note, 4.250%, 11/15/14 | 569,215 | ||||||
| Total U.S. Treasury Obligations | $ | 9,949,469 | ||||||
| U.S. Government Mortgage-Backed Obligations — 3.8% | ||||||||
| 79,732 | FHLMC, Pool #C66916, 7.000%, 5/1/32 | 93,697 | ||||||
| 50,106 | FHLMC, Pool #D94598, 6.500%, 4/1/21 | 56,010 | ||||||
| 248,296 | FHLMC, Pool #G01840, 5.000%, 7/1/35 | 269,833 | ||||||
| 54,135 | FHLMC, Pool #G30085, 7.500%, 10/1/17 | 59,737 | ||||||
| 389,523 | FNMA, Pool #256272, 5.500%, 6/1/26 | 429,106 | ||||||
| 2,719 | FNMA, Pool #323441, 7.000%, 12/1/13 | 2,733 | ||||||
| 83,244 | FNMA, Pool #323832, 7.500%, 7/1/29 | 100,758 | ||||||
| 5,297 | FNMA, Pool #334593, 7.000%, 5/1/24 | 6,215 | ||||||
| 44,090 | FNMA, Pool #546474, 7.000%, 1/1/15 | 44,334 | ||||||
| 144,552 | FNMA, Pool #665773, 7.500%, 6/1/31 | 173,214 | ||||||
| 159,973 | FNMA, Pool #735484, 5.000%, 5/1/35 | 175,291 | ||||||
| 410,734 | FNMA, Pool #735893, 5.000%, 10/1/35 | 450,099 | ||||||
| 484,069 | FNMA, Pool #960376, 5.500%, 12/1/37 | 530,839 | ||||||
| 360,286 | FNMA, Pool #AE0363, 5.000%, 7/1/37 | 394,220 | ||||||
| 177,286 | FNMA, Pool #AL0302, 5.000%, 4/1/24 | 192,621 | ||||||
| 750 | GNMA, Pool #2707, 5.500%, 1/20/14 | 813 | ||||||
| 863 | GNMA, Pool #2802, 5.500%, 7/20/14 | 866 | ||||||
| 12,261 | GNMA, Pool #2843, 5.500%, 11/20/14 | 13,291 | ||||||
| 37,208 | GNMA, Pool #344233, 8.000%, 2/15/23 | 44,035 | ||||||
| 94 |
Touchstone Short Duration Fixed Income Fund (Continued)
| Principal | Market | |||||||
| Amount | Value | |||||||
| U.S. Government Mortgage-Backed Obligations — 3.8% (Continued) | ||||||||
| $ | 90,017 | GNMA, Pool #345123, | ||||||
| 8.000%, 12/15/23 | $ | 107,995 | ||||||
| 680 | GNMA, Pool #462486, 6.500%, 1/15/13 | 697 | ||||||
| 16,780 | GNMA, Pool #569337, 6.500%, 4/15/22 | 19,221 | ||||||
| 43,945 | GNMA, Pool #578189, 6.000%, 2/15/32 | 50,254 | ||||||
| 44,055 | GNMA, Pool #780322, | |||||||
| 8.000%, 11/15/22 | 47,868 | |||||||
| 13,800 | GNMA, Pool #780327, | |||||||
| 8.000%, 11/15/17 | 14,824 | |||||||
| 31,820 | GNMA, Pool #814, 8.000%, 8/20/17 | 35,128 | ||||||
| 7,573 | GNMA, Pool #8426, | |||||||
| 3.000%, 11/20/18(A) | 7,937 | |||||||
| 166,705 | GNMA, Pool #894160, | |||||||
| 2.118%, 6/20/61(A) | 173,790 | |||||||
| Total U.S. Government Mortgage-Backed Obligations | $ | 3,495,426 | ||||||
| Agency Collateralized Mortgage Obligations — 3.2% | ||||||||
| 190,750 | FHLMC REMICS, Ser -2510, Class TA, | |||||||
| 4.000%, 6/15/32 | 204,586 | |||||||
| 310,094 | FNMA REMICS, Ser 2003-119, Class PU, | |||||||
| 4.000%, 11/25/33 | 325,460 | |||||||
| 149,019 | FNMA REMICS, Ser 2003-19, Class ME, | |||||||
| 4.000%, 1/25/33 | 154,846 | |||||||
| 277,411 | FNMA REMICS, Ser 2003-42, Class CA, | |||||||
| 4.000%, 5/25/33 | 303,489 | |||||||
| 72,408 | FNMA REMICS, Ser 2003-66, Class AP, | |||||||
| 3.500%, 11/25/32 | 74,715 | |||||||
| 385,604 | GNMA, Ser 2002-72, Class AB, | |||||||
| 4.500%, 10/20/32 | 428,574 | |||||||
| 80,303 | GNMA, Ser 2004-12, Class BA, | |||||||
| 4.807%, 8/16/32 | 81,568 | |||||||
| 113,162 | GNMA, Ser 2004-78, Class C, | |||||||
| 4.658%, 4/16/29 | 113,747 | |||||||
| 84,966 | GNMA, Ser 2005-76, Class A, | |||||||
| 3.963%, 5/16/30 | 86,560 | |||||||
| 415,687 | GNMA, Ser 2011-161, Class A, | |||||||
| 1.738%, 1/16/34 | 423,727 | |||||||
| 360,406 | GNMA, Ser 2012-27, Class A, | |||||||
| 1.614%, 7/16/39 | 367,654 | |||||||
| 339,623 | NCUA Guaranteed Notes, Ser 2010-C1, | |||||||
| Class A1, 1.600%, 10/29/20 | 345,567 | |||||||
| Total Agency Collateralized Mortgage Obligations | $ | 2,910,493 | ||||||
| Non-Agency Collateralized Mortgage Obligations — 2.3% | ||||||||
| 414,256 | Chase Mortgage Finance Corp., Ser | |||||||
| 2003-S12, Class 2A1, | ||||||||
| 5.000%, 12/25/18 | 422,407 | |||||||
| 293,952 | Community Program Loan Trust, Ser | |||||||
| 1987-A, Class A5, 4.500%, 4/1/29 | 297,054 | |||||||
| 891,545 | FDIC Structured Sale Guaranteed | |||||||
| Notes, Ser 2010-S1, Class 2A, 144a, | ||||||||
| 3.250%, 4/25/38 | 928,322 | |||||||
| 278,146 | FDIC Structured Sale Guaranteed | |||||||
| Notes, Ser 2010-S3, Class A, 144a, | ||||||||
| 2.740%, 12/3/20 | 286,866 | |||||||
| 158,599 | GSR Mortgage Loan Trust, Ser 2003-7F, | |||||||
| Class 1A3, 5.250%, 6/25/33 | 158,780 | |||||||
| Total Non-Agency Collateralized Mortgage Obligations | $ | 2,093,429 | ||||||
| Municipal Bonds — 2.0% | ||||||||
| California — 0.2% | ||||||||
| 180,000 | Southern California Public Power | |||||||
| Authority, Rev, Ser 2010-B, | ||||||||
| 3.326%, 7/1/14 | 185,920 | |||||||
| Connecticut — 0.5% | ||||||||
| 425,000 | State of Connecticut, Ser A, UTGO, | |||||||
| 1.100%, 5/15/18(A) | 430,708 | |||||||
| District of Columbia — 0.2% | ||||||||
| 210,000 | District of Columbia, Ser 2010, UTGO, | |||||||
| 2.585%, 6/1/13 | 212,871 | |||||||
| Louisiana — 0.8% | ||||||||
| 744,686 | Louisiana Local Government | |||||||
| Environmental Facilities & | ||||||||
| Community Development | ||||||||
| Authority, 1.520%, 2/1/18 | 753,787 | |||||||
| Minnesota — 0.3% | ||||||||
| 300,000 | Michigan State Strategic Fund, Waste | |||||||
| Management, Inc. Project, | ||||||||
| 3.200%, 8/1/27(A) | 306,101 | |||||||
| Total Municipal Bonds | 1,889,387 | |||||||
| U.S. Government Agency Obligations — 2.0% | ||||||||
| 123,423 | Small Business Administration | |||||||
| Participation Certificates, | ||||||||
| 5.800%, 12/1/18 | 134,393 | |||||||
| 101,994 | Small Business Administration | |||||||
| Participation Certificates, | ||||||||
| 6.070%, 3/1/22 | 114,082 | |||||||
| 120,347 | Small Business Administration | |||||||
| Participation Certificates, | ||||||||
| 6.140%, 1/1/22 | 134,290 | |||||||
| 119,851 | Small Business Administration | |||||||
| Participation Certificates, Ser | ||||||||
| 2008-10B, Class 1, 4.580%, 3/1/18 | 127,776 | |||||||
| 211,999 | Small Business Administration Pools, | |||||||
| 503795, 0.750%, 6/25/22(A) | 212,853 | |||||||
| 160,160 | Small Business Administration Pools, | |||||||
| 506207, 1.000%, 11/25/14(A) | 160,011 | |||||||
| 116,157 | Small Business Administration Pools, | |||||||
| 507442, 3.625%, 5/25/16(A) | 119,328 | |||||||
| 95 |
Touchstone Short Duration Fixed Income Fund (Continued)
| Principal | Market | |||||||
| Amount | Value | |||||||
| U.S. Government Agency Obligations — 2.0% (Continued) | ||||||||
| $ | 365,949 | Small Business Administration Pools, | ||||||
| 507682, 0.650%, 1/25/26(A) | $ | 366,661 | ||||||
| 262,109 | Small Business Administration Pools, | |||||||
| 508374, 0.750%, 4/25/28(A) | 263,590 | |||||||
| 191,018 | United States Small Business Adminis- | |||||||
| tration, 4.504%, 2/1/14 | 196,342 | |||||||
| Total U.S. Government Agency Obligations | $ | 1,829,326 | ||||||
| Shares | ||||||||
| Investment Fund — 14.7% | ||||||||
| 13,587,181 | Touchstone Institutional Money Market Fund^ | $ | 13,587,181 | |||||
| Total Investment Securities —101.3% | ||||||||
| (Cost $92,578,237) | $ | 93,371,866 | ||||||
| Liabilities in Excess of | ||||||||
| Other Assets — (1.3%) | (1,155,902 | ) | ||||||
| Net Assets — 100.0% | $ | 92,215,964 | ||||||
| (A) | Variable rate security - the rate reflected is the rate in effect as of September 30, 2012. |
| (B) | Step Bond. A bond that pays an initial interest rate for the first period and then a higher interest rate for the following periods until maturity. The interest rate shown reflects the rate in effect at September 30, 2012. |
| (C) | Rate reflects yield at the time of purchase. |
| ^ | Affiliated Fund. See Note 4 in Notes to Financial Statements. |
| †† | The issuers and/or sponsors of certain mortgage-backed securities may no longer exist; however, the securities held by the Fund are separate legal entities organized as trusts and publicly traded. The Fund receives principal and interest payments directly from these trusts. |
Portfolio Abbreviations:
FHLMC - Federal Home Loan Mortgage Corporation
FNMA - Federal National Mortgage Association
GNMA - Government National Mortgage Association
MTN -Medium Term Note
NCUA - National Credit Union Administration
PLC - Public Limited Company
REMIC - Real Estate Mortgage Investment Conduit
UTGO - Unlimited Tax General Obligation
144A - This is a restricted security that was sold in a transaction exempt from Rule 144A of the Securities Act of 1933. This security may be sold in transactions exempt from registration, normally to qualified institutional buyers. At September 30, 2012, these securities were valued at $14,046,904 or 15.2% of net assets. These securities were deemed liquid pursuant to procedures approved by the Board of Trustees.
| 96 |
Touchstone Short Duration Fixed Income Fund (Continued)
Other Information:
The inputs or methodology used for valuing securities may not be an indication of the risk associated with investing in those securities. For more information on valuation inputs, and their aggregation into the levels used in the table below, please refer to the security valuation section in the accompanying Notes to Financial Statements.
Valuation inputs at Reporting Date:
| Description | Level 1 | Level 2 | Level 3 | Total | ||||||||||||
| Asset-Backed Securities | $ | — | $ | 26,160,248 | $ | — | $ | 26,160,248 | ||||||||
| Corporate Bonds | — | 20,891,418 | — | 20,891,418 | ||||||||||||
| Commercial Mortgage-Backed Securities | — | 10,565,489 | — | 10,565,489 | ||||||||||||
| U.S. Treasury Obligations | — | 9,949,469 | — | 9,949,469 | ||||||||||||
| U.S. Government Mortgage-Backed Obligations | — | 3,495,426 | — | 3,495,426 | ||||||||||||
| Agency Collateralized Mortgage Obligations | — | 2,910,493 | — | 2,910,493 | ||||||||||||
| Non-Agency Collateralized Mortgage Obligations | — | 2,093,429 | — | 2,093,429 | ||||||||||||
| Municipal Bonds | — | 1,889,387 | — | 1,889,387 | ||||||||||||
| U.S. Government Agency Obligations | — | 1,829,326 | — | 1,829,326 | ||||||||||||
| Investment Fund | 13,587,181 | — | — | 13,587,181 | ||||||||||||
| $ | 93,371,866 | |||||||||||||||
See accompanying Notes to Financial Statements.
| 97 |
Portfolio of Investments
Touchstone Small Cap Core Fund – September 30, 2012
| Market | ||||||||
| Shares | Value | |||||||
| Common Stocks — 97.4% | ||||||||
| Financials — 23.4% | ||||||||
| Alexander & Baldwin, Inc.* | 463,598 | $ | 13,690,049 | |||||
| Alleghany Corp.* | 26,942 | 9,293,373 | ||||||
| Eaton Vance Corp.† | 681,141 | 19,725,843 | ||||||
| First Industrial Realty Trust, Inc. REIT* | 849,971 | 11,168,619 | ||||||
| Hatteras Financial Corp. REIT | 420,805 | 11,862,493 | ||||||
| MBIA, Inc.†* | 1,449,164 | 14,680,031 | ||||||
| Montpelier Re Holdings Ltd. | 765,292 | 16,935,913 | ||||||
| Tejon Ranch Co.* | 392,409 | 11,787,966 | ||||||
| White Mountains Insurance Group Ltd. | 26,924 | 13,821,166 | ||||||
| 122,965,453 | ||||||||
| Industrials — 16.8% | ||||||||
| Corrections Corp. of America | 615,253 | 20,580,213 | ||||||
| Kaman Corp. | 411,408 | 14,753,091 | ||||||
| Matson, Inc. | 458,836 | 9,594,261 | ||||||
| Old Dominion Freight Line, Inc.* | 780,564 | 23,541,810 | ||||||
| Ritchie Bros Auctioneers, Inc.† | 552,871 | 10,631,709 | ||||||
| Tredegar Corp. | 524,235 | 9,299,929 | ||||||
| 88,401,013 | ||||||||
| Consumer Discretionary — 15.5% | ||||||||
| American Eagle Outfitters, Inc. | 558,179 | 11,766,413 | ||||||
| Cabela's, Inc.* | 496,414 | 27,143,918 | ||||||
| Columbia Sportswear Co.† | 201,291 | 10,869,714 | ||||||
| Service Corp. International | 1,664,750 | 22,407,535 | ||||||
| Sturm Ruger & Co., Inc.† | 191,452 | 9,474,959 | ||||||
| 81,662,539 | ||||||||
| Materials — 12.5% | ||||||||
| Albemarle Corp. | 379,913 | 20,013,817 | ||||||
| Kraton Performance Polymers, Inc.* | 462,209 | 12,063,655 | ||||||
| Martin Marietta Materials, Inc.† | 106,392 | 8,816,705 | ||||||
| NewMarket Corp. | 100,133 | 24,680,782 | ||||||
| 65,574,959 | ||||||||
| Consumer Staples — 9.6% | ||||||||
| Energizer Holdings, Inc. | 136,437 | 10,179,565 | ||||||
| Nu Skin Enterprises, Inc. Class A† | 428,545 | 16,640,402 | ||||||
| Pricesmart, Inc. | 309,945 | 23,469,035 | ||||||
| 50,289,002 | ||||||||
| Energy — 8.5% | ||||||||
| Atwood Oceanics, Inc.* | 515,836 | 23,444,746 | ||||||
| Kinder Morgan Management LLC* | 101,482 | 7,753,248 | ||||||
| World Fuel Services Corp. | 381,999 | 13,602,984 | ||||||
| 44,800,978 | ||||||||
| Information Technology — 8.1% | ||||||||
| Advent Software, Inc.* | 458,765 | 11,271,856 | ||||||
| Micrel, Inc. | 1,298,735 | 13,532,819 | ||||||
| ValueClick, Inc.* | 1,026,504 | 17,645,604 | ||||||
| 42,450,279 | ||||||||
| Health Care — 3.0% | ||||||||
| Tenet Healthcare Corp.* | 2,513,160 | 15,757,513 | ||||||
| Total Common Stocks | $ | 511,901,736 | ||||||
| Investment Funds — 12.5% | ||||||||
| Invesco Government & Agency Portfolio** | 57,448,540 | 57,448,540 | ||||||
| Touchstone Institutional Money Market Fund^ | 8,371,104 | 8,371,104 | ||||||
| Total Investment Funds | $ | 65,819,644 | ||||||
| Total Investment Securities —109.9% | ||||||||
| (Cost $511,837,290) | $ | 577,721,380 | ||||||
| Liabilities in Excess of Other Assets — (9.9%) | (52,040,963 | ) | ||||||
| Net Assets — 100.0% | $ | 525,680,417 | ||||||
| † | All or a portion of the security is on loan. The total value of the securities on loan as of September 30, 2012 was $55,663,314. |
| * | Non-income producing security. |
| ** | Represents collateral for securities loaned. |
| ^ | Affiliated Fund. See Note 4 in Notes to Financial Statements. |
Portfolio Abbreviations:
LLC- Limited Liability Company
REIT - Real Estate Investment Trust
Other Information:
The inputs or methodology used for valuing securities may not be an indication of the risk associated with investing in those securities. For more information on valuation inputs, and their aggregation into the levels used in the table below, please refer to the security valuation section in the accompanying Notes to Financial Statements.
Valuation inputs at Reporting Date:
| Description | Level 1 | Level 2 | Level 3 | Total | ||||||||||||
| Common Stocks | $ | 511,901,736 | $ | — | $ | — | $ | 511,901,736 | ||||||||
| Investment Funds | 65,819,644 | — | — | 65,819,644 | ||||||||||||
| $ | 577,721,380 | |||||||||||||||
See accompanying Notes to Financial Statements.
| 98 |
Portfolio of Investments
Touchstone Small Cap Value Fund – September 30, 2012
| Market | ||||||||
| Shares | Value | |||||||
| Common Stocks — 98.5% | ||||||||
| Financials — 24.2% | ||||||||
| Anworth Mortgage Asset Corp. REIT | 71,720 | $ | 487,696 | |||||
| Astoria Financial Corp. | 19,740 | 195,031 | ||||||
| Brookline Bancorp, Inc. | 48,820 | 430,592 | ||||||
| Capitol Federal Financial, Inc. | 51,167 | 611,957 | ||||||
| Dime Community Bancshares, Inc. | 10,180 | 146,999 | ||||||
| Evercore Partners, Inc. - Class A | 23,925 | 645,975 | ||||||
| First Financial Bancorp | 16,440 | 278,000 | ||||||
| Greenhill & Co., Inc. | 8,290 | 429,008 | ||||||
| Hanover Insurance Group, Inc. (The) | 10,550 | 393,093 | ||||||
| Hercules Technology Growth Capital,Inc. | 47,859 | 526,928 | ||||||
| Iberiabank Corp. | 12,471 | 571,172 | ||||||
| Infinity Property & Casualty Corp. | 8,470 | 511,503 | ||||||
| KBW, Inc.† | 45,990 | 757,455 | ||||||
| Manning & Napier, Inc. | 28,730 | 350,219 | ||||||
| Medical Properties Trust, Inc. REIT | 32,271 | 337,233 | ||||||
| Potlatch Corp. REIT | 20,270 | 757,490 | ||||||
| Spirit Realty Capital, Inc. REIT†* | 27,900 | 432,450 | ||||||
| Sterling Bancorp/NY | 27,925 | 277,016 | ||||||
| 8,139,817 | ||||||||
| Industrials — 20.3% | ||||||||
| ABM Industries, Inc. | 14,950 | 283,004 | ||||||
| Brady Corp. - Class A | 17,255 | 505,226 | ||||||
| Briggs & Stratton Corp. | 17,700 | 330,459 | ||||||
| Con-way, Inc. | 4,990 | 136,576 | ||||||
| Curtiss-Wright Corp. | 10,398 | 340,015 | ||||||
| Harsco Corp. | 22,240 | 456,587 | ||||||
| Kaydon Corp. | 22,640 | 505,778 | ||||||
| Knight Transportation, Inc. | 59,010 | 843,843 | ||||||
| Knoll, Inc. | 37,000 | 516,150 | ||||||
| McGrath Rentcorp | 3,179 | 82,940 | ||||||
| Primoris Services Corp. | 26,340 | 343,737 | ||||||
| Resources Connection, Inc. | 50,675 | 664,349 | ||||||
| Ritchie Bros Auctioneers, Inc.† | 29,380 | 564,977 | ||||||
| Ryder System, Inc. | 18,470 | 721,438 | ||||||
| United Stationers, Inc. | 20,110 | 523,262 | ||||||
| 6,818,341 | ||||||||
| Consumer Discretionary — 11.2% | ||||||||
| Columbia Sportswear Co.† | 10,000 | 540,000 | ||||||
| Ethan Allen Interiors, Inc. | 16,720 | 366,502 | ||||||
| Fred's, Inc. - Class A | 10,899 | 155,093 | ||||||
| Guess?, Inc. | 20,060 | 509,925 | ||||||
| Hillenbrand, Inc. | 19,640 | 357,252 | ||||||
| Jones Group, Inc. (The) | 20,922 | 269,266 | ||||||
| Men's Wearhouse, Inc. (The) | 14,875 | 512,146 | ||||||
| Regis Corp. | 17,970 | 330,289 | ||||||
| Sotheby's | 16,930 | 533,295 | ||||||
| Stewart Enterprises, Inc. - Class A | 20,690 | 173,693 | ||||||
| 3,747,461 | ||||||||
| Materials — 10.8% | ||||||||
| AMCOL International Corp. | 14,750 | 499,730 | ||||||
| Globe Specialty Metals, Inc. | 44,730 | 680,791 | ||||||
| Haynes International, Inc. | 6,110 | 318,636 | ||||||
| Kaiser Aluminum Corp. | 5,675 | 331,363 | ||||||
| Koppers Holdings, Inc. | 4,840 | 169,061 | ||||||
| Noranda Aluminum Holding Corp. | 93,130 | 623,040 | ||||||
| PolyOne Corp. | 16,400 | 271,748 | ||||||
| Schnitzer Steel Industries, Inc. - Class A | 13,060 | 367,639 | ||||||
| Titanium Metals Corp.† | 27,650 | 354,750 | ||||||
| 3,616,758 | ||||||||
| Information Technology — 10.3% | ||||||||
| ADTRAN, Inc.† | 16,655 | 287,798 | ||||||
| Brooks Automation, Inc. | 58,281 | 467,996 | ||||||
| Cohu, Inc. | 34,576 | 324,669 | ||||||
| Intersil Corp. - Class A | 74,910 | 655,462 | ||||||
| Methode Electronics, Inc. | 44,200 | 429,182 | ||||||
| Micrel, Inc. | 77,915 | 811,874 | ||||||
| Tessera Technologies, Inc. | 36,120 | 494,122 | ||||||
| 3,471,103 | ||||||||
| Energy — 9.6% | ||||||||
| Bristow Group, Inc. | 13,805 | 697,843 | ||||||
| CARBO Ceramics, Inc.† | 8,350 | 525,382 | ||||||
| EXCO Resources, Inc.† | 86,990 | 696,790 | ||||||
| Tidewater, Inc. | 6,830 | 331,460 | ||||||
| Tsakos Energy Navigation Ltd. | 47,560 | 246,361 | ||||||
| W&T Offshore, Inc. | 39,675 | 745,096 | ||||||
| 3,242,932 | ||||||||
| Health Care — 4.9% | ||||||||
| Meridian Bioscience, Inc. | 30,965 | 593,909 | ||||||
| Quality Systems, Inc. | 16,782 | 311,306 | ||||||
| STERIS Corp. | 21,120 | 749,126 | ||||||
| 1,654,341 | ||||||||
| Consumer Staples — 4.8% | ||||||||
| Andersons, Inc. (The) | 14,155 | 533,077 | ||||||
| Fresh Del Monte Produce, Inc. | 22,590 | 578,304 | ||||||
| Universal Corp. | 9,860 | 502,071 | ||||||
| 1,613,452 | ||||||||
| Utilities — 2.4% | ||||||||
| Black Hills Corp. | 15,040 | 534,973 | ||||||
| El Paso Electric Co. | 7,760 | 265,780 | ||||||
| 800,753 | ||||||||
| Total Common Stocks | $ | 33,104,958 | ||||||
| Investment Funds — 13.0% | ||||||||
| Invesco Government & Agency Portfolio** | 3,740,079 | 3,740,079 | ||||||
| Touchstone Institutional Money Market Fund^ | 626,030 | 626,030 | ||||||
| Total Investment Funds | $ | 4,366,109 | ||||||
| 99 |
Touchstone Small Cap Value Fund (Continued)
| Market | ||||
| Value | ||||
| Total Investment Securities —111.5% | ||||
| (Cost $36,483,563) | $ | 37,471,067 | ||
| Liabilities in Excess of Other Assets — (11.5%) | (3,870,002 | ) | ||
| Net Assets — 100.0% | $ | 33,601,065 | ||
| † | All or a portion of the security is on loan. The total value of the securities on loan as of September 30, 2012 was $3,589,147. |
| * | Non-income producing security. |
| ** | Represents collateral for securities loaned. |
| ^ | Affiliated Fund. See Note 4 in Notes to Financial Statements. |
Portfolio Abbreviations:
REIT - Real Estate Investment Trust
Other Information:
The inputs or methodology used for valuing securities may not be an indication of the risk associated with investing in those securities. For more information on valuation inputs, and their aggregation into the levels used in the table below, please refer to the security valuation section in the accompanying Notes to Financial Statements.
Valuation inputs at Reporting Date:
| Description | Level 1 | Level 2 | Level 3 | Total | ||||||||||||
| Common Stocks | $ | 33,104,958 | $ | — | $ | — | $ | 33,104,958 | ||||||||
| Investment Funds | 4,366,109 | — | — | 4,366,109 | ||||||||||||
| $ | 37,471,067 | |||||||||||||||
See accompanying Notes to Financial Statements.
| 100 |
Portfolio of Investments
Touchstone Total Return Bond Fund – September 30, 2012
| Principal | Market | |||||||
| Amount | Value | |||||||
| Corporate Bonds — 30.1% | ||||||||
| Financials — 9.9% | ||||||||
| $ | 2,000,000 | American Express Credit Corp. MTN, | ||||||
| 1.750%, 6/12/15 | $ | 2,045,744 | ||||||
| 1,040,000 | Delphi Financial Group, Inc., | |||||||
| 7.875%, 1/31/20 | 1,252,765 | |||||||
| 841,011 | EJM Airport LLC, 6.271%, 5/15/20 | 937,449 | ||||||
| 1,500,000 | Fishers Lane Associates LLC, 144a, | |||||||
| 3.666%, 8/5/30 | 1,529,775 | |||||||
| 1,417,000 | Ford Motor Credit Co. LLC, | |||||||
| 5.625%, 9/15/15 | 1,548,877 | |||||||
| 2,004,000 | General Electric Capital Corp. MTN, | |||||||
| 5.625%, 5/1/18 | 2,363,317 | |||||||
| 1,260,000 | National Rural Utilities Cooperative | |||||||
| Finance Corp., 10.375%, 11/1/18 | 1,864,508 | |||||||
| 1,500,000 | Provident Cos, Inc., 7.000%, 7/15/18 | 1,712,548 | ||||||
| 2,000,000 | Torchmark Corp., 3.800%, 9/15/22 | 2,045,484 | ||||||
| 2,000,000 | USB Capital IX, 3.500%, 10/29/49(A) | 1,713,780 | ||||||
| 2,000,000 | Wachovia Capital Trust III, | |||||||
| 5.570%, 3/29/49(A) | 1,977,500 | |||||||
| 18,991,747 | ||||||||
| Industrials — 8.0% | ||||||||
| 67,326 | Astro Offshore Corp., | |||||||
| 6.000%, 12/20/19 | 76,425 | |||||||
| 151,226 | Burlington Northern and Santa Fe | |||||||
| Railway Co. 1998-C Pass Through | ||||||||
| Trust, 6.230%, 7/2/18 | 166,276 | |||||||
| 118,290 | Burlington Northern and Santa Fe | |||||||
| Railway Co. 2004-1 Pass Through | ||||||||
| Trust, 4.575%, 1/15/21 | 129,743 | |||||||
| 557,113 | Burlington Northern and Santa Fe | |||||||
| Railway Co. 2005-4 Pass Through | ||||||||
| Trust, 4.967%, 4/1/23 | 627,510 | |||||||
| 119,000 | Canal Barge Co., Inc., 4.500%, 11/12/34 | 142,173 | ||||||
| 1,005,029 | Continental Airlines 2000-2 Class A-1 | |||||||
| Pass Through Trust, 7.707%, 4/2/21 | 1,123,120 | |||||||
| 670,933 | CSX Transportation, Inc., | |||||||
| 6.251%, 1/15/23 | 821,893 | |||||||
| 300,000 | CSX Transportation, Inc., | |||||||
| 6.550%, 6/15/13 | 312,390 | |||||||
| 1,882,829 | Delta Air Lines 2010-2 Class A Pass | |||||||
| Through Trust, 4.950%, 5/23/19 | 2,033,455 | |||||||
| 1,277,240 | Federal Express Corp. 1998 Pass | |||||||
| Through Trust, 6.845%, 1/15/19 | 1,446,475 | |||||||
| 127,655 | Federal Express Corp. 1999 Pass | |||||||
| Through Trust, 7.650%, 1/15/22 | 155,101 | |||||||
| 1,350,000 | Kansas City Southern DE Mexico SA | |||||||
| DE CV, 8.000%, 2/1/18 | 1,505,250 | |||||||
| 202,000 | Matson Navigation Co., Inc., | |||||||
| 5.337%, 9/4/28 | 238,013 | |||||||
| 1,291,904 | Southwest Airlines Co. 2007-1 Pass | |||||||
| Through Trust, 6.150%, 8/1/22 | 1,463,081 | |||||||
| 175,174 | Sterling Equipment, 6.125%, 9/28/19 | 197,544 | ||||||
| 144,157 | Union Pacific Railroad Co. 2001 Pass | |||||||
| Through Trust, 6.630%, 1/27/22 | 167,078 | |||||||
| 476,354 | Union Pacific Railroad Co. 2003 Pass | |||||||
| Through Trust, 4.698%, 1/2/24 | 527,908 | |||||||
| 586,277 | Union Pacific Railroad Co. 2006 Pass | |||||||
| Through Trust, 5.866%, 7/2/30 | 678,498 | |||||||
| 1,386,000 | United Rentals North America, Inc., | |||||||
| 9.250%, 12/15/19 | 1,562,715 | |||||||
| 1,738,000 | Vessel Management Services, Inc., | |||||||
| 5.125%, 4/16/35 | 2,025,709 | |||||||
| 15,400,357 | ||||||||
| Utilities — 5.9% | ||||||||
| 1,059,122 | Bruce Mansfield Unit, 6.850%, 6/1/34 | 1,129,236 | ||||||
| 450,000 | California Water Service Co., | |||||||
| 5.500%, 12/1/40 | 561,989 | |||||||
| 1,600,000 | Commonwealth Edison Co., | |||||||
| 5.900%, 3/15/36 | 2,098,798 | |||||||
| 1,330,000 | Dominion Resources, Inc., | |||||||
| 2.761%, 9/30/66(A) | 1,209,463 | |||||||
| 1,775,000 | Entergy Louisiana LLC, | |||||||
| 4.440%, 1/15/26 | 2,003,980 | |||||||
| 99,000 | National Fuel Gas Co., 8.750%, 5/1/19 | 125,386 | ||||||
| 375,000 | Nevada Power Co., 5.875%, 1/15/15 | 416,811 | ||||||
| 1,265,000 | Nevada Power Co., 6.500%, 8/1/18 | 1,611,632 | ||||||
| 2,000,000 | NextEra Energy Capital Holdings, Inc., | |||||||
| 6.350%, 10/1/66(A) | 2,120,000 | |||||||
| 11,277,295 | ||||||||
| Consumer Staples — 1.6% | ||||||||
| 1,476,332 | American Airlines 2011-1 Class B Pass | |||||||
| Through Trust, 144a, | ||||||||
| 7.000%, 1/31/18 | 1,507,704 | |||||||
| 1,299,101 | CVS Pass-Through Trust, | |||||||
| 6.036%, 12/10/28 | 1,508,490 | |||||||
| 3,016,194 | ||||||||
| Energy — 1.5% | ||||||||
| 1,253,000 | Chesapeake Energy Corp., | |||||||
| 6.625%, 8/15/20 | 1,292,156 | |||||||
| 1,551,000 | Petrobras International Finance Co. - | |||||||
| Pifco, 3.500%, 2/6/17 | 1,622,087 | |||||||
| 2,914,243 | ||||||||
| Consumer Discretionary — 1.1% | ||||||||
| 361,000 | PulteGroup, Inc., 5.250%, 1/15/14 | 373,635 | ||||||
| 1,625,000 | Royal Caribbean Cruises Ltd., | |||||||
| 7.000%, 6/15/13 | 1,677,812 | |||||||
| 2,051,447 | ||||||||
| Telecommunication Services — 0.8% | ||||||||
| 1,500,000 | SBA Tower Trust, 144a, | |||||||
| 4.254%, 4/15/15 | 1,580,050 | |||||||
| Transportation — 0.7% | ||||||||
| 1,031,000 | Totem Ocean Trailer Express, Inc., | |||||||
| 6.365%, 4/15/28 | 1,244,365 | |||||||
| Health Care — 0.6% | ||||||||
| 1,075,000 | HCA, Inc., 7.250%, 9/15/20 | 1,204,000 | ||||||
| Total Corporate Bonds | $ | 57,679,698 | ||||||
| 101 |
Touchstone Total Return Bond Fund (Continued)
| Principal | Market | |||||||
| Amount | Value | |||||||
| Asset-Backed Securities — 22.6% | ||||||||
| $ | 1,478,904 | 321 Henderson Receivables I LLC, Ser | ||||||
| 2012-1A, Class A, 144a, | ||||||||
| 4.210%, 2/16/65 | $ | 1,556,086 | ||||||
| 1,397,136 | 321 Henderson Receivables I LLC, Ser | |||||||
| 2012-2A, Class A, 144a, | ||||||||
| 3.840%, 10/15/59 | 1,396,644 | |||||||
| 557,927 | CenterPoint Energy Transition Bond | |||||||
| Co. LLC, Ser 2009-1, Class A1, | ||||||||
| 1.833%, 2/15/16 | 568,674 | |||||||
| 575,000 | FPL Recovery Funding LLC, Ser | |||||||
| 2007-A, Class A4, 5.256%, 8/1/21 | 684,252 | |||||||
| 1,325,000 | JCP&L Transition Funding LLC, Ser | |||||||
| 2006-A, Class A4, 5.610%, 6/5/23 | 1,665,993 | |||||||
| 38,054 | Oncor Electric Delivery Transition | |||||||
| Bond Co. LLC, Ser 2003-1, Class A3, | ||||||||
| 4.950%, 2/15/15 | 38,714 | |||||||
| 94,798 | Small Business Administration | |||||||
| Participation Certificates, Ser | ||||||||
| 2001-20A, Class 1, 6.290%, 1/1/21 | 105,061 | |||||||
| 498,155 | Small Business Administration | |||||||
| Participation Certificates, Ser | ||||||||
| 2002-20H, Class 1, 5.310%, 8/1/22 | 555,191 | |||||||
| 10,132 | Small Business Administration | |||||||
| Participation Certificates, Ser | ||||||||
| 2003-10B, Class 1, 3.390%, 3/1/13 | 10,217 | |||||||
| 555,768 | Small Business Administration | |||||||
| Participation Certificates, Ser | ||||||||
| 2003-20B, Class 1, 4.840%, 2/1/23 | 615,166 | |||||||
| 186,261 | Small Business Administration | |||||||
| Participation Certificates, Ser | ||||||||
| 2003-20D, Class 1, 4.760%, 4/1/23 | 205,414 | |||||||
| 121,798 | Small Business Administration | |||||||
| Participation Certificates, Ser | ||||||||
| 2004-20D, Class 1, 4.770%, 4/1/24 | 134,937 | |||||||
| 783,387 | Small Business Administration | |||||||
| Participation Certificates, Ser | ||||||||
| 2004-20K, Class 1, 4.880%, 11/1/24 | 858,485 | |||||||
| 103,605 | Small Business Administration | |||||||
| Participation Certificates, Ser | ||||||||
| 2005-10E, Class 1, 4.540%, 9/1/15 | 107,481 | |||||||
| 535,954 | Small Business Administration | |||||||
| Participation Certificates, Ser | ||||||||
| 2005-20B, Class 1, 4.625%, 2/1/25 | 597,078 | |||||||
| 461,316 | Small Business Administration | |||||||
| Participation Certificates, Ser | ||||||||
| 2005-20H, Class 1, 5.110%, 8/1/25 | 518,175 | |||||||
| 2,310,350 | Small Business Administration | |||||||
| Participation Certificates, Ser | ||||||||
| 2006-20B, Class 1, 5.350%, 2/1/26 | 2,640,283 | |||||||
| 791,703 | Small Business Administration | |||||||
| Participation Certificates, Ser | ||||||||
| 2006-20H, Class 1, 5.700%, 8/1/26 | 913,531 | |||||||
| 332,944 | Small Business Administration | |||||||
| Participation Certificates, Ser | ||||||||
| 2006-20K, Class 1, 5.360%, 11/1/26 | 380,541 | |||||||
| 463,160 | Small Business Administration | |||||||
| Participation Certificates, Ser | ||||||||
| 2006-20L, Class 1, 5.120%, 12/1/26 | 520,465 | |||||||
| 1,530,687 | Small Business Administration | |||||||
| Participation Certificates, Ser | ||||||||
| 2007-20A, Class 1, 5.320%, 1/1/27 | 1,756,947 | |||||||
| 2,002,476 | Small Business Administration | |||||||
| Participation Certificates, Ser | ||||||||
| 2007-20E, Class 1, 5.310%, 5/1/27 | 2,294,728 | |||||||
| 408,403 | Small Business Administration | |||||||
| Participation Certificates, Ser | ||||||||
| 2007-20F, Class 1, 5.710%, 6/1/27 | 475,044 | |||||||
| 1,865,117 | Small Business Administration | |||||||
| Participation Certificates, Ser | ||||||||
| 2007-20L, Class 1, 5.290%, 12/1/27 | 2,129,501 | |||||||
| 918,080 | Small Business Administration | |||||||
| Participation Certificates, Ser | ||||||||
| 2008-20A, Class 1, 5.170%, 1/1/28 | 1,048,868 | |||||||
| 1,355,877 | Small Business Administration | |||||||
| Participation Certificates, Ser | ||||||||
| 2008-20K, Class 1, 6.770%, 11/1/28 | 1,594,680 | |||||||
| 1,377,542 | Small Business Administration | |||||||
| Participation Certificates, Ser | ||||||||
| 2009-20B, Class 1, 4.760%, 2/1/29 | 1,546,141 | |||||||
| 1,400,303 | Small Business Administration | |||||||
| Participation Certificates, Ser | ||||||||
| 2009-20C, Class 1, 4.660%, 3/1/29 | 1,565,651 | |||||||
| 371,054 | Small Business Administration | |||||||
| Participation Certificates, Ser | ||||||||
| 2009-20D, Class 1, 4.310%, 4/1/29 | 411,328 | |||||||
| 1,735,246 | Small Business Administration | |||||||
| Participation Certificates, Ser | ||||||||
| 2009-20E, Class 1, 4.430%, 5/1/29 | 1,924,902 | |||||||
| 396,263 | Small Business Administration | |||||||
| Participation Certificates, Ser | ||||||||
| 2009-20F, Class 1, 4.950%, 6/1/29 | 450,707 | |||||||
| 420,013 | Small Business Administration | |||||||
| Participation Certificates, Ser | ||||||||
| 2009-20J, Class 1, 3.920%, 10/1/29 | 457,619 | |||||||
| 1,497,437 | Small Business Administration | |||||||
| Participation Certificates, Ser | ||||||||
| 2010-20F, Class 1, 3.880%, 6/1/30 | 1,630,040 | |||||||
| 1,049,828 | Small Business Administration | |||||||
| Participation Certificates, Ser | ||||||||
| 2010-20I, Class 1, 3.210%, 9/1/30 | 1,119,657 | |||||||
| 3,430,996 | Small Business Administration | |||||||
| Participation Certificates, Ser | ||||||||
| 2011-20J, Class 1, 2.760%, 10/1/31 | 3,573,325 | |||||||
| 2,000,000 | Small Business Administration | |||||||
| Participation Certificates, Ser | ||||||||
| 2012-10C, Class 1, 1.240%, 5/1/22 | 2,012,092 | |||||||
| 2,600,000 | Small Business Administration | |||||||
| Participation Certificates, Ser | ||||||||
| 2012-20E, Class 1, 2.380%, 5/1/32 | 2,651,653 | |||||||
| 102 |
Touchstone Total Return Bond Fund (Continued)
| Principal | Market | |||||||
| Amount | Value | |||||||
| Asset-Backed Securities — 22.6% (Continued) | ||||||||
| $ | 2,600,000 | Small Business Administration | ||||||
| Participation Certificates, Ser | ||||||||
| 2012-20F, Class 1, 2.420%, 6/1/32 | $ | 2,628,808 | ||||||
| Total Asset-Backed Securities | $ | 43,344,079 | ||||||
| U.S. Government Mortgage-Backed Obligations — 19.3% | ||||||||
| 565,989 | FHLMC, Pool #A89148, | |||||||
| 4.000%, 10/1/39 | 608,697 | |||||||
| 235,411 | FNMA, Pool #465711, 4.680%, 8/1/28 | 270,054 | ||||||
| 1,677,564 | FNMA, Pool #469616, 3.500%, 11/1/21 | 1,820,024 | ||||||
| 1,700,000 | FNMA, Pool #469667, 3.540%, 12/1/21 | 1,849,426 | ||||||
| 2,117,534 | FNMA, Pool #745275, 5.000%, 2/1/36 | 2,318,781 | ||||||
| 120,478 | FNMA, Pool #874210, 5.260%, 1/1/25 | 143,047 | ||||||
| 79,297 | FNMA, Pool #888829, 5.832%, 6/1/37 | 93,963 | ||||||
| 175,548 | FNMA, Pool #958736, 4.940%, 5/1/19 | 202,567 | ||||||
| 598,039 | FNMA, Pool #AB1152, 4.000%, 6/1/25 | 639,848 | ||||||
| 339,677 | FNMA, Pool #AB3876, 4.000%, 11/1/41 | 371,211 | ||||||
| 452,244 | FNMA, Pool #AD0101, 4.879%, 7/1/19 | 527,574 | ||||||
| 519,434 | FNMA, Pool #AD0166, 4.876%, 8/1/19 | 606,653 | ||||||
| 192,604 | FNMA, Pool #AD0342, 4.639%, 10/1/19 | 225,733 | ||||||
| 460,634 | FNMA, Pool #AD0786, 4.501%, 1/1/20 | 537,563 | ||||||
| 536,232 | FNMA, Pool #AD0910, 4.602%, 4/1/20 | 627,824 | ||||||
| 188,284 | FNMA, Pool #AD1608, 4.000%, 2/1/25 | 201,447 | ||||||
| 1,028,819 | FNMA, Pool #AD1656, 4.500%, 3/1/40 | 1,117,130 | ||||||
| 559,401 | FNMA, Pool #AE0209, 4.331%, 6/1/20 | 650,687 | ||||||
| 1,312,735 | FNMA, Pool #AE0446, 4.086%, 9/1/20 | 1,510,311 | ||||||
| 1,139,259 | FNMA, Pool #AE2771, 3.500%, 8/1/26 | 1,231,214 | ||||||
| 1,048,157 | FNMA, Pool #AE8886, 3.500%, 12/1/25 | 1,116,380 | ||||||
| 540,445 | FNMA, Pool #AH1519, 3.500%, 12/1/25 | 575,622 | ||||||
| 382,898 | FNMA, Pool #AH6301, 4.000%, 5/1/26 | 409,786 | ||||||
| 568,133 | FNMA, Pool #AH8854, 4.500%, 4/1/41 | 627,197 | ||||||
| 885,205 | FNMA, Pool #AI1856, 4.500%, 5/1/41 | 984,702 | ||||||
| 419,962 | FNMA, Pool #AL0247, 4.000%, 4/1/41 | 467,480 | ||||||
| 2,000,000 | FNMA, Pool #AM0566, 1.940%, 9/1/19 | 2,061,694 | ||||||
| 3,996,234 | FNMA, Pool #AP3958, 3.000%, 9/1/42 | 4,222,940 | ||||||
| 71,722 | GNMA, Pool #4441, 5.000%, 5/20/39 | 76,219 | ||||||
| 2,537,900 | GNMA, Pool #5276, 3.000%, 1/20/27 | 2,729,489 | ||||||
| 2,031,392 | GNMA, Pool #710077, 4.700%, 5/20/61 | 2,298,816 | ||||||
| 281,593 | GNMA, Pool #751408, 4.826%, 6/20/61 | 325,686 | ||||||
| 767,655 | GNMA, Pool #751409, 4.626%, 7/20/61 | 860,015 | ||||||
| 403,646 | GNMA, Pool #752631, 4.500%, 10/20/40 | 450,533 | ||||||
| 733,328 | GNMA, Pool #756686, 4.697%, 9/20/61 | 834,282 | ||||||
| 566,519 | GNMA, Pool #757327, 4.295%, 7/20/61 | 637,062 | ||||||
| 2,386,267 | GNMA, Pool #766517, 4.661%, 4/20/62 | 2,741,940 | ||||||
| Total U.S. Government Mortgage-Backed Obligations | $ | 36,973,597 | ||||||
| Agency Collateralized Mortgage Obligations — 9.3% | ||||||||
| 1,000,000 | FREMF Mortgage Trust, Ser 2011-K702, | |||||||
| Class B, 144a, 4.936%, 4/25/44(A) | 1,090,415 | |||||||
| 1,000,000 | FREMF Mortgage Trust, Ser 2012-K19, | |||||||
| Class B, 144a, 4.177%, 5/25/45(A) | 1,025,285 | |||||||
| 1,035,000 | FREMF Mortgage Trust, Ser 2012-K710, | |||||||
| Class B, 144a, 3.949%, 6/25/47(A) | 1,064,736 | |||||||
| 685,000 | GNMA, Ser 2008-39, Class B, | |||||||
| 4.549%, 6/16/28 | 710,772 | |||||||
| 269,766 | GNMA, Ser 2009-114, Class A, | |||||||
| 3.103%, 12/16/38 | 279,918 | |||||||
| 875,000 | GNMA, Ser 2009-27, Class B, | |||||||
| 4.353%, 2/16/41 | 953,074 | |||||||
| 443,693 | GNMA, Ser 2009-86, Class A, | |||||||
| 3.536%, 9/16/35 | 465,844 | |||||||
| 2,300,000 | GNMA, Ser 2010-22, Class AD, | |||||||
| 3.633%, 10/16/39 | 2,461,361 | |||||||
| 771,238 | GNMA, Ser 2010-49, Class A, | |||||||
| 2.870%, 3/16/51 | 800,255 | |||||||
| 1,500,000 | GNMA, Ser 2011-1, Class B, | |||||||
| 4.344%, 6/16/41(A) | 1,650,872 | |||||||
| 1,010,945 | GNMA, Ser 2011-147, Class A, | |||||||
| 2.174%, 7/16/38 | 1,044,472 | |||||||
| 1,808,753 | GNMA, Ser 2011-31, Class A, | |||||||
| 2.210%, 12/16/35 | 1,849,128 | |||||||
| 1,034,961 | GNMA, Ser 2011-47, Class A, | |||||||
| 2.070%, 4/16/32 | 1,053,262 | |||||||
| 717,048 | GNMA, Ser 2012-22, Class AB, | |||||||
| 1.661%, 3/16/33 | 731,494 | |||||||
| 2,555,022 | GNMA, Ser 2012-53, Class AC, | |||||||
| 2.381%, 12/16/43 | 2,674,904 | |||||||
| Total Agency Collateralized Mortgage Obligations | $ | 17,855,792 | ||||||
| U.S. Treasury Obligations — 9.2% | ||||||||
| 1,800,000 | U.S. Treasury Note, 0.750%, 3/31/13 | 1,805,344 | ||||||
| 10,000,000 | U.S. Treasury Note, 1.750%, 5/15/22 | 10,140,620 | ||||||
| 2,510,000 | U.S. Treasury Strip, Principal, | |||||||
| 0.000%, 8/15/25# | 1,871,140 | |||||||
| 3,035,000 | U.S. Treasury Strip, Principal, | |||||||
| 0.000%, 8/15/30# | 1,872,996 | |||||||
| 3,550,000 | U.S. Treasury Strip, Principal, | |||||||
| 0.000%, 8/15/35# | 1,825,545 | |||||||
| Total U.S. Treasury Obligations | $ | 17,515,645 | ||||||
| Commercial Mortgage-Backed Securities — 5.4% | ||||||||
| 1,850,000 | Citigroup Commercial Mortgage Trust, | |||||||
| Ser 2007-C6, Class A4, | ||||||||
| 5.888%, 12/10/49(A) | 2,176,525 | |||||||
| 505,000 | Citigroup/Deutsche Bank Commercial | |||||||
| Mortgage Trust, Ser 2006-CD3, | ||||||||
| Class AJ, 5.688%, 10/15/48 | 378,775 | |||||||
| 1,990,750 | Greenwich Capital Commercial | |||||||
| Funding Corp., Ser 2005-GG5, Class | ||||||||
| A5, 5.224%, 4/10/37(A) | 2,208,576 | |||||||
| 2,000,000 | GS Mortgage Securities Corp. II, Ser | |||||||
| 2007-GG10, Class A4, | ||||||||
| 5.983%, 8/10/45(A) | 2,290,420 | |||||||
| 200,000 | JP Morgan Chase Commercial | |||||||
| Mortgage Securities Corp., Ser | ||||||||
| 2005-LDP4, Class AM, | ||||||||
| 4.999%, 10/15/42(A) | 217,828 | |||||||
| 103 |
Touchstone Total Return Bond Fund (Continued)
| Principal | Market | |||||||
| Amount | Value | |||||||
| Commercial Mortgage-Backed Securities — 5.4% (Continued) | ||||||||
| $ | 442,067 | JP Morgan Chase Commercial | ||||||
| Mortgage Securities Corp., Ser | ||||||||
| 2006-CB17, Class A3, | ||||||||
| 5.450%, 12/12/43 | $ | 443,939 | ||||||
| 1,000,000 | JP Morgan Chase Commercial | |||||||
| Mortgage Securities Corp., Ser | ||||||||
| 2007-LDPX, Class A3S, | ||||||||
| 5.317%, 1/15/49 | 1,035,931 | |||||||
| 1,400,000 | Merrill Lynch/Countrywide | |||||||
| Commercial Mortgage Trust, Ser | ||||||||
| 2006-3, Class AM, | ||||||||
| 5.456%, 7/12/46(A) | 1,528,299 | |||||||
| Total Commercial Mortgage-Backed Securities | $ | 10,280,293 | ||||||
| U.S. Government Agency Obligations — 0.9% | ||||||||
| 4,415 | FHA Reilly, 6.840%, 6/1/14 | 4,264 | ||||||
| 28,475 | FHA USGI, 7.430%, 8/1/23 | 28,475 | ||||||
| 223,406 | Small Business Administration | |||||||
| Participation Certificates, | ||||||||
| 5.340%, 11/1/21 | 246,645 | |||||||
| 72,536 | Small Business Administration | |||||||
| Participation Certificates, | ||||||||
| 6.150%, 2/1/18 | 78,986 | |||||||
| 1,150,000 | Tennessee Valley Authority, | |||||||
| 4.650%, 6/15/35 | 1,383,004 | |||||||
| Total U.S. Government Agency Obligations | $ | 1,741,374 | ||||||
| Sovereign Government Obligations — 0.9% | ||||||||
| 17,073 | Ecuador Government AID Bond, | |||||||
| 7.050%, 5/1/15 | 18,500 | |||||||
| 500,000 | FHLMC, 3.750%, 3/27/19 | 582,676 | ||||||
| 785,000 | Israel Government AID Bond, | |||||||
| 5.500%, 9/18/33 | 1,065,408 | |||||||
| Total Sovereign Government Obligations | $ | 1,666,584 | ||||||
| Non-Agency Collateralized Mortgage Obligation — 0.1% | ||||||||
| 215,302 | Federal Agricultural Mortgage Corp., | |||||||
| Ser AM-1003, Class 1, | ||||||||
| 6.776%, 4/25/13(A) | 220,276 | |||||||
| Investment Fund — 1.6% | ||||||||
| 3,129,218 | Touchstone Institutional Money Market Fund^ | 3,129,218 | ||||||
| Total Investment Securities —99.4% | ||||||||
| (Cost $185,437,872) | $ | 190,406,556 | ||||||
| Other Assets in Excess of Liabilities — 0.6% | 1,117,503 | |||||||
| Net Assets — 100.0% | $ | 191,524,059 | ||||||
| # | Strips Security - Zero Coupon Bond. |
| (A) | Variable rate security - the rate reflected is the rate in effect as of September 30, 2012. |
| ^ | Affiliated Fund. See Note 4 in Notes to Financial Statements. |
Portfolio Abbreviations:
FHA - Federal Housing Authority
FHLMC - Federal Home Loan Mortgage Corporation
FNMA - Federal National Mortgage Association
GNMA - Government National Mortgage Association
MTN -Medium Term Note
144A - This is a restricted security that was sold in a transaction exempt from Rule 144A of the Securities Act of 1933. This security may be sold in transactions exempt from registration, normally to qualified institutional buyers. At September 30, 2012, these securities were valued at $10,750,695 or 5.6% of net assets. These securities were deemed liquid pursuant to procedures approved by the Board of Trustees.
| 104 |
Touchstone Total Return Bond Fund (Continued)
Other Information:
The inputs or methodology used for valuing securities may not be an indication of the risk associated with investing in those securities. For more information on valuation inputs, and their aggregation into the levels used in the table below, please refer to the security valuation section in the accompanying Notes to Financial Statements.
Valuation inputs at Reporting Date:
| Description | Level 1 | Level 2 | Level 3 | Total | ||||||||||||
| Corporate Bonds | $ | — | $ | 57,679,698 | $ | — | $ | 57,679,698 | ||||||||
| Asset-Backed Securities | — | 43,344,079 | — | 43,344,079 | ||||||||||||
| U.S. Government Mortgage-Backed Obligations | — | 36,973,597 | — | 36,973,597 | ||||||||||||
| Agency Collateralized Mortgage Obligations | — | 17,855,792 | — | 17,855,792 | ||||||||||||
| U.S. Treasury Obligations | — | 17,515,645 | — | 17,515,645 | ||||||||||||
| Commercial Mortgage-Backed Securities | — | 10,280,293 | — | 10,280,293 | ||||||||||||
| U.S. Government Agency Obligations | — | 1,741,374 | — | 1,741,374 | ||||||||||||
| Sovereign Government Obligations | — | 1,666,584 | — | 1,666,584 | ||||||||||||
| Non-Agency Collateralized Mortgage Obligation | — | 220,276 | — | 220,276 | ||||||||||||
| Investment Fund | 3,129,218 | — | — | 3,129,218 | ||||||||||||
| $ | 190,406,556 | |||||||||||||||
See accompanying Notes to Financial Statements.
| 105 |
Portfolio of Investments
Touchstone Ultra Short Duration Fixed Income Fund – September 30, 2012
| Principal | Market | |||||||
| Amount | Value | |||||||
| Corporate Bonds — 20.3% | ||||||||
| Utilities — 4.7% | ||||||||
| $ | 1,800,000 | Alabama Power Co., | ||||||
| 4.850%, 12/15/12 | $ | 1,816,115 | ||||||
| 1,000,000 | Dominion Resources, Inc., | |||||||
| 5.150%, 7/15/15 | 1,114,849 | |||||||
| 600,000 | Entergy Mississippi, Inc., | |||||||
| 5.150%, 2/1/13 | 608,408 | |||||||
| 3,800,000 | Great Plains Energy, Inc., | |||||||
| 2.750%, 8/15/13 | 3,852,881 | |||||||
| 514,567 | Kiowa Power Partners LLC, 144a, | |||||||
| 4.811%, 12/30/13 | 518,148 | |||||||
| 1,095,000 | Metropolitan Edison Co., | |||||||
| 4.950%, 3/15/13 | 1,115,486 | |||||||
| 1,200,000 | National Fuel Gas Co., | |||||||
| 5.250%, 3/1/13 | 1,221,486 | |||||||
| 550,000 | NextEra Energy Capital Holdings, | |||||||
| Inc., 2.550%, 11/15/13 | 559,502 | |||||||
| 1,515,000 | NextEra Energy Capital Holdings, | |||||||
| Inc., 5.350%, 6/15/13 | 1,563,209 | |||||||
| 125,000 | Nisource Finance Corp., | |||||||
| 6.150%, 3/1/13 | 127,647 | |||||||
| 7,000,000 | Northern Indiana Public Service | |||||||
| Co., 7.350%, 7/8/13 | 7,319,326 | |||||||
| 220,000 | Ohio Power Co., 5.500%, 2/15/13 | 224,002 | ||||||
| 2,750,000 | Pennsylvania Electric Co., | |||||||
| 5.125%, 4/1/14 | 2,909,816 | |||||||
| 650,000 | Portland General Electric Co. MTN, | |||||||
| 144a, 5.625%, 8/1/13 | 672,387 | |||||||
| 1,000,000 | PSEG Power LLC, 2.500%, 4/15/13 | 1,011,036 | ||||||
| 1,000,000 | Sempra Energy, 2.000%, 3/15/14 | 1,015,954 | ||||||
| 1,571,000 | SPI Electricity & Gas Australia | |||||||
| Holdings Pty Ltd., 144a, | ||||||||
| 6.150%, 11/15/13 | 1,626,818 | |||||||
| 27,277,070 | ||||||||
| Telecommunication Services — 0.2% | ||||||||
| 1,000,000 | Verizon Communications, Inc., | |||||||
| 5.250%, 4/15/13 | 1,025,943 | |||||||
| Materials — 1.1% | ||||||||
| 2,000,000 | Dow Chemical Co. (The), | |||||||
| 6.000%, 10/1/12 | 2,000,000 | |||||||
| 3,000,000 | Georgia-Pacific LLC, 144a, | |||||||
| 8.250%, 5/1/16 | 3,228,288 | |||||||
| 1,000,000 | RPM International, Inc., | |||||||
| 6.250%, 12/15/13 | 1,050,330 | |||||||
| 6,278,618 | ||||||||
| Industrial — 0.3% | ||||||||
| 1,800,000 | Hutchison Whampoa International | |||||||
| (03/13) Ltd., 144a, | ||||||||
| 6.500%, 2/13/13 | 1,835,296 | |||||||
| Health Care — 0.2% | ||||||||
| 1,080,000 | CareFusion Corp., 5.125%, 8/1/14 | 1,154,560 | ||||||
| Financials — 9.0% | ||||||||
| 600,000 | Bank of America Corp. MTN, | |||||||
| 1.867%, 1/30/14(A) | 604,301 | |||||||
| 1,441,000 | Bank of Montreal, 2.125%, 6/28/13 | 1,460,256 | ||||||
| 1,900,000 | Barclays Bank PLC, 2.500%, 1/23/13 | 1,911,786 | ||||||
| 1,830,000 | Bear Stearns Cos LLC (The), | |||||||
| 5.700%, 11/15/14 | 2,004,002 | |||||||
| 3,000,000 | Citigroup Funding, Inc., | |||||||
| 1.875%, 11/15/12 | 3,006,102 | |||||||
| 1,200,000 | Citigroup, Inc., 5.500%, 4/11/13 | 1,229,360 | ||||||
| 2,775,000 | Daimler Finance North America | |||||||
| LLC, 6.500%, 11/15/13 | 2,954,010 | |||||||
| 1,500,000 | Daimler Finance North America | |||||||
| LLC, 144a, 1.300%, 7/31/15 | 1,505,902 | |||||||
| 1,500,000 | Deutsche Bank AG/London, | |||||||
| 2.375%, 1/11/13 | 1,507,544 | |||||||
| 1,200,000 | ERAC USA Finance LLC, 144a, | |||||||
| 2.250%, 1/10/14 | 1,215,512 | |||||||
| 5,425,000 | ERP Operating LP, 5.200%, 4/1/13 | 5,541,806 | ||||||
| 1,500,000 | Goldman Sachs Group, Inc. (The), | |||||||
| 4.750%, 7/15/13 | 1,547,724 | |||||||
| 5,005,000 | HCP, Inc., 5.650%, 12/15/13 | 5,282,457 | ||||||
| 1,250,000 | JPMorgan Chase & Co. MTN, | |||||||
| 2.050%, 1/24/14 | 1,272,099 | |||||||
| 530,000 | KeyCorp. MTN, 6.500%, 5/14/13 | 548,792 | ||||||
| 700,000 | Kimco Realty Corp., 4.820%, 6/1/14 | 736,345 | ||||||
| 1,500,000 | Morgan Stanley, 5.300%, 3/1/13 | 1,526,406 | ||||||
| 1,600,000 | National Australia Bank Ltd/New | |||||||
| York MTN, 2.000%, 3/9/15 | 1,634,866 | |||||||
| 535,000 | ProLogis LP, 7.625%, 8/15/14 | 587,050 | ||||||
| 880,000 | Prudential Financial, Inc. MTN, | |||||||
| 3.875%, 1/14/15 | 934,674 | |||||||
| 1,500,000 | Royal Bank of Canada, | |||||||
| 1.450%, 10/30/14 | 1,525,626 | |||||||
| 1,290,000 | Simon Property Group LP, | |||||||
| 4.200%, 2/1/15 | 1,373,829 | |||||||
| 1,000,000 | Simon Property Group LP, | |||||||
| 6.750%, 5/15/14 | 1,078,004 | |||||||
| 1,250,000 | SunTrust Banks, Inc., | |||||||
| 5.250%, 11/5/12 | 1,256,079 | |||||||
| 3,300,000 | US Central Federal Credit Union, | |||||||
| 1.900%, 10/19/12 | 3,302,607 | |||||||
| 753,000 | WCI Finance LLC / WEA Finance | |||||||
| LLC, 144a, 5.400%, 10/1/12 | 753,000 | |||||||
| 3,350,000 | WEA Finance LLC / WT Finance | |||||||
| Aust Pty Ltd., 144a, | ||||||||
| 7.500%, 6/2/14 | 3,691,281 | |||||||
| 1,360,000 | WT Finance Aust Pty Ltd. / | |||||||
| Westfield Capital / WEA Finance | ||||||||
| LLC, 144a, 5.125%, 11/15/14 | 1,468,539 | |||||||
| 1,045,000 | Xstrata Finance Canada Ltd., 144a, | |||||||
| 2.850%, 11/10/14 | 1,074,303 | |||||||
| 52,534,262 | ||||||||
| Energy — 2.0% | ||||||||
| 1,300,000 | CenterPoint Energy Resources | |||||||
| Corp., 5.950%, 1/15/14 | 1,382,001 | |||||||
| 106 |
Touchstone Ultra Short Duration Fixed Income Fund (Continued)
| Principal | Market | |||||||
| Amount | Value | |||||||
| Corporate Bonds — 20.3% (Continued) | ||||||||
| Energy — (Continued) | ||||||||
| $ | 1,250,000 | Chevron Corp., 3.950%, 3/3/14 | $ | 1,312,256 | ||||
| 1,700,000 | Enbridge Energy Partners LP, | |||||||
| 4.750%, 6/1/13 | 1,744,710 | |||||||
| 3,600,000 | Petrohawk Energy Corp., | |||||||
| 7.875%, 6/1/15 | 3,750,199 | |||||||
| 400,000 | Ras Laffan Liquefied Natural Gas | |||||||
| Co. Ltd. III, 144a, | ||||||||
| 5.500%, 9/30/14 | 432,667 | |||||||
| 1,500,000 | Spectra Energy Capital LLC, | |||||||
| 5.900%, 9/15/13 | 1,571,352 | |||||||
| 1,225,000 | Total Capital Canada Ltd., | |||||||
| 1.625%, 1/28/14 | 1,244,355 | |||||||
| 11,437,540 | ||||||||
| Consumer Staples — 1.0% | ||||||||
| 2,500,000 | Andrew W Mellon Foundation, | |||||||
| 3.950%, 8/1/14 | 2,662,400 | |||||||
| 1,000,000 | Anheuser-Busch InBev Worldwide, | |||||||
| Inc., 0.998%, 1/27/14(A) | 1,007,089 | |||||||
| 2,125,000 | Wesfarmers Ltd., 144a, | |||||||
| 6.998%, 4/10/13 | 2,187,994 | |||||||
| 5,857,483 | ||||||||
| Consumer Discretionary — 1.8% | ||||||||
| 940,000 | Comcast Corp., 5.300%, 1/15/14 | 995,511 | ||||||
| 4,335,000 | Glencore Funding LLC, 144a, | |||||||
| 6.000%, 4/15/14 | 4,555,769 | |||||||
| 1,000,000 | Marriott International, Inc. DE, | |||||||
| 5.625%, 2/15/13 | 1,016,906 | |||||||
| 3,800,000 | Reed Elsevier Capital, Inc., | |||||||
| 7.750%, 1/15/14 | 4,118,995 | |||||||
| 10,687,181 | ||||||||
| Total Corporate Bonds | $ | 118,087,953 | ||||||
| Asset-Backed Securities — 16.4% | ||||||||
| 75,798 | Ally Auto Receivables Trust, Ser | |||||||
| 2010-1, Class A3, | ||||||||
| 1.450%, 5/15/14 | 75,984 | |||||||
| 309,737 | Ally Auto Receivables Trust, Ser | |||||||
| 2010-2, Class A3, | ||||||||
| 1.380%, 7/15/14 | 310,639 | |||||||
| 803,856 | Ally Auto Receivables Trust, Ser | |||||||
| 2010-3, Class A3, | ||||||||
| 1.110%, 10/15/14 | 806,630 | |||||||
| 699,893 | Ally Auto Receivables Trust, Ser | |||||||
| 2010-4, Class A3, | ||||||||
| 0.910%, 11/17/14 | 701,729 | |||||||
| 630,000 | Ally Auto Receivables Trust, Ser | |||||||
| 2010-5, Class B, 144a, | ||||||||
| 2.450%, 6/15/16 | 655,304 | |||||||
| 640,000 | Ally Auto Receivables Trust, Ser | |||||||
| 2012-1, Class A3, | ||||||||
| 0.930%, 2/16/16 | 645,422 | |||||||
| 143,399 | American Credit Acceptance | |||||||
| Receivables Trust, Ser 2012-1, | ||||||||
| Class A1, 144a, 1.960%, 1/15/14 | 143,407 | |||||||
| 1,946,225 | AmeriCredit Automobile | |||||||
| Receivables Trust, Ser 2009-1, | ||||||||
| Class B, 9.790%, 4/15/14 | 2,005,381 | |||||||
| 3,778,455 | AmeriCredit Automobile | |||||||
| Receivables Trust, Ser 2010-1, | ||||||||
| Class B, 3.720%, 11/17/14 | 3,819,111 | |||||||
| 5,700,000 | AmeriCredit Automobile | |||||||
| Receivables Trust, Ser 2010-1, | ||||||||
| Class C, 5.190%, 8/17/15 | 5,994,975 | |||||||
| 444,195 | AmeriCredit Automobile | |||||||
| Receivables Trust, Ser 2011-5, | ||||||||
| Class A2, 1.190%, 8/8/15 | 446,075 | |||||||
| 2,106,513 | Bank of America Auto Trust, Ser | |||||||
| 2009-1A, Class A4, 144a, | ||||||||
| 3.520%, 6/15/16 | 2,120,458 | |||||||
| 2,601,132 | Bank of America Auto Trust, Ser | |||||||
| 2009-2A, Class A4, 144a, | ||||||||
| 3.030%, 10/15/16 | 2,621,121 | |||||||
| 20,047 | Bank of America Auto Trust, Ser | |||||||
| 2010-1A, Class A3, 144a, | ||||||||
| 1.390%, 3/15/14 | 20,055 | |||||||
| 2,198,000 | Capital Auto Receivables Asset | |||||||
| Trust, Ser 2008-2, Class B, 144a, | ||||||||
| 6.460%, 12/15/14 | 2,235,674 | |||||||
| 5,000,000 | Capital Auto Receivables Asset | |||||||
| Trust, Ser 2008-2, Class C, 144a, | ||||||||
| 7.960%, 12/15/14 | 5,241,680 | |||||||
| 2,520,000 | Capital Auto Receivables Asset | |||||||
| Trust, Ser 2008-A, Class B, 144a, | ||||||||
| 6.890%, 1/15/15 | 2,572,083 | |||||||
| 1,300,000 | CarMax Auto Owner Trust, Ser | |||||||
| 2011-3, Class A3, | ||||||||
| 1.070%, 6/15/16 | 1,310,565 | |||||||
| 2,134,493 | CarNow Auto Receivables Trust, | |||||||
| Ser 2012-1A, Class A, 144a, | ||||||||
| 2.090%, 1/15/15 | 2,135,485 | |||||||
| 800,000 | Citibank Credit Card Issuance Trust, | |||||||
| Ser 2003-A10, Class A10, | ||||||||
| 4.750%, 12/10/15 | 842,149 | |||||||
| 1,123,174 | Citigroup Mortgage Loan Trust, | |||||||
| Inc., Ser 2005-WF1, Class A3, | ||||||||
| 5.000%, 11/25/34(A) | 1,126,091 | |||||||
| 4,099,646 | Countrywide Asset-Backed | |||||||
| Certificates, Ser 2005-6, Class | ||||||||
| M1, 0.707%, 12/25/35(A) | 4,027,821 | |||||||
| 842,378 | CPS Auto Trust, Ser 2010-A, Class A, | |||||||
| 144a, 2.890%, 3/15/16 | 843,211 | |||||||
| 3,146,248 | DT Auto Owner Trust, Ser 2012-1A, | |||||||
| Class A, 144a, 1.050%, 1/15/15 | 3,148,192 | |||||||
| 361,987 | Entergy Gulf States Reconstruction | |||||||
| Funding LLC, Ser 2007-A, Class | ||||||||
| A1, 5.510%, 10/1/13 | 362,140 | |||||||
| 1,023,956 | Entergy Texas Restoration Funding | |||||||
| LLC, Ser 2009-A, Class A1, | ||||||||
| 2.120%, 2/1/16 | 1,045,487 | |||||||
| 142,031 | FNMA, Ser 2001-W4, Class AF5, | |||||||
| 6.114%, 2/25/32(A)(B) | 150,961 | |||||||
| 107 |
Touchstone Ultra Short Duration Fixed Income Fund (Continued)
| Principal | Market | |||||||
| Amount | Value | |||||||
| Asset-Backed Securities — 16.4% (Continued) | ||||||||
| $ | 1,429,172 | Ford Credit Auto Owner Trust, Ser | ||||||
| 2009-A, Class A4, | ||||||||
| 6.070%, 5/15/14 | $ | 1,450,354 | ||||||
| 201,239 | Ford Credit Auto Owner Trust, Ser | |||||||
| 2009-E, Class A3, | ||||||||
| 1.510%, 1/15/14 | 201,420 | |||||||
| 348,508 | Ford Credit Auto Owner Trust, Ser | |||||||
| 2010-A, Class A3, | ||||||||
| 1.320%, 6/15/14 | 349,217 | |||||||
| 1,050,000 | Ford Credit Auto Owner Trust, Ser | |||||||
| 2010-B, Class B, 2.540%, 2/15/16 | 1,088,931 | |||||||
| 760,564 | Franklin Auto Trust, Ser 2008-A, | |||||||
| Class C, 144a, 7.160%, 5/20/16 | 763,041 | |||||||
| 654,136 | Honda Auto Receivables Owner | |||||||
| Trust, Ser 2010-3, Class A3, | ||||||||
| 0.700%, 4/21/14 | 654,953 | |||||||
| 1,200,000 | Honda Auto Receivables Owner | |||||||
| Trust, Ser 2011-3, Class A3, | ||||||||
| 0.880%, 9/21/15 | 1,207,390 | |||||||
| 1,335,540 | Hyundai Auto Receivables Trust, | |||||||
| Ser 2009-A, Class A4, | ||||||||
| 3.150%, 3/15/16 | 1,359,831 | |||||||
| 1,045,280 | LAI Vehicle Lease Securitization | |||||||
| Trust, Ser 2010-A, Class A, 144a, | ||||||||
| 2.550%, 9/15/16 | 1,045,509 | |||||||
| 189,741 | Mercedes-Benz Auto Receivables | |||||||
| Trust, Ser 2009-1, Class A3, | ||||||||
| 1.670%, 1/15/14 | 190,226 | |||||||
| 166,947 | Mercedes-Benz Auto Receivables | |||||||
| Trust, Ser 2010-1, Class A3, | ||||||||
| 1.420%, 8/15/14 | 167,645 | |||||||
| 16,463 | Merrill Auto Trust Securitization, | |||||||
| Ser 2008-1, Class B, | ||||||||
| 6.750%, 4/15/15 | 16,511 | |||||||
| 2,678,069 | Montana Higher Education | |||||||
| Student Assistance Corp., Ser | ||||||||
| 2012-1, Class A1, | ||||||||
| 0.819%, 9/20/22(A) | 2,678,069 | |||||||
| 1,344,095 | Residential Asset Mortgage | |||||||
| Products, Inc., Ser 2003-RZ3, | ||||||||
| Class A6, 3.900%, 3/25/33(B) | 1,326,187 | |||||||
| 2,371,377 | Santander Consumer Acquired | |||||||
| Receivables Trust, Ser 2011-S1A, | ||||||||
| Class B, 144a, 1.660%, 8/15/16 | 2,378,526 | |||||||
| 3,250,000 | Santander Drive Auto Receivables | |||||||
| Trust, Ser 2010-2, Class B, | ||||||||
| 2.240%, 12/15/14 | 3,278,304 | |||||||
| 3,875,000 | Santander Drive Auto Receivables | |||||||
| Trust, Ser 2010-2, Class C, | ||||||||
| 3.890%, 7/17/17 | 4,024,060 | |||||||
| 3,820,000 | Santander Drive Auto Receivables | |||||||
| Trust, Ser 2010-3, Class B, | ||||||||
| 2.050%, 5/15/15 | 3,841,694 | |||||||
| 1,642,631 | Santander Drive Auto Receivables | |||||||
| Trust, Ser 2010-B, Class A3, 144a, | ||||||||
| 1.310%, 2/17/14 | 1,644,266 | |||||||
| 5,000,000 | Santander Drive Auto Receivables | |||||||
| �� | Trust, Ser 2010-B, Class C, 144a, | |||||||
| 3.020%, 10/17/16 | 5,091,795 | |||||||
| 948,846 | Santander Drive Auto Receivables | |||||||
| Trust, Ser 2011-2, Class A2, | ||||||||
| 1.040%, 4/15/14 | 950,042 | |||||||
| 3,393,413 | Santander Drive Auto Receivables | |||||||
| Trust, Ser 2011-S1A, Class B, | ||||||||
| 144a, 1.480%, 5/15/17 | 3,402,856 | |||||||
| 2,970,069 | SNAAC Auto Receivables Trust, Ser | |||||||
| 2012-1A, Class A, 144a, | ||||||||
| 1.780%, 6/15/16 | 2,975,576 | |||||||
| 223,525 | SVO VOI Mortgage Corp., Ser | |||||||
| 2005-AA, Class A, 144a, | ||||||||
| 5.250%, 2/20/21 | 225,096 | |||||||
| 666,734 | Toyota Auto Receivables Owner | |||||||
| Trust, Ser 2010-C, Class A3, | ||||||||
| 0.770%, 4/15/14 | 667,540 | |||||||
| 1,750,000 | United Auto Credit Securitization | |||||||
| Trust, Ser 2012-1, Class A2, 144a, | ||||||||
| 1.100%, 3/16/15± | 1,749,851 | |||||||
| 359,389 | Vanderbilt Mortgage Finance, Ser | |||||||
| 2001-C, Class A4, 5.960%, 1/7/27 | 370,913 | |||||||
| 1,675,000 | Volkswagen Auto Lease Trust, Ser | |||||||
| 2012-A, Class A3, | ||||||||
| 0.870%, 7/20/15 | 1,690,031 | |||||||
| 1,000,000 | Volkswagen Auto Loan Enhanced | |||||||
| Trust, Ser 2012-1, Class A3, | ||||||||
| 0.850%, 8/22/16 | 1,006,724 | |||||||
| 93,029 | Wells Fargo Home Equity Trust, Ser | |||||||
| 2006-1, Class A3, | ||||||||
| 0.367%, 5/25/36(A) | 91,990 | |||||||
| 4,000,000 | Westgate Resorts LLC, Ser 2012-2A, | |||||||
| Class A, 144a, 3.000%, 1/20/25± | 4,000,000 | |||||||
| Total Asset-Backed Securities | $ | 95,296,378 | ||||||
| Commercial Mortgage-Backed Securities — 16.1% | ||||||||
| 3,772,000 | Banc of America Large Loan, Inc. | |||||||
| 2007-BMB1, Ser 2007-BMB1, | ||||||||
| Class A2, 144a, | ||||||||
| 0.971%, 8/15/29(A) | 3,670,522 | |||||||
| 777,000 | Banc of America Merrill Lynch | |||||||
| Commercial Mortgage, Inc., Ser | ||||||||
| 2004-4, Class A6, | ||||||||
| 4.877%, 7/10/42(A) | 826,019 | |||||||
| 710,266 | Banc of America Merrill Lynch | |||||||
| Commercial Mortgage, Inc., Ser | ||||||||
| 2004-6, Class A3, | ||||||||
| 4.512%, 12/10/42 | 720,371 | |||||||
| 108 |
Touchstone Ultra Short Duration Fixed Income Fund (Continued)
| Principal | Market | |||||||
| Amount | Value | |||||||
| Commercial Mortgage-Backed Securities — 16.1% (Continued) | ||||||||
| $ | 328,331 | Banc of America Merrill Lynch | ||||||
| Commercial Mortgage, Inc., Ser | ||||||||
| 2005-3, Class ASB, | ||||||||
| 4.589%, 7/10/43 | $ | 338,702 | ||||||
| 2,233,195 | Banc of America Merrill Lynch | |||||||
| Commercial Mortgage, Inc., Ser | ||||||||
| 2005-4, Class ASB, | ||||||||
| 4.867%, 7/10/45 | 2,324,251 | |||||||
| 1,934,508 | Banc of America Merrill Lynch | |||||||
| Commercial Mortgage, Inc., Ser | ||||||||
| 2006-2, Class A2, | ||||||||
| 5.713%, 5/10/45 | 1,932,297 | |||||||
| 1,077,855 | Banc of America Merrill Lynch | |||||||
| Commercial Mortgage, Inc., Ser | ||||||||
| 2007-5, Class A2, | ||||||||
| 5.434%, 2/10/51 | 1,077,246 | |||||||
| 3,133,000 | Banc of America Re-Remic Trust, | |||||||
| Ser 2012-CLRN, Class B, 144a, | ||||||||
| 1.840%, 8/15/29(A)± | 3,133,000 | |||||||
| 2,367,000 | Banc of America Re-Remic Trust, | |||||||
| Ser 2012-CLRN, Class C, 144a, | ||||||||
| 2.340%, 8/15/29(A)± | 2,367,000 | |||||||
| 2,458,175 | Bear Stearns Commercial | |||||||
| Mortgage Securities, Ser | ||||||||
| 2000-WF2, Class E, | ||||||||
| 8.050%, 10/15/32(A)†† | 2,555,754 | |||||||
| 1,500,000 | Bear Stearns Commercial | |||||||
| Mortgage Securities, Ser | ||||||||
| 2004-T14, Class A4, | ||||||||
| 5.200%, 1/12/41(A)†† | 1,576,227 | |||||||
| 252,380 | Bear Stearns Commercial | |||||||
| Mortgage Securities, Ser | ||||||||
| 2007-T26, Class A2, | ||||||||
| 5.330%, 1/12/45†† | 252,315 | |||||||
| 2,200,000 | CDC Commercial Mortgage Trust, | |||||||
| Ser 2002-FX1, Class D, | ||||||||
| 6.005%, 5/15/35 | 2,205,555 | |||||||
| 2,170,049 | Commercial Mortgage Asset Trust, | |||||||
| Ser 1999-C1, Class A4, | ||||||||
| 6.975%, 1/17/32(A) | 2,209,956 | |||||||
| 3,400,000 | Commercial Mortgage Pass | |||||||
| Through Certificates, Ser | ||||||||
| 2001-J2A, Class B, 144a, | ||||||||
| 6.304%, 7/16/34 | 3,401,051 | |||||||
| 3,375,000 | Commercial Mortgage Pass | |||||||
| Through Certificates, Ser | ||||||||
| 2004-LB3A, Class B, | ||||||||
| 5.525%, 7/10/37(A) | 3,551,691 | |||||||
| 4,919,011 | Commercial Mortgage Pass | |||||||
| Through Certificates, Ser | ||||||||
| 2007-FL14, Class AJ, 144a, | ||||||||
| 0.401%, 6/15/22(A) | 4,687,738 | |||||||
| 750,465 | Credit Suisse First Boston | |||||||
| Mortgage Securities Corp., Ser | ||||||||
| 1998-C2, Class D, | ||||||||
| 7.130%, 11/15/30 | 769,799 | |||||||
| 155,886 | Credit Suisse First Boston | |||||||
| Mortgage Securities Corp., Ser | ||||||||
| 2002-CP5, Class A2, | ||||||||
| 4.940%, 12/15/35 | 155,891 | |||||||
| 1,453,559 | Credit Suisse First Boston | |||||||
| Mortgage Securities Corp., Ser | ||||||||
| 2003-C3, Class A5, | ||||||||
| 3.936%, 5/15/38 | 1,469,701 | |||||||
| 711,232 | Credit Suisse First Boston | |||||||
| Mortgage Securities Corp., Ser | ||||||||
| 2003-C4, Class A4, | ||||||||
| 5.137%, 8/15/36(A) | 727,840 | |||||||
| 4,500,000 | Credit Suisse First Boston | |||||||
| Mortgage Securities Corp., Ser | ||||||||
| 2003-C4, Class B, | ||||||||
| 5.253%, 8/15/36(A) | 4,639,748 | |||||||
| 642,732 | Credit Suisse First Boston | |||||||
| Mortgage Securities Corp., Ser | ||||||||
| 2005-C5, Class A3, | ||||||||
| 5.100%, 8/15/38(A) | 645,855 | |||||||
| 185,676 | Credit Suisse Mortgage Capital | |||||||
| Certificates, Ser 2007-C2, Class | ||||||||
| A2, 5.448%, 1/15/49(A) | 187,348 | |||||||
| 652,355 | Credit Suisse Mortgage Capital | |||||||
| Certificates, Ser 2007-C5, Class | ||||||||
| A2, 5.589%, 9/15/40 | 651,411 | |||||||
| 3,229,711 | GMAC Commercial Mortgage | |||||||
| Securities, Inc., Ser 1998-C1, | ||||||||
| Class F, 7.109%, 5/15/30(A) | 3,271,278 | |||||||
| 166,034 | GMAC Commercial Mortgage | |||||||
| Securities, Inc., Ser 2004-C3, | ||||||||
| Class A4, 4.547%, 12/10/41 | 166,071 | |||||||
| 2,185,000 | Greenwich Capital Commercial | |||||||
| Funding Corp., Ser 2002-C1, | ||||||||
| Class J, 144a, 6.306%, 1/11/35(A) | 2,184,626 | |||||||
| 440,116 | Greenwich Capital Commercial | |||||||
| Funding Corp., Ser 2003-C2, | ||||||||
| Class A3, 4.533%, 1/5/36 | 440,240 | |||||||
| 2,750,000 | JP Morgan Chase Commercial | |||||||
| Mortgage Securities Corp., Ser | ||||||||
| 2002-C3, Class B, | ||||||||
| 5.146%, 7/12/35(A) | 2,749,918 | |||||||
| 591,923 | JP Morgan Chase Commercial | |||||||
| Mortgage Securities Corp., Ser | ||||||||
| 2003-PM1A, Class A3, | ||||||||
| 5.169%, 8/12/40(A) | 592,016 | |||||||
| 109 |
Touchstone Ultra Short Duration Fixed Income Fund (Continued)
| Principal | Market | |||||||
| Amount | Value | |||||||
| Commercial Mortgage-Backed Securities — 16.1% (Continued) | ||||||||
| $ | 414,343 | JP Morgan Chase Commercial | ||||||
| Mortgage Securities Corp., Ser | ||||||||
| 2004-LN2, Class A1, | ||||||||
| 4.475%, 7/15/41 | $ | 415,963 | ||||||
| 1,446,863 | JP Morgan Chase Commercial | |||||||
| Mortgage Securities Corp., Ser | ||||||||
| 2005-CB12, Class A3A2, | ||||||||
| 4.928%, 9/12/37 | 1,487,963 | |||||||
| 257,397 | JP Morgan Chase Commercial | |||||||
| Mortgage Securities Corp., Ser | ||||||||
| 2005-LDP2, Class A3A, | ||||||||
| 4.678%, 7/15/42 | 261,040 | |||||||
| 2,475,000 | JP Morgan Chase Commercial | |||||||
| Mortgage Securities Corp., Ser | ||||||||
| 2005-LDP4, Class A3A2, | ||||||||
| 4.903%, 10/15/42 | 2,473,884 | |||||||
| 280,444 | LB Commercial Conduit Mortgage | |||||||
| Trust, Ser 2007-C3, Class A2, | ||||||||
| 5.840%, 7/15/44(A) | 280,918 | |||||||
| 876,408 | LB-UBS Commercial Mortgage | |||||||
| Trust, Ser 2003-C8, Class A3, | ||||||||
| 4.830%, 6/15/13†† | 885,416 | |||||||
| 559,000 | LB-UBS Commercial Mortgage | |||||||
| Trust, Ser 2004-C2, Class A4, | ||||||||
| 4.367%, 3/15/36†† | 584,141 | |||||||
| 391,466 | LB-UBS Commercial Mortgage | |||||||
| Trust, Ser 2005-C7, Class A2, | ||||||||
| 5.103%, 11/15/30†† | 392,255 | |||||||
| 314,667 | LB-UBS Commercial Mortgage | |||||||
| Trust, Ser 2005-C7, Class AAB, | ||||||||
| 5.170%, 11/15/30†† | 329,168 | |||||||
| 4,500,000 | Merrill Lynch Floating Trust, Ser | |||||||
| 2008-LAQA, Class A2, 144a, | ||||||||
| 0.766%, 7/9/21(A) | 4,242,208 | |||||||
| 48,558 | Merrill Lynch Mortgage Trust, Ser | |||||||
| 2003-KEY1, Class A3, | ||||||||
| 4.893%, 11/12/35 | 48,860 | |||||||
| 305,140 | Merrill Lynch/Countrywide | |||||||
| Commercial Mortgage Trust, Ser | ||||||||
| 2006-2, Class A2, | ||||||||
| 5.878%, 6/12/46(A) | 308,831 | |||||||
| 3,586,961 | Morgan Stanley Capital I, Ser | |||||||
| 2007-IQ15, Class A2, | ||||||||
| 6.036%, 6/11/49(A) | 3,646,149 | |||||||
| 85,910 | Morgan Stanley Dean Witter | |||||||
| Capital I, Ser 2001-TOP3, Class | ||||||||
| A4, 6.390%, 7/15/33 | 85,891 | |||||||
| 4,160,000 | Morgan Stanley Dean Witter | |||||||
| Capital I, Ser 2003-HQ2, Class B, | ||||||||
| 5.040%, 3/12/35 | 4,202,174 | |||||||
| 3,000,000 | Morgan Stanley Dean Witter | |||||||
| Capital I, Ser 2003-HQ2, Class C, | ||||||||
| 5.150%, 3/12/35 | 3,037,566 | |||||||
| 3,474,000 | PNC Mortgage Acceptance Corp., | |||||||
| Ser 2001-C1, Class F, 144a, | ||||||||
| 7.356%, 3/12/34(A) | 3,530,320 | |||||||
| 705,000 | Prudential Commercial Mortgage | |||||||
| Trust, Ser 2003-PWR1, Class A2, | ||||||||
| 4.493%, 2/11/36 | 711,457 | |||||||
| 5,000,000 | TIAA Retail Commercial Trust, Ser | |||||||
| 2001-C1A, Class H, 144a, | ||||||||
| 5.770%, 6/19/33 | 5,223,360 | |||||||
| 1,497,423 | Wachovia Bank Commercial | |||||||
| Mortgage Trust, Ser 2003-C9, | ||||||||
| Class A4, 5.012%, 12/15/35(A) | 1,556,162 | |||||||
| 1,223,944 | Wachovia Bank Commercial | |||||||
| Mortgage Trust, Ser 2004-C11, | ||||||||
| Class A4, 5.030%, 1/15/41 | 1,232,377 | |||||||
| 2,121,173 | Wachovia Bank Commercial | |||||||
| Mortgage Trust, Ser 2005-C17, | ||||||||
| Class APB, 5.037%, 3/15/42 | 2,156,190 | |||||||
| 1,033,621 | Wachovia Bank Commercial | |||||||
| Mortgage Trust, Ser 2005-C20, | ||||||||
| Class APB, 5.090%, 7/15/42(A) | 1,046,644 | |||||||
| Total Commercial Mortgage-Backed Securities | $ | 93,620,374 | ||||||
| U.S. Government Mortgage-Backed Obligations — 15.9% | ||||||||
| 626,097 | FHLMC, Pool #1B1580, | |||||||
| 3.057%, 3/1/34(A) | 672,421 | |||||||
| 311,736 | FHLMC, Pool #1B2629, | |||||||
| 2.561%, 11/1/34(A) | 333,380 | |||||||
| 1,185,614 | FHLMC, Pool #1B7189, | |||||||
| 3.485%, 3/1/36(A) | 1,275,487 | |||||||
| 447,577 | FHLMC, Pool #1G1471, | |||||||
| 2.556%, 1/1/37(A) | 479,993 | |||||||
| 2,730,065 | FHLMC, Pool #1H1354, | |||||||
| 5.867%, 11/1/36(A) | 2,937,132 | |||||||
| 248,015 | FHLMC, Pool #1H2524, | |||||||
| 2.375%, 8/1/35(A) | 265,487 | |||||||
| 767,827 | FHLMC, Pool #1J1813, | |||||||
| 3.050%, 8/1/37(A) | 827,247 | |||||||
| 694,140 | FHLMC, Pool #1K1238, | |||||||
| 2.375%, 7/1/36(A) | 740,962 | |||||||
| 479,485 | FHLMC, Pool #1L0087, | |||||||
| 2.375%, 6/1/35(A) | 515,407 | |||||||
| 916,761 | FHLMC, Pool #1L0147, | |||||||
| 2.415%, 7/1/35(A) | 979,302 | |||||||
| 621,477 | FHLMC, Pool #1L1288, | |||||||
| 2.375%, 5/1/36(A) | 667,721 | |||||||
| 588,757 | FHLMC, Pool #1Q0080, | |||||||
| 2.705%, 1/1/36(A) | 628,847 | |||||||
| 1,121,753 | FHLMC, Pool #1Q0119, | |||||||
| 2.953%, 9/1/36(A) | 1,207,941 | |||||||
| 1,858,026 | FHLMC, Pool #1Q0187, | |||||||
| 2.687%, 12/1/36(A) | 1,996,509 | |||||||
| 1,001,458 | FHLMC, Pool #1Q0339, | |||||||
| 2.906%, 4/1/37(A) | 1,078,628 | |||||||
| 110 |
Touchstone Ultra Short Duration Fixed Income Fund (Continued)
| Principal | Market | |||||||
| Amount | Value | |||||||
| U.S. Government Mortgage-Backed Obligations — 15.9% (Continued) | ||||||||
| $ | 462,759 | FHLMC, Pool #1Q0669, | ||||||
| 2.866%, 11/1/37(A) | $ | 496,581 | ||||||
| 2,165,666 | FHLMC, Pool #1Q1303, | |||||||
| 5.543%, 11/1/36(A) | 2,343,679 | |||||||
| 1,820,078 | FHLMC, Pool #781515, | |||||||
| 2.375%, 4/1/34(A) | 1,941,815 | |||||||
| 1,059,321 | FHLMC, Pool #782760, | |||||||
| 6.045%, 11/1/36(A) | 1,139,522 | |||||||
| 551,273 | FHLMC, Pool #847795, | |||||||
| 2.408%, 4/1/35(A) | 584,240 | |||||||
| 405,652 | FHLMC, Pool #848088, | |||||||
| 2.370%, 4/1/35(A) | 434,678 | |||||||
| 2,306,984 | FHLMC, Pool #848539, | |||||||
| 5.236%, 4/1/37(A) | 2,489,463 | |||||||
| 3,003,642 | FHLMC, Pool #848583, | |||||||
| 2.417%, 1/1/36(A) | 3,204,630 | |||||||
| 47,028 | FHLMC, Pool #A92646, | |||||||
| 5.500%, 6/1/40 | 52,675 | |||||||
| 58,968 | FHLMC, Pool #C03505, | |||||||
| 5.500%, 6/1/40 | 64,391 | |||||||
| 55,096 | FHLMC, Pool #G11072, | |||||||
| 7.500%, 12/1/15 | 58,643 | |||||||
| 3,652,764 | FHLMC, Pool #G11769, | |||||||
| 5.000%, 10/1/20 | 3,934,129 | |||||||
| 2,372,022 | FHLMC, Pool #G11773, | |||||||
| 5.000%, 10/1/20 | 2,554,595 | |||||||
| 1,084,148 | FHLMC, Pool #J10895, | |||||||
| 4.000%, 10/1/19 | 1,155,538 | |||||||
| 743,307 | FNMA, Pool #254868, | |||||||
| 5.000%, 9/1/33 | 816,891 | |||||||
| 20,154 | FNMA, Pool #519992, | |||||||
| 7.000%, 10/1/14 | 21,029 | |||||||
| 15,534 | FNMA, Pool #534851, | |||||||
| 7.500%, 4/1/15 | 16,377 | |||||||
| 21,465 | FNMA, Pool #535219, | |||||||
| 7.500%, 3/1/15 | 22,502 | |||||||
| 467,033 | FNMA, Pool #555380, | |||||||
| 2.763%, 4/1/33(A) | 499,036 | |||||||
| 109,842 | FNMA, Pool #555646, | |||||||
| 7.500%, 9/1/16 | 116,443 | |||||||
| 591,940 | FNMA, Pool #679742, | |||||||
| 2.843%, 1/1/40(A) | 635,154 | |||||||
| 163,026 | FNMA, Pool #681842, | |||||||
| 2.250%, 2/1/33(A) | 173,432 | |||||||
| 493,924 | FNMA, Pool #681898, | |||||||
| 2.250%, 4/1/33(A) | 526,318 | |||||||
| 554,280 | FNMA, Pool #725245, | |||||||
| 2.280%, 2/1/34(A) | 590,416 | |||||||
| 2,725,211 | FNMA, Pool #725490, | |||||||
| 2.755%, 4/1/34(A) | 2,909,098 | |||||||
| 972,557 | FNMA, Pool #735439, | |||||||
| 6.000%, 9/1/19 | 1,052,449 | |||||||
| 316,061 | FNMA, Pool #735539, | |||||||
| 2.369%, 4/1/35(A) | 336,751 | |||||||
| 222,326 | FNMA, Pool #743207, | |||||||
| 2.357%, 10/1/33(A) | 237,067 | |||||||
| 225,203 | FNMA, Pool #745467, | |||||||
| 5.508%, 4/1/36(A) | 242,193 | |||||||
| 487,674 | FNMA, Pool #745790, | |||||||
| 4.403%, 8/1/36(A) | 520,772 | |||||||
| 2,591,667 | FNMA, Pool #761411, | |||||||
| 4.500%, 5/1/19 | 2,804,843 | |||||||
| 300,656 | FNMA, Pool #784365, | |||||||
| 2.300%, 5/1/34(A) | 319,489 | |||||||
| 726,670 | FNMA, Pool #791978, | |||||||
| 2.267%, 9/1/34(A) | 777,066 | |||||||
| 215,466 | FNMA, Pool #804001, | |||||||
| 2.310%, 10/1/34(A) | 229,825 | |||||||
| 431,697 | FNMA, Pool #806765, | |||||||
| 2.311%, 11/1/34(A) | 460,835 | |||||||
| 169,126 | FNMA, Pool #809897, | |||||||
| 2.741%, 3/1/35(A) | 181,084 | |||||||
| 835,747 | FNMA, Pool #810896, | |||||||
| 2.274%, 1/1/35(A) | 892,518 | |||||||
| 418,772 | FNMA, Pool #813170, | |||||||
| 2.575%, 1/1/35(A) | 446,682 | |||||||
| 748,085 | FNMA, Pool #813714, | |||||||
| 2.080%, 1/1/35(A) | 793,218 | |||||||
| 3,545,038 | FNMA, Pool #813844, | |||||||
| 2.293%, 1/1/35(A) | 3,767,743 | |||||||
| 537,391 | FNMA, Pool #820364, | |||||||
| 2.275%, 4/1/35(A) | 574,725 | |||||||
| 2,391,051 | FNMA, Pool #825395, | |||||||
| 2.347%, 7/1/35(A) | 2,554,291 | |||||||
| 1,588,387 | FNMA, Pool #827787, | |||||||
| 2.300%, 5/1/35(A) | 1,691,111 | |||||||
| 244,160 | FNMA, Pool #828480, | |||||||
| 2.855%, 6/1/35(A) | 262,195 | |||||||
| 930,348 | FNMA, Pool #839239, | |||||||
| 3.593%, 9/1/35(A) | 994,994 | |||||||
| 263,572 | FNMA, Pool #888179, | |||||||
| 2.792%, 2/1/37(A) | 283,292 | |||||||
| 162,315 | FNMA, Pool #888548, | |||||||
| 2.358%, 5/1/35(A) | 173,060 | |||||||
| 608,311 | FNMA, Pool #889060, | |||||||
| 6.000%, 1/1/38 | 683,739 | |||||||
| 492,986 | FNMA, Pool #889061, | |||||||
| 6.000%, 1/1/38 | 556,117 | |||||||
| 29,700 | FNMA, Pool #889382, | |||||||
| 5.500%, 4/1/38 | 33,822 | |||||||
| 1,358,146 | FNMA, Pool #922674, | |||||||
| 2.898%, 4/1/36(A) | 1,464,456 | |||||||
| 1,710,272 | FNMA, Pool #931676, | |||||||
| 5.500%, 1/1/19 | 1,869,961 | |||||||
| 292,143 | FNMA, Pool #950385, | |||||||
| 1.706%, 8/1/37(A) | 315,388 | |||||||
| 560,382 | FNMA, Pool #995284, | |||||||
| 5.500%, 3/1/20 | 607,801 | |||||||
| 2,457,500 | FNMA, Pool #AA1150, | |||||||
| 4.000%, 4/1/23 | 2,620,515 | |||||||
| 629,512 | FNMA, Pool #AB1827, | |||||||
| 3.500%, 11/1/20 | 670,289 | |||||||
| 111 |
Touchstone Ultra Short Duration Fixed Income Fund (Continued)
| Principal | Market | |||||||
| Amount | Value | |||||||
| U.S. Government Mortgage-Backed Obligations — 15.9% (Continued) | ||||||||
| $ | 1,314,669 | FNMA, Pool #AB1981, | ||||||
| 3.500%, 12/1/20 | $ | 1,403,116 | ||||||
| 24,652 | FNMA, Pool #AD0941, | |||||||
| 5.500%, 4/1/40 | 28,228 | |||||||
| 2,146,597 | FNMA, Pool #AE0727, | |||||||
| 4.000%, 10/1/20 | 2,285,063 | |||||||
| 415,912 | FNMA, Pool #AE5441, | |||||||
| 5.000%, 10/1/40 | 471,968 | |||||||
| 1,411,347 | FNMA, Pool #AI3780, | |||||||
| 3.500%, 8/1/20 | 1,502,770 | |||||||
| 587,872 | FNMA, Pool #AI6588, | |||||||
| 4.000%, 7/1/26 | 629,154 | |||||||
| 512,995 | FNMA, Pool #AI8506, | |||||||
| 4.000%, 8/1/26 | 549,020 | |||||||
| 550,698 | FNMA, Pool #AL0211, | |||||||
| 5.000%, 4/1/41 | 624,919 | |||||||
| 2,886,798 | FNMA, Pool #AL0478, | |||||||
| 2.697%, 4/1/36(A) | 3,082,257 | |||||||
| 1,146,769 | FNMA, Pool #AL0543, | |||||||
| 5.000%, 7/1/41 | 1,269,074 | |||||||
| 1,555,281 | FNMA, Pool #MA0174, | |||||||
| 4.000%, 9/1/19 | 1,664,011 | |||||||
| 876,862 | FNMA, Pool #MA0464, | |||||||
| 3.500%, 6/1/20 | 933,663 | |||||||
| 999,652 | FNMA, Pool #MA0629, | |||||||
| 3.500%, 1/1/21 | 1,067,535 | |||||||
| 4,216,273 | FNMA, Pool #MA0740, | |||||||
| 3.500%, 5/1/21 | 4,497,949 | |||||||
| 1,064,719 | GNMA, Pool #80826, | |||||||
| 1.625%, 2/20/34(A) | 1,108,633 | |||||||
| 646,755 | GNMA, Pool #80889, | |||||||
| 1.750%, 4/20/34(A) | 673,269 | |||||||
| 951,576 | GNMA, Pool #81016, | |||||||
| 1.625%, 8/20/34(A) | 984,560 | |||||||
| Total U.S. Government Mortgage-Backed Obligations | $ | 92,581,219 | ||||||
| Agency Collateralized Mortgage Obligations — 3.8% | ||||||||
| 1,653,097 | FHLMC Reference REMIC, Ser | |||||||
| -R004, Class VG, 6.000%, 8/15/21 | 1,690,376 | |||||||
| 359,915 | FHLMC REMIC, Ser -2571, Class FN, | |||||||
| 0.871%, 8/15/32(A) | 360,497 | |||||||
| 71,252 | FHLMC REMIC, Ser -2575, Class LM, | |||||||
| 4.500%, 5/15/32 | 71,865 | |||||||
| 429,342 | FHLMC REMIC, Ser -2639, Class JE, | |||||||
| 5.000%, 1/15/32 | 434,938 | |||||||
| 1,396,304 | FHLMC REMIC, Ser -2770, Class FH, | |||||||
| 0.621%, 3/15/34(A) | 1,401,895 | |||||||
| 287,398 | FHLMC REMIC, Ser -2904, Class CA, | |||||||
| 5.000%, 4/15/19 | 295,364 | |||||||
| 541,269 | FHLMC REMIC, Ser -2977, Class NY, | |||||||
| 5.500%, 5/15/33 | 555,324 | |||||||
| 270,710 | FHLMC REMIC, Ser -3104, Class BA, | |||||||
| 5.500%, 6/15/24 | 277,433 | |||||||
| 821,964 | FHLMC REMIC, Ser -3010, Class WA, | |||||||
| 4.500%, 3/15/19 | 837,523 | |||||||
| 915,745 | FHLMC REMIC, Ser -3414, Class MB, | |||||||
| 4.250%, 12/15/19 | 967,319 | |||||||
| 1,488,000 | FHLMC REMICS, Ser -2778, Class | |||||||
| BR, 5.000%, 6/15/33 | 1,550,548 | |||||||
| 739,207 | FNMA Prepayment Link Note, Ser | |||||||
| 2005-4, Class 1, | ||||||||
| 4.650%, 12/25/12 | 745,132 | |||||||
| 944,847 | FNMA REMIC, Ser 2011-52, Class | |||||||
| AH, 2.750%, 10/25/18 | 976,954 | |||||||
| 587,935 | FNMA REMICS, Ser 2003-119, Class | |||||||
| PU, 4.000%, 11/25/33 | 617,070 | |||||||
| 20,639 | FNMA REMICS, Ser 2003-129, Class | |||||||
| PW, 4.500%, 7/25/33 | 20,642 | |||||||
| 278,069 | FNMA REMICS, Ser 2003-33, Class | |||||||
| AM, 4.250%, 5/25/33 | 307,946 | |||||||
| 1,499,317 | FNMA REMICS, Ser 2003-81, Class | |||||||
| FE, 0.717%, 9/25/33(A) | 1,508,190 | |||||||
| 248,650 | FNMA REMICS, Ser 2004-96, Class | |||||||
| LF, 1.217%, 12/25/34(A) | 248,746 | |||||||
| 605,994 | FNMA REMICS, Ser 2005-83, Class | |||||||
| TJ, 5.000%, 7/25/31 | 609,017 | |||||||
| 1,209,223 | FNMA REMICS, Ser 2005-88, Class | |||||||
| PC, 5.000%, 4/25/31 | 1,215,890 | |||||||
| 1,051,851 | FNMA REMICS, Ser 2008-35, Class | |||||||
| IO, 4.500%, 4/25/23 | 66,985 | |||||||
| 3,779,257 | FNMA REMICS, Ser 2009-80, Class | |||||||
| EJ, 4.500%, 3/25/27 | 3,884,521 | |||||||
| 1,229,858 | FNMA REMICS, Ser 2010-54, Class | |||||||
| NA, 4.500%, 10/25/39 | 1,263,261 | |||||||
| 248,499 | GNMA, Ser 2006-67, Class A, | |||||||
| 3.947%, 11/16/30 | 249,714 | |||||||
| 1,551,871 | GNMA, Ser 2010-18, Class A, | |||||||
| 3.100%, 12/16/50 | 1,626,086 | |||||||
| Total Agency Collateralized Mortgage Obligations | $ | 21,783,236 | ||||||
| U.S. Government Agency Obligations — 3.4% | ||||||||
| 1,500,000 | Federal Farm Credit Banks, | |||||||
| 2.625%, 4/17/14 | 1,554,312 | |||||||
| 1,750,000 | FHLB, 1.375%, 5/28/14 | 1,784,620 | ||||||
| 2,000,000 | FHLB, 2.375%, 3/14/14 | 2,061,694 | ||||||
| 1,500,000 | FHLB, 2.500%, 6/13/14 | 1,556,894 | ||||||
| 1,825,000 | FHLB, 3.125%, 12/13/13 | 1,888,349 | ||||||
| 1,000,000 | FHLMC, 1.000%, 7/30/14 | 1,012,950 | ||||||
| 1,500,000 | FHLMC, 1.375%, 2/25/14 | 1,523,547 | ||||||
| 1,500,000 | FHLMC, 2.175%, 2/19/14 | 1,539,861 | ||||||
| 1,800,000 | FHLMC, 2.250%, 1/23/17 | 1,846,456 | ||||||
| 112 |
Touchstone Ultra Short Duration Fixed Income Fund (Continued)
| Principal | Market | |||||||
| Amount | Value | |||||||
| U.S. Government Agency Obligations — 3.4% (Continued) | ||||||||
| $ | 2,000,000 | Overseas Private Investment Corp., | ||||||
| 0.000%, 11/18/13 | $ | 2,024,200 | ||||||
| 3,150,000 | Overseas Private Investment Corp., | |||||||
| 0.160%, 3/15/17(A) | 3,150,000 | |||||||
| Total U.S. Government Agency Obligations | $ | 19,942,883 | ||||||
| Municipal Bonds — 3.2% | ||||||||
| Indiana — 0.9% | ||||||||
| 5,000,000 | Indiana St Financial Authority EDR, | |||||||
| Amt Republic Svcs Inc Proj A, | ||||||||
| 0.650%, 5/1/34(A) | 5,000,000 | |||||||
| Louisiana — 0.1% | ||||||||
| 377,552 | LA Local Government | |||||||
| Environmental Facilities & CDA, | ||||||||
| Series 2010-ELL, Tranche A-1, | ||||||||
| 1.110%, 2/1/16 | 378,338 | |||||||
| New Mexico — 0.1% | ||||||||
| 850,000 | NM Edl Asst Foundation Rev (Gtd | |||||||
| St Lns), 1.023%, 12/1/28(A) | 850,144 | |||||||
| New York — 0.5% | ||||||||
| 3,000,000 | NY Environmental Facilities Corp, | |||||||
| Waste Mgmt Inc, 0.650%, 5/1/30 | 3,000,000 | |||||||
| Ohio — 0.2% | ||||||||
| 1,510,000 | Medina Co OH IDR (Mack Inds), | |||||||
| (LOC: JP Morgan Chase Bank), | ||||||||
| 0.340%, 7/1/16(A) | 1,510,000 | |||||||
| South Carolina — 0.9% | ||||||||
| 5,000,000 | SC Public Svc Auth, Ser A, 0.731%, | |||||||
| 7/1/13(A) | 5,002,950 | |||||||
| Texas — 0.5% | ||||||||
| 2,250,000 | North TX Tollway Auth Rev, | |||||||
| 2.441%, 9/1/13 | 2,281,342 | |||||||
| 625,000 | Texas St, Amt Ref College Student | |||||||
| Ln B, UTGO, 5.000%, 8/1/14 | 673,956 | |||||||
| 2,955,298 | ||||||||
| Total Municipal Bonds | $ | 18,696,730 | ||||||
| Non-Agency Collateralized Mortgage Obligations — 3.0% | ||||||||
| 520,327 | American Home Mortgage | |||||||
| Investment Trust, Ser 2005-2, | ||||||||
| Class 5A3, 5.077%, 9/25/35(B) | 529,963 | |||||||
| 947,350 | Bear Stearns Adjustable Rate | |||||||
| Mortgage Trust, Ser 2004-1, | ||||||||
| Class 13A3, 3.031%, 4/25/34(A)†† | 927,893 | |||||||
| 577,035 | Bear Stearns Asset Backed | |||||||
| Securities Trust, Ser 2003-AC7, | ||||||||
| Class A2, 5.750%, 1/25/34(B)†† | 600,424 | |||||||
| 12,278 | CitiCorp Mortgage Securities, Inc., | |||||||
| Ser 2003-10, Class A2, | ||||||||
| 4.500%, 11/25/18 | 12,260 | |||||||
| 26,540 | Countrywide Home Loan | |||||||
| Mortgage Pass Through Trust, | ||||||||
| Ser 2003-J4, Class 1A2, | ||||||||
| 4.750%, 6/25/33 | 26,528 | |||||||
| 172,635 | Credit Suisse First Boston | |||||||
| Mortgage Securities Corp., Ser | ||||||||
| 2005-3, Class 3A30, | ||||||||
| 5.500%, 7/25/35 | 173,270 | |||||||
| 681,969 | FDIC Structured Sale Guaranteed | |||||||
| Notes, Ser 2010-S1, Class 2A, | ||||||||
| 144a, 3.250%, 4/25/38 | 710,100 | |||||||
| 109,909 | JP Morgan Alternative Loan Trust, | |||||||
| Ser 2006-S2, Class A2, | ||||||||
| 5.810%, 5/25/36(B) | 109,782 | |||||||
| 33,687 | JP Morgan Alternative Loan Trust, | |||||||
| Ser 2006-S3, Class A2A, | ||||||||
| 5.870%, 8/25/36(B) | 33,578 | |||||||
| 143,376 | JP Morgan Mortgage Trust, Ser | |||||||
| 2005-A2, Class 5A1, | ||||||||
| 4.281%, 4/25/35(A) | 146,137 | |||||||
| 468,337 | JP Morgan Mortgage Trust, Ser | |||||||
| 2005-A3, Class 11A1, | ||||||||
| 4.471%, 6/25/35(A) | 474,110 | |||||||
| 460,384 | JP Morgan Mortgage Trust, Ser | |||||||
| 2006-A4, Class 2A2, | ||||||||
| 5.551%, 6/25/36(A) | 448,349 | |||||||
| 52,285 | Merrill Lynch Mortgage Investors, | |||||||
| Inc., Ser 2003-A1, Class 2A, | ||||||||
| 2.672%, 12/25/32(A) | 54,124 | |||||||
| 686,012 | MLCC Mortgage Investors, Inc., Ser | |||||||
| 2004-1, Class 1A, | ||||||||
| 2.502%, 12/25/34(A) | 677,260 | |||||||
| 929,488 | PHH Mortgage Capital LLC, Ser | |||||||
| 2008-CIM2, Class 5A1, | ||||||||
| 6.000%, 7/25/38 | 1,005,012 | |||||||
| 866,992 | Provident Funding Mortgage Loan | |||||||
| Trust, Ser 2005-2, Class 2A1A, | ||||||||
| 2.941%, 10/25/35(A) | 858,977 | |||||||
| 517,222 | Residential Accredit Loans, Inc., Ser | |||||||
| 2003-QS10, Class A7, | ||||||||
| 5.500%, 5/25/33 | 541,310 | |||||||
| 1,246,224 | Residential Asset Securitization | |||||||
| Trust, Ser 2003-A8, Class A1, | ||||||||
| 3.750%, 10/25/18 | 1,269,298 | |||||||
| 1,979,663 | RFMSI Trust, Ser 2007-SA1, Class | |||||||
| 1A1, 3.289%, 2/25/37(A) | 1,627,386 | |||||||
| 4,337,094 | Springleaf Mortgage Loan Trust, | |||||||
| Ser 2012-2A, Class A, 144a, | ||||||||
| 2.220%, 10/25/57(A) | 4,356,069 | |||||||
| 5,872 | Wells Fargo Mortgage Backed | |||||||
| Securities Trust, Ser 2003-11, | ||||||||
| Class 1A11, 4.750%, 10/25/18 | 5,865 | |||||||
| 113 |
Touchstone Ultra Short Duration Fixed Income Fund (Continued)
| Principal | Market | |||||||
| Amount | Value | |||||||
| Non-Agency Collateralized Mortgage Obligations — 3.0% (Continued) | ||||||||
| $ | 259,826 | Wells Fargo Mortgage Backed | ||||||
| Securities Trust, Ser 2003-13, | ||||||||
| Class A5, 4.500%, 11/25/18 | $ | 261,575 | ||||||
| 562,188 | Wells Fargo Mortgage Backed | |||||||
| Securities Trust, Ser 2003-G, | ||||||||
| Class A1, 4.100%, 6/25/33(A) | 570,544 | |||||||
| 1,605,492 | Wells Fargo Mortgage Backed | |||||||
| Securities Trust, Ser 2003-M, | ||||||||
| Class A1, 4.681%, 12/25/33(A) | 1,646,871 | |||||||
| 473,871 | Wells Fargo Mortgage Backed | |||||||
| Securities Trust, Ser 2004-3, | ||||||||
| Class A1, 4.750%, 4/25/19 | 481,265 | |||||||
| Total Non-Agency Collateralized Mortgage Obligations | $ | 17,547,950 | ||||||
| U.S. Treasury Obligation — 0.6% | ||||||||
| 3,000,000 | U.S. Treasury Note, 2.625%, 7/31/14 | 3,130,548 | ||||||
| Commercial Paper — 9.1% | ||||||||
| 3,000,000 | AGL CAP Corp, 0.380%, | |||||||
| 10/03/2012 | 2,999,937 | |||||||
| 4,747,000 | American WTR CAP Corp, 0.420%, | |||||||
| 10/24/2012 | 4,745,726 | |||||||
| 3,000,000 | Daimler North America Corp, | |||||||
| 0.742%, 03/04/2013 | 2,991,025 | |||||||
| 5,600,000 | DCP Midstream LLC, 0.470%, | |||||||
| 10/18/2012 | 5,598,757 | |||||||
| 4,500,000 | Duke Energy Corp. 0.521%, | |||||||
| 10/01/2012 | 4,500,000 | |||||||
| 5,000,000 | Enbridge Energy Partners LP, | |||||||
| 0.000%, 10/05/2012 | 4,999,778 | |||||||
| 5,000,000 | Kansas City PWR & LT Co, 0.450%, | |||||||
| 11/19/2012 | 4,996,938 | |||||||
| 5,300,000 | Northeast Utils, 0.410%, | |||||||
| 10/04/2012 | 5,299,819 | |||||||
| 5,000,000 | Oge Energy Corp, 0.000%, | |||||||
| 10/09/2012 | 4,999,556 | |||||||
| 5,000,000 | Weatherford International LTD, | |||||||
| 0.605%, 10/16/2012 | 4,999,000 | |||||||
| 7,000,000 | XSTRATA FINANCE CANADA LTD, | |||||||
| 0.864%, 03/18/2013 | 6,976,094 | |||||||
| Total Commercial Paper | $ | 53,106,630 | ||||||
| Shares | ||||||||
| Investment Fund — 5.8% | ||||||||
| 33,758,248 | Touchstone Institutional Money Market Fund^ | $ | 33,758,248 | |||||
| Total Investment Securities —97.6% | ||||||||
| (Cost $565,802,428) | $ | 567,552,149 | ||||||
| Other Assets in Excess of Liabilities — 2.4% | 14,073,279 | |||||||
| Net Assets — 100.0% | $ | 581,625,428 | ||||||
| (A) | Variable rate security - the rate reflected is the rate in effect as of September 30, 2012. |
| (B) | Step Bond. A bond that pays an initial interest rate for the first period and then a higher interest rate for the following periods until maturity. The interest rate shown reflects the rate in effect at September 30, 2012. |
| ^ | Affiliated Fund. See Note 4 in Notes to Financial Statements. |
| ± | Fair valued security by Fund's Investment Advisor. |
| †† | The issuers and/or sponsors of certain mortgage-backed securities may no longer exist; however, the securities held by the Fund are separate legal entities organized as trusts and publicly traded. The Fund receives principal and interest payments directly from these trusts. |
Portfolio Abbreviations:
CDA - Community Development Authority
EDR - Economy Development Revenue
FHLB - Federal Home Loan Bank
FHLMC - Federal Home Loan Mortgage Corporation
FNMA - Federal National Mortgage Association
GNMA - Government National Mortgage Association
IDR - Industrial Development Revenue
LOC - Letter of Credit
LTD - Limited Liability Company
MTN -Medium Term Note
REIT - Real Estate Investment Trust
REMIC - Real Estate Mortgage Investment Conduit
UTGO - Unlimited Tax General Obligation
| 114 |
Touchstone Ultra Short Duration Fixed Income Fund (Continued)
144A - This is a restricted security that was sold in a transaction exempt from Rule 144A of the Securities Act of 1933. This security may be sold in transactions exempt from registration, normally to qualified institutional buyers. At September 30, 2012, these securities were valued at $111,785,805 or 19.2% of net assets. These securities were deemed liquid pursuant to procedures approved by the Board of Trustees.
Other Information:
The inputs or methodology used for valuing securities may not be an indication of the risk associated with investing in those securities. For more information on valuation inputs, and their aggregation into the levels used in the table below, please refer to the security valuation section in the accompanying Notes to Financial Statements.
| Valuation inputs at Reporting Date: | ||||||||||||||||
| Description | Level 1 | Level 2 | Level 3 | Total | ||||||||||||
| Corporate Bonds | $ | — | $ | 118,087,953 | $ | — | $ | 118,087,953 | ||||||||
| Asset-Backed Securities | — | 95,296,378 | — | 95,296,378 | ||||||||||||
| Commercial Mortgage-Backed Securities | — | 93,620,374 | — | 93,620,374 | ||||||||||||
| U.S. Government Mortgage-Backed Obligations | — | 92,581,219 | — | 92,581,219 | ||||||||||||
| Agency Collateralized Mortgage Obligations | — | 21,783,236 | — | 21,783,236 | ||||||||||||
| U.S. Government Agency Obligations | — | 19,942,883 | — | 19,942,883 | ||||||||||||
| Municipal Bonds | — | 18,696,730 | — | 18,696,730 | ||||||||||||
| Non-Agency Collateralized Mortgage Obligations | — | 17,547,950 | — | 17,547,950 | ||||||||||||
| U.S. Treasury Obligation | — | 3,130,548 | — | 3,130,548 | ||||||||||||
| Commercial Paper | — | 53,106,630 | — | 53,106,630 | ||||||||||||
| Investment Fund | 33,758,248 | — | — | 33,758,248 | ||||||||||||
| $ | 567,552,149 | |||||||||||||||
See accompanying Notes to Financial Statements.
| 115 |
Statements of Assets and Liabilities
September 30, 2012
| Touchstone | ||||||||||||||||
| Emerging | Touchstone | Touchstone | Touchstone | |||||||||||||
| Markets | Focused | Global | Global | |||||||||||||
| Equity | Equity | Equity | Real Estate | |||||||||||||
| Fund | Fund | Fund | Fund | |||||||||||||
| Assets | ||||||||||||||||
| Investments, at cost | $ | 543,691,061 | $ | 106,243,292 | $ | 21,281,276 | $ | 24,233,223 | ||||||||
| Affiliated securities, at market value | $ | 603 | $ | 5,180,604 | $ | 778,516 | $ | 808,114 | ||||||||
| Non-affiliated securities, at market value | 544,462,738 | 102,601,058 | 20,971,850 | 23,933,366 | ||||||||||||
| Investments, at market value (A) | $ | 544,463,341 | $ | 107,781,662 | $ | 21,750,366 | $ | 24,741,480 | ||||||||
| Cash | — | — | — | — | ||||||||||||
| Foreign Currency (B) | 830,001 | — | 8,641 | 2,913 | ||||||||||||
| Unrealized appreciation on forward foreign currency contracts | — | — | — | — | ||||||||||||
| Dividends and interest receivable | 588,956 | 57,351 | 12,714 | 55,266 | ||||||||||||
| Receivable for capital shares sold | 488,128 | 137,759 | 189 | — | ||||||||||||
| Receivable for investments sold | 8,262,171 | 1,276,325 | 116,499 | — | ||||||||||||
| Receivable for securities lending income | 11,980 | 258 | 126 | 97 | ||||||||||||
| Receivable from other affiliates | — | — | — | — | ||||||||||||
| Receivable from Investment Advisor | — | — | 8,621 | 1,592 | ||||||||||||
| Tax reclaim receivable | 40,456 | — | 6,694 | 1,265 | ||||||||||||
| Other assets | 39,045 | 11,325 | 518 | 4,510 | ||||||||||||
| Total Assets | 554,724,078 | 109,264,680 | 21,904,368 | 24,807,123 | ||||||||||||
| Liabilities | ||||||||||||||||
| Securities sold short(C) | — | — | — | — | ||||||||||||
| Dividends for securities sold short payable | — | — | — | — | ||||||||||||
| Bank overdrafts | 1,336,465 | — | — | 92 | ||||||||||||
| Unrealized depreciation on forward foreign currency contracts | — | — | — | — | ||||||||||||
| Payable to Transfer Agent | 120,347 | 200,755 | 541 | 501 | ||||||||||||
| Payable for reports to shareholders | 16,082 | 15,551 | 7,689 | 7,340 | ||||||||||||
| Payable for return of collateral for securities on loan | 22,265,716 | 2,541,236 | 970,747 | 333,900 | ||||||||||||
| Payable for capital shares redeemed | 203,716 | 189,859 | 15,568 | — | ||||||||||||
| Payable for investments purchased | — | 163,755 | — | 364,868 | ||||||||||||
| Payable to Investment Advisor | 349,853 | 11,510 | — | — | ||||||||||||
| Payable to other affiliates | 85,229 | 19,811 | 752 | 611 | ||||||||||||
| Payable to Trustees | 5,200 | 3,363 | 3,350 | 3,350 | ||||||||||||
| Payable for professional services | 34,573 | 17,993 | 23,998 | 24,461 | ||||||||||||
| Other accrued expenses and liabilities | 131,913 | 939 | 8,423 | 11,087 | ||||||||||||
| Total Liabilities | 24,549,094 | 3,164,772 | 1,031,068 | 746,210 | ||||||||||||
| Net Assets | $ | 530,174,984 | $ | 106,099,908 | $ | 20,873,300 | $ | 24,060,913 | ||||||||
| Net assets consist of: | ||||||||||||||||
| Paid-in capital | $ | 536,893,742 | $ | 116,096,823 | $ | 20,121,162 | $ | 23,372,663 | ||||||||
| Accumulated net investment income (loss) | 1,440,319 | 565,983 | 220,943 | 73,789 | ||||||||||||
| Accumulated net realized gains (losses) on investments, warrants, foreign currency transactions and securities sold short | (8,916,664 | ) | (12,101,268 | ) | 62,045 | 105,699 | ||||||||||
| Net unrealized appreciation on investments, foreign currency transactions and securities sold short | 757,587 | 1,538,370 | 469,150 | 508,762 | ||||||||||||
| Net Assets | $ | 530,174,984 | $ | 106,099,908 | $ | 20,873,300 | $ | 24,060,913 | ||||||||
| (A) Includes market value of securities on loan of: | $ | 21,181,186 | $ | 2,407,279 | $ | 949,161 | $ | 318,749 | ||||||||
| (B) Cost of foreign currency: | $ | 829,985 | $ | — | $ | 8,603 | $ | 2,913 | ||||||||
| (C) Proceeds received for securities sold short: | $ | — | $ | — | $ | — | $ | — | ||||||||
See accompanying Notes to Financial Statements.
| 116 |
Statements of Assets and Liabilities (Continued)
| Touchstone | Touchstone | Touchstone | Touchstone | ||||||||||||
| International | Large Cap | Market | Merger | ||||||||||||
| Fixed Income | Relative Value | Neutral Equity | Arbitrage | ||||||||||||
| Fund | Fund | Fund | Fund | ||||||||||||
| $ | 31,778,604 | $ | 34,215,800 | $ | 34,897,100 | $ | 331,361,235 | ||||||||
| $ | 2,061,388 | $ | 943,001 | $ | 778,325 | $ | 10,751,954 | ||||||||
| 30,242,522 | 33,451,633 | 38,448,887 | 325,049,225 | ||||||||||||
| $ | 32,303,910 | $ | 34,394,634 | $ | 39,227,212 | $ | 335,801,179 | ||||||||
| — | — | 39,685,494 | 61,636,301 | ||||||||||||
| 74,535 | — | — | — | ||||||||||||
| 197,149 | — | — | 45,577 | ||||||||||||
| 349,337 | 31,759 | 25,242 | 338,038 | ||||||||||||
| 96 | 47 | 1,400 | 14,638,210 | ||||||||||||
| — | — | 7,074 | 10,082,707 | ||||||||||||
| — | — | — | — | ||||||||||||
| — | — | 44 | — | ||||||||||||
| — | — | — | — | ||||||||||||
| 3,057 | — | — | 5,419 | ||||||||||||
| 6,284 | 4,470 | 7,805 | 18,259 | ||||||||||||
| 32,934,368 | 34,430,910 | 78,954,271 | 422,565,690 | ||||||||||||
| — | — | 38,437,737 | 56,733,640 | ||||||||||||
| — | — | 45,434 | 32,609 | ||||||||||||
| — | — | — | — | ||||||||||||
| 210,331 | — | — | 69,877 | ||||||||||||
| 2,140 | 1,814 | 5,675 | 61,096 | ||||||||||||
| 7,240 | 6,704 | 5,972 | 12,956 | ||||||||||||
| — | — | — | — | ||||||||||||
| 25,187 | 966 | 198,838 | 1,439,533 | ||||||||||||
| 470,355 | — | — | 18,021,394 | ||||||||||||
| 3,444 | 10,612 | 29,688 | 276,791 | ||||||||||||
| 1,081 | 817 | — | 95,528 | ||||||||||||
| 3,351 | 3,350 | 3,354 | 3,379 | ||||||||||||
| 23,632 | 17,208 | 17,666 | 23,705 | ||||||||||||
| 7,547 | 1,151 | 7,446 | 3,019 | ||||||||||||
| 754,308 | 42,622 | 38,751,810 | 76,773,527 | ||||||||||||
| $ | 32,180,060 | $ | 34,388,288 | $ | 40,202,461 | $ | 345,792,163 | ||||||||
| $ | 31,610,412 | $ | 33,996,403 | $ | 41,038,776 | $ | 340,322,456 | ||||||||
| (66,063 | ) | 5,715 | (597,274 | ) | 11,714 | ||||||||||
| 121,955 | 207,336 | (1,084,828 | ) | 2,671,032 | |||||||||||
| 513,756 | 178,834 | 845,787 | 2,786,961 | ||||||||||||
| $ | 32,180,060 | $ | 34,388,288 | $ | 40,202,461 | $ | 345,792,163 | ||||||||
| $ | — | $ | — | $ | — | $ | — | ||||||||
| $ | 75,641 | $ | — | $ | — | $ | — | ||||||||
| $ | — | $ | — | $ | 34,953,412 | $ | 55,104,957 | ||||||||
| 117 |
Statements of Assets and Liabilities (Continued)
| Touchstone | ||||||||||||||||
| Emerging | Touchstone | Touchstone | Touchstone | |||||||||||||
| Markets | Focused | Global | Global | |||||||||||||
| Equity | Equity | Equity | Real Estate | |||||||||||||
| Fund | Fund | Fund | Fund | |||||||||||||
| Pricing of Class A Shares | ||||||||||||||||
| Net assets applicable to Class A shares | $ | 34,368,699 | $ | 94,025,359 | $ | 724,604 | $ | 486,238 | ||||||||
| Shares of beneficial interest outstanding (unlimited number of shares authorized, no par value) | 2,807,729 | 8,092,718 | 69,911 | 40,988 | ||||||||||||
| Net asset value price per share* | $ | 12.24 | $ | 11.62 | $ | 10.36 | $ | 11.86 | ||||||||
| Maximum offering price per share | $ | 12.99 | $ | 12.33 | $ | 10.99 | $ | 12.58 | ||||||||
| Pricing of Class C Shares | ||||||||||||||||
| Net assets applicable to Class C shares | $ | 4,903,358 | $ | 398,650 | $ | 361,198 | $ | 223,330 | ||||||||
| Shares of beneficial interest outstanding (unlimited number of shares authorized, no par value) | 404,375 | 34,795 | 35,224 | 18,764 | ||||||||||||
| Net asset value, offering price per share** | $ | 12.13 | $ | 11.46 | $ | 10.25 | $ | 11.90 | ||||||||
| Pricing of Class Y Shares | ||||||||||||||||
| Net assets applicable to Class Y shares | $ | 219,716,637 | $ | 6,485,379 | $ | 233,337 | $ | 150,312 | ||||||||
| Shares of beneficial interest outstanding (unlimited number of shares authorized, no par value) | 17,911,851 | 552,910 | 22,317 | 12,558 | ||||||||||||
| Net asset value, offering price and redemption price per share | $ | 12.27 | $ | 11.73 | $ | 10.46 | $ | 11.97 | ||||||||
| Pricing of Institutional Class Shares | ||||||||||||||||
| Net assets applicable to Institutional Class Shares | $ | 271,186,290 | $ | 5,190,520 | $ | 19,554,161 | $ | 23,201,033 | ||||||||
| Shares of beneficial interest outstanding (unlimited number of shares authorized, no par value) | 22,077,329 | 458,684 | 1,872,759 | 1,921,617 | ||||||||||||
| Net asset value, offering price and redemption price per share | $ | 12.28 | $ | 11.32 | $ | 10.44 | $ | 12.07 | ||||||||
* There is no sales load on subscriptions of $1 million or more. Redemptions that were part of a $1 million or more subscription may be subject to contingent deferred sales load.
** Redemption price per share varies by length of time shares are held.
See accompanying Notes to Financial Statements.
| 118 |
Statements of Assets and Liabilities (Continued)
| Touchstone | Touchstone | Touchstone | Touchstone | ||||||||||||
| International | Large Cap | Market | Merger | ||||||||||||
| Fixed Income | Relative Value | Neutral Equity | Arbitrage | ||||||||||||
| Fund | Fund | Fund | Fund | ||||||||||||
| $ | 1,934,165 | $ | 1,105,253 | $ | 591,231 | $ | 150,148,479 | ||||||||
| 181,111 | 88,831 | 62,817 | 14,099,981 | ||||||||||||
| $ | 10.68 | $ | 12.44 | $ | 9.41 | $ | 10.65 | ||||||||
| $ | 11.21 | $ | 13.20 | $ | 9.98 | $ | 11.30 | ||||||||
| $ | 431,513 | $ | 321,450 | $ | 182,740 | $ | 25,738,703 | ||||||||
| 40,460 | 26,084 | 19,849 | 2,440,870 | ||||||||||||
| $ | 10.67 | $ | 12.32 | $ | 9.21 | $ | 10.54 | ||||||||
| $ | 517,406 | $ | 3,209,229 | $ | 39,428,490 | $ | 90,740,605 | ||||||||
| 48,524 | 259,081 | 4,155,116 | 8,498,837 | ||||||||||||
| $ | 10.66 | $ | 12.39 | $ | 9.49 | $ | 10.68 | ||||||||
| $ | 29,296,976 | $ | 29,752,356 | $ | — | $ | 79,164,376 | ||||||||
| 2,746,574 | 2,401,958 | — | 7,407,266 | ||||||||||||
| $ | 10.67 | $ | 12.39 | $ | — | $ | 10.69 | ||||||||
| 119 |
Statements of Assets and Liabilities (Continued)
| Touchstone | Touchstone | Touchstone | Touchstone | |||||||||||||
| Mid | Mid Cap | Premium | Sands Capital | |||||||||||||
| Cap | Value | Yield Equity | Select Growth | |||||||||||||
| Fund | Fund | Fund | Fund | |||||||||||||
| Assets | ||||||||||||||||
| Investments, at cost | $ | 57,102,367 | $ | 86,322,248 | $ | 115,627,837 | $ | 2,680,454,621 | ||||||||
| Affiliated securities, at market value | $ | 938,052 | $ | 1,677,943 | $ | 16,172,313 | $ | 83,047,789 | ||||||||
| Non-affiliated securities, at market value | 63,107,273 | 90,717,034 | 112,835,552 | 3,348,216,628 | ||||||||||||
| Investments, at market value (A) | $ | 64,045,325 | $ | 92,394,977 | $ | 129,007,865 | $ | 3,431,264,417 | ||||||||
| Cash | — | 72,019 | 3,855 | — | ||||||||||||
| Dividends and interest receivable | 92,337 | 169,907 | 237,853 | 1,126,640 | ||||||||||||
| Receivable for capital shares sold | 110,427 | 75,987 | 436,597 | 24,931,671 | ||||||||||||
| Receivable for investments sold | 959,306 | 108,344 | — | 3,829,416 | ||||||||||||
| Receivable from securities lending income | 451 | — | — | 19,810 | ||||||||||||
| Receivable from Investment Advisor | — | — | — | — | ||||||||||||
| Tax reclaim receivable | — | — | 7,297 | — | ||||||||||||
| Other assets | 6,100 | 7,727 | 8,161 | 72,259 | ||||||||||||
| Total Assets | 65,213,946 | 92,828,961 | 129,701,628 | 3,461,244,213 | ||||||||||||
| Liabilities | ||||||||||||||||
| Bank overdrafts | — | — | — | — | ||||||||||||
| Dividends payable | — | — | — | — | ||||||||||||
| Payable to Transfer Agent | 4,633 | 10,864 | 26,959 | 930,041 | ||||||||||||
| Payable for reports to shareholders | 8,609 | 8,199 | 7,441 | 126,091 | ||||||||||||
| Payable for return of collateral for securities on loan | 2,855,721 | — | — | 79,587,866 | ||||||||||||
| Payable for capital shares redeemed | 498,877 | 9,121 | 383,560 | 8,688,444 | ||||||||||||
| Payable for investments purchased | — | — | 11,547,078 | 40,014,149 | ||||||||||||
| Payable to Investment Advisor | 34,021 | 49,959 | 29,976 | 1,659,169 | ||||||||||||
| Payable to other affiliates | 2,018 | 1,271 | 39,818 | 2,795,351 | ||||||||||||
| Payable to Trustees | 3,357 | 3,358 | 3,361 | 3,764 | ||||||||||||
| Payable for professional services | 20,982 | 17,612 | 17,827 | 35,087 | ||||||||||||
| Other accrued expenses and liabilities | 817 | 1,870 | 1,153 | 9,207 | ||||||||||||
| Total Liabilities | 3,429,035 | 102,254 | 12,057,173 | 133,849,169 | ||||||||||||
| Net Assets | $ | 61,784,911 | $ | 92,726,707 | $ | 117,644,455 | $ | 3,327,395,044 | ||||||||
| Net assets consist of: | ||||||||||||||||
| Paid-in capital | $ | 208,994,871 | $ | 86,325,090 | $ | 111,437,995 | $ | 2,730,172,267 | ||||||||
| Accumulated net investment income (loss) | 479,274 | 12,512 | 140,299 | (11,933,119 | ) | |||||||||||
| Accumulated net realized gains (losses) on investments | (154,632,192 | ) | 316,376 | (7,313,867 | ) | (141,653,900 | ) | |||||||||
| Net unrealized appreciation on investments and foreign currency transactions | 6,942,958 | 6,072,729 | 13,380,028 | 750,809,796 | ||||||||||||
| Net Assets | $ | 61,784,911 | $ | 92,726,707 | $ | 117,644,455 | $ | 3,327,395,044 | ||||||||
| (A) Includes market value of securities on loan of: | $ | 2,818,354 | $ | — | $ | — | $ | 80,652,124 | ||||||||
See accompanying Notes to Financial Statements.
| 120 |
Statements of Assets and Liabilities (Continued)
| Touchstone | Touchstone | Touchstone | Touchstone | ||||||||||||||||
| Short Duration | Small | Small | Touchstone | Ultra Short | |||||||||||||||
| Fixed Income | Cap Core | Cap Value | Total Return | Duration Fixed | |||||||||||||||
| Fund | Fund | Fund | Bond Fund | Income Fund | |||||||||||||||
| $ | 92,578,237 | $ | 511,837,290 | $ | 36,483,563 | $ | 185,437,872 | $ | 565,802,428 | ||||||||||
| $ | 13,587,181 | $ | 8,371,104 | $ | 626,030 | $ | 3,129,218 | $ | 33,758,248 | ||||||||||
| 79,784,685 | 569,350,276 | 36,845,037 | 187,277,338 | 533,793,901 | |||||||||||||||
| $ | 93,371,866 | $ | 577,721,380 | $ | 37,471,067 | $ | 190,406,556 | $ | 567,552,149 | ||||||||||
| 2 | — | — | — | 532,636 | |||||||||||||||
| 474,145 | 1,482,719 | 42,729 | 1,465,420 | 2,848,146 | |||||||||||||||
| 55,965 | 5,004,666 | 5,076 | 162,138 | 10,530,358 | |||||||||||||||
| 3 | — | 461,606 | 812 | 7,384,172 | |||||||||||||||
| — | 72,840 | 5,311 | — | — | |||||||||||||||
| 4,389 | — | — | — | — | |||||||||||||||
| — | — | — | — | — | |||||||||||||||
| 6,466 | 18,326 | 20,753 | 11,930 | 28,697 | |||||||||||||||
| 93,912,836 | 584,299,931 | 38,006,542 | 192,046,856 | 588,876,158 | |||||||||||||||
| — | — | — | 580 | — | |||||||||||||||
| 3,177 | — | — | — | 172,021 | |||||||||||||||
| 14,260 | 91,060 | 25,322 | 9,411 | 91,646 | |||||||||||||||
| 5,708 | 15,319 | 9,863 | 7,733 | 20,270 | |||||||||||||||
| — | 57,448,540 | 3,740,079 | — | — | |||||||||||||||
| 85,083 | 658,687 | 61,536 | 422,985 | 1,434,989 | |||||||||||||||
| 1,470,822 | — | 518,984 | — | 4,827,478 | |||||||||||||||
| — | 310,484 | 18,548 | 28,444 | 110,988 | |||||||||||||||
| 78,727 | 71,688 | 7,097 | 12,090 | 497,964 | |||||||||||||||
| 3,357 | 3,401 | 3,353 | 3,366 | 3,477 | |||||||||||||||
| 20,595 | 18,946 | 19,404 | 22,566 | 52,366 | |||||||||||||||
| 15,143 | 1,389 | 1,291 | 15,622 | 39,531 | |||||||||||||||
| 1,696,872 | 58,619,514 | 4,405,477 | 522,797 | 7,250,730 | |||||||||||||||
| $ | 92,215,964 | $ | 525,680,417 | $ | 33,601,065 | $ | 191,524,059 | $ | 581,625,428 | ||||||||||
| $ | 95,110,433 | $ | 455,234,802 | $ | 60,781,707 | $ | 186,435,787 | $ | 597,626,314 | ||||||||||
| 21,856 | 1,666,851 | — | 13,107 | 174,488 | |||||||||||||||
| (3,709,954 | ) | 2,894,674 | (28,168,146 | ) | 106,481 | (17,925,095 | ) | ||||||||||||
| 793,629 | 65,884,090 | 987,504 | 4,968,684 | 1,749,721 | |||||||||||||||
| $ | 92,215,964 | $ | 525,680,417 | $ | 33,601,065 | $ | 191,524,059 | $ | 581,625,428 | ||||||||||
| $ | — | $ | 55,663,314 | $ | 3,589,147 | $ | — | $ | — | ||||||||||
| 121 |
Statements of Assets and Liabilities (Continued)
| Touchstone | Touchstone | Touchstone | Touchstone | |||||||||||||
| Mid | Mid Cap | Premium | Sands Capital | |||||||||||||
| Cap | Value | Yield Equity | Select Growth | |||||||||||||
| Fund | Fund | Fund | Fund | |||||||||||||
| Pricing of Class A Shares | ||||||||||||||||
| Net assets applicable to Class A shares | $ | 905,478 | $ | 3,409,044 | $ | 68,780,158 | $ | 186,383,840 | ||||||||
| Shares of beneficial interest outstanding (unlimited number of shares authorized, no par value) | 54,713 | 262,541 | 8,476,363 | 14,737,746 | ||||||||||||
| Net asset value price per share* | $ | 16.55 | $ | 12.98 | $ | 8.11 | $ | 12.65 | ||||||||
| Maximum offering price per share | $ | 17.56 | $ | 13.77 | $ | 8.60 | $ | 13.42 | ||||||||
| Pricing of Class C Shares | ||||||||||||||||
| Net assets applicable to Class C shares | $ | 962,433 | $ | 292,193 | $ | 15,679,500 | $ | 88,930,710 | ||||||||
| Shares of beneficial interest outstanding (unlimited number of shares authorized, no par value) | 59,378 | 22,614 | 1,935,218 | 7,132,224 | ||||||||||||
| Net asset value, offering price per share** | $ | 16.21 | $ | 12.92 | $ | 8.10 | $ | 12.47 | ||||||||
| Pricing of Class Y Shares | ||||||||||||||||
| Net assets applicable to Class Y shares | $ | 47,419,156 | $ | 13,785,161 | $ | 33,184,797 | $ | 1,215,123,511 | ||||||||
| Shares of beneficial interest outstanding (unlimited number of shares authorized, no par value) | 2,856,186 | 1,057,969 | 4,097,062 | 94,205,602 | ||||||||||||
| Net asset value, offering price and redemption price per share | $ | 16.60 | $ | 13.03 | $ | 8.10 | $ | 12.90 | ||||||||
| Pricing of Class Z Shares | ||||||||||||||||
| Net assets applicable to Class Z shares | $ | 266,861 | $ | — | $ | — | $ | 1,836,956,983 | ||||||||
| Shares of beneficial interest outstanding (unlimited number of shares authorized, no par value) | 16,221 | — | — | 145,229,399 | ||||||||||||
| Net asset value, offering price and redemption price per share | $ | 16.45 | $ | — | $ | — | $ | 12.65 | ||||||||
| Pricing of Institutional Class Shares | ||||||||||||||||
| Net assets applicable to Institutional Class Shares | $ | 12,230,983 | $ | 75,240,309 | $ | — | $ | — | ||||||||
| Shares of beneficial interest outstanding (unlimited number of shares authorized, no par value) | 736,275 | 5,756,647 | — | |||||||||||||
| Net asset value, offering price and redemption price per share | $ | 16.61 | $ | 13.07 | $ | — | $ | — | ||||||||
* There is no sales load on subscriptions of $1 million or more. Redemptions that were part of a $1 million or more subscription may be subject to a contingent deferred sales load.
** Redemption price per share varies by length of time shares are held.
See accompanying Notes to Financial Statements.
| 122 |
Statements of Assets and Liabilities (Continued)
| Touchstone | Touchstone | Touchstone | Touchstone | ||||||||||||||||
| Short Duration | Small | Small | Touchstone | Ultra Short | |||||||||||||||
| Fixed Income | Cap Core | Cap Value | Total Return | Duration Fixed | |||||||||||||||
| Fund | Fund | Fund | Fund | Income Fund | |||||||||||||||
| $ | — | $ | 84,538,857 | $ | 32,114,910 | $ | 10,209,923 | $ | 34,227,927 | ||||||||||
| — | 5,277,522 | 1,751,608 | 972,178 | 3,580,255 | |||||||||||||||
| $ | — | $ | 16.02 | $ | 18.33 | $ | 10.50 | $ | 9.56 | ||||||||||
| $ | — | $ | 17.00 | $ | 19.45 | $ | 11.02 | $ | 10.04 | ||||||||||
| $ | — | $ | 24,278,405 | $ | 104,090 | $ | 3,256,960 | $ | 11,516,903 | ||||||||||
| — | 1,547,351 | 5,710 | 310,594 | 1,204,672 | |||||||||||||||
| $ | — | $ | 15.69 | $ | 18.23 | $ | 10.49 | $ | 9.56 | ||||||||||
| $ | 54,903,758 | $ | 168,987,005 | $ | 221,900 | $ | 29,715,806 | $ | 190,514,929 | ||||||||||
| 5,589,668 | 10,476,577 | 12,084 | 2,825,423 | 19,929,705 | |||||||||||||||
| $ | 9.82 | $ | 16.13 | $ | 18.36 | $ | 10.52 | $ | 9.56 | ||||||||||
| $ | 37,312,206 | $ | — | $ | — | $ | — | $ | 338,668,694 | ||||||||||
| 3,797,133 | — | — | — | 35,425,541 | |||||||||||||||
| $ | 9.83 | $ | — | $ | — | $ | — | $ | 9.56 | ||||||||||
| $ | — | $ | 247,876,150 | $ | 1,160,165 | $ | 148,341,370 | $ | 6,696,975 | ||||||||||
| 15,383,757 | 63,237 | 14,110,540 | 700,837 | ||||||||||||||||
| $ | — | $ | 16.11 | $ | 18.35 | $ | 10.51 | $ | 9.56 | ||||||||||
| 123 |
Statements of Operations
For the Year Ended September 30, 2012
| Touchstone | Touchstone | Touchstone | ||||||||||||||
| Emerging | Touchstone | Global | Global | |||||||||||||
| Markets Equity | Focused Equity | Equity | Real Estate | |||||||||||||
| Fund | Fund | Fund | Fund | |||||||||||||
| Investment Income | ||||||||||||||||
| Dividends from affiliated securities | $ | 14,548 | $ | 6,941 | $ | 786 | $ | 535 | ||||||||
| Dividends from non-affiliated securities(A) | 13,518,000 | 1,840,838 | 339,681 | 273,504 | ||||||||||||
| Interest | — | — | — | — | ||||||||||||
| Income from securities loaned | 189,289 | 38,484 | 1,824 | 218 | ||||||||||||
| Total Investment Income | 13,721,837 | 1,886,263 | 342,291 | 274,257 | ||||||||||||
| Expenses | ||||||||||||||||
| Investment advisory fees | 5,304,570 | 682,804 | 73,255 | 67,378 | ||||||||||||
| Administration fees | 993,198 | 187,762 | 16,249 | 15,927 | ||||||||||||
| Compliance fees and expenses | 1,585 | 1,585 | 1,585 | 1,585 | ||||||||||||
| Custody fees | 489,161 | 1,670 | 5,708 | 27,685 | ||||||||||||
| Professional fees | 75,172 | 23,794 | 27,288 | 28,511 | ||||||||||||
| Transfer Agent fees, Class A | 84,917 | 337,768 | 965 | 798 | ||||||||||||
| Transfer Agent fees, Class C | 7,430 | 419 | 26 | — | ||||||||||||
| Transfer Agent fees, Class Y | 113,163 | 5,395 | 121 | 16 | ||||||||||||
| Transfer Agent fees, Institutional Class | 24,239 | 86 | 131 | 99 | ||||||||||||
| Pricing Expense | 13,738 | 548 | — | 14,525 | ||||||||||||
| Registration Fees, Class A | 20,155 | 25,310 | 8,677 | 3,660 | ||||||||||||
| Registration Fees, Class C | 11,609 | 4,694 | 4,698 | 2,923 | ||||||||||||
| Registration Fees, Class Y | 39,761 | 10,962 | 3,177 | 2,895 | ||||||||||||
| Registration Fees, Institutional Class | 36,120 | 4,760 | 4,687 | 2,769 | ||||||||||||
| Dividend expense on securities sold short | — | — | — | — | ||||||||||||
| Reports to Shareholders, Class A | 14,062 | 32,968 | 6,324 | 4,676 | ||||||||||||
| Reports to Shareholders, Class C | 7,160 | 6,001 | 5,928 | 4,332 | ||||||||||||
| Reports to Shareholders, Class Y | 20,482 | 6,333 | 5,959 | 4,341 | ||||||||||||
| Reports to Shareholders, Institutional Class | 14,198 | 6,150 | 5,944 | 4,384 | ||||||||||||
| Distribution expenses, Class A | 76,154 | 215,995 | 1,638 | 2,210 | ||||||||||||
| Distribution expenses, Class C | 52,427 | 2,639 | 1,571 | 1,505 | ||||||||||||
| Trustee fees | 7,918 | 7,708 | 7,662 | 7,662 | ||||||||||||
| Other expenses | 49,596 | 181,471 | 5,201 | 3,995 | ||||||||||||
| Total Expenses | 7,456,815 | 1,746,822 | 186,794 | 201,876 | ||||||||||||
| Fees waived and/or reimbursed by the Advisor and/or Affiliates(B) | (290,432 | ) | (605,722 | ) | (101,255 | ) | (113,063 | ) | ||||||||
| Net Expenses | 7,166,383 | 1,141,100 | 85,539 | 88,813 | ||||||||||||
| Net Investment Income (Loss) | 6,555,454 | 745,163 | 256,752 | 185,444 | ||||||||||||
| Realized and Unrealized Gain (Loss) on Investments | ||||||||||||||||
| Net realized gain (loss) from non-affiliated securities | (7,970,994 | ) | (12,093,716 | ) | 74,492 | 193,576 | ||||||||||
| Net realized gain (loss) on warrants | (58,904 | ) | — | — | — | |||||||||||
| Net realized gain (loss) on foreign currency | (291,745 | ) | — | (30,218 | ) | 6,359 | ||||||||||
| Net realized loss on securities sold short | — | — | — | — | ||||||||||||
| Net change in unrealized appreciation on investments(C) | 72,596,280 | 33,334,544 | 782,698 | 1,143,442 | ||||||||||||
| Net change in unrealized appreciation (depreciation) on foreign currency transactions | 15,867 | — | (49 | ) | 562 | |||||||||||
| Net change in unrealized depreciation on securities sold short | — | — | — | — | ||||||||||||
| Net Realized and Unrealized Gain (Loss) on Investments | 64,290,504 | 21,240,828 | 826,923 | 1,343,939 | ||||||||||||
| Change in Net Assets Resulting from Operations | $ | 70,845,958 | $ | 21,985,991 | $ | 1,083,675 | $ | 1,529,383 | ||||||||
| (A) Net of foreign tax withholding of: | $ | 1,058,438 | $ | 104,678 | $ | 17,622 | $ | 14,087 | ||||||||
(B)See Note 4 in Notes to Financial Statements.
(C)Change in unrealized appreciation does not include net unrealized appreciation of $1,279,684 for the Emerging Market Equity Fund in connection with the Fund's merger. See Note 8 in the Notes to Financial Statements.
See accompanying Notes to Financial Statements.
| 124 |
Statements of Operations (Continued)
| Touchstone | Touchstone | Touchstone | Touchstone | ||||||||||||
| International | Large Cap | Market | Merger | ||||||||||||
| Fixed Income | Relative Value | Neutral Equity | Arbitrage | ||||||||||||
| Fund | Fund | Fund | Fund | ||||||||||||
| $ | 1,399 | $ | 703 | $ | 1,136 | $ | 31,044 | ||||||||
| 1,873 | 253,224 | 674,216 | 1,223,938 | ||||||||||||
| 395,021 | — | — | 350,593 | ||||||||||||
| — | 20 | — | — | ||||||||||||
| 398,293 | 253,947 | 675,352 | 1,605,575 | ||||||||||||
| 89,315 | 85,507 | 587,730 | 1,588,553 | ||||||||||||
| 30,946 | 23,101 | 87,149 | 284,190 | ||||||||||||
| 1,585 | 1,585 | 1,585 | 1,577 | ||||||||||||
| 5,572 | 58 | — | 7,414 | ||||||||||||
| 19,489 | 11,606 | 19,895 | 32,642 | ||||||||||||
| 3,525 | 1,890 | 7,179 | 71,770 | ||||||||||||
| 728 | — | 202 | 7,812 | ||||||||||||
| 845 | 3,189 | 3,803 | 25,026 | ||||||||||||
| 157 | — | — | 869 | ||||||||||||
| — | 1,660 | 15,767 | 2,594 | ||||||||||||
| 11,594 | 6,435 | 6,153 | 3,854 | ||||||||||||
| 8,186 | 2,504 | 6,517 | 2,303 | ||||||||||||
| 5,728 | 2,515 | 7,282 | 6,091 | ||||||||||||
| 4,987 | 2,507 | — | 1,124 | ||||||||||||
| — | — | 911,807 | 466,423 | ||||||||||||
| 5,594 | 4,744 | 6,384 | 14,202 | ||||||||||||
| 4,839 | 4,205 | 4,923 | 7,890 | ||||||||||||
| 4,866 | 3,239 | 5,898 | 12,115 | ||||||||||||
| 4,989 | 4,275 | — | 7,026 | ||||||||||||
| 6,719 | 2,173 | 9,419 | 171,429 | ||||||||||||
| 4,960 | 3,051 | 1,802 | 111,753 | ||||||||||||
| 7,666 | 7,663 | 7,682 | 6,680 | ||||||||||||
| 127 | 5,662 | 4,824 | 20,920 | ||||||||||||
| 222,417 | 177,569 | 1,696,001 | 2,854,257 | ||||||||||||
| (93,070 | ) | (69,566 | ) | (208,150 | ) | (28,259 | ) | ||||||||
| 129,347 | 108,003 | 1,487,851 | 2,825,998 | ||||||||||||
| 268,946 | 145,944 | (812,499 | ) | (1,220,423 | ) | ||||||||||
| 398,685 | 215,799 | 5,211,298 | 4,675,128 | ||||||||||||
| — | — | — | — | ||||||||||||
| 4,776 | — | — | (312,554 | ) | |||||||||||
| — | — | (5,257,522 | ) | (399,366 | ) | ||||||||||
| 543,317 | 899,236 | 7,156,534 | 4,459,242 | ||||||||||||
| (224,551 | ) | — | — | (24,300 | ) | ||||||||||
| — | — | (8,463,814 | ) | (1,655,494 | ) | ||||||||||
| 722,227 | 1,115,035 | (1,353,504 | ) | 6,742,656 | |||||||||||
| $ | 991,173 | $ | 1,260,979 | $ | (2,166,003 | ) | $ | 5,522,233 | |||||||
| $ | 1,234 | $ | — | $ | 2,124 | $ | 16,521 | ||||||||
| 125 |
Statements of Operations (Continued)
| Touchstone | Touchstone | Touchstone | Touchstone | |||||||||||||
| Mid | Mid Cap | Premium Yield | Sands Capital | |||||||||||||
| Cap | Value | Equity | Select Growth | |||||||||||||
| Fund | Fund | Fund | Fund | |||||||||||||
| Investment Income | ||||||||||||||||
| Dividends from affiliated securities | $ | 1,025 | $ | 2,054 | $ | 4,467 | $ | 71,619 | ||||||||
| Dividends from non-affiliated securities(A) | 1,195,203 | 1,398,968 | 3,408,926 | 13,829,419 | ||||||||||||
| Interest | — | — | — | — | ||||||||||||
| Income from securities loaned | 17,858 | 4,150 | — | 366,730 | ||||||||||||
| Total Investment Income | 1,214,086 | 1,405,172 | 3,413,393 | 14,267,768 | ||||||||||||
| Expenses | ||||||||||||||||
| Investment advisory fees | 542,731 | 580,790 | 535,241 | 19,699,570 | ||||||||||||
| Administration fees | 131,195 | 130,903 | 145,950 | 4,353,992 | ||||||||||||
| Compliance fees and expenses | 1,585 | 1,585 | 1,585 | 1,585 | ||||||||||||
| Custody fees | 953 | — | — | 24,480 | ||||||||||||
| Professional fees | 21,450 | 17,746 | 22,358 | 118,995 | ||||||||||||
| Transfer Agent fees, Class A | 1,482 | 3,136 | 22,510 | 101,471 | ||||||||||||
| Transfer Agent fees, Class C | 661 | 289 | 7,822 | 36,770 | ||||||||||||
| Transfer Agent fees, Class Y | 3,497 | 24,472 | 20,186 | 719,236 | ||||||||||||
| Transfer Agent fees, Class Z | — | — | — | 1,294,001 | ||||||||||||
| Transfer Agent fees, Institutional Class | 2,144 | 1,810 | — | — | ||||||||||||
| Pricing Expense | 1,894 | 3,209 | 1,733 | 1,293 | ||||||||||||
| Registration Fees, Class A | 8,185 | 11,001 | 16,708 | 11,525 | ||||||||||||
| Registration Fees, Class C | 9,513 | 9,313 | 8,869 | 9,265 | ||||||||||||
| Registration Fees, Class Y | 6,457 | 8,105 | 17,926 | 67,385 | ||||||||||||
| Registration Fees, Class Z | 9,569 | — | — | 96,901 | ||||||||||||
| Registration Fees, Institutional Class | 468 | 6,910 | — | — | ||||||||||||
| Reports to Shareholders, Class A | 6,103 | 5,667 | 8,677 | 18,113 | ||||||||||||
| Reports to Shareholders, Class C | 5,597 | 5,126 | 6,564 | 11,054 | ||||||||||||
| Reports to Shareholders, Class Y | 7,315 | 8,208 | 7,761 | 131,267 | ||||||||||||
| Reports to Shareholders, Class Z | 5,748 | — | — | 197,579 | ||||||||||||
| Reports to Shareholders, Institutional Class | 4,694 | 5,762 | — | — | ||||||||||||
| Shareholder servicing fees, Class Z | 1,234 | — | — | 2,799,933 | ||||||||||||
| Distribution expenses, Class A | 1,797 | 7,922 | 111,667 | 210,757 | ||||||||||||
| Distribution expenses, Class C | 6,161 | 2,537 | 122,195 | 377,831 | ||||||||||||
| Trustee fees | 7,696 | 7,690 | 7,691 | 8,660 | ||||||||||||
| Other expenses | 7,911 | 6,487 | 8,626 | 88,499 | ||||||||||||
| Total Expenses | 796,040 | 848,668 | 1,074,069 | 30,380,162 | ||||||||||||
| Fees waived and/or reimbursed by the Advisor and/or Affiliates(B) | (164,248 | ) | (208,011 | ) | (113,135 | ) | (1,581,955 | ) | ||||||||
| Net Expenses | 631,792 | 640,657 | 960,934 | 28,798,207 | ||||||||||||
| Net Investment Income (Loss) | 582,294 | 764,515 | 2,452,459 | (14,530,439 | ) | |||||||||||
| Realized and Unrealized Gain (Loss) on Investments | ||||||||||||||||
| Net realized gain (loss) on investments | 12,549,162 | 473,427 | (896,645 | ) | (43,704,614 | ) | ||||||||||
| Net change in unrealized appreciation on investments | 3,359,554 | 13,466,639 | 11,511,482 | 605,600,683 | ||||||||||||
| Net change in unrealized depreciation on foreign currency transactions(C) | — | — | — | — | ||||||||||||
| Net Realized and Unrealized Gain (Loss) on Investments | 15,908,716 | 13,940,066 | 10,614,837 | 561,896,069 | ||||||||||||
| Change in Net Assets Resulting from Operations | $ | 16,491,010 | $ | 14,704,581 | $ | 13,067,296 | $ | 547,365,630 | ||||||||
| (A) Net of foreign tax withholding of: | $ | 739 | $ | — | $ | 76,495 | $ | 131,813 | ||||||||
| (B) | See Note 4 in Notes to Financial Statements. |
| (C) | Change in unrealized appreciation does not include net unrealized appreciation of $1,592,683 and 356,831 for the Total Return Bond Fund and Ultra Short Duration Fixed Income, respectively, in connection with the Fund's merger. See Note 8 in the Notes to Financial Statements. |
See accompanying Notes to Financial Statements.
| 126 |
Statements of Operations (Continued)
| Touchstone | |||||||||||||||||||
| Touchstone | Touchstone | Touchstone | Touchstone | Ultra Short | |||||||||||||||
| Short Duration | Small Cap | Small Cap | Total Return | Duration | |||||||||||||||
| Fixed Income | Core | Value | Bond | Fixed Income | |||||||||||||||
| Fund | Fund | Fund | Fund | Fund | |||||||||||||||
| $ | 4,373 | $ | 14,830 | $ | 1,605 | $ | 5,263 | $ | 38,800 | ||||||||||
| — | 5,208,874 | 883,496 | — | — | |||||||||||||||
| 1,226,061 | — | — | 2,977,218 | 8,426,711 | |||||||||||||||
| — | 212,715 | 46,481 | — | — | |||||||||||||||
| 1,230,434 | 5,436,419 | 931,582 | 2,982,481 | 8,465,511 | |||||||||||||||
| �� | 131,901 | 2,705,709 | 328,865 | 329,808 | 1,013,737 | ||||||||||||||
| 100,776 | 606,647 | 66,702 | 178,084 | 776,838 | |||||||||||||||
| 1,585 | 1,585 | 1,585 | 1,567 | 1,585 | |||||||||||||||
| 237 | 6,709 | 2,275 | 2,828 | 11,959 | |||||||||||||||
| 16,769 | 30,227 | 16,152 | 39,650 | 43,346 | |||||||||||||||
| — | 126,643 | 45,818 | 9,209 | 4,562 | |||||||||||||||
| — | 18,737 | 130 | 2,284 | 3,569 | |||||||||||||||
| 2,479 | 81,084 | 60 | 5,335 | 26,212 | |||||||||||||||
| 29,256 | — | — | — | 131,578 | |||||||||||||||
| — | 3,968 | 51 | 531 | 1,769 | |||||||||||||||
| 30,010 | 716 | 2,846 | — | 39,041 | |||||||||||||||
| — | 20,765 | 12,135 | 7,350 | 6,203 | |||||||||||||||
| — | 14,960 | 2,551 | 3,834 | 6,092 | |||||||||||||||
| 9,003 | 27,060 | 2,551 | 4,544 | 3,304 | |||||||||||||||
| 18,443 | — | — | — | 54,142 | |||||||||||||||
| — | 17,769 | 2,551 | 9,387 | 6,887 | |||||||||||||||
| — | 12,697 | 15,241 | 8,819 | 5,895 | |||||||||||||||
| — | 7,210 | 5,916 | 5,654 | 5,493 | |||||||||||||||
| 7,868 | 17,074 | 8,351 | 6,399 | 14,058 | |||||||||||||||
| 9,084 | — | — | — | 30,079 | |||||||||||||||
| — | 7,137 | 6,023 | 14,606 | 4,991 | |||||||||||||||
| 93,841 | — | — | — | 648,160 | |||||||||||||||
| — | 152,973 | 82,563 | 18,375 | 8,927 | |||||||||||||||
| — | 174,380 | 330 | 29,133 | 24,908 | |||||||||||||||
| 7,683 | 7,792 | 7,677 | 5,666 | 7,607 | |||||||||||||||
| 3,396 | 27,252 | 22,736 | 35,435 | 22,256 | |||||||||||||||
| 462,331 | 4,069,094 | 633,109 | 718,498 | 2,903,198 | |||||||||||||||
| (106,196 | ) | (501,670 | ) | (144,496 | ) | (167,659 | ) | (418,522 | ) | ||||||||||
| 356,135 | 3,567,424 | 488,613 | 550,839 | 2,484,676 | |||||||||||||||
| 874,299 | 1,868,995 | 442,969 | 2,431,642 | 5,980,835 | |||||||||||||||
| 124,837 | 3,764,467 | 1,405,659 | 2,121,439 | 899,320 | |||||||||||||||
| 222,569 | 70,637,554 | 8,960,624 | 2,047,740 | 1,478,527 | |||||||||||||||
| — | — | — | — | (139 | ) | ||||||||||||||
| 347,406 | 74,402,021 | 10,366,283 | 4,169,179 | 2,377,708 | |||||||||||||||
| $ | 1,221,705 | $ | 76,271,016 | $ | 10,809,252 | $ | 6,600,821 | $ | 8,358,543 | ||||||||||
| $ | — | $ | 7,557 | $ | 418 | $ | — | $ | — | ||||||||||
| 127 |
Statements of Changes in Net Assets
| Touchstone | Touchstone | |||||||||||||||
| Emerging Markets | Focused Equity | |||||||||||||||
| Equity Fund | Fund | |||||||||||||||
| For the | For the | For the | For the | |||||||||||||
| Year Ended | Year Ended | Year Ended | Year Ended | |||||||||||||
| September 30, | September 30, | September 30, | September 30, | |||||||||||||
| 2012 | 2011 | 2012 | 2011 | |||||||||||||
| From Operations | ||||||||||||||||
| Net investment income | $ | 6,555,454 | $ | 4,816,007 | $ | 745,163 | $ | 446,784 | ||||||||
| Net realized gain (loss) on investments, warrants and foreign currency transactions and securities sold short | (8,321,643 | ) | 3,465,919 | (12,093,716 | ) | 2,342,938 | ||||||||||
| Net change in unrealized appreciation (depreciation) on investments and foreign currency transactions | 72,612,147 | (90,128,100 | ) | 33,334,544 | (31,882,374 | ) | ||||||||||
| Change in Net Assets from Operations | 70,845,958 | (81,846,174 | ) | 21,985,991 | (29,092,652 | ) | ||||||||||
| Distributions to Shareholders from: | ||||||||||||||||
| Net investment income, Class A | (356,824 | ) | (37,637 | ) | (539,134 | ) | (6,175 | ) | ||||||||
| Net investment income, Class C | (1,404 | ) | — | — | (682 | ) | ||||||||||
| Net investment income, Class Y | (3,413,396 | ) | (105,853 | ) | (57,620 | ) | — | |||||||||
| Net investment income, Institutional Class | (5,335,385 | ) | (412,012 | ) | (6,578 | ) | (29,812 | ) | ||||||||
| Net realized gains, Class A | (210,757 | ) | (43,040 | ) | (2,039,846 | ) | (6,831 | ) | ||||||||
| Net realized gains, Class C | (41,102 | ) | (10,387 | ) | (4,919 | ) | (1,492 | ) | ||||||||
| Net realized gains, Class Y | (1,324,868 | ) | (83,966 | ) | (257,794 | ) | (44,364 | ) | ||||||||
| Net realized gains, Institutional Class | (2,229,013 | ) | (267,192 | ) | (13,399 | ) | (6,070 | ) | ||||||||
| Total Distributions | (12,912,749 | ) | (960,087 | ) | (2,919,290 | ) | (95,426 | ) | ||||||||
| Net Increase (Decrease) from Share Transactions(A) | 44,043,511 | 358,060,340 | (7,121,388 | ) | 121,372,701 | |||||||||||
| Total Increase (Decrease) in Net Assets | 101,976,720 | 275,254,079 | 11,945,313 | 92,184,623 | ||||||||||||
| Net Assets | ||||||||||||||||
| Beginning of period | 428,198,264 | 152,944,185 | 94,154,595 | 1,969,972 | ||||||||||||
| End of period | $ | 530,174,984 | $ | 428,198,264 | $ | 106,099,908 | $ | 94,154,595 | ||||||||
| Accumulated Net Investment Income | $ | 1,440,319 | $ | 4,283,779 | $ | 565,983 | $ | 424,294 | ||||||||
(A) For details on share transactions by class, see Statements of Changes in Net Assets - Capital Stock Activity in pages 138-140.
See accompanying Notes to Financial Statements.
| 128 |
Statements of Changes in Net Assets (Continued)
| Touchstone | Touchstone | ||||||||||||||
| Global Equity | Global Real Estate | ||||||||||||||
| Fund | Fund | ||||||||||||||
| For the | For the | For the | For the | ||||||||||||
| Year Ended | Year Ended | Year Ended | Year Ended | ||||||||||||
| September 30, | September 30, | September 30, | September 30, | ||||||||||||
| 2012 | 2011 | 2012 | 2011 | ||||||||||||
| $ | 256,752 | $ | 33,180 | $ | 185,444 | $ | 123,690 | ||||||||
| 44,274 | 422,631 | 199,935 | 341,369 | ||||||||||||
| 782,649 | (627,093 | ) | 1,144,004 | (953,706 | ) | ||||||||||
| 1,083,675 | (171,282 | ) | 1,529,383 | (488,647 | ) | ||||||||||
| (3,370 | ) | (6,391 | ) | (19,864 | ) | (43,335 | ) | ||||||||
| — | — | (1,218 | ) | (4,244 | ) | ||||||||||
| (1,199 | ) | (1,051 | ) | (2,399 | ) | (5,585 | ) | ||||||||
| (25,871 | ) | (31,387 | ) | (171,907 | ) | (140,094 | ) | ||||||||
| (60,767 | ) | (7,311 | ) | (94,294 | ) | (43,479 | ) | ||||||||
| (10,146 | ) | (1,016 | ) | (5,373 | ) | (5,042 | ) | ||||||||
| (19,543 | ) | (1,580 | ) | (5,438 | ) | (5,269 | ) | ||||||||
| (290,353 | ) | (29,420 | ) | (136,561 | ) | (131,564 | ) | ||||||||
| (411,249 | ) | (78,156 | ) | (437,054 | ) | (378,612 | ) | ||||||||
| 16,341,775 | (1,082,162 | ) | 17,702,523 | 1,768,611 | |||||||||||
| 17,014,201 | (1,331,600 | ) | 18,794,852 | 901,352 | |||||||||||
| 3,859,099 | 5,190,699 | 5,266,061 | 4,364,709 | ||||||||||||
| $ | 20,873,300 | $ | 3,859,099 | $ | 24,060,913 | $ | 5,266,061 | ||||||||
| $ | 220,943 | $ | 24,850 | $ | 73,789 | $ | 1,093 | ||||||||
| 129 |
Statements of Changes in Net Assets (Continued)
| Touchstone | Touchstone | |||||||||||||||
| International | Large Cap | |||||||||||||||
| Fixed Income | Relative Value | |||||||||||||||
| Fund | Fund | |||||||||||||||
| For the | For the | For the | For the | |||||||||||||
| Year Ended | Year Ended | Year Ended | Year Ended | |||||||||||||
| September 30, | September 30, | September 30, | September 30, | |||||||||||||
| 2012 | 2011 | 2012 | 2011 | |||||||||||||
| From Operations | ||||||||||||||||
| Net investment income (loss) | $ | 268,946 | $ | 228,414 | $ | 145,944 | $ | 58,122 | ||||||||
| Net realized gain (loss) on investments, foreign currency transactions and securities sold short | 403,461 | 107,176 | 215,799 | 245,061 | ||||||||||||
| Net change in unrealized appreciation (depreciation) on investments, foreign currency transactions and securities sold short | 318,766 | (213,688 | ) | 899,236 | (1,054,309 | ) | ||||||||||
| Change in Net Assets from Operations | 991,173 | 121,902 | 1,260,979 | (751,126 | ) | |||||||||||
| Distributions to Shareholders from: | ||||||||||||||||
| Net investment income, Class A | (114,995 | ) | (133,401 | ) | (6,206 | ) | (8,077 | ) | ||||||||
| Net investment income, Class C | (17,144 | ) | (34,790 | ) | (412 | ) | (541 | ) | ||||||||
| Net investment income, Class Y | (23,201 | ) | (46,142 | ) | (29,723 | ) | (12,074 | ) | ||||||||
| Net investment income, Institutional Class | (394,900 | ) | (743,823 | ) | (100,230 | ) | (57,889 | ) | ||||||||
| Net realized gains, Class A | (14,566 | ) | (7,028 | ) | (27,239 | ) | (238 | ) | ||||||||
| Net realized gains, Class C | (2,575 | ) | (1,865 | ) | (10,820 | ) | (120 | ) | ||||||||
| Net realized gains, Class Y | (2,724 | ) | (2,365 | ) | (98,779 | ) | (51 | ) | ||||||||
| Net realized gains, Institutional Class | (33,930 | ) | (32,587 | ) | (116,608 | ) | (1,372 | ) | ||||||||
| Total Distributions | (604,035 | ) | (1,002,001 | ) | (390,017 | ) | (80,362 | ) | ||||||||
| Net Increase (Decrease) from Share Transactions(B) | 20,005,296 | 3,001,421 | 27,299,373 | 3,208,959 | ||||||||||||
| Total Increase (Decrease) in Net Assets | 20,392,434 | 2,121,322 | 28,170,335 | 2,377,471 | ||||||||||||
| Net Assets | ||||||||||||||||
| Beginning of period | 11,787,626 | 9,666,304 | 6,217,953 | 3,840,482 | ||||||||||||
| End of period | $ | 32,180,060 | $ | 11,787,626 | $ | 34,388,288 | $ | 6,217,953 | ||||||||
| Accumulated Net Investment Income (Loss) | $ | (66,063 | ) | $ | (5,963 | ) | $ | 5,715 | $ | — | ||||||
| (A) | Represents the period from commencement of operations (August 9, 2011) through September 30, 2011. |
| (B) | For details on share transactions by class, see Statements of Changes in Net Assets - Capital Stock Activity on pages 141-143. |
See accompanying Notes to Financial Statements.
| 130 |
Statements of Changes in Net Assets (Continued)
| Touchstone | Touchstone | ||||||||||||||
| Market Neutral | Merger Arbitrage | ||||||||||||||
| Equity Fund | Fund | ||||||||||||||
| For the | For the | For the | For the Period | ||||||||||||
| Year Ended | Year Ended | Year Ended | Ended | ||||||||||||
| September 30, | September 30, | September 30, | September 30, | ||||||||||||
| 2012 | 2011 | 2012 | 2011(A) | ||||||||||||
| $ | (812,499 | ) | $ | (608,852 | ) | $ | (1,220,423 | ) | $ | (9,112 | ) | ||||
| (46,224 | ) | (596,750 | ) | 3,963,208 | 10,082 | ||||||||||
| (1,307,280 | ) | 1,926,946 | 2,779,448 | 7,513 | |||||||||||
| (2,166,003 | ) | 721,344 | 5,522,233 | 8,483 | |||||||||||
| — | — | (2,875 | ) | — | |||||||||||
| — | — | (267 | ) | — | |||||||||||
| — | — | (1,453 | ) | — | |||||||||||
| — | — | (1,975 | ) | — | |||||||||||
| — | — | (24,576 | ) | — | |||||||||||
| — | — | (2,094 | ) | — | |||||||||||
| — | — | (12,719 | ) | — | |||||||||||
| — | — | (15,125 | ) | — | |||||||||||
| — | — | (61,084 | ) | — | |||||||||||
| (1,533,253 | ) | 9,996,918 | 333,641,571 | 6,680,960 | |||||||||||
| (3,699,256 | ) | 10,718,262 | 339,102,720 | 6,689,443 | |||||||||||
| 43,901,717 | 33,183,455 | 6,689,443 | — | ||||||||||||
| $ | 40,202,461 | $ | 43,901,717 | $ | 345,792,163 | $ | 6,689,443 | ||||||||
| $ | (597,274 | ) | $ | (8,388 | ) | $ | 11,714 | $ | (1,883 | ) | |||||
| 131 |
Statements of Changes in Net Assets (Continued)
| Touchstone | Touchstone | |||||||||||||||
| Mid Cap | Mid Cap Value | |||||||||||||||
| Fund | Fund | |||||||||||||||
| For the | For the | For the | For the | |||||||||||||
| Year Ended | Year Ended | Year Ended | Year Ended | |||||||||||||
| September 30, | September 30, | September 30, | September 30, | |||||||||||||
| 2012 | 2011 | 2012 | 2011 | |||||||||||||
| From Operations | ||||||||||||||||
| Net investment income (loss) | $ | 582,294 | $ | 282,441 | $ | 764,515 | $ | 605,778 | ||||||||
| Net realized gain (loss) on investments | 12,549,162 | 25,256,142 | 473,427 | 3,255,733 | ||||||||||||
| Net change in unrealized appreciation (depreciation) on investments and foreign currency transactions | 3,359,554 | (14,842,998 | ) | 13,466,639 | (8,152,352 | ) | ||||||||||
| Change in Net Assets from Operations | 16,491,010 | 10,695,585 | 14,704,581 | (4,290,841 | ) | |||||||||||
| Distributions to Shareholders from: | ||||||||||||||||
| Net investment income, Class A | (1,165 | ) | — | (24,656 | ) | (18,796 | ) | |||||||||
| Net investment income, Class C | — | — | (275 | ) | (470 | ) | ||||||||||
| Net investment income, Class Y | (141,026 | ) | (273,246 | ) | (119,669 | ) | (28,493 | ) | ||||||||
| Net investment income, Class Z | (395 | ) | — | — | — | |||||||||||
| Net investment income, Institutional Class | — | — | (639,751 | ) | (555,638 | ) | ||||||||||
| Return of capital, Class A | — | — | — | — | ||||||||||||
| Return of capital, Class C | — | — | — | — | ||||||||||||
| Return of capital, Class Y | — | — | — | — | ||||||||||||
| Net realized gains, Class A | — | — | (157,428 | ) | (8,176 | ) | ||||||||||
| Net realized gains, Class C | — | — | (12,580 | ) | (1,773 | ) | ||||||||||
| Net realized gains, Class Y | — | — | (499,702 | ) | (8,159 | ) | ||||||||||
| Net realized gains, Institutional Class | — | — | (2,444,064 | ) | (526,560 | ) | ||||||||||
| Total Distributions | (142,586 | ) | (273,246 | ) | (3,898,125 | ) | (1,148,065 | ) | ||||||||
| Net Increase (Decrease) from Share Transactions(A) | (34,457,537 | ) | (55,607,682 | ) | 34,858,673 | 11,926,306 | ||||||||||
| Total Increase (Decrease) in Net Assets | (18,109,113 | ) | (45,185,343 | ) | 45,665,129 | 6,487,400 | ||||||||||
| Net Assets | ||||||||||||||||
| Beginning of period | 79,894,024 | 125,079,367 | 47,061,578 | 40,574,178 | ||||||||||||
| End of period | $ | 61,784,911 | $ | 79,894,024 | $ | 92,726,707 | $ | 47,061,578 | ||||||||
| Accumulated Net Investment Income (Loss) | $ | 479,274 | $ | 37,908 | $ | 12,512 | $ | 34,420 | ||||||||
| (A) | For details on share transactions by class, see Statements of Changes in Net Assets - Capital Stock Activity on pages 143-146. |
| (B) | Class A and Class C represent the period from commencement of operations (November 15, 2010) through September 30, 2011. |
See accompanying Notes to Financial Statements.
| 132 |
Statements of Changes in Net Assets (Continued)
| Touchstone | Touchstone | ||||||||||||||||||||||
| Touchstone | Sands Capital | Short Duration | |||||||||||||||||||||
| Premium Yield | Select Growth | Fixed Income | |||||||||||||||||||||
| Equity Fund | Fund | Fund | |||||||||||||||||||||
| For the | For the | For the | For the | For the | For the | ||||||||||||||||||
| Year Ended | Year Ended | Year Ended | Year Ended | Year Ended | Year Ended | ||||||||||||||||||
| September 30, | September 30, | September 30, | September 30, | September 30, | September 30, | ||||||||||||||||||
| 2012 | 2011 | 2012 | 2011(B) | 2012 | 2011 | ||||||||||||||||||
| $ | 2,452,459 | $ | 1,300,240 | $ | (14,530,439 | ) | $ | (9,378,288 | ) | $ | 874,299 | $ | 915,586 | ||||||||||
| (896,645 | ) | 2,415,363 | (43,704,614 | ) | 20,212,078 | 124,837 | 100,015 | ||||||||||||||||
| 11,511,482 | (120,647 | ) | 605,600,683 | (15,389,448 | ) | 222,569 | (516,088 | ) | |||||||||||||||
| 13,067,296 | 3,594,956 | 547,365,630 | (4,555,658 | ) | 1,221,705 | 499,513 | |||||||||||||||||
| (1,431,422 | ) | (783,294 | ) | — | — | — | — | ||||||||||||||||
| (302,551 | ) | (179,677 | ) | — | — | — | — | ||||||||||||||||
| (680,147 | ) | (332,573 | ) | — | — | (282,567 | ) | (38,278 | ) | ||||||||||||||
| — | — | — | — | (827,427 | ) | (1,139,078 | ) | ||||||||||||||||
| — | — | — | — | — | — | ||||||||||||||||||
| (35,658 | ) | — | — | — | — | — | |||||||||||||||||
| (7,537 | ) | — | — | — | — | — | |||||||||||||||||
| (16,943 | ) | — | — | — | — | — | |||||||||||||||||
| — | — | — | — | — | — | ||||||||||||||||||
| — | — | — | — | — | — | ||||||||||||||||||
| — | — | — | — | — | — | ||||||||||||||||||
| — | — | — | — | — | — | ||||||||||||||||||
| (2,474,258 | ) | (1,295,544 | ) | — | — | (1,109,994 | ) | (1,177,356 | ) | ||||||||||||||
| 66,832,652 | (2,932,423 | ) | 1,445,845,483 | 678,078,270 | 50,830,158 | (2,226,373 | ) | ||||||||||||||||
| 77,425,690 | (633,011 | ) | 1,993,211,113 | 673,522,612 | 50,941,869 | (2,904,216 | ) | ||||||||||||||||
| 40,218,765 | 40,851,776 | 1,334,183,931 | 660,661,319 | 41,274,095 | 44,178,311 | ||||||||||||||||||
| $ | 117,644,455 | $ | 40,218,765 | $ | 3,327,395,044 | $ | 1,334,183,931 | $ | 92,215,964 | $ | 41,274,095 | ||||||||||||
| $ | 140,299 | $ | 81,863 | $ | (11,933,119 | ) | $ | — | $ | 21,856 | $ | 32,564 | |||||||||||
| 133 |
Statements of Changes in Net Assets (Continued)
| Touchstone | Touchstone | |||||||||||||||
| Small Cap | Small Cap | |||||||||||||||
| Core Fund | Value Fund | |||||||||||||||
| For the | For the | For the | For the | |||||||||||||
| Year Ended | Year Ended | Year Ended | Year Ended | |||||||||||||
| September 30, | September 30, | September 30, | September 30, | |||||||||||||
| 2012 | 2011 | 2012 | 2011(A) | |||||||||||||
| From Operations | ||||||||||||||||
| Net investment income | $ | 1,868,995 | $ | 52,866 | $ | 442,969 | $ | 810,142 | ||||||||
| Net realized gain (loss) on investments | 3,764,467 | 2,090,097 | 1,405,659 | 19,710,768 | ||||||||||||
| Net change in unrealized appreciation (depreciation) on investments and foreign currency transactions | 70,637,554 | (9,589,918 | ) | 8,960,624 | (20,021,935 | ) | ||||||||||
| Change in Net Assets from Operations | 76,271,016 | (7,446,955 | ) | 10,809,252 | 498,975 | |||||||||||
| Net investment income, Class A | (2,404 | ) | (41,566 | ) | (631,909 | ) | (127,653 | ) | ||||||||
| Net investment income, Class C | (718 | ) | (275 | ) | (377 | ) | (19 | ) | ||||||||
| Net investment income, Class Y | (106,623 | ) | (88,965 | ) | (1,414 | ) | (94 | ) | ||||||||
| Net investment income, Class Z | — | — | — | (593,961 | ) | |||||||||||
| Net investment income, Institutional Class | (123,274 | ) | (46,227 | ) | (28,966 | ) | (3,526 | ) | ||||||||
| Net realized gains, Class A | (674,157 | ) | (1,431 | ) | — | — | ||||||||||
| Net realized gains, Class C | (164,641 | ) | (178 | ) | — | — | ||||||||||
| Net realized gains, Class Y | (1,166,246 | ) | (925 | ) | — | — | ||||||||||
| Net realized gains, Institutional Class | (667,757 | ) | (332 | ) | — | — | ||||||||||
| Total Distributions | (2,905,820 | ) | (179,899 | ) | (662,666 | ) | (725,253 | ) | ||||||||
| Net Increase (Decrease) from Share Transactions (B) | 296,303,079 | 64,361,014 | (14,675,728 | ) | (26,196,379 | ) | ||||||||||
| Total Increase (Decrease) in Net Assets | 369,668,275 | 56,734,160 | (4,529,142 | ) | (26,422,657 | ) | ||||||||||
| Net Assets | ||||||||||||||||
| Beginning of period | 156,012,142 | 99,277,982 | 38,130,207 | 64,552,864 | ||||||||||||
| End of period | $ | 525,680,417 | $ | 156,012,142 | $ | 33,601,065 | $ | 38,130,207 | ||||||||
| Accumulated Net Investment Income (Loss) | $ | 1,666,851 | $ | 31,004 | $ | — | $ | 213,882 | ||||||||
| (A) | Class A, Class C, Class Y and Institutional Class represent the period from commencement of operations (March 1, 2011) through September 30, 2011. Effective June 10, 2011, Class Z shares converted to Class A shares. |
| (B) | For details on share transaction by class, See Statements of Changes in Net Assets - Capital Stock Activity on pages 147-149. |
| (C) | Effective August 1, 2011, the Fund changed its fiscal year end from March 31 to September 30 and Investor Class shares and Institutional Class shares were renamed Class A and Class Y shares, respectively. See Note 8 in the Notes to Financial Statements. |
| (D) | Touchstone Total Return Bond Fund acquired all of the assets and liabilities of EARNEST Partners Fixed Income Trust (“Predecessor Fund”) in a reorganization on August 1, 2011. The Predecessor Fund's performance and financial history have been adopted by Touchstone Total Return Bond Fund and will be used going forward. As a result the information prior to August 1, 2011 reflects that of the Predecessor Fund. |
See accompanying Notes to Financial Statements.
| 134 |
Statements of Changes in Net Assets (Continued)
| Touchstone | |||||||||||||||||||
| Touchstone | Ultra Short | ||||||||||||||||||
| Total Return | Duration Fixed | ||||||||||||||||||
| Bond Fund | Income Fund | ||||||||||||||||||
| For the | For the | For the | For the | For the | |||||||||||||||
| Year Ended | Period Ended | Year Ended | Year Ended | Year Ended | |||||||||||||||
| September 30, | September 30, | March 31, | September 30, | September 30, | |||||||||||||||
| 2012 | 2011(C)(D) | 2011 | 2012 | 2011 | |||||||||||||||
| $ | 2,431,642 | $ | 465,041 | $ | 760,499 | $ | 5,980,835 | $ | 3,817,830 | ||||||||||
| 2,121,439 | (32,688 | ) | 124,235 | 899,320 | 198,188 | ||||||||||||||
| 2,047,740 | 655,036 | 292,070 | 1,478,388 | (989,421 | ) | ||||||||||||||
| 6,600,821 | 1,087,389 | 1,176,804 | 8,358,543 | 3,026,597 | |||||||||||||||
| (194,956 | ) | (32,331 | ) | (204 | ) | (66,666 | ) | — | |||||||||||
| (55,442 | ) | (17,889 | ) | — | (51,076 | ) | — | ||||||||||||
| (624,921 | ) | (382,064 | ) | (796,480 | ) | (1,271,104 | ) | — | |||||||||||
| — | (56,657 | ) | — | (7,819,313 | ) | (5,857,004 | ) | ||||||||||||
| (1,931,711 | ) | — | — | (39,807 | ) | — | |||||||||||||
| — | — | — | — | — | |||||||||||||||
| — | — | — | — | — | |||||||||||||||
| — | — | — | — | — | |||||||||||||||
| — | — | — | — | — | |||||||||||||||
| (2,807,030 | ) | (488,941 | ) | (796,684 | ) | (9,247,966 | ) | (5,857,004 | ) | ||||||||||
| 156,210,668 | 14,402,479 | (738,141 | ) | 236,383,467 | 112,311,888 | ||||||||||||||
| 160,004,459 | 15,000,927 | (358,021 | ) | 235,494,044 | 109,481,481 | ||||||||||||||
| 31,519,600 | 16,518,673 | 16,876,694 | 346,131,384 | 236,649,903 | |||||||||||||||
| $ | 191,524,059 | $ | 31,519,600 | $ | 16,518,673 | $ | 581,625,428 | $ | 346,131,384 | ||||||||||
| $ | 13,107 | $ | 211,650 | $ | — | $ | 174,488 | $ | 283,674 | ||||||||||
| 135 |
Statements of Changes in Net Assets - Capital Stock Activity
| Touchstone | ||||||||||||||||
| Emerging Markets | ||||||||||||||||
| Equity Fund | ||||||||||||||||
| For the Year | For the Year | |||||||||||||||
| Ended | Ended | |||||||||||||||
| September 30, 2012 | September 30, 2011 | |||||||||||||||
| Shares | Dollars | Shares | Dollars | |||||||||||||
| Class A | ||||||||||||||||
| Proceeds from shares sold | 1,018,769 | $ | 12,322,032 | 3,547,839 | $ | 45,412,360 | ||||||||||
| Proceeds from shares issued in connection with merger(A) | 511,406 | 6,295,683 | — | — | ||||||||||||
| Reinvestment of distributions | 40,624 | 458,323 | 5,820 | 76,185 | ||||||||||||
| Cost of shares redeemed | (1,251,249 | ) | (14,800,815 | ) | (1,881,202 | ) | (23,746,786 | ) | ||||||||
| Change in Class A Share Transactions | 319,550 | 4,275,223 | 1,672,457 | 21,741,759 | ||||||||||||
| Class C | ||||||||||||||||
| Proceeds from shares sold | 66,481 | 766,525 | 400,532 | 5,128,192 | ||||||||||||
| Proceeds from shares issued in connection with merger(A) | 5,937 | 72,429 | — | — | ||||||||||||
| Reinvestment of distributions | 3,733 | 40,201 | 766 | 9,846 | ||||||||||||
| Cost of shares redeemed | (185,946 | ) | (2,168,600 | ) | (172,503 | ) | (2,139,533 | ) | ||||||||
| Change in Class C Share Transactions | (109,795 | ) | (1,289,445 | ) | 228,795 | 2,998,505 | ||||||||||
| Class Y | ||||||||||||||||
| Proceeds from shares sold | 6,422,019 | 75,627,481 | 13,976,009 | 177,114,328 | ||||||||||||
| Proceeds from shares issued in connection with merger(A) | 1,491,945 | 18,403,858 | — | — | ||||||||||||
| Reinvestment of distributions | 414,534 | 4,734,703 | 14,126 | 185,769 | ||||||||||||
| Cost of shares redeemed | (4,524,551 | ) | (52,860,814 | ) | (951,388 | ) | (11,790,779 | ) | ||||||||
| Change in Class Y Share Transactions | 3,803,947 | 45,905,228 | 13,038,747 | 165,509,318 | ||||||||||||
| Institutional Class | ||||||||||||||||
| Proceeds from shares sold | 11,525,916 | 138,694,659 | 13,367,607 | 173,718,140 | ||||||||||||
| Proceeds from shares issued in connection with merger(A) | 2,222,580 | 27,452,188 | — | — | ||||||||||||
| Reinvestment of distributions | 625,508 | 7,097,193 | 51,241 | 675,282 | ||||||||||||
| Cost of shares redeemed | (15,031,609 | ) | (178,091,535 | ) | (530,487 | ) | (6,582,664 | ) | ||||||||
| Change in Institutional Class Share Transactions | (657,605 | ) | (4,847,495 | ) | 12,888,361 | 167,810,758 | ||||||||||
| Change from Share Transactions | 3,356,097 | $ | 44,043,511 | 27,828,360 | $ | 358,060,340 | ||||||||||
(A)See Note 8 in the Notes to Financial Statements.
See accompanying Notes to Financial Statements.
| 136 |
Statements of Changes in Net Assets - Capital Stock Activity (Continued)
| Touchstone | Touchstone | ||||||||||||||||||||||||||||||
| Focused Equity | Global Equity | ||||||||||||||||||||||||||||||
| Fund | Fund | ||||||||||||||||||||||||||||||
| For the Year | For the Year | For the Year | For the Year | ||||||||||||||||||||||||||||
| Ended | Ended | Ended | Ended | ||||||||||||||||||||||||||||
| September 30, 2012 | September 30, 2011 | September 30, 2012 | September 30, 2011 | ||||||||||||||||||||||||||||
| Shares | Dollars | Shares | Dollars | Shares | Dollars | Shares | Dollars | ||||||||||||||||||||||||
| 1,588,767 | $ | 17,127,663 | 9,710,959 | $ | 120,060,690 | 8,286 | $ | 83,785 | 48,813 | $ | 559,641 | ||||||||||||||||||||
| — | — | — | — | — | — | — | — | ||||||||||||||||||||||||
| 239,234 | 2,323,288 | 1,085 | 12,845 | 7,042 | 64,137 | 1,145 | 13,101 | ||||||||||||||||||||||||
| (2,235,422 | ) | (23,457,198 | ) | (1,286,253 | ) | (14,618,995 | ) | (9,864 | ) | (96,943 | ) | (159,828 | ) | (1,803,215 | ) | ||||||||||||||||
| (407,421 | ) | (4,006,247 | ) | 8,425,791 | 105,454,540 | 5,464 | 50,979 | (109,870 | ) | (1,230,473 | ) | ||||||||||||||||||||
| 16,454 | 180,981 | 15,937 | 185,089 | 24,029 | 226,616 | 215 | 2,723 | ||||||||||||||||||||||||
| — | — | — | — | — | — | — | — | ||||||||||||||||||||||||
| 300 | 2,845 | 185 | 2,173 | 1,128 | 10,146 | 91 | 1,016 | ||||||||||||||||||||||||
| (1,016 | ) | (10,038 | ) | (14,279 | ) | (173,454 | ) | (239 | ) | (2,414 | ) | — | — | ||||||||||||||||||
| 15,738 | 173,788 | 1,843 | 13,808 | 24,918 | 234,348 | 306 | 3,739 | ||||||||||||||||||||||||
| 368,061 | 4,013,563 | 1,555,186 | 18,934,147 | 4,501 | 45,918 | 6,328 | 72,000 | ||||||||||||||||||||||||
| — | — | — | — | — | — | — | — | ||||||||||||||||||||||||
| 16,777 | 165,098 | 125 | 1,474 | 2,260 | 20,741 | 230 | 2,632 | ||||||||||||||||||||||||
| (1,121,749 | ) | (11,549,416 | ) | (283,790 | ) | (3,300,545 | ) | (4,293 | ) | (40,549 | ) | (7 | ) | (78 | ) | ||||||||||||||||
| (736,911 | ) | (7,370,755 | ) | 1,271,521 | 15,635,076 | 2,468 | 26,110 | 6,551 | 74,554 | ||||||||||||||||||||||
| 406,964 | 4,491,265 | 91,822 | 1,125,000 | 1,594,411 | 16,223,987 | 1,629 | 18,219 | ||||||||||||||||||||||||
| — | — | — | — | — | — | — | — | ||||||||||||||||||||||||
| 2,074 | 19,719 | 3,084 | 35,882 | 34,483 | 316,224 | 5,286 | 60,807 | ||||||||||||||||||||||||
| (42,176 | ) | (429,158 | ) | (73,084 | ) | (891,605 | ) | (51,056 | ) | (509,873 | ) | (767 | ) | (9,008 | ) | ||||||||||||||||
| 366,862 | 4,081,826 | 21,822 | 269,277 | 1,577,838 | 16,030,338 | 6,148 | 70,018 | ||||||||||||||||||||||||
| (761,732 | ) | $ | (7,121,388 | ) | 9,720,977 | $ | 121,372,701 | 1,610,688 | $ | 16,341,775 | (96,865 | ) | $ | (1,082,162 | ) | ||||||||||||||||
| 137 |
Statements of Changes in Net Assets - Capital Stock Activity (Continued)
| Touchstone | ||||||||||||||||
| Global Real Estate | ||||||||||||||||
| Fund | ||||||||||||||||
| For the Year | ||||||||||||||||
| Ended | For the Year | |||||||||||||||
| September 30, 2012 | Ended | |||||||||||||||
| (Unaudited) | September 30, 2011 | |||||||||||||||
| Shares | Dollars | Shares | Dollars | |||||||||||||
| Class A | ||||||||||||||||
| Proceeds from shares issued | 33,722 | $ | 353,846 | 212,378 | $ | 2,394,721 | ||||||||||
| Reinvestment of distributions | 2,600 | 25,792 | 3,515 | 39,565 | ||||||||||||
| Cost of shares redeemed | (204,215 | ) | (2,071,273 | ) | (83,869 | ) | (958,256 | ) | ||||||||
| Change in Class A Share Transactions | (167,893 | ) | (1,691,635 | ) | 132,024 | 1,476,030 | ||||||||||
| Class C | ||||||||||||||||
| Proceeds from shares issued | 6,228 | 70,459 | 302 | 3,658 | ||||||||||||
| Reinvestment of distributions | 666 | 6,591 | 896 | 10,112 | ||||||||||||
| Cost of shares redeemed | — | — | — | — | ||||||||||||
| Change in Class C Share Transactions | 6,894 | 77,050 | 1,198 | 13,770 | ||||||||||||
| Class Y | ||||||||||||||||
| Proceeds from shares issued | — | — | 5,583 | 68,805 | ||||||||||||
| Reinvestment of distributions | 776 | 7,837 | 1,066 | 12,019 | ||||||||||||
| Cost of shares redeemed | (231 | ) | (2,470 | ) | (5,789 | ) | (64,842 | ) | ||||||||
| Change in Class Y Share Transactions | 545 | 5,367 | 860 | 15,982 | ||||||||||||
| Institutional Class | ||||||||||||||||
| Proceeds from shares issued | 1,696,950 | 20,216,998 | — | — | ||||||||||||
| Reinvestment of distributions | 28,951 | 308,468 | 24,853 | 282,243 | ||||||||||||
| Cost of shares redeemed | (105,988 | ) | (1,213,725 | ) | (1,633 | ) | (19,414 | ) | ||||||||
| Change in Institutional Class Share Transactions | 1,619,913 | 19,311,741 | 23,220 | 262,829 | ||||||||||||
| Change from Share Transactions | 1,459,459 | $ | 17,702,523 | 157,302 | $ | 1,768,611 | ||||||||||
See accompanying Notes to Financial Statements.
| 138 |
Statements of Changes in Net Assets - Capital Stock Activity (Continued)
| Touchstone | Touchstone | ||||||||||||||||||||||||||||||
| International | Large Cap | ||||||||||||||||||||||||||||||
| Fixed Income | Relative Value | ||||||||||||||||||||||||||||||
| Fund | Fund | ||||||||||||||||||||||||||||||
| Year | Year | ||||||||||||||||||||||||||||||
| Ended | Ended | For the Year | For the Year | ||||||||||||||||||||||||||||
| September 30, | September 30, | Ended | Ended | ||||||||||||||||||||||||||||
| 2012 | 2011 | September 30, 2012 | September 30, 2011 | ||||||||||||||||||||||||||||
| Shares | Dollars | Shares | Dollars | Shares | Dollars | Shares | Dollars | ||||||||||||||||||||||||
| 164,811 | $ | 1,744,296 | 269,862 | $ | 2,912,442 | 30,812 | $ | 370,615 | 110,035 | $ | 1,357,188 | ||||||||||||||||||||
| 8,088 | 81,334 | 12,042 | 128,026 | 2,994 | 33,445 | 664 | 8,315 | ||||||||||||||||||||||||
| (235,275 | ) | (2,406,242 | ) | (154,393 | ) | (1,627,808 | ) | (8,112 | ) | (98,438 | ) | (90,430 | ) | (1,172,139 | ) | ||||||||||||||||
| (62,376 | ) | (580,612 | ) | 127,511 | 1,412,660 | 25,694 | 305,622 | 20,269 | 193,364 | ||||||||||||||||||||||
| 3,881 | 40,710 | 33,150 | 353,277 | 1,340 | 16,534 | 6,820 | 84,858 | ||||||||||||||||||||||||
| 1,441 | 14,407 | 3,439 | 36,366 | 1,027 | 11,232 | 53 | 661 | ||||||||||||||||||||||||
| (20,278 | ) | (208,994 | ) | (16,978 | ) | (176,267 | ) | (1,878 | ) | (21,380 | ) | (2,498 | ) | (31,669 | ) | ||||||||||||||||
| (14,956 | ) | (153,877 | ) | 19,611 | 213,376 | 489 | 6,386 | 4,375 | 53,850 | ||||||||||||||||||||||
| 15,967 | 166,806 | 162,319 | 1,754,869 | 143,267 | 1,740,473 | 275,185 | 3,564,715 | ||||||||||||||||||||||||
| 2,343 | 23,568 | 4,664 | 48,682 | 11,504 | 128,502 | 1,065 | 12,124 | ||||||||||||||||||||||||
| (38,595 | ) | (400,233 | ) | (115,185 | ) | (1,225,137 | ) | (127,451 | ) | (1,545,590 | ) | (54,523 | ) | (674,355 | ) | ||||||||||||||||
| (20,285 | ) | (209,859 | ) | 51,798 | 578,414 | 27,320 | 323,385 | 221,727 | 2,902,484 | ||||||||||||||||||||||
| 2,089,915 | 21,976,658 | 2,438 | 27,361 | 2,178,475 | 27,308,043 | — | — | ||||||||||||||||||||||||
| 38,874 | 393,343 | 74,760 | 789,049 | 18,946 | 216,838 | 4,822 | 59,261 | ||||||||||||||||||||||||
| (138,726 | ) | (1,420,357 | ) | (1,808 | ) | (19,439 | ) | (71,392 | ) | (860,901 | ) | — | — | ||||||||||||||||||
| 1,990,063 | 20,949,644 | 75,390 | 796,971 | 2,126,029 | 26,663,980 | 4,822 | 59,261 | ||||||||||||||||||||||||
| 1,892,446 | $ | 20,005,296 | 274,310 | $ | 3,001,421 | 2,179,532 | $ | 27,299,373 | 251,193 | $ | 3,208,959 | ||||||||||||||||||||
| 139 |
Statements of Changes in Net Assets - Capital Stock Activity (Continued)
| Touchstone | ||||||||||||||||
| Market Neutral | ||||||||||||||||
| Equity Fund | ||||||||||||||||
| For the Year | For the Year | |||||||||||||||
| Ended | Ended | |||||||||||||||
| September 30, 2012 | September 30, 2011 | |||||||||||||||
| Shares | Dollars | Shares | Dollars | |||||||||||||
| Class A | ||||||||||||||||
| Proceeds from shares sold | 385,036 | $ | 3,752,132 | 351,400 | $ | 3,389,554 | ||||||||||
| Reinvestment of distributions | — | — | — | — | ||||||||||||
| Cost of shares redeemed | (663,996 | ) | (6,388,142 | ) | (72,321 | ) | (711,849 | ) | ||||||||
| Change in Class A Share Transactions | (278,960 | ) | (2,636,010 | ) | 279,079 | 2,677,705 | ||||||||||
| Class C | ||||||||||||||||
| Proceeds from shares sold | 8,514 | 81,528 | 13,156 | 127,080 | ||||||||||||
| Reinvestment of distributions | — | — | — | — | ||||||||||||
| Cost of shares redeemed | (7,497 | ) | (71,972 | ) | (11,687 | ) | (112,854 | ) | ||||||||
| Change in Class C Share Transactions | 1,017 | 9,556 | 1,469 | 14,226 | ||||||||||||
| Class Y | ||||||||||||||||
| Proceeds from shares sold | 486,045 | 4,826,169 | 776,631 | 7,781,351 | ||||||||||||
| Reinvestment of distributions | — | — | — | — | ||||||||||||
| Cost of shares redeemed | (381,375 | ) | (3,732,968 | ) | (48,404 | ) | (476,364 | ) | ||||||||
| Change in Class Y Share Transactions | 104,670 | 1,093,201 | 728,227 | 7,304,987 | ||||||||||||
| Class Z | ||||||||||||||||
| Proceeds from Shares sold | — | — | — | — | ||||||||||||
| Reinvestment of distributions | — | — | — | — | ||||||||||||
| Cost of Shares redeemed | — | — | — | — | ||||||||||||
| Change in Class Z Share Transactions | — | — | — | — | ||||||||||||
| Institutional Class (A) | ||||||||||||||||
| Proceeds from shares sold | — | — | — | — | ||||||||||||
| Reinvestment of distributions | — | — | — | — | ||||||||||||
| Cost of shares redeemed | — | — | — | — | ||||||||||||
| Change in Institutional Class Share Transactions | — | — | — | — | ||||||||||||
| Change from Share Transactions | (173,273 | ) | $ | (1,533,253 | ) | 1,008,775 | $ | 9,996,918 | ||||||||
| (A) | Mid Cap Fund began issuing Institutional Class shares on January 27, 2012. |
| (B) | Represents the period from commencement of operations (August 9, 2011) through September 30, 2011. |
See accompanying Notes to Financial Statements.
| 140 |
Statements of Changes in Net Assets - Capital Stock Activity (Continued)
| Touchstone | Touchstone | ||||||||||||||||||||||||||||||
| Merger Arbitrage | Mid Cap | ||||||||||||||||||||||||||||||
| Fund | Fund | ||||||||||||||||||||||||||||||
| For the Year | For the Period | For the Year | For the Year | ||||||||||||||||||||||||||||
| Ended | Ended | Ended | Ended | ||||||||||||||||||||||||||||
| September 30, 2012 | September 30, 2011(B) | September 30, 2012 | September 30, 2011 | ||||||||||||||||||||||||||||
| Shares | Dollars | Shares | Dollars | Shares | Dollars | Shares | Dollars | ||||||||||||||||||||||||
| 15,827,343 | $ | 165,914,329 | 25,902 | $ | 260,434 | 23,786 | $ | 383,402 | 15,088 | $ | 231,656 | ||||||||||||||||||||
| 2,123 | 21,813 | — | — | 74 | 1,073 | — | — | ||||||||||||||||||||||||
| (1,755,387 | ) | (18,544,311 | ) | — | — | (22,199 | ) | (354,172 | ) | (16,080 | ) | (238,503 | ) | ||||||||||||||||||
| 14,074,079 | 147,391,831 | 25,902 | 260,434 | 1,661 | 30,303 | (992 | ) | (6,847 | ) | ||||||||||||||||||||||
| 2,510,261 | 26,227,182 | 25,415 | 254,776 | 27,890 | 428,530 | 21,061 | 309,661 | ||||||||||||||||||||||||
| 234 | 2,400 | — | — | — | — | — | — | ||||||||||||||||||||||||
| (95,040 | ) | (995,364 | ) | — | — | (5,272 | ) | (80,399 | ) | (4,071 | ) | (58,829 | ) | ||||||||||||||||||
| 2,415,455 | 25,234,218 | 25,415 | 254,776 | 22,618 | 348,131 | 16,990 | 250,832 | ||||||||||||||||||||||||
| 9,105,407 | 95,786,495 | 115,733 | 1,163,250 | 260,026 | 4,056,192 | 1,122,323 | 16,486,326 | ||||||||||||||||||||||||
| 1,316 | 13,535 | — | — | 686 | 9,990 | 711 | 10,151 | ||||||||||||||||||||||||
| (723,619 | ) | (7,676,782 | ) | — | — | (3,312,679 | ) | (50,341,380 | ) | (4,956,532 | ) | (72,682,133 | ) | ||||||||||||||||||
| 8,383,104 | 88,123,248 | 115,733 | 1,163,250 | (3,051,967 | ) | (46,275,198 | ) | (3,833,498 | ) | (56,185,656 | ) | ||||||||||||||||||||
| — | — | — | — | 14,276 | 216,275 | 161,305 | 2,449,859 | ||||||||||||||||||||||||
| — | — | — | — | 27 | 395 | — | — | ||||||||||||||||||||||||
| — | — | — | — | (69,537 | ) | (1,015,582 | ) | (141,655 | ) | (2,115,870 | ) | ||||||||||||||||||||
| — | — | — | — | (55,234 | ) | (798,912 | ) | 19,650 | 333,989 | ||||||||||||||||||||||
| 7,925,680 | 83,665,017 | 500,250 | 5,002,500 | 768,703 | 12,749,317 | — | — | ||||||||||||||||||||||||
| 1,386 | 14,253 | — | — | — | — | — | — | ||||||||||||||||||||||||
| (1,020,050 | ) | (10,786,996 | ) | — | — | (32,428 | ) | (511,178 | ) | — | — | ||||||||||||||||||||
| 6,907,016 | 72,892,274 | 500,250 | 5,002,500 | 736,275 | 12,238,139 | — | — | ||||||||||||||||||||||||
| 31,779,654 | $ | 333,641,571 | 667,300 | $ | 6,680,960 | (2,346,647 | ) | $ | (34,457,537 | ) | (3,797,850 | ) | $ | (55,607,682 | ) | ||||||||||||||||
| 141 |
Statements of Changes in Net Assets - Capital Stock Activity (Continued)
| Touchstone | ||||||||||||||||
| Mid Cap Value | ||||||||||||||||
| Fund | ||||||||||||||||
| For the Year | For the Period | |||||||||||||||
| Ended | Ended | |||||||||||||||
| September 30, 2012 | September 30, 2011 | |||||||||||||||
| Shares | Dollars | Shares | Dollars | |||||||||||||
| Class A | ||||||||||||||||
| Proceeds from shares issued | 99,552 | $ | 1,201,459 | 328,003 | $ | 4,384,562 | ||||||||||
| Reinvestment of distributions | 15,672 | 177,583 | 2,099 | 26,888 | ||||||||||||
| Cost of shares redeemed | (70,390 | ) | (860,027 | ) | (141,699 | ) | (1,823,276 | ) | ||||||||
| Change in Class A Share Transactions | 44,834 | 519,015 | 188,403 | 2,588,174 | ||||||||||||
| Class C | ||||||||||||||||
| Proceeds from shares issued | 3,915 | 48,396 | 8,338 | 112,061 | ||||||||||||
| Reinvestment of distributions | 1,153 | 12,855 | 175 | 2,243 | ||||||||||||
| Cost of shares redeemed | (1,356 | ) | (16,449 | ) | (862 | ) | (11,357 | ) | ||||||||
| Change in Class C Share Transactions | 3,712 | 44,802 | 7,651 | 102,947 | ||||||||||||
| Class Y | ||||||||||||||||
| Proceeds from shares issued | 875,349 | 10,720,385 | 392,127 | 5,312,984 | ||||||||||||
| Reinvestment of distributions | 52,526 | 600,697 | 2,997 | 37,124 | ||||||||||||
| Cost of shares redeemed | (300,077 | ) | (3,707,016 | ) | (14,916 | ) | (193,562 | ) | ||||||||
| Change in Class Y Share Transactions | 627,798 | 7,614,066 | 380,208 | 5,156,546 | ||||||||||||
| Class Z | ||||||||||||||||
| Proceeds from Shares issued | — | — | — | — | ||||||||||||
| Cost of Shares redeemed | — | — | — | — | ||||||||||||
| Change in Class Z Share Transactions | — | — | — | — | ||||||||||||
| Institutional Class | ||||||||||||||||
| Proceeds from shares issued | 2,008,546 | 25,632,588 | 219,249 | 2,992,360 | ||||||||||||
| Reinvestment of distributions | 267,687 | 3,077,352 | 86,758 | 1,115,061 | ||||||||||||
| Cost of shares redeemed | (164,030 | ) | (2,029,150 | ) | (2,403 | ) | (28,782 | ) | ||||||||
| Change in Institutional Class Share Transactions | 2,112,203 | 26,680,790 | 303,604 | 4,078,639 | ||||||||||||
| Change from Share Transactions | 2,788,547 | $ | 34,858,673 | 879,866 | $ | 11,926,306 | ||||||||||
See accompanying Notes to Financial Statements.
| 142 |
Statements of Changes in Net Assets - Capital Stock Activity (Continued)
| Touchstone | |||||||||||||||||||||||||||||||
| Touchstone | Sands Capital | ||||||||||||||||||||||||||||||
| Premium Yield | Select Growth | ||||||||||||||||||||||||||||||
| Equity Fund | Fund | ||||||||||||||||||||||||||||||
| For the Year | For the Year | For the Year | For the Year | ||||||||||||||||||||||||||||
| Ended | Ended | Ended | Ended | ||||||||||||||||||||||||||||
| September 30, 2012 | September 30, 2011 | September 30, 2012 | September 30, 2011 | ||||||||||||||||||||||||||||
| Shares | Dollars | Shares | Dollars | Shares | Dollars | Shares | Dollars | ||||||||||||||||||||||||
| 5,256,299 | $ | 41,246,082 | 1,028,857 | $ | 7,308,051 | 15,095,837 | $ | 177,705,991 | 2,652,990 | $ | 27,620,462 | ||||||||||||||||||||
| 173,481 | 1,331,239 | 111,470 | 781,388 | — | — | — | — | ||||||||||||||||||||||||
| (1,201,756 | ) | (9,294,102 | ) | (353,042 | ) | (2,520,094 | ) | (2,616,579 | ) | (30,450,320 | ) | (394,502 | ) | (3,991,793 | ) | ||||||||||||||||
| 4,228,024 | 33,283,219 | 787,285 | 5,569,345 | 12,479,258 | 147,255,671 | 2,258,488 | 23,628,669 | ||||||||||||||||||||||||
| 1,258,265 | 9,752,594 | 282,510 | 1,961,365 | 6,585,865 | 77,198,169 | 944,384 | 9,740,865 | ||||||||||||||||||||||||
| 32,666 | 249,150 | 21,323 | 149,469 | — | — | — | — | ||||||||||||||||||||||||
| (465,502 | ) | (3,611,732 | ) | (253,359 | ) | (1,763,905 | ) | (381,929 | ) | (4,407,155 | ) | (16,096 | ) | (155,138 | ) | ||||||||||||||||
| 825,429 | 6,390,012 | 50,474 | 346,929 | 6,203,936 | 72,791,014 | 928,288 | 9,585,727 | ||||||||||||||||||||||||
| 4,425,665 | 34,247,193 | 1,243,678 | 8,576,183 | 66,657,657 | 796,429,242 | 33,079,380 | 353,708,625 | ||||||||||||||||||||||||
| 59,814 | 463,222 | 40,162 | 274,614 | — | — | — | — | ||||||||||||||||||||||||
| (977,788 | ) | (7,550,994 | ) | (2,477,225 | ) | (17,699,494 | ) | (13,525,927 | ) | (157,829,720 | ) | (5,630,923 | ) | (58,056,051 | ) | ||||||||||||||||
| 3,507,691 | 27,159,421 | (1,193,385 | ) | (8,848,697 | ) | 53,131,730 | 638,599,522 | 27,448,457 | 295,652,574 | ||||||||||||||||||||||
| — | — | — | — | 97,944,548 | 1,150,009,715 | 66,676,446 | 680,698,491 | ||||||||||||||||||||||||
| — | — | — | — | (49,822,471 | ) | (562,810,439 | ) | (31,679,678 | ) | (331,487,191 | ) | ||||||||||||||||||||
| — | — | — | — | 48,122,077 | 587,199,276 | 34,996,768 | 349,211,300 | ||||||||||||||||||||||||
| — | — | — | — | — | — | — | — | ||||||||||||||||||||||||
| — | — | — | — | — | — | — | — | ||||||||||||||||||||||||
| — | — | — | — | — | — | — | — | ||||||||||||||||||||||||
| — | — | — | — | — | — | — | — | ||||||||||||||||||||||||
| 8,561,144 | $ | 66,832,652 | (355,626 | ) | $ | (2,932,423 | ) | 119,937,001 | $ | 1,445,845,483 | 65,632,001 | $ | 678,078,270 | ||||||||||||||||||
| 143 |
Statements of Changes in Net Assets - Capital Stock Activity (Continued)
| Touchstone | ||||||||||||||||
| Short Duration | ||||||||||||||||
| Fixed Income | ||||||||||||||||
| Fund | ||||||||||||||||
| For the Year | For the Year | |||||||||||||||
| Ended | Ended | |||||||||||||||
| September 30, 2012 | September 30, 2011 | |||||||||||||||
| Shares | Dollars | Shares | Dollars | |||||||||||||
| Class A(A) | ||||||||||||||||
| Proceeds from Shares Sold | — | $ | — | — | $ | — | ||||||||||
| Reinvestment of distributions | — | — | — | — | ||||||||||||
| Cost of Shares redeemed | — | — | — | — | ||||||||||||
| Change in Class A Share Transactions | — | — | — | — | ||||||||||||
| Class C(A) | ||||||||||||||||
| Proceeds from Shares Sold | — | — | — | — | ||||||||||||
| Reinvestment of distributions | — | — | — | — | ||||||||||||
| Cost of Shares redeemed | — | — | — | — | ||||||||||||
| Change in Class C Share Transactions | — | — | — | — | ||||||||||||
| Class Y(A) | ||||||||||||||||
| Proceeds from Shares Sold | 6,414,070 | 62,928,842 | 234,596 | 2,313,962 | ||||||||||||
| Reinvestment of distributions | 24,706 | 242,364 | 334 | 3,293 | ||||||||||||
| Cost of Shares redeemed | (967,723 | ) | (9,482,418 | ) | (193,264 | ) | (1,903,448 | ) | ||||||||
| Change in Class Y Share Transactions | 5,471,053 | 53,688,788 | 41,666 | 413,807 | ||||||||||||
| Class Z(A) | ||||||||||||||||
| Proceeds from Shares Sold | 840,365 | 8,240,649 | 804,768 | 7,952,507 | ||||||||||||
| Reinvestment of distributions | 67,228 | 659,311 | 115,476 | 1,140,674 | ||||||||||||
| Cost of Shares redeemed | (1,199,103 | ) | (11,758,590 | ) | (1,188,710 | ) | (11,733,361 | ) | ||||||||
| Change in Class Z Share Transactions | (291,510 | ) | (2,858,630 | ) | (268,466 | ) | (2,640,180 | ) | ||||||||
| Institutional Class(A) | ||||||||||||||||
| Proceeds from Shares Sold | — | — | — | — | ||||||||||||
| Reinvestment of distributions | — | — | — | — | ||||||||||||
| Cost of Shares redeemed | — | — | — | — | ||||||||||||
| Change in Institutional Class Share Transactions | — | — | — | — | ||||||||||||
| Change from Share Transactions | 5,179,543 | $ | 50,830,158 | (226,800 | ) | $ | (2,226,373 | ) | ||||||||
| (A) | Small Cap Value Fund began issuing Class A, Class C, Class Y and Institutional Class shares on March 1, 2011. Effective June 10, 2011, Class Z shares converted to Class A shares. |
See accompanying Notes to Financial Statements.
| 144 |
Statements of Changes in Net Assets - Capital Stock Activity (Continued)
| Touchstone | Touchstone | ||||||||||||||||||||||||||||||
| Small Cap | Small Cap | ||||||||||||||||||||||||||||||
| Core Fund | Value Fund | ||||||||||||||||||||||||||||||
| For the Year | For the Year | For the Year | For the Year | ||||||||||||||||||||||||||||
| Ended | Ended | Ended | Ended | ||||||||||||||||||||||||||||
| September 30, 2012 | September 30, 2011 | September 30, 2012 | September 30, 2011(A) | ||||||||||||||||||||||||||||
| Shares | Dollars | Shares | Dollars | Shares | Dollars | Shares | Dollars | ||||||||||||||||||||||||
| 3,732,087 | $ | 55,599,620 | 3,722,461 | $ | 49,502,790 | 95,975 | $ | 1,624,312 | 3,136,386 | $ | 51,383,529 | ||||||||||||||||||||
| 48,658 | 649,407 | 3,123 | 41,411 | 36,385 | 611,518 | 8,773 | 124,666 | ||||||||||||||||||||||||
| (2,109,999 | ) | (30,986,160 | ) | (4,431,068 | ) | (54,781,287 | ) | (1,079,328 | ) | (17,272,984 | ) | (446,583 | ) | (7,027,740 | ) | ||||||||||||||||
| 1,670,746 | 25,262,867 | (705,484 | ) | (5,237,086 | ) | (946,968 | ) | (15,037,154 | ) | 2,698,576 | 44,480,455 | ||||||||||||||||||||
| 780,792 | 11,485,718 | 731,910 | 9,636,367 | 5,547 | 96,000 | 144 | 2,500 | ||||||||||||||||||||||||
| 10,332 | 135,845 | 29 | 390 | 21 | 377 | 1 | 19 | ||||||||||||||||||||||||
| (239,619 | ) | (3,369,317 | ) | (190,244 | ) | (2,502,825 | ) | (3 | ) | (65 | ) | — | — | ||||||||||||||||||
| 551,505 | 8,252,246 | 541,695 | 7,133,932 | 5,565 | 96,312 | 145 | �� | 2,519 | |||||||||||||||||||||||
| 7,264,844 | 106,479,205 | 3,641,810 | 48,551,714 | 12,874 | 226,591 | 1,266 | 22,500 | ||||||||||||||||||||||||
| 69,684 | 937,735 | 6,188 | 82,193 | 79 | 1,414 | 6 | 94 | ||||||||||||||||||||||||
| (1,705,178 | ) | (25,653,407 | ) | (1,675,553 | ) | (22,803,876 | ) | (1,015 | ) | (17,517 | ) | (1,126 | ) | (15,998 | ) | ||||||||||||||||
| 5,629,350 | 81,763,533 | 1,972,445 | 25,830,031 | 11,938 | 210,488 | 146 | 6,596 | ||||||||||||||||||||||||
| — | — | — | — | — | — | 426,387 | 7,143,600 | ||||||||||||||||||||||||
| — | — | — | — | — | — | 32,993 | 582,090 | ||||||||||||||||||||||||
| — | — | — | — | — | — | (4,792,518 | ) | (79,340,060 | ) | ||||||||||||||||||||||
| — | — | — | — | — | — | (4,333,138 | ) | (71,614,370 | ) | ||||||||||||||||||||||
| 13,411,819 | 205,055,687 | 3,337,526 | 45,250,009 | 95,447 | 1,676,131 | 53,246 | 924,895 | ||||||||||||||||||||||||
| 46,086 | 621,290 | 3,485 | 46,227 | 1,702 | 28,939 | 248 | 3,526 | ||||||||||||||||||||||||
| (1,663,832 | ) | (24,652,544 | ) | (642,952 | ) | (8,662,099 | ) | (87,406 | ) | (1,650,444 | ) | — | — | ||||||||||||||||||
| 11,794,073 | 181,024,433 | 2,698,059 | 36,634,137 | 9,743 | 54,626 | 53,494 | 928,421 | ||||||||||||||||||||||||
| 19,645,674 | $ | 296,303,079 | 4,506,715 | $ | 64,361,014 | (919,722 | ) | $ | (14,675,728 | ) | (1,580,777 | ) | $ | (26,196,379 | ) | ||||||||||||||||
| 145 |
Statements of Changes in Net Assets - Capital Stock Activity (Continued)
| Touchstone | ||||||||||||||||||||||||
| Total Return | ||||||||||||||||||||||||
| Bond Fund | ||||||||||||||||||||||||
| For the | ||||||||||||||||||||||||
| Year | For the | For the Year | ||||||||||||||||||||||
| Ended | Period Ended | Ended | ||||||||||||||||||||||
| September 30, | September 30, | March 31, | ||||||||||||||||||||||
| 2012 | 2011 | 2011 | ||||||||||||||||||||||
| Shares | Dollars | Shares | Dollars | Shares | Dollars | |||||||||||||||||||
| Class A(A) | ||||||||||||||||||||||||
| Proceeds from shares sold | 741,371 | $ | 7,645,356 | 138,426 | $ | 1,404,720 | 693 | $ | 7,000 | |||||||||||||||
| Proceeds from shares issued in connection with merger(B) | — | — | 331,907 | 3,333,082 | — | — | ||||||||||||||||||
| Reinvestment of distributions | 14,900 | 154,569 | 2,604 | 26,290 | 21 | 204 | ||||||||||||||||||
| Cost of shares redeemed | (251,600 | ) | (2,600,131 | ) | (6,144 | ) | (62,433 | ) | — | — | ||||||||||||||
| Change in Class A Share Transactions | 504,671 | 5,199,794 | 466,793 | 4,701,659 | 714 | 7,204 | ||||||||||||||||||
| Class C(A) | ||||||||||||||||||||||||
| Proceeds from shares sold | 106,176 | 1,092,404 | 10,620 | 107,577 | — | — | ||||||||||||||||||
| Proceeds from shares issued in connection with merger(B) | — | — | 248,384 | 2,488,799 | — | — | ||||||||||||||||||
| Reinvestment of distributions | 3,954 | 40,866 | 1,550 | 15,634 | — | — | ||||||||||||||||||
| Cost of shares redeemed | (55,210 | ) | (565,073 | ) | (4,880 | ) | (49,260 | ) | — | — | ||||||||||||||
| Change in Class C Share Transactions | 54,920 | 568,197 | 255,674 | 2,562,750 | — | — | ||||||||||||||||||
| Class Y(A) | ||||||||||||||||||||||||
| Proceeds from shares sold | 2,058,293 | 21,256,329 | 153,969 | 1,548,765 | 208,057 | 2,061,368 | ||||||||||||||||||
| Proceeds from shares issued in connection with merger(B) | — | — | 61,451 | 617,477 | — | — | ||||||||||||||||||
| Reinvestment of distributions | 50,693 | 526,251 | 36,959 | 379,097 | 77,602 | 768,862 | ||||||||||||||||||
| Cost of shares redeemed | (1,038,286 | ) | (10,707,876 | ) | (171,732 | ) | (1,731,835 | ) | (358,757 | ) | (3,575,575 | ) | ||||||||||||
| Change in Class Y Share Transactions | 1,070,700 | 11,074,704 | 80,647 | 813,504 | (73,098 | ) | (745,345 | ) | ||||||||||||||||
| Class Z | ||||||||||||||||||||||||
| Proceeds from Shares sold | — | — | — | — | — | — | ||||||||||||||||||
| Reinvestment of distributions | — | — | — | — | — | — | ||||||||||||||||||
| Cost of Shares redeemed | — | — | — | — | — | — | ||||||||||||||||||
| Change in Class Z Share Transactions | — | — | — | — | — | — | ||||||||||||||||||
| Institutional Class | ||||||||||||||||||||||||
| Proceeds from shares sold | 11,508,592 | 119,047,730 | — | — | — | — | ||||||||||||||||||
| Proceeds from shares issued in connection with merger(B) | 3,233,926 | 33,345,880 | 624,160 | 6,267,909 | — | — | ||||||||||||||||||
| Reinvestment of distributions | 179,219 | 1,865,049 | 5,606 | 56,657 | — | — | ||||||||||||||||||
| Cost of shares redeemed | (1,440,963 | ) | (14,890,686 | ) | — | — | — | — | ||||||||||||||||
| Change in Institutional Class Share Transactions | 13,480,774 | 139,367,973 | 629,766 | 6,324,566 | — | — | ||||||||||||||||||
| Change from Share Transactions | 15,111,065 | $ | 156,210,668 | 1,432,880 | $ | 14,402,479 | (72,384 | ) | $ | (738,141 | ) | |||||||||||||
| (A) | Ultra Short Duration Fixed Income Fund began issuing Class A, Class C and Class Y shares on April 16, 2012. |
| (B) | See Note 8 in the Notes to Financial Statements. |
See accompanying Notes to Financial Statements.
| 146 |
Statements of Changes in Net Assets - Capital Stock Activity (Continued)
| Touchstone | |||||||||||||||
| Ultra Short | |||||||||||||||
| Duration Fixed | |||||||||||||||
| Income Fund | |||||||||||||||
| For the Year | For the Year | ||||||||||||||
| Ended | Ended | ||||||||||||||
| September 30, 2012 | September 30, 2011 | ||||||||||||||
| Shares | Dollars | Shares | Dollars | ||||||||||||
| 276,368 | $ | 2,641,446 | — | $ | — | ||||||||||
| 3,544,125 | 33,870,180 | — | — | ||||||||||||
| 5,391 | 51,532 | — | — | ||||||||||||
| (245,629 | ) | (2,347,253 | ) | — | — | ||||||||||
| 3,580,255 | 34,215,905 | — | — | ||||||||||||
| 86,944 | 830,674 | — | — | ||||||||||||
| 1,273,306 | 12,177,295 | — | — | ||||||||||||
| 1,537 | 14,688 | — | — | ||||||||||||
| (157,115 | ) | (1,501,647 | ) | — | — | ||||||||||
| 1,204,672 | 11,521,010 | — | — | ||||||||||||
| 2,030,490 | 19,402,128 | — | — | ||||||||||||
| 22,513,787 | 215,295,273 | — | — | ||||||||||||
| 124,027 | 1,185,390 | — | — | ||||||||||||
| (4,738,599 | ) | (45,297,679 | ) | — | — | ||||||||||
| 19,929,705 | 190,585,112 | — | — | ||||||||||||
| 30,335,442 | 290,292,920 | 35,550,281 | 342,321,287 | ||||||||||||
| 572,615 | 5,477,285 | 530,809 | 5,111,991 | ||||||||||||
| (31,605,912 | ) | (302,402,489 | ) | (24,416,107 | ) | (235,121,390 | ) | ||||||||
| (697,855 | ) | (6,632,284 | ) | 11,664,983 | 112,311,888 | ||||||||||
| 4,054,101 | 38,712,198 | — | — | ||||||||||||
| 2,397,446 | 22,944,607 | — | — | ||||||||||||
| 3,634 | 34,721 | — | — | ||||||||||||
| (5,754,344 | ) | (54,997,802 | ) | — | — | ||||||||||
| 700,837 | 6,693,724 | — | — | ||||||||||||
| 24,717,614 | $ | 236,383,467 | 11,664,983 | $ | 112,311,888 | ||||||||||
| 147 |
Financial Highlights
Touchstone Emerging Markets Equity Fund—Class A
Selected Data for a Share Outstanding Throughout Each Period
| Year Ended September 30, | ||||||||||||
| 2012 | 2011 | 2010(A) | ||||||||||
| Net asset value at beginning of period | $ | 10.69 | $ | 12.68 | $ | 10.00 | ||||||
| Income (loss) from investment operations: | ||||||||||||
| Net investment income | 0.11 | 0.10 | 0.03 | |||||||||
| Net realized and unrealized gains (losses) on investments | 1.68 | (2.05 | ) | 2.65 | ||||||||
| Total from investment operations | 1.79 | (1.95 | ) | 2.68 | ||||||||
| Distributions from: | ||||||||||||
| Net investment income | (0.15 | ) | (0.02 | ) | — | |||||||
| Realized capital gains | (0.09 | ) | (0.02 | ) | — | |||||||
| Total distributions | (0.24 | ) | (0.04 | ) | — | |||||||
| Net asset value at end of period | $ | 12.24 | $ | 10.69 | $ | 12.68 | ||||||
| Total return(B) | 16.71 | % | (15.45 | )% | 26.80 | % | ||||||
| Ratios and supplemental data: | ||||||||||||
| Net assets at end of period (000's) | $ | 34,369 | $ | 26,592 | $ | 10,343 | ||||||
| Ratio to average net assets: | ||||||||||||
| Net expenses | 1.72 | % | 1.74 | % | 1.74 | % | ||||||
| Gross expenses | 1.99 | % | 1.95 | % | 2.25 | % | ||||||
| Net investment income | 0.94 | % | 0.98 | % | 0.76 | % | ||||||
| Portfolio turnover rate | 33 | %(C) | 18 | % | 8 | % | ||||||
Touchstone Emerging Markets Equity Fund—Class C
Selected Data for a Share Outstanding Throughout Each Period
| Year Ended September 30, | ||||||||||||
| 2012 | 2011 | 2010(A) | ||||||||||
| Net asset value at beginning of period | $ | 10.54 | $ | 12.58 | $ | 10.00 | ||||||
| Income (loss) from investment operations: | ||||||||||||
| Net investment income (loss) | 0.04 | 0.03 | — | (D) | ||||||||
| Net realized and unrealized gains (losses) on investments | 1.64 | (2.05 | ) | 2.58 | ||||||||
| Total from investment operations | 1.68 | (2.02 | ) | 2.58 | ||||||||
| Distributions from: | ||||||||||||
| Net investment income | — | (D) | — | — | ||||||||
| Realized capital gains | (0.09 | ) | (0.02 | ) | — | |||||||
| Total distributions | (0.09 | ) | (0.02 | ) | — | |||||||
| Net asset value at end of period | $ | 12.13 | $ | 10.54 | $ | 12.58 | ||||||
| Total return(B) | 15.84 | % | (16.07 | )% | 25.80 | % | ||||||
| Ratios and supplemental data: | ||||||||||||
| Net assets at end of period (000's) | $ | 4,903 | $ | 5,417 | $ | 3,590 | ||||||
| Ratio to average net assets: | ||||||||||||
| Net expenses | 2.47 | % | 2.49 | % | 2.49 | % | ||||||
| Gross expenses | 2.85 | % | 2.82 | % | 2.99 | % | ||||||
| Net investment income (loss) | 0.19 | % | 0.21 | % | (0.03 | )% | ||||||
| Portfolio turnover rate | 33 | %(C) | 18 | % | 8 | % | ||||||
| (A) | The Fund commenced operations on October 1, 2009. |
| (B) | Total returns shown exclude the effect of applicable sales loads. If these charges were included, the returns would be lower. |
| (C) | Portfolio turnover excludes the purchase and sales of the Acquired Funds (see Note 8). If these transactions were included, portfolio turnover would have been higher. |
| (D) | Amount rounds to less than $0.005 per share. |
See accompanying Notes to Financial Statements.
| 148 |
Financial Highlights (Continued)
Touchstone Emerging Markets Equity Fund—Class Y
Selected Data for a Share Outstanding Throughout Each Period
| Year Ended September 30, | ||||||||||||
| 2012 | 2011 | 2010(A) | ||||||||||
| Net asset value at beginning of period | $ | 10.74 | $ | 12.72 | $ | 10.00 | ||||||
| Income (loss) from investment operations: | ||||||||||||
| Net investment income | 0.14 | 0.11 | 0.01 | |||||||||
| Net realized and unrealized gains (losses) on investments | 1.70 | (2.05 | ) | 2.71 | ||||||||
| Total from investment operations | 1.84 | (1.94 | ) | 2.72 | ||||||||
| Distributions from: | ||||||||||||
| Net investment income | (0.22 | ) | (0.02 | ) | — | |||||||
| Realized capital gains | (0.09 | ) | (0.02 | ) | — | |||||||
| Total distributions | (0.31 | ) | (0.04 | ) | — | |||||||
| Net asset value at end of period | $ | 12.27 | $ | 10.74 | $ | 12.72 | ||||||
| Total return | 17.12 | % | (15.21 | )% | 27.10 | % | ||||||
| Ratios and supplemental data: | ||||||||||||
| Net assets at end of period (000's) | $ | 219,717 | $ | 151,532 | $ | 13,597 | ||||||
| Ratio to average net assets: | ||||||||||||
| Net expenses | 1.41 | % | 1.48 | % | 1.49 | % | ||||||
| Gross expenses | 1.44 | % | 1.48 | % | 2.10 | % | ||||||
| Net investment income | 1.25 | % | 1.50 | % | 0.86 | % | ||||||
| Portfolio turnover rate | 33 | %(B) | 18 | % | 8 | % | ||||||
Touchstone Emerging Markets Equity Fund—Institutional Class
Selected Data for a Share Outstanding Throughout Each Period
| Year Ended September 30, | ||||||||||||
| 2012 | 2011 | 2010(A) | ||||||||||
| Net asset value at beginning of period | $ | 10.76 | $ | 12.74 | $ | 10.00 | ||||||
| Income (loss) from investment operations: | ||||||||||||
| Net investment income | 0.18 | 0.13 | 0.05 | |||||||||
| Net realized and unrealized gains (losses) on investments | 1.67 | (2.06 | ) | 2.69 | ||||||||
| Total from investment operations | 1.85 | (1.93 | ) | 2.74 | ||||||||
| Distributions from: | ||||||||||||
| Net investment income | (0.24 | ) | (0.03 | ) | — | |||||||
| Realized capital gains | (0.09 | ) | (0.02 | ) | — | |||||||
| Total distributions | (0.33 | ) | (0.05 | ) | — | |||||||
| Net asset value at end of period | $ | 12.28 | $ | 10.76 | $ | 12.74 | ||||||
| Total return | 17.28 | % | (15.18 | )% | 27.40 | % | ||||||
| Ratios and supplemental data: | ||||||||||||
| Net assets at end of period (000's) | $ | 271,186 | $ | 244,657 | $ | 125,414 | ||||||
| Ratio to average net assets: | ||||||||||||
| Net expenses | 1.32 | % | 1.34 | % | 1.34 | % | ||||||
| Gross expenses | 1.37 | % | 1.43 | % | 1.74 | % | ||||||
| Net investment income | 1.34 | % | 1.51 | % | 1.26 | % | ||||||
| Portfolio turnover rate | 33 | %(B) | 18 | % | 8 | % | ||||||
| (A) | The Fund commenced operations on October 1, 2009. |
| (B) | Portfolio turnover excludes the purchase and sales of the Acquired Funds (see Note 8). If these transactions were included, portfolio turnover would have been higher. |
See accompanying Notes to Financial Statements.
| 149 |
Financial Highlights (Continued)
Touchstone Focused Equity Fund—Class A
Selected Data for a Share Outstanding Throughout Each Period
| Period | ||||||||||||
| Ended | ||||||||||||
| September | ||||||||||||
| Year Ended September 30, | 30, | |||||||||||
| 2012 | 2011 | 2010(A) | ||||||||||
| Net asset value at beginning of period | $ | 9.50 | $ | 10.95 | $ | 10.00 | ||||||
| Income (loss) from investment operations: | ||||||||||||
| Net investment income | 0.08 | (B) | 0.10 | 0.02 | ||||||||
| Net realized and unrealized gains (losses) on investments | 2.37 | (1.38 | ) | 0.93 | ||||||||
| Total from investment operations | 2.45 | (1.28 | ) | 0.95 | ||||||||
| Distributions from: | ||||||||||||
| Net investment income | (0.07 | ) | (0.08 | ) | — | |||||||
| Realized capital gains | (0.26 | ) | (0.09 | ) | — | |||||||
| Total distributions | (0.33 | ) | (0.17 | ) | — | |||||||
| Net asset value at end of period | $ | 11.62 | $ | 9.50 | $ | 10.95 | ||||||
| Total return(C) | 26.46 | % | (11.95 | )% | 9.40 | %(D) | ||||||
| Ratios and supplemental data: | ||||||||||||
| Net assets at end of period (000's) | $ | 94,025 | $ | 80,741 | $ | 814 | ||||||
| Ratio to average net assets: | ||||||||||||
| Net expenses | 1.20 | % | 1.20 | % | 1.20 | %(E) | ||||||
| Gross expenses | 1.82 | % | 1.70 | % | 4.65 | %(E) | ||||||
| Net investment income | 0.73 | % | 0.56 | % | 0.46 | %(E) | ||||||
| Portfolio turnover rate | 54 | % | 44 | % | 101 | %(D) | ||||||
Touchstone Focused Equity Fund—Class C
Selected Data for a Share Outstanding Throughout Each Period
| Period | ||||||||||||
| Ended | ||||||||||||
| September | ||||||||||||
| Year Ended September 30, | 30, | |||||||||||
| 2012 | 2011 | 2010(A) | ||||||||||
| Net asset value at beginning of period | $ | 9.38 | $ | 10.88 | $ | 10.00 | ||||||
| Income (loss) from investment operations: | ||||||||||||
| Net investment loss | — | (B)(F) | (0.05 | ) | (0.01 | ) | ||||||
| Net realized and unrealized gains (losses) on investments | 2.34 | (1.32 | ) | 0.89 | ||||||||
| Total from investment operations | 2.34 | (1.37 | ) | 0.88 | ||||||||
| Distributions from: | ||||||||||||
| Net investment income | — | (0.04 | ) | — | ||||||||
| Realized capital gains | (0.26 | ) | (0.09 | ) | — | |||||||
| Total distributions | (0.26 | ) | (0.13 | ) | — | |||||||
| Net asset value at end of period | $ | 11.46 | $ | 9.38 | $ | 10.88 | ||||||
| Total return(C) | 25.24 | % | (12.78 | )% | 8.90 | %(D) | ||||||
| Ratios and supplemental data: | ||||||||||||
| Net assets at end of period (000's) | $ | 399 | $ | 179 | $ | 187 | ||||||
| Ratio to average net assets: | ||||||||||||
| Net expenses | 1.95 | % | 1.95 | % | 1.95 | %(E) | ||||||
| Gross expenses | 6.33 | % | 5.90 | % | 5.45 | %(E) | ||||||
| Net investment loss | (0.02 | )% | (0.52 | )% | (0.24 | )%(E) | ||||||
| Portfolio turnover rate | 54 | % | 44 | % | 101 | %(D) | ||||||
| (A) | Represents the period from commencement of operations (December 31, 2009) through September 30, 2010. |
| (B) | Per share amounts for the year or period are calculated based on average outstanding shares. |
| (C) | Total returns shown exclude the effect of applicable sales loads. If these charges were included, the returns would be lower. |
| (D) | Not annualized. |
| (E) | Annualized. |
| (F) | Less than $0.005 per share. |
See accompanying Notes to Financial Statements.
| 150 |
Financial Highlights (Continued)
Touchstone Focused Equity Fund—Class Y
Selected Data for a Share Outstanding Throughout Each Period
| Period | ||||||||||||
| Ended | ||||||||||||
| September | ||||||||||||
| Year Ended September 30, | 30, | |||||||||||
| 2012 | 2011 | 2010(A) | ||||||||||
| Net asset value at beginning of period | $ | 9.60 | $ | 10.96 | $ | 10.00 | ||||||
| Income (loss) from investment operations: | ||||||||||||
| Net investment income | 0.11 | (B) | 0.02 | 0.04 | ||||||||
| Net realized and unrealized gains (losses) on investments | 2.39 | (1.29 | ) | 0.92 | ||||||||
| Total from investment operations | 2.50 | (1.27 | ) | 0.96 | ||||||||
| Distributions from: | ||||||||||||
| Net investment income | (0.11 | ) | — | — | ||||||||
| Realized capital gains | (0.26 | ) | (0.09 | ) | — | |||||||
| Total distributions | (0.37 | ) | (0.09 | ) | — | |||||||
| Net asset value at end of period | $ | 11.73 | $ | 9.60 | $ | 10.96 | ||||||
| Total return | 26.77 | % | (11.77 | )% | 9.60 | %(C) | ||||||
| Ratios and supplemental data: | ||||||||||||
| Net assets at end of period (000's) | $ | 6,485 | $ | 12,383 | $ | 201 | ||||||
| Ratio to average net assets: | ||||||||||||
| Net expenses | 0.95 | % | 0.95 | % | 0.95 | %(D) | ||||||
| Gross expenses | 1.40 | % | 1.18 | % | 4.62 | %(D) | ||||||
| Net investment income | 0.98 | % | 0.79 | % | 0.81 | %(D) | ||||||
| Portfolio turnover rate | 54 | % | 44 | % | 101 | %(C) | ||||||
Touchstone Focused Equity Fund—Institutional Class
Selected Data for a Share Outstanding Throughout Each Period
| Period | ||||||||||||
| Ended | ||||||||||||
| September | ||||||||||||
| Year Ended September 30, | 30, | |||||||||||
| 2012 | 2011 | 2010(A) | ||||||||||
| Net asset value at beginning of period | $ | 9.28 | $ | 10.97 | $ | 10.00 | ||||||
| Income (loss) from investment operations: | ||||||||||||
| Net investment income | 0.12 | (B) | 0.10 | 0.17 | ||||||||
| Net realized and unrealized gains (losses) on investments | 2.30 | (1.28 | ) | 0.80 | ||||||||
| Total from investment operations | 2.42 | (1.18 | ) | 0.97 | ||||||||
| Distributions from: | ||||||||||||
| Net investment income | (0.12 | ) | (0.42 | ) | — | |||||||
| Realized capital gains | (0.26 | ) | (0.09 | ) | — | |||||||
| Total distributions | (0.38 | ) | (0.51 | ) | — | |||||||
| Net asset value at end of period | $ | 11.32 | $ | 9.28 | $ | 10.97 | ||||||
| Total return | 26.94 | % | (11.68 | )% | 9.70 | %(C) | ||||||
| Ratios and supplemental data: | ||||||||||||
| Net assets at end of period (000's) | $ | 5,191 | $ | 852 | $ | 768 | ||||||
| Ratio to average net assets: | ||||||||||||
| Net expenses | 0.80 | % | 0.80 | % | 0.80 | %(D) | ||||||
| Gross expenses | 1.49 | % | 2.12 | % | 3.66 | %(D) | ||||||
| Net investment income | 1.13 | % | 0.50 | % | 0.99 | %(D) | ||||||
| Portfolio turnover rate | 54 | % | 44 | % | 101 | %(C) | ||||||
| (A) | Represents the period from commencement of operations (December 31, 2009) through September 30, 2010. |
| (B) | Per share amounts for the year or period are calculated based on average outstanding shares. |
| (C) | Not annualized. |
| (D) | Annualized. |
See accompanying Notes to Financial Statements.
| 151 |
Financial Highlights (Continued)
Touchstone Global Equity Fund—Class A
Selected Data for a Share Outstanding Throughout Each Period
| Year Ended September 30, | ||||||||||||
| 2012 | 2011 | 2010(A) | ||||||||||
| Net asset value at beginning of period | $ | 9.86 | $ | 10.65 | $ | 10.00 | ||||||
| Income (loss) from investment operations: | ||||||||||||
| Net investment income | 0.26 | (B) | 0.08 | 0.04 | ||||||||
| Net realized and unrealized gains (losses) on investments | 1.27 | (0.68 | ) | 0.61 | ||||||||
| Total from investment operations | 1.53 | (0.60 | ) | 0.65 | ||||||||
| Distributions from: | ||||||||||||
| Net investment income | (0.05 | ) | (0.09 | ) | — | |||||||
| Realized capital gains | (0.98 | ) | (0.10 | ) | — | |||||||
| Total distributions | (1.03 | ) | (0.19 | ) | — | |||||||
| Net asset value at end of period | $ | 10.36 | $ | 9.86 | $ | 10.65 | ||||||
| Total return(C) | 17.17 | % | (5.87 | )% | 6.50 | % | ||||||
| Ratios and supplemental data: | ||||||||||||
| Net assets at end of period (000's) | $ | 725 | $ | 636 | $ | 1,857 | ||||||
| Ratio to average net assets: | ||||||||||||
| Net expenses | 1.34 | % | 1.34 | % | 1.34 | % | ||||||
| Gross expenses | 4.28 | % | 4.13 | % | 3.75 | % | ||||||
| Net investment income | 2.63 | % | 0.18 | % | 1.56 | % | ||||||
| Portfolio turnover rate | 50 | % | 64 | % | 68 | % | ||||||
Touchstone Global Equity Fund—Class C
Selected Data for a Share Outstanding Throughout Each Period
| Year Ended September 30, | ||||||||||||
| 2012 | 2011 | 2010(A) | ||||||||||
| Net asset value at beginning of period | $ | 9.79 | $ | 10.57 | $ | 10.00 | ||||||
| Income (loss) from investment operations: | ||||||||||||
| Net investment income (loss) | 0.18 | (B) | (0.02 | ) | — | (D) | ||||||
| Net realized and unrealized gains (losses) on investments | 1.26 | (0.66 | ) | 0.57 | ||||||||
| Total from investment operations | 1.44 | (0.68 | ) | 0.57 | ||||||||
| Distributions from: | ||||||||||||
| Realized capital gains | (0.98 | ) | (0.10 | ) | — | |||||||
| Net asset value at end of period | $ | 10.25 | $ | 9.79 | $ | 10.57 | ||||||
| Total return(C) | 16.26 | % | (6.54 | )% | 5.70 | % | ||||||
| Ratios and supplemental data: | ||||||||||||
| Net assets at end of period (000's) | $ | 361 | $ | 101 | $ | 106 | ||||||
| Ratio to average net assets: | ||||||||||||
| Net expenses | 2.09 | % | 2.09 | % | 2.09 | % | ||||||
| Gross expenses | 9.37 | % | 11.43 | % | 4.28 | % | ||||||
| Net investment income (loss) | 1.88 | % | (0.23 | )% | 0.02 | % | ||||||
| Portfolio turnover rate | 50 | % | 64 | % | 68 | % | ||||||
| (A) | The Fund commenced operations on October 1, 2009. |
| (B) | Per share amounts for the year or period are calculated based on average outstanding shares. |
| (C) | Total returns shown exclude the effect of applicable sales loads. If these charges were included, the returns would be lower. |
| (D) | Amount rounds to less than $0.005 per share. |
See accompanying Notes to Financial Statements.
| 152 |
Financial Highlights (Continued)
Touchstone Global Equity Fund—Class Y
Selected Data for a Share Outstanding Throughout Each Period
| Year Ended September 30, | ||||||||||||
| 2012 | 2011 | 2010(A) | ||||||||||
| Net asset value at beginning of period | $ | 9.93 | $ | 10.68 | $ | 10.00 | ||||||
| Income (loss) from investment operations: | ||||||||||||
| Net investment income | 0.29 | (B) | 0.06 | 0.09 | ||||||||
| Net realized and unrealized gains (losses) on investments | 1.28 | (0.64 | ) | 0.59 | ||||||||
| Total from investment operations | 1.57 | (0.58 | ) | 0.68 | ||||||||
| Distributions from: | ||||||||||||
| Net investment income | (0.06 | ) | (0.07 | ) | — | |||||||
| Realized capital gains | (0.98 | ) | (0.10 | ) | — | |||||||
| Total distributions | (1.04 | ) | (0.17 | ) | — | |||||||
| Net asset value at end of period | $ | 10.46 | $ | 9.93 | $ | 10.68 | ||||||
| Total return | 17.45 | % | (5.56 | )% | 6.70 | % | ||||||
| Ratios and supplemental data: | ||||||||||||
| Net assets at end of period (000's) | $ | 233 | $ | 197 | $ | 142 | ||||||
| Ratio to average net assets: | ||||||||||||
| Net expenses | 1.09 | % | 1.09 | % | 1.09 | % | ||||||
| Gross expenses | 6.08 | % | 7.29 | % | 3.38 | % | ||||||
| Net investment income | 2.88 | % | 0.76 | % | 1.05 | % | ||||||
| Portfolio turnover rate | 50 | % | 64 | % | 68 | % | ||||||
Touchstone Global Equity Fund—Institutional Class
Selected Data for a Share Outstanding Throughout Each Period
| Year Ended September 30, | ||||||||||||
| 2012 | 2011 | 2010(A) | ||||||||||
| Net asset value at beginning of period | $ | 9.92 | $ | 10.69 | $ | 10.00 | ||||||
| Income (loss) from investment operations: | ||||||||||||
| Net investment income | 0.30 | (B) | 0.10 | 0.11 | ||||||||
| Net realized and unrealized gains (losses) on investments | 1.28 | (0.66 | ) | 0.58 | ||||||||
| Total from investment operations | 1.58 | (0.56 | ) | 0.69 | ||||||||
| Distributions from: | ||||||||||||
| Net investment income | (0.08 | ) | (0.11 | ) | — | (C) | ||||||
| Realized capital gains | (0.98 | ) | (0.10 | ) | — | |||||||
| Total distributions | (1.06 | ) | (0.21 | ) | — | |||||||
| Net asset value at end of period | $ | 10.44 | $ | 9.92 | $ | 10.69 | ||||||
| Total return | 17.55 | % | (5.51 | )% | 6.93 | % | ||||||
| Ratios and supplemental data: | ||||||||||||
| Net assets at end of period (000's) | $ | 19,554 | $ | 2,926 | $ | 3,086 | ||||||
| Ratio to average net assets: | ||||||||||||
| Net expenses | 0.94 | % | 0.94 | % | 0.94 | % | ||||||
| Gross expenses | 1.73 | % | 2.60 | % | 3.11 | % | ||||||
| Net investment income | 3.03 | % | 0.91 | % | 1.18 | % | ||||||
| Portfolio turnover rate | 50 | % | 64 | % | 68 | % | ||||||
| (A) | The Fund commenced operations on October 1, 2009. |
| (B) | Per share amounts for the year or period are calculated based on average outstanding shares. |
| (C) | Amount rounds to less than $0.005 per share. |
See accompanying Notes to Financial Statements.
| 153 |
Financial Highlights (Continued)
Touchstone Global Real Estate Fund—Class A
Selected Data for a Share Outstanding Throughout Each Period
| Year Ended September 30, | ||||||||||||
| 2012 | 2011 | 2010(A) | ||||||||||
| Net asset value at beginning of period | $ | 9.76 | $ | 11.46 | $ | 10.00 | ||||||
| Income (loss) from investment operations: | ||||||||||||
| Net investment income | 0.20 | (B) | 0.35 | 0.36 | ||||||||
| Net realized and unrealized gains (losses) on investments | 2.51 | (1.10 | ) | 1.45 | ||||||||
| Total from investment operations | 2.71 | (0.75 | ) | 1.81 | ||||||||
| Distributions from: | ||||||||||||
| Net investment income | (0.16 | ) | (0.48 | ) | (0.35 | ) | ||||||
| Realized capital gains | (0.45 | ) | (0.47 | ) | — | |||||||
| Total distributions | (0.61 | ) | (0.95 | ) | (0.35 | ) | ||||||
| Net asset value at end of period | $ | 11.86 | $ | 9.76 | $ | 11.46 | ||||||
| Total return(C) | 29.15 | % | (7.47 | )% | 18.54 | % | ||||||
| Ratios and supplemental data: | ||||||||||||
| Net assets at end of period (000's) | $ | 486 | $ | 2,038 | $ | 881 | ||||||
| Ratio to average net assets: | ||||||||||||
| Net expenses | 1.39 | % | 1.39 | % | 1.39 | % | ||||||
| Gross expenses | 3.27 | % | 3.55 | % | 4.27 | % | ||||||
| Net investment income | 1.87 | % | 2.30 | % | 2.94 | % | ||||||
| Portfolio turnover rate | 94 | % | 85 | % | 107 | % | ||||||
Touchstone Global Real Estate Fund—Class C
Selected Data for a Share Outstanding Throughout Each Period
| Year Ended September 30, | ||||||||||||
| 2012 | 2011 | 2010(A) | ||||||||||
| Net asset value at beginning of period | $ | 9.80 | $ | 11.50 | $ | 10.00 | ||||||
| Income (loss) from investment operations: | ||||||||||||
| Net investment income | 0.12 | (B) | 0.20 | 0.17 | ||||||||
| Net realized and unrealized gains (losses) on investments | 2.52 | (1.05 | ) | 1.58 | ||||||||
| Total from investment operations | 2.64 | (0.85 | ) | 1.75 | ||||||||
| Distributions from: | ||||||||||||
| Net investment income | (0.09 | ) | (0.38 | ) | (0.25 | ) | ||||||
| Realized capital gains | (0.45 | ) | (0.47 | ) | — | |||||||
| Total distributions | (0.54 | ) | (0.85 | ) | (0.25 | ) | ||||||
| Net asset value at end of period | $ | 11.90 | $ | 9.80 | $ | 11.50 | ||||||
| Total return(C) | 28.19 | % | (8.20 | )% | 17.75 | % | ||||||
| Ratios and supplemental data: | ||||||||||||
| Net assets at end of period (000's) | $ | 223 | $ | 116 | $ | 123 | ||||||
| Ratio to average net assets: | ||||||||||||
| Net expenses | 2.14 | % | 2.14 | % | 2.14 | % | ||||||
| Gross expenses | 7.79 | % | 11.08 | % | 4.60 | % | ||||||
| Net investment income | 1.12 | % | 1.58 | % | 1.60 | % | ||||||
| Portfolio turnover rate | 94 | % | 85 | % | 107 | % | ||||||
| (A) | The Fund commenced operations on October 1, 2009. |
| (B) | Per share amounts for the year or period are calculated based on average outstanding shares. |
| (C) | Total returns shown exclude the effect of applicable sales loads. If these charges were included, the returns would be lower. |
See accompanying Notes to Financial Statements.
| 154 |
Financial Highlights (Continued)
Touchstone Global Real Estate Fund—Class Y
Selected Data for a Share Outstanding Throughout Each Period
| Year Ended September 30, | ||||||||||||
| 2012 | 2011 | 2010(A) | ||||||||||
| Net asset value at beginning of period | $ | 9.84 | $ | 11.53 | $ | 10.00 | ||||||
| Income (loss) from investment operations: | ||||||||||||
| Net investment income | 0.23 | (B) | 0.32 | 0.28 | ||||||||
| Net realized and unrealized gains (losses) on investments | 2.54 | (1.06 | ) | 1.58 | ||||||||
| Total from investment operations | 2.77 | (0.74 | ) | 1.86 | ||||||||
| Distributions from: | ||||||||||||
| Net investment income | (0.19 | ) | (0.48 | ) | (0.33 | ) | ||||||
| Realized capital gains | (0.45 | ) | (0.47 | ) | — | |||||||
| Total distributions | (0.64 | ) | (0.95 | ) | (0.33 | ) | ||||||
| Net asset value at end of period | $ | 11.97 | $ | 9.84 | $ | 11.53 | ||||||
| Total return | 29.53 | % | (7.27 | )% | 18.90 | % | ||||||
| Ratios and supplemental data: | ||||||||||||
| Net assets at end of period (000's) | $ | 150 | $ | 118 | $ | 129 | ||||||
| Ratio to average net assets: | ||||||||||||
| Net expenses | 1.14 | % | 1.14 | % | 1.14 | % | ||||||
| Gross expenses | 7.29 | % | 9.49 | % | 3.62 | % | ||||||
| Net investment income | 2.12 | % | 2.59 | % | 2.61 | % | ||||||
| Portfolio turnover rate | 94 | % | 85 | % | 107 | % | ||||||
Touchstone Global Real Estate Fund—Institutional Class
Selected Data for a Share Outstanding Throughout Each Period
| Year Ended September 30, | ||||||||||||
| 2012 | 2011 | 2010(A) | ||||||||||
| Net asset value at beginning of period | $ | 9.92 | $ | 11.61 | $ | 10.00 | ||||||
| Income (loss) from investment operations: | ||||||||||||
| Net investment income | 0.26 | (B) | 0.33 | 0.29 | ||||||||
| Net realized and unrealized gains (losses) on investments | 2.55 | (1.07 | ) | 1.59 | ||||||||
| Total from investment operations | 2.81 | (0.74 | ) | 1.88 | ||||||||
| Distributions from: | ||||||||||||
| Net investment income | (0.21 | ) | (0.48 | ) | (0.27 | ) | ||||||
| Realized capital gains | (0.45 | ) | (0.47 | ) | — | |||||||
| Total distributions | (0.66 | ) | (0.95 | ) | (0.27 | ) | ||||||
| Net asset value at end of period | $ | 12.07 | $ | 9.92 | $ | 11.61 | ||||||
| Total return | 29.68 | % | (7.21 | )% | 19.12 | % | ||||||
| Ratios and supplemental data: | ||||||||||||
| Net assets at end of period (000's) | $ | 23,201 | $ | 2,994 | $ | 3,232 | ||||||
| Ratio to average net assets: | ||||||||||||
| Net expenses | 0.99 | % | 0.99 | % | 0.99 | % | ||||||
| Gross expenses | 2.09 | % | 3.15 | % | 3.34 | % | ||||||
| Net investment income | 2.27 | % | 2.73 | % | 2.75 | % | ||||||
| Portfolio turnover rate | 94 | % | 85 | % | 107 | % | ||||||
| (A) | The Fund commenced operations on October 1, 2009. |
| (B) | Per share amounts for the year or period are calculated based on average outstanding shares. |
See accompanying Notes to Financial Statements.
| 155 |
Financial Highlights (Continued)
Touchstone International Fixed Income Fund—Class A
Selected Data for a Share Outstanding Throughout Each Period
| Year Ended September 30, | ||||||||||||
| 2012 | 2011 | 2010(A) | ||||||||||
| Net asset value at beginning of period | $ | 10.49 | $ | 11.38 | $ | 10.00 | ||||||
| Income from investment operations: | ||||||||||||
| Net investment income | 0.14 | (B) | 0.14 | 0.12 | ||||||||
| Net realized and unrealized gains on investments | 0.47 | 0.02 | 1.38 | |||||||||
| Total from investment operations | 0.61 | 0.16 | 1.50 | |||||||||
| Distributions from: | ||||||||||||
| Net investment income | (0.38 | ) | (1.00 | ) | (0.12 | ) | ||||||
| Realized capital gains | (0.04 | ) | (0.05 | ) | — | |||||||
| Total distributions | (0.42 | ) | (1.05 | ) | (0.12 | ) | ||||||
| Net asset value at end of period | $ | 10.68 | $ | 10.49 | $ | 11.38 | ||||||
| Total return(C) | 6.24 | % | 1.67 | % | 15.15 | % | ||||||
| Ratios and supplemental data: | ||||||||||||
| Net assets at end of period (000's) | $ | 1,934 | $ | 2,555 | $ | 1,319 | ||||||
| Ratio to average net assets: | ||||||||||||
| Net expenses | 1.09 | % | 1.09 | % | 1.09 | % | ||||||
| Gross expenses | 1.97 | % | 2.18 | % | 2.47 | % | ||||||
| Net investment income | 1.36 | % | 2.06 | % | 1.39 | % | ||||||
| Portfolio turnover rate | 56 | % | 64 | % | 160 | % | ||||||
Touchstone International Fixed Income Fund—Class C
Selected Data for a Share Outstanding Throughout Each Period
| Year Ended September 30, | ||||||||||||
| 2012 | 2011 | 2010(A) | ||||||||||
| Net asset value at beginning of period | $ | 10.48 | $ | 11.37 | $ | 10.00 | ||||||
| Income (loss) from investment operations: | ||||||||||||
| Net investment income | 0.06 | (B) | 0.13 | 0.05 | ||||||||
| Net realized and unrealized gains (losses) on investments | 0.47 | (0.05 | ) | 1.37 | ||||||||
| Total from investment operations | 0.53 | 0.08 | 1.42 | |||||||||
| Distributions from: | ||||||||||||
| Net investment income | (0.30 | ) | (0.92 | ) | (0.05 | ) | ||||||
| Realized capital gains | (0.04 | ) | (0.05 | ) | — | |||||||
| Total distributions | (0.34 | ) | (0.97 | ) | (0.05 | ) | ||||||
| Net asset value at end of period | $ | 10.67 | $ | 10.48 | $ | 11.37 | ||||||
| Total return(C) | 5.37 | % | 0.94 | % | 14.29 | % | ||||||
| Ratios and supplemental data: | ||||||||||||
| Net assets at end of period (000's) | $ | 432 | $ | 581 | $ | 407 | ||||||
| Ratio to average net assets: | ||||||||||||
| Net expenses | 1.84 | % | 1.84 | % | 1.84 | % | ||||||
| Gross expenses | 4.73 | % | 4.53 | % | 3.16 | % | ||||||
| Net investment income | 0.61 | % | 1.14 | % | 0.59 | % | ||||||
| Portfolio turnover rate | 56 | % | 64 | % | 160 | % | ||||||
| (A) | The Fund commenced operations on October 1, 2009. |
| (B) | Per share amounts for the year or period are calculated based on average outstanding shares. |
| (C) | Total returns shown exclude the effect of applicable sales loads. If these charges were included, the returns would be lower. |
See accompanying Notes to Financial Statements.
| 156 |
Financial Highlights (Continued)
Touchstone International Fixed Income Fund—Class Y
Selected Data for a Share Outstanding Throughout Each Period
| Year Ended September 30, | ||||||||||||
| 2012 | 2011 | 2010(A) | ||||||||||
| Net asset value at beginning of period | $ | 10.48 | $ | 11.37 | $ | 10.00 | ||||||
| Income (loss) from investment operations: | ||||||||||||
| Net investment income | 0.17 | (B) | 0.20 | (C) | 0.16 | |||||||
| Net realized and unrealized gains (losses) on investments | 0.46 | (0.01 | ) | 1.37 | ||||||||
| Total from investment operations | 0.63 | 0.19 | 1.53 | |||||||||
| Distributions from: | ||||||||||||
| Net investment income | (0.41 | ) | (1.03 | ) | (0.16 | ) | ||||||
| Realized capital gains | (0.04 | ) | (0.05 | ) | — | |||||||
| Total distributions | (0.45 | ) | (1.08 | ) | (0.16 | ) | ||||||
| Net asset value at end of period | $ | 10.66 | $ | 10.48 | $ | 11.37 | ||||||
| Total return | 6.42 | % | 1.97 | % | 15.41 | % | ||||||
| Ratios and supplemental data: | ||||||||||||
| Net assets at end of period (000's) | $ | 517 | $ | 721 | $ | 193 | ||||||
| Ratio to average net assets: | ||||||||||||
| Net expenses | 0.84 | % | 0.84 | % | 0.84 | % | ||||||
| Gross expenses | 2.91 | % | 2.91 | % | 2.50 | % | ||||||
| Net investment income | 1.61 | % | 1.92 | % | 1.52 | % | ||||||
| Portfolio turnover rate | 56 | % | 64 | % | 160 | % | ||||||
Touchstone International Fixed Income Fund—Institutional Class
Selected Data for a Share Outstanding Throughout Each Period
| Year Ended September 30, | ||||||||||||
| 2012 | 2011 | 2010(A) | ||||||||||
| Net asset value at beginning of period | $ | 10.48 | $ | 11.37 | $ | 10.00 | ||||||
| Income (loss) from investment operations: | ||||||||||||
| Net investment income | 0.18 | (B) | 0.23 | 0.17 | ||||||||
| Net realized and unrealized gains (losses) on investments | 0.47 | (0.02 | ) | 1.37 | ||||||||
| Total from investment operations | 0.65 | 0.21 | 1.54 | |||||||||
| Distributions from: | ||||||||||||
| Net investment income | (0.42 | ) | (1.05 | ) | (0.17 | ) | ||||||
| Realized capital gains | (0.04 | ) | (0.05 | ) | — | |||||||
| Total distributions | (0.46 | ) | (1.10 | ) | (0.17 | ) | ||||||
| Net asset value at end of period | $ | 10.67 | $ | 10.48 | $ | 11.37 | ||||||
| Total return | 6.69 | % | 2.11 | % | 15.59 | % | ||||||
| Ratios and supplemental data: | ||||||||||||
| Net assets at end of period (000's) | $ | 29,297 | $ | 7,931 | $ | 7,746 | ||||||
| Ratio to average net assets: | ||||||||||||
| Net expenses | 0.69 | % | 0.69 | % | 0.69 | % | ||||||
| Gross expenses | 1.03 | % | 1.41 | % | 1.64 | % | ||||||
| Net investment income | 1.76 | % | 2.25 | % | 1.67 | % | ||||||
| Portfolio turnover rate | 56 | % | 64 | % | 160 | % | ||||||
| (A) | The Fund commenced operations on October 1, 2009. |
| (B) | Per share amounts for the year or period are calculated based on average outstanding shares. |
| (C) | The net investment income per share is based on average shares outstanding for the period or year. |
See accompanying Notes to Financial Statements.
| 157 |
Financial Highlights (Continued)
Touchstone Large Cap Relative Value Fund—Class A
Selected Data for a Share Outstanding Throughout Each Period
| Year Ended September 30, | ||||||||||||
| 2012 | 2011 | 2010(A) | ||||||||||
| Net asset value at beginning of period | $ | 10.47 | $ | 11.11 | $ | 10.00 | ||||||
| Income (loss) from investment operations: | ||||||||||||
| Net investment income | 0.11 | 0.04 | 0.05 | |||||||||
| Net realized and unrealized gains (losses) on investments | 2.37 | (0.59 | ) | 1.08 | ||||||||
| Total from investment operations | 2.48 | (0.55 | ) | 1.13 | ||||||||
| Distributions from: | ||||||||||||
| Net investment income | (0.09 | ) | (0.08 | ) | (0.02 | ) | ||||||
| Realized capital gains | (0.42 | ) | (0.01 | ) | — | |||||||
| Total distributions | (0.51 | ) | (0.09 | ) | (0.02 | ) | ||||||
| Net asset value at end of period | $ | 12.44 | $ | 10.47 | $ | 11.11 | ||||||
| Total return(B) | 24.28 | % | (5.11 | )% | 11.34 | % | ||||||
| Ratios and supplemental data: | ||||||||||||
| Net assets at end of period (000's) | $ | 1,105 | $ | 661 | $ | 476 | ||||||
| Ratio to average net assets: | ||||||||||||
| Net expenses | 1.19 | % | 1.19 | % | 1.19 | % | ||||||
| Gross expenses | 2.87 | % | 3.29 | % | 3.22 | % | ||||||
| Net investment income | 0.89 | % | 0.61 | % | 0.52 | % | ||||||
| Portfolio turnover rate | 10 | % | 22 | % | 2 | % | ||||||
Touchstone Large Cap Relative Value Fund—Class C
Selected Data for a Share Outstanding Throughout Each Period
| Year Ended September 30, | ||||||||||||
| 2012 | 2011 | 2010(A) | ||||||||||
| Net asset value at beginning of period | $ | 10.39 | $ | 11.05 | $ | 10.00 | ||||||
| Income (loss) from investment operations: | ||||||||||||
| Net investment income (loss) | 0.02 | (0.01 | ) | (0.02 | ) | |||||||
| Net realized and unrealized gains (losses) on investments | 2.35 | (0.62 | ) | 1.07 | ||||||||
| Total from investment operations | 2.37 | (0.63 | ) | 1.05 | ||||||||
| Distributions from: | ||||||||||||
| Net investment income | (0.02 | ) | (0.02 | ) | — | |||||||
| Realized capital gains | (0.42 | ) | (0.01 | ) | — | |||||||
| Total distributions | (0.44 | ) | (0.03 | ) | — | |||||||
| Net asset value at end of period | $ | 12.32 | $ | 10.39 | $ | 11.05 | ||||||
| Total return(B) | 23.33 | % | (5.78 | )% | 10.50 | % | ||||||
| Ratios and supplemental data: | ||||||||||||
| Net assets at end of period (000's) | $ | 321 | $ | 266 | $ | 235 | ||||||
| Ratio to average net assets: | ||||||||||||
| Net expenses | 1.94 | % | 1.94 | % | 1.94 | % | ||||||
| Gross expenses | 4.28 | % | 5.31 | % | 3.69 | % | ||||||
| Net investment income (loss) | 0.14 | % | (0.08 | )% | (0.24 | )% | ||||||
| Portfolio turnover rate | 10 | % | 22 | % | 2 | % | ||||||
| (A) | The Fund commenced operations on October 1, 2009. |
| (B) | Total returns shown exclude the effect of applicable sales loads. If these charges were included, the returns would be lower. |
See accompanying Notes to Financial Statements.
| 158 |
Financial Highlights (Continued)
Touchstone Large Cap Relative Value Fund—Class Y
Selected Data for a Share Outstanding Throughout Each Period
| Year Ended September 30, | ||||||||||||
| 2012 | 2011 | 2010(A) | ||||||||||
| Net asset value at beginning of period | $ | 10.42 | $ | 11.12 | $ | 10.00 | ||||||
| Income (loss) from investment operations: | ||||||||||||
| Net investment income | 0.14 | 0.15 | 0.09 | |||||||||
| Net realized and unrealized gains (losses) on investments | 2.37 | (0.66 | ) | 1.07 | ||||||||
| Total from investment operations | 2.51 | (0.51 | ) | 1.16 | ||||||||
| Distributions from: | ||||||||||||
| Net investment income | (0.12 | ) | (0.18 | ) | (0.04 | ) | ||||||
| Realized capital gains | (0.42 | ) | (0.01 | ) | — | |||||||
| Total distributions | (0.54 | ) | (0.19 | ) | (0.04 | ) | ||||||
| Net asset value at end of period | $ | 12.39 | $ | 10.42 | $ | 11.12 | ||||||
| Total return | 24.70 | % | (4.84 | )% | 11.58 | % | ||||||
| Ratios and supplemental data: | ||||||||||||
| Net assets at end of period (000's) | $ | 3,209 | $ | 2,415 | $ | 112 | ||||||
| Ratio to average net assets: | ||||||||||||
| Net expenses | 0.94 | % | 0.94 | % | 0.94 | % | ||||||
| Gross expenses | 1.42 | % | 2.01 | % | 2.77 | % | ||||||
| Net investment income | 1.14 | % | 1.05 | % | 0.78 | % | ||||||
| Portfolio turnover rate | 10 | % | 22 | % | 2 | % | ||||||
Touchstone Large Cap Relative Value Fund—Institutional Class
Selected Data for a Share Outstanding Throughout Each Period
| Year Ended September 30, | ||||||||||||
| 2012 | 2011 | 2010(A) | ||||||||||
| Net asset value at beginning of period | $ | 10.42 | $ | 11.13 | $ | 10.00 | ||||||
| Income (loss) from investment operations: | ||||||||||||
| Net investment income | 0.13 | 0.13 | 0.10 | |||||||||
| Net realized and unrealized gains (losses) on investments | 2.39 | (0.62 | ) | 1.08 | ||||||||
| Total from investment operations | 2.52 | (0.49 | ) | 1.18 | ||||||||
| Distributions from: | ||||||||||||
| Net investment income | (0.13 | ) | (0.21 | ) | (0.05 | ) | ||||||
| Realized capital gains | (0.42 | ) | (0.01 | ) | — | |||||||
| Total distributions | (0.55 | ) | (0.22 | ) | (0.05 | ) | ||||||
| Net asset value at end of period | $ | 12.39 | $ | 10.42 | $ | 11.13 | ||||||
| Total return | 24.89 | % | (4.71 | )% | 11.76 | % | ||||||
| Ratios and supplemental data: | ||||||||||||
| Net assets at end of period (000's) | $ | 29,752 | $ | 2,876 | $ | 3,018 | ||||||
| Ratio to average net assets: | ||||||||||||
| Net expenses | 0.79 | % | 0.79 | % | 0.79 | % | ||||||
| Gross expenses | 1.20 | % | 1.74 | % | 2.48 | % | ||||||
| Net investment income | 1.29 | % | 1.08 | % | 0.93 | % | ||||||
| Portfolio turnover rate | 10 | % | 22 | % | 2 | % | ||||||
| (A) | The Fund commenced operations on October 1, 2009. |
See accompanying Notes to Financial Statements.
| 159 |
Financial Highlights (Continued)
Touchstone Market Neutral Equity Fund—Class A
Selected Data for a Share Outstanding Throughout Each Period
| Year Ended September 30, | ||||||||||||
| 2012 | 2011 | 2010(A) | ||||||||||
| Net asset value at beginning of period | $ | 9.90 | $ | 9.73 | $ | 10.00 | ||||||
| Income (loss) from investment operations: | ||||||||||||
| Net investment loss | (0.20 | )(B) | (0.03 | ) | (0.13 | ) | ||||||
| Net realized and unrealized gains (losses) on investments | (0.29 | ) | 0.20 | (0.14 | ) | |||||||
| Total from investment operations | (0.49 | ) | 0.17 | (0.27 | ) | |||||||
| Net asset value at end of period | $ | 9.41 | $ | 9.90 | $ | 9.73 | ||||||
| Total return(C) | (4.85 | )% | 1.75 | % | (2.70 | )% | ||||||
| Net assets at end of period (000's) | $ | 591 | $ | 3,383 | $ | 610 | ||||||
| Ratio to average net assets: | ||||||||||||
| Net expenses (including dividend expense on securities sold short)(D) | 3.52 | % | 2.80 | % | 2.79 | % | ||||||
| Gross expenses (including dividend expense on securities sold short)(E) | 4.39 | % | 4.13 | % | 3.89 | % | ||||||
| Net investment loss | (2.02 | )% | (2.04 | )% | (1.38 | )% | ||||||
| Portfolio turnover rate | 109 | % | 125 | % | 377 | % | ||||||
Touchstone Market Neutral Equity Fund—Class C
Selected Data for a Share Outstanding Throughout Each Period
| Year Ended September 30, | ||||||||||||
| 2012 | 2011 | 2010(A) | ||||||||||
| Net asset value at beginning of period | $ | 9.76 | $ | 9.66 | $ | 10.00 | ||||||
| Income (loss) from investment operations: | ||||||||||||
| Net investment loss | (0.26 | )(B) | (0.26 | ) | (0.16 | ) | ||||||
| Net realized and unrealized gains (losses) on investments | (0.29 | ) | 0.36 | (0.18 | ) | |||||||
| Total from investment operations | (0.55 | ) | 0.10 | (0.34 | ) | |||||||
| Net asset value at end of period | $ | 9.21 | $ | 9.76 | $ | 9.66 | ||||||
| Total return(C) | (5.64 | )% | 1.04 | % | (3.40 | )% | ||||||
| Net assets at end of period (000's) | $ | 183 | $ | 184 | $ | 168 | ||||||
| Ratio to net average net assets: | ||||||||||||
| Net expenses (including dividend expense on securities sold short)(F) | 4.27 | % | 3.57 | % | 3.40 | % | ||||||
| Gross expenses (including dividend expense on securities sold short)(G) | 11.08 | % | 9.53 | % | 4.48 | % | ||||||
| Net investment loss | (2.77 | )% | (2.64 | )% | (2.18 | )% | ||||||
| Portfolio turnover rate | 109 | % | 125 | % | 377 | % | ||||||
| (A) | The Fund commenced operations on October 1, 2009. |
| (B) | Per share amounts for the year or period are calculated based on average outstanding shares. |
| (C) | Total returns shown exclude the effect of applicable sales loads. If these charges were included, the returns would be lower. |
| (D) | The ratio of net expenses to average net assets excluding dividend expense on securities sold short is 1.50%, 1.50% and 1.61% for the years ended September 2012, 2011 and for the period ended September 2010, respectively. |
| (E) | The ratio of gross expenses to average net assets excluding dividend expense on securities sold short is 2.37%, 2.83% and 2.70% on the years ended September 2012, 2011 and for the period ended September 2010, respectively. |
| (F) | The ratio of net expenses to average net assets excluding dividend expense on securities sold short is 2.25%, 2.25% and 2.37% for the years ended September 2012, 2011 and for the period ended September 2010, respectively. |
| (G) | The ratio of gross expenses to average net assets excluding dividend expense on securities sold short is 9.06%, 8.21% and 3.44% for the years ended 2012, 2011 and for the period ended September 2010, respectively. |
See accompanying Notes to Financial Statements.
| 160 |
Financial Highlights (Continued)
Touchstone Market Neutral Equity Fund—Class Y
Selected Data for a Share Outstanding Throughout Each Period
| Year Ended September 30, | ||||||||||||
| 2012 | 2011 | 2010(A) | ||||||||||
| Net asset value at beginning of period | $ | 9.96 | $ | 9.75 | $ | 10.00 | ||||||
| Income (loss) from investment operations: | ||||||||||||
| Net investment loss | (0.17 | )(B) | (0.14 | ) | (0.04 | ) | ||||||
| Net realized and unrealized gains (losses) on investments | (0.30 | ) | 0.35 | (0.21 | ) | |||||||
| Total from investment operations | (0.47 | ) | 0.21 | (0.25 | ) | |||||||
| Net asset value at end of period | $ | 9.49 | $ | 9.96 | $ | 9.75 | ||||||
| Total return | (4.62 | )% | 2.15 | % | (2.50 | )% | ||||||
| Net assets at end of period (000's) | $ | 39,428 | $ | 40,335 | $ | 32,406 | ||||||
| Ratio to average net assets: | ||||||||||||
| Net expenses (including dividend expense on securities sold short)(C) | 3.27 | % | 2.57 | % | 2.48 | % | ||||||
| Gross expenses (including dividend expense on securities sold short)(D) | 3.66 | % | 3.05 | % | 3.39 | % | ||||||
| Net investment loss | (1.77 | )% | (1.64 | )% | (1.15 | )% | ||||||
| Portfolio turnover rate | 109 | % | 125 | % | 377 | % | ||||||
| (A) | The Fund commenced operations on October 1, 2009. |
| (B) | Per share amounts for the year or period are calculated based on average outstanding shares. |
| (C) | The ratio of net expenses to average net assets excluding dividend expense on securities sold short is 1.25%, 1.25% and 1.38% for the years ended September 2012, 2011 and for the period ended September 2010, respectively. |
| (D) | The ratio of gross expenses to average net assets excluding dividend expense on securities sold short is 1.64%, 1.73% and 2.29% for the years ended 2012, 2011 and for the period ended September 2010, respectively. |
See accompanying Notes to Financial Statements.
| 161 |
Financial Highlights (Continued)
Touchstone Merger Arbitrage Fund—Class A
Selected Data for a Share Outstanding Throughout Each Period
| Year | Period | |||||||
| Ended | Ended | |||||||
| September | September | |||||||
| 30, | 30, | |||||||
| 2012 | 2011(A) | |||||||
| Net asset value at beginning of period | $ | 10.02 | $ | 10.00 | ||||
| Income (loss) from investment operations: | ||||||||
| Net investment loss | (0.09 | )(B) | — | (C) | ||||
| Net realized and unrealized gains on investments | 0.73 | 0.02 | ||||||
| Total from investment operations | 0.64 | 0.02 | ||||||
| Distributions from: | ||||||||
| Net investment income | — | (C) | — | |||||
| Realized capital gains | (0.01 | ) | — | |||||
| Total distributions | (0.01 | ) | — | |||||
| Net asset value at end of period | $ | 10.65 | $ | 10.02 | ||||
| Total return(D) | 6.35 | % | 0.30 | %(E) | ||||
| Ratios and supplemental data: | ||||||||
| Net assets at end of period (000's) | $ | 150,148 | $ | 260 | ||||
| Ratio to average net assets: | ||||||||
| Net expenses (including dividend expense on securities sold short)(F) | 1.96 | % | 3.33 | %(G) | ||||
| Gross expenses (including dividend expense on securities sold short)(H) | 1.97 | % | 28.67 | %(G) | ||||
| Net investment loss | (0.90 | )% | (1.97 | )%(G) | ||||
| Portfolio turnover rate | 307 | % | 311 | %(E) | ||||
| (A) | Represents the period from commencement of operations (August 9, 2011) through September 30, 2011. |
| (B) | Per share amounts for the year or period are calculated based on average outstanding shares. |
| (C) | Amount rounds to less than $0.005. |
| (D) | Total returns shown exclude the effect of applicable sales loads. If these charges were included, the returns would be lower. |
| (E) | Not annualized. |
| (F) | The ratio of net expenses to average net assets excluding dividend expense on securities sold short is 1.65% and 1.69% for the year ended September 2012 and for the period ended September 2011, respectively. |
| (G) | Annualized. |
| (H) | The ratio of gross expenses to average net assets excluding dividend expense on securities sold short is 1.66% and 27.03% for the year ended September 2012 and for the period ended September 2011, respectively. |
See accompanying Notes to Financial Statements.
| 162 |
Financial Highlights (Continued)
Touchstone Merger Arbitrage Fund—Class C
Selected Data for a Share Outstanding Throughout Each Period
| Year | Period | |||||||
| Ended | Ended | |||||||
| September | September | |||||||
| 30, | 30, | |||||||
| 2012 | 2011(A) | |||||||
| Net asset value at beginning of period | $ | 10.01 | $ | 10.00 | ||||
| Income (loss) from investment operations: | ||||||||
| Net investment loss | (0.17 | )(B) | (0.01 | ) | ||||
| Net realized and unrealized gains on investments | 0.71 | 0.02 | ||||||
| Total from investment operations | 0.54 | 0.01 | ||||||
| Distributions from: | ||||||||
| Net investment income | — | (C) | — | |||||
| Realized capital gains | (0.01 | ) | — | |||||
| Total distributions | (0.01 | ) | — | |||||
| Net asset value at end of period | $ | 10.54 | $ | 10.01 | ||||
| Total return(D) | 5.56 | % | 0.10 | %(E) | ||||
| Ratios and supplemental data: | ||||||||
| Net assets at end of period (000's) | $ | 25,739 | $ | 254 | ||||
| Ratio to average net assets: | ||||||||
| Net expenses (including dividend expense on securities sold short)(F) | 2.74 | % | 4.23 | %(G) | ||||
| Gross expenses (including dividend expense on securities sold short)(H) | 2.75 | % | 29.58 | %(G) | ||||
| Net investment loss | (1.68 | )% | (2.74 | )%(G) | ||||
| Portfolio turnover rate | 307 | % | 311 | %(E) | ||||
| (A) | Represents the period from commencement of operations (August 9, 2011) through September 30, 2011. |
| (B) | Per share amounts for the year or period are calculated based on average outstanding shares. |
| (C) | Amount rounds to less than $0.005. |
| (D) | Total returns shown exclude the effect of applicable sales loads. If these charges were included, the returns would be lower. |
| (E) | Not annualized. |
| (F) | The ratio of net expenses to average net assets excluding dividend expense on securities sold short is 2.43% and 2.43% for the year ended September 2012 and for the period ended September 2011, respectively. |
| (G) | Annualized. |
| (H) | The ratio of gross expenses to average net assets excluding dividend expense on securities sold short is 2.44% and 27.78% for the year ended September 2012 and for the period ended September 2011, respectively. |
See accompanying Notes to Financial Statements.
| 163 |
Financial Highlights (Continued)
Touchstone Merger Arbitrage Fund—Class Y
Selected Data for a Share Outstanding Throughout Each Period
| Year | Period | |||||||
| Ended | Ended | |||||||
| September | September | |||||||
| 30, | 30, | |||||||
| 2012 | 2011(A) | |||||||
| Net asset value at beginning of period | $ | 10.02 | $ | 10.00 | ||||
| Income (loss) from investment operations: | ||||||||
| Net investment loss | (0.07 | )(B) | (0.01 | ) | ||||
| Net realized and unrealized gains on investments | 0.74 | 0.03 | ||||||
| Total from investment operations | 0.67 | 0.02 | ||||||
| Distributions from: | ||||||||
| Net investment income | — | (C) | — | |||||
| Realized capital gains | (0.01 | ) | — | |||||
| Total distributions | (0.01 | ) | — | |||||
| Net asset value at end of period | $ | 10.68 | $ | 10.02 | ||||
| Total return | 6.75 | % | 0.20 | %(D) | ||||
| Net assets at end of period (000's) | $ | 90,741 | $ | 1,160 | ||||
| Ratio to average net assets: | ||||||||
| Net expenses (including dividend expense on securities sold short)(E) | 1.68 | % | 2.74 | %(F) | ||||
| Gross expenses (including dividend expense on securities sold short)(G) | 1.70 | % | 8.22 | %(F) | ||||
| Net investment loss | (0.62 | )% | (1.65 | )%(F) | ||||
| Portfolio turnover rate | 307 | % | 311 | %(D) | ||||
| (A) | Represents the period from commencement of operations (August 9, 2011) through September 30, 2011. |
| (B) | Per share amounts for the year or period are calculated based on average outstanding shares. |
| (C) | Amount rounds to less than $0.005. |
| (D) | Not annualized. |
| (E) | The ratio of net expenses to average net assets excluding dividend expense on securities sold short is 1.37% and 1.43% for the year ended September 2012 and for the period ended 2011, respectively. |
| (F) | Annualized. |
| (G) | The ratio of gross expenses to average net assets excluding dividend expense on securities sold short is 1.39% and 6.91% for the year ended September 2012 and for the period ended September 2011, respectively. |
See accompanying Notes to Financial Statements.
| 164 |
Financial Highlights (Continued)
Touchstone Merger Arbitrage Fund—Institutional Class
Selected Data for a Share Outstanding Throughout Each Period
| Year | Period | |||||||
| Ended | Ended | |||||||
| September | September | |||||||
| 30, | 30, | |||||||
| 2012 | 2011(A) | |||||||
| Net asset value at beginning of period | $ | 10.03 | $ | 10.00 | ||||
| Income (loss) from investment operations: | ||||||||
| Net investment loss | (0.06 | )(B) | (0.02 | ) | ||||
| Net realized and unrealized gains on investments | 0.73 | 0.05 | ||||||
| Total from investment operations | 0.67 | 0.03 | ||||||
| Distributions from: | ||||||||
| Net investment income | — | (C) | — | |||||
| Realized capital gains | (0.01 | ) | — | |||||
| Total distributions | (0.01 | ) | — | |||||
| Net asset value at end of period | $ | 10.69 | $ | 10.03 | ||||
| Total return | 6.75 | % | 0.30 | %(D) | ||||
| Net assets at end of period (000's) | $ | 79,164 | $ | 5,016 | ||||
| Ratio to average net assets: | ||||||||
| Net expenses (including dividend expense on securities sold short)(E) | 1.59 | % | 1.86 | %(F) | ||||
| Gross expenses (including dividend expense on securities sold short)(G) | 1.62 | % | 4.83 | %(F) | ||||
| Net investment loss | (0.53 | )% | (1.13 | )%(F) | ||||
| Portfolio turnover rate | 307 | % | 311 | %(D) | ||||
| (A) | Represents the period from commencement of operations (August 9, 2011) through September 30, 2011. |
| (B) | Per share amounts for the year or period are calculated based on average outstanding shares. |
| (C) | Amount rounds to less than $0.005. |
| (D) | Not annualized. |
| (E) | The ratio of net expenses to average net assets excluding dividend expense on securities sold short is 1.28% and 1.28% for the year ended September 2012 and for the period ended September 2011, respectively. |
| (F) | Annualized. |
| (G) | The ratio of gross expenses to average net assets excluding dividend expense on securities sold short is 1.31% and 4.25% for the year ended September 2012 and for the period ended September 2011, respectively. |
See accompanying Notes to Financial Statements.
| 165 |
Financial Highlights (Continued)
Touchstone Mid Cap Fund—Class A
Selected Data for a Share Outstanding Throughout Each Period
| Year Ended September 30, | ||||||||||||||||||||
| 2012 | 2011 | 2010 | 2009 | 2008 | ||||||||||||||||
| Net asset value at beginning of period | $ | 13.16 | $ | 12.67 | $ | 11.20 | $ | 13.07 | $ | 17.86 | ||||||||||
| Income (loss) from investment operations: | 0.10 | (A) | (0.02 | ) | 0.29 | 0.04 | (0.02 | ) | ||||||||||||
| Net investment income (loss) | ||||||||||||||||||||
| Net realized and unrealized gains (losses) on investments | 3.31 | 0.51 | 1.24 | (1.85 | ) | (4.60 | ) | |||||||||||||
| Total from investment operations | 3.41 | 0.49 | 1.53 | (1.81 | ) | (4.62 | ) | |||||||||||||
| Distributions from: | ||||||||||||||||||||
| Net investment income | (0.02 | ) | — | (0.06 | ) | (0.03 | ) | — | ||||||||||||
| Realized capital gains | — | — | — | (0.03 | ) | (0.17 | ) | |||||||||||||
| Total distributions | (0.02 | ) | — | (0.06 | ) | (0.06 | ) | (0.17 | ) | |||||||||||
| Net asset value at end of period | $ | 16.55 | $ | 13.16 | $ | 12.67 | $ | 11.20 | $ | 13.07 | ||||||||||
| Total return(B) | 25.95 | % | 3.87 | % | 13.72 | % | (13.81 | )% | (26.11 | )% | ||||||||||
| Ratios and supplemental data: | ||||||||||||||||||||
| Net assets at end of period (000's) | $ | 905 | $ | 698 | $ | 685 | $ | 453 | $ | 159 | ||||||||||
| Ratio to average net assets: | ||||||||||||||||||||
| Net expenses | 1.21 | % | 1.21 | % | 1.21 | % | 1.15 | % | 1.15 | % | ||||||||||
| Gross expenses | 3.50 | % | 3.05 | % | 2.84 | % | 3.84 | % | 4.09 | % | ||||||||||
| Net investment income (loss) | 0.66 | % | (0.02 | )% | 0.34 | % | 0.39 | % | (0.16 | )% | ||||||||||
| Portfolio turnover rate | 152 | % | 97 | % | 132 | % | 187 | % | 157 | % | ||||||||||
Touchstone Mid Cap Fund—Class C
Selected Data for a Share Outstanding Throughout Each Period
| Year Ended September 30, | ||||||||||||||||||||
| 2012 | 2011 | 2010 | 2009 | 2008 | ||||||||||||||||
| Net asset value at beginning of period | $ | 12.96 | $ | 12.58 | $ | 11.19 | $ | 13.12 | $ | 17.84 | ||||||||||
| Income (loss) from investment operations: | ||||||||||||||||||||
| Net investment loss | (0.01 | )(A)(C) | (0.07 | ) | (0.04 | ) | (0.03 | ) | (0.15 | ) | ||||||||||
| Net realized and unrealized gains (losses) on investments | 3.26 | 0.45 | 1.43 | (1.87 | ) | (4.40 | ) | |||||||||||||
| Total from investment operations | 3.25 | 0.38 | 1.39 | (1.90 | ) | (4.55 | ) | |||||||||||||
| Distributions from: | ||||||||||||||||||||
| Realized capital gains | — | — | — | (0.03 | ) | (0.17 | ) | |||||||||||||
| Net asset value at end of period | $ | 16.21 | $ | 12.96 | $ | 12.58 | $ | 11.19 | $ | 13.12 | ||||||||||
| Total return(B) | 25.08 | % | 3.02 | % | 12.42 | % | (14.47 | )% | (25.74 | )% | ||||||||||
| Ratios and supplemental data: | ||||||||||||||||||||
| Net assets at end of period (000's) | $ | 962 | $ | 476 | $ | 249 | $ | 169 | $ | 30 | ||||||||||
| Ratio to average net assets: | ||||||||||||||||||||
| Net expenses | 1.96 | % | 1.96 | % | 1.94 | % | 1.90 | % | 1.90 | % | ||||||||||
| Gross expenses | 4.62 | % | 4.95 | % | 4.57 | % | 6.99 | % | 31.40 | % | ||||||||||
| Net investment loss | (0.09 | )%(C) | (0.80 | )% | (0.40 | )% | (0.38 | )% | (0.91 | )% | ||||||||||
| Portfolio turnover rate | 152 | % | 97 | % | 132 | % | 187 | % | 157 | % | ||||||||||
| (A) | Per share amounts for the year or period are calculated based on average outstanding shares. |
| (B) | Total returns shown exclude the effect of applicable sales loads. If these charges were included, the returns would be lower. |
| (C) | Amount rounds to less than $0.005 per share or 0.005%. |
See accompanying Notes to Financial Statements.
| 166 |
Financial Highlights (Continued)
Touchstone Mid Cap Fund—Class Y
Selected Data for a Share Outstanding Throughout Each Period
| Year Ended September 30, | ||||||||||||||||||||
| 2012 | 2011 | 2010 | 2009 | 2008 | ||||||||||||||||
| Net asset value at beginning of period | $ | 13.17 | $ | 12.68 | $ | 11.25 | $ | 13.14 | $ | 17.91 | ||||||||||
| Income (loss) from investment operations: | ||||||||||||||||||||
| Net investment income | 0.15 | (A) | 0.05 | 0.08 | 0.07 | 0.01 | ||||||||||||||
| Net realized and unrealized gains (losses) on investments | 3.31 | 0.47 | 1.44 | (1.88 | ) | (4.61 | ) | |||||||||||||
| Total from investment operations | 3.46 | 0.52 | 1.52 | (1.81 | ) | (4.60 | ) | |||||||||||||
| Distributions from: | ||||||||||||||||||||
| Net investment income | (0.03 | ) | (0.03 | ) | (0.09 | ) | (0.05 | ) | — | |||||||||||
| Realized capital gains | — | — | — | (0.03 | ) | (0.17 | ) | |||||||||||||
| Total distributions | (0.03 | ) | (0.03 | ) | (0.09 | ) | (0.08 | ) | (0.17 | ) | ||||||||||
| Net asset value at end of period | $ | 16.60 | $ | 13.17 | $ | 12.68 | $ | 11.25 | $ | 13.14 | ||||||||||
| Total return | 26.29 | % | 4.10 | % | 13.58 | % | (13.68 | )% | (25.92 | )% | ||||||||||
| Ratios and supplemental data: | ||||||||||||||||||||
| Net assets at end of period (000's) | $ | 47,419 | $ | 77,785 | $ | 123,493 | $ | 168,313 | $ | 422,356 | ||||||||||
| Ratio to average net assets: | ||||||||||||||||||||
| Net expenses | 0.92 | % | 0.96 | % | 0.94 | % | 0.90 | % | 0.90 | % | ||||||||||
| Gross expenses | 1.08 | % | 1.06 | % | 1.07 | % | 1.05 | % | 1.03 | % | ||||||||||
| Net investment income | 0.95 | % | 0.26 | % | 0.71 | % | 0.61 | % | 0.09 | % | ||||||||||
| Portfolio turnover rate | 152 | % | 97 | % | 132 | % | 187 | % | 157 | % | ||||||||||
Touchstone Mid Cap Fund—Class Z
Selected Data for a Share Outstanding Throughout Each Period
| Year Ended September 30, | ||||||||||||||||||||
| 2012 | 2011 | 2010 | 2009 | 2008 | ||||||||||||||||
| Net asset value at beginning of period | $ | 13.08 | $ | 12.59 | $ | 11.18 | $ | 13.05 | $ | 17.85 | ||||||||||
| Income (loss) from investment operations: | ||||||||||||||||||||
| Net investment income (loss) | 0.10 | (A) | — | (B) | 0.02 | 0.03 | (0.08 | ) | ||||||||||||
| Net realized and unrealized gains (losses) on investments | 3.28 | 0.49 | 1.45 | (1.84 | ) | (4.55 | ) | |||||||||||||
| Total from investment operations | 3.38 | 0.49 | 1.47 | (1.81 | ) | (4.63 | ) | |||||||||||||
| Distributions from: | ||||||||||||||||||||
| Net investment income | (0.01 | ) | — | (0.06 | ) | (0.03 | ) | — | ||||||||||||
| Realized capital gains | — | — | — | (0.03 | ) | (0.17 | ) | |||||||||||||
| Total distributions | (0.01 | ) | — | (0.06 | ) | (0.06 | ) | (0.17 | ) | |||||||||||
| Net asset value at end of period | $ | 16.45 | $ | 13.08 | $ | 12.59 | $ | 11.18 | $ | 13.05 | ||||||||||
| Total return | 25.89 | % | 3.89 | % | 13.20 | % | (13.83 | )% | (26.18 | )% | ||||||||||
| Ratios and supplemental data: | ||||||||||||||||||||
| Net assets at end of period (000's) | $ | 267 | $ | 934 | $ | 652 | $ | 1,814 | $ | 3,267 | ||||||||||
| Ratio to average net assets: | ||||||||||||||||||||
| Net expenses | 1.21 | % | 1.21 | % | 1.19 | % | 1.15 | % | 1.15 | % | ||||||||||
| Gross expenses | 3.67 | % | 3.68 | % | 2.14 | % | 2.22 | % | 1.48 | % | ||||||||||
| Net investment income (loss) | 0.66 | % | (0.09 | )% | 0.45 | % | 0.39 | % | (0.27 | )% | ||||||||||
| Portfolio turnover rate | 152 | % | 97 | % | 132 | % | 187 | % | 157 | % | ||||||||||
| (A) | Per share amounts for the year or period are calculated based on average outstanding shares. |
| (B) | Amount rounds to less than $0.005 per share. |
See accompanying Notes to Financial Statements.
| 167 |
Financial Highlights (Continued)
Touchstone Mid Cap Fund—Institutional Class
Selected Data for a Share Outstanding Throughout The Period
| Period | ||||
| Ended | ||||
| September | ||||
| 30, | ||||
| 2012(A) | ||||
| Net asset value at beginning of period | $ | 15.36 | ||
| Income from investment operations: | ||||
| Net investment income | 0.10 | (B) | ||
| Net realized and unrealized gains on investments | 1.15 | |||
| Total from investment operations | 1.25 | |||
| Net asset value at end of period | $ | 16.61 | ||
| Total return | 8.14 | %(C) | ||
| Ratios and supplemental data: | ||||
| Net assets at end of period (000's) | $ | 12,231 | ||
| Ratio to average net assets: | ||||
| Net expenses | 0.89 | %(D) | ||
| Gross expenses | 1.38 | %(D) | ||
| Net investment income | 0.98 | %(D) | ||
| Portfolio turnover rate | 152 | % | ||
| (A) | Represents the period from commencement of operations (January 27, 2012) through September 30, 2012. |
| (B) | Per share amounts for the year or period are calculated based on average outstanding shares. |
| (C) | Not annualized. |
| (D) | Annualized. |
See accompanying Notes to Financial Statements.
| 168 |
Financial Highlights (Continued)
Touchstone Mid Cap Value Fund—Class A
Selected Data for a Share Outstanding Throughout Each Period
| Year Ended September 30, | ||||||||||||
| 2012 | 2011 | 2010(A) | ||||||||||
| Net asset value at beginning of period | $ | 10.86 | $ | 11.76 | $ | 10.00 | ||||||
| Income (loss) from investment operations: | ||||||||||||
| Net investment income | 0.09 | 0.09 | 0.12 | |||||||||
| Net realized and unrealized gains (losses) on investments | 2.78 | (0.72 | ) | 1.74 | ||||||||
| Total from investment operations | 2.87 | (0.63 | ) | 1.86 | ||||||||
| Distributions from: | ||||||||||||
| Net investment income | (0.09 | ) | (0.11 | ) | (0.10 | ) | ||||||
| Realized capital gains | (0.66 | ) | (0.16 | ) | — | |||||||
| Total distributions | (0.75 | ) | (0.27 | ) | (0.10 | ) | ||||||
| Net asset value at end of period | $ | 12.98 | $ | 10.86 | $ | 11.76 | ||||||
| Total return(B) | 27.55 | % | (5.72 | )% | 18.70 | % | ||||||
| Ratios and supplemental data: | ||||||||||||
| Net assets at end of period (000's) | $ | 3,409 | $ | 2,364 | $ | 345 | ||||||
| Ratio to average net assets: | ||||||||||||
| Net expenses | 1.29 | % | 1.29 | % | 1.29 | % | ||||||
| Gross expenses | 1.97 | % | 2.07 | % | 3.07 | % | ||||||
| Net investment income | 0.77 | % | 0.86 | % | 1.07 | % | ||||||
| Portfolio turnover rate | 42 | % | 59 | % | 45 | % | ||||||
Touchstone Mid Cap Value Fund—Class C
Selected Data for a Share Outstanding Throughout Each Period
| Year Ended September 30, | ||||||||||||
| 2012 | 2011 | 2010(A) | ||||||||||
| Net asset value at beginning of period | $ | 10.82 | $ | 11.74 | $ | 10.00 | ||||||
| Income (loss) from investment operations: | ||||||||||||
| Net investment income | — | 0.03 | 0.03 | |||||||||
| Net realized and unrealized gains (losses) on investments | 2.77 | (0.75 | ) | 1.75 | ||||||||
| Total from investment operations | 2.77 | (0.72 | ) | 1.78 | ||||||||
| Distributions from: | ||||||||||||
| Net investment income | (0.01 | ) | (0.04 | ) | (0.04 | ) | ||||||
| Realized capital gains | (0.66 | ) | (0.16 | ) | — | |||||||
| Total distributions | (0.67 | ) | (0.20 | ) | (0.04 | ) | ||||||
| Net asset value at end of period | $ | 12.92 | $ | 10.82 | $ | 11.74 | ||||||
| Total return(B) | 26.64 | % | (6.45 | )% | 17.88 | % | ||||||
| Ratios and supplemental data: | ||||||||||||
| Net assets at end of period (000's) | $ | 292 | $ | 204 | $ | 132 | ||||||
| Ratio to average net assets: | ||||||||||||
| Net expenses | 2.04 | % | 2.04 | % | 2.04 | % | ||||||
| Gross expenses | 7.90 | % | 7.74 | % | 3.86 | % | ||||||
| Net investment income | 0.02 | % | 0.10 | % | 0.27 | % | ||||||
| Portfolio turnover rate | 42 | % | 59 | % | 45 | % | ||||||
| (A) | The Fund commenced operations on October 1, 2009. |
| (B) | Total returns shown exclude the effect of applicable sales loads. If these charges were included, the returns would be lower. |
See accompanying Notes to Financial Statements.
| 169 |
Financial Highlights (Continued)
Touchstone Mid Cap Value Fund—Class Y
Selected Data for a Share Outstanding Throughout Each Period
| Year Ended September 30, | ||||||||||||
| 2012 | 2011 | 2010(A) | ||||||||||
| Net asset value at beginning of period | $ | 10.89 | $ | 11.79 | $ | 10.00 | ||||||
| Income (loss) from investment operations: | ||||||||||||
| Net investment income | 0.11 | 0.12 | 0.14 | |||||||||
| Net realized and unrealized gains (losses) on investments | 2.81 | (0.72 | ) | 1.76 | ||||||||
| Total from investment operations | 2.92 | (0.60 | ) | 1.90 | ||||||||
| Distributions from: | ||||||||||||
| Net investment income | (0.12 | ) | (0.14 | ) | (0.11 | ) | ||||||
| Realized capital gains | (0.66 | ) | (0.16 | ) | — | |||||||
| Total distributions | (0.78 | ) | (0.30 | ) | (0.11 | ) | ||||||
| Net asset value at end of period | $ | 13.03 | $ | 10.89 | $ | 11.79 | ||||||
| Total return | 27.97 | % | (5.51 | )% | 19.07 | % | ||||||
| Ratios and supplemental data: | ||||||||||||
| Net assets at end of period (000's) | $ | 13,785 | $ | 4,685 | $ | 589 | ||||||
| Ratio to average net assets: | ||||||||||||
| Net expenses | 1.04 | % | 1.04 | % | 1.04 | % | ||||||
| Gross expenses | 1.46 | % | 1.58 | % | 3.19 | % | ||||||
| Net investment income | 1.02 | % | 1.20 | % | 1.40 | % | ||||||
| Portfolio turnover rate | 42 | % | 59 | % | 45 | % | ||||||
Touchstone Mid Cap Value Fund—Institutional Class
Selected Data for a Share Outstanding Throughout Each Period
| Year Ended September 30, | ||||||||||||
| 2012 | 2011 | 2010(A) | ||||||||||
| Net asset value at beginning of period | $ | 10.92 | $ | 11.83 | $ | 10.00 | ||||||
| Income (loss) from investment operations: | ||||||||||||
| Net investment income | 0.13 | 0.16 | 0.10 | |||||||||
| Net realized and unrealized gains (losses) on investments | 2.82 | (0.75 | ) | 1.82 | ||||||||
| Total from investment operations | 2.95 | (0.59 | ) | 1.92 | ||||||||
| Distributions from: | ||||||||||||
| Net investment income | (0.14 | ) | (0.16 | ) | (0.09 | ) | ||||||
| Realized capital gains | (0.66 | ) | (0.16 | ) | — | |||||||
| Total distributions | (0.80 | ) | (0.32 | ) | (0.09 | ) | ||||||
| Net asset value at end of period | $ | 13.07 | $ | 10.92 | $ | 11.83 | ||||||
| Total return | 28.17 | % | (5.41 | )% | 19.25 | % | ||||||
| Ratios and supplemental data: | ||||||||||||
| Net assets at end of period (000's) | $ | 75,240 | $ | 39,808 | $ | 39,509 | ||||||
| Ratio to average net assets: | ||||||||||||
| Net expenses | 0.89 | % | 0.89 | % | 0.89 | % | ||||||
| Gross expenses | 1.12 | % | 1.15 | % | 1.93 | % | ||||||
| Net investment income | 1.17 | % | 1.21 | % | 1.66 | % | ||||||
| Portfolio turnover rate | 42 | % | 59 | % | 45 | % | ||||||
| (A) | The Fund commenced operations on October 1, 2009. |
See accompanying Notes to Financial Statements.
| 170 |
Financial Highlights (Continued)
Touchstone Premium Yield Equity Fund—Class A
| Selected Data for a Share Outstanding Throughout Each Period |
| Period | ||||||||||||||||||||
| Ended | ||||||||||||||||||||
| September | ||||||||||||||||||||
| Year Ended September 30, | 30, | |||||||||||||||||||
| 2012 | 2011 | 2010 | 2009 | 2008(A) | ||||||||||||||||
| Net asset value at beginning of period | $ | 6.76 | $ | 6.48 | $ | 5.93 | $ | 7.56 | $ | 10.00 | ||||||||||
| Income (loss) from investment operations: | ||||||||||||||||||||
| Net investment income | 0.24 | 0.21 | 0.21 | 0.22 | 0.33 | |||||||||||||||
| Net realized and unrealized gains (losses) on investments | 1.36 | 0.28 | 0.54 | (1.64 | ) | (2.44 | ) | |||||||||||||
| Total from investment operations | 1.60 | 0.49 | 0.75 | (1.42 | ) | (2.11 | ) | |||||||||||||
| Distributions from: | ||||||||||||||||||||
| Net investment income | (0.24 | ) | (0.21 | ) | (0.20 | ) | (0.21 | ) | (0.32 | ) | ||||||||||
| Return of capital | (0.01 | ) | — | — | — | — | ||||||||||||||
| Realized capital gains | — | — | — | — | (0.01 | ) | ||||||||||||||
| Total distributions | (0.25 | ) | (0.21 | ) | (0.20 | ) | (0.21 | ) | (0.33 | ) | ||||||||||
| Net asset value at end of period | $ | 8.11 | $ | 6.76 | $ | 6.48 | $ | 5.93 | $ | 7.56 | ||||||||||
| Total return(B) | 23.98 | % | 7.43 | % | 12.82 | % | (18.40 | )% | (21.48 | )%(C) | ||||||||||
| Ratios and supplemental data: | ||||||||||||||||||||
| Net assets at end of period (000's) | $ | 68,780 | $ | 28,739 | $ | 22,441 | $ | 19,879 | $ | 19,411 | ||||||||||
| Ratio to average net assets: | ||||||||||||||||||||
| Net expenses | 1.20 | % | 1.20 | % | 1.20 | % | 1.20 | % | 1.20 | %(D) | ||||||||||
| Gross expenses | 1.30 | % | 1.35 | % | 1.40 | % | 1.55 | % | 1.53 | %(D) | ||||||||||
| Net investment income | 3.26 | % | 3.02 | % | 3.30 | % | 3.97 | % | 4.68 | %(D) | ||||||||||
| Portfolio turnover rate | 16 | % | 54 | % | 29 | % | 30 | % | 181 | %(C) | ||||||||||
Touchstone Premium Yield Equity Fund—Class C
| Selected Data for a Share Outstanding Throughout Each Period |
| Period | ||||||||||||||||||||
| Ended | ||||||||||||||||||||
| September | ||||||||||||||||||||
| Year Ended September 30, | 30, | |||||||||||||||||||
| 2012 | 2011 | 2010 | 2009 | 2008(A) | ||||||||||||||||
| Net asset value at beginning of period | $ | 6.76 | $ | 6.49 | $ | 5.93 | $ | 7.56 | $ | 10.00 | ||||||||||
| Income (loss) from investment operations: | ||||||||||||||||||||
| Net investment income | 0.18 | 0.16 | 0.16 | 0.10 | 0.29 | |||||||||||||||
| Net realized and unrealized gains (losses) on investments | 1.35 | 0.27 | 0.55 | (1.55 | ) | (2.45 | ) | |||||||||||||
| Total from investment operations | 1.53 | 0.43 | 0.71 | (1.45 | ) | (2.16 | ) | |||||||||||||
| Distributions from: | ||||||||||||||||||||
| Net investment income | (0.18 | ) | (0.16 | ) | (0.15 | ) | (0.18 | ) | (0.27 | ) | ||||||||||
| Return of capital | (0.01 | ) | — | — | — | — | ||||||||||||||
| Realized capital gains | — | — | — | — | (0.01 | ) | ||||||||||||||
| Total distributions | (0.19 | ) | (0.16 | ) | (0.15 | ) | (0.18 | ) | (0.28 | ) | ||||||||||
| Net asset value at end of period | $ | 8.10 | $ | 6.76 | $ | 6.49 | $ | 5.93 | $ | 7.56 | ||||||||||
| Total return(B) | 22.93 | % | 6.60 | % | 12.11 | % | (18.96 | )% | (21.95 | )%(C) | ||||||||||
| Ratios and supplemental data: | ||||||||||||||||||||
| Net assets at end of period (000's) | $ | 15,680 | $ | 7,499 | $ | 6,870 | $ | 3,319 | $ | 567 | ||||||||||
| Ratio to average net assets: | ||||||||||||||||||||
| Net expenses | 1.95 | % | 1.95 | % | 1.95 | % | 1.95 | % | 1.94 | %(D) | ||||||||||
| Gross expenses | 2.14 | % | 2.28 | % | 2.23 | % | 3.08 | % | 5.31 | %(D) | ||||||||||
| Net investment income | 2.51 | % | 2.27 | % | 2.60 | % | 2.80 | % | 3.93 | %(D) | ||||||||||
| Portfolio turnover rate | 16 | % | 54 | % | 29 | % | 30 | % | 181 | %(C) | ||||||||||
| (A) | Represents the period from commencement of operations (December 3, 2007) through September 30, 2008. |
| (B) | Total returns shown exclude the effect of applicable sales loads. If these charges were included, the returns would be lower. |
| (C) | Not annualized. |
| (D) | Annualized. |
See accompanying Notes to Financial Statements.
| 171 |
Financial Highlights (Continued)
Touchstone Premium Yield Equity Fund—Class Y
| Selected Data for a Share Outstanding Throughout Each Period |
| Period | ||||||||||||||||||||
| Ended | ||||||||||||||||||||
| September | ||||||||||||||||||||
| Year Ended September 30, | 30, | |||||||||||||||||||
| 2012 | 2011 | 2010 | 2009 | 2008(A) | ||||||||||||||||
| Net asset value at beginning of period | $ | 6.75 | $ | 6.47 | $ | 5.92 | $ | 7.55 | $ | 8.30 | ||||||||||
| Income (loss) from investment operations: | ||||||||||||||||||||
| Net investment income | 0.27 | 0.20 | 0.22 | 0.22 | 0.04 | |||||||||||||||
| Net realized and unrealized gains (losses) on investments | 1.35 | 0.30 | 0.54 | (1.62 | ) | (0.73 | ) | |||||||||||||
| Total from investment operations | 1.62 | 0.50 | 0.76 | (1.40 | ) | (0.69 | ) | |||||||||||||
| Distributions from: | ||||||||||||||||||||
| Net investment income | (0.26 | ) | (0.22 | ) | (0.21 | ) | (0.23 | ) | (0.05 | ) | ||||||||||
| Return of capital | (0.01 | ) | — | — | — | — | ||||||||||||||
| Realized capital gains | — | — | — | — | (0.01 | ) | ||||||||||||||
| Total distributions | (0.27 | ) | (0.22 | ) | (0.21 | ) | (0.23 | ) | (0.06 | ) | ||||||||||
| Net asset value at end of period | $ | 8.10 | $ | 6.75 | $ | 6.47 | $ | 5.92 | $ | 7.55 | ||||||||||
| Total return | 24.31 | % | 7.67 | % | 13.14 | % | (18.22 | )% | (8.37 | )%(B) | ||||||||||
| Ratios and supplemental data: | ||||||||||||||||||||
| Net assets at end of period (000's) | $ | 33,185 | $ | 3,980 | $ | 11,540 | $ | 551 | $ | 2 | ||||||||||
| Ratio to average net assets: | ||||||||||||||||||||
| Net expenses | 0.95 | % | 0.95 | % | 0.95 | % | 0.95 | % | 0.90 | %(C) | ||||||||||
| Gross expenses | 1.18 | % | 1.25 | % | 1.53 | % | 13.70 | % | 453.70 | %(C) | ||||||||||
| Net investment income | 3.51 | % | 3.16 | % | 3.77 | % | 2.97 | % | 3.16 | %(C) | ||||||||||
| Portfolio turnover rate | 16 | % | 54 | % | 29 | % | 30 | % | 181 | %(B) | ||||||||||
| (A) | Represents the period from commencement of operations (August 12, 2008) through September 30, 2008. |
| (B) | Not annualized. |
| (C) | Annualized. |
See accompanying Notes to Financial Statements.
| 172 |
Financial Highlights (Continued)
Touchstone Sands Capital Select Growth Fund—Class A
| Selected Data for a Share Outstanding |
| Year | Period | |||||||
| Ended | Ended | |||||||
| September | September | |||||||
| 30, | 30, | |||||||
| 2012 | 2011(A) | |||||||
| Net asset value at beginning of period | $ | 9.39 | $ | 9.39 | ||||
| Income (loss) from investment operations: | ||||||||
| Net investment loss | (0.09 | )(B) | (0.03 | ) | ||||
| Net realized and unrealized gains on investments | 3.35 | 0.03 | ||||||
| Total from investment operations | 3.26 | — | ||||||
| Net asset value at end of period | $ | 12.65 | $ | 9.39 | ||||
| Total return(C) | 34.72 | % | 0.00 | %(D) | ||||
| Ratios and supplemental data: | ||||||||
| Net assets at end of period (000's) | $ | 186,384 | $ | 21,211 | ||||
| Ratio to average net assets: | ||||||||
| Net expenses | 1.37 | % | 1.45 | %(E) | ||||
| Gross expenses | 1.47 | % | 1.64 | %(E) | ||||
| Net investment loss | (0.74 | )% | (0.94 | )%(E) | ||||
| Portfolio turnover rate | 19 | % | 19 | %(D) | ||||
Touchstone Sands Capital Select Growth Fund—Class C
| Selected Data for a Share Outstanding |
| Year | Period | |||||||
| Ended | Ended | |||||||
| September | September | |||||||
| 30, | 30, | |||||||
| 2012 | 2011(A) | |||||||
| Net asset value at beginning of period | $ | 9.33 | $ | 9.39 | ||||
| Income (loss) from investment operations: | ||||||||
| Net investment loss | (0.17 | )(B) | (0.06 | ) | ||||
| Net realized and unrealized gains on investments | 3.31 | — | (F) | |||||
| Total from investment operations | 3.14 | (0.06 | ) | |||||
| Net asset value at end of period | $ | 12.47 | $ | 9.33 | ||||
| Total return(C) | 33.66 | % | (0.64 | )%(D) | ||||
| Ratios and supplemental data: | ||||||||
| Net assets at end of period (000's) | $ | 88,931 | $ | 8,660 | ||||
| Ratio to average net assets: | ||||||||
| Net expenses | 2.12 | % | 2.20 | %(E) | ||||
| Gross expenses | 2.22 | % | 2.56 | %(E) | ||||
| Net investment loss | (1.49 | )% | (1.69 | )%(E) | ||||
| Portfolio turnover rate | 19 | % | 19 | %(D) | ||||
| (A) | Represents the period from commencement of operations (November 15, 2010) through September 30, 2011. |
| (B) | Per share amounts for the year or period are calculated based on average outstanding shares. |
| (C) | Total returns shown exclude the effect of applicable sales loads. If these charges were included, the returns would be lower. |
| (D) | Not annualized. |
| (E) | Annualized. |
| (F) | Amount rounds to less than $0.005 per share. |
See accompanying Notes to Financial Statements.
| 173 |
Financial Highlights (Continued)
Touchstone Sands Capital Select Growth Fund—Class Y
Selected Data for a Share Outstanding Throughout Each Period
| Year Ended September 30, | ||||||||||||||||||||
| 2012 | 2011 | 2010 | 2009 | 2008 | ||||||||||||||||
| Net asset value at beginning of period | $ | 9.56 | $ | 8.83 | $ | 7.34 | $ | 6.86 | $ | 9.15 | ||||||||||
| Income (loss) from investment operations: | ||||||||||||||||||||
| Net investment loss | (0.06 | )(A) | (0.14 | ) | (0.07 | ) | (0.03 | ) | (0.06 | ) | ||||||||||
| Net realized and unrealized gains (losses) on investments | 3.40 | 0.87 | 1.56 | 0.51 | (2.23 | ) | ||||||||||||||
| Total from investment operations | 3.34 | 0.73 | 1.49 | 0.48 | (2.29 | ) | ||||||||||||||
| Net asset value at end of period | $ | 12.90 | $ | 9.56 | $ | 8.83 | $ | 7.34 | $ | 6.86 | ||||||||||
| Total return | 34.94 | % | 8.14 | % | 20.44 | % | 7.00 | % | (25.03 | )% | ||||||||||
| Ratios and supplemental data: | ||||||||||||||||||||
| Net assets at end of period (000's) | $ | 1,215,124 | $ | 392,464 | $ | 120,333 | $ | 82,918 | $ | 130,920 | ||||||||||
| Ratio to average net assets: | ||||||||||||||||||||
| Net expenses | 1.11 | % | 1.20 | % | 1.22 | % | 0.98 | % | 1.16 | % | ||||||||||
| Gross expenses | 1.18 | % | 1.23 | % | 1.28 | % | 1.05 | % | 1.19 | % | ||||||||||
| Net investment loss | (0.49 | )% | (0.68 | )% | (0.52 | )% | (0.48 | )% | (0.59 | )% | ||||||||||
| Portfolio turnover rate | 19 | % | 19 | % | 27 | % | 50 | % | 39 | % | ||||||||||
Touchstone Sands Capital Select Growth Fund—Class Z
| Selected Data for a Share Outstanding Throughout Each Period |
| Year Ended September 30, | ||||||||||||||||||||
| 2012 | 2011 | 2010 | 2009 | 2008 | ||||||||||||||||
| Net asset value at beginning of period | $ | 9.39 | $ | 8.70 | $ | 7.24 | $ | 6.79 | $ | 9.08 | ||||||||||
| Income (loss) from investment operations: | ||||||||||||||||||||
| Net investment loss | (0.08 | )(A) | (0.07 | ) | (0.04 | ) | (0.04 | ) | (0.06 | ) | ||||||||||
| Net realized and unrealized gains (losses) on investments | 3.34 | 0.76 | 1.50 | 0.49 | (2.23 | ) | ||||||||||||||
| Total from investment operations | 3.26 | 0.69 | 1.46 | 0.45 | (2.29 | ) | ||||||||||||||
| Net asset value at end of period | $ | 12.65 | $ | 9.39 | $ | 8.70 | $ | 7.24 | $ | 6.79 | ||||||||||
| Total return | 34.72 | % | 7.93 | % | 20.17 | % | 6.63 | % | (25.22 | )% | ||||||||||
| Ratios and supplemental data: | ||||||||||||||||||||
| Net assets at end of period (000's) | $ | 1,836,957 | $ | 911,849 | $ | 540,329 | $ | 333,200 | $ | 363,955 | ||||||||||
| Ratio to average net assets: | ||||||||||||||||||||
| Net expenses | 1.32 | % | 1.42 | % | 1.47 | % | 1.23 | % | 1.41 | % | ||||||||||
| Gross expenses | 1.39 | % | 1.52 | % | 1.53 | % | 1.32 | % | 1.43 | % | ||||||||||
| Net investment loss | (0.70 | )% | (0.93 | )% | (0.79 | )% | (0.74 | )% | (0.85 | )% | ||||||||||
| Portfolio turnover rate | 19 | % | 19 | % | 27 | % | 50 | % | 39 | % | ||||||||||
| (A) | Per share amounts for the year or period are calculated based on average outstanding shares. See accompanying Notes to Financial Statements. |
See accompanying Notes to Financial Statements.
| 174 |
Financial Highlights (Continued)
Touchstone Short Duration Fixed Income Fund—Class Y
Selected Data for a Share Outstanding Throughout Each Period
| Period | ||||||||||||||||||||||||
| Ended | ||||||||||||||||||||||||
| September | ||||||||||||||||||||||||
| Year Ended September 30, | 30, | |||||||||||||||||||||||
| 2012 | 2011 | 2010 | 2009(A) | |||||||||||||||||||||
| Net asset value at beginning of period | $ | 9.81 | $ | 9.97 | $ | 9.95 | $ | 9.79 | ||||||||||||||||
| Income (loss) from investment operations: | ||||||||||||||||||||||||
| Net investment income | 0.18 | (B) | 0.23 | 0.32 | 0.13 | |||||||||||||||||||
| Net realized and unrealized gains (losses) on investments | 0.06 | (0.10 | ) | 0.03 | 0.16 | |||||||||||||||||||
| Total from investment operations | 0.24 | 0.13 | 0.35 | 0.29 | ||||||||||||||||||||
| Distributions from: | ||||||||||||||||||||||||
| Net investment income | (0.23 | ) | (0.29 | ) | (0.33 | ) | (0.13 | ) | ||||||||||||||||
| Net asset value at end of period | $ | 9.82 | $ | 9.81 | $ | 9.97 | $ | 9.95 | ||||||||||||||||
| Total return | 2.49 | % | 1.37 | % | 3.61 | % | 3.02 | %(C) | ||||||||||||||||
| Ratios and supplemental data: | ||||||||||||||||||||||||
| Net assets at end of period (000's) | $ | 54,904 | $ | 1,164 | $ | 767 | $ | 592 | ||||||||||||||||
| Ratio to average net assets: | ||||||||||||||||||||||||
| Net expenses | 0.49 | % | 0.49 | % | 0.49 | % | 0.48 | %(D) | ||||||||||||||||
| Gross expenses | 0.70 | % | 1.43 | % | 3.98 | % | 1.49 | %(D) | ||||||||||||||||
| Net investment income | 1.84 | % | 2.31 | % | 3.22 | % | 3.03 | %(D) | ||||||||||||||||
| Portfolio turnover rate | 42 | % | 48 | % | 45 | % | 79 | % | ||||||||||||||||
Touchstone Short Duration Fixed Income Fund—Class Z
| Selected Data for a Share Outstanding Throughout Each Period |
| Year Ended September 30, | ||||||||||||||||||||||||
| 2012 | 2011 | 2010 | 2009 | 2008 | 2007 | |||||||||||||||||||
| Net asset value at beginning of period | $ | 9.81 | $ | 9.96 | $ | 9.94 | $ | 9.59 | $ | 9.81 | $ | 9.76 | ||||||||||||
| Income (loss) from investment operations: | ||||||||||||||||||||||||
| Net investment income | 0.16 | (B) | 0.21 | 0.29 | 0.32 | 0.45 | 0.45 | |||||||||||||||||
| Net realized and unrealized gains (losses) on investments | 0.07 | (0.09 | ) | 0.04 | 0.35 | (0.22 | ) | 0.05 | ||||||||||||||||
| Total from investment operations | 0.23 | 0.12 | 0.33 | 0.67 | 0.23 | 0.50 | ||||||||||||||||||
| Distributions from: | ||||||||||||||||||||||||
| Net investment income | (0.21 | ) | (0.27 | ) | (0.31 | ) | (0.32 | ) | (0.45 | ) | (0.45 | ) | ||||||||||||
| Net asset value at end of period | $ | 9.83 | $ | 9.81 | $ | 9.96 | $ | 9.94 | $ | 9.59 | $ | 9.81 | ||||||||||||
| Total return | 2.34 | % | 1.22 | % | 3.36 | % | 7.13 | % | 2.36 | % | 5.19 | % | ||||||||||||
| Ratios and supplemental data: | ||||||||||||||||||||||||
| Net assets at end of period (000's) | $ | 37,312 | $ | 40,111 | $ | 43,411 | $ | 43,749 | $ | 46,989 | $ | 59,192 | ||||||||||||
| Ratio to average net assets: | ||||||||||||||||||||||||
| Net expenses | 0.74 | % | 0.74 | % | 0.74 | % | 0.74 | % | 0.74 | % | 0.74 | % | ||||||||||||
| Gross expenses | 0.94 | % | 0.96 | % | 1.04 | % | 0.96 | % | 0.94 | % | 0.82 | % | ||||||||||||
| Net investment income | 1.60 | % | 2.12 | % | 2.94 | % | 3.24 | % | 4.60 | % | 4.62 | % | ||||||||||||
| Portfolio turnover rate | 42 | % | 48 | % | 45 | % | 79 | % | 25 | % | 21 | % | ||||||||||||
| (A) | Represents the period from commencement of operations (May 4, 2009) through September 30, 2009. |
| (B) | Per share amounts for the year or period are calculated based on average outstanding shares. |
| (C) | Not annualized. |
| (D) | Annualized. |
See accompanying Notes to Financial Statements.
| 175 |
Financial Highlights (Continued)
Touchstone Small Cap Core Fund—Class A
| Selected Data for a Share Outstanding Throughout Each Period |
| Year Ended | ||||||||||||
| September 30, | ||||||||||||
| 2012 | 2011 | 2010(A) | ||||||||||
| Net asset value at beginning of period | $ | 11.94 | $ | 11.62 | $ | 10.00 | ||||||
| Income (loss) from investment operations: | ||||||||||||
| Net investment income (loss) | 0.05 | (0.02 | ) | 0.02 | ||||||||
| Net realized and unrealized gains on investments | 4.20 | 0.35 | 1.60 | |||||||||
| Total from investment operations | 4.25 | 0.33 | 1.62 | |||||||||
| Distributions from: | ||||||||||||
| Net investment income | — | (B) | (0.01 | ) | — | |||||||
| Realized capital gains | (0.17 | ) | — | (B) | — | |||||||
| Total distributions | (0.17 | ) | (0.01 | ) | — | |||||||
| Net asset value at end of period | $ | 16.02 | $ | 11.94 | $ | 11.62 | ||||||
| Total return(C) | 35.86 | % | 2.82 | % | 16.20 | % | ||||||
| Ratios and supplemental data: | ||||||||||||
| Net assets at end of period (000's) | $ | 84,539 | $ | 43,074 | $ | 50,110 | ||||||
| Ratio to average net assets: | ||||||||||||
| Net expenses | 1.34 | % | 1.34 | % | 1.34 | % | ||||||
| Gross expenses | 1.58 | % | 1.79 | % | 1.55 | % | ||||||
| Net investment income (loss) | 0.37 | % | (0.10 | )% | 0.32 | % | ||||||
| Portfolio turnover rate | 11 | % | 37 | % | 29 | % | ||||||
Touchstone Small Cap Core Fund—Class C
| Selected Data for a Share Outstanding Throughout Each Period |
| Year Ended | ||||||||||||
| September 30, | ||||||||||||
| 2012 | 2011 | 2010(A) | ||||||||||
| Net asset value at beginning of period | $ | 11.79 | $ | 11.55 | $ | 10.00 | ||||||
| Income (loss) from investment operations: | ||||||||||||
| Net investment loss | (0.01 | ) | (0.08 | ) | (0.02 | ) | ||||||
| Net realized and unrealized gains on investments | 4.08 | 0.32 | 1.57 | |||||||||
| Total from investment operations | 4.07 | 0.24 | 1.55 | |||||||||
| Distributions from: | ||||||||||||
| Net investment income | — | (B) | — | (B) | — | |||||||
| Realized capital gains | (0.17 | ) | — | (B) | — | |||||||
| Total distributions | (0.17 | ) | — | (B) | — | |||||||
| Net asset value at end of period | $ | 15.69 | $ | 11.79 | $ | 11.55 | ||||||
| Total return(C) | 34.78 | % | 2.08 | % | 15.50 | % | ||||||
| Ratios and supplemental data: | ||||||||||||
| Net assets at end of period (000's) | $ | 24,278 | $ | 11,739 | $ | 5,245 | ||||||
| Ratio to average net assets: | ||||||||||||
| Net expenses | 2.09 | % | 2.09 | % | 2.09 | % | ||||||
| Gross expenses | 2.30 | % | 2.51 | % | 2.57 | % | ||||||
| Net investment loss | (0.38 | )% | (0.80 | )% | (0.43 | )% | ||||||
| Portfolio turnover rate | 11 | % | 37 | % | 29 | % | ||||||
| (A) | The Fund commenced operations on October 1, 2009. |
| (B) | Amount rounds to less than $0.005 per share. |
| (C) | Total returns shown exclude the effect of applicable sales loads. If these charges were included, the returns would be lower. |
See accompanying Notes to Financial Statements.
| 176 |
Financial Highlights (Continued)
Touchstone Small Cap Core Fund—Class Y
| Selected Data for a Share Outstanding Throughout Each Period |
| Year Ended | ||||||||||||
| September 30, | ||||||||||||
| 2012 | 2011 | 2010(A) | ||||||||||
| Net asset value at beginning of period | $ | 12.00 | $ | 11.67 | $ | 10.00 | ||||||
| Income from investment operations: | ||||||||||||
| Net investment income | 0.07 | 0.02 | 0.03 | |||||||||
| Net realized and unrealized gains on investments | 4.24 | 0.34 | 1.64 | |||||||||
| Total from investment operations | 4.31 | 0.36 | 1.67 | |||||||||
| Distributions from: | ||||||||||||
| Net investment income | (0.01 | ) | (0.03 | ) | — | |||||||
| Realized capital gains | (0.17 | ) | — | (B) | — | |||||||
| Total distributions | (0.18 | ) | (0.03 | ) | — | |||||||
| Net asset value at end of period | $ | 16.13 | $ | 12.00 | $ | 11.67 | ||||||
| Total return | 36.23 | % | 3.05 | % | 16.70 | % | ||||||
| Ratios and supplemental data: | ||||||||||||
| Net assets at end of period (000's) | $ | 168,987 | $ | 58,164 | $ | 33,536 | ||||||
| Ratio to average net assets: | ||||||||||||
| Net expenses | 1.04 | % | 1.09 | % | 1.09 | % | ||||||
| Gross expenses | 1.17 | % | 1.21 | % | 1.31 | % | ||||||
| Net investment income | 0.66 | % | 0.21 | % | 0.61 | % | ||||||
| Portfolio turnover rate | 11 | % | 37 | % | 29 | % | ||||||
Touchstone Small Cap Core Fund—Institutional Class
| Selected Data for a Share Outstanding Throughout Each Period |
| Year Ended | ||||||||||||
| September 30, | ||||||||||||
| 2012 | 2011 | 2010(A) | ||||||||||
| Net asset value at beginning of period | $ | 11.99 | $ | 11.65 | $ | 10.00 | ||||||
| Income from investment operations: | ||||||||||||
| Net investment income | 0.06 | 0.03 | 0.06 | |||||||||
| Net realized and unrealized gains on investments | 4.26 | 0.35 | 1.61 | |||||||||
| Total from investment operations | 4.32 | 0.38 | 1.67 | |||||||||
| Distributions from: | ||||||||||||
| Net investment income | (0.03 | ) | (0.04 | ) | (0.02 | ) | ||||||
| Realized capital gains | (0.17 | ) | — | (B) | — | |||||||
| Total distributions | (0.20 | ) | (0.04 | ) | (0.02 | ) | ||||||
| Net asset value at end of period | $ | 16.11 | $ | 11.99 | $ | 11.65 | ||||||
| Total return | 36.32 | % | 3.24 | % | 16.74 | % | ||||||
| Ratios and supplemental data: | ||||||||||||
| Net assets at end of period (000's) | $ | 247,876 | $ | 43,035 | $ | 10,386 | ||||||
| Ratio to average net assets: | ||||||||||||
| Net expenses | 0.94 | % | 0.94 | % | 0.94 | % | ||||||
| Gross expenses | 1.09 | % | 1.16 | % | 1.32 | % | ||||||
| Net investment income | 0.77 | % | 0.36 | % | 0.66 | % | ||||||
| Portfolio turnover rate | 11 | % | 37 | % | 29 | % | ||||||
| (A) | The Fund commenced operations on October 1, 2009. |
| (B) | Amount rounds to less than $0.005 per share. |
See accompanying Notes to Financial Statements.
| 177 |
Financial Highlights (Continued)
Touchstone Small Cap Value Fund—Class A
| Selected Data for a Share Outstanding Throughout Each Period |
| Year | Period | |||||||
| Ended | Ended | |||||||
| September | September | |||||||
| 30, | 30, | |||||||
| 2012 | 2011(A)(B) | |||||||
| Net asset value at beginning of period | $ | 13.85 | $ | 17.36 | ||||
| Income (loss) from investment operations: | ||||||||
| Net investment income | 0.21 | (C) | 0.22 | |||||
| Net realized and unrealized gains (losses) on investments | 4.60 | (3.57 | ) | |||||
| Total from investment operations | 4.81 | (3.35 | ) | |||||
| Distributions from: | ||||||||
| Net investment income | (0.33 | ) | (0.16 | ) | ||||
| Net asset value at end of period | $ | 18.33 | $ | 13.85 | ||||
| Total return(D) | 34.87 | % | (19.37 | )%(E) | ||||
| Ratios and supplemental data: | ||||||||
| Net assets at end of period (000's) | $ | 32,115 | $ | 37,385 | ||||
| Ratio to average net assets: | ||||||||
| Net expenses | 1.43 | % | 1.43 | %(F) | ||||
| Gross expenses | 1.77 | % | 1.72 | %(F) | ||||
| Net investment income | 1.26 | % | 1.97 | %(F) | ||||
| Portfolio turnover rate | 109 | % | 206 | %(E) | ||||
Touchstone Small Cap Value Fund—Class C
| Selected Data for a Share Outstanding Throughout Each Period |
| Year | Period | |||||||
| Ended | Ended | |||||||
| September | September | |||||||
| 30, | 30, | |||||||
| 2012 | 2011(A) | |||||||
| Net asset value at beginning of period | $ | 13.82 | $ | 17.36 | ||||
| Income (loss) from investment operations: | ||||||||
| Net investment income | 0.09 | (C) | 0.09 | |||||
| Net realized and unrealized gains (losses) on investments | 4.58 | (3.50 | ) | |||||
| Total from investment operations | 4.67 | (3.41 | ) | |||||
| Distributions from: | ||||||||
| Net investment income | (0.26 | ) | (0.13 | ) | ||||
| Net asset value at end of period | $ | 18.23 | $ | 13.82 | ||||
| Total return(D) | 33.95 | % | (19.77 | )%(E) | ||||
| Ratios and supplemental data: | ||||||||
| Net assets at end of period (000's) | $ | 104 | $ | 2 | ||||
| Ratio to average net assets: | ||||||||
| Net expenses | 2.18 | % | 2.18 | %(F) | ||||
| Gross expenses | 28.35 | % | 342.41 | %(F) | ||||
| Net investment income | 0.51 | % | 0.95 | %(F) | ||||
| Portfolio turnover rate | 109 | % | 206 | %(E) | ||||
| (A) | Represents the period from commencement of operations (March 1, 2011) through September 30, 2011. |
| (B) | Effective June 10, 2011, Class Z shares converted to Class A shares. |
| (C) | Per share amounts for the year or period are calculated based on average outstanding shares. |
| (D) | Total returns shown exclude the effect of applicable sales loads. If these charges were included, the returns would be lower. |
| (E) | Not annualized. |
| (F) | Annualized. |
See accompanying Notes to Financial Statements.
| 178 |
Financial Highlights (Continued)
Touchstone Small Cap Value Fund—Class Y
| Selected Data for a Share Outstanding Throughout Each Period |
| Year | Period | |||||||
| Ended | Ended | |||||||
| September | September | |||||||
| 30, | 30, | |||||||
| 2012 | 2011(A) | |||||||
| Net asset value at beginning of period | $ | 13.89 | $ | 17.36 | ||||
| Income (loss) from investment operations: | ||||||||
| Net investment income | 0.26 | (B) | 0.71 | |||||
| Net realized and unrealized gains (losses) on investments | 4.59 | (4.00 | ) | |||||
| Total from investment operations | 4.85 | (3.29 | ) | |||||
| Distributions from: | ||||||||
| Net investment income | (0.38 | ) | (0.18 | ) | ||||
| Net asset value at end of period | $ | 18.36 | $ | 13.89 | ||||
| Total return | 35.19 | % | (19.10 | )%(C) | ||||
| Ratios and supplemental data: | ||||||||
| Net assets at end of period (000's) | $ | 222 | $ | 2 | ||||
| Ratio to average net assets: | ||||||||
| Net expenses | 1.18 | % | 1.18 | %(D) | ||||
| Gross expenses | 22.47 | % | 70.29 | %(D) | ||||
| Net investment income | 1.51 | % | 2.05 | %(D) | ||||
| Portfolio turnover rate | 109 | % | 206 | %(C) | ||||
Touchstone Small Cap Value Fund—Institutional Class
| Selected Data for a Share Outstanding Throughout Each Period |
| Year | Period | |||||||
| Ended | Ended | |||||||
| September | September | |||||||
| 30, | 30, | |||||||
| 2012 | 2011(A) | |||||||
| Net asset value at beginning of period | $ | 13.86 | $ | 17.36 | ||||
| Income (loss) from investment operations: | ||||||||
| Net investment income | 0.29 | (B) | 0.20 | |||||
| Net realized and unrealized gains (losses) on investments | 4.60 | (3.51 | ) | |||||
| Total from investment operations | 4.89 | (3.31 | ) | |||||
| Distributions from: | ||||||||
| Net investment income | (0.40 | ) | (0.19 | ) | ||||
| Net asset value at end of period | $ | 18.35 | $ | 13.86 | ||||
| Total return | 35.56 | % | (19.23 | )%(C) | ||||
| Ratios and supplemental data: | ||||||||
| Net assets at end of period (000's) | $ | 1,160 | $ | 741 | ||||
| Ratio to average net assets: | ||||||||
| Net expenses | 1.03 | % | 1.03 | %(D) | ||||
| Gross expenses | 1.87 | % | 3.59 | %(D) | ||||
| Net investment income | 1.66 | % | 2.12 | %(D) | ||||
| Portfolio turnover rate | 109 | % | 206 | %(C) | ||||
| (A) | Represents the period from commencement of operations (March 1, 2011) through September 30, 2011. |
| (B) | Per share amounts for the year or period are calculated based on average outstanding shares. |
| (C) | Not annualized. |
| (D) | Annualized. |
See accompanying Notes to Financial Statements.
| 179 |
Financial Highlights (Continued)
Touchstone Total Return Bond Fund—Class A†
| Selected Data for a Share Outstanding Throughout Each Period†† |
| Year | Period | |||||||||||
| Ended | Ended | Period | ||||||||||
| September | September | Ended | ||||||||||
| 30, | 30, | March 31, | ||||||||||
| 2012 | 2011(A) | 2011(B) | ||||||||||
| Net asset value at beginning of period | $ | 10.13 | $ | 9.90 | $ | 10.15 | ||||||
| Income (loss) from investment operations: | ||||||||||||
| Net investment income | 0.23 | 0.24 | 0.28 | |||||||||
| Net realized and unrealized gains (losses) on investments | 0.41 | 0.24 | (0.14 | )(C) | ||||||||
| Total from investment operations | 0.64 | 0.48 | 0.14 | |||||||||
| Distributions from: | ||||||||||||
| Net investment income | (0.27 | ) | (0.25 | ) | (0.39 | ) | ||||||
| Net asset value at end of period | $ | 10.50 | $ | 10.13 | $ | 9.90 | ||||||
| Total return(D) | 6.42 | % | 5.02 | %(E) | 1.31 | %(E)(F) | ||||||
| Ratios and supplemental data: | ||||||||||||
| Net assets at end of period (000's) | $ | 10,210 | $ | 4,737 | $ | 7 | ||||||
| Ratio to average net assets: | ||||||||||||
| Net expenses | 0.90 | % | 0.90 | %(G) | 0.65 | %(G) | ||||||
| Gross expenses | 1.22 | % | 1.69 | %(G) | 1.75 | %(G) | ||||||
| Net investment income | 2.26 | % | 4.40 | %(G) | 4.16 | %(G) | ||||||
| Portfolio turnover rate | 79 | %(H) | 7 | %(E) | 27 | %(E) | ||||||
| † | Touchstone Total Return Bond Fund acquired all of the assets and liabilities of EARNEST Partners Fixed Income Trust (“Predecessor Fund”) in a reorganization on August 1, 2011. The Predecessor Fund's performance and financial history have been adopted by Touchstone Total Return Bond and will be used going forward. As a result, the information prior to August 1, 2011 reflects that of the Predecessor Fund. |
| †† | Per share data prior to August 1, 2011, reflects a 1.01491:1 stock split. All per share amounts prior to that date have been adjusted to reflect the stock split. |
| (A) | Effective August 1, 2011, the Fund changed its fiscal year end from March 31 to September 30 and Investor Class shares were renamed Class A shares. See Note 8 in Notes to Financial Statements. |
| (B) | Class A shares commenced operations on August 16, 2010. |
| (C) | This amount per share is a loss for the Class A shares because of the short time period since the Commencement of Operations on August 16, 2010 relative to the full fiscal year in which the Class Y shares were in operation. The loss during this period is offset by the gain in the Class Y shares during the full fiscal year to create a gain in the Net Realized and Unrealized Gain on Investments in the other classes. |
| (D) | Total returns shown exclude the effect of applicable sales loads. If these charges were included, the returns would be lower. |
| (E) | Not annualized. |
| (F) | Includes adjustments in accordance with accounting principles generally accepted in the United States of America, and, consequently, the net asset value for financial reporting purposes and the returns based upon those net asset values may differ from the net asset values and returns for shareholder transactions. |
| (G) | Annualized. |
| (H) | Portfolio turnover excludes the purchase and sales of the Acquired Funds (see Note 8). If these transactions were included, portfolio turnover would have been higher. |
See accompanying Notes to Financial Statements.
| 180 |
Financial Highlights (Continued)
Touchstone Total Return Bond Fund—Class C
| Selected Data for a Share Outstanding Throughout Each Period |
| Year | Period | |||||||
| Ended | Ended | |||||||
| September | September | |||||||
| 30, | 30, | |||||||
| 2012 | 2011(A) | |||||||
| Net asset value at beginning of period | $ | 10.12 | $ | 10.04 | ||||
| Income from investment operations: | ||||||||
| Net investment income | 0.14 | 0.06 | ||||||
| Net realized and unrealized gains on investments | 0.42 | 0.09 | ||||||
| Total from investment operations | 0.56 | 0.15 | ||||||
| Distributions from: | ||||||||
| Net investment income | (0.19 | ) | (0.07 | ) | ||||
| Net asset value at end of period | $ | 10.49 | $ | 10.12 | ||||
| Total return(B) | 5.63 | % | 1.51 | %(C) | ||||
| Ratios and supplemental data: | ||||||||
| Net assets at end of period (000's) | $ | 3,257 | $ | 2,587 | ||||
| Ratio to average net assets: | 1.65 | %(D) | ||||||
| Net expenses | 1.65 | % | ||||||
| Gross expenses | 2.03 | % | 2.55 | %(D) | ||||
| Net investment income | 1.51 | % | 3.75 | %(D) | ||||
| Portfolio turnover rate | 79 | %(E) | 7 | %(C) | ||||
| (A) | Class C shares commenced operations on August 1, 2011. |
| (B) | Total returns shown exclude the effect of applicable sales loads. If these charges were included, the returns would be lower. |
| (C) | Not annualized. |
| (D) | Annualized. |
| (E) | Portfolio turnover excludes the purchase and sales of the Acquired Funds (see Note 8). If these transactions were included, portfolio turnover would have been higher. |
See accompanying Notes to Financial Statements.
| 181 |
Financial Highlights (Continued)
Touchstone Total Return Bond Fund—Class Y†
| Selected Data for a Share Outstanding Throughout Each Period†† |
| Year | ||||||||||||||||||||||||
| Ended | Period | |||||||||||||||||||||||
| September | Ended | |||||||||||||||||||||||
| 30, | September 30, | Year Ended March 31, | ||||||||||||||||||||||
| 2012 | 2011(A) | 2011 | 2010 | 2009 | 2008 | |||||||||||||||||||
| Net asset value at beginning of period | $ | 10.15 | $ | 9.86 | $ | 9.66 | $ | 8.48 | $ | 9.20 | $ | 9.29 | ||||||||||||
| Income (loss) from investment operations: | ||||||||||||||||||||||||
| Net investment income | 0.25 | 0.24 | 0.45 | 0.48 | 0.48 | 0.46 | ||||||||||||||||||
| Net realized and unrealized gains (losses) on investments | 0.42 | 0.30 | 0.21 | 1.21 | (0.73 | ) | (0.09 | ) | ||||||||||||||||
| Total from investment operations | 0.67 | 0.54 | 0.66 | 1.69 | (0.25 | ) | 0.37 | |||||||||||||||||
| Distributions from: | ||||||||||||||||||||||||
| Net investment income | (0.30 | ) | (0.25 | ) | (0.46 | ) | (0.51 | ) | (0.47 | ) | (0.46 | ) | ||||||||||||
| Total distributions | (0.30 | ) | (0.25 | ) | (0.46 | ) | (0.51 | ) | (0.47 | ) | (0.46 | ) | ||||||||||||
| Net asset value at end of period | $ | 10.52 | $ | 10.15 | $ | 9.86 | $ | 9.66 | $ | 8.48 | $ | 9.20 | ||||||||||||
| Total return | 6.72 | % | 5.29 | %(B) | 6.97 | %(C) | 20.28 | %(C) | (2.79 | )%(C) | 4.16 | %(C) | ||||||||||||
| Ratios and supplemental data: | ||||||||||||||||||||||||
| Net assets at end of period (000's) | $ | 29,716 | $ | 17,810 | $ | 16,512 | $ | 16,877 | $ | 13,075 | $ | 34,652 | ||||||||||||
| Ratio to average net assets: | ||||||||||||||||||||||||
| Net expenses | 0.58 | % | 0.48 | %(D) | 0.40 | % | 0.40 | % | 0.40 | % | 0.40 | % | ||||||||||||
| Gross expenses | 0.70 | % | 1.13 | %(D) | 1.62 | % | 1.56 | % | 1.14 | % | 0.94 | % | ||||||||||||
| Net investment income | 2.59 | % | 4.35 | %(D) | 4.46 | % | 5.10 | % | 5.23 | % | 4.86 | % | ||||||||||||
| Portfolio turnover rate | 79 | %(E) | 7 | %(B) | 27 | % | 29 | % | 24 | % | 19 | % | ||||||||||||
| † | Touchstone Total Return Bond Fund acquired all of the assets and liabilities of EARNEST Partners Fixed Income Trust (“Predecessor Fund”) in a reorganization on August 1, 2011. The Predecessor Fund's performance and financial history have been adopted by Touchstone Total Return Bond and will be used going forward. As a result, the information prior to August 1, 2011 reflects that of the Predecessor Fund. |
| †† | Per share data prior to August 1, 2011, reflects a 0.87567:1 stock split. All per share amounts prior to that date have been adjusted to reflect the stock split. |
| (A) | Effective August 1, 2011, the Fund changed its fiscal year end from March 31 to September 30 and Institutional Class shares were renamed Class Y shares. See Note 8 in the Notes to Financial Statements. |
| (B) | Not annualized. |
| (C) | Includes adjustments in accordance with accounting principles generally accepted in the United States of America, and, consequently, the net asset value for financial reporting purposes and the returns based upon those net asset values may differ from the net asset values and returns for shareholder transactions. |
| (D) | Annualized. |
| (E) | Portfolio turnover excludes the purchase and sales of the Acquired Funds (see Note 8). If these transactions were included, portfolio turnover would have been higher. |
See accompanying Notes to Financial Statements.
| 182 |
Financial Highlights (Continued)
Touchstone Total Return Bond Fund—Institutional Class
| Selected Data for a Share Outstanding Throughout Each Period |
| Year | Period | |||||||
| Ended | Ended | |||||||
| September | September | |||||||
| 30, | 30, | |||||||
| 2012 | 2011(A) | |||||||
| Net asset value at beginning of period | $ | 10.14 | $ | 10.06 | ||||
| Income from investment operations: | ||||||||
| Net investment income | 0.22 | 0.08 | ||||||
| Net realized and unrealized gains on investments | 0.46 | 0.09 | ||||||
| Total from investment operations | 0.68 | 0.17 | ||||||
| Distributions from: | ||||||||
| Net investment income | (0.31 | ) | (0.09 | ) | ||||
| Net asset value at end of period | $ | 10.51 | $ | 10.14 | ||||
| Total return | 6.81 | % | 1.70 | %(B) | ||||
| Ratios and supplemental data: | ||||||||
| Net assets at end of period (000's) | $ | 148,341 | $ | 6,386 | ||||
| Ratio to average net assets: | ||||||||
| Net expenses | 0.50 | % | 0.50 | %(C) | ||||
| Gross expenses | 0.67 | % | 1.21 | %(C) | ||||
| Net investment income | 2.66 | % | 4.89 | %(C) | ||||
| Portfolio turnover rate | 79 | %(D) | 7 | %(B) | ||||
| (A) | Institutional Class shares commenced operations on August 1, 2011. |
| (B) | Not annualized. |
| (C) | Annualized. |
| (D) | Portfolio turnover excludes the purchase and sales of the Acquired Funds (see Note 8). If these transactions were included, portfolio turnover would have been higher. |
See accompanying Notes to Financial Statements.
| 183 |
Financial Highlights (Continued)
Touchstone Ultra Short Duration Fixed Income Fund—Class A
| Selected Data for a Share Outstanding Throughout Each Period |
| Period | ||||
| Ended | ||||
| September 30, | ||||
| 2012(A) | ||||
| Net asset value at beginning of period | $ | 9.57 | ||
| Income (loss) from investment operations: | ||||
| Net investment income | 0.09 | |||
| Net realized and unrealized losses on investments | (0.01 | ) | ||
| Total from investment operations | 0.08 | |||
| Distributions from: | ||||
| Net investment income | (0.09 | ) | ||
| Net asset value at end of period | $ | 9.56 | ||
| Total return(B) | 0.85 | %(C) | ||
| Ratios and supplemental data: | ||||
| Net assets at end of period (000's) | $ | 34,228 | ||
| Ratio to average net assets: | ||||
| Net expenses | 0.69 | %(D) | ||
| Gross expenses | 1.19 | %(D) | ||
| Net investment income | 1.40 | %(D) | ||
| Portfolio turnover rate | 169 | %(E) | ||
Touchstone Ultra Short Duration Fixed Income Fund—Class C
| Selected Data for a Share Outstanding Throughout Each Period |
| Period | ||||
| Ended | ||||
| September | ||||
| 30, | ||||
| 2012(A) | ||||
| Net asset value at beginning of period | $ | 9.57 | ||
| Income (loss) from investment operations: | ||||
| Net investment income | 0.05 | |||
| Net realized and unrealized gains on investments | 0.01 | |||
| Total from investment operations | 0.06 | |||
| Distributions from: | ||||
| Net investment income | (0.07 | ) | ||
| Net asset value at end of period | $ | 9.56 | ||
| Total return(B) | 0.62 | %(C) | ||
| Ratios and supplemental data: | ||||
| Net assets at end of period (000's) | $ | 11,517 | ||
| Ratio to average net assets: | ||||
| Net expenses | 1.19 | %(D) | ||
| Gross expenses | 1.68 | %(D) | ||
| Net investment income | 0.90 | %(D) | ||
| Portfolio turnover rate | 169 | %(E) | ||
| (A) | Represents the period from commencement of operations (April 16, 2012) through September 30, 2012. |
| (B) | Total returns shown exclude the effect of applicable sales loads. If these charges were included, the returns would be lower. |
| (C) | Not annualized. |
| (D) | Annualized. |
| (E) | Portfolio turnover excludes the purchase and sales of the Acquired Funds (See Note 8), if these transactions were included, portfolio turnover would have been higher. |
See accompanying Notes to Financial Statements.
| 184 |
Financial Highlights (Continued)
Touchstone Ultra Short Duration Fixed Income Fund—Class Y
Selected Data for a Share Outstanding Throughout Each Period
| Period | ||||||||||||||||||||
| Ended | ||||||||||||||||||||
| September | ||||||||||||||||||||
| 30, | ||||||||||||||||||||
| 2012(A) | ||||||||||||||||||||
| Net asset value at beginning of period | $ | 9.57 | ||||||||||||||||||
| Income (loss) from investment operations: | ||||||||||||||||||||
| Net investment income | 0.08 | |||||||||||||||||||
| Net realized and unrealized gains on investments | 0.01 | |||||||||||||||||||
| Total from investment operations | 0.09 | |||||||||||||||||||
| Distributions from: | ||||||||||||||||||||
| Net investment income | (0.10 | ) | ||||||||||||||||||
| Total distributions | (0.10 | ) | ||||||||||||||||||
| Net asset value at end of period | $ | 9.56 | ||||||||||||||||||
| Total return | 0.97 | %(B) | ||||||||||||||||||
| Ratios and supplemental data: | ||||||||||||||||||||
| Net assets at end of period (000's) | $ | 190,515 | ||||||||||||||||||
| Ratio to average net assets: | ||||||||||||||||||||
| Net expenses | 0.44 | %(C) | ||||||||||||||||||
| Gross expenses | 0.55 | %(C) | ||||||||||||||||||
| Net investment income | 1.65 | %(C) | ||||||||||||||||||
| Portfolio turnover rate | 169 | %(D) | ||||||||||||||||||
| Touchstone Ultra Short Duration Fixed Income Fund—Class Z |
| Selected Data for a Share Outstanding Throughout Each Period |
| Year Ended September 30, | ||||||||||||||||||||
| 2012 | 2011 | 2010 | 2009 | 2008 | ||||||||||||||||
| Net asset value at beginning of period | $ | 9.58 | $ | 9.68 | $ | 9.66 | $ | 9.74 | $ | 10.08 | ||||||||||
| Income (loss) from investment operations: | ||||||||||||||||||||
| Net investment income | 0.14 | 0.15 | 0.18 | 0.32 | 0.47 | |||||||||||||||
| Net realized and unrealized gains (losses) on investments | 0.06 | (0.04 | ) | 0.06 | (0.07 | ) | (0.34 | ) | ||||||||||||
| Total from investment operations | 0.20 | 0.11 | 0.24 | 0.25 | 0.13 | |||||||||||||||
| Distributions from: | ||||||||||||||||||||
| Net investment income | (0.22 | ) | (0.21 | ) | (0.22 | ) | (0.33 | ) | (0.47 | ) | ||||||||||
| Total distributions | (0.22 | ) | (0.21 | ) | (0.22 | ) | (0.33 | ) | (0.47 | ) | ||||||||||
| Net asset value at end of period | $ | 9.56 | $ | 9.58 | $ | 9.68 | $ | 9.66 | $ | 9.74 | ||||||||||
| Total return | 2.10 | % | 1.12 | % | 2.49 | % | 2.60 | % | 1.26 | % | ||||||||||
| Ratios and supplemental data: | ||||||||||||||||||||
| Net assets at end of period (000's) | $ | 338,669 | $ | 346,131 | $ | 236,650 | $ | 108,552 | $ | 143,837 | ||||||||||
| Ratio to average net assets: | ||||||||||||||||||||
| Net expenses | 0.64 | % | 0.69 | % | 0.69 | % | 0.69 | % | 0.69 | % | ||||||||||
| Gross expenses | 0.73 | % | 0.78 | % | 0.81 | % | 0.85 | % | 0.82 | % | ||||||||||
| Net investment income | 1.45 | % | 1.39 | % | 1.69 | % | 3.41 | % | 4.72 | % | ||||||||||
| Portfolio turnover rate | 169 | %(D) | 144 | % | 119 | % | 15 | % | 56 | % | ||||||||||
| (A) | Represents the period from commencement of operations (April 16, 2012) through September 30, 2012. |
| (B) | Not annualized. |
| (C) | Annualized. |
| (D) | Portfolio turnover excludes the purchase and sales of the Acquired Funds (See Note 8), if these transactions were included, portfolio turnover would have been higher. |
See accompanying Notes to Financial Statements.
| 185 |
Financial Highlights (Continued)
Touchstone Ultra Short Duration Fixed Income Fund—Institutional Class
| Selected Data for a Share Outstanding Throughout Each Period |
| Period | ||||
| Ended | ||||
| September | ||||
| 30, | ||||
| 2012(A) | ||||
| Net asset value at beginning of period | $ | 9.57 | ||
| Income (loss) from investment operations: | ||||
| Net investment income | 0.09 | |||
| Total from investment operations | 0.09 | |||
| Distributions from: | ||||
| Net investment income | (0.10 | ) | ||
| Total distributions | (0.10 | ) | ||
| Net asset value at end of period | $ | 9.56 | ||
| Total return | 0.99 | %(B) | ||
| Ratios and supplemental data: | ||||
| Net assets at end of period (000's) | $ | 6,697 | ||
| Ratio to average net assets: | ||||
| Net expenses | 0.39 | %(C) | ||
| Gross expenses | 1.23 | %(C) | ||
| Net investment income | 1.70 | %(C) | ||
| Portfolio turnover rate | 169 | %(D) | ||
| (A) | Represents the period from commencement of operations (April 16, 2012) through September 30, 2012. |
| (B) | Not annualized. |
| (C) | Annualized. |
| (D) | Portfolio turnover excludes the purchase and sales of the Acquired Funds (See Note 8), if these transactions were included, portfolio turnover would have been higher. |
See accompanying Notes to Financial Statements
| 186 |
Notes to Financial Statements
September 30, 2012
1. Organization
The Touchstone Funds Group Trust (the “Trust”) is registered under the Investment Company Act of 1940, as amended, (the “1940 Act”) as an open-end management investment company. The Trust was established as a Delaware statutory trust under a Declaration of Trust dated October 25, 1993. The Trust consists of the following seventeen funds, individually, a “Fund,” and collectively, the “Funds”:
Touchstone Emerging Markets Equity Fund (“Emerging Markets Equity Fund”)
Touchstone Focused Equity Fund (“Focused Equity Fund”)
Touchstone Global Equity Fund (“Global Equity Fund”)
Touchstone Global Real Estate Fund (“Global Real Estate Fund”)
Touchstone International Fixed Income Fund (“International Fixed Income Fund”)
Touchstone Large Cap Relative Value Fund (“Large Cap Relative Value Fund”)
Touchstone Market Neutral Equity Fund (“Market Neutral Equity Fund”)
Touchstone Merger Arbitrage Fund (“Merger Arbitrage Fund”)
Touchstone Mid Cap Fund (“Mid Cap Fund”)
Touchstone Mid Cap Value Fund (“Mid Cap Value Fund”)
Touchstone Premium Yield Equity Fund (“Premium Yield Equity Fund”)
Touchstone Sands Capital Select Growth Fund (“Sands Capital Select Growth Fund”)
Touchstone Short Duration Fixed Income Fund (“Short Duration Fixed Income Fund”)
Touchstone Small Cap Core Fund (“Small Cap Core Fund”)
Touchstone Small Cap Value Fund (“Small Cap Value Fund”)
Touchstone Total Return Bond Fund (“Total Return Bond Fund”)
Touchstone Ultra Short Duration Fixed Income Fund (“Ultra Short Duration Fixed Income Fund”)
Each Fund is an open end, diversified, management investment company, with the exception of the Focused Equity Fund, Global Real Estate Fund, International Fixed Income Fund, Merger Arbitrage Fund, Sands Capital Select Growth Fund and Small Cap Core Fund, each of which is an open end, non-diversified management investment company.
The Declaration of Trust permits the Trust to issue an unlimited number of shares of beneficial interest of each Fund. The Funds are registered to offer different classes of shares: Class A shares, Class C shares, Class Y shares, Class Z shares, and Institutional Class shares. The assets of each Fund are segregated, and a shareholder’s interest is limited to the Fund in which shares are held. The Funds’ prospectus provides a description of each Fund’s investment objectives, policies, and strategies along with information on the classes of shares currently being offered.
2. Significant Accounting Policies
The following is a summary of the Funds’ significant accounting policies:
Security valuation and fair value measurements — All investments in securities are recorded at their estimated fair value. The Funds use various methods to measure fair value of their portfolio securities on a recurring basis. U.S. GAAP establishes a hierarchy that prioritizes inputs to valuation methods. These inputs are summarized in the three broad levels listed below:
| · | Level 1 – | quoted prices in active markets for identical securities |
| · | Level 2 – | other significant observable inputs (including quoted prices for similar securities, interest rates, prepayment speeds, credit risk, etc.) |
| · | Level 3 – | significant unobservable inputs (including the Fund’s own assumptions in determining the fair value of investments) |
| 187 |
Notes to Financial Statements (Continued)
The inputs or methodology used for valuing securities are not necessarily an indication of the risk associated with investing in those securities. For example, money market instruments are valued using amortized cost, in accordance with rules under the 1940 Act. Generally, amortized cost approximates the current fair value of a security, but since the value is not obtained from a quoted price in an active market, such securities are reflected as Level 2. Transfers in and out of the levels are recognized at the value at the end of the period.
The aggregate value by input level, as of September 30, 2012, for each Fund’s investments, as well as a reconciliation of assets for which significant unobservable inputs (Level 3) were used in determining value, if applicable, is included in each Fund’s Portfolio of Investments, which also includes a breakdown of the Fund’s investments by geographic/industry concentration. There were no material Level 3 securities for the Funds except Emerging Markets Equity Fund during the period.
All transfers are recognized as of the beginning of the reporting period. During the year ended September 30, 2012, there were no transfers between Levels 1, 2 and 3 for all Funds except as shown in the Portfolio of Investments for the Emerging Markets Equity Fund, Global Equity Fund, Global Real Estate Fund, International Small Cap Fund and Merger Arbitrage Fund.
The Funds’ portfolio securities are valued as of the close of the regular session of trading on the New York Stock Exchange (currently 4:00 p.m., Eastern time). Portfolio securities traded on stock exchanges are valued at the last sale price, and to the extent these securities are actively traded, they are categorized in Level 1 of the fair value hierarchy. Portfolio securities quoted by NASDAQ are valued at the NASDAQ Official Closing Price (“NOCP”). Securities not traded on a particular day, or for which the last sale price is not readily available, are valued at their last broker-quoted bid prices as obtained from one or more of the major market makers for such securities by an independent pricing service and are categorized in Level 2. While this method provides consistency in valuation (and may only be used if it approximates market value), it may result in periods during which value, as determined by amortized cost, is higher or lower than the price that would be received if the Fund sold the investment. Debt securities for which market quotations are readily available are valued at their most recent bid prices as obtained from one or more of the major market makers for such securities by an independent pricing service and are categorized in Level 2. Money market instruments and other debt securities with a remaining maturity of less than 60 days are valued at amortized cost, which approximates market value and are categorized in Level 2. Securities for which market quotations or the NOCP are not readily available are valued based on fair value as determined by or under the direction of the Board of Trustees and are categorized in Level 3. Shares of open end mutual funds in which the Funds invest are valued at their respective net asset values as reported by the underlying funds and are categorized in Level 1. The prices for foreign securities are reported in local currency and converted to U.S. dollars using currency exchange rates.
For securities that principally trade on a foreign market or exchange, a significant gap in time can exist between the time of a particular security’s last trade and the time at which a Fund calculates its net asset value. The closing prices of such securities may no longer reflect their market value at the time the Fund calculates its net asset value if an event that could materially affect the value of those securities (a “Significant Event”) has occurred between the time of the security’s last close and the time that the Fund calculates its net asset value.
Certain Funds invest in securities of other investment companies, including exchange traded funds (“ETFs”), open-end funds and closed-end funds. Open-end funds are investment companies that issue new shares continuously and redeem shares daily. Closed-end funds are investment companies that typically issue a fixed number of shares that trade on a securities exchange or over-the-counter. An ETF is an investment company that seeks to track the performance of an index by holding in its portfolio shares of all the companies, or a representative sample of the companies, that are components of a particular index. ETFs are traded on a securities exchange based on their market value. The risks of investment in other investment companies typically reflect the risks of the types of securities in which investment companies invest. Investments in ETFs and closed-end funds
| 188 |
Notes to Financial Statements (Continued)
are subject to the additional risk that shares of the fund may trade at a premium or discount to their NAV per share. When a Fund invests in another investment company, shareholders of the Fund bear their proportionate share of the other investment company’s fees and expenses, including operating, registration, trustee, licensing and marketing, as well as their share of the Fund’s fees and expenses.
A Significant Event may relate to a single issuer or to an entire market sector. If the Advisor or Sub-Advisor of a Fund becomes aware of a Significant Event that has occurred with respect to a security or group of securities after the closing of the exchange or market on which the security or securities principally trade, but before the time at which the Fund calculates its net asset value, it may request that a Fair Value Committee Meeting be called. In addition, the Funds’ Administrator or Sub-Administrator monitors price movements among certain selected indices, securities and/or baskets of securities that may be an indicator that the closing prices received earlier from foreign exchanges or markets may not reflect market value at the time the Fund calculates its net asset value. If price movements in a monitored index or security exceed levels established by the Advisor, the Sub-Administrator notifies the Advisor or Sub-Advisor for any Fund holding the relevant securities that such limits have been exceeded. In such event, the Advisor makes the determination whether a Fair Value Committee meeting should be called based on the information provided. These securities are categorized in Level 3.
New accounting pronouncements — In December 2011, the Financial Accounting Standards Board (“FASB”) issued Accounting Standards Update (ASU) No. 2011-11,“Disclosures about Offsetting Assets and Liabilities” (ASU2011-11). ASU 2011-11 requires disclosures to make financial statements that are prepared under U.S. generally accepted accounting principals (GAAP) more comparable to those prepared under the International Financial Reporting Standards (“IFRS”).The new disclosure requirements mandate that entities disclose both gross and net information about instruments and transactions eligible for offset in the statement of assets and liabilities as well as instruments and transactions subject to an agreement similar to a master netting arrangement. In addition, ASU 2011-11 requires disclosure of collateral received and posted in connection with master netting agreements or similar arrangements. New disclosures are required for annual reporting periods beginning on or after January 1, 2013, and interim periods within those annual periods. Management is evaluating the impact of ASU 2011-11 on the financial statements and disclosures.
In May 2011, FASB issued Accounting Standards Update (“ASUNo.2011-04”), “Amendments to Achieve Common Fair Value Measurement and Disclosure Requirements in GAAP and IFRS.” ASU 2011-04 includes common requirements for measurement of and disclosure about fair value between U.S. GAAP and IFRS. ASU 2011-04 which requires reporting entities to categorize within Level 3 of the fair value hierarchy: quantitative information about the unobservable inputs used in the fair value measurement; the valuation processes used by the reporting entity; and a narrative description of the sensitivity of the fair value measurement to changes in unobservable inputs and the interrelationships between those unobservable inputs. In addition, ASU 2011-04 requires reporting entities to make disclosures about amounts and reasons for all transfers in and out of Level 1 and Level 2 fair value measurements. The new and revised disclosures were effective for fiscal years beginning after December 15, 2011 and for interim periods within those fiscal years.
| 189 |
Notes to Financial Statements (Continued)
Securities sold short — The Funds periodically engage in selling securities short, which obligates a Fund to replace a security borrowed by purchasing the same security at the current market value. A Fund would incur a loss if the price of the security increases between the date of the short sale and the date on which the Fund replaces the borrowed security. A Fund would realize a gain if the price of the security declines between those dates. As of September 30, 2012, Market Neutral Equity Fund and Merger Arbitrage Fund held securities sold short with a fair value of $38,437,737 and $56,733,640 and had cash in the amount of $39,685,494 and $47,882,314, respectively, held as collateral for the securities sold short.
Foreign currency translation — The books and records of the Funds are maintained in U.S. dollars and translated into U.S. dollars on the following basis:
(1) market value of investment securities, assets and liabilities at the current rate of exchange on the valuation date; and
(2) purchases and sales of investment securities, income and expenses at the relevant rates of exchange prevailing on the respective dates of such transactions.
The Funds do not isolate that portion of gains and losses on investments in equity securities that is due to changes in the foreign exchange rates from that which is due to changes in market prices of equity securities.
Forward foreign currency contracts — A forward foreign currency contract is an agreement between two parties to buy and sell a specific currency at a price that is set on the date of the contract. The forward contract calls for delivery of the currency on a future date that is specified in the contract. Risks related to the use of forwards include the possible failure of counterparties to meet the terms of the forward agreement, the failure of the counterparties to timely post collateral, the risk that currency movements will not occur thereby reducing the Fund’s total return, and the potential for losses in excess of the Fund’s initial investment.
The market value of a forward foreign currency contract fluctuates with changes in foreign currency exchange rates. Forward foreign currency contracts are marked to market daily and the change in value is recorded by a Fund as an unrealized gain or loss. Realized gains or losses, equal to the difference between the value of the contract at the time it was opened and the value at the time it was closed, are recorded upon delivery or receipt of the currency.
During the year ended September 30, 2012, the Funds used forward foreign currency contracts to enhance potential gains, hedge against anticipated currency exchange rates, maintain diversity and liquidity of the portfolio and adjust exposure to foreign currencies.
Derivative instruments and hedging activities — The following table sets forth the fair value of the Funds’ derivative financial instruments by primary risk exposure as of September 30, 2012:
Fair Value of Derivative Investments
| As of September 30, 2012 |
| Asset | Liability | |||||||||
| Derivatives* | Derivatives** | |||||||||
| Derivatives not accounted for as hedging | Unrealized | Unrealized | ||||||||
| Fund | instruments under ASC 815 | Appreciation | Depreciation | |||||||
| International Fixed Income Fund | Forward foreign currency exchange contracts | $ | 197,149 | $ | (210,331 | ) | ||||
| Merger Arbitrage Fund | Forward foreign currency exchange contracts | 45,577 | (69,877 | ) | ||||||
* Statements of Assets and Liabilities Location: Unrealized appreciation on forward foreign currency contracts
** Statements of Assets and Liabilities Location: Unrealized depreciation on forward foreign currency contracts
| 190 |
Notes to Financial Statements (Continued)
For the year ended September 30, 2012, the average quarterly balance of outstanding derivative financial instruments were as follows:
| International | Merger | |||||||
| Fixed Income | Arbitrage | |||||||
| Fund | Fund | |||||||
| Forward foreign currency exchange contracts: | ||||||||
| Average number of contracts | 58 | 1 | ||||||
| Average U.S. dollar amount purchased | $ | 13,121,992 | $ | 5,927,268 | ||||
| Average U.S. dollar amount sold | 11,419,087 | — | ||||||
| The Effect of Derivative Investments on the Statement of Operations | ||||||||||
| for the Year Ended September 30, 2012 | ||||||||||
| Change in | ||||||||||
| Unrealized | ||||||||||
| Realized Gain | Depreciation | |||||||||
| Derivatives not accounted for as hedging | (Loss) | on | ||||||||
| Fund | instruments under ASC 815 | on Derivatives* | Derivatives** | |||||||
| International Fixed Income Fund | Forward foreign currency exchange contracts | $ | 46,713 | $ | (237,552 | ) | ||||
| Merger Arbitrage Fund | Forward foreign currency exchange contracts | (312,554 | ) | (24,300 | ) | |||||
* Statements of Operations Location: Net realized gains (losses) from foreign currency transactions
** Statements of Operations Location: Net change in unrealized appreciation (depreciation) on foreign currency transactions
Portfolio securities loaned — Each Fund may lend its portfolio securities. Lending portfolio securities exposes a Fund to the risk that the borrower may fail to return the loaned securities or may not be able to provide additional collateral or that the Fund may experience delays in recovery of the loaned securities or loss of rights in the collateral if the borrower fails financially. To minimize these risks, the borrower must agree to maintain cash collateral with the Funds’ custodian in an amount at least equal to the market value of the loaned securities. The loaned securities are secured by collateral valued at least equal, at all times, to the market value of the securities loaned plus accrued interest. When the collateral falls below specified amounts the lending agent will use its best effort to obtain additional collateral on the next business day to meet required amounts under the security lending agreement. The cash collateral is reinvested by the Funds’ custodian into an approved investment vehicle.
As of September 30, 2012, the following Funds loaned securities and received collateral as follows:
| Market Value of | Market Value of | |||||||
| Securities | Collateral | |||||||
| Fund | Loaned | Received | ||||||
| Emerging Markets Equity Fund | $ | 21,181,186 | $ | 22,265,716 | ||||
| Focused Equity Fund | 2,407,279 | 2,541,236 | ||||||
| Global Equity Fund | 949,161 | 970,747 | ||||||
| Global Real Estate Fund | 318,749 | 333,900 | ||||||
| Mid Cap Fund | 2,818,354 | 2,855,721 | ||||||
| Sands Capital Select Growth Fund | 80,652,124 | 79,587,866 | ||||||
| Small Cap Core Fund | 55,663,314 | 57,448,540 | ||||||
| Small Cap Value Fund | 3,589,147 | 3,740,079 | ||||||
All collateral received as cash is received, held and administered by the Funds’ custodian for the benefit of the Funds in the applicable custody account or other account established for the purpose of holding collateral.
Funds participating in securities lending receive compensation in the form of fees, or retain a portion of interest or dividends on the investment of any cash received as collateral. The Funds also continue to receive interest or dividends on the securities loaned.
| 191 |
Notes to Financial Statements (Continued)
Unrealized gain or loss on the fair value of the securities loaned that may occur during the term of the loan is recognized by the Funds. The Funds have the right under the lending agreement to recover the securities from the borrower on demand.
Delayed delivery transactions — Each Fund may purchase or sell securities on a when-issued or delayed delivery basis. These transactions involve a commitment by the Fund to purchase or sell securities for a predetermined price or yield, with payment and delivery taking place beyond the customary settlement period. When delayed delivery purchases are outstanding, the Fund will set aside liquid assets in an amount sufficient to meet the purchase price. When purchasing a security on a delayed delivery basis, the Fund assumes the rights and risks of ownership of the security, including the risk of price and yield fluctuations, and takes such fluctuations into account when determining net asset value. The Fund may dispose of or renegotiate a delayed delivery transaction after it is entered into, and may sell when-issued securities before they are delivered, which may result in a capital gain or loss. When the Fund has sold a security on a delayed delivery basis, the Fund does not participate in future gains and losses with respect to the security.
Share valuation — The net asset value per share of each class of shares of each Fund is calculated daily by dividing the total value of a Fund’s assets attributable to that class, less liabilities attributable to that class, by the number of outstanding shares of that class.
The maximum offering price per share of Class A shares of the Funds (except International Fixed Income Fund and Total Return Bond Fund) is equal to the net asset value per share plus a sales load equal to 6.10% of the net asset value (or 5.75% of the offering price). The maximum offering price per share of Class A shares of the International Fixed Income Fund and Total Return Bond Fund is equal to the net asset value per share plus a sales load equal to 4.99% of the net asset value (or 4.75% of the offering price). There is no sales load on purchases of $1 million or more of Class A shares. The maximum offering price per share of Class C, Class Y, Class Z, and Institutional Class shares of the Funds is equal to the net asset value per share.
The redemption price per share of each class of shares of the Funds is generally equal to the net asset value per share. However, Class A redemptions that were part of no load $1 million subscriptions may be subject to a contingent deferred sales charge (“CDSC”) of up to 1%. Purchases of Class C shares of the Funds are subject to a CDSC of 1.00% of the original purchase price if redeemed within a one-year period from the date of purchase.
Investment income — Dividend income from securities is recognized on the ex-dividend date, net of foreign withholding taxes, if any, which are reduced by any amounts reclaimable by the Funds, where applicable. Interest income from securities is recorded on the basis of interest accrued, premium amortized and discount accreted. Realized gains and losses resulting from principal paydowns on mortgage-backed and asset-backed securities are included in interest income. Market discounts, original issue discount (“OID”) and market premiums on debt securities are accreted/amortized to interest income over the life of the security with a corresponding adjustment in the cost basis of that security. In addition, it is the Funds’ policy to accrue for foreign capital gains taxes, if applicable, on certain foreign securities held by the Funds. An estimated foreign capital gains tax is recorded daily on net unrealized gains on these securities and is payable upon the sale of such securities when a gain is realized.
Distributions to shareholders — The Emerging Markets Equity Fund, Focused Equity Fund, Global Equity Fund, Market Neutral Equity Fund, Merger Arbitrage Fund, Mid Cap Fund, and Small Cap Core Fund declare and distribute net investment income, if any, annually, as a dividend to shareholders. The Global Real Estate Fund, Large Cap Relative Value Fund, Mid Cap Value Fund, Sands Capital Select Growth Fund, and Small Cap Value Fund declare and distribute net investment income, if any, quarterly, as a dividend to shareholders. The International Fixed Income Fund, Premium Yield Equity Fund and Total Return Bond Fund declare and distribute net investment income, if any, monthly as a dividend to shareholders. The Short Duration Fixed Income Fund,
| 192 |
Notes to Financial Statements (Continued)
and Ultra Short Duration Fixed Income Fund declare net investment income daily and distribute it monthly, as a dividend to shareholders. Any net realized capital gains on sales of securities for all Funds are distributed to shareholders at least annually. Income distributions and capital gain distributions are determined in accordance with income tax regulations. Recognition of the funds net investment that invest in underlying funds is affected by the timing of dividend declarations by investee funds.
Allocations — Investment income earned, realized capital gains and losses, and unrealized appreciation and depreciation for the Funds are allocated daily to each class of shares based upon its proportionate share of total net assets of the Fund. Class specific expenses are charged directly to the class incurring the expense. Common expenses, which are not attributable to a specific class, are allocated daily to each class of shares based upon their proportionate share of total net assets of the Fund. Expenses not directly billed to a Fund are allocated proportionally among all Funds daily in relation to net assets of each Fund or another reasonable measure.
Security transactions — Security transactions are reflected for financial reporting purposes as of the trade date, which may cause the net asset value (“NAV”) as stated in the accompanying financial statements to be different than the NAV applied to Fund share transactions. Realized gains and losses on sales of portfolio securities are calculated using the identified cost basis.
Payment by affiliates — On June 18, 2012, Miller/Howard Investments, Inc. contributed $313 of capital to the Premium Equity Fund to mitigate the negative impact to Shareholders from a trade error.
Estimates — The preparation of financial statements in conformity with U.S. GAAP requires management to make estimates and assumptions that affect the reported amounts of assets and liabilities and disclosure of contingent assets and liabilities at the date of the financial statements and the reported amounts of income and expenses during the reporting period. Actual results could differ from those estimates.
3. Investment Transactions
Investment transactions (excluding short-term investments and U.S. Government securities) were as follows for the year ended September 30, 2012:
| Emerging | Focused | Global | ||||||||||
| Markets Equity | Equity | Equity | ||||||||||
| Fund | Fund | Fund | ||||||||||
| Purchases of investment securities | $ | 168,007,821 | $ | 50,330,261 | $ | 19,777,850 | ||||||
| Proceeds from sales and maturities | $ | 178,263,933 | $ | 62,069,054 | $ | 4,352,914 | ||||||
| Global | International | Large Cap | ||||||||||
| Real Estate | Fixed Income | Relative Value | ||||||||||
| Fund | Fund | Fund | ||||||||||
| Purchases of investment securities | $ | 25,505,247 | $ | 27,120,919 | $ | 27,672,273 | ||||||
| Proceeds from sales and maturities | $ | 8,380,773 | $ | 8,772,106 | $ | 1,333,041 | ||||||
| Merger | ||||||||||||
| Market Neutral | Arbitrage | Mid Cap | ||||||||||
| Equity Fund | Fund | Fund | ||||||||||
| Purchases of investment securities | $ | 43,440,212 | $ | 722,216,651 | $ | 102,790,648 | ||||||
| Proceeds from sales and maturities | $ | 52,341,277 | $ | 412,571,816 | $ | 137,075,734 | ||||||
| Mid Cap | Premium Yield | Sands Capital | Short Duration | |||||||||||||
| Value | Equity | Select Growth | Fixed Income | |||||||||||||
| Fund | Fund | Fund | Fund | |||||||||||||
| Purchases of investment securities | $ | 58,732,333 | $ | 72,536,674 | $ | 1,841,447,056 | $ | 47,596,231 | ||||||||
| Proceeds from sales and maturities | $ | 28,149,906 | $ | 12,245,527 | $ | 438,220,030 | $ | 18,059,319 | ||||||||
| 193 |
Notes to Financial Statements (Continued)
| Small Cap | Small Cap | Total Return | Ultra Short | |||||||||||||
| Core | Value | Bond | Duration Fixed | |||||||||||||
| Fund | Fund | Fund | Income Fund | |||||||||||||
| Purchases of investment securities | $ | 317,625,837 | $ | 36,960,215 | $ | 126,668,849 | $ | 476,686,380 | ||||||||
| Proceeds from sales and maturities | $ | 33,912,528 | $ | 50,870,919 | $ | 34,046,114 | $ | 622,941,948 | ||||||||
Purchases and proceeds from sales and maturities in U.S. Government Securities for Short Duration Fixed Income Fund, Total Return Bond Fund and Ultra Short Duration Fixed Income Fund were $12,795,502, $3,482,257, $69,538,294, $40,539,966, $144,519,902 and $81,984,636, respectively for the period ended September 30, 2012.
4. Transactions with Affiliates and Other Related Parties
Certain officers of theTrust are also officers of the Advisor (Touchstone Advisors, Inc.), the Underwriter (Touchstone Securities, Inc.) and/or BNY Mellon Investment Servicing (US) Inc. (“BNY Mellon”) the Sub-Administrator and Transfer Agent to the Funds. The Advisor and Underwriter are each wholly owned, indirect subsidiaries of The Western and Southern Life Insurance Company (“Western-Southern”).
As of September 30, 2012, the following Funds were owned by Western-Southern and subsidiaries:
| Global Equity Fund | 17.0 | % | ||
| Global Real Estate Fund | 17.8 | % | ||
| Large Cap Relative Value Fund | 12.2 | % | ||
| Market Neutral Equity Fund | 74.9 | % | ||
| Mid Cap Value Fund | 52.2 | % | ||
| Premium Yield Equity Fund | 20.3 | % | ||
| Total Return Bond Fund | 11.2 | % |
MANAGEMENT & EXPENSE LIMITATION AGREEMENTS
The Advisor provides general investment supervisory services for the Funds, under terms of an Advisory Agreement. Under the Advisory Agreement, the Funds pay the Advisor a fee, which is computed and accrued daily and paid monthly, at an annual rate based on average daily net assets as shown in the table below.
| Emerging Markets Equity Fund | 1.05% on the first $200 million |
| 1.00% on assets greater than $200 million to $400 million | |
| 0.90% of such assets in excess of $400 million | |
| Focused Equity Fund | 0.70% on the first $100 million |
| 0.65% on assets greater than $100 million to $500 million | |
| 0.60% of such assets in excess of $500 million | |
| Global Equity Fund | 0.85% on the first $50 million |
| 0.80% on assets greater than $50 million to $500 million | |
| 0.75% of such assets in excess of $500 million | |
| Global Real Estate Fund | 0.80% |
| International Fixed Income Fund | 0.55% on the first $100 million |
| 0.50% on assets greater than $100 million to $250 million | |
| 0.45% of such assets in excess of $250 million | |
| Large Cap Relative Value Fund | 0.70% on the first $100 million |
| 0.65% of such assets in excess of $100 million | |
| Market Neutral Equity Fund | 1.30% |
| Merger Arbitrage Fund | 1.05% |
| 194 |
Notes to Financial Statements (Continued)
| Mid Cap Fund* | 0.80% on the first $500 million |
| 0.75% on assets greater than $500 million to $1 billion | |
| 0.70% of such assets in excess of $1 billion | |
| Mid Cap Value Fund | 0.85% on the first $100 million |
| 0.80% on assets greater than $100 million to $400 million | |
| 0.75% of such assets in excess of $400 million | |
| Premium Yield Equity Fund | 0.70% on the first $100 million |
| 0.65% of such assets in excess of $100 million | |
| Sands Capital Select Growth Fund | 0.85% on the first $1 billion |
| 0.80% on assets greater than $1 billion to $1.5 billion | |
| 0.75% on assets greater than $1.5 billion to $2 billion | |
| 0.70% of such assets in excess of $2 billion | |
| Short Duration Fixed Income Fund | 0.25% |
| Small Cap Core Fund | 0.85% |
| Small Cap Value Fund | 0.95% on the first $100 million |
| 0.90% of such assets in excess of $100 million | |
| Total Return Bond Fund | 0.35% |
| Ultra Short Duration Fixed Income Fund | 0.25% |
* The Board of Trustees approved a change to the Mid Cap Fund’s advisory fee schedule effective December 8, 2011. Under the previous fee schedule, the Fund paid 0.80% of average net assets.
On May 17, 2012, the Board of Trustees of Touchstone Funds Group Trust approved an amendment to the annual advisory fee rate paid pursuant to the advisory agreement between the Emerging Market Equity Fund and Touchstone Advisors, Inc., the Fund’s investment advisor (the “Advisor”). Under the terms of the amendment, the contractual advisory fee paid by the Trust to the Advisor was reduced from 1.10% to 1.05% on the first $200 million of assets; from 1.05% to 1.00% on the next $200 million of assets; and from 0.95% to 0.90% on assets over $400 million.
In addition to the base advisory fee shown above for the Sands Capital Select Growth Fund, a performance fee adjustment will be added to or subtracted from the base advisory fee depending on the performance of the Fund in relation to the investment performance of the Fund’s benchmark index, for the preceding twelve month period, as follows:
| Benchmark | Benchmark | Annual Adjustment | Highest / Lowest Possible Advisory | ||||||
| Index | Threshold | Rate | Fee | ||||||
| Russell1000 | |||||||||
| Sands Capital Select Growth Fund | Growth Index | +/-2.50% | +/-0.15% | 1.00% / 0.55% |
For the year ended September 30, 2012, the Advisor’s base fee was increased by $1,545,592 as a result of the performance fee adjustment.
| 195 |
Notes to Financial Statements (Continued)
The Advisor has entered into investment sub-advisory agreements with the following parties (each, a “Sub-Advisor”):
| AGF Investments America, Inc. | GAM International Management Limited |
| Emerging Markets Equity Fund | International Fixed Income Fund |
| Aronson Johnson Oritz | Lee Munder Capital Group LLC |
| Market Neutral Equity Fund | Mid Cap Value Fund |
| Bedlam Asset Management PLC | The London Company |
| Global Equity Fund | Small Cap Core Fund |
| Mid Cap Fund | |
| Cornerstone Real Estate Advisers LLC | |
| Global Real Estate Fund | Longfellow Investment Management Co. |
| Merger Arbitrage Fund | |
| DePrince, Race & Zollo, Inc. | Short Duration Fixed Income Fund |
| Small Cap Value Fund | |
| Miller/Howard Investments, Inc. | |
| EARNEST Partners LLC | Premium Yield Equity Fund |
| Large Cap Relative Value Fund | |
| Total Return Bond Fund | Sands Capital Management, LLC |
| Sands Capital Select Growth Fund | |
| Fort Washington Investment Advisors, Inc.** | |
| Focused Equity Fund | |
| Ultra Short Duration Fixed Income Fund |
*Affiliate of the Advisor
The Advisor, not the Funds, pays sub-advisory fees to each Sub-Advisor.
The Advisor entered into an expense limitation agreement (“Expense Limitation Agreement”) to contractually limit operating expenses of the Funds which excludes dividend and expense on short sales. The maximum operating expense limit in any year with respect to the Funds is based on a percentage of the average daily net assets of the Funds. The Advisor has agreed to separately waive class level expenses, administration fees and reimburse expenses to maintain expense limitations for the Funds as follows:
| Institutional | ||||||||||||||||||||
| Class A | Class C | Class Y | Class Z | Class | ||||||||||||||||
| Emerging Markets Equity Fund* | 1.69 | % | 2.44 | % | 1.44 | % | — | 1.29 | % | |||||||||||
| Focused Equity Fund | 1.20 | % | 1.95 | % | 0.95 | % | — | 0.80 | % | |||||||||||
| Global Equity Fund | 1.34 | % | 2.09 | % | 1.09 | % | — | 0.94 | % | |||||||||||
| Global Real Estate Fund | 1.39 | % | 2.14 | % | 1.14 | % | — | 0.99 | % | |||||||||||
| International Fixed Income Fund | 1.09 | % | 1.84 | % | 0.84 | % | — | 0.69 | % | |||||||||||
| Large Cap Relative Value Fund | 1.19 | % | 1.94 | % | 0.94 | % | — | 0.79 | % | |||||||||||
| Market Neutral Equity Fund | 1.50 | % | 2.25 | % | 1.25 | % | — | — | ||||||||||||
| Merger Arbitrage Fund | 1.68 | % | 2.43 | % | 1.43 | % | — | 1.28 | % | |||||||||||
| Mid Cap Fund | 1.21 | % | 1.96 | % | 0.96 | % | 1.21 | % | 0.89 | % | ||||||||||
| Mid Cap Value Fund | 1.29 | % | 2.04 | % | 1.04 | % | — | 0.89 | % | |||||||||||
| Premium Yield Equity Fund | 1.20 | % | 1.95 | % | 0.95 | % | — | — | ||||||||||||
| Short Duration Fixed Income Fund | — | — | 0.49 | % | 0.74 | % | — | |||||||||||||
| Small Cap Core Fund | 1.34 | % | 2.09 | % | 1.09 | % | — | 0.94 | % | |||||||||||
| Small Cap Value Fund | 1.43 | % | 2.18 | % | 1.18 | % | — | 1.03 | % | |||||||||||
| 196 |
Notes to Financial Statements (Continued)
| Institutional | ||||||||||||||||||||
| Class A | Class C | Class Y | Class Z | Class | ||||||||||||||||
| Total Return Bond Fund | 0.90 | % | 1.65 | % | 0.65 | % | — | 0.50 | % | |||||||||||
| Ultra Short Duration Fixed Income Fund | 0.69 | % | 1.19 | % | 0.44 | % | 0.69 | % | 0.39 | % | ||||||||||
*Prior to May 17, 2012 the expense limitation for Class A, Class C, Class Y and Institutional Class Shares for Emerging Markets Equity Fund were 1.74%, 2.49%, 1.49% and 1.34%, respectively.
These expense limitations will remain in effect for all funds except Total Return Bond Fund, Emerging Market Equity Fund and Ultra Short Duration Fixed Income Fund until at least January 27, 2013. The fee waivers and expense reimbursements for the Total Return Bond Fund, Emerging Market Equity Fund and Ultra Short Duration Fixed Income Fund will remain in effect until at least April 14, 2014, September 30, 2013 and April 14, 2016, respectively.
The Advisor has agreed to limit certain Funds’ other operating expenses (“Other Expenses”) to the following levels. These expense limitations will remain in effect until at least January 27, 2013.
| Class A | Class C | Class Y | Class Z | |||||||||||||
| Sands Capital Select Growth Fund | 0.25 | % | 0.25 | % | 0.25 | % | 0.25 | % | ||||||||
During the year ended September 30, 2012, the Advisor waived investment advisory fees and administration fees and/or reimbursed expenses of the Funds as follows:
| Other | ||||||||||||
| Investment | Operating | |||||||||||
| Advisory | Administration | Expenses | ||||||||||
| Fees Waived | Fees Waived | Reimbursed | ||||||||||
| Emerging Markets Equity Fund | $ | — | $ | 124,774 | $ | 165,658 | ||||||
| Focused Equity Fund | 119,031 | 187,762 | 298,929 | |||||||||
| Global Equity Fund | 39,963 | 16,249 | 45,043 | |||||||||
| Global Real Estate Fund | 68,063 | 15,927 | 29,073 | |||||||||
| International Fixed Income Fund | 11,995 | 30,946 | 50,129 | |||||||||
| Large Cap Relative Value Fund | 17,494 | 23,101 | 28,971 | |||||||||
| Market Neutral Equity Fund | 72,780 | 87,149 | 48,221 | |||||||||
| Merger Arbitrage Fund | — | 22,294 | 5,965 | |||||||||
| Mid Cap Fund | — | 111,362 | 52,886 | |||||||||
| Mid Cap Value Fund | 9,639 | 130,903 | 67,469 | |||||||||
| Premium Yield Equity Fund | — | 8,308 | 104,827 | |||||||||
| Sands Capital Select Growth Fund | — | — | 1,581,955 | |||||||||
| Short Duration Fixed Income Fund | — | 34,401 | 71,795 | |||||||||
| Small Cap Core Fund | — | 388,812 | 112,858 | |||||||||
| Small Cap Value Fund | 25,779 | 66,702 | 52,015 | |||||||||
| Total Return Bond Fund | — | 121,565 | 46,094 | |||||||||
| Ultra Short Duration Fixed Income Fund | — | 364,070 | 54,452 | |||||||||
Effective January 27, 2012, under the terms of the Expense Limitations Agreement the Advisor is entitled to recover, subject to approval by the Fund’s Board of Trustees, such amounts waived or reimbursed for a period of up to three years from the year in which the Advisor reduced its compensation and/or assumed expenses for the Fund. No recoupment will occur unless a Fund’s operating expenses are below the expense limitation amount.
At September 30, 2012, the Advisor may seek recoupment of previously waived and reimbursed fees as follows:
| Expiration | ||||
| September | ||||
| Fund | 30, 2015 | |||
| Emerging Markets Equity Fund | $ | 141,492 | ||
| Focused Equity Fund | 282,480 | |||
| 197 |
Notes to Financial Statements (Continued)
| Expiration | ||||
| September | ||||
| Fund | 30, 2015 | |||
| Global Equity Fund | 52,542 | |||
| Global Real Estate Fund | 67,941 | |||
| International Fixed Income Fund | 34,638 | |||
| Large Cap Relative Value Fund | 27,719 | |||
| Market Neutral Equity Fund | 93,388 | |||
| Merger Arbitrage Fund | 16,465 | |||
| Mid Cap Fund | 93,133 | |||
| Mid Cap Value Fund | 130,859 | |||
| Premium Yield Equity Fund | 32,094 | |||
| Sands Capital Select Growth Fund | 770,598 | |||
| Short Duration Fixed Income Fund | 58,430 | |||
| Small Cap Core Fund | 313,523 | |||
| Small Cap Value Fund | 87,517 | |||
| Total Return Bond Fund | 126,307 | |||
| Ultra Short Duration Fixed Income Fund | 302,408 | |||
ADMINISTRATION AGREEMENT
The Advisor entered into an Administration and Accounting Services Agreement with the Trust, whereby the Advisor is responsible for: supplying executive and regulatory compliance services; supervising the preparation of tax returns; coordinating the preparation of reports to shareholders and reports to, and filings with, the Securities and Exchange Commission and state securities authorities, as well as materials for meetings of the Board of Trustees; calculating the daily net asset value per share; and maintaining the financial books and records of each Fund. For its services, the Advisor receives an annual fee of 0.20% of the aggregate average daily net assets of the Trust, Touchstone Investment Trust (excluding Institutional Money Market Fund), Touchstone Strategic Trust, and Touchstone Tax-Free Trust up to and including $6 billion; 0.16% of the next $4 billion of aggregate average daily net assets; and 0.12% of the aggregate average daily net assets of all such assets in excess of $10 billion. The fee is allocated among the Funds on the basis of relative daily net assets.
Effective November 12, 2011, the Advisor has engaged BNY Mellon as the Sub-Administrator to the Trust. BNY Mellon provides administrator and accounting services to the Trust and is compensated directly by the Advisor, not theTrust. Prior to November 12, 2011, JPMorgan Chase Bank, N.A. (“JPMorgan”) served as the Sub-Administrator and was compensated directly by the Advisor, not the Trust.
TRANSFER AGENT AGREEMENT
Effective December 5, 2011, under the terms of the Transfer Agent Agreement between the Trust and BNY Mellon, BNY Mellon maintains the records of each shareholder’s account, answers shareholders’ inquiries concerning their accounts, processes purchases and redemptions of each Fund’s shares, acts as dividend and distribution disbursing agent and performs other shareholder service functions. For these services, BNY Mellon receives a monthly fee per shareholder account from each Fund. In addition, each Fund pays out-of-pocket expenses incurred by BNY Mellon including, but not limited to, postage and supplies.
Prior to December 5, 2011, under the terms of the Transfer Agent Agreement between the Trust and JPMorgan, JPMorgan maintained the records of each shareholder’s account, answered shareholders’ inquiries concerning their accounts, processed purchases and redemptions of each Fund’s shares, acted as dividend and distribution disbursing agent and performed other shareholder service functions. For these services, JPMorgan received a monthly fee per shareholder account from each Fund. In addition, each Fund paid out-of-pocket expenses incurred by JPMorgan, including, but not limited to, postage and supplies.
| 198 |
Notes to Financial Statements (Continued)
PLANS OF DISTRIBUTION
The Trust has adopted a Distribution and Shareholder Services Plan for Class A shares of the Emerging Markets Equity Fund, Focused Equity Fund, Global Equity Fund, Global Real Estate Fund, International Fixed Income Fund, Large Cap Relative Value Fund, Market Neutral Equity Fund, Merger Arbitrage Fund, Mid Cap Fund, Mid Cap Value Fund, Premium Yield Equity Fund, Sands Capital Select Growth Fund, Small Cap Core Fund, Small Cap Value Fund, Ultra Short Duration Fixed Income Fund and Total Return Bond Fund (Class A Plan) under which each Fund may directly or indirectly bear expenses relating to the distribution of Class A shares of the Trust and for shareholder services provided to Class A shares. The Fund will incur and/or reimburse expenses for distribution and shareholder services of Class A shares at an annual rate not to exceed 0.25% of the average daily net assets of Class A shares.
The Trust has adopted a Distribution and Shareholder Services Plan for Class C shares of the Emerging Markets Equity Fund, Focused Equity Fund, Global Equity Fund, Global Real Estate Fund, International Fixed Income Fund, Large Cap Relative Value Fund, Market Neutral Equity Fund, Merger Arbitrage Fund, Mid Cap Fund, Mid Cap Value Fund, Premium Yield Equity Fund, Sands Capital Select Growth Fund, Small Cap Core Fund, Small Cap Value Fund and Total Return Bond Fund (Class C Plan) under which each Fund may directly or indirectly bear expenses relating to the distribution of Class C shares of the Trust and for shareholder services provided to Class C shares. The Fund will incur and/or reimburse expenses for distribution and shareholder services of Class C shares at an annual rate not to exceed 0.75% and 0.25%, respectively, of the average daily net assets of Class C shares. The combination of these fees is not to exceed 1.00% of the average daily net assets of Class C shares for all funds mentioned above except Ultra Short Duration Fixed Income Fund. The Ultra Short Duration Fixed Income Fund intends to limit the amount of the 12b-1 fees for Class C shares to 0.75% for at least one year from April 16, 2012.
The Trust has adopted a Shareholder Services Plan for Class Z shares of the Mid Cap Fund, Sands Capital Select Growth Fund, Short Duration Fixed Income Fund, and Ultra Short Duration Fixed Income Fund (Class Z Plan) under which each Fund may directly or indirectly bear expenses for shareholder services provided. The Fund will incur and/or reimburse expense for shareholder services of Class Z shares at an annual rate not to exceed 0.25% of the average daily net assets of Class Z shares.
UNDERWRITING AGREEMENT
The Underwriter is the Funds’ principal underwriter and, as such, acts as exclusive agent for distribution of the Funds’ shares. Under the terms of the Underwriting Agreement between the Trust and Underwriter, the Underwriter earned the following from underwriting and broker commissions on the sale of shares of the following Funds during the year ended September 30, 2012:
| Amount | ||||
| Emerging Markets Equity Fund | $ | 3,228 | ||
| Focused Equity Fund | 1,797 | |||
| Global Equity Fund | 2,797 | |||
| Global Real Estate Fund | 1,480 | |||
| International Fixed Income Fund | 1,727 | |||
| Large Cap Relative Value Fund | 843 | |||
| Market Neutral Equity Fund | 229 | |||
| Merger Arbitrage Fund | 504,176 | |||
| Mid Cap Fund | 5,487 | |||
| Mid Cap Value Fund | 1,630 | |||
| Premium Yield Equity Fund | 135,616 | |||
| Sands Capital Select Growth Fund | 1,041,687 | |||
| Small Cap Core Fund | 146,369 | |||
| Small Cap Value Fund | 1,406 | |||
| 199 |
Notes to Financial Statements (Continued)
| Amount | ||||
| Total Return Bond Fund | 9,797 | |||
| Ultra Short Duration Fixed Income Fund | 6,654 | |||
In addition, the Underwriter collected contingent deferred sales charges on the redemption of Class C shares of the following Funds during the year ended September 30, 2012:
| Amount | ||||
| Emerging Markets Equity Fund | $ | 1,328 | ||
| Global Equity Fund | 22 | |||
| International Fixed Income Fund | 119 | |||
| Large Cap Relative Value Fund | 1 | |||
| Merger Arbitrage Fund | 2,572 | |||
| Mid Cap Value Fund | 9 | |||
| Premium Yield Equity Fund | 4,601 | |||
| Sands Capital Select Growth Fund | 4,940 | |||
| Small Cap Core Fund | 2,582 | |||
| Total Return Bond Fund | 757 | |||
| Ultra Short Duration Fixed Income Fund | 113 | |||
AFFILIATED INVESTMENTS
Each Fund may invest in the Touchstone Institutional Money Market Fund, subject to compliance with several conditions set forth in an order received by the Trust from the Securities and Exchange Commission. To the extent that the other Touchstone Funds are invested in the Touchstone Institutional Money Market Fund, the Advisor and Administrator will be paid additional fees from the Touchstone Institutional Money Market Fund that will not be waived or reimbursed.
A summary of each Fund’s investment, as applicable, in the Touchstone Institutional Money Market Fund for the year ended September 30, 2012, is as follows:
| Share Activity | ||||||||||||||||||||||||
| Balance | Balance | Value | ||||||||||||||||||||||
| 09/30/11 | Purchases | Sales | 09/30/12 | Dividends | 09/30/12 | |||||||||||||||||||
| Emerging Markets Equity Fund | 10,965,632 | 179,706,963 | (190,671,992 | ) | 603 | $ | 14,548 | $ | 603 | |||||||||||||||
| Focused Equity Fund | 4,009,511 | 35,067,940 | (33,896,847 | ) | 5,180,604 | 6,941 | 5,180,604 | |||||||||||||||||
| Global Equity Fund | 68,887 | 19,804,617 | (19,094,988 | ) | 778,516 | 786 | 778,516 | |||||||||||||||||
| Global Real Estate Fund | 100,471 | 22,535,722 | (21,828,079 | ) | 808,114 | 535 | 808,114 | |||||||||||||||||
| International Fixed Income Fund | — | 26,505,690 | (24,444,302 | ) | 2,061,388 | 1,399 | 2,061,388 | |||||||||||||||||
| Large Cap Relative Value Fund | 232,307 | 28,847,883 | (28,137,189 | ) | 943,001 | 703 | 943,001 | |||||||||||||||||
| Market Neutral Equity Fund | 294,473 | 32,610,706 | (32,126,854 | ) | 778,325 | 1,136 | 778,325 | |||||||||||||||||
| Merger Arbitrage Fund | 1,619,183 | 358,445,588 | (349,312,817 | ) | 10,751,954 | 31,044 | 10,751,954 | |||||||||||||||||
| Mid Cap Fund | 900,109 | 41,276,714 | (41,238,771 | ) | 938,052 | 1,025 | 938,052 | |||||||||||||||||
| Mid Cap Value Fund | 978,214 | 39,018,944 | (38,319,215 | ) | 1,677,943 | 2,054 | 1,677,943 | |||||||||||||||||
| Premium Yield Equity Fund | 483,397 | 52,335,545 | (36,646,629 | ) | 16,172,313 | 4,467 | 16,172,313 | |||||||||||||||||
| Sands Capital Select Growth Fund | 34,986,163 | 896,051,455 | (847,989,929 | ) | 83,047,689 | 71,619 | 83,047,689 | |||||||||||||||||
| Short Duration Fixed Income Fund | 202,113 | 76,053,577 | (62,668,509 | ) | 13,587,181 | 4,373 | 13,587,181 | |||||||||||||||||
| Small Cap Core Fund | 3,316,617 | 224,191,800 | (219,137,313 | ) | 8,371,104 | 14,830 | 8,371,104 | |||||||||||||||||
| Small Cap Value Fund | 1,778,524 | 21,653,787 | (22,806,281 | ) | 626,030 | 1,605 | 626,030 | |||||||||||||||||
| Total Return Bond Fund | 1,678,743 | 161,124,518 | (159,674,043 | ) | 3,129,218 | 5,263 | 3,129,218 | |||||||||||||||||
| Ultra Short Duration Fixed Income Fund | 45,836,225 | 605,277,236 | (617,355,213 | ) | 33,758,248 | 38,800 | 33,758,248 | |||||||||||||||||
| 200 |
Notes to Financial Statements (Continued)
5. Federal Tax Information
Federal income tax — It is each Fund’s policy to continue to comply with the special provisions of the Internal Revenue Code applicable to regulated investment companies. As provided therein, in any fiscal year in which a Fund so qualifies and distributes at least 90% of its investment company taxable income, the Fund (but not the shareholders) will be relieved of federal income tax on the income distributed. Accordingly, no provision for income taxes has been made.
In order to avoid imposition of the excise tax applicable to regulated investment companies, it is also each Fund’s intention to declare and pay as dividends in each calendar year at least 98% of its investment company taxable income (earned during the calendar year) and 98.2% of its net realized capital gains (earned during the twelve months ending October 31) plus undistributed amounts from prior years.
The tax character of distributions paid for the years ended September 30, 2012 and 2011 was as follows:
| Emerging Markets | Focused | Global | ||||||||||||||||||||||
| Equity Fund | Equity Fund | Equity Fund | ||||||||||||||||||||||
| Year Ended | Year Ended | Year Ended | Period Ended | Year Ended | Year Ended | |||||||||||||||||||
| September 30, | September 30, | September 30, | September 30, | September 30, | September 30, | |||||||||||||||||||
| 2012 | 2011 | 2012 | 2011 | 2012 | 2011 | |||||||||||||||||||
| From ordinary income | $ | 9,820,137 | $ | 917,181 | $ | 2,840,690 | $ | 95,426 | $ | 125,260 | $ | 54,811 | ||||||||||||
| From long-term capital gains | 3,092,612 | 42,906 | 78,600 | — | 285,989 | 23,345 | ||||||||||||||||||
| $ | 12,912,749 | $ | 960,087 | $ | 2,919,290 | $ | 95,426 | $ | 411,249 | $ | 78,156 | |||||||||||||
| Global Real | International Fixed | |||||||||||||||
| Estate Fund | Income Fund | |||||||||||||||
| Year Ended | Year Ended | Year Ended | Year Ended | |||||||||||||
| September 30, | September 30, | September 30, | September 30, | |||||||||||||
| 2012 | 2011 | 2012 | 2011 | |||||||||||||
| From ordinary income | $ | 336,360 | $ | 358,116 | $ | 550,240 | $ | 994,275 | ||||||||
| From long-term capital gains | 100,694 | 20,496 | 53,795 | 7,726 | ||||||||||||
| $ | 437,054 | $ | 378,612 | $ | 604,035 | $ | 1,002,001 | |||||||||
| Large Cap Relative | Market Neutral | Merger Arbitrage | Mid Cap | |||||||||||||||||||||||||||||
| Value Fund | Equity Fund | Fund | Fund | |||||||||||||||||||||||||||||
| Year | Year | Year | Year | Period | Period | Year | Year | |||||||||||||||||||||||||
| Ended | Ended | Ended | Ended | Ended | Ended | Ended | Ended | |||||||||||||||||||||||||
| September 30, | September 30, | September 30, | September 30, | September 30, | September 30, | September 30, | September 30, | |||||||||||||||||||||||||
| 2012 | 2011 | 2012 | 2011 | 2012 | 2011* | 2012 | 2011 | |||||||||||||||||||||||||
| From ordinary income | $ | 140,229 | $ | 78,312 | $ | — | $ | — | $ | 61,084 | $ | — | $ | 142,586 | $ | 273,246 | ||||||||||||||||
| From long-term capital gains | 249,788 | 2,050 | — | — | — | — | — | — | ||||||||||||||||||||||||
| $ | 390,017 | $ | 80,362 | $ | — | $ | — | $ | 61,084 | $ | — | $ | 142,586 | $ | 273,246 | |||||||||||||||||
| Mid Cap | ||||||||||||||||||||||||
| Value Fund | Premium Yield Equity Fund | Sands Capital Select Growth Fund | ||||||||||||||||||||||
| Year Ended | Year Ended | Year Ended | Year Ended | Year Ended | Year Ended | |||||||||||||||||||
| September 30, | September 30, | September 30, | September 30, | September 30, | September 30, | |||||||||||||||||||
| 2012 | 2011 | 2012 | 2011 | 2012 | 2011 | |||||||||||||||||||
| From ordinary income | $ | 3,391,737 | $ | 1,058,579 | $ | 2,414,120 | $ | 1,295,544 | $ | — | $ | — | ||||||||||||
| From long-term capital gains | 506,388 | 89,486 | — | — | — | — | ||||||||||||||||||
| From return of capital | — | — | 60,138 | — | — | — | ||||||||||||||||||
| $ | 3,898,125 | $ | 1,148,065 | $ | 2,474,258 | $ | 1,295,544 | $ | — | $ | — | |||||||||||||
| 201 |
Notes to Financial Statements (Continued)
| Short Duration Fixed | Small Cap | Small Cap | ||||||||||||||||||||||
| Income Fund | Core Fund | Value Fund | ||||||||||||||||||||||
| Year Ended | Year Ended | Year Ended | Year Ended | Year Ended | Year Ended | |||||||||||||||||||
| September 30, | September 30, | September 30, | September 30, | September 30, | September 30, | |||||||||||||||||||
| 2012 | 2011 | 2012 | 2011 | 2012 | 2011 | |||||||||||||||||||
| From ordinary income | $ | 1,109,994 | $ | 1,177,356 | $ | 207,966 | $ | 179,119 | $ | 662,666 | $ | 725,253 | ||||||||||||
| From long-term capital gains | — | — | 2,697,854 | 780 | — | — | ||||||||||||||||||
| $ | 1,109,994 | $ | 1,177,356 | $ | 2,905,820 | $ | 179,899 | $ | 662,666 | $ | 725,253 | |||||||||||||
| Total Return | Ultra Short Duration | |||||||||||||||
| Bond Fund | Fixed Income Fund | |||||||||||||||
| Year Ended | Period Ended | Year Ended | Year Ended | |||||||||||||
| September 30, | September 30, | September 30, | September 30, | |||||||||||||
| 2012 | 2011** | 2012 | 2011 | |||||||||||||
| From ordinary income | $ | 2,807,030 | $ | 1,208,189 | $ | 9,247,966 | $ | 5,857,004 | ||||||||
| From long-term capital gains | — | 271,911 | — | — | ||||||||||||
| From tax return of capital | — | 29,134 | — | — | ||||||||||||
| $ | 2,807,030 | $ | 1,509,234 | $ | 9,247,966 | $ | 5,857,004 | |||||||||
* Represents the period from commencement of operations (August 9, 2011) through September 30, 2011.
** Represents the period from April 1, 2011 through September 30, 2011.
The following information is computed on a tax basis for each item as of September 30, 2012:
| Emerging | ||||||||||||
| Markets Equity | Focused Equity | Global Equity | ||||||||||
| Fund | Fund | Fund | ||||||||||
| Tax cost of portfolio investments | $ | 548,671,773 | $ | 106,304,675 | $ | 21,283,627 | ||||||
| Gross unrealized appreciation | 42,397,430 | 10,474,121 | 1,101,091 | |||||||||
| Gross unrealized depreciation | (46,605,862 | ) | (8,997,134 | ) | (634,352 | ) | ||||||
| Net unrealized appreciation (depreciation) | (4,208,432 | ) | 1,476,987 | 466,739 | ||||||||
| Net unrealized appreciation (depreciation) on foreign currency and translation of other assets and liabilities denominated in foreign currency | (14,693 | ) | — | 60 | ||||||||
| Accumulated capital losses | (235,181 | ) | (2,569,583 | ) | — | |||||||
| Post-October and qualified late-year losses | (3,700,771 | ) | (9,470,302 | ) | — | |||||||
| Other temporary differences | (5,541 | ) | (7,692 | ) | — | |||||||
| Undistributed ordinary income | 1,445,860 | 573,675 | 220,943 | |||||||||
| Undistributed capital gains | — | — | 64,396 | |||||||||
| Accumulated earnings (deficit) | $ | (6,718,758 | ) | $ | (9,996,915 | ) | $ | 752,138 | ||||
| 202 |
Notes to Financial Statements (Continued)
| Global | International | Large Cap | Market | |||||||||||||
| Real Estate | Fixed Income | Relative Value | Neutral Equity | |||||||||||||
| Fund | Fund | Fund | Fund | |||||||||||||
| Tax cost of portfolio investments | $ | 24,532,714 | $ | 31,780,842 | $ | 34,226,891 | $ | 35,199,318 | ||||||||
| Gross unrealized appreciation | 767,783 | 775,969 | 1,299,473 | 5,217,799 | ||||||||||||
| Gross unrealized depreciation | (559,017 | ) | (252,901 | ) | (1,131,730 | ) | (1,189,905 | ) | ||||||||
| Net unrealized appreciation (depreciation) | 208,766 | 523,068 | 167,743 | 4,027,894 | ||||||||||||
| Net unrealized appreciation (depreciation) on securities sold short | — | — | — | (3,484,325 | ) | |||||||||||
| Net unrealized appreciation (depreciation) on foreign currency and translation of other assets and liabilities denominated in foreign currency | 505 | (11,550 | ) | — | — | |||||||||||
| Accumulated capital losses | — | — | — | — | ||||||||||||
| Post-October and qualified late-year losses | — | — | — | (1,372,013 | ) | |||||||||||
| Undistributed ordinary income | 362,260 | 64,487 | 5,715 | — | ||||||||||||
| Undistributed capital gains | 116,719 | 57,468 | 218,427 | — | ||||||||||||
| Other temporary differences | — | (63,825 | ) | — | (7,871 | ) | ||||||||||
| Accumulated earnings (deficit) | $ | 688,250 | $ | 569,648 | $ | 391,885 | $ | (836,315 | ) | |||||||
| Premium | Sands Capital | |||||||||||||||||||
| Merger | Mid Cap Value | Yield Equity | Select Growth | |||||||||||||||||
| Arbitrage Fund | Mid Cap Fund | Fund | Fund | Fund | ||||||||||||||||
| Tax cost of portfolio investments | $ | 331,523,713 | $ | 57,221,729 | $ | 86,573,573 | $ | 115,699,679 | $ | 2,719,450,380 | ||||||||||
| Gross unrealized appreciation | 6,564,453 | 8,059,629 | 8,549,157 | 14,690,520 | 785,645,199 | |||||||||||||||
| Gross unrealized depreciation | (2,286,987 | ) | (1,236,033 | ) | (2,727,753 | ) | (1,382,334 | ) | (73,831,162 | ) | ||||||||||
| Net unrealized appreciation (depreciation) | 4,277,466 | 6,823,596 | 5,821,404 | 13,308,186 | 711,814,037 | |||||||||||||||
| Net unrealized appreciation (depreciation) on foreign currency and translation of other assets and liabilities denominated in foreign currency | (24,300 | ) | ||||||||||||||||||
| Net unrealized appreciation (depreciation) on securities sold short | (1,628,683 | ) | — | — | — | — | ||||||||||||||
| Accumulated capital losses | — | (154,512,830 | ) | — | (6,150,986 | ) | (51,348,843 | ) | ||||||||||||
| Post-October and qualified late-year losses | — | — | — | (950,740 | ) | (63,242,417 | ) | |||||||||||||
| Undistributed ordinary income | 2,820,888 | 479,273 | 284,635 | — | — | |||||||||||||||
| Undistributed capital gains | 36 | — | 295,577 | — | — | |||||||||||||||
| Other temporary differences | 24,300 | 1 | — | — | — | |||||||||||||||
| Accumulated earnings (deficit) | $ | 5,469,707 | $ | (147,209,960 | ) | $ | 6,401,616 | $ | 6,206,460 | $ | 597,222,777 | |||||||||
| Ultra Short | ||||||||||||||||||||
| Short Duration | Small Cap | Total | Duration | |||||||||||||||||
| Fixed Income | Small Cap Core | Value | Return Bond | Fixed Income | ||||||||||||||||
| Fund | Fund | Fund | Fund | Fund | ||||||||||||||||
| Tax cost of portfolio investments | $ | 92,578,237 | $ | 513,002,160 | $ | 37,065,432 | $ | 185,438,959 | $ | 565,801,636 | ||||||||||
| Gross unrealized appreciation | 930,206 | 70,849,013 | 2,462,827 | 5,175,642 | 3,786,660 | |||||||||||||||
| Gross unrealized depreciation | (136,577 | ) | (6,129,793 | ) | (2,057,192 | ) | (208,045 | ) | (2,036,147 | ) | ||||||||||
| Net unrealized appreciation (depreciation) | 793,629 | 64,719,220 | 405,635 | 4,967,597 | 1,750,513 | |||||||||||||||
| Accumulated capital losses | (3,640,571 | ) | — | (27,324,512 | ) | — | (15,987,506 | ) | ||||||||||||
| Post - October and qualified late-year losses | (69,383 | ) | — | (261,765 | ) | — | (1,938,381 | ) | ||||||||||||
| Undistributed ordinary income | 25,033 | 1,666,851 | — | 13,107 | 346,509 | |||||||||||||||
| Undistributed capital gains | — | 4,059,544 | — | 107,568 | — | |||||||||||||||
| Other temporary differences | (3,177 | ) | — | — | — | (172,021 | ) | |||||||||||||
| Accumulated earnings (deficit) | $ | (2,894,469 | ) | $ | 70,445,615 | $ | (27,180,642 | ) | $ | 5,088,272 | $ | (16,000,886 | ) | |||||||
| 203 |
Notes to Financial Statements (Continued)
The difference between the tax cost of portfolio investments and the financial statement cost is primarily due to wash sale loss deferrals, investments in passive foreign investment companies, regulated investment companies, and real estate investment trusts.
As of September 30, 2012, the Funds had the following capital loss carryforwards for federal income tax purposes.
| No | ||||||||||||||||||||||||||||||||||||||||
| Expiration | No | |||||||||||||||||||||||||||||||||||||||
| Short Term Expiring On | Short | Expiration | ||||||||||||||||||||||||||||||||||||||
| 2013 | 2014 | 2015 | 2016 | 2017 | 2018 | 2019 | Term* | Long Term* | Total | |||||||||||||||||||||||||||||||
| Emerging Markets Equity Fund | $ | — | $ | — | $ | — | $ | — | $ | — | $ | — | $ | — | $ | 205,927 | $ | 29,254 | $ | 235,181 | ||||||||||||||||||||
| Focused Equity Fund | — | — | — | — | — | — | — | 2,473,105 | 96,478 | 2,569,583 | ||||||||||||||||||||||||||||||
| Mid Cap Fund | — | — | — | — | 83,712,038 | 70,800,792 | — | — | — | 154,512,830 | ||||||||||||||||||||||||||||||
| Premium Yield Equity Fund | — | — | — | — | 387,584 | 5,763,402 | — | — | — | 6,150,986 | ||||||||||||||||||||||||||||||
| Sands Capital Select Growth Fund | — | — | — | — | — | 51,348,843 | — | — | — | 51,348,843 | ||||||||||||||||||||||||||||||
| Short Duration Fixed Income Fund | 96,050 | 1,027,850 | 852,134 | 295,319 | 1,193,230 | 7,423 | 2,269 | 92,293 | 74,003 | 3,640,571 | ||||||||||||||||||||||||||||||
| Small Cap Value Fund | — | — | — | — | 9,471,083 | 17,853,429 | — | — | — | 27,324,512 | ||||||||||||||||||||||||||||||
| Ultra Short Duration Fixed Income Fund | 5,028,777 | ** | 371,187 | 164,819 | 576,080 | 3,223,694 | 3,334,355 | 933,830 | 1,641,233 | 713,531 | 15,987,506 | |||||||||||||||||||||||||||||
* The Regulated Investment Company Modernization Act of 2010 (the “Act”) was enacted on December 22, 2010. The Act makes changes to several tax rules impacting the Funds. In general, the provisions of the Act will be effective for the Funds’ fiscal year ending September 30, 2012. Although the Act provides several benefits, including the unlimited carryover of future capital losses, there may be a greater likelihood that all or a portion of each Fund’s pre-enactment capital loss carryovers may expire without being utilized due to the fact that post-enactment capital losses must be utilized before pre-enactment capital loss carryovers may be utilized. Under the Act, new capital losses may now be carried forward indefinitely, and retain the character of the original loss as compared with pre-enactment law, where capital losses could be carried forward for up to eight years, and carried forward as short-term capital losses, irrespective of the character of the original loss.
**Future utilization on losses of ($4,709,395) may be limited.
The capital loss carryforwards may be utilized in future years to offset net realized capital gains, if any, prior to distributing such gains to shareholders.
The following funds had capital losses expiring in the current year as follows:
| Fund | Amount | |||
| Short Duration Fixed Income Fund | $ | 1,994,293 | ||
| Ultra Short Duration Fixed Income Fund | 16,477,537 | |||
During the year September 30, 2012, the Fund utilized capital loss carryforwards:
| Fund | Amount | |||
| Market Neutral Equity Fund | $ | 448,430 | ||
| Mid Cap Fund | 12,244,440 | |||
| Premium Yield Equity Fund | 7,608 | |||
| Sands Capital Select Growth Fund | 14,878,133 | |||
| Small Cap Value Fund | 1,602,910 | |||
| Total Return Bond Fund | 1,623,220 | |||
Under current laws, certain capital losses realized after October 31 and ordinary losses realized after January 1 may be deferred (and certain ordinary losses after January 1st may be deferred) and treated as occurring on the first day of the following fiscal year. For the fiscal year ended September 30, 2012, the Funds elected to defer the following losses:
| 204 |
Notes to Financial Statements (Continued)
| Realized | Realized | |||||||||||
| Short-Term | Long-Term | |||||||||||
| Capital | Capital | Ordinary | ||||||||||
| Fund | Losses | Losses | Losses | |||||||||
| Emerging Markets Equity Fund | $ | 2,049,160 | $ | 1,651,611 | $ | — | ||||||
| Focused Equity Fund | 3,185,551 | 6,284,751 | — | |||||||||
| Market Neutral Equity Fund | 782,610 | — | 589,403 | |||||||||
| Premium Yield Equity Fund | 699,986 | 250,754 | — | |||||||||
| Sands Capital Select Growth Fund | 21,917,146 | 29,392,152 | 11,933,119 | |||||||||
| Short Duration Fixed Income Fund | 56,342 | 13,041 | — | |||||||||
| Small Cap Value Fund | — | 261,765 | — | |||||||||
| Ultra Short Duration Fixed Income Fund | 180,289 | 1,758,092 | — | |||||||||
The Funds have analyzed their tax positions taken on Federal income tax returns for all open tax years (tax years ended September 30, 2009 through 2012) and have concluded that no provision for income tax is required in their financial statements.
Certain reclassifications, the result of permanent differences between financial statement and income tax reporting requirements, have been made to the components of capital. These reclassifications have no impact on the net assets or net asset value per share of the Funds and are designed to present the Funds’ capital accounts on a tax basis. The following reclassifications, which are primarily attributed to the tax treatment of net investment losses, foreign currency gains/losses, gains/losses and dividend expenses on short sales, paydown gains/losses on mortgage backed securities, gains/losses on passive foreign investment companies, gains/losses on partnerships, gains/losses on real estate investment trusts, reclassification of distributions, expiration of prior year capital loss carryovers and carryovers of temporary differences due to mergers have been made to the following Funds for the year ended September 30, 2012:
| Accumulated | Accumulated | |||||||||||
| Paid-In | Net Investment | Net Realized | ||||||||||
| Fund | Capital | Income (Loss) | Gains (Losses) | |||||||||
| Emerging Markets Equity Fund | $ | 862,940 | $ | (291,905 | ) | $ | (571,035 | ) | ||||
| Focused Equity Fund | — | (142 | ) | 142 | ||||||||
| Global Equity Fund | — | (30,219 | ) | 30,219 | ||||||||
| Global Real Estate Fund | 1 | 82,640 | (82,641 | ) | ||||||||
| International Fixed Income Fund | — | 221,194 | (221,194 | ) | ||||||||
| Large Cap Relative Value Fund | — | (3,658 | ) | 3,658 | ||||||||
| Market Neutral Equity Fund | (229,113 | ) | 223,613 | 5,500 | ||||||||
| Merger Arbitrage Fund | — | 1,240,590 | (1,240,590 | ) | ||||||||
| Mid Cap Fund | (22,139 | ) | 1,658 | 20,481 | ||||||||
| Mid Cap Value Fund | — | (2,072 | ) | 2,072 | ||||||||
| Premium Yield Equity Fund | (34,006 | ) | 20,097 | 13,909 | ||||||||
| Sands Capital Select Growth Fund | (2,597,320 | ) | 2,597,320 | — | ||||||||
| Short Duration Fixed Income Fund | (1,994,293 | ) | 224,987 | 1,769,306 | ||||||||
| Small Cap Core Fund | — | (129 | ) | 129 | ||||||||
| Small Cap Value Fund | (23,561 | ) | 5,815 | 17,746 | ||||||||
| Total Return Bond Fund | (1,721,279 | ) | 176,845 | 1,544,434 | ||||||||
| Ultra Short Duration Fixed Income Fund | (879,690 | ) | 3,157,945 | (2,278,255 | ) | |||||||
6. Commitments and Contingencies
The Funds indemnify the Trust’s officers and Trustees for certain liabilities that might arise from their performance of their duties to the Funds. Additionally, in the normal course of business, the Funds enter into contracts that contain a variety of representations and warranties and which provide general indemnifications. The Funds’ maximum exposure under these arrangements is unknown, as this would involve future claims that may be
| 205 |
Notes to Financial Statements (Continued)
made against the Funds that have not yet occurred. However, based on experience, the Funds expect the risk of loss to be remote.
7. Concentrations/Risks
Certain Funds invest a high percentage of their assets in specific sectors of the market in order to achieve a potentially greater investment return. As a result, the Funds may be more susceptible to economic, political, and regulatory developments in a particular sector of the market, positive or negative, and may experience increased volatility on the Fund’s net asset value and magnified effect on the total return.
8. Fund Mergers
On July 27, 2011, a Special Meeting of Shareholders was held to approve or disapprove an Agreement and Plan of Reorganization providing for the transfer of all assets and liabilities of the EARNEST Partners Fixed Income Trust (a series of The Nottingham Investment Trust II) to the Total Return Bond Fund, in exchange for shares of the Total Return Bond Fund and the subsequent liquidation of the EARNEST Partners Fixed Income Trust. The Agreement and Plan of Reorganization was approved and the merger took place on August 1, 2011.
The merger was approved as follows:
| Number of Votes | ||||||||||||
| For | Against | Abstain | ||||||||||
| EARNEST Partners Fixed Income Trust | 1,223,066 | 467 | — | |||||||||
The following is a summary of shares outstanding, net assets, net asset value per share, unrealized appreciation (depreciation) and realized gain (loss) immediately before and after the reorganization:
| After | ||||||||||||
| Before Reorganization | Reorganization | |||||||||||
| EARNEST | ||||||||||||
| Partners Fixed | Total Return | Total Return | ||||||||||
| Class A | Income Trust | Bond Fund | Bond Fund | |||||||||
| Shares | 928 | (A) | 331,907 | 332,835 | ||||||||
| Net Assets | $ | 9,313 | $ | 3,333,082 | $ | 3,342,395 | ||||||
| Net Asset Value | 10.04 | (A) | 10.04 | 10.04 | ||||||||
| Unrealized Appreciation | $ | 370 | $ | 53,560 | $ | 53,930 | ||||||
| Accumulated Net Realized Loss | $ | (390 | ) | $ | (29,791 | ) | $ | (29,791 | ) | |||
| Class C | ||||||||||||
| Shares | — | 248,384 | 248,384 | |||||||||
| Net Assets | $ | — | $ | 2,488,799 | $ | 2,488,799 | ||||||
| Net Asset Value | — | 10.02 | 10.02 | |||||||||
| Unrealized Appreciation | $ | — | $ | 21,852 | $ | 21,852 | ||||||
| Accumulated Net Realized Loss | $ | — | $ | (16,910 | ) | $ | (16,910 | ) | ||||
| Class Y | ||||||||||||
| Shares | 1,648,324 | (B) | 61,451 | 1,709,775 | ||||||||
| Net Assets | $ | 16,562,612 | $ | 617,477 | $ | 17,180,089 | ||||||
| Net Asset Value | 10.05 | (B) | 10.05 | 10.05 | ||||||||
| Unrealized Appreciation | $ | 783,137 | $ | 608 | $ | 783,745 | ||||||
| Accumulated Net Realized Loss | $ | (1,712,437 | ) | $ | (1,942 | ) | $ | (1,942 | ) | |||
| Institutional Class | ||||||||||||
| Shares | — | 624,160 | 624,160 | |||||||||
| Net Assets | $ | — | $ | 6,267,909 | $ | 6,267,909 | ||||||
| Net Asset Value | — | 10.04 | 10.04 | |||||||||
| 206 |
Notes to Financial Statements (Continued)
| After | ||||||||||||
| Before Reorganization | Reorganization | |||||||||||
| EARNEST | ||||||||||||
| Partners Fixed | Total Return | Total Return | ||||||||||
| Class A | Income Trust | Bond Fund | Bond Fund | |||||||||
| Unrealized Appreciation | $ | — | $ | 153,082 | $ | 153,082 | ||||||
| Accumulated Net Realized Gain | $ | — | $ | 115,563 | $ | 115,563 | ||||||
| (A) | Reflects a 1.01491:1 stock split which occurred on the date of reorganization, August 1, 2011. |
| (B) | Reflects a 0.87567:1 stock split which occurred on the date of reorganization, August 1, 2011. |
On February 10, 2012, the shareholders of the Old Mutual Barrow Hanley Core Bond Fund and Old Mutual Dwight ShortTerm Fixed Income Fund (each an “Acquired Fund”) approved an Agreement and Plans of Reorganization (the “Plans”) providing for the transfer of all assets and liabilities of the Acquired Funds to the Touchstone Total Return Bond Fund and the Touchstone Ultra Short Duration Fixed Income Fund (each an “Acquiring Fund”), respectively. The merger took place on April 16, 2012. The fiscal year end of the Acquired Funds was March 31. After the merger, the Funds’ fiscal year end changed to September 30.
The following is a summary of shares outstanding, net assets, net asset value per share and unrealized appreciation (depreciation) immediately before and after the reorganization:
| After | ||||||||||||
| Before Reorganization | Reorganization | |||||||||||
| Old Mutual | ||||||||||||
| Dwight | Touchstone | Touchstone | ||||||||||
| Hanley Core | Total Return | Total Return | ||||||||||
| Bond | Bond | Bond | ||||||||||
| Fund | Fund | Fund | ||||||||||
| Class A | ||||||||||||
| Shares | — | 605,402 | 605,402 | |||||||||
| Net Assets | $ | — | $ | 6,236,803 | $ | 6,236,803 | ||||||
| Net Asset Value | $ | — | $ | 10.30 | $ | 10.30 | ||||||
| Class C | ||||||||||||
| Shares | — | 264,389 | 264,389 | |||||||||
| Net Assets | $ | — | $ | 2,719,605 | $ | 2,719,605 | ||||||
| Net Asset Value | $ | — | $ | 10.29 | $ | 10.29 | ||||||
| Class Y | ||||||||||||
| Shares | — | 2,263,150 | 2,263,150 | |||||||||
| Net Assets | $ | — | $ | 23,347,204 | $ | 23,347,204 | ||||||
| Net Asset Value | $ | — | $ | 10.32 | $ | 10.32 | ||||||
| Institutional Class | ||||||||||||
| Shares | 3,233,926 | (A) | 3,946,025 | 7,179,951 | ||||||||
| Net Assets | $ | 33,345,880 | $ | 40,688,465 | $ | 74,034,345 | ||||||
| Net Asset Value | $ | 10.31 | (A) | $ | 10.31 | $ | 10.31 | |||||
| Fund Total | ||||||||||||
| Shares Outstanding | 3,278,310 | 7,078,966 | 10,312,892 | |||||||||
| Net Assets | $ | 33,345,880 | $ | 72,992,077 | $ | 106,337,957 | ||||||
| Unrealized Appreciation (Depreciation) | $ | 1,592,683 | $ | 1,907,900 | $ | 3,500,583 | ||||||
| 207 |
Notes to Financial Statements (Continued)
| After | ||||||||||||
| Before Reorganization | Reorganization | |||||||||||
| Old Mutual | Touchstone | Touchstone | ||||||||||
| Dwight | Ultra Short | Ultra Short | ||||||||||
| Short Term | Duration | Duration | ||||||||||
| Fixed Income | Fixed Income | Fixed Income | ||||||||||
| Fund | Fund | Fund | ||||||||||
| Class A | ||||||||||||
| Shares | 409,186 | (B) | — | 409,186 | ||||||||
| Net Assets | $ | 3,916,077 | $ | — | $ | 3,916,077 | ||||||
| Net Asset Value | $ | 9.57 | (B) | $ | — | $ | 9.57 | |||||
| Class C | ||||||||||||
| Shares | 707,483 | (C) | — | 707,483 | ||||||||
| Net Assets | $ | 6,770,889 | $ | — | $ | 6,770,889 | ||||||
| Net Asset Value | $ | 9.57 | (C) | $ | — | $ | 9.57 | |||||
| Class Y * | ||||||||||||
| Shares | 11,510,031 | (D) | — | 11,510,031 | ||||||||
| Net Assets | $ | 110,155,119 | $ | — | $ | 110,155,119 | ||||||
| Net Asset Value | $ | 9.57 | (D) | $ | — | $ | 9.57 | |||||
| Class Z | ||||||||||||
| Shares | — | 37,026,535 | 37,026,535 | |||||||||
| Net Assets | $ | — | $ | 354,358,018 | $ | 354,358,018 | ||||||
| Net Asset Value | $ | — | $ | 9.57 | $ | 9.57 | ||||||
| Institutional Class | ||||||||||||
| Shares | 2,397,446 | (E) | — | 2,397,446 | ||||||||
| Net Assets | $ | 22,944,607 | $ | — | $ | 22,944,607 | ||||||
| Net Asset Value | $ | 9.57 | (E) | $ | — | $ | 9.57 | |||||
| Fund Total | ||||||||||||
| Shares Outstanding | 14,270,340 | 37,026,535 | 52,050,681 | |||||||||
| Net Assets | $ | 143,786,692 | $ | 354,358,018 | $ | 498,144,710 | ||||||
| Unrealized Appreciation (Depreciation) | $ | 911,511 | $ | 616,185 | $ | 1,527,696 | ||||||
| (A) | Reflects a 0.9865:1 stock split which occurred on the date of reorganization, April 16, 2012. |
| (B) | Reflects a 1.0527:1 stock split which occurred on the date of reorganization, April 16, 2012. |
| (C) | Reflects a 1.0524:1 stock split which occurred on the date of reorganization, April 16, 2012. |
| (D) | Reflects a 1.0529:1 stock split which occurred on the date of reorganization, April 16, 2012. |
| (E) | Reflects a 1.0524:1 stock split which occurred on the date of reorganization, April 16, 2012. |
| * | The Acquired Fund had Class Z shares outstanding immediately prior to the reorganization, which were exchanged for Class Y shares of the Acquiring Fund. |
On March 13, 2012, the Board of Trustees of the Trust approved an Agreement and Plan of Reorganization (the “Plan”) providing for the transfer of all assets and liabilities of the Fifth Third Short Term Bond Fund (the “Acquired Fund”), a series of Fifth Third Funds (“Fifth Third”), to the Touchstone Ultra Short Duration Fixed Income Fund (the “Acquiring Fund”), respectively. The merger took place on September 10, 2012. The fiscal year end of the Acquired Fund was July 31. After the merger, the Fund’s fiscal year end changed to September 30.
| 208 |
Notes to Financial Statements (Continued)
The following is a summary of shares outstanding, net assets, net asset value per share and unrealized appreciation (depreciation) immediately before and after the reorganization:
| After | ||||||||||||
| Before Reorganization | Reorganization | |||||||||||
| Touchstone | Touchstone | |||||||||||
| Fifth Third | Ultra Short | Ultra Short | ||||||||||
| Short Term | Duration | Duration | ||||||||||
| Bond | Fixed Income | Fixed Income | ||||||||||
| Fund | Fund | Fund | ||||||||||
| Class A | ||||||||||||
| Shares | 3,134,939 | (A) | 493,785 | 3,628,724 | ||||||||
| Net Assets | $ | 29,954,103 | $ | 4,718,051 | $ | 34,672,154 | ||||||
| Net Asset Value | 9.55 | (A) | $ | 9.55 | $ | 9.55 | ||||||
| Class C | ||||||||||||
| Shares | 565,823 | (B) | 688,254 | 1,254,077 | ||||||||
| Net Assets | $ | 5,406,406 | $ | 6,576,186 | $ | 11,982,592 | ||||||
| Net Asset Value | 9.55 | (B) | $ | 9.55 | $ | 9.55 | ||||||
| Class Y * | ||||||||||||
| Shares | 11,003,756 | (C) | 11,701,258 | 22,705,014 | ||||||||
| Net Assets | $ | 105,140,154 | $ | 111,804,391 | $ | 216,944,545 | ||||||
| Net Asset Value | 9.55 | (C) | $ | 9.55 | $ | 9.55 | ||||||
| Class Z | ||||||||||||
| Shares | — | 34,310,738 | 34,310,738 | |||||||||
| Net Assets | $ | — | $ | 327,829,219 | $ | 327,829,219 | ||||||
| Net Asset Value | $ | — | $ | 9.55 | $ | 9.55 | ||||||
| Institutional Class | ||||||||||||
| Shares | — | 598,288 | 598,288 | |||||||||
| Net Assets | $ | — | $ | 5,715,017 | $ | 5,715,017 | ||||||
| Net Asset Value | $ | — | 9.55 | 9.55 | ||||||||
| Fund Total | ||||||||||||
| Shares Outstanding | 14,666,557 | 47,792,323 | 62,496,841 | |||||||||
| Net Assets | $ | 140,500,663 | $ | 456,642,864 | $ | 597,143,527 | ||||||
| Unrealized Appreciation (Depreciation) | $ | (554,680 | ) | $ | 1,115,793 | $ | 561,113 | |||||
| (A) | Reflects a 1.0022:1 stock split which occurred on the date of reorganization, September 10, 2012. |
| (B) | Reflects a 1.0001:1 stock split which occurred on the date of reorganization, September 10, 2012. |
| (C) | Reflects a 1.0028:1 stock split which occurred on the date of reorganization, September 10, 2012. |
* The Acquired Fund had Institutional Class shares outstanding immediately prior to the reorganization, which were exchanged for Class Y shares of the Acquiring Fund.
At a meeting held on June 26, 2012, the Board of Trustees of the Trust approved an Agreement and Plan of Reorganization (the “Plan”) providing for the transfer of all assets and liabilities of the Touchstone Emerging Markets Equity Fund II (the “Acquired Fund”) to the Touchstone Emerging Markets Equity Fund (the “Acquiring Fund”). The merger took place on September 17, 2012.
The following is a summary of shares outstanding, net assets, net asset value per share and unrealized appreciation (depreciation) immediately before and after the reorganization:
| 209 |
Notes to Financial Statements (Continued)
| After | ||||||||||||
| Before Reorganization | Reorganization | |||||||||||
| Touchstone | Touchstone | Touchstone | ||||||||||
| Emerging | Emerging | Emerging | ||||||||||
| Markets | Markets | Markets | ||||||||||
| Equity | Equity | Equity | ||||||||||
| Fund II | Fund | Fund | ||||||||||
| Class A | ||||||||||||
| Shares | 511,406 | (A) | 2,322,326 | 2,833,732 | ||||||||
| Net Assets | $ | 6,295,683 | $ | 28,589,150 | $ | 34,884,833 | ||||||
| Net Asset Value | $ | 12.31 | (A) | $ | 12.31 | $ | 12.31 | |||||
| Class C | ||||||||||||
| Shares | 5,937 | (B) | 399,882 | 405,819 | ||||||||
| Net Assets | $ | 72,429 | $ | 4,877,929 | $ | 4,950,358 | ||||||
| Net Asset Value | $ | 12.20 | (B) | $ | 12.20 | $ | 12.20 | |||||
| Class Y | ||||||||||||
| Shares | 1,491,945 | (C) | 16,430,327 | 17,922,272 | ||||||||
| Net Assets | $ | 18,403,858 | $ | 202,675,547 | $ | 221,079,405 | ||||||
| Net Asset Value | $ | 12.34 | (C) | $ | 12.34 | $ | 12.34 | |||||
| Institutional Class | ||||||||||||
| Shares | 2,222,580 | (D) | 20,677,219 | 22,899,799 | ||||||||
| Net Assets | $ | 27,452,188 | $ | 255,395,482 | $ | 282,847,670 | ||||||
| Net Asset Value | $ | 12.35 | (D) | $ | 12.35 | $ | 12.35 | |||||
| Fund Total | ||||||||||||
| Shares Outstanding | 5,677,643 | 39,829,754 | 44,061,622 | |||||||||
| Net Assets | $ | 52,224,158 | $ | 491,538,108 | $ | 543,762,266 | ||||||
| Unrealized Appreciation (Depreciation) | $ | 1,279,684 | $ | 1,079,112 | $ | 2,358,796 | ||||||
| (A) | Reflects a 0.7464:1 stock split which occurred on the date of reorganization, September 17, 2012. |
| (B) | Reflects a 0.7489:1 stock split which occurred on the date of reorganization, September 17, 2012. |
| (C) | Reflects a 0.7429:1 stock split which occurred on the date of reorganization, September 17, 2012. |
| (D) | Reflects a 0.7467:1 stock split which occurred on the date of reorganization, September 17, 2012. |
Assuming theses reorganizations had been completed on October 1, 2011, the Emerging Markets Equity Fund, Total Return Bond Fund and Ultra Short Duration Fixed Income Fund results of operations for the year ended September 30, 2012 would have been as follows:
| Touchstone | ||||||||||||
| Touchstone | Touchstone | Ultra Short | ||||||||||
| Emerging | Total Return | Duration Fixed | ||||||||||
| Markets Equity | Bond | Income | ||||||||||
| Fund | Fund | Fund | ||||||||||
| Net investment income | $ | 7,030,819 | $ | 3,121,184 | $ | 8,755,622 | ||||||
| Net realized and unrealized gain (loss) on investments | (7,051,623 | ) | 6,249,215 | 4,593,609 | ||||||||
| Net increase (decrease) in asset from operations | (20,804 | ) | 9,370,399 | 13,349,231 | ||||||||
Because the combined investment portfolios have been managed as single portfolios since the Reorganizations were completed, it is not practical to separate the amounts of revenue and earnings to the Acquiring Funds that have been included in their statements of operations since the mergers.
9. Subsequent Events
Subsequent events occurring after the date of this report have been evaluated for potential impact to this report through the date the financial statements were issued. There were no subsequent events to report that would have a material impact on the Funds’ financial statements.
| 210 |
Report of Independent Registered Public Accounting Firm
To the Board of Trustees and Shareholders of Touchstone Funds Group Trust
We have audited the accompanying statements of assets and liabilities, including the portfolios of investments, of Touchstone Funds Group Trust, comprised of Touchstone Emerging Markets Equity Fund, Touchstone Focused Equity Fund,Touchstone Global Equity Fund,Touchstone Global Real Estate Fund,Touchstone International Fixed Income Fund, Touchstone Large Cap Relative Value Fund, Touchstone Market Neutral Equity Fund, Touchstone Merger Arbitrage Fund, Touchstone Mid Cap Fund, Touchstone Mid Cap Value Fund, Touchstone Premium Yield Equity Fund, Touchstone Sands Capital Select Growth Fund, Touchstone Short Duration Fixed Income Fund, Touchstone Small Cap Core Fund, Touchstone Small Cap Value Fund, and Touchstone Ultra Short Duration Fixed Income Fund (the “Funds”) as of September 30, 2012, and the related statements of operations for the year then ended, and the statements of changes in net assets for each of the two years in the period then ended, and the financial highlights for each of the years or periods indicated therein. We have audited the accompanying statement of assets and liabilities, including the portfolio of investments, of Touchstone Total Return Bond Fund as of September 30, 2012, and the related statement of operations for the year then ended, and the statements of changes in net assets and financial highlights for each of the two years or periods in the period then ended, These financial statements and financial highlights are the responsibility of the Funds’ management. Our responsibility is to express an opinion on these financial statements and financial highlights based on our audits. The statement of changes in net assets for the year ended March 31, 2011, and the financial highlights for the year or period ended March 31, 2011 and prior indicated therein of Touchstone Total Return Bond Fund were audited by other auditors whose report dated May 31, 2011, expressed an unqualified opinion on those financial statements and financial highlights.
We conducted our audits in accordance with the standards of the Public Company Accounting Oversight Board (United States). Those standards require that we plan and perform the audits to obtain reasonable assurance about whether the financial statements are free of material misstatement. We were not engaged to perform an audit of the Funds’ internal control over financial reporting. Our audits included consideration of internal control over financial reporting as a basis for designing audit procedures that are appropriate in the circumstances, but not for the purpose of expressing an opinion on the effectiveness of the Funds’ internal control over financial reporting. Accordingly, we express no such opinion. An audit also includes examining, on a test basis, evidence supporting the amounts and disclosures in the financial statements, assessing the accounting principles used and significant estimates made by management, and evaluating the overall financial statement presentation. Our procedures included confirmation of securities owned as of September 30, 2012, by correspondence with the custodian and brokers or by other appropriate auditing procedures where replies from brokers were not received. We believe that our audits provide a reasonable basis for our opinion.
In our opinion, the financial statements and financial highlights referred to above present fairly, in all material respects, the financial position of each of the respective Funds comprising Touchstone Funds Group Trust at September 30, 2012, the results of their operations for the year then ended, and the changes in their net assets and the financial highlights for each of the years or periods in the period then ended indicated above, in conformity with accounting principles generally accepted in the United States.
 |
| Cincinnati, Ohio |
| November 27, 2012 |
| 211 |
Other Items (Unaudited)
Qualified Dividend Income
Under the Jobs and Growth Tax Relief Reconciliation Act of 2003 (the “Act”), the following percentages of ordinary dividends paid during the fiscal year ended September 30, 2012 are designated as “qualified dividend income,” as defined in the Act, and are subject to reduced tax rates. The Funds intend to pass through the maximum allowable percentage for 1099s.
| Emerging Markets Equity Fund | 81.96 | % | ||
| Focused Equity Fund | 54.89 | % | ||
| Global Equity Fund | 100.00 | % | ||
| Global Real Estate Fund | 17.40 | % | ||
| Large Cap Relative Value Fund | 100.00 | % | ||
| Merger Arbitrage Fund | 21.40 | % | ||
| Mid Cap Fund | 100.00 | % | ||
| Mid Cap Value Fund | 64.14 | % | ||
| Premium Yield Equity Fund | 100.00 | % | ||
| Small Cap Core Fund | 100.00 | % | ||
| Small Cap Value Fund | 100.00 | % |
Dividend Received Deduction
For corporate shareholders, the following ordinary distributions paid during the current fiscal year ended September 30, 2012 qualify for the corporate dividends received deduction. The Funds intend to pass through the maximum allowable percentage for 1099s.
| Emerging Markets Equity Fund | 1.95 | % | ||
| Focused Equity Fund | 46.43 | % | ||
| Global Equity Fund | 15.21 | % | ||
| Global Real Estate Fund | 3.98 | % | ||
| Large Cap Relative Value Fund | 100 | % | ||
| Merger Arbitrage Fund | 21.66 | % | ||
| Mid Cap Fund | 100.00 | % | ||
| Mid Cap Value Fund | 45.58 | % | ||
| Premium Yield Equity Fund | 88.74 | % | ||
| Small Cap Core Fund | 100.00 | % | ||
| Small Cap Value Fund | 100.00 | % |
For the fiscal year ended September 30, 2012, the Focused Equity Fund, Global Equity Fund, Global Real Estate Fund, Large Cap Relative Value Fund, International Fixed Income Fund, Merger Arbitrage Fund, Mid Cap Value Fund, Small Cap Core Fund, and Total Return Bond Fund designates $78,600, $73,989, $116,719, $249,788, $111,263, $36, $506,388, $4,059,544 and $107,568 respectively, as long-term capital gains.
Foreign Tax Income & Foreign Tax Credit
Emerging Markets Equity Fund, Global Equity Fund, Global Real Estate Fund and International Fixed Income Fund intends to pass through a foreign tax credit to the shareholders. For the fiscal year ended September 30, 2012, the total amount of foreign source income is $14,413,443 or $0.33 per share, $240,174 or $0.12 per share, $195,817 or $0.10 per share, $387,047 or $0.13 per share. The total amount of foreign taxes to be paid is $662,939 or $0.02 per share, $15,401 or $0.01 per share, $11,779 or $0.01 per share, $1,234 or $0.0004 per share, respectively. Your allocable share of the foreign tax credit will be reported on Form 1099 Div.
| 212 |
Other Items (Unaudited) (Continued)
Proxy Voting
The Sub-Advisors are responsible for exercising the voting rights associated with the securities purchased and held by the Funds. A description of the policies and procedures that the Sub-Advisors use in fulfilling this responsibility and information regarding how those proxies were voted during the twelve month period ended June 30 are available without charge upon request by calling toll free 1.800.543.0407. These items are also available on the Securities and Exchange Commission’s (the Commission) website at http://www.sec.gov.
Quarterly Portfolio Disclosure
The Trust files a complete listing of portfolio holdings for each Fund as of the end of the first and third quarters of each fiscal year on Form N-Q. The complete listing (i) is available on the Commission’s website; (ii) may be reviewed and copied at the Commission’s Public Reference Room in Washington, DC; and (iii) will be made available to shareholders upon request by calling 1.800.543.0407. Information on the operation of the Public Reference Room may be obtained by calling 1-800-SEC-0330.
Schedule of Shareholder Expenses
As a shareholder of the Funds, you incur two types of costs: (1) transaction costs, including reinvested dividends or other distributions; and (2) ongoing costs, including investment advisory fees; distribution (12b-1) fees; and other Fund expenses. This example is intended to help you understand your ongoing costs (in dollars) of investing in the Funds and to compare these costs with the ongoing costs of investing in other mutual funds.
The example is based on an investment of $1,000 invested at the beginning of the period and held for the entire period (April 1, 2012 through September 30, 2012).
Actual Expenses
The first line of the table below provides information about actual account values and actual expenses. You may use the information in this line, together with the amount you invested, to estimate the expenses that you paid over the period. Simply divide your account value by $1,000 (for example, an $8,600 account value divided by $1,000 = 8.6), then multiply the result by the number in the first line under the heading entitled “Expenses Paid During the Six Months Ended September 30, 2012” to estimate the expenses you paid on your account during this period.
Hypothetical Example for Comparison Purposes
The second line of the table below provides information about hypothetical account values and hypothetical expenses based on the Funds’ actual expense ratio and an assumed rate of return of 5% per year before expenses, which is not the Funds’ actual return. The hypothetical account values and expenses may not be used to estimate the actual ending account balance or expenses you paid for the period. You may use this information to compare the ongoing costs of investing in the Funds and other funds. To do so, compare this 5% hypothetical example with the 5% hypothetical examples that appear in the shareholder reports of the other funds.
| 213 |
Other Items (Unaudited) (Continued)
Schedule of Shareholder Expenses (Continued)
| Expenses | ||||||||||||||||||
| Net Expense | Beginning | Ending | Paid During | |||||||||||||||
| Ratio | Account | Account | the Six Months | |||||||||||||||
| Annualized | Value | Value | Ended | |||||||||||||||
| September 30, | April 1, | September 30, | September 30, | |||||||||||||||
| 2012 | 2012 | 2012 | 2012* | |||||||||||||||
| Touchstone Emerging Markets Equity Fund | ||||||||||||||||||
| Class A | Actual | 1.70 | % | $ | 1,000.00 | $ | 984.90 | $ | 8.44 | |||||||||
| Class A | Hypothetical | 1.70 | % | $ | 1,000.00 | $ | 1,016.50 | $ | 8.57 | |||||||||
| Class C | Actual | 2.45 | % | $ | 1,000.00 | $ | 981.40 | $ | 12.14 | |||||||||
| Class C | Hypothetical | 2.45 | % | $ | 1,000.00 | $ | 1,012.75 | $ | 12.33 | |||||||||
| Class Y | Actual | 1.42 | % | $ | 1,000.00 | $ | 986.60 | $ | 7.05 | |||||||||
| Class Y | Hypothetical | 1.42 | % | $ | 1,000.00 | $ | 1,017.90 | $ | 7.16 | |||||||||
| Institutional Class | Actual | 1.30 | % | $ | 1,000.00 | $ | 987.40 | $ | 6.46 | |||||||||
| Institutional Class | Hypothetical | 1.30 | % | $ | 1,000.00 | $ | 1,018.50 | $ | 6.56 | |||||||||
| Touchstone Focused Equity Fund | ||||||||||||||||||
| Class A | Actual | 1.20 | % | $ | 1,000.00 | $ | 1,012.20 | $ | 6.04 | |||||||||
| Class A | Hypothetical | 1.20 | % | $ | 1,000.00 | $ | 1,019.00 | $ | 6.06 | |||||||||
| Class C | Actual | 1.95 | % | $ | 1,000.00 | $ | 1,008.80 | $ | 9.79 | |||||||||
| Class C | Hypothetical | 1.95 | % | $ | 1,000.00 | $ | 1,015.25 | $ | 9.82 | |||||||||
| Class Y | Actual | 0.95 | % | $ | 1,000.00 | $ | 1,013.00 | $ | 4.78 | |||||||||
| Class Y | Hypothetical | 0.95 | % | $ | 1,000.00 | $ | 1,020.25 | $ | 4.80 | |||||||||
| Institutional Class | Actual | 0.80 | % | $ | 1,000.00 | $ | 1,014.30 | $ | 4.03 | |||||||||
| Institutional Class | Hypothetical | 0.80 | % | $ | 1,000.00 | $ | 1,021.00 | $ | 4.04 | |||||||||
| Touchstone Global Equity Fund | ||||||||||||||||||
| Class A | Actual | 1.34 | % | $ | 1,000.00 | $ | 1,015.70 | $ | 6.75 | |||||||||
| Class A | Hypothetical | 1.34 | % | $ | 1,000.00 | $ | 1,018.30 | $ | 6.76 | |||||||||
| Class C | Actual | 2.09 | % | $ | 1,000.00 | $ | 1,011.80 | $ | 10.51 | |||||||||
| Class C | Hypothetical | 2.09 | % | $ | 1,000.00 | $ | 1,014.55 | $ | 10.53 | |||||||||
| Class Y | Actual | 1.09 | % | $ | 1,000.00 | $ | 1,017.50 | $ | 5.50 | |||||||||
| Class Y | Hypothetical | 1.09 | % | $ | 1,000.00 | $ | 1,019.55 | $ | 5.50 | |||||||||
| Institutional Class | Actual | 0.94 | % | $ | 1,000.00 | $ | 1,017.60 | $ | 4.74 | |||||||||
| Institutional Class | Hypothetical | 0.94 | % | $ | 1,000.00 | $ | 1,020.30 | $ | 4.75 | |||||||||
| 214 |
Other Items (Unaudited) (Continued)
Schedule of Shareholder Expenses (Continued)
| Net Expense | Beginning | Ending | Expenses Paid During | |||||||||||||||
| Ratio | Account | Account | the Six Months | |||||||||||||||
| Annualized | Value | Value | Ended | |||||||||||||||
| September 30, | April 1, | September 30, | September 30, | |||||||||||||||
| 2012 | 2012 | 2012 | 2012* | |||||||||||||||
| Touchstone Global Real Estate Fund | ||||||||||||||||||
| Class A | Actual | 1.39 | % | $ | 1,000.00 | $ | 1,068.00 | $ | 7.19 | |||||||||
| Class A | Hypothetical | 1.39 | % | $ | 1,000.00 | $ | 1,018.05 | $ | 7.01 | |||||||||
| Class C | Actual | 2.14 | % | $ | 1,000.00 | $ | 1,064.00 | $ | 11.04 | |||||||||
| Class C | Hypothetical | 2.14 | % | $ | 1,000.00 | $ | 1,014.30 | $ | 10.78 | |||||||||
| Class Y | Actual | 1.14 | % | $ | 1,000.00 | $ | 1,069.50 | $ | 5.90 | |||||||||
| Class Y | Hypothetical | 1.14 | % | $ | 1,000.00 | $ | 1,019.30 | $ | 5.76 | |||||||||
| Institutional Class | Actual | 0.99 | % | $ | 1,000.00 | $ | 1,070.20 | $ | 5.12 | |||||||||
| Institutional Class | Hypothetical | 0.99 | % | $ | 1,000.00 | $ | 1,020.05 | $ | 5.00 | |||||||||
| Touchstone International Fixed Income Fund | ||||||||||||||||||
| Class A | Actual | 1.09 | % | $ | 1,000.00 | $ | 1,037.70 | $ | 5.55 | |||||||||
| Class A | Hypothetical | 1.09 | % | $ | 1,000.00 | $ | 1,019.55 | $ | 5.50 | |||||||||
| Class C | Actual | 1.84 | % | $ | 1,000.00 | $ | 1,034.10 | $ | 9.36 | |||||||||
| Class C | Hypothetical | 1.84 | % | $ | 1,000.00 | $ | 1,015.80 | $ | 9.27 | |||||||||
| Class Y | Actual | 0.84 | % | $ | 1,000.00 | $ | 1,039.10 | $ | 3.52 | |||||||||
| Class Y | Hypothetical | 0.84 | % | $ | 1,000.00 | $ | 1,020.80 | $ | 3.49 | |||||||||
| Institutional Class | Actual | 0.69 | % | $ | 1,000.00 | $ | 1,039.90 | $ | 4.28 | |||||||||
| Institutional Class | Hypothetical | 0.69 | % | $ | 1,000.00 | $ | 1,021.55 | $ | 4.24 | |||||||||
| Touchstone Large Cap Relative Value Fund | ||||||||||||||||||
| Class A | Actual | 1.19 | % | $ | 1,000.00 | $ | 989.00 | $ | 5.92 | |||||||||
| Class A | Hypothetical | 1.19 | % | $ | 1,000.00 | $ | 1,019.05 | $ | 6.01 | |||||||||
| Class C | Actual | 1.94 | % | $ | 1,000.00 | $ | 985.00 | $ | 9.63 | |||||||||
| Class C | Hypothetical | 1.94 | % | $ | 1,000.00 | $ | 1,015.30 | $ | 9.77 | |||||||||
| Class Y | Actual | 0.94 | % | $ | 1,000.00 | $ | 990.20 | $ | 4.68 | |||||||||
| Class Y | Hypothetical | 0.94 | % | $ | 1,000.00 | $ | 1,020.30 | $ | 4.75 | |||||||||
| Institutional Class | Actual | 0.79 | % | $ | 1,000.00 | $ | 990.90 | $ | 3.93 | |||||||||
| Institutional Class | Hypothetical | 0.79 | % | $ | 1,000.00 | $ | 1,021.05 | $ | 3.99 | |||||||||
| Touchstone Market Neutral Equity Fund | ||||||||||||||||||
| Class A | Actual | 3.49 | % | $ | 1,000.00 | $ | 973.10 | $ | 17.22 | ** | ||||||||
| Class A | Hypothetical | 3.49 | % | $ | 1,000.00 | $ | 1,008.20 | $ | 17.52 | |||||||||
| Class C | Actual | 4.23 | % | $ | 1,000.00 | $ | 968.40 | $ | 20.82 | ** | ||||||||
| Class C | Hypothetical | 4.23 | % | $ | 1,000.00 | $ | 1,004.50 | $ | 21.19 | |||||||||
| Class Y | Actual | 3.23 | % | $ | 1,000.00 | $ | 973.40 | $ | 15.94 | ** | ||||||||
| Class Y | Hypothetical | 3.23 | % | $ | 1,000.00 | $ | 1,009.50 | $ | 16.22 | |||||||||
| 215 |
Other Items (Unaudited) (Continued)
Schedule of Shareholder Expenses (Continued)
| Net Expense | Beginning | Ending | Expenses Paid During | |||||||||||||||
| Ratio | Account | Account | the Six Months | |||||||||||||||
| Annualized | Value | Value | Ended | |||||||||||||||
| September 30, | April 1, | September 30, | September 30, | |||||||||||||||
| 2012 | 2012 | 2012 | 2012* | |||||||||||||||
| Touchstone Merger Arbitrage Fund | ||||||||||||||||||
| Class A | Actual | 1.90 | % | $ | 1,000.00 | $ | 1,012.40 | $ | 9.56 | *** | ||||||||
| Class A | Hypothetical | 1.90 | % | $ | 1,000.00 | $ | 1,015.50 | $ | 9.57 | |||||||||
| Class C | Actual | 2.66 | % | $ | 1,000.00 | $ | 1,008.60 | $ | 13.36 | *** | ||||||||
| Class C | Hypothetical | 2.66 | % | $ | 1,000.00 | $ | 1,011.70 | $ | 13.38 | |||||||||
| Class Y | Actual | 1.61 | % | $ | 1,000.00 | $ | 1,014.30 | $ | 8.11 | *** | ||||||||
| Class Y | Hypothetical | 1.61 | % | $ | 1,000.00 | $ | 1,016.95 | $ | 8.12 | |||||||||
| Institutional Class | Actual | 1.51 | % | $ | 1,000.00 | $ | 1,014.20 | $ | 7.60 | *** | ||||||||
| Institutional Class | Hypothetical | 1.51 | % | $ | 1,000.00 | $ | 1,017.45 | $ | 7.62 | |||||||||
| Touchstone Mid Cap Fund | ||||||||||||||||||
| Class A | Actual | 1.21 | % | $ | 1,000.00 | $ | 1,027.30 | $ | 6.13 | |||||||||
| Class A | Hypothetical | 1.21 | % | $ | 1,000.00 | $ | 1,018.95 | $ | 6.11 | |||||||||
| Class C | Actual | 1.96 | % | $ | 1,000.00 | $ | 1,024.00 | $ | 9.92 | |||||||||
| Class C | Hypothetical | 1.96 | % | $ | 1,000.00 | $ | 1,015.20 | $ | 9.87 | |||||||||
| Class Y | Actual | 0.91 | % | $ | 1,000.00 | $ | 1,029.10 | $ | 4.62 | |||||||||
| Class Y | Hypothetical | 0.91 | % | $ | 1,000.00 | $ | 1,020.45 | $ | 4.60 | |||||||||
| Class Z | Actual | 1.21 | % | $ | 1,000.00 | $ | 1,027.50 | $ | 6.13 | |||||||||
| Class Z | Hypothetical | 1.21 | % | $ | 1,000.00 | $ | 1,018.95 | $ | 6.11 | |||||||||
| Institutional Class | Actual | 0.89 | % | $ | 1,000.00 | $ | 1,029.80 | $ | 4.15 | |||||||||
| Institutional Class | Hypothetical | 0.89 | % | $ | 1,000.00 | $ | 1,020.55 | $ | 4.13 | |||||||||
| Touchstone Mid Cap Value Fund | ||||||||||||||||||
| Class A | Actual | 1.29 | % | $ | 1,000.00 | $ | 1,010.30 | $ | 6.48 | |||||||||
| Class A | Hypothetical | 1.29 | % | $ | 1,000.00 | $ | 1,018.55 | $ | 6.51 | |||||||||
| Class C | Actual | 2.04 | % | $ | 1,000.00 | $ | 1,007.00 | $ | 10.24 | |||||||||
| Class C | Hypothetical | 2.04 | % | $ | 1,000.00 | $ | 1,014.80 | $ | 10.28 | |||||||||
| Class Y | Actual | 1.04 | % | $ | 1,000.00 | $ | 1,012.20 | $ | 5.23 | |||||||||
| Class Y | Hypothetical | 1.04 | % | $ | 1,000.00 | $ | 1,019.80 | $ | 5.25 | |||||||||
| Institutional Class | Actual | 0.89 | % | $ | 1,000.00 | $ | 1,013.00 | $ | 4.48 | |||||||||
| Institutional Class | Hypothetical | 0.89 | % | $ | 1,000.00 | $ | 1,020.55 | $ | 4.50 | |||||||||
| Touchstone Premium Yield Equity Fund | ||||||||||||||||||
| Class A | Actual | 1.20 | % | $ | 1,000.00 | $ | 1,032.90 | $ | 6.10 | |||||||||
| Class A | Hypothetical | 1.20 | % | $ | 1,000.00 | $ | 1,019.00 | $ | 6.06 | |||||||||
| Class C | Actual | 1.95 | % | $ | 1,000.00 | $ | 1,029.10 | $ | 9.89 | |||||||||
| Class C | Hypothetical | 1.95 | % | $ | 1,000.00 | $ | 1,015.25 | $ | 9.82 | |||||||||
| Class Y | Actual | 0.95 | % | $ | 1,000.00 | $ | 1,035.50 | $ | 4.83 | |||||||||
| Class Y | Hypothetical | 0.95 | % | $ | 1,000.00 | $ | 1,020.25 | $ | 4.80 | |||||||||
| 216 |
Other Items (Unaudited) (Continued)
Schedule of Shareholder Expenses (Continued)
| Net Expense | Beginning | Ending | Expenses Paid During | |||||||||||||||
| Ratio | Account | Account | the Six Months | |||||||||||||||
| Annualized | Value | Value | Ended | |||||||||||||||
| September 30, | April 1, | September 30, | September 30, | |||||||||||||||
| 2012 | 2012 | 2012 | 2012* | |||||||||||||||
| Touchstone Sands Capital Select Growth Fund | ||||||||||||||||||
| Class A | Actual | 1.36 | % | $ | 1,000.00 | $ | 1,003.20 | $ | 6.81 | |||||||||
| Class A | Hypothetical | 1.36 | % | $ | 1,000.00 | $ | 1,018.20 | $ | 6.86 | |||||||||
| Class C | Actual | 2.11 | % | $ | 1,000.00 | $ | 999.20 | $ | 10.55 | |||||||||
| Class C | Hypothetical | 2.11 | % | $ | 1,000.00 | $ | 1,014.45 | $ | 10.63 | |||||||||
| Class Y | Actual | 1.11 | % | $ | 1,000.00 | $ | 1,004.70 | $ | 5.56 | |||||||||
| Class Y | Hypothetical | 1.11 | % | $ | 1,000.00 | $ | 1,019.45 | $ | 5.60 | |||||||||
| Class Z | Actual | 1.32 | % | $ | 1,000.00 | $ | 1,003.20 | $ | 6.61 | |||||||||
| Class Z | Hypothetical | 1.32 | % | $ | 1,000.00 | $ | 1,018.40 | $ | 6.66 | |||||||||
| Touchstone Short Duration Fixed Income Fund | ||||||||||||||||||
| Class Y | Actual | 0.49 | % | $ | 1,000.00 | $ | 1,013.80 | $ | 2.47 | |||||||||
| Class Y | Hypothetical | 0.49 | % | $ | 1,000.00 | $ | 1,022.55 | $ | 2.48 | |||||||||
| Class Z | Actual | 0.74 | % | $ | 1,000.00 | $ | 1,013.50 | $ | 3.72 | |||||||||
| Class Z | Hypothetical | 0.74 | % | $ | 1,000.00 | $ | 1,021.30 | $ | 3.74 | |||||||||
| Touchstone Small Cap Core Fund | ||||||||||||||||||
| Class A | Actual | 1.34 | % | $ | 1,000.00 | $ | 1,033.60 | $ | 6.81 | |||||||||
| Class A | Hypothetical | 1.34 | % | $ | 1,000.00 | $ | 1,018.30 | $ | 6.76 | |||||||||
| Class C | Actual | 2.09 | % | $ | 1,000.00 | $ | 1,029.50 | $ | 10.60 | |||||||||
| Class C | Hypothetical | 2.09 | % | $ | 1,000.00 | $ | 1,014.55 | $ | 10.53 | |||||||||
| Class Y | Actual | 1.06 | % | $ | 1,000.00 | $ | 1,034.60 | $ | 5.39 | |||||||||
| Class Y | Hypothetical | 1.06 | % | $ | 1,000.00 | $ | 1,019.70 | $ | 5.35 | |||||||||
| Institutional Class | Actual | 0.94 | % | $ | 1,000.00 | $ | 1,035.30 | $ | 4.78 | |||||||||
| Institutional Class | Hypothetical | 0.94 | % | $ | 1,000.00 | $ | 1,020.30 | $ | 4.75 | |||||||||
| Touchstone Small Cap Value Fund | ||||||||||||||||||
| Class A | Actual | 1.43 | % | $ | 1,000.00 | $ | 1,015.20 | $ | 7.20 | |||||||||
| Class A | Hypothetical | 1.43 | % | $ | 1,000.00 | $ | 1,017.85 | $ | 7.21 | |||||||||
| Class C | Actual | 2.18 | % | $ | 1,000.00 | $ | 1,011.90 | $ | 10.96 | |||||||||
| Class C | Hypothetical | 2.18 | % | $ | 1,000.00 | $ | 1,014.10 | $ | 10.98 | |||||||||
| Class Y | Actual | 1.18 | % | $ | 1,000.00 | $ | 1,016.30 | $ | 5.95 | |||||||||
| Class Y | Hypothetical | 1.18 | % | $ | 1,000.00 | $ | 1,019.10 | $ | 5.96 | |||||||||
| Institutional Class | Actual | 1.03 | % | $ | 1,000.00 | $ | 1,017.80 | $ | 5.20 | |||||||||
| Institutional Class | Hypothetical | 1.03 | % | $ | 1,000.00 | $ | 1,019.85 | $ | 5.20 | |||||||||
| Touchstone Total Return Bond Fund | ||||||||||||||||||
| Class A | Actual | 0.90 | % | $ | 1,000.00 | $ | 1,038.20 | $ | 4.59 | |||||||||
| Class A | Hypothetical | 0.90 | % | $ | 1,000.00 | $ | 1,020.50 | $ | 4.55 | |||||||||
| Class C | Actual | 1.65 | % | $ | 1,000.00 | $ | 1,034.40 | $ | 8.39 | |||||||||
| Class C | Hypothetical | 1.65 | % | $ | 1,000.00 | $ | 1,016.75 | $ | 8.32 | |||||||||
| 217 |
Other Items (Unaudited) (Continued)
Schedule of Shareholder Expenses (Continued)
| Net Expense | Beginning | Ending | Expenses Paid During | |||||||||||||||
| Ratio | Account | Account | the Six Months | |||||||||||||||
| Annualized | Value | Value | Ended | |||||||||||||||
| September 30, | April 1, | September 30, | September 30, | |||||||||||||||
| 2012 | 2012 | 2012 | 2012* | |||||||||||||||
| Touchstone Total Return Bond Fund (continued) | ||||||||||||||||||
| Class Y | Actual | 0.60 | % | $ | 1,000.00 | $ | 1,039.70 | $ | 3.06 | |||||||||
| Class Y | Hypothetical | 0.60 | % | $ | 1,000.00 | $ | 1,022.00 | $ | 3.03 | |||||||||
| Institutional Class | Actual | 0.50 | % | $ | 1,000.00 | $ | 1,040.20 | $ | 2.55 | |||||||||
| Institutional Class | Hypothetical | 0.50 | % | $ | 1,000.00 | $ | 1,022.50 | $ | 2.53 | |||||||||
| Touchstone Ultra Short Duration Fixed Income Fund | ||||||||||||||||||
| Class A | Actual**** | 0.69 | % | $ | 1,000.00 | $ | 1,008.50 | $ | 3.18 | |||||||||
| Class A | Hypothetical | 0.69 | % | $ | 1,000.00 | $ | 1,019.78 | $ | 3.20 | |||||||||
| Class C | Actual**** | 1.19 | % | $ | 1,000.00 | $ | 1,006.20 | $ | 5.48 | |||||||||
| Class C | Hypothetical | 1.19 | % | $ | 1,000.00 | $ | 1,017.49 | $ | 5.51 | |||||||||
| Class Y | Actual**** | 0.44 | % | $ | 1,000.00 | $ | 1,009.70 | $ | 2.03 | |||||||||
| Class Y | Hypothetical | 0.44 | % | $ | 1,000.00 | $ | 1,020.93 | $ | 2.04 | |||||||||
| Class Z | Actual**** | 0.61 | % | $ | 1,000.00 | $ | 1,009.90 | $ | 3.07 | |||||||||
| Class Z | Hypothetical | 0.61 | % | $ | 1,000.00 | $ | 1,021.95 | $ | 3.08 | |||||||||
| Institutional Class | Actual**** | 0.39 | % | $ | 1,000.00 | $ | 1,009.90 | $ | 1.80 | |||||||||
| Institutional Class | Hypothetical | 0.39 | % | $ | 1,000.00 | $ | 1,021.16 | $ | 1.81 | |||||||||
| * | Expenses are equal to the Fund's annualized expense ratio, multiplied by the average account value over the period, multiplied by [183/366]] (to reflect one-half year period). |
| ** | Excluding interest and dividend expenses on securities sold short, your actual cost of investment in Class A, Class C and Class Y would be $7.40, $11.07 and $6.17, respectively. |
| *** | Excluding interest and dividend expenses on securities sold short, your actual cost of investment in Class A, Class C, Class Y and Institutional Class would be $8.40, $12.20, $6.45 and $6.95, respectively. |
| **** | The Fund began issuing Class A, Class C, Class Y and Institutional Class Shares on April 16, 2012. Expenses are equal to the Fund's annualized expenses ratio multiplied by the average account value over the period, multiplied by 168/ 366 (to reflect the period April 16, 2012 through September 30, 2012). Actual returns are for the period April 16, 2012 through September 30, 2012. |
| 218 |
Management of the Trust (Unaudited)
Listed below is basic information regarding the Trustees and principal officers of the Trust. The Trust’s Statement of Additional Information includes additional information about the Trustees and is available, without charge, upon request by calling 1.800.543.0407.
Interested Trustees1:
| Number | ||||||||||
| of Funds | ||||||||||
| Overseen | ||||||||||
| Term of | in the | |||||||||
| Name | Position(s) | Office2 And | Touchstone | Other | ||||||
| Address | Held with | Length of | Principal Occupation(s) | Fund | Directorships | |||||
| Age | Trust | Time Served | During Past 5 Years | Complex3 | Held4 | |||||
Jill T. McGruder Touchstone Advisors, Inc 303 Broadway Cincinnati, OH Year of Birth: 1955 | Trustee and President | Until retirement at age 75 or until she resigns or is removed Trustee since 1999 | President and CEO of IFS Financial Services, Inc. (a holding company). | 58 | Director of LaRosa’s (a restaurant chain), Capital Analysts Incorporated (an investment advisor and broker- dealer), IFS Financial Services, Inc. (a holding company), Integrity and National Integrity Life Insurance Co., Touchstone Securities (the Trust’s distributor), Touchstone Advisors (the Trust’s investment advisor and administrator) and W&S Financial Group Distributors (a distribution company). | |||||
| Independent Trustees: | ||||||||||
Phillip R. Cox 105 East Fourth Street Cincinnati, OH Year of Birth: 1947 | Trustee | Until retirement at age 75 or until he resigns or is removed Trustee since 1999 | President and Chief Executive Officer of Cox Financial Corp. (a financial services company). | 58 | Director of Cincinnati Bell (a communications company), Bethesda Inc. (a hospital), Timken Co. (a manufacturing company), Diebold (a technology solutions company), and Ohio Business Alliance for Higher Education. Director of Duke Energy from 1994-2008. | |||||
H. Jerome Lerner c/o Touchstone Advisors, Inc. 303 Broadway Cincinnati, OH Year of Birth: 1938 | Trustee | Until retirement at age 75 or until he resigns or is removed Trustee since 1989 | Principal of HJL Enterprises (a privately held investment company). | 58 | BASCO Shower Enclosures (a design and manufacturing company); Hebrew Union College - Jewish Institute of Religion | |||||
| 219 |
Management of the Trust (Unaudited) (Continued)
Independent Trustees (Continued):
| Number | ||||||||||
| of Funds | ||||||||||
| Overseen | ||||||||||
| Term of | in the | |||||||||
| Name | Position(s) | Office2 And | Touchstone | Other | ||||||
| Address | Held with | Length of | Principal Occupation(s) | Fund | Directorships | |||||
| Age | Trust | Time Served | During Past 5 Years | Complex3 | Held4 | |||||
| Donald C. Siekmann c/o Touchstone Advisors, Inc. 303 Broadway Cincinnati, OH Year of Birth: 1938 | Trustee | Until retirement at age 75 or until he resigns or is removed Trustee since 2005 | Executive for Duro Bag Manufacturing Co. (a bag manufacturer) from 2002-2008. | 58 | Society for Preservation of Music Hall; Riverfront Mutual Funds (until 2008). | |||||
| John P. Zanotti c/o Touchstone Advisors, Inc. 303 Broadway Cincinnati, OH Year of Birth: 1948 | Trustee | Until retirement at age 75 or until he resigns or is removed Trustee since 2002 | CEO, Chairman and Director of Avaton, Inc. (a wireless entertainment company) until 2006. President of Cincinnati Biomedical (a life science and economic development company) from 2003- 2007. Chairman of Integrated Media Technologies (a media company) | 58 | Cincinnati Children’s Hospital from 1994-2010. | |||||
| Susan J. Hickenlooper c/o Touchstone Advisors, Inc. 303 Broadway Cincinnati, OH Year of Birth: 1946 | Trustee | Until retirement at age 75 or until he resigns or is removed Trustee since 2009 | Trustee of Episcopal Retirement Homes Foundation | 58 | Trustee of Cincinnati Parks Foundation (a charitable organization) from 2000-present; Trustee of Episcopal Retirement Homes Foundation from 1998-2011. |
| 1 | Ms. McGruder, as a director of the Advisor and the Trust's Distributor, and an officer of affiliates of the Advisor and the Trust's Distributor, is an “interested person” of the Trust within the meaning of Section 2(a)(19) of the 1940 Act. |
| 2 | Each Trustee is elected to serve until the age of 75 or until he or she sooner resigns or is removed. |
| 3 | The Touchstone Fund Complex consists of 11 variable annuity series of the Trust, 3 series of Touchstone Tax-Free Trust, 1 series of Touchstone Institutional Funds Trust, 4 series of Touchstone Investment Trust, 22 series of Touchstone Strategic Trust, and 17 series of Touchstone Funds Group Trust. |
| 4 | Each Trustee is also a Trustee of Touchstone Funds Group Trust, Touchstone Institutional Funds Trust, Touchstone Investment Trust, Touchstone Strategic Trust, and Touchstone Tax-Free Trust. |
| 220 |
Management of the Trust (Unaudited) (Continued)
Principal Officers1:
| Number | ||||||||||
| of Funds | ||||||||||
| Overseen | ||||||||||
| Term of | in the | |||||||||
| Name | Position(s) | Office2 And | Touchstone | Other | ||||||
| Address | Held with | Length of | Principal Occupation(s) | Fund | Directorships | |||||
| Age | Trust | Time Served | During Past 5 Years | Complex2 | Held | |||||
Jill T. McGruder Touchstone Advisors, Inc. 303 Broadway Cincinnati, OH Year of Birth: 1955 | President | Until resignation, removal or disqualification President since 2004; President from 2000-2002 | See biography above. | 58 | See biography above. | |||||
Steven M. Graziano Touchstone Advisors, Inc. Cincinnati, OH Year of Birth: 1954 | Vice President | Until resignation, removal or disqualification Vice President since 2009 | President of Touchstone Advisors, Inc.; Executive Vice President of Pioneer Investment Management, Head of Retail Distribution and Strategic Marketing 2007- 2008; Executive Vice President of Pioneer Investment Management, Chief Marketing Officer 2002-2007. | 58 | None | |||||
Timothy D. Paulin Touchstone Advisors, Inc. 303 Broadway Cincinnati, OH Year of Birth: 1963 | Vice President | Until resignation, removal or disqualification Vice President since 2010 | Vice President of Investment Research; Principal of Klein Decisions | 58 | None | |||||
Michael Moser3 Western & Southern Financial 400 Broadway Cincinnati, OH Year of Birth: 1968 | Chief Compliance Officer | Until resignation, removal or disqualification Chief Compliance Officer since 2012 | Vice President and Chief Compliance Officer of the Western & Southern Financial Group and Chief Compliance Officer of Touchstone Advisors. | 58 | None | |||||
| Terrie A. Wiedenheft Touchstone Advisors, Inc. 303 Broadway Cincinnati, OH Year of Birth: 1962 | Controller and Treasurer | Until resignation, removal or disqualification Controller since 2000 Treasurer since 2003 | Chief Financial Officer and Senior Vice President of IFS Financial Services, Inc. | 58 | None |
| 221 |
Management of the Trust (Unaudited) (Continued)
Principal Officers1 (Continued):
| Number | ||||||||||
| of Funds | ||||||||||
| Overseen | ||||||||||
| Term of | in the | |||||||||
| Name | Position(s) | Office2 And | Touchstone | Other | ||||||
| Address | Held with | Length of | Principal Occupation(s) | Fund | Directorships | |||||
| Age | Trust | Time Served | During Past 5 Years | Complex2 | Held | |||||
Elizabeth R. Freeman BNY Mellon 201 Washington Street Boston, MA Year of Birth: 1962 | Secretary | Until resignation, removal or disqualification. Secretary since 2011 | Managing Director and Senior Counsel at BNY Mellon Investment Servicing (US) Inc. | 58 | None |
| 1 | Each officer also holds the same office with Touchstone Funds Group Trust, Touchstone Institutional Funds Trust, Touchstone Investment Trust, Touchstone Tax-Free Trust, and Touchstone Tax-Free Trust. |
| 2 | The Touchstone Fund Complex consists of 11 variable annuity series of the Trust, 3 series of Touchstone Tax-Free Trust, 1 series of Touchstone Institutional Funds Trust, 4 series of Touchstone Investment Trust, 22 series of Touchstone Strategic Trust, and 17 series of Touchstone Funds Group Trust. |
| 3 | Joseph Melcher resigned as Chief Officer effective September 5, 2012.. |
| 222 |
PRIVACY PROTECTION POLICY
We Respect Your Privacy
Thank you for your decision to invest with us. Touchstone and its affiliates have always placed a high value on the trust and confidence our clients place in us. We believe that confidence must be earned and validated through time. In today’s world, when technology allows the sharing of information at light speeds, trust must be reinforced by our sincere pledge to take the steps necessary to ensure that the information you share with us is treated with respect and confidentiality.
Our Pledge to Our Clients
| • | We collect only the information we need to service your account and administer our business. |
| • | We are committed to keeping your information confidential and we place strict limits and controls on the use and sharing of your information. |
| • | We make every effort to ensure the accuracy of your information. |
We Collect the Following Nonpublic Personal Information About You:
| • | Information we receive from you on or in applications or other forms, correspondence, or conversations, including, but not limited to, your name, address, phone number, social security number, assets, income and date of birth; and |
| • | Information about your transactions with us, our affiliates, or others, including, but not limited to, your account number and balance, payment history, parties to transactions, cost basis information, and other financial information. |
Categories of Information We Disclose and Parties to Whom We Disclose
We do not disclose any nonpublic personal information about our current or former clients to nonaffiliated third parties, except as required or permitted by law.
We Place Strict Limits and Controls on the Use and Sharing of Your Information
| • | We restrict access to nonpublic personal information about you to authorized employees who need the information to administer your business. |
| • | We maintain physical, electronic and procedural safeguards that comply with federal standards to protect this information. |
| • | We do not disclose any nonpublic personal information about our current or former clients to anyone, except as required or permitted by law or as described in this document. |
| • | We will not sell your personal information to anyone. |
We May Provide Information to Service Your Account
Sometimes it is necessary to provide information about you to various companies such as transfer agents, custodians, broker-dealers and marketing service firms to facilitate the servicing of your account. These organizations have a legitimate business need to see some of your personal information in order for us to provide service to you. We may disclose to these various companies the information that we collect as described above. We require that these companies, including our own subsidiaries and affiliates, strictly maintain the confidentiality of this information and abide by all applicable laws. Companies within our corporate family that may receive this information are financial service providers and insurance companies. We do not permit these associated companies to sell the information for their own purposes, and we never sell our customer information.
This policy is applicable to the following affiliated companies: Touchstone Funds Group Trust, Touchstone Investment Trust, Touchstone Strategic Trust, Touchstone Tax-Free Trust, Touchstone Variable Series Trust, Touchstone Institutional Funds Trust, Touchstone Securities, Inc.,* and W&S Brokerage Services, Inc.
* Touchstone Securities, Inc. serves as the underwriter to the Touchstone Funds.
A Member of Western & Southern Financial Group®
The Privacy Protection Policy is not part of the Annual Report.
| 223 |


Go paperless, sign up today at:
www.touchstoneinvestments.com/home
Touchstone Investments
Distributor
Touchstone Securities, Inc.*
303 Broadway
Cincinnati, Ohio 45202-4203 800.638.8194
www.touchstoneinvestments.com
Investment Advisor
Touchstone Advisors, Inc.*
303 Broadway
Cincinnati, Ohio 45202-4203
Transfer Agent
BNY Mellon Investment Servicing (US) Inc.
4400 Computer Drive
Westborough, MA 01581
Shareholder Service
800.543.0407
* A Member of Western & Southern Financial Group
TSF-56-TFGT-AR-1210
Item 2. Code of Ethics.
| (a) | The registrant, as of the end of the period covered by this report, has adopted a code of ethics that applies to the registrant’s principal executive officer, principal financial officer, principal accounting officer or controller, or persons performing similar functions, regardless of whether these individuals are employed by the registrant or a third party. |
| (c) | There have been no amendments, during the period covered by this report, to a provision of the code of ethics that applies to the registrant’s principal executive officer, principal financial officer, principal accounting officer or controller, or persons performing similar functions, regardless of whether these individuals are employed by the registrant or a third party, and that relates to any element of the code of ethics description. |
| (d) | The registrant has not granted any waivers, including an implicit waiver, from a provision of the code of ethics that applies to the registrant’s principal executive officer, principal financial officer, principal accounting officer or controller, or persons performing similar functions, regardless of whether these individuals are employed by the registrant or a third party, that relates to one or more of the items set forth in paragraph (b) of this item’s instructions. |
Item 3. Audit Committee Financial Expert.
The registrant’s Board of Trustees has determined that the registrant has at least one audit committee financial expert serving on its audit committee. Mr. Donald Siekmann is the registrant’s audit committee financial expert and is an independent trustee within the meaning of the Investment Company Act of 1940, as amended (the “1940 Act”).
Item 4. Principal Accountant Fees and Services.
Audit Fees
| (a) | Audit fees for Touchstone Funds Group Trust totaled $266,800 and $307,600 in fiscal 2012 and 2011, respectively. 2012 fees include $243,800 of fees associated with the annual audit and filing of Form N-1A and Form N-SAR, and $23,000 of fees associated with additional filings of Form N-1A and Form N-14. 2011 fees include $287,600 of fees associated with the annual audit and filing of Form N-1A and Form N-SAR, and $20,000 of fees associated with additional filings of Form N-1A and Form N-14. |
Audit-Related Fees
| (b) | There were no audit-related fees in fiscal 2012 and 2011 related to Touchstone Funds Group Trust. |
Tax Fees
| (c) | Fees for tax compliance services totaled $94,000 and $116,400 in fiscal 2012 and 2011, respectively. The fees relate to the preparation of federal income and excise tax returns and review of capital gains distribution calculations. |
All Other Fees
| (d) | There were no fees for all other services to Touchstone Funds Group Trust not included above. |
| (e)(1) | Disclose the audit committee's pre-approval policies and procedures described in paragraph (c)(7) of Rule 2-01 of Regulation S-X. |
The Audit Committee’s pre-approval policies describe the types of audit, audit-related, tax and other services that have the general pre-approval of the Audit Committee. The pre-approval policies provide that annual audit service fees, tax services not specifically granted pre-approval, services exceeding pre-approved cost levels and other services that have not received general pre-approval will be subject to specific pre-approval by the Audit Committee. The pre-approval policies further provide that the Committee may grant general pre-approval to other audit services (statutory audits and services associated with SEC registration statements, periodic reports and other documents filed with the SEC or other documents issued in connection with securities offerings), audit-related services (accounting consultations related to accounting, financial reporting or disclosure matters not classified as “audit services,” assistance with understanding and implementing new accounting and financial reporting guidance from rulemaking authorities, agreed-upon or expanded audit procedures related to accounting and/or billing records required to respond to or comply with financial, accounting or regulatory reporting matters and assistance with internal control reporting requirements under Form N-SAR and Form N-CSR), tax services that have historically been provided by the auditor that the Committee believes would not impair the independence of the auditor and are consistent with the SEC’s rules on auditor independence and permissible non-audit services classified as “all other services” that are routine and recurring services.
| (e)(2) | All services described in paragraphs (c) through (d) of Item 4 were approved by the Audit Committee. Not applicable for paragraph (b) of Item 4. |
| (f) | The percentage of hours expended on the principal accountant's engagement to audit the registrant's financial statements for the most recent fiscal year that were attributed to work performed by persons other than the principal accountant's full-time, permanent employees was less than fifty percent. |
| (g) | The aggregate non-audit fees for Touchstone Funds Group Trust and certain entities*, totaled approximately $94,000 and $116,400, in 2012 and 2011, respectively. |
* These include the advisors (excluding sub-advisors) and any entity controlling, controlled by or under common control with the advisors that provides ongoing services to the registrant (Funds).
| (h) | The registrant's audit committee of the board of trustees has considered whether the provision of non-audit services that were rendered to the registrant's investment adviser (not including any sub-adviser whose role is primarily portfolio management and is subcontracted with or overseen by another investment adviser), and any entity controlling, controlled by, or under common control with the investment adviser that provides ongoing services to the registrant that were not pre-approved pursuant to paragraph (c)(7)(ii) of Rule 2-01 of Regulation S-X is compatible with maintaining the principal accountant's independence. |
Item 5. Audit Committee of Listed registrants.
Not applicable.
Item 6. Investments.
| (a) | Schedule of Investments in securities of unaffiliated issuers as of the close of the reporting period is included as part of the report to shareholders filed under Item 1 of this form. |
| (b) | Not applicable. |
Item 7. Disclosure of Proxy Voting Policies and Procedures for Closed-End Management Investment Companies.
Not applicable.
Item 8. Portfolio Managers of Closed-End Management Investment Companies.
Not applicable.
Item 9. Purchases of Equity Securities by Closed-End Management Investment Company and Affiliated Purchasers.
Not applicable.
Item 10. Submission of Matters to a Vote of Security Holders.
There have been no material changes to the procedures by which the shareholders may recommend nominees to the registrant’s board of trustees, where those changes were implemented after the registrant last provided disclosure in response to the requirements of Item 407(c)(2)(iv) of Regulation S-K (17 CFR 229.407) (as required by Item 22(b)(15) of Schedule 14A (17 CFR 240.14a-101)), or this Item.
Item 11. Controls and Procedures.
| (a) | The registrant’s principal executive and principal financial officers, or persons performing similar functions, have concluded that the registrant’s disclosure controls and procedures (as defined in Rule 30a-3(c) under the Investment Company Act of 1940, as amended (the “1940 Act”) (17 CFR 270.30a-3(c))) are effective, as of a date within 90 days of the filing date of the report that includes the disclosure required by this paragraph, based on their evaluation of these controls and procedures required by Rule 30a-3(b) under the 1940 Act (17 CFR 270.30a-3(b)) and Rules 13a-15(b) or 15d-15(b) under the Securities Exchange Act of 1934, as amended (17 CFR 240.13a-15(b) or 240.15d-15(b)). |
| (b) | There were no changes in the registrant’s internal control over financial reporting (as defined in Rule 30a-3(d) under the 1940 Act (17 CFR 270.30a-3(d)) that occurred during the registrant’s second fiscal quarter of the period covered by this report that has materially affected, or is reasonably likely to materially affect, the registrant’s internal control over financial reporting. |
Item 12. Exhibits.
| (a)(1) | Code of ethics, or any amendment thereto, that is the subject of disclosure required by Item 2 is attached hereto. |
| (a)(2) | Certifications pursuant to Rule 30a-2(a) under the 1940 Act and Section 302 of the Sarbanes-Oxley Act of 2002 are attached hereto. |
| (a)(3) | Not applicable. |
| (b) | Certifications pursuant to Rule 30a-2(b) under the 1940 Act and Section 906 of the Sarbanes-Oxley Act of 2002 are attached hereto. |
SIGNATURES
Pursuant to the requirements of the Securities Exchange Act of 1934 and the Investment Company Act of 1940, the registrant has duly caused this report to be signed on its behalf by the undersigned, thereunto duly authorized.
| (Registrant) | Touchstone Funds Group Trust |
| By (Signature and Title)* | /s/ Jill T. McGruder | |
| Jill T. McGruder, President | ||
| (principal executive officer) |
| Date | 11/27/12 |
Pursuant to the requirements of the Securities Exchange Act of 1934 and the Investment Company Act of 1940, this report has been signed below by the following persons on behalf of the registrant and in the capacities and on the dates indicated.
| By (Signature and Title)* | /s/ Jill T. McGruder | |
| Jill T. McGruder, President | ||
| (principal executive officer) |
| Date | 11/27/12 |
| By (Signature and Title)* | /s/ Terrie A. Wiedenheft | |
| Terrie A. Wiedenheft, Controller and Treasurer | ||
| (principal financial officer) |
| Date | 11/27/12 |
* Print the name and title of each signing officer under his or her signature.