UNITED STATES
SECURITIES AND EXCHANGE COMMISSION
Washington, D.C. 20549
FORM N-CSR
CERTIFIED SHAREHOLDER REPORT OF REGISTERED MANAGEMENT INVESTMENT COMPANIES
Investment Company Act file number 811-08104
Touchstone Funds Group Trust
(Exact name of registrant as specified in charter)
303 Broadway, Suite 1100
Cincinnati, Ohio 45202-4203
(Address of principal executive offices) (Zip code)
Jill T. McGruder
303 Broadway, Suite 1100
Cincinnati, Ohio 45202-4203
(Name and address of agent for service)
Registrant's telephone number, including area code: 800-638-8194
Date of fiscal year end: September 30
Date of reporting period: September 30, 2015
Form N-CSR is to be used by management investment companies to file reports with the Commission not later than 10 days after the transmission to stockholders of any report that is required to be transmitted to stockholders under Rule 30e-1 under the Investment Company Act of 1940 (17 CFR 270.30e-1). The Commission may use the information provided on Form N-CSR in its regulatory, disclosure review, inspection, and policymaking roles.
A registrant is required to disclose the information specified by Form N-CSR, and the Commission will make this information public. A registrant is not required to respond to the collection of information contained in Form N-CSR unless the Form displays a currently valid Office of Management and Budget ("OMB") control number. Please direct comments concerning the accuracy of the information collection burden estimate and any suggestions for reducing the burden to Secretary, Securities and Exchange Commission, 100 F Street, NE, Washington, DC 20549. The OMB has reviewed this collection of information under the clearance requirements of 44 U.S.C. § 3507.
Item 1. Reports to Stockholders.
The Report to Shareholders is attached herewith.
| September 30, 2015 |
| Annual Report |
| Touchstone Funds Group Trust |
| Touchstone Arbitrage Fund |
| Touchstone Emerging Markets Equity Fund |
| Touchstone Global Real Estate Fund |
| Touchstone Merger Arbitrage Fund |
| Touchstone Mid Cap Fund |
| Touchstone Mid Cap Value Fund |
| Touchstone Premium Yield Equity Fund |
| Touchstone Sands Capital Select Growth Fund |
| Touchstone Small Cap Core Fund |
| Touchstone Small Cap Value Fund |
| Touchstone Total Return Bond Fund |
| Touchstone Ultra Short Duration Fixed Income Fund |

Table of Contents
This report identifies the Funds' investments on September 30, 2015. These holdings are subject to change. Not all investments in each Fund performed the same, nor is there any guarantee that these investments will perform as well in the future. Market forecasts provided in this report may not occur.
| 2 |
Dear Fellow Shareholder:
We are pleased to provide you with the Touchstone Funds Group Trust Annual Report. Inside you will find key financial information, as well as manager commentaries, for the 12 months ended September 30, 2015.
During the fiscal year, the U.S. economy maintained its positive trajectory despite weakness in other major economies around the world. Europe, Japan and China all faced economic challenges, prompting central bank action to loosen monetary conditions and spur economic growth. The accommodative monetary policy, however, was not enough to allay investor concerns of a global economic slowdown. Facing the effects of lower global demand, crude oil and commodity prices declined sharply, weighing on emerging market economies, which are often more reliant on commodity production.
The financial markets reflected the heightened uncertainty surrounding the world’s economic prospects. Equities experienced an increase in volatility, particularly late in the period when macroeconomic concerns became more acute. Domestic equity markets weathered this volatility better than their international counterparts, perhaps an indication of more solid economic footing in the U.S. Emerging market equities were especially challenged during the period, hurt by the sell-off in commodity prices.
The bond markets reflected the heightened uncertainty surrounding the world’s growth prospects. Investors shunned riskier bonds in favor of higher credit quality securities. U.S. Treasuries outperformed Investment Grade Corporate Bonds, while high yield issues were affected in part by weak commodity prices. Interest rates experienced considerable volatility, but ended the period lower to continue their recent decline.
The recent market volatility only reinforces our belief that successful investing requires a long-term approach. Short-term performance can often obscure the value of sound asset allocation and a disciplined approach. Your financial professional can help steer you through the fluctuations of the market by identifying a risk-return profile that will help you meet your financial goals.
We greatly appreciate the opportunity to be part of your investment plan.
Sincerely,

Jill T. McGruder
President
Touchstone Funds Group Trust
| 3 |
Management's Discussion of Fund Performance (Unaudited)
Touchstone Arbitrage Fund
Sub-Advised by Longfellow Investment Management Co.
Investment Philosophy
The Touchstone Arbitrage Fund seeks to achieve positive absolute returns regardless of market conditions over the long term by investing primarily in securities of companies that are involved in publicly announced mergers, takeovers, tender offers, debt restructurings, minority purchases, leveraged buyouts, spin-offs, liquidations and other corporate reorganizations.
Fund Performance
The Touchstone Arbitrage Fund (Class A Shares) outperformed its benchmark, the BofA Merrill Lynch 3-Month U.S. Treasury Bill Index, for the 12-month period ended September 30, 2015. The Fund’s total return was 0.77 percent (excluding the maximum sales charge) while the benchmark’s total return was 0.02 percent.
Market Environment
Volatility in the equity markets was unpredictable over the last 12 months, as represented by the significant fluctuations in the CBOE Volatility Index (VIX) during the period. Historically, spikes in volatility have typically created trading opportunities in merger arbitrage as spreads have temporarily widened, facilitating potentially attractive entry points.
During the period, the equity markets’ response to announced mergers and acquisitions (M&A) was generally positive, which served as a wake-up call to many companies. While historically it is common for a target company’s stock to rise on the announcement of a merger, recently the stock of the acquiring company has increased on the announcement of an acquisition, which is uncharacteristic. Interestingly, as strategic M&A activity has risen substantially, the amount of leveraged buyouts, or deals by financial sponsors, has drifted lower.
The Information Technology and Health Care sectors saw particularly high levels of announced M&A activity during the period. For example, five of the largest managed care providers may consolidate to three primary providers, primarily in response to the Affordable Care Act. Additionally, the semiconductor industry experienced significant consolidation among its largest companies. Although deal volume in these sectors was significant, many of these mergers were accompanied by regulatory risks and substantially long time horizons until close.
Key drivers of the strong M&A environment during 2014 were the favorable financing environment, competitive peer pressure, impatient shareholders and the resurgence of activist investors seeking to optimize growth by capturing potential synergies. While 2014 marked one of the busiest years for M&A activity in recent history, activity through the third quarter of 2015 is already ahead of last year.
Portfolio Review
The spike in volatility that emerged in October 2014 provided merger arbitrage investors a reason to exit their positions. This allowed the Fund to redeploy idle capital into deals at widespread levels during the period, which contributed to Fund performance.
Several holdings contributed to Fund performance during the period. A failed Dutch tender offer in early 2014 from Outerwall Inc., the operator of RedBox DVD kiosks, contributed positively to Fund performance. Outerwall’s stock price rebounded during the period, which allowed the Fund to sell its position at an attractive return. Another positive development regarding a broken deal from 2014 was the merger between Ainsworth Lumber Corp. and Norbord Inc., which created North America’s largest particle board manufacturer. The deal closed in the first quarter of 2015.
| 4 |
Management's Discussion of Fund Performance (Unaudited) (Continued)
The deal between Covidien PLC and Medtronic PLC contributed to Fund performance as the spread tightened significantly from its widest levels in mid-October 2014. Investors grew skeptical of Covidien’s commitment because of the deal’s tax-inversion benefits and many investors exited the position as a result. Medtronic successfully acquired Covidien in January 2015.
Liberty Interactive Corp. spun-off of Liberty Ventures Group in October 2014. Liberty Interactive subsequently changed its ticker symbol from LINTA to QVCA in order to showcase its flagship asset, QVC Group. We believe this move may position Liberty Interactive to acquire the portion of the Home Shopping Network (HSN Inc.) that it does not already own. The Fund’s position in Liberty Interactive contributed to performance.
An ordinary investment in BallyTechnologies Inc., which was acquired by Scientific Games Corp., also contributed to Fund performance. Opportunistic trading, based on the Fund’s entry point, produced an enhanced return on an otherwise unremarkable merger transaction.
The multiple-bidder situation that emerged surrounding the eventual acquisition of Salix Pharmaceuticals Inc. by Valeant Pharmaceuticals International Inc. also contributed to Fund returns during the period.
In January, American Realty Capital Healthcare Trust was successfully acquired by Ventas Inc. in a cash and stock merger, which benefited the Fund.
The Fund’s position in Allergan PLC, acquired in March 2015 by Actavis PLC, contributed to Fund performance during the first quarter of 2015. The highly contested deal was initially exposed to potential regulatory risks as the combined company would have both product and geographic overlaps and operations in several countries. In aggregate, these risks kept the deal spread wide, thus providing an attractive return.
An otherwise unremarkable merger between Dresser-Rand Group Inc. and Siemens AG contributed to performance. A monthly “ticking fee” was triggered when the deal took longer than expected. Beginning in March, this fee was payable on the first of each month and continued through the deal’s consummation on June 30.
Talisman Energy Inc. was successfully acquired by Repsol SA during the second quarter of 2015 which contributed to performance.
In the wake of the failed merger between Time Warner Cable Inc. and Comcast Corp., the DIRECTV and AT&T Inc. merger came under fire. Investors feared that the DIRECTV deal could meet the same Federal Communications Commission (FCC) scrutiny as Time Warner, thus the spread widened accordingly. As the fears subsided, the deal’s spread gradually tightened into the end of the second quarter of 2015. This spread tightening contributed positively to overall performance. The deal ultimately closed in the summer of 2015.
The successful completion of WEC Energy Group Inc.’s acquisition of Integrys Energy Group Inc. also contributed to Fund performance. The merger required a litany of state public utility commission approvals as well as Hart-Scott-Rodino, FCC, Federal Energy Regulatory Commission approvals and SEC review of the proxy and votes from both shareholder groups. This gauntlet of approvals increased volatility in the merger’s spread, allowing an opportunistic addition to the Fund’s position.
The protracted acquisition of Hudson City Bancorp Inc. by M&T Bank Corp. – which was also the Fund’s oldest merger holding – finally earned approval from the U.S. Federal Reserve Board (Fed) on September 30, 2015. M&T Bank Corp. has nearly all of the necessary approvals in place and is expected to close in early November. The spread tightened significantly on the news. As it was the largest position in the portfolio, it similarly became the Fund’s largest positive contributor to return.
| 5 |
Management's Discussion of Fund Performance (Unaudited) (Continued)
CVS Health Corp. successfully acquired Omnicare Inc. in August 2015. There were narrow overlaps in the companies’ operations, which gave way to procedural caution on the antitrust front. This regulatory uncertainty offered a relatively wide deal spread, which was advantageous to Fund performance.
Pfizer Inc. acquired Hospira Inc. in September 2015, and numerous international regulatory approvals were required to complete the merger. As each approval was granted, the spread tightened and the deal moved closer to completion. In particular, there were some product overlaps in injectable medicines that were specifically scrutinized by the FTC. However, the merger was granted without required divestitures and the deal contributed positively to Fund performance.
Dealertrack Technologies Inc., a provider of software to automotive dealerships, was acquired by Cox Automotive Inc. during the third quarter. The Department of Justice determined that the merger would require Cox to divest its inventory management solution system in order for the deal to proceed. The merger’s relatively wide spread due to the regulatory concerns benefited Fund returns.
Tokio Marine Holdings Inc. continued its process of acquiring HCC Insurance Holdings Inc. in an all-cash merger. The deal spread has steadily tightened as the deal meets regulatory milestones. With each regulatory approval granted, the deal has moved one step closer to completion. Several approvals were granted during the third quarter of 2015 and, consequently, the spread tightened meaningfully and contributed positively to returns.
Several holdings negatively impacted performance during the period. The Fund experienced two broken deals over the 12-month period. The first occurred in the fourth quarter of 2014. The combination of pharmaceutical firms Shire PLC and AbbVie Inc. was billed as a watershed event, with the tax inversion benefits serving as an extra benefit. AbbVie’s management team had reiterated the strategic merits of a merger with Shire and, while acknowledging the tax savings by reincorporating in Ireland, they affirmed that the tax savings were not the main motivation behind the deal. However, drastic and unilateral action by the U.S. Treasury in mid-October made the economics of an inversion less attractive. Only days after the U.S.Treasury’s action, AbbVie’s management team advised shareholders to vote against the deal, effectively terminating the acquisition. The second broken deal occurred during the second quarter of 2015. Applied Materials Inc.’s pending acquisition of Tokyo Electron Ltd. was terminated more than a year and a half after the deal was first announced. The management teams agreed to significant divestures to meet regulator demands. However, the companies voluntarily terminated the merger when it was clear that regulators felt the combined entity could still inhibit future microchip technology innovation.
A pair trade of NorthStar Realty Finance Corp. with Vanguard REIT ETF detracted from Fund performance. NorthStar was a significant hedge fund holding and, as hedge fund performance faltered, client redemptions followed and managers were forced to liquidate holdings to meet redemption requests. However, NorthStar is planning a spin-off of its European properties, which remains on schedule for the fourth quarter of 2015.
An investment in Carbonite Inc. a cloud-based computer backup storage provider, also detracted from Fund performance. A significant holder of Carbonite stock, j2 Global Inc., made an unsolicited proposal to acquire the entire company. After the two companies began negotiations, j2 Global amended its proposal to acquire only the enterprise business from Carbonite, excluding the retail application service. Carbonite was unwilling to separate its business. With negotiations stalled, j2 Global cancelled its tender offer.
The utility merger between Pepco Holdings Inc. and Exelon Corp. also detracted from performance. While Maryland regulators narrowly approved the merger, regulators in Washington, D.C. had to approve it as well. Significant public outcry against the merger urged the D.C. Commission to reject the deal. Additionally, the
| 6 |
Management's Discussion of Fund Performance (Unaudited) (Continued)
D.C. Attorney General publicly opposed the merger, as did about half of the D.C. Council and more than half of the city’s neighborhood commissions. With the substantial regulatory approval risk, the Fund exited the position.
A pending spin-off by Fiat Chrysler Automobiles NV of its flagship brand, Ferrari, also detracted from Fund performance, as investors reacted negatively to Fiat’s announced delay for the spin-off. We continue to believe in the thesis underlying this position and the Fund continues to hold the investment. The issues at Volkswagen over claims that it installed software that obstructed diesel emission test devices caused a sell-off across the auto sector near the end of the third quarter of 2015.
Outlook
We believe the rationale for M&A activity continues to remain compelling, as interest rates remain low and organic growth has been difficult. Further, corporate cash continues to be broadly deployed into financial engineering rather than research and development, which will likely leave management teams with few options for growth outside of M&A. Deal spreads in merger situations have widened somewhat from the historically tight range that investors experienced throughout 2014. Spreads appear to have settled in the mid-single digits on an annualized basis. The market is now differentiating between deals that appear riskier and those that are more straightforward. Deals with a greater amount of perceived risk are being assigned a wider spread than transactions with fewer hurdles. This is in contrast to much of 2014 when spreads did not necessarily compensate investors appropriately for the amount of risk being assumed.
Short-term interest rates remain near zero and the Fed has steadfastly defended its data-dependent position. While historically low short-term interest rates will continue to act as a headwind to the merger arbitrage strategy, we continue to believe that the strategy offers an attractive risk-reward profile and serves as a valuable diversification tool. Historically, there has been a strong positive correlation between short-term interest rates and merger arbitrage spreads. When rates eventually rise, deal spreads should be favorably impacted. We believe the idiosyncratic nature of each of the positions in the portfolio, along with the various strategies employed, combines to create a Fund with a low overall correlation to the broad equity and fixed income indexes. We maintain our belief that the robust M&A cycle will continue to present the Fund with attractive risk-adjusted opportunities going forward.
We believe the risks going forward include a general slowdown in M&A activity, which would potentially make it difficult to diversify the Fund across an adequate number of deals. Similarly, interest rates remaining at historically low levels could act as a double-edged sword — on one hand, spreads on merger deals would remain tighter than in an environment of high rates yet, on the other hand, low interest rates could foster an environment of easy financing which helps facilitate deal-making.
| 7 |
Management's Discussion of Fund Performance (Unaudited) (Continued)
Comparison of the Change in Value of a $10,000 Investment in the
Touchstone Arbitrage Fund - Class A* and the BofA Merrill Lynch 3-Month U.S. Treasury Bill Index

| * | The chart above represents performance of Class A shares only, which will vary from the performance of Class C shares, Class Y shares and Institutional Class shares based on the differences in sales loads and fees paid by shareholders in the different classes. The inception date of the Fund was September 30, 2013. The returns of the index listed above are based on the inception date of the Fund. |
| ** | The average annual total returns shown above are adjusted for maximum sales loads and fees, if applicable. The maximum offering price per share of Class A shares is equal to the net assets value (“NAV”) per share plus a sales load equal to 6.10% of the NAV (or 5.75% of the offering price). Class C shares are subject to a contingent deferred sales charge (“CDSC”) of 1.00%. The CDSC will be assessed on an amount equal to the lesser of (1) the NAV at the time of purchase of the shares being redeemed or (2) the NAV of such shares being redeemed, if redeemed within a one-year period from the date of purchase. Class Y shares and Institutional Class shares are not subject to sales charges. |
The performance of the above Fund does not reflect the deduction of taxes that a shareholder would pay on Fund distributions or the redemption of Fund shares.
Note To Chart
BofA Merrill Lynch 3-Month U.S. Treasury Bill Index is an unmanaged index of Treasury securities maturing in 90 days that assumes reinvestment of all income.
| 8 |
Management's Discussion of Fund Performance (Unaudited)
Touchstone Emerging Markets Equity Fund
Sub-Advised by AGF Investments America, Inc.
Investment Philosophy
The Touchstone Emerging Markets Equity Fund seeks capital appreciation by primarily investing in equity securities of companies located in emerging markets. It seeks to invest in businesses believed to be mispriced by the market and that are expected to generate positive and sustainable earnings growth.
Fund Performance
The Touchstone Emerging Markets Equity Fund (Class A Shares) underperformed its benchmark, the MSCI Emerging Markets Index, for the 12-month period ended September 30, 2015. The Fund’s total return was -21.18 percent (excluding the maximum sales charge) while the total return of the benchmark was -19.28 percent.
Market Environment
Emerging Markets closed lower for the one-year period. Asia was the best performing region within Emerging Markets, while Latin America lagged the most. The U.S. Federal Reserve Board (Fed) announced the end of its quantitative easing program in October 2014 and later removed the word “patience” in its message on monetary policy. This was significant, as investors believed it could be an indicator that the Fed was preparing the market for future interest rate hikes. Subsequently, anticipation of an interest rate hike dominated markets. However, at the Federal Open Market Committee (FOMC) meeting in September, the Fed left short-term interest rates unchanged, but indicated that an increase would likely occur this year, which further added to the uncertainty in the market.
The European Central Bank greatly expanded its asset purchase program during the period. This expansion started in March 2015 and is expected to run until at least September 2016, as inflation expectations have fallen significantly in a slowing growth environment. This provided support to equities in the first four months of the calendar year; however, equities declined during May and June as the crisis in Greece intensified. Greece subsequently received its third bailout package, which provided some temporary relief to European equity markets.
Chinese equities were volatile and fell sharply during the last four months of the period, although they outperformed emerging market equities as a whole. During the 12-month period, China’s A-shares entered bear market territory and China’s H-shares sold off, as margin investors aggressively sold shares. In particular, those investors were concerned that the government would suppress margin trading, that equity valuations were overvalued and that initial public offerings (IPOs) would lock up funds. Further, the People’s Bank of China (PBoC) unexpectedly devalued the country’s currency in August, which sparked a global sell-off in equities. In an effort to ease tensions in financial markets and bolster economic growth, the PBoC announced a number of consecutive interest rate cuts and also lowered the amount of reserves banks are required to hold.
In Latin America, Brazil was one of the worst performing markets as the country faced significant headwinds. During August, data reports showed Brazil’s unemployment had climbed notably from the same time last year and its manufacturing activity had contracted. In September, Standard & Poor’s downgraded Brazil’s credit rating to junk with a negative outlook, which put further pressure on the country’s equities. Following the downgrade, Brazil’s finance minister proposed a new round of spending cuts and the re-introduction of a levy on banking transactions in an effort to boost government revenues.
In India, the Reserve Bank of India lowered its policy rates in September amid slowing inflation, which was the fourth interest rate cut in the 12-month period.
| 9 |
Management's Discussion of Fund Performance (Unaudited) (Continued)
Portfolio Review
Security selection detracted from performance relative to the benchmark, while sector allocation and country allocation contributed. From a country perspective, security selection in China, Thailand and South Korea detracted from performance, while security selection in Taiwan, Mexico and India contributed positively to returns. In terms of sector allocation, the Fund’s underweight to the Information Technology sector and overweight to the Energy sector detracted. This was partly offset by an overweight to the Consumer Staples sector, which contributed to returns. Country and sector positioning were a residual of security selection.
During the period, the Fund’s weighting to Brazil was reduced, as there was concern that a deteriorating macro-economic environment could impact its companies’ ability to drive earnings growth. At the end of the period, the Fund’s largest overweight positions were to India and Mexico. In terms of sectors, the Fund’s largest overweight positions were to Consumer Discretionary, Consumer Staples and Health Care.
Among the top detractors from performance during the period was Localiza Rent a Car SA (Industrials sector), an auto rental and fleet management company in Latin America. The company came under pressure in the second half of the period amid a broader slide in Brazilian equities. Further, a new competitor entered the market and investors were concerned about a tougher competitive landscape, which also weighed on its performance. However, we believe that Localiza’s strong market share should position the company to better withstand a competitive market environment going forward.
Weichai Power Co. Ltd. (Industrials sector), a China-based manufacturer of diesel engines, also detracted from performance. The company underperformed as a result of China’s economic slowdown and its weak demand for heavy-duty trucks (HDT), which more than offset growth in demand for the company’s logistics activities. Consequently, the company’s HDT sales volumes remained weak, with those sales down in China during the first six months of the year. Nevertheless, we anticipate HDT demand will recover in the near term on the back of planned government projects in railways and logistics.
One of the largest contributors to performance during the period was SABMiller PLC (Consumer Staples sector), a multinational brewing and beverage company headquartered in the United Kingdom (UK). Toward the end of the period, SABMiller’s shares rallied after brewer Anheuser-Busch InBev SA indicated it intended to make an offer for the company. This transaction would unite two of the world’s largest beer makers. Further, we believe SABMiller’s strong market position in a number of high-growth consumption markets should continue to drive the company’s top-line growth.
Eclat Textile Corp. (Consumer Discretionary sector), a Taiwan-based manufacturer of fabrics and garments, was also a top contributor to performance due to better than expected results during the period. In particular, Eclat’s margins continued to expand during the period, which was well received by investors. The stock further benefited as visibility for the company’s Under Armour brand, underpinned by a strong endorsement line-up, increased globally. Additionally, Eclat is expected to open new factories in the near term, which we believe should increase utilization and further expand margins and asset turns. We also believe the company’s expanding margins, as well as its differentiated manufacturing technology in the weaving and dying process, should continue to benefit the stock.
Outlook
Over the long term, we believe countries that implement reform measures should benefit from higher potential growth rates and financial market outperformance. Countries like India and Mexico are examples of countries that have proposed and implemented a number of reforms, which we believe should benefit their economies and financial markets over the long term. Food prices fell during the quarter and oil-importing countries received a tailwind in the form of lower oil prices, which we believe should also keep inflation from rising materially.
| 10 |
Management's Discussion of Fund Performance (Unaudited) (Continued)
Even though China also implemented a number of reform measures to boost growth, we found it difficult to find securities in China and Hong Kong that meet the Fund’s criteria.
Some of the potential risks we see to emerging market equities are the timing of a U.S. interest rate increase as well as continued strength in the U.S. dollar. We believe we have constructed the Fund to help curtail these risks. For example, we have limited its portfolio’s exposure to those countries with large current account deficits, such as South Africa and Brazil, as these currencies tend to be more adversely affected by rising U.S. interest rates. Deflation is also a risk that we will continue to monitor closely.
In seeking to capture attractive opportunities and help mitigate the potential risks when investing in Emerging Markets, we believe that active management remains key to adding value. We are long-term, bottom-up investors and, as a result, have positioned the Fund to benefit from exposure to the long-term secular trend of Emerging Market domestic demand from both consumers and enterprises.
| 11 |
Management's Discussion of Fund Performance (Unaudited) (Continued)
Comparison of the Change in Value of a $10,000 Investment in the
Touchstone Emerging Markets Equity Fund - Class A* and the
MSCI Emerging Markets Index
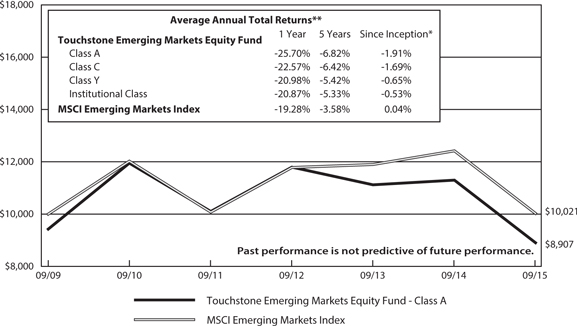
| * | The chart above represents performance of Class A shares only, which will vary from the performance of Class C shares, Class Y shares and Institutional Class shares based on the differences in sales loads and fees paid by shareholders in the different classes. The inception date of the Fund was September 30, 2009. The returns of the index listed above are based on the inception date of the Fund. |
| ** | The average annual total returns shown above are adjusted for maximum sales loads and fees, if applicable. The maximum offering price per share of Class A shares is equal to the net assets value (“NAV”) per share plus a sales load equal to 6.10% of the NAV (or 5.75% of the offering price). Class C shares are subject to a contingent deferred sales charge (“CDSC”) of 1.00%. The CDSC will be assessed on an amount equal to the lesser of (1) the NAV at the time of purchase of the shares being redeemed or (2) the NAV of such shares being redeemed, if redeemed within a one-year period from the date of purchase. Class Y shares and Institutional Class shares are not subject to sales charges. |
The performance of the above Fund does not reflect the deduction of taxes that a shareholder would pay on Fund distributions or the redemption of Fund shares.
Note To Chart
MSCI Emerging Markets Index is a free float-adjusted market capitalization index that is designed to measure equity market performance of emerging markets.
Source: MSCI. MSCI makes no express or implied warranties or representations and shall have no liability whatsoever with respect to any MSCI data contained herein. The MSCI data may not be further redistributed or used to create indices or financial products. This report is not approved or produced by MSCI.
| 12 |
Management's Discussion of Fund Performance (Unaudited)
Touchstone Global Real Estate Fund
Sub-Advised by Forum Securities Limited
Investment Philosophy
The Fund seeks income and capital appreciation by investing primarily in common stocks and other equity securities of U.S. and foreign real estate companies without regard to market capitalization.
Fund Performance
The Touchstone Global Real Estate Fund (Class A Shares) underperformed its benchmark, the FTSE EPRA/NAREIT Developed Index, for the 12-month period ended September 30, 2015. The Fund’s total return was -0.50 percent (excluding the maximum sales charge) while the benchmark’s total return was 3.58 percent.
Market Environment
It was an eventful 12 months. News stories included an Ebola scare, Russia’s annexation of Crimea, the boom then bust of Chinese A-shares, China’s largest devaluation of the yuan since 1994, acceleration of stimulus programs in Japan and the eurozone, interest rate cuts in Canada, Norway, Australia and Sweden and endless discussion of interest rate hikes in the United States. In addition, oil prices plunged and the U.S. dollar rallied. All of this combined to create increased market volatility.
Overall, real estate securities fared among the better-performing asset classes during the period. Regionally, European real estate performed best, followed by North American. Asia Pacific was the only developed region in negative territory. Emerging markets real estate was pulled down by underperformance in Latin America, the Middle East and parts of Southeast Asia.
Storage and Residential sector real estate investment trusts (REITs) were among the strongest subsectors over the past 12 months. Hotel and Diversified sector REITs were among those that declined the most.
Portfolio Review
The Fund’s positioning was driven by evaluation of relative yield and fundamental factors.
Country exposure detracted from performance. The Fund had overweight exposures to Australia, Canada, Latin America and Singapore, all of which underperformed the benchmark. Moreover, the Fund was underweight in the U.S., which outperformed the benchmark. Security selection contributed to performance. In particular security selection in Asia was strong, especially in Japan, Hong Kong and Singapore.
From a subsector perspective, positioning in Diversified, Health Care, Hotel and Specialty REITs contributed to performance, while positioning in Industrial, Residential and Retail REITs detracted from performance.
Among the largest contributors to performance in the past 12 months were AVIV REIT Inc. in the U.S. (acquired at premium valuation; merged with Omega Healthcare Investors Inc. as of April 1, 2015), Premier Investment Corp. REIT in Japan and Prosperity REIT in Hong Kong. Lack of ownership of U.S. hotels and ownership of hotel preferreds instead also contributed to performance. The largest detractors were Campus Crest Communities Inc. (which discontinued its dividend payment), OUTFRONT Media Inc. (formerly CBS Outdoor) and Dream Office REIT in Canada (formerly Dundee REIT; subject to negative market dynamics as a result of the decline in oil prices).
From a regional perspective the Fund had more exposure to Canada, Singapore and Australia than it did a year ago. As these markets declined, the Fund added positions in them in an effort to capture what were believed to be attractive dividend yield levels, undemanding valuation in terms of low price-to-earnings (P/E) ratios and discounted valuations on a net asset value (NAV) basis. The Fund is also overweight Continental Europe
| 13 |
Management's Discussion of Fund Performance (Unaudited) (Continued)
and less under weight Japan relative to a year ago. The funding source for these geographical changes was predominantly from the U.S. and Hong Kong, where we decreased the Fund’s exposure during the year.
From a subsector standpoint we rotated the Fund’s holdings from Hotel to Office REITs; the Fund is now less exposed to Hotel and is overweight Office REITs, versus an underweight at the start of the year.
Outlook
The current environment, one of high macroeconomic and monetary policy uncertainty dominated by political decisions, could significantly impact market direction. While this environment has existed since 2008, we believe an inflection point may be near regarding the prolonged uncertainty surrounding when the U.S. Federal Reserve Board (Fed) will hike interest rates. The rest of the world meanwhile does not appear to be near to a turning point in monetary policy. However, economies and markets are highly intertwined and interdependent. Prevailing conditions may eventually shift from a world dominated by central bank interest rates to one driven by fundamentals and determined by market forces. Such a scenario seems unlikely to become reality anytime soon. If the European Central Bank and the Bank of Japan extend their quantitative easing programs (as speculated by market participants), we think a renewed rally in those markets seems likely. We believe the Fed’s procrastination on interest rate action should continue to bode well for the real estate market in the U.S., in particular if U.S. growth is sustained.
Recent market volatility has also created new opportunities. Investors appear to view REITs in Hong Kong, Singapore, Canada and Australia less favorably than, for example, those in the U.S or Europe. Hong Kong is trading at a significant discount to NAV, having priced in the potential negative impact of an interest rate hike in the U.S., as well as weaker economic conditions in mainland China. At a certain point this valuation gap may present an attractive investment opportunity. Likewise, the fundamentals in the real estate sector seem to be gradually improving and are supported by recent policies. Canada and Australia REITs have been hurt due to exposure to oil price weakness. We believe high comparative dividend yields and valuations at discounted levels with low double digit P/E multiples may produce capital appreciation in these markets over time.
While the effect of quantitative easing deployed in Europe and Japan over the past 12 months led to the out performance of these jurisdictions, significant equity market gains eroded during the recent market correction. If quantitative easing resurfaces in Europe and Japan, we look for their market’s higher-quality holdings with less-expensive valuations to again be in favor.
While the U.S market has corrected, we believe it remains relatively expensive. However, some sectors have suffered more than others. The sell-off in Hotel and Health Care subsectors may provide stock-specific opportunities worth exploring.
The Fund remains overweight the highest yielding jurisdictions: Canada, Singapore and Australia. A recovery in the price of oil could lead to a strong re-rating of REIT markets in Canada and Australia. The Fund also is overweight Continental Europe and Japanese REITs, where additional quantitative economic stimulus could lead to higher valuations. The largest underweight positions are in the U.K., based on valuation, and the U.S., due to the potential negative impact of an interest rate hike and the low overall level of dividend yield and high valuation. From a subsector perspective, the Fund is overweight Hotel and Specialty REITs and underweight Residential and Retail REITs.
We believe higher volatility may continue in the marketplace until greater clarity around the timing of a U.S. interest rate hike emerges. We perceive the greatest risks to the markets as follows: a) a premature hike by the Fed followed by economic stagnation: b) a global recession combined with deflationary pressures; and c) increased emerging market stress.
| 14 |
Management's Discussion of Fund Performance (Unaudited) (Continued)
Policymakers seem committed to forestalling these scenarios by deploying all sorts of monetary tools to ensure at least some level of economic growth and positive inflation. Volatility always presents new opportunities for repositioning. We will respond to market movements with new ideas at the portfolio level.
Dividend paying investments may not experience the same price appreciation as non-dividend paying instruments, dividend-issuing companies may choose not to pay a dividend, or the dividend may be less than what is anticipated.
| 15 |
Management's Discussion of Fund Performance (Unaudited) (Continued)
Comparison of the Change in Value of a $10,000 Investment in the
Touchstone Global Real Estate Fund - Class A* and the FTSE EPRA/NAREIT Developed Index

| * | The chart above represents performance of Class A shares only, which will vary from the performance of Class C shares, Class Y shares and Institutional Class shares based on the differences in sales loads and fees paid by shareholders in the different classes. The inception date of the Fund was September 30, 2009. The returns of the index listed above are based on the inception date of the Fund. |
| ** | The average annual total returns shown above are adjusted for maximum sales loads and fees, if applicable. The maximum offering price per share of Class A shares is equal to the net assets value (“NAV”) per share plus a sales load equal to 6.10% of the NAV (or 5.75% of the offering price). Class C shares are subject to a contingent deferred sales charge (“CDSC”) of 1.00%. The CDSC will be assessed on an amount equal to the lesser of (1) the NAV at the time of purchase of the shares being redeemed or (2) the NAV of such shares being redeemed, if redeemed within a one-year period from the date of purchase. Class Y shares and Institutional Class shares are not subject to sales charges. |
The performance of the above Fund does not reflect the deduction of taxes that a shareholder would pay on Fund distributions or the redemption of Fund shares.
Note To Chart
FTSE EPRA/NAREIT Developed Index measures the general trends in eligible real estate equities worldwide. Relevant real estate activities are defined as the ownership, disposure and development of income-producing real estate.
| 16 |
Management's Discussion of Fund Performance (Unaudited)
Touchstone Merger Arbitrage Fund
Sub-Advised by Longfellow Investment Management Co.
Investment Philosophy
The Touchstone Merger Arbitrage Fund seeks to achieve positive absolute returns regardless of market conditions over the long term by investing primarily in securities of companies that are involved in publicly announced mergers and other corporate reorganizations. Merger arbitrage is an investment strategy that seeks to capture the “arbitrage spread” represented by the difference between the market price of the securities of the company being purchased and the value that is offered for these securities by the acquiring company. The Fund selects securities based on proposed financing terms, the size of the transaction, anti-trust concerns, regulatory approvals and shareholder voting requirements.
Fund Performance
The Touchstone Merger Arbitrage Fund (Class A Shares) outperformed its benchmark, the BofA Merrill Lynch 3-Month U.S. Treasury Bill Index, for the 12-month period ended September 30, 2015. The Fund’s total return was 0.92 percent (excluding the maximum sales charge) while the benchmark’s total return was 0.02 percent.
Market Environment
Volatility in the equity markets was unpredictable over the last 12 months, as represented by the notable fluctuations in the CBOE Volatility Index (VIX) during the period. Historically, spikes in volatility have typically created trading opportunities in merger arbitrage as spreads have temporarily widened, facilitating potentially attractive entry points.
During the period, the equity markets’ response to announced mergers and acquisitions (M&A) was generally positive, which served as a wake-up call to many companies. While historically it is common for a target company’s stock to rise on the announcement of a merger, recently the stock of the acquiring company increased on the announcement of an acquisition, which is uncharacteristic. Interestingly, as strategic M&A activity has risen substantially, the amount of leveraged buyouts, or deals by financial sponsors, has drifted lower.
The Information Technology and Health Care sectors saw particularly high levels of announced M&A activity during the period. For example, five of the largest managed care providers may consolidate to three primary providers, primarily in response to the Affordable Care Act. Additionally, the semiconductor industry experienced significant consolidation among its largest companies. Although deal volume in these sectors was significant, many of these mergers were accompanied by regulatory risks and substantially long time horizons until close.
The key drivers of the strong M&A environment during 2014 were the favorable financing environment, competitive peer pressure, impatient shareholders and the resurgence of activist investors seeking to optimize growth by capturing potential synergies. While 2014 marked one of the busiest years for M&A activity in recent history, activity through the third quarter of 2015 is already ahead of last year.
Portfolio Review
The spike in volatility that emerged in October 2014 provided merger arbitrage investors a reason to exit their positions. This allowed the Fund to redeploy idle capital into deals at widespread levels during the period, which contributed to Fund performance.
Several holdings contributed to Fund performance during the period. A failed Dutch tender offer in early 2014 from Outerwall Inc., the operator of RedBox DVD kiosks, contributed positively to Fund performance. Outerwall’s stock price rebounded during the period, which allowed the Fund to sell its position at an attractive return.
| 17 |
Management's Discussion of Fund Performance (Unaudited) (Continued)
Another positive development regarding a broken deal from 2014 was the merger between Ainsworth Lumber Corp. and Norbord Inc., which created North America’s largest particleboard manufacturer. The deal closed in the first quarter of 2015.
The deal between Covidien PLC and Medtronic Inc. contributed to Fund performance as the spread tightened significantly from its widest levels in mid-October 2014. Investors grew skeptical of Covidien’s commitment because of the deal’s tax-inversion benefits and many investors exited the position as a result. Medtronic successfully acquired Covidien in January 2015.
Liberty Interactive Corp. spun-off of Liberty Ventures Group in October 2014. Liberty Interactive subsequently changed its ticker symbol from LINTA to QVCA in order to showcase its flagship asset, QVC Group. We believe this move may position Liberty Interactive to acquire the portion of the Home Shopping Network (HSN Inc.) that it does not already own. The Fund’s position in Liberty Interactive contributed to performance.
An ordinary investment in BallyTechnologies Inc., which was acquired by Scientific Games Corp., also contributed to Fund performance. Opportunistic trading, based on the Fund’s entry point, produced an enhanced return on an otherwise unremarkable merger transaction.
The multiple-bidder situation that emerged surrounding the eventual acquisition of Salix Pharmaceuticals Inc. by Valeant Pharmaceuticals International Inc. also contributed to Fund returns during the period.
In January, American Realty Capital Healthcare Trust was successfully acquired by Ventas Inc. in a cash and stock merger, which benefited the Fund.
The Fund’s position in Allergan PLC, acquired in March 2015 by Actavis PLC, contributed to Fund performance during the first quarter of 2015. The highly contested deal was initially exposed to potential regulatory risks as the combined company would have both product and geographic overlaps and operations in several countries. In aggregate, these risks kept the deal spread wide, thus providing an attractive return.
An otherwise unremarkable merger between Dresser-Rand Group Inc. and Siemens AG contributed to performance. A monthly “ticking fee” was triggered when the deal took longer than expected. Beginning in March, this fee was payable on the first of each month and continued through the deal’s consummation on June 30.
Talisman Energy Inc. was successfully acquired by Repsol SA during the second quarter of 2015 which contributed to performance.
In the wake of the failed merger between Time Warner Cable Inc. and Comcast Corp., the DIRECTV and AT&T Inc. merger came under fire. Investors feared that the DIRECTV deal could meet the same Federal Communications Commission (FCC) scrutiny as Time Warner, thus the spread widened accordingly. As the fears subsided, the deal’s spread gradually tightened into the end of the second quarter of 2015. This spread tightening contributed positively to overall performance. The deal ultimately closed in the summer of 2015.
The successful completion of WEC Energy Group Inc.’s acquisition of Integrys Energy Group Inc. also contributed to Fund performance. The merger required a litany of state public utility commission approvals as well as Hart-Scott-Rodino, FCC, Federal Energy Regulatory Commission approvals and SEC review of the proxy and votes from both shareholder groups.This gauntlet of approvals increased volatility in the merger’s spread, allowing an opportunistic addition to the Fund’s position.
The protracted acquisition of Hudson City Bancorp Inc. by M&T Bank Corp. – which was also the Fund’s oldest merger holding – finally earned approval from the U.S. Federal Reserve Board (Fed) on September 30, 2015. M&T Bank Corp. has nearly all of the necessary approvals in place and is expected to close in early
| 18 |
Management's Discussion of Fund Performance (Unaudited) (Continued)
November. The spread tightened significantly on the news. As it was the largest position in the portfolio, it similarly became the Fund’s largest positive contributor to return.
CVS Health Corp. successfully acquired Omnicare Inc. in August 2015. There were narrow overlaps in the companies’ operations, which gave way to procedural caution on the antitrust front. This regulatory uncertainty offered a relatively wide deal spread, which was advantageous to Fund performance.
Pfizer Inc. acquired Hospira Inc. in September 2015, and numerous international regulatory approvals were required to complete the merger. As each approval was granted, the spread tightened and the deal moved closer to completion. In particular, there were some product overlaps in injectable medicines that were specifically scrutinized by the FTC. However, the merger was granted without required divestitures and the deal contributed positively to Fund performance.
DealertrackTechnologies Inc., a provider of software to automotive dealerships, was acquired by Cox Automotive Inc. during the third quarter. The Department of Justice determined that the merger would require Cox to divest its inventory management solution system in order for the deal to proceed. The merger’s relatively wide spread due to the regulatory concerns benefited Fund returns.
Tokio Marine Holdings Inc. continued its process of acquiring HCC Insurance Holdings Inc. in an all-cash merger. The deal spread has steadily tightened as the deal meets regulatory milestones. With each regulatory approval granted, the deal moved one step closer to completion. Several approvals were granted during the third quarter of 2015 and, consequently, the spread tightened meaningfully and contributed positively to returns.
Several holdings negatively impacted performance during the period. The Fund experienced two broken deals over the 12-month period. The first occurred in the fourth quarter of 2014.The combination of pharmaceutical firms Shire PLC and AbbVie Inc. was billed as a watershed event, with the tax inversion benefits serving as an extra benefit. AbbVie’s management team had reiterated the strategic merits of a merger with Shire and, while acknowledging the tax savings by reincorporating in Ireland, they affirmed that the tax savings were not the main motivation behind the deal. However, drastic and unilateral action by the U.S. Treasury in mid-October made the economics of an inversion less attractive. Only days after the U.S.Treasury’s action, AbbVie’s management team advised shareholders to vote against the deal, effectively terminating the acquisition. The second broken deal occurred during the second quarter of 2015. Applied Materials Inc.’s pending acquisition of Tokyo Electron Ltd. was terminated more than a year and a half after the deal was first announced. The management teams agreed to significant divestures to meet regulator demands. However, the companies voluntarily terminated the merger when it was clear that regulators felt the combined entity could still inhibit future microchip technology innovation.
A pair trade of NorthStar Realty Finance Corp. with Vanguard REIT ETF detracted from Fund performance. NorthStar was a large hedge fund holding and, as hedge fund performance faltered, client redemptions followed and managers were forced to liquidate holdings to meet redemption requests. However, NorthStar is planning a spin-off of its European properties, which remains on schedule for the fourth quarter of 2015.
An investment in Carbonite Inc., a cloud-based computer backup storage provider, also detracted from Fund performance. A significant holder of Carbonite stock, j2 Global Inc. made an unsolicited proposal to acquire the entire company. After the two companies began negotiations, j2 Global amended its proposal to acquire only the enterprise business from Carbonite, excluding the retail application service. Carbonite was unwilling to separate its business. With negotiations stalled, j2 Global cancelled its tender offer.
The utility merger between Pepco Holdings Inc. and Exelon Corp. also detracted from performance. While Maryland regulators narrowly approved the merger, regulators in Washington, D.C. had to approve it as well. Significant public outcry against the merger urged the D.C. Commission to reject the deal. Additionally, the
| 19 |
Management's Discussion of Fund Performance (Unaudited) (Continued)
D.C. Attorney General publicly opposed the merger, as did about half of the D.C. Council and more than half of the city’s neighborhood commissions. With the substantial regulatory approval risk, the Fund exited the position.
A pending spin-off by Fiat Chrysler Automobiles NV of its flagship brand, Ferrari, also detracted from Fund performance, as investors reacted negatively to Fiat’s announced delay for the spin-off. We continue to believe in the thesis underlying this position and the Fund continues to hold the investment. The issues at Volkswagen over claims that it installed software that obstructed diesel emission test devices caused a sell-off across the auto sector near the end of the third quarter of 2015.
Outlook
We believe the rationale for M&A activity continues to remain compelling, as interest rates remain low and organic growth has been difficult. Further, corporate cash continues to be broadly deployed into financial engineering rather than research and development, which will likely leave management teams with few options for growth outside of M&A. Deal spreads in merger situations have widened somewhat from the historically tight range that investors experienced throughout 2014. Spreads appear to have settled in the mid-single digits on an annualized basis. The market is now differentiating between deals that appear riskier and those that are more straightforward. Deals with a greater amount of perceived risk are being assigned a wider spread than transactions with fewer hurdles. This is in contrast to much of 2014 when spreads did not necessarily compensate investors appropriately for the amount of risk being assumed.
Short-term interest rates remain near zero and the Fed has steadfastly defended its data-dependent position. While historically low short-term interest rates will continue to act as a headwind to the merger arbitrage strategy, we continue to believe that the strategy offers an attractive risk-reward profile and serves as a valuable diversification tool. Historically, there has been a strong positive correlation between short-term interest rates and merger arbitrage spreads. When rates eventually rise, deal spreads should be favorably impacted. We believe the idiosyncratic nature of each of the positions in the Fund’s portfolio, along with the various strategies employed, combine to create a Fund with a low overall correlation to the broad equity and fixed income indexes. We maintain our belief that the robust M&A cycle will continue to present the Fund with attractive risk-adjusted opportunities going forward.
We believe the risks going forward include a general slowdown in M&A activity, which would potentially make it difficult to diversify the Fund across an adequate number of deals. Similarly, interest rates remaining at historically low levels could act as a double-edged sword — on one hand, spreads on merger deals would remain tighter than in an environment of high rates yet, on the other hand, low interest rates could foster an environment of easy financing which helps facilitate deal-making.
| 20 |
Management's Discussion of Fund Performance (Unaudited) (Continued)
Comparison of the Change in Value of a $10,000 Investment in the Touchstone Merger
Arbitrage Fund - Class A* and the BofA Merrill Lynch 3-Month U.S. Treasury Bill Index
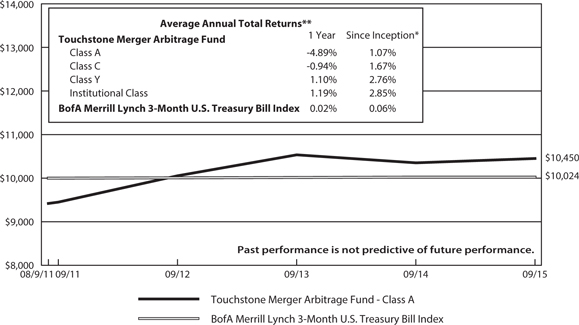
| * | The chart above represents performance of Class A shares only, which will vary from the performance of Class C shares, Class Y shares and Institutional Class shares based on the differences in sales loads and fees paid by shareholders in the different classes. The inception date of the Fund was August 9, 2011. The returns of the index listed above are based on the inception date of the Fund. |
| ** | The average annual total returns shown above are adjusted for maximum sales loads and fees, if applicable. The maximum offering price per share of Class A shares is equal to the net assets value (“NAV”) per share plus a sales load equal to 6.10% of the NAV (or 5.75% of the offering price). Class C shares are subject to a contingent deferred sales charge (“CDSC”) of 1.00%. The CDSC will be assessed on an amount equal to the lesser of (1) the NAV at the time of purchase of the shares being redeemed or (2) the NAV of such shares being redeemed, if redeemed within a one-year period from the date of purchase. Class Y shares and Institutional Class shares are not subject to sales charges. |
The performance of the above Fund does not reflect the deduction of taxes that a shareholder would pay on Fund distributions or the redemption of Fund shares.
Note to Chart
BofA Merrill Lynch 3-Month U.S. Treasury Bill Index is an unmanaged index of Treasury securities maturing in 90 days that assumes reinvestment of all income.
| 21 |
Management's Discussion of Fund Performance (Unaudited)
Touchstone Mid Cap Fund
Sub-Advised by The London Company
Investment Philosophy
The Touchstone Mid Cap Fund seeks long-term capital growth by investing primarily in common stocks of mid-cap U.S.-listed companies. The Fund utilizes a bottom-up security selection process that screens potential investments against a proprietary quantitative model for return on capital, earnings-to-enterprise value ratio, and free cash flow yield. Its goal is to purchase financially stable companies that consistently generate high returns on unleveraged operating capital, are run by shareholder-oriented managements and are trading at a discount to their respective private market values.
Fund Performance
The Touchstone Mid Cap Fund (Class A Shares) underperformed its benchmark, the Russell Midcap® Index, for the 12-month period ended September 30, 2015. The Fund’s total return was -1.94 percent (excluding the maximum sales charge) while the benchmark’s total return was -0.25 percent.
Market Environment
For the one-year period, U.S. equities faced increased volatility and the long-awaited correction in the bull market finally arrived. At the center of the correction, all asset classes moved lower, as small-, mid- and large-cap stocks declined during the narrow window. Market volatility increased due to investors’ growing concerns about the potential for higher interest rates in the U.S., the rapid change in the price of oil and other commodities and slowing economic growth in China. Despite weaker investor sentiment, however, U.S. economic readings continued to reflect moderate but steady growth with low inflation.
The resiliency of growth and momentum stocks during the correction was in contrast to previous environments. During the period, small-cap stocks outperformed large-cap stocks, growth stocks outperformed value stocks, and defensive stocks outperformed cyclical stocks — all of which impacted relative market performance. However, the two biggest factors that impacted performance were quality and beta1. High quality stocks, which Standard & Poor’s defines as those with stability of earnings, outperformed low quality stocks, while low beta1 stocks outperformed high-quality stocks. Within the benchmark, the Health Care, Financials and Consumer Discretionary sectors benefited performance.
Portfolio Review
Within the Fund, sector allocation had a negative impact on relative performance, while stock selection contributed positively. At the sector level, the Fund’s underweight to Health Care and Financials and an overweight to Materials detracted from performance, which was partially offset by an overweight to the Consumer Staples and Consumer Discretionary sectors. Stock selection within the Consumer Discretionary, Materials and Industrials sectors also contributed to Fund performance but was offset by stock selection in the Health Care sector.
Among the individual stocks that contributed to Fund performance during the period were Cintas Corp. (Industrials sector), Vulcan Materials Co. (Materials sector), and CarMax Inc., Dollar Tree Stores Inc. and Tempur Sealy International Inc. (all three from the Consumer Discretionary sector). Cintas, a provider of specialized services to all business types, outperformed as the company consistently met or slightly exceeded expectations during the period. In June, the company announced that it would sell its Shred-it document business and in August announced that it would use substantially all of those proceeds in an expanded share repurchase program, which further benefited the stock. Vulcan Materials is a provider of construction aggregates and aggregates-based construction materials. The company posted positive operating results and positive growth in its end markets, plus stronger than expected pricing power and lower variable costs. Vulcan Materials also benefited from the prospect of a
| 22 |
Management's Discussion of Fund Performance (Unaudited) (Continued)
long-term highway bill in the near term. CarMax, a used-car retailer, rallied in late 2014 after the company reported stronger than expected results. The company also benefited from same-store sales that exceeded expectations and strong traffic gains. Further, we believe CarMax is positioned well for future store growth going forward. Dollar Tree Stores, a chain of discount variety stores, rallied following the announcement that shareholders of Family Dollar Stores Inc. approved a merger with Dollar Tree. We believe the merger will create significant room for margin expansion at Family Dollar Stores going forward. Further, Dollar Tree has a history of consistent topline growth and margin improvement, which we also expect to benefit the stock. Bedding provider Tempur Sealy International outperformed for the year. In particular, performance was boosted by solid results, increased guidance from management and positive management changes. Further, the company’s strong product offering and successful advertising helped sales and earnings exceed expectations and encouraged management to raise its financial goals for the remainder of 2015. The company also appointed a new CFO and new CEO, both of whom were well received by investors.
Among the stocks that detracted from Fund performance were MBIA Inc. (Financials sector), NetApp Inc. (Information Technology sector), Deckers Outdoor Corp. (Consumer Discretionary sector), Tenet Healthcare Corp. (Health Care sector) and Atwood Oceanics Inc. (Energy sector). MBIA, a provider of financial guarantee insurance, was volatile during the year as investor concerns about Puerto Rico’s finances weighed on the stock. As a financial guarantor, MBIA has written insurance covering various municipal bonds issued by different government agencies in Puerto Rico. While the company’s exposure to Puerto Rico has been significant, we believe that the company has sufficient cash and claims-paying reserves to satisfy any potential payments. We also believe Puerto Rico and the various bondholder groups will work together on practical solutions going forward. NetApp is a provider of software, systems and services to manage and store data. The stock declined during the period due to product transitions and increased competition in the technology storage sector. The company named a new CEO as it deals with industry challenges. Going forward, we believe the company has a solid cash position and a willingness to return capital to shareholders, which we expect to benefit the stock. Deckers Outdoor, a footwear, apparel and accessories company, experienced profit taking during 2015, which followed the company’s strong rise in 2014. While the company’s earnings updates and management guidance confirmed its operating outlook, recent results have shown a decline in the company’s core UGG® brand, which renewed questions about the durability of that product line. Tenet Healthcare, a healthcare services company, declined due to the additional expense from recent acquisitions and to management maintaining its full-year outlook. However, longer term, we believe the company should benefit from additional bed capacity as implementation of the Affordable Care Act continues. Atwood Oceanics, an offshore gas and driller company, was pressured along with most of the Energy sector. The decline in energy prices and the associated reductions in the company’s capital spending also weighed on the stock. Further, weakening demand caused the company’s rig rental rates to decline and capacity utilization to run below long-term averages.
The Fund initiated new positions in Ball Corp. (Materials sector), VOYA Financial Inc. (Financials sector), H&R Block Inc. (Consumer Discretionary sector), Copart Inc. and Dover Corp. (both from the Industrials sector). Ball Corp. is a supplier of metal and plastic packaging to beverage and food industries. The company has a stable, high return-on-capital business with a management team driven by economic value added (EVA) and strong returns of capital to shareholders through dividends or share repurchases. VOYA Financial experienced improving return on equity and return on capital during the period, which was driven by its leadership position in its retirement, investment management and insurance solutions. The company’s balance sheet became stronger and management reduced risk in its investment portfolio by limiting its holdings of structured securities and raising its investment grade holdings. H&R Block, a tax preparer, generated returns significantly above the company’s cost of capital, and its large scale has allowed the company to produce solid margins. Copart is a provider of online vehicle auction and remarketing services. The company has a defensible business model with increasing competitive advantages and a sizable market share. Copart also has a large footprint, low transportation
| 23 |
Management's Discussion of Fund Performance (Unaudited) (Continued)
costs, a large audience of buyers and high returns. Dover is a manufacturer of specialized industrial products and equipment. The company has a strong management team and high profitability, and also allocates its capital in a balanced fashion with roughly half of available funds going to growth initiatives via capital spending and acquisitions, and half going to dividends and share buybacks.
The Fund sold its positions in Atwood Oceanics Inc. (Energy sector), Reynolds American Inc. (Consumer Staples sector), Service Corporation International (Consumer Discretionary sector), ATK (prior to its split into Orbital ATK Inc. (Industrials sector) and Vista Outdoor Inc. (Consumer Discretionary sector) and Kinder Morgan Inc. (Energy sector). We trimmed positions in Cintas Corp. (Industrials sector) and Dollar Tree Stores Inc. (Consumer Discretionary sector) to fund transactions, but still have high conviction in both companies.
Outlook
While we do not attempt to forecast the future, we believe many of the headlines in today’s news will likely remain intact though year end. In particular, we expect global uncertainty and weakness in commodities, particularly in China, to remain large macro risks. The anticipation of an interest rate increase by the U.S. Federal Reserve Board and strength in the U.S. dollar could also shake up domestic equities further. In general, we expect the foreign slowdown to continue and believe stocks could be more volatile in the future.
While recent volatility has resulted in significant market declines, stocks are considered less expensive but not necessarily cheap. However, we are still finding high-conviction investment ideas, and the recent correction has increased the number of available opportunities. In addition, the strength of corporate balance sheets, high cash levels, below-average dividend payout ratios and low interest rates continued to provide flexibility for corporate management teams in terms of capital allocation and mergers and acquisitions (M&A) activity. In addition, the dispersion among the asset classes and sectors has been a welcome change from the past few years and we believe it should benefit the Fund’s stock selection going forward.
Our strategy focuses on stocks from a bottom-up standpoint. We seek companies with strong returns on capital and the flexibility to enhance shareholder value using the balance sheet. Low interest rates and relatively high equity risk premiums enable companies to increase shareholder value by adjusting the capital structure of the company. Separately, with elevated cash levels on corporate balance sheets and dividend payout ratios near historic lows, we expect investors to reward companies that wisely deploy capital including higher dividends, share repurchases and M&A transactions. Going forward, we believe the Fund is positioned well for a slow growth environment that rewards strong capital allocation.
| 1 | Beta is a measure of the volatility of a portfolio relative to its benchmark. |
Dividend paying investments may not experience the same price appreciation as non-dividend paying instruments, dividend-issuing companies may choose not to pay a dividend, or the dividend may be less than what is anticipated.
| 24 |
Management's Discussion of Fund Performance (Unaudited) (Continued)
Comparison of the Change in Value of a $10,000 Investment in the Touchstone
Mid Cap Fund - Class A* and the Russell Midcap® Index

| * | The chart above represents performance of Class A shares only, which will vary from the performance of Class C shares, Class Y shares, Class Z shares and Institutional Class shares based on the differences in sales loads and fees paid by shareholders in the different classes. The inception date of Class A shares, Class C shares, Class Y shares, Class Z shares and Institutional Class shares was May 14, 2007, May 14, 2007, January 2, 2003, April 24, 2006 and January 27, 2012, respectively. Class A shares, Class C shares, Class Z shares and Institutional Class shares performance was calculated using the historical performance of Class Y shares for the periods prior to May 14, 2007, May 14, 2007, April 24, 2006 and January 27, 2012, respectively. The returns have been restated for sales loads and fees applicable to Class A, Class C, Class Z and Institutional Class shares. The returns of the index listed above are based on the inception date of the Fund. |
| ** | The average annual total returns shown above are adjusted for maximum sales loads and fees, if applicable. The maximum offering price per share of Class A shares is equal to the net assets value (“NAV”) per share plus a sales load equal to 6.10% of the NAV (or 5.75% of the offering price). Class C shares are subject to a contingent deferred sales charge (“CDSC”) of 1.00%. The CDSC will be assessed on an amount equal to the lesser of (1) the NAV at the time of purchase of the shares being redeemed or (2) the NAV of such shares being redeemed, if redeemed within a one-year period from the date of purchase. Class Y shares, Class Z shares and Institutional Class shares are not subject to sales charges. |
The performance of the above Fund does not reflect the deduction of taxes that a shareholder would pay on Fund distributions or the redemption of Fund shares.
Note to Chart
Russell Midcap® Index measures the performance of the 800 smallest companies in the Russell 1000® Index.
The Frank Russell Company (FRC) is the source and owner of the Index data contained or reflected in this material and all trademarks and copyrights related thereto. The material may contain confidential information and unauthorized use, disclosure, copying, dissemination or redistribution is strictly prohibited. This is a Touchstone Investments presentation of the data, and FRC is not responsible for the formatting or configuration of this material or for any inaccuracy in the presentation thereof.
| 25 |
Management's Discussion of Fund Performance (Unaudited)
Touchstone Mid Cap Value Fund
Sub-Advised by LMCG Investments, LLC
Investment Philosophy
The Touchstone Mid Cap Value Fund seeks capital appreciation by investing primarily in common stocks of medium capitalization companies. The Fund seeks to identify companies believed to be selling at a discount to their inherent value.
Fund Performance
The Touchstone Mid Cap Value Fund (Class A Shares) outperformed its benchmark, the Russell Midcap® Value Index, for the 12-month period ended September 30, 2015. The Fund’s total return was -1.14 percent (excluding the maximum sales charge) while the benchmark’s total return was -2.07 percent.
Market Environment
The economy continued to improve in the U.S. throughout late 2014 and early 2015, as strong corporate earnings and an improving employment picture existed. However, during the second half of the period, volatility returned as slowing global growth, the U.S. Federal Reserve Board’s indecision and growing currency devaluation fears resulted in weak equity market returns. Investor questions and fears regarding China’s ultimate growth rate were magnified when the Chinese government decided to devalue the yuan after other attempts to boost the economy had not proven fruitful.
Portfolio Review
Both sector selection and security selection contributed to relative performance. The Fund’s strongest contributors to performance were reported in the Energy, Consumer Staples and Utilities sectors. Primary detractors were the Financials, Materials and Health Care sectors.
With oil prices falling 50 percent over the last 12 months, the Fund’s underweight combined with good stock selection in the Energy sector was a key contributor to performance. Favorable stock selection in the Utilities sector aided performance as AGL Resources Inc. appreciated on a proposed acquisition of the company by Southern Companies. The Fund’s overweight to the Consumer Staples sector, which historically has benefited during periods of market turmoil, helped performance. Supermarket chain Kroger Co. was a contributor, based on strong execution by management and the market’s rerating the stock higher.
Most of the Fund’s underperformance in the Materials sector was concentrated in Allegheny Technologies Inc. Allegheny declined on increased supply from China and falling demand from Energy companies. We continue to believe the stock of the company represents good value. FMC Corporation (Materials sector) detracted as inventory levels and the company’s 2016 outlook were questioned. The Fund’s underweight to the Health Care sector (particularly to the health care providers/services industry) detracted from performance, which was partially offset by good stock selection within the sector. The Fund’s ongoing underweight to real estate investment trusts (REITs) on a valuation basis hurt performance in the Financials sector. REITs outperformed in this low-interest-rate environment, while more asset-sensitive holdings, including some of the Fund’s bank names, underperformed.
There were no significant changes to the Fund’s positioning made during the year; however, the combination of the Russell reconstitution in the second quarter of 2015, with modest changes to the Fund’s portfolio, did impact some of the relative industry weights. We continue to populate the Fund with what we believe are compelling risk/reward opportunities across all of the industries in a diversified manner.
| 26 |
Management's Discussion of Fund Performance (Unaudited) (Continued)
Outlook
From a macroeconomic standpoint, an improving global economic environment would help the Fund on a relative basis. The Fund remains underweight REITs and the Utilities sector given valuation concerns. In the short term, these sectors historically moved in the opposite direction of interest rates. Given the globally low interest rates, any positive economic news may cause rates to rise and these sectors may underperform. Also, an environment where valuation matters would benefit the Fund’s strategy. While there have been brief periods of time over the past year where “value” was rewarded, growth continues to be in favor and valuation has not been a key concern. The Fund will continue to face short-term periods where its process of buying high-quality companies that are temporarily out of favor faces headwinds, but over the long term, we believe our investment process should reward patient investors. We continue to find attractively valued investment opportunities with favorable risk/reward profiles.
The Fund’s strategy utilizes a classic value-driven philosophy based on the belief that leading businesses selling at a discount to fair value have the potential to generate excess returns. The strategy focuses on stocks that are temporarily out of favor in the market; specifically, companies with higher returns on capital, free cash flow and strong balance sheets. Emphasis is placed on those companies having the cash flow characteristics as well as the balance sheet strength necessary to buffer the company from any prolonged weakness. Companies in the Fund’s portfolio often dominate a particular industry niche and generally have significant barriers to entry. As a result, we believe they are able to perpetuate a higher return on capital over time. The Fund’s overall investment process utilizes fundamental bottom-up security selection, while we believe risk control measures ensure security and sector diversification.
| 27 |
Management's Discussion of Fund Performance (Unaudited) (Continued)
Comparison of the Change in Value of a $10,000 Investment in the
Touchstone Mid Cap Value Fund - Class A* and the Russell Midcap® Value Index
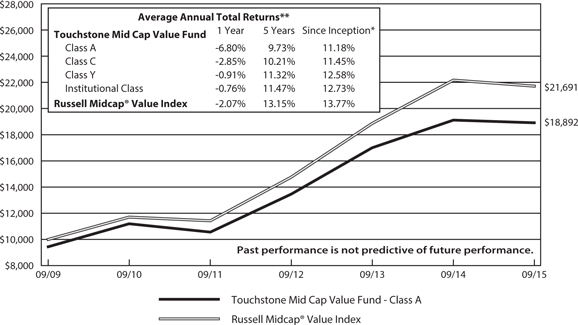
| * | The chart above represents performance of Class A shares only, which will vary from the performance of Class C shares, Class Y shares and Institutional Class shares based on the differences in sales loads and fees paid by shareholders in the different classes. The inception date of the Fund was September 30, 2009. The returns of the index listed above are based on the inception date of the Fund. |
| ** | The average annual total returns shown above are adjusted for maximum sales loads and fees, if applicable. The maximum offering price per share of Class A shares is equal to the net assets value (“NAV”) per share plus a sales load equal to 6.10% of the NAV (or 5.75% of the offering price). Class C shares are subject to a contingent deferred sales charge (“CDSC”) of 1.00%. The CDSC will be assessed on an amount equal to the lesser of (1) the NAV at the time of purchase of the shares being redeemed or (2) the NAV of such shares being redeemed, if redeemed within a one-year period from the date of purchase. Class Y shares and Institutional Class shares are not subject to sales charges. |
The performance of the above Fund does not reflect the deduction of taxes that a shareholder would pay on Fund distributions or the redemption of Fund shares.
Note to Chart
Russell Midcap® Value Index measures the performance of those Russell Midcap companies with lower price-to-book ratios and lower forecasted growth values.
The Frank Russell Company (FRC) is the source and owner of the data contained or reflected in this material and all trademarks and copyrights related thereto. The material may contain confidential information and unauthorized use, disclosure, copying, dissemination or redistribution is strictly prohibited. This is a Touchstone Investments presentation of the data, and FRC is not responsible for the formatting or configuration of this material or for any inaccuracy in the presentation thereof.
| 28 |
Management's Discussion of Fund Performance (Unaudited)
Touchstone Premium Yield Equity Fund
Sub-Advised by Miller/Howard Investments, Inc.
Investment Philosophy
The Touchstone Premium Yield Equity Fund seeks long-term growth of capital and high current income by focusing on dividend-paying equity securities of U.S. and foreign companies believed to possess attractive long-term return potential primarily due to lower than average valuations and improving business outlooks.
Fund Performance
The Touchstone Premium Yield Equity Fund (Class A Shares) underperformed its benchmarks, the Russell 3000® Value Index and the Dow Jones U.S. Select Dividend Index for the 12-month period ended September 30, 2015. The Fund’s total return was -10.79 percent (excluding the maximum sales charge) while the returns of its benchmarks were -4.22 percent and 2.24 percent, respectively.
Market Environment
During the 12-month period, anxiety seemed to be the dominant market sentiment among investors. However, compared with the broad market’s extreme gyrations in the third quarter of 2015, the volatility in the fourth quarter of 2014 seemed placid. There were many similarities between the market’s backdrop at the beginning of the period and at the end — in particular, indications of economic weakness in Emerging Markets, declining oil and commodity prices and uncertainty surrounding the U.S. Federal Reserve Board’s (Fed) decisions about monetary policy. Even as some of these factors prevailed to varying degrees during the period, at the start of 2015 the market seemed complacent due to the U.S. economy’s ability to gradually recover from external pressures. However, that complacency proved to be fragile when, in the third quarter of 2015, investors rushed to bearish positions as concerns about external pressures escalated, namely from economic weakness in China. Market sentiment declined, which in turn drove stock prices even lower as investors were caught in a flurry of selling.
While low commodity prices, including oil, partially reflected low global demand, U.S. economic conditions improved, albeit sluggishly. As such, we believe the U.S. market may have overreacted, especially for stocks that pay dividends. In particular, Utilities, real estate investment trusts (REITs), Master Limited Partnerships (MLPs) and similar income equity categories experienced their worst performance in recent history. Yet, wholesale selling in many sectors resulted in bargain valuations for real and durable assets. Importantly, toward the end of the period, dividend-paying stocks were cheaper than they have been in recent history.
Portfolio Review
Sector positioning was the main driver of Fund underperformance during the period. The largest detractor was an overweight allocation to the Energy sector, which was compounded by poor stock selection within that sector. Nearly all other sectors detracted nominally from relative performance with the exception of an overweight to the Health Care sector and an underweight to the Industrials sector.
From a stock selection standpoint, top relative contributors to performance during the period included LyondellBasell Industries NV (Materials sector), Maxim Integrated Products Inc. (Information Technology sector) and Kinder Morgan Inc. (Energy sector). Chemical producer LyondellBasell Industries benefited from lower commodity prices, as certain commodities are used to manufacture its chemicals. Maxim Integrated Products, a developer of integrated circuits, benefited from consistently better than expected earnings estimates. Kinder Morgan, a pipeline company, outperformed as shareholders responded positively to news that the company planned to acquire its underlying MLPs, thereby lowering its overall cost of capital and affirming dividend growth through 2020.
| 29 |
Management's Discussion of Fund Performance (Unaudited) (Continued)
Among the individual stocks that detracted from performance were LinnCo LLC and ONEOK Inc. (both from the Energy sector) and The Bank of Montreal and Weyerhaeuser Co. (both from the Financials sector). Oil and natural gas companies LinnCo and ONEOK both experienced significant pressure as a result of soft commodity prices and investor uncertainty about the pipeline business model. LinnCo was sold in December 2014 over concerns that a significant drop in crude oil prices would result in a potential dividend cut. ONEOK reported lower than estimated earnings as a result of continued concerns that weak natural gas liquids could impact distribution growth at its underlying MLP. ONEOK remained in the Fund during the period and the company was monitored closely for signs of future strength or weakness. The Bank of Montreal, a personal banking company, sold off due to exposure to the Canadian housing market. Further, overall weakness in the Canadian economy that resulted from lower oil prices also negatively impacted the stock. Weyerhaeuser Co. is a real estate investment trust (REIT) that manufactures, distributes and sells forest products. The company faced difficulty during 2015 due to its exposure to the weakening Chinese housing market.
No significant changes were made to the Fund’s sector positioning over the 12-month period. As bottom up investors, the Fund’s sector weights were a result of the fundamental attributes of its holdings and not a result of an overarching macro philosophy.
The following companies were added to the Fund during the period. Covanta Holding Corp. (Industrials sector) is a waste-to-energy producer. The stock was purchased at what was believed to be a compelling valuation and offers an attractive yield. Host Hotels & Resorts Inc. (Financials sector) is a REIT that offers a generous yield, low debt and strong cash flow growth, all of which we believe should lead to strong dividend growth. Semiconductor company STMicroelectronics NV (Information Technology sector) was added to the Fund because of the company’s ample dividend increase and low historic valuation. Coach Inc. (Consumer Discretionary sector) is a luxury accessories company, which includes watches, footwear and jewelry. The stock’s low price relative to historical valuations, along with the company’s minimal debt and adequate dividend coverage, were appealing. Domtar Corp. (Materials sector), a provider of fiber-based products, reported favorable earnings, an attractive valuation, growth from the fluff pulp business, ample dividend coverage and an anticipated dividend increase. GameStop Corp. (Consumer Discretionary sector), a multichannel video game retailer, increased its dividend and traded at a steep discount that resulted from concerns over its brick and mortar video game retailers. The Procter & Gamble Co. (Consumer Staples sector), a manufacturer of consumer packaged goods, offered a high yield relative to its history and low valuation.
During the period we sold Columbia Pipeline Group Inc. (Energy sector) following the company’s NiSource spinoff because of the stock’s low yield and to take advantage of current liquidity. Golar LNG Ltd. (Energy sector) was sold because of the company’s large capital requirements in order to execute its long-term strategy and because of current spot-market weakness for liquefied natural gas (LNG) tanker leases, both of which jeopardized the dividend. Baxter International Inc. (Health Care sector) was sold after a spinoff resulted in two stocks that did not meet the Fund’s yield criteria. CME Group Inc. (Financials sector) was sold to take profits and make room for new companies.
Outlook
Expectations for an interest rate increase persisted during the period. However, since the Fed’s decision in September 2015 to keep rates unchanged, U.S. dividend-paying stocks have performed better than the broad market. Going forward, when and if the Fed begins to raise short-term interest rates, we do not believe that it will significantly impact long-term interest rates. As such, we believe continued low interest rates, along with investors’ need for high income and growth of income, could provide beneficial tailwinds to dividend-paying stocks.
Looking ahead, we believe the U.S. economy will continue to grow, but at a slower rate due to global economic weakness, a strong U.S. dollar and uncertainty surrounding energy prices. We believe our viewpoint is supported by the weak economic indicators seen in the second quarter, which included falling capacity utilization, slowing
| 30 |
Management's Discussion of Fund Performance (Unaudited) (Continued)
year-over-year growth in industrial production and soft copper and aluminum prices. While we do not currently expect a recession, we are mindful of data that might indicate a shift in momentum from sluggish growth to a general slowdown. Slower U.S. economic growth could prove to be a headwind to cyclical sectors, and fluctuating energy prices could continue to put pressure on the Energy sector.
While the future is uncertain, we believe the Fund is positioned to perform well if dividend-paying stocks are once again favored by the market; however, there are areas within the global economy that could prove to be a headwind to U.S. equities. That said, we believe the diversification of our strategy could help the Fund perform well in a variety of market environments.
Dividend-paying investments may not experience the same price appreciation as non-dividend paying instruments, dividend-issuing companies may choose not to pay a dividend, or the dividend may be less than what is anticipated.
| 31 |
Management's Discussion of Fund Performance (Unaudited) (Continued)
Comparison of the Change in Value of a $10,000 Investment in the
Touchstone Premium Yield Equity Fund - Class A* , the Russell 3000® Value Index and
the Dow Jones U.S. Select Dividend Index
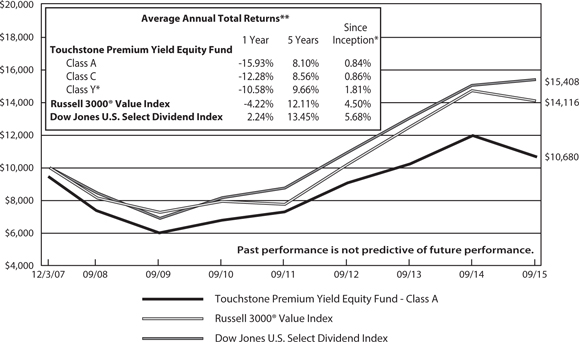
| * | The chart above represents performance of Class A shares only, which will vary from the performance of Class C shares and Class Y shares based on the differences in sales loads and fees paid by shareholders in the different classes. The inception date of Class A shares, Class C shares and Class Y shares was December 3, 2007, December 3, 2007 and August 12, 2008, respectively. Class Y shares performance was calculated using the historical performance of Class A shares for the periods prior to August 12, 2008. The returns have been restated for sales loads and fees applicable to Class Y shares. The returns of the indexes listed above are based on the inception date of the Fund. |
| ** | The average annual total returns shown above are adjusted for maximum sales loads and fees, if applicable. The maximum offering price per share of Class A shares is equal to the Net Asset Value per share plus a sales load equal to 6.10% of the NAV (or 5.75% of the offering price). Class C shares of the Funds are subject to a contingent deferred sales charge (“CDSC”) of 1.00%. The CDSC will be assessed on an amount equal to the lesser of (1) the NAV at the time of purchase of the shares being redeemed or (2) the NAV of such shares being redeemed, if redeemed within a one-year period from the date of purchase. Class Y shares are not subject to sales charges. |
The performance of the above Fund does not reflect the deduction of taxes that a shareholder would pay on Fund distributions or the redemption of Fund shares.
Note to Chart
Russell 3000® Value Index measures the performance of those Russell 3000 companies with lower price-to-book ratios and lower forecasted growth values.
Dow Jones U.S. Select Dividend Index measures 100 leading U.S. dividend-paying companies.
Frank Russell Company (FRC) is the source and owner of the data contained or reflected in this material and all trademarks and copyrights related thereto. The material may contain confidential information and unauthorized use, disclosure, copying, dissemination or redistribution is strictly prohibited. This is a Touchstone Investments presentation of the data, and FRC is not responsible for the formatting or configuration of this material or for any inaccuracy in the presentation thereof.
| 32 |
Management's Discussion of Fund Performance (Unaudited)
Touchstone Sands Capital Select Growth Fund
Sub-Advised by Sands Capital Management, LLC
Investment Philosophy
The Touchstone Sands Capital Select Growth Fund primarily invests in common stocks of large capitalization U.S. companies that are believed to have above-average potential for revenue or earnings growth. The Fund invests in 25 to 35 companies. Sands Capital generally seeks stocks with sustainable above average earnings growth and capital appreciation potential. In addition, Sands Capital looks for companies that have a significant competitive advantage, a leadership position or proprietary niche, a clear mission in an understandable business, financial strength and are valued rationally in relation to comparable companies, the market and the business prospects for that particular company.
Fund Performance
The Touchstone Sands Capital Select Growth Fund (Class A Shares) underperformed its benchmark, the Russell 1000® Growth Index, for the 12-month period ended September 30, 2015. The Fund’s total return was -4.70 percent (excluding the maximum sales charge) while the total return of the benchmark was 3.17 percent.
Market Environment
Throughout 2014 and into 2015, a strengthening U.S. dollar posed a two-pronged headwind for large, leading companies that sell to a multinational base—a description that fits a number of the Fund’s portfolio companies. First, as the dollar strengthens, companies’ goods become more expensive for international consumers, causing demand to slow and growth rates to contract in important end markets. Second, ex-U.S. revenues are translated into dollars before financials are reported, so as international currencies weaken, so do revenues. As the year progressed, we began to hear an increasing number of portfolio companies cite “FX (foreign exchange) headwinds” as a hindrance to revenue growth. Adobe Systems Inc., Alexion Pharmaceuticals Inc., Biogen Inc., Facebook Inc., Google Inc., Nike Inc., Priceline Group Inc. and Visa Inc., among others, have each mentioned this particular headwind.
More recently, we’ve seen increased volatility throughout global equity markets, which we believe stems from worries emanating out of China. Investors are growing increasingly concerned about the country’s slowing growth and the potential implications of that slowdown for the rest of the world. For the past several years, we have expected China’s growth to gradually slow as the country’s economy continues its structural shift from an investment-driven economy to one propelled by consumption, services and increasing productivity. While this creates some near-term headwinds, we believe this shift will lead to growth that is more stable and sustainable going forward, which should support a stronger middle class.We believe the shift toward a more consumption-driven economy favors the China-exposed companies we own, which include Alibaba Group Holding Ltd. and Baidu Inc. Furthermore, we expect certain of the country’s structural characteristics—a massive consumer base, underdeveloped brick-and-mortar retail and high levels of Internet penetration—to drive a long tailwind of secular growth for these companies, as future consumption continues to shift to online channels. We believe this shift is inevitable, regardless of China’s economic cycles.
Portfolio Review
On a relative basis, the top five contributors during the period were Visa Inc., Regeneron Pharmaceuticals Inc., Nike Inc., BioMarin Pharmaceutical Inc. and Salesforce.com Inc. We believe Visa’s last few quarters highlight the continued powerful secular trend of increasing use of electronic payments. Despite macroeconomic headwinds pressuring global consumption and international travel, Visa’s payment volumes continue to grow in the low double digits (excluding the impact of foreign exchange). This validates our view that the shift away from paper-based payments—mainly cash and checks—is a persistent force, regardless of the macroeconomic environment. In
| 33 |
Management's Discussion of Fund Performance (Unaudited) (Continued)
addition, we believe e-commerce and mobile point-of-sale technologies further accelerate the use of electronic payments. In recent news, anticipation surrounding Visa Inc.’s possible acquisition of Visa Europe continued to garner attention after Visa Inc. revealed in May that the two companies had entered formal discussions. Visa Europe is mutually owned by a consortium of European banks and has a contractual right to sell itself to Visa Inc. at any time. Should Visa Inc. buy Visa Europe, we think there would be meaningful benefits, including potential cost synergies, market share gains and opportunities to optimize its capital structure.
The top five relative detractors from performance were Baidu Inc., Alibaba Group Holding Ltd., FMCTechnologies Inc., Southwestern Energy Co. and LendingClub Corp. Often businesses the Fund owns invest substantial amounts of capital in order to realize their full long-term earnings growth potential. Although investment cycles can distort earnings over short periods, we are willing to own businesses through these cycles as long as we believe in the company’s long-term opportunity. Baidu’s near-term margins have been under pressure as it invests to transform from a pure search engine into a transactional platform capable of capturing more value from consumers’ online purchases. While the investment is expected to be significant, we believe it should result in a differentiated search experience that will be difficult for competitors to match. Meanwhile, Baidu’s core search business continues to perform well. Recent results have shown the company’s mobile app is increasingly contributing to overall search revenues, enhancing our conviction that search remains relevant in China’s increasingly mobile world, a key driver of Baidu’s long-term growth.
We diligently monitor and continually evaluate the long-term growth prospects for our portfolio companies while simultaneously seeking opportunities to add compelling new businesses. In the past year, we initiated positions in four companies: Illumina Inc., LendingClub Corp., Mobileye NV and Palo Alto Networks Inc. Over the same time period, we eliminated four positions: Las Vegas Sands Corp., National Oilwell Varco Inc., Southwestern Energy Co. and Twenty-First Century Fox Inc. In addition, we sold Amazon.com Inc. in December 2014 and repurchased it in July 2015; we outline our rationale below.
Illumina is the global leader in genomic sequencing technology with an estimated 80 percent share of installed instruments. The company has a portfolio of integrated systems composed of instruments, consumable reagents and analysis tools that aid in the sequencing and research of genomes (a genome is a complete set of DNA for any organism). Illumina’s next-generation sequencing technology is enabling researchers to use genetic information to discover the cause of certain diseases, guide the development of targeted drugs and inform treatment decisions by physicians.
LendingClub is the world’s largest online marketplace-lending platform with over $6 billion in cumulative loan originations since its founding in 2006. The company disintermediates traditional bank lending by facilitating loans directly to consumer and small-business borrowers from a variety of investor-lenders, ranging from individuals to institutions. Both borrowers and investors share in LendingClub’s value proposition, which includes lower costs, increased transparency and better interest rates.
Mobileye designs and develops patented, proprietary software algorithms for camera-based Advanced Driver Assistance Systems (ADAS), a class of next-generation automotive safety features. The company’s technology is currently being used by approximately 20 original equipment manufacturers (OEMs) in the production of more than 200 vehicle models, giving it industry-leading market share of over 80 percent.
We believe Palo Alto Networks is a leading innovator in cybersecurity and the first true platform provider in the space. Palo Alto’s end-to-end solution protects enterprises against known and unknown threats whether they attack the network or an end point. Cybersecurity has become a board-level concern for companies of all sizes as the frequency, severity and level of sophistication of cyberattacks continues to increase. The integration and communication across the company’s three tightly integrated core products enables an automated feedback
| 34 |
Management's Discussion of Fund Performance (Unaudited) (Continued)
loop to prevent attacks at all threat vectors. Furthermore, the company’s two-way communication with its install base enables it to see a new attack at one customer and push the necessary fix to other customers in near real time.
We sold Las Vegas Sands as virtually all of its long-term growth prospects are directly tied to the continued development of Macau, the only region in China where gambling is currently legal. Throughout our ownership period, Las Vegas Sands benefited from growing numbers of Chinese middle-class leisure travelers, which not only drove increased gaming volumes at Las Vegas Sands’ Macau properties, but also amplified hotel room bookings and retail sales. We expect the company’s growth will eventually return to more normalized levels. However, we believe we can improve the Fund’s overall growth profile by re-allocating funds to other leading franchises in important areas of growth and innovation.
As a leading provider of critical oil and gas drilling and production equipment, National Oilwell Varco benefited from the upgrade and expansion of the global drilling rig fleet as production moved to offshore, deepwater areas in search of unexploited hydrocarbon deposits. Over recent months, falling oil prices have caused new projects to be delayed and drilling activity to slow, which led to lower demand for the company’s equipment and services. Although we believe the fall in oil prices is temporary, we estimate it may take several years for National Oilwell Varco to resume its normal growth trajectory, at which point it will likely be further up the maturity curve. As a result of these factors, we sold it to fund more compelling opportunities.
We sold Southwestern Energy because we no longer believe it is a fit with our six investment criteria.
While we believe Twenty-First Century Fox Inc. remains a fit with our investment criteria, the media space is facing a number of headwinds, including the potential for “cord-cutting” (cancelling one’s entire cable subscription), the advent of slimmed down or a-la-carte channel bundles and increasing proliferation of non-traditional distribution avenues such as Netflix. We think the risks associated with these headwinds could overshadow its advantages and impair our investment case. As a result, we sold Twenty-First Century Fox.
Amazon.com Inc. is one of the largest Internet-based retailers in the U.S. and a growing global leader in the computing infrastructure-as-a-service (IaaS) space. We sold Amazon in December 2014 primarily due to the company’s lack of detailed financial disclosures, which undermined our ability to build conviction in the growth drivers necessary to support a premium valuation. Subsequent to the sale of the Fund’s position, not only did Amazon significantly enhance its level of disclosure, but it also began taking steps to curtail some of the non-core investments we were concerned about (e.g., the Fire phone). After extensive analysis of this new information, we gained enough conviction to re-embrace Amazon in the Fund. We believe Amazon’s retail and IaaS businesses are each positioned to participate in long-duration growth opportunities.The company’s IaaS offering, Amazon Web Services (AWS), provides organizations with on-demand access to computing, storage and other services through its cloud platform. Over the coming decades, we expect AWS will be a key player in the paradigm shift toward shared infrastructure services. Amazon’s recently enhanced level of financial disclosures provides increased transparency that helps strengthen our conviction in the overall health and growth prospects of Amazon’s retail business and significantly raises our expectations for the long-term potential of AWS. As a result, we view Amazon’s two core franchises as attractive and rapidly growing businesses that each meet our investment criteria.
Outlook
In order for a business to possess the above-average earnings growth potential we require, it is often a key innovator or vital facilitator within a platform economy that is benefiting from positive secular change. Secular trends are distinct from short-term economic factors as they tend to persist through market cycles and can provide powerful structural tailwinds that enhance the sustainability of a business’s growth for many years. Our long-term
| 35 |
| Management's Discussion of Fund Performance (Unaudited) (Continued) |
investment horizon allows us to capture the benefit of these trends and realize the ultimate earnings power of a company while weathering volatility over shorter periods.
We have identified several powerful secular tailwinds that are present within the Fund, including the following:
| • | E-commerce and Electronic Payments: We expect e-commerce to remain the fastest growing segment of retail sales as it only accounts for 12 percent of global sales today, and penetration rates within growing countries such as China are well below that of developed economies. E-commerce transactions are enabled by the adoption of electronic forms of payment (such as credit and debit cards), and payment innovations such as near-field communications and app-based payments that continue to reduce friction. It is estimated that only 30 to 40 percent of global personal consumption expenditure is completed using a credit or debit card. |
| • | Mobile Device Functionality and Services: Increasing demand for access to fast, secure and reliable business and personal data from mobile devices is causing manufacturers to develop more efficient and functional mobile devices. Within mobile services, value capture is shifting to content enablers and service providers that can leverage the capabilities of these more powerful devices. |
| • | Biotech and Specialty Pharmaceuticals: Due to advances in molecular diagnostic technology, a growing number of drug therapies that have complex manufacturing processes and significant patent and/or intellectual property protection are being designed to target genetic causes of disease. New technologies are also allowing drug makers to efficiently develop so-called “orphan” drugs for the treatment of rare diseases, of which there are an estimated 7,000 that have been identified. Orphan designated drugs often receive faster regulatory approval at a higher success rate than traditional drug therapies. |
| • | Healthcare Information Technology: Changes in the healthcare landscape—such as the shift from fee-for-service care toward value-based pricing, and the increasing complexity of reimbursement—are driving the continued expansion of healthcare IT solutions to improve patient outcomes and reduce costs. Electronic Medical Records are also rapidly becoming the standard of care in clinical settings, which further increases the need for sophisticated IT solutions. As more data is collected, the need for insightful analytics, as well as remote data storage and aggregation, is increasing. |
Investment risks may come from over- or under-estimating key elements of our investment case such as the strength of competition, rate of adoption for a product or service or the amount of capital investment needed to maintain a company’s growth trajectory. We believe our best risk mitigation tool begins with our portfolio construction process and our strict adherence to our six investment criteria.
We use our criteria in our rigorous fundamental, bottom-up research process to form investment cases that account for a range of outcomes, both positive and negative. We look for businesses that (1) have visible and sustainable growth drivers, (2) are leaders within an attractive business space, (3) possess clear competitive advantages, (4) have strong management teams, (5) have robust financial strength, and (6) are reasonably priced. We continually reassess our investment case over time as we get new information and update our assumptions and expected return accordingly. In the event that a business meaningfully underperforms our expectations, and we conclude it no longer meets one or more of our criteria, we exit the investment.
We believe our criteria provide a common lens to analyze and compare businesses across sectors and geographies, as well as a consistent framework to define, debate and implement the ideas generated by our globally-integrated investment research team.
We believe the Fund owns companies that are positioned to deliver strong business results and earnings growth over our three- to five-year investment horizon. Our focus on the sustainability of a business’s future earnings growth typically steers us toward companies we believe are benefiting from secular trends that should provide
| 36 |
Management's Discussion of Fund Performance (Unaudited) (Continued)
powerful growth tailwinds throughout economic cycles. We have high conviction in the long-term growth estimates for the Fund’s portfolio companies and believe they can deliver the above-average earnings growth necessary to add value for shareholders over the long term.
The portfolio’s sector allocations are a residual of our bottom-up, fundamental approach. Our six investment criteria typically lead us to innovative businesses that are creating new or disrupting existing markets, and/or benefiting from powerful secular tailwinds. Our approach to investment research, portfolio construction and risk management results in a portfolio that we believe is naturally diversified across industries and businesses at different stages of their respective growth lifecycles. We expect to continue to have higher weights in key growth sectors, including Consumer, Life Sciences and Information Technology, and lower weights in highly-cyclical sectors such as Energy, Industrials and Financials.
| 37 |
Management's Discussion of Fund Performance (Unaudited) (Continued)
Comparison of the Change in Value of a $10,000 Investment in the
Touchstone Sands Capital Select Growth Fund - Class A* and the Russell 1000® Growth Index
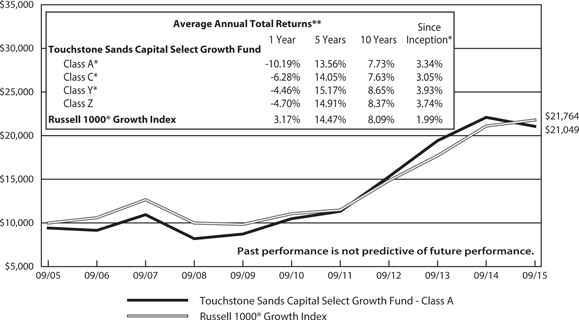
| * | The chart above represents performance of Class A shares only, which will vary from the performance of Class C shares, Class Y shares and Class Z shares based on the differences in sales loads and fees paid by shareholders in the different classes. The inception date of Class A shares, Class C shares, Class Y shares and Class Z shares was November 15, 2010, November 15, 2010, August 27, 2004 and August 11, 2000, respectively. Class A shares, Class C shares and Class Y shares performance was calculated using the historical performance of Class Z shares for the periods prior to November 15, 2010, November 15, 2010 and August 27, 2004, respectively. The returns have been restated for sales loads and fees applicable to Class A, Class C and Class Y shares. The returns of the index listed above are based on the inception date of the Fund. |
| ** | The average annual total returns shown above are adjusted for maximum sales loads and fees, if applicable. The maximum offering price per share of Class A shares is equal to the net asset value (“NAV”) per share plus a sales load equal to 6.10% of the NAV (or 5.75% of the offering price). Class C shares are subject to a contingent deferred sales charge (“CDSC”) of 1.00%. The CDSC will be assessed on an amount equal to the lesser of (1) the NAV at the time of purchase of the shares being redeemed or (2) the NAV of such shares being redeemed, if redeemed within a one-year period from date of purchase. Class Y shares and Class Z shares are not subject to sales charges. |
The performance of the above Fund does not reflect the deduction of taxes that a shareholder would pay on Fund distributions or the redemption of Fund shares.
Note to Chart
Russell 1000® Growth Index measures the performance of those Russell 1000 companies with higher price-to-book ratios and higher forecasted growth values.
The Frank Russell Company (FRC) is the source and owner of the data contained or reflected in this material and all trademarks and copyrights related thereto. The material may contain confidential information and unauthorized use, disclosure, copying, dissemination or redistribution is strictly prohibited. This is a Touchstone Investments presentation of the data, and FRC is not responsible for the formatting or configuration of this material or for any inaccuracy in the presentation thereof.
| 38 |
Management's Discussion of Fund Performance (Unaudited)
Touchstone Small Cap Core Fund
Sub-Advised by The London Company
Investment Philosophy
The Touchstone Small Cap Core Fund seeks capital appreciation by investing primarily in common stocks of U.S. companies with small market capitalizations. The Fund utilizes a bottom-up security selection process that screens potential investments against a proprietary quantitative model for return on capital, earnings-to-enterprise value ratio, and free cash flow yield. The goal is to purchase financially stable companies that are believed to consistently generate high returns on unleveraged operating capital, are run by shareholder-oriented management and are trading at a discount to their respective private market values.
Fund Performance
The Touchstone Small Cap Core Fund (Class A Shares) underperformed its benchmark, the Russell 2000® Index, for the 12-month period ended September 30, 2015. The Fund’s total return was -6.36 percent (excluding the maximum sales charge) while the benchmark’s total return was 1.25 percent.
Market Environment
For the one-year period, U.S. equities faced increased volatility and the long-awaited correction in the bull market finally arrived. At the center of the correction, all asset classes moved lower, as small-, mid- and large-cap stocks declined during the narrow window. Market volatility increased due to investors’ growing concerns about the potential for higher interest rates in the U.S., the rapid change in the price of oil and other commodities, and slowing economic growth in China. Despite weaker investor sentiment, however, U.S. economic readings continued to reflect moderate but steady growth with low inflation.
The resiliency of growth and momentum stocks during the correction was in contrast to previous environments. During the period, small-cap stocks outperformed large-cap stocks, growth stocks outperformed value stocks, and defensive stocks outperformed cyclical stocks — all of which impacted relative market performance. However, the two biggest factors that impacted performance were quality and beta1. High quality stocks, which Standard & Poor’s defines as those with stability of earnings, outperformed low quality stocks, while low beta1 stocks outperformed high beta1 stocks. Within the benchmark, the Health Care, Utilities and Information Technology sectors led relative performance during the period. The Financials, Consumer Discretionary and Consumer Staples sectors also provided a boost to performance, while the Energy sector significantly detracted.
Portfolio Review
Within the Fund, sector allocation detracted from relative performance, and stock selection was slightly negative. Within the Health Care sector, the Fund’s underweight position and stock selection were the greatest detractors during the period. Sector allocation to the Materials sector was also a negative factor, while stock selection within the Industrials sector contributed to Fund performance.
Among the individual stocks that contributed to Fund performance were Service Corporation International, Tempur Sealy International Inc. (both from the Consumer Discretionary sector), Orbital ATK Inc. and Matson Inc. (both from the Industrials sector). Service Corporation International, a provider of funeral goods and services as well as cemetery property and services, outperformed as a result of the company’s consistent gains in revenues and earnings. The company’s pre-need sales also performed well due in part to a new relationship management platform. Further, the company continued to buy back its shares, which also benefited the stock. Bedding provider Tempur Sealy International was boosted by solid quarterly results, increased guidance from management and positive management changes. The company’s strong product offering and successful advertising helped sales and earnings exceed expectations in the most recent quarter and encouraged management to raise
| 39 |
Management's Discussion of Fund Performance (Unaudited) (Continued)
their financial goals for the rest of 2015. The company also appointed a new CFO and new CEO, both of whom were well received by investors. Orbital ATK, an aerospace manufacturer and defense company, performed well all year, particularly since the merger of Orbital Sciences and ATK that was completed in February 2015. Further, business results slightly exceeded expectations and cash-flow generation supported a favorable capital allocation program. Matson, a carrier of containerized cargo and automobiles, rallied after the company announced plans to acquire the Alaskan business of Horizon Lines Inc. This acquisition is expected to expand Matson into another market protected by the Jones Act which regulates maritime commerce in U.S. waters and between U.S. ports.
Among the stocks that detracted from performance were Atwood Oceanics Inc. (Energy sector), MRC Global Inc. (Industrials sector), Olin Corp. (Materials sector), Deckers Outdoor Corp. (Consumer Discretionary sector) and Tenet Healthcare Corp. (Health Care sector). Atwood Oceanics (an offshore drilling company) and MRC Global (a distributor of products to the Energy sector) both moved sharply lower due to the decline in energy prices, along with most of the Energy sector. Weakening demand and the associated reductions in capital spending also negatively impacted both companies. Additionally, weak demand caused Atwood Oceanic’s rig rental rates to decline and capacity utilization to run below long-term averages. Olin is a manufacturer of ammunition, chlorine and sodium hydroxide. Olin’s stock declined due to the company’s reduced earnings guidance and an expected recovery in demand for chlorine and caustic soda that had not yet materialized. However, we believe Olin’s acquisition of The Dow Chemical Co.’s chlor-alkali products offers significant opportunity for the company going forward. Deckers Outdoor, a footwear, apparel and accessories company, experienced profit taking during 2015, which followed the company’s strong rise in 2014. While the company’s quarterly earnings updates and management guidance confirmed its operating outlook, recent results showed a decline in the company’s core UGG® brand, which renewed questions about the durability of that product line. Tenet Healthcare, a healthcare services company, declined due to the additional expense from recent acquisitions and management maintaining its full-year outlook. However, longer term, we believe the company should benefit from additional bed capacity as implementation of the Affordable Care Act continues.
The Fund initiated new positions in Waddell & Reed Financial Inc. (Financials sector), DST Systems Inc. (Information Technology sector), Energizer Holdings Inc. (Consumer Staples sector), GATX Corp. and Landstar System Inc. (both from the Industrials sector). Waddell & Reed Financial is an asset management company with products across multiple strategies (equity, fixed income and global asset allocation). The company’s recent weakness in its two flagship strategies offered a compelling entry point for the stock. Further, because of the company’s strong culture and attractive margins, we feel the overreaction in the share price could offer significant upside. DST Systems operates an attractive business, with high return on capital, limited capital spending needs and high barriers to entry. Approximately 60 percent of the company’s profits come from the financial services segment, which includes mutual fund recordkeeping systems and processing solutions. Approximately 40 percent of the company’s profits include health care solutions (claims adjudication and benefit management) and customer communications (fund statements, health benefit statements and utility bills). Favorably, the vast majority of the company’s revenue is recurring business, as customers typically sign one- to three-year contracts. Energizer Holdings is a consumer goods company built on the Energizer and Eveready brands. We believe the company likely has more value than is reflected on its balance sheet. Further, management’s strategy of growing sales through new product introductions, reducing costs and optimizing spending per distribution channel is expected to benefit the stock. GATX, an independent railcar leasing company, has an impressively large fleet with a high-quality, extensive customer network and long-term fixed contracts that allow the company to generate recurring revenue with low operating margins. Landstar System is an asset-light provider of integrated transportation management solutions and has lower operating leverage than asset-based trucking companies. Landstar System also has large barriers to entry because of its vast network of shippers and truck capacity.
| 40 |
Management's Discussion of Fund Performance (Unaudited) (Continued)
The Fund sold its positions in Columbia Sportswear Co. (Consumer Discretionary sector), Alliance Data Systems Corp. (Information Technology sector), Albemarle Corp. (Materials sector), Old Dominion Freight Lines (Industrials sector), Harris Corp. (Information Technology sector), Endurance Specialty Holdings Ltd. (Financials sector) and Ritchie Bros. Auctioneers Inc. (Industrials sector). We trimmed the Fund’s positions in Service Corporation International (Consumer Discretionary sector) and MRC Global Inc. (Industrials sector).
Outlook
While we do not attempt to forecast the future, we believe many of the headlines in today’s news will likely remain intact though year end. In particular, we expect global uncertainty and weakness in commodities, particularly in China, to remain large macro risks. The anticipation of an interest rate increase by the U.S. Federal Reserve Board and strength in the U.S. dollar could also shake up domestic equities further. In general, we expect the foreign slowdown to continue and believe stocks could be more volatile in the future.
While recent volatility has resulted in significant market declines, stocks are considered less expensive but not necessarily cheap. However, we are still finding high-conviction investment ideas, and the recent correction has increased the number of available opportunities. In addition, the strength of corporate balance sheets, high cash levels, below-average dividend payout ratios and low interest rates continued to provide flexibility for corporate management teams in terms of capital allocation and mergers and acquisitions (M&A) activity. In addition, the dispersion among the asset classes and sectors has been a welcome change from the past few years, and we believe it should benefit the Fund’s stock selection going forward.
Our strategy focuses on stocks from a bottom-up standpoint. We seek companies with strong returns on capital and the flexibility to enhance shareholder value using the balance sheet. Low interest rates and relatively high equity risk premiums enable companies to increase shareholder value by adjusting the capital structure of the company. Separately, with elevated cash levels on corporate balance sheets and dividend payout ratios near historic lows, we expect investors to reward companies that wisely deploy capital including higher dividends, share repurchases and M&A transactions. Going forward, we believe the Fund is positioned well for a slow growth environment that rewards strong capital allocation.
| 1 | Beta is a measure of the volatility of a portfolio relative to its benchmark. |
Dividend paying investments may not experience the same price appreciation as non-dividend paying instruments, dividend-issuing companies may choose not to pay a dividend, or the dividend may be less than what is anticipated.
| 41 |
Management's Discussion of Fund Performance (Unaudited) (Continued)
Comparison of the Change in Value of a $10,000 Investment in the
Touchstone Small Cap Core Fund - Class A* and the
Russell 2000® Index
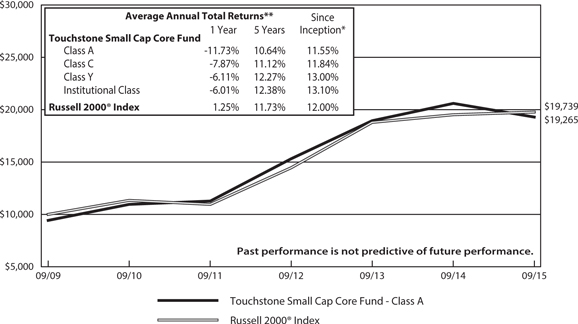
| * | The chart above represents performance of Class A shares only, which will vary from the performance of Class C shares, Class Y shares and Institutional Class shares based on the differences in sales loads and fees paid by shareholders in the different classes. The inception date of the Fund was September 30, 2009. The returns of the index listed above are based on the inception date of the Fund. |
| ** | The average annual total returns shown above are adjusted for maximum sales loads and fees, if applicable. The maximum offering price per share of Class A shares is equal to the net assets value (“NAV”) per share plus a sales load equal to 6.10% of the NAV (or 5.75% of the offering price). Class C shares of the Funds are subject to a contingent deferred sales charge (“CDSC”) of 1.00%. The CDSC will be assessed on an amount equal to the lesser of (1) the NAV at the time of purchase of the shares being redeemed or (2) the NAV of such shares being redeemed, if redeemed within a one-year period from the date of purchase. Class Y shares and Institutional Class shares are not subject to sales charges. |
The performance of the above Fund does not reflect the deduction of taxes that a shareholder would pay on Fund distributions or the redemption of Fund shares.
Note to Chart
Russell 2000® Index measures the performance of the small-cap segment of the U.S. equity universe.
The Frank Russell Company (FRC) is the source and owner of the data contained or reflected in this material and all trademarks and copyrights related thereto. The material may contain confidential information and unauthorized use, disclosure, copying, dissemination or redistribution is strictly prohibited. This is a Touchstone Investments presentation of the data, and FRC is not responsible for the formatting or configuration of this material or for any inaccuracy in the presentation thereof.
| 42 |
Management's Discussion of Fund Performance (Unaudited)
Touchstone Small Cap Value Fund
Sub-Advised by DePrince, Race & Zollo, Inc.
Investment Philosophy
The Touchstone Small Cap Value Fund seeks long-term capital growth by investing primarily in common stocks of small-cap companies that appear to be trading below their intrinsic value and have the potential for growth. The Fund utilizes a bottom-up security selection process that consists of three factors: dividend yield, low valuation, and a fundamental catalyst.
Fund Performance
The Touchstone Small Cap Value Fund (Class A Shares) underperformed its benchmark, the Russell 2000® Value Index, for the 12-month period ended September 30, 2015. The Fund’s total return was -8.32 percent (excluding the maximum sales charge) while the benchmark’s total return was -1.60 percent.
Market Environment
After three consecutive years of positive returns, U.S. small-cap equities retreated by the end of 2014. Despite a dramatic increase in volatility and a sell-off in the Health Care sector during the fourth quarter of 2014, defensive sectors continued to drive the benchmark. Biotechnology stocks, in particular, were among the most volatile. Persistently low oil prices led to a significant decline in the Energy sector, and relative valuations reached historic levels. Stocks within the Materials sector were also negatively impacted as weak global commodity prices, a strong U.S. dollar and fears of an economic slowdown in China weighed on the sector. The Fund’s overweight to the Energy, Materials and Industrials sectors detracted from performance for the 12-month period, as attractively valued cyclical stocks underperformed relative to more expensive defensive stocks.
Portfolio Review
While Fund performance benefited from stock picking across multiple sectors, the greatest contribution came from selections within the Financials sector. Solid fundamentals and increased mergers and acquisitions (M&A) activity provided a beneficial backdrop for the Fund’s asset-sensitive small/regional banks. In particular, Susquehanna Bancshares Inc., a regional financial services company, accepted a takeover offer by BB&T Corp. during the period, which sent the stock meaningfully higher. With loan growth continuing to improve, the Fund favored high-quality banks and thrifts with strong fundamentals. While the Fund’s stock selection in real estate investment trusts (REITs) was positive, an underweight position to that industry detracted from performance as REITs generally outperformed. Mortgage-servicing REIT New Residential Investment Corp. outperformed after the company completed its merger with Home Loan Servicing Solutions Ltd. Going forward, we believe this transaction should improve the company’s long-term growth opportunities and lead to a higher dividend.
Within the Consumer Staples sector, stock selection and an overweight position to the sector contributed to performance. Dean Foods Co. and Universal Corp. were both top performers within the Fund. Dean Foods, a food and beverage company, realized higher profits from lower milk prices and better volumes at the retail level. Universal, a leaf tobacco merchant and processor, reported strong results that were driven by higher margins from lower tobacco leaf costs and market share gains.
Positive stock selection within the Industrials sector also contributed to the Fund’s relative returns, despite the sector’s poor performance within the benchmark. In particular, the Fund favored construction and engineering companies that benefited from increased infrastructure spending and robust construction activity within the U.S. XPO Logistics Inc.’s acquisition of Fund holding Con-way Inc. validated our investment thesis that the freight transportation and logistics company was substantially undervalued. Con-way’s stock moved significantly higher following the acquisition announcement, benefiting the Fund’s relative performance.
| 43 |
Management's Discussion of Fund Performance (Unaudited) (Continued)
An overweight position in the battered Energy sector was the largest headwind to Fund performance, as oil prices plummeted during the period leading to a sharp sell-off in Energy stocks. CARBO Ceramics Inc. was negatively impacted by the downturn in oil. Lower crude prices reduced rig count and drilling activity, and as a result, lowered demand for the company’s products, which are used in the fracking process. However, the company continued to gain market share and develop newer, more efficient products during the period. We maintain our positive outlook on the company and its fundamental catalysts. With the company trading near historic relative valuation lows, we added to the position. The volatility in oil prices provided the opportunity to add to several other Fund positions at attractive relative valuations, including Patterson-UTI Energy Inc. (a provider of onshore contract drilling services) and Superior Energy Services Inc. (a provider of oilfield services and equipment). Looking ahead, we remain constructive on the sector as we expect a more favorable supply and demand dynamic in the crude oil market. This view was reinforced by the aggressive supply response, which included a material reduction in drilling activity and the early stages of industry consolidation.
Stock selection and an overweight position in the Materials sector were significant detractors to Fund performance during the period. Driven in part by a strong U.S. dollar and concerns over weakening economic growth in China, commodity prices weakened, weighing on the sector. Several of the Fund’s Materials stocks, including TimkenSteel Corp., manufacture products that are used in oil and gas drilling. As a result, these companies were also negatively impacted by weakness in the energy market. Management teams from both companies reduced costs and improved efficiencies during the period, which we expect to ultimately lead to margin improvement in a normalized pricing environment. Axiall Corp., a specialty chemicals and building products company, underperformed amid reports of weakening end markets. However, we believe the company may be revalued higher on cost reductions, divestment of lower margin businesses and management changes.
Stock selection within the Information Technology sector also detracted from relative performance. For example, ADTRAN Inc., a manufacturer of datacom and telecom products, traded lower on the loss of a potential contract and the Fund took advantage of the sell-off to increase its position. During the period, ADTRAN reported several growth opportunities with other large clients. The company’s balance sheet also has $5 per share in net cash that could be used to boost shareholder value.
Overall, macro headwinds led to increased volatility in the market during the period, which we viewed as an opportunity for bottom-up stock selection. The Fund slightly increased its cyclical positioning throughout the year. While we executed our discipline and took profits in several defensive stocks that outperformed, we replaced them with more cyclical companies, specifically within the Energy and Materials sectors. We also identified attractive opportunities within the Industrials sector along with banks and thrifts, and maintained little exposure to defensive sectors such as Health Care and Utilities, which we believe are overvalued.
Outlook
We continue to have a favorable outlook on high quality energy equipment and service companies that have solid management teams, company-specific catalysts and strong balance sheets. We believe we are approaching an inflection point in the Energy sector, which could lead to significantly higher energy prices and valuations for energy-related assets. While we view the current oil price environment as unsustainable, persistently low energy prices could hurt the Fund’s overweight position in the Energy sector, hindering relative performance. Additionally, a continued decline in interest rates could sustain speculation in low-quality companies and the extreme valuations that we see in Health Care and Utilities. Our investment philosophy has led us to avoid these types of stocks.
Instead, we believe there is significant value in the Fund that is not being recognized by the market due to the intense focus on global macro developments rather than corporate fundamentals and valuations. In our view, current income from dividends and low relative valuations in cyclical sectors should become more attractive
| 44 |
Management's Discussion of Fund Performance (Unaudited) (Continued)
as Energy prices recover and markets broaden. As always, we remain steadfast in executing our discipline and believe the Fund is positioned to benefit from the shift away from speculative stocks. Accordingly, we favor undervalued cyclical stocks with overweight positions in asset-sensitive banks, as well as the Energy, Materials and Industrials sectors. The Fund’s exposure to overvalued defensive sectors such as Utilities and Health Care is minimal.
Dividend paying investments may not experience the same price appreciation as non-dividend paying instruments, dividend-issuing companies may choose not to pay a dividend, or the dividend may be less than what is anticipated.
| 45 |
Management's Discussion of Fund Performance (Unaudited) (Continued)
Comparison of the Change in Value of a $10,000 Investment in the
Touchstone Small Cap Value Fund - Class A* and the
Russell 2000® Value Index
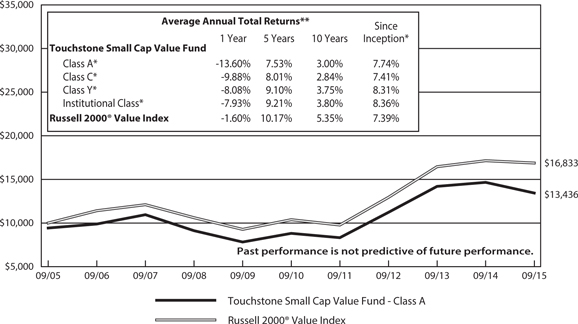
| * | The chart above represents performance of Class A shares only, which will vary from the performance of Class C shares, Class Y shares and Institutional Class shares based on the differences in sales loads and fees paid by shareholders in the different classes. The inception date of Class A shares, Class C shares, Class Y shares, Class Z shares and Institutional Class shares was March 1, 2011, March 1, 2011, March 1, 2011, March 4, 2002 and March 1, 2011, respectively. On June 10, 2011, Class Z shares were converted to Class A shares. Class A shares, Class C shares, Class Y shares and Institutional Class shares performance was calculated using the historical performance of Class Z shares for the periods prior to March 1, 2011. The returns have been restated for sales loads and fees applicable to Class A, Class C, Class Y and Institutional Class shares. The returns of the index listed above are based on the inception date of the Fund. |
| ** | The average annual total returns shown above are adjusted for maximum sales loads and fees, if applicable. The maximum offering price per share of Class A shares is equal to the net assets value (“NAV”) per share plus a sales load equal to 6.10% of the NAV (or 5.75% of the offering price). Class C shares of the Funds are subject to a contingent deferred sales charge (“CDSC”) of 1.00%. The CDSC will be assessed on an amount equal to the lesser of (1) the NAV at the time of purchase of the shares being redeemed or (2) the NAV of such shares being redeemed, if redeemed within a one-year period from the date of purchase. Class Y shares and Institutional Class shares are not subject to sales charges. |
The performance of the above Fund does not reflect the deduction of taxes that a shareholder would pay on Fund distributions or the redemption of Fund shares.
Note to Chart
Russell 2000® Value Index measures the performance of those Russell 2000 companies with lower price-to-book ratios and lower forecasted growth values.
The Frank Russell Company (FRC) is the source and owner of the data contained or reflected in this material and all trademarks and copyrights related thereto. The material may contain confidential information and unauthorized use, disclosure, copying, dissemination or redistribution is strictly prohibited. This is a Touchstone Investments presentation of the data, and FRC is not responsible for the formatting or configuration of this material or for any inaccuracy in the presentation thereof.
| 46 |
Management's Discussion of Fund Performance (Unaudited)
Touchstone Total Return Bond Fund
Sub-Advised by EARNEST Partners LLC
Investment Philosophy
The Touchstone Total Return Bond Fund seeks current income. Capital appreciation is a secondary goal. The Fund invests primarily in fixed income securities or sectors that are considered undervalued for their risk characteristics.
Fund Performance
The Touchstone Total Return Bond Fund (Class A Shares) underperformed its benchmark, the Barclays U.S. Aggregate Bond Index, for the 12-month period ended September 30, 2015. The Fund’s total return was 2.24 percent (excluding the maximum sales charge) while the benchmark’s total return was 2.94 percent.
Market Environment
During the last 12 months, a confluence of macroeconomic events and data points contributed to investors’ flight to quality and placed downward pressure on U.S. interest rates. Global events have created a host of concerns for international investors. Lower commodity prices, geo-political tensions in Ukraine, the debt crisis in Greece and concerns about China’s economic growth reverberated across the financial markets.
Within the U.S., the official unemployment figures signaled an improving labor market and a solid economy, while the underlying data told a conflicting story. Other U.S. economic data points remained mixed, which left investors uncertain as to where the country stands in its economic cycle. With the intersection of these events, the low volatility environment seen in the recent past was disturbed, and market volatility rose to levels not seen in several years. Against this backdrop and with persistent low inflation, the U.S. Federal Reserve Board (Fed) maintained its zero interest rate policy.
With investors’ risk-off sentiment and falling interest rates, most fixed income asset classes struggled to match the performance of U.S. Treasuries. As such, the Barclays U.S. Aggregate Bond Index underperformed similar duration U.S. Treasuries during the period. However, performance among non-U.S. Treasuries varied, largely demonstrating investor preference for higher quality bonds. U.S. Corporate Bonds was the weakest performing sector during the year, negatively impacted by the combination of global growth concerns and an increased amount of new issuance. Much of this new issuance was used for shareholder-friendly purposes such as dividends and stock repurchases, and thus, increased leverage in the system. The Energy and Materials sectors were especially hard hit due to the steep decline in commodity prices. Mortgage-Backed Securities (MBS) also underperformed in the face of several headwinds including heightened refinance concerns due to falling and volatile interest rates.
Despite the underperformance from U.S. Corporate Bonds and MBS, the majority of other sectors provided excess returns, which helped buoy the benchmark’s performance. Asset-Backed Securities (ABS) was among the strongest performing sectors due to the bonds’ short duration, high quality and additional yield. Commercial Mortgage-Backed Securities (CMBS) benefited from increased commercial property values and the additional credit enhancement built into the structure of the loans. Agency Multi-Family MBS outperformed as their high-quality, additional structure and additional yield were in demand by investors during the period. Similarly, the high quality of U.S. Agencies was advantageous during the market’s flight to quality.
Portfolio Review
The economic slowdown and mixed data points hindered Fund performance, which created significant demand for U.S. Treasuries at the expense of other asset classes. Given the Fund’s positioning during the year, events in both the commercial and residential real estate markets benefited the Fund’s performance. After accounting
| 47 |
Management's Discussion of Fund Performance (Unaudited) (Continued)
for differences in duration, the majority of the Fund’s sector allocations added to Fund performance. Overweight positions to CMBS, Agency Multi-Family MBS, ABS and U.S. Agencies were all tailwinds to performance. An underweight position to Single-Family MBS also benefited the Fund. Conversely, an overweight to Single-Family Government National Mortgage Association (GNMA) MBS hurt performance as changes to mortgage insurance premium requirements provided GNMA borrowers with an additional incentive to refinance. Within U.S. Corporate Bonds, the Fund’s minimal exposure to High Yield securities slightly hurt relative performance as those securities underperformed Investment Grade securities during the period.
The Fund does not make active interest rate bets. Its duration was approximately matched to that of the benchmark at year-end.
Outlook
We believe the improving U.S. housing data may be a preamble for additional new issuance from the MBS sector, which has recently regained footing and begun to run at higher levels. With this increased new issuance, demand may falter, and the Fund’s underweight allocation to this sector could benefit. Meanwhile, the increased attention on underwriting quality within the CMBS market could benefit the Fund’s legacy CMBS and Agency Multi-Family MBS as investors seek higher credit quality exposure to commercial real estate.
Though a government shutdown was avoided during the year, negotiations about the debt ceiling are expected to take place later this year. We believe that expectations for new Treasury issuance may be negatively impacted if investors perceive that a compromise will not be reached. With supply limited, demand for Treasuries could increase, which could lead to strong performance from that asset class. It is anticipated that third-quarter corporate earnings data will be a disappointment to investors and gross domestic product (GDP) growth will slow dramatically from the levels seen in the second quarter. Should these events come to fruition, investors may need to deal with renewed pessimism about domestic growth. Adding domestic worries to current concerns about global growth could amplify fears about credit quality and place additional pressure on U.S. Corporate Bonds. Finally, the strong U.S. dollar coupled with falling global growth could be a strain on U.S. exports. This would act as yet another downward force on U.S. Corporate Bonds.
We have remained focused on investing in bonds based on the individual merits of the issuers. If a flight to quality continues, we expect the Fund to perform well due to the high quality of the bonds owned. If investors demand spread products instead of U.S. Treasuries, the Fund’s underweight to U.S. Treasuries should be beneficial.
As we have experienced for most of the year, uncertainty surrounding the Fed, the economy and global growth has left the investment environment unpredictable on many fronts. In this potentially volatile environment, the Fund’s diversification into spread products that offer a yield advantage should benefit the Fund. This focus on investing in high-quality bonds that we believe will offer additional realizable yield and performance over the investment cycle remains core to our investment discipline.
| 48 |
Management's Discussion of Fund Performance (Unaudited) (Continued)
Comparison of the Change in Value of a $10,000 Investment in the
Touchstone Total Return Bond Fund - Class A* and the
Barclays U.S. Aggregate Bond Index
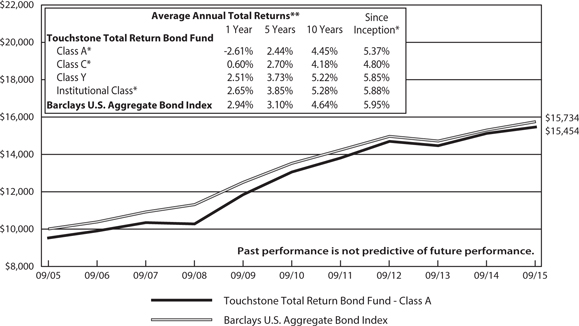
| * | The chart above represents performance of Class A shares only, which will vary from the performance of Class C shares, Class Y shares and Institutional Class shares based on the differences in sales loads and fees paid by shareholders in the different classes. The inception date of Class A shares, Class C shares, Class Y shares and Institutional Class shares was August 16, 2010, August 1, 2011, November 15, 1991 and August 1, 2011, respectively. Class A shares, Class C shares and Institutional Class shares performance was calculated using the historical performance of Class Y shares for the periods prior to August 16, 2010, August 1, 2011 and August 1, 2011, respectively. The returns have been restated for sales loads and fees applicable to Class A, Class C and Institutional Class shares. The returns of the index listed above are based on the inception date of the Fund. |
| ** | The average annual total returns shown above are adjusted for maximum sales loads and fees, if applicable. The maximum offering price per share of Class A shares is equal to the net asset value (“NAV”) per share plus a sales load equal to 4.99% of the NAV (or 4.75% of the offering price). Class C shares are subject to a contingent deferred sales charge (“CDSC”) of 1.00%. The CDSC will be assessed on an amount equal to the lesser of (1) the NAV at the time of purchase of the shares being redeemed or (2) the NAV of such shares being redeemed, if redeemed within a one-year period from date of purchase. Class Y shares and Institutional Class shares are not subject to sales charges. |
The performance of the above Fund does not reflect the deduction of taxes that a shareholder would pay on Fund distributions or the redemption of Fund shares.
Note to Chart
Barclays U.S. Aggregate Bond Index is an unmanaged index comprised of U.S. investment grade, fixed rate bond market securities, including government, government agency, corporate and mortgage-backed securities between one and ten years.
| 49 |
Management's Discussion of Fund Performance (Unaudited)
Touchstone Ultra Short Duration Fixed Income Fund
Sub-Advised by Fort Washington Investment Advisors, Inc.
Investment Philosophy
The Touchstone Ultra Short Duration Fixed Income Fund seeks maximum total return consistent with the preservation of capital by primarily investing in a diversified portfolio of fixed income securities of different maturities, including U.S.Treasury securities, U.S. government agency and U.S. government-sponsored enterprise securities, corporate bonds, mortgage-backed securities, commercial mortgage-backed securities, asset-backed securities, municipal bonds and cash equivalent securities including repurchase agreements and commercial paper. While the Fund may invest in securities of any maturity or duration, interest rate risk is managed by maintaining an effective duration of one year or less under normal market conditions.
Fund Performance
The Touchstone Ultra Short Duration Fixed Income Fund (Class A Shares) outperformed its benchmarks, the BofA Merrill Lynch 3-Month U.S. Treasury Bill Index and the BofA Merrill Lynch 1-Year U.S. Treasury Note Index for the 12-month period ended September 30, 2015. The Fund’s total return was 0.31 percent (excluding the maximum sales charge) while the total returns of its benchmarks were 0.02 percent and 0.25 percent, respectively.
Market Environment
The Fund’s fiscal year was characterized by opposing forces: weakness overseas in China and other emerging markets vs. the relative strength of the U.S. economy and employment growth. The weakness in China and emerging economies affected commodities markets, which declined for the period. For instance, crude oil prices were down 50 percent since mid-2014. These extraneous forces weighed heavily on U.S. markets and challenged the notion that the U.S. Federal Reserve Board’s (Fed) accommodative monetary policy can continue to stimulate job growth and inflation.
While U.S. gross domestic product (GDP) growth has fluctuated from quarter to quarter, the resilience of the labor market and consumer confidence showed greater consistency. Non-farm payrolls, on average, reported solid monthly growth and consumer confidence rebounded to pre-crisis levels.
Despite strong consumer sentiment, market sentiment steadily eroded. Credit spreads widened across multiple sectors and U.S. Treasury bonds rallied – not quite a “flight to quality,” but more of a “migration to quality.” Spreads widened more in the corporate bond sector than in other credit-exposed fixed income sectors, reflecting what we believed to be a developing bifurcation in the bond markets. Securities with greater exposure to the global malaise (e.g., corporate bonds), generally underperformed relative to securities with exposure to U.S. credit fundamentals (e.g., Residential Mortgage-Backed Securities (RMBS), Commercial Mortgage-Backed Securities (CMBS) and Asset-Backed Securities (ABS)). We think domestically-focused securities have the potential to benefit from their closer ties to U.S. consumer and U.S. economic fundamentals, which remain on sound footing.
The U.S. Treasury yield curve flattened, as longer-term bond prices rose during the period. Shorter-term bond yields were generally unchanged to slightly lower. In our view, wider spreads and higher U.S. Treasury yields have made the ultra-short duration landscape more appealing. We believe that a Fed interest rate hike, which seemed inevitable early in the year, now appears to be postponed until 2016, though the possibility of a December 2015 move remains should market conditions improve during the fourth quarter. Uncertainty about the timing of the Fed’s rate hike, the prospects for the global economy and future commodity price movements have resulted in increased interest rate and credit spread volatility.
| 50 |
Management's Discussion of Fund Performance (Unaudited) (Continued)
Portfolio Review
Though the overall yield curve flattened, there were limited changes to the yield curve on securities with maturities of less than two years. As such, the Fund’s duration and curve positioning had a limited impact on returns. Instead, the primary driver of Fund performance was its exposure to credit risk and sector positioning. Spreads widened across all credit-exposed sectors with corporate bonds experiencing the largest moves. Though wider spreads were experienced in RMBS, CMBS, and ABS, they generally outperformed corporate bonds.
Sector allocations saw few meaningful changes during the year. CMBS exposure declined, as bonds with attractive risk-return profiles in this sector were difficult to source. The Fund’s corporate bond position increased slightly as we believed that the wider spreads in this sector presented an opportunity. Cash exposure was also increased and, at the end of the period, is positioned at the high end of the range for the strategy. We believe that these cash levels should allow us to purchase securities at the valuations that the recent market sell-off has created. We have also increased the Fund’s floating rate exposure in an effort to reduce interest rate sensitivity.
Outlook
We believe there are two key questions facing investors: 1) can the U.S. economy overcome weakness in the global economy? and 2) is there reason to worry about inflation? If the answer to either question is yes, the Fed could begin to reverse its accommodative monetary policy with an interest rate hike. Whether the Fed makes its initial move in 2015 or early 2016, we believe that rate increases will be more gradual as compared to prior tightening cycles.
The Fund’s relatively high cash and shorter duration positioning reflects our concern about recent volatility. We think the Fund’s duration positioning should help buffer the effects of a flatter curve and higher rates. We believe that this volatility could continue, or increase, when the Fed finally does begin raising short-term interest rates. In our view, domestic economic fundamentals are still supportive of credit risk, and we believe the economic malaise in Asia and the Emerging Markets will not materially weaken U.S. economic prospects. We think the Fund’s portfolio overweight to non-Treasury securities with targeted exposure to select ABS sectors is positioned properly in this economic environment.
Going forward, we view a rally in short-term rates accompanied by deteriorating market liquidity as a primary risk to the Fund. Many of the securities in the Fund carry significant liquidity premiums that can become volatile in times of poor market liquidity. Ultimately, we believe that taking liquidity risk in securities maturing in less than one year is a better strategy than taking credit risk in a similar duration security. Liquidity risk is transient, especially in short duration securities with significant near-term cash flows, while credit risk can become permanent in the event of a default.
While it is difficult to predict changes in interest rates, the groundwork has been laid by the Fed to end its current monetary policies and begin raising short-term rates. As a result, we expect the front end of the yield curve to rise and experience greater volatility going forward. Ultimately, we believe the Fund’s current positioning and continued emphasis on structured securities make it well placed across a variety of interest rate and credit spread environments.
| 51 |
Management's Discussion of Fund Performance (Unaudited) (Continued)
Comparison of the Change in Value of a $10,000 Investment in the
Touchstone Ultra Short Duration Fixed Income Fund - Class A*,
the BofA Merrill Lynch 3-Month U.S. Treasury Bill Index
and the BofA Merrill Lynch 1-Year U.S. Treasury Note Index
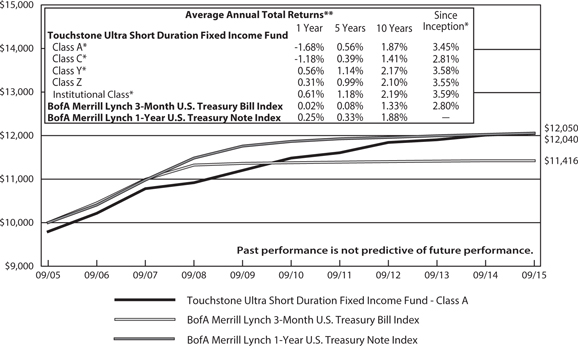
| * | The chart above represents performance of Class A shares only, which will vary from the performance of Class C shares, Class Y shares, Institutional Class shares and Class Z shares based on the differences in sales loads and fees paid by shareholders in the different classes. The inception date of Class A shares, Class C shares, Class Y shares, Class Z shares and Institutional Class shares was April 12, 2012, April 12, 2012, April 12, 2012, March 1, 1994 and April 12, 2012, respectively. Class A shares, Class C shares, Class Y shares and Institutional Class shares performance was calculated using the historical performance of Class Z shares for the periods prior to April 12, 2012. The returns have been restated for sales loads and fees applicable to Class A, Class C, Class Y and Institutional Class shares. The returns of the indexes listed above are based on the inception date of the Fund. |
| ** | The average annual total returns shown above are adjusted for maximum sales loads and fees, if applicable. The maximum offering price per share of Class A shares is equal to the net asset value (“NAV”) per share plus a sales load equal to 2.04% of the NAV (or 2.00% of the offering price). Class C shares are subject to a contingent deferred sales charge (“CDSC”) of 1.00%. The CDSC will be assessed on an amount equal to the lesser of (1) the NAV at the time of purchase of the shares being redeemed or (2) the NAV of such shares being redeemed, if redeemed within a one-year period from date of purchase. Class Y shares, Class Z shares, and Institutional Class shares are not subject to sales charges. |
The performance of the above Fund does not reflect the deduction of taxes that a shareholder would pay on Fund distributions or the redemption of Fund shares.
Note to Chart
BofA Merrill Lynch 3-Month U.S. Treasury Bill Index is an unmanaged index of Treasury securities maturing in 90 days that assumes reinvestment of all income.
BofA Merrill Lynch 1-Year U.S. Treasury Note Index is an unmanaged index comprised of a single issue purchased at the beginning of the month and held for a full month. The issue selected at each month-end rebalancing is the outstanding two-year Treasury Note Bill that matures closest to, but, not beyond one year from the rebalancing date.
| 52 |
Tabular Presentation of Portfolios of Investments (Unaudited)
September 30, 2015
The tables below provide each Fund’s geographic allocation, sector allocation and/or credit quality. We hope it will be useful to shareholders as it summarizes key information about each Fund’s investments.
| Touchstone Arbitrage Fund | ||||
| Sector Allocation* | (% of Net Assets) | |||
| Long Positions | ||||
| Common Stocks | ||||
| Financials | 32.7 | % | ||
| Information Technology | 26.4 | |||
| Health Care | 13.3 | |||
| Materials | 9.3 | |||
| Consumer Discretionary | 7.1 | |||
| Industrials | 4.2 | |||
| Preferred Stock | 1.3 | |||
| Corporate Bonds | 5.1 | |||
| Asset-Backed Security | 0.1 | |||
| Purchased Call Options | 0.0 | |||
| Investment Funds | 5.5 | |||
| Cash Collateral for Securities Sold | 17.9 | |||
| Short | ||||
| Other Assets/Liabilities (Net) | (1.4 | ) | ||
| 121.5 | ||||
| Short Positions | ||||
| Common Stocks | ||||
| Financials | (9.3 | ) | ||
| Information Technology | (9.3 | ) | ||
| Consumer Discretionary | (1.4 | ) | ||
| Exchange Traded Fund | (1.1 | ) | ||
| Written Put Option | (0.4 | ) | ||
| (21.5 | ) | |||
| Total | 100.0 | % | ||
| Touchstone Emerging Markets Equity Fund | ||||
| Geographic Allocation | (% of Net Assets) | |||
| Common Stocks | ||||
| India | 14.5 | % | ||
| South Korea | 11.5 | |||
| Taiwan | 11.1 | |||
| Mexico | 9.6 | |||
| China | 6.9 | |||
| Hong Kong | 6.4 | |||
| Brazil | 4.7 | |||
| Thailand | 4.2 | |||
| South Africa | 4.1 | |||
| Cayman Islands | 3.5 | |||
| Bermuda | 3.2 | |||
| United Kingdom | 2.9 | |||
| Czech Republic | 2.4 | |||
| Indonesia | 2.2 | |||
| Turkey | 1.8 | |||
| Malaysia | 1.6 | |||
| Luxembourg | 1.5 | |||
| United Arab Emirates | 1.4 | |||
| Chile | 1.3 | |||
| United States | 1.2 | |||
| Israel | 1.2 | |||
| Jersey | 0.9 | |||
| Canada | 0.8 | |||
| Investment Funds | 2.1 | |||
| Other Assets/Liabilities (Net) | (1.0 | ) | ||
| Total | 100.0 | % | ||
* Sector Classifications are based upon the Global Industry Classification Standard (GICS®).
| 53 |
Tabular Presentation of Portfolios of Investments (Unaudited) (Continued)
| Touchstone Global Real Estate Fund | ||||
| Geographic Allocation | (% of Net Assets) | |||
| Common Stocks | ||||
| United States | 31.5 | % | ||
| Japan | 8.7 | |||
| Singapore | 8.6 | |||
| Australia | 7.4 | |||
| Canada | 5.3 | |||
| Hong Kong | 5.0 | |||
| United Kingdom | 4.1 | |||
| Germany | 3.0 | |||
| France | 2.2 | |||
| Mexico | 2.2 | |||
| Netherlands | 2.0 | |||
| Finland | 1.8 | |||
| South Africa | 1.2 | |||
| Spain | 1.2 | |||
| Sweden | 1.0 | |||
| New Zealand | 0.9 | |||
| Jersey | 0.7 | |||
| Bermuda | 0.5 | |||
| Preferred Stocks | 5.0 | |||
| Investment Funds | 9.7 | |||
| Other Assets/Liabilities (Net) | (2.0 | ) | ||
| Total | 100.0 | % | ||
| Touchstone Merger Arbitrage Fund | ||||
| Sector Allocation* | (% of Net Assets) | |||
| Long Positions | ||||
| Common Stocks | ||||
| Financials | 25.4 | % | ||
| Information Technology | 21.3 | |||
| Health Care | 8.4 | |||
| Materials | 7.2 | |||
| Consumer Discretionary | 5.3 | |||
| Industrials | 4.0 | |||
| Telecommunication Services | 2.0 | |||
| Preferred Stocks | 2.8 | |||
| Corporate Bonds | 9.9 | |||
| Commercial Mortgage-Backed | 1.3 | |||
| Security | ||||
| Commercial Paper | 1.9 | |||
| Purchased Call Option | 0.0 | |||
| Investment Fund | 24.1 | |||
| Cash Collateral for Securities Sold | 4.9 | |||
| Short and Written Options | ||||
| Other Assets/Liabilities (Net) | (1.6 | ) | ||
| 116.9 | ||||
| Short Positions | ||||
| Common Stocks | ||||
| Financials | (7.5 | ) | ||
| Information Technology | (6.8 | ) | ||
| Consumer Discretionary | (0.9 | ) | ||
| Exchange Traded Fund | (1.3 | ) | ||
| Written Put Options | (0.4 | ) | ||
| (16.9 | ) | |||
| Total | 100.0 | % | ||
* Sector Classifications are based upon the Global Industry Classification Standard (GICS®).
| 54 |
Tabular Presentation of Portfolios of Investments (Unaudited) (Continued)
| Touchstone Mid Cap Fund | ||||
| Sector Allocation* | (% of Net Assets) | |||
| Consumer Discretionary | 32.5 | % | ||
| Information Technology | 14.5 | |||
| Financials | 13.7 | |||
| Industrials | 13.3 | |||
| Materials | 12.7 | |||
| Consumer Staples | 9.3 | |||
| Health Care | 2.7 | |||
| Investment Fund | 1.0 | |||
| Other Assets/Liabilities (Net) | 0.3 | |||
| Total | 100.0 | % | ||
| Touchstone Mid Cap Value Fund | ||||
| Sector Allocation* | (% of Net Assets) | |||
| Financials | 27.1 | % | ||
| Information Technology | 14.3 | |||
| Industrials | 12.3 | |||
| Consumer Staples | 10.7 | |||
| Consumer Discretionary | 9.6 | |||
| Utilities | 9.1 | |||
| Health Care | 7.6 | |||
| Materials | 5.0 | |||
| Energy | 4.2 | |||
| Investment Funds | 2.8 | |||
| Other Assets/Liabilities (Net) | (2.7 | ) | ||
| Total | 100.0 | % | ||
| Touchstone Premium Yield Equity Fund | ||||
| Sector Allocation* | (% of Net Assets) | |||
| Financials | 24.6 | % | ||
| Energy | 17.3 | |||
| Health Care | 16.1 | |||
| Information Technology | 14.1 | |||
| Industrials | 6.1 | |||
| Telecommunication Services | 5.8 | |||
| Materials | 5.0 | |||
| Utilities | 4.1 | |||
| Consumer Discretionary | 4.0 | |||
| Consumer Staples | 3.3 | |||
| Investment Fund | 1.3 | |||
| Other Assets/Liabilities (Net) | (1.7 | ) | ||
| Total | 100.0 | % | ||
| Touchstone Sands Capital Select Growth Fund | ||||
| Sector Allocation* | (% of Net Assets) | |||
| Information Technology | 44.2 | % | ||
| Health Care | 25.5 | |||
| Consumer Discretionary | 16.5 | |||
| Energy | 4.5 | |||
| Financials | 3.2 | |||
| Materials | 3.1 | |||
| Consumer Staples | 2.1 | |||
| Investment Funds | 9.2 | |||
| Other Assets/Liabilities (Net) | (8.3 | ) | ||
| Total | 100.0 | % | ||
* Sector Classifications are based upon the Global Industry Classification Standard (GICS®).
| 55 |
Tabular Presentation of Portfolios of Investments (Unaudited) (Continued)
| Touchstone Small Cap Core Fund | ||||
| Sector Allocation* | (% of Net Assets) | |||
| Consumer Discretionary | 27.1 | % | ||
| Financials | 21.3 | |||
| Industrials | 21.3 | |||
| Materials | 9.6 | |||
| Consumer Staples | 7.3 | |||
| Energy | 5.2 | |||
| Information Technology | 3.7 | |||
| Health Care | 3.6 | |||
| Investment Funds | 5.7 | |||
| Other Assets/Liabilities (Net) | (4.8 | ) | ||
| Total | 100.0 | % | ||
| Touchstone Small Cap Value Fund | ||||
| Sector Allocation* | (% of Net Assets) | |||
| Financials | 37.3 | % | ||
| Industrials | 20.0 | |||
| Materials | 12.2 | |||
| Energy | 11.2 | |||
| Consumer Discretionary | 8.0 | |||
| Information Technology | 7.6 | |||
| Consumer Staples | 1.9 | |||
| Health Care | 0.2 | |||
| Investment Funds | 11.1 | |||
| Other Assets/Liabilities (Net) | (9.5 | ) | ||
| Total | 100.0 | % | ||
| Touchstone Total Return Bond Fund | ||||
| Credit Quality** | (% of Investment Securities) | |||
| AAA/Aaa | 58.7 | % | ||
| AA/Aa | 7.3 | |||
| A/A | 9.6 | |||
| BBB/Baa | 16.6 | |||
| BB/Ba | 2.9 | |||
| B/B | 0.2 | |||
| Not Rated | 4.7 | |||
| Total | 100.0 | % | ||
| Touchstone Ultra Short Duration Fixed Income Fund | ||||
| Credit Quality** | (% of Investment Securities) | |||
| AAA/Aaa | 31.8 | % | ||
| AA/Aa | 11.4 | |||
| A/A | 20.1 | |||
| BBB/Baa | 17.2 | |||
| CCC | 0.2 | |||
| Not Rated | 19.3 | |||
| Total | 100.0 | % | ||
* Sector Classifications are based upon the Global Industry Classification Standard (GICS®).
** Credit quality ratings are from Standard & Poor's (“S&P”) and Moody's Investors Service (“Moody's”). If agency ratings differ, the higher rating will be used. Where no rating has been assigned, it may be for reasons unrelated to the creditworthiness of the issuer.
| 56 |
Touchstone Arbitrage Fund – September 30, 2015
| Market | ||||||||
| Shares | Value | |||||||
| Common Stocks — 93.0% | ||||||||
| Financials — 32.7% | ||||||||
| Chambers Street Properties REIT | 56,730 | $ | 368,178 | |||||
| Chubb Corp. (The) | 31,930 | 3,916,214 | ||||||
| City National Corp.†† | 72,060 | 6,345,604 | ||||||
| HCC Insurance Holdings, Inc.†† | 80,825 | 6,261,513 | ||||||
| Home Properties, Inc. REIT | 26,820 | 2,004,795 | ||||||
| Hudson City Bancorp, Inc.†† | 622,800 | 6,333,876 | ||||||
| National Interstate Corp.†† | 88,866 | 2,370,945 | ||||||
| NorthStar Realty Finance Corp. REIT | 153,120 | 1,891,032 | ||||||
| PartnerRe Ltd. (Bermuda) | 14,900 | 2,069,312 | ||||||
| StanCorp Financial Group, Inc. | 47,860 | 5,465,612 | ||||||
| Symetra Financial Corp. | 126,429 | 4,000,214 | ||||||
| 41,027,295 | ||||||||
| Information Technology — 26.4% | ||||||||
| Alcatel-Lucent ADR* | 1,544,487 | 5,637,378 | ||||||
| Altera Corp.†† | 96,460 | 4,830,717 | ||||||
| Broadcom Corp. - Class A†† | 84,910 | 4,366,921 | ||||||
| Dealertrack Technologies, Inc.* | 89,200 | 5,633,872 | ||||||
| Dot Hill Systems Corp.* | 425,715 | 4,142,207 | ||||||
| Freescale Semiconductor Ltd. (Bermuda)*†† | 115,860 | 4,238,159 | ||||||
| Xoom Corp.* | 174,030 | 4,329,866 | ||||||
| 33,179,120 | ||||||||
| Health Care — 13.3% | ||||||||
| IPC Healthcare, Inc.* | 48,960 | 3,803,702 | ||||||
| KYTHERA Biopharmaceuticals, Inc.* | 73,871 | 5,538,848 | ||||||
| Merge Healthcare, Inc.* | 369,250 | 2,621,675 | ||||||
| Thoratec Corp.* | 74,640 | 4,721,726 | ||||||
| 16,685,951 | ||||||||
| Materials — 9.3% | ||||||||
| Cytec Industries, Inc. | 53,215 | 3,929,928 | ||||||
| OM Group, Inc. | 59,600 | 1,960,244 | ||||||
| Sigma-Aldrich Corp. | 42,025 | 5,838,113 | ||||||
| 11,728,285 | ||||||||
| Consumer Discretionary — 7.1% | ||||||||
| Fiat Chrysler Automobiles N.V. (Netherlands)*† | 91,976 | 1,215,003 | ||||||
| Remy International, Inc. | 134,260 | 3,927,105 | ||||||
| Zulily, Inc., Class A* | 219,750 | 3,823,650 | ||||||
| 8,965,758 | ||||||||
| Industrials — 4.2% | ||||||||
| Precision Castparts Corp. | 22,700 | 5,214,417 | ||||||
| Total Common Stocks | $ | 116,800,826 | ||||||
| Principal | ||||||||||||
| Corporate Bonds — 5.1% | ||||||||||||
| Energy — 1.9% | ||||||||||||
| $ | 2,500,000 | Whiting Canadian Holdings Co., | ||||||||||
| 8.125%, 12/1/19 | 2,412,500 | |||||||||||
| Consumer Discretionary — 1.3% | ||||||||||||
| 1,500,000 | Time Warner Cable, Inc., | |||||||||||
| 5.850%, 5/1/17 | 1,587,514 | |||||||||||
| Financials — 1.2% | ||||||||||||
| 1,620,000 | PNC Preferred Funding Trust II, 144a, | |||||||||||
| 1.560%, 3/29/49(A) | 1,496,475 | |||||||||||
| Utilities — 0.7% | ||||||||||||
| 975,000 | AES Corp. VA, 3.324%, 6/1/19(A) | 926,250 | ||||||||||
| Total Corporate Bonds | $ | 6,422,739 | ||||||||||
| Shares | ||||||||
| Preferred Stock — 1.3% | ||||||||
| Financials — 1.3% | ||||||||
| GMAC Capital Trust I, 8.13%(A) | 64,027 | $ | 1,634,609 | |||||
| Principal | ||||||||||||
| Amount | ||||||||||||
| Asset-Backed Security — 0.1% | ||||||||||||
| $ | 77,396 | Taxable Newman Capital Trust, Ser | ||||||||||
| 2000-1, Class A, 144a, | ||||||||||||
| 7.000%, 7/5/17 | 78,363 | |||||||||||
| Number | ||||||||
| of | ||||||||
| Contracts | ||||||||
| Purchased Call Option — 0.0% | ||||||||
| Baxalta, Inc., Strike @ 40.00 Exp 02/16†† | 840 | 58,800 | ||||||
| Total Purchased Option | 58,800 | |||||||
| Investment Funds — 5.5% | ||||||||
| Dreyfus Cash Management, Institutional Shares, 0.06%∞Ω | 5,728,262 | 5,728,262 | ||||||
| Invesco Government & Agency Portfolio, Institutional Class, 0.04%**∞Ω | 1,137,500 | 1,137,500 | ||||||
| Total Investment Funds | $ | 6,865,762 | ||||||
| Total Long Positions | ||||||||
| (Cost $134,043,404) | $ | 131,861,099 | ||||||
| 57 |
Touchstone Arbitrage Fund (Continued)
| Market | ||||||||
| Shares | Value | |||||||
| Securities Sold Short —(21.1%) | ||||||||
| Common Stocks — (20.0%) | ||||||||
| Financials — (9.3%) | ||||||||
| ACE Ltd. (Switzerland) | (19,218 | ) | $ | (1,987,141 | ) | |||
| Gramercy Property Trust, Inc., REIT | (17,784 | ) | (369,374 | ) | ||||
| M&T Bank Corp. | (52,336 | ) | (6,382,375 | ) | ||||
| Royal Bank of Canada (Canada) | (53,965 | ) | (2,981,566 | ) | ||||
| (11,720,456 | ) | |||||||
| Information Technology — (9.3%) | ||||||||
| Avago Technologies Ltd. (Singapore) | (18,586 | ) | (2,323,436 | ) | ||||
| Nokia OYJ, ADR | (849,512 | ) | (5,759,691 | ) | ||||
| NXP Semiconductors N.V. (Netherlands)* | (40,794 | ) | (3,551,934 | ) | ||||
| (11,635,061 | ) | |||||||
| Consumer Discretionary — (1.4%) | ||||||||
| Liberty Interactive Corp. QVC Group - Class A* | (68,047 | ) | (1,784,873 | ) | ||||
| Total Common Stocks | $ | (25,140,390 | ) | |||||
| Exchange Traded Fund — (1.1%) | ||||||||
| Vanguard REIT ETF | (18,235 | ) | (1,377,472 | ) | ||||
| Total Securities Sold Short | ||||||||
| (Proceeds $27,241,119) | $ | (26,517,862 | ) | |||||
| Number | ||||||||
| of | ||||||||
| Contracts | ||||||||
| Written Put Option — (0.4%) | ||||||||
| Baxalta, Inc., Strike @ 35.00 Exp 02/16 | (840 | ) | (478,800 | ) | ||||
| Total Written Option | ||||||||
| (Proceeds $157,041) | $ | (478,800 | ) | |||||
| Total—83.5% | $ | 104,864,437 | ||||||
| Cash Collateral for Securities | ||||||||
| Sold Short — 17.9% | 22,463,552 | |||||||
| Liabilities in Excess of Other Assets — (1.4%) | (1,799,190 | ) | ||||||
| Net Assets — 100.0% | $ | 125,528,799 | ||||||
| (A) | Variable rate security - Rate reflected is the rate in effect as of September 30, 2015. |
| * | Non-income producing security. |
| ** | Represents collateral for securities loaned. |
| † | All or a portion of the security is on loan. The total market value of the securities on loan as of September 30, 2015 was $1,202,110. |
| †† | All or a portion of these securities are held as collateral for securities sold short and written option. The total value of the securities held as collateral as of September 30, 2015 was $34,806,534. |
| ∞ | Open-End Fund. |
| Ω | Represents the 7-day SEC yield as of September 30, 2015. |
Portfolio Abbreviations:
ADR - American Depositary Receipt
ETF - Exchange Traded Fund
REIT - Real Estate Investment Trust
144a - This is a restricted security that was sold in a transaction qualifying for the exemption under Rule 144A of the Securities Act of 1933. This security may be sold in transactions exempt from registration, normally to qualified institutional buyers. At September 30, 2015, these securities were valued at $1,574,838 or 1.3% of net assets. These securities were deemed liquid pursuant to procedures approved by the Board of Trustees.
| 58 |
Touchstone Arbitrage Fund (Continued)
Other Information:
The inputs or methodology used for valuing securities may not be an indication of the risk associated with investing in those securities. For more information on valuation inputs, and their aggregation into the levels used in the table below, please refer to the security valuation section in the accompanying Notes to Financial Statements.
Valuation inputs at Reporting Date:
| Description | Level 1 | Level 2 | Level 3 | Total | ||||||||||||
| Assets: | ||||||||||||||||
| Common Stocks | $ | 116,800,826 | $ | — | $ | — | $ | 116,800,826 | ||||||||
| Corporate Bonds | — | 6,422,739 | — | 6,422,739 | ||||||||||||
| Preferred Stock | 1,634,609 | — | — | 1,634,609 | ||||||||||||
| Asset-Backed Security | — | 78,363 | — | 78,363 | ||||||||||||
| Purchased Option Equity Contracts | 58,800 | — | — | 58,800 | ||||||||||||
| Investment Funds | 6,865,762 | — | — | 6,865,762 | ||||||||||||
| $ | 131,861,099 | |||||||||||||||
| Liabilities: | ||||||||||||||||
| Securities Sold Short | ||||||||||||||||
| Common Stocks | $ | (25,140,390 | ) | $ | — | $ | — | $ | (25,140,390 | ) | ||||||
| Exchange Traded Fund | (1,377,472 | ) | — | — | (1,377,472 | ) | ||||||||||
| $ | (26,517,862 | ) | ||||||||||||||
| Other Financial Instruments** | ||||||||||||||||
| Written Option Equity Contract | $ | (478,800 | ) | $ | — | $ | — | $ | (478,800 | ) | ||||||
** Other Financial Instruments include derivative instruments.
Transactions in written options for the year ended September 30, 2015.
| Number of | ||||||||
| Contracts | Proceeds | |||||||
| Beginning of Period, September 30, 2014 | 715 | $ | 114,795 | |||||
| Put Options Written | 840 | 157,041 | ||||||
| Put Options Closed | (340 | ) | (79,680 | ) | ||||
| Call Options Expired | (340 | ) | (24,686 | ) | ||||
| Put Options Expired | (35 | ) | (10,429 | ) | ||||
| September 30, 2015 | 840 | $ | 157,041 | |||||
See accompanying Notes to Financial Statements.
| 59 |
Touchstone Emerging Markets Equity Fund – September 30, 2015
| Market | ||||||||
| Shares | Value | |||||||
| Common Stocks — 98.9% | ||||||||
| India — 14.5% | ||||||||
| Consumer Discretionary — 4.0% | ||||||||
| Bharat Forge Ltd. | 368,665 | $ | 5,117,005 | |||||
| Mahindra & Mahindra Ltd. | 131,295 | 2,536,035 | ||||||
| Zee Entertainment Enterprises Ltd. | 464,544 | 2,790,265 | ||||||
| Consumer Staples — 2.0% | ||||||||
| ITC Ltd. | 1,039,530 | 5,212,478 | ||||||
| Energy — 2.5% | ||||||||
| Oil & Natural Gas Corp. Ltd. | 696,875 | 2,440,725 | ||||||
| Reliance Industries Ltd. | 305,740 | 4,023,350 | ||||||
| Health Care — 2.0% | ||||||||
| Lupin Ltd. | 167,948 | 5,204,239 | ||||||
| Information Technology — 1.6% | ||||||||
| HCL Technologies Ltd. | 273,982 | 4,108,935 | ||||||
| Materials — 2.0% | ||||||||
| UPL Ltd. | 718,042 | 5,013,386 | ||||||
| Telecommunication Services — 0.4% | ||||||||
| Bharti Airtel Ltd. | 213,055 | 1,099,457 | ||||||
| Total India | 37,545,875 | |||||||
| South Korea — 11.5% | ||||||||
| Consumer Discretionary — 3.7% | ||||||||
| Hankook Tire Co. Ltd. | 134,087 | 4,488,842 | ||||||
| Kia Motors Corp. | 111,837 | 5,069,707 | ||||||
| Financials — 4.4% | ||||||||
| BS Financial Group, Inc. | 461,019 | 5,345,431 | ||||||
| Shinhan Financial Group Co. Ltd. | 172,867 | 6,045,513 | ||||||
| Information Technology — 3.4% | ||||||||
| Samsung Electronics Co. Ltd. | 9,247 | 8,872,070 | ||||||
| Total South Korea | 29,821,563 | |||||||
| Taiwan — 11.1% | ||||||||
| Consumer Discretionary — 4.3% | ||||||||
| Eclat Textile Co. Ltd. | 378,595 | 6,011,580 | ||||||
| Giant Manufacturing Co. Ltd. | 719,648 | 5,247,421 | ||||||
| Information Technology — 6.8% | ||||||||
| Delta Electronics, Inc. | 1,154,664 | 5,446,272 | ||||||
| Hermes Microvision, Inc. | 88,761 | 3,383,481 | ||||||
| Taiwan Semiconductor Manufacturing Co. Ltd. | 2,193,259 | 8,789,874 | ||||||
| Total Taiwan | 28,878,628 | |||||||
| Mexico — 9.6% | ||||||||
| Consumer Staples — 4.6% | ||||||||
| Fomento Economico Mexicano SAB DE CV ADR | 49,714 | 4,436,974 | ||||||
| Kimberly-Clark de Mexico SAB de CV - Class A | 1,313,196 | 2,969,759 | ||||||
| Wal-Mart DE Mexico SAB de CV - Class A | 1,821,972 | 4,495,410 | ||||||
| Financials — 2.4% | ||||||||
| Grupo Financiero Banorte SAB de CV - Class O | 1,264,780 | 6,203,856 | ||||||
| Health Care — 1.5% | ||||||||
| Genomma Lab Internacional SAB DE CV - Class B* | 4,674,751 | 3,849,330 | ||||||
| Telecommunication Services — 1.1% | ||||||||
| America Movil SAB de CV, Series L ADR | 170,628 | 2,823,893 | ||||||
| Total Mexico | 24,779,222 | |||||||
| China — 6.9% | ||||||||
| Energy — 0.7% | ||||||||
| PetroChina Co. Ltd. - Class H | 2,822,082 | 1,965,307 | ||||||
| Financials — 3.0% | ||||||||
| Industrial & Commercial Bank of China - Class H | 13,410,383 | 7,747,232 | ||||||
| Health Care — 1.3% | ||||||||
| Sinopharm Group Co. Ltd.- Class H | 932,624 | 3,280,363 | ||||||
| Industrials — 1.5% | ||||||||
| Weichai Power Co. Ltd. - Class H | 4,082,687 | 3,819,707 | ||||||
| Materials — 0.4% | ||||||||
| China BlueChemical Ltd. - Class H | 3,806,997 | 1,022,202 | ||||||
| Total China | 17,834,811 | |||||||
| Hong Kong — 6.4% | ||||||||
| Energy — 1.5% | ||||||||
| CNOOC Ltd. | 3,721,748 | 3,832,015 | ||||||
| Financials — 4.9% | ||||||||
| AIA Group Ltd. | 710,471 | 3,694,981 | ||||||
| China Overseas Land & Investment Ltd. | 2,063,968 | 6,275,247 | ||||||
| Wharf Holdings Ltd. | 502,531 | 2,835,484 | ||||||
| Total Hong Kong | 16,637,727 | |||||||
| Brazil — 4.7% | ||||||||
| Consumer Discretionary — 1.1% | ||||||||
| Lojas Americanas SA (Preference) | 694,136 | 2,839,926 | ||||||
| Financials — 1.0% | ||||||||
| Banco Bradesco SA (Preference) | 453,106 | 2,435,535 | ||||||
| 60 |
Touchstone Emerging Markets Equity Fund (Continued)
| Market | ||||||||
| Shares | Value | |||||||
| Common Stocks — 98.9% (Continued) | ||||||||
| Brazil — (Continued) | ||||||||
| Health Care — 0.8% | ||||||||
| Odontoprev SA | 843,533 | $ | 2,083,034 | |||||
| Industrials — 0.9% | ||||||||
| Localiza Rent A Car SA | 385,052 | 2,371,792 | ||||||
| Information Technology — 0.4% | ||||||||
| Totvs SA | 140,245 | 1,037,555 | ||||||
| Materials — 0.5% | ||||||||
| Gerdau SA (Preference) | 437,946 | 599,835 | ||||||
| Vale SA ADR† | 131,322 | 551,552 | ||||||
| Vale SA (Preference) | 64,087 | 214,997 | ||||||
| Total Brazil | 12,134,226 | |||||||
| Thailand — 4.2% | ||||||||
| Energy — 1.8% | ||||||||
| PTT Exploration & Production PCL | 1,116,651 | 2,163,320 | ||||||
| Thai Oil PCL | 1,711,781 | 2,495,437 | ||||||
| Financials — 1.4% | ||||||||
| Kasikornbank PCL | 794,502 | 3,738,653 | ||||||
| Materials — 1.0% | ||||||||
| Siam Cement PCL | 92,637 | 1,190,505 | ||||||
| Siam Cement PCL (Non- Voting) | 99,001 | 1,267,165 | ||||||
| Total Thailand | 10,855,080 | |||||||
| South Africa — 4.1% | ||||||||
| Consumer Discretionary — 3.2% | ||||||||
| Foschini Group Ltd. | 264,604 | 2,687,143 | ||||||
| Woolworths Holdings Ltd. | 795,781 | 5,569,483 | ||||||
| Telecommunication Services — 0.9% | ||||||||
| MTN Group Ltd. | 180,883 | 2,326,029 | ||||||
| Total South Africa | 10,582,655 | |||||||
| Cayman Islands — 3.5% | ||||||||
| Consumer Staples — 1.1% | ||||||||
| Tingyi Cayman Islands Holding Corp. | 1,790,928 | 2,860,782 | ||||||
| Information Technology — 2.4% | ||||||||
| Tencent Holdings Ltd. | 370,248 | 6,241,119 | ||||||
| Total Cayman Islands | 9,101,901 | |||||||
| Bermuda — 3.2% | ||||||||
| Financials — 2.0% | ||||||||
| Credicorp Ltd. | 48,375 | 5,145,165 | ||||||
| Information Technology — 1.2% | ||||||||
| VTech Holdings Ltd. | 273,611 | 3,248,418 | ||||||
| Total Bermuda | 8,393,583 | |||||||
| United Kingdom — 2.9% | ||||||||
| Consumer Staples — 2.9% | ||||||||
| SABMiller PLC | 134,837 | 7,635,502 | ||||||
| Czech Republic — 2.4% | ||||||||
| Financials — 2.4% | ||||||||
| Komercni Banka A/S | 28,888 | 6,261,236 | ||||||
| Indonesia — 2.2% | ||||||||
| Financials — 1.2% | ||||||||
| Bank Mandiri Persero Tbk PT | 5,929,904 | 3,216,673 | ||||||
| Telecommunication Services — 1.0% | ||||||||
| Telekomunikasi Indonesia Persero Tbk PT | 13,723,993 | 2,478,569 | ||||||
| Total Indonesia | 5,695,242 | |||||||
| Turkey — 1.8% | ||||||||
| Energy — 0.5% | ||||||||
| Tupras Turkiye Petrol Rafine* | 54,845 | 1,344,248 | ||||||
| Financials — 0.5% | ||||||||
| Turkiye Garanti Bankasi AS | 615,980 | 1,433,501 | ||||||
| Telecommunication Services — 0.8% | ||||||||
| Turkcell Iletisim Hizmetleri AS | 577,892 | 2,016,513 | ||||||
| Total Turkey | 4,794,262 | |||||||
| Malaysia — 1.6% | ||||||||
| Consumer Staples — 1.6% | ||||||||
| British American Tobacco Malaysia Bhd | 310,992 | 4,270,272 | ||||||
| Luxembourg — 1.5% | ||||||||
| Energy — 1.5% | ||||||||
| Tenaris SA ADR | 157,842 | 3,805,571 | ||||||
| United Arab Emirates — 1.4% | ||||||||
| Financials — 1.4% | ||||||||
| First Gulf Bank PJSC | 965,285 | 3,666,238 | ||||||
| Chile — 1.3% | ||||||||
| Utilities — 1.3% | ||||||||
| Enersis SA | 13,523,194 | 3,405,692 | ||||||
| United States — 1.2% | ||||||||
| Materials — 1.2% | ||||||||
| Southern Copper Corp.† | 117,385 | 3,136,527 | ||||||
| Israel — 1.2% | ||||||||
| Health Care — 1.2% | ||||||||
| Teva Pharmaceutical Industries Ltd. ADR | 53,144 | 3,000,510 | ||||||
| 61 |
Touchstone Emerging Markets Equity Fund (Continued)
| Market | ||||||||
| Shares | Value | |||||||
| Common Stocks — 98.9% (Continued) | ||||||||
| Jersey — 0.9% | ||||||||
| Materials — 0.9% | ||||||||
| Randgold Resources Ltd. ADR† | 38,458 | $ | 2,272,483 | |||||
| Canada — 0.8% | ||||||||
| Materials — 0.8% | ||||||||
| Eldorado Gold Corp. | 666,480 | 2,137,530 | ||||||
| Total Common Stocks | $ | 256,646,336 | ||||||
| Investment Funds — 2.1% | ||||||||
| Dreyfus Cash Management, Institutional Shares, 0.06%∞ Ω | 1,332,849 | 1,332,849 | ||||||
| Invesco Government & Agency Portfolio, Institutional Class, 0.04%**∞ Ω | 3,985,314 | 3,985,314 | ||||||
| Total Investment Funds | $ | 5,318,163 | ||||||
| Total Investment Securities —101.0% | ||||||||
| (Cost $321,685,644) | $ | 261,964,499 | ||||||
| Liabilities in Excess of Other Assets — (1.0%) | (2,469,520 | ) | ||||||
| Net Assets — 100.0% | $ | 259,494,979 | ||||||
| * | Non-income producing security. |
| ** | Represents collateral for securities loaned. |
| † | All or a portion of the security is on loan. The total market value of the securities on loan as of September 30, 2015 was $3,985,440. |
| ∞ | Open-End Fund. |
| Ω | Represents the 7-day SEC yield as of September 30, 2015. |
Portfolio Abbreviations:
ADR - American Depositary Receipt
PCL - Public Company Limited
PLC - Public Limited Company
Other Information:
The inputs or methodology used for valuing securities may not be an indication of the risk associated with investing in those securities. For more information on valuation inputs, and their aggregation into the levels used in the table below, please refer to the security valuation section in the accompanying Notes to Financial Statements.
Valuation inputs at Reporting Date:
| Description | Level 1 | Level 2 | Level 3 | Total | ||||||||||||
| Common Stocks | ||||||||||||||||
| India | $ | 10,217,625 | $ | 27,328,250 | $ | — | $ | 37,545,875 | ||||||||
| South Korea | — | 29,821,563 | — | 29,821,563 | ||||||||||||
| Taiwan | — | 28,878,628 | — | 28,878,628 | ||||||||||||
| Mexico | 24,779,222 | — | — | 24,779,222 | ||||||||||||
| China | — | 17,834,811 | — | 17,834,811 | ||||||||||||
| Hong Kong | — | 16,637,727 | — | 16,637,727 | ||||||||||||
| Brazil | 12,134,226 | — | — | 12,134,226 | ||||||||||||
| Thailand | — | 10,855,080 | — | 10,855,080 | ||||||||||||
| South Africa | — | 10,582,655 | — | 10,582,655 | ||||||||||||
| Cayman Islands | — | 9,101,901 | — | 9,101,901 | ||||||||||||
| Bermuda | 5,145,165 | 3,248,418 | — | 8,393,583 | ||||||||||||
| United Kingdom | — | 7,635,502 | — | 7,635,502 | ||||||||||||
| Czech Republic | — | 6,261,236 | — | 6,261,236 | ||||||||||||
| Indonesia | — | 5,695,242 | — | 5,695,242 | ||||||||||||
| Turkey | — | 4,794,262 | — | 4,794,262 | ||||||||||||
| Malaysia | — | 4,270,272 | — | 4,270,272 | ||||||||||||
| Luxembourg | 3,805,571 | — | — | 3,805,571 | ||||||||||||
| United Arab Emirates | 3,666,238 | — | — | 3,666,238 | ||||||||||||
| Chile | 3,405,692 | — | — | 3,405,692 | ||||||||||||
| United States | 3,136,527 | — | — | 3,136,527 | ||||||||||||
| Israel | 3,000,510 | — | — | 3,000,510 | ||||||||||||
| Jersey | 2,272,483 | — | — | 2,272,483 | ||||||||||||
| Canada | 2,137,530 | — | — | 2,137,530 | ||||||||||||
| Investment Funds | 5,318,163 | — | — | 5,318,163 | ||||||||||||
| $ | 261,964,499 | |||||||||||||||
At September 30, 2015, equity securities valued at $158,109,063 were transferred from Level 1 to Level 2. Transfers from Level 1 to level 2 are due to significant movement of a designated U.S. market index, triggering a systematic valuation model provided by an independent third party to fair value the international equity securities.
See accompanying Notes to Financial Statements.
| 62 |
Touchstone Global Real Estate Fund – September 30, 2015
| Market | ||||||||
| Shares | Value | |||||||
| Common Stocks — 87.3% | ||||||||
| United States — 31.5% | ||||||||
| Diversified — 7.2% | ||||||||
| EPR Properties REIT | 10,679 | $ | 550,716 | |||||
| Lexington Realty Trust REIT | 34,731 | 281,321 | ||||||
| Liberty Property Trust REIT | 12,490 | 393,560 | ||||||
| Outfront Media, Inc. REIT | 9,078 | 188,822 | ||||||
| Spirit Realty Capital, Inc. REIT | 40,348 | 368,781 | ||||||
| Health Care — 1.2% | ||||||||
| Senior Housing Properties Trust REIT | 17,800 | 288,360 | ||||||
| Industrial — 2.6% | ||||||||
| ProLogis, Inc. REIT | 3,018 | 117,400 | ||||||
| STAG Industrial, Inc. REIT | 16,199 | 294,984 | ||||||
| Terreno Realty Corp. REIT | 11,611 | 228,040 | ||||||
| Mortgage — 4.0% | ||||||||
| Apollo Commercial Real Estate Finance, Inc. REIT | 29,227 | 459,156 | ||||||
| Starwood Property Trust, Inc. REIT | 26,133 | 536,249 | ||||||
| Office — 6.5% | ||||||||
| Boston Properties, Inc. REIT | 1,641 | 194,294 | ||||||
| Digital Realty Trust, Inc. REIT | 5,566 | 363,571 | ||||||
| Douglas Emmett, Inc. REIT | 2,237 | 64,247 | ||||||
| Hudson Pacific Properties, Inc. REIT | 3,320 | 95,583 | ||||||
| Kilroy Realty Corp. REIT | 1,196 | 77,931 | ||||||
| Mack-Cali Realty Corp. REIT | 21,881 | 413,113 | ||||||
| QTS Realty Trust, Inc. - Class A REIT | 5,685 | 248,378 | ||||||
| SL Green Realty Corp. REIT | 1,262 | 136,498 | ||||||
| Residential — 2.7% | ||||||||
| AvalonBay Communities, Inc. REIT | 639 | 111,710 | ||||||
| Bluerock Residential Growth REIT, Inc. REIT | 23,977 | 287,244 | ||||||
| Camden Property Trust REIT | 1,128 | 83,359 | ||||||
| Equity Residential REIT | 1,032 | 77,524 | ||||||
| Essex Property Trust, Inc. REIT | 493 | 110,146 | ||||||
| Retail — 2.4% | ||||||||
| General Growth Properties, Inc. REIT | 3,953 | 102,659 | ||||||
| Macerich Co. (The) REIT | 1,313 | 100,865 | ||||||
| Retail Opportunity Investments Corp. REIT | 5,804 | 95,998 | ||||||
| Simon Property Group, Inc. REIT | 1,016 | 186,659 | ||||||
| Taubman Centers, Inc. REIT | 1,505 | 103,965 | ||||||
| Specialized — 4.9% | ||||||||
| Chatham Lodging Trust REIT | 9,572 | 205,606 | ||||||
| Extra Space Storage, Inc. REIT | 1,063 | 82,021 | ||||||
| HCP, Inc. REIT | 2,067 | 76,996 | ||||||
| Omega Healthcare Investors, Inc. REIT | 13,523 | 475,330 | ||||||
| Public Storage REIT | 460 | 97,350 | ||||||
| Sabra Health Care REIT, Inc. REIT | 11,798 | 273,478 | ||||||
| Total United States | 7,771,914 | |||||||
| Japan — 8.7% | ||||||||
| Diversified — 3.9% | ||||||||
| Kenedix Realty Investment Corp. REIT | 108 | 513,347 | ||||||
| Premier Investment Corp. REIT | 87 | 433,367 | ||||||
| Diversified Real Estate Activities — 0.9% | ||||||||
| Mitsubishi Estate Co. Ltd. | 11,000 | 224,703 | ||||||
| Office — 1.6% | ||||||||
| Nippon Building Fund, Inc. REIT | 20 | 96,777 | ||||||
| Orix J REIT, Inc. REIT | 226 | 305,744 | ||||||
| Real Estate Operating Companies — 0.4% | ||||||||
| Aeon Mall Co. Ltd. | 6,890 | 105,839 | ||||||
| Residential — 0.7% | ||||||||
| Kenedix Residential Investment Corp. REIT | 66 | 170,423 | ||||||
| Shopping Centers — 1.2% | ||||||||
| Japan Retail Fund Investment Corp. REIT(Japan) | 151 | 292,164 | ||||||
| Total Japan | 2,142,364 | |||||||
| Singapore — 8.6% | ||||||||
| Diversified — 0.9% | ||||||||
| Soilbuild Business Space REIT | 389,800 | 220,504 | ||||||
| Diversified Financial Services — 1.5% | ||||||||
| Religare Health Trust | 567,200 | 378,651 | ||||||
| Industrial — 2.1% | ||||||||
| AIMS AMP Capital Industrial REIT | 229,600 | 218,905 | ||||||
| Mapletree Logistics Trust REIT | 428,200 | 295,082 | ||||||
| Office — 1.5% | ||||||||
| Keppel REIT | 537,900 | 360,981 | ||||||
| Retail — 2.6% | ||||||||
| CapitaRetail China Trust REIT | 176,140 | 169,278 | ||||||
| Fortune Real Estate Investment Trust REIT | 91,000 | 85,414 | ||||||
| Mapletree Greater China Commercial Trust REIT | 474,400 | 310,555 | ||||||
| Suntec Real Estate Investment Trust REIT | 71,200 | 75,207 | ||||||
| Total Singapore | 2,114,577 | |||||||
| Australia — 7.4% | ||||||||
| Diversified — 2.3% | ||||||||
| Dexus Property Group REIT | 13,945 | 70,323 | ||||||
| GPT Group REIT | 32,494 | 103,272 | ||||||
| Stockland REIT | 148,934 | 404,627 | ||||||
| Diversified Financial Services — 0.4% | ||||||||
| Scentre Group | 37,642 | 103,602 | ||||||
| Industrial — 0.7% | ||||||||
| Industria REIT | 115,408 | 161,736 | ||||||
| 63 |
Touchstone Global Real Estate Fund (Continued)
| Market | ||||||||
| Shares | Value | |||||||
| Common Stocks — 87.3% (Continued) | ||||||||
| Australia — (Continued) | ||||||||
| Office — 1.1% | ||||||||
| Cromwell Property Group REIT | 406,428 | $ | 274,512 | |||||
| Retail — 2.9% | ||||||||
| Charter Hall Retail REIT(Australia) | 139,781 | 400,935 | ||||||
| Federation Centres REIT | 166,565 | 321,645 | ||||||
| Total Australia | 1,840,652 | |||||||
| Canada — 5.3% | ||||||||
| Diversified — 2.4% | ||||||||
| Crombie Real Estate Investment Trust REIT | 10,943 | 105,125 | ||||||
| Dream Office Real Estate Investment Trust REIT | 30,728 | 488,148 | ||||||
| Health Care Facilities — 1.5% | ||||||||
| Sienna Senior Living, Inc.† | 29,793 | 375,733 | ||||||
| Residential — 0.3% | ||||||||
| Boardwalk Real Estate Investment Trust† | 1,789 | 73,490 | ||||||
| Retail — 0.3% | ||||||||
| RioCan Real Estate Investment Trust REIT | 3,608 | 68,862 | ||||||
| Specialized — 0.8% | ||||||||
| InnVest Real Estate Investment Trust REIT | 50,644 | 188,990 | ||||||
| Total Canada | 1,300,348 | |||||||
| Hong Kong — 5.0% | ||||||||
| Diversified — 1.2% | ||||||||
| Hui Xian Real Estate Investment Trust REIT† | 581,000 | 288,384 | ||||||
| Office — 1.1% | ||||||||
| Prosperity REIT | 804,000 | 275,647 | ||||||
| Real Estate Operating Companies — 0.4% | ||||||||
| Hysan Development Co. Ltd. | 25,000 | 104,097 | ||||||
| Retail — 1.0% | ||||||||
| Yuexiu Real Estate Investment Trust REIT | 469,000 | 238,233 | ||||||
| Specialized — 1.3% | ||||||||
| Langham Hospitality Investments and Langham Hospitality Investments Ltd. | 915,000 | 320,532 | ||||||
| Total Hong Kong | 1,226,893 | |||||||
| United Kingdom — 4.1% | ||||||||
| Diversified — 2.4% | ||||||||
| British Land Co. PLC REIT | 37,284 | 473,492 | ||||||
| Land Securities Group PLC REIT | 6,210 | 118,387 | ||||||
| Retail — 1.7% | ||||||||
| Hammerson PLC REIT | 44,648 | 421,595 | ||||||
| Total United Kingdom | 1,013,474 | |||||||
| Germany — 3.0% | ||||||||
| Diversified — 1.3% | ||||||||
| Hamborner Reit AG | 33,188 | 320,781 | ||||||
| Office — 1.4% | ||||||||
| Alstria Office REIT-AG | 26,981 | 350,780 | ||||||
| Real Estate Operating Companies — 0.3% | ||||||||
| LEG Immobilien AG | 785 | 64,946 | ||||||
| Total Germany | 736,507 | |||||||
| France — 2.2% | ||||||||
| Consumer Discretionary — 0.3% | ||||||||
| Nexity SA | 1,676 | 72,278 | ||||||
| Diversified — 0.5% | ||||||||
| Unibail-Rodamco SE REIT | 467 | 121,039 | ||||||
| Retail — 1.4% | ||||||||
| Mercialys SA REIT | 16,369 | 353,744 | ||||||
| Total France | 547,061 | |||||||
| Mexico — 2.2% | ||||||||
| Industrial — 2.2% | ||||||||
| Mexico Real Estate Management SA de CV REIT | 326,619 | 412,889 | ||||||
| Prologis Property Mexico SA de CV REIT | 80,426 | 123,649 | ||||||
| Total Mexico | 536,538 | |||||||
| Netherlands — 2.0% | ||||||||
| Diversified — 1.1% | ||||||||
| Wereldhave N.V. | 4,966 | 286,646 | ||||||
| Retail — 0.9% | ||||||||
| Eurocommercial Properties NV REIT | 4,962 | 216,881 | ||||||
| Total Netherlands | 503,527 | |||||||
| Finland — 1.8% | ||||||||
| Real Estate Operating Companies — 1.8% | ||||||||
| Citycon OYJ | 115,663 | 284,334 | ||||||
| Sponda OYJ | 42,730 | 166,826 | ||||||
| Total Finland | 451,160 | |||||||
| South Africa — 1.2% | ||||||||
| Diversified — 1.2% | ||||||||
| Redefine Properties Ltd. REIT | 347,834 | 294,013 | ||||||
| 64 |
Touchstone Global Real Estate Fund (Continued)
| Market | ||||||||
| Shares | Value | |||||||
| Common Stocks — 87.3% (Continued) | ||||||||
| Spain — 1.2% | ||||||||
| Diversified — 1.2% | ||||||||
| Merlin Properties Socimi SA REIT | 24,333 | $ | 289,577 | |||||
| Sweden — 1.0% | ||||||||
| Diversified — 0.7% | ||||||||
| Akelius Residential AB | 5,334 | 189,696 | ||||||
| Real Estate Operating Companies — 0.3% | ||||||||
| Hufvudstaden AB - Class A | 5,553 | 72,762 | ||||||
| Total Sweden | 262,458 | |||||||
| New Zealand — 0.9% | ||||||||
| Diversified — 0.9% | ||||||||
| Kiwi Property Group Ltd. | 267,374 | 220,402 | ||||||
| Jersey — 0.7% | ||||||||
| Real Estate Operating Companies — 0.7% | ||||||||
| Atrium European Real Estate Ltd. | 42,776 | 187,130 | ||||||
| Bermuda — 0.5% | ||||||||
| Real Estate Operating Companies — 0.5% | ||||||||
| Hongkong Land Holdings Ltd. | 18,100 | 119,854 | ||||||
| Total Common Stocks | $ | 21,558,449 | ||||||
| Preferred Stocks — 5.0% | ||||||||
| Hotels, Resorts & Cruise Lines — 1.9% | ||||||||
| Sunstone Hotel Investors, Inc., 0.05% | 18,538 | 472,719 | ||||||
| Specialized — 1.9% | ||||||||
| Ashford Hospitality Trust, Inc. REIT, 0.06% | 18,374 | 472,395 | ||||||
| Industrial — 1.2% | ||||||||
| STAG Industrial, Inc. REIT, 0.06% | 6,938 | 183,996 | ||||||
| Terreno Realty Corp. REIT, 0.05% | 3,757 | 96,555 | ||||||
| 280,551 | ||||||||
| Total Preferred Stocks | $ | 1,225,665 | ||||||
| Investment Funds — 9.7% | ||||||||
| Dreyfus Cash Management, Institutional Shares, 0.06%∞Ω | 1,759,319 | $ | 1,759,319 | |||||
| Invesco Government & Agency Portfolio, Institutional Class, 0.04%**∞Ω | 623,595 | 623,595 | ||||||
| Total Investment Funds | $ | 2,382,914 | ||||||
| Total Investment Securities —102.0% | ||||||||
| (Cost $26,772,883) | $ | 25,167,028 | ||||||
| Liabilities in Excess of Other Assets — (2.0%) | (485,231 | ) | ||||||
| Net Assets — 100.0% | $ | 24,681,797 | ||||||
| ** | Represents collateral for securities loaned. |
| † | All or a portion of the security is on loan. The total market value of the securities on loan as of September 30, 2015 was $600,357. |
| ∞ | Open-End Fund. |
| Ω | Represents the 7-day SEC yield as of September 30, 2015. |
Portfolio Abbreviations:
PLC - Public Limited Company
REIT - Real Estate Investment Trust
| 65 |
Touchstone Global Real Estate Fund (Continued)
Other Information:
The inputs or methodology used for valuing securities may not be an indication of the risk associated with investing in those securities. For more information on valuation inputs, and their aggregation into the levels used in the table below, please refer to the security valuation section in the accompanying Notes to Financial Statements.
Valuation inputs at Reporting Date:
| Description | Level 1 | Level 2 | Level 3 | Total | ||||||||||||
| Common Stocks | ||||||||||||||||
| United States | $ | 7,771,914 | $ | — | $ | — | $ | 7,771,914 | ||||||||
| Japan | — | 2,142,364 | — | 2,142,364 | ||||||||||||
| Singapore | 960,136 | 1,154,441 | — | 2,114,577 | ||||||||||||
| Australia | — | 1,840,652 | — | 1,840,652 | ||||||||||||
| Canada | 1,300,348 | — | — | 1,300,348 | ||||||||||||
| Hong Kong | — | 1,226,893 | — | 1,226,893 | ||||||||||||
| United Kingdom | — | 1,013,474 | — | 1,013,474 | ||||||||||||
| Germany | 671,561 | 64,946 | — | 736,507 | ||||||||||||
| France | 353,744 | 193,317 | — | 547,061 | ||||||||||||
| Mexico | 536,538 | — | — | 536,538 | ||||||||||||
| Netherlands | — | 503,527 | — | 503,527 | ||||||||||||
| Finland | 284,334 | 166,826 | — | 451,160 | ||||||||||||
| South Africa | — | 294,013 | — | 294,013 | ||||||||||||
| Spain | 289,577 | — | — | 289,577 | ||||||||||||
| Sweden | — | 262,458 | — | 262,458 | ||||||||||||
| New Zealand | — | 220,402 | — | 220,402 | ||||||||||||
| Jersey | 187,130 | — | — | 187,130 | ||||||||||||
| Bermuda | — | 119,854 | — | 119,854 | ||||||||||||
| Preferred Stocks | 1,225,665 | — | — | 1,225,665 | ||||||||||||
| Investment Funds | 2,382,914 | — | — | 2,382,914 | ||||||||||||
| $ | 25,167,028 | |||||||||||||||
At September 30, 2015, equity securities valued at $7,466,625 were transferred from Level 1 to Level 2. Transfers from Level 1 to level 2 are due to significant movement of a designated U.S. market index, triggering a systematic valuation model provided by an independent third party to fair value the international equity securities.
See accompanying Notes to Financial Statements.
| 66 |
Touchstone Merger Arbitrage Fund – September 30, 2015
| Market | ||||||||
| Shares | Value | |||||||
| Common Stocks — 73.6% | ||||||||
| Financials — 25.4% | ||||||||
| Chambers Street Properties REIT | 74,530 | $ | 483,700 | |||||
| Chubb Corp. (The) | 37,580 | 4,609,187 | ||||||
| City National Corp.† | 74,200 | 6,534,052 | ||||||
| HCC Insurance Holdings, Inc.† | 90,281 | 6,994,069 | ||||||
| Hennessy Capital Acquisition Corp. II* | 175,000 | 1,725,500 | ||||||
| Home Properties, Inc. REIT† | 31,560 | 2,359,110 | ||||||
| Hudson City Bancorp, Inc.† | 970,741 | 9,872,436 | ||||||
| National Interstate Corp.† | 225,332 | 6,011,858 | ||||||
| NorthStar Realty Finance Corp. REIT† | 296,195 | 3,658,008 | ||||||
| PartnerRe Ltd. (Bermuda) | 17,535 | 2,435,261 | ||||||
| StanCorp Financial Group, Inc.† | 40,500 | 4,625,100 | ||||||
| Symetra Financial Corp. | 145,242 | 4,595,457 | ||||||
| 53,903,738 | ||||||||
| Information Technology — 21.3% | ||||||||
| Alcatel-Lucent ADR* | 1,614,171 | 5,891,724 | ||||||
| Altera Corp.† | 117,780 | 5,898,422 | ||||||
| Broadcom Corp. - Class A† | 105,620 | 5,432,037 | ||||||
| Dealertrack Technologies, Inc.* | 111,047 | 7,013,729 | ||||||
| Dot Hill Systems Corp.* | 500,970 | 4,874,438 | ||||||
| Envivio, Inc.* | 111,285 | 455,156 | ||||||
| Freescale Semiconductor Ltd. (Bermuda)*† | 182,140 | 6,662,681 | ||||||
| Millennial Media, Inc.* | 2,500,715 | 4,376,251 | ||||||
| Xoom Corp.* | 180,889 | 4,500,518 | ||||||
| 45,104,956 | ||||||||
| Health Care — 8.4% | ||||||||
| IPC Healthcare, Inc.*† | 57,610 | 4,475,721 | ||||||
| KYTHERA Biopharmaceuticals, Inc.* | 68,680 | 5,149,626 | ||||||
| Merge Healthcare, Inc.* | 496,603 | 3,525,881 | ||||||
| Thoratec Corp.* | 74,465 | 4,710,656 | ||||||
| 17,861,884 | ||||||||
| Materials — 7.2% | ||||||||
| Cytec Industries, Inc. | 62,620 | 4,624,487 | ||||||
| OM Group, Inc. | 70,135 | 2,306,740 | ||||||
| Sigma-Aldrich Corp. | 60,000 | 8,335,200 | ||||||
| 15,266,427 | ||||||||
| Consumer Discretionary — 5.3% | ||||||||
| Fiat Chrysler Automobiles N.V. (Netherlands)* | 196,981 | 2,602,119 | ||||||
| Remy International, Inc. | 152,415 | 4,458,139 | ||||||
| Zulily, Inc., Class A* | 243,580 | 4,238,292 | ||||||
| 11,298,550 | ||||||||
| Industrials — 4.0% | ||||||||
| Adept Technology, Inc.* | 142,084 | 1,841,409 | ||||||
| Precision Castparts Corp. | 28,515 | 6,550,181 | ||||||
| 8,391,590 | ||||||||
| Telecommunication Services — 2.0% | ||||||||
| NTELOS Holdings Corp.*† | 481,363 | 4,346,708 | ||||||
| Total Common Stocks | $ | 156,173,853 | ||||||
| Preferred Stocks — 2.8% | ||||||||
| Financials — 2.8% | ||||||||
| GMAC Capital Trust I, 8.125%(A) | 118,996 | 3,037,968 | ||||||
| Morgan Stanley Capital Trust III, 6.25% | 119,000 | 3,021,410 | ||||||
| Total Preferred Stocks | $ | 6,059,378 | ||||||
| Principal | ||||||||
| Amount | ||||||||
| Corporate Bonds — 9.9% | ||||||||
| Consumer Discretionary — 3.5% | ||||||||
| $ | 1,750,000 | 21st Century Fox America, Inc., | ||||||
| 7.600%, 10/11/15 | 1,752,019 | |||||||
| 1,615,000 | Petco Holdings, Inc. PIK, 144a, | |||||||
| 8.500%, 10/15/17 | 1,627,112 | |||||||
| 3,900,000 | Time Warner Cable, Inc., | |||||||
| 5.850%, 5/1/17 | 4,127,538 | |||||||
| 7,506,669 | ||||||||
| Energy — 2.5% | ||||||||
| 5,450,000 | Whiting Canadian Holdings Co., | |||||||
| 8.125%, 12/1/19 | 5,259,250 | |||||||
| Information Technology — 1.9% | ||||||||
| 3,900,000 | SunGard Data Systems, Inc., | |||||||
| 6.625%, 11/1/19 | 4,026,750 | |||||||
| Financials — 1.7% | ||||||||
| 3,845,000 | PNC Preferred Funding Trust II, 144a, | |||||||
| 1.560%, 3/29/49(A) | 3,551,819 | |||||||
| Materials — 0.3% | ||||||||
| 585,000 | Glencore Canada Corp. (Canada), | |||||||
| 6.000%, 10/15/15 | 585,000 | |||||||
| Total Corporate Bonds | $ | 20,929,488 | ||||||
| Commercial Mortgage-Backed Security — 1.3% | ||||||||
| 2,750,000 | CFCRE 2015-RUM Mortgage Trust, Ser | |||||||
| 2015-RUM, Class C, 144a, | ||||||||
| 2.957%, 7/15/30(A) | 2,752,071 | |||||||
| Commercial Paper — 1.9% | ||||||||
| 2,000,000 | PPG Industries, Inc., 0.430%, 10/6/15(B) | 1,999,880 | ||||||
| 2,000,000 | Thermo Fisher Scientific, | |||||||
| 0.600%, 10/9/15(B) | 1,999,785 | |||||||
| Total Commercial Paper | $ | 3,999,665 | ||||||
| Number | ||||||||
| of | ||||||||
| Contracts | ||||||||
| Purchased Call Option — 0.0% | ||||||||
| Baxalta, Inc., Strike @ 40.00 | ||||||||
| Exp 02/16† | 1,475 | 103,250 | ||||||
| 67 |
Touchstone Merger Arbitrage Fund (Continued)
| Market | ||||||||
| Shares | Value | |||||||
| Investment Fund — 24.1% | ||||||||
| Dreyfus Cash Management, Institutional Shares, 0.06%∞ Ω | 51,102,025 | $ | 51,102,025 | |||||
| Total Long Positions | ||||||||
| (Cost $243,793,553) | $ | 241,119,730 | ||||||
| Securities Sold Short —(16.5%) | ||||||||
| Common Stocks — (15.2%) | ||||||||
| Financials — (7.5%) | ||||||||
| ACE Ltd. (Switzerland) | (22,622 | ) | $ | (2,339,115 | ) | |||
| Gramercy Property Trust, Inc., REIT | (23,367 | ) | (485,333 | ) | ||||
| M&T Bank Corp. | (81,445 | ) | (9,932,218 | ) | ||||
| Royal Bank of Canada (Canada) | (55,571 | ) | (3,070,298 | ) | ||||
| (15,826,964 | ) | |||||||
| Information Technology — (6.8%) | ||||||||
| Avago Technologies Ltd. (Singapore) | (23,122 | ) | (2,890,481 | ) | ||||
| Nokia OYJ, ADR | (887,885 | ) | (6,019,860 | ) | ||||
| NXP Semiconductors N.V. (Netherlands)* | (64,135 | ) | (5,584,234 | ) | ||||
| (14,494,575 | ) | |||||||
| Consumer Discretionary — (0.9%) | ||||||||
| Liberty Interactive Corp. QVC Group - Class A* | (75,505 | ) | (1,980,496 | ) | ||||
| Total Common Stocks | $ | (32,302,035 | ) | |||||
| �� | ||||||||
| Exchange Traded Fund — (1.3%) | ||||||||
| Vanguard REIT ETF | (35,270 | ) | (2,664,296 | ) | ||||
| Total Securities Sold Short | ||||||||
| (Proceeds $35,087,910) | $ | (34,966,331 | ) | |||||
| Number | ||||||||
| of | ||||||||
| Contracts | ||||||||
| Written Put Options — (0.4%) | ||||||||
| Baxalta, Inc., Strike @ 35.00 Exp 02/16 | (1,475 | ) | (840,750 | ) | ||||
| Total Written Options | ||||||||
| (Proceeds $275,757) | (840,750 | ) | ||||||
| Total —96.7% | $ | 205,312,649 | ||||||
| Cash Collateral for Securities | ||||||||
| Sold Short and Written Options— 4.9% | 10,349,543 | |||||||
| Liabilities in Excess of Other Assets — (1.6%) | (3,400,937 | ) | ||||||
| Net Assets — 100.0% | $ | 212,261,255 | ||||||
| (A) | Variable rate security - Rate reflected is the rate in effect as of September 30, 2015. |
| (B) | Rate reflects yield at the time of purchase. |
| * | Non-income producing security. |
| † | All or a portion of these securities are held as collateral for securities sold short and written options. The total value of the securities held as collateral as of September 30, 2015 was $64,576,673. |
| ∞ | Open-End Fund. |
| Ω | Represents the 7-day SEC yield as of September 30, 2015. |
Portfolio Abbreviations:
ADR - American Depositary Receipt
ETF - Exchange Traded Fund
PIK - Pay-in-Kind Bond.
REIT - Real Estate Investment Trust
144a - This is a restricted security that was sold in a transaction qualifying for the exemption under Rule 144A of the Securities Act of 1933. This security may be sold in transactions exempt from registration, normally to qualified institutional buyers. At September 30, 2015, these securities were valued at $7,931,002 or 3.7% of net assets. These securities were deemed liquid pursuant to procedures approved by the Board of Trustees.
Other Information:
The inputs or methodology used for valuing securities may not be an indication of the risk associated with investing in those securities. For more information on valuation inputs, and their aggregation into the levels used in the table below, please refer to the security valuation section in the accompanying Notes to Financial Statements.
Valuation inputs at Reporting Date:
| Description | Level 1 | Level 2 | Level 3 | Total | ||||||||||||
| Assets: | ||||||||||||||||
| Common Stocks | $ | 156,173,853 | $ | — | $ | — | $ | 156,173,853 | ||||||||
| Preferred Stocks | 6,059,378 | — | — | 6,059,378 | ||||||||||||
| Corporate Bonds | — | 20,929,488 | — | 20,929,488 | ||||||||||||
| Commercial Mortgage-Backed Security | — | 2,752,071 | — | 2,752,071 | ||||||||||||
| Commercial Paper | — | 3,999,665 | — | 3,999,665 | ||||||||||||
| Purchased Options Equity Contracts | 103,250 | — | — | 103,250 | ||||||||||||
| Investment Fund | 51,102,025 | — | — | 51,102,025 | ||||||||||||
| $ | 241,119,730 | |||||||||||||||
| 68 |
Touchstone Merger Arbitrage Fund (Continued)
Valuation inputs at Reporting Date:
| Description | Level 1 | Level 2 | Level 3 | Total | ||||||||||||
| Liabilities: | ||||||||||||||||
| Securities Sold Short | ||||||||||||||||
| Common Stocks | $ | (32,302,035 | ) | $ | — | $ | — | $ | (32,302,035 | ) | ||||||
| Exchange Traded Fund | (2,664,296 | ) | — | — | (2,664,296 | ) | ||||||||||
| $ | (34,966,331 | ) | ||||||||||||||
| Other Financial Instruments** | ||||||||||||||||
| Written Options Equity Contract | $ | (840,750 | ) | $ | — | $ | — | $ | (840,750 | ) | ||||||
** Other Financial Instruments include derivative instruments.
Transactions in written options for the year ended September 30, 2015.
| Number of | ||||||||
| Contracts | Proceeds | |||||||
| Beginning of Period, September 30, 2014 | 2,527 | $ | 597,434 | |||||
| Put Options Written | 1,475 | 275,757 | ||||||
| Put Options Closed | (971 | ) | (204,786 | ) | ||||
| Call Options Expired | (971 | ) | (218,342 | ) | ||||
| Put Options Expired | (585 | ) | (174,306 | ) | ||||
| September 30, 2015 | 1,475 | $ | 275,757 | |||||
See accompanying Notes to Financial Statements.
| 69 |
Touchstone Mid Cap Fund – September 30, 2015
| Market | ||||||||
| Shares | Value | |||||||
| Common Stocks — 98.7% | ||||||||
| Consumer Discretionary — 32.5% | ||||||||
| Cabela's, Inc.* | 305,200 | $ | 13,917,120 | |||||
| CarMax, Inc.* | 520,160 | 30,855,891 | ||||||
| Deckers Outdoor Corp.* | 229,210 | 13,307,933 | ||||||
| Dollar Tree, Inc.* | 569,720 | 37,977,535 | ||||||
| H&R Block, Inc. | 692,800 | 25,079,360 | ||||||
| Hasbro, Inc. | 333,590 | 24,065,183 | ||||||
| PulteGroup, Inc. | 1,422,200 | 26,836,914 | ||||||
| Tempur Sealy International, Inc.* | 466,740 | 33,339,238 | ||||||
| Whirlpool Corp. | 151,170 | 22,261,294 | ||||||
| 227,640,468 | ||||||||
| Information Technology — 14.5% | ||||||||
| Amphenol Corp. - Class A | 602,500 | 30,703,400 | ||||||
| NetApp, Inc. | 732,550 | 21,683,480 | ||||||
| Paychex, Inc. | 599,960 | 28,576,095 | ||||||
| Symantec Corp. | 1,040,780 | 20,263,986 | ||||||
| 101,226,961 | ||||||||
| Financials — 13.7% | ||||||||
| Alleghany Corp.* | 68,570 | 32,098,303 | ||||||
| M&T Bank Corp. | 244,330 | 29,796,043 | ||||||
| MBIA, Inc.* | 1,979,860 | 12,037,549 | ||||||
| Voya Financial, Inc. | 565,400 | 21,920,558 | ||||||
| 95,852,453 | ||||||||
| Industrials — 13.3% | ||||||||
| Cintas Corp. | 424,710 | 36,418,882 | ||||||
| Copart, Inc.* | 541,600 | 17,818,640 | ||||||
| Dover Corp. | 338,551 | 19,358,346 | ||||||
| Old Dominion Freight Line, Inc.* | 325,600 | 19,861,600 | ||||||
| 93,457,468 | ||||||||
| Materials — 12.7% | ||||||||
| Albemarle Corp. | 375,280 | 16,549,848 | ||||||
| Ball Corp. | 276,830 | 17,218,826 | ||||||
| NewMarket Corp. | 88,250 | 31,505,250 | ||||||
| Vulcan Materials Co. | 268,070 | 23,911,844 | ||||||
| 89,185,768 | ||||||||
| Consumer Staples — 9.3% | ||||||||
| Brown-Forman Corp. - Class B | 250,370 | 24,260,853 | ||||||
| Edgewell Personal Care Co. | 255,410 | 20,841,456 | ||||||
| Energizer Holdings, Inc. | 255,500 | 9,890,405 | ||||||
| Pricesmart, Inc. | 131,590 | 10,177,171 | ||||||
| 65,169,885 | ||||||||
| Health Care — 2.7% | ||||||||
| Tenet Healthcare Corp.* | 511,440 | 18,882,365 | ||||||
| Total Common Stocks | $ | 691,415,368 | ||||||
| Investment Fund — 1.0% | ||||||||
| Dreyfus Cash Management, Institutional Shares, 0.06%∞Ω | 7,041,251 | 7,041,251 | ||||||
| Total Investment Securities —99.7% | ||||||||
| (Cost $686,407,570) | $ | 698,456,619 | ||||||
| Other Assets in Excess of Liabilities — 0.3% | 1,827,131 | |||||||
| Net Assets — 100.0% | $ | 700,283,750 | ||||||
| * | Non-income producing security. |
| ∞ | Open-End Fund. |
| Ω | Represents the 7-day SEC yield as of September 30, 2015. |
Other Information:
The inputs or methodology used for valuing securities may not be an indication of the risk associated with investing in those securities. For more information on valuation inputs, and their aggregation into the levels used in the table below, please refer to the security valuation section in the accompanying Notes to Financial Statements.
Valuation inputs at Reporting Date:
| Description | Level 1 | Level 2 | Level 3 | Total | ||||||||||||
| Common Stocks | $ | 691,415,368 | $ | — | $ | — | $ | 691,415,368 | ||||||||
| Investment Fund | 7,041,251 | — | — | 7,041,251 | ||||||||||||
| $ | 698,456,619 | |||||||||||||||
See accompanying Notes to Financial Statements.
| 70 |
Touchstone Mid Cap Value Fund – September 30, 2015
| Market | ||||||||
| Shares | Value | |||||||
| Common Stocks — 99.9% | ||||||||
| Financials — 27.1% | ||||||||
| Alexandria Real Estate Equities, Inc., REIT | 77,218 | $ | 6,538,048 | |||||
| Allstate Corp. (The) | 53,050 | 3,089,632 | ||||||
| American Campus Communities, Inc., REIT | 146,389 | 5,305,137 | ||||||
| Ameriprise Financial, Inc. | 37,168 | 4,056,144 | ||||||
| Blackstone Mortgage Trust, Inc. - Class A, REIT | 194,395 | 5,334,199 | ||||||
| Brixmor Property Group, Inc., REIT | 237,447 | 5,575,256 | ||||||
| E*TRADE Financial Corp.* | 171,038 | 4,503,431 | ||||||
| Equinix, Inc., REIT | 21,946 | 6,000,036 | ||||||
| Fifth Third Bancorp | 270,892 | 5,122,568 | ||||||
| Hancock Holding Co. | 117,117 | 3,168,015 | ||||||
| Hanover Insurance Group, Inc. (The) | 67,318 | 5,230,609 | ||||||
| Hartford Financial Services Group, Inc. | 118,050 | 5,404,329 | ||||||
| Host Hotels & Resorts, Inc., REIT | 311,903 | 4,931,186 | ||||||
| Investors Bancorp, Inc. | 437,276 | 5,395,986 | ||||||
| Reinsurance Group of America, Inc. | 39,179 | 3,549,226 | ||||||
| SunTrust Banks, Inc. | 130,868 | 5,004,392 | ||||||
| TCF Financial Corp. | 294,069 | 4,458,086 | ||||||
| Unum Group | 157,528 | 5,053,498 | ||||||
| Zions Bancorporation | 189,453 | 5,217,536 | ||||||
| 92,937,314 | ||||||||
| Information Technology — 14.3% | ||||||||
| Cadence Design Systems, Inc.* | 303,040 | 6,266,867 | ||||||
| Citrix Systems, Inc.* | 76,948 | 5,330,957 | ||||||
| Diebold, Inc. | 141,413 | 4,209,865 | ||||||
| Fidelity National Information Services, Inc. | 91,388 | 6,130,307 | ||||||
| IAC/InterActiveCorp. | 45,274 | 2,955,034 | ||||||
| Juniper Networks, Inc. | 103,057 | 2,649,595 | ||||||
| Microchip Technology, Inc.† | 125,614 | 5,412,707 | ||||||
| Qorvo, Inc.* | 125,526 | 5,654,946 | ||||||
| Solera Holdings, Inc. | 76,192 | 4,114,368 | ||||||
| Synopsys, Inc.* | 135,071 | 6,237,579 | ||||||
| 48,962,225 | ||||||||
| Industrials — 12.3% | ||||||||
| Aercap Holdings N.V.* | 129,216 | 4,941,220 | ||||||
| Clean Harbors, Inc.*† | 67,550 | 2,970,174 | ||||||
| Dover Corp. | 65,449 | 3,742,374 | ||||||
| Fluor Corp. | 72,654 | 3,076,897 | ||||||
| KAR Auction Services, Inc. | 163,283 | 5,796,546 | ||||||
| Owens Corning | 99,717 | 4,179,139 | ||||||
| Parker Hannifin Corp. | 34,105 | 3,318,416 | ||||||
| Pentair PLC (Ireland) | 27,681 | 1,412,838 | ||||||
| Precision Castparts Corp. | 17,953 | 4,123,984 | ||||||
| Regal-Beloit Corp. | 77,007 | 4,347,045 | ||||||
| Xylem, Inc. | 129,937 | 4,268,430 | ||||||
| 42,177,063 | ||||||||
| Consumer Staples — 10.7% | ||||||||
| Coca-Cola Enterprises, Inc. | 94,834 | 4,585,224 | ||||||
| Darling International, Inc.* | 386,989 | 4,349,756 | ||||||
| Hershey Co. (The) | 51,749 | 4,754,698 | ||||||
| Ingredion, Inc. | 52,004 | 4,540,469 | ||||||
| JM Smucker Co. (The) | 43,472 | 4,959,720 | ||||||
| Kroger Co. (The) | 82,201 | 2,964,990 | ||||||
| Molson Coors Brewing Co. - Class B | 70,643 | 5,864,782 | ||||||
| Sysco Corp. | 119,035 | 4,638,794 | ||||||
| 36,658,433 | ||||||||
| Consumer Discretionary — 9.6% | ||||||||
| American Eagle Outfitters, Inc. | 308,915 | 4,828,342 | ||||||
| Aramark | 112,971 | 3,348,460 | ||||||
| BorgWarner, Inc. | 126,183 | 5,247,951 | ||||||
| Cabela's, Inc.* | 92,519 | 4,218,866 | ||||||
| Harley-Davidson, Inc. | 85,264 | 4,680,994 | ||||||
| Interpublic Group of Cos, Inc. (The) | 170,017 | 3,252,425 | ||||||
| LKQ Corp.* | 171,488 | 4,863,400 | ||||||
| Urban Outfitters, Inc.* | 87,115 | 2,559,439 | ||||||
| 32,999,877 | ||||||||
| Utilities — 9.1% | ||||||||
| AGL Resources, Inc. | 49,867 | 3,043,882 | ||||||
| Edison International | 96,132 | 6,063,045 | ||||||
| Great Plains Energy, Inc. | 221,445 | 5,983,444 | ||||||
| Pinnacle West Capital Corp. | 83,187 | 5,335,614 | ||||||
| Portland General Electric Co. | 162,421 | 6,004,704 | ||||||
| SCANA Corp. | 83,132 | 4,677,006 | ||||||
| 31,107,695 | ||||||||
| Health Care — 7.6% | ||||||||
| AmerisourceBergen Corp. | 30,443 | 2,891,781 | ||||||
| Charles River Laboratories International, Inc.* | 53,290 | 3,384,981 | ||||||
| Cooper Cos, Inc. (The) | 47,325 | 7,044,800 | ||||||
| DENTSPLY International, Inc.† | 82,770 | 4,185,679 | ||||||
| Patterson Cos., Inc. | 108,862 | 4,708,282 | ||||||
| Quest Diagnostics, Inc. | 62,987 | 3,871,811 | ||||||
| 26,087,334 | ||||||||
| Materials — 5.0% | ||||||||
| Albemarle Corp. | 100,039 | 4,411,720 | ||||||
| Allegheny Technologies, Inc. | 187,370 | 2,656,907 | ||||||
| Bemis Co., Inc. | 82,652 | 3,270,540 | ||||||
| Cabot Corp. | 123,782 | 3,906,560 | ||||||
| FMC Corp. | 87,275 | 2,959,495 | ||||||
| 17,205,222 | ||||||||
| Energy — 4.2% | ||||||||
| EQT Corp. | 68,481 | 4,435,514 | ||||||
| Newfield Exploration Co.* | 85,744 | 2,820,978 | ||||||
| Oasis Petroleum, Inc.*† | 165,483 | 1,436,392 | ||||||
| Pioneer Natural Resources Co. | 26,600 | 3,235,624 | ||||||
| Spectra Energy Corp. | 87,906 | 2,309,291 | ||||||
| 14,237,799 | ||||||||
| Total Common Stocks | $ | 342,372,962 | ||||||
| 71 |
Touchstone Mid Cap Value Fund (Continued)
| Market | ||||||||
| Shares | Value | |||||||
| Investment Funds — 2.8% | ||||||||
| Dreyfus Cash Management, Institutional Shares, 0.06%∞Ω | 2,664,629 | $ | 2,664,629 | |||||
| Invesco Government & Agency Portfolio, Institutional Class, 0.04%**∞Ω | 6,802,416 | 6,802,416 | ||||||
| Total Investment Funds | $ | 9,467,045 | ||||||
| Total Investment Securities —102.7% | ||||||||
| (Cost $345,130,052) | $ | 351,840,007 | ||||||
| Liabilities in Excess of Other Assets — (2.7%) | (9,307,892 | ) | ||||||
| Net Assets — 100.0% | $ | 342,532,115 | ||||||
| * | Non-income producing security. |
| ** | Represents collateral for securities loaned. |
| † | All or a portion of the security is on loan. The total market value of the securities on loan as of September 30, 2015 was $6,860,188. |
| ∞ | Open-End Fund. |
| Ω | Represents the 7-day SEC yield as of September 30, 2015. |
Portfolio Abbreviations:
PLC - Public Limited Company
REIT - Real Estate Investment Trust
Other Information:
The inputs or methodology used for valuing securities may not be an indication of the risk associated with investing in those securities. For more information on valuation inputs, and their aggregation into the levels used in the table below, please refer to the security valuation section in the accompanying Notes to Financial Statements.
Valuation inputs at Reporting Date:
| Description | Level 1 | Level 2 | Level 3 | Total | ||||||||||||
| Common Stocks | $ | 342,372,962 | $ | — | $ | — | $ | 342,372,962 | ||||||||
| Investment Funds | 9,467,045 | — | — | 9,467,045 | ||||||||||||
| $ | 351,840,007 | |||||||||||||||
See accompanying Notes to Financial Statements.
| 72 |
Touchstone Premium Yield Equity Fund – September 30, 2015
| Market | ||||||||
| Shares | Value | |||||||
| Common Stocks — 100.4% | ||||||||
| Financials — 24.6% | ||||||||
| Ares Capital Corp. | 112,207 | $ | 1,624,757 | |||||
| Bank of Montreal (Canada) | 52,363 | 2,856,402 | ||||||
| Care Capital Properties, Inc., REIT | 14,887 | 490,212 | ||||||
| Digital Realty Trust, Inc., REIT | 75,637 | 4,940,609 | ||||||
| HCP, Inc., REIT | 117,196 | 4,365,551 | ||||||
| Hospitality Properties Trust, REIT | 133,400 | 3,412,372 | ||||||
| Host Hotels & Resorts, Inc., REIT | 178,282 | 2,818,638 | ||||||
| Lamar Advertising Co., REIT | 120,934 | 6,310,336 | ||||||
| Omega Healthcare Investors, Inc., REIT | 51,948 | 1,825,972 | ||||||
| People's United Financial, Inc. | 177,871 | 2,797,911 | ||||||
| Ventas, Inc., REIT | 59,014 | 3,308,325 | ||||||
| Weyerhaeuser Co., REIT | 241,454 | 6,601,352 | ||||||
| 41,352,437 | ||||||||
| Energy — 17.3% | ||||||||
| Kinder Morgan, Inc. Delaware | 273,175 | 7,561,479 | ||||||
| ONEOK, Inc. | 159,581 | 5,138,508 | ||||||
| Pembina Pipeline Corp. (Canada) | 58,183 | 1,396,974 | ||||||
| Plains GP Holdings LP - Class A | 193,244 | 3,381,770 | ||||||
| Spectra Energy Corp. | 206,129 | 5,415,009 | ||||||
| Williams Cos., Inc. (The) | 168,728 | 6,217,627 | ||||||
| 29,111,367 | ||||||||
| Health Care — 16.1% | �� | |||||||
| AbbVie, Inc. | 72,725 | 3,956,967 | ||||||
| GlaxoSmithKline PLC, ADR | 89,348 | 3,435,431 | ||||||
| Johnson & Johnson | 58,183 | 5,431,383 | ||||||
| Merck & Co., Inc. | 113,038 | 5,582,947 | ||||||
| Novartis AG, ADR | 43,221 | 3,972,874 | ||||||
| Pfizer, Inc. | 111,377 | 3,498,352 | ||||||
| Senior Housing Properties Trust, REIT | 75,637 | 1,225,319 | ||||||
| 27,103,273 | ||||||||
| Information Technology — 14.1% | ||||||||
| Cisco Systems, Inc. | 237,715 | 6,240,019 | ||||||
| Maxim Integrated Products, Inc. | 95,168 | 3,178,611 | ||||||
| Microchip Technology, Inc. | 95,584 | 4,118,715 | ||||||
| Microsoft Corp. | 119,273 | 5,279,023 | ||||||
| Seagate Technology PLC (Ireland) | 68,571 | 3,071,981 | ||||||
| STMicroelectronics N.V. | 259,739 | 1,771,420 | ||||||
| 23,659,769 | ||||||||
| Industrials — 6.1% | ||||||||
| Covanta Holding Corp. | 87,687 | 1,530,138 | ||||||
| Eaton Corp. PLC (Ireland) | 50,702 | 2,601,013 | ||||||
| General Electric Co. | 240,623 | 6,068,512 | ||||||
| 10,199,663 | ||||||||
| Telecommunication Services — 5.8% | ||||||||
| AT&T, Inc. | 98,491 | 3,208,837 | ||||||
| BCE, Inc. (Canada) | 36,579 | 1,498,276 | ||||||
| Verizon Communications, Inc. | 46,959 | 2,043,186 | ||||||
| Vodafone Group PLC, ADR | 97,660 | 3,099,728 | ||||||
| 9,850,027 | ||||||||
| Materials — 5.0% | ||||||||
| Domtar Corp. | 100,988 | 3,610,321 | ||||||
| LyondellBasell Industries N.V. - Class A (Netherlands) | 56,937 | 4,746,268 | ||||||
| 8,356,589 | ||||||||
| Utilities — 4.1% | ||||||||
| American Water Works Co., Inc. | 88,518 | 4,875,571 | ||||||
| NiSource, Inc. | 113,038 | 2,096,855 | ||||||
| 6,972,426 | ||||||||
| Consumer Discretionary — 4.0% | ||||||||
| Coach, Inc. | 126,339 | 3,654,987 | ||||||
| GameStop Corp. - Class A | 73,971 | 3,048,345 | ||||||
| 6,703,332 | ||||||||
| Consumer Staples — 3.3% | ||||||||
| Procter & Gamble Co. (The) | 77,475 | 5,573,552 | ||||||
| Total Common Stocks | $ | 168,882,435 | ||||||
| Investment Fund — 1.3% | ||||||||
| Dreyfus Cash Management, Institutional Shares, 0.06%∞Ω | 2,230,207 | 2,230,207 | ||||||
| Total Investment Securities —101.7% | ||||||||
| (Cost $177,869,872) | $ | 171,112,642 | ||||||
| Liabilities in Excess of Other Assets — (1.7)% | (2,913,759 | ) | ||||||
| Net Assets — 100.0% | $ | 168,198,883 | ||||||
| ∞ | Open-End Fund. |
| Ω | Represents the 7-day SEC yield as of September 30, 2015. |
Portfolio Abbreviations:
ADR - American Depositary Receipt
LP - Limited Partnership
PLC - Public Limited Company
| 73 |
Touchstone Premium Yield Equity Fund (Continued)
Other Information:
The inputs or methodology used for valuing securities may not be an indication of the risk associated with investing in those securities. For more information on valuation inputs, and their aggregation into the levels used in the table below, please refer to the security valuation section in the accompanying Notes to Financial Statements.
Valuation inputs at Reporting Date:
| Description | Level 1 | Level 2 | Level 3 | Total | ||||||||||||
| Common Stocks | $ | 168,882,435 | $ | — | $ | — | $ | 168,882,435 | ||||||||
| Investment Fund | 2,230,207 | — | — | 2,230,207 | ||||||||||||
| $ | 171,112,642 | |||||||||||||||
See accompanying Notes to Financial Statements.
| 74 |
Touchstone Sands Capital Select Growth Fund – September 30, 2015
| Market | ||||||||
| Shares | Value | |||||||
| Common Stocks — 99.1% | ||||||||
| Information Technology — 44.2% | ||||||||
| Adobe Systems, Inc.* | 1,388,000 | $ | 114,121,360 | |||||
| Alibaba Group Holding, Ltd. ADR* | 2,162,000 | 127,493,140 | ||||||
| ARM Holdings PLC ADR | 2,042,933 | 88,356,852 | ||||||
| ASML Holding NV† | 1,401,000 | 123,259,980 | ||||||
| Baidu, Inc. ADR* | 1,013,000 | 139,196,330 | ||||||
| Facebook, Inc. - Class A* | 2,084,000 | 187,351,600 | ||||||
| Google, Inc. - Class A* | 208,000 | 132,780,960 | ||||||
| Google, Inc. - Class C* | 57,000 | 34,679,940 | ||||||
| LendingClub Corp.*† | 8,012,000 | 105,998,760 | ||||||
| LinkedIn Corp. - Class A* | 672,000 | 127,767,360 | ||||||
| Mobileye N.V. (Netherlands)*† | 2,310,949 | 105,101,961 | ||||||
| Palo Alto Networks, Inc.* | 455,000 | 78,260,000 | ||||||
| Salesforce.com, Inc.* | 2,580,000 | 179,129,400 | ||||||
| Splunk, Inc.* | 1,401,000 | 77,545,350 | ||||||
| Visa, Inc. - Class A | 7,691,000 | 535,755,060 | ||||||
| 2,156,798,053 | ||||||||
| Health Care — 25.5% | ||||||||
| Alexion Pharmaceuticals, Inc.* | 1,308,000 | 204,558,120 | ||||||
| athenahealth, Inc.*† | 896,000 | 119,481,600 | ||||||
| Biogen, Inc.* | 597,000 | 174,210,570 | ||||||
| BioMarin Pharmaceutical, Inc.* | 1,666,000 | 175,463,120 | ||||||
| Cerner Corp.* | 2,293,000 | 137,488,280 | ||||||
| Edwards Lifesciences Corp.* | 97,111 | 13,806,271 | ||||||
| Illumina, Inc.* | 687,000 | 120,788,340 | ||||||
| Regeneron Pharmaceuticals, Inc.* | 645,000 | 300,015,300 | ||||||
| 1,245,811,601 | ||||||||
| Consumer Discretionary — 16.5% | ||||||||
| Amazon.com, Inc.* | 349,000 | 178,649,610 | ||||||
| Chipotle Mexican Grill, Inc.* | 313,000 | 225,438,250 | ||||||
| NIKE, Inc. - Class B | 1,250,000 | 153,712,500 | ||||||
| Priceline Group, Inc. (The)* | 200,000 | 247,372,000 | ||||||
| 805,172,360 | ||||||||
| Energy — 4.5% | ||||||||
| FMC Technologies, Inc.* | 3,027,000 | 93,837,000 | ||||||
| Schlumberger Ltd. (Curacao) | 1,855,000 | 127,939,350 | ||||||
| 221,776,350 | ||||||||
| Financials — 3.2% | ||||||||
| Charles Schwab Corp. (The) | 5,542,000 | 158,279,520 | ||||||
| Materials — 3.1% | ||||||||
| Monsanto Co. | 1,788,000 | 152,587,920 | ||||||
| Consumer Staples — 2.1% | ||||||||
| Whole Foods Market, Inc. | 3,173,000 | 100,425,450 | ||||||
| Total Common Stocks | $ | 4,840,851,254 | ||||||
| Investment Funds — 9.2% | ||||||||
| Dreyfus Cash Management, Institutional Shares, 0.06%∞Ω | 121,556,937 | 121,556,937 | ||||||
| Invesco Government & Agency Portfolio, Institutional Class, 0.04%**∞Ω | 329,118,378 | 329,118,378 | ||||||
| Total Investment Funds | $ | 450,675,315 | ||||||
| Total Investment Securities —108.3% | ||||||||
| (Cost $3,678,748,053) | $ | 5,291,526,569 | ||||||
| Liabilities in Excess of Other Assets — (8.3%) | (405,895,410 | ) | ||||||
| Net Assets — 100.0% | $ | 4,885,631,159 | ||||||
| * | Non-income producing security. |
| ** | Represents collateral for securities loaned. |
| † | All or a portion of the security is on loan. The total market value of the securities on loan as of September 30,2015 was $328,805,184. |
| ∞ | Open-End Fund. |
| Ω | Represents the 7-day SEC yield as of September 30, 2015. |
Portfolio Abbreviation:
ADR - American Depositary Receipt
PLC - Public Limited Company
Other Information:
The inputs or methodology used for valuing securities may not be an indication of the risk associated with investing in those securities. For more information on valuation inputs, and their aggregation into the levels used in the table below, please refer to the security valuation section in the accompanying Notes to Financial Statements.
Valuation inputs at Reporting Date:
| Description | Level 1 | Level 2 | Level 3 | Total | ||||||||||||
| Common Stocks | $ | 4,840,851,254 | $ | — | $ | — | $ | 4,840,851,254 | ||||||||
| Investment Funds | 450,675,315 | — | — | 450,675,315 | ||||||||||||
| $ | 5,291,526,569 | |||||||||||||||
See accompanying Notes to Financial Statements.
| 75 |
Touchstone Small Cap Core Fund – September 30, 2015
| Market | ||||||||
| Shares | Value | |||||||
| Common Stocks — 99.1% | ||||||||
| Consumer Discretionary — 27.1% | ||||||||
| American Eagle Outfitters, Inc. | 677,649 | $ | 10,591,654 | |||||
| Cabela's, Inc.*† | 577,316 | 26,325,610 | ||||||
| Dana Holding Corp. | 1,048,190 | 16,645,257 | ||||||
| Deckers Outdoor Corp.* | 324,820 | 18,859,049 | ||||||
| Service Corp. International | 1,282,090 | 34,744,639 | ||||||
| Sturm Ruger & Co., Inc.† | 348,712 | 20,465,907 | ||||||
| Tempur Sealy International, Inc.* | 546,640 | 39,046,495 | ||||||
| Vista Outdoor, Inc.* | 637,790 | 28,337,010 | ||||||
| 195,015,621 | ||||||||
| Financials — 21.3% | ||||||||
| Alexander & Baldwin, Inc. | 532,738 | 18,288,895 | ||||||
| Corrections Corp. of America REIT | 881,040 | 26,025,922 | ||||||
| Eaton Vance Corp. | 425,419 | 14,217,503 | ||||||
| First Industrial Realty Trust, Inc. REIT | 1,418,701 | 29,721,786 | ||||||
| MBIA, Inc.* | 1,684,934 | 10,244,399 | ||||||
| Tejon Ranch Co.* | 385,361 | 8,404,723 | ||||||
| Waddell & Reed Financial, Inc. - Class A | 650,620 | 22,622,057 | ||||||
| White Mountains Insurance Group Ltd. (Bermuda) | 31,489 | 23,531,730 | ||||||
| 153,057,015 | ||||||||
| Industrials — 21.3% | ||||||||
| GATX Corp. | 481,900 | 21,275,885 | ||||||
| Kaman Corp. | 282,468 | 10,126,478 | ||||||
| Landstar System, Inc. | 355,000 | 22,531,850 | ||||||
| Matson, Inc. | 560,635 | 21,578,841 | ||||||
| MRC Global, Inc.* | 669,290 | 7,462,583 | ||||||
| Orbital ATK, Inc. | 580,732 | 41,737,209 | ||||||
| USG Corp.* | 1,064,100 | 28,326,342 | ||||||
| 153,039,188 | ||||||||
| Materials — 9.6% | ||||||||
| NewMarket Corp. | 119,933 | 42,816,081 | ||||||
| Olin Corp.† | 1,270,190 | 21,351,894 | ||||||
| Tredegar Corp. | 394,900 | 5,165,292 | ||||||
| 69,333,267 | ||||||||
| Consumer Staples — 7.3% | ||||||||
| Energizer Holdings, Inc. | 655,200 | 25,362,792 | ||||||
| Pricesmart, Inc. | 349,155 | 27,003,648 | ||||||
| 52,366,440 | ||||||||
| Energy — 5.2% | ||||||||
| Atwood Oceanics, Inc.† | 888,316 | 13,155,960 | ||||||
| Superior Energy Services, Inc. | 1,228,300 | 15,513,429 | ||||||
| World Fuel Services Corp. | 252,254 | 9,030,693 | ||||||
| 37,700,082 | ||||||||
| Information Technology — 3.7% | ||||||||
| DST Systems, Inc. | 251,700 | 26,463,738 | ||||||
| Health Care — 3.6% | ||||||||
| Tenet Healthcare Corp.* | 710,517 | 26,232,288 | ||||||
| Total Common Stocks | $ | 713,207,639 | ||||||
| Warrants — 0.0% | ||||||||
| Financials — 0.0% | ||||||||
| Tejon Ranch Co., Expiration 08/31/16* | 63,145 | 10,103 | ||||||
| Investment Funds — 5.6% | ||||||||
| Dreyfus Cash Management, Institutional Shares, 0.06%∞Ω | 5,824,190 | 5,824,190 | ||||||
| Invesco Government & Agency Portfolio, Institutional Class, 0.04%**∞Ω | 34,923,382 | 34,923,382 | ||||||
| Total Investment Funds | $ | 40,747,572 | ||||||
| Total Investment Securities —104.7% | ||||||||
| (Cost $708,141,391) | $ | 753,965,314 | ||||||
| Liabilities in Excess of Other Assets — (4.7%) | (34,141,451 | ) | ||||||
| Net Assets — 100.0% | $ | 719,823,863 | ||||||
| * | Non-income producing security. |
| ** | Represents collateral for securities loaned. |
| † | All or a portion of the security is on loan. The total market valueofthesecuritiesonloanasofSeptember30,2015was $34,851,700. |
| ∞ | Open-End Fund. |
| Ω | Represents the 7-day SEC yield as of September 30, 2015. |
Portfolio Abbreviations:
REIT - Real Estate Investment Trust
| 76 |
Touchstone Small Cap Core Fund (Continued)
Other Information:
The inputs or methodology used for valuing securities may not be an indication of the risk associated with investing in those securities. For more information on valuation inputs, and their aggregation into the levels used in the table below, please refer to the security valuation section in the accompanying Notes to Financial Statements.
Valuation inputs at Reporting Date:
| Description | Level 1 | Level 2 | Level 3 | Total | ||||||||||||
| Common Stocks | $ | 713,207,639 | $ | — | $ | — | $ | 713,207,639 | ||||||||
| Warrants | 10,103 | — | — | 10,103 | ||||||||||||
| Investment Funds | 40,747,572 | — | — | 40,747,572 | ||||||||||||
| $ | 753,965,314 | |||||||||||||||
See accompanying Notes to Financial Statements.
| 77 |
Touchstone Small Cap Value Fund – September 30, 2015
| Market | ||||||||
| Shares | Value | |||||||
| Common Stocks — 98.4% | ||||||||
| Financials — 37.3% | ||||||||
| Brookline Bancorp, Inc. | 54,614 | $ | 553,786 | |||||
| Chemical Financial Corp. | 30,715 | 993,630 | ||||||
| Columbia Banking System, Inc. | 26,672 | 832,433 | ||||||
| First Financial Bancorp | 32,910 | 627,923 | ||||||
| First Merchants Corp. | 19,549 | 512,575 | ||||||
| First Midwest Bancorp, Inc. | 36,961 | 648,296 | ||||||
| FNB Corp. | 120,665 | 1,562,612 | ||||||
| Greenhill & Co., Inc. | 21,548 | 613,471 | ||||||
| Hancock Holding Co. | 45,021 | 1,217,818 | ||||||
| Iberiabank Corp. | 17,522 | 1,019,956 | ||||||
| Infinity Property & Casualty Corp. | 7,458 | 600,667 | ||||||
| National Bank Holdings Corp. - Class A | 51,468 | 1,056,638 | ||||||
| New Residential Investment Corp. REIT | 149,116 | 1,953,419 | ||||||
| Northwest Bancshares, Inc. | 63,530 | 825,890 | ||||||
| Old National Bancorp. | 90,550 | 1,261,361 | ||||||
| Potlatch Corp. REIT | 20,165 | 580,550 | ||||||
| ProAssurance Corp. | 11,339 | 556,405 | ||||||
| Prosperity Bancshares, Inc. | 38,018 | 1,867,064 | ||||||
| Provident Financial Services, Inc. | 28,742 | 560,469 | ||||||
| Sterling BanCorp. | 18,799 | 279,541 | ||||||
| UMB Financial Corp. | 8,890 | 451,701 | ||||||
| Union Bankshares Corp. | 33,760 | 810,240 | ||||||
| WesBanco, Inc. | 14,053 | 441,967 | ||||||
| Westamerica Bancorporation | 27,793 | 1,235,121 | ||||||
| 21,063,533 | ||||||||
| Industrials — 20.0% | ||||||||
| Acacia Research Corp.† | 112,476 | 1,021,282 | ||||||
| Astec Industries, Inc. | 15,360 | 514,713 | ||||||
| Crane Co. | 25,873 | 1,205,940 | ||||||
| Granite Construction, Inc. | 52,603 | 1,560,731 | ||||||
| KBR, Inc. | 108,554 | 1,808,510 | ||||||
| McGrath RentCorp | 23,769 | 634,395 | ||||||
| MSA Safety, Inc. | 24,699 | 987,219 | ||||||
| Primoris Services Corp. | 45,372 | 812,612 | ||||||
| Regal-Beloit Corp. | 22,737 | 1,283,504 | ||||||
| Tetra Tech, Inc. | 59,965 | 1,457,749 | ||||||
| 11,286,655 | ||||||||
| Materials — 12.2% | ||||||||
| Axiall Corp. | 39,746 | 623,615 | ||||||
| Cabot Corp. | 59,596 | 1,880,850 | ||||||
| Compass Minerals International, Inc. | 17,099 | 1,340,049 | ||||||
| Greif, Inc. - Class A | 15,753 | 502,678 | ||||||
| Haynes International, Inc. | 17,070 | 645,929 | ||||||
| Kronos Worldwide, Inc. | 87,790 | 545,176 | ||||||
| TimkenSteel Corp. | 70,330 | 711,740 | ||||||
| US Silica Holdings, Inc.† | 45,432 | 640,137 | ||||||
| 6,890,174 | ||||||||
| Energy — 11.2% | ||||||||
| Bristow Group, Inc. | 18,780 | 491,285 | ||||||
| CARBO Ceramics, Inc.† | 64,823 | 1,230,989 | ||||||
| Green Plains Renewable Energy, Inc. | 47,136 | 917,266 | ||||||
| Patterson-UTI Energy, Inc. | 120,253 | 1,580,124 | ||||||
| Precision Drilling Corp. | 179,219 | 666,695 | ||||||
| Superior Energy Services, Inc. | 114,947 | 1,451,781 | ||||||
| 6,338,140 | ||||||||
| Consumer Discretionary — 8.0% | ||||||||
| Abercrombie & Fitch Co. - Class A† | 32,758 | 694,142 | ||||||
| Buckle, Inc. (The)† | 23,075 | 853,083 | ||||||
| Chico's FAS, Inc. | 70,029 | 1,101,556 | ||||||
| Men's Wearhouse, Inc. (The) | 32,393 | 1,377,350 | ||||||
| Sotheby's | 14,227 | 454,979 | ||||||
| 4,481,110 | ||||||||
| Information Technology — 7.6% | ||||||||
| ADTRAN, Inc. | 77,488 | 1,131,325 | ||||||
| Cohu, Inc. | 48,540 | 478,604 | ||||||
| Cypress Semiconductor Corp. | 119,084 | 1,014,596 | ||||||
| Diebold, Inc. | 55,853 | 1,662,744 | ||||||
| 4,287,269 | ||||||||
| Consumer Staples — 1.9% | ||||||||
| Andersons, Inc. (The) | 31,692 | 1,079,429 | ||||||
| Health Care — 0.2% | ||||||||
| Bio-Techne Corp. | 1,184 | 109,473 | ||||||
| Total Common Stocks | $ | 55,535,783 | ||||||
| Investment Funds — 11.1% | ||||||||
| Dreyfus Cash Management, Institutional Shares, 0.06%∞Ω | 1,719,393 | 1,719,393 | ||||||
| Invesco Government & Agency Portfolio, Institutional Class, 0.04%**∞Ω | 4,546,361 | 4,546,361 | ||||||
| Total Investment Funds | $ | 6,265,754 | ||||||
| Total Investment Securities —109.5% | ||||||||
| (Cost $74,354,825) | $ | 61,801,537 | ||||||
| Liabilities in Excess of Other Assets — (9.5%) | (5,359,692 | ) | ||||||
| Net Assets — 100.0% | $ | 56,441,845 | ||||||
| ** | Represents collateral for securities loaned. |
| † | All or a portion of the security is on loan. The total market value of the securities on loan as of September 30, 2015 was $4,332,170. |
| ∞ | Open-End Fund. |
| Ω | Represents the 7-day SEC yield as of September 30, 2015. |
Portfolio Abbreviations:
REIT - Real Estate Investment Trust
| 78 |
Touchstone Small Cap Value Fund (Continued)
Other Information:
The inputs or methodology used for valuing securities may not be an indication of the risk associated with investing in those securities. For more information on valuation inputs, and their aggregation into the levels used in the table below, please refer to the security valuation section in the accompanying Notes to Financial Statements.
Valuation inputs at Reporting Date:
| Description | Level 1 | Level 2 | Level 3 | Total | ||||||||||||
| Common Stocks | $ | 55,535,783 | $ | — | $ | — | $ | 55,535,783 | ||||||||
| Investment Funds | 6,265,754 | — | — | 6,265,754 | ||||||||||||
| $ | 61,801,537 | |||||||||||||||
See accompanying Notes to Financial Statements.
| 79 |
Touchstone Total Return Bond Fund – September 30, 2015
| Principal | Market | |||||||
| Amount | Value | |||||||
| Corporate Bonds — 30.0% | ||||||||
| Industrials — 8.7% | ||||||||
| $ | 1,577,509 | American Airlines 2011-1 Class B Pass | ||||||
| Through Trust, 144a, | ||||||||
| 7.000%, 1/31/18 | $ | 1,668,216 | ||||||
| 32,180 | Burlington Northern and Santa Fe | |||||||
| Railway Co. 1998-C Pass Through | ||||||||
| Trust, 6.230%, 7/2/18 | 33,578 | |||||||
| 97,440 | Burlington Northern and Santa Fe | |||||||
| Railway Co. 2004-1 Pass Through | ||||||||
| Trust, 4.575%, 1/15/21 | 102,891 | |||||||
| 388,152 | Burlington Northern and Santa Fe | |||||||
| Railway Co. 2005-3 Pass Through | ||||||||
| Trust, 4.830%, 1/15/23 | 418,447 | |||||||
| 1,112,725 | Burlington Northern and Santa Fe | |||||||
| Railway Co. 2005-4 Pass Through | ||||||||
| Trust, 4.967%, 4/1/23 | 1,210,876 | |||||||
| 1,471,600 | Continental Airlines 2000-2 Class A-1 | |||||||
| Pass Through Trust, 7.707%, 4/2/21 | 1,604,044 | |||||||
| 595,461 | CSX Transportation, Inc., | |||||||
| 6.251%, 1/15/23 | 696,411 | |||||||
| 1,541,923 | Delta Air Lines 2010-2 Class A Pass | |||||||
| Through Trust, 4.950%, 5/23/19 | 1,626,729 | |||||||
| 1,073,016 | Federal Express Corp. 1998 Pass | |||||||
| Through Trust, 6.845%, 1/15/19 | 1,161,540 | |||||||
| 490,728 | Federal Express Corp. 1999 Pass | |||||||
| Through Trust, 7.650%, 1/15/22 | 576,605 | |||||||
| 600,000 | Kansas City Southern DE Mexico SA | |||||||
| DE CV, 3.000%, 5/15/23 | 580,511 | |||||||
| 1,402,000 | Republic Services, Inc., | |||||||
| 5.250%, 11/15/21 | 1,573,008 | |||||||
| 1,348,956 | Southwest Airlines Co. 2007-1 Pass | |||||||
| Through Trust, 6.150%, 8/1/22 | 1,510,831 | |||||||
| 66,678 | Union Pacific Railroad Co. 2001 Pass | |||||||
| Through Trust, 6.630%, 1/27/22 | 74,787 | |||||||
| 1,135,972 | Union Pacific Railroad Co. 2003 Pass | |||||||
| Through Trust, 4.698%, 1/2/24 | 1,229,732 | |||||||
| 506,831 | Union Pacific Railroad Co. 2006 Pass | |||||||
| Through Trust, 5.866%, 7/2/30 | 587,873 | |||||||
| 1,325,000 | United Rentals North America, Inc., | |||||||
| 5.750%, 11/15/24 | 1,268,688 | |||||||
| 15,924,767 | ||||||||
| Financials — 7.4% | ||||||||
| 1,885,000 | American Express Co., | |||||||
| 2.650%, 12/2/22 | 1,835,775 | |||||||
| 1,216,000 | Delphi Financial Group, Inc., | |||||||
| 7.875%, 1/31/20 | 1,444,655 | |||||||
| 1,550,000 | Ford Motor Credit Co. LLC, | |||||||
| 4.375%, 8/6/23 | 1,609,731 | |||||||
| 1,830,000 | General Electric Capital Corp. MTN, | |||||||
| 3.450%, 5/15/24 | 1,913,770 | |||||||
| 1,500,000 | Provident Cos., Inc., 7.000%, 7/15/18 | 1,686,852 | ||||||
| 1,398,000 | Torchmark Corp., 3.800%, 9/15/22 | 1,417,339 | ||||||
| 2,000,000 | USB Capital IX, 3.500%(A)(B) | 1,627,500 | ||||||
| 2,000,000 | Wachovia Capital Trust III, 5.570%(A)(B) | 1,960,100 | ||||||
| 13,495,722 | ||||||||
| Utilities — 6.2% | ||||||||
| 1,456,495 | Bruce Mansfield Unit, 6.850%, 6/1/34 | 1,525,373 | ||||||
| 450,000 | California Water Service Co., | |||||||
| 5.500%, 12/1/40 | 544,597 | |||||||
| 1,311,000 | Commonwealth Edison Co., | |||||||
| 5.900%, 3/15/36 | 1,583,223 | |||||||
| 1,780,000 | Dominion Resources, Inc., | |||||||
| 2.627%, 9/30/66(A) | 1,388,706 | |||||||
| 1,700,000 | Entergy Louisiana LLC, | |||||||
| 4.440%, 1/15/26 | 1,845,962 | |||||||
| 936,700 | Kiowa Power Partners LLC, 144a, | |||||||
| 5.737%, 3/30/21 | 1,005,922 | |||||||
| 2,000,000 | NextEra Energy Capital Holdings, Inc., | |||||||
| 6.350%, 10/1/66(A) | 1,605,000 | |||||||
| 1,800,000 | South Carolina Electric & Gas Co., | |||||||
| 4.600%, 6/15/43 | 1,833,250 | |||||||
| 11,332,033 | ||||||||
| Energy — 3.4% | ||||||||
| 1,000,000 | Apache Corp., 3.250%, 4/15/22 | 973,577 | ||||||
| 1,253,000 | Chesapeake Energy Corp., | |||||||
| 6.625%, 8/15/20† | 931,129 | |||||||
| 1,530,000 | Newfield Exploration Co., | |||||||
| 5.750%, 1/30/22 | 1,484,100 | |||||||
| 1,551,000 | Petrobras International Finance Co. - | |||||||
| Pifco, 3.500%, 2/6/17 | 1,380,390 | |||||||
| 1,500,000 | Petroleos Mexicanos (Mexico), | |||||||
| 4.875%, 1/24/22 | 1,485,315 | |||||||
| 6,254,511 | ||||||||
| Consumer Staples — 1.8% | ||||||||
| 1,575,363 | CVS Pass-Through Trust, | |||||||
| 6.036%, 12/10/28 | 1,779,548 | |||||||
| 1,500,000 | Kroger Co. (The), 3.850%, 8/1/23 | 1,549,059 | ||||||
| 3,328,607 | ||||||||
| Telecommunication Services — 0.9% | ||||||||
| 1,500,000 | Verizon Communications, Inc., | |||||||
| 6.000%, 4/1/41 | 1,636,526 | |||||||
| Consumer Discretionary — 0.8% | ||||||||
| 410,000 | PulteGroup, Inc., 7.875%, 6/15/32 | 471,500 | ||||||
| 1,000,000 | Royal Caribbean Cruises Ltd., | |||||||
| 5.250%, 11/15/22 | 1,045,000 | |||||||
| 1,516,500 | ||||||||
| Health Care — 0.8% | ||||||||
| 1,400,000 | HCA, Inc., 4.250%, 10/15/19 | 1,414,000 | ||||||
| Total Corporate Bonds | $ | 54,902,666 | ||||||
| U.S. Government Agency Obligations — 27.2% | ||||||||
| 40,284 | Astro Offshore Corp., | |||||||
| 6.000%, 12/20/19 | 42,530 | |||||||
| 345,000 | Canal Barge Co., Inc., 4.500%, 11/12/34 | 386,133 | ||||||
| 573,090 | EJM Airport LLC, 6.271%, 5/15/20 | 642,828 | ||||||
| 80 |
Touchstone Total Return Bond Fund (Continued)
| Principal | Market | |||||||
| Amount | Value | |||||||
| U.S. Government Agency Obligations — 27.2% (Continued) | ||||||||
| $ | 2,000,000 | Fishers Lane Associates LLC, 144a, | ||||||
| 3.666%, 8/5/30 | $ | 2,058,464 | ||||||
| 291,000 | Matson Navigation Co., Inc., | |||||||
| 5.337%, 9/4/28 | 325,260 | |||||||
| 1,610,750 | Petroleos Mexicanos (Mexico), | |||||||
| 2.290%, 2/15/24 | 1,637,028 | |||||||
| 2,275,000 | Small Business Administration, Ser | |||||||
| 2015-20E, Class 1, 2.770%, 5/1/35 | 2,313,853 | |||||||
| 15,554 | Small Business Administration | |||||||
| Participation Certificates, | ||||||||
| 6.150%, 2/1/18 | 16,433 | |||||||
| 32,079 | Small Business Administration | |||||||
| Participation Certificates, Ser | ||||||||
| 2001-20A, Class 1, 6.290%, 1/1/21 | 34,650 | |||||||
| 73,463 | Small Business Administration | |||||||
| Participation Certificates, Ser | ||||||||
| 2001-20K, Class 1, 5.340%, 11/1/21 | 78,877 | |||||||
| 173,222 | Small Business Administration | |||||||
| Participation Certificates, Ser | ||||||||
| 2002-20H, Class 1, 5.310%, 8/1/22 | 187,411 | |||||||
| 190,223 | Small Business Administration | |||||||
| Participation Certificates, Ser | ||||||||
| 2003-20B, Class 1, 4.840%, 2/1/23 | 204,619 | |||||||
| 68,838 | Small Business Administration | |||||||
| Participation Certificates, Ser | ||||||||
| 2003-20D, Class 1, 4.760%, 4/1/23 | 74,005 | |||||||
| 48,038 | Small Business Administration | |||||||
| Participation Certificates, Ser | ||||||||
| 2004-20D, Class 1, 4.770%, 4/1/24 | 51,464 | |||||||
| 435,311 | Small Business Administration | |||||||
| Participation Certificates, Ser | ||||||||
| 2004-20K, Class 1, 4.880%, 11/1/24 | 470,802 | |||||||
| 235,026 | Small Business Administration | |||||||
| Participation Certificates, Ser | ||||||||
| 2005-20B, Class 1, 4.625%, 2/1/25 | 251,318 | |||||||
| 209,129 | Small Business Administration | |||||||
| Participation Certificates, Ser | ||||||||
| 2005-20H, Class 1, 5.110%, 8/1/25 | 228,162 | |||||||
| 1,483,702 | Small Business Administration | |||||||
| Participation Certificates, Ser | ||||||||
| 2006-20B, Class 1, 5.350%, 2/1/26 | 1,628,635 | |||||||
| 408,508 | Small Business Administration | |||||||
| Participation Certificates, Ser | ||||||||
| 2006-20H, Class 1, 5.700%, 8/1/26 | 457,132 | |||||||
| 1,039,567 | Small Business Administration | |||||||
| Participation Certificates, Ser | ||||||||
| 2006-20K, Class 1, 5.360%, 11/1/26 | 1,140,725 | |||||||
| 799,250 | Small Business Administration | |||||||
| Participation Certificates, Ser | ||||||||
| 2006-20L, Class 1, 5.120%, 12/1/26 | 874,064 | |||||||
| 886,348 | Small Business Administration | |||||||
| Participation Certificates, Ser | ||||||||
| 2007-20A, Class 1, 5.320%, 1/1/27 | 984,588 | |||||||
| 1,149,153 | Small Business Administration | |||||||
| Participation Certificates, Ser | ||||||||
| 2007-20E, Class 1, 5.310%, 5/1/27 | 1,275,805 | |||||||
| 458,814 | Small Business Administration | |||||||
| Participation Certificates, Ser | ||||||||
| 2007-20F, Class 1, 5.710%, 6/1/27 | 516,947 | |||||||
| 1,110,223 | Small Business Administration | |||||||
| Participation Certificates, Ser | ||||||||
| 2007-20L, Class 1, 5.290%, 12/1/27 | 1,232,084 | |||||||
| 711,836 | Small Business Administration | |||||||
| Participation Certificates, Ser | ||||||||
| 2008-20A, Class 1, 5.170%, 1/1/28 | 792,055 | |||||||
| 840,167 | Small Business Administration | |||||||
| Participation Certificates, Ser | ||||||||
| 2008-20K, Class 1, 6.770%, 11/1/28 | 969,084 | |||||||
| 1,097,066 | Small Business Administration | |||||||
| Participation Certificates, Ser | ||||||||
| 2009-20B, Class 1, 4.760%, 2/1/29 | 1,191,912 | |||||||
| 1,293,881 | Small Business Administration | |||||||
| Participation Certificates, Ser | ||||||||
| 2009-20C, Class 1, 4.660%, 3/1/29 | 1,402,750 | |||||||
| 260,013 | Small Business Administration | |||||||
| Participation Certificates, Ser | ||||||||
| 2009-20D, Class 1, 4.310%, 4/1/29 | 280,365 | |||||||
| 1,232,026 | Small Business Administration | |||||||
| Participation Certificates, Ser | ||||||||
| 2009-20E, Class 1, 4.430%, 5/1/29 | 1,334,144 | |||||||
| 836,885 | Small Business Administration | |||||||
| Participation Certificates, Ser | ||||||||
| 2009-20F, Class 1, 4.950%, 6/1/29 | 921,965 | |||||||
| 1,246,427 | Small Business Administration | |||||||
| Participation Certificates, Ser | ||||||||
| 2009-20J, Class 1, 3.920%, 10/1/29 | 1,332,169 | |||||||
| 1,378,699 | Small Business Administration | |||||||
| Participation Certificates, Ser | ||||||||
| 2010-20F, Class 1, 3.880%, 6/1/30 | 1,481,272 | |||||||
| 1,818,311 | Small Business Administration | |||||||
| Participation Certificates, Ser | ||||||||
| 2010-20I, Class 1, 3.210%, 9/1/30 | 1,901,012 | |||||||
| 1,097,885 | Small Business Administration | |||||||
| Participation Certificates, Ser | ||||||||
| 2012-10C, Class 1, 1.240%, 5/1/22 | 1,087,844 | |||||||
| 2,177,680 | Small Business Administration | |||||||
| Participation Certificates, Ser | ||||||||
| 2013-20C, Class 1, 2.220%, 3/1/33 | 2,174,064 | |||||||
| 2,423,271 | Small Business Administration | |||||||
| Participation Certificates, Ser | ||||||||
| 2013-20E, Class 1, 2.070%, 5/1/33 | 2,388,705 | |||||||
| 2,973,815 | Small Business Administration | |||||||
| Participation Certificates, Ser | ||||||||
| 2013-20G, Class 1, 3.150%, 7/1/33 | 3,110,415 | |||||||
| 2,986,827 | Small Business Administration | |||||||
| Participation Certificates, Ser | ||||||||
| 2014-20H, Class 1, 2.880%, 8/1/34 | 3,045,630 | |||||||
| 2,492,062 | Small Business Administration | |||||||
| Participation Certificates, Ser | ||||||||
| 2014-20K, Class 1, 2.800%, 11/1/34 | 2,537,543 | |||||||
| 114,381 | Sterling Equipment, 6.125%, 9/28/19 | 126,493 | ||||||
| 1,619,522 | Tagua Leasing LLC, 1.581%, 11/16/24 | 1,589,626 | ||||||
| 81 |
Touchstone Total Return Bond Fund (Continued)
| Principal | Market | |||||||
| Amount | Value | |||||||
| U.S. Government Agency Obligations — 27.2% (Continued) | ||||||||
| $ | 1,650,000 | Tennessee Valley Authority, | ||||||
| 4.650%, 6/15/35 | $ | 1,894,487 | ||||||
| 1,056,000 | Totem Ocean Trailer Express, Inc., | |||||||
| 6.365%, 4/15/28 | 1,228,556 | |||||||
| 1,511,000 | Vessel Management Services, Inc., | |||||||
| 5.125%, 4/16/35 | 1,772,282 | |||||||
| Total U.S. Government Agency Obligations | $ | 49,676,190 | ||||||
| U.S. Government Mortgage-Backed Obligations — 17.6% | ||||||||
| 296,748 | FHLMC, Pool #A89148, | |||||||
| 4.000%, 10/1/39 | 316,897 | |||||||
| 219,394 | FNMA, Pool #465711, 4.680%, 8/1/28 | 257,501 | ||||||
| 1,589,006 | FNMA, Pool #469616, 3.500%, 11/1/21 | 1,723,948 | ||||||
| 1,700,000 | FNMA, Pool #469667, 3.540%, 12/1/21 | 1,830,956 | ||||||
| 113,747 | FNMA, Pool #874210, 5.260%, 1/1/25 | 137,164 | ||||||
| 193,728 | FNMA, Pool #888829, 5.832%, 6/1/37 | 236,266 | ||||||
| 190,972 | FNMA, Pool #958736, 4.940%, 5/1/19 | 211,892 | ||||||
| 215,055 | FNMA, Pool #AB1152, 4.000%, 6/1/25 | 228,887 | ||||||
| 348,437 | FNMA, Pool #AD0101, 4.890%, 7/1/19 | 387,928 | ||||||
| 354,156 | FNMA, Pool #AD0166, 4.838%, 8/1/19 | 393,932 | ||||||
| 1,001,069 | FNMA, Pool #AD0342, 4.656%, 10/1/19 | 1,107,441 | ||||||
| 440,146 | FNMA, Pool #AD0786, 4.501%, 1/1/20 | 487,807 | ||||||
| 512,156 | FNMA, Pool #AD0910, 4.604%, 4/1/20 | 565,533 | ||||||
| 67,006 | FNMA, Pool #AD1608, 4.000%, 2/1/25 | 71,180 | ||||||
| 391,217 | FNMA, Pool #AE0209, 4.380%, 6/1/20 | 429,384 | ||||||
| 1,206,933 | FNMA, Pool #AE0446, 4.014%, 9/1/20 | 1,316,936 | ||||||
| 666,789 | FNMA, Pool #AE2771, 3.500%, 8/1/26 | 708,384 | ||||||
| 407,665 | FNMA, Pool #AE8886, 3.500%, 12/1/25 | 431,459 | ||||||
| 285,012 | FNMA, Pool #AH1519, 3.500%, 12/1/25 | 301,623 | ||||||
| 305,537 | FNMA, Pool #AH8854, 4.500%, 4/1/41 | 331,929 | ||||||
| 482,940 | FNMA, Pool #AI1856, 4.500%, 5/1/41 | 531,254 | ||||||
| 1,835,235 | FNMA, Pool #AM0157, 2.680%, 2/1/22 | 1,899,377 | ||||||
| 1,921,244 | FNMA, Pool #AM0566, 1.940%, 9/1/19 | 1,954,159 | ||||||
| 2,568,193 | FNMA, Pool #AP7488, 3.500%, 9/1/42 | 2,685,779 | ||||||
| 1,281,855 | FNMA, Pool #AT0924, 2.000%, 3/1/28 | 1,265,450 | ||||||
| 2,841,091 | FNMA, Pool #AU1628, 3.000%, 7/1/43 | 2,887,772 | ||||||
| 3,157,424 | FNMA, Pool #AX7699, 3.500%, 2/1/45 | 3,296,780 | ||||||
| 1,364,850 | GNMA, Pool #5276, 3.000%, 1/20/27 | 1,428,779 | ||||||
| 1,828,096 | GNMA, Pool #710077, 4.700%, 5/20/61 | 1,936,021 | ||||||
| 345,808 | GNMA, Pool #751408, 4.826%, 6/20/61 | 379,823 | ||||||
| 713,860 | GNMA, Pool #751409, 4.626%, 7/20/61 | 757,704 | ||||||
| 401,837 | GNMA, Pool #752631, | |||||||
| 4.500%, 10/20/40 | 439,965 | |||||||
| 661,340 | GNMA, Pool #756686, 4.697%, 9/20/61 | 707,050 | ||||||
| 525,289 | GNMA, Pool #757327, 4.295%, 7/20/61 | 554,898 | ||||||
| Total U.S. Government Mortgage-Backed Obligations | $ | 32,201,858 | ||||||
| Agency Collateralized Mortgage Obligations — 4.9% | ||||||||
| 1,000,000 | FREMF Mortgage Trust, Ser 2011-K702, | |||||||
| Class B, 144a, 4.931%, 4/25/44(A) | 1,064,372 | |||||||
| 1,000,000 | FREMF Mortgage Trust, Ser 2012-K19, | |||||||
| Class B, 144a, 4.175%, 5/25/45(A) | 1,064,865 | |||||||
| 1,035,000 | FREMF Mortgage Trust, Ser 2012-K710, | |||||||
| Class B, 144a, 3.950%, 6/25/47(A) | 1,080,198 | |||||||
| 718,353 | GNMA, Ser 2011-147, Class A, | |||||||
| 2.174%, 7/16/38 | 721,745 | |||||||
| 320,160 | GNMA, Ser 2011-31, Class A, | |||||||
| 2.210%, 12/16/35 | 320,870 | |||||||
| 122,126 | GNMA, Ser 2012-22, Class AB, | |||||||
| 1.661%, 3/16/33 | 122,321 | |||||||
| 3,032,594 | GNMA, Ser 2012-53, Class AC, | |||||||
| 2.381%, 12/16/43 | 3,054,380 | |||||||
| 1,575,783 | GNMA, Ser 2013-40, Class AC, | |||||||
| 1.584%, 1/16/46 | 1,553,087 | |||||||
| Total Agency Collateralized Mortgage Obligations | $ | 8,981,838 | ||||||
| Commercial Mortgage-Backed Securities — 4.5% | ||||||||
| 1,675,000 | Citigroup Commercial Mortgage Trust, | |||||||
| Ser 2007-C6, Class A4, | ||||||||
| 5.899%, 12/10/49(A) | 1,768,763 | |||||||
| 505,000 | Citigroup/Deutsche Bank Commercial | |||||||
| Mortgage Trust, Ser 2006-CD3, | ||||||||
| Class AJ, 5.688%, 10/15/48 | 432,611 | |||||||
| 1,805,000 | Citigroup/Deutsche Bank Commercial | |||||||
| Mortgage Trust, Ser 2007-CD4, | ||||||||
| Class A4, 5.322%, 12/11/49 | 1,863,709 | |||||||
| 2,111,384 | GS Mortgage Securities Corp. II, Ser | |||||||
| 2007-GG10, Class A4, | ||||||||
| 5.795%, 8/10/45(A) | 2,226,805 | |||||||
| 1,835,000 | ML-CFC Commercial Mortgage Trust, | |||||||
| Ser 2006-3, Class AM, | ||||||||
| 5.456%, 7/12/46(A) | 1,892,751 | |||||||
| Total Commercial Mortgage-Backed Securities | $ | 8,184,639 | ||||||
| Municipal Bonds — 3.6% | ||||||||
| California — 1.0% | ||||||||
| 1,791,759 | CA State HFA Residential Mortgage | |||||||
| Rev, Ser A, 2.900%, 2/1/42 | 1,809,032 | |||||||
| Florida — 0.7% | ||||||||
| 1,287,507 | FL State HFC Rev, Homeownership | |||||||
| Mortgage Special Project, | ||||||||
| 2.800%, 7/1/41 | 1,296,378 | |||||||
| Missouri — 0.7% | ||||||||
| 1,215,000 | MO State Housing Development | |||||||
| Commission, Special | ||||||||
| Homeownership Loan Program, Ser | ||||||||
| C, 2.650%, 11/1/40 | 1,216,519 | |||||||
| Texas — 0.6% | ||||||||
| 1,100,000 | TX State Dept of Housing, Ser A, | |||||||
| 2.800%, 3/1/36 | 1,112,507 | |||||||
| 82 |
Touchstone Total Return Bond Fund (Continued)
| Principal | Market | |||||||
| Amount | Value | |||||||
| Municipal Bonds — 3.6% (Continued) | ||||||||
| Virginia — 0.6% | ||||||||
| $ | 1,192,076 | VA State Housing Development | ||||||
| Authority, Pass Thru Ser C, | ||||||||
| 2.750%, 4/25/42 | $ | 1,206,369 | ||||||
| Total Municipal Bonds | $ | 6,640,805 | ||||||
| U.S. Treasury Obligations — 3.3% | ||||||||
| 3,146,000 | U.S. Treasury Strip, Principal, | |||||||
| 0.000%, 8/15/35# | 1,799,471 | |||||||
| 3,695,000 | U.S. Treasury Strip, Principal, | |||||||
| 0.000%, 5/15/40# | 1,780,602 | |||||||
| 5,650,000 | U.S. Treasury Strip, Principal, | |||||||
| 0.000%, 5/15/43# | 2,449,315 | |||||||
| Total U.S. Treasury Obligations | $ | 6,029,388 | ||||||
| Asset-Backed Securities — 2.6% | ||||||||
| 1,217,800 | 321 Henderson Receivables I LLC, Ser | |||||||
| 2012-1A, Class A, 144a, | ||||||||
| 4.210%, 2/16/65 | 1,300,609 | |||||||
| 1,185,024 | 321 Henderson Receivables I LLC, Ser | |||||||
| 2012-2A, Class A, 144a, | ||||||||
| 3.840%, 10/15/59 | 1,230,284 | |||||||
| 544,398 | FPL Recovery Funding LLC, Ser | |||||||
| 2007-A, Class A4, 5.256%, 8/1/21 | 591,164 | |||||||
| 1,325,000 | JCP&L Transition Funding LLC, Ser | |||||||
| 2006-A, Class A4, 5.610%, 6/5/23 | 1,532,360 | |||||||
| Total Asset-Backed Securities | $ | 4,654,417 | ||||||
| Shares | ||||||||
| Investment Funds — 3.9% | ||||||||
| 6,206,299 | Dreyfus Cash Management, | |||||||
| Institutional Shares, 0.06%∞Ω | 6,206,299 | |||||||
| 891,413 | Invesco Government & Agency | |||||||
| Portfolio, Institutional Class, | ||||||||
| 0.04%** ∞Ω | 891,413 | |||||||
| Total Investment Funds | $ | 7,097,712 | ||||||
| Total Investment Securities —97.6% | ||||||||
| (Cost $177,847,021) | $ | 178,369,513 | ||||||
| Other Assets in Excess of Liabilities — 2.4% | 4,375,856 | |||||||
| Net Assets — 100.0% | $ | 182,745,369 | ||||||
| # | Strip Security - Separate trading of Registered Interest and Principal. Holders of a principal strip security are entitled to the portion of the payment representing principal only. |
| (A) | Variable rate security - Rate reflected is the rate in effect as of September 30, 2015. |
| (B) | Perpetual Bond - A Bond with no definite maturity date. |
| ** | Represents collateral for securities loaned. |
| † | All or a portion of the security is on loan. The total market value of the securities on loan as of September 30, 2015 was $863,096. |
| ∞ | Open-End Fund. |
| Ω | Represents the 7-day SEC yield as of September 30, 2015. |
Portfolio Abbreviations:
FHLMC - Federal Home Loan Mortgage Corporation
FNMA - Federal National Mortgage Association
FREMF - Finnish Real Estate Management Federation
GNMA - Government National Mortgage Association
HFA - Housing Finance Authority/Agency
HFC - Housing Finance Corporation
LLC - Limited Liability Company
MTN - Medium Term Note
144a - This is a restricted security that was sold in a transaction qualifying for the exemption under Rule 144A of the Securities Act of 1933. This security may be sold in transactions exempt from registration, normally to qualified institutional buyers. At September 30, 2015, these securities were valued at $10,472,930 or 5.7% of net assets. These securities were deemed liquid pursuant to procedures approved by the Board of Trustees.
| 83 |
Touchstone Total Return Bond Fund (Continued)
Other Information:
The inputs or methodology used for valuing securities may not be an indication of the risk associated with investing in those securities. For more information on valuation inputs, and their aggregation into the levels used in the table below, please refer to the security valuation section in the accompanying Notes to Financial Statements.
Valuation inputs at Reporting Date:
| Description | Level 1 | Level 2 | Level 3 | Total | ||||||||||||
| Corporate Bonds | $ | — | $ | 54,902,666 | $ | — | $ | 54,902,666 | ||||||||
| U.S. Government Agency Obligations | — | 49,676,190 | — | 49,676,190 | ||||||||||||
| U.S. Government Mortgage-Backed Obligations | — | 32,201,858 | — | 32,201,858 | ||||||||||||
| Agency Collateralized Mortgage Obligations | — | 8,981,838 | — | 8,981,838 | ||||||||||||
| Commercial Mortgage-Backed Securities | — | 8,184,639 | — | 8,184,639 | ||||||||||||
| Municipal Bonds | — | 6,640,805 | — | 6,640,805 | ||||||||||||
| U.S. Treasury Obligations | — | 6,029,388 | — | 6,029,388 | ||||||||||||
| Asset-Backed Securities | — | 4,654,417 | — | 4,654,417 | ||||||||||||
| Investment Funds | 7,097,712 | — | — | 7,097,712 | ||||||||||||
| $ | 178,369,513 | |||||||||||||||
See accompanying Notes to Financial Statements.
| 84 |
Touchstone Ultra Short Duration Fixed Income Fund – September 30, 2015
| Principal | Market | |||||||
| Amount | Value | |||||||
| Asset-Backed Securities — 33.9% | ||||||||
| $ | 2,174,838 | American Credit Acceptance | ||||||
| Receivables Trust, Ser 2014-3, Class | ||||||||
| A, 144a, 0.990%, 8/10/18 | $ | 2,172,959 | ||||||
| 3,052,462 | American Credit Acceptance | |||||||
| Receivables Trust, Ser 2014-4, Class | ||||||||
| A, 144a, 1.330%, 7/10/18 | 3,051,329 | |||||||
| 5,675,000 | American Credit Acceptance | |||||||
| Receivables Trust, Ser 2015-3, Class | ||||||||
| A, 144a, 1.950%, 9/12/19 | 5,674,618 | |||||||
| 6,715,000 | AmeriCredit Automobile Receivables | |||||||
| Trust, Ser 2011-3, Class E, 144a, | ||||||||
| 5.760%, 12/10/18 | 6,744,741 | |||||||
| 5,417,917 | AmeriCredit Automobile Receivables | |||||||
| Trust, Ser 2011-5, Class C, | ||||||||
| 3.440%, 10/8/17 | 5,441,534 | |||||||
| 2,640,000 | AmeriCredit Automobile Receivables | |||||||
| Trust, Ser 2011-5, Class D, | ||||||||
| 5.050%, 12/8/17 | 2,690,039 | |||||||
| 1,500,000 | AmeriCredit Automobile Receivables | |||||||
| Trust, Ser 2011-5, Class E, | ||||||||
| 6.760%, 3/8/19 | 1,542,470 | |||||||
| 5,015,000 | AmeriCredit Automobile Receivables | |||||||
| Trust, Ser 2012-1, Class D, | ||||||||
| 4.720%, 3/8/18 | 5,110,997 | |||||||
| 4,205,000 | AmeriCredit Automobile Receivables | |||||||
| Trust, Ser 2012-2, Class D, | ||||||||
| 3.380%, 4/9/18 | 4,272,600 | |||||||
| 155,267 | AmeriCredit Automobile Receivables | |||||||
| Trust, Ser 2012-3, Class B, | ||||||||
| 1.590%, 7/10/17 | 155,291 | |||||||
| 1,808,538 | Ascentium Equipment Receivables | |||||||
| LLC, Ser 2014-1A, Class A2, 144a, | ||||||||
| 1.040%, 1/10/17 | 1,808,135 | |||||||
| 4,750,000 | Ascentium Equipment Receivables | |||||||
| LLC, Ser 2015-1A, Class A2, 144a, | ||||||||
| 1.150%, 7/10/17 | 4,756,674 | |||||||
| 1,049,732 | AXIS Equipment Finance Receivables | |||||||
| II LLC, Ser 2013-1A, Class A, 144a, | ||||||||
| 1.750%, 3/20/17 | 1,048,780 | |||||||
| 2,209,851 | Bayview Financial Acquisition Trust, | |||||||
| Ser 2004-C, Class M1, | ||||||||
| 0.844%, 5/28/44(A) | 2,207,140 | |||||||
| 3,778,787 | Bayview Financial Acquisition Trust, | |||||||
| Ser 2004-D, Class M1, | ||||||||
| 0.824%, 8/28/44(A) | 3,768,021 | |||||||
| 378,534 | California Republic Auto Receivables | |||||||
| Trust, Ser 2012-1, Class A, 144a, | ||||||||
| 1.180%, 8/15/17 | 378,588 | |||||||
| 217,846 | Capital Auto Receivables Asset Trust, | |||||||
| Ser 2013-1, Class A3, | ||||||||
| 0.790%, 6/20/17 | 217,827 | |||||||
| 543,543 | Carnow Auto Receivables Trust, Ser | |||||||
| 2014-1A, Class A, 144a, | ||||||||
| 0.960%, 1/17/17 | 543,309 | |||||||
| 5,200,000 | Carnow Auto Receivables Trust, Ser | |||||||
| 2015-1A, Class A, 144a, | ||||||||
| 1.690%, 1/15/20 | 5,199,999 | |||||||
| 4,129,808 | Cazenovia Creek Funding I LLC, Ser | |||||||
| 2015-1A, Class A, 144a, | ||||||||
| 2.000%, 12/10/23 | 4,136,829 | |||||||
| 1,631,712 | CFC 2012-1 LLC, Ser 2014-1A, Class A, | |||||||
| 144a, 1.460%, 12/17/18 | 1,630,124 | |||||||
| 1,250,274 | CFC 2013-2 LLC, Ser 2013-2A, Class A, | |||||||
| 144a, 1.750%, 11/15/17 | 1,250,386 | |||||||
| 47,452 | College & University Facility Loan | |||||||
| Trust, Ser 2 Class D, 4.000%, 6/1/18 | 47,842 | |||||||
| 5,675,000 | Credit Acceptance Auto Loan Trust, | |||||||
| Ser 2013-2A, Class A, 144a, | ||||||||
| 1.500%, 4/15/21 | 5,679,194 | |||||||
| 2,300,000 | Dell Equipment Finance Trust, Ser | |||||||
| 2014-1, Class B, 144a, | ||||||||
| 1.360%, 6/22/20 | 2,300,883 | |||||||
| 3,489,176 | Direct Capital Funding V LLC, Ser | |||||||
| 2013-2, Class A2, 144a, | ||||||||
| 1.730%, 8/20/18 | 3,491,650 | |||||||
| 384,035 | DT Auto Owner Trust, Ser 2014-1A, | |||||||
| Class B, 144a, 1.430%, 3/15/18 | 384,266 | |||||||
| 4,107,911 | DT Auto Owner Trust, Ser 2015-2A, | |||||||
| Class A, 144a, 1.240%, 9/17/18 | 4,104,863 | |||||||
| 1,732,442 | Elara HGV Timeshare Issuer 2014-A | |||||||
| LLC, Ser 2014-A, Class A, 144a, | ||||||||
| 2.530%, 2/25/27 | 1,733,894 | |||||||
| 178,389 | Exeter Automobile Receivables Trust, | |||||||
| Ser 2013-1A, Class A, 144a, | ||||||||
| 1.290%, 10/16/17 | 178,437 | |||||||
| 173,265 | Exeter Automobile Receivables Trust, | |||||||
| Ser 2013-2A, Class A, 144a, | ||||||||
| 1.490%, 11/15/17 | 173,367 | |||||||
| 1,246,374 | Exeter Automobile Receivables Trust, | |||||||
| Ser 2014-2A, Class A, 144a, | ||||||||
| 1.060%, 8/15/18 | 1,244,335 | |||||||
| 4,613,383 | Exeter Automobile Receivables Trust, | |||||||
| Ser 2015-1A, Class A, 144a, | ||||||||
| 1.600%, 6/17/19 | 4,617,341 | |||||||
| 1,345,000 | First Investors Auto Owner Trust, Ser | |||||||
| 2013-1A, Class B, 144a, | ||||||||
| 1.810%, 10/15/18 | 1,347,336 | |||||||
| 3,700,000 | Flagship Credit Auto Trust, Ser 2013-1, | |||||||
| Class B, 144a, 2.760%, 9/17/18 | 3,724,894 | |||||||
| 142,031 | FNMA REMIC Trust, Ser 2001-W4, Class | |||||||
| AF5, 6.114%, 2/25/32(B) | 167,396 | |||||||
| 344,107 | Great America Leasing Receivables, | |||||||
| Ser 2013-1, Class A3, 144a, | ||||||||
| 0.780%, 6/15/16 | 344,130 | |||||||
| 3,810,000 | Great America Leasing Receivables | |||||||
| LLC, Ser 2012-1, Class B, 144a, | ||||||||
| 2.300%, 4/17/17 | 3,819,434 | |||||||
| 3,306,124 | GSC Group CDO Fund VIII Ltd., Ser | |||||||
| 2007-8A, Class A2, 144a, | ||||||||
| 0.669%, 4/17/21(A) | 3,302,606 | |||||||
| 85 |
Touchstone Ultra Short Duration Fixed Income Fund (Continued)
| Principal | Market | |||||||
| Amount | Value | |||||||
| Asset-Backed Securities — 33.9% (Continued) | ||||||||
| $ | 1,841,643 | Gulf Stream - Sextant CLO, Ser | ||||||
| 2007-1X, Class A1A Ltd. Reg S | ||||||||
| Global Senior Notes, | ||||||||
| 0.508%, 6/17/21 | $ | 1,833,236 | ||||||
| 1,967,000 | Hyundai Auto Receivables Trust, Ser | |||||||
| 2012-A, Class D, 2.610%, 5/15/18 | 1,982,075 | |||||||
| 1,947,650 | Katonah Ltd., Ser 2007-10A, Class A1A, | |||||||
| 144a, 0.550%, 4/17/20(A) | 1,941,776 | |||||||
| 55,164 | LA St Local Govt Envrnm Facs & | |||||||
| Cmnty Dev Auth, Tranches A-1, A-2, | ||||||||
| 1.520%, 2/1/18 | 55,288 | |||||||
| 471,602 | Madison Avenue Manufactured | |||||||
| Housing Contract, Ser 2002-A, Class | ||||||||
| M2, 2.444%, 3/25/32(A) | 471,564 | |||||||
| 2,915,595 | MC Funding Ltd. / MC Funding, Ser | |||||||
| 2006-1A, Class C, 144a, | ||||||||
| 1.295%, 12/20/20(A) | 2,914,018 | |||||||
| 70,641 | MMAF Equipment Finance LLC, Ser | |||||||
| 2009-AA, Class A4, 144a, | ||||||||
| 3.510%, 1/15/30 | 70,846 | |||||||
| 998,472 | Navitas Equipment Receivables LLC, | |||||||
| Ser 2013-1, Class A, 144a, | ||||||||
| 1.950%, 11/15/16 | 998,522 | |||||||
| 85,000 | New Mexico Educational Assistance | |||||||
| Foundation, Ser 2010, Class A2, | ||||||||
| 0.979%, 12/1/28(A) | 85,059 | |||||||
| 4,095,714 | Orange Lake Timeshare Trust, Ser | |||||||
| 2012-AA, Class A, 144a, | ||||||||
| 3.450%, 3/10/27 | 4,211,962 | |||||||
| 3,945,000 | Prestige Auto Receivables Trust, Ser | |||||||
| 2012-1A, Class C, 144a, | ||||||||
| 3.250%, 7/15/19 | 3,983,349 | |||||||
| 411,465 | RAMP Trust, Ser 2003-RZ3, Class A6, | |||||||
| 3.900%, 3/25/33(B) | 419,123 | |||||||
| 2,200,000 | Rockwall CDO Ltd., Ser 2006-1A, Class | |||||||
| A1LB, 144a, 0.800%, 8/1/21(A) | 2,180,435 | |||||||
| 3,259,784 | Santander Drive Auto Receivables | |||||||
| Trust, Ser 2011-3, Class D, | ||||||||
| 4.230%, 5/15/17 | 3,284,702 | |||||||
| 1,854,928 | Santander Drive Auto Receivables | |||||||
| Trust, Ser 2012-1, Class C, | ||||||||
| 3.780%, 11/15/17 | 1,861,060 | |||||||
| 4,725,000 | Santander Drive Auto Receivables | |||||||
| Trust, Ser 2012-1, Class D, | ||||||||
| 4.560%, 11/15/17 | 4,812,743 | |||||||
| 622,251 | Santander Drive Auto Receivables | |||||||
| Trust, Ser 2012-2, Class C, | ||||||||
| 3.200%, 2/15/18 | 624,758 | |||||||
| 4,177,603 | Santander Drive Auto Receivables | |||||||
| Trust, Ser 2012-3, Class C, | ||||||||
| 3.010%, 4/16/18 | 4,200,818 | |||||||
| 3,418,745 | Santander Drive Auto Receivables | |||||||
| Trust, Ser 2012-4, Class C, | ||||||||
| 2.940%, 12/15/17 | 3,444,861 | |||||||
| 9,726 | Santander Drive Auto Receivables | |||||||
| Trust, Ser 2012-5, Class B, | ||||||||
| 1.560%, 8/15/18 | 9,728 | |||||||
| 4,725,000 | Santander Drive Auto Receivables | |||||||
| Trust, Ser 2012-5, Class C, | ||||||||
| 2.700%, 8/15/18 | 4,758,949 | |||||||
| 1,388,353 | Santander Drive Auto Receivables | |||||||
| Trust, Ser 2012-AA, Class B, 144a, | ||||||||
| 1.210%, 10/16/17 | 1,388,602 | |||||||
| 1,345,000 | Santander Drive Auto Receivables | |||||||
| Trust, Ser 2012-AA, Class C, 144a, | ||||||||
| 1.780%, 11/15/18 | 1,350,824 | |||||||
| 501,860 | Sierra Timeshare Receivables Funding | |||||||
| LLC, Ser 2011-1A, Class A, 144a, | ||||||||
| 3.350%, 4/20/26 | 503,736 | |||||||
| 1,851,656 | Sierra Timeshare Receivables Funding | |||||||
| LLC, Ser 2011-2A, Class A, 144a, | ||||||||
| 3.260%, 5/20/28 | 1,870,935 | |||||||
| 1,980,034 | Sierra Timeshare Receivables Funding | |||||||
| LLC, Ser 2011-3A, Class A, 144a, | ||||||||
| 3.370%, 7/20/28 | 2,009,525 | |||||||
| 1,028,562 | Sierra Timeshare Receivables Funding | |||||||
| LLC, Ser 2012-1A, Class A, 144a, | ||||||||
| 2.840%, 11/20/28 | 1,035,840 | |||||||
| 4,655,560 | Sierra Timeshare Receivables Funding | |||||||
| LLC, Ser 2012-3A, Class A, 144a, | ||||||||
| 1.870%, 8/20/29 | 4,671,123 | |||||||
| 1,716,973 | Sierra Timeshare Receivables Funding | |||||||
| LLC, Ser 2013-1A, Class A, 144a, | ||||||||
| 1.590%, 11/20/29 | 1,704,557 | |||||||
| 3,791,078 | Sierra Timeshare Receivables Funding | |||||||
| LLC, Ser 2014-3A, Class A, 144a, | ||||||||
| 2.300%, 10/20/31 | 3,814,905 | |||||||
| 4,027,286 | SpringCastle America Funding LLC, | |||||||
| Ser 2014-AA, Class A, 144a, | ||||||||
| 2.700%, 5/25/23 | 4,032,796 | |||||||
| 1,548,169 | Structured Asset Investment Loan | |||||||
| Trust, Ser 2005-5, Class M1, | ||||||||
| 0.824%, 6/25/35(A) | 1,548,398 | |||||||
| 157,096 | Tidewater Auto Receivables Trust, Ser | |||||||
| 2014-AA, Class A2, 144a, | ||||||||
| 0.960%, 7/15/17 | 157,087 | |||||||
| 1,079,319 | United Auto Credit Securitization | |||||||
| Trust, Ser 2013-1, Class D, 144a, | ||||||||
| 2.900%, 12/15/17 | 1,081,929 | |||||||
| 2,083,701 | United Auto Credit Securitization | |||||||
| Trust, Ser 2015-1, Class A, 144a, | ||||||||
| 1.160%, 2/15/17 | 2,086,112 | |||||||
| 798,963 | Venture V CDO Ltd., Ser 2005-1A, Class | |||||||
| A2, 144a, 0.779%, 11/22/18(A) | 798,690 | |||||||
| 3,069,350 | Welk Resorts LLC, Ser 2013-AA, Class | |||||||
| A, 144a, 3.100%, 3/15/29 | 3,098,441 | |||||||
| 3,883,475 | Westgate Resorts, Ser 2015-1A, Class | |||||||
| A, 144a, 2.750%, 5/20/27 | 3,892,329 | |||||||
| 906,105 | Westgate Resorts LLC, Ser 2012-2A, | |||||||
| Class A, 144a, 3.000%, 1/20/25 | 907,092 | |||||||
| 1,050,897 | Westgate Resorts LLC, Ser 2012-3A, | |||||||
| Class A, 144a, 2.500%, 3/20/25 | 1,051,560 | |||||||
| 86 |
Touchstone Ultra Short Duration Fixed Income Fund (Continued)
| Principal | Market | |||||||
| Amount | Value | |||||||
| Asset-Backed Securities — 33.9% (Continued) | ||||||||
| $ | 1,917,329 | Westgate Resorts LLC, Ser 2012-3A, | ||||||
| Class B, 144a, 4.500%, 3/20/25 | $ | 1,926,915 | ||||||
| 3,326,185 | Westgate Resorts LLC, Ser 2013-1A, | |||||||
| Class A, 144a, 2.250%, 8/20/25 | 3,322,027 | |||||||
| 2,828,812 | Westlake Automobile Receivables | |||||||
| Trust, Ser 2014-1A, Class A2, 144a, | ||||||||
| 0.700%, 5/15/17 | 2,827,822 | |||||||
| 4,730,000 | Westlake Automobile Receivables | |||||||
| Trust, Ser 2015-2A, Class A2A, 144a, | ||||||||
| 1.280%, 7/16/18 | 4,733,959 | |||||||
| Total Asset-Backed Securities | $ | 194,424,334 | ||||||
| Corporate Bonds — 28.5% | ||||||||
| Financials — 11.6% | ||||||||
| 968,000 | Ameritech Capital Funding Corp., | |||||||
| 9.100%, 6/1/16 | 1,010,937 | |||||||
| 3,650,000 | Bank of America Corp., | |||||||
| 1.500%, 10/9/15 | 3,650,292 | |||||||
| 950,000 | Bank of America Corp. MTN, | |||||||
| 3.625%, 3/17/16 | 962,535 | |||||||
| 2,310,000 | BB&T Corp., 5.200%, 12/23/15 | 2,335,098 | ||||||
| 3,460,000 | Capital One Bank USA NA, | |||||||
| 1.150%, 11/21/16 | 3,451,506 | |||||||
| 4,800,000 | Credit Suisse/New York (Switzerland) | |||||||
| MTN, 0.822%, 5/26/17(A) | 4,783,718 | |||||||
| 4,563,000 | DBS Bank Ltd.(Singapore), 144a, | |||||||
| 0.899%, 7/15/21(A) | 4,522,846 | |||||||
| 3,627,000 | Equity One, Inc. REIT, 6.000%, 9/15/16 | 3,777,604 | ||||||
| 2,800,000 | Fifth Third Bancorp, 3.625%, 1/25/16 | 2,824,662 | ||||||
| 500,000 | Hospitality Properties Trust REIT, | |||||||
| 6.300%, 6/15/16 | 504,371 | |||||||
| 2,000,000 | Huntington National Bank (The), | |||||||
| 1.300%, 11/20/16 | 2,002,036 | |||||||
| 4,750,000 | JPMorgan Chase & Co., | |||||||
| 2.600%, 1/15/16 | 4,775,455 | |||||||
| 7,200,000 | Kayne Anderson MLP Investment Co., | |||||||
| 1.595%, 8/19/16(A) | 7,196,688 | |||||||
| 2,040,000 | Kilroy Realty LP, 5.000%, 11/3/15 | 2,046,098 | ||||||
| 6,200,000 | Morgan Stanley, 3.450%, 11/2/15 | 6,214,000 | ||||||
| 1,000,000 | Morgan Stanley, 5.375%, 10/15/15 | 1,001,690 | ||||||
| 4,000,000 | Omega Healthcare Investors, Inc. REIT, | |||||||
| 6.750%, 10/15/22 | 4,146,800 | |||||||
| 3,670,000 | Platinum Underwriters Finance, Inc., | |||||||
| 7.500%, 6/1/17 | 3,989,169 | |||||||
| 3,200,000 | Ventas Realty LP REIT, 1.550%, 9/26/16 | 3,208,461 | ||||||
| 3,770,000 | Weingarten Realty Investors REIT MTN, | |||||||
| 5.542%, 12/15/16 | 3,948,091 | |||||||
| 66,352,057 | ||||||||
| Energy — 2.8% | ||||||||
| 2,800,000 | Buckeye Partners LP, 2.650%, 11/15/18 | 2,771,796 | ||||||
| 4,550,000 | Buckeye Partners LP, 6.050%, 1/15/18 | 4,799,445 | ||||||
| 4,700,000 | Devon Energy Corp., | |||||||
| 0.787%, 12/15/15(A) | 4,695,573 | |||||||
| 2,800,000 | Kinder Morgan, Inc. DE, | |||||||
| 7.000%, 6/15/17 | 2,984,898 | |||||||
| 472,590 | Ras Laffan Liquefied Natural Gas Co. | |||||||
| Ltd. II (Qatar), 144a, 5.298%, 9/30/20 | 504,961 | |||||||
| 15,756,673 | ||||||||
| Industrials — 2.6% | ||||||||
| 920,000 | Dun & Bradstreet Corp. (The), | |||||||
| 2.875%, 11/15/15 | 920,889 | |||||||
| 6,642,000 | Dun & Bradstreet Corp. (The), | |||||||
| 3.250%, 12/1/17 | 6,744,227 | |||||||
| 5,160,000 | Embraer Overseas Ltd. (Cayman | |||||||
| Islands), 6.375%, 1/24/17 | 5,289,000 | |||||||
| 1,000,000 | L-3 Communications Corp., | |||||||
| 1.500%, 5/28/17 | 990,860 | |||||||
| 846,000 | Snap-on, Inc., 5.500%, 1/15/17 | 894,755 | ||||||
| 14,839,731 | ||||||||
| Consumer Discretionary — 2.5% | ||||||||
| 4,278,000 | Dollar General Corp., 4.125%, 7/15/17 | 4,411,101 | ||||||
| 350,000 | ERAC USA Finance LLC, 144a, | |||||||
| 1.400%, 4/15/16 | 350,228 | |||||||
| 5,150,000 | Ford Motor Credit Co. LLC, | |||||||
| 1.561%, 5/9/16(A) | 5,166,233 | |||||||
| 700,000 | Ford Motor Credit Co. LLC, | |||||||
| 4.207%, 4/15/16 | 711,022 | |||||||
| 2,600,000 | Hyundai Capital America, 144a, | |||||||
| 1.625%, 10/2/15 | 2,600,000 | |||||||
| 800,000 | Hyundai Capital America, 144a, | |||||||
| 4.000%, 6/8/17 | 827,669 | |||||||
| 14,066,253 | ||||||||
| Utilities — 2.4% | ||||||||
| 500,000 | Alabama Power Co., 0.550%, 10/15/15 | 499,998 | ||||||
| 1,263,000 | Consumers Energy Co., | |||||||
| 5.150%, 2/15/17 | 1,330,641 | |||||||
| 5,300,000 | Dayton Power & Light Co. (The), | |||||||
| 1.875%, 9/15/16 | 5,303,339 | |||||||
| 3,220,000 | LG&E and KU Energy LLC, | |||||||
| 2.125%, 11/15/15 | 3,225,252 | |||||||
| 825,000 | NextEra Energy Capital Holdings, Inc., | |||||||
| 7.875%, 12/15/15 | 836,677 | |||||||
| 1,178,000 | Oklahoma Gas & Electric Co., | |||||||
| 6.500%, 7/15/17 | 1,282,537 | |||||||
| 1,515,000 | Southern Electric Generating Co., | |||||||
| 144a, 2.200%, 12/1/18 | 1,517,913 | |||||||
| 13,996,357 | ||||||||
| Materials — 2.2% | ||||||||
| 1,900,000 | Glencore Canada Corp. (Canada), | |||||||
| 6.000%, 10/15/15 | 1,900,000 | |||||||
| 4,800,000 | Glencore Finance Canada Ltd. | |||||||
| (Canada), 144a, 5.800%, 11/15/16 | 4,559,999 | |||||||
| 400,000 | Glencore Funding LLC, 144a, | |||||||
| 1.700%, 5/27/16 | 380,000 | |||||||
| 3,300,000 | Rio Tinto Finance USA PLC (United | |||||||
| Kingdom), 1.174%, 6/17/16(A) | 3,302,155 | |||||||
| 87 |
Touchstone Ultra Short Duration Fixed Income Fund (Continued)
| Principal | Market | |||||||
| Amount | Value | |||||||
| Corporate Bonds — 28.5% (Continued) | ||||||||
| Materials — (Continued) | ||||||||
| $ | 2,600,000 | Vale Overseas Ltd. (Cayman Islands), | ||||||
| 6.250%, 1/11/16 | $ | 2,617,576 | ||||||
| 12,759,730 | ||||||||
| Telecommunication Services — 1.7% | ||||||||
| 5,500,000 | America Movil SAB DE CV (Mexico), | |||||||
| 2.375%, 9/8/16 | 5,554,560 | |||||||
| 3,500,000 | BellSouth Corp., 144a, 4.821%, 4/26/16 | 3,571,228 | ||||||
| 21,480 | BellSouth Telecommunications, Inc., | |||||||
| 6.300%, 12/15/15 | 21,673 | |||||||
| 600,000 | Crown Castle Towers LLC, 144a, | |||||||
| 5.495%, 1/15/17 | 616,870 | |||||||
| 9,764,331 | ||||||||
| Health Care — 1.3% | ||||||||
| 4,800,000 | Amgen, Inc., 0.709%, 5/22/17(A) | 4,785,432 | ||||||
| 2,800,000 | Bayer US Finance LLC, 144a, | |||||||
| 0.534%, 10/7/16(A) | 2,794,375 | |||||||
| 7,579,807 | ||||||||
| Information Technology — 1.2% | ||||||||
| 7,150,000 | Hewlett Packard Enterprise Co., 144a, | |||||||
| 2.450%, 10/5/17 | 7,145,996 | |||||||
| Consumer Staples — 0.2% | ||||||||
| 1,165,000 | Cintas Corp. No 2, 2.850%, 6/1/16 | 1,177,900 | ||||||
| Total Corporate Bonds | $ | 163,438,835 | ||||||
| U.S. Government Mortgage-Backed Obligations — 7.7% | ||||||||
| 219,154 | FHLMC, Pool #1B1580, | |||||||
| 2.586%, 3/1/34(A) | 232,343 | |||||||
| 190,150 | FHLMC, Pool #1B2629, | |||||||
| 2.321%, 11/1/34(A) | 202,534 | |||||||
| 645,420 | FHLMC, Pool #1B7189, | |||||||
| 3.121%, 3/1/36(A) | 692,456 | |||||||
| 187,797 | FHLMC, Pool #1G1471, | |||||||
| 2.230%, 1/1/37(A) | 200,573 | |||||||
| 980,503 | FHLMC, Pool #1H1354, | |||||||
| 2.419%, 11/1/36(A) | 1,045,186 | |||||||
| 125,260 | FHLMC, Pool #1H2524, | |||||||
| 2.469%, 8/1/35(A) | 133,101 | |||||||
| 548,689 | FHLMC, Pool #1J1813, | |||||||
| 2.675%, 8/1/37(A) | 584,635 | |||||||
| 503,938 | FHLMC, Pool #1K1238, | |||||||
| 2.500%, 7/1/36(A) | 539,249 | |||||||
| 244,413 | FHLMC, Pool #1L0087, | |||||||
| 2.500%, 6/1/35(A) | 260,924 | |||||||
| 529,183 | FHLMC, Pool #1L0147, | |||||||
| 2.540%, 7/1/35(A) | 565,689 | |||||||
| 340,923 | FHLMC, Pool #1L1288, | |||||||
| 2.487%, 5/1/36(A) | 364,678 | |||||||
| 308,949 | FHLMC, Pool #1Q0080, | |||||||
| 2.333%, 1/1/36(A) | 327,371 | |||||||
| 623,302 | FHLMC, Pool #1Q0119, | |||||||
| 2.580%, 9/1/36(A) | 664,352 | |||||||
| 1,503,919 | FHLMC, Pool #1Q0187, | |||||||
| 2.376%, 12/1/36(A) | 1,592,965 | |||||||
| 764,862 | FHLMC, Pool #1Q0339, | |||||||
| 2.499%, 4/1/37(A) | 814,553 | |||||||
| 246,315 | FHLMC, Pool #1Q0669, | |||||||
| 2.375%, 11/1/37(A) | 262,052 | |||||||
| 844,025 | FHLMC, Pool #1Q1303, | |||||||
| 2.429%, 11/1/36(A) | 899,133 | |||||||
| 969,314 | FHLMC, Pool #781515, | |||||||
| 2.500%, 4/1/34(A) | 1,031,104 | |||||||
| 394,324 | FHLMC, Pool #782760, | |||||||
| 2.448%, 11/1/36(A) | 420,060 | |||||||
| 349,662 | FHLMC, Pool #847795, | |||||||
| 2.444%, 4/1/35(A) | 371,244 | |||||||
| 229,106 | FHLMC, Pool #848088, | |||||||
| 2.421%, 4/1/35(A) | 243,718 | |||||||
| 757,831 | FHLMC, Pool #848539, | |||||||
| 3.404%, 4/1/37(A) | 806,762 | |||||||
| 1,906,009 | FHLMC, Pool #848583, | |||||||
| 2.494%, 1/1/36(A) | 2,027,942 | |||||||
| 25,940 | FHLMC, Pool #A92646, 5.500%, 6/1/40 | 29,205 | ||||||
| 24,108 | FHLMC, Pool #C03505, 5.500%, 6/1/40 | 26,732 | ||||||
| 73,723 | FHLMC, Pool #C66916, 7.000%, 5/1/32 | 85,640 | ||||||
| 19,363 | FHLMC, Pool #D94598, 6.500%, 4/1/21 | 22,136 | ||||||
| 84,544 | FHLMC, Pool #G01840, 5.000%, 7/1/35 | 93,557 | ||||||
| 523 | FHLMC, Pool #G11072, | |||||||
| 7.500%, 12/1/15 | 525 | |||||||
| 1,198,042 | FHLMC, Pool #G11769, | |||||||
| 5.000%, 10/1/20 | 1,274,646 | |||||||
| 744,495 | FHLMC, Pool #G11773, | |||||||
| 5.000%, 10/1/20 | 791,052 | |||||||
| 16,089 | FHLMC, Pool #G30085, | |||||||
| 7.500%, 10/1/17 | 16,670 | |||||||
| 448,353 | FHLMC, Pool #J10895, | |||||||
| 4.000%, 10/1/19 | 468,612 | |||||||
| 267,126 | FNMA, Pool #254868, 5.000%, 9/1/33 | 295,724 | ||||||
| 121,044 | FNMA, Pool #256272, 5.500%, 6/1/26 | 135,009 | ||||||
| 201,411 | FNMA, Pool #256852, 6.000%, 8/1/27 | 226,952 | ||||||
| 44,262 | FNMA, Pool #323832, 7.500%, 7/1/29 | 53,782 | ||||||
| 3,241 | FNMA, Pool #334593, 7.000%, 5/1/24 | 3,636 | ||||||
| 254,947 | FNMA, Pool #555380, | |||||||
| 2.268%, 4/1/33(A) | 271,540 | |||||||
| 1,913 | FNMA, Pool #555646, 7.500%, 9/1/16 | 1,927 | ||||||
| 101,147 | FNMA, Pool #665773, 7.500%, 6/1/31 | 113,503 | ||||||
| 163,658 | FNMA, Pool #679742, | |||||||
| 2.817%, 1/1/40(A) | 169,704 | |||||||
| 87,126 | FNMA, Pool #681842, | |||||||
| 2.277%, 2/1/33(A) | 91,776 | |||||||
| 286,819 | FNMA, Pool #681898, | |||||||
| 2.360%, 4/1/33(A) | 304,105 | |||||||
| 297,527 | FNMA, Pool #725245, | |||||||
| 2.314%, 2/1/34(A) | 318,620 | |||||||
| 288,856 | FNMA, Pool #725424, 5.500%, 4/1/34 | 325,080 | ||||||
| 1,625,906 | FNMA, Pool #725490, | |||||||
| 2.253%, 4/1/34(A) | 1,727,189 | |||||||
| 88 |
Touchstone Ultra Short Duration Fixed Income Fund (Continued)
| Principal | Market | |||||||
| Amount | Value | |||||||
| U.S. Government Mortgage-Backed Obligations — 7.7% (Continued) | ||||||||
| $ | 334,527 | FNMA, Pool #735439, 6.000%, 9/1/19 | $ | 347,221 | ||||
| 52,870 | FNMA, Pool #735484, 5.000%, 5/1/35 | 58,344 | ||||||
| 182,629 | FNMA, Pool #735539, | |||||||
| 2.421%, 4/1/35(A) | 193,950 | |||||||
| 123,073 | FNMA, Pool #743207, | |||||||
| 2.151%, 10/1/33(A) | 129,652 | |||||||
| 103,113 | FNMA, Pool #745467, | |||||||
| 2.460%, 4/1/36(A) | 110,179 | |||||||
| 169,083 | FNMA, Pool #745790, | |||||||
| 2.300%, 8/1/36(A) | 179,328 | |||||||
| 873,514 | FNMA, Pool #761411, 4.500%, 5/1/19 | 907,039 | ||||||
| 161,183 | FNMA, Pool #784365, | |||||||
| 1.925%, 5/1/34(A) | 169,414 | |||||||
| 350,373 | FNMA, Pool #791978, | |||||||
| 1.989%, 9/1/34(A) | 365,846 | |||||||
| 111,553 | FNMA, Pool #804001, | |||||||
| 2.358%, 10/1/34(A) | 117,671 | |||||||
| 80,616 | FNMA, Pool #809897, | |||||||
| 2.302%, 3/1/35(A) | 86,049 | |||||||
| 277,685 | FNMA, Pool #813170, | |||||||
| 2.200%, 1/1/35(A) | 294,692 | |||||||
| 269,192 | FNMA, Pool #820364, | |||||||
| 1.698%, 4/1/35(A) | 283,458 | |||||||
| 1,013,240 | FNMA, Pool #827787, | |||||||
| 1.926%, 5/1/35(A) | 1,052,518 | |||||||
| 117,547 | FNMA, Pool #828480, | |||||||
| 2.480%, 6/1/35(A) | 125,362 | |||||||
| 209,527 | FNMA, Pool #839239, | |||||||
| 2.445%, 9/1/35(A) | 221,220 | |||||||
| 175,862 | FNMA, Pool #888179, | |||||||
| 2.399%, 2/1/37(A) | 187,666 | |||||||
| 103,922 | FNMA, Pool #888548, | |||||||
| 2.389%, 5/1/35(A) | 110,434 | |||||||
| 181,346 | FNMA, Pool #889060, 6.000%, 1/1/38 | 206,132 | ||||||
| 174,459 | FNMA, Pool #889061, 6.000%, 1/1/38 | 198,422 | ||||||
| 11,087 | FNMA, Pool #889382, 5.500%, 4/1/38 | 12,557 | ||||||
| 642,362 | FNMA, Pool #922674, | |||||||
| 2.517%, 4/1/36(A) | 680,987 | |||||||
| 510,612 | FNMA, Pool #931676, 5.500%, 1/1/19 | 535,973 | ||||||
| 228,268 | FNMA, Pool #950385, | |||||||
| 1.397%, 8/1/37(A) | 233,927 | |||||||
| 102,539 | FNMA, Pool #960376, 5.500%, 12/1/37 | 114,370 | ||||||
| 94,304 | FNMA, Pool #995284, 5.500%, 3/1/20 | 96,983 | ||||||
| 960,608 | FNMA, Pool #AA1150, 4.000%, 4/1/23 | 1,005,435 | ||||||
| 15,510 | FNMA, Pool #AD0941, 5.500%, 4/1/40 | 17,734 | ||||||
| 133,227 | FNMA, Pool #AE0363, 5.000%, 7/1/37 | 147,489 | ||||||
| 680,740 | FNMA, Pool #AE0727, 4.000%, 10/1/20 | 712,279 | ||||||
| 213,469 | FNMA, Pool #AE5441, 5.000%, 10/1/40 | 236,878 | ||||||
| 299,159 | FNMA, Pool #AI6588, 4.000%, 7/1/26 | 318,497 | ||||||
| 278,435 | FNMA, Pool #AI8506, 4.000%, 8/1/26 | 296,526 | ||||||
| 285,753 | FNMA, Pool #AL0211, 5.000%, 4/1/41 | 316,632 | ||||||
| 54,306 | FNMA, Pool #AL0302, 5.000%, 4/1/24 | 58,501 | ||||||
| 1,745,535 | FNMA, Pool #AL0478, | |||||||
| 2.381%, 4/1/36(A) | 1,857,598 | |||||||
| 484,453 | FNMA, Pool #AL0543, 5.000%, 7/1/41 | 536,197 | ||||||
| 291,515 | FNMA, Pool #AL1105, 4.500%, 12/1/40 | 319,960 | ||||||
| 159,538 | FNMA, Pool #AL2591, 5.500%, 5/1/38 | 173,307 | ||||||
| 21,551 | GNMA, Pool #344233, 8.000%, 2/15/23 | 23,790 | ||||||
| 70,832 | GNMA, Pool #345123, | |||||||
| 8.000%, 12/15/23 | 78,794 | |||||||
| 8,269 | GNMA, Pool #569337, 6.500%, 4/15/22 | 9,481 | ||||||
| 9,991 | GNMA, Pool #578189, 6.000%, 2/15/32 | 11,225 | ||||||
| 20,730 | GNMA, Pool #780322, | |||||||
| 8.000%, 11/15/22 | 23,531 | |||||||
| 2,516 | GNMA, Pool #780327, | |||||||
| 8.000%, 11/15/17 | 2,612 | |||||||
| 726,124 | GNMA, Pool #80826, | |||||||
| 1.750%, 2/20/34(A) | 752,358 | |||||||
| 386,748 | GNMA, Pool #80889, | |||||||
| 1.750%, 4/20/34(A) | 399,605 | |||||||
| 590,508 | GNMA, Pool #81016, | |||||||
| 1.625%, 8/20/34(A) | 613,447 | |||||||
| 6,244 | GNMA, Pool #814, 8.000%, 8/20/17 | 6,425 | ||||||
| 2,932 | GNMA, Pool #8426, | |||||||
| 3.000%, 11/20/18(A) | 2,983 | |||||||
| 116,422 | GNMA, Pool #894160, | |||||||
| 2.078%, 6/20/61(A) | 121,609 | |||||||
| 1,740,401 | GNMA, Pool #MA2392, | |||||||
| 2.000%, 11/20/44(A) | 1,778,939 | |||||||
| 6,044,462 | GNMA, Pool #MA2466, | |||||||
| 2.000%, 12/20/44(A) | 6,180,383 | |||||||
| Total U.S. Government Mortgage-Backed Obligations | $ | 44,151,555 | ||||||
| Commercial Mortgage-Backed Securities — 6.0% | ||||||||
| 34,394 | Banc of America Merrill Lynch | |||||||
| Commercial Mortgage, Inc., Ser | ||||||||
| 2006-4, Class A4, 5.634%, 7/10/46 | 34,960 | |||||||
| 297,105 | Bear Stearns Commercial Mortgage | |||||||
| Securities Trust, Ser 2007-T28, Class | ||||||||
| AAB, 5.746%, 9/11/42†† | 297,028 | |||||||
| 5,443,661 | COMM Mortgage Trust, Ser | |||||||
| 2014-SAVA, Class A, 144a, | ||||||||
| 1.357%, 6/15/34(A) | 5,421,543 | |||||||
| 9,821 | Commercial Mortgage Trust, Ser | |||||||
| 2007-C2, Class A2, | ||||||||
| 5.448%, 1/15/49(A) | 9,837 | |||||||
| 3,750,868 | DBRR Trust, Ser 2013-EZ3, Class A, | |||||||
| 144a, 1.636%, 12/18/49(A) | 3,750,868 | |||||||
| 1,490,920 | DBUBS Mortgage Trust, Ser | |||||||
| 2011-LC2A, Class A1FL, 144a, | ||||||||
| 1.557%, 7/12/44(A) | 1,486,387 | |||||||
| 53,134 | FDIC Structured Sale Guaranteed | |||||||
| Notes, Ser 2010-C1, Class A, 144a, | ||||||||
| 2.980%, 12/6/20 | 54,354 | |||||||
| 1,538,505 | First Union Commercial Mortgage | |||||||
| Trust, Ser 1999-C1, Class F, 144a, | ||||||||
| 5.350%, 10/15/35 | 1,548,601 | |||||||
| 4,965,000 | Hyatt Hotel Portfolio Trust, Ser | |||||||
| 2015-HYT, Class A, 144a, | ||||||||
| 1.457%, 11/15/29(A) | 4,961,311 | |||||||
| 89 |
Touchstone Ultra Short Duration Fixed Income Fund (Continued)
| Principal | Market | |||||||
| Amount | Value | |||||||
| Commercial Mortgage-Backed Securities — 6.0% (Continued) | ||||||||
| $ | 499,007 | JP Morgan Chase Commercial | ||||||
| Mortgage Securities Trust, Ser | ||||||||
| 2005-CB11, Class AJ, | ||||||||
| 5.380%, 8/12/37(A) | $ | 499,006 | ||||||
| 3,050,000 | JP Morgan Chase Commercial | |||||||
| Mortgage Securities Trust, Ser | ||||||||
| 2014-FBLU, Class B, 144a, | ||||||||
| 1.707%, 12/15/28(A) | 3,048,957 | |||||||
| 2,033,926 | LB-UBS Commercial Mortgage Trust, | |||||||
| Ser 2004-C7, Class H, 144a, | ||||||||
| 4.944%, 10/15/36(A)†† | 2,060,526 | |||||||
| 75,000 | Merrill Lynch Mortgage Investors | |||||||
| Trust, Ser 1998-C1, Class A3, | ||||||||
| 6.720%, 11/15/26(A) | 76,647 | |||||||
| 2,800,000 | PFP 2015-2 Ltd., Ser 2015-2, Class A, | |||||||
| 144a, 1.656%, 7/14/34(A) | 2,800,188 | |||||||
| 1,403,059 | PFP III 2014-1 Ltd., Ser 2014-1, Class A, | |||||||
| 144a, 1.368%, 6/14/31(A) | 1,402,199 | |||||||
| 23,484,747 | UBS-Citigroup Commercial Mortgage | |||||||
| Trust 2011-C1, Ser 2011-C1, Class | ||||||||
| XA, 144a, 2.638%, 1/10/45(A)(C) | 1,961,047 | |||||||
| 5,000,000 | Wells Fargo Commercial Mortgage | |||||||
| Trust, Ser 2014-TISH, Class B, 144a, | ||||||||
| 1.548%, 2/15/27(A) | 4,921,950 | |||||||
| Total Commercial Mortgage-Backed Securities | $ | 34,335,409 | ||||||
| Municipal Bonds — 3.3% | ||||||||
| Connecticut — 0.1% | ||||||||
| 425,000 | State of Connecticut, Ser A, UTGO, | |||||||
| 0.940%, 5/15/18(A) | 426,828 | |||||||
| Massachusetts — 0.2% | ||||||||
| 1,000,000 | MA St Dev Fin Agy R, Waste | |||||||
| Management Inc Proj Ser B, 2.125%, | ||||||||
| 12/1/29(A) | 1,002,380 | |||||||
| Minnesota — 0.6% | ||||||||
| 1,500,000 | Saint Paul MN Hsg & Redev Auth, Txbl | |||||||
| Ref Healthpartners Oblig, 1.041%, | ||||||||
| 7/1/16 | 1,501,965 | |||||||
| 1,000,000 | Saint Paul MN Hsg & Redev Auth, Txbl | |||||||
| Ref Healthpartners Oblig, 1.400%, | ||||||||
| 7/1/17 | 999,790 | |||||||
| 1,095,000 | Saint Paul MN Hsg & Redev Auth, Txbl | |||||||
| Ref Healthpartners Oblig, 1.838%, | ||||||||
| 7/1/18 | 1,100,716 | |||||||
| 3,602,471 | ||||||||
| New York — 0.7% | ||||||||
| 3,900,000 | Brookhaven NY IDA, Variable | |||||||
| Intercounty Asso, (LOC: Capital One | ||||||||
| NA), 0.380%, 1/1/25(A) | 3,900,000 | |||||||
| Ohio — 0.5% | ||||||||
| 885,000 | Akron OH COP, Muni Baseball | |||||||
| Stadium, 1.300%, 12/1/15 | 885,894 | |||||||
| 1,540,000 | Akron OH COP, Muni Baseball | |||||||
| Stadium, 1.750%, 12/1/16 | 1,553,721 | |||||||
| 490,000 | Medina Co OH IDR, Mack Inds Proj, | |||||||
| (LOC: JP Morgan Chase Bank NA), | ||||||||
| 0.170%, 7/1/16(A) | 490,000 | |||||||
| 2,929,615 | ||||||||
| Pennsylvania — 0.7% | ||||||||
| 2,500,000 | PA St Econ Dev Fing, Waste Mgmt Proj, | |||||||
| 1.750%, 12/1/33(A) | 2,504,500 | |||||||
| 1,800,000 | PA St IDA, Txbl Ref Econ Dev, 144a, | |||||||
| 144a, 1.635%, 7/1/16 | 1,802,754 | |||||||
| 4,307,254 | ||||||||
| South Carolina — 0.2% | ||||||||
| 230,000 | Spartanburg SC Wtrwks Rev, Txbl Ref | |||||||
| Sys Ser B, 1.219%, 12/1/16 | 230,446 | |||||||
| 535,000 | Spartanburg SC Wtrwks Rev, Txbl Ref | |||||||
| Sys Ser B, 1.519%, 12/1/17 | 536,129 | |||||||
| 280,000 | Spartanburg SC Wtrwks Rev, Txbl Ref | |||||||
| Sys Ser B, 1.785%, 12/1/18 | 282,405 | |||||||
| 1,048,980 | ||||||||
| Texas — 0.3% | ||||||||
| 1,500,000 | TX St Muni Gas Acquisition, 5.000%, | |||||||
| 12/15/15 | 1,512,720 | |||||||
| Total Municipal Bonds | $ | 18,730,248 | ||||||
| Non-Agency Collateralized Mortgage Obligations — 3.0% | ||||||||
| 3,494,890 | Bear Stearns ARM Trust, Ser 2003-1, | |||||||
| Class 5A1, 2.249%, 4/25/33(A)†† | 3,491,707 | |||||||
| 416,248 | Bear Stearns ARM Trust, Ser 2004-1, | |||||||
| Class 13A3, 2.853%, 4/25/34(A)†† | 402,578 | |||||||
| 329,009 | Bear Stearns Asset Backed Securities | |||||||
| Trust, Ser 2003-AC7, Class A2, | ||||||||
| 5.750%, 1/25/34(B)†† | 343,143 | |||||||
| 138,169 | Community Program Loan Trust, Ser | |||||||
| 1987-A, Class A5, 4.500%, 4/1/29 | 139,258 | |||||||
| 127,226 | FDIC Structured Sale Guaranteed | |||||||
| Notes, Ser 2010-S3, Class A, 144a, | ||||||||
| 2.740%, 12/3/20 | 129,901 | |||||||
| 264,379 | JP Morgan Mortgage Trust, Ser | |||||||
| 2006-A4, Class 2A2, | ||||||||
| 2.376%, 6/25/36(A) | 238,118 | |||||||
| 25,240 | Merrill Lynch Mortgage Investors | |||||||
| Trust, Ser 2003-A1, Class 2A, | ||||||||
| 2.468%, 12/25/32(A) | 25,044 | |||||||
| 437,602 | Merrill Lynch Mortgage Investors | |||||||
| Trust, Ser 2004-1, Class 1A, | ||||||||
| 2.132%, 12/25/34(A) | 432,186 | |||||||
| 3,179,463 | People's Choice Home Loan Securities | |||||||
| Trust Series, Ser 2005-1, Class M3, | ||||||||
| 1.064%, 1/25/35(A) | 3,178,150 | |||||||
| 90 |
Touchstone Ultra Short Duration Fixed Income Fund (Continued)
| Principal | Market | |||||||
| Amount | Value | |||||||
| Non-Agency Collateralized Mortgage Obligations — 3.0% (Continued) | ||||||||
| $ | 132,685 | RALI Trust, Ser 2003-QS10, Class A7, | ||||||
| 5.500%, 5/25/33 | $ | 135,050 | ||||||
| 1,186,791 | RFMSI Trust, Ser 2007-SA1, Class 1A1, | |||||||
| 3.227%, 2/25/37(A) | 1,031,141 | |||||||
| 1,192,921 | Springleaf Mortgage Loan Trust, Ser | |||||||
| 2012-3A, Class A, 144a, | ||||||||
| 1.570%, 12/25/59(A) | 1,192,598 | |||||||
| 5,403,511 | Springleaf Mortgage Loan Trust, Ser | |||||||
| 2013-1A, Class M5, 144a, | ||||||||
| 2.073%, 6/25/58(A) | 5,410,687 | |||||||
| 270,725 | Wells Fargo Mortgage Backed | |||||||
| Securities Trust, Ser 2003-G, Class | ||||||||
| A1, 2.615%, 6/25/33(A) | 273,374 | |||||||
| 695,586 | Wells Fargo Mortgage Backed | |||||||
| Securities Trust, Ser 2003-M, Class | ||||||||
| A1, 2.625%, 12/25/33(A) | 697,926 | |||||||
| Total Non-Agency Collateralized Mortgage Obligations | $ | 17,120,861 | ||||||
| U.S. Government Agency Obligations — 1.4% | ||||||||
| 583,000 | Government Trust Certificate, | |||||||
| 0.000%, 10/1/16# | 576,982 | |||||||
| 5,000,000 | Overseas Private Investment Corp., | |||||||
| 0.140%, 7/20/22(A) | 5,000,000 | |||||||
| 2,100,000 | Overseas Private Investment Corp., | |||||||
| 0.140%, 10/15/33(A) | 2,100,000 | |||||||
| 44,696 | Small Business Administration | |||||||
| Participation Certificates, Ser | ||||||||
| 2002-20A, Class 1, 6.140%, 1/1/22 | 48,859 | |||||||
| 66,587 | Small Business Administration | |||||||
| Participation Certificates, Ser | ||||||||
| 2003-20E, Class 1, 4.640%, 5/1/23 | 70,286 | |||||||
| 246,708 | Small Business Administration Pools, | |||||||
| 507682, 0.650%, 1/25/26(A) | 246,434 | |||||||
| 183,446 | Small Business Administration Pools, | |||||||
| 508374, 0.750%, 4/25/28(A) | 183,721 | |||||||
| Total U.S. Government Agency Obligations | $ | 8,226,282 | ||||||
| Agency Collateralized Mortgage Obligations — 1.1% | ||||||||
| 65,206 | FHLMC REMIC, Ser 2510 Class TA, | |||||||
| 4.000%, 6/15/32 | 67,676 | |||||||
| 611,009 | FHLMC REMIC, Ser 2770 Class FH, | |||||||
| 0.607%, 3/15/34(A) | 615,221 | |||||||
| 245,010 | FHLMC REMIC, Ser 3414 Class MB, | |||||||
| 4.250%, 12/15/19 | 253,524 | |||||||
| 379,146 | FNMA REMIC, Ser 2003-119, Class PU, | |||||||
| 4.000%, 11/25/33 | 390,947 | |||||||
| 9,679 | FNMA REMIC, Ser 2003-19, Class ME, | |||||||
| 4.000%, 1/25/33 | 9,723 | |||||||
| 120,151 | FNMA REMIC, Ser 2003-33, Class AM, | |||||||
| 4.250%, 5/25/33 | 129,648 | |||||||
| 113,872 | FNMA REMIC, Ser 2003-42, Class CA, | |||||||
| 4.000%, 5/25/33 | 119,825 | |||||||
| 3,462 | FNMA REMIC, Ser 2003-66, Class AP, | |||||||
| 3.500%, 11/25/32 | 3,478 | |||||||
| 520,093 | FNMA REMIC, Ser 2003-81, Class FE, | |||||||
| 0.694%, 9/25/33(A) | 525,029 | |||||||
| 214,991 | FNMA REMIC, Ser 2008-35, Class IO, | |||||||
| 4.500%, 4/25/23(C) | 7,597 | |||||||
| 229,948 | FNMA REMIC, Ser 2010-13, Class WD, | |||||||
| 4.250%, 3/25/25 | 239,099 | |||||||
| 114,255 | FNMA REMIC, Ser 2010-54, Class NA, | |||||||
| 4.500%, 10/25/39 | 117,862 | |||||||
| 231,006 | FNMA REMIC, Ser 2011-52, Class AH, | |||||||
| 2.750%, 10/25/18 | 235,268 | |||||||
| 502,557 | FNMA REMIC, Ser 2012-102, Class NA, | |||||||
| 1.500%, 9/25/27 | 497,881 | |||||||
| 192,930 | GNMA, Ser 2002-72, Class AB, | |||||||
| 4.500%, 10/20/32 | 208,944 | |||||||
| 21,381,917 | GNMA, Ser 2011-142, Class IO, | |||||||
| 0.920%, 9/16/46(A)(C) | 931,974 | |||||||
| 252,765 | GNMA, Ser 2011-161, Class A, | |||||||
| 1.738%, 1/16/34 | 253,756 | |||||||
| 183,135 | GNMA, Ser 2011-57, Class BA, | |||||||
| 3.000%, 5/20/40 | 188,556 | |||||||
| 233,376 | GNMA, Ser 2011-78, Class AB, | |||||||
| 2.450%, 2/16/39 | 235,123 | |||||||
| 8,785,231 | GNMA, Ser 2011-78, Class IX, | |||||||
| 0.779%, 8/16/46(A)(C) | 356,707 | |||||||
| 301,387 | GNMA, Ser 2012-27, Class A, | |||||||
| 1.614%, 7/16/39 | 298,258 | |||||||
| 14,995,679 | GNMA, Ser 2013-121, Class KX, | |||||||
| 0.648%, 10/16/44(A)(C) | 490,614 | |||||||
| Total Agency Collateralized Mortgage Obligations | $ | 6,176,710 | ||||||
| Commercial Paper — 16.6% | ||||||||
| 10,000,000 | Agrium Inc. | 9,992,051 | ||||||
| 10,000,000 | Cintas Corp. No 2 | 9,999,939 | ||||||
| 5,000,000 | Coca-Cola Enterprises Inc. | 4,999,978 | ||||||
| 10,000,000 | Edison International | 9,999,931 | ||||||
| 8,525,000 | Integrys Holding Inc. | 8,524,941 | ||||||
| 10,000,000 | MDU Resources Group Inc. | 9,999,894 | ||||||
| 10,000,000 | NextEra Energy Capital Holdings Inc. | 9,999,861 | ||||||
| 6,000,000 | NorthWestern Corp. | 5,999,917 | ||||||
| 9,120,000 | ONEOK Partners LP | 9,119,620 | ||||||
| 8,500,000 | RELX Inc. | 8,499,941 | ||||||
| 8,200,000 | Sinopec Century Bright Capital | |||||||
| Investment Ltd. | 8,199,836 | |||||||
| Total Commercial Paper | $ | 95,335,909 | ||||||
| 91 |
Touchstone Ultra Short Duration Fixed Income Fund (Continued)
| Market | ||||||||
| Shares | Value | |||||||
| Investment Fund — 0.0% | ||||||||
| 219,159 | Dreyfus Cash Management, | |||||||
| Institutional Shares, 0.06%∞Ω | $ | 219,159 | ||||||
| Total Investment Securities —101.5% | ||||||||
| (Cost $584,752,310) | $ | 582,159,302 | ||||||
| Liabilities in Excess of Other Assets — (1.5%) | (8,794,988 | ) | ||||||
| Net Assets — 100.0% | $ | 573,364,314 | ||||||
| (A) | Variable rate security - Rate reflected is the rate in effect of September 30, 2015. |
| (B) | Step Bond - A bond that pays an initial interest rate for the first period and then a higher interest rate for the following periods until maturity. The interest rate shown reflects rate in effect as of September 30, 2015. |
| (C) | Interest only security. This type of security represents the right to receive the monthly interest payments on an underlying pool of mortgages. Payments of principal on the pool reduce the value of the “interest only” holding. |
| # | Zero coupon bond - Rate shown reflects effective yield maturity at time of purchase. |
| †† | The issuers and/or sponsors of certain mortgage-backed securities may no longer exist; however, the securities by the Fund are separate legal entities organized as trusts and publicly traded. The Fund receives principal and interest payments directly from these trusts. |
| ∞ | Open-End Fund. |
| Ω | Represents the 7-day SEC yield as of September 30, 2015 |
Portfolio Abbreviations:
ARM - Adjustable Rate Mortgage
COP - Certificate of Participation
CLO - Collateralized Loan Obligations
FDIC - Federal Deposit Insurance Corporation
FHLMC - Federal Home Loan Mortgage Corporation
FNMA - Federal National Mortgage Association
GNMA - Government National Mortgage Association
IDA - Industrial Development Agency
IDR - Industrial Development Revenue
LLC - Limited Liability Company
LOC - Letter of Credit
LP - Limited Partnership
MLP - Master Limited Partnership
MTN - Medium Term Note
PLC - Public Limited Company
REIT - Real Estate Investment Trust
REMIC - Real Estate Mortgage Investment Conduit
UTGO - Unlimited Tax General Obligation
144a - This is a restricted security that was sold in a transaction qualifying for the exemption under Rule 144A of the Securities Act of 1933. This security may be sold in transactions exempt from registration, normally to qualified institutional buyers. At September 30, 2015, these securities were valued at $210,756,773 or 36.8% of net assets. These securities were deemed liquid pursuant to procedures approved by the Board of Trustees.
| 92 |
Touchstone Ultra Short Duration Fixed Income Fund (Continued)
Other Information:
The inputs or methodology used for valuing securities may not be an indication of the risk associated with investing in those securities. For more information on valuation inputs, and their aggregation into the levels used in the table below, please refer to the security valuation section in the accompanying Notes to Financial Statements.
Valuation inputs at Reporting Date:
| Description | Level 1 | Level 2 | Level 3 | Total | ||||||||||||
| Asset-Backed Securities | $ | — | $ | 194,424,334 | $ | — | $ | 194,424,334 | ||||||||
| Corporate Bonds | — | 163,438,835 | — | 163,438,835 | ||||||||||||
| U.S. Government Mortgage-Backed Obligations | — | 44,151,555 | — | 44,151,555 | ||||||||||||
| Commercial Mortgage-Backed Securities | — | 34,335,409 | — | 34,335,409 | ||||||||||||
| Municipal Bonds | — | 18,730,248 | — | 18,730,248 | ||||||||||||
| Non-Agency Collateralized Mortgage Obligations | — | 17,120,861 | — | 17,120,861 | ||||||||||||
| U.S. Government Agency Obligations | — | 8,226,282 | — | 8,226,282 | ||||||||||||
| Agency Collateralized Mortgage Obligations | — | 6,176,710 | — | 6,176,710 | ||||||||||||
| Commercial Paper | — | 95,335,909 | — | 95,335,909 | ||||||||||||
| Investment Fund | 219,159 | — | — | 219,159 | ||||||||||||
| $ | 582,159,302 | |||||||||||||||
See accompanying Notes to Financial Statements.
| 93 |
Statements of Assets and Liabilities
September 30, 2015
| Touchstone | Touchstone | Touchstone | ||||||||||||||
| Touchstone | Emerging | Global | Merger | |||||||||||||
| Arbitrage | Markets Equity | Real Estate | Arbitrage | |||||||||||||
| Fund | Fund | Fund | Fund | |||||||||||||
| Assets | ||||||||||||||||
| Investments, at cost | $ | 134,043,404 | $ | 321,685,644 | $ | 26,772,883 | $ | 243,793,553 | ||||||||
| Investments, at market value (A) | $ | 131,861,099 | $ | 261,964,499 | $ | 25,167,028 | $ | 241,119,730 | ||||||||
| Cash | 53,833 | — | — | 222,603 | ||||||||||||
| Foreign Currency (B) | — | 1,183,503 | 3,434 | — | ||||||||||||
| Cash collateral for securities sold short and written options | 22,463,552 | — | — | 10,349,543 | ||||||||||||
| Dividends and interest receivable | 154,179 | 295,059 | 136,202 | 552,297 | ||||||||||||
| Receivable for capital shares sold | 143,674 | 446,018 | 11,836 | 36,648 | ||||||||||||
| Receivable for investments sold | — | — | 59,755 | — | ||||||||||||
| Receivable for securities sold short | 201,520 | — | — | 150,458 | ||||||||||||
| Receivable for securities lending income | 25 | 2,932 | 254 | — | ||||||||||||
| Tax reclaim receivable | 2,896 | 50,576 | 7,262 | 6,764 | ||||||||||||
| Other assets | 14,512 | 15,493 | 19,340 | 11,698 | ||||||||||||
| Total Assets | 154,895,290 | 263,958,080 | 25,405,111 | 252,449,741 | ||||||||||||
| Liabilities | ||||||||||||||||
| Written options, at market value(C) | 478,800 | — | — | 840,750 | ||||||||||||
| Securities sold short(D) | 26,517,862 | — | — | 34,966,331 | ||||||||||||
| Dividend and interest payable on securities sold short | 22,488 | — | — | 28,752 | ||||||||||||
| Payable for return of collateral for securities on loan | 1,137,500 | 3,985,314 | 623,595 | — | ||||||||||||
| Payable for capital shares redeemed | 292,497 | 66,874 | 20,247 | 301,468 | ||||||||||||
| Payable for investments purchased | 487,365 | — | — | 3,557,611 | ||||||||||||
| Payable to close securities sold short | 202,044 | — | — | 150,918 | ||||||||||||
| Payable to Investment Advisor | 110,971 | 217,763 | 6,123 | 187,210 | ||||||||||||
| Payable to other affiliates | 29,265 | 32,349 | 1,178 | 46,686 | ||||||||||||
| Payable to Trustees | 6,907 | 6,907 | 6,907 | 6,907 | ||||||||||||
| Payable for professional services | 25,872 | 30,262 | 28,288 | 28,126 | ||||||||||||
| Payable to Transfer Agent | 32,323 | 66,076 | 5,897 | 48,803 | ||||||||||||
| Payable for reports to shareholders | 16,627 | 14,980 | 11,992 | 19,893 | ||||||||||||
| Contingencies | — | — | — | — | ||||||||||||
| Other accrued expenses and liabilities | 5,970 | 42,576 | 19,087 | 5,031 | ||||||||||||
| Total Liabilities | 29,366,491 | 4,463,101 | 723,314 | 40,188,486 | ||||||||||||
| Net Assets | $ | 125,528,799 | $ | 259,494,979 | $ | 24,681,797 | $ | 212,261,255 | ||||||||
| Net assets consist of: | ||||||||||||||||
| Par value | $ | 125,911 | $ | 285,024 | $ | 24,293 | $ | 200,491 | ||||||||
| Paid-in capital | 126,670,672 | 365,565,656 | 27,080,178 | 216,924,570 | ||||||||||||
| Accumulated net investment income (loss) | 3,548 | 2,568,970 | 30,501 | (837,461 | ) | |||||||||||
| Accumulated net realized gains (losses) on investments, foreign currency transactions, written options and securities sold short | 509,475 | (49,163,161 | ) | (845,615 | ) | (909,108 | ) | |||||||||
| Net unrealized appreciation (depreciation) on investments, foreign currency transactions, written options and securities sold short | (1,780,807 | ) | (59,761,510 | ) | (1,607,560 | ) | (3,117,237 | ) | ||||||||
| Net Assets | $ | 125,528,799 | $ | 259,494,979 | $ | 24,681,797 | $ | 212,261,255 | ||||||||
| (A) Includes market value of securities on loan of: | $ | 1,202,110 | $ | 3,985,440 | $ | 600,357 | $ | — | ||||||||
| (B) Cost of foreign currency: | $ | — | $ | 1,195,599 | $ | 3,440 | $ | — | ||||||||
| (C) Proceeds from written options: | $ | 157,041 | $ | — | $ | — | $ | 275,757 | ||||||||
| (D) Proceeds received for securities sold short: | $ | 27,241,119 | $ | — | $ | — | $ | 35,087,910 | ||||||||
| (E) See Note 12 in Notes to Financial Statements. | ||||||||||||||||
See accompanying Notes to Financial Statements.
| 94 |
Statements of Assets and Liabilities (Continued)
| Touchstone | Touchstone | Touchstone | Touchstone | |||||||||||
| Mid | Mid Cap | Premium | Sands Capital | |||||||||||
| Cap | Value | Yield Equity | Select Growth | |||||||||||
| Fund | Fund | Fund | Fund | |||||||||||
| $ | 686,407,570 | $ | 345,130,052 | $ | 177,869,872 | $ | 3,678,748,053 | |||||||
| $ | 698,456,619 | $ | 351,840,007 | $ | 171,112,642 | $ | 5,291,526,569 | |||||||
| — | — | — | — | |||||||||||
| — | — | — | — | |||||||||||
| — | — | — | — | |||||||||||
| 640,017 | 632,551 | 278,855 | 2,160,314 | |||||||||||
| 2,893,713 | 935,024 | 294,702 | 6,756,712 | |||||||||||
| — | 733,341 | — | 101,366,464 | |||||||||||
| — | — | — | — | |||||||||||
| 850 | 1,794 | — | 69,309 | |||||||||||
| — | — | 34,259 | — | |||||||||||
| 40,123 | 19,956 | 10,735 | 87,065 | |||||||||||
| 702,031,322 | 354,162,673 | 171,731,193 | 5,401,966,433 | |||||||||||
| — | — | — | — | |||||||||||
| — | — | — | — | |||||||||||
| — | — | — | — | |||||||||||
| — | 6,802,416 | — | 329,118,378 | |||||||||||
| 914,701 | 4,430,949 | 3,294,636 | 21,652,678 | |||||||||||
| — | — | — | 158,235,944 | |||||||||||
| — | — | — | — | |||||||||||
| 322,311 | 249,740 | 88,711 | 2,464,891 | |||||||||||
| 134,645 | 10,909 | 50,020 | 2,787,827 | |||||||||||
| 6,907 | 6,907 | 6,907 | 6,907 | |||||||||||
| 25,916 | 23,665 | 20,369 | 91,782 | |||||||||||
| 290,951 | 77,664 | 55,299 | 1,774,822 | |||||||||||
| 48,609 | 24,807 | 14,401 | 186,989 | |||||||||||
| — | — | (E) | — | — | ||||||||||
| 3,532 | 3,501 | 1,967 | 15,056 | |||||||||||
| 1,747,572 | 11,630,558 | 3,532,310 | 516,335,274 | |||||||||||
| $ | 700,283,750 | $ | 342,532,115 | $ | 168,198,883 | $ | 4,885,631,159 | |||||||
| $ | 300,992 | $ | 217,067 | $ | 203,694 | $ | 2,912,914 | |||||||
| 811,896,708 | 318,281,853 | 166,466,965 | 2,942,736,570 | |||||||||||
| (38,973 | ) | 80,839 | 163,737 | (21,615,887 | ) | |||||||||
| (123,924,026 | ) | 17,242,401 | 8,121,717 | 348,819,046 | ||||||||||
| 12,049,049 | 6,709,955 | (6,757,230 | ) | $ | 1,612,778,516 | |||||||||
| $ | 700,283,750 | $ | 342,532,115 | $ | 168,198,883 | $ | 4,885,631,159 | |||||||
| $ | — | $ | 6,860,188 | $ | — | $ | 328,805,184 | |||||||
| $ | — | $ | — | $ | — | $ | — | |||||||
| $ | — | $ | — | $ | — | $ | — | |||||||
| $ | — | $ | — | $ | — | $ | — | |||||||
| 95 |
Statements of Assets and Liabilities (Continued)
| Touchstone | ||||||||||||||||
| Emerging | Touchstone | Touchstone | ||||||||||||||
| Touchstone | Markets | Global | Merger | |||||||||||||
| Arbitrage | Equity | Real Estate | Arbitrage | |||||||||||||
| Fund | Fund | Fund | Fund | |||||||||||||
| Pricing of Class A Shares | ||||||||||||||||
| Net assets applicable to Class A shares | $ | 20,672,058 | $ | 3,021,774 | $ | 7,367,714 | $ | 21,858,253 | ||||||||
| Shares of beneficial interest outstanding | ||||||||||||||||
| (unlimited number of shares authorized, $0.01 par value) | 2,082,183 | 330,271 | 734,572 | 2,074,406 | ||||||||||||
| Net asset value price per share* | $ | 9.93 | $ | 9.15 | $ | 10.03 | $ | 10.54 | ||||||||
| Maximum sales charge - Class A shares | 5.75 | % | 5.75 | % | 5.75 | % | 5.75 | % | ||||||||
| Maximum offering price per share | ||||||||||||||||
| (100%/(100%-maximum sales charge) of net asset value adjusted to the nearest cent) per share - Class A shares | $ | 10.54 | $ | 9.71 | $ | 10.64 | $ | 11.18 | ||||||||
| Pricing of Class C Shares | ||||||||||||||||
| Net assets applicable to Class C shares | $ | 8,694,215 | $ | 1,565,744 | $ | 1,488,870 | $ | 18,867,632 | ||||||||
| Shares of beneficial interest outstanding | ||||||||||||||||
| (unlimited number of shares authorized, $0.01 par value) | 887,322 | 175,187 | 148,021 | 1,845,411 | ||||||||||||
| Net asset value, offering price per share** | $ | 9.80 | $ | 8.94 | $ | 10.06 | $ | 10.22 | ||||||||
| Pricing of Class Y Shares | ||||||||||||||||
| Net assets applicable to Class Y shares | $ | 87,427,132 | $ | 70,066,488 | $ | 7,365,571 | $ | 88,677,283 | ||||||||
| Shares of beneficial interest outstanding | ||||||||||||||||
| (unlimited number of shares authorized, $0.01 par value) | 8,749,219 | 7,699,682 | 724,663 | 8,348,707 | ||||||||||||
| Net asset value, offering price and redemption price per share | $ | 9.99 | $ | 9.10 | $ | 10.16 | $ | 10.62 | ||||||||
| Pricing of Class Z Shares | ||||||||||||||||
| Net assets applicable to Class Z shares | $ | — | $ | — | $ | — | $ | — | ||||||||
| Shares of beneficial interest outstanding | ||||||||||||||||
| (unlimited number of shares authorized, $0.01 par value) | — | — | — | — | ||||||||||||
| Net asset value, offering price and redemption price per share | $ | — | $ | — | $ | — | $ | — | ||||||||
| Pricing of Institutional Class Shares | ||||||||||||||||
| Net assets applicable to Institutional Class Shares | $ | 8,735,394 | $ | 184,840,973 | $ | 8,459,642 | $ | 82,858,087 | ||||||||
| Shares of beneficial interest outstanding | ||||||||||||||||
| (unlimited number of shares authorized, $0.01 par value) | 872,347 | 20,297,238 | 822,015 | 7,780,594 | ||||||||||||
| Net asset value, offering price and redemption price per share | $ | 10.01 | $ | 9.11 | $ | 10.29 | $ | 10.65 | ||||||||
* There is no sales load on subscriptions of $1 million or more. Redemptions that were part of a $1 million or more subscription may be subject to a contingent deferred sales load if redeemed within a one-year period from the date of purchase.
** Redemption price per share varies by length of time shares are held due to the terms of the contingent deferred sales charge.
See accompanying Notes to Financial Statements.
| 96 |
Statements of Assets and Liabilities (Continued)
| Touchstone | Touchstone | Touchstone | Touchstone | |||||||||||
| Mid | Mid Cap | Premium | Sands Capital | |||||||||||
| Cap | Value | Yield Equity | Select | |||||||||||
| Fund | Fund | Fund | Growth Fund | |||||||||||
| $ | 62,717,286 | $ | 7,662,664 | $ | 36,022,558 | $ | 230,783,251 | |||||||
| 2,701,005 | 488,108 | 4,356,153 | 14,002,398 | |||||||||||
| $ | 23.22 | $ | 15.70 | $ | 8.27 | $ | 16.48 | |||||||
| 5.75 | % | 5.75 | % | 5.75 | % | 5.75 | % | |||||||
| $ | 24.64 | $ | 16.66 | $ | 8.77 | $ | 17.49 | |||||||
| $ | 60,815,094 | $ | 1,752,444 | $ | 31,404,665 | $ | 163,236,506 | |||||||
| 2,721,108 | 113,136 | 3,801,983 | 10,292,544 | |||||||||||
| $ | 22.35 | $ | 15.49 | $ | 8.26 | $ | 15.86 | |||||||
| $ | 481,734,959 | $ | 208,525,474 | $ | — | $ | 3,198,758,472 | |||||||
| 20,604,787 | 13,229,619 | — | 188,578,983 | |||||||||||
| $ | 23.38 | $ | 15.76 | $ | — | $ | 16.96 | |||||||
| $ | 18,692,839 | $ | — | $ | — | $ | 1,292,852,930 | |||||||
| 810,067 | — | — | 78,417,502 | |||||||||||
| $ | 23.08 | $ | — | $ | — | $ | 16.49 | |||||||
| $ | 76,323,572 | $ | 124,591,533 | $ | 100,771,660 | $ | — | |||||||
| 3,262,250 | 7,875,836 | 12,211,218 | — | |||||||||||
| $ | 23.40 | $ | 15.82 | $ | 8.25 | $ | — | |||||||
| 97 |
Statements of Assets and Liabilities (Continued)
| Touchstone | Touchstone | Touchstone | ||||||||||||||
| Small | Small | Touchstone | Ultra Short | |||||||||||||
| Cap Core | Cap Value | Total Return | Duration Fixed | |||||||||||||
| Fund | Fund | Bond Fund | Income Fund | |||||||||||||
| Assets | ||||||||||||||||
| Investments, at cost | $ | 708,141,391 | $ | 74,354,825 | $ | 177,847,021 | $ | 584,752,310 | ||||||||
| Investments, at market value (A) | $ | 753,965,314 | $ | 61,801,537 | $ | 178,369,513 | $ | 582,159,302 | ||||||||
| Cash | — | — | 55,005 | 42,854 | ||||||||||||
| Dividends and interest receivable | 1,156,050 | 90,303 | 1,407,095 | 2,027,845 | ||||||||||||
| Receivable for capital shares sold | 955,343 | 77,252 | 4,093,868 | 2,073,091 | ||||||||||||
| Receivable for investments sold | — | 185,216 | — | 6,229,526 | ||||||||||||
| Receivable from securities lending income | 34,202 | 8,214 | 196 | — | ||||||||||||
| Tax reclaim receivable | 906 | — | — | — | ||||||||||||
| Other assets | 23,506 | 9,384 | 19,780 | 41,480 | ||||||||||||
| Total Assets | 756,135,321 | 62,171,906 | 183,945,457 | 592,574,098 | ||||||||||||
| Liabilities | ||||||||||||||||
| Dividends payable | — | — | — | 102,111 | ||||||||||||
| Payable for return of collateral for securities on loan | 34,923,382 | 4,546,361 | 891,413 | — | ||||||||||||
| Payable for capital shares redeemed | 514,365 | 37,561 | 167,851 | 2,382,154 | ||||||||||||
| Payable for investments purchased | — | 1,033,652 | — | 16,005,568 | ||||||||||||
| Payable to Investment Advisor | 528,998 | 43,668 | 40,994 | 104,233 | ||||||||||||
| Payable to other affiliates | 123,723 | 6,299 | 16,559 | 400,945 | ||||||||||||
| Payable to Trustees | 6,907 | 6,907 | 6,907 | 6,907 | ||||||||||||
| Payable for professional services | 27,877 | 20,826 | 22,652 | 28,646 | ||||||||||||
| Payable to Transfer Agent | 161,574 | 15,644 | 29,376 | 120,527 | ||||||||||||
| Payable for reports to shareholders | 21,312 | 15,302 | 12,641 | 30,169 | ||||||||||||
| Other accrued expenses and liabilities | 3,320 | 3,841 | 11,695 | 28,524 | ||||||||||||
| Total Liabilities | 36,311,458 | 5,730,061 | 1,200,088 | 19,209,784 | ||||||||||||
| Net Assets | $ | 719,823,863 | $ | 56,441,845 | $ | 182,745,369 | $ | 573,364,314 | ||||||||
| Net assets consist of: | ||||||||||||||||
| Par value | $ | 402,502 | $ | 27,970 | $ | 179,122 | $ | 615,039 | ||||||||
| Paid-in capital | 597,604,027 | 71,622,887 | 183,352,902 | 600,586,512 | ||||||||||||
| Accumulated net investment income | 6,559,385 | 39,687 | 32,933 | 462,446 | ||||||||||||
| Accumulated net realized gains (losses) on investments | 69,434,026 | (2,695,411 | ) | (1,342,080 | ) | (25,706,675 | ) | |||||||||
| Net unrealized appreciation (depreciation) on investments | 45,823,923 | (12,553,288 | ) | 522,492 | (2,593,008 | ) | ||||||||||
| Net Assets | $ | 719,823,863 | $ | 56,441,845 | $ | 182,745,369 | $ | 573,364,314 | ||||||||
| (A) Includes market value of securities on loan of: | $ | 34,851,700 | $ | 4,332,170 | $ | 863,096 | $ | — | ||||||||
| See accompanying Notes to Financial Statements. | ||||||||||||||||
| 98 |
Statements of Assets and Liabilities (Continued)
| Touchstone | Touchstone | Touchstone | ||||||||||||||
| Small | Small | Touchstone | Ultra Short | |||||||||||||
| Cap Core | Cap Value | Total Return | Duration Fixed | |||||||||||||
| Fund | Fund | Bond Fund | Income Fund | |||||||||||||
| Pricing of Class A Shares | ||||||||||||||||
| Net assets applicable to Class A shares | $ | 62,422,991 | $ | 24,658,963 | $ | 5,749,409 | $ | 10,675,109 | ||||||||
| Shares of beneficial interest outstanding | ||||||||||||||||
| (unlimited number of shares authorized, $0.01 par value) | 3,520,457 | 1,222,298 | 564,158 | 1,145,218 | ||||||||||||
| Net asset value price per share* | $ | 17.73 | $ | 20.17 | $ | 10.19 | $ | 9.32 | ||||||||
| Maximum sales charge - Class A shares | 5.75 | % | 5.75 | % | 4.75 | % | 2.00 | % | ||||||||
| Maximum offering price per share | ||||||||||||||||
| (100%/(100%-maximum sales charge) of net asset value adjusted to the nearest cent) per share - Class A shares | $ | 18.81 | $ | 21.40 | $ | 10.70 | $ | 9.51 | ||||||||
| Pricing of Class C Shares | ||||||||||||||||
| Net assets applicable to Class C shares | $ | 21,562,445 | $ | 1,395,980 | $ | 2,367,931 | $ | 8,290,978 | ||||||||
| Shares of beneficial interest outstanding | ||||||||||||||||
| (unlimited number of shares authorized, $0.01 par value) | 1,256,863 | 69,865 | 232,677 | 889,238 | ||||||||||||
| Net asset value, offering price per share** | $ | 17.16 | $ | 19.98 | $ | 10.18 | $ | 9.32 | ||||||||
| Pricing of Class Y Shares | ||||||||||||||||
| Net assets applicable to Class Y shares | $ | 333,970,679 | $ | 4,418,774 | $ | 39,751,088 | $ | 200,455,840 | ||||||||
| Shares of beneficial interest outstanding | ||||||||||||||||
| (unlimited number of shares authorized, $0.01 par value) | 18,625,648 | 218,744 | 3,895,512 | 21,503,517 | ||||||||||||
| Net asset value, offering price and redemption price per share | $ | 17.93 | $ | 20.20 | $ | 10.20 | $ | 9.32 | ||||||||
| Pricing of Class Z Shares | ||||||||||||||||
| Net assets applicable to Class Z shares | $ | — | $ | — | $ | — | $ | 304,553,457 | ||||||||
| Shares of beneficial interest outstanding | ||||||||||||||||
| (unlimited number of shares authorized, $0.01 par value) | — | — | — | 32,667,186 | ||||||||||||
| Net asset value, offering price and redemption price per share | $ | — | $ | — | $ | — | $ | 9.32 | ||||||||
| Pricing of Institutional Class Shares | ||||||||||||||||
| Net assets applicable to Institutional Class Shares | $ | 301,867,748 | $ | 25,968,128 | $ | 134,876,941 | $ | 49,388,930 | ||||||||
| Shares of beneficial interest outstanding | ||||||||||||||||
| (unlimited number of shares authorized, $0.01 par value) | 16,847,194 | 1,286,086 | 13,219,879 | 5,298,691 | ||||||||||||
| Net asset value, offering price and redemption price per share | $ | 17.92 | $ | 20.19 | $ | 10.20 | $ | 9.32 | ||||||||
* There is no sales load on subscriptions of $1 million or more. Redemptions that were part of a $1 million or more subscription may be subject to a contingent deferred sales load if redeemed within a one-year period from the date of purchase.
** Redemption price per share varies by length of time shares are held due to the terms of the contingent deferred sales charge.
See accompanying Notes to Financial Statements.
| 99 |
For the Year Ended September 30, 2015
| Touchstone | Touchstone | Touchstone | ||||||||||||||
| Touchstone | Emerging | Global | Merger | |||||||||||||
| Arbitrage | Markets Equity | Real Estate | Arbitrage | |||||||||||||
| Fund | Fund | Fund | Fund | |||||||||||||
| Investment Income | ||||||||||||||||
| Dividends from affiliated securities | $ | 1,209 | $ | 353 | $ | 48 | $ | 4,711 | ||||||||
| Dividends from non-affiliated securities(A) | 2,092,200 | 7,602,698 | 934,395 | 3,799,132 | ||||||||||||
| Interest | 297,618 | — | 180 | 662,118 | ||||||||||||
| Income from securities loaned | 19,654 | 28,278 | 7,786 | — | ||||||||||||
| Total Investment Income | 2,410,681 | 7,631,329 | 942,409 | 4,465,961 | ||||||||||||
| Expenses | ||||||||||||||||
| Investment advisory fees | 1,598,028 | 3,349,536 | 176,468 | 3,187,301 | ||||||||||||
| Administration fees | 227,764 | 484,082 | 32,562 | 455,127 | ||||||||||||
| Compliance fees and expenses | 2,062 | 2,062 | 2,062 | 2,062 | ||||||||||||
| Custody fees | 24,628 | 189,204 | 28,550 | 36,370 | ||||||||||||
| Professional fees | 29,405 | 62,190 | 26,353 | 33,650 | ||||||||||||
| Transfer Agent fees, Class A | 22,367 | 18,501 | 4,088 | 26,682 | ||||||||||||
| Transfer Agent fees, Class C | 6,763 | 4,547 | 1,031 | 21,728 | ||||||||||||
| Transfer Agent fees, Class Y | 74,244 | 85,269 | 8,139 | 76,324 | ||||||||||||
| Transfer Agent fees, Class Z | — | — | — | — | ||||||||||||
| Transfer Agent fees, Institutional Class | 118 | 102,150 | 97 | 9,301 | ||||||||||||
| Registration Fees, Class A | 16,258 | 15,161 | 11,246 | 18,014 | ||||||||||||
| Registration Fees, Class C | 1,755 | 10,314 | 2,962 | 9,462 | ||||||||||||
| Registration Fees, Class Y | 15,374 | 15,699 | 17,668 | 22,978 | ||||||||||||
| Registration Fees, Class Z | — | — | — | — | ||||||||||||
| Registration Fees, Institutional Class | 753 | 25,318 | 2,962 | 11,523 | ||||||||||||
| Dividend expense on securities sold short | 931,881 | — | — | 1,783,342 | ||||||||||||
| Interest expense on securities sold short | 189,391 | — | — | 854,462 | ||||||||||||
| Reports to Shareholders, Class A | 4,577 | 5,191 | 5,759 | 5,149 | ||||||||||||
| Reports to Shareholders, Class C | 5,782 | 5,235 | 5,198 | 7,552 | ||||||||||||
| Reports to Shareholders, Class Y | 14,133 | 9,704 | 6,213 | 16,178 | ||||||||||||
| Reports to Shareholders, Class Z | — | — | — | — | ||||||||||||
| Reports to Shareholders, Institutional Class | 5,233 | 5,605 | 5,530 | 6,625 | ||||||||||||
| Shareholder servicing fees, Class Z | — | — | — | — | ||||||||||||
| Distribution expenses, Class A | 55,206 | 10,907 | 12,683 | 114,474 | ||||||||||||
| Distribution and shareholder servicing expenses, Class C | 99,802 | 21,867 | 12,014 | 257,929 | ||||||||||||
| Trustee fees | 13,169 | 13,169 | 13,169 | 13,169 | ||||||||||||
| Other expenses | 17,547 | 37,174 | 30,517 | 30,765 | ||||||||||||
| Total Expenses | 3,356,240 | 4,472,885 | 405,271 | 7,000,167 | ||||||||||||
| Fees waived and/or reimbursed by the Advisor and/or Affiliates(B) | (7,282 | ) | (145,098 | ) | (145,279 | ) | — | |||||||||
| Fees recouped by the Advisor(B) | — | — | — | — | ||||||||||||
| Net Expenses | 3,348,958 | 4,327,787 | 259,992 | 7,000,167 | ||||||||||||
| Net Investment Income (Loss) | (938,277 | ) | 3,303,542 | 682,417 | (2,534,206 | ) | ||||||||||
| Realized and Unrealized Gains (Losses) on Investments | ||||||||||||||||
| Net realized gains (losses) from non-affiliated securities | 5,684,916 | (8,121,141 | ) | (340,448 | ) | 5,330,896 | ||||||||||
| Net realized gains (losses) on foreign currency transactions | 113,558 | (421,806 | ) | (29,067 | ) | 830,944 | ||||||||||
| Net realized losses on written options | (207,198 | ) | — | — | (322,140 | ) | ||||||||||
| Net realized losses on securities sold short | (3,626,564 | ) | — | — | (3,982,208 | ) | ||||||||||
| Net change in unrealized appreciation (depreciation) on investments | (4,633,610 | ) | (67,452,732 | ) | (1,481,482 | ) | (4,988,710 | ) | ||||||||
| Net change in unrealized appreciation (depreciation) on foreign currency transactions | (87,990 | ) | (5,575 | ) | (1,089 | ) | (508,348 | ) | ||||||||
| Net change in unrealized appreciation (depreciation) on written options | (421,095 | ) | — | — | (439,497 | ) | ||||||||||
| Net change in unrealized appreciation (depreciation) on securities sold short | 5,427,353 | — | — | 10,416,425 | ||||||||||||
| Net Realized and Unrealized Gains (Losses) on Investments | 2,249,370 | (76,001,254 | ) | (1,852,086 | ) | 6,337,362 | ||||||||||
| Change in Net Assets Resulting from Operations | $ | 1,311,093 | $ | (72,697,712 | ) | $ | (1,169,669 | ) | $ | 3,803,156 | ||||||
| (A) Net of foreign tax withholding of: | $ | 40,113 | $ | 824,201 | $ | 51,617 | $ | 67,295 | ||||||||
| (B)See Note 4 in Notes to Financial Statements. | ||||||||||||||||
See accompanying Notes to Financial Statements.
| 100 |
Statements of Operations (Continued)
| Touchstone | Touchstone | Touchstone | Touchstone | |||||||||||
| Mid | Mid Cap | Premium | Sands Capital | |||||||||||
| Cap | Value | Yield Equity | Select Growth | |||||||||||
| Fund | Fund | Fund | Fund | |||||||||||
| $ | 1,030 | $ | 206 | $ | 356 | $ | 6,450 | |||||||
| 7,183,539 | 6,528,584 | 7,452,274 | 26,101,262 | |||||||||||
| — | — | — | — | |||||||||||
| 25,892 | 19,741 | — | 386,143 | |||||||||||
| 7,210,461 | 6,548,531 | 7,452,630 | 26,493,855 | |||||||||||
| 4,854,261 | 2,889,296 | 1,336,085 | 35,695,416 | |||||||||||
| 908,700 | 528,342 | 294,151 | 8,921,142 | |||||||||||
| 2,062 | 2,062 | 2,062 | 2,062 | |||||||||||
| 17,214 | 13,023 | 8,846 | 85,117 | |||||||||||
| 36,351 | 35,975 | 23,955 | 201,021 | |||||||||||
| 49,748 | 15,304 | 41,371 | 217,958 | |||||||||||
| 61,556 | 3,173 | 27,642 | 149,158 | |||||||||||
| 527,603 | 211,923 | 100,176 | 2,485,273 | |||||||||||
| 25,190 | — | — | 2,359,481 | |||||||||||
| 18,421 | 18,508 | — | — | |||||||||||
| 14,787 | 16,139 | 15,307 | 25,703 | |||||||||||
| 15,616 | 8,030 | 13,332 | 15,046 | |||||||||||
| 30,390 | 20,054 | 16,072 | 113,511 | |||||||||||
| 14,362 | — | — | 44,411 | |||||||||||
| 11,367 | 18,621 | — | — | |||||||||||
| — | — | — | — | |||||||||||
| — | — | — | — | |||||||||||
| 9,947 | 7,051 | 7,159 | 21,643 | |||||||||||
| 12,003 | 6,073 | 7,808 | 24,771 | |||||||||||
| 65,628 | 57,098 | 17,744 | 265,014 | |||||||||||
| 8,055 | — | — | 161,499 | |||||||||||
| 7,124 | 11,302 | — | — | |||||||||||
| 50,047 | — | — | 4,120,979 | |||||||||||
| 127,760 | 23,270 | 116,230 | 721,284 | |||||||||||
| 549,743 | 20,648 | 349,403 | 1,968,736 | |||||||||||
| 13,169 | 13,169 | 13,169 | 13,169 | |||||||||||
| 40,637 | 38,063 | 19,584 | 231,555 | |||||||||||
| 7,471,741 | 3,957,124 | 2,410,096 | 57,843,949 | |||||||||||
| (721,862 | ) | (448,793 | ) | (66,988 | ) | (946,970 | ) | |||||||
| — | 14,756 | — | 41,727 | |||||||||||
| 6,749,879 | 3,523,087 | 2,343,108 | 56,938,706 | |||||||||||
| 460,582 | 3,025,444 | 5,109,522 | (30,444,851 | ) | ||||||||||
| 12,577,383 | 21,967,422 | 10,215,915 | 448,220,268 | |||||||||||
| — | — | — | — | |||||||||||
| — | — | — | — | |||||||||||
| — | — | — | — | |||||||||||
| (49,885,177 | ) | (27,750,574 | ) | (36,402,981 | ) | (606,231,963 | ) | |||||||
| — | — | — | — | |||||||||||
| — | — | — | — | |||||||||||
| — | — | — | — | |||||||||||
| (37,307,794 | ) | (5,783,152 | ) | (26,187,066 | ) | (158,011,695 | ) | |||||||
| $ | (36,847,212 | ) | $ | (2,757,708 | ) | $ | (21,077,544 | ) | $ | (188,456,546 | ) | |||
| $ | — | $ | — | $ | 81,787 | $ | 334,280 | |||||||
| 101 |
Statements of Operations (Continued)
| Touchstone | ||||||||||||||||
| Touchstone | Touchstone | Touchstone | Ultra Short | |||||||||||||
| Small Cap | Small Cap | Total Return | Duration | |||||||||||||
| Core | Value | Bond | Fixed Income | |||||||||||||
| Fund | Fund | Fund | Fund | |||||||||||||
| Investment Income | ||||||||||||||||
| Dividends from affiliated securities | $ | 928 | $ | 153 | $ | 586 | $ | 960 | ||||||||
| Dividends from non-affiliated securities(A) | 16,423,881 | 1,912,208 | 378 | 188 | ||||||||||||
| Interest | — | — | 5,173,103 | 7,594,059 | ||||||||||||
| Income from securities loaned | 596,779 | 152,942 | 485 | — | ||||||||||||
| Total Investment Income | 17,021,588 | 2,065,303 | 5,174,552 | 7,595,207 | ||||||||||||
| Expenses | ||||||||||||||||
| Investment advisory fees | 6,781,951 | 643,163 | 602,913 | 1,544,932 | ||||||||||||
| Administration fees | 1,186,303 | 106,472 | 255,348 | 922,569 | ||||||||||||
| Compliance fees and expenses | 2,062 | 2,062 | 2,062 | 2,062 | ||||||||||||
| Custody fees | 16,056 | 13,199 | 8,485 | 31,907 | ||||||||||||
| Professional fees | 40,108 | 22,410 | 25,755 | 38,814 | ||||||||||||
| Transfer Agent fees, Class A | 89,727 | 38,716 | 10,686 | 8,506 | ||||||||||||
| Transfer Agent fees, Class C | 21,545 | 4,245 | 1,915 | 6,173 | ||||||||||||
| Transfer Agent fees, Class Y | 284,215 | 11,466 | 18,370 | 148,185 | ||||||||||||
| Transfer Agent fees, Class Z | — | — | — | 223,739 | ||||||||||||
| Transfer Agent fees, Institutional Class | 67,458 | 219 | 55,710 | 4,184 | ||||||||||||
| Registration Fees, Class A | 16,050 | 12,709 | 10,513 | 15,082 | ||||||||||||
| Registration Fees, Class C | 12,339 | 9,102 | 7,370 | 16,618 | ||||||||||||
| Registration Fees, Class Y | 25,424 | 6,971 | 18,080 | 24,087 | ||||||||||||
| Registration Fees, Class Z | — | — | — | 25,807 | ||||||||||||
| Registration Fees, Institutional Class | 17,564 | 4,316 | 21,082 | 15,276 | ||||||||||||
| Reports to Shareholders, Class A | 6,812 | 10,272 | 5,583 | 5,535 | ||||||||||||
| Reports to Shareholders, Class C | 7,057 | 5,496 | 5,175 | 5,461 | ||||||||||||
| Reports to Shareholders, Class Y | 20,650 | 6,000 | 5,591 | 11,307 | ||||||||||||
| Reports to Shareholders, Class Z | — | — | — | 30,785 | ||||||||||||
| Reports to Shareholders, Institutional Class | 7,314 | 10,300 | 5,965 | 5,181 | ||||||||||||
| Shareholder servicing fees, Class Z | — | — | — | 847,695 | ||||||||||||
| Distribution expenses, Class A | 181,130 | 76,618 | 14,599 | 23,820 | ||||||||||||
| Distribution and shareholder servicing expenses, Class C | 259,849 | 19,172 | 19,955 | 70,587 | ||||||||||||
| Trustee fees | 13,169 | 13,169 | 13,169 | 13,169 | ||||||||||||
| Other expenses | 42,237 | 17,218 | 36,858 | 107,203 | ||||||||||||
| Total Expenses | 9,099,020 | 1,033,295 | 1,145,184 | 4,148,684 | ||||||||||||
| Fees waived and/or reimbursed by the Advisor and/or Affiliates(B) | (38,284 | ) | (176,031 | ) | (196,165 | ) | (512,896 | ) | ||||||||
| Net Expenses | 9,060,736 | 857,264 | 949,019 | 3,635,788 | ||||||||||||
| Net Investment Income | 7,960,852 | 1,208,039 | 4,225,533 | 3,959,419 | ||||||||||||
| Realized and Unrealized Gains (Losses) on Investments | ||||||||||||||||
| Net realized gains (losses) on investments | 83,192,630 | 3,657,420 | 656,088 | (68,741 | ) | |||||||||||
| Net change in unrealized appreciation (depreciation) on investments | (141,878,468 | ) | (9,186,442 | ) | (786,185 | ) | (1,301,049 | ) | ||||||||
| Net Realized and Unrealized Losses on Investments | (58,685,838 | ) | (5,529,022 | ) | (130,097 | ) | (1,369,790 | ) | ||||||||
| Change in Net Assets Resulting from Operations | $ | (50,724,986 | ) | $ | (4,320,983 | ) | $ | 4,095,436 | $ | 2,589,629 | ||||||
| (A) Net of foreign tax withholding of: | $ | 24,704 | $ | 4,592 | $ | — | $ | — | ||||||||
| (B) See Note 4 in Notes to Financial Statements. | ||||||||||||||||
See accompanying Notes to Financial Statements.
| 102 |
This page intentionally left blank.
| 103 |
Statements of Changes in Net Assets
| Touchstone | Touchstone | |||||||||||||||
| Arbitrage | Emerging Markets | |||||||||||||||
| Fund | Equity Fund | |||||||||||||||
| For the | For the | For the | For the | |||||||||||||
| Year Ended | Year Ended | Year Ended | Year Ended | |||||||||||||
| September 30, | September 30, | September 30, | September 30, | |||||||||||||
| 2015 | 2014(A) | 2015 | 2014 | |||||||||||||
| From Operations | ||||||||||||||||
| Net investment income (loss) | $ | (938,277 | ) | $ | (1,353,000 | ) | $ | 3,303,542 | $ | 4,023,192 | ||||||
| Net realized gains (losses) on investments, foreign currency transactions, written options and securities sold short | 1,964,712 | 1,115,422 | (8,542,947 | ) | (3,847,285 | ) | ||||||||||
| Net change in unrealized appreciation (depreciation) on investments, foreign currency transactions, written options and securities sold short | 284,658 | (2,065,465 | ) | (67,458,307 | ) | 11,984,745 | ||||||||||
| Change in Net Assets from Operations | 1,311,093 | (2,303,043 | ) | (72,697,712 | ) | 12,160,652 | ||||||||||
| Distributions to Shareholders from: | ||||||||||||||||
| Net investment income, Class A | — | — | (24,587 | ) | (25,019 | ) | ||||||||||
| Net investment income, Class C | — | — | — | — | ||||||||||||
| Net investment income, Class Y | — | — | (871,078 | ) | (1,423,044 | ) | ||||||||||
| Net investment income, Class Z | — | — | — | — | ||||||||||||
| Net investment income, Institutional Class | — | — | (2,505,846 | ) | (2,744,620 | ) | ||||||||||
| Net realized gains, Class A | (33,828 | ) | — | — | — | |||||||||||
| Net realized gains, Class C | (16,826 | ) | — | — | — | |||||||||||
| Net realized gains, Class Y | (167,228 | ) | — | — | — | |||||||||||
| Net realized gains, Institutional Class | (70,593 | ) | — | — | — | |||||||||||
| Total Distributions | (288,475 | ) | — | (3,401,511 | ) | (4,192,683 | ) | |||||||||
| Net Increase (Decrease) from Share Transactions(B) | (72,683,275 | ) | 199,492,499 | (12,246,077 | ) | (30,664,199 | ) | |||||||||
| Total Increase (Decrease) in Net Assets | (71,660,657 | ) | 197,189,456 | (88,345,300 | ) | (22,696,230 | ) | |||||||||
| Net Assets | ||||||||||||||||
| Beginning of period | 197,189,456 | — | 347,840,279 | 370,536,509 | ||||||||||||
| End of period | $ | 125,528,799 | $ | 197,189,456 | $ | 259,494,979 | $ | 347,840,279 | ||||||||
| Accumulated Net Investment Income (Loss) | $ | 3,548 | $ | (474,401 | ) | $ | 2,568,970 | $ | 3,088,745 | |||||||
(A) Represents the period from commencement of operations (October 1, 2013) through September 30, 2014.
(B) For details on share transactions by class, see Statements of Changes in Net Assets - Capital Stock Activity in pages 110-113.
See accompanying Notes to Financial Statements.
| 104 |
Statements of Changes in Net Assets (Continued)
| Touchstone | Touchstone | Touchstone | ||||||||||||||||||||
| Global Real Estate | Merger Arbitrage | Mid Cap | ||||||||||||||||||||
| Fund | Fund | Fund | ||||||||||||||||||||
| For the | For the | For the | For the | For the | For the | |||||||||||||||||
| Year Ended | Year Ended | Year Ended | Year Ended | Year Ended | Year Ended | |||||||||||||||||
| September 30, | September 30, | September 30, | September 30, | September 30, | September 30, | |||||||||||||||||
| 2015 | 2014 | 2015 | 2014 | 2015 | 2014 | |||||||||||||||||
| $ | 682,417 | $ | 706,713 | $ | (2,534,206 | ) | $ | (6,967,055 | ) | $ | 460,582 | $ | 607,481 | |||||||||
| (369,515 | ) | (87,425 | ) | 1,857,492 | 7,491,803 | 12,577,383 | 10,224,597 | |||||||||||||||
| (1,482,571 | ) | 787,982 | 4,479,870 | (9,163,261 | ) | (49,885,177 | ) | 39,529,023 | ||||||||||||||
| (1,169,669 | ) | 1,407,270 | 3,803,156 | (8,638,513 | ) | (36,847,212 | ) | 50,361,101 | ||||||||||||||
| (176,894 | ) | (49,075 | ) | — | (1,133,607 | ) | — | (55,665 | ) | |||||||||||||
| (35,260 | ) | (25,115 | ) | — | — | — | — | |||||||||||||||
| (130,125 | ) | (21,354 | ) | — | (1,487,742 | ) | (609,061 | ) | (499,864 | ) | ||||||||||||
| — | — | — | — | — | (3,557 | ) | ||||||||||||||||
| (452,574 | ) | (878,015 | ) | — | (1,216,543 | ) | (258,983 | ) | (188,068 | ) | ||||||||||||
| — | (91,730 | ) | (270,079 | ) | (7,622,004 | ) | — | — | ||||||||||||||
| — | (56,232 | ) | (136,421 | ) | (1,468,984 | ) | — | — | ||||||||||||||
| — | (40,405 | ) | (654,494 | ) | (6,316,580 | ) | — | — | ||||||||||||||
| — | (1,918,096 | ) | (505,070 | ) | (4,856,576 | ) | — | — | ||||||||||||||
| (794,853 | ) | (3,080,022 | ) | (1,566,064 | ) | (24,102,036 | ) | (868,044 | ) | (747,154 | ) | |||||||||||
| 12,468,955 | (1,188,269 | ) | (220,660,915 | ) | (225,458,912 | ) | 292,015,815 | 59,436,231 | ||||||||||||||
| 10,504,433 | (2,861,021 | ) | (218,423,823 | ) | (258,199,461 | ) | 254,300,559 | 109,050,178 | ||||||||||||||
| 14,177,364 | 17,038,385 | 430,685,078 | 688,884,539 | 445,983,191 | 336,933,013 | |||||||||||||||||
| $ | 24,681,797 | $ | 14,177,364 | $ | 212,261,255 | $ | 430,685,078 | $ | 700,283,750 | $ | 445,983,191 | |||||||||||
| $ | 30,501 | $ | 4,106 | $ | (837,461 | ) | $ | (2,877,875 | ) | $ | (38,973 | ) | $ | 362,459 | ||||||||
| 105 |
Statements of Changes in Net Assets (Continued)
| Touchstone | Touchstone | |||||||||||||||
| Mid Cap | Premium Yield | |||||||||||||||
| Value Fund | Equity Fund | |||||||||||||||
| For the | For the | For the | For the | |||||||||||||
| Year Ended | Year Ended | Year Ended | Year Ended | |||||||||||||
| September 30, | September 30, | September 30, | September 30, | |||||||||||||
| 2015 | 2014 | 2015 | 2014 | |||||||||||||
| From Operations | ||||||||||||||||
| Net investment income (loss) | $ | 3,025,444 | $ | 1,643,920 | $ | 5,109,522 | $ | 6,939,577 | ||||||||
| Net realized gains on investments | 21,967,422 | 13,549,055 | 10,215,915 | 10,080,991 | ||||||||||||
| Net change in unrealized appreciation (depreciation) on investments | (27,750,574 | ) | 4,289,764 | (36,402,981 | ) | 7,915,835 | ||||||||||
| Change in Net Assets from Operations | (2,757,708 | ) | 19,482,739 | (21,077,544 | ) | 24,936,403 | ||||||||||
| Distributions to Shareholders from: | ||||||||||||||||
| Net investment income, Class A | (48,181 | ) | (38,804 | ) | (1,240,585 | ) | (2,538,944 | ) | ||||||||
| Net investment income, Class C | — | — | (681,106 | ) | (910,643 | ) | ||||||||||
| Net investment income, Class Y | (1,725,242 | ) | (593,150 | ) | (3,439,427 | ) | (3,422,480 | ) | ||||||||
| Net investment income, Institutional Class | (1,326,235 | ) | (947,640 | ) | — | — | ||||||||||
| Net realized gains, Class A | (376,327 | ) | (358,204 | ) | (2,197,270 | ) | — | |||||||||
| Net realized gains, Class C | (76,516 | ) | (70,196 | ) | (1,531,929 | ) | — | |||||||||
| Net realized gains, Class Y | (7,781,541 | ) | (1,353,853 | ) | (5,137,668 | ) | — | |||||||||
| Net realized gains, Class Z | — | — | — | — | ||||||||||||
| Net realized gains, Institutional Class | (5,200,105 | ) | (12,333,363 | ) | — | — | ||||||||||
| Total Distributions | (16,534,147 | ) | (15,695,210 | ) | (14,227,985 | ) | (6,872,067 | ) | ||||||||
| Net Increase (Decrease) from Share Transactions(A) | (1,870,672 | ) | 193,135,111 | 17,989,598 | (9,373,472 | ) | ||||||||||
| Total Increase (Decrease) in Net Assets | (21,162,527 | ) | 196,922,640 | (17,315,931 | ) | 8,690,864 | ||||||||||
| Net Assets | ||||||||||||||||
| Beginning of period | 363,694,642 | 166,772,002 | 185,514,814 | 176,823,950 | ||||||||||||
| End of period | $ | 342,532,115 | $ | 363,694,642 | $ | 168,198,883 | $ | 185,514,814 | ||||||||
| Accumulated Net Investment Income (Loss) | $ | 80,839 | $ | 148,217 | $ | 163,737 | $ | 402,109 | ||||||||
(A) For details on share transactions by class, see Statements of Changes in Net Assets - Capital Stock Activity on pages 113-116.
See accompanying Notes to Financial Statements.
| 106 |
Statements of Changes in Net Assets (Continued)
| Touchstone | ||||||||||||||||||||||
| Sands Capital | Touchstone | Touchstone | ||||||||||||||||||||
| Select Growth | Small Cap | Small Cap | ||||||||||||||||||||
| Fund | Core Fund | Value Fund | ||||||||||||||||||||
| For the | For the | For the | For the | For the | For the | |||||||||||||||||
| Year Ended | Year Ended | Year Ended | Year Ended | Year Ended | Year Ended | |||||||||||||||||
| September 30, | September 30, | September 30, | September 30, | September 30, | September 30, | |||||||||||||||||
| 2015 | 2014 | 2015 | 2014 | 2015 | 2014 | |||||||||||||||||
| $ | (30,444,851 | ) | $ | (48,203,007 | ) | $ | 7,960,852 | $ | (1,713,269 | ) | $ | 1,208,039 | $ | 965,911 | ||||||||
| 448,220,268 | 370,507,684 | 83,192,630 | 60,635,559 | 3,657,420 | 6,848,831 | |||||||||||||||||
| (606,231,963 | ) | 414,249,592 | (141,878,468 | ) | 16,994,276 | (9,186,442 | ) | (9,011,029 | ) | |||||||||||||
| (188,456,546 | ) | 736,554,269 | (50,724,986 | ) | 75,916,566 | (4,320,983 | ) | (1,196,287 | ) | |||||||||||||
| — | — | (4,964 | ) | (1,986,763 | ) | (456,935 | ) | (471,862 | ) | |||||||||||||
| — | — | — | (238,421 | ) | (14,424 | ) | (12,264 | ) | ||||||||||||||
| — | — | (146,568 | ) | (4,569,477 | ) | (139,413 | ) | (88,877 | ) | |||||||||||||
| — | — | (212,904 | ) | (8,066,410 | ) | (583,324 | ) | (380,917 | ) | |||||||||||||
| (14,093,187 | ) | (3,338,561 | ) | (4,610,591 | ) | (1,883,497 | ) | (1,209,646 | ) | — | ||||||||||||
| (10,111,362 | ) | (1,618,597 | ) | (2,081,129 | ) | (436,531 | ) | (80,833 | ) | — | ||||||||||||
| (183,460,195 | ) | (20,484,118 | ) | (23,363,113 | ) | (3,655,120 | ) | (346,677 | ) | — | ||||||||||||
| (90,266,864 | ) | (16,954,589 | ) | — | — | — | — | |||||||||||||||
| — | — | (29,583,949 | ) | (6,236,216 | ) | (1,174,928 | ) | — | ||||||||||||||
| (297,931,608 | ) | (42,395,865 | ) | (60,003,218 | ) | (27,072,435 | ) | (4,006,180 | ) | (953,920 | ) | |||||||||||
| (897,050,296 | ) | 134,315,820 | 40,547,715 | (63,711,351 | ) | (8,100,551 | ) | 35,918,484 | ||||||||||||||
| (1,383,438,450 | ) | 828,474,224 | (70,180,489 | ) | (14,867,220 | ) | (16,427,714 | ) | 33,768,277 | |||||||||||||
| 6,269,069,609 | 5,440,595,385 | 790,004,352 | 804,871,572 | 72,869,559 | 39,101,282 | |||||||||||||||||
| $ | 4,885,631,159 | $ | 6,269,069,609 | $ | 719,823,863 | $ | 790,004,352 | $ | 56,441,845 | $ | 72,869,559 | |||||||||||
| $ | (21,615,887 | ) | $ | (10,152,161 | ) | $ | 6,559,385 | $ | — | $ | 39,687 | $ | 18,730 | |||||||||
| 107 |
Statements of Changes in Net Assets (Continued)
| Touchstone | ||||||||||||||||
| Touchstone | Ultra Short | |||||||||||||||
| Total Return | Duration Fixed | |||||||||||||||
| Bond Fund | Income Fund | |||||||||||||||
| For the | For the | For the | For the | |||||||||||||
| Year Ended | Year Ended | Year Ended | Year Ended | |||||||||||||
| September 30, | September 30, | September 30, | September 30, | |||||||||||||
| 2015 | 2014 | 2015 | 2014 | |||||||||||||
| From Operations | ||||||||||||||||
| Net investment income | $ | 4,225,533 | $ | 4,063,028 | $ | 3,959,419 | $ | 6,239,044 | ||||||||
| Net realized gains (losses) on investments | 656,088 | (86,471 | ) | (68,741 | ) | 1,454,719 | ||||||||||
| Net change in unrealized appreciation (depreciation) on investments | (786,185 | ) | 3,229,980 | (1,301,049 | ) | (643,012 | ) | |||||||||
| Change in Net Assets from Operations | 4,095,436 | 7,206,537 | 2,589,629 | 7,050,751 | ||||||||||||
| Distributions to Shareholders from: | ||||||||||||||||
| Net investment income, Class A | (152,519 | ) | (206,484 | ) | (120,421 | ) | (211,746 | ) | ||||||||
| Net investment income, Class C | (38,190 | ) | (40,162 | ) | (73,655 | ) | (102,390 | ) | ||||||||
| Net investment income, Class Y | (808,571 | ) | (613,793 | ) | (3,184,693 | ) | (3,782,121 | ) | ||||||||
| Net investment income, Class Z | — | — | (4,319,849 | ) | (5,101,470 | ) | ||||||||||
| Net investment income, Institutional Class | (4,108,293 | ) | (4,011,329 | ) | (801,753 | ) | (900,708 | ) | ||||||||
| Total Distributions | (5,107,573 | ) | (4,871,768 | ) | (8,500,371 | ) | (10,098,435 | ) | ||||||||
| Net Increase (Decrease) from Share Transactions(A) | 41,178,974 | (27,064,186 | ) | (140,181,440 | ) | (13,617,210 | ) | |||||||||
| Total Increase (Decrease) in Net Assets | 40,166,837 | (24,729,417 | ) | (146,092,182 | ) | (16,664,894 | ) | |||||||||
| Net Assets | ||||||||||||||||
| Beginning of period | 142,578,532 | 167,307,949 | 719,456,496 | 736,121,390 | ||||||||||||
| End of period | $ | 182,745,369 | $ | 142,578,532 | $ | 573,364,314 | $ | 719,456,496 | ||||||||
| Accumulated Net Investment Income | $ | 32,933 | $ | 16,110 | $ | 462,446 | $ | 687,324 | ||||||||
(A) For details on share transactions by class, see Statements of Changes in Net Assets - Capital Stock Activity on page 117.
See accompanying Notes to Financial Statements.
| 108 |
This page intentionally left blank.
| 109 |
Statements of Changes in Net Assets - Capital Stock Activity
| Touchstone Arbitrage Fund | ||||||||||||||||
| For the Year | For the Year | |||||||||||||||
| Ended | Ended | |||||||||||||||
| September 30, 2015 | September 30, 2014(A) | |||||||||||||||
| Shares | Dollars | Shares | Dollars | |||||||||||||
| Class A | ||||||||||||||||
| Proceeds from Shares issued | 697,405 | $ | 6,923,936 | 9,950,955 | $ | 99,281,747 | ||||||||||
| Reinvestment of distributions | 3,414 | 33,622 | — | — | ||||||||||||
| Cost of Shares redeemed | (920,226 | ) | (9,124,998 | ) | (7,649,365 | ) | (75,910,986 | ) | ||||||||
| Change from Class A Share Transactions | (219,407 | ) | (2,167,440 | ) | 2,301,590 | 23,370,761 | ||||||||||
| Class C | ||||||||||||||||
| Proceeds from Shares issued | 237,911 | 2,335,338 | 1,168,934 | 11,647,230 | ||||||||||||
| Reinvestment of distributions | 1,654 | 16,175 | — | — | ||||||||||||
| Cost of Shares redeemed | (484,282 | ) | (4,756,438 | ) | (36,895 | ) | (364,881 | ) | ||||||||
| Change from Class C Share Transactions | (244,717 | ) | (2,404,925 | ) | 1,132,039 | 11,282,349 | ||||||||||
| Class Y | ||||||||||||||||
| Proceeds from Shares issued | 4,068,067 | 40,496,482 | 15,352,300 | 153,248,950 | ||||||||||||
| Reinvestment of distributions | 16,744 | 165,594 | — | — | ||||||||||||
| Cost of Shares redeemed | (7,205,496 | ) | (71,751,279 | ) | (3,482,396 | ) | (34,581,935 | ) | ||||||||
| Change from Class Y Share Transactions | (3,120,685 | ) | (31,089,203 | ) | 11,869,904 | 118,667,015 | ||||||||||
| Institutional Class | ||||||||||||||||
| Proceeds from Shares issued | 220,191 | 2,220,455 | 5,485,908 | 54,843,892 | ||||||||||||
| Reinvestment of distributions | 7,123 | 70,593 | — | — | ||||||||||||
| Cost of Shares redeemed | (3,968,913 | ) | (39,312,755 | ) | (871,962 | ) | (8,671,518 | ) | ||||||||
| Change from Institutional Class Share Transactions | (3,741,599 | ) | (37,021,707 | ) | 4,613,946 | 46,172,374 | ||||||||||
| Change from Share Transactions | (7,326,408 | ) | $ | (72,683,275 | ) | 19,917,479 | $ | 199,492,499 | ||||||||
(A)Represents the period from commencement of operations (October 1, 2013) through September 30, 2014.
See accompanying Notes to Financial Statements.
| 110 |
Statements of Changes in Net Assets - Capital Stock Activity (Continued)
| Touchstone Emerging Markets Equity Fund | Touchstone Global Real Estate Fund | |||||||||||||||||||||||||||||
| For the Year | For the Year | For the Year | For the Year | |||||||||||||||||||||||||||
| Ended | Ended | Ended | Ended | |||||||||||||||||||||||||||
| September 30, 2015 | September 30, 2014 | September 30, 2015 | September 30, 2014 | |||||||||||||||||||||||||||
| Shares | Dollars | Shares | Dollars | Shares | Dollars | Shares | Dollars | |||||||||||||||||||||||
| 186,600 | $ | 2,072,169 | 349,399 | $ | 4,146,928 | 641,954 | $ | 7,084,908 | 76,285 | $ | 845,552 | |||||||||||||||||||
| 2,103 | 23,322 | 1,822 | 20,389 | 16,173 | 171,876 | 12,669 | 129,331 | |||||||||||||||||||||||
| (313,089 | ) | (3,477,526 | ) | (751,096 | ) | (8,760,914 | ) | (54,627 | ) | (583,064 | ) | (11,552 | ) | (126,540 | ) | |||||||||||||||
| (124,386 | ) | (1,382,035 | ) | (399,875 | ) | (4,593,597 | ) | 603,500 | 6,673,720 | 77,402 | 848,343 | |||||||||||||||||||
| 24,930 | 277,830 | 42,073 | 476,030 | 108,291 | 1,194,851 | 17,395 | 191,715 | |||||||||||||||||||||||
| — | — | — | — | 3,224 | 34,635 | 7,938 | 81,077 | |||||||||||||||||||||||
| (101,198 | ) | (1,098,754 | ) | (118,966 | ) | (1,322,746 | ) | (13,292 | ) | (143,576 | ) | (8,800 | ) | (96,687 | ) | |||||||||||||||
| (76,268 | ) | (820,924 | ) | (76,893 | ) | (846,716 | ) | 98,223 | 1,085,910 | 16,533 | 176,105 | |||||||||||||||||||
| 1,430,819 | 15,269,883 | 2,450,097 | 27,330,935 | 773,961 | 8,768,772 | 31,559 | 354,367 | |||||||||||||||||||||||
| 79,179 | 870,970 | 127,955 | 1,422,862 | 11,493 | 122,168 | 5,690 | 58,651 | |||||||||||||||||||||||
| (2,896,992 | ) | (31,709,119 | ) | (5,490,496 | ) | (63,225,764 | ) | (115,424 | ) | (1,221,470 | ) | (5,322 | ) | (55,823 | ) | |||||||||||||||
| (1,386,994 | ) | (15,568,266 | ) | (2,912,444 | ) | (34,471,967 | ) | 670,030 | 7,669,470 | 31,927 | 357,195 | |||||||||||||||||||
| 4,709,785 | 52,209,046 | 10,770,410 | 119,377,600 | 8,359 | 93,132 | 22,314 | 258,716 | |||||||||||||||||||||||
| 227,026 | 2,497,286 | 245,616 | 2,731,248 | 41,153 | 453,149 | 268,374 | 2,796,111 | |||||||||||||||||||||||
| (4,751,637 | ) | (49,181,184 | ) | (9,818,030 | ) | (112,860,767 | ) | (316,444 | ) | (3,506,426 | ) | (484,042 | ) | (5,624,739 | ) | |||||||||||||||
| 185,174 | 5,525,148 | 1,197,996 | 9,248,081 | (266,932 | ) | (2,960,145 | ) | (193,354 | ) | (2,569,912 | ) | |||||||||||||||||||
| (1,402,474 | ) | $ | (12,246,077 | ) | (2,191,216 | ) | $ | (30,664,199 | ) | 1,104,821 | $ | 12,468,955 | (67,492 | ) | $ | (1,188,269 | ) | |||||||||||||
| 111 |
Statements of Changes in Net Assets - Capital Stock Activity (Continued)
| Touchstone Merger Arbitrage Fund | ||||||||||||||||
| For the Year | For the Year | |||||||||||||||
| Ended | Ended | |||||||||||||||
| September 30, 2015 | September 30, 2014 | |||||||||||||||
| Shares | Dollars | Shares | Dollars | |||||||||||||
| Class A | ||||||||||||||||
| Proceeds from Shares issued | 317,995 | $ | 3,355,747 | 3,878,209 | $ | 42,296,612 | ||||||||||
| Proceeds from Shares issued in connection with merger(A) | — | — | — | — | ||||||||||||
| Reinvestment of distributions | 24,939 | 261,605 | 799,051 | 8,581,806 | ||||||||||||
| Cost of Shares redeemed | (7,506,278 | ) | (78,939,832 | ) | (20,412,258 | ) | (218,274,531 | ) | ||||||||
| Change from Class A Share Transactions | (7,163,344 | ) | (75,322,480 | ) | (15,734,998 | ) | (167,396,113 | ) | ||||||||
| Class C | ||||||||||||||||
| Proceeds from Shares issued | 21,898 | 225,663 | 243,767 | 2,595,260 | ||||||||||||
| Proceeds from Shares issued in connection with merger(A) | — | — | — | — | ||||||||||||
| Reinvestment of distributions | 13,289 | 136,208 | 138,877 | 1,462,374 | ||||||||||||
| Cost of Shares redeemed | (1,671,980 | ) | (17,160,505 | ) | (1,508,097 | ) | (15,791,020 | ) | ||||||||
| Change from Class C Share Transactions | (1,636,793 | ) | (16,798,634 | ) | (1,125,453 | ) | (11,733,386 | ) | ||||||||
| Class Y | ||||||||||||||||
| Proceeds from Shares issued | 1,632,792 | 17,296,230 | 10,667,004 | 115,257,589 | ||||||||||||
| Proceeds from Shares issued in connection with merger(A) | — | — | — | — | ||||||||||||
| Reinvestment of distributions | 59,302 | 626,234 | 689,761 | 7,445,499 | ||||||||||||
| Cost of Shares redeemed | (10,245,967 | ) | (108,541,694 | ) | (11,756,123 | ) | (126,058,926 | ) | ||||||||
| Change from Class Y Share Transactions | (8,553,873 | ) | (90,619,230 | ) | (399,358 | ) | (3,355,838 | ) | ||||||||
| Class Z | ||||||||||||||||
| Proceeds from Shares issued | — | — | — | — | ||||||||||||
| Reinvestment of distributions | — | — | — | — | ||||||||||||
| Cost of Shares redeemed | — | — | — | — | ||||||||||||
| Change from Class Z Share Transactions | — | — | — | — | ||||||||||||
| Institutional Class | ||||||||||||||||
| Proceeds from Shares issued | 1,842,775 | 19,481,278 | 4,951,127 | 53,306,003 | ||||||||||||
| Proceeds from Shares issued in connection with merger(A) | — | — | — | — | ||||||||||||
| Reinvestment of distributions | 43,999 | 465,514 | 531,575 | 5,752,897 | ||||||||||||
| Cost of Shares redeemed | (5,434,586 | ) | (57,867,363 | ) | (9,517,077 | ) | (102,032,475 | ) | ||||||||
| Change from Institutional Class Share Transactions | (3,547,812 | ) | (37,920,571 | ) | (4,034,375 | ) | (42,973,575 | ) | ||||||||
| Change from Share Transactions | (20,901,822 | ) | $ | (220,660,915 | ) | (21,294,184 | ) | $ | (225,458,912 | ) | ||||||
(A) See Note 11 in the Notes to Financial Statements.
See accompanying Notes to Financial Statements.
| 112 |
Statements of Changes in Net Assets - Capital Stock Activity (Continued)
| Touchstone Mid Cap Fund | Touchstone Mid Cap Value Fund | |||||||||||||||||||||||||||||
| For the Year | For the Year | For the Year | For the Year | |||||||||||||||||||||||||||
| Ended | Ended | Ended | Ended | |||||||||||||||||||||||||||
| September 30, 2015 | September 30, 2014 | September 30, 2015 | September 30, 2014 | |||||||||||||||||||||||||||
| Shares | Dollars | Shares | Dollars | Shares | Dollars | Shares | Dollars | |||||||||||||||||||||||
| 1,699,189 | $ | 43,125,179 | 1,607,880 | $ | 35,975,560 | 154,790 | $ | 2,609,534 | 324,500 | $ | 5,381,879 | |||||||||||||||||||
| — | — | — | — | — | — | 913,005 | 14,967,633 | |||||||||||||||||||||||
| — | — | 2,129 | 48,558 | 24,707 | 405,472 | 25,012 | 387,892 | |||||||||||||||||||||||
| (497,769 | ) | (12,575,317 | ) | (2,200,002 | ) | (50,866,081 | ) | (536,569 | ) | (9,007,319 | ) | (747,164 | ) | (12,458,550 | ) | |||||||||||||||
| 1,201,420 | 30,549,862 | (589,993 | ) | (14,841,963 | ) | (357,072 | ) | (5,992,313 | ) | 515,353 | 8,278,854 | |||||||||||||||||||
| 1,235,605 | 30,223,772 | 785,197 | 17,197,751 | 33,065 | 553,321 | 23,980 | 391,285 | |||||||||||||||||||||||
| — | — | — | — | — | — | 75,102 | 1,220,480 | |||||||||||||||||||||||
| — | — | — | — | 4,467 | 72,235 | 4,492 | 68,682 | |||||||||||||||||||||||
| (318,653 | ) | (7,658,547 | ) | (209,079 | ) | (4,696,977 | ) | (46,335 | ) | (771,881 | ) | (26,575 | ) | (437,861 | ) | |||||||||||||||
| 916,952 | 22,565,225 | 576,118 | 12,500,774 | (8,803 | ) | (146,325 | ) | 76,999 | 1,242,586 | |||||||||||||||||||||
| 13,034,302 | 335,664,826 | 6,434,227 | 146,829,608 | 3,429,721 | 58,072,725 | 6,542,963 | 111,989,634 | |||||||||||||||||||||||
| — | — | — | — | — | — | 6,892,271 | 113,504,503 | |||||||||||||||||||||||
| 14,093 | 358,948 | 10,996 | 251,910 | 565,498 | 9,334,998 | 119,461 | 1,892,632 | |||||||||||||||||||||||
| (3,623,295 | ) | (91,336,205 | ) | (3,906,835 | ) | (89,013,478 | ) | (3,569,354 | ) | (60,449,696 | ) | (1,728,316 | ) | (28,855,210 | ) | |||||||||||||||
| 9,425,100 | 244,687,569 | 2,538,388 | 58,068,040 | 425,865 | 6,958,027 | 11,826,379 | 198,531,559 | |||||||||||||||||||||||
| 794,664 | 19,940,900 | 423,307 | 9,357,895 | — | — | — | — | |||||||||||||||||||||||
| — | — | 157 | 3,557 | — | — | — | — | |||||||||||||||||||||||
| (477,159 | ) | (11,756,957 | ) | (551,283 | ) | (12,364,897 | ) | — | — | — | — | |||||||||||||||||||
| 317,505 | 8,183,943 | (127,819 | ) | (3,003,445 | ) | — | — | — | — | |||||||||||||||||||||
| 443,808 | 11,248,537 | 1,648,145 | 37,556,817 | 2,461,723 | 41,633,362 | 4,545,432 | 75,400,128 | |||||||||||||||||||||||
| — | — | — | — | — | — | 1,714,774 | 28,350,276 | |||||||||||||||||||||||
| 7,316 | 186,413 | 4,442 | 101,755 | 269,644 | 4,472,681 | 841,759 | 13,125,594 | |||||||||||||||||||||||
| (1,004,121 | ) | (25,405,734 | ) | (1,371,685 | ) | (30,945,747 | ) | (2,879,594 | ) | (48,796,104 | ) | (8,026,469 | ) | (131,793,886 | ) | |||||||||||||||
| (552,997 | ) | (13,970,784 | ) | 280,902 | 6,712,825 | (148,227 | ) | (2,690,061 | ) | (924,504 | ) | (14,917,888 | ) | |||||||||||||||||
| 11,307,980 | $ | 292,015,815 | 2,677,596 | $ | 59,436,231 | (88,237 | ) | $ | (1,870,672 | ) | 11,494,227 | $ | 193,135,111 | |||||||||||||||||
| 113 |
Statements of Changes in Net Assets - Capital Stock Activity (Continued)
| Touchstone Premium Yield Equity Fund | ||||||||||||||||
| For the Year | For the Year | |||||||||||||||
| Ended | Ended | |||||||||||||||
| September 30, 2015 | September 30, 2014 | |||||||||||||||
| Shares | Dollars | Shares | Dollars | |||||||||||||
| Class A | ||||||||||||||||
| Proceeds from Shares issued | 1,698,528 | $ | 16,405,724 | 2,063,274 | $ | 19,884,099 | ||||||||||
| Reinvestment of distributions | 334,440 | 3,162,900 | 251,310 | 2,362,109 | ||||||||||||
| Cost of Shares redeemed | (2,197,894 | ) | (20,728,402 | ) | (7,456,862 | ) | (70,214,159 | ) | ||||||||
| Change from Class A Share Transactions | (164,926 | ) | (1,159,778 | ) | (5,142,278 | ) | (47,967,951 | ) | ||||||||
| Class C | ||||||||||||||||
| Proceeds from Shares issued | 1,092,280 | 10,483,333 | 908,611 | 8,805,613 | ||||||||||||
| Reinvestment of distributions | 202,879 | 1,912,977 | 82,247 | 774,646 | ||||||||||||
| Cost of Shares redeemed | (620,690 | ) | (5,816,648 | ) | (559,961 | ) | (5,291,191 | ) | ||||||||
| Change from Class C Share Transactions | 674,469 | 6,579,662 | 430,897 | 4,289,068 | ||||||||||||
| Class Y | ||||||||||||||||
| Proceeds from Shares issued | 5,230,685 | 49,314,434 | 6,488,873 | 62,999,341 | ||||||||||||
| Reinvestment of distributions | 809,706 | 7,630,116 | 315,597 | 2,995,329 | ||||||||||||
| Cost of Shares redeemed | (4,787,404 | ) | (44,374,836 | ) | (3,331,773 | ) | (31,689,259 | ) | ||||||||
| Change from Class Y Share Transactions | 1,252,987 | 12,569,714 | 3,472,697 | 34,305,411 | ||||||||||||
| Class Z | ||||||||||||||||
| Proceeds from Shares issued | — | — | — | — | ||||||||||||
| Reinvestment of distributions | — | — | — | — | ||||||||||||
| Cost of Shares redeemed | — | — | — | — | ||||||||||||
| Change from Class Z Share Transactions | — | — | — | — | ||||||||||||
| Institutional Class | ||||||||||||||||
| Proceeds from Shares issued | — | — | — | — | ||||||||||||
| Reinvestment of distributions | — | — | — | — | ||||||||||||
| Cost of Shares redeemed | — | — | — | — | ||||||||||||
| Change from Institutional Class Share Transactions | — | — | — | — | ||||||||||||
| Change from Share Transactions | 1,762,530 | $ | 17,989,598 | (1,238,684 | ) | $ | (9,373,472 | ) | ||||||||
See accompanying Notes to Financial Statements.
| 114 |
Statements of Changes in Net Assets - Capital Stock Activity (Continued)
| Touchstone Sands Capital Select Growth Fund | Touchstone Small Cap Core Fund | |||||||||||||||||||||||||||||
| For the Year | For the Year | For the Year | For the Year | |||||||||||||||||||||||||||
| Ended | Ended | Ended | Ended | |||||||||||||||||||||||||||
| September 30, 2015 | September 30, 2014 | September 30, 2015 | September 30, 2014 | |||||||||||||||||||||||||||
| Shares | Dollars | Shares | Dollars | Shares | Dollars | Shares | Dollars | |||||||||||||||||||||||
| 3,641,024 | $ | 65,559,498 | 6,373,482 | $ | 110,334,538 | 1,922,057 | $ | 37,461,873 | 1,137,776 | $ | 23,406,870 | |||||||||||||||||||
| 632,172 | 11,233,693 | 160,574 | 2,694,434 | 225,866 | 4,210,298 | 179,857 | 3,724,471 | |||||||||||||||||||||||
| (6,220,356 | ) | (111,540,350 | ) | (16,479,495 | ) | (288,364,437 | ) | (1,559,188 | ) | (31,246,980 | ) | (4,682,878 | ) | (97,669,839 | ) | |||||||||||||||
| (1,947,160 | ) | (34,747,159 | ) | (9,945,439 | ) | (175,335,465 | ) | 588,735 | 10,425,191 | (3,365,245 | ) | (70,538,498 | ) | |||||||||||||||||
| 517,357 | 8,977,978 | 984,805 | 16,621,353 | 48,757 | 913,444 | 42,416 | 855,387 | |||||||||||||||||||||||
| 427,832 | 7,358,711 | 71,038 | 1,164,306 | 100,136 | 1,817,469 | 28,666 | 578,774 | |||||||||||||||||||||||
| (2,219,652 | ) | (38,545,926 | ) | (2,109,370 | ) | (35,791,274 | ) | (242,220 | ) | (4,700,467 | ) | (230,065 | ) | (4,680,435 | ) | |||||||||||||||
| (1,274,463 | ) | (22,209,237 | ) | (1,053,527 | ) | (18,005,615 | ) | (93,327 | ) | (1,969,554 | ) | (158,983 | ) | (3,246,274 | ) | |||||||||||||||
| 59,278,345 | 1,111,054,923 | 79,243,960 | 1,412,688,866 | 6,507,540 | 132,883,759 | 5,304,875 | 110,996,257 | |||||||||||||||||||||||
| 6,959,585 | 127,012,426 | 782,694 | 13,438,856 | 874,337 | 16,458,603 | 325,231 | 6,788,917 | |||||||||||||||||||||||
| (64,334,704 | ) | (1,186,531,629 | ) | (56,640,205 | ) | (990,118,898 | ) | (3,686,636 | ) | (73,725,190 | ) | (3,873,708 | ) | (80,927,924 | ) | |||||||||||||||
| 1,903,226 | 51,535,720 | 23,386,449 | 436,008,824 | 3,695,241 | 75,617,172 | 1,756,398 | 36,857,250 | |||||||||||||||||||||||
| 13,122,014 | 236,143,567 | 28,862,264 | 500,750,877 | — | — | — | — | |||||||||||||||||||||||
| 5,044,388 | 89,638,768 | 1,005,601 | 16,873,992 | — | — | — | — | |||||||||||||||||||||||
| (66,561,196 | ) | (1,217,411,955 | ) | (36,175,701 | ) | (625,976,793 | ) | — | — | — | — | |||||||||||||||||||
| (48,394,794 | ) | (891,629,620 | ) | (6,307,836 | ) | (108,351,924 | ) | — | — | — | — | |||||||||||||||||||
| — | — | — | — | 5,353,309 | 107,676,224 | 5,823,585 | 121,353,906 | |||||||||||||||||||||||
| — | — | — | — | 978,565 | 18,399,911 | 382,417 | 7,971,468 | |||||||||||||||||||||||
| — | — | — | — | (8,489,308 | ) | (169,601,229 | ) | (7,427,639 | ) | (156,109,203 | ) | |||||||||||||||||||
| — | — | — | — | (2,157,434 | ) | (43,525,094 | ) | (1,221,637 | ) | (26,783,829 | ) | |||||||||||||||||||
| (49,713,191 | ) | $ | (897,050,296 | ) | 6,079,647 | $ | 134,315,820 | 2,033,215 | $ | 40,547,715 | (2,989,467 | ) | $ | (63,711,351 | ) | |||||||||||||||
| 115 |
Statements of Changes in Net Assets - Capital Stock Activity (Continued)
| Touchstone Small Cap Value Fund | ||||||||||||||||
| For the Year | For the Year | |||||||||||||||
| Ended | Ended | |||||||||||||||
| September 30, 2015 | September 30, 2014 | |||||||||||||||
| Shares | Dollars | Shares | Dollars | |||||||||||||
| Class A | ||||||||||||||||
| Proceeds from Shares issued | 39,094 | $ | 943,019 | 187,663 | $ | 4,638,930 | ||||||||||
| Proceeds from Shares issued in connection with merger(A) | — | — | 100,358 | 2,549,878 | ||||||||||||
| Reinvestment of distributions | 68,652 | 1,602,761 | 18,458 | 456,503 | ||||||||||||
| Cost of Shares redeemed | (253,395 | ) | (6,025,281 | ) | (466,686 | ) | (11,448,628 | ) | ||||||||
| Change from Class A Share Transactions | (145,649 | ) | (3,479,501 | ) | (160,207 | ) | (3,803,317 | ) | ||||||||
| Class C | ||||||||||||||||
| Proceeds from Shares issued | 8,200 | 194,538 | 24,281 | 591,537 | ||||||||||||
| Proceeds from Shares issued in connection with merger(A) | — | — | 59,836 | 1,506,072 | ||||||||||||
| Reinvestment of distributions | 2,405 | 55,586 | 314 | 7,732 | ||||||||||||
| Cost of Shares redeemed | (35,009 | ) | (814,026 | ) | (27,353 | ) | (660,561 | ) | ||||||||
| Change from Class C Share Transactions | (24,404 | ) | (563,902 | ) | 57,078 | 1,444,780 | ||||||||||
| Class Y | ||||||||||||||||
| Proceeds from Shares issued | 32,469 | 756,310 | 154,794 | 3,859,535 | ||||||||||||
| Proceeds from Shares issued in connection with merger(A) | — | — | 269,342 | 6,856,609 | ||||||||||||
| Reinvestment of distributions | 17,660 | 413,841 | 2,269 | 55,553 | ||||||||||||
| Cost of Shares redeemed | (222,703 | ) | (5,207,182 | ) | (68,791 | ) | (1,714,797 | ) | ||||||||
| Change from Class Y Share Transactions | (172,574 | ) | (4,037,031 | ) | 357,614 | 9,056,900 | ||||||||||
| Class Z | ||||||||||||||||
| Proceeds from Shares issued | — | — | — | — | ||||||||||||
| Reinvestment of distributions | — | — | — | — | ||||||||||||
| Cost of Shares redeemed | — | — | — | — | ||||||||||||
| Change in Class Z Share Transactions | — | — | — | — | ||||||||||||
| Institutional Class | ||||||||||||||||
| Proceeds from Shares issued | 181,436 | 4,287,336 | 1,053,391 | 26,269,962 | ||||||||||||
| Proceeds from Shares issued in connection with merger(A) | — | — | 233,106 | 5,932,909 | ||||||||||||
| Reinvestment of distributions | 75,308 | 1,758,252 | 15,448 | 380,917 | ||||||||||||
| Cost of Shares redeemed | (254,262 | ) | (6,065,705 | ) | (135,191 | ) | (3,363,667 | ) | ||||||||
| Change from Institutional Class Share Transactions | 2,482 | (20,117 | ) | 1,166,754 | 29,220,121 | |||||||||||
| Change from Share Transactions | (340,145 | ) | $ | (8,100,551 | ) | 1,421,239 | $ | 35,918,484 | ||||||||
(A) See Note 11 in the Notes to Financial Statements.
See accompanying Notes to Financial Statements.
| 116 |
Statements of Changes in Net Assets - Capital Stock Activity (Continued)
| Touchstone Total Return Bond Fund | Touchstone Ultra Short Duration Fixed Income Fund | |||||||||||||||||||||||||||||
| For the Year | For the Year | For the Year | For the Year | |||||||||||||||||||||||||||
| Ended | Ended | Ended | Ended | |||||||||||||||||||||||||||
| September 30, 2015 | September 30, 2014 | September 30, 2015 | September 30, 2014 | |||||||||||||||||||||||||||
| Shares | Dollars | Shares | Dollars | Shares | Dollars | Shares | Dollars | |||||||||||||||||||||||
| 464,998 | $ | 4,794,879 | 114,274 | $ | 1,162,191 | 527,290 | $ | 4,935,752 | 733,323 | $ | 6,920,969 | |||||||||||||||||||
| — | — | — | — | — | — | — | — | |||||||||||||||||||||||
| 12,299 | 126,552 | 18,766 | 190,466 | 10,396 | 97,320 | 19,343 | 182,582 | |||||||||||||||||||||||
| (416,177 | ) | (4,311,114 | ) | (838,745 | ) | (8,488,953 | ) | (518,482 | ) | (4,862,453 | ) | (3,021,468 | ) | (28,540,488 | ) | |||||||||||||||
| 61,120 | 610,317 | (705,705 | ) | (7,136,296 | ) | 19,204 | 170,619 | (2,268,802 | ) | (21,436,937 | ) | |||||||||||||||||||
| 120,723 | 1,244,614 | 17,872 | 180,777 | 243,405 | 2,278,894 | 155,445 | 1,466,933 | |||||||||||||||||||||||
| — | — | — | — | — | — | — | — | |||||||||||||||||||||||
| 2,936 | 30,186 | 3,760 | 38,169 | 5,658 | 52,983 | 7,105 | 67,050 | |||||||||||||||||||||||
| (50,965 | ) | (526,214 | ) | (105,839 | ) | (1,071,393 | ) | (557,428 | ) | (5,221,331 | ) | (400,339 | ) | (3,779,651 | ) | |||||||||||||||
| 72,694 | 748,586 | (84,207 | ) | (852,447 | ) | (308,365 | ) | (2,889,454 | ) | (237,789 | ) | (2,245,668 | ) | |||||||||||||||||
| 4,023,444 | 41,258,943 | 1,297,006 | 13,228,636 | 9,248,000 | 86,579,336 | 12,370,816 | 116,716,577 | |||||||||||||||||||||||
| — | — | — | — | — | — | — | — | |||||||||||||||||||||||
| 53,383 | 549,588 | 59,444 | 605,211 | 192,324 | 1,800,488 | 210,176 | 1,983,191 | |||||||||||||||||||||||
| (2,075,281 | ) | (21,366,189 | ) | (1,410,172 | ) | (14,348,740 | ) | (13,958,645 | ) | (130,807,171 | ) | (12,930,381 | ) | (122,034,351 | ) | |||||||||||||||
| 2,001,546 | 20,442,342 | (53,722 | ) | (514,893 | ) | (4,518,321 | ) | (42,427,347 | ) | (349,389 | ) | (3,334,583 | ) | |||||||||||||||||
| — | — | — | — | 14,410,836 | 134,971,031 | 24,253,460 | 228,890,297 | |||||||||||||||||||||||
| — | — | — | — | 456,110 | 4,270,605 | 532,096 | 5,020,759 | |||||||||||||||||||||||
| — | — | — | — | (24,898,995 | ) | (233,301,872 | ) | (22,452,531 | ) | (211,938,045 | ) | |||||||||||||||||||
| — | — | — | — | (10,032,049 | ) | (94,060,236 | ) | 2,333,025 | 21,973,011 | |||||||||||||||||||||
| 5,199,931 | 53,765,978 | 1,911,209 | 19,401,033 | 3,274,706 | 30,697,794 | 3,004,848 | 28,350,313 | |||||||||||||||||||||||
| — | — | — | — | — | — | — | — | |||||||||||||||||||||||
| 392,536 | 4,041,700 | 394,031 | 4,011,246 | 64,983 | 608,313 | 87,264 | 823,459 | |||||||||||||||||||||||
| (3,744,321 | ) | (38,429,949 | ) | (4,138,214 | ) | (41,972,829 | ) | (3,445,073 | ) | (32,281,129 | ) | (4,000,850 | ) | (37,746,805 | ) | |||||||||||||||
| 1,848,146 | 19,377,729 | (1,832,974 | ) | (18,560,550 | ) | (105,384 | ) | (975,022 | ) | (908,738 | ) | (8,573,033 | ) | |||||||||||||||||
| 3,983,506 | $ | 41,178,974 | (2,676,608 | ) | $ | (27,064,186 | ) | (14,944,915 | ) | $ | (140,181,440 | ) | (1,431,693 | ) | $ | (13,617,210 | ) | |||||||||||||
| 117 |
| Touchstone Arbitrage Fund—Class A | ||||||||
| Selected Data for a Share Outstanding Throughout Each Period | ||||||||
| Year Ended September 30, | ||||||||
| 2015 | 2014(A) | |||||||
| Net asset value at beginning of period | $ | 9.87 | $ | 10.00 | ||||
| Income (loss) from investments operations: | ||||||||
| Net investment loss | (0.08 | )(B) | (0.10 | )(B) | ||||
| Net realized and unrealized gains (losses) on investments | 0.16 | (0.03 | ) | |||||
| Total from investment operations | 0.08 | (0.13 | ) | |||||
| Distributions from: | ||||||||
| Realized capital gains | (0.02 | ) | — | |||||
| Net asset value at end of period | $ | 9.93 | $ | 9.87 | ||||
| Total return(C) | 0.77 | % | (1.30 | )% | ||||
| Ratios and supplemental data: | ||||||||
| Net assets at end of period (000's) | $ | 20,672 | $ | 22,725 | ||||
| Ratio to average net assets: | ||||||||
| Net expenses (including dividend expense on securities sold short)(D) | 2.42 | % | 2.51 | % | ||||
| Gross expenses (including dividend expense on securities sold short)(E) | 2.44 | % | 2.51 | % | ||||
| Net investment loss | (0.83 | )% | (1.01 | )% | ||||
| Portfolio turnover rate | 276 | % | 293 | % | ||||
| Touchstone Arbitrage Fund—Class C | ||||||||
| Selected Data for a Share Outstanding Throughout Each Period | ||||||||
| Year Ended September 30, | ||||||||
| 2015 | 2014(A) | |||||||
| Net asset value at beginning of period | $ | 9.82 | $ | 10.00 | ||||
| Income (loss) from investments operations: | ||||||||
| Net investments loss | (0.15 | )(B) | (0.17 | )(B) | ||||
| Net realized and unrealized gains (losses) on investments | 0.15 | (0.01 | ) | |||||
| Total from investment operations | — | (0.18 | ) | |||||
| Distributions from: | ||||||||
| Realized capital gains | (0.02 | ) | — | |||||
| Net asset value at end of period | $ | 9.80 | $ | 9.82 | ||||
| Total return(C) | (0.05 | )% | (1.80 | )% | ||||
| Ratios and supplemental data: | ||||||||
| Net assets at end of period (000's) | $ | 8,694 | $ | 11,113 | ||||
| Ratio to average net assets: | ||||||||
| Net expenses (including dividend expense on securities sold short)(D) | 3.14 | % | 3.27 | % | ||||
| Gross expenses (including dividend expense on securities sold short)(E) | 3.14 | % | 3.29 | % | ||||
| Net investment loss | (1.55 | )% | (1.77 | )% | ||||
| Portfolio turnover rate | 276 | % | 293 | % | ||||
| (A) | Represents the period from commencement of operations (October 1, 2013) through September 30, 2014. |
| (B) | The net investment loss per share is based on average shares outstanding for the period. |
| (C) | Total returns shown exclude the effect of applicable sales loads. If these charges were included, the returns would be lower. |
| (D) | The ratio of net expenses to average net assets excluding dividend expense on securities sold short for Class A is 1.68% and 1.67% and for Class C is 2.40% and 2.43% for the years ended September 30, 2015 and 2014, respectively. |
| (E) | The ratio of gross expenses to average net assets excluding dividend expense on securities sold short for Class A is 1.70% and 1.67% and for Class C is 2.40% and 2.45% for the years ended September 30, 2015 and 2014, respectively. |
See accompanying Notes to Financial Statements.
| 118 |
Financial Highlights (Continued)
| Touchstone Arbitrage Fund—Class Y | ||||||||
| Selected Data for a Share Outstanding Throughout Each Period | ||||||||
| Year Ended September 30, | ||||||||
| 2015 | 2014(A) | |||||||
| Net asset value at beginning of period | $ | 9.91 | $ | 10.00 | ||||
| Income (loss) from investment operations: | ||||||||
| Net investment loss | (0.05 | )(B) | (0.07 | )(B) | ||||
| Net realized and unrealized gains (losses) on investments | 0.15 | (0.02 | ) | |||||
| Total from investment operations | 0.10 | (0.09 | ) | |||||
| Distributions from: | ||||||||
| Realized capital gains | (0.02 | ) | — | |||||
| Net asset value at end of period | $ | 9.99 | $ | 9.91 | ||||
| Total return | 0.97 | % | (0.90 | )% | ||||
| Ratios and supplemental data: | ||||||||
| Net assets at end of period (000's) | $ | 87,427 | $ | 117,589 | ||||
| Ratio to average net assets: | ||||||||
| Net expenses (including dividend expense on securities sold short)(C) | 2.10 | % | 2.19 | % | ||||
| Gross expenses (including dividend expense on securities sold short(D) | 2.10 | % | 2.19 | % | ||||
| Net investment loss | (0.51 | )% | (0.69 | )% | ||||
| Portfolio turnover rate | 276 | % | 293 | % | ||||
| Touchstone Arbitrage Fund—Institutional Class | ||||||||
| Selected Data for a Share Outstanding Throughout Each Period | ||||||||
| Year Ended September 30, | ||||||||
| 2015 | 2014(A) | |||||||
| Net asset value at beginning of period | $ | 9.92 | $ | 10.00 | ||||
| Income (loss) from investment operations: | ||||||||
| Net investment loss | (0.04 | )(B) | (0.06 | )(B) | ||||
| Net realized and unrealized gains (losses) on investments | 0.15 | (0.02 | ) | |||||
| Total from investment operations | 0.11 | (0.08 | ) | |||||
| Distributions from: | ||||||||
| Realized capital gains | (0.02 | ) | — | |||||
| Net asset value at end of period | $ | 10.01 | $ | 9.92 | ||||
| Total return | 1.06 | % | (0.80 | )% | ||||
| Ratios and supplemental data: | ||||||||
| Net assets at end of period (000's) | $ | 8,735 | $ | 47,763 | ||||
| Ratio to average net assets: | ||||||||
| Net expenses (including dividend expense on securities sold short)(C) | 2.02 | % | 2.12 | % | ||||
| Gross expenses (including dividend expense on securities sold short)(D) | 2.03 | % | 2.12 | % | ||||
| Net investment income (loss) | (0.43 | )% | (0.62 | )% | ||||
| Portfolio turnover rate | 276 | % | 293 | % | ||||
| (A) | Represents the period from commencement of operations (October 1, 2013) through September 30, 2014. |
| (B) | The net investment loss per share is based on average shares outstanding for the period. |
| (C) | The ratio of net expenses to average net assets excluding dividend expense on securities sold short for Class Y is 1.36% and 1.35% and for Institutional Class is 1.28% and 1.28% for the years ended September 30, 2015 and 2014, respectively. |
| (D) | The ratio of gross expenses to average net assets excluding dividend expense on securities sold short for Class Y is 1.36% and 1.35% and for Institutional Class is 1.29% and 1.28% for the years ended September 30, 2015 and 2014, respectively. |
See accompanying Notes to Financial Statements.
| 119 |
Financial Highlights (Continued)
| Touchstone Emerging Markets Equity Fund—Class A | ||||||||||||||||||||
| Selected Data for a Share Outstanding Throughout Each Period | ||||||||||||||||||||
| Year Ended September 30, | ||||||||||||||||||||
| 2015 | 2014 | 2013 | 2012 | 2011 | ||||||||||||||||
| Net asset value at beginning of period | $ | 11.67 | $ | 11.52 | $ | 12.24 | $ | 10.69 | $ | 12.68 | ||||||||||
| Income (loss) from investment operations: | ||||||||||||||||||||
| Net investment income | 0.07 | (A) | 0.09 | (A) | 0.09 | (A) | 0.11 | 0.10 | ||||||||||||
| Net realized and unrealized gains (losses) on investments | (2.53 | ) | 0.09 | (0.80 | ) | 1.68 | (2.05 | ) | ||||||||||||
| Total from investment operations | (2.46 | ) | 0.18 | (0.71 | ) | 1.79 | (1.95 | ) | ||||||||||||
| Distributions from: | ||||||||||||||||||||
| Net investment income (loss) | (0.06 | ) | (0.03 | ) | (0.01 | ) | (0.15 | ) | (0.02 | ) | ||||||||||
| Realized capital gains | — | — | — | (0.09 | ) | (0.02 | ) | |||||||||||||
| Total distributions | (0.06 | ) | (0.03 | ) | (0.01 | ) | (0.24 | ) | (0.04 | ) | ||||||||||
| Net asset value at end of period | $ | 9.15 | $ | 11.67 | $ | 11.52 | $ | 12.24 | $ | 10.69 | ||||||||||
| Total return(B) | (21.18 | )% | 1.61 | % | (5.69 | )% | 16.71 | % | (15.45 | )% | ||||||||||
| Ratios and supplemental data: | ||||||||||||||||||||
| Net assets at end of period (000's) | $ | 3,022 | $ | 5,307 | $ | 9,843 | $ | 34,369 | $ | 26,592 | ||||||||||
| Ratio to average net assets: | ||||||||||||||||||||
| Net expenses | 1.69 | % | 1.69 | % | 1.69 | % | 1.72 | % | 1.74 | % | ||||||||||
| Gross expenses | 2.41 | % | 2.20 | % | 1.93 | % | 1.99 | % | 1.95 | % | ||||||||||
| Net investment income | 0.66 | % | 0.75 | % | 0.71 | % | 0.94 | % | 0.98 | % | ||||||||||
| Portfolio turnover rate | 28 | % | 38 | % | 25 | % | 33 | %(C) | 18 | % | ||||||||||
| Touchstone Emerging Markets Equity Fund—Class C | ||||||||||||||||||||
| Selected Data for a Share Outstanding Throughout Each Period | ||||||||||||||||||||
| Year Ended September 30, | ||||||||||||||||||||
| 2015 | 2014 | 2013 | 2012 | 2011 | ||||||||||||||||
| Net asset value at beginning of period | $ | 11.43 | $ | 11.33 | $ | 12.13 | $ | 10.54 | $ | 12.58 | ||||||||||
| Income (loss) from investment operations: | ||||||||||||||||||||
| Net investment income (loss) | (0.01 | )(A) | (— | )(A)(D) | (— | )(A)(D) | 0.04 | 0.03 | ||||||||||||
| Net realized and unrealized gains (losses) on investments | (2.48 | ) | 0.10 | (0.80 | ) | 1.64 | (2.05 | ) | ||||||||||||
| Total from investment operations | (2.49 | ) | 0.10 | (0.80 | ) | 1.68 | (2.02 | ) | ||||||||||||
| Distributions from: | ||||||||||||||||||||
| Net investment income | — | — | — | — | (D) | — | ||||||||||||||
| Realized capital gains | — | — | — | (0.09 | ) | (0.02 | ) | |||||||||||||
| Total distributions | — | — | — | (0.09 | ) | (0.02 | ) | |||||||||||||
| Net asset value at end of period | $ | 8.94 | $ | 11.43 | $ | 11.33 | $ | 12.13 | $ | 10.54 | ||||||||||
| Total return(B) | (21.79 | )% | 0.88 | % | (6.44 | )% | 15.84 | % | (16.07 | )% | ||||||||||
| Ratios and supplemental data: | ||||||||||||||||||||
| Net assets at end of period (000's) | $ | 1,566 | $ | 2,874 | $ | 3,719 | $ | 4,903 | $ | 5,417 | ||||||||||
| Ratio to average net assets: | ||||||||||||||||||||
| Net expenses | 2.44 | % | 2.44 | % | 2.44 | % | 2.47 | % | 2.49 | % | ||||||||||
| Gross expenses | 3.19 | % | 3.03 | % | 2.84 | % | 2.85 | % | 2.82 | % | ||||||||||
| Net investment income (loss) | (0.09 | )% | (0.00 | )%(D) | (0.04 | )% | 0.19 | % | 0.21 | % | ||||||||||
| Portfolio turnover rate | 28 | % | 38 | % | 25 | % | 33 | %(C) | 18 | % | ||||||||||
| (A) | The net investment income (loss) per share is based on average shares outstanding for the period. |
| (B) | Total returns shown exclude the effect of applicable sales loads. If these charges were included, the returns would be lower. |
| (C) | Portfolio turnover excludes the purchases and sales of the Touchstone Emerging Markets Equity Fund II acquired on September 17, 2012. If these transactions were included, portfolio turnover would have been higher. |
| (D) | Less than $0.005 per share or 0.005%. |
See accompanying Notes to Financial Statements.
| 120 |
Financial Highlights (Continued)
| Touchstone Emerging Markets Equity Fund—Class Y | ||||||||||||||||||||
| Selected Data for a Share Outstanding Throughout Each Period | ||||||||||||||||||||
| Year Ended September 30, | ||||||||||||||||||||
| 2015 | 2014 | 2013 | 2012 | 2011 | ||||||||||||||||
| Net asset value at beginning of period | $ | 11.63 | $ | 11.54 | $ | 12.27 | $ | 10.74 | $ | 12.72 | ||||||||||
| Income (loss) from investment operations: | ||||||||||||||||||||
| Net investment income | 0.10 | (A) | 0.12 | (A) | 0.13 | (A) | 0.14 | 0.11 | ||||||||||||
| Net realized and unrealized gains (losses) on investments | (2.52 | ) | 0.10 | (0.81 | ) | 1.70 | (2.05 | ) | ||||||||||||
| Total from investment operations | (2.42 | ) | 0.22 | (0.68 | ) | 1.84 | (1.94 | ) | ||||||||||||
| Distributions from: | ||||||||||||||||||||
| Net investment income | (0.11 | ) | (0.13 | ) | (0.05 | ) | (0.22 | ) | (0.02 | ) | ||||||||||
| Realized capital gains | — | — | — | (0.09 | ) | (0.02 | ) | |||||||||||||
| Total distributions | (0.11 | ) | (0.13 | ) | (0.05 | ) | (0.31 | ) | (0.04 | ) | ||||||||||
| Net asset value at end of period | $ | 9.10 | $ | 11.63 | $ | 11.54 | $ | 12.27 | $ | 10.74 | ||||||||||
| Total return | (20.98 | )% | 1.99 | % | (5.45 | )% | 17.12 | % | (15.21 | )% | ||||||||||
| Ratios and supplemental data: | ||||||||||||||||||||
| Net assets at end of period (000's) | $ | 70,066 | $ | 105,641 | $ | 138,451 | $ | 219,717 | $ | 151,532 | ||||||||||
| Ratio to average net assets: | ||||||||||||||||||||
| Net expenses | 1.40 | % | 1.38 | % | 1.37 | % | 1.41 | % | 1.48 | % | ||||||||||
| Gross expenses | 1.40 | % | 1.38 | % | 1.35 | % | 1.44 | % | 1.48 | % | ||||||||||
| Net investment income | 0.95 | % | 1.06 | % | 1.04 | % | 1.25 | % | 1.50 | % | ||||||||||
| Portfolio turnover rate | 28 | % | 38 | % | 25 | % | 33 | %(B) | 18 | % | ||||||||||
| Touchstone Emerging Markets Equity Fund—Institutional Class | ||||||||||||||||||||
| Selected Data for a Share Outstanding Throughout Each Period | ||||||||||||||||||||
| Year Ended September 30, | ||||||||||||||||||||
| 2015 | 2014 | 2013 | 2012 | 2011 | ||||||||||||||||
| Net asset value at beginning of period | $ | 11.64 | $ | 11.55 | $ | 12.28 | $ | 10.76 | $ | 12.74 | ||||||||||
| Income (loss) from investment operations: | ||||||||||||||||||||
| Net investment income | 0.12 | (A) | 0.13 | (A) | 0.14 | (A) | 0.18 | 0.13 | ||||||||||||
| Net realized and unrealized gains (losses) on investments | (2.53 | ) | 0.11 | (0.81 | ) | 1.67 | (2.06 | ) | ||||||||||||
| Total from investment operations | (2.41 | ) | 0.24 | (0.67 | ) | 1.85 | (1.93 | ) | ||||||||||||
| Distributions from: | ||||||||||||||||||||
| Net investment income | (0.12 | ) | (0.15 | ) | (0.06 | ) | (0.24 | ) | (0.03 | ) | ||||||||||
| Realized capital gains | — | — | — | (0.09 | ) | (0.02 | ) | |||||||||||||
| Total distributions | (0.12 | ) | (0.15 | ) | (0.06 | ) | (0.33 | ) | (0.05 | ) | ||||||||||
| Net asset value at end of period | $ | 9.11 | $ | 11.64 | $ | 11.55 | $ | 12.28 | $ | 10.76 | ||||||||||
| Total return | (20.87 | )% | 2.13 | % | (5.43 | )% | 17.28 | % | (15.18 | )% | ||||||||||
| Ratios and supplemental data: | ||||||||||||||||||||
| Net assets at end of period (000's) | $ | 184,841 | $ | 234,019 | $ | 218,523 | $ | 271,186 | $ | 244,657 | ||||||||||
| Ratio to average net assets: | ||||||||||||||||||||
| Net expenses | 1.29 | % | 1.29 | % | 1.29 | % | 1.32 | % | 1.34 | % | ||||||||||
| Gross expenses | 1.33 | % | 1.31 | % | 1.29 | % | 1.37 | % | 1.43 | % | ||||||||||
| Net investment income | 1.06 | % | 1.15 | % | 1.11 | % | 1.34 | % | 1.51 | % | ||||||||||
| Portfolio turnover rate | 28 | % | 38 | % | 25 | % | 33 | %(B) | 18 | % | ||||||||||
| (A) | The net investment income (loss) per share is based on average shares outstanding for the period. |
| (B) | Portfolio turnover excludes the purchases and sales of the Touchstone Emerging Markets Equity Fund II acquired on September 17, 2012. If these transactions were included, portfolio turnover would have been higher. |
See accompanying Notes to Financial Statements.
| 121 |
Financial Highlights (Continued)
| Touchstone Global Real Estate Fund—Class A | ||||||||||||||||||||
| Selected Data for a Share Outstanding Throughout Each Period | ||||||||||||||||||||
| Year Ended September 30, | ||||||||||||||||||||
| 2015 | 2014 | 2013 | 2012 | 2011 | ||||||||||||||||
| Net asset value at beginning of period | $ | 10.49 | $ | 12.03 | $ | 11.86 | $ | 9.76 | $ | 11.46 | ||||||||||
| Income (loss) from investment operations: | ||||||||||||||||||||
| Net investment income | 0.31 | (A) | 0.52 | 0.30 | (A) | 0.20 | (A) | 0.35 | ||||||||||||
| Net realized and unrealized gains (losses) on investments | (0.34 | ) | 0.40 | 0.55 | 2.51 | (1.10 | ) | |||||||||||||
| Total from investment operations | (0.03 | ) | 0.92 | 0.85 | 2.71 | (0.75 | ) | |||||||||||||
| Distributions from: | ||||||||||||||||||||
| Net investment income | (0.43 | ) | (0.69 | ) | (0.58 | ) | (0.16 | ) | (0.48 | ) | ||||||||||
| Realized capital gains | — | (1.77 | ) | (0.10 | ) | (0.45 | ) | (0.47 | ) | |||||||||||
| Total distributions | (0.43 | ) | (2.46 | ) | (0.68 | ) | (0.61 | ) | (0.95 | ) | ||||||||||
| Net asset value at end of period | $ | 10.03 | $ | 10.49 | $ | 12.03 | $ | 11.86 | $ | 9.76 | ||||||||||
| Total return(B) | (0.50 | )% | 9.49 | % | 7.22 | % | 29.15 | % | (7.47 | )% | ||||||||||
| Ratios and supplemental data: | ||||||||||||||||||||
| Net assets at end of period (000's) | $ | 7,368 | $ | 1,375 | $ | 645 | $ | 486 | $ | 2,038 | ||||||||||
| Ratio to average net assets: | ||||||||||||||||||||
| Net expenses | 1.39 | % | 1.39 | % | 1.39 | % | 1.39 | % | 1.39 | % | ||||||||||
| Gross expenses | 2.07 | % | 3.58 | % | 3.73 | % | 3.27 | % | 3.55 | % | ||||||||||
| Net investment income | 2.88 | % | 4.49 | % | 2.42 | % | 1.87 | % | 2.30 | % | ||||||||||
| Portfolio turnover rate | 41 | % | 53 | % | 159 | % | 94 | % | 85 | % | ||||||||||
| Touchstone Global Real Estate Fund—Class C | ||||||||||||||||||||
| Selected Data for a Share Outstanding Throughout Each Period | ||||||||||||||||||||
| Year Ended September 30, | ||||||||||||||||||||
| 2015 | 2014 | 2013 | 2012 | 2011 | ||||||||||||||||
| Net asset value at beginning of period | $ | 10.52 | $ | 12.06 | $ | 11.90 | $ | 9.80 | $ | 11.50 | ||||||||||
| Income (loss) from investment operations: | ||||||||||||||||||||
| Net investment income | 0.23 | (A) | 0.41 | 0.21 | (A) | 0.12 | (A) | 0.20 | ||||||||||||
| Net realized and unrealized gains (losses) on investments | (0.33 | ) | 0.43 | 0.54 | 2.52 | (1.05 | ) | |||||||||||||
| Total from investment operations | (0.10 | ) | 0.84 | 0.75 | 2.64 | (0.85 | ) | |||||||||||||
| Distributions from: | ||||||||||||||||||||
| Net investment income | (0.36 | ) | (0.61 | ) | (0.49 | ) | (0.09 | ) | (0.38 | ) | ||||||||||
| Realized capital gains | — | (1.77 | ) | (0.10 | ) | (0.45 | ) | (0.47 | ) | |||||||||||
| Total distributions | (0.36 | ) | (2.38 | ) | (0.59 | ) | (0.54 | ) | (0.85 | ) | ||||||||||
| Net asset value at end of period | $ | 10.06 | $ | 10.52 | $ | 12.06 | $ | 11.90 | $ | 9.80 | ||||||||||
| Total return(B) | (1.30 | )% | 8.67 | % | 6.35 | % | 28.19 | % | (8.20 | )% | ||||||||||
| Ratios and supplemental data: | ||||||||||||||||||||
| Net assets at end of period (000's) | $ | 1,489 | $ | 524 | $ | 401 | $ | 223 | $ | 116 | ||||||||||
| Ratio to average net assets: | ||||||||||||||||||||
| Net expenses | 2.14 | % | 2.14 | % | 2.14 | % | 2.14 | % | 2.14 | % | ||||||||||
| Gross expenses | 3.17 | % | 4.91 | % | 5.54 | % | 7.79 | % | 11.08 | % | ||||||||||
| Net investment income | 2.13 | % | 3.74 | % | 1.67 | % | 1.12 | % | 1.58 | % | ||||||||||
| Portfolio turnover rate | 41 | % | 53 | % | 159 | % | 94 | % | 85 | % | ||||||||||
| (A) | The net investment income per share is based on average shares outstanding for the period. |
| (B) | Total returns shown exclude the effect of applicable sales loads. If these charges were included, the returns would be lower. |
See accompanying Notes to Financial Statements.
| 122 |
Financial Highlights (Continued)
| Touchstone Global Real Estate Fund—Class Y | ||||||||||||||||||||
| Selected Data for a Share Outstanding Throughout Each Period | ||||||||||||||||||||
| Year Ended September 30, | ||||||||||||||||||||
| 2015 | 2014 | 2013 | 2012 | 2011 | ||||||||||||||||
| Net asset value at beginning of period | $ | 10.62 | $ | 12.14 | $ | 11.97 | $ | 9.84 | $ | 11.53 | ||||||||||
| Income (loss) from investment operations: | ||||||||||||||||||||
| Net investment income | 0.34 | (A) | 0.56 | 0.34 | (A) | 0.23 | (A) | 0.32 | ||||||||||||
| Net realized and unrealized gains (losses) on investments | (0.35 | ) | 0.40 | 0.54 | 2.54 | (1.06 | ) | |||||||||||||
| Total from investment operations | (0.01 | ) | 0.96 | 0.88 | 2.77 | (0.74 | ) | |||||||||||||
| Distributions from: | ||||||||||||||||||||
| Net investment income | (0.45 | ) | (0.71 | ) | (0.61 | ) | (0.19 | ) | (0.48 | ) | ||||||||||
| Realized capital gains | — | (1.77 | ) | (0.10 | ) | (0.45 | ) | (0.47 | ) | |||||||||||
| Total distributions | (0.45 | ) | (2.48 | ) | (0.71 | ) | (0.64 | ) | (0.95 | ) | ||||||||||
| Net asset value at end of period | $ | 10.16 | $ | 10.62 | $ | 12.14 | $ | 11.97 | $ | 9.84 | ||||||||||
| Total return | (0.30 | )% | 9.80 | % | 7.42 | % | 29.53 | % | (7.27 | )% | ||||||||||
| Ratios and supplemental data: | ||||||||||||||||||||
| Net assets at end of period (000's) | $ | 7,366 | $ | 580 | $ | 276 | $ | 150 | $ | 118 | ||||||||||
| Ratio to average net assets: | ||||||||||||||||||||
| Net expenses | 1.14 | % | 1.14 | % | 1.14 | % | 1.14 | % | 1.14 | % | ||||||||||
| Gross expenses | 2.05 | % | 4.59 | % | 5.95 | % | 7.29 | % | 9.49 | % | ||||||||||
| Net investment income | 3.13 | % | 4.74 | % | 2.67 | % | 2.12 | % | 2.59 | % | ||||||||||
| Portfolio turnover rate | 41 | % | 53 | % | 159 | % | 94 | % | 85 | % | ||||||||||
| Touchstone Global Real Estate Fund—Institutional Class | ||||||||||||||||||||
| Selected Data for a Share Outstanding Throughout Each Period | ||||||||||||||||||||
| Year Ended September 30, | ||||||||||||||||||||
| 2015 | 2014 | 2013 | 2012 | 2011 | ||||||||||||||||
| Net asset value at beginning of period | $ | 10.74 | $ | 12.26 | $ | 12.07 | $ | 9.92 | $ | 11.61 | ||||||||||
| Income (loss) from investment operations: | ||||||||||||||||||||
| Net investment income | 0.37 | (A) | 0.53 | 0.36 | (A) | 0.26 | (A) | 0.33 | ||||||||||||
| Net realized and unrealized gains (losses) on investments | (0.35 | ) | 0.45 | 0.56 | 2.55 | (1.07 | ) | |||||||||||||
| Total from investment operations | 0.02 | 0.98 | 0.92 | 2.81 | (0.74 | ) | ||||||||||||||
| Distributions from: | ||||||||||||||||||||
| Net investment income | (0.47 | ) | (0.73 | ) | (0.63 | ) | (0.21 | ) | (0.48 | ) | ||||||||||
| Realized capital gains | — | (1.77 | ) | (0.10 | ) | (0.45 | ) | (0.47 | ) | |||||||||||
| Total distributions | (0.47 | ) | (2.50 | ) | (0.73 | ) | (0.66 | ) | (0.95 | ) | ||||||||||
| Net asset value at end of period | $ | 10.29 | $ | 10.74 | $ | 12.26 | $ | 12.07 | $ | 9.92 | ||||||||||
| Total return | (0.07 | )% | 9.85 | % | 7.67 | % | 29.68 | % | (7.21 | )% | ||||||||||
| Ratios and supplemental data: | ||||||||||||||||||||
| Net assets at end of period (000's) | $ | 8,460 | $ | 11,699 | $ | 15,716 | $ | 23,201 | $ | 2,994 | ||||||||||
| Ratio to average net assets: | ||||||||||||||||||||
| Net expenses | 0.99 | % | 0.99 | % | 0.99 | % | 0.99 | % | 0.99 | % | ||||||||||
| Gross expenses | 1.48 | % | 1.70 | % | 1.54 | % | 2.09 | % | 3.15 | % | ||||||||||
| Net investment income | 3.28 | % | 4.89 | % | 2.82 | % | 2.27 | % | 2.73 | % | ||||||||||
| Portfolio turnover rate | 41 | % | 53 | % | 159 | % | 94 | % | 85 | % | ||||||||||
(A) The net investment income per share is based on average shares outstanding for the period.
See accompanying Notes to Financial Statements.
| 123 |
Financial Highlights (Continued)
Touchstone Merger Arbitrage Fund—Class A
Selected Data for a Share Outstanding Throughout Each Period
| Period | ||||||||||||||||||||
| Ended | ||||||||||||||||||||
| September | ||||||||||||||||||||
| Year Ended September 30, | 30, | |||||||||||||||||||
| 2015 | 2014 | 2013 | 2012 | 2011(A) | ||||||||||||||||
| Net asset value at beginning of period | $ | 10.49 | $ | 11.05 | $ | 10.65 | $ | 10.02 | $ | 10.00 | ||||||||||
| Income (loss) from investment operations: | ||||||||||||||||||||
| Net investment income (loss) | (0.11 | )(B) | (0.13 | )(B) | 0.07 | (B) | (0.09 | )(B) | — | (C) | ||||||||||
| Net realized and unrealized gains (losses) on investments | 0.21 | (0.05 | ) | 0.44 | 0.73 | 0.02 | ||||||||||||||
| Total from investment operations | 0.10 | (0.18 | ) | 0.51 | 0.64 | 0.02 | ||||||||||||||
| Distributions from: | ||||||||||||||||||||
| Net investment income | — | (0.05 | ) | — | (— | )(C) | — | |||||||||||||
| Realized capital gains | (0.05 | ) | (0.33 | ) | (0.11 | ) | (0.01 | ) | — | |||||||||||
| Total distributions | (0.05 | ) | (0.38 | ) | (0.11 | ) | (0.01 | ) | — | |||||||||||
| Net asset value at end of period | $ | 10.54 | $ | 10.49 | $ | 11.05 | $ | 10.65 | $ | 10.02 | ||||||||||
| Total return(D) | 0.92 | % | (1.75 | )% | 4.84 | % | 6.35 | % | 0.30 | %(E) | ||||||||||
| Ratios and supplemental data: | ||||||||||||||||||||
| Net assets at end of period (000's) | $ | 21,858 | $ | 96,916 | $ | 275,858 | $ | 150,148 | $ | 260 | ||||||||||
| Ratio to average net assets: | ||||||||||||||||||||
| Net expenses (including dividend expense on securities sold short)(F) | 2.47 | % | 2.52 | % | 2.27 | % | 1.96 | % | 3.33 | %(G) | ||||||||||
| Gross expenses (including dividend expense on securities sold short)(H) | 2.47 | % | 2.52 | % | 2.27 | % | 1.97 | % | 28.67 | %(G) | ||||||||||
| Net investment income (loss) | (0.99 | )% | (1.25 | )% | 0.65 | % | (0.90 | )% | (1.97 | )%(G) | ||||||||||
| Portfolio turnover rate | 227 | % | 271 | % | 288 | % | 307 | % | 311 | %(E) | ||||||||||
| (A) | Represents the period from commencement of operations (August 9, 2011) through September 30, 2011. |
| (B) | The net investment income (loss) per share is based on average shares outstanding for the period. |
| (C) | Less than $0.005 per share. |
| (D) | Total returns shown exclude the effect of applicable sales loads. If these charges were included, the returns would be lower. . |
| (E) | Not annualized |
| (F) | The ratio of net expenses to average net assets excluding dividend and interest expense on securities sold short is 1.60%, 1.57%, 1.64%, 1.65% and 1.69% for the years ended September 30, 2015, 2014, 2013, 2012 and for the period ended September 30, 2011, respectively. |
| (G) | Annualized. |
| (H) | The ratio of gross expenses to average net assets excluding dividend and interest expense on securities sold short is 1.60%, 1.57%, 1.64%, 1.66% and 27.03% for the years ended September 30, 2015, 2014, 2013, 2012 and for the period ended September 30, 2011, respectively. |
See accompanying Notes to Financial Statements.
| 124 |
Financial Highlights (Continued)
Touchstone Merger Arbitrage Fund—Class C
Selected Data for a Share Outstanding Throughout Each Period
| Period | ||||||||||||||||||||
| Ended | ||||||||||||||||||||
| September | ||||||||||||||||||||
| Year Ended September 30, | 30, | |||||||||||||||||||
| 2015 | 2014 | 2013 | 2012 | 2011(A) | ||||||||||||||||
| Net asset value at beginning of period | $ | 10.26 | $ | 10.85 | $ | 10.54 | $ | 10.01 | $ | 10.00 | ||||||||||
| Income (loss) from investment operations: | ||||||||||||||||||||
| Net investment loss | (0.18 | )(B) | (0.22 | )(B) | (0.01 | )(B) | (0.17 | )(B) | (0.01 | ) | ||||||||||
| Net realized and unrealized gains (losses) on investments | 0.19 | (0.04 | ) | 0.43 | 0.71 | 0.02 | ||||||||||||||
| Total from investment operations | 0.01 | (0.26 | ) | 0.42 | 0.54 | 0.01 | ||||||||||||||
| Distributions from: | ||||||||||||||||||||
| Net investment income | — | — | — | (— | )(C) | — | ||||||||||||||
| Realized capital gains | (0.05 | ) | (0.33 | ) | (0.11 | ) | (0.01 | ) | — | |||||||||||
| Total distributions | (0.05 | ) | (0.33 | ) | (0.11 | ) | (0.01 | ) | — | |||||||||||
| Net asset value at end of period | $ | 10.22 | $ | 10.26 | $ | 10.85 | $ | 10.54 | $ | 10.01 | ||||||||||
| Total return(D) | 0.06 | % | (2.51 | )% | 3.93 | % | 5.56 | % | 0.10 | %(E) | ||||||||||
| Ratios and supplemental data: | ||||||||||||||||||||
| Net assets at end of period (000's) | $ | 18,868 | $ | 35,737 | $ | 50,001 | $ | 25,739 | $ | 254 | ||||||||||
| Ratio to average net assets: | ||||||||||||||||||||
| Net expenses (including dividend expense on securities sold short)(F) | 3.26 | % | 3.32 | % | 3.05 | % | 2.74 | % | 4.23 | %(G) | ||||||||||
| Gross expenses (including dividend expense on securities sold short)(H) | 3.26 | % | 3.32 | % | 3.05 | % | 2.75 | % | 29.58 | %(G) | ||||||||||
| Net investment loss | (1.79 | )% | (2.05 | )% | (0.13 | )% | (1.68 | )% | (2.74 | )%(G) | ||||||||||
| Portfolio turnover rate | 227 | % | 271 | % | 288 | % | 307 | % | 311 | %(E) | ||||||||||
| (A) | Represents the period from commencement of operations (August 9, 2011) through September 30, 2011. |
| (B) | The net investment loss per share is based on average shares outstanding for the period. |
| (C) | Less than $0.005 per share. |
| (D) | Total returns shown exclude the effect of applicable sales loads. If these charges were included, the returns would be lower. |
| (E) | Not annualized. |
| (F) | The ratio of net expenses to average net assets excluding dividend and interest expense on securities sold short is 2.39%, 2.37%, 2.42%, 2.43% and 2.43% for the years ended September 30, 2015, 2014, 2013, 2012 and for the period ended September 30, 2011, respectively. |
| (G) | Annualized. |
| (H) | The ratio of gross expenses to average net assets excluding dividend and interest expense on securities sold short is 2.39%, 2.37%, 2.42%, 2.44% and 27.78% for the years ended September 30, 2015, 2014, 2013, 2012 and for the period ended September 30, 2011, respectively. |
See accompanying Notes to Financial Statements.
| 125 |
Financial Highlights (Continued)
Touchstone Merger Arbitrage Fund—Class Y
Selected Data for a Share Outstanding Throughout Each Period
| Period | ||||||||||||||||||||
| Ended | ||||||||||||||||||||
| September | ||||||||||||||||||||
| Year Ended September 30, | 30, | |||||||||||||||||||
| 2015 | 2014 | 2013 | 2012 | 2011(A) | ||||||||||||||||
| Net asset value at beginning of period | $ | 10.55 | $ | 11.10 | $ | 10.68 | $ | 10.02 | $ | 10.00 | ||||||||||
| Income (loss) from investment operations: | ||||||||||||||||||||
| Net investment income (loss) | (0.08 | )(B) | (0.10 | )(B) | 0.10 | (B) | (0.07 | )(B) | (0.01 | ) | ||||||||||
| Net realized and unrealized gains (losses) on investments | 0.20 | (0.05 | ) | 0.43 | 0.74 | 0.03 | ||||||||||||||
| Total from investment operations | 0.12 | (0.15 | ) | 0.53 | 0.67 | 0.02 | ||||||||||||||
| Distributions from: | ||||||||||||||||||||
| Net investment income | — | (0.07 | ) | — | (— | )(C) | — | |||||||||||||
| Realized capital gains | (0.05 | ) | (0.33 | ) | (0.11 | ) | (0.01 | ) | — | |||||||||||
| Total distributions | (0.05 | ) | (0.40 | ) | (0.11 | ) | (0.01 | ) | — | |||||||||||
| Net asset value at end of period | $ | 10.62 | $ | 10.55 | $ | 11.10 | $ | 10.68 | $ | 10.02 | ||||||||||
| Total return | 1.10 | % | (1.41 | )% | 5.01 | % | 6.75 | % | 0.20 | %(D) | ||||||||||
| Net assets at end of period (000's) | $ | 88,677 | $ | 178,305 | $ | 192,095 | $ | 90,741 | $ | 1,160 | ||||||||||
| Ratio to average net assets: | ||||||||||||||||||||
| Net expenses (including dividend expense on securities sold short)(E) | 2.20 | % | 2.24 | % | 2.02 | % | 1.68 | % | 2.74 | %(F) | ||||||||||
| Gross expenses (including dividend expense on securities sold short)(G) | 2.20 | % | 2.24 | % | 2.01 | % | 1.70 | % | 8.22 | %(F) | ||||||||||
| Net investment income (loss) | (0.73 | )% | (0.97 | )% | 0.90 | % | (0.62 | )% | (1.65 | )%(F) | ||||||||||
| Portfolio turnover rate | 227 | % | 271 | % | 288 | % | 307 | % | 311 | %(D) | ||||||||||
| (A) | Represents the period from commencement of operations (August 9, 2011) through September 30, 2011. |
| (B) | The net investment income (loss) per share is based on average shares outstanding for the period. |
| (C) | Less than $0.005 per share. |
| (D) | Not annualized. |
| (E) | The ratio of net expenses to average net assets excluding dividend and interest expense on securities sold short is 1.33%, 1.29%, 1.39%, 1.37% and 1.43% for the years ended September 30, 2015, 2014, 2013, 2012 and for the period ended September 30, 2011, respectively. |
| (F) | Annualized. |
| (G) | The ratio of gross expenses to average net assets excluding dividend and interest expense on securities sold short is 1.33%, 1.29%, 1.38%, 1.39% and 6.91% for the years ended September 30, 2015, 2014, 2013, 2012 and for the period ended September 30, 2011, respectively. |
See accompanying Notes to Financial Statements.
| 126 |
Financial Highlights (Continued)
Touchstone Merger Arbitrage Fund—Institutional Class
Selected Data for a Share Outstanding Throughout Each Period
| Period | ||||||||||||||||||||
| Ended | ||||||||||||||||||||
| September | ||||||||||||||||||||
| Year Ended September 30, | 30, | |||||||||||||||||||
| 2015 | 2014 | 2013 | 2012 | 2011(A) | ||||||||||||||||
| Net asset value at beginning of period | $ | 10.57 | $ | 11.13 | $ | 10.69 | $ | 10.03 | $ | 10.00 | ||||||||||
| Income (loss) from investment operations: | ||||||||||||||||||||
| Net investment income (loss) | (0.07 | )(B) | (0.10 | )(B) | 0.11 | (B) | (0.06 | )(B) | (0.02 | ) | ||||||||||
| Net realized and unrealized gains (losses) on investments | 0.20 | (0.05 | ) | 0.44 | 0.73 | 0.05 | ||||||||||||||
| Total from investment operations | 0.13 | (0.15 | ) | 0.55 | 0.67 | 0.03 | ||||||||||||||
| Distributions from: | ||||||||||||||||||||
| Net investment income | — | (0.08 | ) | — | (—) | (C) | — | |||||||||||||
| Realized capital gains | (0.05 | ) | (0.33 | ) | (0.11 | ) | (0.01 | ) | — | |||||||||||
| Total distributions | (0.05 | ) | (0.41 | ) | (0.11 | ) | (0.01 | ) | — | |||||||||||
| Net asset value at end of period | $ | 10.65 | $ | 10.57 | $ | 11.13 | $ | 10.69 | $ | 10.03 | ||||||||||
| Total return | 1.19 | % | (1.44 | )% | 5.20 | % | 6.75 | % | 0.30 | %(D) | ||||||||||
| Net assets at end of period (000's) | $ | 82,858 | $ | 119,727 | $ | 170,930 | $ | 79,164 | $ | 5,016 | ||||||||||
| Ratio to average net assets: | ||||||||||||||||||||
| Net expenses (including dividend expense on securities sold short)(E) | 2.13 | % | 2.21 | % | 1.91 | % | 1.59 | % | 1.86 | %(F) | ||||||||||
| Gross expenses (including dividend expense on securities sold short)(G) | 2.13 | % | 2.20 | % | 1.92 | % | 1.62 | % | 4.83 | %(F) | ||||||||||
| Net investment income (loss) | (0.66 | )% | (0.94 | )% | 1.01 | % | (0.53 | )% | (1.13 | )%(F) | ||||||||||
| Portfolio turnover rate | 227 | % | 271 | % | 288 | % | 307 | % | 311 | %(D) | ||||||||||
| (A) | Represents the period from commencement of operations (August 9, 2011) through September 30, 2011. |
| (B) | The net investment income (loss) per share is based on average shares outstanding for the period. |
| (C) | Less than $0.005 per share. |
| (D) | Not annualized. |
| (E) | The ratio of net expenses to average net assets excluding dividend and interest expense on securities sold short is 1.26%, 1.26%, 1.28%, 1.28% and 1.28% for the years ended September 30, 2015, 2014, 2013, 2012 and for the period ended September 30, 2011, respectively. |
| (F) | Annualized. |
| (G) | The ratio of gross expenses to average net assets excluding dividend and interest expense on securities sold short is 1.26%, 1.25%, 1.29%, 1.31% and 4.25% for years ended September 30, 2015, 2014, 2013, 2012 and for the period ended September 30, 2011, respectively. |
See accompanying Notes to Financial Statements.
| 127 |
Financial Highlights (Continued)
Touchstone Mid Cap Fund—Class A
Selected Data for a Share Outstanding Throughout Each Period
| Year Ended September 30, | ||||||||||||||||||||
| 2015 | 2014 | 2013 | 2012 | 2011 | ||||||||||||||||
| Net asset value at beginning of period | $ | 23.68 | $ | 20.87 | $ | 16.55 | $ | 13.16 | $ | 12.67 | ||||||||||
| Income (loss) from investment operations: | ||||||||||||||||||||
| Net investment income (loss) | (0.02 | )(A) | — | (B) | 0.12 | (A) | 0.10 | (A) | (0.02 | ) | ||||||||||
| Net realized and unrealized gains (losses) on investments | (0.44 | ) | 2.83 | 4.51 | 3.31 | 0.51 | ||||||||||||||
| Total from investment operations | (0.46 | ) | 2.83 | 4.63 | 3.41 | 0.49 | ||||||||||||||
| Distributions from: | ||||||||||||||||||||
| Net investment income | — | (0.02 | ) | (0.31 | ) | (0.02 | ) | �� | ||||||||||||
| Net asset value at end of period | $ | 23.22 | $ | 23.68 | $ | 20.87 | $ | 16.55 | $ | 13.16 | ||||||||||
| Total return(C) | (1.94 | )% | 13.57 | % | 28.43 | % | 25.95 | % | 3.87 | % | ||||||||||
| Ratios and supplemental data: | ||||||||||||||||||||
| Net assets at end of period (000's) | $ | 62,717 | $ | 35,513 | $ | 43,611 | $ | 905 | $ | 698 | ||||||||||
| Ratio to average net assets: | ||||||||||||||||||||
| Net expenses | 1.24 | % | 1.23 | % | 1.21 | % | 1.21 | % | 1.21 | % | ||||||||||
| Gross expenses | 1.35 | % | 1.40 | % | 1.50 | % | 3.50 | % | 3.05 | % | ||||||||||
| Net investment income (loss) | (0.07 | )% | 0.01 | % | 0.61 | % | 0.66 | % | (0.02 | )% | ||||||||||
| Portfolio turnover rate | 17 | % | 26 | % | 20 | % | 152 | % | 97 | % | ||||||||||
Touchstone Mid Cap Fund—Class C
Selected Data for a Share Outstanding Throughout Each Period
| Year Ended September 30, | ||||||||||||||||||||
| 2015 | 2014 | 2013 | 2012 | 2011 | ||||||||||||||||
| Net asset value at beginning of period | $ | 22.97 | $ | 20.37 | $ | 16.21 | $ | 12.96 | $ | 12.58 | ||||||||||
| Income (loss) from investment operations: | ||||||||||||||||||||
| Net investment loss | (0.20 | )(A) | (0.15 | ) | (0.03 | )(A) | (0.01 | )(A) | (0.07 | ) | ||||||||||
| Net realized and unrealized gains (losses) on investments | (0.42 | ) | 2.75 | 4.42 | 3.26 | 0.45 | ||||||||||||||
| Total from investment operations | (0.62 | ) | 2.60 | 4.39 | 3.25 | 0.38 | ||||||||||||||
| Distributions from: | ||||||||||||||||||||
| Net investment income | — | — | (0.23 | ) | — | — | ||||||||||||||
| Net asset value at end of period | $ | 22.35 | $ | 22.97 | $ | 20.37 | $ | 16.21 | $ | 12.96 | ||||||||||
| Total return(C) | (2.70 | )% | 12.76 | % | 27.43 | % | 25.08 | % | 3.02 | % | ||||||||||
| Ratios and supplemental data: | ||||||||||||||||||||
| Net assets at end of period (000's) | $ | 60,815 | $ | 41,433 | $ | 25,018 | $ | 962 | $ | 476 | ||||||||||
| Ratio to average net assets: | ||||||||||||||||||||
| Net expenses | 1.99 | % | 1.98 | % | 1.96 | % | 1.96 | % | 1.96 | % | ||||||||||
| Gross expenses | 2.12 | % | 2.16 | % | 2.37 | % | 4.62 | % | 4.95 | % | ||||||||||
| Net investment loss | (0.82 | )% | (0.75 | )% | (0.14 | )% | (0.09 | )% | (0.80 | )% | ||||||||||
| Portfolio turnover rate | 17 | % | 26 | % | 20 | % | 152 | % | 97 | % | ||||||||||
| (A) | The net investment income (loss) per share is based on average shares outstanding for the period. |
| (B) | Less than $0.005 per share. |
| (C) | Total return shown exclude the effect of applicable sales loads. If these charges were included, the returns would be lower. |
See accompanying Notes to Financial Statements.
| 128 |
Financial Highlights (Continued)
Touchstone Mid Cap Fund—Class Y
Selected Data for a Share Outstanding Throughout Each Period
| Year Ended September 30, | ||||||||||||||||||||
| 2015 | 2014 | 2013 | 2012 | 2011 | ||||||||||||||||
| Net asset value at beginning of period | $ | 23.83 | $ | 20.98 | $ | 16.60 | $ | 13.17 | $ | 12.68 | ||||||||||
| Income (loss) from investment operations: | ||||||||||||||||||||
| Net investment income | 0.05 | (A) | 0.06 | 0.17 | (A) | 0.15 | (A) | 0.05 | ||||||||||||
| Net realized and unrealized gains (losses) on investments | (0.45 | ) | 2.84 | 4.53 | 3.31 | 0.47 | ||||||||||||||
| Total from investment operations | (0.40 | ) | 2.90 | 4.70 | 3.46 | 0.52 | ||||||||||||||
| Distributions from: | ||||||||||||||||||||
| Net investment income | (0.05 | ) | (0.05 | ) | (0.32 | ) | (0.03 | ) | (0.03 | ) | ||||||||||
| Net asset value at end of period | $ | 23.38 | $ | 23.83 | $ | 20.98 | $ | 16.60 | $ | 13.17 | ||||||||||
| Total return | (1.69 | )% | 13.83 | % | 28.78 | % | 26.29 | % | 4.10 | % | ||||||||||
| Ratios and supplemental data: | ||||||||||||||||||||
| Net assets at end of period (000's) | $ | 481,735 | $ | 266,446 | $ | 181,276 | $ | 47,419 | $ | 77,785 | ||||||||||
| Ratio to average net assets: | ||||||||||||||||||||
| Net expenses | 0.99 | % | 0.98 | % | 0.95 | % | 0.92 | % | 0.96 | % | ||||||||||
| Gross expenses | 1.11 | % | 1.06 | % | 1.09 | % | 1.08 | % | 1.06 | % | ||||||||||
| Net investment income | 0.18 | % | 0.26 | % | 0.87 | % | 0.95 | % | 0.26 | % | ||||||||||
| Portfolio turnover rate | 17 | % | 26 | % | 20 | % | 152 | % | 97 | % | ||||||||||
Touchstone Mid Cap Fund—Class Z
Selected Data for a Share Outstanding Throughout Each Period
| Year Ended September 30, | ||||||||||||||||||||
| 2015 | 2014 | 2013 | 2012 | 2011 | ||||||||||||||||
| Net asset value at beginning of period | $ | 23.54 | $ | 20.73 | $ | 16.45 | $ | 13.08 | $ | 12.59 | ||||||||||
| Income (loss) from investment operations: | ||||||||||||||||||||
| Net investment income (loss) | (0.02 | )(A) | 0.01 | 0.12 | (A) | 0.10 | (A) | (— | )(B) | |||||||||||
| Net realized and unrealized gains (losses) on investments | (0.44 | ) | 2.81 | 4.48 | 3.28 | 0.49 | ||||||||||||||
| Total from investment operations | (0.46 | ) | 2.82 | 4.60 | 3.38 | 0.49 | ||||||||||||||
| Distributions from: | ||||||||||||||||||||
| Net investment income | — | (0.01 | ) | (0.32 | ) | (0.01 | ) | — | ||||||||||||
| Net asset value at end of period | $ | 23.08 | $ | 23.54 | $ | 20.73 | $ | 16.45 | $ | 13.08 | ||||||||||
| Total return | (1.95 | )% | 13.58 | % | 28.45 | % | 25.89 | % | 3.89 | % | ||||||||||
| Ratios and supplemental data: | ||||||||||||||||||||
| Net assets at end of period (000's) | $ | 18,693 | $ | 11,593 | $ | 12,858 | $ | 267 | $ | 934 | ||||||||||
| Ratio to average net assets: | ||||||||||||||||||||
| Net expenses | 1.24 | % | 1.23 | % | 1.21 | % | 1.21 | % | 1.21 | % | ||||||||||
| Gross expenses | 1.44 | % | 1.55 | % | 1.55 | % | 3.67 | % | 3.68 | % | ||||||||||
| Net investment income (loss) | (0.07 | )% | 0.01 | % | 0.61 | % | 0.66 | % | (0.09 | )% | ||||||||||
| Portfolio turnover rate | 17 | % | 26 | % | 20 | % | 152 | % | 97 | % | ||||||||||
| (A) | The net investment income (loss) per share is based on average shares outstanding for the period. |
| (B) | Less than $0.005 per share. |
See accompanying Notes to Financial Statements.
| 129 |
Financial Highlights (Continued)
Touchstone Mid Cap Fund—Institutional Class
Selected Data for a Share Outstanding Throughout The Period
| Period | ||||||||||||||||
| Ended | ||||||||||||||||
| September | ||||||||||||||||
| Year Ended September 30, | 30, | |||||||||||||||
| 2015 | 2014 | 2013 | 2012(A) | |||||||||||||
| Net asset value at beginning of period | $ | 23.85 | $ | 20.99 | $ | 16.61 | $ | 15.36 | ||||||||
| Income (loss) from investment operations: | ||||||||||||||||
| Net investment income | 0.06 | (B) | 0.08 | 0.19 | (B) | 0.10 | (B) | |||||||||
| Net realized and unrealized gains (losses) on investments | (0.44 | ) | 2.84 | 4.52 | 1.15 | |||||||||||
| Total from investment operations | (0.38 | ) | 2.92 | 4.71 | 1.25 | |||||||||||
| Distributions from: | ||||||||||||||||
| Net investment income | (0.07 | ) | (0.06 | ) | (0.33 | ) | — | |||||||||
| Net asset value at end of period | $ | 23.40 | $ | 23.85 | $ | 20.99 | $ | 16.61 | ||||||||
| Total return | (1.62 | )% | 13.91 | % | 28.85 | % | 8.14 | %(C) | ||||||||
| Ratios and supplemental data: | ||||||||||||||||
| Net assets at end of period (000's) | $ | 76,324 | $ | 90,998 | $ | 74,170 | $ | 12,231 | ||||||||
| Ratio to average net assets: | ||||||||||||||||
| Net expenses | 0.92 | % | 0.91 | % | 0.89 | % | 0.89 | %(D) | ||||||||
| Gross expenses | 1.00 | % | 1.01 | % | 1.07 | % | 1.38 | %(D) | ||||||||
| Net investment income | 0.25 | % | 0.33 | % | 0.93 | % | 0.98 | %(D) | ||||||||
| Portfolio turnover rate | 17 | % | 26 | % | 20 | % | 152 | % | ||||||||
| (A) | Represents the period from commencement of operations (January 27, 2012) through September 30, 2012. |
| (B) | The net investment income per share is based on average shares outstanding for the period. |
| (C) | Not annualized. |
| (D) | Annualized. |
See accompanying Notes to Financial Statements.
| 130 |
Financial Highlights (Continued)
| Touchstone Mid Cap Value Fund—Class A | ||||||||||||||||||||
| Selected Data for a Share Outstanding Throughout Each Period | ||||||||||||||||||||
| Year Ended September 30, | ||||||||||||||||||||
| 2015 | 2014 | 2013 | 2012 | 2011 | ||||||||||||||||
| Net asset value at beginning of period | $ | 16.60 | $ | 16.09 | $ | 12.98 | $ | 10.86 | $ | 11.76 | ||||||||||
| Income (loss) from investment operations: | ||||||||||||||||||||
| Net investment income | 0.12 | 0.05 | 0.10 | 0.09 | 0.09 | |||||||||||||||
| Net realized and unrealized gains (losses) on investments | (0.28 | ) | 1.85 | 3.26 | 2.78 | (0.72 | ) | |||||||||||||
| Total from investment operations | (0.16 | ) | 1.90 | 3.36 | 2.87 | (0.63 | ) | |||||||||||||
| Distributions from: | ||||||||||||||||||||
| Net investment income | (0.10 | ) | (0.05 | ) | (0.10 | ) | (0.09 | ) | (0.11 | ) | ||||||||||
| Realized capital gains | (0.64 | ) | (1.34 | ) | (0.15 | ) | (0.66 | ) | (0.16 | ) | ||||||||||
| Total distributions | (0.74 | ) | (1.39 | ) | (0.25 | ) | (0.75 | ) | (0.27 | ) | ||||||||||
| Net asset value at end of period | $ | 15.70 | $ | 16.60 | $ | 16.09 | $ | 12.98 | $ | 10.86 | ||||||||||
| Total return(A) | (1.14 | )% | 12.49 | % | 26.26 | % | 27.55 | % | (5.72 | )% | ||||||||||
| Ratios and supplemental data: | ||||||||||||||||||||
| Net assets at end of period (000's) | $ | 7,663 | $ | 14,029 | $ | 5,307 | $ | 3,409 | $ | 2,364 | ||||||||||
| Ratio to average net assets: | ||||||||||||||||||||
| Net expenses | 1.29 | % | 1.29 | % | 1.29 | % | 1.29 | % | 1.29 | % | ||||||||||
| Gross expenses | 1.66 | % | 1.58 | % | 1.75 | % | 1.97 | % | 2.07 | % | ||||||||||
| Net investment income | 0.55 | % | 0.41 | % | 0.73 | % | 0.77 | % | 0.86 | % | ||||||||||
| Portfolio turnover rate | 54 | % | 85 | %(B) | 68 | % | 42 | % | 59 | % | ||||||||||
| Touchstone Mid Cap Value Fund—Class C | ||||||||||||||||||||
| Selected Data for a Share Outstanding Throughout Each Period | ||||||||||||||||||||
| Year Ended September 30, | ||||||||||||||||||||
| 2015 | 2014 | 2013 | 2012 | 2011 | ||||||||||||||||
| Net asset value at beginning of period | $ | 16.42 | $ | 16.00 | $ | 12.92 | $ | 10.82 | $ | 11.74 | ||||||||||
| Income (loss) from investment operations: | ||||||||||||||||||||
| Net investment income (loss) | (0.04 | ) | (0.04 | ) | (— | )(C) | — | (C) | 0.03 | |||||||||||
| Net realized and unrealized gains (losses) on investments | (0.25 | ) | 1.80 | 3.24 | 2.77 | (0.75 | ) | |||||||||||||
| Total from investment operations | (0.29 | ) | 1.76 | 3.24 | 2.77 | (0.72 | ) | |||||||||||||
| Distributions from: | ||||||||||||||||||||
| Net investment income | — | — | (0.01 | ) | (0.01 | ) | (0.04 | ) | ||||||||||||
| Realized capital gains | (0.64 | ) | (1.34 | ) | (0.15 | ) | (0.66 | ) | (0.16 | ) | ||||||||||
| Total distributions | (0.64 | ) | (1.34 | ) | (0.16 | ) | (0.67 | ) | (0.20 | ) | ||||||||||
| Net asset value at end of period | $ | 15.49 | $ | 16.42 | $ | 16.00 | $ | 12.92 | $ | 10.82 | ||||||||||
| Total return(A) | (1.91 | )% | 11.62 | % | 25.32 | % | 26.64 | % | (6.45 | )% | ||||||||||
| Ratios and supplemental data: | ||||||||||||||||||||
| Net assets at end of period (000's) | $ | 1,752 | $ | 2,002 | $ | 719 | $ | 292 | $ | 204 | ||||||||||
| Ratio to average net assets: | ||||||||||||||||||||
| Net expenses | 2.04 | % | 2.04 | % | 2.04 | % | 2.04 | % | 2.04 | % | ||||||||||
| Gross expenses | 2.83 | % | 3.05 | % | 4.17 | % | 7.90 | % | 7.74 | % | ||||||||||
| Net investment income (loss) | (0.20 | )% | (0.34 | )% | (0.02 | )% | 0.02 | % | 0.10 | % | ||||||||||
| Portfolio turnover rate | 54 | % | 85 | %(B) | 68 | % | 42 | % | 59 | % | ||||||||||
| (A) | Total returns shown exclude the effect of applicable sales loads. If these charges were included, the returns would be lower. |
| (B) | Portfolio turnover excludes the purchases and sales of the Touchstone Mid Cap Value Opportunities Fund (see Note 11). If these transactions were included, portfolio turnover would have been higher. |
| (C) | Less than $0.005 per share. |
See accompanying Notes to Financial Statements.
| 131 |
Financial Highlights (Continued)
| Touchstone Mid Cap Value Fund—Class Y | ||||||||||||||||||||
| Selected Data for a Share Outstanding Throughout Each Period | ||||||||||||||||||||
| Year Ended September 30, | ||||||||||||||||||||
| 2015 | 2014 | 2013 | 2012 | 2011 | ||||||||||||||||
| Net asset value at beginning of period | $ | 16.67 | $ | 16.15 | $ | 13.03 | $ | 10.89 | $ | 11.79 | ||||||||||
| Income (loss) from investment operations: | ||||||||||||||||||||
| Net investment income | 0.14 | 0.07 | 0.15 | 0.11 | 0.12 | |||||||||||||||
| Net realized and unrealized gains (losses) on investments | (0.27 | ) | 1.88 | 3.26 | 2.81 | (0.72 | ) | |||||||||||||
| Total from investment operations | (0.13 | ) | 1.95 | 3.41 | 2.92 | (0.60 | ) | |||||||||||||
| Distributions from: | ||||||||||||||||||||
| Net investment income | (0.14 | ) | (0.09 | ) | (0.14 | ) | (0.12 | ) | (0.14 | ) | ||||||||||
| Realized capital gains | (0.64 | ) | (1.34 | ) | (0.15 | ) | (0.66 | ) | (0.16 | ) | ||||||||||
| Total distributions | (0.78 | ) | (1.43 | ) | (0.29 | ) | (0.78 | ) | (0.30 | ) | ||||||||||
| Net asset value at end of period | $ | 15.76 | $ | 16.67 | $ | 16.15 | $ | 13.03 | $ | 10.89 | ||||||||||
| Total return | (0.91 | )% | 12.77 | % | 26.53 | % | 27.97 | % | (5.51 | )% | ||||||||||
| Ratios and supplemental data: | ||||||||||||||||||||
| Net assets at end of period (000's) | $ | 208,525 | $ | 213,404 | $ | 15,782 | $ | 13,785 | $ | 4,685 | ||||||||||
| Ratio to average net assets: | ||||||||||||||||||||
| Net expenses | 1.04 | % | 1.04 | % | 1.04 | % | 1.04 | % | 1.04 | % | ||||||||||
| Gross expenses | 1.13 | % | 1.14 | % | 1.37 | % | 1.46 | % | 1.58 | % | ||||||||||
| Net investment income | 0.81 | % | 0.66 | % | 0.98 | % | 1.02 | % | 1.20 | % | ||||||||||
| Portfolio turnover rate | 54 | % | 85 | %(A) | 68 | % | 42 | % | 59 | % | ||||||||||
| Touchstone Mid Cap Value Fund—Institutional Class | ||||||||||||||||||||
| Selected Data for a Share Outstanding Throughout Each Period | ||||||||||||||||||||
| Year Ended September 30, | ||||||||||||||||||||
| 2015 | 2014 | 2013 | 2012 | 2011 | ||||||||||||||||
| Net asset value at beginning of period | $ | 16.73 | $ | 16.20 | $ | 13.07 | $ | 10.92 | $ | 11.83 | ||||||||||
| Income (loss) from investment operations: | ||||||||||||||||||||
| Net investment income | 0.17 | 0.13 | 0.16 | 0.13 | 0.16 | |||||||||||||||
| Net realized and unrealized gains (losses) on investments | (0.27 | ) | 1.85 | 3.28 | 2.82 | (0.75 | ) | |||||||||||||
| Total from investment operations | (0.10 | ) | 1.98 | 3.44 | 2.95 | (0.59 | ) | |||||||||||||
| Distributions from: | ||||||||||||||||||||
| Net investment income | (0.17 | ) | (0.11 | ) | (0.16 | ) | (0.14 | ) | (0.16 | ) | ||||||||||
| Realized capital gains | (0.64 | ) | (1.34 | ) | (0.15 | ) | (0.66 | ) | (0.16 | ) | ||||||||||
| Total distributions | (0.81 | ) | (1.45 | ) | (0.31 | ) | (0.80 | ) | (0.32 | ) | ||||||||||
| Net asset value at end of period | $ | 15.82 | $ | 16.73 | $ | 16.20 | $ | 13.07 | $ | 10.92 | ||||||||||
| Total return | (0.76 | )% | 12.90 | % | 26.71 | % | 28.17 | % | (5.41 | )% | ||||||||||
| Ratios and supplemental data: | ||||||||||||||||||||
| Net assets at end of period (000's) | $ | 124,592 | $ | 134,259 | $ | 144,965 | $ | 75,240 | $ | 39,808 | ||||||||||
| Ratio to average net assets: | ||||||||||||||||||||
| Net expenses | 0.89 | % | 0.89 | % | 0.89 | % | 0.89 | % | 0.89 | % | ||||||||||
| Gross expenses | 1.03 | % | 1.04 | % | 1.09 | % | 1.12 | % | 1.15 | % | ||||||||||
| Net investment income | 0.96 | % | 0.81 | % | 1.13 | % | 1.17 | % | 1.21 | % | ||||||||||
| Portfolio turnover rate | 54 | % | 85 | %(A) | 68 | % | 42 | % | 59 | % | ||||||||||
| (A) | Portfolio turnover excludes the purchases and sales of the Touchstone Mid Cap Value Opportunities Fund (see Note 11). If these transactions were included, portfolio turnover would have been higher. |
See accompanying Notes to Financial Statements.
| 132 |
Financial Highlights (Continued)
| Touchstone Premium Yield Equity Fund—Class A | ||||||||||||||||||||
| Selected Data for a Share Outstanding Throughout Each Period | ||||||||||||||||||||
| Year Ended September 30, | ||||||||||||||||||||
| 2015 | 2014 | 2013 | 2012 | 2011 | ||||||||||||||||
| Net asset value at beginning of period | $ | 9.98 | $ | 8.92 | $ | 8.11 | $ | 6.76 | $ | 6.48 | ||||||||||
| Income from investment operations: | ||||||||||||||||||||
| Net investment income | 0.24 | 0.40 | (A) | 0.24 | 0.24 | 0.21 | ||||||||||||||
| Net realized and unrealized gains (losses) on investments | (1.25 | ) | 1.07 | 0.80 | 1.36 | 0.28 | ||||||||||||||
| Total from investment operations | (1.01 | ) | 1.47 | 1.04 | 1.60 | 0.49 | ||||||||||||||
| Distributions from: | ||||||||||||||||||||
| Net investment income | (0.25 | ) | (0.41 | ) | (0.23 | ) | (0.24 | ) | (0.21 | ) | ||||||||||
| Realized capital gains | (0.45 | ) | — | — | — | — | ||||||||||||||
| Return of capital | — | — | — | (0.01 | ) | — | ||||||||||||||
| Total distributions | (0.70 | ) | (0.41 | ) | (0.23 | ) | (0.25 | ) | (0.21 | ) | ||||||||||
| Net asset value at end of period | $ | 8.27 | $ | 9.98 | $ | 8.92 | $ | 8.11 | $ | 6.76 | ||||||||||
| Total return(B) | (10.79 | )% | 16.79 | % | 12.97 | % | 23.98 | % | 7.43 | % | ||||||||||
| Ratios and supplemental data: | ||||||||||||||||||||
| Net assets at end of period (000's) | $ | 36,023 | $ | 45,124 | $ | 86,171 | $ | 68,780 | $ | 28,739 | ||||||||||
| Ratio to average net assets: | ||||||||||||||||||||
| Net expenses | 1.20 | % | 1.20 | % | 1.20 | % | 1.20 | % | 1.20 | % | ||||||||||
| Gross expenses | 1.25 | % | 1.29 | % | 1.29 | % | 1.30 | % | 1.35 | % | ||||||||||
| Net investment income | 2.57 | % | 4.24 | %(A) | 2.74 | % | 3.26 | % | 3.02 | % | ||||||||||
| Portfolio turnover rate | 31 | % | 26 | % | 56 | % | 16 | % | 54 | % | ||||||||||
| Touchstone Premium Yield Equity Fund—Class C | ||||||||||||||||||||
| Selected Data for a Share Outstanding Throughout Each Period | ||||||||||||||||||||
| Year Ended September 30, | ||||||||||||||||||||
| 2015 | 2014 | 2013 | 2012 | 2011 | ||||||||||||||||
| Net asset value at beginning of period | $ | 9.97 | $ | 8.90 | $ | 8.10 | $ | 6.76 | $ | 6.49 | ||||||||||
| Income from investment operations: | ||||||||||||||||||||
| Net investment income | 0.17 | 0.33 | (A) | 0.16 | 0.18 | 0.16 | ||||||||||||||
| Net realized and unrealized gains (losses) on investments | (1.24 | ) | 1.07 | 0.80 | 1.35 | 0.27 | ||||||||||||||
| Total from investment operations | (1.07 | ) | 1.40 | 0.96 | 1.53 | 0.43 | ||||||||||||||
| Distributions from: | ||||||||||||||||||||
| Net investment income | (0.19 | ) | (0.33 | ) | (0.16 | ) | (0.18 | ) | (0.16 | ) | ||||||||||
| Realized capital gains | (0.45 | ) | — | — | — | — | ||||||||||||||
| Return of capital | — | — | — | (0.01 | ) | — | ||||||||||||||
| Total distributions | (0.64 | ) | (0.33 | ) | (0.16 | ) | (0.19 | ) | (0.16 | ) | ||||||||||
| Net asset value at end of period | $ | 8.26 | $ | 9.97 | $ | 8.90 | $ | 8.10 | $ | 6.76 | ||||||||||
| Total return(B) | (11.45 | )% | 15.99 | % | 12.03 | % | 22.93 | % | 6.60 | % | ||||||||||
| Ratios and supplemental data: | ||||||||||||||||||||
| Net assets at end of period (000's) | $ | 31,405 | $ | 31,190 | $ | 24,009 | $ | 15,680 | $ | 7,499 | ||||||||||
| Ratio to average net assets: | ||||||||||||||||||||
| Net expenses | 1.95 | % | 1.95 | % | 1.95 | % | 1.95 | % | 1.95 | % | ||||||||||
| Gross expenses | 2.00 | % | 2.02 | % | 2.08 | % | 2.14 | % | 2.28 | % | ||||||||||
| Net investment income | 1.82 | % | 3.49 | %(A) | 1.99 | % | 2.51 | % | 2.27 | % | ||||||||||
| Portfolio turnover rate | 31 | % | 26 | % | 56 | % | 16 | % | 54 | % | ||||||||||
| (A) | Reflects the impact of a corporate action event that resulted in a one-time increase to net investment income. If the corporate action event had not occurred, the Class A and Class C net investment income per share and ratio of net investment income to average net assets would have been lower by $0.16 and 1.70%, respectively. |
| (B) | Total returns shown exclude the effect of applicable sales loads. If these charges were included, the returns would be lower. |
See accompanying Notes to Financial Statements.
| 133 |
Financial Highlights (Continued)
| Touchstone Premium Yield Equity Fund—Class Y | ||||||||||||||||||||
| Selected Data for a Share Outstanding Throughout Each Period | ||||||||||||||||||||
| Year Ended September 30, | ||||||||||||||||||||
| 2015 | 2014 | 2013 | 2012 | 2011 | ||||||||||||||||
| Net asset value at beginning of period | $ | 9.97 | $ | 8.90 | $ | 8.10 | $ | 6.75 | $ | 6.47 | ||||||||||
| Income from investment operations: | ||||||||||||||||||||
| Net investment income | 0.26 | 0.43 | (A) | 0.25 | 0.27 | 0.20 | ||||||||||||||
| Net realized and unrealized gains (losses) on investments | (1.25 | ) | 1.07 | 0.80 | 1.35 | 0.30 | ||||||||||||||
| Total from investment operations | (0.99 | ) | 1.50 | 1.05 | 1.62 | 0.50 | ||||||||||||||
| Distributions from: | ||||||||||||||||||||
| Net investment income | (0.28 | ) | (0.43 | ) | (0.25 | ) | (0.26 | ) | (0.22 | ) | ||||||||||
| Realized capital gains | (0.45 | ) | — | — | — | — | ||||||||||||||
| Return of capital | — | — | — | (0.01 | ) | — | ||||||||||||||
| Total distributions | (0.73 | ) | (0.43 | ) | (0.25 | ) | (0.27 | ) | (0.22 | ) | ||||||||||
| Net asset value at end of period | $ | 8.25 | $ | 9.97 | $ | 8.90 | $ | 8.10 | $ | 6.75 | ||||||||||
| Total return | (10.58 | )% | 17.13 | % | 13.14 | % | 24.31 | % | 7.67 | % | ||||||||||
| Ratios and supplemental data: | ||||||||||||||||||||
| Net assets at end of period (000's) | $ | 100,772 | $ | 109,201 | $ | 66,644 | $ | 33,185 | $ | 3,980 | ||||||||||
| Ratio to average net assets: | ||||||||||||||||||||
| Net expenses | 0.95 | % | 0.95 | % | 0.95 | % | 0.95 | % | 0.95 | % | ||||||||||
| Gross expenses | 0.97 | % | 0.96 | % | 1.04 | % | 1.18 | % | 1.25 | % | ||||||||||
| Net investment income | 2.82 | % | 4.49 | %(A) | 2.99 | % | 3.51 | % | 3.16 | % | ||||||||||
| Portfolio turnover rate | 31 | % | 26 | % | 56 | % | 16 | % | 54 | % | ||||||||||
| (A) | Reflects the impact of a corporate action event that resulted in a one-time increase to net investment income. If the corporate action event had not occurred, the Class Y net investment income per share and ratio of net investment income to average net assets would have been lower by $0.16 and 1.70%, respectively. |
See accompanying Notes to Financial Statements.
| 134 |
Financial Highlights (Continued)
| Touchstone Sands Capital Select Growth Fund—Class A | ||||||||||||||||||||
| Selected Data for a Share Outstanding Throughout Each Period | ||||||||||||||||||||
| Period | ||||||||||||||||||||
| Ended | ||||||||||||||||||||
| September | ||||||||||||||||||||
| Year Ended September 30, | 30, | |||||||||||||||||||
| 2015 | 2014 | 2013 | 2012 | 2011(A) | ||||||||||||||||
| Net asset value at beginning of period | $ | 18.15 | $ | 16.08 | $ | 12.65 | $ | 9.39 | $ | 9.39 | ||||||||||
| Income (loss) from investment operations: | ||||||||||||||||||||
| Net investment loss | (0.15 | ) | (0.29 | ) | (0.05 | ) | (0.09 | )(B) | (0.03 | ) | ||||||||||
| Net realized and unrealized gains (losses) on investments | (0.64 | ) | 2.49 | 3.48 | 3.35 | 0.03 | ||||||||||||||
| Total from investment operations | (0.79 | ) | 2.20 | 3.43 | 3.26 | — | ||||||||||||||
| Distributions from: | ||||||||||||||||||||
| Realized capital gains | (0.88 | ) | (0.13 | ) | — | — | — | |||||||||||||
| Net asset value at end of period | $ | 16.48 | $ | 18.15 | $ | 16.08 | $ | 12.65 | $ | 9.39 | ||||||||||
| Total return(C) | (4.70 | )% | 13.73 | % | 27.11 | % | 34.72 | % | 0.00 | %(D) | ||||||||||
| Ratios and supplemental data: | ||||||||||||||||||||
| Net assets at end of period (000's) | $ | 230,783 | $ | 289,506 | $ | 416,396 | $ | 186,384 | $ | 21,211 | ||||||||||
| Ratio to average net assets: | ||||||||||||||||||||
| Net expenses | 1.10 | % | 1.31 | % | 1.28 | % | 1.37 | % | 1.45 | %(E) | ||||||||||
| Gross expenses | 1.10 | % | 1.33 | % | 1.37 | % | 1.47 | % | 1.64 | %(E) | ||||||||||
| Net investment loss | (0.65 | )% | (0.91 | )% | (0.62 | )% | (0.74 | )% | (0.94 | )%(E) | ||||||||||
| Portfolio turnover rate | 29 | % | 30 | % | 37 | % | 19 | % | 19 | %(D) | ||||||||||
| Touchstone Sands Capital Select Growth Fund—Class C | ||||||||||||||||||||
| Selected Data for a Share Outstanding Throughout Each Period | ||||||||||||||||||||
| Period | ||||||||||||||||||||
| Ended | ||||||||||||||||||||
| September | ||||||||||||||||||||
| Year Ended September 30, | 30, | |||||||||||||||||||
| 2015 | 2014 | 2013 | 2012 | 2011(A) | ||||||||||||||||
| Net asset value at beginning of period | $ | 17.62 | $ | 15.74 | $ | 12.47 | $ | 9.33 | $ | 9.39 | ||||||||||
| Income (loss) from investment operations: | ||||||||||||||||||||
| Net investment loss | (0.30 | ) | (0.32 | ) | (0.13 | ) | (0.17 | )(B) | (0.06 | ) | ||||||||||
| Net realized and unrealized gains (losses) on investments | (0.58 | ) | 2.33 | 3.40 | 3.31 | — | (F) | |||||||||||||
| Total from investment operations | (0.88 | ) | 2.01 | 3.27 | 3.14 | (0.06 | ) | |||||||||||||
| Distributions from: | ||||||||||||||||||||
| Realized capital gains | (0.88 | ) | (0.13 | ) | — | — | — | |||||||||||||
| Net asset value at end of period | $ | 15.86 | $ | 17.62 | $ | 15.74 | $ | 12.47 | $ | 9.33 | ||||||||||
| Total return(C) | (5.38 | )% | 12.89 | % | 26.14 | % | 33.66 | % | (0.64 | )%(D) | ||||||||||
| Ratios and supplemental data: | ||||||||||||||||||||
| Net assets at end of period (000's) | $ | 163,237 | $ | 203,865 | $ | 198,584 | $ | 88,931 | $ | 8,660 | ||||||||||
| Ratio to average net assets: | ||||||||||||||||||||
| Net expenses | 1.85 | % | 2.06 | % | 2.03 | % | 2.12 | % | 2.20 | %(E) | ||||||||||
| Gross expenses | 1.85 | % | 2.09 | % | 2.14 | % | 2.22 | % | 2.56 | %(E) | ||||||||||
| Net investment loss | (1.40 | )% | (1.65 | )% | (1.37 | )% | (1.49 | )% | (1.69 | )%(E) | ||||||||||
| Portfolio turnover rate | 29 | % | 30 | % | 37 | % | 19 | % | 19 | %(D) | ||||||||||
| (A) | Represents the period from commencement of operations (November 15, 2010) through September 30, 2011. |
| (B) | The net investment loss per share is based on average shares outstanding for the period. |
| (C) | Total returns shown exclude the effect of applicable sales loads. If these charges were included, the returns would be lower. |
| (D) | Not annualized. |
| (E) | Annualized. |
| (F) | Less than $0.005 per share. |
See accompanying Notes to Financial Statements.
| 135 |
Financial Highlights (Continued)
| Touchstone Sands Capital Select Growth Fund—Class Y | ||||||||||||||||||||
| Selected Data for a Share Outstanding Throughout Each Period | ||||||||||||||||||||
| Year Ended September 30, | ||||||||||||||||||||
| 2015 | 2014 | 2013 | 2012 | 2011 | ||||||||||||||||
| Net asset value at beginning of period | $ | 18.61 | $ | 16.44 | $ | 12.90 | $ | 9.56 | $ | 8.83 | ||||||||||
| Income (loss) from investment operations: | ||||||||||||||||||||
| Net investment loss | (0.08 | ) | (0.10 | ) | (0.02 | ) | (0.06 | )(A) | (0.14 | ) | ||||||||||
| Net realized and unrealized gains (losses) on investments | (0.69 | ) | 2.40 | 3.56 | 3.40 | 0.87 | ||||||||||||||
| Total from investment operations | (0.77 | ) | 2.30 | 3.54 | 3.34 | 0.73 | ||||||||||||||
| Distributions from: | ||||||||||||||||||||
| Realized capital gains | (0.88 | ) | (0.13 | ) | — | — | — | |||||||||||||
| Net asset value at end of period | $ | 16.96 | $ | 18.61 | $ | 16.44 | $ | 12.90 | $ | 9.56 | ||||||||||
| Total return | (4.46 | )% | 14.04 | % | 27.44 | % | 34.94 | % | 8.14 | % | ||||||||||
| Ratios and supplemental data: | ||||||||||||||||||||
| Net assets at end of period (000's) | $ | 3,198,758 | $ | 3,473,661 | $ | 2,684,731 | $ | 1,215,124 | $ | 392,464 | ||||||||||
| Ratio to average net assets: | ||||||||||||||||||||
| Net expenses | 0.83 | % | 1.06 | % | 1.03 | % | 1.11 | % | 1.20 | % | ||||||||||
| Gross expenses | 0.83 | % | 1.03 | % | 1.06 | % | 1.18 | % | 1.23 | % | ||||||||||
| Net investment loss | (0.39 | )% | (0.66 | )% | (0.37 | )% | (0.49 | )% | (0.68 | )% | ||||||||||
| Portfolio turnover rate | 29 | % | 30 | % | 37 | % | 19 | % | 19 | % | ||||||||||
| Touchstone Sands Capital Select Growth Fund—Class Z | ||||||||||||||||||||
| Selected Data for a Share Outstanding Throughout Each Period | ||||||||||||||||||||
| Year Ended September 30, | ||||||||||||||||||||
| 2015 | 2014 | 2013 | 2012 | 2011 | ||||||||||||||||
| Net asset value at beginning of period | $ | 18.15 | $ | 16.08 | $ | 12.65 | $ | 9.39 | $ | 8.70 | ||||||||||
| Income (loss) from investment operations: | ||||||||||||||||||||
| Net investment loss | (0.19 | ) | (0.17 | ) | (0.10 | ) | (0.08 | )(A) | (0.07 | ) | ||||||||||
| Net realized and unrealized gains (losses) on investments | (0.59 | ) | 2.37 | 3.53 | 3.34 | 0.76 | ||||||||||||||
| Total from investment operations | (0.78 | ) | 2.20 | 3.43 | 3.26 | 0.69 | ||||||||||||||
| Distributions from: | ||||||||||||||||||||
| Realized capital gains | (0.88 | ) | (0.13 | ) | — | — | — | |||||||||||||
| Net asset value at end of period | $ | 16.49 | $ | 18.15 | $ | 16.08 | $ | 12.65 | $ | 9.39 | ||||||||||
| Total return | (4.70 | )% | 13.73 | % | 27.11 | % | 34.72 | % | 7.93 | % | ||||||||||
| Ratios and supplemental data: | ||||||||||||||||||||
| Net assets at end of period (000's) | $ | 1,292,853 | $ | 2,302,038 | $ | 2,140,884 | $ | 1,836,957 | $ | 911,849 | ||||||||||
| Ratio to average net assets: | ||||||||||||||||||||
| Net expenses | 1.08 | % | 1.31 | % | 1.28 | % | 1.32 | % | 1.42 | % | ||||||||||
| Gross expenses | 1.13 | % | 1.35 | % | 1.37 | % | 1.39 | % | 1.52 | % | ||||||||||
| Net investment loss | (0.64 | )% | (0.90 | )% | (0.62 | )% | (0.70 | )% | (0.93 | )% | ||||||||||
| Portfolio turnover rate | 29 | % | 30 | % | 37 | % | 19 | % | 19 | % | ||||||||||
| (A) | The net investment loss per share is based on average shares outstanding for the period. |
See accompanying Notes to Financial Statements.
| 136 |
Financial Highlights (Continued)
| Touchstone Small Cap Core Fund—Class A | ||||||||||||||||||||
| Selected Data for a Share Outstanding Throughout Each Period | ||||||||||||||||||||
| Year Ended September 30, | ||||||||||||||||||||
| 2015 | 2014 | 2013 | 2012 | 2011 | ||||||||||||||||
| Net asset value at beginning of period | $ | 20.55 | $ | 19.44 | $ | 16.02 | $ | 11.94 | $ | 11.62 | ||||||||||
| Income (loss) from investment operations: | ||||||||||||||||||||
| Net investment income (loss) | 0.15 | (A) | (0.09 | )(B) | 0.44 | 0.05 | (0.02 | ) | ||||||||||||
| Net realized and unrealized gains (losses) on investments | (1.38 | ) | 1.80 | 3.28 | 4.20 | 0.35 | ||||||||||||||
| Total from investment operations | (1.23 | ) | 1.71 | 3.72 | 4.25 | 0.33 | ||||||||||||||
| Distributions from: | ||||||||||||||||||||
| Net investment income | — | (C) | (0.31 | ) | (0.18 | ) | (— | )(C) | (0.01 | ) | ||||||||||
| Realized capital gains | (1.59 | ) | (0.29 | ) | (0.12 | ) | (0.17 | ) | (— | )(C) | ||||||||||
| Total distributions | (1.59 | ) | (0.60 | ) | (0.30 | ) | (0.17 | ) | (0.01 | ) | ||||||||||
| Net asset value at end of period | $ | 17.73 | $ | 20.55 | $ | 19.44 | $ | 16.02 | $ | 11.94 | ||||||||||
| Total return(D) | (6.36 | )% | 8.80 | % | 23.60 | % | 35.86 | % | 2.82 | % | ||||||||||
| Ratios and supplemental data: | ||||||||||||||||||||
| Net assets at end of period (000's) | $ | 62,423 | $ | 60,246 | $ | 122,394 | $ | 84,539 | $ | 43,074 | ||||||||||
| Ratio to average net assets: | ||||||||||||||||||||
| Net expenses | 1.38 | % | 1.36 | % | 1.34 | % | 1.34 | % | 1.34 | % | ||||||||||
| Gross expenses | 1.42 | % | 1.43 | % | 1.53 | % | 1.58 | % | 1.79 | % | ||||||||||
| Net investment income (loss) | 0.75 | %(A) | (0.45 | )% | 2.47 | % | 0.37 | % | (0.10 | )% | ||||||||||
| Portfolio turnover rate | 42 | % | 17 | % | 15 | % | 11 | % | 37 | % | ||||||||||
| Touchstone Small Cap Core Fund—Class C | ||||||||||||||||||||
| Selected Data for a Share Outstanding Throughout Each Period | ||||||||||||||||||||
| Year Ended September 30, | ||||||||||||||||||||
| 2015 | 2014 | 2013 | 2012 | 2011 | ||||||||||||||||
| Net asset value at beginning of period | $ | 20.07 | $ | 19.01 | $ | 15.69 | $ | 11.79 | $ | 11.55 | ||||||||||
| Income (loss) from investment operations: | ||||||||||||||||||||
| Net investment income (loss) | — | (A)(C) | (0.24 | )(B) | 0.30 | (0.01 | ) | (0.08 | ) | |||||||||||
| Net realized and unrealized gains (losses) on investments | (1.32 | ) | 1.75 | 3.22 | 4.08 | 0.32 | ||||||||||||||
| Total from investment operations | (1.32 | ) | 1.51 | 3.52 | 4.07 | 0.24 | ||||||||||||||
| Distributions from: | ||||||||||||||||||||
| Net investment income | — | (0.16 | ) | (0.08 | ) | (— | )(C) | (— | )(C) | |||||||||||
| Realized capital gains | (1.59 | ) | (0.29 | ) | (0.12 | ) | (0.17 | ) | (— | )(C) | ||||||||||
| Total distributions | (1.59 | ) | (0.45 | ) | (0.20 | ) | (0.17 | ) | (— | )(C) | ||||||||||
| Net asset value at end of period | $ | 17.16 | $ | 20.07 | $ | 19.01 | $ | 15.69 | $ | 11.79 | ||||||||||
| Total return(D) | (7.01 | )% | 7.96 | % | 22.69 | % | 34.78 | % | 2.08 | % | ||||||||||
| Ratios and supplemental data: | ||||||||||||||||||||
| Net assets at end of period (000's) | $ | 21,562 | $ | 27,104 | $ | 28,685 | $ | 24,278 | $ | 11,739 | ||||||||||
| Ratio to average net assets: | ||||||||||||||||||||
| Net expenses | 2.13 | % | 2.12 | % | 2.09 | % | 2.09 | % | 2.09 | % | ||||||||||
| Gross expenses | 2.17 | % | 2.17 | % | 2.24 | % | 2.30 | % | 2.51 | % | ||||||||||
| Net investment income (loss) | 0.00 | %(A)(C) | (1.20 | )% | 1.72 | % | (0.38 | )% | (0.80 | )% | ||||||||||
| Portfolio turnover rate | 42 | % | 17 | % | 15 | % | 11 | % | 37 | % | ||||||||||
| (A) | Reflects the impact of a corporate action event that resulted in a one-time increase to net investment income. If the corporate action event had not occurred, the Class A and Class C net investment income per share and ratio of net investment income to average net assets would have been lower by $0.13 and 0.65%, respectively. |
| (B) | The net investment loss per share is based on average shares outstanding for the period. |
| (C) | Less than $0.005 per share or 0.005%. |
| (D) | Total returns shown exclude the effect of applicable sales loads. If these charges were included, the returns would be lower. |
See accompanying Notes to Financial Statements.
| 137 |
Financial Highlights (Continued)
| Touchstone Small Cap Core Fund—Class Y | ||||||||||||||||||||
| Selected Data for a Share Outstanding Throughout Each Period | ||||||||||||||||||||
| Year Ended September 30, | ||||||||||||||||||||
| 2015 | 2014 | 2013 | 2012 | 2011 | ||||||||||||||||
| Net asset value at beginning of period | $ | 20.72 | $ | 19.59 | $ | 16.13 | $ | 12.00 | $ | 11.67 | ||||||||||
| Income (loss) from investment operations: | ||||||||||||||||||||
| Net investment income (loss) | 0.18 | (A) | (0.03 | )(B) | 0.46 | 0.07 | 0.02 | |||||||||||||
| Net realized and unrealized gains (losses) on investments | (1.37 | ) | 1.81 | 3.34 | 4.24 | 0.34 | ||||||||||||||
| Total from investment operations | (1.19 | ) | 1.78 | 3.80 | 4.31 | 0.36 | ||||||||||||||
| Distributions from: | ||||||||||||||||||||
| Net investment income (loss) | (0.01 | ) | (0.36 | ) | (0.22 | ) | (0.01 | ) | (0.03 | ) | ||||||||||
| Realized capital gains | (1.59 | ) | (0.29 | ) | (0.12 | ) | (0.17 | ) | (— | )(C) | ||||||||||
| Total distributions | (1.60 | ) | (0.65 | ) | (0.34 | ) | (0.18 | ) | (0.03 | ) | ||||||||||
| Net asset value at end of period | $ | 17.93 | $ | 20.72 | $ | 19.59 | $ | 16.13 | $ | 12.00 | ||||||||||
| Total return | (6.11 | )% | 9.12 | % | 24.01 | % | 36.23 | % | 3.05 | % | ||||||||||
| Ratios and supplemental data: | ||||||||||||||||||||
| Net assets at end of period (000's) | $ | 333,971 | $ | 309,367 | $ | 258,024 | $ | 168,987 | $ | 58,164 | ||||||||||
| Ratio to average net assets: | ||||||||||||||||||||
| Net expenses | 1.11 | % | 1.06 | % | 1.03 | % | 1.04 | % | 1.09 | % | ||||||||||
| Gross expenses | 1.11 | % | 1.08 | % | 1.14 | % | 1.17 | % | 1.21 | % | ||||||||||
| Net investment income (loss) | 1.02 | %(A) | (0.15 | )% | 2.78 | % | 0.66 | % | 0.21 | % | ||||||||||
| Portfolio turnover rate | 42 | % | 17 | % | 15 | % | 11 | % | 37 | % | ||||||||||
| Touchstone Small Cap Core Fund—Institutional Class | ||||||||||||||||||||
| Selected Data for a Share Outstanding Throughout Each Period | ||||||||||||||||||||
| Year Ended September 30, | ||||||||||||||||||||
| 2015 | 2014 | 2013 | 2012 | 2011 | ||||||||||||||||
| Net asset value at beginning of period | $ | 20.69 | $ | 19.57 | $ | 16.11 | $ | 11.99 | $ | 11.65 | ||||||||||
| Income from investment operations: | ||||||||||||||||||||
| Net investment income (loss) | 0.24 | (A) | (0.02 | )(B) | 0.49 | 0.06 | 0.03 | |||||||||||||
| Net realized and unrealized gains (losses) on investments | (1.41 | ) | 1.81 | 3.32 | 4.26 | 0.35 | ||||||||||||||
| Total from investment operations | (1.17 | ) | 1.79 | 3.81 | 4.32 | 0.38 | ||||||||||||||
| Distributions from: | ||||||||||||||||||||
| Net investment income (loss) | (0.01 | ) | (0.38 | ) | (0.23 | ) | (0.03 | ) | (0.04 | ) | ||||||||||
| Realized capital gains | (1.59 | ) | (0.29 | ) | (0.12 | ) | (0.17 | ) | (— | )(C) | ||||||||||
| Total distributions | (1.60 | ) | (0.67 | ) | (0.35 | ) | (0.20 | ) | (0.04 | ) | ||||||||||
| Net asset value at end of period | $ | 17.92 | $ | 20.69 | $ | 19.57 | $ | 16.11 | $ | 11.99 | ||||||||||
| Total return | (6.01 | )% | 9.17 | % | 24.13 | % | 36.32 | % | 3.24 | % | ||||||||||
| Ratios and supplemental data: | ||||||||||||||||||||
| Net assets at end of period (000's) | $ | 301,868 | $ | 393,287 | $ | 395,770 | $ | 247,876 | $ | 43,035 | ||||||||||
| Ratio to average net assets: | ||||||||||||||||||||
| Net expenses | 1.04 | % | 1.01 | % | 0.94 | % | 0.94 | % | 0.94 | % | ||||||||||
| Gross expenses | 1.04 | % | 1.04 | % | 1.07 | % | 1.09 | % | 1.16 | % | ||||||||||
| Net investment income | 1.10 | %(A) | (0.10 | )% | 2.87 | % | 0.77 | % | 0.36 | % | ||||||||||
| Portfolio turnover rate | 42 | % | 17 | % | 15 | % | 11 | % | 37 | % | ||||||||||
| (A) | Reflects the impact of a corporate action event that resulted in a one-time increase to net investment income. If the corporate action event had not occurred, the Class Y and Institutional Class net investment income per share and ratio of net investment income to average net assets would have been lower by $0.13 and 0.65%, respectively. |
| (B) | The net investment loss per share is based on average shares outstanding for the period. |
| (C) | Less than $0.005 per share. |
See accompanying Notes to Financial Statements.
| 138 |
Financial Highlights (Continued)
| Touchstone Small Cap Value Fund—Class A | ||||||||||||||||||||
| Selected Data for a Share Outstanding Throughout Each Period | ||||||||||||||||||||
| Period | ||||||||||||||||||||
| Ended | ||||||||||||||||||||
| September | ||||||||||||||||||||
| Year Ended September 30, | 30, | |||||||||||||||||||
| 2015 | 2014 | 2013 | 2012 | 2011(A)(B) | ||||||||||||||||
| Net asset value at beginning of period | $ | 23.23 | $ | 22.79 | $ | 18.33 | $ | 13.85 | $ | 17.36 | ||||||||||
| Income (loss) from investment operations: | ||||||||||||||||||||
| Net investment income | 0.36 | 0.36 | 0.41 | 0.21 | (C) | 0.22 | ||||||||||||||
| Net realized and unrealized gains (losses) on investments | (2.15 | ) | 0.39 | 4.45 | 4.60 | (3.57 | ) | |||||||||||||
| Total from investment operations | (1.79 | ) | 0.75 | 4.86 | 4.81 | (3.35 | ) | |||||||||||||
| Distributions from: | ||||||||||||||||||||
| Net investment income | (0.35 | ) | (0.31 | ) | (0.40 | ) | (0.33 | ) | (0.16 | ) | ||||||||||
| Realized capital gains | (0.92 | ) | — | — | — | — | ||||||||||||||
| Total distributions | (1.27 | ) | (0.31 | ) | (0.40 | ) | (0.33 | ) | (0.16 | ) | ||||||||||
| Net asset value at end of period | $ | 20.17 | $ | 23.23 | $ | 22.79 | $ | 18.33 | $ | 13.85 | ||||||||||
| Total return(D) | (8.32 | )% | 3.19 | % | 26.82 | % | 34.87 | % | (19.37 | )%(E) | ||||||||||
| Ratios and supplemental data: | ||||||||||||||||||||
| Net assets at end of period (000's) | $ | 24,659 | $ | 31,773 | $ | 34,826 | $ | 32,115 | $ | 37,385 | ||||||||||
| Ratio to average net assets: | ||||||||||||||||||||
| Net expenses | 1.38 | % | 1.43 | % | 1.43 | % | 1.43 | % | 1.43 | %(F) | ||||||||||
| Gross expenses | 1.60 | % | 1.67 | % | 1.78 | % | 1.77 | % | 1.72 | %(F) | ||||||||||
| Net investment income | 1.51 | % | 1.44 | % | 1.98 | % | 1.26 | % | 1.97 | %(F) | ||||||||||
| Portfolio turnover rate | 112 | % | 100 | %(G)(H) | 98 | % | 109 | % | 206 | %(E) | ||||||||||
| Touchstone Small Cap Value Fund—Class C | ||||||||||||||||||||
| Selected Data for a Share Outstanding Throughout Each Period | ||||||||||||||||||||
| Period | ||||||||||||||||||||
| Ended | ||||||||||||||||||||
| September | ||||||||||||||||||||
| Year Ended September 30, | 30, | |||||||||||||||||||
| 2015 | 2014 | 2013 | 2012 | 2011(A) | ||||||||||||||||
| Net asset value at beginning of period | $ | 23.00 | $ | 22.61 | $ | 18.23 | $ | 13.82 | $ | 17.36 | ||||||||||
| Income (loss) from investment operations: | ||||||||||||||||||||
| Net investment income | 0.17 | 0.16 | 0.29 | 0.09 | (C) | 0.09 | ||||||||||||||
| Net realized and unrealized gains (losses) on investments | (2.10 | ) | 0.40 | 4.39 | 4.58 | (3.50 | ) | |||||||||||||
| Total from investment operations | (1.93 | ) | 0.56 | 4.68 | 4.67 | (3.41 | ) | |||||||||||||
| Distributions from: | ||||||||||||||||||||
| Net investment income | (0.17 | ) | (0.17 | ) | (0.30 | ) | (0.26 | ) | (0.13 | ) | ||||||||||
| Realized capital gains | (0.92 | ) | — | — | — | — | ||||||||||||||
| Total distributions | (1.09 | ) | (0.17 | ) | (0.30 | ) | (0.26 | ) | (0.13 | ) | ||||||||||
| Net asset value at end of period | $ | 19.98 | $ | 23.00 | $ | 22.61 | $ | 18.23 | $ | 13.82 | ||||||||||
| Total return(D) | (9.01 | )% | 2.46 | % | 25.90 | % | 33.95 | % | (19.77 | )%(E) | ||||||||||
| Ratios and supplemental data: | ||||||||||||||||||||
| Net assets at end of period (000's) | $ | 1,396 | $ | 2,169 | $ | 841 | $ | 104 | $ | 2 | ||||||||||
| Ratio to average net assets: | ||||||||||||||||||||
| Net expenses | 2.13 | % | 2.18 | % | 2.18 | % | 2.18 | % | 2.18 | %(F) | ||||||||||
| Gross expenses | 3.13 | % | 3.25 | % | 5.19 | % | 28.35 | % | 342.41 | %(F) | ||||||||||
| Net investment income | 0.76 | % | 0.69 | % | 1.23 | % | 0.51 | % | 0.95 | %(F) | ||||||||||
| Portfolio turnover rate | 112 | % | 100 | %(G)(H) | 98 | % | 109 | % | 206 | %(E) | ||||||||||
| (A) | Represents the period from commencement of operations (March 1, 2011) through September 30, 2011. |
| (B) | Effective June 10, 2011, Class Z shares converted to Class A shares. |
| (C) | The net investment income per share is based on average shares outstanding for the period. |
| (D) | Total returns shown exclude the effect of applicable sales loads. If these charges were included, the returns would be lower. |
| (E) | Not annualized. |
| (F) | Annualized. |
| (G) | Portfolio turnover rate excludes securities received from a subscription-in-kind. |
| (H) | Portfolio turnover excludes the purchases and sales of the Touchstone Small Company Value Fund (see Note 11). If these transactions were included, portfolio turnover would have been higher. |
See accompanying Notes to Financial Statements.
| 139 |
Financial Highlights (Continued)
| Touchstone Small Cap Value Fund—Class Y | ||||||||||||||||||||
| Selected Data for a Share Outstanding Throughout Each Period | ||||||||||||||||||||
| Period | ||||||||||||||||||||
| Ended | ||||||||||||||||||||
| September | ||||||||||||||||||||
| Year Ended September 30, | 30, | |||||||||||||||||||
| 2015 | 2014 | 2013 | 2012 | 2011(A) | ||||||||||||||||
| Net asset value at beginning of period | $ | 23.25 | $ | 22.82 | $ | 18.36 | $ | 13.89 | $ | 17.36 | ||||||||||
| Income (loss) from investment operations: | ||||||||||||||||||||
| Net investment income | 0.42 | 0.35 | 0.48 | 0.26 | (B) | 0.71 | ||||||||||||||
| Net realized and unrealized gains (losses) on investments | (2.14 | ) | 0.46 | 4.44 | 4.59 | (4.00 | ) | |||||||||||||
| Total from investment operations | (1.72 | ) | 0.81 | 4.92 | 4.85 | (3.29 | ) | |||||||||||||
| Distributions from: | ||||||||||||||||||||
| Net investment income | (0.41 | ) | (0.38 | ) | (0.46 | ) | (0.38 | ) | (0.18 | ) | ||||||||||
| Realized capital gains | (0.92 | ) | — | — | — | — | ||||||||||||||
| Total distributions | (1.33 | ) | (0.38 | ) | (0.46 | ) | (0.38 | ) | (0.18 | ) | ||||||||||
| Net asset value at end of period | $ | 20.20 | $ | 23.25 | $ | 22.82 | $ | 18.36 | $ | 13.89 | ||||||||||
| Total return | (8.08 | )% | 3.47 | % | 27.11 | % | 35.19 | % | (19.10 | )%(C) | ||||||||||
| Ratios and supplemental data: | ||||||||||||||||||||
| Net assets at end of period (000's) | $ | 4,419 | $ | 9,097 | $ | 769 | $ | 222 | $ | 2 | ||||||||||
| Ratio to average net assets: | ||||||||||||||||||||
| Net expenses | 1.13 | % | 1.18 | % | 1.18 | % | 1.18 | % | 1.18 | %(D) | ||||||||||
| Gross expenses | 1.44 | % | 1.65 | % | 3.45 | % | 22.47 | % | 70.29 | %(D) | ||||||||||
| Net investment income | 1.76 | % | 1.70 | % | 2.23 | % | 1.51 | % | 2.05 | %(D) | ||||||||||
| Portfolio turnover rate | 112 | % | 100 | %(E)(F) | 98 | % | 109 | % | 206 | %(C) | ||||||||||
| Touchstone Small Cap Value Fund—Institutional Class | ||||||||||||||||||||
| Selected Data for a Share Outstanding Throughout Each Period | ||||||||||||||||||||
| Period | ||||||||||||||||||||
| Ended | ||||||||||||||||||||
| September | ||||||||||||||||||||
| Year Ended September 30, | 30, | |||||||||||||||||||
| 2015 | 2014 | 2013 | 2012 | 2011(A) | ||||||||||||||||
| Net asset value at beginning of period | $ | 23.24 | $ | 22.81 | $ | 18.35 | $ | 13.86 | $ | 17.36 | ||||||||||
| Income (loss) from investment operations: | ||||||||||||||||||||
| Net investment income | 0.45 | 0.40 | 0.48 | 0.29 | (B) | 0.20 | ||||||||||||||
| Net realized and unrealized gains (losses) on investments | (2.13 | ) | 0.44 | 4.47 | 4.60 | (3.51 | ) | |||||||||||||
| Total from investment operations | (1.68 | ) | 0.84 | 4.95 | 4.89 | (3.31 | ) | |||||||||||||
| Distributions from: | ||||||||||||||||||||
| Net investment income | (0.45 | ) | (0.41 | ) | (0.49 | ) | (0.40 | ) | (0.19 | ) | ||||||||||
| Realized capital gains | (0.92 | ) | — | — | — | — | ||||||||||||||
| Total distributions | (1.37 | ) | (0.41 | ) | (0.49 | ) | (0.40 | ) | (0.19 | ) | ||||||||||
| Net asset value at end of period | $ | 20.19 | $ | 23.24 | $ | 22.81 | $ | 18.35 | $ | 13.86 | ||||||||||
| Total return | (7.93 | )% | 3.59 | % | 27.30 | % | 35.56 | % | (19.23 | )%(C) | ||||||||||
| Ratios and supplemental data: | ||||||||||||||||||||
| Net assets at end of period (000's) | $ | 25,968 | $ | 29,831 | $ | 2,665 | $ | 1,160 | $ | 741 | ||||||||||
| Ratio to average net assets: | ||||||||||||||||||||
| Net expenses | 0.98 | % | 1.03 | % | 1.03 | % | 1.03 | % | 1.03 | %(D) | ||||||||||
| Gross expenses | 1.19 | % | 1.30 | % | 1.83 | % | 1.87 | % | 3.59 | %(D) | ||||||||||
| Net investment income | 1.91 | % | 1.84 | % | 2.38 | % | 1.66 | % | 2.12 | %(D) | ||||||||||
| Portfolio turnover rate | 112 | % | 100 | %(E)(F) | 98 | % | 109 | % | 206 | %(C) | ||||||||||
| (A) | Represents the period from commencement of operations (March 1, 2011) through September 30, 2011. |
| (B) | The net investment income per share is based on average shares outstanding for the period. |
| (C) | Not annualized. |
| (D) | Annualized. |
| (E) | Portfolio turnover rate excludes securities received from a subscription-in-kind. |
| (F) | Portfolio turnover excludes the purchases and sales of the Touchstone Small Company Value Fund (see Note 11). If these transactions were included, portfolio turnover would have been higher. |
See accompanying Notes to Financial Statements.
| 140 |
Financial Highlights (Continued)
| Touchstone Total Return Bond Fund—Class A† | ||||||||||||||||||||||||
| Selected Data for a Share Outstanding Throughout Each Period†† | ||||||||||||||||||||||||
| Period | ||||||||||||||||||||||||
| Ended | Period | |||||||||||||||||||||||
| September | Ended | |||||||||||||||||||||||
| Year Ended September 30, | 30, | March 31, | ||||||||||||||||||||||
| 2015 | 2014 | 2013 | 2012 | 2011(A) | 2011 (B) | |||||||||||||||||||
| Net asset value at beginning of period | $ | 10.23 | $ | 10.07 | $ | 10.50 | $ | 10.13 | $ | 9.90 | $ | 10.15 | ||||||||||||
| Income (loss) from investment operations: | ||||||||||||||||||||||||
| Net investment income | 0.22 | 0.23 | 0.21 | 0.23 | 0.24 | 0.28 | ||||||||||||||||||
| Net realized and unrealized gains (losses) on investments | 0.01 | 0.22 | (0.36 | ) | 0.41 | 0.24 | (0.14 | )(C) | ||||||||||||||||
| Total from investment operations | 0.23 | 0.45 | (0.15 | ) | 0.64 | 0.48 | 0.14 | |||||||||||||||||
| Distributions from: | ||||||||||||||||||||||||
| Net investment income | (0.27 | ) | (0.29 | ) | (0.27 | ) | (0.27 | ) | (0.25 | ) | (0.39 | ) | ||||||||||||
| Realized capital gains | — | — | (0.01 | ) | — | — | — | |||||||||||||||||
| Total distributions | (0.27 | ) | (0.29 | ) | (0.28 | ) | (0.27 | ) | (0.25 | ) | (0.39 | ) | ||||||||||||
| Net asset value at end of period | $ | 10.19 | $ | 10.23 | $ | 10.07 | $ | 10.50 | $ | 10.13 | $ | 9.90 | ||||||||||||
| Total return(D) | 2.24 | % | 4.53 | % | (1.48 | )% | 6.42 | % | 5.02 | %(E) | 1.31 | %(E)(F) | ||||||||||||
| Ratios and supplemental data: | ||||||||||||||||||||||||
| Net assets at end of period (000's) | $ | 5,749 | $ | 5,144 | $ | 12,167 | $ | 10,210 | $ | 4,737 | $ | 7 | ||||||||||||
| Ratio to average net assets: | ||||||||||||||||||||||||
| Net expenses | 0.90 | % | 0.90 | % | 0.90 | % | 0.90 | % | 0.90 | %(G) | 0.65 | %(G) | ||||||||||||
| Gross expenses | 1.26 | % | 1.25 | % | 1.10 | % | 1.22 | % | 1.69 | %(G) | 1.75 | %(G) | ||||||||||||
| Net investment income | 2.10 | % | 2.32 | % | 2.07 | % | 2.26 | % | 4.40 | %(G) | 4.16 | %(G) | ||||||||||||
| Portfolio turnover rate | 19 | % | 5 | % | 35 | % | 79 | %(H) | 7 | %(E) | 27 | %(E) | ||||||||||||
| † | Touchstone Total Return Bond Fund acquired all of the assets and liabilities of EARNEST Partners Fixed Income Trust (“Predecessor Fund”) in a reorganization on August 1, 2011. The Predecessor Fund's performance and financial history have been adopted by Touchstone Total Return Bond Fund. As a result, the information prior to August 1, 2011 reflects that of the Predecessor Fund. |
| †† | Per share data prior to August 1, 2011, reflects a 1.01491:1 stock split. All per share amounts prior to that date have been adjusted to reflect the stock split. |
| (A) | Effective August 1, 2011, the Fund changed its fiscal year end from March 31 to September 30 and Investor Class shares were renamed Class A shares. |
| (B) | Represents the period from commencement of operations (August 16, 2010) through March 31, 2011. |
| (C) | This amount per share is a loss for the Class A shares because of the short time period since the Commencement of Operations on August 16, 2010 relative to the full fiscal year in which the Class Y shares were in operation. The loss during this period is offset by the gain in the Class Y shares during the full fiscal year to create a gain in the Net Realized and Unrealized Gain on Investments in the other classes. |
| (D) | Total returns shown exclude the effect of applicable sales loads. If these charges were included, the returns would be lower. |
| (E) | Not annualized. |
| (F) | Includes adjustments in accordance with U.S. generally accepted accounting principles and, consequently, the net asset value for financial reporting purposes and the returns based upon those net asset values may differ from the net asset values and returns for shareholder transactions. |
| (G) | Annualized. |
| (H) | Portfolio turnover excludes the purchases and sales of the Old Mutual Barrow Hanley Core Bond Fund acquired on April 16, 2012. If these transactions were included, portfolio turnover would have been higher. |
See accompanying Notes to Financial Statements.
| 141 |
Financial Highlights (Continued)
| Touchstone Total Return Bond Fund—Class C | ||||||||||||||||||||
| Selected Data for a Share Outstanding Throughout Each Period | ||||||||||||||||||||
| Period | ||||||||||||||||||||
| Ended | ||||||||||||||||||||
| September | ||||||||||||||||||||
| Year Ended September 30, | 30, | |||||||||||||||||||
| 2015 | 2014 | 2013 | 2012 | 2011(A) | ||||||||||||||||
| Net asset value at beginning of period | $ | 10.21 | $ | 10.05 | $ | 10.49 | $ | 10.12 | $ | 10.04 | ||||||||||
| Income (loss) from investment operations: | ||||||||||||||||||||
| Net investment income | 0.14 | 0.15 | 0.11 | 0.14 | 0.06 | |||||||||||||||
| Net realized and unrealized gains (losses) on investments | 0.02 | 0.22 | (0.35 | ) | 0.42 | 0.09 | ||||||||||||||
| Total from investment operations | 0.16 | 0.37 | (0.24 | ) | 0.56 | 0.15 | ||||||||||||||
| Distributions from: | ||||||||||||||||||||
| Net investment income | (0.19 | ) | (0.21 | ) | (0.19 | ) | (0.19 | ) | (0.07 | ) | ||||||||||
| Realized capital gains | — | — | (0.01 | ) | — | — | ||||||||||||||
| Total distributions | (0.19 | ) | (0.21 | ) | (0.20 | ) | (0.19 | ) | (0.07 | ) | ||||||||||
| Net asset value at end of period | $ | 10.18 | $ | 10.21 | $ | 10.05 | $ | 10.49 | $ | 10.12 | ||||||||||
| Total return(B) | 1.60 | % | 3.75 | % | (2.33 | )% | 5.63 | % | 1.51 | %(C) | ||||||||||
| Ratios and supplemental data: | ||||||||||||||||||||
| Net assets at end of period (000's) | $ | 2,368 | $ | 1,634 | $ | 2,455 | $ | 3,257 | $ | 2,587 | ||||||||||
| Ratio to average net assets: | ||||||||||||||||||||
| Net expenses | 1.65 | % | 1.65 | % | 1.65 | % | 1.65 | % | 1.65 | %(D) | ||||||||||
| Gross expenses | 2.27 | % | 2.47 | % | 2.10 | % | 2.03 | % | 2.55 | %(D) | ||||||||||
| Net investment income | 1.35 | % | 1.57 | % | 1.32 | % | 1.51 | % | 3.75 | %(D) | ||||||||||
| Portfolio turnover rate | 19 | % | 5 | % | 35 | % | 79 | %(E) | 7 | %(C) | ||||||||||
| (A) | Represents the period from commencement of operations (August 1, 2011) through September 30, 2011. |
| (B) | Total returns shown exclude the effect of applicable sales loads. If these charges were included, the returns would be lower. |
| (C) | Not annualized. |
| (D) | Annualized. |
| (E) | Portfolio turnover excludes the purchases and sales of the Old Mutual Barrow Hanley Core Bond Fund acquired on April 16, 2012. If these transactions were included, portfolio turnover would have been higher. |
See accompanying Notes to Financial Statements.
| 142 |
Financial Highlights (Continued)
| Touchstone Total Return Bond Fund—Class Y† | ||||||||||||||||||||||||
| Selected Data for a Share Outstanding Throughout Each Period†† | ||||||||||||||||||||||||
| Period | Year | |||||||||||||||||||||||
| Ended | Ended | |||||||||||||||||||||||
| September | March | |||||||||||||||||||||||
| Year Ended September 30, | 30, | 31, | ||||||||||||||||||||||
| 2015 | 2014 | 2013 | 2012 | 2011(A) | 2011 | |||||||||||||||||||
| Net asset value at beginning of period | $ | 10.24 | $ | 10.08 | $ | 10.52 | $ | 10.15 | $ | 9.86 | $ | 9.66 | ||||||||||||
| Income (loss) from investment operations: | ||||||||||||||||||||||||
| Net investment income | 0.25 | 0.26 | 0.23 | 0.25 | 0.24 | 0.45 | ||||||||||||||||||
| Net realized and unrealized gains (losses) on investments | 0.01 | 0.22 | (0.36 | ) | 0.42 | 0.30 | 0.21 | |||||||||||||||||
| Total from investment operations | 0.26 | 0.48 | (0.13 | ) | 0.67 | 0.54 | 0.66 | |||||||||||||||||
| Distributions from: | ||||||||||||||||||||||||
| Net investment income | (0.30 | ) | (0.32 | ) | (0.30 | ) | (0.30 | ) | (0.25 | ) | (0.46 | ) | ||||||||||||
| Realized capital gains | — | — | (0.01 | ) | — | — | — | |||||||||||||||||
| Total distributions | (0.30 | ) | (0.32 | ) | (0.31 | ) | (0.30 | ) | (0.25 | ) | (0.46 | ) | ||||||||||||
| Net asset value at end of period | $ | 10.20 | $ | 10.24 | $ | 10.08 | $ | 10.52 | $ | 10.15 | $ | 9.86 | ||||||||||||
| Total return | 2.51 | % | 4.84 | % | (1.32 | )% | 6.72 | % | 5.29 | %(B) | 6.97 | %(C) | ||||||||||||
| Ratios and supplemental data: | ||||||||||||||||||||||||
| Net assets at end of period (000's) | $ | 39,751 | $ | 19,397 | $ | 19,635 | $ | 29,716 | $ | 17,810 | $ | 16,512 | ||||||||||||
| Ratio to average net assets: | ||||||||||||||||||||||||
| Net expenses | 0.65 | % | 0.61 | % | 0.62 | % | 0.58 | % | 0.48 | %(D) | 0.40 | % | ||||||||||||
| Gross expenses | 0.70 | % | 0.68 | % | 0.71 | % | 0.70 | % | 1.13 | %(D) | 1.62 | % | ||||||||||||
| Net investment income | 2.35 | % | 2.61 | % | 2.34 | % | 2.59 | % | 4.35 | %(D) | 4.46 | % | ||||||||||||
| Portfolio turnover rate | 19 | % | 5 | % | 35 | % | 79 | %(E) | 7 | %(B) | 27 | % | ||||||||||||
| † | Touchstone Total Return Bond Fund acquired all of the assets and liabilities of EARNEST Partners Fixed Income Trust (“Predecessor Fund”) in a reorganization on August 1, 2011. The Predecessor Fund's performance and financial history have been adopted by Touchstone Total Return Bond Fund. As a result, the information prior to August 1, 2011 reflects that of the Predecessor Fund. |
| †† | Per share data prior to August 1, 2011, reflects a 0.87567:1 stock split. All per share amounts prior to that date have been adjusted to reflect the stock split. |
| (A) | Effective August 1, 2011, the Fund changed its fiscal year end from March 31 to September 30 and Institutional Class shares were renamed Class Y shares. |
| (B) | Not annualized. |
| (C) | Includes adjustments in accordance with U.S. generally accepted accounting principles and, consequently, the net asset value for financial reporting purposes and the returns based upon those net asset values may differ from the net asset values and returns for shareholder transactions. |
| (D) | Annualized. |
| (E) | Portfolio turnover excludes the purchases and sales of the Old Mutual Barrow Hanley Core Bond Fund acquired on April 16, 2012. If these transactions were included, portfolio turnover would have been higher. |
See accompanying Notes to Financial Statements.
| 143 |
Financial Highlights (Continued)
| Touchstone Total Return Bond Fund—Institutional Class | ||||||||||||||||||||
| Selected Data for a Share Outstanding Throughout Each Period | ||||||||||||||||||||
| Period | ||||||||||||||||||||
| Ended | ||||||||||||||||||||
| September | ||||||||||||||||||||
| Year Ended September 30, | 30, | |||||||||||||||||||
| 2015 | 2014 | 2013 | 2012 | 2011(A) | ||||||||||||||||
| Net asset value at beginning of period | $ | 10.24 | $ | 10.08 | $ | 10.51 | $ | 10.14 | $ | 10.06 | ||||||||||
| Income (loss) from investment operations: | ||||||||||||||||||||
| Net investment income | 0.26 | 0.27 | 0.25 | 0.22 | 0.08 | |||||||||||||||
| Net realized and unrealized gains (losses) on investments | 0.01 | 0.22 | (0.36 | ) | 0.46 | 0.09 | ||||||||||||||
| Total from investment operations | 0.27 | 0.49 | (0.11 | ) | 0.68 | 0.17 | ||||||||||||||
| Distributions from: | ||||||||||||||||||||
| Net investment income | (0.31 | ) | (0.33 | ) | (0.31 | ) | (0.31 | ) | (0.09 | ) | ||||||||||
| Realized capital gains | — | — | (0.01 | ) | — | — | ||||||||||||||
| Total distributions | (0.31 | ) | (0.33 | ) | (0.32 | ) | (0.31 | ) | (0.09 | ) | ||||||||||
| Net asset value at end of period | $ | 10.20 | $ | 10.24 | $ | 10.08 | $ | 10.51 | $ | 10.14 | ||||||||||
| Total return | 2.65 | % | 4.96 | % | (1.09 | )% | 6.81 | % | 1.70 | %(B) | ||||||||||
| Ratios and supplemental data: | ||||||||||||||||||||
| Net assets at end of period (000's) | $ | 134,877 | $ | 116,404 | $ | 133,051 | $ | 148,341 | $ | 6,386 | ||||||||||
| Ratio to average net assets: | ||||||||||||||||||||
| Net expenses | 0.50 | % | 0.50 | % | 0.50 | % | 0.50 | % | 0.50 | %(C) | ||||||||||
| Gross expenses | 0.61 | % | 0.60 | % | 0.60 | % | 0.67 | % | 1.21 | %(C) | ||||||||||
| Net investment income | 2.50 | % | 2.72 | % | 2.47 | % | 2.66 | % | 4.89 | %(C) | ||||||||||
| Portfolio turnover rate | 19 | % | 5 | % | 35 | % | 79 | %(D) | 7 | %(B) | ||||||||||
| (A) | Represents the period from commencement of operations (August 1, 2011) through September 30, 2011. |
| (B) | Not annualized. |
| (C) | Annualized. |
| (D) | Portfolio turnover excludes the purchases and sales of the Old Mutual Barrow Hanley Core Bond Fund acquired on April 16, 2012. If these transactions were included, portfolio turnover would have been higher. |
See accompanying Notes to Financial Statements.
| 144 |
Financial Highlights (Continued)
| Touchstone Ultra Short Duration Fixed Income Fund—Class A | ||||||||||||||||
| Selected Data for a Share Outstanding Throughout Each Period | ||||||||||||||||
| Period | ||||||||||||||||
| Ended | ||||||||||||||||
| September | ||||||||||||||||
| Year Ended September 30, | 30, | |||||||||||||||
| 2015 | 2014 | 2013 | 2012(A) | |||||||||||||
| Net asset value at beginning of period | $ | 9.41 | $ | 9.45 | $ | 9.56 | $ | 9.57 | ||||||||
| Income (loss) from investment operations: | ||||||||||||||||
| Net investment income | 0.06 | 0.06 | 0.09 | 0.09 | ||||||||||||
| Net realized and unrealized gains (losses) on investments | (0.03 | ) | 0.03 | (0.04 | ) | (0.01 | ) | |||||||||
| Total from investment operations | 0.03 | 0.09 | 0.05 | 0.08 | ||||||||||||
| Distributions from: | ||||||||||||||||
| Net investment income | (0.12 | ) | (0.13 | ) | (0.16 | ) | (0.09 | ) | ||||||||
| Net asset value at end of period | $ | 9.32 | $ | 9.41 | $ | 9.45 | $ | 9.56 | ||||||||
| Total return(B) | 0.31 | % | 0.92 | % | 0.48 | % | 0.85 | %(C) | ||||||||
| Ratios and supplemental data: | ||||||||||||||||
| Net assets at end of period (000's) | $ | 10,675 | $ | 10,596 | $ | 32,088 | $ | 34,228 | ||||||||
| Ratio to average net assets: | ||||||||||||||||
| Net expenses | 0.69 | % | 0.69 | % | 0.69 | % | 0.69 | %(D) | ||||||||
| Gross expenses | 0.99 | % | 0.93 | % | 0.83 | % | 1.19 | %(D) | ||||||||
| Net investment income | 0.54 | % | 0.79 | % | 0.85 | % | 1.40 | %(D) | ||||||||
| Portfolio turnover rate | 132 | % | 142 | % | 107 | %(E) | 169 | %(F) | ||||||||
| Touchstone Ultra Short Duration Fixed Income Fund—Class C | ||||||||||||||||
| Selected Data for a Share Outstanding Throughout Each Period | ||||||||||||||||
| Period | ||||||||||||||||
| Ended | ||||||||||||||||
| September | ||||||||||||||||
| Year Ended September 30, | 30, | |||||||||||||||
| 2015 | 2014 | 2013 | 2012(A) | |||||||||||||
| Net asset value at beginning of period | $ | 9.41 | $ | 9.45 | $ | 9.56 | $ | 9.57 | ||||||||
| Income (loss) from investment operations: | ||||||||||||||||
| Net investment income | — | 0.02 | 0.04 | 0.05 | ||||||||||||
| Net realized and unrealized gains (losses) on investments | (0.02 | ) | 0.02 | (0.04 | ) | 0.01 | ||||||||||
| Total from investment operations | (0.02 | ) | 0.04 | — | 0.06 | |||||||||||
| Distributions from: | ||||||||||||||||
| Net investment income | (0.07 | ) | (0.08 | ) | (0.11 | ) | (0.07 | ) | ||||||||
| Net asset value at end of period | $ | 9.32 | $ | 9.41 | $ | 9.45 | $ | 9.56 | ||||||||
| Total return(B) | (0.19 | )% | 0.42 | % | (0.02 | )% | 0.62 | %(C) | ||||||||
| Ratios and supplemental data: | ||||||||||||||||
| Net assets at end of period (000's) | $ | 8,291 | $ | 11,272 | $ | 13,568 | $ | 11,517 | ||||||||
| Ratio to average net assets: | ||||||||||||||||
| Net expenses | 1.19 | % | 1.19 | % | 1.19 | % | 1.19 | %(D) | ||||||||
| Gross expenses | 1.48 | % | 1.44 | % | 1.39 | % | 1.68 | %(D) | ||||||||
| Net investment income (loss) | 0.04 | % | 0.29 | % | 0.35 | % | 0.90 | %(D) | ||||||||
| Portfolio turnover rate | 132 | % | 142 | % | 107 | %(E) | 169 | %(F) | ||||||||
| (A) | Represents the period from commencement of operations (April 16, 2012) through September 30, 2012. |
| (B) | Total returns shown exclude the effect of applicable sales loads. If these charges were included, the returns would be lower. |
| (C) | Not annualized. |
| (D) | Annualized. |
| (E) | Portfolio turnover excludes the purchases and sales of the Touchstone Short Duration Fixed Income Fund acquired on May 17, 2013. If these transactions were included, portfolio turnover would have been higher. |
| (F) | Portfolio turnover excludes the purchases and sales of the Old Mutual Dwight Short Term Fixed Income Fund and Fifth Third Short Term Bond Fund acquired on April 16, 2012 and September 10, 2012, respectively. If these transactions were included, portfolio turnover would have been higher. |
See accompanying Notes to Financial Statements.
| 145 |
Financial Highlights (Continued)
| Touchstone Ultra Short Duration Fixed Income Fund—Class Y | ||||||||||||||||
| Selected Data for a Share Outstanding Throughout Each Period | ||||||||||||||||
| Period | ||||||||||||||||
| Ended | ||||||||||||||||
| September | ||||||||||||||||
| Year Ended September 30, | 30, | |||||||||||||||
| 2015 | 2014 | 2013 | 2012(A) | |||||||||||||
| Net asset value at beginning of period | $ | 9.41 | $ | 9.45 | $ | 9.56 | $ | 9.57 | ||||||||
| Income (loss) from investment operations: | ||||||||||||||||
| Net investment income | 0.07 | 0.10 | 0.12 | 0.08 | ||||||||||||
| Net realized and unrealized gains (losses) on investments | (0.02 | ) | 0.01 | (0.05 | ) | 0.01 | ||||||||||
| Total from investment operations | 0.05 | 0.11 | 0.07 | 0.09 | ||||||||||||
| Distributions from: | ||||||||||||||||
| Net investment income | (0.14 | ) | (0.15 | ) | (0.18 | ) | (0.10 | ) | ||||||||
| Net asset value at end of period | $ | 9.32 | $ | 9.41 | $ | 9.45 | $ | 9.56 | ||||||||
| Total return | 0.56 | % | 1.17 | % | 0.74 | % | 0.97 | %(B) | ||||||||
| Ratios and supplemental data: | ||||||||||||||||
| Net assets at end of period (000's) | $ | 200,456 | $ | 244,885 | $ | 249,250 | $ | 190,515 | ||||||||
| Ratio to average net assets: | ||||||||||||||||
| Net expenses | 0.44 | % | 0.44 | % | 0.44 | % | 0.44 | %(C) | ||||||||
| Gross expenses | 0.52 | % | 0.49 | % | 0.51 | % | 0.55 | %(C) | ||||||||
| Net investment income | 0.79 | % | 1.04 | % | 1.10 | % | 1.65 | %(C) | ||||||||
| Portfolio turnover rate | 132 | % | 142 | % | 107 | %(D) | 169 | %(E) | ||||||||
| Touchstone Ultra Short Duration Fixed Income Fund—Class Z | ||||||||||||||||||||
| Selected Data for a Share Outstanding Throughout Each Period | ||||||||||||||||||||
| Year Ended September 30, | ||||||||||||||||||||
| 2015 | 2014 | 2013 | 2012 | 2011 | ||||||||||||||||
| Net asset value at beginning of period | $ | 9.41 | $ | 9.45 | $ | 9.56 | $ | 9.58 | $ | 9.68 | ||||||||||
| Income (loss) from investment operations: | ||||||||||||||||||||
| Net investment income | 0.05 | 0.08 | 0.09 | 0.14 | 0.15 | |||||||||||||||
| Net realized and unrealized gains (losses) on investment | (0.02 | ) | 0.01 | (0.04 | ) | 0.06 | (0.04 | ) | ||||||||||||
| Total from investment operations | 0.03 | 0.09 | 0.05 | 0.20 | 0.11 | |||||||||||||||
| Distributions from: | ||||||||||||||||||||
| Net investment income | (0.12 | ) | (0.13 | ) | (0.16 | ) | (0.22 | ) | (0.21 | ) | ||||||||||
| Net asset value at end of period | $ | 9.32 | $ | 9.41 | $ | 9.45 | $ | 9.56 | $ | 9.58 | ||||||||||
| Total return | 0.31 | % | 0.91 | % | 0.52 | % | 2.10 | % | 1.12 | % | ||||||||||
| Ratios and supplemental data: | ||||||||||||||||||||
| Net assets at end of period (000's) | $ | 304,553 | $ | 401,851 | $ | 381,554 | $ | 338,669 | $ | 346,131 | ||||||||||
| Ratio to average net assets: | ||||||||||||||||||||
| Net expenses | 0.69 | % | 0.69 | % | 0.65 | % | 0.64 | % | 0.69 | % | ||||||||||
| Gross expenses | 0.76 | % | 0.76 | % | 0.73 | % | 0.73 | % | 0.78 | % | ||||||||||
| Net Investment Income | 0.54 | % | 0.79 | % | 0.89 | % | 1.45 | % | 1.39 | % | ||||||||||
| Portfolio turnover rate | 132 | % | 142 | % | 107 | %(D) | 169 | %(E) | 144 | % | ||||||||||
| (A) | Represents the period from commencement of operations (April 16, 2012) through September 30, 2012. |
| (B) | Not annualized. |
| (C) | Annualized. |
| (D) | Portfolio turnover excludes the purchases and sales of the Touchstone Short Duration Fixed Income Fund acquired on May 17, 2013. If these transactions were included, portfolio turnover would have been higher. |
| (E) | Portfolio turnover excludes the purchases and sales of the Old Mutual Dwight Short Term Fixed Income Fund and Fifth Third Short Term Bond Fund acquired on April 16, 2012 and September 10, 2012, respectively. If these transactions were included, portfolio turnover would have been higher. |
See accompanying Notes to Financial Statements.
| 146 |
Financial Highlights (Continued)
| Touchstone Ultra Short Duration Fixed Income Fund—Institutional Class | ||||||||||||||||
| Selected Data for a Share Outstanding Throughout Each Period | ||||||||||||||||
| Period | ||||||||||||||||
| Ended | ||||||||||||||||
| September | ||||||||||||||||
| Year Ended September 30, | 30, | |||||||||||||||
| 2015 | 2014 | 2013 | 2012(A) | |||||||||||||
| Net asset value at beginning of period | $ | 9.41 | $ | 9.45 | $ | 9.56 | $ | 9.57 | ||||||||
| Income (loss) from investment operations: | ||||||||||||||||
| Net investment income | 0.08 | 0.10 | 0.14 | 0.09 | ||||||||||||
| Net realized and unrealized gains (losses) on investments | (0.02 | ) | 0.01 | (0.07 | ) | — | (B) | |||||||||
| Total from investment operations | 0.06 | 0.11 | 0.07 | 0.09 | ||||||||||||
| Distributions from: | ||||||||||||||||
| Net investment income | (0.15 | ) | (0.15 | ) | (0.18 | ) | (0.10 | ) | ||||||||
| Net asset value at end of period | $ | 9.32 | $ | 9.41 | $ | 9.45 | $ | 9.56 | ||||||||
| Total return | 0.61 | % | 1.22 | % | 0.78 | % | 0.99 | %(C) | ||||||||
| Ratios and supplemental data: | ||||||||||||||||
| Net assets at end of period (000's) | $ | 49,389 | $ | 50,853 | $ | 59,662 | $ | 6,697 | ||||||||
| Ratio to average net assets: | ||||||||||||||||
| Net expenses | 0.39 | % | 0.39 | % | 0.39 | % | 0.39 | %(D) | ||||||||
| Gross expenses | 0.48 | % | 0.48 | % | 0.52 | % | 1.23 | %(D) | ||||||||
| Net investment income | 0.84 | % | 1.09 | % | 1.15 | % | 1.70 | %(D) | ||||||||
| Portfolio turnover rate | 132 | % | 142 | % | 107 | %(E) | 169 | %(F) | ||||||||
| (A) | Represents the period from commencement of operations (April 16, 2012) through September 30, 2012. |
| (B) | Less than $0.005 per share. |
| (C) | Not annualized. |
| (D) | Annualized. |
| (E) | Portfolio turnover excludes the purchases and sales of the Touchstone Short Duration Fixed Income Fund acquired on May 17, 2013. If these transactions were included, portfolio turnover would have been higher. |
| (F) | Portfolio turnover excludes the purchases and sales of the Old Mutual Dwight Short Term Fixed Income Fund and Fifth Third Short Term Bond Fund acquired on April 16, 2012 and September 10, 2012, respectively. If these transactions were included, portfolio turnover would have been higher. |
See accompanying Notes to Financial Statements.
| 147 |
September 30, 2015
1. Organization
The Touchstone Funds Group Trust (the “Trust”) is registered under the Investment Company Act of 1940, as amended (the “1940 Act”), as an open-end management investment company. The Trust was established as a Delaware statutory trust pursuant to a Declaration of Trust dated October 25, 1993. The Trust consists of twelve funds (individually, a “Fund,” and collectively, the “Funds”):
Touchstone Arbitrage Fund (“Arbitrage Fund”)
Touchstone Emerging Markets Equity Fund (“Emerging Markets Equity Fund”)
Touchstone Global Real Estate Fund (“Global Real Estate Fund”)
Touchstone Merger Arbitrage Fund (“Merger Arbitrage Fund”)
Touchstone Mid Cap Fund (“Mid Cap Fund”)
Touchstone Mid Cap Value Fund (“Mid Cap Value Fund”)
Touchstone Premium Yield Equity Fund (“Premium Yield Equity Fund”)
Touchstone Sands Capital Select Growth Fund (“Sands Capital Select Growth Fund”)
Touchstone Small Cap Core Fund (“Small Cap Core Fund”)
Touchstone Small Cap Value Fund (“Small Cap Value Fund”)
Touchstone Total Return Bond Fund (“Total Return Bond Fund”)
Touchstone Ultra Short Duration Fixed Income Fund (“Ultra Short Duration Fixed Income Fund”)
Each Fund is diversified, with the exception of the Arbitrage Fund, Global Real Estate Fund, Merger Arbitrage Fund, Sands Capital Select Growth Fund and Small Cap Core Fund, each of which is non-diversified.
The Declaration of Trust permits the Trust to issue an unlimited number of shares of beneficial interest of each Fund. The table below indicates the classes of shares that each Fund is registered to offer:
| Institutional | ||||||||||
| Class A | Class C | Class Y | Class Z | Class | ||||||
| Arbitrage Fund | X | X | X | X | ||||||
| Emerging Markets Equity Fund | X | X | X | X | ||||||
| Global Real Estate Fund | X | X | X | X | ||||||
| Merger Arbitrage Fund | X | X | X | X | ||||||
| Mid Cap Fund | X | X | X | X | X | |||||
| Mid Cap Value Fund | X | X | X | X | ||||||
| Premium Yield Equity Fund | X | X | X | |||||||
| Sands Capital Select Growth Fund | X | X | X | X | ||||||
| Small Cap Core Fund | X | X | X | X | ||||||
| Small Cap Value Fund | X | X | X | X | ||||||
| Total Return Bond Fund | X | X | X | X | ||||||
| Ultra Short Duration Fixed Income Fund | X | X | X | X | X |
The assets of each Fund are segregated, and a shareholder’s interest is limited to the Fund in which shares are held. The Funds’ prospectus provides a description of each Fund’s investment goals, policies, and strategies along with information on the classes of shares currently being offered.
| 148 |
Notes to Financial Statements (Continued)
2. Significant Accounting Policies
The following is a summary of the Funds’ significant accounting policies:
Each Fund is an investment company that follows the accounting and reporting guidance of Accounting Standards Codification Topic 946 applicable to investment companies.
Security valuation and fair value measurements — U.S. generally accepted accounting principles (“U.S. GAAP”) define fair value as the price the Funds would receive to sell an asset or pay to transfer a liability in an orderly transaction between market participants at the measurement date. All investments in securities are recorded at their estimated fair value. The Funds define the term “market value”, as used throughout this report, as the estimated fair value. The Funds use various methods to measure fair value of their portfolio securities on a recurring basis. U.S. GAAP fair value measurement standards require disclosure of a hierarchy that prioritizes inputs to valuation methods. These inputs are summarized in the three broad levels listed below:
| • | Level 1 – quoted prices in active markets for identical securities |
| • | Level 2 – other significant observable inputs (including quoted prices for similar securities, interest rates, prepayment speeds, credit risk, etc.) |
| • | Level 3 – significant unobservable inputs (including a Fund’s own assumptions in determining the fair value of investments) |
The inputs or methodology used for valuing securities are not necessarily an indication of the risk associated with investing in those securities. For example, money market instruments are valued using amortized cost, in accordance with rules under the 1940 Act. Generally, amortized cost approximates the current fair value of a security, but since the value is not obtained from a quoted price in an active market, such securities are reflected as Level 2.
The aggregate value by input level, as of September 30, 2015, for each Fund’s investments, as well as a reconciliation of assets for which significant unobservable inputs (Level 3) were used in determining value, if applicable, is included in the Fund’s Portfolio of Investments, which also includes a breakdown of the Fund’s investments by geographic, portfolio or sector allocation. The Funds did not hold any Level 3 categorized securities during the year ended September 30, 2015.
Changes in valuation techniques may result in transfers into or out of an investment’s assigned level within the hierarchy. All transfers in and out of the levels are recognized at the value at the end of the period. During the year ended September 30, 2015, there were no transfers between Levels 1, 2 and 3 for all Funds, except as shown in the Portfolio of Investments for the Emerging Markets Equity Fund and Global Real Estate Fund.
The Funds’ portfolio securities are valued as of the close of the regular session of trading on the New York Stock Exchange (“NYSE”) (currently 4:00 p.m., Eastern Time). Portfolio securities traded on stock exchanges are valued at the last reported sale price, official close price, or last bid price if no sales are reported. Portfolio securities quoted by NASDAQ are valued at the NASDAQ Official Closing Price (“NOCP”) or from the primary exchange on which the security trades.To the extent these securities are actively traded, they are categorized in Level 1 of the fair value hierarchy. Options are valued at the last quoted sales price. If there is no such reported sale on the valuation date, long option positions are valued at the most recent bid price, and short option positions are valued at the most recent ask price and are categorized in Level 1. Shares of open-end mutual funds in which the Funds invest are valued at their respective net asset values (“NAV”) as reported by the underlying funds (“Underlying Funds”) and are categorized in Level 1.
Debt securities held by the Funds are valued at their most recent evaluated bid by an independent pricing service or at their last broker-quoted bid prices as obtained from one or more of the major market makers for
| 149 |
Notes to Financial Statements (Continued)
such securities. Independent pricing services use information provided by market makers or estimates of market values through accepted market modeling conventions. Inputs to the models may include prepayment speeds, pricing spread, yield, trade information, dealer quotes, market color, cash flow models, the securities’ terms and conditions, among others, and are generally categorized in Level 2. Money market instruments and other debt securities with remaining maturities of 60 days or less are valued at amortized cost, provided such amount approximates market value and are categorized in Level 2. While this method provides consistency in valuation (and may only be used if it approximates market value), it may result in periods during which value, as determined by amortized cost, is higher or lower than the price that would be received if the Fund sold the investment.
Foreign currency exchange contracts are valued at the mean between the bid and ask prices and are determined as of the close of regular trading on the NYSE. Interpolated values are derived when the settlement date of the contract is an interim date for which quotations are not available and categorized in Level 2.
Securities mainly traded on a non-U.S. exchange or denominated in foreign currency are generally valued according to the preceding closing values on that exchange, translated to U.S. dollars using currency exchange rates as of the close of regular trading on the NYSE, and generally categorized in Level 1. However, if an event that may change the value of a security occurs after the time that the closing value on the non-U.S. exchange was determined, but before the close of regular trading on the NYSE, the security may be priced based on fair value and generally categorized in Level 2. This may cause the value of the security, if held on the books of the Fund to be different from the closing value on the non-U.S. exchange and may affect the calculation of that Fund’s NAV.
The Funds may use fair value pricing under the following circumstances, among others:
| • | If the value of a security has been materially affected by events occurring before the Funds’ pricing time but after the close of the primary markets on which the security is traded. |
| • | If the exchange on which a portfolio security is principally traded closes early or if trading in a particular portfolio security was halted during the day and did not resume prior to the Funds’ NAV calculation. |
| • | If a security is so thinly traded that reliable market quotations are unavailable due to infrequent trading. |
| • | If the validity of market quotations is not reliable. |
Securities held by the Funds that do not have readily available market quotations, significant observable inputs, or securities for which the available market quotations are not reliable, are priced at their estimated fair value using procedures approved by the Funds’ Board of Trustees and are generally categorized in Level 3.
Investment companies — Certain Funds may invest in securities of other investment companies, including exchange-traded funds (“ETFs”), open-end funds and closed-end funds. Open-end funds are investment companies that issue new shares continuously and redeem shares daily. Closed-end funds are investment companies that typically issue a fixed number of shares that trade on a securities exchange or over-the-counter. An ETF is an investment company that typically seeks to track the performance of an index by holding in its portfolio shares of all the companies, or a representative sample of the companies, that are components of a particular index. ETFs are traded on a securities exchange based on their market value. The risks of investment in other investment companies typically reflect the risks of the types of securities in which the other investment companies invest. Investments in ETFs and closed-end funds are subject to the additional risk that their shares may trade at a premium or discount to their NAV. When a Fund invests in another investment company, shareholders of the Fund indirectly bear their proportionate share of the other investment company’s fees and expenses, including operating, registration, trustee, licensing, and marketing, as well as their share of the Fund’s fees and expenses.
New Accounting Pronouncement — In June 2014, the Financial Accounting Standards Board (“FASB”) issued Accounting Standards Update (“ASU”) No. 2014-11, “Repurchase-to-Maturity, Repurchase Financings, and
| 150 |
Notes to Financial Statements (Continued)
Disclosures”. A repurchase-to-maturity transaction is one where the repurchase agreement settles at the same time as the maturity of the transferred financial asset. These transactions, unlike other repurchase agreements, were accounted for as sales and purchases instead of being treated as secured borrowings. This ASU changes that accounting practice and treats all repurchase agreements as secured borrowings. The ASU additionally requires two new disclosures which are intended to: a) disclose information on transferred assets accounted for as sales in transactions that are economically similar to repurchase agreements, and b) provide increased transparency about the types of collateral pledged in repurchase agreements and similar transactions accounted for as secured borrowings. The ASU impacts all entities that enter into repurchase-to-maturity transactions, entities that account for these transactions as a sale and a purchase, and entities that engage in repurchase agreements and securities lending transactions.The new disclosures are required to be presented for annual periods beginning after December 15, 2014, and interim periods beginning after March 15, 2015. Management is currently evaluating the impact these updates may have on the Funds’ financial statements and disclosures.
Securities sold short — The Funds periodically engage in selling securities short, which obligates a Fund to replace a security borrowed by purchasing the same security at the current market value. A Fund would incur a loss if the price of the security increases between the date of the short sale and the date on which the Fund replaces the borrowed security. A Fund would realize a gain if the price of the security declines between those dates. As of September 30, 2015, the Arbitrage Fund and Merger Arbitrage Fund held securities sold short with a fair value of $26,517,862 and $34,966,331, respectively, and had securities with a fair value of $34,806,534 and $64,576,673, respectively, held as collateral and cash collateral of $22,463,552 and $10,349,543, respectively, for both securities sold short and written options.
Options — The Funds may write or purchase financial option contracts primarily to hedge against changes in the value of equity securities (or securities that the Funds intend to purchase), against fluctuations in fair value caused by changes in prevailing market interest rates or foreign currency exchange rates and against changes in overall equity market volatility. In addition, the Funds may utilize options in an attempt to generate gains from option premiums or to reduce overall portfolio risk. The Funds’ option strategy primarily focuses on the use of writing call options on equity indexes. When the Funds write or purchase an option, an amount equal to the premium received or paid by the Funds is recorded as a liability or an asset and is subsequently adjusted to the current market value of the option written or purchased. Premiums received or paid from writing or purchasing options which expire unexercised are treated by the Funds on the expiration date as realized gains or losses. The difference between the premium and the amount paid or received on effecting a closing purchase or sale transaction, including brokerage commissions, is also treated as a realized gain or loss. If an option is exercised, the premium paid or received is added to the cost of the purchase or proceeds from the sale in determining whether the Funds have realized a gain or loss on investment transactions. The Funds, as writers of an option, may have no control over whether the underlying securities may be sold (call) or purchased (put) and as a result bear the market risk of an unfavorable change in the price of the security underlying the written option. The Funds, as purchasers of an option, bear the risk that the counterparties to the option may not have the ability to meet the terms of the option contracts. There is minimal counterparty credit risk involved in entering into option contracts since they are exchange-traded instruments and the exchange’s clearinghouse, as counterparty to all exchange-traded options, guarantees the options against default. Options are valued at the last quoted sales price. If there is no such reported sale on the valuation date, long option positions are valued at the most recent bid price, and short option positions are valued at the most recent ask price. As of September 30, 2015, the Arbitrage Fund and Merger Arbitrage Fund held written options with a fair value of $478,800 and $840,750, respectively, and had securities with a fair value of $34,806,534 and $64,576,673, respectively, held as collateral and cash collateral of $22,463,552 and $10,349,543, respectively, for both securities sold short and written options. The Arbitrage Fund and Merger Arbitrage Fund also held purchased options with a fair value of $58,800 and $103,250, as of September 30, 2015.
| 151 |
Notes to Financial Statements (Continued)
Warrants — The Funds can invest in warrants and stock purchase rights of companies of any market capitalization. A warrant gives the company the right to buy stock, typically from the issuer. The warrant specifies the amount of underlying stock, the purchase (or “exercise”) price, and the date the warrant expires. Certain warrants may permit, without legal obligation, net settlement for stock or cash. The Funds have no obligation to exercise the warrant and buy the stock.
Foreign currency translation — The books and records of the Funds are maintained in U.S. dollars and translated into U.S. dollars on the following basis:
(1) market value of investment securities, assets and liabilities at the current rate of exchange on the valuation date; and
(2) purchases and sales of investment securities, income, and expenses at the relevant rates of exchange prevailing on the respective dates of such transactions.
The Funds do not isolate that portion of gains and losses on investments in equity securities that is due to changes in the foreign exchange rates from that which is due to changes in market prices of equity securities.
Forward foreign currency contracts — A forward foreign currency contract is an agreement between two parties to buy and sell a specific currency at a price that is set on the date of the contract. The forward contract calls for delivery of the currency on a future date that is specified in the contract. Risks related to the use of forwards include the possible failure of counterparties to meet the terms of the forward agreement, the failure of the counterparties to timely post collateral, the risk that currency movements will not occur thereby reducing the Fund’s total return, and the potential for losses in excess of the Fund’s initial investment.
The market value of a forward foreign currency contract fluctuates with changes in foreign currency exchange rates. Forward foreign currency contracts are marked to market daily and the change in value is recorded by a Fund as an unrealized gain or loss. Realized gains or losses, equal to the difference between the value of the contract at the time it was opened and the value at the time it was closed, are recorded upon delivery or receipt of the currency.
During year ended September 30, 2015, the Arbitrage Fund and the Merger Arbitrage Fund used forward foreign currency contracts to enhance potential gains, hedge against anticipated currency exchange rates, maintain diversity and liquidity of the portfolio and adjust exposure to foreign currencies. As of September 30, 2015, there were no open forward foreign currency contracts.
Real Estate Investment Trusts – The Funds may invest in real estate investment trusts (“REITs”) that involve risks not associated with investing in stocks. Risks include declines in the value of real estate, general and economic conditions, changes in the value of the underlying property and defaults by borrowers. The value of assets in the real estate industry may go through cycles of relative underperformance and outperformance in comparison to equity securities markets in general. Dividend income is recorded using management’s estimate of the income included in distributions received from REIT investments. The actual amounts of income, return of capital and capital gains are only determined by each REIT after its fiscal year-end and may differ from the estimated amount. Estimates of income are adjusted in the Funds to the actual amounts when the amounts are determined.
Master Limited Partnership – The Funds may invest in Master Limited Partnership (“MLP”) common units that represent limited partnership interests in the MLP. Common units are generally listed and traded on U.S. securities exchanges or OTC with their value fluctuating predominantly based on the success of the MLP. Unlike owners of common stock of a corporation, owners of MLP common units have limited voting rights and have no ability to annually elect directors. MLPs generally distribute all available cash flow (cash flow from operations less maintenance capital expenditures) in the form of quarterly distributions. Common unit holders have first
| 152 |
Notes to Financial Statements (Continued)
priority to receive quarterly cash distributions up to the minimum quarterly distribution and have arrearage rights. In the event of liquidation, common unit holders have preference over subordinated units, but not debt holders or preferred unit holders, to the remaining assets of the MLP.
Pay-In-Kind (“PIK”) Bonds – PIK bonds are securities that, at the issuer’s option, pay interest in either cash or additional securities for a specified period. PIK bonds, like zero coupon bonds, are designed to give an issuer flexibility in managing cash flow. PIK bonds are expected to reflect the market value of the underlying debt plus an amount representing accrued interest since the last payment. PIK bonds are usually less volatile than zero coupon bonds, but more volatile than cash pay securities.
Derivative instruments and hedging activities — In order to better define their contractual rights and to secure rights that will help the Funds mitigate their counterparty risk, the Funds may enter into an International Swaps and Derivatives Associations, Inc. Master Agreement (“ISDA Master Agreement” or “MNA”) or similar agreement with certain counterparties. An ISDA Master Agreement is a bilateral agreement between a Fund and a counterparty that governs over-the-counter (“OTC”) derivatives and foreign exchange contracts, and typically contains, among other things, collateral posting terms and master netting provisions in the event of a default or termination. Under an ISDA Master Agreement, a party may, under certain circumstances, offset with the counterparty certain derivative financial instrument’s payables or receivables with collateral held or posted and create one single net payment. The provisions of the ISDA Master Agreement typically permit a single net payment in the event of default (close-out netting).These default events include bankruptcy or insolvency of the counterparty. Note, however, that bankruptcy or insolvency laws of a particular jurisdiction may impose restrictions on or prohibitions against the right of offset.
When entering into a derivative transaction, a Fund may be required to post and maintain collateral or margin (including both initial and maintenance margin). Collateral and margin requirements differ by type of derivative. Margin requirements are established by the broker or clearing house for exchange traded and centrally cleared derivatives (financial futures contracts, options, and centrally cleared swaps). Brokers can ask for margining in excess of the clearing house’s minimum in certain circumstances. Collateral terms are contract specific for OTC derivatives (foreign currency exchange contracts, options, and swaps). For derivatives traded under an ISDA Master Agreement, the collateral requirements are typically calculated by netting the marked-to-market amount for each transaction under such agreement and comparing that amount to the value of any collateral currently pledged by the Fund and the counterparty. For financial reporting purposes, cash collateral that has been pledged to cover obligations of the Fund and cash collateral received from the counterparty, if any, is reported separately on the Statements of Assets and Liabilities as cash pledged as collateral and cash received as collateral, respectively. Non-cash collateral pledged by the Fund, if any, is noted in the Portfolio of Investments. To the extent amounts due to the Fund from its counterparties are not fully collateralized, contractually or otherwise, the Fund bears the risk of loss from counterparty non-performance. A Fund attempts to mitigate counterparty risk by only entering into agreements with counterparties that it believes have the financial resources to honor their obligations and by monitoring the financial stability of those counterparties.
Certain ISDA Master Agreements allow counterparties to OTC derivatives transactions to terminate derivative contracts prior to maturity in the event a Fund’s net assets decline by a stated percentage or the Fund fails to meet the terms of its ISDA Master Agreement, which would cause the Fund to accelerate payment of any net liability owed to the counterparty.
For financial reporting purposes, a Fund does not offset derivative assets and derivative liabilities that are subject to netting arrangements in the Statements of Assets and Liabilities.
| 153 |
Notes to Financial Statements (Continued)
As of September 30, 2015, the Funds’ assets and liabilities that were subject to a MNA on a gross basis were as follows:
| Assets | Liabilities | |||||||
| Arbitrage Fund | ||||||||
| Written Options | $ | — | $ | 478,800 | ||||
| Merger Arbitrage Fund | ||||||||
| Written Options | — | 840,750 | ||||||
The following table presents the Funds’ liabilities net of amounts available for offset under a MNA and net of the related collateral pledged by the Fund as of September 30, 2015:
| Gross | ||||||||||||||||||||||||
| Amount | ||||||||||||||||||||||||
| Available | ||||||||||||||||||||||||
| for Offset in | ||||||||||||||||||||||||
| Gross | Statement | |||||||||||||||||||||||
| Amount of | of Assets | Non-Cash | Cash | |||||||||||||||||||||
| Derivative | Recognized | and | Collateral | Collateral | Net | |||||||||||||||||||
| Fund | Counterparty | Type | Liabilities | Liabilities | Pledged | Pledged | Amount(A) | |||||||||||||||||
| Arbitrage Fund | BTIG | Written Options | $ | 478,800 | $ | — | $ | (80,397 | ) | $ | (398,403 | ) | $ | — | ||||||||||
| Merger Arbitrage Fund | BTIG | Written Options | 840,750 | — | (597,743 | ) | (243,007 | ) | — | |||||||||||||||
(A) Net amount represents the net amount payable due to the counterparty in the event of default.
The following table sets forth the fair value of the Funds’ derivative financial instruments by primary risk exposure as of September 30, 2015:
| Fair Value of Derivative Investments | ||||||||||
| As of September 30, 2015 | ||||||||||
| Derivatives not accounted for as hedging | Asset | Liability | ||||||||
| Fund | instruments under ASC 815 | Derivatives | Derivatives | |||||||
| Arbitrage Fund | Purchased Options-Equity Contracts* | $ | 58,800 | $ | — | |||||
| Written Options-Equity Contracts** | — | 478,800 | ||||||||
| Merger Arbitrage Fund | Purchased options- Equity contracts* | 103,250 | — | |||||||
| Written Options- Equity contracts** | — | 840,750 | ||||||||
* Statements of Assets and Liabilities Location: Investments, at market value.
** Statements of Assets and Liabilities Location: Written options, at market value.
| 154 |
Notes to Financial Statements (Continued)
The following table sets forth the operations of the Funds’ derivative financial instruments by primary risk exposure for the year ended September 30, 2015:
| The Effect of Derivative Investments on the Statement of Operations | ||||||||||
| for the Year Ended September 30, 2015 | ||||||||||
| Change in | ||||||||||
| Unrealized | ||||||||||
| Realized Gain | Appreciation | |||||||||
| Derivatives not accounted for as hedging | (Loss) | (Depreciation) | ||||||||
| Fund | instruments under ASC 815 | on Derivatives | on Derivatives | |||||||
| Arbitrage Fund | Forward-Foreign Currency Exchange Contracts* | $ | 112,716 | $ | (87,990 | ) | ||||
| Purchased Options-Equity Contracts** | (54,938 | ) | (176,118 | ) | ||||||
| Written Options-Equity Contracts*** | (207,198 | ) | (421,095 | ) | ||||||
| Merger Arbitrage Fund | Forward-Foreign Currency Exchange Contracts* | 842,007 | (508,348 | ) | ||||||
| Purchased Options-Equity Contracts** | (392,072 | ) | (15,521 | ) | ||||||
| Written Options-Equity Contracts*** | (322,140 | ) | (439,497 | ) | ||||||
* Statements of Operations Location: Net realized gains (losses) on foreign currency transactions and net change in unrealized appreciation (depreciation) on foreign currency transactions, respectively.
** Statements of Operations Location: Net realized gains (losses) from non-affiliated securities and net change in unrealized appreciation (depreciation) on investments, respectively.
*** Statements of Operations Location: Net realized losses on written options and net change in unrealized appreciation (depreciation) on written options, respectively.
For the year ended September 30, 2015, the average quarterly balances of outstanding derivative financial instruments were as follows:
| Merger | ||||||||
| Arbitrage | Arbitrage | |||||||
| Fund | Fund | Fund | ||||||
| Equity contracts: | ||||||||
| Purchased Options - Cost | $ | 79,606 | $ | 258,026 | ||||
| Written Options - Proceeds | $ | 61,390 | $ | 253,168 | ||||
| Forward foreign currency exchange contracts: | ||||||||
| Average number of contracts | — | * | — | * | ||||
| Average U.S. dollar amount purchased | $ | — | $ | 2,924,826 | ||||
| Average U.S. dollar amount sold | $ | 406,701 | $ | — | ||||
* Less than 1 contract.
Portfolio securities loaned — Each Fund may lend its portfolio securities. Lending portfolio securities exposes a Fund to the risk that the borrower may fail to return the loaned securities or may not be able to provide additional collateral or that the Funds may experience delays in recovery of the loaned securities or loss of rights in the collateral if the borrower fails financially. To minimize these risks, the borrower must agree to maintain cash collateral with the Funds’ custodian. The loaned securities are secured by collateral valued at least equal, at all times, to the market value of the loaned securities plus accrued interest, if any. When the collateral falls below specified amounts, the lending agent will use its best effort to obtain additional collateral on the next business day to meet required amounts under the security lending agreement. The cash collateral is reinvested by the Funds’ custodian into an approved investment vehicle. The approved investment vehicle is subject to market risk.
| 155 |
Notes to Financial Statements (Continued)
As of September 30, 2015, the following Funds loaned securities and received collateral as follows:
| Market Value of | Market Value of | |||||||
| Securities | Collateral | |||||||
| Fund | Loaned | Received | ||||||
| Arbitrage Fund | $ | 1,202,110 | $ | 1,137,500 | ||||
| Emerging Markets Equity Fund | 3,985,440 | 3,985,314 | ||||||
| Global Real Estate Fund | 600,357 | 623,595 | ||||||
| Mid Cap Value Fund | 6,860,188 | 6,802,416 | ||||||
| Sands Capital Select Growth Fund | 328,805,184 | 329,118,378 | ||||||
| Small Cap Core Fund | 34,851,700 | 34,923,382 | ||||||
| Small Cap Value Fund | 4,332,170 | 4,546,361 | ||||||
| Total Return Bond Fund | 863,096 | 891,413 | ||||||
All cash collateral is received, held, and administered by the Funds’ custodian for the benefit of the lending Fund in its custody account or other account established for the purpose of holding collateral.
Funds participating in securities lending receive compensation in the form of fees. Securities lending income is derived from lending long securities from the Funds to creditworthy approved borrowers at rates that are determined based on daily trading volumes, float, short-term interest rates and market liquidity. A lending Fund retains the interest or dividends on the investment of any cash received as collateral. The lending Fund continues to receive interest or dividends on the loaned securities.
Unrealized gain or loss on the market value of the loaned securities that may occur during the term of the loan is recognized by the lending Fund. The lending Fund has the right under the lending agreement to recover the securities from the borrower on demand.
When-issued or delayed delivery transactions — Each Fund may purchase or sell securities on a when-issued or delayed delivery basis. These transactions involve a commitment by the Fund to purchase or sell securities for a predetermined price or yield, with payment and delivery taking place beyond the customary settlement period. When delayed delivery purchases are outstanding, the Fund will set aside liquid assets in an amount sufficient to meet the purchase price. When purchasing a security on a delayed delivery basis, the Fund assumes the rights and risks of ownership of the security, including the risk of price and yield fluctuations, and takes such fluctuations into account when determining NAV. The Fund may dispose of or renegotiate a delayed delivery transaction after it is entered into, and may sell when-issued securities before they are delivered, which may result in a capital gain or loss. When the Fund has sold a security on a delayed delivery basis, the Fund does not participate in future gains and losses with respect to the security.
Share valuation — The NAV per share of each class of shares of each Fund is calculated daily by dividing the total value of a Fund’s assets attributable to that class, less liabilities attributable to that class, by the number of outstanding shares of that class.
The maximum offering price per share of Class A shares of the Funds (except the Total Return Bond Fund and Ultra Short Duration Fixed Income Fund) is equal to the NAV per share plus a sales load equal to 6.10% of the NAV (or 5.75% of the offering price). The maximum offering price per share of Class A shares of the Total Return Bond Fund is equal to the NAV per share plus a sales load equal to 4.99% of the NAV (or 4.75% of the offering price). The maximum offering price per share of Class A shares of the Ultra Short Duration Fixed Income Fund is equal to the NAV per share plus sales load equal to 2.04% of the NAV (or 2.00% of the offering price). There is no sales load on purchases of $1 million or more of Class A shares. The maximum offering price per share of Classes C, Y, Z, and Institutional Class shares of the Funds is equal to the NAV per share.
The redemption price per share of each class of shares of the Funds is generally equal to the NAV per share. However, Class A redemptions that were part of a no-load $1 million subscription may be subject to a contingent
| 156 |
Notes to Financial Statements (Continued)
deferred sales charge (“CDSC”) of up to 1.00% if redeemed within a one-year period from the date of purchase. Additionally, purchases of Class C shares of the Funds are subject to a CDSC of 1.00%. The CDSC will be assessed on an amount equal to the lesser of (1) the NAV at the time of purchase of the shares being redeemed or (2) the NAV of such shares being redeemed, if redeemed within a one-year period from the date of purchase.
Investment income — Dividend income from securities is recognized on the ex-dividend date, net of foreign withholding taxes, if any, which are reduced by any amounts reclaimable by the Funds, where applicable. Interest income from securities is recorded on the basis of interest accrued, premium amortized and discount accreted. Realized gains and losses resulting from principal paydowns on mortgage-backed and asset-backed securities are included in interest income. Market discounts, original issue discount (“OID”) and market premiums on debt securities are accreted/amortized to interest income over the life of the security with a corresponding adjustment in the cost basis of that security. In addition, it is the Funds’ policy to accrue for foreign capital gains taxes, if applicable, on certain foreign securities held by the Funds. An estimated foreign capital gains tax is recorded daily on net unrealized gains on these securities and is payable upon the sale of such securities when a gain is realized.
Distributions to shareholders — Each Fund intends to distribute to its shareholders substantially all of its income and capital gains. The Arbitrage Fund, Emerging Markets Equity Fund, Merger Arbitrage Fund, Mid Cap Fund, and Small Cap Core Fund distribute their income, if any, annually, as a dividend to shareholders. The Global Real Estate Fund, Mid Cap Value Fund, Sands Capital Select Growth Fund, and Small Cap Value Fund declare and distribute their income, if any, quarterly, as a dividend to shareholders. The Premium Yield Equity Fund and Total Return Bond Fund declare and distribute their income, if any, monthly, as a dividend to shareholders. The Ultra Short Duration Fixed Income Fund declares its income, if any, daily, and distributes such income monthly, as a dividend to shareholders. Each Fund makes distributions of capital gains, if any, at least annually, net of applicable capital loss carryforwards. Income distributions and capital gain distributions are determined in accordance with income tax regulations. Recognition of the Funds’ net investment income for Funds that invest in Underlying Funds is affected by the timing of dividend declarations by those Underlying Funds.
Allocations — Investment income earned, realized capital gains and losses, and unrealized appreciation and depreciation for a Fund are allocated daily to each class of shares based upon its proportionate share of total net assets of the Fund. Class-specific expenses are charged directly to the class incurring the expense. Common expenses, which are not attributable to a specific class, are allocated daily to each class of shares based upon their proportionate share of total net assets of the Fund. Expenses not directly billed to a Fund are allocated proportionally among all the Funds in the Trust, and, if applicable, Touchstone Investment Trust, Touchstone Strategic Trust,Touchstone Variable Series Trust,Touchstone Institutional Funds Trust and Touchstone Tax-Free Trust (collectively with the Trust, “Touchstone Fund Complex”), daily in relation to net assets of each Fund or another reasonable measure.
Security transactions — Security transactions are reflected for financial reporting purposes as of the trade date. Realized gains and losses on sales of portfolio securities are calculated using the identified cost basis.
Estimates — The preparation of financial statements in conformity with U.S. GAAP requires management to make estimates and assumptions that affect the reported amounts of assets and liabilities and disclosure of contingent assets and liabilities at the date of the financial statements and the reported amounts of income and expenses during the reporting period. Actual results could differ from those estimates.
| 157 |
Notes to Financial Statements (Continued)
3. Investment Transactions
Investment transactions (excluding short-term investments and U.S. Government securities) were as follows for the year ended September 30, 2015:
| Emerging | Global | Merger | ||||||||||||||
| Arbitrage | Markets Equity | Real Estate | Arbitrage | |||||||||||||
| Fund | Fund | Fund | Fund | |||||||||||||
| Purchases of investment securities | $ | 398,094,129 | $ | 88,620,863 | $ | 19,315,442 | $ | 591,024,414 | ||||||||
| Proceeds from sales and maturities | $ | 464,054,852 | $ | 100,448,171 | $ | 8,636,188 | $ | 824,812,811 | ||||||||
| Mid Cap | Premium Yield | Sands Capital | ||||||||||||||
| Mid Cap | Value | Equity | Select Growth | |||||||||||||
| Fund | Fund | Fund | Fund | |||||||||||||
| Purchases of investment securities | $ | 390,100,075 | $ | 189,330,601 | $ | 75,465,253 | $ | 1,690,331,952 | ||||||||
| Proceeds from sales and maturities | $ | 100,998,501 | $ | 199,298,847 | $ | 58,995,919 | $ | 2,729,892,815 | ||||||||
| Small Cap | Small Cap | Total Return | Ultra Short | |||||||||||||
| Core | Value | Bond | Duration Fixed | |||||||||||||
| Fund | Fund | Fund | Income Fund | |||||||||||||
| Purchases of investment securities | $ | 325,321,345 | $ | 77,380,861 | $ | 66,111,357 | $ | 738,641,986 | ||||||||
| Proceeds from sales and maturities | $ | 333,066,147 | $ | 89,803,076 | $ | 31,314,900 | $ | 910,755,199 | ||||||||
For the year ended September 30, 2015, purchases and proceeds from sales and maturities in U.S. Government Securities were $21,428,896 and $11,583,756 for theTotal Return Bond Fund and $72,584,083 and $63,395,438 for the Ultra Short Duration Fixed Income Fund, respectively.
4. Transactions with Affiliates and Other Related Parties
Certain officers of the Trust are also officers of Touchstone Advisors, Inc. (the “Advisor”), Touchstone Securities, Inc. (the “Underwriter”), or BNY Mellon Investment Servicing (U.S.) Inc. (“BNY Mellon”), the Sub-Administrator and Transfer Agent to the Funds. Such officers receive no compensation from the Trust. The Advisor the Underwriter are each wholly-owned, indirect subsidiaries of Western & Southern Financial Group, (“Western & Southern”).
On behalf of the Funds, the Advisor pays each Independent Trustee a quarterly retainer plus additional retainers to the Lead Independent Trustee and the chairs of each standing committee. Interested Trustees do not receive compensation from the Funds. Each Independent Trustee also receives compensation for each board meeting and committee meeting attended. Each standing committee chair receives additional compensation for committee meeting that he or she oversees.The Advisor is reimbursed by the Funds for the Independent Trustees’ compensation and out-of-pocket expenses relating to their services. The Funds accrued Trustee-related expenses of $158,028 for the year ended September 30, 2015.
| 158 |
Notes to Financial Statements (Continued)
MANAGEMENT & EXPENSE LIMITATION AGREEMENTS
The Advisor provides general investment supervisory services for the Funds, under terms of an advisory agreement (the “Advisory Agreement”). Under the Advisory Agreement, each Fund pays the Advisor a fee, which is computed and accrued daily and paid monthly, at an annual rate based on average daily net assets of each Fund as shown in the table below.
| Arbitrage Fund | 1.05% on the first $500 million |
| 1.00% on the next $500 million | |
| 0.95% on such assets over $1 billion | |
| Emerging Markets Equity Fund | 1.05% on the first $200 million |
| 1.00% on the next $200 million | |
| 0.90% on such assets over $400 million | |
| Global Real Estate Fund | 0.80% |
| Merger Arbitrage Fund | 1.05% |
| Mid Cap Fund | 0.80% on the first $500 million |
| 0.75% on the next $500 million | |
| 0.70% on such assets over $1 billion | |
| Mid Cap Value Fund | 0.85% on the first $100 million |
| 0.80% on the next $300 million | |
| 0.75% on such assets over $400 million | |
| Premium Yield Equity Fund | 0.70% on the first $100 million |
| 0.65% on such assets over $100 million | |
| Sands Capital Select Growth Fund | 0.85% on the first $1 billion |
| 0.80% on the next $500 million | |
| 0.75% on the next $500 million | |
| 0.70% on such assets over $2 billion | |
| Small Cap Core Fund | 0.85% |
| Small Cap Value Fund | 0.90% |
| Total Return Bond Fund | 0.35% |
| Ultra Short Duration Fixed Income Fund | 0.25% |
In addition to the base advisory fee shown above for the Sands Capital Select Growth Fund, a performance fee adjustment will be added to or subtracted from the base advisory fee depending on the performance of the Fund in relation to the investment performance of the Fund’s benchmark index, for the preceding twelve month period, as follows:
| Annual | Highest / Lowest | |||||||||||
| Benchmark | Benchmark | Adjustment | Possible Advisory | |||||||||
| Index | Threshold | Rate | Fee | |||||||||
| Sands Capital Select Growth Fund | Russell 1000® Growth Index | +/-2.50% | +/-0.15% | 1.00% / 0.55% |
For the year ended September 30, 2015, the Advisor’s base fee was decreased by $8,458,809 as a result of the performance fee adjustment.
The Advisor has entered into investment sub-advisory agreements with the following parties (each, a “Sub-Advisor”):
| LMCG Investments, Inc. (formerly known as Lee Munder | |
| AGF Investments America, Inc. | Capital Group LLC) |
| Emerging Markets Equity Fund | Mid Cap Value Fund |
| 159 |
Notes to Financial Statements (Continued)
| Forum Securities Limited | The London Company |
| Global Real Estate Fund | Mid Cap Fund |
| Small Cap Core Fund | |
| DePrince, Race & Zollo, Inc. | |
| Small Cap Value Fund | Longfellow Investment Management Co. |
| Arbitrage Fund | |
| Merger Arbitrage Fund | |
| EARNEST Partners LLC | |
| Total Return Bond Fund | Miller/Howard Investments, Inc. |
| Premium Yield Equity Fund | |
| Fort Washington Investment Advisors, Inc.* | Sands Capital Management, LLC |
| Ultra Short Duration Fixed Income Fund | Sands Capital Select Growth Fund |
*Affiliate of the Advisor and wholly-owned indirect subsidiary of Western & Southern.
The Advisor, not the Funds, pays sub-advisory fees to each Sub-Advisor.
The Advisor entered into an expense limitation agreement (the “Expense Limitation Agreement”) to contractually limit the annual operating expenses of the Funds, excluding: dividend and interest expenses relating to short sales; interest; taxes; brokerage commissions and other transaction costs; portfolio transactions and investment related expenses; other expenditures which are capitalized in accordance with U.S. GAAP; the cost of “Acquired Fund Fees and Expenses”, if any; and other extraordinary expenses not incurred in the ordinary course of business. The maximum annual operating expense limit in any year with respect to the Funds is based on a percentage of the average daily net assets of the Funds. The Advisor has agreed to separately waive class-level expenses, advisory fees and administration fees, and to reimburse expenses in order to maintain the following expense limitations for the Funds:
| Institutional | ||||||||||||||||||||
| Class A | Class C | Class Y | Class Z | Class | ||||||||||||||||
| Arbitrage Fund | 1.68 | % | 2.43 | % | 1.43 | % | — | 1.28 | % | |||||||||||
| Emerging Markets Equity Fund | 1.69 | % | 2.44 | % | 1.44 | % | — | 1.29 | % | |||||||||||
| Global Real Estate Fund | 1.39 | % | 2.14 | % | 1.14 | % | — | 0.99 | % | |||||||||||
| Merger Arbitrage Fund | 1.68 | % | 2.43 | % | 1.43 | % | — | 1.28 | % | |||||||||||
| Mid Cap Fund | 1.24 | % | 1.99 | % | 0.99 | % | 1.24 | % | 0.92 | % | ||||||||||
| Mid Cap Value Fund | 1.29 | % | 2.04 | % | 1.04 | % | — | 0.89 | % | |||||||||||
| Premium Yield Equity Fund | 1.20 | % | 1.95 | % | 0.95 | % | — | — | ||||||||||||
| Small Cap Core Fund | 1.38 | % | 2.13 | % | 1.13 | % | — | 1.05 | % | |||||||||||
| Small Cap Value Fund | 1.38 | % | 2.13 | % | 1.13 | % | — | 0.98 | % | |||||||||||
| Total Return Bond Fund | 0.90 | % | 1.65 | % | 0.65 | % | — | 0.50 | % | |||||||||||
| Ultra Short Duration Fixed Income Fund | 0.69 | % | 1.19 | % | 0.44 | % | 0.69 | % | 0.39 | % | ||||||||||
These expense limitations will remain in effect for all Funds through at least January 29, 2016, but can be terminated by a vote of the Board of Trustees of the Trust if it deems the termination to be beneficial to the Funds’ shareholders.
The Advisor has agreed to limit certain Funds’ other operating expenses (“Other Expenses”) to the following levels which will remain in effect though at least January 29, 2016.
| Class A | Class C | Class Y | Class Z | |||||||||||||
| Sands Capital Select Growth Fund | 0.25 | % | 0.25 | % | 0.25 | % | 0.25 | % | ||||||||
| 160 |
Notes to Financial Statements (Continued)
During the year ended September 30, 2015, the Advisor or its affiliates waived investment advisory fees and administration fees or reimbursed expenses, including distribution fees of the Funds, as follows:
| Investment | Other | |||||||||||||||
| Advisory | Administration | Operating | ||||||||||||||
| Fees | Fees | Expenses | ||||||||||||||
| Waived | Waived | Reimbursed | Total | |||||||||||||
| Arbitrage Fund | $ | — | $ | — | $ | 7,282 | $ | 7,282 | ||||||||
| Emerging Markets Equity Fund | — | — | 145,098 | 145,098 | ||||||||||||
| Global Real Estate Fund | 60,897 | 32,562 | 51,820 | 145,279 | ||||||||||||
| Mid Cap Fund | — | 211,381 | 510,481 | 721,862 | ||||||||||||
| Mid Cap Value Fund | — | 361,830 | 86,963 | 448,793 | ||||||||||||
| Premium Yield Equity Fund | — | — | 66,988 | 66,988 | ||||||||||||
| Sands Capital Select Growth Fund | — | — | 946,970 | 946,970 | ||||||||||||
| Small Cap Core Fund | — | — | 38,284 | 38,284 | ||||||||||||
| Small Cap Value Fund | 11,416 | 106,472 | 58,143 | 176,031 | ||||||||||||
| Total Return Bond Fund | — | 82,950 | 113,215 | 196,165 | ||||||||||||
| Ultra Short Duration Fixed Income Fund | — | 245,737 | 267,159 | 512,896 | ||||||||||||
Under the terms of the Expense Limitation Agreement, the Advisor is entitled to recover, subject to approval by the Funds’ Board, such amounts waived or reimbursed for a period of up to three years from the year in which the Advisor reduced its compensation or assumed expenses for the Funds. No recoupment will occur unless a Fund’s operating expenses are below the expense limitation amount in effect at the time of the waiver or reimbursement.
As of September 30, 2015, the Advisor may seek recoupment of previously waived fees and reimbursed expenses as follows:
| Expiration | Expiration | Expiration | ||||||||||||||
| September 30, | September 30, | September 30, | ||||||||||||||
| Fund | 2016 | 2017 | 2018 | Total | ||||||||||||
| Arbitrage Fund | $ | — | $ | 1,355 | $ | 2,350 | $ | 3,705 | ||||||||
| Emerging Markets Equity Fund | — | 67,176 | 117,715 | 184,891 | ||||||||||||
| Global Real Estate Fund | 143,253 | 125,217 | 125,318 | 393,788 | ||||||||||||
| Mid Cap Fund | 256,834 | 380,034 | 632,713 | 1,269,581 | ||||||||||||
| Mid Cap Value Fund | 248,780 | 328,349 | 411,352 | 988,481 | ||||||||||||
| Premium Yield Equity Fund | 45,482 | 10,470 | 28,340 | 84,292 | ||||||||||||
| Sands Capital Select Growth Fund | 1,593,217 | 1,033,092 | 946,969 | 3,573,278 | ||||||||||||
| Small Cap Core Fund | 789,388 | 243,573 | — | 1,032,961 | ||||||||||||
| Small Cap Value Fund | 130,886 | 148,793 | 144,541 | 424,220 | ||||||||||||
| Total Return Bond Fund | 163,756 | 143,600 | 170,094 | 477,450 | ||||||||||||
| Ultra Short Duration Fixed Income Fund | 470,719 | 456,994 | 465,366 | 1,393,079 | ||||||||||||
For the year ended September 30, 2015, the Advisor recouped previously waived fees or reimbursed expenses from the Mid Cap Value Fund and Sands Capital Select Growth Fund of $14,756 and $41,727, respectively.
ADMINISTRATION AGREEMENT
The Advisor entered into an Administration Agreement with the Trust, whereby the Advisor is responsible for: supplying executive and regulatory compliance services; supervising the preparation of tax returns; coordinating the preparation of reports to shareholders and reports to, and filings with the Securities and Exchange Commission (the “SEC”) and state securities authorities, as well as materials for meetings of the Board; calculating the daily NAV per share; and maintaining the financial books and records of each Fund.
| 161 |
Notes to Financial Statements (Continued)
For its services through December 31, 2014, the Advisor’s annual administrative fee was:
0.20% on the first $6 billion of the aggregate average daily net assets;
0.16% on the next $4 billion of aggregate average daily net assets; and
0.12% on the aggregate average daily net assets over $10 billion.
The fee was computed and allocated among theTouchstone Fund Complex (excludingTouchstone Institutional Money Market Fund, Touchstone Institutional Funds Trust, and Touchstone Variable Series Trust) on the basis of relative daily net assets.
Beginning January 1, 2015, the Advisor’s annual administrative fee is:
0.145% on the first $20 billion of the aggregate average daily net assets;
0.11% on the next $10 billion of aggregate average daily net assets;
0.09% on the next $10 billion of aggregate average daily net assets; and
0.07% on the aggregate average daily net assets over $40 billion.
The fee is computed and allocated among the Touchstone Fund Complex (excluding Touchstone Institutional Funds Trust) on the basis of relative daily net assets.
The Advisor has engaged BNY Mellon as the Sub-Administrator to theTrust. BNY Mellon provides administrative and accounting services to the Trust and is compensated directly by the Advisor, not the Trust.
TRANSFER AGENT AGREEMENT
Under the terms of the Transfer Agent Agreement between the Trust and BNY Mellon, BNY Mellon maintains the records of each shareholder’s account, answers shareholders’ inquiries concerning their accounts, processes purchases and redemptions of each Fund’s shares, acts as dividend and distribution disbursing agent, and performs other shareholder service functions. For these services, BNY Mellon receives a monthly fee from each Fund. In addition, each Fund pays out-of-pocket expenses incurred by BNY Mellon, including, but not limited to, postage and supplies.
The Funds may reimburse the Advisor for fees paid to intermediaries such as banks, broker-dealers, financial advisors or other financial institutions for sub-transfer agency, sub-administration and other services provided to investors whose shares of record are held in omnibus, other group accounts, retirement plans or accounts traded through registered securities clearing agents. These fees may vary based on, for example, the nature of services provided, but generally range up to 0.15% of the assets of the class serviced or maintained by the intermediary or up to $22 per sub-account maintained by the intermediary. Prior to December 1, 2014, the Funds reimbursed the Advisor up to $17 per sub-account maintained by the intermediary.
PLANS OF DISTRIBUTION AND SHAREHOLDER SERVICING FEE ARRANGEMENTS
The Trust has adopted distribution plans pursuant to Rule 12b-1 under the 1940 Act for each class of shares it offers that is subject to 12b-1 distribution fees. The plans allow each Fund to pay distribution and other fees for the sale and distribution of its shares and for services provided to shareholders. The fees charged to the Funds are limited to the actual expenses incurred. Under the Class A plan, each Fund offering Class A shares pays an annual fee of up to 0.25% of average daily net assets that are attributable to Class A shares. Under the Class C plan, each Fund (except the Ultra Short Duration Fixed Income Fund) pays an annual fee of up to 1.00% of average daily net assets that are attributable to Class C shares (of which up to 0.75% is a distribution fee and up to 0.25% is a shareholder servicing fee). The Ultra Short Duration Fixed Income Fund intends to limit the amount of the 12b-1 fees for Class C shares to 0.75% of average daily net assets for at least one year from January 30, 2015. Under the Class Z plan, each Fund offering Class Z shares pays an annual shareholder servicing fee of up to 0.25% of average daily net assets that are attributed to Class Z shares.
| 162 |
Notes to Financial Statements (Continued)
UNDERWRITING AGREEMENT
The Underwriter is the Funds’ principal underwriter and, as such, acts as exclusive agent for distribution of the Funds’ shares. Under the terms of the Underwriting Agreement between the Trust and the Underwriter, the Underwriter earned the following from underwriting and broker commissions on the sale of Class A shares of the Funds listed below during the year ended September 30, 2015:
| Fund | Amount | |||
| Arbitrage Fund | $ | 1,948 | ||
| Emerging Markets Equity Fund | 471 | |||
| Global Real Estate Fund | 41,832 | |||
| Merger Arbitrage Fund | 141 | |||
| Mid Cap Fund | 47,420 | |||
| Mid Cap Value Fund | 9,843 | |||
| Premium Yield Equity Fund | 21,833 | |||
| Sands Capital Select Growth Fund | 12,910 | |||
| Small Cap Core Fund | 1,771 | |||
| Small Cap Value Fund | 1,710 | |||
| Total Return Bond Fund | 6,214 | |||
| Ultra Short Duration Fixed Income Fund | 1,127 | |||
In addition, the Underwriter collected CDSC on the redemption of Class C shares of the Funds listed below during the year ended September 30, 2015:
| Fund | Amount | |||
| Arbitrage Fund | $ | 1,202 | ||
| Emerging Markets Equity Fund | 756 | |||
| Merger Arbitrage Fund | 118 | |||
| Mid Cap Fund | 1,852 | |||
| Premium Yield Equity Fund | 618 | |||
| Sands Capital Select Growth Fund | 3,173 | |||
| Small Cap Core Fund | 97 | |||
| Small Cap Value Fund | 20 | |||
| Total Return Bond Fund | 1 | |||
| Ultra Short Duration Fixed Income Fund | 2,356 | |||
AFFILIATED INVESTMENTS
Each Fund may have invested in the Touchstone Institutional Money Market Fund through June 19, 2015, subject to compliance with several conditions set forth in an exemptive order received by the Trust from the SEC. To the extent that the Funds were invested in the Touchstone Institutional Money Market Fund, the Advisor and Administrator were paid additional fees from the Touchstone Institutional Money Market Fund that were not waived or reimbursed.
A summary of each Fund’s investment, as applicable, in the Touchstone Institutional Money Market Fund for the year ended September 30, 2015, is as follows:
| 163 |
Notes to Financial Statements (Continued)
| Share Activity | ||||||||||||||||||||||||
| Balance | Balance | Value | ||||||||||||||||||||||
| 09/30/14 | Purchases | Sales | 09/30/15 | Dividends | 09/30/15 | |||||||||||||||||||
| Arbitrage Fund | 14,297,511 | 235,144,330 | (249,441,841 | ) | — | $ | 1,209 | $ | — | |||||||||||||||
| Emerging Markets Equity Fund | 2,403,518 | 62,010,963 | (64,414,481 | ) | — | 353 | — | |||||||||||||||||
| Global Real Estate Fund | 109,965 | 11,481,485 | (11,591,450 | ) | — | 48 | — | |||||||||||||||||
| Merger Arbitrage Fund | 34,031,031 | 396,150,835 | (430,181,866 | ) | — | 4,711 | — | |||||||||||||||||
| Mid Cap Fund | 4,902,428 | 305,377,634 | (310,280,062 | ) | — | 1,030 | — | |||||||||||||||||
| Mid Cap Value Fund | 4,512,194 | 73,433,085 | (77,945,279 | ) | — | 206 | — | |||||||||||||||||
| Premium Yield Equity Fund | 3,920,442 | 58,827,201 | (62,747,643 | ) | — | 356 | — | |||||||||||||||||
| Sands Capital Select Growth Fund | 234,335,221 | 969,942,745 | (1,204,277,966 | ) | — | 6,450 | — | |||||||||||||||||
| Small Cap Core Fund | 10,288,621 | 173,963,718 | (184,252,339 | ) | — | 928 | — | |||||||||||||||||
| Small Cap Value Fund | 126,728 | 23,549,639 | (23,676,367 | ) | — | 153 | — | |||||||||||||||||
| Total Return Bond Fund | 3,288,138 | 67,918,694 | (71,206,832 | ) | — | 586 | — | |||||||||||||||||
| Ultra Short Duration Fixed Income Fund | 576,615 | 662,061,142 | (662,637,757 | ) | — | 960 | — | |||||||||||||||||
5. Federal Tax Information
Federal income tax — It is each Fund’s policy to continue to comply with the special provisions of the Internal Revenue Code applicable to regulated investment companies. As provided therein, in any fiscal year in which a Fund so qualifies and distributes at least 90% of its investment company taxable income, the Fund (but not the shareholders) will be relieved of federal income tax on the income distributed. It is each Fund’s policy to distribute all of its taxable income and accordingly, no provision for income taxes has been made.
In order to avoid imposition of the excise tax applicable to regulated investment companies, it is also each Fund’s intention to declare and pay as dividends in each calendar year at least 98% of its investment company taxable income (earned during the calendar year) and 98.2% of its net realized capital gains (earned during the twelve months ending October 31) plus undistributed amounts from prior years.
The tax character of distributions paid for the years ended September 30, 2015 and 2014 was as follows:
| Arbritrage | Emerging Markets | Global Real | ||||||||||||||||||||||
| Fund | Equity Fund | Estate Fund | ||||||||||||||||||||||
| Year Ended | Year Ended | Year Ended | Year Ended | Year Ended | Year Ended | |||||||||||||||||||
| September 30, | September 30, | September 30, | September 30, | September 30, | September 30, | |||||||||||||||||||
| 2015 | 2014 | 2015 | 2014 | 2015 | 2014 | |||||||||||||||||||
| From ordinary income | $ | — | $ | — | $ | 3,401,511 | $ | 4,192,683 | $ | 794,853 | $ | 2,399,277 | ||||||||||||
| From long-term capital gains | 288,475 | — | — | — | — | 680,745 | ||||||||||||||||||
| Total distributions | $ | 288,475 | $ | — | $ | 3,401,511 | $ | 4,192,683 | $ | 794,853 | $ | 3,080,022 | ||||||||||||
| Merger Arbitrage | Mid Cap | Mid Cap | ||||||||||||||||||||||
| Fund | Fund | Value Fund | ||||||||||||||||||||||
| Year Ended | Year Ended | Year Ended | Year Ended | Year Ended | Year Ended | |||||||||||||||||||
| September 30, | September 30, | September 30, | September 30, | September 30, | September 30, | |||||||||||||||||||
| 2015 | 2014 | 2015 | 2014 | 2015 | 2014 | |||||||||||||||||||
| From ordinary income | $ | — | $ | 24,102,036 | $ | 868,044 | $ | 747,154 | $ | 11,660,373 | $ | 6,818,543 | ||||||||||||
| From long-term capital gains | 1,566,064 | — | — | — | 4,873,774 | 8,876,667 | ||||||||||||||||||
| Total distributions | $ | 1,566,064 | $ | 24,102,036 | $ | 868,044 | $ | 747,154 | $ | 16,534,147 | $ | 15,695,210 | ||||||||||||
| 164 |
Notes to Financial Statements (Continued)
| Premium Yield | Sands Capital | Small Cap | ||||||||||||||||||||||
| Equity Fund | Select Growth Fund | Core Fund | ||||||||||||||||||||||
| Year Ended | Year Ended | Year Ended | Year Ended | Year Ended | Year Ended | |||||||||||||||||||
| September 30, | September 30, | September 30, | September 30, | September 30, | September 30, | |||||||||||||||||||
| 2015 | 2014 | 2015 | 2014 | 2015 | 2014 | |||||||||||||||||||
| From ordinary income | $ | 5,326,219 | $ | 6,872,067 | $ | — | $ | 13,643,843 | $ | 4,878,943 | $ | 14,861,071 | ||||||||||||
| From long-term capital gains | 8,901,766 | — | 297,931,608 | 28,752,022 | 55,124,275 | 12,211,364 | ||||||||||||||||||
| Total distributions | $ | 14,227,985 | $ | 6,872,067 | $ | 297,931,608 | $ | 42,395,865 | $ | 60,003,218 | $ | 27,072,435 | ||||||||||||
| Small Cap | Total Return | Ultra Short Duration | ||||||||||||||||||||||
| Value Fund | Bond Fund | Fixed Income Fund | ||||||||||||||||||||||
| Year Ended | Year Ended | Year Ended | Year Ended | Year Ended | Year Ended | |||||||||||||||||||
| September 30, | September 30, | September 30, | September 30, | September 30, | September 30, | |||||||||||||||||||
| 2015 | 2014 | 2015 | 2014 | 2015 | 2014 | |||||||||||||||||||
| From ordinary income | $ | 1,186,997 | $ | 953,920 | $ | 5,107,573 | $ | 4,871,768 | $ | 8,549,313 | $ | 10,124,310 | ||||||||||||
| From long-term capital gains | 2,819,183 | — | — | — | — | — | ||||||||||||||||||
| Total distributions | $ | 4,006,180 | $ | 953,920 | $ | 5,107,573 | $ | 4,871,768 | $ | 8,549,313 | $ | 10,124,310 | ||||||||||||
The following information is computed on a tax basis for each item as of September 30, 2015:
| Emerging | Global | |||||||||||||||
| Arbitrage | Markets Equity | Real Estate | Merger | |||||||||||||
| Fund | Fund | Fund | Arbitrage Fund | |||||||||||||
| Tax cost of portfolio investments | $ | 134,058,187 | $ | 326,755,593 | $ | 27,137,385 | $ | 243,845,938 | ||||||||
| Gross unrealized appreciation | 1,332,745 | 14,557,138 | 857,451 | 3,264,216 | ||||||||||||
| Gross unrealized depreciation | (3,529,833 | ) | (79,348,232 | ) | (2,827,808 | ) | (5,990,424 | ) | ||||||||
| Net unrealized appreciation (depreciation) on investments | (2,197,088 | ) | (64,791,094 | ) | (1,970,357 | ) | (2,726,208 | ) | ||||||||
| Net unrealized appreciation (depreciation) on written options | (321,759 | ) | — | — | (564,993 | ) | ||||||||||
| Net unrealized appreciation (depreciation) on securities sold short | 723,257 | — | — | 121,579 | ||||||||||||
| Net unrealized appreciation (depreciation) on foreign currency transactions | — | (40,365 | ) | (1,705 | ) | — | ||||||||||
| Accumulated capital losses | — | (44,093,212 | ) | (618,799 | ) | — | ||||||||||
| Qualified late-year losses | — | — | — | (1,694,184 | ) | |||||||||||
| Other temporary differences | — | (4,170 | ) | — | — | |||||||||||
| Undistributed ordinary income | 181,750 | 2,573,140 | 168,187 | — | ||||||||||||
| Undistributed capital gains | 346,056 | — | — | — | ||||||||||||
| Accumulated deficit | $ | (1,267,784 | ) | $ | (106,355,701 | ) | $ | (2,422,674 | ) | $ | (4,863,806 | ) | ||||
| Premium | Sands Capital | |||||||||||||||
| Mid Cap Value | Yield Equity | Select Growth | ||||||||||||||
| Mid Cap Fund | Fund | Fund | Fund | |||||||||||||
| Tax cost of portfolio investments | $ | 686,483,595 | $ | 347,594,916 | $ | 178,267,407 | $ | 3,715,197,547 | ||||||||
| Gross unrealized appreciation | 58,606,159 | 36,994,668 | 10,170,405 | 1,834,649,759 | ||||||||||||
| Gross unrealized depreciation | (46,633,135 | ) | (32,749,577 | ) | (17,325,170 | ) | (258,320,737 | ) | ||||||||
| Net unrealized appreciation (depreciation) on investments | 11,973,024 | 4,245,091 | (7,154,765 | ) | 1,576,329,022 | |||||||||||
| Accumulated capital losses | (123,848,001 | ) | — | — | — | |||||||||||
| Qualified late-year losses | (38,973 | ) | — | — | (21,615,887 | ) | ||||||||||
| Undistributed ordinary income | — | 3,758,126 | — | — | ||||||||||||
| Undistributed capital gains | — | 16,029,978 | 8,682,989 | 385,268,540 | ||||||||||||
| Accumulated earnings (deficit) | $ | (111,913,950 | ) | $ | 24,033,195 | $ | 1,528,224 | $ | 1,939,981,675 | |||||||
| 165 |
Notes to Financial Statements (Continued)
| Ultra Short | ||||||||||||||||
| Total | Duration | |||||||||||||||
| Small Cap Core | Small Cap Value | Return Bond | Fixed Income | |||||||||||||
| Fund | Fund | Fund | Fund | |||||||||||||
| Tax cost of portfolio investments | $ | 710,193,303 | $ | 74,519,483 | $ | 177,847,324 | $ | 584,752,017 | ||||||||
| Gross unrealized appreciation | 136,379,483 | 1,049,907 | 2,899,802 | 1,329,165 | ||||||||||||
| Gross unrealized depreciation | (92,607,472 | ) | (13,767,853 | ) | (2,377,613 | ) | (3,921,880 | ) | ||||||||
| Net unrealized appreciation (depreciation) on investments | 43,772,011 | (12,717,946 | ) | 522,189 | (2,592,715 | ) | ||||||||||
| Accumulated capital losses | — | (4,388,796 | ) | (1,341,777 | ) | (25,706,968 | ) | |||||||||
| Undistributed ordinary income | 12,992,025 | 39,241 | 32,933 | 564,557 | ||||||||||||
| Other temporary differences | — | — | — | (102,111 | ) | |||||||||||
| Undistributed capital gains | 65,053,298 | 1,858,489 | — | — | ||||||||||||
| Accumulated earnings (deficit) | $ | 121,817,334 | $ | (15,209,012 | ) | $ | (786,655 | ) | $ | (27,837,237 | ) | |||||
The difference between the tax cost of portfolio investments and the financial statement cost is primarily due to wash sale loss deferrals, investments in passive foreign investment company (“PFIC”) adjustments, regulated investment companies, and real estate investment trusts.
As of September 30, 2015, the Funds had the following capital loss carryforwards for federal income tax purposes:
| No | No | |||||||||||||||||||||||||||
| Short Term Expiring On | Expiration | Expiration | ||||||||||||||||||||||||||
| 2016 | 2017 | 2018 | 2019 | Short Term* | Long Term* | Total | ||||||||||||||||||||||
| Emerging Markets Equity Fund | $ | — | $ | — | $ | — | $ | — | $ | 8,763,606 | $ | 35,329,606 | $ | 44,093,212 | ||||||||||||||
| Global Real Estate Fund | — | — | — | — | 411,077 | 207,722 | 618,799 | |||||||||||||||||||||
| Mid Cap Fund | — | 53,047,209 | 70,800,792 | — | — | — | 123,848,001 | |||||||||||||||||||||
| Small Cap Value Fund** | — | — | 4,388,796 | — | — | — | 4,388,796 | |||||||||||||||||||||
| Total Return Bond Fund | — | — | — | — | 209,952 | 1,131,825 | 1,341,777 | |||||||||||||||||||||
| Ultra Short Duration Fixed Income Fund** | 1,769,310 | 3,231,117 | 3,336,624 | 933,830 | 7,281,827 | 9,154,260 | 25,706,968 | |||||||||||||||||||||
* The Regulated Investment Company Modernization Act of 2010 (the “Act”) was enacted on December 22, 2010. The Act made changes to several tax rules impacting the Funds. The provisions of the Act first became effective for the Funds’ fiscal year ended September 30, 2012 and are applicable to all subsequent fiscal years. Although the Act provides several benefits, including the unlimited carryover of future capital losses, there may be a greater likelihood that all or a portion of each Fund’s pre-enactment capital loss carryovers may expire without being utilized due to the fact that post-enactment capital losses must be utilized before pre-enactment capital loss carryovers may be utilized. Under the Act, new capital losses may now be carried forward indefinitely, and retain the character of the original loss as compared with pre-enactment law, where capital losses could be carried forward for up to eight years, and carried forward as short-term capital losses, irrespective of the character of the original loss.
** May be subject to limitation.
The capital loss carryforwards may be utilized in future years to offset net realized capital gains, if any, prior to distributing such gains to shareholders.
The following Funds had capital losses expiring in the current year as follows:
| Fund | Amount | |||
| Ultra Short Duration Fixed Income Fund | $ | 460,138 | ||
| 166 |
Notes to Financial Statements (Continued)
During the year ended September 30, 2015, the following Funds utilized capital loss carryforwards:
| Fund | Amount | |||
| Mid Cap Fund | $ | 12,593,959 | ||
| Small Cap Value Fund | 1,462,932 | |||
| Total Return Bond Fund | 138,756 | |||
Under current laws, certain capital losses realized after October 31 and ordinary losses realized after December 31 may be deferred (and certain ordinary losses after October and/or December 31 may be deferred) and treated as occurring on the first day of the following fiscal year. For the year ended September 30, 2015, the Funds elected to defer the following losses:
| Realized | Realized | |||||||||||
| Short-Term | Long-Term | |||||||||||
| Capital | Capital | Ordinary | ||||||||||
| Fund | Losses | Losses | Losses | |||||||||
| Merger Arbitrage Fund | $ | — | $ | 900,813 | $ | 793,371 | ||||||
| Mid Cap Fund | — | — | 38,973 | |||||||||
| Sands Capital Select Growth Fund | — | — | 21,615,887 | |||||||||
The Funds have analyzed their tax positions taken on federal income tax returns for all open tax years (tax years ended September 30, 2012 through 2015) and have concluded that no provision for income tax is required in their financial statements.
Certain reclassifications, the result of permanent differences between financial statement and income tax reporting requirements, have been made to the components of capital. These reclassifications have no impact on the net assets or NAV per share of the Funds. The following reclassifications, which are primarily attributed to the tax treatment of net investment losses, current year overdistributions, equalization utilized, foreign currency gains/losses, gains/losses and dividend expenses on short sales, paydown gains/losses on mortgage-backed securities, gains/losses on passive foreign investment companies, gains/losses on real estate investment trusts, reclassification of distributions, expiration of prior year capital loss carryovers and carryovers of temporary differences due to mergers have been made to the following Funds for the year ended September 30, 2015:
| Accumulated | Accumulated | |||||||||||
| Paid-In | Net Investment | Net Realized | ||||||||||
| Fund | Capital | Income(Loss) | Gains(Losses) | |||||||||
| Arbitrage Fund | $ | (12,641 | ) | $ | 1,416,226 | $ | (1,403,585 | ) | ||||
| Emerging Markets Equity Fund | — | (421,806 | ) | 421,806 | ||||||||
| Global Real Estate Fund | — | 138,831 | (138,831 | ) | ||||||||
| Merger Arbitrage Fund | (1,914,165 | ) | 4,574,620 | (2,660,455 | ) | |||||||
| Mid Cap Fund | (6,030 | ) | 6,030 | — | ||||||||
| Mid Cap Value Fund | 2,877,340 | 6,836 | (2,884,176 | ) | ||||||||
| Premium Yield Equity Fund | 1,389,693 | 13,224 | (1,402,917 | ) | ||||||||
| Sands Capital Select Growth Fund | 29,836,653 | 18,981,125 | (48,817,778 | ) | ||||||||
| Small Cap Core Fund | 10,696,947 | (1,037,031 | ) | (9,659,916 | ) | |||||||
| Small Cap Value Fund | 6,342 | 7,014 | (13,356 | ) | ||||||||
| Total Return Bond Fund | — | 898,863 | (898,863 | ) | ||||||||
| Ultra Short Duration Fixed Income Fund | (460,138 | ) | 4,316,074 | (3,855,936 | ) | |||||||
6. Commitments and Contingencies
The Funds indemnify theTrust’s officers andTrustees for certain liabilities that might arise from their performance of their duties to the Funds. Additionally, in the normal course of business, the Funds enter into contracts that contain a variety of representations and warranties and which provide general indemnifications. The Funds’ maximum exposure under these arrangements is unknown, as this would involve future claims that may be made against the Funds.
| 167 |
Notes to Financial Statements (Continued)
7. Risk Associated with Foreign Investments
Some of the Funds may invest in the securities of foreign issuers. Investing in securities issued by companies whose principal business activities are outside the U.S. may involve significant risks not present in domestic investments. For example, there is generally less publicly available information about foreign companies, particularly those not subject to the disclosure and reporting requirements of the U.S. securities laws. Foreign issuers are generally not bound by uniform accounting, auditing, and financial reporting requirements and standards of practice comparable to those applicable to domestic issuers. Investments in foreign securities also involve the risk of possible adverse changes in investment or exchange control regulations, expropriation or confiscatory taxation, limitations on the removal of funds or other assets of a Fund, political or financial instability or diplomatic and other developments which could affect such investments. Foreign stock markets, while growing in volume and sophistication, are generally not as developed as those in the U.S., and securities of some foreign issuers (particularly those located in developing countries) may be less liquid and more volatile than securities of comparable U.S. companies. In general, there is less overall governmental supervision and regulation of foreign securities markets, broker-dealers, and issuers than in the U.S.
8. Risk Associated with Concentration
Certain Funds may invest a high percentage of their assets in specific sectors of the market in order to achieve a potentially greater investment return. As a result, these Funds may be more susceptible to economic, political, and regulatory developments in a particular sector of the market, positive or negative, and may experience increased volatility on the Funds’ NAVs and magnified effect on the total return.
9. Risks Associated with Credit
An issuer may be unable to make timely payments of either principal or interest. This may cause the issuer’s securities to decline in value. Credit risk is particularly relevant to those Funds that invest a significant amount of their assets in junk bonds or lower-rated securities.
10. Risks Associated with Interest Rate Changes
As interest rates rise, the value of fixed-income securities a Fund owns will likely decrease. The price of debt securities is generally linked to the prevailing market interest rates. In general, when interest rates rise, the price of debt securities falls, and when interest rates fall, the price of debt securities rises. The price volatility of a debt security also depends on its maturity. Longer-term securities are generally more volatile, so the longer the average maturity or duration of these securities, the greater their price risk. Duration is a measure of the expected life, taking into account any prepayment or call features of the security, that is used to determine the price sensitivity of the security for a given change in interest rates. Specifically, duration is the change in the value of a fixed-income security that will result from a 1% change in interest rates, and generally is stated in years. For example, as a general rule a 1% rise in interest rates means a 1% fall in value for every year of duration. Maturity, on the other hand, is the date on which a fixed-income security becomes due for payment of principal. There may be less governmental intervention in the securities markets in the near future. The negative impact on fixed income securities if interest rates increase as a result could negatively impact a Fund’s NAV.
| 168 |
Notes to Financial Statements (Continued)
11. Fund Mergers
Mid Cap Value Fund:
At a meeting held on November 21, 2013, the Board approved an Agreement and Plan of Reorganization providing for the transfer of all assets and liabilities of the Touchstone Mid Cap Value Opportunities Fund to the Touchstone Mid Cap Value Fund. The tax-free merger took place on March 21, 2014.
The following is a summary of shares outstanding, net assets, net asset value per share and unrealized appreciation immediately before and after the reorganization.
| Before Reorganization | After Reorganization | |||||||||||
| Touchstone | ||||||||||||
| Mid Cap Value | Touchstone | Touchstone | ||||||||||
| Opportunities | Mid Cap Value | Mid Cap Value | ||||||||||
| Fund | Fund | Fund | ||||||||||
| Class A | ||||||||||||
| Shares | 913,005 | (A) | 299,971 | 1,212,976 | ||||||||
| Net Assets | $ | 14,967,633 | $ | 4,917,666 | $ | 19,885,299 | ||||||
| Net Asset Value | $ | 16.39 | (A) | $ | 16.39 | $ | 16.39 | |||||
| Class C | ||||||||||||
| Shares | 75,102 | (B) | 59,134 | 134,236 | ||||||||
| Net Assets | $ | 1,220,480 | $ | 960,982 | $ | 2,181,462 | ||||||
| Net Asset Value | $ | 16.25 | (B) | $ | 16.25 | $ | 16.25 | |||||
| Class Y | ||||||||||||
| Shares | 6,892,271 | (C) | 1,016,962 | 7,909,233 | ||||||||
| Net Assets | $ | 113,504,503 | $ | 16,747,761 | $ | 130,252,264 | ||||||
| Net Asset Value | $ | 16.47 | (C) | $ | 16.47 | $ | 16.47 | |||||
| Institutional Class | ||||||||||||
| Shares | 1,714,774 | (D) | 6,203,932 | 7,918,706 | ||||||||
| Net Assets | $ | 28,350,276 | $ | 102,569,628 | $ | 130,919,904 | ||||||
| Net Asset Value | $ | 16.53 | (D) | $ | 16.53 | $ | 16.53 | |||||
| Fund Total | ||||||||||||
| Shares Outstanding | 18,645,593 | 7,579,999 | 17,175,151 | |||||||||
| Net Assets | $ | 158,042,892 | $ | 125,196,037 | $ | 283,238,929 | ||||||
| Unrealized Appreciation (Depreciation) | $ | 8,366,217 | $ | 27,879,439 | $ | 36,245,656 | ||||||
(A) Reflects a 0.5137:1 stock split which occurred on the date of reorganization, March 21, 2014.
(B) Reflects a 0.5117:1 stock split which occurred on the date of reorganization, March 21, 2014.
(C) Reflects a 0.5152:1 stock split which occurred on the date of reorganization, March 21, 2014.
(D) Reflects a 0.5128:1 stock split which occurred on the date of reorganization, March 21, 2014.
Assuming the reorganization had been completed on October 1, 2013, the Mid Cap Value Fund results of operations for the year ended September 30, 2014 would have been as follows:
| Net investment income | $ | 2,123,962 | ||
| Net realized and unrealzed gains on investments | 39,656,887 | |||
| Net increase in net assets from operations | $ | 41,780,849 |
Because the combined investment portfolios have been managed as a single portfolio since the reorganization was completed, it is not practical to separate the amounts of revenue and earnings to the Mid Cap Value Fund that have been included in its statement of operations since the reorganization.
| 169 |
Notes to Financial Statements (Continued)
Small Cap Value Fund:
At a meeting held on November 21, 2013, the Board approved an Agreement and Plan of Reorganization providing for the transfer of all assets and liabilities of the Touchstone Small Company Value Fund to the Touchstone Small Cap Value Fund. The tax-free merger took place on March 21, 2014.
The following is a summary of shares outstanding, net assets, net asset value per share and unrealized appreciation (depreciation) immediately before and after the reorganization.
| Before Reorganization | After Reorganization | |||||||||||
| Touchstone | Touchstone | Touchstone | ||||||||||
| Small Company | Small Cap Value | Small Cap Value | ||||||||||
| Value Fund | Fund | Fund | ||||||||||
| Class A | ||||||||||||
| Shares | 100,358 | (A) | 1,405,942 | 1,506,300 | ||||||||
| Net Assets | $ | 2,549,878 | $ | 35,722,061 | $ | 38,271,939 | ||||||
| Net Asset Value | $ | 25.41 | (A) | $ | 25.41 | $ | 25.41 | |||||
| Class C | ||||||||||||
| Shares | 59,836 | (B) | 30,879 | 90,715 | ||||||||
| Net Assets | $ | 1,506,072 | $ | 777,242 | $ | 2,283,314 | ||||||
| Net Asset Value | $ | 25.17 | (B) | $ | 25.17 | $ | 25.17 | |||||
| Class Y | ||||||||||||
| Shares | 269,342 | (C) | 42,705 | 312,047 | ||||||||
| Net Assets | $ | 6,856,609 | $ | 1,087,134 | $ | 7,943,743 | ||||||
| Net Asset Value | $ | 25.46 | (C) | $ | 25.46 | $ | 25.46 | |||||
| Institutional Class | ||||||||||||
| Shares | 233,106 | (D) | 1,112,220 | 1,345,326 | ||||||||
| Net Assets | $ | 5,932,909 | $ | 28,307,741 | $ | 34,240,650 | ||||||
| Net Asset Value | $ | 25.45 | (D) | $ | 25.45 | $ | 25.45 | |||||
| Fund Total | ||||||||||||
| Shares Outstanding | 939,783 | 2,591,746 | 3,254,388 | |||||||||
| Net Assets | $ | 16,845,468 | $ | 65,894,178 | $ | 82,739,646 | ||||||
| Unrealized Appreciation (Depreciation) | $ | 2,463,630 | $ | 5,238,516 | $ | 7,702,146 | ||||||
(A) Reflects a 0.7013:1 stock split which occurred on the date of reorganization, March 21, 2014.
(B) Reflects a 0.6497:1 stock split which occurred on the date of reorganization, March 21, 2014.
(C) Reflects a 0.7129:1 stock split which occurred on the date of reorganization, March 21, 2014.
(D) Reflects a 0.7133:1 stock split which occurred on the date of reorganization, March 21, 2014.
Assuming this reorganization had been completed on October 1, 2013, the Small Cap Value Fund results of operations for the year ended September 30, 2014 would have been as follows:
| Net investment income | $ | 1,305,913 | ||
| Net realized and unrealized gains on investments | 4,164,012 | |||
| Net increase in net assets from operations | $ | 5,469,925 |
Because the combined investment portfolios have been managed as a single portfolio since the reorganization was completed, it is not practical to separate the amounts of revenue and earnings to the Small Cap Value Fund that have been included in its statement of operations since the reorganization.
| 170 |
Notes to Financial Statements (Continued)
12. Litigation
In January 2012, the Old Mutual Mid-Cap Fund (which reorganized into the TS&W Mid-Cap Value Fund in March 2009, the Touchstone Mid Cap Value Opportunities Fund in April 2012 and the Touchstone Mid Cap Value Fund in March 2014) was served with a summons and complaint in an action brought by Edward S.Weisfelner, as Trustee of the LB Creditor Trust, in the case captioned Weisfelner v. Fund 1 (U.S. Bankr. S.D.N.Y. Adv. Pro. No. 10-4609) (the “Action”). The Action alleges that, under state law, all payments made to shareholders in the December 2007 leveraged buyout of Lyondell Chemical Company were made, by means of intentional and constructive fraudulent transfer and seeks to recover all those payments. The amount sought to be disgorged is $3,784,800, which is what the Fund received in payments in connection with the leveraged buyout. The Fund (along with thousands of other defendants) has filed a joinder to the currently pending motion to dismiss. The court heard oral argument on the motion to dismiss in January 2015, and the parties await the court’s ruling on that motion. The path the litigation will follow (including whether it will proceed at all) depends on the outcome of that ruling; however, it is uncertain when that ruling will come down. At this nascent stage of the litigation, it is not possible to assess the likely outcome. The Fund is currently assessing the case and has not yet determined the potential effect, if any, on its net asset value.
13. Subsequent Events
Subsequent events occurring after the date of this report have been evaluated for potential impact to this report through the date the financial statements were issued. There were no subsequent events that necessitated recognition or disclosure on the Funds’ financial statements.
| 171 |
Report of Independent Registered Public Accounting Firm
To the Board of Trustees and Shareholders of Touchstone Funds Group Trust
We have audited the accompanying statements of assets and liabilities, including the portfolios of investments, of Touchstone Funds Group Trust (comprising, respectively, the Touchstone Arbitrage, Touchstone Emerging Markets Equity, Touchstone Global Real Estate, Touchstone Merger Arbitrage, Touchstone Mid Cap, Touchstone Mid Cap Value, Touchstone Premium Yield Equity, Touchstone Sands Capital Select Growth, Touchstone Small Cap Core, Touchstone Small Cap Value, Touchstone Total Return Bond, and Touchstone Ultra Short Duration Fixed Income Funds) (the “Funds”) as of September 30, 2015, and the related statements of operations for the year then ended, the statements of changes in net assets for each of the two years in the period then ended and the financial highlights for each of the years or periods indicated therein, except as noted below for Touchstone Total Return Bond Fund. These financial statements and financial highlights are the responsibility of the Funds’ management. Our responsibility is to express an opinion on these financial statements and financial highlights based on our audits. The financial highlights for the period ended March 31, 2011 of Touchstone Total Return Bond Fund were audited by other auditors whose report dated May 31, 2011, expressed an unqualified opinion on those financial highlights.
We conducted our audits in accordance with the standards of the Public Company Accounting Oversight Board (United States). Those standards require that we plan and perform the audits to obtain reasonable assurance about whether the financial statements and financial highlights are free of material misstatement. We were not engaged to perform an audit of the Funds’ internal control over financial reporting. Our audits included consideration of internal control over financial reporting as a basis for designing audit procedures that are appropriate in the circumstances, but not for the purpose of expressing an opinion on the effectiveness of the Funds’ internal control over financial reporting. Accordingly, we express no such opinion. An audit also includes examining, on a test basis, evidence supporting the amounts and disclosures in the financial statements and financial highlights, assessing the accounting principles used and significant estimates made by management, and evaluating the overall financial statement presentation. Our procedures included confirmation of securities owned as of September 30, 2015, by correspondence with the custodian, transfer agent, and brokers or by other appropriate auditing procedures where replies from brokers were not received. We believe that our audits provide a reasonable basis for our opinion.
In our opinion, the financial statements and financial highlights referred to above present fairly, in all material respects, the financial position of each of the respective funds constituting Touchstone Funds Group Trust at September 30, 2015, the results of their operations for the year then ended, the changes in their net assets for each of the two years in the period then ended and the financial highlights for each of the years or periods indicated therein, except as noted above for Touchstone Total Return Bond Fund, in conformity with U.S generally accepted accounting principles.

Cincinnati, Ohio
November 24, 2015
| 172 |
Qualified Dividend Income
Under the Jobs and Growth Tax Relief Reconciliation Act of 2003 (the “Act”), the following percentages of ordinary dividends paid during the fiscal year ended September 30, 2015 are designated as “qualified dividend income,” as defined in the Act, and are subject to reduced tax rates. The Funds intend to pass through the maximum allowable percentage for Form 1099 Div.
| Emerging Markets Equity Fund | 100.00 | % | ||
| Global Real Estate Fund | 24.77 | % | ||
| Mid Cap Fund | 100.00 | % | ||
| Mid Cap Value Fund | 42.14 | % | ||
| Premium Yield Equity Fund | 100.00 | % | ||
| Small Cap Core Fund | 29.06 | % | ||
| Small Cap Value Fund | 100.00 | % |
Dividend Received Deduction
For corporate shareholders, the following ordinary distributions paid during the current fiscal year ended September 30, 2015 qualify for the corporate dividends received deduction. The Funds intend to pass through the maximum allowable percentage for Form 1099 Div.
| Emerging Markets Equity Fund | 0.05 | % | ||
| Global Real Estate Fund | 0.28 | % | ||
| Mid Cap Fund | 100.00 | % | ||
| Mid Cap Value Fund | 41.48 | % | ||
| Premium Yield Equity Fund | 87.40 | % | ||
| Small Cap Core Fund | 42.76 | % | ||
| Small Cap Value Fund | 100.00 | % |
For the fiscal year ended September 30, 2015, the Arbitrage Fund, Merger Arbitrage Fund, Mid Cap Value Fund, Premium Yield Equity Fund, Sands Capital Select Growth Fund, Small Cap Core Fund and Small Cap Value Fund designated $350,081, $1,566,064, $18,371,404, $10,291,459, $436,501,746, $77,384,323 and $2,819,183 respectively, as long-term capital gains.
Foreign Tax Income & Foreign Tax Credit
Emerging Markets Equity Fund and Global Real Estate Fund intend to pass through a foreign tax credit to the shareholders. For the fiscal year ended September 30, 2015, the total amount of foreign source income is $8,271,755 or $0.29 per share and $661,463 or $0.27, respectively. The total amount of foreign taxes to be paid is $526,704 or $0.01 per share and $22,095 or $0.01 per share, respectively. Your allocable share of the foreign tax credit will be reported on Form 1099 Div.
Proxy Voting Guidelines and Proxy Voting Records
The Sub-Advisors are responsible for exercising the voting rights associated with the securities purchased and held by the Funds. A description of the policies and procedures that the Sub-Advisors use in fulfilling this responsibility is available as an appendix to the most recent Statement of Additional Information, which can be obtained without charge by calling toll free 1.800.543.0407 or by visiting the Touchstone website at www.touchstoneinvestments.com or on the Securities and Exchange Commission’s (the “Commission”) website www.sec.gov. Information regarding how those proxies were voted during the most recent twelve-month period ended June 30 is also available without charge by calling toll free 1.800.543.0407 or on the Commission’s website at www.sec.gov.
| 173 |
Other Items (Unaudited) (Continued)
Quarterly Portfolio Disclosure
The Trust files a complete listing of portfolio holdings for each Fund as of the end of the first and third quarters of each fiscal year on Form N-Q. The complete listing (i) is available on the Commission’s website; (ii) may be reviewed and copied at the Commission’s Public Reference Room in Washington, DC; or (iii) will be made available to shareholders upon request by calling 1.800.543.0407. Information on the operation of the Public Reference Room may be obtained by calling 1.800.SEC.0330.
Schedule of Shareholder Expenses
As a shareholder of the Funds, you incur two types of costs: (1) transaction costs, including reinvested dividends or other distributions; and (2) ongoing costs, including investment advisory fees; distribution (12b-1) fees; and other Fund expenses. This example is intended to help you understand your ongoing costs (in dollars) of investing in the Funds and to compare these costs with the ongoing costs of investing in other mutual funds. The example is based on an investment of $1,000 invested at the beginning of the period and held for the entire period (April 1, 2015 through September 30, 2015).
Actual Expenses
The first line for each share class of a Fund in the table below provides information about actual account values and actual expenses. You may use the information in this line, together with the amount you invested, to estimate the expenses that you paid over the period. Simply divide your account value by $1,000 (for example, an $8,600 account value divided by $1,000 = 8.6), then multiply the result by the number in the first line under the heading entitled “Expenses Paid During the Six Months Ended September 30, 2015” to estimate the expenses you paid on your account during this period.
Hypothetical Example for Comparison Purposes
The second line for each share class of a Fund in the table below provides information about hypothetical account values and hypothetical expenses based on the Funds’ actual expense ratio and an assumed rate of return of 5% per year before expenses, which is not the Funds’ actual return. The hypothetical account values and expenses may not be used to estimate the actual ending account balance or expenses you paid for the period. You may use this information to compare the ongoing costs of investing in the Funds and other funds. To do so, compare this 5% hypothetical example with the 5% hypothetical examples that appear in the shareholder reports of the other funds.
Please note that the expenses shown in the table below are meant to highlight your ongoing costs only and do not reflect any transactional costs, such as sales charges (loads), redemption fees, or exchange fees. Therefore, the second line for each share class of a Fund in the table below is useful in comparing ongoing costs only, and will not help you determine the relative total costs of owning different funds. In addition, if these transactional costs were included, your costs would have been higher.
| 174 |
Other Items (Unaudited) (Continued)
Schedule of Shareholder Expenses (Continued)
| Expenses | ||||||||||||||||||
| Net Expense | Beginning | Ending | Paid During | |||||||||||||||
| Ratio | Account | Account | the Six Months | |||||||||||||||
| Annualized | Value | Value | Ended | |||||||||||||||
| September 30, | April 1, | September 30, | September 30, | |||||||||||||||
| 2015 | 2015 | 2015 | 2015* | |||||||||||||||
| Touchstone Arbitrage Fund | ||||||||||||||||||
| Class A | Actual | 2.30 | % | $ | 1,000.00 | $ | 994.00 | $ | 11.50 | ** | ||||||||
| Class A | Hypothetical | 2.30 | % | $ | 1,000.00 | $ | 1,013.54 | $ | 11.61 | ** | ||||||||
| Class C | Actual | 3.06 | % | $ | 1,000.00 | $ | 989.90 | $ | 15.26 | ** | ||||||||
| Class C | Hypothetical | 3.06 | % | $ | 1,000.00 | $ | 1,009.73 | $ | 15.42 | ** | ||||||||
| Class Y | Actual | 1.99 | % | $ | 1,000.00 | $ | 995.00 | $ | 9.95 | ** | ||||||||
| Class Y | Hypothetical | 1.99 | % | $ | 1,000.00 | $ | 1,015.09 | $ | 10.05 | ** | ||||||||
| Institutional Class | Actual | 1.90 | % | $ | 1,000.00 | $ | 995.00 | $ | 9.50 | ** | ||||||||
| Institutional Class | Hypothetical | 1.90 | % | $ | 1,000.00 | $ | 1,015.54 | $ | 9.60 | ** | ||||||||
| Touchstone Emerging Markets Equity Fund | ||||||||||||||||||
| Class A | Actual | 1.69 | % | $ | 1,000.00 | $ | 817.70 | $ | 7.70 | |||||||||
| Class A | Hypothetical | 1.69 | % | $ | 1,000.00 | $ | 1,016.60 | $ | 8.54 | |||||||||
| Class C | Actual | 2.44 | % | $ | 1,000.00 | $ | 814.90 | $ | 11.10 | |||||||||
| Class C | Hypothetical | 2.44 | % | $ | 1,000.00 | $ | 1,012.84 | $ | 12.31 | |||||||||
| Class Y | Actual | 1.40 | % | $ | 1,000.00 | $ | 819.10 | $ | 6.38 | |||||||||
| Class Y | Hypothetical | 1.40 | % | $ | 1,000.00 | $ | 1,018.05 | $ | 7.08 | |||||||||
| Institutional Class | Actual | 1.29 | % | $ | 1,000.00 | $ | 820.00 | $ | 5.89 | |||||||||
| Institutional Class | Hypothetical | 1.29 | % | $ | 1,000.00 | $ | 1,018.60 | $ | 6.53 | |||||||||
| Touchstone Global Real Estate Fund | ||||||||||||||||||
| Class A | Actual | 1.39 | % | $ | 1,000.00 | $ | 906.70 | $ | 6.64 | |||||||||
| Class A | Hypothetical | 1.39 | % | $ | 1,000.00 | $ | 1,018.10 | $ | 7.03 | |||||||||
| Class C | Actual | 2.14 | % | $ | 1,000.00 | $ | 902.60 | $ | 10.21 | |||||||||
| Class C | Hypothetical | 2.14 | % | $ | 1,000.00 | $ | 1,014.34 | $ | 10.81 | |||||||||
| Class Y | Actual | 1.14 | % | $ | 1,000.00 | $ | 907.20 | $ | 5.45 | |||||||||
| Class Y | Hypothetical | 1.14 | % | $ | 1,000.00 | $ | 1,019.35 | $ | 5.77 | |||||||||
| Institutional Class | Actual | 0.99 | % | $ | 1,000.00 | $ | 908.20 | $ | 4.74 | |||||||||
| Institutional Class | Hypothetical | 0.99 | % | $ | 1,000.00 | $ | 1,020.10 | $ | 5.01 | |||||||||
| Touchstone Merger Arbitrage Fund | ||||||||||||||||||
| Class A | Actual | 2.06 | % | $ | 1,000.00 | $ | 991.50 | $ | 10.28 | *** | ||||||||
| Class A | Hypothetical | 2.06 | % | $ | 1,000.00 | $ | 1,014.74 | $ | 10.40 | *** | ||||||||
| Class C | Actual | 2.89 | % | $ | 1,000.00 | $ | 986.50 | $ | 14.39 | *** | ||||||||
| Class C | Hypothetical | 2.89 | % | $ | 1,000.00 | $ | 1,010.58 | $ | 14.57 | *** | ||||||||
| Class Y | Actual | 1.89 | % | $ | 1,000.00 | $ | 991.60 | $ | 9.44 | *** | ||||||||
| Class Y | Hypothetical | 1.89 | % | $ | 1,000.00 | $ | 1,015.59 | $ | 9.55 | *** | ||||||||
| Institutional Class | Actual | 1.80 | % | $ | 1,000.00 | $ | 992.50 | $ | 8.99 | *** | ||||||||
| Institutional Class | Hypothetical | 1.80 | % | $ | 1,000.00 | $ | 1,016.04 | $ | 9.10 | *** | ||||||||
| 175 |
Other Items (Unaudited) (Continued)
Schedule of Shareholder Expenses (Continued)
| Expenses | ||||||||||||||||||
| Net Expense | Beginning | Ending | Paid During | |||||||||||||||
| Ratio | Account | Account | the Six Months | |||||||||||||||
| Annualized | Value | Value | Ended | |||||||||||||||
| September 30, | April 1, | September 30, | September 30, | |||||||||||||||
| 2015 | 2015 | 2015 | 2015* | |||||||||||||||
| Touchstone Mid Cap Fund | ||||||||||||||||||
| Class A | Actual | 1.24 | % | $ | 1,000.00 | $ | 894.80 | $ | 5.89 | |||||||||
| Class A | Hypothetical | 1.24 | % | $ | 1,000.00 | $ | 1,018.85 | $ | 6.28 | |||||||||
| Class C | Actual | 1.99 | % | $ | 1,000.00 | $ | 891.50 | $ | 9.44 | |||||||||
| Class C | Hypothetical | 1.99 | % | $ | 1,000.00 | $ | 1,015.09 | $ | 10.05 | |||||||||
| Class Y | Actual | 0.99 | % | $ | 1,000.00 | $ | 895.80 | $ | 4.70 | |||||||||
| Class Y | Hypothetical | 0.99 | % | $ | 1,000.00 | $ | 1,020.10 | $ | 5.01 | |||||||||
| Class Z | Actual | 1.24 | % | $ | 1,000.00 | $ | 894.90 | $ | 5.89 | |||||||||
| Class Z | Hypothetical | 1.24 | % | $ | 1,000.00 | $ | 1,018.85 | $ | 6.28 | |||||||||
| Institutional Class | Actual | 0.92 | % | $ | 1,000.00 | $ | 896.20 | $ | 4.37 | |||||||||
| Institutional Class | Hypothetical | 0.92 | % | $ | 1,000.00 | $ | 1,020.46 | $ | 4.66 | |||||||||
| Touchstone Mid Cap Value Fund | ||||||||||||||||||
| Class A | Actual | 1.29 | % | $ | 1,000.00 | $ | 915.90 | $ | 6.20 | |||||||||
| Class A | Hypothetical | 1.29 | % | $ | 1,000.00 | $ | 1,018.60 | $ | 6.53 | |||||||||
| Class C | Actual | 2.04 | % | $ | 1,000.00 | $ | 912.20 | $ | 9.78 | |||||||||
| Class C | Hypothetical | 2.04 | % | $ | 1,000.00 | $ | 1,014.84 | $ | 10.30 | |||||||||
| Class Y | Actual | 1.07 | % | $ | 1,000.00 | $ | 916.60 | $ | 5.14 | |||||||||
| Class Y | Hypothetical | 1.07 | % | $ | 1,000.00 | $ | 1,019.70 | $ | 5.42 | |||||||||
| Institutional Class | Actual | 0.89 | % | $ | 1,000.00 | $ | 917.30 | $ | 4.28 | |||||||||
| Institutional Class | Hypothetical | 0.89 | % | $ | 1,000.00 | $ | 1,020.61 | $ | 4.51 | |||||||||
| Touchstone Premium Yield Equity Fund | ||||||||||||||||||
| Class A | Actual | 1.20 | % | $ | 1,000.00 | $ | 879.40 | $ | 5.65 | |||||||||
| Class A | Hypothetical | 1.20 | % | $ | 1,000.00 | $ | 1,019.05 | $ | 6.07 | |||||||||
| Class C | Actual | 1.95 | % | $ | 1,000.00 | $ | 875.90 | $ | 9.17 | |||||||||
| Class C | Hypothetical | 1.95 | % | $ | 1,000.00 | $ | 1,015.29 | $ | 9.85 | |||||||||
| Class Y | Actual | 0.95 | % | $ | 1,000.00 | $ | 880.30 | $ | 4.48 | |||||||||
| Class Y | Hypothetical | 0.95 | % | $ | 1,000.00 | $ | 1,020.31 | $ | 4.81 | |||||||||
| Touchstone Sands Capital Select Growth Fund | ||||||||||||||||||
| Class A | Actual | 1.10 | % | $ | 1,000.00 | $ | 916.10 | $ | 5.28 | |||||||||
| Class A | Hypothetical | 1.10 | % | $ | 1,000.00 | $ | 1,019.55 | $ | 5.57 | |||||||||
| Class C | Actual | 1.85 | % | $ | 1,000.00 | $ | 912.50 | $ | 8.87 | |||||||||
| Class C | Hypothetical | 1.85 | % | $ | 1,000.00 | $ | 1,015.79 | $ | 9.35 | |||||||||
| Class Y | Actual | 0.86 | % | $ | 1,000.00 | $ | 916.80 | $ | 4.13 | |||||||||
| Class Y | Hypothetical | 0.86 | % | $ | 1,000.00 | $ | 1,020.76 | $ | 4.36 | |||||||||
| Class Z | Actual | 1.09 | % | $ | 1,000.00 | $ | 915.60 | $ | 5.23 | |||||||||
| Class Z | Hypothetical | 1.09 | % | $ | 1,000.00 | $ | 1,019.60 | $ | 5.52 | |||||||||
| 176 |
Other Items (Unaudited) (Continued)
Schedule of Shareholder Expenses (Continued)
| Expenses | ||||||||||||||||||
| Net Expense | Beginning | Ending | Paid During | |||||||||||||||
| Ratio | Account | Account | the Six Months | |||||||||||||||
| Annualized | Value | Value | Ended | |||||||||||||||
| September 30, | April 1, | September 30, | September 30, | |||||||||||||||
| 2015 | 2015 | 2015 | 2015* | |||||||||||||||
| Touchstone Small Cap Core Fund | ||||||||||||||||||
| Class A | Actual | 1.38 | % | $ | 1,000.00 | $ | 847.50 | $ | 6.39 | |||||||||
| Class A | Hypothetical | 1.38 | % | $ | 1,000.00 | $ | 1,018.15 | $ | 6.98 | |||||||||
| Class C | Actual | 2.13 | % | $ | 1,000.00 | $ | 844.50 | $ | 9.85 | |||||||||
| Class C | Hypothetical | 2.13 | % | $ | 1,000.00 | $ | 1,014.39 | $ | 10.76 | |||||||||
| Class Y | Actual | 1.13 | % | $ | 1,000.00 | $ | 848.60 | $ | 5.24 | |||||||||
| Class Y | Hypothetical | 1.13 | % | $ | 1,000.00 | $ | 1,019.40 | $ | 5.72 | |||||||||
| Institutional Class | Actual | 1.03 | % | $ | 1,000.00 | $ | 849.30 | $ | 4.77 | |||||||||
| Institutional Class | Hypothetical | 1.03 | % | $ | 1,000.00 | $ | 1,019.90 | $ | 5.22 | |||||||||
| Touchstone Small Cap Value Fund | ||||||||||||||||||
| Class A | Actual | 1.38 | % | $ | 1,000.00 | $ | 858.10 | $ | 6.43 | |||||||||
| Class A | Hypothetical | 1.38 | % | $ | 1,000.00 | $ | 1,018.15 | $ | 6.98 | |||||||||
| Class C | Actual | 2.13 | % | $ | 1,000.00 | $ | 854.90 | $ | 9.90 | |||||||||
| Class C | Hypothetical | 2.13 | % | $ | 1,000.00 | $ | 1,014.39 | $ | 10.76 | |||||||||
| Class Y | Actual | 1.13 | % | $ | 1,000.00 | $ | 859.30 | $ | 5.27 | |||||||||
| Class Y | Hypothetical | 1.13 | % | $ | 1,000.00 | $ | 1,019.40 | $ | 5.72 | |||||||||
| Institutional Class | Actual | 0.98 | % | $ | 1,000.00 | $ | 860.00 | $ | 4.57 | |||||||||
| Institutional Class | Hypothetical | 0.98 | % | $ | 1,000.00 | $ | 1,020.16 | $ | 4.96 | |||||||||
| Touchstone Total Return Bond Fund | ||||||||||||||||||
| Class A | Actual | 0.90 | % | $ | 1,000.00 | $ | 992.80 | $ | 4.50 | |||||||||
| Class A | Hypothetical | 0.90 | % | $ | 1,000.00 | $ | 1,020.56 | $ | 4.56 | |||||||||
| Class C | Actual | 1.65 | % | $ | 1,000.00 | $ | 989.20 | $ | 8.23 | |||||||||
| Class C | Hypothetical | 1.65 | % | $ | 1,000.00 | $ | 1,016.80 | $ | 8.34 | |||||||||
| Class Y | Actual | 0.69 | % | $ | 1,000.00 | $ | 993.80 | $ | 3.45 | |||||||||
| Class Y | Hypothetical | 0.69 | % | $ | 1,000.00 | $ | 1,021.61 | $ | 3.50 | |||||||||
| Institutional Class | Actual | 0.50 | % | $ | 1,000.00 | $ | 994.80 | $ | 2.50 | |||||||||
| Institutional Class | Hypothetical | 0.50 | % | $ | 1,000.00 | $ | 1,022.56 | $ | 2.54 | |||||||||
| 177 |
Other Items (Unaudited) (Continued)
Schedule of Shareholder Expenses (Continued)
| Expenses | ||||||||||||||||||
| Net Expense | Beginning | Ending | Paid During | |||||||||||||||
| Ratio | Account | Account | the Six Months | |||||||||||||||
| Annualized | Value | Value | Ended | |||||||||||||||
| September 30, | April 1, | September 30, | September 30, | |||||||||||||||
| 2015 | 2015 | 2015 | 2015* | |||||||||||||||
| Touchstone Ultra Short Duration Fixed Income Fund | ||||||||||||||||||
| Class A | Actual | 0.69 | % | $ | 1,000.00 | $ | 1,001.60 | $ | 3.46 | |||||||||
| Class A | Hypothetical | 0.69 | % | $ | 1,000.00 | $ | 1,021.61 | $ | 3.50 | |||||||||
| Class C | Actual | 1.19 | % | $ | 1,000.00 | $ | 999.10 | $ | 5.96 | |||||||||
| Class C | Hypothetical | 1.19 | % | $ | 1,000.00 | $ | 1,019.10 | $ | 6.02 | |||||||||
| Class Y | Actual | 0.44 | % | $ | 1,000.00 | $ | 1,002.90 | $ | 2.21 | |||||||||
| Class Y | Hypothetical | 0.44 | % | $ | 1,000.00 | $ | 1,022.86 | $ | 2.23 | |||||||||
| Class Z | Actual | 0.69 | % | $ | 1,000.00 | $ | 1,001.60 | $ | 3.46 | |||||||||
| Class Z | Hypothetical | 0.69 | % | $ | 1,000.00 | $ | 1,021.61 | $ | 3.50 | |||||||||
| Institutional Class | Actual | 0.39 | % | $ | 1,000.00 | $ | 1,003.10 | $ | 1.96 | |||||||||
| Institutional Class | Hypothetical | 0.39 | % | $ | 1,000.00 | $ | 1,023.11 | $ | 1.98 | |||||||||
| * | Expenses are equal to the Fund's annualized expense ratio, multiplied by the average account value over the period, multiplied by 183/365 (to reflect one-half year period). |
| ** | Excluding interest and dividend expenses on securities sold short, your actual cost of investment in Class A, Class C, Class Y and Institutional Class would be $8.40, $12.17, $6.85 and $6.40, respectively, and your hypothetical cost of investment in Class A, Class C, Class Y and Institutional Class would be $8.49,$12.31, $6.93, and $6.48, respectively. |
| *** | Excluding interest and dividend expenses on securities sold short, your actual cost of investment in Class A, Class C, Class Y and Institutional Class would be $7.59, $11.70, $6.74 and $6.29, respectively, and your hypothetical cost of investment in Class A, Class C, Class Y and Institutional Class would be $7.69,$11.86, $6.83, and $6.38, respectively. |
| 178 |
Management of the Trust (Unaudited)
Listed below is required information regarding the Trustees and principal officers of the Trust. The Trust’s Statement of Additional Information includes additional information about theTrustees and is available, without charge, upon request by calling 1.800.543.0407 or by visiting the Touchstone website at TouchstoneInvestments.com.
| Interested Trustee1: | ||||||||||
| Number | ||||||||||
| of Funds | ||||||||||
| Overseen | ||||||||||
| Term of | in the | |||||||||
| Name | Position(s) | Office And | Touchstone | Other | ||||||
| Address | Held with | Length of | Principal Occupation(s) | Fund | Directorships | |||||
| Age | Trust | Time Served | During Past 5 Years | Complex2 | Held During the Past 5 Years3 | |||||
Jill T. McGruder Touchstone Advisors, Inc. 303 Broadway Suite 1100 Cincinnati, OH 45202 Year of Birth: 1955 | Trustee and President | Until retirement at age 75 or until she resigns or is removed Trustee since 1999 | President and CEO of IFS Financial Services, Inc. (a holding company). | 43 | Director of LaRosa’s, Inc. (a restaurant chain) from 1999 to 2011; IFS Financial Services, Inc. (a holding company) from 1999 to the present; Integrity and National Integrity Life Insurance Co. from 2005 to the present; Touchstone Securities (the Trust’s distributor) from 1999 to the present; Touchstone Advisors (the Trust’s investment advisor and administrator) from 1999 to the present; W&S Brokerage Services (a brokerage company) from 1999 to the present; W&S Financial Group Distributors (a distribution company) from 1999 to the present; Every Child Succeeds (a social services company) from 2007 to the present; Taft Museum of Art from 2007 to the present; and YMCA of Greater Cincinnati from 2012 to the present. | |||||
| Independent Trustees: | ||||||||||
Phillip R. Cox c/o Touchstone Advisors, Inc. 303 Broadway Suite 1100 Cincinnati, OH 45202 Year of Birth: 1947 | Trustee | Until retirement at age 75 or until he resigns or is removed Trustee since 1999 | President and Chief Executive Officer of Cox Financial Corp. (a financial services company) from 1971 to the present. | 43 | Director of Cincinnati Bell (a communications company) from 1994 to the present; Bethesda Inc. (a hospital) from 2005 to the present; Timken Co. (a manufacturing company) from 2004 to 2014; TimkenSteel from 2014 to the present; Diebold, Inc. (a technology solutions company) from 2004 to the present; and Ohio Business Alliance for Higher Education and the Economy from 2005 to the present. | |||||
William C. Gale c/o Touchstone Advisors, Inc. 303 Broadway Suite 1100 Cincinnati, OH 45202 Year of Birth: 1952 | Trustee | Until retirement at age 75 or until he resigns or is removed Trustee since 2013 | Senior Vice President and Chief Financial Officer (from 2003 to January 2015) of Cintas Corporation (a business services company). | 43 | None. |
| 179 |
Management of the Trust (Unaudited) (Continued)
| Independent Trustees (Continued): | ||||||||||
| Number | ||||||||||
| of Funds | ||||||||||
| Overseen | ||||||||||
| Term of | in the | |||||||||
| Name | Position(s) | Office And | Touchstone | Other | ||||||
| Address | Held with | Length of | Principal Occupation(s) | Fund | Directorships | |||||
| Age | Trust | Time Served | During Past 5 Years | Complex2 | Held During the Past 5 Years3 | |||||
Susan J. Hickenlooper c/o Touchstone Advisors, Inc. 303 Broadway Suite 1100 Cincinnati, OH 45202 Year of Birth: 1946 | Trustee | Until retirement at age 75 or until she resigns or is removed Trustee since 2009 | Financial Analyst for Impact 100 (charitable organization) from 2012 to 2013. | 43 | Trustee of Diocese of Southern Ohio from 2014 to the present; and Trustee of Episcopal Retirement Homes Foundation from 1998 to 2011 (a charitable organization). | |||||
Kevin A. Robie c/o Touchstone Advisors, Inc. 303 Broadway Suite 1100 Cincinnati, OH 45202 Year of Birth: 1956 | Trustee | Until retirement at age 75 or until he resigns or is removed Trustee since 2013 | Vice President of Portfolio Management at Soin International LLC (a multinational holding company) from 2004 to the present. | 43 | Director of Buckeye EcoCare, Inc. (a lawn care company) from 2013 to the present; Trustee of Dayton Region New Market Fund, LLC (a private fund) from 2010 to the present; Trustee of the Entrepreneurs Center, Inc. (a small business incubator) from 2006 to the present; and Director of Interventional Imaging, Inc. (a medical device company) from 2004 to 2011. | |||||
Edward J. VonderBrink c/o Touchstone Advisors, Inc. 303 Broadway Suite 1100 Cincinnati, OH 45202 Year of Birth: 1944 | Trustee | Until retirement at age 75 or until he resigns or is removed Trustee since 2013 | Consultant, VonderBrink Consulting LLC from 2000 to the present. | 43 | Director of Streamline Health Solutions, Inc. (healthcare IT) from 2006 to the present; Mercy Health from 2013 to the present; Mercy Health Foundation (healthcare nonprofit) from 2008 to the present; and Al Neyer Inc. (a construction company) from 2013 to the present. |
| 1 | Ms. McGruder, as a director of the Advisor and the Trust's Distributor, and an officer of affiliates of the Advisor and the Trust's Distributor, is an “interested person” of the Trust within the meaning of Section 2(a)(19) of the 1940 Act. |
| 2 | As of September 30, 2015, the Touchstone Fund Complex consisted of 12 series of the Trust, 9 variable annuity series of the Touchstone Variable Series Trust, 1 series of Touchstone Tax-Free Trust, 1 series of Touchstone Institutional Funds Trust, 2 series of Touchstone Investment Trust, and 18 series of Touchstone Strategic Trust. |
| 3 | Each Trustee is also a Trustee of Touchstone Variable Series Trust, Touchstone Institutional Funds Trust, Touchstone Investment Trust, Touchstone Strategic Trust, and Touchstone Tax-Free Trust. |
| 180 |
Management of the Trust (Unaudited) (Continued)
The following is a list of the Officers of the Trusts, the length of time served and principal occupations for the past five years.
| Principal Officers: | ||||||
| Term of | ||||||
| Name | Position(s) | Office And | ||||
| Address | Held with | Length of | Principal Occupation(s) | |||
| Age | Trust1 | Time Served | During the Past 5 Years | |||
Jill T. McGruder Touchstone Advisors, Inc. 303 Broadway Suite 1100 Cincinnati, OH 45202 Year of Birth: 1955 | President | Until resignation, removal or disqualification President since 2006 | See biography above. | |||
Steven M. Graziano Touchstone Advisors, Inc. 303 Broadway Suite 1100 Cincinnati, OH 45202 Year of Birth: 1954 | Vice President | Until resignation, removal or disqualification Vice President since 2009 | President of Touchstone Advisors, Inc. | |||
Timothy D. Paulin Touchstone Advisors, Inc. 303 Broadway Suite 1100 Cincinnati, OH 45202 Year of Birth: 1963 | Vice President | Until resignation, removal or disqualification Vice President since 2010 | Senior Vice President of Investment Research and Product Management of Touchstone Advisors, Inc.; Director of Product Design of Klein Decisions, Inc. (2003 to 2010). | |||
Timothy S. Stearns Touchstone Advisors, Inc. 303 Broadway Suite 1100 Cincinnati, OH 45202 Year of Birth: 1963 | Chief Compliance Officer | Until resignation, removal or disqualification Chief Compliance Officer since 2013 | Chief Compliance Officer of Touchstone Advisors, Inc.; Chief Compliance Officer of Envestnet Asset Management, Inc. (2009 to 2013). | |||
Terrie A. Wiedenheft Touchstone Advisors, Inc. 303 Broadway Suite 1100 Cincinnati, OH 45202 Year of Birth: 1962 | Controller and Treasurer | Until resignation, removal or disqualification Controller and Treasurer since 2006 | Senior Vice President, Chief Financial Officer and Chief Operations Officer of IFS Financial Services, Inc. (a holding company). | |||
Ellen Blanchard BNY Mellon 201 Washington St, 34th Fl. Boston, MA 02108 Year of Birth: 1973 | Secretary | Until resignation, removal or disqualification Secretary since 2015 | Director and Senior Counsel of BNY Mellon Investment Servicing (US) Inc. |
1 Each officer also holds the same office with Touchstone Variable Series Trust, Touchstone Institutional Funds Trust, Touchstone Investment Trust, Touchstone Strategic Trust, and Touchstone Tax-Free Trust.
| 181 |
This page intentionally left blank.
| 182 |
We Respect Your Privacy
Thank you for your decision to invest with us. Touchstone and its affiliates have always placed a high value on the trust and confidence our clients place in us. We believe that confidence must be earned and validated through time. In today’s world, when technology allows the sharing of information at light speeds, trust must be reinforced by our sincere pledge to take the steps necessary to ensure that the information you share with us is treated with respect and confidentiality.
Our Pledge to Our Clients
| • | We collect only the information we need to service your account and administer our business. |
| • | We are committed to keeping your information confidential and we place strict limits and controls on the use and sharing of your information. |
| • | We make every effort to ensure the accuracy of your information. |
We Collect the Following Nonpublic Personal Information About You:
| • | Information we receive from you on or in applications or other forms, correspondence, or conversations, including, but not limited to, your name, address, phone number, social security number, assets, income and date of birth; and |
| • | Information about your transactions with us, our affiliates, or others, including, but not limited to, your account number and balance, payment history, parties to transactions, cost basis information, and other financial information. |
Categories of Information We Disclose and Parties to Whom We Disclose
We do not disclose any nonpublic personal information about our current or former clients to nonaffiliated third parties, except as required or permitted by law.
We Place Strict Limits and Controls on the Use and Sharing of Your Information
| • | We restrict access to nonpublic personal information about you to authorized employees who need the information to administer your business. |
| • | We maintain physical, electronic and procedural safeguards that comply with federal standards to protect this information. |
| • | We do not disclose any nonpublic personal information about our current or former clients to anyone, except as required or permitted by law or as described in this document. |
| • | We will not sell your personal information to anyone. |
We May Provide Information to Service Your Account
Sometimes it is necessary to provide information about you to various companies such as transfer agents, custodians, broker-dealers and marketing service firms to facilitate the servicing of your account.These organizations have a legitimate business need to see some of your personal information in order for us to provide service to you. We may disclose to these various companies the information that we collect as described above. We require that these companies, including our own subsidiaries and affiliates, strictly maintain the confidentiality of this information and abide by all applicable laws. Companies within our corporate family that may receive this information are financial service providers and insurance companies. We do not permit these associated companies to sell the information for their own purposes, and we never sell our customer information.
This policy is applicable to the following affiliated companies: Touchstone Funds Group Trust, Touchstone Investment Trust, Touchstone Strategic Trust, Touchstone Tax-Free Trust, Touchstone Variable Series Trust, Touchstone Institutional Funds Trust, Touchstone Securities, Inc.,* and W&S Brokerage Services, Inc.
* Touchstone Securities, Inc. serves as the underwriter to the Touchstone Funds.
A Member of Western & Southern Financial Group®
The Privacy Protection Policy is not part of the Annual Report.
| 183 |
 |
| 303 Broadway, Suite 1100 |
| Cincinnati, Ohio 45202-4203 |
|
| Go paperless, sign up today at: |
| www.touchstoneinvestments.com |
| Touchstone Investments |
| Distributor |
| Touchstone Securities, Inc.* |
| 303 Broadway |
| Cincinnati, Ohio 45202-4203 800.638.8194 |
| www.touchstoneinvestments.com |
| Investment Advisor |
| Touchstone Advisors, Inc.* |
| 303 Broadway |
| Cincinnati, Ohio 45202-4203 |
| Transfer Agent |
| BNY Mellon Investment Servicing (US) Inc. |
| 4400 Computer Drive |
| Westborough, MA 01581 |
| Shareholder Service |
| 800.543.0407 |
| * A Member of Western & Southern Financial Group |

TSF-56-TFGT-AR-1510
Item 2. Code of Ethics.
| (a) | The registrant, as of the end of the period covered by this report, has adopted a code of ethics that applies to the registrant’s principal executive officer, principal financial officer, principal accounting officer or controller, or persons performing similar functions, regardless of whether these individuals are employed by the registrant or a third party. |
| (c) | There have been no amendments, during the period covered by this report, to a provision of the code of ethics that applies to the registrant’s principal executive officer, principal financial officer, principal accounting officer or controller, or persons performing similar functions, regardless of whether these individuals are employed by the registrant or a third party, and that relates to any element of the code of ethics description. |
| (d) | The registrant has not granted any waivers, including an implicit waiver, from a provision of the code of ethics that applies to the registrant’s principal executive officer, principal financial officer, principal accounting officer or controller, or persons performing similar functions, regardless of whether these individuals are employed by the registrant or a third party, that relates to one or more of the items set forth in paragraph (b) of this item’s instructions. |
Item 3. Audit Committee Financial Expert.
The registrant’s Board of Trustees has determined that the registrant has at least one audit committee financial expert serving on its audit committee. Mr. William Gale is the registrant’s audit committee financial expert and is an independent trustee within the meaning of the Investment Company Act of 1940, as amended (the “1940 Act”).
Item 4. Principal Accountant Fees and Services.
Audit Fees
| (a) | Audit fees for Touchstone Fund Group Trust totaled $186,000 and $190,100 in fiscal 2015 and 2014, respectively, including fees associated with the annual audits and filings of Form N1A and Form N-SAR. |
Audit-Related Fees
| (b) | There were no audit-related fees for the 2015 and 2014 fiscal years. |
Tax Fees
| (c) | The aggregate fees for tax compliance services totaled $85,990 and $84,350 in fiscal 2015 and 2014, respectively. |
Fees for both 2015 and 2014 relate to the preparation of federal income and excise tax returns review of capital gains distribution calculations and tax agent services.
All Other Fees
| (d) | The aggregate fees billed in each of the last two fiscal years for products and services provided by the principal accountant, other than the services reported in paragraphs (a) through (c) of this Item are for fiscal years 2015 and 2014 are $20,185 and $11,507, respectively. The fees relate to the PFIC analyzer, Global Withholding Tax Reporter subscriptions. |
| (e)(1) | Disclose the audit committee's pre-approval policies and procedures described in paragraph (c)(7) of Rule 2-01 of Regulation S-X. |
The Audit Committee’s pre-approval policies describe the types of audit, audit-related, tax and other services that have the general pre-approval of the Audit Committee. The pre-approval policies provide that annual audit service fees, tax services not specifically granted pre-approval, services exceeding pre-approved cost levels and other services that have not received general pre-approval will be subject to specific pre-approval by the Audit Committee. The pre-approval policies further provide that the Committee may grant general pre-approval to other audit services (statutory audits and services associated with SEC registration statements, periodic reports and other documents filed with the SEC or other documents issued in connection with securities offerings), audit-related services (accounting consultations related to accounting, financial reporting or disclosure matters not classified as “audit services,” assistance with understanding and implementing new accounting and financial reporting guidance from rulemaking authorities, agreed-upon or expanded audit procedures related to accounting and/or billing records required to respond to or comply with financial, accounting or regulatory reporting matters and assistance with internal control reporting requirements under Form N-SAR and Form N-CSR), tax services that have historically been provided by the auditor that the Committee believes would not impair the independence of the auditor and are consistent with the SEC’s rules on auditor independence and permissible non-audit services classified as “all other services” that are routine and recurring services.
| (e)(2) | All of the services described in paragraphs (b) through (d) of Item 4 were approved by the Audit Committee. |
| (f) | The percentage of hours expended on the principal accountant's engagement to audit the registrant's financial statements for the most recent fiscal year that were attributed to work performed by persons other than the principal accountant's full-time, permanent employees was less than fifty percent. |
| (g) | The aggregate non-audit fees billed by the registrant's accountant for services rendered to the registrant, and rendered to the registrant's investment adviser (not including any sub-adviser whose role is primarily portfolio management and is subcontracted with or overseen by another investment adviser), and any entity controlling, controlled by, or under common control with the adviser that provides ongoing services to the registrant for each of the last two fiscal years of the registrant was $106,175 for 2015 and $95,857 for 2014. |
| (h) | The registrant's audit committee of the board of trustees has considered whether the provision of non-audit services that were rendered to the registrant's investment adviser (not including any sub-adviser whose role is primarily portfolio management and is subcontracted with or overseen by another investment adviser), and any entity controlling, controlled by, or under common control with the investment adviser that provides ongoing services to the registrant that were not pre-approved pursuant to paragraph (c)(7)(ii) of Rule 2-01 of Regulation S-X is compatible with maintaining the principal accountant's independence. |
Item 5. Audit Committee of Listed Registrants.
Not applicable.
Item 6. Investments.
| (a) | Schedule of Investments in securities of unaffiliated issuers as of the close of the reporting period is included as part of the report to shareholders filed under Item 1 of this form. |
| (b) | Not applicable. |
Item 7. Disclosure of Proxy Voting Policies and Procedures for Closed-End Management Investment Companies.
Not applicable.
Item 8. Portfolio Managers of Closed-End Management Investment Companies.
Not applicable.
Item 9. Purchases of Equity Securities by Closed-End Management Investment Company and Affiliated Purchasers.
Not applicable.
Item 10. Submission of Matters to a Vote of Security Holders.
There have been no material changes to the procedures by which the shareholders may recommend nominees to the registrant’s board of trustees, where those changes were implemented after the registrant last provided disclosure in response to the requirements of Item 407(c)(2)(iv) of Regulation S-K (17 CFR 229.407) (as required by Item 22(b)(15) of Schedule 14A (17 CFR 240.14a-101)), or this Item.
Item 11. Controls and Procedures.
| (a) | The registrant’s principal executive and principal financial officers, or persons performing similar functions, have concluded that the registrant’s disclosure controls and procedures (as defined in Rule 30a-3(c) under the Investment Company Act of 1940, as amended (the “1940 Act”) (17 CFR 270.30a-3(c))) are effective, as of a date within 90 days of the filing date of the report that includes the disclosure required by this paragraph, based on their evaluation of these controls and procedures required by Rule 30a-3(b) under the 1940 Act (17 CFR 270.30a-3(b)) and Rules 13a-15(b) or 15d-15(b) under the Securities Exchange Act of 1934, as amended (17 CFR 240.13a-15(b) or 240.15d-15(b)). |
| (b) | There were no changes in the registrant’s internal control over financial reporting (as defined in Rule 30a-3(d) under the 1940 Act (17 CFR 270.30a-3(d)) that occurred during the registrant’s second fiscal quarter of the period covered by this report that has materially affected, or is reasonably likely to materially affect, the registrant’s internal control over financial reporting. |
Item 12. Exhibits.
| (a)(1) | Code of ethics, or any amendment thereto, that is the subject of disclosure required by Item 2 is attached hereto. |
| (a)(2) | Certifications pursuant to Rule 30a-2(a) under the 1940 Act and Section 302 of the Sarbanes-Oxley Act of 2002 are attached hereto. | |
| (a)(3) | Not applicable. |
| (b) | Certifications pursuant to Rule 30a-2(b) under the 1940 Act and Section 906 of the Sarbanes-Oxley Act of 2002 are attached hereto. |
| (12.other) | Not applicable. |
SIGNATURES
Pursuant to the requirements of the Securities Exchange Act of 1934 and the Investment Company Act of 1940, the registrant has duly caused this report to be signed on its behalf by the undersigned, thereunto duly authorized.
(Registrant) Touchstone Funds Group Trust
By (Signature and Title)* /s/ Jill T. McGruder
Jill T. McGruder, President
(principal executive officer)
Date 11/30/2015
Pursuant to the requirements of the Securities Exchange Act of 1934 and the Investment Company Act of 1940, this report has been signed below by the following persons on behalf of the registrant and in the capacities and on the dates indicated.
By (Signature and Title)* /s/ Jill T. McGruder
Jill T. McGruder, President
(principal executive officer)
Date 11/30/2015
By (Signature and Title)* /s/ Terrie A. Wiedenheft
Terrie A. Wiedenheft, Controller and Treasurer
(principal financial officer)
Date 11/30/2015
* Print the name and title of each signing officer under his or her signature.