 Forward Looking Statements We make forward-looking statements in this presentation that are subject to risks and uncertainties. We intend these statements to be covered by the safe harbor provision for forward-looking statements contained in the Private Securities Litigation Reform Act of 1995. These forward-looking statements include: •Statements of Southwest's goals, intentions, and expectations; •Estimates of risks and of future costs and benefits; •Expectations regarding our future financial performance and the financial performance of our operating segments; •Expectations regarding regulatory actions; •Expectations regarding our ability to utilize tax loss benefits; •Expectations regarding our stock repurchase program; •Expectations regarding dividends; •Expectations regarding acquisitions and divestitures; •Assessments of loan quality, probable loan losses, and the amount and timing of loan payoffs; •Estimates of the value of assets held for sale or available for sale; and •Statements of our ability to achieve financial and other goals. These forward-looking statements are subject to significant uncertainties because they are based upon: the amount and timing of future changes in interest rates, market behavior, and other economic conditions; future laws, regulations, and accounting principles; changes in regulatory standards and examination policies, and a variety of other matters. These other matters include, among other things, the direct and indirect effects of economic conditions on interest rates, credit quality, loan demand, liquidity, and monetary and supervisory policies of banking regulators. Because of these uncertainties, the actual future results may be materially different from the results indicated by these forward-looking statements. In addition, Southwest's past growth and performance do not necessarily indicate our future results. For other factors, risks, and uncertainties that could cause actual results to differ materially from estimates and projections contained in forward-looking statements, please read the “Risk Factors” contained in Southwest’s reports to the Securities and Exchange Commission. We do not intend, or undertake no obligation, to update or revise any forward-looking statements contained in this presentation, whether as a result of differences in actual results, changes in assumptions, or changes in other factors affecting said statements, except as required by law.
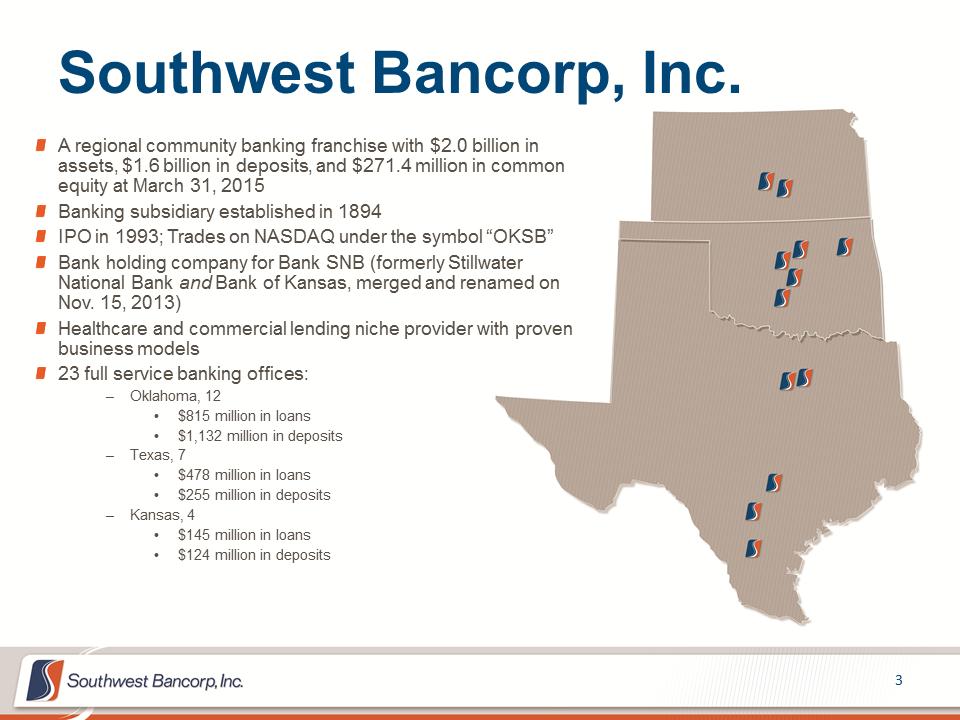 Southwest Bancorp, Inc. A regional community banking franchise with $2.0 billion in assets, $1.6 billion in deposits, and $271.4 million in common equity at March 31, 2015 Banking subsidiary established in 1894 IPO in 1993; Trades on NASDAQ under the symbol “OKSB” Bank holding company for Bank SNB (formerly Stillwater National Bank and Bank of Kansas, merged and renamed on Nov. 15, 2013) Healthcare and commercial lending niche provider with proven business models 23 full service banking offices: –Oklahoma, 12 •$815 million in loans •$1,132 million in deposits –Texas, 7 •$478 million in loans •$255 million in deposits –Kansas, 4 •$145 million in loans •$124 million in deposits
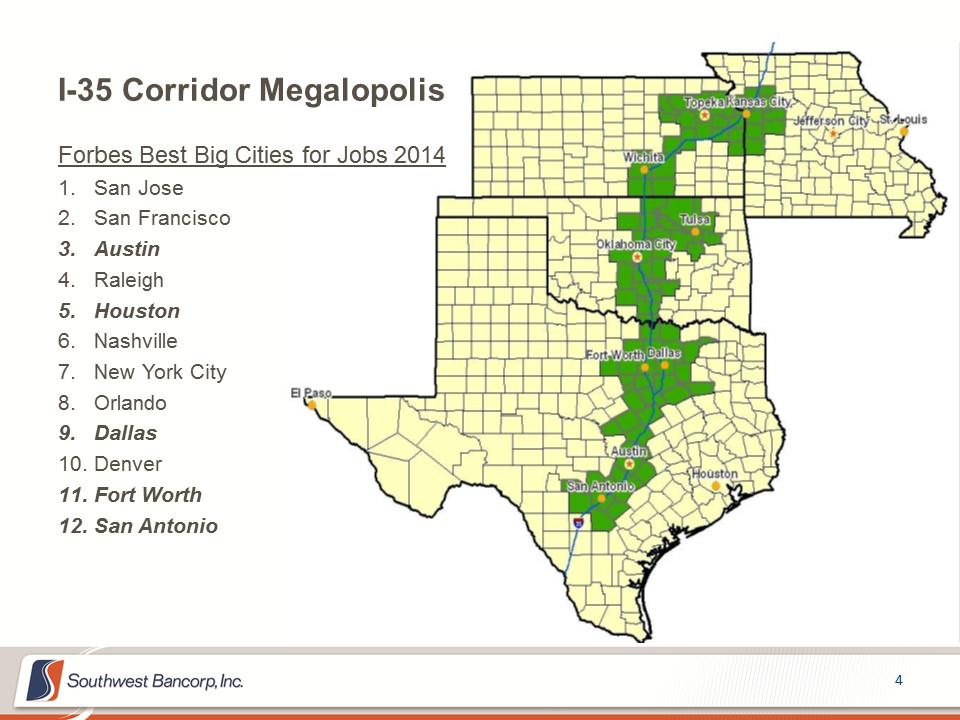 I-35 Corridor Megalopolis Forbes Best Big Cities for Jobs 2014 1.San Jose 2.San Francisco 3.Austin 4.Raleigh 5.Houston 6.Nashville 7.New York City 8.Orlando 9.Dallas 10.Denver 11.Fort Worth 12.San Antonio
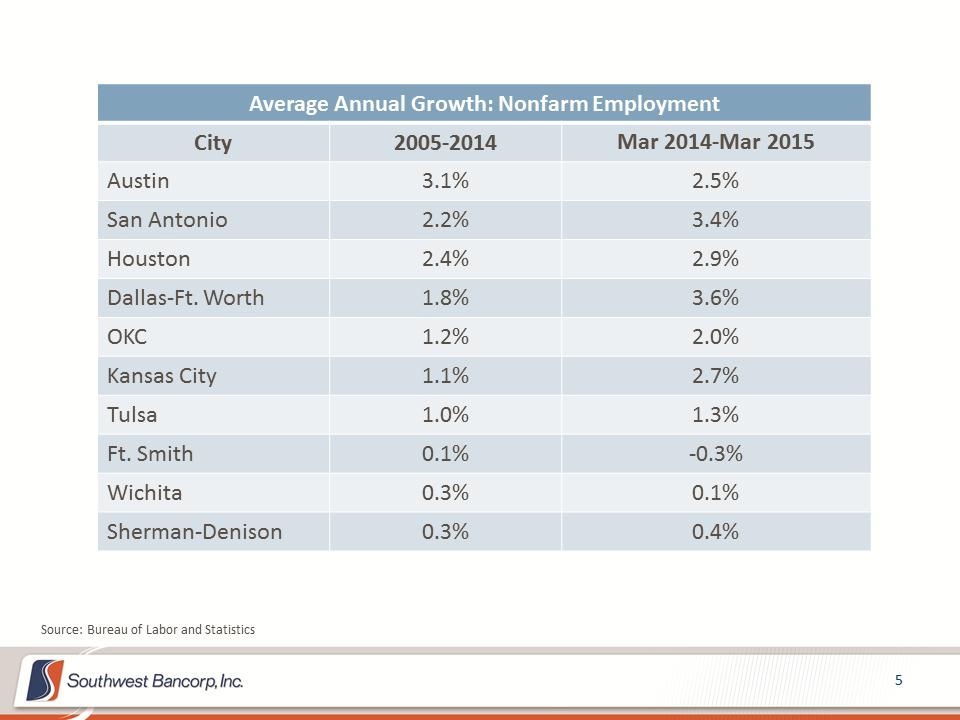 Source: Bureau of Labor and Statistics Average Annual Growth: Nonfarm Employment City 2005-2014 Mar 2014-Mar 2015 Austin 3.1% 2.5% San Antonio 2.2% 3.4% Houston 2.4% 2.9% Dallas-Ft. Worth 1.8% 3.6% OKC 1.2% 2.0% Kansas City 1.1% 2.7% Tulsa 1.0% 1.3% Ft. Smith 0.1% -0.3% Wichita 0.3% 0.1% Sherman-Denison 0.3% 0.4%
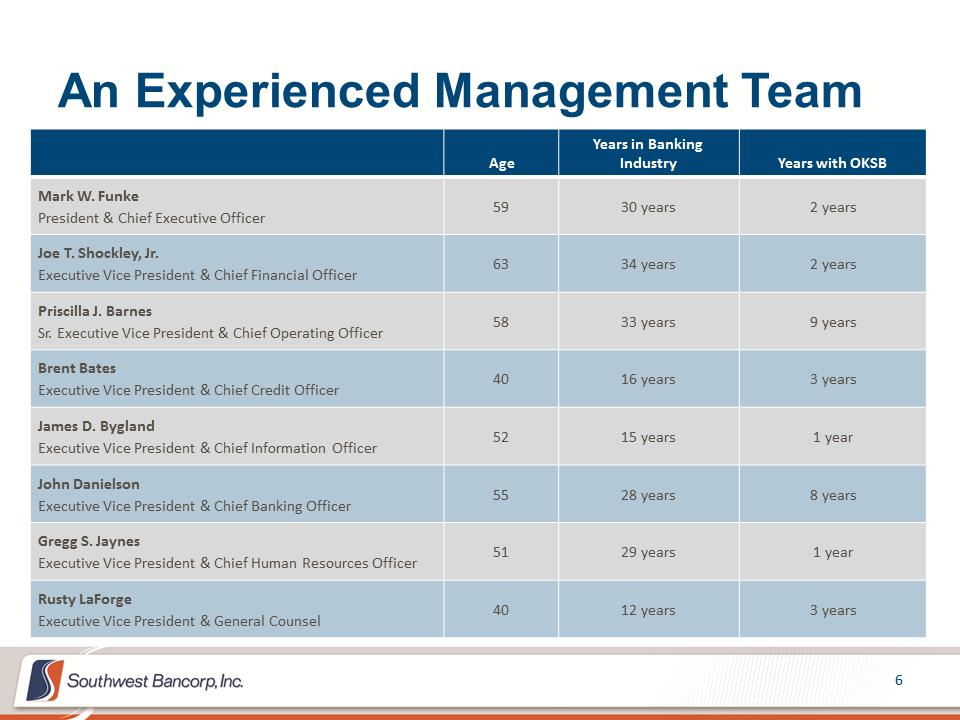 An Experienced Management Team Age Years in Banking Industry Years with OKSB Mark W. Funke President & Chief Executive Officer 59 30 years 2 years Joe T. Shockley, Jr. Executive Vice President & Chief Financial Officer 63 34 years 2 years Priscilla J. Barnes Sr. Executive Vice President & Chief Operating Officer 58 33 years 9 years Brent Bates Executive Vice President & Chief Credit Officer 40 16 years 3 years James D. Bygland Executive Vice President & Chief Information Officer 52 15 years 1 year John Danielson Executive Vice President & Chief Banking Officer 55 28 years 8 years Gregg S. Jaynes Executive Vice President & Chief Human Resources Officer 51 29 years 1 year Rusty LaForge Executive Vice President & General Counsel 40 12 years 3 years
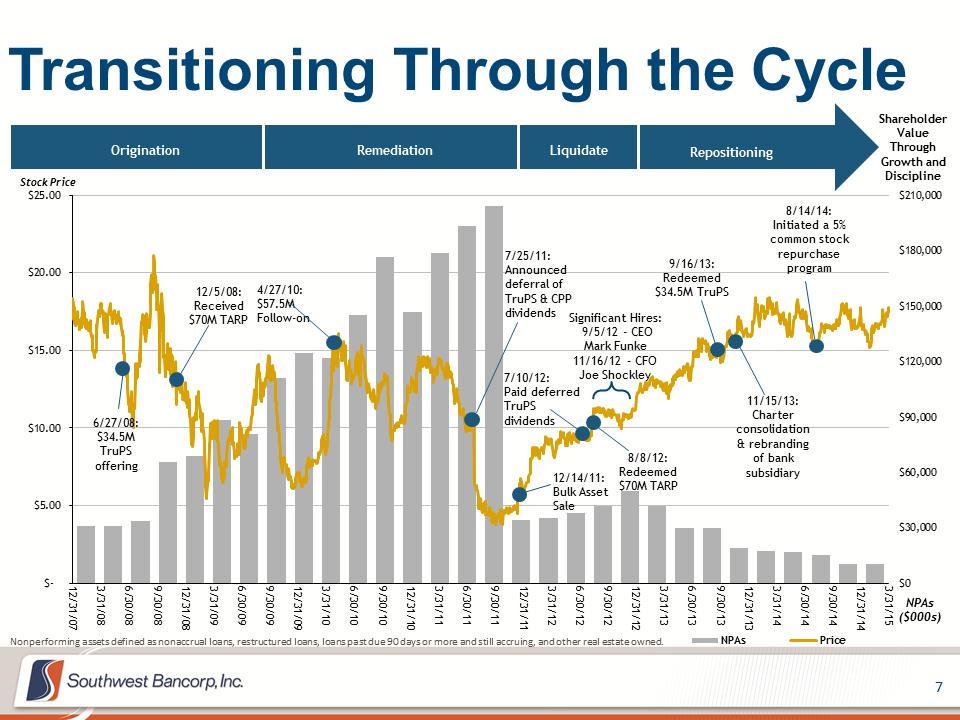 Transitioning Through the Cycle Nonperforming assets defined as nonaccrual loans, restructured loans, loans past due 90 days or more and still accruing, and other real estate owned. $0$30,000$60,000$90,000$120,000$150,000$180,000$210,000 $- $5.00 $10.00 $15.00 $20.00 $25.0012/31/073/31/086/30/089/30/0812/31/083/31/096/30/099/30/0912/31/093/31/106/30/109/30/1012/31/103/31/116/30/119/30/1112/31/113/31/126/30/129/30/1212/31/123/31/136/30/139/30/1312/31/133/31/146/30/149/30/1412/31/143/31/15Stock Price NPAsPriceNPAs ($000s) 4/27/10: $57.5M Follow-on 12/14/11: Bulk Asset Sale 7/10/12: Paid deferred TruPS dividends 8/8/12: Redeemed $70M TARP Significant Hires: 9/5/12 - CEO Mark Funke 11/16/12 - CFO Joe Shockley 12/5/08: Received $70M TARP 6/27/08: $34.5M TruPS offering Origination Remediation Liquidate Repositioning Shareholder Value Through Growth and Discipline 7/25/11: Announced deferral of TruPS & CPP dividends 9/16/13: Redeemed $34.5M TruPS 11/15/13: Charter consolidation & rebranding of bank subsidiary 8/14/14: Initiated a 5% common stock repurchase program
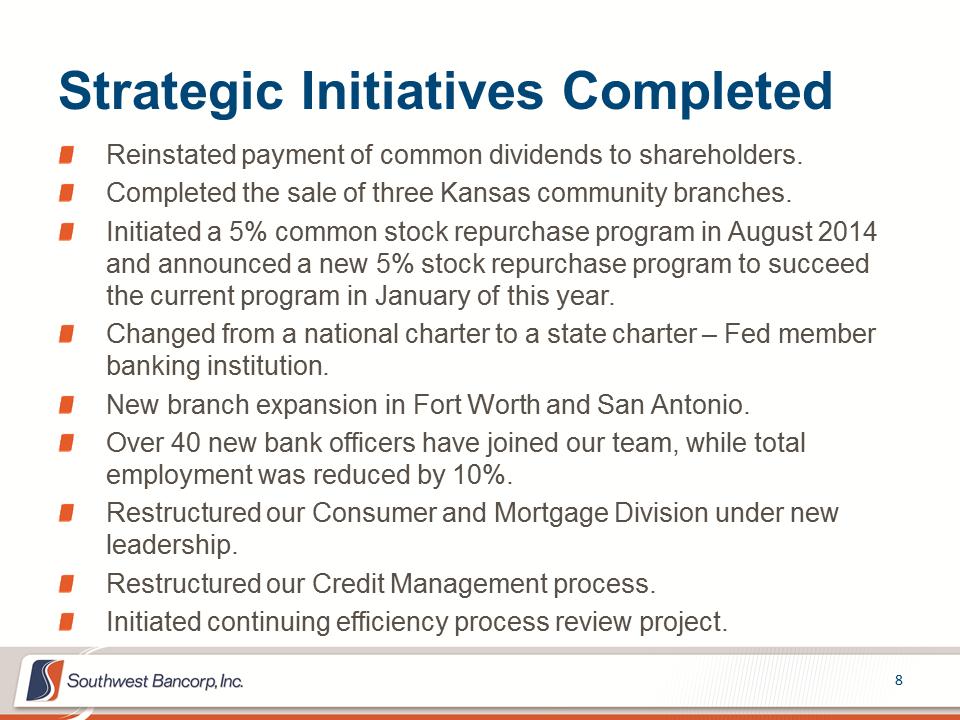 Strategic Initiatives Completed Reinstated payment of common dividends to shareholders. Completed the sale of three Kansas community branches. Initiated a 5% common stock repurchase program in August 2014 and announced a new 5% stock repurchase program to succeed the current program in January of this year. Changed from a national charter to a state charter – Fed member banking institution. New branch expansion in Fort Worth and San Antonio. Over 40 new bank officers have joined our team, while total employment was reduced by 10%. Restructured our Consumer and Mortgage Division under new leadership. Restructured our Credit Management process. Initiated continuing efficiency process review project.
 FINANCIAL RESULTS FIRST QUARTER 2015
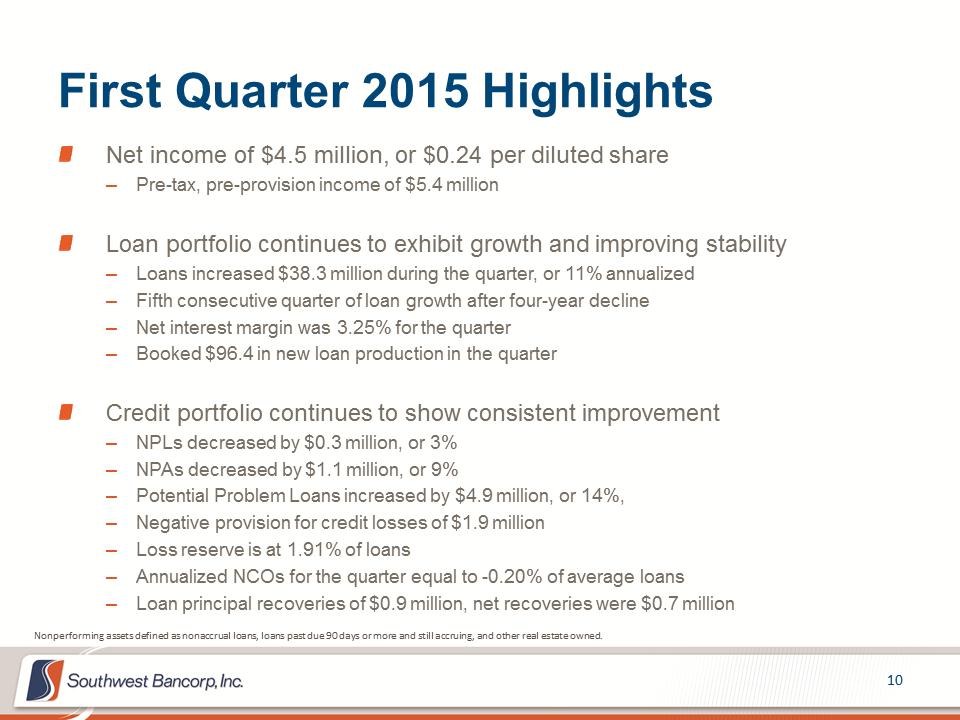 First Quarter 2015 Highlights Net income of $4.5 million, or $0.24 per diluted share –Pre-tax, pre-provision income of $5.4 million Loan portfolio continues to exhibit growth and improving stability –Loans increased $38.3 million during the quarter, or 11% annualized –Fifth consecutive quarter of loan growth after four-year decline –Net interest margin was 3.25% for the quarter –Booked $96.4 in new loan production in the quarter Credit portfolio continues to show consistent improvement –NPLs decreased by $0.3 million, or 3% –NPAs decreased by $1.1 million, or 9% –Potential Problem Loans increased by $4.9 million, or 14%, –Negative provision for credit losses of $1.9 million –Loss reserve is at 1.91% of loans –Annualized NCOs for the quarter equal to -0.20% of average loans –Loan principal recoveries of $0.9 million, net recoveries were $0.7 million Nonperforming assets defined as nonaccrual loans, loans past due 90 days or more and still accruing, and other real estate owned.
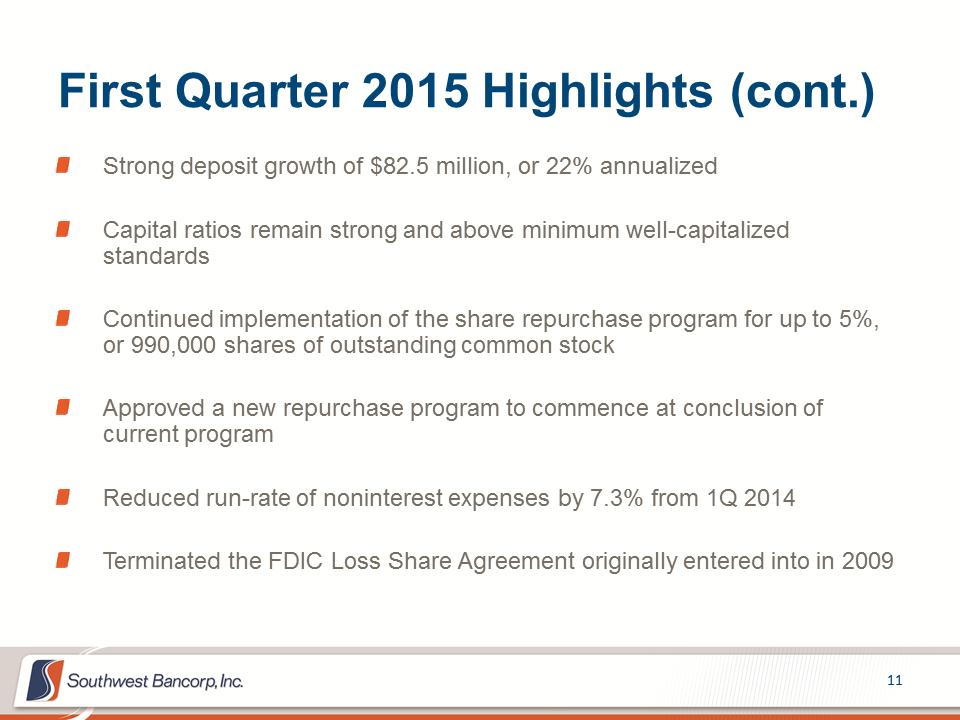 First Quarter 2015 Highlights (cont.) Strong deposit growth of $82.5 million, or 22% annualized Capital ratios remain strong and above minimum well-capitalized standards Continued implementation of the share repurchase program for up to 5%, or 990,000 shares of outstanding common stock Approved a new repurchase program to commence at conclusion of current program Reduced run-rate of noninterest expenses by 7.3% from 1Q 2014 Terminated the FDIC Loss Share Agreement originally entered into in 2009
 Financial Highlights ($ in thousands, except per share) FY 2011 FY 2012 FY 2013 FY 2014 FQ1 2015 Net Income $ (68,295) $ 16,187 $ 17,435 $ 21,030 $ 4,535 Earnings Per Share $ (3.73) $ 0.64 $ 0.89 $ 1.07 $ 0.24 Tangible Book Value Per Share $ 11.93 $ 12.54 $ 13.07 $ 14.05 $ 14.20 ROAA -2.54% 0.72% 0.86% 1.09% 0.92% ROAE -18.33% 5.71% 6.90% 7.82% 6.78% Reserves/Portfolio Loans 2.59% 3.47% 2.89% 2.03% 1.91% Reserves/NPLs 216.1% 111.3% 184.5% 302.3% 297.8%
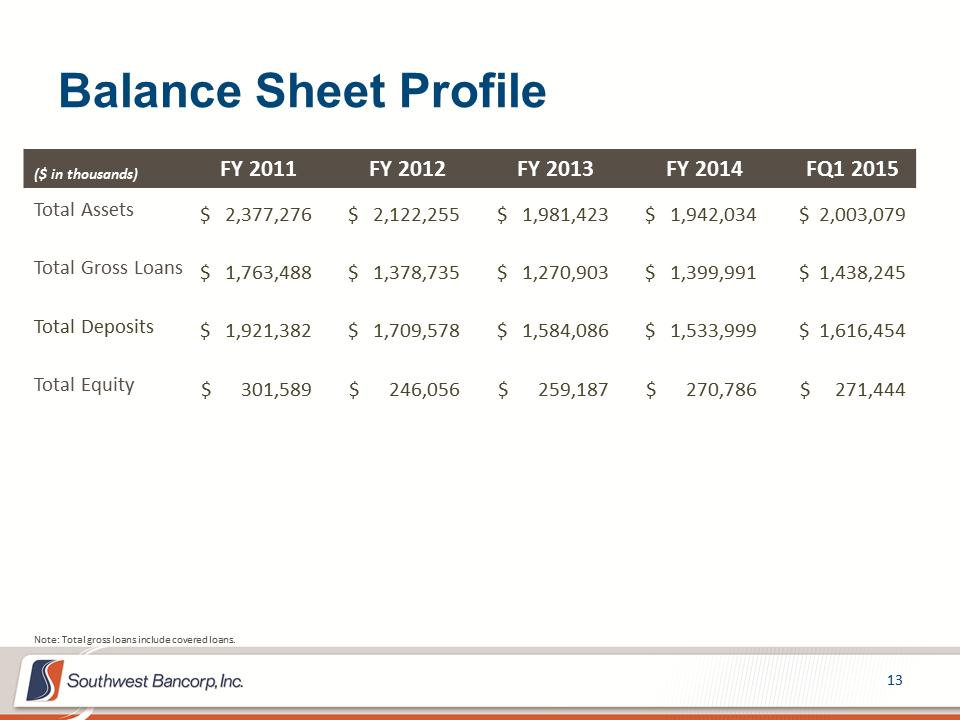 Balance Sheet Profile Note: Total gross loans include covered loans. ($ in thousands) FY 2011 FY 2012 FY 2013 FY 2014 FQ1 2015 Total Assets $ 2,377,276 $ 2,122,255 $ 1,981,423 $ 1,942,034 $ 2,003,079 Total Gross Loans $ 1,763,488 $ 1,378,735 $ 1,270,903 $ 1,399,991 $ 1,438,245 Total Deposits $ 1,921,382 $ 1,709,578 $ 1,584,086 $ 1,533,999 $ 1,616,454 Total Equity $ 301,589 $ 246,056 $ 259,187 $ 270,786 $ 271,444
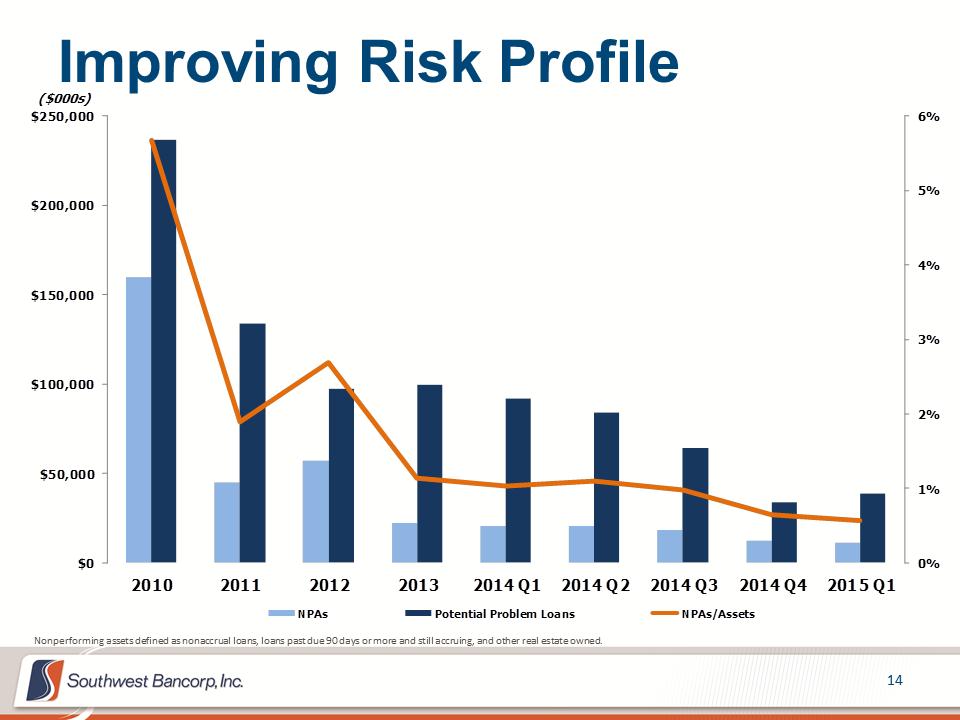 Improving Risk Profile Nonperforming assets defined as nonaccrual loans, loans past due 90 days or more and still accruing, and other real estate owned. 0%1%2%3%4%5%6%$0$50,000$100,000$150,000$200,000$250,00020102011201220132014 Q12014 Q22014 Q32014 Q42015 Q1($000s)NPAsPotential Problem LoansNPAs/Assets
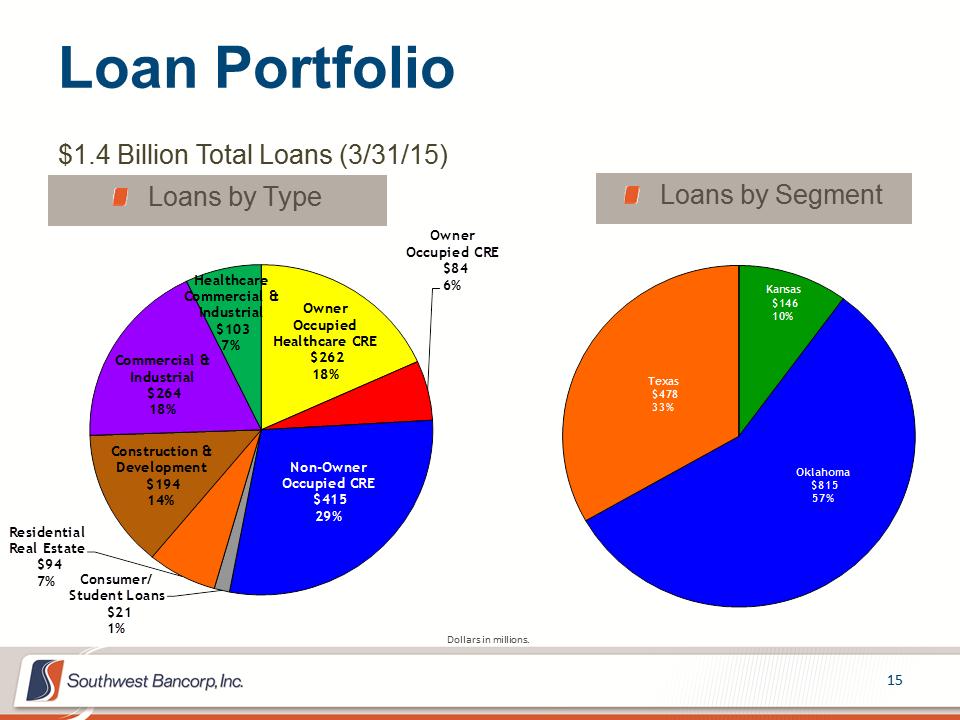 Loan Portfolio Owner Occupied Healthcare CRE$262 18%Owner Occupied CRE$84 6%Non-Owner Occupied CRE$415 29%Consumer/ Student Loans$21 1%Residential Real Estate$94 7%Construction & Development$194 14%Commercial & Industrial$264 18%Healthcare Commercial & Industrial$103 7%Loans by Segment Loans by Type $1.4 Billion Total Loans (3/31/15) Dollars in millions. Kansas$14610%Oklahoma$81557%Texas$478 33%
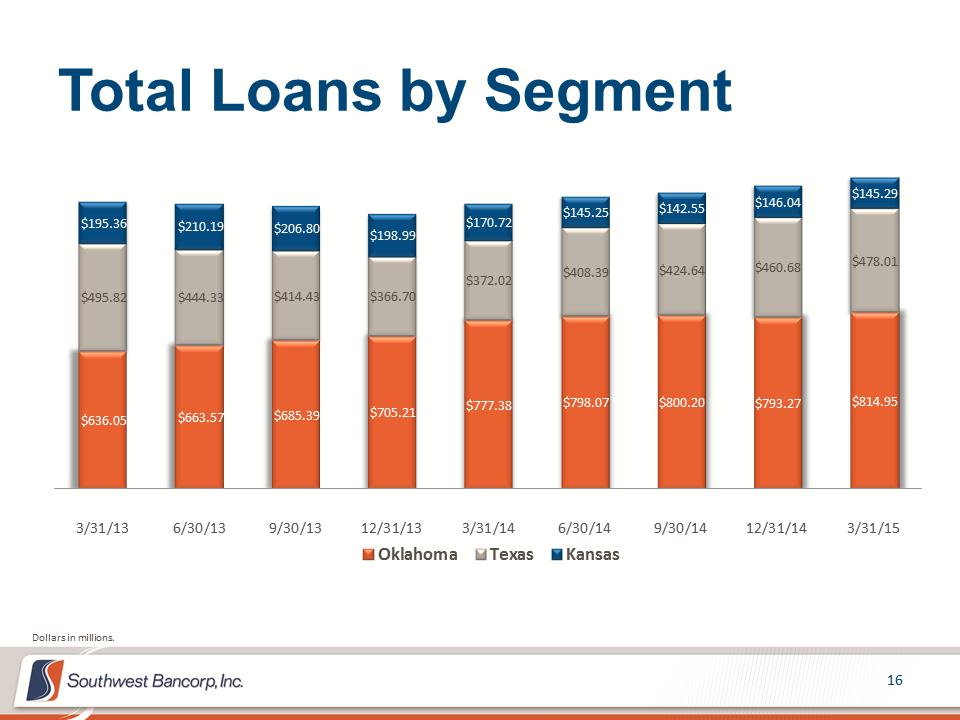 Total Loans by Segment $636.05 $663.57 $685.39 $705.21 $777.38 $798.07 $800.20 $793.27 $814.95 $495.82 $444.33 $414.43 $366.70 $372.02 $408.39 $424.64 $460.68 $478.01 $195.36 $210.19 $206.80 $198.99 $170.72 $145.25 $142.55 $146.04 $145.29 3/31/136/30/139/30/1312/31/133/31/146/30/149/30/1412/31/143/31/15OklahomaTexasKansasDollars in millions.
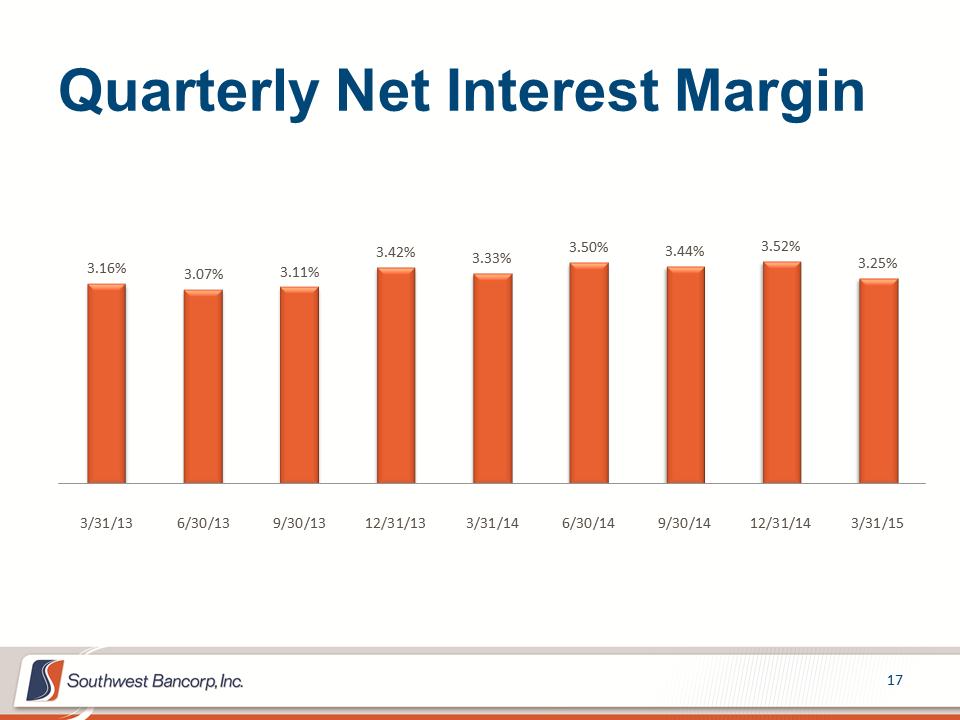 Quarterly Net Interest Margin 3.16% 3.07% 3.11% 3.42% 3.33% 3.50% 3.44% 3.52% 3.25% 3/31/136/30/139/30/1312/31/133/31/146/30/149/30/1412/31/143/31/15
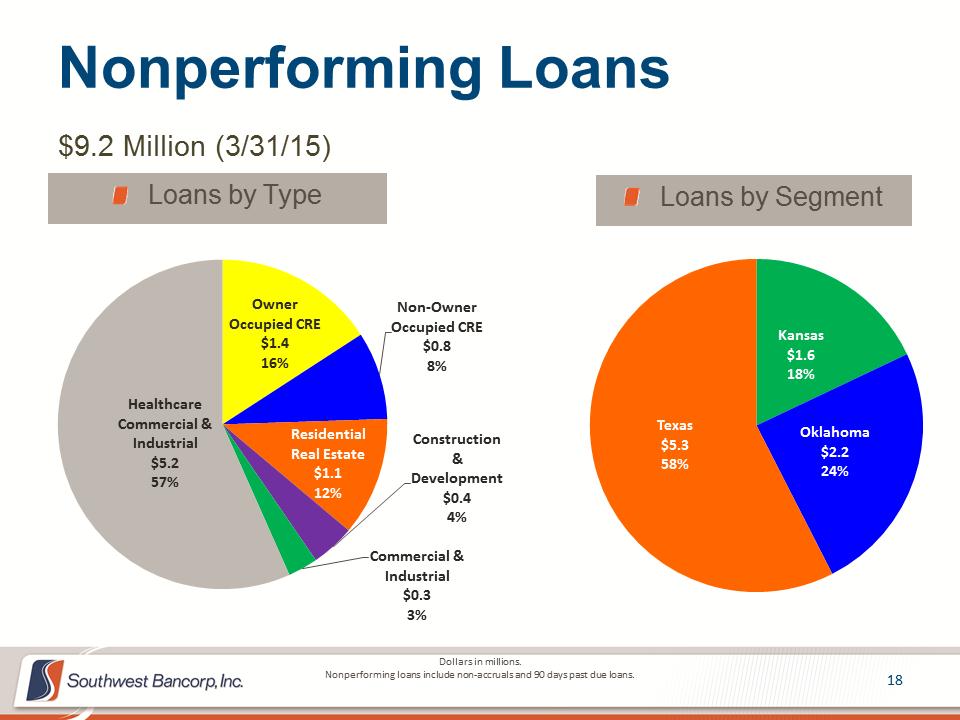 Owner Occupied CRE $1.4 16% Non-Owner Occupied CRE $0.8 8% Residential Real Estate $1.1 12% Construction & Development $0.4 4% Commercial & Industrial $0.3 3% Healthcare Commercial & Industrial $5.2 57% Dollars in millions. Nonperforming loans include non-accruals and 90 days past due loans.Kansas $1.6 18% Oklahoma $2.2 24% Texas $5.3 58% Loans by Segment Loans by Type $9.2 Million (3/31/15) Nonperforming Loans
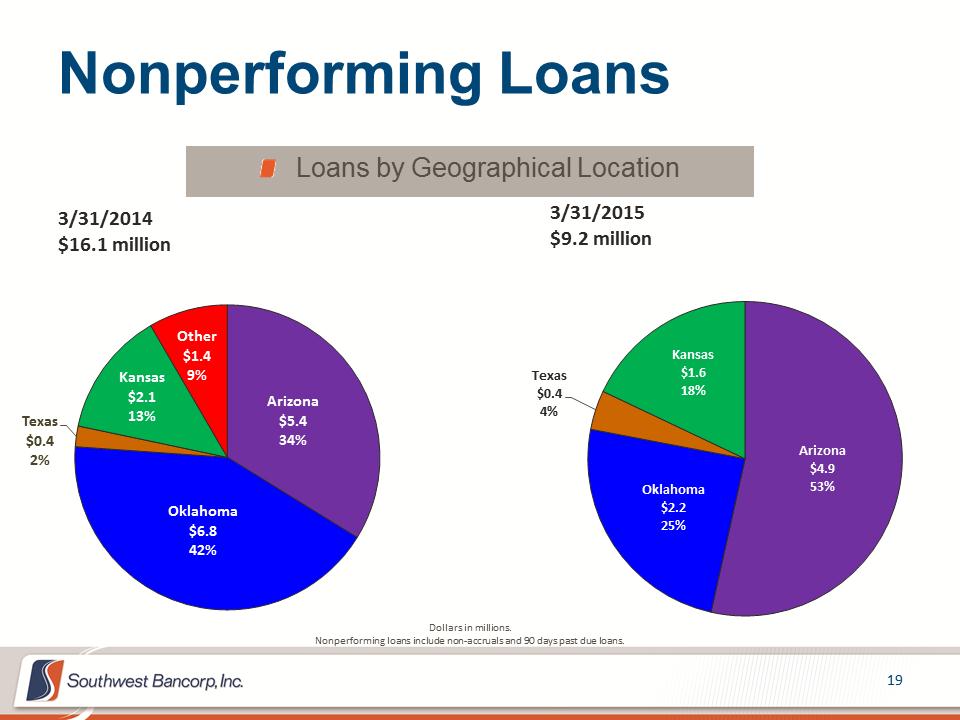 Nonperforming Loans Loans by Geographical Location Dollars in millions. Nonperforming loans include non-accruals and 90 days past due loans. Arizona $4.9 53% Oklahoma $2.2 25% Texas $0.4 4% Kansas $1.6 18% Arizona $5.4 34% Oklahoma $6.8 42% Texas $0.4 2% Kansas $2.1 13% Other $1.4 9% 3/31/2015 $9.2 million 3/31/2014 $16.1 million
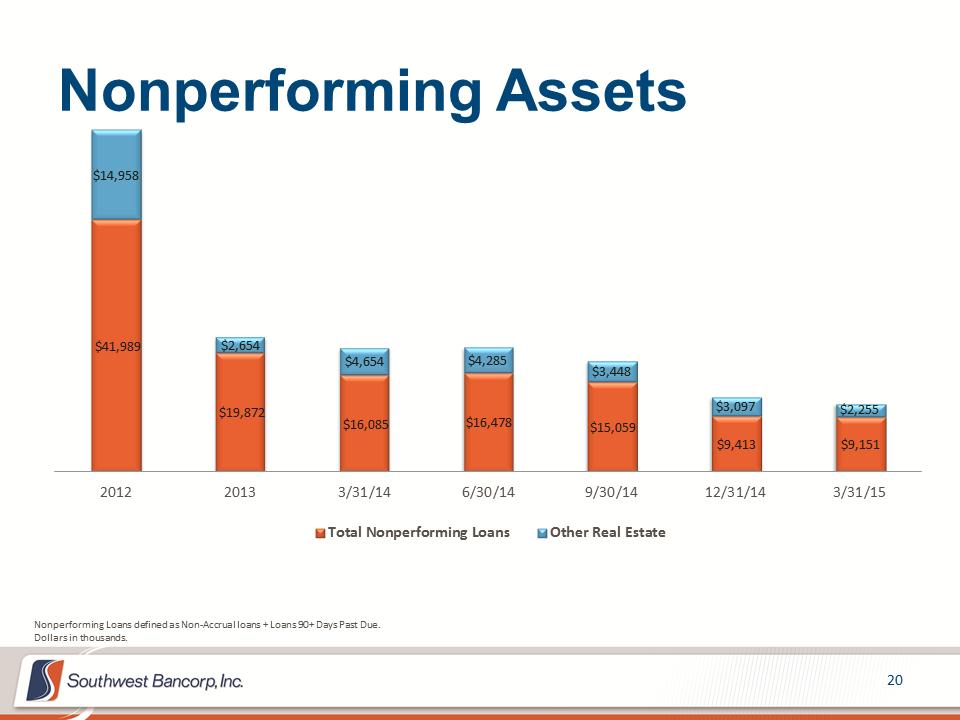 Nonperforming Assets $41,989 $19,872 $16,085 $16,478 $15,059 $9,413 $9,151 $14,958 $2,654 $4,654 $4,285 $3,448 $3,097 $2,255 201220133/31/146/30/149/30/1412/31/143/31/15Total Nonperforming LoansOther Real EstateNonperforming Loans defined as Non-Accrual loans + Loans 90+ Days Past Due. Dollars in thousands.
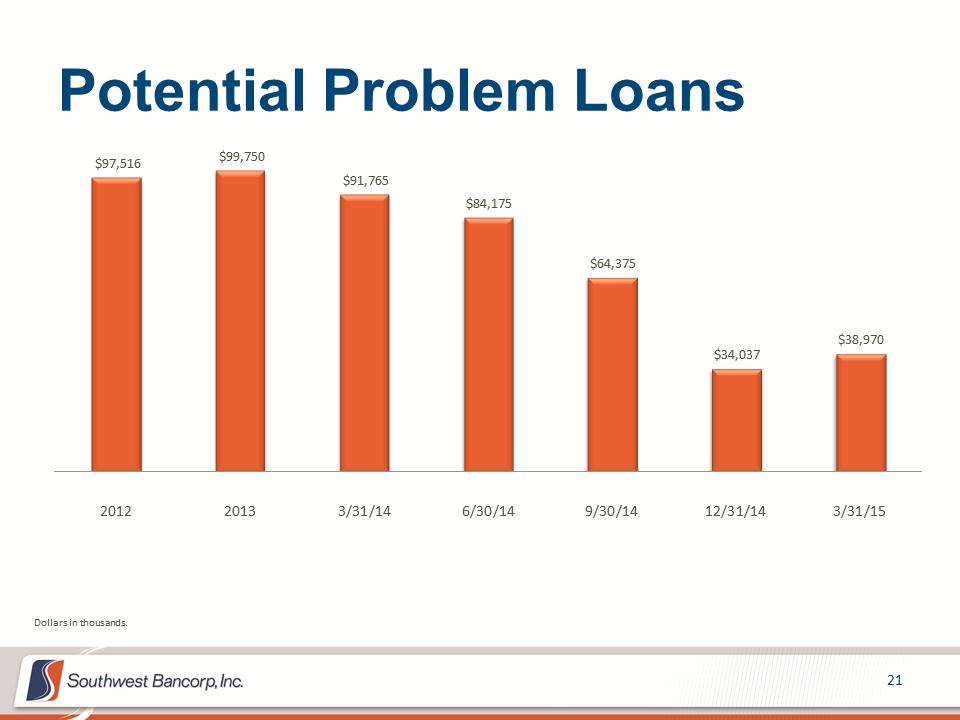 Potential Problem Loans $97,516 $99,750 $91,765 $84,175 $64,375 $34,037 $38,970 201220133/31/146/30/149/30/1412/31/143/31/15Dollars in thousands.
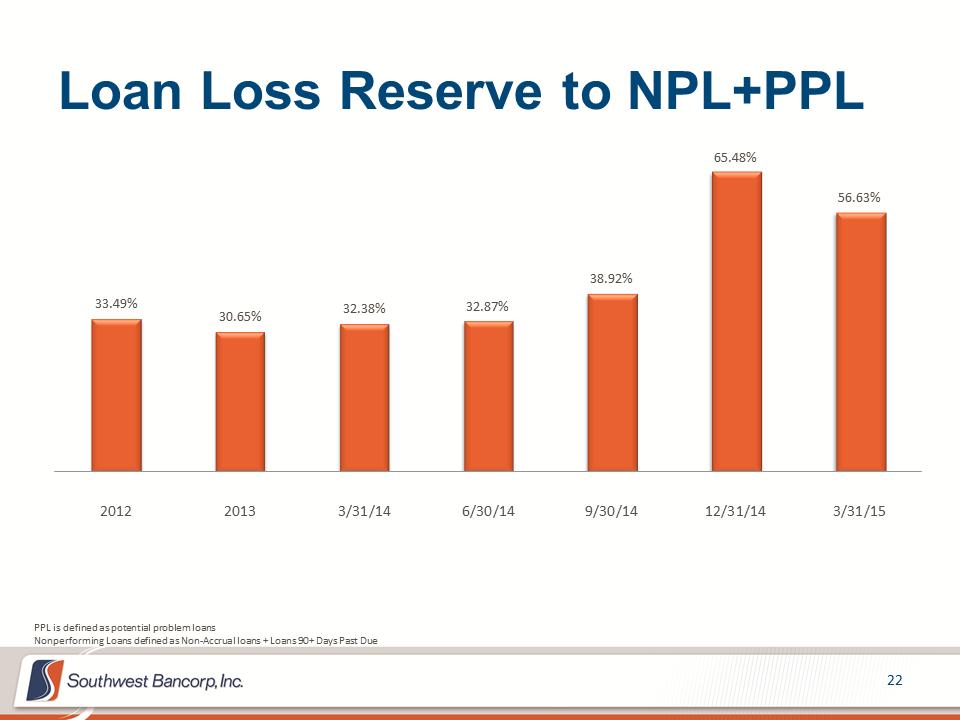 Loan Loss Reserve to NPL+PPL 33.49% 30.65% 32.38% 32.87% 38.92% 65.48% 56.63% 201220133/31/146/30/149/30/1412/31/143/31/15PPL is defined as potential problem loans Nonperforming Loans defined as Non-Accrual loans + Loans 90+ Days Past Due
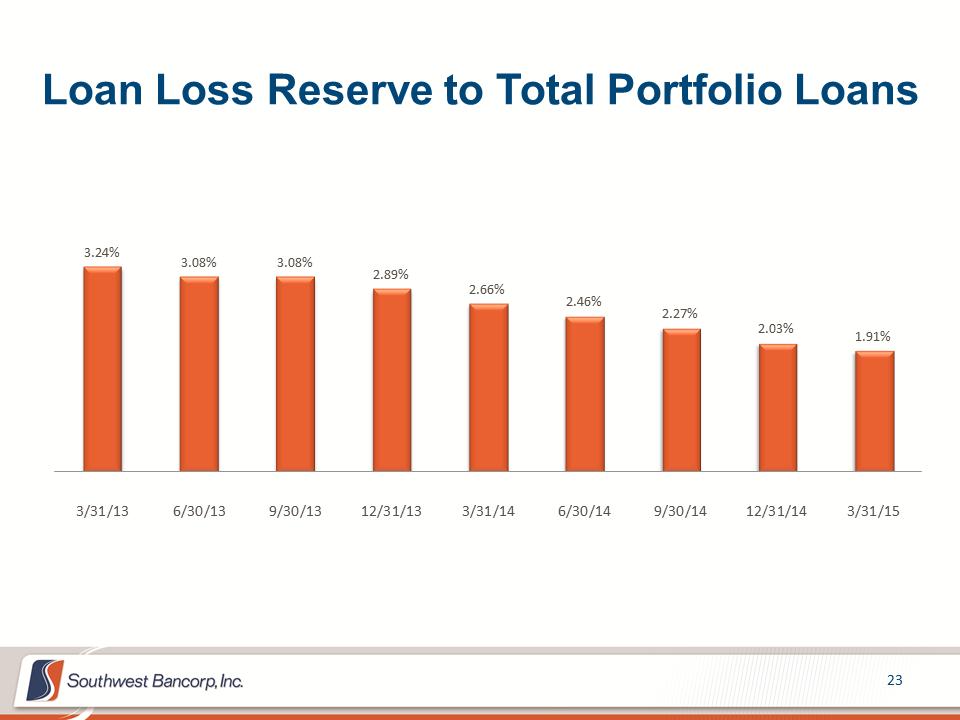 Loan Loss Reserve to Total Portfolio Loans 3.24% 3.08% 3.08% 2.89% 2.66% 2.46% 2.27% 2.03% 1.91% 3/31/136/30/139/30/1312/31/133/31/146/30/149/30/1412/31/143/31/15
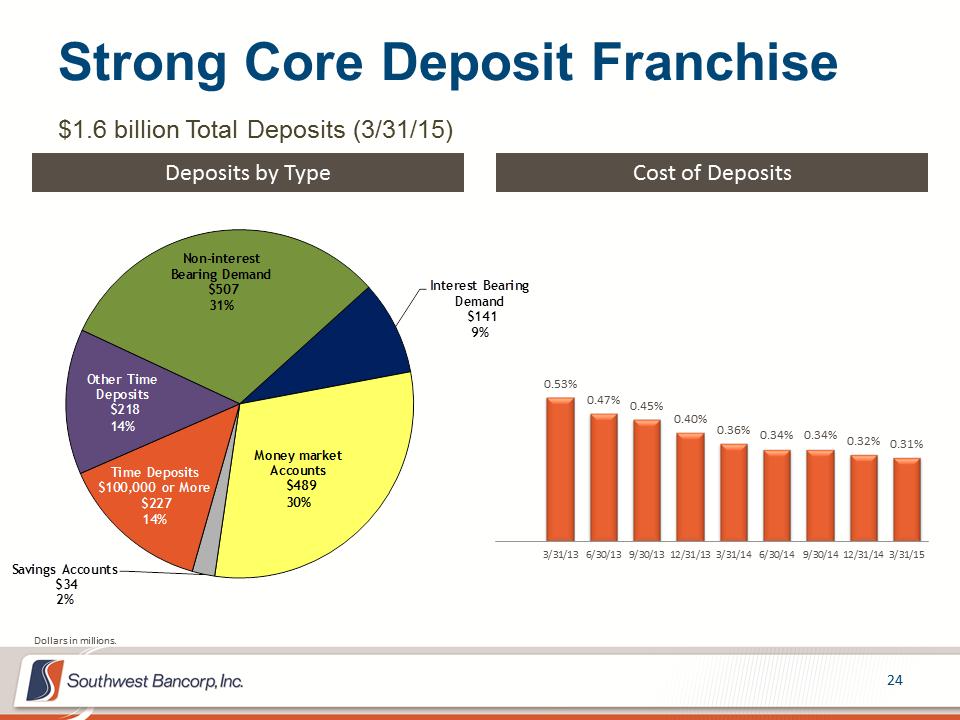 Strong Core Deposit Franchise $1.6 billion Total Deposits (3/31/15) Deposits by Type Cost of Deposits 0.53% 0.47% 0.45% 0.40% 0.36% 0.34% 0.34% 0.32% 0.31% 3/31/136/30/139/30/1312/31/133/31/146/30/149/30/1412/31/143/31/15Non-interest Bearing Demand$507 31%Interest Bearing Demand$141 9%Money market Accounts$489 30%Savings Accounts$34 2%Time Deposits $100,000 or More$227 14%Other Time Deposits$218 14%Dollars in millions.
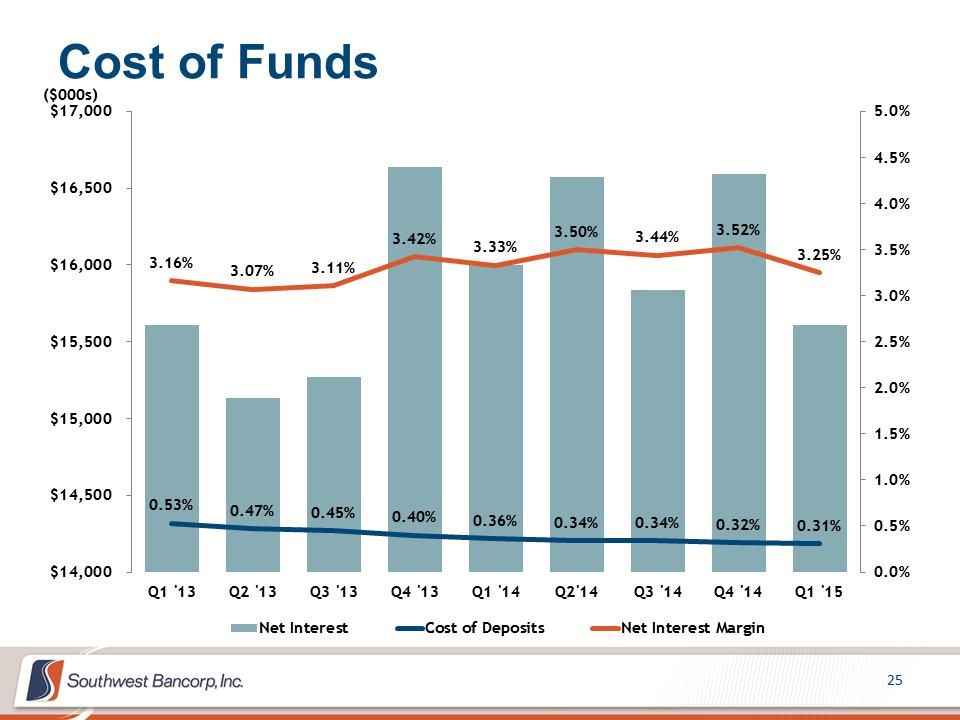 Cost of Funds 0.53% 0.47% 0.45% 0.40% 0.36% 0.34% 0.34% 0.32% 0.31% 3.16% 3.07% 3.11% 3.42% 3.33% 3.50% 3.44% 3.52% 3.25% 0.0%0.5%1.0%1.5%2.0%2.5%3.0%3.5%4.0%4.5%5.0% $14,000 $14,500 $15,000 $15,500 $16,000 $16,500 $17,000Q1 '13Q2 '13Q3 '13Q4 '13Q1 '14Q2'14Q3 '14Q4 '14Q1 '15($000s) Net InterestCost of DepositsNet Interest Margin
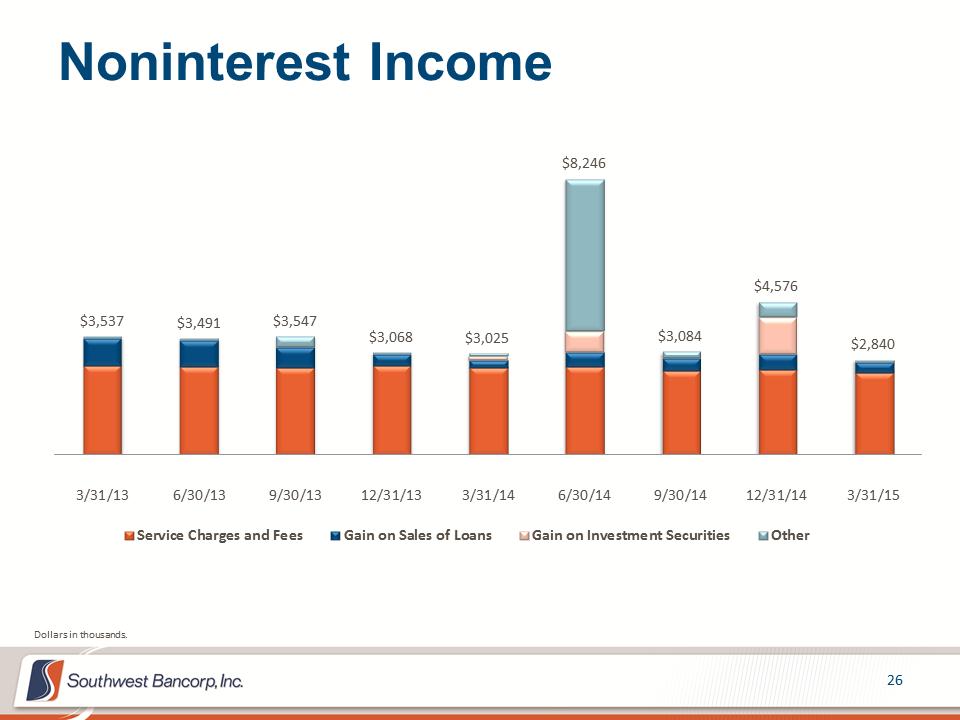 Noninterest Income $3,537 $3,491 $3,547 $3,068 $3,025 $8,246 $3,084 $4,576 $2,840 3/31/136/30/139/30/1312/31/133/31/146/30/149/30/1412/31/143/31/15Service Charges and FeesGain on Sales of LoansGain on Investment SecuritiesOtherDollars in thousands.
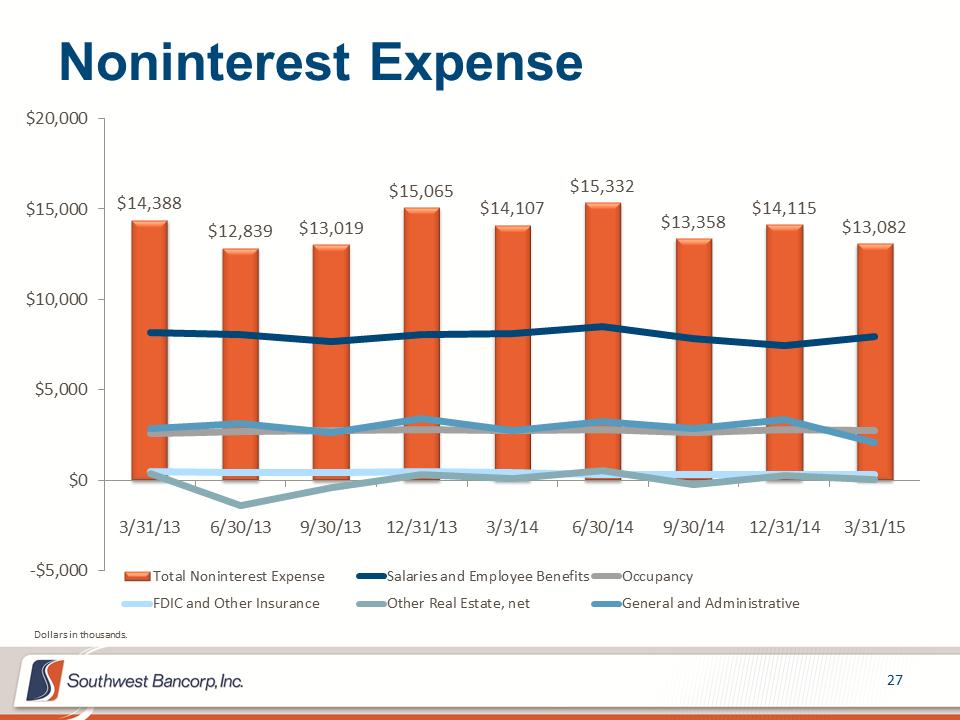 Noninterest Expense $14,388 $12,839 $13,019 $15,065 $14,107 $15,332 $13,358 $14,115 $13,082 -$5,000$0$5,000$10,000$15,000$20,0003/31/136/30/139/30/1312/31/133/3/146/30/149/30/1412/31/143/31/15Total Noninterest ExpenseSalaries and Employee BenefitsOccupancyFDIC and Other InsuranceOther Real Estate, netGeneral and AdministrativeDollars in thousands.
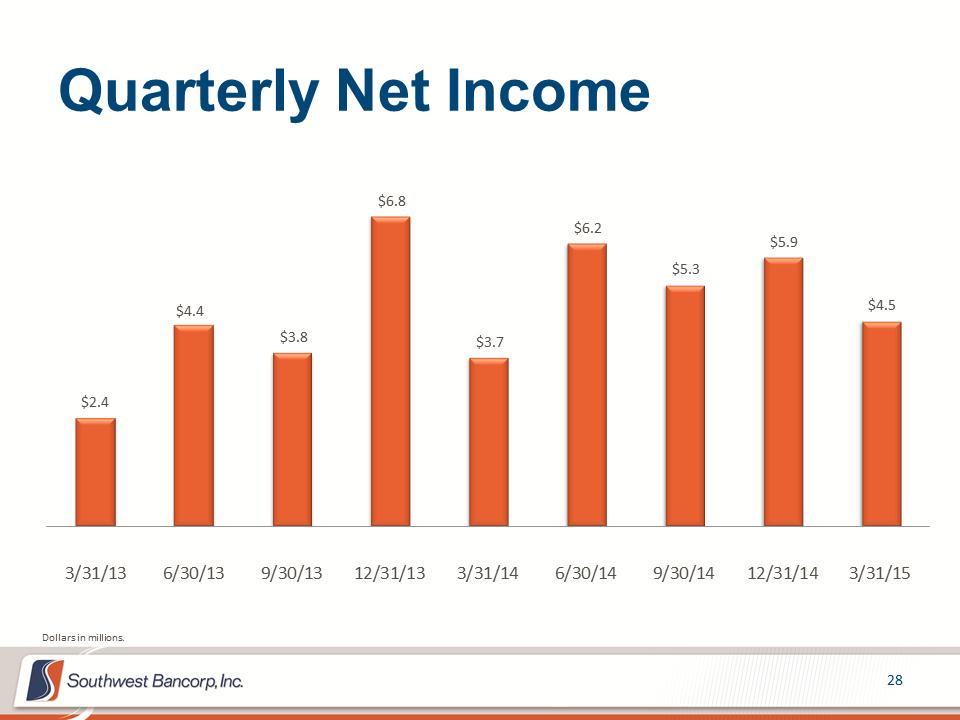 Quarterly Net Income $2.4 $4.4 $3.8 $6.8 $3.7 $6.2 $5.3 $5.9 $4.5 3/31/136/30/139/30/1312/31/133/31/146/30/149/30/1412/31/143/31/15Dollars in millions.
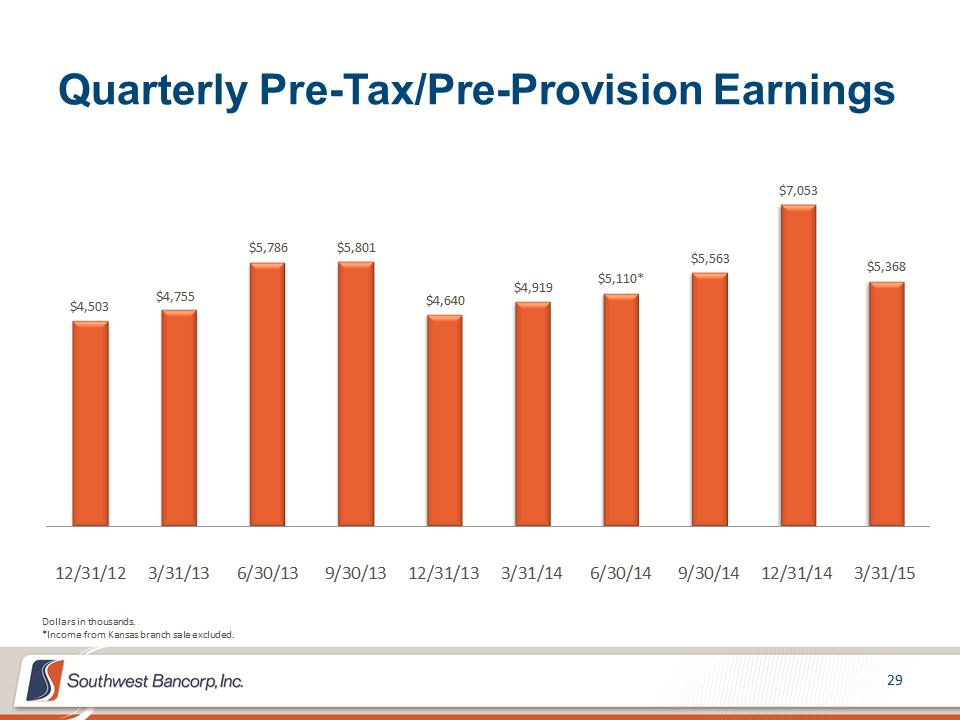 Quarterly Pre-Tax/Pre-Provision Earnings $4,503 $4,755 $5,786 $5,801 $4,640 $4,919 $5,110* $5,563 $7,053 $5,368 12/31/123/31/136/30/139/30/1312/31/133/31/146/30/149/30/1412/31/143/31/15Dollars in thousands. *Income from Kansas branch sale excluded.
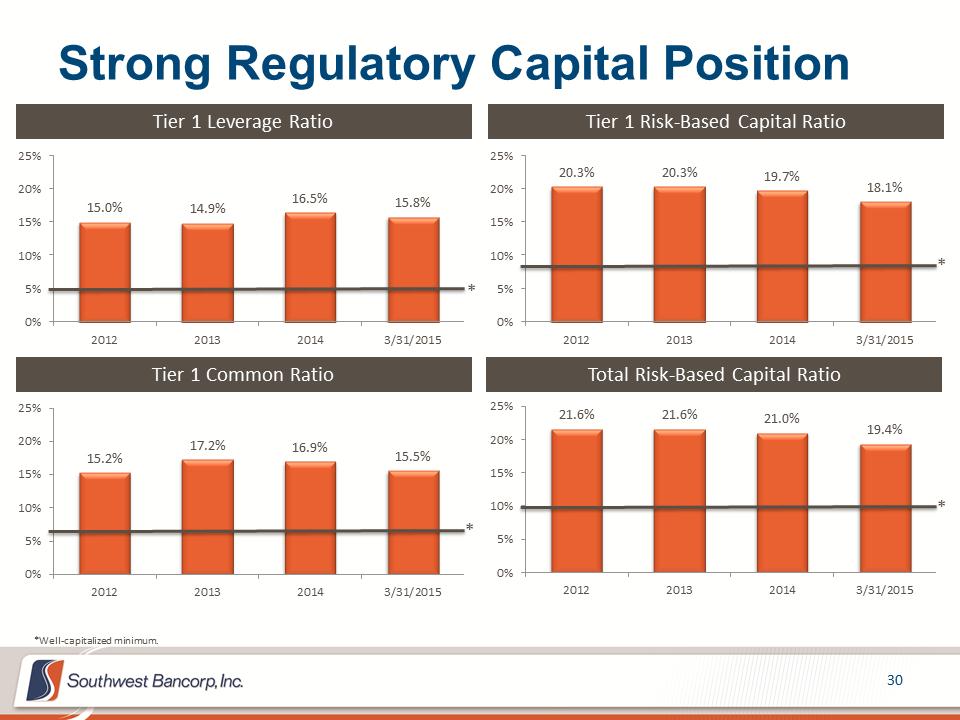 Strong Regulatory Capital Position 20.3% 20.3% 19.7% 18.1% 0%5%10%15%20%25%2012201320143/31/201515.0% 14.9% 16.5% 15.8% 0%5%10%15%20%25%2012201320143/31/2015Tier 1 Leverage Ratio Tier 1 Risk-Based Capital Ratio Total Risk-Based Capital Ratio Tier 1 Common Ratio 15.2% 17.2% 16.9% 15.5% 0%5%10%15%20%25%2012201320143/31/2015* * * * *Well-capitalized minimum. 21.6% 21.6% 21.0% 19.4% 0%5%10%15%20%25%2012201320143/31/2015
 2015 Priorities: Aggressively seek ways to efficiently and profitably deploy our excess capital, including strategic acquisitions, selective de-novo branching and product investments. Identify and acquire talented individuals and teams that will enhance our presence and profitability in select business segments and markets. Continue to improve credit quality and balance sheet strength. Maintain high credit standards while accelerating loan growth focused in areas of expertise, i.e. real estate, healthcare, commercial and energy. Improve internal operating efficiency while providing superior customer service. This includes investment in core operating systems and people. Strengthen and invest in business lines that produce non-interest income and effectively scale them across our geographic footprint. Drive a culture that produces consistent, conservative, and sustainable revenue and earnings growth.
 Significant Positive Attributes for Southwest Bancorp, Inc. An established platform in key high growth U.S. economic markets Seasoned management team aggressively focused on consistent, conservative, sustainable growth in revenue and EPS A unified approach to banking across three states Significant improvement in overall risk profile Organic and new customer loan growth materializing in markets Excellent base of noninterest income products now being scaled across our footprint (Treasury and Mortgage) Strong capital position provides opportunity for future growth through acquisitions Compelling absolute and relative valuation A culture that provides a competitive advantage for our customers
 Bank Strong Bank Safe Bank Successfully
 APPENDIX
 The subsequent tables present non-GAAP reconciliations of the following calculations: –Tangible Book Value per Share –Pre-tax, Pre-provision Income
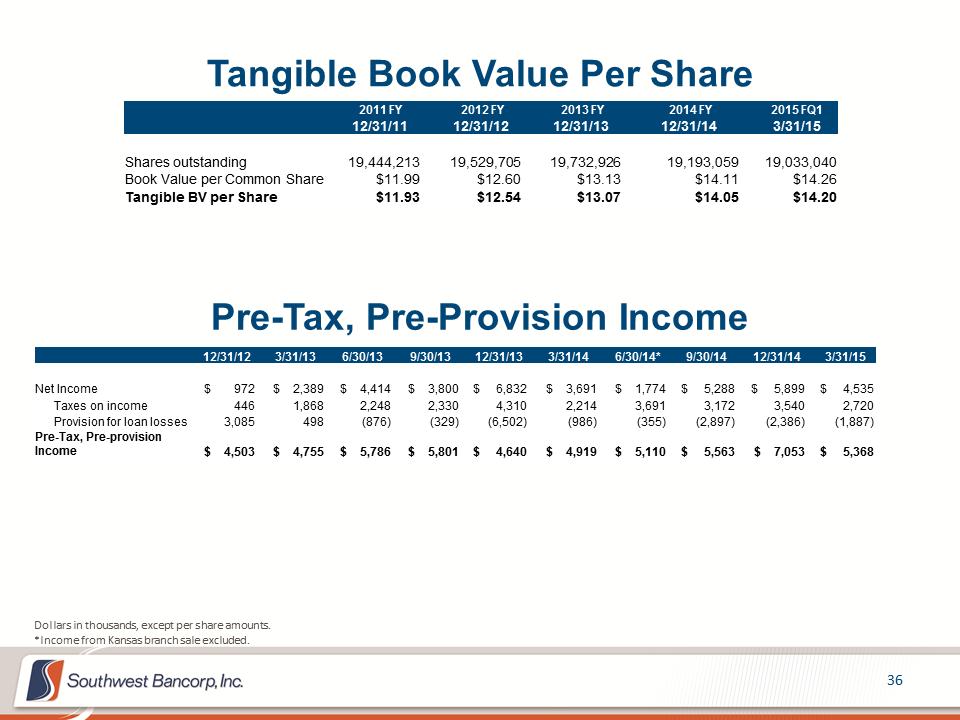 Tangible Book Value Per Share Dollars in thousands, except per share amounts. *Income from Kansas branch sale excluded. 2011 FY 2012 FY 2013 FY 12/31/13 12/31/14 3/31/15 2014 FY 2015 FQ1 12/31/11 12/31/12 Shares outstanding 19,444,213 19,529,705 19,732,926 19,193,059 19,033,040 Book Value per Common Share $11.99 $12.60 $13.13 $14.11 $14.26 Tangible BV per Share $11.93 $12.54 $13.07 $14.05 $14.20 Pre-Tax, Pre-Provision Income 12/31/12 3/31/13 6/30/13 9/30/13 12/31/13 3/31/14 6/30/14* 9/30/14 12/31/14 3/31/15 Net Income $ 972 $ 2,389 $ 4,414 $ 3,800 $ 6,832 $ 3,691 $ 1,774 $ 5,288 $ 5,899 $ 4,535 Taxes on income 446 1,868 2,248 2,330 4,310 2,214 3,691 3,172 3,540 2,720 Provision for loan losses 3,085 498 (876) (329) (6,502) (986) (355) (2,897) (2,386) (1,887) Pre-Tax, Pre-provision Income $ 4,503 $ 4,755 $ 5,786 $ 5,801 $ 4,640 $ 4,919 $ 5,110 $ 5,563 $ 7,053 $ 5,368