 2017 Second Quarter Earnings Presentation NASDAQ: OKSB July 26, 2017
 Forward Looking Statements We make forward-looking statements in this presentation that are subject to risks and uncertainties. We intend these statements to be covered by the safe harbor provision for forward-looking statements contained in the Private Securities Litigation Reform Act of 1995. These forward-looking statements include: • Statements of Southwest's goals, intentions, and expectations; • Estimates of risks and of future costs and benefits; • Expectations regarding our future financial performance and the financial performance of our operating segments; • Expectations regarding regulatory actions; • Expectations regarding our ability to utilize tax loss benefits; • Expectations regarding our stock repurchase program; • Expectations regarding dividends; • Expectations regarding our planned merger with Simmons First National Corporation; • Assessments of loan quality, probable loan losses, and the amount and timing of loan payoffs; • Estimates of the value of assets held for sale or available for sale; and • Statements of our ability to achieve financial and other goals. These forward-looking statements are subject to significant uncertainties because they are based upon: the amount and timing of future changes in interest rates, market behavior, and other economic conditions; future laws, regulations, and accounting principles; changes in regulatory standards and examination policies, and a variety of other matters. These other matters include, among other things, the direct and indirect effects of economic conditions on interest rates, credit quality, loan demand, liquidity, and monetary and supervisory policies of banking regulators. Because of these uncertainties, the actual future results may be materially different from the results indicated by these forward-looking statements. In addition, Southwest's past growth and performance do not necessarily indicate our future results. For other factors, risks, and uncertainties that could cause actual results to differ materially from estimates and projections contained in forward-looking statements, please read the “Risk Factors” contained in Southwest’s reports to the Securities and Exchange Commission. We do not intend, or undertake no obligation, to update or revise any forward-looking statements contained in this presentation, whether as a result of differences in actual results, changes in assumptions, or changes in other factors affecting said statements, except as required by law.
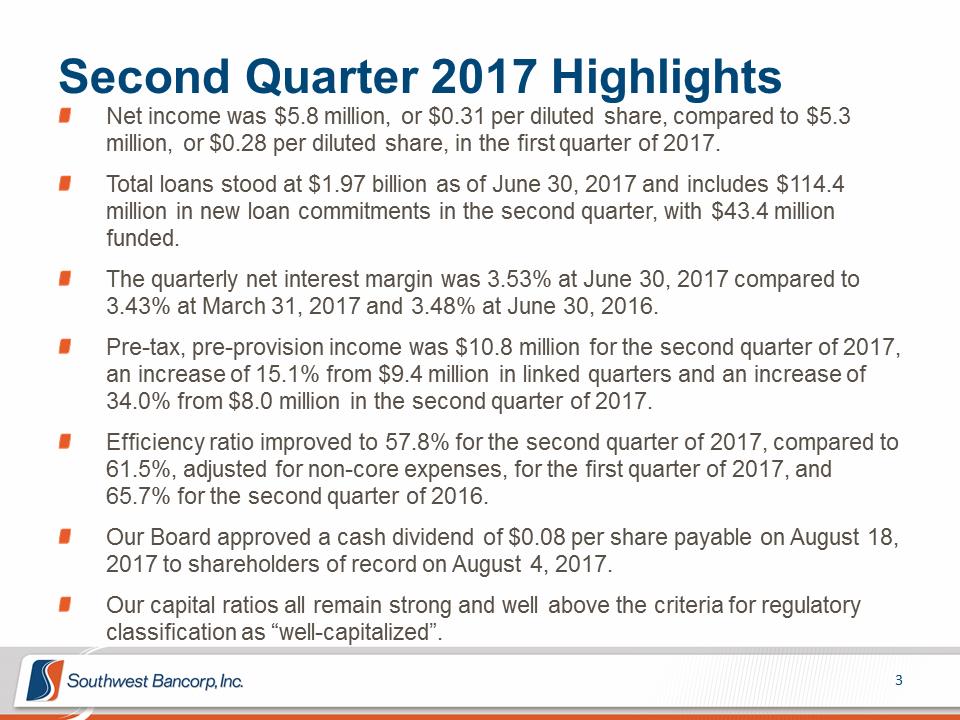 Second Quarter 2017 Highlights Net income was $5.8 million, or $0.31 per diluted share, compared to $5.3 million, or $0.28 per diluted share, in the first quarter of 2017. Total loans stood at $1.97 billion as of June 30, 2017 and includes $114.4 million in new loan commitments in the second quarter, with $43.4 million funded. The quarterly net interest margin was 3.53% at June 30, 2017 compared to 3.43% at March 31, 2017 and 3.48% at June 30, 2016. Pre-tax, pre-provision income was $10.8 million for the second quarter of 2017, an increase of 15.1% from $9.4 million in linked quarters and an increase of 34.0% from $8.0 million in the second quarter of 2017. Efficiency ratio improved to 57.8% for the second quarter of 2017, compared to 61.5%, adjusted for non-core expenses, for the first quarter of 2017, and 65.7% for the second quarter of 2016. Our Board approved a cash dividend of $0.08 per share payable on August 18, 2017 to shareholders of record on August 4, 2017. Our capital ratios all remain strong and well above the criteria for regulatory classification as “well-capitalized”.
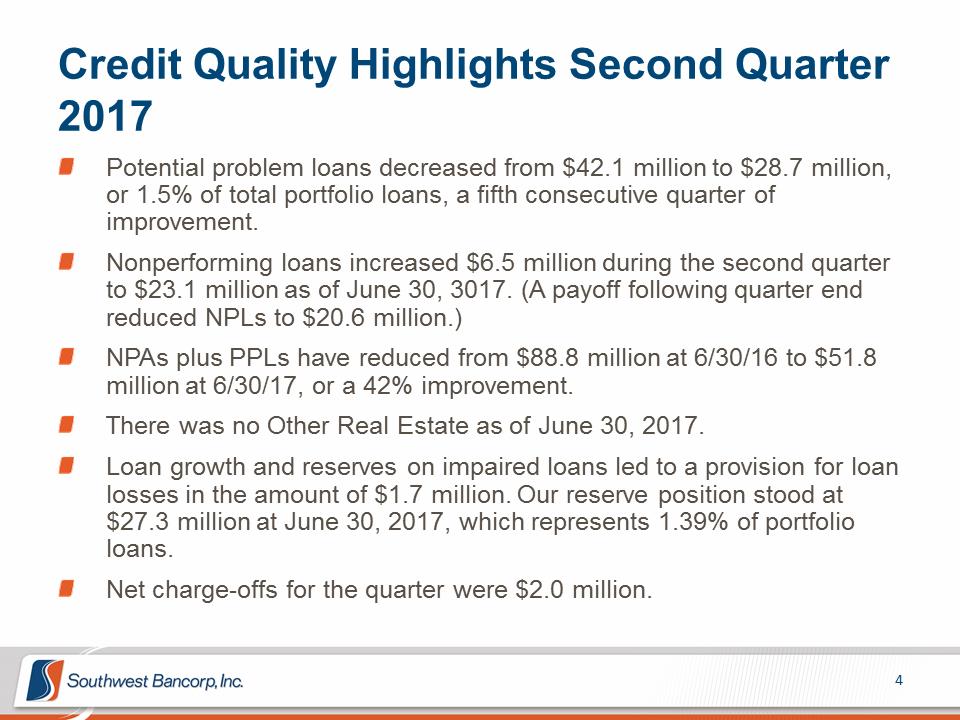 Credit Quality Highlights Second Quarter 2017 Potential problem loans decreased from $42.1 million to $28.7 million, or 1.5% of total portfolio loans, a fifth consecutive quarter of improvement. Nonperforming loans increased $6.5 million during the second quarter to $23.1 million as of June 30, 3017. (A payoff following quarter end reduced NPLs to $20.6 million.) NPAs plus PPLs have reduced from $88.8 million at 6/30/16 to $51.8 million at 6/30/17, or a 42% improvement. There was no Other Real Estate as of June 30, 2017. Loan growth and reserves on impaired loans led to a provision for loan losses in the amount of $1.7 million. Our reserve position stood at $27.3 million at June 30, 2017, which represents 1.39% of portfolio loans. Net charge-offs for the quarter were $2.0 million.
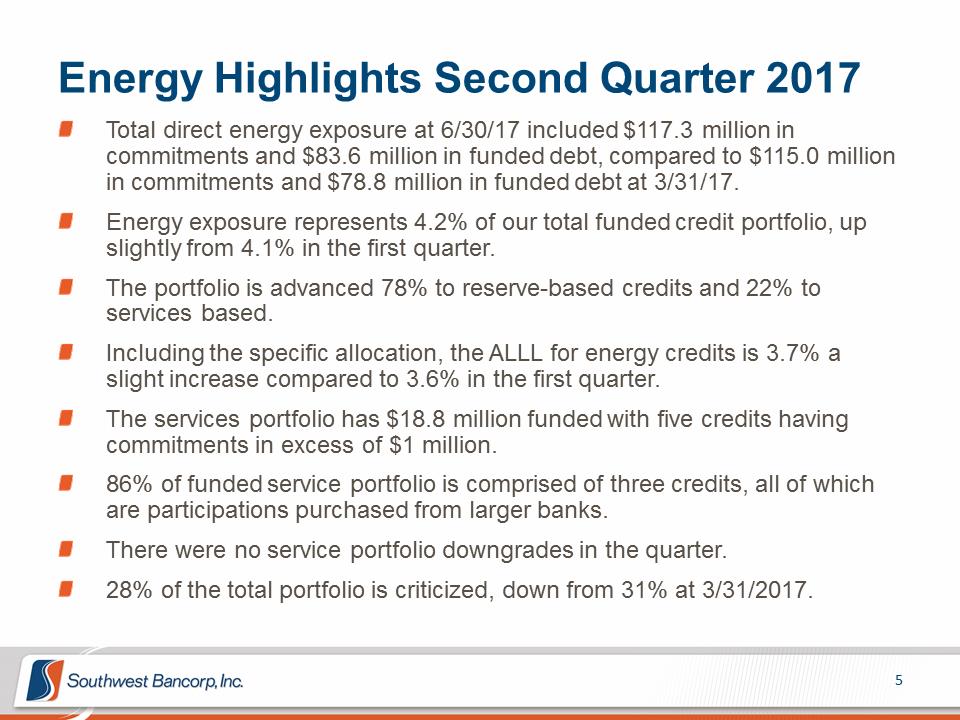 Energy Highlights Second Quarter 2017 Total direct energy exposure at 6/30/17 included $117.3 million in commitments and $83.6 million in funded debt, compared to $115.0 million in commitments and $78.8 million in funded debt at 3/31/17. Energy exposure represents 4.2% of our total funded credit portfolio, up slightly from 4.1% in the first quarter. The portfolio is advanced 78% to reserve-based credits and 22% to services based. Including the specific allocation, the ALLL for energy credits is 3.7% a slight increase compared to 3.6% in the first quarter. The services portfolio has $18.8 million funded with five credits having commitments in excess of $1 million. 86% of funded service portfolio is comprised of three credits, all of which are participations purchased from larger banks. There were no service portfolio downgrades in the quarter. 28% of the total portfolio is criticized, down from 31% at 3/31/2017.
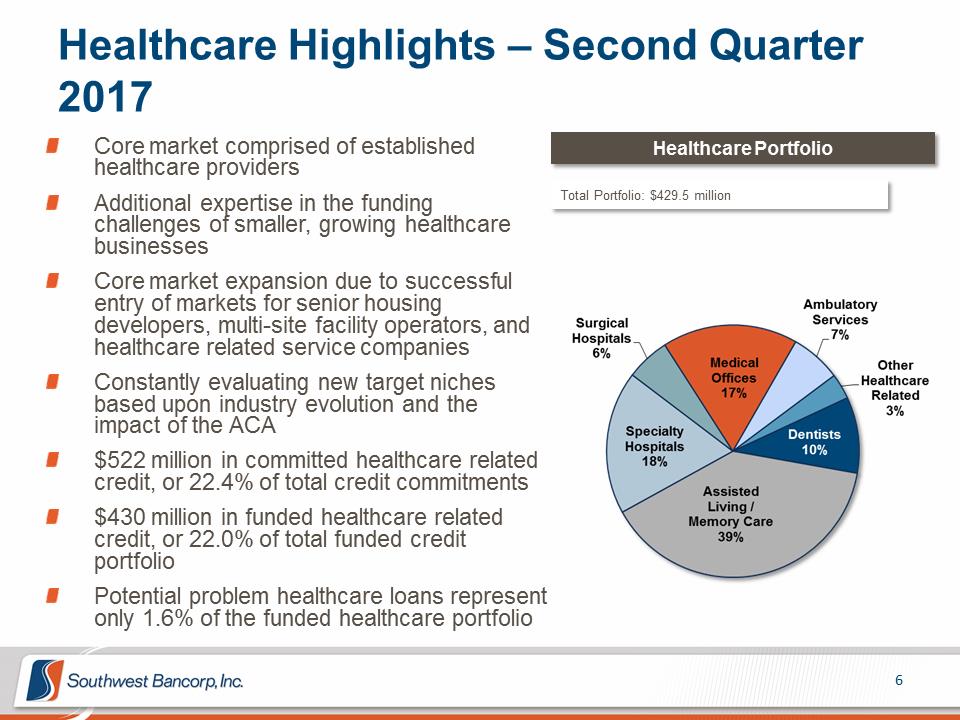 Healthcare Highlights – Second Quarter 2017 Core market comprised of established Healthcare Portfolio healthcare providers Additional expertise in the funding Total Portfolio: $429.5 million challenges of smaller, growing healthcare businesses Core market expansion due to successful entry of markets for senior housing developers, multi-site facility operators, and healthcare related service companies Constantly evaluating new target niches based upon industry evolution and the impact of the ACA $522 million in committed healthcare related credit, or 22.4% of total credit commitments $430 million in funded healthcare related credit, or 22.0% of total funded credit portfolio Potential problem healthcare loans represent only 1.6% of the funded healthcare portfolio
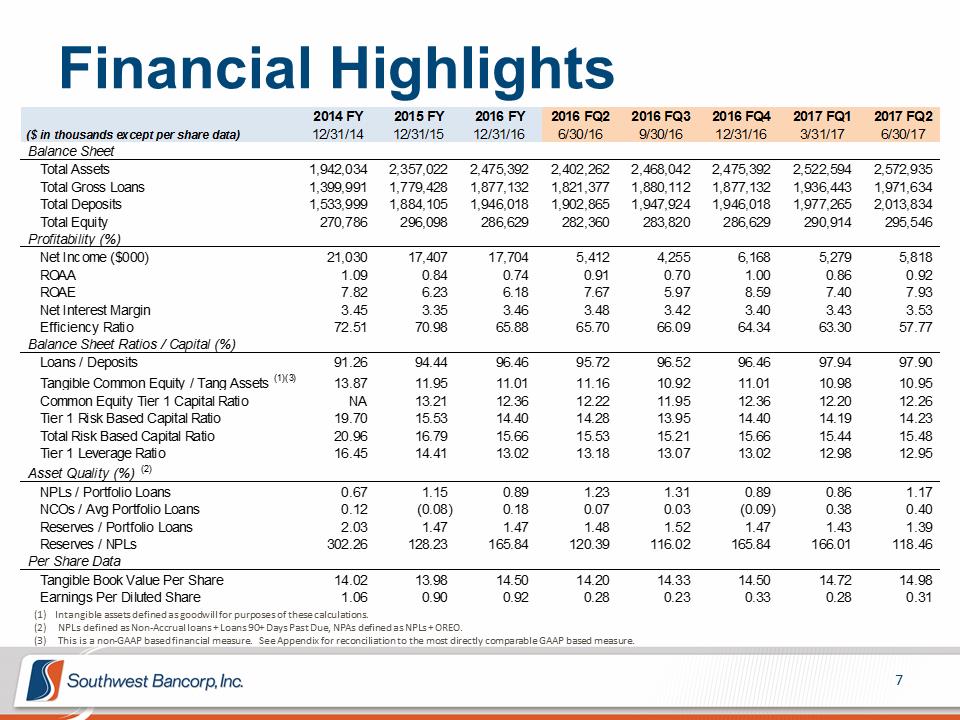 Financial Highlights 2014 FY 2015 FY 2016 FY 2016 FQ2 2016 FQ3 2016 FQ4 2017 FQ1 2017 FQ2 ($ in thousands except per share data) 12/31/14 12/31/15 12/31/16 6/30/16 9/30/16 12/31/16 3/31/17 6/30/17 Balance Sheet Total Assets 1,942,034 2,357,022 2,475,392 2,402,262 2,468,042 2,475,392 2,522,594 2,572,935 Total Gross Loans 1,399,991 1,779,428 1,877,132 1,821,377 1,880,112 1,877,132 1,936,443 1,971,634 Total Deposits 1,533,999 1,884,105 1,946,018 1,902,865 1,947,924 1,946,018 1,977,265 2,013,834 Total Equity 270,786 296,098 286,629 282,360 283,820 286,629 290,914 295,546 Profitability (%) Net Income ($000) 21,030 17,407 17,704 5,412 4,255 6,168 5,279 5,818 ROAA 1.09 0.84 0.74 0.91 0.70 1.00 0.86 0.92 ROAE 7.82 6.23 6.18 7.67 5.97 8.59 7.40 7.93 Net Interest Margin 3.45 3.35 3.46 3.48 3.42 3.40 3.43 3.53 Efficiency Ratio 72.51 70.98 65.88 65.70 66.09 64.34 63.30 57.77 Balance Sheet Ratios / Capital (%) Loans / Deposits 91.26 94.44 96.46 95.72 96.52 96.46 97.94 97.90 Tangible Common Equity / Tang Assets (1)(3) 13.87 11.95 11.01 11.16 10.92 11.01 10.98 10.95 Common Equity Tier 1 Capital Ratio NA 13.21 12.36 12.22 11.95 12.36 12.20 12.26 Tier 1 Risk Based Capital Ratio 19.70 15.53 14.40 14.28 13.95 14.40 14.19 14.23 Total Risk Based Capital Ratio 20.96 16.79 15.66 15.53 15.21 15.66 15.44 15.48 Tier 1 Leverage Ratio 16.45 14.41 13.02 13.18 13.07 13.02 12.98 12.95 Asset Quality (%) (2) NPLs / Portfolio Loans 0.67 1.15 0.89 1.23 1.31 0.89 0.86 1.17 NCOs / Avg Portfolio Loans 0.12 (0.08) 0.18 0.07 0.03 (0.09) 0.38 0.40 Reserves / Portfolio Loans 2.03 1.47 1.47 1.48 1.52 1.47 1.43 1.39 Reserves / NPLs 302.26 128.23 165.84 120.39 116.02 165.84 166.01 118.46 Per Share Data Tangible Book Value Per Share 14.02 13.98 14.50 14.20 14.33 14.50 14.72 14.98 Earnings Per Diluted Share 1.06 0.90 0.92 0.28 0.23 0.33 0.28 0.31 (1) Intangible assets defined as goodwill for purposes of these calculations. (2) NPLs defined as Non-Accrual loans + Loans 90+ Days Past Due, NPAs defined as NPLs + OREO. (3) This is a non-GAAP based financial measure. See Appendix for reconciliation to the most directly comparable GAAP based measure.
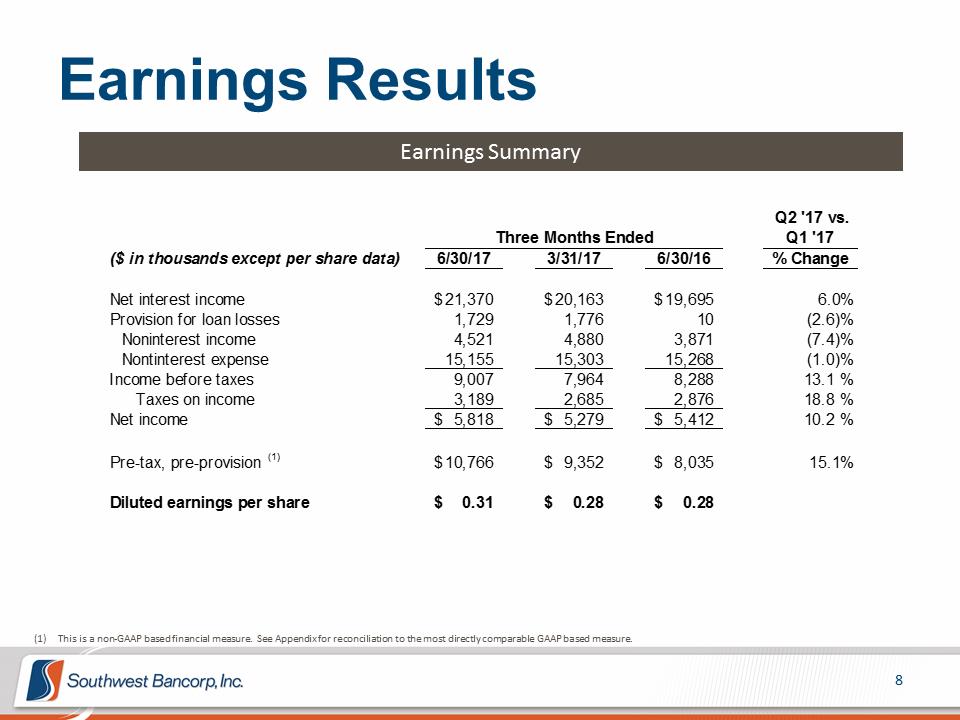 Earnings Results Earnings Summary Q2 '17 vs. Three Months Ended Q1 '17 ($ in thousands except per share data) 6/30/17 3/31/17 6/30/16 % Change Net interest income $ 21,370 $ 20,163 $ 19,695 6.0% Provision for loan losses 1,729 1,776 10 (2.6)% Noninterest income 4,521 4,880 3,871 (7.4)% Nontinterest expense 15,155 15,303 15,268 (1.0)% Income before taxes 9,007 7,964 8,288 13.1 % Taxes on income 3,189 2,685 2,876 18.8 % Net income $ 5,818 $ 5,279 $ 5,412 10.2 % Pre-tax, pre-provision (1) $ 10,766 $ 9,352 $ 8,035 15.1% Diluted earnings per share $ 0.31 $ 0.28 $ 0.28 This is a non-GAAP based financial measure. See Appendix for reconciliation to the most directly comparable GAAP based measure.
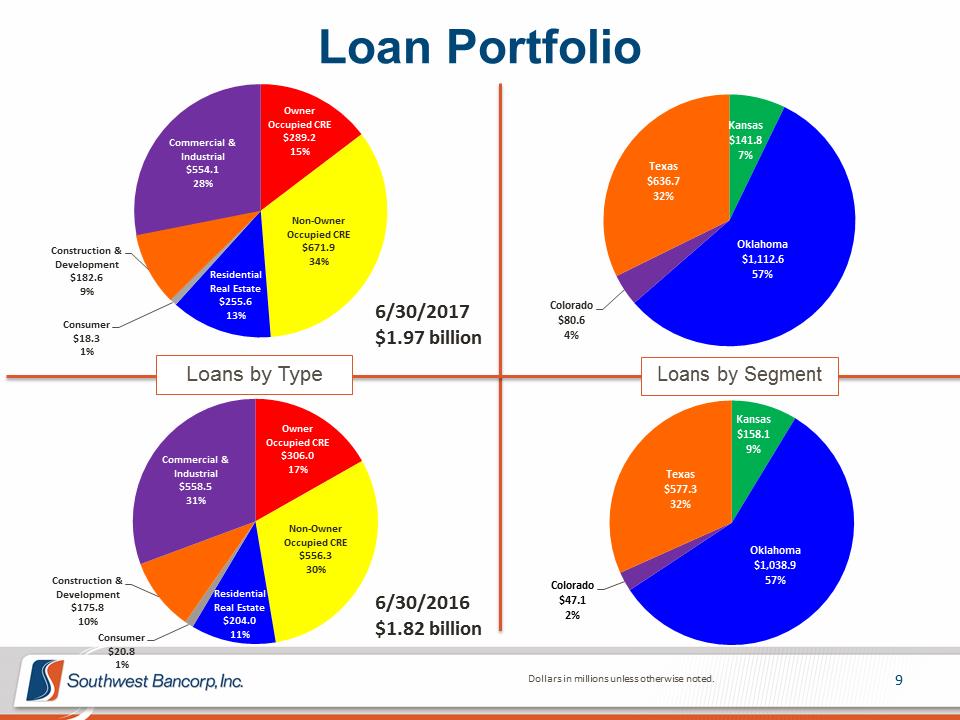 Loan Portfolio Owner Occupied CRE Kansas Commercial & $289.2 $141.8 Industrial 15% 7% $554.1 Texas 28% $636.7 32% Non-Owner Occupied CRE Construction & $671.9 Oklahoma Development 34% $1,112.6 $182.6 Residential 57% Real Estate 9% $255.6 6/30/2017 Colorado Consumer 13% $80.6 $18.3 $1.97 billion 4% 1% Loans by Type Loans by Segment Kansas Owner $158.1 Occupied CRE 9% Commercial & $306.0 Industrial 17% Texas $558.5 $577.3 31% 32% Non-Owner Occupied CRE Oklahoma $556.3 30% $1,038.9 Construction & 57% Colorado Development Residential $175.8 Real Estate 6/30/2016 $47.1 2% 10% $204.0 $1.82 billion Consumer 11% $20.8 1% Dollars in millions unless otherwise noted.
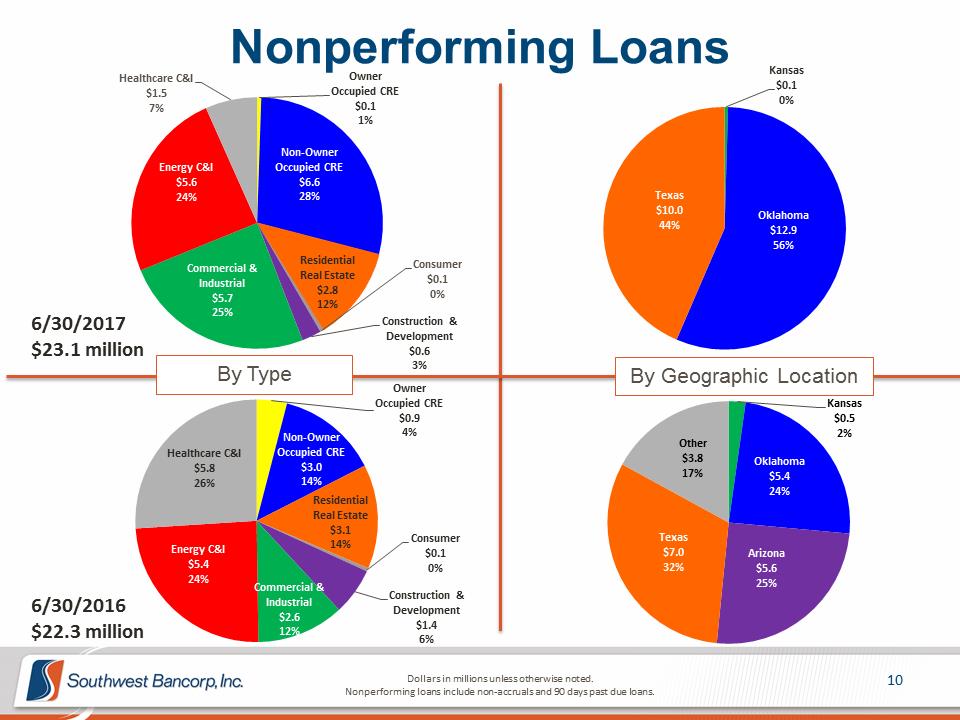 Nonperforming Loans Kansas Healthcare C&I Owner $0.1 $1.5 Occupied CRE 0% 7% $0.1 1% Non-Owner Energy C&I Occupied CRE $5.6 $6.6 24% 28% Texas $10.0 Oklahoma 44% $12.9 56% Residential Commercial & Consumer Industrial Real Estate $0.1 $5.7 $2.8 0% 12% 25% 6/30/2017 Construction & Development $23.1 million $0.6 3% By Type By Geographic Location Owner Occupied CRE Kansas $0.9 $0.5 4% 2% Non-Owner Other Healthcare C&I Occupied CRE $3.8 Oklahoma $5.8 $3.0 17% $5.4 26% 14% 24% Residential Real Estate $3.1 Consumer Texas 14% Energy C&I $0.1 $7.0 Arizona $5.4 0% 32% $5.6 24% Commercial & 25% Construction & 6/30/2016 Industrial Development $2.6 $1.4 $22.3 million 12% 6% Dollars in millions unless otherwise noted. 10 Nonperforming loans include non-accruals and 90 days past due loans.
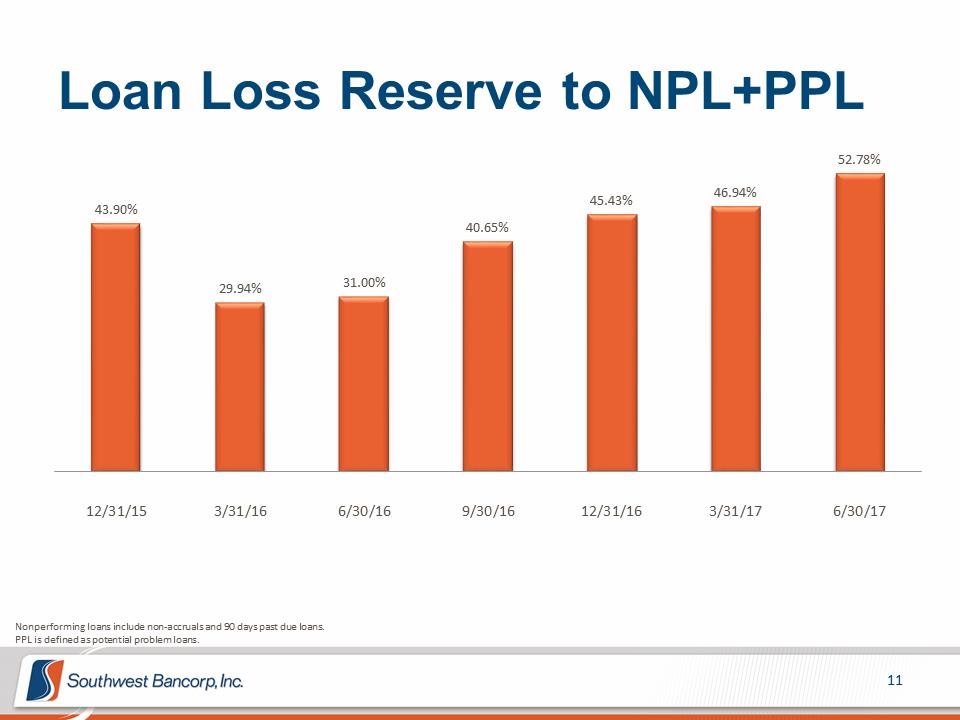 Loan Loss Reserve to NPL+PPL 52.78% 46.94% 45.43% 43.90% 40.65% 31.00% 29.94% 12/31/15 3/31/16 6/30/16 9/30/16 12/31/16 3/31/17 6/30/17 Nonperforming loans include non-accruals and 90 days past due loans. PPL is defined as potential problem loans.
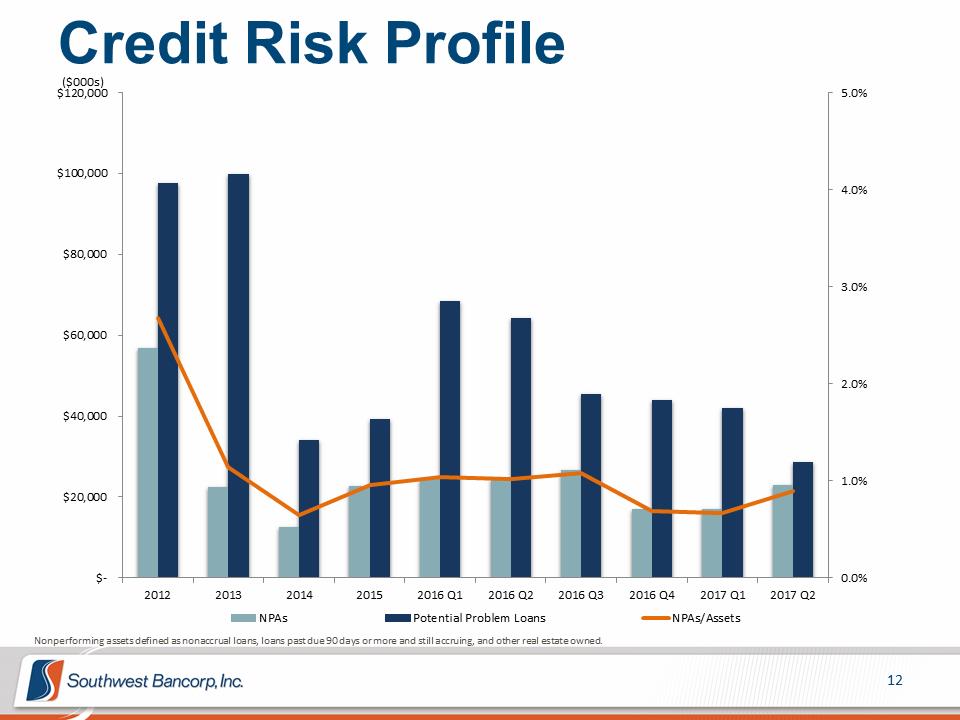 Credit Risk Profile ($000s) $120,000 5.0% $100,000 4.0% $80,000 3.0% $60,000 2.0% $40,000 1.0% $20,000 $- 0.0% 2012 2013 2014 2015 2016 Q1 2016 Q2 2016 Q3 2016 Q4 2017 Q1 2017 Q2 NPAs Potential Problem Loans NPAs/Assets Nonperforming assets defined as nonaccrual loans, loans past due 90 days or more and still accruing, and other real estate owned.
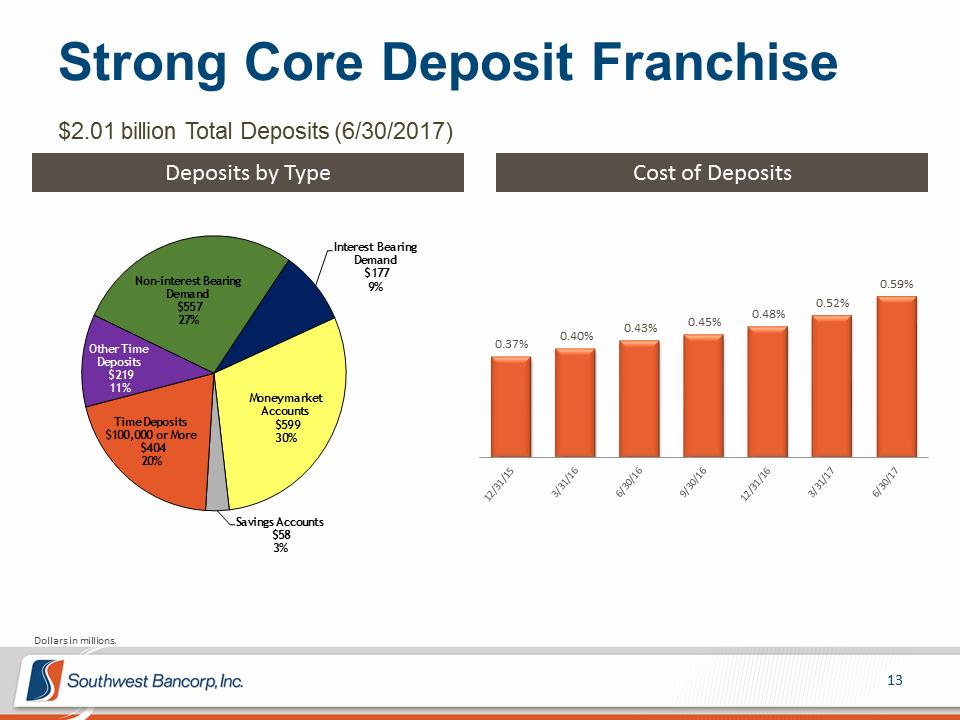 Strong Core Deposit Franchise $2.01 billion Total Deposits (6/30/2017) Deposits by Type Cost of Deposits Interest Bearing Demand $177 Non-interest Bearing 9% 0.59% Demand $557 0.52% �� 0.48% 27% 0.45% 0.43% 0.40% 0.37% Other Time Deposits $219 11% Money market Accounts Time Deposits $599 $100,000 or More 30% $404 20% Savings Accounts $58 3% Dollars in millions.
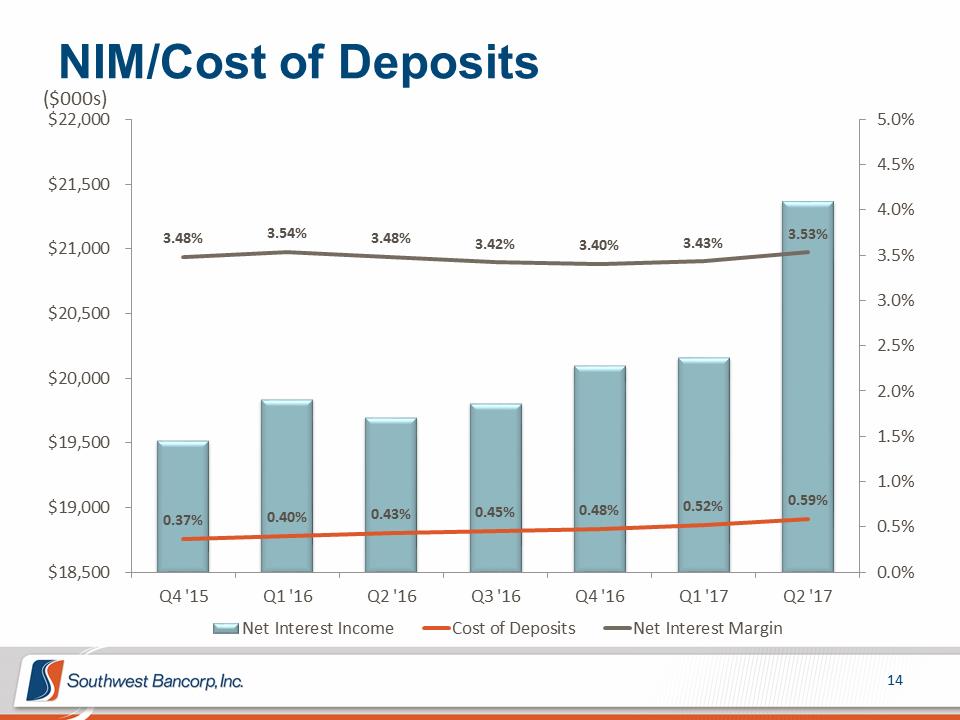 NIM/Cost of Deposits ($000s) $22,000 5.0% 4.5% $21,500 4.0% $21,000 3.48% 3.54% 3.48% 3.42% 3.40% 3.43% 3.53% 3.5% 3.0% $20,500 2.5% $20,000 2.0% $19,500 1.5% 1.0% 0.59% $19,000 0.37% 0.40% 0.43% 0.45% 0.48% 0.52% 0.5% $18,500 0.0% Q4 '15 Q1 '16 Q2 '16 Q3 '16 Q4 '16 Q1 '17 Q2 '17 Net Interest Income Cost of Deposits Net Interest Margin
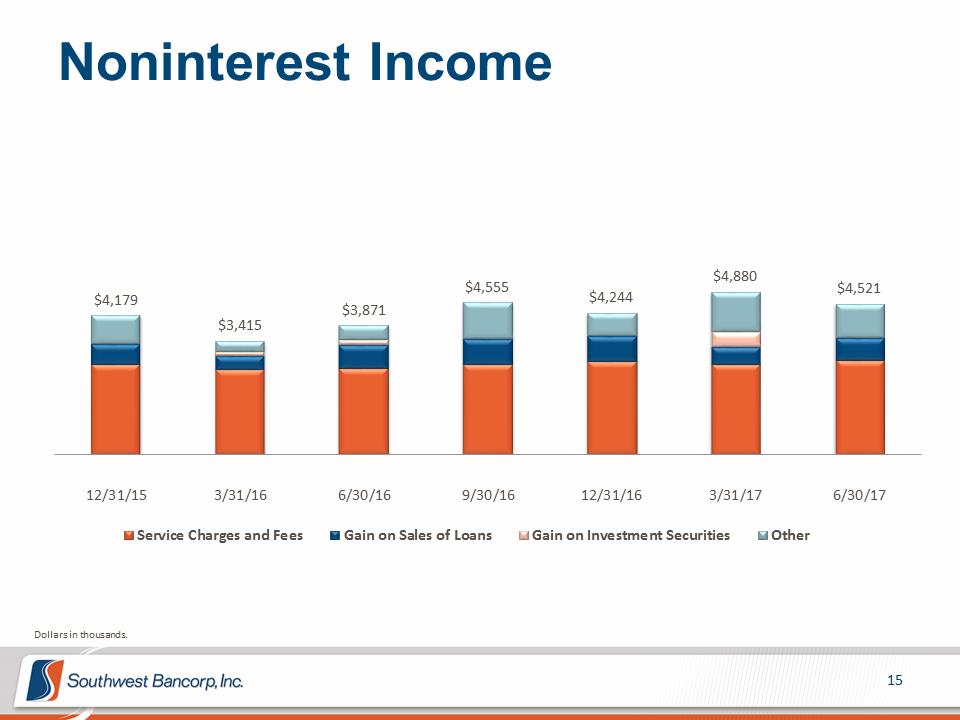 Noninterest Income $4,880 $4,555 $4,521 $4,179 $4,244 $3,871 $3,415 12/31/15 3/31/16 6/30/16 9/30/16 12/31/16 3/31/17 6/30/17 Service Charges and Fees Gain on Sales of Loans Gain on Investment Securities Other Dollars in thousands.
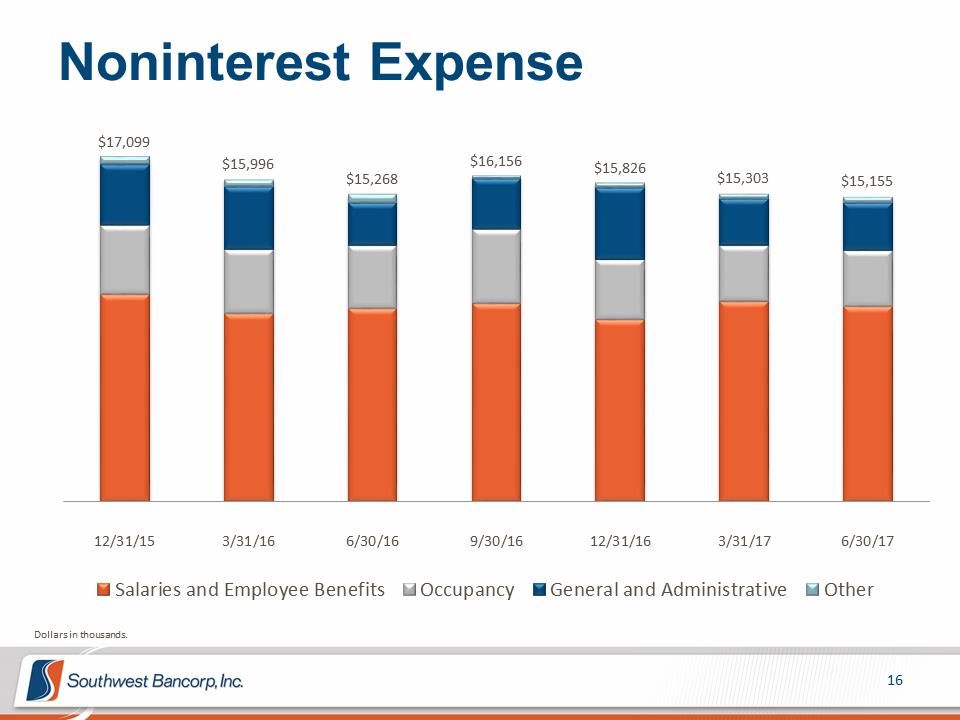 Noninterest Expense $17,099 $15,996 $16,156 $15,826 $15,268 $15,303 $15,155 12/31/15 3/31/16 6/30/16 9/30/16 12/31/16 3/31/17 6/30/17 Salaries and Employee Benefits Occupancy General and Administrative Other Dollars in thousands.
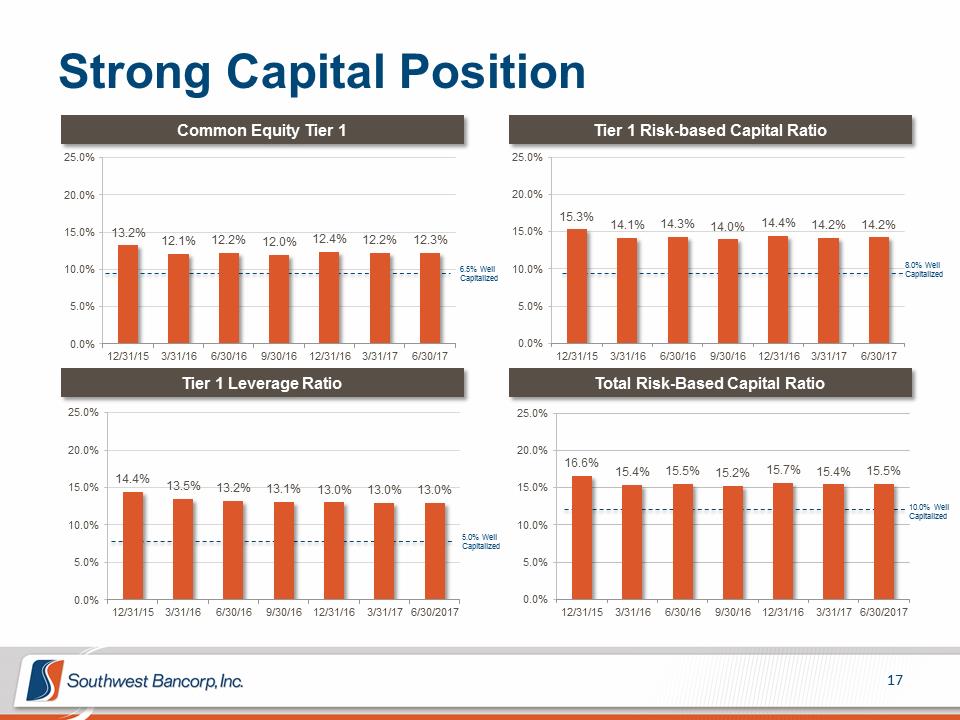 Strong Capital Position Common Equity Tier 1 Tier 1 Risk-based Capital Ratio 25.0% 25.0% 20.0% 20.0% 15.3% 14.1% 14.3% 14.0% 14.4% 14.2% 14.2% 15.0% 13.2% 15.0% 12.1% 12.2% 12.0% 12.4% 12.2% 12.3% 8.0% Well 10.0% 6.5% Well 10.0% Capitalized Capitalized 5.0% 5.0% 0.0% 0.0% 12/31/15 3/31/16 6/30/16 9/30/16 12/31/16 3/31/17 6/30/17 12/31/15 3/31/16 6/30/16 9/30/16 12/31/16 3/31/17 6/30/17 Tier 1 Leverage Ratio Total Risk-Based Capital Ratio 25.0% 25.0% 20.0% 20.0% 16.6% 15.4% 15.5% 15.2% 15.7% 15.4% 15.5% 14.4% 15.0% 13.5% 13.2% 13.1% 13.0% 13.0% 13.0% 15.0% 10.0% Well Capitalized 10.0% 10.0% 5.0% Well Capitalized 5.0% 5.0% 0.0% 0.0% 12/31/15 3/31/16 6/30/16 9/30/16 12/31/16 3/31/17 6/30/2017 12/31/15 3/31/16 6/30/16 9/30/16 12/31/16 3/31/17 6/30/2017
 2017 Priorities Successfully complete the proposed merger and consolidation with Simmons First National Corporation. Maintain strong credit quality along with conservative balance sheet and risk management. Continue appropriate growth in the commercial banking sector. Grow deposit base commensurate with loan growth. Focus on fee based income growth in mortgage, consumer and treasury. Assess, manage and add talent where available and appropriate throughout the organization. Drive growth in the healthcare banking segment.
 ADDITIONAL FINANCIAL INFORMATION
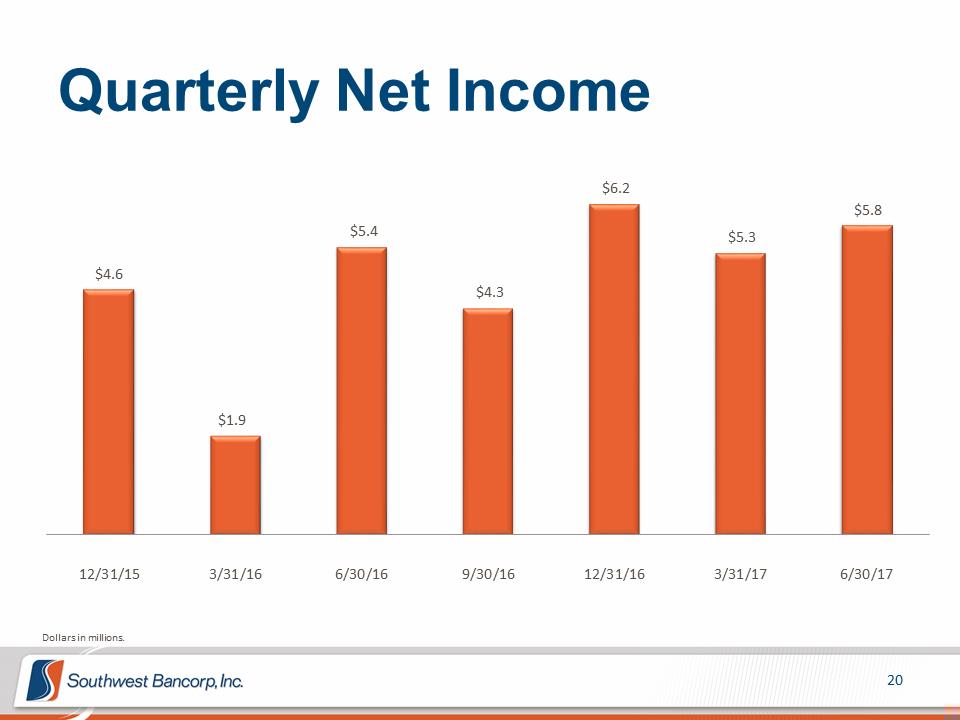 Quarterly Net Income $6.2 $5.8 $5.4 $5.3 $4.6 $4.3 $1.9 12/31/15 3/31/16 6/30/16 9/30/16 12/31/16 3/31/17 6/30/17 Dollars in millions.
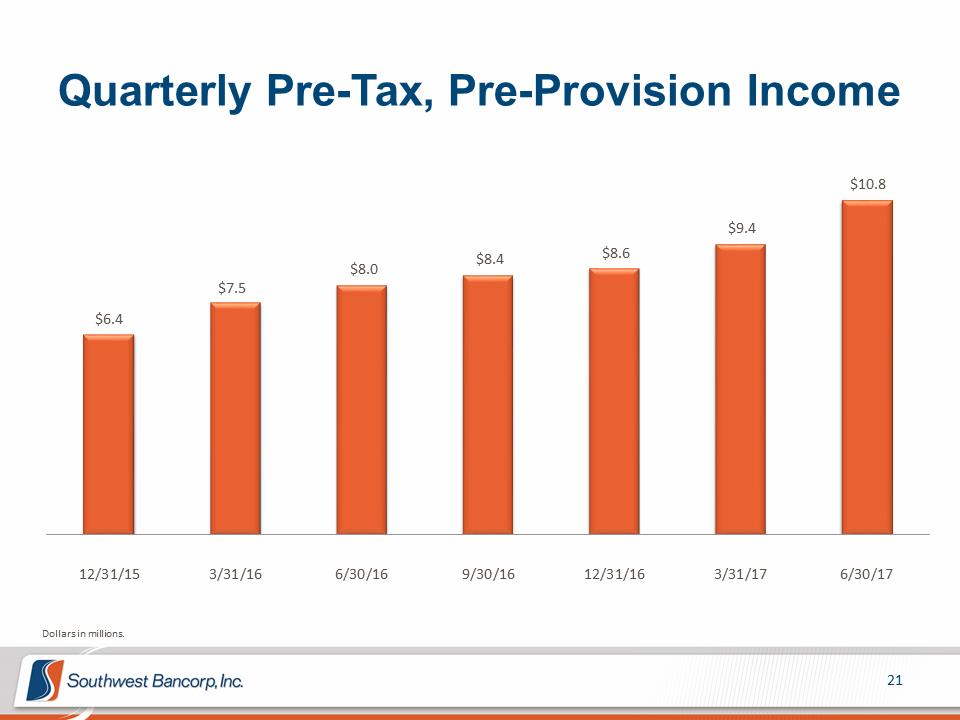 Quarterly Pre-Tax, Pre-Provision Income $10.8 $9.4 $8.4 $8.6 $8.0 $7.5 $6.4 12/31/15 3/31/16 6/30/16 9/30/16 12/31/16 3/31/17 6/30/17 Dollars in millions.
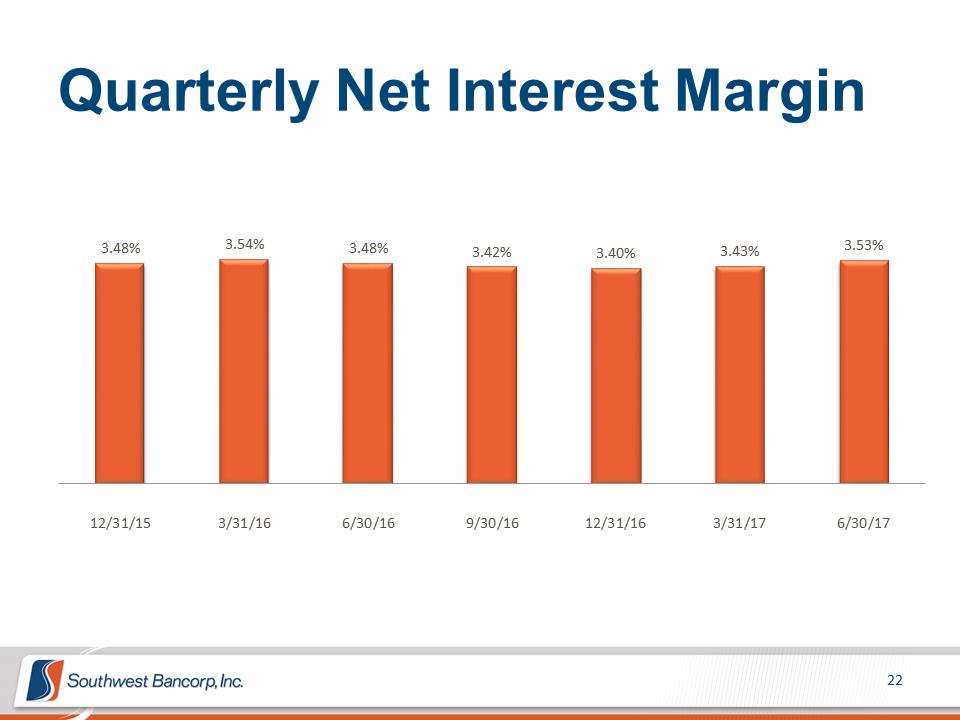 Quarterly Net Interest Margin 3.48% 3.54% 3.48% 3.42% 3.40% 3.43% 3.53% 12/31/15 3/31/16 6/30/16 9/30/16 12/31/16 3/31/17 6/30/17
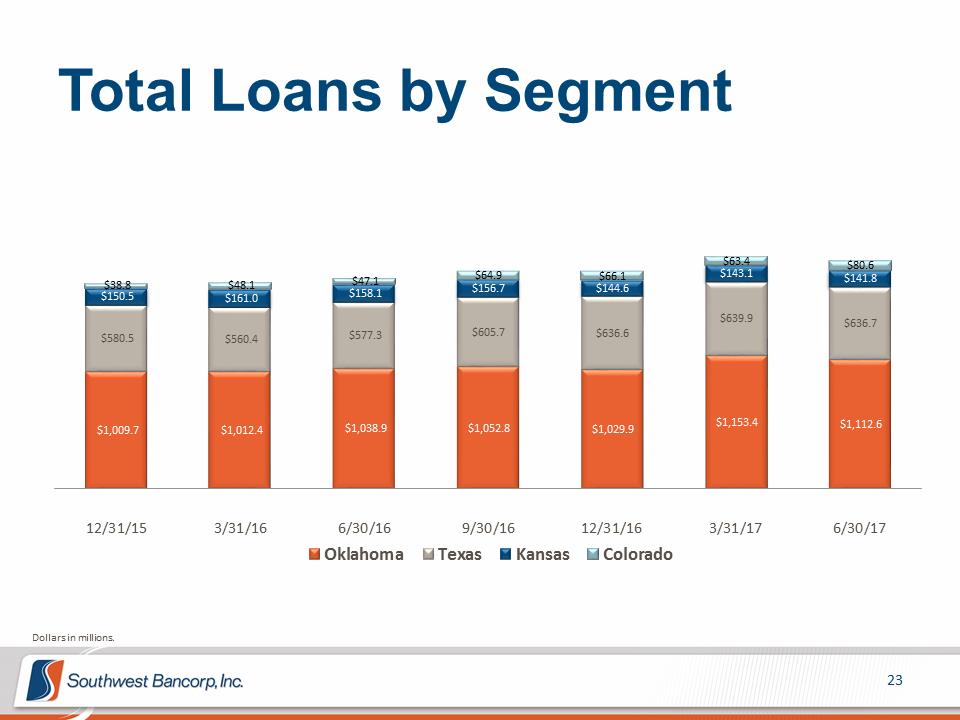 Total Loans by Segment $63.4 $80.6 $38.8 $48.1 $47.1 $64.9 $66.1 $143.1 $141.8 $150.5 $161.0 $158.1 $156.7 $144.6 $639.9 $636.7 $580.5 $560.4 $577.3 $605.7 $636.6 $1,009.7 $1,012.4 $1,038.9 $1,052.8 $1,029.9 $1,153.4 $1,112.6 12/31/15 3/31/16 6/30/16 9/30/16 12/31/16 3/31/17 6/30/17 Oklahoma Texas Kansas Colorado Dollars in millions.
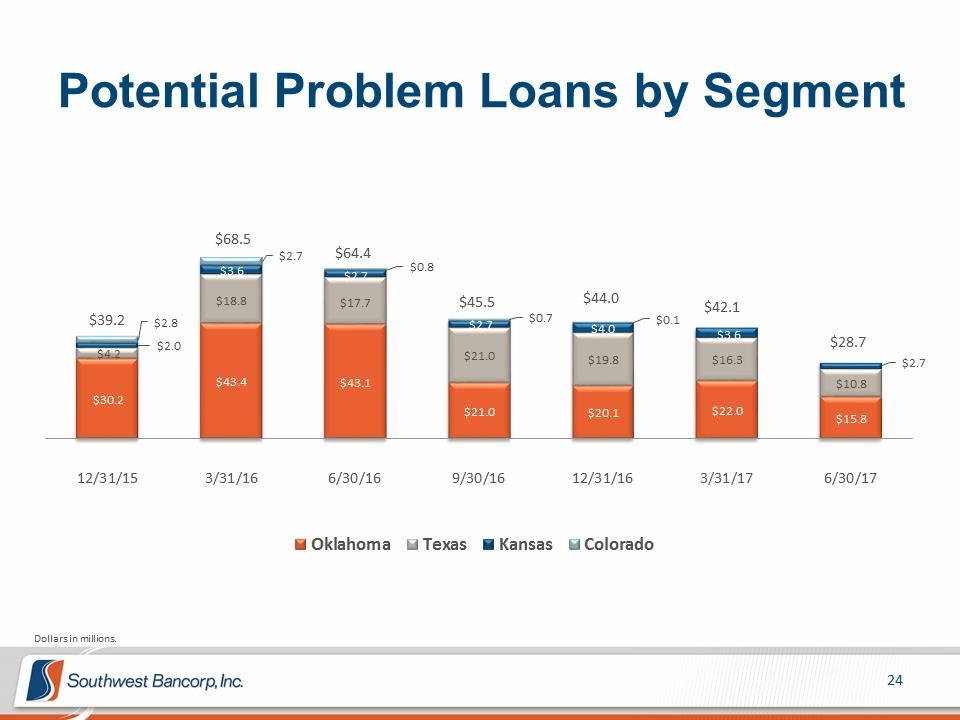 Potential Problem Loans by Segment $68.5 $2.7 $64.4 $3.6 $2.7 $0.8 $18.8 $17.7 $45.5 $44.0 $42.1 $39.2 $2.8 $2.7 $0.7 $4.0 $0.1 $3.6 $2.0 $28.7 $4.2 $21.0 $19.8 $16.3 $2.7 $43.4 $43.1 $10.8 $30.2 $21.0 $20.1 $22.0 $15.8 12/31/15 3/31/16 6/30/16 9/30/16 12/31/16 3/31/17 6/30/17 Oklahoma Texas Kansas Colorado Dollars in millions.
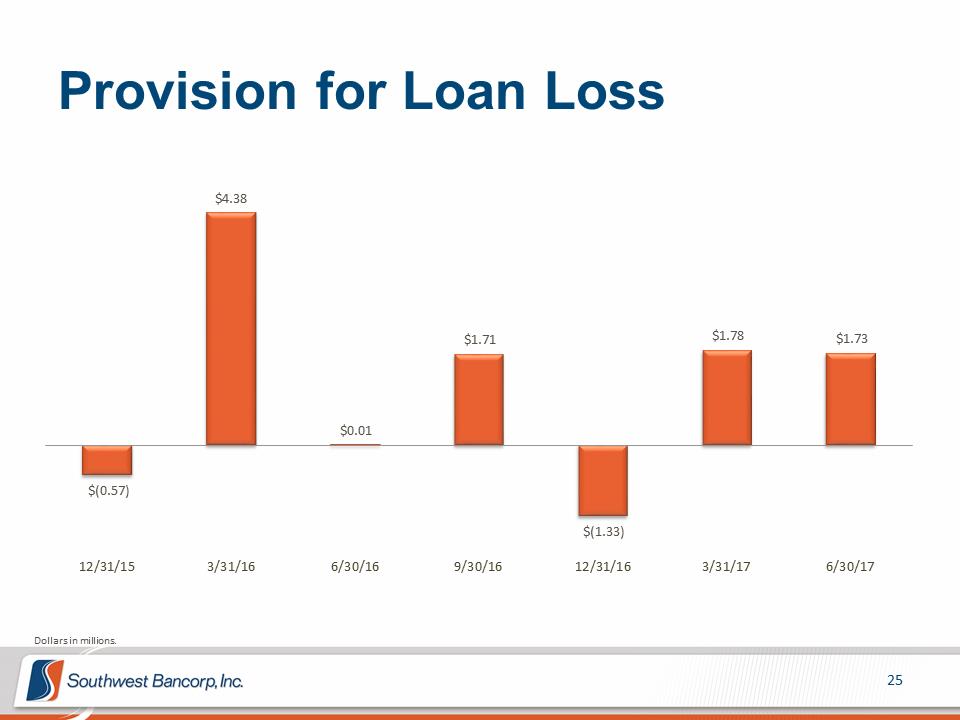 Provision for Loan Loss $4.38 $1.71 $1.78 $1.73 $0.01 $(0.57) $(1.33) 12/31/15 3/31/16 6/30/16 9/30/16 12/31/16 3/31/17 6/30/17 Dollars in millions.
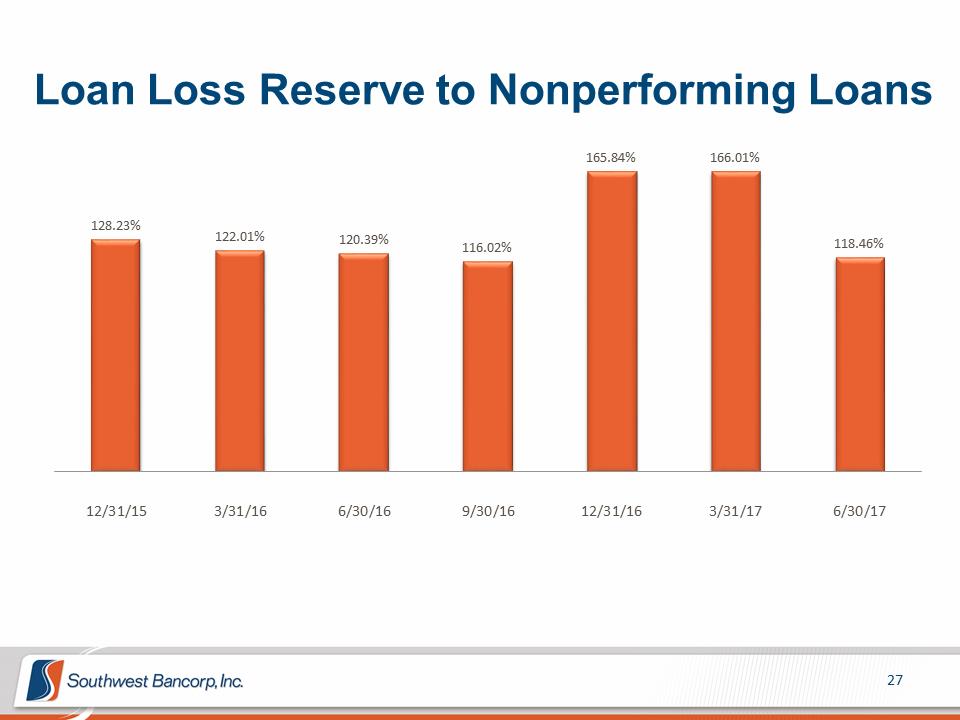
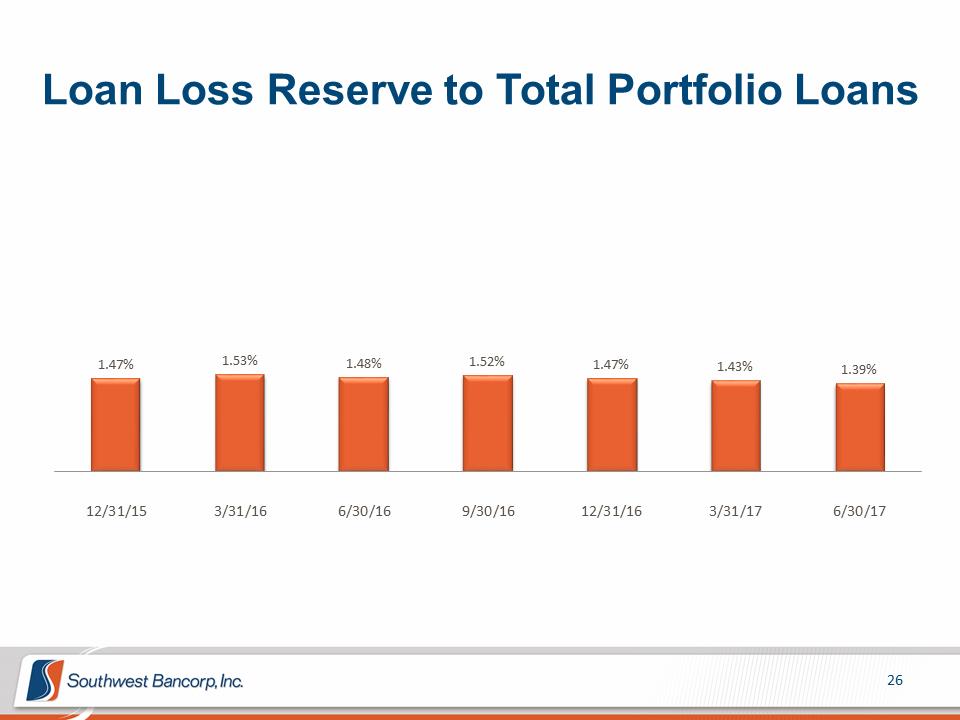 Loan Loss Reserve to Total Portfolio Loans 1.47% 1.53% 1.48% 1.52% 1.47% 1.43% 1.39% 12/31/15 3/31/16 6/30/16 9/30/16 12/31/16 3/31/17 6/30/17 Loan Loss Reserve to Nonperforming Loans 165.84% 166.01% 128.23% 122.01% 120.39% 116.02% 118.46% 12/31/15 3/31/16 6/30/16 9/30/16 12/31/16 3/31/17 6/30/17
 APPENDIX
 The subsequent tables present non-GAAP reconciliations of the following calculations: – Tangible Common Equity (TCE) to Tangible Assets (TA) ratio – Tangible Book Value per Share – Pre-tax, Pre-provision Income
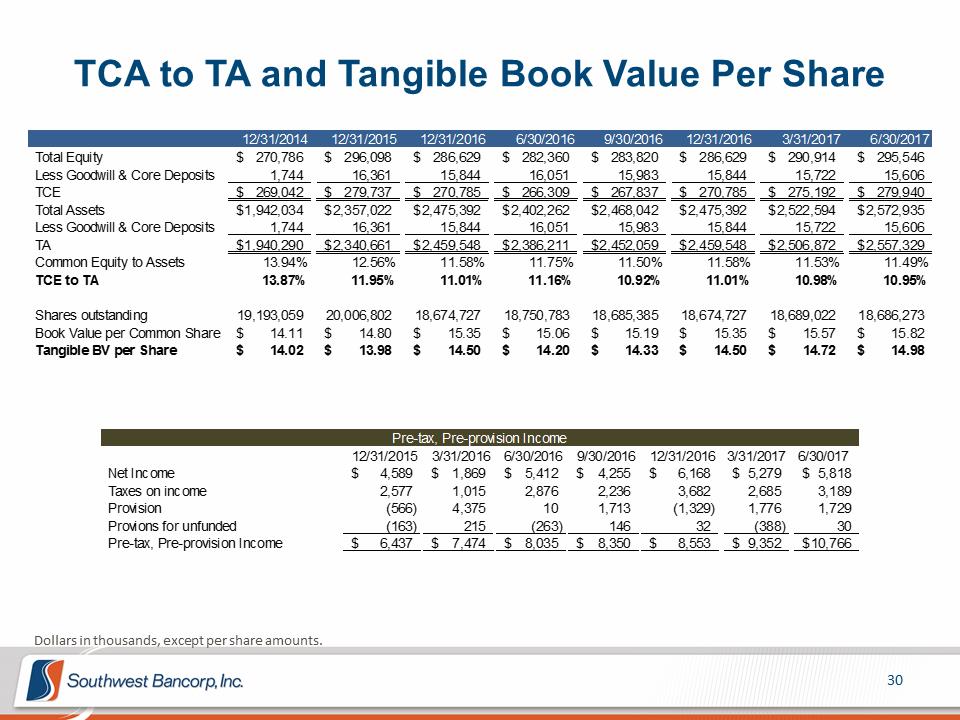 TCA to TA and Tangible Book Value Per Share 12/31/2014 12/31/2015 12/31/2016 6/30/2016 9/30/2016 12/31/2016 3/31/2017 6/30/2017 Total Equity $ 270,786 $ 296,098 $ 286,629 $ 282,360 $ 283,820 $ 286,629 $ 290,914 $ 295,546 Less Goodwill & Core Deposits 1,744 16,361 15,844 16,051 15,983 15,844 15,722 15,606 TCE $ 269,042 $ 279,737 $ 270,785 $ 266,309 $ 267,837 $ 270,785 $ 275,192 $ 279,940 Total Assets $ 1,942,034 $ 2,357,022 $ 2,475,392 $ 2,402,262 $ 2,468,042 $ 2,475,392 $ 2,522,594 $ 2,572,935 Less Goodwill & Core Deposits 1,744 16,361 15,844 16,051 15,983 15,844 15,722 15,606 TA $ 1,940,290 $ 2,340,661 $ 2,459,548 $ 2,386,211 $ 2,452,059 $ 2,459,548 $ 2,506,872 $ 2,557,329 Common Equity to Assets 13.94% 12.56% 11.58% 11.75% 11.50% 11.58% 11.53% 11.49% TCE to TA 13.87% 11.95% 11.01% 11.16% 10.92% 11.01% 10.98% 10.95% Shares outstanding 19,193,059 20,006,802 18,674,727 18,750,783 18,685,385 18,674,727 18,689,022 18,686,273 Book Value per Common Share $ 14.11 $ 14.80 $ 15.35 $ 15.06 $ 15.19 $ 15.35 $ 15.57 $ 15.82 Tangible BV per Share $ 14.02 $ 13.98 $ 14.50 $ 14.20 $ 14.33 $ 14.50 $ 14.72 $ 14.98 Pre-tax, Pre-provision Income 12/31/2015 3/31/2016 6/30/2016 9/30/2016 12/31/2016 3/31/2017 6/30/017 Net Income $ 4,589 $ 1,869 $ 5,412 $ 4,255 $ 6,168 $ 5,279 $ 5,818 Taxes on income 2,577 1,015 2,876 2,236 3,682 2,685 3,189 Provision (566) 4,375 10 1,713 (1,329) 1,776 1,729 Provions for unfunded (163) 215 (263) 146 32 (388) 30 Pre-tax, Pre-provision Income $ 6,437 $ 7,474 $ 8,035 $ 8,350 $ 8,553 $ 9,352 $ 10,766 Dollars in thousands, except per share amounts.
2017 Second Quarter Earnings Presentation NASDAQ: OKSB July 26, 2017