SECURITIES AND EXCHANGE COMMISSION
Washington, D.C. 20549
FORM 10-K
ANNUAL REPORT PURSUANT TO SECTION 13 OR 15(d)
OF THE SECURITIES EXCHANGE ACT OF 1934
For the Year Ended December 31, 2011
Commission File Number 001-34110
SOUTHWEST BANCORP, INC.
(Exact name of registrant as specified in its charter)
| | |
| Oklahoma | | 73-1136584 |
(State or other jurisdiction of incorporation or organization) | | (I.R.S. Employer Identification No.) |
| | |
608 South Main Street, Stillwater, Oklahoma | | 74074 |
| (Address of principal executive office) | | (Zip Code) |
Registrant’s telephone number, including area code: (405) 742-1800
Securities registered pursuant to Section 12(b) of the Act:
| | |
Title of Each Class | | Name of Each Exchange on which Registered |
| Common Stock, par value $1.00 per share | | The NASDAQ Stock Market |
Securities registered pursuant to Section 12(g) of the Act:
None
Indicate by check mark if the registrant is a well-known seasoned issuer, as defined in Rule 405 of the Securities Act. ¨ YES x NO
Indicate by check mark if the registrant is not required to file reports pursuant to Section 13 or Section 15(d) of the Act. ¨ YES x NO*
Indicate by check mark whether the registrant (1) has filed all reports required to be filed by Section 13 or 15(d) of the Securities Exchange Act of 1934 during the preceding 12 months (or for such shorter period that the registrant was required to file such reports), and (2) has been subject to such filing requirements for the past 90 days. x YES ¨ NO
Indicate by check mark whether the registrant has submitted electronically and posted on its corporate Web site, if any, every Interactive Data File required to be submitted and posted pursuant to Rule 405 of Regulation S-T (§232.405 of this chapter) during the preceding 12 months (or for such shorter period that the registrant was required to submit and post such files). x YES ¨ NO
Indicate by check mark if disclosure of delinquent filers pursuant to Item 405 of Regulation S-K is not contained herein, and will not be contained, to the best of registrant’s knowledge, in definitive proxy or information statements incorporated by reference in Part III of this Form 10-K or any amendment to this Form 10-K. x
Indicate by a check mark if the registrant is a large accelerated filer, an accelerated filer, a non-accelerated filer, or a smaller reporting company. See definition of “accelerated filer,” “large accelerated filer,” and “smaller reporting company” in Rule 12b-2 of the Exchange Act (Check one):
| | | | | | |
| Large Accelerated filer | | ¨ | | Accelerated filer | | x |
| | | |
| Non-accelerated filer | | ¨ | | Smaller reporting company | | ¨ |
Indicate by check mark whether the registrant is a shell company (as defined in Rule 12b-2 of the Exchange Act). ¨ YES x NO
The registrant’s Common Stock is traded on the NASDAQ Global Select Market under the symbol OKSB. The aggregate market value of approximately 18,394,745 shares of Common Stock of the registrant issued and outstanding held by nonaffiliates on June 30, 2011, the last day of the registrant’s most recently completed second fiscal quarter, was approximately $180.1 million based on the closing sales price of $9.79 per share of the registrant’s Common Stock on that date. Solely for purposes of this calculation, it is assumed that directors, officers, and 5% stockholders of the registrant (other than institutional investors) are affiliates.
As of the close of business on March 13, 2012, 19,445,913 shares of the registrant’s Common Stock were outstanding.
Documents Incorporated by Reference
| Part III: | Portions of the definitive Proxy Statement relating to registrant’s Annual Meeting of Shareholders, to be held on April 26, 2012, are incorporated by reference to the extent described therein. |
| * | The registrant is required to file reports pursuant to Section 13 of the Act. |
SOUTHWEST BANCORP, INC.
INDEX
1
CAUTIONABOUT FORWARD-LOOKING STATEMENTS
Southwest Bancorp, Inc. (“Southwest”) makes forward-looking statements in this Annual Report on Form 10-K that are subject to risks and uncertainties. We intend these statements to be covered by the safe harbor provision for forward-looking statements contained in the Private Securities Litigation Reform Act of 1995.
These forward-looking statements include:
| | • | | Statements of Southwest’s goals, intentions, and expectations; |
| | • | | Estimates of risks and of future costs and benefits; |
| | • | | Expectations regarding our future financial performance and the financial performance of our operating segments; |
| | • | | Expectations regarding our ability to utilize tax loss benefits; |
| | • | | Assessments of loan quality, probable loan losses, and the amount and timing of loan payoffs; |
| | • | | Estimates of the value of assets held for sale or available for sale; and |
| | • | | Statements of our ability to achieve financial and other goals. |
These forward-looking statements are subject to significant uncertainties because they are based upon: the amount and timing of future changes in interest rates, market behavior, and other economic conditions; future laws, regulations, and accounting principles; changes in regulatory standards and examination policies; and a variety of other matters. These other matters include, among other things, the direct and indirect effects of economic conditions on interest rates, credit quality, loan demand, liquidity, and monetary and supervisory policies of banking regulators. Because of these uncertainties, the actual future results may be materially different from the results indicated by these forward-looking statements. In addition, Southwest’s past growth and performance do not necessarily indicate our future results. For other factors, risks, and uncertainties that could cause actual results to differ materially from estimates and projections contained in forward-looking statements, please read the “Risk Factors” contained in this report and future Southwest reports to the Securities and Exchange Commission.
The cautionary statements in this release also identify important factors and possible events that involve risk and uncertainties that could cause our actual results to differ materially from those contained in the forward-looking statements. These forward-looking statements speak only as of the date on which the statements were made. We do not intend, and undertake no obligation, to update or revise any forward-looking statements contained in this release, whether as a result of differences in actual results, changes in assumptions, or changes in other factors affecting such statements, except as required by law. Please see the discussion of Risk Factors on page 96 and Critical Accounting Policies on page 10.
2
FORM 10-K CROSS REFERENCE SHEETOF MATERIAL INCORPORATEDBY REFERENCE
The following table shows the location in this Annual Report on Form 10-K or the accompanying Proxy Statement of the information required to be disclosed by the United States Securities and Exchange Commission (“SEC”) Form 10-K. Where indicated below, the information has been incorporated by reference in this Report from the Proxy Statement that accompanies it. Other portions of the Proxy Statement are not included in this Report. This Report is not part of the Proxy Statement. References are to pages in this report unless otherwise indicated.
| | | | |
| Item of Form 10-K | | Location |
Part I | | | | |
Item 1. | | Business | | “Forward-Looking Statements” on page 2, “About this Report” on page 5, and “Business” on pages 82 through 92. |
| | |
Item 1A. | | Risk Factors | | “Risk Factors” on pages 96 through 104. |
| | |
Item 1B. | | Unresolved Staff Comments | | None. |
| | |
Item 2. | | Properties | | “Properties” on pages 106 through 108. |
| | |
Item 3. | | Legal Proceedings | | Note 17 “Commitments and Contingencies” on page 77. |
| | |
Item 4. | | Mine Safety Disclosures | | Not applicable. |
| | |
PART II | | | | |
Item 5. | | Market for Registrant’s Common Equity, Related Stockholder Matters, and Issuer Purchases of Equity Securities | | “Securities Listing, Prices, and Dividends” on page 8. |
| | |
Item 6. | | Selected Financial Data | | “Five Year Summary of Selected Financial Data” on pages 6 and 7. |
| | |
Item 7. | | Management’s Discussion and Analysis of Financial Condition and Results of Operations | | “Management’s Discussion and Analysis of Financial Condition and Results of Operations” on pages 10 through 32. |
| | |
Item 7A. | | Quantitative and Qualitative Disclosures about Market Risk | | “Quantitative and Qualitative Disclosures about Market Risk” on pages 32 through 34. |
| | |
Item 8. | | Financial Statements and Supplementary Data | | Pages 37 through 81. |
| | |
Item 9. | | Changes in and Disagreements with Accountants on Accounting and Financial Disclosures | | Not applicable. During the past two years or any subsequent period there has been no change in or reportable disagreement with the independent registered public accounting firm for Southwest or any of its subsidiaries. |
| | |
Item 9A. | | Controls and Procedures | | “Controls and Procedures” on page 34. |
| | |
Item 9B. | | Other Information | | Not applicable. The registrant reported all items required to be reported in a Form 8-K during the fourth quarter of 2011. |
| | |
Part III | | | | |
Item 10. | | Directors, Executive Officers and Corporate Governance | | The material labeled “Election of Directors” on pages 3 through 6, “Board Meetings and Committees” and “Board Leadership Structure and Role in Oversight” on pages 6 through 9, “Section 16(a) Beneficial Ownership Reporting Compliance” on page 32, “Code of Ethics” on page 34, “Shareholder Proposals and Communications” on page 35, and “Report of the Audit Committee” on page 33 of the Proxy Statement is incorporated by reference in this Report. |
| | |
Item 11. | | Executive Compensation | | The material labeled “Director Compensation” on page 12, “Compensation Discussion and Analysis” on pages 15 through 24, and “Compensation Committee Report” on pages 25 through 27, and “Executive Compensation” on pages 28 through 31, of the Proxy Statement is incorporated by reference in this Report. |
| | |
Item 12. | | Security Ownership of Certain Beneficial Owners and Management and Related Stockholder Matters | | The material labeled “Common Stock Owned by Directors and Executive Officers” on pages 13 and 14 and “Owners of More than 5% of Southwest’s Common Stock” on page 14 of the Proxy Statement is incorporated by reference in this Report. Information regarding securities authorized for issuance under equity compensation plans is included under “Equity Compensation Plan Information” on page 9 of this report. |
3
| | | | |
| Item of Form 10-K | | Location |
Item 13. | | Certain Relationships and Related Transactions and Director Independence | | The material labeled “Director Independence” on pages 9 through 11 and “Certain Transactions” on pages 31 and 32 of the Proxy Statement is incorporated by reference in this Report. |
| | |
Item 14. | | Principal Accountant Fees and Services | | The material labeled “Relationship with Independent Public Accountants” on pages 32 and 33 of the Proxy Statement is incorporated by reference in this Report. |
| | |
Part IV | | | | |
Item 15. | | Exhibits, Financial Statement Schedules | | |
4
SOUTHWEST BANCORP, INC.
Southwest Bancorp, Inc. (“Southwest”) is the bank holding company for the Stillwater National Bank and Trust Company (“Stillwater National”) and Bank of Kansas. Through its subsidiaries, Southwest offers commercial and consumer lending, deposit and investment services, and specialized cash management and other financial services from offices in Oklahoma, Texas, and Kansas, and on the internet throughSNB DirectBanker®. We operate six offices in Texas, eleven offices in Oklahoma, and eight offices in Kansas.
Southwest focuses on converting its strategic vision into long-term shareholder value. Our vision includes a commercial banking model and a community banking model focused on more traditional banking operations in our three-state market. Our area of expertise includes the special financial needs of healthcare and health professionals, businesses and their managers and owners, and commercial and commercial real estate borrowers. We established a strategic focus on healthcare in 1974. We provide credit and other services, such as deposits, cash management, and document imaging for physicians and other healthcare practitioners to start or develop their practices and finance the development and purchase of medical offices, clinics, surgical care centers, hospitals, and similar facilities.
We also focus on commercial real estate mortgage and construction credits. We do not focus on one-to-four family residential development loans or “spec” residential property credits. Additionally, subprime lending has never been a part of our business strategy, and our exposure to subprime loans and subprime lenders is minimal.
Southwest’s banking philosophy has led to the development of a line of deposit, lending, and other financial products that respond to professional and commercial customer needs for speed, efficiency, and information and complement more traditional banking products. Southwest has developed a highly automated lockbox, imaging, and information service for commercial customers called “SNB Digital Lockbox”, and deposit products that automatically sweep excess funds from commercial demand deposit accounts and invest them in interest bearing funds.
Southwest maintains close relationships with businesses, professionals and their principals to serve their banking needs throughout their business development and professional lives.
Southwest was organized in 1981 as the holding company for Stillwater National, which was chartered in 1894. Southwest became a public company in late 1993. Southwest’s common stock is traded on the NASDAQ Global Select Market under the symbol OKSB. Southwest Capital Trust II’s public offering of trust preferred securities is traded on the NASDAQ Global Select Market under the symbol OKSBP.
During 2009, Bank of Kansas entered into a purchase and assumption agreement with the Federal Deposit Insurance Corporation (“FDIC”) to acquire substantially all loans as well as certain other related assets of First National Bank of Anthony, Anthony, Kansas (“FNBA”) in an FDIC-assisted transaction. Bank of Kansas and the FDIC entered into loss sharing agreements that provide Bank of Kansas with significant protection against credit losses from loans and related assets acquired in the transaction. Assets covered under the loss sharing agreements with the FDIC, including the amounts of expected reimbursements from the FDIC under these agreements, are referred to as “covered” assets.
ABOUTTHIS REPORT
This report comprises the entire 2011 Form 10-K, other than exhibits, as filed with the SEC. The 2011 Annual Report to shareholders, including this report, and the annual proxy materials for the 2012 annual meeting are being distributed together to shareholders. Copies of exhibits and additional copies of the Form 10-K can be obtained free of charge by writing to Laura Robertson, Southwest Bancorp, Inc., P.O. Box 1988, Stillwater, OK 74076. This report is provided along with the annual Proxy Statement for convenience of use and to decrease costs, but is not part of the proxy materials. The SEC has not approved or disapproved this Report or passed upon its accuracy or adequacy.
5
FIVE YEAR SUMMARYOF SELECTED FINANCIAL DATA
The following table presents Southwest’s selected consolidated financial data for each of the five years in the period ended December 31, 2011. The selected consolidated financial data should be read in conjunction with the Consolidated Financial Statements of Southwest, including the accompanying Notes to the Consolidated Financial Statements, presented elsewhere in this report.
| | | | | | | | | | | | | | | | | | | | |
| | | For the Year Ended December 31, | |
(Dollars in thousands, except per share data) | | 2011 | | | 2010 | | | 2009 | | | 2008 | | | 2007 | |
Operations Data | | | | | | | | | | | | | | | | | | | | |
Interest income | | $ | 120,745 | | | $ | 142,807 | | | $ | 150,399 | | | $ | 162,794 | | | $ | 177,068 | |
Interest expense | | | 24,413 | | | | 35,476 | | | | 51,708 | | | | 73,075 | | | | 84,471 | |
| | | | | | | | | | | | | | | | | | | | |
Net interest income | | | 96,332 | | | | 107,331 | | | | 98,691 | | | | 89,719 | | | | 92,597 | |
Provision for loan losses (1) | | | 132,101 | | | | 35,560 | | | | 39,176 | | | | 18,979 | | | | 8,947 | |
Gain on sales of loans and securities, net (2) | | | 1,658 | | | | 2,736 | | | | 5,888 | | | | 3,566 | | | | 4,923 | |
Noninterest income (3) | | | 12,360 | | | | 15,828 | | | | 16,048 | | | | 12,572 | | | | 11,510 | |
Noninterest expense (1) (4) | | | 90,201 | | | | 63,633 | | | | 60,858 | | | | 62,488 | | | | 65,108 | |
| | | | | | | | | | | | | | | | | | | | |
Income (loss) before taxes | | | (111,952 | ) | | | 26,702 | | | | 20,593 | | | | 24,390 | | | | 34,975 | |
Taxes on income | | | (43,657 | ) | | | 9,738 | | | | 7,611 | | | | 9,489 | | | | 13,597 | |
| | | | | | | | | | | | | | | | | | | | |
Net income (loss) | | $ | (68,295 | ) | | $ | 16,964 | | | $ | 12,982 | | | $ | 14,901 | | | $ | 21,378 | |
| | | | | | | | | | | | | | | | | | | | |
Net income (loss) available to common shareholders | | $ | (72,548 | ) | | $ | 12,777 | | | $ | 8,837 | | | $ | 14,658 | | | $ | 21,378 | |
| | | | | | | | | | | | | | | | | | | | |
Dividends | | | | | | | | | | | | | | | | | | | | |
Preferred stock - declared and paid (5) | | $ | 1,750 | | | $ | 3,500 | | | $ | 3,500 | | | $ | 243 | | | $ | — | |
Preferred stock - in arrears (5) | | | 1,772 | | | | — | | | | — | | | | — | | | | — | |
Common stock | | | — | | | | — | | | | 1,398 | | | | 5,519 | | | | 5,299 | |
Ratio of total dividends to net income | | | (5.16 | )% | | | 20.63 | % | | | 37.73 | % | | | 38.67 | % | | | 24.79 | % |
Per Common Share Data | | | | | | | | | | | | | | | | | | | | |
Basic earnings | | $ | (3.73 | ) | | $ | 0.71 | | | $ | 0.60 | | | $ | 1.01 | | | $ | 1.49 | |
Diluted earnings | | | (3.73 | ) | | | 0.71 | | | | 0.60 | | | | 1.00 | | | | 1.46 | |
Cash dividends | | | — | | | | — | | | | 0.10 | | | | 0.38 | | | | 0.37 | |
Book value (6) | | | 12.28 | | | | 15.97 | | | | 16.46 | | | | 16.18 | | | | 15.16 | |
Weighted average common shares outstanding: | | | | | | | | | | | | | | | | | | | | |
Basic, net of unvested restricted stock | | | 19,414,231 | | | | 17,848,610 | | | | 14,625,847 | | | | 14,471,242 | | | | 14,291,041 | |
Diluted, net of unvested restricted stock | | | 19,433,883 | | | | 17,894,011 | | | | 14,689,448 | | | | 14,641,521 | | | | 14,606,149 | |
Financial Condition Data (6) | | | | | | | | | | | | | | | | | | | | |
Investment securities | | $ | 275,352 | | | $ | 262,525 | | | $ | 244,373 | | | $ | 245,380 | | | $ | 239,369 | |
Noncovered portfolio loans (7) | | | 1,687,178 | | | | 2,331,293 | | | | 2,539,294 | | | | 2,494,506 | | | | 2,145,557 | |
Loans held for sale (7) | | | 38,695 | | | | 35,194 | | | | 43,134 | | | | 56,941 | | | | 66,275 | |
Total noncovered loans (7) (8) | | | 1,725,873 | | | | 2,366,487 | | | | 2,582,428 | | | | 2,551,447 | | | | 2,211,832 | |
Covered portfolio loans (9) | | | 37,615 | | | | 53,628 | | | | 85,405 | | | | — | | | | — | |
Interest-earning assets | | | 2,238,482 | | | | 2,723,658 | | | | 2,996,849 | | | | 2,798,710 | | | | 2,461,190 | |
Total assets | | | 2,382,873 | | | | 2,820,541 | | | | 3,108,291 | | | | 2,879,762 | | | | 2,564,298 | |
Interest-bearing deposits | | | 1,520,397 | | | | 1,875,546 | | | | 2,267,901 | | | | 1,918,181 | | | | 1,801,512 | |
Total deposits | | | 1,921,382 | | | | 2,252,728 | | | | 2,592,730 | | | | 2,180,122 | | | | 2,058,579 | |
Other borrowings | | | 56,479 | | | | 94,602 | | | | 103,022 | | | | 295,138 | | | | 218,356 | |
Subordinated debentures | | | 81,963 | | | | 81,963 | | | | 81,963 | | | | 81,963 | | | | 46,393 | |
Total shareholders’ equity (10) | | | 307,186 | | | | 377,812 | | | | 309,778 | | | | 302,203 | | | | 217,609 | |
Common shareholders’ equity | | | 238,731 | | | | 310,088 | | | | 242,741 | | | | 235,811 | | | | 217,609 | |
Financial Ratios | | | | | | | | | | | | | | | | | | | | |
Return on average assets | | | (2.53 | )% | | | 0.57 | % | | | 0.43 | % | | | 0.54 | % | | | 0.94 | % |
Return on average total shareholders’ equity | | | (18.06 | ) | | | 4.72 | | | | 4.20 | | | | 6.40 | | | | 10.19 | |
Return on average common equity | | | (23.40 | ) | | | 4.37 | | | | 3.65 | | | | 6.44 | | | | 10.19 | |
Net interest margin | | | 3.74 | | | | 3.67 | | | | 3.38 | | | | 3.36 | | | | 4.20 | |
Efficiency ratio (11) | | | 81.74 | | | | 50.54 | | | | 50.45 | | | | 59.03 | | | | 59.72 | |
Average assets per employee (12) | | $ | 6,198 | | | $ | 6,942 | | | $ | 6,411 | | | $ | 6,206 | | | $ | 4,661 | |
6
SELECTED FINANCIAL DATA (CONTINUED)
| | | | | | | | | | | | | | | | | | | | |
| | | At December 31, | |
(Dollars in thousands, except per share data) | | 2011 | | | 2010 | | | 2009 | | | 2008 | | | 2007 | |
Asset Quality | | | | | | | | | | | | | | | | | | | | |
Net loan charge-offs (6) | | $ | 152,646 | | | $ | 32,744 | | | $ | 16,536 | | | $ | 8,790 | | | $ | 6,656 | |
Net loan charge-offs to average portfolio loans | | | 7.01 | % | | | 1.29 | % | | | 0.63 | % | | | 0.37 | % | | | 0.37 | % |
Noncovered: | | | | | | | | | | | | | | | | | | | | |
Allowance for loan losses (6) | | $ | 44,233 | | | $ | 65,229 | | | $ | 62,413 | | | $ | 39,773 | | | $ | 29,584 | |
Allowance for loan losses to portfolio loans | | | 2.62 | % | | | 2.80 | % | | | 2.46 | % | | | 1.59 | % | | | 1.38 | % |
Nonperforming loans (6) (13) | | $ | 13,549 | | | $ | 107,083 | | | $ | 106,197 | | | $ | 63,983 | | | $ | 29,571 | |
Nonperforming loans to portfolio loans | | | 0.80 | % | | | 4.59 | % | | | 4.18 | % | | | 2.56 | % | | | 1.38 | % |
Allowance for loan losses to nonperforming loans | | | 326.47 | | | | 60.91 | | | | 58.77 | | | | 62.16 | | | | 100.04 | |
Nonperforming assets (6) (14) | | $ | 33,393 | | | $ | 144,805 | | | $ | 124,629 | | | $ | 70,075 | | | $ | 32,250 | |
Nonperforming assets to portfolio loans and other real estate | | | 1.96 | % | | | 6.11 | % | | | 4.87 | % | | | 2.80 | % | | | 1.50 | % |
Covered: | | | | | | | | | | | | | | | | | | | | |
Allowance for loan losses (6) | | $ | 451 | | | $ | — | | | $ | — | | | $ | — | | | $ | — | |
Allowance for loan losses to portfolio loans | | | 1.64 | % | | | — | | | | — | | | | — | | | | — | |
Nonperforming loans (6) (9) (13) | | $ | 7,128 | | | $ | 10,806 | | | $ | 13,458 | | | $ | — | | | $ | — | |
Nonperforming loans to portfolio loans (9) | | | 18.95 | % | | | 20.15 | % | | | 15.76 | % | | | — | | | | — | |
Nonperforming assets (6) (9) (14) | | $ | 11,657 | | | $ | 14,993 | | | $ | 18,206 | | | $ | — | | | $ | — | |
Nonperforming assets to portfolio loans and other real estate | | | 27.66 | % | | | 25.93 | % | | | 20.19 | % | | | — | | | | — | |
Capital Ratios | | | | | | | | | | | | | | | | | | | | |
Average shareholders’ equity to average assets | | | | | | | | | | | | | | | | | | | | |
Total | | | 14.02 | % | | | 11.99 | % | | | 10.34 | % | | | 8.49 | % | | | 9.21 | % |
Common | | | 11.50 | | | | 9.74 | | | | 8.11 | | | | 8.30 | | | | 9.21 | |
Tier I capital to risk-weighted assets (6) (15) | | | 19.51 | | | | 17.78 | | | | 13.28 | | | | 13.01 | | | | 9.71 | |
Total capital to risk-weighted assets (6) (15) | | | 20.78 | | | | 19.06 | | | | 14.55 | | | | 14.26 | | | | 10.97 | |
Leverage ratio (15) | | | 14.50 | | | | 15.55 | | | | 12.42 | | | | 13.06 | | | | 10.23 | |
| (1) | Provision for loan losses includes $74.9 million and noninterest expense includes $23.6 million from the sales of loans and other real estate transactions that occurred in December 2011. |
| (2) | Gain on sales includes $1.2 million gain due to the redemption of certain VISA USA common shares in 2008 and a $1.9 million gain on a partial disposition of an equity security in 2007. |
| (3) | Noninterest income in 2009 includes $3.3 million resulting from the gain on acquisition related to the FDIC-assisted acquisition. |
| (4) | Noninterest expense in 2007 includes $3.3 million resulting from the ATM-related write-off and associated legal fees and $713,000 in litigation and settlement costs related to VISA USA. |
| (5) | Please see Note 11 to the Consolidated Financial Statements. |
| (7) | Net of unearned discounts but before deduction of allowance for loan losses. |
| (8) | Total loans include loans held for sale. |
| (9) | These loans are covered by the FDIC loss share agreements, including the amount of expected reimbursements from the FDIC, and are shown net of unearned discounts. Please see Note 3 in the Notes to the Consolidated Financial Statements. |
| (10) | Reflects the issuance of common stock through an offering in 2010 and preferred stock in 2008. Please see “Capital Resources” on page 29 and Note 11 in the Notes to the Consolidated Financial Statements. |
| (11) | The efficiency ratio = noninterest expenses / (net interest income + total noninterest income) as shown on the Consolidated Statements of Operations. |
| (12) | Ratio = average assets for year divided by the number of full-time equivalent employees at year-end. |
| (13) | Nonperforming loans consist of nonaccrual loans, loans contractually past due 90 days or more, and restructured loans not performing in accordance with restructured terms. |
| (14) | Nonperforming assets consist of nonperforming loans and other real estate. |
| (15) | 2010 reflects the effects of capital raised through the public common stock offering and 2008 reflects the effects of capital raised through the sale of preferred securities. Please see Notes 11 and 13 in the Notes to the Consolidated Financial Statements. |
7
SECURITIES LISTING, PRICES,AND DIVIDENDS
Stock Listing
Common shares of Southwest Bancorp, Inc. are traded on the National Association of Security Dealers (NASDAQ) Global Select Market under the symbol OKSB.
Trust preferred securities of Southwest Capital Trust II are traded on the NASDAQ Global Select Market under the symbol OKSBP.
Transfer Agents and Registrars
| | |
For Southwest Bancorp, Inc.: | | For Southwest Capital Trust II: |
Computershare Investor Services, LLC | | U.S. Bank Trust National Association |
2 North LaSalle St. | | 300 East Delaware Avenue |
Chicago, IL 60602 | | Wilmington, DE 19801 |
Recent Stock Prices, Dividends, and Equity Compensation Plan Information
Common shareholders received no quarterly cash dividends in 2011 or 2010.
The Board of Directors decides whether or not to pay dividends on common stock, and the amount of any such dividends, each quarter. In making its decision on dividends, the Board considers operating results, financial condition, capital adequacy, regulatory requirements, shareholder returns, and other factors. The ability of Southwest to pay dividends depends upon regulatory approval and cash resources, which include dividend payments from its subsidiaries. For information regarding the ability of Stillwater National and Bank of Kansas to pay dividends to Southwest and the restrictions on bank dividends under federal banking laws, see “Note 13 Capital Requirements & Regulatory Matters” in the Notes to the Consolidated Financial Statements, “Certain Regulatory Matters” on page 31 of this report, and “Risk Factors” beginning on page 96 of this report.
In July 2011, Southwest determined to defer future payments of dividends on trust preferred securities and on the Series B Preferred Securities issued under the U.S. Treasury Department’s Capital Purchase Program.
Shares issued under the employee stock purchase plan, which commenced on January 1, 1996, totaled 6,213 in 2011 and 6,806 in 2010, while issuances pursuant to the stock plans were 16,100 and 64,381 in the respective years.
As of March 1, 2012, there were approximately 400 holders of record of Southwest’s common stock. The following table sets forth the common stock dividends declared for each quarter during 2011 and 2010, and the range of high and low closing trade prices for the common stock for those periods.
| | | | | | | | | | | | | | | | | | | | | | | | |
| | | 2011 | | | 2010 | |
| | | High | | | Low | | | Dividend
Declared | | | High | | | Low | | | Dividend
Declared | |
For the Quarter Ending: | | | | | | | | | | | | | | | | | | | | | | | | |
March 31 | | $ | 14.82 | | | $ | 12.09 | | | $ | — | | | $ | 10.00 | | | $ | 5.96 | | | $ | — | |
June 30 | | | 14.68 | | | | 9.75 | | | | — | | | | 16.20 | | | | 8.16 | | | | — | |
September 30 | | | 10.60 | | | | 3.79 | | | | — | | | | 15.61 | | | | 11.08 | | | | — | |
December 31 | | | 6.82 | | | | 3.75 | | | | — | | | | 13.61 | | | | 8.91 | | | | — | |
8
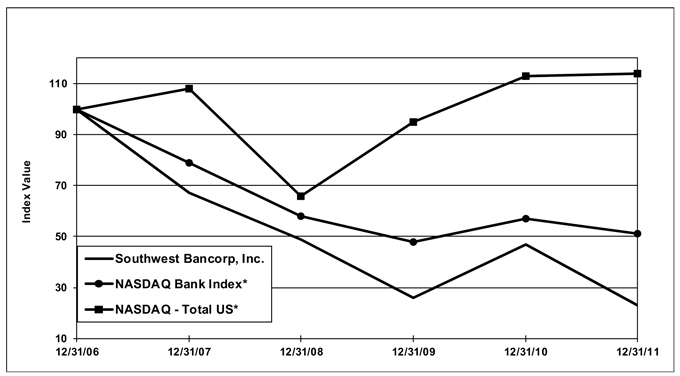
Stock Performance
The following table compares the cumulative total return on a hypothetical investment of $100 in Southwest’s common stock at the closing price on December 31, 2006 through December 31, 2011, with the hypothetical cumulative total return on the NASDAQ Stock Market Index (U.S. Companies) and the NASDAQ Bank Index for the comparable period.
| | | | | | | | | | | | | | | | | | | | | | | | |
| | | 12/31/06 | | | 12/31/07 | | | 12/31/08 | | | 12/31/09 | | | 12/31/10 | | | 12/31/11 | |
Southwest | | $ | 100 | | | $ | 67 | | | $ | 49 | | | $ | 26 | | | $ | 47 | | | $ | 23 | |
NASDAQ Bank Index | | | 100 | | | | 79 | | | | 58 | | | | 48 | | | | 57 | | | | 51 | |
NASDAQ Stock Market Index (U.S.) | | | 100 | | | | 108 | | | | 66 | | | | 95 | | | | 113 | | | | 114 | |
Equity Compensation Plan Information
The following table presents disclosure regarding equity compensation plans in existence at December 31, 2011, consisting of the 1999 stock option plan, which has expired but has outstanding options that may still be exercised, and the 2008 stock based award plan, both of which were approved by the shareholders.
| | | | | | | | | | | | |
Plan category | | Number of securities
to be issued upon
exercise of
outstanding options
warrants and rights
(a) | | | Weighted average
exercise price of
outstanding options,
warrants and rights
(b) | | | Number of securities
available for future issuance
under equity compensation
plans excluding securities
reflected in column (a)
(c) | |
Plans approved by shareholders | | | 73,814 | | | $ | 24.72 | | | | 731,894 | |
Plans not approved by shareholders | | | — | | | | — | | | | — | |
| | | | | | | | | | | | |
Total | | | 73,814 | | | $ | 24.72 | | | | 731,894 | |
| | | | | | | | | | | | |
9
MANAGEMENT’S DISCUSSIONAND ANALYSISOF FINANCIAL CONDITIONSAND RESULTSOF OPERATIONS
The following discussion and analysis presents significant factors affecting Southwest’s financial conditions as of December 31, 2011 and December 31, 2010 and results of operations for each of the years in the three-year period ended December 31, 2011. This discussion and analysis should be read in conjunction with Southwest’s consolidated financial statements, notes thereto, and other financial information appearing elsewhere in this report.
Critical Accounting Policies
Southwest’s consolidated financial statements are prepared in accordance with U.S. generally accepted accounting principles (“GAAP”) and follow general practices within the banking industry. Application of these principles requires management to make estimates, assumptions, and judgments that affect the amounts reported in the financial statements and accompanying notes. These estimates, assumptions, and judgments are based on information that is subject to change. Certain policies inherently rely more on the use of estimates, assumptions, and judgments and as such have a greater possibility of producing results that could be materially different than originally reported. Management is required to use estimates, assumptions, and judgments when assets and liabilities are required to be recorded at fair value, when a decline in the value of an asset not carried on the financial statements at fair value warrants an impairment write-down or valuation allowance to be established, or when an asset or liability must be recorded contingent upon a future event. Carrying assets and liabilities at fair value inherently results in more financial statement volatility. The fair values and the information used to record valuation adjustments for certain assets and liabilities are based either on quoted market prices or are provided by other third-party sources, when readily available.
The most significant accounting policies followed by Southwest are presented in Note 1 to the Consolidated Financial Statements. These policies, along with the disclosures presented in the other financial statement notes and in this discussion, provide information on how significant assets and liabilities are valued in the financial statements and how those values are determined. Based on the valuation techniques used and the sensitivity of financial statement amounts to the methods, estimates, assumptions, and judgments underlying those amounts, management has identified the Allowance for Loan Losses, Goodwill and Other Intangible Assets, and Income Taxes accounting policies to be the accounting areas that require the most subjective or complex judgments, and as such could be most subject to revisions as new information becomes available.
Allowance for Loan Losses – The allowance for loan losses is an estimate of the losses that may be sustained in the loan portfolio. The allowance is based on two basic principles of accounting: (1) ASC 450,Contingencies, which requires that losses be accrued when they are probable of occurring and estimable, and (2) ASC 310.10.35,Receivables: Subsequent Measurement, which requires that losses be accrued when it is probable that Southwest will not collect all principal and interest payments according to the loan’s contractual terms.
The allowance determination process requires significant judgment. Estimates of probable losses inherent in the loan portfolio can vary significantly from the amounts that actually occur. While management uses available information to recognize probable losses, future additions to the allowance may be necessary based on changes in the loans comprising the portfolio and changes in the financial condition of borrowers, such as may result from changes in economic conditions. In addition, various regulatory agencies, as an integral part of their examination process, and independent consultants engaged by Southwest, periodically review the loan portfolio and the allowance. These reviews may result in additional provisions based on the agencies’ judgments based upon information available at the time of each examination. Because the loan portfolio contains a significant number of commercial mortgage and commercial real estate construction loans with relatively large balances, the unexpected deterioration of one or a few of such loans may cause a significant increase in the provision for loan losses and nonperforming assets, and may lead to material increases in charge-offs and the provision for loan losses in future periods.
Southwest’s methodology for assessing the appropriateness of the allowance is in accordance with regulatory guidelines and U.S. generally accepted accounting principles, as described in “Provision for Loan Losses” on page 16 and in Note 1 of the Notes to the Consolidated Financial Statements.
10
Goodwill and Other Intangible Assets– Goodwill and other intangible assets that have indefinite useful lives are subject to an impairment test at least annually and more frequently if circumstances indicate impairment. Goodwill is tested for impairment using a two-step process that begins with an estimation of the fair value of each of Southwest’s reporting units compared with its carrying value. Southwest defines reporting units as a level below each of its operating segments for which there is discrete financial information that is regularly reviewed. As of December 31, 2011, Southwest has eight reporting units, of which three have goodwill allocated to them. If the carrying value exceeds the fair value of a reporting unit, a second test is completed comparing the implied fair value of the reporting unit’s goodwill to its carrying value to measure the amount of impairment. Other intangible assets that are not amortized will be tested for impairment at least annually by comparing the fair values of those assets to their carrying values. Other identifiable intangible assets that are subject to amortization are amortized on an accelerated basis over the years expected to be benefited, which Southwest believes are up to ten years. These amortizable intangible assets are reviewed for impairment if circumstances indicate their carrying value may not be recoverable based on a comparison to fair value. Based on Southwest’s annual goodwill impairment test as of October 1, 2011 and updated through December 31, 2011 management does not believe any of its goodwill is impaired as of December 31, 2011.
The step one test includes an analysis of estimated fair value of reporting units to the aggregate market capitalization of Southwest. Southwest engaged an independent third party to assist in the step one fair market valuations, using both the customary market approaches and the discounted cash flow (income) approach, for the Kansas and Texas reporting units, to which $6.6 million of goodwill has been assigned.
The independent step one valuation indicated that as of the October 1, 2011 annual assessment date, the fair value of both the Kansas and Texas reporting units was less than its carrying amount, indicating a potential impairment. Consequently, further goodwill impairment testing was required under a step two hypothetical purchase price allocation and analysis to determine the amount of impairment existing, if any. The step two market participant discounts and purchase adjustments applied to both reporting units for various categories of loans (such as performing and nonperforming) and deposits, as well as other assets and liabilities, resulted in an implied fair value of goodwill greater than the carrying amount of goodwill. Southwest concluded that there was no goodwill impairment for either the Kansas or Texas reporting units as of October 31, 2011 (and as updated through December 31, 2011).
While Southwest believes no impairment existed at December 31, 2011, different conditions or assumptions used to measure fair value of reporting units, or changes in cash flows or profitability if significantly unfavorable, could have a material adverse effect on the outcome of Southwest’s impairment evaluation and financial condition or future results of operations.
Income Taxes – Southwest uses the asset and liability method of accounting for income taxes. Under this method, deferred tax assets and liabilities are recognized for the future tax consequences attributable to the difference between the financial statement carrying amounts of existing assets and liabilities and their respective tax bases. A valuation allowance is recognized for a deferred tax asset if, based on the weight of available evidence, it is more likely than not that some portion or the entire deferred tax asset will not be realized. The determination of the realizability of the deferred tax asset is highly subjective and dependent upon judgment concerning management’s evaluation of both positive and negative evidence.
As a result of the sale of nonperforming assets and potential problem loans in the fourth quarter, Southwest entered into a three-year cumulative pre-tax loss position as of December 31, 2011. A cumulative loss position is considered significant negative evidence in assessing the realizability of a deferred tax asset. Southwest’s estimate of the realization of its deferred tax assets was based on the scheduled reversal of taxable temporary differences, taxable income available in prior carryback years, and projections of future taxable income in carryforward periods. Management concluded that as of December 31, 2011 that it is more likely than not that Southwest will fully utilize the deferred tax asset and therefore, a valuation allowance against its deferred tax assets was not needed.
11
Non-GAAP Financial Measures
None of the financial measures used in this report are defined as non-GAAP financial measures under federal securities regulations. Other banking organizations, however, may present such non-GAAP financial measures, which differ from measures based upon U.S. generally accepted accounting principles. For example, such non-GAAP measures may exclude certain income or expense items in calculating operating income or efficiency ratios or may increase yields and margins to reflect the benefits of tax-exempt earning assets. Readers of this report should be aware that non-GAAP ratios and other measures presented by some banking organizations or financial analysts may not be directly comparable to similarly named ratios or other measures used by Southwest or other banking organizations.
Significant Developments Over the Last Three Years
Southwest continued to focus on the identification and resolution of problem and potential problem credits in 2011. As a result, in July 2011, Southwest named a new Chief Banking Officer and a new Chief Credit Officer, and bolstered the credit analysis staff and work-out staff with additional experienced officers.
On December 14, 2011, Southwest completed the sales of nonperforming assets and potential problem loans, resulting in a $101.0 million pre-tax loss. Southwest sold nonperforming loans, potential problem loans, other related loans, and other real estate with an aggregate carrying value, before transfer to assets held for sale, of $301.6 million. Southwest recognized $88.6 million in net charge-offs as a result of the sales transactions. The loan sales caused Southwest to increase the provision for loan losses in the quarter by $74.9 million.
In April 2010, Southwest sold 4,600,000 shares of common stock in a public offering resulting in net proceeds of approximately $54.3 million. The proceeds of the offering were used to increase Southwest’s working capital and for general corporate purposes, including investment in Southwest’s banking subsidiaries.
On June 19, 2009, Bank of Kansas entered into a purchase and assumption agreement with loss share with the FDIC to acquire deposits, loans, and certain other liabilities and assets of First National Bank of Anthony, Anthony, Kansas (“FNBA”), in an FDIC-assisted transaction. FNBA was a full service commercial bank that had been placed in receivership with the FDIC. Bank of Kansas acquired assets with a fair value of approximately $149.8 million, including $117.1 million of loans, $20.6 million of investment securities, $6.0 million of cash and cash equivalents, $2.9 million in other real estate owned (“OREO”), and $157.7 million in liabilities, including $135.0 million of deposits and $21.7 million of FHLB advances. Bank of Kansas recorded a core deposit intangible asset of $2.0 million and received a cash payment from the FDIC of approximately $11.1 million. Bank of Kansas entered into loss share agreements with the FDIC and recorded a loss share receivable of $33.1 million. Loans covered under the loss share agreements, including the amount of expected reimbursement from the FDIC, are reported in loans and referred to as “covered” loans. Based upon the acquisition date fair values of the net assets acquired, no goodwill was recorded. The transaction resulted in a gain on acquisition of $3.3 million, which was included in noninterest income.
12
Results of Operations
Net loss available to common shareholders totaled ($72.5) million, or ($3.73) diluted per common share, in 2011 compared to net income available to common shareholders of $12.8 million, or $0.71 diluted per common share, in 2010 and $8.8 million, or $0.60 diluted per common share, in 2009.
The following table presents components of consolidated net income and selected ratios for the years 2011, 2010, and 2009 and the annual changes between those years.
| | | | | | | | | | | | | | | | | | | | |
(Dollars in thousands, except per share data) | | 2011 | | | 2011 Change
From 2010 | | | 2010 | | | 2010 Change
From 2009 | | | 2009 | |
Operations Data | | | | | | | | | | | | | | | | | | | | |
Interest income | | $ | 120,745 | | | $ | (22,062 | ) | | $ | 142,807 | | | $ | (7,592 | ) | | $ | 150,399 | |
Interest expense | | | 24,413 | | | | (11,063 | ) | | | 35,476 | | | | (16,232 | ) | | | 51,708 | |
| | | | | | | | | | | | | | | | | | | | |
Net interest income | | | 96,332 | | | | (10,999 | ) | | | 107,331 | | | | 8,640 | | | | 98,691 | |
Provision for loan losses | | | 132,101 | | | | 96,541 | | | | 35,560 | | | | (3,616 | ) | | | 39,176 | |
Noninterest income | | | 14,018 | | | | (4,546 | ) | | | 18,564 | | | | (3,372 | ) | | | 21,936 | |
Noninterest expense | | | 90,201 | | | | 26,568 | | | | 63,633 | | | | 2,775 | | | | 60,858 | |
| | | | | | | | | | | | | | | | | | | | |
Income (loss) before taxes | | | (111,952 | ) | | | (138,654 | ) | | | 26,702 | | | | 6,109 | | | | 20,593 | |
Taxes on income | | | (43,657 | ) | | | (53,395 | ) | | | 9,738 | | | | 2,127 | | | | 7,611 | |
| | | | | | | | | | | | | | | | | | | | |
Net income (loss) | | $ | (68,295 | ) | | $ | (85,259 | ) | | $ | 16,964 | | | $ | 3,982 | | | $ | 12,982 | |
| | | | | | | | | | | | | | | | | | | | |
Net income (loss) available to common shareholders | | $ | (72,548 | ) | | $ | (85,325 | ) | | $ | 12,777 | | | $ | 3,940 | | | $ | 8,837 | |
| | | | | | | | | | | | | | | | | | | | |
Per Common Share Data | | | | | | | | | | | | | | | | | | | | |
Basic earnings | | $ | (3.73 | ) | | $ | (4.44 | ) | | $ | 0.71 | | | $ | 0.11 | | | $ | 0.60 | |
Diluted earnings | | | (3.73 | ) | | | (4.44 | ) | | | 0.71 | | | | 0.11 | | | | 0.60 | |
Financial Condition Data - Averages | | | | | | | | | | | | | | | | | | | | |
Investment securities | | $ | 264,006 | | | $ | 18,595 | | | $ | 245,411 | | | $ | 18,894 | | | $ | 226,517 | |
Total loans | | | 2,213,907 | | | | (359,535 | ) | | | 2,573,442 | | | | (94,329 | ) | | | 2,667,771 | |
Interest-earning assets | | | 2,574,666 | | | | (347,979 | ) | | | 2,922,645 | | | | 3,605 | | | | 2,919,040 | |
Total assets | | | 2,696,082 | | | | (302,662 | ) | | | 2,998,744 | | | | 11,274 | | | | 2,987,470 | |
Interest-bearing deposits | | | 1,739,526 | | | | (372,542 | ) | | | 2,112,068 | | | | 3,224 | | | | 2,108,844 | |
Total deposits | | | 2,117,306 | | | | (325,760 | ) | | | 2,443,066 | | | | 49,038 | | | | 2,394,028 | |
Other borrowings | | | 84,738 | | | | (11,403 | ) | | | 96,141 | | | | (85,541 | ) | | | 181,682 | |
Subordinated debentures | | | 81,963 | | | | — | | | | 81,963 | | | | — | | | | 81,963 | |
Total shareholders’ equity | | | 378,084 | | | | 18,549 | | | | 359,535 | | | | 50,583 | | | | 308,952 | |
Selected Ratios | | | | | | | | | | | | | | | | | | | | |
Return on average assets | | | (2.53 | )% | | | (3.10 | )% | | | 0.57 | % | | | 0.14 | % | | | 0.43 | % |
Return on average total shareholders’ equity | | | (18.06 | ) | | | (22.78 | ) | | | 4.72 | | | | 0.52 | | | | 4.20 | |
Return on average common equity | | | (23.40 | ) | | | (27.77 | ) | | | 4.37 | | | | 0.72 | | | | 3.65 | |
Net interest margin | | | 3.74 | | | | 0.07 | | | | 3.67 | | | | 0.29 | | | | 3.38 | |
Net income available to common shareholders for 2011 decreased $85.3 million compared to 2010. The decrease was primarily the result of a $96.5 million increase in provision for loan losses and a $26.6 million increase in noninterest expense, both due to the sale of nonperforming loans, potential problem loans, and other real estate during the fourth quarter, a decrease in net interest income of $11.0 million, and a decrease in noninterest income of $4.5 million, offset in part by a $53.4 million decrease in income tax expense.
Net income available to common shareholders for 2010 increased $4.0 million, or 45%, compared to 2009. The increase was primarily the result of an $8.6 million increase in net interest income driven by an improved net interest margin and a $3.6 million decrease in the provision for loan losses, offset in part by a $3.4 million decrease in noninterest income, a $2.8 million increase in noninterest expense, and a $2.1 million increase in income tax expense.
13
Details of the changes in various components of net income are further discussed below.
Net Interest Income
Net interest income is the difference between interest income on earning assets, such as loans and investment securities, and interest expense on interest-bearing liabilities, such as deposits and borrowings, which are used to fund those assets. Net interest income is Southwest’s largest source of revenue representing 87% of total revenue in 2011. Net interest margin is net interest income as a percentage of average earning assets for the period. Net interest income and net interest margin increase or decrease as a result of changes in the levels of interest rates, the volume and the mix of earning assets and interest-bearing liabilities, and the percentage of interest-earning assets funded by noninterest-bearing funding sources.
The Federal Reserve Board influences the general market rates of interest, including the deposit and loan rates offered by many financial institutions. Southwest’s loan portfolio is significantly affected by changes in the prime interest rate. The prime interest rate, which is the rate offered on loans to borrowers with strong credit, has been at 3.25% since 2008. Southwest’s loan portfolio is also affected, to a lesser extent, by changes in the London Interbank Offered Rate (“LIBOR”). At December 31, 2011, the one-month and three-month U.S. dollar LIBOR rates were 0.30% and 0.58%, respectively, while at December 31, 2010 the rates were 0.26% and 0.30%, respectively, and at December 31, 2009 the rates were 0.23% and 0.25%, respectively.
The intended federal fund rate, which is the cost of immediately available overnight funds, fluctuates in a similar manner to the prime interest rate. It has been at 0.25% since 2008.
Net interest income for 2011 was $96.3 million, a decrease of $11.0 million, or 10%, from the $107.3 million earned in 2010. Net interest margin was 3.74% for the year ended December 31, 2011, an increase of seven basis points from 2010. Included in 2011 net interest income was a net reduction of $1.6 million resulting from interest reversals on nonaccrual loans, which includes reversals relating to the nonaccrual loans sold in the fourth quarter, offset by the year-to-date adjustments of the discount accretion on loans and the loss share receivable. This net reduction decreased net interest margin by 6 basis points.
Net interest income for 2010 was $107.3 million, an increase of $8.6 million, or 9%, from the $98.7 million earned in 2010. Net interest margin was 3.67% for the year ended December 31, 2010, an increase of twenty-nine basis points from 2009. Included in 2010 net interest income was a net recovery of $1.0 million from the resolution of nonperforming loans and additional discount accretion on loans and the loss share receivable, offset in part by interest reversals on nonaccrual loans. These net recoveries increased net interest margin by 3 basis points.
Interest rate spread, which represents the difference between the rate earned on interest-earning assets and the rate paid on interest-bearing liabilities, was 3.41% for 2011, compared to 3.34% for 2010, and 2.97% for 2009.
Southwest has seen growth in noninterest-bearing deposit accounts, which are an alternative funding source to interest-bearing deposits and other borrowings. The average balance of noninterest-bearing deposit accounts increased to $377.8 million in 2011 from $331.0 million in 2010 and $285.2 million in 2009.
For further analysis of asset sensitivity please see tables showing the effects of changes in interest rates and changes in volume of interest related assets and liabilities on page 15 of this report and the discussion of Quantitative and Qualitative Disclosures about Market Risk on pages 32 through 34 of this report.
The following table provides information relating to Southwest’s average consolidated statements of financial condition and reflects the interest income on interest-earning assets, interest expense of interest-bearing liabilities, and the average yields earned and rates paid for the periods indicated. Yields and rates are derived by dividing income or expense reflected in the Consolidated Statements of Operations by the average daily balance of the related assets or liabilities, respectively, for the periods presented. Nonaccrual loans have been included in the average balances of total loans.
14
The changes in the composition of interest-earning assets and their funding sources reflect market demand and management’s efforts to maximize net interest margin while controlling interest rate, credit, and other risks.
Consolidated Average Balances, Yields and Rates
| | | | | | | | | | | | | | | | | | | | | | | | | | | | | | | | | | | | |
| | | | | | | | | | | | For the Year Ended December 31, | |
(Dollars in thousands) | | 2011 | | | 2010 | | | 2009 | |
| | | Average
Balance | | | Interest | | | Yield/
Rate (1) | | | Average
Balance | | | Interest | | | Yield/
Rate (1) | | | Average
Balance | | | Interest | | | Yield/
Rate (1) | |
Assets | | | | | | | | | | | | | | | | | | | | | | | | | | | | | | | | | | | | |
Total loans (2) (3) | | $ | 2,213,907 | | | $ | 113,223 | | | | 5.11 | % | | $ | 2,573,442 | | | $ | 133,918 | | | | 5.20 | % | | $ | 2,667,771 | | | $ | 141,239 | | | | 5.29 | % |
Investment securities | | | 264,006 | | | | 6,973 | | | | 2.64 | | | | 245,411 | | | | 8,148 | | | | 3.32 | | | | 226,517 | | | | 8,577 | | | | 3.73 | |
Other interest-earning assets | | | 96,753 | | | | 549 | | | | 0.57 | | | | 103,792 | | | | 741 | | | | 0.71 | | | | 24,752 | | | | 583 | | | | 2.36 | |
| | | | | | | | | | | | | | | | | | | | | | | | | | | | | | | | | | | | |
Total interest-earning assets | | | 2,574,666 | | | | 120,745 | | | | 4.69 | | | | 2,922,645 | | | | 142,807 | | | | 4.89 | | | | 2,919,040 | | | | 150,399 | | | | 5.15 | |
Other assets | | | 121,416 | | | | | | | | | | | | 76,099 | | | | | | | | | | | | 68,430 | | | | | | | | | |
| | | | | | | | | | | | | | | | | | | | | | | | | | | | | | | | | | | | |
Total assets | | $ | 2,696,082 | | | | | | | | | | | $ | 2,998,744 | | | | | | | | | | | $ | 2,987,470 | | | | | | | | | |
| | | | | | | | | | | | | | | | | | | | | | | | | | | | | | | | | | | | |
Liabilities and Shareholders’ Equity | | | | | | | | | | | | | | | | | | | | | | | | | | | | | | | | | | | | |
Interest-bearing demand deposits | | $ | 108,808 | | | $ | 382 | | | | 0.35 | % | | $ | 98,589 | | | $ | 468 | | | | 0.47 | % | | $ | 83,813 | | | $ | 476 | | | | 0.57 | % |
Money market accounts | | | 483,373 | | | | 2,154 | | | | 0.45 | | | | 508,583 | | | | 3,911 | | | | 0.77 | | | | 485,383 | | | | 4,954 | | | | 1.02 | |
Savings accounts | | | 29,862 | | | | 49 | | | | 0.16 | | | | 25,609 | | | | 64 | | | | 0.25 | | | | 21,010 | | | | 78 | | | | 0.37 | |
Time deposits | | | 1,117,483 | | | | 14,208 | | | | 1.27 | | | | 1,479,287 | | | | 23,824 | | | | 1.61 | | | | 1,518,638 | | | | 36,811 | | | | 2.42 | |
| | | | | | | | | | | | | | | | | | | | | | | | | | | | | | | | | | | | |
Total interest-bearing deposits | | | 1,739,526 | | | | 16,793 | | | | 0.97 | | | | 2,112,068 | | | | 28,267 | | | | 1.34 | | | | 2,108,844 | | | | 42,319 | | | | 2.01 | |
Other borrowings | | | 84,738 | | | | 1,799 | | | | 2.12 | | | | 96,141 | | | | 2,079 | | | | 2.16 | | | | 181,682 | | | | 4,049 | | | | 2.23 | |
Subordinated debentures | | | 81,963 | | | | 5,821 | | | | 7.10 | | | | 81,963 | | | | 5,130 | | | | 6.26 | | | | 81,963 | | | | 5,340 | | | | 6.52 | |
| | | | | | | | | | | | | | | | | | | | | | | | | | | | | | | | | | | | |
Total interest-bearing liabilities | | | 1,906,227 | | | | 24,413 | | | | 1.28 | | | | 2,290,172 | | | | 35,476 | | | | 1.55 | | | | 2,372,489 | | | | 51,708 | | | | 2.18 | |
| | | | | | | | | | | | | | | | | | | | | | | | | | | | | | | | | | | | |
Noninterest-bearing demand deposits | | | 377,780 | | | | | | | | | | | | 330,998 | | | | | | | | | | | | 285,184 | | | | | | | | | |
Other liabilities | | | 33,991 | | | | | | | | | | | | 18,039 | | | | | | | | | | | | 20,845 | | | | | | | | | |
Shareholders’ equity | | | 378,084 | | | | | | | | | | | | 359,535 | | | | | | | | | | | | 308,952 | | | | | | | | | |
| | | | | | | | | | | | | | | | | | | | | | | | | | | | | | | | | | | | |
Total liabilities and shareholders’ equity | | $ | 2,696,082 | | | | | | | | | | | $ | 2,998,744 | | | | | | | | | | | $ | 2,987,470 | | | | | | | | | |
| | | | | | | | | | | | | | | | | | | | | | | | | | | | | | | | | | | | |
Net interest income | | | | | | $ | 96,332 | | | | | | | | | | | $ | 107,331 | | | | | | | | | | | $ | 98,691 | | | | | |
| | | | | | | | | | | | | | | | | | | | | | | | | | | | | | | | | | | | |
Interest rate spread | | | | | | | | | | | 3.41 | % | | | | | | | | | | | 3.34 | % | | | | | | | | | | | 2.97 | % |
| | | | | | | | | | | | | | | | | | | | | | | | | | | | | | | | | | | | |
Net interest margin (4) | | | | | | | | | | | 3.74 | % | | | | | | | | | | | 3.67 | % | | | | | | | | | | | 3.38 | % |
| | | | | | | | | | | | | | | | | | | | | | | | | | | | | | | | | | | | |
Ratio of average interest-earning assets to average interest-bearing liabilities | | | | | | | | | | | 135.07 | % | | | | | | | | | | | 127.62 | % | | | | | | | | | | | 123.04 | % |
| | | | | | | | | | | | | | | | | | | | | | | | | | | | | | | | | | | | |
| (1) | Yields, interest rate spreads, and net interest margins are calculated using income recorded in accordance with U.S. generally accepted accounting principles (“GAAP”) and are not shown on the higher, non-GAAP tax-equivalent basis. |
| (2) | Fees included in interest income on loans receivable are not considered material. |
| (3) | Information regarding noncovered and covered loans for the periods shown is not readily available for all reported periods. |
| (4) | Net interest margin = net interest income / total average interest-earning assets. |
The following table analyzes Southwest’s changes in interest income and interest expense for the periods indicated. Information is provided on changes attributable to (i) changes in volume (changes in volume multiplied by prior period’s rate); and (ii) changes in rates (changes in rate multiplied by prior period’s volume). Changes in rate-volume (changes in rate multiplied by changes in volume) are allocated between changes in rate and changes in volume in proportion to the relative contribution of each.
15
Effect of Volume and Rate Changes on Net Interest Income
| | | | | | | | | | | | | | | | | | | | | | | | |
| | | 2011 vs. 2010 | | | 2010 vs. 2009 | |
| | | Increase
Or | | | Due to Change In Average: | | | Increase
Or | | | Due to Change In Average: | |
(Dollars in thousands) | | (Decrease) | | | Volume | | | Rate | | | (Decrease) | | | Volume | | | Rate | |
Interest earned on: | | | | | | | | | | | | | | | | | | | | | | | | |
Loans receivable (1) (2) | | $ | (20,695 | ) | | $ | (18,423 | ) | | $ | (2,272 | ) | | $ | (7,321 | ) | | $ | (4,937 | ) | | $ | (2,384 | ) |
Investment securities | | | (1,175 | ) | | | 583 | | | | (1,758 | ) | | | (486 | ) | | | 560 | | | | (1,046 | ) |
Other interest-earning assets | | | (192 | ) | | | (48 | ) | | | (144 | ) | | | 215 | | | | 214 | | | | 1 | |
| | | | | | | | | | | | | | | | | | | | | | | | |
Total interest income | | | (22,062 | ) | | | (16,492 | ) | | | (5,570 | ) | | | (7,592 | ) | | | 186 | | | | (7,779 | ) |
Interest paid on: | | | | | | | | | | | | | | | | | | | | | | | | |
Interest-bearing demand | | | (86 | ) | | | 45 | | | | (131 | ) | | | (8 | ) | | | 77 | | | | (85 | ) |
Money market accounts | | | (1,757 | ) | | | (185 | ) | | | (1,572 | ) | | | (1,043 | ) | | | 227 | | | | (1,270 | ) |
Savings accounts | | | (15 | ) | | | 9 | | | | (24 | ) | | | (14 | ) | | | 15 | | | | (29 | ) |
Time deposits | | | (9,616 | ) | | | (5,197 | ) | | | (4,419 | ) | | | (12,987 | ) | | | (903 | ) | | | (12,084 | ) |
Other borrowings | | | (280 | ) | | | (243 | ) | | | (37 | ) | | | (1,970 | ) | | | (1,853 | ) | | | (117 | ) |
Subordinated debentures | | | 691 | | | | — | | | | 691 | | | | (210 | ) | | | — | | | | (210 | ) |
| | | | | | | | | | | | | | | | | | | | | | | | |
Total interest expense | | | (11,063 | ) | | | (5,441 | ) | | | (5,622 | ) | | | (16,232 | ) | | | (1,739 | ) | | | (14,493 | ) |
| | | | | | | | | | | | | | | | | | | | | | | | |
Net interest income | | $ | (10,999 | ) | | $ | (11,051 | ) | | $ | 52 | | | $ | 8,640 | | | $ | 1,925 | | | $ | 6,714 | |
| | | | | | | | | | | | | | | | | | | | | | | | |
| (1) | Average balances include nonaccrual loans. Fees included in interest income on loans receivable are not considered material. Interest on tax-exempt loans and securities is not shown on a tax-equivalent basis, because it is not considered material. |
| (2) | Information regarding noncovered and covered loans for the periods shown is not readily available for all reported periods. |
Provision for Loan Losses
The provision for loan losses is the amount of expense that, based on Southwest’s judgment, is required to maintain the allowance for loan losses at an appropriate level based upon the inherent risks in the loan portfolio. The amount of the loan loss provision for a period is based solely upon the amount needed to cause the allowance to reach the level deemed appropriate, after the effects of net charge-offs for the period.
Net charge-offs for the year ended December 31, 2011 were $152.6 million, including $88.6 million resulting from the fourth quarter loan sales, $32.7 million for the year ended December 31, 2010, and $16.5 million for the year ended December 31, 2009. The provision for loan losses for the year ended December 31, 2011 was $132.1 million, including $74.9 million resulting from the fourth quarter loan sales impact, $35.6 million for the year ended December 31, 2010, and $39.2 million for the year ended December 31, 2009.
See the section captioned “Allowance for Loan Losses” on page 26 of this report for further analysis of the provision for loss losses.
Noninterest Income
Noninterest income was $14.0 million for 2011, a 24% decrease when compared with 2010. Noninterest income in 2010 decreased 15% when compared with 2009.
16
| | | | | | | | | | | | | | | | | | | | |
(Dollars in thousands) | | 2011 | | | 2011 Change
From 2010 | | | 2010 | | | 2010 Change
From 2009 | | | 2009 | |
Service charges and fees | | $ | 12,075 | | | $ | (329 | ) | | $ | 12,404 | | | $ | 700 | | | $ | 11,704 | |
Other noninterest income | | | 285 | | | | (478 | ) | | | 763 | | | | (3,581 | ) | | | 4,344 | |
Gain on sales of loans | | | 1,658 | | | | (1,078 | ) | | | 2,736 | | | | (227 | ) | | | 2,963 | |
Gain on sales/calls of investment securities | | | — | | | | (2,661 | ) | | | 2,661 | | | | (264 | ) | | | 2,925 | |
| | | | | | | | | | | | | | | | | | | | |
Total noninterest income | | $ | 14,018 | | | $ | (4,546 | ) | | $ | 18,564 | | | $ | (3,372 | ) | | $ | 21,936 | |
| | | | | | | | | | | | | | | | | | | | |
Service charges and fees – Service charges and fees decreased $0.3 million, or 3%, in 2011 as a result of decreased overdraft charges offset in part by increased brokerage fees and decreased amortization of mortgage servicing rights.
Service charges and fees increased $0.7 million, or 6%, in 2010 as a result of increased interchange service charges, increased brokerage fees, increased loan servicing fees, and decreased amortization of mortgage servicing rights, which factors in the impairments that occurred in 2009.
Other noninterest income – For 2011, other noninterest income includes rent income and other miscellaneous income items. The 2010 decrease of $3.6 million, or 82%, was primarily the result of decreased consulting income in 2010 and the gain on acquisition that occurred in 2009. The 2009 amount includes the $3.3 million gain recognized on the FDIC-assisted acquisition of FNBA.
Gain on sales of loans – Gain on sales of loans includes the net gains recognized from the sale of student loans, mortgage loans, and other commercial loans that are classified as held for sale. For 2011 and 2010, the decrease was the result of reduced sales of student loans and decreased sales of mortgage loans.
Gain on sales/calls of investment securities – There were no investment securities sold in 2011. The 2010 and 2009 gains on sales of investment securities were the result of the sale of investment securities during those years.
Noninterest Expense
Noninterest expense was $90.2 million for 2011, an increase of $26.6 million from 2010. Noninterest expense increased $2.8 million in 2010 from 2009.
| | | | | | | | | | | | | | | | | | | | |
(Dollars in thousands) | | 2011 | | | 2011 Change
From 2010 | | | 2010 | | | 2010 Change
From 2009 | | | 2009 | |
Salaries and employee benefits | | $ | 29,880 | | | $ | (36 | ) | | $ | 29,916 | | | $ | 617 | | | $ | 29,299 | |
Occupancy | | | 10,815 | | | | (356 | ) | | | 11,171 | | | | (466 | ) | | | 11,637 | |
FDIC and other insurance | | | 3,862 | | | | (1,926 | ) | | | 5,788 | | | | 243 | | | | 5,545 | |
Other real estate, net | | | 30,852 | | | | 28,634 | | | | 2,218 | | | | 2,088 | | | | 130 | |
Provision for unfunded loan commitments | | | 377 | | | | 1,980 | | | | (1,603 | ) | | | (1,373 | ) | | | (230 | ) |
Other general and administrative | | | 14,415 | | | | (1,728 | ) | | | 16,143 | | | | 1,666 | | | | 14,477 | |
| | | | | | | | | | | | | | | | | | | | |
Total noninterest expense | | $ | 90,201 | | | $ | 26,568 | | | $ | 63,633 | | | $ | 2,775 | | | $ | 60,858 | |
| | | | | | | | | | | | | | | | | | | | |
Salaries and employee benefits – Salaries and employee benefits remained flat for 2011. The number of full-time equivalent employees increased from 432 at the beginning of the year to 435 as of December 31, 2011.
Salaries and employee benefits increased $0.6 million, or 2%, in 2010 primarily as a result of increased employee insurance expense. The number of full-time equivalent employees decreased from 466 at the beginning of the year to 432 as of December 31, 2010.
Occupancy– Occupancy expense decreased $0.4 million, or 3%, in 2011 primarily due to decreased depreciation expense and decreased building rental expense. Occupancy expense decreased $0.5 million, or 4%, in 2010 primarily due to decreased depreciation expense.
17
FDIC and other insurance– Southwest’s bank subsidiaries pay deposit insurance premiums to the FDIC based on assessment rates. In 2011, the FDIC began assessing insurance premiums based on average consolidated total assets minus average tangible equity. The decrease in FDIC and other insurance expense for 2011 is due to lower assessments.
Other real estate, net – The $28.6 million increase in other real estate expenses for 2011 was primarily the result of the $23.6 million in losses incurred as a result of the assets sold in the fourth quarter. During 2010, the net effect of current year transactions caused an increase in other real estate expenses. Other real estate was $24.4 million at December 31, 2011, $41.9 million at December 31, 2010, and $23.2 million at December 31, 2009.
Provision for unfunded loan commitments– The provision for unfunded loan commitments is computed using a methodology similar to that used to determine the allowance for loan losses, modified to take into account the probability of a drawdown on the commitment.
Other general and administrative – Other general and administrative expenses decreased $1.7 million, or 11%, in 2011 primarily as a result of the settlement of Oklahoma state tax claims for less than the amount accrued of $2.5 million, offset in part by increased loan collection costs of $1.2 million. Other general and administrative expenses increased $1.7 million, or 12%, in 2010 as the result of increased consulting fees and increased legal fees associated with loan and other real estate transactions.
Operating Segments
| | | | | | | | | | | | |
| | | For the Year Ended December 31, | |
(Dollars in thousands) | | 2011 | | | 2010 | | | 2009 | |
Oklahoma banking | | $ | 3,146 | | | $ | 14,864 | | | $ | 12,160 | |
Texas banking | | | (39,236 | ) | | | 4,523 | | | | 10,722 | |
Kansas banking | | | (7,043 | ) | | | 884 | | | | 424 | |
Out of market | | | (19,767 | ) | | | (1,958 | ) | | | (1,618 | ) |
Secondary market | | | 348 | | | | 980 | | | | (148 | ) |
Other operations | | | (5,743 | ) | | | (2,329 | ) | | | (8,558 | ) |
| | | | | | | | | | | | |
Consolidated net income (loss) | | $ | (68,295 | ) | | $ | 16,964 | | | $ | 12,982 | |
| | | | | | | | | | | | |
Oklahoma banking | | $ | 688,592 | | | $ | 871,393 | | | $ | 933,150 | |
Texas banking | | | 665,010 | | | | 982,845 | | | | 1,054,404 | |
Kansas banking | | | 238,468 | | | | 289,642 | | | | 359,633 | |
Out of market | | | 132,723 | | | | 241,041 | | | | 277,512 | |
Secondary market | | | 38,695 | | | | 35,194 | | | | 43,134 | |
| | | | | | | | | | | | |
Consolidated total loans | | $ | 1,763,488 | | | $ | 2,420,115 | | | $ | 2,667,833 | |
| | | | | | | | | | | | |
Oklahoma banking | | $ | 720,815 | | | $ | 899,269 | | | $ | 950,355 | |
Texas banking | | | 665,846 | | | | 976,383 | | | | 1,044,324 | |
Kansas banking | | | 250,602 | | | | 389,813 | | | | 441,114 | |
Out of market | | | 136,579 | | | | 231,590 | | | | 275,653 | |
Secondary market | | | 40,876 | | | | 37,483 | | | | 45,148 | |
Other operations | | | 568,155 | | | | 286,003 | | | | 351,697 | |
| | | | | | | | | | | | |
Consolidated total assets | | $ | 2,382,873 | | | $ | 2,820,541 | | | $ | 3,108,291 | |
| | | | | | | | | | | | |
Oklahoma banking | | $ | 1,406,360 | | | $ | 1,565,124 | | | $ | 1,640,839 | |
Texas banking | | | 156,102 | | | | 160,181 | | | | 160,064 | |
Kansas banking | | | 276,757 | | | | 270,271 | | | | 283,506 | |
Secondary market | | | 1,430 | | | | 1,389 | | | | 1,527 | |
Other operations | | | 80,733 | | | | 255,763 | | | | 506,794 | |
| | | | | | | | | | | | |
Consolidated total deposits | | $ | 1,921,382 | | | $ | 2,252,728 | | | $ | 2,592,730 | |
| | | | | | | | | | | | |
18
Southwest has six reportable operating segments: Oklahoma Banking, Texas Banking, Kansas Banking, Out of Market, loans originated for sale in the secondary market (“Secondary Market”), and Other Operations. These business segments were identified through the products and services that are offered within each segment and the geographic area they serve.
Portfolio loans are allocated based upon the state of the borrower or the location of the real estate in the case of real estate loans. Loans included in the Out of Market segment are portfolio loans attributable to states other than Oklahoma, Texas, or Kansas and primarily consist of healthcare and commercial real estate credits. These out of state loans are administered by offices in Oklahoma, Texas, or Kansas.
Capital is assigned to each of the segments using a risk-based capital pricing methodology that assigns capital by asset, deposit, or revenue category based on Credit, Interest Rate, Market, Operational, and Liquidity Risks.
The contribution of the Oklahoma Banking segment decreased $11.7 million in 2011 as a result of a $16.2 million increase in the provision for loan losses and a $3.1 million increase in noninterest expense, offset in part by a $6.8 million decrease in income tax expense. Oklahoma Banking segment net income increased $2.7 million, or 22%, in 2010, as a result of a $7.9 million decrease in the provision for loan losses, offset in part by a $1.7 million increase in noninterest expense, a $1.3 million increase in income taxes, a $1.1 million decrease in net interest income, and a $1.0 million decrease in other noninterest income.
The contribution of the Texas Banking segment decreased $43.8 million, in 2011 primarily as a result of a $52.0 million increase in the provision for loan losses, a $13.9 million increase in noninterest expense, and a $5.7 million decrease in net interest income, offset in part by a $27.8 million decrease in income tax expense. Texas Banking segment net income decreased $6.2 million, or 58%, in 2010, primarily as a result of a $10.2 million increase in the provision for loan losses, offset in part by a $3.9 million decrease in income taxes.
The contribution of the Kansas Banking segment decreased $7.9 million in 2011, primarily as a result of a $5.9 million increase in the provision for loan losses, a $3.4 million increase in noninterest expense, a $2.1 million decrease in noninterest income, and a $1.6 million decrease in net interest income, offset in part by a $5.0 million decrease in income tax expense. Kansas Banking segment net income increased $0.5 million, or 108%, in 2010 as a result of a $4.4 million decrease in the provision for loan losses and increased net interest income of $0.9 million, offset in part by a $2.0 million decrease in noninterest income, which included the $3.3 million recognized gain on the FDIC-assisted acquisition of FNBA in 2009, a $2.5 million increase in noninterest expense, and an increase in income taxes of $0.4 million.
The contribution of the Out of Market segment decreased by $17.8 million in 2011 primarily as a result of a $22.4 million increase in the provision for loan losses, a $5.1 million increase in noninterest expense, and a $1.6 million decrease in net interest income, offset in part by a $11.5 million decrease in income tax expense. The Out of Market net loss increased by $0.3 million, or 21%, in 2010 primarily as a result of decreased net interest income of $1.2 million, offset in part by a $1.4 million decrease in the provision for loan losses.
At December 31, 2011, Southwest’s eleven Oklahoma offices accounted for $688.6 million in loans, or 40% of total portfolio loans, the six Texas offices accounted for $665.0 million in loans, or 39% of total portfolio loans, the eight Kansas offices accounted for $238.5 million in loans, or 14% of total portfolio loans, and the Out of Market segment accounted for $132.7 million in loans, or 8% of total portfolio loans.
For 2011, the Secondary Market segment contributed net income of $0.3 million, and in 2010, the Secondary Market segment contributed net income of $1.0 million. The decrease occurred primarily as a result of decreased noninterest income as a result of decreased sales of loans held for sale.
For 2011 and 2010, the Other Operations segment, which includes Southwest’s fund management unit, incurred a loss of $5.7 million and $2.3 million, respectively. The value of funds provided and cost of funds borrowed from the funds management unit by the operating segments are internally priced at rates that approximate market rates for funds with similar duration.
19
The segment disclosures above and in Note 18 of the Notes of the Consolidated Financial Statements show that the Oklahoma Banking, Texas Banking, Kansas Banking, and Out of Market segments provide the majority of consolidated net interest income and net earnings, and for the year ended December 31, 2011 accounted for approximately $1.8 billion, or 74%, of total assets.
The segment disclosures are based upon a number of assumptions and allocations of expense. Southwest allocates resources and evaluates performance of its segments after allocation of funds, indirect expenses, taxes, and capital costs. Capital is assigned to each of the segments using a risk-based capital pricing methodology that assigns capital ratios by asset, deposit, or revenue category based on credit risk, interest rate risk, market risk, operational risk, and liquidity risk.
Taxes on Income
The income tax benefit for 2011 totaled ($43.7) million, compared to income tax expense for 2010 and 2009 of $9.7 million, and $7.6 million, respectively. The income tax (benefit) expense fluctuates in relation to pre-tax (loss) income levels. The effective tax rate for the year ended December 31, 2011 was approximately 39.0%, compared to 36.5% for the year ended December 31, 2010 and 37.0% for the year ended December 31, 2009.
Southwest monitors its deferred tax assets, which totaled $40.9 million at December 31, 2011. Southwest considers the cumulative three-year pre-tax operating results as well as timing, nature and amount of future taxable income, taxable income within the carryback and carryforward periods, and the reversal of taxable temporary differences as well as future events and uncertainties in making its determination of the realization of its net deferred tax asset. After evaluating all positive and negative evidence available at December 31, 2011, Southwest concluded that it is more likely than not that it will be able to realize its deferred tax benefits and that a valuation allowance is not needed.
Financial Condition
Southwest’s total assets decreased by $437.7 million, or 16%, to $2.4 billion at December 31, 2011, compared to $2.8 billion at December 31, 2010 after decreasing by $287.8 million, or 9%, between December 31, 2010 and December 31, 2009. The decline in assets in 2011 was primarily attributable to the $656.6 million, or 27%, decrease in total loans and the $17.5 million, or 42%, decrease in other real estate. In December 2011, Southwest completed the sales of $301.6 million in nonperforming assets and potential problem loans.
Investment Securities Portfolio
Southwest maintains an investment securities portfolio consisting of securities issued by U.S. Government sponsored entities, state and political subdivisions, and mortgage-backed and other investments. Mortgage-backed securities consist of agency securities underwritten and guaranteed by Government National Mortgage Association (“Ginnie Mae”), Federal Home Loan Mortgage Corporation (“Freddie Mac”), and Federal National Mortgage Association (“Fannie Mae”). Investment securities are held in safekeeping by an independent custodian.
Investment securities assigned to the available for sale portfolio are generally used to supplement Southwest’s liquidity, provide a prudent yield, and provide collateral for public deposits and other borrowing facilities. Unrealized net gains and losses on available for sale securities are recorded as an adjustment to equity, net of taxes, but are not reflected in the current earnings of Southwest. If management determines any impairment in any available for sale security is “other-than-temporary,” a securities loss will be recognized as a charge to earnings. If a security is sold, any gain or loss is recorded as a credit or charge to earnings and the equity adjustment is reversed. At December 31, 2011, Southwest held $260.1 million in securities classified as available for sale with an unrealized gain of $6.2 million, $2.4 million net of taxes, related to these securities included in shareholders’ equity.
20
Investment securities assigned to the held to maturity portfolio earn a prudent yield, provide liquidity from maturities and paydowns, and provide collateral to pledge for federal, state, and local government deposits and other borrowing facilities. The held to maturity investment portfolio at December 31, 2011 included $15.3 million in fixed-rate securities. If management determines any impairment in any held to maturity security is “other-than-temporary,” a securities loss will be recognized as a charge to earnings.
Southwest had no trading securities at December 31, 2011, 2010, and 2009.
A summary of the investment securities portfolio is as follows for the years ended December 31, 2011, 2010, and 2009.
| | | | | | | | | | | | |
| | | At December 31, | |
(Dollars in thousands) | | 2011 | | | 2010 | | | 2009 | |
U.S. Government obligations | | $ | — | | | $ | 1,108 | | | $ | 1,100 | |
Federal agency securities | | | 65,553 | | | | 65,374 | | | | 75,385 | |
Obligations of states and political subdivisions | | | 26,355 | | | | 14,537 | | | | 7,523 | |
Residential mortgage-backed securities | | | 182,147 | | | | 180,017 | | | | 159,146 | |
Other investments | | | 1,297 | | | | 1,489 | | | | 1,219 | |
| | | | | | | | | | | | |
Total investment securities | | $ | 275,352 | | | $ | 262,525 | | | $ | 244,373 | |
| | | | | | | | | | | | |
Available for sale (fair value) | | $ | 260,100 | | | $ | 248,221 | | | $ | 237,703 | |
Held to maturity (amortized cost) | | | 15,252 | | | | 14,304 | | | | 6,670 | |
| | | | | | | | | | | | |
Total investment securities | | $ | 275,352 | | | $ | 262,525 | | | $ | 244,373 | |
| | | | | | | | | | | | |
Southwest does not have any material amounts of investment securities or other interest-earning assets, other than loans, that would have been classified as nonperforming if such assets were loans or which were recognized by management as potential problem assets based upon known information about possible credit problems of the borrower or issuer.
The following table shows the maturities, carrying value (amortized cost for investment securities being held to maturity or estimated fair value for investment securities available for sale), estimated fair market values, and average yields for Southwest’s investment portfolio at December 31, 2011. Yields are not presented on a tax-equivalent basis. Maturities of mortgage-backed securities are based on expected maturities. Expected maturities differ from contractual maturities because borrowers of the underlying mortgages may have the right to call or prepay obligations with or without prepayment penalties. The securities of no single issuer (other than the United States or its agencies), or in the case of securities issued by state and political subdivisions, no source or group of sources of repayment, accounted for more than 10% of shareholders’ equity of Southwest at December 31, 2011.
21
| | | | | | | | | | | | | | | | | | | | | | | | | | | | | | | | | | | | | | | | | | | | |
| | | One Year
or Less | | | After One
Year through
Five Years | | | After Five
Years through
Ten Years | | | After
Ten Years | | | Total Investment
Securities | |
(Dollars in thousands) | | Cost | | | Yield | | | Cost | | | Yield | | | Cost | | | Yield | | | Cost | | | Yield | | | Cost | | | Market | | | Yield | |
Held to Maturity: | | | | | | | | | | | | | | | | | | | | | | | | | | | | | | | | | | | | | | | | | | | | |
Obligations of states and political subdivisions | | $ | 2,376 | | | | 3.09 | % | | $ | 2,954 | | | | 2.34 | % | | $ | 6,453 | | | | 3.49 | % | | $ | 3,469 | | | | 5.41 | % | | $ | 15,252 | | | $ | 15,885 | | | | 3.64 | % |
| | | | | | | | | | | | | | | | | | | | | | | | | | | | | | | | | | | | | | | | | | | | |
Total | | $ | 2,376 | | | | 3.09 | % | | $ | 2,954 | | | | 2.34 | % | | $ | 6,453 | | | | 3.49 | % | | $ | 3,469 | | | | 5.41 | % | | $ | 15,252 | | | $ | 15,885 | | | | 3.64 | % |
| | | | | | | | | | | | | | | | | | | | | | | | | | | | | | | | | | | | | | | | | | | | |
Available for Sale: | | | | | | | | | | | | | | | | | | | | | | | | | | | | | | | | | | | | | | | | | | | | |
Federal agency securities | | $ | 2,501 | | | | 2.36 | % | | $ | 10,392 | | | | 1.89 | % | | $ | 45,933 | | | | 2.27 | % | | $ | 5,698 | | | | 2.04 | % | | $ | 64,524 | | | $ | 65,553 | | | | 2.22 | % |
Obligations of states and political subdivisions | | | 10 | | | | 3.41 | | | | 10 | | | | 4.58 | | | | 4,815 | | | | 3.34 | | | | 6,091 | | | | 3.87 | | | | 10,926 | | | | 11,103 | | | | 3.64 | |
Residential mortgage-backed securities | | | 16,531 | | | | 2.88 | | | | 151,835 | | | | 2.78 | | | | 3,099 | | | | 2.20 | | | | 5,900 | | | | 3.52 | | | | 177,365 | | | | 182,147 | | | | 2.80 | |
Other securities | | | — | | | | — | | | | 1,054 | | | | — | | | | — | | | | — | | | | — | | | | — | | | | 1,054 | | | | 1,297 | | | | — | |
| | | | | | | | | | | | | | | | | | | | | | | | | | | | | | | | | | | | | | | | | | | | |
Total | | $ | 19,042 | | | | 2.81 | % | | $ | 163,291 | | | | 2.70 | % | | $ | 53,847 | | | | 2.36 | % | | $ | 17,689 | | | | 3.16 | % | | $ | 253,869 | | | $ | 260,100 | | | | 2.68 | % |
| | | | | | | | | | | | | | | | | | | | | | | | | | | | | | | | | | | | | | | | | | | | |
Total | | $ | 21,418 | | | | | | | $ | 166,245 | | | | | | | $ | 60,300 | | | | | | | $ | 21,158 | | | | | | | $ | 269,121 | | | $ | 275,985 | | | | | |
| | | | | | | | | | | | | | | | | | | | | | | | | | | | | | | | | | | | | | | | | | | | |
Note: Average yields for investments held for sale is based on amortized cost. Yields on tax-exempt securities are shown on a tax-equivalent basis.
Loan Portfolio
The following table presents the composition of the loan portfolio over the previous five years.
| | | | | | | | | | | | | | | | | | | | |
| | | At December 31, | |
(Dollars in thousands) | | 2011 | | | 2010 | | | 2009 | | | 2008 | | | 2007 | |
Noncovered: | | | | | | | | | | | | | | | | | | | | |
Real estate mortgage: | | | | | | | | | | | | | | | | | | | | |
Commercial | | $ | 1,028,561 | | | $ | 1,310,464 | | | $ | 1,212,409 | | | $ | 1,118,828 | | | $ | 750,047 | |
One-to-four family residential | | | 80,375 | | | | 89,800 | | | | 114,614 | | | | 113,665 | | | | 111,085 | |
Real estate construction: | | | | | | | | | | | | | | | | | | | | |
Commercial | | | 227,098 | | | | 441,265 | | | | 618,078 | | | | 579,795 | | | | 643,656 | |
One-to-four family residential | | | 4,987 | | | | 27,429 | | | | 41,109 | | | | 79,565 | | | | 81,273 | |
Commercial | | | 346,266 | | | | 452,626 | | | | 520,505 | | | | 564,670 | | | | 521,501 | |
Installment and consumer: | | | | | | | | | | | | | | | | | | | | |
Guaranteed student loans | | | 5,396 | | | | 5,843 | | | | 36,163 | | | | 54,057 | | | | 61,555 | |
Other | | | 33,190 | | | | 39,060 | | | | 39,550 | | | | 40,867 | | | | 42,715 | |
| | | | | | | | | | | | | | | | | | | | |
| | | 1,725,873 | | | | 2,366,487 | | | | 2,582,428 | | | | 2,551,447 | | | | 2,211,832 | |
Less: Allowance for loan losses | | | (44,233 | ) | | | (65,229 | ) | | | (62,413 | ) | | | (39,773 | ) | | | (29,584 | ) |
| | | | | | | | | | | | | | | | | | | | |
Total noncovered loans, net | | $ | 1,681,640 | | | $ | 2,301,258 | | | $ | 2,520,015 | | | $ | 2,511,674 | | | $ | 2,182,248 | |
| | | | | | | | | | | | | | | | | | | | |
22
| | | | | | | | | | | | | | | | | | | | |
| | | At December 31, | |
(Dollars in thousands) | | 2011 | | | 2010 | | | 2009 | | | 2008 | | | 2007 | |
Covered: | | | | | | | | | | | | | | | | | | | | |
Real estate mortgage: | | | | | | | | | | | | | | | | | | | | |
Commercial | | $ | 23,686 | | | $ | 30,997 | | | $ | 39,836 | | | $ | — | | | $ | — | |
One-to-four family residential | | | 7,072 | | | | 9,122 | | | | 12,630 | | | | — | | | | — | |
Real estate construction: | | | | | | | | | | | | | | | | | | | | |
Commercial | | | 3,746 | | | | 6,840 | | | | 12,515 | | | | — | | | | — | |
One-to-four family residential | | | — | | | | 439 | | | | 5,324 | | | | — | | | | — | |
Commercial | | | 2,841 | | | | 5,554 | | | | 13,412 | | | | — | | | | — | |
Installment and consumer | | | 270 | | | | 676 | | | | 1,688 | | | | — | | | | — | |
| | | | | | | | | | | | | | | | | | | | |
| | $ | 37,615 | | | $ | 53,628 | | | $ | 85,405 | | | $ | — | | | $ | — | |
Less: Allowance for loan losses | | | (451 | ) | | | — | | | | — | | | | — | | | | — | |
| | | | | | | | | | | | | | | | | | | | |
Total covered loans, net | | $ | 37,164 | | | $ | 53,628 | | | $ | 85,405 | | | $ | — | | | $ | — | |
| | | | | | | | | | | | | | | | | | | | |
Included in covered loans above are $10.1 million, $14.4 million, and $23.9 million respectively, of loss share receivable from the FDIC.
Southwest has a strategic focus on providing loans and other services to healthcare and health professionals, businesses and their managers and owners, and commercial and commercial real estate borrowers. At December 31, 2011 and December 31, 2010, loans to individuals and businesses in the healthcare industry totaled $614.7 million, or 36%, and $713.7 million, or 30%, of noncovered loans, respectively.
The following table sets forth the remaining maturities for certain loan categories (including loans held for sale) at December 31, 2011. Student loans that do not have stated maturities are treated as due in one year or less. Real estate construction includes certain loans which will convert to permanent financing at the point when construction is completed; these loans are reported according to their final maturity.
| | | | | | | | | | | | | | | | |
(Dollars in thousands) | | One year
or less | | | After one
year through
five years | | | After
five years | | | Total | |
Noncovered: | | | | | | | | | | | | | | | | |
Real estate mortgage: | | | | | | | | | | | | | | | | |
Commercial | | $ | 257,578 | | | $ | 627,039 | | | $ | 143,944 | | | $ | 1,028,561 | |
One-to-four family residential | | | 11,188 | | | | 29,425 | | | | 39,762 | | | | 80,375 | |
Real estate construction | | | 131,589 | | | | 93,936 | | | | 6,560 | | | | 232,085 | |
Commercial | | | 113,638 | | | | 173,885 | | | | 58,743 | | | | 346,266 | |
Installment and consumer: | | | | | | | | | | | | | | | | |
Guaranteed student loans | | | 5,396 | | | | — | | | | — | | | | 5,396 | |
Other | | | 16,104 | | | | 15,207 | | | | 1,879 | | | | 33,190 | |
| | | | | | | | | | | | | | | | |
Total noncovered | | | 535,493 | | | | 939,492 | | | | 250,888 | | | | 1,725,873 | |
Covered: | | | | | | | | | | | | | | | | |
Real estate mortgage: | | | | | | | | | | | | | | | | |
Commercial | | | 3,263 | | | | 7,281 | | | | 13,142 | | | | 23,686 | |
One-to-four family residential | | | 726 | | | | 2,356 | | | | 3,990 | | | | 7,072 | |
Real estate construction | | | 3,028 | | | | 213 | | | | 505 | | | | 3,746 | |
Commercial | | | 2,059 | | | | 748 | | | | 34 | | | | 2,841 | |
Installment and consumer | | | 106 | | | | 164 | | | | — | | | | 270 | |
| | | | | | | | | | | | | | | | |
Total covered | | | 9,182 | | | | 10,762 | | | | 17,671 | | | | 37,615 | |
| | | | | | | | | | | | | | | | |
Total | | $ | 544,675 | | | $ | 950,254 | | | $ | 268,559 | | | $ | 1,763,488 | |
| | | | | | | | | | | | | | | | |
The following table sets forth at December 31, 2011 the dollar amount of all loans due more than one year after December 31, 2011.
23
| | | | | | | | | | | | |
(Dollars in thousands) | | Fixed | | | Variable | | | Total | |
Noncovered: | | | | | | | | | | | | |
Real estate mortgage: | | | | | | | | | | | | |
Commercial | | $ | 234,735 | | | $ | 536,248 | | | $ | 770,983 | |
One-to-four family residential | | | 31,145 | | | | 38,042 | | | | 69,187 | |
Real estate construction | | | 19,401 | | | | 81,095 | | | | 100,496 | |
Commercial | | | 63,236 | | | | 169,392 | | | | 232,628 | |
Installment and consumer | | | 5,525 | | | | 11,561 | | | | 17,086 | |
| | | | | | | | | | | | |
Total noncovered | | | 354,042 | | | | 836,338 | | | | 1,190,380 | |
Covered: | | | | | | | | | | | | |
Real estate mortgage: | | | | | | | | | | | | |
Commercial | | | 6,215 | | | | 14,208 | | | | 20,423 | |
One-to-four family residential | | | 619 | | | | 5,727 | | | | 6,346 | |
Real estate construction | | | 138 | | | | 580 | | | | 718 | |
Commercial | | | 572 | | | | 210 | | | | 782 | |
Installment and consumer | | | 164 | | | | — | | | | 164 | |
| | | | | | | | | | | | |
Total covered | | | 7,708 | | | | 20,725 | | | | 28,433 | |
| | | | | | | | | | | | |
Total | | $ | 361,750 | | | $ | 857,063 | | | $ | 1,218,813 | |
| | | | | | | | | | | | |
Nonperforming Assets and Potential Problem Loans
The following table shows the amounts of nonperforming assets at the end of the periods indicated. Please see Note 1 of the Notes to the Consolidated Financial Statements for a description of Southwest’s policy for placing loans on nonaccrual status. Nonperforming troubled debt restructurings are included in nonaccrual loans.
| | | | | | | | | | | | | | | | | | | | |
| | | At December 31, | |
(Dollars in thousands) | | 2011 | | | 2010 | | | 2009 | | | 2008 | | | 2007 | |
Noncovered: | | | | | | | | | | | | | | | | | | | | |
Nonaccrual loans: | | | | | | | | | | | | | | | | | | | | |
Commercial real estate | | $ | 4,667 | | | $ | 29,996 | | | $ | 28,351 | | | $ | 9,881 | | | $ | 5,274 | |
One-to-four family residential | | | 1,468 | | | | 1,984 | | | | 9,387 | | | | 474 | | | | 740 | |
Real estate construction | | | 3,877 | | | | 67,571 | | | | 57,586 | | | | 37,346 | | | | 2,910 | |
Commercial | | | 3,371 | | | | 6,977 | | | | 10,404 | | | | 11,598 | | | | 10,517 | |
Other consumer | | | 123 | | | | 38 | | | | 159 | | | | 11 | | | | 93 | |
| | | | | | | | | | | | | | | | | | | | |
Total nonaccrual loans | | | 13,506 | | | | 106,566 | | | | 105,887 | | | | 59,310 | | | | 19,534 | |
| | | | | | | | | | | | | | | | | | | | |
Past due 90 days or more: | | | | | | | | | | | | | | | | | | | | |
Commercial real estate | | | — | | | | 514 | | | | 100 | | | | 9 | | | | 8,214 | |
One-to-four family residential | | | 23 | | | | — | | | | 76 | | | | 39 | | | | 74 | |
Real estate construction | | | — | | | | — | | | | — | | | | 4,005 | | | | 3 | |
Commercial | | | 3 | | | | — | | | | 18 | | | | 547 | | | | 1,456 | |
Other consumer | | | 17 | | | | 3 | | | | 116 | | | | 73 | | | | 290 | |
| | | | | | | | | | | | | | | | | | | | |
Total past due 90 days or more | | | 43 | | | | 517 | | | | 310 | | | | 4,673 | | | | 10,037 | |
| | | | | | | | | | | | | | | | | | | | |
Total nonperforming loans | | | 13,549 | | | | 107,083 | | | | 106,197 | | | | 63,983 | | | | 29,571 | |
Other real estate | | | 19,844 | | | | 37,722 | | | | 18,432 | | | | 6,092 | | | | 2,679 | |
| | | | | | | | | | | | | | | | | | | | |
Total nonperforming assets | | $ | 33,393 | | | $ | 144,805 | | | $ | 124,629 | | | $ | 70,075 | | | $ | 32,250 | |
| | | | | | | | | | | | | | | | | | | | |
Total performing restructured | | $ | 1,017 | | | $ | 2,177 | | | $ | — | | | $ | — | | | $ | — | |
| | | | | | | | | | | | | | | | | | | | |
Nonperforming assets to portfolio loans and other real estate | | | 1.96 | % | | | 6.11 | % | | | 4.87 | % | | | 2.80 | % | | | 1.50 | % |
Nonperforming loans to portfolio loans | | | 0.80 | | | | 4.59 | | | | 4.18 | | | | 2.56 | | | | 1.38 | |
Allowance for loan losses to nonperforming loans | | | 326.47 | | | | 60.91 | | | | 58.77 | | | | 62.16 | | | | 100.04 | |
Government-guaranteed portion of nonperforming loans | | $ | 76 | | | $ | 10 | | | $ | 277 | | | $ | 1,072 | | | $ | 1,337 | |
24
| | | | | | | | | | | | | | | | | | | | |
| | | At December 31, | |
(Dollars in thousands) | | 2011 | | | 2010 | | | 2009 | | | 2008 | | | 2007 | |
Covered: | | | | | | | | | | | | | | | | | | | | |
Nonaccrual loans: | | | | | | | | | | | | | | | | | | | | |
Commercial real estate | | $ | 3,554 | | | $ | 4,391 | | | $ | 1,847 | | | $ | — | | | $ | — | |
One-to-four family residential | | | 188 | | | | 932 | | | | 2,243 | | | | — | | | | — | |
Real estate construction | | | 3,009 | | | | 4,897 | | | | 7,525 | | | | — | | | | — | |
Commercial | | | 370 | | | | 581 | | | | 665 | | | | — | | | | — | |
Other consumer | | | 7 | | | | 5 | | | | 42 | | | | — | | | | — | |
| | | | | | | | | | | | | | | | | | | | |
Total nonaccrual loans | | | 7,128 | | | | 10,806 | | | | 12,322 | | | | — | | | | — | |
| | | | | | | | | | | | | | | | | | | | |
Past due 90 days or more: | | | | | | | | | | | | | | | | | | | | |
Commercial real estate | | | — | | | | — | | | | 542 | | | | — | | | | — | |
Real estate construction | | | — | | | | — | | | | 574 | | | | — | | | | — | |
Other consumer | | | — | | | | — | | | | 20 | | | | — | | | | — | |
| | | | | | | | | | | | | | | | | | | | |
Total past due 90 days or more | | | — | | | | — | | | | 1,136 | | | | — | | | | — | |
| | | | | | | | | | | | | | | | | | | | |
Total nonperforming loans | | | 7,128 | | | | 10,806 | | | | 13,458 | | | | — | | | | — | |
Other real estate | | | 4,529 | | | | 4,187 | | | | 4,748 | | | | — | | | | — | |
| | | | | | | | | | | | | | | | | | | | |
Total nonperforming assets | | $ | 11,657 | | | $ | 14,993 | | | $ | 18,206 | | | $ | — | | | $ | — | |
| | | | | | | | | | | | | | | | | | | | |
Nonperforming assets to portfolio loans and other real estate | | | 27.66 | % | | | 25.93 | % | | | 20.19 | % | | | — | | | | — | |
Nonperforming loans to portfolio loans | | | 18.95 | | | | 20.15 | | | | 15.76 | | | | — | | | | — | |
Allowance for loan losses to nonperforming loans | | | 6.33 | | | | — | | | | — | | | | — | | | | — | |
Government-guaranteed portion of nonperforming loans | | $ | 4,764 | | | $ | 6,948 | | | $ | 3,853 | | | $ | — | | | $ | — | |
At December 31, 2011, five credit relationships represented 69% of noncovered nonperforming loans and 28% of noncovered nonperforming assets, while at December 31, 2010, nine credit relationships represented 70% of noncovered nonperforming loans and 52% of noncovered nonperforming assets.
Included in noncovered nonaccrual loans as of December 31, 2011 are five collateral dependent lending relationships with aggregate principal balances of approximately $9.3 million and related impairment reserves of $0.4 million which were established based on recent appraisal values obtained. Four of these lending relationships are in the commercial real estate industry and include a retail building project with one loan outstanding, three commercial real estate lending relationships, two with one loan outstanding and the other with three loans outstanding, and a commercial relationship with one loan outstanding.
Included in noncovered nonaccrual loans as of December 31, 2010 are nine collateral dependent lending relationships with aggregate principal balances of approximately $75.4 million and related impairment reserves of $5.9 million which were established based on recent appraisal values obtained for the respective properties. All nine of these lending relationships are in the commercial real estate industry and include a residential condominium construction project with two loans outstanding, a hotel building with two loans outstanding, a retail building project with one loan outstanding, a lending relationship consisting of two loans that includes two retail commercial real estate buildings for lease, a lending relationship consisting of three loans for residential care buildings, and four residential land development lending relationships, one with two loans and three with one loan.
Noncovered nonperforming assets could fluctuate from period to period. The performance of any individual loan can be affected by external factors such as the interest rate environment, economic conditions, collateral values, or factors particular to the borrower. No assurance can be given that additional increases in noncovered nonaccrual loans will not occur in the future.
Performing loans considered potential problem loans, loans which are not included in the past due, nonaccrual, or restructured categories, but for which known information about possible credit problems cause management to be uncertain as to the ability of the borrowers to comply with the present loan repayment terms, amounted to
25
approximately $134.0 million at December 31, 2011, compared to $236.6 million at December 31, 2010. Included are $0.9 million and $3.5 million, respectively, of covered potential problem loans, which are subject to protection under the loss share agreements with the FDIC. Loans may be monitored by management and reported in potential problem loans for an extended period of time during which management continues to be uncertain as to the ability of certain borrowers to comply with the present loan repayment terms. These loans are subject to continued management attention and are considered by management in determining the level of the allowance for loan losses.
Management strives to carefully monitor credit quality and to identify loans that may become nonperforming. At any time, however, there are loans included in the portfolio that will result in losses to Southwest but that have not been identified as nonperforming or potential problem loans. Because the loan portfolio contains a significant number of commercial and commercial real estate loans with relatively large balances, the unexpected deterioration of one or a few of such loans may cause a significant increase in nonperforming assets, the provision for loan losses, and charge-offs.
Allowance for Loan Losses
Southwest makes provisions for loan losses in amounts necessary to maintain the allowance for loan losses at the level Southwest determines is appropriate. The amount of the allowance is based on careful, continuous review and evaluation of the loan portfolio and ongoing quarterly assessments of the probable losses inherent in the loan portfolio. The allowance for loan losses is determined in accordance with regulatory guidelines and generally accepted accounting principles. See “Allowance for Loan Losses” in Note 1 of the Notes to the Consolidated Financial Statements for a description of Southwest’s allowance for loan losses methodology.
Based upon this methodology, management established an allowance of $44.2 million, or 2.62% of total noncovered portfolio loans, at December 31, 2011, compared to an allowance $65.2 million, or 2.80% of total noncovered portfolio loans, at December 31, 2010. This represents a decrease in the allowance of $21.0 million, or 32%.
Changes in the amount of the allowance resulted from the application of the methodology, which is designed to estimate inherent losses on total noncovered portfolio loans, including nonperforming loans. At December 31, 2011, the allowance on the $13.5 million in noncovered nonaccrual loans was $0.9 million (7.0%), compared with an allowance on the $106.6 million in noncovered nonaccrual loans at December 31, 2010 of $12.9 million (12.1%), creating a decrease in the allowance of $12.0 million. At December 31, 2011, the allowance on the $32.3 million noncovered performing troubled debt restructured loans was less than $0.1 million, compared with an allowance on $63.1 million in noncovered performing troubled debt restructured loans of $7.0 million at December 31, 2010, creating a decrease in the allowance of $7.0 million.
Excluding the impaired loans mentioned above, at December 31, 2011, the allowance for the remaining other noncovered loans was $43.3 million (2.6%), compared to $45.3 million (2.1%) at December 31, 2010, creating a decrease in the allowance of $2.0 million. The decrease in the allowance related to these other noncovered loans mainly resulted from the decline in loans and consideration of certain trends and qualitative factors. These included management’s assessment of economic risk (particularly with respect to commercial and commercial real estate loans), portfolio loss trends, and asset quality trends, including levels of potential problem loans and loan concentrations in commercial real estate mortgage and construction loans, which together comprised approximately 73% of our noncovered portfolio loans at December 31, 2011. Based on its analysis management believes the amount of the allowance is appropriate.
Covered portfolio loans were $37.6 million at December 31, 2011. These loans are subject to protection under the loss sharing agreements with the FDIC and currently have an allowance for loan losses of $0.5 million based on analysis of expected future cash flows.
At December 31, 2011, the allowance for loan losses was 326.47% of noncovered nonperforming loans, compared to 60.91% of noncovered nonperforming loans at December 31, 2010. Noncovered nonaccrual loans, which comprise the majority of noncovered nonperforming loans, were $13.5 million as of December 31, 2011, a
26
decrease of $93.1 million, or 87%, from December 31, 2010. Noncovered nonaccrual loans at December 31, 2011 were comprised of 40 relationships and were primarily concentrated in commercial real estate (35%) loans, real estate construction (29%) loans, and commercial loans (25%). All noncovered nonaccrual loans are considered impaired and are carried at their estimated collectible amounts. Covered nonperforming loans of $7.1 million at December 31, 2011 and $10.8 million at December 31, 2010 are subject to protection under the loss share agreements with the FDIC.
The following table presents a five-year history of the allocation of the allowance for loan losses along with the percentage of total noncovered loans in each category.
| | | | | | | | | | | | | | | | | | | | | | | | | | | | | | | | | | | | | | | | |
| | | At December 31, | |
(Dollars in thousands) | | 2011 | | | 2010 | | | 2009 | | | 2008 | | | 2007 | |
Real estate mortgage: | | | | | | | | | | | | | | | | | | | | | | | | | | | | | | | | | | | | | | | | |
Commercial | | $ | 21,609 | | | | 60 | % | | $ | 32,508 | | | | 55 | % | | $ | 26,670 | | | | 47 | % | | $ | 13,200 | | | | 44 | % | | $ | 10,126 | | | | 34 | % |
One-to-four family residential | | | 1,002 | | | | 5 | | | | 1,597 | | | | 4 | | | | 2,454 | | | | 5 | | | | 1,332 | | | | 4 | | | | 693 | | | | 5 | |
Real estate construction | | | 10,919 | | | | 13 | | | | 19,605 | | | | 20 | | | | 22,241 | | | | 25 | | | | 12,795 | | | | 26 | | | | 5,649 | | | | 33 | |
Commercial | | | 9,788 | | | | 20 | | | | 10,605 | | | | 19 | | | | 10,052 | | | | 20 | | | | 11,401 | | | | 22 | | | | 10,369 | | | | 23 | |
Installment and consumer: | | | | | | | | | | | | | | | | | | | | | | | | | | | | | | | | | | | | | | | | |
Guaranteed student loans | | | — | | | | — | | | | — | | | | — | | | | — | | | | 1 | | | | — | | | | 2 | | | | 31 | | | | 3 | |
Other | | | 915 | | | | 2 | | | | 914 | | | | 2 | | | | 996 | | | | 2 | | | | 1,045 | | | | 2 | | | | 804 | | | | 2 | |
Unallocated* | | | — | | | | — | | | | — | | | | — | | | | — | | | | — | | | | — | | | | — | | | | 1,912 | | | | — | |
| | | | | | | | | | | | | | | | | | | | | | | | | | | | | | | | | | | | | | | | |
Total | | $ | 44,233 | | | | 100 | % | | $ | 65,229 | | | | 100 | % | | $ | 62,413 | | | | 100 | % | | $ | 39,773 | | | | 100 | % | | $ | 29,584 | | | | 100 | % |
| | | | | | | | | | | | | | | | | | | | | | | | | | | | | | | | | | | | | | | | |
| * | Under current methodology, allowance is allocated among respective loan types. |
27
The following table analyzes Southwest’s noncovered allowance for loan losses for the periods indicated.
| | | | | | | | | | | | | | | | | | | | |
| | | For the Year Ended December 31, | |
(Dollars in thousands) | | 2011 | | | 2010 | | | 2009 | | | 2008 | | | 2007 | |
Balance at beginning of period | | $ | 65,229 | | | $ | 62,413 | | | $ | 39,773 | | | $ | 29,584 | | | $ | 27,293 | |
Loans charged-off: | | | | | | | | | | | | | | | | | | | | |
Commercial real estate | | | 71,066 | | | | 4,571 | | | | 3,622 | | | | 1,379 | | | | 1,540 | |
One-to-four family residential | | | 346 | | | | 2,649 | | | | 1,476 | | | | 746 | | | | 337 | |
Real estate construction | | | 62,070 | | | | 20,910 | | | | 7,464 | | | | 2,209 | | | | 129 | |
Commercial | | | 22,103 | | | | 5,182 | | | | 5,223 | | | | 4,552 | | | | 4,663 | |
Other consumer | | | 1,040 | | | | 1,127 | | | | 1,128 | | | | 1,056 | | | | 696 | |
| | | | | | | | | | | | | | | | | | | | |
Total charge-offs | | | 156,625 | | | | 34,439 | | | | 18,913 | | | | 9,942 | | | | 7,365 | |
| | | | | | | | | | | | | | | | | | | | |
Recoveries: | | | | | | | | | | | | | | | | | | | | |
Commercial real estate | | | 411 | | | | 204 | | | | 438 | | | | 8 | | | | 22 | |
One-to-four family residential | | | 67 | | | | 234 | | | | 430 | | | | 49 | | | | 10 | |
Real estate construction | | | 1,521 | | | | 610 | | | | 344 | | | | 2 | | | | — | |
Commercial | | | 1,864 | | | | 421 | | | | 893 | | | | 962 | | | | 606 | |
Other consumer | | | 116 | | | | 226 | | | | 272 | | | | 131 | | | | 71 | |
| | | | | | | | | | | | | | | | | | | | |
Total recoveries | | | 3,979 | | | | 1,695 | | | | 2,377 | | | | 1,152 | | | | 709 | |
| | | | | | | | | | | | | | | | | | | | |
Net loans charged-off | | | 152,646 | | | | 32,744 | | | | 16,536 | | | | 8,790 | | | | 6,656 | |
Provision for loan losses | | | 131,650 | | | | 35,560 | | | | 39,176 | | | | 18,979 | | | | 8,947 | |
| | | | | | | | | | | | | | | | | | | | |
Balance at end of period | | $ | 44,233 | | | $ | 65,229 | | | $ | 62,413 | | | $ | 39,773 | | | $ | 29,584 | |
| | | | | | | | | | | | | | | | | | | | |
Portfolio loans: | | | | | | | | | | | | | | | | | | | | |
Noncovered end of period balance | | $ | 1,687,178 | | | $ | 2,331,293 | | | $ | 2,539,294 | | | $ | 2,494,506 | | | $ | 2,145,557 | |
Noncovered average balance | | | 2,131,063 | | | | 2,466,552 | | | | 2,614,045 | | | | 2,359,471 | | | | 1,816,149 | |
Ratio of allowance for loan losses to noncovered portfolio loans at end of period | | | 2.62 | % | | | 2.80 | % | | | 2.46 | % | | | 1.59 | % | | | 1.38 | % |
Ratio of net charge-offs to noncovered average portfolio loans during the period | | | 7.16 | % | | | 1.33 | % | | | 0.63 | % | | | 0.37 | % | | | 0.37 | % |
Short-term Borrowings
Southwest’s primary source of short-term borrowings is securities sold under agreements to repurchase. During 2011, 2010, and 2009, no category of short-term borrowings had an average balance that exceeded 30% of ending shareholders’ equity.
Off-Balance Sheet Arrangements and Contractual Obligations
In the normal course of business, Southwest makes use of a number of different financial instruments to help meet the financial needs of its customers. In accordance with U.S. generally accepted accounting principles, the full notional amounts of these transactions are not recorded in the accompanying consolidated financial statements and are referred to as off-balance sheet instruments. These transactions and activities include commitments to extend lines of commercial and real estate mortgage credit and standby and commercial letters of credit and are discussed further in Note 16 in the Notes to the Consolidated Financial Statements.
Off-balance sheet arrangements also include trust preferred securities, which have been de-consolidated in this report. Further information regarding trust preferred securities can be found in Note 9 in the Notes to the Consolidated Financial Statements.
Southwest has various contractual obligations that require future cash payment. The following table presents, as of December 31, 2011, significant fixed and determinable contractual obligations to third parties by payment date.
28
| | | | | | | | | | | | | | | | | | | | |
| | | Payments due by period | |
| | | Less than | | | 1-3 | | | 3-5 | | | Over | | | | |
(Dollars in thousands) | | 1 Year | | | Years | | | Years | | | 5 Years | | | Total | |
Deposits without stated maturity: (1) | | | | | | | | | | | | | | | | | | | | |
Noninterest bearing | | $ | 400,985 | | | $ | — | | | $ | — | | | $ | — | | | $ | 400,985 | |
Interest bearing | | | 562,492 | | | | — | | | | — | | | | — | | | | 562,492 | |
Time deposits (2) | | | 765,712 | | | | 189,178 | | | | 12,098 | | | | 28 | | | | 967,016 | |
Other borrowings (2) | | | 32,839 | | | | 2,721 | | | | 2,721 | | | | 36,445 | | | | 74,726 | |
Subordinated debentures (2) | | | 5,334 | | | | 10,669 | | | | 10,669 | | | | 188,917 | | | | 215,589 | |
Operating leases | | | 2,444 | | | | 3,360 | | | | 2,134 | | | | 163 | | | | 8,101 | |
| | | | | | | | | | | | | | | | | | | | |
Total | | $ | 1,769,806 | | | $ | 205,928 | | | $ | 27,622 | | | $ | 225,553 | | | $ | 2,228,909 | |
| | | | | | | | | | | | | | | | | | | | |
| (2) | Includes interest. Interest on variable rate obligations is shown at rates in effect at December 31, 2011. The contractual amounts to be paid on variable rate obligations are affected by changes in market interest rates. Future changes in market interest rates could materially affect the contractual amounts to be paid. |
At December 31, 2011, Southwest’s purchase obligations are not reflected on the Consolidated Statements of Condition.
For additional information regarding contractual obligations, please see “Quantitative and Qualitative Disclosures about Market Risk” on page 32 and in the Notes to the Consolidated Financial Statements in this report, “Note 4 Premises and Equipment”, “Note 7 Deposits and Other Borrowed Funds”, “Note 9 Subordinated Debentures”, “Note 16 Financial Instruments with Off-Balance Sheet Risk”, and “Note 17 Commitments and Contingencies”.
Capital Resources
At December 31, 2011, total shareholders’ equity was $307.2 million, compared to $377.8 million at December 31, 2010, a decrease of $70.6 million. The decrease was primarily the result of a loss of $68.3 million and preferred dividends declared totaling $3.5 million. Net unrealized holding gains on available for sale investment securities and derivative instruments (net of tax) increased to $2.1 million at December 31, 2011, from $1.0 million at December 31, 2010.
At December 31, 2010, total shareholders’ equity was $377.8 million, compared to $309.8 million at December 31, 2009. Issuance of common shares through a public stock offering contributed $54.0 million to shareholders’ equity and earnings, net of preferred dividends, contributed $13.5 million to shareholders’ equity. Sales of common stock through the employee stock purchase plan and the employee stock option plan contributed an additional $0.5 million to shareholders’ equity in 2010, including stock option exercises and restricted stock grants and tax benefits realized by Southwest relating to option exercises. Under U.S. generally accepted accounting principles, these tax benefits increase shareholders’ equity but do not affect net income. Net unrealized holding gains on investment securities available for sale (net of tax) increased to $1.0 million at December 31, 2010, from $0.9 million at December 31, 2009.
Bank holding companies are required to maintain capital ratios in accordance with guidelines adopted by the Federal Reserve Board. The guidelines are commonly known as Risk-Based Capital Guidelines. On December 31, 2011, Southwest exceeded all applicable capital requirements, having a total risk-based capital ratio of 20.78%, a Tier 1 risk-based capital ratio of 19.51%, and a Tier 1 leverage ratio of 14.50%. Banking subsidiaries are also required to maintain capital ratios in accordance with guidelines adopted by their primary regulators. The general regulatory minimums to be well-capitalized are a total capital to risk weighted assets ratio of 10.00%, a Tier I risk-based capital ratio of 6.00%, and a Tier 1 leverage ratio of 5.00%. As of December 31, 2011, Southwest, Stillwater National, and Bank of Kansas each met the criteria for classification as a “well-capitalized” institution under the prompt corrective action rules promulgated under the Federal Deposit Insurance Act. Designation as a well-capitalized institution under these regulations does not constitute a recommendation or endorsement of Southwest, Stillwater National, or Bank of Kansas by Federal bank regulators. See “Certain Regulatory Matters” on page 31 of this report.
29
Liquidity
Liquidity is measured by a financial institution’s ability to raise funds through deposits, borrowed funds, capital, or the sale of highly marketable assets, such as available for sale investments, in order to meet current and future cash flow needs as they become due. Southwest’s portfolio of guaranteed student loans is also readily salable. Additional sources of liquidity, including cash flow from the repayment of loans and maturities of investment securities, are also considered in determining whether liquidity is satisfactory. Liquidity is also achieved through growth of deposits and liquid assets and accessibility to the capital and money markets. These funds are used to meet deposit withdrawals, maintain reserve requirements, fund loans, purchase securities, and operate the organization.
The following table indicates the amount of Southwest’s certificates of deposit of $100,000 or more by time remaining until maturity as of December 31, 2011:
| | | | |
(Dollars in thousands) | | Amount | |
Three months or less (1) | | $ | 136,912 | |
Over three through six months (1) | | | 91,762 | |
Over six through 12 months (1) | | | 154,702 | |
Over 12 months | | | 104,531 | |
| | | | |
Total | | $ | 487,907 | |
| | | | |
| (1) | The amount of certificates of deposit of $100,000 and more that mature within 12 months is $383.4 million. |
The following table illustrates, during the years presented, the mix of Southwest’s funding sources and the assets in which those funds are invested as a percentage of Southwest’s average total assets for the period indicated. Average assets totaled $2.7 billion in 2011, compared to $3.0 billion in 2010 and 2009.
| | | | | | | | |
| | | Percentage of Total Average Assets | |
| | | 2011 | | | 2010 | |
Sources of Funds: | | | | | | | | |
Deposits: | | | | | | | | |
Noninterest-bearing demand | | | 14.01 | % | | | 11.04 | % |
Interest-bearing demand and money market accounts | | | 21.97 | | | | 20.25 | |
Time and savings deposits | | | 42.56 | | | | 50.18 | |
Other borrowings | | | 3.14 | | | | 3.21 | |
Subordinated debentures | | | 3.04 | | | | 2.73 | |
Other liabilities | | | 1.26 | | | | 0.60 | |
Equity capital | | | 14.02 | | | | 11.99 | |
| | | | | | | | |
Total | | | 100.00 | % | | | 100.00 | % |
| | | | | | | | |
Uses of Funds: | | | | | | | | |
Loans | | | 82.12 | % | | | 85.82 | % |
Investment securities | | | 9.79 | | | | 8.18 | |
Other interest-earning assets | | | 3.59 | | | | 3.46 | |
Noninterest-earning assets | | | 4.50 | | | | 2.54 | |
| | | | | | | | |
Total | | | 100.00 | % | | | 100.00 | % |
| | | | | | | | |
Sources and uses of cash are presented in the Consolidated Statements of Cash Flows on page 42 of this report. Total cash and cash equivalents increased by $162.4 million to $229.9 million in 2011 from $67.5 million at year-end 2010. This increase was the net result of cash provided by investing activities of $487.1 million, primarily from principal repayments, net of loan originated, and proceeds from sales of loans, and cash provided by operating activities of $46.7 million, offset by cash used in financing activities of $371.4 million, primarily from decreased deposits and other borrowings.
30
Total cash and cash equivalents decreased by $51.4 million, or 43%, to $67.5 million in 2010 from $118.8 million at year-end 2009. This decrease was the net result of cash used in financing activities of $297.9 million, primarily from decreased deposits net of capital raised, offset by cash provided from investing activities of $152.2 million, primarily from principal repayments net of loans originated, and cash provided by operating activities of $94.3 million.
Effects of Inflation
The consolidated financial statements and related consolidated financial data in this report have been prepared in accordance with accounting principles generally accepted in the United States and practices within the banking industry that require the measurement of financial position and operating results in terms of historical dollars without considering fluctuations in the relative purchasing power of money over time due to inflation. Unlike most industrial companies, virtually all the assets and liabilities of a financial institution are monetary in nature. As a result, interest rates have a more significant impact on a financial institution’s performance than the effects of general levels of inflation.
Certain Regulatory Matters
Our levels of nonperforming assets and our concentrations in commercial real estate loans have led to agreements with and commitments to our banking regulators. Please see the composition of the loan portfolio on page 22, “Nonperforming Assets and Potential Problem Loans” beginning on page 24, “Allowance for Loan Losses” beginning on page 26, and “Risk Factors” beginning on page 96.
Under the terms of a January 27, 2010 Formal Agreement with the Office of the Comptroller of the Currency (“OCC”), Stillwater National is required to submit written plans to the OCC and to take action as required relating to the following items:
| | • | | Establishing and ensuring compliance with a plan to reduce credit risk and improve loan portfolio management; |
| | • | | Eliminating credit weaknesses in nonperforming and potential problem loans; |
| | • | | On-going review and grading of the Stillwater National’s loan portfolio; |
| | • | | Improving Stillwater National’s position regarding nonperforming and potential problem loans and other real estate owned; |
| | • | | Improving loan portfolio concentration risk management; and |
| | • | | Establishing and operating a loan workout department. |
In addition, Stillwater National is required to prepare a three-year capital plan and to obtain OCC approval before increasing its use of brokered deposits above specific thresholds or declaring dividends.
The compliance committee of the Board of Directors of Stillwater National submits quarterly reports to the OCC setting forth a description of the actions needed to achieve full compliance with the Formal Agreement, actions taken to comply, and the results and status of these actions.
The Formal Agreement with the OCC does not require that Stillwater National maintain any specific capital ratios; however, Stillwater National has informally agreed to maintain at least a Tier 1 leverage ratio of 8.5% and a total capital to risk weighted assets ratio of 12.5%. At December 31, 2011, Stillwater National had a Tier 1 leverage ratio of 12.53%, a Tier 1 risk-based capital ratio of 16.41%, and a total capital to risk weighted assets ratio of 18.56%. Stillwater National remains well-capitalized for regulatory purposes and exceeds the general minimum ratios for well-capitalized status and the higher level to which we have committed.
31
Southwest has made informal commitments to the Federal Reserve, which include providing prior notice of the declaration and payment of dividends on trust preferred securities, preferred stock issued under the Treasury Department’s Capital Purchase Program, and common stock, and of planned receipt of dividends from its banking subsidiaries. During 2011, Southwest determined to defer future payments of dividends on trust preferred securities and preferred stock. Southwest also has agreed to submit a capital plan to the Federal Reserve and to obtain Federal Reserve approval for any additional borrowings at the holding company level. Southwest does not intend to increase its borrowings.
Southwest is firmly committed to our regulatory compliance efforts. We have taken actions to reduce our concentrations in commercial real estate and will continue to do so.
QUANTITATIVEAND QUALITATIVE DISCLOSURESABOUT MARKET RISK
Southwest’s income is largely dependent on its net interest income. Southwest seeks to maximize its net interest margin within an acceptable level of interest rate risk. Interest rate risk can be defined as the amount of forecasted net interest income that may be gained or lost due to favorable or unfavorable movements in interest rates. Interest rate risk, or sensitivity, arises when the maturity or repricing characteristics of assets differ significantly from the maturity or repricing characteristics of liabilities. Net interest income is also affected by changes in the portion of interest-earning assets that are funded by interest-bearing liabilities rather than by other sources of funds such as noninterest-bearing deposits and shareholders’ equity.
Southwest attempts to manage interest rate risk while enhancing net interest margin by adjusting its asset/liability position. At times, depending on the level of general interest rates, the relationship between long-term and other interest rates, market conditions, and competitive factors, Southwest may increase its interest rate risk position in order to increase its net interest margin. Southwest monitors interest rate risk and adjusts the composition of its rate-sensitive assets and liabilities in order to limit its exposure to changes in interest rates on net interest income over time. Southwest’s asset/liability committee reviews its interest rate risk position and profitability and recommends adjustments. The asset/liability committee also reviews the securities portfolio, formulates investment strategies, and oversees the timing and implementation of transactions. Notwithstanding Southwest’s interest rate risk management activities, the actual magnitude, direction, and relationship of future interest rates are uncertain and can have adverse effects on net income and liquidity.
Interest rate sensitivity analysis measures the cumulative differences between the amounts of assets and liabilities maturing or repricing within various time periods.
32
The following table shows Southwest’s interest rate sensitivity gaps for selected maturity or repricing periods at December 31, 2011:
| | | | | | | | | | | | | | | | | | | | |
| | | 0 to 3 | | | 4 to 12 | | | Over 1 to | | | Over | | | | |
(Dollars in thousands) | | Months | | | Months | | | 5 Years | | | 5 Years | | | Total | |
Rate-sensitive assets: | | | | | | | | | | | | | | | | | | | | |
Total loans | | $ | 400,534 | | | $ | 269,678 | | | $ | 880,386 | | | $ | 212,890 | | | $ | 1,763,488 | |
Investment securities | | | 1,343 | | | | 4,873 | | | | 15,801 | | | | 253,335 | | | | 275,352 | |
Due from banks | | | 199,642 | | | | — | | | | — | | | | — | | | | 199,642 | |
| | | | | | | | | | | | | | | | | | | | |
Total | | | 801,161 | | | | 274,551 | | | | 896,187 | | | | 466,225 | | | | 2,438,124 | |
Rate-sensitive liabilities: | | | | | | | | | | | | | | | | | | | | |
Money market deposit accounts | | | 423,181 | | | | — | | | | — | | | | — | | | | 423,181 | |
Time deposits | | | 267,219 | | | | 494,833 | | | | 195,828 | | | | 25 | | | | 957,905 | |
Savings accounts | | | 33,406 | | | | — | | | | — | | | | — | | | | 33,406 | |
Interest-bearing demand | | | 105,905 | | | | — | | | | — | | | | — | | | | 105,905 | |
Other borrowings | | | 31,479 | | | | — | | | | — | | | | 25,000 | | | | 56,479 | |
Subordinated debentures | | | — | | | | — | | | | — | | | | 81,963 | | | | 81,963 | |
| | | | | | | | | | | | | | | | | | | | |
Total | | | 861,190 | | | | 494,833 | | | | 195,828 | | | | 106,988 | | | | 1,658,839 | |
| | | | | | | | | | | | | | | | | | | | |
Interest sensitivity gap | | $ | (60,029 | ) | | $ | (220,282 | ) | | $ | 700,359 | | | $ | 359,237 | | | $ | 779,285 | |
| | | | | | | | | | | | | | | | | | | | |
Cumulative interest sensitivity gap | | $ | (60,029 | ) | | $ | (280,311 | ) | | $ | 420,048 | | | $ | 779,285 | | | $ | 779,285 | |
| | | | | | | | | | | | | | | | | | | | |
Percentage of rate-sensitive assets to rate-sensitive liabilities | | | 93.03 | % | | | 55.48 | % | | | 457.64 | % | | | 435.77 | % | | | 146.98 | % |
| | | | | | | | | | | | | | | | | | | | |
Percentage of cumulative gap to total assets | | | (2.52 | )% | | | (11.76 | )% | | | 17.63 | % | | | 32.70 | % | | | 32.70 | % |
| | | | | | | | | | | | | | | | | | | | |
The percentage of rate-sensitive assets to rate-sensitive liabilities presents a static position as of a single day, is not necessarily indicative of Southwest’s position at any other point in time, and does not take into account the sensitivity of yields and costs of specific assets and liabilities to changes in market rates. The foregoing analysis assumes that Southwest’s mortgage-backed securities mature during the period in which they are estimated to prepay. No other prepayment or repricing assumptions have been applied to Southwest’s interest-earning assets for this analysis.
A principal objective of Southwest’s asset/liability management effort is to balance the various factors that generate interest rate risk, thereby maintaining the interest rate sensitivity of Southwest within acceptable risk levels. To measure its interest rate sensitivity position, Southwest utilizes a simulation model that facilitates the forecasting of net interest income over the next twelve month period under a variety of interest rate and growth scenarios.
The earnings simulation model uses numerous assumptions regarding the effect of changes in interest rates on the timing and extent of repricing characteristics, future cash flows, and customer behavior. These assumptions are inherently uncertain and, as a result, the model cannot precisely estimate net income. Actual results differ from simulated results due to the timing, magnitude, and frequency of interest rate changes and changes in market conditions, cash flows, and management strategies, among other factors.
The balance sheet is subject to quarterly testing for six alternative interest rate shock possibilities to indicate the inherent interest rate risk. Average interest rates are shocked by +/- 100, 200, and 300 basis points (“bp”), although Southwest may elect not to use particular scenarios that it determines are impractical in a current rate environment. It is management’s goal to structure the balance sheet so that net interest earnings at risk over a twelve-month period and the economic value of equity at risk do not exceed policy guidelines at various interest rate shock levels.
33
Measures of net interest income at risk produced by simulation analysis are indicators of an institution’s short-term performance in alternative rate environments. These measures are typically based upon a relatively brief period, usually one year. They do not necessarily indicate the long-term prospects or economic value of the institution.
Estimated Changes in Net Interest Income
| | | | | | | | | | | | |
Changes in Interest Rates: | | +300 bp | | | +200 bp | | | +100 bp | |
Policy Limit | | | (18.00 | )% | | | (10.00 | )% | | | (5.00 | )% |
December 31, 2011 | | | 4.84 | % | | | 0.18 | % | | | (2.14 | )% |
December 31, 2010 | | | 1.58 | % | | | (2.77 | )% | | | (3.30 | )% |
The current overnight rate as established by the Federal Open Market Committee is in the 0% to 0.25% range. Southwest believes that all down rate scenarios are impractical since they would result in rates of less than 0%. As a result, the down 100 bp, down 200 bp, and down 300 bp scenarios have been excluded. Net interest income at risk improved in each of the rising interest rate scenarios when compared to the December 31, 2010 risk position. Southwest’s largest exposure to changes in interest rate is in the +100 bp scenario with a decline in net interest income (2.14)% at December 31, 2010, an improvement of 1.16 percentage points from December 31, 2010 level of (3.30)%. All of the above measures of net interest income at risk remain well within prescribed policy limits.
The measure of equity value at risk indicates the ongoing economic value of Southwest by considering the effects of changes in interest rates on all of Southwest’s cash flows and discounting the cash flows to estimate the present value of assets and liabilities. The difference between these discounted values of the assets and liabilities is the economic value of equity, which, in theory, approximates the fair value of Southwest’s net assets.
Estimated Changes in Economic Value of Equity (EVE)
| | | | | | | | | | | | |
Changes in Interest Rates: | | +300 bp | | | +200 bp | | | + 100 bp | |
Policy Limit | | | (35.00 | )% | | | (20.00 | )% | | | (10.00 | )% |
December 31, 2011 | | | 9.96 | % | | | 7.33 | % | | | 3.75 | % |
December 31, 2010 | | | (2.15 | )% | | | (1.35 | )% | | | (0.47 | )% |
As of December 31, 2011, the economic value of equity measure improved in each of the three rising interest rate scenarios when compared to December 31, 2010. Southwest’s largest economic value of equity exposure is the +300 bp scenario. The +300 bp scenario was 9.96% on December 31, 2011, a 12.11% increase over the December 31, 2010 value of (2.15%). The economic value of equity ratio in all scenarios remains well within Southwest’s Asset and Liability Management Policy limits.
CONTROLSAND PROCEDURES
Disclosure Controls and Procedures
As required by SEC rules, Southwest’s management evaluated the effectiveness of Southwest’s disclosure controls and procedures as of December 31, 2011. Southwest’s Chief Executive Officer and Chief Financial Officer participated in the evaluation. Based on this evaluation, Southwest’s Chief Executive Officer and Chief Financial Officer concluded that Southwest’s disclosure controls and procedures were effective as of December 31, 2011.
34
Management’s Report on Internal Control over Financial Reporting
Southwest’s management is responsible for establishing and maintaining adequate internal control over financial reporting. As required by SEC rules, Southwest’s management evaluated the effectiveness of Southwest’s internal control over financial reporting as defined in SEC Rule 13a-15 as of December 31, 2011. Southwest’s Chief Executive Officer and Chief Financial Officer participated in the evaluation, which was based upon the criteria for effective internal control over financial reporting included in the “Internal Control-Integrated Framework” issued by the Committee of Sponsoring Organizations of the Treadway Commission. Based on this evaluation, Southwest’s management concluded that Southwest’s internal control over financial reporting was effective as of December 31, 2011.
The report by Southwest’s independent registered public accounting firm, Ernst & Young LLP, on Southwest’s internal control over financial reporting is included on page 36.
Fourth Quarter 2011 Changes in Internal Control over Financial Reporting
No change occurred during the fourth quarter of 2011 that has materially affected, or is reasonably likely to materially affect, Southwest’s internal control over financial reporting.
35
REPORTSOF INDEPENDENT REGISTERED PUBLIC ACCOUNTING FIRM
Report on Effectiveness of Internal Control over Financial Reporting
The Board of Directors and Shareholders of Southwest Bancorp, Inc.
We have audited Southwest Bancorp, Inc.’s internal control over financial reporting as of December 31, 2011 based on criteria established in Internal Control—Integrated Framework issued by the Committee of Sponsoring Organizations of the Treadway Commission (the COSO criteria). Southwest Bancorp, Inc.’s management is responsible for maintaining effective internal control over financial reporting and for its assessment of the effectiveness of internal control over financial reporting included in the accompanying report on Internal Control over Financial Reporting. Our responsibility is to express an opinion on the company’s internal control over financial reporting based on our audit.
We conducted our audit in accordance with the standards of the Public Company Accounting Oversight Board (United States). Those standards require that we plan and perform the audit to obtain reasonable assurance about whether effective internal control over financial reporting was maintained in all material respects. Our audit included obtaining an understanding of internal control over financial reporting, assessing the risk that a material weakness exists, testing and evaluating the design and operating effectiveness of internal control based on the assessed risk, and performing such other procedures as we considered necessary in the circumstances. We believe that our audit provides a reasonable basis for our opinion.
A company’s internal control over financial reporting is a process designed to provide reasonable assurance regarding the reliability of financial reporting and the preparation of financial statements for external purposes in accordance with generally accepted accounting principles. A company’s internal control over financial reporting includes those policies and procedures that (1) pertain to the maintenance of records that, in reasonable detail, accurately and fairly reflect the transactions and dispositions of the assets of the company; (2) provide reasonable assurance that transactions are recorded as necessary to permit preparation of financial statements in accordance with generally accepted accounting principles, and that receipts and expenditures of the company are being made only in accordance with authorizations of management and directors of the company; and (3) provide reasonable assurance regarding prevention or timely detection of unauthorized acquisition, use, or disposition of the company’s assets that could have a material effect on the financial statements.
Because of its inherent limitations, internal control over financial reporting may not prevent or detect misstatements. Also, projections of any evaluation of effectiveness to future periods are subject to the risk that controls may become inadequate because of changes in conditions, or that the degree of compliance with the policies or procedures may deteriorate.
In our opinion, Southwest Bancorp, Inc. maintained, in all material respects, effective internal control over financial reporting as of December 31, 2011, based on the COSO criteria.
We also have audited, in accordance with the standards of the Public Company Accounting Oversight Board (United States), the 2011 consolidated financial statements of Southwest Bancorp, Inc. and our report dated March 13, 2012 expressed an unqualified opinion thereon.
/s/ Ernst & Young LLP
Tulsa, Oklahoma
March 13, 2012
36
CONSOLIDATED FINANCIAL STATEMENTSAND SUPPLEMENTARY DATA
Report on Consolidated Financial Statements
The Board of Directors and Shareholders of Southwest Bancorp, Inc.
We have audited the accompanying consolidated statements of financial condition of Southwest Bancorp, Inc. as of December 31, 2011 and 2010 and the related consolidated statements of operations, comprehensive income, shareholders’ equity, and cash flows for each of the three years in the period ended December 31, 2011. These financial statements are the responsibility of the Company’s management. Our responsibility is to express an opinion on these financial statements based on our audits.
We conducted our audits in accordance with the standards of the Public Company Accounting Oversight Board (United States). Those standards require that we plan and perform the audit to obtain reasonable assurance about whether the financial statements are free of material misstatement. An audit includes examining, on a test basis, evidence supporting the amounts and disclosures in the financial statements. An audit also includes assessing the accounting principles used and significant estimates made by management, as well as evaluating the overall financial statement presentation. We believe that our audits provide a reasonable basis for our opinion.
In our opinion, the financial statements referred to above present fairly, in all material respects, the consolidated financial position of Southwest Bancorp, Inc. at December 31, 2011 and 2010 and the consolidated results of its operations and its cash flows for each of the three years in the period ended December 31, 2011, in conformity with U.S. generally accepted accounting principles.
We also have audited, in accordance with the standards of the Public Company Accounting Oversight Board (United States), Southwest Bancorp, Inc.’s internal control over financial reporting as of December 31, 2011, based on criteria established in Internal Control––Integrated Framework issued by the Committee of Sponsoring Organizations of the Treadway Commission, and our report dated March 13, 2012 expressed an unqualified opinion thereon.
/s/ Ernst & Young LLP
Tulsa, Oklahoma
March 13, 2012
37
SOUTHWEST BANCORP, INC.
CONSOLIDATED STATEMENTS OF FINANCIAL CONDITION
| | | | | | | | |
| | | AT DECEMBER 31, | |
(Dollars in thousands) | | 2011 | | | 2010 | |
Assets: | | | | | | | | |
Cash and due from banks | | $ | 30,247 | | | $ | 26,478 | |
Interest-bearing deposits | | | 199,642 | | | | 41,018 | |
| | | | | | | | |
Cash and cash equivalents | | | 229,889 | | | | 67,496 | |
Securities held to maturity (fair value $15,885 and $14,029, respectively) | | | 15,252 | | | | 14,304 | |
Securities available for sale (amortized cost $253,869 and $246,649, respectively) | | | 260,100 | | | | 248,221 | |
Loans held for sale | | | 38,695 | | | | 35,194 | |
Noncovered loans receivable | | | 1,687,178 | | | | 2,331,293 | |
Less: Allowance for loan losses | | | (44,233 | ) | | | (65,229 | ) |
| | | | | | | | |
Net noncovered loans receivable | | | 1,642,945 | | | | 2,266,064 | |
Covered loans receivable (includes loss share of $10,073 and $14,370, respectively) | | | 37,615 | | | | 53,628 | |
Less: Allowance for loan losses | | | (451 | ) | | | — | |
| | | | | | | | |
Net noncovered loans receivable | | | 37,164 | | | | 53,628 | |
Net loans receivable | | | 1,680,109 | | | | 2,319,692 | |
Accrued interest receivable | | | 7,176 | | | | 8,590 | |
Income tax receivable | | | 28,666 | | | | — | |
Premises and equipment, net | | | 22,700 | | | | 23,772 | |
Noncovered other real estate | | | 19,844 | | | | 37,722 | |
Covered other real estate | | | 4,529 | | | | 4,187 | |
Goodwill | | | 6,811 | | | | 6,811 | |
Other intangible assets, net | | | 4,857 | | | | 5,371 | |
Other assets | | | 64,245 | | | | 49,181 | |
| | | | | | | | |
Total assets | | $ | 2,382,873 | | | $ | 2,820,541 | |
| | | | | | | | |
Liabilities: | | | | | | | | |
Deposits: | | | | | | | | |
Noninterest-bearing demand | | $ | 400,985 | | | $ | 377,182 | |
Interest-bearing demand | | | 105,905 | | | | 92,584 | |
Money market accounts | | | 423,181 | | | | 495,253 | |
Savings accounts | | | 33,406 | | | | 26,665 | |
Time deposits of $100,000 or more | | | 487,907 | | | | 694,565 | |
Other time deposits | | | 469,998 | | | | 566,479 | |
| | | | | | | | |
Total deposits | | | 1,921,382 | | | | 2,252,728 | |
Accrued interest payable | | | 3,689 | | | | 1,577 | |
Income tax payable | | | — | | | | 2,878 | |
Other liabilities | | | 12,174 | | | | 8,981 | |
Other borrowings | | | 56,479 | | | | 94,602 | |
Subordinated debentures | | | 81,963 | | | | 81,963 | |
| | | | | | | | |
Total liabilities | | | 2,075,687 | | | | 2,442,729 | |
Shareholders’ equity: | | | | | | | | |
Serial preferred stock - $1,000 par value; 2,000,000 shares authorized; 70,000 shares issued and outstanding | | | 68,455 | | | | 67,724 | |
Common stock - $1 par value; 40,000,000 shares authorized; 19,444,213 and 19,421,900 shares issued and outstanding, respectively | | | 19,444 | | | | 19,422 | |
Paid-in capital | | | 98,932 | | | | 98,894 | |
Retained earnings | | | 118,244 | | | | 190,793 | |
Accumulated other comprehensive income | | | 2,111 | | | | 979 | |
| | | | | | | | |
Total shareholders’ equity | | | 307,186 | | | | 377,812 | |
| | | | | | | | |
Total liabilities & shareholders’ equity | | $ | 2,382,873 | | | $ | 2,820,541 | |
| | | | | | | | |
The accompanying notes are an integral part of this statement.
38
SOUTHWEST BANCORP, INC.
CONSOLIDATED STATEMENTS OF OPERATIONS
| | | | | | | | | | | | |
| | | FOR THE YEAR ENDED DECEMBER 31, | |
(Dollars in thousands, except per share data) | | 2011 | | | 2010 | | | 2009 | |
Interest income: | | | | | | | | | | | | |
Interest and fees on loans | | $ | 113,223 | | | $ | 133,918 | | | $ | 141,239 | |
Investment securities: | | | | | | | | | | | | |
U.S. Government and agency obligations | | | 1,500 | | | | 2,006 | | | | 1,960 | |
Mortgage-backed securities | | | 5,046 | | | | 5,630 | | | | 6,257 | |
State and political subdivisions | | | 411 | | | | 285 | | | | 299 | |
Other securities | | | 16 | | | | 227 | | | | 61 | |
Other interest-earning assets | | | 549 | | | | 741 | | | | 583 | |
| | | | | | | | | | | | |
Total interest income | | | 120,745 | | | | 142,807 | | | | 150,399 | |
Interest expense: | | | | | | | | | | | | |
Interest-bearing demand | | | 382 | | | | 468 | | | | 476 | |
Money market accounts | | | 2,154 | | | | 3,911 | | | | 4,954 | |
Savings accounts | | | 49 | | | | 64 | | | | 78 | |
Time deposits of $100,000 or more | | | 7,617 | | | | 13,372 | | | | 20,864 | |
Other time deposits | | | 6,591 | | | | 10,452 | | | | 15,947 | |
Other borrowings | | | 1,799 | | | | 2,079 | | | | 4,049 | |
Subordinated debentures | | | 5,821 | | | | 5,130 | | | | 5,340 | |
| | | | | | | | | | | | |
Total interest expense | | | 24,413 | | | | 35,476 | | | | 51,708 | |
| | | | | | | | | | | | |
Net interest income | | | 96,332 | | | | 107,331 | | | | 98,691 | |
Provision for loan losses | | | 132,101 | | | | 35,560 | | | | 39,176 | |
| | | | | | | | | | | | |
Net interest income (loss) after provision for loan losses | | | (35,769 | ) | | | 71,771 | | | | 59,515 | |
| | | | | | | | | | | | |
Noninterest income: | | | | | | | | | | | | |
Service charges and fees | | | 12,075 | | | | 12,404 | | | | 11,704 | |
Other noninterest income | | | 285 | | | | 763 | | | | 1,063 | |
Gain on acquisition | | | — | | | | — | | | | 3,281 | |
Gains on sales of loans, net | | | 1,658 | | | | 2,736 | | | | 2,963 | |
Gains on sale/call of investment securities, net | | | — | | | | 2,661 | | | | 2,925 | |
| | | | | | | | | | | | |
Total noninterest income | | | 14,018 | | | | 18,564 | | | | 21,936 | |
Noninterest expense: | | | | | | | | | | | | |
Salaries and employee benefits | | | 29,880 | | | | 29,916 | | | | 29,299 | |
Occupancy | | | 10,815 | | | | 11,171 | | | | 11,637 | |
FDIC and other insurance | | | 3,862 | | | | 5,788 | | | | 5,545 | |
Other real estate, net | | | 30,852 | | | | 2,218 | | | | 130 | |
General and administrative | | | 14,792 | | | | 14,540 | | | | 14,247 | |
| | | | | | | | | | | | |
Total noninterest expense | | | 90,201 | | | | 63,633 | | | | 60,858 | |
| | | | | | | | | | | | |
Income (loss) before taxes | | | (111,952 | ) | | | 26,702 | | | | 20,593 | |
Taxes on income | | | (43,657 | ) | | | 9,738 | | | | 7,611 | |
| | | | | | | | | | | | |
Net income (loss) | | $ | (68,295 | ) | | $ | 16,964 | | | $ | 12,982 | |
| | | | | | | | | | | | |
Net income (loss) available to common shareholders | | $ | (72,548 | ) | | $ | 12,777 | | | $ | 8,837 | |
| | | | | | | | | | | | |
Basic earnings per common share | | $ | (3.73 | ) | | $ | 0.71 | | | $ | 0.60 | |
Diluted earnings per common share | | | (3.73 | ) | | | 0.71 | | | | 0.60 | |
Common dividends declared per share | | | — | | | | — | | | | 0.0952 | |
The accompanying notes are an integral part of this statement.
39
SOUTHWEST BANCORP, INC.
CONSOLIDATED STATEMENTS OF COMPREHENSIVE INCOME
| | | | | | | | | | | | |
| | | FOR THE YEAR ENDED DECEMBER 31, | |
(Dollars in thousands) | | 2011 | | | 2010 | | | 2009 | |
Net income (loss) | | $ | (68,295 | ) | | $ | 16,964 | | | $ | 12,982 | |
Other comprehensive income: | | | | | | | | | | | | |
Unrealized holding gain (loss) on available for sale securities | | | 4,659 | | | | 2,729 | | | | (315 | ) |
Reclassification adjustment for net gains realized during the period | | | — | | | | (2,661 | ) | | | (2,925 | ) |
Change in fair value of derivative used for cash flow hedge | | | (2,834 | ) | | | — | | | | — | |
| | | | | | | | | | | | |
Other comprehensive income (loss), before tax | | | 1,825 | | | | 68 | | | | (3,240 | ) |
Tax benefit (expense) related to items of other comprehensive income | | | (693 | ) | | | (34 | ) | | | 1,264 | |
| | | | | | | | | | | | |
Other comprehensive income (loss), net of tax | | | 1,132 | | | | 34 | | | | (1,976 | ) |
| | | | | | | | | | | | |
Comprehensive income (loss) | | $ | (67,163 | ) | | $ | 16,998 | | | $ | 11,006 | |
| | | | | | | | | | | | |
The accompanying notes are an integral part of this statement.
40
SOUTHWEST BANCORP, INC.
CONSOLIDATED STATEMENTS OF SHAREHOLDERS’ EQUITY
| | | | | | | | | | | | | | | | | | | | | | | | | | | | | | | | |
| (Dollars in thousands, | | Preferred | | | Common Stock | | | Additional
Paid-in | | | Retained | | | Accumulated
Other
Comprehensive | | | Treasury | | | Total
Shareholders’ | |
except per share data) | | Stock | | | Shares | | | Amount | | | Capital | | | Earnings | | | Income | | | Stock | | | Equity | |
Balance, December 31, 2008 | | $ | 66,392 | | | | 14,658,042 | | | $ | 14,658 | | | $ | 49,101 | | | $ | 170,579 | | | $ | 2,921 | | | $ | (1,448 | ) | | $ | 302,203 | |
| | | | | | | | | | | | | | | | | | | | | | | | | | | | | | | | |
Dividends (paid and/or accrued): | | | | | | | | | | | | | | | | | | | | | | | | | | | | | | | | |
Preferred | | | — | | | | — | | | | — | | | | — | | | | (3,500 | ) | | | — | | | | — | | | | (3,500 | ) |
Common, $0.0952 per share, and other dividends | | | — | | | | — | | | | — | | | | — | | | | (1,400 | ) | | | — | | | | — | | | | (1,400 | ) |
Warrant amortization | | | 645 | | | | — | | | | — | | | | — | | | | (645 | ) | | | — | | | | — | | | | — | |
Common stock issued | | | — | | | | — | | | | — | | | | (240 | ) | | | — | | | | — | | | | 463 | | | | 223 | |
Net common stock issued under employee plans and related tax expense | | | — | | | | 92,671 | | | | 93 | | | | 136 | | | | — | | | | — | | | | 985 | | | | 1,214 | |
Stock compensation expense | | | — | | | | — | | | | — | | | | 32 | | | | — | | | | — | | | | — | | | | 32 | |
Other comprehensive loss, net of tax | | | — | | | | — | | | | — | | | | — | | | | — | | | | (1,976 | ) | | | — | | | | (1,976 | ) |
Net income | | | — | | | | — | | | | — | | | | — | | | | 12,982 | | | | — | | | | — | | | | 12,982 | |
| | | | | | | | | | | | | | | | | | | | | | | | | | | | | | | | |
Balance, December 31, 2009 | | $ | 67,037 | | | | 14,750,713 | | | $ | 14,751 | | | $ | 49,029 | | | $ | 178,016 | | | $ | 945 | | | $ | — | | | $ | 309,778 | |
| | | | | | | | | | | | | | | | | | | | | | | | | | | | | | | | |
Dividends (paid and/or accrued): | | | | | | | | | | | | | | | | | | | | | | | | | | | | | | | | |
Preferred | | | — | | | | — | | | | — | | | | — | | | | (3,500 | ) | | | — | | | | — | | | | (3,500 | ) |
Warrant amortization | | | 687 | | | | — | | | | — | | | | — | | | | (687 | ) | | | — | | | | — | | | | — | |
Common stock issued | | | — | | | | 4,626,281 | | | | 4,626 | | | | 49,599 | | | | — | | | | — | | | | — | | | | 54,225 | |
Net common stock issued under employee plans and related tax expense | | | — | | | | 44,906 | | | | 45 | | | | 266 | | | | — | | | | — | | | | — | | | | 311 | |
Other comprehensive income, net of tax | | | — | | | | — | | | | — | | | | — | | | | — | | | | 34 | | | | — | | | | 34 | |
Net income | | | — | | | | — | | | | — | | | | — | | | | 16,964 | | | | — | | | | — | | | | 16,964 | |
| | | | | | | | | | | | | | | | | | | | | | | | | | | | | | | | |
Balance, December 31, 2010 | | $ | 67,724 | | | | 19,421,900 | | | $ | 19,422 | | | $ | 98,894 | | | $ | 190,793 | | | $ | 979 | | | $ | — | | | $ | 377,812 | |
| | | | | | | | | | | | | | | | | | | | | | | | | | | | | | | | |
Dividends (paid and/or accrued): | | | | | | | | | | | | | | | | | | | | | | | | | | | | | | | | |
Preferred | | | — | | | | — | | | | — | | | | — | | | | (3,523 | ) | | | — | | | | — | | | | (3,523 | ) |
Warrant amortization | | | 731 | | | | — | | | | — | | | | — | | | | (731 | ) | | | — | | | | — | | | | — | |
Common stock issued | | | — | | | | 16,100 | | | | 16 | | | | 214 | | | | — | | | | — | | | | — | | | | 230 | |
Net common stock issued under employee plans and related tax expense | | | — | | | | 6,213 | | | | 6 | | | | (176 | ) | | | — | | | | — | | | | — | | | | (170 | ) |
Other comprehensive income, net of tax | | | — | | | | — | | | | — | | | | — | | | | — | | | | 1,132 | | | | — | | | | 1,132 | |
Net loss | | | — | | | | — | | | | — | | | | — | | | | (68,295 | ) | | | — | | | | — | | | | (68,295 | ) |
| | | | | | | | | | | | | | | | | | | | | | | | | | | | | | | | |
Balance, December 31, 2011 | | $ | 68,455 | | | | 19,444,213 | | | $ | 19,444 | | | $ | 98,932 | | | $ | 118,244 | | | $ | 2,111 | | | $ | — | | | $ | 307,186 | |
| | | | | | | | | | | | | | | | | | | | | | | | | | | | | | | | |
The accompanying notes are an integral part of this statement.
41
SOUTHWEST BANCORP, INC.
CONSOLIDATED STATEMENTS OF CASH FLOWS
| | | | | | | | | | | | |
| | | FOR THE YEAR ENDED DECEMBER 31, | |
(Dollars in thousands) | | 2011 | | | 2010 | | | 2009 | |
Operating activities: | | | | | | | | | | | | |
Net income (loss) | | $ | (68,295 | ) | | $ | 16,964 | | | $ | 12,982 | |
Adjustments to reconcile net income (loss) to net cash provided by operating activities: | | | | | | | | | | | | |
Provision for loan losses | | | 132,101 | | | | 35,560 | | | | 39,176 | |
Deferred tax benefit | | | (20,463 | ) | | | (2,808 | ) | | | (5,843 | ) |
Asset depreciation | | | 2,581 | | | | 2,853 | | | | 3,187 | |
Securities premium amortization, net of discount accretion | | | 2,197 | | | | 2,018 | | | | 1,732 | |
Amortization of intangibles | | | 1,374 | | | | 1,502 | | | | 1,650 | |
Stock based compensation expense | | | 333 | | | | 378 | | | | 321 | |
Net gain on sales/calls of investment securities | | | — | | | | (2,661 | ) | | | (2,925 | ) |
Net gain on sales of available for sale loans | | | (1,658 | ) | | | (2,736 | ) | | | (2,963 | ) |
Net (gain) loss on sales of premises/equipment | | | (20 | ) | | | 132 | | | | 62 | |
Net (gain) loss on sales other real estate | | | 23,357 | | | | 41 | | | | (636 | ) |
Gain from FDIC-assisted acquisition | | | — | | | | — | | | | (3,281 | ) |
Proceeds from sales of held for sale loans | | | 83,123 | | | | 162,524 | | | | 241,646 | |
Held for sale loans originated for resale | | | (81,903 | ) | | | (126,456 | ) | | | (224,781 | ) |
Net changes in assets and liabilities: | | | | | | | | | | | | |
Accrued interest receivable | | | 1,414 | | | | 2,216 | | | | 706 | |
Other assets | | | 3,777 | | | | 10,179 | | | | (17,097 | ) |
Income taxes receivable / payable | | | (31,762 | ) | | | (1,568 | ) | | | 1,079 | |
Excess tax expense (benefit) from share-based payment arrangements | | | 218 | | | | (40 | ) | | | (244 | ) |
Accrued interest payable | | | 2,112 | | | | (1,614 | ) | | | (3,827 | ) |
Other liabilities | | | (1,790 | ) | | | (2,186 | ) | | | 3,518 | |
| | | | | | | | | | | | |
Net cash provided by operating activities | | | 46,696 | | | | 94,298 | | | | 44,462 | |
| | | | | | | | | | | | |
Investing activities: | | | | | | | | | | | | |
Proceeds from sales of available for sale securities | | | — | | | | 57,782 | | | | 122,694 | |
Proceeds from principal repayments, calls and maturities: | | | | | | | | | | | | |
Held to maturity securities | | | 2,470 | | | | 2,825 | | | | 1,675 | |
Available for sale securities | | | 68,709 | | | | 66,656 | | | | 69,578 | |
Proceeds from sales of other investments | | | — | | | | 9,777 | | | | 1,081 | |
Purchases of other investments | | | (50 | ) | | | (1,116 | ) | | | (1,361 | ) |
Purchases of held to maturity securities | | | (5,894 | ) | | | (6,498 | ) | | | — | |
Purchases of available for sale securities | | | (75,650 | ) | | | (138,205 | ) | | | (174,343 | ) |
Principal repayments, net of loans originated | | | 288,795 | | | | 146,187 | | | | (50,572 | ) |
Proceeds from sales of loans, net | | | 153,713 | | | | — | | | | — | |
Acquisitions, net, FDIC-assisted | | | — | | | | — | | | | 17,161 | |
Purchases of premises and equipment | | | (1,686 | ) | | | (1,037 | ) | | | (5,245 | ) |
Proceeds from sales of premises and equipment | | | 239 | | | | 866 | | | | 90 | |
Proceeds from sales of other real estate | | | 56,425 | | | | 15,032 | | | | 7,050 | |
| | | | | | | | | | | | |
Net cash provided from (used in) investing activities | | | 487,071 | | | | 152,269 | | | | (12,192 | ) |
| | | | | | | | | | | | |
Financing activities: | | | | | | | | | | | | |
Net increase (decrease) in deposits | | | (331,346 | ) | | | (340,002 | ) | | | 277,601 | |
Net decrease in other borrowings | | | (38,123 | ) | | | (8,420 | ) | | | (213,788 | ) |
Net proceeds from issuance of common stock | | | 64 | | | | 54,315 | | | | 970 | |
Excess tax (expense) benefit from share-based payment arrangements | | | (218 | ) | | | 40 | | | | 244 | |
Preferred stock dividends paid | | | (1,751 | ) | | | (3,500 | ) | | | (3,305 | ) |
Common stock dividends paid | | | — | | | | (351 | ) | | | (2,432 | ) |
| | | | | | | | | | | | |
Net cash provided from (used in) financing activities | | | (371,374 | ) | | | (297,918 | ) | | | 59,290 | |
| | | | | | | | | | | | |
Net increase (decrease) in cash and cash equivalents | | | 162,393 | | | | (51,351 | ) | | | 91,560 | |
Cash and cash equivalents beginning of period | | | 67,496 | | | | 118,847 | | | | 27,287 | |
| | | | | | | | | | | | |
Cash and cash equivalents end of period | | $ | 229,889 | | | $ | 67,496 | | | $ | 118,847 | |
| | | | | | | | | | | | |
The accompanying notes are an integral part of this statement.
42
SOUTHWEST BANCORP, INC.
NOTES TO THE CONSOLIDATED FINANCIAL STATEMENTS
FOR THE YEARS ENDED DECEMBER 31, 2011, 2010, AND 2009
| 1. | Summary of Significant Accounting and Reporting Policies |
Organization and Nature of Operations– Southwest Bancorp Inc. (“Southwest”), incorporated in 1981, is a bank holding company headquartered in Stillwater, Oklahoma engaged primarily in commercial and consumer banking services in the states of Oklahoma, Texas, and Kansas. The accompanying consolidated financial statements include the accounts of Stillwater National, a national bank established in 1894, Bank of Kansas, a state-chartered commercial bank established in 1907, SNB Capital Corporation, a lending and loan workout subsidiary established in 2009, and consolidated subsidiaries of Stillwater National, including SNB Real Estate Holdings, Inc. Stillwater National, Bank of Kansas, and SNB Capital Corporation are wholly owned, direct subsidiaries of Southwest. Healthcare Strategic Support, Inc., a healthcare consulting company, was sold on February 28, 2010, and a management consulting subsidiary, Business Consulting Group, Inc., became inactive during the first quarter of 2010. All significant intercompany balances and transactions have been eliminated in consolidation.
Basis of Presentation– The Financial Accounting Standards Board (“FASB”) Accounting Standards Codification (“ASC”) became effective on July 1, 2009. At that date, the ASC became FASB’s officially recognized source of authoritative U.S. generally accepted accounting principles (“GAAP”) applicable to all public and non-public non-governmental entities, superseding existing FASB, American Institute of Certified Public Accountants (“AICPA”), Emerging Issues Task Force (“EITF”) and related literature. Rules and interpretive releases of the Securities and Exchange Commission (“SEC”) under the authority of federal securities laws are also sources of authoritative GAAP for SEC registrants. All other accounting literature is considered non-authoritative.
ASC 855,Subsequent Events, establishes general standards of accounting for and disclosure of events that occur after the balance sheet date but before financial statements are issued or available to be issued. ASC 855.10.05-1 defines (i) the period after the balance sheet date during which a reporting entity’s management should evaluate events or transactions that may occur for potential recognition or disclosure in the financial statements, (ii) the circumstances under which an entity should recognize events or transactions occurring after the balance sheet date in its financial statements, and (iii) the disclosures an entity should make about events or transactions that occurred after the balance sheet date. In accordance with ASC 855, Southwest has evaluated subsequent events for potential recognition and disclosure through the date the consolidated financial statements included in this Annual Report on Form 10-K were issued.
Reclassifications – Certain reclassifications have been made in prior year amounts on the statement of financial condition, statement of operations, statement of shareholder’s equity, and statement of cash flows to conform to current year presentations.
Management Estimates– In preparing Southwest’s financial statements, management is required to make estimates and assumptions that affect the reported amounts of assets and liabilities and disclosures of contingent assets and liabilities as of the dates shown on the consolidated statements of financial condition and revenues and expenses during the periods reported. Actual results could differ significantly from those estimates. Changes in economic conditions could affect the determination of material estimates such as the allowance for loan losses, the valuation of real estate acquired in connection with foreclosures or in satisfaction of loans, income taxes, and the fair value of financial instruments.
Cash and Cash Equivalents– For purposes of reporting cash flows, cash and cash equivalents include cash on hand, amounts due from depository institutions, and federal funds sold. Interest-bearing balances held at depository institutions were $199.6 million at December 31, 2011 and $41.0 million at December 31, 2010. Federal funds sold are sold for one-to-four day periods.
43
Cash paid for interest totaled $26.5 million in 2011, $37.1 million in 2010, and $55.5 million in 2009. Cash paid for income taxes totaled $5.9 million in 2011, $15.2 million in 2010, and $12.4 million in 2009. Noncash transactions included transfer of loans to other real estate totaling $62.3 million in 2011, $33.9 million in 2010, and $23.4 million in 2009.
Stillwater National and Bank of Kansas are required by the Federal Reserve Bank (“FRB”) to maintain average reserve balances. Cash and cash equivalents in the consolidated statements of financial condition include restricted amounts of $2.3 million and $1.3 million at December 31, 2011 and December 31, 2010, respectively.
Investment Securities– Investments in debt and equity securities are identified as held to maturity or available for sale based on management considerations of asset/liability strategy, changes in interest rates and prepayment risk, the need to increase liquidity, and other factors, including management’s intent and ability to hold securities to maturity. Southwest has the ability and intent to hold to maturity its investment securities classified as held to maturity. Southwest had no investments held for trading purposes for any period presented. Under certain circumstances (including the deterioration of the issuer’s creditworthiness, a change in tax law, or statutory or regulatory requirements), Southwest may change the investment security classification. The classifications Southwest utilizes determine the related accounting treatment for each category of investments. Available for sale securities are accounted for at fair value with unrealized gains or losses, net of taxes, excluded from operations and reported as accumulated other comprehensive income or loss. Held to maturity securities are accounted for at amortized cost.
All investment securities are adjusted for amortization of premiums and accretion of discounts. Amortization of premiums and accretion of discounts are recorded to operations over the contractual maturity or estimated life of the individual investment on the level yield method. Gain or loss on sale of investments is based upon the specific identification method. Income earned on Southwest’s investments in state and political subdivisions generally is not subject to ordinary Federal income tax.
In accordance with authoritative accounting guidance under ASC 320,Debt and Equity Securities, declines in fair value of held-to-maturity and available-for-sale securities below their cost that are deemed to be other-than-temporary are reflected in earnings as realized losses to the extent the impairment is related to credit losses. The amount of the impairment related to other factors is recognized in other comprehensive income. Under this guidance, Southwest evaluates investment securities for other-than-temporary impairment on at least a quarterly basis, or more frequently when economic or market conditions warrant such an evaluation. Southwest recognized no other-than-temporary impairment charges in 2011, 2010 or 2009.
Federal Reserve Bank and Federal Home Loan Bank Stock –Stillwater National and Bank of Kansas are members of their regional FRB and are members of the Federal Home Loan Bank (“FHLB”) system. FHLB members are required to own a certain amount of stock based on the level of borrowings and other factors, and may invest in additional accounts. Both FRB and FHLB stock is carried at cost, classified as a restricted security, and periodically evaluated for impairment based on ultimate recovery of par value. Both cash and stock dividends are reported as income.
Loans – Interest on loans is accrued and credited to operations based upon the principal amount outstanding. Loan origination fees and certain costs of originated loans are amortized as an adjustment to the yield over the term of the loan. Net unamortized deferred loan fees were $0.1 million and $0.8 million at December 31, 2011 and December 31, 2010, respectively. Loans are reported at the principal balance outstanding net of the unamortized deferred loan fees.
In general, our policy for nonaccrual loans requires that accrued interest income on nonaccrual loans is written off after the loan is 90 days past due, and that subsequent interest income is recorded when cash receipts are received from the borrower. Southwest identifies past due loans based on contractual terms on a loan by loan basis.
44
A loan is considered to be impaired when, based on current information and events, it is probable that Southwest will be unable to collect all amounts due according to the contractual terms of the loan agreement. The allowance for loan losses related to loans that are evaluated for impairment is based either on the discounted cash flows using the loan’s initial effective interest rate or on the fair value of the collateral for certain collateral dependent loans. Smaller balance, homogeneous loans, including mortgage, student, and consumer, are collectively evaluated for impairment. This evaluation is inherently subjective as it requires material estimates including the amounts and timing of future cash flows expected to be received on impaired loans that may be susceptible to significant change.
Southwest originates real estate mortgage loans for either portfolio investment or sale in the secondary market. During the period of origination, real estate mortgage loans are designated as held either for investment purposes or sale. Mortgage loans held for sale are generally sold within a one-month period from loan closing at amounts determined by the investor commitment based upon the pricing of the loan. Southwest provides United States Department of Agriculture (“USDA”) government guaranteed commercial real estate lending services to rural healthcare providers. The loans are available for sale in the secondary market. Prior to 2010, Southwest originated guaranteed student loans primarily for sale in the secondary market. During the first quarter of 2010, Southwest elected to discontinue the origination of guaranteed student loans for resale, aside from the previously outstanding commitments. Guaranteed student loans have typically been sold at the time the student graduates or withdraws from school. Loans classified as held for sale are carried at lower of cost or market. Gains or losses recognized upon the sale of loans are determined on a specific identification basis.
Loans Acquired through Transfer–The accounting guidance of ASC 310.30,Loan and Debt Securities Acquired with Deteriorated Credit Quality, applies to loans acquired through the completion of a transfer, including loans acquired in a business combination that have evidence of deterioration of credit quality since origination and for which it is probable, at acquisition, that Southwest will be unable to collect all contractually required payment receivables. In accordance with this guidance, these loans are initially recorded at fair value (as determined by the present value of expected future cash flows) with no valuation allowance. The difference between the undiscounted cash flows expected at acquisition and the investment in the loan, or the “accretable yield”, is recognized as interest income over the life of the loan on a method that approximates the level-yield method. Contractually required payments for interest and principal that exceed the undiscounted cash flows expected at acquisition, or the “nonaccretable difference”, are not recognized as a yield adjustment, a loss accrual, or a valuation allowance. Increases in expected cash flows subsequent to the initial investment are recognized prospectively through adjustment of the yield on the loan over its remaining life. Decreases in expected cash flows are recognized as impairments. Valuation allowances on these impaired loans reflect only losses incurred after the acquisition.
Loss Share Receivable – Bank of Kansas and the Federal Deposit Insurance Corporation (“FDIC”) entered into loss sharing agreements that provide Bank of Kansas with significant protection against credit losses from loans and related assets acquired in the First National Bank of Anthony (“FNBA”) FDIC-assisted transaction. Under these agreements, the FDIC will reimburse Bank of Kansas 80% of net losses up to $35.0 million on covered assets, primarily acquired loans and other real estate, and 95% of any net losses above $35.0 million. Bank of Kansas services the covered assets. The loss sharing agreements have terms of ten years for one-to-four family residential loans and eight years for all other loan types. The expected payments from the FDIC under the loss sharing agreements are recorded as part of the covered loans in Southwest’s consolidated statements of financial condition. Assets subject to these agreements are referred to as “covered”.
The difference between the undiscounted expected recoveries at acquisition and the fair value of the loss share receivable is the “accretable portion” and is recognized as interest income over the estimated life of the acquired loan portfolio. The initially recorded loss share receivable represented 85% of the aggregate loan discount related to the acquired loan portfolio. Because of the relationship of the loss share receivable to the loan discount, when an adjustment is made to a loan discount to reflect changes in the expected cash flows of the loan, an adjustment to the corresponding loss share receivable attributable to that loan will also occur.
45
Allowance for Loan Losses– The allowance for loan losses is a reserve established through a provision for loan losses charged to operations. Loan amounts which are determined to be uncollectible are charged against this allowance, and recoveries, if any, are added to the allowance. The appropriate amount of the allowance is based on continuous review and evaluation of the loan portfolio and ongoing, quarterly assessments of the probable losses inherent in the loan portfolio. The allowance for loan losses is determined in accordance with regulatory guidelines and generally accepted accounting principles and is comprised of two primary components, specific and general. Allocations of the allowance for loan losses may be made for specific loans, but the entire allowance is available for any loan that, in management’s judgment, should be charged off.
The specific component relates to loans that are individually classified as impaired. Loans deemed to be impaired are evaluated on an individual basis consistent with ASC 310.10.35,Receivables: Subsequent Measurement. The amount and level of the impairment allowance is ultimately determined by management’s estimate of the amount of expected future cash flows or, if the loan is collateral dependent, on the value of the collateral, which may vary from period to period depending on changes in the financial condition of the borrower or changes in the estimated value of the collateral. Loans for which the terms have been modified resulting in a concession, and for which the borrower is experiencing financial difficulties, are considered troubled debt restructurings and deemed as impaired, and classified as nonperforming, potential problem, or performing restructured as applicable. Charge-offs against the allowance of impaired loans are made when and to the extent the loan is deemed uncollectible.
The general component of the allowance is calculated based on ASC 450,Contingencies. Loans not evaluated for specific allowance are segmented into loan pools by type of loan. The commercial real estate and real estate construction pools are further segmented by the market in which the loan collateral is located. Our primary markets are Oklahoma, Texas, and Kansas, and loans secured by real estate in those states are included in the “in-market” pool, with the remaining defaulting to the “out-of-market” pool. Estimated allowances are based on historical loss trends with adjustments factored in based on qualitative risk factors both internal and external to Southwest. The historical loss trend is determined by loan pool and segmentation and is based on the actual loss history experienced by Southwest over the most recent three years. The qualitative risk factors include, but are not limited to, economic and business conditions, changes in lending staff, lending policies and procedures, quality of loan review, changes in the nature and volume of the portfolios, loss and recovery trends, asset quality trends, and legal and regulatory considerations.
Independent appraisals on real estate collateral securing loans are obtained at origination. New appraisals are obtained periodically and upon discovery of factors that may significantly affect the value of the collateral. Appraisals usually are received within 30 days of request. Results of appraisals on nonperforming and potential problem loans are reviewed promptly upon receipt and also are reviewed monthly and considered in the determination of the allowance for loan losses. Southwest is not aware of any significant time lapses in the process that have resulted, or would result in, a significant delay in determination of a credit weakness, the identification of a loan as nonperforming, or the measurement of an impairment.
Management strives to carefully monitor credit quality and to identify loans that may become nonperforming. At any time, however, there are loans included in the portfolio that will result in losses to Southwest but that have not been identified as nonperforming or potential problem loans. Because the loan portfolio contains a significant number of commercial and commercial real estate loans with relatively large balances, the unexpected deterioration of one or a few of such loans may cause a significant increase in nonperforming assets and may lead to a material increase in charge-offs and the provision for loan losses in future periods.
Unfunded Loan Commitments–Financial instruments include off-balance sheet credit instruments, such as commitments to make loans and commercial letters of credit, issued to meet customer financing needs. The face amount for these items represents the exposure to loss, before considering customer collateral or ability to repay. Such financial instruments are recorded when they are funded.
The reserve for unfunded loan commitments is a liability on Southwest’s consolidated statement of financial condition in other liabilities. The reserve is computed using a methodology similar to that used to determine the allowance for loan losses, modified to take into account the probability of a drawdown on the commitment. At December 31, 2011 and December 31, 2010 the balance was $2.2 million and $1.9 million, respectively.
46
Premises and Equipment– Land is carried at cost. Premises and equipment are stated at cost less accumulated depreciation and amortization. Depreciation and amortization are recorded on a straight-line basis over the estimated useful life of each asset. Useful lives range from 10 years to 40 years for buildings and improvements, and 3 years to 10 years for furniture, fixtures, and equipment. Southwest reviews the carrying value of long-lived assets used in operations when changes in events or circumstances indicate that the assets might have become impaired. This review initially includes a comparison of carrying value to the undiscounted cash flows estimated to be generated by those assets. If this review indicates that an asset is impaired, Southwest records a charge to operations to reduce the asset’s carrying value to fair value, which is based on estimated discounted cash flows. Long-lived assets that are held for disposal are valued at the lower of the carrying amount or fair value less costs to sell.
Other Real Estate– Assets acquired through or instead of loan foreclosure are considered other real estate. Other real estate is initially recorded at the lesser of the carrying value or fair value less the estimated costs to sell the asset. Write-downs of carrying value required at the time of foreclosure are recorded as a charge to the allowance for loan losses. Costs related to the development of such real estate are capitalized, and costs related to holding the property are expensed. Foreclosed property is subject to periodic revaluation based upon estimates of fair value. In determining the valuation of other real estate, management obtains independent appraisals for significant properties. Valuation adjustments are provided, as necessary, by charges to operations. Profits and losses from operations or sales of foreclosed property are recognized as incurred. At December 31, 2011 and December 31, 2010, the balances of noncovered other real estate were $19.8 million and $37.7 million, respectively.
Other real estate covered under the loss sharing agreements with the FDIC is reported exclusive of expected reimbursement cash flows from the FDIC. Fair value adjustments on covered other real estate result in a reduction of the covered other real estate carrying amount and a corresponding increase in the estimated FDIC reimbursement, with the estimated net loss charged against earnings. At December 31, 2011 and December 31, 2010, the balances of covered other real estate were $4.5 million and $4.2 million, respectively.
Goodwill and Other Intangible Assets– Intangible assets consist of goodwill, core deposit intangibles, and loan servicing rights. Goodwill and core deposit intangibles, which generally result from a business combination, are accounted for under the provisions of ASC 350,Intangibles - Goodwill and Other, and ASC 805,Business Combinations. Loan servicing rights are accounted for under the provisions of ASC 860,Transfers and Servicing.
Goodwill represents the excess of the cost of businesses acquired over the fair value of the net assets acquired and is assigned to reporting units. Goodwill is not amortized, but is tested for impairment at least annually or more frequently if conditions indicate impairment. The evaluation of possible impairment involves significant judgment based upon short-term and long-term projections of future performance of each reporting unit. Southwest engaged an independent third party to assist in the step one fair market valuations, using both the customary market approaches and the discounted cash flow (income) approach, for the Kansas and Texas reporting units, to which $6.6 million of goodwill has been assigned.
The independent step one valuations indicated that as of October 1, 2011 and October 1, 2010, the fair values of the Kansas reporting unit were less than the carrying amounts at those dates. Further goodwill impairment testing was required under a step two hypothetical purchase price allocation and analysis to determine the amount of impairment existing, if any. The step two allocations resulted in an implied fair value of goodwill greater than the carrying amount of goodwill at both assessment dates, October 1, 2011 and October 1, 2010 (and updated through December 31, 2011 and December 31, 2010, respectively). Southwest concluded that there was no goodwill impairment for the Kansas reporting unit.
The step one fair value of the Texas reporting unit as of the October 1, 2011 was less than the carrying amount at that date. Further goodwill impairment testing was required under a step two hypothetical purchase price allocation and analysis to determine the amount of impairment existing, if any. The step two allocation resulted in
47
an implied fair value of goodwill greater than the carrying amount of goodwill at the assessment date, October 1, 2011 (and updated through December 31, 2011). Southwest concluded that there was no goodwill impairment for the Texas reporting unit. The step one fair value of the Texas reporting unit as of the October 1, 2010 annual assessment date (and updated through December 31, 2010) was greater than the carrying amount, indicating goodwill was not impaired and no step two analysis was required for this reporting unit as that assessment date.
Core deposit intangibles are amortized using an economic life method based on deposit attrition. As a result, amortization will decline over time with most of the amortization occurring during the initial years. The net book value of core deposit intangibles is evaluated for impairment when economic conditions indicate impairment may exist.
When real estate mortgage loans and other loans are sold with servicing retained, an intangible servicing right is initially capitalized based on estimated fair value at the point of origination with the income statement effect recorded in gains on sales of loans. The servicing rights are amortized on an individual loan by loan basis over the period of estimated net servicing income. Impairment of loan servicing rights is assessed based on the fair value of those rights. Southwest reviews the carrying value of loan servicing rights quarterly for impairment. At least annually, we obtain estimates of fair value from outside sources to corroborate the results of the valuation model. At December 31, 2011 and December 31, 2010, the fair values of loan servicing rights were $1.8 million and $2.4 million, respectively.
Fair Value Measurements– ASC 820,Fair Value Measurements and Disclosure, defines fair value, establishes a framework for measuring fair value in generally accepted accounting principles, and expands disclosures about fair value measurements. In general, fair values of financial instruments are based upon quoted market prices, where available. If such quoted market prices are not available, fair value is based upon internally developed models that primarily use, as inputs, observable market-based parameters. Valuation adjustments may be made to ensure that financial instruments are recorded at fair value. These adjustments may include amounts to reflect counterparty credit quality and Southwest’s creditworthiness, among other things, as well as unobservable parameters. Any such valuation adjustments are applied consistently over time.
Derivative Financial Instruments – Southwest’s hedging policy permits the use of various derivative financial instruments to manage interest rate risk or to hedge specified assets and liabilities. All derivatives are recorded at fair value on Southwest’s balance sheet.
To qualify for hedge accounting, derivatives must be highly effective at reducing the risk associated with the exposure being hedged and must be designated as a hedge at the inception of the derivative contract. Southwest considers a hedge to be highly effective if the change in fair value of the derivative hedging instrument is within 80% to 125% of the opposite change in the fair value of the hedged item attributable to the hedged risk. If derivative instruments are designated as hedges of fair values, and such hedges are highly effective, both the change in the fair value of the hedge and the hedged item are included in current earnings. Fair value adjustments related to cash flow hedges are recorded in other comprehensive income and are reclassified to earnings when the hedged transaction is reflected in earnings. Ineffective portions of hedges are reflected in earnings as they occur. Actual cash receipts and/or payments and related accruals on derivatives related to hedges are recorded as adjustments to the interest income or interest expense associated with the hedged item. During the life of the hedge, Southwest will formally assess whether derivatives designated as hedging instruments continue to be highly effective in offsetting changes in the fair value or cash flows of hedged items. If it is determined that a hedge has ceased to be highly effective, Southwest will discontinue hedge accounting prospectively. At such time, previous adjustments to the carrying value of the hedged item are reversed into current earnings and the derivative instrument is reclassified to a trading position recorded at fair value.
Loan Servicing Income– Southwest earns fees for servicing real estate mortgages and other loans owned by others. These fees are generally calculated on the outstanding principal balance of the loans serviced and are recorded as income when earned.
48
Taxes on Income– Southwest and its subsidiaries file consolidated income tax returns. Income tax expense is the total of the current year income tax due or refundable, adjusted for permanent differences between items of income or expense reported in the financial statements and those reported for tax purposes. Under the liability method, deferred tax assets and liabilities are the expected future tax amounts for the temporary differences between the financial statement carrying amounts and the income tax bases of assets and liabilities, computed using enacted tax rates. A valuation allowance, if needed, reduces deferred tax assets to the expected amount most likely to be realized. Realization of deferred tax assets is dependent upon the generation of a sufficient level of future taxable income and recoverable taxes paid in prior years.
Earnings per Common Share – ASC 260,Earnings Per Share, provides that unvested share-based payment awards that contain nonforfeitable rights to dividends or dividend equivalents (whether paid or unpaid) are participating securities and shall be included in the computation of earnings per share pursuant to the two-class method. Southwest has determined that its unvested restricted stock awards are participating securities. Accordingly, earnings per common share is computed using the two-class method prescribed by ASC 260. Using this method, basic earnings per common share is computed based upon net income available to common shareholders divided by the weighted average number of common shares outstanding during each period, which exclude the outstanding unvested restricted stock. Diluted earnings per share is computed using the weighted average number of common shares determined for the basic earnings per common share computation plus the dilutive effect of stock options using the treasury stock method. Stock options and warrants, where the exercise price was greater than the average market price of common shares, were not included in the computation of earnings per diluted share as they would have been antidilutive. For the years ended December 31, 2011, December 31, 2010, and December 31, 2009, Southwest had 73,814, 213,355, and 380,390, antidilutive options to purchase common shares, respectively. An antidilutive warrant to purchase 703,753 shares of common stock was also outstanding for the years ended December 31, 2011, December 31, 2010, and December 31, 2009.
A reconciliation of the weighted-average common shares used in the calculations of basic and diluted earnings per common share for the reported periods is provided in Note 12 Earnings per Common Share.
Share-Based Compensation– The Southwest Bancorp, Inc. 1999 Stock Option Plan (the “1999 Plan”), and the 2008 Stock Based Award Plan (the “2008 Stock Plan”), collectively the “Stock Plans”, provide selected key employees with the opportunity to acquire common stock through stock options or restricted stock awards. Compensation cost is recognized based on the fair value of these awards at the date of grant. The exercise price of all options granted under the Stock Plans is the fair market value on the grant date, while the market price of Southwest’s common stock at the date of grant is used for restricted stock awards. Compensation cost is recognized over the required service period, generally defined as the vesting period. Depending upon terms of the stock option agreements, stock options generally become exercisable on an annual basis and expire from five to ten years after the date of grant.
The 2008 Stock Plan replaced the 1999 Plan, as amended. Options issued under the 1999 Plan will continue in effect and will be subject to the requirements of that plan, but no new options will be granted under the plan. The 2008 Stock Plan authorized awards for up to 800,000 shares of Southwest common stock over its ten-year term.
Comprehensive Income– Southwest’s comprehensive income (net income plus all other changes in shareholders’ equity from non-equity sources) consists of its net income, the after tax effect of changes in the net unrealized holding gains (losses) in its available for sale securities, and changes in the accumulated gain (loss) on the effective cash flow hedging instrument.
New Authoritative Accounting Guidance
On January 21, 2010, FASB issued Accounting Standards Update No. 2010-06,Improving Disclosures about Fair Value Measurements (“ASU 2010-06”), which amends ASC 820,Fair Value Measurements and Disclosures, to require a number of additional disclosures regarding fair value measurements. Specifically, entities are required to disclose: the amount of significant transfers between Level 1 and Level 2 of the fair value hierarchy and the reasons for these transfers; the reasons for any transfers in or out of Level 3; and information in the reconciliation of recurring Level 3 measurements about purchases, sales, issuances, and settlements on a gross basis. In addition
49
to these new disclosure requirements, ASU 2010-06 also amends ASC 820 to clarify certain existing disclosure requirements. Except for the requirement to disclose information about purchases, sales, issuances, and settlements in the reconciliation of recurring Level 3 measurements on a gross basis, all the amendments to ASC 820 made by ASU 2010-06 were effective for Southwest on January 1, 2010, and the requirement to separately disclose purchases, sales, issuances, and settlements of recurring Level 3 measurements was effective for Southwest on January 1, 2011. These disclosure requirements did not have a significant impact on Southwest’s consolidated financial statements. See Note 6.
On July 21, 2010, FASB issued Accounting Standards Update No. 2010-20,Disclosures about the Credit Quality of Financing Receivables and the Allowance for Credit Losses (“ASU 2010-20”), which amends ASC 830,Receivables, to enhance disclosures about the credit quality of financing receivables and the allowance for credit losses. ASU 2010-20 requires entities to provide disclosures designed to facilitate financial statement users’ evaluation of (i) the nature of credit risk inherent in the entity’s portfolio of financing receivables, (ii) how that risk is analyzed and assessed in arriving at the allowance for credit losses, and (iii) the changes and reasons for those changes in the allowance for credit losses. Disclosures must be disaggregated by portfolio segment, the level at which an entity develops and documents a systematic method for determining its allowance for credit losses, and class of financing receivable, which is generally a disaggregation of portfolio segment. The required disclosures include, among other things, the activity in the allowance for credit losses as well as information about modified, impaired, nonaccrual, and past due loans and credit quality indicators. ASU 2010-20 was effective for Southwest’s consolidated financial statements as of December 31, 2010, as it related to disclosures required as of the end of a reporting period, and disclosures that relate to activity during a reporting period were required for Southwest’s consolidated financial statements issued after January 1, 2011. Southwest incorporated the required disclosures. See Note 3.
On April 5, 2011, FASB issued Accounting Standards Update No. 2011-02,A Creditor’s Determination of Whether a Restructuring Is a Troubled Debt Restructuring (“ASU 2011-02”). ASU 2011-02 clarifies whether loan modifications constitute a troubled debt restructuring. In evaluating whether a restructuring constitutes a troubled debt restructuring, a creditor must separately conclude that both of the following exist: (a) the restructuring constitutes a concession; and (b) the debtor is experiencing financial difficulties. ASU 2011-02 was effective for Southwest’s financial statements ending September 30, 2011, and applied retrospectively to restructurings occurring on or after January 1, 2011. Southwest incorporated the required disclosures. See Note 3.
In May 2011, FASB issued Accounting Standards Update No. 2011-04,Fair Value Measurement – Amendments to Achieve Common Fair Value Measurement and Disclosure Requirements in U.S. GAAP and IFRSs (“ASU 2011-04”). ASU 2011-04 changes the wording used to describe many of the requirements in U.S. GAAP for measuring fair value and for disclosing information about fair value measurements. Consequently, the amendments in this update result in common fair value measurement and disclosure requirements in U.S. GAAP and IFRSs (International Financial Reporting Standards). ASU 2011-04 is effective for Southwest prospectively during interim and annual periods beginning January 1, 2012. Early application by public entities is not permitted. Southwest is assessing the impact of ASU 2011-04 on our fair value disclosures.
In June 2011, FASB issued Accounting Standards Update No. 2011-05,Comprehensive Income – Presentation of Comprehensive Income(“ASU 2011-05”). ASU 2011-05 requires that all nonowner changes in stockholders’ equity be presented either in a single continuous statement of comprehensive income or in two separate but consecutive statements. In both choices, an entity is required to present each component of net income along with total net income, each component of other comprehensive income along with a total for other comprehensive income, and a total amount for comprehensive income. Additionally, ASU 2011-05 requires entities to present, on the face of the financial statements, reclassification adjustments for items that are reclassified from other comprehensive income to net income in the statement or statements where the components of net income and the components of other comprehensive income are presented. The option to present components of other comprehensive income as part of the statement of stockholders’ equity was eliminated. ASU 2011-05, as it relates to comprehensive income presentation is effective for Southwest retrospectively for fiscal years, and interim periods within those years, beginning January 1, 2012, and is not expected to have a significant impact on its consolidated financial statements and disclosures. Disclosure of the reclassification adjustments on the face of the financial statements has been deferred, as of December 23, 2011.
50
A summary of the amortized cost and fair values of investment securities follows:
| | | | | | | | | | | | | | | | |
| | | Amortized | | | Gross Unrealized | | | Fair | |
(Dollars in thousands) | | Cost | | | Gains | | | Losses | | | Value | |
| At December 31, 2011 | | | | | | | | | | | | | | | | |
Held to Maturity: | | | | | | | | | | | | | | | | |
Obligations of state and political subdivisions | | $ | 15,252 | | | $ | 633 | | | $ | — | | | $ | 15,885 | |
| | | | | | | | | | | | | | | | |
Total | | $ | 15,252 | | | $ | 633 | | | $ | — | | | $ | 15,885 | |
| | | | | | | | | | | | | | | | |
Available for Sale: | | | | | | | | | | | | | | | | |
Federal agency securities | | $ | 64,524 | | | $ | 1,051 | | | $ | (22 | ) | | $ | 65,553 | |
Obligations of state and political subdivisions | | | 10,926 | | | | 196 | | | | (19 | ) | | | 11,103 | |
Residential mortgage-backed securities | | | 177,365 | | | | 4,889 | | | | (107 | ) | | | 182,147 | |
Equity securities | | | 1,054 | | | | 243 | | | | — | | | | 1,297 | |
| | | | | | | | | | | | | | | | |
Total | | $ | 253,869 | | | $ | 6,379 | | | $ | (148 | ) | | $ | 260,100 | |
| | | | | | | | | | | | | | | | |
| At December 31, 2010 | | | | | | | | | | | | | | | | |
Held to Maturity: | | | | | | | | | | | | | | | | |
Obligations of state and political subdivisions | | $ | 14,304 | | | $ | 43 | | | $ | (318 | ) | | $ | 14,029 | |
| | | | | | | | | | | | | | | | |
Total | | $ | 14,304 | | | $ | 43 | | | $ | (318 | ) | | $ | 14,029 | |
| | | | | | | | | | | | | | | | |
Available for Sale: | | | | | | | | | | | | | | | | |
U.S. Government obligations | | $ | 1,099 | | | $ | 9 | | | $ | — | | | $ | 1,108 | |
Federal agency securities | | | 65,522 | | | | 545 | | | | (693 | ) | | | 65,374 | |
Obligations of state and political subdivisions | | | 231 | | | | 2 | | | | — | | | | 233 | |
Residential mortgage-backed securities | | | 178,695 | | | | 3,535 | | | | (2,213 | ) | | | 180,017 | |
Equity securities | | | 1,102 | | | | 387 | | | | — | | | | 1,489 | |
| | | | | | | | | | | | | | | | |
Total | | $ | 246,649 | | | $ | 4,478 | | | $ | (2,906 | ) | | $ | 248,221 | |
| | | | | | | | | | | | | | | | |
FRB stock, FHLB stock, and certain other investments are not readily marketable and are carried at cost. Total investments carried at cost were $10.5 million and $10.4 million at December 31, 2011 and December 31, 2010, respectively, and are recorded as other assets on the Consolidated Statement of Financial Condition. There are no identified events or changes in circumstances that may have a significant adverse effect on these investments carried at cost.
A comparison of the amortized cost and approximate fair value of Southwest’s debt securities by maturity date at December 31, 2011 follows in the next table.
| | | | | | | | | | | | | | | | |
| | | Available for Sale | | | Held to Maturity | |
| | | Amortized | | | Fair | | | Amortized | | | Fair | |
(Dollars in thousands) | | Cost | | | Value | | | Cost | | | Value | |
One year or less | | $ | 19,042 | | | $ | 19,272 | | | $ | 2,376 | | | $ | 2,382 | |
More than one year through five years | | | 163,291 | | | | 168,173 | | | | 2,954 | | | | 2,994 | |
More than five years through ten years | | | 53,847 | | | | 54,731 | | | | 6,453 | | | | 6,782 | |
More than ten years | | | 17,689 | | | | 17,924 | | | | 3,469 | | | | 3,727 | |
| | | | | | | | | | | | | | | | |
Total | | $ | 253,869 | | | $ | 260,100 | | | $ | 15,252 | | | $ | 15,885 | |
| | | | | | | | | | | | | | | | |
The foregoing analysis assumes that Southwest’s residential mortgage-backed securities mature during the period in which they are estimated to prepay. No other prepayment or repricing assumptions have been applied to Southwest’s debt securities for this analysis.
51
The proceeds of investment securities sales and the associated gains and losses are listed below.
| | | | | | | | | | | | |
(Dollars in thousands) | | 2011 | | | 2010 | | | 2009 | |
Proceeds from sales | | $ | — | | | $ | 57,782 | | | $ | 122,694 | |
Gross realized gains | | | — | | | | 2,497 | | | | 2,911 | |
Gross realized losses | | | — | | | | (3 | ) | | | — | |
Gross unrealized losses and fair value by length of time that the individual securities have been in a continuous unrealized loss position at December 31, 2011 and December 31, 2010 are as follows:
| | | | | | | | | | | | | | | | | | | | |
| | | | | | Continuous Unrealized Losses Existing for: | |
(Dollars in thousands) | | Number of
securities | | | Amortized cost of
securities with
unrealized losses | | | Less than
12 months | | | 12 months
or more | | | Fair value of
securities with
unrealized losses | |
| At December 31, 2011 | | | | | | | | | | | | | | | | | | | | |
Available for Sale: | | | | | | | | | | | | | | | | | | | | |
Federal agency securities | | | 3 | | | $ | 5,461 | | | $ | (22 | ) | | $ | — | | | $ | 5,439 | |
Obligations of state and political subdivisions | | | 3 | | | | 3,853 | | | | (19 | ) | | | — | | | | 3,834 | |
Residential mortgage-backed securities | | | 22 | | | | 19,666 | | | | (107 | ) | | | — | | | | 19,558 | |
| | | | | | | | | | | | | | | | | | | | |
Total | | | 28 | | | $ | 28,980 | | | $ | (148 | ) | | $ | — | | | $ | 28,831 | |
| | | | | | | | | | | | | | | | | | | | |
| At December 31, 2010 | | | | | | | | | | | | | | | | | | | | |
Held to Maturity: | | | | | | | | | | | | | | | | | | | | |
Obligations of state and political subdivisions | | | 6 | | | $ | 6,490 | | | $ | (318 | ) | | $ | — | | | $ | 6,172 | |
| | | | | | | | | | | | | | | | | | | | |
Total | | | 6 | | | $ | 6,490 | | | $ | (318 | ) | | $ | — | | | $ | 6,172 | |
| | | | | | | | | | | | | | | | | | | | |
Available for Sale: | | | | | | | | | | | | | | | | | | | | |
Federal agency securities | | | 11 | | | $ | 26,645 | | | $ | (693 | ) | | $ | — | | | $ | 25,952 | |
Obligations of state and political subdivisions | | | 1 | | | | 55 | | | | — | | | | — | | | | 55 | |
Residential mortgage-backed securities | | | 27 | | | | 62,197 | | | | (2,213 | ) | | | — | | | | 59,984 | |
| | | | | | | | | | | | | | | | | | | | |
Total | | | 39 | | | $ | 88,897 | | | $ | (2,906 | ) | | $ | — | | | $ | 85,991 | |
| | | | | | | | | | | | | | | | | | | | |
Residential mortgage-backed securities consist of agency securities underwritten and guaranteed by Government National Mortgage Association (“Ginnie Mae”), Federal Home Loan Mortgage Corporation (“Freddie Mac”), and Federal National Mortgage Association (“Fannie Mae”).
Southwest evaluates all securities on an individual basis for other-than-temporary impairment on at least a quarterly basis. Consideration is given to the length of time and the extent to which the fair value has been less than cost, the financial condition and near-term prospects of the issuer, and the intent and ability of Southwest to retain its investment in the issuer for a period of time sufficient to allow for any anticipated recovery in fair value.
Management has the ability and intent to hold the securities classified as held to maturity in the table above until they mature, at which time Southwest will receive full value for the securities. Furthermore, as of December 31, 2011, management does not have the intent to sell any of the securities classified as available for sale in the table above and believes that it is not more likely than not that Southwest will have to sell any such securities before a recovery of cost. The declines in fair value were attributable to increases in market interest rates over the yields available at the time the underlying securities were purchased or increases in spreads over market interest rates. Management does not believe any of the securities are impaired due to credit quality. Accordingly, as of December 31, 2011, management believes the impairment of these investments is not deemed to be other-than-temporary.
52
As required by law, available for sale investment securities are pledged to secure public and trust deposits, sweep agreements, and borrowings from the FHLB. Securities with an amortized cost of $212.3 million and $216.4 million were pledged to meet such requirements of $78.0 million and $84.1 million at December 31, 2011 and December 31, 2010, respectively. Any amount overpledged can be released at any time.
| 3. | Loans and Allowance for Loan Losses |
Southwest extends commercial and consumer credit primarily to customers in the states of Oklahoma, Texas, and Kansas which subjects the loan portfolio to the general economic conditions within these areas. At December 31, 2011 and December 31, 2010, substantially all of Southwest’s loans were collateralized with real estate, inventory, accounts receivable, and/or other assets or were guaranteed by agencies of the United States Government.
Major classifications of loans are as follows:
| | | | | | | | | | | | | | | | |
| | | At December 31, | |
| | | 2011 | | | 2010 | |
(Dollars in thousands) | | Noncovered | | | Covered | | | Noncovered | | | Covered | |
Real estate mortgage: | | | | | | | | | | | | | | | | |
Commercial | | $ | 1,028,561 | | | $ | 23,686 | | | $ | 1,310,464 | | | $ | 30,997 | |
One-to-four family residential | | | 80,375 | | | | 7,072 | | | | 89,800 | | | | 9,122 | |
Real estate construction: | | | | | | | | | | | | | | | | |
Commercial | | | 227,098 | | | | 3,746 | | | | 441,265 | | | | 6,840 | |
One-to-four family residential | | | 4,987 | | | | — | | | | 27,429 | | | | 439 | |
Commercial | | | 346,266 | | | | 2,841 | | | | 452,626 | | | | 5,554 | |
Installment and consumer: | | | | | | | | | | | | | | | | |
Guaranteed student loans | | | 5,396 | | | | — | | | | 5,843 | | | | — | |
Other | | | 33,190 | | | | 270 | | | | 39,060 | | | | 676 | |
| | | | | | | | | | | | | | | | |
| | | 1,725,873 | | | | 37,615 | | | | 2,366,487 | | | | 53,628 | |
Less: Allowance for loan losses | | | (44,233 | ) | | | (451 | ) | | | (65,229 | ) | | | — | |
| | | | | | | | | | | | | | | | |
Total loans, net | | $ | 1,681,640 | | | $ | 37,164 | | | $ | 2,301,258 | | | $ | 53,628 | |
| | | | | | | | | | | | | | | | |
Concentrations of Credit. At December 31, 2011, approximately $614.7 million, or 36%, of Southwest’s noncovered loans consisted of loans to individuals and businesses in the healthcare industry. Southwest does not have any other concentrations of loans to individuals or businesses involved in a single industry of more than 10% of portfolio loans other than referred to in the table above.
Loans Held for Sale. Southwest had loans which were held for sale of $38.7 million and $35.2 million at December 31, 2011 and December 31, 2010, respectively. These loans are carried at the lower of cost or market. Guaranteed student loans are generally sold to a single servicer. A substantial portion of the one-to-four family residential loans and loan servicing rights are sold to four investors. The USDA government guaranteed loans are available for sale in the secondary market.
Loan Servicing. The unpaid principal balance of real estate mortgage loans serviced for others totaled $295.5 million, $278.1 million, and $237.5 million, at December 31, 2011, December 31, 2010, and December 31, 2009, respectively. Southwest maintained escrow accounts totaling $1.1 million and $1.2 million for real estate mortgage loans serviced for others at December 31, 2011 and December 31, 2010, respectively.
53
Acquired Loans. Changes in the carrying and net accretable amounts for the ASC 310.30 loans were as follows for the years ended December 31, 2011 and December 31, 2010:
| | | | | | | | | | | | | | | | |
| | | 2011 | | | 2010 | |
(Dollars in thousands) | | Net
accretable
amount | | | Carrying
amount of
loans | | | Net
accretable
amount | | | Carrying
amount of
loans | |
Fair value of acquired loans at beginning of period | | $ | 2,688 | | | $ | 53,628 | | | $ | 3,074 | | | $ | 85,405 | |
Payments received | | | — | | | | (12,503 | ) | | | — | | | | (27,032 | ) |
Transfers to other real estate / repossessed assets | | | 4 | | | | (3,596 | ) | | | (115 | ) | | | (4,689 | ) |
Charge-offs, net | | | (87 | ) | | | (117 | ) | | | (23 | ) | | | (304 | ) |
Amortization | | | (203 | ) | | | 203 | | | | (248 | ) | | | 248 | |
| | | | | | | | | | | | | | | | |
Balance at end of period | | $ | 2,402 | | | $ | 37,615 | | | $ | 2,688 | | | $ | 53,628 | |
| | | | | | | | | | | | | | | | |
Nonperforming / Past Due Loans. The following table presents the recorded investment in loans on nonaccrual status:
| | | | | | | | | | | | | | | | |
| | | At December 31, | |
| | | 2011 | | | 2010 | |
(Dollars in thousands) | | Noncovered | | | Covered | | | Noncovered | | | Covered | |
Real estate mortgage: | | | | | | | | | | | | | | | | |
Commercial | | $ | 4,667 | | | $ | 3,554 | | | $ | 29,996 | | | $ | 4,391 | |
One-to-four family residential | | | 1,468 | | | | 188 | | | | 1,984 | | | | 932 | |
Real estate construction: | | | | | | | | | | | | | | | | |
Commercial | | | 3,877 | | | | 3,009 | | | | 53,269 | | | | 4,744 | |
One-to-four family residential | | | — | | | | — | | | | 14,302 | | | | 153 | |
Commercial | | | 3,371 | | | | 370 | | | | 6,977 | | | | 581 | |
Other consumer | | | 123 | | | | 7 | | | | 38 | | | | 5 | |
| | | | | | | | | | | | | | | | |
Total nonaccrual loans | | $ | 13,506 | | | $ | 7,128 | | | $ | 106,566 | | | $ | 10,806 | |
| | | | | | | | | | | | | | | | |
If interest on nonaccrual loans had been accrued, the interest income as reported in the accompanying consolidated statements of operations would have increased by approximately $5.7 million, $5.6 million, and $4.8 million, for 2011, 2010, and 2009, respectively.
Charge-offs against noncovered nonaccrual loans at December 31, 2011 and December 31, 2010 were $13.6 million and $14.3 million, respectively.
54
The following table presents an aging of the recorded investment in loans past due at the end of the respective reporting period.
| | | | | | | | | | | | | | | | | | | | | | | | |
(Dollars in thousands) | | 30-89 days
past due | | | 90 days and
greater
past due | | | Total
past due | | | Current | | | Total
loans | | | Recorded loans
> 90 days and
accruing | |
| At December 31, 2011 | | | | | | | | | | | | | | | | | | | | | | | | |
Noncovered: | | | | | | | | | | | | | | | | | | | | | | | | |
Real estate mortgage: | | | | | | | | | | | | | | | | | | | | | | | | |
Commercial real estate | | $ | 2,567 | | | $ | 4,667 | | | $ | 7,234 | | | $ | 1,021,327 | | | $ | 1,028,561 | | | $ | — | |
One-to-four family residential | | | 1,206 | | | | 1,491 | | | | 2,697 | | | | 77,678 | | | | 80,375 | | | | 23 | |
Real estate construction | | | | | | | | | | | | | | | | | | | | | | | | |
Commercial real estate | | | 1,825 | | | | 3,877 | | | | 5,702 | | | | 221,396 | | | | 227,098 | | | | — | |
One-to-four family residential | | | — | | | | — | | | | — | | | | 4,987 | | | | 4,987 | | | | — | |
Commercial | | | 8,331 | | | | 3,374 | | | | 11,705 | | | | 334,561 | | | | 346,266 | | | | 3 | |
Other | | | 362 | | | | 140 | | | | 502 | | | | 38,084 | | | | 38,586 | | | | 17 | |
| | | | | | | | | | | | | | | | | | | | | | | | |
Total - noncovered | | | 14,291 | | | | 13,549 | | | | 27,840 | | | | 1,698,033 | | | | 1,725,873 | | | | 43 | |
Covered: | | | | | | | | | | | | | | | | | | | | | | | | |
Real estate mortgage: | | | | | | | | | | | | | | | | | | | | | | | | |
Commercial real estate | | $ | 2,243 | | | $ | 3,554 | | | $ | 5,797 | | | $ | 17,889 | | | $ | 23,686 | | | $ | — | |
One-to-four family residential | | | — | | | | 188 | | | | 188 | | | | 6,884 | | | | 7,072 | | | | — | |
Real estate construction | | | | | | | | | | | | | | | | | | | | | | | | |
Commercial real estate | | | — | | | | 3,009 | | | | 3,009 | | | | 737 | | | | 3,746 | | | | — | |
One-to-four family residential | | | — | | | | — | | | | — | | | | — | | | | — | | | | — | |
Commercial | | | — | | | | 370 | | | | 370 | | | | 2,471 | | | | 2,841 | | | | — | |
Other | | | — | | | | 7 | | | | 7 | | | | 263 | | | | 270 | | | | — | |
| | | | | | | | | | | | | | | | | | | | | | | | |
Total - covered | | | 2,243 | | | | 7,128 | | | | 9,371 | | | | 28,244 | | | | 37,615 | | | | — | |
| | | | | | | | | | | | | | | | | | | | | | | | |
Total | | $ | 16,534 | | | $ | 20,677 | | | $ | 37,211 | | | $ | 1,726,277 | | | $ | 1,763,488 | | | $ | 43 | |
| | | | | | | | | | | | | | | | | | | | | | | | |
55
| | | | | | | | | | | | | | | | | | | | | | | | |
(Dollars in thousands) | | 30-89 days
past due | | | 90 days and
greater
past due | | | Total past
due | | | Current | | | Total
loans | | | Recorded loans
> 90 days and
accruing | |
| At December 31, 2010 | | | | | | | | | | | | | | | | | | | | | | | | |
Noncovered: | | | | | | | | | | | | | | | | | | | | | | | | |
Real estate mortgage: | | | | | | | | | | | | | | | | | | | | | | | | |
Commercial real estate | | $ | 3,793 | | | $ | 30,510 | | | $ | 34,303 | | | $ | 1,276,161 | | | $ | 1,310,464 | | | $ | 514 | |
One-to-four family residential | | | 1,438 | | | | 1,984 | | | | 3,422 | | | | 86,378 | | | | 89,800 | | | | — | |
Real estate construction | | | | | | | | | | | | | | | | | | | | | | | | |
Commercial real estate | | | 7,569 | | | | 53,269 | | | | 60,838 | | | | 380,427 | | | | 441,265 | | | | — | |
One-to-four family residential | | | — | | | | 14,302 | | | | 14,302 | | | | 13,127 | | | | 27,429 | | | | — | |
Commercial | | | 10,707 | | | | 6,977 | | | | 17,684 | | | | 434,942 | | | | 452,626 | | | | — | |
Other | | | 1,236 | | | | 41 | | | | 1,277 | | | | 43,626 | | | | 44,903 | | | | 3 | |
| | | | | | | | | | | | | | | | | | | | | | | | |
Total - noncovered | | | 24,743 | | | | 107,083 | | | | 131,826 | | | | 2,234,661 | | | | 2,366,487 | | | | 517 | |
Covered: | | | | | | | | | | | | | | | | | | | | | | | | |
Real estate mortgage: | | | | | | | | | | | | | | | | | | | | | | | | |
Commercial real estate | | $ | 227 | | | $ | 4,391 | | | $ | 4,618 | | | $ | 26,379 | | | $ | 30,997 | | | $ | — | |
One-to-four family residential | | | 142 | | | | 932 | | | | 1,074 | | | | 8,048 | | | | 9,122 | | | | — | |
Real estate construction | | | | | | | | | | | | | | | | | | | | | | | | |
Commercial real estate | | | — | | | | 4,744 | | | | 4,744 | | | | 2,096 | | | | 6,840 | | | | — | |
One-to-four family residential | | | 108 | | | | 153 | | | | 261 | | | | 178 | | | | 439 | | | | — | |
Commercial | | | — | | | | 581 | | | | 581 | | | | 4,973 | | | | 5,554 | | | | — | |
Other | | | 14 | | | | 5 | | | | 19 | | | | 657 | | | | 676 | | | | — | |
| | | | | | | | | | | | | | | | | | | | | | | | |
Total - covered | | | 491 | | | | 10,806 | | | | 11,297 | | | | 42,331 | | | | 53,628 | | | | — | |
| | | | | | | | | | | | | | | | | | | | | | | | |
Total | | $ | 25,234 | | | $ | 117,889 | | | $ | 143,123 | | | $ | 2,276,992 | | | $ | 2,420,115 | | | $ | 517 | |
| | | | | | | | | | | | | | | | | | | | | | | | |
Impaired Loans. The following table presents loans individually evaluated for impairment by class of loans at December 31, 2011 and December 31, 2010.
| | | | | | | | | | | | | | | | | | | | |
| | | With No Specific Allowance | | | With A Specific Allowance | |
(Dollars in thousands) | | Recorded
Investment | | | Unpaid
Principal
Balance | | | Recorded
Investment | | | Unpaid
Principal
Balance | | | Related
Allowance | |
| At December 31, 2011 | | | | | | | | | | | | | | | | | | | | |
Noncovered: | | | | | | | | | | | | | | | | | | | | |
Commercial real estate | | $ | 17,985 | | | $ | 18,142 | | | $ | 3,716 | | | $ | 5,366 | | | $ | 411 | |
One-to-four family residential | | | 984 | | | | 1,130 | | | | 484 | | | | 611 | | | | 21 | |
Real estate construction | | | 11,735 | | | | 15,244 | | | | 248 | | | | 262 | | | | 73 | |
Commercial | | | 7,283 | | | | 7,710 | | | | 3,207 | | | | 4,958 | | | | 349 | |
Other | | | 11 | | | | 12 | | | | 112 | | | | 123 | | | | 112 | |
| | | | | | | | | | | | | | | | | | | | |
Total noncovered | | $ | 37,998 | | | $ | 42,238 | | | $ | 7,767 | | | $ | 11,320 | | | $ | 966 | |
| | | | | | | | | | | | | | | | | | | | |
Covered: | | | | | | | | | | | | | | | | | | | | |
Commercial real estate | | $ | 2,486 | | | $ | 2,670 | | | $ | 1,068 | | | $ | 1,271 | | | $ | 140 | |
One-to-four family residential | | | 118 | | | | 190 | | | | 70 | | | | 138 | | | | 5 | |
Real estate construction | | | 758 | | | | 1,071 | | | | 2,251 | | | | 3,102 | | | | 258 | |
Commercial | | | 338 | | | | 542 | | | | 32 | | | | 350 | | | | 32 | |
Other | | | 7 | | | | 29 | | | | — | | | | — | | | | — | |
| | | | | | | | | | | | | | | | | | | | |
Total covered | | $ | 3,707 | | | $ | 4,502 | | | $ | 3,421 | | | $ | 4,861 | | | $ | 435 | |
| | | | | | | | | | | | | | | | | | | | |
56
| | | | | | | | | | | | | | | | | | | | |
| | | With No Specific Allowance | | | With A Specific Allowance | |
(Dollars in thousands) | | Recorded
Investment | | | Unpaid
Principal
Balance | | | Recorded
Investment | | | Unpaid
Principal
Balance | | | Related
Allowance | |
| At December 31, 2010 | | | | | | | | | | | | | | | | | | | | |
Noncovered: | | | | | | | | | | | | | | | | | | | | |
Commercial real estate | | $ | 30,064 | | | $ | 30,534 | | | $ | 42,732 | | | $ | 46,192 | | | $ | 10,813 | |
One-to-four family residential | | | 323 | | | | 368 | | | | 1,660 | | | | 1,909 | | | | 197 | |
Real estate construction | | | 46,978 | | | | 51,644 | | | | 35,579 | | | | 37,667 | | | | 5,313 | |
Commercial | | | 3,790 | | | | 5,039 | | | | 8,464 | | | | 8,728 | | | | 3,643 | |
Other | | | — | | | | — | | | | 38 | | | | 48 | | | | 28 | |
| | | | | | | | | | | | | | | | | | | | |
Total noncovered | | $ | 81,155 | | | $ | 87,585 | | | $ | 88,473 | | | $ | 94,544 | | | $ | 19,994 | |
| | | | | | | | | | | | | | | | | | | | |
Covered: | | | | | | | | | | | | | | | | | | | | |
Commercial real estate | | $ | 4,391 | | | $ | 6,120 | | | $ | — | | | $ | — | | | $ | — | |
One-to-four family residential | | | 932 | | | | 1,104 | | | | — | | | | — | | | | — | |
Real estate construction | | | 4,897 | | | | 6,179 | | | | — | | | | — | | | | — | |
Commercial | | | 581 | | | | 1,092 | | | | — | | | | — | | | | — | |
Other | | | 5 | | | | 14 | | | | — | | | | — | | | | — | |
| | | | | | | | | | | | | | | | | | | | |
Total covered | | $ | 10,806 | | | $ | 14,509 | | | $ | — | | | $ | — | | | $ | — | |
| | | | | | | | | | | | | | | | | | | | |
The average recorded investment and interest income recognized on impaired loans for the 2011, 2010, and 2009 is shown in the next table.
| | | | | | | | | | | | | | | | | | | | | | | | |
| | | For the Years Ended December 31, | |
| | | 2011 | | | 2010 | | | 2009 | |
(Dollars in thousands) | | Average
Recorded
Investment | | | Interest
Income | | | Average
Recorded
Investment | | | Interest
Income | | | Average
Recorded
Investment | | | Interest
Income | |
Noncovered: | | | | | | | | | | | | | | | | | | | | | | | | |
Commercial real estate | | $ | 10,012 | | | $ | — | | | $ | 60,664 | | | $ | 16 | | | $ | 17,592 | | | $ | 652 | |
One-to-four family residential | | | 1,317 | | | | 8 | | | | 1,725 | | | | 19 | | | | 7,752 | | | | 16 | |
Real estate construction | | | 8,222 | | | | — | | | | 62,358 | | | | 741 | | | | 27,810 | | | | — | |
Commercial | | | 9,144 | | | | 147 | | | | 5,046 | | | | (47 | ) | | | 8,374 | | | | 1,394 | |
Other | | | 97 | | | | 1 | | | | 34 | | | | — | | | | 65 | | | | | |
| | | | | | | | | | | | | | | | | | | | | | | | |
Total noncovered | | $ | 28,792 | | | $ | 156 | | | $ | 129,827 | | | $ | 729 | | | $ | 61,593 | | | $ | 2,062 | |
| | | | | | | | | | | | | | | | | | | | | | | | |
Covered: | | | | | | | | | | | | | | | | | | | | | | | | |
Commercial real estate | | $ | 26,642 | | | $ | 10 | | | $ | 35,783 | | | $ | 15 | | | | * | | | $ | — | |
One-to-four family residential | | | 7,926 | | | | — | | | | 10,848 | | | | 43 | | | | * | | | | — | |
Real estate construction | | | 6,003 | | | | — | | | | 12,079 | | | | — | | | | * | | | | — | |
Commercial | | | 4,403 | | | | 1 | | | | 8,852 | | | | 8 | | | | * | | | | — | |
Other | | | 438 | | | | — | | | | 1,144 | | | | — | | | | * | | | | — | |
| | | | | | | | | | | | | | | | | | | | | | | | |
Total covered | | $ | 45,412 | | | $ | 11 | | | $ | 68,706 | | | $ | 66 | | | | * | | | $ | — | |
| | | | | | | | | | | | | | | | | | | | | | | | |
| * | Information regarding average recorded investment for covered loans is not readily available. |
Troubled Debt Restructurings.The loan portfolio also includes certain loans that have been modified in a troubled debt restructuring (“TDR”), where economic concessions have been granted to borrowers who have experienced financial difficulties. These concessions typically result from loss mitigation activities and could include reductions in the interest rate, payment extensions, forgiveness of principal, forbearance or other actions. Certain TDRs are classified as impaired at the time of restructuring and typically are returned to performing status after considering the borrower’s sustained repayment for a reasonable period of at least six months.
57
When Southwest modifies loans in a TDR, an evaluation of any possible impairment is performed similar to other impaired loans based on the present value of expected future cash flows, discounted at the contractual interest rate of the original loan agreement, or use of the current fair value of the collateral, less selling costs for collateral dependent loans. If it is determined that the value of the modified loan is less than the recorded investment in the loan (net of previous charge-offs, deferred loan fees or costs and unamortized premium or discount), impairment is recognized through an allowance estimate or a charge-off to the allowance. In periods subsequent to modification, all TDRs are evaluated, including those that have payment defaults, for possible impairment.
Effective July 1, 2011, Southwest adopted Accounting Standards Update No. 2011-02,A Creditor’s Determination of Whether a Restructuring Is a Troubled Debt Restructuring. As such, Southwest reassessed all loan modifications occurring since January 1, 2011 for identification as troubled debt restructurings.
Loans classified as troubled debt restructurings during the year ended December 31, 2011 are shown in the following table.
| | | | | | | | |
(Dollars in thousands) | | Number of
Modifications | | | Recorded
Investment | |
| For the year ended December 31, 2011 | | | | | | | | |
Commercial real estate | | | 3 | | | $ | 16,017 | |
Real estate construction | | | 1 | | | | 8,106 | |
Commercial | | | 13 | | | | 6,504 | |
Consumer | | | 1 | | | | 112 | |
| | | | | | | | |
Total | | | 18 | | | $ | 30,739 | |
| | | | | | | | |
The modifications of loans identified as troubled debt restructurings primarily related to payment extensions and/or reductions in the interest rate. Financial impact of TDRs is not significant. Southwest has no significant commitments to lend additional amounts to these performing troubled debt restructured loans.
As of December 31, 2011, there have been no defaults on any loans that were modified as troubled debt restructurings during the preceding twelve months. Default occurs when a loan is 90 days or more past due or transferred to nonaccrual and is within twelve months of restructurings.
Credit Quality Indicators.To assess the credit quality of loans, Southwest categorizes loans into risk categories based on relevant information about the ability of the borrowers to service their debts such as: current financial information, historical payment experience, credit documentation, public information, and current economic trends, among other factors. This analysis is performed on a quarterly basis. Southwest uses the following definitions for risk ratings:
Special mention – Loans classified as special mention have potential weaknesses that deserve management’s close attention. If left uncorrected, these potential weaknesses may result in deterioration of the repayment prospects for these loans or of the institution’s credit position at some future date.
Substandard – Loans classified as substandard are inadequately protected by the current net worth and paying capacity of the obligors or of the collateral pledged, if any. Loans so classified have one or more well-defined weaknesses that jeopardize the liquidation of the debt. They are characterized by the distinct possibility that Southwest will sustain some loss if the deficiencies are not corrected. These loans are considered potential nonperforming or nonperforming loans depending on the accrual status of the loans.
Doubtful – Loans classified as doubtful have all the weaknesses inherent in those classified as substandard, with the added characteristics that the weaknesses make collection or liquidation in full, on the basis of currently existing facts, conditions, and values, highly questionable and improbable. These loans are considered nonperforming.
58
Loans not meeting the criteria above that are analyzed as part of the above described process are considered to be pass rated loans. As of December 31, 2011 and December 31, 2010, and based on the most recent analysis performed as of those dates, the risk category of loans by class of loans is as follows:
| | | | | | | | | | | | | | | | | | | | | | | | |
(Dollars in thousands) | | Commercial
Real Estate | | | 1-4 Family
Residential | | | Real Estate
Construction | | | Commercial | | | Other | | | Total | |
| At December 31, 2011 | | | | | | | | | | | | | | | | | | | | | | | | |
Grade: | | | | | | | | | | | | | | | | | | | | | | | | |
Pass | | $ | 927,652 | | | $ | 84,475 | | | $ | 139,431 | | | $ | 301,636 | | | $ | 38,202 | | | $ | 1,491,396 | |
Special Mention | | | 60,000 | | | | 564 | | | | 46,126 | | | | 11,345 | | | | 642 | | | | 118,677 | |
Substandard | | | 62,790 | | | | 2,408 | | | | 50,136 | | | | 35,164 | | | | 12 | | | | 150,510 | |
Doubtful | | | 1,805 | | | | — | | | | 138 | | | | 962 | | | | — | | | | 2,905 | |
| | | | | | | | | | | | | | | | | | | | | | | | |
Total | | $ | 1,052,247 | | | $ | 87,447 | | | $ | 235,831 | | | $ | 349,107 | | | $ | 38,856 | | | $ | 1,763,488 | |
| | | | | | | | | | | | | | | | | | | | | | | | |
| At December 31, 2010 | | | | | | | | | | | | | | | | | | | | | | | | |
Grade: | | | | | | | | | | | | | | | | | | | | | | | | |
Pass | | $ | 1,190,587 | | | $ | 93,961 | | | $ | 276,613 | | | $ | 399,344 | | | $ | 44,161 | | | $ | 2,004,666 | |
Special Mention | | | 13,854 | | | | 1,840 | | | | 24,023 | | | | 13,436 | | | | 1,340 | | | | 54,493 | |
Substandard | | | 132,148 | | | | 2,644 | | | | 168,220 | | | | 41,906 | | | | 54 | | | | 344,972 | |
Doubtful | | | 4,872 | | | | 477 | | | | 7,117 | | | | 3,494 | | | | 24 | | | | 15,984 | |
| | | | | | | | | | | | | | | | | | | | | | | | |
Total | | $ | 1,341,461 | | | $ | 98,922 | | | $ | 475,973 | | | $ | 458,180 | | | $ | 45,579 | | | $ | 2,420,115 | |
| | | | | | | | | | | | | | | | | | | | | | | | |
Allowance for Loan Losses. Activity in the noncovered allowance for loan losses is summarized as follows:
| | | | | | | | | | | | |
| | | For the Year Ended December 31, | |
(Dollars in thousands) | | 2011 | | | 2010 | | | 2009 | |
Beginning balance | | $ | 65,229 | | | $ | 62,413 | | | $ | 39,773 | |
Provision for loan losses | | | 131,650 | | | | 35,560 | | | | 39,176 | |
Loans charged-off | | | (156,625 | ) | | | (34,439 | ) | | | (18,913 | ) |
Recoveries | | | 3,979 | | | | 1,695 | | | | 2,377 | |
| | | | | | | | | | | | |
Total noncovered | | $ | 44,233 | | | $ | 65,229 | | | $ | 62,413 | |
| | | | | | | | | | | | |
As of December 31, 2011, an allowance for loan losses of $0.5 million was established for the covered loans.
The following table presents the balance in the allowance for loan losses and the recorded investment in loans by portfolio segment and based on impairment evaluation method as of December 31, 2011 and December 31, 2010.
| | | | | | | | | | | | | | | | | | | | | | | | |
(Dollars in thousands) | | Commercial
Real Estate | | | 1-4 Family
Residential | | | Real Estate
Construction | | | Commercial | | | Other | | | Total | |
| December 31, 2011 | | | | | | | | | | | | | | | | | | | | | | | | |
Balance at beginning of period | | $ | 32,508 | | | $ | 1,597 | | | $ | 19,605 | | | $ | 10,605 | | | $ | 914 | | | $ | 65,229 | |
Loans charged-off | | | (71,066 | ) | | | (346 | ) | | | (62,070 | ) | | | (22,103 | ) | | | (1,040 | ) | | | (156,625 | ) |
Recoveries | | | 411 | | | | 67 | | | | 1,521 | | | | 1,864 | | | | 116 | | | | 3,979 | |
Provision for loan losses | | | 59,896 | | | | (302 | ) | | | 52,121 | | | | 19,461 | | | | 925 | | | | 132,101 | |
| | | | | | | | | | | | | | | | | | | | | | | | |
Balance at end of period | | $ | 21,749 | | | $ | 1,016 | | | $ | 11,177 | | | $ | 9,827 | | | $ | 915 | | | $ | 44,684 | |
| | | | | | | | | | | | | | | | | | | | | | | | |
Allowance for loan losses ending balance: | | | | | | | | | | | | | | | | | | | | | | | | |
Individually evaluated for impairment | | $ | 411 | | | $ | 21 | | | $ | 73 | | | $ | 349 | | | $ | 112 | | | $ | 966 | |
Collectively evaluated for impairment | | | 21,198 | | | | 981 | | | | 10,846 | | | | 9,439 | | | | 803 | | | | 43,267 | |
Acquired with deteriorated credit quality | | | 140 | | | | 14 | | | | 258 | | | | 39 | | | | — | | | | 451 | |
| | | | | | | | | | | | | | | | | | | | | | | | |
Total ending allowance balance | | $ | 21,749 | | | $ | 1,016 | | | $ | 11,177 | | | $ | 9,827 | | | $ | 915 | | | $ | 44,684 | |
| | | | | | | | | | | | | | | | | | | | | | | | |
Loans receivable ending balance: | | | | | | | | | | | | | | | | | | | | | | | | |
Individually evaluated for impairment | | $ | 21,701 | | | $ | 1,468 | | | $ | 11,983 | | | $ | 10,490 | | | $ | 123 | | | $ | 45,765 | |
Collectively evaluated for impairment | | | 1,006,860 | | | | 78,907 | | | | 220,102 | | | | 335,776 | | | | 38,463 | | | | 1,680,108 | |
Acquired with deteriorated credit quality | | | 23,686 | | | | 7,072 | | | | 3,746 | | | | 2,841 | | | | 270 | | | | 37,615 | |
| | | | | | | | | | | | | | | | | | | | | | | | |
Total ending loans balance | | $ | 1,052,247 | | | $ | 87,447 | | | $ | 235,831 | | | $ | 349,107 | | | $ | 38,856 | | | $ | 1,763,488 | |
| | | | | | | | | | | | | | | | | | | | | | | | |
59
| | | | | | | | | | | | | | | | | | | | | | | | |
(Dollars in thousands) | | Commercial
Real Estate | | | 1-4 Family
Residential | | | Real Estate
Construction | | | Commercial | | | Other | | | Total | |
| December 31, 2010 | | | | | | | | | | | | | | | | | | | | | | | | |
Balance at beginning of period | | $ | 26,670 | | | $ | 2,454 | | | $ | 22,241 | | | $ | 10,052 | | | $ | 996 | | | $ | 62,413 | |
Loans charged-off | | | (4,571 | ) | | | (2,649 | ) | | | (20,910 | ) | | | (5,182 | ) | | | (1,127 | ) | | | (34,439 | ) |
Recoveries | | | 204 | | | | 234 | | | | 610 | | | | 421 | | | | 226 | | | | 1,695 | |
Provision for loan losses | | | 10,205 | | | | 1,558 | | | | 17,664 | | | | 5,314 | | | | 819 | | | | 35,560 | |
| | | | | | | | | | | | | | | | | | | | | | | | |
Balance at end of period | | $ | 32,508 | | | $ | 1,597 | | | $ | 19,605 | | | $ | 10,605 | | | $ | 914 | | | $ | 65,229 | |
| | | | | | | | | | | | | | | | | | | | | | | | |
Allowance for loan losses ending balance: | | | | | | | | | | | | | | | | | | | | | | | | |
Individually evaluated for impairment | | $ | 10,813 | | | $ | 197 | | | $ | 5,313 | | | $ | 3,643 | | | $ | 28 | | | $ | 19,994 | |
Collectively evaluated for impairment | | | 21,695 | | | | 1,400 | | | | 14,292 | | | | 6,962 | | | | 886 | | | | 45,235 | |
Acquired with deteriorated credit quality | | | — | | | | — | | | | — | | | | — | | | | — | | | | — | |
| | | | | | | | | | | | | | | | | | | | | | | | |
Total ending allowance balance | | $ | 32,508 | | | $ | 1,597 | | | $ | 19,605 | | | $ | 10,605 | | | $ | 914 | | | $ | 65,229 | |
| | | | | | | | | | | | | | | | | | | | | | | | |
Loans receivable ending balance: | | | | | | | | | | | | | | | | | | | | | | | | |
Individually evaluated for impairment | | $ | 72,796 | | | $ | 1,983 | | | $ | 82,557 | | | $ | 12,254 | | | $ | 38 | | | $ | 169,628 | |
Collectively evaluated for impairment | | | 1,237,668 | | | | 87,817 | | | | 386,137 | | | | 440,372 | | | | 44,865 | | | | 2,196,859 | |
Acquired with deteriorated credit quality | | | 30,997 | | | | 9,122 | | | | 7,279 | | | | 5,554 | | | | 676 | | | | 53,628 | |
| | | | | | | | | | | | | | | | | | | | | | | | |
Total ending loans balance | | $ | 1,341,461 | | | $ | 98,922 | | | $ | 475,973 | | | $ | 458,180 | | | $ | 45,579 | | | $ | 2,420,115 | |
| | | | | | | | | | | | | | | | | | | | | | | | |
Year-end premises and equipment were as follows:
| | | | | | | | |
| | | At December 31, | |
(Dollars in thousands) | | 2011 | | | 2010 | |
Land | | $ | 5,988 | | | $ | 6,046 | |
Buildings and improvements | | | 18,100 | | | | 17,985 | |
Furniture, fixtures, and equipment | | | 32,425 | | | | 32,015 | |
Construction/Remodeling in progress | | | 426 | | | | 95 | |
| | | | | | | | |
| | | 56,939 | | | | 56,141 | |
Accumulated depreciation | | | (34,239 | ) | | | (32,369 | ) |
| | | | | | | | |
Total premises and equipment, net | | $ | 22,700 | | | $ | 23,772 | |
| | | | | | | | |
Depreciation of premises and equipment totaled $2.5 million in 2011, $2.8 million in 2010, and $3.1 million in 2009.
Southwest leases certain equipment and premises for its operations. Future minimum annual rental payments required under operating leases, net of sublease agreements, that have initial or remaining lease terms in excess of one year as of December 31, 2011 were as follows:
| | | | |
(Dollars in thousands) | | | |
2012 | | $ | 2,444 | |
2013 | | | 1,922 | |
2014 | | | 1,438 | |
2015 | | | 1,198 | |
2016 | | | 936 | |
Thereafter | | | 163 | |
| | | | |
Total | | $ | 8,101 | |
| | | | |
The total rental expense was $2.6 million, $2.8 million, and $2.9 million in 2011, 2010, and 2009, respectively.
60
| 5. | Goodwill and Other Intangible Assets |
Southwest has recorded goodwill and other identifiable intangible assets associated with purchase business combinations. Goodwill is not amortized, but is periodically evaluated for impairment. Southwest did not recognize an impairment during the years ended December 31, 2011 and December 31, 2010. Goodwill totaled $6.8 million at December 31, 2011 and December 31, 2010. As of year-end, approximately $0.2 million of goodwill is reported in the Oklahoma Banking segment, $5.6 million is reported in the Kansas Banking segment, and $1.0 million is reported in the Texas Banking segment. Further information regarding operating segments can be found in Note 18.
The following table presents the gross carrying amount of other intangible assets and accumulated amortization.
| | | | | | | | |
| | | At December 31, | |
(Dollars in thousands) | | 2011 | | | 2010 | |
Core deposit premiums | | $ | 6,353 | | | $ | 6,353 | |
Less accumulated amortization | | | 3,323 | | | | 2,796 | |
| | | | | | | | |
Core deposit premiums, net | | $ | 3,030 | | | $ | 3,557 | |
Loan servicing rights | | $ | 8,641 | | | $ | 7,781 | |
Less accumulated amortization | | | 6,814 | | | | 5,967 | |
| | | | | | | | |
Loan servicing rights, net | | $ | 1,827 | | | $ | 1,814 | |
| | | | | | | | |
Other intangible assets, net | | $ | 4,857 | | | $ | 5,371 | |
| | | | | | | | |
Core deposit intangibles are amortized using an economic life method based on deposit attrition. As a result, amortization will decline over time with most of the amortization occurring during the initial years. The weighted average amortization period for core deposit intangibles is approximately 10 years. Amortization expense related to core deposit intangibles totaled $0.5 million in 2011 and in 2010.
During 2011 and 2010, Southwest had recorded loan servicing right amortization expense of $0.5 million and $1.0 million, respectively.
The estimated aggregate future amortization expense for other intangible assets remaining as of December 31, 2011 is as follows:
| | | | | | | | | | | | |
(Dollars in thousands) | | Core Deposit
Premiums | | | Loan Servicing
Rights | | | Total | |
2012 | | $ | 488 | | | $ | 457 | | | $ | 945 | |
2013 | | | 484 | | | | 377 | | | | 861 | |
2014 | | | 514 | | | | 278 | | | | 792 | |
2015 | | | 474 | | | | 207 | | | | 681 | |
2016 | | | 425 | | | | 148 | | | | 573 | |
Thereafter | | | 645 | | | | 360 | | | | 1,005 | |
| | | | | | | | | | | | |
| | $ | 3,030 | | | $ | 1,827 | | | $ | 4,857 | |
| | | | | | | | | | | | |
| 6. | Fair Value Measurements |
Fair value is defined as the exchange price that would be received for an asset or paid to transfer a liability (an exit price) in the principal or most advantageous market for the asset or liability in an orderly transaction between market participants on the measurement date. In estimating fair value, Southwest utilizes valuation techniques that are consistent with the market approach, the income approach, and/or the cost approach. Such valuation techniques are consistently applied. Inputs to valuation techniques include the assumptions that market participants would use in pricing an asset or liability.
61
ASC 820 establishes a fair value hierarchy which requires an entity to maximize the use of observable inputs and minimize the use of unobservable inputs when measuring fair value. The standard describes three levels of inputs that may be used to measure fair value:
| | |
Level 1 | | Quoted prices in active markets for identical assets or liabilities. Level 1 assets and liabilities include debt and equity securities that are traded in an active exchange market, as well as certain U.S. Treasury securities that are highly liquid and are actively traded in over-the-counter markets. |
| |
Level 2 | | Observable inputs other than Level 1 prices, such as quoted prices for similar assets or liabilities; quoted prices in markets that are not active; or other inputs that are observable or can be corroborated by observable market data for substantially the full term of the assets or liabilities. Level 2 assets and liabilities include debt securities with quoted prices that are traded less frequently than exchange-traded instruments. This category includes U.S. Government and agency securities, residential mortgage-backed debt securities, municipal obligation securities, loans held for sale, certain private equity investments, and other real estate. |
| |
Level 3 | | Unobservable inputs that are supported by little or no market activity and that are significant to the fair value of the assets or liabilities. Level 3 assets and liabilities include financial instruments whose values are determined using pricing models, discounted cash flow methodologies, or similar techniques, as well as instruments for which the determination of fair value requires significant management judgment or estimation. This category includes certain impaired loans, certain other real estate, goodwill, and other intangible assets. |
The estimated fair value amounts have been determined by Southwest using available market information and appropriate valuation methodologies. However, considerable judgment is required to interpret market data to develop the estimates of fair value. Accordingly, the estimates presented herein are not necessarily indicative of the amounts Southwest could realize in a current market exchange. The use of different market assumptions and/or estimation methodologies may have a material effect on the estimated fair value amounts.
A description of the valuation methodology used for financial assets measured at fair value on a recurring basis is as follows:
Loans held for sale – Real estate mortgage loans held for sale are carried at the lower of cost or market, which is determined on an individual loan basis. Guaranteed student loans held for sale are carried at the lower of cost or market, which is determined on an aggregate basis.
Available for sale securities– The fair value of U.S. Government and federal agency obligations, other securities, and mortgage-backed securities is estimated based on quoted market prices or dealer quotes. The fair value for other investments such as obligations of state and political subdivisions is estimated based on quoted market prices. Southwest obtains fair value measurements from an independent pricing service. The fair value measurements consider observable data that may include dealer quotes, market spreads, cash flows, the U.S. Treasury yield curve, live trading levels, trade execution data, market consensus prepayment speeds, credit information, and the bond’s terms and conditions, among other things. Southwest reviews the prices supplied by the independent pricing service, as well as their underlying pricing methodologies, for reasonableness and to ensure such prices are aligned with traditional pricing matrices.
The fair value of a certain private equity investment is estimated based on Southwest’s proportionate share of net asset value, $1.2 million as of December 31, 2011 and $1.3 million as of December 31, 2010. The investee invests in small and mid-sized U.S. financial institutions and other financial-related companies. This investment has a quarterly redemption with sixty-five days’ notice.
Derivative instrument – Southwest utilizes an interest rate swap agreement to convert one of its variable-rate subordinated debentures to a fixed rate (cash flow hedge). The fair value of the interest rate swap agreement is obtained from dealer quotes.
62
The following table summarizes financial assets measured at fair value on a recurring basis as of December 31, 2011 and December 31, 2010, segregated by the level of the valuation inputs within the fair value hierarchy utilized to measure fair value:
| | | | | | | | | | | | | | | | |
| | | | | | Fair Value Measurements Using | |
(Dollars in thousands) | | Total | | | Quoted Prices
in Active
Markets for
Identical Assets
(Level 1) | | | Significant
Other
Observable
Inputs
(Level 2) | | | Significant
Unobservable
Inputs
(Level 3) | |
| At December 31, 2011 | | | | | | | | | | | | | | | | |
Loans held for sale: | | | | | | | | | | | | | | | | |
Student loans | | $ | 5,396 | | | $ | — | | | $ | 5,396 | | | $ | — | |
One-to-four family residential | | | 3,547 | | | | — | | | | 3,547 | | | | — | |
Government guaranteed commercial real estate | | | 29,624 | | | | — | | | | 29,624 | | | | — | |
Government guaranteed commercial | | | 128 | | | | — | | | | 128 | | | | — | |
Available for sale securities: | | | | | | | | | | | | | | | | |
Federal agency securities | | | 65,553 | | | | — | | | | 65,553 | | | | — | |
Obligations of state and political subdivisions | | | 11,103 | | | | — | | | | 11,103 | | | | — | |
Residential mortgage-backed securities | | | 182,147 | | | | — | | | | 182,147 | | | | — | |
Equity securities | | | 1,297 | | | | 80 | | | | 1,217 | | | | — | |
Derivative instrument | | | (2,834 | ) | | | — | | | | (2,834 | ) | | | — | |
| | | | | | | | | | | | | | | | |
Total | | $ | 295,961 | | | $ | 80 | | | $ | 295,881 | | | $ | — | |
| | | | | | | | | | | | | | | | |
| At December 31, 2010 | | | | | | | | | | | | | | | | |
Loans held for sale: | | | | | | | | | | | | | | | | |
Student loans | | $ | 5,843 | | | $ | — | | | $ | 5,843 | | | $ | — | |
One-to-four family residential | | | 2,300 | | | | — | | | | 2,300 | | | | — | |
Other loans held for sale | | | 27,051 | | | | — | | | | 27,051 | | | | — | |
Available for sale securities: | | | | | | | | | | | | | | | | |
U.S. Government obligations | | | 1,108 | | | | 1,108 | | | | — | | | | — | |
Federal agency securities | | | 65,374 | | | | — | | | | 65,374 | | | | — | |
Obligations of state and political subdivisions | | | 233 | | | | — | | | | 233 | | | | — | |
Residential mortgage-backed securities | | | 180,017 | | | | — | | | | 180,017 | | | | — | |
Equity securities | | | 1,489 | | | | 222 | | | | 1,267 | | | | — | |
| | | | | | | | | | | | | | | | |
Total | | $ | 283,415 | | | $ | 1,330 | | | $ | 282,085 | | | $ | — | |
| | | | | | | | | | | | | | | | |
Certain financial assets are measured at fair value on a nonrecurring basis; that is, the instruments are not measured at fair value on an ongoing basis but are subject to fair value adjustments in certain circumstances (for example, when there is evidence of impairment). These assets are recorded at the lower of cost or fair value. Valuation methodologies for assets measured on a nonrecurring basis are as follows:
Impaired loans – Certain impaired loans are reported at the fair value of the underlying collateral if repayment is expected solely from collateral. Collateral values are estimated using Level 2 inputs based on third-party appraisals or Level 3 inputs based on customized discounting criteria. Certain other impaired loans are remeasured and reported at fair value through a specific valuation allowance allocation of the allowance for loan losses based upon the net present value of cash flows.
Other real estate– Other real estate fair value is based on third-party appraisals for significant properties less the estimated costs to sell the asset.
Goodwill– Fair value of goodwill is based on the fair value of each of Southwest’s reporting units to which goodwill is allocated compared with their respective carrying value. There was no impairment during 2011 or 2010; therefore, no fair value adjustments were recorded in earnings.
63
Core deposit premiums– The fair value of core deposit premiums are based on third-party appraisals. There were no impairments during 2011 or 2010; therefore no fair value adjustments were recorded in earnings.
Mortgage loan servicing rights – There is no active trading market for loan servicing rights. The fair value of loan servicing rights is estimated by calculating the present value of net servicing revenue over the anticipated life of each loan. A cash flow model is used to determine fair value. Key assumptions and estimates, including projected prepayment speeds and assumed servicing costs, earnings on escrow deposits, ancillary income and discount rates, used by this model are based on current market sources. A separate third party model is used to estimate prepayment speeds based on interest rates, housing turnover rates, estimated loan curtailment, anticipated defaults and other relevant factors. The prepayment model is updated at least annually for changes in market conditions.
Assets and liabilities measured at fair value on a nonrecurring basis during the years ended December 31, 2011 and December 31, 2010 are summarized in the following table:
| | | | | | | | | | | | | | | | | | | | |
| | | | | | Fair Value Measurements Using | | | | |
(Dollars in thousands) | | Fair Value
Total | | | Quoted Prices
in Active
Markets for
Identical Assets
(Level 1) | | | Significant
Other
Observable
Inputs
(Level 2) | | | Significant
Unobservable
Inputs
(Level 3) | | | Total Gains
(Losses) | |
| At December 31, 2011 | | | | | | | | | | | | | | | | | |
Noncovered impaired loans at fair value: | | | | | | | | | | | | | | | | | | | | |
Commercial real estate | | $ | 3,716 | | | $ | — | | | $ | 3,716 | | | $ | — | | | $ | (1,727 | ) |
One-to-four family residential | | | 604 | | | | — | | | | 604 | | | | — | | | | (55 | ) |
Real estate construction | | | 3,877 | | | | — | | | | 3,877 | | | | | | | | (3,569 | ) |
Commercial | | | 3,239 | | | | — | | | | 3,239 | | | | — | | | | (1,964 | ) |
Other consumer | | | 112 | | | | — | | | | 112 | | | | — | | | | (103 | ) |
Noncovered other real estate | | | 19,844 | | | | — | | | | 19,844 | | | | — | | | | (3,104 | ) |
Mortgage loan servicing rights | | | 1,817 | | | | — | | | | 1,817 | | | | — | | | | (315 | ) |
| | | | | | | | | | | | | | | | | | | | |
Total | | $ | 33,209 | | | $ | — | | | $ | 33,209 | | | $ | — | | | $ | (10,837 | ) |
| | | | | | | | | | | | | | | | | | | | |
| At December 31, 2010 | | | | | | | | | | | | | | | | | |
Noncovered impaired loans at fair value: | | | | | | | | | | | | | | | | | | | | |
Commercial real estate | | $ | 43,349 | | | $ | — | | | $ | 43,349 | | | $ | — | | | $ | (5,003 | ) |
One-to-four family residential | | | 1,660 | | | | — | | | | 1,660 | | | | — | | | | 1,819 | |
Real estate construction | | | 42,577 | | | | — | | | | 29,072 | | | | 13,505 | | | | (4,144 | ) |
Commercial | | | 9,727 | | | | — | | | | 9,727 | | | | — | | | | (1,214 | ) |
Other consumer | | | 38 | | | | — | | | | 38 | | | | — | | | | 86 | |
Noncovered other real estate | | | 37,722 | | | | — | | | | 37,722 | | | | | | | | (360 | ) |
| | | | | | | | | | | | | | | | | | | | |
Total | | $ | 135,073 | | | $ | — | | | $ | 121,568 | | | $ | 13,505 | | | $ | (8,816 | ) |
| | | | | | | | | | | | | | | | | | | | |
Noncovered impaired loans measured at fair value with a carrying amount of $19.7 million were written down to the fair value of $11.5 million at December 31, 2011, resulting in a life-to-date impairment charge of $8.1 million, of which $7.4 million was included in the provision for loan losses for the year ended December 31, 2011. As of December 31, 2010, noncovered impaired loans measured at fair value with a carrying amount of $125.2 million were written down to the fair value of $97.4 million, resulting in a life-to-date impairment charge of $27.9 million, of which $8.5 million was included in the provision for loan losses for the year ended December 31, 2010.
Noncovered other real estate assets were written down to their respective fair value, resulting in impairment charges of $3.1 million and $0.4 million, which was included in noninterest expense for the years ended December 31, 2011 and December 31, 2010, respectively.
64
Mortgage loan servicing rights were written down to their fair value, resulting in impairment charges of $0.3 million, which was included in noninterest income for the year ended December 31, 2011. No impairment of mortgage loan servicing rights was incurred in 2010.
ASC 825,Financial Instruments, requires an entity to provide disclosures about fair value of financial instruments, including those that are not measured and reported at fair value on a recurring or nonrecurring basis. The methodologies for estimating the fair value of financial instruments that are measured on a recurring or nonrecurring basis are discussed above. The methodologies for other financial instruments are discussed below:
Cash and cash equivalents– For cash and cash equivalents, the carrying amount is a reasonable estimate of fair value.
Investment securities– The investment securities held to maturity are carried at cost. The fair value of held to maturity securities is estimated based on quoted market prices or dealer quotes.
Loans – Fair values are estimated for certain homogeneous categories of loans adjusted for differences in loan characteristics. Southwest’s loans have been aggregated by categories consisting of commercial, real estate, student, and other consumer. The fair value of loans is estimated by discounting the cash flows using risks inherent in the loan category and interest rates currently offered for loans with similar terms and credit risks.
Accrued interest receivable– The carrying amount is a reasonable estimate of fair value for accrued interest receivable.
Investment included in other assets – The estimated fair value of investments included in other assets, which primarily consists of investments carried at cost, approximates their carrying values.
Deposits– The fair value of demand deposits, savings accounts, and certain money market deposits is the amount payable on demand at the statement of financial condition date. The fair value of fixed maturity certificates of deposits is estimated using the rates currently offered for deposits of similar remaining maturities.
Other liabilities and accrued interest payable– The estimated fair value of other liabilities, which primarily includes trade accounts payable, and accrued interest payable approximates their carrying value.
Other borrowings– Included in other borrowings are FHLB advances, securities sold under agreements to repurchase, and treasury tax and loan demand notes. The fair value for fixed rate FHLB advances is based upon discounted cash flow analysis using interest rates currently being offered for similar instruments. The fair values of the other borrowings are the amounts payable at the statement of financial condition date, as the carrying amount is a reasonable estimate of fair value due to the short-term maturity dates.
Subordinated debentures– Two subordinated debentures have floating rates that reset quarterly and the third subordinated debenture has a fixed rate. The fair value of the fixed rate subordinated debenture is based on market price. The fair value of the floating rate subordinated debentures is estimated by taking into consideration the liquidity discount implied by the market price of the fixed rate subordinated debenture at December 31, 2011. The fair value of the floating rate subordinated debentures approximates carrying value at December 31, 2010.
The carrying values and estimated fair values of Southwest’s financial instruments follow:
| | | | | | | | | | | | | | | | |
| | | At December 31, 2011 | | | At December 31, 2010 | |
(Dollars in thousands) | | Carrying
Values | | | Fair Values | | | Carrying
Values | | | Fair Values | |
Cash and cash equivalents | | $ | 30,247 | | | $ | 30,247 | | | $ | 67,496 | | | $ | 67,496 | |
Securities held to maturity | | | 15,252 | | | | 15,885 | | | | 14,304 | | | | 14,029 | |
Securities available for sale | | | 260,100 | | | | 260,100 | | | | 248,221 | | | | 248,221 | |
Total loans, net of allowance | | | 1,718,804 | | | | 1,708,894 | | | | 2,354,886 | | | | 2,279,605 | |
Accrued interest receivable | | | 7,176 | | | | 7,176 | | | | 8,590 | | | | 8,590 | |
Investments included in other assets | | | 10,454 | | | | 10,454 | | | | 10,404 | | | | 10,404 | |
Deposits | | | 1,921,382 | | | | 1,883,196 | | | | 2,252,728 | | | | 2,119,840 | |
Accrued interest payable | | | 3,689 | | | | 3,689 | | | | 1,577 | | | | 1,577 | |
Other liabilities | | | 9,340 | | | | 9,340 | | | | 8,981 | | | | 8,981 | |
Derivative instrument | | | 2,834 | | | | 2,834 | | | | — | | | | — | |
Other borrowings | | | 56,479 | | | | 60,688 | | | | 94,602 | | | | 100,550 | |
Subordinated debentures | | | 81,963 | | | | 72,423 | | | | 81,963 | | | | 84,654 | |
65
| 7. | Deposits and Other Borrowed Funds |
The following table summarizes deposits as of December 31, 2011 and December 31, 2010.
| | | | | | | | |
(Dollars in thousands) | | 2011 | | | 2010 | |
Noninterest-bearing demand | | $ | 400,985 | | | $ | 377,182 | |
Interest-bearing demand | | | 105,905 | | | | 92,584 | |
Money market accounts | | | 423,181 | | | | 495,253 | |
Savings accounts | | | 33,406 | | | | 26,665 | |
Time deposits of $100,000 or more | | | 487,907 | | | | 694,565 | |
Other time deposits | | | 469,998 | | | | 566,479 | |
| | | | | | | | |
Total deposits | | $ | 1,921,382 | | | $ | 2,252,728 | |
| | | | | | | | |
The total amount of overdrawn deposit accounts that were reclassified as loans at December 31, 2011 and December 31, 2010 was $0.6 million and $1.3 million, respectively.
Some of Southwest’s interest-bearing deposits were obtained through brokered transactions and Southwest’s participation in the Certificate of Deposit Account Registry Service (“CDARS”). Brokered certificate of deposits totaled $0.2 million at December 31, 2011 and $1.0 million at December 31, 2010. CDARS deposits totaled $14.7 million at December 31, 2011 and $34.3 million at December 31, 2010. Capital market certificate of deposits totaled $0 at December 31, 2011 and $109.9 million at December 31, 2010.
Scheduled time deposit maturities as of December 31, 2011 are as follows:
| | | | |
(Dollars in thousands) | | | |
2012 | | $ | 762,052 | |
2013 | | | 155,162 | |
2014 | | | 29,574 | |
2015 | | | 5,160 | |
2016 | | | 5,932 | |
Thereafter | | | 25 | |
| | | | |
Total time deposits | | $ | 957,905 | |
| | | | |
Southwest has available various forms of other borrowings for cash management and liquidity purposes. These forms of borrowings include short term federal funds purchased and securities sold under agreements to repurchase, and advances from the FHLB and the FRB. Southwest also carries interest-bearing demand notes issued by the U.S. Treasury in connection with the Treasury Tax and Loan note program. The following table summarizes borrowed funds for the periods indicated:
| | | | | | | | | | | | | | | | | | | | | | | | |
| | | 2011 | | | 2010 | |
(Dollars in thousands) | | Balance at
December 31, | | | Average
Balance | | | Weighted
Average
Rate | | | Balance at
December 31, | | | Average
Balance | | | Weighted
Average
Rate | |
Federal funds purchased | | | — | | | | — | | | | 0.00 | % | | $ | 10,060 | | | $ | 6,848 | | | | 0.18 | % |
Securities sold under repurchase agreements | | | 31,482 | | | | 29,701 | | | | 0.11 | | | | 26,492 | | | | 22,945 | | | | 0.25 | |
Federal Home Loan Bank advances | | | 25,000 | | | | 50,092 | | | | 3.45 | | | | 56,500 | | | | 64,967 | | | | 3.03 | |
Treasury, tax and loan note option | | | (3 | ) | | | 1,153 | | | | — | | | | 1,550 | | | | 1,381 | | | | — | |
Other | | | — | | | | — | | | | — | | | | — | | | | — | | | | — | |
| | | | | | | | | | | | | | | | | | | | | | | | |
| | $ | 56,479 | | | | | | | | | | | $ | 94,602 | | | | | | | | | |
| | | | | | | | | | | | | | | | | | | | | | | | |
66
Southwest has approved federal funds purchase lines totaling $160.0 million with four financial entities. Southwest sells securities under agreements to repurchase with Southwest retaining custody of the collateral. Collateral consists of direct obligations of U.S. Government and Federal Agency issues, which are designated as pledged with Southwest’s safekeeping agent. The type of collateral required, the retention of the collateral, and the security sold, minimize Southwest’s risk of exposure to loss. These transactions are for one-to-four day periods. At December 31, 2011 and December 31, 2010, no repurchase agreement exceeded 10% of equity capital.
Southwest has entered into an agreement with the FHLB to obtain advances from the FHLB from time to time. Currently the line of credit totals $25.0 million with a weighted average rate of interest of 3.42%. The terms of the agreement are set forth in the Advance, Pledge and Security Agreement (the “Agreement”). The FHLB requires that Southwest pledge collateral on such advances. Under the terms of the Agreement, the discounted value of the collateral, as defined by the FHLB, should at all times be at least equal to the amount borrowed by Southwest. Such advances outstanding are subject to a blanket collateral arrangement, which requires the pledging of eligible collateral to secure such advances. Such collateral principally includes certain loans and securities. At December 31, 2011 and December 31, 2010, loans pledged under the Agreement were $694.0 million and $844.2 million, and investment securities pledged (at carrying value) were $38.8 million and $85.2 million, respectively. There are no scheduled minimum future principal payments on the FHLB line of credit until after 2016.
Southwest is qualified to borrow funds from the FRB through their Borrower-In-Custody (“BIC”) program. Collateral under this program consists of pledged selected commercial and industrial loans. Currently the collateral will allow Southwest to borrow up to $75.8 million. Southwest also has substantial unused borrowing availability in the form of unsecured brokered certificate of deposits program from Bank of America Merrill Lynch, Morgan Stanley & Co., Citigroup Global Markets, Inc., Wells Fargo Bank, NA, UBS Securities LLC, and RBC Capital Markets Corp. In conjunction with these lines of credit, $0 and $110.0 million in retail certificates of deposit were included in total deposits at December 31, 2011 and December 31, 2010, respectively.
On February 11, 2011, Southwest entered into an interest rate swap agreement with a total notional amount of $25.0 million. The interest rate swap contract was designated as a hedging instrument in cash flow hedges with the objective of protecting the overall cash flow from Southwest’s quarterly interest payments on the SBI Capital Trust II preferred securities throughout the seven year period beginning February 11, 2011 and ending April 7, 2018 from the risk of variability of those payments resulting from changes in the three-month London Interbank Offered Rate (“LIBOR”). Under the swap, Southwest will pay a fixed interest rate of 6.15% and receive a variable interest rate of three-month LIBOR plus a margin of 2.85% on a total notional amount of $25.0 million, with quarterly settlements. The rate received by Southwest as of December 31, 2011 was 3.25%.
The estimated fair value of the interest rate derivative contract outstanding as of December 31, 2011 resulted in a pre-tax loss of $2.8 million and was included in other liabilities in the statement of condition. Southwest obtained the counterparty valuation to validate its interest rate derivative contract as of December 31, 2011.
The effective portion of the gain or loss due to changes in the fair value of the derivative hedging instrument, $1.7 million for the year ended December 31, 2011, is included in other comprehensive income, net of tax, while the ineffective portion (indicated by the excess of the cumulative change in the fair value of the derivative over that which is necessary to offset the cumulative change in expected future cash flows on the hedge transaction) is included in other noninterest income or other noninterest expense. No ineffectiveness related to the interest rate derivative was recognized during the reporting period.
Net cash flows as a result of the interest rate swap agreement were $0.7 million for the year ended December 31, 2011 and were included in interest expense on subordinated debentures.
Derivative contracts involve the risk of dealing with institutional derivative counterparties and their ability to meet contractual terms. Institutional counterparties must have an investment grade credit rating and be approved by Southwest’s asset/liability management committee. Southwest’s credit exposure on interest rate swaps is limited to the net favorable value and interest payments of all swaps by each counterparty. Credit exposure may be reduced by the amount of collateral pledged by the counterparty. There are no credit-risk-related contingent features associated with Southwest’s derivative contract.
67
The fair value of cash and securities posted as collateral by Southwest related to the derivative contract was $3.8 million at December 31, 2011.
| 9. | Subordinated Debentures |
At December 31, 2011, Southwest had the following issues of trust preferred securities outstanding and subordinated debentures owed to the Trusts.
| | | | | | | | | | | | | | | | |
(Dollars in thousands) | | Subordinated
Debentures Owed
to Trusts | | | Trust Preferred
Securities of the
Trusts | | | Interest Rates at
December 31, 2011 | | | Final Maturity Date | |
OKSB Statutory Trust I | | $ | 20,619 | | | $ | 20,000 | | | | 3.67 | % | | | June 26, 2033 | |
SBI Capital Trust II | | | 25,774 | | | | 25,000 | | | | 3.25 | % | | | October 7, 2033 | |
Southwest Capital Trust II | | | 35,570 | | | | 34,500 | | | | 10.50 | % | | | September 15, 2038 | |
| | | | | | | | | | | | | | | | |
| | $ | 81,963 | | | $ | 79,500 | | | | | | | | | |
| | | | | | | | | | | | | | | | |
On June 26, 2003, Southwest’s subsidiary, OKSB Statutory Trust I, sold to investors in a private placement offering $20.0 million of adjustable rate trust preferred securities (the “OKSB Trust Preferred”). The OKSB Trust Preferred bear interest, adjustable quarterly, at 90-day LIBOR plus 3.10%. In addition to these adjustable rate securities, OKSB Statutory Trust I sold $0.6 million of trust common equity to Southwest. The aggregate proceeds of $20.6 million were used to purchase an equal principal amount of adjustable rate subordinated debentures of Southwest that bear interest, adjustable quarterly, at 90-day LIBOR plus 3.10% (the “OKSB Subordinated Debentures”). After deducting underwriter’s compensation and noninterest expenses of the offering, the net proceeds were available to Southwest to increase capital and for general corporate purposes. Interest payments on the OKSB Subordinated Debentures are deductible for federal income tax purposes.
On October 14, 2003, Southwest’s subsidiary, SBI Capital Trust II, sold to investors in a private placement offering $25.0 million of adjustable rate trust preferred securities (the “SBI II Trust Preferred”). The SBI II Trust Preferred bear interest, adjustable quarterly, at 90-day LIBOR plus 2.85%. In addition to these adjustable rate securities, SBI Capital Trust II sold $0.8 million of trust common equity to Southwest. The aggregate proceeds of $25.8 million were used to purchase an equal principal amount of adjustable rate subordinated debentures of Southwest that bear interest, adjustable quarterly 90-day LIBOR plus 2.85% (the “SBI II Subordinated Debentures”). The proceeds were available to Southwest to increase capital and for general corporate purposes. Interest payments on the SBI II Subordinated Debentures are deductible for federal income tax purposes.
In July 2008, Southwest’s subsidiary, Southwest Capital Trust II, sold to investors in a public offering $34.5 million of 10.50% trust preferred securities (the “OKSBP Trust Preferred”). In addition to these trust preferred securities, Southwest Capital Trust II sold $1.1 million of trust common equity to Southwest. The aggregated proceeds of $35.6 million were used to purchase an equal amount of 10.50% subordinated debentures of Southwest (the “OKSBP Subordinated Debentures”).
At December 31, 2011, Southwest had an aggregate of $82.0 million of subordinated debentures outstanding and had an asset of $2.5 million representing its total investment in the common equity issued by the Trusts. The sole assets of the Trusts are the subordinated debentures and the liabilities of the Trusts of the OKSB Trust Preferred, the SBI II Trust Preferred, and the OKSBP Trust Preferred. Southwest has, through various contractual arrangements, unconditionally guaranteed payment of all obligations of the Trusts with respect to the OKSB Trust Preferred, the SBI II Trust Preferred, and the OKSBP Trust Preferred.
68
The OKSB Trust Preferred, the OKSB Subordinated Debentures, the SBI II Trust Preferred, the SBI II Subordinated Debentures, the OKSBP Trust Preferred, and the OKSBP Subordinated Debentures mature at or near the thirtieth anniversary date of their issuance. However, if certain conditions are met, the OKSB Trust Preferred and the OKSB Subordinated Debentures and the SBI II Trust Preferred and the SBI II Subordinated Debentures may be called at Southwest’s discretion with thirty days’ notice, and the maturity dates of the OKSBP Trust Preferred and the OKSBP Subordinated Debentures may be shortened at Southwest’s discretion to a date not earlier than September 15, 2013.
Southwest, OKSB Statutory Trust I, SBI Capital Trust II, and Southwest Capital Trust II believe that, taken together, the obligations of Southwest under the Trust Preferred Guarantee Agreements, the Amended and Restated Trust Agreements, the Subordinated Debentures, the Indentures and the Agreements as to Expenses and Liabilities, entered into in connection with the offering of the Trust Preferred and the Subordinated Debentures, in the aggregate constitute a full and unconditional guarantee by Southwest of the obligations of OKSB Statutory Trust I, SBI Capital Trust II, and Southwest Capital Trust II under the Trust Preferred.
OKSB Statutory Trust I is a Connecticut statutory trust created for the purpose of issuing the OKSB Trust Preferred and purchasing the OKSB Subordinated Debentures, which are its sole assets. Southwest owns all of the 619 outstanding common securities of OKSB Statutory Trust I; the liquidation value is $1,000 per share.
SBI Capital Trust II is a Delaware statutory trust created for the purpose of issuing the SBI II Trust Preferred and purchasing the SBI II Subordinated Debentures, which are its sole assets. Southwest owns all of the 774 outstanding common securities of SBI Capital Trust II; the liquidation value is $1,000 per share.
Southwest Capital Trust II is a Delaware statutory trust created for the purpose of issuing the OKSBP Trust Preferred and purchasing the OKSBP Subordinated Debentures, which are its sole assets. Southwest owns all of the 42,800 outstanding common securities of Southwest Capital Trust II; the liquidation value is $25 per share.
Each of the Trust Preferred issuances meets the regulatory criteria for Tier I capital, subject to Federal Reserve guidelines that limit the amount of the Trust Preferred and cumulative perpetual preferred stock to an aggregate of 25% of Tier I capital. At December 31, 2011, $79.5 million of the Trust Preferred was included in Tier I capital.
Southwest de-consolidates its investments in OKSB Statutory Trust I, SBI Capital Trust II, and Southwest Capital Trust II (the “Trusts”) in this Annual Report and all future reports. Due to this required de-consolidation, the trust preferred securities are not presented on the consolidated statements of financial condition and the subordinated debentures are presented on the consolidated statements of financial condition as a separate liability category.
In July 2011, Southwest determined to suspend payments of interest on its three issues of outstanding debentures effective August 1, 2011 and dividends on the related trust preferred securities.
The terms of the debentures allow Southwest to defer payments of interest for up to 20 consecutive quarterly periods without default or penalty. These terms also allow Southwest to resume payments at the end of any deferral period, or to extend the deferral up to the maximum 20 quarters in total. No deferral can extend past the maturity date of the debenture.
Interest will continue to accrue on the debentures, and dividends will continue to accrue on the related trust preferred securities. As of December 31, 2011, $2.9 million was accrued for interest on the debentures.
69
The components of taxes on income follow:
| | | | | | | | | | | | |
| | | For the Year Ended December 31, | |
(Dollars in thousands) | | 2011 | | | 2010 | | | 2009 | |
Current tax (benefit) expense: | | | | | | | | | | | | |
Federal | | $ | (19,319 | ) | | $ | 11,852 | | | $ | 13,032 | |
State | | | (4,875 | ) | | | 694 | | | | 1,134 | |
Deferred tax benefit: | | | | | | | | | | | | |
Federal | | | (17,375 | ) | | | (2,455 | ) | | | (6,158 | ) |
State | | | (2,088 | ) | | | (353 | ) | | | (397 | ) |
| | | | | | | | | | | | |
Taxes on income | | $ | (43,657 | ) | | $ | 9,738 | | | $ | 7,611 | |
| | | | | | | | | | | | |
A reconciliation from the expected tax expense (benefit) using the U.S. Federal income tax rate of 35% to consolidated effective income tax expense (benefit) follows:
| | | | | | | | | | | | |
| | | For the Year Ended December 31, | |
(Dollars in thousands) | | 2011 | | | 2010 | | | 2009 | |
Computed tax (benefit) expense at statutory rates | | $ | (39,183 | ) | | $ | 9,346 | | | $ | 7,207 | |
Increase (decrease) in income taxes resulting from: | | | | | | | | | | | | |
Benefit of income not subject to U.S. Federal income tax | | | (165 | ) | | | (135 | ) | | | (142 | ) |
Expenses not deductible for U.S. Federal income tax | | | 124 | | | | 191 | | | | 178 | |
State income taxes, net of Federal income tax benefit | | | (3,755 | ) | | | 292 | | | | 165 | |
New markets tax credit | | | — | | | | — | | | | (151 | ) |
Reversal of FIN 48 reserve | | | (953 | ) | | | — | | | | — | |
Texas tax refund (federally tax affected) | | | — | | | | (559 | ) | | | — | |
Other | | | 275 | | | | 603 | | | | 354 | |
| | | | | | | | | | | | |
Taxes on income | | $ | (43,657 | ) | | $ | 9,738 | | | $ | 7,611 | |
| | | | | | | | | | | | |
The calculated year-to-date effective tax rate is 39.0% for 2011, 36.5% for 2010, and 37.0% for 2009.
At December 31, 2011, Southwest had $61.6 million federal net operating loss carryforward expiring in 2031 and $77.4 million of state net operating loss carryforward expiring in 2031. In addition, Southwest had $1.4 million alternative minimum tax credit that can be carried forward indefinitely.
A deferred tax asset or liability is recognized for the tax consequences of temporary differences in the recognition of certain income and expense items for financial statement reporting purposes. A valuation allowance is provided when it is more likely than not that some portion or all of a deferred tax asset will not be realized.
Southwest conducted an analysis to assess the need of a valuation allowance at December 31, 2011. As part of this assessment, all available evidence, including both positive and negative, was considered to determine whether based on the weight of such evidence, a valuation allowance for deferred tax assets was needed. In accordance with ASC 740,Income Taxes, a valuation allowance is deemed to be needed when, based on the weight of the available evidence, it is more likely than not (a likelihood of more than 50%) that some portion or all of a deferred tax asset will not be realized. The future realization of the tax benefit depends on the existence of sufficient taxable income within the carryback and carryforward periods.
As part of its analysis, Southwest considered the following positive evidence:
| | • | | Taxes paid in prior carryback years; |
| | • | | Southwest has a long history of earnings profitability; |
| | • | | No goodwill impairment; |
| | • | | Southwest is projecting future taxable income, exclusive of tax planning strategies, sufficient to utilize the deferred tax assets; |
70
| | • | | The size of loan credits in the pipeline of potential problem loans has significantly decreased; and |
| | • | | Southwest is able to carryforward federal and Oklahoma tax losses for 20 years. |
Southwest’s current year loss resulted in a three-year cumulative pretax loss position that is considered significant negative evidence in the determination of the need for a valuation allowance. Included in the three-year pretax loss position is $101.0 million related to the nonrecurring sale of nonperforming assets and potential problem loans. Management believes that the combination of a strong history of taxable income, the projected current federal income tax receivables, and projected pre-tax income in future years represents positive evidence that the tax benefit will be realized. While realization of the deferred tax benefits is not assured, it is management’s judgment, after review of all available evidence and based on the weight of such evidence, that a valuation allowance is not necessary, as realization of these benefits meets the “more likely than not” standard.
Net deferred tax assets of $40.9 million and $21.1 million at December 31, 2011 and December 31, 2010, respectively, are reflected in the accompanying consolidated statements of financial condition in other assets.
Temporary differences that give rise to the deferred tax assets include the following:
| | | | | | | | |
| | | At December 31, | |
(Dollars in thousands) | | 2011 | | | 2010 | |
Provision for loan losses | | $ | 18,213 | | | $ | 25,694 | |
Accumulated depreciation | | | (3,112 | ) | | | (3,407 | ) |
Prepaid maintenance | | | (320 | ) | | | (384 | ) |
Nonaccrual loan interest | | | 321 | | | | 1,221 | |
Deferred compensation accrual | | | 303 | | | | 316 | |
FHLB stock dividends | | | (277 | ) | | | (1,093 | ) |
Write-downs on other real estate | | | 831 | | | | 142 | |
Amortizable assets | | | (868 | ) | | | (262 | ) |
Stock-based compensation | | | 92 | | | | 174 | |
New markets tax credit | | | — | | | | (460 | ) |
Dividend - equity vs cost method | | | — | | | | (344 | ) |
Section 597 gain - FNBA FDIC-assisted acquisition | | | (281 | ) | | | (278 | ) |
Net operating loss carryforward | | | 24,705 | | | | — | |
Tax credit carryforward | | | 2,419 | | | | — | |
Other | | | 171 | | | | 415 | |
| | | | | | | | |
| | | 42,197 | | | | 21,734 | |
Deferred taxes (payable) receivable on investments securities available for sale | | | (1,286 | ) | | | (593 | ) |
| | | | | | | | |
Net deferred tax asset | | $ | 40,911 | | | $ | 21,141 | |
| | | | | | | | |
Southwest entered into a Settlement Agreement (“the Agreement”) with the Oklahoma Tax Commission (“OTC”) on June 28, 2011 with respect to certain claims made by the OTC. The multi-year claims were protested by Southwest and as a result of settlement of that protest, a previously recorded reserve against those claims was released. As a result of the Agreement, Southwest paid $3.6 million of state tax expense for the years under audit and an additional $1.2 million for tax years 2008 through 2010.
The settlement of this outstanding audit closes the examination period for the years in question and removes the need for Southwest to further reserve for uncertain tax positions in accordance with ASC 740,Income Taxes.
Southwest or one of its subsidiaries files income tax returns in the U.S. federal jurisdiction and various state jurisdictions. Southwest is no longer subject to U.S. federal or state tax examinations for years before 2009. On February 15, 2012, Southwest was notified by the Internal Revenue Service that it was under audit for the 2009 income tax filing.
71
On April 29, 2010, Southwest closed a public offering of 4,600,000 shares of common stock, including 600,000 shares pursuant to the underwriter’s over-allotment option, at a price of $12.50 per share resulting in aggregate proceeds of $57.5 million. The net proceeds of the offering were $54.0 million and were used to increase Southwest’s working capital and for general corporate purposes, including investment of $25.0 million in its banking subsidiaries, Stillwater National and Bank of Kansas.
On December 5, 2008, Southwest issued to the United States Department of the Treasury (the “Treasury Department”) 70,000 shares of Fixed Rate Cumulative Preferred Stock, Series B, par value $1,000 per share (the “Series B Preferred Stock”), having a liquidation amount per share equal to $1,000, for a total price of $70.0 million. The Series B Preferred Stock pays cumulative dividends at a rate of 5% per year for the first 5 years and thereafter at a rate of 9% per year. Southwest may not redeem the Series B Preferred Stock during the first three years except with the proceeds from a qualified equity offering. After three years, Southwest, may, at their option, redeem the Series B Preferred Stock at par value plus accrued and unpaid dividends.
As part of its purchase of the Series B Preferred Stock, the Treasury Department received a warrant to purchase 703,753 shares of common stock at an initial per share exercise price of $14.92. The warrant expires in ten years from the issuance date. Pursuant to the Securities Purchase Agreement, the Treasury Department has agreed not to exercise voting power with respect to any shares of common stock issued upon exercise of the warrant.
Southwest allocated $66.3 million to the Series B Preferred Stock and $3.7 million to the warrant based on their relative fair values at the issue date. The amount allocated to the warrant is accreted over the estimated life of the Series B Preferred Stock using five years. Such accretion for the years ended December 31, 2011 and December 31, 2010 were $0.7 million for both years, respectively.
In July 2011, Southwest determined to defer payment of dividends on its Series B Preferred Securities issued under the U.S. Treasury Department’s Capital Purchase Program, effective for the dividend payments, beginning August 15, 2011. Dividends on the Preferred Securities may not be paid while interest on Southwest’s debentures has been deferred, but will continue to accrue. As of December 31, 2011, Southwest had accrued dividends on these securities of $2.2 million.
Southwest has reserved for issuance 150,000 shares of common stock pursuant to the terms of the Employee Stock Purchase Plan. The Employee Stock Purchase Plan allows Southwest’s employees to acquire additional common shares through payroll deductions. From July 1999 to August 2009, shares issued out of this plan came from treasury shares, subsequent shares issued came from the reserved shares. As of December 31, 2011, 48,969 new shares had been issued and 52,500 treasury shares had been reissued under this plan.
Southwest had reserved 1,960,000 shares of common stock pursuant to the terms of the 1999 Stock Option Plan, which expired during 2008. The 1999 Plan provided selected key employees with the opportunity to acquire common stock. As of December 31, 2011, 275,255 new shares had been issued and 1,622,385 treasury shares had been reissued by this plan. Options issued under this plan will continue in effect and will be subject to the requirements of the plan, but no new options will be granted under this plan.
Southwest has reserved 800,000 shares of common stock pursuant to the terms of the 2008 Stock Based Award Plan. The 2008 Stock Plan provides selected key employees with the opportunity to acquire common stock. As of December 31, 2011, 42,381 new shares had been issued and 25,725 treasury shares had been reissued by this plan.
72
| 12. | Earnings Per Common Share |
The following table sets forth the computation of basic and diluted earnings per common share:
| | | | | | | | | | | | |
(Dollars in thousands, except earnings per share data) | | 2011 | | | 2010 | | | 2009 | |
Numerator: | | | | | | | | | | | | |
Net income (loss) | | $ | (68,295 | ) | | $ | 16,964 | | | $ | 12,982 | |
Preferred dividend | | | (3,522 | ) | | | (3,500 | ) | | | (3,500 | ) |
Warrant amortization | | | (731 | ) | | | (687 | ) | | | (645 | ) |
| | | | | | | | | | | | |
Net income (loss) available to common shareholders | | | (72,548 | ) | | | 12,777 | | | | 8,837 | |
Earnings allocated to participating securities | | | — | | | | (36 | ) | | | (26 | ) |
| | | | | | | | | | | | |
Numerator for basic earnings per common share | | | (72,548 | ) | | | 12,741 | | | | 8,811 | |
Effect of reallocating undistributed earnings of participating securities | | | — | | | | — | | | | — | |
| | | | | | | | | | | | |
Numerator for diluted earnings per common share | | | (72,548 | ) | | | 12,741 | | | | 8,811 | |
Denominator: | | | | | | | | | | | | |
Denominator for basic earnings per common share - | | | | | | | | | | | | |
Weighted average common shares outstanding | | | 19,414,231 | | | | 17,848,610 | | | | 14,625,847 | |
Effect of dilutive securities: | | | | | | | | | | | | |
Stock options | | | — | | | | 16,581 | | | | 48,279 | |
Warrant | | | — | | | | — | | | | — | |
| | | | | | | | | | | | |
Denominator for diluted earnings per common share | | | 19,414,231 | | | | 17,865,191 | | | | 14,674,126 | |
Earnings per common share: | | | | | | | | | | | | |
Basic | | $ | (3.73 | ) | | $ | 0.71 | | | $ | 0.60 | |
| | | | | | | | | | | | |
Diluted | | $ | (3.73 | ) | | $ | 0.71 | | | $ | 0.60 | |
| | | | | | | | | | | | |
| 13. | Capital Requirements and Regulatory Matters |
Southwest, Stillwater National, and Bank of Kansas are subject to various regulatory capital requirements administered by the federal banking agencies. Failure to meet minimum capital requirements can initiate certain mandatory and possible additional discretionary actions by regulators that, if undertaken, could have a direct material effect on Southwest’s, Stillwater National’s, and Bank of Kansas’ financial statements. Under capital adequacy guidelines and the regulatory framework for prompt corrective action, Southwest, Stillwater National, and Bank of Kansas must meet specific capital guidelines that involve quantitative measures of Southwest’s, Stillwater National’s, and Bank of Kansas’ assets, liabilities, and certain off-balance sheet items as calculated under regulatory accounting practices. Southwest’s, Stillwater National’s, and Bank of Kansas’ capital amounts and classifications are also subject to qualitative judgments by the regulators about components, risk weightings, and other factors. Quantitative measures established by regulation to ensure capital adequacy require Southwest, Stillwater National, and Bank of Kansas to maintain minimum amounts of Total and Tier I Capital (as defined in the regulations) to risk-weighted assets (as defined), and of Tier I Capital (as defined) to average assets (as defined).
Management believes, as of December 31, 2011 and December 31, 2010, that Southwest, Stillwater National, and Bank of Kansas met all capital adequacy requirements to which they are subject.
As of December 31, 2011 and December 31, 2010, Stillwater National and Bank of Kansas were categorized as well-capitalized under the regulatory framework for prompt corrective action. To be categorized as well-capitalized, Stillwater National and Bank of Kansas must maintain minimum Total risk-based, Tier I risk-based, and Tier I leverage ratios as set forth in the following table.
Under the terms of the January 27, 2010 Formal Agreement with the OCC, Stillwater National submits quarterly reports describing the actions needed to achieve full compliance with the Formal Agreement, the actions taken to comply, and the results and status of these actions relating to the following items:
| | • | | Establishing and ensuring compliance with a plan to reduce credit risk and improve loan portfolio management; |
73
| | • | | Eliminating credit weaknesses in nonperforming and potential problem loans; |
| | • | | On-going review and grading of the Stillwater National’s loan portfolio; |
| | • | | Improving Stillwater National’s position regarding nonperforming and potential problem loans and other real estate owned; |
| | • | | Improving loan portfolio concentration risk management; and |
| | • | | Establishing and operating a loan workout department. |
On January 27, 2010, Stillwater National informally agreed with the OCC, its primary federal regulator, to maintain a ratio of total capital to risk weighted assets of at least 12.5% and a Tier 1 leverage ratio of at least 8.5%.
Southwest’s, Stillwater National’s, and Bank of Kansas’ actual capital amounts and ratios are presented below.
| | | | | | | | | | | | | | | | | | | | | | | | |
| | | Actual | | | To Be Well
Capitalized Under
Prompt Corrective
Action Provisions | | | For Capital
Adequacy
Purposes | |
(Dollars in thousands) | | Amount | | | Ratio | | | Amount | | | Ratio | | | Amount | | | Ratio | |
As of December 31, 2011: | | | | | | | | | | | | | | | | | | | | | | | | |
Total Capital (to risk-weighted assets) | | | | | | | | | | | | | | | | | | | | | | | | |
Southwest | | $ | 395,292 | | | | 20.78 | % | | | N/A | | | | N/A | | | $ | 152,211 | | | | 8.00 | % |
Stillwater National | | | 314,550 | | | | 18.56 | | | $ | 169,462 | | | | 10.00 | % | | | 135,570 | | | | 8.00 | |
Bank of Kansas | | | 35,731 | | | | 18.82 | | | | 18,984 | | | | 10.00 | | | | 15,187 | | | | 8.00 | |
Tier I Capital (to risk-weighted assets) | | | | | | | | | | | | | | | | | | | | | | | | |
Southwest | | | 371,114 | | | | 19.51 | | | | N/A | | | | N/A | | | | 76,106 | | | | 4.00 | |
Stillwater National | | | 278,079 | | | | 16.41 | | | | 101,677 | | | | 6.00 | | | | 67,785 | | | | 4.00 | |
Bank of Kansas | | | 33,325 | | | | 17.55 | | | | 11,390 | | | | 6.00 | | | | 7,593 | | | | 4.00 | |
Tier I Leverage (to average assets) | | | | | | | | | | | | | | | | | | | | | | | | |
Southwest | | | 371,114 | | | | 14.50 | | | | N/A | | | | N/A | | | | 102,346 | | | | 4.00 | |
Stillwater National | | | 278,079 | | | | 12.53 | | | | 110,966 | | | | 5.00 | | | | 88,773 | | | | 4.00 | |
Bank of Kansas | | | 33,325 | | | | 10.32 | | | | 16,143 | | | | 5.00 | | | | 12,914 | | | | 4.00 | |
As of December 31, 2010: | | | | | | | | | | | | | | | | | | | | | | | | |
Total Capital (to risk-weighted assets) | | | | | | | | | | | | | | | | | | | | | | | | |
Southwest | | $ | 477,930 | | | | 19.06 | % | | | N/A | | | | N/A | | | $ | 200,629 | | | | 8.00 | % |
Stillwater National | | | 392,705 | | | | 17.22 | | | $ | 228,114 | | | | 10.00 | % | | | 182,491 | | | | 8.00 | |
Bank of Kansas | | | 34,501 | | | | 16.58 | | | | 20,814 | | | | 10.00 | | | | 16,651 | | | | 8.00 | |
Tier I Capital (to risk-weighted assets) | | | | | | | | | | | | | | | | | | | | | | | | |
Southwest | | | 445,966 | | | | 17.78 | | | | N/A | | | | N/A | | | | 100,315 | | | | 4.00 | |
Stillwater National | | | 348,685 | | | | 15.29 | | | | 136,868 | | | | 6.00 | | | | 91,245 | | | | 4.00 | |
Bank of Kansas | | | 31,866 | | | | 15.31 | | | | 12,488 | | | | 6.00 | | | | 8,326 | | | | 4.00 | |
Tier I Leverage (to average assets) | | | | | | | | | | | | | | | | | | | | | | | | |
Southwest | | | 445,966 | | | | 15.55 | | | | N/A | | | | N/A | | | | 114,685 | | | | 4.00 | |
Stillwater National | | | 348,685 | | | | 13.84 | | | | 125,991 | | | | 5.00 | | | | 100,793 | | | | 4.00 | |
Bank of Kansas | | | 31,866 | | | | 9.60 | | | | 16,605 | | | | 5.00 | | | | 13,284 | | | | 4.00 | |
The approval of the OCC is required if the total of all dividends declared by Stillwater National in any calendar year exceeds the total of its net profits of that year combined with its retained net profits of the preceding two years. In addition, Stillwater National may not pay a dividend if, after paying the dividend, Stillwater National would be undercapitalized. No dividends were declared by Stillwater National for the years ended December 31, 2011 and December 31, 2010, and dividends declared for the year ended December 31, 2009 did not exceed the threshold requiring regulatory approval.
74
The same dividend restrictions apply to Bank of Kansas with approval required from the FDIC. Bank of Kansas had $5.8 million available for dividend payment at December 31, 2011. No dividends were declared by Bank of Kansas for the years ended December 31, 2011, December 31, 2010, and December 31, 2009.
On October 1, 2010, Southwest began sponsoring a 401(k) defined contribution savings plan, which replaced the noncontributory, defined contribution profit sharing plan. The plan covers all employees who have completed one year of service and have attained the age of 21. The plan is subject to the Employee Retirement Income Security Act of 1974, as amended. This plan permits participants to make before or after-tax contributions in an amount not exceeding 90% of eligible compensation and subject to dollar limits from Internal Revenue Service regulations. Southwest will make an annual nonelective contribution of 3% of eligible compensation. Southwest made a contribution of $0.7 million in 2011 and $0.2 million in 2010. Southwest made contributions of $1.3 million and $1.0 million in 2010 and 2009, respectively, to the noncontributory, defined contribution profit sharing plan.
Stock Options– Southwest recorded $0, $200, and $32,000 of total share-based compensation expense for the periods ended December 31, 2011, December 31, 2010, and December 31, 2009, respectively. The share-based compensation is calculated using the accrual method, which treats each vesting tranche as a separate award and amortizes expense evenly from grant date to vest date for each tranche. The amortization of stock-based compensation reflects actual forfeitures, and as of December 31, 2011, there was no unrecognized compensation expense. The deferred tax asset that was recorded related to this compensation expense was approximately $92,000 for tax year 2011, $174,000 for tax year 2010, and $177,000 for tax year 2009.
Southwest has computed the estimated fair values of all share-based compensation using the Black-Scholes option pricing model. No options were granted in 2011, 2010, or in 2009.
A summary of option activity under the Stock Plans as of December 31, 2011 and changes during the 36 month period then ended is presented below.
| | | | | | | | | | | | | | | | |
| | | Number of
Options | | | Weighted
Average
Exercise
Price | | | Weighted Average Aggregate | |
| | | | Remaining
Contractual
Life (Years) | | | Intrinsic
Value (dollars
in thousands) | |
Outstanding at December 31, 2008 | | | 691,111 | | | $ | 17.10 | | | | | | | | | |
| | | | | | | | | | | | | | | | |
Granted | | | — | | | | — | | | | | | | | | |
Exercised | | | (139,170 | ) | | | 6.39 | | | | | | | | | |
Canceled/expired | | | (172,617 | ) | | | 17.20 | | | | | | | | | |
| | | | | | | | | | | | | | | | |
Outstanding at December 31, 2009 | | | 379,324 | | | $ | 20.98 | | | | | | | | | |
| | | | | | | | | | | | | | | | |
Granted | | | — | | | | — | | | | | | | | | |
Exercised | | | (38,100 | ) | | | 5.29 | | | | | | | | | |
Canceled/expired | | | (139,009 | ) | | | 20.89 | | | | | | | | | |
| | | | | | | | | | | | | | | | |
Outstanding at December 31, 2010 | | | 202,215 | | | $ | 24.00 | | | | | | | | | |
| | | | | | | | | | | | | | | | |
Granted | | | — | | | | — | | | | | | | | | |
Exercised | | | — | | | | — | | | | | | | | | |
Canceled/expired | | | (128,401 | ) | | | 23.59 | | | | | | | | | |
| | | | | | | | | | | | | | | | |
Outstanding at December 31, 2011 | | | 73,814 | | | $ | 24.72 | | | | 0.33 | | | | — | |
| | | | | | | | | | | | | | | | |
Total exercisable at December 31, 2009 | | | 377,657 | | | $ | 21.00 | | | | | | | | | |
Total exercisable at December 31, 2010 | | | 202,215 | | | $ | 24.00 | | | | | | | | | |
Total exercisable at December 31, 2011 | | | 73,814 | | | $ | 24.72 | | | | | | | | — | |
75
The total intrinsic value of options exercised during the years ended December 31, 2011, December 31, 2010, and December 31, 2009 was $0, $0.3 million, and $0.7 million, respectively. The amount of cash received from exercises in 2011, 2010, and 2009 was $0, $0.2 million, and $0.9 million, respectively. The fair value of options that became vested during 2011, 2010, and 2009 was $0, $6,000, and $0.2 million, respectively.
No stock options were exercised in 2011. During 2010, all shares issued in connection with stock option exercises were issued from available authorized shares. During 2009, 90,155 shares issued in connection with stock option exercises were new shares issued from available authorized shares, while 49,015 were issued from available treasury stock.
As of December 31, 2011 there were no nonvested shares.
Restricted Stock - Restricted shares granted as of December 31, 2011 and December 31, 2010 were 120,298 and 104,198, respectively. For 2011 and 2010, Southwest recognized $0.2 million in compensation expense, net of tax, related to all restricted shares outstanding, respectively for each year. At December 31, 2011, there was $28,000 of total unrecognized compensation expense related to restricted shares granted under the Stock Plans. This unrecognized expense is expected to be recognized during the next year.
The 2011 and 2010 grants of restricted stock vest upon the first anniversary of the date of grant provided the director remains a director of Southwest or a subsidiary on that date. The restrictions on the shares expire one year after the award date or upon a change in control of Southwest (subject to the prohibition on parachute payments imposed by the American Reinvestment and Recovery Act) or the permanent and total disability or death of the participant. Southwest will recognize compensation expense over the restricted period.
The 2009 restricted stock grants vest one-third on the first, second and third anniversaries of the date of grant provided the director or employee remains a director or employee of Southwest or a subsidiary on those dates. The restrictions on the shares expire three years after the award date provided that all restrictions will end, and the awards will be fully vested, upon a change in control of Southwest (subject to the prohibition on parachute payments imposed by the American Reinvestment and Recovery Act) or the permanent and total disability or death of the participant. Southwest will continue to recognize compensation expense over the restricted periods.
| 15. | Related Party Transactions |
Directors and officers of Southwest, Stillwater National, and Bank of Kansas were customers of, and had transactions with, Southwest in the ordinary course of business, and similar transactions are expected in the future. All loans included in such transactions were made on substantially the same terms, including interest rates and collateral, as those prevailing at the time for comparable transactions with other persons and in management’s opinion did not involve more than normal risk of loss or present other unfavorable features. Certain directors, and companies in which they have ownership interests, had indebtedness to Southwest totaling $3.4 million and $5.3 million at December 31, 2011 and at December 31, 2010, respectively. During 2011, $2.6 million of new loans and advances on existing loans were made to these persons and repayments totaled $4.5 million.
At December 31, 2011 and December 31, 2010, directors, officers and other related parties had demand, non-interest bearing deposits of $3.3 million and $2.5 million, respectively, savings and interest-bearing transaction accounts of $9.8 million and $5.7 million, respectively, and time certificates of deposit of $1.2 million and $0.8 million, respectively.
| 16. | Financial Instruments with Off-Balance Sheet Risk |
In the normal course of business, Southwest makes use of a number of different financial instruments to help meet the financial needs of its customers. In accordance with U.S. generally accepted accounting principles, these transactions are not presented in the accompanying consolidated financial statements and are referred to as off-balance sheet instruments. These transactions and activities include commitments to extend lines of commercial and real estate mortgage credit and standby and commercial letters of credit.
76
The following table provides a summary of Southwest’s off-balance sheet financial instruments:
| | | | | | | | |
| | | At December 31, | |
(Dollars in thousands) | | 2011 | | | 2010 | |
Commitments to extend commercial and real estate mortgage credit | | $ | 157,461 | | | $ | 219,795 | |
Standby and commercial letters of credit | | | 5,592 | | | | 4,770 | |
| | | | | | | | |
Total | | $ | 163,053 | | | $ | 224,565 | |
| | | | | | | | |
A loan commitment is a binding contract to lend up to a maximum amount for a specified period of time provided there is no violation of any financial, economic, or other terms of the contract. A standby letter of credit obligates Southwest to honor a financial commitment to a third party should Southwest’s customer fail to perform. Many loan commitments and most standby letters of credit expire unfunded, and, therefore, total commitments do not represent future funding obligations of Southwest. Loan commitments and letters of credit are made under normal credit terms, including interest rates and collateral prevailing at the time, and usually require the payment of a fee by the customer. Commercial letters of credit are commitments generally issued to finance the movement of goods between buyers and sellers. Southwest’s exposure to credit loss, assuming commitments are funded, in the event of nonperformance by the other party to the financial instrument is represented by the contractual amount of those instruments. Southwest does not anticipate any material losses as a result of the commitments.
| 17. | Commitments and Contingencies |
In the normal course of business, Southwest is at all times subject to various pending and threatened legal actions. The relief or damages sought in some of these actions may be substantial. After reviewing pending and threatened actions with counsel, management considers that the outcome of such actions will not have a material adverse effect on Southwest’s financial position; however, Southwest is not able to predict whether the outcome of such actions may or may not have a material adverse effect on results of operations in a particular future period as the timing and amount of any resolution of such actions and relationship to the future results of operations are not known.
At periodic intervals, the FRB, the OCC, the FDIC, and the State of Kansas, routinely examine Southwest’s, Stillwater National’s, and Bank of Kansas’ financial statements as part of their legally prescribed oversight of the banking industry. Based on these examinations, the regulators can direct that Southwest’s, Stillwater National’s, and Bank of Kansas’ financial statements be adjusted in accordance with their findings.
Southwest has adopted a Severance Compensation Plan (the “Plan”) for the benefit of certain officers and key members of management. The Plan’s purpose is to protect and retain certain qualified employees in the event of a change in control (as defined) and to reward those qualified employees for loyal service to Southwest by providing severance compensation to them upon their involuntary termination of employment after a change in control of Southwest. At December 31, 2011, Southwest has not recorded any amounts in the consolidated financial statements relating to the Plan. If a change of control were to occur, the maximum amount payable to certain officers and key members of management would approximate $0.7 million.
Southwest operates six principal segments: Oklahoma Banking, Texas Banking, Kansas Banking, Out of Market, Secondary Market, and Other Operations. The Oklahoma Banking segment, Texas Banking segment, and the Kansas Banking segment provide lending and deposit services to customers in the states of Oklahoma, Texas, and Kansas. The Out of Market segment provides lending services to customers outside Oklahoma, Texas, and Kansas. The Secondary Market segment consists of three operating units: one that provides student lending services to post-secondary students in Oklahoma and several other states, one that provides residential mortgage lending services to customers in Oklahoma, Texas, and Kansas, and one that provides United States Department of Agriculture (“USDA”) government guaranteed commercial real estate lending services to rural healthcare providers. Other Operations includes Southwest’s fund management unit.
77
The primary purpose of the funds management unit is to manage Southwest’s overall liquidity needs and interest rate risk. Each segment borrows funds from and provides funds to the funds management unit as needed to support its operations. The value of funds provided to and the cost of funds borrowed from the funds management unit by each segment are internally priced at rates that approximate market rates for funds with similar duration. The yield curve used in the funds transfer pricing curve is a blend of rates based on the volume usage of retail and brokered certificates of deposit, capital market certificates of deposit, and FHLB advances.
The Other Operations segment also includes SNB Wealth Management and corporate investments.
Southwest identifies reportable segments by type of service provided and geographic location. Operating results are adjusted for borrowings, allocated service costs, and management fees. Portfolio loans are allocated based upon the state of the borrower, or the location of the real estate in the case of real estate loans. Loans included in the Out of Market segment are portfolio loans attributable to thirty-five states other than Oklahoma, Texas, or Kansas, and primarily consist of healthcare and commercial real estate credits. These out of market loans are administered by offices in Oklahoma, Texas, or Kansas.
The accounting policies of each reportable segment are the same as those of Southwest as described in Note 1. Expenses for consolidated back-office operations are allocated to operating segments based on estimated uses of those services. General overhead expenses such as executive administration, accounting, and internal audit are allocated based on the direct expense and/or deposit and loan volumes of the operating segment. Income tax expense for the operating segments is calculated at statutory rates. The Other Operations segment records the tax expense or benefit necessary to reconcile to the consolidated financial statements.
Beginning January 1, 2011, all segments of Southwest’s subsidiaries reported results using organizational profitability. Prior to January 1, 2011, only the segments of Stillwater National reported results using organizational profitability, while the segments of Bank of Kansas reported results using a direct profitability approach. The change in method did not materially affect segment reporting and had no impact on the consolidated results of Southwest. The amounts for 2010 and 2009 have been restated using consolidated organizational profitability.
The following table summarizes financial results by operating segment:
| | | | | | | | | | | | | | | | | | | | | | | | | | | | |
| | | For the Year Ended December 31, 2011 | |
(Dollars in thousands) | | Oklahoma
Banking | | | Texas
Banking | | | Kansas
Banking | | | Out of
Market | | | Secondary
Market | | | Other
Operations * | | | Total
Company | |
Net interest income | | $ | 44,494 | | | $ | 36,619 | | | $ | 13,814 | | | $ | 6,565 | | | $ | 1,456 | | | $ | (6,616 | ) | | $ | 96,332 | |
Provision for loan losses | | | 16,226 | | | | 75,027 | | | | 9,494 | | | | 31,293 | | | | 61 | | | | — | | | | 132,101 | |
Noninterest income | | | 7,709 | | | | 1,816 | | | | 1,956 | | | | 221 | | | | 1,297 | | | | 1,019 | | | | 14,018 | |
Noninterest expense | | | 30,821 | | | | 27,723 | | | | 17,820 | | | | 7,896 | | | | 2,121 | | | | 3,820 | | | | 90,201 | |
| | | | | | | | | | | | | | | | | | | | | | | | | | | | |
Income (loss) before taxes | | | 5,156 | | | | (64,315 | ) | | | (11,544 | ) | | | (32,403 | ) | | | 571 | | | | (9,417 | ) | | | (111,952 | ) |
Taxes on income | | | 2,010 | | | | (25,079 | ) | | | (4,501 | ) | | | (12,636 | ) | | | 223 | | | | (3,674 | ) | | | (43,657 | ) |
| | | | | | | | | | | | | | | | | | | | | | | | | | | | |
Net income (loss) | | $ | 3,146 | | | $ | (39,236 | ) | | $ | (7,043 | ) | | $ | (19,767 | ) | | $ | 348 | | | $ | (5,743 | ) | | $ | (68,295 | ) |
| | | | | | | | | | | | | | | | | | | | | | | | | | | | |
|
* Includes externally generated revenue of $3.9 million, primarily from investing services, and an internally generated loss of $9.5 million from the funds management unit | |
| | | | | | | |
Fixed asset expenditures | | $ | 366 | | | $ | 3 | | | $ | 193 | | | $ | — | | | $ | 5 | | | $ | 1,119 | | | $ | 1,686 | |
Total loans at period end | | | 688,592 | | | | 665,010 | | | | 238,468 | | | | 132,723 | | | | 38,695 | | | | — | | | | 1,763,488 | |
Total assets at period end | | | 720,815 | | | | 665,846 | | | | 250,602 | | | | 136,579 | | | | 40,876 | | | | 568,155 | | | | 2,382,873 | |
Total deposits at period end | | | 1,406,360 | | | | 156,102 | | | | 276,757 | | | | — | | | | 1,430 | | | | 80,733 | | | | 1,921,382 | |
78
| | | | | | | | | | | | | | | | | | | | | | | | | | | | |
| | | For the Year Ended December 31, 2010 | |
(Dollars in thousands) | | Oklahoma
Banking | | | Texas
Banking | | | Kansas
Banking | | | Out of
Market | | | Secondary
Market | | | Other
Operations * | | | Total
Company | |
Net interest income | | $ | 43,557 | | | $ | 42,295 | | | $ | 15,437 | | | $ | 8,202 | | | $ | 1,560 | | | $ | (3,720 | ) | | $ | 107,331 | |
Provision for loan losses | | | 66 | | | | 22,992 | | | | 3,605 | | | | 8,897 | | | | — | | | | — | | | | 35,560 | |
Noninterest income | | | 7,866 | | | | 1,718 | | | | 4,050 | | | | 362 | | | | 2,319 | | | | 2,249 | | | | 18,564 | |
Noninterest expense | | | 27,724 | | | | 13,813 | | | | 14,455 | | | | 2,772 | | | | 2,302 | | | | 2,567 | | | | 63,633 | |
| | | | | | | | | | | | | | | | | | | | | | | | | | | | |
Income (loss) before taxes | | | 23,633 | | | | 7,208 | | | | 1,427 | | | | (3,105 | ) | | | 1,577 | | | | (4,038 | ) | | | 26,702 | |
Taxes on income | | | 8,769 | | | | 2,685 | | | | 543 | | | | (1,147 | ) | | | 597 | | | | (1,709 | ) | | | 9,738 | |
| | | | | | | | | | | | | | | | | | | | | | | | | | | | |
Net income (loss) | | $ | 14,864 | | | $ | 4,523 | | | $ | 884 | | | $ | (1,958 | ) | | $ | 980 | | | $ | (2,329 | ) | | $ | 16,964 | |
| | | | | | | | | | | | | | | | | | | | | | | | | | | | |
|
* Includes externally generated revenue of $7.9 million, primarily from investing services, and an internally generated loss of $7.0 million from the funds management unit | |
| | | | | | | |
Fixed asset expenditures | | $ | 161 | | | $ | 40 | | | $ | 152 | | | $ | — | | | $ | 52 | | | $ | 632 | | | $ | 1,037 | |
Total loans at period end | | | 871,393 | | | | 982,845 | | | | 289,642 | | | | 241,041 | | | | 35,194 | | | | — | | | | 2,420,115 | |
Total assets at period end | | | 899,269 | | | | 976,383 | | | | 389,813 | | | | 231,590 | | | | 37,483 | | | | 286,003 | | | | 2,820,541 | |
Total deposits at period end | | | 1,565,124 | | | | 160,181 | | | | 270,271 | | | | — | | | | 1,389 | | | | 255,763 | | | | 2,252,728 | |
| | | | | | | | | | | | | | | | | | | | | | | | | | | | |
| | | For the Year Ended December 31, 2009 | |
(Dollars in thousands) | | Oklahoma
Banking | | | Texas
Banking | | | Kansas
Banking** | | | Out of
Market | | | Secondary
Market | | | Other
Operations * | | | Total
Company | |
Net interest income | | $ | 44,651 | | | $ | 42,236 | | | $ | 14,518 | | | $ | 9,424 | | | $ | 1,139 | | | $ | (13,277 | ) | | $ | 98,691 | |
Provision for loan losses | | | 7,977 | | | | 12,838 | | | | 8,053 | | | | 10,308 | | | | — | | | | — | | | | 39,176 | |
Noninterest income | | | 8,899 | | | | 1,805 | | | | 6,020 | | | | 422 | | | | 2,063 | | | | 2,727 | | | | 21,936 | |
Noninterest expense | | | 25,993 | | | | 13,877 | | | | 11,918 | | | | 2,146 | | | | 3,439 | | | | 3,485 | | | | 60,858 | |
| | | | | | | | | | | | | | | | | | | | | | | | | | | | |
Income (loss) before taxes | | | 19,580 | | | | 17,326 | | | | 567 | | | | (2,608 | ) | | | (237 | ) | | | (14,035 | ) | | | 20,593 | |
Taxes on income | | | 7,420 | | | | 6,604 | | | | 143 | | | | (990 | ) | | | (89 | ) | | | (5,477 | ) | | | 7,611 | |
| | | | | | | | | | | | | | | | | | | | | | | | | | | | |
Net income (loss) | | $ | 12,160 | | | $ | 10,722 | | | $ | 424 | | | $ | (1,618 | ) | | $ | (148 | ) | | $ | (8,558 | ) | | $ | 12,982 | |
| | | | | | | | | | | | | | | | | | | | | | | | | | | | |
|
* Includes externally generated revenue of $10.1 million, primarily from investing services, and an internally generated loss of $19.1 million from the funds management unit | |
** Noninterest income includes the $3.3 million gain on acquisition previously described. | |
| | | | | | | |
Fixed asset expenditures | | $ | 2,290 | | | $ | 10 | | | $ | 2,419 | | | $ | — | | | $ | — | | | $ | 526 | | | $ | 5,245 | |
Total loans at period end | | | 933,150 | | | | 1,054,404 | | | | 359,633 | | | | 277,512 | | | | 43,134 | | | | — | | | | 2,667,833 | |
Total assets at period end | | | 950,355 | | | | 1,044,324 | | | | 441,114 | | | | 275,653 | | | | 45,148 | | | | 351,697 | | | | 3,108,291 | |
Total deposits at period end | | | 1,640,839 | | | | 160,064 | | | | 283,506 | | | | — | | | | 1,527 | | | | 506,794 | | | | 2,592,730 | |
| 19. | Parent Company Condensed Financial Information |
Following are the condensed financial statements of Southwest Bancorp, Inc. (“Parent Company only”) for the periods indicated:
| | | | | | | | |
| | | At December 31, | |
(Dollars in thousands) | | 2011 | | | 2010 | |
Statements of Financial Condition | | | | | | | | |
Assets: | | | | | | | | |
Cash and cash equivalents | | $ | 32,050 | | | $ | 37,542 | |
Investment in subsidiary banks | | | 348,681 | | | | 406,787 | |
Investments in other subsidiaries | | | 9,294 | | | | 12,820 | |
Investment securities, available for sale | | | 1,986 | | | | 1,267 | |
Other assets | | | 5,547 | | | | 2,254 | |
| | | | | | | | |
Total | | $ | 397,558 | | | $ | 460,670 | |
| | | | | | | | |
Liabilities: | | | | | | | | |
Subordinated debentures | | $ | 81,963 | | | $ | 81,963 | |
Other liabilities | | | 8,409 | | | | 895 | |
Shareholders’ Equity: | | | | | | | | |
Preferred stock and related accounts | | | 68,455 | | | | 67,724 | |
Common stock and related accounts | | | 238,731 | | | | 310,088 | |
| | | | | | | | |
Total | | $ | 397,558 | | | $ | 460,670 | |
| | | | | | | | |
79
| | | | | | | | | | | | |
| | | For the Year Ended December 31, | |
(Dollars in thousands) | | 2011 | | | 2010 | | | 2009 | |
Statements of Operations | | | | | | | | | | | | |
Income: | | | | | | | | | | | | |
Cash dividends from subsidiaries | | $ | 160 | | | $ | 159 | | | $ | 6,655 | |
Noninterest income | | | 774 | | | | 802 | | | | 1,091 | |
Investment income | | | 31 | | | | 352 | | | | 101 | |
Other operating income | | | 45 | | | | — | | | | — | |
Security gains | | | — | | | | 13 | | | | — | |
| | | | | | | | | | | | |
Total income | | | 1,010 | | | | 1,326 | | | | 7,847 | |
Expense: | | | | | | | | | | | | |
Interest on subordinated debentures | | | 5,306 | | | | 5,289 | | | | 5,495 | |
Noninterest expense | | | 2,107 | | | | 1,263 | | | | 2,273 | |
| | | | | | | | | | | | |
Total expense | | | 7,413 | | | | 6,552 | | | | 7,768 | |
| | | | | | | | | | | | |
Total income (loss) before taxes and equity in undistributed income of subsidiaries | | | (6,403 | ) | | | (5,226 | ) | | | 79 | |
Taxes on income (loss) | | | (2,563 | ) | | | (1,991 | ) | | | (2,440 | ) |
| | | | | | | | | | | | |
Income (loss) before equity in undistributed income of subsidiaries | | | (3,840 | ) | | | (3,235 | ) | | | 2,519 | |
Equity in undistributed income (loss) of subsidiaries | | | (64,455 | ) | | | 20,199 | | | | 10,463 | |
| | | | | | | | | | | | |
Net income (loss) | | $ | (68,295 | ) | | $ | 16,964 | | | $ | 12,982 | |
| | | | | | | | | | | | |
| | | | | | | | | | | | |
| | | For the Year Ended December 31, | |
(Dollars in thousands) | | 2011 | | | 2010 | | | 2009 | |
Statements of Cash Flows | | | | | | | | | | | | |
Operating activities: | | | | | | | | | | | | |
Net income | | $ | (68,295 | ) | | $ | 16,964 | | | $ | 12,982 | |
Equity in undistributed income of subsidiaries | | | 64,455 | | | | (19,550 | ) | | | (10,463 | ) |
Other, net | | | 499 | | | | 661 | | | | 1,301 | |
| | | | | | | | | | | | |
Net cash provided by (used in) operating activities | | | (3,341 | ) | | | (1,925 | ) | | | 3,820 | |
| | | | | | | | | | | | |
Investing activities: | | | | | | | | | | | | |
Available for sale securities: | | | | | | | | | | | | |
Purchases | | | (724 | ) | | | (180 | ) | | | (156 | ) |
Sales / Maturities | | | 46 | | | | 13 | | | | 118 | |
Capital contribution to Banks | | | — | | | | (25,000 | ) | | | (8,500 | ) |
Investment in/capital contribution to other subsidiaries | | | — | | | | — | | | | (10,010 | ) |
Return of capital/advances from other subsidiaries | | | — | | | | 70 | | | | 100 | |
| | | | | | | | | | | | |
Net cash used in investing activities | | | (678 | ) | | | (25,097 | ) | | | (18,448 | ) |
| | | | | | | | | | | | |
Financing activities: | | | | | | | | | | | | |
Net increase (decrease) in short-term borrowings | | | — | | | | — | | | | (15,000 | ) |
Net proceeds from issuance of common stock | | | 278 | | | | 54,497 | | | | 1,193 | |
Proceeds from issuance of subordinated debentures | | | — | | | | — | | | | — | |
Proceeds from issuance of preferred stock | | | — | | | | — | | | | — | |
Preferred stock dividend | | | (1,751 | ) | | | (3,851 | ) | | | (3,940 | ) |
Common stock dividends | | | — | | | | — | | | | (1,793 | ) |
| | | | | | | | | | | | |
Net cash provided by (used in) financing activities | | | (1,473 | ) | | | 50,646 | | | | (19,540 | ) |
| | | | | | | | | | | | |
Net increase (decrease) in cash and cash equivalents | | | (5,492 | ) | | | 23,624 | | | | (34,168 | ) |
Cash and cash equivalents, | | | | | | | | | | | | |
Beginning of year | | | 37,542 | | | | 13,918 | | | | 48,086 | |
| | | | | | | | | | | | |
End of year | | $ | 32,050 | | | $ | 37,542 | | | $ | 13,918 | |
| | | | | | | | | | | | |
80
| 20. | Selected Quarterly Financial Data (Unaudited) |
| | | | | | | | | | | | | | | | |
| | | For the Quarter Ended | |
(Dollars in thousands, except per share data) | | 12-31-11 | | | 09-30-11 | | | 06-30-11 | | | 03-31-11 | |
Operations Data | | | | | | | | | | | | | | | | |
Interest income | | $ | 27,065 | | | $ | 29,783 | | | $ | 31,472 | | | $ | 32,425 | |
Interest expense | | | 5,164 | | | | 5,758 | | | | 6,487 | | | | 7,004 | |
| | | | | | | | | | | | | | | | |
Net interest income | | | 21,901 | | | | 24,025 | | | | 24,985 | | | | 25,421 | |
Provision for loan losses | | | 78,285 | | | | 24,626 | | | | 20,140 | | | | 9,050 | |
Gain on sales of securities and loans | | | 637 | | | | 426 | | | | 401 | | | | 194 | |
Noninterest income | | | 2,939 | | | | 3,163 | | | | 3,203 | | | | 3,055 | |
Noninterest expenses | | | 41,903 | | | | 17,693 | | | | 14,980 | | | | 15,625 | |
| | | | | | | | | | | | | | | | |
Income (loss) before taxes | | | (94,711 | ) | | | (14,705 | ) | | | (6,531 | ) | | | 3,995 | |
Taxes on income | | | (36,450 | ) | | | (5,180 | ) | | | (3,561 | ) | | | 1,534 | |
| | | | | | | | | | | | | | | | |
Net income (loss) | | $ | (58,261 | ) | | $ | (9,525 | ) | | $ | (2,970 | ) | | $ | 2,461 | |
| | | | | | | | | | | | | | | | |
Net income (loss) available to common shareholders | | $ | (59,340 | ) | | $ | (10,589 | ) | | $ | (4,027 | ) | | $ | 1,408 | |
| | | | | | | | | | | | | | | | |
Per Share Data | | | | | | | | | | | | | | | | |
Basic earnings per common share | | $ | (3.05 | ) | | $ | (0.54 | ) | | $ | (0.21 | ) | | $ | 0.07 | |
Diluted earnings per common share | | | (3.05 | ) | | $ | (0.54 | ) | | $ | (0.21 | ) | | $ | 0.07 | |
Weighted average common shares outstanding | | | | | | | | | | | | | | | | |
Basic | | | 19,418,464 | | | | 19,415,760 | | | | 19,414,658 | | | | 19,409,317 | |
Diluted | | | 19,444,644 | | | | 19,426,736 | | | | 19,421,733 | | | | 19,422,774 | |
| | | | | | | | | | | | | | | | |
| | | For the Quarter Ended | |
(Dollars in thousands, except per share data) | | 12-31-10 | | | 09-30-10 | | | 06-30-10 | | | 03-31-10 | |
Operations Data | | | | | | | | | | | | | | | | |
Interest income | | $ | 34,686 | | | $ | 35,083 | | | $ | 36,279 | | | $ | 36,759 | |
Interest expense | | | 7,716 | | | | 8,631 | | | | 9,171 | | | | 9,958 | |
| | | | | | | | | | | | | | | | |
Net interest income | | | 26,970 | | | | 26,452 | | | | 27,108 | | | | 26,801 | |
Provision for loan losses | | | 7,265 | | | | 11,988 | | | | 7,776 | | | | 8,531 | |
Gain on sales of securities and loans | | | 697 | | | | 3,258 | | | | 450 | | | | 992 | |
Noninterest income | | | 3,392 | | | | 3,077 | | | | 3,512 | | | | 3,186 | |
Noninterest expenses | | | 16,811 | | | | 15,418 | | | | 16,146 | | | | 15,258 | |
| | | | | | | | | | | | | | | | |
Income before taxes | | | 6,983 | | | | 5,381 | | | | 7,148 | | | | 7,190 | |
Taxes on income | | | 2,675 | | | | 1,508 | | | | 2,737 | | | | 2,818 | |
| | | | | | | | | | | | | | | | |
Net income | | $ | 4,308 | | | $ | 3,873 | | | $ | 4,411 | | | $ | 4,372 | |
| | | | | | | | | | | | | | | | |
Net income available to common shareholders | | $ | 3,257 | | | $ | 2,825 | | | $ | 3,366 | | | $ | 3,329 | |
| | | | | | | | | | | | | | | | |
Per Share Data | | | | | | | | | | | | | | | | |
Basic earnings per common share | | $ | 0.17 | | | $ | 0.15 | | | $ | 0.19 | | | $ | 0.23 | |
Diluted earnings per common share | | | 0.17 | | | | 0.15 | | | | 0.19 | | | | 0.23 | |
Weighted average common shares outstanding | | | | | | | | | | | | | | | | |
Basic | | | 19,350,482 | | | | 19,342,909 | | | | 17,920,624 | | | | 14,712,594 | |
Diluted | | | 19,393,034 | | | | 19,386,571 | | | | 17,961,081 | | | | 14,733,599 | |
81
OTHER MATERIAL REQUIREDBY FORM 10-K
BUSINESS
General
Southwest is a bank holding company headquartered in Stillwater, Oklahoma which provides commercial and consumer banking services through its banking subsidiaries, Stillwater National and Bank of Kansas. Southwest was organized in 1981 as the holding company for Stillwater National, which was chartered in 1894. Southwest is registered as a bank holding company pursuant to the Bank Holding Company Act of 1956, as amended (the “Holding Company Act”). As such, Southwest is subject to supervision and regulation by the Federal Reserve. Stillwater National is a national bank subject to supervision and regulation by the OCC. Bank of Kansas, headquartered in South Hutchinson, Kansas, is a state chartered commercial bank and is subject to supervision and regulation by the FDIC and Kansas banking authorities. The deposit accounts of Southwest’s banking subsidiaries are insured by the FDIC to the maximum permitted by law.
Products and Services
Southwest offers a wide variety of commercial and consumer lending and deposit services. Southwest has developed internet banking services, calledSNB DirectBanker®, for consumer and commercial customers, a highly automated lockbox, imaging, and information service for commercial customers called “SNB Digital Lockbox,” and deposit products that automatically sweep excess funds from commercial demand deposit accounts and invest them in interest bearing funds (“Sweep Agreements”). The commercial loans offered by Southwest include (i) commercial real estate loans, (ii) working capital and other commercial loans, (iii) construction loans, and (iv) loans to small businesses. Consumer lending services include (i) student loans, (ii) residential real estate loans and mortgage banking services, and (iii) personal lines of credit and other installment loans. Southwest also offers deposit and personal banking services, including (i) commercial deposit services such as SNB Digital Lockbox, commercial checking, money market, and other deposit accounts, and (ii) retail deposit services such as certificates of deposit, money market accounts, checking accounts, NOW accounts, savings accounts, and automatic teller machine (“ATM”) access. Personal brokerage and credit cards are offered through relationships with independent institutions and Bank of Kansas.
Strategic Focus
Southwest’s banking philosophy is to provide a high level of customer service, a wide range of financial services, and products responsive to customer needs. This philosophy has led to the development of a line of deposit, lending, and other financial products that respond to professional and commercial customer needs for speed, efficiency, and information. These include Southwest’s Sweep Agreements, SNB Digital Lockbox, andSNB DirectBanker® and other internet banking products, which complement Southwest’s more traditional banking products. Southwest also emphasizes the marketing of personal banking, investment, and other financial services to highly educated, professional and business persons in its markets. Southwest seeks to build close relationships with businesses, professionals and their principals and to serve their banking needs throughout their business development and professional lives.
For a number of years, Southwest’s strategic focus has included expansion in carefully selected geographic markets based upon a tested business model developed in connection with its expansion into Oklahoma City in 1982. This geographic expansion has been based on identification of markets with concentrations of customers in Southwest’s traditional areas of expertise: healthcare and health professionals, businesses and their managers and owners, and commercial and commercial real estate lending, and makes use of traditional and specialized financial services. Specialized services include integrated document imaging and cash management services designed to help our customers in the healthcare industry and other record-intensive enterprises operate more efficiently. Southwest’s strategic focus also includes careful expansion of our community banking operations.
82
Organization
Southwest’s business operations are conducted through six operating segments that include regional divisions, a Secondary Market segment consisting of student lending, residential mortgage lending services, and government guaranteed commercial real estate lending, and an “other” segment that includes funds management (investment portfolio and funding). The organizational structure is designed to facilitate high customer service, prompt response, efficiency, and appropriate, uniform credit standards and other controls.
Banking Segments The banking segments include Oklahoma Banking, which includes the Stillwater division, the Central Oklahoma division based in Oklahoma City, and the Tulsa division; Texas Banking, which includes the Dallas-Frisco division, the Dallas-Preston Center division, the Austin division, and the San Antonio division; and Kansas Banking, which includes the FNBA division, the Hutchinson division, the Wichita division, and the Kansas City division. The Stillwater, FNBA, and Hutchinson divisions serve their respective markets as full-service community banks emphasizing both commercial and consumer lending. The other eight divisions pursue a more focused marketing strategy, targeting managers, professionals, and businesses for lending, and offering more specialized services. All of the regional divisions focus on commercial and consumer financial services to local businesses and their senior employees and to other managers and professionals living and working in Southwest’s market areas. Southwest has a high-service level philosophy. Loan officers often meet at the customer’s home or place of business to close loans.
The Out of Market segment primarily consists of healthcare and commercial real estate credits in thirty-five states other than Oklahoma, Texas, and Kansas.
Southwest has a long history of student and residential mortgage lending; however in 2010 Southwest reduced its student loan business. In 2010, Southwest began providing United States Department of Agriculture (“USDA”) government guaranteed commercial real estate lending services to rural healthcare providers. The operations comprise the Secondary Market business segment. Southwest manages its mortgage and student lending operations through its home office. Southwest originates first mortgage loans for sale to the Federal National Mortgage Association (“FNMA”) or private investors. Servicing on these loans may be released in connection with the sale.
Support and Control Functions Support and control functions are centralized, although each segment has support and control personnel. Costs of centrally managed support and control functions other than funds management (which is included in the Other Operations segment) are allocated to the Banking and Secondary Market segments. Southwest’s philosophy of customer service extends to its support and control functions. Southwest manages and offers products that are technology based, or that otherwise are more efficiently offered centrally through its home office. These include products that are marketed through the regional offices, such as Southwest’s internet banking product for commercial and retail customers (SNB DirectBanker®), commercial information, and item processing services (SNB Digital Lockbox). Southwest’s technology products are marketed to existing customers and to help develop new customer relationships. Use of these products by customers enables Southwest to serve its customers more effectively, use its resources more efficiently, and increase fee income.
For additional information regarding Southwest’s operating segments, please see “Note 18 Operating Segments” in the Notes to the Consolidated Financial Statements.
Banking Offices and Geographic Markets
Southwest intends to focus its efforts on markets with characteristics that will allow it to capitalize on its strengths, and to continue establishing new offices in those markets. Southwest considers acquisitions of other financial institutions and other companies, from time to time. Southwest also extends loans to borrowers in Oklahoma, Texas, Kansas and other states through participations with correspondent banks.
Southwest has twenty-three full-service banking offices, four located in Stillwater, Oklahoma, two each located in the Oklahoma City and Tulsa, Oklahoma metropolitan areas, two located in the Dallas, Texas metropolitan areas, two each located in the Hutchinson area and Wichita, Kansas, one each in Chickasha and Edmond, Oklahoma, Austin,
83
San Antonio, and Tilden, Texas, and Anthony, Harper, Mayfield and Overland Park, Kansas. It also operates loan production offices on the campus of the University of Oklahoma Health Sciences Center and in Houston, Texas. Southwest has developed and continues to pursue a business strategy that does not rely on an extensive branch network. National banks headquartered in Oklahoma have broad powers to establish de novo branches anywhere in Oklahoma or Texas, and Kansas chartered banks have broad powers to establish branches in Kansas.
Competition
Southwest encounters competition in seeking deposits and in obtaining loan, cash management, investment, and other customers. The level of competition for deposits is high. Southwest’s principal competitors for deposits are other financial institutions, including other national banks, state chartered banks, federal savings banks, and credit unions. Competition among these institutions is based primarily on interest rates and other terms offered, service charges imposed on deposit accounts, the quality of services rendered, and the convenience of banking facilities. Additional competition for depositors’ funds comes from U.S. Government securities, private issuers of debt obligations, and suppliers of other investment alternatives for depositors, such as securities firms. Competition from credit unions has intensified as historic federal limits on membership have been relaxed. Because federal law subsidizes credit unions by giving them a general exemption from federal income taxes, credit unions have a significant cost advantage over national banks, federal savings banks, and state banks, which are fully subject to federal income taxes. Credit unions may use this advantage to offer rates that are more competitive than those offered by national banks, federal savings banks, and state banks.
Southwest also competes in its lending activities with other financial institutions such as securities firms, insurance companies, credit unions, small loan companies, finance companies, mortgage companies, real estate investment trusts, and other sources of funds. Many of Southwest’s nonbank competitors are not subject to the same extensive federal regulations that govern bank holding companies and federally-insured banks. As a result, such nonbank competitors have advantages over Southwest in providing certain services. A number of the financial institutions with which Southwest competes in lending, deposit, investment, cash management, and other activities are larger than Southwest or have a significantly larger market share. The Texas and Kansas offices compete for loans, deposits, and other services against local and nationally based financial institutions, many of which have much larger market shares and widespread office networks. In recent periods, competition has increased in Southwest’s Oklahoma market areas as new entrants and existing competitors have sought to more aggressively expand their loan and deposit market share.
The business of mortgage banking is highly competitive. Southwest competes for loan originations with other financial institutions, such as mortgage bankers, state and national banks, federal savings banks, credit unions, and insurance companies. Many of Southwest’s competitors have financial resources that are substantially greater than those available to Southwest. Southwest competes principally by providing competitive pricing by motivating its sales force through the payment of commissions on loans originated and by providing high quality service to builders, borrowers, and realtors.
The Holding Company Act permits the Federal Reserve to approve an application of an adequately capitalized and adequately managed bank holding company to acquire control of, or acquire all or substantially all of the assets of, a commercial bank located in a state other than that holding company’s home state. The Federal Reserve may not approve the acquisition of a commercial bank that has not been in existence for the minimum time period (not exceeding five years) specified by the statutory law of the host state. The Holding Company Act also prohibits the Federal Reserve from approving an application if the applicant (and its depository institution affiliates) controls or would control more than 10% of the insured deposits in the United States or 30% or more of the deposits in the target commercial bank’s home state or in any state in which the target commercial bank maintains a branch. The Holding Company Act does not affect the authority of states to limit the percentage of total insured deposits in the state which may be held or controlled by a commercial bank or bank holding company to the extent such limitation does not discriminate against out-of-state commercial banks or bank holding companies. The Dodd-Frank Act substantially amended the legal framework that had previously governed interstate banking activities. Formerly, under the Reigle-Neal Interstate Banking and Branching Efficiency Act of 1994, a bank’s ability to branch into a particular state was largely dependent upon whether the state “opted in” to de novo interstate branching. Many states did not “opt-in”,
84
which resulted in branching restrictions in those states. The Dodd-Frank Act removed the “opt-in” concept and permits banks to engage in de novo branching outside of their home states, provided that the laws of the target state permit banks chartered in that state to branch within that state.
Regulation, Supervision, and Governmental Policy
Following is a brief summary of certain statutes and regulations that significantly affect Southwest and its banking subsidiaries. A number of other statutes and regulations affect Southwest and its subsidiaries but are not summarized below. Although Stillwater National and Bank of Kansas have different primary federal banking regulators, many of the rules that govern them are substantially the same. Where practical, the rules for all banks are discussed together below. For ease of reference the term “banks” is used below to include national and federal savings banks, and state-chartered banks, unless otherwise indicated. The term “commercial banks” includes nationally and state chartered banks, but not federal savings associations or federal savings banks.
Bank Holding Company Regulation – Southwest is registered as a bank holding company under the Holding Company Act and, as such, is subject to supervision and regulation by the Federal Reserve. As a bank holding company, Southwest is required to furnish to the Federal Reserve annual and quarterly reports of its operations and additional information and reports. Southwest is also subject to regular examination by the Federal Reserve.
Under the Holding Company Act, a bank holding company must obtain the prior approval of the Federal Reserve before (1) acquiring direct or indirect ownership or control of any class of voting securities of any national or state bank or bank holding company if, after the acquisition, the bank holding company would directly or indirectly own or control more than 5% of the class; (2) acquiring all or substantially all of the assets of another national bank or bank holding company; or (3) merging or consolidating with another bank holding company.
Under the Holding Company Act, any company must obtain approval of the Federal Reserve prior to acquiring control of Southwest or its banking subsidiaries. For purposes of the Holding Company Act, “control” is defined as ownership of more than 25% of any class of voting securities, the ability to control the election of a majority of the directors, or the exercise of a controlling influence over management or policies.
The federal Change in Bank Control Act and the related regulations of the Federal Reserve require any person or persons acting in concert (except for companies required to make application under the Holding Company Act) to file a written notice with the Federal Reserve before the person or persons acquire control of Southwest or its banking subsidiaries. The Change in Bank Control Act defines “control” as the direct or indirect power to vote 25% or more of any class of voting securities or to direct the management or policies of a bank holding company or an insured bank.
The Holding Company Act also limits the investments and activities of bank holding companies. In general, a bank holding company is prohibited from acquiring direct or indirect ownership or control of more than 5% of the voting shares of a company that is not a commercial bank or a bank holding company or from engaging directly or indirectly in activities other than those of banking, managing, or controlling commercial banks, providing services for its subsidiaries, non-bank activities that are closely related to banking and other financially related activities. The activities of Southwest are subject to these legal and regulatory limitations under the Holding Company Act and Federal Reserve regulations. Non-bank and financially related activities of bank holding companies also may be subject to regulation and oversight by regulators other than the Federal Reserve.
The Federal Reserve also has the power to order a holding company or its subsidiaries to terminate any activity, or to terminate its ownership or control of any subsidiary, when it has reasonable cause to believe that the continuation of such activity or such ownership or control constitutes a serious risk to the financial safety, soundness, or stability of any banking subsidiary of that holding company.
The Federal Reserve has adopted guidelines regarding the capital adequacy of bank holding companies, which require bank holding companies to maintain specified minimum ratios of capital to total assets and capital to risk-weighted assets. See “Regulatory Capital Requirements” on page 87 of this report.
85
The Federal Reserve has the power to prohibit dividends by bank holding companies if their actions constitute unsafe or unsound practices. The Federal Reserve has issued a policy statement on the payment of cash dividends by bank holding companies, which expresses the Federal Reserve’s view that a bank holding company should pay cash dividends only to the extent that the company’s net income for the past year is sufficient to cover both the cash dividends and a rate of earnings retention that is consistent with the company’s capital needs, asset quality, and overall financial condition. Southwest has made informal commitments to the Federal Reserve which include providing prior notice of the declaration and payment of dividends on trust preferred securities, preferred stock issued under the Treasury Department’s Capital Purchase Program, and common stock, and of planned receipt of dividends from its banking subsidiaries.
National Bank Regulation– As a national bank, Stillwater National is subject to the primary supervision of the OCC under the National Bank Act. The prior approval of the OCC is required for a national bank to establish or relocate a branch office or to engage in any merger, consolidation, or significant purchase or sale of assets.
The OCC regularly examines the operations and condition of Stillwater National including but not limited to its capital adequacy, loans, allowance for loan losses, investments, liquidity, interest rate risk, and management practices. These examinations are for the protection of Stillwater National’s depositors and the deposit insurance funds administered by the FDIC. In addition, Stillwater National is required to furnish quarterly and annual reports to the OCC. The OCC’s enforcement authority includes the power to remove officers and directors and the authority to issue cease-and-desist orders to prevent a national bank from engaging in unsafe or unsound practices or violating laws or regulations governing its business.
No national bank may pay dividends from its paid-in capital. All dividends must be paid out of current or retained net profits. The National Bank Act further restricts the payment of dividends out of net profits by prohibiting a national bank from declaring a dividend on its shares of common stock until the surplus fund equals the amount of capital stock or, if the surplus fund does not equal the amount of capital stock, until one-tenth of a national bank’s net profits for the preceding half year in the case of quarterly or semi-annual dividends, or the preceding two half-year periods in the case of annual dividends, are transferred to the surplus fund.
The approval of the OCC is required prior to the payment of a dividend if the total of all dividends declared by a national bank in any calendar year would exceed the total of its net profits for that year combined with its retained net profits for the two preceding years, less any required transfers to surplus or a fund for the retirement of any preferred stock. In addition, Stillwater National is prohibited by federal statute from paying dividends or making any other capital distribution that would cause Stillwater National to fail to meet its regulatory capital requirements. Further, the OCC also has authority to prohibit the payment of dividends by a national bank when it determines that their payment would be an unsafe and unsound banking practice. In addition, the January 2010 Formal Agreement between Stillwater National and the OCC requires prior OCC approval of dividends.
State Non-Member Bank Regulation– As a Kansas-chartered bank that is not a member of the Federal Reserve System, Bank of Kansas is subject to the primary supervision of the FDIC and Kansas state banking authorities. Prior regulatory approval is required for Bank of Kansas to establish or relocate a branch office or to engage in any merger, consolidation, or significant purchase or sale of assets.
The FDIC and Kansas banking authorities regularly examine the operations and condition of Bank of Kansas, including but not limited to its capital adequacy, loans, allowance for loan losses, investments, liquidity, interest rate risk, and management practices. These examinations are for the protection of Bank of Kansas’ depositors and the deposit insurance funds administered by the FDIC. In addition, Bank of Kansas is required to furnish quarterly and annual reports to the FDIC. FDIC and Kansas enforcement authority includes the power to remove officers and directors and the authority to issue cease-and-desist orders to prevent a state non-member bank from engaging in unsafe or unsound practices or violating laws or regulations governing its business.
86
Kansas state non-member banks are subject to limitations on dividends and are prohibited by federal statute from paying dividends or making any other capital distribution that would cause the banks to fail to meet its regulatory capital requirements or when dividend payment would be an unsafe and unsound banking practice.
Limits on Loans to One Borrower– National banks are subject to loans to one borrower limits. With certain limited exceptions, loans and extensions of credit from national banks outstanding to any borrower (including certain related entities of the borrower) at any one time may not exceed 15% of the unimpaired capital and surplus of the institution. A national bank may lend an additional amount, equal to 10% of unimpaired capital and surplus, if the loan is fully secured by readily marketable collateral. Certain types of loans are exempted from the lending limits, including loans secured by in-bank deposits. Kansas chartered banks are generally not allowed to make loans to one borrower (including certain related entities of the borrower) at any one time in excess of 25% of bank capital, with exceptions for certain cash and real estate collateralized extensions of credit.
Transactions with Affiliates– Stillwater National and Bank of Kansas are subject to restrictions imposed by federal law on extensions of credit to, and certain other transactions with, Southwest and other affiliates and on investments in their stock or other securities. These restrictions prevent Southwest and its nonbanking subsidiaries from borrowing from Stillwater National or Bank of Kansas unless the loans are secured by specified collateral and require those transactions to have terms comparable to terms of arms-length transactions with third persons. In addition, secured loans and other transactions and investments by Stillwater National or Bank of Kansas are generally limited in amount as to Southwest and as to any other affiliate to 10% of Stillwater National’s or Bank of Kansas’ capital and surplus and as to Southwest and all other affiliates together to an aggregate of 20% of Stillwater National’s or Bank of Kansas’ capital and surplus. Certain exemptions to these limitations apply to extensions of credit by, and other transactions between, Stillwater National or Bank of Kansas and Southwest’s other subsidiaries. These regulations and restrictions may limit Southwest’s ability to obtain funds from Stillwater National and Bank of Kansas for its cash needs, including funds for acquisitions and for payment of dividends, interest, and operating expenses.
Real Estate Lending Guidelines– Under federal banking regulations, banks must adopt and maintain written policies that establish appropriate limits and standards for extensions of credit secured by liens or interests in real estate or are made for the purpose of financing permanent improvements to real estate. These policies must establish loan portfolio diversification standards; prudent underwriting standards, including loan-to-value limits, that are clear and measurable; loan administration procedures; and documentation, approval, and reporting requirements. A bank’s real estate lending policy must reflect consideration of the Guidelines for Real Estate Lending Policies (the “Guidelines”) adopted by the federal banking regulators. The Guidelines, among other things, call for internal loan-to-value limits for real estate loans that are not in excess of the limits specified in the Guidelines. The Guidelines state, however, that it may be appropriate in individual cases to originate or purchase loans with loan-to-value ratios in excess of the supervisory loan-to-value limits.
Federal Deposit Insurance – Southwest’s bank subsidiaries pay deposit insurance premiums to the FDIC. For additional information, see “Management’s Discussion and Analysis — FDIC and other insurance” on page 18 of this report.
Regulatory Capital Requirements – The Federal Reserve, the OCC, and the FDIC have established guidelines for maintenance of appropriate levels of capital by bank holding companies, national banks, state chartered banks, and federal savings banks, respectively. The regulations impose two sets of capital adequacy requirements: minimum leverage rules, which require bank holding companies and banks to maintain a specified minimum ratio of capital to total average assets, and risk-based capital rules, which require the maintenance of specified minimum ratios of capital to “risk-weighted” assets.
Federal regulations require bank holding companies and banks to maintain a minimum leverage ratio of Tier 1 capital (as defined in the risk-based capital guidelines discussed in the following paragraphs) to total assets of 3.0%. The capital regulations state, however, that only the strongest bank holding companies and banks with composite examination ratings of 1 under the rating system used by the federal banking regulators would be permitted to operate at or near this minimum level of capital. All other bank holding companies and banks are expected to maintain a leverage ratio of at least 1% to 2% above the minimum ratio, depending on the assessment of an individual
87
organization’s capital adequacy by its primary regulator. A bank, or bank holding company, experiencing or anticipating significant growth is expected to maintain capital well above the minimum levels. In addition, the Federal Reserve has indicated that it also may consider the level of an organization’s ratio of tangible Tier 1 capital (after deducting all intangibles) to total assets in making an overall assessment of capital.
The risk-based capital rules require bank holding companies and banks to maintain minimum regulatory capital levels based upon a weighting of their assets and off-balance sheet obligations according to risk. The risk-based capital rules have two basic components: a core capital (Tier 1) requirement and a supplementary capital (Tier 2) requirement. Core capital consists primarily of common stockholders’ equity, and subject to certain limitations, qualifying perpetual preferred stock (noncumulative perpetual preferred stock with respect to national banks), trust preferred securities, minority interests in the equity accounts of consolidated subsidiaries, and deferred tax assets, less all intangible assets, except for certain mortgage servicing rights and purchased credit card relationships. Supplementary capital elements include, subject to certain limitations, the allowance for losses on loans and leases, and the amount of perpetual preferred stock and trust preferred securities that does not qualify as Tier 1 capital, long-term preferred stock with an original maturity of at least 20 years from issuance, hybrid capital instruments, including perpetual debt and mandatory convertible securities, subordinated debt, intermediate-term preferred stock, and up to 45% of pre-tax net unrealized gains on available for sale equity securities.
The Dodd-Frank Act includes certain provisions concerning the components of regulatory capital. Certain of these provisions are intended to eliminate or significantly reduce use of hybrid capital instruments, especially trust preferred securities, as regulatory capital. Under these provisions, trust preferred securities issued before May 19, 2010 by a company, such as Southwest, with total consolidated assets of less than $15 billion and treated as regulatory capital are grandfathered, but any such securities issued later are not eligible as regulatory capital.
The risk-based capital regulations assign balance sheet assets and credit equivalent amounts of off-balance sheet obligations to one of four broad risk categories based principally on the degree of credit risk associated with the obligor. The assets and off-balance sheet items in the four risk categories are weighted at 0%, 20%, 50%, and 100%. These computations result in the total risk-weighted assets. The risk-based capital regulations require all banks and bank holding companies to maintain a minimum ratio of total capital to total risk-weighted assets of 8%, with at least 4% as core capital. For the purpose of calculating these ratios: (i) supplementary capital is limited to no more than 100% of core capital; and (ii) the aggregate amount of certain types of supplementary capital is limited. In addition, the risk-based capital regulations limit the allowance for loan losses that may be included in capital to 1.25% of total risk-weighted assets.
The federal banking regulatory agencies have established a joint policy regarding the evaluation of banks’ capital adequacy for interest rate risk. Under the policy, the assessment of a bank’s capital adequacy includes an assessment of exposure to adverse changes in interest rates. Management believes its interest rate risk management systems and its capital relative to its interest rate risk are adequate.
Federal banking regulations also require banks with significant trading assets or liabilities to maintain supplemental risk-based capital based upon their levels of market risk. Stillwater National and Bank of Kansas did not have any trading assets or liabilities during 2011, 2010, and 2009 and were not required to maintain such supplemental capital.
The federal banking regulators have established regulations that classify banks by capital levels and provide for various “prompt corrective actions” to resolve the problems of any bank that fails to satisfy the capital standards. Under these regulations, a well-capitalized bank is one that is not subject to any regulatory order or directive to meet any specific capital level and that has a total risk-based capital ratio of 10% or more, a Tier 1 risk-based capital ratio of 6% or more, and a leverage ratio of 5% or more. An adequately capitalized bank is one that does not qualify as well-capitalized but meets or exceeds the following capital requirements: a total risk-based capital ratio of 8%, a Tier 1 risk-based capital ratio of 4%, and a leverage ratio of either (i) 4% or (ii) 3% if the bank has the highest composite examination rating. A bank that does not meet these standards is categorized as undercapitalized, significantly undercapitalized, or critically undercapitalized, depending on its capital levels. A bank that falls within any of the three undercapitalized categories established by the prompt corrective action regulation is subject to severe regulatory sanctions. As of December 31, 2011, Stillwater National and Bank of Kansas were well-capitalized as defined in
88
applicable banking regulations. Stillwater National has informally agreed with the OCC to maintain a Tier I leverage ratio of at least 8.5% and a total capital ratio of at least 12.5%. At December 31, 2011, Stillwater National’s ratios substantially exceeded the committed minimums. For information regarding Southwest’s, Stillwater National’s, and Bank of Kansas’ compliance with their respective regulatory capital requirements, see “Management’s Discussion and Analysis — Capital Resources” on page 29 of this report, “Management’s Discussion and Analysis — Certain Regulatory Matters” on page 31 of this report, and in the Notes to the Consolidated Financial Statements in this report, “Note 9 Subordinated Debentures” and “Note 13 Capital Requirements and Regulatory Matters”.
Basel III – United States banking regulators are members of the Basel Committee on Banking Supervision (the “Basel Committee”). The Basel Committee issues accords, which include capital guidelines for use by regulators in individual countries, generally referred to as Basel I (1988), Basel II (2004), and Basel III (2011). Basel III is intended for institutions with assets of $250 million or more or significant foreign exposure. However, United States banking regulators are likely to consider the Basel III guidelines in their determination of appropriate capital standards for all banking organizations. These may result in higher minimum capital requirements, a countercyclical capital buffer requirement, and liquidity standards.
Brokered Deposits – Well-capitalized institutions are not subject to limitations on brokered deposits, while an adequately capitalized institution is able to accept, renew, or rollover brokered deposits only with a waiver from the FDIC and subject to certain restrictions on the yield paid on such deposits. Undercapitalized institutions are not permitted to accept brokered deposits. Stillwater National and Bank of Kansas are each eligible to accept brokered deposits as a result of their capital levels. Stillwater National regularly makes use of brokered deposits. Bank of Kansas has not used brokered deposits but may do so in the future when management deems it appropriate from an asset/liability management perspective. Stillwater National has agreed to obtain OCC approval before increasing its use of brokered deposits. Stillwater National has reduced its reliance on brokered deposits and other non-core funding sources, and does not anticipate any increase in the usage of brokered deposits.
Supervision and Regulation of Mortgage Banking Operations– Southwest’s mortgage banking business is subject to the rules and regulations of the U.S. Department of Housing and Urban Development (“HUD”), the Federal Housing Administration (“FHA”), the Veterans’ Administration (“VA”), and FNMA with respect to originating, processing, selling, and servicing mortgage loans. Those rules and regulations, among other things, prohibit discrimination and establish underwriting guidelines, which include provisions for inspections and appraisals, require credit reports on prospective borrowers, and fix maximum loan amounts. Lenders such as Southwest are required annually to submit financial statements to FNMA, FHA, and VA, and each regulatory entity has its own financial requirements. Southwest’s affairs are also subject to examination by the Federal Reserve, FNMA, FHA, and VA at all times to assure compliance with the applicable regulations, policies, and procedures. Mortgage origination activities are subject to, among others, the Equal Credit Opportunity Act, Federal Truth-in-Lending Act, Fair Housing Act, Home Mortgage Disclosure Act, Fair Credit Reporting Act, the National Flood Insurance Act, and the Real Estate Settlement Procedures Act, and related regulations that prohibit discrimination and require the disclosure of certain basic information to mortgagors concerning credit terms and settlement costs. Southwest’s mortgage banking operations also are affected by various state and local laws and regulations and the requirements of various private mortgage investors.
Community Reinvestment– Under the Community Reinvestment Act (“CRA”), a financial institution has a continuing and affirmative obligation to help meet the credit needs of its entire community, including low- and moderate-income neighborhoods. The CRA does not establish specific lending requirements or programs for financial institutions or limit an institution’s discretion to develop the types of products and services that it believes are best suited to its particular community. However, institutions are rated on their performance in meeting the needs of their communities. Performance is tested in three areas: (a) lending, to evaluate the institution’s record of making loans in its assessment areas; (b) investment, to evaluate the institution’s record of investing in community development projects, affordable housing, and programs benefiting low- or moderate-income individuals and businesses; and (c) service, to evaluate the institution’s delivery of services through its branches, ATMs and other offices. The CRA requires each federal banking agency, in connection with its examination of a financial institution, to assess and assign one of four ratings to the institution’s record of meeting the credit needs of its community and to take such record into account in its evaluation of certain applications by the institution, including applications for
89
charters, branches, and other deposit facilities, relocations, mergers, consolidations, acquisitions of assets or assumptions of liabilities, and savings and loan holding company acquisitions. The CRA also requires that all institutions make public disclosure of their CRA ratings. Stillwater National and Bank of Kansas were assigned a “satisfactory” rating as a result of their last CRA examination.
Bank Secrecy Act– Under the Bank Secrecy Act (“BSA”), a financial institution is required to have systems in place to detect certain transactions based on the size and nature of the transaction. Financial institutions are generally required to report cash transactions involving more than $10,000 to the United States Treasury. In addition, financial institutions are required to file suspicious activity reports for transactions that involve more than $5,000 and which the financial institution knows, suspects, or has reason to suspect involves illegal funds, is designed to evade the requirements of the BSA, or has no lawful purpose. The Uniting and Strengthening America by Providing Appropriate Tools Required to Intercept and Obstruct Terrorism Act, commonly referred to as the “USA PATRIOT Act” or the “Patriot Act,” enacted in response to the September 11, 2001 terrorist attacks, enacted prohibitions against specified financial transactions and account relationships, as well as enhanced due diligence standards intended to prevent the use of the United States financial system for money laundering and terrorist financing activities. The Patriot Act requires banks and other depository institutions, brokers, dealers and certain other businesses involved in the transfer of money to establish anti-money laundering programs, including employee training and independent audit requirements meeting minimum standards specified by the act, to follow standards for customer identification and maintenance of customer identification records, and to compare customer lists against lists of suspected terrorists, terrorist organizations, and money launderers. The Patriot Act also requires federal bank regulators to evaluate the effectiveness of an applicant in combating money laundering in determining whether to approve a proposed bank acquisition.
Sarbanes-Oxley Act of 2002– The Sarbanes-Oxley Act of 2002 (“Sarbanes-Oxley”) established a broad range of corporate governance and accounting measures intended to increase corporate responsibility and protect investors by improving the accuracy and reliability of disclosures under federal securities laws. Southwest is subject to Sarbanes-Oxley because it is required to file periodic reports with the SEC under the Securities and Exchange Act of 1934. Among other things, Sarbanes-Oxley, its implementing regulations, and related NASDAQ Stock Market rules have established membership requirements and additional responsibilities for Southwest’s audit committee, imposed restrictions on the relationship between Southwest and its outside auditors (including restrictions on the types of non-audit services auditors may provide to their clients), imposed additional financial statement certification responsibilities for Southwest’s Chief Executive Officer and Chief Financial Officer, expanded the disclosure requirements for corporate insiders, required management to evaluate Southwest’s disclosure controls and procedures and its internal control over financial reporting, and required Southwest’s auditors to issue a report on Southwest’s internal control over financial reporting.
Capital Purchase Program– Southwest sold securities to the United States Treasury in the Treasury’s Capital Purchase Program, or “CPP”. The CPP is a voluntary program in which the Treasury offered to buy preferred securities and warrants from qualifying banks and bank holding companies. The same terms applied to all public company participants in the plan. The CPP provided an alternative source of capital funds to support growth and for other purposes at a time when the public market for banks securities was weak due to economic uncertainties affecting the whole banking sector. The purpose of the CPP was to stabilize financial markets by providing capital to healthy institutions and increase the flow of credit to businesses and consumers. For a description of CPP securities and their terms, see “Note 10 Shareholders’ Equity” in the Notes to the Consolidated Financial Statements.
Under the Emergency Economic Stabilization Act of 2008 as amended by the American Recovery and Reinvestment Act of 2009, participants in the CPP and certain of their officers are subject to special, complex requirements during the time that Treasury continues to hold their preferred securities, warrants, or common stock issued upon exercise of the warrants. These include prohibitions of: incentive compensation payments payable in cash or stock options to covered officers; incentive compensation paid in stock, except for grants of restricted stock that may not fully vest until after none of Southwest’s CPP preferred shares remain outstanding, and are limited in value to 1/3 of total compensation per covered officer; incentives that would cause a covered officer to take unnecessary and excessive risks that threaten the value of Southwest; payments to a covered officer triggered by his or her departure from employment, other than payments for services performed and accrued benefits; and payments of tax-gross ups, which are reimbursements to cover taxes owed by officers with respect to any compensation.
90
The incentive compensation restrictions apply to the five most highly compensated employees at Southwest. The severance payment restrictions apply to the Named Executive Officers and the next five most highly compensated officers. Some of the additional provisions of the Recovery Act may apply to additional officers at Southwest.
Covered officers also are required to return any bonus or incentive compensation they receive that was based upon statements of earnings, revenues, gains, or other criteria that are later found to be materially inaccurate.
Companies with outstanding CPP preferred securities also are required to: annually provide shareholders with an opportunity to cast nonbinding advisory votes on executive compensation; establish independent compensation committees; establish policies regarding excessive luxury expenditures; and provide certifications of compliance with these requirements.
Severance Payments –As noted above, the laws and regulations governing CPP participants prohibit parachute payments, which generally include any payment to a covered employee in connection with his or her separation from employment other than payment for services performed or benefits accrued. Southwest’s principal banking subsidiary, Stillwater National, also is subject to restrictions on parachute payments under the Federal Deposit Insurance Act. In the course of Southwest’s regular reviews of compliance, Southwest noted that it had made a payment to a former executive officer under a severance and release agreement following his departure in 2011. Southwest has disclosed this matter to the Treasury and its banking regulators, and is discussing it with them. The effect of this matter on Southwest is not currently known. The amount of the payments involved is less than $400,000.
Dodd-Frank Wall Street Reform and Consumer Protection Act (“Dodd Frank Act”) – The Dodd-Frank Act, enacted in July 2010, makes significant changes in laws regarding the structure of banking regulation, the powers of the Federal Reserve and other federal banking regulators, deposit insurance assessments, the handling of troubled institutions, regulatory capital calculations, reporting and governance obligations of public companies, and many other provisions affecting supervision of the banks, bank holding companies, and other financial services organizations. Among other things, the Dodd-Frank Act:
| | • | | Created the Consumer Financial Protection Bureau, whose regulations may adversely affect the business operations of financial institutions offering consumer financial products or services, including Southwest. Although the Consumer Financial Protection Bureau has jurisdiction over banks with $10 billion or greater in assets, rules, regulations and policies issued by the Bureau may also apply to the Southwest through the adoption of similar policies by the Federal Reserve, OCC, FDIC or Kansas banking authorities. In addition, the Dodd-Frank Act permits states to adopt consumer protection laws and regulations that are more stringent than Bureau regulations. |
| | • | | Makes permanent the $250,000 deposit insurance limit for insured deposits. |
| | • | | Revises the assessment base for calculating an insured depository institution’s deposit insurance premiums paid to the Deposit Insurance Fund to be based on average consolidated total assets minus average tangible equity rather than on deposits, and makes changes to the minimum designated reserve ratio of the Deposit Insurance Fund. |
| | • | | Eliminates the prohibition against payment of interest on demand deposits, which allows businesses to have interest bearing demand accounts formerly prohibited by law and Federal Reserve regulations. |
| | • | | Changes the requirements for certain transactions with affiliates and insiders. |
| | • | | Requires banking regulators to establish standards prohibiting as an unsafe and unsound practice any compensation plan of a bank holding company that provides an insider or other employee with excessive compensation or compensation that gives rise to excessive risk or could lead to a material financial loss to the institution. |
91
| | • | | Limits the use of new trust preferred securities issued after May 19, 2010 as regulatory capital. |
Significant elements of the Dodd-Frank Act have been implemented, but implementation of other elements of the Act requires additional regulations, many of which have not yet been established. It is too early to fully assess the effects of the Dodd-Frank Act and related regulations on Southwest’s business, financial condition, or results of operations.
Other Laws and Regulations– Some of the aspects of the lending and deposit business of Stillwater National and Bank of Kansas that are subject to regulation by the Federal Reserve and the FDIC include reserve requirements and disclosure requirements in connection with personal and mortgage loans and deposit accounts. Stillwater National’s federal student lending activities are subject to regulation and examination by the United States Department of Education. In addition, Stillwater National and Bank of Kansas are subject to numerous federal and state laws and regulations that include specific restrictions and procedural requirements with respect to the establishment of branches, investments, interest rates on loans, credit practices, the disclosure of credit terms, and discrimination in credit transactions.
Enforcement Actions– Federal statutes and regulations provide financial institution regulatory agencies with great flexibility to undertake an enforcement action against an institution that fails to comply with regulatory requirements. Possible enforcement actions range from the imposition of a capital plan and capital directive to civil money penalties, cease-and-desist orders, receivership, conservatorship, or the termination of deposit insurance.
Employees
As of December 31, 2011, Southwest employed 435 persons on a full-time equivalent basis, including executive officers, loan and other banking officers, branch personnel, and others. No employees of Southwest or any of its consolidated subsidiaries are represented by a union or covered under a collective bargaining agreement. Management of Southwest considers their employee relations to be excellent.
92
BOARDOF DIRECTORSOF SOUTHWEST BANCORP, INC.AND STILLWATER NATIONAL BANKAND TRUST COMPANY
| | |
| Robert B. Rodgers, Chairman of the Board | | President, Bob Rodgers Motor Company; Owner, Rapid Enterprises |
| |
| Rick Green, Vice Chairman of the Board | | President and Chief Executive Officer |
| | Southwest, Stillwater National, and Bank of Kansas |
| |
| James E. Berry II | | Owner, Pizza Berry, Inc. |
| |
| Tom D. Berry | | Auctioneer, Real Estate Broker, Oil & Gas Exploration |
| |
| Joe Berry Cannon | | Assistant Professor of Management, Oral Roberts |
| | University School of Business |
| |
| John Cohlmia | | Real Estate Broker, Levy Beffort |
| |
| David S. Crockett Jr., CPA | | Owner, David S. Crockett & Co., CPA’s |
| |
| J. Berry Harrison | | Oklahoma State Senator (retired) and Rancher |
| |
| James M. Johnson | | Self-employed Small Business Owner |
| |
| David P. Lambert | | Chairman of the Board, Lambert Construction Company |
| |
| Marran H. Ogilvie | | Independent Advisor |
| |
| Linford R. Pitts | | President, Stillwater Transfer & Storage, Inc. |
| |
| Russell W. Teubner | | Founder and Chief Executive Officer, |
| | HostBridge Technology |
BOARDOF DIRECTORSOF BANKOF KANSAS
| | |
| Robert B. Rodgers, Chairman of the Board | | President, Bob Rodgers Motor Company; Owner, Rapid Enterprises |
| |
| Rick Green, Vice Chairman of the Board | | President and Chief Executive Officer |
| | Southwest, Stillwater National, and Bank of Kansas |
| |
| Patrick L. Gearhart | | President, Wichita Division of Bank of Kansas |
| |
| Kathleen Laubhan | | Vice President, Wichita Division of Bank of Kansas |
| |
| Anthony W. Martin | | Retired Dentist |
| |
| Jon Ott | | President, Rural Banking Division of Bank of Kansas |
| |
| David W. Pitts | | Executive Vice President, Chief Banking Officer, Bank of Kansas; Senior Vice President of Stillwater National |
| |
| Douglas J. Watts | | President, Overland Park Division of Bank of Kansas |
93
EXECUTIVE OFFICERS
The following table sets forth information regarding the executive officers of Southwest, Stillwater National, and Bank of Kansas who are not directors of Southwest.
| | | | |
Name | | Age | | Position |
| Priscilla Barnes | | 55 | | Executive Vice President and Corporate Chief Credit Officer of Southwest, Stillwater National, and Bank of Kansas |
| | |
| John Danielson | | 53 | | Executive Vice President and Corporate Chief Banking Officer of Southwest and Stillwater National |
| | |
| Steven M. Gobel | | 60 | | Executive Vice President and Chief Accounting and Controls Officer of Southwest and Stillwater National; Executive Vice President, Chief Accounting Officer, and Assistant Secretary of Bank of Kansas |
| | |
| Laura Robertson | | 38 | | Executive Vice President and Corporate Chief Financial Officer of Southwest, Stillwater National, and Bank of Kansas |
| | |
| Kimberly G. Sinclair | | 56 | | Executive Vice President and Chief Administrative Officer of Stillwater National and Bank of Kansas |
| | |
| Charles H. Westerheide | | 63 | | Executive Vice President and Treasurer of Southwest, Stillwater National and Bank of Kansas |
The principal occupations and business experience of each executive officer of Southwest, Stillwater National, and Bank of Kansas are shown below.
Priscilla Barneswas elected to the position of Executive Vice President and Corporate Chief Credit Officer for Stillwater National and Bank of Kansas in July 2011. Previous to the appointment, Ms. Barnes served as Executive Vice President, Regulatory Risk Management. Ms. Barnes has 32 years of experience in the banking industry, joining Stillwater National Bank in 2005 as Vice President, Compliance. Prior to joining Stillwater National Bank, Ms. Barnes was a federal bank examiner, a senior consultant for a regional accounting firm, and served as a banker in many similar capacities. She was named an Oklahoma State University Regent’s Distinguished Scholar and attended the Graduate School of Banking in Madison, Wisconsin.
John Danielsonwas appointed Executive Vice President and Corporate Chief Banking Officer, for Stillwater National in July 2011. Previous to this election, Mr. Danielson served as President of SNB Bank of San Antonio where he oversaw two full-service branch locations and grew lending relationships in the San Antonio market. Prior to joining Stillwater National, Mr. Danielson held various positions with operations in South Texas, including Senior Vice President and regional manager for Compass Bank and Bank of America. His financial experience has been focused on commercial and business banking, commercial real estate, and healthcare and private banking. Mr. Danielson has also served as a District Retail Executive. Mr. Danielson received his Bachelor of Science degree and Masters of Business Administration from the University of Florida. He has served as Treasurer for the San Antonio Chapter of the University of Florida Alumni Association. Mr. Danielson’s past community involvement includes: Kiwanis, Habitat for Humanity, Former Director of the San Antonio Business Development Fund, and North San Antonio Chamber of Commerce.
Steven M. Gobelserves as Executive Vice President, Chief Accounting and Controls Officer, and Enterprise Risk Manager. Mr. Gobel currently serves on the Board of Directors, and chairs the Finance Committee, for the Stillwater Country Club. He was a participant in the 2011 Leadership Stillwater Class of XX. From 1990 until
94
joining Stillwater National in September 2000, Mr. Gobel served as Senior Vice President of Finance and in other positions with Bank of America and predecessor institutions in Oklahoma and Kansas (previous institutions included NationsBank, Boatmen’s Bank of St. Louis, Bank IV of Wichita, Kansas, and Fourth National Bank of Tulsa). From 1987 to 1990, Mr. Gobel served as a Vice President and Manager of Financial Reporting and Financial Planning for Sooner Federal Savings and Loan of Oklahoma. He is a Certified Public Accountant and prior to 1987 spent twelve years working for International Public Accounting Firms (previously Touche Ross and Coopers & Lybrand) in Tulsa, Oklahoma, New York City, New York, and Milwaukee, Wisconsin.
Laura Robertsonwas appointed Executive Vice President and Corporate Chief Financial Officer in December 2010. Additionally, Ms. Robertson was named assistant secretary of the Board of Directors for Bank of Kansas in 2010 and she also serves as secretary of Southwest. She joined Stillwater National in April 2006 and served as the Finance Division Manager and became an officer and assistant secretary of Southwest in 2006. Prior to joining Stillwater National, Ms. Robertson practiced public accounting in the Dallas, Texas metro area. She is a Certified Public Accountant and a member of both the Oklahoma and Texas Society of CPAs as well as the American Institute of Certified Public Accountants. Ms. Robertson currently serves on the Board of Directors for Payne County Court Appointed Special Advocates.
Kimberly G. Sinclair was appointed Chief Administrative Officer in 1995 and has been Executive Vice President since 1991. Prior to 1991, she had been Senior Vice President and Chief Operations Officer of Stillwater National since 1985. Ms. Sinclair joined Stillwater National in 1975. She is a member of the Stillwater Junior Service Sustainers and recently served a six year term on the Executive Board of Directors for the Stillwater United Way, where she chaired the 2005 and 2006 Day of Caring, as well as the Leader’s Society. She is past Treasurer of the Board of Trustees of the Stillwater Public Education Foundation and a graduate of the Leadership Stillwater Class IX. She has been an Ambassador with the Stillwater Chamber of Commerce and active with various organizations throughout Stillwater.
Charles H. Westerheide was appointed Executive Vice President and Treasurer in 2000. Prior to that, he served as Senior Vice President and Treasury Manager. He joined Stillwater National in 1997, coming from Bank of America (previously Bank IV and NationsBank), Wichita, Kansas, where he served as Treasury/Funding Manager. Prior to joining Bank IV, Mr. Westerheide served as Executive Vice President and Chief Financial Officer of Security Bank and Trust Co., Ponca City, Oklahoma. Mr. Westerheide has held a number of community leadership positions including Chairman of the Ponca City Chamber of Commerce, President of the Ponca City Foundation for Progress, Inc., and a director and officer of numerous community foundations and clubs. Mr. Westerheide is a graduate of Leadership Oklahoma, Class II.
95
RISK FACTORS
Investing in our common stock involves risks. You should carefully consider the following risk factors before you decide to make an investment decision regarding our stock. The risk factors may cause our future earnings to be lower or our financial condition to be less favorable than we expect. In addition, other risks of which we are not aware, or which we do not believe are material, may cause earnings to be lower or may hurt our financial condition. You should also consider the other information in this Annual Report on Form 10-K, as well as in the documents incorporated by reference into it.
Risks Relating to our Business
Difficult and unsettled market conditions have affected our profits and loan quality and may continue to do so for an unknown period.
Unsettled market conditions may increase the likelihood and the severity of adverse effects discussed in the following risk factors, in particular:
| | • | | there may be less demand for our products and services; |
| | • | | competition in our industry could intensify as a result of increased consolidation of the banking industry; |
| | • | | it may become more difficult to estimate losses inherent in our loan portfolio; |
| | • | | loan delinquencies and problem assets may increase; |
| | • | | collateral for loans may decline in value, increasing loan to value ratios and reducing our customers’ borrowing power and the security for our loans; |
| | • | | deposits and borrowings may become even more expensive relative to yields on loans and securities, reducing our net interest margin, and making it more difficult to maintain adequate sources of liquidity; |
| | • | | asset based liquidity, which depends upon the marketability of assets such as student loans and mortgages, may be reduced; and |
| | • | | compliance with banking regulations enacted in connection with stimulus legislation and other new legislation may increase our costs, limit our ability to pursue business opportunities, and impair our ability to hire and retain talented managers. |
Changes in interest rates and other factors beyond our control may adversely affect our earnings and financial condition.
Our net income depends to a great extent upon the level of our net interest income. Changes in interest rates can increase or decrease net interest income and net income. Net interest income is the difference between the interest income we earn on loans, investments, and other interest-earning assets, and the interest we pay on interest-bearing liabilities, such as deposits and borrowings. Net interest income is affected by changes in market interest rates, because different types of assets and liabilities may react differently, and at different times, to market interest rate changes. When interest-bearing liabilities mature or reprice more quickly than interest-earning assets in a period, an increase in market rates of interest could reduce net interest income. Similarly, when interest-earning assets mature or reprice more quickly than interest-bearing liabilities, falling interest rates could reduce net interest income.
Changes in market interest rates are affected by many factors beyond our control, including inflation, unemployment, money supply, international events, and events in world financial markets. We attempt to manage our risk from changes in market interest rates by adjusting the rates, maturity, repricing, and balances of the different types of interest-earning assets and interest-bearing liabilities, but interest rate risk management techniques are not exact. As a result, a rapid increase or decrease in interest rates could have an adverse effect on our net interest margin and results of operations. Changes in the market interest rates for types of products and services in our various markets also may vary significantly from location to location and over time based upon competition and local or regional economic factors. The results of our interest rate sensitivity simulation model depend upon a number of assumptions which may not prove to be accurate. There can be no assurance that we will be able to successfully manage our interest rate risk.
96
Changes in local economic conditions could adversely affect our business.
Our commercial and commercial real estate lending operations are concentrated in the metropolitan areas of Oklahoma City, Stillwater, Edmond, and Tulsa, Oklahoma; Dallas, Austin, San Antonio, and Houston, Texas; and Hutchinson, Wichita, and Kansas City, Kansas. Our success depends in part upon economic conditions in these markets. Adverse changes in economic conditions in these markets could reduce our growth in loans and deposits, impair our ability to collect our loans, increase our problem loans and charge-offs and otherwise negatively affect our performance and financial condition.
Adverse changes in healthcare-related businesses could lead to slower loan growth and higher levels of problem loans and charge-offs.
We have a substantial amount of loans to individuals and businesses involved in the healthcare industry, including business and personal loans to physicians, dentists, and other healthcare professionals, and loans to for-profit hospitals, nursing homes, suppliers and other healthcare-related businesses. Our strategy calls for continued growth in healthcare lending. This concentration exposes us to the risk that adverse developments in the healthcare industry could hurt our profitability and financial condition as a result of increased levels of nonperforming loans and charge-offs and reduced loan demand and deposit growth.
The Patient Protection and Affordable Care Act, as amended by the Health Care and Educations Reconciliations Act of 2010, is expected to have profound effects on the provision of healthcare in the United States. We have assessed its potential effects on the market for healthcare and our services for the healthcare industry, and believe it will have a net positive effect on them. However, the law is complex and implementation requires the adoption of significant regulations. As a result, our assessment may be wrong, which could have adverse effects on the growth and profitability of our healthcare business.
Our allowance for loan losses may not be adequate to cover our actual loan losses, which could adversely affect our earnings.
We maintain an allowance for loan losses in an amount that we believe is appropriate to provide for losses inherent in the portfolio. While we strive to carefully monitor credit quality and to identify loans that may become nonperforming, at any time there are loans included in the portfolio that will result in losses but that have not been identified as nonperforming or potential problem loans. We cannot be sure that we will be able to identify deteriorating loans before they become nonperforming assets or that we will be able to limit losses on those loans that are identified. As a result, future additions to the allowance may be necessary. Additionally, future additions may be required based on changes in the loans comprising the portfolio and changes in the financial condition of borrowers, such as may result from changes in economic conditions or as a result of incorrect assumptions by management in determining the allowance. Additionally, federal banking regulators, as an integral part of their supervisory function, periodically review our allowance for loan losses. These regulatory agencies may require us to increase our provision for loan losses or to recognize further loan charge-offs based upon their judgments, which may be different from ours. Any increase in the allowance for loan losses could have a negative effect on our financial condition and results of operations.
Commercial and commercial real estate loans comprise a significant portion of our total loan portfolio. These types of loans typically are larger than residential real estate loans and other consumer loans. Because the loan portfolio contains a significant number of commercial and commercial real estate loans with relatively large balances, the deterioration of one or a few of these loans may cause a significant increase in nonperforming assets. An increase in nonperforming loans could result in a loss of earnings from these loans, an increase in the provision for loan losses, or an increase in loan charge-offs, which could have an adverse impact on our results of operations and financial condition.
97
The results of our most recent internal credit stress test may not accurately predict the impact on our financial condition if the economy’s performance is worse than we expect.
We perform internal assessments of our capital as part of our planning process. Our process includes stress testing using alternative credit quality assumptions in order to estimate their effects on loan loss provisions, net income, and regulatory capital ratios. The alternative assumptions include baseline credit quality assumptions and more adverse credit quality assumptions.
The results of these stress tests involve assumptions about the economy and future loan losses and default rates and may not accurately reflect the impact on our earnings or financial condition or actual future conditions. Actual future economic conditions may result in significantly higher credit losses than we assume in our stress tests, with a corresponding negative impact on our earnings, financial condition, and capital than those predicted by our internal stress test.
We may not realize our deferred tax assets.
We may experience negative or unforeseen tax consequences. We reviewed the probability of the realization of our deferred tax assets based on forecasts of taxable income. This review uses historical results, projected future operating results based upon approved business plans, eligible carryforward and carryback periods, tax-planning opportunities and other relevant considerations. Adverse changes in the profitability and financial outlook in the U.S. and our industry may require the creation of a valuation allowance to reduce our deferred tax assets. Such changes could result in material non-cash expenses in the period in which the changes are made and could have a material adverse impact on Southwest’s results of operations and financial condition.
We use wholesale funding sources to supplement our core deposits, which exposes us to liquidity risk and potential earnings volatility or other adverse effects if we are unable to secure adequate funding.
We rely on wholesale funding, including Federal Home Loan Bank, or “FHLB”, borrowings, federal funds purchased, and brokered deposits, to supplement core deposits to fund our business. Wholesale funding sources are affected by general market conditions and the condition and performance of the borrower, and the availability of funding from wholesale lenders may be dependent on the confidence these investors have in our operations. In addition, under Stillwater National’s formal agreement with the OCC and related OCC guidance it must obtain prior approval for increases in brokered deposits as a percentage of total deposits above the amount outstanding on December 31, 2009. We believe, based upon our current levels of brokered deposits and our funding forecasts, that Stillwater National has funding from other sources sufficient enough to avoid any increase in brokered deposit usage above that level and do not believe that we will be required to request approval for any such increase from the OCC. However, our deposit and funding forecasts may be inaccurate, or market conditions could change which could cause us to ask for approval, and the OCC might not approve such an increase.
The continued availability to us of these funding sources cannot be assured, and we may find it difficult to retain or replace them at attractive rates as they mature. Our liquidity will be constrained if we are unable to renew our wholesale funding sources or if adequate financing is not available to us in the future at acceptable rates of interest or at all. We may not have sufficient liquidity to continue to fund new loans, and we may need to liquidate loans or other assets unexpectedly in order to repay obligations as they mature. If we do not have adequate sources of liquidity at attractive rates, we may have to restrain the growth of assets or reduce our asset size, which may adversely affect shareholder value.
Our earnings and financial condition may be adversely affected by changes in accounting principles and in tax laws, or the interpretation of them.
Changes in U.S. generally accepted accounting principles could have negative effects on our reported earnings and financial condition.
98
Changes in tax laws, rules, and regulations, including changes in the interpretation or implementation of tax laws, rules, and regulations by the Internal Revenue Service or other governmental bodies, could affect us in significant and unpredictable ways. Such changes could subject us to additional costs, among other things. Failure to comply with tax laws, rules, and regulations could result in sanctions by regulatory agencies, civil money penalties, and reputation damage.
Additionally, we conduct quarterly assessments of our deferred tax assets. The carrying value of these assets is dependent upon earnings forecasts and prior period changes, among other things. A significant change in our assumptions could affect the carrying value of our deferred tax assets on our balance sheet.
Government regulation significantly affects our business.
The banking industry is heavily regulated. Banking regulations are primarily intended to protect the federal deposit insurance funds and depositors, not shareholders. Stillwater National is subject to regulation and supervision by the OCC. Bank of Kansas is subject to regulation and supervision by the FDIC and Kansas Banking authorities. We are subject to regulation and supervision by the Board of Governors of the Federal Reserve System. The burden imposed by federal and state regulations puts banks at a competitive disadvantage compared to less regulated competitors such as finance companies, mortgage banking companies, and leasing companies.
Changes in the laws, regulations, and regulatory practices affecting the banking industry may limit our ability to increase or assess fees for services provided, increase our costs of doing business or otherwise adversely affect us and create competitive advantages for others. Regulations affecting banks and financial services companies undergo continuous change, and we cannot predict the ultimate effect of these changes, which could have a material adverse effect on our profitability or financial condition. Federal economic and monetary policy may also affect our ability to attract deposits and other funding sources, make loans and investments, and achieve satisfactory interest spreads.
The FDIC insures deposits at insured financial institutions up to certain limits. The FDIC charges insured financial institutions premiums to maintain the Deposit Insurance Fund. Economic conditions in the past three years have increased expectations for bank failures, in which case the FDIC would take control of failed banks and ensure payment of deposits up to insured limits using the resources of the Deposit Insurance Fund. In such case, the FDIC may increase our deposit insurance costs by increasing regular assessment rates and levying special assessments, which may in the future significantly and adversely affect our net income.
The Dodd-Frank Act will continue to increase our regulatory compliance burden and costs, may place restrictions on certain products and services, and limits our future capital raising alternatives.
The 2010 Dodd-Frank Wall Street Reform and Consumer Protection Act (the “Dodd-Frank Act”) made significant, wide-ranging changes in the regulation of the financial services industry that affect all financial institutions, including Southwest. The Dodd-Frank Act is likely to continue to increase Southwest’s regulatory compliance burden, increase the costs associated with regulatory examinations and compliance measures, and increase other operating costs.
Among other things, the Dodd-Frank Act eliminated the prohibition of paying interest on commercial demand deposits, which may increase Southwest’s funding costs, and limits the use of new trust preferred securities as regulatory capital. In addition, the Dodd-Frank Act created the Consumer Financial Protection Bureau, whose regulations may adversely affect the business operations of financial institutions offering consumer financial products or services, including Southwest. Although the Consumer Financial Protection Bureau has jurisdiction over banks with $10 billion or greater in assets, rules, regulations and policies issued by the Bureau may also apply to Southwest through the adoption of similar policies by the Federal Reserve, OCC, FDIC or Kansas banking authorities.
99
Significant elements of the Dodd-Frank Act have been implemented, but implementation of other elements of the Act requires additional regulations, many of which have not yet been established. It is too early to fully assess the effects of the Dodd-Frank Act and related regulations on Southwest’s business, financial condition, or results of operations.
We have entered into formal and informal agreements with the OCC and have made informal commitments to the Federal Reserve that may adversely affect our operations. Failure to comply with these agreements and commitments could subject us, Stillwater National, and our directors to additional enforcement actions and could damage our reputation.
Our agreements and commitments with the OCC and Federal Reserve relate primarily to our concentrations in commercial real estate lending and our high levels of nonperforming and potential nonperforming loans, most of which are commercial real estate loans. Although we are committed to compliance with our agreements and commitments and are taking aggressive actions to comply with them, we may not be able to reduce our commercial real estate loan concentrations or problem and potential problem assets enough to fulfill expectations of the banking regulators. The agreement with the OCC does not require that Stillwater National maintain any specific capital ratios; however, Stillwater National has informally agreed to maintain at least a Tier I leverage ratio of 8.5% and a total capital ratio of 12.5%. At December 31, 2011, Stillwater National’s capital ratios significantly exceeded these levels and the regulatory minimums for well-capitalized status. An inability to sufficiently reduce our commercial real estate loan concentrations and problem and potential problem assets or a decrease in capital ratios below the levels to which Stillwater National has informally committed could lead to a need to raise additional capital upon terms which may not be favorable to our existing securities holders and additional regulatory restrictions which could further limit our operations.
Examination reports may include significant findings and assessments about our condition and operations that are not publicly disclosed. Assessments by bank examiners may cause us to increase our publicly reported problem assets and potential problem loans, charge-offs, or provisions for loan losses.
Examinations by federal and state bank regulatory agencies include assessments of risk, financial health, capital adequacy, loan risk, and other factors that federal banking laws do not allow to be publicly disclosed. The assignment of loans to credit risk categories involves judgment and the application of credit policies. In their examinations, federal and state banking examiners may assign different risk categories to loans than those assigned by our third party loan review firms or management. In that case, Southwest must amend its risk categorizations to match those assigned by the bank examiners, which may result in increases in publicly reported problem and potential problem loans, charge-offs, or provisions for loan losses.
Our decisions regarding the fair value of assets acquired could be inaccurate and our estimated loss share receivable in FDIC-assisted acquisitions may be inadequate, which could adversely affect our business, financial condition, results of operations, and future prospects.
In accordance with generally accepted accounting principles, we record assets acquired and liabilities assumed in business combinations at their fair values. The determination of the initial fair values can be complex and involves a high degree of judgment. Goodwill is initially recorded as the excess of the fair value of liabilities assumed over the fair value of tangible and identifiable intangible assets acquired in a business combination, and thereafter is tested for impairment at least annually. If the current fair value is determined to be less than the carrying value, an impairment loss is recorded. Our impairment testing of goodwill has not resulted in any losses to date.
Management makes various assumptions and judgments about the collectability of acquired loan portfolios, including the creditworthiness of borrowers and the value of the real estate and other assets serving as collateral for the repayment of secured loans. In FDIC-assisted acquisitions that include loss share agreements, we may record a loss share receivable that we consider adequate to absorb future losses which may occur in the acquired loan portfolio. In determining the size of the loss share receivable, we analyze the loan portfolio based on historical loss experience, volume and classification of loans, volume and trends in delinquencies and nonaccruals, local economic conditions, and other pertinent information.
100
If our assumptions are incorrect, our current loss share receivable may be insufficient to cover future loan losses, and increased loss reserves may be needed to respond to different economic conditions or adverse developments in the acquired loan portfolio. Any increase in future loan losses could have a negative effect on our operating results.
The acquisition of banks, bank branches, and other businesses involve risks.
In the future we may acquire additional banks, branches or other financial institutions, or other businesses. We cannot assure you that we will be able to adequately or profitably manage any such acquisitions. The acquisition of banks, bank branches, and other businesses involves risk, including exposure to unknown or contingent liabilities, the uncertainties of asset quality assessment, the difficulty and expense of integrating the operations and personnel of the acquired companies with ours, the potential negative effects on our other operations of the diversion of management’s time and attention, and the possible loss of key employees and customers of the banks, businesses, or branches we acquire. Our failure to execute our internal growth strategy or our acquisition strategy could adversely affect our business, results of operations, financial condition, and future prospects.
We rely on our management and other key personnel, and the loss of any of them may adversely affect our operations.
We are and will continue to be dependent upon the services of our executive management team. In addition, we will continue to depend on our ability to retain and recruit key commercial loan officers. The unexpected loss of services of any key management personnel or the inability to recruit and retain qualified personnel in the future could have an adverse effect on our business and financial condition. Banking regulations adopted in connection with federal stimulus legislation may make it more difficult to retain and recruit senior managers.
Competition may decrease our growth or profits.
We compete for loans, deposits, and investment dollars with other banks and other financial institutions and enterprises, such as securities firms, insurance companies, savings associations, credit unions, mortgage brokers, and private lenders, many of which have substantially greater resources than ours. Credit unions have federal tax exemptions, which they may take advantage of to offer lower rates on loans and higher rates on deposits than taxpaying financial institutions such as commercial banks. In addition, non-depository institution competitors are generally not subject to the extensive regulation applicable to institutions that offer federally insured deposits. Other institutions may have other competitive advantages in particular markets or may be willing to accept lower profit margins on certain products. These differences in resources, regulation, competitive advantages, and business strategy may decrease our net interest margin, may increase our operating costs, and may make it harder for us to compete profitably.
Risks Related to Ownership of Our Common Stock
The market price for our common stock may be highly volatile, which may make it difficult for investors to resell shares of common stock at times or prices they find attractive.
The overall market and the price of our common stock may continue to be volatile as a result of a variety of factors, many of which are beyond our control. These factors include, in addition to those described in these Risk Factors:
| | • | | actual or anticipated quarterly fluctuations in our operating results and financial condition; |
| | • | | changes in financial estimates or publication of research reports and recommendations by financial analysts or actions taken by rating agencies with respect to us or other financial institutions; |
| | • | | speculation in the press or investment community generally or relating to our reputation or the financial services industry; |
| | • | | the size of the public float of our common stock; |
101
| | • | | strategic actions by us or our competitors, such as acquisitions, restructurings, dispositions, or financings; |
| | • | | fluctuations in the stock price and operating results of our competitors; |
| | • | | future sales of our equity or equity-related securities; |
| | • | | proposed or adopted regulatory changes or developments; |
| | • | | anticipated or pending investigations, proceedings, or litigation that involve or affect us; |
| | • | | domestic and international economic factors unrelated to our performance; and |
| | • | | general market conditions and, in particular, developments related to market conditions for the financial services industry. |
In addition, in recent years, the stock market in general has experienced extreme price and volume fluctuations as a result of general economic instability and recession. This volatility has had a significant effect on the market price of securities issued by many companies, including market price effects resulting from reasons unrelated to their operations performance. These broad market fluctuations may adversely affect our stock price, notwithstanding our future operating results. We expect that the market price of our common stock will continue to fluctuate, and there can be no assurance about the levels of the market prices for our common stock.
There is a limited trading market for our common shares, and you may not be able to resell your shares at or above the price you paid for them.
Although our common shares are listed for trading on the NASDAQ Global Select Market, the trading in our common shares has less liquidity than many other companies quoted on the NASDAQ Global Select Market. A public trading market having the desired characteristics of depth, liquidity, and orderliness depends on the presence in the market of willing buyers and sellers for our common shares at any given time. This presence depends on the individual decisions of investors and general economic and market conditions over which we have no control. We cannot assure you that the volume of trading in our common shares will increase in the future. Additionally, general market forces may have a negative effect on our stock price, independent of factors affecting our stock specifically.
Future sales of our common stock or other securities may dilute the value of our common stock.
In many situations, our board of directors has the authority, without any vote of our shareholders, to issue shares of our authorized but unissued stock, including shares authorized and unissued under our stock option plans. In the future, we may issue additional securities, through public or private offerings, in order to raise additional capital. Any such issuance would dilute the percentage of ownership interest of existing shareholders and may dilute the per share book value of the common stock. In addition, option holders may exercise their options at a time when we would otherwise be able to obtain additional equity capital on more favorable terms.
Additionally, if we raise additional capital by making additional offerings of debt or preferred equity securities, upon liquidation, holders of our debt securities and shares of preferred stock, and lenders with respect to other borrowings, will receive distributions of our available assets prior to the holders of our common stock. Additional equity offerings may dilute the holdings of our existing stockholders or reduce the market price of our common stock, or both. Holders of our common stock are not entitled to preemptive rights or other protections against dilution.
The sale, or availability for sale, of a substantial number of shares of common stock in the public market could adversely affect the price of our common stock and could impair our ability to raise additional capital through the sale of equity securities. On December 5, 2008, we sold to the Treasury Department a warrant to purchase up to 703,753 shares of our common stock at a price of $14.92 per common share. Our warrant and common shares issued upon the exercise of our warrant may be sold in the public market or in private transactions.
Our ability to pay dividends is limited by law, contract, and banking agency discretion.
No dividends on our common stock were declared during 2011. Our Board of Directors has not determined whether to declare dividends on our common stock in the future, and there can be no assurance that our regulators will allow us to pay dividends.
102
Our ability to pay dividends to our shareholders in the past and over the long term largely depends on our receipt of dividends from Stillwater National. Bank of Kansas does not currently pay dividends. The amount of dividends that Stillwater National may pay to us is limited by federal laws and regulations. In addition, the agreement entered into by Stillwater National requires prior approval of the OCC for any dividend by Stillwater National, and we have informally committed to consult with the Federal Reserve Bank of Kansas City prior to declaring or paying any dividend, including interest payments on subordinated debentures, or receiving any dividend from Stillwater National or Bank of Kansas. We also have informally committed to submit any planned borrowing by the holding company for approval. Federal Reserve dividend policies state that funds should not be borrowed to pay dividends. We have no plans for any additional holding company borrowings. The Federal Reserve can, at any time, prevent us from paying some or all dividends. Such decisions could result in reputation risk to us and may adversely affect our borrowing costs and liquidity.
We are prohibited from paying dividends on our common stock if the required payments on our Series B Preferred Stock issued to the Treasury Department and our subordinated debentures have not been made. We also may decide to limit the payment of dividends even when we have the legal ability to pay them in order to retain earnings for use in our business.
Our participation in the Treasury Department’s Capital Purchase Program subjects us to additional restrictions, oversight, and costs, and has other potential consequences that could materially affect our business, results of operations, and prospects.
On October 3, 2008, the Emergency Economic Stabilization Act of 2008, or the EESA, was signed into law. Under EESA, the Treasury Department has the authority to, among other things, invest in financial institutions for the purpose of stabilizing and providing liquidity to the U.S. financial markets. Pursuant to this authority, the Treasury Department announced its Capital Purchase Program, under which it has purchased preferred stock and warrants in eligible institutions, including us, to increase the flow of credit to businesses and consumers and to support the overall United States economy.
On December 5, 2008, we issued 70,000 shares of Series B Preferred Stock and a warrant to purchase up to 703,753 shares of common stock at an exercise price of $14.92 per share to the Treasury Department for an aggregate price of $70.0 million. As a result of our participation in the Capital Purchase Program:
| | • | | We are subject to complex restrictions, oversight, and costs that may have an adverse impact on our financial condition, results of operations, and the price of our common stock. For example, the American Recovery and Reinvestment Act of 2009 and related regulations contain significant, complex limitations on the amount and form of bonus, retention, and other incentive compensation that participants in the Capital Purchase Program may pay to executive officers and highly compensated employees. These provisions may adversely affect our ability to attract and retain executive officers and other key personnel. |
| | • | | The Capital Purchase Program imposes restrictions on our ability to pay cash dividends on, and to repurchase, our common stock. |
| | • | | The Treasury Department has the right to appoint two persons to our board of directors if we miss dividend payments for six dividend periods, whether or not consecutive, on the Series B Preferred Stock. |
| | • | | Future federal statutes may adversely affect the terms of the Capital Purchase Program that are applicable to us, and the Treasury Department may amend the terms of our agreement with them unilaterally if required by future statutes, including in a manner materially adverse to us. |
| | • | | Compliance with current and potential regulatory initiatives applicable to Capital Purchase Program participants as well as additional scrutiny from regulatory authorities may significantly increase our costs, impede the efficiency of our internal business processes, require us to increase our regulatory capital and limit our ability to pursue business opportunities in an efficient manner. |
103
The Special Inspector General for the Troubled Asset Relief Program, or TARP, has requested information from Capital Purchase Program and other TARP participants, including a description of past and anticipated uses of the TARP funds and compensation paid to management. We, like other Capital Purchase Program participants, are required to submit monthly reports about our lending and activities to the Treasury Department. It is unclear at this point what the ramifications of such disclosure are or may be in the future.
The holders of our Series B Preferred Stock have rights that are senior to those of our common shareholders.
On December 5, 2008, we sold $70.0 million of our Series B Preferred Stock issued to the Treasury Department under the Capital Purchase Program, which ranks senior to common stock in the payment of dividends and on liquidation. The liquidation amount of the Series B Preferred Stock is $1,000 per share.
Restrictions on unfriendly acquisitions could prevent a takeover.
Our certificate of incorporation and bylaws contain provisions that could discourage takeover attempts that are not approved by the board of directors. The Oklahoma General Corporation Act includes provisions that make an acquisition of Southwest more difficult. These provisions may prevent a future takeover attempt in which our shareholders otherwise might receive a substantial premium for their shares over then-current market prices. These provisions include supermajority provisions for the approval of certain business combinations and certain provisions relating to meetings of shareholders. Our certificate of incorporation also authorizes the issuance of additional shares without shareholder approval on terms or in circumstances that could deter a future takeover attempt. In addition, the Oklahoma General Corporation Act now requires public companies chartered under Oklahoma law to have a classified board of directors with two or three year terms if they have 1,000 or more shareholders of record. We currently elect all directors to one-year terms, and have substantially fewer than 1,000 shareholders of record since many owners hold their shares through third parties.
104
AVAILABILITYOF FILINGS
Southwest provides internet access to Annual Reports on Form 10-K, Quarterly Reports on Form 10-Q, current reports on Form 8-K, and amendments to those reports through its Investor Relations section atwww.oksb.com (This site is also accessible through Stillwater National’s website atwww.banksnb.com and Bank of Kansas’ website atwww.bankofkansas.com). Access to these reports is provided by means of a link to a third party vendor that maintains a database of such filings. In general, Southwest intends that these reports be available as soon as reasonably practicable after they are filed with or furnished to the SEC. However, technical and other operational obstacles or delays caused by the vendor may delay their availability. The SEC maintains a website (www.sec.gov) where these filings also are available through the SEC’s EDGAR system. There is no charge for access to these filings through either Southwest’s site or the SEC’s site, although users should understand that there may be costs associated with electronic access, such as usage charges from Internet access providers and telephone companies, that they may bear. The public also may read and copy materials filed by Southwest with the SEC at the SEC’s Public Reference Room at 100 F Street, N.E., Washington, DC 20549. The public may obtain information on the operation of the Public Reference Room by calling the SEC at 1-800-SEC-0330.
105
PROPERTIES
The locations of Southwest and its subsidiaries are shown below:
| | | | |
| SOUTHWEST BANCORP, INC. LOCATION | | | | |
| CORPORATE HEADQUARTERS | | | | |
608 S. Main Street | | | | |
P.O. Box 1988 | | Stillwater, Oklahoma 74076 | | 405-742-1800 |
www.oksb.com | | | | |
| | |
| BANKOF KANSAS LOCATIONS | | | | |
| CORPORATE HEADQUARTERS | | | | |
524 N. Main Street | | | | |
P.O. Box 1707 | | South Hutchinson, Kansas 67504 | | 620-728-3000 |
www.bankofkansas.com | | | | |
| | |
| ANTHONY | | | | |
203 W. Main Street | | | | |
P.O. Box 484 | | Anthony, Kansas 67003 | | 620-842-1000 |
| | |
| HARPER | | | | |
1002 Central Street* | | | | |
P.O. Box 7 | | Harper, Kansas 67058 | | 620-896-1035 |
| | |
| HUTCHINSON | | | | |
100 East 30th Avenue | | | | |
P.O. Box 1707 | | Hutchinson, Kansas 67504 | | 620-728-3000 |
| | |
| MAYFIELD | | | | |
102 N. Osborn | | Mayfield, Kansas 67103 | | 620-434-5325 |
| | |
| OVERLAND PARK | | | | |
14435 Metcalf Avenue | | Overland Park, Kansas 66223 | | 913-906-4444 |
| | |
| WICHITA - EAST | | | | |
8415 E. 21st Street North | | | | |
Suite 150* | | Wichita, Kansas 67206 | | 316-315-1600 |
| | |
| WICHITA - WEST | | | | |
10111 W. 21st Street North | | Wichita, Kansas 67205 | | 316-315-1600 |
|
| STILLWATER NATIONAL BANK & TRUST COMPANY LOCATIONS |
| CORPORATE HEADQUARTERS | | | | |
608 S. Main Street | | | | |
P.O. Box 1988 | | Stillwater, Oklahoma 74076 | | 405-372-2230 |
www.banksnb.com | | | | |
| | |
| DRIVE-IN FACILITY | | | | |
308 S. Main Street | | | | |
P.O. Box 1988 | | Stillwater, Oklahoma 74076 | | 405-372-2230 |
| | |
| OPERATIONS CENTER | | | | |
1624 Cimarron Plaza* | | | | |
P.O. Box 1988 | | Stillwater, Oklahoma 74076 | | 405-372-2230 |
106
| | | | |
| | |
| 19TH & SANGRE BRANCH | | | | |
1908 S. Sangre | | | | |
P.O. Box 1988 | | Stillwater, Oklahoma 74074 | | 405-372-2230 |
| | |
| OSU CAMPUS BRANCH BANK | | | | |
1102 W. Hall of Fame Avenue* | | | | |
P.O. Box 1988 | | Stillwater, Oklahoma 74076 | | 405-372-2230 |
| | |
| WATERFORD BRANCH | | | | |
6301 Waterford Boulevard | | | | |
Suite 101 & 102* | | Oklahoma City, Oklahoma 73118 | | 405-427-4000 |
| | |
| SOUTH OKC BRANCH | | | | |
8101 S. Walker Avenue | | | | |
Suite B | | Oklahoma City, Oklahoma 73139 | | 405-427-4000 |
| | |
| EDMOND BRANCH | | | | |
1440 S. Bryant Avenue* | | Edmond, Oklahoma 73034 | | 405-427-4000 |
| | |
| CHICKASHA BRANCH | | | | |
500 W. Grand Avenue | | Chickasha, Oklahoma 73018 | | 405-427-3100 |
| | |
| TULSA UTICA BRANCH | | | | |
1500 S. Utica Avenue | | | | |
P.O. Box 521500 | | Tulsa, Oklahoma 74152 | | 918-523-3600 |
| | |
| TULSA 61ST BRANCH | | | | |
2431 E. 61st | | | | |
Suite 170* | | | | |
P.O. Box 521500 | | Tulsa, Oklahoma 74152 | | 918-523-3600 |
| | |
| SNB MCMULLEN BANK-TILDEN BRANCH | | | | |
205 Elm Street | | | | |
P.O. Box 299 | | Tilden, Texas 78072 | | 361-274-3391 |
| | |
| SNB BANKOF DALLAS - FRISCO | | | | |
5300 Town and Country Boulevard | | | | |
Suite 100* | | Frisco, Texas 75034 | | 972-624-2900 |
| | |
| SNB BANKOF DALLAS-PRESTON CENTER | | | | |
5950 Berkshire Lane | | | | |
Suite 350* | | Dallas, Texas 75225 | | 972-624-2900 |
| | |
| SNB BANKOF AUSTIN | | | | |
3900 N. Capital of Texas HWY | | | | |
Suite 100* | | Austin, Texas 78746 | | 512-314-6700 |
| |
| SNB BANKOF SAN ANTONIO-MEDICAL HILL BRANCH | | |
9324 Huebner Road | | San Antonio, Texas 78240 | | 210-442-6100 |
| |
| STILLWATER NATIONAL BANK LOAN PRODUCTION OFFICE | | |
9990 Richmond Avenue | | | | |
Suite 140* | | Houston, Texas 77042 | | 713-268-8900 |
107
| | | | |
| | |
| OUHSC LOAN PRODUCTION OFFICE | | | | |
1106 N. Stonewall* | | Oklahoma City, Oklahoma 73117 | | 405-271-3113 |
| | |
| OSU-STILLWATER MARKETING OFFICE | | | | |
Student Union, Room 056* | | | | |
P.O. Box 1988 | | Stillwater, Oklahoma 74076 | | 405-744-5962 |
| * | Leased from third parties. Other properties are owned. |
PART IV
EXHIBITSAND FINANCIAL STATEMENT SCHEDULES
(a) Documents Filed as Part of this Report
(1)Financial Statements. The following financial statements are filed as part of this report:
| | |
| | Independent Registered Public Accounting Firm’s Report for the Years Ended December 31, 2011 and 2010 |
| |
| | Consolidated Statements of Financial Condition at December 31, 2011 and 2010 |
| |
| | Consolidated Statements of Operations for the Years Ended December 31, 2011, 2010, and 2009 |
| |
| | Consolidated Statements of Comprehensive Income for the Years Ended December 31, 2011, 2010, and 2009 |
| |
| | Consolidated Statements of Shareholders’ Equity for the Years Ended December 31, 2011, 2010, and 2009 |
| |
| | Consolidated Statements of Cash Flows for the Years Ended December 31, 2011, 2010, and 2009 |
| |
| | Notes to the Consolidated Financial Statements for the Years Ended December 31, 2010, 2009, and 2008 |
(2)Financial Statement Schedules. All schedules for which provision is made in the applicable accounting regulations of the SEC are omitted because of the absence of conditions under which they are required or because the required information is included in the consolidated financial statements and related notes thereto.
(3)Exhibits. The following is a list of exhibits filed as part of this Annual Report on Form 10-K.
| | |
No. | | Exhibit |
| 3.1 | | Amended and Restated Certificate of Incorporation of Southwest Bancorp, Inc. (incorporated by reference to Exhibit 3.1 to Quarterly Report on Form 10-Q for the quarter ended June 30, 2010) |
| |
| 3.2 | | Bylaws of Southwest Bancorp, Inc., as amended (incorporated by reference to Exhibit 3.2 to Current Report on Form 8-K filed February 1, 2012) |
| |
| 4.1 | | Certificate of Designations for Fixed Rate Cumulative Perpetual Preferred Stock, Series B (incorporated by reference to Exhibit 4.1 to Current Report on Form 8-K filed December 8, 2008) |
| |
| 4.2 | | Letter Agreement, dated as of December 5, 2008, between Southwest Bancorp, Inc. and the United States Department of Treasury (incorporated by reference to Exhibit 10.1 to Current Report on Form 8-K filed December 8, 2008) |
| |
| *10.1 | | Southwest Bancorp, Inc. Employee Stock Purchase Plan (incorporated by reference to Exhibit 4.1 to Registration Statement on Form S-8 (File No. 33-97850)) |
| |
| *10.2 | | Southwest Bancorp, Inc. and Affiliates Amended and Restated Severance Compensation Plan (incorporated by reference to Exhibit 10.6 to Current Report on Form 8-K filed January 2, 2008) |
108
| | |
| |
| * 10.3 | | [Reserved] |
| |
| *10.4 | | Southwest Bancorp, Inc. 1999 Stock Option Plan as Amended and Restated (incorporated by reference to Exhibit 10 to Quarterly Report on Form 10-Q for the quarter ended June 30, 2007) |
| |
| *10.5 | | Stillwater National Bank and Trust Company 2002 and 2003 Deferred Compensation Plans (incorporated by reference to Exhibit 10.5 to Annual Report on Form 10-K for the fiscal year ended December 31, 2002) |
| |
| *10.6 | | Stillwater National Bank and Trust Company Amended and Restated Supplemental Profit Sharing Plan for Rick Green (incorporated by reference to Exhibit 10.3 to Current Report on Form 8-K filed January 2, 2008) |
| |
| *10.7 | | Stillwater National Bank and Trust Company Amended and Restated Supplemental Profit Sharing Plan for Jerry L. Lanier (incorporated by reference to Exhibit 10.5 to Current Report on Form 8-K filed January 2, 2008) |
| |
| 10.8 | | Indemnification Agreements by and between Southwest Bancorp, Inc. and James E. Berry II, Thomas D. Berry, Joe Berry Cannon, J. Berry Harrison, Erd M. Johnson, David P. Lambert, Linford R. Pitts, Robert B. Rodgers, Russell W. Teubner, John Cohlmia, and Anthony W. Martin (incorporated by reference to Exhibit 10.9 to Annual Report on Form 10-K for the fiscal year ended December 31, 2005) |
| |
| 10.9 | | Indemnification Agreements by and between Southwest Bancorp, Inc. and Rick Green, Steve Gobel, Jerry L. Lanier, Kimberly Sinclair, and Charles H. Westerheide (incorporated by reference to Exhibit 10.10 to Annual Report on Form 10-K for the fiscal year ended December 31, 2005) |
| |
| 10.10 | | Indemnification Agreements by and between Southwest Bancorp, Inc. and David S. Crockett, Jr. (incorporated by reference to Exhibit 10(a) to Quarterly Report on Form 10-Q for the quarter ended September 30, 2006) |
| |
| 10.11 | | Indemnification Agreements by and between Southwest Bancorp, Inc. and James M. Johnson (incorporated by reference to Exhibit 10(b) to Quarterly Report on Form 10-Q for the quarter ended September 30, 2006) |
| |
| *10.12 | | Director’s Deferred Compensation Plan by and between Southwest Bancorp, Inc. and James M. Johnson (incorporated by reference to Exhibit 10 to Current Report on Form 8-K dated December 28, 2006) |
| |
| *10.13 | | Amendment to Director’s Deferred Compensation Plan by and between Southwest Bancorp, Inc. and James M. Johnson (incorporated by reference to Exhibit 10.1 to Current Report on Form 8-K filed January 2, 2008) |
| |
| 10.14 | | Audit Committee Financial Expert Agreement by and between Southwest Bancorp, Inc. and David S. Crockett, Jr. (incorporated by reference to Exhibit 10.15 to Annual Report on Form 10-K for the fiscal year ended December 31, 2006) |
| |
| *10.15 | | Southwest Bancorp, Inc. 2008 Stock Based Award Plan (incorporated by reference to Exhibit 10.1 to Quarterly Report on Form 10-Q for the quarter ended June 30, 2008) |
| |
| *10.16 | | Southwest Bancorp, Inc. Form of Restricted Stock Agreement Amendments (incorporated by reference to Exhibit 10.2 to Quarterly Report on Form 10-Q for the quarter ended June 30, 2008) |
| |
| *10.17 | | Southwest Bancorp, Inc. Form of Omnibus Compensation Compliance Agreement and Waivers dated December 5, 2008 (incorporated by reference to Exhibit 10.19 to Annual Report on Form 10-K for the fiscal year ended December 31, 2008) |
| |
| 10.18 | | Written agreement between Stillwater National Bank and Trust Company and the Comptroller of the Currency of the United States dated January 27, 2010 (incorporated by reference to Exhibit 10 to Current Report on Form 8-K filed January 29, 2010) |
| |
| *10.19 | | Severance and Release Agreement by and between Stillwater National Bank and Trust Company and Jerry Lanier, dated November 2, 2011 |
| |
| **10.20 | | Loan and Real Estate Sale Agreement by and between Southwest Bancorp, Inc. and SW Loan Portfolio Holdings, L.P., dated December 1, 2011 |
| |
| 21 | | Subsidiaries of the Registrant |
| |
| 23 | | Consent of Independent Registered Public Accounting Firm |
| |
| 24 | | Power of Attorney |
| |
| 31(a), (b) | | Rule 13a-14(a)/15d-14(a) Certifications |
| |
| 32(a), (b) | | 18 U.S.C. Section 1350 Certifications |
109
| | |
| |
99(a), (b) | | Certifications by the Principal Executive Officer and Principal Financial Officer pursuant to Section 111 (b) (4) of the Emergency Economic Stabilization Act of 2008 as amended by the American Recovery and Reinvestment Act of 2009 |
| * | Management contract or compensatory plan or arrangement required to be filed pursuant to Item 14(c) of Form 10-K. |
| ** | Portions of this Exhibit have been omitted pursuant to a request for confidential treatment. |
110
SIGNATURES
Pursuant to the requirements of Section 13 or 15(d) of the Securities Exchange Act of 1934, the Registrant has duly caused this report to be signed on its behalf by the undersigned, thereunto duly authorized.
| | | | | | | | |
| | | | SOUTHWEST BANCORP, INC. |
| | | | |
| | March 13, 2012 | | | | by: | | /s/ RICK GREEN |
| | | | | | | | Rick Green |
| | | | | | | | Chief Executive Officer |
Pursuant to the requirements of the Securities Exchange Act of 1934, this report has been signed below by the following persons on behalf of the Registrant and in the capacities and on the dates indicated.
| | | | |
| | |
| /S/ RICK GREEN | | | | March 13, 2012 |
| Rick Green | | | | |
| Director and Chief Executive Officer | | | | |
| (Principal Executive Officer) | | | | |
| | |
| /S/ LAURA ROBERTSON | | | | March 13, 2012 |
| Laura Robertson | | | | |
| Executive Vice President, | | | | |
| Chief Financial Officer | | | | |
| (Principal Financial and Accounting Officer) | | | | |
A majority of the directors of Southwest executed a power of attorney appointing Rick Green as their attorney-in-fact, empowering him to sign this report on their behalf. This power of attorney has been filed with the Securities and Exchange Commission under Part IV, Exhibit 24 of this Annual Report on Form 10-K for the year ended December 31, 2011. This report has been signed below by such attorney-in-fact as of March 13, 2012.
| | |
| |
| By: | | /S/ RICK GREEN |
| | Rick Green |
| | Attorney-in-Fact for Majority of the |
| | Directors of Southwest |
111