UNITED STATES
SECURITIES AND EXCHANGE COMMISSION
Washington, D.C. 20549
FORM N-CSR
CERTIFIED SHAREHOLDER REPORT OF REGISTERED
MANAGEMENT INVESTMENT COMPANIES
Investment Company Act file number | 811-08134 |
|
Eaton Vance Municipals Trust II |
(Exact name of registrant as specified in charter) |
|
The Eaton Vance Building, 255 State Street, Boston, Massachusetts | | 02109 |
(Address of principal executive offices) | | (Zip code) |
|
Alan R. Dynner
The Eaton Vance Building, 255 State Street, Boston, Massachusetts 02109 |
(Name and address of agent for service) |
|
Registrant’s telephone number, including area code: | (617) 482-8260 | |
|
Date of fiscal year end: | January 31 | |
|
Date of reporting period: | July 31, 2005 | |
| | | | | | | | |
Item 1. Reports to Stockholders

Semiannual Report July 31, 2005


EATON VANCE
MUNICIPALS
TRUST II
Florida Insured
Hawaii
Kansas
IMPORTANT NOTICES REGARDING PRIVACY,
DELIVERY OF SHAREHOLDER DOCUMENTS,
PORTFOLIO HOLDINGS, AND PROXY VOTING
Privacy. The Eaton Vance organization is committed to ensuring your financial privacy. Each of the financial institutions identified below has in effect the following policy ("Privacy Policy") with respect to nonpublic personal information about its customers:
• Only such information received from you, through application forms or otherwise, and information about your Eaton Vance fund transactions will be collected. This may include information such as name, address, social security number, tax status, account balances and transactions.
• None of such information about you (or former customers) will be disclosed to anyone, except as permitted by law (which includes disclosure to employees necessary to service your account). In the normal course of servicing a customer's account, Eaton Vance may share information with unaffiliated third parties that perform various required services such as transfer agents, custodians and broker/dealers.
• Policies and procedures (including physical, electronic and procedural safeguards) are in place that are designed to protect the confidentiality of such information.
• We reserve the right to change our Privacy Policy at any time upon proper notification to you. Customers may want to review our Policy periodically for changes by accessing the link on our homepage: www.eatonvance.com.
Our pledge of privacy applies to the following entities within the Eaton Vance organization: the Eaton Vance Family of Funds, Eaton Vance Management, Eaton Vance Investment Counsel, Boston Management and Research, and Eaton Vance Distributors, Inc.
In addition, our Privacy Policy only applies to those Eaton Vance customers who are individuals and who have a direct relationship with us. If a customer's account (i.e., fund shares) is held in the name of a third-party financial adviser/ broker-dealer, it is likely that only such adviser's privacy policies apply to the customer. This notice supersedes all previously issued privacy disclosures.
For more information about Eaton Vance's Privacy Policy, please call 1-800-262-1122.
Delivery of Shareholder Documents. The Securities and Exchange Commission (the "SEC") permits funds to deliver only one copy of shareholder documents, including prospectuses, proxy statements and shareholder reports, to fund investors with multiple accounts at the same residential or post office box address. This practice is often called "householding" and it helps eliminate duplicate mailings to shareholders.
Eaton Vance, or your financial adviser, may household the mailing of your documents indefinitely unless you instruct Eaton Vance, or your financial adviser, otherwise.
If you would prefer that your Eaton Vance documents not be householded, please contact Eaton Vance at 1-800-262-1122, or contact your financial adviser.
Your instructions that householding not apply to delivery of your Eaton Vance documents will be effective within 30 days of receipt by Eaton Vance or your financial adviser.
Portfolio Holdings. Each Eaton Vance Fund and its underlying Portfolio (if applicable) will file a schedule of its portfolio holdings on Form N-Q with the SEC for the first and third quarters of each fiscal year. The Form N-Q will be available on the Eaton Vance website www.eatonvance.com, by calling Eaton Vance at 1-800-262-1122 or in the EDGAR database on the SEC's website at www.sec.gov. Form N-Q may also be reviewed and copied at the SEC's public reference room in Washington, D.C. (call 1-800-732-0330 for information on the operation of the public reference room).
Proxy Voting. From time to time, funds are required to vote proxies related to the securities held by the funds. The Eaton Vance Funds or their underlying Portfolios (if applicable) vote proxies according to a set of policies and procedures approved by the Funds' and Portfolios' Boards. You may obtain a description of these policies and procedures and information on how the Funds or Portfolios voted proxies relating to portfolio securities during the most recent 12 month period ended June 30, without charge, upon request, by calling 1-800-262-1122. This description is also available on the SEC's website at www.sec.gov.
Eaton Vance Municipals Funds as of July 31, 2005
TABLE OF CONTENTS
President’s Letter to Shareholders | 2 |
| |
Market Recap | 3 |
| |
Fund Investment Updates | |
Florida Insured | 4 |
Hawaii | 6 |
Kansas | 8 |
| |
Fund Expenses | 10 |
| |
Financial Statements | 12 |
| |
Board of Trustees’ Annual Approval of the Investment Advisory Agreements | 36 |
| |
Investment Management | 38 |
1
Eaton Vance Municipals Funds as of July 31, 2005
LETTER TO SHAREHOLDERS

Thomas J. Fetter
President
Like all fixed-income markets, the municipal bond market responds to many factors, from changes in interest rates and economic trends to fluctuations in municipal bond issuance. Another key variable is the policy of the Federal Reserve, the nation’s central bank, known popularly as “The Fed.” The Fed’s policies are important to the nation’s economy and markets.
Founded in the wake of crisis, the Federal Reserve plays a vital role...
The Federal Reserve System was established by the Federal Reserve Act of 1913 in the wake of a series of financial crises, the most recent of which – the Panic of 1907 – had caused bank failures, a rash of bankruptcies, a dramatic loss of confidence and a severe economic downturn. Congress was determined to create a central bank that provided a vigilant monetary policy, price stability, a more elastic currency and more careful supervision over the nation’s banks.
The Open Market Committee: influencing the money supply and credit conditions...
The Fed has a number of tools at its disposal to adjust monetary policy. Of these, the most commonly used tools are open market operations. The Federal Open Market Committee (FOMC) meets regularly to review inflation, credit conditions and the overall health of the economy. The Fed uses its own research, as well as that of other key economic agencies, to review its various policy options. Treasury, corporate and municipal bond investors alike eagerly await the transcripts of FOMC meetings for a hint of future interest rate trends.
If it deems a change necessary in short-term rates, the Fed will announce an adjustment to its target for the Federal Funds rate – its primary market instrument. To effect that change, the FOMC issues a directive to the trading desk of the Federal Reserve Bank of New York, whose responsibility it is to implement the policy.
Open market operations:
The Fed intervenes...
If the Fed sees weakness in the economy and little threat of inflation, it may make outright purchases of Treasury securities – either from the “street” or privately from foreign central banks – thus adding reserves to the banking system. This action tends to lower interest rates, increase loans and stimulate economic activity. In so doing, the Fed is said to be easing monetary policy.
On the other hand, if the Fed sees the economy overheating and inflation looming, it may sell Treasury securities, thus draining reserves from the system. This action tends to raise rates, discourage consumer and business borrowing and dampen economic activity. In this case, the Fed is said to be tightening monetary policy.
While changes in Fed policy primarily affect short-term rates, long-term rates are determined by inflationary expectations. However, the Fed’s actions can have a significant effect on market psychology and, over time, impact market rates across the borrowing spectrum – for homebuyers seeking mortgages, businesses seeking bank loans and municipal bond issuers.
Fed-watching: A continuing
pre-occupation of the market...
Interpreting the Federal Reserve’s actions has long been of keen interest to bond market investors. Until the mid-1990s, analysts needed to keep daily tabs on bank reserves and the Fed’s daily open market activity to determine a change in monetary policy. Starting in February 1994, however, the Fed began to indicate specifically its target Federal Funds rate. That marked a significant change, as analysts were now free to focus less on current policy and more on future potential changes in policy.
Throughout its history, the Federal Reserve has contributed to a more stable and safer monetary system. As that history unfolds, investors will surely continue to monitor its activities closely.
Sincerely,

Thomas J. Fetter
President
September 7, 2005
Fund shares are not insured by the FDIC and are not deposits or other obligations of, or guaranteed by, any depository institution. Shares are subject to investment risks, including possible loss of principal invested.
2
Eaton Vance Municipals Funds as of July 31, 2005
MARKET RECAP
The U.S. economy continued to generate moderate growth during the six months ended July 31, 2005, although surging energy prices and high interest rates were a continuing concern for investors.
Signs of a somewhat weaker economy in the first half of 2005...
The nation’s Gross Domestic Product grew by 3.4% in the second quarter of 2005, according to preliminary Commerce Department figures, following a 3.8% rise in the first quarter. Manufacturing reported a mixed picture, with overall factory activity accelerating somewhat, while areas such as durable goods, metals and textiles remained weak. Consumer spending and a strong housing market remained the twin pillars of growth, although signs of strain were evident in those areas. Consumers were increasingly hardpressed by soaring oil prices, which translated to higher costs for heating oil and gasoline, as well as lower savings rates.
Meanwhile, the housing sector remained very strong, although analysts expressed concern over real estate speculation. Further concerns centered on heavily mortgaged homeowners whose adjustable-rate loans may be vulnerable to rising interest rates. Capital spending was another mixed picture, as some businesses weighed their ability to invest in new equipment, facilities and software against a climate of sharply rising energy costs. The trade gap widened further, aggravated by weak export growth. The slow export market has been especially vexing in light of the prolonged weakness of the dollar.
Job growth was erratic in the first half of 2005...
Job creation increased in 2005, although the rate of job growth varied dramatically from month to month. Many employers indicated some uneasiness with the uncertainty of the economy and the continuing unpredictability of energy costs. In the service sector, health care and business services remained primary sources of new employment.
Municipal bond yields were 97% of Treasury yields
30-Year-AAA-rated
General Obligation (GO) Bonds* | | 4.35 | % |
| | | |
Taxable equivalent yield
in 35.0% tax bracket | | 6.69 | % |
| | | |
30-Year Treasury bond | | 4.47 | % |
Principal and interest payments of Treasury securities are guaranteed by the U.S. government.
* GO yields are a compilation of a representative variety of general obligations and are not necessarily representative of a Fund’s yield. Statistics are as of July 31, 2005.
Past performance is no guarantee of future results.
Source: Bloomberg, L.P.
Construction remained strong, although rising inventories of new homes in some markets suggested a clouded outlook for the sector.
The Federal Reserve continued to raise short-term interest rates in 2005...
Inflation accelerated somewhat during the period, an increase apparent not only in core energy costs, but also in finished products, a sign that producers are passing their higher energy costs along to consumers. The Federal Reserve hiked short-term interest rates, suggesting it will continue to raise rates to keep the economy from growing too quickly and to keep inflation under control. Beginning in June 2004, the Fed increased its Federal Funds rate – a key short-term interest rate barometer – on ten occasions (including its most recent rate hike in early August), raising that benchmark from 1.00% to 3.50%.
Against this backdrop, the municipal bond market generated solid gains for the period. For the six months ended July 31, 2005, the Lehman Brothers Municipal Bond Index – a broad-based, unmanaged market index of municipal bonds – had a total return of 1.48%.*
* It is not possible to invest directly in an Index. The Index’s total return does not reflect expenses that would have been incurred if an investor individually purchased or sold the securities represented in the Index.
The views expressed throughout this report are those of the portfolio managers and are current only through the end of the period of the report as stated on the cover. These views are subject to change at any time based upon market or other conditions, and the investment adviser disclaims any responsibility to update such views. These views may not be relied on as investment advice and, because investment decisions for a fund are based on many factors, may not be relied on as an indication of trading intent on behalf of any Eaton Vance fund.
3
Eaton Vance Florida Insured Municipals Fund as of July 31, 2005
INVESTMENT UPDATE
The Fund
Performance for the Past Six Months
• The Fund’s Class A shares had a total return of 1.25% for the six months ended July 31, 2005.(1) This return was the result of a decrease in net asset value (NAV) to $11.27 per share on July 31, 2005 from $11.38 on January 31, 2005, and the reinvestment of $0.250 in dividends.(2)
• The Fund’s Class B shares had a total return of 0.95% for the six months ended July 31, 2005.(1) This return was the result of a decrease in NAV to $11.15 per share on July 31, 2005 from $11.25 on January 31, 2005, and the reinvestment of $0.206 in dividends.(2)
• For comparison, the Lehman Brothers Municipal Bond Index – a broad-based, unmanaged market index of municipal bonds – had a total return of 1.48% for the six months ended July 31, 2005.(3)
• Based on the Fund’s most recent dividends annualized and NAVs on July 31, 2005 of $11.27 per share for Class A and $11.15 for Class B, the Fund’s distribution rates were 4.36% and 3.60%, respectively.(4) The distribution rates are equivalent to taxable rates of 6.71% and 5.54%, respectively.(5)
• The SEC 30-day yields for Class A and Class B shares at July 31, 2005 were 3.55% and 2.97%, respectively.(6) The SEC 30-day yields are equivalent to taxable yields of 5.46% and 4.57%, respectively.(5)
See page 5 for more performance information.

Craig Brandon
Portfolio Manager
Management Discussion
• While moderating early in 2005, Florida’s economy was among the nation’s fastest growing, as tourism, construction and strong migration trends spurred economic activity. Growth was not uniform across the state, however, as some coastal areas coped with after-effects of last year’s severe hurricane season. The state’s July 2005 jobless rate was 3.8%, down from 4.7% a year ago.
• Insured* water and sewer bonds were the Fund’s largest sector weighting at July 31, 2005. Amid rising construction activity and more stringent environmental regulations, many communities have issued bonds to finance improvements to water and wastewater facilities. Water-related revenue issues have historically enjoyed relatively stable revenues.
• Insured* special tax revenue bonds constituted another large investment sector. These high-quality bonds were issued to finance improvements for projects that included a Jacksonville stadium. The bonds are backed by a variety of special levies, such as local sales taxes and tourism development taxes, that were approved specifically for the projects.
• Insured* transportation bonds are frequent issuers in the growing Florida municipal market. The Fund’s investments in this sector included airport authorities, a seaport authority, county expressways and some issues for a Puerto Rico highway authority.
• The Fund had selective investments in housing related bonds. However, with Florida housing prices rising faster than incomes, management continued to monitor the housing picture closely.
• Management continued to focus on call protection. However, some higher coupon bonds were subject to calls. Management continued its efforts to diversify the Fund across a wider range of coupon structures. This shift was accomplished by adding bonds with desirable coupon structures while lowering the Fund’s exposure to hospital bonds.
* Private insurance does not decrease the risk of principal fluctuations associated with this investment.
Past performance is no guarantee of future results. Returns are historical and are calculated by determining the percentage change in net asset value or offering price (as applicable) with all distributions reinvested. Investment return and principal value will fluctuate so that shares, when redeemed, may be worth more or less than their original cost. Performance is for the stated time period only; due to market volatility, the Fund’s current performance may be lower or higher than the quoted return. For performance as of the most recent month end, please refer to www.eatonvance.com.
(1) These returns do not include the 4.75% maximum sales charge for Class A shares or the applicable contingent deferred sales charges (CDSC) for Class B shares. If the sales charge were deducted, returns would be lower. (2) A portion of the Fund’s income may be subject to federal and/or alternative minimum tax and state intangibles taxes. (3) It is not possible to invest directly in an Index. The Index’s total return does not reflect expenses that would have been incurred if an investor individually purchased or sold the securities represented in the Index. (4) The Fund’s distribution rate represents actual distributions paid to shareholders and is calculated by dividing the last distribution per share (annualized) by the net asset value. (5) Taxable-equivalent figures assume a maximum 35.00% federal income tax rate. A lower rate would result in lower tax-equivalent figures. (6) The Fund’s SEC yield is calculated by dividing the net investment income per share for the 30-day period by the offering price at the end of the period and annualizing the result.
4
Eaton Vance Florida Insured Municipals Fund as of July 31, 2005
FUND PERFORMANCE
Performance (1) | | Class A | | Class B | |
Average Annual Total Returns (at net asset value) | | | | | |
One Year | | 5.31 | % | 4.80 | % |
Five Years | | 6.02 | | 5.27 | |
Ten Years | | 5.62 | | 4.90 | |
Life of Fund† | | 6.19 | | 5.37 | |
SEC Average Annual Total Returns (including sales charge or applicable CDSC) | | | | | |
One Year | | 0.29 | % | -0.20 | % |
Five Years | | 5.00 | | 4.94 | |
Ten Years | | 5.11 | | 4.90 | |
Life of Fund† | | 5.74 | | 5.37 | |
† Inception date: Class A: 3/3/94; Class B: 3/2/94
(1) Average annual total returns do not include the 4.75% maximum sales charge for Class A shares or the applicable contingent deferred sales charges (CDSC) for Class B shares. If sales charges were deducted, returns would be lower. SEC average annual total returns for Class A reflect the maximum 4.75% sales charge. SEC returns for Class B reflect applicable CDSC based on the following schedule: 5% - 1st and 2nd years; 4% - 3rd year; 3% - 4th year; 2% - 5th year; 1% - 6th year.
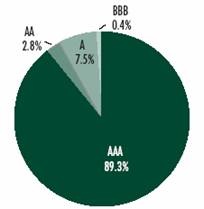
Rating Distribution(2)
By total investments

(2) Reflects the Fund’s investments as of July 31, 2005. May not be representative of the Fund’s current or future investments and may change due to active management.
Past performance is no guarantee of future results. Returns are historical and are calculated by determining the percentage change in net asset value or offering price (as applicable) with all distributions reinvested. Investment return and principal value will fluctuate so that shares, when redeemed, may be worth more or less than their original cost. Performance is for the stated time period only; due to market volatility, the Fund’s current performance may be lower or higher than the quoted return. For performance as of the most recent month end, please refer to www.eatonvance.com.
5
Eaton Vance Hawaii Municipals Fund as of July 31, 2005
INVESTMENT UPDATE
The Fund
Performance for the Past Six Months
• The Fund’s Class A shares had a total return of 1.23% for the six months ended July 31, 2005.(1) This return was the result of a decrease in net asset value (NAV) to $9.76 per share on July 31, 2005 from $9.85 on January 31, 2005, and the reinvestment of $0.210 in dividends.(2)
• The Fund’s Class B shares had a total return of 0.87% for the six months ended July 31, 2005.(1) This return was the result of a decrease in NAV to $9.88 per share on July 31, 2005 from $9.97 on January 31, 2005, and the reinvestment of $0.175 in dividends.(2)
• For comparison, the Lehman Brothers Municipal Bond Index – a broad-based, unmanaged market index of municipal bonds – had a total return of 1.48% for the six months ended July 31, 2005.(3)
• Based on the Fund’s most recent dividends annualized and NAVs on July 31, 2005 of $9.76 per share for Class A and $9.88 for Class B, the Fund’s distribution rates were 4.26% and 3.51%, respectively.(4) The distribution rates are equivalent to taxable rates of 7.14% and 5.89%, respectively.(5)
• The SEC 30-day yields for Class A and Class B shares at July 31, 2005 were 3.25% and 2.66%, respectively.(6) The SEC 30-day yields are equivalent to taxable yields of 5.45% and 4.46%, respectively.(5)
See page 7 for more performance information.

Robert B. MacIntosh
Portfolio Manager
Management Discussion
• In the expanding Hawaii economy, tourism, lodging and leisure, retail and transportation paced job creation. Tourist visits increased more than 10% in the first half of 2005, as both U.S. and Asia-based visitors rose significantly. However, while residential construction generated new jobs, rising interest rates slowed the commercial side. The state’s jobless rate was 2.7% in July 2005, down from 3.1% a year ago.
• Insured* general obligations were the Fund’s largest sector weighting at July 31, 2005. Secured by the state’s various taxing powers – or, for local issuers, by local property taxes – we consider these bonds to be the most secure of all municipal debt. The Fund’s investments included bonds of state, county and selected local issuers.
• Insured* transportation bonds were significant investments for the Fund. The Fund’s investments included an issue for the state’s airport system, a revenue bond for the state harbor authority and an issue that financed maintenance for the state’s highway system.
• The Fund sold some issues with shorter calls, as well as some premium pre-refunded bonds, and used the proceeds to purchase bonds with more attractive call features. The Fund had a portion of a housing bond called as part of a regular sinking fund repurchase.
• The Fund was challenged by the very limited availability of new Hawaii bonds. The Fund invested in just one new Hawaii issue, a Honolulu wastewater bond. Most purchases of new issues were focused on Puerto Rico and Guam issues.
* Private insurance does not decrease the risk of principal fluctuations associated with this investment.
Past performance is no guarantee of future results. Returns are historical and are calculated by determining the percentage change in net asset value or offering price (as applicable) with all distributions reinvested. Investment return and principal value will fluctuate so that shares, when redeemed, may be worth more or less than their original cost. Performance is for the stated time period only; due to market volatility, the Fund’s current performance may be lower or higher than the quoted return. For performance as of the most recent month end, please refer to www.eatonvance.com.
(1) These returns do not include the 4.75% maximum sales charge for Class A shares or the applicable contingent deferred sales charges (CDSC) for Class B shares. If sales charges were deducted, returns would be lower. (2) A portion of the Fund’s income may be subject to federal income and/or alternative minimum tax. Income may be subject to state income taxes. (3) It is not possible to invest directly in an Index. The Index’s total return does not reflect expenses that would have been incurred if an investor individually purchased or sold the securities represented in the Index. (4) The Fund’s distribution rate represents actual distributions paid to shareholders and is calculated by dividing the last distribution per share (annualized) by the net asset value. (5) Taxable-equivalent figures assume a maximum 40.36% combined federal and state tax rate. A lower rate would result in lower tax-equivalent figures.(6) The Fund’s SEC yield is calculated by dividing the net investment income per share for the 30-day period by the offering price at the end of the period and annualizing the result.
6
Eaton Vance Hawaii Municipals Fund as of July 31, 2005
FUND PERFORMANCE
Performance (1) | | Class A | | Class B | |
Average Annual Total Returns (at net asset value) | | | | | |
One Year | | 5.31 | % | 4.69 | % |
Five Years | | 6.10 | | 5.32 | |
Ten Years | | 5. 38 | | 4.75 | |
Life of Fund† | | 4.80 | | 4.38 | |
SEC Average Annual Total Returns (including sales charge or applicable CDSC) | | | | | |
One Year | | 0.34 | % | -0.31 | % |
Five Years | | 5.06 | | 4.99 | |
Ten Years | | 4.87 | | 4.75 | |
Life of Fund† | | 4.35 | | 4.38 | |
† Inception date: Class A: 3/14/94; Class B: 3/2/94
(1) Average annual total returns do not include the 4.75% maximum sales charge for Class A shares or the applicable contingent deferred sales charges (CDSC) for Class B shares. If sales charges were deducted, returns would be lower. SEC average annual total returns for Class A reflect the maximum 4.75% sales charge. SEC returns for Class B reflect applicable CDSC based on the following schedule: 5% - 1st and 2nd years; 4% - 3rd year; 3% - 4th year; 2% - 5th year; 1% - 6th year.
Rating Distribution(2)
By total investments

(2) Reflects the Fund’s investments as of July 31, 2005. May not be representative of the Fund’s current or future investments and may change due to active management.
Past performance is no guarantee of future results. Returns are historical and are calculated by determining the percentage change in net asset value or offering price (as applicable) with all distributions reinvested. Investment return and principal value will fluctuate so that shares, when redeemed, may be worth more or less than their original cost. Performance is for the stated time period only; due to market volatility, the Fund’s current performance may be lower or higher than the quoted return. For performance as of the most recent month end, please refer to www.eatonvance.com.
7
Eaton Vance Kansas Municipals Fund as of July 31, 2005
INVESTMENT UPDATE
The Fund
Performance for the Past Six Months
• The Fund’s Class A shares had a total return of 0.76% for the six months ended July 31, 2005.(1) This return was the result of a decrease in net asset value (NAV) to $10.42 per share on July 31, 2005 from $10.56 on January 31, 2005, and the reinvestment of $0.218 in dividends.(2)
• The Fund’s Class B shares had a total return of 0.37% for the six months ended July 31, 2005.(1) This return was the result of a decrease in NAV to $10.33 per share on July 31, 2005 from $10.47 on January 31, 2005, and the reinvestment of $0.178 in dividends.(2)
• For comparison, the Lehman Brothers Municipal Bond Index – a broad-based, unmanaged market index of municipal bonds – had a total return of 1.48% for the six months ended July 31, 2005.(3)
• Based on the Fund’s most recent dividends annualized and NAVs on July 31, 2005 of $10.42 per share for Class A and $10.33 for Class B, the Fund’s distribution rates were 4.12% and 3.37%, respectively.(4) The distribution rates are equivalent to taxable rates of 6.78% and 5.54%, respectively.(5)
• The SEC 30-day yields for Class A and Class B shares at July 31, 2005 were 3.29% and 2.71%, respectively.(6) The SEC 30-day yields are equivalent to taxable yields of 5.41% and 4.46%, respectively.(5)
See page 9 for more performance information.

Thomas M. Metzold
Portfolio Manager
Management Discussion
• Following three quarters of strong growth, the Kansas economy lost jobs early in 2005, as the information and retail sectors suffered cutbacks. On the positive side, the energy sector was boosted by higher oil prices, while the state’s aircraft manufacturing industry continued to rebound. The state’s July 2005 jobless rate was 5.2%, down from 5.4% a year ago.
• Kansas municipal issuance remained in short supply, a continuing challenge for the Fund. Insured* general obligations (GOs) constituted the Fund’s largest sector weighting at July 31, 2005. The Fund’s GO investments focused on GOs from unified school districts that management believes have relatively sound local economies and a good tax base.
• Insured* hospitals again represented significant holdings for the Fund. In a very competitive and cost-conscious environment, the Fund focused on acute care facilities that management believes are well managed, financially strong and leading care providers in their respective communities.
• Insured* and non-insured escrowed/prerefunded bonds were among the Fund’s major investments. Escrowed bonds are those that have been refinanced by municipal issuers, just as a homeowner refinances a mortgage. Because they are backed by Treasury bonds, they are considered to be of the highest quality.
• From a coupon standpoint, the Fund retained its well-diversified allocation, balancing defensive, highercoupon issues with interest-rate-sensitive, low- and zero-coupon issues. Management continued to monitor call protection. In its limited purchases during the period, call protection was a prime consideration.
• The Fund maintained selective investments in the housing sector. Given rising interest rates and the growing popularity of adjustable-rate mortgages, management monitored these trends for any impact on the housing sector.
* Private insurance does not decrease the risk of principal fluctuations associated with this investment.
Past performance is no guarantee of future results. Returns are historical and are calculated by determining the percentage change in net asset value or offering price (as applicable) with all distributions reinvested. Investment return and principal value will fluctuate so that shares, when redeemed, may be worth more or less than their original cost. Performance is for the stated time period only; due to market volatility, the Fund’s current performance may be lower or higher than the quoted return. For performance as of the most recent month end, please refer to www.eatonvance.com.
(1) These returns do not include the 4.75% maximum sales charge for Class A shares or the applicable contingent deferred sales charges (CDSC) for Class B shares. If sales charges were deducted, returns would be lower. (2) A portion of the Fund’s income may be subject to federal income and/or alternative minimum tax. Income may be subject to state and local income taxes. (3) It is not possible to invest directly in an Index. The Index’s total return does not reflect expenses that would have been incurred if an investor individually purchased or sold the securities represented in the Index. (4) The Fund’s distribution rate represents actual distributions paid to shareholders and is calculated by dividing the last distribution per share (annualized) by the net asset value. (5) Taxable-equivalent figures assume a maximum 39.19% combined federal and state income tax rate. A lower rate would result in lower tax-equivalent figures. (6) The Fund’s SEC yield is calculated by dividing the net investment income per share for the 30-day period by the offering price at the end of the period and annualizing the result.
8
Eaton Vance Kansas Municipals Fund as of July 31, 2005
FUND PERFORMANCE
Performance (1) | | Class A | | Class B | |
Average Annual Total Returns (at net asset value) | | | | | |
One Year | | 4.24 | % | 3.63 | % |
Five Years | | 6.05 | | 5.28 | |
Ten Years | | 5.55 | | 4.88 | |
Life of Fund† | | 5.36 | | 4.80 | |
SEC Average Annual Total Returns (including sales charge or applicable CDSC) | | | | | |
One Year | | -0.70 | % | -1.36 | % |
Five Years | | 5.02 | | 4.96 | |
Ten Years | | 5.04 | | 4.88 | |
Life of Fund† | | 4.91 | | 4.80 | |
† Inception date: Class A: 3/3/94; Class B: 3/2/94
(1) Average annual total returns do not include the 4.75% maximum sales charge for Class A shares or the applicable contingent deferred sales charges (CDSC) for Class shares. If sales charges were deducted, returns would be lower. SEC average annual total returns for Class A reflect the maximum 4.75% sales charge. SEC returns for Class B reflect applicable CDSC based on the following schedule: 5% - 1st and 2nd years; 4% - - 3rd year; 3% - 4th year; 2% - 5th year; 1% - 6th year.
Rating Distribution(2)
By total investments
(2) Reflects the Fund’s investments as of July 31, 2005. May not be representative of the Fund’s current or future investments and may change due to active management.
Past performance is no guarantee of future results. Returns are historical and are calculated by determining the percentage change in net asset value or offering price (as applicable) with all distributions reinvested. Investment return and principal value will fluctuate so that shares, when redeemed, may be worth more or less than their original cost. Performance is for the stated time period only; due to market volatility, the Fund’s current performance may be lower or higher than the quoted return. For performance as of the most recent month end, please refer to www.eatonvance.com.
9
Eaton Vance Municipals Funds as of July 31, 2005
FUND EXPENSES
Example: As a shareholder of a Fund, you incur two types of costs: (1) transaction costs, including sales charges (loads) on purchases and redemption fees (if applicable); and (2) ongoing costs, including management fees; distribution or service fees; and other Fund expenses. This Example is intended to help you understand your ongoing costs (in dollars) of investing in the Fund and to compare these costs with the ongoing costs of investing in other mutual funds. The Example is based on an investment of $1,000 invested at the beginning of the period and held for the entire period (February 1, 2005 – July 31, 2005).
Actual Expenses: The first section of each table below provides information about actual account values and actual expenses. You may use the information in this section, together with the amount you invested, to estimate the expenses that you paid over the period. Simply divide your account value by $1,000 (for example, an $8,600 account value divided by $1,000 = 8.6), then multiply the result by the number in the first line under the heading entitled “Expenses Paid During Period” to estimate the expenses you paid on your account during this period.
Hypothetical Example for Comparison Purposes: The second section of each table below provides information about hypothetical account values and hypothetical expenses based on the Fund’s actual expense ratios and an assumed rate of return of 5% per year before expenses, which is not the actual return of the Fund. The hypothetical account values and expenses may not be used to estimate the actual ending account balance or expenses you paid for the period. You may use this information to compare the ongoing costs of investing in the Fund and other funds. To do so, compare this 5% hypothetical example with the 5% hypothetical examples that appear in the shareholder reports of the other funds.
Please note that the expenses shown in each table are meant to highlight your ongoing costs only and do not reflect any transactional costs, such as sales charges (loads) or redemption fees (if applicable). Therefore, the second section of the table is useful in comparing ongoing costs only, and will not help you determine the relative total costs of owning different funds. In addition, if these transactional costs were included, your costs would have been higher.
Eaton Vance Florida Insured Municipals Fund
| | Beginning Account Value | | Ending Account Value | | Expenses Paid During Period* | |
| | (2/1/05) | | (7/31/05) | | (2/1/05 – 7/31/05) | |
Actual | | | | | | | |
Class A | | $ | 1,000.00 | | $ | 1,012.50 | | $ | 3.54 | |
Class B | | $ | 1,000.00 | | $ | 1,009.50 | | $ | 7.27 | |
| | | | | | | |
Hypothetical | | | | | | | |
(5% return per year before expenses) | | | | | | | |
Class A | | $ | 1,000.00 | | $ | 1,021.30 | | $ | 3.56 | |
Class B | | $ | 1,000.00 | | $ | 1,017.60 | | $ | 7.30 | |
* Expenses are equal to the Fund’s annualized expense ratio of 0.71% for Class A shares and 1.46% for Class B shares multiplied by the average account value over the period, multiplied by 181/365 (to reflect the one-half-year period). The example assumes that the $1,000 was invested at the net asset value per share determined at the close of business on January 31, 2005.
Eaton Vance Hawaii Municipals Fund
| | Beginning Account Value | | Ending Account Value | | Expenses Paid During Period* | |
| | (1/1/05) | | (7/31/05) | | (1/1/05 – 7/31/05) | |
| | | | | | | |
Actual | | | | | | | |
Class A | | $ | 1,000.00 | | $ | 1,012.30 | | $ | 3.99 | |
Class B | | $ | 1,000.00 | | $ | 1,008.70 | | $ | 7.72 | |
| | | | | | | |
Hypothetical | | | | | | | |
(5% return per year before expenses) | | | | | | | |
Class A | | $ | 1,000.00 | | $ | 1,020.80 | | $ | 4.01 | |
Class B | | $ | 1,000.00 | | $ | 1,017.10 | | $ | 7.75 | |
* Expenses are equal to the Fund’s annualized expense ratio of 0.80% for Class A shares and 1.55% for Class B shares multiplied by the average account value over the period, multiplied by 181/365 (to reflect the one-half-year period). The example assumes that the $1,000 was invested at the net asset value per share determined at the close of business on January 31, 2005.
10
Eaton Vance Municipals Funds as of July 31, 2005
FUND EXPENSES
Eaton Vance Kansas Municipals Fund
| | Beginning Account Value | | Ending Account Value | | Expenses Paid During Period* | |
| | (2/1/05) | | (6/30/05) | | (2/1/05 – 7/31/05) | |
| | | | | | | |
Actual | | | | | | | |
Class A | | $ | 1,000.00 | | $ | 1,007.60 | | $ | 4.03 | |
Class B | | $ | 1,000.00 | | $ | 1,003.70 | | $ | 7.75 | |
| | | | | | | |
Hypothetical | | | | | | | |
(5% return per year before expenses) | | | | | | | |
Class A | | $ | 1,000.00 | | $ | 1,020.80 | | $ | 4.06 | |
Class B | | $ | 1,000.00 | | $ | 1,071.10 | | $ | 7.80 | |
* Expenses are equal to the Fund’s annualized expense ratio of 0.81% for Class A shares and 1.56% for Class B shares multiplied by the average account value over the period, multiplied by 181/365 (to reflect the one-half-year period). The example assumes that the $1,000 was invested at the net asset value per share determined at the close of business on January 31, 2005.
11
Eaton Vance Florida Insured Municipals Fund as of July 31, 2005
PORTFOLIO OF INVESTMENTS (Unaudited)
| Tax-Exempt Investments - 99.7% | |
Principal Amount
(000's omitted) | | Security | |
Value | |
| Hospital - 1.8% | |
| $ | 250 | | | Highland County, Health Facilities Authority,
(Adventist Health System), 5.375%, 11/15/35 | | $ | 262,250 | | |
| | 500 | | | Orange County, Health Facilities Authority,
(Nemours Foundation), 5.00%, 1/1/35 | | | 525,875 | | |
| | | | | | | $ | 788,125 | | |
| Housing - 1.0% | |
| $ | 45 | | | Manatee County, HFA, SFMR, (GNMA), (AMT),
6.875%, 11/1/26 | | $ | 45,403 | | |
| | 410 | | | Pinellas County, HFA, SFMR, (GNMA), (AMT),
5.80%, 3/1/29 | | | 423,772 | | |
| | | | | | | $ | 469,175 | | |
| Insured-Education - 2.3% | |
| $ | 1,000 | | | Florida State University, System Improvement Revenue,
(AMBAC), 4.50%, 7/1/23 | | $ | 1,006,940 | | |
| | | | | | | $ | 1,006,940 | | |
| Insured-Electric Utilities - 8.7% | |
| $ | 1,000 | | | Jacksonville Electric Authority, Electric System Revenue (FSA),
4.75%, 10/1/33 | | $ | 1,008,900 | | |
| | 1,100 | | | Jacksonville Electric Authority, Electric System Revenue (FSA),
4.75%, 10/1/34 | | | 1,109,790 | | |
| | 600 | | | Puerto Rico Electric Power Authority, (FSA), Variable Rate,
8.39%, 7/1/29(1)(2) | | | 694,566 | | |
| | 750 | | | Puerto Rico Electric Power Authority, (MBIA), 5.00%, 7/1/32 | | | 790,312 | | |
| | 200 | | | Puerto Rico Electric Power Authority, (MBIA), Variable Rate,
12.295%, 7/1/16(1)(3) | | | 291,338 | | |
| | | | | | | $ | 3,894,906 | | |
| Insured-Escrowed/Prerefunded - 4.6% | |
| $ | 1,160 | | | Dade County, Professional Sports Franchise, (MBIA),
Escrowed to Maturity, 0.00%, 10/1/19 | | $ | 640,946 | | |
| | 1,000 | | | Dade County, Professional Sports Franchise, (MBIA),
Escrowed to Maturity, 5.25%, 10/1/30 | | | 1,144,320 | | |
| | 250 | | | Puerto Rico Public Finance Corp., (AMBAC), Variable Rate,
Prerefunded to 6/1/08, 7.39%, 6/1/26(1)(2) | | | 280,680 | | |
| | | | | | | $ | 2,065,946 | | |
Principal Amount
(000's omitted) | |
Security | |
Value | |
| Insured-General Obligations - 5.6% | |
| $ | 1,000 | | | Florida Board of Education, Capital Outlay, (Public Education),
(AMBAC), 5.00%, 6/1/34 | | $ | 1,057,680 | | |
| | 1,000 | | | Florida Board of Education, Capital Outlay, (Public Education),
(MBIA), 5.00%, 6/1/32(4) | | | 1,048,620 | | |
| | 330 | | | Puerto Rico, (FSA), Variable Rate, 8.479%, 7/1/27(1)(3) | | | 404,369 | | |
| | | | | | | $ | 2,510,669 | | |
| Insured-Hospital - 11.4% | |
| $ | 1,020 | | | Brevard County, Health Facilities Authority, (Health First, Inc.),
(MBIA), 5.125%, 4/1/31 | | $ | 1,065,594 | | |
| | 200 | | | Dade, Public Facilities Board, (Jackson Memorial Hospital),
(MBIA), 4.875%, 6/1/15 | | | 200,154 | | |
| | 250 | | | Jacksonville, Economic Development Commission Health
Care, (Mayo Clinic), (MBIA), 5.50%, 11/15/36 | | | 276,350 | | |
| | 350 | | | Miami Dade County, Health Facilities Authority, (Miami
Children's Hospital), (AMBAC), 5.125%, 8/15/26 | | | 368,578 | | |
| | 1,000 | | | Sarasota County, Public Hospital Board, (Sarasota Memorial
Hospital), (MBIA), 5.50%, 7/1/28 | | | 1,166,550 | | |
| | 1,900 | | | South Miami, Health Facility Authority Hospital Revenue,
(Baptist Health), (AMBAC), 5.25%, 11/15/33 | | | 2,022,892 | | |
| | | | | | | $ | 5,100,118 | | |
| Insured-Housing - 3.5% | |
| $ | 1,000 | | | Florida HFA, (Mariner Club Apartments), (AMBAC), (AMT),
6.375%, 9/1/36 | | $ | 1,033,220 | | |
| | 500 | | | Florida HFA, (Spinnaker Cove Apartments), (AMBAC), (AMT),
6.50%, 7/1/36 | | | 516,140 | | |
| | | | | | | $ | 1,549,360 | | |
Insured-Lease Revenue / Certificates of
Participation - 1.2% | |
| $ | 500 | | | Broward County, School Board, Certificates of Participation,
(FSA), 5.00%, 7/1/26 | | $ | 523,030 | | |
| | | | | | | $ | 523,030 | | |
| Insured-Miscellaneous - 4.1% | |
| $ | 500 | | | St. John's County, IDA, (Professional Golf), (MBIA),
5.00%, 9/1/23 | | $ | 528,780 | | |
| | 1,250 | | | Village Center Community Development District, (MBIA),
5.00%, 11/1/32 | | | 1,311,087 | | |
| | | | | | | $ | 1,839,867 | | |
See notes to financial statements
12
Eaton Vance Florida Insured Municipals Fund as of July 31, 2005
PORTFOLIO OF INVESTMENTS (Unaudited) CONT'D
Principal Amount
(000's omitted) | |
Security | |
Value | |
| | Insured-Solid Waste - 1.2% | | | | |
| $ | 500 | | | Dade County Resource Recovery Facilities, (AMBAC), (AMT),
5.50%, 10/1/13(5) | | $ | 521,820 | | |
| | | | | | | $ | 521,820 | | |
| | Insured-Special Assessment Revenue - 3.8% | | | | |
| $ | 345 | | | Celebration Community Development District, (MBIA),
5.125%, 5/1/20 | | $ | 366,324 | | |
| | 750 | | | Crossings at Fleming Island Community Development District,
(MBIA), 5.80%, 5/1/16 | | | 834,593 | | |
| | 490 | | | Julington Creek, Plantation Community Development District,
(MBIA), 5.00%, 5/1/29 | | | 513,206 | | |
| | | | | | | $ | 1,714,123 | | |
| | Insured-Special Tax Revenue - 15.7% | | | | |
| $ | 415 | | | Dade County, Special Obligations, Residual Certificates,
(AMBAC), Variable Rate, 9.835%, 10/1/35(1)(3) | | $ | 454,682 | | |
| | 1,580 | | | Jacksonville Sales Tax, (AMBAC), 5.00%, 10/1/30 | | | 1,639,740 | | |
| | 500 | | | Jacksonville, Capital Improvement Revenue, (Stadium),
(AMBAC), 4.75%, 10/1/25 | | | 508,800 | | |
| | 5,055 | | | Miami Dade County, (MBIA), 0.00%, 10/1/36 | | | 1,017,925 | | |
| | 300 | | | Orange County, Tourist Development Tax, (AMBAC),
Variable Rate, 10.21%, 10/1/30(1)(3) | | | 346,614 | | |
| | 340 | | | Sunrise Public Facilities Sales Tax, (MBIA), 0.00%, 10/1/15 | | | 223,438 | | |
| | 1,625 | | | Tampa, Utility Tax, (AMBAC), 0.00%, 4/1/21 | | | 817,749 | | |
| | 1,950 | | | Tampa, Utility Tax, (AMBAC), 0.00%, 10/1/21 | | | 960,044 | | |
| | 1,000 | | | Volusia County, Tourist Development Tax, (FSA),
5.00%, 12/1/34 | | | 1,055,290 | | |
| | | | | | | $ | 7,024,282 | | |
| | Insured-Transportation - 12.8% | | | | |
| $ | 500 | | | Dade County Aviation Facilities, (Miami International Airport),
(FSA), (AMT), 5.125%, 10/1/22 | | $ | 513,725 | | |
| | 500 | | | Dade County, Seaport, (MBIA), 5.125%, 10/1/16 | | | 521,725 | | |
| | 400 | | | Greater Orlando, FL, Aviation Authority, (FGIC), (AMT),
Variable Rate, 9.646%, 10/1/18(1)(3) | | | 465,420 | | |
| | 500 | | | Puerto Rico Highway and Transportation Authority, (MBIA),
4.75%, 7/1/38 | | | 522,365 | | |
| | 750 | | | Puerto Rico Highway and Transportation Authority, (MBIA),
5.00%, 7/1/36 | | | 802,305 | | |
| | 150 | | | Puerto Rico Highway and Transportation Authority, (MBIA),
5.50%, 7/1/36 | | | 170,075 | | |
| | 1,000 | | | Tampa-Hillsborough County Expressway Authority, (AMBAC),
4.00%, 7/1/34(6) | | | 906,770 | | |
| | 500 | | | Tampa-Hillsborough County Expressway Authority, (FGIC),
5.00%, 7/1/32 | | | 522,760 | | |
| | 1,250 | | | Tampa-Hillsborough County Expressway Authority, (FGIC),
5.00%, 7/1/35 | | | 1,306,050 | | |
| | | | | | | $ | 5,731,195 | | |
Principal Amount
(000's omitted) | |
Security | |
Value | |
| | Insured-Utilities - 3.0% | | | | |
| $ | 1,250 | | | Ocala Water, Sewer and Electrical Utility System, (FGIC),
5.00%, 10/1/31 | | $ | 1,320,875 | | |
| | | | | | | $ | 1,320,875 | | |
| | Insured-Water and Sewer - 19.0% | | | | |
| $ | 735 | | | Enterprise Community Development District, Water and Sewer,
(MBIA), 6.125%, 5/1/24(5) | | $ | 737,051 | | |
| | 250 | | | Florida Governmental Utility Authority, (Barefoot Bay
Utility System), (AMBAC), 5.00%, 10/1/29 | | | 258,940 | | |
| | 1,000 | | | Jacksonville, Water and Sewer, (AMBAC), (AMT),
6.35%, 8/1/25 | | | 1,022,680 | | |
| | 1,000 | | | Lee County, IDA, (Bonita Springs Utilities), (MBIA), (AMT),
6.05%, 11/1/20 | | | 1,045,090 | | |
| | 1,000 | | | Marco Island, Utility System, (MBIA), 5.00%, 10/1/24 | | | 1,059,840 | | |
| | 500 | | | Marco Island, Utility System, (MBIA), 5.00%, 10/1/27 | | | 527,575 | | |
| | 1,000 | | | Marion County, Utility System, (FGIC), 5.00%, 12/1/31 | | | 1,043,280 | | |
| | 1,000 | | | Marion County, Utility System, (MBIA), 5.00%, 12/1/28 | | | 1,054,660 | | |
| | 1,000 | | | Sunrise Utility System, (AMBAC), 5.00%, 10/1/28 | | | 1,078,670 | | |
| | 250 | | | Tallahassee, Consolidated Utility System, (FGIC),
5.50%, 10/1/19 | | | 290,105 | | |
| | 375 | | | Tampa Bay, Water Utility System, (FGIC), Variable Rate,
6.86%, 10/1/27(1)(2) | | | 395,520 | | |
| | | | | | | $ | 8,513,411 | | |
| | Total Tax-Exempt Investments - 99.7%
(identified cost $41,647,484) | | | | | $ | 44,573,842 | | |
| | Other Assets, Less Liabilities - 0.3% | | | | | $ | 129,484 | | |
| | Net Assets - 100.0% | | | | | $ | 44,703,326 | | |
AMBAC - AMBAC Financial Group, Inc.
AMT - Interest earned from these securities may be considered a tax preference item for purposes of the Federal Alternative Minimum Tax.
FGIC - Financial Guaranty Insurance Company
FSA - Financial Security Assurance, Inc.
MBIA - Municipal Bond Insurance Association
The Fund invests primarily in debt securities issued by Florida municipalities. The ability of the issuers of the debt securities to meet their obligations may be affected by economic developments in a specific industry or municipality. In order to reduce the risk associated with such economic developments, at July 31, 2005, 97.2% of the securities in the portfolio of investments are backed by bond insurance of various financial institutions and financial guaranty assurance agencies. The aggregate percentage insured by an individual financial institution ranged from 11.9% to 40.1% of total investments.
See notes to financial statements
13
Eaton Vance Florida Insured Municipals Fund as of July 31, 2005
PORTFOLIO OF INVESTMENTS (Unaudited) CONT'D
At July 31, 2005, the Fund's insured securities by financial institution are as follows:
| | | Market
Value | | % of
Total Investments | |
| American Municipal Bond Assurance Corp. (AMBAC) | | $ | 14,802,639 | | | | 33.2 | % | |
| Financial Guaranty Insurance Corp. (FGIC) | | | 5,344,010 | | | | 12.0 | % | |
| Financial Security Assurance (FSA) | | | 5,309,670 | | | | 11.9 | % | |
| Municipal Bond Insurance Association (MBIA) | | | 17,860,223 | | | | 40.1 | % | |
| | | $ | 43,316,542 | | | | 97.2 | % | |
(1) Security exempt from registration under Rule 144A of the Securities Act of 1933. These securities may be sold in transactions exempt from registration, normally to qualified institutional buyers. At July 31, 2005, the aggregate value of the securities is $3,333,189 or 7.5% of the Fund's net assets.
(2) Security has been issued as an inverse floater bond. The stated interest rate represents the rate in effect at July 31, 2005.
(3) Security has been issued as a leveraged inverse floater bond. The stated interest rate represents the rate in effect at July 31, 2005.
(4) Security (or a portion thereof) has been segregated to cover margin requirements on open financial futures contracts.
(5) Security (or a portion thereof) has been segregated to cover when-issued securities.
(6) When-issued security.
See notes to financial statements
14
Eaton Vance Hawaii Municipals Fund as of July 31, 2005
PORTFOLIO OF INVESTMENTS (Unaudited)
| Tax-Exempt Investments - 96.3% | |
Principal Amount
(000's omitted) | | Security | | Value | |
| Electric Utilities - 1.7% | |
| $ | 500 | | | Puerto Rico Electric Power Authority, 0.00%, 7/1/17 | | $ | 310,005 | | |
| | | | | | | $ | 310,005 | | |
| Escrowed / Prerefunded - 5.7% | |
| $ | 200 | | | Hawaii Department of Budget and Finance, (Queens Health
System), Prerefunded to 7/1/06, 5.75%, 7/1/26 | | $ | 209,294 | | |
| | 750 | | | Honolulu, Escrowed to Maturity, 4.75%, 9/1/17 | | | 815,107 | | |
| | | | | | | $ | 1,024,401 | | |
| General Obligations - 7.1% | |
| $ | 575 | | | Maui County, 5.00%, 3/1/21 | | $ | 609,132 | | |
| | 200 | | | Maui County, 5.50%, 3/1/19 | | | 219,022 | | |
| | 285 | | | Puerto Rico, 0.00%, 7/1/15 | | | 189,234 | | |
| | 250 | | | Puerto Rico, 5.00%, 7/1/34 | �� | | 260,587 | | |
| | | | | | | $ | 1,277,975 | | |
| Hospital - 3.1% | |
| $ | 100 | | | Hawaii Department of Budget and Finance, (Hawaii Pacific
Health), 5.60%, 7/1/33 | | $ | 104,486 | | |
| | 300 | | | Hawaii Department of Budget and Finance, (Wilcox Memorial
Hospital), 5.35%, 7/1/18 | | | 304,962 | | |
| | 150 | | | Hawaii Department of Budget and Finance, (Wilcox Memorial
Hospital), 5.50%, 7/1/28 | | | 151,309 | | |
| | | | | | | $ | 560,757 | | |
| Housing - 2.6% | |
| $ | 415 | | | Guam Housing Corp., Single Family, (AMT),
5.75%, 9/1/31 | | $ | 469,261 | | |
| | | | | | | $ | 469,261 | | |
| Industrial Development Revenue - 1.9% | |
| $ | 360 | | | Hawaii Department of Transportation Special Facilities,
(Continental Airlines), (AMT), 7.00%, 6/1/20 | | $ | 349,312 | | |
| | | | | | | $ | 349,312 | | |
| Insured-Education - 8.6% | |
| $ | 500 | | | Hawaii State Housing Development Corp., (University of
Hawaii), (AMBAC), 5.65%, 10/1/16 | | $ | 507,295 | | |
| | 240 | | | University of Hawaii Board of Regents, University System,
(FSA), 5.00%, 10/1/18 | | | 257,338 | | |
Principal Amount
(000's omitted) | |
Security | |
Value | |
| | Insured-Education (continued) | | | | |
| $ | 250 | | | University of Hawaii Board of Regents, University System,
(FSA), 5.25%, 10/1/16 | | $ | 272,562 | | |
| | 100 | | | University of Hawaii Board of Regents, University System, (FSA),
5.25%, 10/1/17 | | | 109,025 | | |
| | 400 | | | University of Puerto Rico, (MBIA), 5.375%, 6/1/30 | | | 404,720 | | |
| | | | | | | $ | 1,550,940 | | |
| | Insured-Electric Utilities - 6.0% | | | | |
| $ | 500 | | | Hawaii Department of Budget and Finance, (Hawaii
Electric Co.), (FGIC), (AMT), 4.80%, 1/1/25 | | $ | 504,625 | | |
| | 250 | | | Hawaii Department of Budget and Finance, (Hawaiian
Electric Co.), (AMBAC), (AMT), 5.75%, 12/1/18(1) | | | 272,215 | | |
| | 300 | | | Puerto Rico Electric Power Authority, (CIFG), 5.00%, 7/1/29 | | | 319,677 | | |
| | | | | | | $ | 1,096,517 | | |
| | Insured-Escrowed / Prerefunded - 6.8% | | | | |
| $ | 100 | | | Hawaii Airports System, (MBIA), (AMT), Escrowed to
Maturity, 6.90%, 7/1/12 | | $ | 115,336 | | |
| | 375 | | | Hawaii, (MBIA), Prerefunded to 4/1/08, 5.00%, 4/1/17 | | | 397,916 | | |
| | 300 | | | Puerto Rico Infrastructure Financing Authority, (AMBAC),
Prerefunded to 1/1/08, Variable Rate, 7.031%, 7/1/28(2)(3) | | | 335,649 | | |
| | 210 | | | Puerto Rico Infrastructure Financing Authority, (AMBAC),
Prerefunded to 1/1/08, Variable Rate, 10.286%, 7/1/28(2)(4) | | | 247,432 | | |
| | 100 | | | Puerto Rico, (FGIC), Prerefunded to 7/1/12, Variable Rate,
9.214%, 7/1/32(2)(4) | | | 128,505 | | |
| | | | | | | $ | 1,224,838 | | |
| | Insured-General Obligations - 18.7% | | | | |
| $ | 350 | | | Hawaii County, (FGIC), 5.125%, 7/15/21 | | $ | 374,525 | | |
| | 350 | | | Hawaii County, (FGIC), 5.55%, 5/1/10 | | | 383,975 | | |
| | 100 | | | Hawaii County, (FSA), 5.00%, 7/15/22 | | | 106,150 | | |
| | 375 | | | Hawaii, (FSA), 5.125%, 2/1/22 | | | 402,285 | | |
| | 1,000 | | | Hawaii, (MBIA), 5.25%, 5/1/24 | | | 1,086,500 | | |
| | 345 | | | Honolulu, City & County, (MBIA), 5.25%, 3/1/28 | | | 369,592 | | |
| | 400 | | | Kauai County, (MBIA), 5.00%, 8/1/24(1) | | | 422,128 | | |
| | 200 | | | Puerto Rico, (FSA), Variable Rate, 8.479%, 7/1/27(2)(4) | | | 245,072 | | |
| | | | | | | $ | 3,390,227 | | |
| | Insured-Special Tax Revenue - 1.3% | | | | |
| $ | 210 | | | Puerto Rico Infrastructure Financing Authority, (AMBAC),
0.00%, 7/1/28 | | $ | 74,741 | | |
| | 110 | | | Puerto Rico Infrastructure Financing Authority, (AMBAC),
0.00%, 7/1/37 | | | 24,857 | | |
| | 800 | | | Puerto Rico Infrastructure Financing Authority, (AMBAC),
0.00%, 7/1/43 | | | 132,848 | | |
| | | | | | | $ | 232,446 | | |
See notes to financial statements
15
Eaton Vance Hawaii Municipals Fund as of July 31, 2005
PORTFOLIO OF INVESTMENTS (Unaudited) CONT'D
Principal Amount
(000's omitted) | |
Security | |
Value | |
| | Insured-Transportation - 16.4% | | | | |
| $ | 700 | | | Hawaii Airports System, (FGIC), (AMT), 5.25%, 7/1/21 | | $ | 738,087 | | |
| | 250 | | | Hawaii Highway, (FSA), 5.00%, 7/1/22 | | | 261,515 | | |
| | 900 | | | Hawaii, State Harbor Revenue, (FSA), (AMT),
5.00%, 1/1/23 | | | 934,416 | | |
| | 1,000 | | | Puerto Rico Highway and Transportation Authority, (FSA),
4.75%, 7/1/38 | | | 1,044,730 | | |
| | | | | | | $ | 2,978,748 | | |
| | Insured-Water and Sewer - 12.0% | | | | |
| $ | 1,000 | | | Honolulu, City and County Board Water Supply Systems,
(FSA), 5.25%, 7/1/31(5) | | $ | 1,071,840 | | |
| | 1,000 | | | Honolulu, City and County Wastewater Systems, (FGIC),
0.00%, 7/1/18 | | | 566,240 | | |
| | 500 | | | Honolulu, City and County Wastewater Systems, (FGIC),
5.00%, 7/1/25(6) | | | 531,960 | | |
| | | | | | | $ | 2,170,040 | | |
| | Other Revenue - 1.4% | | | | |
| $ | 200 | | | Puerto Rico Infrastructure Financing Authority, Variable Rate,
9.118%, 10/1/34(2)(4) | | $ | 261,458 | | |
| | | | | | | $ | 261,458 | | |
| | Special Tax Revenue - 1.4% | | | | |
| $ | 250 | | | Virgin Islands Public Facilities Authority, 5.625%, 10/1/25 | | $ | 260,873 | | |
| | | | | | | $ | 260,873 | | |
| | Transportation - 1.6% | | | | |
| $ | 250 | | | Hawaii Highway Revenue, 5.50%, 7/1/18 | | $ | 286,593 | | |
| | | | | | | $ | 286,593 | | |
| | Total Tax-Exempt Investments - 96.3%
(identified cost $16,032,946) | | | | | $ | 17,444,391 | | |
| | Other Assets, Less Liabilities - 3.7% | | | | | $ | 671,692 | | |
| | Net Assets - 100.0% | | | | | $ | 18,116,083 | | |
AMBAC - AMBAC Financial Group, Inc.
AMT - Interest earned from these securities may be considered a tax preference item for purposes of the Federal Alternative Minimum Tax.
CIFG - CDC IXIS Financial Guaranty North America, Inc.
FGIC - Financial Guaranty Insurance Company
FSA - Financial Security Assurance, Inc.
MBIA - Municipal Bond Insurance Association
The Fund invests primarily in debt securities issued by Hawaii municipalities. The ability of the issuers of the debt securities to meet their obligations may be affected by economic developments in a specific industry or municipality. In order to reduce the risk associated with such economic developments, at July 31, 2005, 72.5% of the securities in the portfolio of investments are backed by bond insurance of various financial institutions and financial guaranty assurance agencies. The aggregate percentage insured by an individual financial institution ranged from 1.8% to 27.0% of total investments.
(1) Security (or a portion thereof) has been segregated to cover when-issued securities.
(2) Security exempt from registration under Rule 144A of the Securities Act of 1933. These securities may be sold in transactions exempt from registration, normally to qualified institutional buyers. At July 31, 2005, the aggregate value of the securities is $1,218,116 or 6.7% of the Fund's net assets.
(3) Security has been issued as an inverse floater bond. The stated interest rate represents the rate in effect at July 31, 2005.
(4) Security has been issued as a leveraged inverse floater bond. The stated interest rate represents the rate in effect at July 31, 2005.
(5) Security (or a portion thereof) has been segregated to cover margin requirements on open financial futures contracts.
(6) When-issued security.
See notes to financial statements
16
Eaton Vance Kansas Municipals Fund as of July 31, 2005
PORTFOLIO OF INVESTMENTS (Unaudited)
| | Tax-Exempt Investments - 97.9% | | | | |
Principal Amount
(000's omitted) | | Security | | Value | |
| | Escrowed / Prerefunded - 7.1% | | | | |
| $ | 550 | | | Kansas Highway Transportation Department, Prerefunded to
9/1/09, 5.25%, 9/1/19 | | $ | 593,554 | | |
| | 415 | | | Labette County, SFMR, Escrowed to Maturity, 0.00%, 12/1/14 | | | 286,300 | | |
| | 1,000 | | | Saline County, SFMR, Escrowed to Maturity, 0.00%, 12/1/15 | | | 657,300 | | |
| | | | | | | $ | 1,537,154 | | |
| | Hospital - 6.1% | | | | |
| $ | 250 | | | Sedgwick County, Health Care Facility, (Catholic Care
Center, Inc.), 5.875%, 11/15/31 | | $ | 261,342 | | |
| | 500 | | | University of Kansas Hospital Authority, 5.50%, 9/1/22 | | | 524,625 | | |
| | 500 | | | Wichita, (Christi Health Systems, Inc.), 6.25%, 11/15/24 | | | 544,140 | | |
| | | | | | | $ | 1,330,107 | | |
| | Housing - 0.4% | | | | |
| $ | 80 | | | Puerto Rico Housing Finance Corp., 7.50%, 4/1/22 | | $ | 80,550 | | |
| | | | | | | $ | 80,550 | | |
| | Insured-Education - 3.6% | | | | |
| $ | 100 | | | Kansas Development Finance Authority, (Kansas Board of
Regents), (AMBAC), 5.00%, 4/1/14 | | $ | 109,448 | | |
| | 550 | | | Kansas Development Finance Authority, (Kansas State
University-Athletic Facility), (AMBAC), 0.00%, 7/1/18 | | | 314,198 | | |
| | 350 | | | Washburn University, Topeka, (Living Learning Center),
(AMBAC), 5.00%, 7/1/29 | | | 369,446 | | |
| | | | | | | $ | 793,092 | | |
| | Insured-Electric Utilities - 9.9% | | | | |
| $ | 250 | | | Augusta, Electric System, (AMBAC), 5.00%, 8/1/22 | | $ | 265,065 | | |
| | 1,000 | | | Burlington, PCR, (Kansas Gas & Electric Co.), (MBIA),
5.30%, 6/1/31 | | | 1,083,460 | | |
| | 250 | | | Pratt, Electric System, (AMBAC), 5.25%, 5/1/18 | | | 269,170 | | |
| | 500 | | | Wyandotte County & Kansas City Unified Government Utility
System, (FSA), 5.00%, 9/1/28 | | | 530,140 | | |
| | | | | | | $ | 2,147,835 | | |
| | Insured-Escrowed/Prerefunded - 13.1% | | | | |
| $ | 500 | | | Chisholm Creek Utility Authority, Water and Wastewater, (Bel
Aire & Park City), (MBIA), Prerefunded to 9/1/12,
5.25%, 9/1/20 | | $ | 553,440 | | |
| | 250 | | | Kansas Development Finance Authority, (7th and Harrison
Project), (AMBAC), Prerefunded to 12/1/09,
5.75%, 12/1/27 | | | 275,782 | | |
Principal Amount
(000's omitted) | |
Security | |
Value | |
| | Insured-Escrowed / Prerefunded (continued) | | | | |
| $ | 525 | | | Puerto Rico Infrastructure Financing Authority, (AMBAC),
Prerefunded to 1/1/08, Variable Rate,
10.286%, 7/1/28(1)(2) | | $ | 618,581 | | |
| | 230 | | | Puerto Rico, (FGIC), Prerefunded to 7/1/12, Variable Rate,
9.214%, 7/1/32(1)(2) | | | 295,561 | | |
| | 500 | | | Sedgwick County, Unified School District #267, (AMBAC),
Prerefunded to 11/1/09, 5.00%, 11/1/19 | | | 535,825 | | |
| | 500 | | | Washburn University, Topeka, (Living Learning Center),
(AMBAC), Prerefunded to 7/1/09, 6.125%, 7/1/29 | | | 554,755 | | |
| | | | | | | $ | 2,833,944 | | |
| | Insured-General Obligations - 25.0% | | | | |
| $ | 250 | | | Butler and Sedgwick County, Unified School District #385,
(FGIC), 5.00%, 9/1/19 | | $ | 267,035 | | |
| | 250 | | | Butler and Sedgwick County, Unified School District #385,
(FSA), 5.40%, 9/1/18 | | | 269,178 | | |
| | 500 | | | Butler County, Unified School District #490, (FSA),
5.00%, 9/1/23 | | | 533,240 | | |
| | 200 | | | Johnson County, Unified School District #231, (FGIC),
6.00%, 10/1/16 | | | 238,632 | | |
| | 250 | | | Johnson County, Unified School District #232, (FSA),
4.75%, 9/1/19 | | | 260,830 | | |
| | 300 | | | Johnson County, Unified School District #233, (FGIC),
5.50%, 9/1/17 | | | 346,062 | | |
| | 1,000 | | | Leavenworth County, Unified School District #464, (MBIA),
5.00%, 9/1/28 | | | 1,062,240 | | |
| | 500 | | | Lyon County, Unified School District #253, (FGIC),
4.75%, 9/1/21 | | | 519,020 | | |
| | 80 | | | Puerto Rico, (MBIA), Variable Rate, 11.395%, 7/1/20(1)(2) | | | 120,300 | | |
| | 750 | | | Scott County, Unified School District #466, (FGIC),
5.00%, 9/1/22 | | | 795,300 | | |
| | 500 | | | Sedgwick County, Unified School District #259, (FSA),
2.50%, 10/1/17 | | | 422,415 | | |
| | 700 | | | Sedgwick County, Unified School District #259, (FSA),
2.50%, 10/1/18 | | | 580,839 | | |
| | | | | | | $ | 5,415,091 | | |
| | Insured-Hospital - 11.4% | | | | |
| $ | 250 | | | Coffeyville, Public Building Commission Health Care Facility,
(Coffeyville Regional Medical Center), (AMBAC),
5.00%, 8/1/22 | | $ | 261,565 | | |
| | 250 | | | Kansas Development Finance Authority, (Hays Medical
Center, Inc.), (MBIA), 5.50%, 11/15/22 | | | 261,418 | | |
| | 500 | | | Kansas Development Finance Authority, (Sisters Of Charity -
Leavenworth), (MBIA), 5.00%, 12/1/25 | | | 512,590 | | |
| | 500 | | | Kansas Development Finance Authority, (St. Luke's/Shawnee
Mission), (MBIA), 5.375%, 11/15/26 | | | 522,390 | | |
See notes to financial statements
17
Eaton Vance Kansas Municipals Fund as of July 31, 2005
PORTFOLIO OF INVESTMENTS (Unaudited) CONT'D
Principal Amount
(000's omitted) | |
Security | |
Value | |
| | Insured-Hospital (continued) | | | | |
| $ | 600 | | | Kansas Development Finance Authority, (Stormont-Vail
Healthcare), (MBIA), 5.375%, 11/15/24 | | $ | 651,726 | | |
| | 250 | | | Manhattan Hospital, (Mercy Health Center), (FSA),
5.20%, 8/15/26 | | | 262,430 | | |
| | | | | | | $ | 2,472,119 | | |
| | Insured-Housing - 1.2% | | | | |
| $ | 250 | | | Augusta Public Building Commission Revenue, (Cottonwood
Point, Inc.), (MBIA), 5.25%, 4/1/22 | | $ | 270,563 | | |
| | | | | | | $ | 270,563 | | |
| | Insured-Industrial Development Revenue - 1.2% | | | | |
| $ | 250 | | | Wyandotte County & Kansas City Unified Government Utility
System, (MBIA), 5.00%, 5/1/21 | | $ | 265,498 | | |
| | | | | | | $ | 265,498 | | |
| | Insured-Lease Revenue / Certificates of
Participation - 3.2% | | | | |
| $ | 500 | | | Kansas Development Finance Authority, (Capital Restoration
Parking Facility), (FSA), 5.00%, 10/1/21(3) | | $ | 532,070 | | |
| | 120 | | | Puerto Rico Public Finance Corp., (AMBAC), Variable Rate,
10.135%, 6/1/24(1)(2) | | | 163,783 | | |
| | | | | | | $ | 695,853 | | |
| | Insured-Special Tax Revenue - 1.5% | | | | |
| $ | 280 | | | Puerto Rico Infrastructure Financing Authority, (AMBAC),
0.00%, 7/1/28 | | $ | 99,655 | | |
| | 150 | | | Puerto Rico Infrastructure Financing Authority, (AMBAC),
0.00%, 7/1/37 | | | 33,896 | | |
| | 1,250 | | | Puerto Rico Infrastructure Financing Authority, (FGIC),
0.00%, 7/1/45 | | | 188,375 | | |
| | | | | | | $ | 321,926 | | |
| | Insured-Transportation - 6.2% | | | | |
| $ | 435 | | | Kansas Turnpike Authority, (AMBAC), Variable Rate,
5.306%, 9/1/18(1)(2) | | $ | 434,091 | | |
| | 750 | | | Kansas Turnpike Authority, (FSA), 5.00%, 9/1/24 | | | 791,813 | | |
| | 100 | | | Puerto Rico Highway and Transportation Authority, (FSA),
Variable Rate, 9.895%, 7/1/32(1)(2) | | | 114,370 | | |
| | | | | | | $ | 1,340,274 | | |
| | Insured-Water and Sewer - 5.8% | | | | |
| $ | 500 | | | Kansas Development Finance Authority, Public Water Supply,
(AMBAC), 5.00%, 4/1/24 | | $ | 527,380 | | |
Principal Amount
(000's omitted) | |
Security | |
Value | |
| | Insured-Water and Sewer (continued) | | | | |
| $ | 500 | | | Topeka, Water Pollution Control Utility System, (FGIC),
5.40%, 8/1/31 | | $ | 532,740 | | |
| | 200 | | | Wellington Electric, Waterworks, and Sewer Utilities System,
(AMBAC), 5.20%, 5/1/23 | | | 209,308 | | |
| | | | | | | $ | 1,269,428 | | |
| | Transportation - 1.2% | | | | |
| $ | 250 | | | Puerto Rico Highway and Transportation Authority,
5.00%, 7/1/42 | | $ | 259,173 | | |
| | | | | | | $ | 259,173 | | |
| | Water and Sewer - 1.0% | | | | |
| $ | 200 | | | Kansas Development Finance Authority, 5.00%, 11/1/21 | | $ | 212,850 | | |
| | | | | | | $ | 212,850 | | |
| | Total Tax-Exempt Investments - 97.9%
(identified cost $19,789,928) | | | | | $ | 21,245,457 | | |
| | Other Assets, Less Liabilities - 2.1% | | | | | $ | 445,135 | | |
| | Net Assets - 100.0% | | | | | $ | 21,690,592 | | |
AMBAC - AMBAC Financial Group, Inc.
FGIC - Financial Guaranty Insurance Company
FSA - Financial Security Assurance, Inc.
MBIA - Municipal Bond Insurance Association
The Fund invests primarily in debt securities issued by Kansas municipalities. The ability of the issuers of the debt securities to meet their obligations may be affected by economic developments in a specific industry or municipality. In order to reduce the risk associated with such economic developments, at July 31, 2005, 83.9% of the securities in the portfolio of investments are backed by bond insurance of various financial institutions and financial guaranty assurance agencies. The aggregate percentage insured by an individual financial institution ranged from 15.0% to 25.0% of total investments.
(1) Security exempt from registration under Rule 144A of the Securities Act of 1933. These securities may be sold in transactions exempt from registration, normally to qualified institutional buyers. At July 31, 2005, the aggregate value of the securities is $1,746,686 or 8.1% of the Fund's net assets.
(2) Security has been issued as a leveraged inverse floater bond. The stated interest rate represents the rate in effect at July 31, 2005.
(3) Security (or a portion thereof) has been segregated to cover margin requirements on open financial futures contracts.
See notes to financial statements
18
Eaton Vance Municipals Funds as of July 31, 2005
FINANCIAL STATEMENTS (Unaudited)
Statements of Assets and Liabilities
As of July 31, 2005
| | | Florida Insured Fund | | Hawaii Fund | | Kansas Fund | |
| Assets | | | |
| Investments - | |
| Identified cost | | $ | 41,647,484 | | | $ | 16,032,946 | | | $ | 19,789,928 | | |
| Unrealized appreciation | | | 2,926,358 | | | | 1,411,445 | | | | 1,455,529 | | |
| Investments, at value | | $ | 44,573,842 | | | $ | 17,444,391 | | | $ | 21,245,457 | | |
| Cash | | $ | 475,199 | | | $ | 403,016 | | | $ | 28,906 | | |
| Receivable for investments sold | | | 10,172 | | | | 618,899 | | | | 216,725 | | |
| Receivable for Fund shares sold | | | 98,570 | | | | 11,781 | | | | 92,864 | | |
| Interest receivable | | | 516,416 | | | | 171,140 | | | | 288,926 | | |
| Receivable for daily variation margin on open financial futures contracts | | | 92,812 | | | | 57,750 | | | | 77,344 | | |
| Total assets | | $ | 45,767,011 | | | $ | 18,706,977 | | | $ | 21,950,222 | | |
| Liabilities | | | |
| Payable for Fund shares redeemed | | $ | 7,655 | | | $ | 4,045 | | | $ | 2,033 | | |
| Dividends payable | | | 96,857 | | | | 27,542 | | | | 27,584 | | |
| Payable for when-issued securities | | | 910,802 | | | | 530,420 | | | | 199,350 | | |
| Payable to affiliate for investment advisory fees | | | 9,239 | | | | 2,321 | | | | 2,920 | | |
| Payable to affiliate for distribution and service fees | | | 17,458 | | | | 8,937 | | | | 7,064 | | |
| Accrued expenses | | | 21,674 | | | | 17,629 | | | | 20,679 | | |
| Total liabilities | | $ | 1,063,685 | | | $ | 590,894 | | | $ | 259,630 | | |
| Net Assets | | $ | 44,703,326 | | | $ | 18,116,083 | | | $ | 21,690,592 | | |
| Sources of Net Assets | | | |
| Paid-in capital | | $ | 43,877,431 | | | $ | 17,433,763 | | | $ | 21,238,047 | | |
| Accumulated net realized loss (computed on the basis of identified cost) | | | (2,158,012 | ) | | | (789,388 | ) | | | (1,120,844 | ) | |
| Accumulated distributions in excess of net investment income | | | (64,411 | ) | | | (19,905 | ) | | | (6,635 | ) | |
| Net unrealized appreciation (computed on the basis of identified cost) | | | 3,048,318 | | | | 1,491,613 | | | | 1,580,024 | | |
| Total | | $ | 44,703,326 | | | $ | 18,116,083 | | | $ | 21,690,592 | | |
| Class A Shares | | | |
| Net Assets | | $ | 29,309,588 | | | $ | 9,807,084 | | | $ | 16,360,480 | | |
| Shares Outstanding | | | 2,600,406 | | | | 1,004,324 | | | | 1,570,387 | | |
Net Asset Value and Redemption Price Per Share
(net assets ÷ shares of beneficial interest outstanding) | | $ | 11.27 | | | $ | 9.76 | | | $ | 10.42 | | |
Maximum Offering Price Per Share
(100 ÷ 95.25 of net assets value per share) | | $ | 11.83 | | | $ | 10.25 | | | $ | 10.94 | | |
| Class B Shares | | | |
| Net Assets | | $ | 15,393,738 | | | $ | 8,308,999 | | | $ | 5,330,112 | | |
| Shares Outstanding | | | 1,380,824 | | | | 840,834 | | | | 515,974 | | |
Net Asset Value, Offering Price and Redemption Price Per Share
(net assets ÷ shares of beneficial interest outstanding) | | $ | 11.15 | | | $ | 9.88 | | | $ | 10.33 | | |
On sales of $25,000 or more, the offering price of Class A shares is reduced.
See notes to financial statements
19
Eaton Vance Municipals Funds as of July 31, 2005
FINANCIAL STATEMENTS (Unaudited) CONT'D
Statements of Operations
For the Six Months Ended July 31, 2005
| | | Florida Insured Fund | | Hawaii Fund | | Kansas Fund | |
| Investment Income | |
| Interest | | $ | 1,107,628 | | | $ | 468,225 | | | $ | 544,243 | | |
| Total investment income | | $ | 1,107,628 | | | $ | 468,225 | | | $ | 544,243 | | |
| Expenses | |
| Investment adviser fee | | $ | 53,034 | | | $ | 13,740 | | | $ | 17,540 | | |
| Trustees fees and expenses | | | 933 | | | | 94 | | | | 93 | | |
| Distribution and service fees | |
| Class A | | | 26,570 | | | | 8,436 | | | | 15,919 | | |
| Class B | | | 78,521 | | | | 45,747 | | | | 26,661 | | |
| Legal and accounting services | | | 15,847 | | | | 14,139 | | | | 13,940 | | |
| Printing and postage | | | 3,620 | | | | 2,308 | | | | 3,533 | | |
| Custodian fee | | | 24,458 | | | | 16,406 | | | | 17,559 | | |
| Transfer and dividend disbursing agent | | | 6,770 | | | | 4,669 | | | | 6,294 | | |
| Miscellaneous | | | 6,801 | | | | 5,420 | | | | 6,736 | | |
| Total expenses | | $ | 216,554 | | | $ | 110,959 | | | $ | 108,275 | | |
| Deduct - | |
| Reduction of custodian fee | | | 1,827 | | | | 2,303 | | | | 261 | | |
| Total expense reductions | | $ | 1,827 | | | $ | 2,303 | | | $ | 261 | | |
| Net expenses | | $ | 214,727 | | | $ | 108,656 | | | $ | 108,014 | | |
| Net investment income | | $ | 892,901 | | | $ | 359,569 | | | $ | 436,229 | | |
| Realized and Unrealized Gain (Loss) | |
| Net realized gain (loss) - | |
| Investment transactions (identified cost basis) | | | 149,824 | | | | 78,016 | | | | 16,972 | | |
| Financial futures contracts | | | (672,947 | ) | | | (319,015 | ) | | | (301,664 | ) | |
| Interest rate swap contracts | | | - | | | | - | | | | (49,640 | ) | |
| Net realized loss | | $ | (523,123 | ) | | $ | (240,999 | ) | | $ | (334,332 | ) | |
| Change in unrealized appreciation (depreciation) - | |
| Investments (identified cost basis) | | | (232,044 | ) | | | (178,442 | ) | | | (281,301 | ) | |
| Financial futures contracts | | | 352,061 | | | | 259,542 | | | | 277,876 | | |
| Interest rate swap contracts | | | - | | | | - | | | | 48,595 | | |
| Net change in unrealized appreciation (depreciation) | | $ | 120,017 | | | $ | 81,100 | | | $ | 45,170 | | |
| Net realized and unrealized loss | | $ | (403,106 | ) | | $ | (159,899 | ) | | $ | (289,162 | ) | |
| Net increase in net assets from operations | | $ | 489,795 | | | $ | 199,670 | | | $ | 147,067 | | |
See notes to financial statements
20
Eaton Vance Municipals Funds as of July 31, 2005
FINANCIAL STATEMENTS (Unaudited) CONT'D
Statements of Changes in Net Assets
For the Six Months Ended July 31, 2005
| Increase (Decrease) in Net Assets | | Florida Insured Fund | | Hawaii Fund | | Kansas Fund | |
| From operations - | |
| Net investment income | | $ | 892,901 | | | $ | 359,569 | | | $ | 436,229 | | |
| Net realized loss from investment transactions, financial futures contracts and interest rate swap contracts | | | (523,123 | ) | | | (240,999 | ) | | | (334,332 | ) | |
Net change in unrealized appreciation (depreciation) from investments, financial futures contracts
and interest rate swap contracts | | | 120,017 | | | | 81,100 | | | | 45,170 | | |
| Net increase in net assets from operations | | $ | 489,795 | | | $ | 199,670 | | | $ | 147,067 | | |
| Distributions to shareholders - | |
| From net investment income | |
| Class A | | $ | (590,959 | ) | | $ | (182,515 | ) | | $ | (335,085 | ) | |
| Class B | | | (307,606 | ) | | | (172,072 | ) | | | (97,265 | ) | |
| Total distributions to shareholders | | $ | (898,565 | ) | | $ | (354,587 | ) | | $ | (432,350 | ) | |
| Transactions in shares of beneficial interest - | |
| Proceeds from sale of shares | |
| Class A | | $ | 4,252,937 | | | $ | 213,337 | | | $ | 933,814 | | |
| Class B | | | 335,735 | | | | 229,713 | | | | 136,817 | | |
| Net asset value of shares issued to shareholders in payment of distributions declared | |
| Class A | | | 198,551 | | | | 98,685 | | | | 200,703 | | |
| Class B | | | 148,601 | | | | 93,018 | | | | 59,555 | | |
| Cost of shares redeemed | |
| Class A | | | (1,568,944 | ) | | | (474,424 | ) | | | (829,744 | ) | |
| Class B | | | (2,273,103 | ) | | | (346,031 | ) | | | (603,460 | ) | |
| Net asset value of shares exchanged | |
| Class A | | | 825,450 | | | | 1,643,657 | | | | 342,635 | | |
| Class B | | | (825,450 | ) | | | (1,643,657 | ) | | | (342,635 | ) | |
| Net increase (decrease) in net assets from Fund share transactions | | $ | 1,093,777 | | | $ | (185,702 | ) | | $ | (102,315 | ) | |
| Net increase (decrease) in net assets | | $ | 685,007 | | | $ | (340,619 | ) | | $ | (387,598 | ) | |
| Net Assets | | | |
| At beginning of period | | $ | 44,018,319 | | | $ | 18,456,702 | | | $ | 22,078,190 | | |
| At end of period | | $ | 44,703,326 | | | $ | 18,116,083 | | | $ | 21,690,592 | | |
Accumulated distributions
in excess of net investment
income included in net assets | | | |
| At end of period | | $ | (64,411 | ) | | $ | (19,905 | ) | | $ | (6,635 | ) | |
See notes to financial statements
21
Eaton Vance Municipals Funds as of July 31, 2005
FINANCIAL STATEMENTS CONT'D
Statements of Changes in Net Assets
For the Year Ended January 31, 2005
| Increase (Decrease) in Net Assets | | Florida Insured Fund | | Hawaii Fund | | Kansas Fund | |
| From operations - | |
| Net investment income | | $ | 1,923,339 | | | $ | 779,083 | | | $ | 936,653 | | |
| Net realized loss from investment transactions, financial futures contracts and interest rate swap contracts | | | (897,654 | ) | | | (15,399 | ) | | | (501,238 | ) | |
Net change in unrealized appreciation (depreciation) from investments,
financial futures contracts and interest rate swap contracts | | | 158,726 | | | | (141,364 | ) | | | 223,748 | | |
| Net increase in net assets from operations | | $ | 1,184,411 | | | $ | 622,320 | | | $ | 659,163 | | |
| Distributions to shareholders - | |
| From net investment income | |
| Class A | | $ | (1,155,723 | ) | | $ | (319,962 | ) | | $ | (660,321 | ) | |
| Class B | | | (788,114 | ) | | | (437,646 | ) | | | (285,034 | ) | |
| Total distributions to shareholders | | $ | (1,943,837 | ) | | $ | (757,608 | ) | | $ | (945,355 | ) | |
| Transactions in shares of beneficial interest - | |
| Proceeds from sale of shares | |
| Class A | | $ | 4,179,130 | | | $ | 616,612 | | | $ | 2,938,692 | | |
| Class B | | | 1,228,031 | | | | 303,980 | | | | 511,122 | | |
| Net asset value of shares issued to shareholders in payment of distributions declared | |
| Class A | | | 418,991 | | | | 173,620 | | | | 382,047 | | |
| Class B | | | 428,412 | | | | 251,713 | | | | 181,217 | | |
| Cost of shares redeemed | |
| Class A | | | (5,625,391 | ) | | | (1,008,822 | ) | | | (3,236,697 | ) | |
| Class B | | | (3,765,452 | ) | | | (1,482,939 | ) | | | (1,552,052 | ) | |
| Net asset value of shares exchanged | |
| Class A | | | 6,504,283 | | | | 6,269,214 | | | | 4,893,797 | | |
| Class B | | | (6,504,283 | ) | | | (6,269,214 | ) | | | (4,893,797 | ) | |
| Net decrease in net assets from Fund share transactions | | $ | (3,136,279 | ) | | $ | (1,145,836 | ) | | $ | (775,671 | ) | |
| Net decrease in net assets | | $ | (3,895,705 | ) | | $ | (1,281,124 | ) | | $ | (1,061,863 | ) | |
| Net Assets | | | |
| At beginning of year | | $ | 47,914,024 | | | $ | 19,737,826 | | | $ | 23,140,053 | | |
| At end of year | | $ | 44,018,319 | | | $ | 18,456,702 | | | $ | 22,078,190 | | |
Accumulated distributions in excess of
net investment income included in net assets | | | |
| At end of year | | $ | (58,747 | ) | | $ | (24,887 | ) | | $ | (10,514 | ) | |
See notes to financial statements
22
Eaton Vance Municipals Funds as of July 31, 2005
FINANCIAL STATEMENTS
Financial Highlights
| | | Florida Insured Fund - Class A | |
| | | Six Months Ended
July 31, 2005 | | Year Ended January 31, | |
| | | (Unaudited)(1) | | 2005(1) | | 2004(1) | | 2003 | | 2002(1)(2) | | 2001 | |
| Net asset value - Beginning of period | | $ | 11.380 | | | $ | 11.540 | | | $ | 11.430 | | | $ | 11.170 | | | $ | 11.140 | | | $ | 10.070 | | |
| Income (loss) from operations | | | |
| Net investment income | | $ | 0.247 | | | $ | 0.524 | | | $ | 0.531 | | | $ | 0.554 | | | $ | 0.546 | | | $ | 0.527 | | |
| Net realized and unrealized gain (loss) | | | (0.107 | ) | | | (0.155 | ) | | | 0.129 | | | | 0.256 | | | | 0.026 | | | | 1.084 | | |
| Total income from operations | | $ | 0.140 | | | $ | 0.369 | | | $ | 0.660 | | | $ | 0.810 | | | $ | 0.572 | | | $ | 1.611 | | |
| Less distributions | | | |
| From net investment income | | $ | (0.250 | ) | | $ | (0.529 | ) | | $ | (0.550 | ) | | $ | (0.550 | ) | | $ | (0.542 | ) | | $ | (0.541 | ) | |
| Total distributions | | $ | (0.250 | ) | | $ | (0.529 | ) | | $ | (0.550 | ) | | $ | (0.550 | ) | | $ | (0.542 | ) | | $ | (0.541 | ) | |
| Net asset value - End of period | | $ | 11.270 | | | $ | 11.380 | | | $ | 11.540 | | | $ | 11.430 | | | $ | 11.170 | | | $ | 11.140 | | |
| Total Return(3) | | | 1.25 | % | | | 3.34 | % | | | 5.90 | % | | | 7.40 | % | | | 5.24 | % | | | 16.38 | % | |
| Ratios/Supplemental Data | | | |
| Net assets, end of period (000's omitted) | | $ | 29,310 | | | $ | 25,848 | | | $ | 20,845 | | | $ | 13,499 | | | $ | 9,114 | | | $ | 5,180 | | |
| Ratios (As a percentage of average daily net assets): | |
| Expenses(4) | | | 0.72 | %(6) | | | 0.70 | % | | | 0.72 | % | | | 0.70 | % | | | 0.76 | % | | | 0.91 | % | |
| Expenses after custodian fee reduction(4) | | | 0.71 | %(6) | | | 0.69 | % | | | 0.70 | % | | | 0.69 | % | | | 0.72 | % | | | 0.87 | % | |
| Net investment income | | | 4.41 | %(6) | | | 4.64 | % | | | 4.62 | % | | | 4.90 | % | | | 4.88 | % | | | 4.93 | % | |
| Portfolio Turnover of the Portfolio(5) | | | - | | | | 0 | % | | | 19 | % | | | 16 | % | | | 18 | % | | | 8 | % | |
| Portfolio Turnover of the Fund | | | 8 | % | | | 12 | % | | | - | | | | - | | | | - | | | | - | | |
(1) Net investment income per share was computed using average shares outstanding.
(2) The Fund, through its investment in the Portfolio, has adopted the provisions of the revised AICPA Audit and Accounting Guide for Investment Companies and began using the interest method to amortize premiums on fixed-income securities. The effect of this change for the year ended January 31, 2002 was to increase net investment income per share by $0.004, decrease net realized and unrealized gains per share by $0.004 and increase the ratio of net investment income to average net assets from 4.84% to 4.88%. Per-share data and ratios for the periods prior to February 1, 2001 have not been restated to reflect this change in presentation.
(3) Returns are historical and are calculated by determining the percentage change in net asset value with all distributions reinvested. Total return is not computed on an annualized basis.
(4) Includes the Fund's share of its corresponding Portfolio's allocated expenses while the Fund was making investments directly into the Portfolio.
(5) Portfolio turnover represents the rate of portfolio activity for the period while the Fund was making investments directly into the Portfolio.
(6) Annualized.
See notes to financial statements
23
Eaton Vance Municipals Funds as of July 31, 2005
FINANCIAL STATEMENTS CONT'D
Financial Highlights
| | | Florida Insured Fund - Class B | |
| | | Six Months Ended
July 31, 2005 | | Year Ended January 31, | |
| | | (Unaudited)(1) | | 2005(1) | | 2004(1) | | 2003 | | 2002(1)(2) | | 2001 | |
| Net asset value - Beginning of period | | $ | 11.250 | | | $ | 11.420 | | | $ | 11.300 | | | $ | 11.050 | | | $ | 11.020 | | | $ | 9.950 | | |
| Income (loss) from operations | | | |
| Net investment income | | $ | 0.206 | | | $ | 0.436 | | | $ | 0.442 | | | $ | 0.466 | | | $ | 0.460 | | | $ | 0.440 | | |
| Net realized and unrealized gain (loss) | | | (0.100 | ) | | | (0.167 | ) | | | 0.138 | | | | 0.244 | | | | 0.022 | | | | 1.080 | | |
| Total income from operations | | $ | 0.106 | | | $ | 0.269 | | | $ | 0.580 | | | $ | 0.710 | | | $ | 0.482 | | | $ | 1.520 | | |
| Less distributions | | | |
| From net investment income | | $ | (0.206 | ) | | $ | (0.439 | ) | | $ | (0.460 | ) | | $ | (0.460 | ) | | $ | (0.452 | ) | | $ | (0.450 | ) | |
| Total distributions | | $ | (0.206 | ) | | $ | (0.439 | ) | | $ | (0.460 | ) | | $ | (0.460 | ) | | $ | (0.452 | ) | | $ | (0.450 | ) | |
| Net asset value - End of period | | $ | 11.150 | | | $ | 11.250 | | | $ | 11.420 | | | $ | 11.300 | | | $ | 11.050 | | | $ | 11.020 | | |
| Total Return(3) | | | 0.95 | % | | | 2.64 | %(6) | | | 5.22 | % | | | 6.54 | % | | | 4.43 | % | | | 15.57 | % | |
| Ratios/Supplemental Data | | | |
| Net assets, end of period (000's omitted) | | $ | 15,394 | | | $ | 18,170 | | | $ | 27,069 | | | $ | 23,608 | | | $ | 20,556 | | | $ | 20,131 | | |
| Ratios (As a percentage of average daily net assets): | |
| Expenses(4) | | | 1.47 | %(7) | | | 1.45 | % | | | 1.47 | % | | | 1.45 | % | | | 1.51 | % | | | 1.66 | % | |
| Expenses after custodian fee reduction(4) | | | 1.46 | %(7) | | | 1.44 | % | | | 1.45 | % | | | 1.44 | % | | | 1.47 | % | | | 1.62 | % | |
| Net investment income | | | 3.71 | %(7) | | | 3.89 | % | | | 3.89 | % | | | 4.18 | % | | | 4.15 | % | | | 4.18 | % | |
| Portfolio Turnover of the Portfolio(5) | | | - | | | | 0 | % | | | 19 | % | | | 16 | % | | | 18 | % | | | 8 | % | |
| Portfolio Turnover of the Fund | | | 8 | % | | | 12 | % | | | - | | | | - | | | | - | | | | - | | |
(1) Net investment income per share was computed using average shares outstanding.
(2) The Fund, through its investment in the Portfolio, has adopted the provisions of the revised AICPA Audit and Accounting Guide for Investment Companies and began using the interest method to amortize premiums on fixed-income securities. The effect of this change for the year ended January 31, 2002 was to increase net investment income per share by $0.004, decrease net realized and unrealized gains per share by $0.004 and increase the ratio of net investment income to average net assets from 4.11% to 4.15%. Per-share data and ratios for the periods prior to February 1, 2001 have not been restated to reflect this change in presentation.
(3) Returns are historical and are calculated by determining the percentage change in net asset value with all distributions reinvested. Total return is not computed on an annualized basis.
(4) Includes the Fund's share of its corresponding Portfolio's allocated expenses while the Fund was making investments directly into the Portfolio.
(5) Portfolio turnover represents the rate of portfolio activity for the period while the Fund was making investments directly into the Portfolio.
(6) Total return reflects an increase of 0.13% due to a change in the timing of the payment and reinvestment of distributions.
(7) Annualized.
See notes to financial statements
24
Eaton Vance Municipals Funds as of July 31, 2005
FINANCIAL STATEMENTS CONT'D
Financial Highlights
| | | Hawaii Fund - Class A | |
| | | Six Months Ended
July 31, 2005 | | Year Ended January 31, | |
| | | (Unaudited)(1) | | 2005(1) | | 2004(1) | | 2003(1) | | 2002(1)(2) | | 2001(1) | |
| Net asset value - Beginning of period | | $ | 9.850 | | | $ | 9.910 | | | $ | 9.700 | | | $ | 9.580 | | | $ | 9.580 | | | $ | 8.690 | | |
| Income (loss) from operations | |
| Net investment income | | $ | 0.212 | | | $ | 0.444 | | | $ | 0.433 | | | $ | 0.454 | | | $ | 0.453 | | | $ | 0.466 | | |
| Net realized and unrealized gain (loss) | | | (0.092 | ) | | | (0.069 | ) | | | 0.230 | | | | 0.124 | | | | 0.005 | | | | 0.885 | | |
| Total income from operations | | $ | 0.120 | | | $ | 0.375 | | | $ | 0.663 | | | $ | 0.578 | | | $ | 0.458 | | | $ | 1.351 | | |
| Less distributions | |
| From net investment income | | $ | (0.210 | ) | | $ | (0.435 | ) | | $ | (0.453 | ) | | $ | (0.458 | ) | | $ | (0.458 | ) | | $ | (0.461 | ) | |
| Total distributions | | $ | (0.210 | ) | | $ | (0.435 | ) | | $ | (0.453 | ) | | $ | (0.458 | ) | | $ | (0.458 | ) | | $ | (0.461 | ) | |
| Net asset value - End of period | | $ | 9.760 | | | $ | 9.850 | | | $ | 9.910 | | | $ | 9.700 | | | $ | 9.580 | | | $ | 9.580 | | |
| Total Return(3) | | | 1.23 | %(7) | | | 3.91 | % | | | 6.99 | % | | | 6.14 | % | | | 4.87 | % | | | 15.91 | % | |
| Ratios/Supplemental Data† | |
| Net assets, end of period (000's omitted) | | $ | 9,807 | | | $ | 8,394 | | | $ | 2,442 | | | $ | 694 | | | $ | 537 | | | $ | 458 | | |
| Ratios (As a percentage of average daily net assets): | |
| Net expenses(4) | | | 0.83 | %(6) | | | 0.80 | % | | | 0.83 | % | | | 0.80 | % | | | 0.97 | % | | | 0.77 | % | |
| Net expenses after custodian fee reduction(4) | | | 0.80 | %(6) | | | 0.79 | % | | | 0.81 | % | | | 0.75 | % | | | 0.94 | % | | | 0.70 | % | |
| Net investment income | | | 4.38 | %(6) | | | 4.55 | % | | | 4.41 | % | | | 4.68 | % | | | 4.70 | % | | | 5.07 | % | |
| Portfolio Turnover of the Portfolio(5) | | | - | | | | 20 | % | | | 4 | % | | | 11 | % | | | 22 | % | | | 13 | % | |
| Portfolio Turnover of the Fund | | | 11 | % | | | 8 | % | | | - | | | | - | | | | - | | | | - | | |
† The operating expenses of the Fund and the Portfolio may reflect a reduction of the investment adviser fee, an allocation of expenses to the Investment Adviser, or both. Had such actions not been taken, the ratios and net investment income per share would have been as follows:
| Ratios (As a percentage of average daily net assets): | |
| Expenses(4) | | | 0.82 | % | |
| Expenses after custodian fee reduction(4) | | | 0.75 | % | |
| Net investment income | | | 5.02 | % | |
| Net investment income per share | | $ | 0.461 | | |
(1) Net investment income per share was computed using average shares outstanding.
(2) The Fund, through its investment in the Portfolio, has adopted the provisions of the revised AICPA Audit and Accounting Guide for Investment Companies and began using the interest method to amortize premiums on fixed-income securities. The effect of this change for the year ended January 31, 2002 was to increase net investment income per share by $0.003, decrease net realized and unrealized gain per share by $0.003 and increase the ratio of net investment income to average net assets from 4.67% to 4.70%. Per share data and ratios for the periods prior to February 1, 2001 have not been restated to reflect this change in presentation.
(3) Returns are historical and are calculated by determining the percentage change in net asset value with all distributions reinvested. Total return is not computed on an annualized basis.
(4)�� Includes the Fund's share of its corresponding Portfolio's allocated expenses while the fund was making investments directly into the Portfolio.
(5) Portfolio turnover represents the rate of portfolio activity for the period while the Fund was making investments directly into the Portfolio.
(6) Annualized.
(7) During the six months ended July 31, 2005, the Fund realized a gain on the disposal of an investment security which did not meet investment guidelines. The gain was less than $0.01 per share and had no effect on total return.
See notes to financial statements
25
Eaton Vance Municipals Funds as of July 31, 2005
FINANCIAL STATEMENTS CONT'D
Financial Highlights
| | | Hawaii Fund - Class B | |
| | | Six Months Ended
July 31, 2005 | | Year Ended January 31, | |
| | | (Unaudited)(1) | | 2005(1) | | 2004(1) | | 2003(1) | | 2002(1)(2) | | 2001(1) | |
| Net asset value - Beginning of period | | $ | 9.970 | | | $ | 10.040 | | | $ | 9.830 | | | $ | 9.720 | | | $ | 9.720 | | | $ | 8.820 | | |
| Income (loss) from operations | | | |
| Net investment income | | $ | 0.178 | | | $ | 0.379 | | | $ | 0.374 | | | $ | 0.388 | | | $ | 0.389 | | | $ | 0.404 | | |
| Net realized and unrealized gain (loss) | | | (0.093 | ) | | | (0.083 | ) | | | 0.223 | | | | 0.117 | | | | 0.006 | | | | 0.896 | | |
| Total income from operations | | $ | 0.085 | | | $ | 0.296 | | | $ | 0.597 | | | $ | 0.505 | | | $ | 0.395 | | | $ | 1.300 | | |
| Less distributions | | | |
| From net investment income | | $ | (0.175 | ) | | $ | (0.366 | ) | | $ | (0.387 | ) | | $ | (0.395 | ) | | $ | (0.395 | ) | | $ | (0.400 | ) | |
| Total distributions | | $ | (0.175 | ) | | $ | (0.366 | ) | | $ | (0.387 | ) | | $ | (0.395 | ) | | $ | (0.395 | ) | | $ | (0.400 | ) | |
| Net asset value - End of period | | $ | 9.880 | | | $ | 9.970 | | | $ | 10.040 | | | $ | 9.830 | | | $ | 9.720 | | | $ | 9.720 | | |
| Total Return(3) | | | 0.87 | %(8) | | | 3.21 | %(4) | | | 6.18 | % | | | 5.28 | % | | | 4.11 | % | | | 15.00 | % | |
| Ratios/Supplemental Data† | | | |
| Net assets, end of period (000's omitted) | | $ | 8,309 | | | $ | 10,063 | | | $ | 17,295 | | | $ | 17,172 | | | $ | 17,041 | | | $ | 18,200 | | |
| Ratios (As a percentage of average daily net assets): | |
| Net expenses(5) | | | 1.58 | %(7) | | | 1.55 | % | | | 1.58 | % | | | 1.55 | % | | | 1.73 | % | | | 1.54 | % | |
| Net expenses after custodian fee reduction(5) | | | 1.55 | %(7) | | | 1.54 | % | | | 1.56 | % | | | 1.50 | % | | | 1.70 | % | | | 1.47 | % | |
| Net investment income | | | 3.63 | %(7) | | | 3.83 | % | | | 3.76 | % | | | 3.95 | % | | | 3.98 | % | | | 4.35 | % | |
| Portfolio Turnover of the Portfolio(6) | | | - | | | | 20 | % | | | 4 | % | | | 11 | % | | | 22 | % | | | 13 | % | |
| Portfolio Turnover of the Fund | | | 11 | % | | | 8 | % | | | - | | | | - | | | | - | | | | - | | |
† The operating expenses of the Fund and the Portfolio may reflect a reduction of the investment adviser fee, an allocation of expenses to the Investment Adviser, or both. Had such actions not been taken, the ratios and net investment income per share would have been as follows:
| Ratios (As a percentage of average daily net assets): | |
| Expenses(4) | | | 1.59 | % | |
| Expenses after custodian fee reduction(4) | | | 1.52 | % | |
| Net investment income | | | 4.30 | % | |
| Net investment income per share | | $ | 0.399 | | |
(1) Net investment income per share was computed using average shares outstanding.
(2) The Fund, through its investment in the Portfolio, has adopted the provisions of the revised AICPA Audit and Accounting Guide for Investment Companies and began using the interest method to amortize premiums on fixed-income securities. The effect of this change for the year ended January 31, 2002 was to increase net investment income per share by $0.003, decrease net realized and unrealized gain per share by $0.003 and increase the ratio of net investment income to average net assets from 3.95% to 3.98%. Per share data and ratios for the periods prior to February 1, 2001 have not been restated to reflect this change in presentation.
(3) Returns are historical and are calculated by determining the percentage change in net asset value with all distributions reinvested. Total return is not computed on an annualized basis.
(4) Total return reflects an increase of 0.13% due to a change in the timing of the payment and reinvestment of distributions.
(5) Includes the Fund's share of its corresponding Portfolio's allocated expenses while the Fund was making investments directly into the Portfolio.
(6) Portfolio turnover represents the rate of portfolio activity for the period while the Fund was making investments directly into the Portfolio.
(7) Annualized.
(8) During the six months ended July 31, 2005, the Fund realized a gain on the disposal of an investment security which did not meet investment guidelines. The gain was less than $0.01 per share and had no effect on total return.
See notes to financial statements
26
Eaton Vance Municipals Funds as of July 31, 2005
FINANCIAL STATEMENTS CONT'D
Financial Highlights
| | | Kansas Fund - Class A | |
| | | Six Months Ended
July 31, 2005 | | Year Ended January 31, | |
| | | (Unaudited)(1) | | 2005(1) | | 2004(1) | | 2003(1) | | 2002(1)(2) | | 2001(1) | |
| Net asset value - Beginning of period | | $ | 10.560 | | | $ | 10.680 | | | $ | 10.500 | | | $ | 10.230 | | | $ | 10.200 | | | $ | 9.230 | | |
| Income (loss) from operations | |
| Net investment income | | $ | 0.220 | | | $ | 0.470 | | | $ | 0.487 | | | $ | 0.478 | | | $ | 0.458 | | | $ | 0.488 | | |
| Net realized and unrealized gain (loss) | | | (0.142 | ) | | | (0.114 | ) | | | 0.164 | | | | 0.255 | | | | 0.042 | | | | 0.976 | | |
| Total income from operations | | $ | 0.078 | | | $ | 0.356 | | | $ | 0.651 | | | $ | 0.733 | | | $ | 0.500 | | | $ | 1.464 | | |
| Less distributions | |
| From net investment income | | $ | (0.218 | ) | | $ | (0.476 | ) | | $ | (0.471 | ) | | $ | (0.463 | ) | | $ | (0.470 | ) | | $ | (0.494 | ) | |
| Total distributions | | $ | (0.218 | ) | | $ | (0.476 | ) | | $ | (0.471 | ) | | $ | (0.463 | ) | | $ | (0.470 | ) | | $ | (0.494 | ) | |
| Net asset value - End of period | | $ | 10.420 | | | $ | 10.560 | | | $ | 10.680 | | | $ | 10.500 | | | $ | 10.230 | | | $ | 10.200 | | |
| Total Return(3) | | | 0.76 | % | | | 3.46 | % | | | 6.33 | % | | | 7.30 | % | | | 4.98 | % | | | 16.25 | % | |
| Ratios/Supplemental Data† | |
| Net assets, end of period (000's omitted) | | $ | 16,360 | | | $ | 15,920 | | | $ | 11,179 | | | $ | 10,354 | | | $ | 6,091 | | | $ | 3,110 | | |
| Ratios (As a percentage of average daily net assets): | |
| Net expenses(4) | | | 0.81 | %(6) | | | 0.77 | % | | | 0.79 | % | | | 0.86 | % | | | 1.03 | % | | | 0.74 | % | |
| Net expenses after custodian fee reduction(4) | | | 0.81 | %(6) | | | 0.76 | % | | | 0.78 | % | | | 0.83 | % | | | 0.99 | % | | | 0.73 | % | |
| Net investment income | | | 4.24 | %(6) | | | 4.48 | % | | | 4.59 | % | | | 4.58 | % | | | 4.46 | % | | | 5.03 | % | |
| Portfolio Turnover of the Portfolio(5) | | | - | | | | 10 | % | | | 20 | % | | | 17 | % | | | 18 | % | | | 7 | % | |
| Portfolio Turnover of the Fund | | | 13 | % | | | 8 | % | | | - | | | | - | | | | - | | | | - | | |
† The operating expenses of the Fund and the Portfolio may reflect a reduction of the investment adviser fee, an allocation of expenses to the Investment Adviser, or both. Had such actions not been taken, the ratios and net investment income per share would have been as follows:
| Ratios (As a percentage of average daily net assets): | |
| Expenses(4) | | | 1.06 | % | | | 0.98 | % | |
| Expenses after custodian fee reduction(4) | | | 1.02 | % | | | 0.97 | % | |
| Net investment income | | | 4.43 | % | | | 4.79 | % | |
| Net investment income per share | | $ | 0.455 | | | $ | 0.465 | | |
(1) Net investment income per share was computed using average shares outstanding.
(2) The Fund, through its investment in the Portfolio, has adopted the provisions of the revised AICPA Audit and Accounting Guide for Investment Companies and began using the interest method to amortize premiums on fixed-income securities. The effect of this change for the year ended January 31, 2002 was to increase net investment income per share by $0.007, decrease net realized and unrealized gains per share by $0.007 and increase the ratio of net investment income to average net assets from 4.39% to 4.46%. Per-share data and ratios for the periods prior to February 1, 2001 have not been restated to reflect this change in presentation.
(3) Returns are historical and are calculated by determining the percentage change in net asset value with all distributions reinvested. Total return is not computed on an annualized basis.
(4) Includes the Fund's share of its corresponding Portfolio's allocated expenses while the Fund was making investments directly into the Portfolio.
(5) Portfolio turnover represents the rate of portfolio activity for the period while the Fund was making investments directly into the Portfolio.
(6) Annualized.
See notes to financial statements
27
Eaton Vance Municipals Funds as of July 31, 2005
FINANCIAL STATEMENTS CONT'D
Financial Highlights
| | | Kansas Fund - Class B | |
| | | Six Months Ended
July 31, 2005 | | Year Ended January 31, | |
| | | (Unaudited)(1) | | 2005(1) | | 2004(1) | | 2003(1) | | 2002(1)(2) | | 2001(1) | |
| Net asset value - Beginning of period | | $ | 10.470 | | | $ | 10.590 | | | $ | 10.420 | | | $ | 10.140 | | | $ | 10.120 | | | $ | 9.140 | | |
| Income (loss) from operations | | | |
| Net investment income | | $ | 0.180 | | | $ | 0.394 | | | $ | 0.404 | | | $ | 0.400 | | | $ | 0.380 | | | $ | 0.415 | | |
| Net realized and unrealized gain (loss) | | | (0.142 | ) | | | (0.120 | ) | | | 0.156 | | | | 0.263 | | | | 0.029 | | | | 0.975 | | |
| Total income from operations | | $ | 0.038 | | | $ | 0.274 | | | $ | 0.560 | | | $ | 0.663 | | | $ | 0.409 | | | $ | 1.390 | | |
| Less distributions | | | |
| From net investment income | | $ | (0.178 | ) | | $ | (0.394 | ) | | $ | (0.390 | ) | | $ | (0.383 | ) | | $ | (0.389 | ) | | $ | (0.410 | ) | |
| Total distributions | | $ | (0.178 | ) | | $ | (0.394 | ) | | $ | (0.390 | ) | | $ | (0.383 | ) | | $ | (0.389 | ) | | $ | (0.410 | ) | |
| Net asset value - End of period | | $ | 10.330 | | | $ | 10.470 | | | $ | 10.590 | | | $ | 10.420 | | | $ | 10.140 | | | $ | 10.120 | | |
| Total Return(3) | | | 0.37 | % | | | 2.84 | %(4) | | | 5.45 | % | | | 6.64 | % | | | 4.09 | % | | | 15.51 | % | |
| Ratios/Supplemental Data† | | | |
| Net assets, end of period (000's omitted) | | $ | 5,330 | | | $ | 6,158 | | | $ | 11,961 | | | $ | 11,246 | | | $ | 9,933 | | | $ | 9,147 | | |
| Ratios (As a percentage of average daily net assets): | |
| Net expenses(5) | | | 1.56 | %(7) | | | 1.52 | % | | | 1.54 | % | | | 1.61 | % | | | 1.78 | % | | | 1.48 | % | |
| Net expenses after custodian fee reduction(5) | | | 1.56 | %(7) | | | 1.51 | % | | | 1.53 | % | | | 1.58 | % | | | 1.74 | % | | | 1.47 | % | |
| Net investment income | | | 3.51 | %(7) | | | 3.77 | % | | | 3.85 | % | | | 3.87 | % | | | 3.74 | % | | | 4.32 | % | |
| Portfolio Turnover of the Portfolio(6) | | | - | | | | 10 | % | | | 20 | % | | | 17 | % | | | 18 | % | | | 7 | % | |
| Portfolio Turnover of the Fund | | | 13 | % | | | 8 | % | | | - | | | | - | | | | - | | | | - | | |
† The operating expenses of the Fund and the Portfolio may reflect a reduction of the investment adviser fee, an allocation of expenses to the Investment Adviser, or both. Had such actions not been taken, the ratios and net investment income per share would have been as follows:
| Ratios (As a percentage of average daily net assets): | |
| Expenses(5) | | | 1.81 | % | | | 1.72 | % | |
| Expenses after custodian fee reduction(5) | | | 1.77 | % | | | 1.71 | % | |
| Net investment income | | | 3.71 | % | | | 4.08 | % | |
| Net investment income per share | | $ | 0.378 | | | $ | 0.392 | | |
(1) Net investment income per share was computed using average shares outstanding.
(2) The Fund, through its investment in the Portfolio, has adopted the provisions of the revised AICPA Audit and Accounting Guide for Investment Companies and began using the interest method to amortize premiums on fixed-income securities. The effect of this change for the year ended January 31, 2002 was to increase net investment income per share by $0.007, decrease net realized and unrealized gains per share by $0.007 and increase the ratio of net investment income to average net assets from 3.67% to 3.74%. Per-share data and ratios for the periods prior to February 1, 2001 have not been restated to reflect this change in presentation.
(3) Returns are historical and are calculated by determining the percentage change in net asset value with all distributions reinvested. Total return is not computed on an annualized basis.
(4) Total return reflects an increase of 0.12% due to a change in the timing of the payment and reinvestment of distributions.
(5) Includes the Fund's share of its corresponding Portfolio's allocated expenses while the Fund was making investments directly into the Portfolio.
(6) Portfolio turnover represents the rate of portfolio activity for the period while the Fund was making investments directly into the Portfolio.
(7) Annualized.
See notes to financial statements
28
Eaton Vance Municipals Funds as of July 31, 2005
NOTES TO FINANCIAL STATEMENTS (Unaudited)
1 Significant Accounting Policies
Eaton Vance Municipals Trust II (the Trust) is an entity of the type commonly known as a Massachusetts business trust and is registered under the Investment Company Act of 1940, as amended, as an open-end management investment company. The Trust presently consists of four Funds, three of which are included in these financial statements. They include Eaton Vance Florida Insured Municipals Fund (Florida Insured Fund), Eaton Vance Hawaii Municipals Fund (Hawaii Fund) and Eaton Vance Kansas Municipals Fund (Kansas Fund) (together referred to as the "Funds"). The Funds, each non-diversified, seek to achieve current income exempt from regular federal income tax and particular state or local income or other taxes by investing primarily in investment grade municipal obligations. The Funds offer two classes of shares. Class A shares are generally sold subject to a sales charge imposed at time of pur chase. Class B shares are sold at net asset value and are subject to a declining contingent deferred sales charge (see Note 6). The Trustees have adopted a conversion feature pursuant to which Class B shares of each Fund automatically convert to Class A shares eight years after their purchase, as described in each Fund's prospectus. Each class represents a pro rata interest in the Fund, but votes separately on class-specific matters and (as noted below) is subject to different expenses. Realized and unrealized gains and losses are allocated daily to each class of shares based on the relative net assets of each class to the total net assets of the Fund. Net investment income, other than class specific expenses, is allocated daily to each class of shares based upon the ratio of the value of each class' paid shares to the total value of all paid shares. Each class of shares differs in its distribution plan and certain other class specific expenses.
On September 10, 2004, the Florida Insured Fund, the Hawaii Fund and the Kansas Fund received its pro rata share of cash and securities from the Florida Insured Municipals Portfolio (Florida Insured Portfolio), the Hawaii Municipals Portfolio (Hawaii Portfolio) and the Kansas Municipals Portfolio (Kansas Portfolio), respectively, in a complete liquidation of its interest in its corresponding Portfolio. Subsequent to September 10, 2004, each Fund invests directly in securities rather than through its corresponding Portfolio and maintains the same investment objectives.
The following is a summary of significant accounting policies consistently followed by the Trust in the preparation of its financial statements. The policies are in conformity with accounting principles generally accepted in the United States of America.
A Investment Valuations - Municipal bonds and taxable obligations, if any, are normally valued on the basis of valuations furnished by a pricing service. Futures contracts and options on financial futures contracts listed on commodity exchanges are valued at closing settlement prices. Over-the-counter options on financial futures contracts are normally valued at the mean between the latest bid and asked prices. Interest rate swaps are normally valued on the basis of valuations furnished by a broker. Short-term obligations, maturing in sixty days or less, are valued at am ortized cost, which approximates value. Investments for which valuations or market quotations are not readily available are valued at fair value using methods determined in good faith by or at the direction of the Trustees.
B Income - Interest income is determined on the basis of interest accrued, adjusted for amortization of premium or discount.
C Federal Taxes - Each Fund's policy is to comply with the provisions of the Internal Revenue Code applicable to regulated investment companies and to distribute to shareholders each year all of its taxable and tax-exempt income, including any net realized gain on investments. Accordingly, no provision for federal income or excise tax is necessary. At January 31, 2005, the Funds, for federal income tax purposes, had capital loss carryovers which will reduce taxable income arising from future net realized gain on investments, if any, to the extent permitted by the In ternal Revenue Code, and thus will reduce the amount of distributions to shareholders which would otherwise be necessary to relieve the Funds of any liability for federal income or excise tax. The amounts and expiration dates of the capital loss carryovers are as follows:
| Fund | | Amount | | Expires | |
| Florida Insured Fund | | $ | 18,493 | | | January 31, 2008 | |
|
| | | | 375,493 | | | January 31, 2009 | |
|
| | | | 32,368 | | | January 31, 2010 | |
|
| | | | 216,412 | | | January 31, 2011 | |
|
| | | | 1,271,199 | | | January 31, 2013 | |
|
| Hawaii Fund | | | 75,392 | | | January 31, 2008 | |
|
| | | | 201,940 | | | January 31, 2009 | |
|
| | | | 182,699 | | | January 31, 2011 | |
|
| | | | 93,535 | | | January 31, 2012 | |
|
| | | | 211,449 | | | January 31, 2013 | |
|
| Kansas Fund | | | 32,566 | | | January 31, 2011 | |
|
| | | | 960,378 | | | January 31, 2013 | |
|
Dividends paid by each Fund from net interest on tax-exempt municipal bonds are not includable by shareholders
29
Eaton Vance Municipals Funds as of July 31, 2005
NOTES TO FINANCIAL STATEMENTS (Unaudited) CONT'D
as gross income for federal income tax purposes because each Fund intends to meet certain requirements of the Internal Revenue Code applicable to regulated investment companies which will enable the Funds to pay exempt-interest dividends. The portion of such interest, if any, earned on private activity bonds issued after August 7, 1986 may be considered a tax preference item to shareholders.
Additionally, at January 31, 2005, the Kansas Fund had net capital losses of $12,189 attributable to security transactions incurred after October 31, 2004. These net capital losses are treated as arising on the first day of the Fund's taxable year ending January 31, 2006.
D Financial Futures Contracts - Upon the entering of a financial futures contract, a Fund is required to deposit (initial margin) either in cash or securities an amount equal to a certain percentage of the purchase price indicated in the financial futures contract. Subsequent payments are made or received by a Fund (margin maintenance) each day, dependent on the daily fluctuations in the value of the underlying security, and are recorded for book purposes as unrealized gains or losses by a Fund. A Fund's investment in financial futures contracts is designed only to hedge against anticipated future changes in interest rates. Should interest rates move unexpectedly, a Fund may not achieve the anticipated benefits of the financial futures contracts and may realize a loss.
E Options on Financial Futures Contracts - Upon the purchase of a put option on a financial futures contract by a Fund, the premium paid is recorded as an investment, the value of which is marked-to-market daily. When a purchased option expires, a Fund will realize a loss in the amount of the cost of the option. When a Fund enters into a closing sale transaction, a Fund will realize a gain or loss depending on whether the sales proceeds from the closing sale transaction are greater or less than the cost of the option. When a Fund exercises a put option, settlement is mad e in cash. The risk associated with purchasing put options is limited to the premium originally paid.
F When-issued and Delayed Delivery Transactions - The Funds may engage in when-issued and delayed delivery transactions. The Funds record when-issued securities on trade date and maintain security positions such that sufficient liquid assets will be available to make payments for the securities purchased. Securities purchased on a when-issued or delayed delivery basis are marked-to-market daily and begin earning interest on settlement date.
G Interest Rate Swaps - A Fund may enter into interest rate swap agreements to enhance return, to hedge against fluctuations in securities prices or interest rates or as substitution for the purchase or sale of securities. Pursuant to these agreements, the Fund makes semi-annual payments at a fixed interest rate. In exchange, a Fund receives payment based on the interest rate of a benchmark industry index. During the term of the outstanding swap agreement, changes in the underlying value of the swap are recorded as unrealized gains and losses. The value of the swap is de termined by changes in the relationship between two rates of interest. The Fund is exposed to credit loss in the event of non-performance by the swap counterparty. However, the Fund does not anticipate non-performance by the counterparty. Risk may also arise from the unanticipated movement in value of interest rates.
H Legal Fees - Legal fees and other related expenses incurred as part of negotiations of the terms and requirements of capital infusions, or that are expected to result in the restructuring of or a plan of reorganization for an investment are recorded as realized losses. Ongoing expenditures to protect or enhance an investment are treated as operating expenses.
I Expenses - The majority of expenses of the Trust are directly identifiable to an individual fund. Expenses which are not readily identifiable to a specific fund are allocated taking into consideration, among other things, the nature and type of expense and the relative size of the funds.
J Expense Reduction - Investors Bank & Trust Company (IBT) serves as custodian of the Funds. Pursuant to the respective custodian agreements, IBT receives a fee reduced by credits which are determined based on the average daily cash balance each Fund maintains with IBT. All credit balances used to reduce the Funds' custodian fees are reported as a reduction of total expenses in the Statements of Operations.
K Use of Estimates - The preparation of the financial statements in conformity with accounting principles generally accepted in the United States of America requires management to make estimates and assumptions that affect the reported amounts of assets and liabilities at the date of the financial statements and the reported amounts of income and expense during the reporting period. Actual results could differ from those estimates.
L Indemnifications - Under the Trust's organizational documents, its officers and Trustees may be
30
Eaton Vance Municipals Funds as of July 31, 2005
NOTES TO FINANCIAL STATEMENTS (Unaudited) CONT'D
indemnified against certain liabilities and expenses arising out of the performance of their duties to the Funds and shareholders are indemnified against personal liability for obligations of the Trust. Additionally, in the normal course of business, the Funds enter into agreements with service providers that may contain indemnification clauses. The Funds' maximum exposure under these arrangements is unknown as this would involve future claims that may be made against the Funds that have not yet occurred.
M Other - Investment transactions are accounted for on a trade date basis. Realized gains and losses are computed based on the specific identification of the securities sold.
N Interim Financial Statements - The interim financial statements relating to July 31, 2005 and for the six months then ended have not been audited by an Independent Registered Public Accounting Firm, but in the opinion of the Funds' management reflect all adjustments, consisting only of normal recurring adjustments, necessary for the fair presentation of the financial statements.
2 Distributions to Shareholders
The net income of each Fund is determined daily and substantially all of the net income so determined is declared as a dividend to shareholders of record at the time of declaration. Distributions are declared separately for each class of shares. Distributions are paid monthly. Distributions of realized capital gains, if any, are made at least annually. Shareholders may reinvest income and capital gain distributions in additional shares of the same class of a Fund at the net asset value as of the reinvestment date. Distributions are paid in the form of additional shares of the same class of the Fund or, at the election of the shareholder, in cash.
The Funds distinguish between distributions on a tax basis and a financial reporting basis. Accounting principles generally accepted in the United States of America require that only distributions in excess of tax basis earnings and profits be reported in the financial statements as a return of capital. Permanent differences between book and tax accounting relating to distributions are reclassified to paid in capital.
3 Shares of Beneficial Interest
The Funds' Declaration of Trust permits the Trustees to issue an unlimited number of full and fractional shares of beneficial interest (without par value). Such shares may be issued in a number of different series (such as the Funds) and classes. Transactions in Fund shares were as follows:
| | | Florida Insured Fund | |
| Class A | | Six Months Ended
July 31, 2005
(Unaudited) | | Year Ended
January 31, 2005 | |
| Sales | | | 376,067 | | | | 369,653 | | |
Issued to shareholders electing to
receive payments of distributions
in Fund shares | | | 17,590 | | | | 37,160 | | |
| Redemptions | | | (138,663 | ) | | | (500,206 | ) | |
| Exchange from Class B shares | | | 73,140 | | | | 559,600 | | |
| Net increase | | | 328,134 | | | | 466,207 | | |
| | | Florida Insured Fund | |
| Class B | | Six Months Ended
July 31, 2005
(Unaudited) | | Year Ended
January 31, 2005 | |
| Sales | | | 29,954 | | | | 109,536 | | |
Issued to shareholders electing to
receive payments of distributions
in Fund shares | | | 13,313 | | | | 38,281 | | |
| Redemptions | | | (203,464 | ) | | | (338,412 | ) | |
| Exchange to Class A shares | | | (73,912 | ) | | | (565,740 | ) | |
| Net decrease | | | (234,109 | ) | | | (756,335 | ) | |
| | | Hawaii Fund | |
| Class A | | Six Months Ended
July 31, 2005
(Unaudited) | | Year Ended
January 31, 2005 | |
| Sales | | | 21,892 | | | | 63,170 | | |
Issued to shareholders electing to
receive payments of distributions
in Fund shares | | | 10,114 | | | | 17,818 | | |
| Redemptions | | | (48,380 | ) | | | (103,193 | ) | |
| Exchange from Class B shares | | | 168,374 | | | | 628,171 | | |
| Net increase | | | 152,000 | | | | 605,966 | | |
31
Eaton Vance Municipals Funds as of July 31, 2005
NOTES TO FINANCIAL STATEMENTS (Unaudited) CONT'D
| | | Hawaii Fund | |
| Class B | | Six Months Ended
July 31, 2005
(Unaudited) | | Year Ended
January 31, 2005 | |
| Sales | | | 23,251 | | | | 30,731 | | |
Issued to shareholders electing to
receive payments of distributions
in Fund shares | | | 9,417 | | | | 25,365 | | |
| Redemptions | | | (35,095 | ) | | | (148,968 | ) | |
| Exchange to Class A shares | | | (166,277 | ) | | | (620,913 | ) | |
| Net decrease | | | (168,704 | ) | | | (713,785 | ) | |
| | | Kansas Fund | |
| Class A | | Six Months Ended
July 31, 2005
(Unaudited) | | Year Ended
January 31, 2005 | |
| Sales | | | 89,588 | | | | 279,335 | | |
Issued to shareholders electing to
receive payments of distributions
in Fund shares | | | 19,269 | | | | 36,434 | | |
| Redemptions | | | (79,617 | ) | | | (309,282 | ) | |
| Exchange from Class B shares | | | 32,883 | | | | 454,882 | | |
| Net increase | | | 62,123 | | | | 461,369 | | |
| | | Kansas Fund | |
| Class B | | Six Months Ended
July 31, 2005
(Unaudited) | | Year Ended
January 31, 2005 | |
| Sales | | | 13,225 | | | | 48,921 | | |
Issued to shareholders electing to
receive payments of distributions
in Fund shares | | | 5,768 | | | | 17,345 | | |
| Redemptions | | | (58,204 | ) | | | (148,995 | ) | |
| Exchange to Class A shares | | | (33,150 | ) | | | (458,752 | ) | |
| Net decrease | | | (72,361 | ) | | | (541,481 | ) | |
4 Investment Adviser Fee and Other Transactions with Affiliates
The investment adviser fee is earned by Boston Management and Research (BMR), a wholly-owned subsidiary of Eaton Vance Management (EVM), as compensation for management and investment advisory services rendered to each Fund. The fee is based upon a percentage of average daily net assets plus a percentage of gross income (i.e., income other than gains from the sale of securities). For the six months ended July 31, 2005, each Fund paid advisory fees as follows:
| Fund | | Amount | | Effective Rate* | |
| Florida Insured | | $ | 53,034 | | | | 0.25 | % | |
| Hawaii | | | 13,740 | | | | 0.15 | % | |
| Kansas | | | 17,540 | | | | 0.16 | % | |
* As a percentage of average daily net assets (annualized).
Except as to Trustees of the Funds who are not members of EVM's or BMR's organization, officers and Trustees receive remuneration for their services to the Funds out of such investment adviser fee. EVM serves as the Administrator of each Fund, but receives no compensation. EVM serves as the sub-transfer agent of each Fund and receives from the transfer agent an aggregate fee based upon the actual expenses incurred by EVM in the performance of those services. For the six months ended July 31, 2005, EVM earned $460, $290, and $531 in sub-transfer agent fees from Florida Insured Fund, Hawaii Fund and Kansas Fund, respectively. The Funds were informed that Eaton Vance Distributors, Inc. (EVD), a subsidiary of EVM and the Funds' principal underwriter, received $2,110, $393 and $1,340 as its portion of the sales charge on sales of Class A shares from Florida Insured Fund, Hawaii Fund and Kan sas Fund, respectively, for the six months ended July 31, 2005.
Trustees of the Funds that are not affiliated with the Investment Adviser may elect to defer receipt of all or a percentage of their annual fees in accordance with the terms of the Trustees Deferred Compensation Plan. For the six months ended July 31, 2005, no significant amounts have been deferred.
Certain officers and Trustees of the Funds are officers of the above organizations.
During the six months ended July 31, 2005, Hawaii Fund engaged in a purchase transaction with another fund that also utilizes BMR as an investment adviser. This purchase transaction complied with Rule 17a-7 under the Investment Company Act of 1940 and amounted to $106,984.
During the six months ended July 31, 2005, the Hawaii Fund realized a gain of $4,998 due to the sale of an investment security not meeting investment guidelines.
32
Eaton Vance Municipals Funds as of July 31, 2005
NOTES TO FINANCIAL STATEMENTS (Unaudited) CONT'D
5 Distribution and Service Plans
Each Fund has in effect a distribution plan for Class B (Class B Plan) pursuant to Rule 12b-1 under the Investment Company Act of 1940, and a service plan for Class A (Class A Plan), (collectively, the Plans). The Class B Plan requires each Fund to pay EVD amounts equal to 0.75% (annualized) of each Fund's average daily net assets attributable to Class B shares, for providing ongoing distribution services and facilities to the respective Fund. Each Fund will automatically discontinue payments to EVD during any period in which there are no outstanding Uncovered Distribution Charges, which are equivalent to the sum of (i) 5% of the aggregate amount received by the Fund for Class B shares sold plus (ii) interest calculated by applying the rate of 1% over the prevailing prime rate to the outstanding balance of Uncovered Distribution Charges of EVD re duced by the aggregate amount of contingent deferred sales charges (see Note 6) and amounts theretofore paid to EVD. The amount payable to EVD with respect to each day is accrued on such day as a liability of each Class B and, accordingly, reduces net assets. For the six months ended July 31, 2005, the Class B shares of the Florida Insured Fund, Hawaii Fund and Kansas Fund paid $61,990, $36,116 and $21,048, respectively, to EVD, representing 0.75% (annualized) of each Fund's Class B average daily net assets. At July 31, 2005, the amount of Uncovered Distribution Charges of EVD calculated under the Class B Plans for Florida Insured Fund, Hawaii Fund and Kansas Fund were approximately $624,000, $432,000 and $246,000, respectively.
The Plans authorize each Fund to make payments of service fees to EVD, investment dealers and other persons in amounts not exceeding 0.20% (annualized) of each Fund's average daily net assets attributable to Class A and Class B shares for each fiscal year. Service fee payments will be made for personal services and/or the maintenance of shareholder accounts. Service fees are separate and distinct from the sales commissions and distribution fees payable by each Fund to EVD, and as such are not subject to automatic discontinuance when there are no outstanding Uncovered Distribution Charges of EVD. Service fee payments for the six months ended July 31, 2005 for the Florida Insured Fund, Hawaii Fund and Kansas Fund amounted to $26,570, $8,436, and $15,919 respectively, for Class A shares, and $16,531, $9,631, and $5,613, respectively, for Class B shares.
6 Contingent Deferred Sales Charge
A contingent deferred sales charge (CDSC) generally is imposed on redemptions of Class B shares made within six years of purchase. Class A shares may be subject to a 1% CDSC if redeemed within 18 months of purchase (depending on the circumstances of purchase). Generally, the CDSC is based upon the lower of the net asset value at date of redemption or date of purchase. No charge is levied on shares acquired by reinvestment of dividends or capital gains distributions. The Class B CDSC is imposed at declining rates that begin at 5% in the case of redemptions in the first and second year after purchase, declining one percentage point each subsequent year. No CDSC is levied on shares which have been sold to EVM or its affiliates or to their respective employees or clients and may b e waived under certain other limited conditions. CDSC received on Class B redemptions are paid to EVD to reduce the amount of Uncovered Distribution Charges calculated under each Fund's Class B Distribution Plan (see Note 5). CDSC received on Class B redemptions when no Uncovered Distribution Charges exist will be credited to each Fund. EVD received approximately $0, $0 and $0 of CDSC paid by Class A shareholders of Florida Insured Fund, Hawaii Fund and Kansas Fund, respectively, and approximately $13,000, $2,000 and $7,000 of CDSC paid by Class B shareholders of Florida Insured Fund, Hawaii Fund and Kansas Fund, respectively, for the six months ended July 31, 2005.
7 Investments
Purchases and sales of investments by the Fund, other than U.S. Government securities, put option transactions and short-term obligations, for the six months ended July 31, 2005, were as follows:
| Florida Insured Fund | | | |
| Purchases | | $ | 4,312,558 | | |
| Sales | | | 3,303,666 | | |
| Hawaii Fund | | | |
| Purchases | | $ | 2,008,831 | | |
| Sales | | | 2,285,823 | | |
| Kansas Fund | | | |
| Purchases | | $ | 2,871,462 | | |
| Sales | | | 3,083,945 | | |
8 Federal Income Tax Basis of Unrealized Appreciation (Depreciation)
The cost and unrealized appreciation (depreciation) in value of the investments owned by each Fund at July 31,
33
Eaton Vance Municipals Funds as of July 31, 2005
NOTES TO FINANCIAL STATEMENTS (Unaudited) CONT'D
2005, as computed on a federal income tax basis, are as follows:
| Florida Insured Fund | | | |
| Aggregate cost | | $ | 41,591,787 | | |
| Gross unrealized appreciation | | $ | 3,007,898 | | |
| Gross unrealized depreciation | | | (25,843 | ) | |
| Net unrealized appreciation | | $ | 2,982,055 | | |
| Hawaii Fund | | | |
| Aggregate cost | | $ | 15,994,918 | | |
| Gross unrealized appreciation | | $ | 1,455,461 | | |
| Gross unrealized depreciation | | | (5,988 | ) | |
| Net unrealized appreciation | | $ | 1,449,473 | | |
| Kansas Fund | | | |
| Aggregate cost | | $ | 19,724,721 | | |
| Gross unrealized appreciation | | $ | 1,523,837 | | |
| Gross unrealized depreciation | | | (3,101 | ) | |
| Net unrealized appreciation | | $ | 1,520,736 | | |
9 Line of Credit
The Funds participate with other portfolios and funds managed by BMR and EVM and their affiliates in a $150 million unsecured line of credit agreement with a group of banks. Borrowings will be made by the portfolios or funds solely to facilitate the handling of unusual and/or unanticipated short-term cash requirements. Interest is charged to each portfolio or fund based on its borrowings at an amount above either the Eurodollar rate or Federal Funds rate. In addition, a fee computed at an annual rate of 0.10% on the daily unused portion of the line of credit is allocated among the participating portfolios and funds at the end of each quarter. The Funds did not have any significant borrowings or allocated fees during the six months ended July 31, 2005.
10 Financial Instruments
The Funds regularly trade in financial instruments with off-balance sheet risk in the normal course of their investing activities to assist in managing exposure to various market risks. These financial instruments include futures contracts and interest rate swaps and may involve, to a varying degree, elements of risk in excess of the amounts recognized for financial statement purposes. The notional or contractual amounts of these instruments represent the investment a Fund has in particular classes of financial instruments and does not necessarily represent the amounts potentially subject to risk. The measurement of the risks associated with these instruments is meaningful only when all related and offsetting transactions are considered.
A summary of obligations under these financial instruments at July 31, 2005 is as follows:
Futures Contracts
| Fund | | Expiration
Date | | Contracts | | Position | | Aggregate
Cost | | Value | | Net Unrealized
Appreciation | |
| Florida Insured | | 09/05 | | 90 U.S.
Treasury Bond | |
Short | |
$(10,500,085) | |
$(10,378,125) | |
$121,960 | |
| Hawaii | | 09/05 | | 56 U.S.
Treasury Bond | |
Short | |
$(6,537,668) | |
$(6,457,500) | |
$80,168 | |
| Kansas | | 09/05 | | 75 U.S.
Treasury Bond | |
Short | |
$(8,772,932) | |
$(8,648,437) | |
$124,495 | |
At July 31, 2005, the Funds had sufficient cash and/or securities to cover commitments under these contracts.
34
Eaton Vance Municipals Funds as of July 31, 2005
NOTES TO FINANCIAL STATEMENTS (Unaudited) CONT'D
11 Shareholders Meeting
The Trust held a Special Meeting of Shareholders on April 29, 2005 to elect Trustees. The results of the vote for each Fund were as follows:
| Fund | | Benjamin C.
Esty | | James B.
Hawkes | | Samuel L.
Hayes, III | | William H.
Park | | Ronald A.
Pearlman | | Norton H.
Reamer | | Lynn A.
Stout | | Ralph F.
Verni | |
| Florida Insured Fund | | | |
| Affirmative | | | 3,618,814 | | | | 3,618,814 | | | | 3,618,814 | | | | 3,618,814 | | | | 3,618,814 | | | | 3,618,814 | | | | 3,618,814 | | | | 3,618,814 | | |
| Withhold | | | 7,176 | | | | 7,176 | | | | 7,176 | | | | 7,176 | | | | 7,176 | | | | 7,176 | | | | 7,176 | | | | 7,176 | | |
| Hawaii Fund | | | |
| Affirmative | | | 1,747,756 | | | | 1,747,756 | | | | 1,747,756 | | | | 1,747,756 | | | | 1,747,756 | | | | 1,747,756 | | | | 1,747,756 | | | | 1,747,756 | | |
| Withhold | | | 4,190 | | | | 4,190 | | | | 4,190 | | | | 4,190 | | | | 4,190 | | | | 4,190 | | | | 4,190 | | | | 4,190 | | |
| Kansas Fund | | | |
| Affirmative | | | 1,771,965 | | | | 1,762,978 | | | | 1,762,978 | | | | 1,762,978 | | | | 1,762,978 | | | | 1,771,965 | | | | 1,762,978 | | | | 1,762,978 | | |
| Withhold | | | 10,460 | | | | 19,447 | | | | 19,447 | | | | 19,447 | | | | 19,447 | | | | 10,460 | | | | 19,447 | | | | 19,447 | | |
Results are rounded to the nearest whole number.
35
Eaton Vance Municipals Funds
BOARD OF TRUSTEES' ANNUAL APPROVAL OF THE INVESTMENT ADVISORY AGREEMENTS
The investment advisory agreements between each of Eaton Vance Florida Insured Municipals Fund, Eaton Vance Hawaii Municipals Fund and Eaton Vance Kansas Municipals Fund (collectively the "Funds" and each individually a "Fund"), and the investment adviser, Boston Management and Research, each provide that the advisory agreement will continue in effect from year to year so long as its continuance is approved at least annually (i) by a vote of a majority of the noninterested Trustees of the Fund cast in person at a meeting called for the purpose of voting on such approval and (ii) by the Trustees of the Fund or by vote of a majority of the outstanding interests of the Fund.
In considering the annual approval of the investment advisory agreements between the Funds and the investment adviser, the Special Committee of the Board of Trustees considered information that had been provided throughout the year at regular Board meetings, as well as information furnished for a series of meetings held in February and March in preparation for a Board meeting held on March 21, 2005 to specifically consider the renewal of the investment advisory agreements. Such information included, among other things, the following:
• An independent report comparing the advisory fees of each Fund with those of comparable funds;
• An independent report comparing the expense ratio of each Fund to those of comparable funds;
• Information regarding Fund investment performance in comparison to relevant peer groups of funds and appropriate indices;
• The economic outlook and the general investment outlook in relevant investment markets;
• Eaton Vance Management's ("Eaton Vance") results and financial condition and the overall organization of the investment adviser;
• The procedures and processes used to determine the fair value of Fund assets and actions taken to monitor and test the effectiveness of such procedures and processes;
• Eaton Vance's management of the relationship with the custodian, subcustodians and fund accountants;
• The resources devoted to compliance efforts undertaken by Eaton Vance on behalf of the funds it manages and the record of compliance with the investment policies and restrictions and with policies on personal securities transactions;
• The quality, nature, cost and character of the administrative and other non-investment management services provided by Eaton Vance and its affiliates; and
• The terms of the advisory agreement and the reasonableness and appropriateness of the particular fee paid by the Fund for the services described therein.
The Special Committee also considered the nature, extent and quality of the management services provided by the investment adviser. In so doing, the Special Committee considered the investment adviser's management capabilities with respect to the types of investments held by each Fund, including information relating to the education, experience and number of investment professionals and other personnel who provide services under the investment advisory agreements. Specifically, the Special Committee considered the investment adviser's 30-person municipal bond team, which includes six portfolio managers and nine credit specialists who provide services to each Fund. The Special Committee noted that the investment adviser's municipal bond team affords the investment adviser extensive in-house research capabilities in addition to the other resourceas available to the investment adviser. The Special Committee also took into account the time and attention to be devoted by senior management to the Fund and the other funds in the complex. The Special Committee evaluated the level of skill required to manage each Fund and concluded
36
Eaton Vance Municipals Funds
BOARD OF TRUSTEES' ANNUAL APPROVAL OF THE INVESTMENT ADVISORY AGREEMENTS CONT'D
that the human resources available at the investment adviser were appropriate to fulfill effectively its duties on behalf of each Fund.
In its review of comparative information with respect to each Fund's investment performance, the Special Committee concluded that each Fund's overall performance is within a range that the Special Committee deemed competitive. With respect to its review of investment advisory fees, the Special Committee concluded that the fees paid by each Fund are within the range of those paid by comparable funds within the mutual fund industry. In reviewing the information regarding the expense ratio of each Fund, the Special Committee concluded that each Fund's expense ratio is within a range that is competitive with comparable funds.
In addition to the factors mentioned above, the Special Committee reviewed the level of the investment adviser's profits in providing investment management services for each Fund and for all Eaton Vance funds as a group. The Special Committee also reviewed the benefits to Eaton Vance and its affiliates in providing administration services for each Fund and for all Eaton Vance funds as a group. In addition, the Special Committee considered the fiduciary duty assumed by the investment adviser in connection with the services rendered to each Fund and the business reputation of the investment adviser and its financial resources. The Trustees concluded that in light of the services rendered, the profits realized by the investment adviser are not unreasonable. The Special Committee also considered the extent to which the investment adviser appears to be realizing benefits from economies of scale in m anaging the Funds, and concluded that the fee breakpoints which are in place will allow for an equitable sharing of such benefits, when realized, with the shareholders of the Funds.
The Special Committee did not consider any single factor as controlling in determining whether or not to approve the investment advisory agreements. Nor are the items described herein all the matters considered by the Special Committee. In assessing the information provided by Eaton Vance and its affiliates, the Special Committee also took into consideration the benefits to shareholders of investing in a fund that is a part of a large family of funds which provides a large variety of shareholder services.
Based on its consideration of the foregoing factors and conclusions, and such other factors and conclusions as it deemed relevant, and assisted by independent counsel, the Special Committee concluded that the approval of the investment advisory agreements, including the fee structures, is in the interests of shareholders.
37
Eaton Vance Municipals Funds
INVESTMENT MANAGEMENT
Eaton Vance Municipals Funds
Officers
Thomas J. Fetter
President
William H. Ahern, Jr.
Vice President
Craig R. Brandon
Vice President and Portfolio
Manager of Florida Insured
Municipals Fund
Cynthia J. Clemson
Vice President
James B. Hawkes
Vice President and Trustee
Robert B. MacIntosh
Vice President and Portfolio
Manager of Hawaii Munic ipals
Fund
Thomas M. Metzold
Vice President and Portfolio
Manager of Kansas Municipals
Fund
James L. O'Connor
Treasurer
Alan R. Dynner
Secretary
Paul M. O'Neil
Chief Compliance Officer | | Trustees
Samuel L. Hayes, III
Chairman
Benjamin C. Esty
William H. Park
Ronald A. Pearlman
Norton H. Reamer
Lynn A. Stout
Ralph F. Verni | |
|
38
This Page Intentionally Left Blank
This Page Intentionally Left Blank
Investment Adviser
Boston Management and Research
The Eaton Vance Building
255 State Street
Boston, MA 02109
Fund Administrator
Eaton Vance Management
The Eaton Vance Building
255 State Street
Boston, MA 02109
Principal Underwriter
Eaton Vance Distributors, Inc.
The Eaton Vance Building
255 State Street
Boston, MA 02109
(617) 482-8260
Custodian
Investors Bank & Trust Company
200 Clarendon Street
Boston, MA 02116
Transfer Agent
PFPC Inc.
Attn: Eaton Vance Funds
P.O. Box 9653
Providence, RI 02940-9653
(800) 262-1122
Eaton Vance Municipals Trust II
The Eaton Vance Building
255 State Street
Boston, MA 02109
This report must be preceded or accompanied by a current prospectus. Before investing, investors should consider carefully the Fund's investment
objective(s), risks, and charges and expenses. The Fund's current prospectus contains this and other information about the Fund and is available
through your financial advisor. Please read the prospectus carefully before you invest or send money. For further information please call 800-225-6265.
335-9/05 3CSRC

Semiannual Report July 31, 2005


EATON VANCE
HIGH YIELD
MUNICIPALS
FUND
IMPORTANT NOTICES REGARDING PRIVACY,
DELIVERY OF SHAREHOLDER DOCUMENTS,
PORTFOLIO HOLDINGS, AND PROXY VOTING
Privacy. The Eaton Vance organization is committed to ensuring your financial privacy. Each of the financial institutions identified below has in effect the following policy ("Privacy Policy") with respect to nonpublic personal information about its customers:
• Only such information received from you, through application forms or otherwise, and information about your Eaton Vance fund transactions will be collected. This may include information such as name, address, social security number, tax status, account balances and transactions.
• None of such information about you (or former customers) will be disclosed to anyone, except as permitted by law (which includes disclosure to employees necessary to service your account). In the normal course of servicing a customer's account, Eaton Vance may share information with unaffiliated third parties that perform various required services such as transfer agents, custodians and broker/dealers.
• Policies and procedures (including physical, electronic and procedural safeguards) are in place that are designed to protect the confidentiality of such information.
• We reserve the right to change our Privacy Policy at any time upon proper notification to you. Customers may want to review our Policy periodically for changes by accessing the link on our homepage: www.eatonvance.com.
Our pledge of privacy applies to the following entities within the Eaton Vance organization: the Eaton Vance Family of Funds, Eaton Vance Management, Eaton Vance Investment Counsel, Boston Management and Research, and Eaton Vance Distributors, Inc.
In addition, our Privacy Policy only applies to those Eaton Vance customers who are individuals and who have a direct relationship with us. If a customer's account (i.e., fund shares) is held in the name of a third-party financial adviser/broker-dealer, it is likely that only such adviser's privacy policies apply to the customer. This notice supersedes all previously issued privacy disclosures.
For more information about Eaton Vance's Privacy Policy, please call 1-800-262-1122.
Delivery of Shareholder Documents. The Securities and Exchange Commission (the "SEC") permits funds to deliver only one copy of shareholder documents, including prospectuses, proxy statements and shareholder reports, to fund investors with multiple accounts at the same residential or post office box address. This practice is often called "householding" and it helps eliminate duplicate mailings to shareholders.
Eaton Vance, or your financial adviser, may household the mailing of your documents indefinitely unless you instruct Eaton Vance, or your financial adviser, otherwise.
If you would prefer that your Eaton Vance documents not be householded, please contact Eaton Vance at 1-800-262-1122, or contact your financial adviser.
Your instructions that householding not apply to delivery of your Eaton Vance documents will be effective within 30 days of receipt by Eaton Vance or your financial adviser.
Portfolio Holdings. Each Eaton Vance Fund and its underlying Portfolio (if applicable) will file a schedule of its portfolio holdings on Form N-Q with the SEC for the first and third quarters of each fiscal year. The Form N-Q will be available on the Eaton Vance website www.eatonvance.com, by calling Eaton Vance at 1-800-262-1122 or in the EDGAR database on the SEC's website at www.sec.gov. Form N-Q may also be reviewed and copied at the SEC's public reference room in Washington, D.C. (call 1-800-732-0330 for information on the operation of the public reference room).
Proxy Voting. From time to time, funds are required to vote proxies related to the securities held by the funds. The Eaton Vance Funds or their underlying Portfolios (if applicable) vote proxies according to a set of policies and procedures approved by the Funds' and Portfolios' Boards. You may obtain a description of these policies and procedures and information on how the Funds or Portfolios voted proxies relating to portfolio securities during the most recent 12 month period ended June 30, without charge, upon request, by calling 1-800-262-1122. This description is also available on the SEC's website at www.sec.gov.
Eaton Vance High Yield Municipals Fund as of July 31, 2005
LETTER TO SHAREHOLDERS

Thomas J. Fetter
President
Like all fixed-income markets, the municipal bond market responds to many factors, from changes in interest rates and economic trends to fluctuations in municipal bond issuance. Another key variable is the policy of the Federal Reserve, the nation’s central bank, known popularly as “The Fed.” The Fed’s policies are important to the nation’s economy and markets.
Founded in the wake of crisis, the Federal Reserve plays a vital role...
The Federal Reserve System was established by the Federal Reserve Act of 1913 in the wake of a series of financial crises, the most recent of which – the Panic of 1907 – had caused bank failures, a rash of bankruptcies, a dramatic loss of confidence and a severe economic downturn. Congress was determined to create a central bank that provided a vigilant monetary policy, price stability, a more elastic currency and more careful supervision over the nation’s banks.
The Open Market Committee: influencing the money supply and credit conditions...
The Fed has a number of tools at its disposal to adjust monetary policy. Of these, the most commonly used tools are open market operations. The Federal Open Market Committee (FOMC) meets regularly to review inflation, credit conditions and the overall health of the economy. The Fed uses its own research, as well as that of other key economic agencies, to review its various policy options. Treasury, corporate and municipal bond investors alike eagerly await the transcripts of FOMC meetings for a hint of future interest rate trends.
If it deems a change necessary in short-term rates, the Fed will announce an adjustment to its target for the Federal Funds rate – its primary market instrument. To effect that change, the FOMC issues a directive to the trading desk of the Federal Reserve Bank of New York, whose responsibility it is to implement the policy.
Open market operations: The Fed intervenes...
If the Fed sees weakness in the economy and little threat of inflation, it may make outright purchases of Treasury securities – either from the “street” or privately from foreign central banks – thus adding reserves to the banking system. This action tends to lower interest rates, increase loans and stimulate economic activity. In so doing, the Fed is said to be easing monetary policy.
On the other hand, if the Fed sees the economy overheating and inflation looming, it may sell Treasury securities, thus draining reserves from the system. This action tends to raise rates, discourage consumer and business borrowing and dampen economic activity. In this case, the Fed is said to be tightening monetary policy.
While changes in Fed policy primarily affect short-term rates, long-term rates are determined by inflationary expectations. However, the Fed’s actions can have a significant effect on market psychology and, over time, impact market rates across the borrowing spectrum – for homebuyers seeking mortgages, businesses seeking bank loans and municipal bond issuers.
Fed-watching: A continuing pre-occupation of the market...
Interpreting the Federal Reserve’s actions has long been of keen interest to bond market investors. Until the mid-1990s, analysts needed to keep daily tabs on bank reserves and the Fed’s daily open market activity to determine a change in monetary policy. Starting in February 1994, however, the Fed began to indicate specifically its target Federal Funds rate. That marked a significant change, as analysts were now free to focus less on current policy and more on future potential changes in policy.
Throughout its history, the Federal Reserve has contributed to a more stable and safer monetary system. As that history unfolds, investors will surely continue to monitor its activities closely.
| Sincerely, |
| |
| 
|
| |
| Thomas J. Fetter |
| President |
| September 7, 2005 |
Fund shares are not insured by the FDIC and are not deposits or other obligations of, or guaranteed by, any depository institution. Shares are subject to investment risks, including possible loss of principal invested.
2
Eaton Vance High Yield Municipals Fund as of July 31, 2005
MARKET RECAP
The U.S. economy continued to generate moderate growth during the six months ended July 31, 2005, although surging energy prices and high interest rates were a continuing concern for investors.
Signs of a somewhat weaker economy in the first half of 2005...
The nation’s Gross Domestic Product grew by 3.4% in the second quarter of 2005, according to preliminary Commerce Department figures, following a 3.8% rise in the first quarter. Manufacturing slowed in some areas, especially in durable goods. Consumer spending and a strong housing market remained the twin pillars of growth, although signs of strain were evident in those areas. Consumers were increasingly hard-pressed by soaring oil prices, which translated to higher costs for heating oil and gasoline, as well as lower savings rates.
Meanwhile, the housing sector remained very strong, although analysts expressed concern over real estate speculation. Further concerns centered on heavily mortgaged homeowners whose adjustable-rate loans may be vulnerable to rising interest rates. Capital spending, which started 2005 strongly, weakened as the period progressed as businesses curtailed investment somewhat, possibly in response to higher energy and transportation costs. Purchases of equipment and software were especially weak. The trade gap widened further, aggravated by weak export growth. The slow export market has been especially vexing in light of the prolonged weakness of the dollar.
Job growth was erratic in the first half of 2005...
Job creation increased in 2005, although the rate of job growth varied dramatically from month to month. Many employers indicated some uneasiness with the uncertainty of the economy and the continuing unpredictability of energy costs. In the service sector, health care and business services remained primary sources of new employment.
Municipal bond yields were 97% of Treasury yields
30-Year AAA-rated
General Obligation (GO) Bonds* | | 4.35 | % |
| | | |
Taxable equivalent yield
in 35.0% tax bracket | | 6.69 | % |
| | | |
30-Year Treasury bond | | 4.47 | % |
Principal and interest payments of Treasury securities are guaranteed by the U.S. government.
* GO yields are a compilation of a representative variety of general obligations and are not necessarily representative of the Fund’s yield. Statistics as of July 31, 2005.
Past performance is no guarantee of future results.
Source: Bloomberg, L.P.
In the goods-producing segment, construction remained strong, while manufacturing continued to suffer from weak export demand.
The Federal Reserve continued to raise short-term interest rates in 2005...
Inflation accelerated somewhat during the period, an increase apparent not only in core energy costs, but also in finished products, a sign that producers are passing their higher energy costs along to consumers. The Federal Reserve hiked short-term interest rates, suggesting it will continue to raise rates to keep the economy from growing too quickly and to keep inflation under control. Beginning in June 2004, the Fed increased its Federal Funds rate – a key short-term interest rate barometer – on 10 occasions (including its most recent rate hike in early August), raising that benchmark from 1.00% to 3.50%.
Against this backdrop, the municipal bond market generated solid gains for the period. For the six months ended July 31, 2005, the Lehman Brothers Municipal Bond Index – a broad-based, unmanaged market index of municipal bonds – had a total return of 1.48%.*
* It is not possible to invest directly in an Index. The Index’s total return does not reflect expenses that would have been incurred if an investor individually purchased or sold the securities represented in the Index.
The views expressed throughout this report are those of the portfolio managers and are current only through the end of the period of the report as stated on the cover. These views are subject to change at any time based upon market or other conditions, and the investment adviser claims any responsibility to update such views. These views may not be relied on as investment advice and, because investment decisions for a fund are based on many factors, may not be relied on as an indication of trading intent on behalf of any Eaton Vance fund.
3
Eaton Vance High Yield Municipals Fund as of July 31, 2005
INVESTMENT UPDATE
The Fund
Performance for the Six Months Ended July 31, 2005
• The Fund’s Class A shares had a total return of 4.85% during the six months ended July 31, 2005.(1) This return was the result of an increase in net asset value (NAV) to $10.29 per share on July 31, 2005 from $10.09 on January 31, 2005, and the reinvestment of $0.282 in dividends.(2)
• The Fund’s Class B shares had a total return of 4.37% during the six months ended July 31, 2005.(1) This return was the result of an increase in NAV to $10.25 per share on July 31, 2005 from $10.06 on January 31, 2005, and the reinvestment of $0.243 in dividends.(2)
• The Fund’s Class C shares had a total return of 4.40% during the six months ended July 31, 2005.(1) This return was the result of an increase in NAV to $9.52 per share on July 31, 2005 from $9.34 on January 31, 2005, and the reinvestment of $0.226 in divi-dends.(2)
• For comparison, the Lehman Brothers Municipal Bond Index – a broad-based, unmanaged market index of municipal bonds – had a total return of 1.48% for the six months ended July 31, 2005.(3)
• Based on the Fund’s most recent dividends and NAVs on July 31, 2005 of $10.29 per share for Class A, $10.25 for Class B and $9.52 for Class C, the Fund’s distribution rates were 5.39%, 4.65% and 4.65%, respectively.(4) The distribution rates of Class A, Class B and Class C are equivalent to taxable rates of 8.29%, 7.15% and 7.15%, respectively.(5)
• The SEC 30-day yields for Class A, B and C shares at July 31, 2005 were 4.80%, 4.45% and 4.39%, respectively.(6) The SEC 30-day yields of Class A, Class B and Class C are equivalent to taxable yields of 7.38%, 6.85% and 6.75%, respectively.(5)
See page 5 for more performance information
Management Discussion

| | |
| | |
Cynthia J. Clemson | | |
Co-Portfolio Manager | | |
| | |
• The U.S. economy moderated somewhat in the first half of 2005, as consumers faced the pinch of significantly higher energy costs. While home construction remained strong nationally and a major engine of growth, a weak export climate continued to plague the manufacturing sector. The nation’s jobless rate nonetheless fell to 5.0% in July 2005, down from 5.6% a year ago. |
| | |

| | |
| | |
Thomas M. Metzold | | |
Co-Portfolio Manager | | |
| | |
• Industrial development revenue bonds were the Fund’s largest sector weighting at July 31, 2005. The Fund’s investments represented a diversified range of industrial companies and economic sectors, including airlines, auto manufacturers, wire and fiber producers, paper manufacturers, trash hauling and retailing companies. |
• Other revenue bonds constituted another large investment. These non-sector-specific bonds were issued to finance a diverse array of projects, including Florida tourism development, tribal casino developments in California, New Mexico and Florida and state tobacco settlements in New Jersey and California.
• Hospital bonds were again significant. The Fund’s hospital investments included facilities in 12 states. Amid increasing industry competition and a rising need to restrain expenses, the Fund emphasized institutions with what we believe are sound underlying fundamentals and in-demand health care specialties.
• Amid historically narrow credit spreads, management took advantage of the opportunity to upgrade, adding selectively to BBB-rated hospital and utility bonds. On balance, the Fund’s investments remain economically sensitive, and in the view of management, could be well-positioned to participate in an economic expansion.
Past performance is no guarantee of future results. Returns are historical and are calculated by determining the percentage change in net asset value or offering price (as applicable) with all distributions reinvested. Investment return and principal value will fluctuate so that shares, when redeemed, may be worth more or less than their original cost. Performance is for the stated time period only; due to market volatility, the Fund’s current performance may be lower or higher than the quoted return. For performance as of the most recent month-end, please refer to www.eatonvance.com.
(1) These returns do not include the 4.75% maximum sales charge for Class A shares or the applicable contingent deferred sales charges (CDSC) for Class B and Class C shares. If sales charges were deducted, returns would be lower. (2) A portion of the Fund’s income may be subject to federal income and/or alternative minimum tax. Income may be subject to state and local taxes. (3) It is not possible to invest directly in an Index. The Index’s total return does not reflect the expenses that would have been incurred if an investor individually purchased or sold the securities represented in the Index. (4) The Fund’s distribution rate represents actual distributions paid to shareholders and is calculated by dividing the last distribution per share (annualized) by the net asset value. (5) Taxable-equivalent rates assume maximum 35.00% federal income tax rate. A lower rate would result in lower tax-equivalent figures. (6) The Fund’s SEC yield is calculated by dividing the net investment income per share for the 30-day period by the offering price at the end of the period and annualizing the result.
4
Eaton Vance High Yield Municipals Fund as of July 31, 2005
FUND PERFORMANCE
Performance (1) | | Class A | | Class B | | Class C | |
Average Annual Total Returns (at net asset value) | | | | | | | |
One Year | | 11.11 | % | 10.58 | % | 10.50 | % |
Five Years | | 7.63 | | 6.84 | | 6.84 | |
Life of Fund† | | 6.84 | | 6.00 | | 4.97 | |
| | | | | | | |
SEC Average Annual Total Returns (including sales charge or applicable CDSC) | | | | | |
One Year | | 5.83 | % | 5.58 | % | 9.50 | % |
Five Years | | 6.59 | | 6.54 | | 6.84 | |
Life of Fund† | | 6.32 | | 6.00 | | 4.97 | |
† Inception dates: Class A: 8/7/95; Class B: 8/7/95; Class C: 6/18/97
(1) Average annual total returns do not include the 4.75% maximum sales charge for Class A shares or the applicable contingent deferred sales charges (CDSC) for Class B and Class C shares. If sales charges were deducted, returns would be lower. SEC average annual total returns for Class A reflect the maximum 4.75% sales charge. SEC returns for Class B reflect applicable CDSC based on the following schedule: 5% - 1st and 2nd years; 4% - 3rd year; 3% - 4th year; 2% - 5th year; 1% - 6th year. SEC 1-year return for Class C reflects a 1% CDSC.
Rating Distribution(2)
By total investments

(2) Reflects the Fund’s total investments as of July 31, 2005. May not be representative of the Fund’s current or future investments and may change due to active management.
Past performance is no guarantee of future results. Returns are historical and are calculated by determining the percentage change in net asset value or offering price (as applicable) with all distributions reinvested. Investment return and principal value will fluctuate so that shares, when redeemed, may be worth more or less than their original cost. Performance is for the stated time period only; due to market volatility, the Fund’s current performance may be lower or higher than the quoted return. The Fund’s performance during certain periods reflects the strong bond market performance and/or the strong performance of bonds held during those periods. This performance is not typical and may not be repeated. For performance as of the most recent month-end, please refer to www.eatonvance.com.
5
Eaton Vance High Yield Municipals Fund as of July 31, 2005
FUND EXPENSES
Example: As a shareholder of the Fund, you incur two types of costs: (1) transaction costs, including sales charges (loads) on purchases and redemption fees (if applicable); and (2) ongoing costs, including management fees; distribution or service fees; and other Fund expenses. This Example is intended to help you understand your ongoing costs (in dollars) of investing in the Fund and to compare these costs with the ongoing costs of investing in other mutual funds. The Example is based on an investment of $1,000 invested at the beginning of the period and held for the entire period (February 1, 2005 – July 31, 2005).
Actual Expenses: The first section of the table below provides information about actual account values and actual expenses. You may use the information in this section, together with the amount you invested, to estimate the expenses that you paid over the period. Simply divide your account value by $1,000 (for example, an $8,600 account value divided by $1,000 = 8.6), then multiply the result by the number in the first line under the heading entitled “Expenses Paid During Period” to estimate the expenses you paid on your account during this period.
Hypothetical Example for Comparison Purposes: The second section of the table below provides information about hypothetical account values and hypothetical expenses based on the Fund’s actual expense ratios and an assumed rate of return of 5% per year before expenses, which is not the actual return of the Fund. The hypothetical account values and expenses may not be used to estimate the actual ending account balance or expenses you paid for the period. You may use this information to compare the ongoing costs of investing in the Fund and other funds. To do so, compare this 5% hypothetical example with the 5% hypothetical examples that appear in the shareholder reports of the other funds.
Please note that the expenses shown in the table are meant to highlight your ongoing costs only and do not reflect any transactional costs, such as sales charges (loads) or redemption fees (if applicable). Therefore, the second section of the table is useful in comparing ongoing costs only, and will not help you determine the relative total costs of owning different funds. In addition, if these transactional costs were included, your costs would have been higher.
Eaton Vance High Yield Municipals Fund
| | Beginning Account Value
(2/1/05) | | Ending Account Value
(7/31/05) | | Expenses Paid During Period* (2/1/05 – 7/31/05) | |
| | | | | | | |
Actual | | | | | | | |
Class A | | $ | 1,000.00 | | $ | 1,048.50 | | $ | 4.83 | |
Class B | | $ | 1,000.00 | | $ | 1,043.70 | | $ | 8.61 | |
Class C | | $ | 1,000.00 | | $ | 1,044.00 | | $ | 8.62 | |
| | | | | | | |
Hypothetical | | | | | | | |
(5% return per year before expenses) | | | | | | | |
Class A | | $ | 1,000.00 | | $ | 1,020.10 | | $ | 4.76 | |
Class B | | $ | 1,000.00 | | $ | 1,016.40 | | $ | 8.50 | |
Class C | | $ | 1,000.00 | | $ | 1,016.40 | | $ | 8.50 | |
* Expenses are equal to the Fund’s annualized expense ratio of 0.95% for Class A shares, 1.70% for Class B shares and 1.70% for Class C shares, multiplied by the average account value over the period, multiplied by 181/365 (to reflect the one-half-year period). The example assumes that the $1,000 was invested at the net asset value per share determined at the close of business on January 31, 2005.
6
Eaton Vance High Yield Municipals Fund as of July 31, 2005
PORTFOLIO OF INVESTMENTS (Unaudited)
| Tax-Exempt Investments - 102.3% | |
Principal Amount
(000's omitted) | | Security | | Value | |
| Cogeneration - 2.3% | |
| $ | 7,000 | | | Maryland Energy Cogeneration, (AES Warrior Run), (AMT),
7.40%, 9/1/19 | | $ | 7,144,760 | | |
| | 1,910 | | | Ohio Water Development Authority, Solid Waste Disposal,
(Bay Shore Power), (AMT), 5.875%, 9/1/20 | | | 1,931,354 | | |
| | 4,820 | | | Ohio Water Development Authority, Solid Waste Disposal,
(Bay Shore Power), (AMT), 6.625%, 9/1/20 | | | 5,014,439 | | |
| | 2,050 | | | Pennsylvania Economic Development Financing, (Colver),
(AMT), 5.125%, 12/1/15 | | | 2,067,876 | | |
| | | | | | | $ | 16,158,429 | | |
| Education - 1.7% | |
| $ | 3,000 | | | California Educational Facilities Authority, Stanford University,
Residual Certificates, Variable Rate, 14.67%, 12/1/32(1)(2) | | $ | 3,833,820 | | |
| | 5,000 | | | Massachustts HEFA, (Massachusetts Institute of Technology),
5.50%, 7/1/32 | | | 6,037,400 | | |
| | 2,000 | | | New Hampshire HEFA, (Colby-Sawyer College),
7.50%, 6/1/26(3) | | | 2,077,320 | | |
| | | | | | | $ | 11,948,540 | | |
| Electric Utilities - 4.7% | |
| $ | 3,000 | | | Brazos River Authority, TX, PCR (Texas Energy Co.), (AMT),
6.75%, 4/1/38 | | $ | 3,431,520 | | |
| | 1,250 | | | Connecticut Development Authority, (Connecticut Light and
Power), Variable Rate, 8.599%, 9/1/28(1)(4) | | | 1,465,325 | | |
| | 2,500 | | | Connecticut Development Authority, (Western Mass Electric),
Variable Rate, 8.599%, 9/1/28(1)(4) | | | 2,930,650 | | |
| | 4,000 | | | Matagorda County, TX, Navigation District No.1, (Reliant
Energy), 8.00%, 5/1/29 | | | 4,396,160 | | |
| | 3,965 | | | Matagorda County, TX, Navigation District No.1, (Reliant
Energy), (AMT), 5.95%, 5/1/30 | | | 4,034,982 | | |
| | 1,500 | | | Mississippi Business Finance Corp., (System Energy
Resources, Inc.), 5.90%, 5/1/22 | | | 1,522,740 | | |
| | 3,750 | | | Pennsylvania EDA, (Reliant Energy, Inc.), (AMT),
6.75%, 12/1/36 | | | 4,035,750 | | |
| | 7,700 | | | Pennsylvania EDA, (Reliant Energy, Inc.), (AMT),
6.75%, 12/1/36 | | | 8,286,740 | | |
| | 3,000 | | | Puerto Rico Electric Power Authority, 5.25%, 7/1/31(5) | | | 3,206,160 | | |
| | | | | | | $ | 33,310,027 | | |
| Escrowed / Prerefunded - 4.0% | |
| $ | 25,000 | | | Bakersfield, CA, (Bakersfield Assisted Living Center),
Escrowed to Maturity, 0.00%, 4/15/21 | | $ | 12,292,000 | | |
| | 9,500 | | | Dawson Ridge, CO, Metropolitan District #1, Escrowed to
Maturity, 0.00%, 10/1/22 | | | 4,372,565 | | |
Principal Amount
(000's omitted) | | Security | | Value | |
| Escrowed / Prerefunded (continued) | |
| $ | 3,500 | | | Dawson Ridge, CO, Metropolitan District #1, Escrowed to
Maturity, 0.00%, 10/1/22 | | $ | 1,610,945 | | |
| | 3,685 | | | Forsyth County, GA, Hospital Authority, (Georgia Baptist
Health Care System), Escrowed to Maturity,
6.25%, 10/1/18(3) | | | 4,347,784 | | |
| | 5,250 | | | Northwest Arkansas Regional Airport Authority, (AMT),
Prerefunded to 2/1/08, 7.625%, 2/1/27 | | | 5,849,025 | | |
| | | | | | | $ | 28,472,319 | | |
| General Obligations - 5.8% | |
| $ | 3,390 | | | California, 4.625%, 5/1/30 | | $ | 3,397,695 | | |
| | 1,195 | | | California, 5.00%, 2/1/32 | | | 1,242,370 | | |
| | 2,250 | | | California, 5.25%, 2/1/30 | | | 2,384,190 | | |
| | 2,000 | | | California, 5.25%, 2/1/33 | | | 2,121,440 | | |
| | 15,420 | | | California, 5.25%, 4/1/34(5) | | | 16,473,649 | | |
| | 2,700 | | | California, (AMT), 5.05%, 12/1/36 | | | 2,779,380 | | |
| | 3,440 | | | Georgia, 2.00%, 12/1/23 | | | 2,495,032 | | |
| | 3,000 | | | New York, NY, Variable Rate, 9.323%, 6/1/28(1)(2) | | | 3,609,660 | | |
| | 5,000 | | | Puerto Rico, Variable Rate, 7.893%, 7/1/29(1)(4) | | | 6,479,500 | | |
| | | | | | | $ | 40,982,916 | | |
| Health Care-Miscellaneous - 2.7% | |
| $ | 2,845 | | | Illinois Development Finance Authority, (Community
Rehabilitation Providers), 5.60%, 7/1/19(5) | | $ | 2,880,278 | | |
| | 1,128 | | | Osceola County, FL, IDA, Community Provider
Pooled Loan-93, 7.75%, 7/1/17 | | | 1,129,004 | | |
| | 2,280 | | | Tax Revenue Exempt Securities Trust, Community Health
Provider, (Pooled Loan Program Various States Trust
Certificates), 6.75%, 12/1/36 | | | 2,362,327 | | |
| | 1,175 | | | Tax Revenue Exempt Securities Trust, Community Health
Provider, (Pooled Loan Program Various States Trust
Certificates), 7.00%, 12/1/36 | | | 1,222,455 | | |
| | 972 | | | Tax Revenue Exempt Securities Trust, Community Health
Provider, (Pooled Loan Program Various States Trust
Certificates), 7.00%, 12/1/36 | | | 1,011,053 | | |
| | 2,121 | | | Tax Revenue Exempt Securities Trust, Community Health
Provider, (Pooled Loan Program Various States Trust
Certificates), 7.75%, 12/1/36 | | | 2,260,482 | | |
| | 1,784 | | | Tax Revenue Exempt Securities Trust, Community Health
Provider, (Pooled Loan Program Various States Trust
Certificates), 7.90%, 12/1/36 | | | 1,929,845 | | |
| | 334 | | | Tax Revenue Exempt Securities Trust, Community Health
Provider, (Pooled Loan Program Various States Trust
Certificates), 8.25%, 12/1/36 | | | 356,990 | | |
| | 760 | | | Tax Revenue Exempt Securities Trust, Community Health
Provider, (Pooled Loan Program Various States Trust
Certificates), 8.375%, 12/1/36 | | | 792,109 | | |
See notes to financial statements
7
Eaton Vance High Yield Municipals Fund as of July 31, 2005
PORTFOLIO OF INVESTMENTS (Unaudited) CONT'D
Principal Amount
(000's omitted) | | Security | | Value | |
| Health Care-Miscellaneous (continued) | |
| $ | 2,105 | | | Tax Revenue Exempt Securities Trust, Community Health
Provider, (Pooled Loan Program Various States Trust
Certificates), 8.50%, 12/1/36 | | $ | 2,138,407 | | |
| | 884 | | | Tax Revenue Exempt Securities Trust, Community Health
Provider, (Pooled Loan Program Various States Trust
Certificates), 8.70%, 12/1/36 | | | 922,612 | | |
| | 1,767 | | | Tax Revenue Exempt Securities Trust, Community Health
Provider, (Pooled Loan Program Various States Trust
Certificates), 8.81%, 9/1/36 | | | 1,850,844 | | |
| | 530 | | | Tax Revenue Exempt Securities Trust, Community Health
Provider, (Pooled Loan Program Various States Trust
Certificates), 8.875%, 12/1/36 | | | 555,630 | | |
| | | | | | | $ | 19,412,036 | | |
| Hospital - 8.3% | |
| $ | 6,200 | | | California Health Facilities Authority, (Cedars Sinai Medical
Center), 5.00%, 11/15/34 | | $ | 6,359,774 | | |
| | 2,500 | | | California Health Facilities Authority, (Cedars Sinai Medical
Center), Variable Rate, 9.262%, 12/1/34(1)(4) | | | 3,007,875 | | |
| | 2,350 | | | California Statewide Communities Development Authority,
(Daughters of Charity Health System), 5.25%, 7/1/30 | | | 2,472,411 | | |
| | 2,190 | | | Chautauqua County, NY, IDA, (Women's Christian
Association), 6.40%, 11/15/29 | | | 2,288,835 | | |
| | 600 | | | Gaylord, MI, Hospital Finance Authority, (Otsego Memorial
Hospital Association), 6.20%, 1/1/25 | | | 615,972 | | |
| | 875 | | | Gaylord, MI, Hospital Finance Authority, (Otsego Memorial
Hospital Association), 6.50%, 1/1/37 | | | 903,420 | | |
| | 1,000 | | | Henderson, NV, Health Care Facility, 5.625%, 7/1/24 | | | 1,073,140 | | |
| | 2,000 | | | Hillsborough County, FL, IDA, (Tampa General Hospital),
5.25%, 10/1/28 | | | 2,081,360 | | |
| | 4,810 | | | Macomb County, MI, Hospital Finance Authority, (Mount
Clemens General Hospital), 5.875%, 11/15/34 | | | 4,885,806 | | |
| | 7,000 | | | Maricopa County, AZ, IDA, (Catholic Healthcare),
5.375%, 7/1/23 | | | 7,390,460 | | |
| | 2,000 | | | Maricopa County, AZ, IDA, (Catholic Healthcare),
5.50%, 7/1/26 | | | 2,128,180 | | |
| | 4,890 | | | Montgomery County, PA, Higher Education and Health
Authority, (Catholic Health East), 5.375%, 11/15/34 | | | 5,127,605 | | |
| | 2,000 | | | New Hampshire HEFA, (Littleton Hospital),
6.00%, 5/1/28 | | | 2,045,340 | | |
| | 2,000 | | | New Jersey Health Care Facilities Financing Authority,
(Trinitas Hospital), 7.50%, 7/1/30 | | | 2,254,180 | | |
| | 2,560 | | | Oneida County, NY, Industrial Development Agency,
(Elizabeth Medical Center), 6.00%, 12/1/29 | | | 2,637,901 | | |
| | 875 | | | Prince George's County, MD, (Greater Southeast Healthcare
System), 6.375%, 1/1/13(6) | | | 87,500 | | |
| | 5,900 | | | Prince George's County, MD, (Greater Southeast Healthcare
System), 6.375%, 1/1/23(6) | | | 590,000 | | |
Principal Amount
(000's omitted) | | Security | | Value | |
| Hospital (continued) | |
| $ | 4,890 | | | St. Mary Hospital Authority, PA, (Catholic Health East),
5.375%, 11/15/34 | | $ | 5,135,136 | | |
| | 3,410 | | | Washington County, AR, Hospital, (Regional Medical Center),
5.00%, 2/1/35(7) | | | 3,413,069 | | |
| | 1,400 | | | Wisconsin HEFA, (Vernon Memorial Healthcare, Inc.),
5.10%, 3/1/25 | | | 1,404,466 | | |
| | 2,800 | | | Wisconsin HEFA, (Vernon Memorial Healthcare, Inc.),
5.25%, 3/1/35 | | | 2,812,852 | | |
| | | | | | | $ | 58,715,282 | | |
| Housing - 3.8% | |
| $ | 4,000 | | | Charter Mac Equity Trust, TN, 6.00%, 4/30/19 | | $ | 4,290,480 | | |
| | 2,500 | | | Florida Capital Projects Finance Authority, Student Housing
Revenue, (Florida University), 7.75%, 8/15/20 | | | 2,454,925 | | |
| | 455 | | | Florida Capital Projects Finance Authority, Student Housing
Revenue, (Florida University), 9.50%, 8/15/05 | | | 454,886 | | |
| | 1,800 | | | Jefferson County, MO, IDA, Multifamily, (Riverview Bend
Apartments), (AMT), 6.75%, 11/1/29 | | | 1,818,450 | | |
| | 480 | | | Jefferson County, MO, IDA, Multifamily, (Riverview Bend
Apartments), (AMT), 7.125%, 11/1/29 | | | 481,843 | | |
| | 3,775 | | | Maricopa County, AZ, IDA, (National Health Facilities II),
6.375%, 1/1/19(6) | | | 2,929,400 | | |
| | 1,500 | | | Maricopa County, AZ, IDA, (National Health Facilities II),
6.625%, 7/1/33(6) | | | 1,072,080 | | |
| | 2,320 | | | Maricopa County, AZ, IDA, (National Health Facilities II),
8.00%, 1/1/34 | | | 1,522,430 | | |
| | 5,000 | | | Muni Mae Tax-Exempt Bond, LLC, (AMT),
6.875%, 6/30/49 | | | 5,500,850 | | |
| | 3,235 | | | Oregon Health Authority, (Trillium Affordable Housing),
(AMT), 6.75%, 2/15/29 | | | 2,892,834 | | |
| | 1,420 | | | Oregon Health Authority, (Trillium Affordable Housing),
(AMT), 6.75%, 2/15/29 | | | 1,255,791 | | |
| | 860 | | | Texas Student Housing Corp., (University of Northern Texas),
9.375%, 7/1/06 | | | 726,261 | | |
| | 2,000 | | | Texas Student Housing Corp., (University of Northern Texas),
11.00%, 7/1/31 | | | 1,731,040 | | |
| | | | | | | $ | 27,131,270 | | |
| Industrial Development Revenue - 17.8% | |
| $ | 2,280 | | | ABIA Development Corp., TX, (Austin Cargoport
Development), (AMT), 6.50%, 10/1/24 | | $ | 2,199,132 | | |
| | 3,065 | | | Abia Development Corp., TX, (Austin Cargoport
Development), (AMT), 9.25%, 10/1/21 | | | 3,454,899 | | |
| | 4,500 | | | Alabama IDA, Solid Waste Disposal, (Pine City Fiber Co.),
(AMT), 6.45%, 12/1/23 | | | 4,745,340 | | |
| | 9,095 | | | Alliance Airport Authority, TX, (American Airlines, Inc.),
(AMT), 7.50%, 12/1/29 | | | 8,177,314 | | |
See notes to financial statements
8
Eaton Vance High Yield Municipals Fund as of July 31, 2005
PORTFOLIO OF INVESTMENTS (Unaudited) CONT'D
Principal Amount
(000's omitted) | | Security | | Value | |
| Industrial Development Revenue (continued) | |
| $ | 2,150 | | | Butler, AL, Industrial Development Board,
(Georgia-Pacific Corp.), (AMT), 5.75%, 9/1/28 | | $ | 2,186,700 | | |
| | 2,000 | | | Camden County, NJ, (Holt Hauling), (AMT),
9.875%, 1/1/21(6) | | | 253,100 | | |
| | 3,900 | | | Carbon County, UT, (Laidlaw Environmental Services Inc.),
(AMT), 7.45%, 7/1/17 | | | 4,070,235 | | |
| | 6,810 | | | Dallas-Fort Worth, TX, International Airport Facility
Improvements Corp., (AMT), 7.625%, 11/1/21 | | | 1,840,743 | | |
| | 12,480 | | | Denver, CO, City and County Special Facilities, (United
Airlines), (AMT), 6.875%, 10/1/32(6) | | | 11,390,122 | | |
| | 8,085 | | | Effingham County, GA, Solid Waste Disposal, (Fort James),
(AMT), 5.625%, 7/1/18 | | | 8,083,140 | | |
| | 450 | | | Florence County, SC, (Stone Container), 7.375%, 2/1/07 | | | 451,795 | | |
| | 2,700 | | | Hancock County, KY, (Southwire Co.), (AMT),
7.75%, 7/1/25 | | | 2,728,539 | | |
| | 4,000 | | | Hardeman County, TN, (Correctional Facilities Corp.),
7.75%, 8/1/17 | | | 4,167,920 | | |
| | 5,200 | | | Houston, TX, Airport System, (Continental Airlines), (AMT),
6.75%, 7/1/29 | | | 5,035,056 | | |
| | 3,785 | | | Kansas City, MO, IDA, (Airline Cargo Facilities), (AMT),
8.50%, 1/1/17 | | | 3,928,451 | | |
| | 2,730 | | | Maryland EDA, (AFCO Cargo), (AMT), 6.50%, 7/1/24 | | | 2,647,581 | | |
| | 590 | | | Maryland EDA, (Air Cargo), (AMT), 7.34%, 7/1/24 | | | 611,246 | | |
| | 1,300 | | | Michigan Strategic Fund, (S.D. Warren), (AMT),
7.375%, 1/15/22 | | | 1,357,343 | | |
| | 3,400 | | | Morgantown, KY, Solid Waste Revenue, (IMCO Recycling,
Inc.), (AMT), 7.45%, 5/1/22 | | | 3,394,594 | | |
| | 265 | | | New Albany, IN, IDA, (K-Mart), 7.40%, 6/1/06 | | | 261,839 | | |
| | 13,000 | | | New Jersey EDA, (Continental Airlines), (AMT),
6.25%, 9/15/29 | | | 11,905,790 | | |
| | 3,000 | | | New Jersey EDA, (Continental Airlines), (AMT),
6.40%, 9/15/23 | | | 2,823,750 | | |
| | 4,000 | | | New Jersey EDA, (Holt Hauling), (AMT), 7.90%, 3/1/27(6) | | | 3,776,360 | | |
| | 500 | | | New Jersey EDA, (Holt Hauling), (AMT),
8.95%, 12/15/18(6) | | | 394,575 | | |
| | 5,995 | | | New York City, NY, IDA, (American Airlines, Inc.), (AMT),
8.50%, 8/1/28 | | | 6,019,579 | | |
| | 13,650 | | | Ohio Environmental Facilities, (Ford Motor Co.), (AMT),
5.75%, 4/1/35 | | | 13,033,156 | | |
| | 8,200 | | | Phoenix, AZ, IDA, (America West Airlines, Inc.), (AMT),
6.25%, 6/1/19 | | | 6,725,722 | | |
| | 7,565 | | | Puerto Rico Port Authority, (American Airlines), (AMT),
6.25%, 6/1/26 | | | 5,991,707 | | |
| | 825 | | | Puerto Rico Port Authority, (American Airlines), (AMT),
6.30%, 6/1/23 | | | 667,780 | | |
| | 3,000 | | | Rumford, ME, Solid Waste Disposal, (Boise Cascade Corp.),
(AMT), 6.875%, 10/1/26 | | | 3,232,950 | | |
| | | | | | | $ | 125,556,458 | | |
Principal Amount
(000's omitted) | | Security | | Value | |
| Insured-Education - 0.9% | |
| $ | 6,000 | | | Massachusetts Development Finance Agency, (Boston
University), (AMBAC), 5.00%, 10/1/35 | | $ | 6,345,300 | | |
| | | | | | | $ | 6,345,300 | | |
| Insured-Electric Utilities - 4.6% | |
| $ | 5,700 | | | Jacksonville Electric Authority, FL, Electric System, (FSA),
4.75%, 10/1/33 | | $ | 5,750,730 | | |
| | 13,890 | | | Jacksonville Electric Authority, FL, Electric System, (FSA),
4.75%, 10/1/39 | | | 13,993,897 | | |
| | 6,000 | | | Maricopa County, AZ, Pollution Control Corp., (El Paso
Electric Co.), (FGIC), 4.80%, 8/1/40(7) | | | 6,029,460 | | |
| | 3,600 | | | Memphis, TN, Electric System, (MBIA), Variable Rate,
12.088%, 12/1/17(1)(2) | | | 4,680,504 | | |
| | 1,500 | | | Puerto Rico Electric Power Authority, RITES, (FSA), Variable
Rate, 9.876%, 7/1/29(1)(2) | | | 1,854,630 | | |
| | | | | | | $ | 32,309,221 | | |
| Insured-Escrowed / Prerefunded - 0.4% | |
| $ | 2,000 | | | New Jersey Turnpike Authority, RITES, (MBIA), Variable Rate,
Prerefunded to 6/15/07, 10.557%, 1/1/30(1)(2) | | $ | 2,573,780 | | |
| | | | | | | $ | 2,573,780 | | |
| Insured-General Obligations - 2.5% | |
| $ | 3,865 | | | California, (AMBAC), 4.25%, 3/1/27 | | $ | 3,724,546 | | |
| | 2,500 | | | California, (AMBAC), 4.50%, 5/1/28 | | | 2,481,900 | | |
| | 1,000 | | | California, Residual Certificates, (AMBAC), Variable Rate,
12.275%, 10/1/30(1)(2) | | | 1,262,230 | | |
| | 1,520 | | | California, RITES, (AMBAC), Variable Rate,
9.028%, 2/1/28(1)(2) | | | 2,030,021 | | |
| | 1,580 | | | Mississippi, (FSA), Variable Rate, 10.585%, 11/1/21(1)(2) | | | 2,273,652 | | |
| | 4,900 | | | Puerto Rico, (FSA), Variable Rate, 8.479%, 7/1/27(1)(2) | | | 6,004,264 | | |
| | | | | | | $ | 17,776,613 | | |
| Insured-Hospital - 0.4% | |
| $ | 2,415 | | | California Statewide Communities Development Authority,
(Sutter Health), (FSA), Variable Rate,
12.153%, 8/15/27(1)(2) | | $ | 3,090,500 | | |
| | | | | | | $ | 3,090,500 | | |
| Insured-Housing - 1.1% | |
| $ | 1,315 | | | Virgina Housing Development Authority, (MBIA), Variable
Rate, 10.295%, 7/1/36(1)(2) | | $ | 1,449,051 | | |
| | 6,010 | | | Virginia Housing Development Authority, (MBIA),
5.375%, 7/1/36 | | | 6,214,220 | | |
| | | | | | | $ | 7,663,271 | | |
See notes to financial statements
9
Eaton Vance High Yield Municipals Fund as of July 31, 2005
PORTFOLIO OF INVESTMENTS (Unaudited) CONT'D
Principal Amount
(000's omitted) | | Security | | Value | |
| | Insured-Miscellaneous - 1.0% | | | | |
| $ | 10,510 | | | Harris County-Houston, TX, Sports Authority, (MBIA),
0.00%, 11/15/26 | | $ | 3,756,799 | | |
| | 10,000 | | | Harris County-Houston, TX, Sports Authority, (MBIA),
0.00%, 11/15/28 | | | 3,208,600 | | |
| | | | | | | $ | 6,965,399 | | |
| | Insured-Transportation - 4.5% | | | | |
| $ | 2,250 | | | Central, TX, Regional Mobility Authority, (FGIC),
5.00%, 1/1/45 | | $ | 2,322,450 | | |
| | 1,665 | | | Dallas-Fort Worth, TX, International Airport Facility
Improvements Corp., DRIVERS, (FSA), Variable Rate,
11.158%, 11/1/18(1)(2) | | | 2,111,903 | | |
| | 15,000 | | | E-470 Public Highway Authority, CO, (MBIA),
0.00%, 9/1/33 | | | 3,324,900 | | |
| | 20,000 | | | E-470 Public Highway Authority, CO, (MBIA),
0.00%, 9/1/34 | | | 4,190,200 | | |
| | 3,735 | | | Massachusetts Turnpike Authority, Metropolitan Highway
System, (MBIA), 5.00%, 1/1/37 | | | 3,834,463 | | |
| | 2,985 | | | Monroe County, NY, Airport Authority, (MBIA), DRIVERS,
(AMT), Variable Rate, 9.049%, 1/1/18(1)(4) | | | 3,872,858 | | |
| | 3,155 | | | North Texas Tollway Authority, (FSA), 4.50%, 1/1/38 | | | 3,058,078 | | |
| | 3,000 | | | Puerto Rico Highway and Transportation Authority, (FSA),
Variable Rate, 9.895%, 7/1/32(1)(2) | | | 3,431,100 | | |
| | 20,000 | | | Texas State Turnpike Authority, (AMBAC), 0.00%, 8/15/30 | | | 5,993,600 | | |
| | | | | | | $ | 32,139,552 | | |
| | Insured-Water and Sewer - 2.1% | | | | |
| $ | 2,550 | | | Connecticut Development Authority, Aquarion Water, RITES,
(XLCA), (AMT), Variable Rate, 11.024%, 7/1/38(1)(2) | | $ | 2,672,502 | | |
| | 4,000 | | | Detroit, MI, Water Supply System, (FGIC), 4.50%, 7/1/29 | | | 3,985,360 | | |
| | 5,000 | | | Jacksonville Electric Authority, FL, Water and Sewer System,
(MBIA), 4.75%, 10/1/30 | | | 5,095,800 | | |
| | 10,000 | | | Rahway Valley, NJ, Sewerage Authority, (MBIA),
0.00%, 9/1/29(7) | | | 3,183,900 | | |
| | | | | | | $ | 14,937,562 | | |
| | Nursing Home - 2.8% | | | | |
| $ | 2,850 | | | Clovis, NM, IDR, (Retirement Ranches, Inc.),
7.75%, 4/1/19 | | $ | 2,968,503 | | |
| | 2,300 | | | Colorado HFA, (Volunteers of America), 5.75%, 7/1/20 | | | 2,321,436 | | |
| | 3,600 | | | Colorado HFA, (Volunteers of America), 5.875%, 7/1/28 | | | 3,634,200 | | |
| | 1,100 | | | Colorado HFA, (Volunteers of America), 6.00%, 7/1/29 | | | 1,116,060 | | |
| | 2,500 | | | Massachusetts IFA, (Age Institute of Massachusetts),
8.05%, 11/1/25 | | | 2,550,350 | | |
Principal Amount
(000's omitted) | | Security | | Value | |
| Nursing Home (continued) | |
| $ | 1,170 | | | Mississippi Business Finance Corp., (Magnolia Healthcare),
7.99%, 7/1/25 | | $ | 973,206 | | |
| | 3,055 | | | Westmoreland, PA, (Highland Health Systems, Inc.),
9.25%, 6/1/22 | | | 3,056,741 | | |
| | 3,685 | | | Wisconsin HEFA, (Wisconsin Illinois Senior Housing),
7.00%, 8/1/29 | | | 3,524,555 | | |
| | | | | | | $ | 20,145,051 | | |
| Other Revenue - 14.7% | |
| $ | 6,000 | | | California Statewide Communities Development Authority,
(East Valley Tourist Development Authority),
8.25%, 10/1/14 | | $ | 6,513,120 | | |
| | 1,000 | | | California Statewide Communities Development Authority,
(East Valley Tourist Development Authority),
9.25%, 10/1/20 | | | 1,103,790 | | |
| | 3,000 | | | California Statewide Communities Development Authority,
(East Valley Tourist Development Authority),
11.00%, 10/1/20 | | | 3,088,590 | | |
| | 4,300 | | | Capital Trust Agency, FL, (Seminole Tribe Convention),
8.95%, 10/1/33 | | | 4,700,760 | | |
| | 9,000 | | | Capital Trust Agency, FL, (Seminole Tribe Convention),
10.00%, 10/1/33 | | | 9,905,850 | | |
| | 6,355 | | | Central Falls, RI, Detention Facility Revenue,
7.25%, 7/15/35 | | | 6,536,245 | | |
| | 45,000 | | | Children's Trust Fund, PR, Tobacco Settlement,
0.00%, 5/15/50 | | | 2,854,800 | | |
| | 38,300 | | | Children's Trust Fund, PR, Tobacco Settlement,
0.00%, 5/15/55 | | | 1,294,923 | | |
| | 9,250 | | | Golden Tobacco Securitization Corp., CA, 5.00%, 6/1/45(7) | | | 9,505,670 | | |
| | 5,375 | | | Golden Tobacco Securitization Corp., CA, 5.50%, 6/1/33 | | | 6,036,394 | | |
| | 2,295 | | | Golden Tobacco Securitization Corp., CA, 6.625%, 6/1/40 | | | 2,624,241 | | |
| | 9,125 | | | Golden Tobacco Securitization Corp., CA, Variable Rate,
7.652%, 6/1/33(1)(4) | | | 11,370,754 | | |
| | 3,300 | | | Golden Tobacco Securitization Corp., CA, Variable Rate,
8.178%, 6/1/38(1)(4) | | | 4,167,900 | | |
| | 4,940 | | | Mohegan Tribe Indians, CT, Gaming Authority,
6.25%, 1/1/31 | | | 5,338,460 | | |
| | 2,037 | | | Pueblo of Santa Ana, NM, 15.00%, 4/1/24 | | | 2,076,660 | | |
| | 1,200 | | | Puerto Rico Infrastructure Financing Authority, Variable Rate,
19.305%, 10/1/32(1)(2) | | | 1,814,580 | | |
| | 1,900 | | | Sandoval County, NM, (Santa Ana Pueblo), 7.75%, 7/1/15 | | | 1,983,714 | | |
| | 2,392 | | | Santa Fe, NM, (1st Interstate Plaza), 8.00%, 7/1/13 | | | 2,424,464 | | |
| | 13,345 | | | Tobacco Settlement Financing Corp., NJ, 6.75%, 6/1/39 | | | 15,771,922 | | |
| | 3,525 | | | Tobacco Settlement Financing Corp., NJ, Variable Rate,
10.754%, 6/1/39(1)(4)(8) | | | 4,807,148 | | |
| | | | | | | $ | 103,919,985 | | |
See notes to financial statements
10
Eaton Vance High Yield Municipals Fund as of July 31, 2005
PORTFOLIO OF INVESTMENTS (Unaudited) CONT'D
Principal Amount
(000's omitted) | | Security | | Value | |
| Senior Living / Life Care - 7.0% | |
| $ | 7,655 | | | Albuquerque, NM, Retirement Facilities, (La Vida Liena
Retirement Center), 6.60%, 12/15/28 | | $ | 7,880,057 | | |
| | 2,500 | | | Arizona Health Facilities Authority, (Care Institute, Inc. -
Mesa), 7.625%, 1/1/26(9) | | | 2,014,250 | | |
| | 1,000 | | | Chester, PA, IDA, (Senior Life-Choice of Kimberton), (AMT),
8.50%, 9/1/25 | | | 1,030,670 | | |
| | 3,000 | | | Cliff House Trust, PA, (AMT), 6.625%, 6/1/27 | | | 1,506,150 | | |
| | 3,500 | | | Delaware County, PA, (White Horse Village),
7.30%, 7/1/14 | | | 3,621,625 | | |
| | 1,000 | | | Glen Cove, NY, IDA, (The Regency at Glen Cove),
0.00%, 1/1/13 | | | 503,210 | | |
| | 1,000 | | | Glen Cove, NY, IDA, (The Regency at Glen Cove),
0.00%, 7/1/13 | | | 480,460 | | |
| | 1,000 | | | Glen Cove, NY, IDA, (The Regency at Glen Cove),
0.00%, 1/1/14 | | | 456,900 | | |
| | 1,000 | | | Glen Cove, NY, IDA, (The Regency at Glen Cove),
0.00%, 7/1/14 | | | 436,140 | | |
| | 1,000 | | | Glen Cove, NY, IDA, (The Regency at Glen Cove),
0.00%, 1/1/15 | | | 414,380 | | |
| | 1,000 | | | Glen Cove, NY, IDA, (The Regency at Glen Cove),
0.00%, 7/1/15 | | | 394,670 | | |
| | 1,000 | | | Glen Cove, NY, IDA, (The Regency at Glen Cove),
0.00%, 1/1/16 | | | 375,850 | | |
| | 1,000 | | | Glen Cove, NY, IDA, (The Regency at Glen Cove),
0.00%, 7/1/16 | | | 357,870 | | |
| | 1,000 | | | Glen Cove, NY, IDA, (The Regency at Glen Cove),
0.00%, 1/1/17 | | | 340,650 | | |
| | 1,000 | | | Glen Cove, NY, IDA, (The Regency at Glen Cove),
0.00%, 7/1/17 | | | 324,370 | | |
| | 1,000 | | | Glen Cove, NY, IDA, (The Regency at Glen Cove),
0.00%, 1/1/18 | | | 308,820 | | |
| | 1,000 | | | Glen Cove, NY, IDA, (The Regency at Glen Cove),
0.00%, 7/1/18 | | | 293,980 | | |
| | 1,000 | | | Glen Cove, NY, IDA, (The Regency at Glen Cove),
0.00%, 1/1/19 | | | 279,910 | | |
| | 1,000 | | | Glen Cove, NY, IDA, (The Regency at Glen Cove),
0.00%, 7/1/19 | | | 266,450 | | |
| | 1,830 | | | Grove City, PA, Area Hospital Authority, (Grove Manor),
6.625%, 8/15/29 | | | 1,923,696 | | |
| | 3,395 | | | Illinois Development Finance Authority, (Care Institute, Inc. -
Illinois), 7.80%, 6/1/25 | | | 3,488,329 | | |
| | 7,500 | | | Kansas City, MO, IDA, (Kingswood United Methodist Manor),
5.875%, 11/15/29 | | | 6,982,200 | | |
| | 5,105 | | | Massachusetts IFA, (Forge Hill), (AMT), 6.75%, 4/1/30 | | | 5,148,954 | | |
| | 6,470 | | | Minneapolis, MN, (Walker Methodist Senior Services),
6.00%, 11/15/28 | | | 6,180,662 | | |
| | 5,205 | | | North Miami, FL, Health Care Facilities, (Imperial Club),
8.00%, 1/1/33 | | | 4,146,407 | | |
| | | | | | | $ | 49,156,660 | | |
Principal Amount
(000's omitted) | | Security | | Value | |
| Special Tax Revenue - 5.2% | |
| $ | 2,240 | | | Bell Mountain Ranch, CO, Metropolitan District,
6.625%, 11/15/25 | | $ | 2,298,374 | | |
| | 3,355 | | | Bell Mountain Ranch, CO, Metropolitan District,
7.375%, 11/15/19 | | | 3,563,916 | | |
| | 6,250 | | | Bridgeville, DE, (Heritabe Shores Special Development
District), 5.45%, 7/1/35 | | | 6,257,313 | | |
| | 2,350 | | | Concorde Estates Community Development, FL,
5.85%, 5/1/35 | | | 2,388,000 | | |
| | 3,800 | | | Cottonwood, CO, Water and Sanitation District,
7.75%, 12/1/20 | | | 3,960,322 | | |
| | 2,325 | | | New Jersey EDA, (Cigarette Tax), 5.50%, 6/15/24 | | | 2,460,385 | | |
| | 2,500 | | | New Jersey EDA, (Cigarette Tax), 5.50%, 6/15/31 | | | 2,624,225 | | |
| | 2,000 | | | New Jersey EDA, (Cigarette Tax), 5.75%, 6/15/29 | | | 2,145,620 | | |
| | 8,000 | | | Puerto Rico Infrastructure Financing Authority,
5.00%, 7/1/41 | | | 8,354,160 | | |
| | 2,500 | | | Southern Hills Plantation I Community Development
District, FL, 5.80%, 5/1/35 | | | 2,560,050 | | |
| | | | | | | $ | 36,612,365 | | |
| Transportation - 4.0% | |
| $ | 750 | | | Augusta, GA, Airport Revenue, 5.15%, 1/1/35 | | $ | 761,948 | | |
| | 920 | | | Eagle County, CO, (Eagle County Airport Terminal), (AMT),
7.00%, 5/1/21 | | | 974,556 | | |
| | 1,375 | | | Eagle County, CO, (Eagle County Airport Terminal), (AMT),
7.125%, 5/1/31 | | | 1,457,926 | | |
| | 400 | | | Eagle County, CO, (Eagle County Airport Terminal), (AMT),
7.50%, 5/1/21 | | | 409,884 | | |
| | 5,000 | | | New Jersey Transportation Trust Fund Authority, Variable Rate,
7.42%, 6/15/17(1)(4) | | | 5,577,650 | | |
| | 17,970 | | | Puerto Rico Highway and Transportation Authority,
5.125%, 7/1/39 | | | 18,895,096 | | |
| | | | | | | $ | 28,077,060 | | |
| | Total Tax-Exempt Investments - 102.3%
(identified cost $683,313,545) | | | | | $ | 723,399,596 | | |
| | Other Assets, Less Liabilities - (2.3)% | | | | | $ | (16,382,978 | ) | |
| | Net Assets - 100.0% | | | | | $ | 707,016,618 | | |
AMBAC - AMBAC Financial Group, Inc.
AMT - Interest earned from these securities may be considered a tax preference item for purposes of the Federal Alternative Minimum Tax.
FGIC - Financial Guaranty Insurance Company
FSA - Financial Security Assurance, Inc.
See notes to financial statements
11
Eaton Vance High Yield Municipals Fund as of July 31, 2005
PORTFOLIO OF INVESTMENTS (Unaudited) CONT'D
MBIA - Municipal Bond Insurance Association
XLCA - XL Capital Assurance, Inc.
At July 31, 2005, the concentration of the Fund's investments in the various states, determined as a percentage of net assets, is as follows:
| California | | | 16.0 | % | |
| Others, representing less than 10% individually | | | 86.3 | % | |
The Fund invests primarily in debt securities issued by municipalities. The ability of the issuers of the debt securities to meet their obligations may be affected by economic developments in a specific industry or municipality. In order to reduce the risk associated with such economic developments, at July 31, 2005, 17.0% of the securities in the portfolio of investments are backed by bond insurance of various financial institutions and financial guaranty assurance agencies. The aggregate percentage insured by an individual financial institution ranged from 0.4% to 6.3% of total investments.
(1) Security exempt from registration under Rule 144A of the Securities Act of 1933. These securities may be sold in transactions exempt from registration, normally to qualified institutional buyers. At July 31, 2005, the aggregate value of the securities is $86,371,857 or 12.2% of the Fund's net assets.
(2) Security has been issued as a leveraged inverse floater bond. The stated interest rate represents the rate in effect at July 31, 2005.
(3) Security (or a portion thereof) has been segregated to cover margin requirements on open financial futures contracts.
(4) Security has been issued as an inverse floater bond. The stated interest rate represents the rate in effect at July 31, 2005.
(5) Security (or a portion thereof) has been segregated to cover when-issued securities.
(6) Defaulted bond.
(7) When-issued security.
(8) Security is subject to a shortfall and forebearance agreement.
(9) Security is in default and making only partial interest payments.
See notes to financial statements
12
Eaton Vance High Yield Municipals Fund as of July 31, 2005
FINANCIAL STATEMENTS (Unaudited)
Statement of Assets and Liabilities
As of July 31, 2005
| Assets | | | |
| Investments, at value (identified cost, $683,313,545) | | $ | 723,399,596 | | |
| Cash | | | 1,958,437 | | |
| Receivable for investments sold | | | 485,437 | | |
| Receivable for Fund shares sold | | | 2,711,770 | | |
| Interest receivable | | | 12,858,392 | | |
| Receivable for daily variation margin on open financial futures contracts | | | 1,887,187 | | |
| Total assets | | $ | 743,300,819 | | |
| Liabilities | | | |
| Payable for when-issued securities | | $ | 22,057,485 | | |
| Payable for investments purchased | | | 10,291,257 | | |
| Dividends payable | | | 1,770,921 | | |
| Payable for Fund shares redeemed | | | 1,383,924 | | |
| Payable to affiliate for distribution and service fees | | | 352,913 | | |
| Accrued expenses | | | 427,701 | | |
| Total liabilities | | $ | 36,284,201 | | |
| Net Assets | | $ | 707,016,618 | | |
| Sources of Net Assets | | | |
| Paid-in capital | | $ | 722,727,298 | | |
| Accumulated net realized loss (computed on the basis of identified cost) | | | (57,948,212 | ) | |
| Accumulated distributions in excess of net investment income | | | (963,087 | ) | |
| Net unrealized appreciation (computed on the basis of identified cost) | | | 43,200,619 | | |
| Total | | $ | 707,016,618 | | |
| Class A Shares | | | |
| Net Assets | | $ | 414,798,624 | | |
| Shares Outstanding | | | 40,323,594 | | |
Net Asset Value and Redemption Price Per Share
(net assets ÷ shares of beneficial interest outstanding) | | $ | 10.29 | | |
Maximum Offering Price Per Share
(100 ÷ 95.25 of $10.29) | | $ | 10.80 | | |
| Class B Shares | | | |
| Net Assets | | $ | 155,311,985 | | |
| Shares Outstanding | | | 15,146,441 | | |
Net Asset Value, Offering Price and Redemption Price Per Share
(net assets ÷ shares of beneficial interest outstanding) | | $ | 10.25 | | |
| Class C Shares | | | |
| Net Assets | | $ | 136,906,009 | | |
| Shares Outstanding | | | 14,381,330 | | |
Net Asset Value, Offering Price and Redemption Price Per Share
(net assets ÷ shares of beneficial interest outstanding) | | $ | 9.52 | | |
| On sales of $25,000 or more, the offering price of Class A shares is reduced. | |
Statement of Operations
For the Six Months Ended
July 31, 2005
| Investment Income | | | |
| Interest | | $ | 21,086,720 | | |
| Total investment income | | $ | 21,086,720 | | |
| Expenses | | | |
| Investment adviser fee | | $ | 1,851,391 | | |
| Trustees' fees and expenses | | | 11,874 | | |
Distribution and service fees
Class A | | | 472,500 | | |
| Class B | | | 791,556 | | |
| Class C | | | 582,217 | | |
| Transfer and dividend disbursing agent fees | | | 115,047 | | |
| Custodian fee | | | 127,722 | | |
| Registration fees | | | 82,719 | | |
| Legal and accounting services | | | 61,501 | | |
| Printing and postage | | | 29,290 | | |
| Miscellaneous | | | 34,285 | | |
| Total expenses | | $ | 4,160,102 | | |
Deduct -
Reduction of custodian fee | | $ | 26,141 | | |
| Total expense reductions | | $ | 26,141 | | |
| Net expenses | | $ | 4,133,961 | | |
| Net investment income | | $ | 16,952,759 | | |
| Realized and Unrealized Gain (Loss) | | | |
Net realized gain (loss) -
Investment transactions (identified cost basis) | | $ | 602,649 | | |
| Financial futures contracts | | | (10,528,817 | ) | |
| Swap contracts | | | (1,241,000 | ) | |
| Net realized loss | | $ | (11,167,168 | ) | |
Change in unrealized appreciation (depreciation) -
Investments (identified cost basis) | | $ | 14,597,319 | | |
| Financial futures contracts | | | 8,399,211 | | |
| Swap contracts | | | 1,214,868 | | |
| Net change in unrealized appreciation (depreciation) | | $ | 24,211,398 | | |
| Net realized and unrealized gain | | $ | 13,044,230 | | |
| Net increase in net assets from operations | | $ | 29,996,989 | | |
See notes to financial statements
13
Eaton Vance High Yield Municipals Fund as of July 31, 2005
FINANCIAL STATEMENTS CONT'D
Statements of Changes in Net Assets
Increase (Decrease)
in Net Assets | | Six Months Ended
July 31, 2005
(Unaudited) | | Year Ended
January 31, 2005 | |
From operations -
Net investment income | | $ | 16,952,759 | | | $ | 33,259,713 | | |
Net realized loss from investment
transactions and financial
futures contracts | | | (11,167,168 | ) | | | (18,210,678 | ) | |
Net change in unrealized appreciation
(depreciation) from investments,
financial futures contracts, and
swaps contracts | | | 24,211,398 | | | | 11,582,927 | | |
| Net increase in net assets from operations | | $ | 29,996,989 | | | $ | 26,631,962 | | |
Distributions to shareholders -
From net investment income
Class A | | $ | (10,574,660 | ) | | $ | (19,109,194 | ) | |
| Class B | | | (3,849,197 | ) | | | (9,797,563 | ) | |
| Class C | | | (2,813,481 | ) | | | (5,030,510 | ) | |
| Total distributions to shareholders | | $ | (17,237,338 | ) | | $ | (33,937,267 | ) | |
Transactions in shares of beneficial interest -
Proceeds from sale of shares
Class A | | $ | 78,607,327 | | | $ | 147,156,991 | | |
| Class B | | | 8,355,268 | | | | 30,010,850 | | |
| Class C | | | 38,175,634 | | | | 50,555,874 | | |
Net asset value of shares issued to
shareholders in payment of
distributions declared
Class A | | | 4,234,494 | | | �� | 6,570,379 | | |
| Class B | | | 1,408,466 | | | | 3,603,775 | | |
| Class C | | | 1,078,482 | | | | 1,924,218 | | |
Cost of shares redeemed
Class A | | | (39,154,704 | ) | | | (76,023,685 | ) | |
| Class B | | | (14,376,535 | ) | | | (35,195,688 | ) | |
| Class C | | | (8,607,632 | ) | | | (26,393,719 | ) | |
Net asset value of shares exchanged
Class A | | | 8,807,840 | | | | 42,053,562 | | |
| Class B | | | (8,807,840 | ) | | | (42,053,562 | ) | |
Net increase in net assets from Fund
share transactions | | $ | 69,720,800 | | | $ | 102,208,995 | | |
| Net increase in net assets | | $ | 82,480,451 | | | $ | 94,903,690 | | |
Net Assets | | Six Months Ended
July 31, 2005
(Unaudited) | | Year Ended
January 31, 2005 | |
| At beginning of period | | $ | 624,536,167 | | | $ | 529,632,477 | | |
| At end of period | | $ | 707,016,618 | | | $ | 624,536,167 | | |
Accumulated undistributed
(distributions in excess of)
net investment income
included in net assets | | | |
| At end of period | | $ | (963,087 | ) | | $ | (678,508 | ) | |
See notes to financial statements
14
Eaton Vance High Yield Municipals Fund as of July 31, 2005
FINANCIAL STATEMENTS CONT'D
Financial Highlights
| | | Class A | |
| | | Six Months Ended
July 31, 2005 | | Year Ended January 31, | |
| | | (Unaudited)(1) | | 2005(1) | | 2004(1) | | 2003(1) | | 2002(1)(2) | | 2001(1) | |
| Net asset value - Beginning of period | | $ | 10.090 | | | $ | 10.230 | | | $ | 9.730 | | | $ | 9.660 | | | $ | 9.800 | | | $ | 9.790 | | |
| Income (loss) from operations | | | |
| Net investment income | | $ | 0.277 | | | $ | 0.614 | | | $ | 0.668 | | | $ | 0.682 | | | $ | 0.627 | | | $ | 0.640 | | |
| Net realized and unrealized gain (loss) | | | 0.205 | | | | (0.125 | ) | | | 0.486 | | | | 0.031 | | | | (0.128 | ) | | | 0.015 | | |
| Total income from operations | | $ | 0.482 | | | $ | 0.489 | | | $ | 1.154 | | | $ | 0.713 | | | $ | 0.499 | | | $ | 0.655 | | |
| Less distributions | | | |
| From net investment income | | $ | (0.282 | ) | | $ | (0.629 | ) | | $ | (0.654 | ) | | $ | (0.643 | ) | | $ | (0.639 | ) | | $ | (0.645 | ) | |
| Total distributions | | $ | (0.282 | ) | | $ | (0.629 | ) | | $ | (0.654 | ) | | $ | (0.643 | ) | | $ | (0.639 | ) | | $ | (0.645 | ) | |
| Net asset value - End of period | | $ | 10.290 | | | $ | 10.090 | | | $ | 10.230 | | | $ | 9.730 | | | $ | 9.660 | | | $ | 9.800 | | |
| Total Return(3) | | | 4.85 | % | | | 5.05 | % | | | 12.25 | % | | | 7.59 | % | | | 5.18 | % | | | 6.89 | % | |
| Ratios/Supplemental Data | | | |
| Net assets, end of period (000's omitted) | | $ | 414,799 | | | $ | 354,881 | | | $ | 238,169 | | | $ | 147,004 | | | $ | 134,950 | | | $ | 117,525 | | |
| Ratios (As a percentage of average daily net assets): | |
| Expenses(4) | | | 0.96 | %(6) | | | 0.99 | % | | | 1.02 | % | | | 1.05 | % | | | 1.07 | % | | | 1.08 | % | |
| Expenses after custodian fee reduction(4) | | | 0.95 | %(6) | | | 0.98 | % | | | 1.02 | % | | | 1.05 | % | | | 1.07 | % | | | 1.08 | % | |
| Net investment income | | | 5.51 | %(6) | | | 6.17 | % | | | 6.70 | % | | | 7.01 | % | | | 6.37 | % | | | 6.52 | % | |
| Portfolio Turnover of the Portfolio(5) | | | - | | | | 42 | % | | | 40 | % | | | 15 | % | | | 24 | % | | | 30 | % | |
| Portfolio Turnover of the Fund | | | 15 | % | | | 10 | % | | | - | | | | - | | | | - | | | | - | | |
(1) Net investment income per share was computed using average shares outstanding.
(2) The Fund, through its investment in the Portfolio, has adopted the provisions of the revised AICPA Audit and Accounting Guide for Investment Companies and began using the interest method to amortize premiums on fixed-income securities. The effect of this change for the year ended January 31, 2002 was to increase net investment income per share by less than $0.001, increase net realized and unrealized losses per share by less than $0.001 and increase the ratio of net investment income to average net assets by less than 0.01%. Per-share dat a and ratios for the periods prior to February 1, 2001 have not been restated to reflect this change in presentation.
(3) Returns are historical and are calculated by determining the percentage change in net asset value with all distributions reinvested. Total return is not computed on an annualized basis.
(4) Includes the Fund's share of the Portfolio's allocated expenses while the fund was making investments directly into the Portfolio.
(5) Portfolio turnover represents the rate of portfolio activity for the period while the Fund was making investments directly into the Portfolio.
(6) Annualized.
See notes to financial statements
15
Eaton Vance High Yield Municipals Fund as of July 31, 2005
FINANCIAL STATEMENTS CONT'D
Financial Highlights
| | | Class B | |
| | | Six Months Ended
July 31, 2005 | | Year Ended January 31, | |
| | | (Unaudited)(1) | | 2005(1) | | 2004(1) | | 2003(1) | | 2002(1)(2) | | 2001(1) | |
| Net asset value - Beginning of period | | $ | 10.060 | | | $ | 10.200 | | | $ | 9.700 | | | $ | 9.640 | | | $ | 9.770 | | | $ | 9.750 | | |
| Income (loss) from operations | | | |
| Net investment income | | $ | 0.240 | | | $ | 0.542 | | | $ | 0.600 | | | $ | 0.606 | | | $ | 0.545 | | | $ | 0.559 | | |
| Net realized and unrealized gain (loss) | | | 0.193 | | | | (0.129 | ) | | | 0.479 | | | | 0.022 | | | | (0.120 | ) | | | 0.016 | | |
| Total income from operations | | $ | 0.433 | | | $ | 0.413 | | | $ | 1.079 | | | $ | 0.628 | | | $ | 0.425 | | | $ | 0.575 | | |
| Less distributions | | | |
| From net investment income | | $ | (0.243 | ) | | $ | (0.553 | ) | | $ | (0.579 | ) | | $ | (0.568 | ) | | $ | (0.555 | ) | | $ | (0.555 | ) | |
| Total distributions | | $ | (0.243 | ) | | $ | (0.553 | ) | | $ | (0.579 | ) | | $ | (0.568 | ) | | $ | (0.555 | ) | | $ | (0.555 | ) | |
| Net asset value - End of period | | $ | 10.250 | | | $ | 10.060 | | | $ | 10.200 | | | $ | 9.700 | | | $ | 9.640 | | | $ | 9.770 | | |
| Total Return(3) | | | 4.37 | % | | | 4.52 | %(6) | | | 11.44 | % | | | 6.66 | % | | | 4.38 | % | | | 6.02 | % | |
| Ratios/Supplemental Data | | | |
| Net assets, end of period (000's omitted) | | $ | 155,312 | | | $ | 165,787 | | | $ | 212,391 | | | $ | 188,959 | | | $ | 187,232 | | | $ | 191,418 | | |
| Ratios (As a percentage of average daily net assets): | |
| Expenses(4) | | | 1.71 | %(7) | | | 1.74 | % | | | 1.77 | % | | | 1.80 | % | | | 1.82 | % | | | 1.87 | % | |
| Expenses after custodian fee reduction(4) | | | 1.70 | %(7) | | | 1.73 | % | | | 1.77 | % | | | 1.80 | % | | | 1.82 | % | | | 1.87 | % | |
| Net investment income | | | 4.78 | %(7) | | | 5.46 | % | | | 6.04 | % | | | 6.25 | % | | | 5.56 | % | | | 5.72 | % | |
| Portfolio Turnover of the Portfolio(5) | | | - | | | | 42 | % | | | 40 | % | | | 15 | % | | | 24 | % | | | 30 | % | |
| Portfolio Turnover of the Fund | | | 15 | % | | | 10 | % | | | - | | | | - | | | | - | | | | - | | |
(1) Net investment income per share was computed using average shares outstanding.
(2) The Fund, through its investment in the Portfolio, has adopted the provisions of the revised AICPA Audit and Accounting Guide for Investment Companies and began using the interest method to amortize premiums on fixed-income securities. The effect of this change for the year ended January 31, 2002 was to increase net investment income per share by less than $0.001, increase net realized and unrealized losses per share by less than $0.001 and increase the ratio of net investment income to average net assets by less than 0.01%. Per-share dat a and ratios for the periods prior to February 1, 2001 have not been restated to reflect this change in presentation.
(3) Returns are historical and are calculated by determining the percentage change in net asset value with all distributions reinvested. Total return is not computed on an annualized basis.
(4) Includes the Fund's share of the Portfolio's allocated expenses while the fund was making investments directly into the Portfolio.
(5) Portfolio turnover represents the rate of portfolio activity for the period while the Fund was making investments directly into the Portfolio.
(6) Total return reflects an increase of 0.18% due to a change in timing of payment and reinvestment of distributions.
(7) Annualized.
See notes to financial statements
16
Eaton Vance High Yield Municipals Fund as of July 31, 2005
FINANCIAL STATEMENTS CONT'D
Financial Highlights
| | | Class C | |
| | | Six Months Ended
July 31, 2005 | | Year Ended January 31, | |
| | | (Unaudited)(1) | | 2005(1) | | 2004(1) | | 2003(1) | | 2002(1)(2) | | 2001(1) | |
| Net asset value - Beginning of period | | $ | 9.340 | | | $ | 9.470 | | | $ | 9.000 | | | $ | 8.950 | | | $ | 9.060 | | | $ | 9.030 | | |
| Income (loss) from operations | |
| Net investment income | | $ | 0.221 | | | $ | 0.498 | | | $ | 0.543 | | | $ | 0.561 | | | $ | 0.511 | | | $ | 0.516 | | |
| Net realized and unrealized gain (loss) | | | 0.185 | | | | (0.115 | ) | | | 0.465 | | | | 0.017 | | | | (0.112 | ) | | | 0.019 | | |
| Total income from operations | | $ | 0.406 | | | $ | 0.383 | | | $ | 1.008 | | | $ | 0.578 | | | $ | 0.399 | | | $ | 0.535 | | |
| Less distributions | |
| From net investment income | | $ | (0.226 | ) | | $ | (0.513 | ) | | $ | (0.538 | ) | | $ | (0.528 | ) | | $ | (0.509 | ) | | $ | (0.505 | ) | |
| Total distributions | | $ | (0.226 | ) | | $ | (0.513 | ) | | $ | (0.538 | ) | | $ | (0.528 | ) | | $ | (0.509 | ) | | $ | (0.505 | ) | |
| Net asset value - End of period | | $ | 9.520 | | | $ | 9.340 | | | $ | 9.470 | | | $ | 9.000 | | | $ | 8.950 | | | $ | 9.060 | | |
| Total Return(3) | | | 4.40 | % | | | 4.40 | %(6) | | | 11.53 | % | | | 6.61 | % | | | 4.43 | % | | | 6.04 | % | |
| Ratios/Supplemental Data | |
| Net assets, end of period (000's omitted) | | $ | 136,906 | | | $ | 103,868 | | | $ | 79,072 | | | $ | 35,646 | | | $ | 23,470 | | | $ | 17,285 | | |
| Ratios (As a percentage of average daily net assets): | |
| Expenses(4) | | | 1.71 | %(7) | | | 1.74 | % | | | 1.77 | % | | | 1.80 | % | | | 1.82 | % | | | 1.89 | % | |
| Expenses after custodian fee reduction(4) | | | 1.70 | %(7) | | | 1.73 | % | | | 1.77 | % | | | 1.80 | % | | | 1.82 | % | | | 1.89 | % | |
| Net investment income | | | 4.74 | %(7) | | | 5.41 | % | | | 5.88 | % | | | 6.22 | % | | | 5.62 | % | | | 5.70 | % | |
| Portfolio Turnover of the Portfolio(5) | | | - | | | | 42 | % | | | 40 | % | | | 15 | % | | | 24 | % | | | 30 | % | |
| Portfolio Turnover of the Fund | | | 15 | % | | | 10 | % | | | - | | | | - | | | | - | | | | - | | |
(1) Net investment income per share was computed using average shares outstanding.
(2) The Fund, through its investment in the Portfolio, has adopted the provisions of the revised AICPA Audit and Accounting Guide for Investment Companies and began using the interest method to amortize premiums on fixed-income securities. The effect of this change for the year ended January 31, 2002 was to increase net investment income per share by less than $0.001, increase net realized and unrealized losses per share by less than $0.001 and increase the ratio of net investment income to average net assets by less than 0.01%. Per-share dat a and ratios for the periods prior to February 1, 2001 have not been restated to reflect this change in presentation.
(3) Returns are historical and are calculated by determining the percentage change in net asset value with all distributions reinvested. Total return is not computed on an annualized basis.
(4) Includes the Fund's share of the Portfolio's allocated expenses while the fund was making investments directly into the portfolio.
(5) Portfolio turnover represents the rate of portfolio activity for the period while the Fund was making investments directly into the Portfolio.
(6) Total return reflects an increase of 0.10% due to a change in timing of payment and reinvestment of distributions.
(7) Annualized.
See notes to financial statements
17
Eaton Vance High Yield Municipals Fund as of July 31, 2005
NOTES TO FINANCIAL STATEMENTS
1 Significant Accounting Policies
Eaton Vance High Yield Municipals Fund (the Fund) is a diversified series of Eaton Vance Municipals Trust II (the Trust). The Trust is an entity of the type commonly known as a Massachusetts business trust and is registered under the Investment Company Act of 1940, as amended, as an open-end, management investment company. The Fund seeks to achieve high current income exempt from regular federal income tax. The Fund offers three classes of shares. Class A shares are generally sold subject to a sales charge imposed at time of purchase. Class B and Class C shares are sold at net asset value and are subject to a declining contingent deferred sales charge (see Note 6). The Trustees have adopted a conversion feature pursuant to which Class B shares of the Fund automatically convert to Class A shares eight years after their purchase as described in the Fund's prospectus. Each class represents a pro-rata interest in the Fund, but votes separately on class-specific matters and (as noted below) is subject to different expenses. Realized and unrealized gains and losses are allocated daily to each class of shares based on the relative net assets of each class to the total net assets of the Fund. Net investment income, other than class-specific expenses, is allocated daily to each class of shares based upon the ratio of the value of each class' paid shares to the total value of all paid shares. Each class of shares differs in its distribution plan and certain other class-specific expenses.
On September 10, 2004, the Fund received its pro rata share of cash and securities from the High Yield Municipals Portfolio (the Portfolio) in a complete liquidation of its interest in the Portfolio. Subsequent to September 10, 2004, the Fund invests directly in securities rather than through the Portfolio and maintains the same investment objective.
The following is a summary of significant accounting policies consistently followed by the Fund in the preparation of its financial statements. The policies are in conformity with accounting principles generally accepted in the United States of America.
A Investment Valuation - Municipal bonds and taxable obligations, if any, are normally valued on the basis of valuations furnished by a pricing service. Financial futures contracts and options on financial futures contracts listed on commodity exchanges are valued at closing settlement prices. Over-the-counter options on financial futures contracts are normally valued at the mean between the latest bid and asked prices. Interest rate swaps are normally valued on the basis of valuations furnished by a broker. Short-term obligations, maturing in sixty days or less, ar e valued at amortized cost, which approximates value. Investments for which valuations or market quotations are unavailable are valued at fair value using methods determined in good faith by or at the direction of the Trustees.
B Income - Interest income is determined on the basis of interest accrued, adjusted for amortization of premium or discount.
C Expenses - The majority of expenses of the Trust are directly identifiable to an individual fund. Expenses which are not readily identifiable to a specific fund are allocated taking into consideration, among other things, the nature and type of expense and the relative size of the funds.
D Federal Taxes - The Fund's policy is to comply with the provisions of the Internal Revenue Code applicable to regulated investment companies and to distribute to shareholders each year all of its taxable and tax-exempt income, including any net realized gain on investments. Accordingly, no provision for federal income or excise tax is necessary. At January 31, 2005, the Fund, for federal income tax purposes, had a capital loss carryover of $46,220,511, which will reduce the Fund's taxable income arising from future net realized gain on investments, if any, to the extent permitted by the Internal Revenue Code, and thus will reduce the amount of distributions to shareholders which would otherwise be necessary to relieve the Fund of any liability for federal income or excise tax. Such capital loss carryover will expire January 31, 2013 ($23,032,311), January 31, 2012 ($707,905), January 31, 2011 ($12,893,267), January 31, 2010 ($628,329), January 31, 2009 ($4,844,026), January 31, 2008 ($2,693,858), and January 31, 2006 ($1,420,815). Dividends paid by the Fund from net tax-exempt interest on municipal bonds are not includable by shareholders as gross income for federal income tax purposes because the Fund intends to meet certain requirements of the Internal Revenue Code applicable to regulated investment companies which will enable the Fund to pay exempt-interest dividends. The portion of such interest, if any, earned on private activity bonds issued after August 7, 1986, may be considered a tax preference item to shareholder s.
Additionally, at January 31, 2005, the Fund had net capital losses of $6,370,032 attributable to security transactions incurred after October 31, 2004. These are treated as arising on the first day of the Fund's taxable year ended January 31, 2006.
E Financial Futures Contracts - Upon entering into a financial futures contract, the Fund is required to
18
Eaton Vance High Yield Municipals Fund as of July 31, 2005
NOTES TO FINANCIAL STATEMENTS CONT'D
deposit (initial margin) either in cash or securities an amount equal to a certain percentage of the purchase price indicated in the financial futures contract. Subsequent payments are made or received by the Fund (margin maintenance) each day, dependent on the daily fluctuations in the value of the underlying security, and are recorded for book purposes as unrealized gains or losses by the Fund. The Fund's investment in financial futures contracts is designed only to hedge against anticipated future changes in interest rates. Should interest rates move unexpectedly, the Fund may not achieve the anticipated benefits of the financial futures contracts and may realize a loss.
F Interest Rate Swaps - The Fund may enter into interest rate swap agreements to enhance return, to hedge against fluctuations in securities prices or interest rates or as substitution for the purchase or sale of securities. Pursuant to these agreements the Fund makes bi-annual payments at a fixed interest rate. In exchange, the Fund receives payments based on the interest rate of a benchmark industry index. During the term of the outstanding swap agreement, changes in the underlying value of the swap are recorded as unrealized gains and losses. The value of the swa p is determined by changes in the relationship between two rates of interest. The Fund is exposed to credit loss in the event of non-performance by the swap counterparty. However, the Fund does not anticipate non-performance by the counterparty. Risk may also arise from the unanticipated movements in value of interest rates.
G Legal Fees - Legal fees and other related expenses incurred as part of negotiations of the terms and requirements of capital infusions, or that are expected to result in the restructuring of or a plan of reorganization for an investment are recorded as realized losses. Ongoing expenditures to protect or enhance an investment are treated as operating expenses.
H When-issued and Delayed Delivery Transactions - The Fund may engage in when-issued and delayed delivery transactions. The Fund records when-issued securities on trade date and maintains security positions such that sufficient liquid assets will be available to make payments for the securities purchased. Securities purchased on a when-issued or delayed delivery basis are marked-to-market daily and begin accruing interest on settlement date.
I Expense Reduction - Investors Bank & Trust Company (IBT) serves as custodian to the Fund. Pursuant to the custodian agreement, IBT receives a fee reduced by credits which are determined based on the average daily cash balances the Fund maintains with IBT. All credit balances used to reduce the Fund's custodian fees are reported as a reduction of operating expenses on the Statement of Operations.
J Use of Estimates - The preparation of the financial statements in conformity with accounting principles generally accepted in the United States of America requires management to make estimates and assumptions that affect the reported amounts of assets and liabilities at the date of the financial statements and the reported amounts of income and expense during the reporting period. Actual results could differ from those estimates.
K Indemnifications - Under the Trust's organizational documents, its officers and Trustees may be indemnified against certain liabilities and expenses arising out of the performance of their duties to the Fund and shareholders are indemnified against personal liability for obligations of the Trust. Additionally, in the normal course of business, the Fund enters into agreements with service providers that may contain indemnification clauses. The Fund's maximum exposure under these arrangements is unknown as this would involve future claims that may be made against th e Fund that have not yet occurred.
L Other - Investment transactions are accounted for on a trade-date basis. Realized gains and losses are computed based on the specific identification of securities sold.
M Interim Financial Statements - The interim financial statements relating to July 31, 2005, and for the six months then ended have not been audited by an Independent Registered Public Accounting Firm, but in the opinion of the Fund's management reflect all adjustments, consisting only of normal recurring adjustments, necessary for the fair presentation of the financial statements.
2 Distributions to Shareholders
The net income of the Fund is determined daily, and substantially all of the net income so determined is declared as a dividend to shareholders of record at the time of declaration. Distributions are declared separately for each class of shares. Distributions are paid monthly. Distributions of realized capital gains, if any, are made at least annually. Shareholders may reinvest income and capital gain distributions in additional shares of the same class of the Fund at the net asset value as of the reinvestment date. Distributions are paid in the form of additional shares of the same class or, at the election of the shareholder, in
19
Eaton Vance High Yield Municipals Fund as of July 31, 2005
NOTES TO FINANCIAL STATEMENTS CONT'D
cash. The Fund distinguishes between distributions on a tax basis and a financial reporting basis. Accounting principles generally accepted in the United States of America require that only distributions in excess of tax basis earnings and profits be reported in the financial statements as a return of capital. Permanent differences between book and tax accounting relating to distributions are reclassified to paid-in capital.
3 Shares of Beneficial Interest
The Fund's Declaration of Trust permits the Trustees to issue an unlimited number of full and fractional shares of beneficial interest (without par value). Such shares may be issued in a number of different series (such as the Fund) and classes. Transactions in Fund shares were as follows:
| Class A | | Six Months Ended
July 31, 2005
(Unaudited) | | Year Ended
January 31, 2005 | |
| Sales | | | 7,743,620 | | | | 14,691,208 | | |
Issued to shareholders electing to
receive payments of distributions
in Fund shares | | | 416,965 | | | | 660,372 | | |
| Redemptions | | | (3,860,242 | ) | | | (7,642,191 | ) | |
| Exchange from Class B shares | | | 868,329 | | | | 4,170,262 | | |
| Net increase | | | 5,168,672 | | | | 11,879,651 | | |
| Class B | | Six Months Ended
July 31, 2005
(Unaudited) | | Year Ended
January 31, 2005 | |
| Sales | | | 826,521 | | | | 3,018,638 | | |
Issued to shareholders electing to
receive payments of distributions
in Fund shares | | | 139,238 | | | | 362,159 | | |
| Redemptions | | | (1,424,165 | ) | | | (3,543,506 | ) | |
| Exchange to Class A shares | | | (870,380 | ) | | | (4,184,249 | ) | |
| Net decrease | | | (1,328,786 | ) | | | (4,346,958 | ) | |
| Class C | | Six Months Ended
July 31, 2005
(Unaudited) | | Year Ended
January 31, 2005 | |
| Sales | | | 4,065,687 | | | | 5,431,928 | | |
Issued to shareholders electing to
receive payments of distributions
in Fund shares | | | 114,736 | | | | 208,617 | | |
| Redemptions | | | (917,369 | ) | | | (2,872,362 | ) | |
| Net increase | | | 3,263,054 | | | | 2,768,183 | | |
4 Investment Adviser Fee and Other Transactions with Affiliates
The investment adviser fee is earned by Boston Management and Research (BMR), a wholly-owned subsidiary of Eaton Vance Management (EVM), as compensation for management and investment advisory services rendered to the Fund. The fee is based upon a percentage of average daily net assets plus a percentage of gross income (i.e. income other than gains from the sales of securities). For the six month period ending July 31, 2005, the Fund's advisory fee amounted to $1,851,391, representing 0.57% (annualized) of the Fund's average daily net assets.
EVM serves as the sub-transfer agent of the Fund and receives from the transfer agent an aggregate fee based upon the actual expenses incurred by EVM in the performance of those activities. For the six months ended July 31, 2005, EVM earned $19,244 in sub-transfer agent fees.
The Fund was informed that Eaton Vance Distributors, Inc. (EVD), a subsidiary of EVM and the Fund's principal underwriter, received $73,004 as its portion of the sales charge on sales of Class A shares for the six months ended July 31, 2005.
Except as to Trustees of the Fund who are not members of EVM's or BMR's organization, officers and Trustees receive remuneration for their services to the Fund out of the investment adviser fee earned by BMR. Trustees of the Fund who are not affiliated with the Investment Adviser may elect to defer receipt of all or a percentage of their annual fees in accordance with the terms of the Trustees Deferred Compensation Plan. For the six months ended July 31, 2005, no significant amounts have been deferred.
Certain officers and Trustees of the Fund are officers of the above organizations.
5 Distribution and Service Plans
The Fund has in effect distribution plans for Class B shares (Class B Plan) and Class C shares (Class C Plan) pursuant to Rule 12b-1 under the Investment Company Act of 1940 and a service plan for Class A shares (Class A Plan) (collectively, the Plans). The Class B and Class C Plans require the Fund to pay amounts equal to 1/365 of 0.75% of the Fund's average daily net assets attributable to Class B and Class C shares for providing ongoing distribution services and facilities to the Fund. The Fund will automatically discontinue payments to EVD during any
20
Eaton Vance High Yield Municipals Fund as of July 31, 2005
NOTES TO FINANCIAL STATEMENTS CONT'D
period in which there are no outstanding Uncovered Distribution Charges, which are equivalent to the sum of (i) 5% and 6.25% of the aggregate amount received by the Fund for the Class B and Class C shares sold, respectively, plus (ii) interest calculated by applying the rate of 1% over the prevailing prime rate to the outstanding balance of Uncovered Distribution Charges of EVD, reduced by the aggregate amount of contingent deferred sales charges (see Note 6) and daily amounts theretofore paid to EVD by each respective class. The Fund paid or accrued $593,592 and $436,738 for Class B and Class C shares, respectively, to or payable to EVD for the six months ended July 31, 2005, representing 0.75% of the average daily net assets for Class B and Class C shares. At July 31, 2005, the amount of Uncovered Distribution Charges of EVD calculated under th e Plan was approximately $18,467,000 and $11,411,000 for Class B and Class C shares, respectively.
The Plans authorize the Fund to make payments of service fees to EVD, investment dealers and other persons in amounts equal to 0.25% of the Fund's average daily net assets attributable to Class A, Class B, and Class C shares for each fiscal year. Service fee payments will be made for personal services and/or the maintenance of shareholder accounts. Service fees are separate and distinct from the sales commissions and distribution fees payable by the Fund to EVD and, as such are not subject to automatic discontinuance where there are no outstanding Uncovered Distribution Charges of EVD. Service fee payments for the six months ended July 31, 2005 amounted to $472,500, $197,964, and $145,479 for Class A, Class B, and Class C shares, respectively.
6 Contingent Deferred Sales Charge
A contingent deferred sales charge (CDSC) generally is imposed on redemptions of Class B shares made within six years of purchase and on redemptions of Class C shares made within one year of purchase. Generally, the CDSC is based upon the lower of the net asset value at date of redemption or date of purchase. No charge is levied on shares acquired by reinvestment of dividends or capital gain distributions. Class A shares may be subject to a 1% CDSC if redeemed within one year of purchase (depending upon the circumstances of purchase). The Class B CDSC is imposed at declining rates that begin at 5% in the case of redemptions in the first and second year after purchase, declining one percentage point each subsequent year. Class C shares will be subject to a 1% CDSC if redeemed within one year of purchase. No CDSC is levied on shares which have been sold to EVM or its affil iates or to their respective employees or clients and may be waived under certain other limited conditions. CDSC charges are paid to EVD to reduce the amount of Uncovered Distribution Charges calculated under the Fund's Distribution Plan (see Note 5). CDSC charges received when no Uncovered Distribution Charges exist will be credited to the Fund. EVD received approximately $172,000 and $13,000 of CDSC paid by shareholders for Class B shares and Class C shares, respectively, for the six months ended July 31, 2005.
7 Investment Transactions
Purchases and sales of investments by the Fund, other than U.S. Government securities and short-term obligations, aggregated $190,026,803 and $95,951,065, respectively, for the six months ended July 31, 2005.
8 Federal Income Tax Basis of Unrealized Appreciation (Depreciation)
The cost and unrealized appreciation (depreciation) in value of the investments owned at July 31, 2005 as computed on a federal income tax basis, were as follows:
| Aggregate cost | | $ | 682,366,444 | | |
| Gross unrealized appreciation | | $ | 55,971,767 | | |
| Gross unrealized depreciation | | | (14,938,615 | ) | |
| Net unrealized appreciation | | $ | 41,033,152 | | |
9 Line of Credit
The Fund participates with other portfolios and funds managed by BMR and EVM and its affiliates in a $150 million unsecured line of credit agreement with a group of banks. Borrowings will be made by the Fund solely to facilitate the handling of unusual and/or unanticipated short-term cash requirements. Interest is charged to each participating portfolio or fund based on its borrowings at an amount above either the Eurodollar rate or Federal Funds rate. In addition, a fee computed at an annual rate of 0.10% on the daily unused portion of the line of credit is allocated among the participating portfolios and funds at the end of each quarter. The Fund did not have any significant borrowings or allocated fees during the six months ended July 31, 2005.
10 Financial Instruments
The Fund regularly trades in financial instruments with off-balance sheet risk in the normal course of its investing activities to assist in managing exposure to various market risks. These financial instruments include futures contracts and interest rate swap contracts and may involve, to a varying degree, elements of risk in excess of the amounts
21
Eaton Vance High Yield Municipals Fund as of July 31, 2005
NOTES TO FINANCIAL STATEMENTS CONT'D
recognized for financial statement purposes. The notional or contractual amounts of these instruments represent the investment the Fund has in particular classes of financial instruments and do not necessarily represent the amounts potentially subject to risk. The measurement of the risks associated with these instruments is meaningful only when all related and offsetting transactions are considered.
A summary of obligations under these financial instruments at July 31, 2005 is as follows:
| Futures Contracts | |
Expiration
Date(s) | | Contracts | | Position | | Aggregate
Cost | | Value | | Net
Unrealized
Appreciation | |
| | 9/05 | | | 1,830 U.S.
Treasury Bond | | Short | | $ | (214,136,443 | ) | | $ | (211,021,875 | ) | | $ | 3,114,568 | | |
At July 31, 2005, the Fund had sufficient cash and/or securities to cover commitments under these contracts.
11 Shareholder Meeting
The Fund held a Special Meeting of Shareholders on April 29, 2005 to elect Trustees. The results of the vote were as follows:
| | | Number of Shares | |
| Nominee for Trustee | | Affirmative | | Withhold | |
| Benjamin C. Esty | | | 59,101,539 | | | | 618,816 | | |
| James B. Hawkes | | | 59,115,728 | | | | 604,627 | | |
| Samuel L. Hayes, III | | | 59,099,965 | | | | 620,390 | | |
| William H. Park | | | 59,122,919 | | | | 597,436 | | |
| Ronald A. Pearlman | | | 59,118,183 | | | | 602,173 | | |
| Norton H. Reamer | | | 59,092,150 | | | | 628,205 | | |
| Lynn A. Stout | | | 59,106,592 | | | | 613,763 | | |
| Ralph F. Verni | | | 59,108,164 | | | | 612,192 | | |
Results are rounded to the nearest whole number.
22
Eaton Vance High Yield Municipals Fund
BOARD OF TRUSTEES' ANNUAL APPROVAL OF THE INVESTMENT ADVISORY AGREEMENT
The investment advisory agreement between Eaton Vance High Yield Municipals Fund (the "Fund") and the investment adviser, Boston Management and Research, provides that the advisory agreement will continue in effect from year to year so long as its continuance is approved at least annually (i) by a vote of a majority of the noninterested Trustees of the Fund cast in person at a meeting called for the purpose of voting on such approval and (ii) by the Trustees of the Fund or by vote of a majority of the outstanding interests of the Fund.
In considering the annual approval of the investment advisory agreement between the Fund and the investment adviser, the Special Committee of the Board of Trustees considered information that had been provided throughout the year at regular Board meetings, as well as information furnished for a series of meetings held in February and March in preparation for a Board meeting held on March 21, 2005 to specifically consider the renewal of the investment advisory agreement. Such information included, among other things, the following:
• An independent report comparing the advisory fees of the Fund with those of comparable funds;
• An independent report comparing the expense ratio of the Fund to those of comparable funds;
• Information regarding Fund investment performance in comparison to a relevant peer group of funds and appropriate indices;
• The economic outlook and the general investment outlook in relevant investment markets;
• Eaton Vance Management's ("Eaton Vance") results and financial condition and the overall organization of the investment adviser;
• The procedures and processes used to determine the fair value of Fund assets and actions taken to monitor and test the effectiveness of such procedures and processes;
• Eaton Vance's management of the relationship with the custodian, subcustodians and fund accountants;
• The resources devoted to compliance efforts undertaken by Eaton Vance on behalf of the funds it manages and the record of compliance with the investment policies and restrictions and with policies on personal securities transactions;
• The quality, nature, cost and character of the administrative and other non-investment management services provided by Eaton Vance and its affiliates; and
• The terms of the advisory agreement and the reasonableness and appropriateness of the particular fee paid by the Fund for the services described herein.
The Special Committee also considered the investment adviser's municipal bond portfolio management capabilities, including information relating to the education, experience and number of investment professionals and other personnel who provide services under the investment advisory agreement. Specifically, the Special Committee considered the investment adviser's 30-person municipal bond team, which includes six portfolio managers and nine credit specialists who provide services to the Fund. The Special Committee noted that the investment adviser's municipal bond team affords the investment adviser extensive in-house research capabilities in addition to the other resources available to the investment adviser. The Special Committee also took into account the time and attention to be devoted by senior management to the Fund and the other funds in the complex. The Special Committee evaluated the level of skill required to manage the Fund and concluded that the human resources available at the investment adviser were appropriate to fulfill effectively its duties on behalf of the Fund.
In its review of comparative information with respect to Fund investment performance, the Special Committee noted the performance of the Fund in 2004 and concluded that the Fund has performed within a
23
Eaton Vance High Yield Municipals Fund
BOARD OF TRUSTEES' ANNUAL APPROVAL OF THE INVESTMENT ADVISORY AGREEMENT CONT'D
range that the Special Committee deemed competitive. With respect to its review of investment advisory fees, the Special Committee concluded that the fees paid by the Fund are within the range of those paid by comparable funds within the mutual fund industry. In reviewing the information regarding the expense ratio of the Fund, the Special Committee concluded that the expense ratio of the Fund is reasonable.
In addition to the factors mentioned above, the Special Committee reviewed the level of the investment adviser's profits in providing investment management services for the Fund and for all Eaton Vance funds as a group. The Special Committee also reviewed the benefits to Eaton Vance and its affiliates in providing administration services for the Fund and for all Eaton Vance funds as a group. In addition, the Special Committee considered the fiduciary duty assumed by the investment adviser in connection with the services rendered to the Fund and the business reputation of the investment adviser and its financial resources. The Trustees concluded that in light of the services rendered, the profits realized by the investment adviser are not unreasonable. The Special Committee also considered the extent to which the investment adviser appears to be realizing benefits from economies of scale in mana ging the Fund, and concluded that the fee breakpoints which are in place will allow for an equitable sharing of such benefits, when realized, with the shareholders of the Fund.
The Special Committee did not consider any single factor as controlling in determining whether or not to renew the investment advisory agreement. Nor are the items described herein all the matters considered by the Special Committee. In assessing the information provided by Eaton Vance and its affiliates, the Special Committee also took into consideration the benefits to shareholders of investing in a fund that is a part of a large family of funds which provides a large variety of shareholder services.
Based on its consideration of the foregoing factors and conclusions, and such other factors and conclusions as it deemed relevant, and assisted by independent counsel, the Special Committee concluded that the renewal of the investment advisory agreement, including the fee structure, is in the interests of shareholders.
24
Eaton Vance High Yield Municipals Fund
INVESTMENT MANAGEMENT
Officers
Thomas J. Fetter
President
William H. Ahern, Jr.
Vice President
Craig Brandon
Vice President
Cynthia J. Clemson
Vice President
James B. Hawkes
Vice President and Trustee
Robert B. MacIntosh
Vice President
Thomas M. Metzold
Vice President
James L. O'Connor
Treasurer
Alan R. Dynner
Secretary
Paul M. O'Neil
Chief Compliance Officer | | Trustees
Samuel L. Hayes, III
Chairman
Benjamin C. Esty
William H. Park
Ronald A. Pearlman
Norton H. Reamer
Lynn A. Stout
Ralph F. Verni | |
|
25
Investment Adviser
Boston Management and Research
The Eaton Vance Building
255 State Street
Boston, MA 02109
Administrator
Eaton Vance Management
The Eaton Vance Building
255 State Street
Boston, MA 02109
Principal Underwriter
Eaton Vance Distributors, Inc.
The Eaton Vance Building
255 State Street
Boston, MA 02109
(617) 482-8260
Custodian
Investors Bank & Trust Company
200 Clarendon Street
Boston, MA 02116
Transfer Agent
PFPC Inc.
Attn: Eaton Vance Funds
P.O. Box 9653
Providence, RI 02940-9653
(800) 262-1122
Eaton Vance High Yield Municipals Fund
The Eaton Vance Building
255 State Street
Boston, MA 02109
This report must be preceded or accompanied by a current prospectus. Before investing, investors should consider carefully the Fund's investment
objective(s), risks, and charges and expenses. The Fund's current prospectus contains this and other information about the Fund and is available
through your financial advisor. Please read the prospectus carefully before you invest or send money. For further information please call 800-225-6265.
416-9/05 HYSRC
Item 2. Code of Ethics
The registrant has adopted a code of ethics applicable to its Principal Executive Officer, Principal Financial Officer and Principal Accounting Officer. The registrant undertakes to provide a copy of such code of ethics to any person upon request, without charge, by calling 1-800-262-1122.
Item 3. Audit Committee Financial Expert
The registrant’s Board has designated William H. Park, Samuel L. Hayes, III and Norton H. Reamer, each an independent trustee, as its audit committee financial experts. Mr. Park is a certified public accountant who is the President and Chief Executive Officer of Prizm Capital Management, LLC (investment management firm). Previously, he served as Executive Vice President and Chief Financial Officer of United Asset Management Corporation (“UAM”) (a holding company owning institutional investment management firms). Mr. Hayes is the Jacob H. Schiff Professor of Investment Banking Emeritus of the Harvard University Graduate School of Business Administration. Mr. Reamer is the President, Chief Executive Officer and a Director of Asset Management Finance Corp. (a specialty finance company serving the investment management industry) and is President of Unicorn Corporation (an investment and financial advisory services company). Formerly, Mr. Reamer was Chairman of Hellman, Jordan Management Co., Inc. (an investment management company) and Advisory Director of Berkshire Capital Corporation (an investment banking firm), Chairman of the Board of UAM and Chairman, President and Director of the UAM Funds (mutual funds).
Item 4. Principal Accountant Fees and Services
Not required in this filing.
Item 5. Audit Committee of Listed registrants
Not required in this filing.
Item 6. Schedule of Investments
Please see schedule of investments contained in the Report to Stockholders included under Item 1 of this Form N-CSR.
Item 7. Disclosure of Proxy Voting Policies and Procedures for Closed-End Management Investment Companies
Not required in this filing.
Item 8. Purchases of Equity Securities by Closed-End Management Investment Company and Affiliated Purchasers.
Not required in this filing.
Item 9. Submission of Matters to a Vote of Security Holders.
Effective February 7, 2005, the Governance Committee of the Board of Trustees revised the procedures by which a Fund’s shareholders may recommend nominees to the registrant’s Board of Trustees to add the following (highlighted):
The Governance Committee shall, when identifying candidates for the position of Independent Trustee, consider any such candidate recommended by a shareholder of a Fund if such recommendation contains (i)sufficient background information concerning the candidate, including evidence the candidate is willing to serve as an Independent Trustee if selected for the position; and (ii) is received in a sufficiently timely manner (and in any event no later than the date specified for receipt of shareholder proposals in any applicable proxy statement with respect to a Fund). Shareholders shall be directed to address any such recommendations in writing to the attention of the Governance Committee, c/o the Secretary of the Fund. The Secretary shall retain copies of any shareholder recommendations which meet the foregoing requirements for a period of not more than 12 months following receipt. The Secretary shall have no obligation to acknowledge receipt of any shareholder recommendations
Item 10. Controls and Procedures
(a) It is the conclusion of the registrant’s principal executive officer and principal financial officer that the effectiveness of the registrant’s current disclosure controls and procedures (such disclosure controls and procedures having been evaluated within 90 days of the date of this filing) provide reasonable assurance that the information required to be disclosed by the registrant has been recorded, processed, summarized and reported within the time period specified in the Commission’s rules and forms and that the information required to be disclosed by the registrant has been accumulated and communicated to the registrant’s principal executive officer and principal financial officer in order to allow timely decisions regarding required disclosure.
(b) There have been no changes in the registrant’s internal controls over financial reporting during the second fiscal quarter of the period covered by this report that has materially affected, or is reasonably likely to materially affect, the registrant’s internal control over financial reporting.
Item 11. Exhibits
(a)(1) | | Registrant’s Code of Ethics – Not applicable (please see Item 2). |
(a)(2)(i) | | Treasurer’s Section 302 certification. |
(a)(2)(ii) | | President’s Section 302 certification. |
(b) | | Combined Section 906 certification. |
Signatures
Pursuant to the requirements of the Securities Exchange Act of 1934 and the Investment Company Act of 1940, the registrant has duly caused this report to be signed on its behalf by the undersigned, thereunto duly authorized.
Eaton Vance Municipals Trust II | |
|
By: | /s/ Thomas J. Fetter | |
| Thomas J. Fetter |
| President |
| | |
| | |
Date: | September 16, 2005 | |
| | | |
Pursuant to the requirements of the Securities Exchange Act of 1934 and the Investment Company Act of 1940, this report has been signed below by the following persons on behalf of the registrant and in the capacities and on the dates indicated.
By: | /s/ James L. O’Connor | |
| James L. O’Connor | |
| Treasurer | |
| | |
| | |
Date: | September 16, 2005 | |
| | |
| | |
By: | /s/ Thomas J. Fetter | |
| Thomas J. Fetter | |
| President | |
| | |
| | |
Date: | September 16, 2005 | |