QuickLinks -- Click here to rapidly navigate through this document
UNITED STATES
SECURITIES AND EXCHANGE COMMISSION
Washington, D.C. 20549
FORM 10-K
ANNUAL REPORT PURSUANT TO SECTION 13 OR 15(d) OF
THE SECURITIES EXCHANGE ACT OF 1934
For the fiscal year ended December 30, 2007
Commission file number: 1-11997
SPHERION CORPORATION
(Exact name of registrant as specified in its charter)
Delaware
(State or other jurisdiction of incorporation
or organization) | | 36-3536544
(I.R.S. Employer Identification Number) |
2050 Spectrum Boulevard, Fort Lauderdale, Florida 33309
(Address of principal executive offices) (Zip code)
(954) 308-7600
(Registrant's telephone number, including area code)
Securities registered pursuant to Section 12(b) of the Act:
| | Name of each exchange
|
|---|
Title of each class
COMMON STOCK—$0.01 PAR VALUE | | on which registered
New York Stock Exchange |
Securities registered pursuant to Section 12(g) of the Act:
None
(Title of class)
Indicate by check mark if the registrant is a well-known seasoned issuer, as defined in Rule 405 of the Securities Act. Yes o No ý
Indicate by check mark if the registrant is not required to file reports pursuant to Section 13 or Section 15(d) of the Act. Yes o No ý
Indicate by check mark whether the registrant (1) has filed all reports required to be filed by Section 13 or 15(d) of the Securities Exchange Act of 1934 during the preceding 12 months (or for such shorter period that the registrant was required to file such reports), and (2) has been subject to such filing requirements for the past 90 days. Yes ý No o
Indicate by check mark if disclosure of delinquent filers pursuant to Item 405 of Regulation S-K is not contained herein, and will not be contained, to the best of registrant's knowledge, in definitive proxy or information statements incorporated by reference in Part III of this Form 10-K or any amendment to this Form 10-K. ý
Indicate by check mark whether the registrant is a large accelerated filer, an accelerated filer, a non-accelerated filer, or a smaller reporting company. See the definitions of "large accelerated filer," "accelerated filer" and "smaller reporting company" in Rule 12b-2 of the Exchange Act. (Check one):
| Large accelerated filer o | | Accelerated filer ý | | Non-accelerated filer o
(Do not check if a smaller reporting company) | | Smaller reporting company o |
Indicate by check mark whether the registrant is a shell company (as defined in Rule 12b-2 of the Act). Yes o No ý
The aggregate market value of the voting stock held by non-affiliates of the Registrant, computed by reference to the closing price of the Registrant's Common Stock, par value $0.01 per share ("Common Stock"), as of June 29, 2007 on the New York Stock Exchange, was $527,477,409.
Number of shares of Registrant's Common Stock outstanding on February 24, 2008 was 55,869,080.
Documents Incorporated by Reference:
Certain specified portions of the registrant's definitive proxy statement to be filed within 120 days after December 30, 2007, are incorporated herein by reference in response to Part III, Items 11, 13 and 14, inclusive, and to certain portions of Part III, Items 10 and 12.
SPHERION CORPORATION AND SUBSIDIARIES
TABLE OF CONTENTS
| |
| | Page No.
|
|---|
PART I |
|
|
|
|
ITEM 1 |
|
Business |
|
1 |
| ITEM 1A | | Risk Factors | | 10 |
| ITEM 1B | | Unresolved Staff Comments | | 15 |
| ITEM 2 | | Properties | | 15 |
| ITEM 3 | | Legal Proceedings | | 15 |
| ITEM 4 | | Submission of Matters to a Vote of Security Holders | | 15 |
PART II |
|
|
|
|
ITEM 5 |
|
Market for the Registrant's Common Equity, Related Stockholder Matters
and Issuer Purchases of Equity Securities |
|
16 |
| ITEM 6 | | Selected Financial Data | | 19 |
| ITEM 7 | | Management's Discussion and Analysis of Financial Condition and
Results of Operations | | 20 |
| ITEM 7A | | Quantitative and Qualitative Disclosures About Market Risk | | 39 |
| ITEM 8 | | Financial Statements and Supplementary Data | | 40 |
| ITEM 9 | | Changes in and Disagreements with Accountants on Accounting and
Financial Disclosure | | 76 |
| ITEM 9A | | Controls and Procedures | | 76 |
| ITEM 9B | | Other Information | | 76 |
PART III |
|
|
|
|
ITEM 10 |
|
Directors, Executive Officers and Corporate Governance |
|
76 |
| ITEM 11 | | Executive Compensation | | 76 |
| ITEM 12 | | Security Ownership of Certain Beneficial Owners and Management and
Related Stockholder Matters | | 77 |
| ITEM 13 | | Certain Relationships and Related Transactions, and
Director Independence | | 76 |
| ITEM 14 | | Principal Accountant Fees and Services | | 76 |
PART IV |
|
|
|
|
ITEM 15 |
|
Exhibits and Financial Statement Schedules and Reports on Form 8-K |
|
78 |
| | | Exhibit Index | | 78 |
| SIGNATURES | | 83 |
i
PART I
Item 1. BUSINESS
As used in this report, the terms "we," "us," "our," "Spherion" and the "Company" refer to Spherion Corporation and its consolidated subsidiaries, unless otherwise expressly stated or the context otherwise requires.
Company Overview
Spherion Corporation was founded in 1946 and provides temporary staffing services, managed services and permanent placement services. We are headquartered in Fort Lauderdale, Florida, and operate a network of 742 locations within North America. We are incorporated under the laws of the State of Delaware. As of December 30, 2007, we had 582 company-owned offices, 90 franchised locations and 70 area-based franchised locations.
We provide temporary staffing services, managed services and permanent placement services under two operating segments—Staffing Services and Professional Services, within the United States of America and Canada. As of December 30, 2007, our Canadian operations represented approximately 5.2% of the Company's total revenue. Temporary staffing services include personnel in the following skill categories: clerical, light industrial, information technology, finance and accounting, legal, engineering, sales and marketing, human resources and administrative. Managed services include services where we manage certain aspects of a customer function such as: recruiting, administrative services, data center or network operations. Permanent placement is a service where our employees locate talent on behalf of our customers, screen the candidates and assist in the recruitment efforts.
We provide services to a wide variety of customers across most major industries in North America. Our customers range in size from large Fortune 500 companies to small, locally run businesses.
In 2007, we acquired several staffing companies within the United States. During the second quarter of 2007, we acquired Resulté Universal, Ltd. ("Resulté"), a Texas based temporary staffing and recruiting firm specializing in providing information technology ("IT") and accounting and finance personnel. In the third quarter of 2007, Spherion acquired Todays Staffing, Inc. ("Todays"), a temporary staffing and recruiting company focused in the clerical market. In the fourth quarter of 2007, Spherion acquired IntelliMark Holdings, Inc., and its wholly owned subsidiary Technisource, Inc. ("Technisource"), a company that provides IT temporary staffing and recruiting and managed IT services within the United States. In addition, we periodically enter into transactions with our franchise and area-based franchise owners to buy and sell operations in certain markets. See Note 7, "Acquisitions," in the accompanying Consolidated Financial Statements for further discussion.
During the second quarter of 2007, we sold our outplacement consulting business. This business was included within the Staffing Services segment and the operating results for all periods presented have been reclassified as discontinued operations. During 2005, we sold our operations in the call center outsourcing business in the United States of America. The call center outsourcing business was comprised of four call centers, of which three were sold in 2005, and we retained the remaining call center.
For information concerning our financial condition, results of operations and related financial data, you should review the "Management's Discussion and Analysis of Financial Condition and Results of Operations" and the "Financial Statements and Supplementary Data" sections of this document. You also should review and consider the risks relating to our business and industry that we describe under the heading "Risk Factors."
1
Industry Overview
Spherion Corporation is a temporary staffing and recruiting company operating in North America. The North American staffing market revenues were estimated to be approximately $123.0 billion in 2007. This market includes temporary staffing, permanent placement and other services similar to those provided by Spherion. The North American staffing market in 2007 is estimated to have grown by approximately 1% to 4% with the high end of the range attributable to high demand skill sets such as finance, accounting, legal, engineering, and information technology specialists.
About 55% of the staffing industry is estimated to be concentrated in professional skills, including information technology, finance and accounting, legal, administrative and other skills that are consistent with those offered within Spherion's Professional Services operating segment. The balance of the North American staffing market is concentrated on services in the clerical and light industrial skill sets, similar to those offered in Spherion's Staffing Services operating segment.
Business conditions in the staffing industry are economically sensitive. Over the past three years, Spherion and many of its peers benefited from market expansion; although growth slowed in the most recent year consistent with U.S. economic conditions. Companies have continued to experience success in the usage of temporary help, which has facilitated rapid workforce adjustments as economic conditions improve. This practice has increased the demand for temporary help in North America, which as of December 2007 was almost 2.0% of the total workforce, an increase from 1.0% in the early 1990's. Demographics of the labor force continue to indicate that the overall labor pool may shrink slightly over the next 10 years, creating a shortage of qualified job candidates, especially for certain professional workers. We believe the shortage will increase the need for companies to continue to use the services of Spherion and other companies within the staffing industry.
Operations Overview
The Company is organized around two operating segments—Staffing Services and Professional Services. Within our Staffing Services operating segment, we provide three primary services—temporary staffing, managed services, and permanent placement. Within our Professional Services operating segment, we provide temporary staffing and permanent placement services. These services are further described as follows:
- •
- Temporary staffing—This is a service where our employees work at customer locations under the supervision of customer personnel. The duration of the assignment can be from a day or less to a period of several months. The number of our temporary employees at any given time is directly related to our customers' requirements and these employees are generally only paid when on assignment with a customer. We provide temporary employees with clerical, light industrial, information technology, finance and accounting, legal, engineering, marketing and administrative skill sets. We are responsible for all employment related taxes of these temporary employees, workers' compensation and federal and state unemployment (burden costs). Services are generally billed by the hour for the number of hours worked. Bill rates are often determined as a mark-up over pay or a mark-up over pay plus burden and are estimated prior to the commencement of beginning the work. We typically retain the risk of loss if these estimated mark-ups are not high enough to cover actual losses due to higher than anticipated unemployment, workers' compensation or other losses.
- •
- Managed services—This is a service where we manage aspects of the operation and management of a customer function such as recruiting and administrative services, and generally provide that service under long-term contracts. Managed services are provided by our employees who typically manage and staff aspects of the customer function. In certain cases we may only manage the customer function which could be staffed by a combination of Spherion, customer or other third-party employees. We are responsible for the operation of the customer function and generally are
2
required to meet minimum service level agreements and provide customer driven reporting. A growing area of our managed services business is recruitment outsourcing and within this offering we take responsibility for most aspects of a customer's hiring or recruiting function. Fees are determined based on a combination of headcount, service level provided and/or fixed fee per transaction/unit processed. We are responsible for all employment related taxes of our employees, workers' compensation and federal and state unemployment. As with temporary staffing, we typically retain the risk of loss for unemployment, workers' compensation or other losses if our rates are not high enough to recover these costs.
- •
- Permanent placement—This is a service where we identify candidates on behalf of our customers, screen the candidates and assist in the recruitment efforts. If the customer hires the candidate, our billing is generally a percentage of first year compensation for the candidate placed. Billing is contingent upon filling the assigned position and we establish reserves for candidates placed with customers who do not stay through a guarantee period, typically three months.
The following table represents the fiscal year 2007 revenues derived from each of these services within our operating segments (in thousands):
| | Staffing Services
| | Professional Services
| |
|---|
| | Amount
| | % Total
| | Amount
| | % Total
| |
|---|
| Temporary staffing | | $ | 1,259,411 | | 85.5 | % | $ | 489,713 | | 89.9 | % |
| Managed services | | | 189,574 | | 12.9 | % | | — | | — | |
| Permanent placement | | | 23,251 | | 1.6 | % | | 55,165 | | 10.1 | % |
| | |
| |
| |
| |
| |
| | Total | | $ | 1,472,236 | | 100.0 | % | $ | 544,878 | | 100.0 | % |
| | |
| |
| |
| |
| |
Within the services described above, the Staffing Services operating segment concentrates on temporary staffing and placement of individuals with administrative clerical and light industrial skill sets. Managed services are provided within the Staffing Services operating segment. The Professional Services operating segment concentrates on temporary staffing and placement of professional skill sets in the areas of information technology, finance and accounting, legal, engineering, sales and marketing, human resources and administrative. See Note 16, "Segment Information," in the accompanying Consolidated Financial Statements for additional information regarding the revenues, profits and losses and total assets for both our Staffing Services and Professional Services operating segments for 2007, 2006 and 2005.
Location Structure
Our locations are company-owned, franchised or area-based franchised. We believe that we can increase profitability and serve our customer base through a combination of these locations. For 2007, 88.5% of revenues were derived from company-owned locations, with the remaining derived from franchised and area-based franchised locations.
3
The following table details the number of locations:
| | Fiscal Years
|
|---|
| | 2007
| | 2006
| | 2005
|
|---|
| Company-owned locations | | 582 | | 486 | | 478 |
| Franchised locations | | 90 | | 93 | | 94 |
| Area-based franchised locations | | 70 | | 81 | | 87 |
| | |
| |
| |
|
| | Total | | 742 | | 660 | | 659 |
| | |
| |
| |
|
| United States of America | | 702 | | 624 | | 627 |
| Canada | | 40 | | 36 | | 32 |
| | |
| |
| |
|
| | Total | | 742 | | 660 | | 659 |
| | |
| |
| |
|
We operate both company-owned branch and customer on-premise locations. A branch location is designed to serve multiple customers in a geographic market, while a customer on-premise location is established at the customer's location to serve only that customer. Future new or closed locations are driven by sales success creating the need for new company-owned branches and customer on-premise locations. In 2007, the number of our locations increased from 2006 due primarily to the offices we acquired from Technisource and Todays.
| | Fiscal Years
| |
|---|
| | 2007
| | 2006
| | 2005
| |
|---|
| Franchisee revenues (in thousands) | | $ | 223,468 | | $ | 236,195 | | $ | 256,411 | |
| Franchisee commissions as a % of gross profit | | | 74 | % | | 72 | % | | 70 | % |
| Number of franchisee | | | 52 | | | 51 | | | 52 | |
| Number of franchisee locations | | | 90 | | | 93 | | | 94 | |
We grant franchises, which give the franchisee the right to establish a recruitment business utilizing our tradenames, service marks, advertising materials, sales programs, operating procedures, manuals and forms within a designated territory. We typically grant franchisees the exclusive right to establish an office to market and provide light industrial and clerical temporary personnel within a designated geographic area. We provide franchisees with our national, regional and cooperative local advertising. We also assist our franchisees in obtaining business from our national accounts. Franchise agreements are generally for an initial term of 10 years and are renewable for successive 5-year terms at our discretion. Our franchisees operate in the Staffing Services operating segment.
In our franchise arrangements, we act as the principal in customer transactions through direct contractual relationships with the customers, owning related customer receivables and being the legal employer of the temporary employee and the franchisee acts as our agent providing certain sales and recruiting services. Sales by the franchised locations are included in our revenues and the direct costs of services (payroll for the temporary employees and related payroll taxes and employee benefits) are included in our cost of services. We are responsible for paying the wages of the temporary employees and all related payroll taxes, employee benefits and insurance. We share responsibilities in collecting accounts receivable. The franchisee is responsible to reimburse us up to 100% of uncollected accounts receivable, but we bear the loss in cases where the franchisee does not have sufficient financial wherewithal to reimburse uncollectible accounts.
4
The franchisee is responsible for establishing its location and paying its related administrative and operating expenses, such as the rent, utilities and salaries of their sales and service staff. The franchisee receives a commission from us, which averaged 74% of the franchised offices' gross profit for the fiscal year ended December 30, 2007. Our Consolidated Statements of Earnings reflect the franchisee commission as an operating expense, but do not include the rent, utilities and salaries of the franchisee's full-time office employees as these expenses are the responsibility of the franchisee. Our Consolidated Balance Sheets include the accounts receivable, payroll liabilities for temporary employees and related employee benefit liabilities and the franchisee commission payable. The only exception to this financial statement presentation is the circumstance when we are required to consolidate certain franchisees.
From time to time, we may finance a portion of the purchase price of the franchise at market rates of interest or provide working capital loans to franchisees. The outstanding principal balance of such notes receivable was $0.6 million as of December 30, 2007.
| | Fiscal Years
| |
|---|
| | 2007
| | 2006
| | 2005
| |
|---|
| Area-based franchisee royalty revenues (in thousands) | | $ | 8,243 | | $ | 8,554 | | $ | 8,976 | |
| Royalty revenues as a % of area-based franchisee sales | | | 4 | % | | 4 | % | | 4 | % |
| Number of area-based franchisees | | | 14 | | | 17 | | | 23 | |
| Number of area-based franchisee locations | | | 70 | | | 81 | | | 87 | |
We grant area-based franchises, which give the area-based franchisee the right to establish a recruitment business utilizing our tradenames, service marks, advertising materials, sales programs, operating procedures, manuals and forms within a designated territory. We typically grant area-based franchisees the exclusive right to establish an office to market and provide light industrial and clerical temporary personnel within a designated geographic area. We provide area-based franchisees with our national, regional and local advertising. We also assist our area-based franchisees in obtaining business from our national accounts. Most area-based franchise agreements are 10 years in length and renewable every 5 years thereafter. A number of area-based franchisees are second-generation owners and most operate in more than one area-based franchise territory.
Area-based franchisees operate their businesses autonomously within the framework of our policies and standards and recruit, employ and pay their own full-time and temporary employees. Area-based franchisees are responsible for all employment related taxes and workers' compensation costs of their employees. Area-based franchisees do not use our computer systems except to bill activity relating to national accounts. We receive royalty fees from each area-based franchise based upon the area-based franchisee's revenues.
From time to time, we may finance a portion of the purchase price of the area-based franchise at market rates of interest or provide working capital loans to area-based franchisees. The outstanding principal balance of such notes receivable was $0.6 million as of December 30, 2007.
5
Acquisitions
In the fourth quarter of 2007, Spherion acquired Technisource, a company that provides IT temporary staffing and recruiting and managed IT services within the United States. Total consideration was $140.0 million, consisting of $120.0 million in cash from existing available resources and a deferred payment in the amount of $20.0 million. During the third quarter of 2007, Spherion acquired Todays, a temporary staffing and recruiting company focused in the clerical market, for consideration of $39.3 million. During the second quarter of 2007, Spherion acquired Resulté, a Texas based temporary staffing and recruiting firm specializing in providing IT and accounting and finance personnel. The consideration for Resulté was $15.8 million. See Note 7, "Acquisitions," in the accompanying Consolidated Financial Statements for further discussion.
During the third quarter of 2007, we purchased the remaining 15% interest in our Canadian operations from the minority interest stockholder pursuant to an existing put/call agreement. The purchase price was approximately $6.1 million at current exchange rates of which $5.5 million was paid in 2007 and the final payment of $0.6 million is listed under "Other current liabilities" in the attached Consolidated Balance Sheet. In 2007, we recorded expense of $2.3 million, to adjust the liability under the put/call to the agreed purchase price in accordance with SFAS No. 150, "Accounting for Certain Financial Instruments with Characteristics of Both Liabilities and Equity," as well as to reflect foreign currency fluctuations.
We are generally the purchaser of choice when a Spherion franchisee or area-based franchisee decides to sell its business. We have a right of first refusal on any franchise or area-based franchise sale at the same terms and conditions as may be agreed with another purchaser (who ultimately must be approved by us, even if we waive our right of first refusal), and we have a standard end of term purchase option on our franchises and our more recently granted area-based franchises, however we are not obligated in our standard agreements to repurchase either our franchised or area-based franchised locations. In 2007, we acquired area-based franchise operations in Boston, Kansas City, Lexington, Pittsburgh and several smaller franchised operations for consideration of approximately $12.2 million.
Competition
We operate in highly competitive and fragmented markets in our operating segments. Within temporary staffing and permanent placement services, there are low barriers to entry. Within managed services, there can be more significant barriers to entry as capital and systems requirements are higher.
The staffing industry is served by thousands of competitors with most having small, local operations. There are several very large national and international competitors who also directly compete with us. The local competitors are generally characterized as independent operators serving local marketplaces. The ability to fund working capital requirements is one of the key success factors for these competitors. Local competitors may also be more flexible in offering alternatives to their customers in either attracting candidates or in servicing the customer, but generally cannot service national customers due to a lack of systems or geographic coverage. We compete with local competitors in all of our markets generally when the customer is a local or retail customer, and we expect to continue to do so.
Many of the large national and international competitors are characterized by very broad geographic coverage, large and complex information systems that can handle numerous legal and regulatory requirements and substantial financial resources. We compete against these companies for the larger customers where the customer requires broad geographic coverage, competitive national pricing and typically consolidated reporting to assist in controlling costs. Since most national customers use a central procurement department, the industry has moved towards consolidated competitive bidding with pricing as one of the key selection criteria. This has led to intense price competition within the staffing and recruitment industry, particularly within the large account customer segment.
6
We believe that our customers primarily focus on the following key factors in selecting a service provider: location or geographic coverage, price and service delivery. Geographic coverage is important from the customer and candidate standpoint. Customers require that their providers be able to service most, if not all, of their locations. Location is important to the candidate because many candidates are unwilling to travel outside of their particular geographic market for a position. We have 742 locations in North America throughout the United States of America and Canada, and believe that our coverage is adequate in the markets we serve. Our lack of international coverage could put us at a disadvantage compared to our larger competitors in obtaining new business from multinational customers. However, we do not believe our North American focus to be a significant disadvantage in competing for business in our targeted customer segments. Service delivery is understanding the customers' specific job requirements through consultative assessments, the ability to provide the right candidate for the right job and the ability to measure the quality of job performance. Factors in obtaining qualified candidates for employment assignments with customers include the quality of available opportunities, wages, responsiveness to work schedules and the number of available work hours. No single customer accounted for 10 percent or more of our consolidated revenues in 2007.
Within the Staffing Services operating segment, some of our largest competitors are Adecco S.A., Manpower Inc. and Kelly Services, Inc. Within the Professional Services operating segment, we compete with Robert Half International Inc., MPS Group, Inc. and Kforce Inc., among others.
Trademarks
Through our subsidiaries, we maintain a number of trademarks, tradenames and service marks in the United States of America and certain other countries. We believe that many of these marks and tradenames, including SPHERION®, ON-PREMISE®, THE MERGIS GROUP®, TODAYS STAFFING®, and TECHNISOURCE® are important to our business. In addition, we maintain other intangible property rights including a registered trademark on EMERGING WORKFORCE®. Our trademark registrations in the United States of America for SPHERION®, INTERIM®, TODAYS STAFFING®, and TECHNISOURCE® expire October 9, 2011, March 8, 2013, April 6, 2013, August 14, 2011, and October 9, 2017, but are renewable for ten-year successive terms.
Governmental Regulation
Staffing firms are generally subject to one or more of the following types of government regulations: (i) regulation of the employer/employee relationship between a firm and its flexible staff, (ii) registration, licensing, record keeping and reporting requirements and (iii) substantive limitations on its operations. Staffing firms are the legal employers of their temporary workers. Therefore, staffing firms are governed by laws regulating the employer/employee relationship such as wage and hour regulations, tax withholding and reporting, social security or retirement, anti-discrimination and workers' compensation.
We also have operations in Canada, where there are significant national, provincial or local regulations of staffing services. These laws may require that part-time, temporary and contract workers receive benefits similar to full-time workers, such as vacation, welfare plan contributions, notice prior to termination and severance pay. In some cases, hours of work and the duration of assignments are limited and workers may not be assigned to certain industries. We do not anticipate that these legal structures and requirements will have a material effect on our growth or prospects. However, any material change in national, provincial or local regulation of staffing services could have a material adverse effect on us.
Our sale of area-based franchises and franchises is regulated by the Federal Trade Commission and by authorities in approximately 14 states and is subject to statutory requirements in certain Canadian provinces. Under these laws, we must deliver a franchise disclosure document to prospective franchisees. These and other state laws may also apply substantive standards that govern the relationship between franchisors and franchisees. In states where we are selling area-based franchises and franchises, we have
7
filed either the appropriate registration or obtained an exemption from registration. We do not anticipate that these requirements or other state laws will have a material effect on our ability to sell area-based franchises and franchises or operate our business through area-based franchised and franchised offices.
Employees
We estimate that we employed approximately 258,000 people in 2007. On average, approximately 70,000 billable personnel were assigned with our customers at any given time.
Seasonality and Cyclical Nature of Business
Seasonality—Our businesses are seasonal in nature with customer related demand generally at its highest point during the third and fourth quarters and lowest during the first quarter. The third and fourth quarters are normally higher as our customers increase their temporary workforces for the holiday season. We typically experience a decrease in our first quarter revenues compared with fourth quarter revenues. The decrease in first quarter revenues compared with the preceding fourth quarters for 2007, 2006 and 2005 was 7%, 7%, and 12%, respectively. First quarter revenues in 2005 compared with the preceding fourth quarter decreased partially due to first quarter 2005 including thirteen weeks, whereas fourth quarter 2004 included fourteen weeks.
Cyclical Nature of the Business—The staffing industry has historically been considered to be cyclical, often acting as an indicator of both economic downswings and upswings. Staffing customers tend to use temporary staffing to supplement their existing workforces and generally hire permanent workers when long-term demand is expected to increase. As a consequence of this, our revenues tend to increase quickly when the economy begins to grow. Conversely, our revenues also tend to decrease quickly when the economy begins to weaken as our customers reduce temporary workers before terminating their own employees. While we have longer-term managed service contracts which are not as directly dependent upon the economic cycle, these revenues are not significant enough to offset the impact of cyclical economic activity in our larger service offerings.
8
Executive Officers of the Registrant
Our executive officers are:
Name and Age
| | Position
|
|---|
Roy G. Krause, 61 |
|
President and Chief Executive Officer since October 2004; President and Chief Operating Officer from July 2003 to October 2004; Executive Vice President and Chief Financial Officer from October 1995 to July 2003. |
William J. Grubbs, 50 |
|
Executive Vice President and Chief Operating Officer since November 2007; Executive Vice President from February 2007 to November 2007; Senior Vice President and Chief Marketing and Corporate Development Officer from November 2005 to February 2007. From March 2002 to September 2005, Chief Operating Officer, Spring Group plc, a publicly held information technology and professional staffing and recruiting company based in the United Kingdom. |
Mark W. Smith, 45 |
|
Executive Vice President and Chief Financial Officer since November 2007; Senior Vice President and Chief Financial Officer from July 2003 to November 2007; Vice President, Business Services from September 2002 to July 2003; Vice President, Business Services and Controller from August 2001 to September 2002. |
John D. Heins, 48 |
|
Senior Vice President and Chief Human Resources Officer since October 2006. From 1995 to 2006, Vice President—Human Resources and Administrative Services for JM Family Enterprises, a privately held $9 billion diversified automotive company. |
Loretta A. Penn, 58 |
|
Senior Vice President and Chief Service Excellence Officer since November 2007; Vice President and Chief Service Excellence Advocate from March 2006 to October 2007; Vice President, Strategic Accounts from February 2000 to February 2006. Ms. Penn is a member of the Board of Directors of TECO Energy, a leading energy and public utility company, headquartered in Tampa, Florida. |
Availability of Reports and Other Information
Our corporate website ishttp://www.spherion.com. We make available on this website or in print, free of charge, access to our Annual Report on Form 10-K, Quarterly Reports on Form 10-Q, Current Reports on Form 8-K, Proxy Statement on Schedule 14A and amendments to those materials filed or furnished pursuant to Section 13(a) or 15(d) of the Securities and Exchange Act of 1934 as soon as reasonably practicable after we electronically submit such materials to the Securities and Exchange Commission. Also available on our website, or in print to any stockholder that requests it, are Spherion's Corporate Governance Principles, Code of Business Conduct and Ethics, as well as charters for the Audit Committee, Compensation Committee, Corporate Governance Committee, Executive Committee and Nominating Committee. In addition, the Commission's website ishttp://www.sec.gov. The Commission makes available on its website, free of charge, reports, proxy and information statements, and other information regarding issuers, such as us, that file electronically with the Commission. Information provided on our website or on the Commission's website is not part of this Annual Report on Form 10-K.
9
Item 1A. RISK FACTORS
Our business, financial condition, results of operations, cash flows and prospects, and the prevailing market price and performance of our common stock, may be adversely affected by a number of factors, including the matters discussed below. Certain statements and information set forth in this Annual Report on Form 10-K, as well as other written or oral statements made from time to time by us or by our authorized officers on our behalf, constitute "forward-looking statements" within the meaning of the Federal Private Securities Litigation Reform Act of 1995. We intend for our forward-looking statements to be covered by the safe harbor provisions for forward-looking statements contained in the Private Securities Litigation Reform Act of 1995. You should note that our forward-looking statements speak only as of the date of this Annual Report on Form 10-K or when made and we undertake no duty or obligation to update or revise our forward-looking statements, whether as a result of new information, future events or otherwise. Although we believe that the expectations, plans, intentions and projections reflected in our forward-looking statements are reasonable, such statements are subject to known and unknown risks, uncertainties and other factors that may cause our actual results, performance or achievements to be materially different from any future results, performance or achievements expressed or implied by the forward-looking statements. The risks, uncertainties and other factors that our stockholders and prospective investors should consider include the following:
We operate in highly competitive markets with low barriers to entry, and may be unable to compete successfully against existing or new competitors.
We operate in highly competitive and fragmented markets in both of our operating segments. There are low barriers to entry by potential competitors at the local level. We face significant competition in the markets we serve and will continue to face significant competition in any geographic markets or industry sectors that we may enter. The majority of competitors are significantly smaller than we are. However, certain of our competitors are larger, have greater marketing, technical and financial resources, and have stronger brand name recognition than we have. As a result, some of our competitors may be in a better position to capitalize on new technologies and changes in customer requirements, and to devote more resources than we can to the development, promotion and sale of their service offerings. In some cases, our large competitors have lower operating expenses and as a result, we may face increased competitive pricing pressures and may not be able to obtain or retain our new or existing customers. Some of our competitors can provide broader geographic coverage than we can and this could limit our ability to service large customers who wish to consolidate services.
There has been a significant increase in the number of customers consolidating their staffing services purchases with a single provider or with a small number of providers. The trend to consolidate purchases has in some cases made it more difficult for us to obtain or retain customers. We also face the risk that certain of our current and prospective customers may decide to provide similar services internally. Additionally, pricing pressures have intensified as customers have continued to competitively bid new contracts. This trend is expected to continue for the foreseeable future. As a result, we cannot assure you that we will not encounter increased competition in the future.
Any significant economic downturn could result in less demand from customers and lower revenues.
Because demand for personnel services and recruitment services is sensitive to changes in the level of economic activity, our business may suffer during economic downturns. As economic activity slows down, companies tend to reduce their use of temporary employees and recruitment services before undertaking layoffs of their regular employees, resulting in decreased demand for our personnel. Additionally, an economic downturn could result in higher unemployment claims and costs in future periods. Also, as businesses reduce their hiring of permanent employees, revenues from our recruitment services is adversely affected. As a result, any significant economic downturn could have a material adverse effect on our business, financial condition or results of operations.
10
A loss of customers may result in a material impact on the results of our operations.
We may experience a reduction in business from a large customer or a number of customers, or we may lose such customers. We cannot guarantee that we will be able to retain long-term relationships with our larger customers in the future. Our customers may experience a deterioration in their current financial condition or future prospects, or may experience a bankruptcy. We are also at a risk of losses from uncollectible account receivables if our customers' financial positions deteriorate. A significant reduction in demand from our customers may result in an adverse impact on our business and results of operations in future periods.
Our business strategy is based on profitable growth in North America. We have implemented steps to continue increasing our growth rates by concentrating in local markets with small and mid-sized customers through relationship selling, focusing on key large accounts with profitable margins, targeting new accounts by providing integrated services, and continuing to improve operating leverage by reducing corporate and field overhead. We also plan to grow within our Professional Services segment by providing more services to existing Staffing Services segment customers. If we are not successful in achieving these objectives with our customers, our revenues, costs and overall profitability could be negatively affected. If we are unable to execute our business strategy effectively, our productivity and cost competitiveness could be negatively affected.
Our contracts contain termination provisions and pricing risks that could decrease our revenues, profitability and cash flow.
Some of our customer contracts permit termination in the event our performance is not consistent with service levels specified in those contracts. Our customers' ability to terminate contracts, as well as having many short-term contracts, creates uncertain revenue streams. Some of our contracts contain pricing provisions that allow customers to pay a set fee for our services regardless of whether our costs to perform these services exceed the amount of the set fee. Some of our contracts provide for credits to our customers if we fail to achieve specific contract standards. Some of our contracts contain re-pricing provisions that can result in reductions of our fees for performing our services. Many of our contracts provide for a billing at a set mark-up above the temporary employees pay rate. In estimating these mark-ups we use our best estimates of expected costs for federal and state unemployment, workers' compensation or other costs. If actual costs for these items exceed our estimates, we typically cannot recover these retroactively from customers. Additionally, the actual development of workers' compensation claims can take many years after an accident or injury develops; such development, if adverse could negatively impact the Company.
Our failure or inability to perform under customer contracts could result in damage to our reputation and give rise to legal claims against us.
If customers are not satisfied with our level of performance, our reputation in the industry may suffer, which could materially and adversely affect our business, financial condition, results of operations and cash flow. Certain areas of our business require us to assume a greater level of responsibility for developing or maintaining processes on behalf of our customers. Many of these processes are critical to the operation of our customers' businesses. Our failure or inability to complete these engagements satisfactorily could have a material adverse effect on our customers' operations and consequently may give rise to claims against us for actual or consequential damages or otherwise damage our reputation. Any of these claims could have a material adverse effect on our business, financial condition or results of operations.
We made several acquisitions in 2007 and may make additional future acquisitions to expand our service offerings, broaden our customer base or expand our geographic presence. Acquisitions involve a number of additional risks, including the diversion of management's attention from our existing
11
operations, the failure to retain key personnel or customers of an acquired business, the assumption of unknown liabilities of the acquired business for which there are inadequate indemnifications, the potential impairment of acquired intangible assets and the ability to successfully integrate the business. We could experience financial or other setbacks if any of the businesses that we acquired or acquire have liabilities or problems of which we are not aware. Further, we cannot assure you that any past and future acquired businesses will generate anticipated revenues or earnings. As a result, the anticipated benefits from acquisitions may not be achieved.
The disposition of businesses previously sold may create contractual liabilities associated with indemnifications provided.
We have disposed of several business units over the past five years. The disposition of these businesses usually requires that we indemnify the purchaser for liabilities that arose prior to the disposition date. These liabilities are typically related to audits of tax liabilities by local authorities and other pre-existing liabilities such as lease obligations. Additionally, in the contracts we make various representations and warranties and from time to time claims are made against us related to these items. With regard to businesses we have disposed of over the past five years, the time periods for bringing such indemnity and warrant claims have expired in a number of instances. During 2007, we recorded $0.6 million as part of discontinued operations for these matters. The fair value of these indemnifications are recorded at the time of the sale. Subsequently if any liabilities become known and are both probable and reasonably estimable, they are recorded as an expense. For some of the dispositions, we have or may have future claims which are not yet probable and reasonably estimable and have not been recorded as an expense. Future earnings from discontinued operations could be materially adversely affected if we are not successful in defending our positions with the purchasers of these discontinued operations. Additionally, if we are required to make cash payments for any of these liabilities, our financial condition could be materially adversely affected.
We may experience business interruptions that could have an adverse affect on our operations.
We could be negatively affected by natural disasters (many of our processing functions are located in a hurricane-prone area), fire, power loss, telecommunications failures, hardware or software malfunctions and break-downs, computer viruses or similar events. Although we have disaster recovery plans in place, we may not be able to adequately execute these plans in a timely fashion. If our critical information systems fail or are otherwise unavailable, this could temporarily impact our ability to pay employees, bill customers, service customers, maintain billing and payroll records reliably and pay taxes, which could adversely affect our revenues, operating expenses, and financial condition. A prolonged outage could seriously impact our ability to service customers or hire temporary workers and could seriously threaten the organization.
We are dependent upon availability of qualified personnel, and may not be able to attract and retain sufficient numbers of qualified personnel necessary to succeed.
We depend upon our ability to attract qualified personnel who possess the skills and experience necessary to meet the staffing requirements of our customers or to successfully bid for new customer projects. We must continually evaluate and upgrade our base of available qualified personnel to keep pace with changing customer needs and emerging technologies. Competition for individuals with proven professional or technical skills currently exists. We could have difficulty attracting and retaining sufficient numbers of qualified personnel necessary for our business to succeed.
Regulatory challenges to our tax filing positions could result in additional taxes.
We file tax returns with various governmental entities within the United States and Canada. The filings include returns with the Federal government, the states and numerous cities, counties and municipalities. Additionally, we have a limited number of filings with foreign governments related to the final wind down of our international operations. When we prepare these tax filings, we are required to follow numerous and complex legal and technical requirements where interpretation of rules and
12
regulations is required. We believe that we have appropriately filed our tax returns and properly reported taxable transactions, but the final tax amounts are subject to regulatory audit and interpretation. We believe we have established adequate reserves with respect to any tax liabilities that may arise in relation to these transactions should our position be successfully challenged by tax authorities, however, an unfavorable settlement could result in higher payments and additional charges to income above the amounts reserved.
We may lose key personnel, and therefore, our business may suffer.
Our operations are dependent on the continued efforts of our officers and executive management. In addition, we are dependent on the performance and productivity of our local managers and field personnel. Our ability to attract and retain business is significantly affected by local relationships and the quality of service rendered. The loss of those key officers and members of executive management who have acquired significant experience in our industry may cause a significant disruption to our business. Moreover, the loss of our key managers and field personnel may jeopardize existing customer relationships with businesses that continue to use our services based upon past relationships with these local managers and field personnel. The loss of such key personnel could materially adversely affect our operations, because it may result in an inability to establish and maintain customer relationships and otherwise operate our business.
We may be exposed to employment-related claims and costs that could have a material adverse affect on our business, financial condition and results of operations.
We employ and place people in the workplaces of other businesses. Attendant risks of such activity that could increase our cost of doing business include:
- •
- possible claims of discrimination and harassment;
- •
- errors and omissions by the personnel we place, particularly for the acts of temporary professionals (e.g., accountants, attorneys, engineers and information technology consultants);
- •
- misuse or misappropriation of customer funds or proprietary information; and
- •
- payment of workers' compensation and other similar claims.
Although we maintain insurance coverage for general liability, errors and omissions and employee theft, such insurance coverage may not be adequate in scope or amount to cover any such liability. A failure of any of our personnel to observe our policies and guidelines intended to reduce exposure to these risks could have a material effect upon us. We cannot assure that we will not experience such problems in the future.
We retain all or a portion of the risk under our workers' compensation, general liability, professional liability and employment practices liability insurance programs, and health insurance benefits programs. Changes in the estimates of these accruals are charged or credited to earnings in the period determined, and therefore a large fluctuation in any given quarter could materially adversely affect earnings in that period.
We are a defendant in a variety of litigation and other actions from time to time, which may have a material adverse effect on our business, financial condition and results of operations.
We and our subsidiaries are regularly involved in a variety of litigation arising out of our business. Occasionally, this litigation can be material. We cannot assure you that our insurance will cover all claims that may be asserted against us. Should the ultimate judgments or settlements exceed our insurance coverage, they could have a material adverse effect on our results of operations, financial position and cash flows. We also cannot assure you that we will be able to obtain appropriate types or levels of insurance in the future or that adequate replacement policies will be available on acceptable terms, if at all.
13
Government regulation may significantly increase our costs, including payroll-related costs and unemployment taxes.
In conducting our business, we are required to pay a number of payroll and related expenses, including unemployment taxes, workers' compensation and medical insurance for our personnel. Unemployment insurance premiums paid by employers typically increase during periods of increased levels of unemployment. Workers' compensation costs may increase in the future if states have raised benefit levels and liberalized allowable claims. Attempts to increase revenue from light industrial customers may expose us to increased workers' compensation claims and higher costs. Future earnings could be adversely affected if we are not able to increase the fees charged to customers to offset increased costs related to unemployment insurance or workers' compensation benefits.
We are subject to business risks associated with operations in Canada, which could make this operation significantly more costly.
Operation in this market is subject to risks inherent in international business activities, including:
- •
- fluctuations in currency exchange rates;
- •
- varying economic and political conditions;
- •
- overlapping or differing tax structures; and
- •
- multiple regulations concerning pay rates, benefits, vacation, statutory holiday pay, workers' compensation, union membership, termination pay and the termination of employment.
Failure to meet certain covenant requirements under our revolving lines of credit could impact part or all of our availability to borrow under our revolving lines of credit.
Our revolving lines of credit provide for certain affirmative and negative covenants which may limit the total availability under this line of credit based upon our ability to meet these covenants. These covenants include, but are not limited to: a fixed charge coverage ratio; limitations on capital expenditures, additional debt incurred, mergers, consolidations or sales; and transactions with subsidiaries and related parties. Failure to meet compliance with one or more of these covenants in the future could affect the amount of availability we have to borrow against and as a result, our liquidity and financial condition may be adversely affected. We were in compliance with all aspects of our revolving credit facility at December 30, 2007.
The price of our common stock may fluctuate significantly, which may result in losses for our investors.
The market price for our common stock has been and may continue to be volatile. For example, during the fiscal year ended December 30, 2007, the prices of our common stock as reported on the New York Stock Exchange ranged from a high of $10.37 to a low of $6.90. Our stock price can fluctuate as a result of a variety of factors, including factors listed in these "Risk Factors" and others, many of which are beyond our control. These factors include:
- •
- actual or anticipated variations in our quarterly operating results;
- •
- announcement of new services by us or our competitors;
- •
- announcements relating to strategic relationships or acquisitions;
- •
- changes in financial estimates or other statements by securities analysts; and
- •
- changes in general economic conditions.
14
Item 1B. UNRESOLVED STAFF COMMENTS
None.
Item 2. PROPERTIES
Our corporate headquarters are located at 2050 Spectrum Boulevard, Fort Lauderdale, Florida, in a 125,000 square-foot building owned by us. In addition, we lease approximately 70,000 square feet in Alpharetta, Georgia for operating functions. All other field locations operate in space held primarily under three to five year leases providing fixed monthly rentals. Our corporate headquarters and our field locations are used by both our Staffing Services and our Professional Services operating segments. We believe that our facilities are adequate for our needs.
Item 3. LEGAL PROCEEDINGS
In the ordinary course of our business, we are or may be threatened with or named as a defendant in various lawsuits. We maintain insurance in such amounts and with such coverages and deductibles as we believe are reasonable and prudent. The principal risks that we insure against are workers' compensation, personal injury, bodily injury, property damage, professional malpractice, errors and omissions and fidelity losses. Our management does not expect that the outcome of any pending lawsuits relating to such matters, individually or collectively, will have a material adverse effect on our financial condition, results of operations or cash flows.
On December 13, 2004, and as amended on January 13, 2005 and October 31, 2005, Glidepath Holding B.V. and Jeimon Holdings N.V. filed an action against Spherion Corporation in the U.S. District Court of the Southern District of New York. Glidepath and Jeimon Holdings, investors in the entity that acquired the Cyber Center business of Spherion Technology (UK) Limited, a subsidiary of Spherion Corporation, in 2002, sued Spherion for fraud, negligent misrepresentation, aiding and abetting breach of fiduciary duty and unjust enrichment and seek $32.0 million in damages, and treble for punitive damages, plus attorneys' fees, expert fees and costs. Glidepath and Jeimon Holdings allege that an individual who was an officer of Spherion Technology (UK) fraudulently induced them to invest in a corporation formed to purchase the Cyber Center business, while he remained in the employ of Spherion Technology (UK) and was to be paid an incentive bonus for the sale by Spherion. They allege that he misled them as to his employment status at the time, as to the prospects for the Cyber Center, and as to whether the newly formed corporation was assuming the indebtedness of Spherion Technology (UK) associated with the Cyber Center business. They allege that in doing so, he was acting as Spherion's agent. Spherion intends to vigorously defend this matter. Although this claim is in the preliminary stages, Spherion has a reserve of $0.3 million related to this matter. Spherion does not have insurance coverage for this claim.
Item 4. SUBMISSION OF MATTERS TO A VOTE OF SECURITY HOLDERS
No matters were submitted to a vote of security holders during the fourth quarter of the fiscal year ended December 30, 2007.
15
PART II
Item 5. MARKET FOR REGISTRANT'S COMMON EQUITY, RELATED STOCKHOLDER MATTERS AND ISSUER PURCHASES OF EQUITY SECURITIES
Market for the Registrant's Common Equity
Our common stock is traded on The New York Stock Exchange under the symbol "SFN." The following table sets forth, for the periods indicated, the high and low prices per share of the common stock as reported on The New York Stock Exchange:
2007
| | High
| | Low
|
|---|
| First Quarter | | $ | 9.65 | | $ | 7.32 |
| Second Quarter | | | 10.37 | | | 8.40 |
| Third Quarter | | | 9.77 | | | 6.90 |
| Fourth Quarter | | | 9.72 | | | 6.95 |
2006
|
|
High
|
|
Low
|
|---|
| First Quarter | | $ | 11.41 | | $ | 8.94 |
| Second Quarter | | | 10.94 | | | 7.81 |
| Third Quarter | | | 9.13 | | | 6.80 |
| Fourth Quarter | | | 7.90 | | | 6.76 |
On February 24, 2008, there were approximately 2,199 holders of record of our common stock.
We did not pay cash dividends in 2007 and 2006, and do not intend to pay cash dividends in the foreseeable future. Our U.S. revolving line of credit provides for certain covenants which restrict our ability to pay cash dividends in the event of default or under certain circumstances.
The information required by Item 201(d) of Regulation S-K is set forth in Part III, Item 12 of this Annual Report on Form 10-K.
16
Issuer Purchases of Equity Securities
During 2007, Spherion purchased 1.2 million shares for approximately $10.3 million at an average price per share of $8.69. Repurchases during the fourth quarter were as follows:
Period
| | Total
Number of
Shares
Purchased
| | Average
Price Paid
per Share
| | Total Number of
Shares Purchased
as Part of Publicly
Announced Program
| | Maximum Number
of Shares that
May Yet Be
Purchased Under
the Program(1)
|
|---|
| Month 1 | | | | | | | | | |
| | October 1, 2007 through October 28, 2007 | | 312 | (2) | $ | 8.64 | | — | | — |
Month 2 |
|
|
|
|
|
|
|
|
|
| | October 29, 2007 through November 25, 2007 | | 284 | (2) | | 7.93 | | — | | — |
Month 3 |
|
|
|
|
|
|
|
|
|
| | November 26, 2007 through December 30, 2007 | | 100,479 | (2) | | 7.52 | | 100,000 | | — |
| | |
| |
| |
| |
|
Total |
|
101,075 |
|
$ |
7.52 |
|
100,000 |
|
— |
| | |
| |
| |
| |
|
- (1)
- On January 4, 2008, the Board of Directors authorized the repurchase of up to $25.0 million of the Company's common stock. This authorization replaced the previous repurchase plan authorized on February 20, 2007, which allowed the repurchase of a maximum of 50,000 shares of common stock per week to mitigate the dilutive impact of shares issued under our various employee benefit plans.
- (2)
- Number of shares purchased also includes purchases that relate to deferred compensation plan for highly compensated employees. This is a non-publicly announced program.
17
Performance Graph
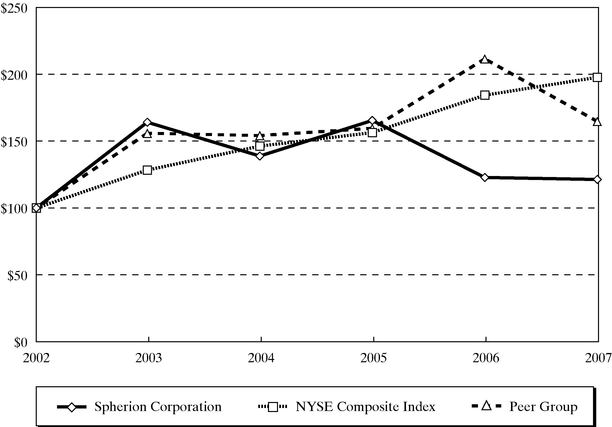
The following graph sets forth the cumulative total stockholder return on our Common Stock, the cumulative total return of the NYSE composite index and the cumulative total return of our Peer Group Index (the "Peer Group Index"), each for the period beginning December 31, 2003 and ending December 30, 2007. The total cumulative return on investment (change in stock price plus reinvested dividends, if any) for us, the NYSE composite index and the Peer Group Index assumes that a $100 investment was made on December 31, 2002. We have not declared any dividends in the period represented in this performance graph.
The Peer Group Index is comprised of the following publicly traded companies: Adecco S.A.; Kelly Services, Inc.; Manpower Inc.; MPS Group, Inc.; and Robert Half International Inc.
The data for this performance graph was compiled for us by Standard and Poor's. The stock price performance shown on this graph is not necessarily indicative of future price performance of our Common Stock.
Comparison of Cumulative Five Year
Total Return
| | Fiscal Years
|
|---|
| | 2002
| | 2003
| | 2004
| | 2005
| | 2006
| | 2007
|
|---|
| Spherion Corporation | | $ | 100.00 | | $ | 164.13 | | $ | 138.84 | | $ | 165.45 | | $ | 122.81 | | $ | 121.32 |
| NYSE Composite Index | | | 100.00 | | | 128.36 | | | 146.23 | | | 156.39 | | | 184.33 | | | 197.74 |
| Peer Group | | | 100.00 | | | 155.87 | | | 154.19 | | | 159.56 | | | 211.50 | | | 164.74 |
18
Item 6. SELECTED FINANCIAL DATA
The following table summarizes selected financial information for each of the most recent five fiscal years and should be read in conjunction with "Management's Discussion and Analysis of Financial Condition and Results of Operations" and the accompanying Consolidated Financial Statements included in this Annual Report on Form 10-K.
| | Fiscal Years
| |
|---|
| | 2007(1,2)
| | 2006(2)
| | 2005(2)
| | 2004(2,3)
| | 2003(2,4)
| |
|---|
| | (in thousands, except per share data and operating locations)
| |
|---|
| Statement of Operation Data: | | | | | | | | | | | | | | | | |
| Revenues | | $ | 2,017,114 | | $ | 1,922,735 | | $ | 1,966,400 | | $ | 2,009,149 | | $ | 1,716,027 | |
| Gross profit | | | 477,986 | | | 447,079 | | | 426,185 | | | 403,753 | | | 368,923 | |
| Earnings (loss) from continuing operations | | | 29,137 | | | 22,323 | | | 22,575 | | | 12,298 | | | (2,137 | ) |
| Net earnings (loss) | | | 25,266 | | | 54,682 | | | 12,029 | | | 35,829 | | | (13,913 | ) |
| Earnings (loss) per share—Basic: | | | | | | | | | | | | | | | | |
| | Earnings (loss) from continuing operations | | $ | 0.52 | | $ | 0.39 | | $ | 0.37 | | $ | 0.20 | | $ | (0.04 | ) |
| | Net earnings (loss) per share | | | 0.45 | | | 0.96 | | | 0.20 | | | 0.59 | | | (0.23 | ) |
| Earnings (loss) per share—Diluted: | | | | | | | | | | | | | | | | |
| | Earnings (loss) from continuing operations | | $ | 0.51 | | $ | 0.39 | | $ | 0.37 | | $ | 0.20 | | $ | (0.04 | ) |
| | Net earnings (loss) per share | | | 0.44 | | | 0.95 | | | 0.20 | | | 0.57 | | | (0.23 | ) |
Weighted Average Shares: |
|
|
|
|
|
|
|
|
|
|
|
|
|
|
|
|
| | Basic | | | 56,234 | | | 57,212 | | | 60,938 | | | 61,036 | | | 59,951 | |
| | Diluted | | | 56,893 | | | 57,784 | | | 61,430 | | | 62,313 | | | 59,951 | |
Additional Data (end of period): |
|
|
|
|
|
|
|
|
|
|
|
|
|
|
|
|
| Total assets | | $ | 844,818 | | $ | 693,387 | | $ | 742,644 | | $ | 830,266 | | $ | 864,834 | |
| Long-term debt, net of current portion | | $ | 22,148 | | $ | 2,377 | | $ | 3,735 | | $ | 4,766 | | $ | 98,073 | |
| Working capital | | $ | 124,938 | | $ | 207,269 | | $ | 129,893 | | $ | 119,832 | | $ | 225,489 | |
| Operating locations | | | 742 | | | 660 | | | 659 | | | 716 | | | 811 | |
- (1)
- The results of operations include Todays and Technisource from the dates of acquisition of September 28, 2007 and December 3, 2007, respectively, and various immaterial acquisitions.
- (2)
- The sale of our outplacement consulting business occurred in the second quarter of 2007 and we reclassified operating results for all periods presented as discontinued operations.
- (3)
- The 2004 fiscal year contains 53 weeks. All other years contain 52 weeks. The 2004 results included pre-tax restructuring and other charges of $8.4 million.
- (4)
- The 2003 results include the Canadian results of operations from the date of acquisition (April 4, 2003) and pre-tax restructuring and other charges of $4.2 million.
19
Item 7. MANAGEMENT'S DISCUSSION AND ANALYSIS OF
FINANCIAL CONDITION AND RESULTS OF OPERATIONS
Organization of Information
Management's Discussion and Analysis provides a narrative on our financial performance and condition that should be read in conjunction with the accompanying Consolidated Financial Statements. It includes the following sections:
- •
- Company Overview
- •
- Executive Summary
- •
- Operating Results
- •
- Liquidity and Capital Resources
- •
- Contractual Obligations and Commitments
- •
- Off-Balance Sheet Arrangements
- •
- Critical Accounting Policies
- •
- New Accounting Pronouncements
- •
- Inflation
- •
- Seasonality and Cyclical Nature of Business
- •
- Forward-Looking Statements-Safe Harbor
Company Overview
Spherion Corporation provides temporary staffing services, managed services and permanent placement services. Founded in 1946, we are headquartered in Fort Lauderdale, Florida, with a network of 742 locations in North America. Our locations are company-owned, franchised or area-based franchised. As of December 30, 2007, we had 582 company-owned locations, 90 franchised locations and 70 area-based franchised locations.
The Company is organized around two operating segments—Staffing Services and Professional Services. The Staffing Services segment provides temporary staffing, managed services and permanent placement of employees with primarily clerical and light industrial skills. The Professional Services segment provides temporary staffing and permanent placement of employees with higher-level skill sets, such as information technology, finance and accounting, legal, engineering, sales and marketing, human resources and administrative. See theOperations Overview section of Part I of this Annual Report on Form 10-K for further description of our operating segments.
In 2007, we acquired several staffing companies within the United States. During the second quarter of 2007, we acquired Resulté Universal, Ltd. ("Resulté"), a Texas based temporary staffing and recruiting firm specializing in providing information technology ("IT") and accounting and finance personnel. In the third quarter of 2007, Spherion acquired Todays Staffing, Inc. ("Todays"), a temporary staffing and recruiting company focused in the clerical market. In the fourth quarter of 2007, Spherion acquired Technisource, Inc. ("Technisource"), a company that provides IT temporary staffing and recruiting and managed IT services within the United States. In addition, we periodically enter into transactions with our franchise and area-based franchise owners to buy and sell operations in certain markets.
20
Item 7. MANAGEMENT'S DISCUSSION AND ANALYSIS OF
FINANCIAL CONDITION AND RESULTS OF OPERATIONS—(Continued)
Executive Summary
The following is a brief summary of our primary 2007 objectives and accomplishments:
- •
- Targeted revenue growth. Our strategy in 2007 was to grow revenue with our targeted small and mid-sized customers and increase the portion of company revenues generated from our Professional Services operating segment. Revenue increased 4.9% in total and 0.4% on an organic basis during 2007 compared with the prior year. Revenue from small to mid-sized accounts (customers that do business with Spherion of $5 million or less, annually) increased to 49.0% of revenue in 2007 from 47.0% in the prior year. Additionally, in 2007 Professional Services revenues increased 10.6% and 0.9% on an organic basis. Including the impact of acquisitions, Professional Services increased to 27.0% of total company revenue, from 25.6% in the prior year.
- •
- Emphasizing higher margin services. During 2007, we continued to focus on providing additional services to existing accounts, particularly for higher value Professional Services and Recruitment Process Outsourcing ("RPO"). In addition to growth in our Professional Services business unit in 2007, much of which came from small to mid-sized customers, our RPO business grew 56.3% year over year. Overall, gross profit margin was 23.7%, an increase of 40 basis points compared with the prior year. The 40 basis point increase in our gross profit margin is primarily due to the change in business mix due to growth of our higher margin RPO and Professional Services as well as expanded gross profit margins for professional temporary staffing services.
- •
- Continuing to improve operating leverage. Improvements in operating leverage required us to balance growth in operating expenses with growth in business volumes and gross profit. Selling, general and administrative expenses were up $16.3 million compared with the prior year with $10.2 million of the increase attributable to the acquisitions. Through effective management of our cost structure, we reduced selling, general and administrative costs as a percentage of gross profit to 90.3% from 92.9% in 2006.
In 2008 we plan to focus on three key operating objectives:
- •
- First, execute our growth strategy among small to mid-sized accounts:
- •
- Continue to concentrate on organic growth;
- •
- Expand services at existing accounts, particularly Professional Services;
- •
- Maintain premium pricing and margin compared with market; and
- •
- Disproportionally grow Professional Services to change our business mix to be more representative of the overall North American recruiting and staffing market.
- •
- Second, reinforce our commitment to grow our higher margin businesses:
- •
- Leverage the addition of Todays and Technisource to expand our margins through business mix change;
- •
- Exploit market-leading RPO services; and
- •
- Increase pricing discipline.
- •
- Third, continue improving operating leverage and maintain financial discipline:
- •
- Effectively integrate our acquisitions to fully realize planned cost synergies;
21
Item 7. MANAGEMENT'S DISCUSSION AND ANALYSIS OF
FINANCIAL CONDITION AND RESULTS OF OPERATIONS—(Continued)
- •
- Limit growth in selling, general and administrative expenses to fifty percent of our growth in gross profit; and
- •
- Maintain Days Sales Outstanding (DSO, a measure of how quickly accounts receivable are collected) at 50 days or better.
Operating Results
Consolidated Operating Results
22
Item 7. MANAGEMENT'S DISCUSSION AND ANALYSIS OF
FINANCIAL CONDITION AND RESULTS OF OPERATIONS—(Continued)
- •
- Our effective tax rate from continuing operations was 37.3% which increased from the prior year rate of 34.2% primarily due to higher state tax expense and certain non-deductable costs associated with the Canadian purchase discussed above.
- •
- Earnings from continuing operations were $0.51 per share for 2007 compared with $0.39 per share in 2006.
- •
- Loss from discontinued operations was $(0.07) per share primarily related to the write-off of goodwill and loss on disposal related to our outplacement consulting business sold in the second quarter of 2007.
- •
- DSO remained stable at 50 days in 2007 compared to 2006.
23
Item 7. MANAGEMENT'S DISCUSSION AND ANALYSIS OF
FINANCIAL CONDITION AND RESULTS OF OPERATIONS—(Continued)
- •
- Restructuring and other charges (credits) were $(0.2) million in 2006 versus $1.8 million in 2005. The charge in 2005 was largely related to staff reductions associated with a contract loss.
- •
- Our effective tax rate from continuing operations was 34.2% in 2006 and 2005.
- •
- Earnings from continuing operations were $0.39 per share for 2006 compared with $0.37 in the prior year. Earnings from continuing operations were impacted by stock option expense for the 2006 period in the amount of $3.2 million, net of tax, or $0.05 per share.
- •
- Discontinued operations had a pre-tax loss of $1.6 million in 2006 as a result of the resolution of certain purchaser claims for previously sold operations in the Asia/Pacific region. Discontinued operations had net earnings of $32.4 million, which includes a tax benefit of $30.8 million related to the resolution of certain international tax matters.
- •
- DSO decreased to 50 days at the end of 2006 compared with 54 days at the end of 2005.
Discontinued Operations
For the fiscal years ended December 30, 2007, December 31, 2006 and January 1, 2006, discontinued operations through the dates of their disposition, as applicable, had pre-tax operating losses of $6.3 million, $1.6 million and $11.3 million, respectively.
See Note 14, "Discontinued Operations," in the accompanying Notes to the Consolidated Financial Statements for further discussion.
Restructuring and Other Charges
The following is a summary of restructuring activities (in thousands):
| | Fiscal Years
| |
|---|
| | 2007
| | 2006
| | 2005
| |
|---|
| Staffing Services | | $ | — | | $ | 363 | | $ | 1,840 | |
| Professional Services | | | — | | | 106 | | | 49 | |
| Corporate | | | — | | | 899 | | | 341 | |
| Reversal of over accrual | | | — | | | (582 | ) | | (175 | ) |
| | |
| |
| |
| |
| Restructuring | | | — | | | 786 | | | 2,055 | |
| Other charges (credits) | | | 700 | | | (963 | ) | | (292 | ) |
| | |
| |
| |
| |
| | Total restructuring and other charges (credits) | | $ | 700 | | $ | (177 | ) | $ | 1,763 | |
| | |
| |
| |
| |
See Note 15, "Restructuring and Other Charges," in the accompanying notes to the Consolidated Financial Statements for further discussion.
24
Item 7. MANAGEMENT'S DISCUSSION AND ANALYSIS OF
FINANCIAL CONDITION AND RESULTS OF OPERATIONS—(Continued)
Operating Segments
We evaluate the performance of our operating segments and allocate resources based on revenues, gross profit and segment operating profit. Segment operating profit from continuing operations is defined as income before unallocated corporate costs, amortization expense, interest expense, interest income, income taxes and restructuring and other charges. All material intercompany revenues and expenses have been eliminated. Additionally, amounts related to discontinued operations have been excluded from the segment information below and are presented as discontinued operations in the Consolidated Statements of Earnings.
Information on operating segments and a reconciliation to earnings from continuing operations before income taxes for the periods indicated were as follows (in thousands):
| | Fiscal Years
| |
|---|
| | 2007
| | 2006
| | 2005
| |
|---|
| |
| | % of
Total
| |
| | % of
Total
| |
| | % of
Total
| |
|---|
| Revenues: | | | | | | | | | | | | | | | | |
| | Staffing Services | | $ | 1,472,236 | | 73.0 | % | $ | 1,430,062 | | 74.4 | % | $ | 1,516,221 | | 77.1 | % |
| | Professional Services | | | 544,878 | | 27.0 | % | | 492,673 | | 25.6 | % | | 450,179 | | 22.9 | % |
| | |
| |
| |
| |
| |
| |
| |
| | Total | | $ | 2,017,114 | | 100.0 | % | $ | 1,922,735 | | 100.0 | % | $ | 1,966,400 | | 100.0 | % |
| | |
| |
| |
| |
| |
| |
| |
| |
| | % of
Revenues
| |
| | % of
Revenues
| |
| | % of
Revenues
| |
|---|
| Gross profit: | | | | | | | | | | | | | | | | |
| | Staffing Services | | $ | 296,303 | | 20.1 | % | $ | 285,537 | | 20.0 | % | $ | 283,042 | | 18.7 | % |
| | Professional Services | | | 181,683 | | 33.3 | % | | 161,542 | | 32.8 | % | | 143,143 | | 31.8 | % |
| | |
| |
| |
| |
| |
| |
| |
| | Total | | $ | 477,986 | | 23.7 | % | $ | 447,079 | | 23.3 | % | $ | 426,185 | | 21.7 | % |
| | |
| |
| |
| |
| |
| |
| |
| Segment operating profit: | | | | | | | | | | | | | | | | |
| | Staffing Services | | $ | 35,459 | | 2.4 | % | $ | 24,127 | | 1.7 | % | $ | 30,220 | | 2.0 | % |
| | Professional Services | | | 28,231 | | 5.2 | % | | 23,279 | | 4.7 | % | | 19,236 | | 4.3 | % |
| | |
| |
| |
| |
| |
| |
| |
| | Total | | | 63,690 | | 3.2 | % | | 47,406 | | 2.5 | % | | 49,456 | | 2.5 | % |
| | Unallocated corporate costs | | | (15,993 | ) | | | | (15,541 | ) | | | | (13,832 | ) | | |
| | Amortization of intangibles | | | (1,406 | ) | | | | (201 | ) | | | | (416 | ) | | |
| | Interest expense | | | (3,746 | ) | | | | (1,965 | ) | | | | (3,205 | ) | | |
| | Interest income | | | 4,631 | | | | | 4,055 | | | | | 4,072 | | | |
| | Restructuring and other (charges) credits | | | (700 | ) | | | | 177 | | | | | (1,763 | ) | | |
| | |
| | | |
| | | |
| | | |
| | Earnings from continuing operations before income taxes | | $ | 46,476 | | | | $ | 33,931 | | | | $ | 34,312 | | | |
| | |
| | | |
| | | |
| | | |
25
Item 7. MANAGEMENT'S DISCUSSION AND ANALYSIS OF
FINANCIAL CONDITION AND RESULTS OF OPERATIONS—(Continued)
RECONCILIATION OF YEAR-OVER-YEAR REVENUE GROWTH RATE
| | Twelve Months Ended December 30, 2007
| | Twelve Months Ended December 31, 2006
| |
|---|
| | Total
Company
| | Staffing
Services
| | Professional
Services
| | Total
Company
| | Staffing
Services
| | Professional
Services
| |
|---|
| Organic revenue growth rate | | 0.4 | % | 0.1 | % | 0.9 | % | (2.8 | )% | (6.3 | )% | 9.1 | % |
| Revenue growth rate contributed from acquisitions | | 4.5 | % | 2.8 | % | 9.7 | % | 0.6 | % | 0.6 | % | 0.3 | % |
| | |
| |
| |
| |
| |
| |
| |
| GAAP revenue growth rate | | 4.9 | % | 2.9 | % | 10.6 | % | (2.2 | )% | (5.7 | )% | 9.4 | % |
| | |
| |
| |
| |
| |
| |
| |
Segment Operating Results
Information on the Staffing Services segment's skill sets and service lines for the periods indicated were as follows (in thousands):
| | Fiscal Years
| |
|---|
| | 2007
| | 2006
| | 2005
| |
|---|
| |
| | % of
Total
| |
| | % of
Total
| |
| | % of
Total
| |
|---|
| Revenues by Skill: | | | | | | | | | | | | | | | | |
| | Clerical | | $ | 920,558 | | 62.5 | % | $ | 897,746 | | 62.8 | % | $ | 930,258 | | 61.4 | % |
| | Light industrial | | | 551,678 | | 37.5 | % | | 532,316 | | 37.2 | % | | 585,963 | | 38.6 | % |
| | |
| |
| |
| |
| |
| |
| |
| | | Segment revenues | | $ | 1,472,236 | | 100.0 | % | $ | 1,430,062 | | 100.0 | % | $ | 1,516,221 | | 100.0 | % |
| | |
| |
| |
| |
| |
| |
| |
| Revenues by Service: | | | | | | | | | | | | | | | | |
| | Temporary staffing | | $ | 1,259,411 | | 85.5 | % | $ | 1,231,301 | | 86.1 | % | $ | 1,312,515 | | 86.6 | % |
| | Managed services | | | 189,574 | | 12.9 | % | | 176,944 | | 12.4 | % | | 185,967 | | 12.3 | % |
| | Permanent placement | | | 23,251 | | 1.6 | % | | 21,817 | | 1.5 | % | | 17,739 | | 1.1 | % |
| | |
| |
| |
| |
| |
| |
| |
| | | Segment revenues | | $ | 1,472,236 | | 100.0 | % | $ | 1,430,062 | | 100.0 | % | $ | 1,516,221 | | 100.0 | % |
| | |
| |
| |
| |
| |
| |
| |
| Gross Profit Margin by Service: | | | | | | | | | | | | | | | | |
(As % of Applicable Revenue)
Temporary staffing | | | 17.0 | % | | | | 17.3 | % | | | | 16.8 | % | | |
| | Managed services | | | 30.9 | % | | | | 29.0 | % | | | | 24.2 | % | | |
| | Permanent placement | | | 100.0 | % | | | | 100.0 | % | | | | 100.0 | % | | |
| | | Total Staffing Services | | | 20.1 | % | | | | 20.0 | % | | | | 18.7 | % | | |
| | Twelve Months Ended December 30, 2007
| |
|---|
| | Revenue Growth Rate by Skill
| | Revenue Growth Rate by Service
| |
|---|
Staffing Services
| | Total Staffing
| | Clerical
| | Light Industrial
| | Total Staffing
| | Permanent Placement
| | Temporary Staffing
| | Managed Services
| |
|---|
| Organic revenue growth rate | | 0.1 | % | (1.3 | )% | 3.0 | % | 0.1 | % | 4.8 | % | (0.8 | )% | 7.1 | % |
Revenue growth rate
contributed from acquisitions | | 2.8 | % | 3.8 | % | 0.6 | % | 2.8 | % | 1.8 | % | 3.1 | % | 0.0 | % |
| | |
| |
| |
| |
| |
| |
| |
| |
| GAAP revenue growth rate | | 2.9 | % | 2.5 | % | 3.6 | % | 2.9 | % | 6.6 | % | 2.3 | % | 7.1 | % |
| | |
| |
| |
| |
| |
| |
| |
| |
26
Item 7. MANAGEMENT'S DISCUSSION AND ANALYSIS OF
FINANCIAL CONDITION AND RESULTS OF OPERATIONS—(Continued)
| | Twelve Months Ended December 31, 2006
| |
|---|
| | Revenue Growth Rate by Skill
| | Revenue Growth Rate by Service
| |
|---|
Staffing Services
| | Total Staffing
| | Clerical
| | Light Industrial
| | Total Staffing
| | Permanent Placement
| | Temporary Staffing
| | Managed Services
| |
|---|
| Organic revenue growth rate | | (6.3 | )% | (3.9 | )% | (9.9 | )% | (6.3 | )% | 23.0 | % | (6.8 | )% | (4.9 | )% |
Revenue growth rate
contributed from acquisitions | | 0.6 | % | 0.4 | % | 0.7 | % | 0.6 | % | 0.0 | % | 0.6 | % | 0.0 | % |
| | |
| |
| |
| |
| |
| |
| |
| |
| GAAP revenue growth rate | | (5.7 | )% | (3.5 | )% | (9.2 | )% | (5.7 | )% | 23.0 | % | (6.2 | )% | (4.9 | )% |
| | |
| |
| |
| |
| |
| |
| |
| |
Revenues—Staffing Services revenue increased 2.9% to $1.47 billion in 2007 from $1.43 billion in the prior year. The increase is primarily due to the acquisition of Todays. On an organic basis revenues were about flat year over year. The growth in our targeted small to mid-sized customers and growth in our recruitment outsourcing business was offset by lower volume at other large temporary staffing customers. Due to our successful sales efforts with our targeted small and mid-sized customer base, our revenue base was less affected by the slower U.S. economy than many of our large national competitors.
- •
- By skill—Clerical revenue increased 2.5% and light industrial revenue increased 3.6% from prior year levels. The increase in clerical revenues is primarily due to the acquisition of Todays and the growth in our recruitment outsourcing business. On an organic basis, clerical revenues decreased 1.3% in 2007 due to lower demand for temporary staffing services driven by slower economic growth in the U.S. Light industrial revenues increased 3.0% on an organic basis due to new business generated in the retail, distribution and manufacturing industries.
- •
- By service—Temporary staffing revenue increased 2.3% compared with the prior year due primarily to the acquisition of Todays. Temporary staffing revenues decreased 0.8% on an organic basis. Growth in new small and mid-sized accounts was offset by decreased demand at other primarily large, existing staffing customers due to the slower U.S. economy. Managed services revenue increased 7.1% to $189.6 million in 2007 from $176.9 million in the prior year. The increase in managed services revenue was primarily due to a 56.3% increase in RPO revenues compared with the prior year. Permanent placement revenue increased 6.6% (4.8% on an organic basis) over the prior year due to the addition of recruiters, particularly in Canada.
Gross Profit—Gross profit increased 3.8% to $296.3 million from $285.5 million in the prior year primarily driven by the acquisitions and growth in RPO. The overall gross profit margin was 20.1% in 2007 compared with 20.0% in the prior year. The increase of 10 basis points in the overall gross profit margin was primarily due to growth of permanent placement and higher margin and volume in managed services, specifically RPO (35 basis points), partially offset by lower temporary staffing pay/bill spreads (25 basis points).
Segment Operating Profit—Staffing Services segment operating profit was $35.5 million compared with $24.1 million in the prior year. The increase from prior year was due to the increase in gross profit of $10.8 million as described above and lower operating expenses of $0.6 million. Decreases in operating expenses were primarily related to better management of employee costs, advertising and other administrative expenses. Operating expenses as a percentage of gross profit decreased to 88.0% compared with 91.6% in the prior year.
Outlook—Our major focus in 2008 will be organic revenue growth and improving operating leverage. We will continue to focus on our targeted customers, small and mid-sized accounts, to obtain higher
27
Item 7. MANAGEMENT'S DISCUSSION AND ANALYSIS OF
FINANCIAL CONDITION AND RESULTS OF OPERATIONS—(Continued)
margins. The market for RPO opportunities is favorable and we continue to win new business. We will also be focusing on effectively integrating all 2007 acquisitions and leveraging the Todays brand to accelerate growth within retail customers. We are taking steps to improve and maintain our productivity and financial discipline gained in 2007. Despite these efforts, there is no assurance that revenues or segment operating profit will grow in 2008.
Revenues—Staffing Services revenue decreased 5.7% (and decreased 6.3% organically) to $1.43 billion in 2006 from $1.52 billion in the prior year. The decrease is primarily due to the loss or intentional exit of business for customers that did not meet minimum profitability thresholds, decreases at certain large accounts and the loss of a large managed services contract at the start of the second quarter of 2005. Partially offsetting these decreases was the growth in our recruitment process outsourcing business.
- •
- By skill—Clerical revenue decreased 3.5% and light industrial revenue decreased 9.2% from prior year levels. The decrease in clerical revenue was primarily due to the loss of a large account at the beginning of the second quarter of 2005 partially offset by revenue growth from small to mid-sized accounts. Both clerical revenue and light industrial revenue were impacted by a decrease in revenue from large accounts in the technology, medical and telecommunications industries combined with new accounts starting-up at a slower pace than business that was exited or lost in 2005.
- •
- By service—Temporary staffing revenues decreased 6.2% compared with the prior year due to a decrease in revenue from large accounts and the loss of business which did not meet profitability thresholds as described above. Managed services revenue decreased 4.9% from prior year levels due to the loss in 2005 of one large managed service customer and the movement of $4.0 million in revenue for locally based technology services contracts from this operating segment to our Professional Services segment, partially offset by an 88.1% increase in recruitment outsourcing. Permanent placement revenues increased 23.0% over the prior year due to the addition of recruiters, particularly in Canada.
Gross Profit—Gross profit of $285.5 million in the current year increased from $283.0 million in the prior year in spite of the decrease in revenue. The overall gross profit margin was 20.0% in 2006 compared with 18.7% in the prior year. The increase of 130 basis points in the overall gross profit margin was primarily due to growth of permanent placement and RPO (70 basis points) and lower payroll taxes and employee benefit costs, including workers' compensation and paid time off (60 basis points).
Segment Operating Profit—Staffing Services segment operating profit was $24.1 million compared with $30.2 million in the prior year. The decrease from prior year was due to higher operating expenses of $8.6 million on a slight increase in gross profit dollars. The increased operating expenses were primarily from higher costs associated with an increase in sales staff focused on small to mid-sized customers, stock option expense, higher commissions due to increased permanent placement revenues and an increase in litigation costs. Operating expenses as a percentage of revenue increased to 18.3% compared with 16.7% in the prior year as our revenue growth did not meet our internal goals. During the fourth quarter we undertook actions to reduce spending in the Staffing Services group.
28
Item 7. MANAGEMENT'S DISCUSSION AND ANALYSIS OF
FINANCIAL CONDITION AND RESULTS OF OPERATIONS—(Continued)
Information on the Professional Services segment's skill sets and service lines for the periods indicated were as follows (in thousands):
| | Fiscal Years
| |
|---|
| | 2007
| | 2006
| | 2005
| |
|---|
| |
| | % of
Total
| |
| | % of
Total
| |
| | % of
Total
| |
|---|
| Revenues by Skill: | | | | | | | | | | | | | | | | |
| | Information technology | | $ | 362,569 | | 66.6 | % | $ | 320,389 | | 65.0 | % | $ | 288,309 | | 64.1 | % |
| | Finance & accounting | | | 109,712 | | 20.1 | % | | 104,225 | | 21.2 | % | | 105,001 | | 23.3 | % |
| | Other | | | 72,597 | | 13.3 | % | | 68,059 | | 13.8 | % | | 56,869 | | 12.6 | % |
| | |
| |
| |
| |
| |
| |
| |
| | | Segment revenues | | $ | 544,878 | | 100.0 | % | $ | 492,673 | | 100.0 | % | $ | 450,179 | | 100.0 | % |
| | |
| |
| |
| |
| |
| |
| |
| Revenues by Service: | | | | | | | | | | | | | | | | |
| | Temporary staffing | | $ | 489,713 | | 89.9 | % | $ | 440,170 | | 89.3 | % | $ | 402,286 | | 89.4 | % |
| | Permanent placement | | | 55,165 | | 10.1 | % | | 52,503 | | 10.7 | % | | 47,893 | | 10.6 | % |
| | |
| |
| |
| |
| |
| |
| |
| | | Segment revenues | | $ | 544,878 | | 100.0 | % | $ | 492,673 | | 100.0 | % | $ | 450,179 | | 100.0 | % |
| | |
| |
| |
| |
| |
| |
| |
| Gross Profit Margin by Service: | | | | | | | | | | | | | | | | |
| (As % of Applicable Revenue) | | | | | | | | | | | | | | | | |
| | Temporary staffing | | | 25.8 | % | | | | 24.8 | % | | | | 23.7 | % | | |
| | Permanent placement | | | 100.0 | % | | | | 100.0 | % | | | | 100.0 | % | | |
| | | Total Professional Services | | | 33.3 | % | | | | 32.8 | % | | | | 31.8 | % | | |
| | Twelve Months Ended December 30, 2007
| |
|---|
| | Revenue Growth Rate by Skill
| | Revenue Growth Rate by Service
| |
|---|
| | Total
Professional
| | Information
Technology
| | Finance &
Accounting
| | Other
| | Total
Professional
| | Permanent
Placement
| | Temporary
Staffing
| |
|---|
| Professional Services | | | | | | | | | | | | | | | |
| Organic revenue growth rate | | 0.9 | % | (0.4 | )% | 4.7 | % | 6.7 | % | 0.9 | % | 1.5 | % | 0.9 | % |
Revenue growth rate
contributed from
acquisitions | | 9.7 | % | 13.6 | % | 0.6 | % | 0.0 | % | 9.7 | % | 3.6 | % | 10.4 | % |
| | |
| |
| |
| |
| |
| |
| |
| |
| GAAP revenue growth rate | | 10.6 | % | 13.2 | % | 5.3 | % | 6.7 | % | 10.6 | % | 5.1 | % | 11.3 | % |
| | |
| |
| |
| |
| |
| |
| |
| |
29
Item 7. MANAGEMENT'S DISCUSSION AND ANALYSIS OF
FINANCIAL CONDITION AND RESULTS OF OPERATIONS—(Continued)
| | Twelve Months Ended December 31, 2006
| |
|---|
| | Revenue Growth Rate by Skill
| | Revenue Growth Rate by Service
| |
|---|
| | Total
Professional
| | Information
Technology
| | Finance &
Accounting
| | Other
| | Total
Professional
| | Permanent
Placement
| | Temporary
Staffing
| |
|---|
| Professional Services | | | | | | | | | | | | | | | |
| Organic revenue growth rate | | 9.1 | % | 10.6 | % | (0.7 | )% | 19.7 | % | 9.1 | % | 9.5 | % | 9.1 | % |
Revenue growth rate
contributed from
acquisitions | | 0.3 | % | 0.5 | % | 0.0 | % | 0.0 | % | 0.3 | % | 0.1 | % | 0.3 | % |
| | |
| |
| |
| |
| |
| |
| |
| |
| GAAP revenue growth rate | | 9.4 | % | 11.1 | % | (0.7 | )% | 19.7 | % | 9.4 | % | 9.6 | % | 9.4 | % |
| | |
| |
| |
| |
| |
| |
| |
| |
Revenues—Professional Services revenue increased 10.6% to $544.9 million in 2007 from $492.7 million in the prior year. The increase in revenues was primarily due to the Resulté and Technisource acquisitions. Revenue on an organic basis increased 0.9% primarily due to growth in small to mid-sized customers.
- •
- By skill—IT increased 13.2% in total from the prior year and decreased 0.4% on an organic basis. Increased demand across our small and mid-sized customer base was offset by a significant decrease in volume at one large customer. Revenues from finance and accounting increased 5.3% (4.7% on an organic basis) compared with the prior year primarily due to growth among a diverse base of small and mid-sized customers. Revenues from other skills increased primarily due to increased demand in human resources, engineering and sales and marketing positions.
- •
- By service—Temporary staffing increased 11.3% primarily due to the acquisitions of Resulté and Technisource. On an organic basis, temporary staffing increased 0.9% as growth in accounting, offset declines in IT. Permanent placement revenue increased 5.1% (1.5% on an organic basis) to meet demand for sales and marketing, IT and finance and accounting skills as unemployment rates among skilled workers remain low. Growth rates in permanent placement slowed in 2007 due to growing concerns of employers about the slower U.S. economy.
Gross Profit—Professional Services gross profit increased 12.5% to $181.7 million from $161.5 million in the prior year. The overall gross profit margin was 33.3% in 2007 compared with 32.8% in the prior year. This 50 basis point increase in gross profit margin was primarily due to higher temporary staffing pay/bill spreads (70 basis points), lower employee benefit costs, insurance and payroll expense (20 basis points), offset by a change in service mix due to lower permanent placement services (40 basis points) as a percentage of total professional revenue.
Segment Operating Profit—Professional Services segment operating profit was $28.2 million compared with $23.2 million in the prior year. The increase in operating profit from the prior year was due to the increase in gross profit of $20.1 million partially offset by higher operating expenses of $15.2 million; operating expenses as a percentage of gross profit were down 110 basis points to 84.5% from 85.6%. The decrease in operating expenses as a percentage of gross profit was primarily due to operating leverage and improved administrative expense management.
Outlook—Profitable organic revenue growth and improving our operating leverage remain our major areas of focus for 2008. We will focus on our targeted customers on small and mid-sized accounts and
30
Item 7. MANAGEMENT'S DISCUSSION AND ANALYSIS OF
FINANCIAL CONDITION AND RESULTS OF OPERATIONS—(Continued)
leverage opportunities to sell Professional Services to our existing larger customers. We believe that we can gain improved operating leverage by continuing our strategy of organically building our business and limiting expense increases in the base business to less than fifty percent of our gross profit growth. In 2008, we will also continue to focus on integrating acquisitions, leveraging the Technisource brand and service offerings and fully realizing planned synergies. Like Staffing Services, we are taking steps to improve and maintain the productivity and financial discipline gained in 2007. There is no assurance that revenues or segment operating profit for the Professional Services segment will continue to grow at the same pace.
Revenues—Professional Services revenue increased 9.4% (9.1% organically) to $492.7 million in 2006 from $450.2 million in the prior year as customer demand continued to be strong in 2006. Revenue also increased as a result of continued investments made in 2005 in additional sales and recruiting staff. Most of the increase, $37.9 million, was in temporary staffing revenues and included $4.0 million due to the movement of revenue for locally based managed services contracts from our Staffing Services segment to this operating segment.
- •
- By skill—IT increased 11.1% from the prior year due to increased permanent placement and temporary staffing services and the movement of $4.0 million of locally based technology services contracts from the Staffing Services segment. Revenues from finance and accounting decreased about 1.0% compared with the prior year. Revenues from other skills increased primarily due to increased demand in the human resources, legal and engineering sectors.
- •
- By service—Temporary staffing increased 9.4% primarily due to continued demand for IT personnel, and the movement of $4.0 million of locally based technology services contracts from Staffing Services. Permanent placement revenue increased 9.6% to meet demand for IT skills combined with the 2005 increases in recruiter headcount.
Gross Profit—Professional Services gross profit increased 12.9% to $161.5 million from $143.1 million in the prior year. Gross profit margin was 32.8% in 2006 compared with 31.8% in the prior year. This 100 basis point increase in gross profit margin was primarily due to higher temporary staffing pay/bill spreads (70 basis points) and lower employee benefit costs, including workers' compensation costs (40 basis points). These increases were partially offset by higher state unemployment taxes (10 basis points).
Segment Operating Profit—Professional Services segment operating profit was $23.3 million compared with $19.2 million in the prior year. The increase in operating profit was the result of the increase in gross profits of $18.4 million partially offset by higher operating expenses of $14.4 million. Operating expenses as a percentage of revenues increased to 28.1% from 27.5% in the prior year. The increase in operating expenses was primarily due to increased commissions and incentive compensation as a result of higher volume and earnings, the hiring and training of new sales staff and recruiters, increased candidate advertising expense and higher bad debt expense.
2007 compared with 2006—Unallocated corporate costs were $16.0 million and $15.5 million in 2007 and 2006, respectively. Unallocated corporate costs increased in 2007 due to foreign exchange costs associated with the purchase of the remaining 15% interest of our Canadian business.
2006 compared with 2005—Unallocated corporate costs were $15.5 million and $13.8 million in 2006 and 2005, respectively. Unallocated corporate costs in 2005 benefited by $0.8 million from the favorable resolution of litigation matters.
31
Item 7. MANAGEMENT'S DISCUSSION AND ANALYSIS OF
FINANCIAL CONDITION AND RESULTS OF OPERATIONS—(Continued)
Liquidity and Capital Resources
As of December 30, 2007, we had total cash and cash equivalents of $15.3 million (a decrease of $39.3 million from December 31, 2006). Cash flows from operating, investing and financing activities, as reflected in the accompanying Consolidated Statements of Cash Flows, are summarized as follows (in thousands):
| | Fiscal Years
| |
|---|
| | 2007
| | 2006
| | 2005
| |
|---|
| Cash Provided By (Used In): | | | | | | | | | | |
| | Operating activities | | $ | 56,087 | | $ | 46,085 | | $ | 72,285 | |
| | Investing activities | | | (171,678 | ) | | 7,959 | | | 18,740 | |
| | Financing activities | | | 75,268 | | | (29,470 | ) | | (66,148 | ) |
| | Effect of exchange rates | | | 1,007 | | | (97 | ) | | 132 | |
| | |
| |
| |
| |
| Net (decrease) increase in cash and cash equivalents | | $ | (39,316 | ) | $ | 24,477 | | $ | 25,009 | |
| | |
| |
| |
| |
Operating cash flows
Operating cash flows for 2007 of $56.1 million were comprised primarily of $25.3 million of earnings, plus non-cash depreciation and amortization of $23.4 million, non-cash deferred income tax expense of $14.8 million, non-cash discontinued operations related charges, share-based compensation and other non-cash charges of $10.5 million partially offset by an increase in working capital items of $18.4 million. The $18.4 million increase in working capital items is due to lower accounts payable and accrued expenses and an increase in accounts receivable due to the growth in the business.
Operating cash flows for 2006 of $46.1 million were comprised of $54.7 million of earnings, plus non-cash depreciation and amortization of $22.2 million, non-cash deferred income tax expense of $26.9 million and non-cash share-based compensation of $3.7 million partially offset by an increase in working capital items of $61.1 million. The $61.1 million increase in working capital items is due to (i) a reduction in the accrued income taxes of $29.7 million as we recorded a non-cash tax benefit in discontinued operations related to the resolution of certain international tax matters, (ii) a reduction in self-insurance reserves due to payments and better loss experience, (iii) the payment or reversal of litigation and disposition related accruals, (iv) the investment in a mutual fund portfolio of $15.2 million, classified within other assets, to match funds on the company's non-qualified deferred compensation liability and (v) lower current liabilities. These items were partially offset by lower receivables due to a 4-day improvement in DSO and the receipt of a $4.5 million income tax refund.
Operating cash flows for 2005 of $72.3 million were primarily comprised of earnings of $12.0 million, plus non-cash depreciation and amortization of $21.9 million, non-cash deferred income tax expense of $6.3 million, the accrual for loss on disposal of discontinued operations of $5.7 million and lower working capital items of $21.4 million. Working capital was reduced primarily due to (i) lower accounts receivable as we lowered DSO from 60 days at the end of December 2004 to 54 days as of January 1, 2006 and as we collected accounts receivable from higher revenues in the prior period, and (ii) the receipt of an income tax refund of $7.5 million. Reductions in accounts receivable and tax refunds received were partially offset by increases in payouts for accounts payable and accrued liabilities.
32
Item 7. MANAGEMENT'S DISCUSSION AND ANALYSIS OF
FINANCIAL CONDITION AND RESULTS OF OPERATIONS—(Continued)
Cash used in investing activities for 2007 of $171.7 million was primarily due to acquisitions of $196.5 million for the purchase of Technisource, Todays, Resulté and various small acquisitions, capital expenditures of $8.3 million which primarily relate to computer hardware upgrades and new system application development, partially offset by reimbursements of insurance claim payments of $7.2 million and the return of $25.2 million of cash collateral from our restricted insurance deposit accounts upon the issuance of additional letters of credit.
Cash provided by investing activities for 2006 of $8.0 million was primarily due to net reimbursements of $29.7 million from insurance deposits with our workers' compensation insurance carrier due to claim payments made and the receipt of about $15.0 million of cash deposits upon issuance of a letter of credit. Capital expenditures of $22.7 million primarily relate to network upgrades to improve bandwidth within our offices and front and back office software initiatives to improve productivity and enhance our abilities to work with customers and candidates.
Cash provided by investing activities for 2005 of $18.7 million was primarily due to net reimbursements of $19.1 million from our insurance deposits for claim payments, proceeds from a note receivable from the 2004 sale of our Australian subsidiary, proceeds from the dispositions of our call centers of $1.4 million, and collections on area-based franchise notes, partially offset by capital expenditures of $9.7 million. Capital expenditures were primarily for further enhancements to our enterprise-wide information system and for client and candidate facing software improvements.
Cash provided by financing activities for 2007 of $75.3 million was primarily from borrowings under our lines of credit of $85.0 million and proceeds from option exercises, offset by the repurchase of common stock of $10.3 million and other debt repayments.
Cash used for financing in 2006 of $29.5 million was primarily due to the repurchase of common stock of $28.3 million.
Cash used for financing in 2005 of $66.1 million was primarily due to the repayments of borrowings from lines of credit and notes payable of $45.7 million and the repurchase of common stock of $24.0 million.
We believe that a combination of our existing cash balances, other liquid assets, operating cash flows and existing revolving lines of credit, taken together, provide adequate resources to fund ongoing operating requirements. However, our operating cash flow could be impacted by factors outside of our control.
We have a U.S. dollar revolving line of credit in the amount of $250.0 million that is secured by substantially all of our domestic accounts receivable. At our option, the amount available can be increased to $300.0 million. As of December 30, 2007, there was $76.4 million outstanding under this facility, and as of December 31, 2006, there were no amounts outstanding. Our total availability was $105.3 million (calculated as eligible receivables of $250.0 million, less: amounts outstanding, if any, letters of credit of $31.1 million and a one week payroll reserve of $37.2 million). Interest on this line of credit is based upon the duration of the loan, availability under the line and other conditions and would have been approximately 5.6% (LIBOR plus a spread) or approximately 7.3% (prime plus a spread) as of December 30, 2007. Amounts borrowed under Libor and prime based loans were $45.0 million and
33
Item 7. MANAGEMENT'S DISCUSSION AND ANALYSIS OF
FINANCIAL CONDITION AND RESULTS OF OPERATIONS—(Continued)
$31.4 million as of December 30, 2007, respectively. We pay an unused line fee in the range of 0.25% to 0.38% per annum that is determined by the unused portion of the revolving line of credit. For letters of credit we pay an annual rate based on availability under the line (currently 1.25%) plus a fixed fronting fee of 0.25%. This line of credit expires in 2010.
We also have a Canadian dollar revolving line of credit (secured by Canadian accounts receivable) that matures July 2010. This facility provides up to CAD$13.0 million of financing (approximately $13.2 million at current exchange rates). As of December 30, 2007, there was $8.6 million outstanding under this facility, and as of December 31, 2006, there were no borrowings outstanding. As of December 30, 2007, the interest rate for amounts borrowed on this facility approximated 6.8% (Canadian prime plus a spread). An unused line fee of 0.5% per annum is payable based on the unused portion of the revolving line of credit. We guarantee the Canadian dollar revolving line of credit.
Our revolving lines of credit provide for certain affirmative and negative covenants which may limit the total availability under these revolving lines of credit based upon our ability to meet these covenants. These covenants include, but are not limited to: a fixed charge coverage ratio; limitations on capital expenditures; additional debt incurred; mergers, consolidations or sales; and transactions with subsidiaries and related parties. Failure to meet compliance with one or more of these covenants in the future could affect the amount of availability we have to borrow against and as a result, our liquidity and financial condition may be adversely affected. At December 30, 2007, we were in compliance with the requirements of these covenants.
In connection with the purchase of Technisource, $20.0 million of the purchase price was deferred and is payable to the sellers including interest at Libor plus 300 basis points (or approximately 7.9% at year-end) and is due in March 2009.
34
Item 7. MANAGEMENT'S DISCUSSION AND ANALYSIS OF
FINANCIAL CONDITION AND RESULTS OF OPERATIONS—(Continued)
Contractual Obligations and Commitments (in thousands)
| | Payments due by period
|
|---|
| | Total
| | 2008
| | 2009
| | 2010
| | 2011
| | 2012
| | Thereafter
|
|---|
| Debt obligations(1) | | $ | 105,051 | | $ | 80 | | $ | 20,000 | | $ | 84,971 | | $ | — | | $ | — | | $ | — |
| Capital lease obligation | | | 3,132 | | | 970 | | | 899 | | | 853 | | | 405 | | | 5 | | | — |
| Operating lease obligations(2) | | | 72,824 | | | 24,967 | | | 19,238 | | | 12,907 | | | 8,024 | | | 4,197 | | | 3,491 |
| Purchase obligations(3) | | | 61,966 | | | 19,293 | | | 17,124 | | | 16,840 | | | 8,694 | | | 15 | | | — |
FIN 48 obligations, including
interest and penalties | | | 929 | | | — | | | — | | | — | | | — | | | — | | | 929 |
| | |
| |
| |
| |
| |
| |
| |
|
| | Total | | $ | 243,902 | | $ | 45,310 | | $ | 57,261 | | $ | 115,571 | | $ | 17,123 | | $ | 4,217 | | $ | 4,420 |
| | |
| |
| |
| |
| |
| |
| |
|
- (1)
- The future maturities of the U.S. and Canadian dollar revolving line of credit balances are presented in their respective year of scheduled maturity, although these revolving lines of credit are classified as current debt obligations in the accompanying Consolidated Balance Sheet in accordance with Generally Accepted Accounting Principles. These amounts do not include interest.
- (2)
- Operating lease obligations for rent and equipment are expected to be offset by future sublease income of $3.6 million in 2008, $3.8 million in 2009, $1.2 million in 2010, $0.2 million in 2011 and $0.4 million in 2012 and thereafter.
- (3)
- Purchase obligations primarily include normal and customary contracts and minimum spend contracts in the ordinary course of business, primarily information technology, outsourcing and maintenance contracts.
Off-Balance Sheet Arrangements
As of December 30, 2007, we had $31.1 million in irrevocable letters of credit outstanding, which were issued primarily to certain insurance carriers to guarantee payment for various insurance programs such as workers' compensation insurance. As of December 30, 2007, none of these irrevocable letters of credit had been drawn upon.
We do not have any other significant off-balance sheet arrangements.
Critical Accounting Policies
The preparation of financial statements in conformity with accounting principles generally accepted in the United States of America requires management to make estimates and assumptions that affect the reported amounts of assets, liabilities, revenues, expenses and the disclosure of contingencies. Due to the inherent uncertainty involved in making estimates, actual results reported in future periods may be materially different from those estimates. The following policies are those that we consider to be the most critical. See Note 1, "Summary of Significant Accounting Policies," for further description of these and all other accounting policies.
Allowance for Doubtful Accounts—Management analyzes aged receivables and the related allowance for doubtful accounts on a quarterly basis. We use historical experience in assessing the adequacy of the reserve and this includes reviewing: net write-offs in relation to revenues, the allowance in comparison to the gross accounts receivable balance and comparative agings. Receivables deemed by management to be uncollectible based on historical trends are reserved for and/or consequently written-off. Historically, losses from uncollectible accounts have not exceeded our allowance. Due to the judgment used in making these assumptions, the ultimate amount of accounts receivable that become uncollectible could differ from
35
Item 7. MANAGEMENT'S DISCUSSION AND ANALYSIS OF
FINANCIAL CONDITION AND RESULTS OF OPERATIONS—(Continued)
our original estimate due to a changing economy or a change in our customers' financial positions, which could result in charges or credits to amounts recorded in selling, general and administrative expenses.
Intangible Assets—As required by Statement of Financial Accounting Standards ("SFAS") No. 142, "Goodwill and Other Intangible Assets," goodwill and other intangible assets with indefinite lives are not amortized, and are tested for impairment on an annual basis, or earlier if an event occurs or circumstances change that would reduce the fair value of a reporting unit below its carrying amount. Performing an impairment test involves estimating the fair value of a reporting unit, which requires us to make assumptions about future market conditions and our ability to perform as planned. When we are able, we use external data in our assumptions. Spherion performs its annual impairment test of intangible assets as of its November month-end. The 2007, 2006 and 2005 tests did not indicate the existence of impairment. Although these annual impairment tests did not result in impairment, due to the judgment inherent in estimating the fair value of a reporting unit, there could be charges in future years to operations for up to the full value of our goodwill balance, which is currently $146.6 million, if the markets in which we operate decline, if the market values of companies in our industry decrease or we are unable to execute our business strategy.
Accrued self insurance losses—We retain a portion of the risk under our workers' compensation, general liability, professional liability, employment practices liability and health benefits insurance programs. Estimated losses for workers' compensation has been discounted at 3.7% and 4.8% as of December 30, 2007 and December 31, 2006, respectively. Recording reserves for self insured losses involves a considerable amount of judgment. In developing the reserves, we use actuarial estimates for most of our accruals under the following circumstances: (i) when the accruals are sufficiently material, (ii) when there is an adequate population of claims upon which to prepare actuarial estimates and (iii) when the claims develop over a longer period of time. For all other accruals we base our reserves on internal estimates. While management believes that the amount recorded for the liabilities is adequate, there can be no assurance that changes to management's estimates may not occur due to limitations inherent in the estimation process. Factors that can affect our reserves are as follows:
- •
- The cost of benefits under the workers' compensation programs are regulated under state law and are subject to change. Legislation can have a significant impact on our ability to control costs related to the amount and frequency of service, the amount of benefits paid if the employee is unable to work and our ability to put the employee back to work. As legislation changes, our estimated liabilities will change.
- •
- Loss estimates from actuaries are primarily based on the historical pattern of losses, including both the frequency and severity of claims. Changes in loss patterns must often be consistently exhibited over a period of time before they are fully reflected in the reserves. Claims can also take a number of years to fully develop until the final loss is known. Changes to loss estimates reserve levels can occur several years after the loss has occurred. A 10% change in either the frequency or severity of claims for one year at current activity levels would impact workers' compensation expense by approximately $1.2 million.
- •
- Changes in the cost of health care services, claims processing costs, or increased litigation could affect the adequacy of these estimated liabilities.
- •
- Prolonged changes in interest rates for risk-free U.S. governmental bonds could also affect the discount rate used in estimating these liabilities. An increase or decrease of 1.0% in the discount rate would result in a reduction or increase, respectively, to pre-tax expense of approximately $1.0 million.
Management reviews these assumptions and related reserves and changes in the estimates of these accruals are charged or credited to cost of services for billable temporary staff and/or selling, general and
36
Item 7. MANAGEMENT'S DISCUSSION AND ANALYSIS OF
FINANCIAL CONDITION AND RESULTS OF OPERATIONS—(Continued)
administrative expenses for branch and administrative staff in the period determined. The Company monitors the impact of reserve changes on its results of operations and over time such reserve changes tend to be insignificant to overall gross profits. During 2007 and 2006, our workers' compensation costs were reduced by adjustments of $3.5 million and $7.5 million, respectively, to prior year reserves and the discount rate.
Spherion partially funds its workers' compensation liability with an insurance deposit that was $18.2 million and $49.7 million at December 30, 2007 and December 31, 2006, respectively, and is included in "Insurance deposit" in the accompanying Consolidated Balance Sheets. The deposit will be used to fund claims and cannot be used for general corporate purposes. In addition to the insurance deposit, the Company maintained letters of credit in the amount of $31.1 million and $16.7 million as of December 30, 2007 and December 31, 2006 as collateral for our self insurance programs.
Share-Based Compensation—We recognize compensation expense for all share-based payments by estimating the fair value of options at grant date using the Black-Scholes-Merton option- pricing model. Calculating the fair value of share-based payment awards requires the input of subjective assumptions, including the expected life of the share-based payment awards and stock price volatility. Management bases expected life on historical exercise and post-vesting employment-termination experience, and expected volatility on historical realized volatility trends. In addition, we are required to estimate the expected forfeiture rate and only recognize expense for those shares expected to vest. The assumptions used in calculating the fair value of share-based payment awards represent management's best estimates, but these estimates involve inherent uncertainties and the application of management's judgment. As a result, if factors change and we use different assumptions, our share-based compensation expense could be materially different in the future. See Note 2, "Share-Based Compensation" to the Consolidated Financial Statements for a further discussion on share-based compensation.
Income Taxes—Deferred tax assets and liabilities are determined based on the difference between the financial statements and tax basis of assets and liabilities using enacted tax rates in effect for the year in which the differences are expected to reverse. Our provision for income taxes is based on domestic and international statutory income tax rates and tax planning opportunities in the jurisdictions in which we operate. Significant judgment is required in determining income tax provisions as well as deferred tax asset and liability balances, including the estimation of valuation allowances and the evaluation of tax positions.
At December 31, 2006, we had a net deferred tax asset of $115.4 million, net of a valuation allowance of $29.1 million. Net deferred tax assets are primarily comprised of net deductible temporary differences, net operating loss carryforwards and tax credit carryforwards that are available to reduce taxable income in future periods. The net deferred tax asset was evaluated under the guidelines of SFAS No. 109, "Accounting for Income Taxes," and a determination on the basis of objective factors was made that the asset will be realized through future years' taxable earnings. These objective factors include historical taxable income, normalized for non-recurring income and expense items. The determination of the amount of valuation allowance to be provided on recorded deferred tax assets involves estimates regarding the timing and amount of the reversal of taxable temporary differences, expected future taxable income and the impact of tax planning strategies. A valuation allowance is required when it is more likely than not that all or a portion of a deferred tax asset will not be realized. In assessing a valuation allowance, we consider all positive and negative evidence available at the time, including past operating results, projections of future taxable income and the feasibility of ongoing tax planning strategies. The current valuation allowance relates primarily to foreign tax credit carryforwards, the benefit on capital loss carryforwards and the benefit on state net operating loss carryforwards that are not expected to be realized. If we determine that future taxable earnings will be insufficient to recover the deferred tax assets, we will be required to write-off all or a portion of the remaining net deferred tax assets by a charge to earnings.
37
Item 7. MANAGEMENT'S DISCUSSION AND ANALYSIS OF
FINANCIAL CONDITION AND RESULTS OF OPERATIONS—(Continued)
We are subject to tax audits in numerous jurisdictions in the U.S. and around the world. Tax audits by their very nature are often complex and can require several years to complete. In the normal course of business, we are subject to challenges from the Internal Revenue Service ("IRS") and other tax authorities regarding amounts of taxes due. These challenges may alter the timing or amount of taxable income or deductions, or the allocation of income among tax jurisdictions. As part of our calculation of the provision for income taxes on earnings, we determine whether the benefits of our tax positions are at least more likely than not of being sustained upon audit based on the technical merits of the tax position. For tax positions that are more likely than not of being sustained upon audit, we accrue the largest amount of the benefit that is more likely than not of being sustained in our Consolidated Financial Statements. Such accruals require management to make estimates and judgments with respect to the ultimate outcome of a tax audit. Actual results could vary materially from these estimates.
See Note 3, "Income Taxes," in the accompanying notes to the Consolidated Financial Statement for further discussion on income taxes.
New Accounting Pronouncements
See Note 1, "Summary of Significant Accounting Policies," in the accompanying Consolidated Financial Statements for discussion of New Accounting Pronouncements.
Non-GAAP Financial Measures
This Annual Report on Form 10-K includes information extracted from consolidated financial information but not required by generally accepted accounting principles ("GAAP") to be presented in the financial statements. Certain of this information are considered "non-GAAP financial measures" as defined by SEC rules. Specifically, organic revenue growth is a non-GAAP financial measure, which includes pro-forma revenues of acquired companies. Organic growth is a key measurement used by management to evaluate its operations. Management includes revenues prior to acquisition date for acquired companies in the organic revenue growth calculation in order to evaluate the Company's operating performance. Organic growth should not be considered a measure of financial performance in isolation or as an alternative to revenue growth as determined in the Statement of Earnings in accordance with GAAP, and, as presented, may not be comparable to similarly titled measures of other companies, and therefore this measure has material limitations. Non-GAAP financial measures should be considered in addition to, but not as a substitute for or superior to, other measures of financial performance prepared in accordance with GAAP. Reconciliations of organic growth are presented in the respective sections of the Management's Discussion and Analysis.
Inflation
Our monetary assets, consisting primarily of cash and receivables, are not affected by inflation because they are short-term. Our non-monetary assets, consisting primarily of intangible assets, goodwill and prepaid expenses and other assets, are not affected significantly by inflation. We believe that replacement costs of equipment, furniture and leasehold improvements will not materially affect our operations. However, the rate of inflation affects our cost of service and expenses, such as those for employee compensation, which may not be readily recoverable in the price of services offered by us.
Forward Looking Statements—Safe Harbor
Our business, financial condition, results of operations, cash flows and prospects, and the prevailing market price and performance of our common stock, may be adversely affected by a number of factors, including the matters discussed below. Certain statements and information set forth in this Annual Report on Form 10-K, as well as other written or oral statements made from time to time by us or by our authorized executive officers on our behalf, constitute "forward-looking statements" within the meaning of
38
Item 7. MANAGEMENT'S DISCUSSION AND ANALYSIS OF
FINANCIAL CONDITION AND RESULTS OF OPERATIONS—(Continued)
the Federal Private Securities Litigation Reform Act of 1995. We intend for our forward-looking statements to be covered by the safe harbor provisions for forward-looking statements contained in the Private Securities Litigation Reform Act of 1995, and we set forth this statement and these risk factors in order to comply with such safe harbor provisions. You should note that our forward-looking statements speak only as of the date of this Annual Report on Form 10-K or when made and we undertake no duty or obligation to update or revise our forward-looking statements, whether as a result of new information, future events or otherwise. Although we believe that the expectations, plans, intentions and projections reflected in our forward-looking statements are reasonable, such statements are subject to known and unknown risks, uncertainties and other factors that may cause our actual results, performance or achievements to be materially different from any future results, performance or achievements expressed or implied by the forward-looking statements. The risks, uncertainties and other factors that our stockholders and prospective investors should consider are included in Item 1A, Risk Factors.
Item 7A. QUANTITATIVE AND QUALITATIVE DISCLOSURES ABOUT MARKET RISK
As of December 30, 2007, approximately $1.9 million of cash and cash equivalents were invested in money market mutual funds. These financial instruments are not considered to be subject to interest rate risk due to their short duration.
We are exposed to interest rate risk related to a portion of our debt. Our outstanding variable-rate debt at December 30, 2007 was $105.0 million and we had no outstanding variable debt as of December 31, 2006. Based on the outstanding balance in 2007, a change of 1% in the interest rate would have caused a change in interest expense of approximately $1.0 million on an annual basis.
From time to time, we participate in foreign exchange hedging activities to mitigate the impact of changes in foreign currency exchange rates. We attempt to hedge transaction exposures through natural offsets. To the extent this is not practicable, exposure areas which are considered for hedging are foreign currency denominated receivables and payables, intercompany loans and firm committed transactions. We use financial instruments, principally forward exchange contracts, in our management of foreign currency exposures. We do not enter into forward contracts for trading purposes. In estimating the fair value of derivative positions, we utilize quoted market prices, if available, or quotes obtained from external sources.
When foreign currency financial instruments are outstanding, exposure to market risk on these instruments results from fluctuations in currency rates during the periods in which the contracts are outstanding. The counterparties to our currency exchange contracts consist of major financial institutions, each of which is rated investment grade. We are exposed to credit risk to the extent of potential nonperformance by counterparties on financial instruments. Any potential credit exposure does not exceed the fair value. We believe the risk of incurring losses due to credit risk is remote.
The carrying amount of cash and cash equivalents, trade receivables and other current assets approximates fair value due to the short-term maturities of these instruments. Our insurance deposits earn a fixed interest rate as determined at the time of funding and are carried at fair value or $18.2 million and $49.7 million as of December 30, 2007 and December 31, 2006, respectively. Company-owned life insurance policies are carried at cash surrender value which approximated $12.9 million as of January 1, 2006. In January 2006, Spherion terminated these policies and invested cash in order to provide an investment balance equal to the deferred compensation liability.
The fair values of all other financial instruments, including debt, approximate their book values as the instruments are short-term in nature or contain market rates of interest.
39
Item 8. FINANCIAL STATEMENTS AND SUPPLEMENTARY DATA
| | Page No.
|
|---|
| Management's Report on Internal Control over Financial Reporting | | 41 |
| Reports of Independent Registered Public Accounting Firm | | 42 |
| Consolidated Statements of Earnings | | 45 |
| Consolidated Balance Sheets | | 46 |
| Consolidated Statements of Stockholders' Equity | | 47 |
| Consolidated Statements of Cash Flows | | 48 |
| Notes to Consolidated Financial Statements: | | |
| | Note 1. Summary of Significant Accounting Policies | | 49 |
| | Note 2. Share-Based Compensation | | 54 |
| | Note 3. Income Taxes | | 57 |
| | Note 4. Earnings Per Share | | 60 |
| | Note 5. Property and Equipment | | 60 |
| | Note 6. Goodwill and Intangible Assets | | 60 |
| | Note 7. Acquisitions | | 61 |
| | Note 8. Short-Term and Long-Term Debt Obligations | | 64 |
| | Note 9. Financial Instruments and Fair Values | | 66 |
| | Note 10. Employee Savings and Investment Plans | | 66 |
| | Note 11. Commitments and Contingencies | | 67 |
| | Note 12. Stockholders' Equity | | 68 |
| | Note 13. Stockholder Rights Plan | | 68 |
| | Note 14. Discontinued Operations | | 69 |
| | Note 15. Restructuring and Other Charges | | 71 |
| | Note 16. Segment Information | | 71 |
| | Note 17. Quarterly Financial Data | | 74 |
| Consolidated Financial Statement Schedule for the Fiscal Years Ended 2007, 2006 and 2005: | | |
| | Schedule II—Valuation and Qualifying Accounts | | 75 |
40
Management's Report on Internal Control Over Financial Reporting
Management is responsible for the fair presentation of the Consolidated Financial Statements of Spherion Corporation. Management is also responsible for establishing and maintaining a system of internal controls over financial reporting as defined in Rule 13a-15(f) under the Securities Exchange Act of 1934. These internal controls are designed to provide reasonable assurance that the reported financial information is presented fairly, that disclosures are adequate and that the judgments inherent in the preparation of financial statements are reasonable. There are inherent limitations in the effectiveness of any system of internal control, including the possibility of human error and overriding of controls. Consequently, an effective internal control system can only provide reasonable, not absolute assurance, with respect to reporting financial information.
Management conducted an evaluation of the effectiveness of our internal control over financial reporting based on the framework inInternal Control—Integrated Framework issued by the Committee of Sponsoring Organizations of the Treadway Commission. Based on our evaluation under the framework inInternal Control—Integrated Framework, management concluded that our internal control over financial reporting was effective as of December 30, 2007.
Management's assessment of and conclusion on the effectiveness of internal control over financial reporting did not include the internal controls of IntelliMark Holdings, Inc., and its wholly owned subsidiary Technisource, Inc. ("Technisource") and Todays Staffing, Inc. ("Todays"), companies acquired in December and September of 2007, respectively. The 2007 Consolidated Financial Statements of Spherion included total assets of approximately $210.5 million at December 30, 2007 and approximately $56.9 million of revenues for the year then ended for Technisource and Todays.
Deloitte & Touche LLP, an independent registered public accounting firm, has issued an attestation report on our internal control over financial reporting, such attestation report is included herein.
/s/ROY G. KRAUSE
| | /s/MARK W. SMITH
|
|---|
| |
|
| Roy G. Krause | | Mark W. Smith |
| President and Chief Executive Officer | | Executive Vice President and
Chief Financial Officer |
41
REPORT OF INDEPENDENT REGISTERED PUBLIC ACCOUNTING FIRM
To the Board of Directors and Stockholders of
Spherion Corporation
Fort Lauderdale, Florida
We have audited the internal control over financial reporting of Spherion Corporation and subsidiaries (the "Company") as of December 30, 2007, based on criteria established inInternal Control—Integrated Framework issued by the Committee of Sponsoring Organizations of the Treadway Commission. As described in Management's Report on Internal Control Over Financial Reporting, management excluded from its assessment the internal control over financial reporting at Todays Staffing Inc. and Technisource, Inc., which were acquired on September 28, 2007 and December 3, 2007, respectively, and whose financial statements constitute approximately $210.5 million of total assets, and approximately $56.9 million of revenues of the consolidated financial statement amounts as of and for the year ended December 30, 2007. Accordingly, our audit did not include the internal control over financial reporting at Todays Staffing, Inc. and Technisource, Inc. The Company's management is responsible for maintaining effective internal control over financial reporting and for its assessment of the effectiveness of internal control over financial reporting, included in the accompanying Management's Report on Internal Control Over Financial Reporting. Our responsibility is to express an opinion on the Company's internal control over financial reporting based on our audit.
We conducted our audit in accordance with the standards of the Public Company Accounting Oversight Board (United States). Those standards require that we plan and perform the audit to obtain reasonable assurance about whether effective internal control over financial reporting was maintained in all material respects. Our audit included obtaining an understanding of internal control over financial reporting, assessing the risk that a material weakness exists, testing and evaluating the design and operating effectiveness of internal control based on the assessed risk, and performing such other procedures as we considered necessary in the circumstances. We believe that our audit provides a reasonable basis for our opinion.
A company's internal control over financial reporting is a process designed by, or under the supervision of, the company's principal executive and principal financial officers, or persons performing similar functions, and effected by the company's board of directors, management, and other personnel to provide reasonable assurance regarding the reliability of financial reporting and the preparation of financial statements for external purposes in accordance with generally accepted accounting principles. A company's internal control over financial reporting includes those policies and procedures that (1) pertain to the maintenance of records that, in reasonable detail, accurately and fairly reflect the transactions and dispositions of the assets of the company; (2) provide reasonable assurance that transactions are recorded as necessary to permit preparation of financial statements in accordance with generally accepted accounting principles, and that receipts and expenditures of the company are being made only in accordance with authorizations of management and directors of the company; and (3) provide reasonable assurance regarding prevention or timely detection of unauthorized acquisition, use, or disposition of the company's assets that could have a material effect on the financial statements.
Because of the inherent limitations of internal control over financial reporting, including the possibility of collusion or improper management override of controls, material misstatements due to error or fraud may not be prevented or detected on a timely basis. Also, projections of any evaluation of the effectiveness of the internal control over financial reporting to future periods are subject to the risk that the controls may become inadequate because of changes in conditions, or that the degree of compliance with the policies or procedures may deteriorate.
In our opinion, the Company maintained, in all material respects, effective internal control over financial reporting as of December 30, 2007, based on the criteria established inInternal Control—Integrated Framework issued by the Committee of Sponsoring Organizations of the Treadway Commission.
42
We have also audited, in accordance with the standards of the Public Company Accounting Oversight Board (United States), the consolidated financial statements and financial statement schedule as of and for the year ended December 30, 2007 of the Company and our report dated March 12, 2008 expressed an unqualified opinion on those financial statements and financial statement schedule.
DELOITTE & TOUCHE LLP
Certified Public Accountants
Fort Lauderdale, Florida
March 12, 2008
43
REPORT OF INDEPENDENT REGISTERED PUBLIC ACCOUNTING FIRM
To the Board of Directors and Stockholders of
Spherion Corporation
Fort Lauderdale, Florida
We have audited the accompanying consolidated balance sheets of Spherion Corporation and subsidiaries (the "Company") as of December 30, 2007 and December 31, 2006, and the related consolidated statements of earnings, stockholders' equity, and cash flows for each of the three years in the period ended December 30, 2007. Our audits also included the financial statement schedule listed in the Index at Item 15. These financial statements and financial statement schedule are the responsibility of the Company's management. Our responsibility is to express an opinion on the financial statements and financial statement schedule based on our audits.
We conducted our audits in accordance with the standards of the Public Company Accounting Oversight Board (United States). Those standards require that we plan and perform the audit to obtain reasonable assurance about whether the financial statements are free of material misstatement. An audit includes examining, on a test basis, evidence supporting the amounts and disclosures in the financial statements. An audit also includes assessing the accounting principles used and significant estimates made by management, as well as evaluating the overall financial statement presentation. We believe that our audits provide a reasonable basis for our opinion.
In our opinion, such consolidated financial statements present fairly, in all material respects, the financial position of Spherion Corporation and subsidiaries as of December 30, 2007 and December 31, 2006, and the results of their operations and their cash flows for each of the three years in the period ended December 30, 2007, in conformity with accounting principles generally accepted in the United States of America. Also, in our opinion, such financial statement schedule, when considered in relation to the basic consolidated financial statements taken as a whole, present fairly, in all material respects, the information set forth therein.
We have also audited, in accordance with the standards of the Public Company Accounting Oversight Board (United States), the Company's internal control over financial reporting as of December 30, 2007, based on the criteria established inInternal Control—Integrated Framework issued by the Committee of Sponsoring Organizations of the Treadway Commission and our report dated March 12, 2008 expressed an unqualified opinion on the Company's internal control over financial reporting.
DELOITTE & TOUCHE LLP
Certified Public Accountants
Fort Lauderdale, Florida
March 12, 2008
44
SPHERION CORPORATION AND SUBSIDIARIES
CONSOLIDATED STATEMENTS OF EARNINGS
(in thousands, except per share amounts)
| | Fiscal Years Ended
| |
|---|
| | December 30,
2007
| | December 31,
2006
| | January 1,
2006
| |
|---|
| Revenues | | $ | 2,017,114 | | $ | 1,922,735 | | $ | 1,966,400 | |
| Cost of services | | | 1,539,128 | | | 1,475,656 | | | 1,540,215 | |
| | |
| |
| |
| |
| | Gross profit | | | 477,986 | | | 447,079 | | | 426,185 | |
| | |
| |
| |
| |
| Selling, general and administrative expenses | | | 431,695 | | | 415,415 | | | 390,977 | |
| Interest expense | | | 3,746 | | | 1,965 | | | 3,205 | |
| Interest income | | | (4,631 | ) | | (4,055 | ) | | (4,072 | ) |
| Restructuring and other charges (credits) | | | 700 | | | (177 | ) | | 1,763 | |
| | |
| |
| |
| |
| | | | 431,510 | | | 413,148 | | | 391,873 | |
| | |
| |
| |
| |
| Earnings from continuing operations before income taxes | | | 46,476 | | | 33,931 | | | 34,312 | |
| Income tax expense | | | (17,339 | ) | | (11,608 | ) | | (11,737 | ) |
| | |
| |
| |
| |
| Earnings from continuing operations | | | 29,137 | | | 22,323 | | | 22,575 | |
| (Loss) earnings from discontinued operations, net of tax | | | (3,871 | ) | | 32,359 | | | (10,546 | ) |
| | |
| |
| |
| |
| Net earnings | | $ | 25,266 | | $ | 54,682 | | $ | 12,029 | |
| | |
| |
| |
| |
| Earnings per share-Basic: | | | | | | | | | | |
| | Earnings from continuing operations | | $ | 0.52 | | $ | 0.39 | | $ | 0.37 | |
| | (Loss) earnings from discontinued operations | | | (0.07 | ) | | 0.57 | | | (0.17 | ) |
| | |
| |
| |
| |
| | | $ | 0.45 | | $ | 0.96 | | $ | 0.20 | |
| | |
| |
| |
| |
| Earnings per share-Diluted: | | | | | | | | | | |
| | Earnings from continuing operations | | $ | 0.51 | | $ | 0.39 | | $ | 0.37 | |
| | (Loss) earnings from discontinued operations | | | (0.07 | ) | | 0.56 | | | (0.17 | ) |
| | |
| |
| |
| |
| | | $ | 0.44 | | $ | 0.95 | | $ | 0.20 | |
| | |
| |
| |
| |
| Weighted average shares used in computation of earnings per share: | | | | | | | | | | |
| | Basic | | | 56,234 | | | 57,212 | | | 60,938 | |
| | Diluted | | | 56,893 | | | 57,784 | | | 61,430 | |
See Notes to Consolidated Financial Statements.
45
SPHERION CORPORATION AND SUBSIDIARIES
CONSOLIDATED BALANCE SHEETS
(in thousands, except share data)
| | December 30,
2007
| | December 31,
2006
| |
|---|
| Assets | | | | | | | |
| Current Assets: | | | | | | | |
| | Cash and cash equivalents | | $ | 15,324 | | $ | 54,640 | |
| | Receivables, less allowance for doubtful accounts of $6,523 and $3,354, respectively | | | 347,908 | | | 274,185 | |
| | Deferred tax asset | | | 13,413 | | | 11,462 | |
| | Insurance deposit | | | 6,986 | | | 24,501 | |
| | Other current assets | | | 22,606 | | | 16,414 | |
| | |
| |
| |
| | | Total current assets | | | 406,237 | | | 381,202 | |
| Goodwill | | | 146,584 | | | 49,703 | |
| Property and equipment, net of accumulated depreciation of $109,229 and $93,265, respectively | | | 78,077 | | | 86,317 | |
| Deferred tax asset | | | 102,024 | | | 122,867 | |
| Tradenames and other intangibles, net | | | 76,776 | | | 271 | |
| Insurance deposit | | | 11,259 | | | 25,177 | |
| Other assets | | | 23,861 | | | 27,850 | |
| | |
| |
| |
| | | $ | 844,818 | | $ | 693,387 | |
| | |
| |
| |
| Liabilities and Stockholders' Equity | | | | | | | |
| Current Liabilities: | | | | | | | |
| | Current portion of long-term debt and revolving lines of credit | | $ | 86,035 | | $ | 2,068 | |
| | Accounts payable and other accrued expenses | | | 79,779 | | | 78,368 | |
| | Accrued salaries, wages and payroll taxes | | | 78,850 | | | 59,062 | |
| | Accrued insurance reserves | | | 19,174 | | | 22,368 | |
| | Accrued income tax payable | | | 1,042 | | | 3,512 | |
| | Other current liabilities | | | 16,419 | | | 8,555 | |
| | |
| |
| |
| | | Total current liabilities | | | 281,299 | | | 173,933 | |
| Long-term debt, net of current portion | | | 22,148 | | | 2,377 | |
| Accrued insurance reserves | | | 20,501 | | | 20,292 | |
| Deferred compensation | | | 17,287 | | | 18,984 | |
| Other long-term liabilities | | | 2,923 | | | 6,659 | |
| | |
| |
| |
| | | Total liabilities | | | 344,158 | | | 222,245 | |
| | |
| |
| |
| Commitments and contingencies (see Notes 11 and 14) | | | | | | | |
| Stockholders' Equity: | | | | | | | |
| | Preferred stock, par value $0.01 per share; authorized, 2,500,000 shares; none issued or outstanding | | | — | | | — | |
| | Common stock, par value $0.01 per share; authorized, 200,000,000; issued 65,341,609 shares | | | 653 | | | 653 | |
| | Treasury stock, at cost, 9,443,034 and 8,777,220 shares, respectively | | | (83,681 | ) | | (77,856 | ) |
| | Additional paid-in capital | | | 848,628 | | | 844,735 | |
| | Accumulated deficit | | | (273,393 | ) | | (300,060 | ) |
| | Accumulated other comprehensive income | | | 8,453 | | | 3,670 | |
| | |
| |
| |
| | | Total stockholders' equity | | | 500,660 | | | 471,142 | |
| | |
| |
| |
| | | $ | 844,818 | | $ | 693,387 | |
| | |
| |
| |
See Notes to Consolidated Financial Statements.
46
SPHERION CORPORATION AND SUBSIDIARIES
CONSOLIDATED STATEMENTS OF STOCKHOLDERS' EQUITY
For Fiscal Years Ended December 30, 2007, December 31, 2006 and January 1, 2006
(amounts in thousands)
| | Common
Stock
| | Treasury
Stock
| | Additional
Paid-In
Capital
| | Accumulated
Deficit
| | Accumulated
Other
Comprehensive
Income
| | Total
| |
|---|
| Balance as of December 31, 2004 | | $ | 653 | | $ | (40,430 | ) | $ | 847,806 | | $ | (366,771 | ) | $ | 3,034 | | $ | 444,292 | |
| | | | | | | | | | | | | | | | | |
| |
| Comprehensive income: | | | | | | | | | | | | | | | | | | | |
| | Net income | | | — | | | — | | | — | | | 12,029 | | | — | | | 12,029 | |
| | Other comprehensive income: | | | | | | | | | | | | | | | | | | | |
| | | Foreign currency translation adjustments arising during the period | | | — | | | — | | | — | | | — | | | 803 | | | 803 | |
| | | | | | | | | | | | | | | | | |
| |
| | Comprehensive income | | | | | | | | | | | | | | | | | | 12,832 | |
| | | | | | | | | | | | | | | | | |
| |
| Proceeds from exercise of employee stock options, including tax benefit | | | — | | | 5,531 | | | (1,717 | ) | | — | | | — | | | 3,814 | |
| Proceeds from issuance of shares under Employee Stock Purchase Plan | | | — | | | 1,193 | | | (511 | ) | | — | | | — | | | 682 | |
| Treasury stock reissued and compensation earned in connection with deferred compensation | | | — | | | 1,426 | | | (522 | ) | | — | | | — | | | 904 | |
| Treasury stock purchases | | | — | | | (24,019 | ) | | — | | | — | | | — | | | (24,019 | ) |
| | |
| |
| |
| |
| |
| |
| |
| Balance as of January 1, 2006 | | | 653 | | | (56,299 | ) | | 845,056 | | | (354,742 | ) | | 3,837 | | | 438,505 | |
| | | | | | | | | | | | | | | | | |
| |
| Comprehensive income: | | | | | | | | | | | | | | | | | | | |
| | Net income | | | — | | | — | | | — | | | 54,682 | | | — | | | 54,682 | |
| | Other comprehensive income: | | | | | | | | | | | | | | | | | | | |
| | | Foreign currency translation adjustments arising during the period | | | — | | | — | | | — | | | — | | | (167 | ) | | (167 | ) |
| | | | | | | | | | | | | | | | | |
| |
| | Comprehensive income | | | | | | | | | | | | | | | | | | 54,515 | |
| | | | | | | | | | | | | | | | | |
| |
| Proceeds from exercise of employee stock options, including tax benefit | | | — | | | 2,728 | | | (456 | ) | | — | | | — | | | 2,272 | |
| Proceeds from issuance of shares under Employee Stock Purchase Plan | | | — | | | 710 | | | (179 | ) | | — | | | — | | | 531 | |
| Treasury stock reissued and compensation earned in connection with deferred compensation | | | — | | | 3,340 | | | (3,155 | ) | | — | | | — | | | 185 | |
| Treasury stock purchases | | | — | | | (28,335 | ) | | — | | | — | | | — | | | (28,335 | ) |
| Share-based compensation expense | | | — | | | — | | | 3,469 | | | — | | | — | | | 3,469 | |
| | |
| |
| |
| |
| |
| |
| |
| Balance as of December 31, 2006 | | | 653 | | | (77,856 | ) | | 844,735 | | | (300,060 | ) | | 3,670 | | | 471,142 | |
| | | | | | | | | | | | | | | | | |
| |
| Comprehensive income: | | | | | | | | | | | | | | | | | | | |
| | Net income | | | — | | | — | | | — | | | 25,266 | | | — | | | 25,266 | |
| | Other comprehensive income: | | | | | | | | | | | | | | | | | | | |
| | | Foreign currency translation adjustments arising during the period | | | — | | | — | | | — | | | — | | | 4,783 | | | 4,783 | |
| | | | | | | | | | | | | | | | | |
| |
| | Comprehensive income | | | | | | | | | | | | | | | | | | 30,049 | |
| | | | | | | | | | | | | | | | | |
| |
| Cumulative effect of change of accounting principle | | | — | | | — | | | — | | | 1,401 | | | — | | | 1,401 | |
| Proceeds from exercise of employee stock options, including tax benefit | | | — | | | 3,412 | | | (346 | ) | | — | | | — | | | 3,066 | |
| Proceeds from issuance of shares under Employee Stock Purchase Plan | | | — | | | 667 | | | (156 | ) | | — | | | — | | | 511 | |
| Treasury stock reissued and compensation earned in connection with deferred compensation | | | — | | | 360 | | | 2,325 | | | — | | | — | | | 2,685 | |
| Treasury stock purchases | | | — | | | (10,264 | ) | | — | | | — | | | — | | | (10,264 | ) |
| Share-based compensation expense | | | — | | | — | | | 2,070 | | | — | | | — | | | 2,070 | |
| | |
| |
| |
| |
| |
| |
| |
| Balance as of December 30, 2007 | | $ | 653 | | $ | (83,681 | ) | $ | 848,628 | | $ | (273,393 | ) | $ | 8,453 | | $ | 500,660 | |
| | |
| |
| |
| |
| |
| |
| |
See Notes to Consolidated Financial Statements.
47
SPHERION CORPORATION AND SUBSIDIARIES
CONSOLIDATED STATEMENTS OF CASH FLOWS
(amounts in thousands)
| | Fiscal Years Ended
| |
|---|
| | December 30,
2007
| | December 31,
2006
| | January 1,
2006
| |
|---|
| Cash flows from operating activities: | | | | | | | | | | |
| | Net earnings | | $ | 25,266 | | $ | 54,682 | | $ | 12,029 | |
| Adjustments to reconcile net earnings to net cash provided by operating activities: | | | | | | | | | | |
| | Discontinued operations (gain) loss on disposal, net of income tax | | | (682 | ) | | (2,438 | ) | | 6,665 | |
| | Discontinued operations goodwill impairment, net of income tax | | | 3,283 | | | — | | | — | |
| | Depreciation and amortization | | | 23,409 | | | 22,198 | | | 21,906 | |
| | Deferred income tax expense | | | 14,793 | | | 26,910 | | | 6,313 | |
| | Restructuring and other charges | | | 473 | | | 750 | | | 1,763 | |
| | Share-based compensation | | | 4,755 | | | 3,654 | | | 939 | |
| | Other non-cash charges | | | 3,170 | | | 1,410 | | | 1,253 | |
| | Changes in assets and liabilities, net of effects of acquisitions: | | | | | | | | | | |
| | | Receivables, net | | | (5,357 | ) | | 20,224 | | | 62,767 | |
| | | Other assets | | | 123 | | | (6,283 | ) | | 2,551 | |
| | | Income tax receivable | | | — | | | 4,613 | | | 8,484 | |
| | | Accounts payable, income taxes payable, accrued liabilities and other liabilities | | | (13,146 | ) | | (79,635 | ) | | (52,385 | ) |
| | |
| |
| |
| |
| | | | Net cash provided by operating activities | | | 56,087 | | | 46,085 | | | 72,285 | |
| | |
| |
| |
| |
| Cash flows from investing activities: | | | | | | | | | | |
| | Proceeds from sale of discontinued operations | | | 100 | | | 1,004 | | | 1,376 | |
| | Acquisitions, net of cash acquired | | | (196,453 | ) | | (1,186 | ) | | (887 | ) |
| | Capital expenditures, net | | | (8,324 | ) | | (22,677 | ) | | (9,651 | ) |
| | Insurance reimbursements | | | 32,368 | | | 29,713 | | | 19,054 | |
| | Surrender of company-owned life insurance policies, net | | | — | | | — | | | 4,179 | |
| | Note receivable proceeds from sale of Australian subsidiary | | | — | | | — | | | 3,781 | |
| | Other | | | 631 | | | 1,105 | | | 888 | |
| | |
| |
| |
| |
| | | | Net cash (used in) provided by investing activities | | | (171,678 | ) | | 7,959 | | | 18,740 | |
| | |
| |
| |
| |
| Cash flows from financing activities: | | | | | | | | | | |
| | Debt repayments | | | (2,503 | ) | | (3,139 | ) | | (5,642 | ) |
| | Retirement of convertible notes | | | — | | | — | | | (8,000 | ) |
| | Proceeds (repayments) of lines of credit, net | | | 84,971 | | | — | | | (32,085 | ) |
| | Proceeds from exercise of employee stock options | | | 2,857 | | | 2,007 | | | 3,605 | |
| | Purchases of treasury stock and other, net | | | (10,264 | ) | | (28,335 | ) | | (24,019 | ) |
| | Other, net | | | 207 | | | (3 | ) | | (7 | ) |
| | |
| |
| |
| |
| | | | Net cash provided by (used in) financing activities | | | 75,268 | | | (29,470 | ) | | (66,148 | ) |
| | |
| |
| |
| |
| Effect of exchange rates on cash and cash equivalents | | | 1,007 | | | (97 | ) | | 132 | |
| | |
| |
| |
| |
| Net (decrease) increase in cash and cash equivalents | | | (39,316 | ) | | 24,477 | | | 25,009 | |
| Cash and cash equivalents, beginning of period | | | 54,640 | | | 30,163 | | | 5,154 | |
| | |
| |
| |
| |
| Cash and cash equivalents, end of period | | $ | 15,324 | | $ | 54,640 | | $ | 30,163 | |
| | |
| |
| |
| |
| Supplemental cash flow information: | | | | | | | | | | |
| | Cash paid (received) during the year for: | | | | | | | | | | |
| | | Income taxes | | $ | 2,396 | | $ | (3,248 | ) | $ | (5,072 | ) |
| | | Interest expense | | $ | 1,311 | | $ | 1,316 | | $ | 1,935 | |
| | Non-cash activities: | | | | | | | | | | |
| | | Deferred payment related to Technisource purchase | | $ | 20,000 | | $ | — | | $ | — | |
| | | Accrual of fixed asset purchases | | $ | 681 | | $ | 900 | | $ | 3,209 | |
| | | Short-term notes payable for purchase of software and related costs | | $ | — | | $ | 709 | | $ | 714 | |
| | | Deferred purchase price from the sale of discontinued operations | | $ | — | | $ | — | | $ | 120 | |
See Notes to Consolidated Financial Statements.
48
SPHERION CORPORATION AND SUBSIDIARIES
NOTES TO CONSOLIDATED FINANCIAL STATEMENTS
1. SUMMARY OF SIGNIFICANT ACCOUNTING POLICIES
Business—Spherion Corporation provides temporary staffing services, managed services and permanent placement services and operates in the United States of America and Canada. Temporary staffing is a service where Spherion's employees work at customer locations under the supervision of customer personnel. Temporary staffing services include personnel in the following skill categories: clerical, light industrial, information technology, finance and accounting, legal, engineering, sales and marketing, human resources and administrative. Managed services includes services where Spherion manages aspects of a customer function such as: recruiting, administrative services, data center or network operations. Permanent placement is a service where Spherion employees locate talent on behalf of its customers, screen the candidates and assist in the recruitment efforts. Spherion has two operating segments, Staffing Services and Professional Services. Founded in 1946, Spherion is headquartered in Fort Lauderdale, Florida, and has a network of 742 locations.
Principles of Consolidation—The accompanying Consolidated Financial Statements include the accounts of Spherion Corporation, its wholly-owned subsidiaries and certain other entities it is required to consolidate ("Spherion"). All material intercompany transactions and balances have been eliminated. Certain immaterial prior year balance sheets amounts have been reclassified to conform to the current period presentation.
In accordance with Financial Accounting Standards Board ("FASB") Interpretation ("FIN") No. 46 ("FIN 46R"), "Consolidation of Variable Interest Entities," Spherion consolidates variable interest entities (VIE's) for which it is the primary beneficiary. VIE's are generally entities that lack sufficient equity to operate without additional financial support from other parties or are entities whose equity holders do not have adequate decision making authority. The primary beneficiary of a VIE is the party that absorbs the majority of the entity's expected losses or receives the majority of the residual returns.
Spherion has evaluated the provisions of FIN 46R and determined that it applies to its two forms of area-based franchise agreements. Spherion has determined that these agreements by themselves do not create a VIE, but in some cases Spherion has provided financing under these agreements which does create a VIE. Spherion evaluates all VIE's to determine if it is the primary beneficiary and consolidates VIE's when it is the primary beneficiary.
Use of Estimates—The preparation of financial statements in conformity with generally accepted accounting principles in the United States of America requires management to make estimates and assumptions that affect the reported amounts of assets and liabilities and disclosure of contingent assets and liabilities at the date of the financial statements and the reported amounts of revenues and expenses during the reporting period. Due to the inherent uncertainty involved in making estimates, actual results reported in future periods may be materially different from those estimates.
Fiscal Year—Effective in 2005, Spherion changed its fiscal year end by two days from 52 or 53 weeks ending on the last Friday in December to 52 or 53 weeks ending on the last Sunday in December. This change conforms Spherion's reporting periods to its normal weekly business cycle. This change did not have a material impact on Spherion's quarterly or annual results of operations, cash flows or financial position. The fiscal years ended in December 30, 2007 ("Fiscal year 2007" or "2007"), December 31, 2006, and January 1, 2006 all contained 52 weeks.
Cash and Cash Equivalents—All highly liquid investments with original maturities of 90 days or less at the time of purchase are classified as cash equivalents. Cash equivalents are carried at cost, which approximates fair value due to the short-term maturities of these instruments.
49
SPHERION CORPORATION AND SUBSIDIARIES
NOTES TO CONSOLIDATED FINANCIAL STATEMENTS—(Continued)
1. SUMMARY OF SIGNIFICANT ACCOUNTING POLICIES (Continued)
Allowance for Doubtful Accounts—Accounts receivable are carried at the amount estimated to be collectible. Accordingly, allowances are provided for accounts receivable estimated to be uncollectible based on management's best estimates based on historical write-off levels and other factors. Recoveries are recognized in the period they are received. The ultimate amount of accounts receivable that become uncollectible could differ from those estimated.
Investments—Spherion invests in mutual funds in an amount approximately equal to its obligation to employees pursuant to the terms of its non-qualified deferred compensation plans (See Note 10, "Employee Savings and Investment Plans"). These investments are classified as trading securities and are reported at fair value with gains and losses included in earnings during the period incurred. The specific identification method is used to determine the cost of investments sold. These investments are included in "Other current assets" and "Other assets" in the accompanying Consolidated Balance Sheets. Spherion did not have any investments in available-for-sale securities as of December 30, 2007 or December 31, 2006.
Goodwill and Other Intangible Assets—Goodwill and other intangible assets are accounted for in accordance with Statement of Financial Accounting Standards ("SFAS") No. 141, "Business Combinations," and No. 142, "Goodwill and Other Intangible Assets." SFAS No. 141 requires to allocate purchase price to tangible and identifiable intangible assets based on their fair value. SFAS No. 142 requires that goodwill and other intangible assets with indefinite lives should not be amortized, but should be tested for impairment on an annual basis, or more often if an event occurs or circumstances change that would more likely than not reduce the fair value of a reporting unit below its carrying amount. Customer relationships and other intangible assets are amortized on an accelerated method over the estimated useful life of the intangible assets ranging from 4 to 19 years. Tradenames have an indefinite life and are therefore not amortized. See Note 6, "Goodwill and Intangible Assets," for further discussion.
Property and Equipment—Property and equipment are stated at cost and depreciated using the straight-line method over the estimated useful lives of the related assets. Leasehold improvements are amortized over the shorter of their estimated useful life or the lease term using the straight-line method. Maintenance and repairs, which do not improve or extend the life of an asset, are expensed as incurred.
Capitalized Software Costs—Software which has been developed for internal use is accounted for in accordance with Statement of Position ("SOP") 98-1, "Accounting for the Costs of Computer Software Developed or Obtained for Internal Use." Only costs incurred during the application development stage, including design, coding, installation and testing are capitalized. These capitalized costs include external consulting fees, software license fees and internal labor costs for employees directly associated with software development. Upgrades or modifications that result in additional functionality are capitalized, while upgrades or modifications that do not result in additional functionality are expensed as incurred.
Impairment of Long-Lived Assets—As required by SFAS No. 144, "Accounting for the Impairment or Disposal of Long-Lived Assets," long-lived assets should be tested for recoverability whenever events or circumstances indicate that their carrying amount may not be recoverable. Spherion evaluates the recoverability of its long-lived assets primarily fixed assets and other intangible assets, at least annually to determine whether an adjustment to carrying values or a revision to estimated useful lives is appropriate if and/or when an event or circumstance arises that would require it to do so. If the estimated future cash flows are projected to be less than the carrying value, an impairment write-down would be recorded, measured by the amount of the asset's carrying value in excess of fair value. The estimated future cash flows of an asset or asset group are calculated on an undiscounted basis.
50
SPHERION CORPORATION AND SUBSIDIARIES
NOTES TO CONSOLIDATED FINANCIAL STATEMENTS—(Continued)
1. SUMMARY OF SIGNIFICANT ACCOUNTING POLICIES (Continued)
Accrued Self-Insurance Losses—Spherion retains a portion of the risk under its workers' compensation, general liability, professional liability, employment practices liability and health benefits insurance programs. Estimated losses for workers' compensation, general liability and employment practices liability have been discounted at 3.7% and 4.8% at December 30, 2007 and December 31, 2006, respectively. While management believes that the amount recorded for the liabilities is adequate, there can be no assurance that changes to management's estimates may not occur due to limitations inherent in the estimation process. Changes in the estimates of these accruals are charged or credited to earnings in the period determined. Spherion provides its workers' compensation insurance carrier with cash deposits ("Insurance deposits" in the accompanying Consolidated Balance Sheets) and letters of credit to collateralize its obligations for outstanding claims. The insurance deposit and letters of credit were $18.2 million and $31.1 million at December 30, 2007, respectively, and $49.7 million and $16.7 million at December 31, 2006, respectively. The deposit will be used to fund claims and cannot be used for general corporate purposes.
Foreign Currency Translation—Spherion's Canadian operation uses the Canadian dollar as its functional currency. Assets and liabilities of this operation are translated at the exchange rates in effect on the balance sheet date. Amounts included in Spherion's Statements of Earnings are translated at the average exchange rates for the year. The impact of currency fluctuation is included in stockholders' equity as part of accumulated other comprehensive income.
Revenue Recognition—Spherion records revenues from sales of services by its company-owned and franchised operations and from royalties earned on sales of services by its area-based franchised operations. Temporary staffing and managed service revenues and the related labor costs are recorded in the period in which services are performed. Permanent placement revenues are recognized upon candidate start date. Allowances are established to estimate losses due to placed candidates not remaining employed for Spherion's guarantee period. Spherion follows Emerging Issues Task Force ("EITF") 99-19, "Reporting Revenue Gross as a Principal versus Net as an Agent" in the presentation of revenues and expenses. This guidance requires Spherion to assess whether it acts as a principal in the transaction or as an agent acting on behalf of others. In situations where Spherion is the principal in the transaction and has the risks and rewards of ownership, the transactions are recorded gross in the Consolidated Statements of Earnings. Sales tax collected from customers and remitted to the applicable taxing authorities is accounted for on a net basis, with no impact on revenues.
Spherion utilizes two forms of franchising agreements. Under the first form, Spherion records area-based franchise royalties in accordance with SFAS No. 45, "Accounting for Franchise Fee Revenue" based upon the contractual percentage of area-based franchise sales in the period in which the area-based franchisee provides the service. Area-based franchise royalties, which are included in revenues, were $8.2 million, $8.6 million, and $9.0 million for the 2007, 2006 and 2005 fiscal years, respectively. The second form of franchising agreement is a franchisee agreement where Spherion acts as the principal in customer transactions through direct contractual relationships with the customers, owning related customer receivables and being the legal employer of the temporary employee and the franchisee acts as Spherion's agent providing certain sales and recruiting services. Accordingly, sales and costs of services generated by the franchised operation are recorded in Spherion's Consolidated Statements of Earnings. Spherion pays the franchisee a commission for acting as Spherion's agent and this commission is based on a percentage of gross profit from the office managed by the franchisee and averaged 74%, 72% and 70% for the fiscal years ended 2007, 2006 and 2005, respectively, of the franchised offices' gross profit. The
51
SPHERION CORPORATION AND SUBSIDIARIES
NOTES TO CONSOLIDATED FINANCIAL STATEMENTS—(Continued)
1. SUMMARY OF SIGNIFICANT ACCOUNTING POLICIES (Continued)
franchisee is responsible for establishing its office location and paying related administrative and operating expenses, such as rent, utilities and salaries of the franchisee's sales and service employees.
Except in the circumstance where Spherion is required to consolidate certain franchisees' operations, Spherion's Consolidated Statements of Earnings reflect the franchisee commission as an expense, but do not include the rent, utilities and salaries of the franchisee's full-time office employees as these expenses are the responsibility of the franchisee. Spherion has credit risk for sales to its customers through franchisee arrangements as Spherion pays all direct costs associated with providing temporary services before related accounts receivable are collected. Spherion has partially mitigated this risk by making the franchisee responsible to reimburse Spherion up to 100% of uncollected accounts receivable (bad debts are deducted from commission payments); however, Spherion bears the loss in cases where the franchisee does not have sufficient financial wherewithal to reimburse uncollected amounts.
As of December 30, 2007 and December 31, 2006, Spherion had eight VIEs all of which are franchisees and were consolidated, which amounted to approximately $64.8 million and $42.2 million of consolidated revenues, respectively. Spherion's VIE consolidated net assets were $1.1 million and $1.8 million at December 30, 2007 and December 31, 2006, respectively. Each franchisee's loan is collateralized by their respective business and in the event of default on the loan, Spherion retains the right to take over their operations. General creditors of Spherion's franchisees do not have any recourse against Spherion. As of December 2007, Spherion currently does not have VIEs that are not consolidated. All loan receivables are included in "Other current assets" in the accompanying Consolidated Balance Sheets.
Income Taxes—Deferred taxes arise from temporary differences between the tax basis of an asset or liability and its reported amount in the Consolidated Financial Statements. Valuation allowances on deferred tax assets are recorded to the extent it is more likely than not that a tax benefit will not be realized. Spherion is subject to tax audits in numerous jurisdictions in the U.S. and Canada. Tax audits by their very nature are often complex and can require several years to complete. In the normal course of business, Spherion is subject to challenges from the IRS and other tax authorities regarding amounts of taxes due. These challenges may alter the timing or amount of taxable income or deductions, or the allocation of income among tax jurisdictions. Prior to January 1, 2007, Spherion recorded the amount expected to incur as a result of tax audits as part of accrued income taxes based upon SFAS No. 5, "Accounting for Contingencies." Effective January 1, 2007, Spherion adopted FASB Interpretation No. (FIN) 48, "Accounting for Uncertainty in Income Taxes." FIN 48 requires that Spherion determine whether the benefits of its tax positions are more likely than not of being sustained upon audit based on the technical merits of the tax position. For tax positions that are at least more likely than not of being sustained upon audit, Spherion recognizes the largest amount of the benefit that is more likely than not of being sustained in Spherion's Consolidated Financial Statements. See Note 3, "Income Taxes," for further discussion.
Earnings Per Share—Basic earnings (loss) per share is computed by dividing Spherion's earnings (loss) by the weighted-average number of shares outstanding during the period. When the effects of the common stock equivalents are not anti-dilutive, diluted earnings per share is computed by dividing Spherion's net earnings plus after-tax interest on the convertible notes, if applicable, by the weighted-average number of shares outstanding and the impact of all dilutive potential common shares, primarily stock options, convertible notes, restricted stock and restricted stock units. During 2005, Spherion repaid its convertible subordinated notes and convertible promissory notes, respectively. The dilutive impact of stock options is determined by applying the "treasury stock" method and the dilutive impact of the convertible notes is
52
SPHERION CORPORATION AND SUBSIDIARIES
NOTES TO CONSOLIDATED FINANCIAL STATEMENTS—(Continued)
1. SUMMARY OF SIGNIFICANT ACCOUNTING POLICIES (Continued)
determined by applying the "if converted" method. See Note 4, "Earnings Per Share," for further discussion.
Derivative Financial Instruments—From time to time, Spherion enters into foreign exchange forward contracts as part of the management of its foreign currency exchange rate exposures. These financial instruments are not held for trading purposes and none of the instruments are leveraged. All financial instruments are put into place to hedge specific exposures. Gains and losses on foreign currency forward contracts offset gains and losses resulting from the underlying transactions. Spherion accounts for its derivatives in accordance with SFAS No. 133, "Accounting for Derivative Instruments and Hedging Activities," as amended. Gains and losses on contracts that hedge foreign currency commitments are recognized in earnings. Amounts receivable or payable under the agreements are included in "Other current assets" or "Other current liabilities" in the accompanying Consolidated Balance Sheets.
Share-Based Compensation—Effective January 2, 2006, Spherion adopted the provisions of SFAS No. 123 (revised 2004, "SFAS No. 123R"), "Share-Based Payment," using the modified prospective transition method. Under this transition method, the compensation cost recognized beginning January 2, 2006 includes compensation cost for (i) all share-based payments granted prior to, but not yet vested as of January 2, 2006, based on the grant-date fair value estimated in accordance with the original provisions of SFAS No. 123, "Accounting for Stock Based Compensation," and (ii) all share-based payments granted subsequent to January 1, 2006 based on the grant-date fair value estimated in accordance with the provisions of SFAS No. 123R. Prior period amounts have not been restated to recognize compensation cost in the Consolidated Statements of Earnings. Under SFAS No. 123R, compensation cost is measured at the grant date based on the value of the award and is recognized in the statement of earnings over the vesting period.
Prior to fiscal year 2006, employee stock options were accounted for under the intrinsic value method in accordance with Accounting Principles Board Opinion No. 25 ("APB 25"), "Accounting for Stock Issued to Employees," and its related interpretations, and were granted at market value. Accordingly, compensation expense for stock option awards for prior periods was not recognized in the Consolidated Statements of Earnings. See Note 2, "Share-Based Compensation," for further discussion.
New Accounting Pronouncements and Interpretations—In December 2007, the FASB issued SFAS No. 141R, "Business Combinations." This statement amends SFAS No. 141 and provides revised guidance for recognizing and measuring assets acquired and liabilities assumed in a business combination. This statement also requires that transaction costs in a business combination be expensed as incurred. SFAS No. 141R applies prospectively to business combinations for which the acquisition date is on or after the beginning of the first annual reporting period beginning on or after December 15, 2008. SFAS No. 141R will impact Spherion's accounting for business combinations completed, if any, beginning January 1, 2009.
In February 2007, SFAS No. 159, "The Fair Value Option for Financial Assets and Financial Liabilities," was issued. SFAS No. 159 enables companies to report selected financial assets and liabilities at their fair value. This statement requires companies to provide additional information to help investors and other users of financial statements understand the effects of a company's election to use fair value on its earnings. SFAS No. 159 also requires companies to display the fair value of assets and liabilities on the face of the balance sheet when a company elects to use fair value. SFAS No. 159 is effective for fiscal years beginning after November 15, 2007. Spherion evaluated the requirements of SFAS No. 159 and has determined that there will be no impact on its financial condition or results of operations.
53
SPHERION CORPORATION AND SUBSIDIARIES
NOTES TO CONSOLIDATED FINANCIAL STATEMENTS—(Continued)
2. SHARE-BASED COMPENSATION
In May 2006, Spherion's stockholders approved the adoption of the 2006 Stock Incentive Plan, which replaced the 2000 Stock Incentive Plan and the Deferred Stock Plan effective July 1, 2006. Under the 2006 Stock Incentive Plan, options to purchase Spherion's common stock may be granted to employees and outside directors of Spherion and its subsidiaries for periods not to exceed seven years at a price that is not less than 100% of fair market value on the date of grant. The 2006 Stock Incentive Plan also allows other types of stock-based awards including common stock, performance shares, performance units, restricted stock and stock appreciation rights, although there are limitations on the amount of full value awards that can be granted. All awards of stock options, restricted stock units and other stock-based awards granted on or after July 1, 2006 will be issued under the 2006 Stock Incentive Plan. As of December 30, 2007, Spherion had 4,673,513 shares reserved for future grants under the 2006 Stock Incentive Plan. Additionally, any shares subject to awards under the 2000 Stock Incentive Plan that are cancelled, forfeited or expired will be available for re-grant under the 2006 Stock Incentive Plan. Spherion expects to satisfy option exercises with treasury stock.
Spherion also has an Employee Stock Purchase Plan that provides substantially all employees who have been employed for at least six months an opportunity to purchase shares of its common stock at a discount of 15%. The provisions of SFAS No. 123R require the expense related to Spherion's Employee Stock Purchase Plan be recorded in the Consolidated Statements of Earnings. The expense related to this plan was not material to the Consolidated Statements of Earnings.
All share-based compensation expense and tax benefits, primarily related to stock option and restricted stock unit awards recognized in the Consolidated Statement of Earnings during the year were as follows (in thousands):
| | Fiscal Years
| |
|---|
| | 2007
| | 2006
| | 2005
| |
|---|
| Share-based compensation expense | | $ | 4,755 | | $ | 3,654 | | $ | 939 | |
| Income tax benefit | | | (1,390 | ) | | (494 | ) | | (367 | ) |
| | |
| |
| |
| |
| | Share-based compensation expense, net of tax | | $ | 3,365 | | $ | 3,160 | | $ | 572 | |
| | |
| |
| |
| |
The fair value of each option grant is estimated using the Black-Scholes-Merton option pricing model. The fair value is then amortized over the requisite vesting periods of the awards. Use of this valuation model requires management to make certain assumptions with respect to selected model inputs. Expected volatility was calculated based on the historical volatility of Spherion's stock. The average expected life was based on the contractual term of the option and expected employee exercise and post-vesting employment termination behavior. The risk-free interest rate is based on U.S. Treasury zero-coupon issues with a remaining term equal to the expected life assumed at the date of grant. Forfeitures are estimated based on historical option forfeitures. Assumptions used in the valuation model were as follows:
| | Fiscal Years
| |
|---|
| | 2007
| | 2006
| | 2005
| |
|---|
| Expected life (in years) | | | 4.6 | | | 4.2 | | | 3.3 | |
| Interest rate | | | 4.7 | % | | 4.6 | % | | 3.6 | % |
| Volatility | | | 40.0 | % | | 49.0 | % | | 52.0 | % |
| Expected dividends | | | — | | | — | | | — | |
| Weighted average per share fair value | | $ | 3.57 | | $ | 4.39 | | $ | 3.14 | |
54
SPHERION CORPORATION AND SUBSIDIARIES
NOTES TO CONSOLIDATED FINANCIAL STATEMENTS—(Continued)
2. SHARE-BASED COMPENSATION (Continued)
Changes under these stock option plans for the fiscal year-ended December 30, 2007 were as follows:
| | Shares
| | Weighted Average Exercise Price
| | Weighted Average Remaining Contractual Term (in years)
| | Aggregate Intrinsic Value*
|
|---|
| |
| |
| |
| | (in thousands)
|
|---|
| Outstanding at December 31, 2006 | | 4,177,910 | | $ | 9.85 | | | | | |
| Granted | | 505,500 | | | 8.88 | | | | | |
| Exercised | | (393,650 | ) | | 7.26 | | | | | |
| Forfeited | | (881,655 | ) | | 10.86 | | | | | |
| | |
| |
| | | | | |
| Outstanding at December 30, 2007 | | 3,408,105 | | $ | 9.74 | | 5.6 | | $ | 430 |
| | |
| |
| |
| |
|
| Vested and expected to vest at December 30, 2007 | | 3,248,235 | | $ | 9.77 | | 5.5 | | $ | 430 |
| | |
| |
| |
| |
|
| Options exercisable at December 30, 2007 | | 2,332,266 | | $ | 10.00 | | 4.9 | | $ | 427 |
| | |
| |
| |
| |
|
- *
- The intrinsic value of an option is the excess of the market price at the balance sheet date of the underlying stock over the exercise price.
The total intrinsic value of options exercised during the fiscal years ended December 30, 2007, December 31, 2006, and January 1, 2006 was $0.7 million, $0.8 million, and $0.4 million, respectively.
As of December 30, 2007, there was $1.2 million, of total unrecognized compensation costs related to nonvested stock options granted under the Plan. That cost is expected to be recognized over a weighted-average period of 1.3 years. The total fair value of stock options vested during the year ended December 30, 2007, December 31, 2006, and January 1, 2006 was $2.2 million, $2.1 million, and $2.0 million, respectively.
Cash received from option exercises was $2.9 million, $2.0 million, and $3.6 million for the fiscal years ended December 30, 2007, December 31, 2006, and January 1, 2006, respectively.
Spherion employees and outside directors are eligible to receive grants of restricted stock units. Restricted stock units entitle the recipient to receive shares of Spherion common stock at a future date after the recipient has met service requirements or Spherion has met financial targets. The majority of the restricted stock units vest based upon attainment of performance criteria; the remainder vest over 1 to 7 years. If performance criteria are not met, the shares do not vest and recognized compensation cost, if any, is reversed to income. The value of the restricted stock units is amortized to compensation expense ratably over the vesting period and was $2.7 million, $0.2 million, and $0.9 million for the fiscal years ended December 30, 2007, December 31, 2006, and January 1, 2006, respectively. The provisions of SFAS
55
SPHERION CORPORATION AND SUBSIDIARIES
NOTES TO CONSOLIDATED FINANCIAL STATEMENTS—(Continued)
2. SHARE-BASED COMPENSATION (Continued)
No. 123R did not materially change the accounting for the restricted stock units. Changes in nonvested stock (restricted stock units) for the fiscal year ended December 30, 2007 were:
| | Shares
| | Weighted Average Grant-Date Fair Value
|
|---|
| Nonvested at beginning of year | | 480,136 | | $ | 8.42 |
| Granted | | 979,418 | | | 8.89 |
| Vested | | (58,282 | ) | | 9.01 |
| Forfeited | | (264,102 | ) | | 8.64 |
| | |
| |
|
| Nonvested at end of year | | 1,137,170 | | $ | 8.74 |
| | |
| |
|
As of December 30, 2007, vested and unissued restricted stock units amounted to 270,392 shares.
As of December 30, 2007, total unrecognized compensation expense related to restricted stock units was $6.7 million; the previously recognized portion was $4.0 million. The unrecognized compensation cost related to restricted stock units that vest solely based on the passage of time is $2.0 million and is being recognized as a selling, general and administrative expense over the vesting period. The unrecognized compensation cost related to restricted stock units that vest solely based on the attainment of performance criteria is $4.7 million of which $2.6 million is estimated to ultimately vest and is being recognized as a selling, general and administrative expense over the vesting period. The remaining $2.1 million related to restricted stock units that vest solely based on the attainment of performance criteria is not being recognized as the performance criteria are not estimated to be achieved. Total unrecognized compensation costs related to restricted stock units are expected to be recognized over a weighted-average period of 2.0 years. The total fair value of restricted stock units vested during the years ended December 30, 2007, December 31, 2006, and January 1, 2006 was $0.5 million, $3.0 million, and $0.4 million, respectively.
The following table reflects pro forma net earnings and earnings per share for the fiscal year 2005, had the Company applied the fair value approach of SFAS No. 123, as reported in the footnotes to the Company's Consolidated Financial Statements (in thousands, except per share amounts):
| | Fiscal Year
| |
|---|
| | 2005
| |
|---|
| Net earnings, as reported | | $ | 12,029 | |
Add: Restricted stock unit expense included in reported
net earnings, net of related tax effects | | | 572 | |
Deduct: Total stock-based employee compensation
expense determined under SFAS No. 123
for all awards, net of related tax effects | | | (2,489 | ) |
| | |
| |
| Pro forma net earnings | | $ | 10,112 | |
| | |
| |
| Earnings per share: | | | | |
| Basic—as reported | | $ | 0.20 | |
| | |
| |
| Basic—pro forma | | $ | 0.17 | |
| | |
| |
| Diluted—as reported | | $ | 0.20 | |
| | |
| |
| Diluted—pro forma | | $ | 0.16 | |
| | |
| |
56
SPHERION CORPORATION AND SUBSIDIARIES
NOTES TO CONSOLIDATED FINANCIAL STATEMENTS—(Continued)
3. INCOME TAXES
Income from continuing operations before income taxes in the United States of America and outside the United States of America, along with the components of the income tax provision, are as follows (in thousands):
| | Fiscal Years
|
|---|
| | 2007
| | 2006
| | 2005
|
|---|
Income from continuing operations before
income taxes: | | | | | | | | | |
| | United States | | $ | 46,246 | | $ | 32,045 | | $ | 32,758 |
| | Foreign | | | 230 | | | 1,886 | | | 1,554 |
| | |
| |
| |
|
| | | $ | 46,476 | | $ | 33,931 | | $ | 34,312 |
| | |
| |
| |
|
| Current tax (benefit) expense: | | | | | | | | | |
| | Federal | | $ | 273 | | $ | (15,878 | ) | $ | 426 |
| | State | | | 1,405 | | | 430 | | | 1,386 |
| | Foreign | | | 54 | | | — | | | 47 |
| | |
| |
| |
|
| | | | 1,732 | | | (15,448 | ) | | 1,859 |
| | |
| |
| |
|
| Deferred tax expense: | | | | | | | | | |
| | Federal | | | 13,819 | | | 25,191 | | | 8,957 |
| | State | | | 1,708 | | | 1,580 | | | 338 |
| | Foreign | | | 80 | | | 285 | | | 583 |
| | |
| |
| |
|
| | | | 15,607 | | | 27,056 | | | 9,878 |
| | |
| |
| |
|
| Total provision for income taxes | | $ | 17,339 | | $ | 11,608 | | $ | 11,737 |
| | |
| |
| |
|
The following table reconciles the United States federal income tax rate to Spherion's effective tax rate:
| | Fiscal Years
| |
|---|
| | 2007
| | 2006
| | 2005
| |
|---|
| Statutory rate | | 35.0 | % | 35.0 | % | 35.0 | % |
| Increase (decrease) in rate resulting from: | | | | | | | |
| | State and local income taxes, net of federal benefit | | 4.4 | | 2.9 | | 2.1 | |
| | Work Opportunity Tax Credit | | (6.3 | ) | (6.5 | ) | (5.1 | ) |
| | Change in valuation allowance | | (2.4 | ) | (2.3 | ) | — | |
| | Nondeductible expense, Canadian put liability | | 1.7 | | — | | — | |
| | Nondeductible meals and entertainment | | 1.1 | | 1.4 | | 1.3 | |
| | Share-based compensation expense | | 0.8 | | 2.4 | | — | |
| | Other, net | | 3.0 | | 1.3 | | 0.9 | |
| | |
| |
| |
| |
| Effective tax rate | | 37.3 | % | 34.2 | % | 34.2 | % |
| | |
| |
| |
| |
57
SPHERION CORPORATION AND SUBSIDIARIES
NOTES TO CONSOLIDATED FINANCIAL STATEMENTS—(Continued)
3. INCOME TAXES (Continued)
Significant components of Spherion's deferred tax assets and liabilities are as follows (in thousands):
| | Fiscal Years
| |
|---|
| | 2007
| | 2006
| |
|---|
| Current deferred tax asset (liability): | | | | | | | |
| | Employee compensation and benefit plans | | $ | 2,702 | | $ | 2,339 | |
| | Self-insurance | | | 6,874 | | | 7,065 | |
| | Accrued expenses | | | 3,456 | | | 2,718 | |
| | Other | | | 2,751 | | | 1,820 | |
| | |
| |
| |
| | | | 15,783 | | | 13,942 | |
| | Valuation allowance | | | (2,370 | ) | | (2,480 | ) |
| | |
| |
| |
| | Net current deferred tax asset | | | 13,413 | | | 11,462 | |
| | |
| |
| |
| Non-current deferred tax asset (liability): | | | | | | | |
| | Employee compensation and benefit plans | | | 11,355 | | | 10,823 | |
| | Self-insurance | | | 8,189 | | | 9,039 | |
| | Fixed assets | | | (6,198 | ) | | (11,437 | ) |
| | Intangibles | | | 32,792 | | | 58,122 | |
| | Accrued expenses and other | | | 2,156 | | | 2,238 | |
| | General business and other credits carryforward | | | 21,340 | | | 16,891 | |
| | Foreign tax credit carryforward | | | 18,857 | | | 18,813 | |
| | Loss carryforwards | | | 40,290 | | | 45,574 | |
| | |
| |
| |
| | | | 128,781 | | | 150,063 | |
| | Valuation allowance | | | (26,757 | ) | | (27,196 | ) |
| | |
| |
| |
| | Long-term deferred tax asset | | | 102,024 | | | 122,867 | |
| | |
| |
| |
| | Total | | $ | 115,437 | | $ | 134,329 | |
| | |
| |
| |
At December 30, 2007, Spherion had a net deferred tax asset of $115.4 million. This deferred tax asset was evaluated under the guidelines of SFAS No. 109 "Accounting for Income Taxes," and a determination on the basis of objective factors was made that the asset will be realized through future years' taxable earnings. These objective factors include historical taxable income, normalized for non-recurring income and expense items. Using an average of this income projected to future years, if the asset can be recovered within the statutory carryforward periods, there is no impairment.
Spherion has a United States federal net operating loss carryforward in the amount of $71.8 million expiring in 2021 and thereafter. Spherion has $238.3 million of state net operating loss carryforwards which expire over the next one to twenty years. Canadian net operating loss carryforwards are available in the amount of $1.9 million, and expire between 2008 and 2013. The Company also has a capital loss carryforward in the amount of $14.6 million.
Spherion's valuation allowance decreased by $0.5 million during 2007. The valuation allowance reduces our deferred tax asset to an amount that is more likely than not to be realized, and is based on the uncertainty of the realization of two principal items. As a result of federal tax return filings in 2005, foreign tax credits and capital losses were released for carry forward from the 2001 tax year. The exit from most of our foreign operations makes it unlikely that we will utilize these foreign tax credits in the future. A
58
SPHERION CORPORATION AND SUBSIDIARIES
NOTES TO CONSOLIDATED FINANCIAL STATEMENTS—(Continued)
3. INCOME TAXES (Continued)
valuation allowance has been recorded against the full amount of foreign tax credit carryforward of $18.8 million. In addition, we have recorded a valuation allowance against the full amount of the $5.1 million benefit on capital loss carry forward of $14.6 million. The benefits on foreign tax credits expire between 2011 and 2015. The benefits on capital loss carryforwards expire between 2009 and 2011; and, general business credits carried forward will expire between 2021 and 2027. Valuation allowances for state net operating loss carryforwards and other items account for remainder of the total $29.1 million. At December 30, 2007 unremitted foreign earnings were $0.1 million. No deferred U.S. federal income taxes were provided for the unremitted earnings as they are permanently reinvested in the Company's international operations. As of December 31, 2006, there were no unremitted foreign earnings.
Spherion adopted the provisions of FIN No. 48 ("FIN 48"), "Accounting for Uncertainty in Income Taxes—An Interpretation of FASB Statement No. 109," on January 1, 2007. As a result of the implementation of FIN 48, Spherion recognized a decrease of approximately $1.4 million in the liability for unrecognized tax benefits, which was accounted for as a decrease to the January 1, 2007 balance of accumulated deficit. After adjustment, total gross liability for unrecognized tax benefits at January 1, 2007 was $1.4 million ($0.9 million net of federal benefit on state taxes.)
Spherion files income tax returns in the U.S. federal jurisdiction and most states. Spherion files tax returns in Canada and continues to file tax returns in certain foreign jurisdictions as it completes the wind down of legal entities related to business units sold in prior years. Spherion is no longer subject to U.S. federal, state and local, or non-U.S. income tax examinations by tax authorities for years before 2001. The Internal Revenue Service ("IRS") has completed examinations of Spherion's tax returns through the 2004 tax year, and all adjustments have been recorded including $30.6 million reversed to tax benefit in discontinued operations in 2006. An additional $1.3 million was also reversed to tax benefit in 2006 related to clearance of a state audit. In years 2002 through 2004, however, Spherion reported a net operating loss, and those losses will be subject to re-examination in the years in which they are utilized to offset future income.
Spherion recognizes interest and penalties accrued with respect to unrecognized tax benefits in income tax expense. The total liabilitiy for interest and penalties recorded as of December 30, 2007 was $0.3 million. The balance of unrecognized tax benefits excluding interest and penalties is $1.2 million of which $0.6 million is attributable to state net operating loss carryforwards and was recorded as a reduction to a deferred tax asset. Included in the balance of unrecognized tax benefits at December 30, 2007, are $0.8 million of tax benefits that, if recognized, would affect the effective tax rate. It is a reasonable possibility that the amounts of unrecognized tax benefits will increase or decrease in the next 12 months, but an estimate of such an increase or decrease is not possible.
A reconciliation of the beginning and ending amount of unrecognized tax benefits is as follows (in thousands):
| Balance at January 1, 2007 | | $ | 1,401 | |
| Settlements | | | (205 | ) |
| | |
| |
| Balance at December 30, 2007 | | $ | 1,196 | |
| | |
| |
59
SPHERION CORPORATION AND SUBSIDIARIES
NOTES TO CONSOLIDATED FINANCIAL STATEMENTS—(Continued)
4. EARNINGS PER SHARE
The following table reconciles the numerator (earnings from continuing operations) and denominator (shares) of the basic and diluted earnings per share computations (amounts in thousands, except per share amounts):
| | Fiscal Years
|
|---|
| | 2007
| | 2006
| | 2005
|
|---|
| | Earnings From
Continuing Operations
| | Shares
| | Per Share Amount
| | Earnings From
Continuing Operations
| | Shares
| | Per Share Amount
| | Earnings From
Continuing Operations
| | Shares
| | Per Share Amount
|
|---|
| Basic EPS | | $ | 29,137 | | 56,234 | | $ | 0.52 | | $ | 22,323 | | 57,212 | | $ | 0.39 | | $ | 22,575 | | 60,938 | | $ | 0.37 |
| | | | | | | |
| | | | | | |
| | | | | | |
|
| Effect of Dilutive | | | | | | | | | | | | | | | | | | | | | | | | |
| | Securities:
Stock options and
other dilutive
securities | | | — | | 659 | | | | | | — | | 572 | | | | | | — | | 492 | | | |
| | |
| |
| | | | |
| |
| | | | |
| |
| | | |
| Diluted EPS | | $ | 29,137 | | 56,893 | | $ | 0.51 | | $ | 22,323 | | 57,784 | | $ | 0.39 | | $ | 22,575 | | 61,430 | | $ | 0.37 |
| | |
| |
| |
| |
| |
| |
| |
| |
| |
|
5. PROPERTY AND EQUIPMENT
A summary of property and equipment follows (dollar amounts in thousands):
| |
| | Fiscal Years
| |
|---|
| | Life
(in years)
| | 2007
| | 2006
| |
|---|
| Land | | — | | $ | 4,167 | | $ | 4,167 | |
| Building and leasehold improvements | | 3-40 | | | 30,144 | | | 29,492 | |
| Office equipment | | 3-5 | | | 9,240 | | | 7,744 | |
| Computer hardware and software | | 3-7 | | | 124,085 | | | 120,534 | |
| Furniture and fixtures | | 5-8 | | | 15,151 | | | 13,574 | |
| Other assets | | 3-5 | | | 4,519 | | | 4,071 | |
| | | | |
| |
| |
| | | | | | 187,306 | | | 179,582 | |
| Less: Accumulated depreciation and amortization | | | | | (109,229 | ) | | (93,265 | ) |
| | | | |
| |
| |
| | | | | $ | 78,077 | | $ | 86,317 | |
| | | | |
| |
| |
Equipment includes capital lease assets of $3.3 million and $3.1 million as of December 30, 2007 and December 31, 2006, respectively. Depreciation and amortization expense of property and equipment including leased assets for the fiscal years 2007, 2006 and 2005 amounted to $21.9 million, $21.7 million and $20.9 million, respectively.
6. GOODWILL AND INTANGIBLE ASSETS
Spherion performed its annual impairment test of goodwill as of its October month-end. The 2007, 2006, and 2005 test results indicated no impairment.
60
SPHERION CORPORATION AND SUBSIDIARIES
NOTES TO CONSOLIDATED FINANCIAL STATEMENTS—(Continued)
6. GOODWILL AND INTANGIBLE ASSETS (Continued)
The changes in the carrying amount of goodwill by segment are as follows (in thousands):
| | Staffing Services
| | Professional Services
| | Total
| |
|---|
| Balance at January 1, 2006 | | $ | 40,144 | | $ | 8,717 | | $ | 48,861 | |
| Foreign currency changes and other | | | (61 | ) | | — | | | (61 | ) |
| Goodwill additions during the period | | | 541 | | | 487 | | | 1,028 | |
| Net operating loss tax benefit realization | | | (125 | ) | | — | | | (125 | ) |
| Transfer of business activity* | | | (6,724 | ) | | 6,724 | | | — | |
| | |
| |
| |
| |
| Balance at December 31, 2006 | | | 33,775 | | | 15,928 | | | 49,703 | |
| Foreign currency changes and other | | | 3,381 | | | — | | | 3,381 | |
| Goodwill additions during the period | | | 22,971 | | | 74,723 | | | 97,694 | |
| Goodwill disposals during the period | | | (4,194 | ) | | — | | | (4,194 | ) |
| | |
| |
| |
| |
| Balance at December 30, 2007 | | $ | 55,933 | | $ | 90,651 | | $ | 146,584 | |
| | |
| |
| |
| |
- *
- Adjusted for the movement of certain Managed Services contracts from within Staffing Services to Professional Services.
A summary of tradenames and other intangibles are as follows (in thousands):
| | Fiscal Years
| |
|---|
| | 2007
| | 2006
| |
|---|
| Indefinite lived intangible assets—Tradenames | | $ | 41,500 | | $ | — | |
| Finite lived intangible assets: | | | | | | | |
| | Customer relationship intangibles and other | | | 36,881 | | | 612 | |
| | Accumulated amortization | | | (1,605 | ) | | (341 | ) |
| | |
| |
| |
| | | | 35,276 | | | 271 | |
| | |
| |
| |
| | | $ | 76,776 | | $ | 271 | |
| | |
| |
| |
Spherion's tradenames have been identified as having an indefinite useful life. Amortization expense associated with finite lived intangible assets for the fiscal years ended 2007, 2006 and 2005 amounted to $1.4 million, $0.2 million and $0.4 million, respectively. Customer relationship intangibles and other are being amortized on an accelerated method over the estimated useful life of the intangible asset ranging from 2 to 19 years. Annual amortization expense for the finite lived intangible assets is expected to be $8.6 million in 2008, $6.7 million in 2009, $5.6 million in 2010, $4.7 million in 2011, $3.5 million in 2012 and $6.2 million thereafter.
7. ACQUISITIONS
In December 2007, Spherion acquired 100% of the equity of IntelliMark Holdings, Inc., parent company of Technisource, a company that provides IT temporary staffing, recruiting and managed IT services within the United States, which has approximately 30 locations. The purchase price of
61
SPHERION CORPORATION AND SUBSIDIARIES
NOTES TO CONSOLIDATED FINANCIAL STATEMENTS—(Continued)
7. ACQUISITIONS (Continued)
$145.8 million, and consisted of cash payment of $120.0 million, deferred payment of $20.0 million, acquisition-related restructuring costs associated with the integration of facilities and severance activities of Technisource for $5.1 million, and direct transaction costs of $0.7 million.
The following table summarizes the allocation of the purchase price for Technisource (in thousands):
| Accounts receivable | | $ | 50,246 | |
| Prepaids | | | 2,095 | |
| Other current assets | | | 1,784 | |
| Deferred tax asset | | | 2,698 | |
| | |
| |
| | Total current assets | | | 56,823 | |
| Property and equipment | | | 2,625 | |
| Goodwill | | | 59,909 | |
| Tradename | | | 33,800 | |
| Customer relationship | | | 23,400 | |
| Other assets | | | 72 | |
| Deferred tax asset | | | (8,160 | ) |
| | |
| |
| | Total assets acquired | | | 168,469 | |
| Accounts payable and other accrued expenses | | | 11,374 | |
| Accrued salaries, wages and payroll taxes | | | 8,264 | |
| Accrued income tax payable | | | (164 | ) |
| Other current liabilities | | | 2,698 | |
| | |
| |
| | Total current liabilities assumed | | | 22,172 | |
| Other long-term liabilities | | | 488 | |
| | |
| |
| Total liabilities assumed | | | 22,660 | |
| | |
| |
| Net assets acquired | | $ | 145,809 | |
| | |
| |
In September of 2007, Spherion acquired the stock of Todays, a temporary staffing and recruiting company focused in the clerical market, which has approximately 60 locations in the United States and Canada. The purchase price was $41.6 million, and consisted of cash payment of $39.3 million (net of working capital adjustments of $0.7 million), acquisition-related restructuring costs associated with the integration of facilities and severance activities of Todays for $2.1 million, and direct transaction costs of $0.2 million.
62
SPHERION CORPORATION AND SUBSIDIARIES
NOTES TO CONSOLIDATED FINANCIAL STATEMENTS—(Continued)
7. ACQUISITIONS (Continued)
The following table summarizes the allocation of the purchase price for Todays (in thousands):
| Cash and cash equivalents | | $ | 693 |
| Accounts receivables, net | | | 18,246 |
| Other current assets | | | 1,127 |
| | |
|
| | Total current assets | | | 20,066 |
| | |
|
| Goodwill | | | 12,942 |
| Tradename | | | 7,700 |
| Customer relationship | | | 7,300 |
| Fixed assets | | | 1,712 |
| Other assets | | | 66 |
| | |
|
| | Total assets acquired | | | 49,786 |
| | |
|
| Accounts payable and other accrued expenses | | | 3,200 |
| Accrued salaries, wages and payroll taxes | | | 4,961 |
| | |
|
| | Total liabilities assumed | | | 8,161 |
| | |
|
| Net assets acquired | | $ | 41,625 |
| | |
|
Supplemental information on an unaudited pro forma basis, as if the Technisource and Todays acquisitions were consummated at the beginning of the fiscal years 2006 and 2007, is as follows (in thousands, except per share amounts):
(Unaudited)
| | 2007
| | 2006
|
|---|
| Revenues | | $ | 2,379,672 | | $ | 2,354,102 |
Net earnings from continuing operations |
|
$ |
27,230 |
|
$ |
20,140 |
Earnings per share from continuing operations—Diluted |
|
$ |
0.48 |
|
$ |
0.35 |
The unaudited pro forma supplemental information is based on estimates and assumption, which the Company believes are reasonable; it is not necessarily indicative of the consolidated financial position or results of income in future periods or the results that actually would have been realized had we been a combined company during 2006 and 2007.
During 2007, Spherion acquired Resulté Universal, Ltd. ("Resulté"), a recruiting firm within the Texas market, providing information technology, accounting and finance recruiting and staffing services. The purchase price of $15.9 million, and consisted of cash payment of $15.8 million, and direct transaction cost of $0.1 million. Also in 2007, we acquired Baystate Select, LLC ("Baystate"), a finance and accounting recruiting firm within the Boston market, and area-based franchise operations in Boston, Kansas City, Lexington, Pittsburgh and several smaller franchised operations for the total purchase price of $12.2 million. The acquisition of Resulté, Baystate and the aforementioned franchise operations are considered immaterial acquisitions and are not included in the unaudited pro forma financial information provided above.
63
SPHERION CORPORATION AND SUBSIDIARIES
NOTES TO CONSOLIDATED FINANCIAL STATEMENTS—(Continued)
7. ACQUISITIONS (Continued)
The following table summarizes the allocation of the purchase price for Resulté and the aforementioned franchise operations (in thousands):
| Goodwill | | $ | 22,681 |
| Intangible assets | | | 5,176 |
| Fixed assets | | | 221 |
| | |
|
| Total | | $ | 28,078 |
| | |
|
As of December 30, 2007, goodwill related to the acquisitions made in 2007 expected to be deductible for taxes amounted to approximately $52.8 million.
During the third quarter of 2007, we purchased the remaining 15% interest in our Canadian operations from the minority interest stockholder pursuant to an existing put/call agreement. The purchase price was approximately $6.1 million at current exchange rates of which $5.5 million was paid in 2007 and the final payment of $0.6 million is listed under "Other current liabilities" in the attached Consolidated Balance Sheet. In 2007, we recorded expense of $2.3 million, to adjust the liability under the put/call to the agreed purchase price in accordance with SFAS No. 150, "Accounting for Certain Financial Instruments with Characteristics of Both Liabilities and Equity," as well as to reflect foreign currency fluctuations.
Acquisition-related Restructuring Costs
As a result of our acquisitions of Technisource and Todays, we recorded acquisition-related restructuring costs related to the integration of operating locations and activities of the acquired business with those of Spherion and elimination duplicative activities. U.S. GAAP (EITF 95-3, "Recognition of Liabilities in Connection with Purchase Business Combinations") requires that these acquisition-related restructuring costs, which are not associated with the generation of future revenues and have no future economic benefit, be recorded as assumed liabilities in the allocation of the purchase price. As a result, during the year ended December 30, 2007, we recorded a liability of approximately $7.1 million, which consisted of $4.7 million for severance reserves related to redundant positions, of which $0.7 million was paid during the current fiscal year, and $2.4 million related to redundant facilities. These activities are based upon plans committed to by management.
8. SHORT-TERM AND LONG-TERM DEBT OBLIGATIONS
A summary of short-term and long-term debt obligations is as follows (in thousands):
| | Fiscal Years
| |
|---|
| | 2007
| | 2006
| |
|---|
| U.S. dollar revolving line of credit, secured by accounts | | | | | | | |
| | receivables, due 2010 | | $ | 76,416 | | $ | — | |
| Deferred purchase payment, due 2009 | | | 20,000 | | | 1,309 | |
| Canadian dollar revolving line of credit, secured by accounts | | | | | | | |
| | receivable, due 2010 | | | 8,555 | | | — | |
| Capital leases, due through 2012 | | | 3,132 | | | 3,136 | |
| Other debt, due through 2008 | | | 80 | | | — | |
| | |
| |
| |
| | | | 108,183 | | | 4,445 | |
| Less current portion of long-term debt and revolving lines of credit | | | (86,035 | ) | | (2,068 | ) |
| | |
| |
| |
| | Long-term debt, net of current portion | | $ | 22,148 | | $ | 2,377 | |
| | |
| |
| |
64
SPHERION CORPORATION AND SUBSIDIARIES
NOTES TO CONSOLIDATED FINANCIAL STATEMENTS—(Continued)
8. SHORT-TERM AND LONG-TERM DEBT OBLIGATIONS (Continued)
Spherion has a U.S. dollar revolving line of credit in the amount of $250.0 million that is secured by substantially all of its domestic accounts receivable. At Spherion's option, the amount available can be increased to $300.0 million. As of December 30, 2007, there was $76.4 million outstanding under this facility, and as of December 31, 2006, there were no amounts outstanding. Total availability under this facility was $105.3 million for the fiscal year ending December 30, 2007 and is calculated as eligible receivables of $250.0 million, less: amounts outstanding, letters of credit of $31.1 million and a one week payroll reserve of $37.2 million. Interest on this line of credit is based upon the duration of the loan, availability under the line and other conditions and would have been approximately 5.6% (LIBOR plus a spread) or approximately 7.3% (prime plus a spread) as of December 30, 2007. Amounts borrowed under Libor and prime based loans were $45.0 million and $31.4 million as of December 30, 2007, respectively. Spherion pays an unused line fee in the range of 0.25% to 0.38% per annum that is determined by the unused portion of the revolving line of credit. For letters of credit we pay an annual rate based on availability under the line (currently 1.25%) plus a fixed fronting fee of 0.25%. This line of credit expires in 2010.
Spherion also has a Canadian dollar revolving line of credit (secured by Canadian accounts receivable) that matures July 2010. This facility provides up to CAD$13.0 million of financing (approximately $13.2 million at current exchange rates). As of December 30, 2007, there was $8.6 million outstanding under this facility, and as of December 31, 2006, there were no borrowings outstanding. As of December 30, 2007, the interest rate for amounts borrowed on this facility approximated 6.8% (Canadian prime plus a spread). An unused line fee of 0.5% per annum is payable based on the unused portion of the revolving line of credit. Spherion guarantees the Canadian dollar revolving line of credit.
Spherion's lines of credit provide for certain affirmative and negative covenants which may limit the total availability under these revolving lines of credit based upon Spherion's ability to meet these covenants. These covenants include, but are not limited to: a fixed charge coverage ratio; limitations on capital expenditures; additional debt incurred; mergers, consolidations or sales; and transactions with subsidiaries and related parties. Failure to meet compliance with one of more of these covenants in the future could affect the amount of availability Spherion has to borrow and as a result, our liquidity and financial condition may be adversely affected in the event of non-compliance. At December 30, 2007, Spherion was in compliance with the requirements of these covenants.
Spherion entered into a seven-year contract with a third party information technology company to outsource its technology infrastructure operations effective as of July 26, 2004. The contract includes the sale at book value (which approximated fair market value) of certain computer hardware to be operated by the outsource provider. Spherion accounted for this portion of the outsourced transaction as a sale-leaseback pursuant to SFAS No. 13, "Accounting for Leases." Spherion recorded an asset and a capital lease obligation of $6.4 million at the start of the contract. The capital lease obligation and imputed interest remaining at December 30, 2007 was $2.1 million and $0.2 million, respectively.
In connection with the purchase of Technisource, $20.0 million of the purchase price was deferred and is payable to the sellers including interest at Libor plus 300 basis points (or approximately 7.9% at year-end) and is due in March 2009.
Aggregate future maturities of long-term debt as of December 30, 2007 are $1.1 million in 2008, $20.9 million in 2009, $85.8 million in 2010 and $0.4 million in 2011. These future maturities include the U.S. and Canadian dollar revolving line of credit balances in their respective year of scheduled maturity,
65
SPHERION CORPORATION AND SUBSIDIARIES
NOTES TO CONSOLIDATED FINANCIAL STATEMENTS—(Continued)
8. SHORT-TERM AND LONG-TERM DEBT OBLIGATIONS (Continued)
although these revolving lines of credit are classified as current debt obligations in the accompanying Consolidated Balance Sheet in accordance with Generally Accepted Accounting Principles.
9. FINANCIAL INSTRUMENTS AND FAIR VALUES
The fair value of a financial instrument represents the amount at which the instrument could be exchanged in a current transaction between willing parties, other than in a forced or liquidation sale. Fair value estimates are made at a specific point in time, based upon relevant market information about the financial instrument.
The carrying amount of cash and cash equivalents, trade receivables and other assets approximates fair value due to the short-term maturities of these instruments. Spherion's insurance deposits earn a fixed interest rate as determined at the time of funding and are carried at fair value or $18.2 million and $49.7 million as of December 30, 2007 and December 31, 2006, respectively. Subsequent to year-end, all remaining insurance deposits were returned to the Company at an amount equal to book value.
In estimating the fair value of derivative positions, Spherion utilizes quoted market prices, if available, or quotes obtained from outside sources. As of December 30, 2007, Spherion had one outstanding forward contract to sell CAD$0.6 million in June 2008. This derivative had a fair value or cost to unwind that is not material to Spherion's consolidated results of operations.
The fair values of all other financial instruments, including debt, approximate their book values as the instruments are short-term in nature or contain market rates of interest.
10. EMPLOYEE SAVINGS AND INVESTMENT PLANS
Spherion has a voluntary employee savings plan (the "401(k) Benefit Plan") covering substantially all eligible employees in the United States of America. This plan has a basic match for those employees eligible to receive the match, which is based on employee contributions. Employer contributions by Spherion under the plan amounted to $0.7 million in 2007, which included contributions to the Technisource and Todays plans as described below. Employer contributions by Spherion under the plan amounted to $0.7 million for fiscal years 2006 and 2005, respectively. There were approximately 1,800 participating employees in this plan as of December 30, 2007.
During 2007, Spherion acquired Technisource and Todays, which currently sponsor separate employee savings plans. The plans associated with these acquisitions will be terminated and the assets will be merged into Spherion's plan in 2008. There were approximately 650 participating employees in the Technisource plan as of December 30, 2007. The Todays plan was frozen in October 2007 and the participants became eligible to participate in Spherion's 401(k) benefit plan.
Spherion also has a voluntary non-qualified deferred compensation plan for highly compensated employees who are not fully eligible to participate in Spherion's 401(k) Benefit Plan. The plan is not formally funded, however, Spherion maintained investments of $23.0 million and $24.1 million in a portfolio of mutual funds held in trust at December 30, 2007 and December 31, 2006, respectively. These balances are classified as "Other current assets" and "Other assets" in the accompanying Consolidated Balance Sheets based on historical timing of distributions. Earnings or losses from these investments are intended to match earnings or losses in participant accounts. These investments could be used to satisfy general corporate purposes. The deferred compensation liability and accumulated investment earnings or losses are accrued. Such accrual amounted to $23.3 million and $24.5 million at December 30, 2007 and
66
SPHERION CORPORATION AND SUBSIDIARIES
NOTES TO CONSOLIDATED FINANCIAL STATEMENTS—(Continued)
10. EMPLOYEE SAVINGS AND INVESTMENT PLANS (Continued)
December 31, 2006, respectively, the short-term portion is within "Other current liabilities" in the accompanying Consolidated Balance Sheets. Employee deferrals within this plan relating to Spherion stock are included in additional paid-in capital within the stockholders' equity section of the accompanying Consolidated Balance Sheets (rather than in "Other long-term liabilities") as employees may only be paid out in shares of Spherion stock. There were approximately 160 employees participating in this plan as of December 30, 2007.
11. COMMITMENTS AND CONTINGENCIES
Substantially all of Spherion's operations are conducted in leased premises. Spherion also leases computers and other equipment. Total lease expense for the fiscal years ended 2007, 2006 and 2005 was $21.5 million, $22.1 million and $22.1 million, respectively. Future minimum lease payments under non-cancelable leases as of December 30, 2007 are $25.0 million, $19.2 million, $12.9 million, $8.0 million and $4.2 million in the years 2008 through 2012, respectively, and $3.5 million thereafter which are partially offset by $9.2 million under future non-cancelable subleases. Of these future minimum lease payments, $7.5 million has been accrued as of December 30, 2007, related to facility closures, in amounts of $3.1 million, $2.3 million and $2.1 million which are included as part of "Other current liabilities," "Accounts payable and other accrued expenses" and "Other long-term liabilities" in the accompanying Consolidated Balance Sheets, respectively.
In connection with the disposition of certain subsidiaries, Spherion, from time to time provides routine indemnifications with respect to equipment and real estate leases and in certain cases the performance of services. The disposition of these businesses also usually requires that we indemnify the purchaser for liabilities that arose prior to the disposition date. As of December 30, 2007, the Company maintained a reserve balance of $2.6 million related to an open indemnification claim asserted by the purchaser of the Asia Pacific education business.
Spherion had outstanding irrevocable letters of credit of approximately $31.1 million and surety bonds outstanding of approximately $0.2 million as of December 30, 2007. These instruments primarily collateralize Spherion's recorded obligations under workers' compensation insurance programs. The level of collateral required is determined by the insurance carrier based on claims experience of the programs and may vary from year to year. Spherion can collateralize its workers' compensation liabilities with either letters of credit or deposits (See Note 9, "Financial Instruments and Fair Values").
Spherion, in the ordinary course of its business, is or may be threatened with or named as a defendant in various lawsuits. Spherion maintains insurance in such amounts and with such coverages and deductibles as management believes are reasonable and prudent. The principal risks that Spherion insures against are workers' compensation, personal injury, bodily injury, property damage, professional malpractice, errors and omissions and fidelity losses. Spherion's management does not expect that the outcome of any pending lawsuits relating to such matters, individually or collectively, will have a material adverse effect on Spherion's financial condition, results of operations or cash flows.
On December 13, 2004, and as amended on January 13, 2005 and October 31, 2005, Glidepath Holding B.V. and Jeimon Holdings N.V. filed an action against Spherion Corporation in the U.S. District Court of the Southern District of New York. Glidepath and Jeimon Holdings, investors in the entity that acquired the Cyber Center business of Spherion Technology (UK) Limited, a subsidiary of Spherion Corporation, in 2002, sued Spherion for fraud, negligent misrepresentation, aiding and abetting, breach of fiduciary duty and unjust enrichment and seek $32.0 million in damages, and treble for punitive damages,
67
SPHERION CORPORATION AND SUBSIDIARIES
NOTES TO CONSOLIDATED FINANCIAL STATEMENTS—(Continued)
11. COMMITMENTS AND CONTINGENCIES (Continued)
plus attorneys' fees, expert fees and costs. Glidepath and Jeimon Holdings allege that an individual who was an officer of Spherion Technology (UK) fraudulently induced them to invest in a corporation formed to purchase the Cyber Center business, while he remained in the employ of Spherion Technology (UK) and was to be paid an incentive bonus for the sale by Spherion. They allege that he misled them as to his employment status at the time, as to the prospects for the Cyber Center, and as to whether the newly formed corporation was assuming the indebtedness of Spherion Technology (UK) associated with the Cyber Center business. They allege that in doing so, he was acting as Spherion's agent. Spherion intends to vigorously defend this matter. Although this claim is in the preliminary stages, Spherion has a reserve of $0.3 million related to this matter. Spherion does not have insurance coverage for this claim.
California has assessed the Company $1.6 million plus potential interest and penalty as a result of a dispute related to 2003 State Unemployment Taxes ("SUTA") rates. This matter has been reviewed by an administrative law judge, a panel of administrative judges and is subject to further administrative reviews. As such, as of December 30, 2007, Spherion had $1.6 million accrued as its best estimate of losses it expects to incur as a result of this matter which is recorded in the Condensed Consolidated Balance Sheet in "Accounts payable and other accrued expenses."
12. STOCKHOLDERS' EQUITY
On January 4, 2008, the Board of Directors authorized the repurchase of up to $25.0 million of the Company's common stock. This authorization replaced the previous repurchase plan authorized on February 20, 2007 which allowed the repurchase of a maximum of 50,000 shares of common stock per week to mitigate the dilutive impact of shares issued under our various employee benefit plans. During 2007, Spherion purchased 1.2 million shares for approximately $10.3 million at an average price per share of $8.69.
In May 2005, the Board of Directors authorized the repurchase of up to six million shares or approximately 10% of the Company's outstanding common stock. Share repurchases were made from time to time in open-market transactions or in privately negotiated transactions. During the fiscal years ended December 31, 2006 and January 1, 2006, Spherion purchased 3.0 million and 3.0 million shares for approximately $28.3 million and $24.0 million at an average price per share of $9.54 and $7.87, respectively.
13. STOCKHOLDER RIGHTS PLAN
On February 17, 1994, Spherion's Board of Directors adopted a rights plan to protect stockholders in the event of an unsolicited attempt to acquire Spherion which is not believed by the Board of Directors to be in the best interest of stockholders. Under the plan, a dividend of one right (a "Right") per share was declared and paid on each share of Spherion's common stock outstanding on April 1, 1994. As to shares issued after such date, rights will automatically attach to them after their issuance.
The Rights become exercisable when a person or group of persons acquires 15% or more of the outstanding shares of Spherion's common stock without the prior written approval of Spherion's Board of Directors (an "Unapproved Stock Acquisition"), and after ten business days following the public announcement of the intent to commence a tender offer that would result in an Unapproved Stock Acquisition.
68
SPHERION CORPORATION AND SUBSIDIARIES
NOTES TO CONSOLIDATED FINANCIAL STATEMENTS—(Continued)
13. STOCKHOLDER RIGHTS PLAN (Continued)
If a person or group of persons makes an Unapproved Stock Acquisition, the registered holder of each Right has the right to purchase, for the exercise price of the Right (currently set at $55), either one-hundredth of a share of a new class of Spherion's preferred stock or shares of Spherion's common stock having a market value equal to two times the exercise price of the Right. Following an Unapproved Stock Acquisition, if Spherion is involved in a merger, or 50% or more of Spherion's assets or earning power are sold, the registered holder of each Right has the right to purchase, for the exercise price of the Right, a number of shares of the common stock of the acquiring company having a market value equal to two times the exercise price of the Right.
After an Unapproved Stock Acquisition, but before any person or group of persons acquires 50% or more of the outstanding shares of Spherion's common stock, the Board of Directors may exchange all or part of the then outstanding and exercisable Rights for Spherion common stock at an exchange ratio of one share of common stock per Right. Upon any such exchange, the right of any holder to exercise a Right terminates.
Spherion may redeem the Rights at a price of $0.01 per Right at any time prior to an Unapproved Stock Acquisition. The Rights expire on April 1, 2014, unless extended by the Board of Directors. Until a Right is exercised, the holder thereof, as such, has no rights as a stockholder of Spherion, including the right to vote or to receive dividends. The issuance of the Rights alone has no dilutive effect and does not affect reported earnings per share. A committee comprised of Spherion's independent board members shall review the Rights plan at least once in every three-year period to determine whether the maintenance of the plan continues to be in the best interest of Spherion and its stockholders. The committee reviewed the plan in 2007 and determined that the plan should be maintained. The committee intends to review the plan again in 2009.
14. DISCONTINUED OPERATIONS
Results from discontinued operations in the accompanying Consolidated Statements of Earnings are as follows (in thousands):
| | 2007
| | 2006
| | 2005
| |
|---|
| | Professional Services
| | Staffing Services
| | Total
| | Professional Services
| | Staffing Services
| | Total
| | Professional Services
| | Staffing Services
| | Total
| |
|---|
| Revenues | | $ | — | | $ | 4,554 | | $ | 4,554 | | $ | — | | $ | 10,328 | | $ | 10,328 | | $ | — | | $ | 25,735 | | $ | 25,735 | |
| | |
| |
| |
| |
| |
| |
| |
| |
| |
| |
| Pre-tax loss from operations | | $ | (1,418 | ) | $ | (4,861 | ) | $ | (6,279 | ) | $ | (1,389 | ) | $ | (220 | ) | $ | (1,609 | ) | $ | (1,034 | ) | $ | (10,218 | ) | $ | (11,252 | ) |
| Pre-tax gain (loss) on disposal | | | 1,313 | | | (1,036 | ) | | 277 | | | 1,800 | | | 173 | | | 1,973 | | | (6,178 | ) | | 499 | | | (5,679 | ) |
| Income tax benefit | | | 554 | | | 1,577 | | | 2,131 | | | 31,978 | | | 17 | | | 31,995 | | | 3,824 | | | 2,561 | | | 6,385 | |
| | |
| |
| |
| |
| |
| |
| |
| |
| |
| |
| Net earnings (loss) from discontinued operations | | $ | 449 | | $ | (4,320 | ) | $ | (3,871 | ) | $ | 32,389 | | $ | (30 | ) | $ | 32,359 | | $ | (3,388 | ) | $ | (7,158 | ) | $ | (10,546 | ) |
| | |
| |
| |
| |
| |
| |
| |
| |
| |
| |
69
SPHERION CORPORATION AND SUBSIDIARIES
NOTES TO CONSOLIDATED FINANCIAL STATEMENTS—(Continued)
14. DISCONTINUED OPERATIONS (Continued)
Summarized activity by operating segment related to discontinued operations is as follows:
Staffing Services
Net loss for the fiscal year ended December 30, 2007, includes primarily the pre-tax loss from operations of $4.9 million, which includes a write-off of goodwill of $4.2 million, and loss on disposal of $1.0 million, net of a $1.6 million tax benefit, related to Spherion's outplacement consulting business which was sold in the second quarter of 2007. As a result of Spherion's decision to sell this business, the operating results for all periods presented have been reclassified as discontinued operations in the accompanying Consolidated Statement of Earnings.
Net loss for the fiscal year ended December 31, 2006, includes a pre-tax loss from operations of $0.2 million for costs primarily associated with the previously sold call center business and $0.2 million gain on sale related to the Company's three call centers which were sold in 2005.
Net loss for the fiscal year ended January 1, 2006, includes the pre-tax loss from operations of $3.9 million related to the outplacement consulting business that was sold in 2007, losses from operations of $6.3 million on a pre-tax basis related to the three call centers which were sold during the period offset by a gain on the sale of the call centers of $0.5 million and an income tax benefit of $2.6 million.
Professional Services
Net earnings for the fiscal year ended December 30, 2007, includes $1.4 million pre-tax loss from operations net of $0.6 million tax benefit and $1.3 million gain on disposal related to the adjustment of accruals due to changes in estimates related to the remaining outstanding litigation and property lease reserves associated with several of the international businesses sold in 2004.
Net earnings for the fiscal year ended December 31, 2006, includes $1.4 million on a pre-tax basis for restructuring and other charges related to the international businesses sold in 2004, offset by a $1.8 million pre-tax gain on disposal for reversal of reserves for foreign legal matters and receipt of contingent consideration related to the sale of the Company's deposition services business and $32.0 million income tax benefit, primarily related to the resolution of certain international tax matters.
Net loss for the year ended January 1, 2006, includes $1.0 million pre-tax loss from operations primarily related to restructuring and other charges and $6.2 million pre-tax loss on disposal to increase or set-up reserves for working capital settlement and indemnification on matters related to the international businesses sold in 2004, net of $3.8 million tax benefit.
70
SPHERION CORPORATION AND SUBSIDIARIES
NOTES TO CONSOLIDATED FINANCIAL STATEMENTS—(Continued)
15. RESTRUCTURING AND OTHER CHARGES
A summary of the charges is as follows (in thousands):
| | Fiscal Years
| |
|---|
| | 2007
| | 2006
| | 2005
| |
|---|
| Staffing Services | | $ | — | | $ | 363 | | $ | 1,840 | |
| Professional Services | | | — | | | 106 | | | 49 | |
| Corporate | | | — | | | 899 | | | 341 | |
| Reversal of over accrual | | | — | | | (582 | ) | | (175 | ) |
| | |
| |
| |
| |
| Restructuring | | | — | | | 786 | | | 2,055 | |
| Other charges (credits) | | | 700 | | | (963 | ) | | (292 | ) |
| | |
| |
| |
| |
| | Total restructuring and other charges (credits) | | $ | 700 | | $ | (177 | ) | $ | 1,763 | |
| | |
| |
| |
| |
During 2006, Spherion incurred restructuring charges of $1.4 million for lease and severance-related costs. There were reversals of prior year accruals of $0.6 million. The reversal of previously accrued amounts to income was primarily a result of lower lease expense than initially anticipated.
Restructuring charges for the fiscal year ended January 1, 2006 totaled $2.2 million for severance related costs for the elimination of 112 positions. The restructuring charges were primarily the result of an announced termination of a customer contract and other changes within the managed services portion of the Staffing Services operating segment. These charges were offset by reversals of accruals of $0.2 million for the fiscal year ended January 1, 2006 that were unnecessary, primarily as the result of lower lease and severance costs than initially anticipated.
During the fourth quarter of 2007, Spherion incurred charges totaling $0.7 million related to integration costs for the acquisitions of Technisource and Todays, primarily due to severance, facility closure and project completion costs.
During the fourth quarter of 2006, Spherion received $1.0 million in proceeds from a favorable legal settlement associated with a previously written-off investment.
During the second quarter of 2005, Spherion identified $0.3 million of prior year accruals for facility closures that were unnecessary and reversed these to income.
16. SEGMENT INFORMATION
Spherion is organized and managed around two operating segments—Staffing Services and Professional Services. Each segment has separate and distinct leadership teams and provides services to customers in different types of skill-sets. The Staffing Services operating segment is concentrated around clerical and light industrial staffing, while the Professional Services operating segment is concentrated around higher level skill-sets, such as information technology, finance and accounting, engineering and administrative. Spherion evaluates the performance of its operating segments and allocates resources based on revenue, gross profit and segment operating profit. Segment operating profit is defined as income before unallocated corporate costs, amortization expense, interest expense, interest income, income taxes
71
SPHERION CORPORATION AND SUBSIDIARIES
NOTES TO CONSOLIDATED FINANCIAL STATEMENTS—(Continued)
16. SEGMENT INFORMATION (Continued)
and restructuring and other charges. All material intercompany revenues and expenses have been eliminated. Additionally, amounts related to discontinued operations have been excluded from the segment information below and are presented as discontinued operations in the Consolidated Statements of Earnings.
Information on operating segments and a reconciliation to earnings from continuing operations before income taxes are as follows (in thousands):
| | Fiscal Years
| |
|---|
| | 2007
| | 2006
| | 2005
| |
|---|
| Revenues: | | | | | | | | | | |
| | Staffing Services | | $ | 1,472,236 | | $ | 1,430,062 | | $ | 1,516,221 | |
| | Professional Services | | | 544,878 | | | 492,673 | | | 450,179 | |
| | |
| |
| |
| |
| | | Total | | $ | 2,017,114 | | $ | 1,922,735 | | $ | 1,966,400 | |
| | |
| |
| |
| |
| Gross profit: | | | | | | | | | | |
| | Staffing Services | | $ | 296,303 | | $ | 285,537 | | $ | 283,042 | |
| | Professional Services | | | 181,683 | | | 161,542 | | | 143,143 | |
| | |
| |
| |
| |
| | | Total | | $ | 477,986 | | $ | 447,079 | | $ | 426,185 | |
| | |
| |
| |
| |
| Segment operating profit: | | | | | | | | | | |
| | Staffing Services | | $ | 35,459 | | $ | 24,127 | | $ | 30,220 | |
| | Professional Services | | | 28,231 | | | 23,279 | | | 19,236 | |
| | |
| |
| |
| |
| | | Total | | | 63,690 | | | 47,406 | | | 49,456 | |
| Unallocated corporate costs | | | (15,993 | ) | | (15,541 | ) | | (13,832 | ) |
| Amortization of intangibles | | | (1,406 | ) | | (201 | ) | | (416 | ) |
| Interest expense | | | (3,746 | ) | | (1,965 | ) | | (3,205 | ) |
| Interest income | | | 4,631 | | | 4,055 | | | 4,072 | |
| Restructuring and other (charges) credits | | | (700 | ) | | 177 | | | (1,763 | ) |
| | |
| |
| |
| |
Earnings from continuing operations before
income taxes | | $ | 46,476 | | $ | 33,931 | | $ | 34,312 | |
| | |
| |
| |
| |
72
SPHERION CORPORATION AND SUBSIDIARIES
NOTES TO CONSOLIDATED FINANCIAL STATEMENTS—(Continued)
16. SEGMENT INFORMATION (Continued)
Geographic, services, depreciation expense, and assets information on operating segments for the periods indicated are as follows (in thousands):
| | Fiscal Years
|
|---|
| | 2007
| | 2006
| | 2005
|
|---|
| Revenues: | | | | | | | | | |
| | Temporary Staffing | | $ | 1,749,124 | | $ | 1,671,471 | | $ | 1,714,801 |
| | Managed Services | | | 189,574 | | | 176,944 | | | 185,967 |
| | Permanent Placement | | | 78,416 | | | 74,320 | | | 65,632 |
| | |
| |
| |
|
| | | Total | | $ | 2,017,114 | | $ | 1,922,735 | | $ | 1,966,400 |
| | |
| |
| |
|
| Depreciation Expense: | | | | | | | | | |
| | Staffing Services | | $ | 14,891 | | $ | 15,764 | | $ | 14,389 |
| | Professional Services | | | 7,007 | | | 5,904 | | | 6,481 |
| | |
| |
| |
|
| | | Total | | $ | 21,898 | | $ | 21,668 | | $ | 20,870 |
| | |
| |
| |
|
| Total Assets: | | | | | | | | | |
| | Staffing Services | | $ | 300,566 | | $ | 230,351 | | $ | 246,069 |
| | Professional Services | | | 278,743 | | | 93,132 | | | 98,251 |
| | Corporate | | | 265,509 | | | 369,904 | | | 398,324 |
| | |
| |
| |
|
| | | Total | | $ | 844,818 | | $ | 693,387 | | $ | 742,644 |
| | |
| |
| |
|
Spherion has no single customer representing greater than 10 percent of revenues. All operations and assets are in North America.
73
SPHERION CORPORATION AND SUBSIDIARIES
NOTES TO CONSOLIDATED FINANCIAL STATEMENTS—(Continued)
17. QUARTERLY FINANCIAL DATA (unaudited—amounts in thousands, except per share data and share price)
The following is an analysis of certain quarterly results of operations and other data for the 2007 and 2006 fiscal years:
| | 2007
|
|---|
| | First Quarter
| | Second Quarter
| | Third Quarter
| | Fourth Quarter
|
|---|
| Revenues | | $ | 461,869 | | $ | 478,477 | | $ | 495,168 | | $ | 581,600 |
| Gross profit | | | 105,721 | | | 118,660 | | | 119,004 | | | 134,601 |
| Net earnings | | | 2,606 | | | 3,412 | | | 9,481 | | | 9,767 |
| Earnings per share, Basic and Diluted | | | 0.05 | | | 0.06 | | | 0.17 | | | 0.17 |
| | 2006
|
|---|
|
|
First Quarter
|
|
Second Quarter
|
|
Third Quarter
|
|
Fourth Quarter
|
|---|
| Revenues | | $ | 461,354 | | $ | 470,766 | | $ | 492,345 | | $ | 498,270 |
| Gross profit | | | 102,338 | | | 111,435 | | | 114,765 | | | 118,541 |
| Net earnings | | | 2,903 | | | 3,611 | | | 8,359 | | | 39,809 |
| Earnings per share, Basic and Diluted | | | 0.05 | | | 0.06 | | | 0.15 | | | 0.70 |
Quarterly results for 2007 and 2006 were impacted by the following significant items:
In the second quarter of 2007, Spherion disposed of its outplacement consulting business resulting in a net loss of $3.4 million or $0.06 per share primarily related to the write-off of goodwill and loss on sale, which was included in discontinued operations. In the fourth quarter of 2007, revenues, gross profit, and net earnings were impacted by the acquisitions of Technisource and Todays.
In the fourth quarter of 2006, net earnings from discontinued operations includes a tax benefit from the resolution of certain international tax matters of $29.7 million, or $0.52 per share.
74
SPHERION CORPORATION AND SUBSIDIARIES
NOTES TO CONSOLIDATED FINANCIAL STATEMENTS—(Continued)
SPHERION CORPORATION AND SUBSIDIARIES
SCHEDULE II—VALUATION AND QUALIFYING ACCOUNTS
(amounts in thousands)
Column A
| | Column B
| | Column C Additions
| | Column D
| | Column E
|
|---|
Description
| | Balance at Beginning of Period
| | Charged to Earnings
| | Transferred (from) to Other Accounts
| | Deductions
| | Balance at End of Period
|
|---|
| Fiscal Year Ended December 30, 2007 | | | | | | | | | | | | | | | |
| Allowance for Doubtful Accounts | | $ | 3,354 | | $ | 4,436 | | $ | — | | $ | 1,267 | | $ | 6,523 |
| Valuation allowance on deferred tax assets | | $ | 29,676 | | $ | 1,552 | | $ | 835 | | $ | 2,936 | | $ | 29,127 |
Fiscal Year Ended December 31, 2006 |
|
|
|
|
|
|
|
|
|
|
|
|
|
|
|
| Allowance for Doubtful Accounts | | $ | 4,708 | | $ | 2,021 | | $ | — | | $ | 3,375 | | $ | 3,354 |
| Valuation allowance on deferred tax assets | | $ | 32,660 | | $ | — | | $ | — | | $ | 2,984 | | $ | 29,676 |
Fiscal Year Ended January 1, 2006 |
|
|
|
|
|
|
|
|
|
|
|
|
|
|
|
| Allowance for Doubtful Accounts | | $ | 7,077 | | $ | 4,902 | | $ | — | | $ | 7,271 | | $ | 4,708 |
| Valuation allowance on deferred tax assets | | $ | 6,128 | | $ | 26,532 | | $ | — | | $ | — | | $ | 32,660 |
75
SPHERION CORPORATION AND SUBSIDIARIES
NOTES TO CONSOLIDATED FINANCIAL STATEMENTS—(Continued)
Item 9. CHANGES IN AND DISAGREEMENTS WITH ACCOUNTANTS ON ACCOUNTING AND FINANCIAL DISCLOSURE
There has been no change in our principal accountants during the two most recent fiscal years or any subsequent interim period.
Item 9A. CONTROLS AND PROCEDURES
We carried out an evaluation, under the supervision and with the participation of our management, including our principal executive officer and principal financial officer, of the effectiveness of our disclosure controls and procedures (as defined in Exchange Act Rules 13a-15(e) and 15d-15(e)) as of the end of the period covered by this Annual Report. Based upon that evaluation, our Chief Executive Officer and Chief Financial Officer concluded that our disclosure controls and procedures were effective as of the end of the period covered by this Annual Report.
There has been no change in our internal control over financial reporting during the quarter ended December 30, 2007, identified in connection with the evaluation referred to above, that has materially affected, or is reasonably likely to materially affect, our internal control over financial reporting.
Management's Report on Internal Control Over Financial Reporting and the corresponding Report of Independent Registered Public Accounting Firm are included in Item 8., Financial Statements and Supplementary Data of this Annual Report on Form 10-K.
Item 9B. OTHER INFORMATION
Not applicable.
PART III
Items 10, 11, 12, 13 and 14.
Certain information regarding our executive officers is contained in Part I and certain information regarding our stock plans is contained in Part III, Item 12 below. The remaining information required by Items 10 and 12 and the information required by Items 11, 13 and 14 of this Part III is omitted because, no later than 120 days from December 30, 2007, we will file and distribute our definitive proxy statement for our 2008 annual meeting of stockholders containing the information required by such Items. Such omitted information is incorporated herein by this reference.
76
SPHERION CORPORATION AND SUBSIDIARIES
NOTES TO CONSOLIDATED FINANCIAL STATEMENTS—(Continued)
Item 12. SECURITY OWNERSHIP OF CERTAIN BENEFICIAL OWNERS AND MANAGEMENT AND RELATED STOCKHOLDER MATTERS
The following table summarizes our stock options and restricted stock units to be issued upon exercise and the number of securities available for future issuances as of December 30, 2007:
Equity Compensation Plan Information
Plan Category
| | (a)
Number of securities
to be issued
upon exercise of outstanding options and restricted
stock units
| | (b)
Weighted-average exercise price of outstanding options and restricted
stock units
| | (c)
Number of securities remaining available for future issuance under equity compensation plans (excluding securities reflected in column (a))
|
|---|
Equity compensation plans
approved by security holders | | 4,338,370 | | $ | 7.65 | | 4,673,513 |
Equity compensation plans not
approved by security holders | | 477,297 | | | — | | — |
| | |
| | | | |
|
| Total | | 4,815,667 | | $ | 6.89 | | 4,673,513 |
| | |
| | | | |
|
The equity compensation plan not approved by security holders is a restricted stock plan which allows grants of restricted stock units to employees and outside directors. Restricted stock units entitle the individual to receive shares of our common stock at a future date after meeting service requirements or financial targets. The restricted stock units vest between one and seven years or a shorter period based upon certain performance criteria.
The information required by Item 403 of Regulation S-K is omitted because, no later than 120 days from December 30, 2007, we will file and distribute our definitive proxy statement for our 2008 annual meeting of stockholders containing the information required by such Item.
77
PART IV
Item 15. EXHIBITS, FINANCIAL STATEMENT SCHEDULES AND REPORTS ON FORM 8-K
- (a)
- Items A through G and Schedule II are presented on the indicated pages of this Form 10-K Annual Report:
- (1)
- Financial Statements for Spherion Corporation and Subsidiaries:
| | Page
|
|---|
| Management's Report on Internal Control over Financial Reporting | | 42 |
| Reports of Independent Registered Public Accounting Firm | | 43 |
| Consolidated Statements of Earnings | | 46 |
| Consolidated Balance Sheets | | 47 |
| Consolidated Statements of Stockholders' Equity | | 48 |
| Consolidated Statements of Cash Flows | | 49 |
| Notes to Consolidated Financial Statements | | 50 |
- (2)
- Consolidated Financial Statement Schedule for Fiscal Years Ended 2007, 2006 and 2005:
| Schedule II—Valuation and Qualifying Accounts | | 76 |
Schedules not filed herewith are either not applicable, the information is not material or the information is set forth in the Consolidated Financial Statements or notes thereto.
- (3)
- Exhibits Required by Item 601 of Regulation S-K:
Exhibit
Number
| | Exhibit Name
|
|---|
| 2.1 | | Stock Purchase Agreement dated September 19, 2007 between Spherion, Spherion Atlantic Enterprises, LLC and CDO Corporation relating to the purchase by Spherion of 100% of the outstanding stock of Todays Staffing, Inc. from CDI, filed as Exhibit 2.1 to Spherion's Form 10-Q for the quarter ended September 30, 2007, is incorporated herein by reference. |
| 2.2 | | Agreement and Plan of Merger, dated Novermber 14, 2007, by and among Spherion, Crystal Acquisition Corporation, Charlesbank Equity Fund V, Limited Partnership, CB Offshore Equity Fund V, L.P., Charlesbank Equity Coinvestment Fund V, Limited Partnership, Charlesbank Coinvestment Partners, Limited Partnership as Principal Stockholders, Charlesbank Capital Partners, LLC, as Stockholders' Representative, and Intellimark Holdings, Inc., filed as Exhibit 2.1 to Spherion's Form 8-K filed on December 4, 2007, is incorporated herein by reference. |
| 3.1 | | Restated Certificate of Incorporation of Spherion, as last amended on May 19, 2004, filed as Exhibit 3.1 to Spherion's Form 10-Q for the quarter ended June 25, 2004, is incorporated herein by reference. |
| 3.2 | | Restated By-Laws of Spherion, as amended through November 11, 2003, filed as Exhibit 3.2 to Spherion's Form 10-K for the fiscal year ended December 26, 2003, is incorporated herein by reference. |
| 4.1 | | Form of Stock Certificate, filed as Exhibit 4.1 to Spherion's Form 10-K for the fiscal year ended December 29, 2000, is incorporated herein by reference. |
| 4.2 | | Rights Agreement dated as of March 17, 1994 between Spherion and Boatmen's Trust Company, filed as Exhibit 1.1 to Spherion's Form 8-A filed April 11, 1994, is incorporated herein by reference. |
| 4.3 | | Restated Certificate of Designation, Preferences and Rights of Participating Preferred Stock of Spherion as filed with the Secretary of State of the State of Delaware, filed as Exhibit 4.3 to Spherion's Report on Form 8-K filed July 7, 2000, is incorporated herein by reference. |
78
| 4.4 | | Amendment No. 1, dated as of June 26, 1996, to Rights Agreement dated March 17, 1994, between Spherion, Boatmen's Trust Company and ChaseMellon Shareholder Services L.L.C., filed as Exhibit 4.1(A) to Spherion's Form 10-Q for the quarter ended September 27, 1996, is incorporated herein by reference. |
| 4.5 | | Amendment No. 2, dated as of February 25, 1997, to Rights Agreement dated March 17, 1994, between Spherion and ChaseMellon Shareholder Services L.L.C., filed as Exhibit 4.1(B) to Spherion's Form 10-Q for the quarter ended March 28, 1997, is incorporated herein by reference. |
| 4.6 | | Articles Fourth, Fifth, Seventh, Eighth and Tenth of the Restated Certificate of Incorporation of Spherion, as last amended May 19, 2004, filed as Exhibit 4.6 to Spherion's Form 10-Q for the quarter ended June 25, 2004, are incorporated herein by reference. |
| 4.7 | | Article I and Article V of the Restated By-Laws of Spherion, as amended through November 11, 2003, filed as Exhibit 4.7 to Spherion's Form 10-Q for the quarter ended June 28, 2002, are incorporated herein by reference. |
| 4.8 | | Certificate of Increase of Shares Designated as Participating Preferred Stock, filed as Exhibit 2.2 to Spherion's Form 8-A/A2, dated November 3, 1997, is incorporated herein by reference. |
| 4.10 | | Amendment No. 3, dated as of January 20, 1998, to Rights Agreement dated as of March 17, 1994, between Spherion and ChaseMellon Shareholder Services L.L.C., filed as Exhibit 4.10 to Spherion's Form 10-K for the fiscal year ended December 25, 1998, is incorporated herein by reference. |
| 4.11 | | Amendment No. 4, dated as of November 21, 2000, to Rights Agreement dated March 17, 1994, between Spherion, ChaseMellon Shareholder Services L.L.C. and the Bank of New York, filed as Exhibit 4.11 to Spherion's Form 10-K for the fiscal year ended December 29, 2000, is incorporated herein by reference. |
| 4.12 | | Amendment No. 5, dated as of March 23, 2001, to Rights Agreement dated March 17, 1994, by and between Spherion and the Bank of New York, filed as Exhibit 4.12 to Spherion's Form 10-Q for the quarter ended March 30, 2001, is incorporated herein by reference. |
| 4.13 | | Spherion is a party to other agreements for unregistered long-term debt securities, which do not exceed 10% of Spherion's total assets. Spherion agrees to furnish a copy of such agreements to the Commission upon request. |
| 4.14 | | Amendment No. 6, dated as of December 1, 2003, to Rights Agreement dated March 17, 1994, by and between Spherion and the Bank of New York, filed as Exhibit 4.14 to Spherion's Form 10-K for the fiscal year ended December 26, 2003, is incorporated herein by reference. |
| 10.1*† | | Spherion Corporation Corporate Executives Management 2007 Variable Pay Plan, filed as Exhibit 10.1 to Spherion's Form 8-K filed on February 6, 2007, is incorporated herein by reference. |
| 10.2 | | Form of Indemnification Agreement between Spherion and each director of Spherion, dated August 10, 1999 for all directors except James J. Forese, David R. Parker, Anne Szostak, and Barbara Pellow, filed as Exhibit 10.2 to Spherion's Form 10-Q for the quarter ended September 24, 1999, is incorporated herein by reference. The Indemnification Agreements for Messrs. Forese and Parker are dated February 25, 2003, Ms. Szostak's Indemnification Agreement is dated March 21, 2005 and Ms. Pellow's Indemnification Agreement is dated October 6, 2006. |
| 10.3*† | | Spherion Corporation Corporate Executives Management 2006 Variable Pay Plan for the individuals listed on Schedule A attached thereto, filed as Exhibit 10.3 to Spherion's Form 10-K for the fiscal year ended January 1, 2006 is incorporated herein by reference. |
| 10.4*† | | Spherion Corporation Line of Business Executive Management 2006 Variable Pay Plan for the individuals listed on Schedule A attached thereto, filed as Exhibit 10.4 to Spherion's Form 10-K for the fiscal year ended January 1, 2006 is incorporated herein by reference. |
| 10.6* | | Spherion Corporation 2006 Stock Incentive Plan filed as Appendix C to Spherion's Proxy Statement dated April 7, 2006, is incorporated herein by reference. |
79
| 10.7* | | Spherion Corporation Director Deferred Restricted Stock Unit Agreement filed as Exhibit 99.1 to Spherion's Form 8-K filed July 3, 2006, is incorporated herein by reference. |
| 10.8* | | Spherion Corporation revised form of Notice of Grant of Stock Options and Option Agreement filed as Exhibit 99.1 to Spherion's Form 8-K filed September 27, 2006, is incorporated herein by reference. |
| 10.9*† | | Spherion Corporation form of Deferred Restricted Stock Unit Agreement based on Corporate EPS Vesting Criteria, filed as Exhibit 10.9 to Spherion's Form 10-K filed February 23, 2007, is incorporated herein by reference. |
| 10.11* | | Norrell Corporation 1994 Stock Incentive Plan, filed as Exhibit 10.27 to Norrell Corporation's Registration Statement on Form S-1, as filed with the Securities and Exchange Commission on June 10, 1994, is incorporated herein by reference. |
| 10.12* | | Separation Agreement effective March 7, 2007, by and between Spherion and Byrne K. Mulrooney, filed as Exhibit 10.10 to Spherion's Form 10-Q for the quarter ended April 1, 2007, is incorporated herein by reference. |
| 10.13* | | First Amendment, dated January 10, 2007, to the Spherion Corporation Deferred Compensation Plan, amended and restated as of January 1, 2005, filed as Exhibit 10.20 to Spherion's Form 10-Q for the quarter ended April 1, 2007, is incorporated herein by reference. |
| 10.14* | | Deferred Stock Unit Agreement for Roy G. Krause relating to 700,000 Deferred Stock Units granted to Mr. Krause on August 27, 2007, filed as Exhibit 10.1 to Spherion's Form 10-Q for the quarter ended September 30, 2007, is incorporated herein by reference. |
| 10.17 | | Restated Stock Purchase Agreement, dated September 26, 1997 among Interim Services Inc., Catamaran Acquisition Corp. and Cornerstone Equity Investors IV, L.P., filed as Exhibit 2.1 to Spherion's Form 8-K dated September 26, 1997 and filed October 13, 1997, is incorporated herein by reference. |
| 10.18* | | Spherion Corporation Deferred Compensation Plan amended and restated as of January 1, 2005, filed as Exhibit 99.1 to Spherion's Form 8-K filed January 5, 2006, is incorporated herein by reference. |
| 10.19* | | Spherion Corporation Outside Directors' Compensation Plan, effective July 1, 2005, filed as Exhibit 10.19 to Spherion's Form 10-Q for the quarter ended July 3, 2005, is incorporated herein by reference. |
| 10.20* | | Spherion Corporation Outside Directors' Compensation Plan, filed as Exhibit 10.1 to Spherion's Form 8-K filed on May 16, 2007, is incorporated herein by reference. |
| 10.22* | | Spherion Corporation 2000 Stock Incentive Plan, filed as Exhibit 10.22 to Spherion's Form 10-K for the fiscal year ended December 29, 2000, is incorporated herein by reference. |
| 10.39* | | Spherion Corporation Amended and Restated 2000 Employee Stock Purchase Plan, as last amended May 19, 2004, filed as Exhibit 10.39 to Spherion's Form 10-Q for the quarter ended June 25, 2004, is incorporated herein by reference. |
| 10.55* | | Restated Employment Agreement by and between Spherion and Roy G. Krause, amended through March 9, 2005, filed as Exhibit 10.55 to Spherion's Form 10-K for the fiscal year ended December 31, 2004, is incorporated herein by reference. |
| 10.56* | | Restated Change in Control Agreement by and between Spherion and Roy G. Krause, amended through March 9, 2005, filed as Exhibit 10.56 to Spherion's Form 10-K for the fiscal year ended December 31, 2004, is incorporated herein by reference. |
| 10.57* | | Form of Restated Employment Agreement by and between Spherion and the individuals listed on Schedule A attached thereto, filed as Exhibit 10.57 to Spherion's Form 10-K for the fiscal year ended January 1, 2006 is incorporated herein by reference. |
| 10.58* | | Form of Restated Change in Control Agreement by and between Spherion and the individuals listed on Schedule A attached to Spherion's Form 10-K filed February 23, 2007, filed as Exhibit 10.58 to Spherion's Form 10-K filed February 23, 2007, is incorporated herein by reference. |
80
| 10.59* | | Spherion Corporation Deferred Stock Plan (as amended and restated December 20, 2002) filed as Exhibit 10.59 to Spherion's Form 10-K for the year ended December 27, 2002, is incorporated herein by reference. |
| 10.60 | | Credit Agreement, dated as of July 24, 2003, made by and among the financial institutions from time to time parties thereto (such financial institutions, together with their respective successors and assigns, are referred to thereinafter each individually as a "Lender" and collectively as the "Lenders"), Bank of America, N.A., as Administrative Agent and Collateral Agent for the Lenders and Spherion, filed as Exhibit 10.60 to Spherion's Form 10-Q for the quarter ended September 26, 2003, is incorporated herein by reference. |
| 10.61 | | First Amendment to Credit Agreement, Security Agreement, Pledge Agreement and Guaranty Agreement dated August 25, 2003 by and among Spherion, as borrower, each subsidiary of Borrower party to the Security Agreement, the Pledge Agreement and the Guaranty Agreement, each of the Lenders signatory hereto and Bank of America, N.A., as agent to the Lenders, filed as Exhibit 10.61 to Spherion's Form 10-Q for the quarter ended September 26, 2003, is incorporated herein by reference. |
| 10.62* | | Form of Restated Employment Agreement by and between Spherion and the individuals listed on Schedule A to Spherion's Form 10-K filed February 23, 2007, filed as Exhibit 10.62 to Spherion's Form 10-K filed February 23, 2007 is incorporated herein by reference. |
| 10.63 | | Second Amendment to Credit Agreement dated as of March 30, 2004, made by and among Spherion, as borrower, each subsidiary of Borrower party to the Guaranty Agreement, each of the Lenders signatory hereto and Bank of America, N.A., as agent for the Lenders, filed as Exhibit 10.63 to Spherion's Form 10-Q for the quarter ended September 24, 2004, is incorporated herein by reference. |
| 10.64 | | Third Amendment to Credit Agreement dated as of July 12, 2004, made by and among Spherion, as borrower, each subsidiary of Borrower party to the Guaranty Agreement, each of the Lenders signatory hereto and Bank of America, N.A., as agent for the Lenders, filed as Exhibit 10.64 to Spherion's Form 10-Q for the quarter ended September 24, 2004, is incorporated herein by reference. |
| 10.65* | | Spherion Corporation form of 2000 Stock Incentive Plan Stock Option Agreement, filed as Exhibit 10.65 to Spherion's Form 10-K for the fiscal year ended December 31, 2004, is incorporated herein by reference. |
| 10.66* | | Spherion Corporation form of standard Deferred Stock Agreement, filed as Exhibit 10.66 to Spherion's Form 10-K for the fiscal year ended December 31, 2004, is incorporated herein by reference. |
| 10.67*† | | Spherion Corporation form of Deferred Stock Agreement with vesting criteria related to implementation of enterprise resource planning system, filed as Exhibit 10.67 to Spherion's Form 10-K for the fiscal year ended December 31, 2004, is incorporated herein by reference. |
| 10.68*† | | Spherion Corporation form of Deferred Stock Agreement with performance based vesting criteria, filed as Exhibit 10.68 to Spherion's Form 10-K for the fiscal year ended January 1, 2006, is incorporated herein by reference. |
| 10.69 | | Fourth Amendment to Credit Agreement dated as of July 29, 2005, made by and among Spherion, as borrower, each subsidiary of Borrower party to the Guaranty Agreement, each of the Lenders signatory hereto and Bank of America, N.A., as agent for the Lenders, filed as Exhibit 99.1 to Spherion's Form 8-K filed August 3, 2005, is incorporated herein by reference. |
| 10.72*† | | Spherion Corporation Corporate Executives Management 2005 Variable Pay Plan for the individuals listed on Schedule A attached thereto, filed as Exhibit 10.72 to Spherion's Form 10-K for the fiscal year ended December 31, 2004, is incorporated herein by reference. |
| 10.73*† | | Spherion Corporation Line of Business Executive Management 2005 Variable Pay Plan for the individuals listed on Schedule A attached thereto, filed as Exhibit 10.73 to Spherion's Form 10-K for the fiscal year ended December 31, 2004, is incorporated herein by reference. |
81
| 10.74*† | | Spherion Corporation form of Deferred Stock Agreement with vesting criteria related to EPS targets filed as Exhibit 10.74 to Spherion's Form 10-K for the fiscal year ended December 31, 2004, is incorporated herein by reference. |
| 10.75 | | Fifth Amendment to Credit Agreement dated as of September 6, 2005, made by and among Spherion, as borrower, each subsidiary of Borrower party to the Guaranty Agreement, each of the Lenders signatory hereto and Bank of America, N.A., as agent for the Lenders, filed as Exhibit 10.75 attached hereto. |
| 10.76 | | Sixth Amendment to Credit Agreement dated as of October 17, 2007, made by and among Spherion, as borrower, each subsidiary of Borrower party to the Guaranty Agreement, each of the Lenders signatory hereto and Bank of America, N.A., as agent for the Lenders, filed as Exhibit 10.76 attached hereto. |
| 11 | | See "Earnings Per Share" in Note 4 of the Notes to Consolidated Financial Statements included herein. |
| 21 | | Subsidiaries of Spherion, filed as Exhibit 21 attached hereto. |
| 23.1 | | Consent of Deloitte & Touche LLP, filed as Exhibit 23.1 attached hereto. |
| 31.1 | | Rule 13a-14(a) Certification in Accordance with Section 302 of the Sarbanes-Oxley Act of 2002, filed as Exhibit 31.1 attached hereto. |
| 31.2 | | Rule 13a-14(a) Certification in Accordance with Section 302 of the Sarbanes-Oxley Act of 2002, filed as Exhibit 31.2 attached hereto. |
| 32 | | Certification of Roy G. Krause and Mark W. Smith pursuant to 18 U.S.C. Section 1350, as Adopted Pursuant to Section 906 of the Sarbanes-Oxley Act of 2002, furnished as Exhibit 32 attached hereto. |
- *
- This Exhibit is a management contract or compensatory plan or arrangement.
- †
- Portions of this Exhibit have been omitted and filed separately with the Commission pursuant to a request for confidential treatment.
- (b)
- EXHIBITS FILED WITH THIS FORM
Exhibit Number
| | Exhibit Name
|
|---|
| 10.75 | | Fifth Amendment to Credit Agreement dated as of September 6, 2005. |
| 10.76 | | Sixth Amendment to Credit Agreement dated as of October 17, 2007. |
| 21 | | Subsidiaries of Spherion. |
| 23.1 | | Consent of Deloitte & Touche LLP. |
| 31.1 | | Rule 13a-14(a) Certification in Accordance with Section 302 of the Sarbanes-Oxley Act of 2002. |
| 31.2 | | Rule 13a-14(a) Certification in Accordance with Section 302 of the Sarbanes-Oxley Act of 2002. |
| 32 | | Certification of Roy G. Krause and Mark W. Smith pursuant to 18 U.S.C. Section 1350, as Adopted Pursuant to Section 906 of the Sarbanes-Oxley Act of 2002. |
- *
- This Exhibit is a management contract or compensatory plan or arrangement.
- †
- Portions of this Exhibit have been omitted and filed separately with the Commission pursuant to a request for confidential treatment.
- (c)
- OTHER FINANCIAL STATEMENTS
There were no other financial statements of the type described in subparagraph (d) of Item 15 of Part IV required to be filed herein.
82
SIGNATURES
Pursuant to the requirements of Section 13 or 15(d) of the Securities Exchange Act of 1934, the registrant has duly caused this report to be signed on its behalf by the undersigned, thereunto duly authorized.
| | | SPHERION CORPORATION |
March 12, 2008 |
|
By: |
/s/ ROY G. KRAUSE
Roy G. Krause
President and Chief Executive Officer |
Pursuant to the requirements of the Securities Exchange Act of 1934, this report has been signed below by the following persons on behalf of Spherion and in the capacities and on the date indicated.
Signature
| | Title
|
|---|
|
|
|
/s/ JAMES J. FORESE
James J. Forese | | Chairman and Director |
/s/ WILLIAM F. EVANS
William F. Evans |
|
Director |
/s/ STEVEN S. ELBAUM
Steven S. Elbaum |
|
Director |
/s/ ROY G. KRAUSE
Roy G. Krause |
|
Director |
/s/ J. IAN MORRISON
J. Ian Morrison |
|
Director |
/s/ DAVID R. PARKER
David R. Parker |
|
Director |
/s/ BARBARA PELLOW
Barbara Pellow |
|
Director |
/s/ M. ANNE SZOSTAK
M. Anne Szostak |
|
Director |
83
/s/ A. MICHAEL VICTORY
A. Michael Victory |
|
Director |
/s/ ROY G. KRAUSE
Roy G. Krause |
|
President and
Chief Executive Officer |
/s/ MARK W. SMITH
Mark W. Smith |
|
Executive Vice President and
Chief Financial Officer
(principal financial and accounting officer) |
(Signed as to each on March 12, 2008)
84
QuickLinks
SPHERION CORPORATION AND SUBSIDIARIES TABLE OF CONTENTSPART IPART IISPHERION CORPORATION AND SUBSIDIARIES CONSOLIDATED STATEMENTS OF EARNINGS (in thousands, except per share amounts)SPHERION CORPORATION AND SUBSIDIARIES CONSOLIDATED BALANCE SHEETS (in thousands, except share data)SPHERION CORPORATION AND SUBSIDIARIES CONSOLIDATED STATEMENTS OF STOCKHOLDERS' EQUITY For Fiscal Years Ended December 30, 2007, December 31, 2006 and January 1, 2006 (amounts in thousands)SPHERION CORPORATION AND SUBSIDIARIES CONSOLIDATED STATEMENTS OF CASH FLOWS (amounts in thousands)SPHERION CORPORATION AND SUBSIDIARIES SCHEDULE II—VALUATION AND QUALIFYING ACCOUNTS (amounts in thousands)PART IIIEquity Compensation Plan InformationPART IVSIGNATURES