| UNITED STATES |
| SECURITIES AND EXCHANGE COMMISSION |
| Washington, D.C. 20549 |
| |
| |
| FORM N-CSR |
| |
| CERTIFIED SHAREHOLDER REPORT OF REGISTERED MANAGEMENT |
| INVESTMENT COMPANIES |
| |
| Investment Company Act file number 811-7123 |
| |
| Dreyfus Growth & Value Funds, Inc. |
| (Exact name of Registrant as specified in charter) |
| |
| |
| c/o The Dreyfus Corporation |
| 200 Park Avenue |
| New York, New York 10166 |
| (Address of principal executive offices) (Zip code) |
| |
| Mark N. Jacobs, Esq. |
| 200 Park Avenue |
| New York, New York 10166 |
| (Name and address of agent for service) |
| |
| Registrant's telephone number, including area code: (212) 922-6000 |
| Date of fiscal year end: | | 08/31 |
| Date of reporting period: | | 08/31/2005 |
FORM N-CSR
Item 1. Reports to Stockholders.
Save time. Save paper. View your next shareholder report online as soon as it’s available. Log into www.dreyfus.com and sign up for Dreyfus eCommunications. It’s simple and only takes a few minutes.
The views expressed in this report reflect those of the portfolio manager only through the end of the period covered and do not necessarily represent the views of Dreyfus or any other person in the Dreyfus organization. Any such views are subject to change at any time based upon market or other conditions and Dreyfus disclaims any responsibility to update such views.These views may not be relied on as investment advice and, because investment decisions for a Dreyfus fund are based on numerous factors, may not be relied on as an indication of trading intent on behalf of any Dreyfus fund.
Not FDIC-Insured • Not Bank-Guaranteed • May Lose Value
| | | Contents |
| |
| | | THE FUND |
| |
|
| 2 | | Letter from the Chairman |
| 3 | | Discussion of Fund Performance |
| 6 | | Fund Performance |
| 7 | | Understanding Your Fund’s Expenses |
| 7 | | Comparing Your Fund’s Expenses |
| | | With Those of Other Funds |
| 8 | | Statement of Investments |
| 13 | | Statement of Assets and Liabilities |
| 14 | | Statement of Operations |
| 15 | | Statement of Changes in Net Assets |
| 16 | | Financial Highlights |
| 17 | | Notes to Financial Statements |
| 24 | | Report of Independent Registered |
| | | Public Accounting Firm |
| 25 | | Information About the Review and Approval |
| | | of the Fund’s Management Agreement |
| 30 | | Board Members Information |
| 32 | | Officers of the Fund |
| |
| | | FOR MORE INFORMATION |
| |
|
| | | Back Cover |
The Fund
| | Dreyfus
Emerging Leaders Fund
|

LETTER FROM THE CHAIRMAN
This annual report for Dreyfus Emerging Leaders Fund covers the 12-month period from September 1, 2004, through August 31, 2005. Inside, you’ll find valuable information about how the fund was managed during the reporting period, including a discussion with the fund’s portfolio managers, John S. Cone, Oliver Buckley, Langton C. Garvin and Kristin Crawford, each of whom comprise the Smallcap Team of Franklin Portfolio Associates, LLC.
On average, stock prices ended the reporting period higher than where they began. However, most of the market’s gains occurred during the closing months of 2004. So far in 2005, positive factors, including steady economic growth and higher corporate profits, were largely offset by headwinds, such as sharply higher energy prices and rising short-term interest rates. Midcap stocks produced higher returns than small-cap stocks in this environment, and small-cap stocks outperformed large-cap stocks. Also, value-oriented stocks have generally produced better results than their more growth-oriented counterparts during the past 12 months.
Recent shocks to the U.S. economy — including sharply higher gasoline prices and other lingering consequences of Hurricane Katrina — have added a degree of uncertainty to the economic outlook.Nonetheless,our economists currently expect the economy to continue to grow without either entering a recession or triggering a significant acceleration of infla-tion.As always, we encourage you to discuss the potential implications of these and other matters with your financial advisor.
Thank you for your continued confidence and support.

DISCUSSION OF FUND PERFORMANCE
| | John S. Cone, Oliver Buckley, Langton C. Garvin and
Kristin Crawford, Portfolio Managers
|
How did Dreyfus Emerging Leaders Fund perform relative to
its benchmark?
|
For the 12-month period ended August 31, 2005, the fund produced a total return of 23.68% .1 In comparison, the fund’s benchmark, the Russell 2000 Index (the “Index”), achieved a 23.10% total return for the same period.2
We attribute these results to continuing growth in the U.S. economy, which led to better-than-forecasted corporate financial results for many companies. These favorable developments outweighed the negative impact of rising interest rates and energy prices, resulting in a generally positive environment for most stocks. Small- to midcap stocks tended to outperform their large-cap counterparts, as they have for the past six years. The fund participated fully in the small-cap market’s gains, delivering particularly strong returns in the health care, producer durables and technology sectors. Although a few individual holdings detracted from returns, the fund roughly matched or exceeded the benchmark’s performance in most investment sectors.
What is the fund’s investment approach?
The fund seeks capital growth by investing at least 80% of its assets in companies we believe are emerging leaders: companies characterized by new or innovative products, services or processes having the potential to enhance earnings growth. The fund primarily invests in companies with market capitalizations of less than $2 billion at the time of purchase. Because the fund may continue to hold a security as its market capitalization grows, a substantial portion of the fund’s holdings can have market capitalizations in excess of $2 billion at any given time.
For the first 10 months of the reporting period, we employed a blended approach, investing in a combination of growth and value stocks. Using fundamental research and direct management contact, we sought stocks with strong positions in major product lines,
| | DISCUSSION OF FUND PERFORMANCE (continued)
|
sustained achievement records and strong financial conditions. We sought special situations, such as corporate restructurings or management changes that could be a catalyst for stock appreciation.
Since June 30, 2005, we have employed a structured, risk-controlled approach in which principles of fundamental analysis are implemented quantitatively.This disciplined,“bottom-up,” approach seeks to identify undervalued securities through computer models that rank stocks based on fundamental momentum, relative value, long-term growth and additional factors, such as technical factors.We attempt to maintain a neutral exposure to industry groups relative to the Index. Within each sector, we overweight the stocks ranked most attractive and underweight or avoid those ranked least attractive.
What other factors influenced the fund’s performance?
The fund secured its greatest gains in the health care sector, where relative returns were bolstered by good individual stock selections and an emphasis on health care facilities and service providers. Top performers included insurer PacifiCare Health Systems, eldercare and rehabilitation specialist Genesis HealthCare and outpatient dialysis services provider DaVita.The fund’s relatively light exposure to biotech-nology stocks further enhanced its performance relative to the benchmark.
Our stock selection strategy also generated relatively strong gains in other sectors. In the producer durables area, the fund’s returns benefited most significantly from its position in United Defense Industries, which was acquired at a premium by BAE Systems; and heavy machinery producer JLG Industries, which rose on the strength of greater industrial demand for roadwork and construction equipment. Most of the fund’s best technology performers were concentrated in the software and services area, including F5 Networks, a provider of application traffic management products, and Anteon International, a designer of governmental defense and emergency response systems. Gains in these holdings, and in Genesis Microchip, a maker of display image processors, more than made up for disappointing returns from other technology holdings, such as semiconductor maker Skyworks Solutions and Internet services provider InfoSpace. Finally, in the
energy sector, the fund’s investment in Arch Coal generated notably good returns amid rising commodity prices due to rising industrial demand for a limited supply of energy commodities.
The fund experienced only a few significant disappointments during the reporting period. In addition to the technology stocks mentioned above, the fund’s returns were hurt by a dip in shares of acute care facilities operator LifePoint Hospitals, which acquired less profitable competitors in the summer of 2005. In the financial sector, a mild earnings shortfall led to a decline in Signature Bank, a New York-based banking, brokerage and insurance service provider.
What is the fund’s current strategy?
The Smallcap Team of Franklin Portfolio Associates, LLC stepped in as the fund’s portfolio manager on June 30, 2005.While we have maintained the fund’s focus on small-cap stocks, during the final two months of the reporting period we began the gradual process of adjusting the fund’s portfolio composition to reflect our quantitatively driven, sector-neutral investment approach. We anticipate that this process will continue over the next several months.
As of the end of the reporting period, the fund continued to reflect the prior managers’ emphasis on certain sectors, with reduced but still overweighted exposure to technology and energy stocks and, within the health care sector, medical service providers.The fund also held slightly underweighted exposure to the financial and specialty retail areas.
| 1 | | Total return includes reinvestment of dividends and any capital gains paid. Past performance is no |
| | | guarantee of future results. Share price and investment return fluctuate such that upon redemption, |
| | | fund shares may be worth more or less than their original cost. Return figures provided reflect the |
| | | absorption of fund expenses by The Dreyfus Corporation pursuant to an agreement effective |
| | | March 16, 2005, through March 31, 2006, at which time it may be extended, terminated or |
| | | modified. Had these expenses not been absorbed, the fund’s returns would have been lower. |
| | | Part of the fund’s recent performance is attributable to positive returns from its initial public |
| | | offering (IPO) investments. There can be no guarantee that IPOs will have or continue to |
| | | have a positive effect on the fund’s performance. |
| 2 | | SOURCE: LIPPER INC. — Reflects reinvestment of dividends and, where applicable, capital |
| | | gain distributions.The Russell 2000 Index is an unmanaged index of small-cap stock performance |
| | | and is composed of the 2,000 smallest companies in the Russell 3000 Index.The Russell 3000 |
| | | Index is composed of the 3,000 largest U.S. companies based on total market capitalization. |
| Average Annual Total Returns | | as of 8/31/05 | | | | |
| | | Inception | | | | | | From |
| | | Date | | 1 Year | | 5 Years | | Inception |
| |
| |
| |
| |
|
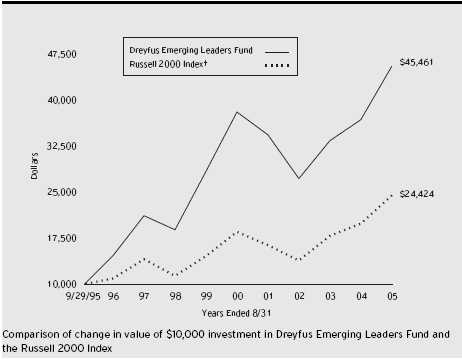
| Fund | | 9/29/95 | | 23.68% | | 3.66% | | 16.49% |
† Source: Lipper Inc.
Past performance is not predictive of future performance.The fund’s performance shown in the graph and table does not reflect the deduction of taxes that a shareholder would pay on fund distributions or the redemption of fund shares. Part of the fund’s recent performance is attributable to positive returns from its initial public offering (IPO) investments. There can be no guarantee that IPOs will have or continue to have a positive effect on fund performance.
The above graph compares a $10,000 investment made in Dreyfus Emerging Leaders Fund on 9/29/95 (inception date) to a $10,000 investment made in the Russell 2000 Index on that date. All dividends and capital gain distributions are reinvested.
The fund’s performance shown in the line graph takes into account all applicable fees and expenses.The Russell 2000 Index is an unmanaged index and is composed of the 2,000 smallest companies in the Russell 3000 Index.The Russell 3000 Index is composed of 3,000 of the largest U.S. companies by market capitalization and does not take into account charges, fees and other expenses. Further information relating to fund performance, including expense reimbursements, if applicable, is contained in the Financial Highlights section of the prospectus and elsewhere in this report.
U N D E R S TA N D I N G YO U R F U N D ’ S E X P E N S E S ( U n a u d i t e d )
As a mutual fund investor, you pay ongoing expenses, such as management fees and other expenses. Using the information below, you can estimate how these expenses affect your investment and compare them with the expenses of other funds.You also may pay one-time transaction expenses, including sales charges (loads) and redemption fees, which are not shown in this section and would have resulted in higher total expenses. For more information, see your fund’s prospectus or talk to your financial adviser.
Review your fund’s expenses
The table below shows the expenses you would have paid on a $1,000 investment in Dreyfus Emerging Leaders Fund from March 1, 2005 to August 31, 2005. It also shows how much a $1,000 investment would be worth at the close of the period, assuming actual returns and expenses.
Expenses and Value of a $1,000 Investment
assuming actual returns for the six months ended August 31, 2005
|
| Expenses paid per $1,000 † | | $ 6.07 |
| Ending value (after expenses) | | $1,058.50 |
COMPARING YOUR FUND’S EXPENSES
WITH THOSE OF OTHER FUNDS (Unaudited)
|
Using the SEC’s method to compare expenses
The Securities and Exchange Commission (SEC) has established guidelines to help investors assess fund expenses. Per these guidelines, the table below shows your fund’s expenses based on a $1,000 investment, assuming a hypothetical 5% annualized return. You can use this information to compare the ongoing expenses (but not transaction expenses or total cost) of investing in the fund with those of other funds.All mutual fund shareholder reports will provide this information to help you make this comparison. Please note that you cannot use this information to estimate your actual ending account balance and expenses paid during the period.
Expenses and Value of a $1,000 Investment
assuming a hypothetical 5% annualized return for the six months ended August 31, 2005
|
| Expenses paid per $1,000 † | | $ 5.96 |
| Ending value (after expenses) | | $1,019.31 |
† Expenses are equal to the fund’s annualized expense ratio of 1.17%, multiplied by the average account value over the period, multiplied by 184/365 (to reflect the one-half year period).
| | STATEMENT OF INVESTMENTS
August 31, 2005
|
| Common Stocks—100.0% | | Shares | | Value ($) |
| |
| |
|
| Commercial & Professional Services—6.7% | | |
| Bell Microproducts | | 99,600 a | | 1,008,948 |
| Cantel Medical | | 127,800 a | | 2,658,240 |
| Harte-Hanks | | 374,600 | | 9,612,236 |
| Rush Enterprises, Cl. A | | 44,900 a | | 717,951 |
| Spartan Stores | | 47,059 a | | 481,884 |
| United Natural Foods | | 109,000 a | | 3,706,000 |
| Valassis Communications | | 340,000 a | | 13,406,200 |
| Valueclick | | 366,400 a,b | | 5,290,816 |
| WESCO International | | 425,000 a | | 14,747,500 |
| | | | | 51,629,775 |
| Communications—.2% | | | | |
| Golden Telecom | | 35,700 b | | 1,053,150 |
| Talk America Holdings | | 53,400 a,b | | 489,678 |
| | | | | 1,542,828 |
| Consumer Non-Durables—2.2% | | | | |
| Church & Dwight | | 355,000 | | 13,546,800 |
| Mannatech | | 78,600 b | | 977,784 |
| Parlux Fragrances | | 83,800 a,b | | 2,628,806 |
| | | | | 17,153,390 |
| Consumer Services—5.7% | | | | |
| Educate | | 349,800 a | | 5,659,764 |
| Intrawest | | 593,500 | | 15,520,025 |
| Lakes Entertainment | | 60,200 a,b | | 746,480 |
| Lin TV, Cl. A | | 47,500 a | | 717,725 |
| Orient-Express Hotels, Cl. A | | 296,300 | | 9,105,299 |
| Pinnacle Entertainment | | 598,400 a | | 11,932,096 |
| World Wrestling Entertainment | | 34,600 | | 436,998 |
| | | | | 44,118,387 |
| Electronic Technology—11.5% | | | | |
| Advanced Energy Industries | | 337,100 a | | 4,018,232 |
| Cypress Semiconductor | | 700,000 a,b | | 10,941,000 |
| DRS Technologies | | 132,100 | | 6,796,545 |
| Extreme Networks | | 1,650,000 a | | 7,128,000 |
| F5 Networks | | 215,000 a | | 8,877,350 |
| Genesis Microchip | | 648,500 a | | 17,049,065 |
| Hexcel | | 748,400 a | | 14,556,380 |
| Common Stocks (continued) | | Shares | | Value ($) |
| |
| |
|
| Electronic Technology (continued) | | | | |
| Integrated Circuit Systems | | 292,700 a | | 6,164,262 |
| Intevac | | 64,600 a | | 844,322 |
| MIPS Technologies | | 361,100 a | | 2,264,097 |
| Omnivision Technologies | | 154,000 a,b | | 2,257,640 |
| Redback Networks | | 63,100 a | | 570,424 |
| Silicon Image | | 361,600 a | | 3,735,328 |
| SpectraLink | | 149,100 | | 1,921,899 |
| TTM Technologies | | 166,500 a | | 1,288,710 |
| X-Rite | | 43,100 | | 542,629 |
| | | | | 88,955,883 |
| Energy Minerals—7.1% | | | | |
| Arch Coal | | 212,300 b | | 13,629,660 |
| Cabot Oil & Gas | | 396,000 | | 17,103,240 |
| Houston Exploration | | 150,000 a | | 8,835,000 |
| Unit | | 290,000 a | | 15,097,400 |
| | | | | 54,665,300 |
| Finance—18.3% | | | | |
| Affiliated Managers Group | | 226,600 a,b | | 16,453,426 |
| Affordable Residential Communities | | 74,400 b | | 879,408 |
| Amegy Bancorp | | 673,600 | | 15,135,792 |
| BFC Financial, Cl. A | | 61,800 a | | 470,916 |
| Bimini Mortgage Management, Cl. A | | 51,400 | | 641,472 |
| Boykin Lodging | | 134,800 a | | 1,773,968 |
| First Midwest Bancorp | | 422,000 | | 16,010,680 |
| Flagstar Bancorp | | 106,900 b | | 1,844,025 |
| Greater Bay Bancorp | | 566,900 | | 14,285,880 |
| Harbor Florida Bancshares | | 354,500 | | 12,910,890 |
| LTC Properties | | 74,800 | | 1,513,204 |
| Luminent Mortgage Capital | | 235,800 | | 2,136,348 |
| Montpelier Re Holdings | | 335,400 | | 10,967,580 |
| Ocwen Financial | | 90,000 a,b | | 618,300 |
| Partners Trust Financial Group | | 72,000 | | 853,200 |
| Presidential Life | | 33,100 | | 582,229 |
| R&G Financial, Cl. B | | 243,300 | | 3,681,129 |
| Reinsurance Group of America | | 256,600 | | 11,010,706 |
| Signature Bank | | 234,700 a | | 7,038,653 |
| | STATEMENT OF INVESTMENTS (continued)
|
| Common Stocks (continued) | | Shares | | Value ($) |
| |
| |
|
| Finance (continued) | | | | |
| Webster Financial | | 262,200 | | 12,040,224 |
| Westamerica Bancorporation | | 200,000 | | 10,442,000 |
| | | | | 141,290,030 |
| Health Technology—3.6% | | | | |
| Andrx | | 582,000 a,b | | 10,551,660 |
| ArQule | | 75,000 a | | 573,000 |
| Candela | | 72,200 a | | 715,502 |
| Cotherix | | 125,200 a,b | | 1,745,288 |
| Enzon Pharmaceuticals | | 248,000 a | | 1,733,520 |
| Eyetech Pharmaceuticals | | 370,800 a,b | | 6,778,224 |
| Genitope | | 171,200 a,b | | 1,374,736 |
| Myogen | | 7,600 a,b | | 157,320 |
| Neurometrix | | 146,700 a | | 4,085,595 |
| | | | | 27,714,845 |
| Industrial Services—5.9% | | | | |
| Superior Energy Services | | 765,000 a | | 16,768,800 |
| Todco, Cl. A | | 580,000 | | 20,137,600 |
| Universal Compression Holdings | | 206,900 a | | 8,524,280 |
| | | | | 45,430,680 |
| Non-Energy Minerals—2.4% | | | | |
| Agnico-Eagle Mines | | 890,000 | | 11,641,200 |
| Olin | | 356,800 | | 6,665,024 |
| | | | | 18,306,224 |
| Process Industries—5.6% | | | | |
| Agrium | | 600,000 | | 12,900,000 |
| Albany International, Cl. A | | 380,000 | | 13,687,600 |
| Cambrex | | 45,100 | | 857,802 |
| Crown Holdings | | 572,400 a | | 9,667,836 |
| Pioneer Cos. | | 40,100 a | | 887,012 |
| Wausau Paper | | 384,800 | | 4,579,120 |
| Wellman | | 51,400 | | 357,230 |
| | | | | 42,936,600 |
| Producer Manufacturing—5.9% | | | | |
| IDEX | | 310,000 | | 13,485,000 |
| JLG Industries | | 541,400 b | | 17,752,506 |
| Common Stocks (continued) | | Shares | | Value ($) |
| |
| |
|
| Producer Manufacturing (continued) | | |
| Steel Technologies | | 62,600 | | 1,465,466 |
| Trinity Industries | | 349,700 b | | 13,089,271 |
| | | | | 45,792,243 |
| Retail Trade—5.4% | | | | |
| Bon-Ton Stores | | 33,000 | | 668,910 |
| Genesco | | 399,600 a | | 15,868,116 |
| Pacific Sunwear of California | | 622,000 a | | 14,853,360 |
| PETCO Animal Supplies | | 451,000 a | | 9,976,120 |
| | | | | 41,366,506 |
| Technology Services—13.4% | | | | |
| Anteon International | | 320,000 a | | 14,704,000 |
| Apria Healthcare Group | | 365,000 a | | 12,493,950 |
| Business Objects, ADR | | 349,500 a,b | | 11,652,330 |
| Chemed | | 300,000 b | | 12,138,000 |
| eCollege.com | | 58,500 a,b | | 734,175 |
| Entercom Communications | | 94,500 a | | 3,161,025 |
| Genesis HealthCare | | 330,000 a | | 13,233,000 |
| Global Payments | | 200,000 | | 13,156,000 |
| Hyperion Solutions | | 235,400 a | | 10,209,298 |
| LifePoint Hospitals | | 115,600 a | | 5,257,488 |
| NDCHealth | | 255,000 | | 4,796,550 |
| Online Resources | | 65,500 a | | 628,145 |
| Vignette | | 102,400 a | | 1,555,456 |
| | | | | 103,719,417 |
| Transportation—2.4% | | | | |
| Skywest | | 619,100 | | 14,678,861 |
| World Air Holdings | | 349,100 a | | 3,515,437 |
| | | | | 18,194,298 |
| Utilities—3.7% | | | | |
| ALLETE | | 274,200 | | 12,407,550 |
| Duquesne Light Holdings | | 600,000 b | | 10,890,000 |
| Puget Energy | | 247,900 | | 5,644,683 |
| | | | | 28,942,233 |
| Total Common Stocks | | | | |
| (cost $534,863,906) | | | | 771,758,639 |
| | STATEMENT OF INVESTMENTS (continued)
|
| Other Investment—.7% | | | | Shares | | Value ($) |
| |
| |
| |
|
| Registered Investment Company; | | | | | | |
| Dreyfus Institutional Preferred Plus Money Market Fund | | |
| (cost $5,501,000) | | | | 5,501,000 c | | 5,501,000 |
| |
| |
| |
|
| |
| Investment of Cash Collateral | | | | |
| for Securities Loaned—7.8% | | | | |
| |
| |
|
| Registered Investment Company; | | | | | | |
| Dreyfus Institutional Cash Advantage Fund | | | | |
| (cost $60,286,082) | | | | 60,286,082 c | | 60,286,082 |
| |
| |
| |
|
| |
| Total Investments (cost $600,650,988) | | 108.5% | | 837,545,721 |
| Liabilities, Less Cash and Receivables | | (8.5%) | | (65,535,720) |
| Net Assets | | | | 100.0% | | 772,010,001 |
| |
| ADR—American Depository Receipts. | | | | | | |
| a | | Non-income producing. | | | | | | |
| b | | All or a portion of these securities are on loan. At August 31, 2005, the total market value of the fund’s securities on |
| | | loan is $58,815,708 and the total market value of the collateral held by the fund is $60,286,082. |
| c | | Investments in affiliated money market mutual funds. | | |
| |
| |
|
| |
| |
| |
| |
| Portfolio Summary † | | | | | | |
| | | | | Value (%) | | | | Value (%) |
| |
| |
| |
| |
|
| Finance | | 18.3 | | Industrial Services | | 5.9 |
| Technology Services | | 13.4 | | Consumer Services | | 5.7 |
| Electronic Technology | | 11.5 | | Process Industries | | 5.6 |
| Money Market Investments | | 8.5 | | Retail Trade | | 5.4 |
| Energy Minerals | | 7.1 | | Other | | 14.5 |
| Commercial & Professional Services | | 6.7 | | | | |
| Producer Manufacturing | | 5.9 | | | | 108.5 |
| |
| † | | Based on net assets. | | | | | | |
| See notes to financial statements. | | | | | | |
STATEMENT OF ASSETS AND LIABILITIES
August 31, 2005
|
| | | Cost | | Value |
| |
| |
|
| Assets ($): | | | | |
| Investments in securities— | | | | |
| See Statement of Investments (including securities | | |
| on loan, valued at $58,815,708)—Note 1(b): | | |
| Unaffiliated issuers | | 534,863,906 | | 771,758,639 |
| Affiliated issuers | | 65,787,082 | | 65,787,082 |
| Cash | | | | 22,127 |
| Dividends and interest receivable | | | | 346,888 |
| Receivable for shares of Common Stock subscribed | | 156,616 |
| Prepaid expenses | | | | 33,450 |
| | | | | 838,104,802 |
| |
| |
|
| Liabilities ($): | | | | |
| Due to The Dreyfus Corporation and affiliates—Note 3(b) | | 785,109 |
| Liability for securities loaned—Note 1(b) | | 60,286,082 |
| Payable for investment securities purchased | | 3,014,912 |
| Payable for shares of Common Stock redeemed | | 1,669,138 |
| Accrued expenses | | | | 339,560 |
| | | | | 66,094,801 |
| |
| |
|
| Net Assets ($) | | | | 772,010,001 |
| |
| |
|
| Composition of Net Assets ($): | | | | |
| Paid-in capital | | | | 428,201,599 |
| Accumulated undistributed investment income—net | | 1,910 |
| Accumulated net realized gain (loss) on investments | | 106,911,759 |
| Accumulated net unrealized appreciation | | |
| (depreciation) on investments | | | | 236,894,733 |
| |
| |
|
| Net Assets ($) | | | | 772,010,001 |
| |
| |
|
| Shares Outstanding | | | | |
| (100 million shares of $.001 par value Common Stock authorized) | | 16,552,328 |
| Net Asset Value, offering and redemption price per share—Note 3(e) ($) | | 46.64 |
See notes to financial statements.
|
| | STATEMENT OF OPERATIONS
Year Ended August 31, 2005
|
| Investment Income ($): | | |
| Income: | | |
| Cash dividends (net of $26,682 foreign taxes withheld at source): | | |
| Unaffiliated issuers | | 9,667,233 |
| Affiliated issuers | | 536,335 |
| Income from securities lending | | 242,324 |
| Total Income | | 10,445,892 |
| Expenses: | | |
| Management fee—Note 3(a) | | 8,270,087 |
| Shareholder servicing costs—Note 3(b) | | 3,707,175 |
| Custodian fees—Note 3(b) | | 66,520 |
| Professional fees | | 48,235 |
| Prospectus and shareholders’ reports | | 35,238 |
| Registration fees | | 19,931 |
| Directors’ fees and expenses—Note 3(c) | | 18,483 |
| Interest expense—Note 2 | | 14,158 |
| Loan commitment fees—Note 2 | | 6,015 |
| Miscellaneous | | 24,630 |
| Total Expenses | | 12,210,472 |
| Less—reduction in management fee | | |
| due to undertaking—Note 3(a) | | (620,065) |
| Net Expenses | | 11,590,407 |
| Investment (Loss)—Net | | (1,144,515) |
| |
|
| Realized and Unrealized Gain (Loss) on Investments—Note 4 ($): |
| Net realized gain (loss) on investments | | 174,321,426 |
| Net unrealized appreciation (depreciation) on investments | | 30,084,682 |
| Net Realized and Unrealized Gain (Loss) on Investments | | 204,406,108 |
| Net Increase in Net Assets Resulting from Operations | | 203,261,593 |
| | See notes to financial statements.
|
STATEMENT OF CHANGES IN NET ASSETS
| | | Year Ended August 31, |
| |
|
| | | 2005 | | 2004 |
| |
| |
|
| Operations ($): | | | | |
| Investment (loss)—net | | (1,144,515) | | (5,932,203) |
| Net realized gain (loss) on investments | | 174,321,426 | | 153,626,269 |
| Net unrealized appreciation | | | | |
| (depreciation) on investments | | 30,084,682 | | (20,290,024) |
| Net Increase (Decrease) in Net Assets | | | | |
| Resulting from Operations | | 203,261,593 | | 127,404,042 |
| |
| |
|
| Capital Stock Transactions ($): | | | | |
| Net proceeds from shares sold | | 124,224,914 | | 316,518,596 |
| Cost of shares redeemed | | (548,335,097) | | (621,998,115) |
| Increase (Decrease) in Net Assets | | | | |
| from Capital Stock Transactions | | (424,110,183) | | (305,479,519) |
| Total Increase (Decrease) in Net Assets | | (220,848,590) | | (178,075,477) |
| |
| |
|
| Net Assets ($): | | | | |
| Beginning of Period | | 992,858,591 | | 1,170,934,068 |
| End of Period | | 772,010,001 | | 992,858,591 |
| Undistributed investment income—net | | 1,910 | | — |
| |
| |
|
| Capital Share Transactions (Shares): | | | | |
| Shares sold | | 2,919,033 | | 8,304,150 |
| Shares redeemed | | (12,695,747) | | (16,228,851) |
| Net Increase (Decrease) in Shares Outstanding | | (9,776,714) | | (7,924,701) |
See notes to financial statements.
|
The following table describes the performance for the fiscal periods indicated. Total return shows how much your investment in the fund would have increased (or decreased) during each period, assuming you had reinvested all dividends and distributions.These figures have been derived from the fund’s financial statements.
| | | | | Year Ended August 31, | | |
| |
| |
| |
|
| | | 2005 | | 2004 | | 2003 | | 2002 | | 2001 |
| |
| |
| |
| |
| |
|
| Per Share Data ($): | | | | | | | | | | |
| Net asset value, beginning of period | | 37.71 | | 34.18 | | 27.85 | | 36.06 | | 40.61 |
| Investment Operations: | | | | | | | | | | |
| Investment (loss)—net a | | (.05) | | (.19) | | (.16) | | (.16) | | (.15) |
| Net realized and unrealized | | | | | | | | | | |
| gain (loss) on investments | | 8.98 | | 3.72 | | 6.49 | | (7.21) | | (3.81) |
| Total from Investment Operations | | 8.93 | | 3.53 | | 6.33 | | (7.37) | | (3.96) |
| Distributions: | | | | | | | | | | |
| Dividends from net realized | | | | | | | | | | |
| gain on investments | | — | | — | | — | | (.84) | | (.59) |
| Net asset value, end of period | | 46.64 | | 37.71 | | 34.18 | | 27.85 | | 36.06 |
| |
| |
| |
| |
| |
|
| Total Return (%) | | 23.68 | | 10.29 | | 22.77 | | (20.78) | | (9.80) |
| |
| |
| |
| |
| |
|
| Ratios/Supplemental Data (%): | | | | | | | | | | |
| Ratio of total expenses | | | | | | | | | | |
| to average net assets | | 1.33 | | 1.31 | | 1.38 | | 1.34 | | 1.29 |
| Ratio of net expenses | | | | | | | | | | |
| to average net assets | | 1.26 | | 1.31 | | 1.38 | | 1.34 | | 1.29 |
| Ratio of net investment (loss) | | | | | | | | | | |
| to average net assets | | (.12) | | (.50) | | (.56) | | (.49) | | (.39) |
| Portfolio Turnover Rate | | 42.07 | | 47.66 | | 50.27 | | 36.24 | | 77.63 |
| |
| |
| |
| |
| |
|
| Net Assets, end of period | | | | | | | | | | |
| ($ x 1,000) | | 772,010 | | 992,859 | | 1,170,934 | | 1,074,004 | | 1,379,534 |
| | a Based on average shares outstanding at each month end.
See notes to financial statements.
|
NOTES TO FINANCIAL STATEMENTS
NOTE 1—Significant Accounting Policies:
Dreyfus Emerging Leaders Fund (the “fund”) is a separate diversified series of Dreyfus Growth and Value Funds, Inc. (the “Company”), which is registered under the Investment Company Act of 1940, as amended (the “Act”), as an open-end management investment company and operates as a series company that offers twelve series, including the fund.The fund’s investment objective is capital growth.The Dreyfus Corporation (the “Manager” or “Dreyfus”) serves as the fund’s investment adviser.The Manager is a wholly-owned subsidiary of Mellon Financial Corporation (“Mellon Financial”). Dreyfus Service Corporation (the “Distributor”), a wholly-owned subsidiary of the Manager, is the distributor of the fund’s shares, which are sold to existing shareholders without a sales charge.The fund is closed to new investors.
The Company accounts separately for the assets, liabilities and operations of each series. Expenses directly attributable to each series are charged to that series’ operations; expenses which are applicable to all series are allocated among them on a pro rata basis.
The fund’s financial statements are prepared in accordance with U.S. generally accepted accounting principles, which may require the use of management estimates and assumptions. Actual results could differ from those estimates.
The fund enters into contracts that contain a variety of indemnifications. The fund’s maximum exposure under these arrangements is unknown.The fund does not anticipate recognizing any loss related to these arrangements.
(a) Portfolio valuation: Investments in securities are valued at the last sales price on the securities exchange or national securities market on which such securities are primarily traded. Securities listed on the National Market System for which market quotations are available are valued at the official closing price or, if there is no official closing price that day, at the last sales price. Securities not listed on an exchange or the national securities market, or securities for which there were no transactions, are valued at the average of the most recent bid and asked
| | NOTES TO FINANCIAL STATEMENTS (continued)
|
prices, except for open short positions, where the asked price is used for valuation purposes. Bid price is used when no asked price is available. Investments in registered investment companies are valued at net assets.When market quotations or official closing prices are not readily available, or are determined not to reflect accurately fair value, such as when the value of a security has been significantly affected by events after the close of the exchange or market on which the security is principally traded (for example, a foreign exchange or market), but before the fund calculates its net asset value, the fund may value these investments at fair value as determined in accordance with the procedures approved by the Board of Directors. Fair valuing of securities may be determined with the assistance of a pricing service using calculations based on indices of domestic securities and other appropriate indicators, such as prices of relevant ADR’s and futures contracts. For other securities that are fair valued by the Board of Directors, certain factors may be considered such as: fundamental analytical data, the nature and duration of restrictions on disposition, an evaluation of the forces that influence the market in which the securities are purchased and sold and public trading in similar securities of the issuer or comparable issuers. Financial futures are valued at the last sales price.
(b) Securities transactions and investment income: Securities transactions are recorded on a trade date basis. Realized gain and loss from securities transactions are recorded on the identified cost basis. Dividend income is recognized on the ex-dividend date and interest income, including, where applicable, accretion of discount and amortization of premium on investments is recognized on the accrual basis.
The fund has an arrangement with the custodian bank whereby the fund receives earnings credits from the custodian when positive cash balances are maintained, which are used to offset custody fees. For financial reporting purposes, the fund includes net earnings credits, if any, as an expense offset in the Statement of Operations.
Pursuant to a securities lending agreement with Mellon Bank, N.A., an affiliate of the Manager, the fund may lend securities to qualified
institutions.At origination, all loans are secured by collateral of at least 102% of the value of U.S. securities loaned and 105% of the value of foreign securities loaned. Collateral equivalent to at least 100% of the market value of securities on loan will be maintained at all times. Cash collateral is invested in certain money market mutual funds managed by the Manager. The fund will be entitled to receive all income on securities loaned, in addition to income earned as a result of the lending transaction. Although each security loaned is fully collateralized, the fund would bear the risk of delay in recovery of, or loss of rights in, the securities loaned should a borrower fail to return the securities in a timely manner.
(c) Affiliated issuers: Investments in other investment companies advised by the Manager are defined as “affiliated” in the Act.
(d) Dividends to shareholders: Dividends are recorded on the ex-dividend date. Dividends from investment income-net and dividends from net realized capital gain, if any, are normally declared and paid annually, but the fund may make distributions on a more frequent basis to comply with the distribution requirements of the Internal Revenue Code of 1986, as amended (the “Code”).To the extent that net realized capital gain can be offset by capital loss carryovers, it is the policy of the fund not to distribute such gain. Income and capital gain distributions are determined in accordance with income tax regulations, which may differ from U.S. generally accepted accounting principles.
(e) Federal income taxes: It is the policy of the fund to continue to qualify as a regulated investment company, if such qualification is in the best interests of its shareholders, by complying with the applicable provisions of the Code, and to make distributions of taxable income sufficient to relieve it from substantially all federal income and excise taxes.
At August 31, 2005, the components of accumulated earnings on a tax basis were as follows: undistributed capital gains $108,744,881 and unrealized appreciation $235,063,521.
| | NOTES TO FINANCIAL STATEMENTS (continued)
|
During the period ended August 31, 2005, as a result of permanent book to tax differences primarily due to the tax treatment for net operating losses and real estate investment trusts, the fund increased accumulated undistributed investment income-net by $1,146,425 and decreased paid-in capital by the same amount. Net assets were not affected by this reclassification.
NOTE 2—Bank Line of Credit:
|
The fund participates with other Dreyfus-managed funds in a $350 million redemption credit facility (the “Facility”) to be utilized for temporary or emergency purposes, including the financing of redemptions. In connection therewith, the fund has agreed to pay commitment fees on its pro rata portion of the Facility. Interest is charged to the fund based on prevailing market rates in effect at the time of borrowings.
The average daily amount of borrowings outstanding under the Facility during the period ended August 31, 2005 was approximately $481,400, with a related weighted average annualized interest rate of 2.94% .
NOTE 3—Management Fee and Other Transactions With Affiliates:
(a) Pursuant to a management agreement with the Manager, the management fee is computed at the annual rate of .90% of the value of the fund’s average daily net assets and is payable monthly.The Manager has undertaken from March 16, 2005 through March 31, 2006 that, if the fund’s aggregate expenses, exclusive of taxes, brokerage fees, interest on borrowings, shareholder services plan fees and extraordinary expenses, exceed an annual rate of .90% of the value of the fund’s average daily net assets, the fund may deduct from the payment to be made to the Manager under the Agreement, or the Manager will bear, such excess expenses. The expense reimbursement, pursuant to the undertaking, amounted to $620,065 during the period ended August 31, 2005.
(b) Under the Shareholder Services Plan, the fund pays the Distributor at an annual rate of .25% of the value of the fund’s average daily net assets for the provision of certain services.The services provided may include personal services relating to shareholder accounts, such as
answering shareholder inquiries regarding the fund and providing reports and other information, and services related to the maintenance of shareholder accounts. The Distributor may make payments to Service Agents (a securities dealer, financial institution or other industry professional) in respect of these services. The Distributor determines the amounts to be paid to Service Agents. During the period ended August 31, 2005, the fund was charged $2,297,246 pursuant to the Shareholder Services Plan.
The fund compensates Dreyfus Transfer, Inc., a wholly-owned subsidiary of the Manager, under a transfer agency agreement for providing personnel and facilities to perform transfer agency services for the fund. During the period ended August 31, 2005, the fund was charged $183,374 pursuant to the transfer agency agreement.
The fund compensates Mellon Bank, N.A., an affiliate of the Manager under a custody agreement for providing custodial services for the fund. During the period ended August 31, 2005, the fund was charged $66,520 pursuant to the custody agreement.
During the period ended August 31, 2005, the fund was charged $2,520 for services performed by the Chief Compliance Officer.
The components of Due to The Dreyfus Corporation and affiliates in the Statement of Assets and Liabilities consist of: management fees $589,030, shareholder services plan fees $163,912, custody fees $14,940, chief compliance officer fees $1,533 and transfer agency per account fees $72,800, which are offset against an expense reimbursement currently in effect in the amount of $57,106.
(c) Each Board member also serves as a Board member of other funds within the Dreyfus complex. Annual retainer fees and attendance fees are allocated to each fund based on net assets.
(d) Pursuant to an exemptive order from the Securities and Exchange Commission, the fund may invest its available cash balances in affiliated money market mutual funds. Management fees of the underlying money market mutual funds have been waived by the Manager.
| | NOTES TO FINANCIAL STATEMENTS (continued)
|
(e) A 1% redemption fee is charged and retained by the fund on certain shares redeemed within thirty days following the date of issuance, including redemptions made through the use of the fund’s exchange privilege.
NOTE 4—Securities Transactions:
|
The aggregate amount of purchases and sales of investment securities, excluding short-term securities, during the period ended August 31, 2005, amounted to $375,547,274 and $753,256,342, respectively.
At August 31, 2005, the cost of investments for federal income tax purposes was $602,482,200; accordingly, accumulated net unrealized appreciation on investments was $235,063,521, consisting of $246,699,768 gross unrealized appreciation and $11,636,247 gross unrealized depreciation.
In early 2004, two purported class and derivative actions were filed against Mellon Financial, Mellon Bank, N.A., Dreyfus, Founders Asset Management LLC, and certain directors of the Dreyfus Funds and the Dreyfus Founders Funds (together, the “Funds”) in the United States District Court for the Western District of Pennsylvania. In September 2004, plaintiffs served a Consolidated Amended Complaint (the “Amended Complaint”) on behalf of a purported class of all persons who acquired interests in any of the Funds between January 30, 1999 and November 17, 2003, and derivatively on behalf of the Funds.The Amended Complaint in the newly styled In re Dreyfus Mutual Funds Fee Litigation also named the Distributor, Premier Mutual Fund Services, Inc. and two additional Fund directors as defendants and alleges violations of the Investment Company Act of 1940, the Investment Advisers Act of 1940, the Pennsylvania Unfair Trade Practices and Consumer Protection Law and common-law claims.
Plaintiffs seek to recover allegedly improper and excessive Rule 12b-1 and advisory fees allegedly charged to the Funds for marketing and distribution services. More specifically, plaintiffs claim, among other things, that 12b-1 fees and directed brokerage were improperly used to pay brokers to recommend the Funds over other funds, and that such payments were not disclosed to investors. In addition, plaintiffs assert that economies of scale and soft-dollar benefits were not passed on to the Funds. Plaintiffs further allege that 12b-1 fees were improperly charged to certain of the Funds that were closed to new investors.The Amended Complaint seeks compensatory and punitive damages, rescission of the advisory contracts, and an accounting and restitution of any unlawful fees, as well as an award of attorneys’ fees and litigation expenses. As noted, some of the claims in this litigation are asserted derivatively on behalf of the Funds that have been named as nominal defendants. With respect to such derivative claims, no relief is sought against the Funds. Dreyfus believes the allegations to be totally without merit and intends to defend the action vigorously. In November 2004, all named defendants moved to dismiss the Amended Complaint in whole or substantial part. Briefing was completed in May 2005.
Additional lawsuits arising out of these circumstances and presenting similar allegations and requests for relief may be filed against the defendants in the future. Neither Dreyfus nor the Funds believe that any of the pending actions will have a material adverse effect on the Funds or Dreyfus’ ability to perform its contract with the Funds.
| | REPORT OF INDEPENDENT REGISTERED
PUBLIC ACCOUNTING FIRM
|
Shareholders and Board of Directors
Dreyfus Emerging Leaders Fund
|
We have audited the accompanying statement of assets and liabilities, including the statement of investments, of Dreyfus Emerging Leaders Fund (one of the funds comprising Dreyfus Growth and Value Funds, Inc.) as of August 31, 2005, and the related statement of operations for the year then ended, the statement of changes in net assets for each of the two years in the period then ended, and financial highlights for each of the years indicated therein. These financial statements and financial highlights are the responsibility of the Fund’s management. Our responsibility is to express an opinion on these financial statements and financial highlights based on our audits.
We conducted our audits in accordance with the standards of the Public Company Accounting Oversight Board (United States).Those standards require that we plan and perform the audit to obtain reasonable assurance about whether the financial statements and financial highlights are free of material misstatement.We were not engaged to perform an audit of the Fund’s internal control over financial reporting.Our audits included consideration of internal control over financial reporting as a basis for designing audit procedures that are appropriate in the circumstances,but not for the purpose of expressing an opinion on the effectiveness of the Fund’s internal control over financial reporting.Accordingly, we express no such opinion.An audit also includes examining, on a test basis, evidence supporting the amounts and disclosures in the financial statements and financial highlights, assessing the accounting principles used and significant estimates made by management, and evaluating the overall financial statement presentation. Our procedures included verification by examination of securities held by the custodian as of August 31, 2005 and confirmation of securities not held by the custodian by correspondence with oth-ers.We believe that our audits provide a reasonable basis for our opinion.
In our opinion, the financial statements and financial highlights referred to above present fairly, in all material respects, the financial position of Dreyfus Emerging Leaders Fund at August 31, 2005, the results of its operations for the year then ended, the changes in its net assets for each of the two years in the period then ended, and the financial highlights for each of the indicated years, in conformity with U.S. generally accepted accounting principles.

New York, New York
October 14, 2005
|
INFORMATION ABOUT THE REVIEW AND APPROVAL OF THE
FUND’S MANAGEMENT AGREEMENT (Unaudited)
|
At a meeting of the Board of Directors held on March 14, 2005, the Board considered the re-approval for an annual period of the Fund’s Management Agreement, pursuant to which the Manager provides the Fund with investment advisory and administrative services. The Board members, none of whom are “interested persons” (as defined in the Investment Company Act of 1940,as amended) of the Fund,were assisted in their review by independent legal counsel and met with counsel in executive session separate from representatives of the Manager.
Analysis of Nature, Extent and Quality of Services Provided to the Fund. The Board members received a presentation from representatives of the Manager regarding services provided to the Fund and other funds in the Dreyfus fund complex, and discussed the nature, extent and quality of the services provided to the Fund pursuant to its Management Agreement. The presentation included a detailed summary of the services provided to Dreyfus-managed mutual funds by each business unit within the Manager.The Manager’s representatives reviewed the Fund’s distribution of accounts and the relationships the Manager has with various intermediaries and the different needs of each.The Manager’s representatives noted the diversity of distribution of the Fund as well as among the funds in the Dreyfus fund complex, and the Manager’s corresponding need for broad, deep, and diverse resources to be able to provide ongoing shareholder services to each of the Fund’s distribution channels.The Board also reviewed the number of shareholder accounts in the Fund, as well as the Fund’s asset size.
The Board members also considered the Manager’s research and portfolio management capabilities and that the Manager also provides oversight of day-to-day Fund operations, including fund accounting and administration and assistance in meeting legal and regulatory requirements. The Board members also considered the Manager’s extensive administrative, accounting and compliance infrastructure.
Comparative Analysis of the Fund’s Performance and Management Fee and Expense Ratio. The Board members reviewed the Fund’s performance, management fee and expense ratios and placed significant emphasis on comparisons to a group of comparable funds and Lipper
| | I N FO R M AT I O N A B O U T T H E R E V I E W A N D A P P R OVA L O F T H E
F U N D ’S M A N A G E M E N T A G R E E M E N T ( U n a u d i t e d ) ( c o n t i n u e d )
|
category averages, as applicable. The group of comparable funds was previously approved by the Board for this purpose, and was prepared using a Board-approved selection methodology that was based, in part, on selecting non-affiliated funds reported in the same Lipper category as the Fund.The Board members discussed the results of the comparisons for various periods ended January 31, 2005, and noted that the Fund’s performance was lower than the comparison group averages for the 1-year, 3-year and 5-year periods, but was higher than the Lipper category averages for each such period.The Board discussed with representatives of the Manager the reasons for the Fund’s underperfor-mance compared to the comparison group for the 1-, 3-, and 5-year periods, and the Manager’s efforts to improve performance.The Board members also discussed the Fund’s management fee and expense ratio and reviewed the range of management fees and expense ratios for the funds in the comparison group.The Fund’s management fee ranked in the bottom half (i.e., higher than most others) of the comparison group funds.The Board noted that the Fund’s total expense ratio was higher than the comparison group average, but was lower than the Lipper category average. After discussions with the Board, the Manager undertook, effective March 16, 2005, to waive its fees or reimburse certain Fund expenses until March 31, 2006, if total Fund operating expenses exceed .90% of the value of the Fund’s average daily net assets.
Representatives of the Manager reviewed with the Board members the fees paid to the Manager or its affiliates by mutual funds managed by the Manager or its affiliates with similar investment objectives, policies and strategies as the Fund (the “Similar Funds”), and by other accounts managed or sub-advised by the Manager or its affiliates with similar investment objectives, policies and strategies as the Fund (the “Separate Accounts” and, collectively with the Similar Funds, the “Similar Accounts”).The Manager’s representatives explained the nature of the Similar Accounts and the differences, from the Manager’s perspective, in management of the Similar Accounts as compared to managing and providing services to the Fund; it was noted that the Similar Funds were mutual funds included in the “small-cap growth” and “small-cap growth variable insurance products” funds categories by Lipper. The
Manager’s representatives also reviewed the costs associated with distribution through intermediaries. The Board analyzed the differences in fees paid to the Manager and discussed the relationship of the advisory fees paid in light of the Manager’s performance and the services provided; it was noted that the Similar Funds generally had management fees that were the same as or lower than the fee borne by the Fund, with one Similar Fund having a higher management fee. The Board members considered the relevance of the fee information provided for the Similar Accounts managed by the Manager to evaluate the appropriateness and reasonableness of the Fund’s advisory fees. The Board acknowledged that differences in fees paid by the Similar Accounts seemed to be consistent with the services provided.
Analysis of Profitability and Economies of Scale. The Manager’s representatives reviewed the dollar amount of expenses allocated and profit received by the Manager and the method used to determine such expenses and profit.The Board received and considered information prepared by an independent consulting firm regarding the Manager’s approach to allocating costs to, and determining the profitability of, individual funds and the entire Dreyfus fund complex.The Manager’s representatives stated that the methodology had also been reviewed by an independent registered public accounting firm which, like the consultant, found the methodology to be reasonable.The consulting firm also analyzed where any economies of scale might emerge in connection with the management of the Fund.The Board members evaluated the analysis in light of the relevant circumstances for the Fund, and the extent to which economies of scale would be realized as the Fund grows and whether fee levels reflect these economies of scale for the benefit of Fund investors. The Board noted that it appeared that the benefits of any economies of scale also would be appropriately shared with shareholders through increased investment in fund management and administration resources. The Board members also considered potential benefits to the Manager from acting as investment adviser and reviewed the soft dollar arrangements with respect to trading the Fund’s portfolio.
| | I N FO R M AT I O N A B O U T T H E R E V I E W A N D A P P R OVA L O F T H E
F U N D ’S M A N A G E M E N T A G R E E M E N T ( U n a u d i t e d ) ( c o n t i n u e d )
|
It was noted that the Board members should consider the Manager’s profitability with respect to the Fund as part of their evaluation of whether the fee under the Management Agreement bears a reasonable relationship to the mix of services provided by the Manager, including the nature, extent and quality of such services and that a discussion of economies of scale is predicated on increasing assets and that, if a Fund’s assets had been decreasing, the possibility that the Manager may have realized any economies of scale would be less.The Board members also discussed the profitability percentage ranges determined by appropriate court cases to be reasonable given the services rendered to investment companies. It was noted that the profitability percentage for managing the Fund was not unreasonable given the Fund’s overall performance and generally superior service levels provided.
At the conclusion of these discussions, each of the Directors expressed the opinion that he or she had been furnished with sufficient information to make an informed business decision with respect to continuation of the Fund’s Management Agreement. Based on their discussions and considerations as described above, the Board made the following conclusions and determinations.
- The Board concluded that the nature, extent and quality of the ser- vices provided by the Manager are adequate and appropriate.
- The Board expressed concern over the Fund’s performance, but was satisfied with the Manager’s efforts to improve such performance, noting that the Manager has undertaken to limit the Fund’s expenses as described above.
- The Board concluded that the fee paid to the Manager by the Fund was reasonable in light of comparative performance and expense and advisory fee information, including the Manager’s undertaking to waive or reimburse certain fees and expenses of the Fund, costs of the services provided and profits to be realized and benefits derived or to be derived by the Manager from its relationship with the Fund.
- The Board determined that the economies of scale which may accrue to the Manager and its affiliates in connection with the man- agement of the Fund had been adequately considered by the Manager in connection with the management fee rate charged to the Fund, and that, to the extent in the future it were to be deter- mined that material economies of scale had not been shared with the Fund, the Board would seek to have those economies of scale shared with the Fund.
The Board members considered these conclusions and determinations, along with the information received on a routine and regular basis throughout the year, and, without any one factor being dispositive, the Board determined that re-approval of the Fund’s Management Agreement was in the best interests of the Fund and its shareholders.
BOARD MEMBERS INFORMATION (Unaudited)
| | Joseph S. DiMartino (61)
Chairman of the Board (1995)
|
| Principal Occupation During Past 5 Years: |
| • Corporate Director and Trustee |
| | Other Board Memberships and Affiliations:
|
- The Muscular Dystrophy Association, Director
- Levcor International, Inc., an apparel fabric processor, Director
- Century Business Services, Inc., a provider of outsourcing functions for small and medium size companies, Director
- The Newark Group, a provider of a national market of paper recovery facilities, paperboard mills and paperboard converting plants, Director
- Azimuth Trust, an institutional asset management firm, Member of Board of Managers and Advisory Board
- Sunair Electronics, Inc., engages in the design, manufacture and sale of high frequency systems for long-range voice and data communications, as well as providing certain outdoor-related services to homes and businesses, Director
No. of Portfolios for which Board Member Serves: 193
| | David P. Feldman (65)
Board Member (1996)
|
| Principal Occupation During Past 5 Years: |
| • Corporate Director & Trustee |
| | Other Board Memberships and Affiliations:
|
- BBH Mutual Funds Group (11 funds), Director
- The Jeffrey Company, a private investment company, Director
- QMED, a medical device company, Director
No. of Portfolios for which Board Member Serves: 58
| | Ehud Houminer (65)
Board Member (1993)
|
| | Principal Occupation During Past 5 Years:
|
- Executive-in-Residence at the Columbia Business School, Columbia University
- Principal of Lear,Yavitz and Associates, a management consulting firm (1996 to 2001)
| | Other Board Memberships and Affiliations:
|
- Avnet Inc., an electronics distributor, Director
- International Advisory Board to the MBA Program School of Management, Ben Gurion University, Chairman
- Explore Charter School, Brooklyn, NY, Chairman
| | No. of Portfolios for which Board Member Serves: 36
|
| | Gloria Messinger (75)
Board Member (1993)
|
| | Principal Occupation During Past 5 Years:
|
- Arbitrator for American Arbitration Association and National Association of Securities Dealers, Inc.
- Consultant in Intellectual Property
| | Other Board Memberships and Affiliations:
|
- Yale Law School Fund, Director
- Theater for a New Audience, Inc., Director
- Brooklyn Philharmonic, Director
- New York Women’s Agenda Music Performance Trust Fund, Director
| | No. of Portfolios for which Board Member Serves: 25
|
| Principal Occupation During Past 5 Years: |
| • Consultant in Photography |
T. John Szarkowski (79) Board Member (1996)
| Other Board Memberships and Affiliations: |
| • Photography Department at The Museum of Modern Art, Director Emeritus |
| | No. of Portfolios for which Board Member Serves: 25
|
| | Anne Wexler (75)
Board Member (1996)
|
| | Principal Occupation During Past 5 Years:
|
- Chairman of the Wexler & Walker Public Policy Associates, consultants specializing in govern- ment relations and public affairs
| | Other Board Memberships and Affiliations:
|
- Wilshire Mutual Funds (5 funds), Director
- Methanex Corporation, a methanol producing company, Director
- Member of the Council of Foreign Relations
- Member of the National Park Foundation
| | No. of Portfolios for which Board Member Serves: 36
|
Once elected all Board Members serve for an indefinite term.The address of the Board Members and Officers is in c/o The Dreyfus Corporation, 200 Park Avenue, New York, New York 10166. Additional information about the Board Members is available in the fund’s Statement of Additional Information which can be obtained from Dreyfus free of charge by calling this toll free number: 1-800-554-4611.
John M. Fraser, Jr., Emeritus Board Member
OFFICERS OF THE FUND (Unaudited)
| STEPHEN E. CANTER, President since | | JAMES BITETTO, Vice President and |
| March 2000. | | Assistant Secretary since August 2005. |
| Chairman of the Board, Chief Executive | | Assistant General Counsel and Assistant |
| Officer and Chief Operating Officer of the | | Secretary of the Manager, and an officer of 91 |
| Manager, and an officer of 90 investment | | investment companies (comprised of 200 |
| companies (comprised of 184 portfolios) | | portfolios) managed by the Manager. He is 39 |
| managed by the Manager. Mr. Canter also is a | | years old and has been an employee of the |
| Board member and, where applicable, an | | Manager since December 1996. |
| |
| Executive Committee Member of the other | | JONI LACKS CHARATAN, Vice President |
| investment management subsidiaries of Mellon | | and Assistant Secretary since |
| Financial Corporation, each of which is an | | August 2005. |
| affiliate of the Manager. He is 60 years old and | | |
| has been an employee of the Manager since | | Assistant General Counsel and Assistant |
| May 1995. | | Secretary of the Manager, and an officer of 91 |
| | | investment companies (comprised of 200 |
| STEPHEN R. BYERS, Executive Vice | | portfolios) managed by the Manager. She is 49 |
| President since November 2002. | | years old and has been an employee of the |
| Chief Investment Officer,Vice Chairman and a | | Manager since October 1998. |
| |
| director of the Manager, and an officer of 90 | | JOSEPH M. CHIOFFI, Vice President and |
| investment companies (comprised of 184 | | Assistant Secretary since August 2005. |
| portfolios) managed by the Manager. Mr. Byers | | |
| also is an officer, director or an Executive | | Assistant General Counsel and Assistant |
| Committee Member of certain other | | Secretary of the Manager, and an officer of 91 |
| investment management subsidiaries of Mellon | | investment companies (comprised of 200 |
| Financial Corporation, each of which is an | | portfolios) managed by the Manager. He is 43 |
| affiliate of the Manager. He is 52 years old and | | years old and has been an employee of the |
| has been an employee of the Manager since | | Manager since July 2000. |
| January 2000. | | JANETTE E. FARRAGHER, Vice President |
| MARK N. JACOBS, Vice President since | | and Assistant Secretary since |
| March 2000. | | August 2005. |
| Executive Vice President, Secretary and | | Associate General Counsel of the Manager, |
| General Counsel of the Manager, and an | | and an officer of 91 investment companies |
| officer of 91 investment companies (comprised | | (comprised of 200 portfolios) managed by the |
| of 200 portfolios) managed by the Manager. | | Manager. She is 42 years old and has been an |
| He is 59 years old and has been an employee | | employee of the Manager since February 1984. |
| of the Manager since June 1977. | | JOHN B. HAMMALIAN, Vice President and |
| MICHAEL A. ROSENBERG, Vice President | | Assistant Secretary since August 2005. |
| and Secretary since August 2005. | | Associate General Counsel of the Manager, |
| Associate General Counsel of the Manager, | | and an officer of 91 investment companies |
| and an officer of 91 investment companies | | (comprised of 200 portfolios) managed by the |
| (comprised of 200 portfolios) managed by the | | Manager. He is 42 years old and has been an |
| Manager. He is 45 years old and has been an | | employee of the Manager since February 1991. |
| employee of the Manager since October 1991. | | |
| ROBERT R. MULLERY, Vice President and | | ROBERT SVAGNA, Assistant Treasurer |
| Assistant Secretary since August 2005. | | since December 2002. |
| Associate General Counsel of the Manager, | | Senior Accounting Manager – Equity Funds of |
| and an officer of 91 investment companies | | the Manager, and an officer of 91 investment |
| (comprised of 200 portfolios) managed by the | | companies (comprised of 200 portfolios) |
| Manager. He is 53 years old and has been an | | managed by the Manager. He is 38 years old |
| employee of the Manager since May 1986. | | and has been an employee of the Manager |
| |
| JEFF PRUSNOFSKY, Vice President and | | since November 1990. |
| Assistant Secretary since August 2005. | | KENNETH J. SANDGREN, Assistant |
| Associate General Counsel of the Manager, | | Treasurer since November 2001. |
| and an officer of 91 investment companies | | Mutual Funds Tax Director of the Manager, |
| (comprised of 200 portfolios) managed by the | | and an officer of 91 investment companies |
| Manager. He is 40 years old and has been an | | (comprised of 200 portfolios) managed by the |
| employee of the Manager since October 1990. | | Manager. He is 51 years old and has been an |
| |
| JAMES WINDELS, Treasurer since | | employee of the Manager since June 1993. |
| November 2001. | | JOSEPH W. CONNOLLY, Chief Compliance |
| Director – Mutual Fund Accounting of the | | Officer since October 2004. |
| Manager, and an officer of 91 investment | | Chief Compliance Officer of the Manager and |
| companies (comprised of 200 portfolios) | | The Dreyfus Family of Funds (91 investment |
| managed by the Manager. He is 46 years old | | companies, comprising 200 portfolios). From |
| and has been an employee of the Manager | | November 2001 through March 2004, Mr. |
| since April 1985. | | Connolly was first Vice-President, Mutual |
| |
| GREGORY S. GRUBER, Assistant | | Fund Servicing for Mellon Global Securities |
| Treasurer since August 2005. | | Services. In that capacity, Mr. Connolly was |
| | | responsible for managing Mellon’s Custody, |
| Senior Accounting Manager – Municipal Bond | | Fund Accounting and Fund Administration |
| Funds of the Manager, and an officer of 91 | | services to third-party mutual fund clients. He |
| investment companies (comprised of 200 | | is 48 years old and has served in various |
| portfolios) managed by the Manager. He is 46 | | capacities with the Manager since 1980, |
| years old and has been an employee of the | | including manager of the firm’s Fund |
| Manager since August 1981. | | Accounting Department from 1997 through |
| ERIK D. NAVILOFF, Assistant Treasurer | | October 2001. |
| since August 2005. | | WILLIAM GERMENIS, Anti-Money |
| Senior Accounting Manager – Taxable Fixed | | Laundering Compliance Officer since |
| Income Funds of the Manager, and an officer | | October 2002. |
| of 91 investment companies (comprised of 200 | | Vice President and Anti-Money Laundering |
| portfolios) managed by the Manager. He is 37 | | Compliance Officer of the Distributor, and the |
| years old and has been an employee of the | | Anti-Money Laundering Compliance Officer |
| Manager since November 1992. | | of 88 investment companies (comprised of 197 |
| ROBERT ROBOL, Assistant Treasurer | | portfolios) managed by the Manager. He is 35 |
| since August 2005. | | years old and has been an employee of the |
| | | Distributor since October 1998. |
| Senior Accounting Manager – Money Market | | |
| Funds of the Manager, and an officer of 91 | | |
| investment companies (comprised of 200 | | |
| portfolios) managed by the Manager. He is 41 | | |
| years old and has been an employee of the | | |
| Manager since October 1988. | | |
| For More | | Information |
| |
|
| |
| Dreyfus | | Transfer Agent & |
| Emerging Leaders Fund | | Dividend Disbursing Agent |
| 200 Park Avenue | | Dreyfus Transfer, Inc. |
| New York, NY 10166 | | 200 Park Avenue |
| Manager | | New York, NY 10166 |
| The Dreyfus Corporation | | Distributor |
| 200 Park Avenue | | Dreyfus Service Corporation |
| New York, NY 10166 | | 200 Park Avenue |
| Custodian | | New York, NY 10166 |
| Mellon Bank, N.A. | | |
| One Mellon Bank Center | | |
| Pittsburgh, PA 15258 | | |
| |
|
| |
| |
| Telephone 1-800-645-6561 | | |
Mail The Dreyfus Family of Funds, 144 Glenn Curtiss Boulevard, Uniondale, NY 11556-0144 E-mail Send your request to info@dreyfus.com Internet Information can be viewed online or downloaded at: http://www.dreyfus.com
The fund files its complete schedule of portfolio holdings with the Securities and Exchange Commission (“SEC”) for the first and third quarters of each fiscal year on Form N-Q. The fund’s Forms N-Q are available on the SEC’s website at http://www.sec.gov and may be reviewed and copied at the SEC’s Public Reference Room in Washington, DC. Information on the operation of the Public Reference Room may be obtained by calling 1-800-SEC-0330.
A description of the policies and procedures that the fund uses to determine how to vote proxies relating to portfolio securities, and information regarding how the fund voted these proxies for the 12-month period ended June 30, 2005, is available at http://www.dreyfus.com and on the SEC’s website at http://www.sec.gov. The description of the policies and procedures is also available without charge, upon request, by calling 1-800-645-6561.

Save time. Save paper. View your next shareholder report online as soon as it’s available. Log into www.dreyfus.com and sign up for Dreyfus eCommunications. It’s simple and only takes a few minutes.
The views expressed in this report reflect those of the portfolio manager only through the end of the period covered and do not necessarily represent the views of Dreyfus or any other person in the Dreyfus organization. Any such views are subject to change at any time based upon market or other conditions and Dreyfus disclaims any responsibility to update such views.These views may not be relied on as investment advice and, because investment decisions for a Dreyfus fund are based on numerous factors, may not be relied on as an indication of trading intent on behalf of any Dreyfus fund.
Not FDIC-Insured • Not Bank-Guaranteed • May Lose Value
| | | Contents |
| |
| | | THE FUND |
| |
|
| 2 | | Letter from the Chairman |
| 3 | | Discussion of Fund Performance |
| 6 | | Fund Performance |
| 7 | | Understanding Your Fund’s Expenses |
| 7 | | Comparing Your Fund’s Expenses |
| | | With Those of Other Funds |
| 8 | | Statement of Investments |
| 14 | | Statement of Assets and Liabilities |
| 15 | | Statement of Operations |
| 16 | | Statement of Changes in Net Assets |
| 17 | | Financial Highlights |
| 18 | | Notes to Financial Statements |
| 25 | | Report of Independent Registered |
| | | Public Accounting Firm |
| 26 | | Information About the Review and Approval |
| | | of the Fund’s Management Agreement |
| 31 | | Board Members Information |
| 33 | | Officers of the Fund |
| | | FOR MORE INFORMATION |
| |
|
| | | Back Cover |
The Fund

LETTER FROM THE CHAIRMAN
This annual report for Dreyfus Midcap Value Fund covers the 12-month period from September 1, 2004, through August 31, 2005. Inside, you’ll find valuable information about how the fund was managed during the reporting period, including a discussion with the fund’s portfolio manager, David A. Daglio.
On average, stock prices ended the reporting period higher than where they began. However, most of the market’s gains occurred during the closing months of 2004. So far in 2005, positive factors, including steady economic growth and higher corporate profits, were largely offset by headwinds, such as sharply higher energy prices and rising short-term interest rates. Midcap stocks produced higher returns than small-cap stocks in this environment, and small-cap stocks outperformed large-cap stocks. Also, value-oriented stocks have generally produced better results than their more growth-oriented counterparts during the past 12 months.
Recent shocks to the U.S. economy — including sharply higher gasoline prices and other lingering consequences of Hurricane Katrina — have added a degree of uncertainty to the economic outlook.Nonetheless,our economists currently expect the economy to continue to grow without either entering a recession or triggering a significant acceleration of infla-tion.As always, we encourage you to discuss the potential implications of these and other matters with your financial advisor.
Thank you for your continued confidence and support.


DISCUSSION OF FUND PERFORMANCE
David A. Daglio, Portfolio Manager
How did Dreyfus Midcap Value Fund perform relative to its
benchmark?
|
For the 12-month period ended August 31, 2005, Dreyfus Midcap Value Fund produced a 24.70% total return.1 This compares with the 28.06% return provided by the fund’s benchmark, the Russell Midcap Value Index (the “Index”), for the same period.2
An improving U.S. economy and rising corporate earnings more than offset concerns related to rising interest rates and soaring energy prices, fueling gains for midcap stocks during the reporting period. The fund’s return underperformed its benchmark, mainly due to weakness among paper manufacturers and disappointing stock selections in the financials, technology and health care areas.
As of August 17, 2005, David Daglio became the fund’s sole primary portfolio manager.
What is the fund’s investment approach?
The fund’s goal is to surpass the performance of the Index by investing in midcap companies.We consider midcap companies to be companies with market capitalizations between $1 billion and $25 billion at the time of purchase.
We identify potential investments through extensive quantitative and fundamental research. When selecting stocks, the fund will focus on individual stock selection, emphasizing three key factors:
- Value, or how the stock is priced relative to its intrinsic worth based on a variety of traditional measures;
- Sound business fundamentals, as defined by the company’s overall efficiency and profitability; and
- Business momentum, or the presence of a catalyst such as corporate restructuring, change in management or a spin-off that could trigger an increase in the stock’s price in the near term to midterm.
| | DISCUSSION OF FUND PERFORMANCE (continued)
|
We typically sell a stock when we no longer consider it attractively valued, when it appears less likely to benefit from the current market and economic environment, when it shows deteriorating fundamentals or declining momentum or when its performance falls short of our expectations.
What other factors influenced the fund’s performance?
Although we choose stocks based on research into individual companies, and not according to broad economic or market trends, it is worth noting that the midcap stock market benefited from stronger economic growth during the reporting period. Corporate profitability and balance sheets generally improved, and a long-awaited increase in capital spending among businesses began to materialize. Despite rising oil and gas prices, consumer spending remained strong as home values continued to rise and borrowing rates remained low. By the second half of the reporting period, however, rising energy prices and higher short-term interest rates began to weigh more heavily on investor sentiment.Yet, midcap stocks continued to gain value, albeit at a slower pace, ending the reporting period with higher returns than their large-and small-cap counterparts.
Although the fund participated to a substantial degree in the midcap market’s strength, its return modestly lagged that of its benchmark.We attribute the fund’s relative performance primarily to our emphasis on paper manufacturers at a time when chemical companies posted stronger returns.The fund’s relative performance also was undermined by its limited exposure to several technology holdings that did not meet our value-oriented investment criteria, but comprise a substantial portion of the Index. Finally, the fund’s performance was held back by its relatively heavy exposure to health care companies, including two large holdings that disappointed during the reporting period.
On the other hand, the fund scored successes with individual stock selections across a wide range of sectors. Not surprisingly, in a market environment characterized by soaring oil and gas prices, energy stocks posted strong absolute returns, and the fund’s emphasis on the high-
flying sector helped boost its relative performance. Similarly, coal stocks gained value amid increased demand for economical alternatives to oil and natural gas.The fund’s consumer durables stocks also fared well, with homebuilders benefiting from persistently strong housing activity. Within the financials sector, the fund’s holdings of online brokers helped the fund’s performance. Other successful positions included several transportation stocks, including trucking companies, that benefited from the economic recovery earlier in the reporting period, when fuel prices were lower.As those stocks reached our price targets, we sold them, locking in gains.
What is the fund’s current strategy?
As of the end of the reporting period, we have continued to find what we believe to be relatively attractive values among paper manufacturers, media companies and reinsurance companies. Conversely, we have found relatively few companies in the technology sector that meet our value-oriented investment criteria. In addition, we recently have trimmed or sold some of the fund’s energy and coal stocks that have reached our price targets. Finally, we have reduced the fund’s exposure to steel manufacturers, focusing instead on steel processors that may be better positioned to benefit from more stable commodity prices. In our view, these strategies position the fund well for the next phase of the business cycle.
| 1 | | Total return includes reinvestment of dividends and any capital gains paid. Past performance is no |
| | | guarantee of future results. Share price and investment return fluctuate such that upon redemption, |
| | | fund shares may be worth more or less than their original cost. |
| | | Part of the fund’s recent performance is attributable to positive returns from its initial public |
| | | offering (IPO) investments. There can be no guarantee that IPOs will have or continue to |
| | | have a positive effect on the fund’s performance. |
| 2 | | SOURCE: LIPPER INC. — Reflects reinvestment of dividends and, where applicable, capital |
| | | gain distributions.The Russell Midcap Value Index is a widely accepted, unmanaged index of |
| | | medium-cap stock market performance and measures the performance of those Russell Midcap |
| | | companies with lower price-to-book ratios and lower forecasted growth values. |
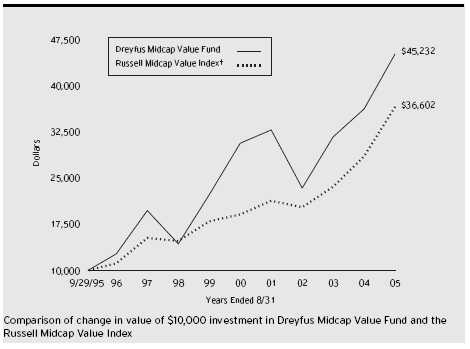
| Average Annual Total Returns | | as of 8/31/05 | | | | | | |
| | | Inception | | | | | | From |
| | | Date | | 1 Year | | 5 Years | | Inception |
| |
| |
| |
| |
|
| Fund | | 9/29/95 | | 24.70% | | 8.05% | | 16.43% |
† Source: Lipper Inc.
Past performance is not predictive of future performance.The fund’s performance shown in the graph and table does not reflect the deduction of taxes that a shareholder would pay on fund distributions or the redemption of fund shares. Part of the fund’s recent performance is attributable to positive returns from its initial public offering (IPO) investments. There can be no guarantee that IPOs will have or continue to have a positive effect on fund performance.
The above graph compares a $10,000 investment made in Dreyfus Midcap Value Fund on 9/29/95 (inception date) to a $10,000 investment made in the Russell Midcap Value Index (the “Index”) on that date. All dividends and capital gain distributions are reinvested.
The fund’s performance shown in the line graph takes into account all applicable fees and expenses.The Index is a widely accepted, unmanaged index of medium-cap stock market performance and measures the performance of those Russell Midcap companies with lower price-to-book ratios and lower forecasted growth values.The Index does not take into account charges, fees and other expenses. Further information relating to fund performance, including expense reimbursements, if applicable, is contained in the Financial Highlights section of the prospectus and elsewhere in this report.
U N D E R S TA N D I N G YO U R F U N D ’ S E X P E N S E S ( U n a u d i t e d )
As a mutual fund investor, you pay ongoing expenses, such as management fees and other expenses. Using the information below, you can estimate how these expenses affect your investment and compare them with the expenses of other funds.You also may pay one-time transaction expenses, including sales charges (loads) and redemption fees, which are not shown in this section and would have resulted in higher total expenses. For more information, see your fund’s prospectus or talk to your financial adviser.
Review your fund’s expenses
The table below shows the expenses you would have paid on a $1,000 investment in Dreyfus Midcap Value Fund from March 1, 2005 to August 31, 2005. It also shows how much a $1,000 investment would be worth at the close of the period, assuming actual returns and expenses.
Expenses and Value of a $1,000 Investment assuming actual returns for the six months ended August 31, 2005
| Expenses paid per $1,000 † | | $ 5.75 |
| Ending value (after expenses) | | $1,054.90 |
COMPARING YOUR FUND’S EXPENSES
WITH THOSE OF OTHER FUNDS (Unaudited)
|
Using the SEC’s method to compare expenses
The Securities and Exchange Commission (SEC) has established guidelines to help investors assess fund expenses. Per these guidelines, the table below shows your fund’s expenses based on a $1,000 investment, assuming a hypothetical 5% annualized return. You can use this information to compare the ongoing expenses (but not transaction expenses or total cost) of investing in the fund with those of other funds.All mutual fund shareholder reports will provide this information to help you make this comparison. Please note that you cannot use this information to estimate your actual ending account balance and expenses paid during the period.
Expenses and Value of a $1,000 Investment
assuming a hypothetical 5% annualized return for the six months ended August 31, 2005
|
| Expenses paid per $1,000 † | | $ 5.65 |
| Ending value (after expenses) | | $1,019.61 |
† Expenses are equal to the fund’s annualized expense ratio of 1.11%; multiplied by the average account value over the period, multiplied by 184/365 (to reflect the one-half year period).
| | STATEMENT OF INVESTMENTS
August 31, 2005
|
| Common Stocks—101.0% | | Shares | | Value ($) |
| |
| |
|
| Airlines—.4% | | | | |
| ACE Aviation Holdings, Cl. A | | 182,300 a,b | | 5,554,681 |
| Banking—1.6% | | | | |
| Advance America Cash Advance Centers | | 997,990 | | 14,271,257 |
| Colonial BancGroup | | 378,850 a | | 8,812,051 |
| | | | | 23,083,308 |
| Basic Industries—10.2% | | | | |
| Abitibi-Consolidated | | 1,558,800 | | 6,765,192 |
| Alpha Natural Resources | | 7,610 b | | 227,006 |
| Applied Micro Circuits | | 1,861,822 a,b | | 5,120,010 |
| Arch Coal | | 48,240 a | | 3,097,008 |
| Bowater | | 270,800 | | 8,402,924 |
| Chemtura | | 1,414,397 | | 24,271,053 |
| Domtar | | 706,000 a | | 4,737,260 |
| Huntsman | | 69,580 a,b | | 1,310,887 |
| Martin Marietta Materials | | 46,400 | | 3,355,648 |
| Massey Energy | | 373,450 a | | 18,971,260 |
| NOVA Chemicals | | 140,650 | | 4,514,865 |
| Nucor | | 67,800 | | 3,829,344 |
| Owens-Illinois | | 230,100 b | | 5,936,580 |
| Peabody Energy | | 44,370 a | | 3,179,998 |
| Smurfit-Stone Container | | 660,000 a,b | | 7,286,400 |
| Timken | | 509,200 a | | 14,955,204 |
| United States Steel | | 88,100 a | | 3,693,152 |
| Walter Industries | | 273,880 | | 12,015,116 |
| Worthington Industries | | 722,900 | | 13,084,490 |
| | | | | 144,753,397 |
| Broadcasting & Publishing—.6% | | | | |
| DreamWorks Animation SKG, Cl. A | | 336,600 a,b | | 8,758,332 |
| Capital Goods—3.9% | | | | |
| Deere & Co. | | 245,800 a | | 16,070,404 |
| General Dynamics | | 29,700 | | 3,403,323 |
| Navistar International | | 1,024,100 b | | 32,730,236 |
| Reliance Steel & Aluminum | | 68,700 | | 3,297,600 |
| | | | | 55,501,563 |
| Common Stocks (continued) | | Shares | | Value ($) |
| |
| |
|
| Consumer Durables—2.2% | | | | |
| Centex | | 286,400 a | | 19,403,600 |
| Pulte Homes | | 99,400 | | 8,568,280 |
| WCI Communities | | 117,300 a,b | | 3,538,941 |
| | | | | 31,510,821 |
| Consumer Non-Durables—4.0% | | | | |
| Colgate-Palmolive | | 10,800 a | | 567,000 |
| Del Monte Foods | | 1,740,900 b | | 18,819,129 |
| Estee Lauder Cos., Cl. A | | 337,100 a | | 13,615,469 |
| Polo Ralph Lauren | | 465,600 a | | 23,070,480 |
| Reader’s Digest Association | | 66,200 | | 1,076,412 |
| | | | | 57,148,490 |
| Consumer Services—17.2% | | | | |
| Aramark, Cl. B | | 446,200 | | 12,190,184 |
| AutoZone | | 92,850 b | | 8,774,325 |
| Best Buy | | 284,150 a | | 13,542,589 |
| Brinker International | | 227,500 a,b | | 8,451,625 |
| Career Education | | 934,910 a,b | | 36,648,472 |
| Citadel Broadcasting | | 651,840 b | | 8,799,840 |
| Clear Channel Communications | | 632,140 a | | 21,050,262 |
| Dollar Tree Stores | | 615,590 a,b | | 14,016,984 |
| Expedia | | 333,794 a,b | | 7,430,254 |
| Gap | | 350,900 a,b | | 6,670,609 |
| Hewitt Associates, Cl. A | | 145,300 | | 4,213,700 |
| IAC/InterActive | | 333,794 a,b | | 8,194,643 |
| Kroger | | 467,100 b | | 9,220,554 |
| Marvel Enterprises | | 810,700 a,b | | 15,605,975 |
| Omnicom Group | | 149,400 a | | 12,017,736 |
| PETCO Animal Supplies | | 149,800 b | | 3,313,576 |
| RadioShack | | 331,910 a | | 8,317,665 |
| Ruby Tuesday | | 136,850 | | 3,024,385 |
| Safeway | | 774,890 a | | 18,388,140 |
| TJX Cos. | | 453,500 | | 9,482,685 |
| Univision Communications, Cl. A | | 487,500 a,b | | 13,113,750 |
| | | | | 242,467,953 |
| | STATEMENT OF INVESTMENTS (continued)
|
| Common Stocks (continued) | | Shares | | | | Value ($) |
| |
| |
| |
|
| Consumer Staples—.5% | | | | | | |
| CBRL Group | | 192,100 | | a | | 6,946,336 |
| Energy—5.8% | | | | | | |
| Chesapeake Energy | | 206,560 | | | | 6,529,362 |
| El Paso | | 1,513,100 | | a | | 17,551,960 |
| Key Energy Services | | 1,057,400 | | b | | 15,067,950 |
| Marathon Oil | | 171,000 | | | | 10,997,010 |
| Maverick Tube | | 114,260 | | b | | 3,639,181 |
| Nabors Industries | | 122,840 | | b | | 8,230,280 |
| Tidewater | | 275,680 | | a | | 12,278,787 |
| Transocean | | 136,800 | | b | | 8,076,672 |
| | | | | | | 82,371,202 |
| Financial Services—13.0% | | | | | | |
| Acxiom | | 10 | | | | 198 |
| CIT Group | | 660,500 | | a | | 29,907,440 |
| Comerica | | 61,900 | | | | 3,744,331 |
| Cousins Properties | | 381,200 | | | | 11,554,172 |
| Doral Financial | | 748,200 | | | | 10,729,188 |
| E*TRADE Financial | | 1,626,060 | | a,b | | 26,016,960 |
| Equity Office Properties Trust | | 160,900 | | a | | 5,357,970 |
| First Marblehead | | 140,950 | | a,b | | 4,077,683 |
| Hudson City Bancorp | | 1,816,000 | | a | | 22,700,000 |
| Janus Capital Group | | 1,220,800 | | | | 17,249,904 |
| Knight Capital Group, Cl. A | | 25 | | b | | 211 |
| Marsh & McLennan Cos. | | 154,900 | | a | | 4,344,945 |
| MBIA | | 288,100 | | a | | 16,701,157 |
| PartnerRe | | 109,600 | | | | 6,652,720 |
| PMI Group | | 292,600 | | a | | 11,838,596 |
| PNC Financial Services Group | | 42,200 | | a | | 2,372,906 |
| SEI Investments | | 182,500 | | a | | 6,599,200 |
| XL Capital, Cl. A | | 48,700 | | | | 3,384,650 |
| | | | | | | 183,232,231 |
| Health Care—10.7% | | | | | | |
| Barr Pharmaceuticals | | 88,900 | | b | | 4,054,729 |
| Biogen Idec | | 322,200 | | a,b | | 13,580,730 |
| Biovail | | 683,640 | | b | | 12,264,501 |
| Boston Scientific | | 1,116,900 | | a,b | | 30,022,272 |
| Common Stocks (continued) | | Shares | | Value ($) |
| |
| |
|
| Health Care (continued) | | | | |
| Cardinal Health | | 112,900 a | | 6,729,969 |
| Cephalon | | 867,800 a,b | | 35,163,256 |
| Omnicare | | 323,520 a | | 17,000,976 |
| Universal Health Services, Cl. B | | 132,800 | | 6,787,408 |
| WebMD | | 2,295,130 a,b | | 25,154,625 |
| | | | | 150,758,466 |
| Technology—18.4% | | | | |
| Advanced Micro Devices | | 550,040 a,b | | 11,424,331 |
| Agere Systems | | 609,420 b | | 6,898,634 |
| Atmel | | 4,150,220 b | | 8,549,453 |
| Axcelis Technologies | | 1,192,800 b | | 7,037,520 |
| BearingPoint | | 1,842,170 a,b | | 15,068,951 |
| Celestica | | 726,300 b | | 8,664,759 |
| Ceridian | | 854,300 b | | 17,342,290 |
| Compuware | | 1,154,050 a,b | | 10,455,693 |
| Conexant Systems | | 2,711,700 b | | 4,664,124 |
| Cypress Semiconductor | | 1,262,200 a,b | | 19,728,186 |
| Diebold | | 127,800 a | | 6,134,400 |
| Fairchild Semiconductor International | | 771,595 b | | 13,001,376 |
| Flextronics International | | 819,280 a,b | | 10,699,797 |
| Gateway | | 608,800 b | | 1,850,752 |
| Intuit | | 78,900 a,b | | 3,616,776 |
| JDS Uniphase | | 3,079,800 b | | 4,896,882 |
| Lam Research | | 455,080 a,b | | 14,426,036 |
| McData | | 56,700 b | | 281,799 |
| McData, Cl. A | | 514,800 a,b | | 2,769,624 |
| Micron Technology | | 2,153,000 a,b | | 25,642,230 |
| Sanmina-SCI | | 4,607,040 a,b | | 23,357,693 |
| Scientific-Atlanta | | 143,600 | | 5,494,136 |
| Symbol Technologies | | 2,903 | | 26,649 |
| Teradyne | | 643,390 a,b | | 10,808,952 |
| Unisys | | 1,176,530 a,b | | 7,823,925 |
| United Microelectronics, ADR | | 3,971,605 a,b | | 13,543,172 |
| Vishay Intertechnology | | 493,900 b | | 6,371,310 |
| | | | | 260,579,450 |
| | STATEMENT OF INVESTMENTS (continued)
|
| Common Stocks (continued) | | Shares | | | | Value ($) |
| |
| |
| |
|
| Tobacco—.3% | | | | | | |
| Reynolds American | | 40,400 | | a | | 3,391,176 |
| Transportation—4.3% | | | | | | |
| Burlington Northern Santa Fe | | 285,800 | | a | | 15,153,116 |
| Continental Airlines, Cl. B | | 622,300 | | a,b | | 8,320,151 |
| EGL | | 99,900 | | b | | 2,506,491 |
| Norfolk Southern | | 239,200 | | | | 8,517,912 |
| Southwest Airlines | | 300,500 | | a | | 4,002,660 |
| Swift Transportation | | 71,883 | | a,b | | 1,433,347 |
| Union Pacific | | 111,400 | | a | | 7,605,278 |
| Yellow Roadway | | 284,330 | | a,b | | 13,320,861 |
| | | | | | | 60,859,816 |
| Utilities—7.9% | | | | | | |
| CMS Energy | | 1,158,200 | | a,b | | 18,647,020 |
| Constellation Energy Group | | 329,100 | | | | 19,334,625 |
| Dobson Communications, Cl. A | | 608,900 | | b | | 4,633,729 |
| Dominion Resources | | 175,700 | | a | | 13,437,536 |
| EchoStar Communications, Cl. A | | 449,580 | | b | | 13,455,929 |
| Entergy | | 176,000 | | | | 13,184,160 |
| Exelon | | 112,100 | | a | | 6,041,069 |
| Leap Wireless International | | 248,200 | | b | | 8,478,512 |
| Ubiquitel | | 189,100 | | b | | 1,639,497 |
| Wisconsin Energy | | 330,000 | | | | 12,926,100 |
| | | | | | | 111,778,177 |
| Total Common Stocks | | | | | | |
| (cost $1,321,426,660) | | | | | | 1,428,695,399 |
| Investment of Cash Collateral | | | | |
| for Securities Loaned—7.3% | | Shares | | Value ($) |
| |
| |
|
| Registered Investment Company; | | | | |
| Dreyfus Institutional Cash Advantage Fund | | | | |
| (cost $102,741,651) | | 102,741,651 c | | 102,741,651 |
| |
| |
|
| |
| Total Investments (cost $1,424,168,311) | | 108.3% | | 1,531,437,050 |
| Liabilities, Less Cash and Receivables | | (8.3%) | | (117,527,428) |
| Net Assets | | 100.0% | | 1,413,909,622 |
| |
| ADR—American Depository Receipts. | | | | |
| a All or a portion of these securities are on loan. At August 31, 2005, the total market value of the fund’s securities on |
| loan is $100,047,073 and the total market value of the collateral held by the fund is $103,916,751, consisting of |
| cash collateral of $102,741,651 and U.S. Government and agency securities valued at $1,175,100. |
| b Non—income producing. | | | | |
| c Investment in affiliated money market mutual fund. | | | | |
| Portfolio Summary † | | | | | | |
| |
| | | Value (%) | | | | Value (%) |
| |
| |
| |
|
| Technology | | 18.4 | | Energy | | 5.8 |
| Consumer Services | | 17.2 | | Transportation | | 4.3 |
| Financial Services | | 13.0 | | Consumer Non-Durables | | 4.0 |
| Health Care | | 10.7 | | Capital Goods | | 3.9 |
| Basic Industries | | 10.2 | | Other | | 5.6 |
| Utilities | | 7.9 | | | | |
| Money Market Investments | | 7.3 | | | | 108.3 |
| |
| † Based on net assets. | | | | | | |
| See notes to financial statements. | | | | | | |
| | STATEMENT OF ASSETS AND LIABILITIES
August 31, 2005
|
| | | Cost | | Value |
| |
| |
|
| Assets ($): | | | | |
| Investments in securities— | | | | |
| See Statement of Investments (including securities | | |
| on loan, valued at $100,047,073)—Note 1(b): | | |
| Unaffiliated issuers | | 1,321,426,660 | | 1,428,695,399 |
| Affiliated issuers | | 102,741,651 | | 102,741,651 |
| Receivable for investment securities sold | | 32,823,917 |
| Dividends and interest receivable | | | | 1,208,161 |
| Receivable for shares of Common Stock subscribed | | 122,739 |
| Prepaid expenses | | | | 36,534 |
| | | | | 1,565,628,401 |
| |
| |
|
| Liabilities ($): | | | | |
| Due to The Dreyfus Corporation and affiliates—Note 3(b) | | 1,316,470 |
| Cash overdraft due to Custodian | | | | 448,070 |
| Liability for securities on loan—Note 1(b) | | 102,741,651 |
| Payable for investment securities purchased | | 32,119,545 |
| Bank loan payable—Note 2 | | | | 10,600,000 |
| Payable for shares of Common Stock redeemed | | 4,001,065 |
| Interest payable—Note 2 | | | | 2,504 |
| Accrued expenses | | | | 489,474 |
| | | | | 151,718,779 |
| |
| |
|
| Net Assets ($) | | | | 1,413,909,622 |
| |
| |
|
| Composition of Net Assets ($): | | | | |
| Paid-in capital | | | | 1,226,519,721 |
| Accumulated undistributed investment income—net | | 26,804 |
| Accumulated net realized gain (loss) on investments | | 80,094,358 |
| Accumulated net unrealized appreciation | | |
| (depreciation) on investments | | | | 107,268,739 |
| |
| |
|
| Net Assets ($) | | | | 1,413,909,622 |
| |
| |
|
| Shares Outstanding | | | | |
| (100 million shares of $.001 par value Common Stock authorized) | | 41,611,066 |
| Net Asset Value, offering and redemption price per share—Note 3(d) ($) | | 33.98 |
| | See notes to financial statements.
|
STATEMENT OF OPERATIONS
Year Ended August 31, 2005
|
| Investment Income ($): | | |
| Income: | | |
| Cash dividends (net of $56,910 foreign taxes withheld at source) | | 8,840,803 |
| Income from securites lending | | 431,348 |
| Interest | | 127,866 |
| Total Income | | 9,400,017 |
| Expenses: | | |
| Management fee—Note 3(a) | | 9,587,428 |
| Shareholder servicing costs—Note 3(b) | | 4,813,366 |
| Custodian fees—Note 3(b) | | 110,977 |
| Prospectus and shareholders’ reports | | 79,659 |
| Professional fees | | 65,152 |
| Interest expense—Note 2 | | 33,992 |
| Registration fees | | 26,370 |
| Directors’ fees and expenses—Note 3(c) | | 21,548 |
| Miscellaneous | | 33,392 |
| Total Expenses | | 14,771,884 |
| Investment (Loss)—Net | | (5,371,867) |
| |
|
| Realized and Unrealized Gain (Loss) on Investments—Note 4 ($): |
| Net realized gain (loss) on investments | | 206,732,784 |
| Net unrealized appreciation (depreciation) on investments | | 72,778,727 |
| Net Realized and Unrealized Gain (Loss) on Investments | | 279,511,511 |
| Net Increase in Net Assets Resulting from Operations | | 274,139,644 |
See notes to financial statements.
|
STATEMENT OF CHANGES IN NET ASSETS
| | | Year Ended August 31, |
| |
|
| | | 2005 | | 2004 |
| |
| |
|
| Operations ($): | | | | |
| Investment (loss)—net | | (5,371,867) | | (4,613,759) |
| Net realized gain (loss) on investments | | 206,732,784 | | 257,214,747 |
| Net unrealized appreciation | | | | |
| (depreciation) on investments | | 72,778,727 | | (109,766,086) |
| Net Increase (Decrease) in Net Assets | | | | |
| Resulting from Operations | | 274,139,644 | | 142,834,902 |
| |
| |
|
| Capital Stock Transactions ($): | | | | |
| Net proceeds from shares sold | | 343,010,935 | | 529,016,395 |
| Cost of shares redeemed | | (383,120,536) | | (497,325,872) |
| Increase (Decrease) in Net Assets | | | | |
| from Capital Stock Transactions | | (40,109,601) | | 31,690,523 |
| Total Increase (Decrease) in Net Assets | | 234,030,043 | | 174,525,425 |
| |
| |
|
| Net Assets ($): | | | | |
| Beginning of Period | | 1,179,879,579 | | 1,005,354,154 |
| End of Period | | 1,413,909,622 | | 1,179,879,579 |
| Undistributed investment income—net | | 26,804 | | — |
| |
| |
|
| Capital Share Transactions (Shares): | | | | |
| Shares sold | | 10,632,399 | | 19,263,012 |
| Shares redeemed | | (12,324,711) | | (18,115,151) |
| Net Increase (Decrease) in Shares Outstanding | | (1,692,312) | | 1,147,861 |
| | See notes to financial statements.
|
The following table describes the performance for the fiscal periods indicated. Total return shows how much your investment in the fund would have increased (or decreased) during each period, assuming you had reinvested all dividends and distributions.These figures have been derived from the fund’s financial statements.
| | | | | | | Year Ended August 31, | | |
| |
| |
| |
| |
|
| | | 2005 | | 2004 | | 2003 | | 2002 | | 2001 |
| |
| |
| |
| |
| |
|
| Per Share Data ($): | | | | | | | | | | |
| Net asset value, | | | | | | | | | | |
| beginning of period | | 27.25 | | 23.85 | | 17.58 | | 26.33 | | 28.11 |
| Investment Operations: | | | | | | | | | | |
| Investment (loss)—net a | | (.13) | | (.10) | | (.08) | | (.12) | | (.06) |
| Net realized and unrealized | | | | | | | | | | |
| gain (loss) on investments | | 6.86 | | 3.50 | | 6.35 | | (6.92) | | 1.56 |
| Total from Investment Operations | | 6.73 | | 3.40 | | 6.27 | | (7.04) | | 1.50 |
| Distributions: | | | | | | | | | | |
| Dividends from net realized | | | | | | | | | | |
| gain on investments | | — | | — | | — | | (1.71) | | (3.28) |
| Net asset value, end of period | | 33.98 | | 27.25 | | 23.85 | | 17.58 | | 26.33 |
| |
| |
| |
| |
| |
|
| Total Return (%) | | 24.70 | | 14.26 | | 35.67 | | (28.81) | | 7.02 |
| |
| |
| |
| |
| |
|
| Ratios/Supplemental Data (%): | | | | | | | | | | |
| Ratio of total expenses | | | | | | | | | | �� |
| to average net assets | | 1.16 | | 1.18 | | 1.35 | | 1.20 | | 1.15 |
| Ratio of net investment (loss) | | | | | | | | | | |
| to average net assets | | (.42) | | (.37) | | (.43) | | (.51) | | (.20) |
| Portfolio Turnover Rate | | 128.55 | | 145.33 | | 158.01 | | 177.31 | | 191.89 |
| |
| |
| |
| |
| |
|
| Net Assets, end of period | | | | | | | | | | |
| ($ x 1,000) | | 1,413,910 | | 1,179,880 | | 1,005,354 | | 800,269 1,136,242 |
| |
| a Based on average shares outstanding at each month end. | | | | | | |
| See notes to financial statements. | | | | | | | | | | |
NOTES TO FINANCIAL STATEMENTS
NOTE 1—Significant Accounting Policies:
Dreyfus Midcap Value Fund (the “fund”) is a separate diversified series of Dreyfus Growth and Value Funds, Inc. (the “Company”) which is registered under the Investment Company Act of 1940, as amended (the “Act”), as an open-end management investment company and operates as a series company that offers twelve series, including the fund.The fund’s investment objective is to surpass the performance of the Russell Midcap Value Index. The Dreyfus Corporation (the “Manager” or “Dreyfus”) serves as the fund’s investment adviser.The Manager is a wholly-owned subsidiary of Mellon Financial Corporation (“Mellon Financial”). Dreyfus Service Corporation (the “Distributor”), a wholly-owned subsidiary of the Manager, is the distributor of the fund’s shares, which are sold to existing shareholders without a sales charge.The fund is closed to new investors.
The Company accounts separately for the assets, liabilities and operations of each series. Expenses directly attributable to each series are charged to that series’ operations; expenses which are applicable to all series are allocated among them on a pro rata basis.
The fund’s financial statements are prepared in accordance with U.S. generally accepted accounting principles, which may require the use of management estimates and assumptions. Actual results could differ from those estimates.
The fund enters into contracts that contain a variety of indemnifications. The fund’s maximum exposure under these arrangements is unknown.The fund does not anticipate recognizing any loss related to these arrangements.
(a) Portfolio valuation: Investments in securities are valued at the last sales price on the securities exchange or national securities market on which such securities are primarily traded. Securities listed on the National Market System for which market quotations are available are valued at the official closing price or, if there is no official closing price that day, at the last sale price. Securities not listed on an exchange or the
national securities market, or securities for which there were no transactions, are valued at the average of the most recent bid and asked prices, except for open short positions, where the asked price is used for valuation purposes. Bid price is used when no asked price is available. Investments in registered investment companies are valued at their net asset value. When market quotations or official closing prices are not readily available, or are determined not to reflect accurately fair value, such as when the value of a security has been significantly affected by events after the close of the exchange or market on which the security is principally traded (for example, a foreign exchange or market), but before the fund calculates its net asset value, the fund may value these investments at fair value as determined in accordance with the procedures approved by the Board of Directors. Fair valuing of securities may be determined with the assistance of a pricing service using calculations based on indices of domestic securities and other appropriate indicators, such as prices of relevant ADR’s and futures contracts. For other securities that are fair valued by the Board of Directors, certain factors may be considered such as: fundamental analytical data, the nature and duration of restrictions on disposition, an evaluation of the forces that influence the market in which the securities are purchased and sold, and public trading in similar securities of the issuer or comparable issuers. Financial futures are valued at the last sales price.
(b) Securities transactions and investment income: Securities transactions are recorded on a trade date basis. Realized gain and loss from securities transactions are recorded on the identified cost basis. Dividend income is recognized on the ex-dividend date and interest income, including, where applicable, accretion of discount and amortization of premium on investments, is recognized on the accrual basis.
The fund has an arrangement with the custodian bank whereby the fund receives earnings credits from the custodian when positive cash balances are maintained, which are used to offset custody fees. For financial reporting purposes, the fund includes net earnings credits, if any, as an expense offset in the Statement of Operations.
| | NOTES TO FINANCIAL STATEMENTS (continued)
|
Pursuant to a securities lending agreement with Mellon Bank, N.A., an affiliate of the Manager, the fund may lend securities to qualified institu-tions.At origination, all loans are secured by collateral of at least 102% of the value of U.S. securities loaned and 105% of the value of foreign securities loaned. Collateral equivalent to at least 100% of the market value of securities on loan will be maintained at all times. Cash collateral is invested in certain money market mutual funds managed by the Manager. The fund will be entitled to receive all income on securities loaned, in addition to income earned as a result of the lending transac-tion.Although each security loaned is fully collateralized, the fund would bear the risk of delay in recovery of, or loss of rights in, the securities loaned should a borrower fail to return the securities in a timely manner.
(c) Affiliated issuers: Investments in other investment companies advised by the Manager are defined as “affiliated” in the Act.
(d) Dividends to shareholders: Dividends are recorded on the ex-dividend date. Dividends from investment income-net and dividends from net realized capital gain, if any, are normally declared and paid annually, but the fund may make distributions on a more frequent basis to comply with the distribution requirements of the Internal Revenue Code of 1986, as amended (the “Code”).To the extent that net realized capital gain can be offset by capital loss carryovers, it is the policy of the fund not to distribute such gain. Income and capital gain distributions are determined in accordance with income tax regulations, which may differ from U.S. generally accepted accounting principles.
(e) Federal income taxes: It is the policy of the fund to continue to qualify as a regulated investment company, if such qualification is in the best interests of its shareholders, by complying with the applicable provisions of the Code, and to make distributions of taxable income sufficient to relieve it from substantially all federal income and excise taxes.
At August 31, 2005, the components of accumulated earnings on a tax basis were as follows: undistributed ordinary income $23,416,209, undistributed capital gains $101,960,120 and unrealized appreciation $62,013,572.
During the period ended August 31, 2005, as a result of permanent book to tax differences, primarily due to the tax treatment for real estate investment trusts and net operating losses, the fund increased accumulated undistributed investment income-net by $5,398,671, decreased accumulated net realized gain (loss) on investments by $5,436,371 and increased paid-in capital by $37,700. Net assets were not affected by this reclassification.
| | NOTE 2—Bank Lines of Credit:
|
The fund may borrow up to $10 million for leveraging purposes under a short-term unsecured line of credit and participates with other Dreyfus-managed funds in a $100 million unsecured line of credit primarily to be utilized for temporary or emergency purposes, including the financing of redemptions. Interest is charged to the fund based on prevailing market rates in effect at the time of borrowings.
The average daily amount of borrowings outstanding under both arrangements during the period ended August 31, 2005 was approximately $1,150,700 with a related weighted average annualized interest rate of 2.95% .
NOTE 3—Management Fee and Other Transactions With
Affiliates:
|
(a) Pursuant to a management agreement with the Manager, the management fee is computed at the annual rate of .75% of the value of the fund’s average daily net assets and is payable monthly.
(b) Under the Shareholder Services Plan, the fund pays the Distributor at an annual rate of .25% of the value of the fund’s average daily net assets for the provision of certain services.The services provided may include personal services relating to shareholder accounts, such as answering shareholder inquiries regarding the fund and providing reports and other information, and services related to the maintenance of shareholder accounts. The Distributor may make payments to Service Agents (a securities dealer, financial institution or other indus-
| | NOTES TO FINANCIAL STATEMENTS (continued)
|
try professional) in respect of these services. The Distributor determines the amounts to be paid to Service Agents. During the period ended August 31, 2005, the fund was charged $3,195,809 pursuant to the Shareholder Services Plan.
The fund compensates Dreyfus Transfer, Inc., a wholly-owned subsidiary of the Manager, under a transfer agency agreement for providing personnel and facilities to perform transfer agency services for the fund. During the period ended August 31, 2005, the fund was charged $274,963 pursuant to the transfer agency agreement.
The fund compensates Mellon Bank, N.A., an affiliate of the Manager, under a custody agreement for providing custodial services for the fund. During the period ended August 31, 2005, the fund was charged $110,977 pursuant to the custody agreement.
During the period ended August 31, 2005, the fund was charged $2,520 for services performed by the Chief Compliance Officer.
The components of Due to The Dreyfus Corporation and affiliates in the Statement of Assets and Liabilities consist of: management fees $914,767, shareholder services plan fees $304,922, custodian fees $46,063, chief compliance officer fees $1,533 and transfer agency per account fees $49,185.
(c) Each Board member also serves as a Board member of other funds within the Dreyfus complex. Annual retainer fees and attendance fees are allocated to each fund based on net assets.
(d) A 1% redemption fee is charged and retained by the fund on certain shares redeemed within thirty days following the date of issuance, including redemptions made through the use of the fund’s exchange privilege. During the period ended August 31, 2005, redemption fees charged and retained by the fund amounted to $141.
NOTE 4—Securities Transactions:
|
The aggregate amount of purchases and sales of investment securities, excluding short-term securities, during the period ended August 31, 2005, amounted to $1,635,942,724 and $1,666,073,994, respectively.
At August 31, 2005, the cost of investments for federal income tax purposes was $1,469,423,478; accordingly, accumulated net unrealized appreciation on investments was $62,013,572, consisting of $175,003,241 gross unrealized appreciation and $112,989,669 gross unrealized depreciation.
In early 2004, two purported class and derivative actions were filed against Mellon Financial, Mellon Bank, N.A., Dreyfus, Founders Asset Management LLC, and certain directors of the Dreyfus Funds and the Dreyfus Founders Funds (together, the “Funds”) in the United States District Court for the Western District of Pennsylvania. In September 2004, plaintiffs served a Consolidated Amended Complaint (the “Amended Complaint”) on behalf of a purported class of all persons who acquired interests in any of the Funds between January 30, 1999 and November 17, 2003, and derivatively on behalf of the Funds.The Amended Complaint in the newly styled In re Dreyfus Mutual Funds Fee Litigation also named the Distributor, Premier Mutual Fund Services, Inc. and two additional Fund directors as defendants and alleges violations of the Investment Company Act of 1940, the Investment Advisers Act of 1940, the Pennsylvania Unfair Trade Practices and Consumer Protection Law and common-law claims. Plaintiffs seek to recover allegedly improper and excessive Rule 12b-1 and advisory fees allegedly charged to the Funds for marketing and distribution services. More specifically, plaintiffs claim, among other things, that 12b-1 fees and directed brokerage were improperly used to pay brokers to recommend the Funds over other funds, and that such payments were not disclosed to investors. In addition, plaintiffs assert that economies of scale and soft-dollar benefits were not passed on to the Funds. Plaintiffs further allege that 12b-1 fees were improperly charged to certain of the Funds that were closed to new investors.The Amended Complaint seeks compensatory and punitive damages, rescission of the advisory contracts, and an accounting and restitution of any unlawful fees, as well as an award of attorneys’ fees and litigation expenses. As noted, some of the claims in this litigation are asserted
| | NOTES TO FINANCIAL STATEMENTS (continued)
|
derivatively on behalf of the Funds that have been named as nominal defendants. With respect to such derivative claims, no relief is sought against the Funds. Dreyfus believes the allegations to be totally without merit and intends to defend the action vigorously. In November 2004, all named defendants moved to dismiss the Amended Complaint in whole or substantial part. Briefing was completed in May 2005.
Additional lawsuits arising out of these circumstances and presenting similar allegations and requests for relief may be filed against the defendants in the future. Neither Dreyfus nor the Funds believe that any of the pending actions will have a material adverse effect on the Funds or Dreyfus’ ability to perform its contract with the Funds.
REPORT OF INDEPENDENT REGISTERED PUBLIC ACCOUNTING FIRM
| | Shareholders and Board of Directors
Dreyfus Midcap Value Fund
|
We have audited the accompanying statement of assets and liabilities, including the statement of investments, of Dreyfus Midcap Value Fund (one of the funds comprising Dreyfus Growth and Value Funds, Inc.) as of August 31, 2005, and the related statement of operations for the year then ended, the statement of changes in net assets for each of the two years in the period then ended, and financial highlights for each of the years indicated therein.These financial statements and financial highlights are the responsibility of the Fund’s management. Our responsibility is to express an opinion on these financial statements and financial highlights based on our audits.
We conducted our audits in accordance with the standards of the Public Company Accounting Oversight Board (United States).Those standards require that we plan and perform the audit to obtain reasonable assurance about whether the financial statements and financial highlights are free of material misstatement.We were not engaged to perform an audit of the Fund’s internal control over financial reporting.Our audits included consideration of internal control over financial reporting as a basis for designing audit procedures that are appropriate in the circumstances,but not for the purpose of expressing an opinion on the effectiveness of the Fund’s internal control over financial reporting.Accordingly, we express no such opinion.An audit also includes examining, on a test basis, evidence supporting the amounts and disclosures in the financial statements and financial highlights, assessing the accounting principles used and significant estimates made by management, and evaluating the overall financial statement presentation. Our procedures included verification by examination of securities held by the custodian as of August 31, 2005 and confirmation of securities not held by the custodian by correspondence with oth-ers.We believe that our audits provide a reasonable basis for our opinion.
In our opinion, the financial statements and financial highlights referred to above present fairly, in all material respects, the financial position of Dreyfus Midcap Value Fund at August 31, 2005, the results of its operations for the year then ended, the changes in its net assets for each of the two years in the period then ended, and the financial highlights for each of the indicated years, in conformity with U.S. generally accepted accounting principles.

| | New York, New York
October 14, 2005
|
| | INFORMATION ABOUT THE REVIEW AND APPROVAL
OF THE FUND’S MANAGEMENT AGREEMENT (Unaudited)
|
At a meeting of the Board of Directors held on March 14, 2005, the Board considered the re-approval for an annual period of the Fund’s Management Agreement, pursuant to which the Manager provides the Fund with investment advisory and administrative services. The Board members, none of whom are “interested persons” (as defined in the Investment Company Act of 1940,as amended) of the Fund,were assisted in their review by independent legal counsel and met with counsel in executive session separate from representatives of the Manager.
Analysis of Nature, Extent and Quality of Services Provided to the Fund. The Board members received a presentation from representatives of the Manager regarding services provided to the Fund and other funds in the Dreyfus fund complex, and discussed the nature, extent and quality of the services provided to the Fund pursuant to its Management Agreement. The presentation included a detailed summary of the services provided to Dreyfus-managed mutual funds by each business unit within the Manager.The Manager’s representatives reviewed the Fund’s distribution of accounts and the relationships the Manager has with various intermediaries and the different needs of each.The Manager’s representatives noted the diversity of distribution of the Fund as well as among the funds in the Dreyfus fund complex, and the Manager’s corresponding need for broad, deep, and diverse resources to be able to provide ongoing shareholder services to each of the Fund’s distribution channels.The Board also reviewed the number of shareholder accounts in the Fund, as well as the Fund’s asset size.
The Board members also considered the Manager’s research and portfolio management capabilities and that the Manager also provides oversight of day-to-day Fund operations, including fund accounting and administration and assistance in meeting legal and regulatory requirements. The Board members also considered the Manager’s extensive administrative, accounting and compliance infrastructure.
Comparative Analysis of the Fund’s Performance and Management Fee and Expense Ratio. The Board members reviewed the Fund’s performance, management fee and expense ratios and placed significant emphasis on comparisons to a group of comparable funds and Lipper
category averages, as applicable.The group of comparable funds was previously approved by the Board for this purpose, and was prepared using a Board-approved selection methodology that was based, in part, on selecting non-affiliated funds reported in the Lipper categories as the Fund.The Board members discussed the results of the comparisons for various periods ended January 31, 2005, and noted that the Fund’s performance was below the comparison group averages for the 1-year, 3-year and 5-year periods, and below the Lipper Mid-Cap Value Funds category averages for the 1-year and 3-year periods,but above such category average for the 5-year period.The Board noted that the Fund’s performance was above the Lipper Multi-Cap Core Value Funds category averages for the 1-year, 3-year and 5-year periods.The Board discussed with representatives of the Manager the reasons for the Fund’s underperfor-mance compared to the comparison group for the 1-,3- and 5-year periods, and the Manager’s efforts to improve performance.The Board members also discussed the Fund’s management fee and expense ratio and reviewed the range of management fees and expense ratios for the funds in the comparison group.The Fund’s management fee ranked in the top half (i.e., lower than most others) of the comparison group funds. The Board noted that the Fund’s total expense ratio was lower than the Fund’s comparison group and Lipper category averages.
Representatives of the Manager reviewed with the Board members the fees paid to the Manager or its affiliates by mutual funds managed by the Manager or its affiliates with similar investment objectives, policies and strategies as the Fund (the “Similar Funds”), and by other accounts managed or sub-advised by the Manager or its affiliates with similar investment objectives, policies and strategies as the Fund (the “Separate Accounts” and, collectively with the Similar Funds, the “Similar Accounts”).The Manager’s representatives explained the nature of the Similar Accounts and the differences, from the Manager’s perspective, in management of the Similar Accounts as compared to managing and providing services to the Fund; it was noted that the Similar Funds were mutual funds included in the “multi-cap core” and “multi-cap core variable insurance products” funds categories by Lipper.The Manager’s
| | I N FO R M AT I O N A B O U T T H E R E V I E W A N D A P P R OVA L O F T H E
F U N D ’S M A N A G E M E N T A G R E E M E N T ( U n a u d i t e d ) ( c o n t i n u e d )
|
representatives also reviewed the costs associated with distribution through intermediaries.The Board analyzed the differences in fees paid to the Manager and discussed the relationship of the advisory fees paid in light of the Manager’s performance and the services provided; it was noted that the Similar Funds which were mid-cap funds had management fees that were the same as the fee borne by the Fund.The Board members considered the relevance of the fee information provided for the Similar Accounts managed by the Manager to evaluate the appropriateness and reasonableness of the Fund’s advisory fees. The Board acknowledged that differences in fees paid by the Similar Accounts seemed to be consistent with the services provided.
Analysis of Profitability and Economies of Scale. The Manager’s representatives reviewed the dollar amount of expenses allocated and profit received by the Manager and the method used to determine such expenses and profit.The Board received and considered information prepared by an independent consulting firm regarding the Manager’s approach to allocating costs to, and determining the profitability of, individual funds and the entire Dreyfus fund complex.The Manager’s representatives stated that the methodology had also been reviewed by an independent registered public accounting firm which, like the consultant, found the methodology to be reasonable.The consulting firm also analyzed where any economies of scale might emerge in connection with the management of the Fund.The Board members evaluated the analysis in light of the relevant circumstances for the Fund, and the extent to which economies of scale would be realized as the Fund grows and whether fee levels reflect these economies of scale for the benefit of Fund investors. The Board noted that it appeared that the benefits of any economies of scale also would be appropriately shared with shareholders through increased investment in fund management and administration resources. The Board members also considered potential benefits to the Manager from acting as investment adviser and reviewed the soft dollar arrangements with respect to trading the Fund’s portfolio.
It was noted that the Board members should consider the Manager’s profitability with respect to the Fund as part of their evaluation of whether the fee under the Management Agreement bears a reasonable relationship to the mix of services provided by the Manager, including the nature, extent and quality of such services and that a discussion of economies of scale is predicated on increasing assets and that, if a fund’s assets had been decreasing, the possibility that the Manager may have realized any economies of scale would be less.The Board members also discussed the profitability percentage ranges determined by appropriate court cases to be reasonable given the services rendered to investment companies. It was noted that the profitability percentage for managing the Fund was not unreasonable given the Fund’s overall performance and generally superior service levels provided.
At the conclusion of these discussions, each of the Directors expressed the opinion that he or she had been furnished with sufficient information to make an informed business decision with respect to continuation of the Fund’s Management Agreement. Based on their discussions and considerations as described above, the Board made the following conclusions and determinations.
- The Board concluded that the nature, extent and quality of the services provided by the Manager are adequate and appropriate.
- While the Board was concerned with the Fund’s short-term perfor- mance, the Board was satisfied with the Manager’s efforts to improve it.Accordingly, the Board approved the Management Agreement for a six-month period (instead of a year) so as to gauge the Manager’s efforts to improve performance over an appropriate period of time.
- The Board concluded that the fee paid to the Manager by the Fund was reasonable in light of comparative performance and expense and advisory fee information, costs of the services provided and profits to be realized and benefits derived or to be derived by the Manager from its relationship with the Fund.
| | I N FO R M AT I O N A B O U T T H E R E V I E W A N D A P P R OVA L O F T H E
F U N D ’S M A N A G E M E N T A G R E E M E N T ( U n a u d i t e d ) ( c o n t i n u e d )
|
- The Board determined that the economies of scale which may accrue to the Manager and its affiliates in connection with the management of the Fund had been adequately considered by the Manager in connection with the management fee rate charged to the Fund, and that, to the extent in the future it were to be deter- mined that material economies of scale had not been shared with the Fund, the Board would seek to have those economies of scale shared with the Fund.
The Board members considered these conclusions and determinations, along with the information received on a routine and regular basis throughout the year, and, without any one factor being dispositive, the Board determined that re-approval of the Fund’s Management Agreement for a six-month period was in the best interests of the Fund and its shareholders.
BOARD MEMBERS INFORMATION (Unaudited)
| | Joseph S. DiMartino (61)
Chairman of the Board (1995)
|
| Principal Occupation During Past 5 Years: |
| • Corporate Director and Trustee |
| | Other Board Memberships and Affiliations:
|
- The Muscular Dystrophy Association, Director
- Levcor International, Inc., an apparel fabric processor, Director
- Century Business Services, Inc., a provider of outsourcing functions for small and medium size companies, Director
- The Newark Group, a provider of a national market of paper recovery facilities, paperboard mills and paperboard converting plants, Director
- Azimuth Trust, an institutional asset management firm, Member of Board of Managers and Advisory Board
- Sunair Electronics, Inc., engages in the design, manufacture and sale of high frequency systems for long-range voice and data communications, as well as providing certain outdoor-related services to homes and businesses, Director
No. of Portfolios for which Board Member Serves: 193
| | David P. Feldman (65)
Board Member (1996)
|
| Principal Occupation During Past 5 Years: |
| • Corporate Director & Trustee |
| | Other Board Memberships and Affiliations:
|
- BBH Mutual Funds Group (11 funds), Director
- The Jeffrey Company, a private investment company, Director
- QMED, a medical device company, Director
No. of Portfolios for which Board Member Serves: 58
Ehud Houminer (65) Board Member (1993)
| | Principal Occupation During Past 5 Years:
|
- Executive-in-Residence at the Columbia Business School, Columbia University
- Principal of Lear,Yavitz and Associates, a management consulting firm (1996 to 2001)
| | Other Board Memberships and Affiliations:
|
- Avnet Inc., an electronics distributor, Director
- International Advisory Board to the MBA Program School of Management, Ben Gurion University, Chairman
- Explore Charter School, Brooklyn, NY, Chairman
| | No. of Portfolios for which Board Member Serves: 36
|
BOARD MEMBERS INFORMATION (Unaudited) (continued)
| | Gloria Messinger (75)
Board Member (1993)
|
| | Principal Occupation During Past 5 Years:
|
- Arbitrator for American Arbitration Association and National Association of Securities Dealers, Inc.
- Consultant in Intellectual Property
| | Other Board Memberships and Affiliations:
|
- Yale Law School Fund, Director
- Theater for a New Audience, Inc., Director
- Brooklyn Philharmonic, Director
- New York Women’s Agenda Music Performance Trust Fund, Director
| | No. of Portfolios for which Board Member Serves: 25
|
T. John Szarkowski (79) Board Member (1996)
———————
| Principal Occupation During Past 5 Years: |
| • Consultant in Photography |
| Other Board Memberships and Affiliations: |
| • Photography Department at The Museum of Modern Art, Director Emeritus |
| | No. of Portfolios for which Board Member Serves: 25
|
| | Anne Wexler (75)
Board Member (1996)
|
| | Principal Occupation During Past 5 Years:
|
- Chairman of the Wexler & Walker Public Policy Associates, consultants specializing in government relations and public affairs
| | Other Board Memberships and Affiliations:
|
- Wilshire Mutual Funds (5 funds), Director
- Methanex Corporation, a methanol producing company, Director
- Member of the Council of Foreign Relations
- Member of the National Park Foundation
| | No. of Portfolios for which Board Member Serves: 36
|
Once elected all Board Members serve for an indefinite term.The address of the Board Members and Officers is in c/o The Dreyfus Corporation, 200 Park Avenue, New York, New York 10166. Additional information about the Board Members is available in the fund’s Statement of Additional Information which can be obtained from Dreyfus free of charge by calling this toll free number: 1-800-554-4611.
John M. Fraser, Jr., Emeritus Board Member
OFFICERS OF THE FUND (Unaudited)
| STEPHEN E. CANTER, President since | | JAMES BITETTO, Vice President and |
| March 2000. | | Assistant Secretary since August 2005. |
| Chairman of the Board, Chief Executive | | Assistant General Counsel and Assistant |
| Officer and Chief Operating Officer of the | | Secretary of the Manager, and an officer of 91 |
| Manager, and an officer of 90 investment | | investment companies (comprised of 200 |
| companies (comprised of 184 portfolios) | | portfolios) managed by the Manager. He is 39 |
| managed by the Manager. Mr. Canter also is a | | years old and has been an employee of the |
| Board member and, where applicable, an | | Manager since December 1996. |
| |
| Executive Committee Member of the other | | JONI LACKS CHARATAN, Vice President |
| investment management subsidiaries of Mellon | | and Assistant Secretary since |
| Financial Corporation, each of which is an | | August 2005. |
| affiliate of the Manager. He is 60 years old and | | |
| has been an employee of the Manager since | | Assistant General Counsel and Assistant |
| May 1995. | | Secretary of the Manager, and an officer of 91 |
| | | investment companies (comprised of 200 |
| STEPHEN R. BYERS, Executive Vice | | portfolios) managed by the Manager. She is 49 |
| President since November 2002. | | years old and has been an employee of the |
| Chief Investment Officer,Vice Chairman and a | | Manager since October 1998. |
| |
| director of the Manager, and an officer of 90 | | JOSEPH M. CHIOFFI, Vice President and |
| investment companies (comprised of 184 | | Assistant Secretary since August 2005. |
| portfolios) managed by the Manager. Mr. Byers | | |
| also is an officer, director or an Executive | | Assistant General Counsel and Assistant |
| Committee Member of certain other | | Secretary of the Manager, and an officer of 91 |
| investment management subsidiaries of Mellon | | investment companies (comprised of 200 |
| Financial Corporation, each of which is an | | portfolios) managed by the Manager. He is 43 |
| affiliate of the Manager. He is 52 years old and | | years old and has been an employee of the |
| has been an employee of the Manager since | | Manager since July 2000. |
| January 2000. | | JANETTE E. FARRAGHER, Vice President |
| MARK N. JACOBS, Vice President since | | and Assistant Secretary since |
| March 2000. | | August 2005. |
| Executive Vice President, Secretary and | | Associate General Counsel of the Manager, |
| General Counsel of the Manager, and an | | and an officer of 91 investment companies |
| officer of 91 investment companies (comprised | | (comprised of 200 portfolios) managed by the |
| of 200 portfolios) managed by the Manager. | | Manager. She is 42 years old and has been an |
| He is 59 years old and has been an employee | | employee of the Manager since February 1984. |
| of the Manager since June 1977. | | JOHN B. HAMMALIAN, Vice President and |
| MICHAEL A. ROSENBERG, Vice President | | Assistant Secretary since August 2005. |
| and Secretary since August 2005. | | Associate General Counsel of the Manager, |
| Associate General Counsel of the Manager, | | and an officer of 91 investment companies |
| and an officer of 91 investment companies | | (comprised of 200 portfolios) managed by the |
| (comprised of 200 portfolios) managed by the | | Manager. He is 42 years old and has been an |
| Manager. He is 45 years old and has been an | | employee of the Manager since February 1991. |
| employee of the Manager since October 1991. | | |
| ROBERT R. MULLERY, Vice President and | | ROBERT SVAGNA, Assistant Treasurer |
| Assistant Secretary since August 2005. | | since December 2002. |
| Associate General Counsel of the Manager, | | Senior Accounting Manager – Equity Funds of |
| and an officer of 91 investment companies | | the Manager, and an officer of 91 investment |
| (comprised of 200 portfolios) managed by the | | companies (comprised of 200 portfolios) |
| Manager. He is 53 years old and has been an | | managed by the Manager. He is 38 years old |
| employee of the Manager since May 1986. | | and has been an employee of the Manager |
| |
| JEFF PRUSNOFSKY, Vice President and | | since November 1990. |
| Assistant Secretary since August 2005. | | KENNETH J. SANDGREN, Assistant |
| Associate General Counsel of the Manager, | | Treasurer since November 2001. |
| and an officer of 91 investment companies | | Mutual Funds Tax Director of the Manager, |
| (comprised of 200 portfolios) managed by the | | and an officer of 91 investment companies |
| Manager. He is 40 years old and has been an | | (comprised of 200 portfolios) managed by the |
| employee of the Manager since October 1990. | | Manager. He is 51 years old and has been an |
| |
| JAMES WINDELS, Treasurer since | | employee of the Manager since June 1993. |
| November 2001. | | JOSEPH W. CONNOLLY, Chief Compliance |
| Director – Mutual Fund Accounting of the | | Officer since October 2004. |
| Manager, and an officer of 91 investment | | Chief Compliance Officer of the Manager and |
| companies (comprised of 200 portfolios) managed | | The Dreyfus Family of Funds (91 investment |
| by the Manager. He is 46 years old and has been | | companies, comprising 200 portfolios). From |
| an employee of the Manager since April 1985. | | November 2001 through March 2004, Mr. |
| |
| GREGORY S. GRUBER, Assistant | | Connolly was first Vice-President, Mutual |
| Treasurer since August 2005. | | Fund Servicing for Mellon Global Securities |
| | | Services. In that capacity, Mr. Connolly was |
| Senior Accounting Manager – Municipal Bond | | responsible for managing Mellon’s Custody, |
| Funds of the Manager, and an officer of 91 | | Fund Accounting and Fund Administration |
| investment companies (comprised of 200 | | services to third-party mutual fund clients. He |
| portfolios) managed by the Manager. He is 46 | | is 48 years old and has served in various |
| years old and has been an employee of the | | capacities with the Manager since 1980, |
| Manager since August 1981. | | including manager of the firm’s Fund |
| ERIK D. NAVILOFF, Assistant Treasurer | | Accounting Department from 1997 through |
| since August 2005. | | October 2001. |
| Senior Accounting Manager – Taxable Fixed | | WILLIAM GERMENIS, Anti-Money |
| Income Funds of the Manager, and an officer | | Laundering Compliance Officer since |
| of 91 investment companies (comprised of 200 | | October 2002. |
| portfolios) managed by the Manager. He is 37 | | Vice President and Anti-Money Laundering |
| years old and has been an employee of the | | Compliance Officer of the Distributor, and the |
| Manager since November 1992. | | Anti-Money Laundering Compliance Officer |
| ROBERT ROBOL, Assistant Treasurer | | of 88 investment companies (comprised of 197 |
| since August 2005. | | portfolios) managed by the Manager. He is 35 |
| | | years old and has been an employee of the |
| Senior Accounting Manager – Money Market | | Distributor since October 1998. |
| Funds of the Manager, and an officer of 91 | | |
| investment companies (comprised of 200 | | |
| portfolios) managed by the Manager. He is 41 | | |
| years old and has been an employee of the | | |
| Manager since October 1988. | | |
NOTES
| For More | | Information |
| |
|
| |
| Dreyfus | | Transfer Agent & |
| Midcap Value Fund | | Dividend Disbursing Agent |
| 200 Park Avenue | | Dreyfus Transfer, Inc. |
| New York, NY 10166 | | 200 Park Avenue |
| Manager | | New York, NY 10166 |
| The Dreyfus Corporation | | Distributor |
| 200 Park Avenue | | Dreyfus Service Corporation |
| New York, NY 10166 | | 200 Park Avenue |
| Custodian | | New York, NY 10166 |
| Mellon Bank, N.A. | | |
| One Mellon Bank Center | | |
| Pittsburgh, PA 15258 | | |
| |
|
| |
| |
| Telephone 1-800-645-6561 | | |
Mail The Dreyfus Family of Funds, 144 Glenn Curtiss Boulevard, Uniondale, NY 11556-0144 E-mail Send your request to info@dreyfus.com Internet Information can be viewed online or downloaded at: http://www.dreyfus.com
The fund files its complete schedule of portfolio holdings with the Securities and Exchange Commission (��SEC”) for the first and third quarters of each fiscal year on Form N-Q. The fund’s Forms N-Q are available on the SEC’s website at http://www.sec.gov and may be reviewed and copied at the SEC’s Public Reference Room in Washington, DC. Information on the operation of the Public Reference Room may be obtained by calling 1-800-SEC-0330.
A description of the policies and procedures that the fund uses to determine how to vote proxies relating to portfolio securities, and information regarding how the fund voted these proxies for the 12-month period ended June 30, 2005, is available at http://www.dreyfus.com and on the SEC’s website at http://www.sec.gov. The description of the policies and procedures is also available without charge, upon request, by calling 1-800-645-6561.

Save time. Save paper. View your next shareholder report online as soon as it’s available. Log into www.dreyfus.com and sign up for Dreyfus eCommunications. It’s simple and only takes a few minutes.
The views expressed in this report reflect those of the portfolio manager only through the end of the period covered and do not necessarily represent the views of Dreyfus or any other person in the Dreyfus organization. Any such views are subject to change at any time based upon market or other conditions and Dreyfus disclaims any responsibility to update such views.These views may not be relied on as investment advice and, because investment decisions for a Dreyfus fund are based on numerous factors, may not be relied on as an indication of trading intent on behalf of any Dreyfus fund.
Not FDIC-Insured • Not Bank-Guaranteed • May Lose Value
| | | Contents |
| |
| | | THE FUND |
| |
|
| 2 | | Letter from the Chairman |
| 3 | | Discussion of Fund Performance |
| 6 | | Fund Performance |
| 8 | | Understanding Your Fund’s Expenses |
| 8 | | Comparing Your Fund’s Expenses |
| | | With Those of Other Funds |
| 9 | | Statement of Investments |
| 14 | | Statement of Assets and Liabilities |
| 15 | | Statement of Operations |
| 16 | | Statement of Changes in Net Assets |
| 18 | | Financial Highlights |
| 23 | | Notes to Financial Statements |
| 32 | | Report of Independent Registered |
| | | Public Accounting Firm |
| 33 | | Information About the Review and Approval |
| | | of the Fund’s Management Agreement |
| 38 | | Board Members Information |
| 40 | | Officers of the Fund |
| | | FOR MORE INFORMATION |
| |
|
| | | Back Cover |
The Fund
| | Dreyfus Premier
Future Leaders Fund
|

LETTER FROM THE CHAIRMAN
This annual report for Dreyfus Premier Future Leaders Fund covers the 12-month period from September 1, 2004, through August 31, 2005. Inside, you’ll find valuable information about how the fund was managed during the reporting period, including a discussion with the fund’s portfolio managers, John S. Cone, Oliver Buckley, Langton C. Garvin and Kristin Crawford, each of whom comprise the Smallcap Team of Franklin Portfolio Associates, LLC.
On average, stock prices ended the reporting period higher than where they began. However, most of the market’s gains occurred during the closing months of 2004. So far in 2005, positive factors, including steady economic growth and higher corporate profits, were largely offset by headwinds, such as sharply higher energy prices and rising short-term interest rates. Midcap stocks produced higher returns than small-cap stocks in this environment, and small-cap stocks outperformed large-cap stocks. Also, value-oriented stocks have generally produced better results than their more growth-oriented counterparts during the past 12 months.
Recent shocks to the U.S. economy — including sharply higher gasoline prices and other lingering consequences of Hurricane Katrina — have added a degree of uncertainty to the economic outlook.Nonetheless,our economists currently expect the economy to continue to grow without either entering a recession or triggering a significant acceleration of infla-tion.As always, we encourage you to discuss the potential implications of these and other matters with your financial advisor.
Thank you for your continued confidence and support.


DISCUSSION OF FUND PERFORMANCE
John S. Cone, Oliver Buckley, Langton C. Garvin and
Kristin Crawford, Portfolio Managers
|
How did Dreyfus Premier Future Leaders Fund perform
relative to its benchmark?
|
For the 12-month period ended August 31,2005,the fund produced total returns of 25.22% for Class A shares,24.48% for Class B shares,24.44% for Class C shares, 25.85% for Class R shares and 24.95% for Class T shares.1 In comparison, the fund’s benchmark, the Russell 2000 Index (the “Index”), achieved a total return of 23.10% for the same period.2
We attribute these results to continued U.S.and global economic growth, accompanied by low inflation and rising corporate earnings.These favorable conditions bolstered investor confidence in the face of rising interest rates and high energy prices. Small-cap stocks delivered notably stronger gains than their large-cap counterparts. The fund produced higher returns than its benchmark, largely due to good individual stock selections in the financial, producer durables and energy sectors.
What is the fund’s investment approach?
The fund seeks capital growth by investing at least 80% of its assets in companies we believe are future leaders: companies characterized by new or innovative products, services or processes having the potential to enhance earnings or revenue growth.The fund primarily invests in companies with market capitalizations of less than $2 billion at the time of purchase. However, since the fund may continue to hold its securities as their market capitalizations grow, a substantial portion of the fund’s holdings can have market capitalizations in excess of $2 billion at any given time.
For the first 10 months of the reporting period, we employed a blended approach, investing in a combination of growth and value stocks. Using fundamental research and direct management contact, we sought stocks with strong positions in major product lines, sustained achievement records and strong financial conditions.We also
| | DISCUSSION OF FUND PERFORMANCE (continued)
|
sought special situations, such as corporate restructurings or management changes that could increase the stock price.
Since June 30, 2005, we have employed a structured, risk-controlled approach in which principles of fundamental analysis are implemented quantitatively.This disciplined,“bottom-up,” approach seeks to identify undervalued securities through computer models that rank stocks based on fundamental momentum, relative value, long-term growth and additional factors, such as technical factors.We attempt to maintain a neutral exposure to industry groups relative to the Index.Within each sector, we overweight the stocks ranked most attractive and underweight or avoid those ranked least attractive.
What other factors influenced the fund’s performance?
The success of our stock selection strategy in the financial services sector boosted the fund’s returns. Top performers included the Nasdaq Stock Market, in which the fund invested shortly after the company completed its public stock offering in early 2005; and Global Payments, an electronic transaction processing company that benefited from the economy’s increasing reliance on electronic funds transfers. Other notably strong performers included life insurer Universal American Financial, educational lender Nelnet, and regional savings and loan Amegy Bancorp, all of which benefited from good earnings reports and solid business fundamentals.
Holdings in the producer durables and energy sectors further contributed to the fund’s positive performance relative to its benchmark. In the producer durables area, the fund derived notably strong returns from its positions in mining equipment maker Joy Global; construction and agricultural machinery producer JLG Industries; and electronic parts manufacturer AMETEK. In the energy sector, gains were fueled by higher commodity prices amid rising industrial demand for a limited supply of energy commodities. A diverse group of energy holdings benefited from these conditions, including oil and gas drilling contractors Todco and Grey Wolf; coal producer Arch Coal; and independent exploration and production company Denbury Resources.
A number of holdings in other sectors had a significant impact on the fund’s returns, either positive or negative. On the positive side, these
included building heating and cooling contractor York International; semiconductor equipment manufacturer Varian Semiconductor Equipment Associates; and rail equipment maker Wabtec. On the negative side, disappointments early in the reporting period included Northwest Airlines, and biotechnology firm Barrier Therapeutics. During the final two months of the reporting period,the fund also suffered losses in health care service provider VistaCare and technology companies Wind River Systems and Hutchinson Technologies.However,dips in these holdings were generally matched by gains in other holdings within the same sectors. On average, the fund roughly matched or exceeded benchmark performance in all of the sectors in which it invested.
What is the fund’s current strategy?
The Smallcap Team of Franklin Portfolio Associates, LLC assumed management of the fund on June 30, 2005. Since then, we have maintained the fund’s focus on small-cap stocks.At the same time, we have gradually shifted the fund’s portfolio composition to reflect our quantitatively driven, sector-neutral investment approach.This process will continue over the next several months.
As of August 31, 2005, the fund’s composition continued to reflect the prior managers’ focus on certain sectors, with reduced but still slightly overweighted exposures to oil services and medical service stocks, and slightly underweighted exposure to the financial sector.
| 1 | | Total return includes reinvestment of dividends and any capital gains paid, and does not take into |
| | | consideration the maximum initial sales charges in the case of Class A and Class T shares, or the |
| | | applicable contingent deferred sales charges imposed on redemptions in the case of Class B and |
| | | Class C shares. Had these charges been reflected, returns would have been lower. Past performance |
| | | is no guarantee of future results. Share price and investment return fluctuate such that upon |
| | | redemption, fund shares may be worth more or less than their original cost. Return figures provided |
| | | reflect the absorption of fund expenses by The Dreyfus Corporation pursuant to an agreement |
| | | effective March 16, 2005, through March 31, 2006, at which time it may be extended, terminated |
| | | or modified. Had these expenses not been absorbed, the fund’s returns would have been lower. |
| | | Part of the fund’s recent performance is attributable to positive returns from its initial public |
| | | offering (IPO) investments. There can be no guarantee that IPOs will have or continue to |
| | | have a positive effect on the fund’s performance. |
| 2 | | SOURCE: LIPPER INC. — Reflects reinvestment of dividends and, where applicable, capital |
| | | gain distributions.The Russell 2000 Index is an unmanaged index of small-cap stock performance |
| | | and is composed of the 2,000 smallest companies in the Russell 3000 Index.The Russell 3000 |
| | | Index is composed of the 3,000 largest U.S. companies based on total market capitalization. |

† Source: Lipper Inc.
Past performance is not predictive of future performance.
Part of the fund’s recent performance is attributable to positive returns from its initial public offering (IPO) investments. There can be no guarantee that IPOs will have or continue to have a positive effect on the fund’s performance. The above graph compares a $10,000 investment made in Class A, Class B, Class C, Class R and Class T shares of Dreyfus Premier Future Leaders Fund on 6/30/00 (inception date) to a $10,000 investment made in the Russell 2000 Index on that date. All dividends and capital gain distributions are reinvested.
The fund’s performance shown in the line graph takes into account the maximum initial sales charges on Class A and Class T shares, the applicable contingent deferred sales charge on Class B shares and all other applicable fees and expenses on all classes.The Russell 2000 Index is an unmanaged index and is composed of the 2,000 smallest companies in the Russell 3000 Index.The Russell 3000 Index is composed of 3,000 of the largest U.S. companies by market capitalization and does not take into account charges, fees and other expenses. Further information relating to fund performance, including expense reimbursements, if applicable, is contained in the Financial Highlights section of the prospectus and elsewhere in this report.
| Average Annual Total Returns as of 8/31/05 | | | | |
| |
| | | | | Inception | | | | | | From |
| | | | | Date | | 1 Year | | 5 Years | | Inception |
| |
| |
| |
| |
| |
|
| Class A shares | | | | | | | | |
| with maximum sales charge (5.75%) | | 6/30/00 | | 18.05% | | 5.67% | | 8.28% |
| without sales charge | | 6/30/00 | | 25.22% | | 6.92% | | 9.53% |
| Class B shares | | | | | | | | |
| with applicable redemption charge † | | 6/30/00 | | 20.48% | | 5.83% | | 8.60% |
| without redemption | | 6/30/00 | | 24.48% | | 6.15% | | 8.73% |
| Class C shares | | | | | | | | |
| with applicable redemption charge †† | | 6/30/00 | | 23.44% | | 6.18% | | 8.77% |
| without redemption | | 6/30/00 | | 24.44% | | 6.18% | | 8.77% |
| Class R shares | | 6/30/00 | | 25.85% | | 7.33% | | 9.94% |
| Class T shares | | | | | | | | |
| with applicable sales charge (4.5%) | | 6/30/00 | | 19.35% | | 5.60% | | 8.21% |
| without sales charge | | 6/30/00 | | 24.95% | | 6.57% | | 9.18% |
| |
| Past performance is not predictive of future performance.The fund’s performance shown in the graph and table does not |
| reflect the deduction of taxes that a shareholder would pay on fund distributions or the redemption of fund shares. |
| † | | The maximum contingent deferred sales charge for Class B shares is 4%. After six years Class B shares convert to |
| | | Class A shares. | | | | | | | | |
| †† | | The maximum contingent deferred sales charge for Class C shares is 1% for shares redeemed within one year of the |
| | | date of purchase. | | | | | | | | |
U N D E R S TA N D I N G YO U R F U N D ’ S E X P E N S E S ( U n a u d i t e d )
As a mutual fund investor, you pay ongoing expenses, such as management fees and other expenses. Using the information below, you can estimate how these expenses affect your investment and compare them with the expenses of other funds.You also may pay one-time transaction expenses, including sales charges (loads) and redemption fees, which are not shown in this section and would have resulted in higher total expenses. For more information, see your fund’s prospectus or talk to your financial adviser.
Review your fund’s expenses
The table below shows the expenses you would have paid on a $1,000 investment in Dreyfus Premier Future Leaders Fund from March 1, 2005 to August 31, 2005. It also shows how much a $1,000 investment would be worth at the close of the period, assuming actual returns and expenses.
| Expenses and Value of a $1,000 Investment | | | | | | |
| assuming actual returns for the six months ended August 31, 2005 | | | | |
| | | Class A | | Class B | | Class C | | Class R | | Class T |
| |
| |
| |
| |
| |
|
| Expenses paid per $1,000 † | | $ 6.81 | | $ 10.35 | | $ 10.14 | | $ 4.65 | | $ 8.14 |
| Ending value (after expenses) | | $1,045.50 | | $1,042.20 | | $1,042.10 | | $1,048.30 | | $1,044.60 |
| | COMPARING YOUR FUND’S EXPENSES
WITH THOSE OF OTHER FUNDS (Unaudited)
|
Using the SEC’s method to compare expenses
The Securities and Exchange Commission (SEC) has established guidelines to help investors assess fund expenses. Per these guidelines, the table below shows your fund’s expenses based on a $1,000 investment, assuming a hypothetical 5% annualized return. You can use this information to compare the ongoing expenses (but not transaction expenses or total cost) of investing in the fund with those of other funds.All mutual fund shareholder reports will provide this information to help you make this comparison. Please note that you cannot use this information to estimate your actual ending account balance and expenses paid during the period.
| | Expenses and Value of a $1,000 Investment
assuming a hypothetical 5% annualized return for the six months ended August 31, 2005
|
| | | Class A | | Class B | | Class C | | Class R | | Class T |
| |
| |
| |
| |
| |
|
| Expenses paid per $1,000 † | | $ 6.72 | | $ 10.21 | | $ 10.01 | | $ 4.58 | | $ 8.03 |
| Ending value (after expenses) | | $1,018.55 | | $1,015.07 | | $1,015.27 | | $1,020.67 | | $1,017.24 |
† Expenses are equal to the fund’s annualized expense ratio of 1.32% for Class A, 2.01% for Class B, 1.97% for Class C, .90% for Class R and 1.58% for Class T; multiplied by the average account value over the period, multiplied by 184/365 (to reflect the one-half year period).
STATEMENT OF INVESTMENTS
August 31, 2005
|
| Common Stocks—99.8% | | Shares | | Value ($) |
| |
| |
|
| Apparel—1.2% | | | | |
| Aeropostale | | 100,000 a | | 2,554,000 |
| Commercial & Professional Services—4.2% | | |
| Agilysys | | 16,400 | | 294,380 |
| Bell Microproducts | | 17,300 a | | 175,249 |
| Handleman | | 9,900 | | 138,501 |
| National Financial Partners | | 90,100 | | 3,955,390 |
| Performance Food Group | | 129,000 a | | 3,995,130 |
| Rush Enterprises, Cl. A | | 19,700 a | | 315,003 |
| | | | | 8,873,653 |
| Communications—.1% | | | | |
| Talk America Holdings | | 17,100 a | | 156,807 |
| Consumer Durables—1.7% | | | | |
| Arctic Cat | | 11,100 | | 239,427 |
| WMS Industries | | 113,500 a | | 3,286,960 |
| | | | | 3,526,387 |
| Consumer Non-Durables—4.2% | | | | |
| Mannatech | | 13,500 | | 167,940 |
| Parlux Fragrances | | 25,800 a,b | | 809,346 |
| Ralcorp Holdings | | 90,000 | | 3,991,500 |
| Warnaco Group | | 161,000 a | | 4,025,000 |
| | | | | 8,993,786 |
| Consumer Services—4.5% | | | | |
| Carmike Cinemas | | 71,200 | | 2,128,880 |
| Central Parking | | 17,200 | | 273,308 |
| Lakes Entertainment | | 23,200 a,b | | 287,680 |
| Lin TV, Cl. A | | 17,400 a | | 262,914 |
| Luby’s | | 25,600 a | | 336,384 |
| Shuffle Master | | 136,000 a,b | | 3,325,200 |
| Sinclair Broadcast Group, Cl. A | | 24,400 | | 229,116 |
| Spanish Broadcasting System, Cl. A | | 312,400 a | | 2,411,728 |
| World Wrestling Entertainment | | 17,400 | | 219,762 |
| | | | | 9,474,972 |
| Electronic Technology—9.8% | | | | |
| Advanced Energy Industries | | 29,100 a | | 346,872 |
| Armor Holdings | | 43,200 a | | 1,832,112 |
| Hutchinson Technology | | 79,500 a | | 2,098,800 |
| | STATEMENT OF INVESTMENTS (continued)
|
| Common Stocks (continued) | | Shares | | Value ($) |
| |
| |
|
| Electronic Technology (continued) | | | | |
| Integrated Circuit Systems | | 145,000 a | | 3,053,700 |
| Integrated Device Technology | | 158,700 a | | 1,698,090 |
| Microsemi | | 65,000 a | | 1,565,850 |
| MIPS Technologies | | 33,300 a | | 208,791 |
| Multi-Fineline Electronix | | 9,200 a | | 235,060 |
| Redback Networks | | 36,200 a | | 327,248 |
| Sigmatel | | 68,500 a | | 1,325,475 |
| SpectraLink | | 28,300 | | 364,787 |
| Triumph Group | | 75,000 a | | 2,945,250 |
| TTM Technologies | | 76,000 a | | 588,240 |
| Varian Semiconductor Equipment Associates | | 86,000 a | | 3,896,660 |
| X-Rite | | 18,200 | | 229,138 |
| | | | | 20,716,073 |
| Energy Minerals—4.8% | | | | |
| Alpha Natural Resources | | 110,000 a | | 3,281,300 |
| Denbury Resources | | 69,100 a | | 3,125,393 |
| Remington Oil & Gas | | 97,000 a | | 3,737,410 |
| | | | | 10,144,103 |
| Finance—18.1% | | | | |
| Advanta, Cl. B | | 7,000 | | 201,950 |
| Affordable Residential Communities | | 35,500 | | 419,610 |
| Amegy Bancorp | | 175,000 | | 3,932,250 |
| Arch Capital Group | | 65,000 a | | 2,824,250 |
| BankAtlantic Bancorp, Cl. A | | 185,000 | | 3,154,250 |
| Boykin Lodging | | 11,700 | | 153,972 |
| First Niagara Financial Group | | 214,500 | | 3,039,465 |
| LTC Properties | | 6,600 | | 133,518 |
| Luminent Mortgage Capital | | 40,600 | | 367,836 |
| Max Re Capital | | 117,700 | | 2,705,923 |
| Maxtor | | 386,000 a | | 1,875,960 |
| Nasdaq Stock Market | | 193,000 a | | 4,535,500 |
| National Health Investors | | 5,000 | | 144,850 |
| Nelnet, Cl. A | | 108,500 a | | 3,884,300 |
| One Liberty Properties | | 8,100 | | 164,916 |
| R&G Financial, Cl. B | | 65,300 | | 987,989 |
| Sunterra | | 21,100 a | | 266,915 |
| Texas Regional Bancshares, Cl. A | | 104,000 | | 3,079,440 |
| Common Stocks (continued) | | Shares | | Value ($) |
| |
| |
|
| Finance (continued) | | | | |
| Universal American Financial | | 149,000 a | | 3,419,550 |
| Westamerica Bancorporation | | 56,000 | | 2,923,760 |
| | | | | 38,216,204 |
| Health Technology—6.1% | | | | |
| Alpharma, Cl. A | | 19,800 | | 527,076 |
| Andrx | | 144,000 a,b | | 2,610,720 |
| Barrier Therapeutics | | 162,200 a | | 1,490,618 |
| Enzon Pharmaceuticals | | 42,700 a | | 298,473 |
| Orchid Cellmark | | 32,400 a | | 291,600 |
| Serologicals | | 149,400 a,b | | 3,554,226 |
| Syneron Medical | | 112,500 a,b | | 4,153,500 |
| | | | | 12,926,213 |
| Industrial—8.1% | | | | |
| Grey Wolf | | 514,500 a | | 4,028,535 |
| Todco, Cl. A | | 148,500 | | 5,155,920 |
| Veritas DGC | | 126,000 a | | 4,052,160 |
| Western Gas Resources | | 83,500 | | 4,008,000 |
| | | | | 17,244,615 |
| Non-Energy Minerals—2.5% | | | | |
| Agnico-Eagle Mines | | 146,200 | | 1,912,296 |
| PAN American Silver | | 215,000 a | | 3,351,850 |
| | | | | 5,264,146 |
| Process Industries—4.1% | | | | |
| Albany International, Cl. A | | 100,000 | | 3,602,000 |
| Crown Holdings | | 181,000 a | | 3,057,090 |
| Pioneer Cos. | | 6,900 a | | 152,628 |
| Wausau Paper | | 165,000 | | 1,963,500 |
| | | | | 8,775,218 |
| Producer Manufacturing—10.6% | | | | |
| AGCO | | 200,000 a | | 4,106,000 |
| Bucyrus International, Cl. A | | 85,000 | | 3,835,200 |
| JLG Industries | | 143,000 | | 4,688,970 |
| Steel Technologies | | 13,300 | | 311,353 |
| Wabtec | | 176,000 | | 4,576,000 |
| York International | | 86,500 | | 4,963,370 |
| | | | | 22,480,893 |
| | STATEMENT OF INVESTMENTS (continued)
|
| Common Stocks (continued) | | Shares | | Value ($) |
| |
| |
|
| Retail Trade—2.5% | | | | |
| Finish Line, Cl. A | | 94,900 | | 1,368,458 |
| Pacific Sunwear of California | | 152,000 a | | 3,629,760 |
| Provide Commerce | | 8,300 a | | 211,816 |
| Shoe Carnival | | 6,600 a | | 107,976 |
| | | | | 5,318,010 |
| Technology Services—11.1% | | | | |
| Anteon International | | 50,500 a | | 2,320,475 |
| Apria Healthcare Group | | 58,300 a | | 1,995,609 |
| Beverly Enterprises | | 299,500 a,b | | 3,758,725 |
| Global Payments | | 54,000 | | 3,552,120 |
| Hyperion Solutions | | 57,500 a | | 2,493,775 |
| Magellan Health Services | | 73,800 a | | 2,616,210 |
| Sykes Enterprises | | 25,800 a | | 274,770 |
| Vignette | | 58,700 a | | 891,653 |
| VistaCare, Cl. A | | 160,000 a | | 2,748,800 |
| Wind River Systems | | 210,000 a | | 2,759,400 |
| | | | | 23,411,537 |
| Transportation—3.3% | | | | |
| AMR | | 242,000 a,b | | 3,046,780 |
| UTI Worldwide | | 51,500 | | 3,886,190 |
| | | | | 6,932,970 |
| Utilities—2.9% | | | | |
| El Paso Electric | | 171,500 a | | 3,594,640 |
| Westar Energy | | 104,000 | | 2,498,080 |
| | | | | 6,092,720 |
| Total Common Stocks | | | | |
| (cost $161,523,174) | | | | 211,102,307 |
| |
| |
|
| |
| Other Investment—.4% | | | | |
| |
| |
|
| Registered Investment Company; | | | | |
| Dreyfus Institutional Preferred Plus Money Market Fund | | |
| (cost $838,000) | | 838,000 c | | 838,000 |
| Investment of Cash Collateral | | | | |
| for Securities Loaned—5.8% | | Shares | | Value ($) |
| |
| |
|
| Registered Investment Company; | | | | |
| Dreyfus Institutional Cash Advantage Plus Fund | | | | |
| (cost $12,129,235) | | 12,129,235 c | | 12,129,235 |
| |
| |
|
| Total Investments (cost $174,490,409) | | 106.0% | | 224,069,542 |
| Liabilities, Less Cash and Receivables | | (6.0%) | | (12,619,709) |
| Net Assets | | 100.0% | | 211,449,833 |
| |
| a Non-income producing. | | | | |
| b All or a portion of these securities are on loan. At August 31, 2005, the total market value of the fund’s securities on |
| loan is $11,876,018 and the total market value of the collateral held by the fund is $12,129,235. |
| c Investments in affiliated money market mutual funds. | | | | |
| Portfolio Summary † | | | | | | |
| |
| | | Value (%) | | | | Value (%) |
| |
| |
| |
|
| Finance | | 18.1 | | Energy Minerals | | 4.8 |
| Technology Services | | 11.1 | | Consumer Services | | 4.5 |
| Producer Manufacturing | | 10.6 | | Commercial & Professional Services | | 4.2 |
| Electronic Technology | | 9.8 | | Consumer Non-Durables | | 4.2 |
| Industrial | | 8.1 | | Other | | 18.3 |
| Money Market Investments | | 6.2 | | | | |
| Health Technology | | 6.1 | | | | 106.0 |
| |
| † Based on net assets. | | | | | | |
| See notes to financial statements. | | | | | | |
| | STATEMENT OF ASSETS AND LIABILITIES
August 31, 2005
|
| | | | | | | | | Cost | | Value |
| |
| |
| |
| |
| |
|
| Assets ($): | | | | | | | | | | |
| Investments in securities— | | | | | | | | |
| See Statement of Investments (including securities | | | | |
| on loan, valued at $11,876,018)—Note 1(b): | | | | | | |
| Unaffiliated issuers | | | | | | 161,523,174 | | 211,102,307 |
| Affiliated issuers | | | | | | 12,967,235 | | 12,967,235 |
| Receivable for shares of Common Stock subscribed | | | | | | 204,969 |
| Dividends and interest receivable | | | | | | | | 40,780 |
| Prepaid expenses | | | | | | | | | | 42,410 |
| | | | | | | | | | | 224,357,701 |
| |
| |
| |
| |
| |
|
| Liabilities ($): | | | | | | | | | | |
| Due to The Dreyfus Corporation and affiliates—Note 3(c) | | | | 264,732 |
| Cash overdraft due to Custodian | | | | | | | | 98,960 |
| Liability for securities on loan—Note 1(b) | | | | | | 12,129,235 |
| Payable for shares of Common Stock redeemed | | | | | | 297,787 |
| Accrued expenses | | | | | | | | | | 117,154 |
| | | | | | | | | | | 12,907,868 |
| |
| |
| |
| |
| |
|
| Net Assets ($) | | | | | | | | | | 211,449,833 |
| |
| |
| |
| |
| |
|
| Composition of Net Assets ($): | | | | | | | | |
| Paid-in capital | | | | | | | | | | 133,461,975 |
| Accumulated undistributed investment income—net | | | | | | 329 |
| Accumulated net realized gain (loss) on investments | | | | 28,408,396 |
| Accumulated net unrealized appreciation | | | | | | |
| (depreciation) on investments | | | | | | | | 49,579,133 |
| |
| |
| |
| |
|
| Net Assets ($) | | | | | | | | | | 211,449,833 |
| |
| |
| |
| |
| |
|
| |
| |
| Net Asset Value Per Share | | | | | | | | |
| | | Class A | | Class B | | Class C | | Class R | | Class T |
| |
| |
| |
| |
| |
|
| Net Assets ($) | | 98,348,072 | | 44,218,086 | | 34,685,202 | | 32,646,009 | | 1,552,464 |
| Shares Outstanding | | 4,914,125 | | 2,294,689 | | 1,796,837 | | 1,600,355 | | 78,903 |
| |
| |
| |
| |
| |
|
| Net Asset Value | | | | | | | | | | |
| Per Share ($) | | 20.01 | | 19.27 | | 19.30 | | 20.40 | | 19.68 |
| |
| See notes to financial statements. | | | | | | | | |
STATEMENT OF OPERATIONS
Year Ended August 31, 2005
|
| Investment Income ($): | | |
| Income: | | |
| Cash dividends (net of $3,278 foreign taxes withheld at source): | | |
| Unaffiliated issuers | | 1,638,712 |
| Affiliated issuers | | 7,186 |
| Income from securities lending | | 151,005 |
| Interest | | 110,209 |
| Total Income | | 1,907,112 |
| Expenses: | | |
| Management fee—Note 3(a) | | 2,197,310 |
| Shareholder servicing costs—Note 3(c) | | 925,946 |
| Distribution fees—Note 3(b) | | 575,201 |
| Registration fees | | 52,224 |
| Prospectus and shareholders’ reports | | 31,172 |
| Professional fees | | 27,567 |
| Custodian fees—Note 3(c) | | 20,451 |
| Directors’ fees and expenses—Note 3(d) | | 4,532 |
| Loan commitment fees—Note 2 | | 518 |
| Interest expense—Note 2 | | 358 |
| Miscellaneous | | 14,680 |
| Total Expenses | | 3,849,959 |
| Less—reduction in management fee | | |
| due to undertaking—Note 3(a) | | (163,418) |
| Less—reduction in cusdody fees | | |
| due to earnings credits—Note 1(b) | | (658) |
| Net Expenses | | 3,685,883 |
| Investment (Loss)—Net | | (1,778,771) |
| |
|
| Realized and Unrealized Gain (Loss) on Investments—Note 4 ($): |
| Net realized gain (loss) on investments | | 44,510,045 |
| Net unrealized appreciation (depreciation) on investments | | 12,807,744 |
| Net Realized and Unrealized Gain (Loss) on Investments | | 57,317,789 |
| Net Increase in Net Assets Resulting from Operations | | 55,539,018 |
See notes to financial statements.
|
STATEMENT OF CHANGES IN NET ASSETS
| | | Year Ended August 31, |
| |
|
| | | 2005 | | 2004 |
| |
| |
|
| Operations ($): | | | | |
| Investment (loss)—net | | (1,778,771) | | (2,278,238) |
| Net realized gain (loss) on investments | | 44,510,045 | | 25,161,395 |
| Net unrealized appreciation | | | | |
| (depreciation) on investments | | 12,807,744 | | (4,374,215) |
| Net Increase (Decrease) in Net Assets | | | | |
| Resulting from Operations | | 55,539,018 | | 18,508,942 |
| |
| |
|
| Capital Stock Transactions ($): | | | | |
| Net proceeds from shares sold: | | | | |
| Class A shares | | 34,230,166 | | 45,713,834 |
| Class B shares | | 2,140,318 | | 7,853,304 |
| Class C shares | | 5,955,862 | | 5,917,890 |
| Class R shares | | 8,314,991 | | 19,297,550 |
| Class T shares | | 633,096 | | 609,277 |
| Net assets received in connection | | | | |
| with reorganization—Note 1: | | | | |
| Class A shares | | — | | 15,022,241 |
| Class B shares | | — | | 6,364,220 |
| Class C shares | | — | | 9,786,450 |
| Class R shares | | — | | 11,199,591 |
| Cost of shares redeemed: | | | | |
| Class A shares | | (51,608,453) | | (26,239,102) |
| Class B shares | | (8,448,947) | | (6,473,462) |
| Class C shares | | (6,820,904) | | (5,193,363) |
| Class R shares | | (76,035,359) | | (48,954,954) |
| Class T shares | | (421,464) | | (213,130) |
| Increase (Decrease) in Net Assets | | | | |
| from Capital Stock Transactions | | (92,060,694) | | 34,690,346 |
| Total Increase (Decrease) in Net Assets | | (36,521,676) | | 53,199,288 |
| |
| |
|
| Net Assets ($): | | | | |
| Beginning of Period | | 247,971,509 | | 194,772,221 |
| End of Period | | 211,449,833 | | 247,971,509 |
| Undistributed investment income—net | | 329 | | — |
| | | Year Ended August 31, |
| |
|
| | | 2005 | | 2004 |
| |
| |
|
| Capital Share Transactions: | | | | |
| Class A a | | | | |
| Shares sold | | 1,870,219 | | 2,869,175 |
| Shares issued in connection | | | | |
| with reorganization—Note 1 | | — | | 904,503 |
| Shares redeemed | | (2,769,979) | | (1,566,368) |
| Net Increase (Decrease) in Shares Outstanding | | (899,760) | | 2,207,310 |
| |
| |
|
| Class B a | | | | |
| Shares sold | | 118,103 | | 475,846 |
| Shares issued in connection | | | | |
| with reorganization—Note 1 | | — | | 394,591 |
| Shares redeemed | | (470,502) | | (398,945) |
| Net Increase (Decrease) in Shares Outstanding | | (352,399) | | 471,492 |
| |
| |
|
| Class C | | | | |
| Shares sold | | 330,408 | | 505,394 |
| Shares issued in connection | | | | |
| with reorganization—Note 1 | | — | | 605,601 |
| Shares redeemed | | (382,599) | | (321,752) |
| Net Increase (Decrease) in Shares Outstanding | | (52,191) | | 789,243 |
| |
| |
|
| Class R | | | | |
| Shares sold | | 453,382 | | 1,441,608 |
| Shares issued in connection | | | | |
| with reorganization—Note 1 | | — | | 665,606 |
| Shares redeemed | | (4,058,511) | | (2,855,961) |
| Net Increase (Decrease) in Shares Outstanding | | (3,605,129) | | (748,747) |
| |
| |
|
| Class T | | | | |
| Shares sold | | 34,390 | | 36,152 |
| Shares redeemed | | (23,184) | | (12,797) |
| Net Increase (Decrease) in Shares Outstanding | | 11,206 | | 23,355 |
| |
| a During the period ended August 31, 2005, 41,724 Class B shares representing $749,997 were automatically |
| converted to 40,309 Class A shares and during the period ended August 31, 2004, 13,886 Class B shares |
| representing $224,669 were automatically converted to 13,500 Class A shares. | | |
| See notes to financial statements. | | | | |
The following tables describe the performance for each share class for the fiscal periods indicated.All information (except portfolio turnover rate) reflects financial results for a single fund share.Total return shows how much your investment in the fund would have increased (or decreased) during each period, assuming you had reinvested all dividends and distributions.These figures have been derived from the fund’s financial statements.
| | | | | | | Year Ended August 31, | | |
| | | |
| |
| |
|
| Class A Shares | | 2005 | | 2004 | | 2003 | | 2002 | | 2001 |
| |
| |
| |
| |
| |
|
| Per Share Data ($): | | | | | | | | | | |
| Net asset value, beginning of period | | 15.97 | | 15.18 | | 12.45 | | 14.65 | | 14.32 |
| Investment Operations: | | | | | | | | | | |
| Investment (loss)—net a | | (.12) | | (.15) | | (.12) | | (.10) | | (.01) |
| Net realized and unrealized | | | | | | | | | | |
| gain (loss) on investments | | 4.16 | | .94 | | 2.85 | | (2.10) | | .34 |
| Total from Investment Operations | | 4.04 | | .79 | | 2.73 | | (2.20) | | .33 |
| Net asset value, end of period | | 20.01 | | 15.97 | | 15.18 | | 12.45 | | 14.65 |
| |
| |
| |
| |
| |
|
| Total Return (%) b | | 25.22 | | 5.27 | | 21.93 | | (15.02) | | 2.30 |
| |
| |
| |
| |
| |
|
| Ratios/Supplemental Data (%): | | | | | | | | | | |
| Ratio of total expenses | | | | | | | | | | |
| to average net assets | | 1.46 | | 1.42 | | 1.50 | | 1.43 | | 1.83 |
| Ratio of net expenses | | | | | | | | | | |
| to average net assets | | 1.39 | | 1.42 | | 1.50 | | 1.43 | | 1.63 |
| Ratio of net investment (loss) | | | | | | | | | | |
| to average net assets | | (.62) | | (.92) | | (.96) | | (.66) | | (.70) |
| Portfolio Turnover Rate | | 65.30 | | 126.92 | | 105.65 | | 100.38 | | 247.87 |
| |
| |
| |
| |
| |
|
| Net Assets, end of period ($ x 1,000) | | 98,348 | | 92,873 | | 54,761 | | 38,350 | | 16,379 |
| |
| a | | Based on average shares outstanding at each month end. | | | | | | | | |
| b | | Exclusive of sales charge. | | | | | | | | | | |
| See notes to financial statements. | | | | | | | | | | |
| | | | | | | Year Ended August 31, | | |
| | | |
| |
| |
|
| Class B Shares | | 2005 | | 2004 | | 2003 | | 2002 | | 2001 |
| |
| |
| |
| |
| |
|
| Per Share Data ($): | | | | | | | | | | |
| Net asset value, beginning of period | | 15.48 | | 14.82 | | 12.25 | | 14.52 | | 14.30 |
| Investment Operations: | | | | | | | | | | |
| Investment (loss)—net a | | (.24) | | (.27) | | (.21) | | (.21) | | (.02) |
| Net realized and unrealized | | | | | | | | | | |
| gain (loss) on investments | | 4.03 | | .93 | | 2.78 | | (2.06) | | .24 |
| Total from Investment Operations | | 3.79 | | .66 | | 2.57 | | (2.27) | | .22 |
| Net asset value, end of period | | 19.27 | | 15.48 | | 14.82 | | 12.25 | | 14.52 |
| |
| |
| |
| |
| |
|
| Total Return (%) b | | 24.48 | | 4.45 | | 20.98 | | (15.63) | | 1.54 |
| |
| |
| |
| |
| |
|
| Ratios/Supplemental Data (%): | | | | | | | | | | |
| Ratio of total expenses | | | | | | | | | | |
| to average net assets | | 2.17 | | 2.17 | | 2.25 | | 2.19 | | 2.58 |
| Ratio of net expenses | | | | | | | | | | |
| to average net assets | | 2.10 | | 2.17 | | 2.25 | | 2.19 | | 2.37 |
| Ratio of net investment (loss) | | | | | | | | | | |
| to average net assets | | (1.33) | | (1.68) | | (1.71) | | (1.43) | | (1.41) |
| Portfolio Turnover Rate | | 65.30 | | 126.92 | | 105.65 | | 100.38 | | 247.87 |
| |
| |
| |
| |
| |
|
| Net Assets, end of period ($ x 1,000) | | 44,218 | | 40,985 | | 32,247 | | 27,898 | | 16,648 |
| |
| a | | Based on average shares outstanding at each month end. | | | | | | | | |
| b | | Exclusive of sales charge. | | | | | | | | | | |
| See notes to financial statements. | | | | | | | | | | |
| | FINANCIAL HIGHLIGHTS (continued)
|
| | | | | | | Year Ended August 31, | | |
| | | |
| |
| |
|
| Class C Shares | | 2005 | | 2004 | | 2003 | | 2002 | | 2001 |
| |
| |
| |
| |
| |
|
| Per Share Data ($): | | | | | | | | | | |
| Net asset value, beginning of period | | 15.51 | | 14.84 | | 12.26 | | 14.53 | | 14.30 |
| Investment Operations: | | | | | | | | | | |
| Investment (loss)—net a | | (.23) | | (.26) | | (.21) | | (.21) | | (.02) |
| Net realized and unrealized | | | | | | | | | | |
| gain (loss) on investments | | 4.02 | | .93 | | 2.79 | | (2.06) | | .25 |
| Total from Investment Operations | | 3.79 | | .67 | | 2.58 | | (2.27) | | .23 |
| Net asset value, end of period | | 19.30 | | 15.51 | | 14.84 | | 12.26 | | 14.53 |
| |
| |
| |
| |
| |
|
| Total Return (%) b | | 24.44 | | 4.51 | | 21.04 | | (15.62) | | 1.61 |
| |
| |
| |
| |
| |
|
| Ratios/Supplemental Data (%): | | | | | | | | | | |
| Ratio of total expenses | | | | | | | | | | |
| to average net assets | | 2.13 | | 2.13 | | 2.26 | | 2.19 | | 2.69 |
| Ratio of net expenses | | | | | | | | | | |
| to average net assets | | 2.05 | | 2.13 | | 2.26 | | 2.19 | | 2.37 |
| Ratio of net investment (loss) | | | | | | | | | | |
| to average net assets | | (1.28) | | (1.62) | | (1.72) | | (1.43) | | (1.41) |
| Portfolio Turnover Rate | | 65.30 | | 126.92 | | 105.65 | | 100.38 | | 247.87 |
| |
| |
| |
| |
| |
|
| Net Assets, end of period ($ x 1,000) | | 34,685 | | 28,674 | | 15,730 | | 12,918 | | 4,353 |
| |
| a | | Based on average shares outstanding at each month end. | | | | | | | | |
| b | | Exclusive of sales charge. | | | | | | | | | | |
| See notes to financial statements. | | | | | | | | | | |
| | | | | | | Year Ended August 31, | | |
| | | |
| |
| |
|
| Class R Shares | | 2005 | | 2004 | | 2003 | | 2002 | | 2001 |
| |
| |
| |
| |
| |
|
| Per Share Data ($): | | | | | | | | | | |
| Net asset value, beginning of period | | 16.21 | | 15.34 | | 12.53 | | 14.69 | | 14.32 |
| Investment Operations: | | | | | | | | | | |
| Investment (loss)—net a | | (.03) | | (.09) | | (.07) | | (.05) | | (.00)b |
| Net realized and unrealized | | | | | | | | | | |
| gain (loss) on investments | | 4.22 | | .96 | | 2.88 | | (2.11) | | .37 |
| Total from Investment Operations | | 4.19 | | .87 | | 2.81 | | (2.16) | | .37 |
| Net asset value, end of period | | 20.40 | | 16.21 | | 15.34 | | 12.53 | | 14.69 |
| |
| |
| |
| |
| |
|
| Total Return (%) | | 25.85 | | 5.67 | | 22.42 | | (14.70) | | 2.58 |
| |
| |
| |
| |
| |
|
| Ratios/Supplemental Data (%): | | | | | | | | | | |
| Ratio of total expenses | | | | | | | | | | |
| to average net assets | | 1.06 | | 1.04 | | 1.12 | | 1.10 | | 1.36 |
| Ratio of net expenses | | | | | | | | | | |
| to average net assets | | 1.01 | | 1.04 | | 1.12 | | 1.10 | | 1.26 |
| Ratio of net investment | | | | | | | | | | |
| (loss) to average net assets | | (.19) | | (.55) | | (.58) | | (.32) | | (.21) |
| Portfolio Turnover Rate | | 65.30 | | 126.92 | | 105.65 | | 100.38 | | 247.87 |
| |
| |
| |
| |
| |
|
| Net Assets, end of period ($ x 1,000) | | 32,646 | | 84,373 | | 91,367 | | 77,506 | | 46,409 |
| |
| a | | Based on average shares outstanding at each month end. | | | | | | | | |
| b | | Amount represents less than $.01 per share. | | | | | | | | |
| See notes to financial statements. | | | | | | | | | | |
| | FINANCIAL HIGHLIGHTS (continued)
|
| | | | | | | Year Ended August 31, | | |
| | | |
| |
| |
|
| Class T Shares | | 2005 | | 2004 | | 2003 | | 2002 | | 2001 |
| |
| |
| |
| |
| |
|
| Per Share Data ($): | | | | | | | | | | |
| Net asset value, beginning of period | | 15.75 | | 15.04 | | 12.39 | | 14.63 | | 14.32 |
| Investment Operations: | | | | | | | | | | |
| Investment (loss)—net a | | (.17) | | (.23) | | (.18) | | (.15) | | (.01) |
| Net realized and unrealized | | | | | | | | | | |
| gain (loss) on investments | | 4.10 | | .94 | | 2.83 | | (2.09) | | .32 |
| Total from Investment Operations | | 3.93 | | .71 | | 2.65 | | (2.24) | | .31 |
| Net asset value, end of period | | 19.68 | | 15.75 | | 15.04 | | 12.39 | | 14.63 |
| |
| |
| |
| |
| |
|
| Total Return (%) b | | 24.95 | | 4.72 | | 21.39 | | (15.31) | | 2.16 |
| |
| |
| |
| |
| |
|
| Ratios/Supplemental Data (%): | | | | | | | | | | |
| Ratio of total expenses | | | | | | | | | | |
| to average net assets | | 1.78 | | 1.90 | | 1.96 | | 1.79 | | 2.53 |
| Ratio of net expenses | | | | | | | | | | |
| to average net assets | | 1.70 | | 1.90 | | 1.96 | | 1.79 | | 1.86 |
| Ratio of net investment (loss) | | | | | | | | | | |
| to average net assets | | (.92) | | (1.40) | | (1.43) | | (1.02) | | (.90) |
| Portfolio Turnover Rate | | 65.30 | | 126.92 | | 105.65 | | 100.38 | | 247.87 |
| |
| |
| |
| |
| |
|
| Net Assets, end of period ($ x 1,000) | | 1,552 | | 1,066 | | 667 | | 441 | | 289 |
| |
| a | | Based on average shares outstanding at each month end. | | | | | | | | |
| b | | Exclusive of sales charge. | | | | | | | | | | |
| See notes to financial statements. | | | | | | | | | | |
NOTES TO FINANCIAL STATEMENTS
NOTE 1—Significant Accounting Policies:
Dreyfus Premier Future Leaders Fund (the “fund”) is a separate diversified series of Dreyfus Growth and Value Funds, Inc. (the “Company”) which is registered under the Investment Company Act of 1940, as amended (the “Act”), as an open-end management investment company and operates as a series company that offers twelve series, including the fund. The fund’s investment objective is capital growth. The Dreyfus Corporation (the “Manager” or “Dreyfus”) serves as the fund’s investment adviser. The Manager is a wholly-owned subsidiary of Mellon Financial Corporation (“Mellon Financial”).
Dreyfus Service Corporation (the “Distributor”), a wholly-owned subsidiary of the Manager, is the distributor of the fund’s shares.The fund is authorized to issue 500 million shares of $.001 par value Common Stock.The fund currently offers five classes of shares: Class A (100 million shares authorized), Class B (100 million shares authorized), Class C (100 million shares authorized), Class R (100 million shares authorized) and Class T (100 million shares authorized). Class A and Class T shares are subject to a sales charge imposed at the time of purchase. Class B shares are subject to a contingent deferred sales charge (“CDSC”) imposed on Class B share redemptions made within six years of purchase and automatically convert to Class A shares after six years. Class C shares are subject to a CDSC imposed on Class C shares redeemed within one year of purchase and Class R shares are sold at net asset value per share only to institutional investors. Other differences between the classes include the services offered to and the expenses borne by each class and certain voting rights. Income, expenses (other than expenses attributable to a specific class), and realized and unrealized gains or losses on investments are allocated to each class of shares based on its relative net assets.
On April 30, 2004, pursuant to an Agreement and Plan of Reorganization previously approved by the fund’s shareholders, all of the assets, subject to the liabilities, of Bear Stearns Small Cap Value Portfolio, were transferred to the fund in exchange for shares of Common Stock
| | NOTES TO FINANCIAL STATEMENTS (continued)
|
of the fund of equal value. Shareholders of Class A, Class B, Class C and Class Y shares of Bear Stearns Small Cap Value Portfolio received Class A, Class B,Class C and Class R shares,respectively,of the fund,in each case, in an amount equal to the aggregate net asset value of their respective investment in Bear Stearns Small Cap Value Portfolio at the time of the exchange.The fund’s net asset value on April 30, 2004 was $16.61 per share for Class A shares, $16.13 per share for Class B shares, $16.16 per share for Class C shares and $16.83 per share for Class R shares and a total of 904,503 Class A shares, 394,591 Class B shares, 605,601 Class C shares and 665,606 Class R shares, representing net assets of $15,022,241 Class A shares, $6,364,220 Class B shares, $9,786,450 Class C shares and $11,199,591 Class R shares (including $9,808,410 net unrealized appreciation on investments), were issued to the shareholders of Bear Stearns Small Cap Value Portfolio in the exchange.The exchange was a tax free event to shareholders.
As of August 31, 2005, MBC Investment Corp., an indirect subsidiary of Mellon Financial, held 5,096 shares of Class T.
The Company accounts separately for the assets, liabilities and operations of each series. Expenses directly attributable to each series are charged to that series’ operations; expenses which are applicable to all series are allocated among them on a pro rata basis.
The fund’s financial statements are prepared in accordance with U.S. generally accepted accounting principles, which may require the use of management estimates and assumptions. Actual results could differ from those estimates.
The fund enters into contracts that contain a variety of indemnifications. The fund’s maximum exposure under these arrangements is unknown.The fund does not anticipate recognizing any loss related to these arrangements.
(a) Portfolio valuation: Investments in securities are valued at the last sales price on the securities exchange or national securities market on which such securities are primarily traded. Securities listed on
the National Market System for which market quotations are available are valued at the official closing price or, if there is no official closing price that day, at the last sales price. Securities not listed on an exchange or the national securities market, or securities for which there were no transactions, are valued at the average of the most recent bid and asked prices, except for open short positions, where the asked price is used for valuation purposes. Bid price is used when no asked price is available. Investments in registered investment companies are valued at their net asset value.When market quotations or official closing prices are not readily available, or are determined not to reflect accurately fair value, such as when the value of a security has been significantly affected by events after the close of the exchange or market on which the security is principally traded (for example, a foreign exchange or market), but before the fund calculates its net asset value, the fund may value these investments at fair value as determined in accordance with the procedures approved by the Board of Directors. Fair valuing of securities may be determined with the assistance of a pricing service using calculations based on indices of domestic securities and other appropriate indicators, such as prices of relevant ADR’s and futures contracts. For other securities that are fair valued by the Board of Directors, certain factors may be considered such as: fundamental analytical data, the nature and duration of restrictions on disposition, an evaluation of the forces that influence the market in which the securities are purchased and sold and public trading in similar securities of the issuer or comparable issuers. Financial futures are valued at the last sales price.
(b) Securities transactions and investment income: Securities transactions are recorded on a trade date basis. Realized gain and loss from securities transactions are recorded on the identified cost basis. Dividend income is recognized on the ex-dividend date and interest income, including, where applicable, accretion of discount and amortization of premium on investments, is recognized on the accrual basis.
| | NOTES TO FINANCIAL STATEMENTS (continued)
|
The fund has an arrangement with the custodian bank whereby the fund receives earnings credits from the custodian when positive cash balances are maintained, which are used to offset custody fees. For financial reporting purposes, the fund includes net earnings credits as an expense offset in the Statement of Operations.
Pursuant to a securities lending agreement with Mellon Bank, N.A., an affiliate of the Manager, the fund may lend securities to qualified institutions.At origination, all loans are secured by collateral of at least 102% of the value of U.S. securities loaned and 105% of the value of foreign securities loaned. Collateral equivalent to at least 100% of the market value of securities on loan will be maintained at all times. Cash collateral is invested in certain money market mutual funds managed by the Manager. The fund will be entitled to receive all income on securities loaned, in addition to income earned as a result of the lending transaction. Although each security loaned is fully collateralized, the fund would bear the risk of delay in recovery of, or loss of rights in, the securities loaned should a borrower fail to return the securities in a timely manner.
(c) Affiliated issuers: Investments in other investment companies advised by the Manager are defined as “affiliated” in the Act.
(d) Dividends to shareholders: Dividends are recorded on the ex-dividend date. Dividends from investment income-net and dividends from net realized capital gain, if any, are normally declared and paid annually, but the fund may make distributions on a more frequent basis to comply with the distribution requirements of the Internal Revenue Code of 1986, as amended (the “Code”).To the extent that net realized capital gain can be offset by capital loss carryovers, if any, it is the policy of the fund not to distribute such gain. Income and capital gain distributions are determined in accordance with income tax regulations, which may differ from U.S. generally accepted accounting principles.
(e) Federal income taxes: It is the policy of the fund to continue to qualify as a regulated investment company, if such qualification is in the best interests of its shareholders, by complying with the applicable pro-
visions of the Code, and to make distributions of taxable income sufficient to relieve it from substantially all federal income and excise taxes.
At August 31, 2005, the components of accumulated earnings on a tax basis were as follows: undistributed capital gains $28,536,187 and unrealized appreciation $49,451,671.
During the period ended August 31, 2005, as a result of permanent book to tax differences, primarily due to the tax treatment for net operating losses, the fund increased accumulated undistributed investment income-net by $1,779,100 and decreased paid-in capital by the same amount. Net assets were not affected by this reclassification.
| | NOTE 2—Bank Line of Credit:
|
The fund participates with other Dreyfus-managed funds in a $100 million unsecured line of credit primarily to be utilized for temporary or emergency purposes, including the financing of redemptions. Interest is charged to the fund based on prevailing market rates in effect at the time of borrowings.
The average daily amount of borrowings outstanding under the line of credit during the period ended August 31, 2005 was approximately $11,500, with a related weighted average annualized interest rate of 3.12% .
NOTE 3—Management Fee and Other Transactions With
Affiliates:
|
(a) Pursuant to a management agreement with the Manager, the management fee is computed at the annual rate of .90% of the value of the fund’s average daily net assets and is payable monthly.The Manager has undertaken from March 16, 2005 through March 31, 2006 that, if the fund’s aggregate expenses, exclusive of taxes, brokerage fees, interest on borrowings, Rule 12b-1 distribution plan fees, shareholder services plan fees and extraordinary expenses, exceed an annual rate of 1% of the value of the fund’s average daily net assets, the fund may deduct
| | NOTES TO FINANCIAL STATEMENTS (continued)
|
from the payment to be made to the Manager under the Agreement, or the Manager will bear, such excess expenses.The reduction in the management fee, pursuant to the undertaking, amounted to $163,418 during the period ended August 31, 2005.
During the period ended August 31, 2005, the Distributor retained $18,409 and $205 from commissions earned on sales of the fund’s Class A and Class T shares, respectively, and $110,625 and $7,253 from contingent deferred sales charges on redemptions of the fund’s Class B and Class C shares, respectively.
(b) Under the Distribution Plan (the “Plan”) adopted pursuant to Rule 12b-1 under the Act, Class B, Class C and Class T shares pay the Distributor for distributing their shares at an annual rate of .75% of the value of the average daily net assets of Class B and Class C shares, respectively, and .25% of the value of the average daily net assets of Class T shares. During the period ended August 31, 2005, Class B, Class C and Class T shares were charged $330,450,$241,440 and $3,311,respectively, pursuant to the Plan.
(c) Under the Shareholder Services Plan, Class A, Class B, Class C and Class T shares pay the Distributor at an annual rate of .25% of the value of their average daily net assets for the provision of certain services. The services provided may include personal services relating to shareholder accounts, such as answering shareholder inquiries regarding the fund and providing reports and other information, and services related to the maintenance of shareholder accounts. The Distributor may make payments to Service Agents (a securities dealer, financial institution or industry professional) in respect of these services. The Distributor determines the amounts to be paid to Service Agents. During the period ended August 31, 2005 Class A, Class B, Class C and Class T shares were charged $259,935, $110,150, $80,480 and $3,311, respectively, pursuant to the Shareholder Services Plan.
The fund compensates Dreyfus Transfer, Inc., a wholly-owned subsidiary of the Manager, under a transfer agency agreement for providing personnel and facilities to perform transfer agency services for the fund.
During the period ended August 31, 2005, the fund was charged $225,613 pursuant to the transfer agency agreement.
The fund compensates Mellon Bank, N.A., an affiliate of the Manager, under a custody agreement for providing custodial services for the fund. During the period ended August 31, 2005, the fund was charged $20,451 pursuant to the custody agreement.
During the period ended August 31, 2005, the fund was charged $2,520 for services performed by the Chief Compliance Officer.
The components of Due to The Dreyfus Corporation and affiliates in the Statement of Assets and Liabilities consist of: management fees $161,033, Rule 12b-1 distribution plan fees $50,169, shareholder services plan fees $37,851, custodian fees $7,061, chief compliance officer fees $1,533 and transfer agency per account fees $35,820, which are offset against an expense reimbursement currently in effect in the amount of $28,735.
(d) Each Board member also serves as a Board member of other funds within the Dreyfus complex. Annual retainer fees and attendance fees are allocated to each fund based on net assets.
(e) Pursuant to an exemptive order from the Securities and Exchange Commission, the fund may invest its available cash balances in affiliated money market mutual funds. Management fees of the underlying money market mutual funds have been waived by the Manager.
NOTE 4—Securities Transactions:
The aggregate amount of purchases and sales of investment securities, excluding short-term securities, during the period ended August 31, 2005, amounted to $154,680,898 and $239,127,606, respectively.
At August 31, 2005, the cost of investments for federal income tax purposes was $174,617,871; accordingly, accumulated net unrealized appre-
| | NOTES TO FINANCIAL STATEMENTS (continued)
|
ciation on investments was $49,451,671, consisting of $55,299,717 gross unrealized appreciation and $5,848,046 gross unrealized depreciation.
In early 2004, two purported class and derivative actions were filed against Mellon Financial, Mellon Bank, N.A., Dreyfus, Founders Asset Management LLC, and certain directors of the Dreyfus Funds and the Dreyfus Founders Funds (together, the “Funds”) in the United States District Court for the Western District of Pennsylvania. In September 2004, plaintiffs served a Consolidated Amended Complaint (the “Amended Complaint”) on behalf of a purported class of all persons who acquired interests in any of the Funds between January 30, 1999 and November 17, 2003, and derivatively on behalf of the Funds.The Amended Complaint in the newly styled In re Dreyfus Mutual Funds Fee Litigation also named the Distributor, Premier Mutual Fund Services, Inc. and two additional Fund directors as defendants and alleges violations of the Investment Company Act of 1940, the Investment Advisers Act of 1940, the Pennsylvania Unfair Trade Practices and Consumer Protection Law and common-law claims. Plaintiffs seek to recover allegedly improper and excessive Rule 12b-1 and advisory fees allegedly charged to the Funds for marketing and distribution services. More specifically, plaintiffs claim, among other things, that 12b-1 fees and directed brokerage were improperly used to pay brokers to recommend the Funds over other funds, and that such payments were not disclosed to investors. In addition, plaintiffs assert that economies of scale and soft-dollar benefits were not passed on to the Funds. Plaintiffs further allege that 12b-1 fees were improperly charged to certain of the Funds that were closed to new investors.The
Amended Complaint seeks compensatory and punitive damages, rescission of the advisory contracts, and an accounting and restitution of any unlawful fees, as well as an award of attorneys’ fees and litigation expenses. As noted, some of the claims in this litigation are asserted derivatively on behalf of the Funds that have been named as nominal defendants. With respect to such derivative claims, no relief is sought against the Funds. Dreyfus believes the allegations to be totally without merit and intends to defend the action vigorously. In November 2004, all named defendants moved to dismiss the Amended Complaint in whole or substantial part. Briefing was completed in May 2005.
Additional lawsuits arising out of these circumstances and presenting similar allegations and requests for relief may be filed against the defendants in the future. Neither Dreyfus nor the Funds believe that any of the pending actions will have a material adverse effect on the Funds or Dreyfus’ ability to perform its contract with the Funds.
| | REPORT OF INDEPENDENT REGISTERED
PUBLIC ACCOUNTING FIRM
|
Shareholders and Board of Directors
Dreyfus Premier Future Leaders Fund
|
We have audited the accompanying statement of assets and liabilities, including the statement of investments, of Dreyfus Premier Future Leaders Fund (one of the funds comprising Dreyfus Growth and Value Funds, Inc.) as of August 31, 2005, and the related statement of operations for the year then ended, the statement of changes in net assets for each of the two years in the period then ended, and financial highlights for each of the years indicated therein.These financial statements and financial highlights are the responsibility of the Fund’s management. Our responsibility is to express an opinion on these financial statements and financial highlights based on our audits.
We conducted our audits in accordance with the standards of the Public Company Accounting Oversight Board (United States).Those standards require that we plan and perform the audit to obtain reasonable assurance about whether the financial statements and financial highlights are free of material misstatement.We were not engaged to perform an audit of the Fund’s internal control over financial reporting.Our audits included consideration of internal control over financial reporting as a basis for designing audit procedures that are appropriate in the circumstances,but not for the purpose of expressing an opinion on the effectiveness of the Fund’s internal control over financial reporting.Accordingly, we express no such opinion.An audit also includes examining, on a test basis, evidence supporting the amounts and disclosures in the financial statements and financial highlights, assessing the accounting principles used and significant estimates made by management, and evaluating the overall financial statement presentation. Our procedures included verification by examination of securities held by the custodian as of August 31, 2005 and confirmation of securities not held by the custodian by correspondence with oth-ers.We believe that our audits provide a reasonable basis for our opinion.
In our opinion, the financial statements and financial highlights referred to above present fairly, in all material respects, the financial position of Dreyfus Premier Future Leaders Fund at August 31, 2005, the results of its operations for the year then ended, the changes in its net assets for each of the two years in the period then ended, and the financial highlights for each of the indicated years, in conformity with U.S. generally accepted accounting principles.

New York, New York
October 14, 2005
|
INFORMATION ABOUT THE REVIEW AND APPROVAL
OF THE FUND’S MANAGEMENT AGREEMENT (Unaudited)
|
At a meeting of the Board of Directors held on March 14, 2005, the Board considered the re-approval for an annual period of the Fund’s Management Agreement, pursuant to which the Manager provides the Fund with investment advisory and administrative services. The Board members, none of whom are “interested persons” (as defined in the Investment Company Act of 1940,as amended) of the Fund,were assisted in their review by independent legal counsel and met with counsel in executive session separate from representatives of the Manager.
Analysis of Nature, Extent and Quality of Services Provided to the Fund. The Board members received a presentation from representatives of the Manager regarding services provided to the Fund and other funds in the Dreyfus fund complex, and discussed the nature, extent and quality of the services provided to the Fund pursuant to its Management Agreement. The presentation included a detailed summary of the services provided to Dreyfus-managed mutual funds by each business unit within the Manager.The Manager’s representatives reviewed the Fund’s distribution of accounts and the relationships the Manager has with various intermediaries and the different needs of each.The Manager’s representatives noted the diversity of distribution of the Fund as well as among the funds in the Dreyfus fund complex, and the Manager’s corresponding need for broad, deep, and diverse resources to be able to provide ongoing shareholder services to each of the Fund’s distribution channels.The Board also reviewed the number of shareholder accounts in the Fund, as well as the Fund’s asset size.
The Board members also considered the Manager’s research and portfolio management capabilities and that the Manager also provides oversight of day-to-day Fund operations, including fund accounting and administration and assistance in meeting legal and regulatory requirements. The Board members also considered the Manager’s extensive administrative, accounting and compliance infrastructure.
Comparative Analysis of the Fund’s Performance and Management Fee and Expense Ratio. The Board members reviewed the Fund’s performance, management fee and expense ratios and placed significant emphasis on comparisons to a group of comparable funds and Lipper
| | I N FO R M AT I O N A B O U T T H E R E V I E W A N D A P P R OVA L O F
T H E F U N D ’ S M A N A G E M E N T A G R E E M E N T ( U n a u d i t e d ) ( c o n t i n u e d )
|
category averages, as applicable.The group of comparable funds was previously approved by the Board for this purpose, and was prepared using a Board-approved selection methodology that was based, in part, on selecting non-affiliated funds reported in the same Lipper category as the fund.The Board members discussed the results of the comparisons for various periods ended January 31, 2005, and noted that the Fund’s performance was lower than the comparison group and Lipper category averages for the 1-year and 3-year periods. The Board discussed with representatives of the Manager the reasons for the Fund’s underperfor-mance compared to the comparison group and Lipper category for the 1- and 3-year periods, and the Manager’s efforts to improve perfor-mance.The Board members also discussed the Fund’s management fee and expense ratio and reviewed the range of management fees and expense ratios for the funds in the comparison group.The Fund’s management fee ranked in the lower half (i.e., higher than most others) of the comparison group funds. The Board noted that the Fund’s total expense ratio was lower than the Lipper category average, but was higher than the Fund’s comparison group average.After discussions with the Board, the Manager undertook, effective March 16, 2005, to waive its fees or reimburse certain Fund expenses until March 31, 2006, if total Fund operating expenses (other than certain expenses) exceed 1% of the value of the Fund’s average daily net assets.
Representatives of the Manager reviewed with the Board members the fees paid to the Manager or its affiliates by mutual funds managed by the Manager or its affiliates with similar investment objectives, policies and strategies as the Fund (the “Similar Funds”), and by other accounts managed or sub-advised by the Manager or its affiliates with similar investment objectives, policies and strategies as the Fund (the “Separate Accounts” and, collectively with the Similar Funds, the “Similar Accounts”). The Manager’s representatives explained the nature of the Similar Accounts and the differences, from the Manager’s perspective, in management of the Similar Accounts as compared to managing and providing services to the Fund; it was noted that the Similar Funds were mutual funds included in the “small cap core” and
“small cap core variable insurance products” funds categories by Lipper. The Manager’s representatives also reviewed the costs associated with distribution through intermediaries.The Board analyzed the differences in fees paid to the Manager and discussed the relationship of the advisory fees paid in light of the Manager’s performance and the services provided; it was noted that the Similar Funds had management fees that were the same as or lower than the fee borne by the Fund. The Board members considered the relevance of the fee information provided for the Similar Accounts managed by the Manager to evaluate the appropriateness and reasonableness of the Fund’s advisory fees. The Board acknowledged that differences in fees paid by the Similar Accounts seemed to be consistent with the services provided.
Analysis of Profitability and Economies of Scale. The Manager’s representatives reviewed the dollar amount of expenses allocated and profit received by the Manager and the method used to determine such expenses and profit.The Board received and considered information prepared by an independent consulting firm regarding the Manager’s approach to allocating costs to, and determining the profitability of, individual funds and the entire Dreyfus fund complex.The Manager’s representatives stated that the methodology had also been reviewed by an independent registered public accounting firm which, like the consultant, found the methodology to be reasonable.The consulting firm also analyzed where any economies of scale might emerge in connection with the management of the Fund.The Board members evaluated the analysis in light of the relevant circumstances for the Fund, and the extent to which economies of scale would be realized as the Fund grows and whether fee levels reflect these economies of scale for the benefit of Fund investors. The Board noted that it appeared that the benefits of any economies of scale also would be appropriately shared with shareholders through increased investment in fund management and administration resources. The Board members also considered potential benefits to the Manager from acting as investment adviser and reviewed the soft dollar arrangements with respect to trading the Fund’s portfolio.
| | I N FO R M AT I O N A B O U T T H E R E V I E W A N D A P P R OVA L O F
T H E F U N D ’ S M A N A G E M E N T A G R E E M E N T ( U n a u d i t e d ) ( c o n t i n u e d )
|
It was noted that the Board members should consider the Manager’s profitability with respect to the Fund as part of their evaluation of whether the fee under the Management Agreement bears a reasonable relationship to the mix of services provided by the Manager, including the nature, extent and quality of such services and that a discussion of economies of scale is predicated on increasing assets and that, if a fund’s assets had been decreasing, the possibility that the Manager may have realized any economies of scale would be less.The Board members also discussed the profitability percentage ranges determined by appropriate court cases to be reasonable given the services rendered to investment companies. It was noted that the profitability percentage for managing the Fund was not unreasonable given the Fund’s overall performance and generally superior service levels provided.
At the conclusion of these discussions, each of the Directors expressed the opinion that he or she had been furnished with sufficient information to make an informed business decision with respect to continuation of the Fund’s Management Agreement. Based on their discussions and considerations as described above, the Board made the following conclusions and determinations.
- The Board concluded that the nature, extent and quality of the ser- vices provided by the Manager are adequate and appropriate.
- The Board expressed concern over the performance of the Fund, but was satisfied with the Manager’s efforts to improve such performance, noting that the Manager has undertaken to limit the Fund’s expenses as described above.
- The Board concluded that the fee paid to the Manager by the Fund was reasonable in light of comparative performance and expense and advisory fee information, including the Manager’s undertaking to waive or reimburse certain fees and expenses of the Fund, costs of the services provided and profits to be realized and benefits derived or to be derived by the Manager from its relationship with the Fund.
- The Board determined that the economies of scale which may accrue to the Manager and its affiliates in connection with the management of the Fund had been adequately considered by the Manager in connection with the management fee rate charged to the Fund, and that, to the extent in the future it were to be deter- mined that material economies of scale had not been shared with the Fund, the Board would seek to have those economies of scale shared with the Fund.
The Board members considered these conclusions and determinations, along with the information received on a routine and regular basis throughout the year, and, without any one factor being dispositive, the Board determined that re-approval of the Fund’s Management Agreement was in the best interests of the Fund and its shareholders.
BOARD MEMBERS INFORMATION (Unaudited)
Joseph S. DiMartino (61)
Chairman of the Board (1995)
|
| Principal Occupation During Past 5 Years: |
| • Corporate Director and Trustee |
Other Board Memberships and Affiliations:
|
- The Muscular Dystrophy Association, Director
- Levcor International, Inc., an apparel fabric processor, Director
- Century Business Services, Inc., a provider of outsourcing functions for small and medium size companies, Director
- The Newark Group, a provider of a national market of paper recovery facilities, paperboard mills and paperboard converting plants, Director
- Azimuth Trust, an institutional asset management firm, Member of Board of Managers and Advisory Board
- Sunair Electronics, Inc., engages in the design, manufacture and sale of high frequency systems for long-range voice and data communications, as well as providing certain outdoor-related services to homes and businesses, Director
No. of Portfolios for which Board Member Serves: 193
David P. Feldman (65)
Board Member (1996)
|
| Principal Occupation During Past 5 Years: |
| • Corporate Director & Trustee |
Other Board Memberships and Affiliations:
|
- BBH Mutual Funds Group (11 funds), Director
- The Jeffrey Company, a private investment company, Director
- QMED, a medical device company, Director
No. of Portfolios for which Board Member Serves: 58
Ehud Houminer (65) Board Member (1993)
———————
Principal Occupation During Past 5 Years:
|
- Executive-in-Residence at the Columbia Business School, Columbia University
- Principal of Lear,Yavitz and Associates, a management consulting firm (1996 to 2001)
Other Board Memberships and Affiliations:
|
- Avnet Inc., an electronics distributor, Director
- International Advisory Board to the MBA Program School of Management, Ben Gurion University, Chairman
- Explore Charter School, Brooklyn, NY, Chairman
No. of Portfolios for which Board Member Serves: 36
|
| | Gloria Messinger (75)
Board Member (1993)
|
| | Principal Occupation During Past 5 Years:
|
- Arbitrator for American Arbitration Association and National Association of Securities Dealers, Inc.
- Consultant in Intellectual Property
| | Other Board Memberships and Affiliations:
|
- Yale Law School Fund, Director
- Theater for a New Audience, Inc., Director
- Brooklyn Philharmonic, Director
- New York Women’s Agenda Music Performance Trust Fund, Director
| | No. of Portfolios for which Board Member Serves: 25
|
T. John Szarkowski (79) Board Member (1996)
| Principal Occupation During Past 5 Years: |
| • Consultant in Photography |
Other Board Memberships and Affiliations:
• Photography Department at The Museum of Modern Art, Director Emeritus
| | No. of Portfolios for which Board Member Serves: 25
|
| | Anne Wexler (75)
Board Member (1996)
|
| | Principal Occupation During Past 5 Years:
|
- Chairman of the Wexler & Walker Public Policy Associates, consultants specializing in government relations and public affairs
| | Other Board Memberships and Affiliations:
|
- Wilshire Mutual Funds (5 funds), Director
- Methanex Corporation, a methanol producing company, Director
- Member of the Council of Foreign Relations
- Member of the National Park Foundation
| | No. of Portfolios for which Board Member Serves: 36
|
Once elected all Board Members serve for an indefinite term.The address of the Board Members and Officers is in c/o The Dreyfus Corporation, 200 Park Avenue, New York, New York 10166. Additional information about the Board Members is available in the fund’s Statement of Additional Information which can be obtained from Dreyfus free of charge by calling this toll free number: 1-800-554-4611.
John M. Fraser, Jr., Emeritus Board Member
OFFICERS OF THE FUND (Unaudited)
| STEPHEN E. CANTER, President since | | JAMES BITETTO, Vice President and |
| March 2000. | | Assistant Secretary since August 2005. |
| Chairman of the Board, Chief Executive | | Assistant General Counsel and Assistant |
| Officer and Chief Operating Officer of the | | Secretary of the Manager, and an officer of 91 |
| Manager, and an officer of 90 investment | | investment companies (comprised of 200 |
| companies (comprised of 184 portfolios) | | portfolios) managed by the Manager. He is 39 |
| managed by the Manager. Mr. Canter also is a | | years old and has been an employee of the |
| Board member and, where applicable, an | | Manager since December 1996. |
| |
| Executive Committee Member of the other | | JONI LACKS CHARATAN, Vice President |
| investment management subsidiaries of Mellon | | and Assistant Secretary since |
| Financial Corporation, each of which is an | | August 2005. |
| affiliate of the Manager. He is 60 years old and | | |
| has been an employee of the Manager since | | Assistant General Counsel and Assistant |
| May 1995. | | Secretary of the Manager, and an officer of 91 |
| | | investment companies (comprised of 200 |
| STEPHEN R. BYERS, Executive Vice | | portfolios) managed by the Manager. She is 49 |
| President since November 2002. | | years old and has been an employee of the |
| Chief Investment Officer,Vice Chairman and a | | Manager since October 1998. |
| |
| director of the Manager, and an officer of 90 | | JOSEPH M. CHIOFFI, Vice President and |
| investment companies (comprised of 184 | | Assistant Secretary since August 2005. |
| portfolios) managed by the Manager. Mr. Byers | | |
| also is an officer, director or an Executive | | Assistant General Counsel and Assistant |
| Committee Member of certain other | | Secretary of the Manager, and an officer of 91 |
| investment management subsidiaries of Mellon | | investment companies (comprised of 200 |
| Financial Corporation, each of which is an | | portfolios) managed by the Manager. He is 43 |
| affiliate of the Manager. He is 52 years old and | | years old and has been an employee of the |
| has been an employee of the Manager since | | Manager since July 2000. |
| January 2000. | | JANETTE E. FARRAGHER, Vice President |
| MARK N. JACOBS, Vice President since | | and Assistant Secretary since |
| March 2000. | | August 2005. |
| Executive Vice President, Secretary and | | Associate General Counsel of the Manager, |
| General Counsel of the Manager, and an | | and an officer of 91 investment companies |
| officer of 91 investment companies (comprised | | (comprised of 200 portfolios) managed by the |
| of 200 portfolios) managed by the Manager. | | Manager. She is 42 years old and has been an |
| He is 59 years old and has been an employee | | employee of the Manager since February 1984. |
| of the Manager since June 1977. | | JOHN B. HAMMALIAN, Vice President and |
| MICHAEL A. ROSENBERG, Vice President | | Assistant Secretary since August 2005. |
| and Secretary since August 2005. | | Associate General Counsel of the Manager, |
| Associate General Counsel of the Manager, | | and an officer of 91 investment companies |
| and an officer of 91 investment companies | | (comprised of 200 portfolios) managed by the |
| (comprised of 200 portfolios) managed by the | | Manager. He is 42 years old and has been an |
| Manager. He is 45 years old and has been an | | employee of the Manager since February 1991. |
| employee of the Manager since October 1991. | | |
| ROBERT R. MULLERY, Vice President and | | ROBERT SVAGNA, Assistant Treasurer |
| Assistant Secretary since August 2005. | | since August 2005. |
| Associate General Counsel of the Manager, | | Senior Accounting Manager – Equity Funds of |
| and an officer of 91 investment companies | | the Manager, and an officer of 91 investment |
| (comprised of 200 portfolios) managed by the | | companies (comprised of 200 portfolios) |
| Manager. He is 53 years old and has been an | | managed by the Manager. He is 38 years old |
| employee of the Manager since May 1986. | | and has been an employee of the Manager |
| |
| JEFF PRUSNOFSKY, Vice President and | | since November 1990. |
| Assistant Secretary since August 2005. | | KENNETH J. SANDGREN, Assistant |
| Associate General Counsel of the Manager, | | Treasurer since November 2001. |
| and an officer of 91 investment companies | | Mutual Funds Tax Director of the Manager, |
| (comprised of 200 portfolios) managed by the | | and an officer of 91 investment companies |
| Manager. He is 40 years old and has been an | | (comprised of 200 portfolios) managed by the |
| employee of the Manager since October 1990. | | Manager. He is 51 years old and has been an |
| |
| JAMES WINDELS, Treasurer since | | employee of the Manager since June 1993. |
| November 2001. | | JOSEPH W. CONNOLLY, Chief Compliance |
| Director – Mutual Fund Accounting of the | | Officer since October 2004. |
| Manager, and an officer of 91 investment | | Chief Compliance Officer of the Manager and |
| companies (comprised of 200 portfolios) | | The Dreyfus Family of Funds (91 investment |
| managed by the Manager. He is 46 years old | | companies, comprising 200 portfolios). From |
| and has been an employee of the Manager | | November 2001 through March 2004, Mr. |
| since April 1985. | | Connolly was first Vice-President, Mutual |
| |
| GREGORY S. GRUBER, Assistant | | Fund Servicing for Mellon Global Securities |
| Treasurer since August 2005. | | Services. In that capacity, Mr. Connolly was |
| | | responsible for managing Mellon’s Custody, |
| Senior Accounting Manager – Municipal Bond | | Fund Accounting and Fund Administration |
| Funds of the Manager, and an officer of 91 | | services to third-party mutual fund clients. He |
| investment companies (comprised of 200 | | is 48 years old and has served in various |
| portfolios) managed by the Manager. He is 46 | | capacities with the Manager since 1980, |
| years old and has been an employee of the | | including manager of the firm’s Fund |
| Manager since August 1981. | | Accounting Department from 1997 through |
| ERIK D. NAVILOFF, Assistant Treasurer | | October 2001. |
| since August 2005. | | WILLIAM GERMENIS, Anti-Money |
| Senior Accounting Manager – Taxable Fixed | | Laundering Compliance Officer since |
| Income Funds of the Manager, and an officer | | October 2002. |
| of 91 investment companies (comprised of 200 | | Vice President and Anti-Money Laundering |
| portfolios) managed by the Manager. He is 37 | | Compliance Officer of the Distributor, and the |
| years old and has been an employee of the | | Anti-Money Laundering Compliance Officer |
| Manager since November 1992. | | of 88 investment companies (comprised of 197 |
| ROBERT ROBOL, Assistant Treasurer | | portfolios) managed by the Manager. He is 35 |
| since August 2005. | | years old and has been an employee of the |
| | | Distributor since October 1998. |
| Senior Accounting Manager – Money Market | | |
| Funds of the Manager, and an officer of 91 | | |
| investment companies (comprised of 200 | | |
| portfolios) managed by the Manager. He is 41 | | |
| years old and has been an employee of the | | |
| Manager since October 1988. | | |
| For More | | Information |
| |
|
| |
| Dreyfus Premier | | Transfer Agent & |
| Future Leaders Fund | | Dividend Disbursing Agent |
| 200 Park Avenue | | |
| | | Dreyfus Transfer, Inc. |
| New York, NY 10166 | | |
| | | 200 Park Avenue |
| Manager | | New York, NY 10166 |
| The Dreyfus Corporation | | Distributor |
| 200 Park Avenue | | |
| | | Dreyfus Service Corporation |
| New York, NY 10166 | | |
| | | 200 Park Avenue |
| Custodian | | New York, NY 10166 |
| Mellon Bank, N.A. | | |
| One Mellon Bank Center | | |
| Pittsburgh, PA 15258 | | |
Telephone Call your financial representative or 1-800-554-4611
| Mail | | The Dreyfus Premier Family of Funds |
| | | 144 Glenn Curtiss Boulevard, Uniondale, NY 11556-0144 |
The fund files its complete schedule of portfolio holdings with the Securities and Exchange Commission (“SEC”) for the first and third quarters of each fiscal year on Form N-Q. The fund’s Forms N-Q are available on the SEC’s website at http://www.sec.gov and may be reviewed and copied at the SEC’s Public Reference Room in Washington, DC. Information on the operation of the Public Reference Room may be obtained by calling 1-800-SEC-0330.
A description of the policies and procedures that the fund uses to determine how to vote proxies relating to portfolio securities, and information regarding how the fund voted these proxies for the 12-month period ended June 30, 2005, is available at http://www.dreyfus.com and on the SEC’s website at http://www.sec.gov. The description of the policies and procedures is also available without charge, upon request, by calling 1-800-645-6561.

Save time. Save paper. View your next shareholder report online as soon as it’s available. Log into www.dreyfus.com and sign up for Dreyfus eCommunications. It’s simple and only takes a few minutes.
The views expressed in this report reflect those of the portfolio manager only through the end of the period covered and do not necessarily represent the views of Dreyfus or any other person in the Dreyfus organization. Any such views are subject to change at any time based upon market or other conditions and Dreyfus disclaims any responsibility to update such views.These views may not be relied on as investment advice and, because investment decisions for a Dreyfus fund are based on numerous factors, may not be relied on as an indication of trading intent on behalf of any Dreyfus fund.
Not FDIC-Insured • Not Bank-Guaranteed • May Lose Value
| | | Contents |
| |
| | | THE FUND |
| |
|
| 2 | | Letter from the Chairman |
| 3 | | Discussion of Fund Performance |
| 6 | | Fund Performance |
| 8 | | Understanding Your Fund’s Expenses |
| 8 | | Comparing Your Fund’s Expenses |
| | | With Those of Other Funds |
| 9 | | Statement of Investments |
| 15 | | Statement of Assets and Liabilities |
| 16 | | Statement of Operations |
| 17 | | Statement of Changes in Net Assets |
| 20 | | Financial Highlights |
| 25 | | Notes to Financial Statements |
| 35 | | Report of Independent Registered |
| | | Public Accounting Firm |
| 36 | | Important Tax Information |
| 37 | | Information About the Review and Approval |
| | | of the Fund’s Management Agreement |
| 41 | | Board Members Information |
| 43 | | Officers of the Fund |
| |
| | | FOR MORE INFORMATION |
| |
|
| | | Back Cover |
The Fund
| | Dreyfus Premier
International Value Fund
|

LETTER FROM THE CHAIRMAN
This annual report for Dreyfus Premier International Value Fund covers the 12-month period from September 1, 2004, through August 31, 2005. Inside, you’ll find valuable information about how the fund was managed during the reporting period, including a discussion with the fund’s portfolio manager, D. Kirk Henry.
International stocks generally rose more robustly than U.S. stocks over the past year, with gains achieved in the industrialized markets of Europe and Asia as well as many emerging markets. Stocks were driven higher by solid global economic growth, fueled primarily by consumers in the United States and expanding industrial production in emerging markets such as China.
Recent shocks to the U.S. economy — including sharply higher gasoline prices and other consequences of Hurricane Katrina — have added a degree of uncertainty to the domestic economic outlook, which could affect exports from other countries. However, our economists currently expect the economy to continue to grow without either entering a recession or triggering a significant acceleration of inflation. As always, we encourage you to discuss the potential implications of these and other matters with your financial advisor.
Thank you for your continued confidence and support.


DISCUSSION OF FUND PERFORMANCE
D. Kirk Henry, Portfolio Manager
How did Dreyfus Premier International Value Fund perform
relative to its benchmark?
|
For the 12-month period ended August 31, 2005, the fund produced total returns of 19.65% for its Class A shares, 18.70% for its Class B shares, 18.79% for its Class C shares, 20.11% for its Class R shares and 19.18% for its Class T shares.1 The fund’s benchmark, the Morgan Stanley Capital International Europe, Australasia, Far East Index (“MSCI EAFE Index”), produced a total return of 23.58% for the same period.2
We attribute the international market’s returns to steady global economic growth and improved corporate earnings, which helped bolster investor sentiment in many regions of the world. The fund’s returns trailed the benchmark, chiefly due to its exposure in the materials sector, higher weight in Japan, and technology stock selection.
What is the fund’s investment approach?
The fund seeks long-term capital growth.To pursue this goal, the fund ordinarily invests most of its assets in stocks of foreign issuers that we consider to be value companies.The fund normally invests in companies in at least 10 foreign countries and generally limits its investments in any single company to no more than 5% of its assets at the time of purchase.
The fund’s investment approach is value-oriented and research-driven. When selecting stocks, we attempt to identify potential investments through extensive quantitative and fundamental research. Emphasizing individual stock selection over economic or industry trends, the fund focuses on three key factors:
- Value, or how a stock is priced relative to traditional business per- formance measures;
- Business health, or overall efficiency and profitability as measured by return on assets and return on equity; and
| | DISCUSSION OF FUND PERFORMANCE (continued)
|
- Business momentum, or the presence of a catalyst such as corporate restructuring, management changes or positive earnings surprises that can potentially trigger a price increase in the near- to midterm.
The fund typically sells a stock when it is no longer considered a value company, appears less likely to benefit from the current market and economic environment, shows deteriorating fundamentals or declining momentum or falls short of our expectations.
What other factors influenced the fund’s performance?
Steady global economic growth, rising commodity prices and higher corporate earnings helped international stock markets post generally strong returns over the reporting period’s first half. Europe’s economic recovery gained some momentum, the result of corporate restructuring efforts, which helped boost returns in Germany, France and Italy.The United Kingdom posted more modest gains due to lackluster consumer spending and market volatility following the London terrorist attacks. During the second half of the reporting period, international stock market returns moderated as investors became concerned that corporate earnings and global economic growth might already have peaked.
Some of the fund’s greatest gains stemmed from the emerging markets, which benefited from rising demand for a limited supply of industrial and energy commodities. Not surprisingly, energy stocks benefited from surging oil and gas prices. The fund enjoyed attractive returns from Brazil’s Petrobras. Outside of the emerging markets, the fund received positive contributions from France’s Total, Italy’s ENI and Spanish refiner Repsol YPF. Conversely, Ciba Specialty Chemicals declined due to margin pressure from rising fuel costs.
Corporate restructuring in Germany helped several holdings boost profits, including automobile manufacturer Volkswagen and insurance firm Allianz. In France, information technology firm Thomson, which specializes in the film industry, benefited from the release of new editing software.
In the U.K., greater export activity benefited the fund’s core metals and mining holding, Rio Tinto, while defense contractor BAE Systems
and drug producer GlaxoSmithKline fared well due to a shift in market leadership toward companies with records of consistent earnings growth in a variety of economic conditions.
On the other hand, the fund’s performance was hindered by its overweighted position in Japan, which lagged most other markets during the reporting period. Our stock selection strategy in Japan, which focused on information technology and domestic stocks, also undermined the fund’s relative performance. To a lesser degree, the fund’s limited exposure to metals stocks in Australia, which we regarded as fully valued, also detracted from its relative performance.
What is the fund’s current strategy?
As of the end of the reporting period, we have trimmed positions that have reached our price targets, locking in their gains. In our view, many stocks have become more fully valued in today’s market environment. In markets such as these, patience and discipline are central to our strategy of seeking high-quality companies that may have been overlooked by the market. However, our longer-term outlook for the international stock markets remains positive, and we expect our quantitative and fundamental analyses to help us identify new opportunities as they arise.
| 1 | | Total return includes reinvestment of dividends and any capital gains paid, and does not take into |
| | | consideration the maximum initial sales charges in the case of Class A and Class T shares, or the |
| | | applicable contingent deferred sales charges imposed on redemptions in the case of Class B and |
| | | Class C shares. Had these charges been reflected, returns would have been lower. Past performance |
| | | is no guarantee of future results. Share price, yield and investment return fluctuate such that upon |
| | | redemption, fund shares may be worth more or less than their original cost. Investments in foreign |
| | | securities involve special risks. Please read the prospectus for further discussion of these risks. |
| 2 | | SOURCE: LIPPER INC. — Reflects reinvestment of net dividends and, where applicable, |
| | | capital gain distributions.The Morgan Stanley Capital International Europe, Australasia, Far |
| | | East (MSCI EAFE) Index is an unmanaged index composed of a sample of companies |
| | | representative of the market structure of European and Pacific Basin countries. |

† Source: Lipper Inc.
Past performance is not predictive of future performance.
The above graph compares a $10,000 investment made in Class A shares of Dreyfus Premier International Value Fund on 9/29/95 (inception date) to a $10,000 investment made in the Morgan Stanley Capital International Europe, Australasia, Far East Index (the “Index”) on that date. All dividends and capital gain distributions are reinvested. Performance for Class B, Class C, Class R and Class T shares will vary from the performance of Class A shares shown above due to differences in charges and expenses.
The fund’s performance shown in the line graph takes into account the maximum initial sales charge on Class A shares and all other applicable fees and expenses.The Index is a free float-adjusted market capitalization index that is designed to measure developed market equity performance, excluding the U.S. and Canada.The Index consists of 21 MSCI developed market country indices.The Index does not take into account charges, fees and other expenses. Further information relating to fund performance, including expense reimbursements, if applicable, is contained in the Financial Highlights section of the prospectus and elsewhere in this report.
| Average Annual Total Returns as of 8/31/05 | | | | |
| |
| | | | | Inception | | | | | | From |
| | | | | Date | | 1 Year | | 5 Years | | Inception |
| |
| |
| |
| |
| |
|
| Class A shares | | | | | | | | |
| with maximum sales charge (5.75%) | | 9/29/95 | | 12.79% | | 4.72% | | 7.48% |
| without sales charge | | 9/29/95 | | 19.65% | | 5.96% | | 8.12% |
| Class B shares | | | | | | | | |
| with applicable redemption charge † | | 11/15/02 | | 14.70% | | — | | 19.46% |
| without redemption | | 11/15/02 | | 18.70% | | — | | 20.24% |
| Class C shares | | | | | | | | |
| with applicable redemption charge †† | | 11/15/02 | | 17.79% | | — | | 20.40% |
| without redemption | | 11/15/02 | | 18.79% | | — | | 20.40% |
| Class R shares | | 11/15/02 | | 20.11% | | — | | 21.61% |
| Class T shares | | | | | | | | |
| with applicable sales charge (4.5%) | | 11/15/02 | | 13.83% | | — | | 18.44% |
| without sales charge | | 11/15/02 | | 19.18% | | — | | 20.42% |
| |
| Past performance is not predictive of future performance.The fund’s performance shown in the graph and table does not |
| reflect the deduction of taxes that a shareholder would pay on fund distributions or the redemption of fund shares. |
| † | | The maximum contingent deferred sales charge for Class B shares is 4%. After six years Class B shares convert to |
| | | Class A shares. | | | | | | | | |
| †† | | The maximum contingent deferred sales charge for Class C shares is 1% for shares redeemed within one year of the |
| | | date of purchase. | | | | | | | | |
UNDERSTANDING YOUR FUND’S EXPENSES(Unaudited)
As a mutual fund investor, you pay ongoing expenses, such as management fees and other expenses. Using the information below, you can estimate how these expenses affect your investment and compare them with the expenses of other funds.You also may pay one-time transaction expenses, including sales charges (loads) and redemption fees, which are not shown in this section and would have resulted in higher total expenses. For more information, see your fund’s prospectus or talk to your financial adviser.
Review your fund’s expenses
The table below shows the expenses you would have paid on a $1,000 investment in Dreyfus Premier International Value Fund from March 1, 2005 to August 31, 2005. It also shows how much a $1,000 investment would be worth at the close of the period, assuming actual returns and expenses.
| Expenses and Value of a $1,000 Investment | | | | | | |
| assuming actual returns for the six months ended August 31, 2005 | | | | |
| | | Class A | | Class B | | Class C | | Class R | | Class T |
| |
| |
| |
| |
| |
|
| Expenses paid per $1,000 † | | $ 7.53 | | $ 11.45 | | $ 11.30 | | $ 5.72 | | $ 9.79 |
| Ending value (after expenses) | | $1,005.00 | | $1,001.00 | | $1,001.50 | | $1,006.90 | | $1,003.00 |
| | COMPARING YOUR FUND’S EXPENSES
WITH THOSE OF OTHER FUNDS (Unaudited)
|
Using the SEC’s method to compare expenses
The Securities and Exchange Commission (SEC) has established guidelines to help investors assess fund expenses. Per these guidelines, the table below shows your fund’s expenses based on a $1,000 investment, assuming a hypothetical 5% annualized return. You can use this information to compare the ongoing expenses (but not transaction expenses or total cost) of investing in the fund with those of other funds.All mutual fund shareholder reports will provide this information to help you make this comparison. Please note that you cannot use this information to estimate your actual ending account balance and expenses paid during the period.
Expenses and Value of a $1,000 Investment
assuming a hypothetical 5% annualized return for the six months ended August 31, 2005
|
| | | Class A | | Class B | | Class C | | Class R | | Class T |
| |
| |
| |
| |
| |
|
| Expenses paid per $1,000 † | | $ 7.58 | | $ 11.52 | | $ 11.37 | | $ 5.75 | | $ 9.86 |
| Ending value (after expenses) | | $1,017.69 | | $1,013.76 | | $1,013.91 | | $1,019.51 | | $1,015.43 |
† Expenses are equal to the fund’s annualized expense ratio of 1.49% for Class A, 2.27% for Class B, 2.24% for Class C, 1.13% for Class R and 1.94% for Class T multiplied by the average account value over the period, multiplied by 184/365 (to reflect the one-half year period).
STATEMENT OF INVESTMENTS
August 31, 2005
|
| Common Stocks—96.4% | | Shares | | Value ($) |
| |
| |
|
| Australia—1.6% | | | | |
| Amcor | | 1,254,418 | | 6,297,546 |
| National Australia Bank | | 335,535 | | 7,941,010 |
| | | | | 14,238,556 |
| Belgium—1.0% | | | | |
| Fortis | | 323,623 | | 9,219,274 |
| Brazil—1.2% | | | | |
| Contax Participacoes, ADR | | 155,567 a | | 101,682 |
| Petroleo Brasileiro, ADR | | 91,800 | | 5,743,008 |
| Petroleo Brasileiro, ADR (Pfd Block) | | 8,515 | | 468,240 |
| Telecomunicacoes Brasileiras, ADR | | 155,567 | | 4,458,550 |
| | | | | 10,771,480 |
| Finland—1.6% | | | | |
| M-real, Cl. B | | 1,020,900 | | 5,574,993 |
| Nokia | | 122,900 | | 1,921,005 |
| Nokia, ADR | | 128,934 | | 2,033,289 |
| UPM-Kymmene | | 249,953 | | 4,991,497 |
| | | | | 14,520,784 |
| France—8.6% | | | | |
| BNP Paribas | | 135,340 | | 9,834,842 |
| Carrefour | | 253,860 | | 11,788,194 |
| Credit Agricole | | 295,740 | | 7,874,468 |
| France Telecom | | 372,360 | | 11,204,389 |
| Sanofi-Aventis | | 89,460 | | 7,631,192 |
| Schneider Electric | | 56,292 | | 4,423,686 |
| Total | | 33,950 | | 8,918,270 |
| Total, ADR | | 50,614 | | 6,672,950 |
| Valeo | | 188,076 | | 7,715,678 |
| | | | | 76,063,669 |
| Germany—8.4% | | | | |
| Allianz | | 53,510 | | 6,916,092 |
| Deutsche Bank | | 109,613 | | 9,488,123 |
| Deutsche Lufthansa | | 497,437 | | 6,616,326 |
| Deutsche Post | | 425,494 | | 10,736,647 |
| | STATEMENT OF INVESTMENTS (continued)
|
| Common Stocks (continued) | | Shares | | Value ($) |
| |
| |
|
| Germany (continued) | | | | |
| Deutsche Postbank | | 96,619 | | 5,296,477 |
| Deutsche Telekom | | 381,470 | | 7,227,559 |
| E.ON | | 78,997 | | 7,537,181 |
| Hannover Rueckversicherung | | 16,000 | | 574,537 |
| Heidelberger Druckmaschinen | | 118,500 | | 4,225,948 |
| Infineon Technologies | | 568,300 b | | 5,303,114 |
| KarstadtQuelle | | 58,104 b | | 773,548 |
| Medion | | 77,200 | | 1,226,670 |
| Volkswagen | | 151,819 | | 7,981,832 |
| | | | | 73,904,054 |
| Hong Kong—.9% | | | | |
| Bank of East Asia | | 2,341,339 | | 6,834,067 |
| China Mobile (Hong Kong) | | 65,300 | | 283,926 |
| Citic Pacific | | 193,900 | | 543,581 |
| | | | | 7,661,574 |
| Ireland—1.4% | | | | |
| Bank of Ireland | | 789,495 | | 12,505,755 |
| Italy—4.5% | | | | |
| Banche Popolari Unite Scrl | | 92,091 | | 1,876,495 |
| Banco Popolare di Verona e Novara Scrl | | 204,100 | | 3,665,726 |
| Benetton Group | | 437,810 | | 4,306,713 |
| ENI | | 391,335 | | 11,577,568 |
| Finmeccanica | | 285,329 | | 5,346,221 |
| UniCredito Italiano | | 2,227,100 | | 12,676,636 |
| | | | | 39,449,359 |
| Japan—25.5% | | | | |
| Aeon | | 480,000 | | 8,995,843 |
| Alps Electric | | 234,700 | | 3,825,740 |
| Canon | | 175,100 | | 8,863,528 |
| Credit Saison | | 133,200 | | 5,241,668 |
| Dentsu | | 1,672 | | 4,413,364 |
| Fuji Heavy Industries | | 1,347,200 | | 5,891,447 |
| Fuji Photo Film | | 178,100 | | 5,770,916 |
| Funai Electric | | 64,800 | | 6,084,076 |
| Common Stocks (continued) | | Shares | | Value ($) |
| |
| |
|
| Japan (continued) | | | | |
| JS Group | | 292,500 | | 4,950,444 |
| Kao | | 309,800 | | 7,388,341 |
| KDDI | | 1,650 | | 8,739,099 |
| Kuraray | | 551,500 | | 4,881,612 |
| Mabuchi Motor | | 127,800 | | 6,606,019 |
| Matsumotokiyoshi | | 116,600 | | 3,483,377 |
| Minebea | | 1,183,000 | | 4,933,603 |
| Mitsubishi Tokyo Financial Group | | 604 | | 6,165,214 |
| Murata Manufacturing | | 96,200 | | 5,061,119 |
| Nippon Express | | 2,602,600 | | 11,626,781 |
| Nippon Telegraph & Telephone | | 1,259 | | 5,478,036 |
| ORIX | | 33,300 | | 5,496,292 |
| Rinnai | | 245,100 | | 5,721,428 |
| Rohm | | 85,000 | | 7,774,605 |
| Sekisui House | | 611,900 | | 6,745,564 |
| 77 Bank | | 1,008,900 | | 6,897,402 |
| Shin-Etsu Chemical | | 213,500 | | 8,669,330 |
| Skylark | | 363,700 | | 5,507,888 |
| Sohgo Security Services | | 166,600 | | 2,242,768 |
| Sumitomo Bakelite | | 573,800 | | 3,838,676 |
| Sumitomo Chemical | | 1,069,900 | | 5,980,834 |
| Sumitomo Mitsui Financial Group | | 1,769 | | 14,519,189 |
| Takeda Pharmaceutical | | 146,300 | | 7,926,379 |
| Takefuji | | 134,100 | | 9,405,687 |
| TDK | | 43,400 | | 3,239,442 |
| Toyoda Gosei | | 299,000 | | 4,996,941 |
| Toyota Motor | | 183,500 | | 7,511,629 |
| Yamaha Motor | | 31,500 | | 592,826 |
| | | | | 225,467,107 |
| Mexico—1.3% | | | | |
| Coca-Cola Femsa, ADR | | 200,100 | | 5,402,700 |
| Telefonos de Mexico, ADR | | 295,962 | | 5,682,470 |
| | | | | 11,085,170 |
| | STATEMENT OF INVESTMENTS (continued)
|
| Common Stocks (continued) | | Shares | | Value ($) |
| |
| |
|
| Netherlands—6.3% | | | | |
| ABN AMRO Holding | | 252,626 | | 6,053,851 |
| Aegon | | 553,381 | | 7,756,077 |
| Heineken | | 312,251 | | 10,080,840 |
| Koninklijke Philips Electronics | | 287,760 | | 7,569,762 |
| Koninklijke Philips Electronics (New York Shares) | | 109,100 | | 2,896,605 |
| Royal Dutch Shell, Cl. A | | 296,420 | | 9,661,095 |
| VNU | | 156,260 | | 4,796,280 |
| Wolters Kluwer | | 353,971 | | 6,632,369 |
| | | | | 55,446,879 |
| Portugal—.8% | | | | |
| Energias de Portugal | | 2,582,250 | | 7,257,558 |
| Singapore—1.9% | | | | |
| DBS Group Holdings | | 1,110,070 | | 10,339,707 |
| United Overseas Bank | | 753,800 | | 6,378,398 |
| | | | | 16,718,105 |
| South Africa—1.6% | | | | |
| Anglo American | | 383,759 | | 9,699,069 |
| Nedbank Group | | 334,948 | | 4,625,071 |
| | | | | 14,324,140 |
| South Korea—1.6% | | | | |
| Korea Electric Power, ADR | | 277,124 | | 4,447,840 |
| KT, ADR | | 226,800 | | 4,615,380 |
| SK Telecom, ADR | | 248,520 | | 5,283,535 |
| | | | | 14,346,755 |
| Spain—2.7% | | | | |
| Banco Sabadell | | 120,581 | | 3,139,281 |
| Endesa | | 467,584 | | 10,547,952 |
| Repsol YPF | | 112,300 | | 3,319,604 |
| Repsol YPF, ADR | | 246,108 | | 7,274,952 |
| | | | | 24,281,789 |
| Sweden—1.0% | | | | |
| Svenska Cellulosa, Cl. B | | 257,740 | | 9,165,694 |
| Switzerland—7.0% | | | | |
| Ciba Specialty Chemicals | | 158,856 | | 9,662,728 |
| Common Stocks (continued) | | Shares | | Value ($) |
| |
| |
|
| Switzerland (continued) | | | | |
| Clariant | | 276,950 | | 3,960,526 |
| Lonza Group | | 49,231 | | 2,806,308 |
| Nestle | | 40,970 | | 11,489,356 |
| Novartis | | 250,610 | | 12,139,172 |
| Swiss Reinsurance | | 177,470 | | 11,424,136 |
| UBS | | 127,410 | | 10,414,489 |
| | | | | 61,896,715 |
| Taiwan—.5% | | | | |
| United Microelectronics, ADR | | 1,305,096 b | | 4,450,377 |
| United Kingdom—17.0% | | | | |
| BAA | | 659,936 | | 7,274,811 |
| BAE Systems | | 587,513 | | 3,465,937 |
| Barclays | | 902,040 | | 8,992,375 |
| BOC Group | | 266,475 | | 5,029,521 |
| Boots Group | | 803,303 | | 8,934,865 |
| BP | | 1,042,800 | | 11,880,687 |
| BT Group | | 1,772,830 | | 6,887,123 |
| Bunzl | | 3,620 | | 35,598 |
| Centrica | | 2,153,654 | | 9,696,274 |
| Diageo | | 616,862 | | 8,807,176 |
| GKN | | 1,185,590 | | 6,144,631 |
| GlaxoSmithKline | | 604,635 | | 14,594,772 |
| HSBC Holdings | | 387,927 | | 6,244,892 |
| Marks & Spencer Group | | 780,886 | | 5,021,981 |
| Rexam | | 385,420 | | 3,496,564 |
| Royal Bank of Scotland Group | | 459,989 | | 13,441,691 |
| Sainsbury (J) | | 965,481 | | 4,929,889 |
| Unilever | | 938,220 | | 9,429,160 |
| Vodafone Group | | 5,924,160 | | 16,206,116 |
| | | | | 150,514,063 |
| Total Common Stocks | | | | |
| (cost $748,237,944) | | | | 853,288,857 |
| | STATEMENT OF INVESTMENTS (continued)
|
| Other Investment—2.4% | | | | Shares | | Value ($) |
| |
| |
| |
|
| Registered Investment Company; | | | | |
| Dreyfus Institutional Preferred Plus Money Market Fund | | |
| (cost $21,250,000) | | | | 21,250,000 c | | 21,250,000 |
| |
| |
| |
|
| |
| Total Investments (cost $769,487,944) | | 98.8% | | 874,538,857 |
| |
| Cash and Receivables (Net) | | | | 1.2% | | 10,372,150 |
| |
| Net Assets | | | | 100.0% | | 884,911,007 |
| |
| ADR—American Depository Receipt. | | | | |
| a | | The valuation of this security has been determined in good faith under the direction of the Board of Directors. |
| b | | Non-income producing. | | | | | | |
| c | | Investment in affiliated money market mutual fund. | | | | |
| |
| |
| |
|
| |
| |
| |
| |
| Portfolio Summary (Unaudited) † | | | | |
| |
| | | | | Value (%) | | | | Value (%) |
| |
| |
| |
| |
|
| Banking | | 15.8 | | Utilities | | 4.5 |
| Financial Services | | 8.3 | | Healthcare | | 3.9 |
| Telecommunications | | 7.6 | | Transportation | | 3.4 |
| Energy | | 5.7 | | Automobiles | | 3.2 |
| Food & Household Products | | 5.7 | | Other | | 35.3 |
| Chemicals | | 5.4 | | | | 98.8 |
| |
| † | | Based on net assets. | | | | | | |
| See notes to financial statements. | | | | | | |
STATEMENT OF ASSETS AND LIABILITIES
August 31, 2005
|
| | | | | | | | | Cost | | Value |
| |
| |
| |
| |
| |
|
| Assets ($): | | | | | | | | | | |
| Investments in securities—See Statement of Investments: | | | | |
| Unaffiliated issuers | | | | 748,237,944 | | 853,288,857 |
| Affiliated issuers | | | | | | 21,250,000 | | 21,250,000 |
| Cash | | | | | | | | | | 2,389,441 |
| Cash denominated in foreign currencies | | 10,203,047 | | 10,229,082 |
| Dividends receivable | | | | | | | | 2,247,424 |
| Receivable for shares of Common Stock subscribed | | | | | | 1,364,824 |
| Receivable for investment securities sold | | | | | | 198,708 |
| Net unrealized appreciation on forward | | | | | | |
| currency exchange contracts—Note 4 | | | | | | 6,746 |
| Prepaid expenses | | | | | | | | | | 53,182 |
| | | | | | | | | 891,028,264 |
| |
| |
| |
| |
|
| Liabilities ($): | | | | | | | | | | |
| Due to The Dreyfus Corporation and affiliates—Note 3(c) | | | | | | 1,033,476 |
| Payable for investment securities purchased | | | | | | 2,975,274 |
| Payable for shares of Common Stock redeemed | | | | | | 1,781,774 |
| Accrued expenses and other liabilities | | | | | | | | 326,733 |
| | | | | | | | | | | 6,117,257 |
| |
| |
| |
| |
| |
|
| Net Assets ($) | | | | | | | | 884,911,007 |
| |
| |
| |
| |
|
| Composition of Net Assets ($): | | | | | | | | |
| Paid-in capital | | | | | | | | | | 723,439,409 |
| Accumulated undistributed investment income—net | | | | | | 7,128,040 |
| Accumulated net realized gain (loss) on investments | | | | | | 49,274,438 |
| Accumulated net unrealized appreciation (depreciation) | | | | | | |
| on investments and foreign currency transactions | | | | | | 105,069,120 |
| |
| |
| |
|
| Net Assets ($) | | | | | | | | 884,911,007 |
| |
| |
| |
| |
|
| |
| |
| Net Asset Value Per Share | | | | | | | | |
| | | Class A | | Class B | | Class C | | Class R | | Class T |
| |
| |
| |
| |
| |
|
| Net Assets ($) | | 715,767,619 | | 21,101,086 | | 73,347,626 | | 72,470,392 | | 2,224,284 |
| Shares Outstanding | | 35,306,035 | | 1,059,256 | | 3,673,534 | | 3,564,350 | | 111,954 |
| |
| |
| |
| |
| |
|
| Net Asset Value | | | | | | | | | | |
| Per Share ($) | | 20.27 | | 19.92 | | 19.97 | | 20.33 | | 19.87 |
| |
| See notes to financial statements. | | | | | | | | |
| | STATEMENT OF OPERATIONS
Year Ended August 31, 2005
|
| Investment Income ($): | | |
| Income: | | |
| Cash dividends (net of $1,877,178 foreign taxes withheld at source): | | |
| Unaffiliated issuers | | 19,089,865 |
| Affiliated issuers | | 542,669 |
| Interest | | 155,465 |
| Total Income | | 19,787,999 |
| Expenses: | | |
| Management fee—Note 3(a) | | 7,769,059 |
| Shareholder servicing costs—Note 3(c) | | 2,833,022 |
| Custodian fees | | 654,341 |
| Distribution fees—Note 3(b) | | 578,936 |
| Registration fees | | 96,640 |
| Prospectus and shareholders’ reports | | 56,309 |
| Professional fees | | 45,038 |
| Directors’ fees and expenses—Note 3(d) | | 11,697 |
| Loan commitment fees—Note 2 | | 4,606 |
| Miscellaneous | | 50,098 |
| Total Expenses | | 12,099,746 |
| Less—reduction in custody fees due to earnings credits—Note 1(c) | | (2,798) |
| Net Expenses | | 12,096,948 |
| Investment Income—Net | | 7,691,051 |
| |
|
| Realized and Unrealized Gain (Loss) on Investments—Note 4 ($): |
| Net realized gain (loss) on investments and foreign currency transactions | | 71,525,165 |
| Net realized gain (loss) on forward currency exchange contracts | | (274,714) |
| Net Realized Gain (Loss) | | 71,250,451 |
| Net unrealized appreciation (depreciation) on investments | | |
| and foreign currency transactions | | 50,394,356 |
| Net Realized and Unrealized Gain (Loss) on Investments | | 121,644,807 |
| Net Increase in Net Assets Resulting from Operations | | 129,335,858 |
| | See notes to financial statements.
|
STATEMENT OF CHANGES IN NET ASSETS
| | | Year Ended August 31, |
| |
|
| | | 2005 | | 2004 |
| |
| |
|
| Operations ($): | | | | |
| Investment income—net | | 7,691,051 | | 5,409,849 |
| Net realized gain (loss) on investments | | 71,250,451 | | 33,970,788 |
| Net unrealized appreciation | | | | |
| (depreciation) on investments | | 50,394,356 | | 45,357,110 |
| Net Increase (Decrease) in Net Assets | | |
| Resulting from Operations | | 129,335,858 | | 84,737,747 |
| |
| |
|
| Dividends to Shareholders from ($): | | | | |
| Investment income—net: | | | | |
| Class A shares | | (5,699,694) | | (3,795,436) |
| Class B shares | | (72,580) | | (28,252) |
| Class C shares | | (273,321) | | (54,975) |
| Class R shares | | (583,252) | | (56,142) |
| Class T shares | | (14,038) | | (6,310) |
| Total Dividends | | (6,642,885) | | (3,941,115) |
| |
| |
|
| Capital Stock Transactions ($): | | | | |
| Net proceeds from shares sold: | | | | |
| Class A shares | | 308,094,029 | | 283,031,667 |
| Class B shares | | 8,574,834 | | 6,565,468 |
| Class C shares | | 31,678,554 | | 22,197,300 |
| Class R shares | | 36,299,900 | | 19,190,483 |
| Class T shares | | 2,064,755 | | 969,530 |
| Net assets received in connection with | | | | |
| reorganization—Note 1: | | | | |
| Class A shares | | — | | 10,341,505 |
| Class B shares | | — | | 5,043,246 |
| Class C shares | | — | | 16,352,278 |
| Class R shares | | — | | 17,126,521 |
| | STATEMENT OF CHANGES IN NET ASSETS (continued)
|
| | | Year Ended August 31, |
| |
|
| | | 2005 | | 2004 |
| |
| |
|
| Capital Stock Transactions ($) (continued): | | |
| Dividends reinvested: | | | | |
| Class A shares | | 4,173,168 | | 2,845,772 |
| Class B shares | | 56,628 | | 21,458 |
| Class C shares | | 120,726 | | 21,941 |
| Class R shares | | 527,855 | | 792 |
| Class T shares | | 7,379 | | 5,753 |
| Cost of shares redeemed: | | | | |
| Class A shares | | (217,746,980) | | (193,590,792) |
| Class B shares | | (2,677,129) | | (910,499) |
| Class C shares | | (7,393,660) | | (1,646,495) |
| Class R shares | | (14,066,656) | | (4,567,092) |
| Class T shares | | (1,137,641) | | (52,550) |
| Increase (Decrease) in Net Assets | | | | |
| from Capital Stock Transactions | | 148,575,762 | | 182,946,286 |
| Total Increase (Decrease) in Net Assets | | 271,268,735 | | 263,742,918 |
| |
| |
|
| Net Assets ($): | | | | |
| Beginning of Period | | 613,642,272 | | 349,899,354 |
| End of Period | | 884,911,007 | | 613,642,272 |
| Undistributed investment income—net | | 7,128,040 | | 5,817,862 |
| | | Year Ended August 31, |
| |
|
| | | 2005 | | 2004 |
| |
| |
|
| Capital Share Transactions: | | | | |
| Class A a | | | | |
| Shares sold | | 16,096,093 | | 17,111,998 |
| Shares issued in connection with reorganization—Note 1 | | — | | 604,919 |
| Shares issued for dividends reinvested | | 219,064 | | 181,375 |
| Shares redeemed | | (11,357,328) | | (11,917,196) |
| Net Increase (Decrease) in Shares Outstanding | | 4,957,829 | | 5,981,096 |
| |
| |
|
| Class B a | | | | |
| Shares sold | | 453,705 | | 439,144 |
| Shares issued in connection with reorganization—Note 1 | | — | | 298,362 |
| Shares issued for dividends reinvested | | 3,007 | | 1,379 |
| Shares redeemed | | (141,231) | | (54,151) |
| Net Increase (Decrease) in Shares Outstanding | | 315,481 | | 684,734 |
| |
| |
|
| Class C | | | | |
| Shares sold | | 1,672,576 | | 1,399,911 |
| Shares issued in connection with reorganization—Note 1 | | — | | 965,483 |
| Shares issued for dividends reinvested | | 6,398 | | 1,408 |
| Shares redeemed | | (389,771) | | (99,782) |
| Net Increase (Decrease) in Shares Outstanding | | 1,289,203 | | 2,267,020 |
| |
| |
|
| Class R | | | | |
| Shares sold | | 1,867,185 | | 1,385,222 |
| Shares issued in connection with reorganization—Note 1 | | — | | 1,001,213 |
| Shares issued for dividends reinvested | | 27,709 | | 51 |
| Shares redeemed | | (719,819) | | (264,812) |
| Net Increase (Decrease) in Shares Outstanding | | 1,175,075 | | 2,121,674 |
| |
| |
|
| Class T | | | | |
| Shares sold | | 114,452 | | 60,775 |
| Shares issued for dividends reinvested | | 394 | | 372 |
| Shares redeemed | | (62,770) | | (3,186) |
| Net Increase (Decrease) in Shares Outstanding | | 52,076 | | 57,961 |
| |
| a During the period ended August 31, 2005, 11,262 Class B shares representing $213,210 were automatically |
| converted to 11,104 Class A shares and during the year ended August 31, 2004, 4,923 Class B shares |
| representing $83,430 were automatically converted to 4,862 Class A shares. | | |
| See notes to financial statements. | | | | |
The following tables describe the performance for each share class for the fiscal periods indicated.All information (except portfolio turnover rate) reflects financial results for a single fund share.Total return shows how much your investment in the fund would have increased (or decreased) during each period, assuming you had reinvested all dividends and distributions.These figures have been derived from the fund’s financial statements.
| | | | | | | Year Ended August 31, | | |
| | | |
| |
| |
|
| Class A Shares | | 2005 | | 2004 | | 2003a | | 2002 | | 2001 |
| |
| |
| |
| |
| |
|
| Per Share Data ($): | | | | | | | | | | |
| Net asset value, beginning of period | | 17.10 | | 14.10 | | 13.29 | | 14.70 | | 17.21 |
| Investment Operations: | | | | | | | | | | |
| Investment income—net b | | .20 | | .18 | | .15 | | .17 | | .13 |
| Net realized and unrealized gain | | | | | | | | | | |
| (loss) on investments | | 3.15 | | 2.97 | | .83 | | (1.29) | | (1.47) |
| Total from Investment Operations | | 3.35 | | 3.15 | | .98 | | (1.12) | | (1.34) |
| Distributions: | | | | | | | | | | |
| Dividends from investment income—net | | (.18) | | (.15) | | (.17) | | (.12) | | (.11) |
| Dividends from net realized | | | | | | | | | | |
| gain on investments | | — | | — | | — | | (.17) | | (1.06) |
| Total Distributions | | (.18) | | (.15) | | (.17) | | (.29) | | (1.17) |
| Net asset value, end of period | | 20.27 | | 17.10 | | 14.10 | | 13.29 | | 14.70 |
| |
| |
| |
| |
| |
|
| Total Return (%) | | 19.65c | | 22.46c | | 7.56c | | (7.64) | | (8.22) |
| |
| |
| |
| |
| |
|
| Ratios/Supplemental Data (%): | | | | | | | | | | |
| Ratio of total expenses | | | | | | | | | | |
| to average net assets | | 1.51 | | 1.49 | | 1.54 | | 1.40 | | 1.39 |
| Ratio of net expenses | | | | | | | | | | |
| to average net assets | | 1.51 | | 1.49 | | 1.54 | | 1.40 | | 1.39 |
| Ratio of net investment income | | | | | | | | | | |
| to average net assets | | 1.02 | | 1.11 | | 1.22 | | 1.21 | | .84 |
| Portfolio Turnover Rate | | 43.05 | | 49.82 | | 42.86 | | 29.14 | | 30.70 |
| |
| |
| |
| |
| |
|
| Net Assets, end of period ($ x 1,000) | | 715,768 | | 518,880 | | 343,621 | | 322,490 | | 327,478 |
| |
| a | | The fund commenced offering five classes of shares on November 15, 2002.The existing shares were redesignated |
| | | Class A shares. | | | | | | | | | | |
| b | | Based on average shares outstanding at each month end. | | | | | | | | |
| c | | Exclusive of sales charge. | | | | | | | | | | |
| See notes to financial statements. | | | | | | | | | | |
| | | | | Year Ended August 31, |
| | | |
|
| Class B Shares | | 2005 | | 2004 | | 2003 a |
| |
| |
| |
|
| Per Share Data ($): | | | | | | |
| Net asset value, beginning of period | | 16.86 | | 14.00 | | 12.24 |
| Investment Operations: | | | | | | |
| Investment income—net b | | .06 | | .09 | | .09 |
| Net realized and unrealized gain | | | | | | |
| (loss) on investments | | 3.09 | | 2.91 | | 1.84 |
| Total from Investment Operations | | 3.15 | | 3.00 | | 1.93 |
| Distributions: | | | | | | |
| Dividends from investment income—net | | (.09) | | (.14) | | (.17) |
| Net asset value, end of period | | 19.92 | | 16.86 | | 14.00 |
| |
| |
| |
|
| Total Return (%) c | | 18.70 | | 21.43 | | 16.04d |
| |
| |
| |
|
| Ratios/Supplemental Data (%): | | | | | | |
| Ratio of total expenses to average net assets | | 2.32 | | 2.33 | | 2.00d |
| Ratio of net expenses to average net assets | | 2.32 | | 2.33 | | 2.00d |
| Ratio of net investment income | | | | | | |
| to average net assets | | .30 | | .55 | | .70d |
| Portfolio Turnover Rate | | 43.05 | | 49.82 | | 42.86 |
| |
| |
| |
|
| Net Assets, end of period ($ x 1,000) | | 21,101 | | 12,538 | | 827 |
| |
| a | | From November 15, 2002 (commencement of initial offering) to August 31, 2003. | | | | |
| b | | Based on average shares outstanding at each month end. | | | | |
| c | | Exclusive of sales charge. | | | | | | |
| d | | Not annualized. | | | | | | |
| See notes to financial statements. | | | | | | |
| | FINANCIAL HIGHLIGHTS (continued)
|
| | | | | | | Year Ended August 31, |
| | | |
| |
|
| Class C Shares | | 2005 | | 2004 | | 2003 a |
| |
| |
| |
|
| Per Share Data ($): | | | | | | |
| Net asset value, beginning of period | | 16.90 | | 14.04 | | 12.24 |
| Investment Operations: | | | | | | |
| Investment income—net b | | .07 | | .12 | | .12 |
| Net realized and unrealized gain | | | | | | |
| (loss) on investments | | 3.10 | | 2.89 | | 1.85 |
| Total from Investment Operations | | 3.17 | | 3.01 | | 1.97 |
| Distributions: | | | | | | |
| Dividends from investment income—net | | (.10) | | (.15) | | (.17) |
| Net asset value, end of period | | 19.97 | | 16.90 | | 14.04 |
| |
| |
| |
|
| Total Return (%) c | | 18.79 | | 21.51 | | 16.29d |
| |
| |
| |
|
| Ratios/Supplemental Data (%): | | | | | | |
| Ratio of total expenses to average net assets | | 2.26 | | 2.26 | | 1.80d |
| Ratio of net expenses to average net assets | | 2.26 | | 2.26 | | 1.80d |
| Ratio of net investment income | | | | | | |
| to average net assets | | .35 | | .73 | | .89d |
| Portfolio Turnover Rate | | 43.05 | | 49.82 | | 42.86 |
| |
| |
| |
|
| Net Assets, end of period ($ x 1,000) | | 73,348 | | 40,291 | | 1,647 |
| |
| a | | From November 15, 2002 (commencement of initial offering) to August 31, 2003. | | |
| b | | Based on average shares outstanding at each month end. | | | | |
| c | | Exclusive of sales charge. | | | | | | |
| d | | Not annualized. | | | | | | |
| See notes to financial statements. | | | | | | |
| | | | | | | Year Ended August 31, |
| | | |
| |
|
| Class R Shares | | 2005 | | 2004 | | 2003 a |
| |
| |
| |
|
| Per Share Data ($): | | | | | | |
| Net asset value, beginning of period | | 17.13 | | 14.12 | | 12.24 |
| Investment Operations: | | | | | | |
| Investment income—net b | | .30 | | .31 | | .22 |
| Net realized and unrealized gain | | | | | | |
| (loss) on investments | | 3.13 | | 2.90 | | 1.83 |
| Total from Investment Operations | | 3.43 | | 3.21 | | 2.05 |
| Distributions: | | | | | | |
| Dividends from investment income—net | | (.23) | | (.20) | | (.17) |
| Net asset value, end of period | | 20.33 | | 17.13 | | 14.12 |
| |
| |
| |
|
| Total Return (%) | | 20.11 | | 22.86 | | 16.95c |
| |
| |
| |
|
| Ratios/Supplemental Data (%): | | | | | | |
| Ratio of total expenses to average net assets | | 1.13 | | 1.16 | | .96c |
| Ratio of net expenses to average net assets | | 1.13 | | 1.16 | | .96c |
| Ratio of net investment income | | | | | | |
| to average net assets | | 1.56 | | 1.82 | | 1.73c |
| Portfolio Turnover Rate | | 43.05 | | 49.82 | | 42.86 |
| |
| |
| |
|
| Net Assets, end of period ($ x 1,000) | | 72,470 | | 40,927 | | 3,778 |
| |
| a | | From November 15, 2002 (commencement of initial offering) to August 31, 2003. | | |
| b | | Based on average shares outstanding at each month end. | | | | |
| c | | Not annualized. | | | | | | |
| See notes to financial statements. | | | | | | |
| | FINANCIAL HIGHLIGHTS (continued)
|
| | | | | | | Year Ended August 31, |
| | | |
| |
|
| Class T Shares | | 2005 | | 2004 | | 2003 a |
| |
| |
| |
|
| Per Share Data ($): | | | | | | |
| Net asset value, beginning of period | | 16.81 | | 13.95 | | 12.24 |
| Investment Operations: | | | | | | |
| Investment income (loss)—net b | | .13 | | .18 | | (.04) |
| Net realized and unrealized gain | | | | | | |
| (loss) on investments | | 3.09 | | 2.87 | | 1.92 |
| Total from Investment Operations | | 3.22 | | 3.05 | | 1.88 |
| Distributions: | | | | | | |
| Dividends from investment income—net | | (.16) | | (.19) | | (.17) |
| Net asset value, end of period | | 19.87 | | 16.81 | | 13.95 |
| |
| |
| |
|
| Total Return (%) c | | 19.18 | | 21.95 | | 15.54d |
| |
| |
| |
|
| Ratios/Supplemental Data (%): | | | | | | |
| Ratio of total expenses to average net assets | | 1.92 | | 1.81 | | 1.92d |
| Ratio of net expenses to average net assets | | 1.92 | | 1.81 | | 1.92d |
| Ratio of net investment income | | | | | | |
| (loss) to average net assets | | .65 | | 1.05 | | (.45)d |
| Portfolio Turnover Rate | | 43.05 | | 49.82 | | 42.86 |
| |
| |
| |
|
| Net Assets, end of period ($ x 1,000) | | 2,224 | | 1,006 | | 27 |
| |
| a | | From November 15, 2002 (commencement of initial offering) to August 31, 2003. | | |
| b | | Based on average shares outstanding at each month end. | | | | |
| c | | Exclusive of sales charge. | | | | | | |
| d | | Not annualized. | | | | | | |
| See notes to financial statements. | | | | | | |
NOTES TO FINANCIAL STATEMENTS
NOTE 1—Significant Accounting Policies:
Dreyfus Premier International Value Fund (the “fund”) is a separate diversified series of Dreyfus Growth and Value Funds, Inc. (the “Company”), which is registered under the Investment Company Act of 1940, as amended (the “Act”), as an open-end management investment company and operates as a series company that offers twelve series, including the fund.The fund’s investment objective is long-term capital growth.The Dreyfus Corporation (the “Manager” or “Dreyfus”) serves as the fund’s investment adviser.The Manager is a wholly-owned subsidiary of Mellon Financial Corporation (“Mellon Financial”).
Dreyfus Service Corporation (the “Distributor”), a wholly-owned subsidiary of the Manager, is the distributor of the fund’s shares. The fund is authorized to issue 500 million shares of $.001 par value Common Stock.The fund currently offers five classes of shares: Class A (100 million shares authorized), Class B (100 million shares authorized), Class C (100 million shares authorized), Class R (100 million shares authorized) and Class T (100 million shares authorized). Class A and Class T shares are subject to a sales charge imposed at the time of purchase. Class B shares are subject to a contingent deferred sales charge (“CDSC”) imposed on Class B share redemptions made within six years of purchase and automatically convert to Class A shares after six years. Class C shares are subject to a CDSC on Class C shares redeemed within one year of purchase and Class R shares are sold at net asset value per share only to institutional investors. Other differences between the classes include the services offered to and the expenses borne by each class and certain voting rights. Income, expenses (other than expenses attributable to a specific class), and realized and unrealized gains or losses on investments are allocated to each class of shares based on its relative net assets.
On April 30, 2004, pursuant to an Agreement and Plan of Reorganization previously approved by the fund’s shareholders, all of the assets, subject to the liabilities, of Bear Stearns International Equity Portfolio, were transferred to the fund in exchange for shares
| | NOTES TO FINANCIAL STATEMENTS (continued)
|
of Common Stock of the fund of equal value. Shareholders of Class A, Class B, Class C and Class Y shares of Bear Stearns International Equity Portfolio received Class A, Class B, Class C and Class R shares, respectively, of the fund, in each case in an amount equal to the aggregate net asset value of their investment in Bear Stearns International Equity Portfolio at the time of the exchange. The fund’s net asset value on April 30, 2004 was $17.09 per share for Class A shares, $16.90 per share for Class B shares, $16.94 per share for Class C shares and $17.10 per share for Class R shares, and a total of 604,919 Class A shares, 298,362 Class B shares, 965,483 Class C shares and 1,001,213 Class R shares, representing net assets of $10,341,505 Class A shares, $5,043,246 Class B shares, $16,352,278 Class C shares and $17,126,521 Class R shares (including $6,174,995 net unrealized appreciation on investments), were issued to the shareholders of Bear Stearns International Equity Portfolio in the exchange.The exchange was a tax free event to shareholders.
The Company accounts separately for the assets, liabilities and operations of each series. Expenses directly attributable to each series are charged to that series’ operations; expenses which are applicable to all series are allocated among them on a pro rata basis.
The fund’s financial statements are prepared in accordance with U.S. generally accepted accounting principles, which may require the use of management estimates and assumptions. Actual results could differ from those estimates.
The fund enters into contracts that contain a variety of indemnifications. The fund’s maximum exposure under these arrangements is unknown.The fund does not anticipate recognizing any loss related to these arrangements.
(a) Portfolio valuation: Investments in securities are valued at the last sales price on the securities exchange or national securities market on which such securities are primarily traded. Securities listed on the National Market System for which market quotations are available are
valued at the official closing price or, if there is no official closing price that day, at the last sale price. Securities not listed on an exchange or the national securities market, or securities for which there were no transactions, are valued at the average of the most recent bid and asked prices, except for open short positions, where the asked price is used for valuation purposes. Bid price is used when no asked price is avail-able.When market quotations or official closing prices are not readily available, or are determined not to reflect accurately fair value, such as when the value of a security has been significantly affected by events after the close of the exchange or market on which the security is principally traded (for example, a foreign exchange or market), but before the fund calculates its net asset value, the fund may value these investments at fair value as determined in accordance with the procedures approved by the Board of Directors. Fair valuing of securities may be determined with the assistance of a pricing service using calculations based on indices of domestic securities and other appropriate indicators, such as prices of relevant ADR’s and futures contracts. For other securities that are fair valued by the Board of Directors, certain factors may be considered such as: fundamental analytical data, the nature and duration of restrictions on disposition, an evaluation of the forces that influence the market in which the securities are purchased and sold, and public trading in similar securities of the issuer or comparable issuers. Investments in registered investment companies are valued at their net asset value. Financial futures are valued at the last sales price. Investments denominated in foreign currencies are translated to U.S. dollars at the prevailing rates of exchange. Forward currency exchange contracts are valued at the forward rate.
(b) Foreign currency transactions: The fund does not isolate that portion of the results of operations resulting from changes in foreign exchange rates on investments from the fluctuations arising from changes in market prices of securities held. Such fluctuations are included with the net realized and unrealized gain or loss on investments.
| | NOTES TO FINANCIAL STATEMENTS (continued)
|
Net realized foreign exchange gains or losses arise from sales and maturities of short-term securities, sales of foreign currencies, currency gains or losses realized on securities transactions and the difference between the amounts of dividends, interest and foreign withholding taxes recorded on the fund’s books and the U.S. dollar equivalent of the amounts actually received or paid. Net unrealized foreign exchange gains or losses arise from changes in the value of assets and liabilities other than investments in securities, resulting from changes in exchange rates. Such gains and losses are included with net realized and unrealized gain or loss on investments.
(c) Securities transactions and investment income: Securities transactions are recorded on a trade date basis. Realized gain and loss from securities transactions are recorded on the identified cost basis. Dividend income is recognized on the ex-dividend date and interest income, including, where applicable, accretion of discount and amortization of premium on investments, is recognized on the accrual basis.
The fund has an arrangement with the custodian bank whereby the fund receives earnings credits from the custodian when positive cash balances are maintained, which are used to offset custody fees. For financial reporting purposes, the fund includes net earnings credits as an expense offset in the Statement of Operations.
(d) Affiliated issuers: Investments in other investment companies advised by the Manager are defined as “affiliated” in the Act.
(e) Dividends to shareholders: Dividends are recorded on the ex-dividend date. Dividends from investment income-net and dividends from net realized capital gain, if any, are normally declared and paid annually, but the fund may make distributions on a more frequent basis to comply with the distribution requirements of the Internal Revenue Code of 1986, as amended (the “Code”).To the extent that net realized capital gain can be offset by capital loss carryovers, it is the policy
of the fund not to distribute such gain. Income and capital gain distributions are determined in accordance with income tax regulations, which may differ from U.S. generally accepted accounting principles.
(f) Federal income taxes: It is the policy of the fund to continue to qualify as a regulated investment company, if such qualification is in the best interests of its shareholders, by complying with the applicable provisions of the Code, and to make distributions of taxable income sufficient to relieve it from substantially all federal income and excise taxes.
At August 31, 2005, the components of accumulated earnings on a tax basis were as follows: undistributed ordinary income $20,851,477, undistributed capital gains $48,660,080 and unrealized appreciation $102,490,136.
The fund also has an accumulated capital loss carryover of $10,530,095, which can be utilized in subsequent years subject to an annual limitation due to the fund’s merger with Bear Stearns International Equity Portfolio. If not applied, the capital loss carryover expires in fiscal 2010. The accumulated capital loss carryover reflected above represents the capital loss carryover from Bear Stearns International Equity Portfolio after limitations pursuant to Section 383 of the Code. Due to the limitation on utilization of capital loss carryover of $2,106,019 per year, only $10,530,095 of the remaining $46,275,337 will actually be eligible to offset future capital gains. Consequently, the difference of $35,745,242 has been recorded as a reduction of paid in capital in fiscal 2005.
The tax character of distributions paid to shareholders during the fiscal periods ended August 31, 2005 and August 31, 2004, respectively, were as follows: ordinary income $6,642,885 and $3,941,115, respectively.
During the period ended August 31, 2005, as a result of permanent book to tax differences primarily due to the tax treatment for passive foreign investment companies, foreign exchange gain and losses and the
| | NOTES TO FINANCIAL STATEMENTS (continued)
|
capital loss carryover from the merger with Bear Stearns International Equity Portfolio, the fund increased accumulated undistributed investment income-net by $262,012, increased accumulated net realized gain (loss) on investments by $35,483,230 and decreased paid-in capital by $35,745,242. Net assets were not affected by this reclassification.
NOTE 2—Bank Line of Credit:
|
The fund participates with other Dreyfus-managed funds in a $350 million redemption credit facility (the “Facility”) to be utilized for temporary or emergency purposes, including the financing of redemptions. In connection therewith, the fund has agreed to pay commitment fees on its pro rata portion of the Facility. Interest is charged to the fund based on prevailing market rates in effect at the time of borrowings. During the period ended August 31, 2005, the fund did not borrow under the Facility.
NOTE 3—Management Fee and Other Transactions with Affiliates:
(a) Pursuant to a management agreement with the Manager, the management fee is computed at the annual rate of 1% of the value of the fund’s average daily net assets and is payable monthly.
During the period ended August 31, 2005, the Distributor retained $80,025 and $820 from commissions earned on sales of the fund’s Class A and Class T shares, respectively, and $40,931 and $11,895 from contingent deferred sales charges on redemptions of the fund’s Class B and Class C shares, respectively.
(b) Under the Distribution Plan (the “Plan”) adopted pursuant to Rule 12b-1 under the Act, Class B, Class C and Class T shares pay the Distributor for distributing their shares at an annual rate of .75% of the value of the average daily net assets of Class B and Class C shares and .25% of the value of the average daily net assets of Class T shares. During the period ended August 31, 2005, Class B, Class C and Class T shares were charged $133,940, $440,501 and $4,495, respectively, pursuant to the Plan.
(c) Under the Shareholder Services Plan, Class A, Class B, Class C and Class T shares pay the Distributor at an annual rate of .25% of the value of their average daily net assets for the provision of certain services. The services provided may include personal services relating to shareholder accounts, such as answering shareholder inquiries regarding the fund and providing reports and other information, and services related to the maintenance of shareholder accounts. The Distributor may make payments to Service Agents (a securities dealer, financial institution or industry professional) in respect of these services. The Distributor determines the amounts to be paid to Service Agents. During the period ended August 31, 2005, Class A, Class B, Class C and Class T shares were charged $1,599,239, $44,646, $146,834 and $4,495, respectively, pursuant to the Shareholder Services Plan.
The fund compensates Dreyfus Transfer, Inc., a wholly-owned subsidiary of the Manager, under a transfer agency agreement for providing personnel and facilities to perform transfer agency services for the fund. During the period ended August 31, 2005, the fund was charged $324,228, pursuant to the transfer agency agreement.
During the period ended August 31, 2005, the fund was charged $2,520 for services performed by the Chief Compliance Officer.
The components of Due to The Dreyfus Corporation and affiliates in the Statement of Assets and Liabilities consist of: management fees $748,882, Rule 12b-1 distribution plan fees $60,126, shareholder services plan fees $171,738, chief compliance officer fees $1,533 and transfer agency per account fees $51,197.
(d) Each Board member also serves as a Board member of other funds within the Dreyfus complex. Annual retainer fees and attendance fees are allocated to each fund based on net assets.
(e) Pursuant to an exemptive order from the Securities and Exchange Commission, the fund may invest its available cash balances in affiliated money market mutual funds. Management fees of the underlying money market mutual funds have been waived by the Manager.
| | NOTES TO FINANCIAL STATEMENTS (continued)
|
| | NOTE 4—Securities Transactions:
|
The aggregate amount of purchases and sales of investment securities (excluding short-term securities and forward currency exchange contracts) during the period ended August 31, 2005, amounted to $466,979,404 and $317,223,226, respectively.
The fund enters into forward currency exchange contracts in order to hedge its exposure to changes in foreign currency exchange rates on its foreign portfolio holdings and to settle foreign currency transactions. When executing forward currency exchange contracts, the fund is obligated to buy or sell a foreign currency at a specified rate on a certain date in the future.With respect to sales of forward currency exchange contracts, the fund would incur a loss if the value of the contract increases between the date the forward contract is opened and the date the forward contract is closed.The fund realizes a gain if the value of the contract decreases between those dates.With respect to purchases of forward currency exchange contracts, the fund would incur a loss if the value of the contract decreases between the date the forward contract is opened and the date the forward contract is closed.The fund realizes a gain if the value of the contract increases between those dates. The fund is also exposed to credit risk associated with counter party nonperformance on these forward currency exchange contracts which is typically limited to the unrealized gain on each open contract. The following summarizes open forward currency exchange contracts at August 31, 2005:
| | | Foreign | | | | | | |
| Forward Currency | | Currency | | | | | | Unrealized |
| Exchange Contracts | | Amounts | | Cost ($) | | Value ($) | | Appreciation ($) |
| |
| |
| |
| |
|
| Purchases: | | | | | | | | |
| Hong Kong Dollar, | | | | | | | | |
| expiring 9/1/2005 | | 250,214 | | 32,191 | | 32,195 | | 4 |
| Japanese Yen, | | | | | | | | |
| expiring 9/1/2005 | | 167,545,109 | | 1,506,695 | | 1,513,437 | | 6,742 |
| Total | | | | | | | | 6,746 |
At August 31, 2005, the cost of investments for federal income tax purposes was $772,066,928; accordingly, accumulated net unrealized appreciation on investments was $102,471,929, consisting of $121,594,516 gross unrealized appreciation and $19,122,587 gross unrealized depreciation.
In early 2004, two purported class and derivative actions were filed against Mellon Financial, Mellon Bank, N.A., Dreyfus, Founders Asset Management LLC, and certain directors of the Dreyfus Funds and the Dreyfus Founders Funds (together, the “Funds”) in the United States District Court for the Western District of Pennsylvania. In September 2004, plaintiffs served a Consolidated Amended Complaint (the “Amended Complaint”) on behalf of a purported class of all persons who acquired interests in any of the Funds between January 30, 1999 and November 17, 2003, and derivatively on behalf of the Funds.The Amended Complaint in the newly styled In re Dreyfus Mutual Funds Fee Litigation also named the Distributor, Premier Mutual Fund Services, Inc. and two additional Fund directors as defendants and alleges violations of the Investment Company Act of 1940, the Investment Advisers Act of 1940, the Pennsylvania Unfair Trade Practices and Consumer Protection Law and common-law claims. Plaintiffs seek to recover allegedly improper and excessive Rule 12b-1 and advisory fees allegedly charged to the Funds for marketing and distribution services. More specifically, plaintiffs claim, among other things, that 12b-1 fees and directed brokerage were improperly used to pay brokers to recommend the Funds over other funds, and that such payments were not disclosed to investors. In addition, plaintiffs assert that economies of scale and soft-dollar benefits were not passed on to the Funds. Plaintiffs further allege that 12b-1 fees were improperly
| | NOTES TO FINANCIAL STATEMENTS (continued)
|
charged to certain of the Funds that were closed to new investors.The Amended Complaint seeks compensatory and punitive damages, rescission of the advisory contracts, and an accounting and restitution of any unlawful fees, as well as an award of attorneys’ fees and litigation expenses. As noted, some of the claims in this litigation are asserted derivatively on behalf of the Funds that have been named as nominal defendants. With respect to such derivative claims, no relief is sought against the Funds. Dreyfus believes the allegations to be totally without merit and intends to defend the action vigorously. In November 2004, all named defendants moved to dismiss the Amended Complaint in whole or substantial part. Briefing was completed in May 2005.
Additional lawsuits arising out of these circumstances and presenting similar allegations and requests for relief may be filed against the defendants in the future. Neither Dreyfus nor the Funds believe that any of the pending actions will have a material adverse effect on the Funds or Dreyfus’ ability to perform its contract with the Funds.
REPORT OF INDEPENDENT REGISTERED
PUBLIC ACCOUNTING FIRM
|
| | Shareholders and Board of Directors
Dreyfus International Value Fund
|
We have audited the accompanying statement of assets and liabilities, including the statement of investments, of Dreyfus International Value Fund (one of the funds comprising Dreyfus Growth and Value Funds, Inc.) as of August 31, 2005, and the related statement of operations for the year then ended, the statement of changes in net assets for each of the two years in the period then ended, and financial highlights for each of the periods indicated therein. These financial statements and financial highlights are the responsibility of the Fund’s management. Our responsibility is to express an opinion on these financial statements and financial highlights based on our audits.
We conducted our audits in accordance with the standards of the Public Company Accounting Oversight Board (United States).Those standards require that we plan and perform the audit to obtain reasonable assurance about whether the financial statements and financial highlights are free of material misstatement.We were not engaged to perform an audit of the Fund’s internal control over financial reporting. Our audits included consideration of internal control over financial reporting as a basis for designing audit procedures that are appropriate in the circumstances, but not for the purpose of expressing an opinion on the effectiveness of the Fund’s internal control over financial reporting. Accordingly, we express no such opinion.An audit also includes examining, on a test basis, evidence supporting the amounts and disclosures in the financial statements and financial highlights, assessing the accounting principles used and significant estimates made by management, and evaluating the overall financial statement presentation. Our procedures included confirmation of securities owned as of August 31, 2005 by correspondence with the custodian and others.We believe that our audits provide a reasonable basis for our opinion.
In our opinion, the financial statements and financial highlights referred to above present fairly, in all material respects, the financial position of Dreyfus International Value Fund at August 31, 2005, the results of its operations for the year then ended, the changes in its net assets for each of the two years in the period then ended, and the financial highlights for each of the indicated periods, in conformity with U.S. generally accepted accounting principles.

| | New York, New York
October 14, 2005
|
IMPORTANT TAX INFORMATION (Unaudited)
In accordance with federal tax law, the fund elects to provide each shareholder with their portion of the fund’s foreign taxes paid and the income sourced from foreign countries.Accordingly, the fund hereby makes the following designations regarding its fiscal year ended August 31, 2005:
—the total amount of taxes paid to foreign countries was $1,764,672
—the total amount of income sourced from foreign countries was $13,692,162
As required by federal tax law rules, shareholders will receive notification of their proportionate share of foreign taxes paid and foreign sourced income for the 2005 calendar year with Form 1099-DIV which will be mailed by January 31, 2006.
Also certain dividends paid by the fund may be subject to a maximum tax rate of 15%, as provided by the Jobs and Growth Tax Relief Reconciliation Act of 2003. Of the distributions paid during the fiscal year, $6,642,885 represents the maximum amount that may be considered qualified dividend income.
INFORMATION ABOUT THE REVIEW AND APPROVAL
OF THE FUND’S MANAGEMENT AGREEMENT (Unaudited)
|
At a meeting of the Board of Directors held on March 14, 2005, the Board considered the re-approval for an annual period of the Fund’s Management Agreement, pursuant to which the Manager provides the Fund with investment advisory and administrative services. The Board members, none of whom are “interested persons” (as defined in the Investment Company Act of 1940,as amended) of the Fund,were assisted in their review by independent legal counsel and met with counsel in executive session separate from representatives of the Manager.
Analysis of Nature, Extent and Quality of Services Provided to the Fund. The Board members received a presentation from representatives of the Manager regarding services provided to the Fund and other funds in the Dreyfus fund complex, and discussed the nature, extent and quality of the services provided to the Fund pursuant to its Management Agreement. The presentation included a detailed summary of the services provided to Dreyfus-managed mutual funds by each business unit within the Manager.The Manager’s representatives reviewed the Fund’s distribution of accounts and the relationships the Manager has with various intermediaries and the different needs of each.The Manager’s representatives noted the diversity of distribution of the Fund as well as among the funds in the Dreyfus fund complex, and the Manager’s corresponding need for broad, deep, and diverse resources to be able to provide ongoing shareholder services to each of the Fund’s distribution channels.The Board also reviewed the number of shareholder accounts in the Fund, as well as the Fund’s asset size.
The Board members also considered the Manager’s research and portfolio management capabilities and that the Manager also provides oversight of day-to-day Fund operations, including fund accounting and administration and assistance in meeting legal and regulatory requirements. The Board members also considered the Manager’s extensive administrative, accounting and compliance infrastructure.
Comparative Analysis of the Fund’s Performance and Management Fee and Expense Ratio. The Board members reviewed the Fund’s performance, management fee and expense ratios and placed significant emphasis on comparisons to a group of comparable funds and Lipper category averages, as applicable.The group of comparable funds was pre-
| | I N FO R M AT I O N A B O U T T H E R E V I E W A N D A P P R OVA L O F
T H E F U N D ’ S M A N A G E M E N T A G R E E M E N T ( U n a u d i t e d ) ( c o n t i n u e d )
|
viously approved by the Board for this purpose, and was prepared using a Board-approved selection methodology that was based, in part, on selecting non-affiliated funds reported in the same Lipper category as the Fund.The Board members discussed the results of the comparisons for various periods ended January 31, 2005, and noted that the Fund’s performance was lower than the comparison group averages for the 1-year, 3-year and 5-year periods and lower than the Lipper category averages for the 1-year and 3-year periods, but was higher than the Lipper category average for the 5-year period.The Board members noted that the Fund’s calendar year performance exceeded the performance of the MSCI EAFE Index for four out of the last five years and six out of nine years since its inception.The Board members also discussed the Fund’s management fee and expense ratio and reviewed the range of management fees and expense ratios for the funds in the comparison group.The Fund’s management fee ranked in the bottom half (i.e., higher than most others) of the comparison group funds.The Board noted that the Fund’s total expense ratio was higher than the Fund’s comparison group average, but was lower than the Lipper category average.
Representatives of the Manager reviewed with the Board members the fees paid to the Manager or its affiliates by mutual funds managed by the Manager or its affiliates with similar investment objectives, policies and strategies as the Fund (the “Similar Funds”), and by other accounts managed or sub-advised by the Manager or its affiliates with similar investment objectives, policies and strategies as the Fund (the “Separate Accounts” and, collectively with the Similar Funds, the “Similar Accounts”). The Manager’s representatives explained the nature of the Similar Accounts and the differences, from the Manager’s perspective, in management of the Similar Accounts as compared to managing and providing services to the Fund; it was noted that the Similar Funds were mutual funds included in the “international multi-cap value” and “international value variable insurance products” funds categories by Lipper.The Manager’s representatives also reviewed the costs associated with distribution through intermediaries. The Board analyzed the differences in fees paid to the Manager and discussed the relationship of the advisory fees paid in light of the Manager’s perfor-
mance and the services provided; it was noted that the Similar Funds had the same or lower management fees as the fee borne by the Fund. The Board members considered the relevance of the fee information provided for the Similar Accounts managed by the Manager to evaluate the appropriateness and reasonableness of the Fund’s advisory fees. The Board acknowledged that differences in fees paid by the Similar Accounts seemed to be consistent with the services provided.
Analysis of Profitability and Economies of Scale. The Manager’s representatives reviewed the dollar amount of expenses allocated and profit received by the Manager and the method used to determine such expenses and profit. The Board received and considered information prepared by an independent consulting firm regarding the Manager’s approach to allocating costs to, and determining the profitability of, individual funds and the entire Dreyfus fund complex.The Manager’s representatives stated that the methodology had also been reviewed by an independent registered public accounting firm which, like the consultant, found the methodology to be reasonable.The consulting firm also analyzed where any economies of scale might emerge in connection with the management of the Fund.The Board members evaluated the analysis in light of the relevant circumstances for the Fund, and the extent to which economies of scale would be realized as the Fund grows and whether fee levels reflect these economies of scale for the benefit of Fund investors.The Board noted that it appeared that the benefits of any economies of scale also would be appropriately shared with shareholders through increased investment in fund management and administration resources.The Board members also considered potential benefits to the Manager from acting as investment adviser and reviewed the soft dollar arrangements with respect to trading the Fund’s portfolio.
It was noted that the Board members should consider the Manager’s profitability with respect to the Fund as part of their evaluation of whether the fee under the Management Agreement bears a reasonable relationship to the mix of services provided by the Manager, including the nature, extent and quality of such services and that a discussion of economies of scale is predicated on increasing assets and that, if a fund’s
| | I N FO R M AT I O N A B O U T T H E R E V I E W A N D A P P R OVA L O F
T H E F U N D ’ S M A N A G E M E N T A G R E E M E N T ( U n a u d i t e d ) ( c o n t i n u e d )
|
assets had been decreasing, the possibility that the Manager may have realized any economies of scale would be less.The Board members also discussed the profitability percentage ranges determined by appropriate court cases to be reasonable given the services rendered to investment companies. It was noted that the profitability percentage for managing the Fund was not unreasonable given the Fund’s overall performance and generally superior service levels provided.
At the conclusion of these discussions, each of the Directors expressed the opinion that he or she had been furnished with sufficient information to make an informed business decision with respect to continuation of the Fund’s Management Agreement. Based on their discussions and considerations as described above, the Board made the following conclusions and determinations.
- The Board concluded that the nature, extent and quality of the ser- vices provided by the Manager are adequate and appropriate.
- The Board generally was satisfied with the Fund’s overall perfor- mance, particularly as compared to the Fund’s benchmark index.
- The Board concluded that the fee paid to the Manager by the Fund was reasonable in light of comparative performance and expense and advisory fee information, costs of the services provided and profits to be realized and benefits derived or to be derived by the Manager from its relationship with the Fund.
- The Board determined that the economies of scale which may accrue to the Manager and its affiliates in connection with the management of the Fund had been adequately considered by the Manager in con- nection with the management fee rate charged to the Fund, and that, to the extent in the future it were to be determined that material economies of scale had not been shared with the Fund, the Board would seek to have those economies of scale shared with the Fund.
The Board members considered these conclusions and determinations, along with the information received on a routine and regular basis throughout the year, and, without any one factor being dispositive, the Board determined that re-approval of the Fund’s Management Agreement was in the best interests of the Fund and its shareholders.
BOARD MEMBERS INFORMATION (Unaudited)
| | Joseph S. DiMartino (61)
Chairman of the Board (1995)
|
| | Principal Occupation During Past 5 Years:
• Corporate Director and Trustee
|
| | Other Board Memberships and Affiliations:
|
- The Muscular Dystrophy Association, Director
- Levcor International, Inc., an apparel fabric processor, Director
- Century Business Services, Inc., a provider of outsourcing functions for small and medium size companies, Director
- The Newark Group, a provider of a national market of paper recovery facilities, paperboard mills and paperboard converting plants, Director
- Azimuth Trust, an institutional asset management firm, Member of Board of Managers and Advisory Board
- Sunair Electronics, Inc., engages in the design, manufacture and sale of high frequency systems for long-range voice and data communications, as well as providing certain outdoor-related services to homes and businesses, Director
No. of Portfolios for which Board Member Serves: 193
| | David P. Feldman (65)
Board Member (1996)
|
| Principal Occupation During Past 5 Years: |
| • Corporate Director & Trustee |
| | Other Board Memberships and Affiliations:
|
- BBH Mutual Funds Group (11 funds), Director
- The Jeffrey Company, a private investment company, Director
- QMED, a medical device company, Director
No. of Portfolios for which Board Member Serves: 58
| | Ehud Houminer (65)
Board Member (1993)
|
| | Principal Occupation During Past 5 Years:
|
- Executive-in-Residence at the Columbia Business School, Columbia University
- Principal of Lear,Yavitz and Associates, a management consulting firm (1996 to 2001)
| | Other Board Memberships and Affiliations:
|
- Avnet Inc., an electronics distributor, Director
- International Advisory Board to the MBA Program School of Management, Ben Gurion University, Chairman
- Explore Charter School, Brooklyn, NY, Chairman
| | No. of Portfolios for which Board Member Serves: 36
|
BOARD MEMBERS INFORMATION (Unaudited) (continued)
| | Gloria Messinger (75)
Board Member (1993)
|
| | Principal Occupation During Past 5 Years:
|
- Arbitrator for American Arbitration Association and National Association of Securities Dealers, Inc.
- Consultant in Intellectual Property
| | Other Board Memberships and Affiliations:
|
- Yale Law School Fund, Director
- Theater for a New Audience, Inc., Director
- Brooklyn Philharmonic, Director
- New York Women’s Agenda Music Performance Trust Fund, Director
| | No. of Portfolios for which Board Member Serves: 25
|
T. John Szarkowski (79) Board Member (1996)
———————
| Principal Occupation During Past 5 Years: |
| • Consultant in Photography |
| Other Board Memberships and Affiliations: |
| • Photography Department at The Museum of Modern Art, Director Emeritus |
| | No. of Portfolios for which Board Member Serves: 25
|
| | Anne Wexler (75)
Board Member (1996)
|
| | Principal Occupation During Past 5 Years:
|
- Chairman of the Wexler & Walker Public Policy Associates, consultants specializing in government relations and public affairs
| | Other Board Memberships and Affiliations:
|
- Wilshire Mutual Funds (5 funds), Director
- Methanex Corporation, a methanol producing company, Director
- Member of the Council of Foreign Relations
- Member of the National Park Foundation
| | No. of Portfolios for which Board Member Serves: 36
|
Once elected all Board Members serve for an indefinite term.The address of the Board Members and Officers is in c/o The Dreyfus Corporation, 200 Park Avenue, New York, New York 10166. Additional information about the Board Members is available in the fund’s Statement of Additional Information which can be obtained from Dreyfus free of charge by calling this toll free number: 1-800-554-4611.
John M. Fraser, Jr., Emeritus Board Member
OFFICERS OF THE FUND (Unaudited)
| STEPHEN E. CANTER, President since | | JAMES BITETTO, Vice President and |
| March 2000. | | Assistant Secretary since August 2005. |
| Chairman of the Board, Chief Executive | | Assistant General Counsel and Assistant |
| Officer and Chief Operating Officer of the | | Secretary of the Manager, and an officer of 91 |
| Manager, and an officer of 90 investment | | investment companies (comprised of 200 |
| companies (comprised of 184 portfolios) | | portfolios) managed by the Manager. He is 39 |
| managed by the Manager. Mr. Canter also is a | | years old and has been an employee of the |
| Board member and, where applicable, an | | Manager since December 1996. |
| |
| Executive Committee Member of the other | | JONI LACKS CHARATAN, Vice President |
| investment management subsidiaries of Mellon | | and Assistant Secretary since |
| Financial Corporation, each of which is an | | August 2005. |
| affiliate of the Manager. He is 60 years old and | | |
| has been an employee of the Manager since | | Assistant General Counsel and Assistant |
| May 1995. | | Secretary of the Manager, and an officer of 91 |
| | | investment companies (comprised of 200 |
| STEPHEN R. BYERS, Executive Vice | | portfolios) managed by the Manager. She is 49 |
| President since November 2002. | | years old and has been an employee of the |
| Chief Investment Officer,Vice Chairman and a | | Manager since October 1998. |
| |
| director of the Manager, and an officer of 90 | | JOSEPH M. CHIOFFI, Vice President and |
| investment companies (comprised of 184 | | Assistant Secretary since August 2005. |
| portfolios) managed by the Manager. Mr. Byers | | |
| also is an officer, director or an Executive | | Assistant General Counsel and Assistant |
| Committee Member of certain other | | Secretary of the Manager, and an officer of 91 |
| investment management subsidiaries of Mellon | | investment companies (comprised of 200 |
| Financial Corporation, each of which is an | | portfolios) managed by the Manager. He is 43 |
| affiliate of the Manager. He is 52 years old and | | years old and has been an employee of the |
| has been an employee of the Manager since | | Manager since July 2000. |
| January 2000. | | JANETTE E. FARRAGHER, Vice President |
| MARK N. JACOBS, Vice President since | | and Assistant Secretary since |
| March 2000. | | August 2005. |
| Executive Vice President, Secretary and | | Associate General Counsel of the Manager, |
| General Counsel of the Manager, and an | | and an officer of 91 investment companies |
| officer of 91 investment companies (comprised | | (comprised of 200 portfolios) managed by the |
| of 200 portfolios) managed by the Manager. | | Manager. She is 42 years old and has been an |
| He is 59 years old and has been an employee | | employee of the Manager since February 1984. |
| of the Manager since June 1977. | | JOHN B. HAMMALIAN, Vice President and |
| MICHAEL A. ROSENBERG, Vice President | | Assistant Secretary since August 2005. |
| and Secretary since August 2005. | | Associate General Counsel of the Manager, |
| Associate General Counsel of the Manager, | | and an officer of 91 investment companies |
| and an officer of 91 investment companies | | (comprised of 200 portfolios) managed by the |
| (comprised of 200 portfolios) managed by the | | Manager. He is 42 years old and has been an |
| Manager. He is 45 years old and has been an | | employee of the Manager since February 1991. |
| employee of the Manager since October 1991. | | |
OFFICERS OF THE FUND (Unaudited) (continued)
| ROBERT R. MULLERY, Vice President and | | ROBERT SVAGNA, Assistant Treasurer |
| Assistant Secretary since August 2005. | | since December 2002. |
| Associate General Counsel of the Manager, | | Senior Accounting Manager – Equity Funds of |
| and an officer of 91 investment companies | | the Manager, and an officer of 91 investment |
| (comprised of 200 portfolios) managed by the | | companies (comprised of 200 portfolios) |
| Manager. He is 53 years old and has been an | | managed by the Manager. He is 38 years old |
| employee of the Manager since May 1986. | | and has been an employee of the Manager |
| |
| JEFF PRUSNOFSKY, Vice President and | | since November 1990. |
| Assistant Secretary since August 2005. | | KENNETH J. SANDGREN, Assistant |
| Associate General Counsel of the Manager, | | Treasurer since November 2001. |
| and an officer of 91 investment companies | | Mutual Funds Tax Director of the Manager, |
| (comprised of 200 portfolios) managed by the | | and an officer of 91 investment companies |
| Manager. He is 40 years old and has been an | | (comprised of 200 portfolios) managed by the |
| employee of the Manager since October 1990. | | Manager. He is 51 years old and has been an |
| |
| JAMES WINDELS, Treasurer since | | employee of the Manager since June 1993. |
| November 2001. | | JOSEPH W. CONNOLLY, Chief Compliance |
| | | Officer since October 2004. |
| Director – Mutual Fund Accounting of the | | |
| Manager, and an officer of 91 investment | | Chief Compliance Officer of the Manager and |
| companies (comprised of 200 portfolios) managed | | The Dreyfus Family of Funds (91 investment |
| by the Manager. He is 46 years old and has been | | companies, comprising 200 portfolios). From |
| an employee of the Manager since April 1985. | | November 2001 through March 2004, Mr. |
| | | Connolly was first Vice-President, Mutual |
| GREGORY S. GRUBER, Assistant | | Fund Servicing for Mellon Global Securities |
| Treasurer since August 2005. | | Services. In that capacity, Mr. Connolly was |
| Senior Accounting Manager – Municipal Bond | | responsible for managing Mellon’s Custody, |
| Funds of the Manager, and an officer of 91 | | Fund Accounting and Fund Administration |
| investment companies (comprised of 200 | | services to third-party mutual fund clients. He |
| portfolios) managed by the Manager. He is 46 | | is 48 years old and has served in various |
| years old and has been an employee of the | | capacities with the Manager since 1980, |
| Manager since August 1981. | | including manager of the firm’s Fund |
| |
| ERIK D. NAVILOFF, Assistant Treasurer | | Accounting Department from 1997 through |
| since August 2005. | | October 2001. |
| Senior Accounting Manager – Taxable Fixed | | WILLIAM GERMENIS, Anti-Money |
| Income Funds of the Manager, and an officer | | Laundering Compliance Officer since |
| of 91 investment companies (comprised of 200 | | October 2002. |
| portfolios) managed by the Manager. He is 37 | | Vice President and Anti-Money Laundering |
| years old and has been an employee of the | | Compliance Officer of the Distributor, and the |
| Manager since November 1992. | | Anti-Money Laundering Compliance Officer |
| |
| ROBERT ROBOL, Assistant Treasurer | | of 87 investment companies (comprised of 196 |
| since August 2005. | | portfolios) managed by the Manager. He is 35 |
| | | years old and has been an employee of the |
| Senior Accounting Manager – Money Market | | Distributor since October 1998. |
| Funds of the Manager, and an officer of 91 | | |
| investment companies (comprised of 200 | | |
| portfolios) managed by the Manager. He is 41 | | |
| years old and has been an employee of the | | |
| Manager since October 1988. | | |
| For More | | Information |
| |
|
| |
| Dreyfus Premier | | Transfer Agent & |
| International Value Fund | | Dividend Disbursing Agent |
| 200 Park Avenue | | |
| | | Dreyfus Transfer, Inc. |
| New York, NY 10166 | | |
| | | 200 Park Avenue |
| Manager | | New York, NY 10166 |
| The Dreyfus Corporation | | Distributor |
| 200 Park Avenue | | |
| | | Dreyfus Service Corporation |
| New York, NY 10166 | | |
| | | 200 Park Avenue |
| Custodian | | New York, NY 10166 |
| The Bank of New York | | |
| One Wall Street | | |
| New York, NY 10286 | | |
Telephone Call your financial representative or 1-800-554-4611
| Mail | | The Dreyfus Premier Family of Funds |
| | | 144 Glenn Curtiss Boulevard, Uniondale, NY 11556-0144 |
The fund files its complete schedule of portfolio holdings with the Securities and Exchange Commission (“SEC”) for the first and third quarters of each fiscal year on Form N-Q. The fund’s Forms N-Q are available on the SEC’s website at http://www.sec.gov and may be reviewed and copied at the SEC’s Public Reference Room in Washington, DC. Information on the operation of the Public Reference Room may be obtained by calling 1-800-SEC-0330.
A description of the policies and procedures that the fund uses to determine how to vote proxies relating to portfolio securities, and information regarding how the fund voted these proxies for the 12-month period ended June 30, 2005, is available at http://www.dreyfus.com and on the SEC’s website at http://www.sec.gov. The description of the policies and procedures is also available without charge, upon request, by calling 1-800-645-6561.

Save time. Save paper. View your next shareholder report online as soon as it’s available. Log into www.dreyfus.com and sign up for Dreyfus eCommunications. It’s simple and only takes a few minutes.
The views expressed in this report reflect those of the portfolio manager only through the end of the period covered and do not necessarily represent the views of Dreyfus or any other person in the Dreyfus organization. Any such views are subject to change at any time based upon market or other conditions and Dreyfus disclaims any responsibility to update such views.These views may not be relied on as investment advice and, because investment decisions for a Dreyfus fund are based on numerous factors, may not be relied on as an indication of trading intent on behalf of any Dreyfus fund.
Not FDIC-Insured • Not Bank-Guaranteed • May Lose Value
| | | Contents |
| |
| | | THE FUND |
| |
|
| 2 | | Letter from the Chairman |
| 3 | | Discussion of Fund Performance |
| 6 | | Fund Performance |
| 8 | | Understanding Your Fund’s Expenses |
| 8 | | Comparing Your Fund’s Expenses |
| | | With Those of Other Funds |
| 9 | | Statement of Investments |
| 13 | | Statement of Assets and Liabilities |
| 14 | | Statement of Operations |
| 15 | | Statement of Changes in Net Assets |
| 17 | | Financial Highlights |
| 22 | | Notes to Financial Statements |
| 30 | | Report of Independent Registered |
| | | Public Accounting Firm |
| 31 | | Important Tax Information |
| 32 | | Information About the Review and Approval |
| | | of the Fund’s Management Agreement |
| 37 | | Board Members Information |
| 39 | | Officers of the Fund |
| |
| | | FOR MORE INFORMATION |
| |
|
| | | Back Cover |
The Fund
| | Dreyfus Premier
Midcap Value Fund
|

LETTER FROM THE CHAIRMAN
This annual report for Dreyfus Premier Midcap Value Fund covers the 12-month period from September 1, 2004, through August 31, 2005. Inside, you’ll find valuable information about how the fund was managed during the reporting period, including a discussion with the fund’s portfolio manager, David A. Daglio.
On average, stock prices ended the reporting period higher than where they began. However, most of the market’s gains occurred during the closing months of 2004. So far in 2005, positive factors, including steady economic growth and higher corporate profits, were largely offset by headwinds, such as sharply higher energy prices and rising short-term interest rates. Midcap stocks produced higher returns than small-cap stocks in this environment, and small-cap stocks outperformed large-cap stocks. Also, value-oriented stocks have generally produced better results than their more growth-oriented counterparts during the past 12 months.
Recent shocks to the U.S. economy — including sharply higher gasoline prices and other lingering consequences of Hurricane Katrina — have added a degree of uncertainty to the economic outlook.Nonetheless,our economists currently expect the economy to continue to grow without either entering a recession or triggering a significant acceleration of infla-tion.As always, we encourage you to discuss the potential implications of these and other matters with your financial advisor.
Thank you for your continued confidence and support.


DISCUSSION OF FUND PERFORMANCE
David A. Daglio, Portfolio Manager
How did Dreyfus Premier Midcap Value Fund perform relative
to its benchmark?
|
For the 12-month period ended August 31, 2005, the fund produced total returns of 20.67% for its Class A shares, 19.67% for its Class B shares, 19.63% for its Class C shares, 18.84% for its Class R shares and 19.45% for its Class T shares.1 In comparison, the fund’s benchmark, the Russell Midcap Value Index, achieved a total return of 28.06% .2
An improving U.S. economy and rising corporate earnings more than offset concerns related to rising interest rates and soaring energy prices, fueling gains for midcap stocks during the reporting period. The fund’s returns underperformed its benchmark, mainly due to weakness among paper manufacturers, disappointing stock selections in the financials area and relatively light exposure to energy stocks.
What is the fund’s investment approach?
The fund’s goal is to exceed the performance of the Russell Midcap Value Index.To pursue this goal, the fund normally invests at least 80% of its assets in stocks of midcap companies.The fund currently considers companies with market capitalizations that fall in the range of the capitalizations of the companies that comprise the S&P Midcap 400 Index or the Russell Midcap Index at the time of purchase to be mid-cap companies. As of August 31, 2005, the market capitalizations of companies that comprise such indexes ranged between $500 million and $15 billion; however, based on market conditions, the range of midcap companies may vary. Because the fund may continue to hold a security whose market capitalization grows, a substantial portion of the fund’s holdings can have market capitalizations in excess of $15 billion at any given time.
When selecting stocks for the fund, we utilize a “bottom-up” approach, where the focus is on individual stock selection rather than
| | DISCUSSION OF FUND PERFORMANCE (continued)
|
attempting to forecast market trends, and look for value companies. A three-step screening process is used to select stocks:
- Value, quantitative screens track traditional measures such as price- to-earnings, price-to-book and price-to-sales ratios; these ratios are analyzed and compared against the market;
- Sound business fundamentals, a company balance sheet and income data are examined to determine the company’s financial history; and
- Positive business momentum, a company’s earnings and forecast changes are analyzed and sales and earnings trends are reviewed to determine the company’s financial condition or the presence of a catalyst that will trigger a price increase near- to midterm.
The fund typically sells a stock when it reaches our target price, is no longer considered a value company, appears less likely to benefit from the current market and economic environment, shows deteriorating fundamentals or declining momentum or falls short of our expectations.
What other factors influenced the fund’s performance?
Favorable employment statistics and low borrowing rates during the first half of the reporting period helped produce stronger economic growth. Corporate profitability and balance sheets improved, and a long-awaited increase in capital spending among businesses began to materialize. Despite rising oil and natural gas costs, consumer spending remained strong. By the second half of the reporting period, however, rising oil prices and short-term interest rates began to weigh more heavily on investor sentiment. However, midcap stocks continued to gain value, ending the reporting period with higher returns than their large- and small-cap counterparts.
Although the fund participated to a substantial degree in the midcap market’s strength, its return lagged that of its benchmark, primarily due to our emphasis on paper companies at a time when chemical stocks posted stronger returns. Finally, the fund’s limited exposure to high-flying energy stocks, many of which did not meet our value-oriented investment criteria, detracted from the fund’s relative performance.
On the other hand, the fund scored successes with its holdings across a wide range of sectors. Not surprisingly, several individual energy
stocks posted strong returns. Semiconductor and semiconductor capital equipment stocks rebounded on the heels of increased capital spending for technology, benefiting holdings such as Advanced Micro Devices, Fairchild Semiconductor and Lam Research. Within the financials sector, the fund’s holdings of online brokers helped the fund’s performance. The fund’s consumer stocks also fared well, including specialty retailer Abercrombie & Fitch and restaurant chain Brinker International. Other successful positions included Baxter Pharmaceutical and two telecommunications companies, Sprint and Nextel, that benefited from the merger of their businesses.
What is the fund’s current strategy?
As of the end of the reporting period, we have continued to find what we believe to be relatively attractive values among paper manufacturers, media companies, technology firms and reinsurance companies. Conversely, we recently have trimmed or sold some of the fund’s energy and coal stocks as they reached our price targets.We have also reduced the fund’s exposure to steel manufacturers, focusing instead on steel processors that, in our judgment, may be better positioned to benefit from more stable commodity prices.
| 1 | | Total return includes reinvestment of dividends and any capital gains paid, and does not take into |
| | | consideration the maximum initial sales charges in the case of Class A and Class T shares, or the |
| | | applicable contingent deferred sales charges imposed on redemptions in the case of Class B and |
| | | Class C shares. Had these charges been reflected, returns would have been lower. Past performance |
| | | is no guarantee of future results. Share price, yield and investment return fluctuate such that upon |
| | | redemption, fund shares may be worth more or less than their original cost. Return figures |
| | | provided reflect the absorption of fund expenses by The Dreyfus Corporation pursuant to an |
| | | agreement in effect through August 31, 2006, at which time it may be extended, terminated or |
| | | modified. Had these expenses not been absorbed, the fund’s returns would have been lower. |
| | | Part of the fund’s recent performance is attributable to positive returns from its initial public |
| | | offering (IPO) investments.There can be no guarantee that IPOs will have or continue to have a |
| | | positive effect on the fund’s performance. Currently, the fund is relatively small in asset size. IPOs |
| | | tend to have a reduced effect on performance as a fund’s asset base grows. |
| 2 | | SOURCE: LIPPER INC. — Reflects reinvestment of dividends and, where applicable, capital |
| | | gain distributions.The Russell Midcap Value Index is a widely accepted, unmanaged index of |
| | | medium-cap stock market performance and measures the performance of those Russell Midcap |
| | | companies with lower price-to-book ratios and lower forecasted growth values. |
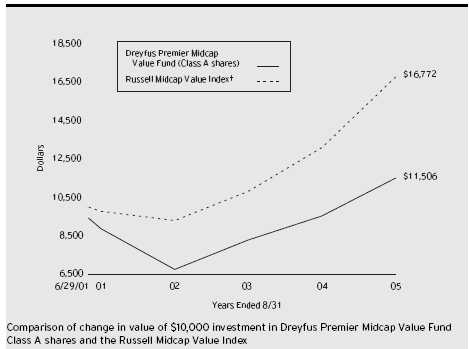
† Source: Lipper Inc.
Past performance is not predictive of future performance.
Part of the fund’s recent performance is attributable to positive returns from its initial public offering (IPO) investments. There can be no guarantee that IPOs will have or continue to have a positive effect on fund performance. Currently, the fund is relatively small in asset size. IPOs tend to have a reduced effect on performance as a fund’s asset base grows. The above graph compares a $10,000 investment made in Class A shares of Dreyfus Premier Midcap Value Fund on 6/29/01 (inception date) to a $10,000 investment made in the Russell Midcap Value Index (the “Index”) on that date. Performance for Class B, Class C, Class R and Class T shares will vary from the performance of Class A shares shown above due to differences in charges and expenses. All dividends and capital gain distributions are reinvested. The fund’s performance shown in the line graph takes into account the maximum initial sales charge on Class A shares and all other applicable fees and expenses.The Index is a widely accepted, unmanaged index of medium-cap stock market performance and measures the performance of those Russell Midcap companies with lower price-to-book ratios and lower forecasted growth values.The Index does not take into account charges, fees and other expenses. Further information relating to fund performance, including expense reimbursements, if applicable, is contained in the Financial Highlights section of the prospectus and elsewhere in this report.
| Average Annual Total Returns as of 8/31/05 | | | | |
| |
| | | | | Inception | | | | From |
| | | | | Date | | 1 Year | | Inception |
| |
| |
| |
| |
|
| Class A shares | | | | | | |
| with maximum sales charge (5.75%) | | 6/29/01 | | 13.71% | | 3.42% |
| without sales charge | | 6/29/01 | | 20.67% | | 4.90% |
| Class B shares | | | | | | |
| with applicable redemption charge † | | 6/30/04 | | 15.67% | | 6.88% |
| without redemption | | 6/30/04 | | 19.67% | | 10.25% |
| Class C shares | | | | | | |
| with applicable redemption charge †† | | 6/30/04 | | 18.63% | | 10.07% |
| without redemption | | 6/30/04 | | 19.63% | | 10.07% |
| Class R shares | | 6/30/04 | | 18.84% | | 9.67% |
| Class T shares | | | | | | |
| with applicable sales charge (4.5%) | | 6/30/04 | | 14.10% | | 5.85% |
| without sales charge | | 6/30/04 | | 19.45% | | 10.08% |
| |
| Past performance is not predictive of future performance.The fund’s performance shown in the graph and table does not |
| reflect the deduction of taxes that a shareholder would pay on fund distributions or the redemption of fund shares. |
| † | | The maximum contingent deferred sales charge for Class B shares is 4%. After six years Class B shares convert to |
| | | Class A shares. | | | | | | |
| †† | | The maximum contingent deferred sales charge for Class C shares is 1% for shares redeemed within one year of the |
| | | date of purchase. | | | | | | |
U N D E R S TA N D I N G YO U R F U N D ’ S E X P E N S E S ( U n a u d i t e d )
As a mutual fund investor, you pay ongoing expenses, such as management fees and other expenses. Using the information below, you can estimate how these expenses affect your investment and compare them with the expenses of other funds.You also may pay one-time transaction expenses, including sales charges (loads) and redemption fees, which are not shown in this section and would have resulted in higher total expenses. For more information, see your fund’s prospectus or talk to your financial adviser.
Review your fund’s expenses
The table below shows the expenses you would have paid on a $1,000 investment in Dreyfus Premier Midcap Value Fund from March 1, 2005 to August 31, 2005. It also shows how much a $1,000 investment would be worth at the close of the period, assuming actual returns and expenses.
| Expenses and Value of a $1,000 Investment | | | | | | |
| assuming actual returns for the six months ended August 31, 2005 | | | | |
| | | Class A | | Class B | | Class C | | Class R | | Class T |
| |
| |
| |
| |
| |
|
| Expenses paid per $1,000 † | | $ 7.71 | | $ 12.14 | | $ 12.08 | | $ 15.01 | | $ 10.18 |
| Ending value (after expenses) | | $1,053.30 | | $1,049.10 | | $1,048.40 | | $1,046.30 | | $1,050.80 |
| | COMPARING YOUR FUND’S EXPENSES
WITH THOSE OF OTHER FUNDS (Unaudited)
|
Using the SEC’s method to compare expenses
The Securities and Exchange Commission (SEC) has established guidelines to help investors assess fund expenses. Per these guidelines, the table below shows your fund’s expenses based on a $1,000 investment, assuming a hypothetical 5% annualized return. You can use this information to compare the ongoing expenses (but not transaction expenses or total cost) of investing in the fund with those of other funds.All mutual fund shareholder reports will provide this information to help you make this comparison. Please note that you cannot use this information to estimate your actual ending account balance and expenses paid during the period.
| | Expenses and Value of a $1,000 Investment
assuming a hypothetical 5% annualized return for the six months ended August 31, 2005
|
| | | Class A | | Class B | | Class C | | Class R | | Class T |
| |
| |
| |
| |
| |
|
| Expenses paid per $1,000 † | | $ 7.58 | | $ 11.93 | | $ 11.88 | | $ 14.75 | | $ 10.01 |
| Ending value (after expenses) | | $1,017.69 | | $1,013.36 | | $1,013.41 | | $1,010.54 | | $1,015.27 |
† Expenses are equal to the fund’s annualized expense ratio of 1.49% for Class A, 2.35% for Class B, 2.34% for Class C, 2.91% for Class R and 1.97% for Class T; multiplied by the average account value over the period, multiplied by 184/365 (to reflect the one-half year period).
STATEMENT OF INVESTMENTS
August 31, 2005
|
| Common Stocks—97.9% | | Shares | | Value ($) |
| |
| |
|
| Airlines—1.4% | | | | |
| Ace Aviation Holdings, Cl. A | | 4,700 a | | 143,209 |
| Southwest Airlines | | 7,900 | | 105,228 |
| | | | | 248,437 |
| Banking—3.3% | | | | |
| Advance America Cash Advance Centers | | 28,630 | | 409,409 |
| Colonial BancGroup | | 6,800 | | 158,168 |
| | | | | 567,577 |
| Basic Industries—11.0% | | | | |
| Abitibi-Consolidated | | 42,000 | | 182,280 |
| Bowater | | 7,200 | | 223,416 |
| Chemtura | | 10,000 | | 171,600 |
| Huntsman | | 1,860 a | | 35,042 |
| Martin Marietta Materials | | 1,200 | | 86,784 |
| Massey Energy | | 2,400 | | 121,920 |
| Owens-Illinois | | 5,700 a | | 147,060 |
| Smurfit-Stone Container | | 11,550 a | | 127,512 |
| Timken | | 14,400 | | 422,928 |
| Walter Industries | | 2,600 | | 114,062 |
| Worthington Industries | | 15,000 | | 271,500 |
| | | | | 1,904,104 |
| Capital Goods—3.2% | | | | |
| General Dynamics | | 800 | | 91,672 |
| Navistar International | | 14,500 a | | 463,420 |
| | | | | 555,092 |
| Consumer Durables—1.4% | | | | |
| Centex | | 3,700 | | 250,675 |
| Consumer Non-Durables—7.5% | | | | |
| Colgate-Palmolive | | 300 | | 15,750 |
| Del Monte Foods | | 37,700 a | | 407,537 |
| Estee Lauder Cos., Cl. A | | 8,900 | | 359,471 |
| Polo Ralph Lauren | | 8,000 | | 396,400 |
| Reader’s Digest Association | | 1,600 | | 26,016 |
| Reynolds American | | 1,100 b | | 92,334 |
| | | | | 1,297,508 |
| Consumer Services—14.4% | | | | |
| ARAMARK, Cl. B | | 11,900 b | | 325,108 |
| Brinker International | | 5,900 a | | 219,185 |
| Common Stocks (continued) | | Shares | | Value ($) |
| |
| |
|
| Consumer Services (continued) | | | | |
| Career Education | | 10,900 a | | 427,280 |
| CBRL Group | | 3,500 | | 126,560 |
| Clear Channel Communications | | 5,100 | | 169,830 |
| Expedia | | 2,300 a,b | | 51,198 |
| IAC/InterActive | | 2,300 a,b | | 56,465 |
| Kroger | | 15,400 a | | 303,996 |
| Marvel Enterprises | | 4,200 a | | 80,850 |
| Omnicom Group | | 4,200 | | 337,848 |
| Safeway | | 11,800 | | 280,014 |
| Univision Communications, Cl. A | | 4,500 a | | 121,050 |
| | | | | 2,499,384 |
| Energy—5.9% | | | | |
| El Paso | | 31,300 | | 363,080 |
| Key Energy Services | | 25,800 a | | 367,650 |
| Marathon Oil | | 4,700 | | 302,257 |
| | | | | 1,032,987 |
| Financial Services—15.3% | | | | |
| CIT Group | | 11,600 | | 525,248 |
| Comerica | | 1,700 | | 102,833 |
| Doral Financial | | 14,800 | | 212,232 |
| E*TRADE Financial | | 12,100 a | | 193,600 |
| Equity Office Properties Trust | | 4,600 | | 153,180 |
| Hudson City Bancorp | | 38,194 | | 477,425 |
| Janus Capital Group | | 15,070 b | | 212,939 |
| MBIA | | 5,300 | | 307,241 |
| PartnerRe | | 3,600 | | 218,520 |
| PNC Financial Services Group | | 1,400 | | 78,722 |
| SEI Investments | | 4,600 | | 166,336 |
| | | | | 2,648,276 |
| Forest Products & Paper—.7% | | | | |
| Domtar | | 18,600 b | | 124,806 |
| Health Care—7.8% | | | | |
| Barr Pharmaceuticals | | 2,800 a | | 127,708 |
| Biogen Idec | | 2,300 a | | 96,945 |
| Biovail | | 6,800 a | | 121,992 |
| Boston Scientific | | 7,600 a | | 204,288 |
| Cephalon | | 4,800 a | | 194,496 |
| | STATEMENT OF INVESTMENTS (continued)
|
| Common Stocks (continued) | | Shares | | Value ($) |
| |
| |
|
| Health Care (continued) | | | | |
| Omnicare | | 3,300 | | 173,415 |
| Universal Health Services, Cl. B | | 1,500 | | 76,665 |
| WebMD | | 31,900 a | | 349,624 |
| | | | | 1,345,133 |
| Real Estate Investment Trusts—1.8% | | |
| Cousins Properties | | 10,300 b | | 312,193 |
| Retailing—1.0% | | | | |
| PMI Group | | 4,300 | | 173,978 |
| Technology—10.6% | | | | |
| Advanced Micro Devices | | 4,200 a | | 87,234 |
| BearingPoint | | 16,700 a,b | | 136,606 |
| Ceridian | | 15,700 a | | 318,710 |
| Compuware | | 25,100 a | | 227,406 |
| Cypress Semiconductor | | 6,300 a | | 98,469 |
| Diebold | | 2,700 | | 129,600 |
| Intuit | | 2,200 a | | 100,848 |
| JDS Uniphase | | 38,200 a | | 60,738 |
| Micron Technology | | 18,700 a,b | | 222,717 |
| Sanmina-SCI | | 37,600 a | | 190,632 |
| Scientific-Atlanta | | 2,700 | | 103,302 |
| Unisys | | 11,000 a | | 73,150 |
| United Microelectronics, ADR | | 23,300 | | 79,453 |
| | | | | 1,828,865 |
| Transportation—2.4% | | | | |
| Burlington Northern Santa Fe | | 2,500 | | 132,550 |
| Norfolk Southern | | 2,400 | | 85,464 |
| Union Pacific | | 2,900 | | 197,983 |
| | | | | 415,997 |
| Utilities—10.2% | | | | |
| CMS Energy | | 16,200 a | | 260,820 |
| Constellation Energy Group | | 4,900 | | 287,875 |
| Dominion Resources | | 4,700 b | | 359,456 |
| Entergy | | 4,800 | | 359,568 |
| Exelon | | 2,900 | | 156,281 |
| Wisconsin Energy | | 8,700 | | 340,779 |
| | | | | 1,764,779 |
| Total Common Stocks | | | | |
| (cost $15,549,070) | | | | 16,969,791 |
| | STATEMENT OF INVESTMENTS (continued)
|
| | | | | | | Principal | | |
| Short-Term Investment—1.7% | | Amount ($) | | Value ($) |
| |
| |
|
| U.S. Treasury Bill; | | | | | | |
| 3.30%, 9/22/2005 | | | | | | |
| (cost $297,426) | | | | 298,000 | | 297,431 |
| |
| |
| |
|
| |
| Investment of Cash Collateral | | | | |
| for Securities Loaned—9.4% | | Shares | | Value ($) |
| |
| |
|
| Registered Investment Company; | | | | |
| Dreyfus Institutional Cash Advantage Plus Fund | | |
| (cost $1,629,841) | | | | 1,629,841 c | | 1,629,841 |
| |
| |
| |
|
| |
| Total Investments (cost $17,476,337) | | 109.0% | | 18,897,063 |
| Liabilities, Less Cash and Receivables | | (9.0%) | | (1,564,960) |
| Net Assets | | | | 100.0% | | 17,332,103 |
| |
| ADR—American Depository Receipts. | | | | |
| a | | Non-income producing. | | | | | | |
| b | | All or a portion of these securities are on loan. At August 31, 2005, the total market value of the fund’s securities on |
| | | loan is $1,575,373 and the total market value of the collateral held by the fund is $1,629,841. |
| c | | Investment in affiliated money market mutual fund. | | | | |
| |
| |
| |
|
| |
| |
| |
| |
| Portfolio Summary † | | | | | | |
| | | | | Value (%) | | | | Value (%) |
| |
| |
| |
| |
|
| Financial Services | | 15.3 | | Utilities | | 10.2 |
| Consumer Services | | 14.4 | | Health Care | | 7.8 |
| Short-Term/ | | | | Consumer Non-Durables | | 7.5 |
| Money Market Investments | | 11.1 | | Energy | | 5.9 |
| Basic Industries | | 11.0 | | Other | | 15.2 |
| Technology | | 10.6 | | | | 109.0 |
| |
| † | | Based on net assets. | | | | | | |
| See notes to financial statements. | | | | | | |
STATEMENT OF ASSETS AND LIABILITIES
August 31, 2005
|
| | | Cost | | Value |
| |
| |
|
| Assets ($): | | | | |
| Investments in securities— | | | | |
| See Statement of Investments (including securities | | |
| on loan, valued at $1,575,373)—Note 1(b): | | |
| Unaffiliated issuers | | 15,846,496 | | 17,267,222 |
| Affiliated issuers | | 1,629,841 | | 1,629,841 |
| Cash | | | | 46,809 |
| Receivable for investment securities sold | | 108,478 |
| Dividends and interest receivable | | 26,921 |
| Receivable for shares of Common Stock subscribed | | 18,442 |
| Prepaid expenses | | | | 34,829 |
| | | | | 19,132,542 |
| |
| |
|
| Liabilities ($): | | | | |
| Due to The Dreyfus Corporation and affiliates—Note 3(c) | | | | 16,211 |
| Liability for securities on loan—Note 1(b) | | | | | | 1,629,841 |
| Payable for investment securities purchased | | | | | | 100,205 |
| Payable for shares of Common Stock redeemed | | | | | | 21,772 |
| Accrued expenses | | | | | | | | | | 32,410 |
| | | | | | | | | | | 1,800,439 |
| |
| |
| |
| |
| |
|
| Net Assets ($) | | | | | | | | | | 17,332,103 |
| |
| |
| |
| |
| |
|
| Composition of Net Assets ($): | | | | | | | | |
| Paid-in capital | | | | | | | | | | 14,372,591 |
| Accumulated undistributed investment income—net | | | | | | 912 |
| Accumulated net realized gain (loss) on investments | | | | | | 1,537,874 |
| Accumulated net unrealized appreciation | | | | | | |
| (depreciation) on investments | | | | | | | | 1,420,726 |
| |
| |
| |
| |
|
| Net Assets ($) | | | | | | | | | | 17,332,103 |
| |
| |
| |
| |
| |
|
| |
| |
| Net Asset Value Per Share | | | | | | | | |
| | | Class A | | Class B | | Class C | | Class R | | Class T |
| |
| |
| |
| |
| |
|
| Net Assets ($) | | 16,612,775 | | 344,868 | | 337,557 | | 5,667 | | 31,236 |
| Shares Outstanding | | 1,168,291 | | 24,461 | | 23,986 | | 404.476 | | 2,220 |
| |
| |
| |
| |
| |
|
| Net Asset Value | | | | | | | | | | |
| Per Share ($) | | 14.22 | | 14.10 | | 14.07 | | 14.01 | | 14.07 |
| |
| See notes to financial statements. | | | | | | | | |
| | STATEMENT OF OPERATIONS
Year Ended August 31, 2005
|
| Investment Income ($): | | |
| Income: | | |
| Cash dividends (net of $1,275 foreign taxes withheld at source) | | 198,792 |
| Income from securities lending | | 4,315 |
| Interest | | 2,183 |
| Total Income | | 205,290 |
| Expenses: | | |
| Investment advisory fee—Note 3(a) | | 127,492 |
| Registration fees | | 70,082 |
| Shareholder servicing costs—Note 3(c) | | 61,972 |
| Audit fees | | 29,216 |
| Prospectus and shareholders’ reports | | 12,770 |
| Custodian fees—Note 3(c) | | 3,834 |
| Distribution fees—Note 3(b) | | 2,832 |
| Legal fees | | 801 |
| Directors’ fees and expenses—Note 3(d) | | 533 |
| Interest expense—Note 2 | | 208 |
| Miscellaneous | | 7,989 |
| Total Expenses | | 317,729 |
| Less—reduction in investment advisory fee | | |
| due to undertaking—Note 3(a) | | (60,636) |
| Net Expenses | | 257,093 |
| Investment (Loss)—Net | | (51,803) |
| |
|
| Realized and Unrealized Gain (Loss) on Investments—Note 4 ($): |
| Net realized gain (loss) on investments | | 2,031,962 |
| Net unrealized appreciation (depreciation) on investments | | 1,179,100 |
| Net Realized and Unrealized Gain (Loss) on Investments | | 3,211,062 |
| Net Increase in Net Assets Resulting from Operations | | 3,159,259 |
| | See notes to financial statements.
|
STATEMENT OF CHANGES IN NET ASSETS
| | | Year Ended August 31, |
| |
|
| | | 2005 | | 2004 a |
| |
| |
|
| Operations ($): | | | | |
| Investment (loss)—net | | (51,803) | | (44,686) |
| Net realized gain (loss) on investments | | 2,031,962 | | 2,296,418 |
| Net unrealized appreciation | | | | |
| (depreciation) on investments | | 1,179,100 | | (765,695) |
| Net Increase (Decrease) in Net Assets | | | | |
| Resulting from Operations | | 3,159,259 | | 1,486,037 |
| |
| |
|
| Dividends to Shareholders from ($): | | | | |
| Net realized gain on investments: | | | | |
| Class A shares | | (1,132,318) | | — |
| Class B shares | | (11,614) | | — |
| Class C shares | | (4,006) | | — |
| Class R shares | | (67) | | — |
| Class T shares | | (1,932) | | — |
| Total Dividends | | (1,149,937) | | — |
| |
| |
|
| Capital Stock Transactions ($): | | | | |
| Net proceeds from shares sold: | | | | |
| Class A shares | | 2,551,761 | | 7,914,815 |
| Class B shares | | 259,178 | | 108,857 |
| Class C shares | | 304,782 | | 12,084 |
| Class R shares | | 4,251 | | 1,000 |
| Class T shares | | 32,174 | | 1,000 |
| Dividends reinvested: | | | | |
| Class A shares | | 1,089,841 | | — |
| Class B shares | | 11,525 | | — |
| Class C shares | | 4,006 | | — |
| Class R shares | | 67 | | — |
| Class T shares | | 1,932 | | — |
| Cost of shares redeemed: | | | | |
| Class A shares | | (4,929,564) | | (2,887,635) |
| Class B shares | | (54,281) | | — |
| Class C shares | | (1,945) | | — |
| Class T shares | | (4,729) | | — |
| Increase (Decrease) in Net Assets | | | | |
| from Capital Stock Transactions | | (731,002) | | 5,150,121 |
| Total Increase (Decrease) in Net Assets | | 1,278,320 | | 6,636,158 |
| |
| |
|
| Net Assets ($): | | | | |
| Beginning of Period | | 16,053,783 | | 9,417,625 |
| End of Period | | 17,332,103 | | 16,053,783 |
| Undistributed investment income—net | | 912 | | 838 |
| | STATEMENT OF CHANGES IN NET ASSETS (continued)
|
| | | Year Ended August 31, |
| |
|
| | | 2005 | | 2004 a |
| |
| |
|
| Capital Share Transactions: | | | | |
| Class A | | | | |
| Shares sold | | 189,929 | | 635,600 |
| Shares issued for dividends reinvested | | 81,027 | | — |
| Shares redeemed | | (368,632) | | (232,607) |
| Net Increase (Decrease) in Shares Outstanding | | (97,676) | | 402,993 |
| |
| |
|
| Class B | | | | |
| Shares sold | | 19,013 | | 8,619 |
| Shares issued for dividends reinvested | | 860 | | — |
| Shares redeemed | | (4,031) | | — |
| Net Increase (Decrease) in Shares Outstanding | | 15,842 | | 8,619 |
| |
| |
|
| Class C | | | | |
| Shares sold | | 22,906 | | 935 |
| Shares issued for dividends reinvested | | 299 | | — |
| Shares redeemed | | (154) | | — |
| Net Increase (Decrease) in Shares Outstanding | | 23,051 | | 935 |
| |
| |
|
| Class R | | | | |
| Shares sold | | 325 | | 74 |
| Shares issued for dividends reinvested | | 5 | | — |
| Net Increase (Decrease) in Shares Outstanding | | 330 | | 74 |
| |
| |
|
| Class T | | | | |
| Shares sold | | 2,346 | | 74 |
| Shares issued for dividends reinvested | | 145 | | — |
| Shares redeemed | | (345) | | — |
| Net Increase (Decrease) in Shares Outstanding | | 2,146 | | 74 |
| |
| a The fund commenced offering five classes of shares on June 30, 2004.The existing shares were redesignated Class A |
| shares and the fund added Class B, Class C, Class R and Class T shares. | | |
| See notes to financial statements. | | | | |
The following tables describe the performance for each share class for the fiscal periods indicated.All information (except portfolio turnover rate) reflects financial results for a single fund share.Total return shows how much your investment in the fund would have increased (or decreased) during each period, assuming you had reinvested all dividends and distributions.These figures have been derived from the fund’s financial statements.
| | | | | | | Year Ended August 31, | | |
| | | |
| |
| |
|
| Class A Shares | | 2005 | | 2004 a | | 2003 | | 2002 | | 2001 b |
| |
| |
| |
| |
| |
|
| Per Share Data ($) | | | | | | | | | | |
| Net asset value, beginning of period | | 12.58 | | 10.91 | | 8.90 | | 11.77 | | 12.50 |
| Investment Operations: | | | | | | | | | | |
| Investment (loss)—net c | | (.04) | | (.04) | | (.03) | | (.08) | | (.00)d |
| Net realized and unrealized | | | | | | | | | | |
| gain (loss) on investments | | 2.59 | | 1.71 | | 2.04 | | (2.73) | | (.73) |
| Total from Investment Operations | | 2.55 | | 1.67 | | 2.01 | | (2.81) | | (.73) |
| Distributions: | | | | | | | | | | |
| Dividends from investment income—net | | — | | — | | — | | (.01) | | — |
| Dividends from net realized | | | | | | | | | | |
| gain on investments | | (.91) | | — | | — | | (.05) | | — |
| Total Distributions | | (.91) | | — | | — | | (.06) | | — |
| Net asset value, end of period | | 14.22 | | 12.58 | | 10.91 | | 8.90 | | 11.77 |
| |
| |
| |
| |
| |
|
| Total Return (%) | | 20.67e | | 15.20e | | 22.70 | | (24.00) | | (5.84)f |
| |
| |
| |
| |
| |
|
| Ratios/Supplemental Data (%): | | | | | | | | | | |
| Ratio of total expenses | | | | | | | | | | |
| to average net assets | | 1.85 | | 1.86 | | 2.35 | | 3.31 | | 1.26f |
| Ratio of net expenses | | | | | | | | | | |
| to average net assets | | 1.50 | | 1.50 | | 1.50 | | 1.50 | | .26f |
| Ratio of net investment (loss) | | | | | | | | | | |
| to average net assets | | (.29) | | (.31) | | (.33) | | (.74) | | (.02)f |
| Portfolio Turnover Rate | | 122.57 | | 154.39 | | 159.07 | | 146.66 | | 35.82f |
| |
| |
| |
| |
| |
|
| Net Assets, end of period ($ x 1,000) | | 16,613 | | 15,932 | | 9,418 | | 6,432 | | 2,057 |
| |
| a | | The fund commenced offering five classes of shares on June 30, 2004.The existing shares were redesignated |
| | | Class A shares. | | | | | | | | | | |
| b | | From June 29, 2001 (commencement of operations) to August 31, 2001. | | | | | | |
| c | | Based on average shares outstanding at each month end. | | | | | | | | |
| d | | Amount represents less than $.01 per share. | | | | | | | | |
| e | | Exclusive of sales charge. | | | | | | | | | | |
| f | | Not annualized. | | | | | | | | | | |
| See notes to financial statements. | | | | | | | | | | |
| | FINANCIAL HIGHLIGHTS (continued)
|
| | | | | Year Ended August 31, |
| | | |
|
| Class B Shares | | 2005 | | 2004 a |
| |
| |
|
| Per Share Data ($): | | | | |
| Net asset value, beginning of period | | 12.58 | | 13.43 |
| Investment Operations: | | | | |
| Investment (loss)—net b | | (.15) | | (.02) |
| Net realized and unrealized | | | | |
| gain (loss) on investments | | 2.58 | | (.83) |
| Total from Investment Operations | | 2.43 | | (.85) |
| Distributions: | | | | |
| Dividends from net realized gain on investments | | (.91) | | — |
| Net asset value, end of period | | 14.10 | | 12.58 |
| |
| |
|
| Total Return (%) c | | 19.67 | | (6.33)d |
| |
| |
|
| Ratios/Supplemental Data (%): | | | | |
| Ratio of total expenses to average net assets | | 2.72 | | .62d |
| Ratio of net expenses to average net assets | | 2.34 | | .39d |
| Ratio of net investment (loss) | | | | |
| to average net assets | | (1.14) | | (.17)d |
| Portfolio Turnover Rate | | 122.57 | | 154.39 |
| |
| |
|
| Net Assets, end of period ($ x 1,000) | | 345 | | 108 |
| |
| a | | The fund commenced offering five classes of shares on June 30, 2004.The existing shares were redesignated |
| | | Class A shares. | | | | |
| b | | Based on average shares outstanding at each month end. | | | | |
| c | | Exclusive of sales charge. | | | | |
| d | | Not annualized. | | | | |
| See notes to financial statements. | | | | |
| | | | | Year Ended August 31, |
| | | |
|
| Class C Shares | | 2005 | | 2004 a |
| |
| |
|
| Per Share Data ($): | | | | |
| Net asset value, beginning of period | | 12.56 | | 13.43 |
| Investment Operations: | | | | |
| Investment (loss)—net b | | (.15) | | (.02) |
| Net realized and unrealized | | | | |
| gain (loss) on investments | | 2.57 | | (.85) |
| Total from Investment Operations | | 2.42 | | (.87) |
| Distributions: | | | | |
| Dividends from net realized gain on investments | | (.91) | | — |
| Net asset value, end of period | | 14.07 | | 12.56 |
| |
| |
|
| Total Return (%) c | | 19.63 | | (6.48)d |
| |
| |
|
| Ratios/Supplemental Data (%): | | | | |
| Ratio of total expenses to average net assets | | 2.76 | | .59d |
| Ratio of net expenses to average net assets | | 2.35 | | .39d |
| Ratio of net investment (loss) | | | | |
| to average net assets | | (1.15) | | (.18)d |
| Portfolio Turnover Rate | | 122.57 | | 154.39 |
| |
| |
|
| Net Assets, end of period ($ x 1,000) | | 338 | | 12 |
| |
| a | | The fund commenced offering five classes of shares on June 30, 2004.The existing shares were redesignated |
| | | Class A shares. | | | | |
| b | | Based on average shares outstanding at each month end. | | | | |
| c | | Exclusive of sales charge. | | | | |
| d | | Not annualized. | | | | |
| See notes to financial statements. | | | | |
| | FINANCIAL HIGHLIGHTS (continued)
|
| | | | | Year Ended August 31, |
| | | |
|
| Class R Shares | | 2005 | | 2004 a |
| |
| |
|
| Per Share Data ($): | | | | |
| Net asset value, beginning of period | | 12.59 | | 13.43 |
| Investment Operations: | | | | |
| Investment (loss)—net b | | (.25) | | (.00)c |
| Net realized and unrealized | | | | |
| gain (loss) on investments | | 2.58 | | (.84) |
| Total from Investment Operations | | 2.33 | | (.84) |
| Distributions: | | | | |
| Dividends from net realized gain on investments | | (.91) | | — |
| Net asset value, end of period | | 14.01 | | 12.59 |
| |
| |
|
| Total Return (%) | | 18.84 | | (6.26)d |
| |
| |
|
| Ratios/Supplemental Data (%): | | | | |
| Ratio of total expenses to average net assets | | 3.47 | | .34d |
| Ratio of net expenses to average net assets | | 3.04 | | .21d |
| Ratio of net investment (loss) | | | | |
| to average net assets | | (1.83) | | (.03)d |
| Portfolio Turnover Rate | | 122.57 | | 154.39 |
| |
| |
|
| Net Assets, end of period ($ x 1,000) | | 6 | | 1 |
| |
| a | | The fund commenced offering five classes of shares on June 30, 2004.The existing shares were redesignated |
| | | Class A shares. | | | | |
| b | | Based on average shares outstanding at each month end. | | | | |
| c | | Amount represents less than $.01 per share. | | | | |
| d | | Not annualized. | | | | |
| See notes to financial statements. | | | | |
| | | | | Year Ended August 31, |
| | | |
|
| Class T Shares | | 2005 | | 2004 a |
| |
| |
|
| Per Share Data ($): | | | | |
| Net asset value, beginning of period | | 12.58 | | 13.43 |
| Investment Operations: | | | | |
| Investment (loss)—net b | | (.10) | | (.01) |
| Net realized and unrealized | | | | |
| gain (loss) on investments | | 2.50 | | (.84) |
| Total from Investment Operations | | 2.40 | | (.85) |
| Distributions: | | | | |
| Dividends from net realized gain on investments | | (.91) | | — |
| Net asset value, end of period | | 14.07 | | 12.58 |
| |
| |
|
| Total Return (%) c | | 19.45 | | (6.33)d |
| |
| |
|
| Ratios/Supplemental Data (%): | | | | |
| Ratio of total expenses to average net assets | | 2.35 | | .43d |
| Ratio of net expenses to average net assets | | 1.96 | | .30d |
| Ratio of net investment (loss) | | | | |
| to average net assets | | (.73) | | (.12)d |
| Portfolio Turnover Rate | | 122.57 | | 154.39 |
| |
| |
|
| Net Assets, end of period ($ x 1,000) | | 31 | | 1 |
| |
| a | | The fund commenced offering five classes of shares on June 30, 2004.The existing shares were redesignated |
| | | Class A shares. | | | | |
| b | | Based on average shares outstanding at each month end. | | | | |
| c | | Exclusive of sales charge. | | | | |
| d | | Not annualized. | | | | |
| See notes to financial statements. | | | | |
NOTES TO FINANCIAL STATEMENTS
NOTE 1—Significant Accounting Policies:
Dreyfus Premier Midcap Value Fund (the “fund”) is a separate diversified series of Dreyfus Growth and Value Funds, Inc. (the “Company”) which is registered under the Investment Company Act of 1940, as amended (the “Act”), as an open-end management investment company and operates as a series company that offers twelve series, including the fund. The fund’s investment objective is to exceed the performance of the Russell Midcap Value Index. The Dreyfus Corporation (the “Manager” or “Dreyfus”) serves as the fund’s investment adviser. Dreyfus is a wholly-owned subsidiary of Mellon Financial Corporation (“Mellon Financial”). The Boston Company Asset Management, LLC (“TBCAM”), an affiliate of Dreyfus, serves as the fund’s sub-investment adviser.
Dreyfus Service Corporation (the “Distributor”), a wholly-owned subsidiary of the Manager, is the distributor of the fund’s shares. The fund is authorized to issue 500 million shares of $.001 par value Common Stock.The fund currently offers five classes of shares: Class A (100 million shares authorized), Class B (100 million shares authorized), Class C (100 million shares authorized), Class R (100 million shares authorized) and Class T (100 million shares authorized). Class A and Class T shares are subject to a sales charge imposed at the time of purchase. Class B shares are subject to a contingent deferred sales charge (“CDSC”) imposed on Class B share redemptions made within six years of purchase and automatically convert to Class A shares after six years. Class C shares are subject to a CDSC imposed on Class C shares redeemed within one year of purchase and Class R shares are sold at net asset value per share only to institutional investors. Other differences between the classes include the services offered to and the expenses borne by each class and certain voting rights. Income, expenses (other than expenses attributable to a specific class), and realized and unrealized gains or losses on investments are allocated to each class of shares based on its relative net assets.
As of August 31, 2005, MBC Investment Corp., an indirect subsidiary of Mellon Financial, held 80 shares of Class R.
The Company accounts separately for the assets, liabilities and operations of each series. Expenses directly attributable to each series are charged to that series’ operations; expenses which are applicable to all series are allocated among them on a pro rata basis.
The fund’s financial statements are prepared in accordance with U.S. generally accepted accounting principles, which may require the use of management estimates and assumptions. Actual results could differ from those estimates.
The fund enters into contracts that contain a variety of indemnifications. The fund’s maximum exposure under these arrangements is unknown.The fund does not anticipate recognizing any loss related to these arrangements.
(a) Portfolio valuation: Investments in securities are valued at the last sales price on the securities exchange or national securities market on which such securities are primarily traded. Securities listed on the National Market System for which market quotations are available are valued at the official closing price or, if there is no official closing price that day, at the last sales price. Securities not listed on an exchange or the national securities market, or securities for which there were no transactions, are valued at the average of the most recent bid and asked prices, except for open short positions, where the asked price is used for valuation purposes. Bid price is used when no asked price is available. Investments in registered investment companies are valued at their net asset value. When market quotations or official closing prices are not readily available, or are determined not to reflect accurately fair value, such as when the value of a security has been significantly affected by events after the close of the exchange or market on which the security is principally traded (for example, a foreign exchange or market), but before the fund calculates its net asset value, the fund may value these investments at fair value as determined in accordance with the procedures approved by the Board of Directors. Fair valuing of securities may be determined with the assistance of a pricing service using calculations based on indices of domestic securities and other appropriate indicators,
| | NOTES TO FINANCIAL STATEMENTS (continued)
|
such as prices of relevant ADR’s and futures contracts. For other securities that are fair valued by the Board of Directors, certain factors may be considered such as: fundamental analytical data, the nature and duration of restrictions on disposition, an evaluation of the forces that influence the market in which the securities are purchased and sold and public trading in similar securities of the issuer or comparable issuers. Financial futures are valued at the last sales price.
(b) Securities transactions and investment income: Securities transactions are recorded on a trade date basis. Realized gain and loss from securities transactions are recorded on the identified cost basis. Dividend income is recognized on the ex-dividend date and interest income, including, where applicable, accretion of discount and amortization of premium on investments, is recognized on the accrual basis.
The fund has an arrangement with the custodian bank whereby the fund receives earnings credits from the custodian when positive cash balances are maintained, which are used to offset custody fees. For financial reporting purposes, the fund includes net earnings credits, if any, as an expense offset in the Statement of Operations.
Pursuant to a securities lending agreement with Mellon Bank, N.A., an affiliate of Dreyfus, the fund may lend securities to qualified institutions. At origination, all loans are secured by collateral of at least 102% of the value of U.S. securities loaned and 105% of the value of foreign securities loaned. Collateral equivalent to at least 100% of the market value of securities on loan will be maintained at all times. Cash collateral is invested in certain money market mutual funds managed by Dreyfus.The fund will be entitled to receive all income on securities loaned, in addition to income earned as a result of the lending transaction. Although each security loaned is fully collateralized, the fund would bear the risk of delay in recovery of, or loss of rights in, the securities loaned should a borrower fail to return the securities in a timely manner.
(c) Affiliated issuers: Investments in other investment companies advised by Dreyfus are defined as “affiliated” in the Act.
(d) Dividends to shareholders: Dividends are recorded on the ex-dividend date. Dividends from investment income-net and dividends from net realized capital gain, if any, are normally declared and paid annually, but the fund may make distributions on a more frequent basis to comply with the distribution requirements of the Internal Revenue Code of 1986, as amended (the “Code”).To the extent that net realized capital gain can be offset by capital loss carryovers, it is the policy of the fund not to distribute such gain. Income and capital gain distributions are determined in accordance with income tax regulations, which may differ from U.S. generally accepted accounting principles.
(e) Federal income taxes: It is the policy of the fund to continue to qualify as a regulated investment company, if such qualification is in the best interests of its shareholders, by complying with the applicable provisions of the Code, and to make distributions of taxable income sufficient to relieve it from substantially all federal income and excise taxes.
At August 31, 2005, the components of accumulated earnings on a tax basis were as follows: undistributed ordinary income $1,186,277, undistributed capital gains $521,729 and unrealized appreciation $1,251,506.
The tax character of distributions paid to shareholders during the fiscal periods ended August 31, 2005 and August 31, 2004 were as follows: ordinary income $1,022,040 and $0 and long-term capital gains $127,897 and $0, respectively.
During the period ended August 31, 2005, as a result of permanent book to tax differences, primarily due to the tax treatment for net operating losses and real estate investment trusts, the fund increased accumulated undistributed investment income-net by $51,877, decreased accumulated net realized gain (loss) on investments by $51,833 and decreased paid-in capital by $44. Net assets were not affected by this reclassification.
| | NOTES TO FINANCIAL STATEMENTS (continued)
|
NOTE 2—Bank Line of Credit:
|
The fund participates with other Dreyfus-managed funds in a $100 million unsecured line of credit primarily to be utilized for temporary or emergency purposes, including the financing of redemptions. Interest is charged to the fund based on prevailing market rates in effect at the time of borrowings.
The average daily amount of borrowings outstanding under the line of credit during the period ended August 31, 2005 was approximately $6,600, with a related weighted average annualized interest rate of 3.17% .
NOTE 3—Investment Advisory Fee, Sub-Investment Advisory Fee and Other Transactions With Affiliates:
(a) Pursuant to an Investment Advisory Agreement (“Agreement”) with Dreyfus, the investment advisory fee is computed at the annual rate of .75% of the value of the fund’s average daily net assets and is payable monthly. Dreyfus has undertaken, from September 1, 2004 through August 31, 2006, that, if the fund’s aggregate expenses, exclusive of taxes, brokerage fees, interest on borrowings, Rule 12b-1 distribution plan fees,shareholder services plan fees and extraordinary expenses,exceed an annual rate of 1.25% of the value of the fund’s average daily net assets, the fund may deduct from the payment to be made to Dreyfus under the Agreement, or Dreyfus will bear, such excess expenses.The reduction in investment advisory fee, pursuant to the undertaking, amounted to $60,636 during the period ended August 31, 2005.
Pursuant to a Sub-Investment Advisory Agreement between Dreyfus and TBCAM, the sub-investment advisory fee is payable monthly by Dreyfus, and is based upon the value of the fund’s average daily net assets, computed at the following annual rates:
| Average Net Assets | | |
| 0 to $100 million | | 25% |
| $100 million to $1 billion | | 20% |
| $1 billion to $1.5 billion | | 16% |
| $1.5 billion or more | | 10% |
During the period ended August 31, 2005, the Distributor retained $5,143 from commissions earned on sales of the fund’s Class A shares and $567 from contingent deferred sales charges on redemptions of the fund’s Class B shares.
(b) Under the Distribution Plan (the “Plan”) adopted pursuant to Rule 12b-1 under the Act, Class B, Class C and Class T shares pay the Distributor for distributing their shares at an annual rate of .75% of the value of the average daily net assets of Class B and Class C shares and .25% of the value of the average daily net assets of Class T shares. During the period ended August 31, 2005, Class B, Class C and Class T shares were charged $1,675, $1,099 and $58, respectively, pursuant to the Plan.
(c) Under the Shareholder Services Plan, Class A, Class B, Class C and Class T shares pay the Distributor at an annual rate of .25% of the value of their average daily net assets for the provision of certain services.The services provided may include personal services relating to shareholder accounts, such as answering shareholder inquiries regarding the fund and providing reports and other information, and services related to the maintenance of shareholder accounts.The Distributor may make payments to Service Agents (a securities dealer, financial institution or industry professional) in respect of these services. The Distributor determines the amounts to be paid to Service Agents. During the period ended August 31, 2005, Class A, Class B, Class C and Class T shares were charged $41,507, $558, $367 and $58, respectively, pursuant to the Shareholder Services Plan.
The fund compensates Dreyfus Transfer, Inc., a wholly-owned subsidiary of Dreyfus, under a transfer agency agreement for providing personnel and facilities to perform transfer agency services for the fund. During the period ended August 31, 2005, the fund was charged $12,228 pursuant to the transfer agency agreement.
The fund compensates Mellon Bank, N.A., an affiliate of Dreyfus, under a custody agreement for providing custodial services for the fund. During the period ended August 31, 2005, the fund was charged $3,834 pursuant to the custody agreement.
| | NOTES TO FINANCIAL STATEMENTS (continued)
|
During the period ended August 31, 2005, the fund was charged $2,520 for services performed by the Chief Compliance Officer.
The components of Due to The Dreyfus Corporation and affiliates in the Statement of Assets and Liabilities consist of: management fees $10,947, Rule 12b-1 distribution plan fees $411, shareholder services plan fees $3,648, custodian fees $2,831, chief compliance officer fees $1,533 and transfer agency per account fees $1,828, which are offset against an expense reimbursement currently in effect in the amount of $4,987.
(d) Each Board member also serves as a Board member of other funds within the Dreyfus complex. Annual retainer fees and attendance fees are allocated to each fund based on net assets.
| | NOTE 4—Securities Transactions:
|
The aggregate amount of purchases and sales of investment securities, excluding short-term securities, during the period ended August 31, 2005, amounted to $20,573,235 and $22,668,874, respectively.
At August 31, 2005, the cost of investments for federal income tax purposes was $17,645,557; accordingly, accumulated net unrealized appreciation on investments was $1,251,506, consisting of $2,011,762 gross unrealized appreciation and $760,256 gross unrealized depreciation.
In early 2004, two purported class and derivative actions were filed against Mellon Financial, Mellon Bank, N.A., Dreyfus, Founders Asset Management LLC, and certain directors of the Dreyfus Funds and the Dreyfus Founders Funds (together, the “Funds”) in the United States District Court for the Western District of Pennsylvania. In September 2004, plaintiffs served a Consolidated Amended Complaint (the “Amended Complaint”) on behalf of a purported class of all persons who acquired interests in any of the Funds between January 30, 1999 and November 17, 2003, and derivatively on behalf of the Funds.The
Amended Complaint in the newly styled In re Dreyfus Mutual Funds Fee Litigation also named the Distributor, Premier Mutual Fund Services, Inc. and two additional Fund directors as defendants and alleges violations of the Investment Company Act of 1940, the Investment Advisers Act of 1940, the Pennsylvania Unfair Trade Practices and Consumer Protection Law and common-law claims. Plaintiffs seek to recover allegedly improper and excessive Rule 12b-1 and advisory fees allegedly charged to the Funds for marketing and distribution services. More specifically, plaintiffs claim, among other things, that 12b-1 fees and directed brokerage were improperly used to pay brokers to recommend the Funds over other funds, and that such payments were not disclosed to investors. In addition, plaintiffs assert that economies of scale and soft-dollar benefits were not passed on to the Funds. Plaintiffs further allege that 12b-1 fees were improperly charged to certain of the Funds that were closed to new investors.The Amended Complaint seeks compensatory and punitive damages, rescission of the advisory contracts, and an accounting and restitution of any unlawful fees, as well as an award of attorneys’ fees and litigation expenses. As noted, some of the claims in this litigation are asserted derivatively on behalf of the Funds that have been named as nominal defendants. With respect to such derivative claims, no relief is sought against the Funds. Dreyfus believes the allegations to be totally without merit and intends to defend the action vigorously. In November 2004, all named defendants moved to dismiss the Amended Complaint in whole or substantial part. Briefing was completed in May 2005.
Additional lawsuits arising out of these circumstances and presenting similar allegations and requests for relief may be filed against the defendants in the future. Neither Dreyfus nor the Funds believe that any of the pending actions will have a material adverse effect on the Funds or Dreyfus’ ability to perform its contract with the Funds.
| | REPORT OF INDEPENDENT REGISTERED
PUBLIC ACCOUNTING FIRM
|
Shareholders and Board of Directors
Dreyfus Premier Midcap Value Fund
|
We have audited the accompanying statement of assets and liabilities, including the statement of investments, of Dreyfus Premier Midcap Value Fund (one of the funds comprising Dreyfus Growth and Value Funds, Inc.) as of August 31, 2005, and the related statement of operations for the year then ended, the statement of changes in net assets for each of the two years in the period then ended, and financial highlights for each of the periods indicated therein.These financial statements and financial highlights are the responsibility of the Fund’s management. Our responsibility is to express an opinion on these financial statements and financial highlights based on our audits.
We conducted our audits in accordance with the standards of the Public Company Accounting Oversight Board (United States).Those standards require that we plan and perform the audit to obtain reasonable assurance about whether the financial statements and financial highlights are free of material misstatement.We were not engaged to perform an audit of the Fund’s internal control over financial reporting.Our audits included consideration of internal control over financial reporting as a basis for designing audit procedures that are appropriate in the circumstances,but not for the purpose of expressing an opinion on the effectiveness of the Fund’s internal control over financial reporting.Accordingly, we express no such opinion.An audit also includes examining, on a test basis, evidence supporting the amounts and disclosures in the financial statements and financial highlights, assessing the accounting principles used and significant estimates made by management, and evaluating the overall financial statement presentation. Our procedures included verification by examination of securities held by the custodian as of August 31, 2005 and confirmation of securities not held by the custodian by correspondence with oth-ers.We believe that our audits provide a reasonable basis for our opinion.
In our opinion, the financial statements and financial highlights referred to above present fairly, in all material respects, the financial position of Dreyfus Premier Midcap Value Fund at August 31, 2005, the results of its operations for the year then ended, the changes in its net assets for each of the two years in the period then ended, and the financial highlights for each of the indicated periods, in conformity with U.S. generally accepted accounting principles.

New York, New York
October 14, 2005
|
IMPORTANT TAX INFORMATION (Unaudited)
For federal tax purposes the fund hereby designates 86.95% of the ordinary dividends paid during the fiscal year ended August 31, 2005 as qualifying for the corporate dividends received deduction.Also certain dividends paid by the fund may be subject to a maximum tax rate of 15%, as provided for by the Jobs and Growth Tax Relief Reconciliation Act of 2003. Of the distributions paid during the fiscal year, $165,686 represents the maximum amount that may be considered qualified dividend income. Shareholders will receive notification in January 2006 of the percentage applicable to the preparation of their 2005 income tax returns.Also, the fund designates $.1010 per share as a long-term capital gain distribution of the $.9081 per share paid on December 21, 2004.
| | INFORMATION ABOUT THE REVIEW
AND APPROVAL OF THE FUND’S
M A N A G E M E N T A G R E E M E N T (Unaudited)
|
At a meeting of the Board of Directors held on March 14, 2005, the Board considered the re-approval for an annual period of the Fund’s Management Agreement, pursuant to which the Manager provides the Fund with investment advisory and administrative services, and the Board also considered the re-approval of the Fund’s Sub-Investment Advisory Agreement with The Boston Company Asset Management, LLC (“TBCAM”), an affiliate of the Manager, pursuant to which TBCAM provides day-to-day management of the Fund’s investments subject to the Manager’s oversight. The Board members, none of whom are “interested persons” (as defined in the Investment Company Act of 1940, as amended) of the Fund, were assisted in their review by independent legal counsel and met with counsel in executive session separate from representatives of the Manager and TBCAM.
Analysis of Nature, Extent and Quality of Services Provided to the Fund. The Board members received a presentation from representatives of the Manager regarding services provided to the Fund and other funds in the Dreyfus fund complex, and discussed the nature, extent and quality of the services provided to the fund pursuant to its Management Agreement, and by TBCAM pursuant to the Sub-Investment Advisory Agreement.The presentation included a detailed summary of the services provided to Dreyfus-managed mutual funds by each business unit within the Manager.The Manager’s representatives reviewed the Fund’s distribution of accounts and the relationships the Manager has with various intermediaries and the different needs of each.The Manager’s representatives noted the diversity of distribution of the Fund as well as among the funds in the Dreyfus fund complex, and the Manager’s corresponding need for broad, deep, and diverse resources to be able to provide ongoing shareholder services to each of the Fund’s distribution channels.The Board also reviewed the number of shareholder accounts in the Fund, as well as the Fund’s asset size.
The Board members also considered the Manager’s and TBCAM’s research and portfolio management capabilities and that the Manager also provides oversight of day-to-day fund operations, including fund accounting and administration and assistance in meeting legal and reg-
ulatory requirements. The Board members also considered the Manager’s extensive administrative, accounting and compliance infrastructure, as well as the Manager’s supervisory activities over TBCAM.
Comparative Analysis of the Fund’s Performance and Management Fee and Expense Ratio. The Board members reviewed the Fund’s performance, management fee and expense ratios and placed significant emphasis on comparisons to a group of comparable funds and Lipper category averages, as applicable.The group of comparable funds was previously approved by the Board for this purpose, and was prepared using a Board-approved selection methodology that was based, in part, on selecting non-affiliated funds reported in the same Lipper category as the Fund.The Board members discussed the results of the comparisons for various periods ended January 31, 2005, and noted that the Fund’s performance was below the comparison group and Lipper category averages for the 1-year and 3-year periods. The Board noted that the Fund commenced operations in June 2001 and that the Fund’s performance record was negatively impacted by the Fund’s underperformance during calendar year 2002.The Board discussed with representatives of the Manager and TBCAM the reasons for the Fund’s underperformance compared to the comparison group and Lipper category for the 1- and 3-year periods, and the Manager’s and TBCAM’s efforts to improve performance. The Board members also discussed the Fund’s management fee and expense ratio and reviewed the range of management fees and expense ratios for the funds in the comparison group.The Board noted that the Manager, and not the Fund, paid TBCAM for its services pursuant to the Sub-Investment Advisory Agreement.The Fund’s management fee ranked in the top half (i.e., lower than most others) of the comparison group funds.The Board further noted that the Fund’s total expense ratio (after fee waivers and/or expense reimbursements by the Manager) was lower than the Fund’s comparison group average, but higher than the Fund’s Lipper category average.The Board noted that the Manager had agreed to continue its current fee waiver and expense reimbursement arrangement through August 2006.
I N FO R M AT I O N A B O U T T H E R E V I E W A N D A P P R OVA L O F T H E
F U N D ’S M A N A G E M E N T A G R E E M E N T ( U n a u d i t e d ) ( c o n t i n u e d )
|
Representatives of the Manager reviewed with the Board members the fees paid to the Manager or its affiliates, including TBCAM, by mutual funds managed by the Manager or its affiliates, with similar investment objectives, policies and strategies as the Fund (the “Similar Funds”), and by other accounts managed or sub-advised by the Manager,TBCAM or their respective affiliates with similar investment objectives, policies and strategies as the Fund (“Separate Accounts” and, collectively with the Similar Funds, the “Similar Accounts”). The Manager’s representatives explained the nature of the Similar Accounts and the differences, from the Manager’s perspective, in management of the Similar Accounts as compared to managing and providing services to the Fund; it was noted that the Similar Funds were mutual funds included in the “multi-cap value” funds category by Lipper. The Manager’s representatives also reviewed the costs associated with distribution through intermediaries. The Board analyzed the differences in fees paid to the Manager and discussed the relationship of the advisory fees paid in light of the Manager’s performance and the services provided; it was noted that the Similar Funds had the same management fees as the fee borne by the Fund.The Board members considered the relevance of the fee information provided for the Similar Accounts managed by the Manager to evaluate the appropriateness and reasonableness of the Fund’s advisory fees. The Board acknowledged that differences in fees paid by the Similar Accounts seemed to be consistent with the services provided.
Analysis of Profitability and Economies of Scale. The Manager’s representatives reviewed the dollar amount of expenses allocated and profit received by the Manager and the method used to determine such expenses and profit. The Board received and considered information prepared by an independent consulting firm regarding the Manager’s approach to allocating costs to, and determining the profitability of, individual funds and the entire Dreyfus fund complex.The Manager’s representatives stated that the methodology had also been reviewed by an independent registered public accounting firm which, like the consultant, found the methodology to be reasonable.The consulting firm also analyzed where any economies of scale might emerge in connec-
tion with the management of the Fund.The Board members evaluated the analysis in light of the relevant circumstances for the Fund, and the extent to which economies of scale would be realized as the Fund grows and whether fee levels reflect these economies of scale for the benefit of Fund investors. The Board noted that it appeared that the benefits of any economies of scale also would be appropriately shared with shareholders through increased investment in fund management and administration resources. The Board members also considered potential benefits to the Manager and TBCAM from acting as investment adviser and sub-investment adviser, respectively, and reviewed the soft dollar arrangements with respect to trading the Fund’s portfolio.
It was noted that the Board members should consider the Manager’s profitability with respect to the Fund as part of their evaluation of whether the fee under the Management Agreement bears a reasonable relationship to the mix of services provided by the Manager, including the nature, extent and quality of such services and that a discussion of economies of scale is predicated on increasing assets and that, if a fund’s assets had been decreasing, the possibility that the Manager may have realized any economies of scale would be less. Since the Manager, and not the Fund, pays TBCAM pursuant to the Sub-Investment Advisory Agreement, the Board did not consider TBCAM’s profitability to be relevant to their deliberations.The Board members also discussed the profitability percentage ranges determined by appropriate court cases to be reasonable given the services rendered to investment companies. It was noted that the profitability percentage for managing the Fund was not unreasonable given the Fund’s overall performance and generally superior service levels provided.The Board also noted the current fee waiver and expense reimbursement arrangement and its effect on the profitability of the Manager.
At the conclusion of these discussions, each of the Directors expressed the opinion that he or she had been furnished with sufficient information to make an informed business decision with respect to continuation of the Fund’s Management Agreement and
| | I N FO R M AT I O N A B O U T T H E R E V I E W A N D A P P R OVA L O F T H E
F U N D ’S M A N A G E M E N T A G R E E M E N T ( U n a u d i t e d ) ( c o n t i n u e d )
|
Sub-Investment Advisory Agreement. Based on their discussions and considerations as described above, the Board made the following conclusions and determinations.
- The Board concluded that the nature, extent and quality of the ser- vices provided by the Manager and TBCAM are adequate and appropriate.
- While the Board was concerned with the Fund’s performance, the Board was satisfied with the Manager’s and TBCAM’s efforts to improve it. Accordingly, the Board approved the Management Agreement and Sub-Investment Advisory Agreement for a six- month period (instead of a year) so as to gauge the Manager’s and TBCAM’s efforts to improve performance over an appropriate period of time.
- The Board concluded that the fee paid to the Manager by the Fund was reasonable in light of comparative performance and expense and advisory fee information, including the Manager’s current undertaking to waive or reimburse certain fees and expenses of the Fund, costs of the services provided and profits to be realized and benefits derived or to be derived by the Manager from its relation- ship with the Fund.
- The Board determined that the economies of scale which may accrue to the Manager and its affiliates in connection with the man- agement of the Fund had been adequately considered by the Manager in connection with the management fee rate charged to the Fund, and that, to the extent in the future it were to be deter- mined that material economies of scale had not been shared with the Fund, the Board would seek to have those economies of scale shared with the Fund.
The Board members considered these conclusions and determinations, along with the information received on a routine and regular basis throughout the year, and, without any one factor being dispositive, the Board determined that re-approval of the Fund’s Management Agreement and Sub-Investment Advisory Agreement for a six-month period was in the best interests of the Fund and its shareholders.
BOARD MEMBERS INFORMATION (Unaudited)
| | Joseph S. DiMartino (61)
Chairman of the Board (1995)
|
| Principal Occupation During Past 5 Years: |
| • Corporate Director and Trustee |
| Other Board Memberships and Affiliations: |
| • The Muscular Dystrophy Association, Director |
| • Levcor International, Inc., an apparel fabric processor, Director |
| • Century Business Services, Inc., a provider of outsourcing functions for small and medium size |
| companies, Director |
| • The Newark Group, a provider of a national market of paper recovery facilities, paperboard |
| mills and paperboard converting plants, Director |
| • Azimuth Trust, an institutional asset management firm, Member of Board of Managers and |
| Advisory Board |
| • Sunair Electronics, Inc., engages in the design, manufacture and sale of high frequency systems |
| for long-range voice and data communications, as well as providing certain outdoor-related |
| services to homes and businesses, Director |
| • Sunair Electronics, Inc., engages in the design, manufacture and sale of high frequency systems |
| for long-range voice and data communications, as well as providing certain outdoor-related |
| services to homes and businesses, Director |
No. of Portfolios for which Board Member Serves: 193
| | David P. Feldman (65)
Board Member (1996)
|
| Principal Occupation During Past 5 Years: |
| • Corporate Director & Trustee |
| | Other Board Memberships and Affiliations:
|
- BBH Mutual Funds Group (11 funds), Director
- The Jeffrey Company, a private investment company, Director
- QMED, a medical device company, Director
No. of Portfolios for which Board Member Serves: 58
Ehud Houminer (65) Board Member (1993)
| | Principal Occupation During Past 5 Years:
|
- Executive-in-Residence at the Columbia Business School, Columbia University
- Principal of Lear,Yavitz and Associates, a management consulting firm (1996 to 2001)
| | Other Board Memberships and Affiliations:
|
- Avnet Inc., an electronics distributor, Director
- International Advisory Board to the MBA Program School of Management, Ben Gurion University, Chairman
- Explore Charter School, Brooklyn, NY, Chairman
| | No. of Portfolios for which Board Member Serves: 36
|
BOARD MEMBERS INFORMATION (Unaudited) (continued)
| | Gloria Messinger (75)
Board Member (1993)
|
| | Principal Occupation During Past 5 Years:
|
- Arbitrator for American Arbitration Association and National Association of Securities Dealers, Inc.
- Consultant in Intellectual Property
| | Other Board Memberships and Affiliations:
|
- Yale Law School Fund, Director
- Theater for a New Audience, Inc., Director
- Brooklyn Philharmonic, Director
- New York Women’s Agenda Music Performance Trust Fund, Director
| | No. of Portfolios for which Board Member Serves: 25
|
T. John Szarkowski (79) Board Member (1996)
| Principal Occupation During Past 5 Years: |
| • Consultant in Photography |
| Other Board Memberships and Affiliations: |
| • Photography Department at The Museum of Modern Art, Director Emeritus |
| | No. of Portfolios for which Board Member Serves: 25
|
| | Anne Wexler (75)
Board Member (1996)
|
| | Principal Occupation During Past 5 Years:
|
- Chairman of the Wexler & Walker Public Policy Associates, consultants specializing in government relations and public affairs
| | Other Board Memberships and Affiliations:
|
- Wilshire Mutual Funds (5 funds), Director
- Methanex Corporation, a methanol producing company, Director
- Member of the Council of Foreign Relations
- Member of the National Park Foundation
| | No. of Portfolios for which Board Member Serves: 36
|
Once elected all Board Members serve for an indefinite term.The address of the Board Members and Officers is in c/o The Dreyfus Corporation, 200 Park Avenue, New York, New York 10166. Additional information about the Board Members is available in the fund’s Statement of Additional Information which can be obtained from Dreyfus free of charge by calling this toll free number: 1-800-554-4611.
John M. Fraser, Jr., Emeritus Board Member
| STEPHEN E. CANTER, President since | | JAMES BITETTO, Vice President and |
| March 2000. | | Assistant Secretary since August 2005. |
| Chairman of the Board, Chief Executive | | Assistant General Counsel and Assistant |
| Officer and Chief Operating Officer of the | | Secretary of the Manager, and an officer of 91 |
| Manager, and an officer of 90 investment | | investment companies (comprised of 200 |
| companies (comprised of 184 portfolios) | | portfolios) managed by the Manager. He is 39 |
| managed by the Manager. Mr. Canter also is a | | years old and has been an employee of the |
| Board member and, where applicable, an | | Manager since December 1996. |
| |
| Executive Committee Member of the other | | JONI LACKS CHARATAN, Vice President |
| investment management subsidiaries of Mellon | | and Assistant Secretary since |
| Financial Corporation, each of which is an | | August 2005. |
| affiliate of the Manager. He is 60 years old and | | |
| has been an employee of the Manager since | | Assistant General Counsel and Assistant |
| May 1995. | | Secretary of the Manager, and an officer of 91 |
| | | investment companies (comprised of 200 |
| STEPHEN R. BYERS, Executive Vice | | portfolios) managed by the Manager. She is 49 |
| President since November 2002. | | years old and has been an employee of the |
| Chief Investment Officer,Vice Chairman and a | | Manager since October 1998. |
| |
| director of the Manager, and an officer of 90 | | JOSEPH M. CHIOFFI, Vice President and |
| investment companies (comprised of 184 | | Assistant Secretary since August 2005. |
| portfolios) managed by the Manager. Mr. Byers | | |
| also is an officer, director or an Executive | | Assistant General Counsel and Assistant |
| Committee Member of certain other | | Secretary of the Manager, and an officer of 91 |
| investment management subsidiaries of Mellon | | investment companies (comprised of 200 |
| Financial Corporation, each of which is an | | portfolios) managed by the Manager. He is 43 |
| affiliate of the Manager. He is 52 years old and | | years old and has been an employee of the |
| has been an employee of the Manager since | | Manager since July 2000. |
| January 2000. | | JANETTE E. FARRAGHER, Vice President |
| MARK N. JACOBS, Vice President since | | and Assistant Secretary since |
| March 2000. | | August 2005 |
| Executive Vice President, Secretary and | | Associate General Counsel of the Manager, |
| General Counsel of the Manager, and an | | and an officer of 91 investment companies |
| officer of 91 investment companies (comprised | | (comprised of 200 portfolios) managed by the |
| of 200 portfolios) managed by the Manager. | | Manager. She is 42 years old and has been an |
| He is 59 years old and has been an employee | | employee of the Manager since February 1984. |
| of the Manager since June 1977. | | JOHN B. HAMMALIAN, Vice President and |
| MICHAEL A. ROSENBERG, Vice President | | Assistant Secretary since August 2005. |
| and Secretary since August 2005. | | Associate General Counsel of the Manager, |
| Associate General Counsel of the Manager, | | and an officer of 91 investment companies |
| and an officer of 91 investment companies | | (comprised of 200 portfolios) managed by the |
| (comprised of 200 portfolios) managed by the | | Manager. He is 42 years old and has been an |
| Manager. He is 45 years old and has been an | | employee of the Manager since February 1991. |
| employee of the Manager since October 1991. | | |
OFFICERS OF THE FUND (Unaudited)
OFFICERS OF THE FUND (Unaudited) (continued)
| ROBERT R. MULLERY, Vice President and | | ROBERT SVAGNA, Assistant Treasurer |
| Assistant Secretary since August 2005. | | since August 2005. |
| Associate General Counsel of the Manager, | | Senior Accounting Manager – Equity Funds of |
| and an officer of 91 investment companies | | the Manager, and an officer of 91 investment |
| (comprised of 200 portfolios) managed by the | | companies (comprised of 200 portfolios) |
| Manager. He is 53 years old and has been an | | managed by the Manager. He is 38 years old |
| employee of the Manager since May 1986. | | and has been an employee of the Manager |
| JEFF PRUSNOFSKY, Vice President and | | since November 1990. |
| Assistant Secretary since August 2005. | | KENNETH J. SANDGREN, Assistant |
| Associate General Counsel of the Manager, | | Treasurer since November 2001. |
| and an officer of 91 investment companies | | Mutual Funds Tax Director of the Manager, |
| (comprised of 200 portfolios) managed by the | | and an officer of 91 investment companies |
| Manager. He is 40 years old and has been an | | (comprised of 200 portfolios) managed by the |
| employee of the Manager since October 1990. | | Manager. He is 51 years old and has been an |
| JAMES WINDELS, Treasurer since | | employee of the Manager since June 1993. |
| November 2001. | | JOSEPH W. CONNOLLY, Chief Compliance |
| Director – Mutual Fund Accounting of the | | Officer since October 2004. |
| Manager, and an officer of 91 investment | | Chief Compliance Officer of the Manager and |
| companies (comprised of 200 portfolios) | | The Dreyfus Family of Funds (91 investment |
| managed by the Manager. He is 46 years old | | companies, comprising 200 portfolios). From |
| and has been an employee of the Manager | | November 2001 through March 2004, Mr. |
| since April 1985. | | Connolly was first Vice-President, Mutual |
| GREGORY S. GRUBER, Assistant | | Fund Servicing for Mellon Global Securities |
| Treasurer since August 2005. | | Services. In that capacity, Mr. Connolly was |
| Senior Accounting Manager – Municipal Bond | | responsible for managing Mellon’s Custody, |
| Funds of the Manager, and an officer of 91 | | Fund Accounting and Fund Administration |
| investment companies (comprised of 200 | | services to third-party mutual fund clients. He |
| portfolios) managed by the Manager. He is 46 | | is 48 years old and has served in various |
| years old and has been an employee of the | | capacities with the Manager since 1980, |
| Manager since August 1981. | | including manager of the firm’s Fund |
| | | Accounting Department from 1997 through |
| ERIK D. NAVILOFF, Assistant Treasurer | | October 2001. |
| since August 2005. | | |
| | | WILLIAM GERMENIS, Anti-Money |
| Senior Accounting Manager – Taxable Fixed | | Laundering Compliance Officer since |
| Income Funds of the Manager, and an officer | | October 2002. |
| of 91 investment companies (comprised of 200 | | |
| portfolios) managed by the Manager. He is 37 | | Vice President and Anti-Money Laundering |
| years old and has been an employee of the | | Compliance Officer of the Distributor, and the |
| Manager since November 1992 | | Anti-Money Laundering Compliance Officer |
| | | of 88 investment companies (comprised of 197 |
| ROBERT ROBOL, Assistant Treasurer | | portfolios) managed by the Manager. He is 35 |
| since August 2005. | | years old and has been an employee of the |
| Senior Accounting Manager – Money Market | | Distributor since October 1998. |
| Funds of the Manager, and an officer of 91 | | |
| investment companies (comprised of 200 | | |
| portfolios) managed by the Manager. He is 41 | | |
| years old and has been an employee of the | | |
| Manager since October 1988. | | |
| For More | | Information |
| |
|
| |
| |
| |
| Dreyfus Premier | | Custodian |
| |
| Midcap Value Fund | | |
| | | Mellon Bank, N.A. |
| 200 Park Avenue | | |
| | | One Mellon Bank Center |
| New York, NY 10166 | | |
| | | Pittsburgh, PA 15258 |
| |
| |
| Investment Adviser | | Transfer Agent & |
| |
| The Dreyfus Corporation | | Dividend Disbursing Agent |
| |
| 200 Park Avenue | | |
| | | Dreyfus Transfer, Inc. |
| New York, NY 10166 | | |
| | | 200 Park Avenue |
| |
| Sub-Investment Adviser | | New York, NY 10166 |
| |
| The Boston Company Asset | | Distributor |
| |
| Management, LLC | | |
| | | Dreyfus Service Corporation |
| One Boston Place | | |
| | | 200 Park Avenue |
| Boston, MA 02108 | | |
| | | New York, NY 10166 |
Telephone Call your financial representative or 1-800-554-4611
| Mail | | The Dreyfus Premier Family of Funds |
| | | 144 Glenn Curtiss Boulevard, Uniondale, NY 11556-0144 |
The fund files its complete schedule of portfolio holdings with the Securities and Exchange Commission (“SEC”) for the first and third quarters of each fiscal year on Form N-Q. The fund’s Forms N-Q are available on the SEC’s website at http://www.sec.gov and may be reviewed and copied at the SEC’s Public Reference Room in Washington, DC. Information on the operation of the Public Reference Room may be obtained by calling 1-800-SEC-0330.
A description of the policies and procedures that the fund uses to determine how to vote proxies relating to portfolio securities, and information regarding how the fund voted these proxies for the 12-month period ended June 30, 2005, is available at http://www.dreyfus.com and on the SEC’s website at http://www.sec.gov. The description of the policies and procedures is also available without charge, upon request, by calling 1-800-645-6561.

Save time. Save paper. View your next shareholder report online as soon as it’s available. Log into www.dreyfus.com and sign up for Dreyfus eCommunications. It’s simple and only takes a few minutes.
The views expressed in this report reflect those of the portfolio manager only through the end of the period covered and do not necessarily represent the views of Dreyfus or any other person in the Dreyfus organization. Any such views are subject to change at any time based upon market or other conditions and Dreyfus disclaims any responsibility to update such views.These views may not be relied on as investment advice and, because investment decisions for a Dreyfus fund are based on numerous factors, may not be relied on as an indication of trading intent on behalf of any Dreyfus fund.
Not FDIC-Insured • Not Bank-Guaranteed • May Lose Value
| | | Contents |
| |
| | | THE FUND |
| |
|
| 2 | | Letter from the Chairman |
| 3 | | Discussion of Fund Performance |
| 6 | | Fund Performance |
| 8 | | Understanding Your Fund’s Expenses |
| 8 | | Comparing Your Fund’s Expenses |
| | | With Those of Other Funds |
| 9 | | Statement of Investments |
| 11 | | Statement of Assets and Liabilities |
| 12 | | Statement of Operations |
| 13 | | Statement of Changes in Net Assets |
| 15 | | Financial Highlights |
| 20 | | Notes to Financial Statements |
| 28 | | Report of Independent Registered |
| | | Public Accounting Firm |
| 29 | | Important Tax Information |
| 30 | | Information About the Review and Approval |
| | | of the Fund’s Management Agreement |
| 34 | | Board Members Information |
| 36 | | Officers of the Fund |
| |
| | | FOR MORE INFORMATION |
| |
|
| | | Back Cover |
The Fund
Dreyfus Premier
Select Midcap
Growth Fund
|

LETTER FROM THE CHAIRMAN
This annual report for Dreyfus Premier Select Midcap Growth Fund covers the 12-month period from September 1, 2004, through August 31, 2005. Inside, you’ll find valuable information about how the fund was managed during the reporting period, including a discussion with the fund’s portfolio managers, Fred Kuehndorf, Terence J. McLaughlin and Deborah C. Ohl.
On average, stock prices ended the reporting period higher than where they began. However, most of the market’s gains occurred during the closing months of 2004. So far in 2005, positive factors, including steady economic growth and higher corporate profits, were largely offset by headwinds, such as sharply higher energy prices and rising short-term interest rates. Midcap stocks produced higher returns than small-cap stocks in this environment, and small-cap stocks outperformed large-cap stocks. Also, value-oriented stocks have generally produced better results than their more growth-oriented counterparts during the past 12 months.
Recent shocks to the U.S. economy — including sharply higher gasoline prices and other lingering consequences of Hurricane Katrina — have added a degree of uncertainty to the economic outlook.Nonetheless,our economists currently expect the economy to continue to grow without either entering a recession or triggering a significant acceleration of infla-tion.As always, we encourage you to discuss the potential implications of these and other matters with your financial advisor.
Thank you for your continued confidence and support.


DISCUSSION OF FUND PERFORMANCE
| | Fred Kuehndorf, Terence J. McLaughlin and Deborah C. Ohl,
Portfolio Managers
|
How did Dreyfus Premier Select Midcap Growth Fund perform
relative to its benchmark?
|
For the 12-month period ended August 31, 2005, the fund produced total returns of 23.23% for Class A shares, 22.21% for Class B shares, 22.55% for Class C shares, 23.73% for Class R shares and 23.07% for Class T shares.1 In comparison, the fund’s benchmark, the Russell Midcap Growth Index (the “Index”), provided a 26.45% total return for the same period.2
While midcap stocks gained value throughout the reporting period as investors increasingly recognized their sound business fundamentals and attractive valuations, the majority of the market’s returns were produced during a sharp rally in the closing weeks of 2004, when the resolution of the U.S. presidential election and new signs of economic strength buoyed investor sentiment. The fund’s results lagged the Index, primarily due to weakness in the financials area and strong performance among a few stocks that were part of the Index but did not meet the fund’s quantitative investment criteria.
What is the fund’s investment approach?
The fund seeks capital appreciation. To pursue this goal, the fund normally invests at least 80% of its assets in the stocks of midcap growth companies.The fund considers midcap companies to be companies with market capitalizations that fall within the range of the Russell Midcap Growth Index at the time of purchase.The fund invests in companies that we believe have solid market positions and reasonable financial strength.
We seek investment opportunities for the fund in companies that have a history of consistent earnings growth and above-average profitability.We focus on individual stock selection,building the portfolio from the bottom up, searching one by one for companies whose fundamental strengths suggest the potential to provide superior earnings growth over time.
| | DISCUSSION OF FUND PERFORMANCE (continued)
|
The fund typically sells a stock when the company’s earnings are no longer growing, or it no longer possesses the characteristics that caused its purchase.A stock may be a sell candidate when its valuation reaches or exceeds its calculated fair value, or there are deteriorating fundamentals. The fund may also sell a stock if it becomes an overweighted portfolio position, as determined by portfolio managers.
What other factors influenced the fund’s performance?
U.S. stock prices were driven higher over the reporting period by a steadily expanding economy and rising corporate earnings, which more than offset other, potentially adverse influences, such as surging energy prices and rising short-term interest rates. The stock market’s strength was concentrated mainly within the middle part of its capitalization range, helping midcap stocks produce higher returns than large- and small-cap shares. In our judgment, midcap stocks have benefited from renewed attention from investors who are attracted to companies that have grown beyond the small-cap range but still have plenty of potential for further gains.
The fund achieved above-average returns in a number of market sectors. In the technology area, positive customer response to product upgrades helped fuel gains for CAD/CAM software developer Autodesk.The fund’s energy holdings, including natural gas producer XTO Energy and oil services provider BJ Services, prospered amid sharply higher prices for oil and gas. In the autos and transport area, shares of logistics manager C.H. Robinson Worldwide rose as investors recognized the strength of its underlying business fundamentals.
The fund’s disciplined security selection process also scored successes among individual stocks in other areas. For example, in the consumer discretionary area, strong results from retailers Coach and Chico’s FAS helped support the fund’s overall performance. The trend toward corporate outsourcing of non-core business activities helped drive higher the stock of Cognizant Technology Solutions. Among stocks added to the portfolio in 2005, the fund already has seen attractive results from energy producer Consolidated Energy, financial services provider Legg Mason and organic grocer Whole Foods Market.
Conversely, the fund’s performance was held back by a handful of disappointments, most notably Puerto Rico mortgage lender Doral Financial, which encountered management problems related to its portfolio pricing and risk hedging activities. In addition, the fund’s relative performance suffered due to its lack of participation in some of the benchmark’s better-performing stocks, such as health benefits company WellPoint, computer and electronics maker Apple Computer and energy provider AES Corp., which did not meet our investment criteria.
What is the fund’s current strategy?
Our investment strategy has not changed.We have continued to search for individual midcap companies that, in our judgment, have exhibited the qualities that define successful businesses.Although we select investments through “bottom-up” research into individual companies, and not according to broader macroeconomic or market trends, we believe the fund is well positioned for the next phase of the business cycle.
| 1 | | Total return includes reinvestment of dividends and any capital gains paid, and does not take into |
| | | consideration the maximum initial sales charges in the case of Class A and Class T shares, or the |
| | | applicable contingent deferred sales charges imposed on redemptions in the case of Class B and |
| | | Class C shares. Had these charges been reflected, returns would have been lower. Past performance |
| | | is no guarantee of future results. Share price, yield and investment return fluctuate such that upon |
| | | redemption, fund shares may be worth more or less than their original cost. Return figures |
| | | provided reflect the absorption of fund expenses by The Dreyfus Corporation pursuant to an |
| | | agreement in effect through August 31, 2006, at which time it may be extended, terminated or |
| | | modified. Had these expenses not been absorbed, the fund’s returns would have been lower. |
| | | A significant portion of the fund’s recent performance is attributable to positive returns from its |
| | | initial public offering (IPO) investments.There can be no guarantee that IPOs will have or |
| | | continue to have a positive effect on the fund’s performance. Currently, the fund is relatively small |
| | | in asset size. IPOs tend to have a reduced effect on performance as a fund’s asset base grows. |
| 2 | | SOURCE: LIPPER INC. — Reflects reinvestment of dividends and, where applicable, capital |
| | | gain distributions.The Russell Midcap Growth Index is a widely accepted, unmanaged index of |
| | | medium-cap stock market performance and measures the performance of those Russell Midcap |
| | | companies with higher price-to-book ratios and higher forecasted growth values. |
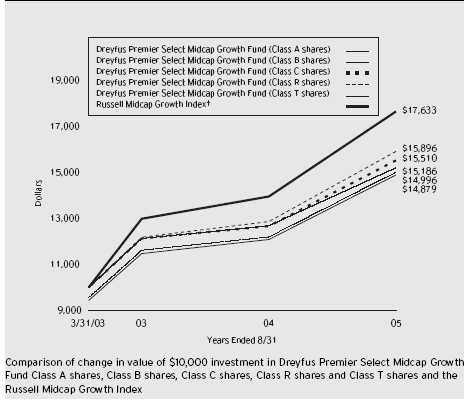
† Source: Lipper Inc.
Past performance is not predictive of future performance.
A significant portion of the fund’s recent performance is attributable to positive returns from its initial public offering (IPO) investments.There can be no guarantee that IPOs will have or continue to have a positive effect on the fund’s performance. Currently, the fund is relatively small in asset size. IPOs tend to have a reduced effect on performance as a fund’s asset base grows.
The above graph compares a $10,000 investment made in Class A, Class B, Class C, Class R and Class T shares of Dreyfus Premier Select Midcap Growth Fund on 3/31/03 (inception date) to a $10,000 investment made in the Russell Midcap Growth Index (the “Index”) on that date. All dividends and capital gain distributions are reinvested. The fund’s performance shown in the line graph takes into account the maximum initial sales charges on Class A and Class T shares, the maximum contingent deferred sales charge on Class B shares and all other applicable fees and expenses on all classes.The Index is a widely accepted, unmanaged index of medium-cap stock market performance and measures the performance of those Russell Midcap companies with higher price-to-book ratios and higher forecasted growth values.The Index does not take into account charges, fees and other expenses. Further information relating to fund performance, including expense reimbursements, if applicable, is contained in the Financial Highlights section of the prospectus and elsewhere in this report.
| Average Annual Total Returns as of 8/31/05 | | | | |
| |
| | | | | Inception | | | | From |
| | | | | Date | | 1 Year | | Inception |
| |
| |
| |
| |
|
| Class A shares | | | | | | |
| with maximum sales charge (5.75%) | | 3/31/03 | | 16.13% | | 17.85% |
| without sales charge | | 3/31/03 | | 23.23% | | 20.76% |
| Class B shares | | | | | | |
| with applicable redemption charge † | | 3/31/03 | | 18.21% | | 18.84% |
| without redemption | | 3/31/03 | | 22.21% | | 19.81% |
| Class C shares | | | | | | |
| with applicable redemption charge †† | | 3/31/03 | | 21.55% | | 19.89% |
| without redemption | | 3/31/03 | | 22.55% | | 19.89% |
| Class R shares | | 3/31/03 | | 23.73% | | 21.11% |
| Class T shares | | | | | | |
| with applicable sales charge (4.5%) | | 3/31/03 | | 17.54% | | 18.23% |
| without sales charge | | 3/31/03 | | 23.07% | | 20.50% |
| |
| Past performance is not predictive of future performance.The fund’s performance shown in the graph and table does not |
| reflect the deduction of taxes that a shareholder would pay on fund distributions or the redemption of fund shares. |
| † | | The maximum contingent deferred sales charge for Class B shares is 4%. After six years Class B shares convert to |
| | | Class A shares. | | | | | | |
| †† | | The maximum contingent deferred sales charge for Class C shares is 1% for shares redeemed within one year of the |
| | | date of purchase. | | | | | | |
U N D E R S TA N D I N G YO U R F U N D ’ S E X P E N S E S ( U n a u d i t e d )
As a mutual fund investor, you pay ongoing expenses, such as management fees and other expenses. Using the information below, you can estimate how these expenses affect your investment and compare them with the expenses of other funds.You also may pay one-time transaction expenses, including sales charges (loads) and redemption fees, which are not shown in this section and would have resulted in higher total expenses. For more information, see your fund’s prospectus or talk to your financial adviser.
Review your fund’s expenses
The table below shows the expenses you would have paid on a $1,000 investment in Dreyfus Premier Select Midcap Growth Fund from March 1, 2005 to August 31, 2005. It also shows how much a $1,000 investment would be worth at the close of the period, assuming actual returns and expenses.
| Expenses and Value of a $1,000 Investment | | | | | | |
| assuming actual returns for the six months ended August 31, 2005 | | | | |
| | | Class A | | Class B | | Class C | | Class R | | Class T |
| |
| |
| |
| |
| |
|
| Expenses paid per $1,000 † | | $ 8.19 | | $ 11.90 | | $ 11.44 | | $ 6.07 | | $ 8.71 |
| Ending value (after expenses) | | $1,056.80 | | $1,053.20 | | $1,053.20 | | $1,058.60 | | $1,055.90 |
| | C O M P A R I N G Y O U R F U N D ’ S E X P E N S E S
W I T H T H O S E O F O T H E R F U N D S ( U n a u d i t e d )
|
Using the SEC’s method to compare expenses
The Securities and Exchange Commission (SEC) has established guidelines to help investors assess fund expenses. Per these guidelines, the table below shows your fund’s expenses based on a $1,000 investment, assuming a hypothetical 5% annualized return. You can use this information to compare the ongoing expenses (but not transaction expenses or total cost) of investing in the fund with those of other funds.All mutual fund shareholder reports will provide this information to help you make this comparison. Please note that you cannot use this information to estimate your actual ending account balance and expenses paid during the period.
Expenses and Value of a $1,000 Investment
assuming a hypothetical 5% annualized return for the six months ended August 31, 2005
|
| | | Class A | | Class B | | Class C | | Class R | | Class T |
| |
| |
| |
| |
| |
|
| Expenses paid per $1,000 † | | $ 8.03 | | $ 11.67 | | $ 11.22 | | $ 5.96 | | $ 8.54 |
| Ending value (after expenses) | | $1,017.24 | | $1,013.61 | | $1,014.06 | | $1,019.31 | | $1,016.74 |
| |
| † Expenses are equal to the fund’s annualized expense ratio of 1.58% for Class A, 2.30% for Class B, 2.21% for |
| Class C, 1.17% for Class R and 1.68% for Class T; multiplied by the average account value over the period, |
| multiplied by 184/365 (to reflect the one-half year period). | | | | | | |
STATEMENT OF INVESTMENTS
August 31, 2005
|
| Common Stocks—99.5% | | Shares | | | | Value ($) |
| |
| |
| |
|
| Autos & Transports—5.0% | | | | | | |
| CH Robinson Worldwide | | 1,575 | | | | 97,256 |
| Expeditors International Washington | | 1,200 | | | | 66,612 |
| | | | | | | 163,868 |
| Consumer Discretionary—23.7% | | | | | | |
| Apollo Group, Cl. A | | 550 | | a | | 43,263 |
| Bed Bath & Beyond | | 2,550 | | a | | 103,402 |
| Black & Decker | | 800 | | | | 68,240 |
| Chico’s FAS | | 2,450 | | a | | 85,040 |
| Coach | | 3,500 | | a | | 116,165 |
| Fisher Scientific International | | 1,200 | | a | | 77,376 |
| Michaels Stores | | 2,500 | | | | 90,750 |
| Netease.com, ADR | | 900 | | a | | 65,403 |
| Starbucks | | 1,000 | | a | | 49,040 |
| Williams-Sonoma | | 1,950 | | a | | 78,488 |
| | | | | | | 777,167 |
| Consumer Staples—2.7% | | | | | | |
| Whole Foods Market | | 675 | | | | 87,251 |
| Energy—11.8% | | | | | | |
| BJ Services | | 1,500 | | | | 94,620 |
| CONSOL Energy | | 1,350 | | | | 94,095 |
| Smith International | | 2,000 | | | | 69,480 |
| XTO Energy | | 3,250 | | | | 129,350 |
| | | | | | | 387,545 |
| Financial Services—9.9% | | | | | | |
| E*TRADE Financial | | 5,700 | | a | | 91,200 |
| Fiserv | | 1,550 | | a | | 69,549 |
| Legg Mason | | 850 | | | | 88,850 |
| T. Rowe Price Group | | 1,200 | | | | 75,600 |
| | | | | | | 325,199 |
| Health Care—11.6% | | | | | | |
| Coventry Health Care | | 1,000 | | a | | 80,000 |
| DaVita | | 1,700 | | a | | 78,047 |
| Gilead Sciences | | 1,550 | | a | | 66,650 |
| Kinetic Concepts | | 600 | | a | | 32,880 |
| Quest Diagnostics | | 1,450 | | | | 72,471 |
| Zimmer Holdings | | 600 | | a | | 49,302 |
| | | | | | | 379,350 |
| | STATEMENT OF INVESTMENTS (continued)
|
| Common Stocks (continued) | | Shares | | | | Value ($) |
| |
| |
| |
|
| Internet—2.3% | | | | | | | | |
| Baidu.com, ADR | | | | 150 | | a | | 12,161 |
| Shanda Interactive Entertainment, ADR | | 1,900 | | a | | 63,194 |
| | | | | | | | | 75,355 |
| Manufacturing—2.2% | | | | | | | | |
| Eaton | | | | 1,100 | | | | 70,312 |
| Materials & Processing—2.1% | | | | | | |
| American Standard Cos. | | | | 1,500 | | | | 68,400 |
| Producer Durables—7.6% | | | | | | | | |
| Centex | | | | 1,350 | | | | 91,462 |
| Cummins | | | | 850 | | | | 73,500 |
| Rockwell Collins | | | | 1,750 | | | | 84,227 |
| | | | | | | | | 249,189 |
| Technology—20.6% | | | | | | | | |
| Adobe Systems | | | | 2,400 | | | | 64,896 |
| Amphenol, Cl. A | | | | 1,600 | | | | 67,856 |
| Autodesk | | | | 2,900 | | | | 125,280 |
| Cognizant Technology Solutions, Cl. A | | 2,400 | | a | | 109,272 |
| Cognos | | | | 2,200 | | a | | 79,442 |
| Microchip Technology | | | | 2,300 | | | | 71,576 |
| NAVTEQ | | | | 1,700 | | a | | 79,118 |
| Rockwell Automation | | | | 1,500 | | | | 78,060 |
| | | | | | | | | 675,500 |
| |
| |
| |
| |
|
| |
| Total Investments (cost $2,440,071) | | 99.5% | | | | 3,259,136 |
| Cash and Receivables (Net) | | .5% | | | | 16,845 |
| Net Assets | | | | 100.0% | | | | 3,275,981 |
| |
| ADR—American Depository Receipts. | | | | | | |
| a Non-income producing. | | | | | | | | |
| |
| |
| |
| |
|
| |
| |
| Portfolio Summary † | | | | | | | | |
| | | Value (%) | | | | | | Value (%) |
| |
| |
| |
| |
|
| Consumer Discretionary | | 23.7 | | Producer Durables | | | | 7.6 |
| Technology | | 20.6 | | Auto & Transports | | | | 5.0 |
| Energy | | 11.8 | | Other | | | | 9.3 |
| Health Care | | 11.6 | | | | | | |
| Financial Services | | 9.9 | | | | | | 99.5 |
| |
| † Based on net assets. | | | | | | | | |
| See notes to financial statements. | | | | | | | | |
10
STATEMENT OF ASSETS AND LIABILITIES
August 31, 2005
|
| | | | | | | | | Cost | | Value |
| |
| |
| |
| |
| |
|
| Assets ($): | | | | | | | | | | |
| Investments in securities—See Statement of Investments | | 2,440,071 | | 3,259,136 |
| Cash | | | | | | | | | | 11,215 |
| Receivable for shares of Common Stock subscribed | | | | | | | | 9,021 |
| Dividends receivable | | | | | | | | | | 2,371 |
| Prepaid expenses | | | | | | | | | | 25,154 |
| Due from The Dreyfus Corporation and affiliates—Note 3(c) | | | | | | 2,146 |
| | | | | | | | | | | 3,309,043 |
| |
| |
| |
| |
| |
|
| Liabilities ($): | | | | | | | | | | |
| Accrued expenses | | | | | | | | | | 33,062 |
| |
| |
| |
| |
| |
|
| Net Assets ($) | | | | | | | | | | 3,275,981 |
| |
| |
| |
| |
| |
|
| Composition of Net Assets ($): | | | | | | | | | | |
| Paid-in capital | | | | | | | | | | 2,334,078 |
| Accumulated net realized gain (loss) on investments | | | | | | 122,838 |
| Accumulated net unrealized appreciation | | | | | | | | |
| (depreciation) on investments | | | | | | | | | | 819,065 |
| |
| |
| |
| |
| |
|
| Net Assets ($) | | | | | | | | | | 3,275,981 |
| |
| |
| |
| |
| |
|
| |
| |
| Net Asset Value Per Share | | | | | | | | | | |
| | | Class A | | Class B | | Class C | | Class R | | Class T |
| |
| |
| |
| |
| |
|
| Net Assets ($) | | 814,614 | | 903,785 | | 882,220 | | 328,585 | | 346,777 |
| Shares Outstanding | | 42,087 | | 47,621 | | 46,402 | | 16,857 | | 18,013 |
| |
| |
| |
| |
| |
|
| Net Asset Value Per Share ($) | | 19.36 | | 18.98 | | 19.01 | | 19.49 | | 19.25 |
See notes to financial statements.
|
| | STATEMENT OF OPERATIONS
Year Ended August 31, 2005
|
| Investment Income ($): | | |
| Income: | | |
| Cash dividends (net of $276 foreign taxes withheld at source) | | 12,026 |
| Interest | | 499 |
| Income from securities lending | | 82 |
| Total Income | | 12,607 |
| Expenses: | | |
| Management fee—Note 3(a) | | 21,366 |
| Registration fees | | 48,305 |
| Professional fees | | 25,308 |
| Distribution fees—Note 3(b) | | 12,662 |
| Shareholder servicing costs—Note 3(c) | | 12,288 |
| Prospectus and shareholders’ reports | | 10,812 |
| Custodian fees—Note 3(c) | | 1,914 |
| Directors’ fees and expenses—Note 3(d) | | 328 |
| Loan commitment fees—Note 2 | | 12 |
| Miscellaneous | | 7,034 |
| Total Expenses | | 140,029 |
| Less—expense reimbursement from The Dreyfus | | |
| Corporation due to undertaking—Note 3(a) | | (84,994) |
| Less—reduction in custody fees | | |
| due to earnings credits—Note 1(b) | | (395) |
| Net Expenses | | 54,640 |
| Investment (Loss)—Net | | (42,033) |
| |
|
| Realized and Unrealized Gain (Loss) on Investments—Note 4 ($): |
| Net realized gain (loss) on investments | | 123,105 |
| Net unrealized appreciation (depreciation) on investments | | 465,344 |
| Net Realized and Unrealized Gain (Loss) on Investments | | 588,449 |
| Net Increase in Net Assets Resulting from Operations | | 546,416 |
| | See notes to financial statements.
|
STATEMENT OF CHANGES IN NET ASSETS
| | | Year Ended August 31, |
| |
|
| | | 2005 | | 2004 |
| |
| |
|
| Operations ($): | | | | |
| Investment (loss)—net | | (42,033) | | (34,027) |
| Net realized gain (loss) on investments | | 123,105 | | 53,143 |
| Net unrealized appreciation | | | | |
| (depreciation) on investments | | 465,344 | | 79,611 |
| Net Increase (Decrease) in Net Assets | | | | |
| Resulting from Operations | | 546,416 | | 98,727 |
| |
| |
|
| Dividends to Shareholders from ($): | | | | |
| Net realized gain on investments: | | | | |
| Class A shares | | (10,901) | | — |
| Class B shares | | (18,983) | | — |
| Class C shares | | (11,011) | | — |
| Class R shares | | (5,963) | | — |
| Class T shares | | (6,092) | | — |
| Total Dividends | | (52,950) | | — |
| |
| |
|
| Capital Stock Transactions ($): | | | | |
| Net proceeds from shares sold: | | | | |
| Class A shares | | 308,532 | | 124,892 |
| Class B shares | | 379,097 | | 330,421 |
| Class C shares | | 357,183 | | 159,526 |
| Class R shares | | 20,441 | | 7,990 |
| Class T shares | | 37,182 | | 4,904 |
| Dividends reinvested: | | | | |
| Class A shares | | 10,711 | | — |
| Class B shares | | 17,655 | | — |
| Class C shares | | 10,260 | | — |
| Class R shares | | 5,963 | | — |
| Class T shares | | 5,808 | | — |
| Cost of shares redeemed: | | | | |
| Class A shares | | (85,505) | | (144,868) |
| Class B shares | | (446,522) | | (403,059) |
| Class C shares | | (41,530) | | — |
| Class R shares | | (20,198) | | (10) |
| Class T shares | | (12,134) | | — |
| Increase (Decrease) in Net Assets | | | | |
| from Capital Stock Transactions | | 546,943 | | 79,796 |
| Total Increase (Decrease) in Net Assets | | 1,040,409 | | 178,523 |
| |
| |
|
| Net Assets ($): | | | | |
| Beginning of Period | | 2,235,572 | | 2,057,049 |
| End of Period | | 3,275,981 | | 2,235,572 |
| | STATEMENT OF CHANGES IN NET ASSETS (continued)
|
| | | Year Ended August 31, |
| |
|
| | | 2005 | | 2004 |
| |
| |
|
| Capital Share Transactions: | | | | |
| Class Aa | | | | |
| Shares sold | | 16,965 | | 7,738 |
| Shares issued for dividends reinvested | | 592 | | — |
| Shares redeemed | | (4,542) | | (9,118) |
| Net Increase (Decrease) in Shares Outstanding | | 13,015 | | (1,380) |
| |
| |
|
| Class B a | | | | |
| Shares sold | | 21,307 | | 20,796 |
| Shares issued for dividends reinvested | | 989 | | — |
| Shares redeemed | | (24,476) | | (24,997) |
| Net Increase (Decrease) in Shares Outstanding | | (2,180) | | (4,201) |
| |
| |
|
| Class C | | | | |
| Shares sold | | 19,257 | | 9,694 |
| Shares issued for dividends reinvested | | 574 | | — |
| Shares redeemed | | (2,284) | | — |
| Net Increase (Decrease) in Shares Outstanding | | 17,547 | | 9,694 |
| |
| |
|
| Class R | | | | |
| Shares sold | | 1,131 | | 502 |
| Shares issued for dividends reinvested | | 328 | | — |
| Shares redeemed | | (1,103) | | (1) |
| Net Increase (Decrease) in Shares Outstanding | | 356 | | 501 |
| |
| |
|
| Class T | | | | |
| Shares sold | | 2,043 | | 300 |
| Shares issued for dividends reinvested | | 322 | | — |
| Shares redeemed | | (652) | | — |
| Net Increase (Decrease) in Shares Outstanding | | 1,713 | | 300 |
| |
| a During the period ended August 31, 2005, 2,972 Class B shares representing $54,554 were automatically |
| converted to 2,923 Class A shares and during the year ended August 31, 2004, 1,821 Class B shares representing |
| $30,061 were automatically converted to 1,807 Class A shares. | | |
| See notes to financial statements. | | | | |
The following tables describe the performance for each share class for the fiscal periods indicated.All information (except portfolio turnover rate) reflects financial results for a single fund share.Total return shows how much your investment in the fund would have increased (or decreased) during the period, assuming you had reinvested all dividends and distributions.These figures have been derived from the fund’s financial statements.
| | | | | Year Ended August 31, |
| | | |
|
| Class A Shares | | 2005 | | 2004 | | 2003 a |
| |
| |
| |
|
| Per Share Data ($): | | | | | | |
| Net asset value, beginning of period | | 16.01 | | 15.19 | | 12.50 |
| Investment Operations: | | | | | | |
| Investment (loss)—net b | | (.20) | | (.18) | | (.08) |
| Net realized and unrealized gain | | | | | | |
| (loss) on investments | | 3.90 | | 1.00 | | 2.77 |
| Total from Investment Operations | | 3.70 | | .82 | | 2.69 |
| Distributions: | | | | | | |
| Dividends from net realized gain on investments | | (.35) | | — | | — |
| Net asset value, end of period | | 19.36 | | 16.01 | | 15.19 |
| |
| |
| |
|
| Total Return (%) c | | 23.23 | | 5.33 | | 21.60d |
| |
| |
| |
|
| Ratios/Supplemental Data (%): | | | | | | |
| Ratio of total expenses to average net assets | | 4.54 | | 7.15 | | 6.39d |
| Ratio of net expenses to average net assets | | 1.54 | | 1.50 | | .64d |
| Ratio of net investment (loss) | | | | | | |
| to average net assets | | (1.10) | | (1.10) | | (.53)d |
| Portfolio Turnover Rate | | 45.08 | | 97.27 | | 39.58d |
| |
| |
| |
|
| Net Assets, end of period ($ X 1,000) | | 815 | | 465 | | 463 |
| |
| a | | From March 31, 2003 (commencement of operations) to August 31, 2003. | | | | |
| b | | Based on average shares outstanding at each month end. | | | | |
| c | | Exclusive of sales charge. | | | | | | |
| d | | Not annualized. | | | | | | |
| See notes to financial statements. | | | | | | |
| | FINANCIAL HIGHLIGHTS (continued)
|
| | | | | Year Ended August 31, |
| | | |
|
| Class B Shares | | 2005 | | 2004 | | 2003 a |
| |
| |
| |
|
| Per Share Data ($): | | | | | | |
| Net asset value, beginning of period | | 15.84 | | 15.15 | | 12.50 |
| Investment Operations: | | | | | | |
| Investment (loss)—net b | | (.33) | | (.30) | | (.13) |
| Net realized and unrealized gain | | | | | | |
| (loss) on investments | | 3.82 | | .99 | | 2.78 |
| Total from Investment Operations | | 3.49 | | .69 | | 2.65 |
| Distributions: | | | | | | |
| Dividends from net realized gain on investments | | (.35) | | — | | — |
| Total Distributions | | | | | | |
| Net asset value, end of period | | 18.98 | | 15.84 | | 15.15 |
| |
| |
| |
|
| Total Return (%) c | | 22.21 | | 4.56 | | 21.20d |
| |
| |
| |
|
| Ratios/Supplemental Data (%): | | | | | | |
| Ratio of total expenses to average net assets | | 5.26 | | 7.96 | | 5.98d |
| Ratio of net expenses to average net assets | | 2.27 | | 2.25 | | .95d |
| Ratio of net investment (loss) | | | | | | |
| to average net assets | | (1.83) | | (1.85) | | (.83)d |
| Portfolio Turnover Rate | | 45.08 | | 97.27 | | 39.58d |
| |
| |
| |
|
| Net Assets, end of period ($ X 1,000) | | 904 | | 789 | | 818 |
| |
| a | | From March 31, 2003 (commencement of operations) to August 31, 2003. | | | | |
| b | | Based on average shares outstanding at each month end. | | | | |
| c | | Exclusive of sales charge. | | | | | | |
| d | | Not annualized. | | | | | | |
| See notes to financial statements. | | | | | | |
| | | | | Year Ended August 31, |
| | | |
|
| Class C Shares | | 2005 | | 2004 | | 2003 a |
| |
| |
| |
|
| Per Share Data ($): | | | | | | |
| Net asset value, beginning of period | | 15.82 | | 15.15 | | 12.50 |
| Investment Operations: | | | | | | |
| Investment (loss)—net b | | (.31) | | (.30) | | (.12) |
| Net realized and unrealized gain | | | | | | |
| (loss) on investments | | 3.85 | | .97 | | 2.77 |
| Total from Investment Operations | | 3.54 | | .67 | | 2.65 |
| Distributions: | | | | | | |
| Dividends from net realized gain on investments | | (.35) | | — | | — |
| Net asset value, end of period | | 19.01 | | 15.82 | | 15.15 |
| |
| |
| |
|
| Total Return (%) c | | 22.55 | | 4.42 | | 21.20d |
| |
| |
| |
|
| Ratios/Supplemental Data (%): | | | | | | |
| Ratio of total expenses to average net assets | | 5.19 | | 7.66 | | 7.49d |
| Ratio of net expenses to average net assets | | 2.22 | | 2.25 | | .95d |
| Ratio of net investment (loss) | | | | | | |
| to average net assets | | (1.78) | | (1.86) | | (.84)d |
| Portfolio Turnover Rate | | 45.08 | | 97.27 | | 39.58d |
| |
| |
| |
|
| Net Assets, end of period ($ X 1,000) | | 882 | | 456 | | 290 |
| |
| a | | From March 31, 2003 (commencement of operations) to August 31, 2003. | | | | |
| b | | Based on average shares outstanding at each month end. | | | | |
| c | | Exclusive of sales charge. | | | | | | |
| d | | Not annualized. | | | | | | |
| See notes to financial statements. | | | | | | |
| | FINANCIAL HIGHLIGHTS (continued)
|
| | | | | Year Ended August 31, |
| | | |
|
| Class R Shares | | 2005 | | 2004 | | 2003 a |
| |
| |
| |
|
| Per Share Data ($): | | | | | | |
| Net asset value, beginning of period | | 16.06 | | 15.21 | | 12.50 |
| Investment Operations: | | | | | | |
| Investment (loss)—net b | | (.14) | | (.14) | | (.06) |
| Net realized and unrealized gain | | | | | | |
| (loss) on investments | | 3.92 | | .99 | | 2.77 |
| Total from Investment Operations | | 3.78 | | .85 | | 2.71 |
| Distributions: | | | | | | |
| Dividends from net realized gain on investments | | (.35) | | — | | — |
| Net asset value, end of period | | 19.49 | | 16.06 | | 15.21 |
| |
| |
| |
|
| Total Return (%) | | 23.73 | | 5.52 | | 21.76c |
| |
| |
| |
|
| Ratios/Supplemental Data (%): | | | | | | |
| Ratio of total expenses to average net assets | | 4.16 | | 6.81 | | 7.10c |
| Ratio of net expenses to average net assets | | 1.20 | | 1.25 | | .53c |
| Ratio of net investment (loss) | | | | | | |
| to average net assets | | (.76) | | (.85) | | (.42)c |
| Portfolio Turnover Rate | | 45.08 | | 97.27 | | 39.58c |
| |
| |
| |
|
| Net Assets, end of period ($ X 1,000) | | 329 | | 265 | | 243 |
| |
| a | | From March 31, 2003 (commencement of operations) to August 31, 2003. | | | | |
| b | | Based on average shares outstanding at each month end. | | | | |
| c | | Not annualized. | | | | | | |
| See notes to financial statements. | | | | | | |
| | | | | Year Ended August 31, |
| | | |
|
| Class T Shares | | 2005 | | 2004 | | 2003 a |
| |
| |
| |
|
| Per Share Data ($): | | | | | | |
| Net asset value, beginning of period | | 15.95 | | 15.18 | | 12.50 |
| Investment Operations: | | | | | | |
| Investment (loss)—net b | | (.23) | | (.22) | | (.09) |
| Net realized and unrealized gain | | | | | | |
| (loss) on investments | | 3.88 | | .99 | | 2.77 |
| Total from Investment Operations | | 3.65 | | .77 | | 2.68 |
| Distributions: | | | | | | |
| Dividends from net realized gain on investments | | (.35) | | — | | — |
| Net asset value, end of period | | 19.25 | | 15.95 | | 15.18 |
| |
| |
| |
|
| Total Return (%) c | | 23.07 | | 5.00 | | 21.52d |
| |
| |
| |
|
| Ratios/Supplemental Data (%): | | | | | | |
| Ratio of total expenses to average net assets | | 4.67 | | 7.31 | | 7.32d |
| Ratio of net expenses to average net assets | | 1.71 | | 1.75 | | .74d |
| Ratio of net investment (loss) | | | | | | |
| to average net assets | | (1.27) | | (1.36) | | (.63)d |
| Portfolio Turnover Rate | | 45.08 | | 97.27 | | 39.58d |
| |
| |
| |
|
| Net Assets, end of period ($ X 1,000) | | 347 | | 260 | | 243 |
| |
| a | | From March 31, 2003 (commencement of operations) to August 31, 2003. | | | | |
| b | | Based on average shares outstanding at each month end. | | | | |
| c | | Exclusive of sales charge. | | | | | | |
| d | | Not annualized. | | | | | | |
| See notes to financial statements. | | | | | | |
NOTES TO FINANCIAL STATEMENTS
NOTE 1—Significant Accounting Policies:
Dreyfus Premier Select Midcap Growth Fund (the “fund”) is a separate diversified series of Dreyfus Growth and Value Funds, Inc. (the “Company”) which is registered under the Investment Company Act of 1940, as amended (the “Act”), as an open-end management investment company and operates as a series company currently offering twelve series, including the fund. The fund’s investment objective is long-term capital appreciation. The Dreyfus Corporation (the “Manager” or “Dreyfus”) serves as the fund’s investment adviser.The Manager is a wholly-owned subsidiary of Mellon Financial Corporation (“Mellon Financial”).
Dreyfus Service Corporation (the “Distributor”) a wholly-owned subsidiary of the Manager, is the distributor of the fund’s shares.The fund is authorized to issue 500 million shares of $.001 par value Common Stock.The fund currently offers five classes of shares: Class A (100 million shares authorized), Class B (100 million shares authorized), Class C (100 million shares authorized), Class R (100 million shares authorized) and Class T (100 million shares authorized). Class A and Class T shares are subject to a sales charge imposed at the time of purchase. Class B shares are subject to a contingent deferred sales charge (“CDSC”) imposed on Class B share redemptions made within six years of purchase and automatically convert to Class A shares after six years. Class C shares are subject to a CDSC imposed on Class C shares redeemed within one year of purchase and Class R shares are sold at net asset value per share only to institutional investors. Other differences between the classes include the services offered to and the expenses borne by each class and certain voting rights. Income, expenses (other than expenses attributable to a specific class), and realized and unrealized gains or losses on investments are allocated to each class of shares based on its relative net assets.
As of August 31, 2005, MBC Investment Corp., an indirect subsidiary of Mellon Financial, held 16,306 Class A shares, 16,310 Class B shares, 16,309 Class C shares, 16,304 Class R shares and 16,307 Class T shares of the fund.
The Company accounts separately for the assets, liabilities and operations of each series. Expenses directly attributable to each series are charged to that series’ operations; expenses which are applicable to all series are allocated among them on a pro rata basis.
The fund’s financial statements are prepared in accordance with U.S. generally accepted accounting principles, which may require the use of management estimates and assumptions. Actual results could differ from those estimates.
The fund enters into contracts that contain a variety of indemnifications. The fund’s maximum exposure under these arrangements is unknown.The fund does not anticipate recognizing any loss related to these arrangements.
(a) Portfolio valuation: Investments in securities (including options) are valued at the last sales price on the securities exchange or national securities market on which such securities are primarily traded. Securities listed on the National Market System for which market quotations are available are valued at the official closing price or, if there is no official closing price that day, at the last sale price. Securities not listed on an exchange or the national securities market, or securities for which there were no transactions, are valued at the average of the most recent bid and asked prices, except for open short positions, where the asked price is used for valuation purposes. Bid price is used when no asked price is available. When market quotations or official closing prices are not readily available, or are determined not to reflect accurately fair value, such as when the value of a security has been significantly affected by events after the close of the exchange or market on which the security is principally traded (for example, a foreign exchange or market), but before the fund calculates its net asset value, the fund may value these investments at fair value as determined in accordance with the procedures approved by the Board of Directors. Fair valuing of securities may be determined with the assistance of a pricing service using calculations based on indices of domestic securities and other appropriate indicators, such as prices of relevant ADR’s
| | NOTES TO FINANCIAL STATEMENTS (continued)
|
and futures contracts. For other securities that are fair valued by the Board of Directors, certain factors may be considered such as: fundamental analytical data, the nature and duration of restrictions on disposition, an evaluation of the forces that influence the market in which the securities are purchased and sold, and public trading in similar securities of the issuer or comparable issuers. Investments in registered investment companies are valued at their net asset value. Financial futures are valued at the last sales price.
(b) Securities transactions and investment income: Securities transactions are recorded on a trade date basis. Realized gain and loss from securities transactions are recorded on the identified cost basis. Dividend income is recognized on the ex-dividend date and interest income, including, where applicable, accretion of discount and amortization of premium on investments, is recognized on the accrual basis.
The fund has an arrangement with the custodian bank whereby the fund receives earnings credits from the custodian when positive cash balances are maintained, which are used to offset custody fees. For financial reporting purposes, the fund includes net earnings credits as an expense offset in the Statement of Operations.
Pursuant to a securities lending agreement with Mellon Bank, N.A., an affiliate of the Manager, the fund may lend securities to qualified institutions.At origination, all loans are secured by collateral of at least 102% of the value of U.S. securities loaned and 105% of the value of foreign securities loaned. Collateral equivalent to at least 100% of the market value of securities on loan will be maintained at all times. Cash collateral is invested in certain money market mutual funds managed by the Manager. The fund will be entitled to receive all income on securities loaned, in addition to income earned as a result of the lending transaction. Although each security loaned is fully collateralized, the fund would bear the risk of delay in recovery of, or loss of rights in, the securities loaned should a borrower fail to return the securities in a timely manner.
(c) Affiliated issuers: Investments in other investment companies advised by the Manager are defined as “affiliated” in the Act.
(d) Dividends to shareholders: Dividends are recorded on the ex-dividend date. Dividends from investment income-net and dividends from net realized capital gain, if any, are normally declared and paid annually, but the fund may make distributions on a more frequent basis to comply with the distribution requirements of the Internal Revenue Code of 1986, as amended (the “Code”).To the extent that net realized capital gain can be offset by capital loss carryovers, if any, it is the policy of the fund not to distribute such gain. Income and capital gain distributions are determined in accordance with income tax regulations, which may differ from U.S. generally accepted accounting principles.
(e) Federal income taxes: It is the policy of the fund to continue to qualify as a regulated investment company, if such qualification is in the best interests of its shareholders, by complying with the applicable provisions of the Code, and to make distributions of taxable income sufficient to relieve it from substantially all federal income and excise taxes.
At August 31, 2005, the components of accumulated earnings on a tax basis were as follows: undistributed capital gains $123,757 and unrealized appreciation $818,146.
The tax character of distributions paid to shareholders during the fiscal periods ended August 31, 2005 and August 31, 2004 were as follows: long-term capital gains $52,950 and $0, respectively.
During the period ended August 31, 2005, as a result of permanent book to tax differences primarily due to the tax treatment for net operating losses, the fund increased accumulated undistributed investment income-net by $42,033 and decreased paid-in capital by the same amount. Net assets were not affected by this reclassification.
NOTE 2—Bank Line of Credit:
|
The fund participates with other Dreyfus-managed funds in a $350 million redemption credit facility (the “Facility”) to be utilized for temporary or emergency purposes, including the financing of redemptions. In connection therewith, the fund has agreed to pay commitment fees on its pro rata portion of the Facility. Interest is charged to the fund
| | NOTES TO FINANCIAL STATEMENTS (continued)
|
based on prevailing market rates in effect at the time of borrowings. During the period ended August 31, 2005, the fund did not borrow under the Facility.
NOTE 3—Management Fee and Other Transactions With
Affiliates:
|
(a) Pursuant to a management agreement (the “Agreement”) with the Manager, the management fee is computed at the annual rate of .75% of the value of the fund’s average daily net assets and is payable monthly. The Manager has undertaken from September 1, 2004 through August 31, 2006 that, if the fund’s aggregate expenses, exclusive of taxes, brokerage fees, interest on borrowings, Rule 12b-1 distribution plan fees, shareholder services plan fees and extraordinary expenses, exceed an annual rate of 1.25% of the value of the fund’s average daily net assets, the fund may deduct from the payment to be made to the Manager under the Agreement, or the Manager will bear, such excess expense. The expense reimbursement, pursuant to the undertaking, amounted to $84,994 during the period ended August 31, 2005.
During the period ended August 31, 2005, the Distributor retained $1,209 and $23 from commissions earned on sales of the fund’s Class A and Class T shares, respectively, and $2,824 and $99 from contingent deferred sales charges on redemptions of the fund’s Class B and Class C shares, respectively.
(b) Under the Distribution Plan (the “Plan”) adopted pursuant to Rule 12b-1 under the Act, Class B, Class C and Class T shares pay the Distributor for distributing their shares at an annual rate of .75% of the value of the average daily net assets of Class B and Class C shares, and .25% of the value of the average daily net assets of Class T shares. During the period ended August 31, 2005, Class B, Class C and Class T shares were charged $7,287, $4,572 and $803, respectively, pursuant to the Plan.
(c) Under the Shareholder Services Plan, Class A, Class B, Class C and Class T shares pay the Distributor at an annual rate of .25% of the value of their average daily net assets for the provision of certain services.
The services provided may include personal services relating to shareholder accounts, such as answering shareholder inquiries regarding the fund and providing reports and other information, and services related to the maintenance of shareholder accounts. The Distributor may make payments to Service Agents (a securities dealer, financial institution or industry professional) in respect of these services. The Distributor determines the amounts to be paid to Service Agents. During the period ended August 31, 2005, Class A, Class B, Class C and Class T shares were charged $1,599, $2,429, $1,524 and $803, respectively, pursuant to the Shareholder Services Plan.
The fund compensates Dreyfus Transfer, Inc., a wholly-owned subsidiary of the Manager, under a transfer agency agreement for providing personnel and facilities to perform transfer agency services for the fund. During the period ended August 31, 2005, the fund was charged $2,359 pursuant to the transfer agency agreement.
The fund compensates Mellon Bank, N.A., an affiliate of the Manager, under a custody agreement for providing custodial services for the fund. During the period ended August 31, 2005, the fund was charged $1,914 pursuant to the custody agreement.
During the period ended August 31, 2005, the fund was charged $2,520 for services performed by the Chief Compliance Officer.
The components of Due from The Dreyfus Corporation and affiliates in the Statement of Assets and Liabilities consist of: management fees $2,092, Rule 12b-1 distribution plan fees $1,218, shareholder services plan fees $628, custody fees $348, chief compliance officer fees $1,533 and transfer agency per account fees $384, which are offset against an expense reimbursement currently in effect in the amount of $8,349.
(d) Each Board member also serves as a Board member of other funds within the Dreyfus complex. Annual retainer fees and attendance fees are allocated to each fund based on net assets.
| | NOTES TO FINANCIAL STATEMENTS (continued)
|
NOTE 4—Securities Transactions:
|
The aggregate amount of purchases and sales of investment securities, excluding short-term securities, during the period ended August 31, 2005, amounted to $1,739,769 and $1,248,093, respectively.
At August 31, 2005, the cost of investments for federal income tax purposes was $2,440,990; accordingly, accumulated net unrealized appreciation on investments was $818,146, consisting of $841,984 gross unrealized appreciation and $23,838 gross unrealized depreciation.
In early 2004, two purported class and derivative actions were filed against Mellon Financial, Mellon Bank, N.A., Dreyfus, Founders Asset Management LLC, and certain directors of the Dreyfus Funds and the Dreyfus Founders Funds (together, the “Funds”) in the United States District Court for the Western District of Pennsylvania. In September 2004, plaintiffs served a Consolidated Amended Complaint (the “Amended Complaint”) on behalf of a purported class of all persons who acquired interests in any of the Funds between January 30, 1999 and November 17, 2003, and derivatively on behalf of the Funds.The Amended Complaint in the newly styled In re Dreyfus Mutual Funds Fee Litigation also named the Distributor, Premier Mutual Fund Services, Inc. and two additional Fund directors as defendants and alleges violations of the Investment Company Act of 1940, the Investment Advisers Act of 1940, the Pennsylvania Unfair Trade Practices and Consumer Protection Law and common-law claims. Plaintiffs seek to recover allegedly improper and excessive Rule 12b-1 and advisory fees allegedly charged to the Funds for marketing and distribution services. More specifically, plaintiffs claim, among other things, that 12b-1 fees and directed brokerage were improperly used to
pay brokers to recommend the Funds over other funds, and that such payments were not disclosed to investors. In addition, plaintiffs assert that economies of scale and soft-dollar benefits were not passed on to the Funds. Plaintiffs further allege that 12b-1 fees were improperly charged to certain of the Funds that were closed to new investors.The Amended Complaint seeks compensatory and punitive damages, rescission of the advisory contracts, and an accounting and restitution of any unlawful fees, as well as an award of attorneys’ fees and litigation expenses. As noted, some of the claims in this litigation are asserted derivatively on behalf of the Funds that have been named as nominal defendants. With respect to such derivative claims, no relief is sought against the Funds. Dreyfus believes the allegations to be totally without merit and intends to defend the action vigorously. In November 2004, all named defendants moved to dismiss the Amended Complaint in whole or substantial part. Briefing was completed in May 2005.
Additional lawsuits arising out of these circumstances and presenting similar allegations and requests for relief may be filed against the defendants in the future. Neither Dreyfus nor the Funds believe that any of the pending actions will have a material adverse effect on the Funds or Dreyfus’ ability to perform its contract with the Funds.
| | REPORT OF INDEPENDENT REGISTERED
PUBLIC ACCOUNTING FIRM
|
Shareholders and Board of Directors
Dreyfus Premier Select Midcap Growth Fund
|
We have audited the accompanying statement of assets and liabilities, including the statement of investments, of Dreyfus Premier Select Midcap Growth Fund (one of the funds comprising Dreyfus Growth and Value Funds, Inc.) as of August 31, 2005, and the related statement of operations for the year then ended, the statement of changes in net assets for each of the two years in the period then ended, and financial highlights for each of the periods indicated therein. These financial statements and financial highlights are the responsibility of the Fund’s management. Our responsibility is to express an opinion on these financial statements and financial highlights based on our audits.
We conducted our audits in accordance with the standards of the Public Company Accounting Oversight Board (United States).Those standards require that we plan and perform the audit to obtain reasonable assurance about whether the financial statements and financial highlights are free of material misstatement.We were not engaged to perform an audit of the Fund’s internal control over financial reporting.Our audits included consideration of internal control over financial reporting as a basis for designing audit procedures that are appropriate in the circumstances,but not for the purpose of expressing an opinion on the effectiveness of the Fund’s internal control over financial reporting.Accordingly, we express no such opinion.An audit also includes examining, on a test basis, evidence supporting the amounts and disclosures in the financial statements and financial highlights, assessing the accounting principles used and significant estimates made by management, and evaluating the overall financial statement presentation. Our procedures included verification by examination of securities held by the custodian as of August 31, 2005 and confirmation of securities not held by the custodian by correspondence with oth-ers.We believe that our audits provide a reasonable basis for our opinion.
In our opinion, the financial statements and financial highlights referred to above present fairly, in all material respects, the financial position of Dreyfus Premier Select Midcap Growth Fund at August 31, 2005, the results of its operations for the year then ended, the changes in its net assets for each of the two years in the period then ended, and the financial highlights for each of the indicated periods, in conformity with U.S. generally accepted accounting principles.

New York, New York
October 14, 2005
|
IMPORTANT TAX INFORMATION (Unaudited)
The fund designates $.3456 per share as a long-term capital gain distribution paid on December 10, 2004.
| | INFORMATION ABOUT THE REVIEW AND APPROVAL OF THE
FUND’S MANAGEMENT AGREEMENT (Unaudited)
|
At a meeting of the Board of Directors held on March 14, 2005, the Board considered the re-approval for an annual period of the Fund’s Management Agreement, pursuant to which the Manager provides the Fund with investment advisory and administrative services. The Board members, none of whom are “interested persons” (as defined in the Investment Company Act of 1940,as amended) of the Fund,were assisted in their review by independent legal counsel and met with counsel in executive session separate from representatives of the Manager.
Analysis of Nature, Extent and Quality of Services Provided to the Fund. The Board members received a presentation from representatives of the Manager regarding services provided to the Fund and other funds in the Dreyfus fund complex, and discussed the nature, extent and quality of the services provided to the Fund pursuant to its Management Agreement. The presentation included a detailed summary of the services provided to Dreyfus-managed mutual funds by each business unit within the Manager.The Manager’s representatives reviewed the Fund’s distribution of accounts and the relationships the Manager has with various intermediaries and the different needs of each.The Manager’s representatives noted the diversity of distribution of the Fund as well as among the funds in the Dreyfus fund complex, and the Manager’s corresponding need for broad, deep, and diverse resources to be able to provide ongoing shareholder services to each of the Fund’s distribution channels.The Board also reviewed the number of shareholder accounts in the Fund, as well as the Fund’s asset size.
The Board members also considered the Manager’s research and portfolio management capabilities and that the Manager also provides oversight of day-to-day Fund operations, including fund accounting and administration and assistance in meeting legal and regulatory requirements. The Board members also considered the Manager’s extensive administrative, accounting and compliance infrastructure.
Comparative Analysis of the Fund’s Performance and Management Fee and Expense Ratio. The Board members reviewed the Fund’s perfor-mance,management fee and expense ratios and placed significant emphasis on comparisons to a group of comparable funds and Lipper category
averages, as applicable. The group of comparable funds was previously approved by the Board for this purpose, and was prepared using a Board-approved selection methodology that was based, in part, on selecting non-affiliated funds reported in the same Lipper category as the Fund. The Board members discussed the results of the comparisons for the 1-year period ended January 31, 2005, (the Fund commenced operations in March 2003), and noted that the Fund’s performance was higher than the comparison group and Lipper category averages for such period.The Board members also discussed the Fund’s management fee and expense ratio and reviewed the range of management fees and expense ratios for the funds in the comparison group.The Fund’s management fee ranked in the top half (i.e., lower than most others) of the comparison group funds. The Board noted that the Fund’s total expense ratio (after fee waivers and/or expense reimbursements by the Manager) was lower than the Fund’s comparison group and Lipper category averages.
Representatives of the Manager reviewed with the Board members the fees paid to the Manager or its affiliates by mutual funds managed by the Manager or its affiliates with similar investment objectives, policies and strategies as the Fund, of which there was one (the “Similar Fund”), and by other accounts managed or sub-advised by the Manager or its affiliates with similar investment objectives, policies and strategies as the Fund (the “Separate Accounts” and, collectively with the Similar Fund, the “Similar Accounts”). The Manager’s representatives explained the nature of the Similar Accounts and the differences, from the Manager’s perspective, in management of the Similar Accounts as compared to managing and providing services to the Fund; it was noted that the Similar Fund was a mutual fund included in the “mid-cap growth” funds category by Lipper.The Manager’s representatives also reviewed the costs associated with distribution through intermediaries. The Board analyzed the differences in fees paid to the Manager and discussed the relationship of the advisory fees paid in light of the Manager’s performance and the services provided; it was noted that the Similar Fund had the same management fee as the fee borne by the Fund. The Board members considered the relevance of the fee infor-
| | I N FO R M AT I O N A B O U T T H E R E V I E W A N D A P P R OVA L O F
T H E F U N D ’ S M A N A G E M E N T A G R E E M E N T ( U n a u d i t e d ) ( c o n t i n u e d )
|
mation provided for the Similar Accounts managed by the Manager to evaluate the appropriateness and reasonableness of the Fund’s advisory fees. The Board acknowledged that differences in fees paid by the Similar Accounts seemed to be consistent with the services provided.
Analysis of Profitability and Economies of Scale. The Manager’s representatives reviewed the dollar amount of expenses allocated and profit received by the Manager and the method used to determine such expenses and profit. The Board received and considered information prepared by an independent consulting firm regarding the Manager’s approach to allocating costs to,and determining the profitability of,indi-vidual funds and the entire Dreyfus fund complex.The Manager’s representatives stated that the methodology had also been reviewed by an independent registered public accounting firm which, like the consultant, found the methodology to be reasonable.The consulting firm also analyzed where any economies of scale might emerge in connection with the management of the Fund.The Board members evaluated the analysis in light of the relevant circumstances for the Fund, and the extent to which economies of scale would be realized as the Fund grows and whether fee levels reflect these economies of scale for the benefit of Fund investors.The Board noted that it appeared that the benefits of any economies of scale also would be appropriately shared with shareholders through increased investment in fund management and administration resources.The Board members also considered potential benefits to the Manager from acting as investment adviser and reviewed the soft dollar arrangements with respect to trading the Fund’s portfolio.
It was noted that the Board members should consider the Manager’s profitability with respect to the Fund as part of their evaluation of whether the fee under the Management Agreement bears a reasonable relationship to the mix of services provided by the Manager, including the nature, extent and quality of such services and that a discussion of economies of scale is predicated on increasing assets and that, if a fund’s assets had been decreasing, the possibility that the Manager may have realized any economies of scale would be less.The Board members also discussed the profitability percentage ranges determined by appropriate court cases to be reasonable given the services rendered to investment
companies. It was noted that the profitability percentage for managing the Fund was not unreasonable given the Fund’s overall performance and generally superior service levels provided.The Board also noted the current fee waiver and expense reimbursement arrangement and its effect on the profitability of the Manager.
At the conclusion of these discussions, each of the Directors expressed the opinion that he or she had been furnished with sufficient information to make an informed business decision with respect to continuation of the Fund’s Management Agreement. Based on their discussions and considerations as described above, the Board made the following conclusions and determinations.
- The Board concluded that the nature, extent and quality of the ser- vices provided by the Manager are adequate and appropriate.
- The Board was satisfied with the Fund’s overall performance.
- The Board concluded that the fee paid to the Manager by the Fund was reasonable in light of comparative performance and expense and advisory fee information, including the Manager’s current undertaking to waive or reimburse certain fees and expenses of the Fund, costs of the services provided and profits to be realized and benefits derived or to be derived by the Manager from its relationship with the Fund.
- The Board determined that the economies of scale which may accrue to the Manager and its affiliates in connection with the management of the Fund had been adequately considered by the Manager in connection with the management fee rate charged to the Fund, and that, to the extent in the future it were to be deter- mined that material economies of scale had not been shared with the Fund, the Board would seek to have those economies of scale shared with the Fund.
The Board members considered these conclusions and determinations, along with the information received on a routine and regular basis throughout the year, and, without any one factor being dispositive, the Board determined that re-approval of the Fund’s Management Agreement was in the best interests of the Fund and its shareholders.
BOARD MEMBERS INFORMATION (Unaudited)
| | Joseph S. DiMartino (61)
Chairman of the Board (1995)
|
| Principal Occupation During Past 5 Years: |
| • Corporate Director and Trustee |
| | Other Board Memberships and Affiliations:
|
- The Muscular Dystrophy Association, Director
- Levcor International, Inc., an apparel fabric processor, Director
- Century Business Services, Inc., a provider of outsourcing functions for small and medium size companies, Director
- The Newark Group, a provider of a national market of paper recovery facilities, paperboard mills and paperboard converting plants, Director
- Azimuth Trust, an institutional asset management firm, Member of Board of Managers and Advisory Board
- Sunair Electronics, Inc., engages in the design, manufacture and sale of high frequency systems for long-range voice and data communications, as well as providing certain outdoor-related services to homes and businesses, Director
No. of Portfolios for which Board Member Serves: 193
| | David P. Feldman (65)
Board Member (1996)
|
| Principal Occupation During Past 5 Years: |
| • Corporate Director & Trustee |
| | Other Board Memberships and Affiliations:
|
- BBH Mutual Funds Group (11 funds), Director
- The Jeffrey Company, a private investment company, Director
- QMED, a medical device company, Director
No. of Portfolios for which Board Member Serves: 58
| | Ehud Houminer (65)
Board Member (1993)
|
| | Principal Occupation During Past 5 Years:
|
- Executive-in-Residence at the Columbia Business School, Columbia University
- Principal of Lear,Yavitz and Associates, a management consulting firm (1996 to 2001)
| | Other Board Memberships and Affiliations:
|
- Avnet Inc., an electronics distributor, Director
- International Advisory Board to the MBA Program School of Management, Ben Gurion University, Chairman
- Explore Charter School, Brooklyn, NY, Chairman
| | No. of Portfolios for which Board Member Serves: 36
|
| | Gloria Messinger (75)
Board Member (1993)
|
| | Principal Occupation During Past 5 Years:
|
- Arbitrator for American Arbitration Association and National Association of Securities Dealers, Inc.
- Consultant in Intellectual Property
| | Other Board Memberships and Affiliations:
|
- Yale Law School Fund, Director
- Theater for a New Audience, Inc., Director
- Brooklyn Philharmonic, Director
- New York Women’s Agenda Music Performance Trust Fund, Director
| | No. of Portfolios for which Board Member Serves: 25
|
———————
| | T. John Szarkowski (79)
Board Member (1996)
|
| Principal Occupation During Past 5 Years: |
| • Consultant in Photography |
| Other Board Memberships and Affiliations: |
| • Photography Department at The Museum of Modern Art, Director Emeritus |
| | No. of Portfolios for which Board Member Serves: 25
|
| | Anne Wexler (75)
Board Member (1996)
|
Principal Occupation During Past 5 Years:
- Chairman of the Wexler & Walker Public Policy Associates, consultants specializing in govern- ment relations and public affairs
Other Board Memberships and Affiliations:
- Wilshire Mutual Funds (5 funds), Director
- Methanex Corporation, a methanol producing company, Director
- Member of the Council of Foreign Relations
- Member of the National Park Foundation
No. of Portfolios for which Board Member Serves: 36
Once elected all Board Members serve for an indefinite term.The address of the Board Members and Officers is in c/o The Dreyfus Corporation, 200 Park Avenue, New York, New York 10166. Additional information about the Board Members is available in the fund’s Statement of Additional Information which can be obtained from Dreyfus free of charge by calling this toll free number: 1-800-554-4611.
John M. Fraser, Jr., Emeritus Board Member
OFFICERS OF THE FUND (Unaudited)
| STEPHEN E. CANTER, President since | | JAMES BITETTO, Vice President and |
| March 2000. | | Assistant Secretary since August 2005. |
| Chairman of the Board, Chief Executive | | Assistant General Counsel and Assistant |
| Officer and Chief Operating Officer of the | | Secretary of the Manager, and an officer of 91 |
| Manager, and an officer of 90 investment | | investment companies (comprised of 200 |
| companies (comprised of 184 portfolios) | | portfolios) managed by the Manager. He is 39 |
| managed by the Manager. Mr. Canter also is a | | years old and has been an employee of the |
| Board member and, where applicable, an | | Manager since December 1996. |
| |
| Executive Committee Member of the other | | JONI LACKS CHARATAN, Vice President |
| investment management subsidiaries of Mellon | | and Assistant Secretary since |
| Financial Corporation, each of which is an | | August 2005. |
| affiliate of the Manager. He is 60 years old and | | |
| has been an employee of the Manager since | | Assistant General Counsel and Assistant |
| May 1995. | | Secretary of the Manager, and an officer of 91 |
| | | investment companies (comprised of 200 |
| STEPHEN R. BYERS, Executive Vice | | portfolios) managed by the Manager. She is 49 |
| President since November 2002. | | years old and has been an employee of the |
| Chief Investment Officer,Vice Chairman and a | | Manager since October 1998. |
| |
| director of the Manager, and an officer of 90 | | JOSEPH M. CHIOFFI, Vice President and |
| investment companies (comprised of 184 | | Assistant Secretary since August 2005. |
| portfolios) managed by the Manager. Mr. Byers | | |
| also is an officer, director or an Executive | | Assistant General Counsel and Assistant |
| Committee Member of certain other | | Secretary of the Manager, and an officer of 91 |
| investment management subsidiaries of Mellon | | investment companies (comprised of 200 |
| Financial Corporation, each of which is an | | portfolios) managed by the Manager. He is 43 |
| affiliate of the Manager. He is 52 years old and | | years old and has been an employee of the |
| has been an employee of the Manager since | | Manager since July 2000. |
| January 2000. | | JANETTE E. FARRAGHER, Vice President |
| MARK N. JACOBS, Vice President since | | and Assistant Secretary since |
| March 2000. | | August 2005. |
| Executive Vice President, Secretary and | | Associate General Counsel of the Manager, |
| General Counsel of the Manager, and an | | and an officer of 91 investment companies |
| officer of 91 investment companies (comprised | | (comprised of 200 portfolios) managed by the |
| of 200 portfolios) managed by the Manager. | | Manager. She is 42 years old and has been an |
| He is 59 years old and has been an employee | | employee of the Manager since February 1984. |
| of the Manager since June 1977. | | JOHN B. HAMMALIAN, Vice President and |
| MICHAEL A. ROSENBERG, Vice President | | Assistant Secretary since August 2005. |
| and Secretary since August 2005. | | Associate General Counsel of the Manager, |
| Associate General Counsel of the Manager, | | and an officer of 91 investment companies |
| and an officer of 91 investment companies | | (comprised of 200 portfolios) managed by the |
| (comprised of 200 portfolios) managed by the | | Manager. He is 42 years old and has been an |
| Manager. He is 45 years old and has been an | | employee of the Manager since February 1991. |
| employee of the Manager since October 1991. | | |
36
| ROBERT R. MULLERY, Vice President and | | ROBERT SVAGNA, Assistant Treasurer |
| Assistant Secretary since August 2005. | | since December 2002. |
| Associate General Counsel of the Manager, | | Senior Accounting Manager – Equity Funds of |
| and an officer of 91 investment companies | | the Manager, and an officer of 91 investment |
| (comprised of 200 portfolios) managed by the | | companies (comprised of 200 portfolios) |
| Manager. He is 53 years old and has been an | | managed by the Manager. He is 38 years old |
| employee of the Manager since May 1986. | | and has been an employee of the Manager |
| |
| JEFF PRUSNOFSKY, Vice President and | | since November 1990. |
| Assistant Secretary since August 2005. | | KENNETH J. SANDGREN, Assistant |
| Associate General Counsel of the Manager, | | Treasurer since November 2001. |
| and an officer of 91 investment companies | | Mutual Funds Tax Director of the Manager, |
| (comprised of 200 portfolios) managed by the | | and an officer of 91 investment companies |
| Manager. He is 40 years old and has been an | | (comprised of 200 portfolios) managed by the |
| employee of the Manager since October 1990. | | Manager. He is 51 years old and has been an |
| |
| JAMES WINDELS, Treasurer since | | employee of the Manager since June 1993. |
| November 2001. | | JOSEPH W. CONNOLLY, Chief Compliance |
| Director – Mutual Fund Accounting of the | | Officer since October 2004. |
| Manager, and an officer of 91 investment | | Chief Compliance Officer of the Manager and |
| companies (comprised of 200 portfolios) | | The Dreyfus Family of Funds (91 investment |
| managed by the Manager. He is 46 years old | | companies, comprising 200 portfolios). From |
| and has been an employee of the Manager | | November 2001 through March 2004, Mr. |
| since April 1985. | | Connolly was first Vice-President, Mutual |
| |
| GREGORY S. GRUBER, Assistant | | Fund Servicing for Mellon Global Securities |
| Treasurer since August 2005. | | Services. In that capacity, Mr. Connolly was |
| | | responsible for managing Mellon’s Custody, |
| Senior Accounting Manager – Municipal Bond | | Fund Accounting and Fund Administration |
| Funds of the Manager, and an officer of 91 | | services to third-party mutual fund clients. |
| investment companies (comprised of 200 | | He is 48 years old and has served in various |
| portfolios) managed by the Manager. He is 46 | | capacities with the Manager since 1980, |
| years old and has been an employee of the | | including manager of the firm’s Fund |
| Manager since August 1981. | | Accounting Department from 1997 through |
| ERIK D. NAVILOFF, Assistant Treasurer | | October 2001. |
| since August 2005. | | WILLIAM GERMENIS, Anti-Money |
| Senior Accounting Manager – Taxable Fixed | | Laundering Compliance Officer since |
| Income Funds of the Manager, and an officer | | October 2002. |
| of 91 investment companies (comprised of 200 | | Vice President and Anti-Money Laundering |
| portfolios) managed by the Manager. He is 37 | | Compliance Officer of the Distributor, and the |
| years old and has been an employee of the | | Anti-Money Laundering Compliance Officer |
| Manager since November 1992. | | of 88 investment companies (comprised of 197 |
| ROBERT ROBOL, Assistant Treasurer | | portfolios) managed by the Manager. He is 35 |
| since August 2005. | | years old and has been an employee of the |
| | | Distributor since October 1998. |
| Senior Accounting Manager – Money Market | | |
| Funds of the Manager, and an officer of 91 | | |
| investment companies (comprised of 200 | | |
| portfolios) managed by the Manager. He is 41 | | |
| years old and has been an employee of the | | |
| Manager since October 1988. | | |
For More Information
| Dreyfus Premier | | Transfer Agent & |
| Select Midcap Growth Fund | | Dividend Disbursing Agent |
| 200 Park Avenue | | |
| | | Dreyfus Transfer, Inc. |
| New York, NY 10166 | | |
| | | 200 Park Avenue |
| Manager | | New York, NY 10166 |
| The Dreyfus Corporation | | Distributor |
| 200 Park Avenue | | |
| | | Dreyfus Service Corporation |
| New York, NY 10166 | | |
| | | 200 Park Avenue |
| Custodian | | New York, NY 10166 |
| Mellon Bank, N.A. | | |
| One Mellon Bank Center | | |
| Pittsburgh, PA 15258 | | |
Telephone Call your financial representative or 1-800-554-4611
| Mail | | The Dreyfus Premier Family of Funds |
| | | 144 Glenn Curtiss Boulevard, Uniondale, NY 11556-0144 |
The fund files its complete schedule of portfolio holdings with the Securities and Exchange Commission (“SEC”) for the first and third quarters of each fiscal year on Form N-Q. The fund’s Forms N-Q are available on the SEC’s website at http://www.sec.gov and may be reviewed and copied at the SEC’s Public Reference Room in Washington, DC. Information on the operation of the Public Reference Room may be obtained by calling 1-800-SEC-0330.
A description of the policies and procedures that the fund uses to determine how to vote proxies relating to portfolio securities, and information regarding how the fund voted these proxies for the 12-month period ended June 30, 2005, is available at http://www.dreyfus.com and on the SEC’s website at http://www.sec.gov. The description of the policies and procedures is also available without charge, upon request, by calling 1-800-645-6561.

Save time. Save paper. View your next shareholder report online as soon as it’s available. Log into www.dreyfus.com and sign up for Dreyfus eCommunications. It’s simple and only takes a few minutes.
The views expressed in this report reflect those of the portfolio manager only through the end of the period covered and do not necessarily represent the views of Dreyfus or any other person in the Dreyfus organization. Any such views are subject to change at any time based upon market or other conditions and Dreyfus disclaims any responsibility to update such views.These views may not be relied on as investment advice and, because investment decisions for a Dreyfus fund are based on numerous factors, may not be relied on as an indication of trading intent on behalf of any Dreyfus fund.
Not FDIC-Insured • Not Bank-Guaranteed • May Lose Value
| | | Contents |
| |
| | | THE FUND |
| |
|
| 2 | | Letter from the Chairman |
| 3 | | Discussion of Fund Performance |
| 6 | | Fund Performance |
| 8 | | Understanding Your Fund’s Expenses |
| 8 | | Comparing Your Fund’s Expenses |
| | | With Those of Other Funds |
| 9 | | Statement of Investments |
| 15 | | Statement of Assets and Liabilities |
| 16 | | Statement of Operations |
| 17 | | Statement of Changes in Net Assets |
| 19 | | Financial Highlights |
| 24 | | Notes to Financial Statements |
| 32 | | Report of Independent Registered |
| | | Public Accounting Firm |
| 33 | | Important Tax Information |
| 34 | | Information About the Review and Approval |
| | | of the Fund’s Management Agreement |
| 39 | | Board Members Information |
| 41 | | Officers of the Fund |
| |
| | | FOR MORE INFORMATION |
| |
|
| | | Back Cover |
The Fund
Dreyfus Premier
Small Company Growth Fund
|

LETTER FROM THE CHAIRMAN
This annual report for Dreyfus Premier Small Company Growth Fund covers the 12-month period from September 1, 2004, through August 31, 2005. Inside, you’ll find valuable information about how the fund was managed during the reporting period, including a discussion with the fund’s portfolio manager, Randy Watts.
On average, stock prices ended the reporting period higher than where they began. However, most of the market’s gains occurred during the closing months of 2004. So far in 2005, positive factors, including steady economic growth and higher corporate profits, were largely offset by headwinds, such as sharply higher energy prices and rising short-term interest rates. Midcap stocks produced higher returns than small-cap stocks in this environment, and small-cap stocks outperformed large-cap stocks. Also, value-oriented stocks have generally produced better results than their more growth-oriented counterparts during the past 12 months.
Recent shocks to the U.S. economy — including sharply higher gasoline prices and other lingering consequences of Hurricane Katrina — have added a degree of uncertainty to the economic outlook.Nonetheless,our economists currently expect the economy to continue to grow without either entering a recession or triggering a significant acceleration of infla-tion.As always, we encourage you to discuss the potential implications of these and other matters with your financial advisor.
Thank you for your continued confidence and support.

DISCUSSION OF FUND PERFORMANCE
Randy Watts, Portfolio Manager
|
How did Dreyfus Premier Small Company Growth Fund
perform relative to its benchmark?
|
During the 12-month period ended August 31, 2005, the fund produced total returns of 26.00% for Class A shares, 25.06% for Class B shares, 25.06% for Class C shares, 26.61% for Class R shares and 25.51% for Class T shares.1 In comparison, the Russell 2000 Growth Index, the fund’s benchmark, produced a 23.51% total return for the same period.2
Although small-cap stocks generally produced attractive returns throughout the reporting period, the bulk of the market’s returns were achieved during the closing weeks of 2004, when signs of stronger economic growth and diminished political uncertainty helped buoy investor sentiment.The fund produced higher returns than its benchmark, primarily due to its stock selection strategy, which protected the fund from the full brunt of periodic market declines while enabling it to participate to a significant degree in rallies.
What is the fund’s investment approach?
The fund seeks long-term capital appreciation.To pursue this goal, the fund normally invests at least 80% of its assets in the stocks of small companies. The fund invests in growth companies that the manager believes have solid market positions, visionary leadership and reasonable financial strength.The fund may also invest up to 35% of its assets in foreign companies.
The fund’s strategy combines market economics with fundamental research.The portfolio manager begins by assessing current economic conditions and forecasting economic expectations. Each industry sector of the Russell 2000 Growth Index is examined to determine the sector’s market-capitalized weighting and to estimate the performance of the sector relative to the index as a whole.A balance is determined for the fund, giving greater relative weight to sectors that are expected to outperform the overall market.
| | DISCUSSION OF FUND PERFORMANCE (continued)
|
The fund typically sells a stock when the portfolio manager believes there is a more attractive alternative, the stock’s valuation is excessive or there are deteriorating fundamentals, such as the loss of competitive advantage, a failure in management execution or deteriorating capital structure.The fund also may sell stocks when the manager’s valuation of a sector has changed.
What other factors influenced the fund’s performance?
After rallying strongly during the final weeks of 2005, the small-cap stock market proved to be relatively trendless over the first eight months of 2005.The fund fared relatively well in this lower-volatility environment, as our stock selection strategy enabled it to weather occasional market declines better than the benchmark while capturing most, but not all, of the market’s gains during rallies.
Our evaluation of economic and market trends, combined with fundamental research into individual companies, led us to a greater number of opportunities among health care and energy companies, and a slightly lower-than-average number of companies in the technology and financials areas. These mild sector biases helped support the fund’s overall performance as energy prices surged and interest rates continued to rise.
In the energy sector, the fund received especially strong contributions to performance from energy service providers, such as Oil States International and Dril-Quip, as well as coal and methane gas producer CONSOL Energy. In the health care area, strong performers included Respironics, which makes masks for the treatment of sleep apnea, and Matria Healthcare, which provides disease management services to patients, physicians, health plans and employers.A number of holdings in other areas also helped boost the fund’s overall results. Most notably, financial software developer SS&C Technologies was the subject of an acquisition offer during the reporting period, and medical research and development company Covance benefited from greater outsourcing activities among its customers.
As is to be expected from a broadly diversified fund, some holdings produced relatively disappointing performance during the reporting period.
For example, e-business software company Borland Software encountered heightened competitive pressures when one of its rivals was acquired by technology giant International Business Machines. Investors reacted negatively when Coinstar, which operates machines enabling consumers to convert loose change into cash, attempted to expand into vending machines.InfoSpace,an Internet information infrastructure services company, suffered as its business appeared to become more seasonal.
What is the fund’s current strategy?
Our strategy has not changed. We have continued to monitor the economy to find those small-cap market sectors that we expect to prosper, and we have continued to employ fundamental research to find individual companies that appear poised to benefit. As of the reporting period’s end, we believe that surging energy prices, higher interest rates and the aftermath of Hurricane Katrina may impede the rate of U.S. economic growth and erode consumer confidence. Accordingly, we recently have reduced the fund’s emphasis on consumer-oriented stocks, and we have increased its focus on shares of industrial, capital equipment and industrial companies. In our judgment, these are prudent strategies as the economy moves to the next phase of the business cycle.
| 1 | | Total return includes reinvestment of dividends and any capital gains paid, and does not take into |
| | | consideration the maximum initial sales charges in the case of Class A and Class T shares, or the |
| | | applicable contingent deferred sales charges imposed on redemptions in the case of Class B and |
| | | Class C shares. Had these charges been reflected, returns would have been lower. Past performance |
| | | is no guarantee of future results. Share price, yield and investment return fluctuate such that upon |
| | | redemption, fund shares may be worth more or less than their original cost. Return figures |
| | | provided reflect the absorption of fund expenses by The Dreyfus Corporation pursuant to an |
| | | agreement in effect through August 31, 2006, at which time it may be extended, terminated or |
| | | modified. Had these expenses not been absorbed, the fund’s returns would have been lower. |
| | | A significant portion of the fund’s recent performance is attributable to positive returns from |
| | | its initial public offering (IPO) investments. There can be no guarantee that IPOs will |
| | | have or continue to have a positive effect on the fund’s performance. Currently, the fund is |
| | | relatively small in asset size. IPOs tend to have a reduced effect on performance as a |
| | | fund’s asset base grows. |
| 2 | | SOURCE: LIPPER INC. — Reflects the reinvestment of dividends and, where applicable, |
| | | capital gain distributions.The Russell 2000 Growth Index is an unmanaged index which |
| | | measures the performance of those Russell 2000 companies with higher price-to-book ratios and |
| | | higher forecasted growth values.Total returns are calculated on a month-end basis. |
FUND PERFORMANCE
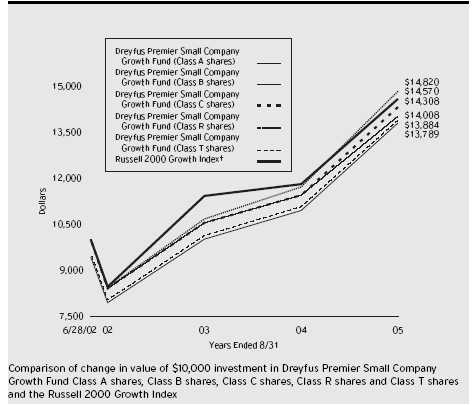
† Source: Lipper Inc.
Past performance is not predictive of future performance.
A significant portion of the fund’s recent performance is attributable to positive returns from its initial public offering (IPO) investments.There can be no guarantee that IPOs will have or continue to have a positive effect on the fund’s performance. Currently, the fund is relatively small in asset size. IPOs tend to have a reduced effect on performance as a fund’s asset base grows.
The above graph compares a $10,000 investment made in Class A, Class B, Class C, Class R and Class T shares of Dreyfus Premier Small Company Growth Fund on 6/28/02 (inception date) to a $10,000 investment made in the Russell 2000 Growth Index (the “Index”) on that date. For comparative purposes, the value of the Index on 6/30/02 is used as the beginning value on 6/28/02. All dividends and capital gain distributions are reinvested.
The fund’s performance shown in the line graph takes into account the maximum initial sales charges on Class A and Class T shares, the applicable contingent deferred sales charge on Class B shares and all other applicable fees and expenses on all classes. The Index is an unmanaged index which measures the performance of those Russell 2000 companies with higher price-to-book ratios and higher forecasted growth values.The Index does not take into account charges, fees and other expenses. Further information relating to fund performance, including expense reimbursements, if applicable, is contained in the Financial Highlights section of the prospectus and elsewhere in this report.
| Average Annual Total Returns as of 8/31/05 | | | | |
| |
| | | | | Inception | | | | From |
| | | | | Date | | 1 Year | | Inception |
| |
| |
| |
| |
|
| Class A shares | | | | | | |
| with maximum sales charge (5.75%) | | 6/28/02 | | 18.80% | | 10.63% |
| without sales charge | | 6/28/02 | | 26.00% | | 12.71% |
| Class B shares | | | | | | |
| with applicable redemption charge † | | 6/28/02 | | 21.06% | | 11.18% |
| without redemption | | 6/28/02 | | 25.06% | | 11.92% |
| Class C shares | | | | | | |
| with applicable redemption charge †† | | 6/28/02 | | 24.06% | | 11.92% |
| without redemption | | 6/28/02 | | 25.06% | | 11.92% |
| Class R shares | | 6/28/02 | | 26.61% | | 13.17% |
| Class T shares | | | | | | |
| with applicable sales charge (4.5%) | | 6/28/02 | | 19.87% | | 10.87% |
| without sales charge | | 6/28/02 | | 25.51% | | 12.49% |
| |
| Past performance is not predictive of future performance.The fund’s performance shown in the graph and table does not |
| reflect the deduction of taxes that a shareholder would pay on fund distributions or the redemption of fund shares. |
| † | | The maximum contingent deferred sales charge for Class B shares is 4%. After six years Class B shares convert to |
| | | Class A shares. | | | | | | |
| †† | | The maximum contingent deferred sales charge for Class C shares is 1% for shares redeemed within one year of the |
| | | date of purchase. | | | | | | |
UNDERSTANDING YOUR FUND’S EXPENSES(Unaudited)
As a mutual fund investor, you pay ongoing expenses, such as management fees and other expenses. Using the information below, you can estimate how these expenses affect your investment and compare them with the expenses of other funds.You also may pay one-time transaction expenses, including sales charges (loads) and redemption fees, which are not shown in this section and would have resulted in higher total expenses. For more information, see your fund’s prospectus or talk to your financial adviser.
Review your fund’s expenses
The table below shows the expenses you would have paid on a $1,000 investment in Dreyfus Premier Small Company Growth Fund from March 1, 2005 to August 31, 2005. It also shows how much a $1,000 investment would be worth at the close of the period, assuming actual returns and expenses.
| Expenses and Value of a $1,000 Investment | | | | | | |
| assuming actual returns for the six months ended August 31, 2005 | | | | |
| | | Class A | | Class B | | Class C | | Class R | | Class T |
| |
| |
| |
| |
| |
|
| Expenses paid per $1,000 † | | $ 8.46 | | $ 12.56 | | $ 12.56 | | $ 6.69 | | $ 10.90 |
| Ending value (after expenses) | | $1,071.70 | | $1,067.00 | | $1,067.00 | | $1,075.00 | | $1,068.40 |
| | COMPARING YOUR FUND’S EXPENSES
WITH THOSE OF OTHER FUNDS (Unaudited)
|
Using the SEC’s method to compare expenses
The Securities and Exchange Commission (SEC) has established guidelines to help investors assess fund expenses. Per these guidelines, the table below shows your fund’s expenses based on a $1,000 investment, assuming a hypothetical 5% annualized return. You can use this information to compare the ongoing expenses (but not transaction expenses or total cost) of investing in the fund with those of other funds.All mutual fund shareholder reports will provide this information to help you make this comparison. Please note that you cannot use this information to estimate your actual ending account balance and expenses paid during the period.
Expenses and Value of a $1,000 Investment
assuming a hypothetical 5% annualized return for the six months ended August 31, 2005
|
| | | Class A | | Class B | | Class C | | Class R | | Class T |
| |
| |
| |
| |
| |
|
| Expenses paid per $1,000 † | | $ 8.24 | | $ 12.23 | | $ 12.23 | | $ 6.51 | | $ 10.61 |
| Ending value (after expenses) | | $1,017.04 | | $1,013.06 | | $1,013.06 | | $1,018.75 | | $1,014.67 |
† Expenses are equal to the fund’s annualized expense ratio of 1.62% for Class A, 2.41% for Class B, 2.41% for Class C, 1.28% for Class R and 2.09% for Class T; multiplied by the average account value over the period, multiplied by 184/365 (to reflect the one-half year period).
STATEMENT OF INVESTMENTS
August 31, 2005
|
| Common Stocks—94.4% | | Shares | | Value ($) |
| |
| |
|
| Banking—1.9% | | | | |
| Center Financial | | 1,004 | | 25,522 |
| First Community Bancorp | | 450 | | 21,240 |
| Mercantile Bank | | 377 | | 17,116 |
| Vineyard National Bancorp | | 420 a | | 12,541 |
| | | | | 76,419 |
| Basic Industries—4.4% | | | | |
| Church & Dwight | | 1,090 | | 41,595 |
| Cleveland-Cliffs | | 450 | | 31,986 |
| CONSOL Energy | | 760 | | 52,972 |
| Jarden | | 1,180 b | | 46,834 |
| | | | | 173,387 |
| Broadcasting & Publishing—3.4% | | | | |
| DreamWorks Animation SKG, Cl. A | | 750 b | | 19,515 |
| Lions Gate Entertainment | | 6,380 b | | 60,929 |
| Outdoor Channel Holdings | | 1,100 b | | 14,619 |
| Playboy Enterprises, Cl. B | | 2,850 b | | 38,646 |
| | | | | 133,709 |
| Capital Goods—2.8% | | | | |
| Kennametal | | 990 | | 46,174 |
| Navigant Consulting | | 1,050 b | | 20,307 |
| Valmont Industries | | 850 | | 24,437 |
| Wabtec | | 720 | | 18,720 |
| | | | | 109,638 |
| Construction & Housing—.8% | | | | |
| Interline Brands | | 1,680 b | | 33,482 |
| Consumer Durables—1.7% | | | | |
| AC Moore Arts & Crafts | | 740 b | | 16,842 |
| Speedway Motorsports | | 800 | | 30,096 |
| Thor Industries | | 570 | | 18,924 |
| | | | | 65,862 |
| Consumer Non-Durables—.7% | | | | |
| Playtex Products | | 2,710 b | | 29,322 |
| Consumer Services—15.6% | | | | |
| Applebee’s International | | 1,520 | | 33,607 |
| | STATEMENT OF INVESTMENTS (continued)
|
| Common Stocks (continued) | | Shares | | Value ($) |
| |
| |
|
| Consumer Services (continued) | | | | |
| Casual Male Retail Group | | 2,120 b | | 15,073 |
| Eddie Bauer | | 1,450 b | | 39,005 |
| Educate | | 1,350 b | | 21,843 |
| Emmis Communications, Cl. A | | 2,390 b | | 57,265 |
| FTI Consulting | | 2,070 b | | 51,543 |
| JOS. A Bank Clothiers | | 720 a,b | | 28,476 |
| LECG | | 2,410 b | | 55,502 |
| Marvel Enterprises | | 2,080 b | | 40,040 |
| NU Skin Enterprises, Cl. A | | 1,800 | | 38,412 |
| Papa John’s International | | 740 b | | 35,387 |
| Performance Food Group | | 1,750 b | | 54,198 |
| Rare Hospitality International | | 1,010 b | | 27,007 |
| Stericycle | | 520 b | | 30,228 |
| Tractor Supply | | 470 b | | 24,186 |
| Waste Connections | | 1,095 b | | 38,697 |
| Watson Wyatt & Co. Holdings | | 1,040 | | 28,361 |
| | | | | 618,830 |
| Electronic Components | | | | |
| & Instruments—2.9% | | | | |
| Cymer | | 910 b | | 30,485 |
| Imax | | 3,190 a,b | | 29,157 |
| Mercury Computer Systems | | 740 b | | 19,336 |
| Unica | | 630 b | | 7,818 |
| WebEx Communications | | 1,090 b | | 28,100 |
| | | | | 114,896 |
| Energy—8.3% | | | | |
| AGL Resources | | 570 | | 21,290 |
| Atmos Energy | | 1,480 | | 43,793 |
| Double Eagle Petroleum | | 150 b | | 2,790 |
| Dril-Quip | | 1,170 b | | 49,164 |
| Evergreen Solar | | 1,900 b | | 13,395 |
| Global Industries | | 1,800 b | | 24,786 |
| Oceaneering International | | 320 b | | 15,910 |
| Oil States International | | 1,190 b | | 41,245 |
| Penn Virginia | | 990 | | 55,519 |
| Common Stocks (continued) | | Shares | | Value ($) |
| |
| |
|
| Energy (continued) | | | | |
| Tidewater | | 1,060 | | 47,213 |
| W-H Energy Services | | 400 b | | 12,980 |
| | | | | 328,085 |
| Finance—5.4% | | | | |
| Affiliated Managers Group | | 310 b | | 22,509 |
| Cathay General Bancorp | | 450 | | 15,151 |
| Cullen/Frost Bankers | | 390 | | 19,059 |
| First Midwest Bancorp | | 1,000 | | 37,940 |
| Huron Consulting Group | | 1,330 b | | 33,317 |
| National Financial Partners | | 300 | | 13,170 |
| Online Resources | | 3,600 b | | 34,524 |
| UTI Worldwide | | 480 | | 36,221 |
| | | | | 211,891 |
| Health Care—20.0% | | | | |
| Animas | | 1,150 b | | 20,010 |
| Array BioPharma | | 2,260 b | | 14,916 |
| Applera—Celera Genomics Group | | 1,480 b | | 17,375 |
| Charles River Laboratories International | | 380 b | | 19,312 |
| Conceptus | | 1,850 a,b | | 19,388 |
| Cooper Cos. | | 250 | | 17,142 |
| Covance | | 940 b | | 49,162 |
| Coventry Health Care | | 160 b | | 12,800 |
| Cytyc | | 1,200 b | | 29,940 |
| Eclipsys | | 870 b | | 14,686 |
| Fisher Scientific International | | 940 a,b | | 60,611 |
| Herbalife | | 1,030 b | | 30,488 |
| Human Genome Sciences | | 1,420 b | | 18,332 |
| ImmunoGen | | 2,520 b | | 16,002 |
| InterMune | | 1,260 b | | 20,198 |
| LifePoint Hospitals | | 540 b | | 24,559 |
| Matria Healthcare | | 2,260 b | | 81,925 |
| Medarex | | 1,870 b | | 18,793 |
| Neurocrine Biosciences | | 400 a,b | | 18,320 |
| PerkinElmer | | 2,010 | | 41,607 |
| Protein Design Labs | | 1,270 a,b | | 33,960 |
| | STATEMENT OF INVESTMENTS (continued)
|
| Common Stocks (continued) | | Shares | | Value ($) |
| |
| |
|
| Health Care (continued) | | | | |
| PSS World Medical | | 1,380 b | | 19,996 |
| Respironics | | 1,470 b | | 57,565 |
| Sybron Dental Specialties | | 580 b | | 22,487 |
| Triad Hospitals | | 440 b | | 21,182 |
| VCA Antech | | 1,620 b | | 38,864 |
| Vertex Pharmaceuticals | | 1,080 b | | 19,872 |
| Vnus Medical Technologies | | 1,700 b | | 17,340 |
| ZymoGenetics | | 790 b | | 13,304 |
| | | | | 790,136 |
| Industrial Components—.5% | | | | |
| ITC Holdings | | 770 a | | 20,990 |
| Insurance Brokers—.1% | | | | |
| James River Group | | 100 b | | 2,000 |
| Machinery & Engineering—2.1% | | | | |
| Bucyrus International, Cl. A | | 800 | | 36,096 |
| FMC Technologies | | 1,210 b | | 48,654 |
| | | | | 84,750 |
| Merchandising—1.4% | | | | |
| MSC Industrial Direct | | 1,210 | | 42,350 |
| Sportsman’s Guide | | 480 b | | 12,062 |
| | | | | 54,412 |
| Real Estate Investment Trust—1.5% | | |
| Crescent Real Estate Equities | | 3,000 | | 58,890 |
| Technology—18.0% | | | | |
| Akamai Technologies | | 2,680 b | | 37,091 |
| Anteon International | | 790 b | | 36,301 |
| Blue Nile | | 900 a,b | | 30,429 |
| Cypress Semiconductor | | 2,580 b | | 40,325 |
| Exar | | 2,260 b | | 35,279 |
| F5 Networks | | 520 b | | 21,471 |
| FileNet | | 1,530 b | | 40,652 |
| Common Stocks (continued) | | Shares | | Value ($) |
| |
| |
|
| Technology (continued) | | | | |
| Incyte | | 2,130 b | | 15,677 |
| Informatica | | 1,730 b | | 19,757 |
| Ingram Micro, Cl. A | | 2,140 b | | 37,471 |
| Internet Security Systems | | 1,810 b | | 41,123 |
| IRIS International | | 600 b | | 10,434 |
| Jack Henry & Associates | | 1,050 | | 20,559 |
| Jamdat Mobile | | 930 a,b | | 22,125 |
| Lam Research | | 720 b | | 22,824 |
| ManTech International, Cl. A | | 1,080 b | | 33,491 |
| McAfee | | 970 b | | 29,730 |
| Packeteer | | 1,660 b | | 19,621 |
| Power Integrations | | 910 b | | 20,129 |
| Progress Software | | 930 b | | 28,514 |
| SafeNet | | 610 b | | 19,520 |
| Secure Computing | | 2,140 b | | 24,674 |
| SS&C Technologies | | 1,340 | | 48,897 |
| Varian Semiconductor | | | | |
| Equipment Associates | | 670 b | | 30,358 |
| VeriSign | | 1,220 b | | 26,596 |
| | | | | 713,048 |
| Transportation—1.6% | | | | |
| Landstar System | | 600 | | 21,792 |
| Pacer International | | 1,600 b | | 41,984 |
| | | | | 63,776 |
| Wholesale & International Trade—.0% | | | | |
| MWI Veterinary Supply | | 90 b | | 1,935 |
| Other—1.3% | | | | |
| iShares Russell 2000 Growth Index Fund | | 770 a | | 52,768 |
| Total Common Stocks | | | | |
| (cost $2,981,143) | | | | 3,738,226 |
| | STATEMENT OF INVESTMENTS (continued)
|
| | | Principal | | |
| Short-Term Investments—2.7% | | Amount ($) | | Value ($) |
| |
| |
|
| U.S. Treasury Bills: | | | | |
| 2.97%, 9/1/2005 | | 27,000 | | 27,000 |
| 3.48%, 9/22/2005 | | 80,000 | | 79,847 |
| (cost $106,847) | | | | 106,847 |
| |
| |
|
| |
| Investment of Cash Collateral | | | | |
| for Securities Loaned—5.6% | | Shares | | Value ($) |
| |
| |
|
| Registered Investment Company; | | | | |
| Dreyfus Institutional Cash Advantage Plus Fund | | | | |
| (cost $223,280) | | 223,280 c | | 223,280 |
| |
| |
|
| Total Investments (cost $3,311,270) | | 102.7% | | 4,068,353 |
| Liabilities, Less Cash and Receivables | | (2.7%) | | (107,738) |
| Net Assets | | 100.0% | | 3,960,615 |
| |
| a All or a portion of these securities are on loan. At August 31, 2005, the total market value of the fund’s securities on |
| loan is $217,992 and the total market value of the collateral held by the fund is $223,280. | | |
| b Non-income producing. | | | | |
| c Investment in affiliated money market mutual fund. | | | | |
| Portfolio Summary † | | | | | | |
| |
| Value (%) | | | | Value (%) |
| |
| |
|
| Health Care | | 20.0 | | Basic Industries | | 4.4 |
| Technology | | 18.0 | | Broadcasting & Publishing | | 3.4 |
| Consumer Services | | 15.6 | | Electronic Components & Instruments | | 2.9 |
| Short-Term/Money Market Investments | | 8.3 | | Capital Goods | | 2.8 |
| Energy | | 8.3 | | Other | | 13.6 |
| Finance | | 5.4 | | | | 102.7 |
| |
| † Based on net assets. | | | | | | |
| See notes to financial statements. | | | | | | |
STATEMENT OF ASSETS AND LIABILITIES
August 31, 2005
|
| | | | | | | | | Cost | | Value |
| |
| |
| |
| |
| |
|
| Assets ($): | | | | | | | | | | |
| Investments in securities—See Statement | | | | | | | | |
| of Investments (including securities on loan, | | | | | | | | |
| valued at $217,992)—Note 1(b): | | | | | | | | |
| Unaffiliated issuers | | | | | | 3,087,990 | | 3,845,073 |
| Affiliated issuers | | | | | | 223,280 | | 223,280 |
| Receivable for investment securities sold | | | | | | | | 186,000 |
| Receivable for shares of Common Stock subscribed | | | | | | | | 8,789 |
| Dividends and interest receivable | | | | | | | | | | 2,342 |
| Prepaid expenses | | | | | | | | | | 31,795 |
| | | | | | | | | | | 4,297,279 |
| |
| |
| |
| |
| |
|
| Liabilities ($): | | | | | | | | | | |
| Due to the Dreyfus Corporation and affiliates—Note 3(c) | | | | | | 1,284 |
| Cash overdraft due to Custodian | | | | | | | | | | 37,751 |
| Liability for securities on loan—Note 1(b) | | | | | | | | 223,280 |
| Payable for investment securities purchased | | | | | | | | 31,050 |
| Payable for shares of Common Stock redeemed | | | | | | | | 7,311 |
| Accrued expenses | | | | | | | | | | 35,988 |
| | | | | | | | | | | 336,664 |
| |
| |
| |
| |
| |
|
| Net Assets ($) | | | | | | | | | | 3,960,615 |
| |
| |
| |
| |
| |
|
| Composition of Net Assets ($): | | | | | | | | |
| Paid-in capital | | | | | | | | | | 3,043,681 |
| Accumulated undistributed investment income—net | | | | | | | | 625 |
| Accumulated net realized gain (loss) on investments | | | | | | 159,226 |
| Accumulated net unrealized appreciation | | | | | | | | |
| (depreciation) on investments | | | | | | | | | | 757,083 |
| |
| |
| |
| |
| |
|
| Net Assets ($) | | | | | | | | | | 3,960,615 |
| |
| |
| |
| |
| |
|
| |
| |
| Net Asset Value Per Share | | | | | | | | | | |
| | | Class A | | Class B | | Class C | | Class R | | Class T |
| |
| |
| |
| |
| |
|
| Net Assets ($) | | 3,091,658 | | 388,967 | | 384,437 | | 10,893 | | 84,660 |
| Shares Outstanding | | 169,537 | | 21,802 | | 21,548 | | 589.515 | | 4,669 |
| |
| |
| |
| |
| |
|
| Net Asset Value Per Share ($) | | 18.24 | | 17.84 | | 17.84 | | 18.48 | | 18.13 |
See notes to financial statements.
|
| | STATEMENT OF OPERATIONS
Year Ended August 31, 2005
|
| Investment Income ($): | | |
| Income: | | |
| Cash dividends (net of $41 foreign taxes withheld at source) | | 17,890 |
| Income from securities lending | | 5,396 |
| Interest | | 2,406 |
| Total Income | | 25,692 |
| Expenses: | | |
| Management fee—Note 3(a) | | 38,273 |
| Registration fees | | 50,555 |
| Professional fees | | 31,498 |
| Custodian fees—Note 3(c) | | 27,937 |
| Shareholder servicing costs—Note 3(c) | | 20,356 |
| Prospectus and shareholders’ reports | | 10,934 |
| Distribution fees—Note 3(b) | | 8,058 |
| Directors’ fees and expenses—Note 3(d) | | 317 |
| Miscellaneous | | 8,863 |
| Total Expenses | | 196,791 |
| Less—expense reimbursement from The | | |
| Dreyfus Corporation due to undertaking—Note 3(a) | | (119,111) |
| Less—reduction in custody fees | | |
| due to earnings credits—Note 1(b) | | (630) |
| Net Expenses | | 77,050 |
| Investment (Loss)—Net | | (51,358) |
| |
|
| Realized and Unrealized Gain (Loss) on Investments—Note 4 ($): |
| Net realized gain (loss) on investments | | 240,291 |
| Net unrealized appreciation (depreciation) on investments | | 631,112 |
| Net Realized and Unrealized Gain (Loss) on Investments | | 871,403 |
| Net Increase in Net Assets Resulting from Operations | | 820,045 |
| | See notes to financial statements.
|
STATEMENT OF CHANGES IN NET ASSETS
| | | Year Ended August 31, |
| |
|
| | | 2005 | | 2004 |
| |
| |
|
| Operations ($): | | | | |
| Investment (loss)—net | | (51,358) | | (30,747) |
| Net realized gain (loss) on investments | | 240,291 | | 121,933 |
| Net unrealized appreciation | | | | |
| (depreciation) on investments | | 631,112 | | (82,962) |
| Net Increase (Decrease) in Net Assets | | | | |
| Resulting from Operations | | 820,045 | | 8,224 |
| |
| |
|
| Dividends to Shareholders from ($): | | | | |
| Net realized gain on investments: | | | | |
| Class A shares | | (4,635) | | — |
| Class B shares | | (883) | | — |
| Class C shares | | (820) | | — |
| Class R shares | | (454) | | — |
| Class T shares | | (471) | | — |
| Total Dividends | | (7,263) | | — |
| |
| |
|
| Capital Stock Transactions ($): | | | | |
| Net proceeds from shares sold: | | | | |
| Class A shares | | 2,591,594 | | 1,568,756 |
| Class B shares | | 243,661 | | 182,873 |
| Class C shares | | 202,970 | | 139,406 |
| Class R shares | | 6,419 | | 3,010 |
| Class T shares | | 83,464 | | — |
| Dividends reinvested: | | | | |
| Class A shares | | 4,538 | | — |
| Class B shares | | 774 | | — |
| Class C shares | | 712 | | — |
| Class R shares | | 454 | | — |
| Class T shares | | 452 | | — |
| Cost of shares redeemed: | | | | |
| Class A shares | | (1,749,292) | | (81,433) |
| Class B shares | | (393,621) | | (22,956) |
| Class C shares | | (285,710) | | (17,674) |
| Class R shares | | (274,296) | | (20) |
| Class T shares | | (275,390) | | — |
| Increase (Decrease) in Net Assets | | | | |
| from Capital Stock Transactions | | 156,729 | | 1,771,962 |
| Total Increase (Decrease) in Net Assets | | 969,511 | | 1,780,186 |
| |
| |
|
| Net Assets ($): | | | | |
| Beginning of Period | | 2,991,104 | | 1,210,918 |
| End of Period | | 3,960,615 | | 2,991,104 |
| Undistributed investment income—net | | 625 | | 206 |
| | STATEMENT OF CHANGES IN NET ASSETS (continued)
|
| | | Year Ended August 31, |
| |
|
| | | 2005 | | 2004 |
| |
| |
|
| Capital Share Transactions: | | | | |
| Class Aa | | | | |
| Shares sold | | 155,807 | | 102,460 |
| Shares issued for dividends reinvested | | 271 | | — |
| Shares redeemed | | (105,038) | | (5,608) |
| Net Increase (Decrease) in Shares Outstanding | | 51,040 | | 96,852 |
| |
| |
|
| Class B a | | | | |
| Shares sold | | 15,035 | | 12,316 |
| Shares issued for dividends reinvested | | 47 | | — |
| Shares redeemed | | (24,005) | | (1,502) |
| Net Increase (Decrease) in Shares Outstanding | | (8,923) | | 10,814 |
| |
| |
|
| Class C | | | | |
| Shares sold | | 12,303 | | 9,562 |
| Shares issued for dividends reinvested | | 43 | | — |
| Shares redeemed | | (17,243) | | (1,203) |
| Net Increase (Decrease) in Shares Outstanding | | (4,897) | | 8,359 |
| |
| |
|
| Class R | | | | |
| Shares sold | | 383 | | 207 |
| Shares issued for dividends reinvested | | 27 | | — |
| Shares redeemed | | (16,026) | | (1) |
| Net Increase (Decrease) in Shares Outstanding | | (15,616) | | 206 |
| |
| |
|
| Class T | | | | |
| Shares sold | | 4,985 | | — |
| Shares issued for dividends reinvested | | 27 | | — |
| Shares redeemed | | (16,343) | | — |
| Net Increase (Decrease) in Shares Outstanding | | (11,331) | | — |
| a During the period ended August 31, 2005, 2,172 Class B shares representing $37,417, were automatically |
| converted to 2,130 Class A shares and during the period ended August 31, 2004, 1,421 Class B shares |
| representing $21,777, were automatically converted to 1,406 Class A shares. | | |
| See notes to financial statements. | | | | |
The following tables describe the performance for each share class for the fiscal periods indicated.All information (except portfolio turnover rate) reflects financial results for a single fund share.Total return shows how much your investment in the fund would have increased (or decreased) during each period, assuming you had reinvested all dividends and distributions.These figures have been derived from the fund’s financial statements.
| | | | | | | Year Ended August 31, | | |
| | | |
| |
| |
|
| Class A Shares | | 2005 | | 2004 | | 2003 | | 2002 a |
| |
| |
| |
| |
|
| Per Share Data ($): | | | | | | | | |
| Net asset value, beginning of period | | 14.44 | | 13.25 | | 10.51 | | 12.50 |
| Investment Operations: | | | | | | | | |
| Investment (loss)—net b | | (.17) | | (.21) | | (.13) | | (.02) |
| Net realized and unrealized | | | | | | | | |
| gain (loss) on investments | | 4.00 | | 1.40 | | 2.87 | | (1.97) |
| Total from Investment Operations | | 3.83 | | 1.19 | | 2.74 | | (1.99) |
| Distributions: | | | | | | | | |
| Dividends from net realized | | | | | | | | |
| gain on investments | | (.03) | | — | | — | | — |
| Net asset value, end of period | | 18.24 | | 14.44 | | 13.25 | | 10.51 |
| |
| |
| |
| |
|
| Total Return (%) c | | 26.00 | | 9.35 | | 26.05 | | (15.77)d,e |
| |
| |
| |
| |
|
| Ratios/Supplemental Data (%): | | | | | | | | |
| Ratio of total expenses | | | | | | | | |
| to average net assets | | 4.45 | | 6.60 | | 15.80 | | 4.47d |
| Ratio of net expenses | | | | | | | | |
| to average net assets | | 1.64 | | 1.65 | | 1.65 | | .29d |
| Ratio of net investment (loss) | | | | | | | | |
| to average net assets | | (1.01) | | (1.28) | | (1.19) | | (.21)d |
| Portfolio Turnover Rate | | 253.34 | | 236.76 | | 279.61 | | 14.72d |
| |
| |
| |
| |
|
| Net Assets, end of period ($ X 1,000) | | 3,092 | | 1,711 | | 287 | | 261 |
| |
| a | | From June 28, 2002 (commencement of operations) to August 31, 2002. | | | | |
| b | | Based on average shares outstanding at each month end. | | | | | | |
| c | | Exclusive of sales charge. | | | | | | | | |
| d | | Not annualized. | | | | | | | | |
| e | | Calculated based on net asset value on the close of business on June 28, 2002 (commencement of initial offering) to |
| | | August 31, 2002. | | | | | | | | |
| See notes to financial statements. | | | | | | | | |
| | FINANCIAL HIGHLIGHTS (continued)
|
| | | | | | | Year Ended August 31, | | |
| | | |
| |
| |
|
| Class B Shares | | 2005 | | 2004 | | 2003 | | 2002 a |
| |
| |
| |
| |
|
| Per Share Data ($): | | | | | | | | |
| Net asset value, beginning of period | | 14.23 | | 13.15 | | 10.50 | | 12.50 |
| Investment Operations: | | | | | | | | |
| Investment (loss)—net b | | (.29) | | (.30) | | (.20) | | (.04) |
| Net realized and unrealized | | | | | | | | |
| gain (loss) on investments | | 3.93 | | 1.38 | | 2.85 | | (1.96) |
| Total from Investment Operations | | 3.64 | | 1.08 | | 2.65 | | (2.00) |
| Distributions: | | | | | | | | |
| Dividends from net realized | | | | | | | | |
| gain on investments | | (.03) | | — | | — | | — |
| Net asset value, end of period | | 17.84 | | 14.23 | | 13.15 | | 10.50 |
| |
| |
| |
| |
|
| Total Return (%) c | | 25.06 | | 8.59 | | 25.33 | | (15.93)d,e |
| |
| |
| |
| |
|
| Ratios/Supplemental Data (%): | | | | | | | | |
| Ratio of total expenses | | | | | | | | |
| to average net assets | | 5.17 | | 8.49 | | 16.42 | | 4.51d |
| Ratio of net expenses | | | | | | | | |
| to average net assets | | 2.40 | | 2.40 | | 2.40 | | .43d |
| Ratio of net investment (loss) | | | | | | | | |
| to average net assets | | (1.82) | | (2.07) | | (1.91) | | (.34)d |
| Portfolio Turnover Rate | | 253.34 | | 236.76 | | 279.61 | | 14.72d |
| |
| |
| |
| |
|
| Net Assets, end of period ($ X 1,000) | | 389 | | 437 | | 262 | | 172 |
| |
| a | | From June 28, 2002 (commencement of operations) to August 31, 2002. | | | | |
| b | | Based on average shares outstanding at each month end. | | | | | | |
| c | | Exclusive of sales charge. | | | | | | | | |
| d | | Not annualized. | | | | | | | | |
| e | | Calculated based on net asset value on the close of business on June 28, 2002 (commencement of initial offering) to |
| | | August 31, 2002. | | | | | | | | |
| See notes to financial statements. | | | | | | | | |
| | | | | | | Year Ended August 31, | | |
| | | |
| |
| |
|
| Class C Shares | | 2005 | | 2004 | | 2003 | | 2002 a |
| |
| |
| |
| |
|
| Per Share Data ($): | | | | | | | | |
| Net asset value, beginning of period | | 14.23 | | 13.15 | | 10.50 | | 12.50 |
| Investment Operations: | | | | | | | | |
| Investment (loss)—net b | | (.29) | | (.30) | | (.20) | | (.04) |
| Net realized and unrealized | | | | | | | | |
| gain (loss) on investments | | 3.93 | | 1.38 | | 2.85 | | (1.96) |
| Total from Investment Operations | | 3.64 | | 1.08 | | 2.65 | | (2.00) |
| Distributions: | | | | | | | | |
| Dividends from net realized | | | | | | | | |
| gain on investments | | (.03) | | — | | — | | — |
| Net asset value, end of period | | 17.84 | | 14.23 | | 13.15 | | 10.50 |
| |
| |
| |
| |
|
| Total Return (%) c | | 25.06 | | 8.59 | | 25.33 | | (15.93)d,e |
| |
| |
| |
| |
|
| Ratios/Supplemental Data (%): | | | | | | | | |
| Ratio of total expenses | | | | | | | | |
| to average net assets | | 5.20 | | 8.57 | | 16.50 | | 4.49d |
| Ratio of net expenses | | | | | | | | |
| to average net assets | | 2.40 | | 2.40 | | 2.40 | | .43d |
| Ratio of net investment (loss) | | | | | | | | |
| to average net assets | | (1.81) | | (2.07) | | (1.91) | | (.34)d |
| Portfolio Turnover Rate | | 253.34 | | 236.76 | | 279.61 | | 14.72d |
| |
| |
| |
| |
|
| Net Assets, end of period ($ X 1,000) | | 384 | | 376 | | 238 | | 168 |
| |
| a | | From June 28, 2002 (commencement of operations) to August 31, 2002. | | | | |
| b | | Based on average shares outstanding at each month end. | | | | | | |
| c | | Exclusive of sales charge. | | | | | | | | |
| d | | Not annualized. | | | | | | | | |
| e | | Calculated based on net asset value on the close of business on June 28, 2002 (commencement of initial offering) to |
| | | August 31, 2002. | | | | | | | | |
| See notes to financial statements. | | | | | | | | |
| | FINANCIAL HIGHLIGHTS (continued)
|
| | | | | | | Year Ended August 31, | | |
| | | |
| |
| |
|
| Class R Shares | | 2005 | | 2004 | | 2003 | | 2002 a |
| |
| |
| |
| |
|
| Per Share Data ($): | | | | | | | | |
| Net asset value, beginning of period | | 14.56 | | 13.31 | | 10.52 | | 12.50 |
| Investment Operations: | | | | | | | | |
| Investment (loss)—net b | | (.12) | | (.14) | | (.10) | | (.02) |
| Net realized and unrealized | | | | | | | | |
| gain (loss) on investments | | 4.07 | | 1.39 | | 2.89 | | (1.96) |
| Total from Investment Operations | | 3.95 | | 1.25 | | 2.79 | | (1.98) |
| Distributions: | | | | | | | | |
| Dividends from net realized | | | | | | | | |
| gain on investments | | (.03) | | — | | — | | — |
| Net asset value, end of period | | 18.48 | | 14.56 | | 13.31 | | 10.52 |
| |
| |
| |
| |
|
| Total Return (%) | | 26.61 | | 9.76 | | 26.62 | | (15.77)c,d |
| |
| |
| |
| |
|
| Ratios/Supplemental Data (%): | | | | | | | | |
| Ratio of total expenses | | | | | | | | |
| to average net assets | | 4.03 | | 7.72 | | 15.51 | | 4.32c |
| Ratio of net expenses | | | | | | | | |
| to average net assets | | 1.28 | | 1.40 | | 1.40 | | .25c |
| Ratio of net investment (loss) | | | | | | | | |
| to average net assets | | (.77) | | (1.08) | | (.91) | | (.16)c |
| Portfolio Turnover Rate | | 253.34 | | 236.76 | | 279.61 | | 14.72c |
| |
| |
| |
| |
|
| Net Assets, end of period ($ X 1,000) | | 11 | | 236 | | 213 | | 168 |
| |
| a | | From June 28, 2002 (commencement of operations) to August 31, 2002. | | | | |
| b | | Based on average shares outstanding at each month end. | | | | | | |
| c | | Not annualized. | | | | | | | | |
| d | | Calculated based on net asset value on the close of business on June 28, 2002 (commencement of initial offering) to |
| | | August 31, 2002. | | | | | | | | |
| See notes to financial statements. | | | | | | | | |
| | | | | | | Year Ended August 31, | | |
| | | |
| |
| |
|
| Class T Shares | | 2005 | | 2004 | | 2003 | | 2002 a |
| |
| |
| |
| |
|
| Per Share Data ($): | | | | | | | | |
| Net asset value, beginning of period | | 14.40 | | 13.23 | | 10.51 | | 12.50 |
| Investment Operations: | | | | | | | | |
| Investment (loss)—net b | | (.23) | | (.22) | | (.15) | | (.03) |
| Net realized and unrealized | | | | | | | | |
| gain (loss) on investments | | 3.99 | | 1.39 | | 2.87 | | (1.96) |
| Total from Investment Operations | | 3.76 | | 1.17 | | 2.72 | | (1.99) |
| Distributions: | | | | | | | | |
| Dividends from net realized | | | | | | | | |
| gain on investments | | (.03) | | — | | — | | — |
| Net asset value, end of period | | 18.13 | | 14.40 | | 13.23 | | 10.51 |
| |
| |
| |
| |
|
| Total Return (%) c | | 25.51 | | 9.29 | | 25.98 | | (15.85)d,e |
| |
| |
| |
| |
|
| Ratios/Supplemental Data (%): | | | | | | | | |
| Ratio of total expenses | | | | | | | | |
| to average net assets | | 4.67 | | 8.23 | | 16.01 | | 4.40d |
| Ratio of net expenses | | | | | | | | |
| to average net assets | | 1.93 | | 1.90 | | 1.90 | | .34d |
| Ratio of net investment (loss) | | | | | | | | |
| to average net assets | | (1.40) | | (1.58) | | (1.41) | | (.25)d |
| Portfolio Turnover Rate | | 253.34 | | 236.76 | | 279.61 | | 14.72d |
| |
| |
| |
| |
|
| Net Assets, end of period ($ X 1,000) | | 85 | | 230 | | 212 | | 168 |
| |
| a | | From June 28, 2002 (commencement of operations) to August 31, 2002. | | | | |
| b | | Based on average shares outstanding at each month end. | | | | | | |
| c | | Exclusive of sales charge. | | | | | | | | |
| d | | Not annualized. | | | | | | | | |
| e | | Calculated based on net asset value on the close of business on June 28, 2002 (commencement of initial offering) to |
| | | August 31, 2002. | | | | | | | | |
| See notes to financial statements. | | | | | | | | |
NOTES TO FINANCIAL STATEMENTS
NOTE 1—Significant Accounting Policies:
Dreyfus Premier Small Company Growth Fund (the “fund”) is a separate diversified series of Dreyfus Growth and Value Funds, Inc. (the “Company”), which is registered under the Investment Company Act of 1940, as amended (the “Act”), as an open-end management investment company and operates as a series company that offers twelve series, including the fund.The fund’s investment objective is long-term capital appreciation. The Dreyfus Corporation (the “Manager” or “Dreyfus”) serves as the fund’s investment adviser.The Manager is a wholly-owned subsidiary of Mellon Financial Corporation (“Mellon Financial”).
Dreyfus Service Corporation (the “Distributor”), a wholly-owned subsidiary of the Manager, is the distributor of the fund’s shares. The fund is authorized to issue 500 million shares of $.001 par value Common Stock.The fund currently offers five classes of shares: Class A (100 million shares authorized), Class B (100 million shares authorized), Class C (100 million shares authorized), Class R (100 million shares authorized) and Class T (100 million shares authorized). Class A and Class T shares are subject to a sales charge imposed at the time of purchase. Class B shares are subject to a contingent deferred sales charge (“CDSC”) imposed on Class B share redemptions made within six years of purchase and automatically convert to Class A shares after six years. Class C shares are subject to a CDSC imposed on Class C shares redeemed within one year of purchase and Class R shares are sold at net asset value per share only to institutional investors. Other differences between the classes include the services offered to and the expenses borne by each class and certain voting rights. Income, expenses (other than expenses attributable to a specific class), and realized and unrealized gains or losses on investments are allocated to each class of shares based on its relative net assets.
The Company accounts separately for the assets, liabilities and operations of each series. Expenses directly attributable to each series are charged to that series’ operations; expenses which are applicable to all series are allocated among them on a pro rata basis.
The fund’s financial statements are prepared in accordance with U.S. generally accepted accounting principles, which may require the use of management estimates and assumptions. Actual results could differ from those estimates.
The fund enters into contracts that contain a variety of indemnifications. The fund’s maximum exposure under these arrangements is unknown.The fund does not anticipate recognizing any loss related to these arrangements.
(a) Portfolio valuation: Investments in securities are valued at the last sales price on the securities exchange or national securities market on which such securities are primarily traded. Securities listed on the National Market System for which market quotations are available are valued at the official closing price or, if there is no official closing price that day, at the last sale price. Securities not listed on an exchange or the national securities market, or securities for which there were no transactions, are valued at the average of the most recent bid and asked prices, except for open short positions, where the asked price is used for valuation purposes. Bid price is used when no asked price is available. Investments in registered investment companies are valued at their net asset value. When market quotations or official closing prices are not readily available, or are determined not to reflect accurately fair value, such as when the value of a security has been significantly affected by events after the close of the exchange or market on which the security is principally traded (for example, a foreign exchange or market), but before the fund calculates its net asset value, the fund may value these investments at fair value as determined in accordance with the procedures approved by the Board of Directors. Fair valuing of securities may be determined with the assistance of a pricing service using calculations based on indices of domestic securities and other appropriate indicators, such as prices of relevant ADR’s and futures contracts. For other securities that are fair valued by the Board of Directors, certain factors may be considered such as: fundamental analytical data, the nature and duration
| | NOTES TO FINANCIAL STATEMENTS (continued)
|
of restrictions on disposition, an evaluation of the forces that influence the market in which the securities are purchased and sold, and public trading in similar securities of the issuer or comparable issuers. Financial futures are valued at the last sales price.
(b) Securities transactions and investment income: Securities transactions are recorded on a trade date basis. Realized gain and loss from securities transactions are recorded on the identified cost basis. Dividend income is recognized on the ex-dividend date and interest income, including, where applicable, accretion of discount and amortization of premium on investments, is recognized on the accrual basis.
The fund has an arrangement with the custodian bank whereby the fund receives earnings credits from the custodian when positive cash balances are maintained, which are used to offset custody fees. For financial reporting purposes, the fund includes net earnings credits as an expense offset in the Statement of Operations.
Pursuant to a securities lending agreement with Mellon Bank, N.A., an affiliate of the Manager, the fund may lend securities to qualified institutions.At origination, all loans are secured by collateral of at least 102% of the value of U.S. securities loaned and 105% of the value of foreign securities loaned. Collateral equivalent to at least 100% of the market value of securities on loan will be maintained at all times. Cash collateral is invested in certain money market mutual funds managed by the Manager. The fund will be entitled to receive all income on securities loaned, in addition to income earned as a result of the lending transaction. Although each security loaned is fully collateralized, the fund would bear the risk of delay in recovery of, or loss of rights in, the securities loaned should a borrower fail to return the securities in a timely manner.
(c) Affiliated issuers: Investments in other investment companies advised by the Manager are defined as “affiliated” in the Act.
(d) Dividends to shareholders: Dividends are recorded on the ex-dividend date. Dividends from investment income-net and dividends from net realized capital gain, if any, are normally declared and paid annually,
but the fund may make distributions on a more frequent basis to comply with the distribution requirements of the Internal Revenue Code of 1986, as amended (the “Code”).To the extent that net realized capital gain can be offset by capital loss carryovers, if any, it is the policy of the fund not to distribute such gain. Income and capital gain distributions are determined in accordance with income tax regulations, which may differ from U.S. generally accepted accounting principles.
(e) Federal income taxes: It is the policy of the fund to continue to qualify as a regulated investment company, if such qualification is in the best interests of its shareholders, by complying with the applicable provisions of the Code, and to make distributions of taxable income sufficient to relieve it from substantially all federal income and excise taxes.
At August 31, 2005, the components of accumulated earnings on a tax basis were as follows: undistributed ordinary income $96,828, undistributed capital gains $88,653 and unrealized appreciation $731,453.
The tax character of distributions paid to shareholders during the fiscal period ended August 31, 2005, was as follows: long-term capital gains $7,263.
During the period ended August 31, 2005, as a result of permanent book to tax differences, primarily due to the tax treatment for real estate investment trusts and net operating losses, the fund increased accumulated undistributed investment income-net by $51,777, decreased accumulated net realized gain (loss) on investments by $51,848 and increased paid-in capital by $71. Net assets were not affected by this reclassification.
NOTE 2—Bank Line of Credit:
|
The fund participates with other Dreyfus-managed funds in a $100 million unsecured line of credit primarily to be utilized for temporary or emergency purposes, including the financing of redemptions. Interest is charged to the fund based on prevailing market rates in effect at the time of borrowings. During the period ended August 31, 2005, the fund did not borrow under the line of credit.
| | NOTES TO FINANCIAL STATEMENTS (continued)
|
NOTE 3—Management Fee and Other Transactions With
Affiliates:
|
(a) Pursuant to a management agreement (the “Agreement”) with the Manager, the management fee is computed at the annual rate of .90% of the value of the fund’s average daily net assets and is payable monthly. The Manager has undertaken from September 1, 2004 through August 31, 2006, that, if the fund’s aggregate expenses, exclusive of taxes, brokerage fees, interest on borrowings, Rule 12b-1 distribution plan fees, shareholder services plan fees and extraordinary expenses, exceed an annual rate of 1.40% of the value of the fund’s average daily net assets, the fund may deduct from the payment to be made to the Manager under the Agreement, or the Manager will bear, such excess expense. The expense reimbursement, pursuant to the undertaking, amounted to $119,111 during the period ended August 31, 2005.
During the period ended August 31, 2005, the Distributor retained $1,247 from commissions earned on sales of the fund’s Class A shares, and $151 and $37 from contingent deferred sales charges on redemptions of the fund’s Class B and Class C shares, respectively.
(b) Under the Distribution Plan (the “Plan”) adopted pursuant to Rule 12b-1 under the Act, Class B, Class C and Class T shares pay the Distributor for distributing their shares at an annual rate of .75% of the value of the average daily net assets of Class B and Class C shares, and .25% of the value of the average daily net assets of Class T shares. During the period ended August 31, 2005, Class B, Class C and Class T shares were charged $3,980, $3,439 and $639, respectively, pursuant to the Plan.
(c) Under the Shareholder Services Plan, Class A, Class B, Class C and Class T shares pay the Distributor at an annual rate of .25% of the value of their average daily net assets for the provision of certain services. The services provided may include personal services relating to shareholder accounts, such as answering shareholder inquiries regarding the
fund and providing reports and other information, and services related to the maintenance of shareholder accounts. The Distributor may make payments to Service Agents (a securities dealer, financial institution or industry professional) in respect of these services. The Distributor determines the amounts to be paid to Service Agents. During the period ended August 31, 2005, Class A, Class B, Class C and Class T shares were charged $6,973, $1,327, $1,146 and $639 respectively, pursuant to the Shareholder Services Plan.
The fund compensates Dreyfus Transfer, Inc., a wholly-owned subsidiary of the Manager, under a transfer agency agreement for providing personnel and facilities to perform transfer agency services for the fund. During the period ended August 31, 2005, the fund was charged $373 pursuant to the transfer agency agreement.
The fund compensates Mellon Bank, N.A., an affiliate of the Manager, under a custody agreement for providing custodial services for the fund. During the period ended August 31, 2005, the fund was charged $27,937 pursuant to the custody agreement.
During the period ended August 31, 2005, the fund was charged $2,520 for services performed by the Chief Compliance Officer.
The components of Due to The Dreyfus Corporation and affiliates in the Statement of Assets and Liabilities consist of: management fees $2,986, Rule 12b-1 distribution plan fees $489, shareholder services plan fees $827, custodian fees $7,966, chief compliance officer fees $1,533 and transfer agency per account fees $373, which are offset against an expense reimbursement currently in effect in the amount of $12,890.
(d) Each Board member also serves as a Board member of other funds within the Dreyfus complex. Annual retainer fees and attendance fees are allocated to each fund based on net assets.
| | NOTES TO FINANCIAL STATEMENTS (continued)
|
NOTE 4—Securities Transactions:
|
The aggregate amount of purchases and sales of investment securities, excluding short-term securities, during the period ended August 31, 2005, amounted to $10,156,157 and $10,299,987, respectively.
At August 31, 2005, the cost of investments for federal income tax purposes was $3,336,900; accordingly, accumulated net unrealized appreciation on investments was $731,453, consisting of $785,822 gross unrealized appreciation and $54,369 gross unrealized depreciation.
In early 2004, two purported class and derivative actions were filed against Mellon Financial, Mellon Bank, N.A., Dreyfus, Founders Asset Management LLC, and certain directors of the Dreyfus Funds and the Dreyfus Founders Funds (together, the “Funds”) in the United States District Court for the Western District of Pennsylvania. In September 2004, plaintiffs served a Consolidated Amended Complaint (the “Amended Complaint”) on behalf of a purported class of all persons who acquired interests in any of the Funds between January 30, 1999 and November 17, 2003, and derivatively on behalf of the Funds.The Amended Complaint in the newly styled In re Dreyfus Mutual Funds Fee Litigation also named the Distributor, Premier Mutual Fund Services, Inc. and two additional Fund directors as defendants and alleges violations of the Investment Company Act of 1940, the Investment Advisers Act of 1940, the Pennsylvania Unfair Trade Practices and Consumer Protection Law and common-law claims. Plaintiffs seek to recover allegedly improper and excessive Rule 12b-1 and advisory fees allegedly charged to the Funds for marketing and distribution services. More specifically, plaintiffs claim, among other things, that 12b-1 fees and directed brokerage were improperly used to pay brokers to recommend the Funds over other funds, and that such payments were not disclosed to investors. In addition, plaintiffs assert that economies of scale and soft-dollar benefits were not passed on to the Funds. Plaintiffs further allege that 12b-1 fees were improperly
charged to certain of the Funds that were closed to new investors.The Amended Complaint seeks compensatory and punitive damages, rescission of the advisory contracts, and an accounting and restitution of any unlawful fees, as well as an award of attorneys’ fees and litigation expenses. As noted, some of the claims in this litigation are asserted derivatively on behalf of the Funds that have been named as nominal defendants. With respect to such derivative claims, no relief is sought against the Funds. Dreyfus believes the allegations to be totally without merit and intends to defend the action vigorously. In November 2004, all named defendants moved to dismiss the Amended Complaint in whole or substantial part. Briefing was completed in May 2005.
Additional lawsuits arising out of these circumstances and presenting similar allegations and requests for relief may be filed against the defendants in the future. Neither Dreyfus nor the Funds believe that any of the pending actions will have a material adverse effect on the Funds or Dreyfus’ ability to perform its contract with the Funds.
| | REPORT OF INDEPENDENT REGISTERED
PUBLIC ACCOUNTING FIRM
|
Shareholders and Board of Directors
Dreyfus Premier Small Company Growth Fund
|
We have audited the accompanying statement of assets and liabilities, including the statement of investments, of Dreyfus Premier Small Company Growth Fund (one of the funds comprising Dreyfus Growth and Value Funds, Inc.) as of August 31, 2005, and the related statement of operations for the year then ended, the statement of changes in net assets for each of the two years in the period then ended, and financial highlights for each of the periods indicated therein. These financial statements and financial highlights are the responsibility of the Fund’s management. Our responsibility is to express an opinion on these financial statements and financial highlights based on our audits.
We conducted our audits in accordance with the standards of the Public Company Accounting Oversight Board (United States).Those standards require that we plan and perform the audit to obtain reasonable assurance about whether the financial statements and financial highlights are free of material misstatement.We were not engaged to perform an audit of the Fund’s internal control over financial reporting.Our audits included consideration of internal control over financial reporting as a basis for designing audit procedures that are appropriate in the circumstances,but not for the purpose of expressing an opinion on the effectiveness of the Fund’s internal control over financial reporting.Accordingly, we express no such opinion.An audit also includes examining, on a test basis, evidence supporting the amounts and disclosures in the financial statements and financial highlights, assessing the accounting principles used and significant estimates made by management, and evaluating the overall financial statement presentation. Our procedures included verification by examination of securities held by the custodian as of August 31, 2005 and confirmation of securities not held by the custodian by correspondence with oth-ers.We believe that our audits provide a reasonable basis for our opinion.
In our opinion, the financial statements and financial highlights referred to above present fairly, in all material respects, the financial position of Dreyfus Premier Small Company Growth Fund at August 31, 2005, the results of its operations for the year then ended, the changes in its net assets for each of the two years in the period then ended, and the financial highlights for each of the indicated periods, in conformity with U.S. generally accepted accounting principles.

New York, New York
October 14, 2005
|
IMPORTANT TAX INFORMATION (Unaudited)
The fund designates $.0280 per share as a long-term capital gain distribution paid on December 7, 2004.
| | INFORMATION ABOUT THE REVIEW
AND APPROVAL OF THE FUND’S
M A N A G E M E N T A G R E E M E N T (Unaudited)
|
At a meeting of the Board of Directors held on March 14, 2005, the Board considered the re-approval for an annual period of the Fund’s Management Agreement, pursuant to which the Manager provides the Fund with investment advisory and administrative services. The Board members, none of whom are “interested persons” (as defined in the Investment Company Act of 1940,as amended) of the Fund,were assisted in their review by independent legal counsel and met with counsel in executive session separate from representatives of the Manager.
Analysis of Nature, Extent and Quality of Services Provided to the Fund. The Board members received a presentation from representatives of the Manager regarding services provided to the Fund and other funds in the Dreyfus fund complex, and discussed the nature, extent and quality of the services provided to the Fund pursuant to its Management Agreement. The presentation included a detailed summary of the services provided to Dreyfus-managed mutual funds by each business unit within the Manager.The Manager’s representatives reviewed the Fund’s distribution of accounts and the relationships the Manager has with various intermediaries and the different needs of each.The Manager’s representatives noted the diversity of distribution of the Fund as well as among the funds in the Dreyfus fund complex, and the Manager’s corresponding need for broad, deep, and diverse resources to be able to provide ongoing shareholder services to each of the Fund’s distribution channels.The Board also reviewed the number of shareholder accounts in the Fund, as well as the Fund’s asset size.
The Board members also considered the Manager’s research and portfolio management capabilities and that the Manager also provides oversight of day-to-day Fund operations, including fund accounting and administration and assistance in meeting legal and regulatory requirements. The Board members also considered the Manager’s extensive administrative, accounting and compliance infrastructure.
Comparative Analysis of the Fund’s Performance and Management Fee and Expense Ratio. The Board members reviewed the Fund’s performance, management fee and expense ratios and placed significant
emphasis on comparisons to a group of comparable funds and Lipper category averages, as applicable. The group of comparable funds was previously approved by the Board for this purpose, and was prepared using a Board-approved selection methodology that was based, in part, on selecting non-affiliated funds reported in the same Lipper category as the Fund.The Board members discussed the results of the comparisons for various periods ended January 31, 2005, and noted that the Fund’s performance was below the comparison group and Lipper category averages for the 1-year, 3-year and 5-year periods and above the comparison group and Lipper category averages for the 10-year period. The Board also observed that the Fund ranked first in its comparison group for the 10-year period.The Board discussed with representatives of the Manager the reasons for the Fund’s underperformance compared to the comparison group and Lipper category for the 1-, 3- and 5-year periods, and the Manager’s efforts to improve performance.The Board members also discussed the Fund’s management fee and expense ratio and reviewed the range of management fees and expense ratios for the funds in the comparison group.The Fund’s management fee ranked in the top half (i.e., lower than most others) of the comparison group funds. The Board noted that the Fund’s total expense ratio was lower than the Fund’s comparison group and Lipper category averages.
Representatives of the Manager reviewed with the Board members the fees paid to the Manager or its affiliates by mutual funds managed by the Manager or its affiliates with similar investment objectives, policies and strategies as the Fund (the “Similar Funds”), and by other accounts managed or sub-advised by the Manager or its affiliates with similar investment objectives, policies and strategies as the Fund (the “Separate Accounts” and, collectively with the Similar Funds, the “Similar Accounts”). The Manager’s representatives explained the nature of the Similar Accounts and the differences, from the Manager’s perspective, in management of the Similar Accounts as compared to managing and providing services to the Fund; it was noted that the Similar Funds were mutual funds included in the “small cap core” and
| | I N FO R M AT I O N A B O U T T H E R E V I E W A N D A P P R OVA L O F T H E
F U N D ’S M A N A G E M E N T A G R E E M E N T ( U n a u d i t e d ) ( c o n t i n u e d )
|
“small cap core variable insurance products” categories by Lipper.The Manager’s representatives also reviewed the costs associated with distribution through intermediaries. The Board analyzed the differences in fees paid to the Manager and discussed the relationship of the advisory fees paid in light of the Manager’s performance and the services provided; it was noted that the Similar Funds generally had the same or higher management fees than the fee borne by the Fund.The Board members considered the relevance of the fee information provided for the Similar Accounts managed by the Manager to evaluate the appropriateness and reasonableness of the Fund’s advisory fees. The Board acknowledged that differences in fees paid by the Similar Accounts seemed to be consistent with the services provided.
Analysis of Profitability and Economies of Scale. The Manager’s representatives reviewed the dollar amount of expenses allocated and profit received by the Manager and the method used to determine such expenses and profit. The Board received and considered information prepared by an independent consulting firm regarding the Manager’s approach to allocating costs to, and determining the profitability of, individual funds and the entire Dreyfus fund complex.The Manager’s representatives stated that the methodology had also been reviewed by an independent registered public accounting firm which, like the consultant, found the methodology to be reasonable.The consulting firm also analyzed where any economies of scale might emerge in connection with the management of the Fund.The Board members evaluated the analysis in light of the relevant circumstances for the Fund, and the extent to which economies of scale would be realized as the Fund grows and whether fee levels reflect these economies of scale for the benefit of Fund investors.The Board noted that it appeared that the benefits of any economies of scale also would be appropriately shared with shareholders through increased investment in fund management and administration resources.The Board members also considered potential benefits to the Manager from acting as investment adviser and reviewed the soft dollar arrangements with respect to trading the Fund’s portfolio.
It was noted that the Board members should consider the Manager’s profitability with respect to the Fund as part of their evaluation of whether the fee under the Management Agreement bears a reasonable relationship to the mix of services provided by the Manager, including the nature, extent and quality of such services and that a discussion of economies of scale is predicated on increasing assets and that, if a fund’s assets had been decreasing, the possibility that the Manager may have realized any economies of scale would be less.The Board members also discussed the profitability percentage ranges determined by appropriate court cases to be reasonable given the services rendered to investment companies. It was noted that the profitability percentage for managing the Fund was not unreasonable given the Fund’s overall performance and generally superior service levels provided.
At the conclusion of these discussions, each of the Directors expressed the opinion that he or she had been furnished with sufficient information to make an informed business decision with respect to continuation of the Fund’s Management Agreement. Based on their discussions and considerations as described above, the Board made the following conclusions and determinations.
- The Board concluded that the nature, extent and quality of the ser- vices provided by the Manager are adequate and appropriate.
- While the Board was concerned with the Fund’s short-term perfor- mance, the Board was satisfied with the Manager’s efforts to improve it.Accordingly, the Board approved the Management Agreement for a six-month period (instead of a year) so as to gauge the Manager’s efforts to improve performance over an appropriate period of time.
- The Board concluded that the fee paid to the Manager by the Fund was reasonable in light of comparative performance and expense and advisory fee information, costs of the services provided and profits to be realized and benefits derived or to be derived by the Manager from its relationship with the Fund.
| | I N FO R M AT I O N A B O U T T H E R E V I E W A N D A P P R OVA L O F T H E
F U N D ’S M A N A G E M E N T A G R E E M E N T ( U n a u d i t e d ) ( c o n t i n u e d )
|
- The Board determined that the economies of scale which may accrue to the Manager and its affiliates in connection with the man- agement of the Fund had been adequately considered by the Manager in connection with the management fee rate charged to the Fund, and that, to the extent in the future it were to be deter- mined that material economies of scale had not been shared with the Fund, the Board would seek to have those economies of scale shared with the Fund.
The Board members considered these conclusions and determinations, along with the information received on a routine and regular basis throughout the year, and, without any one factor being dispositive, the Board determined that re-approval of the Fund’s Management Agreement for a six-month period was in the best interests of the Fund and its shareholders.
BOARD MEMBERS INFORMATION (Unaudited)
| | Joseph S. DiMartino (61)
Chairman of the Board (1995)
|
| Principal Occupation During Past 5 Years: |
| • Corporate Director and Trustee |
| Other Board Memberships and Affiliations: |
| • The Muscular Dystrophy Association, Director |
| • Levcor International, Inc., an apparel fabric processor, Director |
| • Century Business Services, Inc., a provider of outsourcing functions for small and medium size |
| companies, Director |
| • The Newark Group, a provider of a national market of paper recovery facilities, paperboard |
| mills and paperboard converting plants, Director |
| • Azimuth Trust, an institutional asset management firm, Member of Board of Managers and |
| Advisory Board |
| • Sunair Electronics, Inc., engages in the design, manufacture and sale of high frequency systems |
| for long-range voice and data communications, as well as providing certain outdoor-related |
| services to homes and businesses, Director |
| • Sunair Electronics, Inc., engages in the design, manufacture and sale of high frequency systems |
| for long-range voice and data communications, as well as providing certain outdoor-related |
| services to homes and businesses, Director |
No. of Portfolios for which Board Member Serves: 193
| | David P. Feldman (65)
Board Member (1996)
|
| | Principal Occupation During Past 5 Years:
• Corporate Director & Trustee
|
| | Other Board Memberships and Affiliations:
|
- BBH Mutual Funds Group (11 funds), Director
- The Jeffrey Company, a private investment company, Director
- QMED, a medical device company, Director
No. of Portfolios for which Board Member Serves: 58
———————
Ehud Houminer (65) Board Member (1993)
| | Principal Occupation During Past 5 Years:
|
- Executive-in-Residence at the Columbia Business School, Columbia University
- Principal of Lear,Yavitz and Associates, a management consulting firm (1996 to 2001)
| | Other Board Memberships and Affiliations:
|
- Avnet Inc., an electronics distributor, Director
- International Advisory Board to the MBA Program School of Management, Ben Gurion University, Chairman
- Explore Charter School, Brooklyn, NY, Chairman
| | No. of Portfolios for which Board Member Serves: 36
|
BOARD MEMBERS INFORMATION (Unaudited) (continued)
| | Gloria Messinger (75)
Board Member (1993)
|
| | Principal Occupation During Past 5 Years:
|
- Arbitrator for American Arbitration Association and National Association of Securities Dealers, Inc.
- Consultant in Intellectual Property
| | Other Board Memberships and Affiliations:
|
- Yale Law School Fund, Director
- Theater for a New Audience, Inc., Director
- Brooklyn Philharmonic, Director
- New York Women’s Agenda Music Performance Trust Fund, Director
| | No. of Portfolios for which Board Member Serves: 25
|
T. John Szarkowski (79) Board Member (1996)
| Principal Occupation During Past 5 Years: |
| • Consultant in Photography |
| Other Board Memberships and Affiliations: |
| • Photography Department at The Museum of Modern Art, Director Emeritus |
| | No. of Portfolios for which Board Member Serves: 25
|
| | Anne Wexler (75)
Board Member (1996)
|
| | Principal Occupation During Past 5 Years:
|
- Chairman of the Wexler & Walker Public Policy Associates, consultants specializing in government relations and public affairs
| | Other Board Memberships and Affiliations:
|
- Wilshire Mutual Funds (5 funds), Director
- Methanex Corporation, a methanol producing company, Director
- Member of the Council of Foreign Relations
- Member of the National Park Foundation
| | No. of Portfolios for which Board Member Serves: 36
|
Once elected all Board Members serve for an indefinite term.The address of the Board Members and Officers is in c/o The Dreyfus Corporation, 200 Park Avenue, New York, New York 10166. Additional information about the Board Members is available in the fund’s Statement of Additional Information which can be obtained from Dreyfus free of charge by calling this toll free number: 1-800-554-4611.
John M. Fraser, Jr., Emeritus Board Member
OFFICERS OF THE FUND (Unaudited)
| STEPHEN E. CANTER, President since | | JAMES BITETTO, Vice President and |
| March 2000. | | Assistant Secretary since August 2005. |
| Chairman of the Board, Chief Executive | | Assistant General Counsel and Assistant |
| Officer and Chief Operating Officer of the | | Secretary of the Manager, and an officer of 91 |
| Manager, and an officer of 90 investment | | investment companies (comprised of 200 |
| companies (comprised of 184 portfolios) | | portfolios) managed by the Manager. He is 39 |
| managed by the Manager. Mr. Canter also is a | | years old and has been an employee of the |
| Board member and, where applicable, an | | Manager since December 1996. |
| |
| Executive Committee Member of the other | | JONI LACKS CHARATAN, Vice President |
| investment management subsidiaries of Mellon | | and Assistant Secretary since |
| Financial Corporation, each of which is an | | August 2005. |
| affiliate of the Manager. He is 60 years old and | | |
| has been an employee of the Manager since | | Assistant General Counsel and Assistant |
| May 1995. | | Secretary of the Manager, and an officer of 91 |
| | | investment companies (comprised of 200 |
| STEPHEN R. BYERS, Executive Vice | | portfolios) managed by the Manager. She is 49 |
| President since November 2002. | | years old and has been an employee of the |
| Chief Investment Officer,Vice Chairman and a | | Manager since October 1998. |
| |
| director of the Manager, and an officer of 90 | | JOSEPH M. CHIOFFI, Vice President and |
| investment companies (comprised of 184 | | Assistant Secretary since August 2005. |
| portfolios) managed by the Manager. Mr. Byers | | |
| also is an officer, director or an Executive | | Assistant General Counsel and Assistant |
| Committee Member of certain other | | Secretary of the Manager, and an officer of 91 |
| investment management subsidiaries of Mellon | | investment companies (comprised of 200 |
| Financial Corporation, each of which is an | | portfolios) managed by the Manager. He is 43 |
| affiliate of the Manager. He is 52 years old and | | years old and has been an employee of the |
| has been an employee of the Manager since | | Manager since July 2000. |
| January 2000. | | JANETTE E. FARRAGHER, Vice President |
| MARK N. JACOBS, Vice President since | | and Assistant Secretary since |
| March 2000. | | August 2005 |
| Executive Vice President, Secretary and | | Associate General Counsel of the Manager, |
| General Counsel of the Manager, and an | | and an officer of 91 investment companies |
| officer of 91 investment companies (comprised | | (comprised of 200 portfolios) managed by the |
| of 200 portfolios) managed by the Manager. | | Manager. She is 42 years old and has been an |
| He is 59 years old and has been an employee | | employee of the Manager since February 1984. |
| of the Manager since June 1977. | | JOHN B. HAMMALIAN, Vice President and |
| MICHAEL A. ROSENBERG, Vice President | | Assistant Secretary since August 2005. |
| and Secretary since August 2005. | | Associate General Counsel of the Manager, |
| Associate General Counsel of the Manager, | | and an officer of 91 investment companies |
| and an officer of 91 investment companies | | (comprised of 200 portfolios) managed by the |
| (comprised of 200 portfolios) managed by the | | Manager. He is 42 years old and has been an |
| Manager. He is 45 years old and has been an | | employee of the Manager since February 1991. |
| employee of the Manager since October 1991. | | |
OFFICERS OF THE FUND (Unaudited) (continued)
| ROBERT R. MULLERY, Vice President and | | ROBERT SVAGNA, Assistant Treasurer |
| Assistant Secretary since August 2005. | | since December 2002. |
| Associate General Counsel of the Manager, | | Senior Accounting Manager – Equity Funds of |
| and an officer of 91 investment companies | | the Manager, and an officer of 91 investment |
| (comprised of 200 portfolios) managed by the | | companies (comprised of 200 portfolios) |
| Manager. He is 53 years old and has been an | | managed by the Manager. He is 38 years old |
| employee of the Manager since May 1986. | | and has been an employee of the Manager |
| JEFF PRUSNOFSKY, Vice President and | | since November 1990. |
| Assistant Secretary since August 2005. | | KENNETH J. SANDGREN, Assistant |
| Associate General Counsel of the Manager, | | Treasurer since November 2001. |
| and an officer of 91 investment companies | | Mutual Funds Tax Director of the Manager, |
| (comprised of 200 portfolios) managed by the | | and an officer of 91 investment companies |
| Manager. He is 40 years old and has been an | | (comprised of 200 portfolios) managed by the |
| employee of the Manager since October 1990. | | Manager. He is 51 years old and has been an |
| JAMES WINDELS, Treasurer since | | employee of the Manager since June 1993. |
| November 2001. | | JOSEPH W. CONNOLLY, Chief Compliance |
| Director – Mutual Fund Accounting of the | | Officer since October 2004. |
| Manager, and an officer of 91 investment | | Chief Compliance Officer of the Manager and |
| companies (comprised of 200 portfolios) | | The Dreyfus Family of Funds (91 investment |
| managed by the Manager. He is 46 years old | | companies, comprising 200 portfolios). From |
| and has been an employee of the Manager | | November 2001 through March 2004, Mr. |
| since April 1985. | | Connolly was first Vice-President, Mutual |
| GREGORY S. GRUBER, Assistant | | Fund Servicing for Mellon Global Securities |
| Treasurer since August 2005. | | Services. In that capacity, Mr. Connolly was |
| Senior Accounting Manager – Municipal Bond | | responsible for managing Mellon’s Custody, |
| Funds of the Manager, and an officer of 91 | | Fund Accounting and Fund Administration |
| investment companies (comprised of 200 | | services to third-party mutual fund clients. He |
| portfolios) managed by the Manager. He is 46 | | is 48 years old and has served in various |
| years old and has been an employee of the | | capacities with the Manager since 1980, |
| Manager since August 1981. | | including manager of the firm’s Fund |
| | | Accounting Department from 1997 through |
| ERIK D. NAVILOFF, Assistant Treasurer | | October 2001. |
| since August 2005. | | |
| | | WILLIAM GERMENIS, Anti-Money |
| Senior Accounting Manager – Taxable Fixed | | Laundering Compliance Officer since |
| Income Funds of the Manager, and an officer | | October 2002. |
| of 91 investment companies (comprised of 200 | | |
| portfolios) managed by the Manager. He is 37 | | Vice President and Anti-Money Laundering |
| years old and has been an employee of the | | Compliance Officer of the Distributor, and the |
| Manager since November 1992. | | Anti-Money Laundering Compliance Officer |
| | | of 88 investment companies (comprised of 197 |
| ROBERT ROBOL, Assistant Treasurer | | portfolios) managed by the Manager. He is 35 |
| since August 2005. | | years old and has been an employee of the |
| Senior Accounting Manager – Money Market | | Distributor since October 1998. |
| Funds of the Manager, and an officer of 91 | | |
| investment companies (comprised of 200 | | |
| portfolios) managed by the Manager. He is 41 | | |
| years old and has been an employee of the | | |
| Manager since October 1988. | | |
NOTES
| For More | | Information |
| |
|
| |
| Dreyfus Premier | | Transfer Agent & |
| Small Company | | Dividend Disbursing Agent |
| Growth Fund | | |
| | | Dreyfus Transfer, Inc. |
| 200 Park Avenue | | |
| | | 200 Park Avenue |
| New York, NY 10166 | | |
| | | New York, NY 10166 |
| |
| Manager | | Distributor |
| The Dreyfus Corporation | | |
| | | Dreyfus Service Corporation |
| 200 Park Avenue | | |
| | | 200 Park Avenue |
| New York, NY 10166 | | |
| | | New York, NY 10166 |
| Custodian | | |
| Mellon Bank, N.A. | | |
| One Mellon Bank Center | | |
| Pittsburgh, PA 15258 | | |
Telephone Call your financial representative or 1-800-554-4611
| Mail | | The Dreyfus Premier Family of Funds |
| | | 144 Glenn Curtiss Boulevard, Uniondale, NY 11556-0144 |
The fund files its complete schedule of portfolio holdings with the Securities and Exchange Commission (“SEC”) for the first and third quarters of each fiscal year on Form N-Q. The fund’s Forms N-Q are available on the SEC’s website at http://www.sec.gov and may be reviewed and copied at the SEC’s Public Reference Room in Washington, DC. Information on the operation of the Public Reference Room may be obtained by calling 1-800-SEC-0330.
A description of the policies and procedures that the fund uses to determine how to vote proxies relating to portfolio securities, and information regarding how the fund voted these proxies for the 12-month period ended June 30, 2005, is available at http://www.dreyfus.com and on the SEC’s website at http://www.sec.gov. The description of the policies and procedures is also available without charge, upon request, by calling 1-800-645-6561.

Save time. Save paper. View your next shareholder report online as soon as it’s available. Log into www.dreyfus.com and sign up for Dreyfus eCommunications. It’s simple and only takes a few minutes.
The views expressed in this report reflect those of the portfolio manager only through the end of the period covered and do not necessarily represent the views of Dreyfus or any other person in the Dreyfus organization. Any such views are subject to change at any time based upon market or other conditions and Dreyfus disclaims any responsibility to update such views.These views may not be relied on as investment advice and, because investment decisions for a Dreyfus fund are based on numerous factors, may not be relied on as an indication of trading intent on behalf of any Dreyfus fund.
Not FDIC-Insured • Not Bank-Guaranteed • May Lose Value
| | | Contents |
| |
| | | THE FUND |
| |
|
| 2 | | Letter from the Chairman |
| 3 | | Discussion of Fund Performance |
| 6 | | Fund Performance |
| 8 | | Understanding Your Fund’s Expenses |
| 8 | | Comparing Your Fund’s Expenses |
| | | With Those of Other Funds |
| 9 | | Statement of Investments |
| 13 | | Statement of Assets and Liabilities |
| 14 | | Statement of Operations |
| 16 | | Statement of Changes in Net Assets |
| 17 | | Financial Highlights |
| 22 | | Notes to Financial Statements |
| 30 | | Report of Independent Registered |
| | | Public Accounting Firm |
| 31 | | Information About the Review and Approval |
| | | of the Fund’s Management Agreement |
| 35 | | Board Members Information |
| 37 | | Officers of the Fund |
| |
| | | FOR MORE INFORMATION |
| |
|
| | | Back Cover |
The Fund
| | Dreyfus Premier
Strategic Value Fund
|

LETTER FROM THE CHAIRMAN
This annual report for Dreyfus Premier Strategic Value Fund covers the 12-month period from September 1, 2004, through August 31, 2005. Inside, you’ll find valuable information about how the fund was managed during the reporting period, including a discussion with the fund’s portfolio manager, Brian Ferguson.
On average, stock prices ended the reporting period higher than where they began. However, most of the market’s gains occurred during the closing months of 2004. So far in 2005, positive factors, including steady economic growth and higher corporate profits, were largely offset by headwinds, such as sharply higher energy prices and rising short-term interest rates. Midcap stocks produced higher returns than small-cap stocks in this environment, and small-cap stocks outperformed large-cap stocks. Also, value-oriented stocks have generally produced better results than their more growth-oriented counterparts during the past 12 months.
Recent shocks to the U.S. economy — including sharply higher gasoline prices and other lingering consequences of Hurricane Katrina — have added a degree of uncertainty to the economic outlook.Nonetheless,our economists currently expect the economy to continue to grow without either entering a recession or triggering a significant acceleration of infla-tion.As always, we encourage you to discuss the potential implications of these and other matters with your financial advisor.
Thank you for your continued confidence and support.


DISCUSSION OF FUND PERFORMANCE
Brian Ferguson, Portfolio Manager
How did Dreyfus Premier Strategic Value Fund perform
relative to its benchmark?
|
For the 12-month period ended August 31, 2005, the fund produced total returns of 18.97% for Class A shares, 18.12% for Class B shares, 18.10% for Class C shares, 19.13% for Class R shares and 18.53% for Class T shares.1 The fund’s benchmark, the Russell 1000 Value Index, produced a total return of 16.86% for the same period.2
While concerns related to inflationary pressures, higher interest rates and rising energy costs weighed on investor sentiment at times during the reporting period, a growing economy and rising corporate earnings helped support higher stocks prices, especially in the closing weeks of 2004.The fund produced higher returns than its benchmark, primarily due to the success of our stock selection strategy in the technology and materials sectors.
What is the fund’s investment approach?
The fund seeks capital appreciation. To pursue this goal, we invest at least 80% of the fund’s assets in stocks, including common stocks, preferred stocks and convertible securities.The fund may invest up to 30% of its assets in foreign issuers.
When selecting stocks for the fund, we utilize a “bottom-up” approach, where the focus is on individual stock selection rather than attempting to forecast market trends.The fund’s investment approach is value-oriented and research-driven.When selecting stocks, we identify potential investments through extensive quantitative and fundamental research with a focus on value, business health and business momentum.
What other factors influenced the fund’s performance?
Although political uncertainty hindered the stock market when the reporting period began, investors’ concerns dissipated quickly after the
| | DISCUSSION OF FUND PERFORMANCE (continued)
|
November presidential election, and stocks rallied strongly in the closing months of 2004. The rally sputtered in early 2005, however, as investors again worried about the potential effects of soaring energy prices, rising interest rates, mounting inflationary pressures and a growing trade imbalance with China. As a result, the first quarter of 2005 proved to be a relatively volatile time for stocks.These concerns were later offset by more positive influences, including steady economic growth and higher corporate profits, and the market reclaimed much of the ground it had lost earlier in the year.
As they have for some time, small- and midcap stocks fared better than large-cap stocks during the reporting period, and value-oriented stocks tended to produce higher returns than their more growth-oriented counterparts. However, we began to detect signs later in the reporting period that investors were becoming increasingly attracted to high-quality, large-cap companies with track records of consistent growth under a variety of economic conditions. Indeed, our bottom-up security selection process began to identify more opportunities among attractively valued, larger-cap stocks with these characteristics, and strong results from these holdings helped the fund outperform its benchmark.
Technology stocks made the most substantial contribution of any market sector to the fund’s relative performance during the reporting period.The sector’s greatest gains came from transaction data management provider NCR, which benefited from strong growth for its integrated enterprise data-warehousing product.NCR’s stock also rose amid investor optimism regarding the company’s earnings potential after the passage of “Check 21,” a new check processing law that allows the use of digital images instead of paper checks. Another technology holding that boosted the fund’s performance was Advanced Micro Devices, which enjoyed increased demand for its server and mobile processors.
The materials sector also helped drive the fund’s relative performance. Rising demand for ethylene used in food packaging, PVC pipes, antifreeze and soft drink bottles drove the plastic’s price — and manufacturers’ earnings —higher. Ethylene-related holdings that performed well during the reporting period included Lyondell Chemical, NOVA
Chemicals and Westlake Chemical Corporation.The fund also benefited from relatively light exposure to paper companies, which continued to experience pricing pressure and the adverse effects of higher energy costs.
On the other hand, the fund’s relatively light exposure to energy stocks, at the beginning of the reporting period, prevented it from participating fully in the sector’s gains as oil and gas prices soared. However, we added to the fund’s energy holdings in May 2005, when energy stocks pulled back temporarily. New positions focused primarily on companies with refining exposure, such as Marathon Oil Corporation, that have benefited from favorable supply-and-demand dynamics. Returns from the financials area, the fund’s largest sector position, were relatively flat over the reporting period, as weakness among mortgage lenders was largely offset by better results from investment banks and brokerage firms, such as Goldman Sachs Group.
What is the fund’s current strategy?
Increasingly, we have found attractively valued opportunities among higher-quality, larger-cap stocks. Accordingly, the fund’s average weighted capitalization has shifted toward the larger end of the spectrum. In addition, as of the end of the reporting period, the fund has maintained greater exposure than its benchmark to the technology sector, where we have focused mainly on companies with healthy balance sheets and strong business prospects.
| 1 | | Total return includes reinvestment of dividends and any capital gains paid, and does not take into |
| | | consideration the maximum initial sales charges in the case of Class A and Class T shares, or the |
| | | applicable contingent deferred sales charges imposed on redemptions in the case of Class B and |
| | | Class C shares. Had these charges been reflected, returns would have been lower. Past performance |
| | | is no guarantee of future results. Share price, yield and investment return fluctuate such that upon |
| | | redemption, fund shares may be worth more or less than their original cost. |
| | | Part of the fund’s recent performance is attributable to positive returns from its initial public |
| | | offering (IPO) investments. There can be no guarantee that IPOs will have or continue to |
| | | have a positive effect on fund performance. |
| 2 | | SOURCE: LIPPER INC. — Reflects the reinvestment of dividends and, where applicable, |
| | | capital gain distributions.The Russell 1000 Value Index is an unmanaged index which measures |
| | | the performance of those Russell 1000 companies with lower price-to-book ratios and lower |
| | | forecasted growth values. |

† Source: Lipper Inc.
Past performance is not predictive of future performance.
Part of the fund’s recent performance is attributable to positive returns from its initial public offering (IPO) investments. There can be no guarantee that IPOs will have or continue to have a positive effect on fund performance.
The above graph compares a $10,000 investment made in Class A shares of Dreyfus Premier Strategic Value Fund on 9/29/95 (inception date) to a $10,000 investment made in the Russell 1000 Value Index (the “Index”) on that date. Performance for Class B, Class C, Class R and Class T shares will vary from the performance of Class A shares shown above due to the differences in charges and expenses. All dividends and capital gain distributions are reinvested.
The fund’s performance shown in the line graph takes into account the maximum initial sales charge on Class A shares and all applicable fees and expenses.The Index uses company price-to-book ratios and long-term growth rates to calculate a composite ranking which is used to determine if a stock is “growth” or “value.”The Index does not take into account charges, fees and other expenses. Further information relating to fund performance, including expense reimbursements, if applicable, is contained in the Financial Highlights section of the prospectus and elsewhere in this report.
| Average Annual Total Returns as of 8/31/05 | | | | | | |
| |
| | | | | Inception | | | | | | From |
| | | | | Date | | 1 Year | | 5 Years | | Inception |
| |
| |
| |
| |
| |
|
| Class A shares | | | | | | | | |
| with maximum sales charge (5.75%) | | 9/29/95 | | 12.13% | | 3.41% | | 14.17% |
| without sales charge | | 9/29/95 | | 18.97% | | 4.64% | | 14.85% |
| Class B shares | | | | | | | | |
| with applicable redemption charge † | | 5/31/01 | | 14.12% | | — | | 4.55% |
| without redemption | | 5/31/01 | | 18.12% | | — | | 4.96% |
| Class C shares | | | | | | | | |
| with applicable redemption charge †† | | 5/31/01 | | 17.10% | | — | | 4.97% |
| without redemption | | 5/31/01 | | 18.10% | | — | | 4.97% |
| Class R shares | | 5/31/01 | | 19.13% | | — | | 5.68% |
| Class T shares | | | | | | | | |
| with applicable sales charge (4.5%) | | 5/31/01 | | 13.19% | | — | | 4.05% |
| without sales charge | | 5/31/01 | | 18.53% | | — | | 5.18% |
| |
| Past performance is not predictive of future performance.The fund’s performance shown in the graph and table does not |
| reflect the deduction of taxes that a shareholder would pay on fund distributions or the redemption of fund shares. |
| † | | The maximum contingent deferred sales charge for Class B shares is 4%. After six years Class B shares convert to |
| | | Class A shares. | | | | | | | | |
| †† | | The maximum contingent deferred sales charge for Class C shares is 1% for shares redeemed within one year of the |
| | | date of purchase. | | | | | | | | |
UNDERSTANDING YOUR FUND’S EXPENSES(Unaudited)
As a mutual fund investor, you pay ongoing expenses, such as management fees and other expenses. Using the information below, you can estimate how these expenses affect your investment and compare them with the expenses of other funds.You also may pay one-time transaction expenses, including sales charges (loads) and redemption fees, which are not shown in this section and would have resulted in higher total expenses. For more information, see your fund’s prospectus or talk to your financial adviser.
Review your fund’s expenses
The table below shows the expenses you would have paid on a $1,000 investment in Dreyfus Premier Strategic Value Fund from March 1, 2005 to August 31, 2005. It also shows how much a $1,000 investment would be worth at the close of the period, assuming actual returns and expenses.
| Expenses and Value of a $1,000 Investment | | | | | | |
| assuming actual returns for the six months ended August 31, 2005 | | | | |
| | | Class A | | Class B | | Class C | | Class R | | Class T |
| |
| |
| |
| |
| |
|
| Expenses paid per $1,000 † | | $ 6.72 | | $ 10.42 | | $ 10.17 | | $ 5.81 | | $ 7.84 |
| Ending value (after expenses) | | $1,019.70 | | $1,016.30 | | $1,016.70 | | $1,021.10 | | $1,018.70 |
| COMPARING YOUR FUND’S EXPENSES |
| WITH THOSE OF OTHER FUNDS (Unaudited) |
Using the SEC’s method to compare expenses
The Securities and Exchange Commission (SEC) has established guidelines to help investors assess fund expenses. Per these guidelines, the table below shows your fund’s expenses based on a $1,000 investment, assuming a hypothetical 5% annualized return. You can use this information to compare the ongoing expenses (but not transaction expenses or total cost) of investing in the fund with those of other funds.All mutual fund shareholder reports will provide this information to help you make this comparison. Please note that you cannot use this information to estimate your actual ending account balance and expenses paid during the period.
Expenses and Value of a $1,000 Investment
assuming a hypothetical 5% annualized return for the six months ended August 31, 2005
|
| | | Class A | | Class B | | Class C | | Class R | | Class T |
| |
| |
| |
| |
| |
|
| Expenses paid per $1,000 † | | $ 6.72 | | $ 10.41 | | $ 10.16 | | $ 5.80 | | $ 7.83 |
| Ending value (after expenses) | | $1,018.55 | | $1,014.87 | | $1,015.12 | | $1,019.46 | | $1,017.44 |
† Expenses are equal to the fund’s annualized expense ratio of 1.32% for Class A, 2.05% for Class B, 2.00% for
Class C, 1.14% for Class R and 1.54% for Class T; multiplied by the average account value over the period,
multiplied by 184/365 (to reflect the one-half year period).
|
STATEMENT OF INVESTMENTS
August 31, 2005
|
| Common Stocks—99.3% | | Shares | | Value ($) |
| |
| |
|
| Basic Industries—3.9% | | | | |
| Air Products & Chemicals | | 16,700 | | 925,180 |
| Arch Coal | | 16,900 | | 1,084,980 |
| Bowater | | 34,400 | | 1,067,432 |
| Martin Marietta Materials | | 43,100 | | 3,116,992 |
| Mosaic | | 69,100 a | | 1,115,965 |
| Owens-Illinois | | 15,200 a | | 392,160 |
| Walter Industries | | 17,200 | | 754,564 |
| | | | | 8,457,273 |
| Beverages & Tobacco—2.1% | | | | |
| Altria Group | | 64,900 | | 4,588,430 |
| Capital Goods—11.2% | | | | |
| Agilent Technologies | | 58,200 a | | 1,871,712 |
| Avery Dennison | | 19,900 | | 1,063,456 |
| Eaton | | 13,000 | | 830,960 |
| Emerson Electric | | 47,100 | | 3,168,888 |
| Johnson Controls | | 21,900 | | 1,313,562 |
| Navistar International | | 72,900 a | | 2,329,884 |
| NCR | | 151,000 a | | 5,167,220 |
| Thermo Electron | | 52,700 a | | 1,470,330 |
| Tyco International | | 79,400 | | 2,209,702 |
| United Technologies | | 97,700 | | 4,885,000 |
| | | | | 24,310,714 |
| Consumer Non-Durables—6.1% | | | | |
| Campbell Soup | | 36,100 | | 1,061,340 |
| Colgate-Palmolive | | 83,700 | | 4,394,250 |
| Dean Foods | | 37,500 a | | 1,385,250 |
| Del Monte Foods | | 189,700 a | | 2,050,657 |
| Kraft Foods, Cl. A | | 31,300 | | 970,300 |
| NIKE, Cl. B | | 17,100 | | 1,349,361 |
| Polo Ralph Lauren | | 40,000 | | 1,982,000 |
| | | | | 13,193,158 |
| Consumer Services—10.9% | | | | |
| ARAMARK, Cl. B | | 58,800 | | 1,606,416 |
| Brinker International | | 27,400 a | | 1,017,910 |
| Cendant | | 48,100 | | 978,354 |
| Clear Channel Communications | | 177,400 | | 5,907,420 |
| CSK Auto | | 31,500 a | | 527,625 |
| | STATEMENT OF INVESTMENTS (continued)
|
| Common Stocks (continued) | | Shares | | Value ($) |
| |
| |
|
| Consumer Services (continued) | | | | |
| Entercom Communications | | 29,400 a | | 983,430 |
| Kohl’s | | 19,400 a | | 1,017,530 |
| Liberty Global, Cl. A | | 33,948 a | | 1,722,861 |
| McDonald’s | | 75,900 | | 2,462,955 |
| Omnicom Group | | 34,000 | | 2,734,960 |
| Payless ShoeSource | | 55,400 a | | 1,027,116 |
| PHH | | 40,750 a | | 1,232,280 |
| Talbots | | 33,600 | | 1,031,520 |
| Viacom, Cl. B | | 37,900 | | 1,288,221 |
| | | | | 23,538,598 |
| Electrical & Electronics—.5% | | | | |
| Advanced Micro Devices | | 52,700 a | | 1,094,579 |
| Electronic Technology—.9% | | | | |
| EMC | | 118,900 a | | 1,529,054 |
| Lucent Technologies | | 144,500 a | | 445,060 |
| | | | | 1,974,114 |
| Energy—12.9% | | | | |
| Amerada Hess | | 9,900 | | 1,258,290 |
| BP, ADR | | 31,800 | | 2,174,484 |
| Chevron | | 128,078 | | 7,863,989 |
| ConocoPhillips | | 65,600 | | 4,325,664 |
| Cooper Cameron | | 16,700 a | | 1,204,905 |
| Exxon Mobil | | 132,340 | | 7,927,166 |
| Kerr-McGee | | 12,989 | | 1,143,422 |
| Marathon Oil | | 29,800 | | 1,916,438 |
| | | | | 27,814,358 |
| Financial Services—16.2% | | | | |
| American Express | | 18,100 | | 999,844 |
| American International Group | | 61,329 | | 3,630,677 |
| Chubb | | 51,000 | | 4,434,960 |
| E*TRADE Financial | | 66,200 a | | 1,059,200 |
| Fannie Mae | | 20,700 | | 1,056,528 |
| Genworth Financial, Cl. A | | 83,300 | | 2,679,761 |
| Janus Capital Group | | 72,400 | | 1,023,012 |
| Merrill Lynch & Co. | | 67,200 | | 3,841,152 |
| PMI Group | | 94,400 | | 3,819,424 |
| PNC Financial Services Group | | 40,800 | | 2,294,184 |
| Common Stocks (continued) | | Shares | | Value ($) |
| |
| |
|
| Financial Services (continued) | | | | |
| Radian Group | | 31,300 | | 1,601,934 |
| St. Paul Travelers Cos. | | 48,700 | | 2,094,587 |
| SunTrust Banks | | 34,700 | | 2,438,716 |
| Washington Mutual | | 68,500 | | 2,848,230 |
| Wells Fargo & Co. | | 19,900 | | 1,186,438 |
| | | | | 35,008,647 |
| Foods—1.0% | | | | |
| General Mills | | 48,100 | | 2,218,372 |
| Health Care—2.8% | | | | |
| Boston Scientific | | 75,900 a | | 2,040,192 |
| Medco Health Solutions | | 25,900 a | | 1,276,093 |
| WebMD | | 54,800 a | | 600,608 |
| Wyeth | | 45,600 | | 2,088,024 |
| | | | | 6,004,917 |
| Insurance—1.9% | | | | |
| CIGNA | | 12,200 | | 1,406,904 |
| Endurance Specialty Holdings | | 29,350 | | 1,077,145 |
| Reinsurance Group of America | | 37,300 | | 1,600,543 |
| | | | | 4,084,592 |
| Interest Sensitive—11.9% | | | | |
| Capital One Financial | | 19,700 | | 1,620,128 |
| Citigroup | | 195,414 | | 8,553,271 |
| Freddie Mac | | 46,400 | | 2,801,632 |
| Goldman Sachs Group | | 32,600 | | 3,624,468 |
| JPMorgan Chase & Co. | | 176,976 | | 5,997,716 |
| Morgan Stanley | | 20,300 | | 1,032,661 |
| Wachovia | | 40,500 | | 2,009,610 |
| | | | | 25,639,486 |
| Merchandising—.6% | | | | |
| Estee Lauder Cos., Cl. A | | 34,400 | | 1,389,416 |
| Technology—8.1% | | | | |
| Agere Systems | | 93,160 a | | 1,054,571 |
| Automatic Data Processing | | 54,700 | | 2,338,425 |
| Ceridian | | 49,300 a | | 1,000,790 |
| Fairchild Semiconductor International | | 129,800 a | | 2,187,130 |
| Hewlett-Packard | | 102,100 | | 2,834,296 |
| International Business Machines | | 29,500 | | 2,378,290 |
| | STATEMENT OF INVESTMENTS (continued)
|
| Common Stocks (continued) | | Shares | | Value ($) |
| |
| |
|
| Technology (continued) | | | | |
| Microsoft | | 119,400 | | 3,271,560 |
| Motorola | | 57,700 | | 1,262,476 |
| Solectron | | 298,900 a | | 1,225,490 |
| | | | | 17,553,028 |
| Transportation—1.5% | | | | |
| CSX | | 22,300 | | 979,639 |
| Union Pacific | | 31,400 | | 2,143,678 |
| | | | | 3,123,317 |
| Utilities—6.8% | | | | |
| ALLTEL | | 33,900 | | 2,101,461 |
| Constellation Energy Group | | 19,000 | | 1,116,250 |
| Entergy | | 13,500 | | 1,011,285 |
| Exelon | | 42,700 | | 2,301,103 |
| Leap Wireless International | | 36,000 a | | 1,229,760 |
| NRG Energy | | 48,400 a | | 1,936,968 |
| PG & E | | 58,700 | | 2,202,424 |
| SBC Communications | | 115,700 | | 2,786,056 |
| | | | | 14,685,307 |
| |
| |
|
| |
| Total Investments (cost $191,448,547) | | 99.3% | | 214,678,306 |
| Cash and Receivables (Net) | | .7% | | 1,593,070 |
| Net Assets | | 100.0% | | 216,271,376 |
| |
| ADR—American Depository Receipts. | | | | |
| a Non-income producing. | | | | |
| Portfolio Summary † | | | | | | |
| |
| | | Value (%) | | | | Value (%) |
| |
| |
| |
|
| Financial Services | | 16.2 | | Utilities | | 6.8 |
| Energy | | 12.9 | | Consumer Non-Durables | | 6.1 |
| Interest Sensitive | | 11.9 | | Basic Industries | | 3.9 |
| Capital Goods | | 11.2 | | Health Care | | 2.8 |
| Consumer Services | | 10.9 | | Other | | 8.5 |
| Technology | | 8.1 | | | | 99.3 |
| |
| † Based on net assets. | | | | | | |
| See notes to financial statements. | | | | | | |
STATEMENT OF ASSETS AND LIABILITIES
August 31, 2005
|
| | | | | | | | | Cost | | Value |
| |
| |
| |
| |
| |
|
| Assets ($): | | | | | | | | | | |
| Investments in securities—See Statement of Investments | | 191,448,547 214,678,306 |
| Receivable for investment securities sold | | | | | | | | 3,554,304 |
| Dividends and interest receivable | | | | | | | | 316,743 |
| Receivable for shares of Common Stock subscribed | | | | | | 280,852 |
| Prepaid expenses | | | | | | | | | | 41,429 |
| | | | | | | | | 218,871,634 |
| |
| |
| |
| |
|
| Liabilities ($): | | | | | | | | | | |
| Due to The Dreyfus Corporation and affiliates—Note 3(c) | | | | | | 233,578 |
| Cash overdraft due to Custodian | | | | | | | | 235,341 |
| Payable for investment securities purchased | | | | | | 1,858,313 |
| Payable for shares of Common Stock redeemed | | | | | | 133,008 |
| Accrued expenses | | | | | | | | | | 140,018 |
| | | | | | | | | | | 2,600,258 |
| |
| |
| |
| |
| |
|
| Net Assets ($) | | | | | | | | 216,271,376 |
| |
| |
| |
| |
|
| Composition of Net Assets ($): | | | | | | | | |
| Paid-in capital | | | | | | | | 179,727,579 |
| Accumulated undistributed investment income—net | | | | | | 788,165 |
| Accumulated net realized gain (loss) on investments | | | | | | 12,525,873 |
| Accumulated net unrealized appreciation | | | | | | | | |
| (depreciation) on investments | | | | | | | | 23,229,759 |
| |
| |
| |
| |
|
| Net Assets ($) | | | | | | | | 216,271,376 |
| |
| |
| |
| |
|
| |
| |
| Net Asset Value Per Share | | | | | | | | |
| | | Class A | | Class B | | Class C | | Class R | | Class T |
| |
| |
| |
| |
| |
|
| Net Assets ($) | | 194,491,408 | | 11,685,077 | | 8,748,049 | | 541,979 | | 804,863 |
| Shares Outstanding | | 6,597,527 | | 408,337 | | 305,460 | | 18,400 | | 27,842 |
| |
| |
| |
| |
| |
|
| Net Asset Value | | | | | | | | | | |
| Per Share ($) | | 29.48 | | 28.62 | | 28.64 | | 29.46 | | 28.91 |
See notes to financial statements.
|
| | STATEMENT OF OPERATIONS
Year Ended August 31, 2005
|
| Investment Income ($): | | |
| Income: | | |
| Cash dividends (net of $294 foreign taxes withheld at source) | | 2,968,913 |
| Interest | | 44,067 |
| Income from securities lending | | 12,374 |
| Total Income | | 3,025,354 |
| Expenses: | | |
| Management fee—Note 3(a) | | 1,257,007 |
| Shareholder servicing costs—Note 3(c) | | 625,791 |
| Distribution fees—Note 3(b) | | 134,134 |
| Prospectus and shareholders’ reports | | 84,601 |
| Registration fees | | 55,105 |
| Professional fees | | 33,983 |
| Custodian fees—Note 3(c) | | 29,764 |
| Directors’ fees and expenses—Note 3(d) | | 3,458 |
| Interest expense—Note 2 | | 1,447 |
| Loan commitment fees—Note 2 | | 647 |
| Miscellaneous | | 11,252 |
| Total Expenses | | 2,237,189 |
| Investment Income—Net | | 788,165 |
| |
|
| Realized and Unrealized Gain (Loss) on Investments—Note 4 ($): |
| Net realized gain (loss) on investments | | 18,551,484 |
| Net unrealized appreciation (depreciation) on investments | | 16,969,635 |
| Net Realized and Unrealized Gain (Loss) on Investments | | 35,521,119 |
| Net Increase in Net Assets Resulting from Operations | | 36,309,284 |
| | See notes to financial statements.
|
STATEMENT OF CHANGES IN NET ASSETS
| | | Year Ended August 31, |
| |
|
| | | 2005 | | 2004 |
| |
| |
|
| Operations ($): | | | | |
| Investment income (loss)—net | | 788,165 | | (541,855) |
| Net realized gain (loss) on investments | | 18,551,484 | | 21,963,573 |
| Net unrealized appreciation | | | | |
| (depreciation) on investments | | 16,969,635 | | (6,817,381) |
| Net Increase (Decrease) in Net Assets | | | | |
| Resulting from Operations | | 36,309,284 | | 14,604,337 |
| |
| |
|
| Capital Stock Transactions ($): | | | | |
| Net proceeds from shares sold: | | | | |
| Class A shares | | 34,389,020 | | 37,409,020 |
| Class B shares | | 3,392,749 | | 4,866,655 |
| Class C shares | | 3,842,551 | | 3,876,686 |
| Class R shares | | 383,432 | | 85,113 |
| Class T shares | | 651,930 | | 138,414 |
| Net assets received in connection with | | | | |
| reorganization—Note 1 | | 61,323,097 | | — |
| Cost of shares redeemed: | | | | |
| Class A shares | | (45,668,130) | | (41,862,237) |
| Class B shares | | (2,395,578) | | (856,236) |
| Class C shares | | (774,585) | | (454,674) |
| Class R shares | | (46,846) | | (440) |
| Class T shares | | (48,199) | | (10,728) |
| Increase (Decrease) in Net Assets | | | | |
| from Capital Stock Transactions | | 55,049,441 | | 3,191,573 |
| Total Increase (Decrease) in Net Assets | | 91,358,725 | | 17,795,910 |
| |
| |
|
| Net Assets ($): | | | | |
| Beginning of Period | | 124,912,651 | | 107,116,741 |
| End of Period | | 216,271,376 | | 124,912,651 |
| Undistributed investment income—net | | 788,165 | | — |
| | STATEMENT OF CHANGES IN NET ASSETS (continued)
|
| | | Year Ended August 31, |
| |
|
| | | 2005 | | 2004 |
| |
| |
|
| Capital Share Transactions: | | | | |
| Class Aa | | | | |
| Shares sold | | 1,507,782 | | 1,524,719 |
| Shares issued in connection with | | | | |
| reorganization—Note 1 | | 2,247,090 | | — |
| Shares redeemed | | (1,637,156) | | (1,741,943) |
| Net Increase (Decrease) in Shares Outstanding | | 2,117,716 | | (217,224) |
| |
| |
|
| Class B a | | | | |
| Shares sold | | 124,997 | | 200,732 |
| Shares redeemed | | (87,329) | | (35,791) |
| Net Increase (Decrease) in Shares Outstanding | | 37,668 | | 164,941 |
| |
| |
|
| Class C | | | | |
| Shares sold | | 140,309 | | 160,421 |
| Shares redeemed | | (28,039) | | (18,617) |
| Net Increase (Decrease) in Shares Outstanding | | 112,270 | | 141,804 |
| |
| |
|
| Class R | | | | |
| Shares sold | | 13,083 | | 3,484 |
| Shares redeemed | | (1,646) | | (17) |
| Net Increase (Decrease) in Shares Outstanding | | 11,437 | | 3,467 |
| |
| |
|
| Class T | | | | |
| Shares sold | | 23,576 | | 5,681 |
| Shares redeemed | | (1,707) | | (454) |
| Net Increase (Decrease) in Shares Outstanding | | 21,869 | | 5,227 |
| |
| a During the period ended August 31, 2005, 19,655 Class B shares representing $540,163 were automatically |
| converted to 19,129 Class A shares and during the period ended August 31, 2004, 4,139 Class B shares |
| representing $100,106 were automatically converted to 4,059 Class A shares. | | |
| See notes to financial statements. | | | | |
The following tables describe the performance for each share class for the fiscal periods indicated.All information (except portfolio turnover rate) reflects financial results for a single fund share.Total return shows how much your investment in the fund would have increased (or decreased) during each period, assuming you had reinvested all dividends and distributions.These figures have been derived from the fund’s financial statements.
| | | | | | | Year Ended August 31, | | |
| | | |
| |
| |
|
| Class A Shares | | 2005 | | 2004 | | 2003 | | 2002 | | 2001a |
| |
| |
| |
| |
| |
|
| Per Share Data ($): | | | | | | | | | | |
| Net asset value, beginning of period | | 24.76 | | 21.62 | | 17.14 | | 22.45 | | 28.81 |
| Investment Operations: | | | | | | | | | | |
| Investment income (loss)—net b | | .15 | | (.10) | | (.02) | | (.07) | | .11 |
| Net realized and unrealized | | | | | | | | | | |
| gain (loss) on investments | | 4.57 | | 3.24 | | 4.50 | | (4.55) | | (2.10) |
| Total from Investment Operations | | 4.72 | | 3.14 | | 4.48 | | (4.62) | | (1.99) |
| Distributions: | | | | | | | | | | |
| Dividends from investment | | | | | | | | | | |
| income—net | | — | | — | | — | | (.07) | | (.38) |
| Dividends from net realized | | | | | | | | | | |
| gain on investments | | — | | — | | — | | (.62) | | (3.99) |
| Total Distributions | | — | | — | | — | | (.69) | | (4.37) |
| Net asset value, end of period | | 29.48 | | 24.76 | | 21.62 | | 17.14 | | 22.45 |
| |
| |
| |
| |
| |
|
| Total Return (%) c | | 18.97 | | 14.62 | | 26.14 | | (21.25) | | (7.38) |
| |
| |
| |
| |
| |
|
| Ratios/Supplemental Data (%): | | | | | | | | | | |
| Ratio of total expenses | | | | | | | | | | |
| to average net assets | | 1.25 | | 1.37 | | 1.43 | | 1.48 | | 1.29 |
| Ratio of net investment income | | | | | | | | | | |
| (loss) to average net assets | | .55 | | (.41) | | (.12) | | (.31) | | .43 |
| Portfolio Turnover Rate | | 123.17 | | 115.26 | | 36.93 | | 35.71 | | 337.44 |
| |
| |
| |
| |
| |
|
| Net Assets, end of period ($ x 1,000) | | 194,491 | | 110,939 | | 101,555 | | 120,206 | | 119,455 |
| |
| a | | The fund changed to a five class fund on June 1, 2001.The existing shares were redesignated Class A shares. |
| b | | Based on average shares outstanding at each month end. | | | | | | | | |
| c | | Exclusive of sales charge. | | | | | | | | | | |
| See notes to financial statements. | | | | | | | | | | |
| | FINANCIAL HIGHLIGHTS (continued)
|
| | | | | | | Year Ended August 31, | | |
| | | |
| |
| |
|
| Class B Shares | | 2005 | | 2004 | | 2003 | | 2002 | | 2001a |
| |
| |
| |
| |
| |
|
| Per Share Data ($): | | | | | | | | | | |
| Net asset value, beginning of period | | 24.21 | | 21.28 | | 16.98 | | 22.40 | | 24.04 |
| Investment Operations: | | | | | | | | | | |
| Investment (loss)—net b | | (.06) | | (.25) | | (.14) | | (.17) | | (.02) |
| Net realized and unrealized | | | | | | | | | | |
| gain (loss) on investments | | 4.47 | | 3.18 | | 4.44 | | (4.55) | | (1.62) |
| Total from Investment Operations | | 4.41 | | 2.93 | | 4.30 | | (4.72) | | (1.64) |
| Distributions: | | | | | | | | | | |
| Dividends from investment | | | | | | | | | | |
| income—net | | — | | — | | — | | (.08) | | — |
| Dividends from net realized | | | | | | | | | | |
| gain on investments | | — | | — | | — | | (.62) | | — |
| Total Distributions | | — | | — | | — | | (.70) | | — |
| Net asset value, end of period | | 28.62 | | 24.21 | | 21.28 | | 16.98 | | 22.40 |
| |
| |
| |
| |
| |
|
| Total Return (%) c | | 18.12 | | 13.86 | | 25.32 | | (21.79) | | (6.82)d |
| |
| |
| |
| |
| |
|
| Ratios/Supplemental Data (%): | | | | | | | | | | |
| Ratio of total expenses | | | | | | | | | | |
| to average net assets | | 2.04 | | 2.03 | | 2.11 | | 2.07 | | .57d |
| Ratio of net investment | | | | | | | | | | |
| (loss) to average net assets | | (.23) | | (1.03) | | (.78) | | (.82) | | (.09)d |
| Portfolio Turnover Rate | | 123.17 | | 115.26 | | 36.93 | | 35.71 | | 337.44 |
| |
| |
| |
| |
| |
|
| Net Assets, end of period ($ x 1,000) | | 11,685 | | 8,975 | | 4,377 | | 2,763 | | 258 |
| |
| a | | From June 1, 2001 (commencement of initial offering) to August 31, 2001. | | | | | | |
| b | | Based on average shares outstanding at each month end. | | | | | | | | |
| c | | Exclusive of sales charge. | | | | | | | | | | |
| d | | Not annualized. | | | | | | | | | | |
| See notes to financial statements. | | | | | | | | | | |
| | | | | | | Year Ended August 31, | | |
| | | |
| |
| |
|
| Class C Shares | | 2005 | | 2004 | | 2003 | | 2002 | | 2001a |
| |
| |
| |
| |
| |
|
| Per Share Data ($): | | | | | | | | | | |
| Net asset value, beginning of period | | 24.23 | | 21.29 | | 16.99 | | 22.39 | | 24.04 |
| Investment Operations: | | | | | | | | | | |
| Investment (loss)—net b | | (.05) | | (.24) | | (.13) | | (.18) | | (.01) |
| Net realized and unrealized | | | | | | | | | | |
| gain (loss) on investments | | 4.46 | | 3.18 | | 4.43 | | (4.53) | | (1.64) |
| Total from Investment Operations | | 4.41 | | 2.94 | | 4.30 | | (4.71) | | (1.65) |
| Distributions: | | | | | | | | | | |
| Dividends from investment | | | | | | | | | | |
| income—net | | — | | — | | — | | (.07) | | — |
| Dividends from net realized | | | | | | | | | | |
| gain on investments | | — | | — | | — | | (.62) | | — |
| Total Distributions | | — | | — | | — | | (.69) | | — |
| Net asset value, end of period | | 28.64 | | 24.23 | | 21.29 | | 16.99 | | 22.39 |
| |
| |
| |
| |
| |
|
| Total Return (%) c | | 18.10 | | 13.90 | | 25.31 | | (21.73) | | (6.86)d |
| |
| |
| |
| |
| |
|
| Ratios/Supplemental Data (%): | | | | | | | | | | |
| Ratio of total expenses | | | | | | | | | | |
| to average net assets | | 1.99 | | 1.99 | | 2.08 | | 2.08 | | .57d |
| Ratio of net investment | | | | | | | | | | |
| (loss) to average net assets | | (.19) | | (.97) | | (.74) | | (.86) | | (.06)d |
| Portfolio Turnover Rate | | 123.17 | | 115.26 | | 36.93 | | 35.71 | | 337.44 |
| |
| |
| |
| |
| |
|
| Net Assets, end of period ($ x 1,000) | | 8,748 | | 4,681 | | 1,094 | | 483 | | 124 |
| |
| a | | From June 1, 2001 (commencement of initial offering) to August 31, 2001. | | | | | | |
| b | | Based on average shares outstanding at each month end. | | | | | | | | |
| c | | Exclusive of sales charge. | | | | | | | | | | |
| d | | Not annualized. | | | | | | | | | | |
| See notes to financial statements. | | | | | | | | | | |
| | FINANCIAL HIGHLIGHTS (continued)
|
| | | | | | | Year Ended August 31, | | |
| | | |
| |
| |
|
| Class R Shares | | 2005 | | 2004 | | 2003 | | 2002 | | 2001a |
| |
| |
| |
| |
| |
|
| Per Share Data ($): | | | | | | | | | | |
| Net asset value, beginning of period | | 24.71 | | 21.52 | | 17.02 | | 22.38 | | 24.04 |
| Investment Operations: | | | | | | | | | | |
| Investment income (loss)—net b | | .18 | | (.04) | | .01 | | .01 | | (.04) |
| Net realized and unrealized | | | | | | | | | | |
| gain (loss) on investments | | 4.57 | | 3.23 | | 4.49 | | (4.67) | | (1.62) |
| Total from Investment Operations | | 4.75 | | 3.19 | | 4.50 | | (4.66) | | (1.66) |
| Distributions: | | | | | | | | | | |
| Dividends from investment | | | | | | | | | | |
| income—net | | — | | — | | — | | (.08) | | — |
| Dividends from net realized | | | | | | | | | | |
| gain on investments | | — | | — | | — | | (.62) | | — |
| Total Distributions | | — | | — | | — | | (.70) | | — |
| Net asset value, end of period | | 29.46 | | 24.71 | | 21.52 | | 17.02 | | 22.38 |
| |
| |
| |
| |
| |
|
| Total Return (%) | | 19.13 | | 14.92 | | 26.44 | | (21.52) | | (6.91)c |
| |
| |
| |
| |
| |
|
| Ratios/Supplemental Data (%): | | | | | | | | | | |
| Ratio of total expenses | | | | | | | | | | |
| to average net assets | | 1.16 | | 1.13 | | 1.19 | | 1.11 | | .60c |
| Ratio of net investment income | | | | | | | | | | |
| (loss) to average net assets | | .65 | | (.17) | | .06 | | .06 | | (.19)c |
| Portfolio Turnover Rate | | 123.17 | | 115.26 | | 36.93 | | 35.71 | | 337.44 |
| |
| |
| |
| |
| |
|
| Net Assets, end of period ($ x 1,000) | | 542 | | 172 | | 75 | | 88 | | 1 |
| |
| a | | From June 1, 2001 (commencement of initial offering) to August 31, 2001. | | | | | | |
| b | | Based on average shares outstanding at each month end. | | | | | | | | |
| c | | Not annualized. | | | | | | | | | | |
| See notes to financial statements. | | | | | | | | | | |
| | | | | | | Year Ended August 31, | | |
| | | |
| |
| |
|
| Class T Shares | | 2005 | | 2004 | | 2003 | | 2002 | | 2001a |
| |
| |
| |
| |
| |
|
| Per Share Data ($): | | | | | | | | | | |
| Net asset value, beginning of period | | 24.37 | | 21.31 | | 16.94 | | 22.35 | | 24.04 |
| Investment Operations: | | | | | | | | | | |
| Investment income (loss)—net b | | .06 | | (.15) | | (.04) | | (.14) | | (.07) |
| Net realized and unrealized | | | | | | | | | | |
| gain (loss) on investments | | 4.48 | | 3.21 | | 4.41 | | (4.60) | | (1.62) |
| Total from Investment Operations | | 4.54 | | 3.06 | | 4.37 | | (4.74) | | (1.69) |
| Distributions: | | | | | | | | | | |
| Dividends from investment | | | | | | | | | | |
| income—net | | — | | — | | — | | (.05) | | — |
| Dividends from net realized | | | | | | | | | | |
| gain on investments | | — | | — | | — | | (.62) | | — |
| Total Distributions | | — | | — | | — | | (.67) | | — |
| Net asset value, end of period | | 28.91 | | 24.37 | | 21.31 | | 16.94 | | 22.35 |
| |
| |
| |
| |
| |
|
| Total Return (%) c | | 18.53 | | 14.45 | | 25.80 | | (21.86) | | (7.07)d |
| |
| |
| |
| |
| |
|
| Ratios/Supplemental Data (%): | | | | | | | | | | |
| Ratio of total expenses | | | | | | | | | | |
| to average net assets | | 1.58 | | 1.68 | | 1.61 | | 1.94 | | .73d |
| Ratio of net investment income | | | | | | | | | | |
| (loss) to average net assets | | .20 | | (.63) | | (.20) | | (.72) | | (.32)d |
| Portfolio Turnover Rate | | 123.17 | | 115.26 | | 36.93 | | 35.71 | | 337.44 |
| |
| |
| |
| |
| |
|
| Net Assets, end of period ($ x 1,000) | | 805 | | 146 | | 16 | | 3 | | 1 |
| |
| a | | From June 1, 2001 (commencement of initial offering) to August 31, 2001. | | | | | | |
| b | | Based on average shares outstanding at each month end. | | | | | | | | |
| c | | Exclusive of sales charge. | | | | | | | | | | |
| d | | Not annualized. | | | | | | | | | | |
| See notes to financial statements. | | | | | | | | | | |
NOTES TO FINANCIAL STATEMENTS
NOTE 1—Significant Accounting Policies:
Dreyfus Premier Strategic Value Fund (the “fund”) is a separate diversified series of Dreyfus Growth and Value Funds, Inc. (the “Company”), which is registered under the Investment Company Act of 1940, as amended (the “Act”), as an open-end management investment company and operates as a series company currently offering twelve series, including the fund.The fund’s investment objective is capital appreciation.The Dreyfus Corporation (the “Manager” or “Dreyfus”) serves as the fund’s investment adviser. The Manager is a wholly-owned subsidiary of Mellon Financial Corporation (“Mellon Financial”).
As of the close of business on April 18, 2005, pursuant to an Agreement and Plan of Reorganization previously approved by the fund’s Board of Directors, all of the assets, subject to the liabilities, of Dreyfus Large Company Value Fund, a series of Dreyfus Growth and Value Funds, Inc., were transferred to the fund. Shareholders of Dreyfus Large Company Value Fund received Class A shares of the fund, in an amount equal to the aggregate net asset value of their investment in Dreyfus Large Company Value Fund at the time of the exchange.The net asset value of the fund’s Class A shares at the close of business on April 18, 2005, after the reorganization, was $27.29 per share, and a total of 2,247,090 Class A shares representing net assets of $61,323,097 (including $7,565,590 net unrealized appreciation on investments), were issued to Dreyfus Large Company Value Fund shareholders in the exchange.The exchange was a tax-free event to shareholders.
Dreyfus Service Corporation (the “Distributor”), a wholly-owned subsidiary of the Manager, is the distributor of the fund’s shares. The fund is authorized to issue 500 million shares of $.001 par value Common Stock.The fund currently offers five classes of shares: Class A (100 million shares authorized), Class B (100 million shares authorized), Class C (100 million shares authorized), Class R (100 million shares authorized) and Class T (100 million shares authorized). Class A and Class T shares are subject to a sales charge imposed at the time of purchase. Class B shares are subject to a contingent deferred sales
charge (“CDSC”) imposed on Class B share redemptions made within six years of purchase and automatically convert to Class A shares after six years. Class C shares are subject to a CDSC imposed on Class C shares redeemed within one year of purchase and Class R shares are sold at net asset value per share only to institutional investors. Other differences between the classes include the services offered to and the expenses borne by each class and certain voting rights. Income, expenses (other than expenses attributable to a specific class), and realized and unrealized gains or losses on investments are allocated to each class of shares based on its relative net assets.
The Company accounts separately for the assets, liabilities and operations of each series. Expenses directly attributable to each series are charged to that series’ operations; expenses which are applicable to all series are allocated among them on a pro rata basis.
The fund’s financial statements are prepared in accordance with U.S. generally accepted accounting principles, which may require the use of management estimates and assumptions. Actual results could differ from those estimates.
The fund enters into contracts that contain a variety of indemnifications. The fund’s maximum exposure under these arrangements is unknown.The fund does not anticipate recognizing any loss related to these arrangements.
(a) Portfolio valuation: Investments in securities are valued at the last sales price on the securities exchange or national securities market on which such securities are primarily traded. Securities listed on the National Market System for which market quotations are available are valued at the official closing price or, if there is no official closing price that day, at the last sale price. Securities not listed on an exchange or the national securities market, or securities for which there were no transactions, are valued at the average of the most recent bid and asked prices, except for open short positions, where the asked price is used for valuation purposes. Bid price is used when no asked price is avail-
| | NOTES TO FINANCIAL STATEMENTS (continued)
|
able.When market quotations or official closing prices are not readily available, or are determined not to reflect accurately fair value, such as when the value of a security has been significantly affected by events after the close of the exchange or market on which the security is principally traded (for example, a foreign exchange or market), but before the fund calculates its net asset value, the fund may value these investments at fair value as determined in accordance with the procedures approved by the Board of Directors. Fair valuing of securities may be determined with the assistance of a pricing service using calculations based on indices of domestic securities and other appropriate indicators, such as prices of relevant ADR’s and futures contracts. For other securities that are fair valued by the Board of Directors, certain factors may be considered such as: fundamental analytical data, the nature and duration of restrictions on disposition, an evaluation of the forces that influence the market in which the securities are purchased and sold, and public trading in similar securities of the issuer or comparable issuers. Investments in registered investment companies are valued at their net asset value. Investments denominated in foreign currencies are translated to U.S. dollars at the prevailing rates of exchange. Forward currency exchange contracts are valued at the forward rate.
(b) Securities transactions and investment income: Securities transactions are recorded on a trade date basis. Realized gain and loss from securities transactions are recorded on the identified cost basis. Dividend income is recognized on the ex-dividend date and interest income, including accretion of discount and amortization of premium on investments, is recognized on the accrual basis.
The fund has an arrangement with the custodian bank whereby the fund receives earnings credits from the custodian when positive cash balances are maintained, which are used to offset custody fees. For financial reporting purposes, the fund includes net earnings credits, if any, as an expense offset in the Statement of Operations.
Pursuant to a securities lending agreement with Mellon Bank, N.A., an affiliate of the Manager, the fund may lend securities to qualified
institutions.At origination, all loans are secured by collateral of at least 102% of the value of U.S. securities loaned and 105% of the value of foreign securities loaned. Collateral equivalent to at least 100% of the market value of securities on loan will be maintained at all times. Cash collateral is invested in certain money market mutual funds managed by the Manager. The fund will be entitled to receive all income on securities loaned, in addition to income earned as a result of the lending transaction. Although each security loaned is fully collateralized, the fund would bear the risk of delay in recovery of, or loss of rights in, the securities loaned should a borrower fail to return the securities in a timely manner.
(c) Affiliated issuers: Investments in other investment companies advised by the Manager are defined as “affiliated” in the Act.
(d) Dividends to shareholders: Dividends are recorded on the ex-dividend date. Dividends from investment income-net and dividends from net realized capital gain, if any, are normally declared and paid annually, but the fund may make distributions on a more frequent basis to comply with the distribution requirements of the Internal Revenue Code of 1986, as amended (the “Code”).To the extent that net realized capital gain can be offset by capital loss carryovers, it is the policy of the fund not to distribute such gain. Income and capital gain distributions are determined in accordance with income tax regulations, which may differ from U.S. generally accepted accounting principles.
(e) Federal income taxes: It is the policy of the fund to continue to qualify as a regulated investment company, if such qualification is in the best interests of its shareholders, by complying with the applicable provisions of the Code, and to make distributions of taxable income sufficient to relieve it from substantially all federal income and excise taxes.
At August 31, 2005, the components of accumulated earnings on a tax basis were as follows: undistributed ordinary income $8,709,418 undistributed capital gains $6,160,327 and unrealized appreciation $21,674,052.
| | NOTES TO FINANCIAL STATEMENTS (continued)
|
During the period ended August 31, 2005, as a result of permanent book to tax differences primarily due to the tax treatment for the reversal of wash sales from the merger with Dreyfus Large Company Value Fund, the fund decreased accumulated net realized gain (loss) on investments by $207,402 and increased paid-in capital by the same amount. Net assets were not affected by this reclassification.
| | NOTE 2—Bank Line of Credit:
|
The fund participates with other Dreyfus-managed funds in a $350 million redemption credit facility (the “Facility”) primarily to be utilized for temporary or emergency purposes, including the financing of redemptions. In connection therewith, the fund has agreed to pay commitment fees on its pro rata portion of the Facility. Interest is charged to the fund based on prevailing market rates in effect at the time of borrowings.
The average daily amount of borrowings outstanding under the Facility during the period ended August 31, 2005, was approximately $41,900 with a related weighted average annualized interest rate of 3.45% .
NOTE 3—Management Fee and Other Transactions with Affiliates:
(a) Pursuant to a management agreement with the Manager, the management fee is computed at the annual rate of .75% of the value of the fund’s average daily net assets and is payable monthly.
During the period ended August 31, 2005, the Distributor retained $23,014 and $101 from commissions earned on sales of the fund’s Class A and Class T shares, respectively, and $25,146 and $1,344 from contingent deferred sales charges on redemptions of the fund’s Class B and Class C shares, respectively.
(b) Under the Distribution Plan (the “Plan”) adopted pursuant to Rule 12b-1 under the Act, Class B, Class C and Class T shares pay the Distributor for distributing their shares at an annual rate of .75% of the value of the average daily net assets of Class B and Class C shares,
respectively, and .25% of the value of the average daily net assets of Class T shares. During the period ended August 31, 2005, Class B, Class C and Class T shares were charged $81,354, $51,523 and $1,257, respectively, pursuant to the Plan.
(c) Under the Shareholder Services Plan, Class A, Class B, Class C and Class T shares pay the Distributor at an annual rate of .25% of the value of their average daily net assets for the provision of certain services. The services provided may include personal services relating to shareholder accounts, such as answering shareholder inquiries regarding the fund and providing reports and other information, and services related to the maintenance of shareholder accounts. The Distributor may make payments to Service Agents (a securities dealer, financial institution or industry professional) in respect of these services. The Distributor determines the amounts to be paid to Service Agents. During the period ended August 31, 2005, Class A, Class B, Class C and Class T shares were charged $372,844, $27,118, $17,174 and $1,257, respectively, pursuant to the Shareholder Services Plan.
The fund compensates Dreyfus Transfer, Inc., a wholly-owned subsidiary of the Manager, under a transfer agency agreement for providing personnel and facilities to perform transfer agency services for the fund. During the period ended August 31, 2005, the fund was charged $107,908 pursuant to the transfer agency agreement.
The fund compensates Mellon under a custody agreement for providing custodial services for the fund. During the period ended August 31, 2005, the fund was charged $29,764 pursuant to the custody agreement.
During the period ended August 31, 2005, the fund was charged $3,506 for services performed by the Chief Compliance Officer.
The components of Due to The Dreyfus Corporation and affiliates in the Statement of Assets and Liabilities consist of: management fees $137,987, Rule 12b-1 distribution plan fees $13,087, shareholder services plan fees $45,895, custody fees $9,418, chief compliance officer fees $1,533 and transfer agency per account fees $25,658.
| | NOTES TO FINANCIAL STATEMENTS (continued)
|
(d) Each Board member also serves as a Board member of other funds within the Dreyfus complex. Annual retainer fees and attendance fees are allocated to each fund based on net assets.
NOTE 4—Securities Transactions:
|
The aggregate amount of purchases and sales of investment securities, excluding short-term securities and $52,056,900 of securities received pursuant to the merger with Dreyfus Large Company Value Fund, during the period ended August 31, 2005, amounted to $180,342,250 and $175,745,431, respectively.
At August 31, 2005, the cost of investments for federal income tax purposes was $193,004,254; accordingly, accumulated net unrealized appreciation on investments was $21,674,052, consisting of $27,376,832 gross unrealized appreciation and $5,702,780 gross unrealized depreciation.
In early 2004, two purported class and derivative actions were filed against Mellon Financial, Mellon Bank, N.A., Dreyfus, Founders Asset Management LLC, and certain directors of the Dreyfus Funds and the Dreyfus Founders Funds (together, the “Funds”) in the United States District Court for the Western District of Pennsylvania. In September 2004, plaintiffs served a Consolidated Amended Complaint (the “Amended Complaint”) on behalf of a purported class of all persons who acquired interests in any of the Funds between January 30, 1999 and November 17, 2003, and derivatively on behalf of the Funds.The Amended Complaint in the newly styled In re Dreyfus Mutual Funds Fee Litigation also named the Distributor, Premier Mutual Fund Services, Inc. and two additional Fund directors as defendants and alleges violations of the Investment Company Act of 1940, the Investment Advisers Act of 1940, the Pennsylvania Unfair Trade Practices and Consumer Protection Law and common-law claims.
Plaintiffs seek to recover allegedly improper and excessive Rule 12b-1 and advisory fees allegedly charged to the Funds for marketing and distribution services. More specifically, plaintiffs claim, among other things, that 12b-1 fees and directed brokerage were improperly used to pay brokers to recommend the Funds over other funds, and that such payments were not disclosed to investors. In addition, plaintiffs assert that economies of scale and soft-dollar benefits were not passed on to the Funds. Plaintiffs further allege that 12b-1 fees were improperly charged to certain of the Funds that were closed to new investors.The Amended Complaint seeks compensatory and punitive damages, rescission of the advisory contracts, and an accounting and restitution of any unlawful fees, as well as an award of attorneys’ fees and litigation expenses. As noted, some of the claims in this litigation are asserted derivatively on behalf of the Funds that have been named as nominal defendants. With respect to such derivative claims, no relief is sought against the Funds. Dreyfus believes the allegations to be totally without merit and intends to defend the action vigorously. In November 2004, all named defendants moved to dismiss the Amended Complaint in whole or substantial part. Briefing was completed in May 2005.
Additional lawsuits arising out of these circumstances and presenting similar allegations and requests for relief may be filed against the defendants in the future. Neither Dreyfus nor the Funds believe that any of the pending actions will have a material adverse effect on the Funds or Dreyfus’ ability to perform its contract with the Funds.
| | REPORT OF INDEPENDENT REGISTERED
PUBLIC ACCOUNTING FIRM
|
Shareholders and Board of Directors
Dreyfus Premier Strategic Value Fund
|
We have audited the accompanying statement of assets and liabilities, including the statement of investments, of Dreyfus Premier Strategic Value Fund (one of the funds comprising Dreyfus Growth and Value Funds, Inc.) as of August 31, 2005, and the related statement of operations for the year then ended, the statement of changes in net assets for each of the two years in the period then ended, and financial highlights for each of the periods indicated therein. These financial statements and financial highlights are the responsibility of the Fund’s management. Our responsibility is to express an opinion on these financial statements and financial highlights based on our audits.
We conducted our audits in accordance with the standards of the Public Company Accounting Oversight Board (United States).Those standards require that we plan and perform the audit to obtain reasonable assurance about whether the financial statements and financial highlights are free of material misstatement.We were not engaged to perform an audit of the Fund’s internal control over financial reporting.Our audits included consideration of internal control over financial reporting as a basis for designing audit procedures that are appropriate in the circumstances,but not for the purpose of expressing an opinion on the effectiveness of the Fund’s internal control over financial reporting.Accordingly, we express no such opinion.An audit also includes examining, on a test basis, evidence supporting the amounts and disclosures in the financial statements and financial highlights, assessing the accounting principles used and significant estimates made by management, and evaluating the overall financial statement presentation. Our procedures included verification by examination of securities held by the custodian as of August 31, 2005 and confirmation of securities not held by the custodian by correspondence with oth-ers.We believe that our audits provide a reasonable basis for our opinion.
In our opinion, the financial statements and financial highlights referred to above present fairly, in all material respects, the financial position of Dreyfus Premier Strategic Value Fund at August 31, 2005, the results of its operations for the year then ended, the changes in its net assets for each of the two years in the period then ended, and the financial highlights for each of the indicated periods, in conformity with accounting principles generally accepted in the United States.

New York, New York
October 14, 2005
|
INFORMATION ABOUT THE REVIEW AND APPROVAL OF THE
FUND’S MANAGEMENT AGREEMENT (Unaudited)
|
At a meeting of the Board of Directors held on March 14, 2005, the Board considered the re-approval for an annual period of the Fund’s Management Agreement, pursuant to which the Manager provides the Fund with investment advisory and administrative services. The Board members, none of whom are “interested persons” (as defined in the Investment Company Act of 1940,as amended) of the Fund,were assisted in their review by independent legal counsel and met with counsel in executive session separate from representatives of the Manager.
Analysis of Nature, Extent and Quality of Services Provided to the Fund. The Board members received a presentation from representatives of the Manager regarding services provided to the Fund and other funds in the Dreyfus fund complex, and discussed the nature, extent and quality of the services provided to the Fund pursuant to its Management Agreement. The presentation included a detailed summary of the services provided to Dreyfus-managed mutual funds by each business unit within the Manager.The Manager’s representatives reviewed the Fund’s distribution of accounts and the relationships the Manager has with various intermediaries and the different needs of each.The Manager’s representatives noted the diversity of distribution of the Fund as well as among the funds in the Dreyfus fund complex, and the Manager’s corresponding need for broad, deep, and diverse resources to be able to provide ongoing shareholder services to each of the Fund’s distribution channels.The Board also reviewed the number of shareholder accounts in the Fund, as well as the Fund’s asset size.
The Board members also considered the Manager’s research and portfolio management capabilities and that the Manager also provides oversight of day-to-day Fund operations, including fund accounting and administration and assistance in meeting legal and regulatory requirements. The Board members also considered the Manager’s extensive administrative, accounting and compliance infrastructure.
Comparative Analysis of the Fund’s Performance and Management Fee and Expense Ratio. The Board members reviewed the Fund’s perfor-mance,management fee and expense ratios and placed significant empha-
| | I N FO R M AT I O N A B O U T T H E R E V I E W A N D A P P R OVA L O F
T H E F U N D ’ S M A N A G E M E N T A G R E E M E N T ( U n a u d i t e d ) ( c o n t i n u e d )
|
sis on comparisons to a group of comparable funds and Lipper category averages, as applicable. The group of comparable funds was previously approved by the Board for this purpose, and was prepared using a Board-approved selection methodology that was based, in part, on selecting non-affiliated funds reported in the same Lipper category as the fund. The Board members discussed the results of the comparisons for various periods ended January 31, 2005, and noted that the Fund’s performance was higher than the comparison group averages for the 1-year and 3-year periods and higher than the Lipper category averages for the 1-year, 3-year and 5-year periods, but was lower than the comparison group average for the 5-year period.The Board members also discussed the Fund’s management fee and expense ratio and reviewed the range of management fees and expense ratios for the funds in the comparison group.The Fund’s management fee was ranked in the top half (i.e., lower than most others) of the comparison group funds.The Board noted that the Fund’s total expense ratio was higher than the Fund’s comparison group average, but was lower than the Lipper category average.
Representatives of the Manager reviewed with the Board members the fees paid to the Manager or its affiliates by mutual funds managed by the Manager or its affiliates with similar investment objectives, policies and strategies as the Fund (the “Similar Funds”), and by other accounts managed or sub-advised by the Manager or its affiliates with similar investment objectives, policies and strategies as the Fund (the “Separate Accounts” and, collectively with the Similar Funds, the “Similar Accounts”). The Manager’s representatives explained the nature of the Similar Accounts and the differences, from the Manager’s perspective, in management of the Similar Accounts as compared to managing and providing services to the Fund; it was noted that the Similar Funds were mutual funds included in the “multi-cap value” funds category by Lipper.The Manager’s representatives also reviewed the costs associated with distribution through intermediaries. The Board analyzed the differences in fees paid to the Manager and discussed the relationship of the advisory fees paid in light of the Manager’s performance and the services provided; it was noted that the Similar Funds had the same management fee as the fee borne by the
Fund.The Board members considered the relevance of the fee information provided for the Similar Accounts managed by the Manager to evaluate the appropriateness and reasonableness of the Fund’s advisory fees. The Board acknowledged that differences in fees paid by the Similar Accounts seemed to be consistent with the services provided.
Analysis of Profitability and Economies of Scale. The Manager’s representatives reviewed the dollar amount of expenses allocated and profit received by the Manager and the method used to determine such expenses and profit.The Board received and considered information prepared by an independent consulting firm regarding the Manager’s approach to allocating costs to, and determining the profitability of, individual funds and the entire Dreyfus fund complex.The Manager’s representatives stated that the methodology had also been reviewed by an independent registered public accounting firm which, like the consultant, found the methodology to be reasonable.The consulting firm also analyzed where any economies of scale might emerge in connection with the management of the Fund.The Board members evaluated the analysis in light of the relevant circumstances for the Fund, and the extent to which economies of scale would be realized as the Fund grows and whether fee levels reflect these economies of scale for the benefit of Fund investors. The Board noted that it appeared that the benefits of any economies of scale also would be appropriately shared with shareholders through increased investment in fund management and administration resources. The Board members also considered potential benefits to the Manager from acting as investment adviser and reviewed the soft dollar arrangements with respect to trading the Fund’s portfolio.
It was noted that the Board members should consider the Manager’s profitability with respect to the Fund as part of their evaluation of whether the fee under the Management Agreement bears a reasonable relationship to the mix of services provided by the Manager, including the nature, extent and quality of such services and that a discussion of economies of scale is predicated on increasing assets and that, if a fund’s assets had been decreasing, the possibility that the Manager may have
| | I N FO R M AT I O N A B O U T T H E R E V I E W A N D A P P R OVA L O F
T H E F U N D ’ S M A N A G E M E N T A G R E E M E N T ( U n a u d i t e d ) ( c o n t i n u e d )
|
realized any economies of scale would be less.The Board members also discussed the profitability percentage ranges determined by appropriate court cases to be reasonable given the services rendered to investment companies. It was noted that the profitability percentage for managing the Fund was not unreasonable given the Fund’s overall performance and generally superior service levels provided.
At the conclusion of these discussions, each of the Directors expressed the opinion that he or she had been furnished with sufficient information to make an informed business decision with respect to continuation of the Fund’s Management Agreement. Based on their discussions and considerations as described above, the Board made the following conclusions and determinations.
- The Board concluded that the nature, extent and quality of the ser- vices provided by the Manager are adequate and appropriate.
- The Board was satisfied with the Fund’s overall performance.
- The Board concluded that the fee paid to the Manager by the Fund was reasonable in light of comparative performance and expense and advisory fee information, costs of the services provided and profits to be realized and benefits derived or to be derived by the Manager from its relationship with the Fund.
- The Board determined that the economies of scale which may accrue to the Manager and its affiliates in connection with the man- agement of the Fund had been adequately considered by the Manager in connection with the management fee rate charged to the Fund, and that, to the extent in the future it were to be deter- mined that material economies of scale had not been shared with the Fund, the Board would seek to have those economies of scale shared with the Fund.
The Board members considered these conclusions and determinations, along with the information received on a routine and regular basis throughout the year, and, without any one factor being dispositive, the Board determined that re-approval of the Fund’s Management Agreement was in the best interests of the Fund and its shareholders.
BOARD MEMBERS INFORMATION (Unaudited)
| | Joseph S. DiMartino (61)
Chairman of the Board (1995)
|
Principal Occupation During Past 5 Years:
| • Corporate Director and Trustee |
| Other Board Memberships and Affiliations: |
| • The Muscular Dystrophy Association, Director |
| • Levcor International, Inc., an apparel fabric processor, Director |
| • Century Business Services, Inc., a provider of outsourcing functions for small and medium size |
| companies, Director |
| • The Newark Group, a provider of a national market of paper recovery facilities, paperboard |
| mills and paperboard converting plants, Director |
| • Azimuth Trust, an institutional asset management firm, Member of Board of Managers and |
| Advisory Board |
| • Sunair Electronics, Inc., engages in the design, manufacture and sale of high frequency systems |
| for long-range voice and data communications, as well as providing certain outdoor-related |
| services to homes and businesses, Director |
No. of Portfolios for which Board Member Serves: 193
| | David P. Feldman (65)
Board Member (1996)
|
| Principal Occupation During Past 5 Years: |
| • Corporate Director & Trustee |
Other Board Memberships and Affiliations:
- BBH Mutual Funds Group (11 funds), Director
- The Jeffrey Company, a private investment company, Director
- QMED, a medical device company, Director
No. of Portfolios for which Board Member Serves: 58
| | Ehud Houminer (65)
Board Member (1993)
|
Principal Occupation During Past 5 Years:
- Executive-in-Residence at the Columbia Business School, Columbia University
- Principal of Lear,Yavitz and Associates, a management consulting firm (1996 to 2001)
Other Board Memberships and Affiliations:
- Avnet Inc., an electronics distributor, Director
- International Advisory Board to the MBA Program School of Management, Ben Gurion University, Chairman
- Explore Charter School, Brooklyn, NY, Chairman
No. of Portfolios for which Board Member Serves: 36
BOARD MEMBERS INFORMATION (Unaudited) (continued)
| | Gloria Messinger (75)
Board Member (1993)
|
| | Principal Occupation During Past 5 Years:
|
- Arbitrator for American Arbitration Association and National Association of Securities Dealers, Inc.
- Consultant in Intellectual Property
| | Other Board Memberships and Affiliations:
|
- Yale Law School Fund, Director
- Theater for a New Audience, Inc., Director
- Brooklyn Philharmonic, Director
- New York Women’s Agenda Music Performance Trust Fund, Director
| | No. of Portfolios for which Board Member Serves: 25
|
| | T. John Szarkowski (79)
Board Member (1996)
|
| Principal Occupation During Past 5 Years: |
| • Consultant in Photography |
| Other Board Memberships and Affiliations: |
| • Photography Department at The Museum of Modern Art, Director Emeritus |
| | No. of Portfolios for which Board Member Serves: 25
|
| | Anne Wexler (75)
Board Member (1996)
|
| | Principal Occupation During Past 5 Years:
|
- Chairman of the Wexler & Walker Public Policy Associates, consultants specializing in govern- ment relations and public affairs
| | Other Board Memberships and Affiliations:
|
- Wilshire Mutual Funds (5 funds), Director
- Methanex Corporation, a methanol producing company, Director
- Member of the Council of Foreign Relations
- Member of the National Park Foundation
| | No. of Portfolios for which Board Member Serves: 36
|
Once elected all Board Members serve for an indefinite term.The address of the Board Members and Officers is in c/o The Dreyfus Corporation, 200 Park Avenue, New York, New York 10166. Additional information about the Board Members is available in the fund’s Statement of Additional Information which can be obtained from Dreyfus free of charge by calling this toll free number: 1-800-554-4611.
John M. Fraser, Jr., Emeritus Board Member
OFFICERS OF THE FUND (Unaudited)
| STEPHEN E. CANTER, President since | | JAMES BITETTO, Vice President and |
| March 2000. | | Assistant Secretary since August 2005. |
| Chairman of the Board, Chief Executive | | Assistant General Counsel and Assistant |
| Officer and Chief Operating Officer of the | | Secretary of the Manager, and an officer of 91 |
| Manager, and an officer of 90 investment | | investment companies (comprised of 200 |
| companies (comprised of 184 portfolios) | | portfolios) managed by the Manager. He is 39 |
| managed by the Manager. Mr. Canter also is a | | years old and has been an employee of the |
| Board member and, where applicable, an | | Manager since December 1996. |
| |
| Executive Committee Member of the other | | JONI LACKS CHARATAN, Vice President |
| investment management subsidiaries of Mellon | | and Assistant Secretary since |
| Financial Corporation, each of which is an | | August 2005. |
| affiliate of the Manager. He is 60 years old and | | |
| has been an employee of the Manager since | | Assistant General Counsel and Assistant |
| May 1995. | | Secretary of the Manager, and an officer of 91 |
| | | investment companies (comprised of 200 |
| STEPHEN R. BYERS, Executive Vice | | portfolios) managed by the Manager. She is 49 |
| President since November 2002. | | years old and has been an employee of the |
| Chief Investment Officer,Vice Chairman and a | | Manager since October 1998. |
| |
| director of the Manager, and an officer of 90 | | JOSEPH M. CHIOFFI, Vice President and |
| investment companies (comprised of 184 | | Assistant Secretary since August 2005. |
| portfolios) managed by the Manager. Mr. Byers | | |
| also is an officer, director or an Executive | | Assistant General Counsel and Assistant |
| Committee Member of certain other | | Secretary of the Manager, and an officer of 91 |
| investment management subsidiaries of Mellon | | investment companies (comprised of 200 |
| Financial Corporation, each of which is an | | portfolios) managed by the Manager. He is 43 |
| affiliate of the Manager. He is 52 years old and | | years old and has been an employee of the |
| has been an employee of the Manager since | | Manager since July 2000. |
| January 2000. | | JANETTE E. FARRAGHER, Vice President |
| MARK N. JACOBS, Vice President since | | and Assistant Secretary since |
| March 2000. | | August 2005. |
| Executive Vice President, Secretary and | | Associate General Counsel of the Manager, |
| General Counsel of the Manager, and an | | and an officer of 91 investment companies |
| officer of 91 investment companies (comprised | | (comprised of 200 portfolios) managed by the |
| of 200 portfolios) managed by the Manager. | | Manager. She is 42 years old and has been an |
| He is 59 years old and has been an employee | | employee of the Manager since February 1984. |
| of the Manager since June 1977. | | JOHN B. HAMMALIAN, Vice President and |
| MICHAEL A. ROSENBERG, Vice President | | Assistant Secretary since August 2005. |
| and Secretary since August 2005. | | Associate General Counsel of the Manager, |
| Associate General Counsel of the Manager, | | and an officer of 91 investment companies |
| and an officer of 91 investment companies | | (comprised of 200 portfolios) managed by the |
| (comprised of 200 portfolios) managed by the | | Manager. He is 42 years old and has been an |
| Manager. He is 45 years old and has been an | | employee of the Manager since February 1991. |
| employee of the Manager since October 1991. | | |
OFFICERS OF THE FUND (Unaudited) (continued)
| ROBERT R. MULLERY, Vice President and | | ROBERT SVAGNA, Assistant Treasurer |
| Assistant Secretary since August 2005. | | since December 2002. |
| Associate General Counsel of the Manager, | | Senior Accounting Manager – Equity Funds of |
| and an officer of 91 investment companies | | the Manager, and an officer of 91 investment |
| (comprised of 200 portfolios) managed by the | | companies (comprised of 200 portfolios) |
| Manager. He is 53 years old and has been an | | managed by the Manager. He is 38 years old |
| employee of the Manager since May 1986. | | and has been an employee of the Manager |
| |
| JEFF PRUSNOFSKY, Vice President and | | since November 1990. |
| Assistant Secretary since August 2005. | | KENNETH J. SANDGREN, Assistant |
| Associate General Counsel of the Manager, | | Treasurer since November 2001. |
| and an officer of 91 investment companies | | Mutual Funds Tax Director of the Manager, |
| (comprised of 200 portfolios) managed by the | | and an officer of 91 investment companies |
| Manager. He is 40 years old and has been an | | (comprised of 200 portfolios) managed by the |
| employee of the Manager since October 1990. | | Manager. He is 51 years old and has been an |
| |
| JAMES WINDELS, Treasurer since | | employee of the Manager since June 1993. |
| November 2001. | | JOSEPH W. CONNOLLY, Chief Compliance |
| Director – Mutual Fund Accounting of the | | Officer since October 2004. |
| Manager, and an officer of 91 investment | | Chief Compliance Officer of the Manager and |
| companies (comprised of 200 portfolios) | | The Dreyfus Family of Funds (91 investment |
| managed by the Manager. He is 46 years old | | companies, comprising 200 portfolios). From |
| and has been an employee of the Manager | | November 2001 through March 2004, Mr. |
| since April 1985. | | Connolly was first Vice-President, Mutual |
| |
| GREGORY S. GRUBER, Assistant | | Fund Servicing for Mellon Global Securities |
| Treasurer since August 2005. | | Services. In that capacity, Mr. Connolly was |
| | | responsible for managing Mellon’s Custody, |
| Senior Accounting Manager – Municipal Bond | | Fund Accounting and Fund Administration |
| Funds of the Manager, and an officer of 91 | | services to third-party mutual fund clients. |
| investment companies (comprised of 200 | | He is 48 years old and has served in various |
| portfolios) managed by the Manager. He is 46 | | capacities with the Manager since 1980, |
| years old and has been an employee of the | | including manager of the firm’s Fund |
| Manager since August 1981. | | Accounting Department from 1997 through |
| ERIK D. NAVILOFF, Assistant Treasurer | | October 2001. |
| since August 2005. | | WILLIAM GERMENIS, Anti-Money |
| Senior Accounting Manager – Taxable Fixed | | Laundering Compliance Officer since |
| Income Funds of the Manager, and an officer | | October 2002. |
| of 91 investment companies (comprised of 200 | | Vice President and Anti-Money Laundering |
| portfolios) managed by the Manager. He is 37 | | Compliance Officer of the Distributor, and the |
| years old and has been an employee of the | | Anti-Money Laundering Compliance Officer |
| Manager since November 1992. | | of 88 investment companies (comprised of 197 |
| ROBERT ROBOL, Assistant Treasurer | | portfolios) managed by the Manager. He is 35 |
| since August 2005. | | years old and has been an employee of the |
| | | Distributor since October 1998. |
| Senior Accounting Manager – Money Market | | |
| Funds of the Manager, and an officer of 91 | | |
| investment companies (comprised of 200 | | |
| portfolios) managed by the Manager. He is 41 | | |
| years old and has been an employee of the | | |
| Manager since October 1988. | | |
NOTES
| For More | | Information |
| |
|
| |
| Dreyfus Premier | | Transfer Agent & |
| Strategic Value Fund | | Dividend Disbursing Agent |
| 200 Park Avenue | | |
| | | Dreyfus Transfer, Inc. |
| New York, NY 10166 | | |
| | | 200 Park Avenue |
| Manager | | New York, NY 10166 |
| The Dreyfus Corporation | | Distributor |
| 200 Park Avenue | | |
| | | Dreyfus Service Corporation |
| New York, NY 10166 | | |
| | | 200 Park Avenue |
| Custodian | | New York, NY 10166 |
| Mellon Bank, N.A. | | |
| One Mellon Bank Center | | |
| Pittsburgh, PA 15258 | | |
Telephone Call your financial representative or 1-800-554-4611
| Mail | | The Dreyfus Premier Family of Funds |
| | | 144 Glenn Curtiss Boulevard, Uniondale, NY 11556-0144 |
The fund files its complete schedule of portfolio holdings with the Securities and Exchange Commission (“SEC”) for the first and third quarters of each fiscal year on Form N-Q. The fund’s Forms N-Q are available on the SEC’s website at http://www.sec.gov and may be reviewed and copied at the SEC’s Public Reference Room in Washington, DC. Information on the operation of the Public Reference Room may be obtained by calling 1-800-SEC-0330.
A description of the policies and procedures that the fund uses to determine how to vote proxies relating to portfolio securities, and information regarding how the fund voted these proxies for the 12-month period ended June 30, 2005, is available at http://www.dreyfus.com and on the SEC’s website at http://www.sec.gov. The description of the policies and procedures is also available without charge, upon request, by calling 1-800-645-6561.

Save time. Save paper. View your next shareholder report online as soon as it’s available. Log into www.dreyfus.com and sign up for Dreyfus eCommunications. It’s simple and only takes a few minutes.
The views expressed in this report reflect those of the portfolio manager only through the end of the period covered and do not necessarily represent the views of Dreyfus or any other person in the Dreyfus organization. Any such views are subject to change at any time based upon market or other conditions and Dreyfus disclaims any responsibility to update such views.These views may not be relied on as investment advice and, because investment decisions for a Dreyfus fund are based on numerous factors, may not be relied on as an indication of trading intent on behalf of any Dreyfus fund.
Not FDIC-Insured • Not Bank-Guaranteed • May Lose Value
| | | Contents |
| |
| | | THE FUND |
| |
|
| 2 | | Letter from the Chairman |
| 3 | | Discussion of Fund Performance |
| 6 | | Fund Performance |
| 8 | | Understanding Your Fund’s Expenses |
| 8 | | Comparing Your Fund’s Expenses |
| | | With Those of Other Funds |
| 9 | | Statement of Investments |
| 13 | | Statement of Assets and Liabilities |
| 14 | | Statement of Operations |
| 15 | | Statement of Changes in Net Assets |
| 18 | | Financial Highlights |
| 23 | | Notes to Financial Statements |
| 31 | | Report of Independent Registered |
| | | Public Accounting Firm |
| 32 | | Important Tax Information |
| 33 | | Information About the Review and Approval |
| | | of the Fund’s Management Agreement |
| 38 | | Board Members Information |
| 40 | | Officers of the Fund |
| | | FOR MORE INFORMATION |
| |
|
| | | Back Cover |
The Fund
| | Dreyfus Premier
Structured Large Cap
Value Fund
|

LETTER FROM THE CHAIRMAN
This annual report for Dreyfus Premier Structured Large Cap Value Fund covers the 12-month period from September 1, 2004, through August 31, 2005. Inside, you’ll find valuable information about how the fund was managed during the reporting period, including a discussion with the fund’s portfolio manager, Oliver Buckley.
On average, stock prices ended the reporting period higher than where they began. However, most of the market’s gains occurred during the closing months of 2004. So far in 2005, positive factors, including steady economic growth and higher corporate profits, were largely offset by headwinds, such as sharply higher energy prices and rising short-term interest rates. Midcap stocks produced higher returns than small-cap stocks in this environment, and small-cap stocks outperformed large-cap stocks. Also, value-oriented stocks have generally produced better results than their more growth-oriented counterparts during the past 12 months.
Recent shocks to the U.S. economy — including sharply higher gasoline prices and other lingering consequences of Hurricane Katrina — have added a degree of uncertainty to the economic outlook.Nonetheless,our economists currently expect the economy to continue to grow without either entering a recession or triggering a significant acceleration of infla-tion.As always, we encourage you to discuss the potential implications of these and other matters with your financial advisor.
Thank you for your continued confidence and support.


DISCUSSION OF FUND PERFORMANCE
Oliver Buckley, Portfolio Manager
|
How did Dreyfus Premier Structured Large Cap Value Fund
perform relative to its benchmark?
|
For the 12-month period ended August 31,2005,the fund produced total returns of 17.34% for Class A shares,16.50% for Class B shares,16.44% for Class C shares, 17.68% for Class R shares and 17.02% for Class T shares.1 In comparison, the fund’s benchmark, the Russell 1000 Value Index (the “Index”), provided a 16.86% total return for the same period.2
Stocks rallied strongly during the final weeks of 2004 as investors looked forward to stronger economic growth, but the market gained only modest value over the first eight months of 2005,when rising interest rates and soaring energy prices weighed on investor sentiment.The fund’s returns were in line with its benchmark, primarily due to the success of our security selection strategy among housing-related companies and retailers.
What is the fund’s investment approach?
The fund seeks long-term capital growth.To pursue this goal, the fund normally invests at least 80% of its assets in the stocks of companies included in the Russell 1000 Value Index at the time of purchase.The fund’s stock investments may include common stocks, preferred stocks and convertible securities of U.S. and foreign issuers, including those purchased in initial public offerings.
We select stocks using a “bottom-up” structured approach that seeks to identify undervalued securities through a quantitative screening process. This process is driven by computer models that identify and rank stocks based on:
- Fundamental momentum, meaning measures that reflect the changes in short-term earnings outlook through factors such as revised earnings estimates and earnings surprises;
- Relative value, such as current and forecasted price-to-earnings ratios, price-to-book ratios, yields and other price-sensitive data for a stock compared to its past, its peers and the models’ overall stock universe;
| | DISCUSSION OF FUND PERFORMANCE (continued)
|
- Long-term growth, based on measures that reflect changes in estimated long-term earnings growth over multiple time periods; and
- Additional factors, such as technical factors, trading by company insiders or share issuance/buyback data.
We select what we believe to be the most attractive of the top-ranked securities for the fund. We will generally sell a stock that falls below the median ranking, and we may reinvest the proceeds in a top-ranked security in order to remain fully invested. We attempt to maintain a neutral exposure to sectors relative to the Russell 1000 Value Index. Within each sector, we overweight the most attractive stocks and underweight or avoid the stocks that have been ranked least attractive.
What other factors influenced the fund’s performance?
Although we choose investments based on our disciplined security selection process, and not according to broad economic or market trends, it is worth noting that large-cap stocks were influenced during the reporting period by shifts in investors’ economic expectations. Early in the reporting period, stocks generally failed to advance due to uncertainty in advance of the U.S. presidential election. After the election concluded and signs of more robust economic growth emerged, stocks rallied strongly. However, the rally sputtered soon after 2005 began as investors grew concerned that rising interest rates and surging energy prices might constrain economic growth.
In this environment, we continued to employ our “bottom-up” security selection process, which helped us identify some of the market’s better-performing stocks. For example, a number of home-builders — including DR Horton and KB HOME — met our growth, value and momentum criteria in a persistently strong U.S. housing market. The fund also participated in gains posted by mortgages lenders and title insurance companies, such as First American Corp., that benefited from robust housing activity.
A number of retailers also met our investment criteria during the reporting period. For example, the fund participated in gains from
apparel retailer American Eagle Outfitters, which apparently offered the right fashions to its teenage customers, and Sears Holdings, which benefited when investors recognized the value of its real estate assets. In other areas, the fund received positive contributions to performance from video game developer Activision, which continued to outperform its competition.
As is to be expected from a diversified portfolio, these strong results were partially offset by a handful of disappointments.While the fund participated substantially in the rally of energy stocks during the reporting period, our selections within the sector did not match the results posted by the benchmark’s energy component. In addition, the fund’s relatively light exposure to utilities stocks limited its participation in the sector’s gains.
What is the fund’s current strategy?
We recently began to reduce the fund’s exposure to homebuilding stocks, which have been slipping in our model’s rankings. Despite the magnitude of their recent rally, we have continued to emphasize energy stocks, which we believe may post further gains if oil and gas prices stay high. Otherwise, we have continued to identify potential opportunities through company-by-company research into the growth prospects and valuations of large-cap stocks.
| 1 | | Total return includes reinvestment of dividends and any capital gains paid, and does not take into |
| | | consideration the maximum initial sales charges in the case of Class A and Class T shares, or the |
| | | applicable contingent deferred sales charges imposed on redemptions in the case of Class B and |
| | | Class C shares. Had these charges been reflected, returns would have been lower. Past performance |
| | | is no guarantee of future results. Share price, yield and investment return fluctuate such that upon |
| | | redemption, fund shares may be worth more or less than their original cost. Return figures |
| | | provided reflect the absorption of fund expenses by The Dreyfus Corporation pursuant to an |
| | | agreement in effect through August 31, 2006, at which time it may be extended, terminated or |
| | | modified. Had these expenses not been absorbed, the fund’s returns would have been lower. |
| 2 | | SOURCE: LIPPER INC. — Reflects the reinvestment of dividends and, where applicable, |
| | | capital gain distributions.The Russell 1000 Value Index is an unmanaged index which measures |
| | | the performance of those Russell 1000 companies with lower price-to-book ratios and lower |
| | | forecasted growth values. |

† Source: Lipper Inc.
Past performance is not predictive of future performance.
The above graph compares a $10,000 investment made in Class A, Class B, Class C, Class R and Class T shares of Dreyfus Premier Structured Large Cap Value Fund on 12/31/03 (inception date) to a $10,000 investment made in the Russell 1000 Value Index (the “Index”) on that date. All dividends and capital gain distributions are reinvested. The fund’s performance shown in the line graph takes into account the maximum initial sales charges on Class A and Class T shares, the applicable contingent deferred sales charge on Class B shares and all other applicable fees and expenses on all classes.The Index is an unmanaged index which measures the performance of those Russell 1000 companies with lower price-to-book ratios and lower forecasted growth values.The Index does not take into account charges, fees and other expenses. Further information relating to fund performance, including expense reimbursements, if applicable, is contained in the Financial Highlights section of the prospectus and elsewhere in this report.
| Average Annual Total Returns as of 8/31/05 | | | | |
| |
| | | | | Inception | | | | From |
| | | | | Date | | 1 Year | | Inception |
| |
| |
| |
| |
|
| Class A shares | | | | | | |
| with maximum sales charge (5.75%) | | 12/31/03 | | 10.56% | | 9.00% |
| without sales charge | | 12/31/03 | | 17.34% | | 12.92% |
| Class B shares | | | | | | |
| with applicable redemption charge † | | 12/31/03 | | 12.50% | | 9.84% |
| without redemption | | 12/31/03 | | 16.50% | | 12.08% |
| Class C shares | | | | | | |
| with applicable redemption charge †† | | 12/31/03 | | 15.44% | | 12.04% |
| without redemption | | 12/31/03 | | 16.44% | | 12.04% |
| Class R shares | | 12/31/03 | | 17.68% | | 13.22% |
| Class T shares | | | | | | |
| with applicable sales charge (4.5%) | | 12/31/03 | | 11.78% | | 9.57% |
| without sales charge | | 12/31/03 | | 17.02% | | 12.63% |
| |
| Past performance is not predictive of future performance.The fund’s performance shown in the graph and table does not |
| reflect the deduction of taxes that a shareholder would pay on fund distributions or the redemption of fund shares. |
| † | | The maximum contingent deferred sales charge for Class B shares is 4%. After six years Class B shares convert to |
| | | Class A shares. | | | | | | |
| †† | | The maximum contingent deferred sales charge for Class C shares is 1% for shares redeemed within one year of the |
| | | date of purchase. | | | | | | |
U N D E R S TA N D I N G YO U R F U N D ’ S E X P E N S E S ( U n a u d i t e d )
As a mutual fund investor, you pay ongoing expenses, such as management fees and other expenses. Using the information below, you can estimate how these expenses affect your investment and compare them with the expenses of other funds.You also may pay one-time transaction expenses, including sales charges (loads) and redemption fees, which are not shown in this section and would have resulted in higher total expenses. For more information, see your fund’s prospectus or talk to your financial adviser.
Review your fund’s expenses
The table below shows the expenses you would have paid on a $1,000 investment in Dreyfus Premier Structured Large Cap Value Fund from March 1, 2005 to August 31, 2005. It also shows how much a $1,000 investment would be worth at the close of the period, assuming actual returns and expenses.
| Expenses and Value of a $1,000 Investment | | | | | | |
| assuming actual returns for the six months ended August 31, 2005 | | | | |
| | | Class A | | Class B | | Class C | | Class R | | Class T |
| |
| |
| |
| |
| |
|
| Expenses paid per $1,000 † | | $ 7.41 | | $ 11.25 | | $ 11.35 | | $ 6.15 | | $ 8.63 |
| Ending value (after expenses) | | $1,014.30 | | $1,010.20 | | $1,010.30 | | $1,016.40 | | $1,013.00 |
| | COMPARING YOUR FUND’S EXPENSES
WITH THOSE OF OTHER FUNDS (Unaudited)
|
Using the SEC’s method to compare expenses
The Securities and Exchange Commission (SEC) has established guidelines to help investors assess fund expenses. Per these guidelines, the table below shows your fund’s expenses based on a $1,000 investment, assuming a hypothetical 5% annualized return. You can use this information to compare the ongoing expenses (but not transaction expenses or total cost) of investing in the fund with those of other funds.All mutual fund shareholder reports will provide this information to help you make this comparison. Please note that you cannot use this information to estimate your actual ending account balance and expenses paid during the period.
Expenses and Value of a $1,000 Investment
assuming a hypothetical 5% annualized return for the six months ended August 31, 2005
|
| | | Class A | | Class B | | Class C | | Class R | | Class T |
| |
| |
| |
| |
| |
|
| Expenses paid per $1,000 † | | $ 7.43 | | $ 11.27 | | $ 11.37 | | $ 6.16 | | $ 8.64 |
| Ending value (after expenses) | | $1,017.85 | | $1,014.01 | | $1,013.91 | | $1,019.11 | | $1,016.64 |
† Expenses are equal to the fund’s annualized expense ratio of 1.46% for Class A, 2.22% for Class B, 2.24% for Class C, 1.21% for Class R and 1.70% for Class T; multiplied by the average account value over the period, multiplied by 184/365 (to reflect the one-half year period).
STATEMENT OF INVESTMENTS
August 31, 2005
|
| Common Stocks—101.2% | | Shares | | | | Value ($) |
| |
| |
| |
|
| Banking—14.1% | | | | | | |
| Bank of America | | 2,900 | | | | 124,787 |
| SunTrust Banks | | 900 | | | | 63,252 |
| Wachovia | | 1,500 | | | | 74,430 |
| Washington Mutual | | 1,600 | | | | 66,528 |
| Wells Fargo & Co. | | 700 | | | | 41,734 |
| | | | | | | 370,731 |
| Commercial & Professional Services—.9% | | | | |
| Ingram Micro, Cl. A | | 1,400 | | a | | 24,514 |
| Communications—4.3% | | | | | | |
| CenturyTel | | 400 | | | | 14,360 |
| SBC Communications | | 2,600 | | | | 62,608 |
| Verizon Communications | | 1,100 | | | | 35,981 |
| | | | | | | 112,949 |
| Consumer Durables—3.2% | | | | | | |
| Activision | | 700 | | a | | 15,645 |
| DR Horton | | 766 | | | | 28,281 |
| Goodyear Tire & Rubber | | 1,600 | | a,b | | 26,880 |
| KB HOME | | 200 | | | | 14,832 |
| | | | | | | 85,638 |
| Consumer Non-Durables—2.8% | | | | | | |
| Kimberly-Clark | | 500 | | | | 31,160 |
| Pepsi Bottling Group | | 800 | | | | 23,584 |
| Pilgrim’s Pride | | 300 | | | | 10,170 |
| UST | | 200 | | | | 8,512 |
| | | | | | | 73,426 |
| Consumer Services—5.5% | | | | | | |
| Cendant | | 2,700 | | | | 54,918 |
| McDonald’s | | 1,000 | | | | 32,450 |
| Walt Disney | | 2,300 | | | | 57,937 |
| | | | | | | 145,305 |
| Electronic Technology—5.1% | | | | | | |
| Apple Computer | | 300 | | a | | 14,079 |
| General Dynamics | | 300 | | | | 34,377 |
| Lockheed Martin | | 300 | | | | 18,672 |
| Northrop Grumman | | 1,200 | | | | 67,308 |
| | | | | | | 134,436 |
| | STATEMENT OF INVESTMENTS (continued)
|
| Common Stocks (continued) | | Shares | | | | Value ($) |
| |
| |
| |
|
| Energy Minerals—15.2% | | | | | | |
| Chevron | | 1,700 | | | | 104,380 |
| ConocoPhillips | | 1,400 | | | | 92,316 |
| Exxon Mobil | | 3,400 | | | | 203,660 |
| | | | | | | 400,356 |
| Finance—19.7% | | | | | | |
| American International Group | | 100 | | | | 5,920 |
| Bear Stearns Cos. | | 400 | | | | 40,200 |
| CBL & Associates Properties | | 400 | | | | 16,968 |
| Cincinnati Financial | | 540 | | | | 22,129 |
| CIT Group | | 300 | | | | 13,584 |
| Citigroup | | 900 | | | | 39,393 |
| Comerica | | 200 | | | | 12,098 |
| Countrywide Financial | | 1,300 | | | | 43,927 |
| First American | | 500 | | | | 20,805 |
| Friedman Billings Ramsey Group Cl. A | | 1,300 | | b | | 15,210 |
| Host Marriott | | 400 | | | | 6,996 |
| KeyCorp | | 1,200 | | b | | 39,744 |
| Lehman Brothers Holdings | | 200 | | | | 21,132 |
| Loews | | 400 | | | | 35,076 |
| MetLife | | 1,300 | | | | 63,674 |
| National City | | 1,900 | | | | 69,597 |
| Prudential Financial | | 600 | | | | 38,622 |
| SL Green Realty | | 200 | | | | 13,226 |
| | | | | | | 518,301 |
| Health Technology—7.5% | | | | | | |
| Applera—Applied Biosystems Group | | 500 | | | | 10,750 |
| Becton, Dickinson & Co. | | 200 | | | | 10,526 |
| Invitrogen | | 500 | | a | | 42,365 |
| Merck & Co. | | 1,200 | | | | 33,876 |
| Pfizer | | 2,300 | | | | 58,581 |
| Universal Health Services, Cl. B | | 700 | | | | 35,777 |
| Wyeth | | 100 | | | | 4,579 |
| | | | | | | 196,454 |
| Industrial Services—.7% | | | | | | |
| Waste Management | | 700 | | | | 19,201 |
| Non-Energy Minerals—3.2% | | | | | | |
| Louisiana-Pacific | | 700 | | | | 17,703 |
| Common Stocks (continued) | | Shares | | Value ($) |
| |
| |
|
| Non-Energy Minerals (continued) | | | | |
| Nucor | | 400 | | 22,592 |
| Phelps Dodge | | 400 | | 43,012 |
| | | | | 83,307 |
| Process Industries—2.2% | | | | |
| Archer-Daniels-Midland | | 1,200 | | 27,012 |
| Rohm & Haas | | 300 | | 13,023 |
| Sigma-Aldrich | | 300 | | 18,720 |
| | | | | 58,755 |
| Producer Manufacturing—4.1% | | | | |
| Autoliv | | 600 | | 26,700 |
| Avery Dennison | | 200 | | 10,688 |
| General Electric | | 2,100 | | 70,581 |
| | | | | 107,969 |
| Retail Trade—1.5% | | | | |
| American Eagle Outfitters | | 1,400 | | 40,082 |
| Technology Services—1.7% | | | | |
| Caremark Rx | | 300 a | | 14,019 |
| CIGNA | | 200 | | 23,064 |
| Community Health Systems | | 200 a | | 7,366 |
| | | | | 44,449 |
| Transportation—2.8% | | | | |
| Burlington Northern Santa Fe | | 400 | | 21,208 |
| CSX | | 400 | | 17,572 |
| Norfolk Southern | | 1,000 | | 35,610 |
| | | | | 74,390 |
| Utilities—6.7% | | | | |
| American Electric Power | | 600 | | 22,308 |
| CMS Energy | | 2,000 a | | 32,200 |
| Duke Energy | | 600 | | 17,394 |
| Edison International | | 700 | | 31,521 |
| KeySpan | | 300 | | 11,451 |
| ONEOK | | 700 | | 23,800 |
| PG&E | | 1,000 | | 37,520 |
| | | | | 176,194 |
| Total Common Stocks | | | | |
| (cost $2,397,681) | | | | 2,666,457 |
| | STATEMENT OF INVESTMENTS (continued)
|
| Investment of Cash Collateral | | | | |
| for Securities Loaned—2.8% | | Shares | | Value ($) |
| |
| |
|
| Registered Investment Company: | | | | |
| Dreyfus Institutional Cash Advantage Plus Fund | | | | |
| (cost $75,100) | | 75,100 c | | 75,100 |
| |
| |
|
| Total Investments (cost $2,472,781) | | 104.0% | | 2,741,557 |
| Liabilities, Less Cash and Receivables | | (4.0%) | | (106,679) |
| Net Assets | | 100.0% | | 2,634,878 |
| |
| a Non-income producing. | | | | |
| b All or a portion of these securities are on loan. At August 31, 2005, the total market value of the fund’s securities on |
| loan is $73,434 and the total market value of the collateral held is $75,100. | | |
| c Investment in affiliated money market mutual fund. | | | | |
| Portfolio Summary † | | | | | | |
| |
| | | Value (%) | | | | Value (%) |
| |
| |
| |
|
| Finance | | 19.7 | | Electronic Technology | | 5.1 |
| Energy Minerals | | 15.2 | | Communications | | 4.3 |
| Banking | | 14.1 | | Producer Manufacturing | | 4.1 |
| Health Technology | | 7.5 | | Other | | 21.8 |
| Utilities | | 6.7 | | | | |
| Consumer Services | | 5.5 | | | | 104.0 |
| |
| † Based on net assets. | | | | | | |
| See notes to financial statements. | | | | | | |
STATEMENT OF ASSETS AND LIABILITIES
August 31, 2005
|
| | | | | | | | | Cost | | Value |
| |
| |
| |
| |
| |
|
| Assets ($): | | | | | | | | | | |
| Investments in securities— | | | | | | | | |
| See Statement of Investments (including securities | | | | |
| on loan valued at $73,434)—Note 1(b): | | | | | | |
| Unaffiliated issuers | | | | | | 2,397,681 | | 2,666,457 |
| Affiliated issuers | | | | | | 75,100 | | 75,100 |
| Cash | | | | | | | | | | 9,453 |
| Prepaid expenses | | | | | | | | | | 16,055 |
| Dividends receivable | | | | | | | | 8,669 |
| | | | | | | | | | | 2,775,734 |
| |
| |
| |
| |
| |
|
| Liabilities ($): | | | | | | | | | | |
| Due to The Dreyfus Corporation and affiliates—Note 3(c) | | | | 952 |
| Liability for securities on loan | | | | | | | | 75,100 |
| Accrued expenses and other liabilities | | | | | | 64,804 |
| | | | | | | | | | | 140,856 |
| |
| |
| |
| |
| |
|
| Net Assets ($) | | | | | | | | | | 2,634,878 |
| |
| |
| |
| |
| |
|
| Composition of Net Assets ($): | | | | | | | | |
| Paid-in capital | | | | | | | | | | 2,234,142 |
| Accumulated undistributed investment income—net | | | | | | 9,878 |
| Accumulated net realized gain (loss) on investments | | | | | | 122,082 |
| Accumulated net unrealized appreciation | | | | | | |
| (depreciation) on investments | | | | | | | | 268,776 |
| |
| |
| |
| |
|
| Net Assets ($) | | | | | | | | | | 2,634,878 |
| |
| |
| |
| |
| |
|
| |
| |
| Net Asset Value Per Share | | | | | | | | |
| | | Class A | | Class B | | Class C | | Class R | | Class T |
| |
| |
| |
| |
| |
|
| Net Assets ($) | | 499,492 | | 561,711 | | 590,395 | | 495,300 | | 487,980 |
| Shares Outstanding | | 33,547 | | 37,953 | | 39,908 | | 33,205 | | 32,835 |
| |
| |
| |
| |
| |
|
| Net Asset Value | | | | | | | | | | |
| Per Share ($) | | 14.89 | | 14.80 | | 14.79 | | 14.92 | | 14.86 |
| |
| See notes to financial statements. | | | | | | | | |
| | STATEMENT OF OPERATIONS
Year Ended August 31, 2005
|
| Investment Income ($): | | |
| Income: | | |
| Cash dividends | | 59,438 |
| Income from securities lending | | 66 |
| Total Income | | 59,504 |
| Expenses: | | |
| Investment advisory fee—Note 3(a) | | 18,297 |
| Registration fees | | 49,086 |
| Professional fees | | 29,534 |
| Distribution fees—Note 3(b) | | 8,972 |
| Shareholder servicing costs—Note 3(c) | | 6,209 |
| Prospectus and shareholders’ reports | | 5,740 |
| Custodian fees—Note 3(c) | | 2,930 |
| Directors’ fees and expenses—Note 3(d) | | 198 |
| Miscellaneous | | 8,372 |
| Total Expenses | | 129,338 |
| Less—expense reimbursement from | | |
| The Dreyfus Corporation due to undertaking—Note 3(a) | | (84,945) |
| Less—reduction in custody fees | | |
| due to earnings credits—Note 1(b) | | (610) |
| Net Expenses | | 43,783 |
| Investment income—Net | | 15,721 |
| |
|
| Realized and Unrealized Gain (Loss) on Investments—Note 4 ($): |
| Net realized gain (loss) on investments | | 131,552 |
| Net unrealized appreciation (depreciation) on investments | | 223,211 |
| Net Realized and Unrealized Gain (Loss) on Investments | | 354,763 |
| Net Increase in Net Assets Resulting from Operations | | 370,484 |
| | See notes to financial statements.
|
STATEMENT OF CHANGES IN NET ASSETS
| | | Year Ended August 31, |
| |
|
| | | 2005 | | 2004 a |
| |
| |
|
| Operations ($): | | | | |
| Investment income—net | | 15,721 | | 8,520 |
| Net realized gain (loss) on investments | | 131,552 | | 30,555 |
| Net unrealized appreciation | | | | |
| (depreciation) on investments | | 223,211 | | 45,565 |
| Net Increase (Decrease) in Net Assets | | |
| Resulting from Operations | | 370,484 | | 84,640 |
| |
| |
|
| Dividends to Shareholders from ($): | | | | |
| Investment income—net: | | | | |
| Class A shares | | (4,736) | | — |
| Class B shares | | (2,014) | | — |
| Class C shares | | (2,035) | | — |
| Class R shares | | (5,838) | | — |
| Class T shares | | (3,712) | | — |
| Net realized gain on investments: | | | | |
| Class A shares | | (7,840) | | — |
| Class B shares | | (8,810) | | — |
| Class C shares | | (8,596) | | — |
| Class R shares | | (7,859) | | — |
| Class T shares | | (7,840) | | — |
| Total Dividends | | (59,280) | | — |
| |
| |
|
| Capital Stock Transactions ($): | | | | |
| Net proceeds from shares sold: | | | | |
| Class A shares | | 9,589 | | 409,428 |
| Class B shares | | 21,404 | | 448,541 |
| Class C shares | | 70,125 | | 430,257 |
| Class R shares | | 2,000 | | 401,000 |
| Class T shares | | — | | 400,000 |
| | STATEMENT OF CHANGES IN NET ASSETS (continued)
|
| | | Year Ended August 31, |
| |
|
| | | 2005 | | 2004 a |
| |
| |
|
| Capital Stock Transactions ($) (continued): | | |
| Dividends reinvested: | | | | |
| Class A shares | | 12,576 | | — |
| Class B shares | | 9,632 | | — |
| Class C shares | | 9,771 | | — |
| Class R shares | | 13,697 | | — |
| Class T shares | | 11,552 | | — |
| Cost of shares redeemed: | | | | |
| Class A shares | | (10,337) | | — |
| Class B shares | | (105) | | — |
| Class C shares | | (96) | | — |
| Increase (Decrease) in Net Assets | | | | |
| from Capital Stock Transactions | | 149,808 | | 2,089,226 |
| Total Increase (Decrease) in Net Assets | | 461,012 | | 2,173,866 |
| |
| |
|
| Net Assets ($): | | | | |
| Beginning of Period | | 2,173,866 | | — |
| End of Period | | 2,634,878 | | 2,173,866 |
| Undistributed investment income—net | | 9,878 | | 33,587 |
| | | Year Ended August 31, |
| |
|
| | | 2005 | | 2004 a |
| |
| |
|
| Capital Share Transactions: | | | | |
| Class A | | | | |
| Shares sold | | 644 | | 32,724 |
| Shares issued for dividends reinvested | | 909 | | — |
| Shares redeemed | | (730) | | — |
| Net Increase (Decrease) in Shares Outstanding | | 823 | | 32,724 |
| |
| |
|
| Class B | | | | |
| Shares sold | | 1,478 | | 35,786 |
| Shares issued for dividends reinvested | | 696 | | — |
| Shares redeemed | | (7) | | — |
| Net Increase (Decrease) in Shares Outstanding | | 2,167 | | 35,786 |
| |
| |
|
| Class C | | | | |
| Shares sold | | 4,846 | | 34,363 |
| Shares issued for dividends reinvested | | 706 | | — |
| Shares redeemed | | (7) | | — |
| Net Increase (Decrease) in Shares Outstanding | | 5,545 | | 34,363 |
| |
| |
|
| Class R | | | | |
| Shares sold | | 139 | | 32,076 |
| Shares issued for dividends reinvested | | 990 | | — |
| Net Increase (Decrease) in Shares Outstanding | | 1,129 | | 32,076 |
| |
| |
|
| Class T | | | | |
| Shares sold | | — | | 32,000 |
| Shares issued for dividends reinvested | | 835 | | — |
| Net Increase (Decrease) in Shares Outstanding | | 835 | | 32,000 |
| |
| a From December 31, 2003 (commencement of operations) to August 31, 2004. | | |
| See notes to financial statements. | | | | |
The following tables describe the performance for each share class for the fiscal periods indicated.All information (except portfolio turnover rate) reflects financial results for a single fund share.Total return shows how much your investment in the fund would have increased or (decreased) during each period, assuming you had reinvested all dividends and distributions.These figures have been derived from the fund’s financial statements.
| | | | | Year Ended August 31, |
| | | |
|
| Class A Shares | | 2005 | | 2004 a |
| |
| |
|
| Per Share Data ($): | | | | |
| Net asset value, beginning of period | | 13.05 | | 12.50 |
| Investment Operations: | | | | |
| Investment income—net b | | .14 | | .08 |
| Net realized and unrealized | | | | |
| gain (loss) on investments | | 2.10 | | .47 |
| Total from Investment Operations | | 2.24 | | .55 |
| Distributions: | | | | |
| Dividends from investment income—net | | (.15) | | — |
| Dividends from net realized gain on investments | | (.25) | | — |
| Total distributions | | (.40) | | — |
| Net asset value, end of period | | 14.89 | | 13.05 |
| |
| |
|
| Total Return (%) c | | 17.34 | | 4.40d |
| |
| |
|
| Ratios/Supplemental Data (%): | | | | |
| Ratio of total expenses to average net assets | | 4.96 | | 7.32d |
| Ratio of net expenses to average net assets | | 1.47 | | 1.00d |
| Ratio of net investment income | | | | |
| to average net assets | | .97 | | .61d |
| Portfolio Turnover Rate | | 82.50 | | 57.46d |
| |
| |
|
| Net Assets, end of period ($ x 1,000) | | 499 | | 427 |
| |
| a | | From December 31, 2003 (commencement of operations) to August 31, 2004. | | |
| b | | Based on average shares outstanding at each month end. | | | | |
| c | | Exclusive of sales charge. | | | | |
| d | | Not annualized | | | | |
| See notes to financial statements. | | | | |
| | | | | Year Ended August 31, |
| | | |
|
| Class B Shares | | 2005 | | 2004 a |
| |
| |
|
| Per Share Data ($): | | | | |
| Net asset value, beginning of period | | 12.98 | | 12.50 |
| Investment Operations: | | | | |
| Investment income—net b | | .03 | | .01 |
| Net realized and unrealized | | | | |
| gain (loss) on investments | | 2.10 | | .47 |
| Total from Investment Operations | | 2.13 | | .48 |
| Distributions: | | | | |
| Dividends from investment income—net | | (.06) | | — |
| Dividends from net realized gain on investments | | (.25) | | — |
| Total distributions | | (.31) | | — |
| Net asset value, end of period | | 14.80 | | 12.98 |
| |
| |
|
| Total Return (%) c | | 16.50 | | 3.84d |
| |
| |
|
| Ratios/Supplemental Data (%): | | | | |
| Ratio of total expenses to average net assets | | 5.71 | | 7.84d |
| Ratio of net expenses to average net assets | | 2.23 | | 1.51d |
| Ratio of net investment income | | | | |
| to average net assets | | .21 | | .11d |
| Portfolio Turnover Rate | | 82.50 | | 57.46d |
| |
| |
|
| Net Assets, end of period ($ x 1,000) | | 562 | | 465 |
| |
| a | | From December 31, 2003 (commencement of operations) to August 31, 2004. | | |
| b | | Based on average shares outstanding at each month end. | | | | |
| c | | Exclusive of sales charge. | | | | |
| d | | Not annualized. | | | | |
| See notes to financial statements. | | | | |
| | FINANCIAL HIGHLIGHTS (continued)
|
| | | | | Year Ended August 31, |
| | | |
|
| Class C Shares | | 2005 | | 2004 a |
| |
| |
|
| Per Share Data ($): | | | | |
| Net asset value, beginning of period | | 12.98 | | 12.50 |
| Investment Operations: | | | | |
| Investment income—net b | | .03 | | .01 |
| Net realized and unrealized | | | | |
| gain (loss) on investments | | 2.09 | | .47 |
| Total from Investment Operations | | 2.12 | | .48 |
| Distributions: | | | | |
| Dividends from investment income—net | | (.06) | | — |
| Dividends from net realized gain on investments | | (.25) | | — |
| Total distributions | | (.31) | | — |
| Net asset value, end of period | | 14.79 | | 12.98 |
| |
| |
|
| Total Return (%) c | | 16.44 | | 3.84d |
| |
| |
|
| Ratios/Supplemental Data (%): | | | | |
| Ratio of total expenses to average net assets | | 5.71 | | 7.83d |
| Ratio of net expenses to average net assets | | 2.24 | | 1.51d |
| Ratio of net investment income | | | | |
| to average net assets | | .20 | | .11d |
| Portfolio Turnover Rate | | 82.50 | | 57.46d |
| |
| |
|
| Net Assets, end of period ($ x 1,000) | | 590 | | 446 |
| |
| a | | From December 31, 2003 (commencement of operations) to August 31, 2004. | | |
| b | | Based on average shares outstanding at each month end. | | | | |
| c | | Exclusive of sales charge. | | | | |
| d | | Not annualized. | | | | |
| See notes to financial statements. | | | | |
| | | | | Year Ended August 31, |
| | | |
|
| Class R Shares | | 2005 | | 2004 a |
| |
| |
|
| Per Share Data ($): | | | | |
| Net asset value, beginning of period | | 13.07 | | 12.50 |
| Investment Operations: | | | | |
| Investment income—net b | | .17 | | .10 |
| Net realized and unrealized | | | | |
| gain (loss) on investments | | 2.11 | | .47 |
| Total from Investment Operations | | 2.28 | | .57 |
| Distributions: | | | | |
| Dividends from investment income—net | | (.18) | | — |
| Dividends from net realized gain on investments | | (.25) | | — |
| Total distributions | | (.43) | | — |
| Net asset value, end of period | | 14.92 | | 13.07 |
| |
| |
|
| Total Return (%) | | 17.68 | | 4.56c |
| |
| |
|
| Ratios/Supplemental Data (%): | | | | |
| Ratio of total expenses to average net assets | | 4.70 | | 7.15c |
| Ratio of net expenses to average net assets | | 1.22 | | .84c |
| Ratio of net investment income | | | | |
| to average net assets | | 1.22 | | .78c |
| Portfolio Turnover Rate | | 82.50 | | 57.46c |
| |
| |
|
| Net Assets, end of period ($ x 1,000) | | 495 | | 419 |
| |
| a | | From December 31, 2003 (commencement of operations) to August 31, 2004. | | |
| b | | Based on average shares outstanding at each month end. | | | | |
| c | | Not annualized. | | | | |
| See notes to financial statements. | | | | |
| | FINANCIAL HIGHLIGHTS (continued)
|
| | | | | Year Ended August 31, |
| | | |
|
| Class T Shares | | 2005 | | 2004 a |
| |
| |
|
| Per Share Data ($): | | | | |
| Net asset value, beginning of period | | 13.03 | | 12.50 |
| Investment Operations: | | | | |
| Investment income—net b | | .10 | | .06 |
| Net realized and unrealized | | | | |
| gain (loss) on investments | | 2.10 | | .47 |
| Total from Investment Operations | | 2.20 | | .53 |
| Distributions: | | | | |
| Dividends from investment income—net | | (.12) | | — |
| Dividends from net realized gain on investments | | (.25) | | — |
| Total distributions | | (.37) | | — |
| Net asset value, end of period | | 14.86 | | 13.03 |
| |
| |
|
| Total Return (%) c | | 17.02 | | 4.24d |
| |
| |
|
| Ratios/Supplemental Data (%): | | | | |
| Ratio of total expenses to average net assets | | 5.20 | | 7.49d |
| Ratio of net expenses to average net assets | | 1.71 | | 1.17d |
| Ratio of net investment income | | | | |
| to average net assets | | .72 | | .44d |
| Portfolio Turnover Rate | | 82.50 | | 57.46d |
| |
| |
|
| Net Assets, end of period ($ x 1,000) | | 488 | | 417 |
| |
| a | | From December 31, 2003 (commencement of operations) to August 31, 2004. | | |
| b | | Based on average shares outstanding at each month end. | | | | |
| c | | Exclusive of sales charge. | | | | |
| d | | Not annualized. | | | | |
| See notes to financial statements. | | | | |
NOTES TO FINANCIAL STATEMENTS
NOTE 1—Significant Accounting Policies:
Dreyfus Premier Structured Large Cap Value Fund (the “fund”) is a separate diversified series of Dreyfus Growth and Value Funds, Inc. (the “Company”) which is registered under the Investment Company Act of 1940, as amended (the “Act”), as an open-end management investment company and operates as a series company that offers twelve series, including the fund.The fund’s investment objective is long-term capital growth. The Dreyfus Corporation (the “Manager” or “Dreyfus”) serves as the fund’s investment adviser. Dreyfus is a wholly-owned subsidiary of Mellon Financial Corporation (“Mellon Financial”). Franklin Portfolio Associates, LLC (“Franklin Portfolio”), an affiliate of Dreyfus, serves as the fund’s sub-investment adviser.
Dreyfus Service Corporation (the “Distributor”), a wholly-owned subsidiary of Dreyfus, is the distributor of the fund’s shares. The fund is authorized to issue 500 million shares of $.001 par value Common Stock.The fund currently offers five classes of shares: Class A (100 million shares authorized), Class B (100 million shares authorized), Class C (100 million shares authorized), Class R (100 million shares authorized) and Class T (100 million shares authorized). Class A and Class T shares are subject to a sales charge imposed at the time of purchase. Class B shares are subject to a contingent deferred sales charge (“CDSC”) imposed on Class B share redemptions made within six years of purchase and automatically convert to Class A shares after six years. Class C shares are subject to a CDSC imposed on Class C shares redeemed within one year of purchase and Class R shares are sold at net asset value per share only to institutional investors. Other differences between the classes include the services offered to and the expenses borne by each class and certain voting rights. Income, expenses (other than expenses attributable to a specific class), and realized and unrealized gains or losses on investments are allocated to each class of shares based on its relative net assets.
| | NOTES TO FINANCIAL STATEMENTS (continued)
|
As of August 31, 2005, MBC Investment Corp., an indirect subsidiary of Mellon Financial, held 32,909 Class A shares, 32,696 Class B shares, 32,701 Class C shares, 32,987 Class R shares and 32,835 Class T shares of the fund.
The Company accounts separately for the assets, liabilities and operations of each series. Expenses directly attributable to each series are charged to that series’ operations; expenses which are applicable to all series are allocated among them on a pro rata basis.
The fund’s financial statements are prepared in accordance with U.S. generally accepted accounting principles, which may require the use of management estimates and assumptions. Actual results could differ from those estimates.
The fund enters into contracts that contain a variety of indemnifications. The fund’s maximum exposure under these arrangements is unknown.The fund does not anticipate recognizing any loss related to these arrangements.
(a) Portfolio valuation: Investments in securities are valued at the last sales price on the securities exchange or national securities market on which such securities are primarily traded. Securities listed on the National Market System for which market quotations are available are valued at the official closing price or, if there is no official closing price that day, at the last sale price. Securities not listed on an exchange or the national securities market, or securities for which there were no transactions, are valued at the average of the most recent bid and asked prices, except for open short positions, where the asked price is used for valuation purposes. Bid price is used when no asked price is available. Investments in registered investment companies are valued at their net asset value. When market quotations or official closing prices are not readily available, or are determined not to reflect accurately fair value, such as when the value of a security has been significantly affected by events after the close of the exchange or market on which the security is principally traded (for example, a foreign exchange or market), but
before the fund calculates its net asset value, the fund may value these investments at fair value as determined in accordance with the procedures approved by the Board of Directors. Fair valuing of securities may be determined with the assistance of a pricing service using calculations based on indices of domestic securities and other appropriate indicators, such as prices of relevant ADR’s and futures contracts. For other securities that are fair valued by the Board of Directors, certain factors may be considered such as: fundamental analytical data, the nature and duration of restrictions on disposition, an evaluation of the forces that influence the market in which the securities are purchased and sold, and public trading in similar securities of the issuer or comparable issuers. Financial futures are valued at the last sales price.
(b) Securities transactions and investment income: Securities transactions are recorded on a trade date basis. Realized gain and loss from securities transactions are recorded on the identified cost basis. Dividend income is recognized on the ex-dividend date and interest income, including accretion of discount and amortization of premium on investments, is recognized on the accrual basis.
The fund has an arrangement with the custodian bank whereby the fund receives earnings credits from the custodian when positive cash balances are maintained, which are used to offset custody fees. For financial reporting purposes, the fund includes net earnings credits as an expense offset in the Statement of Operations.
Pursuant to a securities lending agreement with Mellon Bank, N.A., an affiliate of Dreyfus, the fund may lend securities to qualified institutions. At origination, all loans are secured by collateral of at least 102% of the value of U.S. securities loaned and 105% of the value of foreign securities loaned. Collateral equivalent to at least 100% of the market value of securities on loan will be maintained at all times. Cash collateral is invested in certain money market mutual funds managed by Dreyfus.The fund will be entitled to receive all income on securities loaned, in addition to income earned as a result of the lending transaction. Although
| | NOTES TO FINANCIAL STATEMENTS (continued)
|
each security loaned is fully collateralized, the fund would bear the risk of delay in recovery of, or loss of rights in, the securities loaned should a borrower fail to return the securities in a timely manner.
(c) Affiliated issuers: Investments in other investment companies advised by Dreyfus are defined as “affiliated” in the Act.
(d) Dividends to shareholders: Dividends are recorded on the ex-dividend date. Dividends from investment income-net and dividends from net realized capital gain, if any, are normally declared and paid annually, but the fund may make distributions on a more frequent basis to comply with the distribution requirements of the Internal Revenue Code of 1986, as amended (the “Code”).To the extent that net realized capital gain can be offset by capital loss carryovers, it is the policy of the fund not to distribute such gain. Income and capital gain distributions are determined in accordance with income tax regulations, which may differ from U.S. generally accepted accounting principles.
(e) Federal income taxes: It is the policy of the fund to continue to qualify as a regulated investment company, if such qualification is in the best interests of its shareholders, by complying with the applicable provisions of the Code, and to make distributions of taxable income sufficient to relieve it from substantially all federal income and excise taxes.
At August 31, 2005, the components of accumulated earnings on a tax basis were as follows: undistributed ordinary income $72,426, undistributed capital gains $60,162 and unrealized appreciation $268,148.
The tax character of distributions paid to shareholders during the fiscal year ended August 31, 2005 were as follows: ordinary income $59,035 and long-term capital gains $245.
During the period ended August 31, 2005, as a result of permanent book to tax differences primarily due to the tax treatment for real estate investment trusts, the fund decreased accumulated undistributed investment income-net by $21,095, increased accumulated net realized gain (loss) on investments by $819 and increased paid-in capital by $20,276. Net assets were not affected by this reclassification.
NOTE 2—Bank Line of Credit:
|
The fund participates with other Dreyfus-managed funds in a $100 million unsecured line of credit primarily to be utilized for temporary or emergency purposes, including the financing of redemptions. Interest is charged to the fund based on prevailing market rates in effect at the time of borrowings. During the period ended August 31, 2005, the fund did not borrow under the line of credit.
NOTE 3—Investment Advisory Fee, Sub-Investment Advisory Fee and Other Transactions With Affiliates:
(a) Pursuant to an Investment Advisory Agreement (“Agreement”) with Dreyfus, the investment advisory fee is computed at the annual rate of .75% of the value of the fund’s average daily net assets and is payable monthly. Dreyfus has undertaken from September 1, 2004 through August 31, 2006 that, if the fund’s aggregate expenses, exclusive of taxes, brokerage fees, interest on borrowings, Rule 12b-1 distribution plan fees, shareholder services plan fees and extraordinary expenses, exceed an annual rate of 1.25% of the value of the fund’s average daily net assets, the fund may deduct from the payment to be made to Dreyfus under the Agreement, or Dreyfus will bear, such excess expenses. The expense reimbursement, pursuant to the undertaking, amounted to $84,945 during the period ended August 31, 2005.
Pursuant to a Sub-Investment Advisory Agreement between Dreyfus and Franklin Portfolio, the sub-investment advisory fee is payable monthly by Dreyfus, and is based upon the value of the fund’s average daily net assets, computed at the following annual rates:
| Average Net Assets | | |
| 0 to $100 million | | 25% |
| $100 million to $1 billion | | 20% |
| $1 billion to $1.5 billion | | 16% |
| $1.5 billion or more | | 10% |
| | NOTES TO FINANCIAL STATEMENTS (continued)
|
During the period ended August 31, 2005, the Distributor retained $1 from commissions earned on sales of the fund’s Class A shares and $4 from contingent deferred sales charges on redemptions of the fund’s Class B shares.
(b) Under the Distribution Plan (the “Plan”) adopted pursuant to Rule 12b-1 under the Act, Class B, Class C and Class T shares pay the Distributor for distributing their shares at an annual rate of .75% of the value of the average daily net assets of Class B and Class C shares and .25% of the value of the average daily net assets of Class T shares. During the period ended August 31, 2005, Class B, Class C and Class T shares were charged $3,913, $3,902 and $1,157, respectively, pursuant to the Plan.
(c) Under the Shareholder Services Plan, Class A, Class B, Class C and Class T shares pay the Distributor at an annual rate of .25% of the value of their average daily net assets for the provision of certain services.The services provided may include personal services relating to shareholder accounts, such as answering shareholder inquiries regarding the fund and providing reports and other information, and services related to the maintenance of shareholder accounts.The Distributor may make payments to Service Agents (a securities dealer, financial institution or industry professional) in respect of these services. The Distributor determines the amounts to be paid to Service Agents. During the period ended August 31, 2005, Class A, Class B, Class C and Class T shares were charged $1,169, $1,304, $1,301 and $1,157, respectively, pursuant to the Shareholder Services Plan.
The fund compensates Dreyfus Transfer, Inc., a wholly-owned subsidiary of Dreyfus, under a transfer agency agreement for providing personnel and facilities to perform transfer agency services for the fund. During the period ended August 31, 2005, the fund was charged $615 pursuant to the transfer agency agreement.
The fund compensates Mellon Bank, N.A., an affiliate of Dreyfus, under a custody agreement for providing custodial services for the fund. During the period ended August 31, 2005, the fund was charged $2,930 pursuant to the custody agreement.
During the period ended August 31, 2005, the fund was charged $2,520 for services performed by the Chief Compliance Officer.
The components of Due to The Dreyfus Corporation and affiliates in the Statement of Assets and Liabilities consist of: management fees $1,674, Rule 12b-1 distribution plan fees $834, shareholder services plan fees $453, custodian fees $352, chief compliance officer fees $1,533 and transfer agency per account fees $107, which are offset against an expense reimbursement currently in effect in the amount of $4,001.
(d) Each Board member also serves as a Board member of other funds within the Dreyfus complex. Annual retainer fees and attendance fees are allocated to each fund based on net assets.
NOTE 4—Securities Transactions:
The aggregate amount of purchases and sales of investment securities, excluding short-term securities, during the period ended August 31, 2005, amounted to $2,162,626, and $2,006,863, respectively.
At August 31, 2005, the cost of investments for federal income tax purposes was $2,473,409; accordingly, accumulated net unrealized appreciation on investments was $268,148, consisting of $309,416 gross unrealized appreciation and $41,268 gross unrealized depreciation.
In early 2004, two purported class and derivative actions were filed against Mellon Financial, Mellon Bank, N.A., Dreyfus, Founders Asset Management LLC, and certain directors of the Dreyfus Funds and the Dreyfus Founders Funds (together, the “Funds”) in the United States District Court for the Western District of Pennsylvania. In September 2004, plaintiffs served a Consolidated Amended Complaint (the “Amended Complaint”) on behalf of a purported class of all persons who acquired interests in any of the Funds between January 30, 1999 and November 17, 2003, and derivatively on behalf of the Funds.The Amended Complaint in the newly styled In re Dreyfus Mutual Funds Fee Litigation also named the Distributor, Premier Mutual Fund Services, Inc. and two additional Fund directors as defendants and
| | NOTES TO FINANCIAL STATEMENTS (continued)
|
alleges violations of the Investment Company Act of 1940, the Investment Advisers Act of 1940, the Pennsylvania Unfair Trade Practices and Consumer Protection Law and common-law claims. Plaintiffs seek to recover allegedly improper and excessive Rule 12b-1 and advisory fees allegedly charged to the Funds for marketing and distribution services. More specifically, plaintiffs claim, among other things, that 12b-1 fees and directed brokerage were improperly used to pay brokers to recommend the Funds over other funds, and that such payments were not disclosed to investors. In addition, plaintiffs assert that economies of scale and soft-dollar benefits were not passed on to the Funds. Plaintiffs further allege that 12b-1 fees were improperly charged to certain of the Funds that were closed to new investors.The Amended Complaint seeks compensatory and punitive damages, rescission of the advisory contracts, and an accounting and restitution of any unlawful fees, as well as an award of attorneys’ fees and litigation expenses. As noted, some of the claims in this litigation are asserted derivatively on behalf of the Funds that have been named as nominal defendants. With respect to such derivative claims, no relief is sought against the Funds. Dreyfus believes the allegations to be totally without merit and intends to defend the action vigorously. In November 2004, all named defendants moved to dismiss the Amended Complaint in whole or substantial part. Briefing was completed in May 2005.
Additional lawsuits arising out of these circumstances and presenting similar allegations and requests for relief may be filed against the defendants in the future. Neither Dreyfus nor the Funds believe that any of the pending actions will have a material adverse effect on the Funds or Dreyfus’ ability to perform its contract with the Funds.
REPORT OF INDEPENDENT REGISTERED
PUBLIC ACCOUNTING FIRM
|
Shareholders and Board of Directors
Dreyfus Premier Structured Large Cap Value Fund
|
We have audited the accompanying statement of assets and liabilities, including the statement of investments, of Dreyfus Premier Structured Large Cap Value Fund (one of the funds comprising Dreyfus Growth and Value Funds, Inc.) as of August 31, 2005, and the related statement of operations for the year then ended, the statement of changes in net assets for each of the two years in the period then ended and financial highlights for each of the periods indicated therein. These financial statements and financial highlights are the responsibility of the Fund’s management. Our responsibility is to express an opinion on these financial statements and financial highlights based on our audits.
We conducted our audits in accordance with the standards of the Public Company Accounting Oversight Board (United States).Those standards require that we plan and perform the audit to obtain reasonable assurance about whether the financial statements and financial highlights are free of material misstatement.We were not engaged to perform an audit of the Fund’s internal control over financial reporting.Our audits included consideration of internal control over financial reporting as a basis for designing audit procedures that are appropriate in the circumstances,but not for the purpose of expressing an opinion on the effectiveness of the Fund’s internal control over financial reporting.Accordingly, we express no such opinion.An audit also includes examining, on a test basis, evidence supporting the amounts and disclosures in the financial statements and financial highlights, assessing the accounting principles used and significant estimates made by management, and evaluating the overall financial statement presentation. Our procedures included verification by examination of securities held by the custodian as of August 31, 2005 and confirmation of securities not held by the custodian by correspondence with oth-ers.We believe that our audits provide a reasonable basis for our opinion.
In our opinion, the financial statements and financial highlights referred to above present fairly, in all material respects, the financial position of Dreyfus Premier Structured Large Cap Value Fund at August 31, 2005, the results of its operations for the year then ended, the changes in its net assets for each of the two years in the period then ended, and the financial highlights for each of the indicated periods, in conformity with U.S. generally accepted accounting principles.

| | New York, New York
October 14, 2005
|
IMPORTANT TAX INFORMATION (Unaudited)
For federal tax purposes the fund hereby designates 47.66% of the ordinary dividends paid during the fiscal year ended August 31, 2005 as qualifying for the corporate dividends received deduction.Also certain dividends paid by the fund may be subject to a maximum tax rate of 15%, as provided for by the Jobs and Growth Tax Relief Reconciliation Act of 2003. Of the distributions paid during the fiscal year, $44,465 represents the maximum amount that may be considered qualified dividend income. Shareholders will receive notification in January 2006 of the percentage applicable to the preparation of their 2005 income tax returns.Also, the fund designates $.0015 per share as a long-term capital gain distribution of the $.2450 per share paid on December 8, 2004.
INFORMATION ABOUT THE REVIEW AND APPROVAL OF THE
FUND’S MANAGEMENT AGREEMENT (Unaudited)
|
At a meeting of the Board of Directors held on March 14, 2005, the Board considered the re-approval for an annual period of the Fund’s Management Agreement, pursuant to which the Manager provides the Fund with investment advisory and administrative services and the Board also considered the re-approval of the Fund’s Sub-Investment Advisory Agreement with Franklin Portfolio Associates, LLC (“Franklin Associates”), an affiliate of the Manager, pursuant to which Franklin Associates provides day-to-day management of the Fund’s investments subject to the Manager’s oversight.The Board members, none of whom are “interested persons” (as defined in the Investment Company Act of 1940, as amended) of the Fund, were assisted in their review by independent legal counsel and met with counsel in executive session separate from representatives of the Manager and Franklin Associates.
Analysis of Nature, Extent and Quality of Services Provided to the Fund. The Board members received a presentation from representatives of the Manager regarding services provided to the Fund and other funds in the Dreyfus fund complex, and discussed the nature, extent and quality of the services provided to the Fund pursuant to its Management Agreement, and by Franklin Associates pursuant to the Sub-Investment Advisory Agreement.The presentation included a detailed summary of the services provided to Dreyfus-managed mutual funds by each business unit within the Manager. The Manager’s representatives reviewed the Fund’s distribution of accounts and the relationships the Manager has with various intermediaries and the different needs of each. The Manager’s representatives noted the diversity of distribution of the Fund as well as among the funds in the Dreyfus fund complex, and the Manager’s corresponding need for broad, deep, and diverse resources to be able to provide ongoing shareholder services to each of the Fund’s distribution channels. The Board also reviewed the number of shareholder accounts in the Fund, as well as the Fund’s asset size.
The Board members also considered the Manager’s and Franklin Associates’ research and portfolio management capabilities and that the Manager also provides oversight of day-to-day Fund operations, including
| | I N FO R M AT I O N A B O U T T H E R E V I E W A N D A P P R OVA L O F T H E
F U N D ’S M A N A G E M E N T A G R E E M E N T ( U n a u d i t e d ) ( c o n t i n u e d )
|
fund accounting and administration and assistance in meeting legal and regulatory requirements.The Board members also considered the Manager’s extensive administrative, accounting, and compliance infrastructure, as well as the Manager’s supervisory activities over Franklin Associates.
Comparative Analysis of the Fund’s Performance and Management Fee and Expense Ratio. The Board members reviewed the Fund’s performance, management fee and expense ratios and placed significant emphasis on comparisons to a group of comparable funds and Lipper category averages, as applicable. The group of comparable funds was previously approved by the Board for this purpose, and was prepared using a Board-approved selection methodology that was based, in part, on selecting non-affiliated funds reported in the same Lipper category as the Fund.The Board members discussed the results of the comparisons for the 1-year period ended January 31, 2005 (the Fund commenced operations in December 2003), and noted that the Fund’s performance was higher than the comparison group and Lipper category averages for such period.The Board members also discussed the Fund’s management fee and expense ratio and reviewed the range of management fees and expense ratios for the funds in the comparison group.The Fund’s management fee was lower than seven of the nine funds in the comparison group. The Board noted that the Manager, and not the Fund, paid Franklin Associates for its services pursuant to the Sub-Investment Advisory Agreement. The Board noted that the Fund’s total expense ratio (after fee waivers and/or expense reimbursements by the Manager) was lower than the comparison group average, but was higher than the Lipper category average.
Representatives of the Manager reviewed with the Board members the fees paid to the Manager or its affiliates, including Franklin Associates, by mutual funds managed by the Manager or its affiliates with similar investment objectives, policies and strategies as the Fund (the “Similar Funds”), and by other accounts managed or sub-advised by the Manager, Franklin Associates or their affiliates with similar investment objectives, policies and strategies as the Fund (the “Separate Accounts”
and, collectively with the Similar Funds, the “Similar Accounts”).The Manager’s representatives explained the nature of the Similar Accounts and the differences, from the Manager’s perspective, in management of the Similar Accounts as compared to managing and providing services to the Fund; it was noted that the Similar Funds were mutual funds included in the “multi-cap value” funds category by Lipper. The Manager’s representatives also reviewed the costs associated with distribution through intermediaries. The Board analyzed the differences in fees paid to the Manager and discussed the relationship of the advisory fees paid in light of the Manager’s performance and the services provided; it was noted that the Similar Funds had management fees that were the same as the fee borne by the Fund.The Board members considered the relevance of the fee information provided for the Similar Accounts managed by the Manager and Franklin Associates to evaluate the appropriateness and reasonableness of the Fund’s advisory fees.The Board acknowledged that differences in fees paid by the Similar Accounts seemed to be consistent with the services provided.
Analysis of Profitability and Economies of Scale. The Manager’s representatives reviewed the dollar amount of expenses allocated and profit received by the Manager and the method used to determine such expenses and profit. The Board received and considered information prepared by an independent consulting firm regarding the Manager’s approach to allocating costs to, and determining the profitability of, individual funds and the entire Dreyfus fund complex.The Manager’s representatives stated that the methodology had also been reviewed by an independent registered public accounting firm which, like the consultant, found the methodology to be reasonable.The consulting firm also analyzed where any economies of scale might emerge in connection with the management of the Fund.The Board members evaluated the analysis in light of the relevant circumstances for the Fund, and the extent to which economies of scale would be realized as the Fund grows and whether fee levels reflect these economies of scale for the benefit of Fund investors.The Board noted that it appeared that the benefits of any
| | I N FO R M AT I O N A B O U T T H E R E V I E W A N D A P P R OVA L O F T H E
F U N D ’S M A N A G E M E N T A G R E E M E N T ( U n a u d i t e d ) ( c o n t i n u e d )
|
economies of scale also would be appropriately shared with shareholders through increased investment in fund management and administration resources.The Board members also considered potential benefits to the Manager and Franklin Associates from acting as investment adviser and sub-investment adviser, respectively, and reviewed the soft dollar arrangements with respect to trading the Fund’s portfolio.
It was noted that the Board members should consider the Manager’s profitability with respect to the Fund as part of their evaluation of whether the fee under the Management Agreement bears a reasonable relationship to the mix of services provided by the Manager, including the nature, extent and quality of such services and that a discussion of economies of scale is predicated on increasing assets and that, if a fund’s assets had been decreasing, the possibility that the Manager may have realized any economies of scale would be less. Since the Manager, and not the Fund, pays Franklin Associates pursuant to the Sub-Investment Advisory Agreement, the Board did not consider Franklin Associates’ profitability to be relevant to their deliberations.The Board members also discussed the profitability percentage ranges determined by appropriate court cases to be reasonable given the services rendered to investment companies. It was noted that the profitability percentage for managing the Fund was not unreasonable given the Fund’s overall performance and generally superior service levels provided.The Board also noted the current fee waiver and expense reimbursement arrangement and its effect on the profitability of the Manager.
At the conclusion of these discussions,each of the Directors expressed the opinion that he or she had been furnished with sufficient information to make an informed business decision with respect to continuation of the Fund’s Management Agreement and Sub-Investment Advisory Agreement. Based on their discussions and considerations as described above, the Board made the following conclusions and determinations.
- The Board concluded that the nature, extent and quality of the ser- vices provided by the Manager and Franklin Associates are adequate and appropriate.
- The Board was satisfied with the Fund’s overall performance.
- The Board concluded that the fee paid to the Manager by the Fund was reasonable in light of comparative performance and expense and advisory fee information, including the Manager’s current undertak- ing to waive or reimburse certain fees and expenses of the Fund, costs of the services provided and profits to be realized and benefits derived or to be derived by the Manager from its relationship with the Fund.
- The Board determined that the economies of scale which may accrue to the Manager and its affiliates in connection with the man- agement of the Fund had been adequately considered by the Manager in connection with the management fee rate charged to the Fund, and that, to the extent in the future it were to be deter- mined that material economies of scale had not been shared with the Fund, the Board would seek to have those economies of scale shared with the Fund.
The Board members considered these conclusions and determinations, along with the information received on a routine and regular basis throughout the year, and, without any one factor being dispositive, the Board determined that re-approval of the Fund’s Management Agreement with the Manager and Sub-Investment Advisory Agreement with Franklin Associates was in the best interests of the Fund and its shareholders.
BOARD MEMBERS INFORMATION (Unaudited)
| | Joseph S. DiMartino (61)
Chairman of the Board (1995)
|
| Principal Occupation During Past 5 Years: |
| • Corporate Director and Trustee |
| Other Board Memberships and Affiliations: |
| • The Muscular Dystrophy Association, Director |
| • Levcor International, Inc., an apparel fabric processor, Director |
| • Century Business Services, Inc., a provider of outsourcing functions for small and medium size |
| companies, Director |
| • The Newark Group, a provider of a national market of paper recovery facilities, paperboard |
| mills and paperboard converting plants, Director |
| • Azimuth Trust, an institutional asset management firm, Member of Board of Managers and |
| Advisory Board |
| • Sunair Electronics, Inc., engages in the design, manufacture and sale of high frequency systems |
| for long-range voice and data communications, as well as providing certain outdoor-related |
| services to homes and businesses, Director |
No. of Portfolios for which Board Member Serves: 193
| | David P. Feldman (65)
Board Member (1996)
|
| Principal Occupation During Past 5 Years: |
| • Corporate Director & Trustee |
| | Other Board Memberships and Affiliations:
|
- BBH Mutual Funds Group (11 funds), Director
- The Jeffrey Company, a private investment company, Director
- QMED, a medical device company, Director
No. of Portfolios for which Board Member Serves: 58
| | Ehud Houminer (65)
Board Member (1993)
|
| | Principal Occupation During Past 5 Years:
|
- Executive-in-Residence at the Columbia Business School, Columbia University
- Principal of Lear,Yavitz and Associates, a management consulting firm (1996 to 2001)
| | Other Board Memberships and Affiliations:
|
- Avnet Inc., an electronics distributor, Director
- International Advisory Board to the MBA Program School of Management, Ben Gurion University, Chairman
- Explore Charter School, Brooklyn, NY, Chairman
| | No. of Portfolios for which Board Member Serves: 36
|
| | Gloria Messinger (75)
Board Member (1993)
|
| | Principal Occupation During Past 5 Years:
|
- Arbitrator for American Arbitration Association and National Association of Securities Dealers, Inc.
- Consultant in Intellectual Property
| | Other Board Memberships and Affiliations:
|
- Yale Law School Fund, Director
- Theater for a New Audience, Inc., Director
- Brooklyn Philharmonic, Director
- New York Women’s Agenda Music Performance Trust Fund, Director
| | No. of Portfolios for which Board Member Serves: 25
|
T. John Szarkowski (79) Board Member (1996)
| Principal Occupation During Past 5 Years: |
| • Consultant in Photography |
| Other Board Memberships and Affiliations: |
| • Photography Department at The Museum of Modern Art, Director Emeritus |
| | No. of Portfolios for which Board Member Serves: 25
|
| | Anne Wexler (75)
Board Member (1996)
|
| | Principal Occupation During Past 5 Years:
|
- Chairman of the Wexler & Walker Public Policy Associates, consultants specializing in government relations and public affairs
| | Other Board Memberships and Affiliations:
|
- Wilshire Mutual Funds (5 funds), Director
- Methanex Corporation, a methanol producing company, Director
- Member of the Council of Foreign Relations
- Member of the National Park Foundation
| | No. of Portfolios for which Board Member Serves: 36
|
Once elected all Board Members serve for an indefinite term.The address of the Board Members and Officers is in c/o The Dreyfus Corporation, 200 Park Avenue, New York, New York 10166. Additional information about the Board Members is available in the fund’s Statement of Additional Information which can be obtained from Dreyfus free of charge by calling this toll free number: 1-800-554-4611.
John M. Fraser, Jr., Emeritus Board Member
OFFICERS OF THE FUND (Unaudited)
| STEPHEN E. CANTER, President since | | JAMES BITETTO, Vice President and |
| March 2000. | | Assistant Secretary since August 2005. |
| Chairman of the Board, Chief Executive | | Assistant General Counsel and Assistant |
| Officer and Chief Operating Officer of | | Secretary of Dreyfus, and an officer of 91 |
| Dreyfus, and an officer of 90 investment | | investment companies (comprised of 200 |
| companies (comprised of 184 portfolios) | | portfolios) managed by Dreyfus. He is 39 years |
| managed by Dreyfus. Mr. Canter also is a | | old and has been an employee of Dreyfus since |
| Board member and, where applicable, an | | December 1996. |
| |
| Executive Committee Member of the other | | JONI LACKS CHARATAN, Vice President |
| investment management subsidiaries of Mellon | | and Assistant Secretary since |
| Financial Corporation, each of which is an | | August 2005. |
| affiliate of Dreyfus. He is 60 years old and has | | |
| been an employee of Dreyfus since May 1995. | | Assistant General Counsel and Assistant |
| | | Secretary of Dreyfus, and an officer of 91 |
| STEPHEN R. BYERS, Executive Vice | | investment companies (comprised of 200 |
| President since November 2002. | | portfolios) managed by Dreyfus. She is 49 years |
| Chief Investment Officer,Vice Chairman and | | old and has been an employee of Dreyfus since |
| a director of Dreyfus, and an officer of 90 | | October 1998. |
| |
| investment companies (comprised of 184 | | JOSEPH M. CHIOFFI, Vice President and |
| portfolios) managed by Dreyfus. Mr. Byers | | Assistant Secretary since August 2005. |
| also is an officer, director or an Executive | | |
| Committee Member of certain other | | Assistant General Counsel and Assistant |
| investment management subsidiaries of | | Secretary of Dreyfus, and an officer of 91 |
| Mellon Financial Corporation, each of which | | investment companies (comprised of 200 |
| is an affiliate of Dreyfus. He is 52 years old | | portfolios) managed by Dreyfus. He is 43 years |
| and has been an employee of Dreyfus since | | old and has been an employee of Dreyfus since |
| January 2000. | | July 2000. |
| |
| MARK N. JACOBS, Vice President since | | JANETTE E. FARRAGHER, Vice President |
| March 2000. | | and Assistant Secretary since |
| | | August 2005. |
| Executive Vice President, Secretary and | | |
| General Counsel of Dreyfus, and an officer of | | Associate General Counsel of Dreyfus, and an |
| 91 investment companies (comprised of 200 | | officer of 91 investment companies (comprised |
| portfolios) managed by Dreyfus. He is 59 years | | of 200 portfolios) managed by Dreyfus. She is |
| old and has been an employee of Dreyfus since | | 42 years old and has been an employee of |
| June 1977. | | Dreyfus since February 1984. |
| |
| MICHAEL A. ROSENBERG, Vice President | | JOHN B. HAMMALIAN, Vice President and |
| and Secretary since August 2005. | | Assistant Secretary since August 2005. |
| Associate General Counsel of Dreyfus, and an | | Associate General Counsel of Dreyfus, and an |
| officer of 91 investment companies (comprised | | officer of 91 investment companies (comprised |
| of 200 portfolios) managed by Dreyfus. He is | | of 200 portfolios) managed by Dreyfus. He is |
| 45 years old and has been an employee of | | 42 years old and has been an employee of |
| Dreyfus since October 1991. | | Dreyfus since February 1991. |
| ROBERT R. MULLERY, Vice President and | | ROBERT SVAGNA, Assistant Treasurer |
| Assistant Secretary since August 2005. | | since December 2002. |
| Associate General Counsel of Dreyfus, and an | | Senior Accounting Manager – Equity Funds of |
| officer of 91 investment companies (comprised | | Dreyfus, and an officer of 91 investment |
| of 200 portfolios) managed by Dreyfus. He is | | companies (comprised of 200 portfolios) |
| 53 years old and has been an employee of | | managed by Dreyfus. He is 38 years old and |
| Dreyfus since May 1986. | | has been an employee of Dreyfus since |
| |
| JEFF PRUSNOFSKY, Vice President and | | November 1990. |
| Assistant Secretary since August 2005. | | KENNETH J. SANDGREN, Assistant |
| Associate General Counsel of Dreyfus, and an | | Treasurer since November 2001. |
| officer of 91 investment companies (comprised | | Mutual Funds Tax Director of Dreyfus, and an |
| of 200 portfolios) managed by Dreyfus. He is | | officer of 91 investment companies (comprised |
| 40 years old and has been an employee of | | of 200 portfolios) managed by Dreyfus. He is |
| Dreyfus since October 1990. | | 51 years old and has been an employee of |
| |
| JAMES WINDELS, Treasurer since | | Dreyfus since June 1993. |
| November 2001. | | JOSEPH W. CONNOLLY, Chief Compliance |
| Director – Mutual Fund Accounting of | | Officer since October 2004. |
| Dreyfus, and an officer of 91 investment | | Chief Compliance Officer of Dreyfus and The |
| companies (comprised of 200 portfolios) | | Dreyfus Family of Funds (91 investment |
| managed by Dreyfus. He is 46 years old and has | | companies, comprising 200 portfolios). From |
| been an employee of Dreyfus since April 1985. | | November 2001 through March 2004, Mr. |
| |
| GREGORY S. GRUBER, Assistant | | Connolly was first Vice-President, Mutual Fund |
| Treasurer since August 2005. | | Servicing for Mellon Global Securities |
| | | Services. In that capacity, Mr. Connolly was |
| Senior Accounting Manager – Municipal Bond | | responsible for managing Mellon’s Custody, |
| Funds of Dreyfus, and an officer of 91 | | Fund Accounting and Fund Administration |
| investment companies (comprised of 200 | | services to third-party mutual fund clients. He |
| portfolios) managed by Dreyfus. He is 46 years | | is 48 years old and has served in various |
| old and has been an employee of Dreyfus since | | capacities with Dreyfus since 1980, including |
| August 1981. | | manager of the firm’s Fund Accounting |
| ERIK D. NAVILOFF, Assistant Treasurer | | Department from 1997 through October 2001. |
| since August 2005. | | WILLIAM GERMENIS, Anti-Money |
| Senior Accounting Manager – Taxable Fixed | | Laundering Compliance Officer since |
| Income Funds of Dreyfus, and an officer of 91 | | October 2002. |
| investment companies (comprised of 200 | | Vice President and Anti-Money Laundering |
| portfolios) managed by Dreyfus. He is 37 years | | Compliance Officer of the Distributor, and the |
| old and has been an employee of Dreyfus since | | Anti-Money Laundering Compliance Officer |
| November 1992. | | of 88 investment companies (comprised of 197 |
| ROBERT ROBOL, Assistant Treasurer | | portfolios) managed by Dreyfus. He is 35 years |
| since August 2005. | | old and has been an employee of the |
| | | Distributor since October 1998. |
| Senior Accounting Manager – Money Market | | |
| Funds of Dreyfus, and an officer of 91 | | |
| investment companies (comprised of 200 | | |
| portfolios) managed by Dreyfus. He is 41 years | | |
| old and has been an employee of Dreyfus since | | |
| October 1988. | | |
| For More | | Information |
| |
|
| |
| |
| |
| Dreyfus Premier | | Custodian |
| |
| Structured Large Cap | | |
| | | Mellon Bank, N.A. |
| Value Fund | | |
| | | One Mellon Bank Center |
| 200 Park Avenue | | |
| | | Pittsburgh, PA 15258 |
| New York, NY 10166 | | |
| |
| | | Transfer Agent & |
| |
| Investment Adviser | | Dividend Disbursing Agent |
| |
| The Dreyfus Corporation | | |
| | | Dreyfus Transfer, Inc. |
| 200 Park Avenue | | |
| | | 200 Park Avenue |
| New York, NY 10166 | | |
| | | New York, NY 10166 |
| |
| |
| Sub-Investment Adviser | | Distributor |
| |
| Franklin Portfolio Associates, LLC |
| | | Dreyfus Service Corporation |
| One Boston Place | | |
| | | 200 Park Avenue |
| Boston, MA 02108 | | |
| | | New York, NY 10166 |
Telephone Call your financial representative or 1-800-554-4611
| Mail | | The Dreyfus Premier Family of Funds |
| | | 144 Glenn Curtiss Boulevard, Uniondale, NY 11556-0144 |
The fund files its complete schedule of portfolio holdings with the Securities and Exchange Commission (“SEC”) for the first and third quarters of each fiscal year on Form N-Q. The fund’s Forms N-Q are available on the SEC’s website at http://www.sec.gov and may be reviewed and copied at the SEC’s Public Reference Room in Washington, DC. Information on the operation of the Public Reference Room may be obtained by calling 1-800-SEC-0330.
A description of the policies and procedures that the fund uses to determine how to vote proxies relating to portfolio securities, and information regarding how the fund voted these proxies for the 12-month period ended June 30, 2005, is available at http://www.dreyfus.com and on the SEC’s website at http://www.sec.gov. The description of the policies and procedures is also available without charge, upon request, by calling 1-800-645-6561.

Save time. Save paper. View your next shareholder report online as soon as it’s available. Log into www.dreyfus.com and sign up for Dreyfus eCommunications. It’s simple and only takes a few minutes.
The views expressed in this report reflect those of the portfolio manager only through the end of the period covered and do not necessarily represent the views of Dreyfus or any other person in the Dreyfus organization. Any such views are subject to change at any time based upon market or other conditions and Dreyfus disclaims any responsibility to update such views.These views may not be relied on as investment advice and, because investment decisions for a Dreyfus fund are based on numerous factors, may not be relied on as an indication of trading intent on behalf of any Dreyfus fund.
Not FDIC-Insured • Not Bank-Guaranteed • May Lose Value
| | | Contents |
| |
| | | THE FUND |
| |
|
| 2 | | Letter from the Chairman |
| 3 | | Discussion of Fund Performance |
| 6 | | Fund Performance |
| 8 | | Understanding Your Fund’s Expenses |
| 8 | | Comparing Your Fund’s Expenses |
| | | With Those of Other Funds |
| 9 | | Statement of Investments |
| 15 | | Statement of Assets and Liabilities |
| 16 | | Statement of Operations |
| 17 | | Statement of Changes in Net Assets |
| 19 | | Financial Highlights |
| 24 | | Notes to Financial Statements |
| 32 | | Report of Independent Registered |
| | | Public Accounting Firm |
| 33 | | Important Tax Information |
| 34 | | Information About the Review and Approval |
| | | of the Fund’s Management Agreement |
| 39 | | Board Members Information |
| 41 | | Officers of the Fund |
| |
| | | FOR MORE INFORMATION |
| |
|
| | | Back Cover |
The Fund
| | Dreyfus Premier
Structured Midcap Fund
|

LETTER FROM THE CHAIRMAN
This annual report for Dreyfus Premier Structured Midcap Fund covers the 12-month period from September 1, 2004, through August 31, 2005. Inside, you’ll find valuable information about how the fund was managed during the reporting period, including a discussion with the fund’s portfolio manager, Michael Dunn.
On average, stock prices ended the reporting period higher than where they began. However, most of the market’s gains occurred during the closing months of 2004. So far in 2005, positive factors, including steady economic growth and higher corporate profits, were largely offset by headwinds, such as sharply higher energy prices and rising short-term interest rates. Midcap stocks produced higher returns than small-cap stocks in this environment, and small-cap stocks outperformed large-cap stocks. Also, value-oriented stocks have generally produced better results than their more growth-oriented counterparts during the past 12 months.
Recent shocks to the U.S. economy — including sharply higher gasoline prices and other lingering consequences of Hurricane Katrina — have added a degree of uncertainty to the economic outlook.Nonetheless,our economists currently expect the economy to continue to grow without either entering a recession or triggering a significant acceleration of infla-tion.As always, we encourage you to discuss the potential implications of these and other matters with your financial advisor.
Thank you for your continued confidence and support.


DISCUSSION OF FUND PERFORMANCE
Michael Dunn, Portfolio Manager
|
How did Dreyfus Premier Structured Midcap Fund perform
relative to its benchmark?
|
For the 12-month period ended August 31, 2005, the fund produced total returns of 22.88% for Class A shares, 21.90% for Class B shares, 21.91% for Class C shares, 23.05% for Class R shares and 22.60% for Class T shares.1 In comparison, the fund’s benchmark, the Standard & Poor’s MidCap 400 Index (“S&P 400 Index”), produced a total return of 24.82% for the same period.2
An improving U.S. economy and rising corporate earnings more than offset concerns related to rising interest rates and soaring energy prices, fueling gains for midcap stocks during the reporting period.The fund’s returns modestly trailed its benchmark, mainly due to limited participation in some of the better-performing stocks in the S&P 400 Index.
What is the fund’s investment approach?
The fund seeks long-term capital growth.To pursue this goal, the fund invests primarily in a blended portfolio of growth and value stocks of midsize companies. The fund’s stock investments may include U.S. common stocks, preferred stocks and convertible securities of U.S. and foreign issuers.
When selecting stocks for the fund, we utilize a “bottom-up,” structured approach that seeks to identify undervalued securities using a quantitative screening process. This process is driven by computer models that identify and rank stocks based on:
- Fundamental momentum, meaning measures that reflect the changes in short-term earnings outlook through factors such as revised earn- ings estimates and earnings surprises;
- Relative value, such as current and forecasted price-to-earnings ratios, price-to-book ratios, yields and other price-sensitive data for a stock compared to its past, its peers and the models’ overall stock universe;
| | DISCUSSION OF FUND PERFORMANCE (continued)
|
- Long-term growth, based on measures that reflect the changes in esti- mated long-term earnings growth over multiple horizons; and
- Additional factors, such as trading by company insiders or share issuance/buy-back data.
We select what we believe to be the most attractive of the top-ranked securities for the fund. We will generally sell a stock that falls below the median ranking, and we may reinvest the proceeds in a higher-ranked security in order to remain fully invested.
What other factors influenced the fund’s performance?
The U.S. economy strengthened moderately over the first half of the reporting period, fueling a sharp stock market rally during the closing weeks of 2004. Corporate profitability and balance sheets improved, and a long-awaited increase in capital spending among businesses began to materialize. Despite rising oil and natural gas prices, consumer spending remained strong, and the labor market added jobs. By the second half of the reporting period, however, rising oil prices and short-term interest rates began to weigh more heavily on investor sentiment.However,mid-cap stocks continued to gain value, ending the reporting period with higher returns than their large- and small-cap counterparts.
Although the fund participated to a substantial degree in the midcap market’s strength, its returns lagged its benchmark, mainly due to its limited participation in a handful of the better-performing stocks in the S&P 400 Index.A significant portion of the fund’s relative underperfor-mance can be attributed to its lack of exposure to Peabody Energy,a coal company that produced particularly strong gains amid rising demand for alternative energy sources. In addition, during the first half of the reporting period, the fund’s returns were hindered by its relatively light positions in S&P 400 Index components Cognizant Technology Solutions, a provider of outsourced technology services, and Lyondell Chemical, a producer of basic chemicals and their derivatives.
On the other hand, the fund scored successes in four key areas. Not surprisingly, energy stocks posted especially strong absolute returns as
oil and gas prices soared, and relatively heavy exposure to the energy sector contributed positively to the fund’s performance. In the health care area, the fund’s position in health insurer CIGNA and its lack of exposure to some of the S&P 400 Index’s larger pharmaceutical companies helped bolster returns. Finally, the fund did not participate in some of the benchmark’s poorer-performing retailers, restaurants and publishing firms, which helped support its relative performance in the consumer cyclical and consumer services sectors.
What is the fund’s current strategy?
We have continued to maintain the fund’s roughly neutral sector allocation strategy, in which we strive to maintain weightings across industry groups that roughly match those of the S&P 400 Index.This strategy is designed to help manage risk, and it enables us to focus on adding value within each sector through our disciplined security selection process. However, as some industry groups gained value during the reporting period, their weightings increased modestly. Conversely, weightings declined somewhat for industry groups that lagged the averages. Accordingly, we recently have trimmed or added to positions in various market sectors in an attempt to maintain the fund’s sector-neutral strategy relative to the S&P 400 Index.
| 1 | | Total return includes reinvestment of dividends and any capital gains paid, and does not take into |
| | | consideration the maximum initial sales charges in the case of Class A and Class T shares, or the |
| | | applicable contingent deferred sales charges imposed on redemptions in the case of Class B and |
| | | Class C shares. Had these charges been reflected, returns would have been lower. Past performance |
| | | is no guarantee of future results. Share price, yield and investment return fluctuate such that upon |
| | | redemption, fund shares may be worth more or less than their original cost. Return figures |
| | | provided reflect the absorption of fund expenses by The Dreyfus Corporation pursuant to an |
| | | agreement in effect through August 31, 2006, at which time it may be extended, terminated or |
| | | modified. Had these expenses not been absorbed, the fund’s returns would have been lower. |
| 2 | | SOURCE: LIPPER INC. — Reflects reinvestment of dividends and, where applicable, capital |
| | | gain distributions.The Standard & Poor’s MidCap 400 Index is a widely accepted, unmanaged |
| | | total return index measuring the performance of the midsize company segment of the U.S. market. |
FUND PERFORMANCE
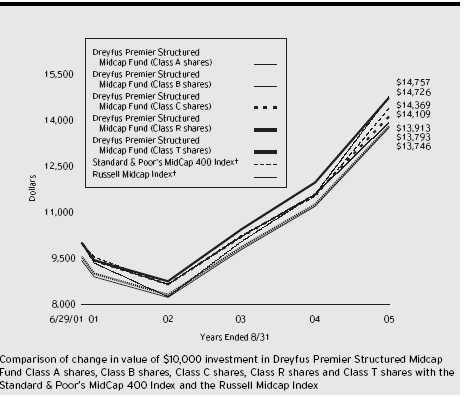
† Source: Lipper Inc.
Past performance is not predictive of future performance.
The above graph compares a $10,000 investment made in Class A, Class B, Class C, Class R and Class T shares of Dreyfus Premier Structured Midcap Fund on 6/29/01 (inception date) to a $10,000 investment made in the Standard & Poor’s MidCap 400 Index (the “S&P 400 Index”) and the Russell Midcap Index on that date. All dividends and capital gain distributions are reinvested.
The fund’s performance shown in the line graph takes into account the maximum initial sales charges on Class A and Class T shares, the applicable contingent deferred sales charge on Class B shares and all other applicable fees and expenses on all classes.The S&P 400 Index is a widely accepted, unmanaged total return index measuring the performance of the midsize company segment of the U.S. market.The Russell Midcap Index is a widely accepted, unmanaged index of medium-cap stock market performance.The foregoing indices do not take into account charges, fees and other expenses. Further information relating to fund performance, including expense reimbursements, if applicable, is contained in the Financial Highlights section of the prospectus and elsewhere in this report.
| Average Annual Total Returns as of 8/31/05 | | | | |
| |
| | | | | Inception | | | | From |
| | | | | Date | | 1 Year | | Inception |
| |
| |
| |
| |
|
| Class A shares | | | | | | |
| with maximum sales charge (5.75%) | | 6/29/01 | | 15.81% | | 7.93% |
| without sales charge | | 6/29/01 | | 22.88% | | 9.47% |
| Class B shares | | | | | | |
| with applicable redemption charge † | | 6/29/01 | | 17.90% | | 8.24% |
| without redemption | | 6/29/01 | | 21.90% | | 8.61% |
| Class C shares | | | | | | |
| with applicable redemption charge †† | | 6/29/01 | | 20.91% | | 8.61% |
| without redemption | | 6/29/01 | | 21.91% | | 8.61% |
| Class R shares | | 6/29/01 | | 23.05% | | 9.73% |
| Class T shares | | | | | | |
| with applicable sales charge (4.5%) | | 6/29/01 | | 17.09% | | 8.02% |
| without sales charge | | 6/29/01 | | 22.60% | | 9.22% |
| |
| Past performance is not predictive of future performance.The fund’s performance shown in the graph and table does not |
| reflect the deduction of taxes that a shareholder would pay on fund distributions or the redemption of fund shares. |
| † | | The maximum contingent deferred sales charge for Class B shares is 4%. After six years Class B shares convert to |
| | | Class A shares. | | | | | | |
| †† | | The maximum contingent deferred sales charge for Class C shares is 1% for shares redeemed within one year of the |
| | | date of purchase. | | | | | | |
UNDERSTANDING YOUR FUND’S EXPENSES(Unaudited)
As a mutual fund investor, you pay ongoing expenses, such as management fees and other expenses. Using the information below, you can estimate how these expenses affect your investment and compare them with the expenses of other funds.You also may pay one-time transaction expenses, including sales charges (loads) and redemption fees, which are not shown in this section and would have resulted in higher total expenses. For more information, see your fund’s prospectus or talk to your financial adviser.
Review your fund’s expenses
The table below shows the expenses you would have paid on a $1,000 investment in Dreyfus Premier Structured Midcap Fund from March 1, 2005 to August 31, 2005. It also shows how much a $1,000 investment would be worth at the close of the period, assuming actual returns and expenses.
| | Expenses and Value of a $1,000 Investment
assuming actual returns for the six months ended August 31, 2005
|
| | | Class A | | Class B | | Class C | | Class R | | Class T |
| |
| |
| |
| |
| |
|
| Expenses paid per $1,000 † | | $ 7.54 | | $ 11.91 | | $ 11.55 | | $ 8.01 | | $ 8.88 |
| Ending value (after expenses) | | $1,049.10 | | $1,044.90 | | $1,044.90 | | $1,049.20 | | $1,047.60 |
| | COMPARING YOUR FUND’S EXPENSES
WITH THOSE OF OTHER FUNDS (Unaudited)
|
Using the SEC’s method to compare expenses
The Securities and Exchange Commission (SEC) has established guidelines to help investors assess fund expenses. Per these guidelines, the table below shows your fund’s expenses based on a $1,000 investment, assuming a hypothetical 5% annualized return. You can use this information to compare the ongoing expenses (but not transaction expenses or total cost) of investing in the fund with those of other funds.All mutual fund shareholder reports will provide this information to help you make this comparison. Please note that you cannot use this information to estimate your actual ending account balance and expenses paid during the period.
Expenses and Value of a $1,000 Investment
assuming a hypothetical 5% annualized return for the six months ended August 31, 2005
|
| | | Class A | | Class B | | Class C | | Class R | | Class T |
| |
| |
| |
| |
| |
|
| Expenses paid per $1,000 † | | $ 7.43 | | $ 11.72 | | $ 11.37 | | $ 7.88 | | $ 8.74 |
| Ending value (after expenses) | | $1,017.85 | | $1,013.56 | | $1,013.91 | | $1,017.39 | | $1,016.53 |
† Expenses are equal to the fund’s annualized expense ratio of 1.46% for Class A, 2.31% for Class B, 2.24% for Class C, 1.55% for Class R and 1.72% for Class T; multiplied by the average account value over the period, multiplied by 184/365 (to reflect the one-half year period).
STATEMENT OF INVESTMENTS
August 31, 2005
|
| Common Stocks—93.7% | | Shares | | Value ($) |
| |
| |
|
| Chemicals—1.0% | | | | |
| Rohm & Haas | | 9,300 | | 403,713 |
| Commercial & Professional Services—7.9% | | |
| Arrow Electronics | | 12,200 a | | 363,804 |
| Avnet | | 12,800 a | | 320,640 |
| CDW | | 11,400 | | 673,512 |
| Copart | | 5,700 a | | 140,733 |
| Dun & Bradstreet | | 3,000 a | | 191,010 |
| Harte-Hanks | | 4,700 | | 120,602 |
| Ingram Micro, Cl. A | | 15,200 a | | 266,152 |
| Korn/Ferry International | | 11,900 a | | 235,858 |
| Manpower | | 14,700 | | 662,382 |
| MSC Industrial Direct, Cl. A | | 4,600 | | 161,000 |
| WW Grainger | | 2,300 | | 147,936 |
| | | | | 3,283,629 |
| Consumer Durables—3.9% | | | | |
| Furniture Brands International | | 9,600 | | 183,456 |
| KB HOME | | 2,300 | | 170,568 |
| Lennar, Cl. A | | 6,900 | | 428,490 |
| Polaris Industries | | 2,900 | | 152,772 |
| Ryland Group | | 3,300 | | 238,788 |
| Standard Pacific | | 3,600 | | 158,148 |
| Toll Brothers | | 5,800 a | | 278,690 |
| | | | | 1,610,912 |
| Consumer Non-Durables—3.0% | | | | |
| Blyth | | 11,500 | | 285,775 |
| Hormel Foods | | 7,800 | | 248,742 |
| PepsiAmericas | | 16,600 | | 418,652 |
| Pilgrim’s Pride | | 8,400 | | 284,760 |
| | | | | 1,237,929 |
| Consumer Services—6.6% | | | | |
| Boyd Gaming | | 9,700 | | 451,341 |
| Darden Restaurants | | 8,600 | | 270,126 |
| Education Management | | 9,300 a | | 314,991 |
| Entercom Communications | | 9,900 a | | 331,155 |
| | STATEMENT OF INVESTMENTS (continued)
|
| Common Stocks (continued) | | Shares | | Value ($) |
| |
| |
|
| Consumer Services (continued) | | | | |
| GTECH Holdings | | 20,200 | | 577,316 |
| Marriott International, Cl. A | | 2,500 | | 158,025 |
| Meredith | | 6,000 | | 294,600 |
| Sotheby’s Holdings, Cl. A | | 19,500 a | | 339,105 |
| | | | | 2,736,659 |
| Electronic Technology—8.6% | | | | |
| Amphenol, Cl. A | | 10,300 | | 436,823 |
| CommScope | | 22,600 a | | 422,620 |
| F5 Networks | | 2,400 a | | 99,096 |
| Imation | | 3,200 | | 134,752 |
| KLA-Tencor | | 6,900 | | 350,244 |
| L-3 Communications Holdings | | 3,700 | | 302,956 |
| Lam Research | | 19,700 a | | 624,490 |
| Microchip Technology | | 8,700 | | 270,744 |
| Thermo Electron | | 8,400 a | | 234,360 |
| Western Digital | | 51,100 a | | 707,735 |
| | | | | 3,583,820 |
| Energy Minerals—2.4% | | | | |
| Chesapeake Energy | | 8,700 | | 275,007 |
| Murphy Oil | | 7,700 | | 420,805 |
| Premcor | | 3,100 b | | 289,199 |
| | | | | 985,011 |
| Finance—15.8% | | | | |
| American Financial Group | | 13,500 | | 452,655 |
| AmeriCredit | | 26,300 a | | 655,922 |
| ChoicePoint | | 5,600 a | | 240,408 |
| Comerica | | 3,600 | | 217,764 |
| Crescent Real Estate Equities | | 16,700 | | 327,821 |
| Fidelity National Financial | | 5,900 | | 230,808 |
| First American | | 7,700 | | 320,397 |
| First Horizon National | | 6,900 | | 269,652 |
| Common Stocks (continued) | | Shares | | Value ($) |
| |
| |
|
| Finance (continued) | | | | |
| GATX | | 10,800 | | 437,724 |
| HCC Insurance Holdings | | 10,000 | | 266,500 |
| Host Marriott | | 15,600 | | 272,844 |
| IndyMac Bancorp | | 9,900 | | 394,317 |
| Jefferies Group | | 9,300 | | 367,164 |
| Nationwide Financial Services, Cl. A | | 3,500 | | 134,960 |
| Ohio Casualty | | 16,800 | | 424,368 |
| Old Republic International | | 12,000 | | 302,040 |
| Rayonier | | 4,900 | | 265,825 |
| TCF Financial | | 13,900 | | 393,509 |
| WR Berkley | | 9,975 | | 354,013 |
| Weingarten Realty Investors | | 4,500 | | 173,475 |
| Wilmington Trust | | 2,300 | | 83,858 |
| | | | | 6,586,024 |
| Health Technology—4.8% | | | | |
| Applera—Applied Biosystems Group | | 9,900 | | 212,850 |
| Edwards Lifesciences | | 14,000 a | | 616,000 |
| Invitrogen | | 8,000 a | | 677,840 |
| Millipore | | 4,300 a | | 274,985 |
| Steris | | 9,300 | | 231,942 |
| | | | | 2,013,617 |
| Industrial Services—4.7% | | | | |
| BJ Services | | 3,200 | | 201,856 |
| Grant Prideco | | 14,700 a | | 541,842 |
| Patterson-UTI Energy | | 18,300 | | 622,566 |
| Weatherford International | | 8,400 a | | 568,764 |
| | | | | 1,935,028 |
| Interest Sensitive—1.4% | | | | |
| Bear Stearns Cos. | | 1,900 | | 190,950 |
| Zions Bancorporation | | 5,700 | | 398,202 |
| | | | | 589,152 |
| | STATEMENT OF INVESTMENTS (continued)
|
| Common Stocks (continued) | | Shares | | Value ($) |
| |
| |
|
| Medical Equipment—.4% | | | | |
| Intuitive Surgical | | 2,300 a | | 171,120 |
| Non-Energy Minerals—3.0% | | | | |
| Freeport-McMoRan Copper & Gold, Cl. B | | 9,800 | | 413,266 |
| Martin Marietta Materials | | 2,600 | | 188,032 |
| Nucor | | 4,100 | | 231,568 |
| Phelps Dodge | | 3,800 | | 408,614 |
| | | | | 1,241,480 |
| Oil & Gas/Exploration & Production—.5% | | |
| XTO Energy | | 5,700 | | 226,860 |
| Process Industries—2.1% | | | | |
| AptarGroup | | 2,300 | | 114,379 |
| FMC | | 4,200 a | | 239,232 |
| Lubrizol | | 8,800 | | 363,880 |
| Sensient Technologies | | 8,600 | | 161,422 |
| | | | | 878,913 |
| Producer Manufacturing—4.1% | | | | |
| Autoliv | | 6,800 | | 302,600 |
| Energizer Holdings | | 4,900 a | | 318,010 |
| Thomas & Betts | | 13,500 a | | 479,790 |
| Timken | | 20,600 | | 605,022 |
| | | | | 1,705,422 |
| Retail Trade—5.3% | | | | |
| Abercrombie & Fitch, Cl. A | | 4,800 | | 266,928 |
| American Eagle Outfitters | | 19,700 | | 564,011 |
| Dollar General | | 20,500 | | 390,730 |
| Michaels Stores | | 18,900 | | 686,070 |
| Pacific Sunwear of California | | 12,500 a | | 298,500 |
| | | | | 2,206,239 |
| Common Stocks (continued) | | Shares | | Value ($) |
| |
| |
|
| Technology Services—9.2% | | | | |
| CheckFree | | 13,700 a | | 504,023 |
| CIGNA | | 2,400 | | 276,768 |
| Community Health Systems | | 17,600 a | | 648,208 |
| Fiserv | | 6,900 a | | 309,603 |
| Keane | | 8,500 a | | 97,750 |
| LifePoint Hospitals | | 3,900 a | | 177,372 |
| Lincare Holdings | | 14,500 a | | 613,930 |
| McAfee | | 16,800 a | | 514,920 |
| Triad Hospitals | | 3,400 a | | 163,676 |
| Universal Health Services, Cl. B | | 10,000 | | 511,100 |
| | | | | 3,817,350 |
| Transportation—3.0% | | | | |
| CSX | | 6,400 | | 281,152 |
| JB Hunt Transport Services | | 27,300 | | 493,311 |
| Swift Transportation | | 12,800 a | | 255,232 |
| Yellow Roadway | | 4,800 a | | 224,880 |
| | | | | 1,254,575 |
| Utilities—6.0% | | | | |
| DPL | | 16,800 | | 453,432 |
| Energy East | | 17,100 | | 448,362 |
| Equitable Resources | | 7,300 | | 550,420 |
| ONEOK | | 14,800 | | 503,200 |
| Pepco Holdings | | 13,900 | | 317,476 |
| Sierra Pacific Resources | | 16,200 a | | 236,196 |
| | | | | 2,509,086 |
| Total Common Stocks | | | | |
| (cost $36,598,459) | | | | 38,976,539 |
| | STATEMENT OF INVESTMENTS (continued)
|
| | | Principal | | |
| Short-Term Investment—2.0% | | Amount ($) | | Value ($) |
| |
| |
|
| U.S. Treasury Bill; | | | | |
| 3.15%, 9/22/2005 | | | | |
| (cost $828,477) | | 830,000 | | 828,415 |
| |
| |
|
| Total Investments (cost $37,426,936) | | 95.7% | | 39,804,954 |
| Cash and Receivables (Net) | | 4.3% | | 1,802,813 |
| Net Assets | | 100.0% | | 41,607,767 |
| a Non-income producing. | | | | |
| b The valuation of this security has been determined in good faith under the direction of the Board of Directors. |
| Portfolio Summary † | | | | | | |
| |
| | | Value (%) | | | | Value (%) |
| |
| |
| |
|
| Finance | | 15.8 | | Retail Trade | | 5.3 |
| Technology Services | | 9.2 | | Health Technology | | 4.8 |
| Electronic Technology | | 8.6 | | Industrial Services | | 4.7 |
| Commercial & Professional Services | | 7.9 | | Producer Manufacturing | | 4.1 |
| Consumer Services | | 6.6 | | Other | | 22.7 |
| Utilities | | 6.0 | | | | 95.7 |
| |
| † Based on net assets. | | | | | | |
| See notes to financial statements. | | | | | | |
STATEMENT OF ASSETS AND LIABILITIES
August 31, 2005
|
| | | | | | | | | Cost | | Value |
| |
| |
| |
| |
| |
|
| Assets ($): | | | | | | | | | | |
| Investments in securities—See Statement of Investments | | 37,426,936 | | 39,804,954 |
| Cash | | | | | | | | | | 106,009 |
| Receivable for investment securities sold | | | | | | 3,022,462 |
| Receivable for shares of Common Stock subscribed | | | | | | 2,460,936 |
| Dividends receivable | | | | | | | | 34,282 |
| Prepaid expenses | | | | | | | | | | 39,307 |
| | | | | | | | | | | 45,467,950 |
| |
| |
| |
| |
| |
|
| Liabilities ($): | | | | | | | | | | |
| Due to The Dreyfus Corporation and affiliates—Note 3(c) | | | | 51,744 |
| Payable for investment securities purchased | | | | | | 3,496,488 |
| Payable for shares of Common Stock redeemed | | | | | | 269,537 |
| Accrued expenses | | | | | | | | | | 42,414 |
| | | | | | | | | | | 3,860,183 |
| |
| |
| |
| |
| |
|
| Net Assets ($) | | | | | | | | | | 41,607,767 |
| |
| |
| |
| |
| |
|
| Composition of Net Assets ($): | | | | | | | | |
| Paid-in capital | | | | | | | | | | 37,876,407 |
| Accumulated undistributed investment income—net | | | | | | 3,739 |
| Accumulated net realized gain (loss) on investments | | | | | | 1,349,603 |
| Accumulated net unrealized appreciation | | | | | | |
| (depreciation) on investments | | | | | | | | 2,378,018 |
| |
| |
| |
| |
|
| Net Assets ($) | | | | | | | | | | 41,607,767 |
| |
| |
| |
| |
| |
|
| |
| |
| Net Asset Value Per Share | | | | | | | | |
| | | Class A | | Class B | | Class C | | Class R | | Class T |
| |
| |
| |
| |
| |
|
| Net Assets ($) | | 18,910,118 | | 5,288,116 | | 13,394,787 | | 2,068,210 | | 1,946,536 |
| Shares Outstanding | | 1,065,098 | | 306,882 | | 777,612 | | 115,487 | | 110,582 |
| |
| |
| |
| |
| |
|
| Net Asset Value | | | | | | | | | | |
| Per Share ($) | | 17.75 | | 17.23 | | 17.23 | | 17.91 | | 17.60 |
| |
| See notes to financial statements. | | | | | | | | |
| | STATEMENT OF OPERATIONS
Year Ended August 31, 2005
|
| Investment Income ($): | | |
| Income: | | |
| Cash dividends | | 243,810 |
| Interest | | 16,072 |
| Income from securities lending | | 1,523 |
| Total Income | | 261,405 |
| Expenses: | | |
| Investment advisory fee—Note 3(a) | | 145,573 |
| Distribution fees—Note 3(b) | | 76,433 |
| Shareholder servicing costs—Note 3(c) | | 74,242 |
| Registration fees | | 54,931 |
| Auditing fees | | 28,854 |
| Prospectus and shareholders’ reports | | 15,134 |
| Custodian fees—Note 3(c) | | 10,610 |
| Directors’ fees and expenses—Note 3(d) | | 505 |
| Legal fees | | 416 |
| Miscellaneous | | 7,961 |
| Total Expenses | | 414,659 |
| Less—reduction in management fee | | |
| due to undertaking—Note 3(a) | | (47,644) |
| Less—reduction in custody fees due to | | |
| earnings credits—Note 1(b) | | (1,767) |
| Net Expenses | | 365,248 |
| Investment (Loss)—Net | | (103,843) |
| |
|
| Realized and Unrealized Gain (Loss) on Investments—Note 4 ($): |
| Net realized gain (loss) on investments | | 1,567,724 |
| Net unrealized appreciation (depreciation) on investments | | 1,697,565 |
| Net Realized and Unrealized Gain (Loss) on Investments | | 3,265,289 |
| Net Increase in Net Assets Resulting from Operations | | 3,161,446 |
| | See notes to financial statements.
|
STATEMENT OF CHANGES IN NET ASSETS
| | | Year Ended August 31, |
| |
|
| | | 2005 | | 2004 |
| |
| |
|
| Operations ($): | | | | |
| Investment (loss)—net | | (103,843) | | (25,234) |
| Net realized gain (loss) on investments | | 1,567,724 | | 381,085 |
| Net unrealized appreciation | | | | |
| (depreciation) on investments | | 1,697,565 | | 204,189 |
| Net Increase (Decrease) in Net Assets | | | | |
| Resulting from Operations | | 3,161,446 | | 560,040 |
| |
| |
|
| Dividends to Shareholders from ($): | | | | |
| Net realized gain on investments | | | | |
| Class A shares | | (108,481) | | — |
| Class B shares | | (66,961) | | — |
| Class C shares | | (57,736) | | — |
| Class R shares | | (5,381) | | — |
| Class T shares | | (6,855) | | — |
| Total Dividends | | (245,414) | | — |
| |
| |
|
| Capital Stock Transactions ($): | | | | |
| Net proceeds from shares sold: | | | | |
| Class A shares | | 17,035,236 | | 2,081,663 |
| Class B shares | | 4,061,702 | | 1,033,835 |
| Class C shares | | 12,233,284 | | 982,282 |
| Class R shares | | 2,110,599 | | — |
| Class T shares | | 2,297,996 | | 7,281 |
| Dividends reinvested: | | | | |
| Class A shares | | 99,868 | | — |
| Class B shares | | 62,672 | | — |
| Class C shares | | 27,444 | | — |
| Class R shares | | 5,381 | | — |
| Class T shares | | 5,888 | | — |
| Cost of shares redeemed: | | | | |
| Class A shares | | (2,722,377) | | (504,490) |
| Class B shares | | (1,636,865) | | (176,160) |
| Class C shares | | (994,783) | | (79,988) |
| Class R shares | | (327,895) | | — |
| Class T shares | | (697,737) | | — |
| Increase (Decrease) in Net Assets | | | | |
| from Capital Stock Transactions | | 31,560,413 | | 3,344,423 |
| Total Increase (Decrease) in Net Assets | | 34,476,445 | | 3,904,463 |
| |
| |
|
| Net Assets ($): | | | | |
| Beginning of Period | | 7,131,322 | | 3,226,859 |
| End of Period | | 41,607,767 | | 7,131,322 |
| Undistributed investment income—net | | 3,739 | | — |
| | STATEMENT OF CHANGES IN NET ASSETS (continued)
|
| | | Year Ended August 31, |
| |
|
| | | 2005 | | 2004 |
| |
| |
|
| Capital Share Transactions: | | | | |
| Class A a | | | | |
| Shares sold | | 1,008,951 | | 144,846 |
| Shares issued for dividends reinvested | | 6,138 | | — |
| Shares redeemed | | (162,665) | | (33,851) |
| Net Increase (Decrease) in Shares Outstanding | | 852,424 | | 110,995 |
| |
| |
|
| Class B a | | | | |
| Shares sold | | 249,392 | | 73,847 |
| Shares issued for dividends reinvested | | 3,944 | | — |
| Shares redeemed | | (100,826) | | (12,374) |
| Net Increase (Decrease) in Shares Outstanding | | 152,510 | | 61,473 |
| |
| |
|
| Class C | | | | |
| Shares sold | | 745,925 | | 69,647 |
| Shares issued for dividends reinvested | | 1,728 | | — |
| Shares redeemed | | (59,242) | | (5,647) |
| Net Increase (Decrease) in Shares Outstanding | | 688,411 | | 64,000 |
| |
| |
|
| Class R | | | | |
| Shares sold | | 118,523 | | — |
| Shares issued for dividends reinvested | | 328 | | — |
| Shares redeemed | | (19,483) | | — |
| Net Increase (Decrease) in Shares Outstanding | | 99,368 | | — |
| |
| |
|
| Class T | | | | |
| Shares sold | | 134,133 | | 498 |
| Shares issued for dividends reinvested | | 364 | | — |
| Shares redeemed | | (40,496) | | — |
| Net Increase (Decrease) in Shares Outstanding | | 94,001 | | 498 |
| |
| a During the period ended August 31, 2005, 7,124 Class B shares representing $116,697 were automatically |
| converted to 6,941 Class A shares and during the period ended August 31, 2004, 814 Class B shares representing |
| $12,086 were automatically converted to 800 Class A shares. | | |
| See notes to financial statements. | | | | |
The following tables describe the performance for each share class for the fiscal periods indicated. All information (except portfolio turnover rate) reflects financial results for a single fund share.Total return shows how much your investment in the fund would have increased or (decreased) during the period, assuming you had reinvested all dividends and distributions.These figures have been derived from the fund’s financial statements.
| | | | | | | Year Ended August 31, | | |
| | | |
| |
| |
|
| Class A Shares | | 2005 | | 2004 | | 2003 | | 2002 | | 2001 a |
| |
| |
| |
| |
| |
|
| Per Share Data ($): | | | | | | | | | | |
| Net asset value, beginning of period | | 14.74 | | 12.88 | | 10.84 | | 11.79 | | 12.50 |
| Investment Operations: | | | | | | | | | | |
| Investment income (loss)—net b | | (.02) | | (.01) | | (.04) | | (.05) | | .00c |
| Net realized and unrealized gain | | | | | | | | | | |
| (loss) on investments | | 3.36 | | 1.87 | | 2.08 | | (.82) | | (.71) |
| Total from Investment Operations | | 3.34 | | 1.86 | | 2.04 | | (.87) | | (.71) |
| Distributions: | | | | | | | | | | |
| Dividends from investment income—net | | — | | — | | — | | (.08) | | — |
| Dividends from net realized gain | | | | | | | | | | |
| on investments | | (.33) | | — | | — | | — | | — |
| Total Distributions | | (.33) | | — | | — | | (.08) | | — |
| Net asset value, end of period | | 17.75 | | 14.74 | | 12.88 | | 10.84 | | 11.79 |
| |
| |
| |
| |
| |
|
| Total Return (%) d | | 22.88 | | 14.35 | | 18.91 | | (7.47) | | (5.68)e |
| |
| |
| |
| |
| |
|
| Ratios/Supplemental Data (%): | | | | | | | | | | |
| Ratio of total expenses | | | | | | | | | | |
| to average net assets | | 1.71 | | 3.05 | | 5.50 | | 8.41 | | 1.65e |
| Ratio of net expenses | | | | | | | | | | |
| to average net assets | | 1.46 | | 1.50 | | 1.50 | | 1.50 | | .26e |
| Ratio of net investment income | | | | | | | | | | |
| (loss) to average net assets | | (.11) | | (.12) | | (.35) | | (.47) | | .03e |
| Portfolio Turnover Rate | | 160.45 | | 90.83 | | 109.53 | | 96.81 | | 24.76e |
| |
| |
| |
| |
| |
|
| Net Assets, end of period ($ x 1,000) | | 18,910 | | 3,135 | | 1,310 | | 623 | | 660 |
| |
| a | | From June 29, 2001 (commencement of operations) to August 31, 2001. | | | | | | |
| b | | Based on average shares outstanding at each month end. | | | | | | | | |
| c | | Amount represents less than $.01 per share. | | | | | | | | |
| d | | Exclusive of sales charge. | | | | | | | | | | |
| e | | Not annualized. | | | | | | | | | | |
| See notes to financial statements. | | | | | | | | | | |
| | FINANCIAL HIGHLIGHTS (continued)
|
| | | | | | | Year Ended August 31, | | |
| | | |
| |
| |
|
| Class B Shares | | 2005 | | 2004 | | 2003 | | 2002 | | 2001 a |
| |
| |
| |
| |
| |
|
| Per Share Data ($): | | | | | | | | | | |
| Net asset value, beginning of period | | 14.43 | | 12.72 | | 10.78 | | 11.78 | | 12.50 |
| Investment Operations: | | | | | | | | | | |
| Investment (loss)—net b | | (.15) | | (.13) | | (.12) | | (.14) | | (.01) |
| Net realized and unrealized gain | | | | | | | | | | |
| (loss) on investments | | 3.28 | | 1.84 | | 2.06 | | (.82) | | (.71) |
| Total from Investment Operations | | 3.13 | | 1.71 | | 1.94 | | (.96) | | (.72) |
| Distributions: | | | | | | | | | | |
| Dividends from investment income—net | | — | | — | | — | | (.04) | | — |
| Dividends from net realized gain | | | | | | | | | | |
| on investments | | (.33) | | — | | — | | — | | — |
| Total Distributions | | (.33) | | — | | — | | (.04) | | — |
| Net asset value, end of period | | 17.23 | | 14.43 | | 12.72 | | 10.78 | | 11.78 |
| |
| |
| |
| |
| |
|
| Total Return (%) c | | 21.90 | | 13.44 | | 18.00 | | (8.15) | | (5.76)d |
| |
| |
| |
| |
| |
|
| Ratios/Supplemental Data (%): | | | | | | | | | | |
| Ratio of total expenses | | | | | | | | | | |
| to average net assets | | 2.62 | | 3.81 | | 6.34 | | 9.16 | | 1.78d |
| Ratio of net expenses | | | | | | | | | | |
| to average net assets | | 2.30 | | 2.25 | | 2.25 | | 2.25 | | .39d |
| Ratio of net investment | | | | | | | | | | |
| (loss) to average net assets | | (.96) | | (.88) | | (1.11) | | (1.22) | | (.11)d |
| Portfolio Turnover Rate | | 160.45 | | 90.83 | | 109.53 | | 96.81 | | 24.76d |
| |
| |
| |
| |
| |
|
| Net Assets, end of period ($ x 1,000) | | 5,288 | | 2,228 | | 1,182 | | 615 | | 660 |
| |
| a | | From June 29, 2001 (commencement of operations) to August 31, 2001. | | | | | | |
| b | | Based on average shares outstanding at each month end. | | | | | | | | |
| c | | Exclusive of sales charge. | | | | | | | | | | |
| d | | Not annualized. | | | | | | | | | | |
| See notes to financial statements. | | | | | | | | | | |
| | | | | | | Year Ended August 31, | | |
| | | |
| |
| |
|
| Class C Shares | | 2005 | | 2004 | | 2003 | | 2002 | | 2001 a |
| |
| |
| |
| |
| |
|
| Per Share Data ($): | | | | | | | | | | |
| Net asset value, beginning of period | | 14.42 | | 12.71 | | 10.77 | | 11.78 | | 12.50 |
| Investment Operations: | | | | | | | | | | |
| Investment (loss)—net b | | (.15) | | (.12) | | (.12) | | (.14) | | (.01) |
| Net realized and unrealized gain | | | | | | | | | | |
| (loss) on investments | | 3.29 | | 1.83 | | 2.06 | | (.83) | | (.71) |
| Total from Investment Operations | | 3.14 | | 1.71 | | 1.94 | | (.97) | | (.72) |
| Distributions: | | | | | | | | | | |
| Dividends from investment income—net | | — | | — | | — | | (.04) | | — |
| Dividends from net realized gain | | | | | | | | | | |
| on investments | | (.33) | | — | | — | | — | | — |
| Total Distributions | | (.33) | | — | | — | | (.04) | | — |
| Net asset value, end of period | | 17.23 | | 14.42 | | 12.71 | | 10.77 | | 11.78 |
| |
| |
| |
| |
| |
|
| Total Return (%) c | | 21.91 | | 13.45 | | 18.01 | | (8.20) | | (5.76)d |
| |
| |
| |
| |
| |
|
| Ratios/Supplemental Data (%): | | | | | | | | | | |
| Ratio of total expenses | | | | | | | | | | |
| to average net assets | | 2.45 | | 3.81 | | 6.41 | | 9.16 | | 1.79d |
| Ratio of net expenses | | | | | | | | | | |
| to average net assets | | 2.25 | | 2.25 | | 2.25 | | 2.25 | | .40d |
| Ratio of net investment | | | | | | | | | | |
| (loss) to average net assets | | (.90) | | (.87) | | (1.12) | | (1.22) | | (.11)d |
| Portfolio Turnover Rate | | 160.45 | | 90.83 | | 109.53 | | 96.81 | | 24.76d |
| |
| |
| |
| |
| |
|
| Net Assets, end of period ($ x 1,000) | | 13,395 | | 1,286 | | 320 | | 219 | | 226 |
| |
| a | | From June 29, 2001 (commencement of operations) to August 31, 2001. | | | | | | |
| b | | Based on average shares outstanding at each month end. | | | | | | | | |
| c | | Exclusive of sales charge. | | | | | | | | | | |
| d | | Not annualized. | | | | | | | | | | |
| See notes to financial statements. | | | | | | | | | | |
| | FINANCIAL HIGHLIGHTS (continued)
|
| | | | | | | Year Ended August 31, | | |
| | | |
| |
| |
|
| Class R Shares | | 2005 | | 2004 | | 2003 | | 2002 | | 2001 a |
| |
| |
| |
| |
| |
|
| Per Share Data ($): | | | | | | | | | | |
| Net asset value, beginning of period | | 14.85 | | 12.94 | | 10.85 | | 11.80 | | 12.50 |
| Investment Operations: | | | | | | | | | | |
| Investment income (loss)—net b | | .00c | | .03 | | (.01) | | (.03) | | .01 |
| Net realized and unrealized gain | | | | | | | | | | |
| (loss) on investments | | 3.39 | | 1.88 | | 2.10 | | (.82) | | (.71) |
| Total from Investment Operations | | 3.39 | | 1.91 | | 2.09 | | (.85) | | (.70) |
| Distributions: | | | | | | | | | | |
| Dividends from investment income—net | | — | | — | | — | | (.10) | | — |
| Dividends from net realized gain | | | | | | | | | | |
| on investments | | (.33) | | — | | — | | — | | — |
| Total Distributions | | (.33) | | — | | — | | (.10) | | — |
| Net asset value, end of period | | 17.91 | | 14.85 | | 12.94 | | 10.85 | | 11.80 |
| |
| |
| |
| |
| |
|
| Total Return (%) | | 23.05 | | 14.67 | | 19.36 | | (7.29) | | (5.60)d |
| |
| |
| |
| |
| |
|
| Ratios/Supplemental Data (%): | | | | | | | | | | |
| Ratio of total expenses | | | | | | | | | | |
| to average net assets | | 1.73 | | 2.84 | | 5.41 | | 8.15 | | 1.61d |
| Ratio of net expenses | | | | | | | | | | |
| to average net assets | | 1.29 | | 1.25 | | 1.25 | | 1.25 | | .22d |
| Ratio of net investment income | | | | | | | | | | |
| (loss) to average net assets | | .05 | | .11 | | (.07) | | (.22) | | .07d |
| Portfolio Turnover Rate | | 160.45 | | 90.83 | | 109.53 | | 96.81 | | 24.76d |
| |
| |
| |
| |
| |
|
| Net Assets, end of period ($ x 1,000) | | 2,068 | | 239 | | 209 | | 175 | | 189 |
| |
| a | | From June 29, 2001 (commencement of operations) to August 31, 2001. | | | | | | |
| b | | Based on average shares outstanding at each month end. | | | | | | | | |
| c | | Amount represents less than $.01 per share. | | | | | | | | |
| d | | Not annualized. | | | | | | | | | | |
| See notes to financial statements. | | | | | | | | | | |
| | | | | | | Year Ended August 31, | | |
| | | |
| |
| |
|
| Class T Shares | | 2005 | | 2004 | | 2003 | | 2002 | | 2001 a |
| |
| |
| |
| |
| |
|
| Per Share Data ($): | | | | | | | | | | |
| Net asset value, beginning of period | | 14.65 | | 12.83 | | 10.82 | | 11.79 | | 12.50 |
| Investment Operations: | | | | | | | | | | |
| Investment (loss)—net b | | (.05) | | (.04) | | (.06) | | (.08) | | (.00)c |
| Net realized and unrealized gain | | | | | | | | | | |
| (loss) on investments | | 3.33 | | 1.86 | | 2.07 | | (.82) | | (.71) |
| Total from Investment Operations | | 3.28 | | 1.82 | | 2.01 | | (.90) | | (.71) |
| Distributions: | | | | | | | | | | |
| Dividends from investment income—net | | — | | — | | — | | (.07) | | — |
| Dividends from net realized gain | | | | | | | | | | |
| on investments | | (.33) | | — | | — | | — | | — |
| Total Distributions | | (.33) | | — | | — | | (.07) | | — |
| Net asset value, end of period | | 17.60 | | 14.65 | | 12.83 | | 10.82 | | 11.79 |
| |
| |
| |
| |
| |
|
| Total Return (%) d | | 22.60 | | 14.10 | | 18.67 | | (7.67) | | (5.68)e |
| |
| |
| |
| |
| |
|
| Ratios/Supplemental Data (%): | | | | | | | | | | |
| Ratio of total expenses | | | | | | | | | | |
| to average net assets | | 1.93 | | 3.34 | | 5.92 | | 8.65 | | 1.70e |
| Ratio of net expenses | | | | | | | | | | |
| to average net assets | | 1.71 | | 1.75 | | 1.75 | | 1.75 | | .31e |
| Ratio of net investment | | | | | | | | | | |
| (loss) to average net assets | | (.32) | | (.39) | | (.57) | | (.72) | | (.02)e |
| Portfolio Turnover Rate | | 160.45 | | 90.83 | | 109.53 | | 96.81 | | 24.76e |
| |
| |
| |
| |
| |
|
| Net Assets, end of period ($ x 1,000) | | 1,947 | | 243 | | 206 | | 174 | | 189 |
| |
| a | | From June 29, 2001 (commencement of operations) to August 31, 2001. | | | | | | |
| b | | Based on average shares outstanding at each month end. | | | | | | | | |
| c | | Amount represents less than $.01 per share. | | | | | | | | |
| d | | Exclusive of sales charge. | | | | | | | | | | |
| e | | Not annualized. | | | | | | | | | | |
| See notes to financial statements. | | | | | | | | | | |
NOTES TO FINANCIAL STATEMENTS
NOTE 1—Significant Accounting Policies:
Dreyfus Premier Structured Midcap Fund (the “fund”) is a separate diversified series of Dreyfus Growth and Value Funds, Inc. (the “Company”) which is registered under the Investment Company Act of 1940, as amended (the “Act”), as an open-end management investment company and operates as a series company that offers twelve series, including the fund.The fund’s investment objective is long-term capital growth.The Dreyfus Corporation (the “Manager” or “Dreyfus”) serves as the fund’s investment adviser. Dreyfus is a wholly-owned subsidiary of Mellon Financial Corporation (“Mellon Financial”). Franklin Portfolio Associates, LLC (“Franklin Portfolio”), an affiliate of Dreyfus, serves as the fund’s sub-investment adviser.
Dreyfus Service Corporation (the “Distributor”), a wholly-owned subsidiary of Dreyfus, is the distributor of the fund’s shares. The fund is authorized to issue 500 million shares of $.001 par value Common Stock.The fund currently offers five classes of shares: Class A (100 million shares authorized), Class B (100 million shares authorized), Class C (100 million shares authorized), Class R (100 million shares authorized) and Class T (100 million shares authorized). Class A and Class T shares are subject to a sales charge imposed at the time of purchase. Class B shares are subject to a contingent deferred sales charge (“CDSC”) imposed on Class B share redemptions made within six years of purchase and automatically convert to Class A shares after six years. Class C shares are subject to a CDSC imposed on Class C shares redeemed within one year of purchase and Class R shares are sold at net asset value per share only to institutional investors. Other differences between the classes include the services offered to and the expenses borne by each class and certain voting rights. Income, expenses (other than expenses attributable to a specific class), and realized and unrealized gains or losses on investments are allocated to each class of shares based on its relative net assets.
The Company accounts separately for the assets, liabilities and operations of each series. Expenses directly attributable to each series are charged to that series’ operations; expenses which are applicable to all series are allocated among them on a pro rata basis.
The fund’s financial statements are prepared in accordance with U.S. generally accepted accounting principles, which may require the use of management estimates and assumptions. Actual results could differ from those estimates.
The fund enters into contracts that contain a variety of indemnifications. The fund’s maximum exposure under these arrangements is unknown.The fund does not anticipate recognizing any loss related to these arrangements.
(a) Portfolio valuation: Investments in securities are valued at the last sales price on the securities exchange or national securities market on which such securities are primarily traded. Securities listed on the National Market System for which market quotations are available are valued at the official closing price or, if there is no official closing price that day, at the last sale price. Securities not listed on an exchange or the national securities market, or securities for which there were no transactions, are valued at the average of the most recent bid and asked prices, except for open short positions, where the asked price is used for valuation purposes. Bid price is used when no asked price is available. Investments in registered investment companies are valued at their net asset value. When market quotations or official closing prices are not readily available, or are determined not to reflect accurately fair value, such as when the value of a security has been significantly affected by events after the close of the exchange or market on which the security is principally traded (for example, a foreign exchange or market), but before the fund calculates its net asset value, the fund may value these investments at fair value as determined in accordance with the procedures approved by the Board of Directors. Fair valuing of securities may be determined with the assistance of a pricing service using calculations based on indices of domestic securities and other appropriate indicators, such as prices of relevant ADR’s and futures contracts. For other securities that are fair valued by the Board of Directors, certain factors may be considered such as: fundamental analytical data, the nature and duration of restrictions on disposition, an evaluation of the forces that influence the market in which the securities are purchased and sold, and public
| | NOTES TO FINANCIAL STATEMENTS (continued)
|
trading in similar securities of the issuer or comparable issuers. Financial futures are valued at the last sales price.
(b) Securities transactions and investment income: Securities transactions are recorded on a trade date basis. Realized gain and loss from securities transactions are recorded on the identified cost basis. Dividend income is recognized on the ex-dividend date and interest income, including accretion of discount and amortization of premium on investments, is recognized on the accrual basis.
The fund has an arrangement with the custodian bank whereby the fund receives earnings credits from the custodian when positive cash balances are maintained, which are used to offset custody fees. For financial reporting purposes, the fund includes net earnings credits as an expense offset in the Statement of Operations.
Pursuant to a securities lending agreement with Mellon Bank, N.A., an affiliate of the Manager, the fund may lend securities to qualified institutions.At origination, all loans are secured by collateral of at least 102% of the value of U.S. securities loaned and 105% of the value of foreign securities loaned. Collateral equivalent to at least 100% of the market value of securities on loan will be maintained at all times. Cash collateral is invested in certain money market mutual funds managed by Dreyfus.The fund will be entitled to receive all income on securities loaned, in addition to income earned as a result of the lending transaction. Although each security loaned is fully collateralized, the fund would bear the risk of delay in recovery of, or loss of rights in, the securities loaned should a borrower fail to return the securities in a timely manner.
(c) Affiliated issuers: Investments in other investment companies advised by Dreyfus are defined as “affiliated” in the Act.
(d) Dividends to shareholders: Dividends are recorded on the ex-dividend date. Dividends from investment income-net and dividends from net realized capital gain, if any, are normally declared and paid
annually, but the fund may make distributions on a more frequent basis to comply with the distribution requirements of the Internal Revenue Code of 1986, as amended (the “Code”).To the extent that net realized capital gain can be offset by capital loss carryovers, it is the policy of the fund not to distribute such gain. Income and capital gain distributions are determined in accordance with income tax regulations, which may differ from U.S. generally accepted accounting principles.
(e) Federal income taxes: It is the policy of the fund to continue to qualify as a regulated investment company, if such qualification is in the best interests of its shareholders, by complying with the applicable provisions of the Code, and to make distributions of taxable income sufficient to relieve it from substantially all federal income and excise taxes.
At August 31, 2005, the components of accumulated earnings on a tax basis were as follows: undistributed ordinary income $473,533, undistributed capital gains $886,838 and unrealized appreciation $2,370,989.
The tax character of distributions paid to shareholders during the fiscal period ended August 31, 2005, was as follows: long-term capital gains $245,414.
During the period ended August 31, 2005, as a result of permanent book to tax differences primarily due to the tax treatment of real estate investment trusts and net operating losses, the fund increased accumulated undistributed investment income-net by $107,582, decreased accumulated net realized gain (loss) on investments by $106,373 and decreased paid-in capital by $1,209. Net assets were not affected by this reclassification.
NOTE 2—Bank Line of Credit:
|
The fund participates with other Dreyfus-managed funds in a $100 million unsecured line of credit primarily to be utilized for temporary or emergency purposes, including the financing of redemptions.
| | NOTES TO FINANCIAL STATEMENTS (continued)
|
Interest is charged to the fund based on prevailing market rates in effect at the time of borrowings. During the period ended August 31, 2005, the fund did not borrow under the line of credit.
NOTE 3—Investment Advisory Fee, Sub-Investment Advisory
Fee and Other Transactions With Affiliates:
|
(a) Pursuant to an Investment Advisory Agreement (“Agreement”) with Dreyfus, the investment advisory fee is computed at the annual rate of .75% of the value of the fund’s average daily net assets and is payable monthly. Dreyfus has undertaken from September 1, 2004 through August 31, 2006, that, if the fund’s aggregate expenses, exclusive of taxes, brokerage fees, interest on borrowings, Rule 12b-1 distribution plan fees, shareholder services plan fees and extraordinary expenses, exceed an annual rate of 1.25% of the value of the fund’s average daily net assets, the fund may deduct from the payment to be made to Dreyfus under the Agreement, or Dreyfus will bear, such excess expenses. The expense reimbursement, pursuant to the undertaking, amounted to $47,644 during the period ended August 31, 2005.
Pursuant to a Sub-Investment Advisory Agreement between Dreyfus and Franklin Portfolio, the sub-investment advisory fee is payable monthly by Dreyfus, and is based upon the value of the fund’s average daily net assets, computed at the following annual rates:
| Average Net Assets | | |
| 0 up to $100 million | | 25% |
| $100 million up to $1 billion | | 20% |
| $1 billion up to $1.5 billion | | 16% |
| In excess of $1.5 billion | | 10% |
During the period ended August 31, 2005, the Distributor retained $24,935 and $568 from commissions earned on sales of the fund’s Class A and Class T shares, respectively, and $5,370 and $1,287 from contingent deferred sales charges on redemptions of the fund’s Class B and Class C shares, respectively.
(b) Under the Distribution Plan (the “Plan”) adopted pursuant to Rule 12b-1 under the Act, Class B, Class C and Class T shares pay the Distributor for distributing their shares at an annual rate of .75% of the value of the average daily net assets of Class B and Class C shares and .25% of the value of the average daily net assets of Class T shares. During the period ended August 31, 2005, Class B, Class C and Class T shares were charged $28,095, $46,835 and $1,503, respectively, pursuant to the Plan.
(c) Under the Shareholder Services Plan, Class A, Class B, Class C and Class T shares pay the Distributor at an annual rate of .25% of the value of their average daily net assets for the provision of certain services. The services provided may include personal services relating to shareholder accounts, such as answering shareholder inquiries regarding the fund and providing reports and other information, and services related to the maintenance of shareholder accounts. The Distributor may make payments to Service Agents (a securities dealer, financial institution or industry professional) in respect of these services. The Distributor determines the amounts to be paid to Service Agents. During the period ended August 31, 2005, Class A, Class B, Class C and Class T shares were charged $21,480, $9,365, $15,612 and $1,503, respectively, pursuant to the Shareholder Services Plan.
The fund compensates Dreyfus Transfer, Inc., a wholly-owned subsidiary of Dreyfus, under a transfer agency agreement for providing personnel and facilities to perform transfer agency services for the fund. During the period ended August 31, 2005, the fund was charged $11,655 pursuant to the transfer agency agreement.
The fund compensates Mellon Bank, N.A., an affiliate of Dreyfus, under a custody agreement for providing custodial services for the fund. During the period ended August 31, 2005, the fund was charged $10,610 pursuant to the custody agreement.
| | NOTES TO FINANCIAL STATEMENTS (continued)
|
During the period ended August 31, 2005, the fund was charged $2,520 for services performed by the Chief Compliance Officer.
The components of Due to The Dreyfus Corporation and affiliates in the Statement of Assets and Liabilities consist of: management fees $25,467, Rule 12b-1 distribution plan fees $11,798, shareholder services plan fees $7,960, custodian fees $2,076, chief compliance officer fees $1,533 and transfer agency per account fees $2,910.
(d) Each Board member also serves as a Board member of other funds within the Dreyfus complex. Annual retainer fees and attendance fees are allocated to each fund based on net assets.
NOTE 4—Securities Transactions:
|
The aggregate amount of purchases and sales of investment securities, excluding short-term securities, during the period ended August 31, 2005, amounted to $59,131,873, and $30,209,021, respectively.
At August 31, 2005, the cost of investments for federal income tax purposes was $37,433,965; accordingly, accumulated net unrealized appreciation on investments was $2,370,989, consisting of $3,068,610 gross unrealized appreciation and $697,621 gross unrealized depreciation.
In early 2004, two purported class and derivative actions were filed against Mellon Financial, Mellon Bank, N.A., Dreyfus, Founders Asset Management LLC, and certain directors of the Dreyfus Funds and the Dreyfus Founders Funds (together, the “Funds”) in the United States District Court for the Western District of Pennsylvania. In September 2004, plaintiffs served a Consolidated Amended Complaint (the “Amended Complaint”) on behalf of a purported class of all persons who acquired interests in any of the Funds between January 30, 1999 and November 17, 2003, and derivatively on behalf of the Funds.The Amended Complaint in the newly styled In re Dreyfus Mutual Funds Fee Litigation also named the Distributor, Premier Mutual Fund Services, Inc. and two additional Fund directors as defendants and
alleges violations of the Investment Company Act of 1940, the Investment Advisers Act of 1940, the Pennsylvania Unfair Trade Practices and Consumer Protection Law and common-law claims. Plaintiffs seek to recover allegedly improper and excessive Rule 12b-1 and advisory fees allegedly charged to the Funds for marketing and distribution services. More specifically, plaintiffs claim, among other things, that 12b-1 fees and directed brokerage were improperly used to pay brokers to recommend the Funds over other funds, and that such payments were not disclosed to investors. In addition, plaintiffs assert that economies of scale and soft-dollar benefits were not passed on to the Funds. Plaintiffs further allege that 12b-1 fees were improperly charged to certain of the Funds that were closed to new investors.The Amended Complaint seeks compensatory and punitive damages, rescission of the advisory contracts, and an accounting and restitution of any unlawful fees, as well as an award of attorneys’ fees and litigation expenses. As noted, some of the claims in this litigation are asserted derivatively on behalf of the Funds that have been named as nominal defendants. With respect to such derivative claims, no relief is sought against the Funds. Dreyfus believes the allegations to be totally without merit and intends to defend the action vigorously. In November 2004, all named defendants moved to dismiss the Amended Complaint in whole or substantial part. Briefing was completed in May 2005.
Additional lawsuits arising out of these circumstances and presenting similar allegations and requests for relief may be filed against the defendants in the future. Neither Dreyfus nor the Funds believe that any of the pending actions will have a material adverse effect on the Funds or Dreyfus’ ability to perform its contract with the Funds.
| | REPORT OF INDEPENDENT REGISTERED
PUBLIC ACCOUNTING FIRM
|
Shareholders and Board of Directors
Dreyfus Premier Structured Midcap Fund
|
We have audited the accompanying statement of assets and liabilities, including the statement of investments, of Dreyfus Premier Structured Midcap Fund (one of the funds comprising Dreyfus Growth and Value Fund, Inc.) as of August 31, 2005, and the related statement of operations for the year then ended, the statement of changes in net assets for each of the two years in the period then ended and financial highlights for each of the periods indicated therein. These financial statements and financial highlights are the responsibility of the Fund’s management. Our responsibility is to express an opinion on these financial statements and financial highlights based on our audits.
We conducted our audits in accordance with the standards of the Public Company Accounting Oversight Board (United States).Those standards require that we plan and perform the audit to obtain reasonable assurance about whether the financial statements and financial highlights are free of material misstatement. An audit includes consideration of internal control over financial reporting as a basis for designing audit procedures that are appropriate in the circumstances, but not for the purpose of expressing an opinion on the effectiveness of the Fund’s internal control over financial reporting. Accordingly, we express no such opinion. An audit also includes examining, on a test basis, evidence supporting the amounts and disclosures in the financial statements and financial highlights, assessing the accounting principles used and significant estimates made by management, and evaluating the overall financial statement presentation. Our procedures included verification by examination of securities held by the custodian as of August 31, 2005 and confirmation of securities not held by the custodian by correspondence with others.We believe that our audits provide a reasonable basis for our opinion.
In our opinion, the financial statements and financial highlights referred to above present fairly, in all material respects, the financial position of Dreyfus Premier Structured Midcap Fund at August 31, 2005, the results of its operations for the year then ended, the changes in its net assets for each of the two years in the period then ended, and the financial highlights for each of the indicated periods, in conformity with U.S. generally accepted accounting principles.

New York, New York
October 14, 2005
|
IMPORTANT TAX INFORMATION (Unaudited)
The fund designates $.3320 per share as a long-term capital gain distribution paid on December 13, 2004.
| | INFORMATION ABOUT THE REVIEW AND APPROVAL
OF THE FUND’S MANAGEMENT AGREEMENT (Unaudited)
|
At a meeting of the Board of Directors held on March 14, 2005, the Board considered the re-approval for an annual period of the Fund’s Management Agreement, pursuant to which the Manager provides the Fund with investment advisory and administrative services and the Board also considered the approval of the Fund’s Sub-Investment Advisory Agreement with Franklin Portfolio Associates, LLC (“Franklin Associates”), an affiliate of the Manager, pursuant to which Franklin Associates provides day-to-day management of the Fund’s investments subject to the Manager’s oversight.The Board members, none of whom are “interested persons” (as defined in the Investment Company Act of 1940, as amended) of the Fund, were assisted in their review by independent legal counsel and met with counsel in executive session separate from representatives of the Manager and Franklin Associates.
Analysis of Nature, Extent and Quality of Services Provided to the Fund. The Board members received a presentation from representatives of the Manager regarding services provided to the Fund and other funds in the Dreyfus fund complex, and discussed the nature, extent and quality of the services provided to the Fund pursuant to its Management Agreement, and by Franklin Associates pursuant to the Sub-Investment Advisory Agreement.The presentation included a detailed summary of the services provided to Dreyfus-managed mutual funds by each business unit within the Manager. The Manager’s representatives reviewed the Fund’s distribution of accounts and the relationships the Manager has with various intermediaries and the different needs of each. The Manager’s representatives noted the diversity of distribution of the Fund as well as among the funds in the Dreyfus fund complex, and the Manager’s corresponding need for broad, deep, and diverse resources to be able to provide ongoing shareholder services to each of the Fund’s distribution channels. The Board also reviewed the number of shareholder accounts in the Fund, as well as the Fund’s asset size.
The Board members also considered the Manager’s and Franklin Associates’ research and portfolio management capabilities and that the Manager also provides oversight of day-to-day Fund operations, including fund accounting and administration and assistance in meet-
ing legal and regulatory requirements.The Board members also considered the Manager’s extensive administrative, accounting and compliance infrastructure, as well as the Manager’s supervisory activities over Franklin Associates.
Comparative Analysis of the Fund’s Performance and Management Fee and Expense Ratio. The Board members reviewed the Fund’s performance, management fee and expense ratios and placed significant emphasis on comparisons to a group of comparable funds and Lipper category averages, as applicable. The group of comparable funds was previously approved by the Board for this purpose, and was prepared using a Board-approved selection methodology that was based, in part, on selecting non-affiliated funds reported in the same Lipper category as the Fund.The Board members discussed the results of the comparisons for various periods ended January 31, 2005, and noted that the Fund’s performance was higher than the comparison group and Lipper category averages for the 1-year and 3-year periods.The Board members also discussed the Fund’s management fee and expense ratio and reviewed the range of management fees and expense ratios for the funds in the comparison group.The Fund’s management fee ranked in the top half (i.e., lower than most others) of the comparison group funds. The Board noted that the Manager, and not the Fund, paid Franklin Associates for its services pursuant to the Sub-Investment Advisory Agreement. The Board noted that the Fund’s total expense ratio was higher than the Fund’s comparison group average, but was lower than the Lipper category average.
Representatives of the Manager reviewed with the Board members the fees paid to the Manager or its affiliates, including Franklin Associates, by mutual funds managed by the Manager or its affiliates with similar investment objectives, policies and strategies as the Fund (the “Similar Funds”), and by other accounts managed or sub-advised by the Manager, Franklin Associates or their affiliates with similar investment objectives, policies and strategies as the Fund (the “Separate Accounts” and, collectively with the Similar Funds, the “Similar Accounts”).The Manager’s representatives explained the nature of the Similar Accounts
| | I N FO R M AT I O N A B O U T T H E R E V I E W A N D A P P R OVA L O F T H E
F U N D ’S M A N A G E M E N T A G R E E M E N T ( U n a u d i t e d ) ( c o n t i n u e d )
|
and the differences, from the Manager’s perspective, in management of the Similar Accounts as compared to managing and providing services to the Fund; it was noted that the Similar Funds were mutual funds included in the “mid-cap core” and “mid-cap core variable insurance products” funds categories by Lipper.The Manager’s representatives also reviewed the costs associated with distribution through intermediaries. The Board analyzed the differences in fees paid to the Manager and discussed the relationship of the advisory fees paid in light of the Manager’s performance and the services provided; it was noted that all but one of the Similar Funds had management fees that were the same as or higher than the fee borne by the Fund.The Board members considered the relevance of the fee information provided for the Similar Accounts managed by the Manager and Franklin Associates to evaluate the appropriateness and reasonableness of the Fund’s advisory fees.The Board acknowledged that differences in fees paid by the Similar Accounts seemed to be consistent with the services provided.
Analysis of Profitability and Economies of Scale. The Manager’s representatives reviewed the dollar amount of expenses allocated and profit received by the Manager and the method used to determine such expenses and profit.The Board received and considered information prepared by an independent consulting firm regarding the Manager’s approach to allocating costs to, and determining the profitability of, individual funds and the entire Dreyfus fund complex.The Manager’s representatives stated that the methodology had also been reviewed by an independent registered public accounting firm which, like the consultant, found the methodology to be reasonable.The consulting firm also analyzed where any economies of scale might emerge in connection with the management of the Fund.The Board members evaluated the analysis in light of the relevant circumstances for the Fund, and the extent to which economies of scale would be realized as the Fund grows and whether fee levels reflect these economies of scale for the benefit of Fund investors. The Board noted that it appeared that the benefits of any economies of scale also would be
appropriately shared with shareholders through increased investment in fund management and administration resources. The Board members also considered potential benefits to the Manager and Franklin Associates from acting as investment adviser and sub-investment adviser, respectively, and reviewed the soft dollar arrangements with respect to trading the Fund’s portfolio.
It was noted that the Board members should consider the Manager’s profitability with respect to the Fund as part of their evaluation of whether the fee under the Management Agreement bears a reasonable relationship to the mix of services provided by the Manager, including the nature, extent and quality of such services and that a discussion of economies of scale is predicated on increasing assets and that, if a fund’s assets had been decreasing, the possibility that the Manager may have realized any economies of scale would be less. Since the Manager, and not the Fund, pays Franklin Associates pursuant to the Sub-Investment Advisory Agreement, the Board did not consider Franklin Associates’ profitability to be relevant to their deliberations.The Board members also discussed the profitability percentage ranges determined by appropriate court cases to be reasonable given the services rendered to investment companies. It was noted that the profitability percentage for managing the Fund was not unreasonable given the Fund’s overall performance and generally superior service levels provided.
At the conclusion of these discussions,each of the Directors expressed the opinion that he or she had been furnished with sufficient information to make an informed business decision with respect to continuation of the Fund’s Management Agreement and Sub-Investment Advisory Agreement. Based on their discussions and considerations as described above, the Board made the following conclusions and determinations.
- The Board concluded that the nature, extent and quality of the ser- vices provided by the Manager and Franklin Associates are adequate and appropriate.
| | I N FO R M AT I O N A B O U T T H E R E V I E W A N D A P P R OVA L O F T H E
F U N D ’S M A N A G E M E N T A G R E E M E N T ( U n a u d i t e d ) ( c o n t i n u e d )
|
- The Board was satisfied with the Fund’s overall performance.
- The Board concluded that the fee paid to the Manager by the Fund was reasonable in light of comparative performance and expense and advisory fee information, costs of the services provided and profits to be realized and benefits derived or to be derived by the Manager from its relationship with the fund.
- The Board determined that the economies of scale which may accrue to the Manager and its affiliates in connection with the man- agement of the Fund had been adequately considered by the Manager in connection with the management fee rate charged to the Fund, and that, to the extent in the future it were to be deter- mined that material economies of scale had not been shared with the Fund, the Board would seek to have those economies of scale shared with the Fund.
The Board members considered these conclusions and determinations, along with the information received on a routine and regular basis throughout the year, and, without any one factor being dispositive, the Board determined that re-approval of the Fund’s Management Agreement with the Manager and Sub-Investment Advisory Agreement with Franklin Associates was in the best interests of the Fund and its shareholders.
BOARD MEMBERS INFORMATION (Unaudited)
| | Joseph S. DiMartino (61)
Chairman of the Board (1995)
|
| Principal Occupation During Past 5 Years: |
| • Corporate Director and Trustee |
| Other Board Memberships and Affiliations: |
| • The Muscular Dystrophy Association, Director |
| • Levcor International, Inc., an apparel fabric processor, Director |
| • Century Business Services, Inc., a provider of outsourcing functions for small and medium size |
| companies, Director |
| • The Newark Group, a provider of a national market of paper recovery facilities, paperboard |
| mills and paperboard converting plants, Director |
| • Azimuth Trust, an institutional asset management firm, Member of Board of Managers and |
| Advisory Board |
| • Sunair Electronics, Inc., engages in the design, manufacture and sale of high frequency systems |
| for long-range voice and data communications, as well as providing certain outdoor-related |
| services to homes and businesses, Director |
No. of Portfolios for which Board Member Serves: 193
| | David P. Feldman (65)
Board Member (1996)
|
| | Principal Occupation During Past 5 Years:
• Corporate Director & Trustee
|
| | Other Board Memberships and Affiliations:
|
- BBH Mutual Funds Group (11 funds), Director
- The Jeffrey Company, a private investment company, Director
- QMED, a medical device company, Director
Ehud Houminer (65) Board Member (1993)
| | Principal Occupation During Past 5 Years:
|
- Executive-in-Residence at the Columbia Business School, Columbia University
- Principal of Lear,Yavitz and Associates, a management consulting firm (1996 to 2001)
| | Other Board Memberships and Affiliations:
|
- Avnet Inc., an electronics distributor, Director
- International Advisory Board to the MBA Program School of Management, Ben Gurion University, Chairman
- Explore Charter School, Brooklyn, NY, Chairman
| | No. of Portfolios for which Board Member Serves: 36
|
No. of Portfolios for which Board Member Serves: 58
BOARD MEMBERS INFORMATION (Unaudited) (continued)
| | Gloria Messinger (75)
Board Member (1993)
|
| | Principal Occupation During Past 5 Years:
|
- Arbitrator for American Arbitration Association and National Association of Securities Dealers, Inc.
- Consultant in Intellectual Property
| | Other Board Memberships and Affiliations:
|
- Yale Law School Fund, Director
- Theater for a New Audience, Inc., Director
- Brooklyn Philharmonic, Director
- New York Women’s Agenda Music Performance Trust Fund, Director
| | No. of Portfolios for which Board Member Serves: 25
|
T. John Szarkowski (79) Board Member (1996)
| Principal Occupation During Past 5 Years: |
| • Consultant in Photography |
| Other Board Memberships and Affiliations: |
| • Photography Department at The Museum of Modern Art, Director Emeritus |
| | No. of Portfolios for which Board Member Serves: 25
|
| | Anne Wexler (75)
Board Member (1996)
|
| | Principal Occupation During Past 5 Years:
|
- Chairman of the Wexler & Walker Public Policy Associates, consultants specializing in govern- ment relations and public affairs
| | Other Board Memberships and Affiliations:
|
- Wilshire Mutual Funds (5 funds), Director
- Methanex Corporation, a methanol producing company, Director
- Member of the Council of Foreign Relations
- Member of the National Park Foundation
| | No. of Portfolios for which Board Member Serves: 36
|
Once elected all Board Members serve for an indefinite term.The address of the Board Members and Officers is in c/o The Dreyfus Corporation, 200 Park Avenue, New York, New York 10166. Additional information about the Board Members is available in the fund’s Statement of Additional Information which can be obtained from Dreyfus free of charge by calling this toll free number: 1-800-554-4611.
John M. Fraser, Jr., Emeritus Board Member
OFFICERS OF THE FUND (Unaudited)
| STEPHEN E. CANTER, President since | | JAMES BITETTO, Vice President and |
| March 2000. | | Assistant Secretary since August 2005. |
| Chairman of the Board, Chief Executive | | Assistant General Counsel and Assistant |
| Officer and Chief Operating Officer of | | Secretary of Dreyfus, and an officer of 91 |
| Dreyfus, and an officer of 90 investment | | investment companies (comprised of 200 |
| companies (comprised of 184 portfolios) | | portfolios) managed by Dreyfus. He is 39 years |
| managed by Dreyfus. Mr. Canter also is a | | old and has been an employee of Dreyfus since |
| Board member and, where applicable, an | | December 1996. |
| |
| Executive Committee Member of the other | | JONI LACKS CHARATAN, Vice President |
| investment management subsidiaries of Mellon | | and Assistant Secretary since |
| Financial Corporation, each of which is an | | August 2005. |
| affiliate of Dreyfus. He is 60 years old and has | | |
| been an employee of Dreyfus since May 1995. | | Assistant General Counsel and Assistant |
| | | Secretary of Dreyfus, and an officer of 91 |
| STEPHEN R. BYERS, Executive Vice | | investment companies (comprised of 200 |
| President since November 2002. | | portfolios) managed by Dreyfus. She is 49 years |
| Chief Investment Officer,Vice Chairman and a | | old and has been an employee of Dreyfus since |
| director of Dreyfus, and an officer of 90 | | October 1998. |
| |
| investment companies (comprised of 184 | | JOSEPH M. CHIOFFI, Vice President and |
| portfolios) managed by Dreyfus. Mr. Byers also | | Assistant Secretary since August 2005. |
| is an officer, director or an Executive | | |
| Committee Member of certain other | | Assistant General Counsel and Assistant |
| investment management subsidiaries of Mellon | | Secretary of Dreyfus, and an officer of 91 |
| Financial Corporation, each of which is an | | investment companies (comprised of 200 |
| affiliate of Dreyfus. He is 52 years old and has | | portfolios) managed by Dreyfus. He is 43 years |
| been an employee of Dreyfus since January | | old and has been an employee of Dreyfus since |
| 2000. | | July 2000. |
| |
| MARK N. JACOBS, Vice President since | | JANETTE E. FARRAGHER, Vice President |
| March 2000. | | and Assistant Secretary since |
| | | August 2005. |
| Executive Vice President, Secretary and | | |
| General Counsel of Dreyfus, and an officer of | | Associate General Counsel of Dreyfus, and an |
| 91 investment companies (comprised of 200 | | officer of 91 investment companies (comprised |
| portfolios) managed by Dreyfus. He is 59 years | | of 200 portfolios) managed by Dreyfus. She is |
| old and has been an employee of Dreyfus since | | 42 years old and has been an employee of |
| June 1977. | | Dreyfus since February 1984. |
| |
| MICHAEL A. ROSENBERG, Vice President | | JOHN B. HAMMALIAN, Vice President and |
| and Secretary since August 2005. | | Assistant Secretary since August 2005. |
| Associate General Counsel of Dreyfus, and an | | Associate General Counsel of Dreyfus, and an |
| officer of 91 investment companies (comprised | | officer of 91 investment companies (comprised |
| of 200 portfolios) managed by Dreyfus. He is | | of 200 portfolios) managed by Dreyfus. He is |
| 45 years old and has been an employee of | | 42 years old and has been an employee of |
| Dreyfus since October 1991. | | Dreyfus since February 1991. |
OFFICERS OF THE FUND (Unaudited) (continued)
| ROBERT R. MULLERY, Vice President and | | ROBERT SVAGNA, Assistant Treasurer |
| Assistant Secretary since August 2005. | | since December 2002. |
| Associate General Counsel of Dreyfus, and an | | Senior Accounting Manager – Equity Funds of |
| officer of 91 investment companies (comprised | | Dreyfus, and an officer of 91 investment |
| of 200 portfolios) managed by Dreyfus. He is | | companies (comprised of 200 portfolios) |
| 53 years old and has been an employee of | | managed by Dreyfus. He is 38 years old and |
| Dreyfus since May 1986. | | has been an employee of Dreyfus since |
| |
| JEFF PRUSNOFSKY, Vice President and | | November 1990. |
| Assistant Secretary since August 2005. | | KENNETH J. SANDGREN, Assistant |
| Associate General Counsel of Dreyfus, and an | | Treasurer since November 2001. |
| officer of 91 investment companies (comprised | | Mutual Funds Tax Director of Dreyfus, and an |
| of 200 portfolios) managed by Dreyfus. He is | | officer of 91 investment companies (comprised |
| 40 years old and has been an employee of | | of 200 portfolios) managed by Dreyfus. He is |
| Dreyfus since October 1990. | | 51 years old and has been an employee of |
| |
| JAMES WINDELS, Treasurer since | | Dreyfus since June 1993. |
| November 2001. | | JOSEPH W. CONNOLLY, Chief Compliance |
| Director – Mutual Fund Accounting of | | Officer since October 2004. |
| Dreyfus, and an officer of 91 investment | | Chief Compliance Officer of Dreyfus and The |
| companies (comprised of 200 portfolios) | | Dreyfus Family of Funds (91 investment |
| managed by Dreyfus. He is 46 years old and has | | companies, comprising 200 portfolios). From |
| been an employee of Dreyfus since April 1985. | | November 2001 through March 2004, Mr. |
| |
| GREGORY S. GRUBER, Assistant | | Connolly was first Vice-President, Mutual Fund |
| Treasurer since August 2005. | | Servicing for Mellon Global Securities |
| | | Services. In that capacity, Mr. Connolly was |
| Senior Accounting Manager – Municipal Bond | | responsible for managing Mellon’s Custody, |
| Funds of Dreyfus, and an officer of 91 | | Fund Accounting and Fund Administration |
| investment companies (comprised of 200 | | services to third-party mutual fund clients. He |
| portfolios) managed by Dreyfus. He is 46 years | | is 48 years old and has served in various |
| old and has been an employee of Dreyfus since | | capacities with Dreyfus since 1980, including |
| August 1981. | | manager of the firm’s Fund Accounting |
| ERIK D. NAVILOFF, Assistant Treasurer | | Department from 1997 through October 2001. |
| since August 2005. | | WILLIAM GERMENIS, Anti-Money |
| Senior Accounting Manager – Taxable Fixed | | Laundering Compliance Officer since |
| Income Funds of Dreyfus, and an officer of 91 | | October 2002. |
| investment companies (comprised of 200 | | Vice President and Anti-Money Laundering |
| portfolios) managed by Dreyfus. He is 37 years | | Compliance Officer of the Distributor, and the |
| old and has been an employee of Dreyfus since | | Anti-Money Laundering Compliance Officer |
| November 1992. | | of 88 investment companies (comprised of 197 |
| ROBERT ROBOL, Assistant Treasurer | | portfolios) managed by Dreyfus. He is 35 years |
| since August 2005. | | old and has been an employee of the |
| | | Distributor since October 1998. |
| Senior Accounting Manager – Money Market | | |
| Funds of Dreyfus, and an officer of 91 | | |
| investment companies (comprised of 200 | | |
| portfolios) managed by Dreyfus. He is 41 years | | |
| old and has been an employee of Dreyfus since | | |
| October 1988. | | |
NOTES
For More Information
| Dreyfus Premier | | Custodian |
| |
| Structured Midcap Fund | | |
| | | Mellon Bank, N.A. |
| 200 Park Avenue | | |
| | | One Mellon Bank Center |
| New York, NY 10166 | | |
| | | Pittsburgh, PA 15258 |
| |
| |
| Investment Adviser | | Transfer Agent & |
| |
| The Dreyfus Corporation | | Dividend Disbursing Agent |
| |
| 200 Park Avenue | | |
| | | Dreyfus Transfer, Inc. |
| New York, NY 10166 | | |
| | | 200 Park Avenue |
| |
| Sub-Investment Adviser | | New York, NY 10166 |
| |
| Franklin Portfolio Associates, LLC | | Distributor |
| |
| One Boston Place | | |
| | | Dreyfus Service Corporation |
| Boston, MA 02108 | | |
| | | 200 Park Avenue |
| |
| | | New York, NY 10166 |
Telephone Call your financial representative or 1-800-554-4611
| Mail | | The Dreyfus Premier Family of Funds |
| | | 144 Glenn Curtiss Boulevard, Uniondale, NY 11556-0144 |
The fund files its complete schedule of portfolio holdings with the Securities and Exchange Commission (“SEC”) for the first and third quarters of each fiscal year on Form N-Q. The fund’s Forms N-Q are available on the SEC’s website at http://www.sec.gov and may be reviewed and copied at the SEC’s Public Reference Room in Washington, DC. Information on the operation of the Public Reference Room may be obtained by calling 1-800-SEC-0330.
A description of the policies and procedures that the fund uses to determine how to vote proxies relating to portfolio securities, and information regarding how the fund voted these proxies for the 12-month period ended June 30, 2005, is available at http://www.dreyfus.com and on the SEC’s website at http://www.sec.gov. The description of the policies and procedures is also available without charge, upon request, by calling 1-800-645-6561.

Save time. Save paper. View your next shareholder report online as soon as it’s available. Log into www.dreyfus.com and sign up for Dreyfus eCommunications. It’s simple and only takes a few minutes.
The views expressed in this report reflect those of the portfolio manager only through the end of the period covered and do not necessarily represent the views of Dreyfus or any other person in the Dreyfus organization. Any such views are subject to change at any time based upon market or other conditions and Dreyfus disclaims any responsibility to update such views.These views may not be relied on as investment advice and, because investment decisions for a Dreyfus fund are based on numerous factors, may not be relied on as an indication of trading intent on behalf of any Dreyfus fund.
Not FDIC-Insured • Not Bank-Guaranteed • May Lose Value
| | | Contents |
| |
| | | THE FUND |
| |
|
| 2 | | Letter from the Chairman |
| 3 | | Discussion of Fund Performance |
| 6 | | Fund Performance |
| 8 | | Understanding Your Fund’s Expenses |
| 8 | | Comparing Your Fund’s Expenses |
| | | With Those of Other Funds |
| 9 | | Statement of Investments |
| 13 | | Statement of Assets and Liabilities |
| 14 | | Statement of Operations |
| 15 | | Statement of Changes in Net Assets |
| 17 | | Financial Highlights |
| 22 | | Notes to Financial Statements |
| 31 | | Report of Independent Registered |
| | | Public Accounting Firm |
| 32 | | Information About the Review and Approval |
| | | of the Fund’s Management Agreement |
| 36 | | Board Members Information |
| 38 | | Officers of the Fund |
| | | FOR MORE INFORMATION |
| |
|
| | | Back Cover |
The Fund
| | Dreyfus Premier
Technology Growth Fund
|

LETTER FROM THE CHAIRMAN
This annual report for Dreyfus Premier Technology Growth Fund covers the 12-month period from September 1, 2004, through August 31, 2005. Inside, you’ll find valuable information about how the fund was managed during the reporting period, including a discussion with the fund’s portfolio manager, Mark Herskovitz.
On average, stock prices ended the reporting period higher than where they began. However, most of the market’s gains occurred during the closing months of 2004. So far in 2005, positive factors, including steady economic growth and higher corporate profits, were largely offset by headwinds, such as sharply higher energy prices and rising short-term interest rates. Midcap stocks produced higher returns than small-cap stocks in this environment, and small-cap stocks outperformed large-cap stocks. Also, value-oriented stocks have generally produced better results than their more growth-oriented counterparts during the past 12 months.
Recent shocks to the U.S. economy — including sharply higher gasoline prices and other lingering consequences of Hurricane Katrina — have added a degree of uncertainty to the economic outlook.Nonetheless,our economists currently expect the economy to continue to grow without either entering a recession or triggering a significant acceleration of inflation. As always, we encourage you to discuss the potential implications of these and other matters with your financial advisor.
Thank you for your continued confidence and support.


DISCUSSION OF FUND PERFORMANCE
Mark Herskovitz, Primary Portfolio Manager
How did Dreyfus Premier Technology Growth Fund perform
relative to its benchmarks?
|
For the 12-month period ended August 31, 2005, the fund produced total returns of 14.05% for its Class A shares, 12.91% for its Class B shares, 12.95% for its Class C shares, 14.51% for its Class R shares and 13.48% for its Class T shares.1 In comparison, the fund’s benchmarks, the Morgan Stanley High Technology 35 Index (“MS High Tech 35 Index”) and the Standard & Poor’s 500 Composite Stock Price Index (“S&P 500 Index”), produced total returns of 18.23% and 12.55%, respectively, over the same period.2,3
After rallying sharply in the closing weeks of 2004, stock prices were little changed over the first eight months of 2005 as rising interest rates and surging energy prices largely offset positive factors, such as a growing economy and higher corporate profits. Technology stocks, which tend to be relatively sensitive to economic trends, generally fared better than the overall market.The fund produced lower returns than the MS High Tech 35 Index, primarily due to its lack of participation in some of the MS High Tech 35 Index’s better-performing stocks.
What is the fund’s investment approach?
The fund seeks capital appreciation by investing in growth companies of any size that we believe are leading producers or beneficiaries of technological innovation. When choosing stocks, we look for sectors within the technology area that we expect to outperform other sectors. We seek to emphasize the most attractive sectors and deemphasize the less appealing sectors. Among the sectors evaluated are those that develop, produce or distribute products or services in the computer, internet, semi-conductor, electronics, communications, biotechnology, computer software and hardware, electronic components and systems, network and cable broadcasting, telecommunications, defense and aerospace, and environmental sectors.
| | DISCUSSION OF FUND PERFORMANCE (continued)
|
Typically, we look for companies that are leaders in their market segments and are characterized by rapid earnings growth and strong market shares. We conduct extensive fundamental research to understand these companies’ competitive advantages and to evaluate their ability to maintain leadership positions over time.Although we look for companies with the potential for strong earnings growth rates, some of our investments may currently be experiencing losses. Moreover, we may invest in small-, mid- and large-cap securities in all available trading markets, including initial public offerings and the aftermarket.
What other factors influenced the fund’s performance?
Although the reporting period began in a time of relative weakness for technology shares, the sector more than made up for any lost ground during a sharp rally in the closing weeks of 2004, when the resolution of the presidential election and signs of stronger economic growth buoyed investor sentiment. However, the rally’s leaders tended to be more speculative companies, and not the better-established leaders in which the fund primarily invests. For example, the fund was underweight Internet portal Yahoo! and held shares of Internet search engine Google only briefly due to valuation concerns. Similarly, the fund did not own and as a result did not participate in gains produced by enterprise software developer PeopleSoft when the company was acquired by a rival. As a result, the fund’s returns began to lag the MS High Tech 35 Index, and better performance later in the reporting period was not enough to offset earlier weakness.
Over the first eight months of 2005, technology stocks posted relatively modest gains in a generally trendless market environment. Nonetheless, the fund received positive contributions to its performance in a number of areas. For example, telecommunication equipment provider Corning prospered due to rising demand for the glass used in flat-panel televisions and monitors. Semiconductor manufacturer Marvell Technology Group benefited from rising demand for the microchips used in disk drives and the Apple Computer iPod music player. Consolidation among its customers in the telecommunications services industry helped
drive gains in the stock of billing management provider Amdocs.Among the fund’s non-traditional technology holdings, biotechnology leader Genentech saw its stock price rise when a cancer drug was approved by the U.S. Food and Drug Administration for new applications.
What is the fund’s current strategy?
Our strategy has not changed.We have continued to search the markets for growing companies in areas that we believe are likely to produce new technological innovations.The fund’s largest holding, Corning, is a good example of a company that has found new applications for its products and processes.We recently established a new position in Apple Computer, which has revitalized its business with the iPod music player and iTunes music service. Wireless communications software and services provider Comverse Technology is expected to fare well as its products increasingly are used to create new wireless telephony features, such as digital voicemail. Finally, the fund has invested in companies, such as Cognizant Technology and Infosys Technologies Solutions that are involved in the outsourcing of technology services to India and other emerging markets. In our view, companies such as these are well positioned to lead the technology sector into the future.
| | | The technology sector has been among the most volatile sectors of the stock market. |
| | | Technology companies involve greater risk because their revenue and/or earnings tend to be |
| | | less predictable and some companies may be experiencing significant losses. An investment |
| | | in the fund should be considered only as a supplement to a complete investment program. |
| 1 | | Total return includes reinvestment of dividends and any capital gains paid, and does not take into |
| | | consideration the maximum initial sales charges in the case of Class A and Class T shares, or the |
| | | applicable contingent deferred sales charges imposed on redemptions in the case of Class B and |
| | | Class C shares. Had these charges been reflected, returns would have been lower. Past performance |
| | | is no guarantee of future results. Share price, yield and investment return fluctuate such that upon |
| | | redemption, fund shares may be worth more or less than their original cost. |
| 2 | | SOURCE: BLOOMBERG L.P. — Reflects reinvestment of net dividends and, where |
| | | applicable, capital gain distributions.The Morgan Stanley High Technology 35 Index is an |
| | | unmanaged, equal dollar-weighted index of 35 stocks from the electronics-based subsectors. |
| 3 | | SOURCE: LIPPER INC. — Reflects monthly reinvestment of dividends and, where |
| | | applicable, capital gain distributions.The Standard & Poor’s 500 Composite Stock Price Index is |
| | | a widely accepted, unmanaged index of U.S. stock market performance. |
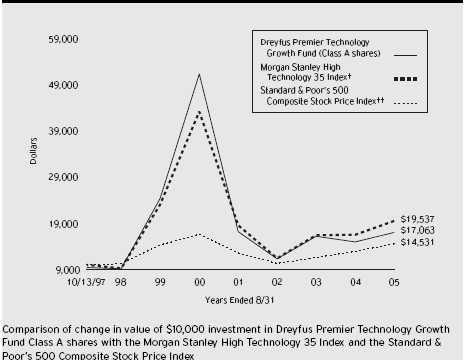
† Source: Bloomberg L.P. Source: Lipper Inc.
Past performance is not predictive of future performance.
The above graph compares a $10,000 investment made in Class A shares of Dreyfus Premier Technology Growth Fund on 10/13/97 (inception date) to a $10,000 investment made in each of the Standard & Poor’s 500 Composite Stock Price Index (the “S&P 500 Index”) and the Morgan Stanley High Technology 35 Index (the “MS High Tech 35 Index”). For comparative purposes, the value of each index on 9/30/97 is used as the beginning value on 10/13/97. Performance for Class B, Class C, Class R and Class T shares will vary from the performance of Class A shares shown above due to differences in charges and expenses. All dividends and capital gain distributions are reinvested.
The fund’s performance shown in the line graph takes into account the maximum initial sales charge on Class A shares and all other applicable fees and expenses.The S&P 500 Index is a widely accepted, unmanaged index of U.S. stock market performance.The MS High Tech 35 Index reflects reinvestment of net dividends and, where applicable, capital gain distributions.The MS High Tech 35 Index is an unmanaged, equal dollar-weighted index from the electronics-based subsectors.The indices do not take into account charges, fees and other expenses. Further information relating to fund performance, including expense reimbursements, if applicable, is contained in the Financial Highlights section of the prospectus and elsewhere in this report.
| Average Annual Total Returns as of 8/31/05 | | | | |
| |
| | | | | Inception | | | | | | From |
| | | | | Date | | 1 Year | | 5 Years | | Inception |
| |
| |
| |
| |
| |
|
| Class A shares | | | | | | | | |
| with maximum sales charge (5.75%) | | 10/13/97 | | 7.49% | | (20.74%) | | 7.02% |
| without sales charge | | 10/13/97 | | 14.05% | | (19.80%) | | 7.82% |
| Class B shares | | | | | | | | |
| with applicable redemption charge † | | 4/15/99 | | 8.91% | | (20.86%) | | (4.29%) |
| without redemption | | 4/15/99 | | 12.91% | | (20.54%) | | (4.29%) |
| Class C shares | | | | | | | | |
| with applicable redemption charge †† | | 4/15/99 | | 11.95% | | (20.51%) | | (4.33%) |
| without redemption | | 4/15/99 | | 12.95% | | (20.51%) | | (4.33%) |
| Class R shares | | 4/15/99 | | 14.51% | | (19.44%) | | (3.11%) |
| Class T shares | | | | | | | | |
| with applicable sales charge (4.5%) | | 8/31/99 | | 8.35% | | (20.90%) | | (6.93%) |
| without sales charge | | 8/31/99 | | 13.48% | | (20.17%) | | (6.21%) |
| |
| Past performance is not predictive of future performance.The fund’s performance shown in the graph and table does not |
| reflect the deduction of taxes that a shareholder would pay on fund distributions or the redemption of fund shares. |
| † | | The maximum contingent deferred sales charge for Class B shares is 4%. After six years Class B shares convert to |
| | | Class A shares. | | | | | | | | |
| †† | | The maximum contingent deferred sales charge for Class C shares is 1% for shares redeemed within one year of the |
| | | date of purchase. | | | | | | | | |
UNDERSTANDING YOUR FUND’S EXPENSES(Unaudited)
As a mutual fund investor, you pay ongoing expenses, such as management fees and other expenses. Using the information below, you can estimate how these expenses affect your investment and compare them with the expenses of other funds.You also may pay one-time transaction expenses, including sales charges (loads) and redemption fees, which are not shown in this section and would have resulted in higher total expenses. For more information, see your fund’s prospectus or talk to your financial adviser.
Review your fund’s expenses
The table below shows the expenses you would have paid on a $1,000 investment in Dreyfus Premier Technology Growth Fund from March 1, 2005 to August 31, 2005. It also shows how much a $1,000 investment would be worth at the close of the period, assuming actual returns and expenses.
| Expenses and Value of a $1,000 Investment | | | | | | |
| assuming actual returns for the six months ended August 31, 2005 | | | | |
| | | Class A | | Class B | | Class C | | Class R | | Class T |
| |
| |
| |
| |
| |
|
| Expenses paid per $1,000 † | | $ 6.98 | | $ 11.63 | | $ 11.63 | | $ 4.42 | | $ 8.87 |
| Ending value (after expenses) | | $1,037.00 | | $1,032.20 | | $1,032.70 | | $1,039.40 | | $1,035.10 |
| | COMPARING YOUR FUND’S EXPENSES
WITH THOSE OF OTHER FUNDS (Unaudited)
|
Using the SEC’s method to compare expenses
The Securities and Exchange Commission (SEC) has established guidelines to help investors assess fund expenses. Per these guidelines, the table below shows your fund’s expenses based on a $1,000 investment, assuming a hypothetical 5% annualized return. You can use this information to compare the ongoing expenses (but not transaction expenses or total cost) of investing in the fund with those of other funds.All mutual fund shareholder reports will provide this information to help you make this comparison. Please note that you cannot use this information to estimate your actual ending account balance and expenses paid during the period.
Expenses and Value of a $1,000 Investment
assuming a hypothetical 5% annualized return for the six months ended August 31, 2005
|
| | | Class A | | Class B | | Class C | | Class R | | Class T |
| |
| |
| |
| |
| |
|
| Expenses paid per $1,000 † | | $ 6.92 | | $ 11.52 | | $ 11.52 | | $ 4.38 | | $ 8.79 |
| Ending value (after expenses) | | $1,018.35 | | $1,013.76 | | $1,013.76 | | $1,020.87 | | $1,016.48 |
| | † Expenses are equal to the fund’s annualized expense ratio of 1.36% for Class A, 2.27% for Class B, 2.27% for
Class C, .86% for Class R and 1.73% for Class T; multiplied by the average account value over the period,
multiplied by 184/365 (to reflect the one-half year period).
|
STATEMENT OF INVESTMENTS
August 31, 2005
|
| Common Stocks—98.4% | | Shares | | Value ($) |
| |
| |
|
| Computers—10.5% | | | | |
| Apple Computer | | 1,175,000 a | | 55,142,750 |
| Cognizant Technology Solutions, Cl. A | | 1,010,000 a,b | | 45,985,300 |
| Dell | | 1,084,000 a | | 38,590,400 |
| Network Appliance | | 1,205,000 a,b | | 28,606,700 |
| | | | | 168,325,150 |
| E.D.P. Services—2.9% | | | | |
| Automatic Data Processing | | 940,000 | | 40,185,000 |
| Bluestream Ventures,LP | | 11,535,000 a,e | | 5,570,459 |
| Ingenex | | 20,900 a,e | | 0 |
| | | | | 45,755,459 |
| Electrical & Electronics—1.2% | | | | |
| Garmin | | 325,000 b | | 18,817,500 |
| Electronic Components—8.3% | | | | |
| Cognos | | 970,000 a,b | | 35,026,700 |
| EMC | | 2,825,000 a | | 36,329,500 |
| Samsung Electronics, GDR | | 45,400 b,c | | 11,906,150 |
| Taiwan Semiconductor Manufacturing | | 30,187,255 | | 49,968,177 |
| | | | | 133,230,527 |
| Health Care—8.7% | | | | |
| Amgen | | 455,000 a | | 36,354,500 |
| Genentech | | 380,000 a,b | | 35,697,200 |
| Teva Pharmaceutical Industries, ADR | | 1,120,000 b | | 36,332,800 |
| Zimmer Holdings | | 375,000 a,b | | 30,813,750 |
| | | | | 139,198,250 |
| Industrial—4.3% | | | | |
| Corning | | 3,450,000 a | | 68,862,000 |
| | STATEMENT OF INVESTMENTS (continued)
|
| Common Stocks (continued) | | Shares | | Value ($) |
| |
| |
|
| Internet—10.2% | | | | |
| Check Point Software Technologies | | 1,500,000 a | | 33,840,000 |
| CheckFree | | 729,100 a | | 26,823,589 |
| eBay | | 570,000 a | | 23,079,300 |
| Symantec | | 1,600,000 a | | 33,568,000 |
| Yahoo! | | 1,380,000 a | | 46,009,200 |
| | | | | 163,320,089 |
| Semiconductors—10.9% | | | | |
| Intel | | 855,000 | | 21,990,600 |
| Linear Technology | | 830,000 | | 31,481,900 |
| Marvell Technology Group | | 1,125,000 a | | 53,088,750 |
| National Semiconductor | | 1,280,000 | | 31,910,400 |
| Xilinx | | 1,290,000 | | 36,236,100 |
| | | | | 174,707,750 |
| Software—13.4% | | | | |
| Cisco Systems | | 2,775,000 a | | 48,895,500 |
| Electronic Arts | | 730,000 a,b | | 41,814,400 |
| Mercury Interactive | | 146,500 a,b | | 5,372,155 |
| Microsoft | | 2,260,000 | | 61,924,000 |
| Oracle | | 1,800,000 a | | 23,346,000 |
| SAP, ADR | | 775,000 b | | 33,069,250 |
| | | | | 214,421,305 |
| Technology—15.6% | | | | |
| Accenture, Cl. A | | 1,425,000 a | | 34,770,000 |
| Adobe Systems | | 1,800,000 b | | 48,672,000 |
| Applied Materials | | 1,720,000 | | 31,493,200 |
| Broadcom, Cl. A | | 1,075,000 a | | 46,762,500 |
| Common Stocks (continued) | | Shares | | Value ($) |
| |
| |
|
| Technology (continued) | | | | |
| KLA-Tencor | | 700,000 b | | 35,532,000 |
| Motorola | | 2,425,000 | | 53,059,000 |
| | | | | 250,288,700 |
| Telecommunications—10.4% | | | | |
| Amdocs | | 1,415,000 a | | 41,530,250 |
| Comverse Technology | | 1,815,000 a,b | | 46,790,700 |
| Juniper Networks | | 1,600,000 a,b | | 36,384,000 |
| QUALCOMM | | 1,050,000 | | 41,695,500 |
| | | | | 166,400,450 |
| Wholesale & International Trade—2.0% | | |
| Infosys Technologies, ADR | | 450,000 b | | 31,855,500 |
| Total Common Stocks | | | | |
| (cost $1,395,043,156) | | | | 1,575,182,680 |
| |
| |
|
| |
| Preferred Stocks—.1% | | | | |
| |
| |
|
| Telecommunications Equipment | | | | |
| AXSUN Technologies Ser. C, Conv. | | | | |
| (cost $5,000,000) | | 428,449 e | | 1,713,796 |
| |
| |
|
| | | Principal | | |
| Short-Term Investments—1.5% | | Amount ($) | | Value ($) |
| |
| |
|
| U.S. Treasury Bills: | | | | |
| 3.24%, 9/15/2005 | | 672,000 | | 671,107 |
| 3.30%, 9/22/2005 | | 23,757,000 | | 23,711,624 |
| 3.25%, 9/29/2005 | | 230,000 | | 229,411 |
| Total Short-Term Investments | | | | |
| (cost $24,611,863) | | | | 24,612,142 |
| | STATEMENT OF INVESTMENTS (continued)
|
| Investment of Cash Collateral | | | | |
| for Securities Loaned—3.2% | | Shares | | Value ($) |
| |
| |
|
| Registered Investment Company; | | | | |
| Dreyfus Institutional Cash Advantage Fund | | | | |
| (cost $50,278,990) | | 50,278,990 d | | 50,278,990 |
| |
| |
|
| Total Investments (cost $1,474,934,009) | | 103.2% | | 1,651,787,608 |
| Liabilities, Less Cash and Receivables | | (3.2%) | | (51,568,050) |
| Net Assets | | 100.0% | | 1,600,219,558 |
| |
| ADR—American Depository Receipts. | | | | |
| GDR—Global Depository Receipts. | | | | |
| a Non-income producing. | | | | |
| b | | All or a portion of these securities are on loan. At August 31, 2005, the total market value of the fund’s securities on |
| | | loan is $49,569,986 and the total market value of the collateral held by the portfolio is $50,278,990. |
| c | | Securities exempt from registration, under Rule 144A of the Securities Act of 1933.These securities may be resold in |
| | | transactions exempt from registration, normally to qualified buyers. At August 31, 2005, these securities amounted to |
| | | $11,906,150 or .74% of net assets. | | | | | | |
| d | | Investment in affiliated money market mutual fund. | | | | | | |
| e | | Securities restricted as to public resale. Investment in restricted securities with an aggregate market value of |
| | | $7,284,255 representing approximately .50% of net assets (see below). | | | | |
| |
| Issuer | | Acquisition Date | | Purchase Price ($) | | Net Assets (%) | | Valuation ($)† |
| |
| |
| |
| |
|
| AXSUN Technologies | | | | | | | | |
| | | Ser. C, Conv. | | 1/3/2001 | | 11.67 | | .10 | | 4 per share |
| BlueStream Ventures, LP | | 4/30/2004 | | .29 | | .40 | | .48 per share |
| Ingenex | | 4/30/2004 | | .00 | | .00 | | .00 per share |
| |
| † | | The valuation of these securities has been determined in good faith under the direction of the Board of Directors. |
| |
|
| |
| |
| |
| |
| Portfolio Summary†† | | | | | | |
| |
| | | | | Value (%) | | | | | | Value (%) |
| |
| |
| |
| |
| |
|
| Technology | | 15.6 | | Health Care | | | | 8.7 |
| Software | | 13.4 | | Electronic Components | | 8.3 |
| Semiconductors | | 10.9 | | Short-Term/Money Market Investments 4.7 |
| Computers | | 10.5 | | Industrial | | | | 4.3 |
| Telecommunications | | 10.4 | | Other | | | | 6.2 |
| Internet | | 10.2 | | | | | | 103.2 |
| |
| †† | | Based on net assets. | | | | | | | | |
| See notes to financial statements. | | | | | | |
STATEMENT OF ASSETS AND LIABILITIES
August 31, 2005
|
| | | Cost | | Value |
| |
| |
|
| Assets ($): | | | | |
| Investments in securities— | | | | |
| See Statement of Investments (including securities | | |
| on loan valued at $49,569,986)—Note 1(c): | | |
| Unaffiliated issuers | | 1,424,655,019 | | 1,601,508,618 |
| Affiliated issuers | | 50,278,990 | | 50,278,990 |
| Cash | | | | 51,975 |
| Cash denominated in foreign currencies | | 87,948 | | 92,230 |
| Receivable for investment securities sold | | | | 17,694,021 |
| Dividends and interest receivable | | | | 531,559 |
| Receivable for shares of Common Stock subscribed | | 500,601 |
| Prepaid expenses | | | | 28,272 |
| | | | | 1,670,686,266 |
| |
| |
|
| Liabilities ($): | | | | |
| Due to the Dreyfus Corporation and affiliates—Note 3(c) | | | | 1,623,964 |
| Liability for securities on loan—Note 1(c) | | | | | | 50,278,990 |
| Payable for investment securities purchased | | | | | | 14,880,143 |
| Payable for shares of Common Stock redeemed | | | | | | 2,740,179 |
| Accrued expenses | | | | | | | | | | 943,432 |
| | | | | | | | | | | 70,466,708 |
| |
| |
| |
| |
| |
|
| Net Assets ($) | | | | | | | | 1,600,219,558 |
| |
| |
| |
| |
|
| Composition of Net Assets ($): | | | | | | | | |
| Paid-in capital | | | | | | | | 1,882,150,118 |
| Accumulated net realized gain (loss) on investments | | | | (458,788,441) |
| Accumulated net unrealized appreciation (depreciation) | | | | |
| on investments and foreign currency transactions | | | | | | 176,857,881 |
| |
| |
| |
|
| Net Assets ($) | | | | | | | | 1,600,219,558 |
| |
| |
| |
| |
|
| |
| |
| Net Asset Value Per Share | | | | | | | | |
| | | Class A | | Class B | | Class C | | Class R | | Class T |
| |
| |
| |
| |
| |
|
| Net Assets ($) | | 384,411,167 | | 162,848,597 | | 67,294,949 | | 981,036,300 | | 4,628,545 |
| Shares Outstanding | | 17,164,095 | | 7,692,526 | | 3,176,470 | | 42,703,908 | | 212,200 |
| |
| |
| |
| |
| |
|
| Net Asset Value | | | | | | | | | | |
| Per Share ($) | | 22.40 | | 21.17 | | 21.19 | | 22.97 | | 21.81 |
| |
| See notes to financial statements. | | | | | | | | |
| | STATEMENT OF OPERATIONS
Year Ended August 31, 2005
|
| Investment Income ($): | | |
| Income: | | |
| Cash dividends (net of $616,195 foreign taxes withheld at source): | | 14,204,180 |
| Interest | | 823,194 |
| Income on securities lending | | 181,069 |
| Total Income | | 15,208,443 |
| Expenses: | | |
| Management fee—Note 3(a) | | 13,109,334 |
| Shareholder servicing costs—Note 3(c) | | 4,761,341 |
| Distribution fees—Note 3(b) | | 2,083,124 |
| Custodian fees—Note 3(c) | | 318,528 |
| Prospectus and shareholders’ reports | | 298,355 |
| Registration fees | | 100,693 |
| Professional fees | | 86,433 |
| Directors’ fees and expenses—Note 3(d) | | 30,193 |
| Interest expense—Note 2 | | 24,868 |
| Miscellaneous | | 60,944 |
| Total Expenses | | 20,873,813 |
| Less—reduction in custody fees due to | | |
| earnings credits—Note 1(c) | | (2,725) |
| Net Expenses | | 20,871,088 |
| Investment (Loss)—Net | | (5,662,645) |
| |
|
| Realized and Unrealized Gain (Loss) on Investments—Note 4 ($): |
| Net realized gain (loss) on investments and foreign currency transactions | | 73,667,763 |
| Net unrealized appreciation (depreciation) | | |
| on investments and foreign currency transactions | | 162,944,382 |
| Net Realized and Unrealized Gain (Loss) on Investments | | 236,612,145 |
| Net Increase in Net Assets Resulting from Operations | | 230,949,500 |
| | See notes to financial statements.
|
STATEMENT OF CHANGES IN NET ASSETS
| | | Year Ended August 31, |
| |
|
| | | 2005 | | 2004 |
| |
| |
|
| Operations ($): | | | | |
| Investment (loss)—net | | (5,662,645) | | (13,179,637) |
| Net realized gain (loss) on investments | | 73,667,763 | | (59,507,012) |
| Net unrealized appreciation | | | | |
| (depreciation) on investments | | 162,944,382 | | (87,060,329) |
| Net Increase (Decrease) in Net Assets | | | | |
| Resulting from Operations | | 230,949,500 | | (159,746,978) |
| |
| |
|
| Capital Stock Transactions ($): | | | | |
| Net proceeds from shares sold: | | | | |
| Class A shares | | 106,181,572 | | 176,465,930 |
| Class B shares | | 2,459,692 | | 3,226,436 |
| Class C shares | | 2,230,474 | | 6,575,046 |
| Class R shares | | 186,764,693 | | 1,292,633,559 |
| Class T shares | | 1,783,852 | | 617,309 |
| Net assets received in connection | | | | |
| with reorganization—Note 1: | | | | |
| Class A shares | | — | | 17,878,863 |
| Class B shares | | — | | 26,473,963 |
| Class C shares | | — | | 8,495,607 |
| Class T shares | | — | | 1,299,662 |
| Cost of shares redeemed: | | | | |
| Class A shares | | (174,298,851) | | (183,195,441) |
| Class B shares | | (71,659,212) | | (49,111,671) |
| Class C shares | | (33,527,229) | | (28,026,408) |
| Class R shares | | (397,775,151) | | (152,919,070) |
| Class T shares | | (2,709,856) | | (1,163,620) |
| Increase (Decrease) in Net Assets | | | | |
| from Capital Stock Transactions | | (380,550,016) | | 1,119,250,165 |
| Total Increase (Decrease) in Net Assets | | (149,600,516) | | 959,503,187 |
| |
| |
|
| Net Assets ($): | | | | |
| Beginning of Period | | 1,749,820,074 | | 790,316,887 |
| End of Period | | 1,600,219,558 | | 1,749,820,074 |
| | STATEMENT OF CHANGES IN NET ASSETS (continued)
|
| | | Year Ended August 31, |
| |
|
| | | 2005 | | 2004 |
| |
| |
|
| Capital Share Transactions: | | | | |
| Class A a | | | | |
| Shares sold | | 4,873,202 | | 7,811,737 |
| Shares issued in connection | | | | |
| with reorganization—Note 1 | | — | | 814,156 |
| Shares redeemed | | (8,008,064) | | (8,227,754) |
| Net Increase (Decrease) in Shares Outstanding | | (3,134,862) | | 398,139 |
| |
| |
|
| Class B a | | | | |
| Shares sold | | 119,230 | | 382,949 |
| Shares issued in connection | | | | |
| with reorganization—Note 1 | | — | | 1,254,690 |
| Shares redeemed | | (3,462,180) | | (2,306,177) |
| Net Increase (Decrease) in Shares Outstanding | | (3,342,950) | | (668,538) |
| |
| |
|
| Class C | | | | |
| Shares sold | | 108,821 | | 345,676 |
| Shares issued in connection | | | | |
| with reorganization—Note 1 | | — | | 402,445 |
| Shares redeemed | | (1,621,255) | | (1,311,816) |
| Net Increase (Decrease) in Shares Outstanding | | (1,512,434) | | (563,695) |
| |
| |
|
| Class R | | | | |
| Shares sold | | 8,299,682 | | 58,871,026 |
| Shares redeemed | | (18,005,233) | | (7,143,405) |
| Net Increase (Decrease) in Shares Outstanding | | (9,705,551) | | 51,727,621 |
| |
| |
|
| Class T | | | | |
| Shares sold | | 83,610 | | 36,579 |
| Shares issued in connection | | | | |
| with reorganization—Note 1 | | — | | 60,337 |
| Shares redeemed | | (127,974) | | (53,363) |
| Net Increase (Decrease) in Shares Outstanding | | (44,364) | | 43,553 |
| |
| a During the period ended August 31, 2005, 598,310 Class B shares representing $12,482,881 were automatically |
| converted to 567,030 Class A shares and during the period ended August 31, 2004, 161,351 Class B shares |
| representing $3,480,611 were automatically converted to 154,779 Class A shares. | | |
| See notes to financial statements. | | | | |
The following tables describes the performance for each share class for the fiscal periods indicated.All information (except portfolio turnover rate) reflects financial results for a single fund share.Total return shows how much your investment in the fund would have increased or (decreased) during the period, assuming you had reinvested all dividends and distributions.These figures have been derived from the fund’s financial statements.
| | | | | | | Year Ended August 31, | | |
| | | |
| |
| |
|
| Class A Shares | | 2005 | | 2004 | | 2003 | | 2002 | | 2001 |
| |
| |
| |
| |
| |
|
| Per Share Data ($): | | | | | | | | | | |
| Net asset value, beginning of period | | 19.64 | | 21.28 | | 14.89 | | 22.58 | | 67.51 |
| Investment Operations: | | | | | | | | | | |
| Investment (loss)—net a | | (.10) | | (.24) | | (.18) | | (.25) | | (.25) |
| Net realized and unrealized | | | | | | | | | | |
| gain (loss) on investments | | 2.86 | | (1.40) | | 6.57 | | (7.44) | | (44.68) |
| Total from Investment Operations | | 2.76 | | (1.64) | | 6.39 | | (7.69) | | (44.93) |
| Net asset value, end of period | | 22.40 | | 19.64 | | 21.28 | | 14.89 | | 22.58 |
| |
| |
| |
| |
| |
|
| Total Return (%) b | | 14.05 | | (7.71) | | 42.91 | | (34.06) | | (66.55) |
| |
| |
| |
| |
| |
|
| Ratios/Supplemental Data (%): | | | | | | | | | | |
| Ratio of total expenses | | | | | | | | | | |
| to average net assets | | 1.32 | | 1.42 | | 1.57 | | 1.55 | | 1.22 |
| Ratio of net investment (loss) | | | | | | | | | | |
| to average net assets | | (.45) | | (1.06) | | (1.06) | | (1.13) | | (.66) |
| Portfolio Turnover Rate | | 44.59 | | 127.75 | | 61.71 | | 77.42 | | 100.86 |
| |
| |
| |
| |
| |
|
| Net Assets, end of period ($ x 1,000) | | 384,411 | | 398,767 | | 423,425 | | 314,261 | | 568,402 |
| |
| a | | Based on average shares outstanding at each month end. | | | | | | | | |
| b | | Exclusive of sales charge. | | | | | | | | | | |
| See notes to financial statements. | | | | | | | | | | |
| | FINANCIAL HIGHLIGHTS (continued)
|
| | | | | | | Year Ended August 31, | | |
| | | |
| |
| |
|
| Class B Shares | | 2005 | | 2004 | | 2003 | | 2002 | | 2001 |
| |
| |
| |
| |
| |
|
| Per Share Data ($): | | | | | | | | | | |
| Net asset value, beginning of period | | 18.75 | | 20.50 | | 14.49 | | 22.16 | | 66.81 |
| Investment Operations: | | | | | | | | | | |
| Investment (loss)—net a | | (.29) | | (.43) | | (.33) | | (.42) | | (.55) |
| Net realized and unrealized | | | | | | | | | | |
| gain (loss) on investments | | 2.71 | | (1.32) | | 6.34 | | (7.25) | | (44.10) |
| Total from Investment Operations | | 2.42 | | (1.75) | | 6.01 | | (7.67) | | (44.65) |
| Net asset value, end of period | | 21.17 | | 18.75 | | 20.50 | | 14.49 | | 22.16 |
| |
| |
| |
| |
| |
|
| Total Return (%) b | | 12.91 | | (8.54) | | 41.48 | | (34.61) | | (66.83) |
| |
| |
| |
| |
| |
|
| Ratios/Supplemental Data (%): | | | | | | | | | | |
| Ratio of total expenses | | | | | | | | | | |
| to average net assets | | 2.29 | | 2.36 | | 2.54 | | 2.43 | | 2.04 |
| Ratio of net investment (loss) | | | | | | | | | | |
| to average net assets | | (1.41) | | (2.00) | | (2.03) | | (2.00) | | (1.48) |
| Portfolio Turnover Rate | | 44.59 | | 127.75 | | 61.71 | | 77.42 | | 100.86 |
| |
| |
| |
| |
| |
|
| Net Assets, end of period ($ x 1,000) | | 162,849 | | 206,901 | | 239,954 | | 198,340 | | 375,112 |
| |
| a | | Based on average shares outstanding at each month end. | | | | | | | | |
| b | | Exclusive of sales charge. | | | | | | | | | | |
| See notes to financial statements. | | | | | | | | | | |
| | | | | | | Year Ended August 31, | | |
| | | |
| |
| |
|
| Class C Shares | | 2005 | | 2004 | | 2003 | | 2002 | | 2001 |
| |
| |
| |
| |
| |
|
| Per Share Data ($): | | | | | | | | | | |
| Net asset value, beginning of period | | 18.76 | | 20.51 | | 14.49 | | 22.15 | | 66.75 |
| Investment Operations: | | | | | | | | | | |
| Investment (loss)—net a | | (.29) | | (.42) | | (.32) | | (.41) | | (.54) |
| Net realized and unrealized | | | | | | | | | | |
| gain (loss) on investments | | 2.72 | | (1.33) | | 6.34 | | (7.25) | | (44.06) |
| Total from Investment Operations | | 2.43 | | (1.75) | | 6.02 | | (7.66) | | (44.60) |
| Net asset value, end of period | | 21.19 | | 18.76 | | 20.51 | | 14.49 | | 22.15 |
| |
| |
| |
| |
| |
|
| Total Return (%) b | | 12.95 | | (8.53) | | 41.55 | | (34.58) | | (66.82) |
| |
| |
| |
| |
| |
|
| Ratios/Supplemental Data (%): | | | | | | | | | | |
| Ratio of total expenses | | | | | | | | | | |
| to average net assets | | 2.28 | | 2.33 | | 2.51 | | 2.38 | | 2.00 |
| Ratio of net investment (loss) | | | | | | | | | | |
| to average net assets | | (1.39) | | (1.98) | | (2.00) | | (1.95) | | (1.44) |
| Portfolio Turnover Rate | | 44.59 | | 127.75 | | 61.71 | | 77.42 | | 100.86 |
| |
| |
| |
| |
| |
|
| Net Assets, end of period ($ x 1,000) | | 67,295 | | 87,980 | | 107,737 | | 91,048 | | 182,418 |
| |
| a | | Based on average shares outstanding at each month end. | | | | | | | | |
| b | | Exclusive of sales charge. | | | | | | | | | | |
| See notes to financial statements. | | | | | | | | | | |
| | FINANCIAL HIGHLIGHTS (continued)
|
| | | | | | | Year Ended August 31, | | |
| | | |
| |
| |
|
| Class R Shares | | 2005 | | 2004 | | 2003 | | 2002 | | 2001 |
| |
| |
| |
| |
| |
|
| Per Share Data ($): | | | | | | | | | | |
| Net asset value, beginning of period | | 20.06 | | 21.63 | | 15.05 | | 22.72 | | 67.69 |
| Investment Operations: | | | | | | | | | | |
| Investment income (loss)—net a | | .00b | | (.05) | | (.08) | | (.16) | | (.14) |
| Net realized and unrealized | | | | | | | | | | |
| gain (loss) on investments | | 2.91 | | (1.52) | | 6.66 | | (7.51) | | (44.83) |
| Total from Investment Operations | | 2.91 | | (1.57) | | 6.58 | | (7.67) | | (44.97) |
| Net asset value, end of period | | 22.97 | | 20.06 | | 21.63 | | 15.05 | | 22.72 |
| |
| |
| |
| |
| |
|
| Total Return (%) | | 14.51 | | (7.26) | | 43.72 | | (33.76) | | (66.44) |
| |
| |
| |
| |
| |
|
| Ratios/Supplemental Data (%): | | | | | | | | | | |
| Ratio of total expenses | | | | | | | | | | |
| to average net assets | | .86 | | .86 | | .97 | | 1.15 | | .86 |
| Ratio of net investment income | | | | | | | | | | |
| (loss) to average net assets | | .01 | | (.26) | | (.45) | | (.73) | | (.34) |
| Portfolio Turnover Rate | | 44.59 | | 127.75 | | 61.71 | | 77.42 | | 100.86 |
| |
| |
| |
| |
| |
|
| Net Assets, end of period ($ x 1,000) | | 981,036 | | 1,051,240 | | 14,750 | | 8,318 | | 9,872 |
| |
| a | | Based on average shares outstanding at each month end. | | | | | | | | |
| b | | Amount represents less than $.01 per share. | | | | | | | | |
| See notes to financial statements. | | | | | | | | | | |
| | | | | | | Year Ended August 31, | | |
| | | |
| |
| |
|
| Class T Shares | | 2005 | | 2004 | | 2003 | | 2002 | | 2001 |
| |
| |
| |
| |
| |
|
| Per Share Data ($): | | | | | | | | | | |
| Net asset value, beginning of period | | 19.22 | | 20.90 | | 14.70 | | 22.38 | | 67.26 |
| Investment Operations: | | | | | | | | | | |
| Investment (loss)—net a | | (.19) | | (.31) | | (.25) | | (.34) | | (.39) |
| Net realized and unrealized | | | | | | | | | | |
| gain (loss) on investments | | 2.78 | | (1.37) | | 6.45 | | (7.34) | | (44.49) |
| Total from Investment Operations | | 2.59 | | (1.68) | | 6.20 | | (7.68) | | (44.88) |
| Net asset value, end of period | | 21.81 | | 19.22 | | 20.90 | | 14.70 | | 22.38 |
| |
| |
| |
| |
| |
|
| Total Return (%) b | | 13.48 | | (8.04) | | 42.18 | | (34.32) | | (66.72) |
| |
| |
| |
| |
| |
|
| Ratios/Supplemental Data (%): | | | | | | | | | | |
| Ratio of total expenses | | | | | | | | | | |
| to average net assets | | 1.79 | | 1.79 | | 2.07 | | 1.99 | | 1.59 |
| Ratio of net investment (loss) | | | | | | | | | | |
| to average net assets | | (.91) | | (1.43) | | (1.56) | | (1.56) | | (1.04) |
| Portfolio Turnover Rate | | 44.59 | | 127.75 | | 61.71 | | 77.42 | | 100.86 |
| |
| |
| |
| |
| |
|
| Net Assets, end of period ($ x 1,000) | | 4,629 | | 4,931 | | 4,451 | | 3,364 | | 6,583 |
| |
| a | | Based on average shares outstanding at each month end. | | | | | | | | |
| b | | Exclusive of sales charge. | | | | | | | | | | |
| See notes to financial statements. | | | | | | | | | | |
NOTES TO FINANCIAL STATEMENTS
NOTE 1—Significant Accounting Policies:
Dreyfus Premier Technology Growth Fund (the “fund”) is a separate diversified series of Dreyfus Growth and Value Funds, Inc. (the “Company”) which is registered under the Investment Company Act of 1940, as amended (the “Act”), as an open-end management investment company and operates as a series company that offers twelve series, including the fund. The fund’s investment objective is capital appreciation. The Dreyfus Corporation (the “Manager” or “Dreyfus”) serves as the fund’s investment adviser.The Manager is a wholly-owned subsidiary of Mellon Financial Corporation (“Mellon Financial”).
Dreyfus Service Corporation (the “Distributor”), a wholly-owned subsidiary of the Manager, is the distributor of the fund’s shares. The fund is authorized to issue 500 million shares of $.001 par value Capital Stock.The fund currently offers five classes of shares: Class A (100 million shares authorized), Class B (100 million shares authorized), Class C (100 million shares authorized), Class R (100 million shares authorized) and Class T (100 million shares authorized). Class A and Class T shares are subject to a sales charge imposed at the time of purchase. Class B shares are subject to a contingent deferred sales charge (“CDSC”) imposed on Class B share redemptions made within six years of purchase and automatically convert to Class A shares after six years. Class C shares are subject to a CDSC imposed on Class C shares redeemed within one year of purchase and Class R shares are sold at net asset value per share only to institutional investors. Other differences between the classes include the services offered to and the expenses borne by each class and certain voting rights. Income, expenses (other than expenses attributable to a specific class), and realized and unrealized gains or losses on investments are allocated to each class of shares based on its relative net assets.
On December 17, 2003, pursuant to an Agreement and Plan of Reorganization previously approved by the fund’s shareholders, all of the assets, subject to the liabilities, of the Dreyfus Premier NextTech Fund, a series of Dreyfus Premier Opportunity Funds, Inc., were transferred to the fund in exchange for shares of Common Stock of the
fund of equal value.The fund’s net asset value on December 17, 2003 was $21.96 per share for Class A shares, $21.10 per share for Class B shares, $21.11 per share for Class C shares and $21.54 per share for Class T shares and a total of 814,156 Class A shares, 1,254,690 Class B shares, 402,445 Class C shares and 60,337 Class T shares, representing net assets of $17,878,863 Class A shares, $26,473,963 Class B shares, $8,495,607 Class C shares and $1,299,662 Class T shares (including $6,108,533 net unrealized appreciation on investments), were issued to Dreyfus Premier NexTech Fund shareholders in the exchange. The exchange was a tax free event to shareholders.
The Company accounts separately for the assets, liabilities and operations of each series. Expenses directly attributable to each series are charged to that series’ operations; expenses which are applicable to all series are allocated among them on a pro rata basis.
The fund’s financial statements are prepared in accordance with U.S. generally accepted accounting principles, which may require the use of management estimates and assumptions. Actual results could differ from those estimates.
The fund enters into contracts that contain a variety of indemnifications. The fund’s maximum exposure under these arrangements is unknown.The fund does not anticipate recognizing any loss related to these arrangements.
(a) Portfolio valuation: Investments in securities are valued at the last sales price on the securities exchange or national securities market on which such securities are primarily traded. Securities listed on the National Market System for which market quotations are available are valued at the official closing price or, if there is no official closing price that day, at the last sales price. Securities not listed on an exchange or the national securities market, or securities for which there were no transactions, are valued at the average of the most recent bid and asked prices, except for open short positions, where the asked price is used for valuation purposes. Bid price is used when no asked price is available.When market quotations or official closing prices are not readily available, or
| | NOTES TO FINANCIAL STATEMENTS (continued)
|
are determined not to reflect accurately fair value, such as when the value of a security has been significantly affected by events after the close of the exchange or market on which the security is principally traded (for example, a foreign exchange or market), but before the fund calculates its net asset value, the fund may value these investments at fair value as determined in accordance with the procedures approved by the Board of Directors. Fair valuing of securities may be determined with the assistance of a pricing service using calculations based on indices of domestic securities and other appropriate indicators, such as prices of relevant ADR’s and futures contracts. For other securities that are fair valued by the Board of Directors, certain factors may be considered such as: fundamental analytical data, the nature and duration of restrictions on disposition, an evaluation of the forces that influence the market in which the securities are purchased and sold, and public trading in similar securities of the issuer or comparable issuers. Financial futures are valued at the last sales price. Investments denominated in foreign currencies are translated to U.S. dollars at the prevailing rates of exchange. Forward currency exchange contracts are valued at the forward rate.
(b) Foreign currency transactions: The fund does not isolate that portion of the results of operations resulting from changes in foreign exchange rates on investments from the fluctuations arising from changes in market prices of securities held. Such fluctuations are included with the net realized and unrealized gain or loss on investments.
Net realized foreign exchange gains or losses arise from sales and maturities of short-term securities, sales of foreign currencies, currency gains or losses realized on securities transactions and the difference between the amounts of dividends, interest and foreign withholding taxes recorded on the fund’s books and the U.S. dollar equivalent of the amounts actually received or paid. Net unrealized foreign exchange gains and losses arise from changes in the value of assets and liabilities other than investments in securities, resulting from changes in exchange rates. Such gains and losses are included with net realized and unrealized gain or loss on investments.
(c) Securities transactions and investment income: Securities transactions are recorded on a trade date basis. Realized gain and loss from
securities transactions are recorded on the identified cost basis. Dividend income is recognized on the ex-dividend date and interest income, including, where applicable, accretion of discount and amortization of premium on investments is recognized on the accrual basis.
The fund has an arrangement with the custodian bank whereby the fund receives earnings credits from the custodian when positive cash balances are maintained, which are used to offset custody fees. For financial reporting purposes, the fund includes net earnings credits as an expense offset in the Statement of Operations.
Pursuant to a securities lending agreement with Mellon Bank, N.A., an affiliate of the Manager, the fund may lend securities to qualified institu-tions.At origination, all loans are secured by collateral of at least 102% of the value of U.S. securities loaned and 105% of the value of foreign securities loaned. Collateral equivalent to at least 100% of the market value of securities on loan will be maintained at all times. Cash collateral is invested in certain money market mutual funds managed by the Manager. The fund will be entitled to receive all income on securities loaned, in addition to income earned as a result of the lending transac-tion.Although each security loaned is fully collateralized, the fund would bear the risk of delay in recovery of, or loss of rights in, the securities loaned should a borrower fail to return the securities in a timely manner.
(d) Affiliated issuers: Investment companies advised by the Manager are defined as “affiliated” in the Act.
(e) Dividends to shareholders: Dividends are recorded on the ex-dividend date. Dividends from investment income-net and dividends from net realized capital gain, if any, are normally declared and paid annually, but the fund may make distributions on a more frequent basis to comply with the distribution requirements of the Internal Revenue Code of 1986, as amended (the “Code”).To the extent that net realized capital gain can be offset by capital loss carryovers, it is the policy of the fund not to distribute such gain. Income and capital gain distributions are determined in accordance with income tax regulations, which may differ from U.S. generally accepted accounting principles.
| | NOTES TO FINANCIAL STATEMENTS (continued)
|
(f) Federal income taxes: It is the policy of the fund to continue to qualify as a regulated investment company, if such qualification is in the best interests of its shareholders, by complying with the applicable provisions of the Code, and to make distributions of taxable income sufficient to relieve it from substantially all federal income and excise taxes.
At August 31, 2005, the components of accumulated earnings on a tax basis were as follows: accumulated capital losses $442,576,799 and unrealized appreciation $160,646,239.
The accumulated capital loss carryover of $442,576,799, which can be utilized in subsequent years subject to an annual limitation due to the fund’s merger with Dreyfus Premier NexTech Fund and other ownership changes, is available to be applied against future net securities profits, if any, realized subsequent to August 31, 2005. If not applied, $369,351,297 of the carryover expires in fiscal 2011 and $73, 225,502 expires in fiscal 2012. The accumulated capital loss carryover reflected above represents the amount available after limitations pursuant to Section 382 of the Code. Due to the limitation on utilization of the capital loss carryover, only $442,576,799 of the remaining $1,533,146,302 will actually be eligible to offset future gains. Consequently, the difference of $1,090,569,503 has been recorded as a reduction of paid-in capital in fiscal 2005.
During the period ended August 31,2005,as a result of permanent book to tax differences, primarily due to the tax treatment for net operating losses, limited partnerships, foreign currency transactions and other permanent book to tax differences under the provisions of Section 382 of the Code, the fund increased accumulated undistributed investment income-net by $5,662,645, increased accumulated net realized gain (loss) on investments by $1,088,763,689 and decreased paid-in capital by $1,094,426,334. Net assets were not affected by this reclassification.
NOTE 2—Bank Lines of Credit:
|
The fund may borrow up to $5 million for leveraging purposes under a short-term unsecured line of credit and participates with other Dreyfus-managed funds in a $100 million unsecured line of credit pri-
marily to be utilized for temporary or emergency purposes, including the financing of redemptions. Interest is charged to the fund based on prevailing market rates in effect at the time of borrowings.
The average daily amount of borrowings outstanding under arrangements during the period ended August 31, 2005 was approxi mately $828,200, with a related weighted average annualized interest rate of 3.00% .
NOTE 3—Management Fee and Other Transactions With
Affiliates:
|
(a) Pursuant to a management agreement with the Manager, the management fee is computed at the annual rate of .75% of the value of the fund’s average daily net assets and is payable monthly.
During the period ended August 31, 2005, the Distributor retained $20,505 and $305 from commissions earned on sales of the fund’s Class A and Class T shares, respectively, and $767,793 and $10,854 from contingent deferred sales charges on redemptions of the fund’s Class B and Class C shares, respectively.
(b) Under the Distribution Plan (the “Plan”) adopted pursuant to Rule 12b-1 under the Act, Class B, Class C and Class T shares pay the Distributor for distributing their shares at an annual rate of .75% of the value of the average daily net assets of Class B and Class C shares and .25% of the value of the average daily net assets of Class T shares. During the period ended August 31, 2005, Class B, Class C and Class T shares were charged $1,467,664, $602,602 and $12,858, respectively, pursuant to the Plan.
(c) Under the Shareholder Services Plan, Class A, Class B, Class C and Class T shares pay the Distributor at an annual rate of .25% of the value of their average daily net assets for the provision of certain services. The services provided may include personal services relating to shareholder accounts, such as answering shareholder inquiries regarding the fund and providing reports and other information, and services related to the maintenance of shareholder accounts. The Distributor may
| | NOTES TO FINANCIAL STATEMENTS (continued)
|
make payments to Service Agents (a securities dealer, financial institution or industry professional) in respect of these services. The Distributor determines the amounts to be paid to Service Agents. During the period ended August 31, 2005, Class A, Class B, Class C and Class T shares were charged $1,012,596, $489,221, $200,867 and $12,858, respectively, pursuant to the Shareholder Services Plan.
The fund compensates Dreyfus Transfer, Inc., a wholly-owned subsidiary of the Manager, under a transfer agency agreement for providing personnel and facilities to perform transfer agency services for the fund. During the period ended August 31, 2005, the fund was charged $1,460,396 pursuant to the transfer agency agreement.
The fund compensates Mellon Bank, N.A., an affiliate of the Manager, under a custody agreement for providing custodial services for the fund. During the period ended August 31, 2005, the fund was charged $318,528 pursuant to the custody agreement.
During the period ended August 31, 2005, the fund was charged $2,520 for services performed by the Chief Compliance Officer.
The components of Due to The Dreyfus Corporation and affiliates in the Statement of Assets and Liabilities consist of: management fees $1,036,326, Rule 12b-1 distribution plan fees $150,219, shareholder services plan fees $133,256, custody fees $75,380, chief compliance officer fees $1,533 and transfer agency per account fees $227,250.
(d) Each Board member also serves as a Board member of other funds within the Dreyfus complex. Annual retainer fees and attendance fees are allocated to each fund based on net assets.
NOTE 4—Securities Transactions:
|
The aggregate amount of purchases and sales of investment securities, excluding short-term securities and forward currency exchange contracts, during the period ended August 31, 2005, amounted to $759,213,948 and $1,113,401,179, respectively.
The fund enters into forward currency exchange contracts in order to hedge its exposure to changes in foreign currency exchange rates on its foreign portfolio holdings and to settle foreign currency transactions. When executing forward currency exchange contracts, the fund is obligated to buy or sell a foreign currency at a specified rate on a certain date in the future. With respect to sales of forward currency exchange contracts, the fund would incur a loss if the value of the contract increases between the date the forward contract is opened and the date the forward contract is closed.The fund realizes a gain if the value of the contract decreases between those dates.With respect to purchases of forward currency exchange contracts, the fund would incur a loss if the value of the contract decreases between the date the forward contract is opened and the date the forward contract is closed. The fund realizes a gain if the value of the contract increases between those dates. The fund is also exposed to credit risk associated with counter party nonperformance on these forward currency exchange contracts which is typically limited to the unrealized gain on each contract.At August 31, 2005, there were no forward currency exchange contracts outstanding.
At August 31, 2005, the cost of investments for federal income tax purposes was $1,491,145,651; accordingly, accumulated net unrealized appreciation on investments was $160,641,957, consisting of $215,022,791 gross unrealized appreciation and $54,380,834 gross unrealized depreciation.
In early 2004, two purported class and derivative actions were filed against Mellon Financial, Mellon Bank, N.A., Dreyfus, Founders Asset Management LLC, and certain directors of the Dreyfus Funds and the Dreyfus Founders Funds (together, the “Funds”) in the United States District Court for the Western District of Pennsylvania. In September 2004, plaintiffs served a Consolidated Amended Complaint (the “Amended Complaint”) on behalf of a purported class of all persons
| | NOTES TO FINANCIAL STATEMENTS (continued)
|
who acquired interests in any of the Funds between January 30, 1999 and November 17, 2003, and derivatively on behalf of the Funds.The Amended Complaint in the newly styled In re Dreyfus Mutual Funds Fee Litigation also named the Distributor, Premier Mutual Fund Services, Inc. and two additional Fund directors as defendants and alleges violations of the Investment Company Act of 1940, the Investment Advisers Act of 1940, the Pennsylvania Unfair Trade Practices and Consumer Protection Law and common-law claims. Plaintiffs seek to recover allegedly improper and excessive Rule 12b-1 and advisory fees allegedly charged to the Funds for marketing and distribution services. More specifically, plaintiffs claim, among other things, that 12b-1 fees and directed brokerage were improperly used to pay brokers to recommend the Funds over other funds, and that such payments were not disclosed to investors. In addition, plaintiffs assert that economies of scale and soft-dollar benefits were not passed on to the Funds. Plaintiffs further allege that 12b-1 fees were improperly charged to certain of the Funds that were closed to new investors.The Amended Complaint seeks compensatory and punitive damages, rescission of the advisory contracts, and an accounting and restitution of any unlawful fees, as well as an award of attorneys’ fees and litigation expenses. As noted, some of the claims in this litigation are asserted derivatively on behalf of the Funds that have been named as nominal defendants. With respect to such derivative claims, no relief is sought against the Funds. Dreyfus believes the allegations to be totally without merit and intends to defend the action vigorously. In November 2004, all named defendants moved to dismiss the Amended Complaint in whole or substantial part. Briefing was completed in May 2005.
Additional lawsuits arising out of these circumstances and presenting similar allegations and requests for relief may be filed against the defendants in the future. Neither Dreyfus nor the Funds believe that any of the pending actions will have a material adverse effect on the Funds or Dreyfus’ ability to perform its contract with the Funds.
REPORT OF INDEPENDENT REGISTERED
PUBLIC ACCOUNTING FIRM
|
| | Shareholders and Board of Directors
Dreyfus Premier Technology Growth Fund
|
We have audited the accompanying statement of assets and liabilities, including the statement of investments, of Dreyfus Premier Technology Growth Fund (one of the funds comprising Dreyfus Growth and Value Fund, Inc.) as of August 31, 2005, and the related statement of operations for the year then ended, the statement of changes in net assets for each of the two years in the period then ended, and financial highlights for each of the years indicated therein.These financial statements and financial highlights are the responsibility of the Fund’s management. Our responsibility is to express an opinion on these financial statements and financial highlights based on our audits.
We conducted our audits in accordance with the standards of the Public Company Accounting Oversight Board (United States).Those standards require that we plan and perform the audit to obtain reasonable assurance about whether the financial statements and financial highlights are free of material misstatement.We were not engaged to perform an audit of the Fund’s internal control over financial reporting.Our audits included consideration of internal control over financial reporting as a basis for designing audit procedures that are appropriate in the circumstances,but not for the purpose of expressing an opinion on the effectiveness of the Fund’s internal control over financial reporting.Accordingly, we express no such opinion.An audit also includes examining, on a test basis, evidence supporting the amounts and disclosures in the financial statements and financial highlights, assessing the accounting principles used and significant estimates made by management, and evaluating the overall financial statement presentation. Our procedures included verification by examination of securities held by the custodian as of August 31, 2005 and confirmation of securities not held by the custodian by correspondence with oth-ers.We believe that our audits provide a reasonable basis for our opinion.
In our opinion, the financial statements and financial highlights referred to above present fairly, in all material respects, the financial position of Dreyfus Premier Technology Growth Fund at August 31, 2005, the results of its operations for the year then ended, the changes in its net assets for each of the two years in the period then ended, and the financial highlights for each of the indicated years, in conformity with U.S. generally accepted accounting principles.

| | New York, New York
October 14, 2005
|
| | INFORMATION ABOUT THE REVIEW AND APPROVAL OF THE
FUND’S MANAGEMENT AGREEMENT (Unaudited)
|
At a meeting of the Board of Directors held on March 14, 2005, the Board considered the re-approval for an annual period of the Fund’s Management Agreement, pursuant to which the Manager provides the Fund with investment advisory and administrative services. The Board members, none of whom are “interested persons” (as defined in the Investment Company Act of 1940,as amended) of the Fund,were assisted in their review by independent legal counsel and met with counsel in executive session separate from representatives of the Manager.
Analysis of Nature, Extent and Quality of Services Provided to the Fund. The Board members received a presentation from representatives of the Manager regarding services provided to the Fund and other funds in the Dreyfus fund complex, and discussed the nature, extent and quality of the services provided to the Fund pursuant to its Management Agreement. The presentation included a detailed summary of the services provided to Dreyfus-managed mutual funds by each business unit within the Manager.The Manager’s representatives reviewed the Fund’s distribution of accounts and the relationships the Manager has with various intermediaries and the different needs of each.The Manager’s representatives noted the diversity of distribution of the Fund as well as among the funds in the Dreyfus fund complex, and the Manager’s corresponding need for broad, deep, and diverse resources to be able to provide ongoing shareholder services to each of the Fund’s distribution channels.The Board also reviewed the number of shareholder accounts in the Fund, as well as the Fund’s asset size.
The Board members also considered the Manager’s research and portfolio management capabilities and that the Manager also provides oversight of day-to-day fund operations, including fund accounting and administration and assistance in meeting legal and regulatory requirements. The Board members also considered the Manager’s extensive administrative, accounting and compliance infrastructure.
Comparative Analysis of the Fund’s Performance and Management Fee and Expense Ratio. The Board members reviewed the Fund’s perfor-mance,management fee and expense ratios and placed significant emphasis on comparisons to a group of comparable funds and Lipper category
averages, as applicable. The group of comparable funds was previously approved by the Board for this purpose, and was prepared using a Board-approved selection methodology that was based, in part, on selecting non-affiliated funds reported in the same Lipper category as the Fund. The Board members discussed the results of the comparisons for various periods ended January 31, 2005, and noted that the Fund’s performance was higher than the comparison group averages for the 3-year and 5-year periods, but was lower than the comparison group average for the 1-year period. The Board also noted that the Fund’s performance was higher than the Lipper category average for the 5-year period, but was lower than the Lipper category averages for the 1-year and 3-year periods.The Board discussed with representatives of the Manager the reasons for the Fund’s underperformance compared to the Lipper category for the 1-and 3-year periods and the Manager’s efforts to improve performance. The Board members also discussed the Fund’s management fee and expense ratio and reviewed the range of management fees and expense ratios for the funds in the comparison group.The Fund’s management fee ranked in the top half (i.e., lower than most others) of the comparison group funds. The Board noted that the Fund’s total expense ratio was lower than the Fund’s comparison group and Lipper category averages.
Representatives of the Manager reviewed with the Board members the fees paid to the Manager or its affiliates by other accounts managed or sub-advised by the Manager or its affiliates with similar investment objectives, policies and strategies as the Fund (the “Similar Accounts”). The Manager’s representatives explained the nature of the Similar Accounts and the differences, from Dreyfus’ perspective, in management of the Similar Accounts as compared to managing and providing services to the Fund. The Manager’s representatives also reviewed the costs associated with distribution through intermediaries. The Board analyzed the differences in fees paid to the Manager and discussed the relationship of the advisory fees paid in light of the Manager’s performance and the services provided.The Board members considered the relevance of the fee information provided for the Similar Accounts managed by the Manager to evaluate the appropriateness and reason-
| | I N FO R M AT I O N A B O U T T H E R E V I E W A N D A P P R OVA L O F T H E
F U N D ’ S M A N A G E M E N T A G R E E M E N T ( U n a u d i t e d ) ( c o n t i n u e d )
|
ableness of the Fund’s advisory fees.The Board acknowledged that differences in fees paid by the Similar Accounts seemed to be consistent with the services provided.
Analysis of Profitability and Economies of Scale. The Manager’s representatives reviewed the dollar amount of expenses allocated and profit received by the Manager and the method used to determine such expenses and profit.The Board received and considered information prepared by an independent consulting firm regarding the Manager’s approach to allocating costs to, and determining the profitability of, individual funds and the entire Dreyfus fund complex.The Manager’s representatives stated that the methodology had also been reviewed by an independent registered public accounting firm which, like the consultant, found the methodology to be reasonable.The consulting firm also analyzed where any economies of scale might emerge in connection with the management of the Fund.The Board members evaluated the analysis in light of the relevant circumstances for the Fund, and the extent to which economies of scale would be realized as the Fund grows and whether fee levels reflect these economies of scale for the benefit of Fund investors. The Board noted that it appeared that the benefits of any economies of scale also would be appropriately shared with shareholders through increased investment in fund management and administration resources. The Board members also considered potential benefits to the Manager from acting as investment adviser and reviewed the soft dollar arrangements with respect to trading the Fund’s portfolio.
It was noted that the Board members should consider the Manager’s profitability with respect to the Fund as part of their evaluation of whether the fee under the Management Agreement bears a reasonable relationship to the mix of services provided by the Manager, including the nature, extent and quality of such services and that a discussion of economies of scale is predicated on increasing assets and that, if a fund’s assets had been decreasing, the possibility that the Manager may have realized any economies of scale would be less.The Board members also discussed the profitability percentage ranges determined by appropriate
court cases to be reasonable given the services rendered to investment companies. It was noted that the profitability percentage for managing the Fund was not unreasonable given the Fund’s overall performance and generally superior service levels provided.
At the conclusion of these discussions, each of the Directors expressed the opinion that he or she had been furnished with sufficient information to make an informed business decision with respect to continuation of the Fund’s Management Agreement. Based on their discussions and considerations as described above, the Board made the following conclusions and determinations.
- The Board concluded that the nature, extent and quality of the services provided by the Manager are adequate and appropriate.
- The Board expressed concern over the Fund’s performance, but was satisfied with the Manager’s efforts to improve such performance.
- The Board concluded that the fee paid to the Manager by the Fund was reasonable in light of comparative performance and expense and advisory fee information, costs of the services provided and profits to be realized and benefits derived or to be derived by the Manager from its relationship with the Fund.
- The Board determined that the economies of scale which may accrue to the Manager and its affiliates in connection with the man- agement of the Fund had been adequately considered by the Manager in connection with the management fee rate charged to the Fund, and that, to the extent in the future it were to be deter- mined that material economies of scale had not been shared with the Fund, the Board would seek to have those economies of scale shared with the Fund.
The Board members considered these conclusions and determinations, along with the information received on a routine and regular basis throughout the year, and, without any one factor being dispositive, the Board determined that re-approval of the Fund’s Management Agreement was in the best interests of the Fund and its shareholders.
BOARD MEMBERS INFORMATION (Unaudited)
| | Joseph S. DiMartino (61)
Chairman of the Board (1995)
|
Principal Occupation During Past 5 Years:
| • Corporate Director and Trustee |
| Other Board Memberships and Affiliations: |
| • The Muscular Dystrophy Association, Director |
| • Levcor International, Inc., an apparel fabric processor, Director |
| • Century Business Services, Inc., a provider of outsourcing functions for small and medium size |
| companies, Director |
| • The Newark Group, a provider of a national market of paper recovery facilities, paperboard |
| mills and paperboard converting plants, Director |
| • Azimuth Trust, an institutional asset management firm, Member of Board of Managers and |
| Advisory Board |
| • Sunair Electronics, Inc., engages in the design, manufacture and sale of high frequency systems |
| for long-range voice and data communications, as well as providing certain outdoor-related |
| services to homes and businesses, Director |
No. of Portfolios for which Board Member Serves: 193
| | David P. Feldman (65)
Board Member (1996)
|
| Principal Occupation During Past 5 Years: |
| • Corporate Director & Trustee |
| | Other Board Memberships and Affiliations:
|
- BBH Mutual Funds Group (11 funds), Director
- The Jeffrey Company, a private investment company, Director
- QMED, a medical device company, Director
No. of Portfolios for which Board Member Serves: 58
| | Ehud Houminer (65)
Board Member (1993)
|
| | Principal Occupation During Past 5 Years:
|
- Executive-in-Residence at the Columbia Business School, Columbia University
- Principal of Lear,Yavitz and Associates, a management consulting firm (1996 to 2001)
| | Other Board Memberships and Affiliations:
|
- Avnet Inc., an electronics distributor, Director
- International Advisory Board to the MBA Program School of Management, Ben Gurion University, Chairman
- Explore Charter School, Brooklyn, NY, Chairman
| | No. of Portfolios for which Board Member Serves: 36
|
| | Gloria Messinger (75)
Board Member (1993)
|
| | Principal Occupation During Past 5 Years:
|
- Arbitrator for American Arbitration Association and National Association of Securities Dealers, Inc.
- Consultant in Intellectual Property
| | Other Board Memberships and Affiliations:
|
- Yale Law School Fund, Director
- Theater for a New Audience, Inc., Director
- Brooklyn Philharmonic, Director
- New York Women’s Agenda Music Performance Trust Fund, Director
| | No. of Portfolios for which Board Member Serves: 25
|
T. John Szarkowski (79) Board Member (1996)
| Principal Occupation During Past 5 Years: |
| • Consultant in Photography |
| Other Board Memberships and Affiliations: |
| • Photography Department at The Museum of Modern Art, Director Emeritus |
| | No. of Portfolios for which Board Member Serves: 25
|
| | Anne Wexler (75)
Board Member (1996)
|
| | Principal Occupation During Past 5 Years:
|
- Chairman of the Wexler & Walker Public Policy Associates, consultants specializing in government relations and public affairs
| | Other Board Memberships and Affiliations:
|
- Wilshire Mutual Funds (5 funds), Director
- Methanex Corporation, a methanol producing company, Director
- Member of the Council of Foreign Relations
- Member of the National Park Foundation
| | No. of Portfolios for which Board Member Serves: 36
|
Once elected all Board Members serve for an indefinite term.The address of the Board Members and Officers is in c/o The Dreyfus Corporation, 200 Park Avenue, New York, New York 10166. Additional information about the Board Members is available in the fund’s Statement of Additional Information which can be obtained from Dreyfus free of charge by calling this toll free number: 1-800-554-4611.
John M. Fraser, Jr., Emeritus Board Member
OFFICERS OF THE FUND (Unaudited)
| STEPHEN E. CANTER, President since | | JAMES BITETTO, Vice President and |
| March 2000. | | Assistant Secretary since August 2005. |
| Chairman of the Board, Chief Executive | | Assistant General Counsel and Assistant |
| Officer and Chief Operating Officer of the | | Secretary of the Manager, and an officer of 91 |
| Manager, and an officer of 90 investment | | investment companies (comprised of 200 |
| companies (comprised of 184 portfolios) | | portfolios) managed by the Manager. He is 39 |
| managed by the Manager. Mr. Canter also is a | | years old and has been an employee of the |
| Board member and, where applicable, an | | Manager since December 1996. |
| |
| Executive Committee Member of the other | | JONI LACKS CHARATAN, Vice President |
| investment management subsidiaries of Mellon | | and Assistant Secretary since |
| Financial Corporation, each of which is an | | August 2005. |
| affiliate of the Manager. He is 60 years old and | | |
| has been an employee of the Manager since | | Assistant General Counsel and Assistant |
| May 1995. | | Secretary of the Manager, and an officer of 91 |
| | | investment companies (comprised of 200 |
| STEPHEN R. BYERS, Executive Vice | | portfolios) managed by the Manager. She is 49 |
| President since November 2002. | | years old and has been an employee of the |
| Chief Investment Officer,Vice Chairman and a | | Manager since October 1998. |
| |
| director of the Manager, and an officer of 90 | | JOSEPH M. CHIOFFI, Vice President and |
| investment companies (comprised of 184 | | Assistant Secretary since August 2005. |
| portfolios) managed by the Manager. Mr. Byers | | |
| also is an officer, director or an Executive | | Assistant General Counsel and Assistant |
| Committee Member of certain other | | Secretary of the Manager, and an officer of 91 |
| investment management subsidiaries of Mellon | | investment companies (comprised of 200 |
| Financial Corporation, each of which is an | | portfolios) managed by the Manager. He is 43 |
| affiliate of the Manager. He is 52 years old and | | years old and has been an employee of the |
| has been an employee of the Manager since | | Manager since July 2000. |
| January 2000. | | JANETTE E. FARRAGHER, Vice President |
| MARK N. JACOBS, Vice President since | | and Assistant Secretary since |
| March 2000. | | August 2005. |
| Executive Vice President, Secretary and | | Associate General Counsel of the Manager, |
| General Counsel of the Manager, and an | | and an officer of 91 investment companies |
| officer of 91 investment companies (comprised | | (comprised of 200 portfolios) managed by the |
| of 200 portfolios) managed by the Manager. | | Manager. She is 42 years old and has been an |
| He is 59 years old and has been an employee | | employee of the Manager since February 1984. |
| of the Manager since June 1977. | | JOHN B. HAMMALIAN, Vice President and |
| MICHAEL A. ROSENBERG, Vice President | | Assistant Secretary since August 2005. |
| and Secretary since August 2005. | | Associate General Counsel of the Manager, |
| Associate General Counsel of the Manager, | | and an officer of 91 investment companies |
| and an officer of 91 investment companies | | (comprised of 200 portfolios) managed by the |
| (comprised of 200 portfolios) managed by the | | Manager. He is 42 years old and has been an |
| Manager. He is 45 years old and has been an | | employee of the Manager since February 1991. |
| employee of the Manager since October 1991. | | |
| ROBERT R. MULLERY, Vice President and | | ROBERT SVAGNA, Assistant Treasurer |
| Assistant Secretary since August 2005. | | since December 2002. |
| Associate General Counsel of the Manager, | | Senior Accounting Manager – Equity Funds of |
| and an officer of 91 investment companies | | the Manager, and an officer of 91 investment |
| (comprised of 200 portfolios) managed by the | | companies (comprised of 200 portfolios) |
| Manager. He is 53 years old and has been an | | managed by the Manager. He is 38 years old |
| employee of the Manager since May 1986. | | and has been an employee of the Manager |
| |
| JEFF PRUSNOFSKY, Vice President and | | since November 1990. |
| Assistant Secretary since August 2005. | | KENNETH J. SANDGREN, Assistant |
| Associate General Counsel of the Manager, | | Treasurer since November 2001. |
| and an officer of 91 investment companies | | Mutual Funds Tax Director of the Manager, |
| (comprised of 200 portfolios) managed by the | | and an officer of 91 investment companies |
| Manager. He is 40 years old and has been an | | (comprised of 200 portfolios) managed by the |
| employee of the Manager since October 1990. | | Manager. He is 51 years old and has been an |
| |
| JAMES WINDELS, Treasurer since | | employee of the Manager since June 1993. |
| November 2001. | | JOSEPH W. CONNOLLY, Chief Compliance |
| Director – Mutual Fund Accounting of the | | Officer since October 2004. |
| Manager, and an officer of 91 investment | | Chief Compliance Officer of the Manager and |
| companies (comprised of 200 portfolios) | | The Dreyfus Family of Funds (91 investment |
| managed by the Manager. He is 46 years old | | companies, comprising 200 portfolios). From |
| and has been an employee of the Manager | | November 2001 through March 2004, Mr. |
| since April 1985. | | Connolly was first Vice-President, Mutual |
| |
| GREGORY S. GRUBER, Assistant | | Fund Servicing for Mellon Global Securities |
| Treasurer since August 2005. | | Services. In that capacity, Mr. Connolly was |
| | | responsible for managing Mellon’s Custody, |
| Senior Accounting Manager – Municipal Bond | | Fund Accounting and Fund Administration |
| Funds of the Manager, and an officer of 91 | | services to third-party mutual fund clients. He |
| investment companies (comprised of 200 | | is 48 years old and has served in various |
| portfolios) managed by the Manager. He is 46 | | capacities with the Manager since 1980, |
| years old and has been an employee of the | | including manager of the firm’s Fund |
| Manager since August 1981. | | Accounting Department from 1997 through |
| ERIK D. NAVILOFF, Assistant Treasurer | | October 2001. |
| since August 2005. | | WILLIAM GERMENIS, Anti-Money |
| Senior Accounting Manager – Taxable Fixed | | Laundering Compliance Officer since |
| Income Funds of the Manager, and an officer | | October 2002. |
| of 91 investment companies (comprised of 200 | | Vice President and Anti-Money Laundering |
| portfolios) managed by the Manager. He is 37 | | Compliance Officer of the Distributor, and the |
| years old and has been an employee of the | | Anti-Money Laundering Compliance Officer |
| Manager since November 1992. | | of 88 investment companies (comprised of 197 |
| ROBERT ROBOL, Assistant Treasurer | | portfolios) managed by the Manager. He is 35 |
| since August 2005. | | years old and has been an employee of the |
| | | Distributor since October 1998. |
| Senior Accounting Manager – Money Market | | |
| Funds of the Manager, and an officer of 91 | | |
| investment companies (comprised of 200 | | |
| portfolios) managed by the Manager. He is 41 | | |
| years old and has been an employee of the | | |
| Manager since October 1988. | | |
NOTES
| For More | | Information |
| |
|
| |
| Dreyfus Premier | | Transfer Agent & |
| Technology Growth Fund | | Dividend Disbursing Agent |
| 200 Park Avenue | | |
| | | Dreyfus Transfer, Inc. |
| New York, NY 10166 | | |
| | | 200 Park Avenue |
| Manager | | New York, NY 10166 |
| The Dreyfus Corporation | | Distributor |
| 200 Park Avenue | | |
| | | Dreyfus Service Corporation |
| New York, NY 10166 | | |
| | | 200 Park Avenue |
| Custodian | | New York, NY 10166 |
| Mellon Bank, N.A. | | |
| One Mellon Bank Center | | |
| Pittsburgh, PA 15258 | | |
Telephone Call your financial representative or 1-800-554-4611
| Mail | | The Dreyfus Premier Family of Funds |
| | | 144 Glenn Curtiss Boulevard, Uniondale, NY 11556-0144 |
The fund files its complete schedule of portfolio holdings with the Securities and Exchange Commission (“SEC”) for the first and third quarters of each fiscal year on Form N-Q. The fund’s Forms N-Q are available on the SEC’s website at http://www.sec.gov and may be reviewed and copied at the SEC’s Public Reference Room in Washington, DC. Information on the operation of the Public Reference Room may be obtained by calling 1-800-SEC-0330.
A description of the policies and procedures that the fund uses to determine how to vote proxies relating to portfolio securities, and information regarding how the fund voted these proxies for the 12-month period ended June 30, 2005, is available at http://www.dreyfus.com and on the SEC’s website at http://www.sec.gov. The description of the policies and procedures is also available without charge, upon request, by calling 1-800-645-6561.


Save time. Save paper. View your next shareholder report online as soon as it’s available. Log into www.dreyfus.com and sign up for Dreyfus eCommunications. It’s simple and only takes a few minutes.
The views expressed in this report reflect those of the portfolio manager only through the end of the period covered and do not necessarily represent the views of Dreyfus or any other person in the Dreyfus organization. Any such views are subject to change at any time based upon market or other conditions and Dreyfus disclaims any responsibility to update such views.These views may not be relied on as investment advice and, because investment decisions for a Dreyfus fund are based on numerous factors, may not be relied on as an indication of trading intent on behalf of any Dreyfus fund.
Not FDIC-Insured • Not Bank-Guaranteed • May Lose Value
| | | Contents |
| |
| | | THE FUND |
| |
|
| 2 | | Letter from the Chairman |
| 3 | | Discussion of Fund Performance |
| 6 | | Fund Performance |
| 7 | | Understanding Your Fund’s Expenses |
| 7 | | Comparing Your Fund’s Expenses |
| | | With Those of Other Funds |
| 8 | | Statement of Investments |
| 13 | | Statement of Assets and Liabilities |
| 14 | | Statement of Operations |
| 15 | | Statement of Changes in Net Assets |
| 16 | | Financial Highlights |
| 17 | | Notes to Financial Statements |
| 24 | | Report of Independent Registered |
| | | Public Accounting Firm |
| 25 | | Information About the Review and Approval |
| | | of the Fund’s Management Agreement |
| 30 | | Board Members Information |
| 32 | | Officers of the Fund |
| |
| | | FOR MORE INFORMATION |
| |
|
| | | Back Cover |
The Fund
Dreyfus
Small Company Value Fund
|

LETTER FROM THE CHAIRMAN
This annual report for Dreyfus Small Company Value Fund covers the 12-month period from September 1, 2004, through August 31, 2005. Inside, you’ll find valuable information about how the fund was managed during the reporting period, including a discussion with the fund’s portfolio manager, David A. Daglio.
On average, stock prices ended the reporting period higher than where they began. However, most of the market’s gains occurred during the closing months of 2004. So far in 2005, positive factors, including steady economic growth and higher corporate profits, were largely offset by headwinds, such as sharply higher energy prices and rising short-term interest rates. Midcap stocks produced higher returns than small-cap stocks in this environment, and small-cap stocks outperformed large-cap stocks. Also, value-oriented stocks have generally produced better results than their more growth-oriented counterparts during the past 12 months.
Recent shocks to the U.S. economy — including sharply higher gasoline prices and other lingering consequences of Hurricane Katrina — have added a degree of uncertainty to the economic outlook.Nonetheless,our economists currently expect the economy to continue to grow without either entering a recession or triggering a significant acceleration of inflation. As always, we encourage you to discuss the potential implications of these and other matters with your financial advisor.
Thank you for your continued confidence and support.


DISCUSSION OF FUND PERFORMANCE
David A. Daglio, Portfolio Manager
How did Dreyfus Small Company Value Fund perform relative
to its benchmark?
|
For the 12-month period ended August 31, 2005, the fund produced a total return of 33.74% .1 In comparison, the fund’s benchmark, the Russell 2000 Value Index (the “Index”), produced a total return of 22.61% for the same period.2
An improving U.S. economy and rising corporate earnings more than offset concerns related to rising interest rates and soaring energy prices, fueling gains for small-cap stocks during the reporting period. The fund produced a higher return than its benchmark, due largely to its overweight position in the energy, capital goods, utilities and technology sectors.
As of August 17, 2005, David A. Daglio became the fund’s primary portfolio manager. Mr. Daglio is a senior vice president of The Boston Company Asset Management, an affiliate of Dreyfus.
What is the fund’s investment approach?
The fund seeks capital appreciation. To pursue this goal, the fund normally invests at least 80% of its assets in small-company stocks of companies with market capitalizations between $100 million and $2 billion at the time of purchase. Because the fund may continue to hold a security whose market capitalization grows, a substantial portion of the fund’s holdings can have market capitalizations in excess of $2 billion at any given time. The fund’s stock investments may include common stocks, preferred stocks and convertible securities of both U.S. and foreign issuers, including those purchased in initial public offerings (IPOs).
The portfolio manager identifies potential investments through extensive quantitative and fundamental research.When selecting stocks, we emphasize three key factors: value, or how a stock is valued relative to its intrinsic worth based on traditional value measures; business health,
| | DISCUSSION OF FUND PERFORMANCE (continued)
|
or the overall efficiency and profitability as measured by return on assets and return on equity; and business momentum, or the presence of a catalyst, such as corporate restructuring, change in management or a spin-off that will trigger a price increase in the near- to midterm.
What other factors influenced the fund’s performance?
Although we choose investments through quantitative and fundamental research into individual companies and not according to broader economic or market trends, it is worth noting that small-cap stocks generally benefited from stronger economic growth during the reporting period, which helped make investors more comfortable assuming the risks of investing in smaller companies. Corporate profitability and balance sheets improved, and a long-awaited increase in capital spending among businesses began to materialize. Despite rising oil and natural gas prices, consumer spending remained strong as borrowing rates remained low,the labor market improved and home values rose.By the second half of the reporting period, however, soaring energy prices and rising short-term interest rates began to weigh more heavily on investor sentiment, and gains from small-cap stocks began to moderate.
In this environment, the fund enjoyed success across a number of market sectors. Not surprisingly, several energy stocks posted strong returns as oil and gas prices reached record highs.The fund’s relatively heavy exposure to the energy sector boosted returns further. Similarly, stocks of coal producers gained value due to rising demand for alternative energy sources. Within the capital goods area, the fund’s stock selection strategy drove returns. For example, York International, an independent supplier of heating, air conditioning, ventilation and refrigeration systems, benefited from a robust environment for renovations and new construction.
Our stock selection strategy was particularly successful in the utilities area, with attractive contributions to performance from telecommunications service providers Dobson Communications and UbiquiTel. In the technology area, semiconductor and semiconductor capital equipment stocks rebounded amid increased corporate capital spending.
Some of the Index’s smaller industry groups detracted from the fund’s performance. Some holdings in the consumer non-durables sector were affected by disappointing earnings and rising fuel costs. Finally, in the transportation sector, higher fuel prices during the second half of the reporting period eroded earlier gains.
What is the fund’s current strategy?
As of the end of the reporting period, our security selection process has continued to find relatively attractive values among technology companies, radio broadcasters and several areas within the health care group, including the biotechnology, pharmaceutical and home health care industries. Conversely, we have found limited opportunities in the traditional dividend-paying areas of the market, which include banks, thrifts and utilities.
In addition, we recently trimmed or sold some of the fund’s energy and coal stocks as they reached our price targets.We have also reduced the fund’s exposure to steel manufacturers, focusing instead on steel processors that, in our judgment, may be better positioned to benefit from more stable commodity prices. In our judgment, these strategies position the fund well for the next phase of the business cycle.
| 1 | | Total return includes reinvestment of dividends and any capital gains paid. Past performance is no |
| | | guarantee of future results. Share price and investment return fluctuate such that upon redemption, |
| | | fund shares may be worth more or less than their original cost. |
| | | Part of the fund’s recent performance is attributable to positive returns from its initial public |
| | | offering (IPO) investments. There can be no guarantee that IPOs will have or continue to |
| | | have a positive effect on the fund’s performance. |
| 2 | | SOURCE: LIPPER INC. — Reflects the reinvestment of dividends and, where applicable, |
| | | capital gain distributions.The Russell 2000 Value Index is an unmanaged index, which measures |
| | | the performance of those Russell 2000 companies with lower price-to-book ratios and lower |
| | | forecasted growth values. |
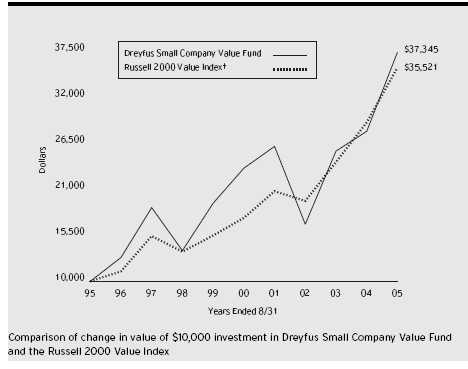
| Average Annual Total Returns | | as of 8/31/05 | | | | |
| | | 1 Year | | 5 Years | | 10 Years |
| |
| |
| |
|
| Fund | | 33.74% | | 9.70% | | 14.08% |
| † Source: Lipper Inc. | | | | | | |
Past performance is not predictive of future performance.The fund’s performance shown in the graph and table does not reflect the deduction of taxes that a shareholder would pay on fund distributions or the redemption of fund shares. Part of the fund’s recent performance is attributable to positive returns from its initial public offering (IPO) investments. There can be no guarantee that IPOs will have or continue to have a positive effect on the fund’s performance. The above graph compares a $10,000 investment made in Dreyfus Small Company Value Fund on 8/31/95 to a $10,000 investment made on that date in the Russell 2000 Value Index (the “Index”). All dividends and capital gain distributions are reinvested.
The fund’s performance shown in the line graph takes into account all applicable fees and expenses.The Index is an unmanaged index of small-cap value stock performance.The Index does not take into account charges, fees and other expenses. Further information relating to fund performance, including expense reimbursements, if applicable, is contained in the Financial Highlights section of the prospectus and elsewhere in this report.
U N D E R S TA N D I N G YO U R F U N D ’ S E X P E N S E S ( U n a u d i t e d )
As a mutual fund investor, you pay ongoing expenses, such as management fees and other expenses. Using the information below, you can estimate how these expenses affect your investment and compare them with the expenses of other funds.You also may pay one-time transaction expenses, including sales charges (loads) and redemption fees, which are not shown in this section and would have resulted in higher total expenses. For more information, see your fund’s prospectus or talk to your financial adviser.
Review your fund’s expenses
The table below shows the expenses you would have paid on a $1,000 investment in Dreyfus Small Company Value Fund from March 1, 2005 to August 31, 2005. It also shows how much a $1,000 investment would be worth at the close of the period, assuming actual returns and expenses.
Expenses and Value of a $1,000 Investment
assuming actual returns for the six months ended August 31, 2005
|
| Expenses paid per $1,000 † | | $ 6.31 |
| Ending value (after expenses) | | $1,087.60 |
COMPARING YOUR FUND’S EXPENSES
WITH THOSE OF OTHER FUNDS (Unaudited)
|
Using the SEC’s method to compare expenses
The Securities and Exchange Commission (SEC) has established guidelines to help investors assess fund expenses. Per these guidelines, the table below shows your fund’s expenses based on a $1,000 investment, assuming a hypothetical 5% annualized return. You can use this information to compare the ongoing expenses (but not transaction expenses or total cost) of investing in the fund with those of other funds.All mutual fund shareholder reports will provide this information to help you make this comparison. Please note that you cannot use this information to estimate your actual ending account balance and expenses paid during the period.
Expenses and Value of a $1,000 Investment
assuming a hypothetical 5% annualized return for the six months ended August 31, 2005
|
| Expenses paid per $1,000 † | | $ 6.11 |
| Ending value (after expenses) | | $1,019.16 |
† Expenses are equal to the fund’s annualized expense ratio of 1.20%; multiplied by the average account value over the period, multiplied by 184/365 (to reflect the one-half year period).
| | STATEMENT OF INVESTMENTS
August 31, 2005
|
| Common Stocks—96.5% | | Shares | | Value ($) |
| |
| |
|
| Banking—2.5% | | | | |
| Advance America Cash Advance Centers | | 203,580 | | 2,911,194 |
| EuroBancshares | | 4,525 a | | 68,056 |
| PHH | | 53,630 a | | 1,621,771 |
| | | | | 4,601,021 |
| Basic Industries—10.5% | | | | |
| America West Holdings, Cl. B | | 208,100 a,b | | 1,465,024 |
| Applied Micro Circuits | | 436,900 a | | 1,201,475 |
| Arch Coal | | 25,400 b | | 1,630,680 |
| Chemtura | | 222,920 | | 3,825,307 |
| Gibraltar Industries | | 69,450 | | 1,487,619 |
| GrafTech International | | 305,000 a | | 1,811,700 |
| Massey Energy | | 60,300 | | 3,063,240 |
| PolyOne | | 118,400 a | | 803,936 |
| Timken | | 50,500 | | 1,483,185 |
| Walter Industries | | 58,300 b | | 2,557,621 |
| | | | | 19,329,787 |
| Beverages & Tobacco—.9% | | | | |
| CBRL Group | | 47,600 | | 1,721,216 |
| Broadcasting & Publishing—.7% | | | | |
| Salem Communications, Cl. A | | 63,805 a | | 1,183,583 |
| Capital Goods—7.0% | | | | |
| AGCO | | 127,500 a | | 2,617,575 |
| Apogee Enterprises | | 100,900 | | 1,620,454 |
| CommScope | | 34,000 a,b | | 635,800 |
| Navistar International | | 74,100 a | | 2,368,236 |
| Shaw Group | | 104,400 a | | 2,202,840 |
| Terex | | 9,800 a | | 478,044 |
| Varian | | 37,800 a | | 1,345,680 |
| Wabash National | | 73,200 | | 1,524,024 |
| | | | | 12,792,653 |
| Consumer Durables—3.6% | | | | |
| Comstock Homebuilding Cos., Cl. A | | 38,600 a | | 822,180 |
| Fleetwood Enterprises | | 126,400 a,b | | 1,277,904 |
| Interface, Cl. A | | 123,500 a | | 1,253,525 |
| WCI Communities | | 106,500 a,b | | 3,213,105 |
| Winnebago Industries | | 2,900 | | 88,363 |
| | | | | 6,655,077 |
| Common Stocks (continued) | | Shares | | Value ($) |
| |
| |
|
| Consumer Non-Durables—2.4% | | | | |
| Intertape Polymer Group | | 91,100 a | | 650,454 |
| NBTY | | 72,600 a | | 1,589,214 |
| ProQuest | | 59,200 a | | 2,129,424 |
| | | | | 4,369,092 |
| Consumer Services—9.3% | | | | |
| Cache | | 28,500 a | | 487,635 |
| Christopher & Banks | | 9,900 | | 159,093 |
| Cost Plus | | 51,100 a | | 1,099,161 |
| Cumulus Media, Cl. A | | 139,200 a | | 1,777,584 |
| Eddie Bauer Holdings | | 33,300 a | | 895,770 |
| Emmis Communications, Cl. A | | 169,100 a | | 4,051,636 |
| J Jill Group | | 78,100 a | | 1,383,932 |
| Kirkland’s | | 56,200 a | | 525,470 |
| Marvel Enterprises | | 135,000 a,b | | 2,598,750 |
| Performance Food Group | | 45,800 a | | 1,418,426 |
| PETCO Animal Supplies | | 33,500 a | | 741,020 |
| Ruby Tuesday | | 44,000 | | 972,400 |
| Tetra Tech | | 59,400 a | | 936,738 |
| | | | | 17,047,615 |
| Electrical Components—1.0% | | | | |
| Bookham | | 279,440 a,b | | 1,169,456 |
| Creative Technology | | 71,200 b | | 600,216 |
| | | | | 1,769,672 |
| Energy—7.3% | | | | |
| Chesapeake Energy | | 70,200 | | 2,219,022 |
| Global Industries | | 142,000 a | | 1,955,340 |
| Key Energy Services | | 324,100 a | | 4,618,425 |
| Lone Star Technologies | | 46,400 a | | 2,565,920 |
| Maverick Tube | | 65,600 a | | 2,089,360 |
| | | | | 13,448,067 |
| Financial Services—9.1% | | | | |
| Ameritrade Holding | | 63,800 a | | 1,269,620 |
| Delphi Financial Group, Cl. A | | 12,450 | | 586,395 |
| Doral Financial | | 44,900 | | 643,866 |
| E*TRADE Financial | | 281,100 a | | 4,497,600 |
| Erie Indemnity, Cl. A | | 14,300 | | 745,602 |
| Infinity Property & Casualty | | 19,970 | | 649,425 |
| | STATEMENT OF INVESTMENTS (continued)
|
| Common Stocks (continued) | | Shares | | Value ($) |
| |
| |
|
| Financial Services (continued) | | | | |
| Montpelier Re Holdings | | 25,850 | | 845,295 |
| PartnerRe | | 18,500 | | 1,122,950 |
| Phoenix Cos. | | 153,900 b | | 1,845,261 |
| PXRE Group | | 44,100 | | 1,027,089 |
| Safety Insurance Group | | 29,900 b | | 1,048,892 |
| Santander BanCorp | | 31,150 | | 808,031 |
| Scottish Re Group | | 46,900 | | 1,128,414 |
| Webster Financial | | 11,900 | | 546,448 |
| | | | | 16,764,888 |
| Food & Household Products—1.3% | | | | |
| Cosi | | 261,600 a | | 2,383,176 |
| Health Care—6.5% | | | | |
| Enzon Pharmaceuticals | | 156,000 a | | 1,090,440 |
| NDCHealth | | 38,900 | | 731,709 |
| Odyssey HealthCare | | 41,000 a | | 684,700 |
| Par Pharmaceutical Cos. | | 94,100 a | | 2,274,397 |
| Quidel | | 325,800 a | | 2,652,012 |
| Regeneration Technologies | | 408,600 a | | 3,779,550 |
| Savient Pharmaceuticals | | 93,400 a | | 377,336 |
| Zoll Medical | | 10,400 a | | 277,368 |
| | | | | 11,867,512 |
| Insurance—1.1% | | | | |
| Bristol West Holdings | | 53,800 | | 938,810 |
| USI Holdings | | 91,400 a | | 1,119,650 |
| | | | | 2,058,460 |
| Leisure & Tourism—.4% | | | | |
| West Marine | | 43,100 a | | 802,522 |
| Merchandising—.8% | | | | |
| Cash America International | | 71,900 | | 1,507,743 |
| Metals—1.8% | | | | |
| Steel Technologies | | 74,100 | | 1,734,681 |
| Worthington Industries | | 90,400 | | 1,636,240 |
| | | | | 3,370,921 |
| Miscellaneous Materials—.4% | | | | |
| Alpha Natural Resources | | 25,400 a | | 757,682 |
| Common Stocks (continued) | | Shares | | Value ($) |
| |
| |
|
| Recreational Products/Toys—.7% | | | | |
| Hot Topic | | 84,000 a | | 1,302,000 |
| Technology—19.4% | | | | |
| Amkor Technology | | 155,200 a,b | | 791,520 |
| Ariba | | 37,200 a,b | | 220,968 |
| Atmel | | 527,700 a | | 1,087,062 |
| Axcelis Technologies | | 316,400 a | | 1,866,760 |
| BearingPoint | | 154,600 a | | 1,264,628 |
| Borland Software | | 120,800 a | | 738,088 |
| Brooks Automation | | 172,100 a | | 2,443,820 |
| Cypress Semiconductor | | 255,900 a | | 3,999,717 |
| Enterasys Networks | | 825,500 a,b | | 941,070 |
| Entravision Communications, Cl. A | | 46,300 a | | 376,882 |
| Fairchild Semiconductor International | | 120,700 a | | 2,033,795 |
| Gateway | | 142,800 a | | 434,112 |
| Insight Enterprises | | 15,700 a | | 295,631 |
| iPass | | 165,300 a | | 922,374 |
| LTX | | 384,900 a,b | | 1,639,674 |
| Manugistics Group | | 288,100 a | | 547,390 |
| Mattson Technology | | 163,800 a | | 1,556,100 |
| Maxtor | | 444,500 a | | 2,160,270 |
| McData, Cl. A | | 229,400 a | | 1,234,172 |
| Mobility Electronics | | 158,200 a | | 1,732,290 |
| Photon Dynamics | | 89,700 a | | 1,749,150 |
| SafeNet | | 93,700 a | | 2,998,400 |
| webMethods | | 236,300 a | | 1,609,203 |
| Zoran | | 182,600 a | | 2,877,776 |
| | | | | 35,520,852 |
| Transportation—3.4% | | | | |
| Continental Airlines, Cl. B | | 67,800 a,b | | 906,486 |
| EGL | | 145,200 a | | 3,643,068 |
| Northwest Airlines | | 128,200 a,b | | 644,846 |
| Swift Transportation | | 48,800 a,b | | 973,072 |
| | | | | 6,167,472 |
| Utilities—6.2% | | | | |
| Dobson Communications, Cl. A | | 899,300 a | | 6,843,673 |
| | STATEMENT OF INVESTMENTS (continued)
|
| Common Stocks (continued) | | Shares | | Value ($) |
| |
| |
|
| Utilities (continued) | | | | |
| UbiquiTel | | 509,800 a | | 4,419,966 |
| UIL Holdings | | 1,000 | | 52,960 |
| | | | | 11,316,599 |
| Wholesale—.2% | | | | |
| NuCo2 | | 12,500 a | | 313,000 |
| Total Common Stocks | | | | |
| (cost $153,752,855) | | | | 177,050,610 |
| |
| |
|
| | | Principal | | |
| Short-Term Investments—2.3% | | Amount ($) | | Value ($) |
| |
| |
|
| U.S. Treasury Bills; | | | | |
| 3.30%, 9/22/2005 | | | | |
| (cost $4,105,092) | | 4,113,000 | | 4,105,144 |
| |
| |
|
| |
| Investment of Cash Collateral | | | | |
| for Securities Loaned—9.2% | | Shares | | Value ($) |
| |
| |
|
| Registered Investment Company; | | | | |
| Dreyfus Institutional Cash Advantage Fund | | | | |
| (cost $16,935,769) | | 16,935,769 c | | 16,935,769 |
| |
| |
|
| |
| Total Investments (cost $174,793,716) | | 108.0% | | 198,091,523 |
| Liabilities, Less Cash and Receivables | | (8.0%) | | (14,662,810) |
| Net Assets | | 100.0% | | 183,428,713 |
| |
| a Non-income producing. | | | | |
| b All or portion of these securities are on loan. At August 31, 2005, the total market value of the fund’s securities on |
| loan is $15,902,283 and the total market value of the collateral held by the fund is $16,935,769. |
| c Investment in affiliated money market mutual fund. | | |
| Portfolio Summary † | | | | | | |
| |
| Value (%) | | | | Value (%) |
| |
| |
|
| Technology | | 19.4 | | Capital Goods | | 7.0 |
| Short-Term/Money Market Investments | | 11.5 | | Health Care | | 6.5 |
| Basic Industries | | 10.5 | | Utilities | | 6.2 |
| Consumer Services | | 9.3 | | Consumer Durables | | 3.6 |
| Financial Services | | 9.1 | | Other | | 17.6 |
| Energy | | 7.3 | | | | 108.0 |
| |
| † Based on net assets. | | | | | | |
| See notes to financial statements. | | | | | | |
STATEMENT OF ASSETS AND LIABILITIES
August 31, 2005
|
| | | Cost | | Value |
| |
| |
|
| Assets ($): | | | | |
| Investments in securities—See Statement | | | | |
| of Investments (including securities on loan, | | |
| valued at $15,902,283)—Note 1(c): | | | | |
| Unaffiliated issuers | | 157,857,947 | | 181,155,754 |
| Affiliated issuers | | 16,935,769 | | 16,935,769 |
| Cash | | | | 11,110 |
| Receivable for investment securities sold | | | | 5,508,696 |
| Dividends and interest receivable | | | | 69,879 |
| Receivable for shares of Common Stock subscribed | | 67,409 |
| Prepaid expenses | | | | 11,089 |
| | | | | 203,759,706 |
| |
| |
|
| Liabilities ($): | | | | |
| Due to The Dreyfus Corporation and affiliates—Note 3(b) | | 180,698 |
| Liability for securities on loan—Note 1(c) | | | | 16,935,769 |
| Payable for investment securities purchased | | 2,741,801 |
| Payable for shares of Common Stock redeemed | | 399,373 |
| Accrued expenses | | | | 73,352 |
| | | | | 20,330,993 |
| |
| |
|
| Net Assets ($) | | | | 183,428,713 |
| |
| |
|
| Composition of Net Assets ($): | | | | |
| Paid-in capital | | | | 157,979,654 |
| Accumulated net realized gain (loss) on investments | | 2,151,252 |
| Accumulated net unrealized appreciation | | | | |
| (depreciation) on investments | | | | 23,297,807 |
| |
| |
|
| Net Assets ($) | | | | 183,428,713 |
| |
| |
|
| Shares Outstanding | | | | |
| (100 million shares of $.001 par value Common Stock authorized) | | 6,717,048 |
| Net Asset Value, offering and redemption price per share—Note 3(d) ($) | | 27.31 |
See notes to financial statements.
|
| | STATEMENT OF OPERATIONS
Year Ended August 31, 2005
|
| Investment Income ($): | | |
| Income: | | |
| Cash dividends (net of $1,658 foreign taxes withheld at source) | | 693,395 |
| Income from securities lending | | 134,464 |
| Interest | | 5,584 |
| Total Income | | 833,443 |
| Expenses: | | |
| Management fee—Note 3(a) | | 1,329,057 |
| Shareholder servicing costs—Note 3(b) | | 622,566 |
| Custodian fees—Note 3(b) | | 44,152 |
| Professional fees | | 33,033 |
| Prospectus and shareholders’ reports | | 26,103 |
| Registration fees | | 12,411 |
| Interest expense—Note 2 | | 4,924 |
| Directors’ fees and expenses—Note 3(c) | | 3,046 |
| Miscellaneous | | 7,379 |
| Total Expenses | | 2,082,671 |
| Investment (Loss)—Net | | (1,249,228) |
| |
|
| Realized and Unrealized Gain (Loss) on Investments—Note 4 ($): |
| Net realized gain (loss) on investments | | 34,623,698 |
| Net unrealized appreciation (depreciation) on investments | | 18,819,662 |
| Net Realized and Unrealized Gain (Loss) on Investments | | 53,443,360 |
| Net Increase in Net Assets Resulting from Operations | | 52,194,132 |
| | See notes to financial statements.
|
STATEMENT OF CHANGES IN NET ASSETS
| | | Year Ended August 31, |
| |
|
| | | 2005 | | 2004 |
| |
| |
|
| Operations ($): | | | | |
| Investment (loss)—net | | (1,249,228) | | (1,828,993) |
| Net realized gain (loss) on investments | | 34,623,698 | | 46,586,180 |
| Net unrealized appreciation | | | | |
| (depreciation) on investments | | 18,819,662 | | (23,473,154) |
| Net Increase (Decrease) in Net Assets | | | | |
| Resulting from Operations | | 52,194,132 | | 21,284,033 |
| |
| |
|
| Capital Stock Transactions ($): | | | | |
| Net proceeds from shares sold | | 14,929,661 | | 39,482,924 |
| Cost of shares redeemed | | (54,862,393) | | (99,364,803) |
| Increase (Decrease) in Net Assets | | | | |
| from Capital Stock Transactions | | (39,932,732) | | (59,881,879) |
| Total Increase (Decrease) in Net Assets | | 12,261,400 | | (38,597,846) |
| |
| |
|
| Net Assets ($): | | | | |
| Beginning of Period | | 171,167,313 | | 209,765,159 |
| End of Period | | 183,428,713 | | 171,167,313 |
| |
| |
|
| Capital Share Transactions (Shares): | | | | |
| Shares sold | | 626,553 | | 1,784,339 |
| Shares redeemed | | (2,290,652) | | (4,624,475) |
| Net Increase (Decrease) in Shares Outstanding | | (1,664,099) | | (2,840,136) |
See notes to financial statements.
|
The following table describes the performance for the fiscal periods indicated. Total return shows how much your investment in the fund would have increased (or decreased) during each period, assuming you had reinvested all dividends and distributions.These figures have been derived from the fund’s financial statements.
| | | | | | | | | | | | | Ten Months | | |
| | | | | | | | | | | | | Ended | | Year Ended |
| | | | | | | Year Ended August 31, | | August 31, | | October 31, |
| | | |
| |
| | | | |
| | | | | 2005 | | 2004 | | 2003 | | 2002 | | 2001 a | | 2000 |
| |
| |
| |
| |
| |
| |
| |
|
| Per Share Data ($): | | | | | | | | | | | | |
| Net asset value, | | | | | | | | | | | | |
| beginning of period | | 20.42 | | 18.69 | | 12.29 | | 25.86 | | 24.03 | | 20.72 |
| Investment Operations: | | | | | | | | | | | | |
| Investment (loss)—net b | | (.17) | | (.18) | | (.10) | | (.15) | | (.13) | | (.13) |
| Net realized and unrealized | | | | | | | | | | | | |
| gain (loss) on investments | | 7.06 | | 1.91 | | 6.50 | | (6.36) | | 3.57 | | 4.85 |
| Total from Investment | | | | | | | | | | | | |
| Operations | | 6.89 | | 1.73 | | 6.40 | | (6.51) | | 3.44 | | 4.72 |
| Distributions: | | | | | | | | | | | | |
| Dividends from net realized | | | | | | | | | | | | |
| gain on investments | | — | | — | | — | | (7.06) | | (1.61) | | (1.41) |
| Net asset value, | | | | | | | | | | | | |
| end of period | | 27.31 | | 20.42 | | 18.69 | | 12.29 | | 25.86 | | 24.03 |
| |
| |
| |
| |
| |
| |
|
| Total Return (%) | | 33.74 | | 9.26 | | 52.08 | | (35.65) | | 16.23c | | 23.78 |
| |
| |
| |
| |
| |
| |
|
| Ratios/Supplemental Data (%): | | | | | | | | | | |
| Ratio of total expenses | | | | | | | | | | | | |
| to average net assets | | 1.18 | | 1.22 | | 1.29 | | 1.21 | | .93c | | 1.20 |
| Ratio of net investment (loss) | | | | | | | | | | |
| to average net assets | | (.70) | | (.83) | | (.79) | | (.79) | | (.50)c | | (.57) |
| Portfolio Turnover Rate | | 107.07 | | 113.42 | | 128.80 | | 126.43 | | 129.27c | | 169.12 |
| |
| |
| |
| |
| |
| |
|
| Net Assets, end of period | | | | | | | | | | | | |
| ($ x 1,000) | | 183,429 | | 171,167 | | 209,765 | | 170,376 | | 368,354 | | 303,336 |
| |
| a | | The fund changed its fiscal year end from October 31 to August 31. | | | | | | |
| b | | Based on average shares outstanding at each month end. | | | | | | | | |
| c | | Not annualized. | | | | | | | | | | | | |
| See notes to financial statements. | | | | | | | | | | | | |
NOTES TO FINANCIAL STATEMENTS
NOTE 1—Significant Accounting Policies:
Dreyfus Small Company Value Fund (the “fund”) is a separate diversified series of Dreyfus Growth and Value Funds, Inc. (the “Company”) which is registered under the Investment Company Act of 1940, as amended (the “Act”), as an open-end management investment company and operates as a series company that offers twelve series, including the fund. The fund’s investment objective is capital appreciation. The Dreyfus Corporation (the “Manager” or “Dreyfus”) serves as the fund’s investment adviser.The Manager is a wholly-owned subsidiary of Mellon Financial Corporation (“Mellon Financial”). Dreyfus Service Corporation (the “Distributor”), a wholly-owned subsidiary of the Manager, is the distributor of the fund’s shares, which are sold to the public without a sales charge.
The Company accounts separately for the assets, liabilities and operations of each series. Expenses directly attributable to each series are charged to that series’ operations; expenses which are applicable to all series are allocated among them on a pro rata basis.
The fund’s financial statements are prepared in accordance with U.S. generally accepted accounting principles, which may require the use of management estimates and assumptions. Actual results could differ from those estimates.
The fund enters into contracts that contain a variety of indemnifications. The fund’s maximum exposure under these arrangements is unknown.The fund does not anticipate recognizing any loss related to these arrangements.
(a) Portfolio valuation: Investments in securities are valued at the last sales price on the securities exchange or national securities market on which such securities are primarily traded. Securities listed on the National Market System for which market quotations are available are valued at the official closing price or, if there is no official closing price that day, at the last sales price. Securities not listed on an exchange or the national securities market, or securities for which there were no trans-
| | NOTES TO FINANCIAL STATEMENTS (continued)
|
actions, are valued at the average of the most recent bid and asked prices, except for open short positions, where the asked price is used for valuation purposes. Bid price is used when no asked price is available. Investments in registered investment companies are valued at their net asset value. When market quotations or official closing prices are not readily available, or are determined not to reflect accurately fair value, such as when the value of a security has been significantly affected by events after the close of the exchange or market on which the security is principally traded (for example, a foreign exchange or market), but before the fund calculates its net asset value, the fund may value these investments at fair value as determined in accordance with the procedures approved by the Board of Directors. Fair valuing of securities may be determined with the assistance of a pricing service using calculations based on indices of domestic securities and other appropriate indicators, such as prices of relevant ADR’s and futures contracts. For other securities that are fair valued by the Board of Directors, certain factors may be considered such as: fundamental analytical data, the nature and duration of restrictions on disposition, an evaluation of the forces that influence the market in which the securities are purchased and sold and public trading in similar securities of the issuer or comparable issuers. Financial futures are valued at the last sales price.
(b) Securities transactions and investment income: Securities transactions are recorded on a trade date basis. Realized gain and loss from securities transactions are recorded on the identified cost basis. Dividend income is recognized on the ex-dividend date and interest income, including, where applicable, accretion of discount and amortization of premium on investments, is recognized on the accrual basis.
The fund has an arrangement with the custodian bank whereby the fund receives earnings credits from the custodian when positive cash balances are maintained, which are used to offset custody fees. For financial reporting purposes, the fund includes net earnings credits, if any, as an expense offset in the Statement of Operations.
Pursuant to a securities lending agreement with Mellon Bank, N.A., an affiliate of the Manager, the fund may lend securities to qualified institutions.At origination, all loans are secured by collateral of at least 102% of the value of U.S. securities loaned and 105% of the value of foreign securities loaned. Collateral equivalent to at least 100% of the market value of securities on loan will be maintained at all times. Cash collateral is invested in certain money market mutual funds managed by the Manager. The fund will be entitled to receive all income on securities loaned, in addition to income earned as a result of the lending transaction. Although each security loaned is fully collateralized, the fund would bear the risk of delay in recovery of, or loss of rights in, the securities loaned should a borrower fail to return the securities in a timely manner.
(c) Affiliated issuers: Investments in other investment companies advised by the Manager are defined as “affiliated” in the Act.
(d) Dividends to shareholders: Dividends are recorded on the ex-dividend date. Dividends from investment income-net and dividends from net realized capital gain, if any, are normally declared and paid annually, but the fund may make distributions on a more frequent basis to comply with the distribution requirements of the Internal Revenue Code of 1986, as amended (the “Code”).To the extent that net realized capital gain can be offset by capital loss carryovers, if any, it is the policy of the fund not to distribute such gain. Income and capital gain distributions are determined in accordance with income tax regulations, which may differ from U.S. generally accepted accounting principles.
(e) Federal income taxes: It is the policy of the fund to continue to qualify as a regulated investment company, if such qualification is in the best interests of its shareholders, by complying with the applicable provisions of the Code, and to make distributions of taxable income sufficient to relieve it from substantially all federal income and excise taxes.
| | NOTES TO FINANCIAL STATEMENTS (continued)
|
At August 31, 2005, the components of accumulated earnings on a tax basis were as follows: undistributed capital gains $6,730,807 and unrealized appreciation $18,718,252.
During the period ended August 31, 2005, as a result of permanent book to tax differences, primarily due to the tax treatment for net operating losses, the fund increased accumulated undistributed investment income-net by $1,249,228 and decreased paid-in capital by the same amount. Net assets were not affected by this reclassification.
NOTE 2—Bank Lines of Credit:
|
The fund may borrow up to $10 million for leveraging purposes under a short-term unsecured line of credit and participates with other Dreyfus-managed funds in a $100 million unsecured line of credit primarily to be utilized for temporary or emergency purposes, including the financing of redemptions. Interest is charged to the fund based on prevailing market rates in effect at the time of borrowings.
The average daily amount of borrowings outstanding under both arrangements during the period ended August 31, 2005 was approximately $174,500, with a related weighted average annualized interest rate of 2.80% .
NOTE 3—Management Fee and Other Transactions with Affiliates:
(a) Pursuant to a management agreement with the Manager, the management fee is computed at the annual rate of .75% of the value of the fund’s average daily net assets and is payable monthly.
(b) Under the Shareholder Services Plan, the fund pays the Distributor at an annual rate of .25% of the value of the fund’s average daily net assets for the provision of certain services. The services provided may include personal services relating to shareholder accounts, such as answering shareholder inquiries regarding the fund and providing reports and other information, and services related to the maintenance of shareholder accounts. The Distributor may make
payments to Service Agents (a securities dealer, financial institution or other industry professional) in respect of these services. The Distributor determines the amounts to be paid to Service Agents. During the period ended August 31, 2005, the fund was charged $443,019 pursuant to the Shareholder Services Plan.
The fund compensates Dreyfus Transfer, Inc., a wholly-owned subsidiary of the Manager, under a transfer agency agreement for providing personnel and facilities to perform transfer agency services for the fund. During the period ended August 31, 2005, the fund was charged $94,504 pursuant to the transfer agency agreement.
The fund compensates Mellon Bank, N.A., an affiliate of the Manager, under a custody agreement for providing custodial services for the fund. During the period ended August 31, 2005, the fund was charged $44,152 pursuant to the custody agreement.
During the period ended August 31, 2005, the fund was charged $2,520 for services performed by the Chief Compliance Officer.
The components of Due to The Dreyfus Corporation and affiliates in the Statement of Assets and Liabilities consist of: management fees $115,515, shareholder services plan fees $38,364, custodian fees $9,518, chief compliance officer fees $1,533 and transfer agency per account fees $15,768.
(c) Each Board member also serves as a Board member of other funds within the Dreyfus complex. Annual retainer fees and attendance fees are allocated to each fund based on net assets.
(d) A 1% redemption fee is charged and retained by the fund on shares redeemed within thirty days following the date of issuance, including redemptions made through the use of the fund’s exchange privilege.
NOTE 4—Securities Transactions:
The aggregate amount of purchases and sales of investment securities, excluding short-term securities, during the period ended August 31, 2005, amounted to $188,997,400 and $234,899,499, respectively.
| | NOTES TO FINANCIAL STATEMENTS (continued)
|
At August 31, 2005, the cost of investments for federal income tax purposes was $179,373,271; accordingly, accumulated net unrealized appreciation on investments was $18,718,252, consisting of $34,849,194 gross unrealized appreciation and $16,130,942 gross unrealized depreciation.
In early 2004, two purported class and derivative actions were filed against Mellon Financial, Mellon Bank, N.A., Dreyfus, Founders Asset Management LLC, and certain directors of the Dreyfus Funds and the Dreyfus Founders Funds (together, the “Funds”) in the United States District Court for the Western District of Pennsylvania. In September 2004, plaintiffs served a Consolidated Amended Complaint (the “Amended Complaint”) on behalf of a purported class of all persons who acquired interests in any of the Funds between January 30, 1999 and November 17, 2003, and derivatively on behalf of the Funds.The Amended Complaint in the newly styled In re Dreyfus Mutual Funds Fee Litigation also named the Distributor, Premier Mutual Fund Services, Inc. and two additional Fund directors as defendants and alleges violations of the Investment Company Act of 1940, the Investment Advisers Act of 1940, the Pennsylvania Unfair Trade Practices and Consumer Protection Law and common-law claims. Plaintiffs seek to recover allegedly improper and excessive Rule 12b-1 and advisory fees allegedly charged to the Funds for marketing and distribution services. More specifically, plaintiffs claim, among other things, that 12b-1 fees and directed brokerage were improperly used to pay brokers to recommend the Funds over other funds, and that such payments were not disclosed to investors. In addition, plaintiffs assert that economies of scale and soft-dollar benefits were not passed on to the Funds. Plaintiffs further allege that 12b-1 fees were improperly charged to certain of the Funds that were closed to new investors.The
Amended Complaint seeks compensatory and punitive damages, rescission of the advisory contracts, and an accounting and restitution of any unlawful fees, as well as an award of attorneys’ fees and litigation expenses. As noted, some of the claims in this litigation are asserted derivatively on behalf of the Funds that have been named as nominal defendants. With respect to such derivative claims, no relief is sought against the Funds. Dreyfus believes the allegations to be totally without merit and intends to defend the action vigorously. In November 2004, all named defendants moved to dismiss the Amended Complaint in whole or substantial part. Briefing was completed in May 2005.
Additional lawsuits arising out of these circumstances and presenting similar allegations and requests for relief may be filed against the defendants in the future. Neither Dreyfus nor the Funds believe that any of the pending actions will have a material adverse effect on the Funds or Dreyfus’ ability to perform its contract with the Funds.
| | REPORT OF INDEPENDENT REGISTERED
PUBLIC ACCOUNTING FIRM
|
Shareholders and Board of Directors
Dreyfus Small Company Value Fund
|
We have audited the accompanying statement of assets and liabilities, including the statement of investments,of Dreyfus Small Company Value Fund (one of the funds comprising Dreyfus Growth and Value Funds, Inc.) as of August 31, 2005, and the related statement of operations for the year then ended, the statement of changes in net assets for each of the two years in the period then ended, and financial highlights for each of the periods indicated therein.These financial statements and financial highlights are the responsibility of the Fund’s management. Our responsibility is to express an opinion on these financial statements and financial highlights based on our audits.
We conducted our audits in accordance with the standards of the Public Company Accounting Oversight Board (United States).Those standards require that we plan and perform the audit to obtain reasonable assurance about whether the financial statements and financial highlights are free of material misstatement.We were not engaged to perform an audit of the Fund’s internal control over financial reporting.Our audits included consideration of internal control over financial reporting as a basis for designing audit procedures that are appropriate in the circumstances,but not for the purpose of expressing an opinion on the effectiveness of the Fund’s internal control over financial reporting.Accordingly, we express no such opinion.An audit also includes examining, on a test basis, evidence supporting the amounts and disclosures in the financial statements and financial highlights, assessing the accounting principles used and significant estimates made by management, and evaluating the overall financial statement presentation. Our procedures included verification by examination of securities held by the custodian as of August 31, 2005 and confirmation of securities not held by the custodian by correspondence with oth-ers.We believe that our audits provide a reasonable basis for our opinion.
In our opinion, the financial statements and financial highlights referred to above present fairly, in all material respects, the financial position of Dreyfus Small Company Value Fund at August 31, 2005, the results of its operations for the year then ended, the changes in its net assets for each of the two years in the period then ended, and the financial highlights for each of the indicated periods, in conformity with U.S. generally accepted accounting principles.

New York, New York
October 14, 2005
|
INFORMATION ABOUT THE REVIEW AND APPROVAL OF THE
FUND’S INVESTMENT MANAGEMENT AGREEMENT (Unaudited)
|
At a meeting of the Board of Directors held on March 14, 2005, the Board considered the re-approval for an annual period of the Fund’s Management Agreement, pursuant to which the Manager provides the Fund with investment advisory and administrative services. The Board members, none of whom are “interested persons” (as defined in the Investment Company Act of 1940,as amended) of the Fund,were assisted in their review by independent legal counsel and met with counsel in executive session separate from representatives of the Manager.
Analysis of Nature, Extent and Quality of Services Provided to the Fund. The Board members received a presentation from representatives of the Manager regarding services provided to the Fund and other funds in the Dreyfus fund complex, and discussed the nature, extent and quality of the services provided to the Fund pursuant to its Management Agreement. The presentation included a detailed summary of the services provided to Dreyfus-managed mutual funds by each business unit within the Manager.The Manager’s representatives reviewed the Fund’s distribution of accounts and the relationships the Manager has with various intermediaries and the different needs of each.The Manager’s representatives noted the diversity of distribution of the Fund as well as among the funds in the Dreyfus fund complex, and the Manager’s corresponding need for broad, deep, and diverse resources to be able to provide ongoing shareholder services to each of the Fund’s distribution channels.The Board also reviewed the number of shareholder accounts in the Fund, as well as the Fund’s asset size.
The Board members also considered the Manager’s research and portfolio management capabilities and that the Manager also provides oversight of day-to-day Fund operations, including fund accounting and administration and assistance in meeting legal and regulatory requirements. The Board members also considered the Manager’s extensive administrative, accounting and compliance infrastructure.
Comparative Analysis of the Fund’s Performance and Management Fee and Expense Ratio. The Board members reviewed the Fund’s performance, management fee and expense ratios and placed significant emphasis on comparisons to a group of comparable funds and Lipper
| | I N FO R M AT I O N A B O U T T H E R E V I E W A N D A P P R OVA L O F
T H E F U N D ’ S I N V E S T M E N T M A N A G E M E N T A G R E E M E N T ( U n a u d i t e d ) ( c o n t i n u e d )
|
category averages, as applicable. The group of comparable funds was previously approved by the Board for this purpose, and was prepared using a Board-approved selection methodology that was based, in part, on selecting non-affiliated funds reported in the same Lipper category as the Fund.The Board members discussed the results of the comparisons for various periods ended January 31, 2005, and noted that the Fund’s performance was below the comparison group and Lipper category averages for the 1-year, 3-year and 5-year periods and above the comparison group and Lipper category averages for the 10-year period. The Board also observed that the Fund ranked first in its comparison group for the 10-year period.The Board discussed with representatives of the Manager the reasons for the Fund’s underperformance compared to the comparison group and Lipper category for the 1-, 3- and 5-year periods, and the Manager’s efforts to improve performance.The Board members also discussed the Fund’s management fee and expense ratio and reviewed the range of management fees and expense ratios for the funds in the comparison group.The Fund’s management fee ranked in the top half (i.e., lower than most others) of the comparison group funds. The Board noted that the Fund’s total expense ratio was lower than the Fund’s comparison group and Lipper category averages.
Representatives of the Manager reviewed with the Board members the fees paid to the Manager or its affiliates by mutual funds managed by the Manager or its affiliates with similar investment objectives, policies and strategies as the Fund (the “Similar Funds”), and by other accounts managed or sub-advised by the Manager or its affiliates with similar investment objectives, policies and strategies as the Fund (the “Separate Accounts” and, collectively with the Similar Funds, the “Similar Accounts”). The Manager’s representatives explained the nature of the Similar Accounts and the differences, from the Manager’s perspective, in management of the Similar Accounts as compared to managing and providing services to the Fund; it was noted that the Similar Funds were mutual funds included in the “small cap core” and “small cap core variable insurance products” categories by Lipper.The
Manager’s representatives also reviewed the costs associated with distribution through intermediaries. The Board analyzed the differences in fees paid to the Manager and discussed the relationship of the advisory fees paid in light of the Manager’s performance and the services provided; it was noted that the Similar Funds generally had the same or higher management fees than the fee borne by the Fund.The Board members considered the relevance of the fee information provided for the Similar Accounts managed by the Manager to evaluate the appropriateness and reasonableness of the Fund’s advisory fees. The Board acknowledged that differences in fees paid by the Similar Accounts seemed to be consistent with the services provided.
Analysis of Profitability and Economies of Scale. The Manager’s representatives reviewed the dollar amount of expenses allocated and profit received by the Manager and the method used to determine such expenses and profit. The Board received and considered information prepared by an independent consulting firm regarding the Manager’s approach to allocating costs to, and determining the profitability of, individual funds and the entire Dreyfus fund complex.The Manager’s representatives stated that the methodology had also been reviewed by an independent registered public accounting firm which, like the consultant, found the methodology to be reasonable.The consulting firm also analyzed where any economies of scale might emerge in connection with the management of the Fund.The Board members evaluated the analysis in light of the relevant circumstances for the Fund, and the extent to which economies of scale would be realized as the Fund grows and whether fee levels reflect these economies of scale for the benefit of Fund investors.The Board noted that it appeared that the benefits of any economies of scale also would be appropriately shared with shareholders through increased investment in fund management and administration resources.The Board members also considered potential benefits to the Manager from acting as investment adviser and reviewed the soft dollar arrangements with respect to trading the Fund’s portfolio.
| | I N FO R M AT I O N A B O U T T H E R E V I E W A N D A P P R OVA L O F
T H E F U N D ’ S I N V E S T M E N T M A N A G E M E N T A G R E E M E N T ( U n a u d i t e d ) ( c o n t i n u e d )
|
It was noted that the Board members should consider the Manager’s profitability with respect to the Fund as part of their evaluation of whether the fee under the Management Agreement bears a reasonable relationship to the mix of services provided by the Manager, including the nature, extent and quality of such services and that a discussion of economies of scale is predicated on increasing assets and that, if a fund’s assets had been decreasing, the possibility that the Manager may have realized any economies of scale would be less.The Board members also discussed the profitability percentage ranges determined by appropriate court cases to be reasonable given the services rendered to investment companies. It was noted that the profitability percentage for managing the Fund was not unreasonable given the Fund’s overall performance and generally superior service levels provided.
At the conclusion of these discussions, each of the Directors expressed the opinion that he or she had been furnished with sufficient information to make an informed business decision with respect to continuation of the Fund’s Management Agreement. Based on their discussions and considerations as described above, the Board made the following conclusions and determinations.
- The Board concluded that the nature, extent and quality of the ser- vices provided by the Manager are adequate and appropriate.
- While the Board was concerned with the Fund’s short-term per- formance, the Board was satisfied with the Manager’s efforts to improve it. Accordingly, the Board approved the Management Agreement for a six-month period (instead of a year) so as to gauge the Manager’s efforts to improve performance over an appropriate period of time.
- The Board concluded that the fee paid to the Manager by the Fund was reasonable in light of comparative performance and expense and advisory fee information, costs of the services provided and profits to be realized and benefits derived or to be derived by the Manager from its relationship with the Fund.
- The Board determined that the economies of scale which may accrue to the Manager and its affiliates in connection with the management of the Fund had been adequately considered by the Manager in connection with the management fee rate charged to the Fund, and that, to the extent in the future it were to be deter- mined that material economies of scale had not been shared with the Fund, the Board would seek to have those economies of scale shared with the Fund.
The Board members considered these conclusions and determinations, along with the information received on a routine and regular basis throughout the year, and, without any one factor being dispositive, the Board determined that re-approval of the Fund’s Management Agreement for a six-month period was in the best interests of the Fund and its shareholders.
BOARD MEMBERS INFORMATION (Unaudited)
| | Joseph S. DiMartino (61)
Chairman of the Board (1995)
|
| Principal Occupation During Past 5 Years: |
| • Corporate Director and Trustee |
| Other Board Memberships and Affiliations: |
| • The Muscular Dystrophy Association, Director |
| • Levcor International, Inc., an apparel fabric processor, Director |
| • Century Business Services, Inc., a provider of outsourcing functions for small and medium size |
| companies, Director |
| • The Newark Group, a provider of a national market of paper recovery facilities, paperboard |
| mills and paperboard converting plants, Director |
| • Azimuth Trust, an institutional asset management firm, Member of Board of Managers and |
| Advisory Board |
| • Sunair Electronics, Inc., engages in the design, manufacture and sale of high frequency systems |
| for long-range voice and data communications, as well as providing certain outdoor-related |
| services to homes and businesses, Director |
No. of Portfolios for which Board Member Serves: 193
| | David P. Feldman (65)
Board Member (1996)
|
| Principal Occupation During Past 5 Years: |
| • Corporate Director & Trustee |
| | Other Board Memberships and Affiliations:
|
- BBH Mutual Funds Group (11 funds), Director
- The Jeffrey Company, a private investment company, Director
- QMED, a medical device company, Director
No. of Portfolios for which Board Member Serves: 58
Ehud Houminer (65) Board Member (1993)
| | Principal Occupation During Past 5 Years:
|
- Executive-in-Residence at the Columbia Business School, Columbia University
- Principal of Lear,Yavitz and Associates, a management consulting firm (1996 to 2001)
| | Other Board Memberships and Affiliations:
|
- Avnet Inc., an electronics distributor, Director
- International Advisory Board to the MBA Program School of Management, Ben Gurion University, Chairman
- Explore Charter School, Brooklyn, NY, Chairman
| | No. of Portfolios for which Board Member Serves: 36
|
| | Gloria Messinger (75)
Board Member (1993)
|
| | Principal Occupation During Past 5 Years:
|
- Arbitrator for American Arbitration Association and National Association of Securities Dealers, Inc.
- Consultant in Intellectual Property
| | Other Board Memberships and Affiliations:
|
- Yale Law School Fund, Director
- Theater for a New Audience, Inc., Director
- Brooklyn Philharmonic, Director
- New York Women’s Agenda Music Performance Trust Fund, Director
| | No. of Portfolios for which Board Member Serves: 25
|
T. John Szarkowski (79) Board Member (1996)
| Principal Occupation During Past 5 Years: |
| • Consultant in Photography |
| Other Board Memberships and Affiliations: |
| • Photography Department at The Museum of Modern Art, Director Emeritus |
| | No. of Portfolios for which Board Member Serves: 25
|
| | Anne Wexler (75)
Board Member (1996)
|
| | Principal Occupation During Past 5 Years:
|
- Chairman of the Wexler & Walker Public Policy Associates, consultants specializing in govern- ment relations and public affairs
| | Other Board Memberships and Affiliations:
|
- Wilshire Mutual Funds (5 funds), Director
- Methanex Corporation, a methanol producing company, Director
- Member of the Council of Foreign Relations
- Member of the National Park Foundation
| | No. of Portfolios for which Board Member Serves: 36
|
Once elected all Board Members serve for an indefinite term.The address of the Board Members and Officers is in c/o The Dreyfus Corporation, 200 Park Avenue, New York, New York 10166. Additional information about the Board Members is available in the fund’s Statement of Additional Information which can be obtained from Dreyfus free of charge by calling this toll free number: 1-800-554-4611.
John M. Fraser, Jr., Emeritus Board Member
OFFICERS OF THE FUND (Unaudited)
| STEPHEN E. CANTER, President since | | JAMES BITETTO, Vice President and |
| March 2000. | | Assistant Secretary since August 2005. |
| Chairman of the Board, Chief Executive | | Assistant General Counsel and Assistant |
| Officer and Chief Operating Officer of the | | Secretary of the Manager, and an officer of 91 |
| Manager, and an officer of 90 investment | | investment companies (comprised of 200 |
| companies (comprised of 184 portfolios) | | portfolios) managed by the Manager. He is 39 |
| managed by the Manager. Mr. Canter also is a | | years old and has been an employee of the |
| Board member and, where applicable, an | | Manager since December 1996. |
| |
| Executive Committee Member of the other | | JONI LACKS CHARATAN, Vice President |
| investment management subsidiaries of Mellon | | and Assistant Secretary since |
| Financial Corporation, each of which is an | | August 2005. |
| affiliate of the Manager. He is 60 years old and | | |
| has been an employee of the Manager since | | Assistant General Counsel and Assistant |
| May 1995. | | Secretary of the Manager, and an officer of 91 |
| | | investment companies (comprised of 200 |
| STEPHEN R. BYERS, Executive Vice | | portfolios) managed by the Manager. She is 49 |
| President since November 2002. | | years old and has been an employee of the |
| Chief Investment Officer,Vice Chairman and a | | Manager since October 1998. |
| |
| director of the Manager, and an officer of 90 | | JOSEPH M. CHIOFFI, Vice President and |
| investment companies (comprised of 184 | | Assistant Secretary since August 2005. |
| portfolios) managed by the Manager. Mr. Byers | | |
| also is an officer, director or an Executive | | Assistant General Counsel and Assistant |
| Committee Member of certain other | | Secretary of the Manager, and an officer of 91 |
| investment management subsidiaries of Mellon | | investment companies (comprised of 200 |
| Financial Corporation, each of which is an | | portfolios) managed by the Manager. He is 43 |
| affiliate of the Manager. He is 52 years old and | | years old and has been an employee of the |
| has been an employee of the Manager since | | Manager since July 2000. |
| January 2000. | | JANETTE E. FARRAGHER, Vice President |
| MARK N. JACOBS, Vice President since | | and Assistant Secretary since |
| March 2000. | | August 2005. |
| Executive Vice President, Secretary and | | Associate General Counsel of the Manager, |
| General Counsel of the Manager, and an | | and an officer of 91 investment companies |
| officer of 91 investment companies (comprised | | (comprised of 200 portfolios) managed by the |
| of 200 portfolios) managed by the Manager. | | Manager. She is 42 years old and has been an |
| He is 59 years old and has been an employee | | employee of the Manager since February 1984. |
| of the Manager since June 1977. | | JOHN B. HAMMALIAN, Vice President and |
| MICHAEL A. ROSENBERG, Vice President | | Assistant Secretary since August 2005. |
| and Secretary since August 2005. | | Associate General Counsel of the Manager, |
| Associate General Counsel of the Manager, | | and an officer of 91 investment companies |
| and an officer of 91 investment companies | | (comprised of 200 portfolios) managed by the |
| (comprised of 200 portfolios) managed by the | | Manager. He is 42 years old and has been an |
| Manager. He is 45 years old and has been an | | employee of the Manager since February 1991. |
| employee of the Manager since October 1991. | | |
| ROBERT R. MULLERY, Vice President and | | ROBERT SVAGNA, Assistant Treasurer |
| Assistant Secretary since August 2005. | | since December 2002. |
| Associate General Counsel of the Manager, | | Senior Accounting Manager – Equity Funds of |
| and an officer of 91 investment companies | | the Manager, and an officer of 91 investment |
| (comprised of 200 portfolios) managed by the | | companies (comprised of 200 portfolios) |
| Manager. He is 53 years old and has been an | | managed by the Manager. He is 38 years old |
| employee of the Manager since May 1986. | | and has been an employee of the Manager |
| JEFF PRUSNOFSKY, Vice President and | | since November 1990. |
| Assistant Secretary since August 2005. | | KENNETH J. SANDGREN, Assistant |
| Associate General Counsel of the Manager, | | Treasurer since November 2001. |
| and an officer of 91 investment companies | | Mutual Funds Tax Director of the Manager, |
| (comprised of 200 portfolios) managed by the | | and an officer of 91 investment companies |
| Manager. He is 40 years old and has been an | | (comprised of 200 portfolios) managed by the |
| employee of the Manager since October 1990. | | Manager. He is 51 years old and has been an |
| JAMES WINDELS, Treasurer since | | employee of the Manager since June 1993. |
| November 2001. | | JOSEPH W. CONNOLLY, Chief Compliance |
| Director – Mutual Fund Accounting of the | | Officer since October 2004. |
| Manager, and an officer of 91 investment | | Chief Compliance Officer of the Manager and |
| companies (comprised of 200 portfolios) | | The Dreyfus Family of Funds (91 investment |
| managed by the Manager. He is 46 years old | | companies, comprising 200 portfolios). From |
| and has been an employee of the Manager | | November 2001 through March 2004, Mr. |
| since April 1985. | | Connolly was first Vice-President, Mutual |
| GREGORY S. GRUBER, Assistant | | Fund Servicing for Mellon Global Securities |
| Treasurer since August 2005. | | Services. In that capacity, Mr. Connolly was |
| Senior Accounting Manager – Municipal Bond | | responsible for managing Mellon’s Custody, |
| Funds of the Manager, and an officer of 91 | | Fund Accounting and Fund Administration |
| investment companies (comprised of 200 | | services to third-party mutual fund clients. |
| portfolios) managed by the Manager. He is 46 | | He is 48 years old and has served in various |
| years old and has been an employee of the | | capacities with the Manager since 1980, |
| Manager since August 1981. | | including manager of the firm’s Fund |
| | | Accounting Department from 1997 through |
| ERIK D. NAVILOFF, Assistant Treasurer | | October 2001. |
| since August 2005. | | |
| | | WILLIAM GERMENIS, Anti-Money |
| Senior Accounting Manager – Taxable Fixed | | Laundering Compliance Officer since |
| Income Funds of the Manager, and an officer | | October 2002. |
| of 91 investment companies (comprised of 200 | | |
| portfolios) managed by the Manager. He is 37 | | Vice President and Anti-Money Laundering |
| years old and has been an employee of the | | Compliance Officer of the Distributor, and the |
| Manager since November 1992. | | Anti-Money Laundering Compliance Officer |
| | | of 88 investment companies (comprised of 197 |
| ROBERT ROBOL, Assistant Treasurer | | portfolios) managed by the Manager. He is 35 |
| since August 2005. | | years old and has been an employee of the |
| Senior Accounting Manager – Money Market | | Distributor since October 1998. |
| Funds of the Manager, and an officer of 91 | | |
| investment companies (comprised of 200 | | |
| portfolios) managed by the Manager. He is 41 | | |
| years old and has been an employee of the | | |
| Manager since October 1988. | | |
| For More | | Information |
| |
|
| |
| Dreyfus | | Transfer Agent & |
| Small Company Value Fund | | Dividend Disbursing Agent |
| 200 Park Avenue | | Dreyfus Transfer, Inc. |
| New York, NY 10166 | | 200 Park Avenue |
| Manager | | New York, NY 10166 |
| The Dreyfus Corporation | | Distributor |
| 200 Park Avenue | | Dreyfus Service Corporation |
| New York, NY 10166 | | 200 Park Avenue |
| Custodian | | New York, NY 10166 |
| Mellon Bank, N.A. | | |
| One Mellon Bank Center | | |
| Pittsburgh, PA 15258 | | |
| |
|
| |
| |
| Telephone 1-800-645-6561 | | |
Mail The Dreyfus Family of Funds, 144 Glenn Curtiss Boulevard, Uniondale, NY 11556-0144 E-mail Send your request to info@dreyfus.com Internet Information can be viewed online or downloaded at: http://www.dreyfus.com
The fund files its complete schedule of portfolio holdings with the Securities and Exchange Commission (“SEC”) for the first and third quarters of each fiscal year on Form N-Q. The fund’s Forms N-Q are available on the SEC’s website at http://www.sec.gov and may be reviewed and copied at the SEC’s Public Reference Room in Washington, DC. Information on the operation of the Public Reference Room may be obtained by calling 1-800-SEC-0330.
A description of the policies and procedures that the fund uses to determine how to vote proxies relating to portfolio securities, and information regarding how the fund voted these proxies for the 12-month period ended June 30, 2005, is available at http://www.dreyfus.com and on the SEC’s website at http://www.sec.gov. The description of the policies and procedures is also available without charge, upon request, by calling 1-800-645-6561.

Item 2. Code of Ethics.
The Registrant has adopted a code of ethics that applies to the Registrant's principal executive officer, principal financial officer, principal accounting officer or controller, or persons performing similar functions. There have been no amendments to, or waivers in connection with, the Code of Ethics during the period covered by this Report.
Item 3. Audit Committee Financial Expert.
The Registrant's Board has determined that David Feldman, a member of the Audit Committee of the Board, is an audit committee financial expert as defined by the Securities and Exchange Commission (the "SEC"). David Feldman is "independent" as defined by the SEC for purposes of audit committee financial expert determinations.
Item 4. Principal Accountant Fees and Services
(a) Audit Fees. The aggregate fees billed for each of the last two fiscal years (the "Reporting Periods") for professional services rendered by the Registrant's principal accountant (the "Auditor") for the audit of the Registrant's annual financial statements, or services that are normally provided by the Auditor in connection with the statutory and regulatory filings or engagements for the Reporting Periods, were $289,354 in 2004 and $287,229 in 2005.
(b) Audit-Related Fees. The aggregate fees billed in the Reporting Periods for assurance and related services by the Auditor that are reasonably related to the performance of the audit of the Registrant's financial statements and are not reported under paragraph (a) of this Item 4 were $54,000 in 2004 and $56,700 in 2005. These services consisted of [(i) security counts required by Rule 17f-2 under the Investment Company Act of 1940, as amended].
The aggregate fees billed in the Reporting Periods for non-audit assurance and related services by the Auditor to the Registrant's investment adviser (not including any sub-investment adviser whose role is primarily portfolio management and is subcontracted with or overseen by another investment adviser), and any entity controlling, controlled by or under common control with the investment adviser that provides ongoing services to the Registrant ("Service Affiliates"), that were reasonably related to the performance of the annual audit of the Service Affiliate, which required pre-approval by the Audit Committee were $218,500 in 2004 and $0 in 2005.
Note: For the second paragraph in each of (b) through (d) of this Item 4, certain of such services were not pre-approved prior to May 6, 2003, when such services were required to be pre-approved. On and after May 6, 2003, 100% of all services provided by the Auditor were pre-approved as required. For comparative purposes, the fees shown assume that all such services were pre-approved, including services that were not pre-approved prior to the compliance date of the pre-approval requirement.
(c) Tax Fees. The aggregate fees billed in the Reporting Periods for professional services rendered by the Auditor for tax compliance, tax advice and tax planning ("Tax Services") were $48,665 in 2004 and $47,927 in 2005. These services consisted of (i) review or preparation of U.S. federal, state, local and excise tax returns; (ii) U.S. federal, state and local tax planning, advice and assistance regarding statutory, regulatory or
administrative developments, (iii) tax advice regarding tax qualification matters and/or treatment of various financial instruments held or proposed to be acquired or held, and (iv) determination of Passive Foreign Investment Companies (as applicable).
The aggregate fees billed in the Reporting Periods for Tax Services by the Auditor to Service Affiliates which required pre-approval by the Audit Committee were $0 in 2004 and $0 in 2005.
(d) All Other Fees. The aggregate fees billed in the Reporting Periods for products and services provided by the Auditor, other than the services reported in paragraphs (a) through (c) of this Item, were $8,772 in 2004 and $9,080 in 2005. These services consisted of a review of the Registrant's anti-money laundering program.
The aggregate fees billed in the Reporting Periods for Non-Audit Services by the Auditor to Service Affiliates, other than the services reported in paragraphs (b) through (c) of this Item, which required pre-approval by the Audit Committee were $0 in 2004 and $0 in 2005.
Audit Committee Pre-Approval Policies and Procedures. The Registrant's Audit Committee has established policies and procedures (the "Policy") for pre-approval (within specified fee limits) of the Auditor's engagements for non-audit services to the Registrant and Service Affiliates without specific case-by-case consideration. Pre-approval considerations include whether the proposed services are compatible with maintaining the Auditor's independence. Pre-approvals pursuant to the Policy are considered annually.
Non-Audit Fees. The aggregate non-audit fees billed by the Auditor for services rendered to the Registrant, and rendered to Service Affiliates, for the Reporting Periods were $557,202 in 2004 and $1,013,651 in 2005.
Auditor Independence. The Registrant's Audit Committee has considered whether the provision of non-audit services that were rendered to Service Affiliates which were not pre-approved (not requiring pre-approval) is compatible with maintaining the Auditor's independence.
| Item 5. | | Audit Committee of Listed Registrants. |
| | | Not applicable. |
| Item 6. | | Schedule of Investments. |
| | | Not applicable. |
| Item 7. | | Disclosure of Proxy Voting Policies and Procedures for Closed-End Management |
| | | Investment Companies. |
| | | Not applicable. |
| Item 8. | | Portfolio Managers of Closed-End Management Investment Companies. |
| | | Not applicable. |
| Item 9. | | Purchases of Equity Securities by Closed-End Management Investment Companies and |
| | | Affiliated Purchasers. |
| | | Not applicable. |
| Item 10. | | Submission of Matters to a Vote of Security Holders. |
The Registrant has a Nominating Committee (the "Committee"), which is responsible for selecting and nominating persons for election or appointment by the Registrant's Board as Board members. The Committee has adopted a Nominating Committee Charter (the "Charter"). Pursuant to the Charter, the Committee will consider recommendations for nominees from shareholders submitted to the Secretary of the Registrant, c/o The Dreyfus Corporation Legal Department, 200 Park Avenue, 8th Floor East, New York, New York 10166. A nomination submission must include information regarding the recommended nominee as specified in the Charter. This information includes all information relating to a recommended nominee that is required to be disclosed in solicitations or proxy statements for the election of Board members, as well as information sufficient to evaluate the factors to be considered by the Committee, including character and integrity, business and professional experience, and whether the person has the ability to apply sound and independent business judgment and would act in the interests of the Registrant and its shareholders.
Nomination submissions are required to be accompanied by a written consent of the individual to stand for election if nominated by the Board and to serve if elected by the shareholders, and such additional information must be provided regarding the recommended nominee as reasonably requested by the Committee.
Item 11. Controls and Procedures.
(a) The Registrant's principal executive and principal financial officers have concluded, based on their evaluation of the Registrant's disclosure controls and procedures as of a date within 90 days of the filing date of this report, that the Registrant's disclosure controls and procedures are reasonably designed to ensure that information required to be disclosed by the Registrant on Form N-CSR is recorded, processed, summarized and reported within the required time periods and that information required to be disclosed by the Registrant in the reports that it files or submits on Form N-CSR is accumulated and communicated to the Registrant's management, including its principal executive and principal financial officers, as appropriate to allow timely decisions regarding required disclosure.
(b) There were no changes to the Registrant's internal control over financial reporting that occurred during the second fiscal quarter of the period covered by this report that have materially affected, or are reasonably likely to materially affect, the Registrant's internal control over financial reporting.
Item 12. Exhibits.
(a)(1) Code of ethics referred to in Item 2.
(a)(2) Certifications of principal executive and principal financial officers as required by Rule 30a-2(a) under the Investment Company Act of 1940.
(a)(3) Not applicable.
(b) Certification of principal executive and principal financial officers as required by Rule 30a-2(b) under the Investment Company Act of 1940.
Pursuant to the requirements of the Securities Exchange Act of 1934 and the Investment Company Act of 1940, the Registrant has duly caused this Report to be signed on its behalf by the undersigned, thereunto duly authorized.
Dreyfus Growth & Value Funds, Inc.
|
| By: | | /s/ Stephen E. Canter |
| | | Stephen E. Canter |
| | | President |
| |
| Date: | | October 28, 2005 |
Pursuant to the requirements of the Securities Exchange Act of 1934 and the Investment Company Act of 1940, this Report has been signed below by the following persons on behalf of the Registrant and in the capacities and on the dates indicated.
| By: | | /s/ Stephen E. Canter |
| | | Stephen E. Canter |
| | | Chief Executive Officer |
| |
| Date: | | October 28, 2005 |
| |
| By: | | /s/ James Windels |
| James Windels |
| | | Chief Financial Officer |
| |
| Date: | | October 28, 2005 |
EXHIBIT INDEX
| (a)(1) | | Code of ethics referred to in Item 2. |
| |
| (a)(2) | | Certifications of principal executive and principal financial officers as required by Rule 30a- |
| 2(a) under the Investment Company Act of 1940. (EX-99.CERT) |
| |
| (b) | | Certification of principal executive and principal financial officers as required by Rule 30a- |
| 2(b) under the Investment Company Act of 1940. (EX-99.906CERT) |