| | | UNITED STATES |
| | | SECURITIES AND EXCHANGE COMMISSION |
| | | Washington, D.C. 20549 |
| |
| |
| | | FORM N-CSR |
| |
| CERTIFIED SHAREHOLDER REPORT OF REGISTERED MANAGEMENT |
| | | INVESTMENT COMPANIES |
| |
| Investment Company Act file number 811-7123 |
| |
| | | Advantage Funds, Inc. |
| | | (Exact name of Registrant as specified in charter) |
| |
| |
| | | c/o The Dreyfus Corporation |
| | | 200 Park Avenue |
| | | New York, New York 10166 |
| | | (Address of principal executive offices) (Zip code) |
| |
| | | Mark N. Jacobs, Esq. |
| | | 200 Park Avenue |
| | | New York, New York 10166 |
| | | (Name and address of agent for service) |
| |
| Registrant's telephone number, including area code: (212) 922-6000 |
| |
| Date of fiscal year end: | | 10/31 |
| |
| Date of reporting period: | | 10/31/06 |
The following N-CSR relates only to the Registrant’s series listed below and does not affect the other series of the Registrant, which have different fiscal year ends and, therefore, different N-CSR reporting requirements. Separate N-CSR Forms will be filed for these series, as appropriate.
Dreyfus Premier Total Return Advantage Fund
Global Alpha Fund
|
FORM N-CSR
Item 1. Reports to Stockholders.
Save time. Save paper. View your next shareholder report online as soon as it’s available. Log into www.dreyfus.com and sign up for Dreyfus eCommunications. It’s simple and only takes a few minutes.
The views expressed in this report reflect those of the portfolio manager only through the end of the period covered and do not necessarily represent the views of Dreyfus or any other person in the Dreyfus organization. Any such views are subject to change at any time based upon market or other conditions and Dreyfus disclaims any responsibility to update such views.These views may not be relied on as investment advice and, because investment decisions for a Dreyfus fund are based on numerous factors, may not be relied on as an indication of trading intent on behalf of any Dreyfus fund.
Not FDIC-Insured • Not Bank-Guaranteed • May Lose Value
| Contents |
| |
| | | THE FUND |
| |
|
| 2 | | Letter from the Chairman |
| 3 | | Discussion of Fund Performance |
| 6 | | Fund Performance |
| 8 | | Understanding Your Fund’s Expenses |
| 8 | | Comparing Your Fund’s Expenses |
| With Those of Other Funds |
| 9 | | Statement of Investments |
| 12 | | Statement of Financial Futures |
| 13 | | Statement of Assets and Liabilities |
| 14 | | Statement of Operations |
| 15 | | Statement of Changes in Net Assets |
| 16 | | Financial Highlights |
| 17 | | Notes to Financial Statements |
| 26 | | Report of Independent Registered |
| | | Public Accounting Firm |
| 27 | | Proxy Results |
| 28 | | Board Members Information |
| 31 | | Officers of the Fund |
| |
| FOR MORE INFORMATION |
|
| | | Back Cover |
The Fund

LETTER FROM THE CHAIRMAN
Dear Shareholder:
We are pleased to present this annual report for Global Alpha Fund, covering from the fund’s inception, May 2, 2006, through the end of the reporting period, October 31, 2006.
Although reports of slower economic growth and declining housing prices in the United States recently have raised economic concerns among both U.S. and international investors, we believe that neither a domestic recession nor a major shortfall in global growth is likely. Stimulative monetary policies among many central banks over the last several years have left a legacy of ample financial liquidity worldwide, which should continue to support global economic growth. Indeed, most nations’ monetary policies have so far tightened only from stimulative to neutral, leaving room for further expansion.
The long rally in many international equity markets seems to support our view that global economic conditions are sound. However, over the past six months, investors anticipating more subdued profit growth in a slower-growth economy recently have begun to favor high-quality, multinational companies and other businesses with the ability to sustain profitability in a variety of economic environments.This pattern is consistent with previous mid-cycle slowdowns. As always, we encourage you to discuss the implications of these and other matters with your financial adviser.
For information about how the fund performed during the reporting period, as well as market perspectives, we have provided a Discussion of Fund Performance given by the fund’s portfolio manager.
Thank you for your continued confidence and support.


DISCUSSION OF FUND PERFORMANCE
Helen Potter, Portfolio Manager
How did Global Alpha Fund perform relative to its benchmark?
Between the fund’s inception on May 2, 2006, and the end of its annual reporting period on October 31, 2006, the fund produced total returns of 5.84% for its Class A Shares, 5.36% for its Class C shares, 5.92% for its Class R shares and 5.68% for its Class T shares.1 In comparison, the fund’s benchmark, a hybrid index comprised of 60% Morgan Stanley Capital International World Index (half-hedged) and 40% Citigroup World Government Bond Index 1+ World Index (half-hedged), produced a total return of 3.83% from May 2, 2006, through October 31, 2006.2 Separately,the Morgan Stanley Capital International World Index (half-hedged) produced a total return of 3.89% from May 2, 2006, through October 31, 2006, and the Citigroup World Government Bond Index 1+ World Index (half-hedged) produced a 3.61% total return for the same period.
Despite rising short-term interest rates and volatile energy prices for much of the reporting period, securities markets worldwide generally posted strong returns due to robust economic growth and improving corporate earnings. The fund produced returns well in excess of its benchmark, with the fund’s currency component ranking as the most substantial contributor to relative performance for the reporting period.
What is the fund’s investment approach?
The fund seeks total return through investments in securities and instruments that provide exposure to global stock, bond and currency markets. The strategy utilizes a proprietary,fundamentals-based quantitative model to construct and optimally integrate a diverse set of four alpha generating signals: stock markets vs. bond markets within each country, country allocation among equity markets, country allocation among sovereign bond markets, and currency allocation. Our quantitative investment approach is designed to identify and exploit these relative misvaluations
DISCUSSION OF FUND PERFORMANCE (continued)
|
across and within major developed capital markets, such as the United States, Canada, Japan,Australia and Western Europe.
What other factors influenced the fund’s performance?
Strong global economic growth over most of the reporting period and a decline in fuel prices in the late summer and early fall paved the way for robust gains in many securities markets. Generally, both international equity and bond markets produced positive absolute returns. While inflation remained a concern and some central banks around the world gradually raised interest rates during the reporting period, rate hikes mostly remained within investors’ expectations and held relatively few surprises. International equity markets began the reporting period on a down note but rallied back starting over the summer, with European markets leading the charge. In Europe, stock prices rose amid strong corporate earnings and an increase in mergers-and-acquisitions activity. However, gains in Japan tended to lag those in Europe.
In this environment, the fund’s currency positions provided the most substantial contribution to its relative outperformance. In particular the fund benefited from an overweight to the British pound, which gained value relative to the U.S. dollar as investors anticipated further interest rate increases in the United Kingdom, where inflation-adjusted “real” interest rates had already been relatively high.The fund also benefited from its underweight position in the Norwegian krone, which, as a result of its sensitivity to energy prices, suffered as oil prices declined. These positive results were undermined to a small degree by the fund’s underweight to the Australian dollar, which strengthened against the U.S. dollar on expectations of further rate hikes in Australia.
As for equities, the fund maintained greater exposure to stocks than its benchmark, with the most rewarding contributions to relative performance coming from Spain and Switzerland. The Spanish stock market enjoyed a great run as mergers-and-acquisitions activity took center stage. In Switzerland, the fund benefited from relatively heavy exposure to a market where equities substantially outperformed the global average. More disappointing for the fund’s relative performance was the Japanese equities market, where economic growth expectations were not met.
On the fixed income side, Australian government bonds trailed other countries, and the fund’s underweight to them boosted its relative performance. However, the fund’s underweight to Canadian bonds, which performed well, detracted from the fund’s relative performance.
What is the fund’s current strategy?
In the context of our four alpha signals, we continue to see the most compelling opportunity in our global stock versus bond decision. Strong earnings expectations continue to support equity expected returns while long-term bond yields remain low.Accordingly, we are overweight stocks and underweight bonds relative to our global balanced benchmark.As far as cross country equity selection we continue to prefer the stock markets in Spain, Japan and the United States.Among bond markets, we maintain significant underweights in Australia, the United States and Canada versus an overweight position in European bonds. In currency markets, we have maintained our overweights to the British pound and the US dollar, but we remain less optimistic about the prospects of the Australian dollar and the Norwegian krone.
November 15, 2006
| | | Investing in foreign companies involves special risks, including changes in currency rates, |
| | | political, economic and social instability, a lack of comprehensive company information, |
| | | differing auditing and legal standards and less market liquidity. An investment in this fund |
| | | should be considered only as a supplement to an overall investment program. |
| 1 | | Total return includes reinvestment of dividends and any capital gains paid, and does not take into |
| | | consideration the maximum initial sales charge in the case of Class A shares, or the applicable |
| | | contingent deferred sales charge imposed on redemptions in the case of Class C shares. Had these |
| | | charges been reflected, returns would have been lower. Past performance is no guarantee of future |
| | | results. Share price, yield and investment return fluctuate such that upon redemption, fund shares |
| | | may be worth more or less than their original cost. Return figures provided reflect the absorption of |
| | | certain fund expenses by The Dreyfus Corporation in effect through October 31, 2007, at which |
| | | time it may be extended, terminated or modified. Had these expenses not been absorbed, the |
| | | fund’s returns would have been lower. |
| 2 | | SOURCES: Morgan Stanley Capital International and Citigroup — Reflects reinvestment of |
| | | net dividends and, where applicable, capital gain distributions.The Morgan Stanley Capital |
| | | International (MSCI) World Index is an unmanaged index of global stock market performance, |
| | | including the United States, Canada, Europe,Australia, New Zealand and the Far East.The |
| | | Citigroup World Government Bond Index includes the 22 government bond markets. |
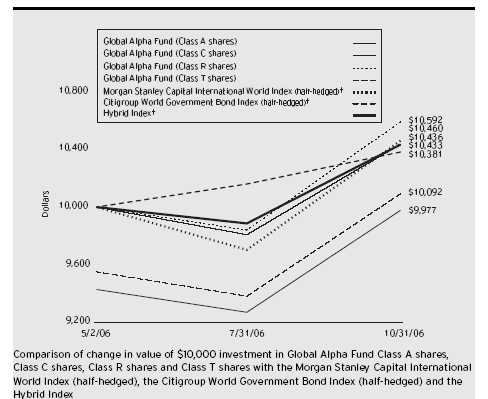
| † Source: FactSet |
| Past performance is not predictive of future performance. |
| The above graph compares a $10,000 investment made in Class A, Class C, Class R and Class T shares of Global |
| Alpha Fund on May 2, 2006 (inception date) to a $10,000 investment made on that date in each of the following: the |
| Morgan Stanley Capital International World Index (the “MSCI Index”) (half-hedged); the Citigroup World |
| Government Bond Index 1 + World Index (the “CWGB Index”) (half-hedged); and an unmanaged hybrid index |
| composed of 60% MSCI Index and 40% CWGB Index (the “Hybrid Index”) (half-hedged). Returns assume all |
| dividends and capital gain distributions are reinvested. |
| The fund invests primarily in instruments that provide exposure to global equity, bond and currency markets.The fund’s |
| performance shown in the line graph takes into account the maximum initial sales charge on Class A, and Class T shares, |
| the applicable contingent deferred sales charge on Class C shares and all other applicable fees and expenses on all shares. |
| The MSCI Index (half-hedged) is an unmanaged index of global stock market performance, including the United States, |
| Canada,Australia, New Zealand and the Far East and includes net dividends reinvested.The CWGB Index (half- |
| hedged) is an unmanaged index that tracks the performance of 22 government bond markets.The indices do not take into |
| account charges, fees and other expenses. Further information relating to fund performance, including expense |
| reimbursements, if applicable, is contained in the Financial Highlights section of the prospectus and elsewhere in this report. |
| Actual Aggregate Total Returns as of 10/31/06 | | |
| |
| | | Inception | | From |
| | | Date | | Inception |
| |
| |
|
| Class A shares | | | | |
| with maximum sales charge (5.75%) | | 5/2/06 | | (0.23)% |
| without sales charge | | 5/2/06 | | 5.84% |
| Class C shares | | | | |
| with applicable redemption charge † | | 5/2/06 | | 4.36% |
| without redemption | | 5/2/06 | | 5.36% |
| Class R shares | | 5/2/06 | | 5.92% |
| Class T shares | | | | |
| with applicable sales charge (4.5%) | | 5/2/06 | | 0.92% |
| without sales charge | | 5/2/06 | | 5.68% |
Past performance is not predictive of future performance.The fund’s performance shown in the graph and table does not reflect the deduction of taxes that a shareholder would pay on fund distributions or the redemption of fund shares.
† The maximum contingent deferred sales charge for Class C shares is 1% for shares redeemed within one year of the date of purchase.
UNDERSTANDING YOUR FUND’ S EXPENSES (Unaudited)
As a mutual fund investor, you pay ongoing expenses, such as management fees and other expenses. Using the information below, you can estimate how these expenses affect your investment and compare them with the expenses of other funds.You also may pay one-time transaction expenses, including sales charges (loads) and redemption fees, which are not shown in this section and would have resulted in higher total expenses. For more information, see your fund’s prospectus or talk to your financial adviser.
Review your fund’s expenses
The table below shows the expenses you would have paid on a $1,000 investment in Global Alpha Fund from May 2, 2006 to October 31, 2006†. It also shows how much a $1,000 investment would be worth at the close of the period, assuming actual returns and expenses.
| Expenses and Value of a $1,000 Investment | | | | | | |
| assuming actual returns for the six months ended October 31, 2006 † | | | | |
| | | Class A | | Class C | | Class R | | Class T |
| |
| |
| |
| |
|
| Expenses paid per $1,000 †† | | $ 7.95 | | $ 11.79 | | $ 6.56 | | $ 9.54 |
| Ending value (after expenses) | | $1,058.40 | | $1,053.60 | | $1,059.20 | | $1,056.80 |
COMPARING YOUR FUND’S EXPENSES WITH THOSE OF OTHER FUNDS (Unaudited)
Using the SEC’s method to compare expenses
The Securities and Exchange Commission (SEC) has established guidelines to help investors assess fund expenses. Per these guidelines, the table below shows your fund’s expenses based on a $1,000 investment, assuming a hypothetical 5% annualized return. You can use this information to compare the ongoing expenses (but not transaction expenses or total cost) of investing in the fund with those of other funds.All mutual fund shareholder reports will provide this information to help you make this comparison. Please note that you cannot use this information to estimate your actual ending account balance and expenses paid during the period.
Expenses and Value of a $1,000 Investment assuming a hypothetical 5% annualized return for the six months ended October 31, 2006†
| | | Class A | | Class C | | Class R | | Class T |
| |
| |
| |
| |
|
| Expenses paid per $1,000 †† | | $ 7.79 | | $ 11.56 | | $ 6.43 | | $ 9.35 |
| Ending value (after expenses) | | $1,017.35 | | $1,013.59 | | $1,018.70 | | $1,015.79 |
† From May 2, 2006 (commencement of initial offering) to October 31, 2006.
† †Expenses are equal to the fund’s annualized expense ratio of 1.54% for Class A, 2.29% for Class C, 1.27% for Class R and 1.85% for Class T, multiplied by the average account value over the period, multiplied by 183/365 (to reflect actual days since inception).
STATEMENT OF INVESTMENTS
October 31, 2006
|
| | | Coupon | | Maturity | | Principal | | |
| Bonds and Notes—2.3% | | Rate (%) | | Date | | Amount ($) | | Value ($) |
| |
| |
| |
| |
|
| Foreign/Governmental | | | | | | | | |
| Bundesrepublik Deutschland, | | | | | | | | |
| Bonds, Ser. 05 | | | | | | | | |
| (cost $1,305,306) | | 3.50 | | 1/4/16 | | 1,072,000 | | 1,345,738 |
| |
| |
| |
| |
|
| |
| Options—27.2% | | | | | | Contracts | | Value ($) |
| |
| |
| |
| |
|
| Call Options—25.2% | | | | | | | | |
| British Pound Currency Futures, | | | | | | |
| December 2006 @ 167 | | | | | | 93 | | 1,384,537 |
| DJ Euro STOXX 50 Index, | | | | | | | | |
| December 2006 @ 2900 | | | | | | 29 | | 409,932 |
| Euro-Bond Index | | | | | | | | |
| November 2006 @ 108 | | | | | | 83 | | 70,844 |
| Euro FX Currency Futures, | | | | | | | | |
| December 2006 @ 1.15 | | | | | | 36 | | 583,200 |
| Nikkei 225 Index Futures, | | | | | | | | |
| December 2006 @ 10500 | | | | | | 104 | | 2,603,218 |
| S & P 500 Index Futures, | | | | | | | | |
| December 2006 @ 800 | | | | | | 60 | | 8,748,000 |
| Swiss Franc Currency Futures, | | | | | | |
| December 2006 @ 73 | | | | | | 3 | | 29,288 |
| Swiss Market Index, | | | | | | | | |
| December 2006 @ 6000 | | | | | | 46 | | 955,214 |
| | | | | | | | | 14,784,233 |
| Put Options—2.0% | | | | | | | | |
| Australian Dollar Currency | | | | | | | | |
| Futures, December 2006 @ 86 | | | | 71 | | 612,730 |
| Canadian Dollar Currency Futures, | | | | | | |
| December 2006 @ 99 | | | | | | 28 | | 272,440 |
| Japanese Yen Currency Futures, | | | | | | |
| December 2006 @ 94 | | | | | | 8 | | 79,200 |
| U.S. Treasury 10 Year Note | | | | | | | | |
| Futures, December 2006 @ 115 | | | | 35 | | 237,344 |
| | | | | | | �� | | 1,201,714 |
| Total Options | | | | | | | | |
| (cost $15,046,154) | | | | | | | | 15,985,947 |
STATEMENT OF INVESTMENTS (continued)
|
| | | Principal | | |
| Short-Term Investments—48.3% | | Amount ($) | | Value ($) |
| |
| |
|
| Commercial Paper—.9% | | | | |
| HBOS Treasury, | | | | |
| 5.36%, 11/7/06 | | 500,000 | | 499,554 |
| U.S. Government Agencies—45.5% | | | | |
| Federal Home Loan Mortgage Corp., | | | | |
| 5.15%, 11/15/06 | | 4,400,000 | | 4,391,205 |
| Federal Home Loan Mortgage Corp., | | | | |
| 5.21%, 12/18/06 | | 5,000,000 | | 4,966,610 |
| Federal Home Loan Mortgage Corp., | | | | |
| 5.26%, 12/19/06 | | 2,100,000 | | 2,085,776 |
| Federal National Mortgage | | | | |
| Association, 5.09%, 1/10/07 | | 4,000,000 | | 3,960,411 |
| Federal National Mortgage | | | | |
| Association, 5.11%, 1/22/07 | | 3,700,000 | | 3,657,103 |
| Federal National Mortgage | | | | |
| Association, 5.16%, 11/29/06 | | 4,000,000 | | 3,984,071 |
| Federal National Mortgage | | | | |
| Association, 5.27%, 1/10/07 | | 3,700,000 | | 3,663,021 |
| | | | | 26,708,197 |
| U.S. Treasury Bills—1.9% | | | | |
| 4.86%, 12/7/06 | | 1,150,000 a | | 1,144,284 |
| Total Short-Term Investments | | | | |
| (cost $28,352,162) | | | | 28,352,035 |
| Other Investment—13.0% | | Shares | | Value ($) |
| |
| |
|
| Registered Investment Company; | | | | |
| Dreyfus Institutional Preferred | | | | |
| Plus Money Market Fund | | | | |
| (cost $7,639,000) | | | | 7,639,000 b | | 7,639,000 |
| |
| |
| |
|
| Total Investments (cost $52,342,622) | | 90.8% | | 53,322,720 |
| Cash and Receivables (Net) | | 9.2% | | 5,386,945 |
| Net Assets | | | | 100.0% | | 58,709,665 |
| |
| a | | All or partially held by a broker as collateral for open financial futures positions. | | |
| b | | Investment in affiliated money market mutual fund. | | | | |
| |
| |
| |
|
| |
| |
| |
| |
| Portfolio Summary | | (Unaudited) † | | | | |
| | | | | Value (%) | | | | Value (%) |
| |
| |
| |
| |
|
| Short-Term/Money | | | | Futures/Options/Forward | | |
| Market Investments | | 61.3 | | Currency Exchange Contracts | | 27.7 |
| Foreign/Governmental | | 2.3 | | | | 91.3 |
| |
| † | | Based on net assets. | | | | | | |
| See notes to financial statements. | | | | |
STATEMENT OF FINANCIAL FUTURES
October 31, 2006
|
| | | | | | | | | Unrealized |
| | | | | Market Value | | | | Appreciation |
| | | | | Covered by | | | | (Depreciation) |
| | | Contracts | | Contracts ($) | | Expiration | | at 10/31/2006 ($) |
| |
| |
| |
| |
|
| Financial Futures Long | | | | | | | | |
| Amsterdam Exchanges Index | | 10 | | 1,242,144 | | November 2006 | | (6,757) |
| CAC 40 | | 12 | | 820,642 | | November 2006 | | (1,978) |
| Long Gilt | | 19 | | 3,986,515 | | December 2006 | | 16,234 |
| Hang Seng Stock Index | | 10 | | 1,178,625 | | November 2006 | | 10,668 |
| IBEX 35 Index | | 29 | | 5,076,861 | | November 2006 | | 116,667 |
| 10 Year Mini JGB | | 67 | | 7,681,653 | | December 2006 | | 13,631 |
| S & P/MIB Index | | 3 | | 758,114 | | December 2006 | | 21,130 |
| S & P/Toronto Stock | | | | | | | | |
| Exchange 60 Index | | 17 | | 2,139,319 | | December 2006 | | 96,487 |
| S & P ASX 200 Index | | 20 | | 2,074,305 | | December 2006 | | 75,936 |
| Financial Futures Short | | | | | | | | |
| Australian 10 Year Bond | | 71 | | (5,635,505) | | December 2006 | | 1,816 |
| Canadian 10 Year Bond | | 98 | | (10,045,339) | | December 2006 | | (80,429) |
| FTSE 100 | | 7 | | (819,803) | | December 2006 | | (16,574) |
| | | | | | | | | 246,831 |
See notes to financial statements.
|
STATEMENT OF ASSETS AND LIABILITIES
October 31, 2006
|
| | | | | | | Cost | | Value |
| |
| |
| |
| |
|
| Assets ($): | | | | | | | | |
| Investments in securities—See Statement of Investments: | | | | |
| Unaffiliated issuers | | | | 44,703,622 | | 45,683,720 |
| Affiliated issuers | | | | | | 7,639,000 | | 7,639,000 |
| Cash | | | | | | | | 4,064,821 |
| Cash denominated in foreign currencies | | | | 99,138 | | 98,582 |
| Receivable for shares of Common Stock subscribed | | | | | | 2,331,981 |
| Receivable for investment securities sold | | | | | | 87,813 |
| Dividends and interest receivable | | | | | | 78,497 |
| Unrealized appreciation on forward | | | | | | |
| currency exchange contracts—Note 4 | | | | | | 44,370 |
| Prepaid expenses | | | | | | | | 56,146 |
| | | | | | | | | 60,084,930 |
| |
| |
| |
| |
|
| Liabilities ($): | | | | | | | | |
| Due to The Dreyfus Corporation and affiliates—Note 3(c) | | | | 11,458 |
| Payable for investment securities purchased | | | | | | 1,291,709 |
| Payable for futures variation margin—Note 4 | | | | | | 12,162 |
| Unrealized depreciation on forward | | | | | | |
| currency exchange contracts—Note 4 | | | | | | 6,812 |
| Accrued expenses | | | | | | | | 53,124 |
| | | | | | | | | 1,375,265 |
| |
| |
| |
| |
|
| Net Assets ($) | | | | | | | | 58,709,665 |
| |
| |
| |
| |
|
| Composition of Net Assets ($): | | | | | | |
| Paid-in capital | | | | | | | | 56,416,328 |
| Accumulated undistributed investment income—net | | | | | | 224,516 |
| Accumulated net realized gain (loss) on investments | | | | 801,058 |
| Accumulated net unrealized appreciation (depreciation) on | | | | |
| investments and foreign currency transactions (including | | | | |
| $246,831 net unrealized appreciation on financial futures) | | | | 1,267,763 |
| |
| |
|
| Net Assets ($) | | | | | | | | 58,709,665 |
| |
| |
| |
| |
|
| |
| |
| Net Asset Value Per Share | | | | | | |
| | | Class A | | Class C | | Class R | | Class T |
| |
| |
| |
| |
|
| Net Assets ($) | | 47,215,343 | | 3,501,030 | | 7,705,433 | | 287,859 |
| Shares Outstanding | | 3,569,004 | | 265,715 | | 581,925 | | 21,774 |
| |
| |
| |
| |
|
| Net Asset Value | | | | | | | | |
| Per Share ($) | | 13.23 | | 13.18 | | 13.24 | | 13.22 |
See notes to financial statements.
|
STATEMENT OF OPERATIONS
From May 2, 2006 (commencement of operations) to October 31, 2006
|
| Investment Income ($): | | |
| Income: | | |
| Interest | | 298,434 |
| Cash dividends; | | |
| Affiliated issuers | | 93,479 |
| Total Income | | 391,913 |
| Expenses: | | |
| Management fee—Note 3(a) | | 119,858 |
| Legal fees | | 78,952 |
| Auditing fees | | 47,258 |
| Shareholder servicing costs—Note 3(c) | | 25,666 |
| Registration fees | | 11,385 |
| Distribution fees—Note 3(b) | | 6,310 |
| Prospectus and shareholders’ reports | | 1,041 |
| Custodian fees—Note 3(c) | | 600 |
| Directors’ fees and expenses—Note 3(d) | | 332 |
| Miscellaneous | | 7,013 |
| Total Expenses | | 298,415 |
| Less—expense reimbursement | | |
| due to undertaking—Note 3(a) | | (125,601) |
| Less—reduction in custody fees | | |
| due to earnings credits—Note 1(c) | | (3,599) |
| Net Expenses | | 169,215 |
| Investment Income—Net | | 222,698 |
| |
|
| Realized and Unrealized Gain (Loss) on Investments—Note 4 ($): |
| Net realized gain (loss) on investments and foreign currency transactions | | (2,138) |
| Net realized gain (loss) on financial futures | | 593,405 |
| Net realized gain (loss) on forward currency exchange contracts | | 194,585 |
| Net realized gain (loss) on options transactions | | 17,024 |
| Net Realized Gain (Loss) | | 802,876 |
| Net unrealized appreciation (depreciation) on investments and | | |
| foreign currency transactions (including $246,831 net | | |
| unrealized appreciation on financial futures) | | 1,267,763 |
| Net Realized and Unrealized Gain (Loss) on Investments | | 2,070,639 |
| Net Increase in Net Assets Resulting from Operations | | 2,293,337 |
See notes to financial statements.
|
STATEMENT OF CHANGES IN NET ASSETS
From May 2, 2006 (commencement of operations) to October 31, 2006
|
| Operations ($): | | |
| Investment income—net | | 222,698 |
| Net realized gain (loss) on investments | | 802,876 |
| Net unrealized appreciation (depreciation) on investments | | 1,267,763 |
| Net Increase (Decrease) in Net Assets Resulting from Operations | | 2,293,337 |
| |
|
| Capital Stock Transactions ($): | | |
| Net proceeds from shares sold: | | |
| Class A shares | | 54,706,127 |
| Class C shares | | 3,849,007 |
| Class R shares | | 7,902,691 |
| Class T shares | | 779,205 |
| Cost of shares redeemed: | | |
| Class A shares | | (9,260,046) |
| Class C shares | | (519,039) |
| Class R shares | | (521,306) |
| Class T shares | | (520,311) |
| Increase (Decrease) in Net Assets from Capital Stock Transactions | | 56,416,328 |
| Total Increase (Decrease) in Net Assets | | 58,709,665 |
| |
|
| Net Assets ($): | | |
| Beginning of Period | | — |
| End of Period | | 58,709,665 |
| Undistributed investment income—net | | 224,516 |
| |
|
| Capital Share Transactions (Shares): | | |
| Class A | | |
| Shares sold | | 4,280,453 |
| Shares redeemed | | (711,449) |
| Net Increase (Decrease) in Shares Outstanding | | 3,569,004 |
| |
|
| Class C | | |
| Shares sold | | 305,717 |
| Shares redeemed | | (40,002) |
| Net Increase (Decrease) in Shares Outstanding | | 265,715 |
| |
|
| Class R | | |
| Shares sold | | 621,927 |
| Shares redeemed | | (40,002) |
| Net Increase (Decrease) in Shares Outstanding | | 581,925 |
| |
|
| Class T | | |
| Shares sold | | 61,784 |
| Shares redeemed | | (40,010) |
| Net Increase (Decrease) in Shares Outstanding | | 21,774 |
See notes to financial statements.
|
FINANCIAL HIGHLIGHTS
The following table describes the performance for each share class for the period from May 2, 2006 (commencement of operations) to October 31, 2006. All information (except portfolio turnover rate) reflects financial results for a single fund share.Total return shows how much your investment in the fund would have increased (or decreased) during the period, assuming you had reinvested all dividends and distrib-utions.These figures have been derived from the fund’s financial statements.
| | | | | Class A | | Class C | | Class R | | Class T |
| | | | | Shares | | Shares | | Shares | | Shares |
| |
| |
| |
| |
| |
|
| Per Share Data ($): | | | | | | | | |
| Net asset value, beginning of period | | 12.50 | | 12.50 | | 12.50 | | 12.50 |
| Investment Operations: | | | | | | | | |
| Investment income—net a | | .12 | | .08 | | .13 | | .12 |
| Net realized and unrealized | | | | | | | | |
| gain (loss) on investments | | .61 | | .60 | | .61 | | .60 |
| Total from Investment Operations | | .73 | | .68 | | .74 | | .72 |
| Net asset value, end of period | | 13.23 | | 13.18 | | 13.24 | | 13.22 |
| |
| |
| |
| |
|
| Total Return (%) b | | 5.84c | | 5.36c | | 5.92 | | 5.68c |
| |
| |
| |
| |
|
| Ratios/Supplemental Data (%): | | | | | | | | |
| Ratio of total expenses | | | | | | | | |
| to average net assets d | | 2.67 | | 3.49 | | 2.51 | | 3.10 |
| Ratio of net expenses | | | | | | | | |
| to average net assets d | | 1.54 | | 2.29 | | 1.27 | | 1.85 |
| Ratio of net investment income | | | | | | | | |
| to average net assets d | | 2.09 | | 1.33 | | 2.31 | | 1.89 |
| Portfolio Turnover Rate | | — | | — | | — | | — |
| |
| |
| |
| |
|
| Net Assets, end of period ($ x 1,000) | | 47,215 | | 3,501 | | 7,705 | | 288 |
| |
| a | | Based on average shares outstanding at each month end. | | | | | | |
| b | | Not annualized. | | | | | | | | |
| c | | Exclusive of sales charge. | | | | | | | | |
| d | | Annualized. | | | | | | | | |
| See notes to financial statements. | | | | | | | | |
NOTES TO FINANCIAL STATEMENTS
NOTE 1—Significant Accounting Policies:
Global Alpha Fund (the “fund”) is a separate diversified series of Advantage Funds, Inc. (the “Company”) which is registered under the Investment Company Act of 1940, as amended (the “Act”), as an open-end management investment company and operates as a series company that offers thirteen series, including the fund, which commenced operations on May 2, 2006.The fund’s investment objective seeks total return by investing in instruments that provide investment exposure to global equity, bond and currency markets, and in fixed-income securities.The Dreyfus Corporation (the “Manager” or “Dreyfus”) serves as the fund’s investment adviser. The Manager is a wholly-owned subsidiary of Mellon Financial Corporation (“Mellon Financial”). Mellon Capital Management Corporation (“Mellon Capital”) serves as the fund’s sub-investment adviser.
Dreyfus Service Corporation (the “Distributor”) a wholly-owned subsidiary of Dreyfus, is the distributor of the fund’s shares. The fund is authorized to issue 400 million shares of $.001 par value Common Stock.The fund currently offers four classes of shares: Class A (100 million shares authorized), Class C (100 million shares authorized), Class R (100 million shares authorized) and Class T (100 million shares authorized). Class A and Class T shares are subject to a sales charge imposed at the time of purchase. Class C shares are subject to a contingent deferred sales charge (“CDSC”) imposed on Class C shares redeemed within one year of purchase. Class R shares are sold at net asset value per share only to institutional investors. Other differences between the classes include the services offered to and the expenses borne by each class and certain voting rights. Income, expenses (other than expenses attributable to a specific class), and realized and unrealized gains or losses on investments are allocated to each class of shares based on its relative net assets.
The Company accounts separately for the assets, liabilities and operations of each series. Expenses directly attributable to each series are charged to that series’ operations; expenses which are applicable to all series are allocated among them on a pro rata basis.
NOTES TO FINANCIAL STATEMENTS (continued)
|
The fund’s financial statements are prepared in accordance with U.S. generally accepted accounting principles, which may require the use of management estimates and assumptions. Actual results could differ from those estimates.
The fund enters into contracts that contain a variety of indemnifications. The fund’s maximum exposure under these arrangements is unknown.The fund does not anticipate recognizing any loss related to these arrangements.
(a) Portfolio valuation: Investments in securities (excluding short-term investments (other than U.S.Treasury Bills), financial futures, options and forward currency exchange contracts) are valued each business day by an independent pricing service (the “Service”) approved by the Board of Directors. Investments for which quoted bid prices are readily available and are representative of the bid side of the market in the judgment of the Service are valued at the mean between the quoted bid prices (as obtained by the Service from dealers in such securities) and asked prices (as calculated by the Service based upon its evaluation of the market for such securities). Other investments (which constitute a majority of the portfolio securities) are valued as determined by the Service, based on methods which include consideration of: yields or prices of securities of comparable quality, coupon, maturity and type; indications as to values from dealers; and general market conditions. Securities for which there are no such valuations are valued at fair value as determined in good faith under the direction of the Board of Directors. Restricted securities, as well as securities or other assets for which recent market quotations are not readily available, that are not valued by a pricing service approved by the Board of Directors,or are determined by the fund not to reflect accurately fair value (such as when an event occurs after the close of the exchange on which the security is principally traded and that is determined by the fund to have changed the value of the security), are valued at fair value as determined in good faith under the direction of the Board of Directors.The factors that may be considered when fair valuing a security include fundamental analytical data, the nature and duration of
restrictions on disposition, an evaluation of the forces that influence the market in which the securities are purchased and sold and public trading in similar securities of the issuer or comparable issuers.Short-term investments, excluding U.S.Treasury Bills, are carried at amortized cost, which approximates value. Investments in registered investment companies are valued at their NAV. Financial futures and options, which are traded on an exchange, are valued at the last sales price on the securities exchange on which such securities are primarily traded or at the last sales price on the national securities market on each business day. Options traded over-the-counter are priced at the mean between the bid and asked price. Investments denominated in foreign currencies are translated to U.S. dollars at the prevailing rates of exchange. Forward currency exchange contracts are valued at the forward rate.
On September 20, 2006, the FASB released Statement of Financial Accounting Standards No. 157 “Fair Value Measurements” (“FAS 157”). FAS 157 establishes an authoritative definition of fair value, sets out a framework for measuring fair value, and requires additional disclosures about fair-value measurements.The application of FAS 157 is required for fiscal years beginning after November 15, 2007 and interim periods within those fiscal years. Management does not believe that the application of this standard will have a material impact on the financial statements of the fund.
(b) Foreign currency transactions: The fund does not isolate that portion of the results of operations resulting from changes in foreign exchange rates on investments from the fluctuations arising from changes in the market prices of securities held. Such fluctuations are included with the net realized and unrealized gain or loss on investments.
Net realized foreign exchange gains or losses arise from sales and maturities of short-term securities, sales of foreign currencies, currency gains or losses realized on securities transactions and the difference between the amounts of dividends, interest and foreign withholding taxes recorded on the fund’s books and the U.S. dollar equivalent of the
NOTES TO FINANCIAL STATEMENTS (continued)
|
amounts actually received or paid. Net unrealized foreign exchange gains and losses arise from changes in the value of assets and liabilities other than investments in securities, resulting from changes in exchange rates. Such gains and losses are included with net realized and unrealized gain or loss on investments.
(c) Securities transactions and investment income: Securities transactions are recorded on a trade date basis. Realized gain and loss from securities transactions are recorded on the identified cost basis. Dividend income is recognized on the ex-dividend date and interest income, including, where applicable, accretion of discount and amortization of premium on investments, is recognized on the accrual basis.
The fund has an arrangement with the custodian bank whereby the fund receives earnings credits from the custodian when positive cash balances are maintained, which are used to offset custody fees. For financial reporting purposes, the fund includes net earnings credits as an expense offset in the Statement of Operations.
(d) Affiliated issuers: Investments in other investment companies advised by Dreyfus are defined as “affiliated” in the Act.
(e) Dividends to shareholders: Dividends are recorded on the ex-dividend date. Dividends from investment income-net and dividends from net realized capital gain, if any, are normally declared and paid annually, but the fund may make distributions on a more frequent basis to comply with the distribution requirements of the Internal Revenue Code of 1986, as amended (the “Code”).To the extent that net realized capital gain can be offset by capital loss carryovers, if any, it is the policy of the fund not to distribute such gain. Income and capital gain distributions are determined in accordance with income tax regulations, which may differ from U.S. generally accepted accounting principles.
(f) Federal income taxes: It is the policy of the fund to continue to qualify as a regulated investment company, if such qualification is in the best interests of its shareholders, by complying with the applicable provisions of the Code, and to make distributions of taxable income sufficient to relieve it from substantially all federal income and excise taxes.
On July 13, 2006, the Financial Accounting Standards Board (FASB) released FASB Interpretation No. 48 “Accounting for Uncertainty in Income Taxes” (FIN 48). FIN 48 provides guidance for how uncertain tax positions should be recognized, measured, presented and disclosed in the financial statements. FIN 48 requires the evaluation of tax positions taken or expected to be taken in the course of preparing the fund’s tax returns to determine whether the tax positions are “more-likely-than-not” of being sustained by the applicable tax authority.Tax positions not deemed to meet the more-likely-than-not threshold would be recorded as a tax benefit or expense in the current year. Adoption of FIN 48 is required for fiscal years beginning after December 15, 2006 and is to be applied to all open tax years as of the effective date. Management does not believe that the application of this standard will have a material impact on the financial statements of the fund.
At October 31, 2006, the components of accumulated earnings on a tax basis were as follows: undistributed ordinary income $1,360,006, undistributed capital gains $386,810 and unrealized appreciation $546,521.
During the period ended October 31, 2006, as a result of permanent book to tax differences, primarily due to foreign currency transactions, the fund increased accumulated undistributed investment income-net by $1,818 and decreased accumulated net realized gain (loss) on investments by the same amount. Net assets were not affected by this reclassification.
NOTE 2—Bank Line of Credit:
|
The fund participates with other Dreyfus-managed funds in a $350 million redemption credit facility (the “Facility”) to be utilized for temporary or emergency purposes, including the financing of redemptions. In connection therewith, the fund has agreed to pay commitment fees on its pro rata portion of the Facility. Interest is charged to the fund based on prevailing market rates in effect at the time of borrowing. During the period ended October 31, 2006, the fund did not borrow under the Facility.
NOTES TO FINANCIAL STATEMENTS (continued)
|
NOTE 3—Management Fee, Sub-Investment Advisory Fee and Other Transactions With Affiliates:
(a) Pursuant to a Management Agreement (“Agreement”) with Dreyfus, the management fee is computed at the annual rate of 1.10% of the value of the fund’s average daily net assets and is payable monthly. Dreyfus has agreed, from August 1, 2006 to October 31, 2007, to waive receipt of its fees and/or assume the expenses of the fund so that the expenses of none of the classes, exclusive of taxes, brokerage fees, interest on borrowings, commitment fees and extraordinary expenses, exceed an annual rate of 1.25% of the value of the average daily net assets of their class. Dreyfus had agreed, from May 2, 2006 to July 31, 2006, to waive receipt of its fees and/or assume the expenses of the fund so that the expenses of none of the classes, exclusive of certain expenses as described above, exceeded an annual rate of 1.45% of the value of the average daily net assets of their class. The expense reimbursement, pursuant to the undertaking, amounted to $125,601 during the period ended October 31, 2006.
Pursuant to a Sub-Investment Advisory Agreement between Dreyfus and Mellon Capital, Dreyfus pays Mellon Capital an annual fee of .65% of the value of the fund’s average daily net assets, payable monthly.
During the period ended October 31, 2006, the Distributor retained $26,063 and $92 from commissions earned on sales of the fund’s Class A and Class T shares, respectively.
(b) Under the Distribution Plan (the “Plan”) adopted pursuant to Rule 12b-1 under the Act, Class C and Class T shares pay the Distributor for distributing their shares at an annual rate of .75% and .25% of the value of their respective average daily net assets. During the period ended October 31, 2006, Class C and Class T shares were charged $5,699 and $611, respectively, pursuant to the Plan.
(c) Under the Shareholder Services Plan, Class A, Class C and Class T shares pay the Distributor at an annual rate of .25% of the value of their average daily net assets for the provision of certain services.The services provided may include personal services relating to shareholder accounts, such as answering shareholder inquiries regarding the fund
and providing reports and other information, and services related to the maintenance of shareholder accounts.The Distributor may make payments to Service Agents (a securities dealer, financial institution or other industry professional) in respect of these services.The Distributor determines the amounts to be paid to Service Agents. During the period ended October 31, 2006, Class A, Class C and Class T shares were charged $21,610, $1,900 and $611, respectively, pursuant to the Shareholder Services Plan.
The fund compensates Dreyfus Transfer, Inc., a wholly-owned subsidiary of Dreyfus, under a transfer agency agreement for providing personnel and facilities to perform transfer agency services for the fund. During the period ended October 31, 2006, the fund was charged $738 pursuant to the transfer agency agreement.
The fund compensates Mellon Bank, N.A., an affiliate of Dreyfus, under a custody agreement for providing custodial services for the fund. During the period ended October 31, 2006, the fund was charged $600 pursuant to the custody agreement.
During the period ended October 31, 2006, the fund was charged $1,022 for services performed by the Chief Compliance Officer.
The components of Due to The Dreyfus Corporation and affiliates in the Statement of Assets and Liabilities consist of: management fees $43,477, Rule 12b-1 distribution plan fees $2,019, shareholder services plan fees $8,509, chief compliance officer fees $1,363 and transfer agency per account fees $738, which are offset against an expense reimbursement currently in effect in the amount of $44,648.
(d) Each Board member also serves as a Board member of other funds within the Dreyfus complex. Annual retainer fees and attendance fees are allocated to each fund based on net assets.
(e) Pursuant to an exemptive order from the SEC, the fund may invest its available cash balances in affiliated money market mutual funds. Management fees of the underlying money market mutual funds have been waived by Dreyfus.
NOTES TO FINANCIAL STATEMENTS (continued)
|
NOTE 4—Securities Transactions:
|
The aggregate amount of purchases and sales of investment securities, excluding short-term securities, financial futures, options transactions and forward currency exchange contracts during the period ended October 31, 2006, amounted to $1,302,654 and $0, respectively.
The fund may invest in financial futures contracts in order to gain exposure to or protect against changes in the market.The fund is exposed to market risk as a result of changes in the value of the underlying financial instruments. Investments in financial futures require the fund to “mark to market” on a daily basis, which reflects the change in market value of the contracts at the close of each day’s trading.Accordingly, variation margin payments are received or made to reflect daily unrealized gains or losses. When the contracts are closed, the fund recognizes a realized gain or loss. These investments require initial margin deposits with a broker, which consist of cash or cash equivalents.The amount of these deposits is determined by the exchange or Board of Trade on which the contract is traded and is subject to change.Contracts open at October 31,2006,are set forth in the Statement of Financial Futures.
The fund enters into forward currency exchange contracts to gain exposure to foreign currency, hedge its exposure against changes in exchange rates on its foreign portfolio holdings and to settle foreign currency transactions. When executing forward currency exchange contracts, the fund is obligated to buy or sell a foreign currency at a specified rate on a certain date in the future.With respect to sales of forward currency exchange contracts, the fund would incur a loss if the value of the contract increases between the date the forward contract is opened and the date the forward contract is closed.The fund realizes a gain if the value of the contract decreases between those dates. With respect to purchases of forward currency exchange contracts, the fund would incur a loss if the value of the contract decreases between the date the forward contract is opened and the date the forward contract is closed.The fund realizes a gain if the value of the contract increases
between those dates.The fund is also exposed to credit risk associated with counterparty nonperformance on these forward currency exchange contracts which is typically limited to the unrealized gain on each open contract.The following summarizes open forward currency exchange contracts at October 31, 2006:
| | | Foreign | | | | | | Unrealized |
| Forward Currency | | Currency | | | | | | Appreciation |
| Exchange Contracts | | Amounts | | Cost ($) | | Value ($) (Depreciation) ($) |
| |
| |
| |
|
| Purchases: | | | | | | | | |
| Euro, expiring | | | | | | | | |
| 12/14/2006 | | 317,000 | | 405,587 | | 405,459 | | (128) |
| British Pound, expiring | | | | | | | | |
| 12/14/2006 | | 237,000 | | 450,884 | | 452,156 | | 1,272 |
| New Zealand Dollar, | | | | | | | | |
| expiring 12/14/2006 | | 4,623,000 | | 3,044,800 | | 3,087,563 | | 42,763 |
| Sales: | | | | Proceeds ($) | | | | |
| Australian Dollar, | | | | | | | | |
| expiring 12/14/2006 | | 299,000 | | 231,157 | | 231,139 | | 18 |
| Canadian Dollar, | | | | | | | | |
| expiring 12/14/2006 | | 266,000 | | 237,980 | | 237,702 | | 278 |
| Norwegian Krone, | | | | | | | | |
| expiring | | | | | | | | |
| 12/14/2006 | | 22,310,000 | | 3,416,021 | | 3,418,345 | | (2,324) |
| Swedish Krona, | | | | | | | | |
| expiring | | | | | | | | |
| 12/14/2006 | | 11,874,000 | | 1,644,578 | | 1,648,938 | | (4,360) |
| Swiss Franc, expiring | | | | | | | | |
| 12/14/2006 | | 20,080 | | 16,249 | | 16,210 | | 39 |
| Total | | | | | | | | 37,558 |
At October 31, 2006, the cost of investments for federal income tax purposes was $52,342,622; accordingly, accumulated net unrealized appreciation on investments was $980,098, consisting of $1,183,815 gross unrealized appreciation and $203,717 gross unrealized depreciation.
REPORT OF INDEPENDENT REGISTERED PUBLIC ACCOUNTING FIRM
Shareholders and Board of Directors Global Alpha Fund
We have audited the accompanying statement of assets and liabilities, including the statements of investments and financial futures, of Global Alpha Fund (one of the fund’s comprising Advantage Funds, Inc.) as of October 31, 2006, and the related statements of operations and changes in net assets and financial highlights for the period from May 2, 2006 (commencement of operations) to October 31, 2006. These financial statements and financial highlights are the responsibility of the Fund’s management. Our responsibility is to express an opinion on these financial statements and financial highlights based on our audit.
We conducted our audit in accordance with the standards of the Public Company Accounting Oversight Board (United States).Those standards require that we plan and perform the audit to obtain reasonable assurance about whether the financial statements and financial highlights are free of material misstatement.We were not engaged to perform an audit of the Fund’s internal control over financial reporting. Our audit included consideration of internal control over financial reporting as a basis for designing audit procedures that are appropriate in the circumstances,but not for the purpose of expressing an opinion on the effectiveness of the Fund’s internal control over financial reporting.Accordingly, we express no such opinion.An audit includes examining, on a test basis, evidence supporting the amounts and disclosures in the financial statements and financial highlights, assessing the accounting principles used and significant estimates made by management, and evaluating the overall financial statement presentation. Our procedures included verification by examination of securities held by the custodian as of October 31, 2006 and confirmation of securities not held by the custodian by correspondence with oth-ers.We believe that our audit provides a reasonable basis for our opinion.
In our opinion, the financial statements and financial highlights referred to above present fairly, in all material respects, the financial position of Global Alpha Fund at October 31, 2006, and the results of its operations, the changes in its net assets and the financial highlights for the period from May 2, 2006 (commencement of operations) to October 31, 2006, in conformity with U.S. generally accepted accounting principles.

New York, New York
December 12, 2006
|
PROXY RESULTS (Unaudited)
|
Advantage Funds, Inc. held a special meeting of shareholders on June 29, 2006.The proposal considered at the meeting, and the results, are as follows:
| | | | | Shares | | |
| |
| |
| |
|
| | | Votes For | | | | Authority Withheld |
| |
| |
| |
|
| To elect additional Board Members: | | | | | | |
| Peggy C. Davis † | | 75,634,549 | | | | 1,727,669 |
| James F. Henry † | | 75,604,546 | | | | 1,757,672 |
| Dr. Martin Peretz † | | 75,621,544 | | | | 1,740,674 |
† Each will serve as an Independent Board member of the fund commencing, subject to the discretion of the Board, on or about January 1, 2007.
In addition Joseph S. DiMartino, David P. Feldman, Ehud Houminer, Gloria Messinger, and Anne Wexler continue as Board members of the fund.
BOARD MEMBERS INFORMATION (Unaudited)
Joseph S. DiMartino (63)
Chairman of the Board (1995)
|
Principal Occupation During Past 5 Years:
• Corporate Director and Trustee
|
Other Board Memberships and Affiliations:
|
- The Muscular Dystrophy Association, Director
- Century Business Services, Inc., a provider of outsourcing functions for small and medium size companies, Director
- The Newark Group, a provider of a national market of paper recovery facilities, paperboard mills and paperboard converting plants, Director
- Sunair Services Corporation, engaging in the design, manufacture and sale of high frequency systems for long-range voice and data communications, as well as providing certain outdoor-related services to homes and businesses, Director
| No. of Portfolios for which Board Member Serves: 189 |
| ——————— |
| Peggy C. Davis (63) |
| Board Member (2006) |
Principal Occupation During Past 5 Years:
|
- Shad Professor of Law, New York University School of Law (1983-present)
- Writer and teacher in the fields of evidence, constitutional theory, family law, social sciences and the law, legal process and professional methodology and training
| No. of Portfolios for which Board Member Serves: 71 |
| ——————— |
| David P. Feldman (66) |
| Board Member (1996) |
Principal Occupation During Past 5 Years:
• Corporate Director and Trustee
|
Other Board Memberships and Affiliations:
|
- BBH Mutual Funds Group (11 funds), Director
- The Jeffrey Company, a private investment company, Director
- QMED, a medical device company, Director
No. of Portfolios for which Board Member Serves: 57
|
James F. Henry (75)
Board Member (2006)
|
Principal Occupation During Past 5 Years:
|
- President,The International Institute for Conflict Prevention and Resolution, a non-profit organization principally engaged in the development of alternatives to business litigation (Retired 2003)
- Advisor to The Elaw Forum, a consultant on managing corporate legal costs
- Advisor to John Jay Homestead (the restored home of the first U.S. Chief Justice)
- Individual Trustee of several trusts
Other Board Memberships and Affiliations:
|
- Director, advisor and mediator involved in several non-profit organizations, primarily engaged in domestic and international dispute resolution, and historic preservation
No. of Portfolios for which Board Member Serves: 48
|
| ——————— |
| Ehud Houminer (66) |
| Board Member (1993) |
| Principal Occupation During Past 5 Years: |
| • Executive-in-Residence at the Columbia Business School, Columbia University |
Other Board Memberships and Affiliations:
|
- Avnet Inc., an electronics distributor, Director
- International Advisory Board to the MBA Program School of Management, Ben Gurion University, Chairman
- Explore Charter School, Brooklyn, NY, Chairman
No. of Portfolios for which Board Member Serves: 60
|
| | | ——————— |
| Dr. Paul A. Marks (80) | | |
| Board Member (2006) | | |
Principal Occupation During Past 5 Years:
|
- President, Emeritus (2000-present) and President and Chief Executive Officer of Memorial Sloan-Kettering Cancer Center (Retired 1999)
Other Board Memberships and Affiliations:
|
- Pfizer, Inc., Director-Emeritus
- Lazard Freres & Company, LLC, Senior Adviser
- Armgo-Start-Up Biotech; Board of Directors
- Nanoviricide, Scientific Advisory Board
- PTC, Scientific Advisory Board
- IKONYSIS, Scientific Advisory Board
No. of Portfolios for which Board Member Serves: 48
|
BOARD MEMBERS INFORMATION (Unaudited) (continued)
Gloria Messinger (76)
Board Member (1993)
|
Principal Occupation During Past 5 Years:
|
- Arbitrator for American Arbitration Association and National Association of Securities Dealers, Inc.
- Consultant in Intellectual Property
Other Board Memberships and Affiliations:
|
- Theater for a New Audience, Inc., Director
- Brooklyn Philharmonic, Director
| No. of Portfolios for which Board Member Serves: 48 |
| ——————— |
| Dr. Martin Peretz (67) |
| Board Member (2006) |
Principal Occupation During Past 5 Years:
|
- Editor-in-Chief of The New Republic Magazine
- Lecturer in Social Studies at Harvard University (1965-2002)
- Director of TheStreet.com, a financial information service on the web
Other Board Memberships and Affiliations:
|
- American Council of Trustees and Alumni, Director
- Pershing Square Capital Management, Adviser
- Montefiore Ventures, General Partner
- Harvard Center for Blood Research,Trustee
- Bard College,Trustee
- Board of Overseers of YIVO Institute for Jewish Research, Chairman
| No. of Portfolios for which Board Member Serves: 48 |
| ——————— |
| Anne Wexler (76) |
| Board Member (1996) |
Principal Occupation During Past 5 Years:
|
- Chairman of the Wexler & Walker Public Policy Associates, consultants specializing in government relations and public affairs
Other Board Memberships and Affiliations:
|
- Wilshire Mutual Funds (5 funds), Director
- Methanex Corporation, a methanol producing company, Director
- Member of the Council of Foreign Relations
- Member of the National Park Foundation
| No. of Portfolios for which Board Member Serves: 57 |
| ——————— |
| Once elected all Board Members serve for an indefinite term.The address of the Board Members and Officers is in c/o |
| The Dreyfus Corporation, 200 Park Avenue, New York, New York 10166. Additional information about the Board |
| Members is available in the fund’s Statement of Additional Information which can be obtained from Dreyfus free of |
| charge by calling this toll free number: 1-800-554-4611. |
| John M. Fraser, Jr., Emeritus Board Member |
| T. John Szarkowski, Emeritus Board Member |
OFFICERS OF THE FUND (Unaudited)
STEPHEN E. CANTER, President since March 2000.
Chairman of the Board and Chief Executive Officer of the Manager, and an officer of 90 investment companies (comprised of 189 portfolios) managed by the Manager. Mr. Canter also is a Board member and, where applicable, an Executive Committee Member of the other investment management subsidiaries of Mellon Financial Corporation, each of which is an affiliate of the Manager. He is 61 years old and has been an employee of the Manager since May 1995.
MARK N. JACOBS, Vice President since March 2000.
Executive Vice President, Secretary and General Counsel of the Manager, and an officer of 91 investment companies (comprised of 205 portfolios) managed by the Manager. He is 60 years old and has been an employee of the Manager since June 1977.
MICHAEL A. ROSENBERG, Vice President and Secretary since August 2005.
Associate General Counsel of the Manager, and an officer of 91 investment companies (comprised of 205 portfolios) managed by the Manager. He is 46 years old and has been an employee of the Manager since October 1991.
JAMES BITETTO, Vice President and Assistant Secretary since August 2005.
Associate General Counsel and Assistant Secretary of the Manager, and an officer of 91 investment companies (comprised of 205 portfolios) managed by the Manager. He is 40 years old and has been an employee of the Manager since December 1996.
JONI LACKS CHARATAN, Vice President and Assistant Secretary since August 2005.
Associate General Counsel of the Manager, and an officer of 91 investment companies (comprised of 205 portfolios) managed by the Manager. She is 50 years old and has been an employee of the Manager since October 1988.
JOSEPH M. CHIOFFI, Vice President and Assistant Secretary since August 2005.
Associate General Counsel of the Manager, and an officer of 91 investment companies (comprised of 205 portfolios) managed by the Manager. He is 44 years old and has been an employee of the Manager since June 2000.
JANETTE E. FARRAGHER, Vice President and Assistant Secretary since August 2005.
Associate General Counsel of the Manager, and an officer of 91 investment companies (comprised of 205 portfolios) managed by the Manager. She is 43 years old and has been an employee of the Manager since February 1984.
JOHN B. HAMMALIAN, Vice President and Assistant Secretary since August 2005.
Associate General Counsel of the Manager, and an officer of 91 investment companies (comprised of 205 portfolios) managed by the Manager. He is 43 years old and has been an employee of the Manager since February 1991.
ROBERT R. MULLERY, Vice President and Assistant Secretary since August 2005.
Associate General Counsel of the Manager, and an officer of 91 investment companies (comprised of 205 portfolios) managed by the Manager. He is 54 years old and has been an employee of the Manager since May 1986.
JEFF PRUSNOFSKY, Vice President and Assistant Secretary since August 2005.
Associate General Counsel of the Manager, and an officer of 91 investment companies (comprised of 205 portfolios) managed by the Manager. He is 41 years old and has been an employee of the Manager since October 1990.
JAMES WINDELS, Treasurer since November 2001.
Director – Mutual Fund Accounting of the Manager, and an officer of 91 investment companies (comprised of 205 portfolios) managed by the Manager. He is 48 years old and has been an employee of the Manager since April 1985.
OFFICERS OF THE FUND (Unaudited) (continued)
ERIK D. NAVILOFF, Assistant Treasurer since August 2005.
Senior Accounting Manager – Taxable Fixed Income Funds of the Manager, and an officer of 91 investment companies (comprised of 205 portfolios) managed by the Manager. He is 38 years old and has been an employee of the Manager since November 1992.
ROBERT ROBOL, Assistant Treasurer since August 2005.
Senior Accounting Manager – Money Market and Municipal Bond Funds of the Manager, and an officer of 91 investment companies (comprised of 205 portfolios) managed by the Manager. He is 42 years old and has been an employee of the Manager since October 1988.
ROBERT SVAGNA, Assistant Treasurer since December 2002.
Senior Accounting Manager – Equity Funds of the Manager, and an officer of 91 investment companies (comprised of 205 portfolios) managed by the Manager. He is 39 years old and has been an employee of the Manager since November 1990.
GAVIN C. REILLY, Assistant Treasurer since December 2005.
Tax Manager of the Investment Accounting and Support Department of the Manager, and an officer of 91 investment companies (comprised of 205 portfolios) managed by the Manager. He is 38 years old and has been an employee of the Manager since April 1991.
JOSEPH W. CONNOLLY, Chief Compliance Officer since October 2004.
Chief Compliance Officer of the Manager and The Dreyfus Family of Funds (91 investment companies, comprised of 205 portfolios). From November 2001 through March 2004, Mr. Connolly was first Vice-President, Mutual Fund Servicing for Mellon Global Securities Services. In that capacity, Mr. Connolly was responsible for managing Mellon’s Custody, Fund Accounting and Fund Administration services to third-party mutual fund clients. He is 49 years old and has served in various capacities with the Manager since 1980, including manager of the firm’s Fund Accounting Department from 1997 through October 2001.
WILLIAM GERMENIS, Anti-Money Laundering Compliance Officer since October 2002.
Vice President and Anti-Money Laundering Compliance Officer of the Distributor, and the Anti-Money Laundering Compliance Officer of 87 investment companies (comprised of 201 portfolios) managed by the Manager. He is 36 years old and has been an employee of the Distributor since October 1998.
| For More | | Information |
| |
|
| |
| Global Alpha Fund | | Custodian |
| 200 Park Avenue | | |
| | | Mellon Bank, N.A. |
| New York, NY 10166 | | |
| | | One Mellon Bank Center |
| Manager | | Pittsburgh, PA 15258 |
| The Dreyfus Corporation | | Transfer Agent & |
| 200 Park Avenue | | Dividend Disbursing Agent |
| New York, NY 10166 | | Dreyfus Transfer, Inc. |
| Sub-Investment Adviser | | 200 Park Avenue |
| | | New York, NY 10166 |
| Mellon Capital Management | | |
| Corporation | | Distributor |
| 595 Market Street | | Dreyfus Service Corporation |
| Suite 3000 | | 200 Park Avenue |
| San Francisco, CA 94105 | | New York, NY 10166 |
Telephone Call your financial representative or 1-800-554-4611
| Mail | | The Dreyfus Premier Family of Funds |
| | | 144 Glenn Curtiss Boulevard, Uniondale, NY 11556-0144 |
The fund files its complete schedule of portfolio holdings with the Securities and Exchange Commission (“SEC”) for the first and third quarters of each fiscal year on Form N-Q. The fund’s Forms N-Q are available on the SEC’s website at http://www.sec.gov and may be reviewed and copied at the SEC’s Public Reference Room in Washington, DC. Information on the operation of the Public Reference Room may be obtained by calling 1-202-551-8090.
A description of the policies and procedures that the fund uses to determine how to vote proxies relating to portfolio securities is available at http://www.dreyfus.com and on the SEC’s website at http://www.sec.gov. The description of the policies and procedures is also available without charge, upon request, by calling 1-800-645-6561.

Save time. Save paper. View your next shareholder report online as soon as it’s available. Log into www.dreyfus.com and sign up for Dreyfus eCommunications. It’s simple and only takes a few minutes.
The views expressed in this report reflect those of the portfolio manager only through the end of the period covered and do not necessarily represent the views of Dreyfus or any other person in the Dreyfus organization. Any such views are subject to change at any time based upon market or other conditions and Dreyfus disclaims any responsibility to update such views.These views may not be relied on as investment advice and, because investment decisions for a Dreyfus fund are based on numerous factors, may not be relied on as an indication of trading intent on behalf of any Dreyfus fund.
Not FDIC-Insured • Not Bank-Guaranteed • May Lose Value
| Contents |
| |
| | | THE FUND |
| |
|
| 2 | | Letter from the Chairman |
| 3 | | Discussion of Fund Performance |
| 6 | | Fund Performance |
| 8 | | Understanding Your Fund’s Expenses |
| 8 | | Comparing Your Fund’s Expenses |
| With Those of Other Funds |
| 9 | | Statement of Investments |
| 15 | | Statement of Financial Futures |
| 16 | | Statement of Assets and Liabilities |
| 17 | | Statement of Operations |
| 18 | | Statement of Changes in Net Assets |
| 20 | | Financial Highlights |
| 21 | | Notes to Financial Statements |
| 31 | | Report of Independent Registered |
| | | Public Accounting Firm |
| 32 | | Important Tax Information |
| 32 | | Proxy Results |
| 33 | | Board Members Information |
| 36 | | Officers of the Fund |
| |
| FOR MORE INFORMATION |
|
| | | Back Cover |
| Dreyfus Premier |
| Total Return |
| Advantage Fund |

LETTER FROM THE CHAIRMAN
We are pleased to present this annual report for Dreyfus Premier Total Return Advantage Fund, covering the period since the fund’s inception on March 15, 2006, through October 31, 2006.
Although reports of slower U.S. economic growth and declining housing prices recently have raised economic concerns, we believe that neither a domestic recession nor a major shortfall in global growth is likely.A stubbornly low unemployment rate suggests that labor market conditions remain strong, and stimulative monetary policies over the last several years have left a legacy of ample financial liquidity worldwide. These and other factors should continue to support further economic expansion, but at a slower rate than we saw earlier this year.
The U.S. bond market also appears to be expecting a slower economy, as evidenced by an “inverted yield curve” at the end of October, in which yields of two-year U.S.Treasury securities were lower than the overnight federal funds rate. This anomaly may indicate that short-term interest rates have peaked, and that investors expect the Federal Reserve Board’s next move to be toward lower short-term interest rates.As always, we encourage you to discuss the implications of these and other matters with your financial adviser.
For information about how the fund performed during the reporting period, as well as market perspectives, we have provided a Discussion of Fund Performance given by the fund’s portfolio managers.
Thank you for your continued confidence and support.

DISCUSSION OF FUND PERFORMANCE
David Kwan and Lowell Bennett, Portfolio Managers
How did Dreyfus Premier Total Return Advantage Fund perform compared to its benchmark?
Between the fund’s inception on March 15,2006,and the end of its annual reporting period on October 31, 2006, the fund produced total returns of 3.86% for Class A shares, 3.41% for Class C shares and 4.04% for Class R shares.1 In comparison, the fund’s benchmark, the Lehman Brothers U.S. Aggregate Index, produced a total return of 4.03% for the same period.2
Despite bond market weakness in the spring, U.S. and global bond markets rallied over the summer and early fall as, inflation and growth fears eased in most markets. The fund achieved especially attractive results from its currency positions. However, the fund’s performance relative to its benchmark was constrained by a relatively short average duration in the U.S. bond market. In addition, the benchmark’s return does not reflect fund fees and expenses to which the fund is subject.
What is the fund’s investment approach?
The fund seeks to maximize total return from capital appreciation and income.To pursue its goal, the fund normally invests in securities and other instruments that provide exposure to fixed income and currency markets.
To focus the fund’s investments on the U.S. fixed income market, we employ an active core bond strategy, in which four proprietary quantitative models are run and implemented independently of one another.We overlay the active core bond strategy with a separate global bond strategy, setting the fund’s exposures to the world’s major bond markets according to our view of their relative valuations. Finally, we employ an active currency strategy in which we evaluate and establish exposure to various currencies based on relative valuations as determined by real interest rates and purchasing power parity.
| | DISCUSSION OF FUND PERFORMANCE (continued)
|
The fund typically will invest in bonds rated investment grade or the unrated equivalent, but we may invest up to 30% of the fund’s assets in securities rated below investment grade at the time of purchase. The average effective maturity of the fund’s portfolio typically will range between three and 10 years.
What other factors influenced the fund’s performance?
The U.S. Federal Reserve Board (the “Fed”) continued to raise short-term interest rates in the spring of 2006 in its attempts to forestall potential inflationary pressures. Nonetheless, inflation appeared to accelerate in May when labor markets strengthened and energy prices surged, sparking a decline in the U.S. bond market. Investors’ inflation concerns proved to be relatively short-lived, however, as signs of an economic slowdown emerged in the summer, and fuel prices moderated. The Fed factored in slowing economic growth and the cooling of the housing market as it held interest rates steady at 5.25% at its meetings in August, September and October — its first pause in a string of rate hikes extended back more than two years.
The fund’s core portfolio of U.S. bonds fared relatively well in the spring as interest rates rose and the fund’s relatively short average duration helped protect it from the full brunt of market weakness. However, this relatively defensive posture also prevented the fund from participating fully in the subsequent rally. We placed an emphasis on high quality investment-grade corporate bonds, asset-backed securities and mortgage-backed securities, all of which produced higher returns than U.S.Treasury securities with comparable maturities.
Although overseas bond markets generally followed the tone of the U.S. market, differences among markets in inflation, interest rates and economic forecasts gave rise to a number of potential investment opportunities. For example, we focused the fund’s global bond portfolio on bonds from Europe, and we maintained an underweight to Canadian bonds, reflecting our view of Europe’s milder long-run inflation and growth outlook.While this positioning worked well over
the reporting period’s first half, a recent rally in Canada’s bond market had erased most of those gains by the end of October.
The fund achieved strong results in its currency portfolio.We favored currencies that we believed would appreciate relative to the U.S. dollar, including those from nations with relatively high inflation-adjusted interest rates.We established positions in the currencies of the United Kingdom and New Zealand, both of which gained value. An underweight position in the Norwegian krone, which declined relative to the U.S. dollar, also contributed positively to the fund’s performance.
What is the fund’s current strategy?
Because we expect U.S. interest rates to rise from current levels, we have maintained a relatively short average duration in the fund’s core U.S. bond portfolio. In the global bond portfolio, we have intensified our focus on Europe and Japan while underweighting Canada. Finally, we also have continued to emphasize the British pound and New Zealand dollar while de-emphasizing the Australian dollar and the Norwegian krone. In our view, these are prudent strategies designed to take advantage of relative value opportunities as well as economic and market conditions worldwide.
November 15, 2006
| 1 | | Total return includes reinvestment of dividends and any capital gains paid and does not take into |
| | | consideration the maximum initial sales charge in the case of Class A shares or the applicable |
| | | contingent deferred sales charge imposed on redemptions in the case of Class C shares. Had these |
| | | charges been reflected, returns would have been lower. Past performance is no guarantee of future |
| | | results. Share price and investment return fluctuate such that upon redemption, fund shares may be |
| | | worth more or less than their original cost. Return figures provided reflect the absorption of certain |
| | | fund expenses by The Dreyfus Corporation pursuant to an agreement in effect through |
| | | October 31, 2006, at which time it was terminated. Had these expenses not been absorbed, the |
| | | fund’s returns would have been lower. |
| 2 | | SOURCE: LIPPER INC. — Reflects reinvestment of dividends and, where applicable, capital |
| | | gain distributions.The Lehman Brothers U.S. Aggregate Index is a widely accepted, unmanaged |
| | | total return index of corporate, U.S. government and U.S. government agency debt instruments, |
| | | mortgage-backed securities and asset-backed securities with an average maturity of 1-10 years. |
FUND PERFORMANCE
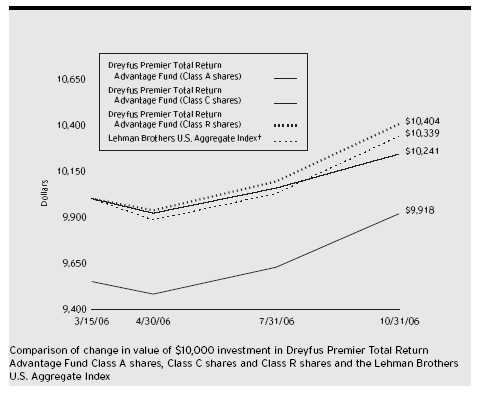
† Source: Lipper Inc.
Past performance is not predictive of future performance.
The above graph compares a $10,000 investment made in Class A, Class C and Class R shares of Dreyfus Premier Total Return Advantage Fund on 3/15/06 (inception date) to a $10,000 investment made in the Lehman Brothers U.S.Aggregate Index (the “Index”) on that date. For comparative purposes, the value of the Index on 2/28/06 is used as the beginning value on 3/15/06.All dividends and capital gain distributions are reinvested.
The fund invests primarily in fixed-income securities and instruments that provide investment exposure to fixed-income markets.The fund’s performance shown in the line graph takes into account the maximum initial sales charge on Class A shares, the applicable contingent deferred sales charge on Class C shares and all other applicable fees and expenses on all classes.The Index is a widely accepted, unmanaged total return index of corporate, U.S. government and U.S. government agency debt instruments, mortgage-backed securities and asset-backed securities with an average maturity of 1-10 years. The Index does not take into account charges, fees and other expenses. Further information relating to fund performance, including expense reimbursements, if applicable, is contained in the Financial Highlights section of the prospectus and elsewhere in this report.
6
| Actual Aggregate Total Returns as of 10/31/06 | | |
| |
| | | Inception | | From |
| | | Date | | Inception |
| |
| |
|
| Class A shares | | | | |
| with maximum sales charge (4.5%) | | 3/15/06 | | (0.82)% |
| without sales charge | | 3/15/06 | | 3.86% |
| Class C shares | | | | |
| with applicable redemption charge † | | 3/15/06 | | 2.41% |
| without redemption | | 3/15/06 | | 3.41% |
| Class R shares | | 3/15/06 | | 4.04% |
Past performance is not predictive of future performance.The fund’s performance shown in the graph and table does not reflect the deduction of taxes that a shareholder would pay on the fund distributions or the redemption of fund shares.
† The maximum contingent deferred sales charge for Class C shares is 1% for shares redeemed within one year of the date of purchase.
UNDERSTANDING YOUR FUND’ S EXPENSES (Unaudited)
As a mutual fund investor, you pay ongoing expenses, such as management fees and other expenses. Using the information below, you can estimate how these expenses affect your investment and compare them with the expenses of other funds.You also may pay one-time transaction expenses, including sales charges (loads) and redemption fees, which are not shown in this section and would have resulted in higher total expenses. For more information, see your fund’s prospectus or talk to your financial adviser.
Review your fund’s expenses
The table below shows the expenses you would have paid on a $1,000 investment in Dreyfus Premier Total Return Advantage Fund from May 1, 2006 to October 31, 2006. It also shows how much a $1,000 investment would be worth at the close of the period, assuming actual returns and expenses.
| Expenses and Value of a $1,000 Investment | | | | |
| assuming actual returns for the six months ended October 31, 2006 | | |
| | | Class A | | Class C | | Class R |
| |
| |
| |
|
| Expenses paid per $1,000 † | | $ 4.64 | | $ 8.39 | | $ 3.35 |
| Ending value (after expenses) | | $1,046.10 | | $1,042.40 | | $1,047.10 |
| COMPARING YOUR FUND’S EXPENSES |
| WITH THOSE OF OTHER FUNDS (Unaudited) |
Using the SEC’s method to compare expenses
The Securities and Exchange Commission (SEC) has established guidelines to help investors assess fund expenses. Per these guidelines, the table below shows your fund’s expenses based on a $1,000 investment, assuming a hypothetical 5% annualized return. You can use this information to compare the ongoing expenses (but not transaction expenses or total cost) of investing in the fund with those of other funds.All mutual fund shareholder reports will provide this information to help you make this comparison. Please note that you cannot use this information to estimate your actual ending account balance and expenses paid during the period.
Expenses and Value of a $1,000 Investment assuming a hypothetical 5% annualized return for the six months ended October 31, 2006
| | | Class A | | Class C | | Class R |
| |
| |
| |
|
| Expenses paid per $1,000 † | | $ 4.58 | | $ 8.29 | | $ 3.31 |
| Ending value (after expenses) | | $1,020.67 | | $1,016.99 | | $1,021.93 |
† Expenses are equal to the fund’s annualized expense ratio of .90% for Class A, 1.63% for Class C and .65% for Class R, multiplied by the average account value over the period, multiplied by 184/365 (to reflect the one-half year period).
| | STATEMENT OF INVESTMENTS
October 31, 2006
|
| | | Coupon | | Maturity | | Principal | | |
| Bonds and Notes—84.5% | | Rate (%) | | Date | | Amount ($) | | Value ($) |
| |
| |
| |
| |
|
| Asset-Backed Ctfs./ | | | | | | | | |
| Auto Receivables—14.2% | | | | | | | | |
| AmeriCredit Automobile Receivables | | | | | | |
| Trust, Ser. 2004-BM, Cl. A4 | | 2.67 | | 3/7/11 | | 99,998 | | 98,398 |
| Bank One Auto Securitization | | | | | | | | |
| Trust, Ser. 2003-1, Cl. A4 | | 2.43 | | 3/22/10 | | 74,112 | | 73,134 |
| Capital Auto Receivables Asset | | | | | | | | |
| Trust, Ser. 2004-2, Cl. A2 | | 3.35 | | 2/15/08 | | 72,837 | | 72,537 |
| Capital One Auto Finance Trust, | | | | | | | | |
| Ser. 2005-C, Cl. A3 | | 4.61 | | 7/15/10 | | 100,000 | | 99,542 |
| Carmax Auto Owner Trust, | | | | | | | | |
| Ser. 2003-2, Cl. A4 | | 3.07 | | 10/15/10 | | 78,446 | | 77,619 |
| Chase Manhattan Auto Owner Trust, | | | | | | |
| Ser. 2003-B, Cl. A4 | | 2.57 | | 2/16/10 | | 70,815 | | 69,936 |
| Chase Manhattan Auto Owner Trust, | | | | | | |
| Ser. 2003-C, Cl. A4 | | 2.94 | | 6/15/10 | | 89,591 | | 88,240 |
| Daimler Chrysler Auto Trust, | | | | | | | | |
| Ser. 2004-A, Cl. A4 | | 2.58 | | 4/8/09 | | 100,000 | | 98,668 |
| Harley-Davidson Motorcycle Trust, | | | | | | |
| Ser. 2004-1, Cl. A2 | | 2.53 | | 11/15/11 | | 87,843 | | 85,600 |
| Honda Auto Receivables Owner | | | | | | | | |
| Trust, Ser. 2005-5, Cl. A4 | | 4.69 | | 2/15/11 | | 140,000 | | 139,145 |
| Household Automotive Trust, | | | | | | | | |
| Ser. 2003-2, Cl. A4 | | 3.02 | | 12/17/10 | | 85,136 | | 83,879 |
| Hyundai Auto Receivables Trust, | | | | | | |
| Ser. 2004-A, Cl. A4 | | 3.54 | | 8/15/11 | | 100,000 | | 97,655 |
| Nissan Auto Receivables Owner | | | | | | | | |
| Trust, Ser. 2003-B, Cl. A4 | | 2.05 | | 3/16/09 | | 60,738 | | 59,950 |
| Triad Auto Receivables Owner | | | | | | | | |
| Trust, Ser. 2006-A, Cl. A3 | | 4.77 | | 1/12/11 | | 100,000 | | 99,531 |
| USAA Auto Owner Trust, | | | | | | | | |
| Ser. 2004-3, Cl. A4 | | 3.53 | | 6/15/11 | | 100,000 | | 97,982 |
| Wells Fargo Financial Auto Owner | | | | | | |
| Trust, Ser. 2005-A, Cl. A3 | | 4.09 | | 1/15/10 | | 100,000 | | 99,219 |
| WFS Financial Owner Trust, | | | | | | | | |
| Ser. 2004-2, Cl. A4 | | 3.54 | | 11/21/11 | | 100,000 | | 98,637 |
| World Omni Auto Receivables Trust, | | | | | | |
| Ser. 2005-A, Cl. A3 | | 3.54 | | 6/12/09 | | 102,261 | | 101,364 |
| | | | | | | | | 1,641,036 |
| | STATEMENT OF INVESTMENTS (continued)
|
| | | Coupon | | Maturity | | Principal | | |
| Bonds and Notes (continued) | | Rate (%) | | Date | | Amount ($) | | Value ($) |
| |
| |
| |
| |
|
| Asset-Backed Ctfs./Credit Cards—2.6% | | | | | | |
| Capital One Multi-Asset Execution | | | | | | | | |
| Trust, Ser. 2005-A2, Cl. A2 | | 4.05 | | 2/15/11 | | 100,000 | | 98,632 |
| Citibank Credit Card Issuance | | | | | | | | |
| Trust, Ser. 2003-A8, Cl. A8 | | 3.50 | | 8/16/10 | | 100,000 | | 97,444 |
| MBNA Master Credit Card Trust, | | | | | | | | |
| Ser. 2000-L, Cl. A | | 6.50 | | 4/15/10 | | 100,000 | | 101,470 |
| | | | | | | | | 297,546 |
| Asset-Backed Ctfs./Equipment—.9% | | | | | | |
| CIT Equipment Collateral, | | | | | | | | |
| Ser. 2004-VT1, Cl. A4 | | 2.70 | | 12/20/11 | | 100,000 | | 99,183 |
| Asset-Backed Ctfs./ | | | | | | | | |
| Home Equity Loans—4.8% | | | | | | | | |
| MASTR Asset-Backed Securities | | | | | | | | |
| Trust, Ser. 2005-AB1, Cl. A2 | | 5.05 | | 11/25/35 | | 100,000 a | | 99,361 |
| Popular ABS Mortgage Pass-Through | | | | | | |
| Trust, Ser. 2005-B, Cl. AF2 | | 4.55 | | 8/25/35 | | 100,000 a | | 99,138 |
| Renaissance Home Equity Loan | | | | | | | | |
| Trust, Ser. 2005-2, Cl. AF3 | | 4.50 | | 8/25/35 | | 100,000 a | | 98,632 |
| Residential Asset Mortgage | | | | | | | | |
| Products, Ser. 2003-RZ4, Cl. A7 | | 4.79 | | 6/25/33 | | 100,000 a | | 98,233 |
| Specialty Underwriting & | | | | | | | | |
| Residential Finance, | | | | | | | | |
| Ser. 2003-BC4, Cl. A3B | | 4.79 | | 11/25/34 | | 69,938 | | 65,202 |
| Structured Asset Securities, | | | | | | | | |
| Ser. 2005-NC1, Cl. A3 | | 4.15 | | 2/25/35 | | 100,000 a | | 98,860 |
| | | | | | | | | 559,426 |
| Asset-Backed Ctfs./Student Loans—1.1% | | | | | | |
| College Loan Corporation Trust, | | | | | | | | |
| Stripped Security, Interest | | | | | | | | |
| Only Class, Ser. 2006-1, Cl. AIO | | 10.00 | | 7/25/08 | | 200,000 b | | 32,750 |
| SLM Student Loan Trust, | | | | | | | | |
| Ser. 2005-7, Cl. A3 | | 4.41 | | 7/25/25 | | 100,000 | | 98,818 |
| | | | | | | | | 131,568 |
| Banks—2.1% | | | | | | | | |
| ABN AMRO Bank, | | | | | | | | |
| Sr. Notes | | 5.42 | | 4/18/08 | | 50,000 a,c | | 50,086 |
| | | Coupon | | Maturity | | Principal | | |
| Bonds and Notes (continued) | | Rate (%) | | Date | | Amount ($) | | Value ($) |
| |
| |
| |
| |
|
| Banks (continued) | | | | | | | | |
| Royal Bank of Canada, | | | | | | | | |
| Notes | | 3.88 | | 5/4/09 | | 100,000 | | 97,160 |
| Wells Fargo, | | | | | | | | |
| Notes | | 5.43 | | 3/10/08 | | 100,000 a | | 100,119 |
| | | | | | | | | 247,365 |
| Commercial Mortgage | | | | | | | | |
| Pass-Through Ctfs.—2.7% | | | | | | | | |
| GMAC Commercial Mortgage | | | | | | | | |
| Securities, Ser. 2001-C2, Cl. A1 | | 6.25 | | 4/15/34 | | 80,201 | | 81,810 |
| J.P. Morgan Chase Commercial | | | | | | | | |
| Mortgage Securities, | | | | | | | | |
| Ser. 2005-LDP5, Cl. ASB | | 5.17 | | 12/15/44 | | 100,000 a | | 100,027 |
| Morgan Stanley Dean Witter Capital | | | | | | |
| I, Ser. 2003-HQ2, Cl. A1 | | 4.18 | | 3/12/35 | | 129,343 | | 125,294 |
| | | | | | | | | 307,131 |
| Diversified Financial Services—13.4% | | | | | | |
| Allstate Life Global Funding | | | | | | | | |
| Trusts, Notes, Ser. 04-1 | | 4.50 | | 5/29/09 | | 200,000 | | 197,031 |
| Bear Stearns Cos., | | | | | | | | |
| Sr. Unscd. Notes | | 5.61 | | 1/31/11 | | 100,000 a | | 100,347 |
| Citigroup, | | | | | | | | |
| Notes | | 5.13 | | 5/5/14 | | 150,000 | | 148,623 |
| Citigroup, | | | | | | | | |
| Notes | | 5.53 | | 6/9/09 | | 50,000 a | | 50,171 |
| Credit Suisse USA, | | | | | | | | |
| Sr. Notes | | 5.52 | | 12/9/08 | | 50,000 a | | 50,111 |
| Credit Suisse USA, | | | | | | | | |
| Notes | | 5.61 | | 8/15/10 | | 100,000 a | | 100,327 |
| General Electric Capital, | | | | | | | | |
| Unscd. Notes, Ser. A | | 6.00 | | 6/15/12 | | 200,000 | | 208,287 |
| Goldman Sachs Group, | | | | | | | | |
| Notes | | 3.88 | | 1/15/09 | | 100,000 | | 97,437 |
| Household Finance, | | | | | | | | |
| Unscd. Notes | | 4.13 | | 11/16/09 | | 100,000 | | 97,065 |
| JPMorgan Chase & Co., | | | | | | | | |
| Notes | | 5.54 | | 1/17/11 | | 100,000 a | | 100,311 |
| | STATEMENT OF INVESTMENTS (continued)
|
| | | Coupon | | Maturity | | Principal | | |
| Bonds and Notes (continued) | | Rate (%) | | Date | | Amount ($) | | Value ($) |
| |
| |
| |
| |
|
| Diversified Financial | | | | | | | | |
| Services (continued) | | | | | | | | |
| Lehman Brothers Holdings, | | | | | | | | |
| Notes | | 5.60 | | 12/23/10 | | 100,000 a | | 100,276 |
| MBNA, | | | | | | | | |
| Bonds | | 5.00 | | 6/15/15 | | 100,000 | | 97,569 |
| Merrill Lynch & Co., | | | | | | | | |
| Notes, Ser. B | | 3.70 | | 4/21/08 | | 100,000 | | 97,929 |
| Morgan Stanley, | | | | | | | | |
| Unsub. Bonds | | 6.75 | | 4/15/11 | | 100,000 | | 105,908 |
| | | | | | | | | 1,551,392 |
| Diversified Metals & Mining—.7% | | | | | | | | |
| Alcoa, | | | | | | | | |
| Notes | | 7.38 | | 8/1/10 | | 75,000 | | 80,543 |
| Electric Utilities—.9% | | | | | | | | |
| SCANA, | | | | | | | | |
| Notes | | 6.88 | | 5/15/11 | | 50,000 | | 53,067 |
| Wisconsin Energy, | | | | | | | | |
| Sr. Notes | | 5.50 | | 12/1/08 | | 50,000 | | 50,317 |
| | | | | | | | | 103,384 |
| Oil & Gas—1.4% | | | | | | | | |
| Conoco Funding, | | | | | | | | |
| Gtd. Notes | | 6.35 | | 10/15/11 | | 100,000 | | 105,337 |
| KeySpan, | | | | | | | | |
| Notes | | 7.63 | | 11/15/10 | | 50,000 | | 54,090 |
| | | | | | | | | 159,427 |
| Property & Casualty Insurance—3.4% | | | | | | |
| Berkshire Hathaway Finance, | | | | | | | | |
| Gtd. Notes | | 4.63 | | 10/15/13 | | 100,000 | | 96,717 |
| Hartford Life Global Funding | | | | | | | | |
| Trusts, Notes | | 5.20 | | 2/15/11 | | 150,000 | | 150,930 |
| Principal Life Income Funding | | | | | | | | |
| Trusts, Notes | | 5.13 | | 3/1/11 | | 150,000 | | 150,048 |
| | | | | | | | | 397,695 |
| | | Coupon | | Maturity | | Principal | | |
| Bonds and Notes (continued) | | Rate (%) | | Date | | Amount ($) | | Value ($) |
| |
| |
| |
| |
|
| Telecommunications—1.8% | | | | | | | | |
| BellSouth, | | | | | | | | |
| Sr. Unscd. Notes | | 6.00 | | 10/15/11 | | 100,000 | | 102,821 |
| Cisco Systems, | | | | | | | | |
| Sr. Unscd. Notes | | 5.25 | | 2/22/11 | | 100,000 | | 100,700 |
| | | | | | | | | 203,521 |
| U.S. Government Agencies/ | | | | | | | | |
| Mortgage-Backed—31.1% | | | | | | | | |
| Federal Home Loan Mortgage Corp.: | | | | | | |
| 4.50%, 12/1/19 | | | | | | 926,276 | | 896,018 |
| 5.00%, 7/1/35 | | | | | | 473,874 | | 458,212 |
| 5.50%, 12/1/18—11/1/19 | | | | | | 81,857 | | 82,943 |
| 6.00%, 10/1/19—9/1/34 | | | | | | 330,276 | | 334,549 |
| 6.50%, 8/1/12 | | | | | | 131,849 | | 134,501 |
| 7.00%, 1/1/36 | | | | | | 272,274 | | 280,346 |
| Federal National Mortgage Association: | | | | | | |
| 4.00%, 3/1/21 | | | | | | 96,522 | | 91,411 |
| 5.00%, 7/1/19—11/1/34 | | | | | | 697,611 | | 682,855 |
| 5.50%, 8/1/19—8/1/35 | | | | | | 640,719 | | 636,574 |
| | | | | | | | | 3,597,409 |
| U.S. Government Securities—3.4% | | | | | | |
| U.S. Treasury Bonds | | | | | | | | |
| 6.25%, 5/15/30 | | | | | | 295,000 | | 356,305 |
| U.S. Treasury Notes | | | | | | | | |
| 4.88%, 7/31/11 | | | | | | 40,000 | | 40,509 |
| | | | | | | | | 396,814 |
| Total Bonds and Notes | | | | | | | | |
| (cost $9,699,366) | | | | | | | | 9,773,440 |
| |
| |
| |
| |
|
| |
| Short-Term Investment—.7% | | | | | | | | |
| |
| |
| |
| |
|
| U.S. Treasury Bill; | | | | | | | | |
| 4.85%, 12/7/06 | | | | | | | | |
| (cost $74,636) | | | | | | 75,000 d | | 74,627 |
| | STATEMENT OF INVESTMENTS (continued)
|
| Other Investment—10.0% | | Shares | | Value ($) |
| |
| |
|
| Registered Investment Company; | | | | |
| Dreyfus Institutional Preferred | | | | |
| Plus Money Market Fund | | | | |
| (cost $1,161,000) | | 1,161,000 e | | 1,161,000 |
| |
| |
|
| Total Investments (cost $10,935,002) | | 95.2% | | 11,009,067 |
| Cash and Receivables (Net) | | 4.8% | | 559,028 |
| Net Assets | | 100.0% | | 11,568,095 |
| a Variable rate security—interest rate subject to periodic change. |
| b Notional face amount shown. |
| c Security exempt from registration under Rule 144A of the Securities Act of 1933.This security may be resold in |
| transactions exempt from registration, normally to qualified institutional buyers. At October 31, 2006, this security |
| amounted to $50,086 or .4% of net assets. |
| d Held by a broker as collateral for open financial futures positions. |
| e Investment in affiliated money market mutual fund. |
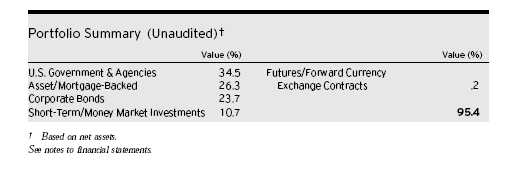
STATEMENT OF FINANCIAL FUTURES
October 31, 2006
|
| | | | | | | | | Unrealized |
| | | | | Market Value | | | | Appreciation |
| | | | | Covered by | | | | (Depreciation) |
| | | Contracts | | Contracts ($) | | Expiration | | at 10/31/2006 ($) |
| |
| |
| |
| |
|
| Financial Futures Long | | | | | | | | |
| 10 Year Euro-Bond | | 3 | | 451,139 | | December 2006 | | 2,588 |
| Long Gilt | | 1 | | 209,817 | | December 2006 | | 420 |
| 10 Year Mini JGB | | 2 | | 229,303 | | December 2006 | | (946) |
| U.S. Treasury 2 year Notes | | 2 | | 408,813 | | December 2006 | | 307 |
| U.S. Treasury 5 year Notes | | 15 | | 1,583,438 | | December 2006 | | 7,660 |
| U.S. Treasury 30 year Bonds | | 9 | | 1,013,906 | | December 2006 | | 15,848 |
| Financial Futures Short | | | | | | | | |
| Australian 10 Year Bonds | | 1 | | (79,373) | | December 2006 | | 328 |
| Canadian 10 Year Bonds | | 6 | | (615,021) | | December 2006 | | (7,277) |
| U.S. Treasury 10 year Notes | | 1 | | (108,219) | | December 2006 | | (472) |
| | | | | | | | | 18,456 |
See notes to financial statements.
|
| | STATEMENT OF ASSETS AND LIABILITIES
October 31, 2006
|
| | | | | Cost | | Value |
| |
| |
| |
|
| Assets ($): | | | | | | |
| Investments in securities—See Statement of Investments: | | | | |
| Unaffiliated issuers | | | | 9,774,002 | | 9,848,067 |
| Affiliated issuers | | | | 1,161,000 | | 1,161,000 |
| Cash | | | | | | 31,374 |
| Receivable for investment securities sold | | | | 1,010,750 |
| Receivable for shares of Common Stock subscribed | | | | 80,000 |
| Dividends and interest receivable | | | | | | 72,663 |
| Receivable for futures variation margin—Note 4 | | | | 11,522 |
| Unrealized appreciation on forward | | | | | | |
| currency exchange contracts—Note 4 | | | | 7,474 |
| Prepaid expenses | | | | | | 31,352 |
| Due from The Dreyfus Corporation and affiliates—Note 3(c) | | | | 13,871 |
| | | | | | | 12,268,073 |
| |
| |
| |
|
| Liabilities ($): | | | | | | |
| Payable for investment securities purchased | | | | 651,443 |
| Unrealized depreciation on forward | | | | | | |
| currency exchange contracts—Note 4 | | | | 6,754 |
| Accrued expenses | | | | | | 41,781 |
| | | | | | | 699,978 |
| |
| |
| |
|
| Net Assets ($) | | | | | | 11,568,095 |
| |
| |
| |
|
| Composition of Net Assets ($): | | | | | | |
| Paid-in capital | | | | | | 11,313,690 |
| Accumulated undistributed investment income—net | | | | 109,807 |
| Accumulated net realized gain (loss) on investments | | | | 51,358 |
| Accumulated net unrealized appreciation (depreciation) on | | | | |
| investments and foreign currency transactions (including | | | | |
| $18,456 net unrealized appreciation on financial futures) | | | | 93,240 |
| |
| |
|
| Net Assets ($) | | | | | | 11,568,095 |
| |
| |
| |
|
| |
| |
| |
| Net Asset Value Per Share | | | | | | |
| | | Class A | | Class C | | Class R |
| |
| |
| |
|
| Net Assets ($) | | 10,006,024 | | 985,145 | | 576,926 |
| Shares Outstanding | | 782,206 | | 77,156 | | 45,073 |
| |
| |
| |
|
| Net Asset Value Per Share ($) | | 12.79 | | 12.77 | | 12.80 |
| | See notes to financial statements.
|
STATEMENT OF OPERATIONS
From March 15, 2006 (commencement of operations) to October 31, 2006
|
| Investment Income ($): | | |
| Income: | | |
| Interest | | 304,484 |
| Dividends; | | |
| Affiliated issuers | | 14,418 |
| Total Income | | 318,902 |
| Expenses: | | |
| Management fee—Note 3(a) | | 35,999 |
| Legal fees | | 76,858 |
| Auditing fees | | 33,200 |
| Registration fees | | 21,768 |
| Shareholder servicing costs—Note 3(c) | | 16,075 |
| Prospectus and shareholders’ reports | | 10,339 |
| Custodian fees—Note 3(c) | | 6,218 |
| Distribution fees—Note 3(b) | | 2,762 |
| Directors’ fees and expenses—Note 3(d) | | 327 |
| Miscellaneous | | 15,847 |
| Total Expenses | | 219,393 |
| Less—expense reimbursement from The Dreyfus | | |
| Corporation due to undertaking—Note 3(a) | | (158,534) |
| Less—reduction in custody fees due to | | |
| earnings credits—Note 1(c) | | (1,599) |
| Net Expenses | | 59,260 |
| Investment Income—Net | | 259,642 |
| |
|
| Realized and Unrealized Gain (Loss) on Investments—Note 4 ($): |
| Net realized gain (loss) on investments and foreign currency transactions | | (19,124) |
| Net realized gain (loss) on financial futures | | 19,098 |
| Net realized gain (loss) on forward currency exchange contracts | | 50,998 |
| Net Realized Gain (Loss) | | 50,972 |
| Net unrealized appreciation (depreciation) on | | |
| investments and foreign currency transactions (including | | |
| $18,456 net unrealized appreciation on financial futures) | | 93,240 |
| Net Realized and Unrealized Gain (Loss) on Investments | | 144,212 |
| Net Increase in Net Assets Resulting from Operations | | 403,854 |
| |
| See notes to financial statements. | | |
| | STATEMENT OF CHANGES IN NET ASSETS
From March 15, 2006 (commencement of operations) to October 31, 2006
|
| Operations ($): | | |
| Investment income—net | | 259,642 |
| Net realized gain (loss) on investments | | 50,972 |
| Net unrealized appreciation (depreciation) on investments | | 93,240 |
| Net Increase (Decrease) in Net Assets | | |
| Resulting from Operations | | 403,854 |
| |
|
| Dividends to Shareholders from ($): | | |
| Investment income—net: | | |
| Class A shares | | (135,349) |
| Class C shares | | (6,088) |
| Class R shares | | (8,012) |
| Total Dividends | | (149,449) |
| |
|
| Capital Stock Transactions ($): | | |
| Net proceeds from shares sold: | | |
| Class A shares | | 9,647,803 |
| Class C shares | | 963,446 |
| Class R shares | | 556,000 |
| Dividends reinvested: | | |
| Class A shares | | 134,854 |
| Class C shares | | 6,088 |
| Class R shares | | 8,012 |
| Cost of shares redeemed: | | |
| Class A shares | | (2,513) |
| Increase (Decrease) in Net Assets | | |
| from Capital Stock Transactions | | 11,313,690 |
| Total Increase (Decrease) in Net Assets | | 11,568,095 |
| |
|
| Net Assets ($): | | |
| Beginning of Period | | — |
| End of Period | | 11,568,095 |
| Undistributed investment income—net | | 109,807 |
| Capital Share Transactions: | | |
| Class A | | |
| Shares sold | | 771,527 |
| Shares issued for dividends reinvested | | 10,881 |
| Shares redeemed | | (202) |
| Net Increase (Decrease) in Shares Outstanding | | 782,206 |
| |
|
| Class C | | |
| Shares sold | | 76,664 |
| Shares issued for dividends reinvested | | 492 |
| Net Increase (Decrease) in Shares Outstanding | | 77,156 |
| |
|
| Class R | | |
| Shares sold | | 44,426 |
| Shares issued for dividends reinvested | | 647 |
| Net Increase (Decrease) in Shares Outstanding | | 45,073 |
See notes to financial statements.
|
The following table describes the performance for each share class for the period from March 15, 2006 (commencement of operations) to October 31, 2006.All information (except portfolio turnover rate) reflects financial results for a single fund share. Total return shows how much your investment in the fund would have increased (or decreased) during the period, assuming you had reinvested all dividends and distrib-utions.These figures have been derived from the fund’s financial statements.
| | | | | Class A | | Class C | | Class R |
| | | | | Shares | | Shares | | Shares |
| |
| |
| |
| |
|
| Per Share Data ($): | | | | | | |
| Net asset value, beginning of period | | 12.50 | | 12.50 | | 12.50 |
| Investment Operations: | | | | | | |
| Investment income—net a | | .32 | | .25 | | .33 |
| Net realized and unrealized | | | | | | |
| gain (loss) on investments | | .16 | | .17 | | .17 |
| Total from Investment Operations | | .48 | | .42 | | .50 |
| Distributions: | | | | | | |
| Dividends from investment income—net | | (.19) | | (.15) | | (.20) |
| Net asset value, end of period | | 12.79 | | 12.77 | | 12.80 |
| |
| |
| |
|
| Total Return (%) b | | 3.86c | | 3.41c | | 4.04 |
| |
| |
| |
|
| Ratios/Supplemental Data (%): | | | | | | |
| Ratio of total expenses to average net assets d | | 3.32 | | 4.12 | | 3.08 |
| Ratio of net expenses to average net assets d | | .88 | | 1.61 | | .63 |
| Ratio of net investment income | | | | | | |
| to average net assets d | | 3.99 | | 3.28 | | 4.25 |
| Portfolio Turnover Rate b,e | | 104.30 | | 104.30 | | 104.30 |
| |
| |
| |
|
| Net Assets, end of period ($ x 1,000) | | 10,006 | | 985 | | 577 |
| |
| a | | Based on average shares outstanding at each month end. | | | | |
| b | | Not annualized. | | | | | | |
| c | | Exclusive of sales charge. | | | | | | |
| d | | Annualized. | | | | | | |
| e | | The portfolio turnover rate excluding mortgage dollar roll transactions for the period from March 15, 2006 |
| | | (commencement of operations) to October 31, 2006 was 101.24%. | | | | |
| See notes to financial statements. | | | | | | |
NOTES TO FINANCIAL STATEMENTS
NOTE 1—Significant Accounting Policies:
Dreyfus Premier Total Return Advantage Fund (the “fund”) is a separate diversified series of Advantage Funds, Inc. (the “Company”), which is registered under the Investment Company Act of 1940, as amended (the “Act”), as an open-end management investment company and operates as a series company currently offering thirteen series,including the fund, which commenced operations on March 15, 2006. The fund’s investment objective seeks to maximize total return, consisting of capital appreciation and current income. The Dreyfus Corporation (the “Manager” or “Dreyfus”) serves as the fund’s investment adviser. The Manager is a wholly-owned subsidiary of Mellon Financial Corporation (“Mellon Financial”).
On May 2, 2006, the Board of Directors approved a change of the Company name from “Dreyfus Advantage Funds, Inc.” to “Advantage Funds, Inc.” Previously, on March 15, 2006, the Board of Directors approved a change of the Company name from “Dreyfus Growth and Value Funds, Inc.” to “Dreyfus Advantage Funds, Inc.”
Dreyfus Service Corporation (“the Distributor”), a wholly-owned subsidiary of the Manager, is the distributor of the fund’s shares. The fund is authorized to issue 300 million shares of $.001 par value Common Stock. The fund currently offers three classes of shares: Class A (100 million shares authorized), Class C (100 million shares authorized) and Class R (100 million shares authorized). Class A shares are subject to a sales charge imposed at the time of purchase. Class C shares are subject to a contingent deferred sales charge (“CDSC”) imposed on Class C shares redeemed within one year of purchase. Class R shares are sold at net asset value per share only to institutional investors. Other differences between the classes include the services offered to and the expenses borne by each class and certain voting rights. Income, expenses (other than expenses attributable to a specific class), and realized and unrealized gains or losses on investments are allocated to each class of shares based on its relative net assets.
| | NOTES TO FINANCIAL STATEMENTS (continued)
|
As of October 31, 2006, MBC Investments Corp., an indirect subsidiary of Mellon Financial, held 730,841, 40,489 and 40,641 of the outstanding Class A, Class C and Class R shares of the fund, respectively.
The Company accounts separately for the assets, liabilities and operations of each series. Expenses directly attributable to each series are charged to that series’ operations; expenses which are applicable to all series are allocated among them on a pro rata basis.
The fund’s financial statements are prepared in accordance with U.S. generally accepted accounting principles, which may require the use of management estimates and assumptions. Actual results could differ from those estimates.
The fund enters into contracts that contain a variety of indemnifications. The fund’s maximum exposure under these arrangements is unknown.The fund does not anticipate recognizing any loss related to these arrangements.
(a) Portfolio valuation: Investments in securities (excluding short-term investments (other than U.S.Treasury Bills), financial futures and forward currency exchange contracts) are valued each business day by an independent pricing service (the “Service”) approved by the Board of Directors. Investments for which quoted bid prices are readily available and are representative of the bid side of the market in the judgment of the Service are valued at the mean between the quoted bid prices (as obtained by the Service from dealers in such securities) and asked prices (as calculated by the Service based upon its evaluation of the market for such securities). Other investments (which constitute a majority of the portfolio securities) are valued as determined by the Service, based on methods which include consideration of: yields or prices of securities of comparable quality, coupon, maturity and type; indications as to values from dealers; and general market conditions. Securities for which there are no such valuations are valued at fair value as determined in good faith under the direction of the Board of Directors. Restricted securities, as well as securities or other assets for which recent market quotations are not readily available, that are not valued by a pricing service
approved by the Board of Directors, or are determined by the fund not to reflect accurately fair value (such as when an event occurs after the close of the exchange on which the security is principally traded and that is determined by the fund to have changed the value of the secu-rity),are valued at fair value as determined in good faith under the direction of the Board of Directors.The factors that may be considered when fair valuing a security include fundamental analytical data,the nature and duration of restrictions on disposition, an evaluation of the forces that influence the market in which the securities are purchased and sold and public trading in similar securities of the issuer or comparable issuers. Short-term investments, excluding U.S. Treasury Bills, are carried at amortized cost, which approximates value. Investments in registered investment companies are valued at their NAV. Financial futures and options, which are traded on an exchange, are valued at the last sales price on the securities exchange on which such securities are primarily traded or at the last sales price on the national securities market on each business day. Investments denominated in foreign currencies are translated to U.S.dollars at the prevailing rates of exchange.Forward currency exchange contracts are valued at the forward rate.
On September 20, 2006, the FASB released Statement of Financial Accounting Standards No. 157 “Fair Value Measurements” (“FAS 157”). FAS 157 establishes an authoritative definition of fair value, sets out a framework for measuring fair value, and requires additional disclosures about fair-value measurements.The application of FAS 157 is required for fiscal years beginning after November 15, 2007 and interim periods within those fiscal years. Management does not believe that the application of this standard will have a material impact on the financial statements of the fund.
(b) Foreign currency transactions: The fund does not isolate that portion of the results of operations resulting from changes in foreign exchange rates on investments from the fluctuations arising from changes in the market prices of securities held. Such fluctuations are included with the net realized and unrealized gain or loss on investments.
| | NOTES TO FINANCIAL STATEMENTS (continued)
|
Net realized foreign exchange gains or losses arise from sales and maturities of short-term securities, sales of foreign currencies, currency gains or losses realized on securities transactions and the difference between the amounts of dividends, interest and foreign withholding taxes recorded on the fund’s books and the U.S. dollar equivalent of the amounts actually received or paid. Net unrealized foreign exchange gains and losses arise from changes in the value of assets and liabilities other than investments in securities, resulting from changes in exchange rates. Such gains and losses are included with net realized and unrealized gain or loss on investments.
(c) Securities transactions and investment income: Securities transactions are recorded on a trade date basis. Realized gain and loss from securities transactions are recorded on the identified cost basis. Dividend income is recognized on the ex-dividend date and interest income, including, where applicable, accretion of discount and amortization of premium on investments is recognized on the accrual basis.
The fund has an arrangement with the custodian bank whereby the fund receives earnings credits from the custodian when positive cash balances are maintained, which are used to offset custody fees. For financial reporting purposes, the fund includes net earnings credits as an expense offset in the Statement of Operations.
(d) Affiliated issuers: Investments in other investment companies advised by the Manager are defined as “affiliated” in the Act.
(e) Dividends to shareholders: It is the policy of the fund to declare and pay dividends from investment income-net, quarterly. Dividends from net realized capital gain, if any, are normally declared and paid annually, but the fund may make distributions on a more frequent basis to comply with the distribution requirements of the Internal Revenue Code of 1986, as amended (the “Code”).To the extent that net realized capital gain can be offset by capital loss carryovers, if any, it is the policy of the fund not to distribute such gain. Income and capital gain distributions are determined in accordance with income tax regulations,which may differ from U.S. generally accepted accounting principles.
On October 31, 2006, the Board of Directors declared a cash dividend of $.121, $.106 and $.129 per share from undistributed investment income-net for Class A, Class C and Class R, respectively, payable on November 1, 2006 (ex-dividend date), to shareholders of record as of the close of business on October 31, 2006.
(f) Federal income taxes: It is the policy of the fund to continue to qualify as a regulated investment company, if such qualification is in the best interests of its shareholders, by complying with the applicable provisions of the Code, and to make distributions of taxable income sufficient to relieve it from substantially all federal income and excise taxes.
On July 13, 2006, the Financial Accounting Standards Board (FASB) released FASB Interpretation No. 48 “Accounting for Uncertainty in Income Taxes” (FIN 48). FIN 48 provides guidance for how uncertain tax positions should be recognized, measured, presented and disclosed in the financial statements. FIN 48 requires the evaluation of tax positions taken or expected to be taken in the course of preparing the fund’s tax returns to determine whether the tax positions are “more-likely-than-not” of being sustained by the applicable tax authority.Tax positions not deemed to meet the more-likely-than-not threshold would be recorded as a tax benefit or expense in the current year. Adoption of FIN 48 is required for fiscal years beginning after December 15, 2006 and is to be applied to all open tax years as of the effective date. Management does not believe that the application of this standard will have a material impact on the financial statements of the fund.
At October 31, 2006, the components of accumulated earnings on a tax basis were as follows: undistributed ordinary income $133,663, undistributed capital gains $55,640 and unrealized appreciation $65,102.
The tax character of distributions paid to shareholders during the fiscal period ended October 31, 2006 were as follows: ordinary income $149,449.
During the period ended October 31, 2006, as a result of permanent book to tax differences, primarily due to the tax treatment for amor-
| | NOTES TO FINANCIAL STATEMENTS (continued)
|
tization of premiums and paydown gains and losses on mortgage-backed securities, the fund decreased accumulated undistributed investment income-net by $386 and increased accumulated net realized gain (loss) on investments by the same amount. Net assets were not affected by this reclassification.
NOTE 2—Bank Line of Credit:
|
The fund participates with other Dreyfus-managed funds in a $350 million redemption credit facility (the “Facility”) to be utilized for temporary or emergency purposes, including the financing of redemptions. In connection therewith, the fund has agreed to pay commitment fees on its pro rata portion of the Facility. Interest is charged to the fund based on prevailing market rates in effect at the time of borrowing. During the period ended October 31, 2006, the fund did not borrow under the Facility.
NOTE 3—Management Fee and Other Transactions With Affiliates:
(a) Pursuant to a Management Agreement (“Agreement”) with the Manager, the management fee is computed at the annual rate of .55% of the value of the fund’s average daily net assets and is payable monthly. The Manager has undertaken, from November 1, 2006 through October 31, 2007, that, if the fund’s aggregate expenses, exclusive of taxes, brokerage fees, Rule 12b-1 distribution plan fees, interest expense, commitment fees, shareholder services plan fees and extraordinary expenses, exceed an annual rate of .80% of the value of the fund’s average daily net assets, the fund may deduct from the payment to be made to the Manager under the Agreement, or the Manager will bear, such excess expense. The Manager had undertaken, from March 15, 2006 through October 31, 2006, that, if the fund’s aggregate expenses, exclusive of certain expenses as described above, exceed an annual rate of .65% of the value of the fund’s average daily net assets, the fund may deduct from the payment to be made to the Manager under the Agreement, or the Manager will bear, such excess expense.The expense
reimbursement, pursuant to the undertaking, amounted to $158,534 during the period ended October 31, 2006.
(b) Under the Distribution Plan (the “Plan”) adopted pursuant to Rule 12b-1 under the Act, Class C shares pay the Distributor for distributing its shares at an annual rate of .75% of the value of the average daily net assets of Class C shares. During the period ended October 31, 2006, Class C shares were charged $2,762 pursuant to the Plan.
(c) Under the Shareholder Services Plan, Class A and Class C shares pay the Distributor at an annual rate of .25% of the value of their average daily net assets for the provision of certain services. The services provided may include personal services relating to shareholder accounts, such as answering shareholder inquiries regarding the fund and providing reports and other information, and services related to the maintenance of shareholder accounts.The Distributor may make payments to Service Agents (a securities dealer, financial institution or other industry professional) in respect of these services.The Distributor determines the amounts to be paid to Service Agents. During the period ended October 31, 2006, Class A and Class C shares were charged $14,633 and $920, respectively, pursuant to the Shareholder Services Plan.
The fund compensates Dreyfus Transfer, Inc., a wholly-owned subsidiary of the Manager, under a transfer agency agreement for providing personnel and facilities to perform transfer agency services for the fund. During the period ended October 31, 2006, the fund was charged $95 pursuant to the transfer agency agreement.
The fund compensates Mellon Bank, N.A., an affiliate of the Manager, under a custody agreement for providing custodial services for the fund. During the period ended October 31, 2006, the fund was charged $6,218 pursuant to the custody agreement.
During the period ended October 31, 2006, the fund was charged $3,522 for services performed by the Chief Compliance Officer.
| | NOTES TO FINANCIAL STATEMENTS (continued)
|
The components of Due from The Dreyfus Corporation and affiliates in the Statement of Assets and Liabilities consist of: management fees $5,282,Rule 12b-1 distribution plan fees $576,shareholder services plan fees $2,285, custodian fees $3,005 chief compliance officer fees $1,363 and transfer agency per account fees $27, which are offset against an expense reimbursement currently in effect in the amount of $26,409.
(d) Each Board member also serves as a Board member of other funds within the Dreyfus complex. Annual retainer fees and attendance fees are allocated to each fund based on net assets.
(e) Pursuant to an exemptive order from the SEC, the fund may invest its available cash balances in affiliated money market mutual funds. Management fees of the underlying money market mutual funds have been waived by the Manager.
NOTE 4—Securities Transactions:
|
The aggregate amount of purchases and sales (including paydowns) of investment securities, excluding short-term securities, financial futures and forward currency exchange contracts during the period ended October 31, 2006, amounted to $19,323,407 and $9,610,199, respectively, of which $281,688 in purchases and $281,719 in sales were from mortgage dollar roll transactions.
A mortgage dollar roll transaction involves a sale by the fund of mortgage related securities that it holds with an agreement by the fund to repurchase similar securities at an agreed upon price and date. The securities purchased will bear the same interest rate as those sold, but generally will be collateralized by pools of mortgages with different prepayment histories than those securities sold.
The fund may invest in financial futures contracts in order to gain exposure to or protect against changes in the market.The fund is exposed to market risk as a result of changes in the value of the underlying financial instruments. Investments in financial futures require the fund to “mark to market” on a daily basis, which reflects the change in market value of the contracts at the close of each day’s trading.Accordingly, variation margin
payments are received or made to reflect daily unrealized gains or losses. When the contracts are closed, the fund recognizes a realized gain or loss. These investments require initial margin deposits with a broker, which consist of cash or cash equivalents.The amount of these deposits is determined by the exchange or Board of Trade on which the contract is traded and is subject to change.Contracts open at October 31,2006,are set forth in the Statement of Financial Futures.
The fund enters into forward currency exchange contracts to gain exposure to foreign currency, hedge its exposure against changes in exchange rates on its foreign portfolio holdings and to settle foreign currency transactions. When executing forward currency exchange contracts, the fund is obligated to buy or sell a foreign currency at a specified rate on a certain date in the future.With respect to sales of forward currency exchange contracts, the fund would incur a loss if the value of the contract increases between the date the forward contract is opened and the date the forward contract is closed.The fund realizes a gain if the value of the contract decreases between those dates. With respect to purchases of forward currency exchange contracts, the fund would incur a loss if the value of the contract decreases between the date the forward contract is opened and the date the forward contract is closed.The fund realizes a gain if the value of the contract increases between those dates.The fund is also exposed to credit risk associated with counterparty nonperformance on these forward currency exchange contracts which is typically limited to the unrealized gain on each open contract.The following summarizes open forward currency exchange contracts at October 31, 2006:
| | | Foreign | | | | | | Unrealized |
| Forward Currency | | Currency | | | | | | Appreciation |
| Exchange Contracts | | Amounts | | Cost ($) | | Value ($) (Depreciation) ($) |
| |
| |
| |
|
| Purchases: | | | | | | | | |
| British Pound, expiring | | | | | | | | |
| 12/14/2006 | | 238,000 | | 450,560 | | 454,063 | | 3,503 |
| New Zealand Dollar, | | | | | | | | |
| expiring 12/14/2006 | | 235,000 | | 154,745 | | 156,949 | | 2,204 |
| | NOTES TO FINANCIAL STATEMENTS (continued)
|
| | | | | Foreign | | | | | | Unrealized |
| Forward Currency | | | | Currency | | | | | | Appreciation |
| Exchange Contracts | | | | Amounts | | Proceeds ($) | | Value ($) (Depreciation) ($) |
| |
| |
| |
| |
|
| Sales: | | | | | | | | | | |
| Australian Dollar, | | | | | | | | | | |
| expiring 12/14/2006 | | 330,000 | | 248,424 | | 255,103 | | (6,679) |
| Canadian Dollar, | | | | | | | | | | |
| expiring 12/14/2006 | | 88,000 | | 78,563 | | 78,638 | | (75) |
| Euro, expiring | | | | | | | | | | |
| 12/14/2006 | | | | 95,000 | | 121,543 | | 121,510 | | 33 |
| Japanese Yen, | | | | | | | | | | |
| expiring | | | | | | | | | | |
| 12/14/2006 | | 11,381,000 | | 97,835 | | 97,712 | | 123 |
| Norwegian Krone, | | | | | | | | | | |
| expiring | | | | | | | | | | |
| 12/14/2006 | | | | 1,272,000 | | 196,029 | | 194,896 | | 1,133 |
| Swedish Krona, | | | | | | | | | | |
| expiring | | | | | | | | | | |
| 12/14/2006 | | | | 377,000 | | 52,378 | | 52,354 | | 24 |
| Swiss Franc, | | | | | | | | | | |
| expiring 12/14/2006 | | 235,000 | | 190,162 | | 189,708 | | 454 |
| Total | | | | | | | | | | 720 |
At October 31, 2006, the cost of investments for federal income tax purposes was $10,939,077; accordingly, accumulated net unrealized appreciation on investments was $69,990, consisting of $77,306 gross unrealized appreciation and $7,316 gross unrealized depreciation.
REPORT OF INDEPENDENT REGISTERED
PUBLIC ACCOUNTING FIRM
|
| | Shareholders and Board of Directors
Dreyfus Premier Total Return Advantage Fund
|
We have audited the accompanying statement of assets and liabilities, including the statements of investments, financial futures and securities sold short, of Dreyfus Premier Total Return Advantage Fund (one of the fund’s comprising Advantage Funds, Inc.) as of October 31, 2006, and the related statements of operations and changes in net assets and financial highlights for the period from March 15, 2006 (commencement of operations) through October 31, 2006. These financial statements and financial highlights are the responsibility of the Fund’s management.Our responsibility is to express an opinion on these financial statements and financial highlights based on our audit.
We conducted our audit in accordance with the standards of the Public Company Accounting Oversight Board (United States).Those standards require that we plan and perform the audit to obtain reasonable assurance about whether the financial statements and financial highlights are free of material misstatement.We were not engaged to perform an audit of the Fund’s internal control over financial reporting. Our audit included consideration of internal control over financial reporting as a basis for designing audit procedures that are appropriate in the circumstances,but not for the purpose of expressing an opinion on the effectiveness of the Fund’s internal control over financial reporting.Accordingly, we express no such opinion.An audit includes examining, on a test basis, evidence supporting the amounts and disclosures in the financial statements and financial highlights, assessing the accounting principles used and significant estimates made by management, and evaluating the overall financial statement presentation. Our procedures included verification by examination of securities held by the custodian as of October 31, 2006 and confirmation of securities not held by the custodian by correspondence with oth-ers.We believe that our audit provides a reasonable basis for our opinion.
In our opinion, the financial statements and financial highlights referred to above present fairly, in all material respects, the financial position of Dreyfus Premier Total Return Advantage Fund at October 31, 2006, and the results of its operations, the changes in its net assets and the financial highlights for the period from March 15, 2006 (commencement of operations) through October 31, 2006, in conformity with U.S. generally accepted accounting principles.

| | New York, New York
December 12, 2006
|
IMPORTANT TAX INFORMATION (Unaudited)
The Fund hereby designates 99.53% of ordinary income dividends paid during the fiscal year ended October 31, 2006 as qualifying “interest related dividends”.
| | PROXY RESULTS (Unaudited)
|
Advantage Funds, Inc. held a special meeting of shareholders on June 29, 2006.The proposal considered at the meeting, and the results, are as follows:
| | | | | Shares | | |
| |
| |
| |
|
| | | Votes For | | | | Authority Withheld |
| |
| |
| |
|
| To elect additional Board Members: | | | | | | |
| Peggy C. Davis † | | 75,634,549 | | | | 1,727,669 |
| James F. Henry † | | 75,604,546 | | | | 1,757,672 |
| Dr. Martin Peretz † | | 75,621,544 | | | | 1,740,674 |
† Each will serve as an Independent Board member of the fund commencing, subject to the discretion of the Board, on or about January 1, 2007.
In addition Joseph S. DiMartino, David P. Feldman, Ehud Houminer, Gloria Messinger, and Anne Wexler continue as Board members of the fund.
BOARD MEMBERS INFORMATION (Unaudited)
| Joseph S. DiMartino (63) |
| Chairman of the Board (1995) |
| Principal Occupation During Past 5 Years: |
| • Corporate Director and Trustee |
Other Board Memberships and Affiliations:
|
- The Muscular Dystrophy Association, Director
- Century Business Services, Inc., a provider of outsourcing functions for small and medium size companies, Director
- The Newark Group, a provider of a national market of paper recovery facilities, paperboard mills and paperboard converting plants, Director
- Sunair Services Corporation, engaging in the design, manufacture and sale of high frequency systems for long-range voice and data communications, as well as providing certain outdoor-related services to homes and businesses, Director
No. of Portfolios for which Board Member Serves: 189
———————
Peggy C. Davis (63) Board Member (2006)
Principal Occupation During Past 5 Years:
|
- Shad Professor of Law, New York University School of Law (1983-present)
- Writer and teacher in the fields of evidence, constitutional theory, family law, social sciences and the law, legal process and professional methodology and training
No. of Portfolios for which Board Member Serves: 71
|
| David P. Feldman (66) |
| Board Member (1996) |
| Principal Occupation During Past 5 Years: |
| • Corporate Director and Trustee |
Other Board Memberships and Affiliations:
|
- BBH Mutual Funds Group (11 funds), Director
- The Jeffrey Company, a private investment company, Director
- QMED, a medical device company, Director
No. of Portfolios for which Board Member Serves: 57
|
BOARD MEMBERS INFORMATION (Unaudited) (continued)
| James F. Henry (75) |
| Board Member (2006) |
| | Principal Occupation During Past 5 Years:
|
- President,The International Institute for Conflict Prevention and Resolution, a non- profit organization principally engaged in the development of alternatives to business litigation (Retired 2003)
- Advisor to The Elaw Forum, a consultant on managing corporate legal costs
- Advisor to John Jay Homestead (the restored home of the first U.S. Chief Justice)
- Individual Trustee of several trusts
| | Other Board Memberships and Affiliations:
|
- Director, advisor and mediator involved in several non-profit organizations, primarily engaged in domestic and international dispute resolution, and historic preservation
No. of Portfolios for which Board Member Serves: 48
———————
Ehud Houminer (66) Board Member (1993)
Principal Occupation During Past 5 Years:
• Executive-in-Residence at the Columbia Business School, Columbia University
| | Other Board Memberships and Affiliations:
|
- Avnet Inc., an electronics distributor, Director
- International Advisory Board to the MBA Program School of Management, Ben Gurion University, Chairman
- Explore Charter School, Brooklyn, NY, Chairman
No. of Portfolios for which Board Member Serves: 60
| Dr. Paul A. Marks (80) |
| Board Member (2006) |
| | Principal Occupation During Past 5 Years:
|
- President, Emeritus (2000-present) and President and Chief Executive Officer of Memorial Sloan-Kettering Cancer Center (Retired 1999)
| | Other Board Memberships and Affiliations:
|
- Pfizer, Inc., Director-Emeritus
- Lazard Freres & Company, LLC, Senior Adviser
- Armgo-Start-Up Biotech; Board of Directors
- Nanoviricide, Scientific Advisory Board
- PTC, Scientific Advisory Board
- IKONYSIS, Scientific Advisory Board
No. of Portfolios for which Board Member Serves: 48
| Gloria Messinger (76) |
| Board Member (1993) |
Principal Occupation During Past 5 Years:
|
- Arbitrator for American Arbitration Association and National Association of Securities Dealers, Inc.
- Consultant in Intellectual Property
Other Board Memberships and Affiliations:
|
- Theater for a New Audience, Inc., Director
- Brooklyn Philharmonic, Director
No. of Portfolios for which Board Member Serves: 48
|
| Dr. Martin Peretz (67) |
| Board Member (2006) |
Principal Occupation During Past 5 Years:
|
- Editor-in-Chief of The New Republic Magazine
- Lecturer in Social Studies at Harvard University (1965-2002)
- Director of TheStreet.com, a financial information service on the web
Other Board Memberships and Affiliations:
|
- American Council of Trustees and Alumni, Director
- Pershing Square Capital Management, Adviser
- Montefiore Ventures, General Partner
- Harvard Center for Blood Research,Trustee
- Bard College,Trustee
- Board of Overseers of YIVO Institute for Jewish Research, Chairman
No. of Portfolios for which Board Member Serves: 48
———————
Anne Wexler (76) Board Member (1996)
Principal Occupation During Past 5 Years:
|
- Chairman of the Wexler & Walker Public Policy Associates, consultants specializing in government relations and public affairs
Other Board Memberships and Affiliations:
|
- Wilshire Mutual Funds (5 funds), Director
- Methanex Corporation, a methanol producing company, Director
- Member of the Council of Foreign Relations
- Member of the National Park Foundation
No. of Portfolios for which Board Member Serves: 57
Once elected all Board Members serve for an indefinite term.The address of the Board Members and Officers is in c/o The Dreyfus Corporation, 200 Park Avenue, New York, New York 10166.Additional information about the Board Members is available in the fund’s Statement of Additional Information which can be obtained from Dreyfus free of charge by calling this toll free number: 1-800-554-4611.
John M. Fraser, Jr., Emeritus Board Member T. John Szarkowski, Emeritus Board Member
OFFICERS OF THE FUND (Unaudited)
| STEPHEN E. CANTER, President since |
| March 2000. |
Chairman of the Board and Chief Executive Officer of the Manager, and an officer of 90 investment companies (comprised of 189 portfolios) managed by the Manager. Mr. Canter also is a Board member and, where applicable, an Executive Committee Member of the other investment management subsidiaries of Mellon Financial Corporation, each of which is an affiliate of the Manager. He is 61 years old and has been an employee of the Manager since May 1995.
| MARK N. JACOBS, Vice President since |
| March 2000. |
Executive Vice President, Secretary and General Counsel of the Manager, and an officer of 91 investment companies (comprised of 205 portfolios) managed by the Manager. He is 60 years old and has been an employee of the Manager since June 1977.
| MICHAEL A. ROSENBERG, Vice President |
| and Secretary since August 2005. |
Associate General Counsel of the Manager, and an officer of 91 investment companies (comprised of 205 portfolios) managed by the Manager. He is 46 years old and has been an employee of the Manager since October 1991.
| JAMES BITETTO, Vice President and |
| Assistant Secretary since August 2005. |
Associate General Counsel and Assistant Secretary of the Manager, and an officer of 91 investment companies (comprised of 205 portfolios) managed by the Manager. He is 40 years old and has been an employee of the Manager since December 1996.
| JONI LACKS CHARATAN, Vice President |
| and Assistant Secretary since |
| August 2005. |
Associate General Counsel of the Manager, and an officer of 91 investment companies (comprised of 205 portfolios) managed by the Manager. She is 50 years old and has been an employee of the Manager since October 1988.
| JOSEPH M. CHIOFFI, Vice President and |
| Assistant Secretary since August 2005. |
Associate General Counsel of the Manager, and an officer of 91 investment companies (comprised of 205 portfolios) managed by the Manager. He is 44 years old and has been an employee of the Manager since June 2000.
| JANETTE E. FARRAGHER, Vice President |
| and Assistant Secretary since |
| August 2005. |
Associate General Counsel of the Manager, and an officer of 91 investment companies (comprised of 205 portfolios) managed by the Manager. She is 43 years old and has been an employee of the Manager since February 1984.
| JOHN B. HAMMALIAN, Vice President and |
| Assistant Secretary since August 2005. |
Associate General Counsel of the Manager, and an officer of 91 investment companies (comprised of 205 portfolios) managed by the Manager. He is 43 years old and has been an employee of the Manager since February 1991.
| ROBERT R. MULLERY, Vice President and |
| Assistant Secretary since August 2005. |
Associate General Counsel of the Manager, and an officer of 91 investment companies (comprised of 205 portfolios) managed by the Manager. He is 54 years old and has been an employee of the Manager since May 1986.
| JEFF PRUSNOFSKY, Vice President and |
| Assistant Secretary since August 2005. |
Associate General Counsel of the Manager, and an officer of 91 investment companies (comprised of 205 portfolios) managed by the Manager. He is 41 years old and has been an employee of the Manager since October 1990.
| JAMES WINDELS, Treasurer since |
| November 2001. |
Director – Mutual Fund Accounting of the Manager, and an officer of 91 investment companies (comprised of 205 portfolios) managed by the Manager. He is 48 years old and has been an employee of the Manager since April 1985.
36
| ERIK D. NAVILOFF, Assistant Treasurer |
| since August 2005. |
Senior Accounting Manager – Taxable Fixed Income Funds of the Manager, and an officer of 91 investment companies (comprised of 205 portfolios) managed by the Manager. He is 38 years old and has been an employee of the Manager since November 1992.
| ROBERT ROBOL, Assistant Treasurer |
| since August 2005. |
Senior Accounting Manager – Money Market and Municipal Bond Funds of the Manager, and an officer of 91 investment companies (comprised of 205 portfolios) managed by the Manager. He is 42 years old and has been an employee of the Manager since October 1988.
| ROBERT SVAGNA, Assistant Treasurer |
| since December 2002. |
Senior Accounting Manager – Equity Funds of the Manager, and an officer of 91 investment companies (comprised of 205 portfolios) managed by the Manager. He is 39 years old and has been an employee of the Manager since November 1990.
| GAVIN C. REILLY, Assistant Treasurer |
| since December 2005. |
Tax Manager of the Investment Accounting and Support Department of the Manager, and an officer of 91 investment companies (comprised of 205 portfolios) managed by the Manager. He is 38 years old and has been an employee of the Manager since April 1991.
| JOSEPH W. CONNOLLY, Chief Compliance |
| Officer since October 2004. |
Chief Compliance Officer of the Manager and The Dreyfus Family of Funds (91 investment companies, comprised of 205 portfolios). From November 2001 through March 2004, Mr. Connolly was first Vice-President, Mutual Fund Servicing for Mellon Global Securities Services. In that capacity, Mr. Connolly was responsible for managing Mellon’s Custody, Fund Accounting and Fund Administration services to third-party mutual fund clients. He is 49 years old and has served in various capacities with the Manager since 1980, including manager of the firm’s Fund Accounting Department from 1997 through October 2001.
| WILLIAM GERMENIS, Anti-Money |
| Laundering Compliance Officer since |
| October 2002. |
Vice President and Anti-Money Laundering Compliance Officer of the Distributor, and the Anti-Money Laundering Compliance Officer of 87 investment companies (comprised of 201 portfolios) managed by the Manager. He is 36 years old and has been an employee of the Distributor since October 1998.
| For More | | Information |
| |
|
| |
| Dreyfus Premier | | Transfer Agent & |
| Total Return | | Dividend Disbursing Agent |
| Advantage Fund | | |
| | | Dreyfus Transfer, Inc. |
| 200 Park Avenue | | |
| | | 200 Park Avenue |
| New York, NY 10166 | | |
| | | New York, NY 10166 |
| |
| Manager | | Distributor |
| The Dreyfus Corporation | | |
| | | Dreyfus Service Corporation |
| 200 Park Avenue | | |
| | | 200 Park Avenue |
| New York, NY 10166 | | |
| | | New York, NY 10166 |
| Custodian | | |
| Mellon Bank, N.A. | | |
| One Mellon Bank Center | | |
| Pittsburgh, PA 15258 | | |
Telephone Call your financial representative or 1-800-554-4611
| Mail | | The Dreyfus Premier Family of Funds |
| | | 144 Glenn Curtiss Boulevard, Uniondale, NY 11556-0144 |
The fund files its complete schedule of portfolio holdings with the Securities and Exchange Commission (“SEC”) for the first and third quarters of each fiscal year on Form N-Q. The fund’s Forms N-Q are available on the SEC’s website at http://www.sec.gov and may be reviewed and copied at the SEC���s Public Reference Room in Washington, DC. Information on the operation of the Public Reference Room may be obtained by calling 1-202-551-8090.
A description of the policies and procedures that the fund uses to determine how to vote proxies relating to portfolio securities, and information regarding how the fund voted these proxies for the 12-month period ended June 30, 2006, is available at http://www.dreyfus.com and on the SEC’s website at http://www.sec.gov. The description of the policies and procedures is also available without charge, upon request, by calling 1-800-645-6561.
Item 2. Code of Ethics.
The Registrant has adopted a code of ethics that applies to the Registrant's principal executive officer, principal financial officer, principal accounting officer or controller, or persons performing similar functions. There have been no amendments to, or waivers in connection with, the Code of Ethics during the period covered by this Report.
Item 3. Audit Committee Financial Expert.
The Registrant's Board has determined that David P. Feldman, a member of the Audit Committee of the Board, is an audit committee financial expert as defined by the Securities and Exchange Commission (the "SEC"). David P. Feldman is "independent" as defined by the SEC for purposes of audit committee financial expert determinations.
Item 4. Principal Accountant Fees and Services
(a) Audit Fees. The aggregate fees billed for each of the last two fiscal years (the "Reporting Periods") for professional services rendered by the Registrant's principal accountant (the "Auditor") for the audit of the Registrant's annual financial statements, or services that are normally provided by the Auditor in connection with the statutory and regulatory filings or engagements for the Reporting Periods, were $0 in 2005 and $58,804 in 2006.
(b) Audit-Related Fees. The aggregate fees billed in the Reporting Periods for assurance and related services by the Auditor that are reasonably related to the performance of the audit of the Registrant's financial statements and are not reported under paragraph (a) of this Item 4 were $0 in 2005 and $0 in 2006. These services consisted of (i) security counts required by Rule 17f-2 under the Investment Company Act of 1940, as amended.
The aggregate fees billed in the Reporting Periods for non-audit assurance and related services by the Auditor to the Registrant's investment adviser (not including any sub-investment adviser whose role is primarily portfolio management and is subcontracted with or overseen by another investment adviser), and any entity controlling, controlled by or under common control with the investment adviser that provides ongoing services to the Registrant ("Service Affiliates"), that were reasonably related to the performance of the annual audit of the Service Affiliate, which required pre-approval by the Audit Committee were $0 in 2005 and $0 in 2006.
Note: For the second paragraph in each of (b) through (d) of this Item 4, certain of such services were not pre-approved prior to May 6, 2003, when such services were required to be pre-approved. On and after May 6, 2003, 100% of all services provided by the Auditor were pre-approved as required. For comparative purposes, the fees shown assume that all such services were pre-approved, including services that were not pre-approved prior to the compliance date of the pre-approval requirement.
(c) Tax Fees. The aggregate fees billed in the Reporting Periods for professional services rendered by the Auditor for tax compliance, tax advice and tax planning ("Tax Services") were $0 in 2005 and $2,428 in 2006. These services consisted of (i) review or preparation of U.S. federal, state, local and excise tax returns; (ii) U.S. federal, state and local tax planning, advice and assistance regarding statutory, regulatory or
administrative developments, (iii) tax advice regarding tax qualification matters and/or treatment of various financial instruments held or proposed to be acquired or held, and (iv) determination of Passive Foreign Investment Companies (as applicable).
The aggregate fees billed in the Reporting Periods for Tax Services by the Auditor to Service Affiliates which required pre-approval by the Audit Committee were $0 in 2005 and $0 in 2006.
(d) All Other Fees. The aggregate fees billed in the Reporting Periods for products and services provided by the Auditor, other than the services reported in paragraphs (a) through (c) of this Item, were $0 in 2005 and $59 in 2006. These services consisted of a review of the Registrant's anti-money laundering program.
The aggregate fees billed in the Reporting Periods for Non-Audit Services by the Auditor to Service Affiliates, other than the services reported in paragraphs (b) through (c) of this Item, which required pre-approval by the Audit Committee were $0 in 2005 and $0 in 2006.
Audit Committee Pre-Approval Policies and Procedures. The Registrant's Audit Committee has established policies and procedures (the "Policy") for pre-approval (within specified fee limits) of the Auditor's engagements for non-audit services to the Registrant and Service Affiliates without specific case-by-case consideration. Pre-approval considerations include whether the proposed services are compatible with maintaining the Auditor's independence. Pre-approvals pursuant to the Policy are considered annually.
Non-Audit Fees. The aggregate non-audit fees billed by the Auditor for services rendered to the Registrant, and rendered to Service Affiliates, for the Reporting Periods were $755,822 in 2005 and $436,321 in 2006.
Auditor Independence. The Registrant's Audit Committee has considered whether the provision of non-audit services that were rendered to Service Affiliates which were not pre-approved (not requiring pre-approval) is compatible with maintaining the Auditor's independence.
Item 5. Audit Committee of Listed Registrants.
Not applicable. [CLOSED-END FUNDS ONLY]
Item 6. Schedule of Investments.
Not applicable.
Item 7. Disclosure of Proxy Voting Policies and Procedures for Closed-End Management
Investment Companies.
Not applicable. [CLOSED-END FUNDS ONLY]
Item 8. Portfolio Managers of Closed-End Management Investment Companies.
Not applicable. [CLOSED-END FUNDS ONLY, beginning with reports for periods ended
on and after December 31, 2005]
Item 9. Purchases of Equity Securities by Closed-End Management Investment Companies and
Affiliated Purchasers.
Not applicable. [CLOSED-END FUNDS ONLY]
Item 10. Submission of Matters to a Vote of Security Holders.
|
The Registrant has a Nominating Committee (the "Committee"), which is responsible for selecting and nominating persons for election or appointment by the Registrant's Board as Board members. The Committee has adopted a Nominating Committee Charter (the "Charter"). Pursuant to the Charter, the Committee will consider recommendations for nominees from shareholders submitted to the Secretary of the Registrant, c/o The Dreyfus Corporation Legal Department, 200 Park Avenue, 8th Floor East, New York, New York 10166. A nomination submission must include information regarding the recommended nominee as specified in the Charter. This information includes all information relating to a recommended nominee that is required to be disclosed in solicitations or proxy statements for the election of Board members, as well as information sufficient to evaluate the factors to be considered by the Committee, including character and integrity, business and professional experience, and whether the person has the ability to apply sound and independent business judgment and would act in the interests of the Registrant and its shareholders.
Nomination submissions are required to be accompanied by a written consent of the individual to stand for election if nominated by the Board and to serve if elected by the shareholders, and such additional information must be provided regarding the recommended nominee as reasonably requested by the Committee.
Item 11. Controls and Procedures.
(a) The Registrant's principal executive and principal financial officers have concluded, based on their evaluation of the Registrant's disclosure controls and procedures as of a date within 90 days of the filing date of this report, that the Registrant's disclosure controls and procedures are reasonably designed to ensure that information required to be disclosed by the Registrant on Form N-CSR is recorded, processed, summarized and reported within the required time periods and that information required to be disclosed by the Registrant in the reports that it files or submits on Form N-CSR is accumulated and communicated to the Registrant's management, including its principal executive and principal financial officers, as appropriate to allow timely decisions regarding required disclosure.
(b) There were no changes to the Registrant's internal control over financial reporting that occurred during the second fiscal quarter of the period covered by this report that have materially affected, or are reasonably likely to materially affect, the Registrant's internal control over financial reporting.
Item 12. Exhibits.
(a)(1) Code of ethics referred to in Item 2.
(a)(2) Certifications of principal executive and principal financial officers as required by Rule 30a-2(a)
under the Investment Company Act of 1940.
(a)(3) Not applicable.
(b) Certification of principal executive and principal financial officers as required by Rule 30a-2(b)
under the Investment Company Act of 1940.
|
SIGNATURES
Pursuant to the requirements of the Securities Exchange Act of 1934 and the Investment Company Act of 1940, the Registrant has duly caused this Report to be signed on its behalf by the undersigned, thereunto duly authorized.
ADVANTAGE FUNDS, INC.
| By: | | /s/ Stephen E. Canter |
| | | Stephen E. Canter |
| | | President |
| Date: | | 12/28/06 |
Pursuant to the requirements of the Securities Exchange Act of 1934 and the Investment Company Act of 1940, this Report has been signed below by the following persons on behalf of the Registrant and in the capacities and on the dates indicated.
| By: | | /s/ Stephen E. Canter |
| | | Stephen E. Canter |
| | | Chief Executive Officer |
| Date: | | 12/28/06 |
| |
| By: | | /s/ James Windels |
| | | James Windels |
| | | Chief Financial Officer |
| Date: | | 12/28/06 |
EXHIBIT INDEX
(a)(1) Code of ethics referred to in Item 2.
(a)(2) Certifications of principal executive and principal financial officers as required by Rule 30a-
2(a) under the Investment Company Act of 1940. (EX-99.CERT)
(b) Certification of principal executive and principal financial officers as required by Rule 30a-
2(b) under the Investment Company Act of 1940. (EX-99.906CERT)
|