| UNITED STATES |
| SECURITIES AND EXCHANGE COMMISSION |
| Washington, D.C. 20549 |
FORM N-CSR
| CERTIFIED SHAREHOLDER REPORT OF REGISTERED MANAGEMENT |
| INVESTMENT COMPANIES |
| Investment Company Act file number | | 811- 7123 |
| Advantage Funds, Inc. |
| (Exact name of Registrant as specified in charter) |
| c/o The Dreyfus Corporation |
| 200 Park Avenue |
| New York, New York 10166 |
| (Address of principal executive offices) | | (Zip code) |
| Michael A. Rosenberg, Esq. |
| 200 Park Avenue |
| New York, New York 10166 |
| (Name and address of agent for service) |
| Registrant's telephone number, including area code: | | (212) 922-6000 |
| Date of fiscal year end: | | 10/31 |
| Date of reporting period: | | 10/31/07 |
The following N-CSR relates only to the Registrant’s series listed below and does not affect the other series of the Registrant, which has a different fiscal year end and, therefore, different N-CSR reporting requirements. A separate N-CSR Form will be filed for this series, as appropriate.
| ADVANTAGE FUNDS, INC. |
| |
| - | | Dreyfus Premier Total Return Advantage Fund |
| - | | Global Alpha Fund |
FORM N-CSR
| Item 1. | | Reports to Stockholders. |
Save time. Save paper. View your next shareholder report online as soon as it’s available. Log into www.dreyfus.com and sign up for Dreyfus eCommunications. It’s simple and only takes a few minutes.
The views expressed in this report reflect those of the portfolio manager only through the end of the period covered and do not necessarily represent the views of Dreyfus or any other person in the Dreyfus organization. Any such views are subject to change at any time based upon market or other conditions and Dreyfus disclaims any responsibility to update such views.These views may not be relied on as investment advice and, because investment decisions for a Dreyfus fund are based on numerous factors, may not be relied on as an indication of trading intent on behalf of any Dreyfus fund.
Not FDIC-Insured • Not Bank-Guaranteed • May Lose Value
| Contents |
| |
| | | THE FUND |
| |
|
| 2 | | A Letter from the CEO |
| 3 | | Discussion of Fund Performance |
| 6 | | Fund Performance |
| 8 | | Understanding Your Fund’s Expenses |
| 8 | | Comparing Your Fund’s Expenses |
| With Those of Other Funds |
| 9 | | Statement of Investments |
| 16 | | Statement of Financial Futures |
| 16 | | Statement of Options Written |
| 17 | | Statement of Assets and Liabilities |
| 18 | | Statement of Operations |
| 19 | | Statement of Changes in Net Assets |
| 21 | | Financial Highlights |
| 24 | | Notes to Financial Statements |
| 35 | | Report of Independent Registered |
| | | Public Accounting Firm |
| 36 | | Important Tax Information |
| 37 | | Board Members Information |
| 40 | | Officers of the Fund |
| |
| FOR MORE INFORMATION |
|
| | | Back Cover |
| Dreyfus Premier |
| Total Return |
| Advantage Fund |

A LETTER FROM THE CEO
Dear Shareholder:
We are pleased to present this annual report for Dreyfus Premier Total Return Advantage Fund, covering the 12-month period from November 1, 2006, through October 31, 2007.
After a prolonged period of relative price stability, volatility has returned to the U.S. financial markets.The third quarter of 2007 provided greater swings in security valuations than we’ve seen in several years, as the economic cycle matured and credit concerns spread from the sub-prime mortgage sector to other credit-sensitive areas of the fixed-income markets. In contrast, U.S. Treasury securities rallied strongly as investors became more averse to credit risks and engaged in a “flight to quality.”
In our view, these developments signaled a shift to a new phase of the credit cycle in which the price of risk has increased to reflect a more borrower-friendly tone in the credit markets. Although the housing downturn and sub-prime turmoil may persist for the next few months or quarters, lower short-term interest rates from the Federal Reserve Board should help keep credit available to borrowers and forestall a more severe economic downturn. In addition, turning points such as this one may be a good time to review your portfolio with your financial advisor, who can help you reposition your fixed-income investments for a changing market environment.
For information about how the fund performed during the reporting period, as well as market perspectives, we have provided a Discussion of Fund Performance given by the fund’s Portfolio Managers.
Thank you for your continued confidence and support.
2

DISCUSSION OF FUND PERFORMANCE
For the period of November 1, 2006, through October 31, 2007, as provided by David Kwan and Lowell Bennett, Portfolio Managers
Fund and Market Performance Overview
The U.S. bond market encountered heightened turbulence during the summer of 2007 when a credit crisis originating in the sub-prime mortgage sector sparked a “flight to quality” among fixed-income investors, and prices of higher-yielding securities declined sharply.The fund’s returns were lower than its benchmark, primarily due to its active currency strategy, which emphasized the weakening U.S. dollar.
For the 12-month period ended October 31, 2007, Dreyfus Premier Total Return Advantage Fund achieved total returns of 3.57% for Class A shares, 2.73% for Class C shares and 3.75% for Class I shares.1 In comparison, the fund’s benchmark, the Lehman Brothers U.S. Aggregate Index (the “Index”), achieved a total return of 5.38% for the same period.2
The Fund’s Investment Approach
The fund seeks to maximize total return from capital appreciation and income.To pursue its goal, the fund normally invests in securities and other instruments that provide exposure to fixed income and currency markets.
To focus the fund’s investments on the U.S. fixed income market, we employ an active core bond strategy, in which four proprietary quantitative models are run and implemented independently of one another.We overlay the active core bond strategy with a separate global bond strategy, setting the fund’s exposures to the world’s major bond markets according to our view of their relative valuations. Finally, we employ an active currency strategy in which we evaluate and establish exposure to various currencies based on relative valuations as determined by real interest rates and purchasing power parity.
The fund typically will invest in bonds rated investment grade or the unrated equivalent, but we may invest up to 30% of the fund’s assets in securities rated below investment grade at the time of purchase. The average effective maturity of the fund’s portfolio typically will range between three and 10 years.
The Fund 3
DISCUSSION OF FUND PERFORMANCE (continued)
Sub-Prime Deterioration Drove Bond Market Results
The U.S. bond market fared relatively well over the first half of the reporting period in an environment of moderate economic growth, low inflation and stable short-term interest rates. However, investor sentiment deteriorated rapidly in June 2007, when credit concerns spread from sub-prime mortgages to other areas of the financial markets. Heightened credit concerns caused a “flight to quality,” causing prices of corporate and asset-backed securities to fall sharply while U.S.Treasury securities gained value.
The Federal Reserve Board (the “Fed”) acted, along with other central banks, in August to promote greater market liquidity, and the market began to rebound. The Fed took action again in September and October, cutting short-term interest rates by a total of 75 basis points. While these moves helped restore a degree of investor confidence, risk premiums remained high by the end of the reporting period.
Weak U.S. Dollar Detracts from Performance
A relatively short average duration in the fund’s core bond portfolio relative to the benchmark over the first half of the reporting period aided the fund’s performance as U.S. interest rates increased. As rates rose we maintained a more neutral average duration, which positioned the fund well for the fall in interest rates in the wake of the credit crunch. The sub-prime mortgage meltdown had a relatively muted impact on the performance of the fund’s core bond strategy due to our focus on higher-quality securities.
Our global bond strategy produced results that slightly trailed the benchmark. An emphasis on securities in nations with higher interest rates, such as Australia, detracted from performance when rates in those markets rose further. Conversely, the fund’s relatively short exposure to the lower-yielding Japanese bond market also detracted from performance as that market gained modestly.
The fund’s active currency strategy had the greatest impact on the fund’s results over the reporting period.We focused most of our attention on currencies from countries with higher inflation-adjusted interest rates and, when it was significant enough, we focused on currencies that we believed to have become significantly undervalued on a purchasing power parity basis. For example, we found such favorable valuation with the Japanese yen, in which we held an overweight position during the
4
first half of the year. Initially this hurt the strategy as the ongoing carry trade worked against the yen, but as the carry trade unwound in the wake of the credit crunch, the yen appreciated. A similar overweight positioning in the undervalued U.S. dollar, versus an underweight to several of the overvalued commodity currencies (Australian dollar, Canadian dollar, and Norwegian krone) detracted from the fund’s per-formance.We attribute the weakening U.S. dollar to the Fed’s cutting of short-term interest rates in light of the credit crunch and mortgage situation, as well as to the commodity currencies, which have continued to strengthen significantly as commodity prices have climbed.
Finding Opportunities in a Changing Market
We have maintained a generally conservative approach in the core bond portfolio, including a slightly shorter-than-average duration posture and a high-quality bias. In the global bond portfolio, we have continued to emphasize higher-yielding Australian bonds while underweighting the British bond market.The fund’s currency component has continued to focus on the British pound with high inflation-adjusted interest rates, and the U.S. dollar, which appears undervalued to us. In our judgment, these are prudent strategies in a volatile market environment.
November 15, 2007
| | | Foreign bonds are subject to special risks including exposure to currency fluctuations, |
| | | changing political and economic conditions, and potentially less liquidity. |
| | | Investments in foreign currencies are subject to the risk that those currencies will decline in |
| | | value relative to the U.S. dollar, or, in the case of hedged positions, that the U.S. dollar will |
| | | decline relative to the currency being hedged. Currency rates in foreign countries may |
| | | fluctuate significantly over short periods of time. A decline in the value of foreign currencies |
| | | relative to the U.S. dollar will reduce the value of securities held by the fund and |
| | | denominated in those currencies. |
| 1 | | Total return includes reinvestment of dividends and any capital gains paid and does not take into |
| | | consideration the maximum initial sales charge in the case of Class A shares or the applicable |
| | | contingent deferred sales charge imposed on redemptions in the case of Class C shares. Had these |
| | | charges been reflected, returns would have been lower. Past performance is no guarantee of future |
| | | results. Share price and investment return fluctuate such that upon redemption, fund shares may be |
| | | worth more or less than their original cost. Return figures provided reflect the absorption of certain |
| | | fund expenses by The Dreyfus Corporation pursuant to an agreement in effect through October |
| | | 31, 2008, at which time it may be extended, modified or terminated. Had these expenses not |
| | | been absorbed, the fund’s returns would have been lower. |
| 2 | | SOURCE: LIPPER INC. — Reflects reinvestment of dividends and, where applicable, capital |
| | | gain distributions.The Lehman Brothers U.S.Aggregate Index is a widely accepted, unmanaged total |
| | | return index of corporate, U.S. government and U.S. government agency debt instruments, mortgage- |
| | | backed securities and asset-backed securities with an average maturity of 1-10 years. Index returns |
| | | do not reflect fees and expenses associated with operating a mutual fund. |
The Fund 5
FUND PERFORMANCE
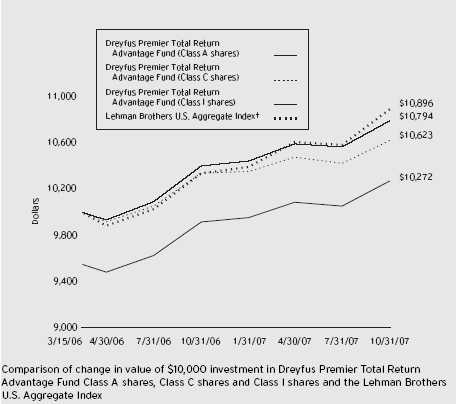
| † Source: Lipper Inc. |
| Past performance is not predictive of future performance. |
| The above graph compares a $10,000 investment made in Class A, Class C and Class I shares of Dreyfus Premier |
| Total Return Advantage Fund on 3/15/06 (inception date) to a $10,000 investment made in the Lehman Brothers |
| U.S. Aggregate Index (the “Index”) on that date. For comparative purposes, the value of the Index on 2/28/06 is used |
| as the beginning value on 3/15/06. All dividends and capital gain distributions are reinvested. |
| The fund invests primarily in fixed-income securities and instruments that provide investment exposure to fixed-income |
| markets.The fund’s performance shown in the line graph takes into account the maximum initial sales charge on Class A |
| shares and all other applicable fees and expenses on all classes.The Index is a widely accepted, unmanaged total return |
| index of corporate, U.S. government and U.S. government agency debt instruments, mortgage-backed securities and asset- |
| backed securities with an average maturity of 1-10 years.The Index does not take into account charges, fees and other |
| expenses. Further information relating to fund performance, including expense reimbursements, if applicable, is contained |
| in the Financial Highlights section of the prospectus and elsewhere in this report. |
6
| Average Annual Total Returns as of 10/31/07 | | | | |
| |
| | | Inception | | | | From |
| | | Date | | 1 Year | | Inception |
| |
| |
| |
|
| Class A shares | | | | | | |
| with maximum sales charge (4.5%) | | 3/15/06 | | (1.07)% | | 1.66% |
| without sales charge | | 3/15/06 | | 3.57% | | 4.58% |
| Class C shares | | | | | | |
| with applicable redemption charge † | | 3/15/06 | | 1.75% | | 3.78% |
| without redemption | | 3/15/06 | | 2.73% | | 3.78% |
| Class I shares | | 3/15/06 | | 3.75% | | 4.80% |
| Past performance is not predictive of future performance.The fund’s performance shown in the graph and table does not |
| reflect the deduction of taxes that a shareholder would pay on the fund distributions or the redemption of fund shares. |
| † The maximum contingent deferred sales charge for Class C shares is 1% for shares redeemed within one year of the |
| date of purchase. |
The Fund 7
UNDERSTANDING YOUR FUND’S EXPENSES (Unaudited)
As a mutual fund investor, you pay ongoing expenses, such as management fees and other expenses. Using the information below, you can estimate how these expenses affect your investment and compare them with the expenses of other funds.You also may pay one-time transaction expenses, including sales charges (loads) and redemption fees, which are not shown in this section and would have resulted in higher total expenses. For more information, see your fund’s prospectus or talk to your financial adviser.
Review your fund’s expenses
The table below shows the expenses you would have paid on a $1,000 investment in Dreyfus Premier Total Return Advantage Fund from May 1, 2007 to October 31, 2007. It also shows how much a $1,000 investment would be worth at the close of the period, assuming actual returns and expenses.
| Expenses and Value of a $1,000 Investment | | | | |
| assuming actual returns for the six months ended October 31, 2007 | | |
| | | Class A | | Class C | | Class I |
| |
| |
| |
|
| Expenses paid per $1,000 † | | $ 4.63 | | $ 8.43 | | $ 3.36 |
| Ending value (after expenses) | | $1,018.20 | | $1,013.80 | | $1,018.80 |
| COMPARING YOUR FUND’S EXPENSES |
| WITH THOSE OF OTHER FUNDS (Unaudited) |
Using the SEC’s method to compare expenses
The Securities and Exchange Commission (SEC) has established guidelines to help investors assess fund expenses. Per these guidelines, the table below shows your fund’s expenses based on a $1,000 investment, assuming a hypothetical 5% annualized return. You can use this information to compare the ongoing expenses (but not transaction expenses or total cost) of investing in the fund with those of other funds.All mutual fund shareholder reports will provide this information to help you make this comparison. Please note that you cannot use this information to estimate your actual ending account balance and expenses paid during the period.
| Expenses and Value of a $1,000 Investment | | | | |
| assuming a hypothetical 5% annualized return for the six months ended October 31, 2007 |
| | | Class A | | Class C | | Class I |
| |
| |
| |
|
| Expenses paid per $1,000 † | | $ 4.63 | | $ 8.44 | | $ 3.36 |
| Ending value (after expenses) | | $1,020.62 | | $1,016.84 | | $1,021.88 |
† Expenses are equal to the fund’s annualized expense ratio of .91% for Class A, 1.66% for Class C and .66% for Class I, multiplied by the average account value over the period, multiplied by 184/365 (to reflect the one-half year period).
8
| STATEMENT OF INVESTMENTS |
| October 31, 2007 |
| | | Coupon | | Maturity | | Principal | | |
| Bonds and Notes—93.3% | | Rate (%) | | Date | | Amount ($) | | Value ( |
| |
| |
| |
| |
|
| Asset-Backed Ctfs./ | | | | | | | | |
| Auto Receivables—6.1% | | | | | | | | |
| Americredit Automobile Receivables | | | | | | |
| Trust, Ser. 2007-CM, Cl. A4A | | 5.55 | | 4/7/14 | | 50,000 | | 50,314 |
| Capital One Auto Finance Trust, | | | | | | | | |
| Ser. 2005-C, Cl. A3 | | 4.61 | | 7/15/10 | | 41,541 | | 41,489 |
| Chase Manhattan Auto Owner Trust, | | | | | | |
| Ser. 2006-B, Cl. A4 | | 5.11 | | 4/15/14 | | 100,000 | | 100,725 |
| Daimler Chrysler Auto Trust, | | | | | | | | |
| Ser. 2004-A, Cl. A4 | | 2.58 | | 4/8/09 | | 25,108 | | 25,094 |
| Harley-Davidson Motorcycle Trust, | | | | | | |
| Ser. 2004-1, Cl. A2 | | 2.53 | | 11/15/11 | | 50,803 | | 49,916 |
| Honda Auto Receivables Owner | | | | | | | | |
| Trust, Ser. 2005-5, Cl. A4 | | 4.69 | | 2/15/11 | | 140,000 | | 139,825 |
| Honda Auto Receivables Owner | | | | | | | | |
| Trust, Ser. 2006-2, Cl. A4 | | 5.28 | | 1/23/12 | | 100,000 | | 100,963 |
| Household Automotive Trust, | | | | | | | | |
| Ser. 2003-2, Cl. A4 | | 3.02 | | 12/17/10 | | 40,393 | | 40,291 |
| Nissan Auto Receivables Owner | | | | | | | | |
| Trust, Ser. 2006-A, Cl. A4 | | 4.77 | | 7/15/11 | | 50,000 | | 49,869 |
| USAA Auto Owner Trust, | | | | | | | | |
| Ser. 2004-3, Cl. A4 | | 3.53 | | 6/15/11 | | 90,331 | | 89,641 |
| WFS Financial Owner Trust, | | | | | | | | |
| Ser. 2004-2, Cl. A4 | | 3.54 | | 11/21/11 | | 52,058 | | 51,752 |
| | | | | | | | | 739,879 |
| Asset-Backed Ctfs./Credit Cards—4.1% | | | | | | |
| Capital One Multi-Asset Execution | | | | | | |
| Trust, Ser. 2005-A2, Cl. A2 | | 4.05 | | 2/15/11 | | 100,000 | | 99,598 |
| Chase Issuance Trust, | | | | | | | | |
| Ser. 2005-A10, Cl. A10 | | 4.65 | | 12/17/12 | | 100,000 | | 99,513 |
| Citibank Credit Card Issuance | | | | | | | | |
| Trust, Ser. 2003-A8, Cl. A8 | | 3.50 | | 8/16/10 | | 100,000 | | 98,788 |
| Citibank Credit Card Master Trust, | | | | | | |
| Ser. 1992-2, Cl. A | | 5.88 | | 3/10/11 | | 100,000 | | 101,441 |
| MBNA Master Credit Card Trust, | | | | | | | | |
| Ser. 2000-L, Cl. A | | 6.50 | | 4/15/10 | | 100,000 | | 100,052 |
| | | | | | | | | 499,392 |
The Fund 9
STATEMENT OF INVESTMENTS (continued)
| | | Coupon | | Maturity | | Principal | | |
| Bonds and Notes (continued) | | Rate (%) | | Date | | Amount ($) | | Value ($) |
| |
| |
| |
| |
|
| Asset-Backed Ctfs./ | | | | | | | | |
| Home Equity Loans—2.4% | | | | | | | | |
| MASTR Asset-Backed Securities | | | | | | | | |
| Trust, Ser. 2005-AB1, Cl. A2 | | 5.05 | | 11/25/35 | | 100,000 a | | 99,084 |
| Renaissance Home Equity Loan | | | | | | | | |
| Trust, Ser. 2005-2, Cl. AF3 | | 4.50 | | 8/25/35 | | 100,000 a | | 99,129 |
| Residential Asset Mortgage | | | | | | | | |
| Products, Ser. 2003-RZ4, Cl. A7 | | 4.79 | | 6/25/33 | | 91,485 a | | 87,611 |
| Specialty Underwriting & | | | | | | | | |
| Residential Finance, | | | | | | | | |
| Ser. 2003-BC4, Cl. A3B | | 4.79 | | 11/25/34 | | 7,426 a | | 6,861 |
| | | | | | | | | 292,685 |
| Asset-Backed Ctfs./Student Loans—.1% | | | | | | |
| College Loan Corporation Trust, | | | | | | | | |
| Stripped Security, Interest | | | | | | | | |
| Only Class, Ser. 2006-1, Cl. AIO | | 10.00 | | 7/25/08 | | 200,000 b | | 14,031 |
| Banks—3.8% | | | | | | | | |
| ABN AMRO Bank, | | | | | | | | |
| Sr. Notes | | 5.26 | | 4/18/08 | | 50,000 a,c | | 50,025 |
| Bank One, | | | | | | | | |
| Sub. Notes | | 7.88 | | 8/1/10 | | 50,000 | | 53,427 |
| Royal Bank of Canada, | | | | | | | | |
| Notes | | 3.88 | | 5/4/09 | | 100,000 | | 99,137 |
| U.S. Bank, | | | | | | | | |
| Sub. Notes | | 6.30 | | 2/4/14 | | 100,000 | | 106,090 |
| Wells Fargo, | | | | | | | | |
| Sr. Unscd., Notes | | 4.20 | | 1/15/10 | | 50,000 | | 49,264 |
| Wells Fargo, | | | | | | | | |
| Notes | | 5.76 | | 3/10/08 | | 100,000 a | | 100,058 |
| | | | | | | | | 458,001 |
| Commercial Mortgage | | | | | | | | |
| Pass-Through Ctfs.—4.6% | | | | | | | | |
| GMAC Commercial Mortgage | | | | | | | | |
| Securities, Ser. 2001-C2, Cl. A1 | | 6.25 | | 4/15/34 | | 53,839 | | 54,387 |
| J.P. Morgan Chase Commercial | | | | | | | | |
| Mortgage Securities, | | | | | | | | |
| Ser. 2005-LDP3, Cl. A4A | | 4.94 | | 8/15/42 | | 102,000 a | | 97,939 |
| J.P. Morgan Chase Commercial | | | | | | | | |
| Mortgage Securities, | | | | | | | | |
| Ser. 2005-LDP3, Cl. A3 | | 4.96 | | 8/15/42 | | 75,000 | | 73,429 |
10
| | | Coupon | | Maturity | | Principal | | |
| Bonds and Notes (continued) | | Rate (%) | | Date | | Amount ($) | | Value ($) |
| |
| |
| |
| |
|
| Commercial Mortgage | | | | | | | | |
| Pass-Through Ctfs. (continued) | | | | | | | | |
| J.P. Morgan Chase Commercial | | | | | | | | |
| Mortgage Securities, | | | | | | | | |
| Ser. 2005-LDP5, Cl. ASB | | 5.17 | | 12/15/44 | | 100,000 a | | 99,044 |
| Morgan Stanley Capital I, | | | | | | | | |
| Ser. 2006-HQ8, Cl. AJ | | 5.47 | | 3/12/44 | | 65,000 a | | 63,211 |
| Morgan Stanley Dean Witter Capital | | | | | | |
| I, Ser. 2003-HQ2, Cl. A1 | | 4.18 | | 3/12/35 | | 114,783 | | 111,146 |
| Wachovia Bank Commercial Mortgage | | | | | | |
| Trust, Ser. 2005-C16, Cl. A2 | | 4.38 | | 10/15/41 | | 60,829 | | 59,950 |
| | | | | | | | | 559,106 |
| Diversified Financial Services—14.0% | | | | | | |
| Allstate Life Global Funding | | | | | | | | |
| Trusts, Notes, Ser. 04-1 | | 4.50 | | 5/29/09 | | 200,000 | | 198,885 |
| Bear Stearns Cos., | | | | | | | | |
| Sr. Unscd. Notes | | 5.19 | | 1/31/11 | | 100,000 a | | 96,963 |
| Boeing Capital, | | | | | | | | |
| Unscd. Notes | | 6.50 | | 2/15/12 | | 50,000 | | 52,900 |
| Citigroup, | | | | | | | | |
| Notes | | 5.13 | | 5/5/14 | | 150,000 | | 147,267 |
| Citigroup, | | | | | | | | |
| Notes | | 5.86 | | 6/9/09 | | 50,000 a | | 50,054 |
| Credit Suisse USA, | | | | | | | | |
| Gtd. Notes | | 5.76 | | 8/15/10 | | 100,000 a | | 99,830 |
| Credit Suisse USA, | | | | | | | | |
| Gtd. Notes | | 5.85 | | 12/9/08 | | 50,000 a | | 49,992 |
| General Electric Capital, | | | | | | | | |
| Sr. Unscd. Notes, Ser. A | | 6.00 | | 6/15/12 | | 200,000 | | 207,676 |
| Goldman Sachs Group, | | | | | | | | |
| Notes | | 5.70 | | 9/1/12 | | 100,000 | | 101,659 |
| Household Finance, | | | | | | | | |
| Sr. Unscd. Notes | | 4.13 | | 11/16/09 | | 100,000 | | 98,240 |
| International Lease Finance, | | | | | | | | |
| Notes | | 5.75 | | 6/15/11 | | 100,000 | | 101,079 |
| JPMorgan Chase & Co., | | | | | | | | |
| Sr. Unscd. Notes | | 5.38 | | 1/17/11 | | 100,000 a | | 99,614 |
| Lehman Brothers Holdings, | | | | | | | | |
| Sr. Unscd. Notes | | 5.42 | | 12/23/10 | | 100,000 a | | 98,159 |
The Fund 11
STATEMENT OF INVESTMENTS (continued)
| | | Coupon | | Maturity | | Principal | | |
| Bonds and Notes (continued) | | Rate (%) | | Date | | Amount ($) | | Value ($) |
| |
| |
| |
| |
|
| Diversified Financial | | | | | | | | |
| Services (continued) | | | | | | | | |
| MBNA, | | | | | | | | |
| Bonds | | 5.00 | | 6/15/15 | | 100,000 | | 96,268 |
| Merrill Lynch & Co., | | | | | | | | |
| Notes | | 5.56 | | 11/1/11 | | 100,000 a | | 97,610 |
| Morgan Stanley, | | | | | | | | |
| Unsub. Bonds | | 6.75 | | 4/15/11 | | 100,000 | | 104,576 |
| | | | | | | | | 1,700,772 |
| Electric Utilities—.8% | | | | | | | | |
| SCANA, | | | | | | | | |
| Notes | | 6.88 | | 5/15/11 | | 50,000 | | 52,197 |
| Wisconsin Energy, | | | | | | | | |
| Sr. Unscd. Notes | | 5.50 | | 12/1/08 | | 50,000 | | 50,204 |
| | | | | | | | | 102,401 |
| Foreign/Governmental—.4% | | | | | | | | |
| United Mexican States, | | | | | | | | |
| Notes | | 6.63 | | 3/3/15 | | 50,000 | | 54,550 |
| Health Care—1.2% | | | | | | | | |
| Abbott Laboratories, | | | | | | | | |
| Notes | | 5.60 | | 5/15/11 | | 50,000 | | 51,125 |
| Merck & Co., | | | | | | | | |
| Notes | | 4.38 | | 2/15/13 | | 100,000 | | 97,100 |
| | | | | | | | | 148,225 |
| Oil & Gas—1.3% | | | | | | | | |
| Conoco Funding, | | | | | | | | |
| Gtd. Bonds | | 6.35 | | 10/15/11 | | 100,000 | | 105,063 |
| KeySpan, | | | | | | | | |
| Sr. Unsub. Notes | | 7.63 | | 11/15/10 | | 50,000 | | 53,523 |
| | | | | | | | | 158,586 |
| Property & Casualty Insurance—3.3% | | | | | | |
| Berkshire Hathaway Finance, | | | | | | | | |
| Gtd. Notes | | 4.63 | | 10/15/13 | | 100,000 | | 97,267 |
| Hartford Life Global Funding | | | | | | | | |
| Trusts, Notes | | 5.20 | | 2/15/11 | | 150,000 | | 150,263 |
| Principal Life Income Funding | | | | | | | | |
| Trusts, Notes | | 5.13 | | 3/1/11 | | 150,000 | | 149,706 |
| | | | | | | | | 397,236 |
12
| | | Coupon | | Maturity | | Principal | | |
| Bonds and Notes (continued) | | Rate (%) | | Date | | Amount ($) | | Value ($) |
| |
| |
| |
| |
|
| Residential Mortgage | | | | | | | | |
| Pass-Through Ctfs.—1.7% | | | | | | | | |
| Credit Suisse Mortgage Capital | | | | | | | | |
| Ctfs., Ser. 2006-C3, Cl. A3 | | 5.83 | | 6/15/38 | | 100,000 a | | 102,024 |
| Merrill Lynch/Countrywide | | | | | | | | |
| Commercial Mortgage, | | | | | | | | |
| Ser. 2006-2, Cl. A4 | | 5.91 | | 6/12/46 | | 100,000 a | | 102,511 |
| | | | | | | | | 204,535 |
| Retail—.9% | | | | | | | | |
| Wal-Mart Stores, | | | | | | | | |
| Sr. Unscd. Notes | | 6.88 | | 8/10/09 | | 100,000 | | 103,626 |
| Technology—.8% | | | | | | | | |
| International Business Machines, | | | | | | | | |
| Unscd. Notes | | 4.25 | | 9/15/09 | | 50,000 | | 49,722 |
| Oracle, | | | | | | | | |
| Unscd. Notes | | 5.00 | | 1/15/11 | | 50,000 | | 50,094 |
| | | | | | | | | 99,816 |
| Telecommunications—2.1% | | | | | | | | |
| BellSouth, | | | | | | | | |
| Sr. Unscd. Notes | | 6.00 | | 10/15/11 | | 100,000 | | 103,042 |
| Cisco Systems, | | | | | | | | |
| Sr. Unscd. Notes | | 5.25 | | 2/22/11 | | 100,000 | | 101,133 |
| Motorola, | | | | | | | | |
| Unscd. Notes | | 7.63 | | 11/15/10 | | 50,000 | | 53,407 |
| | | | | | | | | 257,582 |
| U.S. Government Agencies/ | | | | | | | | |
| Mortgage-Backed—42.4% | | | | | | | | |
| Federal Home Loan Mortgage Corp.: | | | | | | |
| 4.50%, 12/1/19 | | | | | | 798,667 | | 773,598 |
| 5.00%, 11/1/33—7/1/35 | | | | | | 646,904 | | 622,002 |
| 5.50%, 12/1/18—10/1/21 | | | | | | 661,988 | | 664,054 |
| 5.65%, 2/1/37 | | | | | | 47,439 a | | 47,495 |
| 5.72%, 2/1/37 | | | | | | 89,830 a | | 90,906 |
| 5.96%, 1/1/37 | | | | | | 87,708 a | | 88,908 |
| 6.00%, 10/1/19—9/1/34 | | | | | | 252,886 | | 256,970 |
| 6.50%, 8/1/12 | | | | | | 96,704 | | 99,327 |
| 7.00%, 1/1/36 | | | | | | 180,560 | | 188,038 |
The Fund 13
STATEMENT OF INVESTMENTS (continued)
| | | Principal | | |
| Bonds and Notes (continued) | | Amount ($) | | Value ($) |
| |
| |
|
| U.S. Government Agencies/ | | | | |
| Mortgage-Backed (continued) | | | | |
| Federal National Mortgage Association: | | | | |
| 4.00%, 3/1/21 | | 91,496 | | 86,272 |
| 5.00%, 7/1/19—11/1/34 | | 882,228 | | 865,005 |
| 5.50%, 12/1/16 | | 175,000 d | | 175,191 |
| 5.50%, 7/1/17—8/1/35 | | 583,465 | | 581,848 |
| 5.76%, 4/1/37 | | 94,203 a | | 95,211 |
| 6.00%, 8/1/17 | | 142,573 | | 145,362 |
| 6.50%, 7/1/33 | | 108,271 | | 111,705 |
| 7.00%, 4/1/32 | | 86,735 | | 90,854 |
| Government National Mortgage Association I | | |
| 5.00%, 9/15/33—1/15/34 | | 178,961 | | 173,955 |
| | | | | 5,156,701 |
| U.S. Government Securities—3.3% | | | | |
| U.S. Treasury Bonds | | | | |
| 6.25%, 5/15/30 | | 295,000 | | 354,807 |
| U.S. Treasury Notes | | | | |
| 4.88%, 7/31/11 | | 40,000 | | 41,172 |
| | | | | 395,979 |
| Total Bonds and Notes | | | | |
| (cost $11,288,922) | | | | 11,343,103 |
| |
| |
|
| |
| | | Principal | | |
| Short-Term Investment—.8% | | Amount ($) | | Value ($) |
| |
| |
|
| U.S. Treasury Bill | | | | |
| 4.00%, 12/20/07 | | | | |
| (cost $94,483) | | 95,000 e | | 94,499 |
14
| Other Investment—3.2% | | Shares | | Value ($) |
| |
| |
|
| Registered Investment Company; | | | | |
| Dreyfus Institutional Preferred | | | | |
| Plus Money Market Fund | | | | |
| (cost $384,000) | | 384,000 f | | 384,000 |
| |
| |
|
| Total Investments (cost $11,767,405) | | 97.3% | | 11,821,602 |
| Cash and Receivables (Net) | | 2.7% | | 333,106 |
| Net Assets | | 100.0% | | 12,154,708 |
| a Variable rate security—interest rate subject to periodic change. |
| b Notional face amount shown. |
| c Security exempt from registration under Rule 144A of the Securities Act of 1933.This security may be resold in |
| transactions exempt from registration, normally to qualified institutional buyers. At October 31, 2007, this security |
| amounted to $50,025 or .4% of net assets. |
| d Purchased on a forward commitment basis. |
| e All or partially held by a broker as collateral for open financial futures positions. |
| f Investment in affiliated money market mutual fund. |
| Portfolio Summary (Unaudited) † | | | | |
| |
| | | Value (%) | | | | Value (%) |
| |
| |
| |
|
| U.S. Government & Agencies | | 45.7 | | Short-Term/Money Market Investment | | 4.0 |
| Corporate Bonds | | 28.2 | | Foreign/Governmental | | .4 |
| Asset/Mortgage-Backed | | 19.0 | | | | 97.3 |
| † Based on net assets. |
| See notes to financial statements. |
The Fund 15
| STATEMENT OF FINANCIAL FUTURES |
| October 31, 2007 |
| | | | | | | | | Unrealized |
| | | | | Market Value | | | | Appreciation |
| | | | | Covered by | | | | (Depreciation) |
| | | Contracts | | Contracts ($) | | Expiration | | at 10/31/2007 ($) |
| |
| |
| |
| |
|
| Financial Futures Long | | | | | | | | |
| U.S. Treasury 10 year Notes | | 13 | | 1,430,203 | | December 2007 | | 6,971 |
| U.S. Treasury 30 year Bonds | | 9 | | 1,013,344 | | December 2007 | | 7,629 |
| 10 Year Euro-Bond | | 4 | | 655,841 | | December 2007 | | 6,331 |
| Australian 10 Year Bonds | | 8 | | 731,284 | | December 2007 | | (8,320) |
| Financial Futures Short | | | | | | | | |
| U.S. Treasury 2 year Notes | | 1 | | (207,109) | | December 2007 | | 356 |
| U.S. Treasury 5 year Notes | | 1 | | (107,344) | | December 2007 | | 356 |
| Canadian 10 Year Bonds | | 1 | | (118,751) | | December 2007 | | (291) |
| British Long Gilt | | 4 | | (891,599) | | December 2007 | | (1,096) |
| Japanese 10 Year Bond | | 4 | | (472,186) | | December 2007 | | (4,314) |
| | | | | | | | | 7,622 |
See notes to financial statements.
| STATEMENT OF OPTIONS WRITTEN |
| October 31, 2007 |
| | | Face Amount | | |
| | | Covered by | | |
| | | Contracts ($) | | Value ($) |
| |
| |
|
| Call Options | | | | |
| U.S. Treasury 10 Year Notes | | | | |
| November 2007 @ 110 | | 200,000 | | (1,188) |
| Put Options | | | | |
| U.S. Treasury 10 Year Notes | | | | |
| November 2007 @ 109 | | 200,000 | | (437) |
| (Premiums received $2,582) | | | | (1,625) |
| |
| See notes to financial statements. | | | | |
16
| STATEMENT OF ASSETS AND LIABILITIES |
| October 31, 2007 |
| | | | | Cost | | Value |
| |
| |
| |
|
| Assets ($): | | | | | | |
| Investments in securities—See Statement of Investments: | | | | |
| Unaffiliated issuers | | | | 11,383,405 | | 11,437,602 |
| Affiliated issuers | | | | 384,000 | | 384,000 |
| Cash | | | | | | 4,552 |
| Receivable for investment securities sold | | | | 477,993 |
| Receivable for open mortgage-backed dollar rolls—Note 4 | | | | 176,233 |
| Dividends and interest receivable | | | | | | 93,195 |
| Receivable for shares of Common Stock subscribed | | | | 75,500 |
| Unrealized appreciation on forward currency exchange contracts—Note 4 | | 62,354 |
| Prepaid expenses | | | | | | 6,195 |
| | | | | | | 12,717,624 |
| |
| |
| |
|
| Liabilities ($): | | | | | | |
| Due to The Dreyfus Corporation and affiliates—Note 3(c) | | | | 9,460 |
| Payable for open mortgage-backed dollar rolls—Note 4 | | | | 351,394 |
| Unrealized depreciation on forward currency exchange contracts—Note 4 | | 106,346 |
| Payable for investment securities purchased | | | | 25,203 |
| Payable for futures variation margin—Note 4 | | | | 17,105 |
| Payable for shares of Common Stock redeemed | | | | 6,790 |
| Outstanding options written, at value (premiums received | | | | |
| $2,582)—See Statement of Options Written—Note 4 | | | | 1,625 |
| Accrued expenses | | | | | | 44,993 |
| | | | | | | 562,916 |
| |
| |
| |
|
| Net Assets ($) | | | | | | 12,154,708 |
| |
| |
| |
|
| Composition of Net Assets ($): | | | | | | |
| Paid-in capital | | | | | | 12,056,579 |
| Accumulated undistributed investment income—net | | | | 132,397 |
| Accumulated net realized gain (loss) on investments | | | | (53,052) |
| Accumulated net unrealized appreciation (depreciation) on investments, | | |
| foreign currency transactions and options transactions (including | | |
| $7,622 net unrealized appreciation on financial futures) | | | | 18,784 |
| |
| |
|
| Net Assets ($) | | | | | | 12,154,708 |
| |
| |
| |
|
| |
| |
| Net Asset Value Per Share | | | | | | |
| | | Class A | | Class C | | Class I |
| |
| |
| |
|
| Net Assets ($) | | 10,512,348 | | 1,043,608 | | 598,752 |
| Shares Outstanding | | 833,228 | | 82,949 | | 47,428 |
| |
| |
| |
|
| Net Asset Value Per Share ($) | | 12.62 | | 12.58 | | 12.62 |
See notes to financial statements.
The Fund 17
| STATEMENT OF OPERATIONS |
| Year Ended October 31, 2007 |
| Investment Income ($): | | |
| Income: | | |
| Interest | | 612,422 |
| Dividends; | | |
| Affiliated issuers | | 24,279 |
| Total Income | | 636,701 |
| Expenses: | | |
| Management fee—Note 3(a) | | 65,546 |
| Registration fees | | 58,770 |
| Auditing fees | | 39,907 |
| Shareholder servicing costs—Note 3(c) | | 29,603 |
| Custodian fees—Note 3(c) | | 11,696 |
| Prospectus and shareholders’ reports | | 9,202 |
| Distribution fees—Note 3(b) | | 8,594 |
| Directors’ fees and expenses—Note 3(d) | | 803 |
| Legal fees | | 172 |
| Loan commitment fees—Note 2 | | 72 |
| Miscellaneous | | 23,183 |
| Total Expenses | | 247,548 |
| Less—expense reimbursement from | | |
| The Dreyfus Corporation due to undertaking—Note 3(a) | | (133,159) |
| Less—reduction in custody fees due to earnings credits—Note 1(c) | | (1,116) |
| Net Expenses | | 113,273 |
| Investment Income—Net | | 523,428 |
| |
|
| Realized and Unrealized Gain (Loss) on Investments—Note 4 ($): |
| Net realized gain (loss) on investments | | 33,512 |
| Net realized gain (loss) on financial futures | | 778 |
| Net realized gain (loss) on forward currency exchange contracts | | (75,956) |
| Net Realized Gain (Loss) | | (41,666) |
| Net unrealized appreciation (depreciation) on investments, foreign | | |
| currency transactions and options transactions [including ($10,834) |
| net unrealized (depreciation) on financial futures] | | (74,456) |
| Net Realized and Unrealized Gain (Loss) on Investments | | (116,122) |
| Net Increase in Net Assets Resulting from Operations | | 407,306 |
See notes to financial statements.
18
STATEMENT OF CHANGES IN NET ASSETS
| | | Year Ended October 31, |
| |
|
| | | 2007 a | | 2006 b |
| |
| |
|
| Operations ($): | | | | |
| Investment income—net | | 523,428 | | 259,642 |
| Net realized gain (loss) on investments | | (41,666) | | 50,972 |
| Net unrealized appreciation | | | | |
| (depreciation) on investments | | (74,456) | | 93,240 |
| Net Increase (Decrease) in Net Assets | | | | |
| Resulting from Operations | | 407,306 | | 403,854 |
| |
| |
|
| Dividends to Shareholders from ($): | | | | |
| Investment income—net: | | | | |
| Class A shares | | (419,622) | | (135,349) |
| Class C shares | | (38,774) | | (6,088) |
| Class I shares | | (25,611) | | (8,012) |
| Net realized gain on investments: | | | | |
| Class A shares | | (68,019) | | — |
| Class C shares | | (7,649) | | — |
| Class I shares | | (3,907) | | — |
| Total Dividends | | (563,582) | | (149,449) |
| |
| |
|
| Capital Stock Transactions ($): | | | | |
| Net proceeds from shares sold: | | | | |
| Class A shares | | 655,488 | | 9,647,803 |
| Class C shares | | 316,237 | | 963,446 |
| Class I shares | | — | | 556,000 |
| Dividends reinvested: | | | | |
| Class A shares | | 484,809 | | 134,854 |
| Class C shares | | 22,864 | | 6,088 |
| Class I shares | | 29,517 | | 8,012 |
| Cost of shares redeemed: | | | | |
| Class A shares | | (500,598) | | (2,513) |
| Class C shares | | (265,428) | | — |
| Increase (Decrease) in Net Assets | | | | |
| from Capital Stock Transactions | | 742,889 | | 11,313,690 |
| Total Increase (Decrease) in Net Assets | | 586,613 | | 11,568,095 |
| |
| |
|
| Net Assets ($): | | | | |
| Beginning of Period | | 11,568,095 | | — |
| End of Period | | 12,154,708 | | 11,568,095 |
| Undistributed investment income—net | | 132,397 | | 109,807 |
The Fund 19
STATEMENT OF CHANGES IN NET ASSETS (continued)
| | | Year Ended October 31, |
| |
|
| | | 2007 a | | 2006 b |
| |
| |
|
| Capital Share Transactions: | | | | |
| Class A | | | | |
| Shares sold | | 52,259 | | 771,527 |
| Shares issued for dividends reinvested | | 38,679 | | 10,881 |
| Shares redeemed | | (39,916) | | (202) |
| Net Increase (Decrease) in Shares Outstanding | | 51,022 | | 782,206 |
| |
| |
|
| Class C | | | | |
| Shares sold | | 25,205 | | 76,664 |
| Shares issued for dividends reinvested | | 1,825 | | 492 |
| Shares redeemed | | (21,237) | | — |
| Net Increase (Decrease) in Shares Outstanding | | 5,793 | | 77,156 |
| |
| |
|
| Class I | | | | |
| Shares sold | | — | | 44,426 |
| Shares issued for dividends reinvested | | 2,355 | | 647 |
| Net Increase (Decrease) in Shares Outstanding | | 2,355 | | 45,073 |
| a | | Effective June 1, 2007, the fund redesignated Class R shares to Class I shares. |
| b | | From March 15, 2006 (commencement of operations) to October 31, 2006. |
| See notes to financial statements. |
20
FINANCIAL HIGHLIGHTS
The following tables describe the performance for each share class for the fiscal periods indicated.All information (except portfolio turnover rate) reflects financial results for a single fund share.Total return shows how much your investment in the fund would have increased (or decreased) during each period, assuming you had reinvested all dividends and distributions.These figures have been derived from the fund’s financial statements.
| | | Year Ended October 31, |
| |
|
| Class A Shares | | 2007 | | 2006 a |
| |
| |
|
| Per Share Data ($): | | | | |
| Net asset value, beginning of period | | 12.79 | | 12.50 |
| Investment Operations: | | | | |
| Investment income—net b | | .56 | | .32 |
| Net realized and unrealized gain (loss) on investments | | (.11) | | .16 |
| Total from Investment Operations | | .45 | | .48 |
| Distributions: | | | | |
| Dividends from investment income—net | | (.53) | | (.19) |
| Dividends from net realized gain on investments | | (.09) | | — |
| Total Distributions | | (.62) | | (.19) |
| Net asset value, end of period | | 12.62 | | 12.79 |
| |
| |
|
| Total Return (%) c | | 3.57 | | 3.86d |
| |
| |
|
| Ratios/Supplemental Data (%): | | | | |
| Ratio of total expenses to average net assets | | 2.01 | | 3.32e |
| Ratio of net expenses to average net assets | | .89 | | .88e |
| Ratio of net investment income to average net assets | | 4.45 | | 3.99e |
| Portfolio Turnover Rate f | | 75.04 | | 104.30d |
| |
| |
|
| Net Assets, end of period ($ x 1,000) | | 10,512 | | 10,006 |
| a | | From March 15, 2006 (commencement of operations) to October 31, 2006. |
| b | | Based on average shares outstanding at each month end. |
| c | | Exclusive of sales charge. |
| d | | Not annualized. |
| e | | Annualized. |
| f | | The portfolio turnover rates excluding mortgage dollar roll transactions for the periods ended October 31, 2007 and |
| | | October 31, 2006, were 51.54% and 101.24%, respectively. |
| See notes to financial statements. |
The Fund 21
FINANCIAL HIGHLIGHTS (continued)
| | | Year Ended October 31, |
| |
|
| Class C Shares | | 2007 | | 2006 a |
| |
| |
|
| Per Share Data ($): | | | | |
| Net asset value, beginning of period | | 12.77 | | 12.50 |
| Investment Operations: | | | | |
| Investment income—net b | | .47 | | .25 |
| Net realized and unrealized gain (loss) on investments | | (.13) | | .17 |
| Total from Investment Operations | | .34 | | .42 |
| Distributions: | | | | |
| Dividends from investment income—net | | (.44) | | (.15) |
| Dividends from net realized gain on investments | | (.09) | | — |
| Total Distributions | | (.53) | | (.15) |
| Net asset value, end of period | | 12.58 | | 12.77 |
| |
| |
|
| Total Return (%) c | | 2.73 | | 3.41d |
| |
| |
|
| Ratios/Supplemental Data (%): | | | | |
| Ratio of total expenses to average net assets | | 2.79 | | 4.12e |
| Ratio of net expenses to average net assets | | 1.64 | | 1.61e |
| Ratio of net investment income to average net assets | | 3.71 | | 3.28e |
| Portfolio Turnover Rate f | | 75.04 | | 104.30d |
| |
| |
|
| Net Assets, end of period ($ x 1,000) | | 1,044 | | 985 |
| a From March 15, 2006 (commencement of operations) to October 31, 2006. |
| b Based on average shares outstanding at each month end. |
| c Exclusive of sales charge. |
| d Not annualized. |
| e Annualized. |
| f The portfolio turnover rates excluding mortgage dollar roll transactions for the periods ended October 31, 2007 and |
| October 31, 2006 were 51.54% and 101.24%, respectively. |
| See notes to financial statements. |
22
| | | Year Ended October 31, |
| |
|
| Class I Shares | | 2007 a | | 2006 b |
| |
| |
|
| Per Share Data ($): | | | | |
| Net asset value, beginning of period | | 12.80 | | 12.50 |
| Investment Operations: | | | | |
| Investment income—net c | | .59 | | .33 |
| Net realized and unrealized gain (loss) on investments | | (.12) | | .17 |
| Total from Investment Operations | | .47 | | .50 |
| Distributions: | | | | |
| Dividends from investment income—net | | (.56) | | (.20) |
| Dividends from net realized gain on investments | | (.09) | | — |
| Total Distributions | | (.65) | | (.20) |
| Net asset value, end of period | | 12.62 | | 12.80 |
| |
| |
|
| Total Return (%) | | 3.75 | | 4.04d |
| |
| |
|
| Ratios/Supplemental Data (%): | | | | |
| Ratio of total expenses to average net assets | | 1.78 | | 3.08e |
| Ratio of net expenses to average net assets | | .64 | | .63e |
| Ratio of net investment income to average net assets | | 4.70 | | 4.25e |
| Portfolio Turnover Rate f | | 75.04 | | 104.30d |
| |
| |
|
| Net Assets, end of period ($ x 1,000) | | 599 | | 577 |
| a Effective June 1, 2007, the fund redesignated Class R shares to Class I shares. |
| b From March 15, 2006 (commencement of operations) to October 31, 2006. |
| c Based on average shares outstanding at each month end. |
| d Not annualized. |
| e Annualized. |
| f The portfolio turnover rates excluding mortgage dollar roll transactions for the periods ended October 31, 2007 and |
| October 31, 2006 were 51.54% and 101.24%, respectively. |
| See notes to financial statements. |
The Fund 23
NOTES TO FINANCIAL STATEMENTS
NOTE 1—Significant Accounting Policies:
Dreyfus Premier Total Return Advantage Fund (the “fund”) is a separate diversified series of Advantage Funds, Inc. (the “Company”), which is registered under the Investment Company Act of 1940, as amended (the “Act”), as an open-end management investment company and operates as a series company currently offering twelve series, including the fund. The fund’s investment objective seeks to maximize total return through capital appreciation and income.The Dreyfus Corporation (the “Manager” or “Dreyfus”) serves as the fund’s investment adviser.
On July 1, 2007, Mellon Financial Corporation (‘Mellon Financial”) and The Bank of New York Company, Inc. merged, forming The Bank of New York Mellon Corporation (“BNY Mellon”). As part of this transaction, Dreyfus became a wholly-owned subsidiary of BNY Mellon.
The fund’s Board of Directors approved the redesignation of the fund’s Class R shares as Class I shares, effective June 1, 2007.The description of the eligibility requirements for Class I shares remains the same as it was for Class R shares.
MBSC Securities Corporation (“the Distributor”), a wholly-owned subsidiary of the Manager, is the distributor of the fund’s shares. The fund is authorized to issue 300 million shares of $.001 par value Common Stock.The fund currently offers three classes of shares: Class A (100 million shares authorized), Class C (100 million shares authorized) and Class I (100 million shares authorized). Class A shares are subject to a sales charge imposed at the time of purchase. Class C shares are subject to a contingent deferred sales charge (“CDSC”) imposed on Class C shares redeemed within one year of purchase. Class I shares are sold at net asset value per share only to institutional investors. Other differences between the classes include the services offered to and the expenses borne by each class, the allocation of certain transfer agency costs and certain voting rights. Income, expenses (other than expenses attributable to a specific class), and realized and unrealized gains or losses on investments are allocated to each class of shares based on its relative net assets.
24
As of October 31, 2007, MBC Investments Corp., an indirect subsidiary of BNY Mellon, held 767,131 of Class A, 42,223 of Class C and 42,765 of Class I shares of the fund.
The Company accounts separately for the assets, liabilities and operations of each series. Expenses directly attributable to each series are charged to that series’ operations; expenses which are applicable to all series are allocated among them on a pro rata basis.
The fund’s financial statements are prepared in accordance with U.S. generally accepted accounting principles, which may require the use of management estimates and assumptions. Actual results could differ from those estimates.
The fund enters into contracts that contain a variety of indemnifications. The fund’s maximum exposure under these arrangements is unknown.The fund does not anticipate recognizing any loss related to these arrangements.
(a) Portfolio valuation: Investments in securities excluding short-term investments (other than U.S. Treasury Bills), financial futures and forward currency exchange contracts are valued each business day by an independent pricing service (the “Service”) approved by the Board of Directors. Investments for which quoted bid prices are readily available and are representative of the bid side of the market in the judgment of the Service are valued at the mean between the quoted bid prices (as obtained by the Service from dealers in such securities) and asked prices (as calculated by the Service based upon its evaluation of the market for such securities). Other investments (which constitute a majority of the portfolio securities) are valued as determined by the Service, based on methods which include consideration of: yields or prices of securities of comparable quality, coupon, maturity and type; indications as to values from dealers; and general market conditions. Restricted securities, as well as securities or other assets for which recent market quotations are not readily available, that are not valued by a pricing service approved by the Board of Directors, or are determined by the fund not
The Fund 25
NOTES TO FINANCIAL STATEMENTS (continued)
to reflect accurately fair value, are valued at fair value as determined in good faith under the direction of the Board of Directors. The factors that may be considered when fair valuing a security include fundamental analytical data, the nature and duration of restrictions on disposition, an evaluation of the forces that influence the market in which the securities are purchased and sold and public trading in similar securities of the issuer or comparable issuers. Short-term investments, excluding U.S. Treasury Bills, are carried at amortized cost, which approximates value. Registered open-end investment companies that are not traded on an exchange are valued at their net asset value. Financial futures and options, which are traded on an exchange, are valued at the last sales price on the securities exchange on which such securities are primarily traded or at the last sales price on the national securities market on each business day. Investments denominated in foreign currencies are translated to U.S. dollars at the prevailing rates of exchange. Forward currency exchange contracts are valued at the forward rate.
The Financial Accounting Standards Board (“FASB”) released Statement of Financial Accounting Standards No. 157 “Fair Value Measurements” (“FAS 157”). FAS 157 establishes an authoritative definition of fair value, sets out a framework for measuring fair value, and requires additional disclosures about fair-value measurements.The application of FAS 157 is required for fiscal years beginning after November 15, 2007 and interim periods within those fiscal years. Management does not believe that the application of this standard will have a material impact on the financial statements of the fund.
(b) Foreign currency transactions: The fund does not isolate that portion of the results of operations resulting from changes in foreign exchange rates on investments from the fluctuations arising from changes in the market prices of securities held. Such fluctuations are included with the net realized and unrealized gain or loss on investments.
Net realized foreign exchange gains or losses arise from sales and maturities of short-term securities, sales of foreign currencies, currency gains
26
or losses realized on securities transactions and the difference between the amounts of dividends, interest and foreign withholding taxes recorded on the fund’s books and the U.S. dollar equivalent of the amounts actually received or paid. Net unrealized foreign exchange gains and losses arise from changes in the value of assets and liabilities other than investments in securities, resulting from changes in exchange rates. Such gains and losses are included with net realized and unrealized gain or loss on investments.
(c) Securities transactions and investment income: Securities transactions are recorded on a trade date basis. Realized gain and loss from securities transactions are recorded on the identified cost basis. Dividend income is recognized on the ex-dividend date and interest income, including, where applicable, accretion of discount and amortization of premium on investments is recognized on the accrual basis.
The fund has an arrangement with the custodian bank whereby the fund receives earnings credits from the custodian when positive cash balances are maintained, which are used to offset custody fees. For financial reporting purposes, the fund includes net earnings credits as an expense offset in the Statement of Operations.
(d) Affiliated issuers: Investments in other investment companies advised by the Manager are defined as “affiliated” in the Act.
(e) Dividends to shareholders: It is the policy of the fund to declare and pay dividends from investment income-net, quarterly. Dividends from net realized capital gain, if any, are normally declared and paid annually, but the fund may make distributions on a more frequent basis to comply with the distribution requirements of the Internal Revenue Code of 1986, as amended (the “Code”).To the extent that net realized capital gain can be offset by capital loss carryovers, it is the policy of the fund not to distribute such gain. Income and capital gain distributions are determined in accordance with income tax regulations, which may differ from U.S. generally accepted accounting principles.
The Fund 27
NOTES TO FINANCIAL STATEMENTS (continued)
On October 31, 2007, the Board of Directors declared a cash dividend of $.139, $.109 and $.147 per share from undistributed investment income-net for Class A, Class C and Class I, respectively, payable on November 1, 2007 (ex-dividend date), to shareholders of record as of the close of business on October 31, 2007.
(f) Federal income taxes: It is the policy of the fund to continue to qualify as a regulated investment company, if such qualification is in the best interests of its shareholders, by complying with the applicable provisions of the Code, and to make distributions of taxable income sufficient to relieve it from substantially all federal income and excise taxes.
The FASB released FASB Interpretation No. 48 “Accounting for Uncertainty in Income Taxes” (FIN 48). FIN 48 provides guidance for how uncertain tax positions should be recognized, measured, presented and disclosed in the financial statements. FIN 48 requires the evaluation of tax positions taken or expected to be taken in the course of preparing the fund’s tax returns to determine whether the tax positions are “more-likely-than-not” of being sustained by the applicable tax authority. Tax positions not deemed to meet the more-likely-than-not threshold would be recorded as a tax benefit or expense in the current year.Adoption of FIN 48 is required for fiscal years beginning after December 15, 2006 and is to be applied to all open tax years as of the effective date. Management does not believe that the application of this standard will have a material impact on the financial statements of the fund.
At October 31, 2007, the components of accumulated earnings on a tax basis were as follows: undistributed ordinary income $132,397, accumulated capital losses $59,164 and unrealized appreciation $24,896.
The accumulated capital loss carryover is available to be applied against future net securities profits, if any, realized subsequent to October 31, 2007. If not applied, the carryover expires in fiscal 2015.
The tax characters of distributions paid to shareholders during the fiscal periods ended October 31, 2007 and October 31, 2006 were as follows: ordinary income $507,935 and $149,449 and long-term capital gains $55,647 and $0, respectively.
28
During the period ended October 31, 2007, as a result of permanent book to tax differences, primarily due to the tax treatment for amortization of premiums and paydown gains and losses on mortgage-backed securities, the fund decreased accumulated undistributed investment income-net by $16,831 and increased accumulated net realized gain (loss) on investments by the same amount. Net assets and net asset value per share were not affected by this reclassification.
NOTE 2—Bank Line of Credit:
The fund participates with other Dreyfus-managed funds in a $350 million redemption credit facility (the “Facility”) to be utilized for temporary or emergency purposes, including the financing of redemptions. In connection therewith, the fund has agreed to pay commitment fees on its pro rata portion of the Facility. Interest is charged to the fund based on prevailing market rates in effect at the time of borrowing. During the period ended October 31, 2007, the fund did not borrow under the Facility.
| NOTE 3—Management Fee and Other Transactions With |
| Affiliates: |
(a) Pursuant to a Management Agreement (“Agreement”) with the Manager, the management fee is computed at the annual rate of .55% of the value of the fund’s average daily net assets and is payable monthly. The Manager has undertaken from November 1, 2006, through October 31, 2008, that, if the fund’s aggregate expenses, exclusive of taxes, brokerage fees, Rule 12b-1 distribution plan fees, interest expense, commitment fees, shareholder services plan fees and extraordinary expenses, exceed an annual rate of .65% of the value of the fund’s average daily net assets, the fund may deduct from the payment to be made to the Manager under the Agreement, or the Manager will bear, such excess expense.The expense reimbursement, pursuant to the undertaking, amounted to $133,159 during the period ended October 31, 2007.
During the period ended October 31, 2007, the Distributor retained $72 from commissions earned on sales of the fund’s Class A shares.
The Fund 29
NOTES TO FINANCIAL STATEMENTS (continued)
(b) Under the Distribution Plan (the “Plan”) adopted pursuant to Rule 12b-1 under the Act, Class C shares pay the Distributor for distributing its shares at an annual rate of .75% of the value of the average daily net assets of Class C shares. During the period ended October 31, 2007, Class C shares were charged $8,594 pursuant to the Plan.
(c) Under the Shareholder Services Plan, Class A and Class C shares pay the Distributor at an annual rate of .25% of the value of their average daily net assets for the provision of certain services.The services provided may include personal services relating to shareholder accounts, such as answering shareholder inquiries regarding the fund and providing reports and other information, and services related to the maintenance of shareholder accounts.The Distributor may make payments to Service Agents (a securities dealer, financial institution or other industry professional) in respect of these services.The Distributor determines the amounts to be paid to Service Agents. During the period ended October 31, 2007, Class A and Class C shares were charged $25,466 and $2,865, respectively, pursuant to the Shareholder Services Plan.
The fund compensates Dreyfus Transfer, Inc., a wholly-owned subsidiary of the Manager, under a transfer agency agreement for providing personnel and facilities to perform transfer agency services for the fund. During the period ended October 31, 2007, the fund was charged $800 pursuant to the transfer agency agreement.
The fund compensates Mellon Bank, N.A., an affiliate of the Manager, under a custody agreement for providing custodial services for the fund. During the period ended October 31, 2007, the fund was charged $11,696 pursuant to the custody agreement.
During the period ended October 31, 2007, the fund was charged $4,660 for services performed by the Chief Compliance Officer.
The components of “Due to The Dreyfus Corporation and affiliates” in the Statement of Assets and Liabilities consist of: management fees $5,268,Rule 12b-1 distribution plan fees $728,shareholder services plan
30
fees $2,454, custodian fees $7,719 chief compliance officer fees $2,812 and transfer agency per account fees $156, which are offset against an expense reimbursement currently in effect in the amount of $9,677.
(d) Each Board member also serves as a Board member of other funds within the Dreyfus complex. Annual retainer fees and attendance fees are allocated to each fund based on net assets.
NOTE 4—Securities Transactions:
The aggregate amount of purchases and sales (including paydowns) of investment securities, excluding short-term securities, financial futures, options transactions and forward currency exchange contracts during the period ended October 31, 2007, amounted to $9,186,140 and $8,744,303, respectively, of which $2,737,564 in purchases and $2,738,850 in sales were from mortgage dollar roll transactions.
A mortgage dollar roll transaction involves a sale by the fund of mortgage related securities that it holds with an agreement by the fund to repurchase similar securities at an agreed upon price and date. The securities purchased will bear the same interest rate as those sold, but generally will be collateralized by pools of mortgages with different prepayment histories than those securities sold.
The fund may invest in financial futures contracts in order to gain exposure to or protect against changes in the market. The fund is exposed to market risk as a result of changes in the value of the underlying financial instruments. Investments in financial futures require the fund to “mark to market” on a daily basis, which reflects the change in market value of the contracts at the close of each day’s trading. Accordingly, variation margin payments are received or made to reflect daily unrealized gains or losses.When the contracts are closed, the fund recognizes a realized gain or loss.These investments require initial margin deposits with a broker, which consist of cash or cash equivalents. The amount of these deposits is determined by the exchange or Board
The Fund 31
NOTES TO FINANCIAL STATEMENTS (continued)
of Trade on which the contract is traded and is subject to change. Contracts open October 31, 2007, are set forth in the Statement of Financial Futures.
The fund may purchase and write (sell) put and call options in order to gain exposure to or to protect against changes in the market.
As a writer of call options, the fund receives a premium at the outset and then bears the market risk of unfavorable changes in the price of the financial instrument underlying the option. Generally, the fund would incur a gain, to the extent of the premium, if the price of the underlying financial instrument decreases between the date the option is written and the date on which the option is terminated. Generally, the fund would realize a loss, if the price of the financial instrument increases between those dates.
As a writer of put options, the fund receives a premium at the outset and then bears the market risk of unfavorable changes in the price of the financial instrument underlying the option. Generally, the fund would incur a gain, to the extent of the premium, if the price of the underlying financial instrument increases between the date the option is written and the date on which the option is terminated. Generally, the fund would realize a loss, if the price of the financial instrument decreases between those dates.
The following summarizes the fund’s call/put options written for the period ended October 31, 2007:
| | | Face Amount | | |
| | | Covered by | | Premiums |
| Options Written: | | Contracts ($) | | Received ($) |
| |
| |
|
| Contracts outstanding | | | | |
| October 31, 2006 | | — | | — |
| Contracts written | | 4,000 | | 2,582 |
| Contracts outstanding | | | | |
| October 31, 2007 | | 4,000 | | 2,582 |
The fund enters into forward currency exchange contracts to gain exposure to foreign currency, hedge its exposure against changes in
32
exchange rates on its foreign portfolio holdings and to settle foreign currency transactions. When executing forward currency exchange contracts, the fund is obligated to buy or sell a foreign currency at a specified rate on a certain date in the future.With respect to sales of forward currency exchange contracts, the fund would incur a loss if the value of the contract increases between the date the forward contract is opened and the date the forward contract is closed.The fund realizes a gain if the value of the contract decreases between those dates. With respect to purchases of forward currency exchange contracts, the fund would incur a loss if the value of the contract decreases between the date the forward contract is opened and the date the forward contract is closed.The fund realizes a gain if the value of the contract increases between those dates.The fund is also exposed to credit risk associated with counterparty nonperformance on these forward currency exchange contracts which is typically limited to the unrealized gain on each open contract.The following summarizes open forward currency exchange contracts at October 31, 2007:
| | | Foreign | | | | | | Unrealized |
| Forward Currency | | Currency | | | | | | Appreciation |
| Exchange Contracts | | Amounts | | Cost ($) | | Value ($) (Depreciation) ($) |
| |
| |
| |
|
| Purchases: | | | | | | | | |
| British Pound, | | | | | | | | |
| expiring 12/19/2007 | | 491,000 | | 989,129 | | 1,018,442 | | 29,313 |
| Japanese Yen, expiring | | | | | | | | |
| 12/19/2007 | | 24,002,000 | | 207,695 | | 209,321 | | 1,626 |
| New Zealand Dollar, | | | | | | | | |
| expiring 12/19/2007 | | 399,000 | | 273,992 | | 305,407 | | 31,415 |
| Sales: | | | | Proceeds ($) | | | | |
| Australian Dollar, | | | | | | | | |
| expiring 12/19/2007 | | 484,000 | | 419,311 | | 447,366 | | (28,055) |
| Canadian Dollar, | | | | | | | | |
| expiring 12/19/2007 | | 261,000 | | 248,229 | | 274,855 | | (26,626) |
| Euro, expiring | | | | | | | | |
| 12/19/2007 | | 138,000 | | 193,657 | | 199,780 | | (6,123) |
The Fund 33
NOTES TO FINANCIAL STATEMENTS (continued)
| | | Foreign | | | | | | Unrealized |
| Forward Currency | | Currency | | | | | | Appreciation |
| Exchange Contracts | | Amounts | | Proceeds ($) | | Value ($) (Depreciation) ($) |
| |
| |
| |
|
| Sales (continued): | | | | | | | | |
| Norwegian Krone, | | | | | | | | |
| expiring 12/19/2007 | | 1,987,000 | | 348,600 | | 368,279 | | (19,679) |
| Swedish Krone, | | | | | | | | |
| expiring 12/19/2007 | | 761,000 | | 111,519 | | 119,731 | | (8,212) |
| Swiss Franc, | | | | | | | | |
| expiring 12/19/2007 | | 851,000 | | 718,874 | | 736,525 | | (17,651) |
| Total | | | | | | | | (43,992) |
| At October 31, 2007, the cost of investments for federal income tax |
| purposes was $11,781,356; accordingly, accumulated net unrealized |
| appreciation on investments was $40,246, consisting of $91,455 gross |
| unrealized appreciation and $51,209 gross unrealized depreciation. |
34
| REPORT OF INDEPENDENT REGISTERED |
| PUBLIC ACCOUNTING FIRM |
Shareholders and Board of Directors
Dreyfus Premier Total Return Advantage Fund
We have audited the accompanying statement of assets and liabilities, including the statements of investments, financial futures and securities sold short, of Dreyfus Premier Total Return Advantage Fund (one of the fund’s comprising Advantage Funds, Inc.) as of October 31, 2007, and the related statements of operations for the year then ended and the changes in net assets and financial highlights for the periods indicated. These financial statements and financial highlights are the responsibility of the Fund’s management. Our responsibility is to express an opinion on these financial statements and financial highlights based on our audit.
We conducted our audit in accordance with the standards of the Public Company Accounting Oversight Board (United States).Those standards require that we plan and perform the audit to obtain reasonable assurance about whether the financial statements and financial highlights are free of material misstatement.We were not engaged to perform an audit of the Fund’s internal control over financial reporting. Our audit included consideration of internal control over financial reporting as a basis for designing audit procedures that are appropriate in the circumstances, but not for the purpose of expressing an opinion on the effectiveness of the Fund’s internal control over financial reporting. Accordingly, we express no such opinion.An audit includes examining, on a test basis, evidence supporting the amounts and disclosures in the financial statements and financial highlights, assessing the accounting principles used and significant estimates made by management, and evaluating the overall financial statement presentation. Our procedures included confirmation of securities owned as of October 31, 2007 by correspondence with the custodian and others.We believe that our audit provides a reasonable basis for our opinion.
In our opinion, the financial statements and financial highlights referred to above present fairly, in all material respects, the financial position of Dreyfus Premier Total Return Advantage Fund at October 31, 2007, and the results of its operations for the year then ended and the changes in its net assets and the financial highlights for the indicated periods, in conformity with U.S. generally accepted accounting principles.

| | New York, New York
December 20, 2007
|
The Fund 35
IMPORTANT TAX INFORMATION (Unaudited)
For federal tax purposes, the fund hereby designates 99.69% of ordinary dividends paid during the fiscal year ended October 31, 2007 as qualifying for “interest related dividends. Also, the fund hereby designates $.0600 per share as a long-term capital gain distribution and $.0258 per share as a short-term capital gain distribution paid on December 28, 2006.
36
BOARD MEMBERS INFORMATION (Unaudited)
| Joseph S. DiMartino (64) |
| Chairman of the Board (1995) |
| Principal Occupation During Past 5 Years: |
| • Corporate Director and Trustee |
| Other Board Memberships and Affiliations: |
| • The Muscular Dystrophy Association, Director |
| • Century Business Services, Inc., a provider of outsourcing functions for small and medium size |
| companies, Director |
| • The Newark Group, a provider of a national market of paper recovery facilities, paperboard |
| mills and paperboard converting plants, Director |
| • Sunair Services Corporation, a provider of certain outdoor-related services to homes and |
| businesses, Director |
| No. of Portfolios for which Board Member Serves: 165 |
| Peggy C. Davis (64) |
| Board Member (2006) |
| Principal Occupation During Past 5 Years: |
| • Shad Professor of Law, New York University School of Law (1983-present) |
| • Writer and teacher in the fields of evidence, constitutional theory, family law, social sciences |
| and the law, legal process and professional methodology and training |
| No. of Portfolios for which Board Member Serves: 65 |
| David P. Feldman (67) |
| Board Member (1996) |
| Principal Occupation During Past 5 Years: |
| • Corporate Director and Trustee |
| Other Board Memberships and Affiliations: |
| • BBH Mutual Funds Group (11 funds), Director |
| • The Jeffrey Company, a private investment company, Director |
| No. of Portfolios for which Board Member Serves: 49 |
The Fund 37
BOARD MEMBERS INFORMATION (Unaudited) (continued)
| James F. Henry (76) |
| Board Member (2006) |
| Principal Occupation During Past 5 Years: |
| • President,The International Institute for Conflict Prevention and Resolution, a non-profit |
| organization principally engaged in the development of alternatives to business litigation |
| (Retired 2003) |
| • Advisor to The Elaw Forum, a consultant on managing corporate legal costs |
| • Advisor to John Jay Homestead (the restored home of the first U.S. Chief Justice) |
| • Individual Trustee of several trusts |
| Other Board Memberships and Affiliations: |
| • Director, advisor and mediator involved in several non-profit organizations, primarily engaged |
| in domestic and international dispute resolution, and historic preservation |
| No. of Portfolios for which Board Member Serves: 40 |
| Ehud Houminer (67) |
| Board Member (1993) |
| Principal Occupation During Past 5 Years: |
| • Executive-in-Residence at the Columbia Business School, Columbia University |
| Other Board Memberships and Affiliations: |
| • Avnet Inc., an electronics distributor, Director |
| • International Advisory Board to the MBA Program School of Management, Ben Gurion |
| University, Chairman |
| No. of Portfolios for which Board Member Serves: 67 |
| Gloria Messinger (77) |
| Board Member (1993) |
| Principal Occupation During Past 5 Years: |
| • Arbitrator for American Arbitration Association and National Association of Securities Dealers, Inc. |
| • Consultant in Intellectual Property |
| Other Board Memberships and Affiliations: |
| • Theater for a New Audience, Inc., Director |
| • Brooklyn Philharmonic, Director |
| No. of Portfolios for which Board Member Serves: 40 |
38
| Dr. Martin Peretz (68) |
| Board Member (2006) |
| Principal Occupation During Past 5 Years: |
| • Editor-in-Chief of The New Republic Magazine |
| • Lecturer in Social Studies at Harvard University (1965-2002) |
| • Director of TheStreet.com, a financial information service on the web |
| Other Board Memberships and Affiliations: |
| • American Council of Trustees and Alumni, Director |
| • Pershing Square Capital Management, Adviser |
| • Montefiore Ventures, General Partner |
| • Harvard Center for Blood Research,Trustee |
| • Bard College,Trustee |
| • Board of Overseers of YIVO Institute for Jewish Research, Chairman |
| No. of Portfolios for which Board Member Serves: 40 |
| Anne Wexler (77) |
| Board Member (1996) |
| Principal Occupation During Past 5 Years: |
| • Chairman of the Wexler & Walker Public Policy Associates, consultants specializing in |
| government relations and public affairs from January 1981 to present |
| Other Board Memberships and Affiliations: |
| • Wilshire Mutual Funds (5 funds), Director |
| • The Community Foundation for the National Capital Region, Director |
| • Member of the Council of Foreign Relations |
| • Member of the National Park Foundation |
| No. of Portfolios for which Board Member Serves: 49 |
Once elected all Board Members serve for an indefinite term, but achieve Emeritus status upon reaching age 80.The address of the Board Members and Officers is in c/o The Dreyfus Corporation, 200 Park Avenue, New York, New York 10166. Additional information about the Board Members is available in the fund’s Statement of Additional Information which can be obtained from Dreyfus free of charge by calling this toll free number: 1-800-554-4611.
Dr. Paul A. Marks, Emeritus Board Member John M. Fraser, Jr., Emeritus Board Member
The Fund 39
OFFICERS OF THE FUND (Unaudited)
| J. DAVID OFFICER, President since |
| December 2006. |
| Chief Operating Officer,Vice Chairman and a |
| Director of the Manager, and an officer of 82 |
| investment companies (comprised of 165 |
| portfolios) managed by the Manager. He is 59 |
| years old and has been an employee of the |
| Manager since April 1998. |
| PHILLIP N. MAISANO, Executive Vice |
| President since July 2007. |
| Chief Investment Officer,Vice Chair and a |
| director of the Manager, and an officer of 82 |
| investment companies (comprised of 165 |
| portfolios) managed by the Manager. Mr. |
| Maisano also is an officer and/or Board |
| member of certain other investment |
| management subsidiaries of The Bank of New |
| York Mellon Corporation, each of which is an |
| affiliate of the Manager. He is 60 years old and |
| has been an employee of the Manager since |
| November 2006. Prior to joining the Manager, |
| Mr. Maisano served as Chairman and Chief |
| Executive Officer of EACM Advisors, an |
| affiliate of the Manager, since August 2004, and |
| served as Chief Executive Officer of Evaluation |
| Associates, a leading institutional investment |
| consulting firm, from 1988 until 2004. |
| MICHAEL A. ROSENBERG, Vice President |
| and Secretary since August 2005. |
| Associate General Counsel of the Manager, |
| and an officer of 83 investment companies |
| (comprised of 182 portfolios) managed by the |
| Manager. He is 47 years old and has been an |
| employee of the Manager since October 1991. |
| JAMES BITETTO, Vice President and |
| Assistant Secretary since August 2005. |
| Associate General Counsel and Secretary of |
| the Manager, and an officer of 83 investment |
| companies (comprised of 182 portfolios) |
| managed by the Manager. He is 41 years old |
| and has been an employee of the Manager |
| since December 1996. |
| JONI LACKS CHARATAN, Vice President |
| and Assistant Secretary since |
| August 2005. |
| Associate General Counsel of the Manager, |
| and an officer of 83 investment companies |
| (comprised of 182 portfolios) managed by the |
| Manager. She is 51 years old and has been an |
| employee of the Manager since October 1988. |
| JOSEPH M. CHIOFFI, Vice President and |
| Assistant Secretary since August 2005. |
| Associate General Counsel of the Manager, |
| and an officer of 83 investment companies |
| (comprised of 182 portfolios) managed by the |
| Manager. He is 45 years old and has been an |
| employee of the Manager since June 2000. |
| JANETTE E. FARRAGHER, Vice President |
| and Assistant Secretary since |
| August 2005. |
| Associate General Counsel of the Manager, |
| and an officer of 83 investment companies |
| (comprised of 182 portfolios) managed by the |
| Manager. She is 44 years old and has been an |
| employee of the Manager since February 1984. |
| JOHN B. HAMMALIAN, Vice President and |
| Assistant Secretary since August 2005. |
| Associate General Counsel of the Manager, |
| and an officer of 83 investment companies |
| (comprised of 182 portfolios) managed by the |
| Manager. He is 44 years old and has been an |
| employee of the Manager since February 1991. |
| ROBERT R. MULLERY, Vice President and |
| Assistant Secretary since August 2005. |
| Associate General Counsel of the Manager, |
| and an officer of 83 investment companies |
| (comprised of 182 portfolios) managed by the |
| Manager. He is 55 years old and has been an |
| employee of the Manager since May 1986. |
40
| JEFF PRUSNOFSKY, Vice President and |
| Assistant Secretary since August 2005. |
| Associate General Counsel of the Manager, |
| and an officer of 83 investment companies |
| (comprised of 182 portfolios) managed by the |
| Manager. He is 42 years old and has been an |
| employee of the Manager since October 1990. |
| JAMES WINDELS, Treasurer since |
| November 2001. |
| Director – Mutual Fund Accounting of the |
| Manager, and an officer of 83 investment |
| companies (comprised of 182 portfolios) |
| managed by the Manager. He is 49 years old |
| and has been an employee of the Manager |
| since April 1985. |
| ROBERT ROBOL, Assistant Treasurer |
| since August 2005. |
| Senior Accounting Manager – Money Market |
| and Municipal Bond Funds of the Manager, |
| and an officer of 83 investment companies |
| (comprised of 182 portfolios) managed by the |
| Manager. He is 43 years old and has been an |
| employee of the Manager since October 1988. |
| ROBERT SALVIOLO, Assistant Treasurer |
| since May 2007. |
| Senior Accounting Manager – Equity Funds of |
| the Manager, and an officer of 83 investment |
| companies (comprised of 182 portfolios) |
| managed by the Manager. He is 40 years old |
| and has been an employee of the Manager |
| since June 1989. |
| ROBERT SVAGNA, Assistant Treasurer |
| since December 2002. |
| Senior Accounting Manager – Equity Funds of |
| the Manager, and an officer of 83 investment |
| companies (comprised of 182 portfolios) |
| managed by the Manager. He is 40 years old |
| and has been an employee of the Manager |
| since November 1990. |
| GAVIN C. REILLY, Assistant Treasurer |
| since December 2005. |
| Tax Manager of the Investment Accounting |
| and Support Department of the Manager, and |
| an officer of 83 investment companies |
| (comprised of 182 portfolios) managed by the |
| Manager. He is 39 years old and has been an |
| employee of the Manager since April 1991. |
| JOSEPH W. CONNOLLY, Chief Compliance |
| Officer since October 2004. |
| Chief Compliance Officer of the Manager and |
| The Dreyfus Family of Funds (83 investment |
| companies, comprised of 182 portfolios). From |
| November 2001 through March 2004, Mr. |
| Connolly was first Vice-President, Mutual |
| Fund Servicing for Mellon Global Securities |
| Services. In that capacity, Mr. Connolly was |
| responsible for managing Mellon’s Custody, |
| Fund Accounting and Fund Administration |
| services to third-party mutual fund clients. He |
| is 50 years old and has served in various |
| capacities with the Manager since 1980, |
| including manager of the firm’s Fund |
| Accounting Department from 1997 through |
| October 2001. |
| WILLIAM GERMENIS, Anti-Money |
| Laundering Compliance Officer since |
| October 2002. |
| Vice President and Anti-Money Laundering |
| Compliance Officer of the Distributor, and the |
| Anti-Money Laundering Compliance Officer |
| of 79 investment companies (comprised of 178 |
| portfolios) managed by the Manager. He is 37 |
| years old and has been an employee of the |
| Distributor since October 1998. |
The Fund 41

Save time. Save paper. View your next shareholder report online as soon as it’s available. Log into www.dreyfus.com and sign up for Dreyfus eCommunications. It’s simple and only takes a few minutes.
The views expressed in this report reflect those of the portfolio manager only through the end of the period covered and do not necessarily represent the views of Dreyfus or any other person in the Dreyfus organization. Any such views are subject to change at any time based upon market or other conditions and Dreyfus disclaims any responsibility to update such views.These views may not be relied on as investment advice and, because investment decisions for a Dreyfus fund are based on numerous factors, may not be relied on as an indication of trading intent on behalf of any Dreyfus fund.
Not FDIC-Insured • Not Bank-Guaranteed • May Lose Value
| Contents |
| |
| | | THE FUND |
| |
|
| 2 | | A Letter from the CEO |
| 3 | | Discussion of Fund Performance |
| 6 | | Fund Performance |
| 8 | | Understanding Your Fund’s Expenses |
| 8 | | Comparing Your Fund’s Expenses |
| With Those of Other Funds |
| 9 | | Statement of Investments |
| 41 | | Statement of Financial Futures |
| 42 | | Statement of Assets and Liabilities |
| 43 | | Statement of Operations |
| 44 | | Statement of Changes in Net Assets |
| 46 | | Financial Highlights |
| 50 | | Notes to Financial Statements |
| 60 | | Report of Independent Registered |
| | | Public Accounting Firm |
| 61 | | Important Tax Information |
| 62 | | Board Members Information |
| 65 | | Officers of the Fund |
| |
| FOR MORE INFORMATION |
|
| | | Back Cover |

A LETTER FROM THE CEO
Dear Shareholder:
We are pleased to present this annual report for Global Alpha Fund, covering the 12-month period from November 1, 2006, through October 31, 2007.
After an extended period of steady gains, turmoil in U.S. credit markets over the summer of 2007 has led to heightened volatility in many international equity markets. Nonetheless, fundamentals in the global economy have remained relatively robust, particularly in the “Greater China” region, and recent rate cuts in the United States helped to sustain market rebounds in many regions of the world.
While we expect the global expansion to continue, it probably will do so at a slower rate as U.S. consumer spending moderates and as some high-flying emerging markets, notably China, take steps to reduce unsustainably high growth rates by tightening their respective monetary policies. However, the U.S. dollar has declined against most major currencies throughout most of the reporting period, making investments denominated in foreign currencies more valuable for U.S. residents. Lastly, a stubborn U.S. trade deficit and stronger economic growth in overseas markets continue to attract global capital away from U.S. markets and toward those with higher potential returns. As always, we encourage you to discuss these developments with your financial advisor, who can help you make any adjustments that may be right for your portfolio.
For information about how the fund performed during the reporting period, as well as market perspectives, we have provided a Discussion of Fund Performance given by the fund’s Portfolio Manager.
Thank you for your continued confidence and support.
2

DISCUSSION OF FUND PERFORMANCE
For the period of November 1, 2006, through October 31, 2007, as provided by Helen Potter, Portfolio Manager
Fund and Market Performance Overview
Despite headwinds from a slowing U.S. economy and a credit crisis that originated in the U.S. bond market’s sub-prime mortgage sector, international equities generally advanced due to robust economic growth, vigorous mergers-and-acquisitions (“M&A”) activity and strong corporate profit growth. The fund’s returns lagged its benchmark, primarily due to its underexposure to the currencies of certain commodity-exporting countries.
For the 12-month period ended October 31, 2007, Global Alpha Fund produced total returns of 9.53% for Class A shares, 8.80% for Class C shares, 9.86% for Class I shares and 9.26% for Class T shares.1 In comparison, the fund’s benchmark, a hybrid index comprised of 60% Morgan Stanley Capital International World Index (half-hedged) and 40% Citigroup World Government Bond Index 1+ World Index (half-hedged), produced a total return of 13.53% for the reporting period.2 Separately, the Morgan Stanley Capital International World Index (half-hedged) produced a total return of 17.98%, and the Citigroup World Government Bond Index 1+ World Index (half-hedged) produced a 6.88% total return for the same period.
The Fund’s Investment Approach
The fund seeks total return through investments in securities and instruments that provide exposure to global stock, bond and currency markets. The strategy utilizes a proprietary,fundamentals-based quantitative model to construct and optimally integrate a diverse set of four alpha-generating signals: stock markets vs. bond markets within each country, country allocation among equity markets, country allocation among sovereign bond markets, and currency allocation. Our quantitative investment approach is designed to identify and exploit these relative misvaluations across and within major developed capital markets such as the United States, Canada, Japan,Australia and Western Europe.
The Fund 3
DISCUSSION OF FUND PERFORMANCE (continued)
Strong Economic Growth Supported International Financial Markets
Accelerating economic growth across numerous geographic regions fueled gains in international equity markets.In Europe,impressive corporate earnings growth and ongoing M&A activity bolstered stock prices. However, U.S. equities did not keep pace as turmoil in the sub-prime mortgage market caused investors to reassess their attitudes toward risk. Concerns regarding the effects of lackluster consumer spending on the domestic economy also limited gains for U.S. stocks.
In this environment, global equities appeared more attractive to us than global bonds.Therefore,for the majority of the reporting period,the fund maintained heavier exposure to stronger-performing global equities, which benefited the fund’s returns.The fund’s overweighted allocation to Spanish and Hong Kong equities proved particularly advantageous. We had determined that these strong-performing markets were undervalued, both compared to global equity markets and relative to each country’s bond markets.
The fund also received robust contributions from foreign currencies. A larger relative weighting in the U.K. pound, New Zealand dollar and Japanese yen bolstered returns during the reporting period. Higher interest rates increased the attractiveness of the currencies of the United Kingdom and New Zealand, while overexposure to an undervalued yen proved favorable as Japan’s currency began appreciating over the summer.
Certain Currencies Weighed on Fund
However, the greatest detractor from fund performance was its underweighted exposure to the currencies of certain commodity-exporting countries. Strong oil and precious metal export prices helped support the economies of Australia, Norway and Canada. However, our analysis showed that the Australia dollar and Norwegian kroner were overvalued, and an underweighted position in these currencies proved detrimental. Canada’s interest rates relative to other economies made its currency appear unattractive to us. However, the Canadian dollar remained strong, valuing at parity with the U.S. dollar during the reporting period, its strongest valuation in decades.
Japanese equities also hurt the fund’s relative performance due to sluggish U.S. demand for Japanese imports, which was precipitated by a
4
slowing American economy and the credit crisis. Underexposure to German equity markets also worked against the fund. Our data showed that German equities were overvalued and less attractive than German bonds, but strong earnings growth and a more muted role by labor unions allowed German stocks to post greater gains than other European markets.
The Fund’s Primary Focus Is Long-Term Value
According to our quantitative models, Japan appears to be a desirable equity market relative to other global equity markets and to local Japanese bond returns. Australian bonds appear likely to outperform other bond markets and, in currency markets, the U.K. pound has remained attractive to us.We currently estimate that the U.S.dollar could be undervalued by as much as 15% and may appreciate in value in the near-term. Finally, we believe the Swiss franc is overvalued, and that U.K. bonds are unattractive when compared to expected returns in other bond markets and the equity risk premium in the United Kingdom.
In our view, these strategies position the fund well for today’s global economic and market environments. As always, we have maintained a strategy that focuses on the long-term horizon, making adjustments based not on short-term movements but on long-term value.
November 15, 2007
| | | Investing in foreign companies involves special risks, including changes in currency rates, |
| | | political, economic and social instability, a lack of comprehensive company information, |
| | | differing auditing and legal standards, and less market liquidity. An investment in this fund |
| | | should be considered only as a supplement to an overall investment program. |
| 1 | | Total return includes reinvestment of dividends and any capital gains paid, and does not take into |
| | | consideration the maximum initial sales charges in the case of Class A or Class T shares, or the |
| | | applicable contingent deferred sales charge imposed on redemptions in the case of Class C shares. |
| | | Had these charges been reflected, returns would have been lower. Past performance is no guarantee |
| | | of future results. Share price, yield and investment return fluctuate such that upon redemption, |
| | | fund shares may be worth more or less than their original cost. Return figures provided reflect the |
| | | absorption of certain fund expenses by The Dreyfus Corporation in effect through October 31, |
| | | 2007, at which time it was terminated. Had these expenses not been absorbed, the fund’s returns |
| | | would have been lower. |
| 2 | | SOURCES: Morgan Stanley Capital International and Citigroup – Reflects reinvestment of net |
| | | dividends and, where applicable, capital gain distributions.The Morgan Stanley Capital |
| | | International (MSCI) World Index is an unmanaged index of global stock market performance, |
| | | including the United States, Canada, Europe,Australia, New Zealand and the Far East.The |
| | | Citigroup World Government Bond Index includes the 22 government bond markets. |
The Fund 5
FUND PERFORMANCE
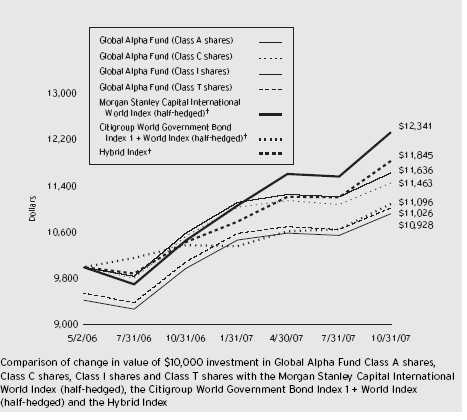
| † Source: FactSet |
| Past performance is not predictive of future performance. |
| The above graph compares a $10,000 investment made in Class A, Class C, Class I and Class T shares of Global |
| Alpha Fund on May 2, 2006 (inception date) to a $10,000 investment made on that date in each of the following: the |
| Morgan Stanley Capital International World Index (the “MSCI Index”) (half-hedged); the Citigroup World |
| Government Bond Index 1 + World Index (the “CWGB Index”) (half-hedged); and an unmanaged hybrid index |
| composed of 60% MSCI Index and 40% CWGB Index (the “Hybrid Index”) (half-hedged). Returns assume all |
| dividends and capital gain distributions are reinvested. |
| The fund invests primarily in instruments that provide exposure to global equity, bond and currency markets.The fund’s |
| performance shown in the line graph takes into account the maximum initial sales charge on Class A Shares, Class T |
| shares and all other applicable fees and expenses on all classes.The MSCI Index (half-hedged) is an unmanaged index |
| of global stock market performance, including the United States, Canada,Australia, New Zealand and the Far East and |
| includes net dividends reinvested.The CWGB Index (half-hedged) is an unmanaged index that tracks the performance |
| of 22 government bond markets.The indices do not take into account charges, fees and other expenses. Further |
| information relating to fund performance, including expense reimbursements, if applicable, is contained in the Financial |
| Highlights section of the prospectus and elsewhere in this report. |
6
| Average Annual Total Returns as of 10/31/07 | | | | |
| |
| | | Inception | | | | From |
| | | Date | | 1 Year | | Inception |
| |
| |
| |
|
| Class A shares | | | | | | |
| with maximum sales charge (5.75%) | | 5/2/06 | | 3.21% | | 6.10% |
| without sales charge | | 5/2/06 | | 9.53% | | 10.35% |
| Class C shares | | | | | | |
| with applicable redemption charge † | | 5/2/06 | | 7.80% | | 9.53% |
| without redemption | | 5/2/06 | | 8.80% | | 9.53% |
| Class I shares | | 5/2/06 | | 9.86% | | 10.63% |
| Class T shares | | | | | | |
| with applicable sales charge (4.5%) | | 5/2/06 | | 4.36% | | 6.73% |
| without sales charge | | 5/2/06 | | 9.26% | | 10.06% |
| Past performance is not predictive of future performance.The fund’s performance shown in the graph and table does not |
| reflect the deduction of taxes that a shareholder would pay on fund distributions or the redemption of fund shares. |
| † The maximum contingent deferred sales charge for Class C shares is 1% for shares redeemed within one year of the |
| date of purchase. |
The Fund 7
UNDERSTANDING YOUR FUND’S EXPENSES (Unaudited)
As a mutual fund investor, you pay ongoing expenses, such as management fees and other expenses. Using the information below, you can estimate how these expenses affect your investment and compare them with the expenses of other funds.You also may pay one-time transaction expenses, including sales charges (loads) and redemption fees, which are not shown in this section and would have resulted in higher total expenses. For more information, see your fund’s prospectus or talk to your financial adviser.
Review your fund’s expenses
The table below shows the expenses you would have paid on a $1,000 investment in Global Alpha Fund from May 1, 2007 to October 31, 2007. It also shows how much a $1,000 investment would be worth at the close of the period, assuming actual returns and expenses.
| Expenses and Value of a $1,000 Investment | | | | | | |
| assuming actual returns for the six months ended October 31, 2007 | | | | |
| | | Class A | | Class C | | Class I | | Class T |
| |
| |
| |
| |
|
| Expenses paid per $1,000 †† | | $ 7.22 | | $ 11.14 | | $ 5.84 | | $ 8.24 |
| Ending value (after expenses) | | $1,031.90 | | $1,027.70 | | $1,033.20 | | $1,030.50 |
| COMPARING YOUR FUND’S EXPENSES |
| WITH THOSE OF OTHER FUNDS (Unaudited) |
Using the SEC’s method to compare expenses
The Securities and Exchange Commission (SEC) has established guidelines to help investors assess fund expenses. Per these guidelines, the table below shows your fund’s expenses based on a $1,000 investment, assuming a hypothetical 5% annualized return. You can use this information to compare the ongoing expenses (but not transaction expenses or total cost) of investing in the fund with those of other funds.All mutual fund shareholder reports will provide this information to help you make this comparison. Please note that you cannot use this information to estimate your actual ending account balance and expenses paid during the period.
| Expenses and Value of a $1,000 Investment | | | | | | |
| assuming a hypothetical 5% annualized return for the six months ended October 31, 2007 |
| | | Class A | | Class C | | Class I | | Class T |
| |
| |
| |
| |
|
| Expenses paid per $1,000 †† | | $ 7.17 | | $ 11.07 | | $ 5.80 | | $ 8.19 |
| Ending value (after expenses) | | $1,018.10 | | $1,014.22 | | $1,019.46 | | $1,017.09 |
† Expenses are equal to the fund’s annualized expense ratio of 1.41% for Class A, 2.18% for Class C, 1.14% for Class I and 1.61% for Class T, multiplied by the average account value over the period, multiplied by 184/365 (to reflect the one-half year period).
8
| STATEMENT OF INVESTMENTS |
| October 31, 2007 |
| Common Stocks—37.8% | | Shares | | | | Value ($) |
| |
| |
| |
|
| Austria—.2% | | | | | | |
| Andritz | | 520 | | | | 38,195 |
| Erste Bank der Oesterreichischen Sparkassen | | 1,603 | | | | 129,872 |
| IMMOEAST | | 3,657 a | | | | 44,442 |
| IMMOFINANZ | | 3,449 | | | | 40,917 |
| Meinl European Land | | 2,613 a | | | | 36,594 |
| OMV | | 1,535 | | | | 114,613 |
| Raiffeisen International Bank-Holding | | 353 | | | | 58,271 |
| Telekom Austria | | 2,985 | | | | 85,507 |
| Verbund-Oesterreichische | | | | | | |
| Elektrizitaetswirtschafts, Cl. A | | 759 | | | | 50,084 |
| Voestalpine | | 1,110 | | | | 99,678 |
| Wiener Staedtische Versicherung | | 354 | | | | 26,068 |
| Wienerberger | | 726 | | | | 45,165 |
| | | | | | | 769,406 |
| Belgium—.4% | | | | | | |
| AGFA-Gevaert | | 1,266 | | | | 17,565 |
| Bekaert | | 176 | | | | 24,185 |
| Belgacom | | 1,635 | | | | 78,036 |
| Colruyt | | 205 | | | | 43,791 |
| Delhaize Group | | 735 | | | | 69,618 |
| Dexia | | 4,616 | | | | 147,855 |
| Fortis | | 17,906 | | | | 571,475 |
| Groupe Bruxelles Lambert | | 738 | | | | 94,129 |
| Groupe Bruxelles Lambert (Strip) | | 31 a | | | | 1 |
| InBev | | 1,682 | | | | 158,563 |
| KBC Groep | | 1,596 | �� | | | 223,282 |
| Mobistar | | 324 | | | | 29,278 |
| Solvay | | 597 | | | | 90,612 |
| UCB | | 999 | | | | 58,564 |
| Umicore | | 262 | | | | 65,196 |
| | | | | | | 1,672,150 |
| Bermuda—.4% | | | | | | |
| Accenture, Cl. A | | 5,476 | | | | 213,838 |
| ACE | | 3,037 | | | | 184,073 |
| Axis Capital Holdings | | 1,327 | | | | 52,735 |
| Covidien | | 4,567 | | | | 189,987 |
The Fund 9
STATEMENT OF INVESTMENTS (continued)
| Common Stocks (continued) | | Shares | | Value ($) |
| |
| |
|
| Bermuda (continued) | | | | |
| Everest Re Group | | 599 | | 63,817 |
| Ingersoll-Rand, Cl. A | | 2,798 | | 140,879 |
| Marvell Technology Group | | 4,683 a | | 84,434 |
| Nabors Industries | | 2,650 a | | 74,412 |
| PartnerRe | | 460 | | 38,295 |
| RenaissanceRe Holdings | | 560 | | 32,670 |
| Tyco Electronics | | 4,577 | | 163,262 |
| Tyco International | | 4,562 | | 187,818 |
| Weatherford International | | 3,113 a | | 202,065 |
| XL Capital, Cl. A | | 1,629 | | 117,207 |
| | | | | 1,745,492 |
| Canada—.0% | | | | |
| Tim Hortons | | 1,906 | | 72,237 |
| Cayman Islands—.1% | | | | |
| Garmin | | 1,111 | | 119,321 |
| Seagate Technology | | 5,056 | | 140,759 |
| | | | | 260,080 |
| Denmark—.3% | | | | |
| AP Moller—Maersk, Cl. B | | 11 | | 151,596 |
| Carlsberg, Cl. B | | 329 | | 44,255 |
| Coloplast, Cl. B | | 271 | | 26,196 |
| Danisco | | 417 | | 32,053 |
| Danske Bank | | 3,463 | | 152,418 |
| DSV | | 2,023 | | 53,404 |
| FLSmidth & Co. | | 523 | | 56,646 |
| GN Store Nord | | 1,864 a | | 19,809 |
| Jyske Bank | | 547 a | | 45,018 |
| NKT Holding | | 293 | | 31,906 |
| Novo Nordisk, Cl. B | | 2,126 | | 263,282 |
| Novozymes, Cl. B | | 471 | | 51,197 |
| Sydbank | | 599 | | 27,527 |
| Topdanmark | | 179 a | | 30,506 |
| TrygVesta | | 274 | | 21,699 |
| Vestas Wind Systems | | 1,717 a | | 152,975 |
| William Demant Holding | | 266 a | | 24,344 |
| | | | | 1,184,831 |
10
| Common Stocks (continued) | | Shares | | Value ($) |
| |
| |
|
| Finland—.6% | | | | |
| Amer Sports, Cl. A | | 1,079 | | 28,661 |
| Elisa | | 1,470 | | 43,534 |
| Fortum | | 3,962 | | 171,559 |
| Kesko, Cl. B | | 671 | | 40,073 |
| Kone, Cl. B | | 781 | | 64,484 |
| Konecranes | | 778 | | 34,780 |
| Metso | | 1,241 | | 75,336 |
| Neste Oil | | 1,236 | | 44,365 |
| Nokia | | 35,668 | | 1,411,333 |
| Nokian Renkaat | | 1,056 | | 39,722 |
| OKO Bank, Cl. A | | 1,013 | | 21,690 |
| Orion, Cl. B | | 929 | | 23,816 |
| Outokumpu | | 1,157 | | 43,103 |
| Rautaruukki | | 854 | | 48,803 |
| Sampo, Cl. A | | 3,880 | | 121,418 |
| Sanoma-WSOY | | 938 | | 27,046 |
| Stora Enso, Cl. R | | 5,146 | | 94,253 |
| Tietoenator | | 832 | | 20,379 |
| UPM-Kymmene | | 4,546 | | 101,614 |
| Uponor | | 717 | | 18,713 |
| Wartsila, Cl. B | | 661 | | 53,935 |
| YIT | | 1,350 | | 41,504 |
| | | | | 2,570,121 |
| Greece—.2% | | | | |
| Alpha Bank | | 3,490 | | 128,955 |
| Coca-Cola Hellenic Bottling | | 1,067 | | 66,131 |
| Cosmote Mobile Communications | | 1,200 | | 41,493 |
| EFG Eurobank Ergasias | | 2,996 | | 116,424 |
| Hellenic Petroleum | | 1,214 | | 18,898 |
| Hellenic Telecommunications Organization | | 3,434 | | 125,495 |
| National Bank of Greece | | 3,714 | | 257,808 |
| OPAP | | 2,079 | | 84,820 |
| Piraeus Bank | | 3,072 | | 123,021 |
| Public Power | | 1,195 | | 48,374 |
| Titan Cement | | 488 | | 23,764 |
| | | | | 1,035,183 |
The Fund 11
STATEMENT OF INVESTMENTS (continued)
| Common Stocks (continued) | | Shares | | Value ($) |
| |
| |
|
| Ireland—.2% | | | | |
| Allied Irish Banks | | 7,584 | | 189,160 |
| Bank of Ireland | | 5,127 | | 94,499 |
| Bank of Ireland | | 3,626 | | 66,833 |
| C & C Group | | 3,158 | | 25,495 |
| CRH | | 5,031 | | 191,573 |
| DCC | | 1,007 | | 27,025 |
| Elan | | 4,174 a | | 98,523 |
| Grafton Group (Units) | | 3,543 a | | 39,418 |
| IAWS Group | | 1,393 | | 32,836 |
| Independent News & Media | | 7,864 | | 28,841 |
| Kerry Group, Cl. A | | 1,517 | | 46,001 |
| Kingspan Group | | 1,552 | | 36,822 |
| | | | | 877,026 |
| Japan—5.9% | | | | |
| 77 Bank | | 4,000 | | 27,033 |
| Acom | | 870 | | 20,794 |
| Aderans Holdings | | 800 | | 12,881 |
| Advantest | | 1,600 | | 46,016 |
| Aeon | | 5,900 | | 92,533 |
| Aiful | | 1,150 | | 27,155 |
| Aisin Seiki | | 1,800 | | 73,701 |
| Ajinomoto | | 6,000 | | 67,451 |
| All Nippon Airways | | 8,000 | | 30,826 |
| Alps Electric | | 2,900 | | 36,292 |
| Amada | | 3,000 | | 30,430 |
| Aoyama Trading | | 600 | | 15,612 |
| Asahi Breweries | | 4,100 | | 67,850 |
| Asahi Glass | | 9,000 | | 123,787 |
| Asatsu-DK | | 800 | | 26,742 |
| Ashai Kasei | | 10,000 | | 76,111 |
| Astellas Pharma | | 4,900 | | 216,719 |
| Autobacs Seven | | 700 | | 16,226 |
| Bank of Kyoto | | 3,000 | | 38,260 |
| Bank of Yokohama | | 11,000 | | 77,694 |
| Benesse | | 800 | | 29,848 |
| Bridgestone | | 5,700 | | 126,107 |
| Canon | | 9,600 | | 485,405 |
12
| Common Stocks (continued) | | Shares | | Value ($) |
| |
| |
|
| Japan (continued) | | | | |
| Casio Computer | | 2,900 | | 27,300 |
| Central Japan Railway | | 14 | | 144,835 |
| Chiba Bank | | 8,000 | | 64,092 |
| Chiyoda | | 2,000 | | 37,073 |
| Chubu Electric Power | | 6,100 | | 156,320 |
| Chugai Pharmaceutical | | 2,800 | | 48,495 |
| Circle K Sunkus | | 1,100 | | 16,819 |
| Citizen Holdings | | 3,800 | | 40,978 |
| COMSYS Holdings | | 3,000 | | 29,358 |
| Credit Saison | | 1,900 | | 60,314 |
| CSK HOLDINGS | | 700 | | 27,498 |
| Dai Nippon Printing | | 6,000 | | 87,077 |
| Daicel Chemical Industries | | 3,000 | | 22,197 |
| Daido Steel | | 5,000 | | 34,018 |
| Daifuku | | 1,000 | | 11,914 |
| Daiichi Sankyo | | 6,400 | | 182,178 |
| Daikin Industries | | 2,400 | | 120,590 |
| Dainippon Ink and Chemicals | | 8,000 | | 38,298 |
| Daito Trust Construction | | 800 | | 37,082 |
| Daiwa House Industry | | 4,000 | | 57,007 |
| Daiwa Securities Group | | 13,000 | | 125,303 |
| Denki Kagaku Kogyo | | 8,000 | | 47,013 |
| Denso | | 4,300 | | 173,890 |
| Dentsu | | 20 | | 52,450 |
| Dowa Holdings | | 3,000 | | 34,975 |
| East Japan Railway | | 31 | | 255,371 |
| Eisai | | 2,300 | | 96,543 |
| Electric Power Development | | 1,500 | | 59,504 |
| Elpida Memory | | 1,000 a | | 34,113 |
| FamilyMart | | 1,200 | | 35,023 |
| Fanuc | | 1,700 | | 186,201 |
| Fast Retailing | | 500 | | 28,758 |
| Fuji Electric Holdings | | 7,000 | | 26,501 |
| FUJIFILM Holdings | | 4,500 | | 215,171 |
| Fujikura | | 5,000 | | 32,166 |
| Fujitsu | | 17,000 | | 134,112 |
| Fukuoka Financial Group | | 8,000 | | 51,462 |
The Fund 13
STATEMENT OF INVESTMENTS (continued)
| Common Stocks (continued) | | Shares | | Value ($) |
| |
| |
|
| Japan (continued) | | | | |
| Furukawa Electric | | 6,000 | | 28,786 |
| Glory | | 1,100 | | 36,611 |
| Gunma Bank | | 5,000 | | 35,527 |
| Hankyu Hashin Holdings | | 12,000 | | 56,289 |
| Haseko | | 10,500 a | | 25,240 |
| Hirose Electric | | 300 | | 35,897 |
| Hitachi | | 31,000 | | 210,492 |
| Hitachi Construction Machinery | | 1,200 | | 49,036 |
| Hokkaido Electric Power | | 2,000 | | 43,111 |
| Hokuhoku Financial Group | | 12,000 | | 37,023 |
| Honda Motor | | 14,100 | | 528,743 |
| HOYA | | 3,900 | | 141,841 |
| Ibiden | | 1,200 | | 102,044 |
| IHI CORPORATION | | 12,000 | | 28,702 |
| INPEX Holdings | | 8 | | 86,732 |
| Isetan | | 1,900 | | 25,645 |
| Itochu | | 14,000 | | 178,363 |
| J Front Retailing Co. | | 4,200 | | 37,707 |
| Jafco | | 600 | | 24,607 |
| Japan Real Estate Investment | | 5 | | 61,826 |
| Japan Retail Fund Investment | | 4 | | 29,632 |
| Japan Steel Works | | 4,000 | | 65,681 |
| Japan Tobacco | | 41 | | 238,794 |
| JFE Holdings, Inc. | | 5,200 | | 303,978 |
| JGC | | 2,000 | | 40,115 |
| Joyo Bank | | 7,000 | | 43,302 |
| JS Group | | 2,400 | | 38,804 |
| JSR | | 1,700 | | 44,028 |
| JTEKT | | 1,700 | | 32,471 |
| Kajima | | 9,000 | | 31,871 |
| Kaneka | | 3,000 | | 26,607 |
| Kansai Electric Power | | 6,900 | | 155,406 |
| Kao | | 5,000 | | 143,520 |
| Kawasaki Heavy Industries | | 13,000 | | 47,344 |
| Kawasaki Kisen Kaisha | | 5,000 | | 69,340 |
| KDDI | | 23 | | 174,232 |
| Keihin Electric Express Railway | | 6,000 | | 36,764 |
14
| Common Stocks (continued) | | Shares | | Value ($) |
| |
| |
|
| Japan (continued) | | | | |
| Keio | | 7,000 | | 42,608 |
| Keyence | | 300 | | 69,131 |
| Kintetsu | | 18,000 | | 54,727 |
| Kirin Holdings | | 8,000 | | 111,887 |
| Kobe Steel | | 24,000 | | 86,211 |
| Kokuyo | | 2,000 | | 17,621 |
| Komatsu | | 8,000 | | 268,186 |
| Konami | | 1,200 | | 35,539 |
| Konica Minolta Holdings | | 4,500 | | 79,406 |
| Kubota | | 10,000 | | 84,146 |
| Kuraray | | 3,500 | | 45,451 |
| Kurita Water Industries | | 1,600 | | 53,204 |
| Kyocera | | 1,500 | | 127,110 |
| Kyowa Hakko Kogyo | | 4,000 | | 43,714 |
| Kyushu Electric Power | | 3,500 | | 85,281 |
| Leopalace21 | | 1,300 | | 41,769 |
| Makita | | 1,200 | | 58,052 |
| Marubeni | | 15,000 | | 128,483 |
| Marui Group | | 3,200 | | 33,230 |
| Matsumotokiyoshi Holdings | | 900 | | 15,965 |
| Matsushita Electric Industrial | | 18,000 | | 344,261 |
| Matsushita Electric Works | | 3,000 | | 33,137 |
| Mediceo Paltac Holdings | | 1,800 | | 26,186 |
| Meiji Dairies | | 4,000 | | 21,171 |
| Meitec | | 800 | | 23,549 |
| Millea Holdings | | 6,600 | | 260,131 |
| Minebea | | 5,000 | | 34,640 |
| Mitsubishi | | 12,300 | | 382,655 |
| Mitsubishi Chemical Holdings | | 10,000 | | 82,542 |
| Mitsubishi Electric | | 18,000 | | 218,479 |
| Mitsubishi Estate | | 11,000 | | 328,904 |
| Mitsubishi Gas Chemical | | 4,000 | | 40,198 |
| Mitsubishi Heavy Industries | | 29,000 | | 169,330 |
| Mitsubishi Materials | | 10,000 | | 58,643 |
| Mitsubishi Rayon | | 5,000 | | 28,325 |
| Mitsubishi Tanabe Pharma Corporation | | 3,000 | | 34,482 |
| Mitsubishi UFJ Financial Group | | 78,560 | | 783,117 |
The Fund 15
STATEMENT OF INVESTMENTS (continued)
| Common Stocks (continued) | | Shares | | Value ($) |
| |
| |
|
| Japan (continued) | | | | |
| Mitsui & Co. | | 15,000 | | 390,224 |
| Mitsui Chemicals | | 6,000 | | 56,206 |
| Mitsui Engineering & Shipbuilding | | 9,000 | | 52,780 |
| Mitsui Fudosan | | 8,000 | | 221,028 |
| Mitsui Mining & Smelting | | 6,000 | | 25,428 |
| Mitsui OSK Lines | | 10,000 | | 165,197 |
| Mitsui Sumitomo Insurance | | 11,000 | | 125,527 |
| Mitsui Trust Holdings | | 7,000 | | 55,949 |
| Mitsukoshi | | 7,000 | | 32,486 |
| Mizuho Financial Group | | 90 | | 506,155 |
| Murata Manufacturing | | 2,000 | | 121,300 |
| Namco Bandai Holdings | | 2,300 | | 35,341 |
| NEC | | 19,000 | | 94,504 |
| NGK Insulators | | 3,000 | | 106,162 |
| NGK Spark Plug | | 2,000 | | 33,547 |
| Nidec | | 1,100 | | 82,887 |
| Nikon | | 3,000 | | 95,778 |
| Nintendo | | 900 | | 567,541 |
| Nippon Building Fund | | 5 | | 72,543 |
| Nippon Electric Glass | | 3,000 | | 50,868 |
| Nippon Express | | 8,000 | | 40,045 |
| Nippon Light Metal | | 8,000 | | 16,466 |
| Nippon Meat Packers | | 3,000 | | 30,296 |
| Nippon Mining Holdings | | 8,000 | | 75,411 |
| Nippon Oil | | 12,000 | | 106,559 |
| Nippon Paper Group | | 9 | | 27,039 |
| Nippon Sheet Glass | | 6,000 | | 36,430 |
| Nippon Steel | | 52,000 | | 344,983 |
| Nippon Telegraph & Telephone | | 47 | | 215,516 |
| Nippon Yusen | | 10,000 | | 103,249 |
| Nishi-Nippon City Bank | | 7,000 | | 20,756 |
| Nissan Chemical Industries | | 3,000 | | 41,326 |
| Nissan Motor | | 20,600 | | 237,516 |
| Nisshin Steel | | 8,000 | | 30,756 |
| Nissin Food Products | | 1,000 | | 31,415 |
| Nitto Denko | | 1,500 | | 73,217 |
| Nomura Holdings | | 16,200 | | 288,831 |
16
| Common Stocks (continued) | | Shares | | Value ($) |
| |
| |
|
| Japan (continued) | | | | |
| Nomura Real Estate Office Fund | | 3 | | 30,253 |
| Nomura Research Institute | | 1,200 | | 42,242 |
| NSK | | 4,000 | | 35,590 |
| NTN | | 4,000 | | 38,061 |
| NTT Data | | 12 | | 54,531 |
| NTT DoCoMo | | 147 | | 213,188 |
| Obayashi | | 6,000 | | 30,224 |
| Odakyu Electric Railway | | 8,000 | | 55,991 |
| OJI Paper | | 7,000 | | 32,049 |
| OKUMA | | 2,000 | | 28,285 |
| Olympus | | 2,000 | | 83,694 |
| Omron | | 2,100 | | 51,448 |
| Oriental Land | | 700 | | 41,567 |
| ORIX | | 860 | | 175,140 |
| Osaka Gas | | 20,000 | | 77,801 |
| Promise | | 950 | | 28,538 |
| Rakuten | | 69 | | 33,639 |
| Resona Holdings | | 53 | | 94,049 |
| Ricoh | | 6,000 | | 118,368 |
| Rohm | | 1,000 | | 87,463 |
| Ryohin Keikaku | | 500 | | 31,504 |
| Sankyo | | 700 | | 29,857 |
| Sanwa Holdings | | 3,000 | | 15,806 |
| Sanyo Electric | | 20,000 a | | 33,007 |
| Sapporo Hokuyo Holdings | | 4 | | 41,154 |
| SBI Holdings | | 86 | | 27,124 |
| Secom | | 2,000 | | 102,719 |
| Sega Sammy Holdings | | 2,100 | | 28,924 |
| Seiko Epson | | 1,300 | | 30,952 |
| Sekisui Chemical | | 4,000 | | 27,335 |
| Sekisui House | | 4,000 | | 51,173 |
| Seven & I Holdings | | 7,200 | | 185,501 |
| Sharp | | 9,000 | | 141,791 |
| Shimachu | | 700 | | 20,059 |
| Shimamura | | 300 | | 29,184 |
| Shimizu | | 6,000 | | 31,335 |
| Shin-Etsu Chemical | | 3,600 | | 230,763 |
The Fund 17
STATEMENT OF INVESTMENTS (continued)
| Common Stocks (continued) | | Shares | | Value ($) |
| |
| |
|
| Japan (continued) | | | | |
| Shinsei Bank | | 16,000 | | 51,731 |
| Shionogi & Co. | | 3,000 | | 51,196 |
| Shiseido | | 3,000 | | 72,368 |
| Shizuoka Bank | | 6,000 | | 62,804 |
| Showa Denko | | 10,000 | | 39,021 |
| Showa Shell Sekiyu | | 2,900 | | 34,261 |
| SMC | | 500 | | 67,023 |
| Softbank | | 6,800 | | 158,646 |
| Sojitz | | 9,800 | | 45,055 |
| Sompo Japan Insurance | | 8,000 | | 93,444 |
| Sony | | 9,200 | | 454,852 |
| Stanley Electric | | 1,600 | | 35,539 |
| SUMCO | | 1,100 | | 40,047 |
| Sumitomo | | 9,700 | | 169,119 |
| Sumitomo Bakelite | | 5,000 | | 30,575 |
| Sumitomo Chemical | | 14,000 | | 124,252 |
| Sumitomo Electric Industries | | 6,500 | | 104,735 |
| Sumitomo Heavy Industries | | 5,000 | | 66,157 |
| Sumitomo Metal Industries | | 37,000 | | 182,448 |
| Sumitomo Metal Mining | | 5,000 | | 111,391 |
| Sumitomo Mitsui Financial Group | | 60 | | 489,932 |
| Sumitomo Realty & Development | | 4,000 | | 140,859 |
| Sumitomo Rubber Industries | | 2,900 | | 35,453 |
| Sumitomo Trust & Banking | | 12,000 | | 89,178 |
| Suruga Bank | | 2,000 | | 26,307 |
| Suzuken | | 900 | | 29,093 |
| T & D Holdings | | 1,850 | | 111,099 |
| Taiheiyo Cement | | 9,000 | | 28,248 |
| Taisei | | 9,000 | | 27,053 |
| Taisho Pharmaceutical | | 2,000 | | 38,492 |
| Taiyo Nippon Sanso | | 4,000 | | 35,568 |
| Taiyo Yuden | | 2,000 | | 33,172 |
| Takara Holdings | | 3,000 | | 17,609 |
| Takashimaya | | 3,000 | | 36,420 |
| Takeda Pharmaceutical | | 7,500 | | 468,449 |
| Takefuji | | 1,330 | | 34,012 |
18
| Common Stocks (continued) | | Shares | | Value ($) |
| |
| |
|
| Japan (continued) | | | | |
| TDK | | 1,200 | | 98,643 |
| Teijin | | 8,000 | | 38,576 |
| Terumo | | 1,600 | | 77,994 |
| THK | | 1,300 | | 28,611 |
| Tobu Railway | | 9,000 | | 42,448 |
| Tohoku Electric Power | | 4,000 | | 84,454 |
| Tokai Rika | | 800 | | 23,555 |
| Tokuyama | | 2,000 | | 28,081 |
| Tokyo Electric Power | | 11,000 | | 279,256 |
| Tokyo Electron | | 1,600 | | 93,716 |
| Tokyo Gas | | 21,000 | | 93,925 |
| Tokyo Tatemono | | 3,000 | | 38,502 |
| Tokyu | | 11,000 | | 71,459 |
| Tokyu Land | | 4,000 | | 41,237 |
| TonenGeneral Sekiyu | | 4,000 | | 40,396 |
| Toppan Printing | | 6,000 | | 58,590 |
| Toray Industries | | 12,000 | | 92,543 |
| Toshiba | | 28,000 | | 236,265 |
| Tosoh | | 6,000 | | 38,274 |
| TOTO | | 3,000 | | 21,724 |
| Toyo Seikan Kaisha | | 1,800 | | 32,593 |
| Toyota Industries | | 1,700 | | 72,666 |
| Toyota Motor | | 24,400 | | 1,394,878 |
| Toyota Tsusho | | 2,200 | | 61,565 |
| Trend Micro | | 1,500 | | 67,139 |
| Ube Industries | | 10,000 | | 35,835 |
| Uni-Charm | | 600 | | 35,759 |
| UNY�� | | 3,000 | | 25,945 |
| West Japan Railway | | 16 | | 80,039 |
| Yahoo! Japan | | 152 | | 67,478 |
| Yakult Honsha | | 1,300 | | 30,115 |
| Yamada Denki | | 800 | | 82,399 |
| Yamaha | | 1,900 | | 44,262 |
| Yamaha Motor | | 1,800 | | 51,272 |
| Yamato Holdings | | 4,000 | | 58,746 |
| Yaskawa Electric | | 3,000 | | 40,235 |
The Fund 19
STATEMENT OF INVESTMENTS (continued)
| Common Stocks (continued) | | Shares | | Value ($) |
| |
| |
|
| Japan (continued) | | | | |
| Yokogawa Electric | | 2,500 | | 31,562 |
| Zeon | | 3,000 | | 28,272 |
| | | | | 26,671,242 |
| Luxembourg—.0% | | | | |
| Oriflame Cosmetics | | 490 | | 29,580 |
| New Zealand—.0% | | | | |
| Auckland International Airport | | 19,141 | | 42,431 |
| Fletcher Building | | 5,808 | | 53,214 |
| Sky City Entertainment Group | | 7,890 | | 32,709 |
| Telecom of New Zealand | | 14,019 | | 46,995 |
| | | | | 175,349 |
| Norway—.3% | | | | |
| Acergy | | 1,852 | | 53,245 |
| Aker Kvaerner | | 1,785 | | 61,913 |
| DNB NOR | | 6,638 | | 108,964 |
| Frontline | | 598 | | 26,842 |
| Marine Harvest | | 24,155 a | | 24,373 |
| Norsk Hydro | | 7,636 | | 111,608 |
| Norske Skogindustrier | | 2,033 | | 22,248 |
| Orkla | | 7,958 | | 147,164 |
| Petroleum Geo-Services | | 1,588 | | 46,538 |
| Prosafe Se | | 2,146 | | 37,894 |
| Schibsted | | 645 | | 36,489 |
| SeaDrill | | 2,638 a | | 62,508 |
| Statoil Hydro | | 11,455 | | 385,855 |
| Storebrand | | 2,712 | | 38,532 |
| Telenor | | 7,659 a | | 178,997 |
| TGS Nopec Geophysical | | 1,149 a | | 19,181 |
| Yara International | | 1,930 | | 74,371 |
| | | | | 1,436,722 |
| Panama—.0% | | | | |
| McDermott International | | 2,074 a | | 126,638 |
| Portugal—.1% | | | | |
| Banco BPI | | 2,091 | | 18,272 |
| Banco Comercial Portugues, Cl. R | | 21,481 | | 103,799 |
| Banco Espirito Santo | | 2,213 | | 53,532 |
| Brisa-Auto Estradas de Portugal | | 3,020 | | 42,818 |
20
| Common Stocks (continued) | | Shares | | Value ($) |
| |
| |
|
| Portugal (continued) | | | | |
| Energias de Portugal | | 18,932 | | 121,611 |
| Portugal Telecom | | 6,626 | | 88,672 |
| PT Multimedia Servicos | | 1,167 | | 15,851 |
| Sonae | | 11,813 | | 34,523 |
| | | | | 479,078 |
| Singapore—.4% | | | | |
| Ascendas Real Estate Investment Trust | | 14,000 | | 25,028 |
| Capitacommercial Trust | | 14,000 | | 25,995 |
| CapitaLand | | 16,000 | | 89,948 |
| CapitaMall Trust | | 14,000 | | 35,368 |
| City Developments | | 6,000 | | 66,288 |
| ComfortDelgro | | 21,000 | | 28,243 |
| DBS Group Holdings | | 10,000 | | 156,021 |
| Flextronics International | | 10,060 a | | 123,839 |
| Fraser & Neave | | 4,000 | | 16,774 |
| Keppel | | 11,000 | | 113,361 |
| Keppel Land | | 5,000 | | 28,880 |
| Oversea-Chinese Banking | | 23,000 | | 147,639 |
| SembCorp Industries | | 10,000 | | 41,213 |
| Singapore Airlines | | 6,866 | | 93,622 |
| Singapore Exchange | | 9,000 | | 98,869 |
| Singapore Press Holdings | | 16,000 | | 50,895 |
| Singapore Technologies Engineering | | 15,000 | | 39,620 |
| Singapore Telecommunications | | 70,000 | | 198,584 |
| United Overseas Bank | | 11,000 | | 164,767 |
| Venture | | 4,000 | | 38,909 |
| | | | | 1,583,863 |
| Sweden—.7% | | | | |
| Alfa Laval | | 931 | | 73,618 |
| Assa Abloy, Cl. B | | 2,921 | | 61,073 |
| Atlas Copco, Cl. A | | 5,995 | | 100,135 |
| Atlas Copco, Cl. B | | 4,341 | | 67,560 |
| Boliden | | 2,756 | | 48,525 |
| Castellum | | 1,765 | | 22,336 |
| Electrolux, Ser. B | | 2,817 | | 54,360 |
| Elekta, Cl. B | | 960 | | 18,487 |
| Eniro | | 2,015 | | 25,737 |
The Fund 21
STATEMENT OF INVESTMENTS (continued)
| Common Stocks (continued) | | Shares | | Value ($ |
| |
| |
|
| Sweden (continued) | | | | |
| Eniro (Rights) | | 2,015 a | | 580 |
| Fabege | | 1,563 | | 18,551 |
| Getinge, Cl. B | | 1,644 | | 43,419 |
| Hennes & Mauritz, Cl. B | | 4,206 | | 279,690 |
| Holmen, Cl. B | | 391 | | 15,367 |
| Husqvarna, Cl. B | | 3,063 | | 36,836 |
| Kungsleden | | 1,530 | | 21,767 |
| Lundin Petroleum | | 2,300 a | | 27,570 |
| Modern Times Group, Cl. B | | 516 | | 36,219 |
| Nobia | | 1,743 | | 15,276 |
| Nordea Bank | | 18,018 | | 321,775 |
| OMX | | 955 | | 40,085 |
| Sandvik | | 8,746 | | 164,990 |
| Securitas, Cl. B | | 3,280 | | 41,380 |
| Skandinaviska Enskilda Banken, Cl. A | | 4,008 | | 122,551 |
| Skanska, Cl. B | | 3,655 | | 72,111 |
| SKF, Cl. B | | 4,010 | | 77,696 |
| Ssab Svenskt Stal, Ser. A | | 2,633 | | 85,268 |
| Svenska Cellulosa, Cl. B | | 4,404 | | 77,541 |
| Svenska Handelsbanken, Cl. A | | 4,023 | | 133,128 |
| Swedish Match | | 2,100 | | 46,879 |
| Tele2, Cl. B | | 3,036 | | 71,353 |
| Telefonaktiebolaget LM Ericsson, Cl. B | | 131,201 | | 391,885 |
| TeliaSonera | | 19,836 | | 194,896 |
| Trelleborg, Cl. B | | 1,024 | | 25,998 |
| Volvo, Cl. A | | 4,354 | | 84,361 |
| Volvo, Cl. B | | 9,641 | | 187,558 |
| | | | | 3,106,561 |
| United Kingdom—.0% | | | | |
| Willis Group Holdings | | 1,220 | | 51,643 |
| United States—28.0% | | | | |
| 3M | | 6,265 | | 541,045 |
| Abbott Laboratories | | 14,091 | | 769,650 |
| Abercrombie & Fitch, Cl. A | | 830 | | 65,736 |
| Activision | | 3,683 a | | 87,103 |
| ADC Telecommunications | | 1,195 a | | 22,347 |
| Adobe Systems | | 5,419 a | | 259,570 |
22
| Common Stocks (continued) | | Shares | | Value ($) |
| |
| |
|
| United States (continued) | | | | |
| Advance Auto Parts | | 850 | | 29,002 |
| Advanced Micro Devices | | 5,212 a | | 68,173 |
| AES | | 6,213 a | | 133,020 |
| Aetna | | 4,719 | | 265,066 |
| Affiliated Computer Services, Cl. A | | 740 a | | 37,488 |
| Aflac | | 4,505 | | 282,824 |
| Agilent Technologies | | 3,749 a | | 138,151 |
| Air Products & Chemicals | | 2,002 | | 195,896 |
| Akamai Technologies | | 1,395 a | | 54,670 |
| Alcoa | | 7,996 | | 316,562 |
| Allegheny Technologies | | 861 | | 87,968 |
| Alliant Energy | | 930 | | 37,200 |
| Allied Capital | | 1,230 | | 36,260 |
| Allstate | | 5,305 | | 277,982 |
| Alltel | | 3,186 | | 226,684 |
| Altera | | 3,342 | | 65,570 |
| Altria Group | | 19,214 | | 1,401,277 |
| Amazon.com | | 2,830 a | | 252,295 |
| AMB Property | | 1,008 | | 65,873 |
| Ambac Financial Group | | 1,022 | | 37,640 |
| Ameren | | 1,936 | | 104,660 |
| American Capital Strategies | | 1,629 | | 70,715 |
| American Eagle Outfitters | | 1,610 | | 38,286 |
| American Electric Power | | 3,690 | | 177,895 |
| American Express | | 9,788 | | 596,579 |
| American International Group | | 20,143 | | 1,271,426 |
| American Standard Cos. | | 1,729 | | 64,440 |
| American Tower, Cl. A | | 3,870 a | | 170,977 |
| Ameriprise Financial | | 2,185 | | 137,611 |
| AmerisourceBergen | | 1,799 | | 84,751 |
| Amgen | | 10,619 a | | 617,070 |
| Amphenol, Cl. A | | 1,695 | | 75,038 |
| Amylin Pharmaceuticals | | 1,050 a | | 47,271 |
| Anadarko Petroleum | | 4,277 | | 252,429 |
| Analog Devices | | 3,053 | | 102,153 |
| Anheuser-Busch Cos. | | 6,977 | | 357,781 |
| AON | | 2,465 | | 111,714 |
The Fund 23
STATEMENT OF INVESTMENTS (continued)
| Common Stocks (continued) | | Shares | | Value ($ |
| |
| |
|
| United States (continued) | | | | |
| Apache | | 3,048 | | 316,413 |
| Apartment Investment & Management, Cl. A | | 770 | | 35,982 |
| Apollo Group, Cl. A | | 1,381 a | | 109,458 |
| Apple | | 7,902 a | | 1,500,985 |
| Applera—Applied Biosystems Group | | 1,870 | | 69,452 |
| Applied Materials | | 12,724 | | 247,100 |
| Aqua America | | 1,317 | | 30,633 |
| Arch Coal | | 1,130 | | 46,330 |
| Archer-Daniels-Midland | | 5,434 | | 194,429 |
| Arrow Electronics | | 990 a | | 39,580 |
| Associated Banc-Corp | | 990 | | 28,571 |
| AT & T | | 56,278 | | 2,351,858 |
| Autodesk | | 2,148 a | | 105,037 |
| Automatic Data Processing | | 5,098 | | 252,657 |
| AutoNation | | 1,270 a | | 22,466 |
| AutoZone | | 380 a | | 47,276 |
| AvalonBay Communities | | 747 | | 91,620 |
| Avery Dennison | | 770 | | 44,583 |
| Avis Budget Group | | 1,038 a | | 21,663 |
| Avnet | | 1,424 a | | 59,409 |
| Avon Products | | 4,069 | | 166,748 |
| Baker Hughes | | 2,949 | | 255,737 |
| Ball | | 740 | | 36,689 |
| Bank of America | | 40,512 | | 1,955,919 |
| Baxter International | | 5,986 | | 359,220 |
| BB & T | | 5,008 | | 185,146 |
| BEA Systems | | 3,150 a | | 53,235 |
| Beckman Coulter | | 500 | | 35,410 |
| Becton, Dickinson & Co. | | 2,265 | | 189,037 |
| Bed Bath & Beyond | | 2,599 a | | 88,210 |
| Best Buy | | 3,768 | | 182,823 |
| Biogen Idec | | 2,653 a | | 197,489 |
| BJ Services | | 2,770 | | 69,776 |
| Black & Decker | | 683 | | 61,409 |
| BMC Software | | 1,909 a | | 64,601 |
| Boeing | | 6,844 | | 674,750 |
| Boston Properties | | 1,108 | | 120,041 |
24
| Common Stocks (continued) | | Shares | | Value ($) |
| |
| |
|
| United States (continued) | | | | |
| Boston Scientific | | 12,355 a | | 171,364 |
| Brinker International | | 990 | | 25,136 |
| Bristol-Myers Squibb | | 18,031 | | 540,750 |
| Broadcom, Cl. A | | 4,339 a | | 141,234 |
| Broadridge Financial Solutions | | 1,401 | | 28,020 |
| Brown & Brown | | 1,186 | | 29,875 |
| Brown-Forman, Cl. B | | 430 | | 31,811 |
| Brunswick | | 930 | | 20,748 |
| Bunge | | 1,126 | | 129,704 |
| Burlington Northern Santa Fe | | 3,278 | | 285,678 |
| C.R. Bard | | 973 | | 81,353 |
| CA | | 3,956 | | 104,636 |
| Cablevision Systems (NY Group), Cl. A | | 2,170 a | | 63,646 |
| Cadence Design Systems | | 2,654 a | | 52,018 |
| Camden Property Trust | | 460 | | 28,681 |
| Cameron International | | 1,031 a | | 100,378 |
| Campbell Soup | | 2,204 | | 81,504 |
| Capital One Financial | | 3,825 | | 250,882 |
| Cardinal Health | | 3,548 | | 241,370 |
| Career Education | | 953 a | | 34,060 |
| CarMax | | 1,720 a | | 35,896 |
| Carnival | | 4,030 | | 193,359 |
| Caterpillar | | 5,872 | | 438,110 |
| CB Richard Ellis Group, Cl. A | | 1,966 a | | 47,931 |
| CBS, Cl. B | | 5,900 | | 169,330 |
| Celgene | | 3,500 a | | 231,000 |
| CenterPoint Energy | | 2,380 | | 39,889 |
| Centex | | 950 | | 23,807 |
| Cephalon | | 638 a | | 47,046 |
| Ceridian | | 1,120 a | | 40,253 |
| Charles River Laboratories International | | 550 a | | 31,900 |
| Charles Schwab | | 9,030 | | 209,857 |
| CheckFree | | 737 a | | 35,030 |
| Chesapeake Energy | | 4,062 | | 160,368 |
| Chevron | | 19,624 | | 1,795,792 |
| Chico’s FAS | | 1,410 a | | 18,527 |
| ChoicePoint | | 650 a | | 25,558 |
The Fund 25
STATEMENT OF INVESTMENTS (continued)
| Common Stocks (continued) | | Shares | | Value ($) |
| |
| |
|
| United States (continued) | | | | |
| Chubb | | 3,708 | | 197,822 |
| CIGNA | | 2,854 | | 149,806 |
| Cimarex Energy | | 680 | | 27,547 |
| Cincinnati Financial | | 1,467 | | 58,357 |
| Cintas | | 1,110 | | 40,626 |
| Cisco Systems | | 55,436 a | | 1,832,714 |
| CIT Group | | 1,914 | | 67,449 |
| Citigroup | | 45,154 | | 1,891,953 |
| Citrix Systems | | 1,710 a | | 73,513 |
| Clear Channel Communications | | 4,369 | | 165,017 |
| Clorox | | 1,426 | | 89,225 |
| CME Group | | 453 | | 301,811 |
| Coach | | 3,438 a | | 125,693 |
| Coca-Cola | | 18,999 | | 1,173,378 |
| Cognizant Technology Solutions, Cl. A | | 2,684 a | | 111,279 |
| Colonial BancGroup | | 1,230 | | 23,591 |
| Comcast, Cl. A | | 18,025 a | | 379,426 |
| Comcast, Cl. A (Special) | | 9,536 a | | 199,016 |
| Comerica | | 1,470 | | 68,620 |
| Commerce Bancorp/NJ | | 1,724 | | 70,253 |
| Community Health Systems | | 770 a | | 25,356 |
| Computer Sciences | | 1,624 a | | 94,825 |
| Compuware | | 3,269 a | | 32,690 |
| ConAgra Foods | | 4,643 | | 110,178 |
| Consol Energy | | 1,714 | | 96,841 |
| Consolidated Edison | | 2,521 | | 118,714 |
| Constellation Brands, Cl. A | | 1,690 a | | 42,453 |
| Constellation Energy Group | | 1,674 | | 158,528 |
| Cooper Cos. | | 456 | | 19,152 |
| Cooper Industries, Cl. A | | 1,747 | | 91,525 |
| Corning | | 14,441 | | 350,483 |
| Costco Wholesale | | 4,113 | | 276,640 |
| Countrywide Financial | | 5,537 | | 85,934 |
| Covance | | 520 a | | 42,900 |
| Coventry Health Care | | 1,467 a | | 88,475 |
| Crown Castle International | | 2,530 a | | 103,907 |
| CSX | | 4,047 | | 181,184 |
26
| Common Stocks (continued) | | Shares | | Value ($) |
| |
| |
|
| United States (continued) | | | | |
| Cummins | | 922 | | 110,603 |
| CVS | | 14,328 | | 598,481 |
| D.R. Horton | | 2,190 | | 27,791 |
| Danaher | | 2,286 | | 195,842 |
| Darden Restaurants | | 1,070 | | 46,010 |
| DaVita | | 1,000 a | | 65,190 |
| Dean Foods | | 1,080 | | 29,992 |
| Deere & Co. | | 2,086 | | 323,121 |
| Dell | | 19,770 a | | 604,962 |
| Denbury Resources | | 970 a | | 54,902 |
| Dentsply International | | 1,160 | | 48,117 |
| Developers Diversified Realty | | 1,183 | | 59,623 |
| Devon Energy | | 3,885 | | 362,859 |
| Diamond Offshore Drilling | | 654 | | 74,052 |
| DIRECTV Group | | 6,798 a | | 180,011 |
| Discover Financial Services | | 4,488 | | 86,618 |
| Discovery Holding, Cl. A | | 2,536 a | | 72,301 |
| Dominion Resources/VA | | 2,683 | | 245,843 |
| Domtar | | 4,030 a | | 34,577 |
| Dover | | 1,915 | | 88,090 |
| Dow Chemical | | 8,750 | | 394,100 |
| Dow Jones & Co. | | 470 | | 28,111 |
| DST Systems | | 430 a | | 36,425 |
| DTE Energy | | 1,658 | | 82,237 |
| Duke Energy | | 11,617 | | 222,698 |
| Duke Realty | | 1,387 | | 44,592 |
| Dun & Bradstreet | | 480 | | 46,488 |
| Dynergy, Cl. A | | 4,765 a | | 43,886 |
| E*TRADE FINANCIAL | | 3,380 a | | 37,653 |
| E.I. du Pont de Nemours & Co. | | 8,474 | | 419,548 |
| Eastman Kodak | | 2,716 | | 77,841 |
| Eaton | | 1,361 | | 126,001 |
| eBay | | 10,013 a | | 361,469 |
| EchoStar Communications, Cl. A | | 1,952 a | | 95,570 |
| Ecolab | | 1,742 | | 82,170 |
| Edison International | | 2,868 | | 166,774 |
| El Paso | | 6,533 | | 115,373 |
The Fund 27
STATEMENT OF INVESTMENTS (continued)
| Common Stocks (continued) | | Shares | | Value ($) |
| |
| |
|
| United States (continued) | | | | |
| Electronic Arts | | 2,884 a | | 176,270 |
| Electronic Data Systems | | 4,754 | | 102,639 |
| Eli Lilly & Co. | | 9,349 | | 506,248 |
| Embarq | | 1,423 | | 75,305 |
| EMC/Massachusetts | | 19,254 a | | 488,859 |
| Emerson Electric | | 7,299 | | 381,519 |
| Energizer Holdings | | 430 a | | 44,849 |
| Energy East | | 1,280 | | 35,686 |
| ENSCO International | | 1,405 | | 77,963 |
| Entergy | | 1,822 | | 218,403 |
| EOG Resources | | 2,264 | | 200,590 |
| Equifax | | 1,170 | | 45,045 |
| Equitable Resources | | 1,101 | | 62,008 |
| Equity Residential | | 2,710 | | 113,224 |
| Estee Lauder Cos., Cl. A | | 940 | | 41,266 |
| Exelon | | 6,167 | | 510,504 |
| Expedia | | 1,806 a | | 58,984 |
| Expeditors International Washington | | 1,996 | | 101,097 |
| Express Scripts | | 2,157 a | | 136,107 |
| Exterran Holdings | | 591 a | | 49,762 |
| Exxon Mobil | | 51,544 | | 4,741,533 |
| Family Dollar Stores | | 1,160 | | 29,406 |
| Fannie Mae | | 8,929 | | 509,310 |
| Fastenal | | 1,225 | | 54,488 |
| Federal Realty Investment Trust | | 440 | | 38,817 |
| FedEx | | 2,690 | | 277,985 |
| Fidelity National Financial, Cl. A | | 1,610 | | 24,778 |
| Fidelity National Information Services | | 1,814 | | 83,662 |
| Fifth Third Bancorp | | 4,588 | | 143,513 |
| First American | | 660 | | 19,866 |
| First Horizon National | | 1,000 | | 26,080 |
| First Solar | | 383 a | | 60,824 |
| FirstEnergy | | 2,818 | | 196,415 |
| Fiserv | | 1,503 a | | 83,266 |
| Fluor | | 821 | | 129,718 |
| FMC Technologies | | 1,080 a | | 65,480 |
| Foot Locker | | 1,280 | | 19,059 |
28
| Common Stocks (continued) | | Shares | | Value ($) |
| |
| |
|
| United States (continued) | | | | |
| Ford Motor | | 13,990 a | | 124,091 |
| Forest City Enterprises, Cl. A | | 500 | | 28,460 |
| Fortune Brands | | 1,424 | | 119,288 |
| Foster Wheeler | | 661 a | | 97,993 |
| FPL Group | | 3,561 | | 243,644 |
| Franklin Resources | | 1,613 | | 209,174 |
| Freddie Mac | | 6,073 | | 317,193 |
| Freeport-McMoRan Copper & Gold | | 3,499 | | 411,762 |
| Gannett | | 2,197 | | 93,175 |
| Gap | | 5,344 | | 101,002 |
| Genentech | | 4,354 a | | 322,762 |
| General Dynamics | | 3,168 | | 288,161 |
| General Electric | | 93,867 | | 3,863,566 |
| General Growth Properties | | 2,057 | | 111,819 |
| General Mills | | 3,202 | | 184,851 |
| General Motors | | 4,195 | | 164,402 |
| Genuine Parts | | 1,604 | | 78,708 |
| Genworth Financial, Cl. A | | 4,047 | | 110,483 |
| Genzyme | | 2,446 a | | 185,823 |
| Getty Images | | 715 a | | 20,199 |
| Gilead Sciences | | 8,577 a | | 396,172 |
| GlobalSantaFe | | 2,113 | | 171,216 |
| Goldman Sachs Group | | 3,363 | | 833,755 |
| Google, Cl. A | | 2,115 a | | 1,495,305 |
| Grant Prideco | | 1,209 a | | 59,434 |
| H & R Block | | 3,061 | | 66,730 |
| H.J. Heinz | | 3,018 | | 141,182 |
| Halliburton | | 8,399 | | 331,089 |
| Hanesbrands | | 970 a | | 30,109 |
| Harley-Davidson | | 2,400 | | 123,600 |
| Harman International Industries | | 641 | | 53,972 |
| Harrah’s Entertainment | | 1,731 | | 152,761 |
| Harsco | | 680 | | 41,222 |
| Hartford Financial Services Group | | 2,914 | | 282,745 |
| Hasbro | | 1,210 | | 36,119 |
| HCP | | 1,953 | | 66,480 |
| Health Management Associates, Cl. A | | 3,164 | | 20,914 |
The Fund 29
STATEMENT OF INVESTMENTS (continued)
| Common Stocks (continued) | | Shares | | Value ($) |
| |
| |
|
| United States (continued) | | | | |
| Health Net | | 900 a | | 48,249 |
| Hershey | | 1,510 | | 65,096 |
| Hertz Global Holdings | | 1,100 a | | 23,848 |
| Hess | | 2,643 | | 189,265 |
| Hewlett-Packard | | 23,930 | | 1,236,702 |
| Hillenbrand Industries | | 480 | | 26,506 |
| Hologic | | 473 a | | 32,131 |
| Home Depot | | 15,443 | | 486,609 |
| Honeywell International | | 6,797 | | 410,607 |
| Hospira | | 1,490 a | | 61,582 |
| Host Hotels & Resorts | | 4,871 | | 107,941 |
| Hudson City Bancorp | | 4,879 | | 76,405 |
| Huntington Bancshares/OH | | 3,304 | | 59,175 |
| IAC/InterActiveCorp | | 1,560 a | | 45,958 |
| Idearc | | 1,170 | | 31,567 |
| Illinois Tool Works | | 4,359 | | 249,596 |
| IMS Health | | 1,873 | | 47,218 |
| Intel | | 53,074 | | 1,427,691 |
| IntercontinentalExchange | | 530 a | | 94,446 |
| International Business Machines | | 13,560 | | 1,574,587 |
| International Flavors & Fragrances | | 650 | | 33,937 |
| International Game Technology | | 3,090 | | 134,755 |
| International Paper | | 3,844 | | 142,074 |
| Interpublic Group of Cos. | | 4,897 a | | 50,684 |
| Intersil, Cl. A | | 1,120 | | 33,981 |
| Intuit | | 2,999 a | | 96,478 |
| Invitrogen | | 390 a | | 35,439 |
| Iron Mountain | | 1,930 a | | 67,029 |
| iStar Financial | | 980 | | 29,900 |
| ITT Industries | | 1,612 | | 107,875 |
| J.C. Penney | | 1,997 | | 112,311 |
| Jabil Circuit | | 1,550 | | 33,682 |
| Jacobs Engineering Group | | 1,119 a | | 97,521 |
| Janus Capital Group | | 1,530 | | 52,800 |
| JDS Uniphase | | 2,045 a | | 31,207 |
| Johnson & Johnson | | 26,449 | | 1,723,681 |
| Johnson Controls | | 5,462 | | 238,799 |
30
| Common Stocks (continued) | | Shares | | | | Value ($) |
| |
| |
| |
|
| United States (continued) | | | | | | |
| Jones Apparel Group | | 1,109 | | | | 23,222 |
| Joy Global | | 920 | | | | 53,415 |
| JPMorgan Chase & Co. | | 31,202 | | | | 1,466,494 |
| Juniper Networks | | 4,976 a | | | | 179,136 |
| KB Home | | 620 | | | | 17,137 |
| Kellogg | | 2,585 | | | | 136,462 |
| KeyCorp | | 3,653 | | | | 103,928 |
| Kimberly-Clark | | 4,195 | | | | 297,384 |
| Kimco Realty | | 2,123 | | | | 88,147 |
| KLA-Tencor | | 1,793 | | | | 94,401 |
| Kohl’s | | 2,825 a | | | | 155,290 |
| Kraft Foods, Cl. A | | 14,700 | | | | 491,127 |
| Kroger | | 6,241 | | | | 183,423 |
| L-3 Communications Holdings | | 1,166 | | | | 127,840 |
| Laboratory Corp. of America Holdings | | 1,105 a | | | | 75,969 |
| Lam Research | | 1,354 a | | | | 67,971 |
| Lamar Advertising, Cl. A | | 650 | | | | 34,749 |
| Las Vegas Sands | | 991 a | | | | 131,882 |
| Lear | | 708 a | | | | 25,155 |
| Legg Mason | | 1,232 | | | | 102,182 |
| Leggett & Platt | | 1,430 | | | | 27,785 |
| Lehman Brothers Holdings | | 4,168 | | | | 264,001 |
| Lennar, Cl. A | | 1,020 | | | | 23,307 |
| Leucadia National | | 1,533 | | | | 77,662 |
| Level 3 Communications | | 14,483 a | | | | 43,883 |
| Lexmark International, Cl. A | | 790 a | | | | 33,172 |
| Liberty Global, Cl. A | | 1,480 a | | | | 58,090 |
| Liberty Global, Ser. C | | 1,758 a | | | | 64,483 |
| Liberty Media-Capital, Ser. A | | 1,142 a | | | | 142,727 |
| Liberty Media-Interactive, Cl. A | | 5,798 a | | | | 123,092 |
| Liberty Property Trust | | 730 | | | | 27,463 |
| Limited Brands | | 3,396 | | | | 74,746 |
| Lincare Holdings | | 760 a | | | | 26,425 |
| Lincoln National | | 2,508 | | | | 156,424 |
| Linear Technology | | 2,310 | | | | 76,276 |
| Liz Claiborne | | 840 | | | | 23,915 |
| Lockheed Martin | | 3,276 | | | | 360,491 |
The Fund 31
STATEMENT OF INVESTMENTS (continued)
| Common Stocks (continued) | | Shares | | Value ($ |
| |
| |
|
| United States (continued) | | | | |
| Lowe’s Cos. | | 13,819 | | 371,593 |
| LSI | | 7,883 a | | 52,028 |
| Lyondell Chemical | | 2,130 | | 101,069 |
| M & T Bank | | 616 | | 61,280 |
| Macerich | | 682 | | 58,454 |
| Macy’s | | 4,080 | | 130,682 |
| Manpower | | 865 | | 64,650 |
| Marathon Oil | | 6,299 | | 372,460 |
| Marriott International, Cl. A | | 3,228 | | 132,703 |
| Marsh & McLennan Cos | | 5,161 | | 133,618 |
| Marshall & Ilsley | | 2,183 | | 93,214 |
| Martin Marietta Materials | | 350 | | 45,273 |
| Masco | | 3,701 | | 89,120 |
| Massey Energy | | 856 | | 27,118 |
| MasterCard, Cl. A | | 634 | | 120,175 |
| Mattel | | 3,694 | | 77,168 |
| MBIA | | 1,233 | | 53,068 |
| McClatchy, Cl. A | | 250 | | 4,148 |
| McCormick & Co. | | 940 | | 32,928 |
| McDonald’s | | 10,932 | | 652,640 |
| McGraw-Hill Cos. | | 3,177 | | 158,977 |
| McKesson | | 2,756 | | 182,172 |
| MeadWestvaco | | 1,768 | | 59,476 |
| Medco Health Solutions | | 2,582 a | | 243,689 |
| Medtronic | | 10,522 | | 499,164 |
| MEMC Electronic Materials | | 2,087 a | | 152,810 |
| Merck & Co. | | 19,810 | | 1,154,131 |
| Merrill Lynch & Co. | | 7,575 | | 500,102 |
| MetLife | | 6,799 | | 468,111 |
| MGIC Investment | | 660 | | 12,778 |
| MGM MIRAGE | | 1,192 a | | 109,199 |
| Microchip Technology | | 2,061 | | 68,363 |
| Micron Technology | | 7,134 a | | 74,978 |
| Microsoft | | 78,593 | | 2,893,008 |
| Millennium Pharmaceuticals | | 3,178 a | | 37,564 |
| Millipore | | 430 a | | 33,390 |
| Mirant | | 2,395 a | | 101,452 |
32
| Common Stocks (continued) | | Shares | | Value ($) |
| |
| |
|
| United States (continued) | | | | |
| Mohawk Industries | | 419 a | | 35,757 |
| Monsanto | | 4,992 | | 487,369 |
| Monster Worldwide | | 940 a | | 38,145 |
| Moody’s | | 2,030 | | 88,752 |
| Morgan Stanley | | 8,687 | | 584,288 |
| Mosaic | | 1,457 a | | 101,699 |
| Motorola | | 21,240 | | 399,100 |
| National City | | 5,583 | | 135,388 |
| National Oilwell Varco | | 3,274 a | | 239,788 |
| National Semiconductor | | 2,953 | | 74,238 |
| NAVTEQ | | 978 a | | 75,502 |
| Network Appliance | | 3,480 a | | 109,585 |
| New York Community Bancorp | | 2,784 | | 51,810 |
| New York Times, Cl. A | | 1,110 | | 21,712 |
| Newell Rubbermaid | | 2,630 | | 76,691 |
| Newfield Exploration | | 1,238 a | | 66,654 |
| Newmont Mining | | 4,170 | | 212,086 |
| News, Cl. A | | 16,864 | | 365,443 |
| News, Cl. B | | 3,800 | | 87,134 |
| NII Holdings | | 1,524 a | | 88,392 |
| NIKE, Cl. B | | 3,402 | | 225,417 |
| NiSource | | 2,180 | | 44,581 |
| Noble | | 2,497 | | 132,216 |
| Noble Energy | | 1,915 | | 146,574 |
| Norfolk Southern | | 3,636 | | 187,799 |
| Northern Trust | | 1,838 | | 138,236 |
| Northrop Grumman | | 3,022 | | 252,700 |
| Novellus Systems | | 1,010 a | | 28,694 |
| Nucor | | 2,796 | | 173,408 |
| NVIDIA | | 4,786 a | | 169,329 |
| NVR | | 40 a | | 19,030 |
| Nymex Holdings | | 817 | | 105,001 |
| NYSE Euronext | | 1,190 | | 111,705 |
| Occidental Petroleum | | 7,643 | | 527,749 |
| Office Depot | | 2,622 a | | 49,189 |
| Old Republic International | | 1,770 | | 27,134 |
| Omnicare | | 980 | | 28,910 |
The Fund 33
STATEMENT OF INVESTMENTS (continued)
| Common Stocks (continued) | | Shares | | Value ($ |
| |
| |
|
| United States (continued) | | | | |
| Omnicom Group | | 3,069 | | 156,458 |
| Oracle | | 37,617 a | | 833,969 |
| Oshkosh Truck | | 600 | | 32,520 |
| Owens-Illinois | | 1,471 a | | 65,342 |
| Paccar | | 3,273 | | 181,848 |
| Pactiv | | 1,070 a | | 29,393 |
| Pall | | 980 | | 39,269 |
| Parker Hannifin | | 1,620 | | 130,199 |
| Patterson Cos. | | 900 a | | 35,199 |
| Patterson-UTI Energy | | 1,270 | | 25,324 |
| Paychex | | 3,197 | | 133,571 |
| PDL BioPharma | | 950 a | | 20,140 |
| Peabody Energy | | 2,468 | | 137,591 |
| Pentair | | 780 | | 27,604 |
| People’s United Financial | | 3,105 | | 55,207 |
| Pepco Holdings | | 1,530 | | 43,590 |
| PepsiCo | | 14,887 | | 1,097,470 |
| PetSmart | | 1,090 | | 32,646 |
| Pfizer | | 64,093 | | 1,577,329 |
| PG & E | | 3,311 | | 162,007 |
| Pinnacle West Capital | | 810 | | 32,724 |
| Pioneer Natural Resources | | 1,265 | | 64,540 |
| Pitney Bowes | | 2,059 | | 82,442 |
| Plum Creek Timber | | 1,669 | | 74,554 |
| PMI Group | | 700 | | 11,221 |
| PNC Financial Services Group | | 3,182 | | 229,613 |
| Polo Ralph Lauren | | 480 | | 33,024 |
| PPG Industries | | 1,530 | | 114,352 |
| PPL | | 3,573 | | 184,724 |
| Praxair | | 2,938 | | 251,140 |
| Pride International | | 1,582 a | | 58,376 |
| Principal Financial Group | | 2,482 | | 167,957 |
| Procter & Gamble | | 28,747 | | 1,998,491 |
| Progress Energy | | 2,288 | | 109,824 |
| Progressive | | 6,508 | | 120,398 |
| ProLogis | | 2,377 | | 170,526 |
| Prudential Financial | | 4,248 | | 410,867 |
34
| Common Stocks (continued) | | Shares | | Value ($) |
| |
| |
|
| United States (continued) | | | | |
| Public Service Enterprise Group | | 2,342 | | 223,895 |
| Public Storage | | 1,197 | | 96,921 |
| Pulte Homes | | 1,690 | | 25,080 |
| QLogic | | 1,589 a | | 24,677 |
| QUALCOMM | | 15,257 | | 651,932 |
| Quest Diagnostics | | 1,538 | | 81,791 |
| Questar | | 1,621 | | 92,527 |
| Qwest Communications International | | 14,611 a | | 104,907 |
| R.R. Donnelley & Sons | | 2,076 | | 83,642 |
| Radian Group | | 640 | | 8,058 |
| RadioShack | | 1,050 | | 21,651 |
| Range Resources | | 1,411 | | 63,396 |
| Raytheon | | 4,087 | | 259,974 |
| Regency Centers | | 550 | | 39,314 |
| Regions Financial | | 6,508 | | 176,497 |
| Reliant Energy | | 3,215 a | | 88,477 |
| Republic Services | | 1,962 | | 67,081 |
| Robert Half International | | 1,270 | | 38,214 |
| Rockwell Automation | | 1,402 | | 96,570 |
| Rockwell Collins | | 1,560 | | 116,704 |
| Rohm & Haas | | 1,332 | | 69,104 |
| Roper Industries | | 700 | | 49,567 |
| Ross Stores | | 1,130 | | 30,533 |
| Rowan Cos. | | 890 | | 34,692 |
| Royal Caribbean Cruises | | 1,604 | | 68,780 |
| Safeco | | 1,010 | | 58,479 |
| Safeway | | 4,103 | | 139,502 |
| SanDisk | | 2,129 a | | 94,528 |
| Sanmina-SCI | | 2,430 a | | 5,370 |
| Sara Lee | | 6,850 | | 113,299 |
| SCANA | | 890 | | 36,125 |
| Schlumberger | | 10,770 | | 1,040,059 |
| Sealed Air | | 1,290 | | 32,160 |
| Sears Holdings | | 789 a | | 106,349 |
| Sempra Energy | | 2,329 | | 143,257 |
| Sherwin-Williams | | 1,062 | | 67,883 |
| Sigma-Aldrich | | 1,330 | | 68,721 |
The Fund 35
STATEMENT OF INVESTMENTS (continued)
| Common Stocks (continued) | | Shares | | Value ($) |
| |
| |
|
| United States (continued) | | | | |
| Simon Property Group | | 2,061 | | 214,571 |
| Sirius Satellite Radio | | 11,260 a | | 37,834 |
| SL Green Realty | | 563 | | 67,932 |
| SLM | | 3,803 | | 179,349 |
| Smith International | | 1,864 | | 123,117 |
| Smurfit-Stone Container | | 2,090 a | | 25,310 |
| Southern | | 6,924 | | 253,834 |
| Southwest Airlines | | 1,952 | | 27,738 |
| Southwestern Energy | | 1,608 a | | 83,182 |
| Sovereign Bancorp | | 3,632 | | 52,410 |
| Spectra Energy | | 5,864 | | 152,347 |
| Sprint Nextel | | 25,792 | | 441,043 |
| SPX | | 460 | | 46,598 |
| St. Joe | | 580 | | 19,639 |
| St. Jude Medical | | 3,143 a | | 128,014 |
| Stanley Works | | 600 | | 34,530 |
| Staples | | 6,636 | | 154,884 |
| Starbucks | | 6,850 a | | 182,758 |
| Starwood Hotels & Resorts Worldwide | | 2,003 | | 113,891 |
| State Street | | 3,660 | | 291,958 |
| Station Casinos | | 380 | | 34,124 |
| Stryker | | 2,647 | | 187,937 |
| Sun Microsystems | | 32,997 a | | 188,413 |
| Sunoco | | 1,143 | | 84,125 |
| SunTrust Banks | | 3,122 | | 226,657 |
| SUPERVALU | | 1,987 | | 76,996 |
| Synopsys | | 1,170 a | | 33,064 |
| Synovus Financial | | 2,474 | | 65,215 |
| SYSCO | | 5,707 | | 195,693 |
| T. Rowe Price Group | | 2,346 | | 150,707 |
| Target | | 7,448 | | 457,009 |
| TCF Financial | | 1,154 | | 26,277 |
| Telephone & Data Systems | | 510 | | 35,598 |
| Telephone & Data Systems (special shares) | | 514 | | 33,847 |
| Tellabs | | 3,340 a | | 29,425 |
| Temple-Inland | | 1,011 | | 54,260 |
| Teradata | | 1,736 a | | 49,528 |
36
| Common Stocks (continued) | | Shares | | Value ($) |
| |
| |
|
| United States (continued) | | | | |
| Teradyne | | 1,915 a | | 23,631 |
| Terex | | 970 a | | 71,993 |
| Tesoro | | 1,299 | | 78,628 |
| Texas Instruments | | 13,143 | | 428,462 |
| Textron | | 2,313 | | 160,083 |
| Thermo Fisher Scientific | | 3,892 a | | 228,889 |
| Tiffany & Co. | | 1,289 | | 69,838 |
| Time Warner | | 34,480 | | 629,605 |
| Time Warner Cable, Cl. A | | 1,722 a | | 49,232 |
| TJX Cos. | | 4,233 | | 122,461 |
| Toll Brothers | | 1,070 a | | 24,514 |
| Torchmark | | 760 | | 49,522 |
| Transocean | | 2,650 a | | 316,331 |
| Travelers Cos. | | 6,103 | | 318,638 |
| Tyson Foods, Cl. A | | 2,621 | | 41,412 |
| U.S. Bancorp | | 15,929 | | 528,206 |
| UDR | | 1,090 | | 25,877 |
| Ultra Petroleum | | 1,427 a | | 101,117 |
| Union Pacific | | 2,357 | | 301,790 |
| UnionBanCal | | 547 | | 29,543 |
| Unisys | | 3,524 a | | 21,426 |
| United Parcel Service, Cl. B | | 6,209 | | 466,296 |
| United States Steel | | 1,103 | | 119,014 |
| United Technologies | | 8,646 | | 662,197 |
| UnitedHealth Group | | 12,272 | | 603,169 |
| Unum Group | | 3,228 | | 75,342 |
| Valero Energy | | 5,044 | | 355,249 |
| Varian Medical Systems | | 1,030 a | | 50,233 |
| VeriSign | | 2,290 a | | 78,066 |
| Verizon Communications | | 26,528 | | 1,222,145 |
| Vertex Pharmaceuticals | | 1,030 a | | 33,310 |
| VF | | 842 | | 73,363 |
| Viacom, Cl. B | | 5,524 a | | 228,086 |
| Virgin Media | | 2,643 | | 58,437 |
| Vornado Realty Trust | | 1,268 | | 141,661 |
| Vulcan Materials | | 896 | | 76,617 |
| W.R. Berkley | | 1,587 | | 47,753 |
The Fund 37
STATEMENT OF INVESTMENTS (continued)
| Common Stocks (continued) | | Shares | | Value ($) |
| |
| |
|
| United States (continued) | | | | |
| W.W. Grainger | | 676 | | 60,786 |
| Wachovia | | 18,081 | | 826,844 |
| Wal-Mart Stores | | 22,605 | | 1,021,972 |
| Walgreen | | 9,159 | | 363,154 |
| Walt Disney | | 17,239 | | 596,987 |
| Washington Mutual | | 8,117 | | 226,302 |
| Washington Post, Cl. B | | 53 | | 44,997 |
| Waste Management | | 4,785 | | 174,126 |
| Waters | | 958 a | | 73,747 |
| WellPoint | | 5,628 a | | 445,906 |
| Wells Fargo & Co. | | 29,541 | | 1,004,689 |
| Wendy’s International | | 780 | | 27,113 |
| Western Digital | | 1,800 a | | 46,656 |
| Western Union | | 7,167 | | 157,961 |
| Weyerhaeuser | | 2,004 | | 152,124 |
| Whirlpool | | 747 | | 59,147 |
| Whole Foods Market | | 1,340 | | 66,384 |
| Williams Cos. | | 5,535 | | 201,972 |
| Williams-Sonoma | | 931 | | 29,271 |
| Wisconsin Energy | | 930 | | 44,528 |
| Wm. Wrigley Jr. | | 1,800 | | 111,006 |
| Wyeth | | 12,320 | | 599,122 |
| Wyndham Worldwide | | 1,530 | | 50,230 |
| Wynn Resorts | | 528 | | 85,235 |
| Xcel Energy | | 3,844 | | 86,682 |
| Xerox | | 8,695 a | | 151,641 |
| Xilinx | | 2,560 | | 62,464 |
| XM Satellite Radio Holdings, Cl. A | | 2,355 a | | 31,274 |
| XTO Energy | | 3,400 | | 225,692 |
| Yahoo! | | 11,122 a | | 345,894 |
| Yum! Brands | | 4,851 | | 195,350 |
| Zimmer Holdings | | 2,191 a | | 152,253 |
| Zions Bancorporation | | 1,021 | | 60,351 |
| | | | | 125,912,303 |
| Total Common Stocks | | | | |
| (cost $174,690,942) | | | | 169,759,505 |
38
| | | | | Coupon | | Maturity | | Principal | | |
| Bonds and Notes—.3% | | | | Rate (%) | | Date | | Amount ($) | | Value ($) |
| |
| |
| |
| |
| |
|
| Germany | | | | | | | | | | |
| Bundesrepublik Deutschland, | | | | | | | | | | |
| Bonds, Ser. 05 | | | | | | | | | | |
| (cost $1,310,930) | | EUR | | 3.50 | | 1/4/16 | | 1,072,000 b | | 1,475,835 |
| |
| |
| |
| |
| |
|
| | | | | | | | | Principal | | |
| Short-Term Investments—38.9% | | | | Amount ($) | | Value ($) |
| |
| |
| |
|
| U.S. Government Agencies—36.1% | | | | | | | | |
| Federal Home Loan Bank System, | | | | | | | | |
| 4.53%, 12/5/07 | | | | | | | | 20,300,000 | | 20,213,150 |
| Federal Home Loan Bank System, | | | | | | | | |
| 4.70%, 11/16/07 | | | | | | | | 26,000,000 | | 25,949,083 |
| Federal Home Loan Bank System, | | | | | | | | |
| 4.72%, 12/19/07 | | | | | | | | 20,000,000 | | 19,874,133 |
| Federal Home Loan Bank System, | | | | | | | | |
| 4.80%, 11/2/07 | | | | | | | | 16,700,000 | | 16,697,773 |
| Federal National Mortgage Association, | | | | | | | | |
| 4.49%, 11/9/07 | | | | | | | | 29,400,000 | | 29,370,665 |
| Federal National Mortgage Association, | | | | | | | | |
| 4.53%, 1/16/08 | | | | | | | | 25,000,000 | | 24,760,917 |
| Federal National Mortgage Association, | | | | | | | | |
| 4.60%, 1/2/08 | | | | | | | | 25,000,000 | | 24,801,944 |
| | | | | | | | | | | 161,667,665 |
| U.S. Treasury Bills—2.8% | | | | | | | | | | |
| 4.04%, 12/20/07 | | | | | | | | 12,850,000 c | | 12,782,281 |
| Total Short-Term Investments | | | | | | | | |
| (cost $161,667,666) | | | | | | | | | | 174,449,946 |
| |
| |
| |
| |
| |
|
| |
| | | | | | | | | Face Amount | | |
| | | | | | | | | Covered by | | |
| Options—8.0% | | | | | | | | Contracts ($) | | Value ($) |
| |
| |
| |
| |
| |
|
| Call Options—7.7% | | | | | | | | | | |
| Euro Bond, | | | | | | | | | | |
| November 2007 @ 106 | | | | | | | | 550,000 | | 5,832,572 |
| S&P 500 Future Index, | | | | | | | | | | |
| December 2007 @ 100 | | | | | | | | 3,475,000 | | 19,282,775 |
| Swiss Market OTC Index, | | | | | | | | | | |
| December 2007 @ 600 | | | | | | | | 369,000 | | 9,679,990 |
| | | | | | | | | | | 34,795,337 |
The Fund 39
STATEMENT OF INVESTMENTS (continued)
| | | Face Amount | | |
| | | Covered by | | |
| Options (continued) | | Contracts ($) | | Value ($) |
| |
| |
|
| Put Options—.3% | | | | |
| U.S. Treasury 10 Year Notes, | | | | |
| November 2007 @ 117 | | 17,600,000 | | 1,229,251 |
| Total Options | | | | |
| (cost $33,853,635) | | | | 36,024,588 |
| |
| |
|
| |
| Other Investment—17.1% | | Shares | | Value ($) |
| |
| |
|
| Registered Investment Company; | | | | |
| Dreyfus Institutional Preferred Plus Money Market Fund | | |
| (cost $76,892,000) | | 76,892,000 d | | 76,892,000 |
| |
| |
|
| Total Investments (cost $448,415,173) | | 102.1% | | 458,601,874 |
| Liabilities, Less Cash and Receivables | | (2.1%) | | (9,424,284) |
| Net Assets | | 100.0% | | 449,177,590 |
| a | | Non-income producing security. |
| b | | Principal amount stated in U.S. Dollars unless otherwise noted. |
| | | EUR—Euro |
| c | | All or partially held by a broker as collateral for open financial futures positions. |
| d | | Investment in affiliated money market mutual fund. |
| Portfolio Summary (Unaudited) † | | | | |
| |
| | | Value (%) | | | | Value (%) |
| |
| |
| |
|
| U.S. Government Agencies | | 36.1 | | Health Care | | 3.7 |
| Short-Term Money | | | | Energy | | 3.5 |
| Market Investments | | 19.9 | | Consumer Staples | | 3.0 |
| Options | | 8.0 | | Materials | | 1.9 |
| Financial | | 7.6 | | Telecommunication Services | | 1.5 |
| Information Technology | | 6.3 | | Utilities | | 1.3 |
| Industrial | | 4.9 | | Foreign/Governmental | | .3 |
| Consumer Discretionary | | 4.1 | | | | 102.1 |
| † Based on net assets. |
| See notes to financial statements. |
40
| STATEMENT OF FINANCIAL FUTURES |
| October 31, 2007 |
| | | | | | | | | Unrealized |
| | | | | Market Value | | | | Appreciation |
| | | | | Covered by | | | | (Depreciation) |
| | | Contracts | | Contracts ($) | | Expiration | | at 10/31/2007 ($) |
| |
| |
| |
| |
|
| Financial Futures Long | | | | | | | | |
| Amsterdam Exchanges Index | | 32 | | 5,074,042 | | November 2007 | | (11,519) |
| Australian 10 Year Bond | | 842 | | 76,967,622 | | December 2007 | | (495,625) |
| 10 Year Euro Bond | | 78 | | 12,788,894 | | December 2007 | | 133,272 |
| FTSE 100 Index | | 116 | | 16,262,036 | | December 2007 | | 205,373 |
| Hang Seng Stock Index | | 15 | | 3,025,720 | | November 2007 | | 101,471 |
| IBEX 35 Index | | 107 | | 24,551,637 | | November 2007 | | 736,444 |
| S & P/MIB Index | | 51 | | 15,008,823 | | December 2007 | | 189,228 |
| S & P/Toronto | | | | | | | | |
| Stock Exchange 60 Index | | 13 | | 2,333,649 | | December 2007 | | 87,343 |
| Topix Index | | 383 | | 53,703,387 | | December 2007 | | 2,713,983 |
| U.S. Treasury 10 Year Notes | | 64 | | 7,041,000 | | December 2007 | | 65,863 |
| Financial Futures Short | | | | | | | | |
| S&P ASX 200 Index | | 24 | | (3,777,804) | | December 2007 | | (77,625) |
| Canadian 10 Year Bond | | 138 | | (16,387,682) | | December 2007 | | (100,898) |
| Japanese 10 Year Bond | | 21 | | (24,771,566) | | December 2007 | | (197,350) |
| CAC 40 10 Euro | | 138 | | (11,665,637) | | November 2007 | | (111,945) |
| Dax Index | | 64 | | (18,656,131) | | December 2007 | | (477,256) |
| 10 Year Long Gilt | | 283 | | (63,080,602) | | December 2007 | | (103,737) |
| S & P 500 Emini | | 161 | | (12,517,750) | | December 2007 | | 60,419 |
| | | | | | | | | 2,717,441 |
See notes to financial statements.
The Fund 41
| STATEMENT OF ASSETS AND LIABILITIES |
| October 31, 2007 |
| | | | | | | Cost | | Value |
| |
| |
| |
| |
|
| Assets ($): | | | | | | | | |
| Investments in securities—See Statement of Investments: | | | | |
| Unaffiliated issuers | | | | | | 371,523,173 | | 381,709,874 |
| Affiliated issuers | | | | | | 76,892,000 | | 76,892,000 |
| Cash denominated in foreign currencies | | | | 502,693 | | 512,808 |
| Unrealized appreciation on forward | | | | | | |
| currency exchange contracts—Note 4 | | | | | | 9,894,033 |
| Receivable for investment securities sold | | | | | | 1,625,724 |
| Receivable for shares of Common Stock subscribed | | | | | | 1,589,692 |
| Dividends and interest receivable | | | | | | | | 600,111 |
| Prepaid expenses | | | | | | | | 36,282 |
| | | | | | | | | 472,860,524 |
| |
| |
| |
| |
|
| Liabilities ($): | | | | | | | | |
| Due to The Dreyfus Corporation and affiliates—Note 3(c) | | | | 596,616 |
| Cash overdraft due to Custodian | | | | | | | | 2,107,183 |
| Unrealized depreciation on forward | | | | | | |
| currency exchange contracts—Note 4 | | | | | | 13,508,768 |
| Payable for investment securities purchased | | | | | | 6,208,723 |
| Payable for shares of Common Stock redeemed | | | | | | 644,135 |
| Payable for futures variation margin—Note 4 | | | | | | 548,498 |
| Accrued expenses | | | | | | | | 69,011 |
| | | | | | | | | 23,682,934 |
| |
| |
| |
| |
|
| Net Assets ($) | | | | | | | | 449,177,590 |
| |
| |
| |
| |
|
| Composition of Net Assets ($): | | | | | | | | |
| Paid-in capital | | | | | | | | 426,985,901 |
| Accumulated undistributed investment income—net | | | | | | 6,328,900 |
| Accumulated net realized gain (loss) on investments | | | | | | 6,559,036 |
| Accumulated net unrealized appreciation (depreciation) on | | | | |
| investments and foreign currency transactions (including | | | | 9,303,753 |
| $2,717,441 net unrealized appreciation on financial futures) | | | | |
| |
| |
|
| Net Assets ($) | | | | | | | | 449,177,590 |
| |
| |
| |
| |
|
| |
| |
| Net Asset Value Per Share | | | | | | | | |
| | | Class A | | Class C | | Class I | | Class T |
| |
| |
| |
| |
|
| Net Assets ($) | | 298,284,262 | | 84,660,319 | | 62,712,045 | | 3,520,964 |
| Shares Outstanding | | 20,932,553 | | 6,004,195 | | 4,386,242 | | 247,821 |
| |
| |
| |
| |
|
| Net Asset Value Per Share ($) | | 14.25 | | 14.10 | | 14.30 | | 14.21 |
| |
| See notes to financial statements. | | | | | | | | |
42
| STATEMENT OF OPERATIONS |
| Year Ended October 31, 2007 |
| Investment Income ($): | | |
| Income: | | |
| Interest | | 7,153,992 |
| Cash dividends: | | |
| Unaffiliated issuers | | 1,336,272 |
| Affiliated issuers | | 2,774,619 |
| Total Income | | 11,264,883 |
| Expenses: | | |
| Management fee—Note 3(a) | | 3,305,140 |
| Shareholder servicing costs—Note 3(c) | | 790,642 |
| Distribution fees—Note 3(b) | | 371,541 |
| Custodian fees—Note 3(c) | | 137,747 |
| Registration fees | | 126,090 |
| Professional fees | | 38,664 |
| Prospectus and shareholders’ reports | | 27,114 |
| Directors’ fees and expenses—Note 3(d) | | 13,919 |
| Loan commitment fees—Note 2 | | 211 |
| Miscellaneous | | 19,371 |
| Total Expenses | | 4,830,439 |
| Less—reduction in management fee | | |
| due to undertaking—Note 3(a) | | (229,091) |
| Less—reduction in custody fees | | |
| due to earnings credits—Note 1(c) | | (10,213) |
| Net Expenses | | 4,591,135 |
| Investment Income—Net | | 6,673,748 |
| |
|
| Realized and Unrealized Gain (Loss) on Investments—Note 4 ($): |
| Net realized gain (loss) on investments and foreign currency transactions | | 26,613 |
| Net realized gain (loss) on options transactions | | 3,287,480 |
| Net realized gain (loss) on financial futures | | 5,356,412 |
| Net realized gain (loss) on forward currency exchange contracts | | (1,343,600) |
| Net Realized Gain (Loss) | | 7,326,905 |
| Net unrealized appreciation (depreciation) on investments, options | | |
| transactions and foreign currency transactions (including | | |
| $2,470,610 net unrealized appreciation on financial futures) | | 8,035,990 |
| Net Realized and Unrealized Gain (Loss) on Investments | | 15,362,895 |
| Net Increase in Net Assets Resulting from Operations | | 22,036,643 |
| |
| See notes to financial statements. | | |
The Fund 43
STATEMENT OF CHANGES IN NET ASSETS
| | | Year Ended October 31, |
| |
|
| | | 2007 a | | 2006 b |
| |
| |
|
| Operations ($): | | | | |
| Investment income—net | | 6,673,748 | | 222,698 |
| Net realized gain (loss) on investments | | 7,326,905 | | 802,876 |
| Net unrealized appreciation | | | | |
| (depreciation) on investments | | 8,035,990 | | 1,267,763 |
| Net Increase (Decrease) in Net Assets | | | | |
| Resulting from Operations | | 22,036,643 | | 2,293,337 |
| |
| |
|
| Dividends to Shareholders from ($): | | | | |
| Investment income—net: | | | | |
| Class A shares | | (485,921) | | — |
| Class C shares | | (53,687) | | — |
| Class I shares | | (63,602) | | — |
| Class T shares | | (11,569) | | — |
| Net realized gain on investments: | | | | |
| Class A shares | | (1,191,979) | | — |
| Class C shares | | (153,298) | | — |
| Class I shares | | (146,892) | | — |
| Class T shares | | (31,343) | | — |
| Total Dividends | | (2,138,291) | | — |
| |
| |
|
| Capital Stock Transactions ($): | | | | |
| Net proceeds from shares sold: | | | | |
| Class A shares | | 300,359,829 | | 54,706,127 |
| Class C shares | | 83,421,689 | | 3,849,007 |
| Class I shares | | 57,909,486 | | 7,902,691 |
| Class T shares | | 3,890,452 | | 779,205 |
| Dividends reinvested: | | | | |
| Class A shares | | 1,512,242 | | — |
| Class C shares | | 122,768 | | — |
| Class I shares | | 186,213 | | — |
| Class T shares | | 42,912 | | — |
| Cost of shares redeemed: | | | | |
| Class A shares | | (64,694,169) | | (9,260,046) |
| Class C shares | | (5,295,684) | | (519,039) |
| Class I shares | | (5,952,741) | | (521,306) |
| Class T shares | | (933,424) | | (520,311) |
| Increase (Decrease) in Net Assets | | | | |
| from Capital Stock Transactions | | 370,569,573 | | 56,416,328 |
| Total Increase (Decrease) in Net Assets | | 390,467,925 | | 58,709,665 |
| |
| |
|
| Net Assets ($): | | | | |
| Beginning of Period | | 58,709,665 | | — |
| End of Period | | 449,177,590 | | 58,709,665 |
| Undistributed investment income—net | | 6,328,900 | | 224,516 |
44
| | | Year Ended October 31, |
| |
|
| | | 2007 a | | 2006 b |
| |
| |
|
| Capital Share Transactions: | | | | |
| Class A | | | | |
| Shares sold | | 21,915,964 | | 4,280,453 |
| Shares issued for dividends reinvested | | 112,018 | | — |
| Shares redeemed | | (4,664,433) | | (711,449) |
| Net Increase (Decrease) in Shares Outstanding | | 17,363,549 | | 3,569,004 |
| |
| |
|
| Class C | | | | |
| Shares sold | | 6,115,891 | | 305,717 |
| Shares issued for dividends reinvested | | 9,128 | | — |
| Shares redeemed | | (386,539) | | (40,002) |
| Net Increase (Decrease) in Shares Outstanding | | 5,738,480 | | 265,715 |
| |
| |
|
| Class I | | | | |
| Shares sold | | 4,218,296 | | 621,927 |
| Shares issued for dividends reinvested | | 13,774 | | — |
| Shares redeemed | | (427,753) | | (40,002) |
| Net Increase (Decrease) in Shares Outstanding | | 3,804,317 | | 581,925 |
| |
| |
|
| Class T | | | | |
| Shares sold | | 290,593 | | 61,784 |
| Shares issued for dividends reinvested | | 3,181 | | — |
| Shares redeemed | | (67,727) | | (40,010) |
| Net Increase (Decrease) in Shares Outstanding | | 226,047 | | 21,774 |
| a | | Effective June 1, 2007, the fund redesignated Class R shares to Class I shares. |
| b | | From May 2, 2006 (commencement of operations) to October 31, 2006. |
| See notes to financial statements. |
The Fund 45
FINANCIAL HIGHLIGHTS
The following tables describe the performance for each share class for the fiscal periods indicated.All information (except portfolio turnover rate) reflects financial results for a single fund share.Total return shows how much your investment in the fund would have increased (or decreased) during each period, assuming you had reinvested all dividends and distributions.These figures have been derived from the fund’s financial statements.
| | | Year Ended October 31, |
| |
|
| Class A Shares | | 2007 | | 2006 a |
| |
| |
|
| Per Share Data ($): | | | | |
| Net asset value, beginning of period | | 13.23 | | 12.50 |
| Investment Operations: | | | | |
| Investment income—net b | | .32 | | .12 |
| Net realized and unrealized gain (loss) on investments | | .93 | | .61 |
| Total from Investment Operations | | 1.25 | | .73 |
| Distributions: | | | | |
| Dividends from investment income—net | | (.07) | | — |
| Dividends from net realized gain on investments | | (.16) | | — |
| Total Distributions | | (.23) | | — |
| Net asset value, end of period | | 14.25 | | 13.23 |
| |
| |
|
| Total Return (%) c | | 9.53 | | 5.84d |
| |
| |
|
| Ratios/Supplemental Data (%): | | | | |
| Ratio of total expenses to average net assets | | 1.52 | | 2.67e |
| Ratio of net expenses to average net assets | | 1.44 | | 1.54e |
| Ratio of net investment income to average net assets | | 2.31 | | 2.09e |
| Portfolio Turnover Rate | | 3.05 | | — |
| |
| |
|
| Net Assets, end of period ($ x 1,000) | | 298,284 | | 47,215 |
| a | | From May 2, 2006 (commencement of operations) to October 31, 2006. |
| b | | Based on average shares outstanding at each month end. |
| c | | Exclusive of sales charge. |
| d | | Not annualized. |
| e | | Annualized. |
| See notes to financial statements. |
46
| | | Year Ended October 31, |
| |
|
| Class C Shares | | 2007 | | 2006 a |
| |
| |
|
| Per Share Data ($): | | | | |
| Net asset value, beginning of period | | 13.18 | | 12.50 |
| Investment Operations: | | | | |
| Investment income—net b | | .21 | | .08 |
| Net realized and unrealized gain (loss) on investments | | .93 | | .60 |
| Total from Investment Operations | | 1.14 | | .68 |
| Distributions: | | | | |
| Dividends from investment income—net | | (.06) | | — |
| Dividends from net realized gain on investments | | (.16) | | — |
| Total Distributions | | (.22) | | — |
| Net asset value, end of period | | 14.10 | | 13.18 |
| |
| |
|
| Total Return (%) c | | 8.80 | | 5.36d |
| |
| |
|
| Ratios/Supplemental Data (%): | | | | |
| Ratio of total expenses to average net assets | | 2.28 | | 3.49e |
| Ratio of net expenses to average net assets | | 2.19 | | 2.29e |
| Ratio of net investment income to average net assets | | 1.53 | | 1.33e |
| Portfolio Turnover Rate | | 3.05 | | — |
| |
| |
|
| Net Assets, end of period ($ x 1,000) | | 84,660 | | 3,501 |
| a | | From May 2, 2006 (commencement of operations) to October 31, 2006. |
| b | | Based on average shares outstanding at each month end. |
| c | | Exclusive of sales charge. |
| d | | Not annualized. |
| e | | Annualized. |
| See notes to financial statements. |
The Fund 47
FINANCIAL HIGHLIGHTS (continued)
| | | Year Ended October 31, |
| |
|
| Class I Shares | | 2007 a | | 2006 b |
| |
| |
|
| Per Share Data ($): | | | | |
| Net asset value, beginning of period | | 13.24 | | 12.50 |
| Investment Operations: | | | | |
| Investment income—net c | | .36 | | .13 |
| Net realized and unrealized gain (loss) on investments | | .93 | | .61 |
| Total from Investment Operations | | 1.29 | | .74 |
| Distributions: | | | | |
| Dividends from investment income—net | | (.07) | | — |
| Dividends from net realized gain on investments | | (.16) | | — |
| Total Distributions | | (.23) | | — |
| Net asset value, end of period | | 14.30 | | 13.24 |
| |
| |
|
| Total Return (%) | | 9.86 | | 5.92d |
| |
| |
|
| Ratios/Supplemental Data (%): | | | | |
| Ratio of total expenses to average net assets | | 1.23 | | 2.51e |
| Ratio of net expenses to average net assets | | 1.17 | | 1.27e |
| Ratio of net investment income to average net assets | | 2.58 | | 2.31e |
| Portfolio Turnover Rate | | 3.05 | | — |
| |
| |
|
| Net Assets, end of period ($ x 1,000) | | 62,712 | | 7,705 |
| a | | Effective June 1, 2007, the fund redesignated Class R shares to Class I shares. |
| b | | From May 2, 2006 (commencement of operations) to October 31, 2006. |
| c | | Based on average shares outstanding at each month end. |
| d | | Not annualized. |
| e | | Annualized. |
| See notes to financial statements. |
48
| | | Year Ended October 31, |
| |
|
| Class T Shares | | 2007 | | 2006 a |
| |
| |
|
| Per Share Data ($): | | | | |
| Net asset value, beginning of period | | 13.22 | | 12.50 |
| Investment Operations: | | | | |
| Investment income—net b | | .31 | | .12 |
| Net realized and unrealized gain (loss) on investments | | .90 | | .60 |
| Total from Investment Operations | | 1.21 | | .72 |
| Distributions: | | | | |
| Dividends from investment income—net | | (.06) | | — |
| Dividends from net realized gain on investments | | (.16) | | — |
| Total Distributions | | (.22) | | — |
| Net asset value, end of period | | 14.21 | | 13.22 |
| |
| |
|
| Total Return (%) c | | 9.26 | | 5.68d |
| |
| |
|
| Ratios/Supplemental Data (%): | | | | |
| Ratio of total expenses to average net assets | | 1.77 | | 3.10e |
| Ratio of net expenses to average net assets | | 1.68 | | 1.85e |
| Ratio of net investment income to average net assets | | 2.12 | | 1.89e |
| Portfolio Turnover Rate | | 3.05 | | — |
| |
| |
|
| Net Assets, end of period ($ x 1,000) | | 3,521 | | 288 |
| a | | From May 2, 2006 (commencement of operations) to October 31, 2006. |
| b | | Based on average shares outstanding at each month end. |
| c | | Exclusive of sales charge. |
| d | | Not annualized. |
| e | | Annualized. |
| See notes to financial statements. |
The Fund 49
NOTES TO FINANCIAL STATEMENTS
NOTE 1—Significant Accounting Policies:
Global Alpha Fund (the “fund”) is a separate diversified series of Advantage Funds, Inc. (the “Company”) which is registered under the Investment Company Act of 1940, as amended (the “Act”), as an open-end management investment company and operates as a series company that offers twelve series, including the fund.The fund’s investment objective seeks total return by investing in instruments that provide investment exposure to global equity, bond and currency markets, and in fixed-income securities.The Dreyfus Corporation (the “Manager” or “Dreyfus”) serves as the fund’s investment adviser. Mellon Capital Management Corporation (“Mellon Capital”) serves as the fund’s sub-investment adviser.
On July 1, 2007, Mellon Financial Corporation (‘Mellon Financial”) and The Bank of New York Company, Inc. merged, forming The Bank of New York Mellon Corporation (“BNY Mellon”). As part of this transaction, Dreyfus became a wholly-owned subsidiary of BNY Mellon.
The fund’s Board of Directors approved the redesignation of the fund’s Class R shares as Class I shares, effective June 1, 2007.The description of the eligibility requirements for Class I shares remains the same as it was for Class R shares.
MBSC Securities Corporation (the “Distributor”) a wholly-owned subsidiary of Dreyfus, is the distributor of the fund’s shares.The fund is authorized to issue 400 million shares of $.001 par value Common Stock.The fund currently offers four classes of shares: Class A (100 million shares authorized), Class C (100 million shares authorized), Class I (100 million shares authorized) and Class T (100 million shares authorized). Class A and Class T shares are subject to a sales charge imposed at the time of purchase. Class C shares are subject to a contingent deferred sales charge (“CDSC”) imposed on Class C shares redeemed within one year of purchase. Class I shares are sold at net asset value per share only to institutional investors. Other differences between the classes include the services offered to and the expenses borne by each class, the allocation of certain transfer agency costs and certain voting
50
rights. Income, expenses (other than expenses attributable to a specific class), and realized and unrealized gains or losses on investments are allocated to each class of shares based on its relative net assets.
The Company accounts separately for the assets, liabilities and operations of each series. Expenses directly attributable to each series are charged to that series’ operations; expenses which are applicable to all series are allocated among them on a pro rata basis.
The fund’s financial statements are prepared in accordance with U.S. generally accepted accounting principles, which may require the use of management estimates and assumptions. Actual results could differ from those estimates.
The fund enters into contracts that contain a variety of indemnifications. The fund’s maximum exposure under these arrangements is unknown.The fund does not anticipate recognizing any loss related to these arrangements.
(a) Portfolio valuation: Investments in equity securities are valued at the last sales price on the securities exchange or national securities market on which such securities are primarily traded. Securities listed on the National Market System for which market quotations are available are valued at the official closing price or, if there is no official closing price that day, at the last sale price. Securities not listed on an exchange or the national securities market, or securities for which there were no transactions, are valued at the average of the most recent bid and asked prices, except for open short positions, where the asked price is used for valuation purposes. Bid price is used when no asked price is available. Registered open-end investment companies that are not traded on an exchange are valued at their net asset value.When market quotations or official closing prices are not readily available, or are determined not to reflect accurately fair value, such as when the value of a security has been significantly affected by events after the close of the exchange or market on which the security is principally traded (for example, a foreign exchange or market), but before the fund calculates its net asset
The Fund 51
NOTES TO FINANCIAL STATEMENTS (continued)
value, the fund may value these investments at fair value as determined in accordance with the procedures approved by the Board of Directors. Fair valuing of securities may be determined with the assistance of a pricing service using calculations based on indices of domestic securities and other appropriate indicators, such as prices of relevant ADR’s and futures contracts. For other securities that are fair valued by the Board of Directors, certain factors may be considered such as: fundamental analytical data, the nature and duration of restrictions on disposition, an evaluation of the forces that influence the market in which the securities are purchased and sold, and public trading in similar securities of the issuer or comparable issuers. Financial futures are valued at the last sales price.
Investments in debt securities excluding short-term investments (other than U.S.Treasury Bills), financial futures, options and forward currency exchange contracts are valued each business day by an independent pricing service (the “Service”) approved by the Board of Directors. Investments for which quoted bid prices are readily available and are representative of the bid side of the market in the judgment of the Service are valued at the mean between the quoted bid prices (as obtained by the Service from dealers in such securities) and asked prices (as calculated by the Service based upon its evaluation of the market for such securities). Other investments are valued as determined by the Service, based on methods which include consideration of: yields or prices of securities of comparable quality, coupon, maturity and type; indications as to values from dealers; and general market conditions. Restricted securities, as well as securities or other assets for which recent market quotations are not readily available, that are not valued by a pricing service approved by the Board of Directors, or are determined by the fund not to reflect accurately fair value, are valued at fair value as determined in good faith under the direction of the Board of Directors.The factors that may be considered when fair valuing a security include fundamental analytical data, the nature and duration of restrictions on disposition, an evaluation of the forces that influence the market in which the securities are purchased and sold and public trading in similar securities of the issuer or comparable issuers. Short-term
52
investments, excluding U.S.Treasury Bills, are carried at amortized cost, which approximates value. Financial futures and options, which are traded on an exchange, are valued at the last sales price on the securities exchange on which such securities are primarily traded or at the last sales price on the national securities market on each business day. Options traded over-the-counter are priced at the mean between the bid and asked price. Investments denominated in foreign currencies are translated to U.S. dollars at the prevailing rates of exchange. Forward currency exchange contracts are valued at the forward rate.
The Financial Accounting Standards Board (“FASB”) released Statement of Financial Accounting Standards No. 157 “Fair Value Measurements” (“FAS 157”). FAS 157 establishes an authoritative definition of fair value, sets out a framework for measuring fair value, and requires additional disclosures about fair-value measurements.The application of FAS 157 is required for fiscal years beginning after November 15, 2007 and interim periods within those fiscal years. Management does not believe that the application of this standard will have a material impact on the financial statements of the fund.
(b) Foreign currency transactions: The fund does not isolate that portion of the results of operations resulting from changes in foreign exchange rates on investments from the fluctuations arising from changes in the market prices of securities held. Such fluctuations are included with the net realized and unrealized gain or loss on investments.
Net realized foreign exchange gains or losses arise from sales and maturities of short-term securities, sales of foreign currencies, currency gains or losses realized on securities transactions and the difference between the amounts of dividends, interest and foreign withholding taxes recorded on the fund’s books and the U.S. dollar equivalent of the amounts actually received or paid. Net unrealized foreign exchange gains and losses arise from changes in the value of assets and liabilities other than investments in securities, resulting from changes in exchange rates. Such gains and losses are included with net realized and unrealized gain or loss on investments.
The Fund 53
NOTES TO FINANCIAL STATEMENTS (continued)
(c) Securities transactions and investment income: Securities transactions are recorded on a trade date basis. Realized gain and loss from securities transactions are recorded on the identified cost basis. Dividend income is recognized on the ex-dividend date and interest income, including, where applicable, accretion of discount and amortization of premium on investments, is recognized on the accrual basis.
The fund has an arrangement with the custodian bank whereby the fund receives earnings credits from the custodian when positive cash balances are maintained, which are used to offset custody fees. For financial reporting purposes, the fund includes net earnings credits as an expense offset in the Statement of Operations.
(d) Affiliated issuers: Investments in other investment companies advised by Dreyfus are defined as “affiliated” in the Act.
(e) Dividends to shareholders: Dividends are recorded on the ex-dividend date. Dividends from investment income-net and dividends from net realized capital gain, if any, are normally declared and paid annually, but the fund may make distributions on a more frequent basis to comply with the distribution requirements of the Internal Revenue Code of 1986, as amended (the “Code”).To the extent that net realized capital gain can be offset by capital loss carryovers, if any, it is the policy of the fund not to distribute such gain. Income and capital gain distributions are determined in accordance with income tax regulations, which may differ from U.S. generally accepted accounting principles.
(f) Federal income taxes: It is the policy of the fund to continue to qualify as a regulated investment company, if such qualification is in the best interests of its shareholders, by complying with the applicable provisions of the Code, and to make distributions of taxable income sufficient to relieve it from substantially all federal income and excise taxes.
The FASB released FASB Interpretation No. 48 “Accounting for Uncertainty in Income Taxes” (FIN 48). FIN 48 provides guidance for how uncertain tax positions should be recognized, measured, presented and disclosed in the financial statements. FIN 48 requires the evaluation
54
of tax positions taken or expected to be taken in the course of preparing the fund’s tax returns to determine whether the tax positions are “more-likely-than-not” of being sustained by the applicable tax authority. Tax positions not deemed to meet the more-likely-than-not threshold would be recorded as a tax benefit or expense in the current year.Adoption of FIN 48 is required for fiscal years beginning after December 15, 2006 and is to be applied to all open tax years as of the effective date. Management does not believe that the application of this standard will have a material impact on the financial statements of the fund.
At October 31, 2007, the components of accumulated earnings on a tax basis were as follows: undistributed ordinary income $10,692,543, undistributed capital gains $669,049 and unrealized appreciation $10,830,097.
The tax characters of distributions paid to shareholders during the fiscal periods ended October 31, 2007 and October 31, 2006 were as follows: ordinary income $1,750,614 and $0 and long-term capital gains $387,677 and $0, respectively.
During the period ended October 31, 2007, as a result of permanent book to tax differences, primarily due to foreign currency transactions and real estate investment trusts, the fund increased accumulated undistributed investment income-net by $45,415 and decreased accumulated net realized gain (loss) on investments by the same amount. Net assets and net asset value per share were not affected by this reclassification.
NOTE 2—Bank Line of Credit:
The fund participates with other Dreyfus-managed funds in a $350 million redemption credit facility (the “Facility”) to be utilized for temporary or emergency purposes, including the financing of redemptions. In connection therewith, the fund has agreed to pay commitment fees on its pro rata portion of the Facility. Interest is charged to the fund based on prevailing market rates in effect at the time of borrowing. During the period ended October 31, 2007, the fund did not borrow under the Facility.
The Fund 55
NOTES TO FINANCIAL STATEMENTS (continued)
NOTE 3—Management Fee, Sub-Investment Advisory Fee and Other Transactions With Affiliates:
(a) Pursuant to a Management Agreement (“Agreement”) with Dreyfus, the management fee is computed at the annual rate of 1.10% of the value of the fund’s average daily net assets and is payable monthly. Dreyfus had agreed, from November 1, 2006 through October 31, 2007, to waive receipt of its fees and/or assume the expenses of the fund so that the expenses of none of the classes, exclusive of taxes, brokerage fees, Rule 12b-1 distribution plan fees, interest on borrowings, shareholder services plan fees, commitment fees and extraordinary expenses, exceed an annual rate of 1.25% of the value of the average daily net assets of their class.The reduction in management fee, pursuant to the undertaking, amounted to $229,091 during the period ended October 31, 2007.
Pursuant to a Sub-Investment Advisory Agreement between Dreyfus and Mellon Capital, Dreyfus pays Mellon Capital an annual fee of .65% of the value of the fund’s average daily net assets, payable monthly.
During the period ended October 31, 2007, the Distributor retained $211,826 and $536 from commissions earned on sales of the fund’s Class A and Class T shares, respectively, and $18,530 from CDSC on redemptions of the fund’s Class C shares.
(b) Under the Distribution Plan (the “Plan”) adopted pursuant to Rule 12b-1 under the Act, Class C and Class T shares pay the Distributor for distributing their shares at an annual rate of .75% and .25% of the value of their respective average daily net assets. During the period ended October 31, 2007, Class C and Class T shares were charged $363,764 and $7,777, respectively, pursuant to the Plan.
(c) Under the Shareholder Services Plan, Class A, Class C and Class T shares pay the Distributor at an annual rate of .25% of the value of their average daily net assets for the provision of certain services.The services provided may include personal services relating to shareholder accounts, such as answering shareholder inquiries regarding the fund
56
and providing reports and other information, and services related to the maintenance of shareholder accounts.The Distributor may make payments to Service Agents (a securities dealer, financial institution or other industry professional) in respect of these services.The Distributor determines the amounts to be paid to Service Agents. During the period ended October 31, 2007, Class A, Class C and Class T shares were charged $522,385, $121,255 and $7,777, respectively, pursuant to the Shareholder Services Plan.
The fund compensates Dreyfus Transfer, Inc., a wholly-owned subsidiary of Dreyfus, under a transfer agency agreement for providing personnel and facilities to perform transfer agency services for the fund. During the period ended October 31, 2007, the fund was charged $47,627 pursuant to the transfer agency agreement.
The fund compensates Mellon Bank, N.A., an affiliate of Dreyfus, under a custody agreement for providing custodial services for the fund. During the period ended October 31, 2007, the fund was charged $137,747 pursuant to the custody agreement.
During the period ended October 31, 2007, the fund was charged $4,660 for services performed by the Chief Compliance Officer.
The components of “Due to The Dreyfus Corporation and affiliates” in the Statement of Assets and Liabilities consist of: management fees $413,764, Rule 12b-1 distribution plan fees $53,378, shareholder services plan fees $81,024, custodian fees $55,235, chief compliance officer fees $2,812 and transfer agency per account fees $9,880, which are offset against an expense reimbursement currently in effect in the amount of $19,477.
(d) Each Board member also serves as a Board member of other funds within the Dreyfus complex. Annual retainer fees and attendance fees are allocated to each fund based on net assets.
The Fund 57
NOTES TO FINANCIAL STATEMENTS (continued)
NOTE 4—Securities Transactions:
The aggregate amount of purchases and sales of investment securities, excluding short-term securities, financial futures, options transactions and forward currency exchange contracts during the period ended October 31, 2007, amounted to $164,073,001 and $2,274,112, respectively.
The fund may invest in financial futures contracts in order to gain exposure to or protect against changes in the market.The fund is exposed to market risk as a result of changes in the value of the underlying financial instruments. Investments in financial futures require the fund to “mark to market” on a daily basis, which reflects the change in market value of the contracts at the close of each day’s trading.Accordingly, variation margin payments are received or made to reflect daily unrealized gains or losses.When the contracts are closed, the fund recognizes a realized gain or loss.These investments require initial margin deposits with a broker, which consist of cash or cash equivalents.The amount of these deposits is determined by the exchange or Board of Trade on which the contract is traded and is subject to change. Contracts open at October 31, 2007, are set forth in the Statement of Financial Futures.
The fund enters into forward currency exchange contracts to gain exposure to foreign currency, hedge its exposure against changes in exchange rates on its foreign portfolio holdings and to settle foreign currency transactions. When executing forward currency exchange contracts, the fund is obligated to buy or sell a foreign currency at a specified rate on a certain date in the future.With respect to sales of forward currency exchange contracts, the fund would incur a loss if the value of the contract increases between the date the forward contract is opened and the date the forward contract is closed.The fund realizes a gain if the value of the contract decreases between those dates. With respect to purchases of forward currency exchange contracts, the fund would incur a loss if the value of the contract decreases between the date the forward contract is opened and the date the forward contract is closed.The fund realizes a gain if the value of the contract increases between those dates.The fund is also exposed to credit risk associated
58
with counterparty nonperformance on these forward currency exchange contracts which is typically limited to the unrealized gain on each open contract.The following summarizes open forward currency exchange contracts at October 31, 2007:
| | | Foreign | | | | | | Unrealized |
| Forward Currency | | Currency | | | | | | Appreciation |
| Exchange Contracts | | Amounts | | Cost ($) | | Value ($) (Depreciation) ($) |
| |
| |
| |
|
| Purchases: | | | | | | | | |
| British Pound, | | | | | | | | |
| expiring | | | | | | | | |
| 12/19/2007 | | 69,849,500 | | 140,857,152 | | 144,883,230 | | 4,026,078 |
| Euro, expiring | | | | | | | | |
| 12/19/2007 | | 54,162,000 | | 76,033,207 | | 78,409,244 | | 2,376,037 |
| Japanese Yen, | | | | | | | | |
| expiring | | | | | | | | |
| 12/19/2007 | | 3,015,486,000 | | 26,055,719 | | 26,297,996 | | 242,277 |
| New Zealand Dollar, | | | | | | |
| expiring | | | | | | | | |
| 12/19/2007 | | 43,367,000 | | 29,944,762 | | 33,194,403 | | 3,249,641 |
| Sales: | | | | Proceeds ($) | | | | |
| Australian Dollar, | | | | | | | | |
| expiring | | | | | | | | |
| 12/19/2007 | | 45,330,000 | | 39,032,963 | | 41,898,972 | | (2,866,009) |
| Canadian Dollar, | | | | | | | | |
| expiring | | | | | | | | |
| 12/19/2007 | | 45,718,000 | | 43,556,160 | | 48,144,989 | | (4,588,829) |
| Norwegian Krone, | | | | | | | | |
| expiring | | | | | | | | |
| 12/19/2007 | | 227,215,000 | | 39,722,520 | | 42,112,960 | | (2,390,440) |
| Swedish Krona, | | | | | | | | |
| expiring | | | | | | | | |
| 12/19/2007 | | 144,619,000 | | 21,288,034 | | 22,753,397 | | (1,465,363) |
| Swiss Franc, expiring | | | | | | |
| 12/19/2007 | | 111,383,637 | | 94,202,033 | | 96,400,160 | | (2,198,127) |
| Total | | | | | | | | (3,614,735) |
At October 31, 2007, the cost of investments for federal income tax purposes was $448,436,675; accordingly, accumulated net unrealized appreciation on investments was $10,165,199, consisting of $17,436,114 gross unrealized appreciation and $7,270,915 gross unrealized depreciation.
The Fund 59
| REPORT OF INDEPENDENT REGISTERED |
| PUBLIC ACCOUNTING FIRM |
| Shareholders and Board of Directors |
| Global Alpha Fund |
We have audited the accompanying statement of assets and liabilities, including the statements of investments and financial futures, of Global Alpha Fund (one of the fund’s comprising Advantage Funds, Inc.) as of October 31, 2007, and the related statement of operations for the year then ended, the statement of changes in net assets and financial highlights for each of the periods indicated therein. These financial statements and financial highlights are the responsibility of the Fund’s management. Our responsibility is to express an opinion on these financial statements and financial highlights based on our audit.
We conducted our audits in accordance with the standards of the Public Company Accounting Oversight Board (United States).Those standards require that we plan and perform the audit to obtain reasonable assurance about whether the financial statements and financial highlights are free of material misstatement.We were not engaged to perform an audit of the Fund’s internal control over financial reporting. Our audit included consideration of internal control over financial reporting as a basis for designing audit procedures that are appropriate in the circumstances, but not for the purpose of expressing an opinion on the effectiveness of the Fund’s internal control over financial reporting. Accordingly, we express no such opinion.An audit includes examining, on a test basis, evidence supporting the amounts and disclosures in the financial statements and financial highlights, assessing the accounting principles used and significant estimates made by management, and evaluating the overall financial statement presentation. Our procedures included confirmation of securities owned as of October 31, 2007 by correspondence with the custodian and others. We believe that our audits provide a reasonable basis for our opinion.
In our opinion, the financial statements and financial highlights referred to above present fairly, in all material respects, the financial position of Global Alpha Fund at October 31, 2007, the results of its operations for the year then ended and the changes in its net assets and the financial highlights for each of the indicated periods, in conformity with U.S. generally accepted accounting principles.

New York, New York
December 20, 2007
|
60
IMPORTANT TAX INFORMATION (Unaudited)
For federal tax purposes, the fund hereby designates 1.85% of the ordinary dividends paid during the fiscal year ended October 31, 2007 as qualifying for the corporate dividends received deduction. Also certain dividends paid by the fund may be subject to a maximum tax rate of 15%, as provided for by the Jobs and Growth Tax Relief Reconciliation Act of 2003. Of the distributions paid during the fiscal year, $390,608 represents the maximum amount that may be considered qualified dividend income. Shareholders will receive notification in January 2008 of the percentage applicable to the preparation of their 2007 income tax returns. Also, the Fund hereby designates 86.93% of ordinary income dividends paid during the fiscal year ended October 31, 2007 as qualifying “interest related dividends”. Also, the fund hereby designates $.0412 per share as a long-term capital gain distribution and $.1207 per share as a short-term capital gain distribution paid on December 28, 2006.
The Fund 61
BOARD MEMBERS INFORMATION (Unaudited)
| Joseph S. DiMartino (64) |
| Chairman of the Board (1995) |
| Principal Occupation During Past 5 Years: |
| • Corporate Director and Trustee |
| Other Board Memberships and Affiliations: |
| • The Muscular Dystrophy Association, Director |
| • Century Business Services, Inc., a provider of outsourcing functions for small and medium size |
| companies, Director |
| • The Newark Group, a provider of a national market of paper recovery facilities, paperboard |
| mills and paperboard converting plants, Director |
| • Sunair Services Corporation, a provider of certain outdoor-related services to homes and |
| businesses, Director |
| No. of Portfolios for which Board Member Serves: 165 |
| Peggy C. Davis (64) |
| Board Member (2006) |
| Principal Occupation During Past 5 Years: |
| • Shad Professor of Law, New York University School of Law (1983-present) |
| • Writer and teacher in the fields of evidence, constitutional theory, family law, social sciences |
| and the law, legal process and professional methodology and training |
| No. of Portfolios for which Board Member Serves: 65 |
| David P. Feldman (67) |
| Board Member (1996) |
| Principal Occupation During Past 5 Years: |
| • Corporate Director and Trustee |
| Other Board Memberships and Affiliations: |
| • BBH Mutual Funds Group (11 funds), Director |
| • The Jeffrey Company, a private investment company, Director |
| No. of Portfolios for which Board Member Serves: 49 |
62
| James F. Henry (76) |
| Board Member (2006) |
| Principal Occupation During Past 5 Years: |
| • President,The International Institute for Conflict Prevention and Resolution, a non-profit |
| organization principally engaged in the development of alternatives to business litigation |
| (Retired 2003) |
| • Advisor to The Elaw Forum, a consultant on managing corporate legal costs |
| • Advisor to John Jay Homestead (the restored home of the first U.S. Chief Justice) |
| • Individual Trustee of several trusts |
| Other Board Memberships and Affiliations: |
| • Director, advisor and mediator involved in several non-profit organizations, primarily engaged |
| in domestic and international dispute resolution, and historic preservation |
| No. of Portfolios for which Board Member Serves: 40 |
| Ehud Houminer (67) |
| Board Member (1993) |
| Principal Occupation During Past 5 Years: |
| • Executive-in-Residence at the Columbia Business School, Columbia University |
| Other Board Memberships and Affiliations: |
| • Avnet Inc., an electronics distributor, Director |
| • International Advisory Board to the MBA Program School of Management, Ben Gurion |
| University, Chairman |
| No. of Portfolios for which Board Member Serves: 67 |
| Gloria Messinger (77) |
| Board Member (1993) |
| Principal Occupation During Past 5 Years: |
| • Arbitrator for American Arbitration Association and National Association of Securities Dealers, Inc |
| • Consultant in Intellectual Property |
| Other Board Memberships and Affiliations: |
| • Theater for a New Audience, Inc., Director |
| • Brooklyn Philharmonic, Director |
| No. of Portfolios for which Board Member Serves: 40 |
The Fund 63
BOARD MEMBERS INFORMATION (Unaudited) (continued)
| Dr. Martin Peretz (68) |
| Board Member (2006) |
| Principal Occupation During Past 5 Years: |
| • Editor-in-Chief of The New Republic Magazine |
| • Lecturer in Social Studies at Harvard University (1965-2002) |
| • Director of TheStreet.com, a financial information service on the web |
| Other Board Memberships and Affiliations: |
| • American Council of Trustees and Alumni, Director |
| • Pershing Square Capital Management, Adviser |
| • Montefiore Ventures, General Partner |
| • Harvard Center for Blood Research,Trustee |
| • Bard College,Trustee |
| • Board of Overseers of YIVO Institute for Jewish Research, Chairman |
| No. of Portfolios for which Board Member Serves: 40 |
| Anne Wexler (77) |
| Board Member (1996) |
| Principal Occupation During Past 5 Years: |
| • Chairman of the Wexler & Walker Public Policy Associates, consultants specializing in |
| government relations and public affairs from January 1981 to present |
| Other Board Memberships and Affiliations: |
| • Wilshire Mutual Funds (5 funds), Director |
| • The Community Foundation for the National Capital Region, Director |
| • Member of the Council of Foreign Relations |
| • Member of the National Park Foundation |
| No. of Portfolios for which Board Member Serves: 49 |
———————
Once elected all Board Members serve for an indefinite term, but achieve Emeritus status upon reaching age 80.The address of the Board Members and Officers is in c/o The Dreyfus Corporation, 200 Park Avenue, New York, New York 10166.Additional information about the Board Members is available in the fund’s Statement of Additional Information which can be obtained from Dreyfus free of charge by calling this toll free number: 1-800-554-4611.
John M. Fraser, Jr., Emeritus Board Member Dr. Paul A. Marks, Emeritus Board Member
64
OFFICERS OF THE FUND (Unaudited)
| J. DAVID OFFICER, President since |
| December 2006. |
| Chief Operating Officer,Vice Chairman and a |
| Director of the Manager, and an officer of 82 |
| investment companies (comprised of 165 |
| portfolios) managed by the Manager. He is 59 |
| years old and has been an employee of the |
| Manager since April 1998. |
| PHILLIP N. MAISANO, Executive Vice |
| President since July 2007. |
| Chief Investment Officer,Vice Chair and a |
| director of the Manager, and an officer of 82 |
| investment companies (comprised of 165 |
| portfolios) managed by the Manager. Mr. |
| Maisano also is an officer and/or Board |
| member of certain other investment |
| management subsidiaries of The Bank of New |
| York Mellon Corporation, each of which is an |
| affiliate of the Manager. He is 60 years old and |
| has been an employee of the Manager since |
| November 2006. Prior to joining the Manager, |
| Mr. Maisano served as Chairman and Chief |
| Executive Officer of EACM Advisors, an |
| affiliate of the Manager, since August 2004, and |
| served as Chief Executive Officer of Evaluation |
| Associates, a leading institutional investment |
| consulting firm, from 1988 until 2004. |
| MICHAEL A. ROSENBERG, Vice President |
| and Secretary since August 2005. |
| Associate General Counsel of the Manager, |
| and an officer of 83 investment companies |
| (comprised of 182 portfolios) managed by the |
| Manager. He is 47 years old and has been an |
| employee of the Manager since October 1991. |
| JAMES BITETTO, Vice President and |
| Assistant Secretary since August 2005. |
| Associate General Counsel and Secretary of |
| the Manager, and an officer of 83 investment |
| companies (comprised of 182 portfolios) |
| managed by the Manager. He is 41 years old |
| and has been an employee of the Manager |
| since December 1996. |
| JONI LACKS CHARATAN, Vice President |
| and Assistant Secretary since |
| August 2005. |
| Associate General Counsel of the Manager, |
| and an officer of 83 investment companies |
| (comprised of 182 portfolios) managed by the |
| Manager. She is 51 years old and has been an |
| employee of the Manager since October 1988. |
| JOSEPH M. CHIOFFI, Vice President and |
| Assistant Secretary since August 2005. |
| Associate General Counsel of the Manager, |
| and an officer of 83 investment companies |
| (comprised of 182 portfolios) managed by the |
| Manager. He is 45 years old and has been an |
| employee of the Manager since June 2000. |
| JANETTE E. FARRAGHER, Vice President |
| and Assistant Secretary since |
| August 2005. |
| Associate General Counsel of the Manager, |
| and an officer of 83 investment companies |
| (comprised of 182 portfolios) managed by the |
| Manager. She is 44 years old and has been an |
| employee of the Manager since February 1984. |
| JOHN B. HAMMALIAN, Vice President and |
| Assistant Secretary since August 2005. |
| Associate General Counsel of the Manager, |
| and an officer of 83 investment companies |
| (comprised of 182 portfolios) managed by the |
| Manager. He is 44 years old and has been an |
| employee of the Manager since February 1991. |
| ROBERT R. MULLERY, Vice President and |
| Assistant Secretary since August 2005. |
| Associate General Counsel of the Manager, |
| and an officer of 83 investment companies |
| (comprised of 182 portfolios) managed by the |
| Manager. He is 55 years old and has been an |
| employee of the Manager since May 1986. |
The Fund 65
OFFICERS OF THE FUND (Unaudited) (continued)
| JEFF PRUSNOFSKY, Vice President and |
| Assistant Secretary since August 2005. |
| Associate General Counsel of the Manager, |
| and an officer of 83 investment companies |
| (comprised of 182 portfolios) managed by the |
| Manager. He is 42 years old and has been an |
| employee of the Manager since October 1990. |
| JAMES WINDELS, Treasurer since |
| November 2001. |
| Director – Mutual Fund Accounting of the |
| Manager, and an officer of 83 investment |
| companies (comprised of 182 portfolios) |
| managed by the Manager. He is 49 years old |
| and has been an employee of the Manager |
| since April 1985. |
| ROBERT ROBOL, Assistant Treasurer |
| since August 2005. |
| Senior Accounting Manager – Money Market |
| and Municipal Bond Funds of the Manager, |
| and an officer of 83 investment companies |
| (comprised of 182 portfolios) managed by the |
| Manager. He is 43 years old and has been an |
| employee of the Manager since October 1988. |
| ROBERT SALVIOLO, Assistant Treasurer |
| since May 2007. |
| Senior Accounting Manager – Equity Funds of |
| the Manager, and an officer of 83 investment |
| companies (comprised of 182 portfolios) |
| managed by the Manager. He is 40 years old |
| and has been an employee of the Manager |
| since June 1989. |
| ROBERT SVAGNA, Assistant Treasurer |
| since December 2002. |
| Senior Accounting Manager – Equity Funds of |
| the Manager, and an officer of 83 investment |
| companies (comprised of 182 portfolios) |
| managed by the Manager. He is 40 years old |
| and has been an employee of the Manager |
| since November 1990. |
| GAVIN C. REILLY, Assistant Treasurer |
| since December 2005. |
| Tax Manager of the Investment Accounting |
| and Support Department of the Manager, and |
| an officer of 83 investment companies |
| (comprised of 182 portfolios) managed by the |
| Manager. He is 39 years old and has been an |
| employee of the Manager since April 1991. |
| JOSEPH W. CONNOLLY, Chief Compliance |
| Officer since October 2004. |
| Chief Compliance Officer of the Manager and |
| The Dreyfus Family of Funds (83 investment |
| companies, comprised of 182 portfolios). From |
| November 2001 through March 2004, Mr. |
| Connolly was first Vice-President, Mutual |
| Fund Servicing for Mellon Global Securities |
| Services. In that capacity, Mr. Connolly was |
| responsible for managing Mellon’s Custody, |
| Fund Accounting and Fund Administration |
| services to third-party mutual fund clients. He |
| is 50 years old and has served in various |
| capacities with the Manager since 1980, |
| including manager of the firm’s Fund |
| Accounting Department from 1997 through |
| October 2001. |
| WILLIAM GERMENIS, Anti-Money |
| Laundering Compliance Officer since |
| October 2002. |
| Vice President and Anti-Money Laundering |
| Compliance Officer of the Distributor, and the |
| Anti-Money Laundering Compliance Officer |
| of 79 investment companies (comprised of 178 |
| portfolios) managed by the Manager. He is 37 |
| years old and has been an employee of the |
| Distributor since October 1998. |
66
NOTES
The Registrant has adopted a code of ethics that applies to the Registrant's principal executive officer, principal financial officer, principal accounting officer or controller, or persons performing similar functions There have been no amendments to, or waivers in connection with, the Code of Ethics during the period covered by this Report.
| Item 3. | | Audit Committee Financial Expert. |
The Registrant's Board has determined that David P. Feldman, a member of the Audit Committee of the Board, is an audit committee financial expert as defined by the Securities and Exchange Commission (the "SEC"). David P. Feldman is "independent" as defined by the SEC for purposes of audit committee financial expert determinations.
| Item 4. | | Principal Accountant Fees and Services |
(a) Audit Fees. The aggregate fees billed for each of the last two fiscal years (the "Reporting Periods") for professional services rendered by the Registrant's principal accountant (the "Auditor") for the audit of the Registrant's annual financial statements, or services that are normally provided by the Auditor in connection with the statutory and regulatory filings or engagements for the Reporting Periods, were $58,804 in 2006 and $58,804 in 2007.
(b) Audit-Related Fees. The aggregate fees billed in the Reporting Periods for assurance and related services by the Auditor that are reasonably related to the performance of the audit of the Registrant's financial statements and are not reported under paragraph (a) of this Item 4 were $-0- in 2006 and $10,244 in 2007. These services consisted of (i) security counts required by Rule 17f-2 under the Investment Company Act of 1940, as amended.
The aggregate fees billed in the Reporting Periods for non-audit assurance and related services by the Auditor to the Registrant's investment adviser (not including any sub-investment adviser whose role is primarily portfolio management and is subcontracted with or overseen by another investment adviser), and any entity controlling, controlled by or under common control with the investment adviser that provides ongoing services to the Registrant ("Service Affiliates"), that were reasonably related to the performance of the annual audit of the Service Affiliate, which required pre-approval by the Audit Committee were $-0- in 2006 and $-0- in 2007.
Note: For the second paragraph in each of (b) through (d) of this Item 4, certain of such services were not pre-approved prior to May 6, 2003, when such services were required to be pre-approved. On and after May 6, 2003, 100% of all services provided by the Auditor were pre-approved as required. For comparative purposes, the fees shown assume that all such services were pre-approved, including services that were not pre-approved prior to the compliance date of the pre-approval requirement.
(c) Tax Fees. The aggregate fees billed in the Reporting Periods for professional services rendered by the Auditor for tax compliance, tax advice and tax planning ("Tax Services") were $2,428 in 2006 and $8,792 in 2007. These services consisted of (i) review or preparation of U.S. federal, state, local and excise tax returns; (ii) U.S. federal, state and local tax planning, advice and assistance regarding statutory, regulatory or
-2-
administrative developments, (iii) tax advice regarding tax qualification matters and/or treatment of various financial instruments held or proposed to be acquired or held, and (iv) determination of Passive Foreign Investment Companies (as applicable).
The aggregate fees billed in the Reporting Periods for Tax Services by the Auditor to Service Affiliates which required pre-approval by the Audit Committee were $-0- in 2006 and $-0- in 2007.
(d) All Other Fees. The aggregate fees billed in the Reporting Periods for products and services provided by the Auditor, other than the services reported in paragraphs (a) through (c) of this Item, were $59 in 2006 and $-0- in 2007. These services consisted of a review of the Registrant's anti-money laundering program.
The aggregate fees billed in the Reporting Periods for Non-Audit Services by the Auditor to Service Affiliates, other than the services reported in paragraphs (b) through (c) of this Item, which required pre-approval by the Audit Committee were $-0- in 2006 and $-0- in 2007.
Audit Committee Pre-Approval Policies and Procedures. The Registrant's Audit Committee has established policies and procedures (the "Policy") for pre-approval (within specified fee limits) of the Auditor's engagements for non-audit services to the Registrant and Service Affiliates without specific case-by-case consideration. Pre-approval considerations include whether the proposed services are compatible with maintaining the Auditor's independence. Pre-approvals pursuant to the Policy are considered annually.
Non-Audit Fees. The aggregate non-audit fees billed by the Auditor for services rendered to the Registrant, and rendered to Service Affiliates, for the Reporting Periods were $436,321 in 2006 and $1,627,514 in 2007.
Auditor Independence. The Registrant's Audit Committee has considered whether the provision of non-audit services that were rendered to Service Affiliates which were not pre-approved (not requiring pre-approval) is compatible with maintaining the Auditor's independence.
| Item 5. | | Audit Committee of Listed Registrants. |
| | | Not applicable. | | [CLOSED-END FUNDS ONLY] |
| Item 6. | | Schedule of Investments. |
| | | Not applicable. | | |
| Item 7. | | Disclosure of Proxy Voting Policies and Procedures for Closed-End Management |
| | | Investment Companies. |
| | | Not applicable. | | [CLOSED-END FUNDS ONLY] |
| Item 8. | | Portfolio Managers of Closed-End Management Investment Companies. |
| | | Not applicable. | | [CLOSED-END FUNDS ONLY, beginning with reports for periods ended |
| | | | | on and after December 31, 2005] |
| Item 9. | | Purchases of Equity Securities by Closed-End Management Investment Companies and |
| | | Affiliated Purchasers. |
| | | Not applicable. | | [CLOSED-END FUNDS ONLY] |
| Item 10. | | Submission of Matters to a Vote of Security Holders. |
-3-
SSL-DOCS2 70128344v15
The Registrant has a Nominating Committee (the "Committee"), which is responsible for selecting and nominating persons for election or appointment by the Registrant's Board as Board members. The Committee has adopted a Nominating Committee Charter (the "Charter"). Pursuant to the Charter, the Committee will consider recommendations for nominees from shareholders submitted to the Secretary of the Registrant, c/o The Dreyfus Corporation Legal Department, 200 Park Avenue, 8th Floor East, New York, New York 10166. A nomination submission must include information regarding the recommended nominee as specified in the Charter. This information includes all information relating to a recommended nominee that is required to be disclosed in solicitations or proxy statements for the election of Board members, as well as information sufficient to evaluate the factors to be considered by the Committee, including character and integrity, business and professional experience, and whether the person has the ability to apply sound and independent business judgment and would act in the interests of the Registrant and its shareholders.
Nomination submissions are required to be accompanied by a written consent of the individual to stand for election if nominated by the Board and to serve if elected by the shareholders, and such additional information must be provided regarding the recommended nominee as reasonably requested by the Committee.
| Item 11. | | Controls and Procedures. |
(a) The Registrant's principal executive and principal financial officers have concluded, based on their evaluation of the Registrant's disclosure controls and procedures as of a date within 90 days of the filing date of this report, that the Registrant's disclosure controls and procedures are reasonably designed to ensure that information required to be disclosed by the Registrant on Form N-CSR is recorded, processed, summarized and reported within the required time periods and that information required to be disclosed by the Registrant in the reports that it files or submits on Form N-CSR is accumulated and communicated to the Registrant's management, including its principal executive and principal financial officers, as appropriate to allow timely decisions regarding required disclosure.
(b) There were no changes to the Registrant's internal control over financial reporting that occurred during the second fiscal quarter of the period covered by this report that have materially affected, or are reasonably likely to materially affect, the Registrant's internal control over financial reporting.
(a)(1) Code of ethics referred to in Item 2.
(a)(2) Certifications of principal executive and principal financial officers as required by Rule 30a-2(a) under the Investment Company Act of 1940.
(a)(3) Not applicable.
(b) Certification of principal executive and principal financial officers as required by Rule 30a-2(b) under the Investment Company Act of 1940.
SSL-DOCS2 70128344v15
SIGNATURES
Pursuant to the requirements of the Securities Exchange Act of 1934 and the Investment Company Act of 1940, the Registrant has duly caused this Report to be signed on its behalf by the undersigned, thereunto duly authorized.
Advantage Funds, Inc.
| By: | | /s/ J. David Officer |
| | | J. David Officer |
| | | President |
| |
| Date: | | December 18, 2007 |
Pursuant to the requirements of the Securities Exchange Act of 1934 and the Investment Company Act of 1940, this Report has been signed below by the following persons on behalf of the Registrant and in the capacities and on the dates indicated.
| By: | | /s/ J. David Officer |
| | | J. David Officer |
| | | President |
| |
| Date: | | December 18, 2007 |
| By: | | /s/ James Windels |
| | | James Windels |
| | | Treasurer |
| |
| Date: | | December 18, 2007 |
EXHIBIT INDEX
(a)(1) Code of ethics referred to in Item 2.
(a)(2) Certifications of principal executive and principal financial officers as required by Rule 30a-2(a) under the Investment Company Act of 1940. (EX-99.CERT)
(b) Certification of principal executive and principal financial officers as required by Rule 30a-2(b) under the Investment Company Act of 1940. (EX-99.906CERT)
-5-
SSL-DOCS2 70128344v15
Exhibit (a)(1)
| | THE DREYFUS FAMILY OF FUNDS
CODE OF ETHICS FOR PRINCIPAL EXECUTIVE
AND SENIOR FINANCIAL OFFICERS
|
1. Covered Officers/Purpose of the Code
This code of ethics (the "Code") for the investment companies within the complex (each, a "Fund") applies to each Fund's Principal Executive Officer, Principal Financial Officer, Principal Accounting Officer or Controller, or other persons performing similar functions, each of whom is listed on Exhibit A (the "Covered Officers"), for the purpose of promoting:
- honest and ethical conduct, including the ethical handling of actual or apparent conflicts of interest between personal and professional relationships;
- full, fair, accurate, timely and understandable disclosure in reports and documents that the Fund files with, or submits to, the Securities and Exchange Commission (the "SEC") and in other public communications made by the Fund;
- compliance with applicable laws and governmental rules and regulations;
- the prompt internal reporting of violations of the Code to an appropriate person or persons identified in the Code; and
- accountability for adherence to the Code.
Each Covered Officer should adhere to a high standard of business ethics and should be sensitive to situations that may give rise to actual as well as apparent conflicts of interest.
2. Covered Officers Should Handle Ethically Actual and Apparent Conflicts of Interest
Overview. A "conflict of interest" occurs when a Covered Officer's private interest interferes with the interests of, or his service to, the Fund. For example, a conflict of interest would arise if a Covered Officer, or a member of his family, receives improper personal benefits as a result of his position with the Fund.
Certain conflicts of interest arise out of the relationships between Covered Officers and the Fund and already are subject to conflict of interest provisions in the Investment Company Act of 1940, as amended (the "Investment Company Act"), and the Investment Advisers Act of 1940, as amended (the "Investment Advisers Act"). For example, Covered Officers may not individually engage in certain transactions (such as the purchase or sale of securities or other property) with the Fund because of their status as "affiliated persons" of the Fund. The compliance programs and procedures of the Fund and the Fund's investment adviser (the "Adviser") are designed to prevent, or identify and correct, violations of these provisions. The Code does not, and is not intended to, repeat or replace these programs and procedures, and the circumstances they cover fall outside of the parameters of the Code.
Although typically not presenting an opportunity for improper personal benefit, conflicts arise from, or as a result of, the contractual relationship between the Fund and the Adviser of
which the Covered Officers are also officers or employees. As a result, the Code recognizes that the Covered Officers, in the ordinary course of their duties (whether formally for the Fund or for the Adviser, or for both), will be involved in establishing policies and implementing decisions that will have different effects on the Adviser and the Fund. The participation of the Covered Officers in such activities is inherent in the contractual relationship between the Fund and the Adviser and is consistent with the performance by the Covered Officers of their duties as officers of the Fund and, if addressed in conformity with the provisions of the Investment Company Act and the Investment Advisers Act, will be deemed to have been handled ethically. In addition, it is recognized by the Fund's Board that the Covered Officers also may be officers or employees of one or more other investment companies covered by this or other codes of ethics.
Other conflicts of interest are covered by the Code, even if such conflicts of interest are not subject to provisions in the Investment Company Act and the Investment Advisers Act. Covered Officers should keep in mind that the Code cannot enumerate every possible scenario. The overarching principle of the Code is that the personal interest of a Covered Officer should not be placed improperly before the interest of the Fund.
| | Each Covered Officer must:
|
- not use his personal influence or personal relationships improperly to influence investment decisions or financial reporting by the Fund whereby the Covered Officer would benefit personally to the detriment of the Fund;
- not cause the Fund to take action, or fail to take action, for the individual personal benefit of the Covered Officer rather than the benefit of the Fund; and
- not retaliate against any employee or Covered Officer for reports of potential violations that are made in good faith.
3. Disclosure and Compliance
- Each Covered Officer should familiarize himself with the disclosure requirements generally applicable to the Fund within his area of responsibility;
- each Covered Officer should not knowingly misrepresent, or cause others to misrepresent, facts about the Fund to others, whether within or outside the Fund, including to the Fund's Board members and auditors, and to governmental regulators and self-regulatory organizations;
- each Covered Officer should, to the extent appropriate within his area of responsibility, consult with other officers and employees of the Fund and the Adviser with the goal of promoting full, fair, accurate, timely and understandable disclosure in the reports and documents the Fund files with, or submits to, the SEC and in other public communications made by the Fund; and
- it is the responsibility of each Covered Officer to promote compliance with the standards and restrictions imposed by applicable laws, rules and regulations.
4. Reporting and Accountability
Each Covered Officer must:
|
- upon adoption of the Code (or thereafter, as applicable, upon becoming a Covered Officer), affirm in writing to the Board that he has received, read, and understands the Code;
- annually thereafter affirm to the Board that he has complied with the requirements of the Code; and
- notify the Adviser's General Counsel (the "General Counsel") promptly if he knows of any violation of the Code. Failure to do so is itself a violation of the Code.
The General Counsel is responsible for applying the Code to specific situations in which questions are presented under it and has the authority to interpret the Code in any particular situation. However, waivers sought by any Covered Officer will be considered by the Fund's Board.
The Fund will follow these procedures in investigating and enforcing the Code:
- the General Counsel will take all appropriate action to investigate any potential violations reported to him;
- if, after such investigation, the General Counsel believes that no violation has occurred, the General Counsel is not required to take any further action;
- any matter that the General Counsel believes is a violation will be reported to the Board;
- if the Board concurs that a violation has occurred, it will consider appropriate action, which may include: review of, and appropriate modifications to, applicable policies and procedures; notification to appropriate personnel of the Adviser or its board; or dismissal of the Covered Officer;
- the Board will be responsible for granting waivers, as appropriate; and
- any waivers of or amendments to the Code, to the extent required, will be disclosed as provided by SEC rules.
5. Other Policies and Procedures
|
The Code shall be the sole code of ethics adopted by the Fund for purposes of Section 406 of the Sarbanes-Oxley Act of 2002 and the rules and forms applicable to registered investment companies thereunder. The Fund's, its principal underwriter's and the Adviser's codes of ethics under Rule 17j-1 under the Investment Company Act and the Adviser's additional policies and procedures, including its Code of Conduct, are separate requirements applying to the Covered Officers and others, and are not part of the Code.
6. Amendments
The Code may not be amended except in written form, which is specifically approved or ratified by a majority vote of the Fund's Board, including a majority of independent Board members.
7. Confidentiality
All reports and records prepared or maintained pursuant to the Code will be considered confidential and shall be maintained and protected accordingly. Except as otherwise required by law or the Code, such matters shall not be disclosed to anyone other than the appropriate Funds and their counsel, the appropriate Boards (or Committees) and their counsel and the Adviser.
The Code is intended solely for the internal use by the Fund and does not constitute an admission, by or on behalf of the Fund, as to any fact, circumstance, or legal conclusion.
| | Dated as of: July 1, 2003
|
| Exhibit A | | | | |
| Persons Covered by the Code of Ethics | | |
| J. David Officer | | President | | (Principal Executive Officer) |
| | | | | (Principal Financial and |
| James Windels | | Treasurer | | Accounting Officer) |
| Revised as of December 29, 2006 | | |