Exhibit (g)
| Presentation Materials For: Regarding Project Diamond September 2009 |

| Notice to Recipient “Bank of America Merrill Lynch” is the marketing name for the global banking and global markets businesses of Bank of America Corporation. Lending, derivatives, and other commercial banking activities are performed globally by banking affiliates of Bank of America Corporation, including Bank of America, N.A., member FDIC. Securities, strategic advisory, and other investment banking activities are performed globally by investment banking affiliates of Bank of America Corporation (“Investment Banking Affiliates”), including, in the United States, Banc of America Securities LLC and Merrill Lynch, Pierce, Fenner & Smith Incorporated, which are both registered broker-dealers and members of FINRA and SIPC, and, in other jurisdictions, locally registered entities. Investment products offered by Investment Banking Affiliates: Are Not FDIC Insured * May Lose Value * Are Not Bank Guaranteed. These materials have been prepared by one or more subsidiaries of Bank of America Corporation for Fairfax Financial Holdings Limited to whom such materials are directly addressed and delivered (the “Company”) in connection with an actual or potential mandate or engagement and may not be publicly disclosed, used or relied upon for any purpose other than as specifically contemplated by a written agreement with us. These materials are based on information provided by or on behalf of the Company and/or other potential transaction participants, from public sources or otherwise reviewed by us. We assume no responsibility for independent investigation or verification of such information (including, without limitation, data from third party suppliers) or any independent valuation or appraisal of any of the assets or liabilities the Company or any other entity, or concerning solvency or fair value of the Company or any other entity, and have relied on such information being complete and accurate. To the extent such information includes estimates and forecasts of future financial performance prepared by or reviewed with the managements of the Company and/or other potential transaction participants or obtained from public sources, we have assumed without investigation that such estimates and forecasts have been reasonably prepared on bases reflecting the best currently available estimates and judgments of such managements (or, with respect to estimates and forecasts obtained from public sources, represent reasonable estimates). No representation or warranty, express or implied, is made as to the accuracy or completeness as to such information, forecast or assumption and nothing contained herein is, or shall be relied upon as, a representation, whether as to the past, the present or the future. These materials were designed for use by specific persons familiar with the business and affairs of the Company and are being furnished and should be considered only in connection with other information, oral or written, being provided by us in connection herewith. These materials are not intended to provide the sole basis for evaluating, and should not be considered a recommendation with respect to, any transaction or other matter. These materials do not constitute an offer or solicitation to sell or purchase any securities and are not a commitment by Bank of America Corporation or any of its affiliates to provide or arrange any financing for any transaction or to purchase any security in connection therewith. These materials are for discussion purposes only and are subject to our review and assessment from a legal, compliance, accounting policy and risk perspective, as appropriate, following our discussion with the Company. We assume no obligation to update or otherwise revise these materials. These materials have not been prepared with a view toward public disclosure under applicable securities laws or otherwise, are intended for the benefit and use of the Company, and may not be reproduced, disseminat ed, quoted or referred to, in whole or in part, without our prior written consent. These materials may not reflect information known to other professionals in other business areas of Bank of America Corporation and its affiliates. Bank of America Corporation and its affiliates (collectively, the “BAC Group”) comprise a full service securities firm and commercial bank engaged in securities, commodities and derivatives trading, foreign exchange and other brokerage activities, and principal investing as well as providing investment, corporate and private banking, asset and investment management, financing and strategic advisory services and other commercial services and products to a wide range of corporations, governments and individuals, domestically and offshore, from which conflicting interests or duties, or a perception thereof, may arise. In the ordinary course of these activities, parts of the BAC Group at any time may invest on a principal basis or manage funds that invest, make or hold long or short positions, finance positions or trade or otherwise effect transactions, for their own accounts or the accounts of customers, in debt, equity or other securities or financial instruments (including derivatives, bank loans or other obligations) of the Company, potential counterparties or any other company that may be involved in a transaction. Products and services that may be referenced in the accompanying materials may be provided through one or more affiliates of Bank of America Corporation. We have adopted policies and guidelines designed to preserve the independence of our research analysts. These policies prohibit employees from offering research coverage, a favorable research rating or a specific price target or offering to change a research rating or price target as consideration for or an inducement to obtain business or other compensation. We are required to obtain, verify and record certain information that identifies the Company, which information includes the name and address of the Company and other information that will allow us to identify the Company in accordance, as applicable, with the USA Patriot Act (Title III of Pub. L. 107-56 (signed into law October 26, 2001)) and such other laws, rules and regulations as applicable within and outside the United States. We do not provide legal, compliance, tax or accounting advice. Accordingly, any statements contained herein as to tax matters were neither written nor intended by us to be used and cannot be used by any taxpayer for the purpose of avoiding tax penalties that may be imposed on such taxpayer. If any person uses or refers to any such tax statement in promoting, marketing or recommending a partnership or other entity, investment plan or arrangement to any taxpayer, then the statement expressed herein is being delivered to support the promotion or marketing of the transaction or matter addressed and the recipient should seek advice based on its particular circumstances from an independent tax advisor. Notwithstanding anything that may appear herein or in other materials to the contrary, the Company shall be permitted to disclose the tax treatment and tax structure of a transaction (including any materials, opinions or analyses relating to such tax treatment or tax structure, but without disclosure of identifying information or, except to the extent relating to such tax structure or tax treatment, any nonpublic commercial or financial information) on and after the earliest to occur of the date of (i) public announcement of discussions relating to such transaction, (ii) public announcement of such transaction or (iii) execution of a definitive agreement (with or without conditions) to enter into such transaction; provided, however, that if such transaction is not consummated for any reason, the provisions of this sentence shall cease to apply. Copyright 2009 Bank of America Corporation. |
| Notice to Recipient Assumptions and Limitations For purposes of our valuation contained herein, we have assumed without investigation and relied upon, without independent verification, the accuracy and completeness of the financial and other information and data publicly available or provided to or otherwise reviewed by or discussed with us and have relied upon the assurances of the management of Diamond that they are not aware of any facts or circumstances that would make such information or data inaccurate or misleading. With respect to the financial forecasts relating to Diamond prepared by management of Diamond, we have been advised by Diamond, and have assumed without investigation, that they have been reasonably prepared on bases reflecting the best currently available estimates and good faith judgments of the management of Diamond as to the future financial performance of Diamond. We have not made or been provided with any independent evaluation or appraisal of the assets or liabilities (contingent or otherwise) of Diamond, nor have we made any physical inspection of the properties or assets of Diamond. We have not evaluated the solvency or fair value of Diamond under any state, federal or other laws relating to bankruptcy, insolvency or similar matters. In addition, we were not requested to, and we did not, solicit indications of interest from third parties with respect to the acquisition of all or any part of Diamond. We make no representation as to the sufficiency or adequacy of our valuation or the manner in which it was determined for any particular purpose. We are not expressing any opinion as to the prices at which Diamond shares may be sold at any time. The valuation contained herein is only an estimate, subject to uncertainties and contingencies, which are difficult to predict and beyond our control; and, accordingly, the valuation should not be viewed as providing any assurances or guarantees regarding, and should not be relied upon with respect to, the likelihood of completing any sale of Diamond shares or the actual price at which such shares may be sold in any sale. Our views set forth herein are necessarily based on financial, economic, monetary, market and other conditions and circumstances as in effect on, and the information made available to us as of, September 17, 2009. We have not taken into account any changes in such conditions or circumstances or any developments since such date. |
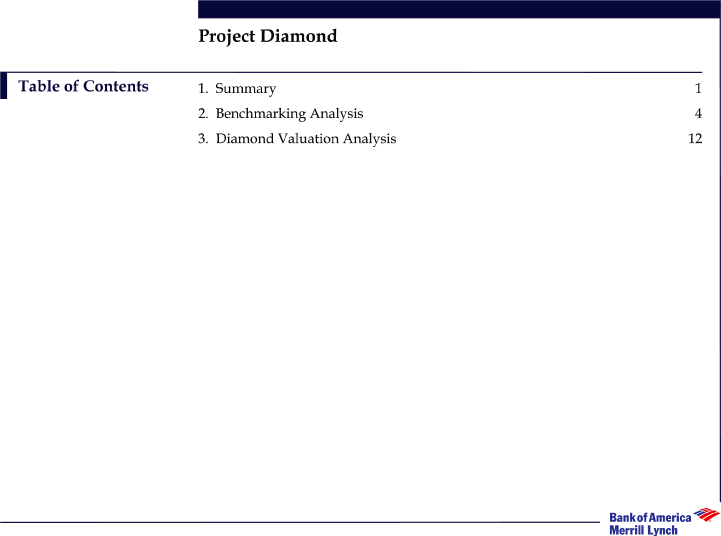
| Project Diamond Table of Contents 1. Summary 1 2. Benchmarking Analysis 4 3. Diamond Valuation Analysis 12 |

| Summary |
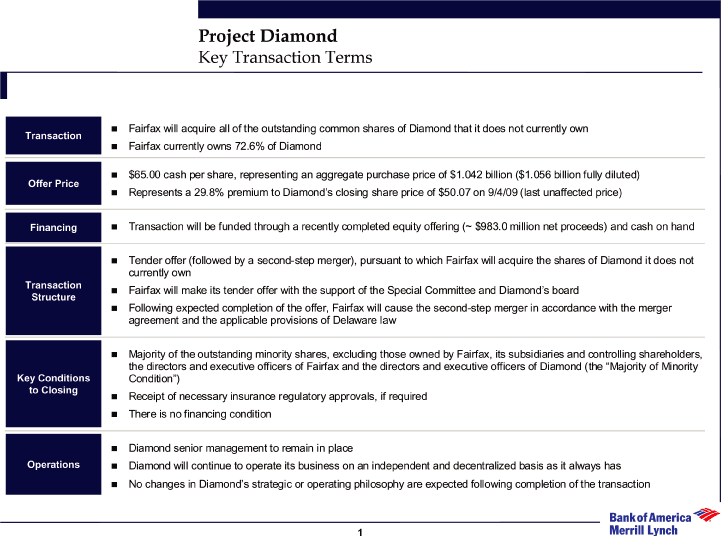
| Project Diamond Key Transaction Terms Transaction Fairfax will acquire all of the outstanding common shares of Diamond that it does not currently own Transaction Fairfax currently owns 72.6% of Diamond Offer Price$ 65.00 cash per share, representing an aggregate purchase price of $1.042 billion ($1.056 billion fully diluted) Offer Price Represents a 29.8% premium to Diamond’s closing share price of $50.07 on 9/4/09 (last unaffected price) Financing Financing Transaction will be funded through a recently completed equity offering (~ $983.0 million net proceeds) and cash on hand Management Tender offer (followed by a second-step merger), pursuant to which Fairfax will acquire the shares of Diamond it does not Positions currently own Transaction Fairfax will make its tender offer with the support of the Special Committee and Diamond’s board Structure Following expected completion of the offer, Fairfax will cause the second-step merger in accordance with the merger agreement and the applicable provisions of Delaware law Key Conditions to Majority of the outstanding minority shares, excluding those owned by Fairfax, its subsidiaries and controlling shareholders, Closing the directors and executive officers of Fairfax and the directors and executive officers of Diamond (the “Majority of Minority Key Conditions Condition”) to Closing Receipt of necessary insurance regulatory approvals, if required There is no financing condition Ongoing Diamond senior management to remain in place Operations Operations Diamond will continue to operate its business on an independent and decentralized basis as it always has No changes in Diamond’s strategic or operating philosophy are expected following completion of the transaction |
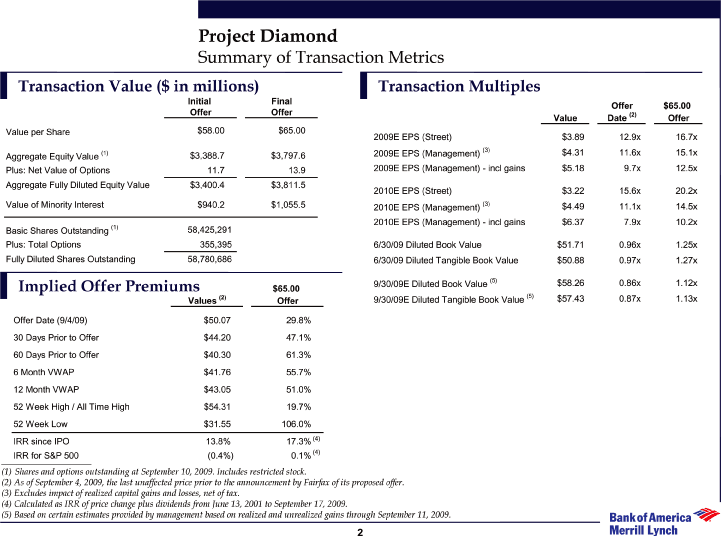
| Project Diamond Summary of Transaction Metrics Transaction Value ($ in millions) Transaction Multiples Initial Final Offer $65.00 Offer Offer Value Date (2) Offer Value per Share $58.00 $65.00 2009E EPS (Street) $3.89 12.9x 16.7x Aggregate Equity Value (1) $3,388.7 $3,797.6 2009E EPS (Management) (3) $4.31 11.6x 15.1x Plus: Net Value of Options 11.7 13.9 2009E EPS (Management) - incl gains $5.18 9.7x 12.5x Aggregate Fully Diluted Equity Value $3,400.4 $3,811.5 2010E EPS (Street) $3.22 15.6x 20.2x Value of Minority Interest $940.2 $1,055.5 2010E EPS (Management) (3) $4.49 11.1x 14.5x 2010E EPS (Management) — incl gains $6.37 7.9x 10.2x Basic Shares Outstanding (1) 58,425,291 Plus: Total Options 355,395 6/30/09 Diluted Book Value $51.71 0.96x 1.25x Fully Diluted Shares Outstanding 58,780,686 6/30/09 Diluted Tangible Book Value $50.88 0.97x 1.27x Implied Offer Premiums 9/30/09E Diluted Book Value (5) $58.26 0.86x 1.12x $65.00 Values (2) Offer 9/30/09E Diluted Tangible Book Value (5) $57.43 0.87x 1.13x Offer Date (9/4/09) $50.07 29.8% 30 Days Prior to Offer $44.20 47.1% 60 Days Prior to Offer $40.30 61.3% 6 Month VWAP $41.76 55.7% 12 Month VWAP $43.05 51.0% 52 Week High / All Time High $54.31 19.7% 52 Week Low $31.55 106.0% IRR since IPO 13.8% 17.3% (4) IRR for S&P 500 (0.4%) 0.1% (4) ___(1) Shares and options outstanding at September 10, 2009. Includes restricted stock. (2) As of September 4, 2009, the last unaffected price prior to the announcement by Fairfax of its proposed offer. (3) Excludes impact of realized capital gains and losses, net of tax. (4) Calculated as IRR of price change plus dividends from June 13, 2001 to September 17, 2009. (5) Based on certain estimates provided by management based on realized and unrealized gains through September 11, 2009. 2 |
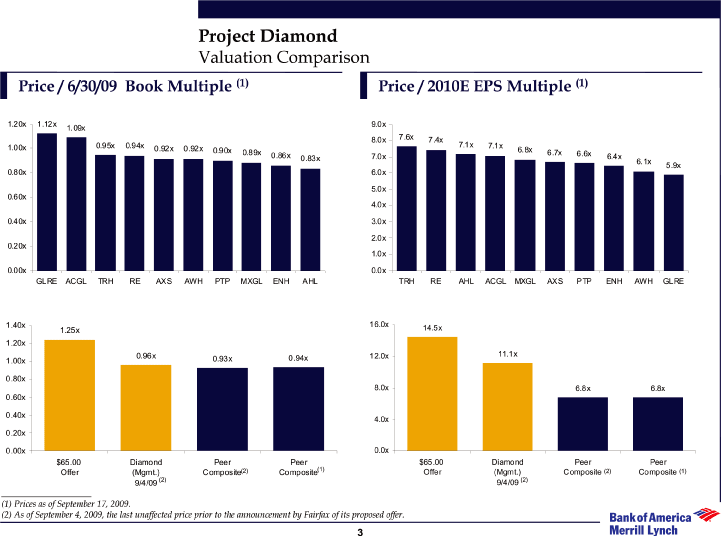
| Project Diamond Valuation Comparison Price / 6/30/09 Book Multiple (1) Price / 2010E EPS Multiple (1) (1) Prices as of September 17, 2009. (2) As of September 4, 2009, the last unaffected price prior to the announcement by Fairfax of its proposed offer. 3 |

| Benchmarking Analysis |
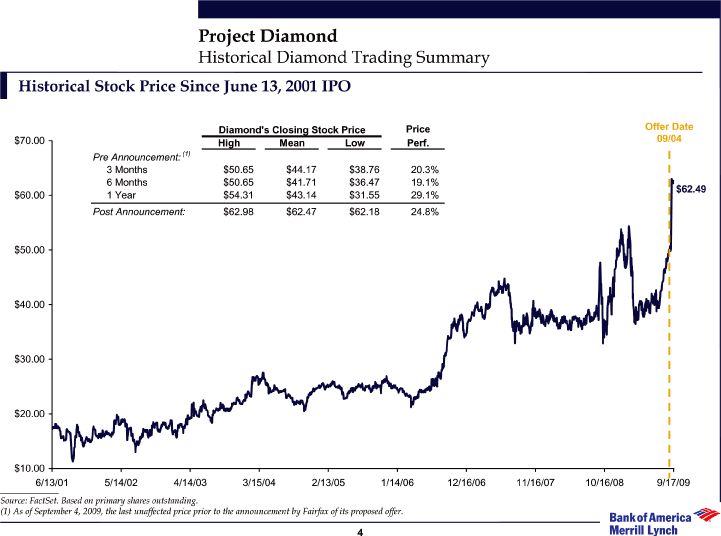
| Project Diamond Historical Diamond Trading Summary Historical Stock Price Since June 13, 2001 IPO Source: FactSet. Based on primary shares outstanding. (1) As of September 4, 2009, the last unaffected price prior to the announcement by Fairfax of its proposed offer. |
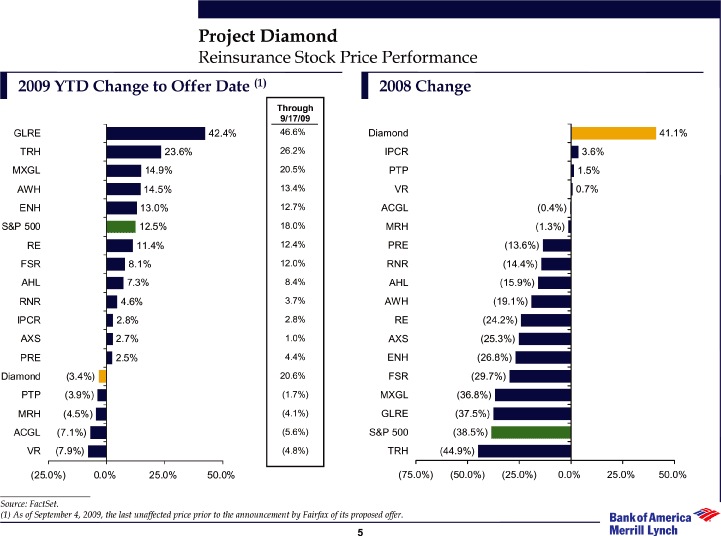
| Project Diamond Reinsurance Stock Price Performance 2009 YTD Change to Offer Date (1) 2008 Change Source: FactSet. (1) As of September 4, 2009, the last unaffected price prior to the announcement by Fairfax of its proposed offer. |
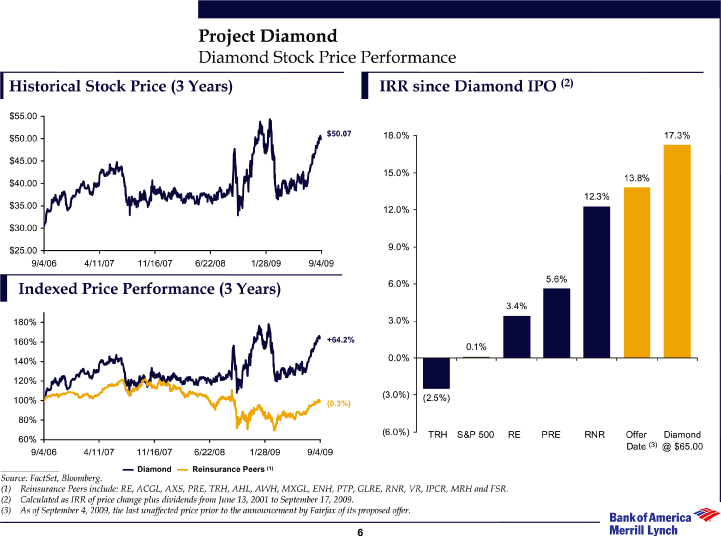
| Project Diamond Diamond Stock Price Performance Historical Stock Price (3 Years) IRR since Diamond IPO (2) Indexed Price Performance (3 Years) Source: FactSet, Bloomberg. (1) Reinsurance Peers include: RE, ACGL, AXS, PRE, TRH, AHL, AWH, MXGL, ENH, PTP, GLRE, RNR, VR, IPCR, MRH and FSR. (2) Calculated as IRR of price change plus dividends from June 13, 2001 to September 17, 2009. (3) As of September 4, 2009, the last unaffected price prior to the announcement by Fairfax of its proposed offer. |
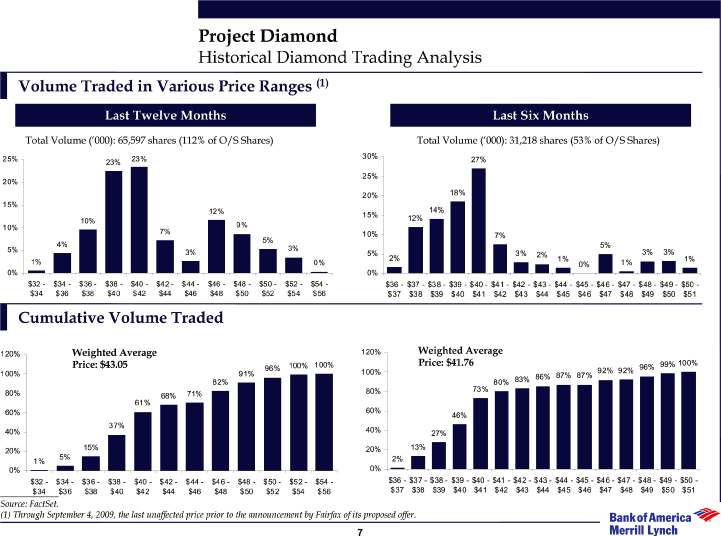
| Project Diamond Historical Diamond Trading Analysis Volume Traded in Various Price Ranges (1) Last Twelve Months Last Six Months Total Volume (‘000): 65,597 shares (112% of O/S Shares) Total Volume (‘000): 31,218 shares (53% of O/S Shares) Cumulative Volume Traded Source: FactSet. (1) Through September 4, 2009, the last unaffected price prior to the announcement by Fairfax of its proposed offer. |
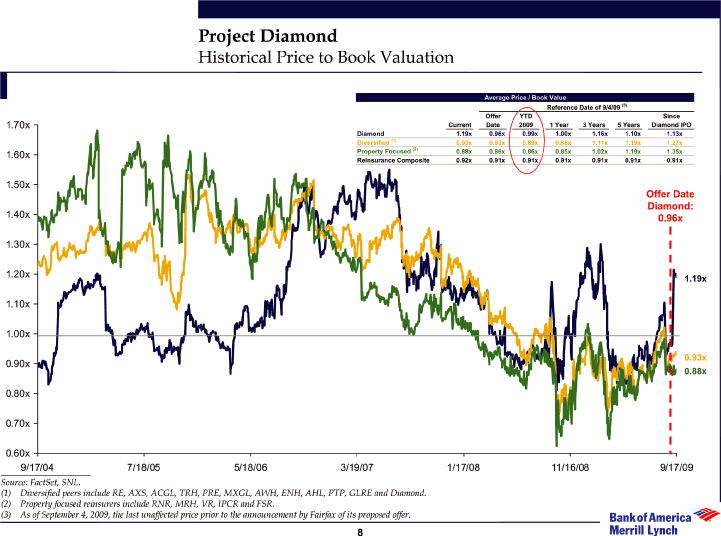
| Project Diamond Historical Price to Book Valuation Source: FactSet, SNL. (1) Diversified peers include RE, AXS, ACGL, TRH, PRE, MXGL, AWH, ENH, AHL, PTP, GLRE and Diamond. (2) Property focused reinsurers include RNR, MRH, VR, IPCR and FSR. (3) As of September 4, 2009, the last unaffected price prior to the announcement by Fairfax of its proposed offer. |
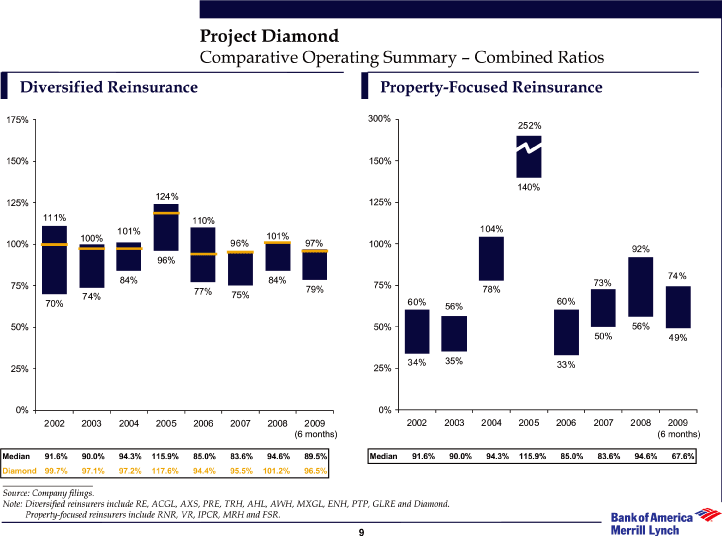
| Project Diamond Comparative Operating Summary — Combined Ratios Diversified Reinsurance Property-Focused Reinsurance Source: Company filings. Note: Diversified reinsurers include RE, ACGL, AXS, PRE, TRH, AHL, AWH, MXGL, ENH, PTP, GLRE and Diamond. Property-focused reinsurers include RNR, VR, IPCR, MRH and FSR. |
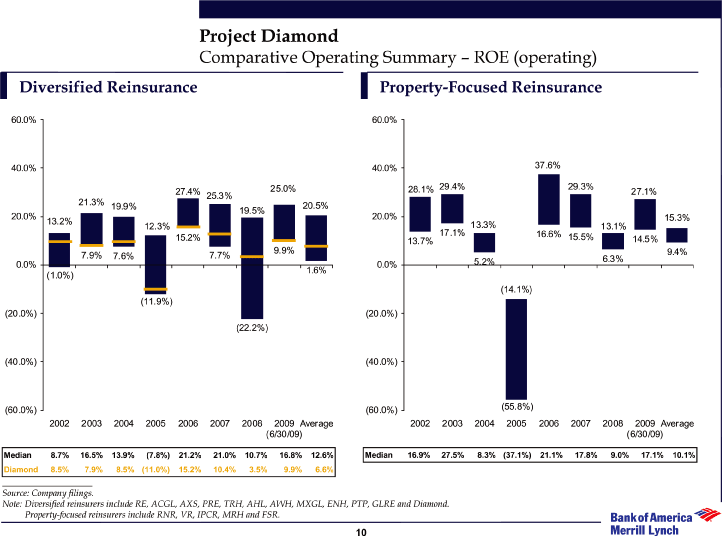
| Project Diamond Comparative Operating Summary — ROE (operating) Diversified Reinsurance Property-Focused Reinsurance Source: Company filings. Note: Diversified reinsurers include RE, ACGL, AXS, PRE, TRH, AHL, AWH, MXGL, ENH, PTP, GLRE and Diamond. Property-focused reinsurers include RNR, VR, IPCR, MRH and FSR. |
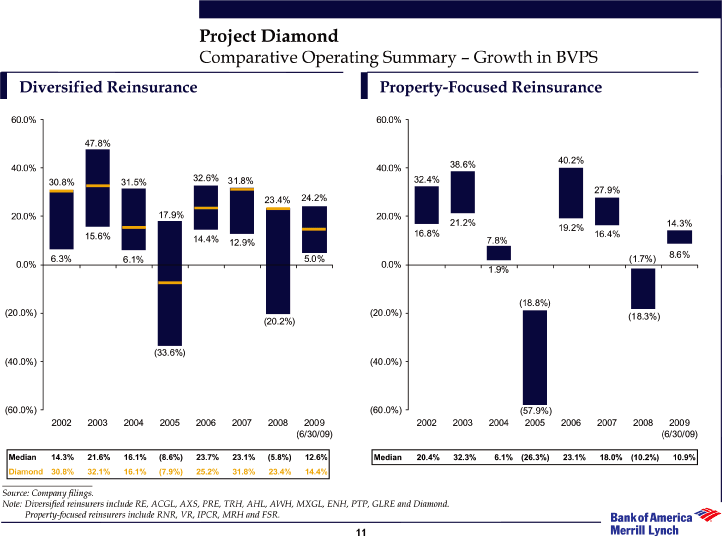
| Project Diamond Comparative Operating Summary — Growth in BVPS Diversified Reinsurance Property-Focused Reinsurance Source: Company filings. Note: Diversified reinsurers include RE, ACGL, AXS, PRE, TRH, AHL, AWH, MXGL, ENH, PTP, GLRE and Diamond. Property-focused reinsurers include RNR, VR, IPCR, MRH and FSR. |
| Diamond Valuation Analysis |
| Project Diamond Valuation Considerations In evaluating the implied valuation of Diamond, we considered the following indicators of implied values: Publicly traded comparable company analysis Equity analysts’ price targets Discounted cash flow analysis Precedent transaction premiums Acquisition comparables analysis We considered projections through 2012 provided by Diamond management We considered the impact to book value of Diamond from changes in market value of its investment portfolio since its last reported value as of June 30, 2009 As part of projections provided by management, we assessed the impact on implied values of realized capital gains factored in for each year We considered the investment posture/history of Diamond under Fairfax’s ownership in contrast to those of Diamond’s peers We considered potential synergies and its impact on implied values as part of a transaction As Fairfax intends to continue to operate Diamond on an independent and decentralized basis, as it has in the past, Fairfax assumed there are no material synergies |
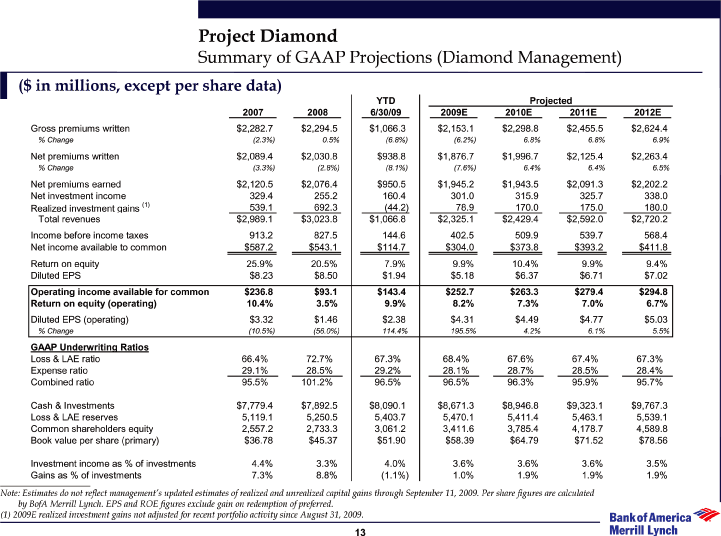
| Project Diamond Summary of GAAP Projections (Diamond Management) ($ in millions, except per share data) YTD Projected 2007 2008 6/30/09 2009E 2010E 2011E 2012E Gross premiums written $2,282.7 $2,294.5 $1,066.3 $2,153.1 $2,298.8 $2,455.5 $2,624.4 % Change (2.3%) 0.5% (6.8%) (6.2%) 6.8% 6.8% 6.9% Net premiums written $2,089.4 $2,030.8 $938.8 $1,876.7 $1,996.7 $2,125.4 $2,263.4 % Change (3.3%) (2.8%) (8.1%) (7.6%) 6.4% 6.4% 6.5% Net premiums earned $2,120.5 $2,076.4 $950.5 $1,945.2 $1,943.5 $2,091.3 $2,202.2 Net investment income 329.4 255.2 160.4 301.0 315.9 325.7 338.0 Realized investment gains (1) 539.1 692.3 (44.2) 78.9 170.0 175.0 180.0 Total revenues $2,989.1 $3,023.8 $1,066.8 $2,325.1 $2,429.4 $2,592.0 $2,720.2 Income before income taxes 913.2 827.5 144.6 402.5 509.9 539.7 568.4 Net income available to common $587.2 $543.1 $114.7 $304.0 $373.8 $393.2 $411.8 Return on equity 25.9% 20.5% 7.9% 9.9% 10.4% 9.9% 9.4% Diluted EPS $8.23 $8.50 $1.94 $5.18 $6.37 $6.71 $7.02 Operating income available for common $236.8 $93.1 $143.4 $252.7 $263.3 $279.4 $294.8 Return on equity (operating) 10.4% 3.5% 9.9% 8.2% 7.3% 7.0% 6.7% Diluted EPS (operating) $3.32 $1.46 $2.38 $4.31 $4.49 $4.77 $5.03 % Change (10.5%) (56.0%) 114.4% 195.5% 4.2% 6.1% 5.5% GAAP Underwriting Ratios Loss & LAE ratio 66.4% 72.7% 67.3% 68.4% 67.6% 67.4% 67.3% Expense ratio 29.1% 28.5% 29.2% 28.1% 28.7% 28.5% 28.4% Combined ratio 95.5% 101.2% 96.5% 96.5% 96.3% 95.9% 95.7% Cash & Investments $7,779.4 $7,892.5 $8,090.1 $8,671.3 $8,946.8 $9,323.1 $9,767.3 Loss & LAE reserves 5,119.1 5,250.5 5,403.7 5,470.1 5,411.4 5,463.1 5,539.1 Common shareholders equity 2,557.2 2,733.3 3,061.2 3,411.6 3,785.4 4,178.7 4,589.8 Book value per share (primary) $36.78 $45.37 $51.90 $58.39 $64.79 $71.52 $78.56 Investment income as % of investments 4.4% 3.3% 4.0% 3.6% 3.6% 3.6% 3.5% Gains as % of investments 7.3% 8.8% (1.1%) 1.0% 1.9% 1.9% 1.9% ___Note: Estimates do not reflect management’s updated estimates of realized and unrealized capital gains through September 11, 2009. Per share figures are calculated by BofA Merrill Lynch. EPS and ROE figures exclude gain on redemption of preferred. (1) 2009E realized investment gains not adjusted for recent portfolio activity since August 31, 2009. 13 |
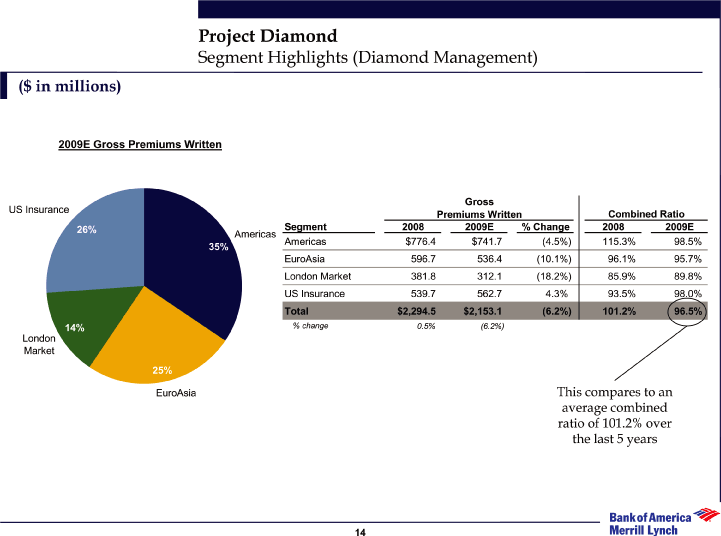
| Project Diamond Segment Highlights (Diamond Management) ($ in millions) 2009E Gross Premiums Written This compares to an average combined ratio of 101.2% over the last 5 years |
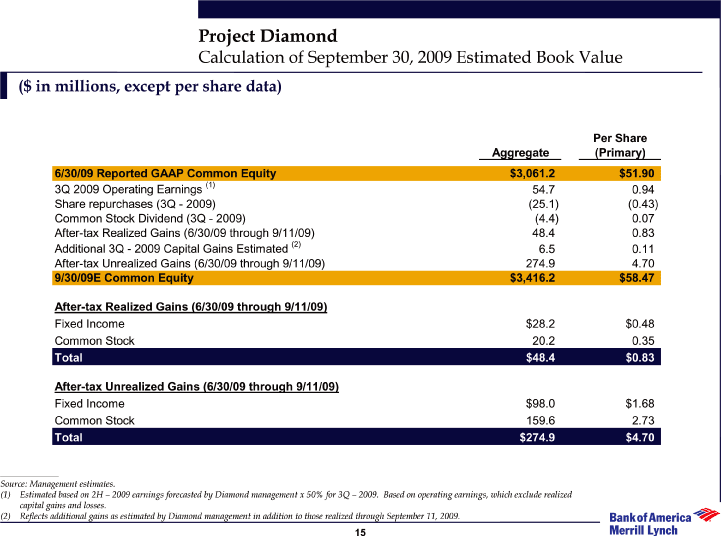
| Project Diamond Calculation of September 30, 2009 Estimated Book Value ($ in millions, except per share data) Per Share Aggregate (Primary) 6/30/09 Reported GAAP Common Equity $3,061.2 $51.90 3Q 2009 Operating Earnings (1) 54.7 0.94 Share repurchases (3Q — 2009) (25.1) (0.43) Common Stock Dividend (3Q — 2009) (4.4) 0.07 After-tax Realized Gains (6/30/09 through 9/11/09) 48.4 0.83 Additional 3Q — 2009 Capital Gains Estimated (2) 6.5 0.11 After-tax Unrealized Gains (6/30/09 through 9/11/09) 274.9 4.70 9/30/09E Common Equity $3,416.2 $58.47 After-tax Realized Gains (6/30/09 through 9/11/09) Fixed Income $28.2 $0.48 Common Stock 20.2 0.35 Total $48.4 $0.83 After-tax Unrealized Gains (6/30/09 through 9/11/09) Fixed Income $98.0 $1.68 Common Stock 159.6 2.73 Total $274.9 $4.70 ___Source: Management estimates. (1) Estimated based on 2H — 2009 earnings forecasted by Diamond management x 50% for 3Q — 2009. Based on operating earnings, which exclude realized capital gains and losses. (2) Reflects additional gains as estimated by Diamond management in addition to those realized through September 11, 2009. 15 |
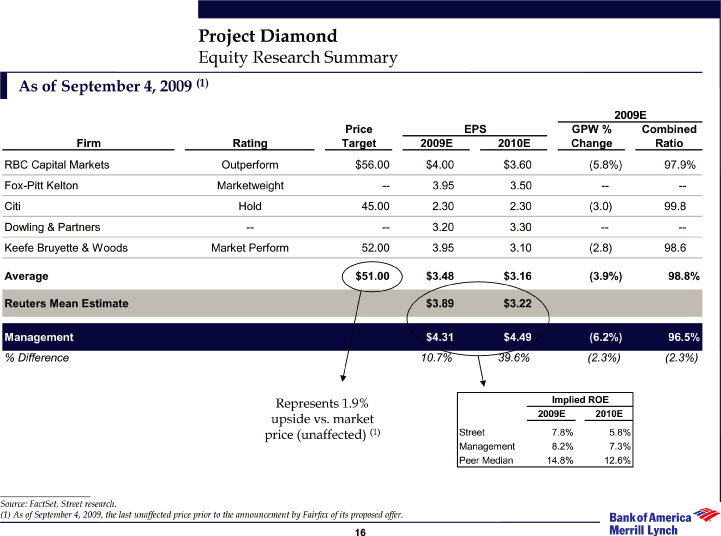
| Project Diamond Equity Research Summary As of September 4, 2009 (1)2009E Price EPS GPW % Combined Firm Rating Target 2009E 2010E Change Ratio RBC Capital Markets Outperform $56.00 $4.00 $3.60 (5.8%) 97.9% Fox-Pitt Kelton Marketweight — 3.95 3.50 — —Citi Hold 45.00 2.30 2.30 (3.0) 99.8 Dowling & Partners — — 3.20 3.30 — —Keefe Bruyette & Woods Market Perform 52.00 3.95 3.10 (2.8) 98.6 Average $51.00 $3.48 $3.16 (3.9%) 98.8% Reuters Mean Estimate $3.89 $3.22 Management $4.31 $4.49 (6.2%) 96.5% % Difference 10.7% 39.6% (2.3%) (2.3%) Represents 1.9% Implied ROE upside vs. market 2009E 2010E price (unaffected) (1) Street 7.8% 5.8%Management 8.2% 7.3% Peer Median 14.8% 12.6% ___Source: FactSet, Street research. (1) As of September 4, 2009, the last unaffected price prior to the announcement by Fairfax of its proposed offer. 16 |
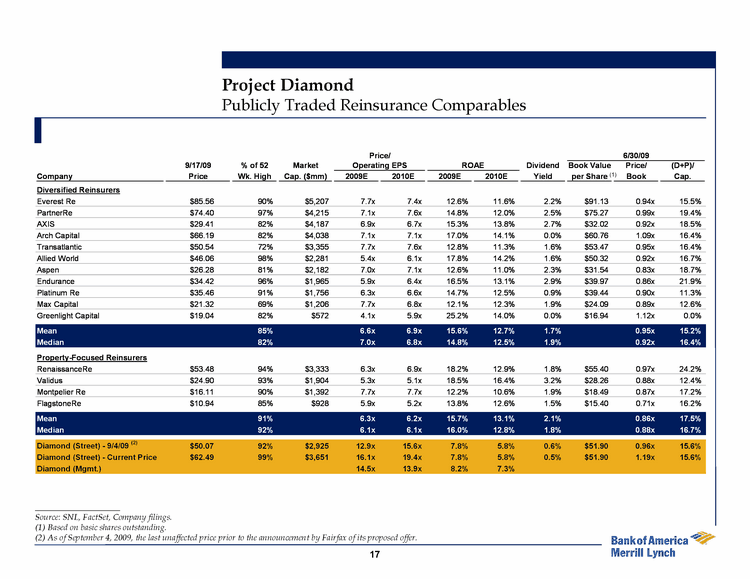
| Project Diamond Publicly Traded Reinsurance Comparables Price/ 6/30/09 9/17/09 % of 52 Market Operating EPS ROAE Dividend Book Value Price/ (D+P)/ Company Price Wk. High Cap. ($mm) 2009E 2010E 2009E 2010E Yield per Share(1) Book Cap. Everest Re $85.56 90% $5,207 7.7x 7.4x 12.6% 11.6% 2.2% $91.13 0.94x 15.5% PartnerRe $74.40 97% $4,215 7.1x 7.6x 14.8% 12.0% 2.5% $75.27 0.99x 19.4% AXIS $29.41 82% $4,187 6.9x 6.7x 15.3% 13.8% 2.7% $32.02 0.92x 18.5% Arch Capital $66.19 82% $4,038 7.1x 7.1x 17.0% 14.1% 0.0% $60.76 1.09x 16.4% Transatlantic $50.54 72% $3,355 7.7x 7.6x 12.8% 11.3% 1.6% $53.47 0.95x 16.4% RenaissanceRe $53.48 94% $3,333 6.3x 6.9x 18.2% 12.9% 1.8% $55.40 0.97x 24.2% Allied World $46.06 98% $2,281 5.4x 6.1x 17.8% 14.2% 1.6% $50.32 0.92x 16.7% Aspen $26.28 81% $2,182 7.0x 7.1x 12.6% 11.0% 2.3% $31.54 0.83x 18.7% Endurance $34.42 96% $1,965 5.9x 6.4x 16.5% 13.1% 2.9% $39.97 0.86x 21.9% Validus $24.90 93% $1,904 5.3x 5.1x 18.5% 16.4% 3.2% $28.26 0.88x 12.4% Platinum Re $35.46 91% $1,756 6.3x 6.6x 14.7% 12.5% 0.9% $39.44 0.90x 11.3% Montpelier Re $16.11 90% $1,392 7.7x 7.7x 12.2% 10.6% 1.9% $18.49 0.87x 17.2% Max Capital $21.32 69% $1,206 7.7x 6.8x 12.1% 12.3% 1.9% $24.09 0.89x 12.6% FlagstoneRe $10.94 85% $928 5.9x 5.2x 13.8% 12.6% 1.5% $15.40 0.71x 16.2% Greenlight Capital $19.04 82% $572 4.1x 5.9x 25.2% 14.0% 0.0% $16.94 1.12x 0.0% Mean 87% 6.5x 6.7x 15.6% 12.8% 1.8% 0.92x 15.8% Median 90% 6.9x 6.8x 14.8% 12.6% 1.9% 0.92x 16.4% Diamond (Street) — 9/4/09 (2) $50.07 92% $2,925 12.9x 15.6x 7.8% 5.8% 0.6% $51.90 0.96x 15.6% Diamond (Street) — Current Price $62.49 99% $3,651 16.1x 19.4x 7.8% 5.8% 0.5% $51.90 1.19x 15.6% Diamond (Mgmt.) 14.5x 13.9x 8.2% 7.3% ___Source: SNL, FactSet, Company filings. (1) Based on basic shares outstanding. (2) As of September 4, 2009, the last unaffected price prior to the announcement by Fairfax of its proposed offer. 17 |

| Project Diamond Minority Buy-In Premium Analysis (U.S. Targets with > 50% Ownership Pre-Transaction) — Last 5 Years Annc Close Equity Value Percent Premium Paid Over Annc Close Equity Value Percent Premium Paid Over Date Date Buyer Name Seller Name ($mm) Acquired 1 Day 5 Day 30 Day Date Date Buyer Name Seller Name ($mm) Acquired 1 Day 5 Day 30 Day 8/11/09 Pending TPG Capital LP Armstrong World Industries $156 12.0% 11% 15% 77% 2/6/06 5/16/06 Lafarge SA Lafarge North America 2,870 46.8% 33% 34% 57% 7/29/09 Pending Overseas Shipholding OSG America LP 56 46.7% 10% 22% 20% 1/19/06 1/19/06 Nestle SA Dreyer’s Grand Ice Cream 2,595 33.0% 0% 0% 1% 6/29/09 Pending The First American First Advantage Corp. 218 26.0% 10% 25% 25% 12/13/05 11/1/06 Societe Virbac SA Virbac Corp. 51 39.7% 57% 53% 44% 3/25/09 6/5/09 The Hearst Corp. Hearst-Argyle Television 76 18.0% 115% 150% 13% 10/10/05 1/6/06 ev3, Inc. Micro Therapeutics 114 29.8% 33% 41% 34% 3/23/09 5/29/09 Cox Enterprises, Inc. Cox Radio, Inc. 82 21.6% 45% 48% (11%) 9/27/05 12/13/05 Vector Group Ltd. New Valley LLC 102 42.3% 45% 44% 45% 10/21/08 Pending BGH GP Holdings Buckeye GP Holdings 188 38.8% 23% 18% 0% 9/1/05 11/9/05 Seven & I Holdings 7-Eleven, Inc. 1,182 22.7% 32% 31% 14% 8/12/08 9/29/08 Mitsubishi UFJ Financial UnionBanCal Corp. 3,513 34.6% 26% 29% 82% 7/8/05 3/22/06 V&S Vin & Sprit AB Todhunter International 58 36.4% 12% 9% 104% 7/21/08 3/26/09 Roche Holding AG Genentech, Inc. 44,291 44.3% 16% 26% 29% 3/4/05 5/16/05 Vishay Intertechnology Siliconix, Inc. 199 19.6% 17% 19% 12% 3/10/08 1/2/09 Nationwide Mutual Nationwide Financial 2,471 33.7% 38% 29% 32% 2/21/05 7/21/05 Novartis AG Eon Labs, Inc. 889 32.3% 11% 8% 14% 10/23/07 5/9/08 Waste Industries Waste Industries USA, Inc. 264 49.0% 33% 41% 28% 1/27/05 4/20/05 Danisco A/S Genencor International 184 16.0% 24% 22% 21% 7/17/07 4/15/08 Alfa Mutual Alfa Corp. 821 46.1% 45% 45% 31% 1/18/05 6/15/05 Liberty Media Intl UnitedGlobalCom 3,770 47.0% (2%) 2% 8% 2/22/07 9/28/07 American Financial Great American Financial 222 19.0% 13% 15% 9% 1/10/05 3/21/05 News Corp. Fox Entertainment Group 6,055 40.9% 11% 11% 17% 1/24/07 9/27/07 AIG 21st Century Insurance Grp 760 39.3% 35% 31% 28% 9/13/04 10/13/04 Rogers Communications AT&T Wireless Services 1,359 34.0% (2%) (4%) (6%) 11/20/06 4/20/07 Toronto-Dominion Bank TD Banknorth, Inc. 3,176 43.0% 7% 8% 11% Summary Statistics: 10/9/06 6/22/07 Nielsen (Valcon) NetRatings, Inc. 296 39.5% 44% 45% 45% All Deals — 5 years (31) Mean 26% 29% 26% Median 23% 25% 20% 3/21/06 5/25/06 Erie Indemnity Co Erie Family Life Insurance 75 24.9% 7% 14% 13% FIG Deals (7) Mean 24% 24% 29% 3/17/06 7/26/06 William Lyon Homes William Lyon Homes 241 25.5% 44% 51% 8% Median 26% 29% 28% 3/13/06 9/29/06 Lukoil Holdings OAO Chaparral Resources 89 40.0% 9% 10% 13% ___Source: Factset Mergerstat. Note: Includes public completed or pending transactions with an equity value of greater than $50mm where the acquiror owns 50% or more of the target prior to announcing the transaction. Premiums based on 1, 5 and 30 trading days. Bold denotes financial institutions transaction. 18 |
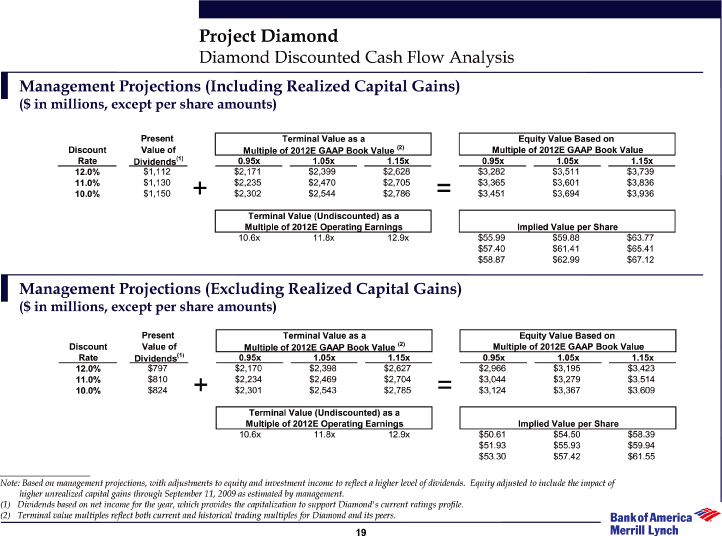
| Project Diamond Diamond Discounted Cash Flow Analysis Management Projections (Including Realized Capital Gains) ($ in millions, except per share amounts) Present Terminal Value as a Equity Value Based on Discount Value of Multiple of 2012E GAAP Book Value (2) Multiple of 2012E GAAP Book Value Rate Dividends(1) 0.95x 1.05x 1.15x 0.95x 1.05x 1.15x 12.0% $1,112 $2,171 $2,399 $2,628 $3,282 $3,511 $3,739 11.0% $1,130 $2,235 $2,470 $2,705 $3,365 $3,601 $3,836 10.0% $1,150 + $2,302 $2,544 $2,786 = $3,451 $3,694 $3,936 Terminal Value (Undiscounted) as a Multiple of 2012E Operating Earnings Implied Value per Share 10.6x 11.8x 12.9x $55.99 $59.88 $63.77 $57.40 $61.41 $65.41 $58.87 $62.99 $67.12 Management Projections (Excluding Realized Capital Gains) ($ in millions, except per share amounts) Present Terminal Value as a Equity Value Based on Discount Value of Multiple of 2012E GAAP Book Value (2) Multiple of 2012E GAAP Book Value Rate Dividends(1) 0.95x 1.05x 1.15x 0.95x 1.05x 1.15x 12.0% $797 $2,170 $2,398 $2,627 $2,966 $3,195 $3,423 11.0% $810 $2,234 $2,469 $2,704 $3,044 $3,279 $3,514 10.0% $824 + $2,301 $2,543 $2,785 = $3,124 $3,367 $3,609 Terminal Value (Undiscounted) as a Multiple of 2012E Operating Earnings Implied Value per Share 10.6x 11.8x 12.9x $50.61 $54.50 $58.39 $51.93 $55.93 $59.94 $53.30 $57.42 $61.55 ___Note: Based on management projections, with adjustments to equity and investment income to reflect a higher level of dividends. Equity adjusted to include the impact of higher unrealized capital gains through September 11, 2009 as estimated by management. (1) Dividends based on net income for the year, which provides the capitalization to support Diamond’s current ratings profile. (2) Terminal value multiples reflect both current and historical trading multiples for Diamond and its peers. 19 |
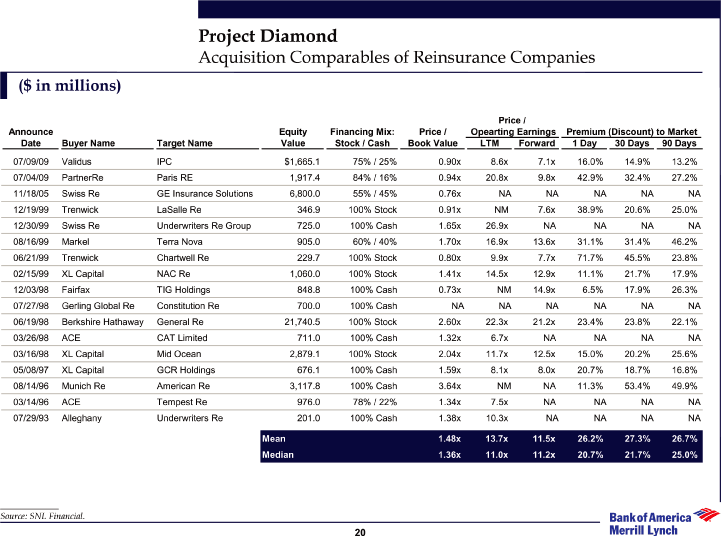
| Project Diamond Acquisition Comparables of Reinsurance Companies ($ in millions) Price / Announce Equity Financing Mix: Price / Opearting Earnings Premium (Discount) to Market Date Buyer Name Target Name Value Stock / Cash Book Value LTM Forward 1 Day 30 Days 90 Days 07/09/09 Validus IPC $1,665.1 75% / 25% 0.90x 8.6x 7.1x 16.0% 14.9% 13.2% 07/04/09 PartnerRe Paris RE 1,917.4 84% / 16% 0.94x 20.8x 9.8x 42.9% 32.4% 27.2% 11/18/05 Swiss Re GE Insurance Solutions 6,800.0 55% / 45% 0.76x NA NA NA NA NA 12/19/99 Trenwick LaSalle Re 346.9 100% Stock 0.91x NM 7.6x 38.9% 20.6% 25.0% 12/30/99 Swiss Re Underwriters Re Group 725.0 100% Cash 1.65x 26.9x NA NA NA NA 08/16/99 Markel Terra Nova 905.0 60% / 40% 1.70x 16.9x 13.6x 31.1% 31.4% 46.2% 06/21/99 Trenwick Chartwell Re 229.7 100% Stock 0.80x 9.9x 7.7x 71.7% 45.5% 23.8% 02/15/99 XL Capital NAC Re 1,060.0 100% Stock 1.41x 14.5x 12.9x 11.1% 21.7% 17.9% 12/03/98 Fairfax TIG Holdings 848.8 100% Cash 0.73x NM 14.9x 6.5% 17.9% 26.3% 07/27/98 Gerling Global Re Constitution Re 700.0 100% Cash NA NA NA NA NA NA 06/19/98 Berkshire Hathaway General Re 21,740.5 100% Stock 2.60x 22.3x 21.2x 23.4% 23.8% 22.1% 03/26/98 ACE CAT Limited 711.0 100% Cash 1.32x 6.7x NA NA NA NA 03/16/98 XL Capital Mid Ocean 2,879.1 100% Stock 2.04x 11.7x 12.5x 15.0% 20.2% 25.6% 05/08/97 XL Capital GCR Holdings 676.1 100% Cash 1.59x 8.1x 8.0x 20.7% 18.7% 16.8% 08/14/96 Munich Re American Re 3,117.8 100% Cash 3.64x NM NA 11.3% 53.4% 49.9% 03/14/96 ACE Tempest Re 976.0 78% / 22% 1.34x 7.5x NA NA NA NA 07/29/93 Alleghany Underwriters Re 201.0 100% Cash 1.38x 10.3x NA NA NA NA Mean 1.48x 13.7x 11.5x 26.2% 27.3% 26.7% Median 1.36x 11.0x 11.2x 20.7% 21.7% 25.0% Source: SNL Financial. |
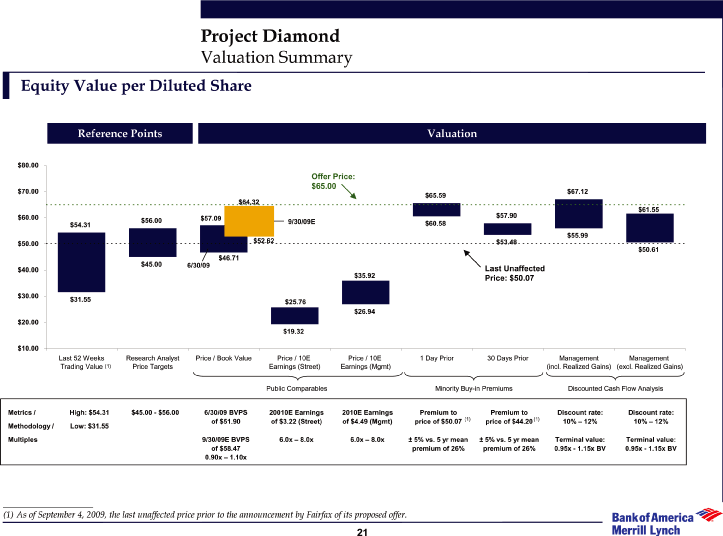
| Project Diamond Valuation Summary Equity Value per Diluted Share Reference Points Valuation $80.00 Offer Price: $65.00 $70.00 $67.12 $65.59 $64.32 $61.55 $60.00 $57.09 $57.90 $56.00 9/30/09E $60.58 $54.31 $55.99 $50.00 $52.62 $53.48 $50.61 $46.71 $45.00 6/30/09 $40.00 Last Unaffected $35.92 Price: $50.07 $30.00 $31.55 $25.76 $26.94 $20.00 $19.32 $10.00 Last 52 Weeks Research Analyst Price / Book Value Price / 10E Price / 10E 1 Day Prior 30 Days Prior Management Management Trading Value (1) Price Targets Earnings (Street) Earnings (Mgmt) (incl. Realized Gains) (excl. Realized Gains) Public Comparables Minority Buy-in Premiums Discounted Cash Flow Analysis Metrics / High: $54.31 $45.00 — $56.00 6/30/09 BVPS 20010E Earnings 2010E Earnings Premium to Premium to Discount rate: Discount rate: of $51.90 of $3.22 (Street) of $4.49 (Mgmt) price of $50.07 (1) price of $44.20(1) 10% — 12% 10% — 12% Methodology / Low: $31.55 Multiples 9/30/09E BVPS 6.0x — 8.0x 6.0x — 8.0x ± 5% vs. 5 yr mean ± 5% vs. 5 yr mean Terminal value: Terminal value: of $58.47 premium of 26% premium of 26% 0.95x — 1.15x BV 0.95x — 1.15x BV 0.90x — 1.10x |