Eastman Chemical Company
2012 Databook
1
Contents
| Eastman at a glance | 3 | |
| Regions | 4 | |
| Financial information | 5 | |
| Product and raw material information | 6 | |
| Selected annual capacities | 7 | |
| Segment Information (2009 - 2012) | 8 | |
| Exhibit A (Pro forma combined description) | 12 | |
| Exhibit B (Notes to segment information) | 13 | |
| Stockholder information | 15 | |
Eastman Chemical Company's products and operations are managed and reported in five reportable operating segments, consisting of Additives and Functional Products, Adhesives and Plasticizers, Advanced Materials, Fibers, and Specialty Fluids and Intermediates. Goods and services are transferred among the segments at cost.
Unless otherwise noted, information provided in this databook is presented on a pro forma combined basis. The unaudited pro forma financial results for years ended December 31, 2012, 2011, 2010, and 2009 and the respective interim quarters combine the consolidated results of Eastman and Solutia giving effect to the acquisition of Solutia as if it had been completed on January 1, 2009, the beginning of the earliest period presented. For more information, see Exhibit A.
2
Eastman at a glance
| Additives & Functional Products | Key competitors: Specialty Materials: Bayer AG, Styron LLC, Evonik Industries AG, Saudi Basic Industries Corporation, Mitsubishi Chemical Corporation, S.K. Chemical Industries, Sichuan Push Acetati Company Limited, Daicel Chemical Industries Ltd. Interlayers: Sekisui Chemical Co., Ltd., Kuraray Co., Ltd., DuPont Performance Films: 3M Company, Saint- Gobain S.A., Commonwealth Laminating & Coating, Inc., Garware Chemicals Limited | |||||
| 2012 Sales Revenue: | $1,613 million | |||||
| 2012 Operating Earnings: | 395 | million | ||||
| 2012 Depreciation & Amortization Expense | 93 | million | ||||
Key products: Solvents: Coalescents, Ketones, Esters, Glycol Ethers, Alcohol Solvents Polymers: Cellulosic, Polyester, and Polyolefin-based Polymers Insoluble Sulfur: Marketed under the Crystex® brand Antidegradants: Marketed under the Santoflex® brand | ||||||
| Fibers | ||||||
| 2012 Sales Revenue: | $1,315 million | |||||
Key markets & applications: Transportation: Insoluble sulfur and antidegradants used in rubber tire manufacturing, polymers and solvents used in OEM and refinish coatings Building & Construction: Solvents used in architectural coatings Durable Goods: Polymers and solvents used in industrial coatings applications | 2012 Operating Earnings: | 388 | million | |||
| 2012 Depreciation & Amortization Expense | 66 | million | ||||
Key products: Acetate Tow; Acetate Yarn; Acetyl Chemical Products: Includes cellulose diacetate flake, acetylation-grade acetic acid, acetic anhydride, triacetin plasticizers | ||||||
Key raw materials: Propane, Propylene, Napthenic Process Oil, Methyl Isobutyl Ketone, Aniline, Nitrobenzene, Butyl Alcohol, Sulfur, Acetone, Ethane | ||||||
Key markets & applications: Tobacco: Cigarette filters Consumables: Apparel Health & Wellness: Medical Tape | ||||||
Key competitors: BASF SE, Dow, Oriental Carbon & Chemicals, Ltd., Shikoku Chemicals Corporation, Jiangsu Sinorgchem Technology Co. Ltd., Korea Kumho Petrochemical Co., Ltd., Lanxess AG | ||||||
Key raw materials: Wood Pulp, Methanol, High Sulfur Coal | ||||||
Key competitors: Acetate Tow: Celanese, Daicel, Mitsubishi Rayon, Solvay S.A. Acetate Yarn: Industrias del Acetato de Celulosa S.A., UAB Korelita, Mitsubishi Rayon | ||||||
| Adhesives & Plasticizers | ||||||
| 2012 Sales Revenue: | $1,432 million | Specialty Fluids & Intermediates | ||||
| 2012 Operating Earnings: | 263 | million | 2012 Sales Revenue: | $2,473 million | ||
| 2012 Depreciation & Amortization Expense | 46 | million | 2012 Operating Earnings: | 359 | million | |
Key products: Resins: Hydrogenated Hydrocarbon Resins (Regalite™, Eastotac™), Non-Hydrogenated Hydrocarbon Resins (Kristalex™, Plastolyn™), Rosins, Polyolefins Plasticizers: Primary Non-Phthalate Plasticizers (Eastman 168™, Eastman™ DOA), Niche Non-Phthalate Plasticizers (Benzoflex™, Eastman TXIB™, Admex™, Eastman™ DBT) | 2012 Depreciation & Amortization Expense | 82 | million | |||
Key products: Specialty Fluids: Heat transfer fluids marketed under the Therminol® brand, aviation hydraulic fluids marketed under the Skydrol® brand Chemical Intermediates: Acetic Anhydride, oxo alcohols and derivatives, acetyl derivatives Other Intermediates: Lower-margin intermediates produced to achieve high capacity utilization (includes low-margin grades of acetic acid, oxo alcohols, ethylene, and polymer intermediates) | ||||||
Key markets & applications: Consumables: Resins used in hygiene and packaging adhesives Building & Construction: Non-phthalate plasticizers used in interior surfaces, resins for construction adhesives and interior flooring Durable Goods: Packaging adhesives for appliances | ||||||
Key markets & applications: Industrial Chemicals & Processing: Heat transfer fluids for chemical processes, olefin & acetyl-based intermediates serving a wide range of industrial processing needs Building & Construction: Intermediates for paint/coating applications, construction chemicals, building materials | ||||||
Key raw materials: Propane, C9 Resin Oil, Piperylene, Propylene, Gum Rosin, Toluene | ||||||
Key raw materials: Propane, Ethane, Propylene, Paraxylene, Metaxylene, Benzene | ||||||
Key competitors: BASF SE, LG Chem, Ltd., Exxon Mobil Corp. | ||||||
| Advanced Materials | Key competitors: BASF SE, Celanese, Dow, Exxon Mobil Corp. | |||||
| 2012 Sales Revenue: | $2,254 million | |||||
| 2012 Operating Earnings: | 210 | million | Eastman Chemical Company | |||
| 2012 Depreciation & Amortization Expense | 144 | million | 2012 Sales Revenue by end-market | |||
Key products: Specialty Materials: Specialty Copolyesters (including Eastman Tritan™), Cellulose Esters, Cellulosics Interlayers: Adhesive interlayers used in the production of laminated safetly glass and primarily marketed under the SAFLEX® and BUTVAR® brand names Performance Films: Aftermarket window film products including the LLumar® and V-Kool® brands | Transportation | 16 | % | |||
| Building & Construction | 16 | % | ||||
| Consumables | 15 | % | ||||
| Tobacco | 13 | % | ||||
Key markets & applications: Transportation: Interlayers for auto- motive safety glass, automotive after-market window film, cellulose es- ters used in automotive performance additives Consumables: Specialty copolyesters used in specialty packaging (e.g. medical and electronic component trays), consumer packaging, personal care and cosmetics packaging, in-store fixtures and displays Building & Construction: PVB for architectural interlayers, residential and commercial window films | Industrial Chemicals & Processing | 11 | % | |||
| Durable Goods | 8 | % | ||||
| Health & Wellness | 7 | % | ||||
| Other | 6 | % | ||||
| Energy, Fuels & Water | 4 | % | ||||
Key raw materials: Paraxylene, Polyvinyl Alcohol, Ethylene Glycol, Cellulose, Polyethylene Terephthalate Film, 2-EH, Vinyl Acetate Mono- mer, Butyraldehyde, Ethanol | Electronics | 2 | % | |||
| Agriculture | 2 | % | ||||
3
Regions
Global manufacturing locations

| Sales revenue by region | |||||||||
| (Dollars in millons) | |||||||||
| Year | 2012 | 2011 | 2010 | ||||||
| United States and Canada | $ | 4,264 | $ | 4,364 | $ | 3,468 | |||
| Asia Pacific | 2,396 | 2,315 | 2,023 | ||||||
| Europe, Middle East, and Africa | 1,968 | 2,119 | 1,855 | ||||||
| Latin America | 492 | 477 | 446 | ||||||
| Eastman Chemical Company | $ | 9,120 | $ | 9,275 | $ | 7,792 | |||
4
Financial information
(Dollars in millions, except per share amounts) Selected operating items | 2012 | 2011 | 2010 | 2009 | ||||||||
| Sales Revenue | $ | 9,120 | $ | 9,275 | $ | 7,792 | $ | 6,014 | ||||
| Operating earnings | 1,120 | 1,254 | 1,199 | 302 | ||||||||
| Additional costs of acquired Solutia inventories | — | — | — | 79 | ||||||||
| Transaction and integration costs related to the acquisition of Solutia | — | — | — | 69 | ||||||||
| Mark-to-market pension and other postretirement benefits losses (gains), net | 276 | 209 | 4 | 89 | ||||||||
| Asset impairments and restructuring charges, net | 93 | 11 | 45 | 281 | ||||||||
| Other operating (income) expense | — | (46 | ) | — | 2 | |||||||
| Operating earnings excluding items | 1,489 | 1,428 | 1,248 | 822 | ||||||||
| Depreciation and amortization expense | 438 | 429 | 395 | 384 | ||||||||
| Diluted earnings from continuing operations per share* | 2.92 | 4.24 | 2.81 | 0.76 | ||||||||
| Additional costs of acquired Solutia inventories, net of tax | 0.37 | — | — | — | ||||||||
| Solutia transaction and integration costs, net of tax | 0.35 | — | — | — | ||||||||
| Asset impairments and restructuring charges, net of tax | 0.54 | (0.03 | ) | 0.12 | 0.86 | |||||||
| Mark-to-market pension and other postretirement benefit losses (gains), net of tax | 1.20 | 0.60 | 0.22 | 0.39 | ||||||||
| Early debt extinguishment costs, net of tax | — | — | 0.48 | — | ||||||||
| Diluted earnings from continuing operations per share excluding items | 5.38 | 4.81 | 3.63 | 2.01 | ||||||||
* Diluted earnings from continuing operations per share and excluded items are presented on an Eastman historical basis as reported in the 2012 Annual
Report to Shareholders on Form 10-K and the Current Report on Form 8-K dated May 16, 2012.
5
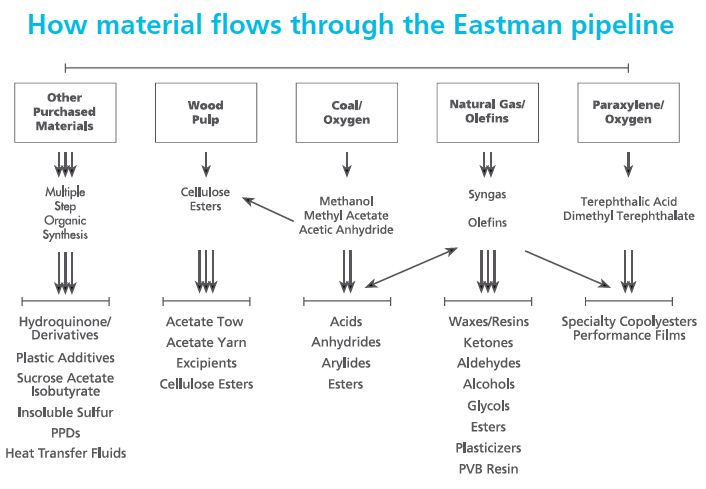
Product and raw material information

6
Selected annual capacities
2012 Capacities | 2011 Capacities | 2010 Capacities | ||||||||||
| (in millions) | (in millions) | (in millions) | ||||||||||
| lbs | kgs | lbs | kgs | lbs | kgs | |||||||
| Acetyl Chemicals | ||||||||||||
| Acetic Acid | 611 | 277 | 611 | 277 | 654 | 297 | ||||||
| Acetic Anhydride | 1,631 | 740 | 1,631 | 740 | 1,638 | 743 | ||||||
| Methanol | 475 | 215 | 475 | 215 | 475 | 215 | ||||||
| Ethylene | ||||||||||||
| Ethylene | 1,310 | 594 | 1,310 | 594 | 1,010 | 458 | ||||||
| Ethylene Derivatives | ||||||||||||
| Acetaldehyde | 404 | 183 | 404 | 183 | 404 | 183 | ||||||
| Ethylene Glycol | 220 | 100 | 220 | 100 | 222 | 101 | ||||||
| Propylene | ||||||||||||
| Propylene | 567 | 257 | 567 | 257 | 392 | 178 | ||||||
| Oxo Products | ||||||||||||
| Oxo Aldehydes | 2,100 | 953 | 2,013 | 913 | 1,921 | 871 | ||||||
| Oxo Alcohols | 1,106 | 502 | 1,077 | 489 | 1,073 | 487 | ||||||
| Plasticizers | 771 | 350 | 654 | 297 | 475 | 216 | ||||||
| Fibers | ||||||||||||
| Acetate Tow | 463 | 210 | 463 | 210 | 463 | 210 | ||||||
Note: These quantities are an expected average for an annual reporting period and actual production can vary based on a variety of factors, including the number of operating days, daily rates per manufacturing asset, routine improvements of operating efficiencies, and maintenance activities.
7
2012 segment information
| (Dollars in millions) | 1st Qtr | 2nd Qtr | 3rd Qtr | 4th Qtr | Year | ||||||||||
Additives & Functional Products Sales | $ | 400 | $ | 423 | $ | 406 | $ | 384 | $ | 1,613 | |||||
| Operating earnings | 94 | 107 | 105 | 72 | 378 | ||||||||||
Asset impairments and restructuring charges, net (1)(2)(3) | — | — | — | 17 | 17 | ||||||||||
| Operating earnings excluding item | 94 | 107 | 105 | 89 | 395 | ||||||||||
| Depreciation and amortization expense | 93 | ||||||||||||||
Adhesives & Plasticizers Sales | $ | 374 | $ | 372 | $ | 348 | $ | 338 | $ | 1,432 | |||||
| Operating earnings | 66 | 72 | 73 | 49 | 260 | ||||||||||
Asset impairments and restructuring charges, net (1) | — | — | — | 3 | 3 | ||||||||||
| Operating earnings excluding item | 66 | 72 | 73 | 52 | 263 | ||||||||||
| Depreciation and amortization expense | 46 | ||||||||||||||
Advanced Materials Sales | $ | 567 | $ | 600 | $ | 559 | $ | 528 | $ | 2,254 | |||||
| Operating earnings | 57 | 62 | 57 | — | 176 | ||||||||||
Asset impairments and restructuring charges, net (1)(2)(4) | 4 | 1 | — | 29 | 34 | ||||||||||
| Operating earnings excluding item | 61 | 63 | 57 | 29 | 210 | ||||||||||
| Depreciation and amortization expense | 144 | ||||||||||||||
Fibers Sales | $ | 323 | $ | 318 | $ | 349 | $ | 325 | $ | 1,315 | |||||
| Operating earnings | 101 | 96 | 98 | 90 | 385 | ||||||||||
Asset impairments and restructuring charges, net (1) | — | — | — | 3 | 3 | ||||||||||
| Operating earnings excluding item | 101 | 96 | 98 | 93 | 388 | ||||||||||
| Depreciation and amortization expense | 66 | ||||||||||||||
Specialty Fluids & Intermediates Sales | $ | 642 | $ | 649 | $ | 592 | $ | 590 | $ | 2,473 | |||||
| Operating earnings | 73 | 97 | 96 | 84 | 350 | ||||||||||
Asset impairments and restructuring charges, net (1)(2) | — | — | — | 9 | 9 | ||||||||||
| Operating earnings excluding item | 73 | 97 | 96 | 93 | 359 | ||||||||||
| Depreciation and amortization expense | 82 | ||||||||||||||
Other (5) Sales | $ | 13 | $ | 11 | $ | 5 | $ | 4 | $ | 33 | |||||
| Operating loss | |||||||||||||||
| Growth initiatives and businesses not allocated to segments | (25 | ) | (26 | ) | (36 | ) | (48 | ) | (135 | ) | |||||
| Pension and OPEB gain (loss) not allocated to operating segments | (7 | ) | (6 | ) | (5 | ) | (276 | ) | (294 | ) | |||||
| Operating loss before exclusions | (32 | ) | (32 | ) | (41 | ) | (324 | ) | (429 | ) | |||||
Mark-to-market pension and other postretirement benefits losses (gains), net (6) | — | — | — | 276 | 276 | ||||||||||
Asset impairments and restructuring charges, net (1)(7) | — | — | 9 | 18 | 27 | ||||||||||
| Operating loss excluding items | (32 | ) | (32 | ) | (32 | ) | (30 | ) | (126 | ) | |||||
| Depreciation and amortization expense | 7 | ||||||||||||||
Eastman Chemical Company Sales | $ | 2,319 | $ | 2,373 | $ | 2,259 | $ | 2,169 | $ | 9,120 | |||||
| Operating earnings (loss) | 359 | 402 | 388 | (29 | ) | 1,120 | |||||||||
Mark-to-market pension and other postretirement benefits losses (gains), net (6) | — | — | — | 276 | 276 | ||||||||||
Asset impairments and restructuring charges, net (1)(2)(3)(4)(7) | 4 | 1 | 9 | 79 | 93 | ||||||||||
| Operating earnings excluding items | 363 | 403 | 397 | 326 | 1,489 | ||||||||||
| Depreciation and amortization expense | 438 | ||||||||||||||
Note: See Exhibit B for footnotes.
8
2011 segment information
| (Dollars in millions) | 1st Qtr | 2nd Qtr | 3rd Qtr | 4th Qtr | Year | ||||||||||
Additives & Functional Products Sales | $ | 429 | $ | 437 | $ | 412 | $ | 399 | $ | 1,677 | |||||
| Operating earnings | 125 | 105 | 84 | 68 | 382 | ||||||||||
Other operating income (1) | (17 | ) | — | — | — | (17 | ) | ||||||||
| Operating earnings excluding item | 108 | 105 | 84 | 68 | 365 | ||||||||||
| Depreciation and amortization expense | 95 | ||||||||||||||
Adhesives & Plasticizers Sales | $ | 340 | $ | 371 | $ | 349 | $ | 321 | $ | 1,381 | |||||
| Operating earnings | 70 | 70 | 61 | 49 | 250 | ||||||||||
| Depreciation and amortization expense | 44 | ||||||||||||||
Advanced Materials Sales | $ | 574 | $ | 632 | $ | 558 | $ | 549 | $ | 2,313 | |||||
| Operating earnings | 69 | 82 | 63 | 37 | 251 | ||||||||||
| Depreciation and amortization expense | 135 | ||||||||||||||
Fibers Sales | $ | 290 | $ | 331 | $ | 334 | $ | 324 | $ | 1,279 | |||||
| Operating earnings | 86 | 97 | 98 | 84 | 365 | ||||||||||
| Depreciation and amortization expense | 68 | ||||||||||||||
Specialty Fluids & Intermediates Sales | $ | 612 | $ | 638 | $ | 657 | $ | 641 | $ | 2,548 | |||||
| Operating earnings | 76 | 79 | 69 | 47 | 271 | ||||||||||
Asset impairments and restructuring charges, net (2) | — | — | 7 | — | 7 | ||||||||||
| Operating earnings excluding item | 76 | 79 | 76 | 47 | 278 | ||||||||||
| Depreciation and amortization expense | 80 | ||||||||||||||
Other (3) Sales | $ | 21 | $ | 20 | $ | 20 | $ | 16 | $ | 77 | |||||
| Operating loss (earnings) | |||||||||||||||
| Growth initiatives and businesses not allocated to segments | (20 | ) | 5 | 10 | (24 | ) | (29 | ) | |||||||
| Pension and OPEB gain (loss) not allocated to operating segments | 9 | (5 | ) | (10 | ) | (230 | ) | (236 | ) | ||||||
| Operating loss before exclusions | (11 | ) | — | — | (254 | ) | (265 | ) | |||||||
Mark-to-market pension and other postretirement benefits losses (gains), net (4) | (15 | ) | — | — | 224 | 209 | |||||||||
Asset impairments and restructuring charges, net (5)(6)(7) | 12 | (14 | ) | 6 | — | 4 | |||||||||
Other operating expense (income) (8) | — | — | (29 | ) | — | (29 | ) | ||||||||
| Operating loss excluding items | (14 | ) | (14 | ) | (23 | ) | (30 | ) | (81 | ) | |||||
| Depreciation and amortization expense | 7 | ||||||||||||||
Eastman Chemical Company Sales | $ | 2,266 | $ | 2,429 | $ | 2,330 | $ | 2,250 | $ | 9,275 | |||||
| Operating earnings (loss) | 415 | 433 | 375 | 31 | 1,254 | ||||||||||
Mark-to-market pension and other postretirement benefits losses (gains), net (4) | (15 | ) | — | — | 224 | 209 | |||||||||
Asset impairments and restructuring charges, net (2)(5)(6)(7) | 12 | (14 | ) | 13 | — | 11 | |||||||||
Other operating expense (income) (1)(8) | (17 | ) | — | (29 | ) | — | (46 | ) | |||||||
| Operating earnings excluding items | 395 | 419 | 359 | 225 | 1,428 | ||||||||||
| Depreciation and amortization expense | 429 | ||||||||||||||
Note: See Exhibit B for footnotes.
9
2010 segment information
| (Dollars in millions) | 1st Qtr | 2nd Qtr | 3rd Qtr | 4th Qtr | Year | ||||||||||
Additives & Functional Products Sales | $ | 377 | $ | 405 | $ | 401 | $ | 377 | $ | 1,560 | |||||
| Operating earnings | 81 | 106 | 104 | 70 | 361 | ||||||||||
Asset impairments and restructuring charges, net (1)(2) | 5 | 4 | 1 | 5 | 15 | ||||||||||
Other operating income (3) | — | — | — | (5 | ) | (5 | ) | ||||||||
| Operating earnings excluding items | 86 | 110 | 105 | 70 | 371 | ||||||||||
| Depreciation and amortization expense | 90 | ||||||||||||||
Adhesives & Plasticizers Sales | $ | 217 | $ | 283 | $ | 276 | $ | 274 | $ | 1,050 | |||||
| Operating earnings | 34 | 50 | 55 | 43 | 182 | ||||||||||
Asset impairments and restructuring charges, net (2) | — | 3 | — | 2 | 5 | ||||||||||
| Operating earnings excluding item | 34 | 53 | 55 | 45 | 187 | ||||||||||
| Depreciation and amortization expense | 37 | ||||||||||||||
Advanced Materials Sales | $ | 486 | $ | 545 | $ | 526 | $ | 513 | $ | 2,070 | |||||
| Operating earnings | 52 | 56 | 57 | 38 | 203 | ||||||||||
Asset impairments and restructuring charges, net (2) | 1 | — | — | 5 | 6 | ||||||||||
| Operating earnings excluding item | 53 | 56 | 57 | 43 | 209 | ||||||||||
| Depreciation and amortization expense | 129 | ||||||||||||||
Fibers Sales | $ | 267 | $ | 274 | $ | 301 | $ | 300 | $ | 1,142 | |||||
| Operating earnings | 82 | 85 | 93 | 79 | 339 | ||||||||||
Asset impairments and restructuring charges, net (2) | — | — | — | 3 | 3 | ||||||||||
| Operating earnings excluding item | 82 | 85 | 93 | 82 | 342 | ||||||||||
| Depreciation and amortization expense | 61 | ||||||||||||||
Specialty Fluids & Intermediates Sales | $ | 468 | $ | 485 | $ | 487 | $ | 467 | $ | 1,907 | |||||
| Operating earnings | 42 | 65 | 67 | 40 | 214 | ||||||||||
Asset impairments and restructuring charges, net (2) | — | — | — | 4 | 4 | ||||||||||
| Operating earnings excluding item | 42 | 65 | 67 | 44 | 218 | ||||||||||
| Depreciation and amortization expense | 72 | ||||||||||||||
Other Sales | $ | 4 | $ | 12 | $ | 26 | $ | 21 | $ | 63 | |||||
| Operating loss | |||||||||||||||
| Growth initiatives and businesses not allocated to segments | (14 | ) | (14 | ) | (10 | ) | (20 | ) | (58 | ) | |||||
| Pension and OPEB gain (loss) not allocated to operating segments | (8 | ) | (10 | ) | (9 | ) | (15 | ) | (42 | ) | |||||
| Operating loss before exclusions | (22 | ) | (24 | ) | (19 | ) | (35 | ) | (100 | ) | |||||
Mark-to-market pension and other postretirement benefits losses (gains), net (5) | — | — | — | 4 | 4 | ||||||||||
Asset impairments and restructuring charges, net (2)(6) | 1 | 1 | — | 10 | 12 | ||||||||||
Other operating income (7) | — | — | 5 | — | 5 | ||||||||||
| Operating loss excluding items | (21 | ) | (23 | ) | (14 | ) | (21 | ) | (79 | ) | |||||
| Depreciation and amortization expense | 6 | ||||||||||||||
Eastman Chemical Company Sales | $ | 1,819 | $ | 2,004 | $ | 2,017 | $ | 1,952 | $ | 7,792 | |||||
| Operating earnings (loss) | 269 | 338 | 357 | 235 | 1,199 | ||||||||||
Mark-to-market pension and other postretirement benefits losses (gains), net (5) | — | — | — | 4 | 4 | ||||||||||
Asset impairments and restructuring charges, net (1)(2)(6) | 7 | 8 | 1 | 29 | 45 | ||||||||||
Other operating income (3)(7) | — | — | 5 | (5 | ) | — | |||||||||
| Operating earnings excluding items | 276 | 346 | 363 | 263 | 1,248 | ||||||||||
| Depreciation and amortization expense | 395 | ||||||||||||||
Note: See Exhibit B for footnotes.
10
2009 segment information
| (Dollars in millions) | 1st Qtr | 2nd Qtr | 3rd Qtr | 4th Qtr | Year | ||||||||||
Additives & Functional Products Sales | $ | 261 | $ | 305 | $ | 350 | $ | 345 | $ | 1,261 | |||||
| Operating earnings | 17 | 64 | 100 | 101 | 282 | ||||||||||
Additional costs of acquired Solutia inventories (1) | 21 | — | — | — | 21 | ||||||||||
Asset impairments and restructuring charges, net (2)(3)(4)(5) | 6 | (5 | ) | — | 1 | 2 | |||||||||
Other operating income (6) | — | — | — | (4 | ) | (4 | ) | ||||||||
| Operating earnings excluding items | 44 | 59 | 100 | 98 | 301 | ||||||||||
| Depreciation and amortization expense | 87 | ||||||||||||||
Adhesives & Plasticizers Sales | $ | 149 | $ | 167 | $ | 182 | $ | 181 | $ | 679 | |||||
| Operating earnings | 2 | 18 | 34 | 30 | 84 | ||||||||||
Asset impairments and restructuring charges, net (2) | 4 | (1 | ) | — | — | 3 | |||||||||
| Operating earnings excluding item | 6 | 17 | 34 | 30 | 87 | ||||||||||
| Depreciation and amortization expense | 37 | ||||||||||||||
Advanced Materials Sales | $ | 324 | $ | 401 | $ | 435 | $ | 464 | $ | 1,624 | |||||
| Operating earnings | (62 | ) | 34 | 48 | 37 | 57 | |||||||||
Additional costs of acquired Solutia inventories (1) | 41 | — | — | — | 41 | ||||||||||
Asset impairments and restructuring charges, net (2)(7)(8) | 18 | 5 | 2 | 7 | 32 | ||||||||||
| Operating earnings excluding items | (3 | ) | 39 | 50 | 44 | 130 | |||||||||
| Depreciation and amortization expense | 123 | ||||||||||||||
Fibers Sales | $ | 259 | $ | 263 | $ | 257 | $ | 253 | $ | 1,032 | |||||
| Operating earnings | 72 | 77 | 82 | 77 | 308 | ||||||||||
Asset impairments and restructuring charges, net (2) | 4 | — | — | — | 4 | ||||||||||
| Operating earnings excluding item | 76 | 77 | 82 | 77 | 312 | ||||||||||
| Depreciation and amortization expense | 62 | ||||||||||||||
Specialty Fluids & Intermediates Sales | $ | 302 | $ | 323 | $ | 378 | $ | 396 | $ | 1,399 | |||||
| Operating earnings | (18 | ) | 16 | 36 | 28 | 62 | |||||||||
Additional costs of acquired Solutia inventories (1) | 17 | — | — | — | 17 | ||||||||||
Asset impairments and restructuring charges, net (2) | 5 | — | — | — | 5 | ||||||||||
| Operating earnings excluding items | 4 | 16 | 36 | 28 | 84 | ||||||||||
| Depreciation and amortization expense | 71 | ||||||||||||||
Other Sales | $ | 6 | $ | 6 | $ | 4 | $ | 3 | $ | 19 | |||||
| Operating loss | |||||||||||||||
| Growth initiatives and businesses not allocated to segments | (16 | ) | (11 | ) | (20 | ) | (199 | ) | (246 | ) | |||||
| Pension and OPEB gain (loss) not allocated to operating segments | (17 | ) | (17 | ) | (17 | ) | (93 | ) | (144 | ) | |||||
| Transaction, integration, and restructuring costs related to the acquisition of Solutia | (101 | ) | — | — | — | (101 | ) | ||||||||
| Operating loss before exclusions | (134 | ) | (28 | ) | (37 | ) | (292 | ) | (491 | ) | |||||
| Transaction, integration, and restructuring costs related to the acquisition of Solutia | 69 | — | — | — | 69 | ||||||||||
Mark-to-market pension and other postretirement benefits losses (gains), net (10) | — | — | 8 | 81 | 89 | ||||||||||
Asset impairments and restructuring charges, net (2)(11)(12) | 39 | — | 8 | 188 | 235 | ||||||||||
Other operating loss (13) | — | — | 6 | — | 6 | ||||||||||
| Operating loss excluding items | (26 | ) | (28 | ) | (15 | ) | (23 | ) | (92 | ) | |||||
| Depreciation and amortization expense | 4 | ||||||||||||||
Eastman Chemical Company Sales | $ | 1,301 | $ | 1,465 | $ | 1,606 | $ | 1,642 | $ | 6,014 | |||||
| Operating earnings (loss) | (123 | ) | 181 | 263 | (19 | ) | 302 | ||||||||
Additional costs of acquired Solutia inventories (1) | 79 | — | — | — | 79 | ||||||||||
| Transaction, integration, and restructuring costs related to the acquisition of Solutia | 69 | — | — | — | 69 | ||||||||||
Mark-to-market pension and other postretirement benefits losses (gains), net (10) | — | — | 8 | 81 | 89 | ||||||||||
Asset impairments and restructuring charges, net (1)(2)(3)(4)(5)(7)(8)(11)(12) | 76 | (1 | ) | 10 | 196 | 281 | |||||||||
Other operating loss (income) (6)(13) | — | — | 6 | (4 | ) | 2 | |||||||||
| Operating earnings excluding items | 101 | 180 | 287 | 254 | 822 | ||||||||||
| Depreciation and amortization expense | 384 | ||||||||||||||
Note: See Exhibit B for footnotes.
11
Exhibit A
Unaudited Pro Forma Combined Segment Information
The unaudited pro forma financial results for years ended December 31, 2012, 2011, 2010, and 2009 combine the consolidated results of Eastman and Solutia giving effect to the acquisition of Solutia as if it had been completed on January 1, 2009, the beginning of the earliest period presented. As a result, additional costs of acquired Solutia inventories and transaction, integration, and restructuring costs occurring in 2012 have been reallocated to first quarter 2009. The unaudited pro forma financial results presented do not include any anticipated synergies or other expected benefits of the acquisition. This unaudited pro forma financial information is presented for informational purposes only and is not indicative of future operations or results had the acquisition been completed as of January 1, 2009.
The unaudited pro forma combined segment information reflects the combination of Eastman and Solutia and the impact of increased depreciation and amortization expense resulting from the fair valuation of assets acquired from Solutia in accordance with Accounting Standards Codification No. 805, “Business Combinations.” The information also includes adjustments to Solutia historical information to be consistent with Eastman's change in method of accounting for actuarial gains and losses for its pension and other postretirement benefit (“OPEB”) plans and adjustments to Solutia exclusions from operating earnings consistent with Eastman's historical presentation of non-GAAP results. In addition, corporate expenses, adjustments to environmental liabilities, and gains and losses from asset dispositions and restructuring charges that were previously reported as “Other” have been allocated to Eastman's reportable segments using a percentage of total revenue methodology based on Solutia's full year 2011 results. This allocation of corporate overhead from “Other” to the reportable segments is in accordance with Eastman's presentation of such costs. In conjunction with the change in accounting principle, the service cost, which represents the benefits earned by active employees during the period, and amortization of prior service credits continue to be allocated to each segment. Interest costs, expected return on assets, and the mark-to-market (“MTM”) adjustment for actuarial gains and losses are included in corporate expense and not allocated to segments.
12
Exhibit B
Notes to segment information
| Year | Footnote | |
| 2012 | 1 | Fourth quarter includes asset impairments and restructuring charges of $3 million, $3 million, $5 million, $3 million, and $6 million in the Additives & Functional Products, Adhesives & Plasticizers, Advanced Materials, Fibers, and Specialty Fluids & Intermediates segments, respectively, primarily due to a change in approach to address recently finalized boiler air emissions regulations. |
| 2 | Amounts include business exit costs and asset impairments of $8 million, $24 million, and $3 million in the Additives & Functional Products, Advanced Materials, and Specialty Fluids & Intermediates segments, respectively, for production businesses exited in Sao Jose dos Campos, Brazil in fourth quarter. | |
| 3 | Amount includes asset impairments and restructuring charges of $6 million related to the closure of a production facility in China. | |
| 4 | Amounts include acquisition related expenses on the Southwall Technologies Inc. acquisition. | |
| 5 | Research and development, pension and OPEB, and other expenses not identifiable to an operating segment are not included in segment operating results for either of the periods presented and are shown as “other” operating earnings (loss). | |
| 6 | Amounts are MTM losses (gains), net, for pension and OPEB plans actuarial adjustments. | |
| 7 | Fourth quarter includes restructuring charges of $17 million for inventory costs in excess of recoverable value of certain discontinued Perennial WoodTM product lines and to accrue for losses on take-or-pay contracts with third parties. Third and fourth quarters include asset impairments and restructuring charges of $3 million and $1 million, respectively, for termination of the research and development activities for renewable chemicals. Third quarter also includes a charge of $6 million for the impairment of land retained from the terminated Beaumont, Texas industrial gasification project. | |
| 2011 | 1 | Amount includes gains on certain other rubber chemicals divestitures. |
| 2 | Amount includes restructuring charges primarily for severance associated with the acquisition and integration of Sterling Chemicals, Inc. | |
| 3 | Research and development, pension and OPEB, and other expenses not identifiable to an operating segment are not included in segment operating results for either of the periods presented and are shown as “other” operating earnings (loss). | |
| 4 | MTM losses (gains), net, for pension and OPEB plans actuarial adjustments. First quarter 2011 included MTM gain of $15 million in due to the interim remeasurement of the OPEB plan obligation, triggered by the exit of employees associated with the sale of the PET business. | |
| 5 | First quarter, second quarter, third quarter, and full year include $12 million, $1 million, $1 million, and $14 million, respectively, for severance, pension settlement and other charges related to the relocation of European regional headquarters. | |
| 6 | Second quarter and full year include $15 million gain from the sale of the previously impaired methanol and ammonia assets related to the terminated Beaumont, Texas industrial gasification project. | |
| 7 | Third quarter and full year include $3 million for severance and $2 million for share-based compensation costs on executive officer separation agreement. | |
| 8 | Third quarter and full year include $29 million gain related to the sale of remaining 2% ownership interest in Ascend Performance Materials Holdings Inc. | |
13
Exhibit B (continued)
Notes to segment information
| Year | Footnote | |
| 2010 | 1 | First, second, third, and fourth quarters reflect restructuring costs of $4 million, $4 million, $1 million, and $1 million, respectively, related to the closure of the Ruabon and Cologne facilities. |
| 2 | Includes charges for severance programs of: $1 million and $4 million in first and fourth quarters, respectively, in the Additives and Functional Products segment; $3 million and $2 million in second and fourth quarters, respectively, in the Adhesives and Plasticizers segment; $1 million and $5 million in first and fourth quarters, respectively, in the Advanced Materials segment; $3 million in fourth quarter in the Fibers segment; $4 million in fourth quarter in the Specialty Fluids and Intermediates segment; and $1 million, $1 million, and $2 million in first, second, and fourth quarters, respectively, in Other. | |
| 3 | Includes gain on the sale of select assets of Perkalink. | |
| 4 | Research and development, pension and OPEB, and other expenses not identifiable to an operating segment are not included in segment operating results for either of the periods presented and are shown as “other” operating earnings (loss). | |
| 5 | Amounts include MTM losses (gains), net, for pension and OPEB plans actuarial adjustments. | |
| 6 | Fourth quarter includes $8 million for intangible asset impairment charges resulting from an environmental regulatory change during the fourth quarter impacting the fair value of air emission credits remaining from the previously discontinued Beaumont, Texas, gasification project. | |
| 7 | Includes loss on the sale of European Plastic Products business. | |
| 2009 | 1 | As required by purchase accounting, the acquired Solutia inventories were marked to fair value. These inventories were sold in 2012 resulting in an increase in cost of sales, net of the LIFO impact for these inventories in third and fourth quarters 2012. For purposes of this pro forma combined financial information, the acquisition is presented as if the acquisition of Solutia had been consummated on January 1, 2009. |
| 2 | Includes charges and adjustments for corporate severance program of: charges of $5 million and $1 million in first and fourth quarters, respectively, and an adjustment of $1 million in second quarter in the Additives and Functional Products segment; a charge of $4 million in first quarter and an adjustment of $1 million in second quarter in the Adhesives and Plasticizers segment; charges of $14 million, $4 million, $2 million, and $4 million in first, second, third, and fourth quarters in the Advanced Materials segment; charges of $4 million in first quarter in the Fibers segment; a charge of $5 million in first quarter in the Specialty Fluids and Intermediates segment; and charges of $7 million, $2 million, and $9 million in first, second, and fourth quarters, respectively, in Other. | |
| 3 | First quarter, second quarter, and fourth quarter include charges of $1 million, gains of $4 million, and charges of $1 million, respectively, related to the announced closure of the Ruabon facility. | |
| 4 | Fourth quarter includes $2 million gain from the reversal of a reserve for previously divested businesses and product lines within the former Coatings, Adhesives, and Specialty Polymers and Inks segment. | |
| 5 | Fourth quarter includes $1 million impairment of intangible assets related to the sale of the Thiurams business. | |
| 6 | Reflects gain on the sale of the Thiurams business. | |
| 7 | First quarter and second quarter include $4 million and $1 million, respectively, related to the announced closure of the SAFLEX® plastic interlayer production line at the Trenton facility. | |
| 8 | Fourth quarter includes net charges of $3 million related to consolidation of certain European manufacturing and distribution sites. | |
| 9 | Research and development, pension and OPEB, and other expenses not identifiable to an operating segment are not included in segment operating results for either of the periods presented and are shown as “other” operating earnings (loss). | |
| 10 | Amounts include MTM losses (gains), net, for pension and OPEB plans actuarial adjustments. | |
| 11 | Amounts include restructuring charges of $32 million primarily for severance related to the acquisition and integration of Solutia. | |
| 12 | Fourth quarter includes $179 million for asset impairments related to the Company's previously announced discontinuance of its Beaumont, Texas industrial gasification project. | |
| 13 | Third quarter includes loss on the sale of North America Plastic Products and related impairment of intangible assets. | |
14
Stockholder information
Stock exchange listing Eastman Chemical Company common stock is listed and traded on the New York Stock Exchange under the ticker symbol EMN. Dividends Quarterly dividends on common stock, if declared by the Board of Directors, are usually paid on or about the first business day of the month following the end of each quarter. On a split- adjusted basis, dividends declared were $1.08 in 2012, $0.99 in 2011, and $0.895 in 2010. Corporate offices Eastman Chemical Company 200 S Wilcox Drive P.O. Box 431 Kingsport, TN 37660-5280 U.S.A. http://www.eastman.com Stock transfer agent and registrar Inquiries and changes to stockholder accounts should be directed to our transfer agent: American Stock Transfer & Trust Company 59 Maiden Lane New York, NY 10038 In the United States: 800-937-5449 Outside the United States: (1) 212-936-5100 or (1) 718-921-8200 http://www.amstock.com | Eastman stockholder information 877-EMN-INFO (877-366-4636) http://www.eastman.com Eastman Databook Eastman Chemical Company's databook has been developed to assist investors in understanding and evaluating Eastman. It provides financial and operations data and other information about the Company and its operating segments. The notes to the financial statements are not included. Complete financial statements and Management's Discussion and Analysis of Financial Condition and Results of Operations appear in Eastman's Annual Report on Form 10-K and Annual Report to Stockholders, both of which are available on http://www.eastman.com. Eastman Investor Relations www.eastman.com/Company/Investors/Pages/Introduction.aspx 877-366-4636 Gregory Riddle Vice President, Investor Relations and Communications 1-212-835-1620 griddle@eastman.com Josh Morgan Investor Relations Manager 1-423-229-5503 jmorgan@eastman.com |
15

Eastman Chemical Company Kingsport, Tennessee, U.S.A.
423.229.2000
www.eastman.com
16