
Exhibit 99.02 Third-Quarter 2019 Financial Results Mark Costa, Board Chair & CEO Curt Espeland, EVP & CFO October 25, 2019
Forward-looking statements During this presentation, we make certain forward-looking statements concerning plans and expectations for Eastman Chemical Company. We caution you that actual events or results may differ materially from our plans and expectations. See these slides and the remarks in the conference call and webcast, the third quarter 2019 financial results 8-K and news release, and our Form 10-K for 2018 and Form 10-Q filed for second quarter 2019 and the Form 10-Q to be filed for third quarter 2019 for risks and uncertainties which could cause actual results to differ materially from current plans and expectations. GAAP and Non-GAAP financial measures Earnings referenced in this presentation exclude certain non-core and unusual items. In addition, interim period earnings use an adjusted effective tax rate using the Company’s forecasted tax rate for the full year as of the end of the interim period and earnings per share are calculated with an adjusted tax rate that excludes the provision for income taxes for non-core and unusual items. “Free Cash Flow” is cash provided by operating activities minus net capital expenditures (typically cash used for additions to properties and equipment). Reconciliations to the most directly comparable GAAP financial measures and other associated disclosures, including a description of the excluded and adjusted items, are available in our third quarter 2019 financial results news release available in the “Investors” section of our website and in the “Management’s Discussion and Analysis of Financial Condition and Results of Operations” sections of the Forms 10-K and 10-Q filed with the SEC for the periods for which non-GAAP financial measures are presented. Projections of future earnings exclude any non-core, unusual, or non-recurring items. 2
Third-quarter 2019 business and strategic highlights Growing portfolio of specialty products Continued progress on new business revenue from innovation, particularly in Advanced Materials Continued progress on aggressive cost management Returned $583 million to stockholders in first 9M 2019 and continued focus on delevering Achieved commercial operation of innovative carbon renewal technology Received “LUXE PACK in green” Award for activating the circular economy 3
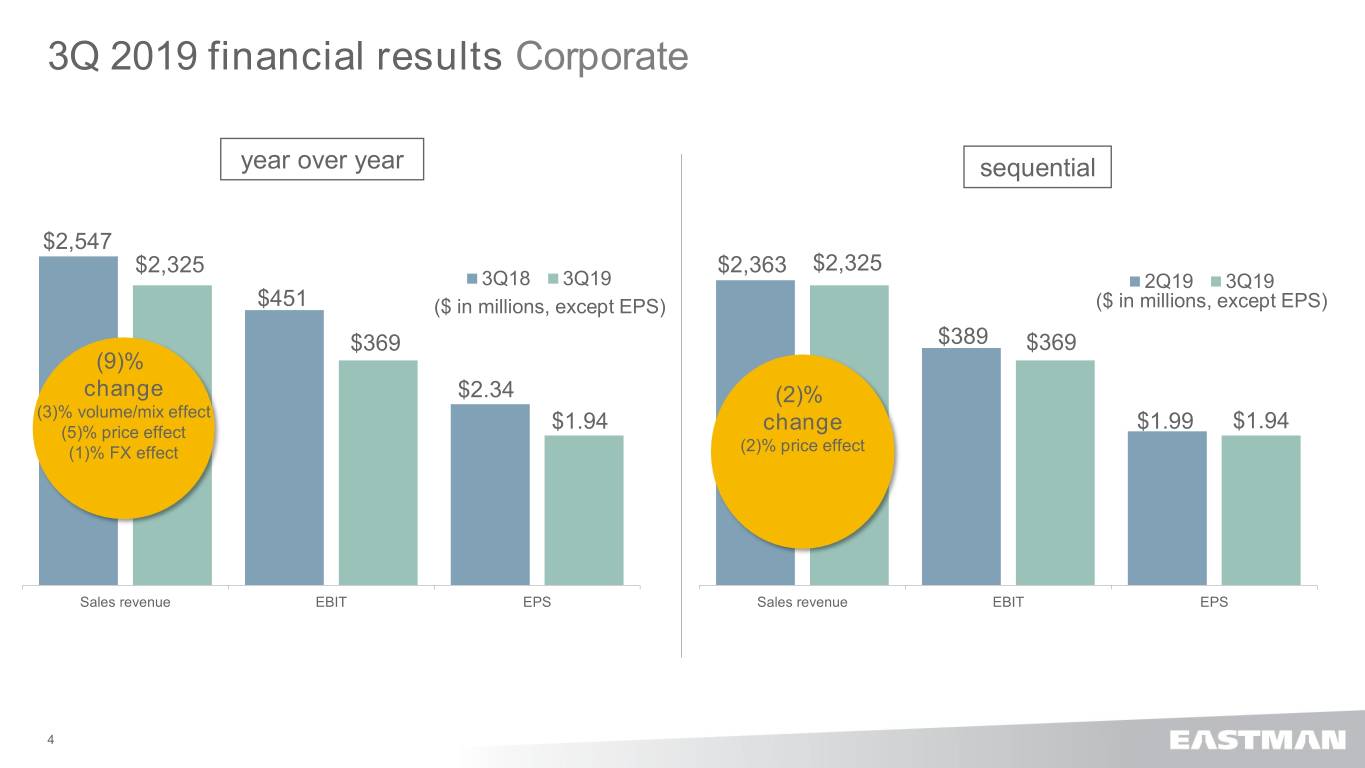
3Q 2019 financial results Corporate year over year sequential $2,547 $2,325 $2,363 $2,325 3Q18 3Q19 2Q19 3Q19 $451 ($ in millions, except EPS) ($ in millions, except EPS) $369 $389 $369 (9)% change $2.34 (2)% (3)% volume/mix effect $1.94 (5)% price effect $1.94 change $1.99 (1)% FX effect (2)% price effect Sales revenue EBIT EPS Sales revenue EBIT EPS 4
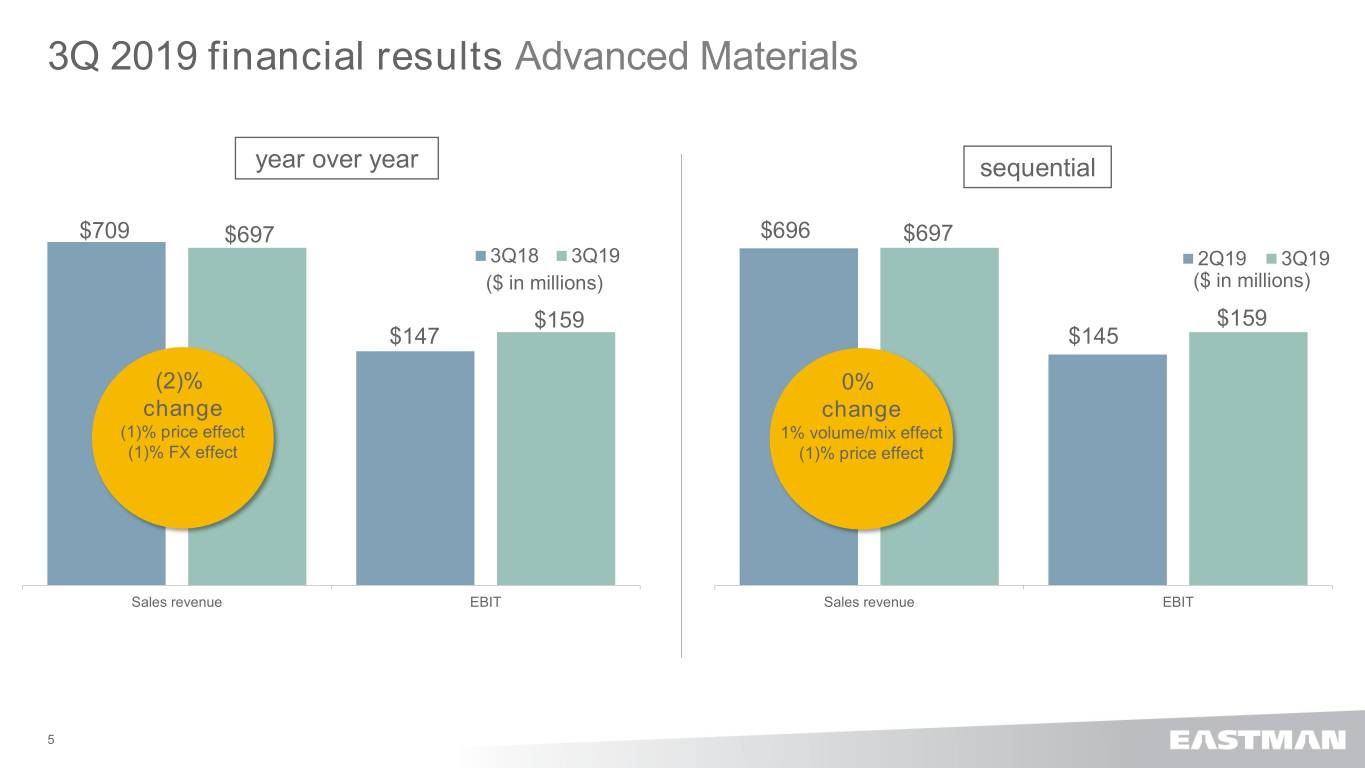
3Q 2019 financial results Advanced Materials year over year sequential $709 $697 $696 $697 3Q18 3Q19 2Q19 3Q19 ($ in millions) ($ in millions) $159 $159 $147 $145 (2)% 0% change change (1)% price effect 1% volume/mix effect (1)% FX effect (1)% price effect Sales revenue EBIT Sales revenue EBIT 5
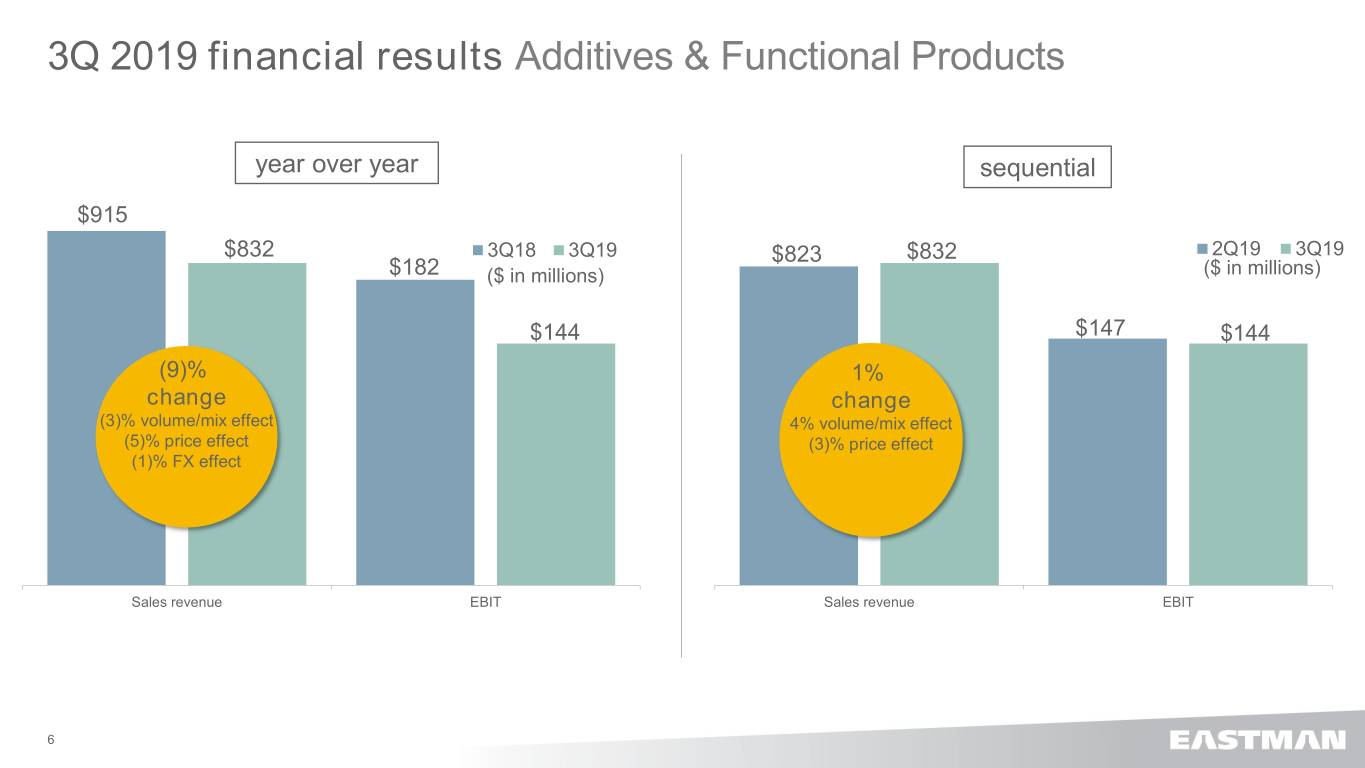
3Q 2019 financial results Additives & Functional Products year over year sequential $915 $832 3Q18 3Q19 $823 $832 2Q19 3Q19 $182 ($ in millions) ($ in millions) $144 $147 $144 (9)% 1% change change (3)% volume/mix effect 4% volume/mix effect (5)% price effect (3)% price effect (1)% FX effect Sales revenue EBIT Sales revenue EBIT 6
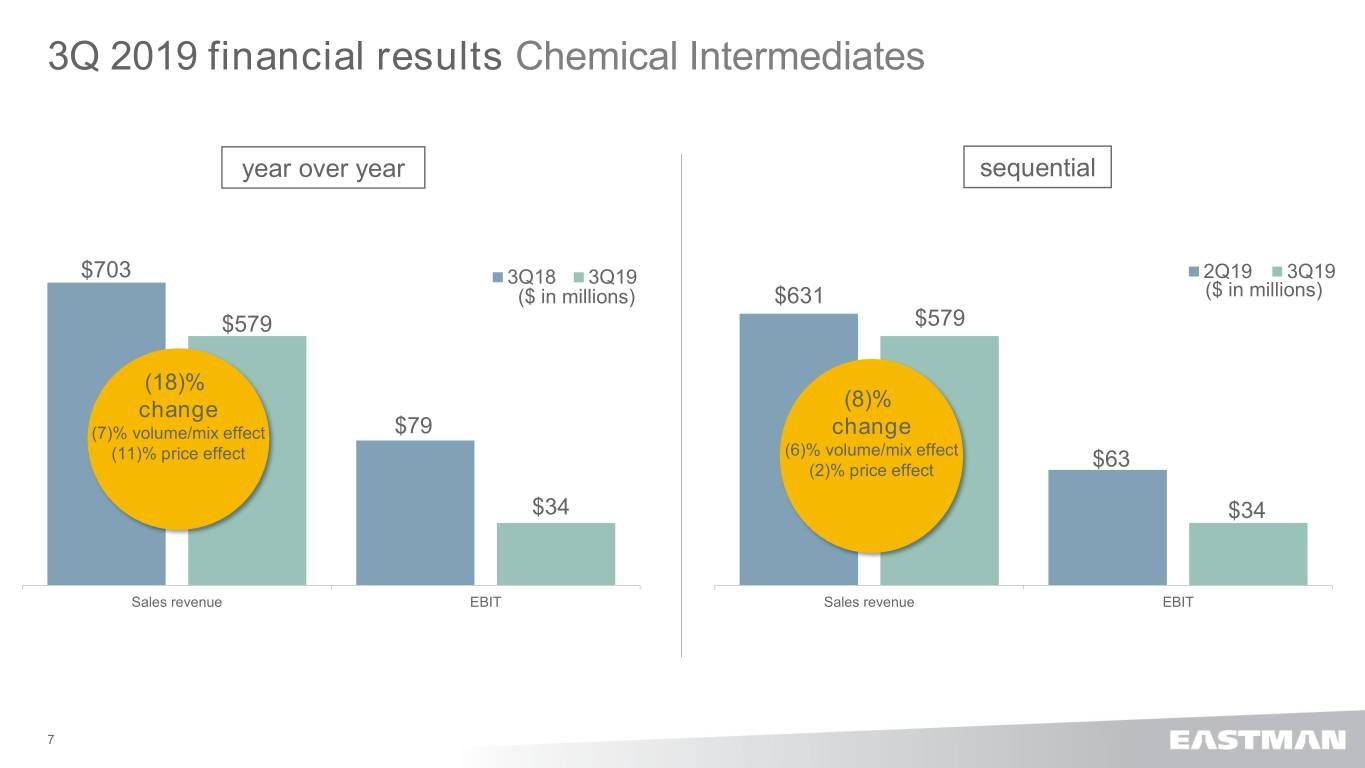
3Q 2019 financial results Chemical Intermediates year over year sequential $703 3Q18 3Q19 2Q19 3Q19 ($ in millions) $631 ($ in millions) $579 $579 (18)% change (8)% (7)% volume/mix effect $79 change (11)% price effect (6)% volume/mix effect (2)% price effect $63 $34 $34 Sales revenue EBIT Sales revenue EBIT 7
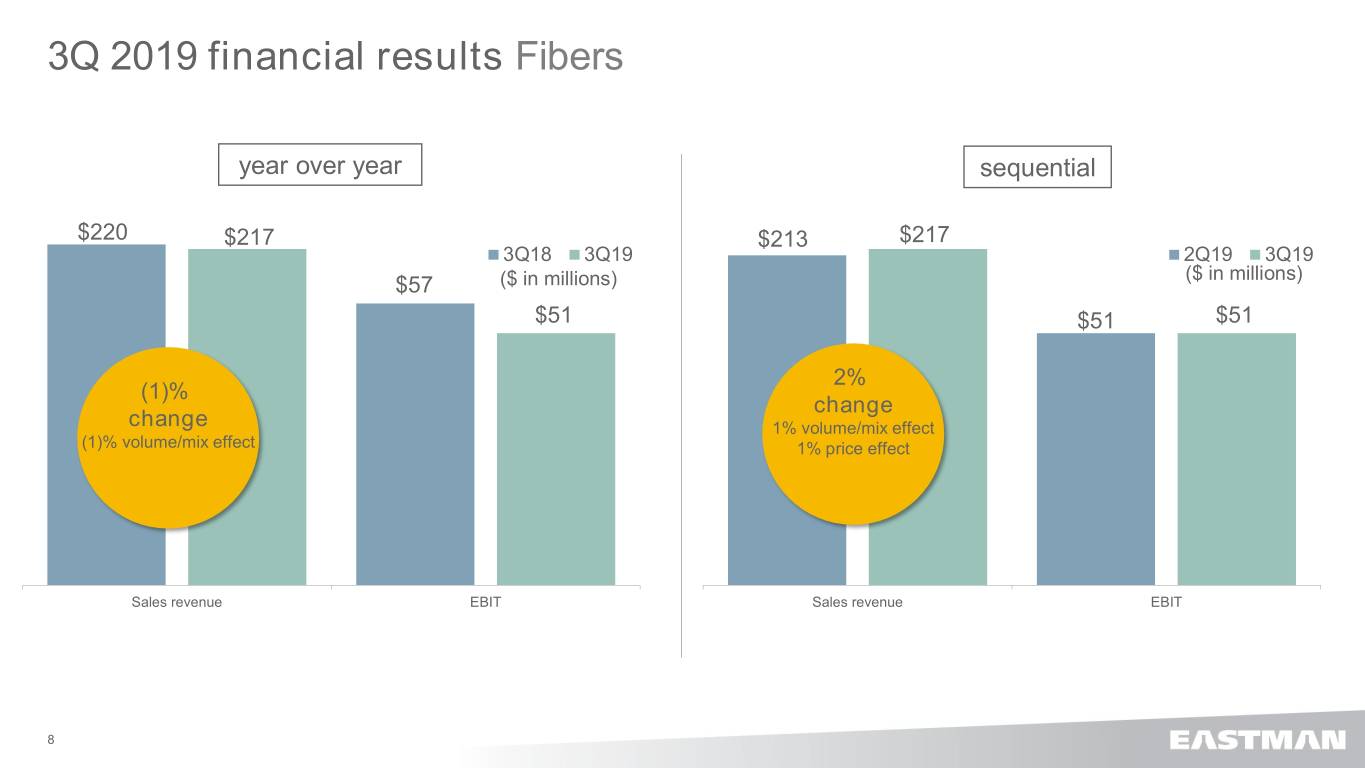
3Q 2019 financial results Fibers year over year sequential $220 $217 $213 $217 3Q18 3Q19 2Q19 3Q19 ($ in millions) $57 ($ in millions) $51 $51 $51 2% (1)% change change 1% volume/mix effect (1)% volume/mix effect 1% price effect Sales revenue EBIT Sales revenue EBIT 8
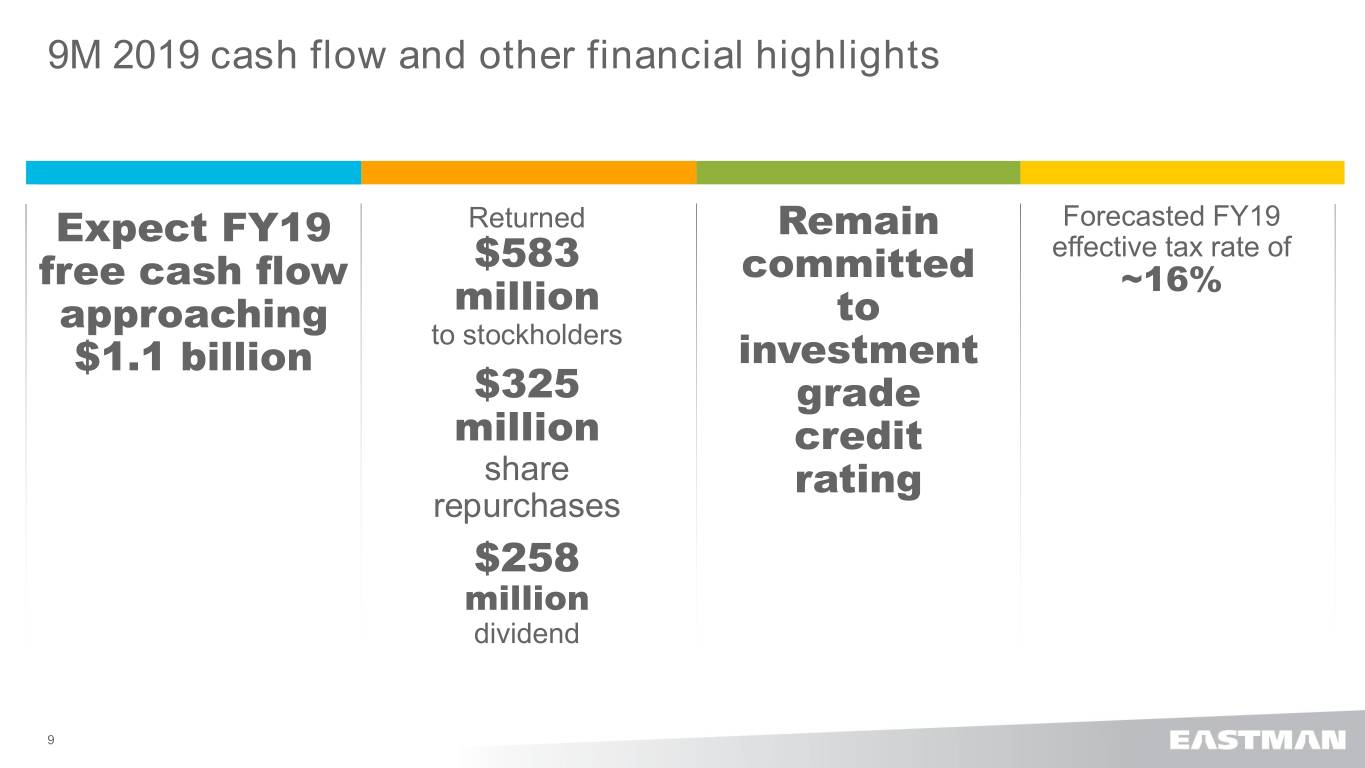
9M 2019 cash flow and other financial highlights Expect FY19 Returned Remain Forecasted FY19 $583 effective tax rate of free cash flow committed ~16% approaching million to to stockholders $1.1 billion investment $325 grade million credit share rating repurchases $258 million dividend 9
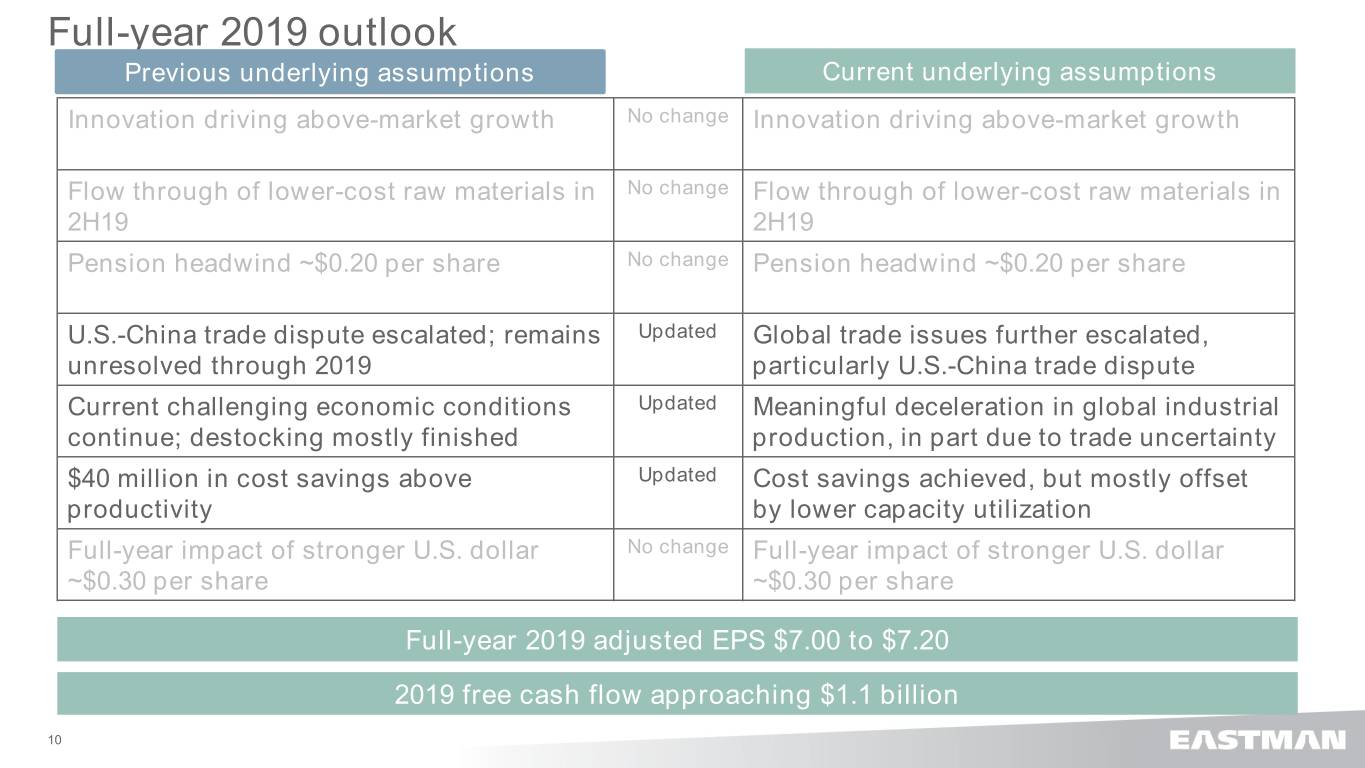
Full-year 2019 outlook Previous underlying assumptions Current underlying assumptions Innovation driving above-market growth No change Innovation driving above-market growth Flow through of lower-cost raw materials in No change Flow through of lower-cost raw materials in 2H19 2H19 Pension headwind ~$0.20 per share No change Pension headwind ~$0.20 per share U.S.-China trade dispute escalated; remains Updated Global trade issues further escalated, unresolved through 2019 particularly U.S.-China trade dispute Current challenging economic conditions Updated Meaningful deceleration in global industrial continue; destocking mostly finished production, in part due to trade uncertainty $40 million in cost savings above Updated Cost savings achieved, but mostly offset productivity by lower capacity utilization Full-year impact of stronger U.S. dollar No change Full-year impact of stronger U.S. dollar ~$0.30 per share ~$0.30 per share Full-year 2019 adjusted EPS $7.00 to $7.20 2019 free cash flow approaching $1.1 billion 10
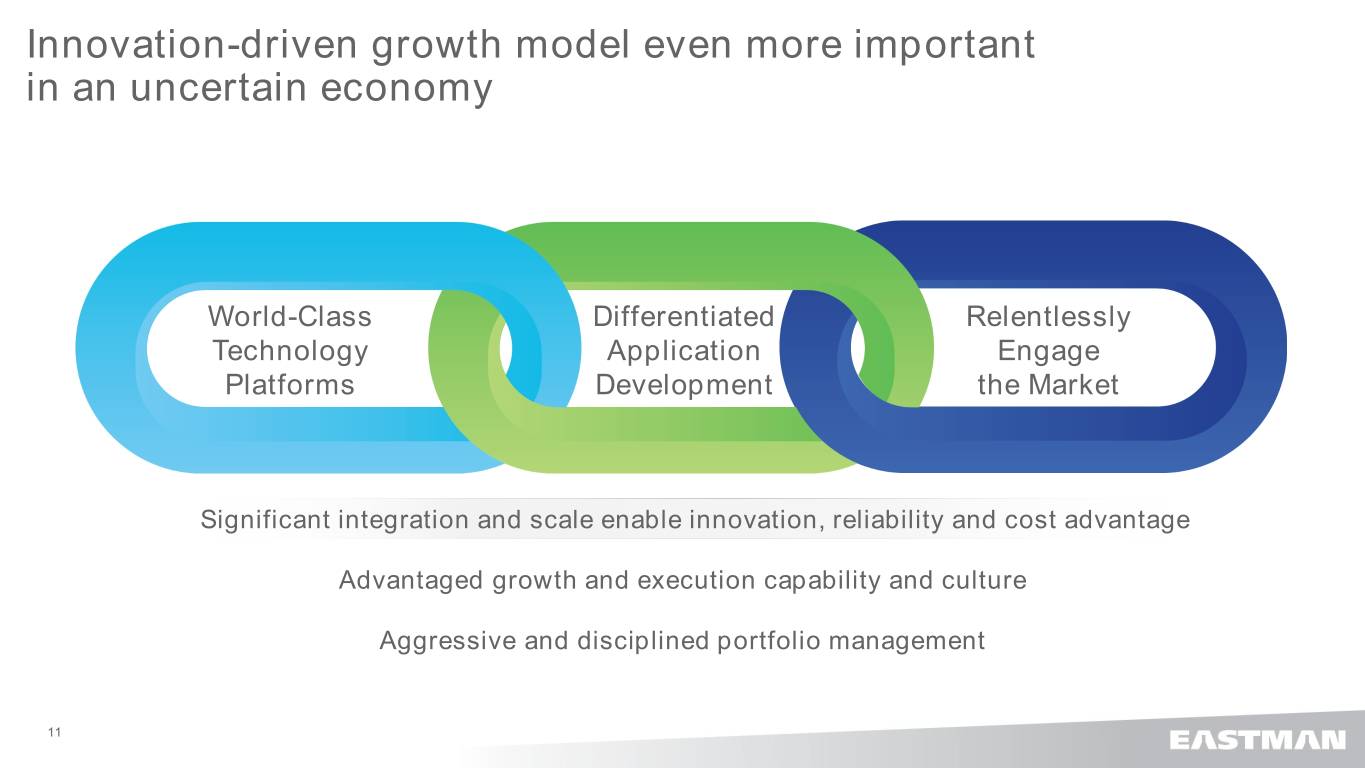
Innovation-driven growth model even more important in an uncertain economy World-Class Differentiated Relentlessly Technology Application Engage Platforms Development the Market Significant integration and scale enable innovation, reliability and cost advantage Advantaged growth and execution capability and culture Aggressive and disciplined portfolio management 11


