0000091576us-gaap:LongTermDebtMemberus-gaap:InterestRateContractMember2024-12-31
UNITED STATES SECURITIES AND EXCHANGE COMMISSION
Washington, D.C. 20549
FORM 10-K
ANNUAL REPORT
PURSUANT TO SECTION 13 OR 15(d)
OF THE SECURITIES EXCHANGE ACT OF 1934
For the fiscal year ended
December 31, 2024
Commission file number: 1-11302
KeyCorp
Exact name of registrant as specified in its charter:
| | | | | |
| Ohio | 34-6542451 |
| State or other jurisdiction of incorporation or organization: | I.R.S. Employer Identification Number: |
| | | | | | | | | | | |
| 127 Public Square, | Cleveland, | Ohio | 44114-1306 |
| Address of principal executive offices: | Zip Code: |
(216) 689-3000
Registrant’s telephone number, including area code:
SECURITIES REGISTERED PURSUANT TO SECTION 12(b) OF THE ACT:
| | | | | | | | |
| Title of each class | Trading Symbol(s) | Name of each exchange on which registered |
| Common Shares, $1 par value | KEY | New York Stock Exchange |
| Depositary Shares (each representing a 1/40th interest in a share of Fixed-to-Floating Rate | KEY PrI | New York Stock Exchange |
| Perpetual Non-Cumulative Preferred Stock, Series E) | | |
| Depositary Shares (each representing a 1/40th interest in a share of Fixed Rate Perpetual Non- | KEY PrJ | New York Stock Exchange |
| Cumulative Preferred Stock, Series F) | | |
| Depositary Shares (each representing a 1/40th interest in a share of Fixed Rate Perpetual Non- | KEY PrK | New York Stock Exchange |
| Cumulative Preferred Stock, Series G) | | |
| Depositary Shares (each representing a 1/40th interest in a share of Fixed Rate Reset Perpetual Non- | KEY PrL | New York Stock Exchange |
| Cumulative Preferred Stock, Series H) | | |
SECURITIES REGISTERED PURSUANT TO SECTION 12(g) OF THE ACT: NONE
Indicate by check mark if the registrant is a well-known seasoned issuer, as defined in Rule 405 of the Securities Act. Yes ☒ No ☐
Indicate by check mark if the registrant is not required to file reports pursuant to Section 13 or Section 15(d) of the Act. Yes ☐ No ☒
Indicate by check mark whether the registrant (1) has filed all reports required to be filed by Section 13 or 15(d) of the Securities Exchange Act of 1934 during the preceding 12 months (or for such shorter period that the registrant was required to file such reports), and (2) has been subject to such filing requirements for the past 90 days. Yes ☒ No ☐
Indicate by check mark whether the registrant has submitted electronically every Interactive Data File required to be submitted pursuant to Rule 405 of Regulation S-T (§ 232.405 of this Chapter) during the preceding 12 months (or for such shorter period that the registrant was required to submit such files). Yes ☒ No ☐
Indicate by check mark whether the registrant is a large accelerated filer, an accelerated filer, a non-accelerated filer, a smaller reporting company, or an emerging growth company. See the definitions of “large accelerated filer,” “accelerated filer,” “smaller reporting company,” and “emerging growth company” in Rule 12b-2 of the Exchange Act.
| | | | | | | | | | | | | | | | | |
| Large accelerated filer | ☒ | Accelerated filer | ☐ | Non-accelerated filer | ☐ |
| Smaller reporting company | ☐ | Emerging growth company | ☐ | | |
If an emerging growth company, indicate by check mark if the registrant has elected not to use the extended transition period for complying with any new or revised financial accounting standards provided pursuant to Section 13(a) of the Exchange Act. ☐
Indicate by check mark whether the registrant has filed a report on and attestation to its management’s assessment of the effectiveness of its internal control over financial reporting under Section 404(b) of the Sarbanes-Oxley Act (15 U.S.C. 7262(b)) by the registered public accounting firm that prepared or issued its audit report. ☒
If securities are registered pursuant to Section 12(b) of the Act, indicate by check mark whether the financial statements of the registrant included in the filing reflect the correction of an error to previous issued financial statements. ☐
Indicate by check mark whether any of those error corrections are restatements that required a recovery analysis of incentive-based compensation received by any of the registrant’s executive officers during the relevant recovery period pursuant to § 240.10D-1(b). ☐
Indicate by check mark whether the registrant is a shell company (as defined in Rule 12b-2 of the Exchange Act). Yes ☐ No ☒
The aggregate market value of voting and non-voting common stock held by nonaffiliates of the Registrant was $13,402,865,321 (based on the June 28, 2024, closing price of KeyCorp Common Shares of $14.21 as reported on the New York Stock Exchange). As of February 19, 2025, there were 1,105,119,318 Common Shares outstanding.
Certain specifically designated portions of KeyCorp’s definitive Proxy Statement for its 2025 Annual Meeting of Shareholders are incorporated by reference into Part III of this Form 10-K.
Forward-looking Statements
From time to time, we have made or will make forward-looking statements within the meaning of the Private Securities Litigation Reform Act of 1995. These statements do not relate strictly to historical or current facts. Forward-looking statements usually can be identified by the use of words such as “goal,” “objective,” “plan,” “expect,” “assume,” “anticipate,” “intend,” “project,” “believe,” “estimate,” “will,” “would,” “should,” “could,” or other words of similar meaning. Forward-looking statements provide our current expectations or forecasts of future events, circumstances, results or aspirations. Our disclosures in this report contain forward-looking statements. We may also make forward-looking statements in other documents filed with or furnished to the SEC. In addition, we may make forward-looking statements orally to analysts, investors, representatives of the media and others.
Forward-looking statements, by their nature, are subject to assumptions, risks, and uncertainties, many of which are outside of our control. Our actual results may differ materially from those set forth in our forward-looking statements. There is no assurance that any list of risks and uncertainties or risk factors is complete. In addition, no assurance can be given that any plan, initiative, projection, goal, commitment, expectation, or prospect set forth in this report can or will be achieved. Factors that could cause our actual results to differ from those described in forward-looking statements include, but are not limited to:
•the extensive regulation of the U.S. financial services industry;
•complex and evolving laws and regulations regarding privacy and cybersecurity;
•operational or risk management failures by us or critical third parties;
•breaches of security or failures of our technology systems due to technological or other factors, cybersecurity threats, and increased risks resulting from remote work;
•an ineffective risk management framework;
•negative outcomes from claims, litigation, arbitration, investigations, or governmental proceedings;
•failure or circumvention of our controls and procedures;
•our exposure to a wide range of climate-related physical risks across different geographical areas;
•evolving capital and liquidity standards under applicable regulatory rules;
•disruption of the U.S. financial system, including the impact of inflation and a potential global economic downturn or recession;
•unanticipated changes in our liquidity position, including but not limited to, changes in our access to or the cost of funding and our ability to secure alternative funding sources;
•our ability to receive dividends from our subsidiaries, including KeyBank;
•downgrades in our credit ratings or those of KeyBank;
•a worsening of the U.S. economy due to financial, political or other shocks;
•our ability to anticipate interest rate changes and manage interest rate risk;
•deterioration of economic conditions in the geographic regions where we operate;
•the soundness of other financial institutions, including instability in the financial industry;
•our concentrated credit exposure in commercial and industrial loans;
•deterioration of commercial real estate market fundamentals;
•defaults by our loan clients or counterparties;
•adverse changes in credit quality trends;
•declining asset prices;
•deterioration of asset quality and an increase in credit losses;
•geopolitical destabilization;
•labor shortages and supply chain constraints, as well as the impact of inflation;
•our ability to develop and effectively use the quantitative models we rely upon in our business planning;
•our ability to manage reputational risk, including risks related to corporate responsibility and sustainability efforts;
•our ability to timely and effectively implement our strategic initiatives;
•increased competitive pressure;
•our ability to adapt our products and services to industry standards and consumer preferences;
•our ability to attract and retain talented executives and employees;
•unanticipated adverse effects of strategic partnerships or acquisitions and dispositions of assets or businesses;
•the potential impact of Scotiabank’s significant equity interest in our business;
•inaccurate assumptions or estimates underlying our consolidated financial statements;
•changes in accounting policies, standards, and interpretations; and
•impairment of goodwill.
Any forward-looking statements made by us or on our behalf speak only as of the date they are made, and we do not undertake any obligation to update any forward-looking statement to reflect the impact of subsequent events or circumstances, except as required by applicable securities laws. Before making an investment decision, you should carefully consider all risks and uncertainties disclosed in our SEC filings, including this report on Form 10-K, our subsequent reports on Forms 10-Q and 8-K, and our registration statements filed with the SEC under the Securities Act of 1933, as amended, all of which are or will upon filing be accessible on the SEC’s website at www.sec.gov and on our website at www.key.com/ir.
Terminology
Throughout this discussion, references to “Key,” “we,” “our,” “us,” and similar terms refer to the consolidated entity consisting of KeyCorp and its subsidiaries. “KeyCorp” refers solely to the parent holding company, and “KeyBank” refers solely to KeyCorp’s subsidiary bank, KeyBank National Association. “KeyBank (consolidated)” refers to the consolidated entity consisting of KeyBank and its subsidiaries.
We want to explain some industry-specific terms at the outset so you can better understand the discussion that follows.
•We use the phrase continuing operations in this document to mean all of our businesses other than our government-guaranteed and private education lending business, which are accounted for as discontinued operations.
•We engage in capital markets activities primarily through business conducted by our Commercial Bank segment. These activities encompass a variety of products and services. Among other things, we trade securities as a dealer, enter into derivative contracts (both to accommodate clients’ financing needs and to mitigate certain risks), and conduct transactions in foreign currencies (to accommodate clients’ needs).
•For regulatory purposes, capital is divided into two classes. Federal regulations currently prescribe that at least one-half of a bank or BHC’s total risk-based capital must qualify as Tier 1 capital. Both total and Tier 1 capital serve as bases for several measures of capital adequacy, which is an important indicator of financial stability and condition. Banking regulators evaluate a component of Tier 1 capital, known as Common Equity Tier 1, under the Regulatory Capital Rules. The “Capital” section of this report under the heading “Capital adequacy” provides more information on total capital, Tier 1 capital, and the Regulatory Capital Rules, including Common Equity Tier 1, and describes how these measures are calculated.
The acronyms and abbreviations identified below are used throughout this report, including in the Notes to Consolidated Financial Statements and in the Management’s Discussion and Analysis of Financial Condition and Results of Operations. You may find it helpful to refer back to this page as you read this report.
| | | | | |
ABO: Accumulated benefit obligation. ALCO: Asset/Liability Management Committee. ALLL: Allowance for loan and lease losses. A/LM: Asset/liability management. AML: Anti-money laundering. AOCI: Accumulated other comprehensive income (loss). APBO: Accumulated postretirement benefit obligation. ASC: Accounting Standards Codification. ASU: Accounting Standards Update. ATMs: Automated teller machines. BSA: Bank Secrecy Act. BHCA: Bank Holding Company Act of 1956, as amended. BHCs: Bank holding companies. Board: KeyCorp Board of Directors. CAPM: Capital Asset Pricing Model. CCAR: Comprehensive Capital Analysis and Review. CECL: Current Expected Credit Losses. CFPB: Consumer Financial Protection Bureau, also known as the Bureau of Consumer Financial Protection. CFTC: Commodities Futures Trading Commission. CMBS: Commercial mortgage-backed securities. CMO: Collateralized mortgage obligation. Common Shares: KeyCorp common shares, $1 par value. CVA: Credit valuation adjustment. DCF: Discounted cash flow. DIF: Deposit Insurance Fund of the FDIC. Dodd-Frank Act: Dodd-Frank Wall Street Reform and Consumer Protection Act of 2010. EAD: Exposure at default. EBITDA: Earnings before interest, taxes, depreciation, and amortization. EPS: Earnings per share. ERISA: Employee Retirement Income Security Act of 1974. ERM: Enterprise risk management. EVE: Economic value of equity. FASB: Financial Accounting Standards Board. FDIA: Federal Deposit Insurance Act, as amended. FDIC: Federal Deposit Insurance Corporation. Federal Reserve: Board of Governors of the Federal Reserve System. FHLB: Federal Home Loan Bank of Cincinnati. FHLMC: Federal Home Loan Mortgage Corporation. FICO: Fair Isaac Corporation. FINRA: Financial Industry Regulatory Authority. First Niagara: First Niagara Financial Group, Inc. FNMA: Federal National Mortgage Association. FSOC: Financial Stability Oversight Council. FVA: Fair value of employee benefit plan assets. | GAAP: U.S. generally accepted accounting principles. GNMA: Government National Mortgage Association. HTC: Historic tax credit. IDI: Insured depository institution. IRS: Internal Revenue Service. ISDA: International Swaps and Derivatives Association. KBCM: KeyBanc Capital Markets, Inc. KCC: Key Capital Corporation. KCDC: Key Community Development Corporation. KCIC: Key Community Investment Capital LLC. LCR: Liquidity coverage ratio. LGD: Loss given default. LIHTC: Low-income housing tax credit. LTV: Loan-to-value. Moody’s: Moody’s Investor Services, Inc. MTRM: Market & Treasury Risk Management. MRC: Market Risk Committee. N/A: Not applicable. NAV: Net asset value. NFA: National Futures Association. N/M: Not meaningful. NMTC: New market tax credit. NPR: Notice of proposed rulemaking. NSF: Non-sufficient funds. NYSE: New York Stock Exchange. OCC: Office of the Comptroller of the Currency. OCI: Other comprehensive income (loss). OREO: Other real estate owned. PBO: Projected benefit obligation. PCCR: Purchased credit card relationship. PCD: Purchased credit deteriorated. PD: Probability of default. RMBS: Residential mortgage-backed securities. S&P: Standard and Poor’s Ratings Services, a Division of The McGraw-Hill Companies, Inc. SEC: U.S. Securities & Exchange Commission. Scotiabank: The Bank of Nova Scotia SIFIs: Systemically important financial institutions, including large, interconnected BHCs and nonbank financial companies designated by FSOC for supervision by the Federal Reserve. SOFR: Secured Overnight Financing Rate. TE: Taxable-equivalent. TROC: Treasury Risk Oversight Committee. U.S. Treasury: United States Department of the Treasury. VaR: Value at risk. VEBA: Voluntary Employee Beneficiary Association. VIE: Variable interest entity. |
KEYCORP
2024 FORM 10-K ANNUAL REPORT
TABLE OF CONTENTS
| | | | | | | | | | | |
Item Number | | | Page Number |
| | | |
| | PART I | |
| 1 | | | |
| 1A | | | |
| 1B | | | |
| 1C | | | |
| 2 | | | |
| 3 | | | |
| 4 | | | |
| | | |
| | PART II | |
| 5 | | | |
| 6 | | | |
| 7 | | | |
| 7A | | | |
| 8 | | | |
| | | |
| | | |
| | | |
| | | |
| | | |
| | | |
| | | |
| | | |
| | | |
| 9 | | | |
| 9A | | | |
| 9B | | | |
| 9C | | | |
| | | |
| | PART III | |
| 10 | | | |
| 11 | | | |
| 12 | | | |
| 13 | | | |
| 14 | | | |
| | | |
| | PART IV | |
| 15 | | | |
| | | |
| | | |
| | | |
| 16 | | | |
| | | |
PART I
ITEM 1. BUSINESS
Overview
KeyCorp, organized in 1958 under the laws of the State of Ohio, is headquartered in Cleveland, Ohio. We are a BHC under the BHCA and one of the nation’s largest bank-based financial services companies, with consolidated total assets of approximately $187.2 billion at December 31, 2024. KeyCorp is the parent holding company for KeyBank National Association, its principal subsidiary, through which most of our banking services are provided. Through KeyBank and certain other subsidiaries, we provide a wide range of retail and commercial banking, commercial leasing, investment management, consumer finance, student loan refinancing, commercial mortgage servicing and special servicing, and investment banking products and services to individual, corporate, and institutional clients through two major business segments: Consumer Bank and Commercial Bank.
As of December 31, 2024, these services were provided across the country through KeyBank’s 944 full-service retail banking branches and a network of 1,182 ATMs in 15 states, as well as additional offices, online and mobile banking capabilities, including our national digital brand, Laurel Road, and a telephone banking call center. Additional information pertaining to our two business segments is included in the “Business Segment Results” section in Item 7. Management’s Discussion and Analysis of Financial Condition and Results of Operations of this report, and in Note 25 (“Business Segment Reporting”) of the Notes to Consolidated Financial Statements presented in Item 8. Financial Statements and Supplementary Data, which are incorporated herein by reference.
In addition to the customary banking services of accepting deposits and making loans, our bank and its trust company subsidiary offer personal and institutional trust custody services, personal financial and planning services, access to mutual funds, treasury services, and international banking services. Through our bank, trust company, and registered investment adviser subsidiaries, we provide investment management services to clients that include large corporate and public retirement plans, foundations and endowments, high-net-worth individuals, and multi-employer trust funds established for providing pension or other benefits to employees.
We provide other financial services — both within and outside of our primary banking markets — through various nonbank subsidiaries. These services include community development financing, securities underwriting, investment banking and capital markets products, and brokerage. We also provide merchant services to businesses.
KeyCorp is a legal entity separate and distinct from its banks and other subsidiaries. Accordingly, the right of KeyCorp, its security holders, and its creditors to participate in any distribution of the assets or earnings of its banks and other subsidiaries is subject to the prior claims of the creditors of such banks and other subsidiaries, except to the extent that KeyCorp’s claims in its capacity as a creditor may be recognized.
We derive the majority of our revenues within the United States from customers domiciled in the United States. Revenue from foreign countries and external customers domiciled in foreign countries was immaterial to our consolidated financial statements.
Demographics
Our management structure and basis of presentation is divided into two business segments, Consumer Bank and Commercial Bank. Note 25 (“Business Segment Reporting”) describes the products and services offered by each of these business segments and provides more detailed financial information pertaining to the segments, including changes in basis of presentation.
The Consumer Bank serves individuals and small businesses throughout our 15-state branch footprint and through our Laurel Road digital brand by offering a variety of deposit and investment products, personal finance and financial wellness services, lending, student loan refinancing, mortgage and home equity, credit card, treasury services, and business advisory services. In addition, wealth management and investment services are offered to assist non-profit and high-net-worth clients with their banking, trust, portfolio management, charitable giving, and related needs.
The Commercial Bank consists of the Commercial and Institutional operating segments. The Commercial operating segment is a full-service, commercial banking platform that focuses primarily on serving the borrowing, cash
management, and capital markets needs of middle market clients within Key’s 15-state branch footprint. The Institutional operating segment operates nationally in providing lending, equipment financing, and banking products and services to large corporate and institutional clients. The industry coverage and product teams have established expertise in the following sectors: Consumer, Energy, Healthcare, Industrial, Public Sector, Real Estate, and Technology. It is also a significant, national, commercial real estate lender and third-party master and special servicer of commercial mortgage loans. The operating segment includes the KBCM platform which provides a broad suite of capital markets products and services including syndicated finance, debt and equity underwriting, fixed income and equity sales and trading, derivatives, foreign exchange, mergers & acquisition and other advisory, and public finance.
Additional Information
Our executive offices are located at 127 Public Square, Cleveland, Ohio 44114-1306, and our telephone number is (216) 689-3000. Our website is www.key.com, and the investor relations section of our website may be reached through www.key.com/ir. We make available free of charge, on or through the investor relations section of our website, annual reports on Form 10-K, quarterly reports on Form 10-Q, and current reports on Form 8-K, and amendments to those reports filed or furnished pursuant to Section 13(a) or 15(d) of the Securities Exchange Act of 1934, as amended (the “Exchange Act”), as well as proxy statements, as soon as reasonably practicable after we electronically file such material with, or furnish it to, the SEC. Also posted on our website, and available in print upon request from any shareholder to our Investor Relations Department, are the charters for the committees of our Board of Directors, which includes the Audit Committee, Compensation and Organization Committee, Executive Committee, Nominating and Corporate Governance Committee, Risk Committee, and Technology Committee; our Corporate Governance Guidelines; the Code of Business Conduct and Ethics for our directors, officers, and employees; our Standards for Determining Independence of Directors; our policy for Review of Transactions Between KeyCorp and Its Directors, Executive Officers and Other Related Persons; our Statement of Political Activity; and our Corporate Responsibility Report. Within the time period required by the SEC and the NYSE, we will post on our website any amendment to the Code of Ethics and any waiver applicable to any senior executive officer or director. We also make available a summary of filings made with the SEC of statements of beneficial ownership of our equity securities filed by our directors and officers under Section 16 of the Exchange Act. The “Regulatory Disclosures & Filings” section under the “Financials” tab of the investor relations section of our website includes public disclosures concerning our historic annual and mid-year stress-testing activities under the Dodd-Frank Act and our quarterly regulatory capital disclosures under the third pillar of Basel III.
Information contained on or accessible through, including any reports available on, our website or any other website referenced in this report is not part of this report. References to websites in this report are intended to be inactive textual references only.
Shareholders may obtain a copy of any of the above-referenced corporate governance documents by writing to our Investor Relations Department at Investor Relations, KeyCorp, 127 Public Square, Mailcode OH-01-27-0737, Cleveland, Ohio 44114-1306; by calling (216) 689-4221; or by sending an e-mail to investor_relations@keybank.com.
Competition
The market for banking and related financial services is highly competitive and continuously evolving. Legislative, regulatory, economic, and technology changes, as well as consolidation within the financial services industry, could result in increased competition from new and existing market participants. Key competes with other providers of financial services, such as BHCs, commercial banks, savings associations, credit unions, mortgage banking companies, finance companies, mutual funds, insurance companies, investment management firms, private credit funds, investment banking firms, broker-dealers, financial technology companies, and other local, regional, national, and global institutions that offer financial services. Some of our competitors are larger and may have more financial resources, while some of our competitors enjoy fewer regulatory constraints and may have lower cost structures. The financial services industry has become more competitive as technology advances have lowered barriers to entry, enabling more companies, including nonbank companies, to provide financial services. Mergers and acquisitions have also led to increased concentration in the banking industry, placing added competitive pressure on Key’s core banking products and services as we see competitors enter some of our markets or offer similar products. We compete by offering quality products and innovative services at competitive prices, and by maintaining our product and service offerings to keep pace with customer preferences and industry standards. Successfully competing in our markets also depends on our ability to invest in technology and infrastructure, execute transactions reliably and effectively, maintain and enhance our reputation, and attract, retain, and motivate talented employees, all while prudently managing risks and expenses. For more information on competition and related risks, see Item 1A. Risk Factors - “We operate in a highly competitive industry.”
Human Capital
Engaging a high performing and collaborative workforce is a top strategic priority for Key. Our human capital management strategy is focused on attracting, retaining, developing, motivating and rewarding the talent our businesses need to drive sound, profitable growth, and ultimately, enhance shareholder value, which we do by offering a competitive total rewards package, providing opportunities for career development and growth, and fostering a culture that is fair and inclusive for all.
Competitive Rewards
We make investments to hire and retain the people we need to serve our customers and communities and regularly review our pay practices to reflect changing market and economic conditions. We have steadily increased our starting minimum wage since 2015, and as of December 31, 2024, 93% of employees earned $20 or more per hour. We have made other compensation adjustments in response to market trends, competitive pressures, and a dynamic market for talent.
These investments include a comprehensive and competitive total rewards program, representing our investment in our teammates’ collective success and reflecting our commitment to helping them thrive. Key’s benefits offerings include employee health and welfare plans, a 401(k) plan with competitive matching contributions (dollar for dollar, up to the first 7% of eligible pay contributed on a per pay period basis for eligible employees), up to ten weeks of paid parental leave, a Discounted Stock Purchase Plan, wellness incentives, and a lifestyle reimbursement account program for covered expenses related to health, mental wellness, family needs, and finances.
Teammates can also participate in a variety of company-sponsored volunteer and giving opportunities, including Neighbors Make the Difference Day, our national employee volunteer day, and the Employee Matching Gift Program, which offers eligible employees the opportunity to support qualified nonprofit organizations and multiply their contributions through the KeyBank Foundation.
We have a pay-for-performance culture that is guided by the following three principles:
•Pay decisions are based on Key’s performance, business unit performance, and individual performance.
•We deliver pay in a way that balances short-term and long-term financial performance objectives and aligns to shareholder value creation.
•We support sustainable performance with policies that focus on prudent risk-taking and the balance between risk and reward.
We design our compensation programs to balance risk and reward and align with the guidance of our regulators, and we regularly monitor these programs to remain within our risk tolerances. We subject all discretionary
incentives paid to our employees to a robust risk adjustment process that begins before grant and extends beyond payment.
Career Development and Growth
We invest in our teammates’ growth and professional development through a variety of internal networking groups that are open to all teammates, including our Key Business Impact and Networking Groups (“KBINGs”), formal and informal mentoring programs, including Key’s enterprise-wide formal mentoring program, MentorMe at Key, and a suite of leadership development programs. We also offer employees the opportunities to develop and enhance their skills through formal learning curricula and to obtain tuition reimbursement for eligible collegiate or post-collegiate education and relevant certifications.
Key’s Workforce
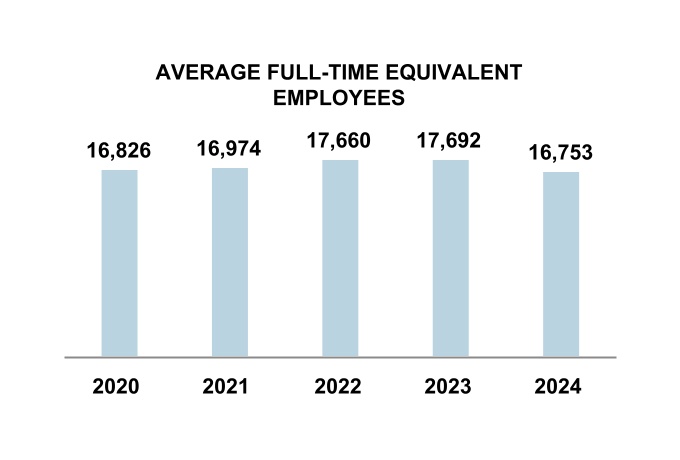
Key had an average of 16,753 full time equivalent employees in 2024. As of December 31, 2024, a total of 17,406 full-time and part-time employees worked in the following regions, which are generally aligned to the regions Key uses for its retail branch banking network:
| | | | | | | | |
| Region | Employee Count |
| East | 12,399 |
| West | 2,834 |
| All Other | 2,173 |
We invest significant time and resources in creating an attractive work environment and competitive total rewards package that attracts and retains top talent. Key’s annualized rate for voluntary turnover as of December 31, 2024, was 13.2%, lower than our annualized voluntary turnover rate for 2023, which was 14.6%, and lower than our previous five-year historical average of 15.3%.
Information About Our Executive Officers
KeyCorp’s executive officers are principally responsible for managing the operations of KeyCorp, making policy for KeyCorp, executing on strategic decisions, and managing material risks, subject to the supervision and direction of
the Board. All executive officers are subject to annual election at the annual organizational meeting of the Board held each May.
Set forth below are the names and ages of the executive officers of KeyCorp as of December 31, 2024, the positions held by each at KeyCorp during the past five years, and the year each first became an executive officer of KeyCorp. On January 23, 2025, Mohit (Mo) Ramani became Chief Risk Officer. Because Mo Ramani and James Waters have been employed at KeyCorp for less than five years, information is being provided concerning their prior business experience. There are no family relationships among the directors or the executive officers, and there is no arrangement or understanding between any executive officer and any other person pursuant to which the executive officer was selected.
Victor B. Alexander (45) - Mr. Alexander has been KeyCorp’s Head of Consumer Bank and an executive officer of KeyCorp since January 2020. Prior to that time, he served as the Head of Home Lending from October 2018 to January 2020 and Treasurer from July 2017 to October 2018.
Darrin L. Benhart (59) - On December 31, 2024, Mr. Benhart was Chief Risk Officer and an executive officer of KeyCorp and had served in such capacity since January 1, 2024. Prior to that time, he served as Deputy Chief Risk Officer and Head of Enterprise Risk Management from August 2023 to December 2023 and Chief Enterprise Risk Officer from July 2022 to August 2023. Prior to July 2022, he served as a National Bank Examiner with the OCC from March 1992 to March 2022.
Amy G. Brady (58) - Ms. Brady is KeyCorp’s Chief Information Officer, serving in that role since May 2012. Ms. Brady has been an executive officer of KeyCorp since she joined in 2012. She has been a director of DuPont de Nemours, Inc., a multi-industry specialty solutions company, since 2019.
Trina M. Evans (60) - Ms. Evans has been the Director of Corporate Center for KeyCorp since August 2012. Prior to this role, Ms. Evans was the Chief Administrative Officer for Key Community Bank and the Director of Client Experience for KeyBank. She became an executive officer of KeyCorp in March 2013.
Kenneth C. Gavrity (48) - Mr. Gavrity has been Head of Commercial Bank since November 2023 and became an executive officer of KeyCorp in May 2021. Prior to this, Mr. Gavrity served as Head of Enterprise Payments from January 2019 to November 2023 and Head of Commercial Payments from 2016 to 2019.
Stacy L. Gilbert (53) - Ms. Gilbert has been the Chief Accounting Officer and an executive officer of KeyCorp since March 2024. Prior to her appointment as Chief Accounting Officer, Ms. Gilbert served as Corporate Controller for KeyCorp since August 2023. She previously served as Assistant Corporate Controller and Senior Director of External Reporting and Accounting Policy. She first joined the Company in 2002, holding a variety of accounting roles, before leaving to join FirstMerit Corporation in 2008. She re-joined the Company in 2016.
Christopher M. Gorman (64) - Mr. Gorman has been Chairman, Chief Executive Officer, and President of KeyCorp since May 1, 2020. Mr. Gorman previously served as President and Chief Operating Officer from September 2019 to May 2020 and President of Banking and Vice Chairman from 2017 to September 2019. From 2016 to 2017, he served as Merger Integration Executive responsible for leading the integration efforts related to KeyCorp’s merger with First Niagara. Prior to that, Mr. Gorman was the President of Key Corporate Bank from 2010 to 2016. He became an executive officer of KeyCorp in 2010.
Clark H.I. Khayat (53) - Mr. Khayat has been Chief Financial Officer since March 2023 and an executive officer since September 2018. Mr. Khayat rejoined KeyCorp as Chief Strategy Officer in January 2018 and served in that role until March 2023. Mr. Khayat had previously served as Head of Key’s Enterprise Commercial Payments group from April 2014 to June 2016.
Allyson M. Kidik (45) - Ms. Kidik has been the Chief Risk Review Officer and General Auditor and an executive officer of KeyCorp since July 2022. Ms. Kidik previously served as Senior Deputy General Auditor from 2018 to 2022 and Deputy General Auditor from 2015 to 2018.
Angela G. Mago (59) - Ms. Mago has served as the Chief Human Resources Officer since November 2023. She previously served as Head of Commercial Bank from May 2019 to November 2023 and Co-Head of Key Corporate Bank from 2016 to May 2019. She became an executive officer of KeyCorp in 2016.
Andrew J. Paine III (55) - Mr. Paine has been the Head of Institutional Bank since 2019. He previously served as Co-Head of Key Corporate Bank from 2016 to May 2019. He also serves as President of KeyBanc Capital Markets Inc., a role he has held since 2013. He became an executive officer of KeyCorp in 2016.
Mohit Ramani (51) - Mr. Ramani became Chief Risk Officer and an executive officer of KeyCorp on January 23, 2025. Prior to that time, he served in a variety of roles with Truist Financial Corporation, including Deputy Chief Risk Officer and Chief Credit Officer from January 2023 to January 2025 and Chief Business Unit Risk Officer from 2000 to 2023.
James L. Waters (58) - Mr. Waters became the General Counsel and Secretary and an executive officer of KeyCorp in July 2021. From 2018 to 2021, he served as General Counsel and Corporate Secretary of Cullen/Frost Bankers, Inc., a financial holding company.
Supervision and Regulation
The regulatory framework applicable to BHCs and banks is intended primarily to protect consumers, the DIF, taxpayers and the banking system as a whole, rather than to protect the security holders and creditors of financial services companies. Comprehensive reform of the legislative and regulatory environment for financial services companies occurred in 2010 and remains ongoing. We cannot predict changes in applicable laws, regulations or regulatory agency policies, but any such changes may materially affect our business, financial condition, results of operations, or access to liquidity or credit.
Overview
Federal law establishes a system of regulation under which the Federal Reserve is the umbrella regulator for BHCs, while their subsidiaries are principally regulated by prudential or functional regulators: (i) the OCC for national banks and federal savings associations; (ii) the FDIC for state non-member banks and savings associations; (iii) the Federal Reserve for state member banks; (iv) the CFPB for consumer financial products or services; (v) the SEC and FINRA for securities broker/dealer activities; (vi) the SEC, CFTC, and NFA for swaps and other derivatives; and (vii) state insurance regulators for insurance activities. Certain specific activities, including traditional bank trust and fiduciary activities, may be conducted in a bank without the bank being deemed a “broker” or a “dealer” in securities for purposes of securities functional regulation.
Under the BHCA, BHCs generally may not directly or indirectly own or control more than 5% of the voting shares, or substantially all of the assets, of any bank, without prior approval from the Federal Reserve. In addition, BHCs are generally prohibited from engaging in commercial or industrial activities. However, a BHC that satisfies certain requirements regarding management, capital adequacy, and Community Reinvestment Act performance may elect to be treated as a Financial Holding Company (“FHC”) for purposes of federal law, and as a result may engage in a substantially broader scope of activities that are considered to be financial in nature or complementary to those activities. KeyCorp has elected to be treated as a FHC and, as such, is authorized to engage in securities underwriting and dealing, insurance agency and underwriting, and merchant banking activities. In addition, the Federal Reserve has permitted FHCs, like KeyCorp, to engage in the following activities, under the view that such activities are complementary to a financial activity: physical commodities trading activities, energy management services, and energy tolling, among others.
Under federal law, a BHC also must serve as a source of financial strength to its subsidiary depository institution(s) by providing financial assistance in the event of financial distress. This support may be required when the BHC does not have the resources to, or would prefer not to, provide it. Certain loans by a BHC to a subsidiary bank are subordinate in right of payment to deposits in, and certain other indebtedness of, the subsidiary bank. In addition, federal law provides that in the bankruptcy of a BHC, any commitment by the BHC to a federal bank regulatory agency to maintain the capital of a subsidiary bank will be assumed by the bankruptcy trustee and entitled to priority of payment.
The Dodd-Frank Act created the FSOC to overlay the U.S. supervisory framework for BHCs, insured depository institutions, and other financial service providers, by serving as a systemic risk oversight body. Specifically, the FSOC is authorized to: (i) identify risks to U.S. financial stability that could arise from the material financial distress or failure, or ongoing activities, of large, interconnected SIFIs, or that could arise outside the financial services marketplace; (ii) promote market discipline by eliminating expectations that the U.S. government will shield shareholders, creditors, and counterparties from losses in the event of failure; and (iii) respond to emerging threats
to the stability of the U.S. financial system. The FSOC is responsible for facilitating regulatory coordination; information collection and sharing; designating nonbank financial companies for consolidated supervision by the Federal Reserve; designating systemic financial market utilities and systemic payment, clearing, and settlement activities requiring prescribed risk management standards and heightened federal regulatory oversight; recommending stricter standards for SIFIs; and, together with the Federal Reserve, determining whether action should be taken to break up firms that pose a grave threat to U.S. financial stability.
As an FHC, KeyCorp is subject to regulation, supervision, and examination by the Federal Reserve under the BHCA. Our national bank subsidiaries and their subsidiaries are subject to regulation, supervision, and examination by the OCC. At December 31, 2024, we operated one full-service, FDIC-insured national bank subsidiary, KeyBank, and one national bank subsidiary that is limited to fiduciary activities. The FDIC also has certain, more limited regulatory, supervisory, and examination authority over KeyBank and KeyCorp under the FDIA and the Dodd-Frank Act.
We have other financial services subsidiaries that are subject to regulation, supervision, and examination by the Federal Reserve, as well as other state and federal regulatory agencies and self-regulatory organizations. Because KeyBank engages in derivative transactions, in 2013 it provisionally registered as a swap dealer with the CFTC and became a member of the NFA, the self-regulatory organization for participants in the U.S. derivatives industry. Our securities brokerage and asset management subsidiaries are subject to supervision and regulation by the SEC, FINRA, and state securities regulators, and our insurance subsidiaries are subject to regulation by the insurance regulatory authorities of the states in which they operate. Our other nonbank subsidiaries are subject to laws and regulations of both the federal government and the various states in which they are authorized to do business.
Regulatory capital requirements
Background
KeyCorp and KeyBank are subject to regulatory capital requirements that are based largely on the work of an international group of supervisors known as the Basel Committee on Banking Supervision (“Basel Committee”). The Basel Committee is responsible for establishing international bank supervisory standards for implementation in member jurisdictions, to enhance and align bank regulation on a global scale, and to promote financial stability.
The regulatory capital framework developed by the Basel Committee and implemented in the United States is a predominately risk-based capital framework that establishes minimum capital requirements based on the amount of regulatory capital a banking organization maintains relative to the amount of its total assets, adjusted to reflect credit risk (“risk-weighted assets”). Each banking organization subject to this regulatory capital framework is required to satisfy certain minimum risk-based capital measures (e.g., a tier 1 risk-based capital ratio requirement of tier 1 capital to total risk-weighted assets), and in the United States, a minimum leverage ratio requirement of tier 1 capital to average total on-balance sheet assets, which serves as a backstop to the risk-based measures.
A capital instrument is assigned to one of two tiers based on the relative strength and ability of that instrument to absorb credit losses on a going concern basis. Capital instruments with relatively robust loss-absorption capacity are assigned to tier 1, while other capital instruments with relatively less loss-absorption capacity are assigned to tier 2. A banking organization’s total capital equals the sum of its tier 1 and tier 2 capital.
The Basel Committee also developed a market risk capital framework (that also has been implemented in the United States) to address the substantial exposure to market risk faced by banking organizations with significant trading activity and augment the credit risk-based capital requirements described above. For example, the minimum total risk-based capital ratio requirement for a banking organization subject to the market risk capital rule equals the ratio of the banking organization’s total capital to the sum of its credit risk-weighted assets and market risk-weighted assets. Only KeyCorp is subject to the market risk capital rule, as KeyBank does not engage in substantial trading activity.
Basel III
To address deficiencies in the international regulatory capital standards identified during the 2007-2009 global financial crisis, in 2010 the Basel Committee released comprehensive revisions to the international regulatory capital framework, commonly referred to as “Basel III.” The Basel III revisions are designed to strengthen the quality and quantity of regulatory capital, in part through the introduction of a Common Equity Tier 1 capital requirement; provide more comprehensive and robust risk coverage, particularly for securitization exposures, equities, and off-balance sheet positions; and address pro-cyclicality concerns through the implementation of capital
buffers. The Basel Committee also released a series of revisions to the market risk capital framework to address deficiencies identified during its initial implementation (e.g., arbitrage opportunities between the credit risk-based and market risk capital rules) and in connection with the global financial crisis.
KeyCorp and KeyBank are subject to regulatory capital requirements implemented by the U.S. banking agencies that are based largely on Basel III (“Regulatory Capital Rules”). Consistent with the international framework, the Regulatory Capital Rules further restrict the type of instruments that may be recognized in tier 1 and tier 2 capital; establish a minimum Common Equity Tier 1 capital ratio requirement of 4.5% and capital buffers to absorb losses during periods of financial stress while allowing an institution to provide credit intermediation as it would during a normal economic environment; and refine several of the methodologies used for determining risk-weighted assets. The Regulatory Capital Rules provide additional requirements for large banking organizations with over $250 billion in total consolidated assets or $10 billion in foreign exposure, but those additional requirements do not apply to KeyCorp or KeyBank. However, some of those additional requirements will apply to KeyCorp and KeyBank if proposed revisions to the Regulatory Capital Rules are adopted. The proposed revisions to the Regulatory Capital Rules are discussed below under the heading “Recent regulatory capital-related developments.” For purposes of the Regulatory Capital Rules, KeyCorp and KeyBank are treated as “standardized approach” banking organizations.
Under the Regulatory Capital Rules, standardized approach banking organizations, such as KeyCorp and KeyBank, are required to meet the minimum capital and leverage ratios set forth in the following table. At December 31, 2024, KeyCorp’s ratios under the fully phased-in Regulatory Capital Rules are set forth in the following table.
Minimum Capital Ratios and KeyCorp Ratios Under Regulatory Capital Rules
| | | | | | | | | | | | | | |
| Ratios (including stress capital buffer) | Regulatory Minimum Requirement | Stress Capital Buffer (b) | Regulatory Minimum With Stress Capital Buffer | KeyCorp December 31, 2024 (c) |
| Common Equity Tier 1 | 4.50 | % | 3.10 | % | 7.60 | % | 11.92 | % |
| Tier 1 Capital | 6.00 | | 3.10 | | 9.10 | | 13.69 | |
| Total Capital | 8.00 | | 3.10 | | 11.10 | | 16.15 | |
Leverage (a) | 4.00 | | N/A | 4.00 | | 10.03 | |
(a)As a standardized approach banking organization, KeyCorp is not subject to the 3% supplementary leverage ratio requirement, which became effective January 1, 2018. However, KeyCorp will be subject to the supplementary leverage ratio if proposed revisions to the Regulatory Capital Rules discussed below are adopted.
(b)Stress capital buffer must consist of Common Equity Tier 1 capital. As a standardized approach banking organization, KeyCorp is not subject to the countercyclical capital buffer of up to 2.5% imposed upon an advanced approaches banking organization under the Regulatory Capital Rules. However, KeyCorp will be subject to the countercyclical capital buffer if proposed revisions to the Regulatory Capital Rules discussed below are adopted.
(c)Ratios reflect the five-year transition of CECL impacts on regulatory ratios.
Key elected the CECL phase-in option provided by regulatory guidance which delayed for two years the estimated impact of CECL on regulatory capital and phases it in over three years beginning in 2022. Effective for the first quarter 2022, Key entered a three-year transition period, and the full impact of the CECL standard was phased-in to regulatory capital through December 31, 2024. In the first quarter of 2025, CECL will be fully reflected in regulatory capital. On a fully phased-in basis, Key’s Common Equity Tier 1 ratio would be reduced by five basis points.
Revised prompt corrective action framework
The federal prompt corrective action (“PCA”) framework under the FDIA groups FDIC-insured depository institutions into one of five prompt corrective action capital categories: “well capitalized,” “adequately capitalized,” “undercapitalized,” “significantly undercapitalized,” and “critically undercapitalized.” In addition to implementing the Basel III capital framework in the United States, the Regulatory Capital Rules also revised the PCA capital category threshold ratios applicable to FDIC-insured depository institutions such as KeyBank. The Revised PCA framework table below identifies the capital category threshold ratios for a “well capitalized” and an “adequately capitalized” institution under the Prompt Corrective Action Framework.
“Well Capitalized” and “Adequately Capitalized” Capital Category Ratios under
Revised Prompt Corrective Action Framework
| | | | | | | | | | | | | | |
| Prompt Corrective Action | | Capital Category |
| Ratio | | Well Capitalized (a) | | Adequately Capitalized |
| Common Equity Tier 1 Risk-Based | | 6.5 | % | | 4.5 | % |
| Tier 1 Risk-Based | | 8.0 | | | 6.0 | |
| Total Risk-Based | | 10.0 | | | 8.0 | |
Tier 1 Leverage (b) | | 5.0 | | | 4.0 | |
(a)A “well capitalized” institution also must not be subject to any written agreement, order or directive to meet and maintain a specific capital level for any capital measure.
(b)As a standardized approach banking organization, KeyBank is not subject to the 3% supplementary leverage ratio requirement, which became effective January 1, 2018. However, KeyCorp will be subject to the supplementary leverage ratio if proposed revisions to the Regulatory Capital Rules discussed below are adopted.
As of December 31, 2024, KeyBank (consolidated) satisfied the risk-based and leverage capital requirements necessary to be considered “well capitalized” for purposes of the revised prompt corrective action framework. However, investors should not regard this determination as a representation of the overall financial condition or prospects of KeyBank because the PCA framework is intended to serve a limited supervisory function. Moreover, it is important to note that the PCA framework does not apply to BHCs, like KeyCorp.
Recent regulatory capital-related developments
On July 27, 2023, the federal banking agencies issued a proposal (the “Capital Proposal”) that would make significant changes to the Regulatory Capital Rules applicable to banking organizations with total assets of $100 billion or more and their depository institution subsidiaries (“Large Banking Organizations”) (including KeyCorp and KeyBank) and banking organizations with significant trading activity. This proposal would implement the final elements of the Basel III capital framework and make other changes to the Regulatory Capital Rules in response to the bank failures that occurred in 2023. The Capital Proposal would establish a new framework for calculating risk-weighted assets (the “expanded risk-based approach”) that would apply to Large Banking Organizations. The expanded risk-based approach would include a new more risk-sensitive standardized approach for measuring credit risk and operational risk. It would also include new standardized approaches for measuring market risk and credit valuation adjustment risk but would allow the use of internal models for market risk in certain circumstances with regulatory approval. Under the Capital Proposal, a Large Banking Organization would be required to calculate its risk-based capital ratios under both the expanded risk-based approach and the current standardized approach and would use the lower of the two. All capital buffer requirements, including the stress capital buffer requirement, would apply regardless of whether the expanded risk-based approach or the existing standardized approach produces the lower ratio.
The Capital Proposal would also align the calculation of regulatory capital for Category III and IV banking organizations with the calculation of regulatory capital for Category I and II banking organizations. KeyCorp and KeyBank are Category IV banking organizations. Under the proposal, Category III and IV banking organizations would be required to include most components of AOCI, including net unrealized gains and losses on available-for-sale securities, in regulatory capital. Category III and IV banking organizations would also be required to apply the same capital deductions and minority interest treatments that currently apply to Category I and Category II banking organizations. In addition, all Large Banking Organizations would be subject to the supplementary leverage ratio and countercyclical capital buffer requirement and would be required to make certain enhanced public disclosures.
The expanded total risk-weighted assets calculation used in the expanded risk-based approach would be phased in over a three-year period. For Category III and IV banking organizations, the requirement to reflect AOCI in regulatory capital would also be phased in over a three-year period. All other elements of the calculation of regulatory capital would apply on the effective date of a final rule if the proposal is adopted. Comments on this proposal were due by January 16, 2024.
Liquidity requirements
U.S. banking organizations are subject to regulatory liquidity requirements based on international liquidity standards established by the Basel Committee (the “Basel III liquidity framework”). The Basel III liquidity framework establishes quantitative standards designed to ensure that a banking organization is appropriately positioned, from a balance sheet perspective, to satisfy its short- and long-term funding needs.
To address short-term liquidity risk, the Basel III liquidity framework established a liquidity coverage ratio (“Basel III LCR”), calculated as the ratio of a banking organization’s high-quality liquid assets to its total net cash outflows over 30 consecutive calendar days. In addition, to address long-term liquidity risk, the Basel III liquidity framework established a net stable funding ratio (“Basel III NSFR”), calculated as the ratio of the amount of stable funding available to a banking organization to its required amount of stable funding.
Consistent with the Basel III LCR, the final rules implementing the Basel III LCR for U.S. banking organizations (the “Liquidity Coverage Rules”) established a minimum LCR for certain internationally active bank and nonbank financial companies (excluding KeyCorp), and a modified version of the LCR (“Modified LCR”) for BHCs and other depository institution holding companies with over $50 billion in consolidated assets that are not internationally active (including KeyCorp). Under the Liquidity Coverage Rules, KeyCorp was required to calculate a Modified LCR on a monthly basis and was required to satisfy a minimum Modified LCR requirement of 100%. KeyBank was not subject to the LCR or the Modified LCR under the Liquidity Coverage Rules.
Large BHCs, like KeyCorp, are also subject to liquidity requirements contained in regulations adopted pursuant to the Dodd-Frank Act and the Economic Growth, Regulatory Relief, and Consumer Protection Act (“EGRRCPA”). As enacted in 2010, the Dodd-Frank Act required the Federal Reserve to impose enhanced prudential standards and early remediation requirements, including enhanced liquidity standards, upon BHCs (like KeyCorp) with at least $50 billion in total consolidated assets.
EGRRCPA, enacted on May 24, 2018, raised the asset threshold above which the Federal Reserve is required to apply enhanced prudential standards to BHCs from $50 billion to $250 billion. EGRRCPA gave the Federal Reserve the authority to continue to apply enhanced prudential standards to any BHCs having at least $100 billion but less than $250 billion in total consolidated assets (like KeyCorp) if it determines that the application of the standard is appropriate to prevent or mitigate risks to financial stability or to promote the safety and soundness of the BHC or BHCs, taking into consideration the BHC’s or BHCs’ capital structure, riskiness, complexity, financial activities, size, and other relevant factors.
As a result of the Federal Reserve’s implementation of certain of the enhanced prudential standards, KeyCorp is subject to requirements relating to cash flow projections, a contingency funding plan, liquidity risk limits, the monitoring of liquidity risks (with respect to collateral, legal entities, currencies, business lines, and intraday exposures), liquidity stress testing, a liquidity buffer, and liquidity risk management requirements, including requirements that apply to the board of directors, the risk committee, senior management, and the independent review function.
Final rules related to the implementation of EGRRCPA (“Tailoring Rules”) established four risk-based categories of banking organizations with $100 billion or more in total consolidated assets and applied tailored regulatory requirements to each respective category. KeyCorp falls within the least restrictive of those categories (“Category IV Firms”).
Under one of the Tailoring Rules, Category IV Firms with weighted short-term wholesale funding of less than $50 billion will not be subject to a modified LCR. KeyCorp does not meet the $50 billion threshold and is not subject to the modified LCR or an LCR public disclosure requirement.
Under another Tailoring Rule, Category IV Firms (like KeyCorp) are required to conduct internal liquidity stress tests quarterly and are subject to simplified liquidity risk management requirements. Category IV Firms are still required to maintain a liquidity buffer that is sufficient to meet the projected net stressed cash-flow need over a 30-day planning horizon under the firm’s internal liquidity stress test and remain subject to monthly tailored FR 2052a liquidity reporting requirements.
Under the final rules adopted by the federal banking agencies to implement the Basel III NSFR for U.S. banking organizations, certain banking organizations with more than $100 billion in total assets must maintain minimum amounts of stable funding to support their assets, commitments, and derivatives exposures over a one-year time horizon. Under the rules, KeyCorp, as a Category IV firm with average weighted short-term wholesale funding of less than $50 billion, is not subject to an NSFR requirement.
Capital planning and stress testing
The Federal Reserve’s capital plan rule requires each U.S.-domiciled, top-tier BHC with total consolidated assets of at least $100 billion (like KeyCorp) to develop and maintain a written capital plan supported by a robust internal capital adequacy process. The capital plan must be submitted to the Federal Reserve for supervisory review in connection with the BHC’s CCAR (described below). The supervisory review includes an assessment of many factors, including KeyCorp’s ability to maintain capital above each minimum regulatory capital ratio on a pro forma basis under expected and stressful conditions throughout the planning horizon.
The Federal Reserve’s CCAR is an intensive assessment of the capital adequacy of large U.S. BHCs and of the practices these BHCs use to assess their capital needs. The Federal Reserve expects BHCs subject to CCAR to have and maintain regulatory capital in an amount that is sufficient to withstand a severely adverse operating environment and, at the same time, be able to continue operations, maintain ready access to funding, meet obligations to creditors and counterparties, and provide credit intermediation.
The Federal Reserve has conducted a supervisory stress test on KeyCorp, pursuant to which the Federal Reserve projects revenues, expenses, losses, and resulting post-stress capital levels and regulatory capital ratios under conditions that affect the U.S. economy or the financial condition of KeyCorp, including supervisory baseline and severely adverse scenarios, that are determined by the Federal Reserve. KeyCorp and KeyBank have also been required to conduct their own company-run stress tests to assess the impact of stress scenarios (including supervisor-provided baseline, adverse, and severely adverse scenarios and, for KeyCorp, one KeyCorp-defined baseline scenario and at least one KeyCorp-defined stress scenario) on their consolidated earnings, losses, and capital over a nine-quarter planning horizon, taking into account their current condition, risks, exposures, strategies, and activities. While KeyBank currently only has to conduct an annual stress test, KeyCorp has had to conduct both an annual and a mid-cycle stress test in the past. KeyCorp and KeyBank have been required to report the results of their annual stress tests to the Federal Reserve and the OCC.
Under one of the Tailoring Rules, KeyCorp is no longer required to conduct and publicly disclose the results of company-run stress tests and is subject to a supervisory stress test conducted by the Federal Reserve every other year rather than every year. In 2024, KeyCorp was required to participate in the Federal Reserve’s CCAR process and was subject to a supervisory stress test conducted by the Federal Reserve.
Since the adoption of a final rule by the federal banking agencies in October 2019, KeyBank is no longer required to conduct annual company-run stress tests. Also, this final rule removes the “adverse” scenario as a required scenario for all stress testing requirements applicable to BHCs and federally-regulated banks so that such stress tests will be required to include only “baseline” and “severely adverse” scenarios.
On March 4, 2020, the Federal Reserve adopted a final rule integrating certain aspects of the Federal Reserve’s Regulatory Capital Rules with CCAR and the stress test rules in order to simplify the overall capital framework that is currently applicable to BHCs that have $100 billion or more in total consolidated assets (including KeyCorp). The final rule amended the capital conservation buffer requirement under the Regulatory Capital Rules by replacing the static risk-weighted assets component of the buffer with a new measure, the stress capital buffer, which will be based on the results of an individual BHC’s supervisory stress test and cannot be less than 2.5 percent of risk-weighted assets. A firm will be subject to limitations on capital distributions and discretionary bonus payments if it does not satisfy all minimum capital requirements and its stress capital buffer requirement. A firm’s stress capital buffer requirement will become effective on October 1 of each year and will remain in effect until September 30 of the following year unless the firm receives an updated stress capital buffer requirement from the Federal Reserve.
On August 26, 2020, the federal banking agencies issued a final rule that revises the definition of eligible retained income as that term is used in the agencies’ Regulatory Capital Rules. The revised definition applies to all buffer requirements applicable to a banking organization, including the stress capital buffer requirement adopted by the Federal Reserve on March 4, 2020. The revised definition of eligible retained income will make any automatic limitations on capital distributions that could apply under the agencies’ capital rules more gradual with the objective of promoting continued lending during a period of stress.
On January 19, 2021, the Federal Reserve issued a final rule to make conforming changes to the capital planning, regulatory reporting, and stress capital buffer requirements for firms subject to Category IV standards (including KeyCorp) to make these requirements consistent with the tailored regulatory framework for large banking organizations that the Federal Reserve adopted in an October 2019 rulemaking. The final rule revised the elements of the capital plan that Category IV firms are required to submit to the Federal Reserve and makes related changes to regulatory reporting requirements. Also, the final rule updated the frequency for calculating the stress capital buffer for these firms.
On June 26, 2024, the Federal Reserve announced the results of the supervisory stress test that it conducted of 31 BHCs having more than $100 billion in total consolidated assets (including KeyCorp). The Federal Reserve indicated that all BHCs subject to the stress test maintained capital ratios above the minimum required levels under the severely adverse scenario. The stress test results for individual BHCs (including KeyCorp) were used by the Federal Reserve to determine a BHC’s updated stress capital buffer requirement. The Federal Reserve published the updated stress capital buffer requirements on August 28, 2024. KeyCorp’s updated stress capital buffer is 3.1%. This stress capital buffer became effective on October 1, 2024 and will remain in effect until September 30, 2025, unless KeyCorp later receives an updated stress capital buffer requirement from the Federal Reserve.
On December 23, 2024, the Federal Reserve announced that it intends to propose changes to its stress testing framework in order to improve the transparency of the stress tests and reduce the volatility of the resulting capital
requirements. The Federal Reserve said that it plans to, among other things, disclose and seek public comment on the models and scenarios used in the stress tests and to average results over two years to reduce year-over-year changes in capital requirements. Changes to the stress testing framework would apply to KeyCorp.
On December 24, 2024, five trade associations filed a lawsuit against the Federal Reserve in the United States District Court for the Southern District of Ohio to challenge the stress testing framework on the basis that the current framework violates the Administrative Procedures Act and the Due Process Clause of the United States Constitution. The parties bringing the lawsuit indicated that they do not object to the use of stress tests to set stress capital buffer requirements but that they want to ensure that the Federal Reserve subjects the stress tests to public notice and comment and complies with other applicable legal requirements. KeyCorp is monitoring developments in this case.
Dividend restrictions
Federal law and regulation impose limitations on the payment of dividends by our national bank subsidiaries, like KeyBank. Historically, dividends paid by KeyBank have been an important source of cash flow for KeyCorp to pay dividends on its equity securities and interest on its debt. Dividends by our national bank subsidiaries are limited to the lesser of the amounts calculated under an earnings retention test and an undivided profits test. Under the earnings retention test, without the prior approval of the OCC, a dividend may not be paid if the total of all dividends declared by a bank in any calendar year is in excess of the current year’s net income combined with the retained net income of the two preceding years. Under the undivided profits test, a dividend may not be paid in excess of a bank’s undivided profits. Moreover, under the FDIA, an insured depository institution may not pay a dividend if the payment would cause it to be less than “adequately capitalized” under the prompt corrective action framework or if the institution is in default in the payment of an assessment due to the FDIC. Similarly, under the Regulatory Capital Rules, a banking organization that fails to satisfy the minimum capital conservation buffer requirement will be subject to certain limitations, which include restrictions on capital distributions. For more information about the payment of dividends by KeyBank to KeyCorp, please see Note 3 (“Restrictions on Cash, Dividends, and Lending Activities”) in this report.
FDIA, Resolution Authority and Financial Stability
Deposit insurance and assessments
The DIF provides insurance coverage for domestic deposits funded through assessments on insured depository institutions like KeyBank. The amount of deposit insurance coverage for each depositor’s deposits is $250,000 per depository.
The FDIC must assess the premium based on an insured depository institution’s assessment base, calculated as its average consolidated total assets minus its average tangible equity. KeyBank’s current annualized premium assessments can range from $.025 to $.45 for each $100 of its assessment base. The rate charged depends on KeyBank’s performance on the FDIC’s “large and highly complex institution” risk-assessment scorecard, which includes factors such as KeyBank’s regulatory rating, its ability to withstand asset and funding-related stress, and the relative magnitude of potential losses to the FDIC in the event of KeyBank’s failure.
On October 18, 2022, the FDIC adopted a final rule, applicable to all insured depository institutions (including KeyBank), to increase the initial base deposit insurance assessment rate schedules uniformly by two basis points consistent with the Amended Restoration Plan approved by the FDIC on June 21, 2022. The FDIC indicated that it was taking this action in order to restore the DIF reserve ratio to the required statutory minimum of 1.35% by the statutory deadline of September 30, 2028. Under the final rule, the increase in rates began with the first quarterly assessment period of 2023 and will remain in effect unless and until the reserve ratio meets or exceeds 2% in order to support growth in the DIF in progressing toward the FDIC’s long-term goal of a 2% reserve ratio.
On March 10, 2023, and March 12, 2023, Silicon Valley Bank (“SVB”) and Signature Bank (“Signature”) were closed by the state banking authorities in California and New York, respectively, and the FDIC was appointed as receiver of SVB and Signature. All deposits of SVB and Signature were transferred to bridge banks established by the FDIC under the systemic risk exception to the least cost test in the FDIA so that the uninsured deposits as well as the insured deposits of both banks were protected by the FDIC. Under the FDIA, the loss to the DIF arising from the use of the systemic risk exception must be recovered through one or more special assessments.
On November 16, 2023, the FDIC issued a final rule to impose a special assessment on IDIs to recover the loss to the DIF resulting from the use of the systemic risk exception to protect the uninsured depositors of SVB and Signature. Under the final rule, the FDIC would collect a special assessment from IDIs at an annual rate of approximately 13.4 basis points over eight quarterly assessment periods, starting with the first quarterly assessment period of 2024. The assessment base for the proposed special assessment is equal to an IDI’s estimated uninsured deposits reported as of December 31, 2022, adjusted to exclude the first $5 billion in estimated uninsured deposits held by the IDI. Because the estimated loss to the DIF from the use of the systemic risk exception will be periodically adjusted and because the total assessments collected may change due to corrective amendments filed by covered IDIs regarding the reported amount of uninsured deposits for the December 31, 2022 reporting period, the FDIC may cease collection of the special assessment early, extend the special assessment collection period, or impose a final shortfall special assessment.
In the final rule, the FDIC indicated that the special assessment is a tax-deductible operating expense for IDIs, and that it assumed that the effect on income of the entire amount of the special assessment would occur in one quarter for the IDIs subject to the assessment. The initial impact of the special assessment to Key was approximately $190 million in pre-tax expense, which was recognized upon issuance of the final rule in the fourth quarter of 2023.
The FDIC has indicated that the loss estimates to be recovered by the special assessment will be periodically adjusted as the FDIC (as receiver of the failed banks) sells assets, satisfies liabilities, and incurs receivership expenses. The FDIC said that it will provide any updates regarding the amount and collection period for the special assessment when it sends the quarterly deposit insurance assessment invoices to the IDIs subject to the special assessment. In the first quarter of 2024, the FDIC announced an increase in its estimate of losses from protecting the uninsured depositors of SVB and Signature and, therefore, increased the amount that it would collect through the special assessment. Because of this updated estimate, Key incurred an incremental pre-tax expense of $29 million in the first quarter of 2024. Based on the quarterly invoices Key received from the FDIC in June 2024, September 2024, and December 2024, Key recorded an incremental pre-tax expense of $5 million in the second quarter of 2024, and a reversal of pre-tax expense of $6 million and $3 million in the third and fourth quarter of 2024, respectively, to true-up initial estimates to invoiced amounts.
The FDIC’s final rule for a special assessment discussed above was not intended to recover the loss to the DIF from the failure of First Republic Bank in May 2023 (initially estimated as a $13 billion loss) or to the DIF from the failures of SVB and Signature that was not related to the protection of uninsured depositors (initially estimated as a $2.7 billion loss). The FDIC indicated that no further adjustments to assessments are contemplated at this time to recover those losses but that it will re-evaluate this issue in the future when it updates projections for the DIF balance and the reserve ratio in connection with its periodic review of the DIF Restoration Plan that was adopted in 2022. The FDIC updates these projections at least semiannually.
Conservatorship and receivership of insured depository institutions
Upon the insolvency of an insured depository institution, the FDIC will be appointed as receiver or, in rare circumstances, conservator for the insolvent institution under the FDIA. In an insolvency, the FDIC may repudiate or disaffirm any contract to which the institution is a party if the FDIC determines that performance of the contract would be burdensome and that disaffirming or repudiating the contract would promote orderly administration of the institution’s affairs. If the contractual counterparty made a claim against the receivership (or conservatorship) for breach of contract, the amount paid to the counterparty would depend upon, among other factors, the receivership (or conservatorship) assets available to pay the claim and the priority of the claim relative to others. In addition, the FDIC may enforce most contracts entered into by the insolvent institution, notwithstanding any provision that would terminate, cause a default, accelerate or give other rights under the contract solely because of the insolvency, the appointment of the receiver (or conservator), or the exercise of rights or powers by the receiver (or conservator). The FDIC may also transfer any asset or liability of the insolvent institution without obtaining approval or consent from the institution’s shareholders or creditors. These provisions would apply to obligations and liabilities of KeyCorp’s insured depository institution subsidiary, KeyBank, including obligations under senior or subordinated debt issued to public investors.
Receivership of certain SIFIs
The Dodd-Frank Act created a new resolution regime, as an alternative to bankruptcy, known as the “orderly liquidation authority” (“OLA”) for certain SIFIs, including BHCs and their affiliates. Under the OLA, the FDIC would generally be appointed as receiver to liquidate and wind down a failing SIFI. The determination that a SIFI should be placed into OLA receivership is made by the U.S. Treasury Secretary, who must conclude that the SIFI is in default or in danger of default and that the SIFI’s failure poses a risk to the stability of the U.S. financial system. This determination must come after supermajority recommendations by the Federal Reserve and the FDIC, and consultation between the U.S. Treasury Secretary and the President.
If the FDIC is appointed as receiver under the OLA, its powers and the rights and obligations of creditors and other relevant parties would be determined exclusively under the OLA. The powers of a receiver under the OLA are generally based on the FDIC’s powers as receiver for insured depository institutions under the FDIA. Certain provisions of the OLA were modified to reduce disparate treatment of creditors’ claims between the U.S. Bankruptcy Code and the OLA. However, substantial differences between the two regimes remain, including the FDIC’s right to disregard claim priority in some circumstances, the use of an administrative claims procedure under OLA to determine creditors’ claims (rather than a judicial procedure in bankruptcy), the FDIC’s right to transfer claims to a bridge entity, and limitations on the ability of creditors to enforce contractual cross-defaults against potentially viable affiliates of the entity in receivership. OLA liquidity would be provided through credit support from the U.S. Treasury and assessments made, first, on claimants against the receivership that received more in the OLA resolution than they would have received in ordinary liquidation (to the full extent of the excess), and second, if necessary, on SIFIs like KeyCorp utilizing a risk-based methodology.
Depositor preference
The FDIA provides that, in the event of the liquidation or other resolution of an insured depository institution, the claims of its depositors (including claims of its depositors that have subrogated to the FDIC) and certain claims for administrative expenses of the FDIC as receiver have priority over other general unsecured claims. If an insured depository institution fails, insured and uninsured depositors, along with the FDIC, will be placed ahead of unsecured, nondeposit creditors, including the institution’s parent BHC and subordinated creditors, in order of priority of payment.
Resolution and recovery plans
BHCs with at least $50 billion in total consolidated assets, like KeyCorp, have been required to periodically submit to the Federal Reserve and FDIC a plan discussing how the company could be rapidly and orderly resolved if the company failed or experienced material financial distress. Insured depository institutions with at least $50 billion in total consolidated assets, like KeyBank, have also been required to submit a resolution plan to the FDIC. These plans have been due annually unless the requirement to submit the plans was deferred by the regulators. The Federal Reserve and FDIC make available on their websites the public sections of resolution plans for the companies, including KeyCorp and KeyBank, that submitted plans. The public sections of the resolution plans of KeyCorp and KeyBank are available at http://www.federalreserve.gov/supervisionreg/resolution-plans.htm and https://www.fdic.gov/resolutions/fdic-and-financial-regulatory-reform-title-i-and-idi-resolution-planning/. KeyCorp’s last resolution plan was submitted in 2017, and KeyBank’s last resolution plan was submitted in 2022. KeyCorp is no longer required to submit a resolution plan because of the rule change discussed below while KeyBank remains subject to resolution plan requirements as discussed below.
BHCs with less than $250 billion in total consolidated assets are no longer required to submit a resolution plan unless they have $75 billion or more in certain risk-based indicators. Under this rule, KeyCorp is no longer subject to resolution planning requirements.
On June 20, 2024, the FDIC adopted a final rule to amend and restate its current resolution plan rule in order to clarify and strengthen resolution plan submission requirements and reflect lessons learned since the adoption of the FDIC’s current resolution plan rule in 2012. Among other things, the final rule (i) requires IDIs with more than $100 billion in total assets that are affiliated with a U.S. G-SIB to submit full resolution plans every two years, (ii) requires IDIs with more than $100 billion in total assets that are not affiliated with a U.S. G-SIB (including KeyBank) to submit full resolution plans every three years, (iii) requires IDIs with total assets between $50 billion and $100 billion to submit informational filings every three years, (iv) requires triennial filers to submit more limited supplements in the off years, (v) enhances and clarifies the requirements for the content of resolution submissions, (vi) codifies certain
aspects of guidance and feedback provided to filers subject to the current rule, (vii) expands expectations regarding engagement and capabilities testing, and (viii) establishes an enhanced credibility standard for the evaluation of resolution submissions. The final rule was effective on October 1, 2024. KeyBank is required to file its next resolution plan by July 1, 2025, which will be its initial filing under the final rule.
On October 21, 2024, the OCC adopted revisions to its recovery planning guidelines. The OCC’s recovery planning guidelines require large OCC-regulated banks to develop and maintain a recovery plan that identifies triggers and options for responding to a wide range of severe internal and external stress scenarios so that the bank can be restored to financial strength and viability in a timely manner if it were to experience such stress situations. The OCC revised these guidelines to (i) expand the applicability of the guidelines to banks with at least $100 billion in average total consolidated assets, (ii) add a requirement for covered banks to test their recovery plans to ensure that their plans will be effective during periods of severe stress, and (iii) clarify that recovery plans should consider non-financial risks (including operational and strategic risks) as well as financial risks. KeyBank is subject to the OCC’s revised recovery planning guidelines. KeyBank is required to be in compliance with these guidelines by January 1, 2026 except that KeyBank’s compliance with the testing requirement is delayed until January 1, 2027.
Other Regulatory Requirements and Developments
The Bank Secrecy Act
The BSA requires all financial institutions (including banks and securities broker-dealers) to, among other things, maintain a risk-based system of internal controls reasonably designed to prevent money laundering and the financing of terrorism. It includes a variety of recordkeeping and reporting requirements (such as cash and suspicious activity reporting) as well as due diligence and know-your-customer documentation requirements. Key has established and maintains an AML program to comply with the BSA’s requirements.
Consumer Financial Protection Bureau
Title X of the Dodd-Frank Act created the CFPB, a consumer financial services regulator with supervisory authority over banks and their affiliates with assets of more than $10 billion, like Key, to carry out federal consumer protection laws. The CFPB also regulates financial products and services sold to consumers and has rulemaking authority with respect to federal consumer financial laws. Any new regulatory requirements promulgated by the CFPB or modifications in the interpretations of existing regulations could require changes to Key’s consumer-facing businesses. The Dodd-Frank Act also gives the CFPB broad data collecting powers for fair lending for both small business and mortgage loans, as well as extensive authority to prevent unfair, deceptive and abusive practices.
Volcker Rule
The Volcker Rule implements Section 619 of the Dodd-Frank Act, which prohibits “banking entities,” such as KeyCorp, KeyBank and their affiliates and subsidiaries, from owning, sponsoring, or having certain relationships with hedge funds and private equity funds (referred to as “covered funds”) and engaging in short-term proprietary trading of financial instruments, including securities, derivatives, commodity futures and options on these instruments.
The Volcker Rule excepts certain transactions from the general prohibition against proprietary trading, including transactions in government securities (e.g., U.S. Treasuries or any instruments issued by the GNMA, FNMA, FHLMC, a Federal Home Loan Bank, or any state or a political division of any state, among others); transactions in connection with underwriting or market-making activities; and transactions as a fiduciary on behalf of customers. A banking entity may also engage in risk-mitigating hedging activity if it can demonstrate that the hedge reduces or mitigates a specific, identifiable risk or aggregate risk position of the entity. The banking entity is required to conduct an analysis supporting its hedging strategy and the effectiveness of the hedges must be monitored and, if necessary, adjusted on an ongoing basis.
Key does not anticipate that the proprietary trading or covered fund restrictions in the Volcker Rule will have a material impact on its business, but it was required to divest certain fund investments. As of June 30, 2023, Key has completed conforming and/or divesting certain indirect investments subject to the Volcker Rule.
Enhanced prudential standards and early remediation requirements
The Dodd-Frank Act required the Federal Reserve to impose enhanced prudential standards upon BHCs, like KeyCorp, with at least $50 billion in total consolidated assets. Prudential standards were required to include enhanced risk-based capital requirements and leverage limits, liquidity requirements, risk-management and risk committee requirements, resolution plan requirements, credit exposure report requirements, single counterparty credit limits (“SCCL”), supervisory and company-run stress test requirements and, for certain financial companies, a debt-to-equity limit. Early remediation requirements were required to include limits on capital distributions, acquisitions, and asset growth in early stages of financial decline and capital restoration plans, capital raising requirements, limits on transactions with affiliates, management changes, and asset sales in later stages of financial decline, which would be triggered by forward-looking indicators including regulatory capital and liquidity measures.
EGRRCPA raised the asset threshold above which the Federal Reserve is required to apply enhanced prudential standards to BHCs from $50 billion to $250 billion and gave the Federal Reserve the authority to apply enhanced prudential standards to BHCs with at least $100 billion in assets. Please see the discussion under the headings “Regulatory capital requirements - Liquidity requirements” and “Regulatory capital requirements - Capital planning and stress testing” for more information about EGRRCPA and the related Tailoring Rules.
Since 2010, the Federal Rule has implemented the following enhanced prudential standards required under the Dodd-Frank Act: (i) the resolution plan requirements (through a joint final rule adopted with the FDIC), (ii) stress test requirements, (iii) the incorporation of the Regulatory Capital Rules through the Federal Reserve’s previously finalized rules on capital planning and stress tests; (iv) liquidity requirements; (v) the risk management framework, including requirements around the risk committee and the chief risk officer as well as the corporate governance requirements as they relate to liquidity risk management; and (vi) a 15-to-1 debt-to-equity, limit for companies that the FSOC determines pose a “grave threat” to U.S. financial stability. In addition, the Federal Reserve has issued a final rule establishing SCCL requirements, but that rule does not apply to KeyCorp. The Federal Reserve has yet to implement a final rule on the early remediation requirements.
Bank transactions with affiliates
Federal banking law and regulation imposes qualitative standards and quantitative limitations upon certain transactions by a bank with its affiliates, including the bank’s parent BHC and certain companies the parent BHC may be deemed to control for these purposes. Transactions covered by these provisions must be on arm’s-length terms, and cannot exceed certain amounts that are determined with reference to the bank’s regulatory capital. Moreover, if the transaction is a loan or other extension of credit, it must be secured by collateral in an amount and quality expressly prescribed by statute, and if the affiliate is unable to pledge sufficient collateral, the BHC may be required to provide it. These provisions significantly restrict the ability of KeyBank to fund its affiliates, including KeyCorp, KBCM, and KeyCorp’s nonbanking subsidiaries engaged in making merchant banking investments (and certain companies in which these subsidiaries have invested). The Dodd-Frank Act expanded the coverage and scope of these regulations, including by applying them to the credit exposure arising under derivative transactions, repurchase and reverse repurchase agreements, and securities borrowing and lending transactions.
Supervision and governance
KeyCorp is subject to the Federal Reserve’s supervisory rating system for large financial institutions, which includes BHCs with total consolidated assets of $100 billion or more (including KeyCorp) (“LFI Rating System”). The LFI Rating System provides a supervisory evaluation of whether an institution possesses sufficient operational strength and resilience to maintain safe and sound operations through a range of conditions and assesses an institution’s capital planning and positions, liquidity risk management and positions, and governance and controls. Ratings issued under the LFI Rating System are confidential.
Community Reinvestment Act
The Community Reinvestment Act (“CRA”) was enacted in 1977 to encourage depository institutions to help meet the credit needs of the communities that they serve, including low- and moderate-income (“LMI”) neighborhoods, consistent with the institutions’ safe and sound operations. The CRA requires the federal banking agencies to assess the record of each institution that they supervise in meeting the credit needs of its entire community, including LMI neighborhoods.
On October 24, 2023, the federal banking agencies adopted a final rule to strengthen and modernize their regulations implementing the CRA to better achieve the purposes of the law, adapt to changes in the banking industry, and provide clarity and consistency in the application of their regulations. Among other things, the final rule (1) clarifies what activities constitute eligible community development activities, (2) adopts four new tests under which large banks with more than $2 billion in assets (including KeyBank) will be evaluated, (3) applies a new framework for assigning conclusions and ratings to banks, (4) updates requirements for delineating facility-based assessment areas, (5) provides for the evaluation of certain large banks in retail lending assessment areas as well as facility-based assessment areas, and (6) imposes new data collection and reporting requirements. The four new tests under which large banks will be evaluated are a retail lending test, a retail services and products test, a community development financing test, and a community development services test. Various metrics and performance standards will be applied under these tests. Most provisions of the final rule will be effective on January 1, 2026, while certain reporting requirements will be effective on January 1, 2027. KeyBank is subject to the final rule.
Various trade associations filed a lawsuit in the United States District Court for the Northern District of Texas seeking to invalidate the CRA final rule. In their lawsuit, the trade associations argued that the federal banking agencies exceeded their authority in adopting the CRA final rule. On March 29, 2024, the court in that case issued a preliminary injunction barring the federal banking agencies from enforcing the CRA final rule against the plaintiffs pending the resolution of this lawsuit. The court also extended all implementation dates under the CRA final rule, day for day, for each day that the injunction remains in place. The court concluded that the plaintiffs had demonstrated a substantial likelihood of success on the merits and would suffer irreparable harm if they had to incur costs to prepare to comply with a rule that might later be invalidated. The court’s decision granting a preliminary injunction is on appeal to the United States Court of Appeals for the Fifth Circuit. Key is monitoring developments in this case.
Developments relating to climate change
On October 24, 2023, the federal banking agencies issued a set of principles that provide a high-level framework for the safe and sound management of exposures to climate-related financial risks for financial institutions with over $100 billion in total consolidated assets. These principles are intended to provide large financial institutions with guidance in their efforts to identify, measure, monitor, and mitigate physical and transition risks associated with climate change. These principles discuss how these risks can be addressed in the following areas: governance; policies, procedures, and limits; strategic planning; risk management; data, risk measurement, and reporting; and scenario analysis. These principles also describe how climate-related financial risks can be addressed in connection with various specific risk categories, including credit risk, liquidity risk, operational risk, and legal/compliance risk. This interagency guidance applies to KeyCorp and KeyBank.
Long-term debt requirement
On August 29, 2023, the federal banking agencies issued for public comment a proposal that would require certain large BHCs and certain large IDIs to issue and maintain minimum amounts of long-term debt (“LTD”). This proposal would apply to Category II, III, and IV BHCs (including KeyCorp) and IDIs that (i) are not consolidated subsidiaries of U.S. global systemically important banks and (ii) have at least $100 billion in total assets (including KeyBank) or are affiliated with an IDI that has at least $100 billion in total assets. Under the proposal, the required minimum amount of LTD would be the greater of 6 percent of an entity’s total risk-weighted assets, 3.5 percent of an entity’s average total consolidated assets, and 2.5 percent of an entity’s total leverage exposure if it is subject to the supplementary leverage ratio. IDIs that are consolidated subsidiaries of BHCs would be required to issue the LTD to their parent company or another entity that consolidates the IDI.
Debt instruments issued to satisfy the minimum LTD requirement would have to meet certain criteria including, among other things, being unsecured, have a remaining maturity of more than one year, and not provide the holder with acceleration rights except in limited circumstances. BHCs subject to the proposal would also have to comply with certain “clean holding-company” requirements such as a cap on liabilities other than eligible LTD and a prohibition on entering into most qualified financial contracts with third parties. The proposal would provide a three-year transition period with the incremental phase-in of the requirements during this period. The federal banking agencies indicated that the proposal would improve the resolvability of the covered entities in case of their failure, reduce costs to the DIF, and mitigate contagion and financial stability risks by reducing the risk of loss to uninsured depositors. Comments on the proposal were due by January 16, 2024.
Debit card interchange fee cap
On October 25, 2023, the Federal Reserve issued for public comment a proposal to lower the maximum interchange fee that a debit card issuer with $10 billion or more in total consolidated assets (including KeyBank) can receive for a debit card transaction. The interchange fee cap is currently set at the sum of 21 cents for each transaction plus an amount equal to 0.05% of the value of the transaction and a one cent fraud prevention adjustment for issuers that satisfy certain criteria. In the new proposal, the Federal Reserve proposed to lower the cap to the sum of 14.4 cents for each transaction plus an amount equal to 0.04% of the value of the transaction and a 1.3 cent fraud prevention adjustment. The Federal Reserve indicated that it was proposing this revision to the fee cap to reflect changes in issuer costs. The Federal Reserve also proposed to update the amount of the fee cap every other year going forward by using data it collects in a biennial survey of large debit card issuers. Comments on the proposal were due by May 12, 2024.
Personal financial data rights
On October 22, 2024, the CFPB issued a final rule to implement Section 1033 of the Dodd-Frank Act, which gives individuals the right to obtain data regarding consumer financial products and services they have obtained. The final rule requires financial institutions (including KeyBank) and other financial service providers (collectively “data providers”) to make available to consumers and authorized third parties, upon request, data in the data provider’s possession or control concerning covered consumer financial products or services (including credit cards, deposit accounts, and other accounts that facilitate payments) in an electronic form usable by the consumers and authorized third parties. The data that must be provided includes account balance information, at least 24 months of transaction history, pricing information, information on upcoming third-party bill payments, and account verification information. The data providers are required to create and maintain consumer and developer interfaces that will be able to transfer the data. A data provider will not be allowed to charge any fees or other charges for making the covered data available or for maintaining the required interfaces. The CFPB indicated that it adopted this rule in order to foster competition and consumer choice and said that this rule is a step towards bringing about an “open banking” system in the United States. Compliance with the rule will be phased in over several years with KeyBank required to be in compliance by April 1, 2027. Following the issuance of this rule, two trade associations and a national bank headquartered in Kentucky filed a lawsuit challenging the rule in the United States District Court for the Eastern District of Kentucky. In this lawsuit, the plaintiffs alleged that the CFPB exceeded its statutory authority in adopting the rule. Key is monitoring developments in this case.
ITEM 1A. RISK FACTORS
Summary of Risk Factors
The following is a summary of some of the material risks and uncertainties that could have an adverse effect on our business.
•Credit Risk
◦We have concentrated credit exposure in commercial and industrial loans, commercial real estate loans, and commercial leases.
◦Should the fundamentals of the commercial real estate market deteriorate, our financial condition and results of operations could be adversely affected.
◦We are subject to the risk of defaults by our loan clients and counterparties.
◦Declining asset prices could adversely affect us.
◦Various factors may cause our allowance for loan and lease losses to increase or to be inadequate.
◦Geopolitical destabilization could adversely impact our loan portfolios.
•Market Risk
◦A worsening of the U.S. economy and volatile or recessionary conditions in the U.S. or abroad could negatively affect our business or our access to capital markets.
◦We are subject to interest rate risk, which could adversely affect net interest income.
◦Our profitability depends upon economic conditions in the geographic regions where we have significant operations and in certain market segments in which we conduct significant business.
◦The soundness of other financial institutions could adversely affect us.
•Liquidity Risk
◦We are subject to liquidity risk, which could negatively affect our funding levels.
◦Capital and liquidity requirements imposed by banking regulations require banks and BHCs to maintain more and higher quality capital and more and higher quality liquid assets.
◦Federal agencies’ actions to ensure stability of the U.S. economy and financial system may have costly or disruptive effects on us.
◦We rely on dividends by our subsidiaries for most of our funds.
◦Our credit ratings affect our liquidity position.
•Operational Risk
◦We are subject to a variety of operational risks.
◦We and third parties on which we rely (including their downstream service providers) may experience a cyberattack, technology failure, information system or security breach or interruption.
◦We rely on third parties to perform significant operational services for us, and their failure to perform to our standards or other issues of concern with them could harm us.
◦Our framework for managing risks and mitigating losses may not be effective.
◦We are, and may in the future be, subject to claims, litigation, arbitration, investigations, and governmental proceedings, which could result in significant financial liability and/or reputational harm.
◦Our controls and procedures may fail or be circumvented, and our methods of reducing risk exposure may not be effective.
◦Our operations and financial performance could be adversely affected by severe weather and natural disasters exacerbated by climate change.
◦Societal and governmental responses to climate change could adversely affect our business and performance, including indirectly through impacts on our customers.
◦The increased use of remote work infrastructure has expanded potential attack vectors and resulted in increased operational risks.
•Compliance Risk
◦We are subject to extensive government regulation, supervision, and tax legislation.
◦We are subject to complex and evolving laws and regulations regarding privacy and cybersecurity, which could limit our ability to pursue business initiatives, increase the cost of doing business and subject us to compliance risks and potential liability.
•Strategic Risk
◦We may not realize the expected benefits of our strategic initiatives.
◦We operate in a highly competitive industry.
◦Maintaining or increasing our market share depends upon our ability to adapt our products and services to evolving industry standards and consumer preferences, while maintaining competitive products and services.
◦We may not be able to attract and retain skilled people.
◦Acquisitions or strategic partnerships may disrupt our business and dilute shareholder value.
◦Scotiabank holds a significant equity interest in our business and may exercise influence over us, including through its ability to designate up to two directors to our Board of Directors.
•Reputation Risk
◦Damage to our reputation could significantly impact our business and major stakeholders.
◦Key is subject to corporate responsibility and sustainability efforts risks that could adversely affect our reputation and our business and results of operations.
•Model Risk
◦We rely on quantitative models to manage certain accounting, risk management, capital planning, and treasury functions.
•Estimates and Assumptions Risk
◦The preparation of our consolidated financial statements requires us to make subjective determinations and use estimates that may vary from actual results and materially impact our financial condition and results of operations.
◦Changes in accounting policies, standards, and interpretations could materially affect how we report our financial condition and results of operations.
◦Impairment of goodwill could require charges to earnings, which could result in a negative impact on our results of operations.
As a financial services organization, we are subject to a number of risks inherent in our transactions and present in the business decisions we make. Described below are the material risks and uncertainties that if realized could have a material and adverse effect on our business, financial condition, results of operations or cash flows, and our access to liquidity. Although the risks are organized by headings and each risk is discussed separately, many are interrelated. The risks and uncertainties described below are not the only risks we face. Disclosures of risks should not be interpreted to imply that the risks have not already materialized.
Our ERM program incorporates risk management throughout our organization to identify, understand, and manage the risks presented by our business activities. Our ERM program identifies Key’s major risk categories as: compliance risk, operational risk, liquidity risk, market risk, credit risk, model risk, reputation risk, strategic risk, and estimates and assumptions risk. These risk factors, and other risks we may face, are discussed in more detail in other sections of this report.
I. Credit Risk
We have concentrated credit exposure in commercial and industrial loans, commercial real estate loans, and commercial leases.
As of December 31, 2024, approximately 69% of our loan portfolio consisted of commercial and industrial loans, commercial real estate loans, including commercial mortgage and construction loans, and commercial leases. These types of loans are typically larger than single family residential real estate loans and other types of consumer loans and have a different risk profile. The deterioration of a larger loan or a group of loans in this category could cause an increase in criticized, classified, and nonperforming loans, which could result in lower earnings from these loans, additional provision for loan and lease losses, and ultimately an increase in loan losses.
Should the fundamentals of the commercial real estate market deteriorate, our financial condition and results of operations could be adversely affected.
Recent Federal Reserve monetary policy, including shrinkage of its balance sheet and incremental increases in target interest rates early in 2023 followed by a sustained period of relatively higher target interest rates throughout the latter part of 2023 and 2024, continue to impact the commercial and residential real estate markets. Capitalization rates have risen, and property value appreciation has slowed and continues to decline. In many markets within Key’s footprint, property values continue to decrease. Industrial and retail properties continue to remain stable, but multifamily, office, hospitality, and single family detached properties show signs of deterioration. Development and construction continue, but at muted levels, and deliveries of additional units into the market have been supported. Oversupply of multifamily housing is a concern in certain urban and gateway markets. However, our exposures in those markets are limited (for example, approximately 5% of our multifamily portfolio is located in New York City, Chicago, Los Angeles, and San Francisco; we also have no exposure to rent controlled properties in New York City).
The most severely impacted commercial real estate segments have been in office. Key’s non-owner occupied office exposures are 5% of our total commercial real estate exposure. Substantial deterioration in property market fundamentals could negatively impact our portfolio, with a large portion of our clients active in real estate but in the comparatively better performing multifamily space over the cycle. A correction in the real estate markets could impact the ability of borrowers to make debt service payments on loans or to refinance the loans at maturity.
A relatively small portion of our commercial real estate loans are construction loans. New construction and value-add or rehabilitation construction projects may not be fully leased at loan origination. These properties typically require additional leasing through the life of the loan to provide adequate cash flow to support debt service payments. If property market fundamentals deteriorate sharply, performance under existing leases could deteriorate and the execution of new leases could slow, compromising the borrower’s ability to cover debt service payments.
We are subject to the risk of defaults by our loan clients and counterparties.
Many of our routine transactions expose us to credit risk, including the risk of default of our counterparties, which include other financial institutions, or clients. Our credit risk may be exacerbated when the collateral held cannot be realized or is liquidated at prices insufficient to recover the full amount of the loan or derivative exposure due to us. In deciding whether to extend credit or enter into other transactions, we rely on information furnished by or on behalf of counterparties and clients, including financial statements, credit reports and other information. We also rely on representations of those counterparties, clients, or other third parties as to the accuracy and completeness of that information. The inaccuracy of that information or those representations affects our ability to accurately evaluate the default risk of a counterparty or client. In addition, given the Dodd-Frank legislative mandate to centrally clear eligible derivative contracts, we rely on central clearing counterparties to remain open and operationally viable at all times. A financial institution or other counterparty failure or a cybersecurity breach that causes the failure of or disruption to a counterparty or client, may materially and adversely affect our business, financial condition, or results of operations. Further, market volatility or difficulty accessing liquidity in the capital markets can result in a weaker counterparty profile and eventual failure of the counterparty to meet its contractual obligations.
Declining asset prices could adversely affect us.
During periods of economic stress, the volatility and disruption that the capital and credit markets experience may reach, and have in the past reached, extreme levels. Market disruption may severely stress or even lead to the failure of financial institutions, which can cause further credit market constriction and further liquidation of assets, driving asset prices down even more. Asset price deterioration has a negative effect on the valuation of collateral and certain assets represented on our balance sheet and reduces our ability to sell assets at prices we deem acceptable.
The most recent recession in the U.S., resulting from the impact of the COVID-19 pandemic, did not have significant lasting impact on collateral value. However, there are still risks to economic stability that could reverse recent stable trends in asset prices.
These risks include, but are not limited to:
•A correction in equity or housing markets;
•Supply chain issues such as closed factories and disrupted port activity, as well as the impact of the Russia-Ukraine war and the Israel-Hamas war on global transportation and the availability of materials;
•Recessionary pressures on other major international economies, such as China, that may impact the broader global and our domestic economy;
•Labor-supply constraints, including as a result of potential changes to U.S. immigration policies and laws, leading to slowing job growth and rising wages along with inflation (wage-price spiral); and
•Negative real GDP growth, as a result of, in part, the Federal Reserve’s monetary policy to arrest inflationary pressures within the broader economy.
Various factors may cause our allowance for loan and lease losses to increase or to be inadequate.
We maintain an ALLL (a reserve established through a provision for loan and lease losses charged to expense) that represents our estimate of losses based on our evaluation of risks within our existing portfolio of loans. The level of the allowance at December 31, 2024 represents management’s estimate of expected credit losses over the contractual life of our existing loan portfolio. The determination of the appropriate level of the ALLL inherently involves a degree of subjectivity and requires that we make significant estimates of current credit risks, current trends, and reasonable and supportable forecasts of future economic conditions, all of which may undergo frequent and material changes. Changes in economic conditions affecting borrowers, the softening of certain macroeconomic variables that we are more susceptible to, such as GDP, unemployment, SOFR and other interest rates, the producer price index, and real estate values, along with updated information regarding existing loans, identification of additional problem loans and other factors, both within and outside of our control, may require an increase in the ALLL. Further, the multitude and totality of factors impacting our estimates and the subjectivity of components of its calculation may cause the ALLL to be an inadequate representation of the actual losses incurred over the life of our loan portfolio. Both an increase in the ALLL and actual losses exceeding our current estimates will reduce our net income and could impact our capital positions and may materially and adversely affect our business, financial condition or results of operations.
Geopolitical destabilization could adversely impact our loan portfolios.
While we have minimal direct foreign company exposure in our loan portfolios, there are correlated and contingent risks posed by geopolitical destabilization within our loan portfolio. For example, conflicts across the world, including the Russia-Ukraine war and the Israel-Hamas war, have proven to have a material impact on certain domestic commodity prices, impacting our borrowers' input costs and disrupting supply chains both domestically and abroad. These factors increase potential defaults in our loan portfolio and could ultimately increase loan losses.
II. Market Risk
A worsening of the U.S. economy and volatile or recessionary conditions in the U.S. or abroad could negatively affect our business or our access to capital markets.
A worsening of economic and market conditions or downside shocks could result in adverse effects on Key and others in the financial services industry. Recent and persistent interest rate increases and a slowing economy could present a challenge for the industry, including Key, and negatively affect business and financial performance.
In particular, we face the following risks, and other unforeseeable risks, in connection with a downturn in the economic and market environment or in the face of downside shocks or a recession, whether in the United States or internationally:
•A loss of confidence in the financial services industry and the debt and equity markets by investors, placing pressure on the price of our common shares or decreasing the credit or liquidity available to Key, while also increasing the cost of such credit or liquidity;
•A decrease in consumer and business confidence levels generally, decreasing credit usage and investment or increasing delinquencies and defaults;
•A decrease in household or corporate incomes, reducing demand for our products and services;
•A decrease in the value of collateral securing loans to our borrowers or a decrease in the quality of our loan portfolio, increasing loan charge-offs and reducing Key’s net income;
•A decrease in our ability to liquidate financial positions at acceptable market prices;
•An increase in competition or consolidation in the financial services industry;
•Increased concern over and scrutiny of the capital and liquidity levels of financial institutions generally, and those of our transaction counterparties specifically with a corresponding increase in our cost of capital, liquidity and/or funding;
•A decrease in confidence in the creditworthiness of the United States or other issuers whose securities we hold; and
•An increase in limitations on or the regulation of financial services companies like Key.
In the event of severely adverse business and economic conditions generally or specifically in the principal markets in which we conduct business, there can be no assurance that the federal government and the Federal Reserve would intervene or make adjustments to fiscal or monetary policy that would cause business and economic conditions to improve. A worsening of business and economic conditions or market volatility related thereto could have a material adverse effect on our business, financial condition, and results of operations.
In addition, volatility and uncertainty related to inflation and the effects of inflation, which has, in recent years, led to increased costs for businesses and consumers and could cause the Federal Reserve to reinitiate a series of interest rate increases, which may amplify or contribute to some of the risks of our business by adversely affecting the creditworthiness of our borrowers, increasing our costs, or resulting in lower values for our investment securities and other fixed-rate assets. To the extent that the Federal Reserve’s policies around managing inflation fail to mitigate the volatility and uncertainty related to inflation and the effects of inflation, or to the extent conditions otherwise worsen or are exacerbated by policies enacted by the U.S. government, including the imposition of tariffs or other trade policies, we could experience adverse effects on our business, financial condition, and results of operations.
In addition, when U.S. economic conditions are weak or recessionary, unemployment may rise and corporate profits may fall significantly, creating adverse credit conditions in our lending businesses. Rising credit costs may materially reduce our profitability as we generate the majority of our income from lending activity; See the section entitled “Credit Risk” in this Item 1A. “Risk Factors.”
We are subject to interest rate risk, which could adversely affect net interest income.
Our earnings depend heavily upon our net interest income. Net interest income is the difference between interest income earned on interest-earning assets such as loans and securities and interest expense paid on interest-bearing liabilities such as deposits and borrowed funds. Hence, interest rate risk is inherent to our banking business and takes four primary forms: repricing risk, yield curve risk, basis risk, and option risk. Repricing risk occurs when assets and liabilities respond to interest rate changes at different paces and to a different degree. Yield curve risk arises when short- and long-term interest rates change to a different extent. We incur basis risk to the extent that the relationship between different interest rate indices changes over time. Option risk is present in assets, liabilities or other financial instruments that allow a party to change the timing of interest or principal payments.
Interest rates are highly sensitive to many factors that are beyond our control, including general economic conditions, the competitive environment within our markets, consumer preferences for specific loan and deposit products and their payment behavior, and policies of various governmental and regulatory agencies, in particular, the Federal Reserve. Our ability to anticipate changes in these factors or to hedge the related on-and off-balance sheet exposures, and the cost of any such hedging activity, can significantly influence the success of our asset-and-liability management activities and our net interest income and net interest margin. Changes in monetary policy, including changes in interest rate controls being applied by the Federal Reserve, could influence the amount and timing of interest we receive on loans and securities, the amount and timing of interest we pay on deposits and borrowings, our ability to originate loans and obtain deposits, and the fair value of our financial assets and liabilities. When the Federal Reserve raises or reduces interest rates, the behavior of national money market rate indices, the correlation of consumer deposit rates to financial market interest rates, and the setting of benchmark rates may not follow historical relationships, which could influence net interest income and net interest margin through basis and other risks. In addition, our ability to change deposit rates in response to changes in interest rates and other market and related factors is limited by client relationship considerations.
Moreover, if the interest we pay on deposits and other borrowings increases at a faster rate than the interest we receive on loans and other investments, net interest income, and therefore our earnings, would be adversely affected. Conversely, earnings could also be adversely affected if the interest we receive on loans and other investments falls more quickly than the interest we pay on deposits and other borrowings. These scenarios illustrate repricing risk.
The impact of interest rates on our investment portfolio and consolidated financial results, including AOCI, can also affect our ability to maintain our capital ratios within our target ranges as well as the amount and timing of our future share repurchases and dividends. For additional information about the effects on interest rates on our business, refer to the information included under the caption “Risk Management — Market risk management” in Item 7 of this report.
Our profitability depends upon economic conditions in the geographic regions where we have significant operations and in certain market segments in which we conduct significant business.
We have concentrations of loans and other business activities in geographic regions where our bank branches are located — Washington; Oregon/Alaska; Rocky Mountains; Indiana/Northwest Ohio/Michigan; Central/Southwest Ohio; East Ohio/Western Pennsylvania; Atlantic; Western New York; Eastern New York; and New England — and additional exposure to geographic regions outside of our branch footprint. Economic growth in the various regions where we operate has been uneven, and the health of the overall U.S. economy may differ from the economy of any particular geographic region. Adverse conditions in a geographic region such as inflation, unemployment, recession, natural disasters, impact of public health crises, or other factors beyond our control could impact the ability of borrowers in these regions to repay their loans, decrease the value of collateral securing loans made in these regions, or affect the ability of our customers in these regions to continue conducting business with us.
Additionally, a significant portion of our business activities are concentrated within the commercial real estate, healthcare, finance, and utilities market segments. The profitability of some of these market segments depends upon the health of the overall economy, seasonality, the impact of regulation, and other factors that are beyond our control and may be beyond the control of our customers in these market segments.
An economic downturn or recession in one or more geographic regions where we conduct our business, or any significant or prolonged impact on the profitability of one or more of the market segments with which we conduct significant business activity, could adversely affect the demand for our products and services, the ability of our customers to repay loans, the value of the collateral securing loans, and the stability of our deposit funding sources.
The soundness of other financial institutions could adversely affect us.
Our ability to engage in routine funding transactions could be adversely affected by the actions and commercial soundness of other financial institutions. We have exposure to many different industries and counterparties in the financial services industries, and we routinely execute transactions with such counterparties, including brokers and dealers, banks, mortgage originators, hedge funds, insurance companies, and other institutional clients. Financial services institutions are interrelated as a result of trading, clearing, counterparty, or other relationships. As a result, defaults by, or even rumors or questions about, one or more financial services institutions, or the financial services industry generally, have led to, and may further lead to, market-wide liquidity problems and could lead to losses or defaults by us or other financial institutions. Disruption within the financial markets, including negative news regarding the banking industry or perceived risks of a bank’s safety and soundness, can adversely impact the market price and volatility of our common stock or deposit runoff. Online and mobile banking have made it easier for customers to withdraw their deposits. Higher withdrawals can raise funding cost, which may reduce Key’s net interest margin and net interest income. In addition, many of our transactions with other financial institutions expose us to credit risk in the event of default of a counterparty or client. Our credit risk may be affected when the collateral held by us cannot be realized or is liquidated at prices not sufficient to recover the full amount of our loan or derivatives exposure. There can be no assurance that any such losses would not adversely and materially affect our results of operations.
III. Liquidity Risk
We are subject to liquidity risk, which could negatively affect our funding levels.
Liquidity risk refers to our ability to fund liability maturities and deposit withdrawals, meet contractual obligations, or fund asset growth and new business initiatives at a reasonable cost, in a timely manner and without adverse consequences. Our banking business is subject to four primary liquidity risks: contingency risk, mismatch risk, funding risk, and refinancing risk. Contingency risk arises from unexpected funding or liquidity needs occurring during challenging economic or financial market conditions. Mismatch risk may occur when illiquid assets are funded with less stable funding sources. Funding risk arises if funding sources become too concentrated. Refinancing risk arises when a concentrated liability maturity profile creates near-term funding stress. Despite actions that we take to manage these risks, unanticipated changes in assets, liabilities, and off-balance sheet commitments under various economic conditions (including a reduced level of wholesale funding sources), a substantial, unexpected, or prolonged change in the level or cost of liquidity could have a material adverse effect on us. If the cost effectiveness or the availability of supply in these credit markets is reduced for a prolonged period of time, our funding needs may require us to access funding and manage liquidity by other means. These alternatives may include generating client deposits, securitizing or selling loans, extending the maturity of wholesale borrowings, borrowing under certain secured borrowing arrangements, using relationships developed with a variety of fixed income investors to access new funds or renegotiate the terms of outstanding debt, and further managing loan growth and investment opportunities. These alternative means of funding may result in an increase in the overall cost of funds and may not be available under stressed conditions, which would cause us to liquidate a portion of our liquid asset portfolio to meet any funding needs.
Capital and liquidity requirements imposed by banking regulations require banks and BHCs to maintain more and higher quality capital and more and higher quality liquid assets.
Evolving capital standards resulting from the Dodd-Frank Act and the Regulatory Capital Rules adopted by our regulators have had and will continue to have a significant impact on banks and BHCs, including Key. For a detailed explanation of the capital and liquidity rules that apply to us, see the section titled “Regulatory capital requirements” under the heading “Supervision and Regulation” in Item 1 of this report.
Regulatory capital standards require Key to maintain significant amounts of high-quality capital (e.g., common equity) and could limit our business activities (including lending) and our ability to expand organically or through acquisitions. They could also result in our taking steps to increase our capital that may be dilutive to shareholders or limit our ability to pay dividends or otherwise return capital to shareholders.
In addition, regulatory liquidity standards require us to hold high-quality liquid assets, which has caused us to change, and may in the future cause us to change, our mix of investments, and may impact future business relationships with certain customers. Additionally, support of liquidity standards may be satisfied through the use of long-term wholesale borrowings, which tend to have a higher cost than that of traditional core deposits.
Further, the Federal Reserve has detailed the processes that BHCs should maintain to ensure they hold adequate capital under severely adverse conditions and have ready access to funding before engaging in any capital activities. The severity and other features of these processes, which take the form of stress tests and other measures, may evolve from year to year and are used by the Federal Reserve to, among other things, evaluate our management of capital and the adequacy of our regulatory capital and to determine the stress capital buffer that we must maintain above our minimum regulatory capital requirements. Despite recent announcements by the Federal Reserve declaring intent to increase transparency into capital stress tests and models, the results of these processes are difficult to predict due to, among other things, the Federal Reserve’s use of proprietary stress models that differ from our internal models. Consequently, the Federal Reserve may impose capital requirements in excess of our expectations which could require us, as applicable, to revise our stress-testing or capital management approaches, resubmit our capital plan or postpone, cancel, or alter our planned capital actions. The results may also lead to limits on Key’s ability to make distributions, including paying out dividends or buying back shares.
From time to time, federal banking regulators tailor the extent to which various categories of large banks are subject to certain capital, liquidity and other regulations. For instance, Category IV banks with assets between $100 billion and $250 billion, including Key, are not currently subject to certain capital and liquidity standards required of larger banks. However, the bank regulatory environment evolves continually, and regulatory standards, expectations and
requirements evolve along with that environment, raising the risk of increased compliance costs in the future. Moreover, often in response to industry or macroeconomic stress events, informal regulatory expectations of capital and liquidity management practices may exceed formal requirements. Consequently, Key may not be able to realize any potential benefits of periodic regulatory tailoring.
For more information on regulatory requirements and proposals regarding the management of liquidity risk, see the section titled “Regulatory capital requirements” under the heading “Supervision and Regulation” in Item 1 of this report.
Federal agencies’ actions to ensure stability of the U.S. economy and financial system may have costly or disruptive effects on us.
The federal government’s actions can impact financial markets. For example, during 2024 the Federal Reserve, after an extended period of raising its monetary policy rate, began lowering interest rates in an effort to prevent a recession. These types of actions can impact financial markets and our business and cause increased financial market and interest rate volatility.
Bank failures, such as those that occurred in 2023, have led the U.S. Treasury Secretary, the FDIC, and the Federal Reserve to invoke the systemic risk exception to the least-cost resolution requirement under the FDIA to guarantee uninsured deposits of the failed banks. The systemic bank exception can only be invoked for financial market risks that pose a threat to financial stability. The FDIC may impose a special assessment on IDIs to recover the loss to the failed bank resulting from the use of the systemic risk exception to protect the uninsured depositors. The potential impact of a special assessment to Key could increase noninterest expense for that quarter, as was the case during the first and second quarters of 2024.
Regulators can implement measures designed to strengthen capital and liquidity standards and restore confidence in the banking system applicable to Key including those discussed in “Regulatory capital requirements” under the heading “Supervision and Regulation” in Item 1 of this report. These regulatory rules could have a material effect on our business, financial condition, and results of operations. Capital and long-term debt requirements require us to divert resources from otherwise profitable lending and investment opportunities to ensure compliance, which may be dilutive to shareholders or limit Key’s ability to buy back shares or pay dividends.
The Federal Home Loan Bank (FHLB) system continues to be a source of funding. Changes in FHLB lending policy could adversely affect our liquidity and profitability.
Further, as market conditions evolve and respond to the influence of government agency initiatives, or lack thereof, the slope of the yield curve will shift and influence our loan and deposit rates and value of investments. The actions of federal agencies are not fully predictable which contributes to market volatility and changes to the slope of the yield curve.
We rely on dividends by our subsidiaries for most of our funds.
We are a legal entity separate and distinct from our subsidiaries. With the exception of cash that we may raise from debt and equity issuances, we receive substantially all of our funding from dividends by our subsidiaries. Dividends by our subsidiaries are the principal source of funds for the dividends we pay on our common and preferred stock and interest and principal payments on our debt. Federal banking law and regulations limit the amount of dividends that KeyBank (KeyCorp’s largest subsidiary) can pay. For further information on the regulatory restrictions on the payment of dividends by KeyBank, see “Supervision and Regulation” in Item 1 of this report.
In the event KeyBank is unable to pay dividends to us, we may not be able to service debt, pay obligations, or pay dividends on our common or preferred stock. Such a situation could result in Key losing access to alternative wholesale funding sources. In addition, our right to participate in a distribution of assets upon a subsidiary’s liquidation or reorganization is subject to the prior claims of the subsidiary’s creditors.
Our credit ratings affect our liquidity position.
The rating agencies regularly evaluate the securities issued by KeyCorp and KeyBank. The ratings of our long-term debt and other securities are based on a number of factors, including our financial strength, ability to generate earnings, and other factors. Some of these factors are not entirely within our control, such as conditions affecting the financial services industry and the economy and changes in rating methodologies. Changes in any of these factors could impair our ability to maintain our current credit ratings. We may be unable to maintain our current ratings and our ratings may be downgraded again in the future. The impact of downgrades to KeyCorp's or KeyBank's credit ratings could adversely affect our access to liquidity and could significantly increase our cost of funds, trigger additional collateral or funding requirements, and decrease the number of investors and counterparties willing to lend to us, reducing our ability to generate income. If KeyCorp’s or KeyBank's credit ratings fell below investment grade, it could also create obligations or liabilities under the terms of existing arrangements that could increase our costs and reduce our profitability.
IV. Operational Risk
We are subject to a variety of operational risks.
We are subject to operational risk, which represents the risk of loss resulting from human error, inadequate or failed internal processes, internal controls, systems, and external events. Operational risk includes the risk of fraud by employees or others outside of Key, clerical and recordkeeping errors, nonperformance by vendors, threats from cyber activity, and computer/telecommunications malfunctions. Fraudulent activity has escalated, become more sophisticated, and is ever evolving as there are more options to access financial services. Operational risk also encompasses compliance and legal risk, which is the risk of loss from violations of, or noncompliance with, laws, rules, regulations, prescribed practices, or ethical standards, as well as the risk of our noncompliance with contractual and other obligations. We are also exposed to operational risk through our outsourcing arrangements, and the effect that changes in circumstances or capabilities of our outsourcing vendors can have on our ability to continue to perform operational functions necessary to our business, such as certain loan processing functions. For example, breakdowns or failures of our vendors’ systems or employees could be a source of operational risk to us. Resulting losses from operational risk could take the form of explicit charges, increased operational costs (including remediation costs), harm to our reputation, inability to secure insurance, litigation, regulatory intervention or sanctions, or foregone business opportunities.
We rely on our employees to design, manage, and operate our systems and controls to assure that we properly enter into, record and manage processes, transactions and other relationships with customers, vendors, suppliers, and other parties with whom we do business. We also depend on employees and the systems and controls for which they are responsible to assure that we identify and mitigate the risks that are inherent in our relationships and activities. These concerns are increased when we change processes or procedures, introduce new products or services, or implement new technologies, as we may fail to adequately identify or manage operational risks resulting from such changes. These concerns may be further exacerbated by employee turnover or labor shortages. As a result of our necessary reliance on employees to perform these tasks and manage resulting risks, we are thus subject to human vulnerabilities. These range from innocent human error to misconduct or malfeasance, potentially leading to operational breakdowns or other failures. Our controls may not be adequate to prevent problems resulting from human involvement in our business, including risks associated with the design, operation and monitoring of automated systems. We may also fail to adequately develop a culture of risk management among our employees.
We and third parties on which we rely (including their downstream service providers) may experience a cyberattack, technology failure, information system or security breach or interruption.
We rely heavily on communications, information systems (both internal and provided by third parties), and the internet to conduct our business. Our business is dependent on our ability to process and monitor large numbers of daily transactions in compliance with legal, regulatory, and internal standards and specifications. In addition, a significant portion of our operations relies heavily on the secure processing, storage, and transmission of personal and confidential information, such as the personal information of our employees, customers, and clients. These risks may increase in the future as we continue to increase mobile payments and other internet-based product offerings, expand our internal usage of web/cloud-based products and applications, and maintain and develop new relationships with third-party providers, including their downstream service providers. In addition, our ability to extend protections to customers’ information to individual customer devices is limited, especially if the customers willingly provide third parties access to their devices or information.
In the event of a failure, interruption, or breach of our information systems, or that of a third party that provides services to us or our customers, we may be unable to avoid impact to our customers. For example, we may experience operational disruptions or interruptions as a result of a cyber incident, including disruption caused by protective containment measures taken by us, such as taking certain first- or third-party systems off-line for a prolonged period. Such a failure, interruption, or breach could result in legal liability, remediation costs, regulatory action, or reputational harm. U.S. financial service institutions and companies have reported breaches in the security of their websites or other systems and several financial institutions, including Key, have had third parties on which they rely experience such breaches. In addition, several financial institutions, including Key, have experienced significant distributed denial-of-service attacks, some of which involved sophisticated and targeted attacks intended to disrupt, disable, or degrade services, or sabotage systems or data. Other attacks have attempted to obtain unauthorized access to confidential, proprietary, or personal information or intellectual property, to extort money through the use of “ransomware” or other extortion tactics, or to alter or destroy data or systems, often through various attack vectors and methods, including the introduction of computer viruses or malicious or destructive code (commonly referred to as “malware”), phishing, cyberattacks, account takeovers, credential stuffing, and other means. To the extent that we use third parties to provide services to our clients, we cannot control all of the risks at these third parties or third parties’ downstream service providers. Hardware, software, or applications developed by Key or received from third parties may contain exploitable vulnerabilities, bugs, or defects in design, maintenance or manufacture or other issues that could unpredictably compromise information and cybersecurity. We depend on third party service providers and their downstream service providers to implement adequate controls and safeguards to protect against and report cyber incidents. While we have a third party risk management program, because we do not control our third party service providers or their downstream service providers and our ability to monitor their cybersecurity is limited, we cannot ensure the cybersecurity measures they take will be sufficient to protect any information we share with them or prevent any disruption arising from a technology failure, cyberattack or other information or security breach. If such parties fail to deter, detect, or report cyber incidents in a timely manner, we may suffer from financial and other harm, including to our information, operations, performance, employees, and reputation. In addition, should an adverse event affecting another company’s systems occur, we may not have indemnification or other protection from the other company sufficient to fully compensate us or otherwise protect us or our clients from the consequences. To date, our losses and costs related to these breaches have not been material, but other similar events in the future could have a material impact on our business strategy, results of operations, or financial condition.
In addition, our customers routinely use Key-issued credit and debit cards to pay for transactions conducted with businesses in person and over the internet. If the business’s systems that process or store debit or credit card information experience a security breach, our card holders may experience fraud on their card accounts. We may suffer losses associated with such fraudulent transactions, as well as for other costs, such as replacing impacted cards. Key also provides card transaction processing services to some merchant customers under agreements we have with payment networks. Under these agreements, we may be responsible for certain losses and penalties if one of our merchant customers suffers a data breach.
We also face risks related to the increasing interdependence and interconnectivity of financial entities and technology systems. A technology failure, cyberattack or other security breach that significantly compromises the systems of one or more financial parties or service providers in the financial system could have a material impact on counterparties or market participants, including us. Such incidents could also lead to widespread technology outages, interruptions or other failures of operational, communication, or other systems globally and across companies and industries. Any third-party technology failure, cyberattack, or security breach could adversely affect our ability to effect transactions, service clients, or otherwise operate our business and could result in legal liability, remediation costs, regulatory action, or reputational harm. Additionally, the increasing use of third-party financial data aggregators and emerging technologies, including the use of automation, artificial intelligence and robotics, introduces new information security risks and exposure for us and for our third party service providers, and, additionally, such technologies may be used to identify vulnerabilities; such technologies have resulted in a substantial increase in the volume and sophistication of cyberattacks against financial and other institutions, including the use of generative artificial intelligence to conduct more sophisticated social engineering attacks. Such security attacks can originate from a wide variety of sources/malicious actors, including, but not limited to, persons who constitute an insider threat, who are involved with organized crime, or who may be linked to terrorist organizations or hostile foreign governments. Those same parties may also attempt to fraudulently induce employees, customers, or other users of our systems to disclose sensitive information in order to gain access to our data or that of our customers or clients through social engineering, phishing, mobile phone malware and SIM card swapping, and other methods. Our security systems, and those of the third-party service providers on which we rely,
may not be able to protect our information systems or data from similar attacks due to the rapid evolution and creation of sophisticated cyberattacks. We are also subject to the risk that a malicious actor or our employees may intercept and/or transmit or otherwise misuse unauthorized personal, confidential, or proprietary information or intellectual property. An interception, misuse, or mishandling of personal, confidential, or proprietary information or intellectual property being sent to or received from a customer or third party could result in legal liability, remediation costs, regulatory action, and reputational harm.
We have incurred and will continue to incur significant expense in an effort to improve the reliability and resilience of our systems and their security against internal and external threats. Nonetheless, we cannot guarantee our measures will be effective or sufficient to prevent a cyber incident, and there remains the risk that one or more adverse events might occur. If one does occur, it could go undetected and persist for an extended period of time and/or we may be unable to remediate the event or its consequences timely or adequately. While we do maintain cyber information security and business interruption insurance, losses from a major interruption may exceed our coverage and there can be no assurance that liabilities or losses we may incur will be covered under such policies, that such insurance will continue to be available to us on economically reasonable terms, or at all, or that any insurer will not deny coverage as to any future claim.
We rely on third parties to perform significant operational services for us, and their failure to perform to our standards or other issues of concern with them could harm us.
Third parties perform significant operational services on our business, and many of our third party vendors outsource aspects of their operations and contractual obligations to downstream service providers. These parties – both our vendors and their downstream service providers – are subject to similar risks as Key. While we have a third party risk management program and can exert varying degrees of influence over our service providers, we do not control them, their actions, or their businesses. For example, one or more of these parties may experience a cybersecurity event, financial distress (including, but not limited to, filing for bankruptcy), operational difficulties, or operational disruptions that could negatively impact performance and delivery of our services. In addition, some of our third party arrangements are located overseas and, therefore, are subject to risks unique to the regions in which they operate. Service providers have not always met our requirements and expectations, and no assurance can be provided that in the future they will perform to our standards, adequately represent our brand, comply with applicable law, appropriately manage their own risks, including cybersecurity, remain financially or operationally viable, abide by their contractual obligations, or continue to provide us with the services that we require or that they are contractually obligated to provide. Disruption in services provided by these third parties, including a discontinuation or delay in services, could increase the costs of doing business and adversely affect our ability to deliver products and services to clients, to support teammates, and otherwise to conduct business, which would negatively impact our customer relationships, our reputation, and our business.
Further, regulatory guidance adopted by federal banking regulators related to how banks select, contract with, evaluate, engage with, and manage their third parties, including such third parties’ use of subcontractors and downstream service providers, impacts whether and how we work with such parties, as well as the cost of managing such relationships. In some instances, we may be responsible for failures of third parties to comply with government regulations. We may need to incur substantial expenses to address issues with a service provider, and if the issues cannot be acceptably resolved, we may not be able to timely or effectively replace the service provider due to contractual restrictions, the unavailability of acceptable alternative providers, or other reasons. Further, regardless of how much we can influence our service providers, issues of concern with them could result in supervisory actions and private litigation against us and could harm our reputation, business, and financial results. Certain third parties may have limited identification obligations to us or may not have the financial capacity to satisfy their indemnification obligations, and our insurance coverage may be inadequate to protect us from losses related to the actions of our third party vendors and their downstream service providers.
Our framework for managing risks and mitigating losses may not be effective.
Our risk management framework seeks to maintain safety and soundness and maximize profitability. We have established policies, processes, and procedures intended to identify, measure, monitor, report, and analyze the types of risk to which we are subject, including compliance, operational, liquidity, market, credit, model, reputational, and strategic risk, among others. We cannot provide assurance that our risk management framework will effectively mitigate risk and limit losses in our business and operations. For example, our risk management framework and measures that we take to mitigate risk may not be fully effective in identifying and mitigating our risk exposure in all
market environments or against all types of risks, including risks that are unidentified or unanticipated, even if the frameworks for assessing risk are properly designed and implemented. In addition, some of our methods of managing risk are based upon our use of observed historical market behavior and management’s judgment. These methods may not accurately predict future exposures, which could be significantly greater than historical measures indicate. If our risk management framework proves ineffective, we could suffer unexpected losses and our business, results of operations, and financial condition could be adversely affected.
We are, and may in the future be, subject to claims, litigation, arbitration, investigations, and governmental proceedings, which could result in significant financial liability and/or reputational harm.
We are subject to, and may in the future be subject to, claims or legal actions taken against us by customers, vendors, shareholders, or other parties. Further, KeyCorp is currently named, and KeyCorp and certain of its officers and directors have in the past been named, and may in the future be named, as defendants in various class actions, mass arbitrations, and other litigation relating to our business and activities. We maintain reserves for certain claims when deemed appropriate based upon our assessment that a loss is probable, estimable, and consistent with applicable accounting guidance. At any given time, we have a variety of legal actions asserted against us in various stages of litigation. Resolution of a legal action can often take years. Whether any particular claims and legal actions are founded or unfounded, if such claims and legal actions are not resolved in our favor, they may result in significant financial liability and adversely affect how the market perceives us and our products and services as well as impact customer demand for those products and services.
We are also involved, from time to time, in other information-gathering requests, reviews, investigations, and proceedings (both formal and informal) by governmental and self-regulatory agencies regarding our business, including, among other things, accounting, compliance, and operational matters, which may result in adverse judgments, settlements, fines, penalties, injunctions, or other relief which, if significant, could adversely affect our business, results of operations and/or financial condition. Enforcement authorities may also seek admissions of wrongdoing and, in some cases, criminal pleas as part of the resolutions of matters and any such resolution of a matter involving Key could lead to increased exposure to private litigation, could adversely affect Key’s reputation, and could result in limitations on our ability to do business in certain jurisdictions. Further, enforcement matters could impact our supervisory and CRA ratings, which may in turn restrict or limit certain of our business activities. In recent years, there has been an increase in the number of investigations and proceedings in the financial services industry. A violation of law or regulation by another financial institution has, in the past, resulted in, and may, in the future, give rise to an inquiry or investigation by regulators or other authorities of the same or similar practices by Key. The outcome of regulatory matters as well as the timing of ultimate resolution are inherently difficult to predict, and the uncertain regulatory enforcement environment makes it difficult to estimate probable losses, which can lead to substantial disparities between legal reserves and actual settlements or penalties.
Our controls and procedures may fail or be circumvented, and our methods of reducing risk exposure may not be effective.
We regularly review and update our internal controls, disclosure controls and procedures, compliance monitoring activities, and corporate governance policies and procedures. We also maintain an ERM program designed to identify, measure, monitor, report, and analyze our risks. Additionally, our internal audit function provides an independent assessment and testing of Key’s internal controls, policies, and procedures. Any system of controls and any system to reduce risk exposure, however well designed, operated, and tested, is based in part on certain assumptions and can provide only reasonable, not absolute, assurances that the objectives of the system are met. The systems may not work as intended or be circumvented by employees, third parties, or others outside of Key. Additionally, instruments, systems, and strategies used to hedge or otherwise manage exposure to various types of market compliance, credit, liquidity, operational, and business risks and enterprise-wide risk could be less effective than anticipated. As a result, we may not be able to effectively or fully mitigate our risk exposures in particular market environments or against particular types of risk.
Our operations and financial performance could be adversely affected by severe weather and natural disasters exacerbated by climate change.
Natural disasters, including wildfires, tornadoes, severe storms, and hurricanes, have seemingly become more frequent and severe due to climate change. The timing and effects of these climate-related physical risks are difficult to accurately predict, and the potential impact of such risks on our operations, employees, communities, and
customers could have a material adverse effect on our business, financial position, and results of operations. Given our broad regional focus, we are exposed to a wide range of climate-related physical risks across different geographical areas. Severe weather events can directly affect our operations by interrupting systems, damaging facilities, disrupting our supply chain, and hindering our ability to conduct business as usual. Additionally, these events can indirectly impact us by damaging or destroying customer businesses, impairing their ability to repay loans, or causing damage to properties pledged as collateral for loans made by Key. Although preventative measures may help to mitigate damage, such measures could be costly, and any disaster could adversely affect our ability to conduct our business as usual. Furthermore, the insurance we maintain may not be adequate to cover our losses resulting from any business interruption resulting from a natural disaster or other severe weather events. Recurring extreme weather events could also reduce the availability or increase the cost of insurance. Our failure to comply with evolving regulatory requirements related to natural disaster risk management may also result in legal and financial consequences.
Societal and governmental responses to climate change could adversely affect our business and performance, including indirectly through impacts on our customers.
Concerns over the long-term impacts of climate change have led and may continue to lead to governmental efforts around the world to mitigate those impacts, creating potential transition risk. Transition risks could include additional regulatory requirements or legislation, changes in stakeholder behaviors, or the development of new technologies to aid in the transition to a low-carbon economy, New and/or changing regulatory requirements could affect our results by requiring us to take costly measures to comply with any new laws or regulations related to climate change that may be adopted by federal, state, and local governments or regulators. Consumers and businesses also may change their own behavior as a result of these concerns. We and our customers may face cost increases, asset value reductions, operating process changes, and the like. In addition, the multiple and potentially conflicting laws and regulations regarding climate change that have been or may be adopted by various jurisdictions could increase our cost of doing business and make compliance with such laws and regulations more difficult. The impact on our customers will likely vary depending on their specific attributes, including reliance on or role in carbon-intensive activities.
The increased use of remote work infrastructure has expanded potential attack vectors and resulted in increased operational risks.
The increase in remote work over the past several years has resulted in an expanded potential attack surface and heightened operational risks and may negatively impact our ability, and the ability of our third-party service providers (including their downstream service providers), to perform services efficiently, securely, and without interruptions. In addition to some of our workforce working remotely periodically or on a full-time basis, our third-party service providers (including their downstream service providers) may utilize personnel who work remotely. Increased levels of remote access create additional cybersecurity risk and opportunities for cybercriminals to exploit vulnerabilities. These fraudulent activities have resulted in increased fraud losses to us and the financial services industry generally. In addition to enhanced cybersecurity risk, employees and other personnel performing services for us who work remotely may experience disruptions to their home internet or phone connections, decreased efficiency due to delayed network speeds or other interruptions, and/or delays in the dissemination and exchange of information, any of which could negatively impact our operations. We have experienced, and may continue to experience, disruption related to remote work, which disruptions could adversely impact our business, and could result in legal liability, regulatory penalties, litigation expenses, remediation costs, or reputational harm.
V. Compliance Risk
We are subject to extensive government regulation, supervision, and tax legislation.
As a financial services institution, we are subject to extensive federal and state regulation, supervision, and tax legislation. Banking regulations are primarily intended to protect depositors’ funds, the DIF, consumers, taxpayers, and the banking system as a whole, not our debtholders or shareholders. These regulations increase our costs and affect our lending practices, capital structure, investment practices, dividend policy, ability to repurchase our common shares, and growth, among other things.
KeyBank and KeyCorp remain covered institutions under the Dodd-Frank Act’s enhanced prudential standards and regulations, including its provisions designed to protect consumers from financial abuse. Like similarly situated
institutions, Key undergoes routine scrutiny from bank supervisors in the examination process and is subject to enforcement of regulations at the federal and state levels, particularly with respect to customer practices involving fair and responsible banking, fair lending, unfair, deceptive or abusive practices, and the Community Reinvestment Act, as well as compliance with AML, BSA and Office of Foreign Assets Control efforts.
Changes to existing statutes and regulations, and taxes (including industry-specific taxes and surcharges), or their interpretation or implementation, could affect us in substantial and unpredictable ways, particularly with those laws and regulations that serve to protect customers. Such changes may subject us to additional costs, adversely impact our income, and increase our litigation risk should we fail to appropriately comply and may also impact consumer behavior, limit the types of financial services and products we may offer, affect the investments we make, and change the manner in which we operate. In addition, changes to laws and regulations may impact our customers by requiring them to adjust their operations or practices or impair their ability to pay fees or outstanding loans or afford new products, which could negatively impact demand for our products and services.
Certain federal regulations have been in existence for decades without modification to account for modern banking practices, such as digital delivery of products and services, which can create challenges in execution and in the examination process. Emerging technologies, such as cryptocurrencies, could limit KeyBank’s ability to track the movement of funds. KeyBank’s ability to comply with BSA/AML and other regulations is dependent on its ability to continuously improve detection and reporting capabilities and reduce variation in control processes and oversight accountability.
Additionally, federal banking law grants substantial enforcement powers to federal banking regulators. This enforcement authority includes, among other things, the ability to assess civil money penalties, fines, or restitution, to issue cease and desist or removal orders, and to initiate injunctive actions against banking organizations and affiliated parties. These enforcement actions may be initiated for violations of laws and regulations, for practices determined to be unsafe or unsound, or for practices or acts that are determined to be unfair, deceptive, or abusive. Failure to comply with these and other regulations, and supervisory expectations related thereto, may result in fines, penalties, lawsuits, regulatory sanctions, reputational damage , or restrictions on our business. Moreover, different government administrations may have different regulatory priorities, which may impact the level of regulation of financial institutions and the enforcement environment. For more information, see “Supervision and Regulation” in Item 1 of this report.
We are subject to complex and evolving laws and regulations regarding privacy and cybersecurity, which could limit our ability to pursue business initiatives, increase the cost of doing business and subject us to compliance risks and potential liability.
We are subject to complex and evolving laws, regulations, and requirements governing the privacy and protection of personal information of our customers, employees, job applicants, and other individuals. Complying with laws, regulations, and requirements applicable to our collection, use, transfer, and storage of personal information, as well as notification requirements related to our obligations with respect to such personal information, can increase operating costs, impact the development and marketing of new products or services, and reduce operational efficiency. Any mishandling or misuse of personal information by Key or our vendors or our failure to comply with notification requirements related to incidents relating to such personal information could expose us to litigation or regulatory fines, penalties, or other sanctions.
At the federal level, we are subject to the Gramm-Leach-Bliley Act of 1999, as amended, which requires financial institutions to, among other things, periodically disclose their privacy policies and practices relating to sharing personal information and, in some cases, enables customers to opt out of the sharing of certain non-public personal information with unaffiliated third parties. We are also subject to the rules and regulations promulgated under the authority of the Federal Trade Commission, which regulates unfair or deceptive acts or practices, including with respect to privacy and cybersecurity. A number of states have also recently enacted consumer privacy laws that impose compliance obligations with respect to personal information or issued guidance regarding the same, such as the California Consumer Privacy Act of 2018, as amended by the California Privacy Rights Act (known as the “CCPA”), and the New York Department of Financial Services Cybersecurity Regulations. In addition, there has been a significant increase in privacy-related litigation in recent years with respect to how organizations collect information and technical data from their public facing websites, and federal and state courts have been creating new legal frameworks around consumer and website privacy, which also creates new risks on businesses. As new privacy-related laws and regulations, and judicially-created frameworks, are implemented in jurisdictions in which
KeyBank operates, the time and resources needed for us to comply with such laws and regulations, as well as our potential liability for noncompliance and reporting obligations in the case of data breaches, may significantly increase. Compliance with these laws and regulations has required and may continue to require us to change our policies, procedures, and technology for information security and segregation of data, which could, among other things, make us more vulnerable to operational failures, result in increased costs as a result of continually evaluating our policies and processes and adapting to new requirements that are or become applicable to us, and subject us to monetary penalties for breach of such laws and regulations. As a result, some uncertainty remains as to the aggregate impact upon Key of significant regulations.
VI. Strategic Risk
We may not realize the expected benefits of our strategic initiatives.
Our ability to compete depends on a number of factors, including, among others, our ability to develop and successfully execute our strategic plans and initiatives. Our strategic priorities include growing profitability; acquiring and expanding targeted client relationships; effectively managing risk and rewards; maintaining financial strength; fostering an inclusive work environment for all employees; and engaging, retaining, and inspiring our high-performing and talented workforce. The success of these initiatives can be subject to changes in the macroeconomic environment that are beyond our control. In addition, our inability to execute on or achieve the anticipated outcomes of our strategic priorities, or to do so in the expected timeframe, may affect how the market perceives us and could impede our growth and profitability.
We operate in a highly competitive industry.
We face substantial competition in all areas of our operations from a variety of competitors, some of which are larger and may have more financial resources than us. Our competitors primarily include national and super-regional banks as well as smaller community banks within the various geographic regions in which we operate. We also face competition from many other types of financial institutions, including, without limitation, savings associations, credit unions, mortgage banking companies, finance companies, mutual funds, insurance companies, investment management firms, private credit funds, investment banking firms, broker-dealers, financial technology companies, and other local, regional, national, and global financial services firms. In addition, technology has lowered barriers to entry and made it possible for nonbanks, including large technology companies, to offer products and services traditionally provided by banks. We expect the competitive landscape of the financial services industry to become even more intense as a result of legislative, regulatory, structural, customer preference, and technological changes.
Our ability to compete successfully depends on a number of factors, including: our ability to develop and execute strategic plans and initiatives; our ability to develop, maintain, and build long-term client relationships; our ability to develop and deliver competitive products and technologies expected by our customers, while maintaining safety and soundness, effective risk management practices, and high ethical standards; our ability to attract, retain, and develop an employee workforce with the required skills and expertise; and industry and economic trends. Increased competition in the financial services industry, or our failure to perform in any of these areas, could significantly weaken our competitive position, which could adversely affect our growth and profitability.
Strategic risk may also be realized due to events or issues that materialize in other risk factor areas. For example, significant deficiencies in end-to-end operational execution and/or product delivery or failure to comply with applicable laws and regulations may result in unmet client expectations or harm and impact our competitive standing in the industry.
Maintaining or increasing our market share depends upon our ability to adapt our products and services to evolving industry standards and consumer preferences, while maintaining competitive products and services.
The continuous, widespread adoption of new technologies requires us to continually evaluate our product and service offerings to ensure they remain competitive. Our success depends, in part, on our ability to adapt our products and services, as well as our distribution of them, to evolving industry standards and consumer preferences. New technologies have altered consumer behavior by allowing consumers to complete transactions such as paying bills or transferring funds directly without the assistance of banks. New products allow consumers to maintain funds in brokerage accounts or mutual funds that would have historically been held as bank deposits. The
process of eliminating banks as intermediaries, known as “disintermediation,” could result in the loss of fee income, as well as the loss of customer loans and deposits and related income generated from those products.
The increasing pressure from our competitors, both bank and nonbank, to keep pace and adopt new technologies and products and services requires us to incur substantial expense. We may be unsuccessful in developing or introducing new products and services, modifying our existing products and services, adapting to changing consumer preferences and spending and saving habits, achieving market acceptance or regulatory approval, sufficiently developing or maintaining a loyal customer base, or offering products and services at prices equal to or lower than the prices offered by our competitors. These risks may affect our ability to achieve growth in our market share and could reduce both our revenue streams from certain products and services and our revenues from our net interest income.
We may not be able to attract and retain skilled people.
Our success depends on our ability to attract, retain, motivate, and develop a high performing, inclusive, and collaborative workforce. Competition for talent in our business is strong and requires us to make investments to provide compensation and benefits at market levels. Rising wages, as well as inflation, may cause us to increase these investments. Such investments cause compensation and benefits to represent our greatest expense.
Additionally, we increasingly compete for talent outside of the core financial services industry. Non-financial institutions may be subject to different pay and hiring expectations than us, which may make it more difficult for us to attract qualified teammates. For example, we are required to deliver a substantial portion of the variable compensation of certain teammates in the form of awards tied to our financial performance and/or share price performance. Our failure to achieve our long-term financial goals and/or our share price performance may cause the value of these awards to decline or fall to zero, which would impact our ability to retain and incentivize qualified teammates. Similarly, our pay practices are subject to scrutiny by our regulators who may identify deficiencies in the structure of, or issue additional guidance on our compensation practices, causing us to make changes that may affect our ability to offer competitive pay to these individuals or that place us at a disadvantage to non-financial service industry competitors.
Finally, while remote work opportunities allow us to hire outside of our traditional footprint, it also increases competition. These factors individually, or collectively, may constrain our ability to hire or retain a sufficient number of qualified employees, which could impact our ability to serve our customers and clients.
Acquisitions or strategic partnerships may disrupt our business and dilute shareholder value.
Acquiring other banks, bank branches, or other businesses involves various risks commonly associated with acquisitions or partnerships, including exposure to unknown or contingent liabilities of the acquired company; diversion of our management’s time and attention; significant integration risk with respect to employees, accounting systems, and technology platforms; increased regulatory scrutiny; and the possible loss of key employees and customers of the acquired company. We regularly evaluate merger and acquisition and strategic partnership opportunities and conduct due diligence activities related to possible transactions. As a result, mergers or acquisitions involving cash, debt or equity securities may occur at any time. Acquisitions may involve the payment of a premium over book and market values. Therefore, some dilution of our tangible book value and net income per common share could occur in connection with any future transaction.
Scotiabank holds a significant equity interest in our business and may exercise influence over us, including through its ability to designate up to two directors to our Board of Directors.
Scotiabank holds approximately 14.9% of our issued and outstanding common shares. Pursuant to the Investment Agreement, dated August 12, 2024, between us and Scotiabank (the “Investment Agreement”), Scotiabank is entitled to designate up to two directors to our Board of Directors, subject to specified minimum ownership requirements. As of the date hereof, our Board of Directors includes two directors who were appointed pursuant to Scotiabank’s director designation rights. As a result of the amount of common shares that are currently held by Scotiabank, together with its director designation rights, Scotiabank may be able to influence our policies and operations and impact matters requiring shareholder approval. In addition, the existence of a large shareholder may have the effect of deterring takeovers, delaying or preventing changes in control or changes in management, or limiting the ability of our other shareholders to approve transactions that they may deem to be in the best interests
of our company. The interests of Scotiabank with respect to matters potentially or actually involving or affecting us and our other shareholders, such as future acquisitions, financings, and other corporate opportunities and attempts to acquire us, may conflict with the interests of our other shareholders.
VII. Reputation Risk
Damage to our reputation could significantly impact our business and major stakeholders.
Our ability to attract and retain customers, clients, investors, and highly skilled management and employees is affected by our reputation. Damage to our reputation could also adversely impact our credit ratings and access to capital markets.
Significant harm to our reputation can arise from various sources, including inappropriate behavior or misconduct of employees, actual or perceived unethical behavior, litigation or regulatory outcomes, inadequate or ineffective risk management practices, failing to deliver minimum or required standards of service and quality, corporate governance and regulatory compliance failures, disclosure of confidential information, significant or numerous failures, interruptions or breaches of our information systems, complex fraud threats, failure to meet external commitments and goals, including financial corporate responsibility and sustainability related commitments, the activities of our clients, customers and counterparties, including vendors, and actions taken by shareholder activists and community organizations. Additionally, actions by the financial services industry generally or by certain members or individuals in the industry as well as legislative or regulatory actions that target or negatively impact the industry may also have a significant adverse effect on our reputation.
Negative coverage about Key published in traditional media or on social media websites, whether or not factually correct, may affect our reputation and our business prospects and impact our ability to attract and retain highly skilled employees. Social media facilitates the rapid dissemination of information or misinformation, thereby increasing the potential for widespread dissemination of inaccurate, false, misleading, or other negative information that could damage our reputation. Negative public opinion can also adversely affect our ability to attract and maintain customer relationships and could subject us to litigation and regulatory action.
We are also subject to the risk that disruptions to how our customers access our banking services, such as disruptions to our technology platforms (e.g., online banking websites or mobile applications) or other impacts to our branches, could harm our reputation with customers. In particular, a cybersecurity event impacting Key or our customers’ data or personal information could negatively impact our reputation and customer confidence in Key and our data security procedures. Increased model and generative AI use could expose us to liability or adverse legal or regulatory consequences and harm our reputation and the public perception of our business or the effectiveness of our security measures.
We could also suffer significant reputational harm if we fail to properly identify and manage potential conflicts of interest. Management of potential conflicts of interests is complex as we expand our business activities through more numerous transactions, obligations, and interests with and among our clients. The actual or perceived failure to adequately address conflicts of interest could affect the willingness of clients to deal with us, which could adversely affect our businesses, and could give rise to litigation or enforcement actions.
Key is subject to corporate responsibility and sustainability efforts risks that could adversely affect our reputation and our business and results of operations.
Views about corporate responsibility and sustainability-related issues are diverse, dynamic, and rapidly changing. Financial services companies, including Key, face increasing criticism from social and environmental activists who target companies, including Key, for engaging in business with clients engaged in industries which such activists perceive to be harmful to communities or the environment. Such criticism directed at Key could generate dissatisfaction among our stakeholders. Additionally, however we respond to such criticism, we face the risk that current or potential clients may decline to do business with us or current or potential employees refuse to work with us. This can be true regardless of whether we are perceived by some as not having done enough to address activist concerns or by others as having inappropriately yielded to activist pressures. Conversely, there exists anti-environmental, social and governance (ESG) and anti-diversity, equity, and inclusion (DEI) sentiment among certain stakeholders and government institutions, which has gained momentum across the U.S. For example, President Trump recently issued an executive order opposing DEI initiatives in the private sector, and certain states have
taken, and may in the future take, actions or proposed measures to limit the state’s ability to do business with financial institutions or other businesses identified as discriminating against certain industries or practices based on environmental or social criteria. We could be exposed to reputational, financial, and legal risk as a result of anti-ESG and anti-DEI sentiment, and our ability to retain and attract customers and employees may be negatively impacted as a result of these contrasting arguments in how a financial institution should address these issues.
Companies are facing increasing scrutiny from customers, regulators, investors, and other stakeholders related to their corporate responsibility and sustainability practices and disclosures. We may face criticism or a loss of confidence, with accompanying reputational risk, from our perceived action or inaction to deliver on our corporate responsibility and sustainability-related commitments. Investors and other stakeholders, including U.S. institutional investors, are increasingly considering how corporations are incorporating corporate responsibility and sustainability matters, including climate-related financial risks, into their business strategy when analyzing the expected risk and return of potential investments. The specific factors considered, as well as the approach to incorporating the factors into a broader investment process, vary by investor and can shift over time. These shifts in investing priorities may result in adverse effects on the trading price of our common stock if investors determine that Key has not made sufficient progress on corporate responsibility and sustainability matters or is not aligned with the investors’ priorities. In addition, collecting, measuring, and reporting corporate responsibility and sustainability information and metrics can be costly, difficult and time consuming, is subject to evolving and potentially conflicting reporting standards, and can present numerous operational, reputational, financial, legal, and other risks. Further, inadequate processes to collect and review this information prior to disclosure could result in potential liability related to such information.
VIII. Model Risk
We rely on quantitative models to manage certain accounting, risk management, capital planning, and treasury functions.
We use quantitative models to help manage certain aspects of our business and to assist with certain business decisions, including, but not limited to, estimating ALLL, measuring the fair value of financial instruments when reliable market prices are unavailable, estimating the effects of changing interest rates and other market measures on our financial condition and results of operations, managing risk, predicting cash flows, and for capital planning purposes (including during the capital stress testing process). Models are simplified representations of real-world relationships. Thus, our modeling methodologies rely on many assumptions, historical analyses, correlations, and available data. These assumptions provide only reasonable, not absolute, estimates, particularly in times of market distress when historical correlations on which we rely may no longer be relevant. Additionally, as businesses and markets evolve, our measurements may not accurately reflect this evolution. Models can also produce inadequate estimates due to errors in computer code, use of unsuitable data during development or input into the model during model use, or the use of a model for a purpose outside the scope of the model’s design.
Some models we use employ methodologies based on artificial intelligence (AI) or machine learning (ML). These models bring some unique complexities from those of traditional models, such as the need for large datasets for training, the potential for algorithmic bias, and the difficulty in interpreting model decisions.
If our models fail to produce reliable results on an ongoing basis, we may not make appropriate risk management, capital planning, or other business or financial decisions. Furthermore, strategies that we employ to manage and govern the risks associated with our use of models may not be effective or fully reliable, and as a result, we may realize losses or other lapses.
We have an enterprise-wide model risk management program designed to accurately identify, measure, report, monitor, and manage model risk. The management of model risk includes independent validation and model governance, establishing and monitoring model control standards and model risk metrics, and completeness and accuracy of the inventory of models.
Banking regulators continue to focus on the models used by banks and bank holding companies in their businesses. The failure or inadequacy of a model may result in increased regulatory scrutiny on us or may result in an enforcement action or proceeding against us by one of our regulators.
IX. Estimates and Assumptions Risk
The preparation of our consolidated financial statements requires us to make subjective determinations and use estimates that may vary from actual results and materially impact our financial condition and results of operations.
The preparation of consolidated financial statements in conformity with U.S. GAAP requires management to make significant estimates that affect the financial statements. Our accounting policies and methods are fundamental to how we record and report our financial condition and results of operations. Some of these policies require the use of estimates and assumptions that may affect the value of the Key’s assets or liabilities and financial results. Certain accounting policies are critical because they require management to make difficult, subjective or complex judgments about matters that are inherently uncertain and the likelihood that materially different estimates would result under different conditions or through the utilization of different assumptions. If assumptions or estimates underlying the Key’s consolidated financial statements are incorrect or are adjusted periodically, our financial condition and results of operations could be materially impacted. See the “Critical Accounting Policies” section of Item 7. Management’s Discussion and Analysis of Financial Condition and Results of Operations in this report for additional information.
Changes in accounting policies, standards, and interpretations could materially affect how we report our financial condition and results of operations.
The FASB periodically changes the financial accounting and reporting standards governing the preparation of Key’s consolidated financial statements. Additionally, those bodies that establish and/or interpret the financial accounting and reporting standards (such as the FASB, SEC, and other regulatory agencies) may change prior interpretations or positions on how these standards should be applied. These changes can be difficult to predict and can materially affect how Key records and reports its consolidated financial condition and results of operations. In some cases, Key could be required to retroactively apply a new or revised standard, resulting in changes to previously reported financial results.
Impairment of goodwill could require charges to earnings, which could result in a negative impact on our results of operations.
Goodwill is periodically tested for impairment by comparing the fair value of each reporting unit to its carrying amount. If the fair value is greater than the carrying amount, then the reporting unit’s goodwill is deemed not to be impaired. The fair value of a reporting unit is impacted by the reporting unit’s expected financial performance and susceptibility to adverse economic, regulatory, and legislative changes. A significant decline in a reporting unit’s expected future cash flows, a significant adverse change in the business climate, slower economic growth or a significant and sustained decline in the price of our common stock may cause the fair value of a reporting unit to be below its carrying amount, resulting in goodwill impairment. If an impairment loss is recorded, it will have little or no impact on the tangible book value of our common stock, or on our regulatory capital levels, but such an impairment loss could significantly reduce our earnings and thereby restrict KeyBank’s ability to make dividend payments to us without prior regulatory approval, which in turn could impact our ability to pay dividends. At December 31, 2024, the book value of our goodwill was $2.8 billion, substantially all of which was recorded at KeyBank. Any such write down of goodwill will reduce Key’s earnings, as well. See the “Critical Accounting Policies” section of Item 7. Management’s Discussion and Analysis of Financial Condition and Results of Operations in this report for additional information.
ITEM 1B. UNRESOLVED STAFF COMMENTS
None.
ITEM 1C. CYBERSECURITY
Cybersecurity Risk Management
As a financial services institution, Key faces heightened risk of cybersecurity incidents. Risks and exposures related
to cybersecurity incidents are expected to remain high for the foreseeable future due to the rapidly evolving nature
and sophistication of cybersecurity threats and geopolitical events, as well as due to the expanding use of Internet and mobile banking and other technology-based products and services utilized by us and our clients, including products and services that utilize the cloud and artificial intelligence (AI), among other emerging technologies. To date, Key has not experienced material disruption to our operations, or material harm to our client base, from cyberattacks. However, we have incurred, and may again incur, expenses related to the investigation of cybersecurity incidents involving third-party providers or related to the protection of our clients from identity theft as a result of such incidents. We have also incurred, and may continue to incur, expenses to enhance our systems or processes to protect against cyber or other security incidents. For more information, see “Risk Factors—We and third parties on which we rely (including their downstream service providers) may experience a cyberattack, technology failure, information system or security breach or interruption” in Item 1A. Risk Factors of this report.
Key maintains an Information Security Program (the “IS Program”) to support the management of information security risk, including cybersecurity risk, across the organization. The IS Program is designed to protect Key’s
clients, employees, third parties, and assets from threats by managing the confidentiality, availability, and integrity of
Key’s information assets. Our Chief Information Security Officer (“CISO”), who is also the Enterprise Security
Executive, oversees the IS Program and its related policy and has overall responsibility for managing the appropriate identification and ownership of cybersecurity risks. Key’s Corporate Information Security Team, under the oversight of the CISO, is responsible for maintaining the IS Program, assessing program-level risks and threats to our information assets, and overseeing the proper level of investment in security resources.
The IS Program is designed to provide safeguards for Key’s assets through a series of administrative, technical,
and physical controls. Key employs a variety of security practices and controls to protect information and assets,
including, but not limited to, access controls, vulnerability scans, network monitoring, internal and external
penetration testing, monitoring of vendor vulnerability notices and patch releases, scanning of systems and emails
for malware and other vulnerabilities, firewalls and intrusion detection and prevention systems, and dedicated
security personnel.
As described in more detail in “Risk Management — Overview” in Item 7 of this report and in “Cybersecurity
Governance” below, Key employs the “Three Lines of Defense” in its risk governance framework. Assessing,
identifying, and managing cybersecurity risk across the organization in support of the IS Program is a cross-functional effort that requires collaboration and direction from all lines of defense – the lines of business and support functions (First Line of Defense), Risk Management (Second Line of Defense), and the Risk Review Group (RRG), Key’s internal audit function (Third Line of Defense):
•First Line of Defense – Lines of Business and Support Functions. Primary responsibility for day-to-day management of cybersecurity risk lies with the senior management of each of Key’s lines of business (LOB) and support functions. The LOB and support functions own and manage the individual processes and procedures that are used throughout the IS Program, implement and manage business-specific security controls, and enforce behavioral controls throughout the management structure.
•Second Line of Defense – Risk Management. Risk Management oversees risk and monitors the First Line of Defense controls. Operational Risk Management performs review and challenge of controls, monitors the operational risk profile, and ensures Key operates within its operational risk appetite. Compliance Risk Management provides an independent, enterprise-wide function that focuses on compliance with laws, rules, regulations, and guidance applicable to Key. Privacy Compliance, which sits within Compliance Risk Management, provides advisory support, governance, and oversight of privacy-related statutes, regulations, and risks related to Key’s customers, employees, and other individuals from who Key collects personally identifiable information.
•Third Line of Defense – Risk Review Group (RRG). The RRG reviews and evaluates the scope and breadth of security activities throughout Key and the effectiveness of the IS Program. RRG conducts independent internal
audits on Key’s LOBs, operations, information systems, and technologies. These internal audits provide an independent perspective on Key’s processes and risks. Technology risks are evaluated in areas including cybersecurity and information security, data control, acquisition and development, delivery and support, business continuity, and information technology governance. RRG shares the results of its audits with the LOB management, Key’s Operational and Compliance Risk Management Groups, the Board’s Audit Committee, and banking regulators.
As part of its cybersecurity risk management strategy, Key regularly reviews its security and privacy controls in the context of industry standard practices, frameworks, evolving laws, and changing client expectations. Key engages external providers periodically to perform a maturity assessment of the IS Program against industry cybersecurity frameworks. Key also engages external advisors periodically to perform security posture assessments of our environment to proactively identify weakness within our security policy and/or configurations. Summary level results from these assessments are shared to internal stakeholders through Key’s Risk Governance committee structure. Key is also subject to cybersecurity and privacy regulatory exams, as required by law for financial institutions.
Key has implemented cybersecurity, privacy, and fraud education and awareness programs across the
enterprise to educate teammates on how to identify and report cybersecurity and privacy concerns. Employees and
contractors with access to assets or data owned or maintained by Key receive mandatory enterprise-wide
cybersecurity, privacy, and fraud training on an annual basis. In addition, our management team from time to time participates in cybersecurity tabletop exercises that simulate cybersecurity incidents. These exercises are intended to test our response to potential incidents and assess the procedures outlined in our incident response playbooks.
With respect to third party service providers, Key maintains a third party management program that is designed to
identify, review, monitor, escalate, and, if necessary, remediate third party information security risks. Key’s third
party onboarding process includes risk-based due diligence and security-relevant contract language. Risk-based
due diligence can also include an assessment of the strength of certain control areas, including, but not limited to,
information security management, physical security, network security, platform security, application security, cloud
security, encryption management, business resiliency, and privacy. Once a business relationship is established with a service provider, Key performs risk-based periodic reviews of the third party service provider's security programs. In addition to an established governance approval process for new engagements, Key has established a Third Party Management Committee to oversee compliance with Key’s Third Party Management Policy and Program.
Cybersecurity Governance
As described in more detail in “Risk Management — Overview” in Item 7 of this report, the Board serves in an
oversight capacity to ensure that Key’s risks, including risk from cybersecurity threats, are managed in a manner that is effective and balanced and adds value for our shareholders. The Board’s Risk Committee exercises primary oversight over enterprise-wide risk at Key, including operational risk, which includes cybersecurity risk, and provides oversight of management’s activities related to cybersecurity risk. The Board’s Audit Committee monitors and exercises oversight over cybersecurity risk as part of its joint oversight of operational risk with the Risk Committee. The Board’s Technology Committee provides additional oversight of management’s activities related to Key’s technology strategic investment plan, cybersecurity investments, and major technology vendor relationships and is expected to escalate to the Risk Committee on certain risk management issues.
Key’s CISO oversees the IS Program and its related policies and is responsible for determining whether relevant security risk information is properly integrated into strategic and business decisions, overseeing the appropriate identification and ownership of security risks, monitoring critical risks, and maintaining the appropriate oversight and governance of information security through associated programs and/or standards. Our CISO has served in various roles in information technology and information security at Key for over 30 years, including serving as Enterprise Security Executive. The CISO holds a B.S.B.A in Management Information Systems.
The CISO is responsible for reporting on information security matters, including cybersecurity risk, to the Board. The CISO provides updates to the Audit Committee on cybersecurity matters at each regularly scheduled Committee meeting (six times in 2024). The CISO’s update to the Committee generally address the cybersecurity threat landscape, information security trends, strategic initiatives related to information security, and cybersecurity program reviews. The CISO also updates the Risk Committee on cybersecurity matters and on Key’s compliance with the Gramm-Leach-Bliley Act on an annual basis and presents the Information Security Policy for approval. The CISO, along with Key’s Deputy CISO, also report annually to the Technology Committee to obtain approval on Key’s Cyber Strategy and Investment Plan. The CISO provides updates to the Board as needs arise and from time to time.
Key’s Deputy CISO leads the Corporate Information Security function, including the Cyber Defense Center, Identity
& Access Management Operations, Information Security Governance and Data Protection, and Security Architecture, Engineering and Platform Operations. The Deputy CISO has over 17 years of cybersecurity and technology risk management experience across financial services and retail, previously served as the Head of Information Security Governance within KeyCorp’s Corporate Information Security group, as well as the Head of Cybersecurity and Technology Risk Oversight within KeyCorp’s Risk Management group. He holds a bachelor’s degree in Finance and Management Information Systems and an MBA.
The CISO reports to Key’s Chief Information Officer who oversees all of Key’s shared services for technology,
operations, data, servicing, cyber and physical security, and corporate real estate solutions. Our Chief Information Officer, who has served in the role since 2012, has extensive experience overseeing technology and operations delivery for critical enterprise functions and has held various leadership roles during her over 30-year career in the financial services industry.
At the management level, our Enterprise Risk Management (ERM) Committee, chaired by the Chief Executive
Officer and comprising other senior level executives, including the Chief Information Officer, reports to the Board’s
Risk Committee and is responsible for managing risk, including cybersecurity risk. The ERM Committee serves as a
senior level forum for review and discussion of material operational risk issues, including cybersecurity risk, and
receives regular updates from the CISO regarding cybersecurity risk. The ERM Committee directly oversees the
Operational Risk Committee, which provides governance, direction, oversight, and high-level management of
operational risk, including cybersecurity risk, and includes senior management representation from the LOB and
support areas. The CISO is a voting member of the Operational Risk Committee.
The Operational Risk Committee also includes subcommittees which, among other things, address security issues
and concerns, pursue security-related program enhancements, address fraud trends, provide input on fraud
strategy, weigh the impacts of fraud risk on customers, business clients, and the LOB, and cascades awareness of
fraud risks across Key.
Key also has a Privacy Team led by a Chief Privacy Officer (CPO) who has over ten years of experience in legal,
compliance, and risk roles at financial institutions, focusing primarily on data protection and privacy. Our CPO holds
an undergraduate degree in finance, a master’s degree in business administration, and a juris doctorate. He is
licensed to practice law in the state of Ohio and has obtained the CIPP/US certification through the International
Association of Privacy Professionals. The CPO and Privacy team have the authority to escalate privacy risks to the
Board. The Privacy and Information Security teams work together to implement controls around how personally
identifiable information is managed and protected and to comply with applicable laws and regulations.
Cybersecurity Incidents
When a cybersecurity incident is identified, we follow established processes in our enterprise privacy and cyber
incident response plans, which are a supplement to our corporate incident response plan. These plans provide a
framework to enable the appropriate personnel to recover operations in the event of a cyberattack and manage
incidents impacting banking information, including our clients’ and employees’ information.
Our Core Incident Response Rapid Emergency Assessment and Coordination Team (Core IR REACT) is
responsible for responding to incidents, including cyberattacks, performing a preliminary assessment, and engaging
additional support team members as necessary. The Core IR REACT team is a multidisciplinary team that is
empowered to escalate issues, as appropriate, to our Crisis Management Team (CMT), which includes the CEO
and senior executives from Key’s LOB and major support areas. The CMT provides overall strategic
direction for incident responses and recovery. Incidents are also reported internally to key stakeholders through Key’s risk governance committee structure.
As discussed above in “Cybersecurity Risk Management,” the RRG shares the results of its independent internal
audits of security activities at Key and the effectiveness of the IS Program with the line of business management,
Key’s Operational and Compliance Risk Management Groups, the Board’s Audit Committee, and banking
regulators. Any identified gaps are risk rated, issued a due date for remediation, and tracked through completion of
remediation. Remediation is then verified by the RRG.
ITEM 2. PROPERTIES
The headquarters of KeyCorp and KeyBank are located at 127 Public Square, Cleveland, Ohio 44114-1306 in the Key Center. At December 31, 2024, Key leased approximately 375,414 square feet of the complex, encompassing the first floor branch, the 2nd, 3rd and 5th through 9th office floors, the 12th floor, and the 54th through 56th floors of the 57-story Key Center. In addition, Key owned two buildings in Brooklyn, Ohio, with office space that it operated from and totaling 584,930 square feet at December 31, 2024. Our office space is used by all of our segments. As of the same date, KeyBank owned 410 branches and leased 534 branches. The lease terms for applicable branches are not individually material, with terms ranging from month-to-month to 99 years from inception.
ITEM 3. LEGAL PROCEEDINGS
The information presented in the Legal Proceedings section of Note 22 (“Commitments, Contingent Liabilities, and Guarantees”) of the Notes to Consolidated Financial Statements is incorporated herein by reference.
On at least a quarterly basis, we assess our liabilities and contingencies in connection with outstanding legal proceedings utilizing the latest information available. Where it is probable that we will incur a loss and the amount of the loss can be reasonably estimated, we record a liability in our consolidated financial statements. These legal reserves may be increased or decreased to reflect any relevant developments on a quarterly basis. Where a loss is not probable or the amount of the loss is not estimable, we have not accrued legal reserves, consistent with applicable accounting guidance. Based on information currently available to us, advice of counsel, and available insurance coverage, we believe that our established reserves are adequate and any liabilities that may arise from outstanding legal proceedings will not have a material adverse effect on our consolidated financial condition. We note, however, that in light of the inherent uncertainty in legal proceedings there can be no assurance that the ultimate resolution will not exceed established reserves. As a result, the outcome of a particular matter or a combination of matters may be material to our results of operations for a particular period, depending upon the size of the loss or our income for that particular period.
ITEM 4. MINE SAFETY DISCLOSURES
Not applicable.
PART II
ITEM 5. MARKET FOR THE REGISTRANT’S COMMON EQUITY, RELATED STOCKHOLDER MATTERS AND ISSUER PURCHASES OF EQUITY SECURITIES
The following disclosures included in Item 7. Management’s Discussion and Analysis of Financial Condition and Results of Operations are incorporated herein by reference:
| | | | | |
| | Page(s) |
| Discussion of dividends in the section captioned “Capital — Dividends” | |
| Discussion of our common shares, shareholder information, and repurchase activities in the section captioned “Capital — Common Shares outstanding” | |
The following graph compares the price performance of our Common Shares (based on an initial investment of $100 on December 31, 2019, and assuming reinvestment of dividends) with that of the S&P 500 Index and a group of other banks that constitute our peer group. The peer group consists of the banks that make up the S&P 500 Regional Bank Index and the banks that make up the Standard & Poor’s 500 Diversified Bank Index. We are included in the S&P 500 Index and the peer group. Share price performance is not necessarily indicative of future price performance.
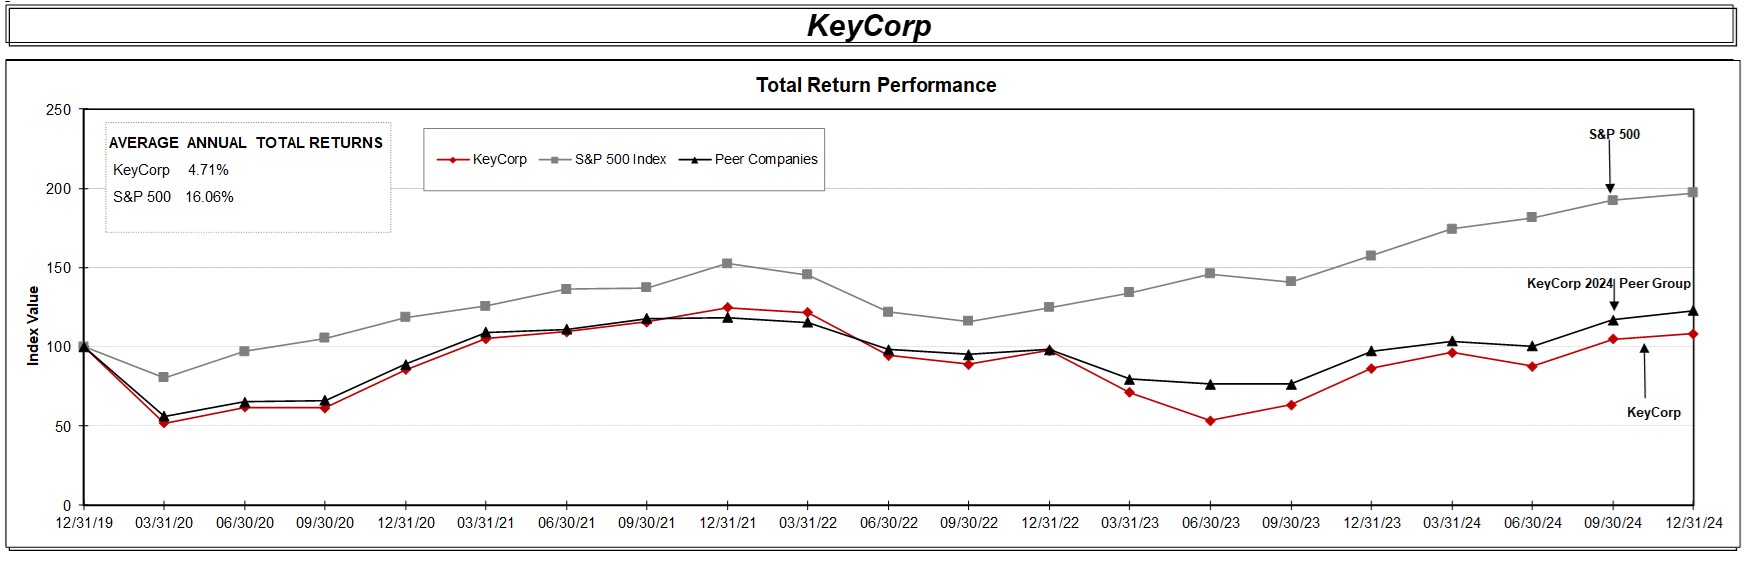
From time to time, KeyCorp or its principal subsidiary, KeyBank, may seek to retire, repurchase, or exchange outstanding debt of KeyCorp or KeyBank, and capital securities or preferred stock of KeyCorp, through cash purchase, privately negotiated transactions, or otherwise. Such transactions, if any, depend on prevailing market conditions, our liquidity and capital requirements, contractual restrictions, and other factors. The amounts involved may be material.
We did not complete any open market share repurchases in 2024, and have no Board-approved repurchase authorizations outstanding.
During 2024, Key repurchased $28 million of shares related to equity compensation programs.
On August 30, 2024, KeyCorp issued 47,829,359 Common Shares for approximately $821 million in gross proceeds to Scotiabank pursuant to the first closing under the Investment Agreement. On December 27, 2024, Scotiabank completed the second and final purchase of 115,042,316 Common Shares under the Investment Agreement with an investment of approximately $2.0 billion in gross proceeds. These acquisitions were exempt from registration under the Securities Act of 1933, as amended (“Securities Act”), by virtue of the exemption provided by Section 4(a)(s) of the Securities Act.
The following table summarizes our repurchases of our Common Shares for the three months ended December 31, 2024. See Note 24 (“Shareholders' Equity”) for more information regarding share repurchases.
| | | | | | | | | | | | | | | |
| Calendar month | Total number of shares repurchased(a) | Average price paid
per share | Total number of shares purchased as part of publicly announced plans or programs | Dollar value of shares that may yet be purchased as part of publicly announced plans or programs (b) | |
| October 1 - 31 | 236 | | $ | 17.21 | | — | | $ | — | | |
| November 1 - 30 | 103,712 | | 19.49 | | — | | — | | |
| December 1 -30 | 262 | | 18.84 | | — | | — | | |
| Total | 104,210 | | $ | 19.48 | | — | | | |
| | | | | |
(a)Includes Common Shares deemed surrendered by employees in connection with our stock compensation and benefit plans to satisfy tax obligations. We did not complete any open market share repurchases in the fourth quarter of 2024.
ITEM 6. [RESERVED]
ITEM 7. MANAGEMENT’S DISCUSSION AND ANALYSIS OF FINANCIAL CONDITION AND RESULTS OF OPERATIONS
Introduction
This section reviews the financial condition and results of operations of KeyCorp and its subsidiaries for 2024 and 2023. Some tables may include additional periods to comply with disclosure requirements or to illustrate trends in greater depth. When you read this discussion, you should also refer to the consolidated financial statements and related notes in this report. The page locations of specific sections and notes that we refer to are presented in the Table of Contents. To review our financial condition and results of operations for 2022 and a comparison between the 2022 and 2023 results, see Item 7. Management’s Discussion and Analysis of Financial Condition and Results of Operations of our 2023 Form 10-K filed with the SEC on February 22, 2024, which discussion is incorporated herein by reference.
Corporate strategy
We remain committed to enhancing long-term shareholder value by continuing to execute our relationship-based business model, growing our franchise, and being disciplined with respect to capital management. We intend to pursue this commitment by growing profitably; acquiring and expanding targeted client relationships; effectively managing risk and rewards; maintaining financial strength; and engaging, retaining, and inspiring our high-performing and talented workforce and fostering a culture that is fair and inclusive for all. These strategic priorities for enhancing long-term shareholder value are described in more detail below.
•Grow profitably — We intend to continue to focus on generating positive operating leverage by growing revenue and creating a more efficient operating environment. We expect our relationship business model to keep generating organic growth as it helps us expand engagement with existing clients and attract new customers. We plan to leverage our continuous improvement culture to maintain an efficient cost structure that is aligned, sustainable, and consistent with the current operating environment and that supports our relationship business model.
•Acquire and expand targeted client relationships — We seek to be client-centric in our actions and have taken purposeful steps to enhance our ability to acquire and expand targeted relationships. We seek to provide solutions to serve our clients' needs. We focus on markets and clients where we can be the most relevant. In aligning our businesses and investments against these targeted client segments, we are able to make a meaningful positive impact for our clients.
•Effectively manage risk and rewards — Our risk management activities are focused on ensuring we properly identify, measure, and manage risks across the entire company to maintain safety and soundness and maximize profitability.
•Maintain financial strength — With the foundation of a strong balance sheet, we intend to remain focused on sustaining strong reserves, liquidity, and capital. We plan to work closely with our Board and regulators to manage capital to support our clients’ needs and drive long-term shareholder value. Our capital position remains strong, and we are well-positioned relative to our capital priorities.
•Engage a high-performing and talented workforce — Every day our employees provide our clients with great ideas, extraordinary service, and smart solutions. We intend to continue to engage our high-performing and talented workforce to create an environment where everyone can make a difference, own their careers, be respected, and feel a sense of pride.
Executive overview
Our 2024 financial results were generally positive and reflected the impact of large securities repositioning trades that enhanced our future earnings trajectory. Net interest income was down, reflecting lower loans and changes in interest rates, but remained within our target range versus 2023. Fee growth was stronger than expected reflecting the second highest year of investment banking revenues in our history. At December 31, 2024, our Common Equity Tier 1 and Tier 1 risk-based capital ratios stood at 11.92% and 13.69%, respectively. We achieved meaningful positive operating leverage in the second half of the year and look to continue to deliver earnings growth and operating leverage in 2025.
Strategic Minority Investment by Scotiabank
On August 12, 2024, we entered into an Investment Agreement with Scotiabank pursuant to which Scotiabank agreed to make a strategic minority investment in KeyCorp of approximately $2.8 billion, representing approximately 14.9% pro forma common stock ownership of KeyCorp, for a fixed price of $17.17 per share. On August 30, 2024, Scotiabank completed the initial purchase of our Common Shares with an investment of approximately $821 million in gross proceeds. Following the initial purchase, Scotiabank owned approximately 4.9% of KeyCorp’s common stock.
On December 13, 2024, Key announced that all necessary bank regulatory approvals had been received for completion of Scotiabank’s strategic minority investment in KeyCorp. On December 27, 2024, Scotiabank completed the final purchase of our Common Shares contemplated under the Investment Agreement with an investment of approximately $2.0 billion (the “Second Closing”). Following the Second Closing, Scotiabank owns approximately 14.9% of our Common Shares.
On December 27, 2024, in connection with the Second Closing, the Board of Directors of KeyCorp increased the size of the Board to fifteen directors and appointed Jacqueline Allard and Somesh Khanna to serve on the Board, effectively immediately upon the Second Closing.
Refer to Note 24 (“Shareholders' Equity”) for additional information on this transaction.
Securities Repositioning
On September 6, 2024, we initiated a strategic repositioning of our available-for-sale investment securities portfolio by selling approximately $7.0 billion in market value of low-yielding mortgage-backed securities. The mortgage-backed securities that were sold had a weighted average book yield of approximately 2.3% and an average duration of approximately six years. Reinvestment of the proceeds from the sale was completed in October 2024, with the new securities having an average book yield of approximately 4.95% and an average duration of approximately four years. During the third quarter of 2024, along with our customary sale of short-dated U.S. Treasuries set to mature within the quarter, we also sold approximately $3 billion in U.S. Treasuries yielding 50 basis points that were set to mature in the fourth quarter of 2024. The total pre-tax loss on the sale of securities available for sale for the third quarter was $935 million of which $918 million was associated with the strategic repositioning.
Prior to the Second Closing, KeyCorp completed the strategic repositioning of its available-for-sale investment securities portfolio by selling an additional $3.0 billion in market value of low-yielding investment securities and terminating approximately $3.0 billion of fair value hedges, resulting in a pre-tax loss of $915 million in the fourth quarter of 2024. The investment securities that were sold had a weighted average book yield of approximately 1.5% and an average duration of approximately eight years. The reinvestment of the proceeds from the repositioning was completed in December 2024, with the new securities having an average book yield of 5.5% and an average duration of approximately four years.
In addition to the items described above, the following actions and results during 2024 also supported our overall corporate strategy.
•We have expanded our commercial banking business in Chicago and Southern California to serve more middle market clients with our differentiated platform, which includes a full range of commercial lending and capital markets capabilities as well as payments solutions designed specifically for the segment.
•We completed core technological modernization projects of our commercial loan platform and our derivatives platform.
•We ended the year with $61.4 billion in assets under management and administration, a record high, reflecting the strong sales production in our mass affluent segment.
•Within our Consumer Bank, we grew relationship households in excess of three percent for the second consecutive year, including growth of five to eight percent throughout our western markets.
•We remained committed to our strategy to engage a high-performing and talented workforce and fostering an inclusive environment for all. We continue to be recognized by multiple organizations for our dedication to creating an environment where all employees are treated with respect and empowered to bring their authentic selves to work.
Business Outlook
Consistent with the forward guidance we provided on January 21, 2025, we expect these results for full year 2025 versus full year 2024.
| | | | | | | | | | | | | | | | | | | | |
| Category | | 2024 Baseline | | FY2024 vs FY2023 | | FY2025 (vs FY 2024)(a) |
| Average loans | | $107.7 Billion | | (9)% | | down 2% to 5% |
| Ending loans | | $104.3 Billion | | (7)% | | Flat vs YE 2024 |
| PE Commercial Loans | | $71.9 Billion | | (7)% | | up 2% to 4% |
| Net interest income (TE) | | $3,810 Million | | (3)% | | up ~20%(b) |
Adjusted noninterest income(c) | | $2,645 Million | | +7% | | up 5%+ |
Adjusted noninterest expense(c) | | $4,520 Million | | +3% | | up 3% to 5% |
| Net charge-offs to average loans | | 41 bps | | + 20 bps | | 40 to 45 basis points (FY2025) |
| Effective tax rate | | | | | | ~21% to 22% (FY2025) |
Tax-equivalent Effective Rate(d) | | | | | | ~23% to 24% (FY2025) |
(a) Ranges are shown on an operating basis.
(b) Additional Guidance: Net interest income (TE): 10%+ 4Q25 vs. 4Q24.
(c) Refer to the GAAP to Non-GAAP Reconciliation within Management's Discussion and Analysis of this Form 10-K for the reconciliation of these non-GAAP measures.
(d) Reflects the estimated full year taxable-equivalent adjustment.
Results of Operations
Earnings Overview
The following chart provides a reconciliation of net income from continuing operations attributable to Key common shareholders for the year ended December 31, 2023, to the year ended December 31, 2024 (dollars in millions):
Net interest income
One of our principal sources of revenue is net interest income. Net interest income is the difference between interest income received on earning assets (such as loans and securities) and loan-related fee income, and interest expense paid on deposits and borrowings. There are several factors that affect net interest income, including:
•the volume, pricing, mix, and maturity of earning assets and interest-bearing liabilities;
•the volume and value of net free funds, such as noninterest-bearing deposits and equity capital;
•the use of derivative instruments to manage interest rate risk;
•interest rate fluctuations and competitive conditions within the marketplace;
•asset quality; and
•fair value accounting of acquired earning assets and interest-bearing liabilities.
To make it easier to compare both the results among several periods and the yields on various types of earning assets (some taxable, some not), we present net interest income in this discussion on a “TE basis” (i.e., as if all income were taxable and at the same rate). For example, $100 of tax-exempt income would be presented as $126, an amount that, if taxed at the statutory federal income tax rate of 21%, would yield $100.
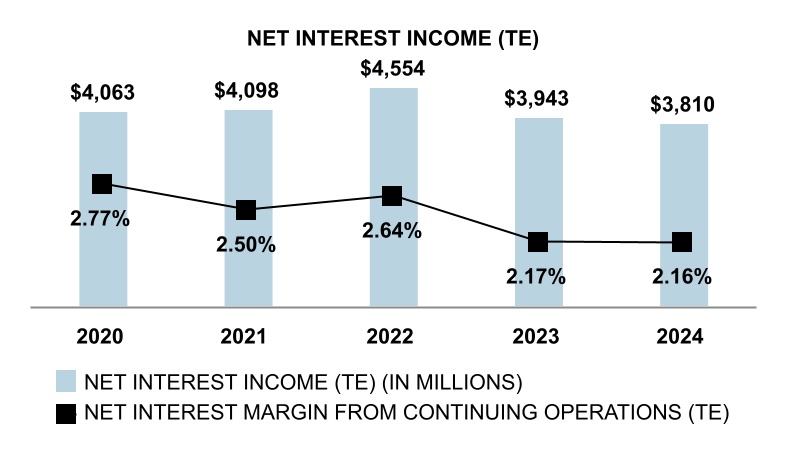
Net interest income (TE) for 2024 was $3.8 billion, and the net interest margin was 2.16%. Compared to 2023, net interest income (TE) decreased $133 million, and the net interest margin was relatively stable, decreasing by one basis point. The decline in net interest income (TE) and the net interest margin reflects higher deposit costs, partly due to a shift in funding mix from noninterest-bearing deposits to higher cost deposits in 2024, and lower loan balances, in part due to the residual effect of Key’s balance sheet optimization efforts during the second half of 2023. Net interest income (TE) and the net interest margin benefited from higher earning asset yields as a result of the higher interest rate environment, including the reinvestment of proceeds from maturing investment securities into higher-yielding investments. Net interest income (TE) and the net interest margin also benefited from the maturity of interest rate swaps with negative carry, and an increase in lower-cost deposits, which contributed to the decline in wholesale borrowings. In addition, during the second half of 2024, Key completed the available-for-sale portfolio repositioning, which involved the sale and reinvestment of approximately $10.0 billion of lower-yielding mortgaged-backed securities into higher-yielding investments.
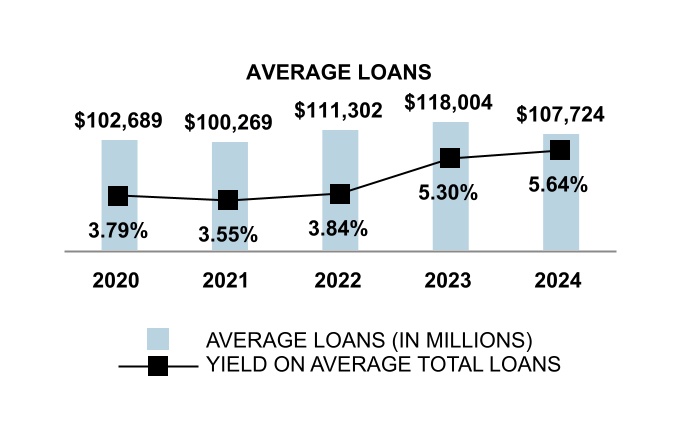
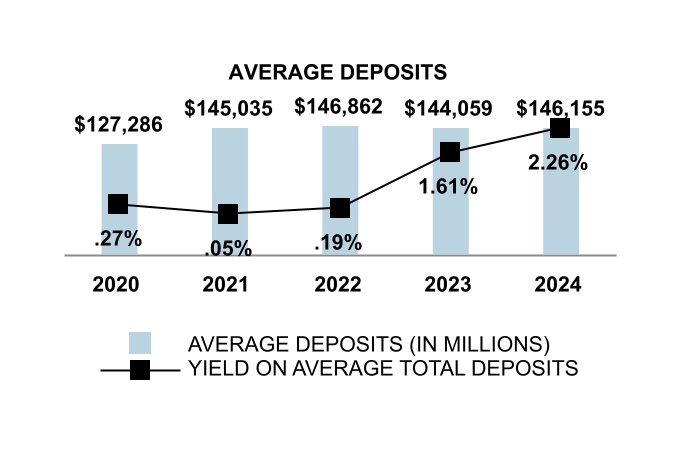
Average loans totaled $107.7 billion for 2024, compared to $118.0 billion in 2023. The $10.3 billion decrease reflected continued tepid client loan demand. Commercial loans decreased $7.6 billion, due to lower commercial and industrial loans and commercial mortgage real estate loans. Additionally, average consumer loans declined by $2.6 billion, reflective of broad-based declines across all consumer loan categories.
Average deposits totaled $146.2 billion for 2024, an increase of $2.1 billion compared to 2023, reflecting growth in both consumer and commercial deposits, partially offset by a decline in brokered CDs.
Figure 1 shows the various components of our balance sheet that affect interest income and expense and their respective yields or rates over the past three years. This figure also presents a reconciliation of TE net interest income to net interest income reported in accordance with GAAP for each of those years. The net interest margin, which is an indicator of the profitability of our earning assets less the cost of funding, is calculated by dividing taxable-equivalent net interest income by average earning assets.
Figure 1. Consolidated Average Balance Sheets, Net Interest Income, and Yields/Rates from Continuing Operations(g)
| | | | | | | | | | | | | | | | | | | | | | | | | | | | | | | | | | | |
| Year ended December 31, | 2024 | | 2023 | | 2022 |
| Dollars in millions | Average Balance | Interest (a) | Yield/ Rate (a) | | Average Balance | Interest (a) | Yield/ Rate (a) | | Average
Balance | Interest (a) | Yield/
Rate (a) |
| ASSETS | | | | | | | | | | | |
Loans (b), (c) | | | | | | | | | | | |
Commercial and industrial (d) | $ | 53,951 | | $ | 3,378 | | 6.26 | % | | $ | 59,379 | | $ | 3,444 | | 5.80 | % | | $ | 54,970 | | $ | 2,148 | | 3.91 | % |
| Real estate — commercial mortgage | 14,080 | | 873 | | 6.20 | | | 15,968 | | 931 | | 5.83 | | | 15,572 | | 633 | | 4.07 | |
| Real estate — construction | 3,042 | | 227 | | 7.48 | | | 2,755 | | 185 | | 6.71 | | | 2,229 | | 99 | | 4.44 | |
| Commercial lease financing | 3,087 | | 105 | | 3.41 | | | 3,703 | | 116 | | 3.13 | | | 3,869 | | 98 | | 2.54 | |
| Total commercial loans | 74,160 | | 4,583 | | 6.18 | | | 81,805 | | 4,676 | | 5.72 | | | 76,640 | | 2,978 | | 3.89 | |
| Real estate — residential mortgage | 20,382 | | 674 | | 3.31 | | | 21,428 | | 699 | | 3.26 | | | 19,036 | | 559 | | 2.94 | |
| Home equity loans | 6,729 | | 398 | | 5.92 | | | 7,522 | | 433 | | 5.76 | | | 8,115 | | 347 | | 4.28 | |
| Other consumer loans | 5,519 | | 278 | | 5.04 | | | 6,263 | | 305 | | 4.86 | | | 6,552 | | 277 | | 4.27 | |
| Credit cards | 934 | | 138 | | 14.78 | | | 986 | | 136 | | 13.88 | | | 959 | | 107 | | 11.23 | |
| | | | | | | | | | | |
| Total consumer loans | 33,564 | | 1,488 | | 4.43 | | | 36,199 | | 1,573 | | 4.35 | | | 34,662 | | 1,290 | | 3.72 | |
| Total loans | 107,724 | | 6,071 | | 5.64 | | | 118,004 | | 6,249 | | 5.30 | | | 111,302 | | 4,268 | | 3.84 | |
| Loans held for sale | 979 | | 60 | | 6.11 | | | 1,012 | | 61 | | 6.06 | | | 1,278 | | 56 | | 4.41 | |
Securities available for sale (b), (e) | 37,127 | | 1,142 | | 2.71 | | | 37,718 | | 793 | | 1.80 | | | 42,325 | | 752 | | 1.62 | |
Held-to-maturity securities (b) | 7,980 | | 284 | | 3.56 | | | 9,008 | | 312 | | 3.46 | | | 7,676 | | 213 | | 2.77 | |
| Trading account assets | 1,175 | | 61 | | 5.16 | | | 1,138 | | 55 | | 4.85 | | | 850 | | 31 | | 3.61 | |
| Short-term investments | 14,846 | | 792 | | 5.33 | | | 7,349 | | 414 | | 5.63 | | | 4,264 | | 97 | | 2.28 | |
Other investments (e) | 1,177 | | 62 | | 5.25 | | | 1,392 | | 73 | | 5.28 | | | 952 | | 22 | | 2.26 | |
| Total earning assets | 171,008 | | 8,472 | | 4.81 | | | 175,621 | | 7,957 | | 4.37 | | | 168,647 | | 5,439 | | 3.15 | |
| Allowance for loan and lease losses | (1,515) | | | | | (1,419) | | | | | (1,101) | | | |
| Accrued income and other assets | 17,322 | | | | | 17,425 | | | | | 18,340 | | | |
| Discontinued assets | 296 | | | | | 384 | | | | | 492 | | | |
| Total assets | $ | 187,111 | | | | | $ | 192,011 | | | | | $ | 186,378 | | | |
| LIABILITIES | | | | | | | | | | | |
| Money market deposits | $ | 39,525 | | $ | 1,146 | | 2.90 | % | | $ | 34,539 | | $ | 666 | | 1.93 | % | | $ | 35,966 | | $ | 52 | | .14 | % |
| Demand deposits | 56,130 | | 1,402 | | 2.50 | | | 54,711 | | 1,102 | | 2.01 | | | 49,707 | | 182 | | .37 | |
| Savings deposits | 5,010 | | 7 | | .14 | | | 6,343 | | 3 | | .04 | | | 7,798 | | 1 | | .01 | |
| | | | | | | | | | | |
| Time deposits | 16,497 | | 752 | | 4.56 | | | 13,794 | | 551 | | 4.00 | | | 4,347 | | 44 | | |
| | | | | | | | | | | |
| Total interest-bearing deposits | 117,162 | | 3,307 | | 2.82 | | | 109,387 | | 2,322 | | 2.12 | | | 97,818 | | 279 | | .29 | |
| Federal funds purchased and securities sold under repurchase agreements | 103 | | 4 | | 4.35 | | | 1,647 | | 79 | | 4.81 | | | 2,107 | | 41 | | 1.93 | |
| Bank notes and other short-term borrowings | 2,984 | | 164 | | 5.49 | | | 5,890 | | 308 | | 5.24 | | | 2,963 | | 90 | | 3.02 | |
Long-term debt (g) | 17,279 | | 1,187 | | 6.87 | | | 20,983 | | 1,305 | | 6.22 | | | 14,915 | | 475 | | 3.19 | |
| Total interest-bearing liabilities | 137,528 | | 4,662 | | 3.39 | | | 137,907 | | 4,014 | | 2.91 | | | 117,803 | | 885 | | .75 | |
| Noninterest-bearing deposits | 28,993 | | | | | 34,672 | | | | | 49,044 | | | |
| Accrued expense and other liabilities | 4,886 | | | | | 5,167 | | | | | 4,309 | | | |
Discontinued liabilities (f) | 296 | | | | | 384 | | | | | 492 | | | |
| Total liabilities | 171,703 | | | | | 178,130 | | | | | 171,648 | | | |
| EQUITY | | | | | | | | | | | |
| | | | | | | | | | | |
| | | | | | | | | | | |
| Total equity | 15,408 | | | | | 13,881 | | | | | 14,730 | | | |
| Total liabilities and equity | $ | 187,111 | | | | | $ | 192,011 | | | | | $ | 186,378 | | | |
| Interest rate spread (TE) | | | 1.42 | % | | | | 1.46 | % | | | | 2.40 | % |
| Net interest income (TE) and net interest margin (TE) | | $ | 3,810 | | 2.16 | % | | | $ | 3,943 | | 2.17 | % | | | $ | 4,554 | | 2.64 | % |
Less: TE adjustment (b) | | 45 | | | | | 30 | | | | | 27 | | |
| Net interest income, GAAP basis | | $ | 3,765 | | | | | $ | 3,913 | | | | | $ | 4,527 | | |
| | | | | | | | | | | |
(a)Results are from continuing operations. Interest excludes the interest associated with the liabilities referred to in (g) below, calculated using a matched funds transfer pricing methodology.
(b)Interest income on tax-exempt securities and loans has been adjusted to a taxabale-equivalent basis using the statutory federal income tax rate in effect that calendar year.
(c)For purposes of these computations, nonaccrual loans are included in average loan balances.
(d)Commercial and industrial average loan balances include $215 million, $196 million, and $157 million of assets from commercial credit cards for the years ended December 31, 2024, December 31, 2023, and December 31, 2022, respectively.
(e)Yield presented is calculated on the basis of amortized cost excluding fair value hedge basis adjustments. The average amortized cost for securities available for sale was $42.2 billion and $44.0 billion for the twelve months ended December 31, 2024, and December 31, 2023, respectively. Yield based on the fair value of securities available for sale was 3.08% and 2.10% for the twelve months ended December 31, 2024, and December 31, 2023, respectively.
(f)A portion of long-term debt and the related interest expense is allocated to discontinued liabilities as a result of applying our matched funds transfer pricing methodology to discontinued operations.
(g)Average balances presented are based on daily average balances over the respective stated period.
Figure 2 shows how the changes in yields or rates and average balances from the prior year affected net interest income. The section entitled “Financial Condition” contains additional discussion about changes in earning assets and funding sources.
Figure 2. Components of Net Interest Income Changes from Continuing Operations
| | | | | | | | | | | | | | | |
| | 2024 vs. 2023 | | |
| Dollars in millions | Average Volume | Yield/ Rate | Net Change(a) | | | | |
| INTEREST INCOME | | | | | | | |
| Loans | $ | (568) | | $ | 390 | | $ | (178) | | | | | |
| Loans held for sale | (2) | | 1 | | (1) | | | | | |
| Securities available for sale | (13) | | 362 | | 349 | | | | | |
| Held-to-maturity securities | (36) | | 8 | | (28) | | | | | |
| Trading account assets | 2 | | 4 | | 6 | | | | | |
| Short-term investments | 401 | | (23) | | 378 | | | | | |
| Other investments | (11) | | — | | (11) | | | | | |
| Total interest income (TE) | (227) | | 742 | | 515 | | | | | |
| INTEREST EXPENSE | | | | | | | |
| Money market deposits | 107 | | 373 | | 480 | | | | | |
| Demand deposits | 29 | | 271 | | 300 | | | | | |
| Savings deposits | (1) | | 5 | | 4 | | | | | |
| | | | | | | |
| Time deposits | 117 | | 84 | | 201 | | | | | |
| | | | | | | |
| Total interest-bearing deposits | 252 | | 733 | | 985 | | | | | |
| Federal funds purchased and securities sold under repurchase agreements | (62) | | (13) | | (75) | | | | | |
| Bank notes and other short-term borrowings | (159) | | 15 | | (144) | | | | | |
| Long-term debt | (245) | | 127 | | (118) | | | | | |
| Total interest expense | (214) | | 862 | | 648 | | | | | |
| Net interest income (TE) | $ | (13) | | $ | (120) | | $ | (133) | | | | | |
| | | | | | | |
(a)The change in interest not due solely to volume or rate has been allocated in proportion to the absolute dollar amounts of the change in each.
Provision for credit losses
Our provision for credit losses was a net charge of $335 million for 2024, compared to $489 million for 2023. The decrease in our provision for credit losses was driven by reserve releases, partly offset by higher net charge-offs. The net reserve release in 2024 was driven by changes in the economic outlook and planned balance sheet optimization efforts, which offset reserve increases attributable to asset quality migration. The higher net charge-offs were largely driven by the commercial and industrial portfolio.
Noninterest income
Noninterest income for 2024 was $809 million, inclusive of the $1.8 billion loss from the investment portfolio repositioning, compared to $2.5 billion during 2023. Noninterest income represented 18% of total revenue for 2024 and 39% of total revenue for 2023.
The following discussion explains the composition of certain elements of our noninterest income and the factors that caused those elements to change.
Figure 3. Noninterest Income
Trust and investment services income
Trust and investment services income consists of brokerage commissions, trust and asset management fees, and insurance income. The assets under management or administration that primarily generate these revenues are shown in Figure 4. For 2024, trust and investment services income increased $41 million, or 7.9%. This was primarily due to an increase in investment management income and other fees stemming from increased assets under management.
A significant portion of our trust and investment services income depends on the value and mix of assets under management. At December 31, 2024, our bank, trust, and registered investment advisory subsidiaries had assets under management or administration of $61.4 billion, compared to $54.9 billion at December 31, 2023. The increase from 2023 to 2024 was attributable to movements in the market and net new business.
Figure 4. Assets Under Management or Administration
| | | | | | | | | | | | | | |
| Year ended December 31, | | | Change 2024 vs. 2023 |
| Dollars in millions | 2024 | 2023 | Amount | Percent |
| Discretionary assets under management by investment type: | | | | |
| Equity | $ | 34,541 | | $ | 30,724 | | $ | 3,817 | | 12.4 | % |
| | | | |
| Fixed income | 13,942 | | 13,775 | | 167 | | 1.2 | |
| Money market | 6,785 | | 6,187 | | 598 | | 9.7 | |
| Total discretionary assets under management | $ | 55,268 | | $ | 50,686 | | $ | 4,582 | | 9.0 | % |
| Non-discretionary assets under administration | 6,093 | | 4,173 | | 1,920 | | 46.0 | |
| Total | $ | 61,361 | | $ | 54,859 | | $ | 6,502 | | 11.9 | % |
| | | | |
Investment banking and debt placement fees
Investment banking and debt placement fees consist of syndication fees, debt and equity securities underwriting fees, merger and acquisition and debt placement advisor fees, gains on sales of commercial mortgages, and agency origination fees. For 2024, investment banking and debt placement fees increased $146 million, or 26.9%, from the prior year reflective of growth across all products excluding commercial mortgage activity.
Service charges on deposit accounts
Service charges on deposit accounts decreased $9 million, or 3.3%, in 2024 compared to the prior year. This decrease was driven by lower overdraft, maintenance, and service fees, offset slightly by higher account analysis fees.
Cards and payments income
Cards and payments income, which consists of debit card, consumer and commercial credit card, and merchant services income decreased $9 million, or 2.6%, in 2024 compared to 2023, driven by a decrease in debit interchange fees, partially offset by an increase in card reward costs.
Other noninterest income
Other noninterest income includes operating lease income and other leasing gains, corporate services income, corporate-owned life insurance income, consumer mortgage income, commercial mortgage servicing fees, net securities gains (losses), and other income. Other noninterest income decreased $1.8 billion in 2024 compared to 2023, primarily attributable to approximately $1.8 billion in losses on the sales of securities available for sale as part of portfolio repositioning activity during the third and fourth quarters of 2024. Excluding the impact of the repositioning activity, other noninterest income was relatively flat, increasing $3 million, reflecting an increase in commercial mortgage servicing fees offset by decreases in operating lease income and corporate services income.
Noninterest expense
Noninterest expense for 2024 was $4.5 billion, compared to $4.7 billion for 2023. Figure 5 gives a breakdown of our major categories of noninterest expense as a percentage of total noninterest expense for the twelve months ended December 31, 2024.
The following discussion explains the composition of certain elements of our noninterest expense and the factors that caused those elements to change.
Figure 5. Noninterest Expense
(a)Other noninterest expense includes equipment, operating lease expense, marketing, intangible asset amortization and other miscellaneous expense. See the "Consolidated Statements of Income" in Part II, Item 8. Financial Statements and Supplementary Data of this report.
Personnel
As shown in Figure 6, personnel expense, the largest category of our noninterest expense, increased by $54 million, or 2.0%, in 2024 compared to 2023. Overall activity for the year was driven by higher incentive compensation from strong capital markets activity during the year, partially offset by a decrease in severance expense. Salaries and contract labor were down reflecting a decrease in FTE’s, offset slightly by increased contract labor costs.
Figure 6. Personnel Expense
| | | | | | | | | | | | | | |
Year ended December 31, Dollars in millions | | | Change 2024 vs. 2023 |
| 2024 | 2023 | Amount | Percent |
| Salaries and contract labor | $ | 1,609 | | $ | 1,649 | | $ | (40) | | (2.4) | % |
Incentive and stock-based compensation (a) | 661 | | 525 | | 136 | | 25.9 | |
| Employee benefits | 442 | | 405 | | 37 | | 9.1 | |
| Severance | 2 | | 81 | | (79) | | N/M |
| Total personnel expense | $ | 2,714 | | $ | 2,660 | | $ | 54 | | 2.0 | % |
| | | | |
| | | | |
| | | | |
| | | | |
N/M - Not meaningful
(a)Excludes directors’ stock-based compensation of $4 million in 2024 and $3 million in 2023, reported as “other noninterest expense” in Figure 5.
Non-personnel expense
In total, other non-personnel expense decreased $243 million, or 11.7%, in 2024 compared to 2023 primarily due to items impacting non-personnel expense in 2023, including a $190 million FDIC special assessment charge, as well as corporate real estate related rationalization costs recorded within other expense.
Income taxes
We recorded a tax benefit from continuing operations of $143 million for 2024, compared to tax expense of $196 million for 2023. The effective tax rate, which is the provision for income taxes as a percentage of income from continuing operations before income taxes, was 46.6% for 2024 and 16.9% for 2023. The tax benefit recorded and increased effective tax rate for the year resulted primarily from the $1.8 billion loss on the sales of securities incurred as part of a strategic repositioning of our securities portfolio.
In 2024, our federal tax expense and effective tax rate differ from the amount that would be calculated using the federal statutory tax rate primarily due to investments in tax-advantaged assets, such as corporate-owned life insurance, and tax credits associated with low-income housing investments, and periodic adjustments to our tax reserves as described in Note 14 (“Income Taxes”).
Business Segment Results
This section summarizes the financial performance of our two major business segments (operating segments): Consumer Bank and Commercial Bank. Note 25 (“Business Segment Reporting”) describes the products and services offered by each of these business segments and provides more detailed financial information pertaining to the segments. Dollars in the charts are presented in millions.
Consumer Bank
Segment imperatives
•Execute a relationship-oriented growth strategy, which will enable us to grow (i) stable, low-cost deposits and (ii) valuable fee income streams, including wealth management and cards and payments
•Simplify our business to improve execution and efficiency while managing risk
•Meet the needs of our clients and communities in markets where we operate
Market and business overview
As the banking industry moves forward, so do our clients. Anticipating our clients’ needs not only today, but also for tomorrow and into the future, has become one of the biggest challenges for the banking industry. We view these challenges as an opportunity to help our current client base meet their own goals, as well as attract new and diverse clients. Key Consumer Bank’s focus on durable, long-term client relationships centered in core checking has been evident through the execution of our strategic priorities through focus areas such as developing a core Consumer relationship product suite and driving long-term deposits and fee income through new and enhanced products and services. Key continues to adapt to an increasingly digital world with an increased focus on client experience across our online banking channels. The advice our bankers provide, in combination with our products, services and digital platforms, place Key in a strong position to develop long-lasting and meaningful relationships with our current and prospective clients. Our goal is to help our clients move forward on their financial journeys and to be by their sides along the way.
Summary of operations
•Net income attributable to Key of $283 million in 2024, compared to $202 million in 2023, an increase of 40.1%, largely driven by favorable rates on deposits and lower FDIC special assessment charges
•Taxable-equivalent net interest income increased in 2024 by $67 million, or 3.0%, from the prior year, due to favorable rates on deposits
•Average loans and leases decreased in 2024 by $3.0 billion, or 7.3%, from the prior year, driven by broad-based declines across all loan categories
•Average deposits increased in 2024 by $3.1 billion, or 3.7%, from the prior year, driven by growth in retail deposits, particularly in money market deposit accounts and certificates of deposit
•Provision for credit losses increased $15 million in 2024 compared to the prior year, driven by higher net charge-offs, partly offset by a reserve release due to changes in the portfolio and economic conditions
•Noninterest income decreased in 2024 by $12 million, or 1.3%, driven by decreases in cards and payments income and service charges on deposit accounts
•Noninterest expense decreased in 2024 by $67 million, or 2.4%, primarily reflective of lower FDIC special assessment charges
Commercial Bank
Segment imperatives
•Solve complex client needs through a differentiated product set of banking and capital markets capabilities
•Drive targeted scale through distinct product capabilities delivered to a broad set of clients
•Utilize industry expertise and broad capabilities to build relationships with narrowly targeted client sets
Market and business overview
Building relationships and delivering complex solutions for middle market clients requires a distinctive operating model that understands their business and can provide a broad set of product capabilities. As competition for these clients intensifies, we have positioned the business to maintain and grow our competitive advantage by building targeted scale in businesses and client segments. Strong market share in businesses such as real estate loan servicing and equipment finance highlights our ability to successfully meet customer needs through targeted scale in distinct product capabilities. Clients expect us to understand every aspect of their business. Our seven industry verticals are aligned to drive targeted scale in segments where we have a breadth of industry expertise. Our business model is positioned to meet our client needs because our focus is not on being a universal bank, but rather being the right bank for our clients.
Summary of operations
•Net income attributable to Key of $1.1 billion in 2024, compared to $885 million in 2023, an increase of 23.3%, largely driven by an increase in investment banking and debt placement fees and commercial mortgage servicing income, along with lower FDIC assessment charges
•Taxable equivalent net interest income decreased in 2024 by $61 million, or 3.3%, from the prior year, primarily driven by a reduction in loan balances
•Average loan and lease balances decreased $7.3 billion in 2024, or 9.6%, driven by a decline in commercial and industrial loans
•Average deposit balances increased $3.0 billion in 2024, or 5.4%, driven by our focus on growing deposits across our commercial businesses
•Provision for credit losses decreased $152 million in 2024 compared to the prior year, resulting from reserve releases due to changes in the portfolio and economic conditions, partially offset by higher net charge-offs
•Noninterest income increased $198 million in 2024, or 13.8%, from the prior year, driven by growth in investment banking and debt placement fees and commercial mortgage servicing income
•Noninterest expense increased by $28 million in 2024, or 1.6%, from the prior year, primarily due to increases in incentive compensation and other personnel expenses, partially offset by decreases in FDIC special assessment charges and operating lease expenses
Financial Condition
Loans and loans held for sale
Figure 7. Breakdown of Loans as of December 31, 2024
(a)Other consumer loans include Consumer loans and Credit cards. See Note 4 (“Loan Portfolio”) Item 8. Financial Statements of this report.
Figure 8 shows the composition of our loan portfolio at December 31 for each of the past two years.
Figure 8. Composition of Loans
| | | | | | | | | | | | | | | | | | | | | | | | | | | | | | |
| | | 2024 | | 2023 | | |
December 31, Dollars in millions | | Amount | | Percent of Total | | Amount | | Percent of Total | | | | |
| COMMERCIAL | | | | | | | | | | | | |
Commercial and industrial (a) | | $ | 52,909 | | | 50.7 | % | | $ | 55,815 | | | 49.6 | % | | | | |
| Commercial real estate: | | | | | | | | | | | | |
| Commercial mortgage | | 13,310 | | | 12.8 | | | 15,187 | | | 13.5 | | | | | |
| Construction | | 2,936 | | | 2.8 | | | 3,066 | | | 2.7 | | | | | |
| Total commercial real estate loans | | 16,246 | | | 15.6 | | | 18,253 | | | 16.2 | | | | | |
Commercial lease financing (b) | | 2,736 | | | 2.6 | | | 3,523 | | | 3.1 | | | | | |
| Total commercial loans | | 71,891 | | | 68.9 | | | 77,591 | | | 68.9 | | | | | |
| CONSUMER | | | | | | | | | | | | |
| Real estate — residential mortgage | | 19,886 | | | 19.1 | | | 20,958 | | | 18.6 | | | | | |
| Home equity loans | | 6,358 | | | 6.1 | | | 7,139 | | | 6.4 | | | | | |
| Other consumer loans | | 5,167 | | | 5.0 | | | 5,916 | | | 5.2 | | | | | |
| Credit cards | | 958 | | | 0.9 | | | 1,002 | | | 0.9 | | | | | |
| | | | | | | | | | | | |
| Total consumer loans | | 32,369 | | | 31.1 | | | 35,015 | | | 31.1 | | | | | |
Total loans (c) | | $ | 104,260 | | | 100.0 | % | | $ | 112,606 | | | 100.0 | % | | | | |
| | | | | | | | | | | | |
| | | | | | | | |
| | | | | | | | | | | | |
| | | | | | | | | | | | |
| | | | | | | | | | | | |
| | | | | | | | | | | | |
| | | | | | | | | | | | |
| | | | | | | | | | | | |
| | | | | | | | | | | | |
| | | | | | | | | | | | |
| | | | | | | | | | | | |
| | | | | | | | | | | | |
| | | | | | | | | | | | |
| | | | | | | | | | | | |
| | | | | | | | | | | | |
| | | | | | | | | | | | |
| | | | | | | | | | | | |
| | | | | | | | | | | | |
| | | | | | | | | | | | |
| | | | | | | | | | | | |
(a)Loan balances include $212 million and $207 million, of commercial credit card balances at December 31, 2024, and December 31, 2023, respectively.
(b)Commercial lease financing includes receivables held as collateral for a secured borrowing of $3 million and $7 million at December 31, 2024, and December 31, 2023, respectively. Principal reductions are based on the cash payments received from these related receivables. Additional information pertaining to this secured borrowing is included in Note 20 (“Long-Term Debt”).
(c)Total loans exclude loans of $257 million at December 31, 2024, and $339 million at December 31, 2023, related to the discontinued operations of the education lending business.
At December 31, 2024, total loans outstanding from continuing operations were $104.3 billion, compared to $112.6 billion at the end of 2023. For more information on balance sheet carrying value, see Note 1 (“Summary of Significant Accounting Policies”) under the headings “Loans” and “Loans Held for Sale.”
Commercial loan portfolio
Commercial loans outstanding were $71.9 billion at December 31, 2024, a decrease of $5.7 billion, or 7.3%, compared to December 31, 2023, primarily reflecting declines in commercial and industrial loans and commercial mortgage real estate loans.
Figure 9 provides our commercial loan portfolio by industry classification as of December 31, 2024, and December 31, 2023.
Figure 9. Commercial Loans by Industry
| | | | | | | | | | | | | | | | | | | | | | | | | | | | | |
| December 31, 2024 | Commercial and industrial | | Commercial
real estate | | Commercial
lease financing | | Total commercial
loans | | Percent of
total |
| Dollars in millions | | | | |
| Industry classification: | | | | | | | | | |
| Agriculture | $ | 875 | | | $ | 99 | | | $ | 80 | | | $ | 1,054 | | | 1.5 | % |
| Automotive | 2,173 | | | 673 | | | 2 | | | 2,848 | | | 4.0 | |
| | | | | | | | | |
| Business services | 2,899 | | | 262 | | | 81 | | | 3,242 | | | 4.5 | |
| Commercial real estate | 7,799 | | | 11,909 | | | 3 | | | 19,711 | | | 27.4 | |
| Construction materials and contractors | 1,839 | | | 258 | | | 203 | | | 2,300 | | | 3.2 | |
| Consumer goods | 3,556 | | | 533 | | | 190 | | | 4,279 | | | 5.9 | |
| Consumer services | 4,127 | | | 616 | | | 328 | | | 5,071 | | | 7.1 | |
| Equipment | 1,740 | | | 159 | | | 137 | | | 2,036 | | | 2.8 | |
| Finance | 10,103 | | | 99 | | | 209 | | | 10,411 | | | 14.5 | |
| Healthcare | 2,707 | | | 1,204 | | | 210 | | | 4,121 | | | 5.7 | |
| Materials and extraction | 2,135 | | | 196 | | | 134 | | | 2,465 | | | 3.4 | |
| Oil and gas | 1,950 | | | 28 | | | 10 | | | 1,988 | | | 2.8 | |
| Public exposure | 1,961 | | | 7 | | | 387 | | | 2,355 | | | 3.3 | |
| Technology, media, and telecom | 521 | | | 10 | | | 44 | | | 575 | | | .8 | |
| Transportation | 849 | | | 127 | | | 291 | | | 1,267 | | | 1.8 | |
| Utilities | 7,279 | | | 6 | | | 422 | | | 7,707 | | | 10.7 | |
| Other | 396 | | | 60 | | | 5 | | | 461 | | | .6 | |
| Total | $ | 52,909 | | | $ | 16,246 | | | $ | 2,736 | | | $ | 71,891 | | | 100.0 | % |
| | | | | | | | | |
| December 31, 2023 | Commercial and industrial | | Commercial
real estate | | Commercial
lease financing | | Total commercial
loans | | Percent of
total |
| Dollars in millions | | | | |
| Industry classification: | | | | | | | | | |
| Agriculture | $ | 925 | | | $ | 114 | | | $ | 74 | | | $ | 1,113 | | | 1.4 | % |
| Automotive | 2,153 | | | 833 | | | 4 | | | 2,990 | | | 3.9 | |
| | | | | | | | | |
| Business services | 3,387 | | | 243 | | | 112 | | | 3,742 | | | 4.8 | |
| Commercial real estate | 8,229 | | | 13,113 | | | 8 | | | 21,350 | | | 27.5 | |
| Construction materials and contractors | 2,311 | | | 292 | | | 265 | | | 2,868 | | | 3.7 | |
| Consumer goods | 3,851 | | | 622 | | | 268 | | | 4,741 | | | 6.1 | |
| Consumer services | 4,568 | | | 774 | | | 327 | | | 5,669 | | | 7.3 | |
| Equipment | 2,405 | | | 171 | | | 168 | | | 2,744 | | | 3.5 | |
| Finance | 8,908 | | | 104 | | | 284 | | | 9,296 | | | 12.0 | |
| Healthcare | 3,222 | | | 1,456 | | | 303 | | | 4,981 | | | 6.4 | |
| Materials and extraction | 2,402 | | | 304 | | | 152 | | | 2,858 | | | 3.7 | |
| Oil and gas | 2,212 | | | 37 | | | 12 | | | 2,261 | | | 2.9 | |
| Public exposure | 2,241 | | | 8 | | | 513 | | | 2,762 | | | 3.6 | |
| Technology, media, and telecom | 807 | | | 11 | | | 78 | | | 896 | | | 1.2 | |
| Transportation | 988 | | | 97 | | | 466 | | | 1,551 | | | 2.0 | |
| Utilities | 6,418 | | | 6 | | | 459 | | | 6,883 | | | 8.9 | |
| Other | 788 | | | 68 | | | 30 | | | 886 | | | 1.1 | |
| Total | $ | 55,815 | | | $ | 18,253 | | | $ | 3,523 | | | $ | 77,591 | | | 100.0 | % |
| | | | | | | | | |
Commercial and industrial. Commercial and industrial loans are the largest component of our loan portfolio, representing 51% of our total loan portfolio at December 31, 2024, and 50% at December 31, 2023. This portfolio is approximately 89% variable rate and consists of loans primarily to large corporate, middle market, and small business clients.
Commercial and industrial loans totaled $52.9 billion at December 31, 2024, a decrease of $2.9 billion, or 5.2%, compared to December 31, 2023. The decrease was broad-based and spread across most industry categories, reflecting our planned balance sheet optimization efforts.
Commercial real estate loans. Our commercial real estate portfolio includes project loans primarily focused in market-rate and affordable multi-family housing loans, owner-occupied commercial and industrial operating company buildings, and community center grocer-anchored retail centers. These three commercial real estate segments make up 75% of our commercial real estate portfolio. Our non-owner-occupied portfolio is focused on operators of commercial real estate who not only utilize our loan products, but also our broader industry-focused products and services and provide consistent pipelines into our agency, CMBS, and other long-term market take out products. This focus ensures our relationship clients foster and build portfolios with stable, recurring cash flows, with adequate, balanced cash reserves to support our balance sheet exposures through the economic cycle.
At December 31, 2024, commercial real estate loans totaled $16.2 billion, which includes $13.3 billion of mortgage loans and $2.9 billion of construction loans. Compared to December 31, 2023, this portfolio decreased $2.0 billion or 11.0%, driven mainly by decreases in nonowner-occupied.
Since the global financial crisis in 2008, we have limited our construction business and reduced our overall construction loans from 42% to 18% of commercial real estate loans as of December 31, 2024. Construction loans provide a stream of funding for properties not fully leased at origination to support debt service payments over the term of the contract or project. As of December 31, 2024, 82% of our construction portfolio are multi-family project loans. Our office exposure only represents 5% of commercial real estate loans at period end.
As shown in Figure 10, our commercial real estate loan portfolio includes various property types and geographic locations of the underlying collateral. These loans include commercial mortgage and construction loans in both Consumer Bank and Commercial Bank.
Figure 10. Commercial Real Estate Loans
| | | | | | | | | | | | | | | | | | | | | | | | | | | | | | | | | | | |
| | Geographic Region | | | | |
| Dollars in millions | West | Southwest | Central | Midwest | Southeast | Northeast | National | Total | Percent of Total | Construction | Commercial Mortgage |
| December 31, 2024 | | | | | | | | | | | |
| Nonowner-occupied: | | | | | | | | | | | |
| Data Center | $ | — | | $ | — | | $ | — | | $ | 98 | | $ | 54 | | $ | — | | $ | — | | $ | 152 | | .9 | % | $ | — | | $ | 152 | |
| Diversified | 1 | | — | | — | | 3 | | — | | 13 | | 118 | | 135 | | .8 | | — | | 135 | |
| Industrial | 44 | | 1 | | 95 | | 103 | | 214 | | 258 | | 18 | | 733 | | 4.5 | | 54 | | 679 | |
| Land & Residential | 10 | | 7 | | 3 | | 7 | | — | | 21 | | — | | 48 | | .3 | | 28 | | 20 | |
| Lodging | 48 | | — | | 12 | | 14 | | 46 | | 55 | | 59 | | 234 | | 1.4 | | — | | 234 | |
| Medical Office | 35 | | 43 | | 42 | | — | | 37 | | 97 | | 17 | | 271 | | 1.7 | | — | | 271 | |
| Multifamily | 1,303 | | 485 | | 1,201 | | 1,204 | | 2,325 | | 1,336 | | 156 | | 8,010 | | 49.3 | | 2,405 | | 5,605 | |
| Office | 152 | | 1 | | 129 | | 77 | | 134 | | 232 | | 13 | | 738 | | 4.5 | | — | | 738 | |
| Retail | 152 | | 6 | | 81 | | 172 | | 97 | | 293 | | 79 | | 880 | | 5.4 | | 43 | | 837 | |
| Self Storage | 44 | | — | | 44 | | 8 | | 222 | | 18 | | 24 | | 360 | | 2.2 | | 14 | | 346 | |
| Senior Housing | 172 | | 39 | | 97 | | 85 | | 54 | | 142 | | 4 | | 593 | | 3.7 | | 154 | | 439 | |
| Skilled Nursing | — | | — | | — | | — | | 132 | | 170 | | 90 | | 392 | | 2.4 | | — | | 392 | |
| Student Housing | 41 | | — | | 13 | | 63 | | 123 | | — | | — | | 240 | | 1.5 | | 50 | | 190 | |
| Other | 1 | | 10 | | 7 | | 112 | | 40 | | 48 | | — | | 218 | | 1.3 | | — | | 218 | |
| Total nonowner-occupied | 2,003 | | 592 | | 1,724 | | 1,946 | | 3,478 | | 2,683 | | 578 | | 13,004 | | 80.0 | | 2,748 | | 10,256 | |
| Owner-occupied | 1,078 | | — | | 330 | | 601 | | 182 | | 1,051 | | — | | 3,242 | | 20.0 | | 188 | | 3,054 | |
| Total | $ | 3,081 | | $ | 592 | | $ | 2,054 | | $ | 2,547 | | $ | 3,660 | | $ | 3,734 | | $ | 578 | | $ | 16,246 | | 100.0 | % | $ | 2,936 | | $ | 13,310 | |
| | | | | | | | | | | |
| Nonowner-occupied: | | | | | | | | | | |
| Nonperforming loans | $ | 5 | | $ | — | | $ | 64 | | $ | 80 | | $ | 81 | | $ | 13 | | $ | — | | $ | 243 | | N/M | $ | — | | $ | 243 | |
| Accruing loans past due 90 days or more | 10 | | — | | 2 | | 1 | | — | | 7 | | — | | 20 | | N/M | 4 | | 16 | |
| Accruing loans past due 30 through 89 days | 1 | | — | | — | | 3 | | 19 | | 9 | | — | | 32 | | N/M | — | | 32 | |
| December 31, 2023 | | | | | | | | | | | |
| Nonowner-occupied: | | | | | | | | | | | |
| Data Center | $ | — | | $ | — | | $ | — | | $ | — | | $ | — | | $ | — | | $ | — | | $ | — | | — | % | $ | — | | $ | — | |
| Diversified | 3 | | — | | — | | 3 | | — | | 16 | | 164 | | 186 | | 1.0 | | — | | 186 | |
| Industrial | 58 | | 24 | | 80 | | 110 | | 230 | | 280 | | 20 | | 802 | | 4.4 | | 168 | | 634 | |
| Land & Residential | 5 | | 3 | | 3 | | 5 | | 3 | | 21 | | — | | 40 | | .2 | | 18 | | 22 | |
| Lodging | 48 | | — | | 3 | | 4 | | 46 | | 66 | | 55 | | 222 | | 1.2 | | 5 | | 217 | |
| Medical Office | 37 | | — | | 42 | | 1 | | 21 | | 97 | | 75 | | 273 | | 1.5 | | 27 | | 246 | |
| Multifamily | 1,237 | | 552 | | 1,271 | | 1,272 | | 2,707 | | 1,370 | | 444 | | 8,853 | | 48.5 | | 2,389 | | 6,464 | |
| Office | 142 | | — | | 153 | | 76 | | 118 | | 285 | | 50 | | 824 | | 4.5 | | — | | 824 | |
| Retail | 213 | | 6 | | 84 | | 183 | | 102 | | 297 | | 213 | | 1,098 | | 6.0 | | 75 | | 1,023 | |
| Self Storage | 62 | | — | | 45 | | 15 | | 72 | | 32 | | 171 | | 397 | | 2.2 | | 4 | | 393 | |
| Senior Housing | 124 | | 22 | | 143 | | 88 | | 65 | | 120 | | 213 | | 775 | | 4.2 | | 126 | | 649 | |
| Skilled Nursing | — | | — | | — | | 66 | | — | | 202 | | 215 | | 483 | | 2.6 | | — | | 483 | |
| Student Housing | — | | — | | — | | 27 | | 158 | | — | | — | | 185 | | 1.0 | | 59 | | 126 | |
| Other | 1 | | 12 | | 8 | | 35 | | 37 | | 67 | | 160 | | 320 | | 1.8 | | — | | 320 | |
| Total nonowner-occupied | 1,930 | | 619 | | 1,832 | | 1,885 | | 3,559 | | 2,853 | | 1,780 | | 14,458 | | 79.2 | | 2,871 | | 11,587 | |
| Owner-occupied | 1,141 | | 1 | | 414 | | 720 | | 167 | | 1,352 | | — | | 3,795 | | 20.8 | | 195 | | 3,600 | |
| Total | $ | 3,071 | | $ | 620 | | $ | 2,246 | | $ | 2,605 | | $ | 3,726 | | $ | 4,205 | | $ | 1,780 | | $ | 18,253 | | 100.0 | % | $ | 3,066 | | $ | 15,187 | |
| | | | | | | | | | | |
| Nonperforming loans | $ | 1 | | $ | — | | $ | 46 | | $ | 1 | | $ | 9 | | $ | 5 | | $ | 38 | | $ | 100 | | N/M | $ | — | | $ | 100 | |
| Accruing loans past due 90 days or more | 1 | | — | | — | | 6 | | — | | 3 | | — | | 10 | | N/M | — | | 10 | |
| Accruing loans past due 30 through 89 days | 3 | | — | | 12 | | — | | 7 | | 7 | | — | | 29 | | N/M | — | | 29 | |
| | | | | |
| West – | Alaska, California, Hawaii, Idaho, Montana, Oregon, Washington, and Wyoming |
| Southwest – | Arizona, Nevada, and New Mexico |
| Central – | Arkansas, Colorado, Oklahoma, Texas, and Utah |
| Midwest – | Illinois, Indiana, Iowa, Kansas, Michigan, Minnesota, Missouri, Nebraska, North Dakota, Ohio, South Dakota, and Wisconsin |
| Southeast – | Alabama, Delaware, Florida, Georgia, Kentucky, Louisiana, Maryland, Mississippi, North Carolina, South Carolina, Tennessee, Virginia, Washington, D.C., and West Virginia |
| Northeast – | Connecticut, Maine, Massachusetts, New Hampshire, New Jersey, New York, Pennsylvania, Rhode Island, and Vermont |
| National – | Accounts in three or more regions |
Consumer loan portfolio
Consumer loans outstanding at December 31, 2024, totaled $32.4 billion, a decrease of $2.6 billion, or 7.6%, from one year ago. The decrease was driven by declines across all consumer loan categories and reflect the higher interest rate environment and our focus on originating salable loans.
The residential mortgage portfolio is comprised of loans originated by our Consumer Bank and is the largest segment of our consumer loan portfolio as of December 31, 2024, representing approximately 61% of consumer loans. This is followed by our home equity portfolio comprising approximately 20% of consumer loans outstanding at year end.
We held the first lien position for approximately 65% of the home equity portfolio at December 31, 2024, and 64% at December 31, 2023. For loans with real estate collateral, we track borrower performance monthly. Regardless of the lien position, credit metrics are refreshed quarterly, including recent FICO scores as well as updated loan-to-value ratios. This information is used in establishing the ALLL. Our methodology is described in Note 1 (“Summary of Significant Accounting Policies”) under the heading “Allowance for Loan and Lease Losses”.
Figure 11 presents our consumer loans by geography.
Figure 11. Consumer Loans by State
| | | | | | | | | | | | | | | | | | |
| Dollars in millions | Real estate — residential mortgage | Home equity loans | Consumer direct loans | Credit cards | | Total |
| December 31, 2024 | | | | | | |
| Washington | $ | 4,312 | | $ | 929 | | $ | 214 | | $ | 85 | | | $ | 5,540 | |
| Ohio | 2,662 | | 895 | | 111 | | 197 | | | 3,865 | |
| New York | 723 | | 1,756 | | 737 | | 330 | | | 3,546 | |
| Colorado | 2,891 | | 258 | | 131 | | 30 | | | 3,310 | |
| California | 2,191 | | 12 | | 442 | | 3 | | | 2,648 | |
| Oregon | 1,195 | | 532 | | 92 | | 40 | | | 1,859 | |
| Pennsylvania | 403 | | 449 | | 333 | | 60 | | | 1,245 | |
| Florida | 733 | | 41 | | 384 | | 13 | | | 1,171 | |
| Utah | 805 | | 232 | | 56 | | 18 | | | 1,111 | |
| Connecticut | 684 | | 223 | | 105 | | 28 | | | 1,040 | |
| Other | 3,287 | | 1,031 | | 2,562 | | 154 | | | 7,034 | |
| Total | $ | 19,886 | | $ | 6,358 | | $ | 5,167 | | $ | 958 | | | $ | 32,369 | |
| | | | | | |
| December 31, 2023 | | | | | | |
| Washington | $ | 4,520 | | $ | 1,020 | | $ | 227 | | $ | 88 | | | $ | 5,855 | |
| Ohio | 2,704 | | 1,029 | | 251 | | 203 | | | 4,187 | |
| New York | 805 | | 1,993 | | 775 | | 347 | | | 3,920 | |
| Colorado | 3,001 | | 277 | | 149 | | 32 | | | 3,459 | |
| California | 2,294 | | 14 | | 500 | | 3 | | | 2,811 | |
| Oregon | 1,269 | | 585 | | 108 | | 43 | | | 2,005 | |
| Pennsylvania | 445 | | 517 | | 379 | | 63 | | | 1,404 | |
| Florida | 782 | | 42 | | 416 | | 14 | | | 1,254 | |
| Utah | 851 | | 252 | | 64 | | 18 | | | 1,185 | |
| Connecticut | 765 | | 255 | | 113 | | 29 | | | 1,162 | |
| Other | 3,522 | | 1,155 | | 2,934 | | 162 | | | 7,773 | |
| Total | $ | 20,958 | | $ | 7,139 | | $ | 5,916 | | $ | 1,002 | | | $ | 35,015 | |
| | | | | | |
Loan sales
As shown in Figure 12, during 2024, we sold $8.2 billion of our loans. Sales of loans classified as held for sale generated net gains of $120 million during 2024.
Figure 12 summarizes our loan sales during 2024 and 2023.
Figure 12. Loans Sold (Including Loans Held for Sale)
| | | | | | | | | | | | | | | | | | | |
| Dollars in millions | Commercial | Commercial Real Estate | Commercial Lease Financing | Residential Real Estate | | | Total |
| 2024 | | | | | | | |
| Fourth quarter | $ | 150 | | $ | 2,584 | | $ | — | | $ | 342 | | | | $ | 3,076 | |
| Third quarter | 60 | | 1,406 | | 90 | | 393 | | | | 1,949 | |
| Second quarter | 56 | | 860 | | 61 | | 312 | | | | 1,289 | |
| First quarter | 86 | | 1,554 | | 85 | | 209 | | | | 1,934 | |
| Total | $ | 352 | | $ | 6,404 | | $ | 236 | | $ | 1,256 | | | | $ | 8,248 | |
| | | | | | | |
| 2023 | | | | | | | |
| Fourth quarter | $ | 34 | | $ | 1,735 | | $ | 21 | | $ | 340 | | | | $ | 2,130 | |
| Third quarter | 85 | | 2,861 | | 49 | | 345 | | | | 3,340 | |
| Second quarter | 118 | | 1,431 | | 28 | | 283 | | | | 1,860 | |
| First quarter | 125 | | 1,121 | | 164 | | 135 | | | | 1,545 | |
| Total | $ | 362 | | $ | 7,148 | | $ | 262 | | $ | 1,103 | | | | $ | 8,875 | |
| | | | | | | |
Figure 13 shows loans that are either administered or serviced by us but not recorded on the balance sheet; this includes loans that were sold.
Figure 13. Loans Administered or Serviced
| | | | | | | | | | | | | |
December 31, Dollars in millions | 2024 | 2023 | 2022 | | |
| Commercial real estate loans | $ | 557,633 | | $ | 499,449 | | $ | 488,478 | | | |
| Residential mortgage | 11,344 | | 11,193 | | 11,026 | | | |
| Education loans | 189 | | 248 | | 312 | | | |
| Commercial lease financing | 1,735 | | 1,946 | | 1,646 | | | |
| Commercial loans | 603 | | 667 | | 723 | | | |
| Consumer direct | 328 | | 408 | | 509 | | | |
| Consumer indirect | 319 | | 792 | | 1,536 | | | |
| Total | $ | 572,151 | | $ | 514,703 | | $ | 504,230 | | | |
| | | | | |
In the event of default by a borrower, we are subject to recourse with respect to approximately $7.8 billion of the $572.2 billion of loans administered or serviced at December 31, 2024. These are primarily associated with commercial real estate loans administered or serviced. Additional information about this recourse arrangement is included in Note 22 (“Commitments, Contingent Liabilities, and Guarantees”) under the heading “Recourse agreement with FNMA.”
We derive income from several sources when retaining the right to administer or service loans that are sold. We earn noninterest income (recorded as “Consumer mortgage income” and “Commercial mortgage servicing fees”) from fees for servicing or administering loans. This fee income is reduced by the amortization of related servicing assets. In addition, we earn interest income from investing funds generated by escrow deposits collected in connection with the servicing loans. Additional information about our mortgage servicing assets is included in Note 9 (“Mortgage Servicing Assets”).
Maturities and sensitivity of certain loans to changes in interest rates
Figure 14 shows the remaining maturities of our loan portfolio and the sensitivity of certain loans to changes in interest rates as of December 31, 2024.
Figure 14. Remaining Maturities and Sensitivity of Certain Loans to Changes in Interest Rates(a)
| | | | | | | | | | | | | | | | | | |
| December 31, 2024 | | | | | | |
| Dollars in millions | Within One Year | One - Five Years | Five - Fifteen Years | Over Fifteen Years | Total | |
| Commercial | | | | | | |
| Commercial and industrial | $ | 13,360 | | $ | 35,689 | | $ | 3,733 | | $ | 127 | | $ | 52,909 | | |
| Commercial Mortgage | 6,483 | | 4,322 | | 2,176 | | 329 | | 13,310 | | |
| Real estate — construction | 1,829 | | 750 | | 165 | | 192 | | 2,936 | | |
| Commercial lease financing | 181 | | 1,586 | | 969 | | — | | 2,736 | | |
| Total commercial loans | $ | 21,853 | | $ | 42,347 | | $ | 7,043 | | $ | 648 | | $ | 71,891 | | |
| | | | | | |
| Consumer | | | | | | |
| Real estate - residential mortgage | $ | 183 | | $ | 36 | | $ | 678 | | $ | 18,989 | | $ | 19,886 | | |
| Home equity loans | 99 | | 205 | | 1,798 | | 4,256 | | 6,358 | | |
| Other consumer loans | 505 | | 807 | | 2,040 | | 1,815 | | 5,167 | | |
| Credit Cards | 958 | | — | | — | | — | | 958 | | |
| | | | | | |
| Total consumer loans | 1,745 | | 1,048 | | 4,516 | | 25,060 | | 32,369 | | |
| Total loans | $ | 23,598 | | $ | 43,395 | | $ | 11,559 | | $ | 25,708 | | $ | 104,260 | | |
Loans with floating or adjustable interest rates (b) | | $ | 37,592 | | $ | 2,991 | | $ | 12,385 | | $ | 52,968 | | |
Loans with predetermined interest rates (c) | | 5,803 | | 8,568 | | 13,323 | | 27,694 | | |
| Total | | $ | 43,395 | | $ | 11,559 | | $ | 25,708 | | $ | 80,662 | | |
| | | | | | |
(a)Accrued interest of $456 million at December 31, 2024, is presented in "Accrued income and other assets" on the Consolidated Balance Sheets and is excluded from the amortized cost basis disclosed in this table.
(b)Floating and adjustable rates vary in relation to other interest rates (such as the base lending rate) or a variable index that may change during the term of the loan.
(c)Predetermined interest rates either are fixed or may change during the term of the loan according to a specific formula or schedule.
Securities
Our securities portfolio is constructed to store liquidity and help manage interest rate risk, including holding securities used to accommodate pledging requirements. Our securities portfolio totaled $45.1 billion at December 31, 2024, compared to $45.8 billion at December 31, 2023. Available-for-sale securities were $37.7 billion at December 31, 2024, compared to $37.2 billion at December 31, 2023. Held-to-maturity securities were $7.4 billion at December 31, 2024, compared to $8.6 billion at December 31, 2023.
As shown in Figure 15, all of our mortgage-backed securities, which include both securities available-for-sale and held-to-maturity securities, are issued by government-sponsored enterprises or GNMA, and are traded in liquid secondary markets. These securities are recorded on the balance sheet at fair value for the available-for-sale portfolio and at cost for the held-to-maturity portfolio. For more information about these securities, see Note 6 (“Fair Value Measurements”) under the heading “Qualitative Disclosures of Valuation Techniques,” and Note 7 (“Securities”).
Figure 15. Mortgage-Backed Securities by Issuer
| | | | | | | | |
December 31, Dollars in millions | 2024 | 2023 |
| FHLMC & FNMA | $ | 14,291 | | $ | 24,302 | |
| | |
| GNMA | 21,573 | | 11,665 | |
Total (a) | $ | 35,864 | | $ | 35,967 | |
| | |
(a)Includes securities held in the available-for-sale and held-to-maturity portfolios.
Securities available for sale
The majority of our securities available-for-sale portfolio consists of federal agency mortgage-backed securities and CMOs. CMOs are debt securities secured by a pool of mortgages or mortgage-backed securities. In September 2024, we initiated a strategic repositioning of our securities available for sale portfolio by selling approximately $7.0 billion in market value of low-yielding mortgage-backed securities. The investment securities that were sold had a weighted average book yield of approximately 2.3% and an average duration of approximately six years. Reinvestment of the proceeds from the sale was completed in October 2024, with the new securities having an average book yield of approximately 4.95% and an average duration of approximately four years. During the third quarter of 2024, along with our customary sale of short-dated U.S. Treasuries set to mature within the quarter, we also sold approximately $3 billion in U.S. Treasuries yielding 50 basis points that were set to mature in the fourth quarter of 2024.
In December 2024, we completed the strategic repositioning of our securities available-for-sale portfolio by selling an additional $3.0 billion of low-yielding investment securities and terminating approximately $3.0 billion of fair value hedges. The investment securities sold had a weighted average book yield of approximately 1.5% and an average duration of approximately eight years. Reinvestment of the proceeds from the sale was completed in December 2024, with the new securities having an average book yield of 5.5% and an average duration of approximately four years.
Figure 16 shows the composition, TE yields, and remaining maturities of our securities available for sale. For more information about these securities, including gross unrealized gains and losses by type of security and securities pledged, see Note 7 (“Securities”).
Figure 16. Securities Available for Sale
| | | | | | | | | | | | | | | | | | | | | | |
| Dollars in millions | U.S. Treasury, Agencies, and Corporations | | Agency Residential Collateralized Mortgage Obligations(a) | Agency Residential Mortgage-backed Securities(a) | Agency Commercial Mortgage-backed Securities(a) | | Total | Weighted-Average Yield(b) |
| December 31, 2024 | | | | | | | | |
| Remaining maturity: | | | | | | | | |
| One year or less | $ | 2,585 | | | $ | 4 | | $ | 6 | | $ | 580 | | | $ | 3,175 | | 3.93 | % |
| After one through five years | 6,212 | | | 1,140 | | 2,931 | | 612 | | | 10,895 | | 3.66 | |
| After five through ten years | 40 | | | 6,073 | | 6,934 | | 2,358 | | | 15,405 | | 3.29 | |
| After ten years | 67 | | | 2,007 | | 5,298 | | 860 | | | 8,232 | | 3.49 | |
| Fair value | $ | 8,904 | | | $ | 9,224 | | $ | 15,169 | | $ | 4,410 | | | $ | 37,707 | | |
Amortized cost(b) | 8,928 | | | 11,409 | | 16,038 | | 4,927 | | | 41,302 | | 3.48 | % |
Weighted-average yield(c) | 4.21 | % | | 1.98 | % | 4.32 | % | 2.91 | % | | 3.48 | % | — | |
| Weighted-average maturity | 1.7 years | | 8.3 years | 9.9 years | 6.7 years | | 7.3 years | — | |
| December 31, 2023 | | | | | | | | |
| Fair value | $ | 9,026 | | | $ | 15,478 | | $ | 3,589 | | $ | 9,092 | | | $ | 37,185 | | — | % |
| Amortized cost | 9,300 | | | 18,911 | | 4,189 | | 10,295 | | | 42,695 | | 1.79 | |
| | | | | | | | |
| | | | | | | | |
| | | | | | | | |
(a)Maturity is based upon expected average lives rather than contractual terms.
(b)Excluded from the amortized cost of securities available for sale are basis adjustments for securities designated in active fair value hedges. Basis adjustments totaled $(6) million and $140 million as of December 31, 2024 and December 31, 2023, respectively. The securities being hedged are primarily U.S Treasuries, Agency RMBS, and Agency CMBS.
(c)Weighted-average yields are calculated based on amortized cost. Such yields have been adjusted to a TE basis using the statutory federal income tax rate in effect that calendar year.
Held-to-maturity securities
The majority of our held-to-maturity portfolio consists of federal agency CMOs and mortgage-backed securities. The portfolio is also comprised of asset-backed securities and foreign bonds. Figure 17 shows the composition, yields, and remaining maturities of these securities.
Figure 17. Held-to-Maturity Securities
| | | | | | | | | | | | | | | | | | | | | | | | | | | |
| Dollars in millions | | | Agency Residential Collateralized Mortgage Obligations(a) | Agency Residential Mortgage-backed Securities(a) | Agency Commercial Mortgage-backed Securities(a) | Asset-backed securities(a) | Other
Securities | | Total | | Weighted-Average Yield(b) |
| December 31, 2024 | | | | | | | | | | | |
| Remaining maturity: | | | | | | | | | | | |
| One year or less | | | $ | 35 | | $ | — | | $ | 41 | | $ | 2 | | $ | 7 | | | $ | 85 | | | 2.54 | % |
| After one through five years | | | 1,160 | | 101 | | 1,221 | | 304 | | 19 | | | 2,805 | | | 3.05 | |
| After five through ten years | | | 2,429 | | 7 | | 236 | | 2 | | — | | | 2,674 | | | 3.59 | |
| After ten years | | | 953 | | 43 | | 835 | | — | | — | | | 1,831 | | | 3.79 | |
| Amortized cost | | | $ | 4,577 | | $ | 151 | | $ | 2,333 | | $ | 308 | | $ | 26 | | | $ | 7,395 | | | 3.43 | % |
| Fair value | | | 4,248 | | 134 | | 2,130 | | 300 | | 25 | | | 6,837 | | | — | |
Weighted-average yield(b) | | | 3.78 | % | 2.82 | % | 2.94 | % | 2.09 | % | 4.17 | % | | 3.43 | % | | — | |
| Weighted-average maturity | | | 7.2 years | 7.1 years | 8.3 years | 1.4 years | 1.9 years | | 7.3 years | | — | |
| December 31, 2023 | | | | | | | | | | | |
| Amortized cost | | | $ | 5,170 | | $ | 165 | | $ | 2,473 | | $ | 738 | | $ | 29 | | | $ | 8,575 | | | 3.49 | % |
| Fair value | | | 4,896 | | 152 | | 2,270 | | 709 | | 29 | | | 8,056 | | | — | |
| | | | | | | | | | | |
| | | | | | | | | | | |
| | | | | | | | | | | |
(a)Maturity is based upon expected average lives rather than contractual terms.
(b)Weighted-average yields are calculated based on amortized cost. Such yields have been adjusted to a TE basis using the statutory federal income tax rate in effect that calendar year.
Deposits and other sources of funds
Figure 18. Breakdown of Deposits at December 31, 2024
The following presents the breakdown of our deposits by product for the noted periods.
| | | | | | | | |
| December 31, | | |
| Dollars in billions | 2024 | 2023 |
| Money market deposits | $ | 41.0 | | $ | 37.0 | |
| Demand deposits | 57.6 | | 57.7 | |
| Savings deposits | 4.6 | | 5.4 | |
| Time deposits | 17.0 | | 14.8 | |
| Noninterest bearing deposits | 29.6 | | 30.7 | |
| Total | $ | 149.8 | | $ | 145.6 | |
| | |
Our highly diversified deposit base is our primary source of funding. At December 31, 2024, our deposits totaled $149.8 billion, an increase of $4.2 billion, compared to December 31, 2023. The increase reflects our durable relationship-based business model, in addition to changing client behavior as a result of higher interest rates.
Uninsured deposits totaled $64.4 billion and $61.5 billion at December 31, 2024 and December 31, 2023, respectively. Uninsured deposits are defined as the portion of deposit accounts in U.S. offices that exceed the FDIC insurance limit or similar state deposit insurance regimes and amounts in any other uninsured investment or deposit accounts that are classified as deposits and not subject to any federal or state deposit insurance regimes.
Figure 19 presents estimated uninsured deposits for the noted periods which reflect amounts disclosed in KeyBank’s Call Report adjusted for intercompany deposits, which are not customer facing and are eliminated in consolidation, and accrued interest.
Figure 19. Estimated Uninsured Deposits
| | | | | | | | | | | |
| December 31, | | | | | |
| Dollars in billions | 2024 | | | | 2023 |
Uninsured deposits(a) | $ | 64.4 | | | | | $ | 61.5 | |
| Total deposits | 149.8 | | | | | 145.6 | |
| Uninsured % of Deposits | 43 | % | | | | 42 | % |
(a) Intercompany deposits and accrued interest excluded from uninsured deposits | $ | 12.4 | | | | | $ | 9.5 | |
As of December 31, 2024 and December 31, 2023, approximately $12.3 billion and $13.1 billion, respectively, of uninsured deposits were collateralized by government-backed securities.
Figure 20 presents the maturity distribution of estimated uninsured time deposits.
Figure 20. Maturity Distribution of Uninsured Time Deposit Amounts
| | | | | | | | |
| December 31, | | |
| Dollars in millions | 2024 | 2023 |
| Remaining maturity: | | |
| Three months or less | $ | 575 | | $ | 480 | |
| After three through six months | 582 | | 324 | |
| After six through twelve months | 220 | | 353 | |
| After twelve months | 77 | | 52 | |
| Total | $ | 1,454 | | $ | 1,209 | |
| | |
Wholesale funds, consisting of short-term borrowings and long-term debt, totaled $14.2 billion at December 31, 2024, compared to $22.6 billion at December 31, 2023. The decrease reflects our balance sheet optimization efforts, which reduced our need for wholesale borrowings. For more information regarding our wholesale funds, see Item 7. Management’s Discussion & Analysis of Financial Condition & Results of Operations under the heading “Risk Management - Liquidity risk management” of this report.
Capital
Our capital management objective is to maintain capital levels consistent with our risk appetite and of a sufficient amount to operate under a wide range of economic conditions. Our current capital levels position us well to execute against our capital priorities including supporting organic growth and paying dividends.
The following sections discuss certain ways we have deployed our capital. For further information, see the Consolidated Statements of Changes in Equity and Note 24 (“Shareholders' Equity”).
(a)Common Share repurchases were suspended during the second quarter of 2020 in response to the COVID-19 pandemic and resumed in the first quarter of 2021.
Dividends
Consistent with our capital plans, the Board declared a quarterly dividend of $.205 per Common Share for each of the four quarters of 2024. These quarterly dividend payments brought our annual dividend to $.82 per Common Share for 2024.
Common Shares outstanding
Our Common Shares are traded on the NYSE under the symbol KEY with 27,154 holders of record at December 31, 2024. Our book value per Common Share was $14.21 based on 1.1 billion shares outstanding at
December 31, 2024, compared to $13.02 based on 936.6 million shares outstanding at December 31, 2023. At December 31, 2024, our tangible book value per Common Share was $11.70, compared to $10.02 at December 31, 2023.
Figure 21 shows activities that caused the change in our outstanding Common Shares over the past two years.
Figure 21. Changes in Common Shares Outstanding
| | | | | | | | | | | | | | | | | | | | |
| | | 2024 Quarters | |
| In thousands | 2024 | Fourth | Third | Second | First | 2023 |
| Shares outstanding at beginning of period | 936,564 | | 991,251 | | 943,200 | | 942,776 | | 936,564 | | 933,325 | |
| Open market share repurchases | — | | — | | — | | — | | — | | (2,550) | |
| Shares issued under employee compensation plans (net of cancellations and returns) | 7,351 | | 493 | | 222 | | 424 | | 6,212 | | 5,789 | |
| Shares issued under Scotiabank investment agreement | 162,871 | | 115,042 | | 47,829 | | — | | — | | — | |
| Shares outstanding at end of period | 1,106,786 | | 1,106,786 | | 991,251 | | 943,200 | | 942,776 | | 936,564 | |
| | | | | | |
During 2024, Common Shares outstanding increased by 170.2 million shares, primarily driven by issuances under the Scotiabank investment agreement. For more information on share activity, see Note 24 (“Shareholders' Equity”).
At December 31, 2024, we had 149.9 million treasury shares, compared to 320.1 million treasury shares at December 31, 2023. The decrease in treasury shares during the year was primarily attributable to the issuance of 162.9 million shares to Scotiabank in connection with the strategic minority investment. Going forward, we expect to reissue treasury shares as needed in connection with stock-based compensation awards and for other corporate purposes.
Capital adequacy
Capital adequacy is an important indicator of financial stability and performance. All of our capital ratios remained in excess of regulatory requirements at December 31, 2024. Our capital and liquidity levels are intended to position us to weather an adverse operating environment while continuing to serve our clients’ needs, as well as to meet the Regulatory Capital Rules described in the “Supervision and regulation” section of Item 1 of this report. Our shareholders’ equity to assets ratio was 9.7% at December 31, 2024, compared to 7.8% at December 31, 2023. Our tangible common equity to tangible assets ratio was 7.0% at December 31, 2024, compared to 5.1% at December 31, 2023. The minimum capital and leverage ratios under the Regulatory Capital Rules together with the estimated ratios of KeyCorp at December 31, 2024, calculated on a fully phased-in basis, are set forth under the heading “Basel III” in the “Supervision and Regulation” section in Item 1 of this report.
Figure 22 represents the details of our regulatory capital positions at December 31, 2024, and December 31, 2023, under the Regulatory Capital Rules. Information regarding the regulatory capital ratios of KeyCorp’s banking subsidiaries is presented in Note 24 (“Shareholders' Equity”).
Figure 22. Capital Components and Risk-Weighted Assets
| | | | | | | | | | | |
December 31, Dollars in millions | 2024 | 2023 |
| COMMON EQUITY TIER 1 | | |
| Key shareholders’ equity (GAAP) | $ | 18,176 | | $ | 14,637 | |
| Less: | Preferred Stock (a) | 2,446 | | 2,446 | |
| Add: | CECL phase-in (b) | 59 | | 118 | |
| | Common Equity Tier 1 capital before adjustments and deductions | 15,789 | | 12,309 | |
| Less: | Goodwill, net of deferred taxes | 2,574 | | 2,594 | |
| Intangible assets, net of deferred taxes | 24 | | 49 | |
| Deferred tax assets | 172 | | 1 | |
| Net unrealized gains (losses) on available-for-sale securities, net of deferred taxes | (2,729) | | (4,296) | |
| Accumulated gains (losses) on cash flow hedges, net of deferred taxes | (438) | | (656) | |
| | Amounts in AOCI attributed to pension and postretirement benefit costs, net of deferred taxes | (303) | | (277) | |
| | Total Common Equity Tier 1 capital | 16,489 | | 14,894 | |
| TIER 1 CAPITAL | | |
| Common Equity Tier 1 | 16,489 | | 14,894 | |
| Additional Tier 1 capital instruments and related surplus | 2,445 | | 2,446 | |
| Less: | Deductions | — | | — | |
| | Total Tier 1 capital | 18,934 | | 17,340 | |
| TIER 2 CAPITAL | | |
| Tier 2 capital instruments and related surplus | 1,767 | | 2,020 | |
Allowance for losses on loans and liability for losses on lending-related commitments (c) | 1,635 | | 1,668 | |
| Less: | Deductions | — | | — | |
| | Total Tier 2 capital | 3,402 | | 3,688 | |
| Total risk-based capital | $ | 22,336 | | $ | 21,028 | |
| | | |
| RISK-WEIGHTED ASSETS | | |
| Risk-weighted assets on balance sheet | $ | 105,047 | | $ | 115,861 | |
| Risk-weighted off-balance sheet exposure | 31,883 | | 31,555 | |
| Market risk-equivalent assets | 1,366 | | 1,159 | |
| Gross risk-weighted assets | 138,296 | | 148,575 | |
| Less: | Excess allowance for loan and lease losses | — | | — | |
| Net risk-weighted assets | $ | 138,296 | | $ | 148,575 | |
| AVERAGE QUARTERLY TOTAL ASSETS | $ | 188,855 | | $ | 191,948 | |
| | | |
| CAPITAL RATIOS | | |
| Tier 1 risk-based capital | 13.69 | % | 11.67 | % |
| Total risk-based capital | 16.15 | | 14.15 | |
Leverage (d) | 10.03 | | 9.03 | |
| Common Equity Tier 1 | 11.92 | | 10.02 | |
| | | | |
(a)Net of capital surplus.
(b)Amount reflects our decision to adopt the CECL transitional provision.
(c)The ALLL included in Tier 2 capital is limited by regulation to 1.25% of the institution’s standardized total risk-weighted assets (excluding its standardized market risk-weighted assets). The ALLL includes $13 million and $16 million of allowance classified as “discontinued assets” on the balance sheet at December 31, 2024, and December 31, 2023, respectively.
(d)This ratio is Tier 1 capital divided by average quarterly total assets as defined by the Federal Reserve less: (i) goodwill, (ii) the disallowed intangible and deferred tax assets, and (iii) other deductions from assets for leverage capital purposes.
Off-Balance Sheet Arrangements
Off-balance sheet arrangements
We are party to various types of off-balance sheet arrangements, which could lead to contingent liabilities or risks of loss that are not reflected on the balance sheet.
Variable interest entities
In accordance with the applicable accounting guidance for consolidations, we consolidate a VIE if we have: (i) a variable interest in the entity; (ii) the power to direct activities of the VIE that most significantly impact the entity’s economic performance; and (iii) the obligation to absorb losses of the entity or the right to receive benefits from the entity that could potentially be significant to the VIE (i.e., we are considered to be the primary beneficiary). Additional information regarding the nature of VIEs and our involvement with them is included in Note 1 (“Summary of Significant Accounting Policies”) under the heading “Principles of Consolidation and Basis of Presentation” and in Note 13 (“Variable Interest Entities”).
Commitments to extend credit or funding
Loan commitments provide for financing on predetermined terms as long as the client continues to meet specified criteria. These commitments generally carry variable rates of interest and have fixed expiration dates or other termination clauses. We typically charge a fee for our loan commitments. Since a commitment may expire without resulting in a loan or being fully utilized, the total amount of an outstanding commitment may significantly exceed any related cash outlay. Further information about our loan commitments at December 31, 2024, is presented in Note 22 (“Commitments, Contingent Liabilities, and Guarantees”) under the heading “Commitments to Extend Credit or Funding.”
Other off-balance sheet arrangements
Other off-balance sheet arrangements include financial instruments that do not meet the definition of a guarantee in accordance with the applicable accounting guidance, and other relationships, such as liquidity support provided to asset-backed commercial paper conduits, indemnification agreements and intercompany guarantees. Information about such arrangements is provided in Note 22 under the heading “Other Off-Balance Sheet Risk.”
Guarantees
We are a guarantor in various agreements with third parties. As guarantor, we may be contingently liable to make payments to the guaranteed party based on changes in a specified interest rate, foreign exchange rate or other variable (including the occurrence or nonoccurrence of a specified event). These variables, known as underlyings, may be related to an asset or liability, or another entity’s failure to perform under a contract. Additional information regarding these types of arrangements is presented in Note 22 (“Commitments, Contingent Liabilities, and Guarantees”) under the heading “Guarantees.”
Risk Management
Overview
Like all financial services companies, we engage in business activities and assume the related risks. The most significant risks we face are credit, compliance, operational, liquidity, market, reputation, strategic, and model risks. Our risk management activities are shown in the following chart, and we manage such risks across the entire enterprise to maintain safety and soundness and maximize profitability. Certain of these risks are defined and discussed in greater detail in the remainder of this section.
Federal banking regulators continue to emphasize with financial institutions the importance of relating capital management strategy to the level of risk at each institution. We believe our internal risk management processes help us achieve and maintain capital levels that are commensurate with our business activities and risks, and
conform to regulatory expectations. The table below depicts our risk management hierarchy and associated responsibilities and activities of each group.
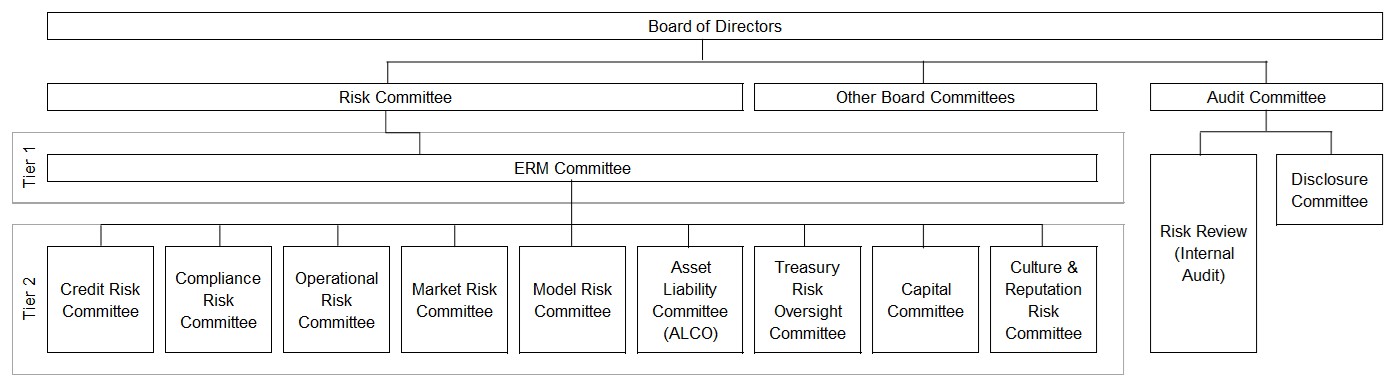
| | | | | | | | |
| Group | Overview and Responsibilities | Activities |
| Board of Directors | –Oversight capacity –Oversees that Key’s risks are managed in a manner that is effective and balanced –Fiduciary duty to Key’s shareholders
| –Understands Key's risk philosophy –Approves the risk appetite –Inquires about risk practices –Reviews the portfolio of risks –Compares the actual risks to the risk appetite –Is apprised of significant risks, both actual and emerging, and determines whether management is responding appropriately –Challenges management and promotes accountability |
Board of Directors Audit Committee (a) | –Assists the Board in oversight of financial statement integrity, regulatory and legal requirements, independent auditors’ qualifications and independence, and the performance of the internal audit function and independent auditors –Assists the Board in oversight of financial reporting, legal matters, and fraud risk | –Meets with management and approves significant policies relating to the risk areas overseen by the Audit Committee –Receives reports on enterprise risk –Meets bi-monthly –Convenes to discuss the content of our financial disclosures and quarterly earnings releases |
Board of Directors Risk Committee (a) | –Assists the Board in oversight of strategies, policies, procedures, and practices relating to the assessment and management of enterprise-wide risk, including credit, market, liquidity, model, operational, compliance, reputation, and strategic risks –Assists the Board in overseeing risks related to capital adequacy, capital planning, and capital actions | –Reviews and provides oversight of management’s activities related to the enterprise-wide risk management framework, which includes an annual review of the ERM Policy, including the Risk Appetite Statement, and management and ERM reports –Approves any material changes to the charter of the ERM Committee and significant policies relating to risk management, including corporate risk tolerances for major risk categories |
| ERM Committee | –Chaired by the Chief Executive Officer and comprising the Chief Risk Officer and other senior level executives –Manage risk and ensure that the corporate risk profile is managed in a manner consistent with our risk appetite –Oversees the ERM Program, which encompasses our risk philosophy, policy, framework, and governance structure for the management of risks across the entire company | –Approves and manages the risk-adjusted capital framework we use to manage risks
|
| Disclosure Committee | –Includes representatives from each of the Three Lines of Defense –Meets quarterly to review recent internal and external events to determine whether all appropriate disclosures have been made in reports filed with the SEC | –Convenes quarterly to discuss the content of our 10-Q and 10-K
|
| Tier 2 Risk Governance Committees | –Includes attendees from each of the Three Lines of Defense –The First Line of Defense is the line of business primarily responsible to accept, own, proactively identify, monitor, and manage risk –The Second Line of Defense comprises Risk Management representatives who provide independent, centralized oversight over all risk categories by aggregating, analyzing, and reporting risk information –Risk Review, our internal audit function, provides the Third Line of Defense. Its role is to provide independent assessment and testing of the effectiveness of, appropriateness of, and adherence to KeyCorp’s risk management policies, practices, and controls | –Supports the ERM Committee by identifying early warning events and trends, escalating emerging risks, and discussing forward-looking assessments |
| | |
| Internal Audit | –Provide the KeyCorp Board and management with independent, risk-based, and objective assurance, advice, insight, and foresight. | –Conducts objective examinations of evidence for the purpose of providing independent assessments to the Audit Committee, management, and outside parties on the adequacy and effectiveness of business processes, risk management activities, internal controls, and governance processes for KeyCorp. |
(a) The Audit and Risk Committees meet jointly, as appropriate, to discuss matters that relate to each committee’s responsibilities. Committee chairpersons routinely meet with management during interim months to plan agendas for upcoming meetings and to discuss emerging trends and events that have transpired since the preceding meeting. All members of the Board receive formal reports designed to keep them abreast of significant developments during the interim months.
Market risk management
Market risk is the risk that movements in market risk factors, including interest rates, foreign exchange rates, equity prices, commodity prices, credit spreads, and volatilities will reduce Key’s income and the value of its portfolios. These factors influence prospective yields, values, or prices associated with the instrument. We are exposed to market risk both in our trading and nontrading activities, which include asset and liability management activities. Our risk management activities are focused on ensuring that we properly identify, measure, and manage such risks across the entire enterprise to maintain safety and soundness, and to maximize profitability. Information regarding our fair value policies, procedures, and methodologies is provided in Note 1 (“Summary of Significant Accounting Policies”) under the heading “Fair Value Measurements” and Note 6 (“Fair Value Measurements”) in this report.
Trading market risk
Key incurs market risk as a result of trading activities that are used in support of client facilitation and hedging activities, principally within our investment banking and capital markets businesses. Key has exposures to a wide range of risk factors including interest rates, equity prices, foreign exchange rates, credit spreads, and commodity prices, as well as the associated implied volatilities and spreads. Our primary market risk exposures are a result of trading and hedging activities in the derivative and fixed income markets, including securitization exposures. At December 31, 2024, we did not have any re-securitization positions. We maintain modest trading inventories to facilitate customer flow, make markets in securities, and hedge certain risks including but not limited to credit risk and interest rate risk. The risks associated with these activities are mitigated in accordance with the Market Risk hedging policy. The majority of our positions are traded in active markets.
Governance structure - Trading market risk
Market risk management is an integral part of Key’s risk culture. The Risk Committee of our Board provides oversight of trading market risks. The ERM Committee and the Market Risk Committee regularly review and discuss market risk exposures and results of monitoring activities. Market risk policies and procedures have been defined and take into account our tolerance for risk and consideration for the business environment. The Market Risk Committee approves market risk policies and recommends our significant market risk policy to the ERM Committee, the KeyBank Board, and the Risk Committee of the Board for approval.
MTRM, as the second line of defense, is an independent risk management function that partners with the lines of business to identify, measure, and monitor market risks throughout our company. MTRM is responsible for ensuring transparency of significant market risks, monitoring compliance with established limits, and escalating limit exceptions to appropriate senior management. The various business units and trading desks are responsible for ensuring that market risk exposures are well-managed and prudent. Market risk is monitored through various measures, such as VaR, and through routine stress testing, sensitivity, and scenario analyses. MTRM conducts stress tests for each position using historical worst case and standard shock scenarios. VaR, stressed VaR, and other analyses are prepared daily and distributed to appropriate management.
Covered positions. We monitor the market risk of our covered positions as defined in the Market Risk Rule, which includes all of our trading positions as well as all foreign exchange and commodity positions, regardless of whether the position is in a trading account. Key’s covered positions may also include mortgage-backed and asset-backed securities that may be identified as securitization positions or re-securitization positions under the Market Risk Rule. MTRM as well as the LOB that trades securitization positions monitor the positions, the portfolio composition and the risks identified in this section on a daily basis consistent with the Market Risk policies and procedures. At December 31, 2024, covered positions did not include any re-securitization positions. Instruments that are used to hedge nontrading activities, such as bank-issued debt and loan portfolios, equity positions that are not actively traded, and securities financing activities, do not meet the definition of a covered position. MTRM is responsible for identifying our portfolios as either covered or non-covered. The Covered Position Working Group develops the final list of covered positions, and a summary is provided to the Market Risk Committee.
Our significant portfolios of covered positions are detailed below. We analyze market risk by portfolios of covered positions and do not separately measure and monitor our portfolios by risk type. The descriptions below incorporate the respective risk types associated with each of these portfolios.
•Fixed income includes those instruments associated with our capital markets business and the trading of securities as a dealer. These instruments may include positions in municipal bonds, bonds backed by the U.S. government, agency and corporate bonds, certain mortgage-backed and asset-backed securities, securities issued by the U.S. Treasury, money markets, and certain CMOs. The activities and instruments within the fixed income portfolio create exposures to interest rate and credit spread risks.
•Interest rate derivatives include interest rate swaps, caps, and floors, which are transacted primarily to accommodate the needs of commercial loan clients. In addition, we enter into interest rate derivatives to offset or mitigate the interest rate risk related to the client positions. The activities within this portfolio create exposures to interest rate risk.
VaR and stressed VaR. VaR is the estimate of the maximum amount of loss on an instrument or portfolio due to adverse market conditions during a given time interval within a stated confidence level. Stressed VaR is used to assess extreme conditions on market risk within our trading portfolios. MTRM calculates VaR and stressed VaR at
various confidence levels and the results are closely monitored. VaR and stressed VaR results are also provided to our regulators and utilized in regulatory capital calculations.
We use a historical simulation VaR model to measure the potential adverse effect of changes in interest rates, foreign exchange rates, equity prices, and credit spreads on the fair value of our covered positions and other non-covered positions. Historical moves in risk factors across various asset classes are incorporated in VaR metrics. Additional consideration is given to the risk factors to estimate the exposures that contain optionality features, such as options and cancellable provisions. VaR is calculated using daily observations over a one-year time horizon, and approximates a 95% confidence level. Statistically, this means that we would expect to incur losses greater than VaR, on average, five out of 100 trading days, or three to four times each quarter. We also calculate VaR and stressed VaR at a 99% confidence level.
The VaR model is an effective tool in estimating ranges of possible gains and losses on our positions. However, there are limitations inherent in the VaR model since it uses historical results over a given time interval to estimate future performance. Historical results may not be indicative of future results, and changes in the market or composition of our portfolios could have a significant impact on the accuracy of the VaR model. We regularly review and enhance the modeling techniques, inputs, and assumptions used. Our market risk policy includes the independent validation of our VaR model by Key’s internal model validation group on an annual basis. The Model Risk Committee oversees the Model Validation Program, and results of validations are discussed with the ERM Committee.
Actual losses for the total covered positions did not exceed aggregate daily VaR for any day during the quarters ended December 31, 2024, and December 31, 2023. MTRM backtests our VaR model on a daily basis to evaluate its predictive power. The test compares VaR model results at the 99% confidence level to daily held profit and loss. Results of back testing are provided to the Market Risk Committee. Backtesting exceptions occur when daily held profit and loss exceed VaR. We do not engage in correlation trading or utilize the internal model approach for measuring default and credit migration risk. Our net VaR approach incorporates diversification, but our VaR calculation does not include the impact of counterparty risk and our own credit spreads on derivatives.
The aggregate VaR at the 99% confidence level with a one day holding period for all covered positions was $1.4 million at December 31, 2024, and $1.6 million at December 31, 2023. Figure 23 summarizes our VaR at the 99% confidence level with a one day holding period for significant portfolios of covered positions for the three months ended December 31, 2024, and December 31, 2023.
Figure 23. VaR for Significant Portfolios of Covered Positions
| | | | | | | | | | | | | | | | | | | | | | | | | | | | | |
| | 2024 | | 2023 |
| | Three months ended December 31, | | | Three months ended December 31, | |
| Dollars in millions | High | Low | Mean | December 31, | | High | Low | Mean | December 31, |
| Trading account assets: | | | | | | | | | |
| Fixed income | $ | 1.3 | | $ | .4 | | $ | .9 | | $ | .8 | | | $ | 1.3 | | $ | .7 | | $ | 1.1 | | $ | 1.1 | |
| Derivatives: | | | | | | | | | |
| Interest rate | $ | .6 | | $ | .4 | | $ | .5 | | $ | .5 | | | $ | .5 | | $ | .3 | | $ | .4 | | $ | .4 | |
Stressed VaR is calculated by running the portfolios through a predetermined stress period which is approved by the Market Risk Committee and is calculated at the 99% confidence level using the same model and assumptions used for general VaR. The aggregate stressed VaR for all covered positions was $5.2 million at December 31, 2024, and $4.0 million at December 31, 2023. Figure 24 summarizes our stressed VaR at the 99% confidence level with a one day holding period for significant portfolios of covered positions for the three months ended December 31, 2024, and December 31, 2023. The increase in stressed VaR is due to a change in the size and composition of our fixed income inventory.
Figure 24. Stressed VaR for Significant Portfolios of Covered Positions
| | | | | | | | | | | | | | | | | | | | | | | | | | | | | |
| | 2024 | | 2023 |
| | Three months ended December 31, | | | Three months ended December 31, | |
| Dollars in millions | High | Low | Mean | December 31, | | High | Low | Mean | December 31, |
| Trading account assets: | | | | | | | | | |
| Fixed income | $ | 5.2 | | $ | 1.3 | | $ | 3.3 | | $ | 4.8 | | | $ | 4.7 | | $ | 1.9 | | $ | 3.1 | | $ | 3.6 | |
| Derivatives: | | | | | | | | | |
| Interest rate | $ | .4 | | $ | .2 | | $ | .3 | | $ | .3 | | | $ | .4 | | $ | .2 | | $ | .3 | | $ | .3 | |
Market risk is a component of our internal capital adequacy assessment. Our risk-weighted assets include a market risk-equivalent asset amount, which consists of a VaR component, stressed VaR component, a de minimis exposure amount, and a specific risk add-on including the securitization positions. The aggregate market value of the securitization positions as defined by the Market Risk Rule was $24 million at December 31, 2024, all of which were mortgage-backed security positions. Specific risk is the price risk of individual financial instruments, which is not accounted for by changes in broad market risk factors and is measured through a standardized approach. Market risk weighted assets, including the specific risk calculations, are run quarterly by MTRM in accordance with the Market Risk Rule, and approved by the Chief Market Risk Officer.
Nontrading market risk
Most of our nontrading market risk is derived from interest rate fluctuations and its impacts on our traditional loan and deposit products, as well as investments, hedging relationships, long-term debt, and certain short-term borrowings. Interest rate risk, which is inherent in the banking industry, is measured by the potential for fluctuations in net interest income and the EVE. Such fluctuations may result from changes in interest rates and differences in the repricing and maturity characteristics of interest-earning assets and interest-bearing liabilities. We manage the exposure to changes in net interest income and the EVE in accordance with our risk appetite and in accordance with the Board-approved ERM policy.
Interest rate risk positions are influenced by a number of factors, including the balance sheet positioning that arises out of customer preferences for loan and deposit products, economic conditions, the competitive environment within our markets, changes in market interest rates that affect client activity, and our hedging, investing, funding, and capital positions. The primary components of interest rate risk exposure consist of reprice risk, yield curve risk, option risk, and basis risk.
•“Reprice risk” is the exposure to changes in the level of interest rates and occurs when the volume of interest-bearing liabilities and the volume of interest-earning assets they fund (e.g., deposits used to fund loans) do not mature or reprice at the same time.
•“Yield curve risk” is the exposure to non-parallel changes in the slope of the yield curve (where the yield curve depicts the relationship between the yield on a particular type of security and its term to maturity) and occurs when interest-bearing liabilities and the interest-earning assets that they fund do not price or reprice to the same term point on the yield curve.
•“Option risk” is the exposure to a customer or counterparty’s ability to take advantage of the interest rate environment and terminate or reprice one of our assets, liabilities, or off-balance sheet instruments prior to contractual maturity. Option risk occurs when exposures to customer and counterparty early withdrawals or prepayments are not mitigated with an offsetting position or appropriate compensation.
•“Basis risk” is the exposure to asymmetrical changes in interest rate indexes and occurs when floating-rate assets and floating-rate liabilities reprice at the same time, but in response to different market factors or indexes.
Governance structure - Nontrading market risk
The management of nontrading market risk is centralized within Corporate Treasury. The Risk Committee of our Board provides oversight of nontrading market risk. The ERM Committee, the ALCO, and the Treasury Risk Oversight Committee (“TROC”) review reports on the interest rate risk exposures described above. In addition, the ALCO reviews reports on stress tests and sensitivity analyses related to interest rate risk. These committees have various responsibilities related to managing nontrading market risk, including recommending, approving, and monitoring strategies that maintain risk positions within approved tolerance ranges. The A/LM Policy provides the framework for the oversight and management of interest rate risk and is administered by the ALCO. MTRM, as the second line of defense, provides additional oversight.
Net interest income simulation analysis. The primary tool we use to measure our interest rate risk is simulation analysis. For purposes of this analysis, we estimate our net interest income based on the current and projected composition of our on- and off-balance sheet positions, accounting for recent and anticipated trends in customer activity. The analysis also incorporates assumptions for the current and projected interest rate environments and balance sheet growth projections based on a most likely macroeconomic view. The modeling incorporates investment portfolio and swap portfolio balances consistent with management's desired interest rate risk positioning. The simulation model estimates the amount of net interest income at risk by simulating the change in net interest
income that would occur if rates were to gradually increase or decrease from current levels over the next 12 months (subject to a floor on market interest rates at zero).
Figure 25 presents the results of the simulation analysis at December 31, 2024, and December 31, 2023. At December 31, 2024, our simulated impact to changes in interest rates was relatively neutral. The exposure to declining rates has changed from (0.01)% as of December 31, 2023 to 0.15% as of December 31, 2024, as a result of the change in balance sheet mix and positioning. Tolerance levels for risk management require the development of remediation plans to maintain residual risk within tolerance if simulation modeling demonstrates that a gradual, parallel 200 basis point increase or 200 basis point decrease in interest rates over the next 12 months would adversely affect net interest income over the same period by more than 5.5%. Current modeled exposure is within Board-approved tolerances. If a tolerance level is breached and determined inconsistent with risk appetite, the development of a remediation plan is required to reduce exposure back to within tolerance.
Figure 25. Simulated Change in Net Interest Income
| | | | | | | | | | | | | | |
| December 31, 2024 | December 31, 2023 |
| Basis point change assumption | -200 | 200 | -200 | 200 |
| | | | |
| | | | |
| Tolerance level | (5.50) | % | (5.50) | % | (5.50) | % | (5.50) | % |
| Interest rate risk assessment | 0.15 | % | (0.39) | % | (0.01) | % | (2.08) | % |
| | | | |
| |
| | | | |
| | | | |
Simulation analyses produce an estimate of interest rate exposure based on assumption inputs within the model. Assumptions are tailored to the specific interest rate environment and validated on a regular basis. However, actual results may differ from those derived in simulation analyses due to unanticipated changes to the balance sheet composition, customer behavior, product pricing, market interest rates, changes in management’s desired interest rate risk positioning, investment, funding and hedging activities or repercussions from exogenous events.
Regular stress tests and sensitivity analyses are performed on the model inputs that could materially change the resulting risk assessments. Assessments are performed using different yield curve shapes, including steepenings or flattenings of the curve, immediate changes in market interest rates, and changes in the relationship of money market interest rates. Assessments are also performed on changes to the following assumptions: loan and deposit balances, the pricing of deposits without contractual maturities, changes in lending spreads, prepayments on loans and securities, investment, funding and hedging activities, and liquidity and capital management strategies.
The results of additional assessments indicate that net interest income could increase or decrease from the base simulation results presented in Figure 25. Net interest income is highly dependent on the timing, magnitude, frequency, and path of interest rate changes and the associated assumptions for deposit repricing relationships, lending spreads, and the balance behavior of transaction accounts. If fixed-rate assets increase by $1 billion, or fixed-rate liabilities decrease by $1 billion, then the potential benefit to declining rates would increase by approximately 23 basis points. A five percentage point increase or decrease in the interest-bearing deposit beta assumption changes the current simulation results by approximately 120 basis points.
The current interest rate risk position could fluctuate to higher or lower levels of risk depending on the competitive environment and client behavior that may affect the actual volume, mix, maturity, and repricing characteristics of loan and deposit flows. Corporate Treasury discretionary activities related to funding, investing, and hedging may also change as a result of changes in customer business flows or changes in management’s desired interest rate risk positioning. As changes occur to both the configuration of the balance sheet and the outlook for the economy, management proactively evaluates hedging opportunities that may change our interest rate risk profile.
Simulations are also conducted that measure the effect of changes in market interest rates in the second and third years of a three-year horizon. These simulations are conducted in a similar manner to those based on a 12-month horizon. To capture longer-term exposures, changes in the EVE are calculated as discussed in the following section.
Economic value of equity modeling. EVE complements net interest income simulation analysis as it estimates risk exposure beyond 12-, 24-, and 36-month horizons. EVE modeling measures the extent to which the economic values of assets, liabilities, and off-balance sheet instruments may change in response to fluctuations in interest rates. EVE is calculated by subjecting the balance sheet to an immediate increase or decrease in interest rates, measuring the resulting change in the values of assets, liabilities, and off-balance sheet instruments, and comparing those amounts with the base case of the current interest rate environment. EVE policy limits are measured against a +/-200 basis point scenario subject to a floor on market interest rates at zero. This analysis is highly dependent
upon assumptions applied to assets and liabilities with non-contractual maturities. Those assumptions are based on historical behaviors, as well as forward expectations. Remediation plans are similarly developed if this analysis indicates that our EVE will decrease by more than 15% in response to an immediate increase or decrease in interest rates. The position is within these guidelines as of December 31, 2024.
Management of interest rate exposure. The results of the various interest rate risk analyses are used to formulate A/LM strategies to achieve the desired risk profile while managing to objectives for capital adequacy and liquidity risk exposures. Specifically, risk positions are managed by purchasing or selling securities, issuing term debt with floating or fixed interest rates, and using derivatives. Interest rate swaps and options are predominantly used, which modify the interest rate characteristics of certain assets and liabilities.
Figure 26 shows all swap positions held for A/LM purposes. These positions are used to convert the contractual interest rate index of agreed-upon amounts of assets and liabilities (i.e., notional amounts) to another interest rate index. For example, fixed-rate debt is converted to a floating rate through a “receive fixed/pay variable” interest rate swap. The volume, maturity, and mix of portfolio swaps change frequently to reflect broader A/LM objectives and the balance sheet positions to be hedged. For more information about how interest rate swaps are used to manage our risk profile, see Note 8 (“Derivatives and Hedging Activities”).
Figure 26. Portfolio Swaps and Options by Interest Rate Risk Management Strategy
| | | | | | | | | | | | | | | | | | | | | | | | | | | | | | | | |
| | December 31, 2024 | | | | |
| | | | | Weighted-Average | | December 31, 2023 | |
| Dollars in millions | Notional
Amount | Fair
Value | | Maturity
(Years) | Receive
Rate | Pay
Rate | | Notional
Amount | Fair
Value | |
| Receive fixed/pay variable — conventional loans | $ | 18,750 | | $ | (442) | | | 1.4 | 2.3 | % | 4.5 | % | | $ | 15,000 | | $ | (641) | | |
| Receive fixed/pay variable — conventional debt | 9,818 | | (470) | | | 3.5 | 2.6 | | 4.5 | | | 8,976 | | (395) | | |
| Receive fixed/pay variable — forward loans | 19,200 | | (114) | | | 3.1 | 3.8 | | 4.5 | | | 4,000 | | (27) | | |
| Receive fixed/pay variable — forward debt | 950 | | (22) | | | 9.2 | 3.8 | | 4.5 | | | 1,411 | | (40) | | |
| Pay fixed/receive variable — conventional debt | 50 | | 1 | | | 3.5 | 4.7 | | 3.6 | | | 50 | | 1 | | |
| | | | | | | | | | |
| Pay fixed/receive variable — securities | 9,405 | | 5 | | | 2.8 | 4.5 | | 4.1 | | | 8,655 | | (152) | | |
| Total portfolio swaps | $ | 58,173 | | $ | (1,042) | | (a) | 2.7 | 3.2 | % | 4.4 | % | | $ | 38,092 | | $ | (1,254) | | (a) |
| | | | | | | | | | |
| Floors — forward purchased | $ | 3,250 | | $ | 2 | | | 1.1 | — | % | — | % | | $ | 3,250 | | $ | 26 | | |
| Floors — forward sold | 3,250 | | (1) | | | 1.1 | — | | — | | | 3,250 | | (11) | | |
| Total floors | $ | 6,500 | | $ | 1 | | | — | — | % | — | % | | $ | 6,500 | | $ | 15 | | |
| | | | | | | | | | |
(a)Excludes accrued interest of $51 million and $58 million at December 31, 2024, and December 31, 2023, respectively.
Liquidity risk management
Liquidity risk, which is inherent in the banking industry, is measured by our ability to accommodate liability maturities and deposit withdrawals, meet contractual obligations, and fund new business opportunities at a reasonable cost, in a timely manner, and without adverse consequences. Liquidity management involves maintaining sufficient and diverse sources of funding to accommodate planned, as well as unanticipated, changes in assets and liabilities under both normal and adverse conditions.
Governance structure
We manage liquidity for all of our affiliates on a consolidated basis. This approach considers the funding sources available to each entity, as well as each entity’s capacity to manage through adverse conditions.
The management of consolidated liquidity risk is centralized within Corporate Treasury. Oversight and governance is provided by the Board, the ERM Committee, the ALCO, the TROC, and the Chief Risk Officer. The Asset Liability Management Policy provides the framework for the oversight and management of liquidity risk and is administered by the ALCO. The Corporate Treasury Oversight group within MTRM, as the second line of defense, provides additional oversight. Our current liquidity risk management practices are in compliance with the Federal Reserve Board’s Enhanced Prudential Standards.
The committees mentioned above regularly review liquidity and funding summaries, liquidity trends, peer comparisons, variance analyses, liquidity projections, internal liquidity stress tests, and goal tracking reports. The reviews generate a discussion of positions, trends, and directives on liquidity risk and shape a number of our decisions. When liquidity pressure is elevated, positions are monitored more closely and reporting is more intensive.
To ensure that emerging issues are identified, we monitor an extensive set of systematic and idiosyncratic early warning indicators daily.
Factors affecting liquidity
Our liquidity could be adversely affected by both direct and indirect events. An example of a direct event would be a downgrade in our credit ratings by a rating agency. Examples of indirect events (events unrelated to us) that could impair our access to liquidity would be an act of terrorism or war, natural disasters, global pandemics, political events, or the default or bankruptcy of a major corporation, mutual fund, or hedge fund. Similarly, market speculation, or rumors about us or the banking industry in general, may adversely affect the cost and availability of normal funding sources.
Our credit ratings at December 31, 2024, are shown in Figure 27. While we believe these credit ratings, under normal conditions in the capital markets, will enable KeyCorp or KeyBank to issue fixed income securities to investors, downgrades in our credit ratings could increase our cost of funds, trigger additional collateral or funding requirements, and decrease the number of investors and counterparties willing to lend to us.
Figure 27. Credit Ratings
| | | | | | | | | | | | | | | | | | | | | | | |
| December 31, 2024 | Outlook | Short-Term
Borrowings | Long-Term
Deposits(a) | Senior
Long-Term
Debt | Subordinated
Long-Term
Debt | Capital
Securities | Preferred
Stock |
| KEYCORP | | | | | | | |
| Standard & Poor’s | Stable | A-2 | N/A | BBB | BBB- | BB | BB |
| Moody’s | Stable | P-2 | N/A | Baa2 | Baa2 | Baa3 | Ba1 |
| Fitch | Positive | F2 | N/A | BBB+ | N/A | BB | BB |
| DBRS | Stable | R-1 (low) | N/A | A (low) | BBB (high) | BBB (high) | BBB (low) |
| | | | | | | |
| KEYBANK | | | | | | | |
| Standard & Poor’s | Stable | A-2 | N/A | BBB+ | BBB | N/A | N/A |
| Moody’s | Stable | P-2 | P-1/A2 | Baa1 | Baa2 | N/A | N/A |
| Fitch | Positive | F2 | F2/A- | BBB+ | BBB | N/A | N/A |
| DBRS | Stable | R-1 (low) | A | A | A (low) | N/A | N/A |
(a)P-1 rating assigned by Moody’s is specific to KeyBank’s short-term bank deposit ratings. F2 assigned by Fitch Ratings, Inc. is specific to KeyBank’s short-term deposit ratings.
Managing liquidity risk
Most of our liquidity risk is derived from our business model, which involves taking in deposits, many of which can be withdrawn at any time, and lending them out in the form of illiquid loan assets. The assessments of liquidity risk are measured under the assumption of normal operating conditions as well as under stressed environments. We manage these exposures in accordance with our risk appetite, and within Board-approved policy limits.
We regularly monitor our liquidity position and funding sources and measure our capacity to obtain funds in a variety of hypothetical scenarios in an effort to maintain an appropriate mix of available and affordable funding. In the normal course of business, we perform a monthly internal liquidity stress test at the consolidated KeyCorp level. From time to time, we may conduct internal liquidity stress tests more frequently, and use assumptions to reflect the changed market environment. Our testing incorporates estimates for loan and deposit lives based on our historical studies. Internal liquidity stress tests analyze potential liquidity scenarios under various funding constraints and time periods. Ultimately, they determine the periodic effects that major direct and indirect events would have on our access to funding markets and our ability to fund our normal operations. To compensate for the effect of these assumed liquidity pressures, we consider alternative sources of liquidity and maturities over different time periods to project how funding needs would be managed.
Our primary source of funding for KeyBank is customer deposits resulting in a consolidated loan-to-deposit ratio of 70% as of December 31, 2024. If the cash flows needed to support operating and investing activities are not satisfied by deposit balances, we rely on wholesale funding or on-balance sheet liquid reserves. Conversely, excess cash generated by operating, investing, and deposit-gathering activities may be used to repay outstanding debt or invest in liquid assets.
We maintain a Contingency Funding Plan that outlines the process for addressing a liquidity crisis. As part of the plan, we maintain on-balance sheet liquid reserves referred to as our liquid asset portfolio, which consists of high-quality liquid assets. During a problem period, that reserve could be used as a source of funding to provide time to develop and execute a longer-term strategy. Figure 28 shows our available contingent liquidity at December 31,
2024 and December 31, 2023. In 2024, our secured term borrowings decreased $8.5 billion from a reduction in FHLB borrowings.
Figure 28. Available Contingent Liquidity
| | | | | | | | |
| December 31, | | |
| Dollars in billions | 2024 | 2023 |
| Available contingent liquidity: | | |
| Unpledged securities | $ | 25.5 | | $ | 7.5 | |
| Net balances of federal funds sold and balances in our Federal Reserve account | 17.4 | | 10.7 | |
| Unused secured borrowing capacity at the Federal Reserve Bank of Cleveland | 36.7 | | 54.7 | |
| Unused secured borrowing capacity at the FHLB | 18.9 | | 13.6 | |
| Total | $ | 98.5 | | $ | 86.5 | |
| | |
Long-term liquidity strategy
Our long-term liquidity strategy is to be predominantly funded by core deposits. However, we may use wholesale funds to sustain an adequate liquid asset portfolio, meet daily cash demands, and allow management flexibility to execute business initiatives. Key’s client-based relationship strategy provides for a strong core deposit base that, in conjunction with intermediate and long-term wholesale funds managed to a diversified maturity structure and investor base, supports our liquidity risk management strategy. We use the loan-to-deposit ratio as a metric to monitor these strategies. Our target loan-to-deposit ratio is around 80% (at December 31, 2024, our loan-to-deposit ratio was 70.3%), which we calculate as the sum of total loans, loans held for sale, and nonsecuritized discontinued loans divided by deposits.
Liquidity programs
We have several liquidity programs, which are described in Note 20 (“Long-Term Debt”), that are designed to enable KeyCorp and KeyBank to raise funds in the public and private debt markets. The proceeds from most of these programs can be used for general corporate purposes, including acquisitions. These liquidity programs are reviewed from time to time by the Board and are renewed and replaced as necessary. There are no restrictive financial covenants in any of these programs.
KeyBank had no bank note issuances during 2024. At December 31, 2024, there was $20.0 billion available for issuance under the KeyBank Bank Note Program.
Liquidity for KeyCorp
The primary source of liquidity for KeyCorp is from subsidiary dividends, primarily from KeyBank. KeyCorp has sufficient liquidity when it can service its debt; support customary corporate operations and activities (including acquisitions); support occasional guarantees of subsidiaries’ obligations in transactions with third parties at a reasonable cost, in a timely manner, and without adverse consequences; and fund capital distributions in the form of dividends and share buybacks.
We use a parent cash coverage months metric as the primary measure to assess parent company liquidity. The parent cash coverage months metric measures the number of months into the future where projected obligations can be met with the current quantity of liquidity. We generally issue term debt to supplement dividends from KeyBank to manage our liquidity position at or above our targeted levels. The parent company generally maintains cash and short-term investments in an amount sufficient to meet projected debt maturities over at least the next 24 months. At December 31, 2024, KeyCorp held $5.2 billion in cash and short-term investments, which we projected to be sufficient to meet our projected obligations, including the repayment of our maturing debt obligations for the periods prescribed by our risk tolerance.
Typically, KeyCorp meets its liquidity requirements through regular dividends from KeyBank, supplemented with term debt. Federal banking law limits the amount of capital distributions that a bank can make to its holding company without prior regulatory approval. A national bank’s dividend-paying capacity is affected by several factors, including net profits (as defined by statute) for the two previous calendar years and for the current year, up to the date of dividend declaration. During 2024, KeyBank paid $750 million in cash dividends to KeyCorp, and during the fourth quarter of 2024, KeyBank paid no cash dividends to KeyCorp. KeyCorp issued debt of $1.0 billion in the first
quarter of 2024. At December 31, 2024, KeyBank had no regulatory capacity to pay any dividends to KeyCorp without prior regulatory approval.
Our liquidity position and recent activity
Over the past 12 months, our liquid asset portfolio, which includes overnight and short-term investments, as well as unencumbered, high quality liquid securities held as protection against a range of potential liquidity stress scenarios, has increased primarily due to an increase in Key's cash position. The liquid asset portfolio continues to exceed the amount that we estimate would be necessary to manage through an adverse liquidity event by providing sufficient time to develop and execute a longer-term solution.
On August 12, 2024, we entered into an Investment Agreement with Scotiabank pursuant to which Scotiabank agreed to make a strategic minority investment in KeyCorp of approximately $2.8 billion, representing approximately 14.9% pro forma common stock ownership of KeyCorp, for a fixed price of $17.17 per share. On August 30, 2024, Scotiabank completed the initial purchase of 47,829,359 of our Common Shares with an investment of approximately $821 million in gross proceeds.
On December 13, 2024, we announced that all necessary bank regulatory approvals had been received for completion of Scotiabank’s strategic minority investment in KeyCorp. On December 27, 2024, Scotiabank completed the final purchase of 115,042,316 of our Common Shares, contemplated under the Investment Agreement with an investment of approximately $2.0 billion. Following the Second Closing, Scotiabank owns approximately 14.9% of our common stock.
In conjunction with the investment from Scotiabank, we executed a strategic repositioning of our securities available-for-sale portfolio, selling $7.0 billion and $3.0 billion in market value of low-yielding investment securities in the third and fourth quarters of 2024, respectively. The sales resulted in a total pre-tax loss of $1.8 billion. Proceeds from the sales were invested in shorter-duration, higher-yielding investment securities.
From time to time, KeyCorp or KeyBank may seek to retire, repurchase, or exchange outstanding debt, capital securities, preferred shares, or common shares through cash purchase, privately negotiated transactions or other means. Additional information on repurchases of Common Shares by KeyCorp is included in Part II, Item 5. Market for the Registrant’s Common Equity, Related Stockholder Matters and Issuer Purchases of Equity Securities of this report. Such transactions depend on prevailing market conditions, our liquidity and capital requirements, contractual restrictions, regulatory requirements, and other factors. The amounts involved may be material, individually or collectively.
The Consolidated Statements of Cash Flows summarize our sources and uses of cash by type of activity for the years ended December 31, 2024, and December 31, 2023.
Credit risk management
Credit risk is the risk of loss arising from an obligor’s inability or failure to meet contractual payment or performance terms. Like other financial services institutions, we make loans, extend credit, distribute credit risk, purchase securities, provide financial and payments products, and enter into financial derivative contracts, all of which have related credit risk.
Credit policy, approval, and evaluation
We manage credit risk exposure through a multifaceted program. The Credit Risk Committee approves management credit policies and recommends significant credit policies to the Enterprise Risk Management Committee, the KeyBank Board, and the Risk Committee of the Board for approval. These policies are communicated throughout the organization to foster a consistent approach to granting credit.
Our credit risk management team and certain individuals within our lines of business, to whom credit risk management has delegated limited credit authority, are responsible for credit approval. Individuals with assigned credit authority are authorized to grant exceptions to credit policies. It is not unusual to make exceptions to established policies when mitigating circumstances dictate, however, a corporate level tolerance has been established to keep exceptions at an acceptable level based upon portfolio and economic considerations.
Our credit risk management team uses risk models to evaluate consumer loans. These models, known as scorecards, forecast the probability of serious delinquency and default for an applicant. The scorecards are embedded in the application processing system, which allows for real-time scoring and automated decisions for many of our products. We periodically validate the loan scoring processes.
We maintain an active concentration management program to mitigate concentration risk in our credit portfolios. For individual obligors, we employ a sliding scale of exposure, known as hold limits, which is dictated by the type of loan and strength of the borrower.
Allowance for loan and lease losses
We estimate the appropriate level of the ALLL on at least a quarterly basis. The methodology used is described in Note 1 (“Summary of Significant Accounting Policies”) under the heading “Allowance for Loan and Lease Losses.” Briefly, the ALLL estimate uses various models and estimation techniques based on our historical loss experience, current borrower characteristics, current conditions, reasonable and supportable forecasts and other relevant factors. The ALLL at December 31, 2024, represents our best estimate of the lifetime expected credit losses inherent in the loan portfolio at that date. For more information, see Note 5 (“Asset Quality”).
As shown in Figure 29, our ALLL from continuing operations decreased by $99 million, or 6.6%, from December 31, 2023. The commercial ALLL decreased by $23 million, or 2.2%, from December 31, 2023, driven by strategic balance sheet reductions and changes in the economic outlook, partly offset by portfolio credit migration. The consumer ALLL decreased $76 million, or 17.0%, from December 31, 2023, also largely driven by balance sheet reductions and economic forecasts, including improved home price values.
Figure 29. Allocation of the Allowance for Loan and Lease Losses
| | | | | | | | | | | | | | | | | | | | | | | | | | | |
| | 2024 | | 2023 | | |
December 31, Dollars in millions | Total Allowance | Percent of Allowance to Total Allowance | Percent of Loan Type to Total Loans | | Total Allowance | Percent of Allowance to Total Allowance | Percent of Loan Type to Total Loans | | | | |
| Commercial and industrial | $ | 639 | | 45.4 | % | 50.7 | % | | $ | 556 | | 36.9 | % | 49.6 | % | | | | |
| Commercial real estate: | | | | | | | | | | | |
| Commercial mortgage | 320 | | 22.7 | | 12.8 | | | 419 | | 27.8 | | 13.5 | | | | | |
| Construction | 51 | | 3.6 | | 2.8 | | | 52 | | 3.4 | | 2.7 | | | | | |
| Total commercial real estate loans | 371 | | 26.3 | | 15.6 | | | 471 | | 31.2 | | 16.2 | | | | | |
| Commercial lease financing | 27 | | 1.9 | | 2.6 | | | 33 | | 2.2 | | 3.1 | | | | | |
| Total commercial loans | 1,037 | | 73.6 | | 68.9 | | | 1,060 | | 70.3 | | 68.9 | | | | | |
| Real estate — residential mortgage | 90 | | 6.4 | | 19.1 | | | 162 | | 10.7 | | 18.6 | | | | | |
| Home equity loans | 70 | | 5.0 | | 6.1 | | | 86 | | 5.7 | | 6.4 | | | | | |
| Other consumer loans | 136 | | 9.6 | | 5.0 | | | 122 | | 8.1 | | 5.2 | | | | | |
| Credit cards | 76 | | 5.4 | | .9 | | | 78 | | 5.2 | | .9 | | | | | |
| | | | | | | | | | | |
| Total consumer loans | 372 | | 26.4 | | 31.1 | | | 448 | | 29.7 | | 31.1 | | | | | |
Total loans (a) | $ | 1,409 | | 100.0 | % | 100.0 | % | | $ | 1,508 | | 100.0 | % | 100.0 | % | | | | |
| | | | | | | | | | | |
| | | | | |
| | | | | | | | | | | |
| | | | | | | | | | | |
| | | | | | | | | | | |
| | | | | | | | | | | |
| | | | | | | | | | | |
| | | | | | | | | | | |
| | | | | | | | | | | |
| | | | | | | | | | | |
| | | | | | | | | | | |
| | | | | | | | | | | |
| | | | | | | | | | | |
| | | | | | | | | | | |
| | | | | | | | | | | |
| | | | | | | | | | | |
| | | | | | | | | | | |
| | | | | | | | | | | |
(a)Excludes allocations of the ALLL related to the discontinued operations of the education lending business in the amount of $13 million at December 31, 2024, and $16 million at December 31, 2023.
Net loan charge-offs
Figure 30 shows the trend in our net loan charge-offs by loan type, while the composition of loan charge-offs and recoveries by type of loan is presented in Figure 32. Figure 31 shows the ratio of net charge-offs by loan category as a percentage of the respective average loan balance.
Over the past 12 months, net loan charge-offs increased $196 million, with the most significant amounts coming from charge-offs of commercial and industrial loans from consumer goods related exposures.
Figure 30. Net Loan Charge-offs from Continuing Operations(a)
| | | | | | | | | | | |
| Year ended December 31, | | | | | |
| Dollars in millions | 2024 | 2023 | | | |
| Commercial and industrial | $ | 305 | | $ | 144 | | | | |
| Real estate — commercial mortgage | 38 | | 37 | | | | |
| Real estate — construction | — | | (1) | | | | |
| Commercial lease financing | 2 | | (5) | | | | |
| Total commercial loans | 345 | | 175 | | | | |
| Real estate — residential mortgage | (2) | | (3) | | | | |
| Home equity loans | — | | (1) | | | | |
| Other consumer loans | 56 | | 43 | | | | |
| Credit cards | 41 | | 30 | | | | |
| | | | | |
| Total consumer loans | 95 | | 69 | | | | |
| Total net loan charge-offs | $ | 440 | | $ | 244 | | | | |
| Net loan charge-offs to average loans | .41 | % | .21 | % | | | |
| Net loan charge-offs from discontinued operations — education lending business | $ | 3 | | $ | 3 | | | | |
(a)Credit amounts indicate that recoveries exceeded charge-offs.
Figure 31. Net Loan Charge-offs to Average Loans from Continuing Operations(a)
| | | | | | | | | | | |
| Year ended December 31, | | | | | |
| 2024 | 2023 | | | |
| Commercial and industrial | 0.56 | % | 0.24 | % | | | |
| Real estate — commercial mortgage | 0.27 | | 0.23 | | | | |
| Real estate — construction | — | | (0.04) | | | | |
| Commercial lease financing | 0.05 | | (0.14) | | | | |
| Total commercial loans | 0.46 | | 0.21 | | | | |
| Real estate — residential mortgage | (0.01) | | (0.01) | | | | |
| Home equity loans | — | | (0.01) | | | | |
| Other consumer loans | 1.01 | | 0.69 | | | | |
| Credit cards | 4.44 | | 3.04 | | | | |
| | | | | |
| Total consumer loans | 0.29 | | 0.19 | | | | |
| Total net loan charge-offs | 0.41 | % | 0.21 | % | | | |
| | | | | |
(a)Credit amounts indicate that recoveries exceeded charge-offs.
Figure 32. Summary of Loan and Lease Loss Experience from Continuing Operations
| | | | | | | | | | | |
Year ended December 31, Dollars in millions | 2024 | 2023 | | | |
| Average loans outstanding | $ | 107,724 | | $ | 118,004 | | | | |
| | | | | |
| | | | | |
| Allowance for loan and lease losses at beginning of period | $ | 1,508 | | $ | 1,337 | | | | |
| Loans charged off: | | | | | |
| Commercial and industrial | $ | 363 | | $ | 188 | | | | |
| Real estate — commercial mortgage | 40 | | 39 | | | | |
| Real estate — construction | — | | — | | | | |
Total commercial real estate loans (a) | 40 | | 39 | | | | |
| Commercial lease financing | 7 | | — | | | | |
Total commercial loans (b) | 410 | | 227 | | | | |
| Real estate — residential mortgage | 3 | | 1 | | | | |
| Home equity loans | 2 | | 2 | | | | |
| Other consumer loans | 64 | | 51 | | | | |
| Credit cards | 47 | | 37 | | | | |
| | | | | |
| Total consumer loans | 116 | | 91 | | | | |
| Total loans charged off | 526 | | 318 | | | | |
| Recoveries: | | | | | |
| Commercial and industrial | 58 | | 44 | | | | |
| Real estate — commercial mortgage | 2 | | 2 | | | | |
| Real estate — construction | — | | 1 | | | | |
Total commercial real estate loans (a) | 2 | | 3 | | | | |
| Commercial lease financing | 5 | | 5 | | | | |
Total commercial loans (b) | 65 | | 52 | | | | |
| Real estate — residential mortgage | 5 | | 4 | | | | |
| Home equity loans | 2 | | 3 | | | | |
| Other consumer loans | 8 | | 8 | | | | |
| Credit cards | 6 | | 7 | | | | |
| | | | | |
| Total consumer loans | 21 | | 22 | | | | |
| Total recoveries | 86 | | 74 | | | | |
| Net loan charge-offs | (440) | | (244) | | | | |
| Provision (credit) for loan and lease losses | 341 | | 415 | | | | |
| | | | | |
| Allowance for loan and lease losses at end of year | $ | 1,409 | | $ | 1,508 | | | | |
| | | | | |
| | | | | |
| | | | | |
| Liability for credit losses on lending-related commitments at beginning of the year | 296 | | 225 | | | | |
| Provision (credit) for losses on lending-related commitments | (6) | | 74 | | | | |
Liability for credit losses on lending-related commitments at end of the year (c) | $ | 290 | | $ | 296 | | | | |
| Total allowance for credit losses at end of the year | $ | 1,699 | | $ | 1,804 | | | | |
| Net loan charge-offs to average total loans | .41 | % | .21 | % | | | |
| Allowance for loan and lease losses to period-end loans | 1.35 | | 1.34 | | | | |
| Allowance for credit losses to period-end loans | 1.63 | | 1.60 | | | | |
| Allowance for loan and lease losses to nonperforming loans | 185.9 | | 262.7 | | | | |
| Allowance for credit losses to nonperforming loans | 224.1 | % | 314.3 | % | | | |
| Discontinued operations — education lending business: | | | | | |
| Loans charged off | $ | 4 | | $ | 4 | | | | |
| Recoveries | 1 | | 1 | | | | |
| Net loan charge-offs | $ | (3) | | $ | (3) | | | | |
| | | | | |
(a)See Figure 10 and the accompanying discussion in the “Loans and loans held for sale” section for more information related to our commercial real estate loan portfolio.
(b)See Figure 9 and the accompanying discussion in the “Loans and loans held for sale” section for more information related to our commercial loan portfolio.
(c)Included in “accrued expense and other liabilities” on the balance sheet.
Nonperforming assets
Figure 33 shows the composition of our nonperforming assets. As shown in Figure 33, nonperforming assets increased $181 million during 2024. See Note 1 (“Summary of Significant Accounting Policies”) under the headings “Nonperforming Loans,” “Impaired Loans,” and “Allowance for Loan and Lease Losses” for a summary of our nonaccrual and charge-off policies.
Figure 33. Summary of Nonperforming Assets and Past Due Loans from Continuing Operations
| | | | | | | | | | | |
| December 31, | | | | | |
| Dollars in millions | 2024 | 2023 | | | |
| Commercial and industrial | $ | 322 | | $ | 297 | | | | |
| | | | | |
| Real estate — commercial mortgage | 243 | | 100 | | | | |
| Real estate — construction | — | | — | | | | |
Total commercial real estate loans (a) | 243 | | 100 | | | | |
| Commercial lease financing | — | | — | | | | |
Total commercial loans (b) | 565 | | 397 | | | | |
| Real estate — residential mortgage | 92 | | 71 | | | | |
| Home equity loans | 89 | | 97 | | | | |
| Other consumer loans | 5 | | 4 | | | | |
| Credit cards | 7 | | 5 | | | | |
| | | | | |
| Total consumer loans | 193 | | 177 | | | | |
| Total nonperforming loans | 758 | | 574 | | | | |
| Nonperforming loans held for sale | — | | — | | | | |
| OREO | 14 | | 17 | | | | |
| Other nonperforming assets | — | | — | | | | |
| Total nonperforming assets | $ | 772 | | $ | 591 | | | | |
| | | | | |
| Accruing loans past due 90 days or more | $ | 90 | | $ | 107 | | | | |
| Accruing loans past due 30 through 89 days | 206 | | 222 | | | | |
Restructured loans — accruing and nonaccruing (c) | N/A | N/A | | | |
Restructured loans included in nonperforming loans (c) | N/A | N/A | | | |
| Nonperforming assets from discontinued operations — education lending business | 2 | | 3 | | | | |
| Nonperforming loans to period-end portfolio loans | .73 | % | .51 | % | | | |
Nonperforming assets to period-end portfolio loans plus OREO and other nonperforming assets (c) | .74 | | .52 | | | | |
| | | | | |
(a)See Figure 10 and the accompanying discussion in the “Loans and loans held for sale” section for more information related to our commercial real estate loan portfolio.
(b)See Figure 9 and the accompanying discussion in the “Loans and loans held for sale” section for more information related to our commercial loan portfolio.
(c)Restructured loans are those for which Key, for reasons related to a borrower’s financial difficulties, grants a concession to the borrower that it would not otherwise consider. See Note 5 (“Asset Quality“) for more information. These concessions are made to improve the collectability of the loan and generally take the form of a reduction of the interest rate, extension of the maturity date or reduction in the principal balance.
Figure 34 shows the types of activity that caused the change in our nonperforming loans during each of the last four quarters and the years ended December 31, 2024, and December 31, 2023.
Figure 34. Summary of Changes in Nonperforming Loans from Continuing Operations
| | | | | | | | | | | | | | | | | | | | |
| | | 2024 Quarters | |
| Dollars in millions | 2024 | Fourth | Third | Second | First | 2023 |
| Balance at beginning of period | $ | 574 | | $ | 728 | | $ | 710 | | $ | 658 | | $ | 574 | | $ | 387 | |
| Loans placed on nonaccrual status | 1,140 | | 309 | | 271 | | 317 | | 243 | | 768 | |
| Charge-offs | (526) | | (131) | | (167) | | (131) | | (97) | | (318) | |
| Loans sold | (72) | | (13) | | (32) | | (22) | | (5) | | (38) | |
| Payments | (259) | | (111) | | (37) | | (76) | | (35) | | (132) | |
| Transfers to OREO | (6) | | (2) | | (1) | | (1) | | (2) | | (9) | |
| | | | | | |
| | | | | | |
| Loans returned to accrual status | (93) | | (22) | | (16) | | (35) | | (20) | | (84) | |
| Balance at end of period | $ | 758 | | $ | 758 | | $ | 728 | | $ | 710 | | $ | 658 | | $ | 574 | |
| | | | | | |
Operational and compliance risk management
Like all businesses, we are subject to operational risk, which is the risk of loss resulting from human error or malfeasance, inadequate or failed internal processes and systems, and external events. These events include, among other things, threats to our cybersecurity, as we are reliant upon information systems and the internet to conduct our business activities. Operational risk intersects with compliance risk, which is the risk of loss from violations of, or noncompliance with, laws, rules and regulations, prescribed practices, and ethical standards. Under the Dodd-Frank Act, large financial companies like Key are subject to heightened prudential standards and regulation. This heightened level of regulation has increased our operational risk. While operational and compliance risk are separate risk disciplines in KeyCorp’s ERM framework, losses and/or additional regulatory compliance costs are included in operational loss reporting and could take the form of explicit charges, increased operational costs, or harm to our reputation.
We seek to mitigate operational risk through identification and measurement of risk, alignment of business strategies with risk appetite and tolerance, and a system of internal controls and reporting. We continuously strive to strengthen our system of internal controls to improve the oversight of our operational risk and to ensure compliance with laws, rules, and regulations. For example, an operational event database tracks the amounts and sources of
operational risk and losses. This tracking mechanism helps to identify weaknesses and to highlight the need to take corrective action. We also rely upon software programs designed to assist in assessing operational risk and monitoring our control processes. This technology has enhanced the reporting of the effectiveness of our controls to senior management and the Board.
The Operational Risk Management Program provides the framework for the structure, governance, roles, and responsibilities, as well as the content, to manage operational risk for Key. The Compliance Risk Management Program serves the same function in managing compliance risk for Key. The Operational Risk Committee and the Compliance Risk Committee support the ERM Committee by identifying early warning events and trends, escalating emerging risks, and discussing forward-looking assessments. Both the Operational Risk Committee and the Compliance Risk Committee include attendees from each of the Three Lines of Defense. Primary responsibility for managing and monitoring internal control mechanisms lies with the managers of our various lines of business. The Operational Risk Committee and Compliance Risk Committee are senior management committees that oversee our level of operational and compliance risk and direct and support our operational and compliance infrastructure and related activities. These committees and the Operational Risk Management and Compliance Risk Management functions are an integral part of our ERM Program. Our Risk Review function regularly assesses the overall effectiveness of our Operational Risk Management and Compliance Risk Management Programs and our system of internal controls. Risk Review reports the results of reviews on internal controls and systems to senior management and the Audit Committee and updates the Risk Committee, as appropriate, on matters related to the oversight of these controls.
Cybersecurity
For information on our cybersecurity risk management and governance practices, please see Item 1C. Cybersecurity of this report.
GAAP to Non-GAAP Reconciliations
Non-GAAP financial measures have inherent limitations, are not required to be uniformly applied, and are not
audited. Although these non-GAAP financial measures are frequently used by investors to evaluate a company,
they have limitations as analytical tools, and should not be considered in isolation, nor as a substitute for analyses
of results as reported under GAAP.
The tangible common equity ratio and the return on tangible common equity ratio have been a focus for some investors, and management believes that these ratios may assist investors in analyzing Key’s capital position without regard to the effects of intangible assets and preferred stock. Since analysts and banking regulators may assess our capital adequacy using tangible common equity, we believe it is useful to enable investors to assess our capital adequacy on these same bases.
| | | | | | | | | | | | | | | | |
| Year ended December 31, | | | | | |
| Dollars in millions | 2024 | 2023 | 2022 | | |
| Tangible common equity to tangible assets at period end | | | | | |
| Key shareholders’ equity (GAAP) | $ | 18,176 | | $ | 14,637 | | $ | 13,454 | | | |
| Less: | Intangible assets (a) | 2,779 | | 2,806 | | 2,844 | | | |
| Preferred Stock (b) | 2,446 | | 2,446 | | 2,446 | | | |
| Tangible common equity (non-GAAP) | $ | 12,951 | | $ | 9,385 | | $ | 8,164 | | | |
| Total assets (GAAP) | $ | 187,168 | | $ | 188,281 | | $ | 189,813 | | | |
| Less: | Intangible assets (a) | 2,779 | | 2,806 | | 2,844 | | | |
| Tangible assets (non-GAAP) | $ | 184,389 | | $ | 185,475 | | $ | 186,969 | | | |
| Tangible common equity to tangible assets ratio (non-GAAP) | 7.02 | % | 5.06 | % | 4.37 | % | | |
| Average tangible common equity | | | | | |
| Average Key shareholders’ equity (GAAP) | $ | 15,408 | | $ | 13,881 | | $ | 14,730 | | | |
| Less: | Intangible assets (average) (c) | 2,793 | | 2,826 | | 2,839 | | | |
| Preferred Stock (average) | 2,500 | | 2,500 | | 2,114 | | | |
| Average tangible common equity (non-GAAP) | $ | 10,115 | | $ | 8,555 | | $ | 9,777 | | | |
| Return on average tangible common equity from continuing operations | | | | | |
| Income (loss) from continuing operations attributable to Key common shareholders (GAAP) | $ | (306) | | $ | 821 | | $ | 1,793 | | | |
| | | | | | |
| | | | | | |
| | | | | |
| Average tangible common equity (non-GAAP) | $ | 10,115 | | $ | 8,555 | | $ | 9,777 | | | |
| Return on average tangible common equity from continuing operations (non-GAAP) | (3.03) | % | 9.60 | % | 18.34 | % | | |
| | | | | |
| Return on average tangible common equity consolidated | | | | | |
| Net income (loss) attributable to Key common shareholders (GAAP) | $ | (304) | | $ | 824 | | $ | 1,799 | | | |
| Average tangible common equity (non-GAAP) | 10,115 | | 8,555 | | 9,777 | | | |
| Return on average tangible common equity consolidated (non-GAAP) | (3.01) | % | 9.63 | % | 18.40 | % | | |
(a)For the years ended December 31, 2024, December 31, 2023, and December 31, 2022, intangible assets exclude less than $1 million, $1 million, and $2 million, respectively, of period-end purchased credit card relationships.
(b)Net of capital surplus.
(c)For the years ended December 31, 2024, December 31, 2023, and December 31, 2022, average intangible assets exclude less than $1 million, $1 million, and $2 million, respectively, of average purchased credit card relationships.
Adjusted noninterest expense and adjusted noninterest income are non-GAAP measures in that they are adjusted to exclude the impact of certain items. Management believes adjusting for the selected items provide investors with useful information to gain a better understanding of ongoing operations and enhance comparability of results with prior periods, as well as demonstrate the effects of the financial impacts related to those selected items. | | | | | | | | | | | | | | | | |
| Year ended December 31, | | | | | |
| Dollars in millions | 2024 | 2023 | 2022 | | |
| Adjusted noninterest expense | | | | | |
| Noninterest expense (GAAP) | $ | 4,545 | | $ | 4,734 | | $ | 4,410 | | | |
| Adjustments: | | | | | |
| Efficiency related expenses | — | | (131) | | — | | | |
| Pension settlement (other expense) | — | | (18) | | — | | | |
| FDIC special assessment (other expense) | (25) | | (190) | | — | | | |
| Adjusted noninterest expense (non-GAAP) | $ | 4,520 | | $ | 4,395 | | $ | 4,410 | | | |
| | | | | |
| Adjusted noninterest income | | | | | |
| Noninterest income (GAAP) | $ | 809 | | $ | 2,470 | | $ | 2,718 | | | |
| Adjustments: | | | | | |
| Loss on sale of securities for securities repositioning | 1,833 | | — | | — | | | |
| Scotiabank investment agreement valuation (other income) | 3 | | — | | — | | | |
| Adjusted noninterest income (non-GAAP) | $ | 2,645 | | $ | 2,470 | | $ | 2,718 | | | |
| | | | | | |
Critical Accounting Policies and Estimates
Our business is dynamic and complex. Consequently, we must exercise judgment in choosing and applying accounting policies and methodologies. These choices are critical; not only are they necessary to comply with GAAP, they also reflect our view of the appropriate way to record and report our overall financial performance. All accounting policies are important, and all policies described in Note 1 (“Summary of Significant Accounting Policies”) should be reviewed for a greater understanding of how we record and report our financial performance.
In our opinion, some accounting policies are more likely than others to have a critical effect on our financial results and to expose those results to potentially greater volatility. These policies apply to areas of relatively greater business importance, or require us to exercise judgment and to make assumptions and estimates that affect amounts reported in the financial statements. Because these assumptions and estimates are based on current circumstances, they may prove to be inaccurate, or we may find it necessary to change them. The following is a description of our current critical accounting policies.
Allowance for loan and lease losses
The allowance for loan and lease losses represents management’s estimate of all expected credit losses over the expected contractual life of our existing loan portfolio. Determining the appropriateness of the allowance is complex and requires judgment by management about the effect of matters that are inherently uncertain. These critical estimates include significant use of our own historical data and complex methods to interpret them. We have an ongoing process to evaluate and enhance the quality, quantity, and timeliness of our data and interpretation methods used in the determination of these allowances. These evaluations are inherently subjective, as they require material estimates and may be susceptible to significant change, and include, among others:
•PD,
•LGD,
•Outstanding balance of the loan,
•Movement through delinquency stages,
•Amounts and timing of expected future cash flows,
•Value of collateral, which may be obtained from third parties,
•Economic forecasts which are obtained from a third party provider, and
•Qualitative factors, such as changes in current economic conditions, that may not be reflected in modeled results.
As described in our accounting policy related to the ALLL in Note 1 (“Summary of Significant Accounting Policies”) of this report under the heading “Allowance for Loan and Lease Losses," we employ a disciplined process and methodology to establish our ALLL, which has three main components: (i) asset specific / individual loan reserves; (ii) quantitative (formulaic or pooled) reserves; and (iii) qualitative (judgmental) reserves.
We use a non-DCF factor-based approach to estimate expected credit losses that include component PD/LGD/EAD models as well as less complex estimation methods for smaller loan portfolios. Probability of default models estimate the likelihood a borrower will cease making payments as agreed. These models use observed loan-level information and projected paths of macroeconomic variables. Borrower credit attributes including FICO scores of consumers and internally assigned risk ratings for commercial borrowers are significant inputs to the models. Consumer FICO scores are refreshed quarterly and commercial risk ratings are updated annually with select borrowers updated more frequently. The macroeconomic trends that have a significant impact on the probability of default vary by portfolio segment. Exposure at default models estimate the loan balance at the time of default. We use an amortization based formulaic approach to estimate account level EAD for all term loans. We use portfolio specific methods in each of our revolving product portfolios. LGD models estimate the loss we will suffer once a loan is in default. Account level inputs to LGD models include collateral attributes, such as loan to value.
If we observe limitations in the data or models, we use model overlays to make adjustments to model outputs to capture a particular risk or compensate for a known limitation. These variables and others may result in actual loan losses that differ from the originally estimated amounts.
This estimate produced by our models is forward-looking and requires management to use forecasts about future economic conditions to determine the expected credit loss over the remaining life of an instrument. Moody’s Consensus forecast is our source of macroeconomic projections, including the interest rate forecasts used in the credit models. We use a two year reasonable and supportable period across all products to forecast economic conditions. As the length of the life of a financial asset increases, these inputs may become impractical to estimate as reasonable and supportable. We believe the two year time horizon appropriately aligns with our business planning, available industry guidance, and reliability of various forecasting services. Following this two year period in which supportable forecasts can be generated, for all modeled loan portfolios, we revert expected credit losses to a level that is consistent with our historical information by reverting the macroeconomic variables (model inputs) to their long run average. We revert to historical loss rates for less complex estimation methods for smaller portfolios.
A four quarter reversion period is used where the macroeconomic variables linearly revert to their long run average following the two year reasonable and supportable period. We use a 20 year lookback period for determining long run historical average of the macroeconomic variables. We determined the 20 year lookback period is appropriate as it captures the previous two economic cycles as well as the impact from the pandemic.
The ALLL is sensitive to various macroeconomic drivers such as GDP and unemployment as well as portfolio attributes such as remaining term, outstanding balance, risk ratings, FICO, LTV, and delinquency status. Our ALLL models were designed to capture the correlation between economic and portfolio changes. As such, evaluating
shifts in individual portfolio attributes and macroeconomic variables in isolation may not be indicative of past or future performance.
It is difficult to estimate how potential changes in any one factor or input might affect the overall ALLL because we consider a wide variety of factors and inputs in estimating the ALLL. Changes in the factors and inputs considered may not occur at the same rate and may not be consistent across all geographies or product types, and changes in factors and input may be directionally inconsistent, such that improvement in one factor may offset deterioration in others. However, to consider the impact of a hypothetical alternate economic forecast, we compare the modeled quantitative allowance results using a downside economic scenario. The maximum difference in the quarterly macroeconomic variables between the base and downside scenarios over the two year reasonable and supportable period includes an approximate 5 percentage point decline in GDP annualized growth and an approximate 4 percentage point increase in the U.S. unemployment rate. The difference between these two scenarios would have driven an increase of approximately 1.6x for commercial and 1.7x for the consumer modeled allowance results.
Similarly, deteriorating conditions for portfolio factors were also considered by moderately stressing key portfolio drivers, relative to the baseline portfolio conditions. Stressing risk ratings by two ratings for commercial loans generates a 1.5x increase in the commercial modeled allowance results. Stressing FICO by ten points, and LTV and utilization by 10% for consumer loans generates a 1.2x increase in the consumer modeled allowance results.
Note that these analyses demonstrate the sensitivity of the ALLL to key quantitative assumptions, but exclude potential impacts to non-modeled allowance components and reserves for individually assessed loans. Furthermore, these analyses are not intended to estimate changes in the overall ALLL as they do not reflect qualitative factors, changes in current economic conditions that may not be reflected in quantitatively derived results, and other relevant factors that must be considered to ensure the ALLL reflects our best estimate of current expected credit losses.
Valuation methodologies
Fair value measurements
We measure or monitor many of our assets and liabilities on a fair value basis. Fair value is generally defined as the price that would be received to sell an asset or paid to transfer a liability (an exit price) as opposed to the price that would be paid to acquire the asset or received to assume the liability (an entry price), in an orderly transaction between market participants at the measurement date under current market conditions. While management uses judgment when determining the price at which willing market participants would transact when there has been a significant decrease in the volume or level of activity for the asset or liability in relation to “normal” market activity, management’s objective is to determine the point within the range of fair value estimates that is most representative of a sale to a third-party investor under current market conditions.
A fair value measure should reflect the assumptions that market participants would use in pricing the asset or liability, including the assumptions about the risk inherent in a particular valuation technique, the effect of a restriction on the sale or use of an asset and the risk of nonperformance. Fair value is measured based on a variety of inputs. Fair value may be based on quoted market prices for identical assets or liabilities traded in active markets (Level 1 valuations). If market prices are not available, quoted market prices for similar instruments traded in active markets, quoted prices for identical or similar instruments in markets that are not active, or model-based valuation techniques for which all significant assumptions are observable in the market are used (Level 2 valuations). Where observable market data is not available, the valuation is generated from model based techniques that use significant assumptions not observable in the market, but observable based on our specific data (Level 3 valuations). Unobservable assumptions reflect our estimates for assumptions that market participants would use in pricing the asset or liability. Valuation techniques typically include option pricing models, discounted cash flow models and similar techniques, but may also include the use of market prices of assets or liabilities that are not directly comparable to the subject asset or liability.
The selection and weighting of the various fair value techniques may result in a fair value higher or lower than carrying value. Considerable judgment may be involved in determining the amount that is most representative of fair value.
For assets and liabilities recorded at fair value, our policy is to maximize the use of observable inputs
and minimize the use of unobservable inputs when developing fair value measurements for those items where there
is an active market. In certain cases, when market observable inputs for model-based valuation techniques may not
be readily available, we are required to make judgments about assumptions market participants would use
in estimating the fair value of the financial instrument. The models used to determine fair value adjustments are
regularly evaluated by management for relevance under current facts and circumstances.
Changes in market conditions may reduce the availability of quoted prices or observable data. For example, reduced liquidity in the capital markets or changes in secondary market activities could result in observable market inputs becoming unavailable. When market data is not available, we use valuation techniques requiring more management judgment to estimate the appropriate fair value.
Fair value is used on a recurring basis for certain assets and liabilities in which fair value is the primary measure of
accounting. Fair value is used on a nonrecurring basis to measure certain assets or liabilities (including held-to-maturity securities, commercial loans held for sale, and OREO) for impairment or for disclosure purposes in accordance with current accounting guidance.
Impairment analysis also relates to long-lived assets and core deposit and other intangible assets. An
impairment loss is recognized if the carrying amount of the asset is not likely to be recoverable and exceeds its fair
value. In determining the fair value, management uses models and applies the techniques and assumptions
previously discussed.
See Note 1 under the heading “Fair Value Measurements” and Note 6 (“Fair Value Measurements”) for a detailed discussion of determining fair value, including pricing validation processes.
Goodwill
The valuation and testing methodologies used in our analysis of goodwill impairment are summarized in Note 1
under the heading “Goodwill and Other Intangible Assets.” Goodwill is initially recorded as the excess of the purchase price over the fair value of net assets acquired in a business combination. Goodwill is tested for impairment for all three of our reporting units: Consumer Bank, Commercial Bank and Institutional Bank. We perform our annual impairment test as of October 1st and on an interim basis if events or changes in circumstances between annual tests suggest additional testing is needed. Testing may be either quantitative or qualitative. Fair value is measured during quantitative tests using a combination of income and market approaches. If the fair value of a reporting unit declines below its carrying value, an impairment charge will be recognized for any amount by which the carrying value exceeds the reporting unit’s fair value, to the extent that the loss recognized does not exceed the amount of the goodwill allocated to that reporting unit. When utilizing the qualitative testing approach, Key examines numerous qualitative factors such as financial performance, market capitalization and other industry and economic trends to conclude whether it is more likely than not that goodwill is impaired.
Effective in the first quarter of 2024, we realigned our real estate capital business from our Commercial Bank reporting unit to our Institutional Bank reporting unit. The move was done to align product-based teams to the client-facing businesses they serve with the goal of reducing overhead and complexity and creating a better client experience. Additionally, due to the realignment, a portion of goodwill was reallocated from our Commercial Bank reporting unit to our Institutional Bank reporting unit immediately after the realignment based on the relative fair value of the transferred business. This realignment was identified as a triggering event for purposes of goodwill impairment testing. As a result, interim goodwill impairment tests were performed during the first quarter of 2024 reflecting the reporting units both immediately before and immediately after the realignment, neither of which resulted in impairment.
The quantitative test estimates the fair value of the reporting units using the income approach (weighted 50%) and two market based approaches: the publicly traded company approach (weighted 25%) and the recent transactions approach (weighted 25%). For the market based approaches, valuations of reporting units considered a combination of earnings and equity multiples based on either public companies with characteristics similar to the reporting unit or actual prices paid from recent transactions. Since the fair values determined under the market approaches are representative of noncontrolling interests, the valuations incorporated a control premium. For the income approach, estimated future cash flows were derived from internal forecasts and economic expectations for each reporting unit.
The inputs and assumptions utilized for the valuation of each reporting unit include projections of future cash flows, discount rates, valuation multiples of comparable public companies, and recent transaction information. Future cash
flows are based on multi-year forecasts for each reporting unit and include inputs and assumptions such as net interest margin, expected credit losses, noninterest income, noninterest expense, and required capital. A terminal growth rate is estimated for each reporting unit based on market expectations of inflation and economic conditions in the financial services industry. Discount rates are developed using the Capital Asset Pricing Model (“CAPM”) which considers a risk free rate, 5-year adjusted beta based on peer companies, a market equity risk premium, a size premium, and a company specific risk premium. The discount rates used for the Consumer, Commercial, and Institutional reporting units were, 13%, 13.5%, and 13.5%, respectively.
The results of the interim quantitative goodwill impairment tests indicated that the fair values of the Consumer, Commercial and Institutional Bank reporting units were in excess of their respective carrying values both immediately prior to and immediately after the realignment, therefore, there was no goodwill impairment. The fair values of the Consumer Bank and Commercial Bank reporting units were in excess of their respective carrying values by greater than 10% immediately prior to the realignment. However, for the Institutional Bank reporting unit, the fair value of the reporting unit exceeded its carrying value by less than 4% prior to the reporting unit realignment. The fair values of all reporting units were in excess of their carrying values by greater than 10% immediately after the realignment.
The combined fair value of all reporting units immediately before and immediately after the realignment was considered reasonable by comparison to Key's market capitalization. The estimated fair values of each reporting unit are sensitive to changes in management’s estimates and assumptions. Changes in the estimates and assumptions could result in instances in which the fair value of a reporting unit is less than its carrying value. We performed sensitivity analyses around certain assumptions to assess their reasonableness and impact on the reporting units’ fair values. The analysis of the Institutional Bank reporting unit immediately before the realignment indicated that if the discount rate utilized in the income approach was increased or decreased by 50 basis points, the estimated fair value of the reporting unit would have decreased or increased approximately 4%, respectively. If the net interest margin utilized in the income approach was increased or decreased by 25 basis points, the estimated fair value of the reporting unit would have increased or decreased by approximately 19%, respectively, with a decrease resulting in impairment of goodwill recorded at the Institutional Bank reporting unit. Determining the fair value of a reporting unit is subject to uncertainty as it is reliant on estimates of cash flows that extend far into the future, and, by their nature, are difficult to estimate over such an extended time frame. In the future, changes in the assumptions or the discount rate could produce a material non-cash goodwill impairment. The results of the impairment test after the realignment, however, indicated the fair value of each of the three reporting units, Consumer, Commercial, and Institutional, exceeded their respective carrying values by more than 10%. The estimated fair value of the Consumer Bank reporting unit was 18% greater than its carrying amount, the estimated fair value of the Commercial Bank reporting unit was 25% greater than its carrying amount, and the estimated fair value of the Institutional Bank reporting unit was 34% greater than its carrying amount.
We performed an annual qualitative impairment test for all three of our reporting units as of October 1, 2024. This test involved reviewing updated internal forecasts, evaluating market data, assessing reasonableness of critical assumptions used in the last quantitative goodwill impairment test and considering recent transactions and events that could impact the goodwill at each reporting unit. Key concluded it was not more likely than not that goodwill was impaired as of October 1, 2024, our annual testing date.
Additionally, we monitored events and circumstances during the period from October 1, 2024 through December 31, 2024, including macroeconomic and market factors, industry and banking sector events, Key specific performance indicators, and updated management forecasts. Based on these considerations, we concluded that it was not more-likely-than-not that the fair value of one or more of the reporting units was below its respective carrying value as of December 31, 2024.
Additional information is provided in Note 12 (“Goodwill and Other Intangible Assets”).
Derivatives and hedging
We primarily use interest rate swaps to hedge interest rate risk for asset and liability management purposes. These derivative instruments modify the interest rate characteristics of specified on-balance sheet assets and liabilities. Our accounting policies related to derivatives reflect the current accounting guidance, which provides that all derivatives should be recognized as either assets or liabilities on the balance sheet at fair value, after taking into account the effects of master netting agreements. Accounting for changes in the fair value (i.e., gains or losses) of a particular derivative depends on whether the derivative has been designated and qualifies as part of a hedging relationship, and further, on the type of hedging relationship.
The application of hedge accounting requires significant judgment to interpret the relevant accounting guidance, as well as to assess hedge effectiveness, identify similar hedged item groupings, and measure changes in the fair value of the hedged items. We believe our methods of addressing these judgments and applying the accounting guidance are consistent with both the guidance and industry practices. Additional information relating to our use of derivatives is included in Note 1 under the heading “Derivatives and Hedging,” and Note 8 (“Derivatives and Hedging Activities”).
Contingent liabilities, guarantees and income taxes
Note 22 (“Commitments, Contingent Liabilities, and Guarantees”) summarizes contingent liabilities arising from litigation and contingent liabilities arising from guarantees in various agreements with third parties under which we are a guarantor, and the potential effects of these items on the results of our operations. We record a liability for the fair value of the obligation to stand ready to perform over the term of a guarantee. Contingent aspects of guarantees within the scope of ASC 326 are assessed a reserve under CECL. There is a risk that our actual future payments in the event of a default by the guaranteed party could exceed the recorded amount. See Note 22 (“Commitments, Contingent Liabilities, and Guarantees”) for a comparison of the liability recorded and the maximum potential undiscounted future payments for the various types of guarantees that we had outstanding at December 31, 2024.
It is not always clear how the Internal Revenue Code and various state tax laws apply to transactions that we undertake. In the normal course of business, we may record tax benefits and then have those benefits contested by the IRS or state tax authorities. We have provided tax reserves that we believe are adequate to absorb potential adjustments that such challenges may necessitate. However, if our judgment later proves to be inaccurate, the tax reserves may need to be adjusted, which could have an adverse effect on our results of operations and capital.
Additionally, we conduct quarterly assessments that determine the amount of deferred tax assets that are more-likely-than-not to be realized, and therefore recorded. The available evidence used in connection with these assessments includes a history of pretax income, projected future taxable income, potential tax-planning strategies, and projected future reversals of deferred tax liabilities. These assessments are subjective and may change. Based on these criteria, and all available positive and negative evidence, we establish a valuation allowance for deferred tax assets when we are unable to conclude it is more likely than not that they will be realized. However, if our assessments prove incorrect, they could have a material adverse effect on our results of operations in the period in which they occur. For further information on our accounting for income taxes, see Note 1 (“Summary of Significant Accounting Policies”) and Note 14 (“Income Taxes”).
Accounting and reporting developments
The following table presents accounting guidance pending adoption.
| | | | | | | | | | | |
| Standard | Required Adoption | Description | Effect on Financial Statements or
Other Significant Matters |
ASU 2023-06
Disclosure
Improvements | The date on which the SEC’s removal of related
disclosures from
Regulation S-X or
Regulation S-K becomes effective.
Early adoption is
prohibited. | This guidance clarifies and improves disclosure requirements for a variety of topics to align with the SEC's regulations.
The amendments should be applied prospectively. | The guidance is not expected to have a material impact on Key’s disclosures. |
| | | |
ASU 2024-03
Income Statement—Reporting Comprehensive
Income—Expense Disaggregation Disclosures (Topic 220-40) | January 1, 2027
Early adoption is permitted. | The guidance requires public companies disclose additional information about certain types of costs and expenses.
The guidance should be applied on a prospective or retrospective basis. | The guidance is not expected to have a material impact on Key’s disclosures. |
ASU 2024-04
Debt—Debt with Conversion and
Other Options (Topic 470-20) | January 1, 2026
Early adoption is permitted. | The guidance clarifies criteria to determine whether a settlement of a convertible debt instrument should be accounted for as an induced conversion.
The guidance should be applied on a prospective or retrospective basis. | The guidance is not expected to have a material impact on Key’s disclosures. |
ITEM 7A. QUANTITATIVE AND QUALITATIVE DISCLOSURES ABOUT MARKET RISK
The information included under the caption “Risk Management — Market risk management” in the MD&A beginning on page 78 is incorporated herein by reference.
ITEM 8. FINANCIAL STATEMENTS AND SUPPLEMENTARY DATA
Management’s Annual Report on Internal Control over Financial Reporting
We are responsible for the preparation, content and integrity of the financial statements and other statistical data and analyses compiled for this annual report. The financial statements and related notes have been prepared in conformity with U.S. generally accepted accounting principles and include amounts which of necessity are based on management’s best estimates and judgments and give due consideration to materiality. We believe the financial statements and notes present fairly our financial position, results of operations and cash flows in all material respects.
We are responsible for establishing and maintaining a system of internal control that is designed to protect our assets and the integrity of our financial reporting as defined in the Securities Exchange Act of 1934, as amended. This corporate-wide system of controls includes policies and procedures that (1) pertain to the maintenance of records that, in reasonable detail, accurately and fairly reflect the transactions and dispositions of the assets of KeyCorp; (2) provide reasonable assurance that transactions are recorded as necessary to permit preparation of the consolidated financial statements in conformity with U.S. generally accepted accounting principles, and that receipts and expenditures of KeyCorp are made only in accordance with authorizations of management and directors of KeyCorp; and (3) provide reasonable assurance regarding prevention or timely detection of unauthorized acquisition, use or disposition of KeyCorp’s assets that could have a material effect on the consolidated financial statements. All employees are required to comply with our code of ethics. We conduct an annual certification process to ensure that our employees meet this obligation. Although any system of internal control can be compromised by human error or intentional circumvention of required procedures, we believe our system provides reasonable assurance that financial transactions are recorded and reported properly, providing an adequate basis for reliable financial statements.
During 2024, the Audit Committee of the Board of Directors met regularly with Management, internal audit, and the independent registered public accounting firm, Ernst & Young LLP, to review the scope of their audits and to discuss the evaluation of internal accounting controls and financial reporting matters. The independent registered public accounting firm and the internal auditors have free access to, and meet confidentially with, the audit committee to discuss appropriate matters. Also, KeyCorp maintains a Disclosure Review Committee. This committee’s purpose is to design and maintain disclosure controls and procedures to ensure that material information relating to the financial and operating condition of KeyCorp is properly reported to its Chief Executive Officer, Chief Financial Officer, General Auditor, and the Audit Committee of the Board of Directors in connection with the preparation and filing of periodic reports and the certification of those reports by the Chief Executive Officer and the Chief Financial Officer.
Management’s Assessment of Internal Control over Financial Reporting
Management assessed, with participation of the KeyCorp’s Chief Executive Officer and Chief Financial Officer, the effectiveness of our internal control and procedures over financial reporting using criteria described in “Internal Control - Integrated Framework,” issued by the Committee of Sponsoring Organizations of the Treadway Commission (2013 framework). Based on that assessment, we believe we maintained an effective system of internal control over financial reporting as of December 31, 2024.
Because of inherent limitations, internal control over financial reporting may not prevent or detect misstatements. Also, projections of any evaluation of effectiveness to future periods are subject to risk that controls may become inadequate because of changes in conditions, or that the degree of compliance with the policies or procedures may deteriorate.
KeyCorp's internal control over financial reporting as of December 31, 2024, has been audited by Ernst & Young LLP, an independent registered public accounting firm, as stated in their accompanying report dated February 21, 2025.
Christopher M. Gorman Clark H. Khayat
Chairman and Chief Executive Officer Chief Financial Officer
Report of Independent Registered Public Accounting Firm
To the Shareholders and the Board of Directors of KeyCorp
Opinion on Internal Control over Financial Reporting
We have audited KeyCorp’s internal control over financial reporting as of December 31, 2024, based on criteria established in Internal Control-Integrated Framework issued by the Committee of Sponsoring Organizations of the Treadway Commission (2013 framework) (the COSO criteria). In our opinion, KeyCorp maintained, in all material respects, effective internal control over financial reporting as of December 31, 2024, based on the COSO criteria.
We also have audited, in accordance with the standards of the Public Company Accounting Oversight Board (United States) (PCAOB), the consolidated balance sheets of KeyCorp as of December 31, 2024 and 2023, and the related consolidated statements of income, comprehensive income, changes in equity and cash flows for each of the three years in the period ended December 31, 2024, and the related notes and our report dated February 21, 2025 expressed an unqualified opinion thereon.
Basis for Opinion
KeyCorp’s management is responsible for maintaining effective internal control over financial reporting and for its assessment of the effectiveness of internal control over financial reporting included in the accompanying Management’s Annual Report on Internal Control over Financial Reporting. Our responsibility is to express an opinion on KeyCorp’s internal control over financial reporting based on our audit. We are a public accounting firm registered with the PCAOB and are required to be independent with respect to KeyCorp in accordance with the U.S. federal securities laws and the applicable rules and regulations of the Securities and Exchange Commission and the PCAOB.
We conducted our audit in accordance with the standards of the PCAOB. Those standards require that we plan and perform the audit to obtain reasonable assurance about whether effective internal control over financial reporting was maintained in all material respects.
Our audit included obtaining an understanding of internal control over financial reporting, assessing the risk that a material weakness exists, testing and evaluating the design and operating effectiveness of internal control based on the assessed risk, and performing such other procedures as we considered necessary in the circumstances. We believe that our audit provides a reasonable basis for our opinion.
Definition and Limitations of Internal Control Over Financial Reporting
A company’s internal control over financial reporting is a process designed to provide reasonable assurance regarding the reliability of financial reporting and the preparation of financial statements for external purposes in accordance with generally accepted accounting principles. A company’s internal control over financial reporting includes those policies and procedures that (1) pertain to the maintenance of records that, in reasonable detail, accurately and fairly reflect the transactions and dispositions of the assets of the company; (2) provide reasonable assurance that transactions are recorded as necessary to permit preparation of financial statements in accordance with generally accepted accounting principles, and that receipts and expenditures of the company are being made only in accordance with authorizations of management and directors of the company; and (3) provide reasonable assurance regarding prevention or timely detection of unauthorized acquisition, use, or disposition of the company’s assets that could have a material effect on the financial statements.
Because of its inherent limitations, internal control over financial reporting may not prevent or detect misstatements. Also, projections of any evaluation of effectiveness to future periods are subject to the risk that controls may become inadequate because of changes in conditions, or that the degree of compliance with the policies or procedures may deteriorate.
| | |
|
|
| Cleveland, Ohio |
| February 21, 2025 |
Report of Independent Registered Public Accounting Firm
To the Shareholders and the Board of Directors of KeyCorp
Opinion on the Financial Statements
We have audited the accompanying consolidated balance sheets of KeyCorp as of December 31, 2024 and 2023, and the related consolidated statements of income, comprehensive income, changes in equity, and cash flows for each of the three years in the period ended December 31, 2024, and the related notes (collectively referred to as the “consolidated financial statements”). In our opinion, the consolidated financial statements present fairly, in all material respects, the financial position of KeyCorp at December 31, 2024 and 2023, and results of its operations and its cash flows for each of the three years in the period ended December 31, 2024, in conformity with U.S. generally accepted accounting principles.
We also have audited, in accordance with the standards of the Public Company Accounting Oversight Board (United States) (PCAOB), KeyCorp’s internal control over financial reporting as of December 31, 2024, based on criteria established in Internal Control-Integrated Framework issued by the Committee of Sponsoring Organizations of the Treadway Commission (2013 framework) and our report dated February 21, 2025 expressed an unqualified opinion thereon.
Basis for Opinion
These financial statements are the responsibility of KeyCorp’s management. Our responsibility is to express an opinion on KeyCorp’s financial statements based on our audits. We are a public accounting firm registered with the PCAOB and are required to be independent with respect to KeyCorp in accordance with the U.S. federal securities laws and the applicable rules and regulations of the Securities and Exchange Commission and the PCAOB.
We conducted our audits in accordance with the standards of the PCAOB. Those standards require that we plan and perform the audit to obtain reasonable assurance about whether the financial statements are free of material misstatement, whether due to error or fraud. Our audits included performing procedures to assess the risks of material misstatement of the financial statements, whether due to error or fraud, and performing procedures that respond to those risks. Such procedures included examining, on a test basis, evidence regarding the amounts and disclosures in the financial statements. Our audits also included evaluating the accounting principles used and significant estimates made by management, as well as evaluating the overall presentation of the financial statements. We believe that our audits provide a reasonable basis for our opinion.
Critical Audit Matters
The critical audit matters communicated below are matters arising from the current period audit of the financial statements that were communicated or required to be communicated to the audit committee and that: (1) relate to accounts or disclosures that are material to the financial statements and (2) involved our especially challenging, subjective or complex judgments. The communication of critical audit matters does not alter in any way our opinion on the consolidated financial statements, taken as a whole, and we are not, by communicating the critical audit matters below, providing separate opinions on the critical audit matters or on the accounts or disclosures to which they relate.
| | | | | | | | |
| | Allowance for Loan and Lease Losses |
Description of the Matter | |
KeyCorp’s loan and lease portfolio totaled $104.3 billion as of December 31, 2024 and the associated ALLL was $1.4 billion. As discussed in Note 1 and 5 of the financial statements, the ALLL represents management’s current estimate of lifetime credit losses inherent in the loan portfolio at the balance sheet date. Management estimates the ALLL using relevant available information, from internal and external sources, relating to past events, current economic conditions, idiosyncratic risk factors and reasonable and supportable forecasts. The ALLL is the sum of (i) asset specific / individual loan reserves; (ii) quantitative (formulaic or pooled) reserves; and (iii) qualitative (judgmental) reserves. Management estimates the quantitative reserves using probability of default / loss given default / exposure at default models (“loss forecasting models”), as well as other estimation methods for smaller loan portfolios. The ALLL also considers qualitative factors related to idiosyncratic risk factors, changes in current economic conditions that may not be reflected in quantitatively derived results, and other relevant factors to reflect management’s best estimate of current expected credit losses.
Auditing management’s ALLL was complex due to the loss forecasting models used to compute the quantitative reserve and involves a high degree of subjectivity and judgment in evaluating management’s determination of the economic forecast and qualitative factor adjustments to the ALLL described above. |
How We Addressed the Matter in Our Audit | |
We obtained an understanding, evaluated the design and tested the operating effectiveness of controls over KeyCorp’s ALLL process, including controls over the appropriateness of the ALLL methodology, operation and monitoring of loss forecasting models, the reliability and accuracy of data used in developing the ALLL estimate, and management’s review and approval process over the economic forecast, qualitative adjustments and overall ALLL results.
With the assistance of EY specialists, we tested management’s loss forecasting models including evaluating the conceptual soundness of model methodology, assessing model performance and governance, testing key modeling assumptions and independently recalculating model output. We also verified the underlying economic forecast data used to estimate the quantitative reserve was complete and accurate.
To test the qualitative factor adjustments, among other procedures, we assessed management’s methodology and considered whether relevant risks were reflected in the models and whether adjustments to the model output were appropriate. We tested the completeness, accuracy and relevance of the underlying data used to estimate the qualitative adjustments. We evaluated whether qualitative adjustments were reasonable based on changes in economic conditions, the loan portfolio, and management’s policies and procedures. For example, we evaluated the reasonableness of qualitative adjustments (or lack thereof) for concentrations of credit by independently comparing to loan portfolio information. We also assessed whether qualitative adjustments were consistent with publicly available information (e.g., macroeconomic data). Further, we performed an independent search for the existence of new or contrary information relating to risks impacting the qualitative factor adjustments to validate that management’s considerations are appropriate. Additionally, we evaluated whether the overall ALLL, inclusive of qualitative factor adjustments, reasonably reflects losses expected in the loan and lease portfolio by comparing to peer bank data and KeyCorp’s actual historical loss data. |
| | | | | | | | |
| | Goodwill Impairment Test of the Institutional Bank Reporting Unit |
Description of the Matter | |
KeyCorp has a goodwill balance of $2.8 billion as of December 31, 2024, of which $715 million is allocated to the Institutional Bank reporting unit. As discussed in Notes 1 and 12 of the financial statements, management performs an annual goodwill impairment test at the reporting unit level as of October 1, or more frequently as events occur or circumstances change that may indicate that it is more likely than not that the fair value of any reporting unit may be less than its carrying value. Effective in the first quarter of 2024, management realigned KeyCorp’s real estate capital business from the Commercial Bank reporting unit to the Institutional Bank reporting unit. The realignment was identified as a triggering event for purposes of performing an interim quantitative goodwill impairment test immediately before and immediately after the realignment. Management estimates the fair value of its reporting units by using a combination of income and market approaches. The income approach consists of discounted cash flow modeling that uses internal forecasts and various other inputs and assumptions. The market approach incorporates comparable public company multiples along with data related to recent merger and acquisition activity.
Auditing management's interim quantitative goodwill impairment test, for the Institutional Bank reporting unit, immediately before the realignment, was complex and highly judgmental due to the significant estimation required to determine the fair value of the reporting unit as of the interim measurement date. In particular, the fair value estimate was sensitive to certain assumptions, which includes the internal forecast and discount rate utilized in the discounted cash flow method of the income approach. |
| How We Addressed the Matter in Our Audit | | We obtained an understanding, evaluated the design and tested the operating effectiveness of controls over KeyCorp’s goodwill impairment review process, including controls over management’s review of the significant assumptions described above.
To test management’s interim quantitative goodwill impairment test for the Institutional Bank reporting unit, we evaluated certain assumptions of the internal forecast utilized by management in the discounted cash flow method of the income approach with historical performance (e.g., trend analysis), current industry and economic trends, and changes in KeyCorp’s strategies. We evaluated the consistency of the internal forecast utilized in the income approach by comparing the internal forecast to other analyses used within the organization and inquiries performed of senior management regarding strategic plans for the reporting unit. We also performed sensitivity analyses related to significant assumptions to evaluate the change in the fair value of the reporting unit resulting from changes in the assumptions.
With the assistance of EY specialists, we evaluated management’s fair value methodology, assessed the reasonableness of significant assumptions used in the discounted cash flow method of the income approach and reconciled management’s estimated fair value of KeyCorp to its market capitalization as of the interim measurement date. |
| | |
|
|
We have served as KeyCorp’s auditor since 1994. Cleveland, Ohio February 21, 2025 |
Consolidated Balance Sheets
| | | | | | | | |
| December 31, |
| Dollars in millions, except per share data | 2024 | 2023 |
| ASSETS | | |
| Cash and due from banks | $ | 1,743 | | $ | 941 | |
| Short-term investments | 17,504 | | 10,817 | |
| Trading account assets | 1,283 | | 1,142 | |
| Securities available for sale | 37,707 | | 37,185 | |
| Held-to-maturity securities (fair value: $6,837 and $8,056) | 7,395 | | 8,575 | |
| Other investments | 1,041 | | 1,244 | |
| Loans, net of unearned income of $311 and $356 | 104,260 | | 112,606 | |
| Allowance for loan and lease losses | (1,409) | | (1,508) | |
| Net loans | 102,851 | | 111,098 | |
Loans held for sale (a) | 797 | | 483 | |
| Premises and equipment | 614 | | 661 | |
| Goodwill | 2,752 | | 2,752 | |
| Other intangible assets | 27 | | 55 | |
| Corporate-owned life insurance | 4,394 | | 4,383 | |
| Accrued income and other assets | 8,797 | | 8,601 | |
| Discontinued assets | 263 | | 344 | |
| Total assets | $ | 187,168 | | $ | 188,281 | |
| LIABILITIES | | |
| Deposits in domestic offices: | | |
| | |
| | |
| | |
| | |
| Interest-bearing deposits | $ | 120,132 | | $ | 114,859 | |
| Noninterest-bearing deposits | 29,628 | | 30,728 | |
| Total deposits | 149,760 | | 145,587 | |
| Federal funds purchased and securities sold under repurchase agreements | 14 | | 38 | |
| Bank notes and other short-term borrowings | 2,130 | | 3,053 | |
| Accrued expense and other liabilities | 4,983 | | 5,412 | |
| Long-term debt | 12,105 | | 19,554 | |
| Total liabilities | 168,992 | | 173,644 | |
| EQUITY | | |
| Preferred stock | 2,500 | | 2,500 | |
| Common Shares, $1 par value; authorized 2,100,000,000 shares; issued 1,256,702,081 shares at December 31, 2024 and 2023 | 1,257 | | 1,257 | |
| Capital surplus | 6,038 | | 6,281 | |
| Retained earnings | 14,584 | | 15,672 | |
| Treasury stock, at cost (149,915,630 and 320,138,094 shares) | (2,733) | | (5,844) | |
| Accumulated other comprehensive income (loss) | (3,470) | | (5,229) | |
| | |
| | |
| Total equity | 18,176 | | 14,637 | |
| Total liabilities and equity | $ | 187,168 | | $ | 188,281 | |
| | |
(a)Total loans held for sale include Real estate — residential mortgage loans held for sale at fair value of $93 million at December 31, 2024, and $51 million at December 31, 2023.
See Notes to Consolidated Financial Statements
Consolidated Statements of Income
| | | | | | | | | | | |
| Year ended December 31, | | | |
| Dollars in millions, except per share amounts | 2024 | 2023 | 2022 |
| INTEREST INCOME | | | |
| Loans | $ | 6,026 | | $ | 6,219 | | $ | 4,241 | |
| Loans held for sale | 60 | | 61 | | 56 | |
| Securities available for sale | 1,142 | | 793 | | 752 | |
| Held-to-maturity securities | 284 | | 312 | | 213 | |
| Trading account assets | 61 | | 55 | | 31 | |
| Short-term investments | 792 | | 414 | | 97 | |
| Other investments | 62 | | 73 | | 22 | |
| Total interest income | 8,427 | | 7,927 | | 5,412 | |
| INTEREST EXPENSE | | | |
| Deposits | 3,307 | | 2,322 | | 279 | |
| Federal funds purchased and securities sold under repurchase agreements | 4 | | 79 | | 41 | |
| Bank notes and other short-term borrowings | 164 | | 308 | | 90 | |
| Long-term debt | 1,187 | | 1,305 | | 475 | |
| Total interest expense | 4,662 | | 4,014 | | 885 | |
| NET INTEREST INCOME | 3,765 | | 3,913 | | 4,527 | |
| Provision for credit losses | 335 | | 489 | | 502 | |
| Net interest income after provision for credit losses | 3,430 | | 3,424 | | 4,025 | |
| NONINTEREST INCOME | | | |
| Trust and investment services income | 557 | | 516 | | 526 | |
| Investment banking and debt placement fees | 688 | | 542 | | 638 | |
| Cards and payments income | 331 | | 340 | | 341 | |
| Service charges on deposit accounts | 261 | | 270 | | 350 | |
| Corporate services income | 275 | | 302 | | 372 | |
| Commercial mortgage servicing fees | 258 | | 190 | | 167 | |
| Corporate-owned life insurance income | 138 | | 132 | | 132 | |
| Consumer mortgage income | 58 | | 51 | | 58 | |
| Operating lease income and other leasing gains | 76 | | 92 | | 103 | |
| Other income | 23 | | 46 | | 22 | |
| Net securities gains (losses) | (1,856) | | (11) | | 9 | |
| Total noninterest income | 809 | | 2,470 | | 2,718 | |
| NONINTEREST EXPENSE | | | |
| Personnel | 2,714 | | 2,660 | | 2,566 | |
| Net occupancy | 266 | | 267 | | 295 | |
| Computer processing | 414 | | 368 | | 314 | |
| Business services and professional fees | 174 | | 168 | | 212 | |
| Equipment | 80 | | 88 | | 92 | |
| Operating lease expense | 63 | | 77 | | 101 | |
| Marketing | 94 | | 109 | | 123 | |
| | | |
| | | |
| | | |
| Other expense | 740 | | 997 | | 707 | |
| Total noninterest expense | 4,545 | | 4,734 | | 4,410 | |
| INCOME (LOSS) FROM CONTINUING OPERATIONS BEFORE INCOME TAXES | (306) | | 1,160 | | 2,333 | |
| Income taxes | (143) | | 196 | | 422 | |
| INCOME (LOSS) FROM CONTINUING OPERATIONS | (163) | | 964 | | 1,911 | |
| Income (loss) from discontinued operations | 2 | | 3 | | 6 | |
| NET INCOME (LOSS) | $ | (161) | | $ | 967 | | $ | 1,917 | |
| | | |
| | | |
| Income (loss) from continuing operations attributable to Key common shareholders | $ | (306) | | $ | 821 | | $ | 1,793 | |
| Net income (loss) attributable to Key common shareholders | (304) | | 824 | | 1,799 | |
| Per Common Share: | | | |
| Income (loss) from continuing operations attributable to Key common shareholders | $ | (.32) | | $ | .88 | | $ | 1.94 | |
| Income (loss) from discontinued operations, net of taxes | — | | — | | .01 | |
Net income (loss) attributable to Key common shareholders (a) | (.32) | | .89 | | 1.94 | |
| Per Common Share — assuming dilution: | | | |
| Income (loss) from continuing operations attributable to Key common shareholders | $ | (.32) | | $ | .88 | | $ | 1.92 | |
| Income (loss) from discontinued operations, net of taxes | — | | — | | .01 | |
Net income (loss) attributable to Key common shareholders (a) | (.32) | | .88 | | 1.93 | |
| Weighted-average Common Shares outstanding (000) | 949,561 | | 927,217 | | 924,363 | |
| | | |
Effect of Common Share options and other stock awards(b) | — | | 5,542 | | 8,696 | |
Weighted-average Common Shares and potential Common Shares outstanding (000)(c) | 949,561 | | 932,759 | | 933,059 | |
| | | |
(a)EPS may not foot due to rounding.
(b)For periods ended in a loss from continuing operations attributable to Key common shareholders, anti-dilutive instruments have been excluded from the calculation of diluted earnings per share.
(c)Assumes conversion of Common Share options and other stock awards and/or convertible preferred stock, as applicable.
See Notes to Consolidated Financial Statements.
Consolidated Statements of Comprehensive Income
| | | | | | | | | | | |
| Year ended December 31, | | | |
| Dollars in millions | 2024 | 2023 | 2022 |
| Net income (loss) | $ | (161) | | $ | 967 | | $ | 1,917 | |
| Other comprehensive income (loss), net of tax: | | | |
| Net unrealized gains (losses) on securities available for sale, net of income taxes of $(459), $(222), and $1,415 | 1,456 | | 705 | | (4,492) | |
| Net unrealized gains (losses) on derivative financial instruments, net of income taxes of $(104), $(114), and $382 | 329 | | 361 | | (1,212) | |
| | | |
| Net pension and postretirement benefit costs, net of income taxes of $8, $0, and $1 | (26) | | — | | (5) | |
| Total other comprehensive income (loss), net of tax | 1,759 | | 1,066 | | (5,709) | |
| | | |
| | | |
| Comprehensive income (loss) attributable to Key | $ | 1,598 | | $ | 2,033 | | $ | (3,792) | |
| | | |
See Notes to Consolidated Financial Statements.
Consolidated Statements of Changes in Equity
| | | | | | | | | | | | | | | | | | | | | | | | | | | | | | |
| | Key Shareholders’ Equity | | |
| Dollars in millions, except per share amounts | Preferred Shares Outstanding (000) | Common Shares Outstanding (000) | Preferred Stock | Common Shares | Capital Surplus | Retained Earnings | Treasury Stock, at Cost | Accumulated Other Comprehensive Income (Loss) | | Total Shareholder’s Equity |
| BALANCE AT DECEMBER 31, 2021 | 1,396 | | 928,850 | | $ | 1,900 | | $ | 1,257 | | $ | 6,278 | | $ | 14,553 | | $ | (5,979) | | $ | (586) | | | $ | 17,423 | |
| | | | | | | | | | |
| Net income (loss) | | | | | | 1,917 | | | | | 1,917 | |
| | | | | | | | | | |
| Other comprehensive income (loss) | | | | | | | | (5,709) | | | (5,709) | |
| Deferred compensation | | | | | (6) | | | | | | (6) | |
| Cash dividends declared | | | | | | | | | | |
| Common Shares ($.79 per share) | | | | | | (736) | | | | | (736) | |
| Series D Preferred Stock ($50.00 per depositary share) | | | | | | (26) | | | | | (26) | |
| Series E Preferred Stock ($1.531252 per depositary share) | | | | | | (31) | | | | | (31) | |
| Series F Preferred Stock ($1.4125 per depositary share) | | | | | | (24) | | | | | (24) | |
| Series G Preferred Stock ($.1.406252 per depositary share) | | | | | | (25) | | | | | (25) | |
| Series H Preferred Stock ($.477917 per depositary share) | | | | | | (12) | | | | | (12) | |
| | | | | | | | | | |
| | | | | | | | | | |
| Employee equity compensation program Common Share repurchases | | (1,736) | | | | — | | | (44) | | | | (44) | |
| Common shares reissued (returned) for stock options and other employee benefit plans | | 6,211 | | | | 24 | | | 113 | | | | 137 | |
| Issuance of Series H Preferred Stock | 600 | | 600 | | (10) | | | | | | 590 | |
| BALANCE AT DECEMBER 31, 2022 | 1,996 | | 933,325 | | $ | 2,500 | | $ | 1,257 | | $ | 6,286 | | $ | 15,616 | | $ | (5,910) | | $ | (6,295) | | | $ | 13,454 | |
| | | | | | | | | | |
| | | | | | | | | | |
| Net income (loss) | | | | | | 967 | | | | | 967 | |
| Other comprehensive income (loss) | | | | | | | | 1,066 | | | 1,066 | |
| Deferred compensation | | | | | (5) | | | | | | (5) | |
| Cash dividends declared | | | | | | | | | | |
| Common Shares ($.82 per share) | | | | | | (768) | | | | | (768) | |
| Series D Preferred Stock ($50.00 per depositary share) | | | | | | (26) | | | | | (26) | |
| Series E Preferred Stock ($1.531252 per depositary share) | | | | | | (31) | | | | | (31) | |
| Series F Preferred Stock ($1.4125 per depositary share) | | | | | | (24) | | | | | (24) | |
| Series G Preferred Stock ($1.406252 per depositary share) | | | | | | (25) | | | | | (25) | |
| Series H Preferred Stock ($1.55 per depositary share) | | | | | | (37) | | | | | (37) | |
| Open market Common Share repurchases | | (2,550) | | | | | | (38) | | | | (38) | |
| Employee equity compensation program Common Share repurchases | | (1,833) | | | | — | | | (34) | | | | (34) | |
| Common Shares reissued (returned) for stock options and other employee benefit plans | | 7,622 | | | | — | | | 138 | | | 138 | |
| | | | | | | | | | |
| BALANCE AT DECEMBER 31, 2023 | 1,996 | | 936,564 | | $ | 2,500 | | $ | 1,257 | | $ | 6,281 | | $ | 15,672 | | $ | (5,844) | | $ | (5,229) | | | $ | 14,637 | |
| | | | | | | | | | |
| | | | | | | | | | |
| Net income (loss) | | | | | | (161) | | | | | (161) | |
| Other comprehensive income (loss) | | | | | | | | 1,759 | | | 1,759 | |
| Deferred compensation | | | | | (3) | | | | | | (3) | |
| Cash dividends declared | | | | | | | | | | |
| Common Shares ($0.82 per share) | | | | | | (784) | | | | | (784) | |
| Series D Preferred Stock ($50.00 per depositary share) | | | | | | (26) | | | | | (26) | |
| Series E Preferred Stock ($1.531252 per depositary share) | | | | | | (31) | | | | | (31) | |
| Series F Preferred Stock ($1.4125 per depositary share) | | | | | | (24) | | | | | (24) | |
| Series G Preferred Stock ($1.406252 per depositary share) | | | | | | (25) | | | | | (25) | |
| Series H Preferred Stock ( $1.55 per depositary share) | | | | | | (37) | | | | | (37) | |
| | | | | | | | | | |
| Employee equity compensation program Common Share repurchases | | (1,991) | | | | | | (28) | | | | (28) | |
| Common Shares reissued (returned) for stock options and other employee benefit plans | | 9,342 | | | | (42) | | | 170 | | | | 128 | |
| | | | | | | | | | |
| Common Shares reissued under Scotiabank investment agreement, net of issuance costs | | 162,871 | | | | (198) | | | 2,969 | | | | 2,771 | |
| BALANCE AT DECEMBER 31, 2024 | 1,996 | | 1,106,786 | | $ | 2,500 | | $ | 1,257 | | $ | 6,038 | | $ | 14,584 | | $ | (2,733) | | $ | (3,470) | | | $ | 18,176 | |
| | | | | | | | | | |
Consolidated Statements of Cash Flows
| | | | | | | | | | | |
| Year ended December 31, | | | |
| Dollars in millions | 2024 | 2023 | 2022 |
| OPERATING ACTIVITIES | | | |
| Net income (loss) | $ | (161) | | $ | 967 | | $ | 1,917 | |
| Adjustments to reconcile net income (loss) to net cash provided by (used in) operating activities: | | | |
| Provision for credit losses | 335 | | 489 | | 502 | |
| Depreciation, amortization, and accretion, net | 73 | | 154 | | 164 | |
| Increase in cash surrender value of corporate-owned life insurance | (118) | | (110) | | (113) | |
| Stock-based compensation expense | 104 | | 121 | | 120 | |
| Deferred income taxes (benefit) | (351) | | (108) | | (27) | |
| Proceeds from sales of loans held for sale | 8,174 | | 8,859 | | 12,496 | |
| Originations of loans held for sale, net of repayments | (8,490) | | (8,434) | | (10,684) | |
| Net losses (gains) from sale of loans held for sale | (120) | | (135) | | (151) | |
| | | |
| Net losses (gains) on leased equipment | (9) | | (9) | | 7 | |
| Net securities and other investments losses (gains) | 1,856 | | 11 | | (9) | |
| Net losses (gains) on sales of fixed assets | (7) | | 18 | | (7) | |
| Net change in: | | | |
| Trading account assets | (141) | | (313) | | (128) | |
| Accrued income and other assets | (270) | | 554 | | (1,044) | |
| Accrued expense and other liabilities | (72) | | 450 | | 1,409 | |
| Other operating activities, net | (139) | | 389 | | 17 | |
| NET CASH PROVIDED BY (USED IN) OPERATING ACTIVITIES | 664 | | 2,903 | | 4,469 | |
| INVESTING ACTIVITIES | | | |
| Purchases of intangible assets via acquisitions | — | | — | | (12) | |
| Cash received (used) in acquisitions, net of cash acquired | — | | — | | (58) | |
| | | |
| Net decrease (increase) in short-term investments, excluding acquisitions | (6,687) | | (8,385) | | 8,578 | |
| Purchases of securities available for sale | (21,078) | | (2,160) | | (4,473) | |
| Proceeds from sales of securities available for sale | 17,932 | | 1,752 | | — | |
| Proceeds from prepayments and maturities of securities available for sale | 2,758 | | 3,225 | | 4,545 | |
| Proceeds from prepayments and maturities of held-to-maturity securities | 1,190 | | 1,343 | | 2,291 | |
| Purchases of held-to-maturity securities | — | | (1,194) | | (3,670) | |
| Net decrease (increase) in other investments | 202 | | 58 | | (635) | |
| Net decrease (increase) in loans, excluding acquisitions, sales, and transfers | 7,920 | | 6,668 | | (17,649) | |
| Proceeds from sales of portfolio loans | 194 | | 151 | | 157 | |
| Proceeds from corporate-owned life insurance | 107 | | 96 | | 72 | |
| Purchases of premises, equipment, and software | (65) | | (142) | | (96) | |
| Proceeds from sales of premises and equipment | 24 | | 5 | | 16 | |
| | | |
| NET CASH PROVIDED BY (USED IN) INVESTING ACTIVITIES | 2,497 | | 1,417 | | (10,934) | |
| FINANCING ACTIVITIES | | | |
| Net increase (decrease) in deposits | 4,173 | | 2,992 | | (9,977) | |
| Net increase (decrease) in short-term borrowings | (947) | | (6,372) | | 8,702 | |
| Net proceeds from issuance of long-term debt | 1,646 | | 5,240 | | 16,596 | |
| Payments on long-term debt | (9,057) | | (5,052) | | (8,580) | |
| Repurchases of long-term debt | — | | (92) | | — | |
| Issuance of preferred shares | — | | — | | 590 | |
| Open market common share repurchases | — | | (38) | | — | |
| Employee equity compensation program Common Share repurchases | (28) | | (34) | | (44) | |
| | | |
| Net proceeds from reissuance of Common Shares | 10 | | 1 | | 6 | |
| Net proceeds from Scotiabank investment | 2,771 | | — | | — | |
| Cash dividends paid | (927) | | (911) | | (854) | |
| NET CASH PROVIDED BY (USED IN) FINANCING ACTIVITIES | (2,359) | | (4,266) | | 6,439 | |
| NET INCREASE (DECREASE) IN CASH AND DUE FROM BANKS | 802 | | 54 | | (26) | |
| CASH AND DUE FROM BANKS AT BEGINNING OF YEAR | 941 | | 887 | | 913 | |
| CASH AND DUE FROM BANKS AT END OF YEAR | $ | 1,743 | | $ | 941 | | $ | 887 | |
| | | |
| Additional disclosures relative to cash flows: | | | |
| Interest paid | $ | 4,160 | | $ | 3,109 | | $ | 601 | |
| Income taxes paid | 68 | | 156 | | 292 | |
| Noncash items: | | | |
| Reduction of secured borrowing and related collateral | $ | 4 | | $ | 6 | | $ | 9 | |
| Loans transferred to portfolio from held for sale | 124 | | 208 | | 105 | |
| Loans transferred to held for sale from portfolio | 3 | | 19 | | — | |
| Loans transferred to other real estate owned | 6 | | 7 | | 6 | |
| CMBS risk retentions | — | | — | | 12 | |
| ABS risk retentions | 5 | | 7 | | 8 | |
| | | |
See Notes to Consolidated Financial Statements.
1. Summary of Significant Accounting Policies
Organization
We are one of the nation’s largest bank-based financial services companies, providing deposit, lending, cash management, and investment services to individuals and small and medium-sized businesses through our subsidiary, KeyBank. We also provide a broad range of sophisticated corporate and investment banking products, such as merger and acquisition advice, public and private debt and equity, syndications, and derivatives to middle market companies in selected industries throughout the United States through our subsidiary, KBCM. As of December 31, 2024, KeyBank operated 944 full-service retail banking branches and 1,182 ATMs in 15 states, as well as additional offices, online and mobile banking capabilities, and a telephone banking call center. Additional information pertaining to our two reportable business segments, Consumer Bank and Commercial Bank, is included in Note 25 (“Business Segment Reporting”).
Use of Estimates
Our accounting policies conform to US GAAP and prevailing practices within the financial services industry. We must make certain estimates and judgments when determining the amounts presented in our consolidated financial statements and the related notes. If these estimates prove to be inaccurate, actual results could differ from those reported.
Principles of Consolidation and Basis of Presentation
The consolidated financial statements include the accounts of KeyCorp and its subsidiaries. All significant intercompany accounts and transactions have been eliminated in consolidation. Some previously reported amounts have been reclassified in the Consolidated Statements of Cash Flows from “other operating activities, net” to either the net change in “accrued income and other assets” or “accrued expense and other liabilities” to align with updated presentation. Some previously reported amounts have been reclassified in the Consolidated Statements of Income from “other income” to “net securities gains (losses)”.
The consolidated financial statements also include the accounts of any voting rights entities in which we have a controlling financial interest and certain VIEs. In accordance with the applicable accounting guidance for consolidations, we consolidate a VIE if we have (i) a variable interest in the entity; (ii) the power to direct activities of the VIE that most significantly affect the entity’s economic performance; and (iii) the obligation to absorb losses of the entity or the right to receive benefits from the entity that could potentially be significant to the VIE (i.e., we are considered to be the primary beneficiary). See Note 13 (“Variable Interest Entities”) for information on our involvement with VIEs.
We use the equity method to account for unconsolidated investments in voting rights entities or VIEs if we have significant influence over the entity’s operating and financing decisions (usually defined as a voting or economic interest of 20% to 50%, but not controlling). Unconsolidated investments in voting rights entities or VIEs in which we have a voting or economic interest of less than 20% generally are carried at fair value or a cost measurement alternative. Investments held by our registered broker-dealer and investment company subsidiaries (principal investing entities and Real Estate Capital line of business) are carried at fair value.
In preparing these financial statements, subsequent events were evaluated through the time the financial statements were issued. Financial statements are considered issued when they are widely distributed to all shareholders and other financial statement users or filed with the SEC.
Cash and Cash Equivalents
Cash and due from banks are considered “cash and cash equivalents” for financial reporting purposes. We do not consider cash on deposit with the Federal Reserve to be restricted.
Loans
We assess all loan modifications to determine whether one is granted to a borrower experiencing financial difficulty, regardless of whether the modification loan terms include a concession. Modifications granted to borrowers
experiencing financial difficulty may be in the form of an interest rate reduction, payment delay, other modifications, or some combination thereof. A borrower is considered to be experiencing financial difficulty when there is significant doubt about the borrower’s ability to make required payments on the loan or to get equivalent financing from another creditor at a market rate for a similar loan.
Loans held in portfolio, which management has the intent and ability to hold for the foreseeable future or until maturity or payoff, are carried at the principal amount outstanding, net of unearned income, including net deferred loan fees and costs and unamortized premiums and discounts. We defer certain nonrefundable loan origination and commitment fees, and the direct costs of originating or acquiring loans. The net deferred amount is amortized over the estimated lives of the related loans as an adjustment to the yield.
Accrued interest on loans is included in "other assets" on the balance sheet and is excluded from the calculation of the allowance for credit losses due to our charge-off policy to reverse accrued interest on nonperforming loans against interest income in a timely manner.
Sales-type leases are carried at the aggregate of the lease receivable, estimated unguaranteed residual values, and deferred initial direct fees and costs if certain criteria are met. Direct financing leases are carried at the aggregate of the lease receivable, estimated unguaranteed residual values, and deferred initial direct fees and costs, less unearned income. Unearned income on direct financing leases is amortized over the lease terms using a method approximating the interest method that produces a constant rate of return. Deferred initial direct fees and costs for both sales-type and direct financing leases are amortized over the lease terms as an adjustment to the yield.
Expected credit losses on net investments in leases, including any unguaranteed residual asset, are included in the ALLL. Net gains or losses on sales of lease residuals are included in “other income” or “other expense” on the income statement. Additional information pertaining to the value of lease residuals is provided in Note 10 (“Leases”).
Loans Held for Sale
Loans held for sale generally include certain residential and commercial mortgage loans, other commercial loans, and student loans. Loans are initially classified as held for sale when they are individually identified as being available for immediate sale and a formal plan exists to sell them. Loans held for sale are recorded at either fair value, if elected, or the lower of cost or fair value. Fair value is determined based on available market data for similar assets. When a loan is originated as held-for-sale, origination fees and costs are deferred but not amortized. Upon sale of the loans, deferred origination fees and costs are recognized as part of the calculated gain or loss on sale. Our commercial loans (including commercial mortgage and non-mortgage loans) and student loans, which we originated and intend to sell, are carried at the lower of aggregate cost or fair value. Subsequent declines in fair value for loans held for sale are recognized as a charge to “other income” on the income statement. Consumer real estate - residential mortgages loans have been elected to be carried at fair value. Subsequent increases and decreases in fair value for loans elected to be measured at fair value are recorded to “consumer mortgage income” on the income statement. Additional information regarding fair value measurements associated with our loans held for sale is provided in Note 6 (“Fair Value Measurements”).
We may transfer certain loans to held for sale at the lower of cost or fair value. If a loan is transferred from the loan portfolio to the held-for-sale category, any write-down in the carrying amount of the loan at the date of transfer is recorded as a reduction in the ALLL. When a loan is transferred into the held for sale category, we stop amortizing the related deferred fees and costs. The remaining unamortized fees and costs are recognized as part of the cost basis of the loan at the time it is sold. We may also transfer loans from held for sale to the loan portfolio held for investment. If a loan held for sale for which fair value accounting was elected is transferred to held for investment, it will continue to be accounted for at fair value in the loan portfolio.
Nonperforming Loans
Nonperforming loans are loans for which we do not accrue interest income and may include commercial and consumer loans and leases, modified loans to borrowers experiencing financial difficulty. Nonperforming loans do not include loans held for sale. Once a loan is designated nonaccrual, the interest accrued but not collected is reversed against interest income, and payments subsequently received are applied to principal until qualifying for return to accrual.
We generally classify commercial loans as nonperforming and stop accruing interest (i.e., designate the loan “nonaccrual”) when the borrower’s principal or interest payment is 90 days past due unless the loan is well-secured and in the process of collection. Commercial loans are also placed on nonaccrual status when payment is not past due but we have serious doubts about the borrower’s ability to comply with existing repayment terms. Once a loan is designated nonaccrual (and as a result assessed for impairment), the interest accrued but not collected is reversed against loan interest income, and payments subsequently received are applied to principal. Commercial loans are typically charged off in full or charged down to the fair value of the underlying collateral when the borrower’s payment is 180 days past due.
We classify consumer loans as nonperforming and stop accruing interest when the borrower’s payment is 120 days past due, unless the loan is well-secured and in the process of collection. Any second lien home equity loan with an associated first lien that is 120 days or more past due or in foreclosure, or for which the first mortgage delinquency timeframe is unknown, is reported as a nonperforming loan. Secured loans that are discharged through Chapter 7 bankruptcy and not formally re-affirmed are designated as nonperforming loans. Our charge-off policy for most consumer loans takes effect when payments are 120 days past due. Home equity and residential mortgage loans generally are charged down to net realizable value when payment is 180 days past due. Credit card loans and similar unsecured products continue to accrue interest until the account is charged off at 180 days past due.
Commercial and consumer loans may be returned to accrual status if we are reasonably assured that all contractually due principal and interest are collectible and the borrower has demonstrated a sustained period (generally six months) of repayment performance under the contracted terms of the loan and applicable regulation.
Purchased Loans
Purchased performing loans that do not have evidence of deterioration in credit quality at acquisition are recorded at fair value at the acquisition date. Any premium or discount associated with purchased performing loans is recognized in interest income based on the effective yield method of amortization for term loans or the straight-line method of amortization for revolving loans. The methods utilized to estimate the required ALLL for purchased performing loans is similar to originated loans.
Purchased loans that have experienced a more-than-insignificant deterioration in credit quality since origination are deemed PCD loans. PCD loans are initially recorded at fair value along with an allowance for credit losses determined using the same methodology as originated loans. The sum of the loan's purchase price and allowance for credit losses becomes its initial amortized cost basis. The difference between the initial amortized cost basis and the par value of the loan is a noncredit discount or premium, which is amortized into interest income over the life of the loan. Subsequent changes to the allowance for credit losses are recorded through provision for credit losses.
Allowance for Loan and Lease Losses
We estimate the ALLL using relevant available information, from internal and external sources, relating to past events, current conditions, and reasonable and supportable forecasts. The ALLL is measured on a collective (pool) basis when similar risk characteristics exist. Our portfolio segments include commercial and consumer. Each of these two segments comprises multiple loan classes. Classes are characterized by similarities in initial measurement, risk attributes, and the manner in which we monitor and assess credit risk. The commercial segment is composed of commercial and industrial, commercial real estate, and commercial lease financing loan classes. The consumer lending segment is composed of residential mortgage, home equity, consumer direct, credit card, student lending and consumer indirect loan classes.
The ALLL represents our current estimate of lifetime credit losses inherent in our loan portfolio at the balance sheet date. In determining the ALLL, we estimate expected future losses for the loan's entire contractual term adjusted for expected prepayments when appropriate. The contractual term excludes expected extensions, renewals, and modifications.
The ALLL is the sum of three components: (i) asset specific/ individual loan reserves; (ii) quantitative (formulaic or pooled) reserves; and (iii) qualitative (judgmental) reserves.
Asset Specific / Individual Component
Loans that do not share risk characteristics are evaluated on an individual basis. Loans evaluated individually are not included in the collective evaluation. We have elected to apply the practical expedient to measure expected credit losses of a collateral dependent asset using the fair value of the collateral, less any costs to sell, when foreclosure is not probable, when repayment of the loan is expected to be provided substantially through the operation or sale of the collateral, and the borrower is experiencing financial difficulty.
Individual reserves are determined as follows:
• For commercial non-accruing loans greater than or equal to a defined dollar threshold, individual reserves
are determined based on an analysis of the present value of the loan's expected future cash flows or the fair
value of the collateral less costs to sell.
• For commercial non-accruing loans below the defined dollar threshold, an established LGD percentage is
multiplied by the loan balance and the results are aggregated for purposes of measuring specific reserve
impairment.
• The population of individually assessed consumer loans includes loans deemed collateral dependent. These loans are written down based on the collateral's fair market value less costs to sell.
Quantitative Component
We use a non-DCF factor-based approach to estimate expected credit losses that include component PD/LGD/EAD
models as well as less complex estimation methods for smaller loan portfolios.
• PD: This component model is used to estimate the likelihood that a borrower will cease making payments
as agreed. The major contributors to this are the borrower credit attributes and macro-economic trends. The
objective of the PD model is to produce default likelihood forecasts based on the observed loan-level
information and projected paths of macroeconomic variables.
• LGD: This component model is used to estimate the loss on a loan once a loan is in default.
• EAD: This component model estimates the loan balance at the time the borrower stops making payments.
For all term loans, an amortization based formulaic approach is used for account level EAD estimates. We
calculate EAD using a portfolio specific method in each of our revolving product portfolios. For line products
that are unconditionally cancellable, the balances will either use a paydown curve or be held flat through the
life of the loan.
Qualitative Component
The ALLL also includes identified qualitative factors related to idiosyncratic risk factors, changes in current economic conditions that may not be reflected in quantitatively derived results, and other relevant factors to ensure the ALLL reflects our best estimate of current expected credit losses. While our reserve methodologies strive to reflect all relevant risk factors, there continues to be uncertainty associated with, but not limited to, potential imprecision in the estimation process due to the inherent time lag of obtaining information and normal variations between estimates
and actual outcomes. We provide additional reserves that are designed to provide coverage for losses attributable to such risks. The ALLL also includes factors that may not be directly measured in the determination of individual or collective reserves. Such qualitative factors may include:
• The nature and volume of the institution’s financial assets;
• The existence, growth, and effect of any concentrations of credit;
• The volume and severity of past due financial assets, the volume of nonaccrual assets, and the volume and
severity of adversely classified or graded assets;
• The value of the underlying collateral for loans that are not collateral dependent;
• The institution’s lending policies and procedures, including changes in underwriting standards and practices
for collections, write-offs, and recoveries;
• The quality of the institution’s credit review function;
• The experience, ability, and depth of the institution’s lending, investment, collection, and other relevant
management and staff;
• The effect of other external factors such as the regulatory, legal and technological environments;
competition; and events such as natural disasters; and
• Actual and expected changes in international, national, regional, and local economic and business
conditions and developments in which the institution operates that affect the collectability of financial assets.
Liability for Credit Losses on Lending-Related Commitments
The liability for credit losses on lending-related commitments, such as letters of credit and unfunded loan commitments, is included in “accrued expense and other liabilities” on the balance sheet. Expected credit losses are estimated over the contractual period in which we are exposed to credit risk via a contractual obligation unless that obligation is unconditionally cancellable by us. The liability for credit losses on lending-related commitments is adjusted as a provision for credit losses. The estimate includes consideration of the likelihood that funding will occur and an estimate of expected credit losses on commitments expected to be funded over its estimated useful life. Consistent with our estimation process on our loan and lease portfolio, we use a non-DCF factor-based approach to estimate expected credit losses that include component PD/LGD/EAD models as well as less complex estimation methods for smaller portfolios.
Allowance for Credit Losses on Other Financial Assets
The allowance for credit losses on other financial assets, such as other receivables and servicing advances, is
determined based on historical loss information and other available indicators. If such information does not indicate
any expected credit losses, Key may estimate the allowance for credit losses on other financial assets to be zero or
close to zero.
Fair Value Measurements
Fair value is defined as the price to sell an asset or transfer a liability in an orderly transaction between market participants in the principal market. Therefore, fair value represents an exit price at the measurement date. We value our assets and liabilities based on the principal or most advantageous market where each would be sold (in the case of assets) or transferred (in the case of liabilities). In the absence of observable market transactions, we consider liquidity valuation adjustments to reflect the uncertainty in pricing the instruments.
Valuation inputs can be observable or unobservable. Observable inputs are assumptions based on market data obtained from an independent source. Unobservable inputs are assumptions based on our own information or assessment of assumptions used by other market participants in pricing the asset or liability. Our unobservable inputs are based on the best and most current information available on the measurement date.
All inputs, whether observable or unobservable, are ranked in accordance with a prescribed fair value hierarchy that gives the highest ranking to quoted prices in active markets for identical assets or liabilities (Level 1) and the lowest ranking to unobservable inputs (Level 3). Fair values for Level 2 assets and liabilities are based on one or a combination of the following factors: (i) quoted market prices for similar assets or liabilities; (ii) observable inputs, such as interest rates or yield curves; or (iii) inputs derived principally from or corroborated by observable market data. The level in the fair value hierarchy ascribed to a fair value measurement in its entirety is based on the lowest level input that is significant to the measurement. Assets and liabilities may transfer between levels based on the observable and unobservable inputs used at the valuation date.
Assets and liabilities are recorded at fair value on a recurring or nonrecurring basis. Nonrecurring fair value adjustments are typically recorded as a result of the application of lower of cost or fair value accounting; or impairment. At a minimum, we conduct our valuations quarterly.
Additional information regarding fair value measurements and disclosures is provided in Note 6 (“Fair Value Measurements”).
Short-Term Investments
Short-term investments consist of segregated, interest-bearing deposits due from banks, the Federal Reserve, and certain non-U.S. banks as well as reverse repurchase agreements and United States Treasury Bills with an original maturity of three months or less.
Trading Account Assets
Trading account assets are debt and equity securities, as well as commercial loans, that we purchase and hold but intend to sell in the near term. These assets are reported at fair value. Realized and unrealized gains and losses on trading account assets are reported in “other income” on the income statement.
Securities
Securities available for sale. Debt securities that we intend to hold for an indefinite period of time but that may be sold in response to changes in interest rates, prepayment risk, liquidity needs, or other factors are classified as available-for-sale and reported at fair value. Realized gains and losses resulting from sales of securities using the specific identification method, are included in “net securities gains (losses)” on the income statement. Unrealized holding gains are recorded through other comprehensive income. Unrealized losses in fair value below the amortized cost basis are assessed to determine whether the impairment gets recorded through other comprehensive income or through earnings using a valuation allowance.
For available-for-sale securities in an unrealized loss position, we first assess whether we intend to sell, or it is more likely than not that we will be required to sell the security before recovery of its amortized cost basis. If either of these criteria regarding intent or requirement to sell is met, the security’s amortized cost basis is written down to fair value in “net securities gains (losses)” on the income statement. For debt securities that do not meet the aforementioned criteria, we evaluate whether the decline in fair value has resulted from credit losses or other factors. In making this assessment, management considers the extent to which fair value is less than amortized costs, the nature of the security, the underlying collateral, and the financial condition of the issuers, among other factors. If this assessment indicates a credit loss exists, the present value of cash flows expected to be collected from the security are compared to the amortized cost basis of the security. If the present value of the cash flows expected to be collected is less than the amortized cost basis, a credit loss exists and an allowance for available-for-sale securities is recorded for the credit loss, limited by the amount that the fair value is less than the amortized costs basis. Any impairment that has not been recorded through an allowance for available-for-sale securities is recognized in other comprehensive income.
Changes in the allowance for available-for-sale securities are recorded as provision for (or reversal of) credit loss. Losses are charged against the allowance for available-for-sale securities when management believes the uncollectibility of an available-for-sale security is confirmed or when either criteria regarding intent or requirement to sell is met.
For additional information on our available-for-sale portfolio, refer to Note 7 (“Securities”).
Held-to-maturity securities. Debt securities that we have the intent and ability to hold until maturity are classified as held-to-maturity and are carried at cost and adjusted for amortization of premiums and accretion of discounts using the interest method. This method produces a constant rate of return on the adjusted carrying amount.
The held-to-maturity portfolio is classified by the following major security types: agency residential collateralized mortgage obligations, agency residential mortgage-backed securities, agency commercial mortgage-backed securities, asset backed securities, and other. “Other securities” held in the held-to-maturity portfolio consist of foreign bonds and capital securities. Management measures expected credit losses on held-to-maturity securities on a collective basis by major security type. The estimate of expected losses considers historical credit loss information that is adjusted for current conditions and reasonable and supportable forecasts. We do not measure expected credit losses on held-to-maturity securities in which historical credit loss information adjusted for current conditions and reasonable and supportable forecasts results in an expectation that nonpayment of the amortized cost basis is zero.
For additional information on our held-to-maturity portfolio, refer to Note 7 (“Securities”).
Other Investments
Other investments include equity and mezzanine instruments as well as other types of investments that generally are carried at the alternative cost method. The alternative cost method results in these investments being recorded at cost, less any impairment, plus or minus changes resulting from observable market transactions. Adjustments are included in “other income” on the income statement. At each reporting period, we assess if these investments continue to qualify for this measurement alternative.
Derivatives and Hedging
All derivatives are recognized on the balance sheet at fair value in “accrued income and other assets” or “accrued expense and other liabilities.” The net increase or decrease in derivatives is included in “other operating activities,
net” within the statement of cash flows. Accounting for changes in fair value (i.e., gains or losses) of derivatives differs depending on whether the derivative has been designated and qualifies as part of a hedge relationship, and on the type of hedge relationship. For derivatives that are not in a hedge relationship, any gain or loss, as well as any premium paid or received, is recognized immediately in earnings in “corporate services income” or “other income” on the income statement, depending whether the derivative is for customer accommodation or risk management, respectively. A derivative that is designated and qualifies as a hedging instrument must be designated as a fair value hedge, a cash flow hedge, or a hedge of a net investment in a foreign operation.
A fair value hedge is used to limit exposure to changes in the fair value of existing assets, liabilities, and commitments caused by changes in interest rates or other economic factors. The change in the fair value of an instrument designated as a fair value hedge is recorded in earnings at the same time as a change in fair value of the hedged item attributable to the hedged risk and recorded in the same income statement line as the change in fair value of the hedged item.
A cash flow hedge is used to minimize the variability of future cash flows that is caused by changes in interest rates or other economic factors. The gain or loss on a cash flow hedge is recorded as a component of AOCI on the balance sheet and reclassified to earnings in the same period in which the hedged transaction affects earnings (e.g., when we incur variable-rate interest on debt, earn variable-rate interest on loans, or sell commercial real estate loans) and recorded in the same income statement line as the hedged transaction.
A net investment hedge is used to hedge the exposure of changes in the carrying value of investments as a result of changes in the related foreign exchange rates. The gain or loss on a net investment hedge is recorded as a component of AOCI on the balance sheet when the terms of the derivative match the notional and currency risk being hedged. The amount in AOCI is reclassified into income when the hedged transaction affects earnings (e.g., when we dispose or liquidate a foreign subsidiary).
Hedge “effectiveness” is determined by the extent to which changes in the fair value of a derivative instrument offset changes in the fair value, cash flows, or carrying value attributable to the risk being hedged. If the relationship between the change in the fair value of the derivative instrument and the change in the hedged item falls within a range considered to be the industry norm, the hedge is considered “highly effective” and qualifies for hedge accounting. A hedge is “ineffective” if the relationship between the changes falls outside the acceptable range. In that case, hedge accounting is discontinued on a prospective basis. Hedge effectiveness is tested at least quarterly.
We take into account the impact of bilateral collateral and master netting agreements that allow us to settle all derivative contracts held with a single counterparty on a net basis, and to offset the net derivative position with the related cash collateral when recognizing derivative assets and liabilities. As a result, we could have derivative contracts with negative fair values included in derivative assets on the balance sheet and contracts with positive fair values included in derivative liabilities. Derivative assets and derivative liabilities are recorded within “accrued income and other assets” and “accrued expense and other liabilities,” respectively.
Additional information regarding the accounting for derivatives is provided in Note 8 (“Derivatives and Hedging Activities”).
Loan Sales and Securitizations
We sell and at times may securitize loans and other financial assets. We recognize the sale and securitization of loans or other financial assets when the transferred assets are legally isolated from our creditors and the appropriate accounting criteria are met. When we securitize loans or other financial assets, we may retain a portion of the securities issued, including senior interests, subordinated interests, interest-only strips, servicing rights, and other interests, all of which are considered retained interests in the transferred assets. The interests are initially measured at fair value which is based on independent third party market prices or market prices for similar assets. If market prices are not available, fair value is estimated based on the present value of expected future cash flows using assumptions as to discount rates, interest rates, prepayment speeds, and credit losses. Loans sold or securitized are removed from the balance sheet and a net gain or loss is recorded depending on the fair value of the loans sold and the retained interests at the date of sale. The net gain or loss is recognized in “other income,” “consumer mortgage income,” or “investment banking and debt placement fees” at the time of sale.
Servicing Assets
We service commercial real estate and residential mortgage loans. Servicing assets and liabilities purchased or retained are initially measured at fair value and are recorded as a component of “accrued income and other assets” on the balance sheet. When no ready market value (such as quoted market prices, or prices based on sales or purchases of similar assets) is available to determine the fair value of servicing assets, fair value is determined by calculating the present value of future cash flows associated with servicing the loans. This calculation is based on a number of assumptions, including the market cost of servicing, the discount rate, the prepayment rate, and the default rate.
We account for our servicing assets using the amortization method. The amortization of servicing assets is determined in proportion to, and over the period of, the estimated net servicing income and recorded in either “consumer mortgage income” or “commercial mortgage servicing fees” on the income statement.
Servicing assets are evaluated quarterly for possible impairment. This process involves stratifying the assets based upon one or more predominant risk characteristics and determining the fair value of each class. The characteristics may include financial asset type, size, interest rate, date of origination, term and geographic location. If the evaluation indicates that the carrying amount of the servicing assets exceeds their fair value, the carrying amount is reduced by recording a charge to income in the amount of such excess and establishing a valuation reserve allowance. If impairment is determined to be other-than-temporary, a direct write-off of the carrying amount would be recorded. Additional information pertaining to servicing assets is included in Note 9 (“Mortgage Servicing Assets”).
Leases
For leases where Key is the lessee that have initial terms greater than one year, right-of-use assets and corresponding lease liabilities are reported on the balance sheet. Leases with an initial term of less than one year are not recorded on the balance sheet. Our leases where Key is the lessee are primarily classified as operating leases. Operating lease expense is recognized in "net occupancy" and "equipment" on a straight-line basis over the lease term. For additional information, see Note 10 (“Leases”).
Premises and Equipment
Premises and equipment, including leasehold improvements, are stated at cost less accumulated depreciation and amortization. We determine depreciation of premises and equipment using the straight-line method over the estimated useful lives of the particular assets. Leasehold improvements are amortized using the straight-line method over the shorter of their useful lives or terms of the leases. Premises and equipment are evaluated for impairment whenever events or circumstances indicate that the carrying value of the asset may not be recoverable.
Goodwill and Other Intangible Assets
Goodwill represents the amount by which the cost of net assets acquired in a business combination exceeds their fair value. Goodwill is assigned to reporting units as of the acquisition date based on the expected benefit to such reporting unit from the synergies of the business combination. Goodwill is not amortized. Goodwill is tested at the reporting unit level for impairment, at least annually as of October 1, or when indicators of impairment exist.
We may elect to perform a qualitative analysis to determine whether or not it is more-likely-than-not that the fair value of a reporting unit is less than its carrying amount. When conducting a qualitative analysis, we evaluate both internal and external factors, including recent performance, updated projections, stock prices and economic conditions. If we elect to bypass this qualitative analysis, or conclude via qualitative analysis that it is more-likely-than-not that the fair value of a reporting unit is less than its carrying value, a quantitative goodwill impairment test is performed. If the fair value is less than the carrying value, an impairment charge is recorded for the difference, to the extent that the loss recognized does not exceed the amount of the goodwill allocated to that reporting unit.
The amount of capital being allocated to our reporting units as a proxy for the carrying value is based on a combination of regulatory and economic equity. Fair values are estimated using a combination of market and income approaches. The market approach incorporates comparable public company multiples along with data related to recent merger and acquisition activity. The income approach consists of discounted cash flow modeling that utilizes internal forecasts and various other inputs and assumptions. A multi-year internal forecast is prepared
for each reporting unit and a terminal growth rate is estimated for each one based on market expectations of inflation and economic conditions in the financial services industry. Earnings projections for reporting units are adjusted for after tax cost savings expected to be realized by a market participant. The discount rate applied to our cash flows is derived from the CAPM. The buildup to the discount rate includes a risk-free rate, 5-year adjusted beta based on peer companies, a market equity risk premium, a size premium and a company specific risk premium. The discount rates differ between our reporting units as they have different levels of risk. A sensitivity analysis is typically performed on key assumptions, such as the discount rates, net interest margin and cost savings estimates.
Other intangible assets with finite lives are amortized on either an accelerated or straight-line basis. We monitor for impairment indicators for goodwill and other intangible assets on a quarterly basis. Additional information pertaining to goodwill and other intangible assets is included in Note 12 (“Goodwill and Other Intangible Assets”).
Business Combinations
We account for our business combinations using the acquisition method of accounting. Under this accounting method, the acquired company’s assets and liabilities are recorded at fair value at the date of acquisition, except as provided for by the applicable accounting guidance, and the results of operations of the acquired company are combined with Key’s results from the date of acquisition forward. Acquisition costs are expensed when incurred. The difference between the purchase price and the fair value of the net assets acquired (including identifiable intangible assets) is recorded as goodwill. Our accounting policy for intangible assets is summarized in this note under the heading “Goodwill and Other Intangible Assets.”
Securities Financing Activities
We enter into repurchase agreements to finance overnight customer sweep deposits. We also enter into repurchase and reverse repurchase agreements to settle other securities obligations. We account for these securities financing agreements as collateralized financing transactions. Repurchase and reverse repurchase agreements are recorded on the balance sheet at the amounts that the securities will be subsequently sold or repurchased. Securities borrowed transactions are recorded on the balance sheet at the amounts of cash collateral advanced. While our securities financing agreements incorporate a right of set off, the assets and liabilities are reported on a gross basis. Reverse repurchase agreements and securities borrowed transactions are included in “short-term investments” on the balance sheet; repurchase agreements are included in “federal funds purchased and securities sold under repurchase agreements.” Fees received in connection with these transactions are recorded in interest income; fees paid are recorded in interest expense.
Additional information regarding securities financing activities is included in Note 16 (“Securities Financing Activities”).
Contingencies and Guarantees
We recognize liabilities for the fair value of our obligations under certain guarantees issued. These liabilities are included in “accrued expense and other liabilities” on the balance sheet. If we receive a fee for a guarantee requiring liability recognition, the amount of the fee represents the initial fair value of the “stand ready” obligation. If there is no fee, the fair value of the stand ready obligation is determined using expected present value measurement techniques, unless observable transactions for comparable guarantees are available. The subsequent accounting for these stand ready obligations depends on the nature of the underlying guarantees. We account for our release from risk under a particular guarantee when the guarantee expires or is settled, or by a systematic and rational amortization method, depending on the risk profile of the guarantee. Contingent aspects of certain guarantees are assessed a reserve under CECL if required.
Contingent liabilities may result from litigation, claims and assessments, loss or damage to Key. We recognize liabilities from contingencies when a loss is probable and can be reasonably estimated.
Additional information regarding contingencies and guarantees is included in Note 22 (“Commitments, Contingent Liabilities, and Guarantees”).
Revenue Recognition
We recognize revenues as they are earned based on contractual terms, as transactions occur, or as services are provided and collectability is reasonably assured. Our principal source of revenue is interest income from loans and investments. We also earn noninterest income from various banking and financial services offered through both the Commercial and Consumer banks.
Interest Income. The largest source of revenue for us is interest income. Interest income is primarily recognized on an accrual basis according to nondiscretionary formulas in written contracts, such as loan agreements or securities contracts.
Noninterest Income. We earn noninterest income through a variety of financial and transaction services provided to commercial and consumer clients. Revenue is recorded for noninterest income based on the contractual terms for the service or transaction performed. In certain circumstances, noninterest income is reported net of associated expenses.
Trust and Investment Services Income. Trust and investment services revenues include brokerage commissions trust and asset management commissions.
Revenue from trade execution and brokerage services is earned through commissions from trade execution on behalf of clients. Revenue from these transactions is recognized at the trade date. Any ongoing service fees are recognized on a monthly basis as services are performed.
Trust and asset management services include asset custody and investment management services provided to individual and institutional customers. Revenue is recognized monthly based on a minimum annual fee, and the market value of assets in custody. Additional fees are recognized for transactional activity at a point in time.
Investment Banking and Debt Placement Fees. Investment banking and debt placement fees consist of syndication fees, debt and equity underwriting fees, financial advisor fees, gains on sales of commercial mortgages, and agency origination fees. Revenues for these services are recorded at a point in time, upon completion of a contractually identified transaction, or when an advisory opinion is provided. Investment banking and debt placement costs are reported on a gross basis within other expense on the income statement.
Service Charges on Deposit Accounts. Revenue from service charges on deposit accounts is earned through cash management, wire transfer, and other deposit-related services as well as overdraft, non-sufficient funds, account management and other deposit-related fees. Revenue is recognized for these services either over time, corresponding with deposit accounts’ monthly cycle, or at a point in time for transactional related services and fees. Certain reward costs are netted within revenues from service charges on deposits.
Corporate Services Income. Corporate services income includes various ancillary service revenue including letter of credit fees, loan fees, non-hedging derivatives gains and losses, and certain capital market fees. Revenue from these fees is recorded in a manner that reflects the timing of when transactions occur, and as services are provided.
Cards and Payments Income. Cards and payments income consists of debit card, consumer and commercial credit card, and merchant services income. Revenue sources include interchange fees from credit and debit cards processed through card association networks, merchant services, and other card related services. Interchange rates are generally set by the credit card associations and based on purchase volumes and other factors. Interchange fees are recognized as transactions occur. Certain card network costs and reward costs are netted within interchange revenues. Merchant services income represents account management fees and transaction fees charged to merchants for the processing of card association network transactions. Merchant services revenue is recognized as transactions occur, or as services are performed.
Corporate-Owned Life Insurance Income. Income from corporate-owned life insurance primarily represents changes in the cash surrender value of life insurance policies held on certain key employees. Revenue is recognized in each period based on the change in the cash surrender value during the period.
Stock-Based Compensation
Stock-based compensation is measured using the fair value method of accounting on the grant date. The measured cost is recognized over the period during which the recipient is required to provide service in exchange for the award. We estimate expected forfeitures when stock-based awards are granted and record compensation expense only for awards that are expected to vest. Compensation expense related to awards granted to employees is recorded in “personnel expense” on the Consolidated Statements of Income while compensation expense related to awards granted to directors is recorded in “other expense.”
We recognize compensation expense for stock-based, mandatory deferred incentive compensation awards using the accelerated method of amortization over a period of approximately 5 years (the current year performance period and a four-year vesting period, which generally starts in the first quarter following the performance period).
We estimate the fair value of options granted using the Black-Scholes option-pricing model, as further described in Note 17 (“Stock-Based Compensation”). Employee stock options typically become exercisable at the rate of 25% per year, beginning one year after the grant date. Options expire no later than 10 years after their grant date. We recognize stock-based compensation expense for stock options with graded vesting using an accelerated method of amortization.
We use shares repurchased under our annual capital plan submitted to our regulators (treasury shares) for share issuances under all stock-based compensation programs.
Income Taxes
Deferred tax assets and liabilities are determined based on temporary differences between financial statement asset and liability amounts and their respective tax bases and are measured using enacted tax laws and rates that are expected to apply in the periods in which the deferred tax assets or liabilities are expected to be realized. Deferred tax assets are also recorded for any tax attributes, such as tax credit and net operating loss carryforwards. The net balance of deferred tax assets and liabilities is reported in “Accrued income and other assets” or “Accrued expense and other liabilities” in the consolidated balance sheets, as appropriate. Subsequent changes in the tax laws require adjustment to these assets and liabilities with the cumulative effect included in the provision for income taxes for the period in which the change is enacted. A valuation allowance is recognized for a deferred tax asset if, based on the weight of available evidence, it is more-likely-than-not that some portion or all of the deferred tax asset will not be realized.
We use the proportional amortization method for LIHTC and certain NMTC investments, whereby the associated investment tax credits are recognized as a reduction to tax expense. Certain federal tax credits that are nonrefundable and transferable under applicable regulations are accounted for as government grants and recorded as a reduction to the amortized cost or net investment in the applicable asset generating the credit, generally within “Accrued income and other assets” or “Loans, net of unearned income”. Amounts are amortized through depreciation or as an adjustment to yield over the estimated life of the asset. Any gain or loss on the transfer of a tax credit is recorded within “Other income”.
Earnings Per Share
Basic net income per common share is calculated using the two-class method. The two-class method is an earnings allocation formula that determines earnings per share for each share of common stock and participating securities according to dividends declared (distributed earnings) and participation rights in undistributed earnings. Distributed and undistributed earnings are allocated between common and participating security shareholders based on their respective rights to receive dividends. Nonvested share-based payment awards that contain nonforfeitable rights to dividends or dividend equivalents are considered participating securities (e.g., nonvested service-based restricted stock units). Undistributed net losses are not allocated to nonvested restricted shareholders, as these shareholders do not have a contractual obligation to fund the incurred losses. Net income attributable to common shares is then divided by the weighted-average number of common shares outstanding during the period.
Diluted net income per common share is calculated using the more dilutive of either the treasury method or the two-class method. The dilutive calculation considers the potential dilutive effect of common stock equivalents determined under the treasury stock method. Common stock equivalents include stock options and service- and performance-based restricted stock and stock units granted under our stock plans. Net income attributable to
common shares is then divided by the total of weighted-average number of common shares and common stock equivalents outstanding during the period.
Accounting Guidance Adopted in 2024
| | | | | | | | | | | |
| Standard | Date of Adoption | Description | Effect on Financial Statements or Other Significant Matters |
| ASU 2022-03, Fair Value Measurement - Fair Value Measurement of Equity Securities Subject to Contractual Sale Restrictions (Topic 820) | January 1, 2024 | The amendments clarify that a contractual restriction on the sale of an equity security is not considered part of the unit of account of the equity security and is not considered in measuring fair value.
Entities cannot, as a separate unit of account, recognize and measure a contractual sale restriction.
The amendments require disclosures for equity securities subject to contractual restrictions including; the fair value of equity securities subject to contractual sale restrictions reflected in the balance sheet, the nature and remaining duration of the restriction(s) and the circumstances that could cause a lapse in the restriction(s).
The guidance should be applied prospectively with any adjustments from the adoption of the amendments recognized in earnings and disclosed on the date of adoption. | The guidance did not have a material impact on Key’s financial condition or results of operations. |
| ASU 2023-07 Segment Reporting (Topic 280) | January 1, 2024 | This guidance requires certain segment disclosures in annual and interim periods. It also clarifies that companies may report on additional measures if the chief operating decision maker uses more than one measure of a segment’s profit or loss in assessing segment performance and deciding how to allocate resources.
The guidance should be applied on a retrospective basis. | This guidance did not have a material impact on Key’s financial condition or results of operations.
Key updated its segment disclosures in Note. 25, Business Segment Reporting, to reflect this new guidance. |
Accounting Guidance Adopted in 2025
| | | | | | | | | | | |
| Standard | Date of Adoption | Description | Effect on Financial Statements or Other Significant Matters |
| ASU 2023-09 Income Taxes (Topic 740) | Annual periods beginning January 1, 2025
Early adoption is permitted. | This guidance requires certain tax disclosures related to rate reconciliation and income taxes paid.
The guidance should be applied on a prospective or retrospective basis. | The guidance is not expected to have a material impact on Key’s disclosures. |
| | | |
| | | |
| | | |
2. Earnings Per Common Share
Basic earnings per share is the amount of earnings (adjusted for dividends declared on our preferred stock) available to each Common Share outstanding during the reporting periods. Diluted earnings per share is the amount of earnings available to each Common Share outstanding during the reporting periods adjusted to include the effects of potentially dilutive Common Shares. Potentially dilutive Common Shares include stock options and other stock-based awards. Potentially dilutive Common Shares are excluded from the computation of diluted earnings per share in the periods where the effect would be antidilutive.
Our basic and diluted earnings per Common Share are calculated as follows:
| | | | | | | | | | | |
| Year ended December 31, | | | |
| Dollars in millions, except per share amounts | 2024 | 2023 | 2022 |
| EARNINGS | | | |
| Income (loss) from continuing operations | $ | (163) | | $ | 964 | | $ | 1,911 | |
| | | |
| | | |
| Less: Dividends on preferred stock | 143 | | 143 | | 118 | |
| Income (loss) from continuing operations attributable to Key common shareholders | (306) | | 821 | | 1,793 | |
| Income (loss) from discontinued operations, net of taxes | 2 | | 3 | | 6 | |
| Net income (loss) attributable to Key common shareholders | $ | (304) | | $ | 824 | | $ | 1,799 | |
| WEIGHTED-AVERAGE COMMON SHARES | | | |
| Weighted-average Common Shares outstanding (000) | 949,561 | | 927,217 | | 924,363 | |
| | | |
Effect of common share options and other stock awards(a) | — | | 5,542 | | 8,696 | |
Weighted-average common shares and potential Common Shares outstanding (000) (b) | 949,561 | | 932,759 | | 933,059 | |
| EARNINGS PER COMMON SHARE | | | |
| Income (loss) from continuing operations attributable to Key common shareholders | $ | (.32) | | $ | .88 | | $ | 1.94 | |
| Income (loss) from discontinued operations, net of taxes | — | | — | | .01 | |
Net income (loss) attributable to Key common shareholders (c) | (.32) | | .89 | | 1.94 | |
| Income (loss) from continuing operations attributable to Key common shareholders — assuming dilution | (.32) | | .88 | | 1.92 | |
| Income (loss) from discontinued operations, net of taxes — assuming dilution | — | | — | | .01 | |
Net income (loss) attributable to Key common shareholders — assuming dilution (c) | (.32) | | .88 | | 1.93 | |
(a)For periods ended in a loss from continuing operations attributable to Key common shareholders, anti-dilutive instruments have been excluded from the calculation of diluted earnings per share.
(b)Assumes conversion of Common Share options and other stock awards and/or convertible preferred stock, as applicable.
(c)EPS may not foot due to rounding.
3. Restrictions on Cash, Dividends, and Lending Activities
Capital distributions from KeyBank and other subsidiaries are our principal source of cash flows for paying dividends on our common and preferred shares, servicing our debt, and financing corporate operations. Federal banking law limits the amount of capital distributions that a bank can make to its holding company without prior regulatory approval. A national bank’s dividend-paying capacity is affected by several factors, including net profits (as defined by statute) for the previous two calendar years and for the current year, up to the date the dividend is declared.
During 2024, KeyBank paid $750 million in dividends to KeyCorp. At December 31, 2024, KeyBank had no regulatory capacity to pay dividends to KeyCorp without prior regulatory approval. At December 31, 2024, KeyCorp held $5.2 billion in cash and short-term investments, which can be used to pay dividends to shareholders, service debt, and finance corporate operations.
4. Loan Portfolio
Loan Portfolio by Portfolio Segment and Class of Financing Receivable (a)
| | | | | | | | |
| December 31, | | |
| Dollars in millions | 2024 | 2023 |
Commercial and industrial (b) | $ | 52,909 | | $ | 55,815 | |
| Commercial real estate: | | |
| Commercial mortgage | 13,310 | | 15,187 | |
| Construction | 2,936 | | 3,066 | |
| Total commercial real estate loans | 16,246 | | 18,253 | |
Commercial lease financing (c) | 2,736 | | 3,523 | |
| Total commercial loans | 71,891 | | 77,591 | |
| Residential — prime loans: | | |
| Real estate — residential mortgage | 19,886 | | 20,958 | |
| Home equity loans | 6,358 | | 7,139 | |
| Total residential — prime loans | 26,244 | | 28,097 | |
| Other consumer loans | 5,167 | | 5,916 | |
| Credit cards | 958 | | 1,002 | |
| | |
| Total consumer loans | 32,369 | | 35,015 | |
Total loans (d) | $ | 104,260 | | $ | 112,606 | |
| | |
(a)Accrued interest of $456 million and $522 million at December 31, 2024, and December 31, 2023, respectively, is presented in "Accrued income and other assets" on the Consolidated Balance Sheets and is excluded from the amortized cost basis disclosed in this table.
(b)Loan balances include $212 million and $207 million of commercial credit card balances at December 31, 2024, and December 31, 2023, respectively.
(c)Commercial lease financing includes receivables of $3 million and $7 million held as collateral for secured borrowings at December 31, 2024, and December 31, 2023, respectively. Principal reductions are based on the cash payments received from these related receivables. Additional information pertaining to this secured borrowing is included in Note 20 (“Long-Term Debt”).
(d)Total loans exclude loans of $257 million at December 31, 2024, and $339 million at December 31, 2023, related to the discontinued operations of the education lending business.
5. Asset Quality
ALLL
We estimate the appropriate level of the ALLL on at least a quarterly basis. The methodology is described in Note 1 ("Basis of Presentation and Accounting Policies") under the heading "Allowance for Loan and Lease Losses" of this report.
The ALLL at December 31, 2024, represents our current estimate of lifetime credit losses inherent in the loan portfolio at that date. The changes in the ALLL by loan category for the periods indicated are as follows:
Twelve Months Ended December 31, 2024:
| | | | | | | | | | | | | | | | | | | | | | | | |
| Dollars in millions | | | December 31, 2023 | Provision | | Charge-offs | Recoveries | December 31, 2024 | | |
| Commercial and Industrial | | | $ | 556 | | $ | 388 | | | $ | (363) | | $ | 58 | | $ | 639 | | | |
| Commercial real estate: | | | | | | | | | | |
| Real estate — commercial mortgage | | | 419 | | (61) | | | (40) | | 2 | | 320 | | | |
| Real estate — construction | | | 52 | | (1) | | | — | | — | | 51 | | | |
| Total commercial real estate loans | | | 471 | | (62) | | | (40) | | 2 | | 371 | | | |
| Commercial lease financing | | | 33 | | (4) | | | (7) | | 5 | | 27 | | | |
| Total commercial loans | | | 1,060 | | 322 | | | (410) | | 65 | | 1,037 | | | |
| Real estate — residential mortgage | | | 162 | | (74) | | | (3) | | 5 | | 90 | | | |
| Home equity loans | | | 86 | | (16) | | | (2) | | 2 | | 70 | | | |
| Other consumer loans | | | 122 | | 70 | | | (64) | | 8 | | 136 | | | |
| Credit cards | | | 78 | | 39 | | | (47) | | 6 | | 76 | | | |
| | | | | | | | | | |
| Total consumer loans | | | 448 | | 19 | | | (116) | | 21 | | 372 | | | |
| Total ALLL — continuing operations | | | 1,508 | | 341 | | (a) | (526) | | 86 | | 1,409 | | | |
| Discontinued operations | | | 16 | | — | | | (4) | | 1 | | 13 | | | |
| Total ALLL — including discontinued operations | | | $ | 1,524 | | $ | 341 | | | $ | (530) | | $ | 87 | | $ | 1,422 | | | |
| | | | | | | | | | |
| | | | | | | | | | |
(a)Excludes a credit related to reserves on lending-related commitments of $6 million.
Twelve Months Ended December 31, 2023:
| | | | | | | | | | | | | | | | | | | | | |
| Dollars in millions | December 31, 2022 | Provision | | | Charge-offs | Recoveries | December 31, 2023 |
| Commercial and Industrial | $ | 601 | | $ | 99 | | | | $ | (188) | | $ | 44 | | $ | 556 | |
| Commercial real estate: | | | | | | | |
| Real estate — commercial mortgage | 203 | | 253 | | | | (39) | | 2 | | 419 | |
| Real estate — construction | 28 | | 23 | | | | — | | 1 | | 52 | |
| Total commercial real estate loans | 231 | | 276 | | | | (39) | | 3 | | 471 | |
| Commercial lease financing | 32 | | (4) | | | | — | | 5 | | 33 | |
| Total commercial loans | 864 | | 371 | | | | (227) | | 52 | | 1,060 | |
| Real estate — residential mortgage | 196 | | (37) | | | | (1) | | 4 | | 162 | |
| Home equity loans | 98 | | (13) | | | | (2) | | 3 | | 86 | |
| Other consumer loans | 113 | | 52 | | | | (51) | | 8 | | 122 | |
| Credit cards | 66 | | 42 | | | | (37) | | 7 | | 78 | |
| | | | | | | |
| Total consumer loans | 473 | | 44 | | | | (91) | | 22 | | 448 | |
| Total ALLL — continuing operations | 1,337 | | 415 | | | (a) | (318) | | 74 | | 1,508 | |
| Discontinued operations | 21 | | (2) | | | | (4) | | 1 | | 16 | |
| Total ALLL — including discontinued operations | $ | 1,358 | | $ | 413 | | | | $ | (322) | | $ | 75 | | $ | 1,524 | |
| | | | | | | |
(a)Excludes a provision related to reserves on lending-related commitments of $74 million.
Twelve Months Ended December 31, 2022
| | | | | | | | | | | | | | | | | | | | | | |
| Dollars in millions | December 31, 2021 | | | Provision | | Charge-offs | Recoveries | December 31, 2022 |
| Commercial and industrial | $ | 445 | | | | $ | 259 | | | $ | (153) | | $ | 50 | | $ | 601 | |
| Commercial real estate: | | | | | | | | |
| Real estate — commercial mortgage | 182 | | | | 39 | | | (23) | | 5 | | 203 | |
| Real estate — construction | 29 | | | | (2) | | | — | | 1 | | 28 | |
| Total commercial real estate loans | 211 | | | | 37 | | | (23) | | 6 | | 231 | |
| Commercial lease financing | 32 | | | | (2) | | | (2) | | 4 | | 32 | |
| Total commercial loans | 688 | | | | 294 | | | (178) | | 60 | | 864 | |
| Real estate — residential mortgage | 95 | | | | 94 | | | 2 | | 5 | | 196 | |
| Home equity loans | 110 | | | | (14) | | | (1) | | 3 | | 98 | |
| Other consumer loans | 107 | | | | 34 | | | (38) | | 10 | | 113 | |
| Credit cards | 61 | | | | 29 | | | (30) | | 6 | | 66 | |
| | | | | | | | |
| Total consumer loans | 373 | | | | 143 | | | (67) | | 24 | | 473 | |
| Total ALLL — continuing operations | 1,061 | | | | 437 | | (a) | (245) | | 84 | | 1,337 | |
| Discontinued operations | 28 | | | | (3) | | | (6) | | 2 | | 21 | |
| Total ALLL — including discontinued operations | $ | 1,089 | | | | $ | 434 | | | $ | (251) | | $ | 86 | | $ | 1,358 | |
| | | | | | | | |
(a)Excludes a provision related to reserves on lending-related commitments of $65 million.
As described in Note 1 ("Basis of Presentation and Accounting Policies"), we estimate the ALLL using relevant available information, from internal and external sources, relating to past events, current conditions, and reasonable and supportable forecasts. In our estimation of expected credit losses, we use a two year reasonable and supportable period across all products. Following this two year period in which supportable forecasts can be generated, for all modeled loan portfolios, we revert expected credit losses to a level that is consistent with our historical information by reverting the macroeconomic variables (model inputs) to their long run average. We revert to historical loss rates for less complex estimation methods for smaller portfolios. A 20 year fixed length look back period is used to calculate the long run average of the macroeconomic variables. A four quarter reversion period is used where the macroeconomic variables linearly revert to their long run average following the two year reasonable and supportable period.
We develop our reasonable and supportable forecasts using relevant data including, but not limited to, changes in economic output, unemployment rates, property values, and other factors associated with the credit losses on financial assets. Some macroeconomic variables apply to all portfolio segments, while others are more portfolio specific. The following table discloses key macroeconomic variables for each loan portfolio.
| | | | | | | | |
| Segment | Portfolio | Key Macroeconomic Variables (a) |
| Commercial | Commercial and industrial | BBB corporate bond rate (spread), fixed investment, business bankruptcies, GDP, industrial production, unemployment rate, and Producer Price Index |
| Commercial real estate | Property & real estate price indices, unemployment rate, business bankruptcies, GDP, SOFR |
| Commercial lease financing | BBB corporate bond rate (spread), GDP, and unemployment rate |
| Consumer | Real estate — residential mortgage | GDP, home price index, unemployment rate, and 30 year mortgage rate |
| Home equity | Home price index, unemployment rate, and 30 year mortgage rate |
| Other consumer | Unemployment rate and U.S. household income |
| |
| Credit cards | Unemployment rate and U.S. household income |
| Discontinued operations | Unemployment rate |
(a)Variables include all transformations and interactions with other risk drivers. Additionally, variables may have varying impacts at different points in the economic cycle.
In addition to macroeconomic drivers, portfolio attributes such as remaining term, outstanding balance, risk ratings, utilization, FICO, LTV, and delinquency also drive ALLL changes. Our ALLL models were designed to capture the correlation between economic and portfolio changes. As such, evaluating shifts in individual portfolio attributes and macroeconomic variables in isolation may not be indicative of past or future performance.
Economic Outlook
As of December 31, 2024, economic uncertainty remains elevated due to geopolitical tensions and the interest rate environment, as well as the U.S. presidential administration change. The unemployment rate remained at a relatively low level, although job growth remains stable. Inflation has continued to come down and commercial real estate pressures have eased. We utilized the Moody’s November 2024 Consensus forecast as the baseline forecast to estimate our expected credit losses as of December 31, 2024. We determined such forecast to be a reasonable view of the outlook for the economy given all available information at year end.
The baseline scenario reflects continued economic resiliency, but slowing growth into 2025. U.S. GDP is expected to grow at an annual rate of approximately 2.0% for both 2025 and 2026, compared to 2.7% in 2024. The expected National Unemployment Rate was 4.2% in the fourth quarter of 2024, with the forecast remaining at 4.4% through late-2025. The U.S. Consumer Price Index is forecasted at 2.2% for 2025. The outlook for the National Home Price Index reflects 2% growth in 2025, while the Commercial Real Estate Price Index is forecasted to remain stable.
We did not identify material limitations in the third-party economic forecast that required management qualitative adjustments to the ALLL. As a result of the current economic uncertainty, our future loss estimates may vary considerably from our December 31, 2024 assumptions.
Commercial Loan Portfolio
The commercial ALLL decreased by $23 million, or 2.2%, from December 31, 2023, through December 31, 2024. The overall decrease is driven by changes in portfolio activity and the economic outlook.
The change in the reserve levels is reflective of the strategic and ongoing balance sheet optimization efforts, in addition to improving credit quality and economic conditions for the commercial real estate portfolio. Reserve decreases due to these drivers are partly offset by a reserve build due to credit quality migration in the commercial and industrial portfolio and changes in management qualitative adjustments for commercial real estate price volatility.
Consumer Loan Portfolio
The consumer ALLL decreased $76 million, or 17.0%, from December 31, 2023, through December 31, 2024. The overall decrease in the allowance is primarily driven by changes in portfolio activity.
The reserve decrease is concentrated in the real estate portfolio and is largely attributable to the ongoing loan reductions. The most meaningful change to the economic forecast year-over-year is the improvement in the home price index outlook, which contributed to reserve decreases for both the residential mortgage and home equity portfolios.
Credit Risk Profile
The prevalent risk characteristic for both commercial and consumer loans is the risk of loss arising from an obligor’s inability or failure to meet contractual payment or performance terms. Evaluation of this risk is stratified and monitored by the loan risk rating grades assigned for the commercial loan portfolios and the refreshed FICO score assigned for the consumer loan portfolios. The internal risk grades assigned to loans follow our definitions of Pass and Criticized, which are consistent with published definitions of regulatory risk classifications. Loans with a pass rating represent those loans not classified on our rating scale for credits, as minimal credit risk has been identified. Criticized loans are those loans that either have a potential weakness deserving management's close attention or have a well-defined weakness that may put full collection of contractual cash flows at risk. Borrower FICO scores provide information about the credit quality of our consumer loan portfolio as they provide an indication as to the likelihood that a debtor will repay its debts. The scores are obtained from a nationally recognized consumer rating agency and are presented in the tables below at the dates indicated.
Most extensions of credit are subject to loan grading or scoring. Loan grades are assigned at the time of origination, verified by credit risk management, and periodically re-evaluated thereafter. This risk rating methodology blends our judgment with quantitative modeling. Commercial loans generally are assigned two internal risk ratings. The first rating reflects the probability that the borrower will default on an obligation; the second rating reflects expected recovery rates on the credit facility. Default probability is determined based on, among other factors, the financial strength of the borrower, an assessment of the borrower’s management, the borrower’s competitive position within its industry sector, and our view of industry risk in the context of the general economic outlook. Types of exposure, transaction structure, and collateral, including credit risk mitigants, affect the expected recovery assessment.
Commercial Credit Exposure
Credit Risk Profile by Creditworthiness Category and Vintage (a)
| | | | | | | | | | | | | | | | | | | | | | | | | | | | | |
| As of December 31, 2024 | Term Loans | Revolving Loans Amortized Cost Basis | Revolving Loans Converted to Term Loans Amortized Cost Basis | |
| Amortized Cost Basis by Origination Year and Internal Risk Rating | |
| Dollars in millions | 2024 | 2023 | 2022 | 2021 | 2020 | Prior | Total |
| Commercial and Industrial | | | | | | | | | |
| Risk Rating: | | | | | | | | | |
| Pass | $ | 6,345 | | $ | 3,097 | | $ | 7,119 | | $ | 3,934 | | $ | 1,617 | | $ | 3,969 | | $ | 22,709 | | $ | 115 | | $ | 48,905 | |
| Criticized (Accruing) | 172 | | 219 | | 597 | | 419 | | 208 | | 476 | | 1,550 | | 41 | | 3,682 | |
| Criticized (Nonaccruing) | 23 | | 13 | | 68 | | 30 | | 2 | | 31 | | 153 | | 2 | | 322 | |
| Total commercial and industrial | 6,540 | | 3,329 | | 7,784 | | 4,383 | | 1,827 | | 4,476 | | 24,412 | | 158 | | 52,909 | |
| Current period gross write-offs | 1 | | 12 | 65 | 106 | 4 | 31 | 144 | — | | 363 | |
| Real estate — commercial mortgage | | | | | | | | | |
| Risk Rating: | | | | | | | | | |
| Pass | 1,052 | | 748 | | 2,818 | | 2,202 | | 594 | | 3,194 | | 1,001 | | 41 | | 11,650 | |
| Criticized (Accruing) | 31 | | 85 | | 571 | | 281 | | 93 | | 316 | | 30 | | 9 | | 1,416 | |
| Criticized (Nonaccruing) | — | | — | | 123 | | 52 | | 3 | | 66 | | — | | — | | 244 | |
| Total real estate — commercial mortgage | 1,083 | | 833 | | 3,512 | | 2,535 | | 690 | | 3,576 | | 1,031 | | 50 | | 13,310 | |
| Current period gross write-offs | — | | 0 | 1 | 6 | 0 | 32 | 1 | — | | 40 | |
| Real estate — construction | | | | | | | | | |
| Risk Rating: | | | | | | | | | |
| Pass | 199 | | 846 | | 1,021 | | 340 | | 87 | | 67 | | 42 | | 2 | | 2,604 | |
| Criticized (Accruing) | — | | 17 | | 112 | | 58 | | 68 | | 77 | | — | | — | | 332 | |
| Criticized (Nonaccruing) | — | | — | | — | | — | | — | | — | | — | | — | | — | |
| Total real estate — construction | 199 | | 863 | | 1,133 | | 398 | | 155 | | 144 | | 42 | | 2 | | 2,936 | |
| Current period gross write-offs | — | | — | | — | | — | | — | | — | | — | | — | | — | |
| Commercial lease financing | | | | | | | | | |
| Risk Rating: | | | | | | | | | |
| Pass | 301 | | 430 | | 626 | | 368 | | 217 | | 679 | | — | | — | | 2,621 | |
| Criticized (Accruing) | 2 | | 34 | | 33 | | 9 | | 16 | | 21 | | — | | — | | 115 | |
| Criticized (Nonaccruing) | — | | — | | — | | — | | — | | — | | — | | — | | — | |
| Total commercial lease financing | 303 | | 464 | | 659 | | 377 | | 233 | | 700 | | — | | — | | 2,736 | |
| Current period gross write-offs | — | | — | | — | | — | | — | | 7 | | — | | — | | 7 | |
| Total commercial loans | $ | 8,125 | | $ | 5,489 | | $ | 13,088 | | $ | 7,693 | | $ | 2,905 | | $ | 8,896 | | $ | 25,485 | | $ | 210 | | $ | 71,891 | |
| Total commercial loan current period gross write-offs | $ | 1 | | $ | 12 | | $ | 66 | | $ | 112 | | $ | 4 | | $ | 70 | | $ | 145 | | $ | — | | $ | 410 | |
| | | | | | | | | |
(a)Accrued interest of $322 million, presented in “Accrued income and other assets” on the Consolidated Balance Sheets, was excluded from the amortized cost basis disclosed in this table.
Consumer Credit Exposure
Credit Risk Profile by FICO Score and Vintage (a)
| | | | | | | | | | | | | | | | | | | | | | | | | | | | | |
| As of December 31, 2024 | Term Loans | Revolving Loans Amortized Cost Basis | Revolving Loans Converted to Term Loans Amortized Cost Basis | |
| Amortized Cost Basis by Origination Year and FICO Score | |
| Dollars in millions | 2024 | 2023 | 2022 | 2021 | 2020 | Prior | Total |
| Real estate — residential mortgage | | | | | | | | | |
| FICO Score: | | | | | | | | | |
| 750 and above | $ | 281 | | $ | 669 | | $ | 5,720 | | $ | 7,203 | | $ | 2,247 | | $ | 1,510 | | $ | — | | $ | — | | $ | 17,630 | |
| 660 to 749 | 67 | | 116 | | 597 | | 655 | | 199 | | 280 | | — | | — | | 1,914 | |
| Less than 660 | 4 | | 13 | | 81 | | 63 | | 24 | | 134 | | — | | — | | 319 | |
| No Score | 3 | | 2 | | 1 | | — | | 1 | | 15 | | 1 | | — | | 23 | |
| Total real estate — residential mortgage | 355 | | 800 | | 6,399 | | 7,921 | | 2,471 | | 1,939 | | 1 | | — | | 19,886 | |
| Current period gross write-offs | 1 | | — | | 1 | | — | | — | | 1 | | — | | — | | 3 | |
| Home equity loans | | | | | | | | | |
| FICO Score: | | | | | | | | | |
| 750 and above | 33 | | 31 | | 139 | | 775 | | 612 | | 731 | | 1,886 | | 251 | | 4,458 | |
| 660 to 749 | 17 | | 17 | | 50 | | 181 | | 129 | | 186 | | 772 | | 80 | | 1,432 | |
| Less than 660 | 2 | | 5 | | 15 | | 40 | | 31 | | 82 | | 263 | | 25 | | 463 | |
| No Score | — | | — | | — | | — | | — | | 1 | | 4 | | — | | 5 | |
| Total home equity loans | 52 | | 53 | | 204 | | 996 | | 772 | | 1,000 | | 2,925 | | 356 | | 6,358 | |
| Current period gross write-offs | — | | — | | — | | — | | — | | 1 | | 1 | | — | | 2 | |
| Other consumer loans | | | | | | | | | |
| FICO Score: | | | | | | | | | |
| 750 and above | 107 | | 143 | | 1,149 | | 1,210 | | 527 | | 245 | | 88 | | — | | 3,469 | |
| 660 to 749 | 70 | | 109 | | 275 | | 268 | | 128 | | 108 | | 184 | | — | | 1,142 | |
| Less than 660 | 9 | | 23 | | 59 | | 59 | | 29 | | 24 | | 56 | | — | | 259 | |
| No Score | 35 | | 12 | | 18 | | 17 | | 7 | | 12 | | 196 | | — | | 297 | |
| Total consumer direct loans | 221 | | 287 | | 1,501 | | 1,554 | | 691 | | 389 | | 524 | | — | | 5,167 | |
| Current period gross write-offs | — | | 7 | | 17 | | 12 | | 7 | | 6 | | 15 | | — | | 64 | |
| Credit cards | | | | | | | | | |
| FICO Score: | | | | | | | | | |
| 750 and above | — | | — | | — | | — | | — | | — | | 476 | | — | | 476 | |
| 660 to 749 | — | | — | | — | | — | | — | | — | | 372 | | — | | 372 | |
| Less than 660 | — | | — | | — | | — | | — | | — | | 109 | | — | | 109 | |
| No Score | — | | — | | — | | — | | — | | — | | 1 | | — | | 1 | |
| Total credit cards | — | | — | | — | | — | | — | | — | | 958 | | — | | 958 | |
| Current period gross write-offs | — | | — | | — | | — | | — | | — | | 47 | | — | | 47 | |
| | | | | | | | | |
| | | | | | | | | |
| | | | | | | | | |
| | | | | | | | | |
| | | | | | | | | |
| | | | | | | | | |
| | | | | | | | | |
| | | | | | | | | |
| Total consumer loans | $ | 628 | | $ | 1,140 | | $ | 8,104 | | $ | 10,471 | | $ | 3,934 | | $ | 3,328 | | $ | 4,408 | | $ | 356 | | $ | 32,369 | |
| Total consumer loan current period gross write-offs | $ | 1 | | $ | 7 | | $ | 18 | | $ | 12 | | $ | 7 | | $ | 8 | | $ | 63 | | $ | — | | $ | 116 | |
| | | | | | | | | |
(a)Accrued interest of $134 million, presented in “Accrued income and other assets” on the Consolidated Balance Sheets, was excluded from the amortized cost basis disclosed in this table.
Nonperforming and Past Due Loans
Our policies for determining past due loans, placing loans on nonaccrual, applying payments on nonaccrual loans, and resuming accrual of interest for our commercial and consumer loan portfolios are disclosed in Note 1 (“Summary of Significant Accounting Policies”) under the heading “Nonperforming Loans”.
The following aging analysis of past due and current loans as of December 31, 2024, and December 31, 2023, provides further information regarding Key’s credit exposure.
Aging Analysis of Loan Portfolio
| | | | | | | | | | | | | | | | | | | | | | | |
| December 31, 2024 | Current(b)(c) | 30-59 Days Past Due (b) | 60-89 Days Past Due (b) | 90 and Greater Days Past Due (b) | Non-performing
Loans | Total Past
Due and
Non-performing
Loans | Total Loans (d) |
| Dollars in millions |
LOAN TYPE(a) | | | | | | | |
| Commercial and industrial | $ | 52,473 | | $ | 48 | | $ | 21 | | $ | 45 | | $ | 322 | | $ | 436 | | $ | 52,909 | |
| Commercial real estate: | | | | | | | |
| Commercial mortgage | 13,018 | | 4 | | 29 | | 16 | | 243 | | 292 | | 13,310 | |
| Construction | 2,932 | | — | | — | | 4 | | — | | 4 | | 2,936 | |
| Total commercial real estate loans | 15,950 | | 4 | | 29 | | 20 | | 243 | | 296 | | 16,246 | |
| Commercial lease financing | 2,728 | | 1 | | 6 | | 1 | | — | | 8 | | 2,736 | |
| Total commercial loans | $ | 71,151 | | $ | 53 | | $ | 56 | | $ | 66 | | $ | 565 | | $ | 740 | | $ | 71,891 | |
| Real estate — residential mortgage | $ | 19,766 | | $ | 20 | | $ | 8 | | $ | — | | $ | 92 | | $ | 120 | | $ | 19,886 | |
| Home equity loans | 6,232 | | 26 | | 8 | | 3 | | 89 | | 126 | | 6,358 | |
| Other consumer loans | 5,129 | | 15 | | 9 | | 9 | | 5 | | 38 | | 5,167 | |
| Credit cards | 928 | | 6 | | 5 | | 12 | | 7 | | 30 | | 958 | |
| | | | | | | |
| Total consumer loans | $ | 32,055 | | $ | 67 | | $ | 30 | | $ | 24 | | $ | 193 | | $ | 314 | | $ | 32,369 | |
| Total loans | $ | 103,206 | | $ | 120 | | $ | 86 | | $ | 90 | | $ | 758 | | $ | 1,054 | | $ | 104,260 | |
| | | | | | | |
(a)Amounts in table represent amortized cost and exclude loans held for sale.
(b)Accrued interest of $456 million presented in “Accrued income and other assets” on the Consolidated Balance Sheets is excluded from the amortized cost basis disclosed in this table.
(c)Includes balances of $75 million in Commercial mortgage and $7 million in Real estate - residential mortgage associated with loans sold to GNMA where Key has the right but not the obligation to repurchase.
(d)Net of unearned income, net of deferred fees and costs, and unamortized discounts and premiums.
| | | | | | | | | | | | | | | | | | | | | | | | |
| December 31, 2023 | Current(b)(c) | 30-59 Days Past Due (b) | 60-89 Days Past Due (b) | 90 and Greater Days Past Due (b) | Non-performing
Loans | Total Past Due and Non-performing Loans | | Total Loans (d) |
| Dollars in millions |
LOAN TYPE(a) | | | | | | | | |
| Commercial and industrial | $ | 55,354 | | $ | 62 | | $ | 30 | | $ | 72 | | $ | 297 | | $ | 461 | | | $ | 55,815 | |
| Commercial real estate: | | | | | | | | |
| Commercial mortgage | 15,049 | | 25 | | 3 | | 10 | | 100 | | 138 | | | 15,187 | |
| Construction | 3,065 | | 1 | | — | | — | | — | | 1 | | | 3,066 | |
| Total commercial real estate loans | 18,114 | | 26 | | 3 | | 10 | | 100 | | 139 | | | 18,253 | |
| Commercial lease financing | 3,520 | | 2 | | 1 | | — | | — | | 3 | | | 3,523 | |
| Total commercial loans | $ | 76,988 | | $ | 90 | | $ | 34 | | $ | 82 | | $ | 397 | | $ | 603 | | | $ | 77,591 | |
| Real estate — residential mortgage | $ | 20,863 | | $ | 17 | | $ | 7 | | $ | — | | $ | 71 | | $ | 95 | | | $ | 20,958 | |
| Home equity loans | 7,001 | | 27 | | 10 | | 4 | | 97 | | 138 | | | 7,139 | |
| Other consumer loans | 5,877 | | 16 | | 10 | | 9 | | 4 | | 39 | | | 5,916 | |
| Credit cards | 974 | | 6 | | 5 | | 12 | | 5 | | 28 | | | 1,002 | |
| | | | | | | | |
| Total consumer loans | $ | 34,715 | | $ | 66 | | $ | 32 | | $ | 25 | | $ | 177 | | $ | 300 | | | $ | 35,015 | |
| Total loans | $ | 111,703 | | $ | 156 | | $ | 66 | | $ | 107 | | $ | 574 | | $ | 903 | | | $ | 112,606 | |
| | | | | | | | |
(a)Amounts in table represent amortized cost and exclude loans held for sale.
(b)Accrued interest of $522 million presented in “Accrued income and other assets” on the Consolidated Balance Sheets is excluded from the amortized cost basis disclosed in this table.
(c)Includes balances of $94 million in Commercial mortgage and $3 million in Real estate - residential mortgage associated with loans sold to GNMA where Key has the right but not the obligation to repurchase.
(d)Net of unearned income, net of deferred fees and costs, and unamortized discounts and premiums.
At December 31, 2024, the carrying amount of our commercial nonperforming loans outstanding represented 72% of their original contractual amount owed, total nonperforming loans outstanding represented 77% of their original contractual amount owed, and nonperforming assets in total were carried at 79% of their original contractual amount owed.
Nonperforming loans reduced expected interest income by $54 million, $37 million, and $17 million for each of the twelve months ended December 31, 2024, December 31, 2023, and December 31, 2022, respectively.
The amortized cost basis of nonperforming loans on nonaccrual status for which there is no related allowance for credit losses was $381 million at December 31, 2024.
As of December 31, 2024, 43% of our nonperforming loans were contractually current versus 51% as of December 31, 2023.
Collateral-dependent Financial Assets
We classify financial assets as collateral-dependent when our borrower is experiencing financial difficulty, and we expect repayment to be provided substantially through the operation or sale of the collateral. Our commercial loans have collateral that includes cash, accounts receivable, inventory, commercial machinery, commercial properties, commercial real estate construction projects, enterprise value, and stock or ownership interests in the borrowing entity. When appropriate we also consider the enterprise value of the borrower as a repayment source for collateral-dependent loans. Our consumer loans have collateral that includes residential real estate, automobiles, boats, and RVs.
At December 31, 2024 and December 31, 2023, the recorded investment of consumer residential mortgage loans in the process of foreclosure was approximately $72 million and $89 million, respectively.
There were no significant changes in the extent to which collateral secures our collateral-dependent financial assets during 2024.
Loan Modifications Made to Borrowers Experiencing Financial Difficulty
As part of our loss mitigation activities, we may agree to modify the contractual terms of a loan to a borrower experiencing financial difficulty. Our loan modifications are handled on a case-by-case basis and are negotiated to achieve mutually agreeable terms that maximize loan collectability and meet the borrower’s financial needs. Such modifications may include an extension of maturity date, interest rate reduction, an other than insignificant payment delay, other modifications, or some combination thereof. Many factors can go into what is considered an other than insignificant payment delay such as the significance of the restricted payment amount relative to the normal loan payment or the relative significance of the delay to the original loan terms. Generally, Key considers any delay in payment of greater than 90 days in the last 12 months to be significant. The ALLL for loans modified for borrowers experiencing financial difficulty is determined based on Key’s ALLL policy as described within Note 1 (“Basis of Presentation and Accounting Policies”).
Modifications for Borrowers Experiencing Financial Difficulty
Our strategy in working with commercial borrowers is to allow them time to improve their financial position through loan modification. Commercial borrowers that are rated substandard or worse in accordance with the regulatory definition, or that cannot otherwise restructure at market terms and conditions, are considered to be experiencing financial difficulty. A modification of a loan is subject to the normal underwriting standards and processes for other similar credit extensions, both new and existing. The modified loan is evaluated to determine if it is a new loan or a continuation of the prior loan.
Consumer loans in which a borrower requires a modification as a result of negative changes to their financial condition or to avoid default, generally indicate the borrower is experiencing financial difficulty. The primary modifications made to consumer loans are amortization, maturity date and interest rate changes. Consumer borrowers identified as experiencing financial difficulty are generally unable to refinance their loans through our normal origination channel or through other independent sources.
The following table shows the amortized cost basis at the end of the reporting period of the loans modified to borrowers experiencing financial difficulty within the past 12 months or since the adoption of ASU 2022-02 for the reporting period in 2023. The table does not include those modifications that only resulted in an insignificant payment delay. The table does not include consumer loans that are still within a trial modification period. Trial modifications may be done for consumer borrowers where a trial payment plan period is offered in advance of a permanent loan modification. As of December 31, 2024, there were 120 loans totaling $20 million in a trial modification period. As of December 31, 2023, there were 121 loans totaling $15 million in a trial modification period.
Commitments outstanding to lend additional funds to borrowers experiencing financial difficulty whose loans were modified were $15 million and $61 million at December 31, 2024 and December 31, 2023, respectively.
| | | | | | | | | | | | | | | | | | | | | | | | |
| As of December 31, 2024 | Interest Rate Reduction | Term Extension | Other | Combination(a) | Total |
| Dollars in millions | Amortized Cost Basis | | Amortized Cost Basis | | Amortized Cost Basis | | Amortized Cost Basis | | Amortized Cost Basis | % of Total Loan Type |
| LOAN TYPE | | | | | | | | | | |
| Commercial and Industrial | $ | — | | | $ | 118 | | | $ | 25 | | | $ | 20 | | | $ | 163 | | 0.31 | % |
| Commercial real estate: | | | | | | | | | | |
| Commercial mortgage | 28 | | | 236 | | | 22 | | | 21 | | | 307 | | 2.31 | |
| Construction | — | | | 29 | | | — | | | — | | | 29 | | 0.99 | |
| Total commercial real estate loans | 28 | | | 265 | | | 22 | | | 21 | | | 336 | | 2.07 | |
| Commercial lease financing | — | | | — | | | — | | | — | | | — | | — | |
| Total commercial loans | $ | 28 | | | $ | 383 | | | $ | 47 | | | $ | 41 | | | $ | 499 | | 0.69 | % |
| Real estate — residential mortgage | $ | 1 | | | $ | 1 | | | $ | — | | | $ | 12 | | | $ | 14 | | 0.07 | % |
| Home equity loans | 3 | | | 1 | | | 2 | | | 7 | | | 13 | | 0.20 | |
| Other consumer loans | — | | | 2 | | | — | | | 3 | | | 5 | | 0.10 | |
| Credit cards | — | | | — | | | — | | | 3 | | | 3 | | 0.31 | |
| | | | | | | | | | |
| Total consumer loans | $ | 4 | | | $ | 4 | | | $ | 2 | | | $ | 25 | | | $ | 35 | | 0.11 | % |
| Total loans | $ | 32 | | | $ | 387 | | | $ | 49 | | | $ | 66 | | | $ | 534 | | 0.51 | % |
| | | | | | | | | | |
(a)Combination modifications consist primarily of loans modified with both an interest rate reduction and a term extension.
| | | | | | | | | | | | | | | | | | | | | | | | |
| As of December 31, 2023 | Interest Rate Reduction | Term Extension | Other | Combination(a) | Total |
| Dollars in millions | Amortized Cost Basis | | Amortized Cost Basis | | Amortized Cost Basis | | Amortized Cost Basis | | Amortized Cost Basis | % of Total Loan Type |
| LOAN TYPE | | | | | | | | | | |
| Commercial and Industrial | $ | — | | | $ | 180 | | | $ | 49 | | | $ | 34 | | | $ | 263 | | 0.47 | % |
| Commercial real estate: | | | | | | | | | | |
| Commercial mortgage | — | | | 4 | | | 2 | | | — | | | 6 | | 0.04 | |
| Construction | — | | | — | | | — | | | — | | | — | | — | |
| Total commercial real estate loans | — | | | 4 | | | 2 | | | — | | | 6 | | 0.03 | |
| Commercial lease financing | — | | | — | | | — | | | — | | | — | | — | |
| Total commercial loans | $ | — | | | $ | 184 | | | $ | 51 | | | $ | 34 | | | $ | 269 | | 0.35 | % |
| Real estate — residential mortgage | $ | — | | | $ | — | | | $ | 1 | | | $ | 9 | | | $ | 10 | | 0.05 | % |
| Home equity loans | 2 | | | 1 | | | 1 | | | 5 | | | 9 | | 0.13 | |
| Other consumer loans | — | | | 1 | | | — | | | 2 | | | 3 | | 0.05 | |
| Credit cards | — | | | — | | | — | | | 4 | | | 4 | | 0.40 | |
| | | | | | | | | | |
| Total consumer loans | $ | 2 | | | $ | 2 | | | $ | 2 | | | $ | 20 | | | $ | 26 | | 0.07 | % |
| Total loans | $ | 2 | | | $ | 186 | | | $ | 53 | | | $ | 54 | | | $ | 295 | | 0.26 | % |
| | | | | | | | | | |
(a)Combination modifications consist primarily of loans modified with both an interest rate reduction and a term extension.
Financial Effects of Modifications to Borrowers Experiencing Financial Difficulty
The following table summarizes the financial impacts of loan modifications made to specific loans during the twelve months ended December 31, 2024.
| | | | | | | | |
| Twelve months ended December 31, 2024 | Weighted-average Interest Rate Change | Weighted-average Term Extension (in years) |
| LOAN TYPE | | |
| Commercial and Industrial | (4.12) | % | 1.75 |
| Commercial mortgage | (1.49) | % | 0.66 |
| Construction | — | % | 2.87 |
| | |
| Real estate — residential mortgage | (1.81) | % | 6.15 |
| Home equity loans | (4.03) | % | 6.53 |
| Other consumer loans | (4.06) | % | 0.77 |
| Credit cards | (16.26) | % | 1.00 |
| | |
| | |
| | | | | | | | |
| Twelve months ended December 31, 2023 | Weighted-average Interest Rate Change | Weighted-average Term Extension (in years) |
| LOAN TYPE | | |
| Commercial and Industrial | (5.69) | % | 0.59 |
| Commercial mortgage | — | % | 1.37 |
| | |
| | |
| Real estate — residential mortgage | (1.97) | % | 7.58 |
| Home equity loans | (4.02) | % | 6.87 |
| Other consumer loans | (3.62) | % | 1.01 |
| Credit cards | (14.90) | % | 1.00 |
| | |
| | |
Amortized Cost Basis of Modified Loans That Subsequently Defaulted
| | | | | | | | | | | | | | | | | |
| Twelve months ended December 31, 2024 | | | | | |
| Dollars in millions | Interest Rate Reduction | Term Extension | Other | Combination | Total |
| LOAN TYPE | | | | | |
| Commercial and Industrial | $ | — | | $ | 22 | | $ | — | | $ | 1 | | $ | 23 | |
| Commercial real estate | | | | | |
| Commercial mortgage | 11 | | — | | | — | | 11 | |
| Construction | — | | — | | — | | — | | — | |
| Total commercial real estate loans | 11 | | — | | — | | — | | 11 | |
| Commercial lease financing | — | | — | | — | | — | | — | |
| Total commercial loans | $ | 11 | | $ | 22 | | $ | — | | $ | 1 | | $ | 34 | |
| Real estate — residential mortgage | $ | — | | $ | — | | $ | — | | $ | 1 | | $ | 1 | |
| Home equity loans | — | | — | | — | | 2 | | 2 | |
| Other consumer loans | — | | — | | — | | — | | — | |
| Credit cards | — | | — | | — | | — | | — | |
| | | | | |
| Total consumer loans | $ | — | | $ | — | | $ | — | | $ | 3 | | $ | 3 | |
| Total loans | $ | 11 | | $ | 22 | | $ | — | | $ | 4 | | $ | 37 | |
| | | | | |
| | | | | | | | | | | | | | | | | |
| Twelve months ended December 31, 2023 | | | | | |
| Dollars in millions | Interest Rate Reduction | Term Extension | Other | Combination | Total |
| LOAN TYPE | | | | | |
| Commercial and Industrial | $ | — | | $ | 7 | | $ | — | | $ | 3 | | $ | 10 | |
| Commercial real estate | | | | | |
| Commercial mortgage | — | | — | | 1 | | — | | 1 | |
| Construction | — | | — | | — | | — | | — | |
| Total commercial real estate loans | — | | 7 | | 1 | | 3 | | 11 | |
| Commercial lease financing | — | | — | | — | | — | | — | |
| Total commercial loans | $ | — | | $ | 7 | | $ | 1 | | $ | 3 | | $ | 11 | |
| Real estate — residential mortgage | $ | — | | $ | — | | $ | — | | $ | — | | $ | — | |
| Home equity loans | — | | — | | — | | — | | — | |
| Other consumer loans | — | | — | | — | | — | | — | |
| Credit cards | — | | — | | — | | — | | — | |
| | | | | |
| Total consumer loans | $ | — | | $ | — | | $ | — | | $ | — | | $ | — | |
| Total loans | $ | — | | $ | 7 | | $ | 1 | | $ | 3 | | $ | 11 | |
| | | | | |
Key closely monitors the performance of loans that are modified for borrowers experiencing financial difficulty to understand the effectiveness of its modification efforts. The following table depicts the performance of loans that have been modified for borrowers experiencing financial difficulty in the past 12 months as of each respective period.
| | | | | | | | | | | | | | | |
| As of December 31, 2024 | Current | 30-89
Days Past
Due | | 90 and
Greater
Days Past
Due | Total |
| Dollars in millions |
| LOAN TYPE | | | | | |
| Commercial and Industrial | $ | 154 | | $ | 3 | | | $ | 6 | | $ | 163 | |
| Commercial real estate | | | | | |
| Commercial mortgage | 260 | | 19 | | | 28 | | 307 | |
| Construction | 29 | | — | | | — | | 29 | |
| Total commercial real estate loans | 289 | | 19 | | | 28 | | 336 | |
| Commercial lease financing | — | | — | | | — | | — | |
| Total commercial loans | $ | 443 | | $ | 22 | | | $ | 34 | | $ | 499 | |
| Real estate — residential mortgage | $ | 12 | | $ | 1 | | | $ | 1 | | $ | 14 | |
| Home equity loans | 11 | | 1 | | | 1 | | 13 | |
| Other consumer loans | 5 | | — | | | — | | 5 | |
| Credit cards | 3 | | — | | | — | | 3 | |
| | | | | |
| Total consumer loans | $ | 31 | | $ | 2 | | | $ | 2 | | $ | 35 | |
| Total loans | $ | 474 | | $ | 24 | | | $ | 36 | | $ | 534 | |
| | | | | |
| | | | | | | | | | | | | | | |
| As of December 31, 2023 | Current | 30-89
Days Past
Due | | 90 and
Greater
Days Past
Due | Total |
| Dollars in millions |
| LOAN TYPE | | | | | |
| Commercial and Industrial | $ | 238 | | $ | 25 | | | $ | — | | $ | 263 | |
| Commercial real estate | | | | | |
| Commercial mortgage | 6 | | — | | | — | | 6 | |
| Construction | — | | — | | | — | | — | |
| Total commercial real estate loans | 244 | | 25 | | | — | | 269 | |
| Commercial lease financing | — | | — | | | — | | — | |
| Total commercial loans | $ | 244 | | $ | 25 | | | $ | — | | $ | 269 | |
| Real estate — residential mortgage | $ | 9 | | $ | 1 | | | $ | — | | $ | 10 | |
| Home equity loans | 8 | | — | | | 1 | | 9 | |
| Other consumer loans | 3 | | — | | | — | | 3 | |
| Credit cards | 3 | | 1 | | | — | | 4 | |
| | | | | |
| Total consumer loans | $ | 23 | | $ | 2 | | | $ | 1 | | $ | 26 | |
| Total loans | $ | 267 | | $ | 27 | | | $ | 1 | | $ | 295 | |
| | | | | |
Liability for Credit Losses on Off Balance Sheet Exposures
The liability for credit losses on off balance sheet exposure is included in “accrued expense and other liabilities” on the balance sheet. This includes credit risk for recourse associated with loans sold under the Fannie Mae Delegated Underwriting and Servicing program and credit losses inherent in unfunded lending-related commitments, such as letters of credit and unfunded loan commitments, and certain financial guarantees.
Changes in the liability for credit losses for off balance sheet exposures are summarized as follows:
| | | | | | | | | | |
| | | Twelve months ended December 31, |
| Dollars in millions | | | 2024 | 2023 |
| | | | |
| | | | |
| | | | |
| Balance at beginning of period | | | $ | 296 | | $ | 225 | |
| Provision (credit) for losses on off balance sheet exposures | | | (6) | | 74 | |
| Other | | | — | | (3) | |
| Balance at end of period | | | $ | 290 | | $ | 296 | |
| | | | |
6. Fair Value Measurements
In accordance with GAAP, Key measures certain assets and liabilities at fair value. Fair value is defined as the price to sell an asset or transfer a liability in an orderly transaction between market participants in our principal market. Additional information regarding our accounting policies for determining fair value is provided in Note 1 (“Summary of Significant Accounting Policies”) under the heading “Fair Value Measurements.”
Assets and Liabilities Measured at Fair Value on a Recurring Basis
Certain assets and liabilities are measured at fair value on a recurring basis in accordance with GAAP. For more information on the valuation techniques used to measure classes of assets and liabilities reported at fair value on a recurring basis as well as the classification of each in the valuation hierarchy, refer below. The following tables present assets and liabilities measured at fair value on a recurring basis at December 31, 2024, and December 31, 2023.
| | | | | | | | | | | | | | | | | | | | | | | | | | |
| December 31, 2024 | December 31, 2023 |
| Level 1 | Level 2 | Level 3 | Total | Level 1 | Level 2 | Level 3 | Total |
| Dollars in millions |
| ASSETS MEASURED ON A RECURRING BASIS | | | | | | | | |
| Trading account assets: | | | | | | | | |
| U.S. Treasury, agencies and corporations | $ | — | | $ | 930 | | $ | — | | $ | 930 | | $ | — | | $ | 685 | | $ | — | | $ | 685 | |
| States and political subdivisions | — | | 127 | | — | | 127 | | — | | 93 | | — | | 93 | |
| | | | | | | | |
| Other mortgage-backed securities | — | | 183 | | — | | 183 | | — | | 340 | | — | | 340 | |
| Other securities | — | | 25 | | — | | 25 | | — | | 21 | | — | | 21 | |
| Total trading account securities | — | | 1,265 | | — | | 1,265 | | — | | 1,139 | | — | | 1,139 | |
| Commercial loans | — | | 18 | | — | | 18 | | — | | 3 | | — | | 3 | |
| Total trading account assets | — | | 1,283 | | — | | 1,283 | | — | | 1,142 | | — | | 1,142 | |
| Securities available for sale: | | | | | | | | |
| U.S. Treasury, agencies and corporations | — | | 8,904 | | — | | 8,904 | | — | | 9,026 | | — | | 9,026 | |
| States and political subdivisions | — | | — | | — | | — | | — | | — | | — | | — | |
| Agency residential collateralized mortgage obligations | — | | 9,224 | | — | | 9,224 | | — | | 15,478 | | — | | 15,478 | |
| Agency residential mortgage-backed securities | — | | 15,169 | | — | | 15,169 | | — | | 3,589 | | — | | 3,589 | |
| Agency commercial mortgage-backed securities | — | | 4,410 | | — | | 4,410 | | — | | 9,092 | | — | | 9,092 | |
| Other securities | — | | — | | — | | — | | — | | — | | — | | — | |
| Total securities available for sale | $ | — | | $ | 37,707 | | $ | — | | $ | 37,707 | | $ | — | | $ | 37,185 | | $ | — | | $ | 37,185 | |
| Other investments: | | | | | | | | |
| Principal investments: | | | | | | | | |
| | | | | | | | |
Indirect (measured at NAV) (a) | — | | — | | — | | 14 | | — | | — | | — | | 17 | |
| Total principal investments | — | | — | | — | | 14 | | — | | — | | — | | 17 | |
| Equity investments: | | | | | | | | |
| Direct | — | | — | | 2 | | 2 | | — | | — | | 2 | | 2 | |
Direct (measured at NAV) (a) | — | | — | | — | | 54 | | — | | — | | — | | 40 | |
Indirect (measured at NAV) (a) | — | | — | | — | | 3 | | — | | — | | — | | 4 | |
| Total equity investments | — | | — | | 2 | | 59 | | — | | — | | 2 | | 46 | |
| Total other investments | — | | — | | 2 | | 73 | | — | | — | | 2 | | 63 | |
| Loans, net of unearned income (residential) | — | | — | | 10 | | 10 | | — | | — | | 9 | | 9 | |
| Loans held for sale (residential) | — | | 93 | | — | | 93 | | — | | 51 | | — | | 51 | |
| Derivative assets: | | | | | | | | |
| Interest rate | — | | 114 | | (4) | | 110 | | — | | 175 | | (2) | | 173 | |
| Foreign exchange | 93 | | 31 | | — | | 124 | | 74 | | 15 | | — | | 89 | |
| Commodity | — | | 363 | | — | | 363 | | — | | 721 | | — | | 721 | |
| Credit | — | | — | | — | | — | | — | | — | | — | | — | |
| Other | — | | 15 | | — | | 15 | | — | | 14 | | 2 | | 16 | |
| Derivative assets | 93 | | 523 | | (4) | | 612 | | 74 | | 925 | | — | | 999 | |
Netting adjustments (b) | — | | — | | — | | (363) | | — | | — | | — | | (818) | |
| Total derivative assets | 93 | | 523 | | (4) | | 249 | | 74 | | 925 | | — | | 181 | |
| | | | | | | | |
| Total assets on a recurring basis at fair value | $ | 93 | | $ | 39,606 | | $ | 8 | | $ | 39,415 | | $ | 74 | | $ | 39,303 | | $ | 11 | | $ | 38,631 | |
| LIABILITIES MEASURED ON A RECURRING BASIS | | | | | | | | |
| Bank notes and other short-term borrowings: | | | | | | | | |
| Short positions | $ | 107 | | $ | 773 | | $ | — | | $ | 880 | | $ | 30 | | $ | 774 | | $ | — | | $ | 804 | |
| Derivative liabilities: | | | | | | | | |
| Interest rate | — | | 965 | | — | | 965 | | — | | 985 | | — | | 985 | |
| Foreign exchange | 85 | | 32 | | — | | 117 | | 58 | | 15 | | — | | 73 | |
| Commodity | — | | 343 | | — | | 343 | | — | | 698 | | — | | 698 | |
| Credit | — | | — | | — | | — | | — | | 1 | | — | | 1 | |
| Other | — | | 14 | | — | | 14 | | — | | 20 | | — | | 20 | |
| Derivative liabilities | 85 | | 1,354 | | — | | 1,439 | | 58 | | 1,719 | | — | | 1,777 | |
Netting adjustments (b) | — | | — | | — | | (411) | | — | | — | | — | | (473) | |
| Total derivative liabilities | 85 | | 1,354 | | — | | 1,028 | | 58 | | 1,719 | | — | | 1,304 | |
| | | | | | | | |
| Total liabilities on a recurring basis at fair value | $ | 192 | | $ | 2,127 | | $ | — | | $ | 1,908 | | $ | 88 | | $ | 2,493 | | $ | — | | $ | 2,108 | |
| | | | | | | | |
(a)Certain investments that are measured at fair value using the net asset value per share (or its equivalent) practical expedient have not been classified in the fair value hierarchy.
(b)Netting adjustments represent the amounts recorded to convert our derivative assets and liabilities from a gross basis to a net basis in accordance with the applicable accounting guidance. The net basis takes into account the impact of bilateral collateral and master netting agreements that allow us to settle all derivative contracts with a single counterparty on a net basis and to offset the net derivative position with the related cash collateral. Total derivative assets and liabilities include these netting adjustments.
Qualitative Disclosures of Valuation Techniques
The following table describes the valuation techniques and significant inputs used to measure the classes of assets and liabilities reported at fair value on a recurring basis, as well as the classification of each within the valuation hierarchy.
| | | | | | | | |
| Asset/liability class | Valuation technique | Valuation hierarchy classification(s) |
| Securities (includes trading account assets, securities available for sale, and U.S. Treasury Bills classified as short-term investments) | Fair value of level 1 securities is determined by: • Quoted market prices available in an active market for identical securities. This includes exchange-traded equity securities. Fair value of level 2 securities is determined by: • Pricing models (either by a third party pricing service or internally). Inputs include: yields, benchmark securities, bids, offers, actual trade data (i.e., spreads, credit ratings, and interest rates) for comparable assets, spread tables, matrices, high-grade scales, and option-adjusted spreads. • Observable market prices of similar securities.
The valuations provided by the third-party pricing service are based on observable market inputs, which include benchmark yields, reported trades, issuer spreads, benchmark securities, bids, offers, and reference data obtained from market research publications. Inputs used by the third-party pricing service in valuing CMOs and other mortgage-backed securities also include new issue data, monthly payment information, whole loan collateral performance, and “To Be Announced” prices. In valuations of securities issued by state and political subdivisions, inputs used by the third-party pricing service also include material event notices. We regularly validate the pricing methodologies of valuations derived from a third-party pricing service to ensure the fair value determination is consistent with applicable accounting guidance and that our assets are properly classified in the fair value hierarchy. To perform this validation, we:
•review documentation received from our third-party pricing service regarding the inputs used in its valuations and determine a level assessment for each category of securities; •substantiate actual inputs used for a sample of securities by comparing the actual inputs used by our third-party pricing service to comparable inputs for similar securities; and •substantiate the fair values determined for a sample of securities by comparing the fair values provided by our third-party pricing service to prices from other independent sources for the same and similar securities.
We analyze variances and conduct additional research with our third-party pricing service and take appropriate steps based on our findings. | Level 1 and 2 (primarily Level 2) |
| Commercial loans (trading account assets) | Fair value is based on: • Observable market price spreads for similar loans. Valuations reflect prices within the bid-ask spread that are most representative of fair value. | Level 2 |
| | |
| | | | | | | | |
| Asset/liability class | Valuation technique | Valuation hierarchy classification(s) |
| Principal investments (indirect) | Indirect principal investments include primary and secondary investments in private equity funds engaged mainly in venture- and growth-oriented investing. These investments do not have readily determinable fair values and qualify for the practical expedient to estimate fair value based upon net asset value per share (or its equivalent, such as member units or an ownership interest in partners’ capital to which a proportionate share of net assets is attributed). Indirect principal investments are also accounted for as investment companies, whereby each investment is adjusted to fair value with any net realized or unrealized gain/loss recorded in the current period’s earnings.
Under the provisions of the Volcker Rule, we were required to dispose or conform our indirect investments to the requirements of the statute by no later than July 21, 2023. Key completed conforming and/or divesting certain indirect investments subject to the Volcker Rule as of June 30, 2023. | NAV |
The following table presents the fair value of our indirect principal investments and related unfunded commitments at December 31, 2024, as well as financial support provided for the years ended December 31, 2024, and December 31, 2023.
| | | | | | | | | | | | | | | | | | | | | | | | | | | | | | | | | | | | | | |
| | | | | Financial support provided |
| | | | | Year ended December 31, |
| | | December 31, 2024 | | 2024 | | 2023 |
| Dollars in millions | | Fair Value | | Unfunded Commitments | | Funded Commitments | | Funded Other | | Funded Commitments | | Funded Other |
| INVESTMENT TYPE | | | | | | | | | | | | |
| | | | | | | | | | | | |
Indirect investments (a) | | 14 | | | 1 | | | — | | | — | | | — | | | — | |
| Total | | $ | 14 | | | $ | 1 | | | $ | — | | | $ | — | | | $ | — | | | $ | — | |
| | | | | | | | | | | | |
(a)Our indirect investments consist of buyout funds, venture capital funds, and fund of funds. These investments are generally not redeemable. Instead, distributions are received through the liquidation of the underlying investments of the fund. An investment in any one of these funds typically can be sold only with the approval of the fund’s general partners. At December 31, 2024, no significant liquidation of the underlying investments has been communicated to Key. The purpose of funding our capital commitments to these investments is to allow the funds to make additional follow-on investments and pay fund expenses until the fund dissolves. We, and all other investors in the fund, are obligated to fund the full amount of our respective capital commitments to the fund based on our and their respective ownership percentages, as noted in the applicable Limited Partnership Agreement.
| | | | | | | | |
| Asset/liability class | Valuation technique | Valuation hierarchy classification(s) |
| Other direct equity investments | Fair value is determined using: • Discounted cash flows • Operating performance and market/exit multiples of comparable businesses • Other unique facts and circumstances related to each individual investment For level 3 securities, increases in the discount rate applied in the discounted cash flow models would negatively affect the fair value. Increases in valuation multiples of comparable companies would positively affect the fair value. Level 1 investments reflect the quoted market prices of the investments available in an active market. | Level 1 and 3 |
| Other direct and indirect equity investments (NAV) | Certain direct and indirect investments do not have readily determinable fair values and qualify for the practical expedient in the accounting guidance that allows us to estimate fair value based upon net asset value per share. | NAV |
| | |
| | | | | | | | |
| Asset/liability class | Valuation technique | Valuation hierarchy classification(s) |
| Loans held for sale and held for investment (residential) | Residential mortgage loans held for sale are accounted for at fair value. Fair values are based on: • Quoted market prices, where available • Prices for other traded mortgage loans with similar characteristics • Purchase commitments and bid information received from market participants Prices are adjusted as necessary to include: • The embedded servicing value in the loans • The specific characteristics of certain loans that are priced based on the pricing of similar loans. (These adjustments represent unobservable inputs to the valuation but are not considered significant given the relative insensitivity of the value to changes in these inputs to the fair value of the loans.) Residential loans held for investment: Certain residential loans held for sale contain salability exceptions that make them unable to be sold into the performing loan sales market. Loans in this category are transferred to the held to maturity loan portfolio and are included in “Loans, net of unearned income” on the balance sheet. This type of loan is classified as level 3 in the valuation hierarchy as transaction details regarding sales of this type of loan are often unavailable. Fair value is based upon: • Unobservable bid information from brokers and investors
Higher (lower) unobservable bid information would have resulted in higher (lower) fair value measurements. | Level 2 and 3 (primarily level 2) |
| Derivatives | Exchange-traded derivatives are valued using quoted prices in active markets and, therefore, are classified as Level 1 instruments.
The majority of our derivative positions are Level 2 and are valued using internally developed models based on market convention and observable market inputs. These derivative contracts include interest rate swaps, commodity swaps, certain options, floors, cross currency swaps, credit default swaps, and forward mortgage loan sale commitments. Significant inputs used in the valuation models include: • SOFR and Overnight Index Swap (OIS) curves, index pricing curves, foreign currency curves • Volatility surfaces (a three-dimensional graph of implied volatility against strike price and maturity) We have customized derivative instruments and risk participations that are classified as Level 3 instruments. These derivative positions are valued using internally developed models, with inputs consisting of available market data, including:
• Credit spreads and interest rates
The unobservable internally derived assumptions include:
• Loss given default • Internal risk assessments of customers The fair value represents an estimate of the amount that the risk participation counterparty would need to pay/receive as of the measurement date based on the probability of customer default on the swap transaction and the fair value of the underlying customer swap. Therefore, for sold risk participation agreements, a higher loss probability and a lower credit rating would negatively affect the fair value of the risk participations and a lower loss probability and higher credit rating would positively affect the fair value of the risk participations. (For purchased risk participation agreements, higher loss probabilities and lower credit ratings would positively affect the fair value.) | Level 1, 2, and 3 (primarily level 2) |
| | | | | | | | |
| Asset/liability class | Valuation technique | Valuation hierarchy classification(s) |
| Derivatives (continued) | We use interest rate lock commitments for our residential mortgage business, which are classified as Level 3 instruments. The significant components of the valuation model include: • Interest rates observable in the market • Investor supplied prices for similar loans and securities • The probability of the loan closing (i.e. the "pull-through" amount, a significant unobservable input). Increases (decreases) in the probability of the loan closing would have resulted in higher (lower) fair value measurements. Valuation of residential mortgage forward sale commitments utilizes observable market prices of comparable commitments and mortgage securities (Level 2).
The fair values of our derivatives include a credit valuation adjustment related to both counterparty and our own creditworthiness. The credit component considers master netting and collateral agreements and is determined by the individual counterparty based on potential future exposures, expected recovery rates, and market-implied probabilities of default. | Level 1, 2, and 3 (primarily level 2) |
| Liability for short positions | This includes fixed income securities held by our broker dealer in its trading inventory. Fair value of level 1 securities is determined by: • Quoted market prices available in an active market for identical securities Fair value of level 2 securities is determined by: • Observable market prices of similar securities • Market activity, spreads, credit ratings and interest rates for each security type | Level 1 and 2 |
We also make liquidity valuation adjustments to the fair value of certain assets to reflect the uncertainty in the pricing and trading of the instruments when we are unable to observe recent market transactions for identical or similar instruments. Liquidity valuation adjustments are based on the following factors:
•the amount of time since the last relevant valuation;
•whether there is an actual trade or relevant external quote available at the measurement date; and
•volatility associated with the primary pricing components.
Changes in Level 3 Fair Value Measurements
The following table shows the change in the fair values of our Level 3 financial instruments measured at fair value on a recurring basis for the years ended December 31, 2024, and December 31, 2023.
| | | | | | | | | | | | | | | | | | | | | | | | | | | | | | | | | | | | | | | | | | | | | |
| Dollars in millions | Beginning of Period Balance | Gains (Losses) included in
comprehensive income | Gains (Losses) Included in Earnings | | Purchases | Sales | Settlements | Transfers Other | Transfers into Level 3 | | Transfers out of Level 3 | | End of Period Balance | Unrealized Gains (Losses) Included in Earnings | |
| Year ended December 31, 2024 | | | | | | | | | | | | | | | |
| | | | | | | | | | | | | | | |
| | | | | | | | | | | | | | | |
| Other investments | | | | | | | | | | | | | | | |
| | | | | | | | | | | | | | | |
| | | | | | | | | | | | | | | |
| | | | | | | | | | | | | | | |
| Equity investments | | | | | | | | | | | | | | | |
| Direct | $ | 2 | | $ | — | | $ | — | | (c) | $ | — | | $ | — | | $ | — | | $ | — | | $ | — | | | $ | — | | | $ | 2 | | $ | — | | |
| | | | | | | | | | | | | | | |
| Loans held for investment (residential) | 9 | | — | | 1 | | | — | | — | | — | | (2) | | — | | | 2 | | | 10 | | — | | |
Derivative instruments (a) | | | | | | | | | | | | | | | |
| Interest rate | (2) | | — | | (8) | | (d) | 4 | | — | | — | | — | | 2 | | (e) | — | | | (4) | | — | | |
| Credit | — | | — | | — | | | — | | — | | — | | — | | — | | | — | | | — | | — | | |
Other (b) | 2 | | — | | — | | | — | | — | | — | | (2) | | — | | | — | | | — | | — | | |
| | | | | | | | | | | | | | | |
| | | | | | | | | | | | | | | | | | | | | | | | | | | | | | | | | | | | | | | | | | | | | |
| Dollars in millions | Beginning of Period Balance | Gains (Losses) included in comprehensive income | Gains (Losses) Included in Earnings | | Purchases | Sales | Settlements | Transfers Other | Transfers into Level 3 | | Transfers out of Level 3 | | End of Period Balance | Unrealized Gains (Losses) Included in Earnings | |
| Year ended December 31, 2023 | | | | | | | | | | | | | | | |
| | | | | | | | | | | | | | | |
| | | | | | | | | | | | | | | |
| Other investments | | | | | | | | | | | | | | | |
| Principal investments | | | | | | | | | | | | | | | |
| Direct | $ | 1 | | $ | — | | $ | (1) | | (c) | $ | — | | $ | — | | $ | — | | $ | — | | $ | — | | | $ | — | | | $ | — | | $ | — | | |
| Equity investments | | | | | | | | | | | | | | | |
| Direct | 2 | | | — | | | | — | | | — | | — | | | — | | | 2 | | — | | |
| | | | | | | | | | | | | | | |
| Loans held for investment (residential) | 9 | | — | | — | | | — | | — | | — | | — | | — | | | — | | | 9 | | — | | |
Derivative instruments (a) | | | | | | | | | | | | | | | |
| Interest rate | 2 | | | (23) | | (d) | 19 | | 1 | | | — | | (6) | | (e) | 5 | | (e) | (2) | | | |
| Credit | (2) | | — | | — | | | — | | 2 | | — | | — | | — | | | — | | | — | | — | | |
Other (b) | — | | — | | — | | | — | | — | | — | | 2 | | — | | | — | | | 2 | | — | | |
| | | | | | | | | | | | | | | |
(a)Amounts represent Level 3 derivative assets less Level 3 derivative liabilities.
(b)Amounts represent Level 3 interest rate lock commitments.
(c)Realized and unrealized gains and losses on principal investments are reported in “other income” on the income statement.
(d)Realized and unrealized gains and losses on derivative instruments are reported in “corporate services income” and “other income” on the income statement.
(e)Certain derivatives previously classified as Level 2 were transferred to Level 3 because Level 3 unobservable inputs became significant. Certain derivatives previously classified as Level 3 were transferred to Level 2 because Level 3 unobservable inputs became less significant.
Assets and Liabilities Measured at Fair Value on a Nonrecurring Basis
Certain assets and liabilities are measured at fair value on a nonrecurring basis in accordance with GAAP. The adjustments to fair value generally result from the application of accounting guidance that requires assets and liabilities to be recorded at the lower of cost or fair value, or assessed for impairment. There were no liabilities measured at fair value on a nonrecurring basis at December 31, 2024, and December 31, 2023.
The following table presents our assets measured at fair value on a nonrecurring basis at December 31, 2024, and December 31, 2023:
| | | | | | | | | | | | | | | | | | | | | | | | | | |
| | December 31, 2024 | December 31, 2023 |
| Dollars in millions | Level 1 | Level 2 | Level 3 | Total | Level 1 | Level 2 | Level 3 | Total |
| ASSETS MEASURED ON A NONRECURRING BASIS | | | | | | | | |
| Collateral-dependent loans | $ | — | | $ | — | | $ | 152 | | $ | 152 | | $ | — | | $ | — | | $ | 104 | | $ | 104 | |
| | | | | | | | |
| Accrued income and other assets | — | | — | | 14 | | 14 | | — | | — | | 29 | | 29 | |
| Total assets on a nonrecurring basis at fair value | $ | — | | $ | — | | $ | 166 | | $ | 166 | | $ | — | | $ | — | | $ | 133 | | $ | 133 | |
| | | | | | | | |
Qualitative Disclosures of Valuation Techniques
The following table describes the valuation techniques and significant inputs used to measure the significant classes of assets and liabilities reported at fair value on a nonrecurring basis, as well as the classification of each within the valuation hierarchy.
| | | | | | | | |
| Asset/liability class | Valuation technique | Valuation hierarchy classification(s) |
| Collateral-dependent loans | When a loan is collateral-dependent, the fair value of the loan is determined based on the fair value of the underlying collateral less estimated selling costs. | Level 3 |
| | |
| | |
OREO, other repossessed personal properties, and right-of-use assets(a) | OREO, other repossessed properties, and right-of-use assets are valued based on:
• Appraisals and third-party price opinions, less estimated selling costs
Generally, we classify these assets as Level 3, but OREO and other repossessed properties for which we receive binding purchase agreements are classified as Level 2. Returned lease inventory is valued based on market data for similar assets and is classified as Level 2. | Level 2 and 3 |
| | |
| Other equity investments | We have other investments in equity securities that do not have readily determinable fair values and do not qualify for the practical expedient to measure the investment using a net asset value per share. We have elected to measure these securities at cost less impairment plus or minus adjustments due to observable orderly transactions. Impairment is recorded when there is evidence that the expected fair value of the investment has declined to below the recorded cost. At each reporting period, we assess if these investments continue to qualify for this measurement alternative.
At December 31, 2024, and December 31, 2023, the carrying amount of equity investments recorded under this method was $394 million and $339 million, respectively. We recorded $5 million of impairment for the year ended December 31, 2024. We recorded no impairment for the year ended December 31, 2023. | Level 3 |
Mortgage Servicing Rights(a) | Refer to Note 9 (“Mortgage Servicing Assets”). | Level 3 |
(a)Asset classes included in “Accrued income and other assets” on the Consolidated Balance Sheets
Quantitative Information about Level 3 Fair Value Measurements
The range and weighted-average of the significant unobservable inputs used to fair value our material Level 3 recurring and nonrecurring assets at December 31, 2024, and December 31, 2023, along with the valuation techniques used, are shown in the following table:
| | | | | | | | | | | | | | | | | | | | |
| Level 3 Asset (Liability) | Valuation Technique | Significant
Unobservable Input | Range (Weighted-Average) (a), (b) |
Dollars in millions | December 31, 2024 | December 31, 2023 | December 31, 2024 | December 31, 2023 |
| Recurring | | | | | | |
| | | | | | |
| | | | | | |
| | | | | | |
| | | | | | |
| | | | | | |
| | | | | | |
| | | | | | |
| | | | | | |
| | | | | | |
| | | | | | |
| Loans, net of unearned income (residential) | $ | 10 | | $ | 9 | | Market comparable pricing | Comparability factor | 68.00%-95.00% (77.48%) | 62.67 - 89.60% (70.83%) |
| Derivative instruments: | | | | | | |
| Interest rate | (4) | | 2 | | Discounted cash flows | Probability of default | .02 - 100% (5.00%) | .02 - 100% (5.30%) |
| | | | | | |
| | | | Loss given default | 0 - 1 (.50) | 0 - 1 (.48) |
| | | | | | |
| | | | | | |
| | | | | | |
| | | | | | |
| | | | | | |
| | | | | | |
| | | | | | |
Insignificant level 3 assets, net of liabilities(c) | 2 | | 4 | | | | | |
| Nonrecurring | | | | | | |
| Collateral dependent loans | 152 | | 104 | | Fair value of underlying collateral | Liquidity discount | 0 - 100.00% (33.00%) | 0 - 10.00% (5.00%) |
| | | | | | |
Accrued income and other assets:(d) | | | | | | |
| | | | | | |
| OREO and other assets | 14 | | 21 | | Appraised value | Appraised value | N/M | N/M |
(a)The weighted average of significant unobservable inputs is calculated using a weighting relative to fair value.
(b)For significant unobservable inputs with no range, a single figure is reported to denote the single quantitative factor used.
(c)Represents the aggregate amount of level 3 assets and liabilities measured at fair value on a recurring basis that are individually and in the aggregate insignificant. The amount includes certain equity investments and certain financial derivative assets and liabilities.
(d)Excludes $8 million pertaining to mortgage servicing assets measured as of December 31, 2023. Refer to Note 9 (“Mortgage Servicing Assets”) for significant unobservable inputs pertaining to these assets.
Fair Value Disclosures of Financial Instruments
The levels in the fair value hierarchy ascribed to our financial instruments and the related carrying amounts at December 31, 2024, and December 31, 2023, are shown in the following table. Assets and liabilities are further arranged by measurement category.
| | | | | | | | | | | | | | | | | | | | | | | | | | |
| | December 31, 2024 |
| | | Fair Value |
| Dollars in millions | Carrying Amount | Level 1 | Level 2 | Level 3 | Measured at NAV | Netting Adjustment | | Total |
| ASSETS (by measurement category) | | | | | | | | |
| Fair value - net income | | | | | | | | |
Trading account assets (b) | $ | 1,283 | | $ | — | | $ | 1,283 | | $ | — | | $ | — | | $ | — | | | $ | 1,283 | |
Other investments (b) | 1,041 | | — | | — | | 969 | | 72 | | — | | | 1,041 | |
Loans, net of unearned income (residential) (d) | 10 | | — | | — | | 10 | | — | | — | | | 10 | |
Loans held for sale (residential) (b) | 93 | | — | | 93 | | — | | — | | — | | | 93 | |
Derivative assets - trading (b) | 255 | | 93 | | 527 | | (4) | | — | | (361) | | (f) | 255 | |
| Fair value - OCI | | | | | | | | |
Securities available for sale (b) | 37,707 | | — | | 37,707 | | — | | — | | — | | | 37,707 | |
Derivative assets - hedging (b) (g) | (6) | | — | | (4) | | — | | — | | (2) | | (f) | (6) | |
| Amortized cost | | | | | | | | |
Held-to-maturity securities (c) | 7,395 | | — | | 6,837 | | — | | — | | — | | | 6,837 | |
Loans, net of unearned income (d) | 102,841 | | — | | — | | 99,105 | | — | | — | | | 99,105 | |
Loans held for sale (b) | 704 | | — | | — | | 704 | | — | | — | | | 704 | |
| Other | | | | | | | | |
Cash and short-term investments (a) | 19,247 | | 19,247 | | — | | — | | — | | — | | | 19,247 | |
| LIABILITIES (by measurement category) | | | | | | | | |
| Fair value - net income | | | | | | | | |
Derivative liabilities - trading (b) | $ | 1,028 | | $ | 85 | | $ | 1,351 | | $ | — | | $ | — | | $ | (408) | | (f) | $ | 1,028 | |
| Fair value - OCI | | | | | | | | |
Derivative liabilities - hedging (b) (g) | — | | — | | 3 | | — | | — | | (3) | | (f) | — | |
| Amortized cost | | | | | | | | |
Time deposits (e) | 16,952 | | — | | 17,068 | | — | | — | | — | | | 17,068 | |
Short-term borrowings (a) | 2,144 | | 107 | | 2,037 | | — | | — | | — | | | 2,144 | |
Long-term debt (e) | 12,105 | | 11,430 | | 477 | | — | | — | | — | | | 11,907 | |
| Other | | | | | | | | |
Deposits with no stated maturity (a) | 132,808 | | — | | 132,808 | | — | | — | | — | | | 132,808 | |
| | | | | | | | | | | | | | | | | | | | | | | | | | |
| December 31, 2023 |
| | | Fair Value |
| Dollars in millions | Carrying Amount | Level 1 | Level 2 | Level 3 | Measured at NAV | Netting Adjustment | | Total |
| ASSETS (by measurement category) | | | | | | | | |
| Fair value - net income | | | | | | | | |
Trading account assets (b) | $ | 1,142 | | $ | — | | $ | 1,142 | | $ | — | | $ | — | | $ | — | | | $ | 1,142 | |
Other investments (b) | 1,244 | | — | | — | | 1,183 | | 61 | | — | | | 1,244 | |
Loans, net of unearned income (residential) (d) | 9 | | — | | — | | 9 | | — | | — | | | 9 | |
Loans held for sale (residential) (b) | 51 | | — | | 51 | | — | | — | | — | | | 51 | |
Derivative assets - trading (b) | 168 | | 74 | | 886 | | — | | — | | (792) | | (f) | 168 | |
| Fair value - OCI | | | | | | | | |
Securities available for sale (b) | 37,185 | | — | | 37,185 | | — | | — | | — | | | 37,185 | |
Derivative assets - hedging (b) (g) | 13 | | — | | 39 | | — | | — | | (26) | | (f) | 13 | |
| Amortized cost | | | | | | | | |
Held-to-maturity securities (c) | 8,575 | | — | | 8,056 | | — | | — | | — | | | 8,056 | |
Loans, net of unearned income (d) | 111,089 | | — | | — | | 105,950 | | — | | — | | | 105,950 | |
Loans held for sale (b) | 432 | | — | | — | | 432 | | — | | — | | | 432 | |
| Other | | | | | | | | |
Cash and short-term investments (a) | 11,758 | | 11,758 | | — | | — | | — | | — | | | 11,758 | |
| LIABILITIES (by measurement category) | | | | | | | | |
| Fair value - net income | | | | | | | | |
Derivative liabilities - trading (b) | $ | 1,304 | | $ | 58 | | $ | 1,707 | | $ | — | | $ | — | | $ | (461) | | (f) | $ | 1,304 | |
| Fair value - OCI | | | | | | | | |
Derivative liabilities - hedging (b) (g) | — | | — | | 12 | | — | | — | | (12) | | (f) | — | |
| Amortized cost | | | | | | | | |
Time deposits (e) | 14,776 | | — | | 14,911 | | — | | — | | — | | | 14,911 | |
Short-term borrowings (a) | 3,091 | | 30 | | 3,061 | | — | | — | | — | | | 3,091 | |
Long-term debt (e) | 19,554 | | 11,288 | | $ | 7,720 | | — | | — | | — | | | 19,008 | |
| Other | | | | | | | | |
Deposits with no stated maturity (a) | 130,811 | | — | | 130,811 | | — | | — | | — | | | 130,811 | |
Valuation Methods and Assumptions
(a)Fair value equals or approximates carrying amount. The fair value of deposits with no stated maturity does not take into consideration the value ascribed to core deposit intangibles.
(b)Information pertaining to our methodology for measuring the fair values of these assets and liabilities is included in the sections entitled “Qualitative Disclosures of Valuation Techniques” and “Assets and Liabilities Measured at Fair Value on a Nonrecurring Basis” in this Note. Investments accounted for under the cost method (or cost less impairment adjusted for observable price changes for certain equity investments) are classified as Level 3 assets. These investments are not actively traded in an open market as sales for these types of investments are rare. The carrying amount of the investments carried at cost are adjusted for declines in value if they are considered to be other-than-temporary (or due to observable orderly transactions of the same issuer for equity investments eligible for the cost less impairment measurement alternative). These adjustments are included in “other income” on the income statement.
(c)Fair values of held-to-maturity securities are determined by using models that are based on security-specific details, as well as relevant industry and economic factors. The most significant of these inputs are quoted market prices, interest rate spreads on relevant benchmark securities, and certain prepayment assumptions. We review the valuations derived from the models to ensure that they are reasonable and consistent with the values placed on similar securities traded in the secondary markets.
(d)The fair value of loans is based on the present value of the expected cash flows. The projected cash flows are based on the contractual terms of the loans, adjusted for prepayments and use of a discount rate based on the relative risk of the cash flows, taking into account the loan type, maturity of the loan, liquidity risk, servicing costs, and a required return on debt and capital. In addition, an incremental liquidity discount is applied to certain loans, using historical sales of loans during periods of similar economic conditions as a benchmark. The fair value of loans includes lease financing receivables at their aggregate carrying amount, which is equivalent to their fair value.
(e)Fair values of time deposits and long-term debt are based on discounted cash flows utilizing relevant market inputs.
(f)Netting adjustments represent the amounts recorded to convert our derivative assets and liabilities from a gross basis to a net basis in accordance with the applicable accounting guidance. The net basis takes into account the impact of bilateral collateral and master netting agreements that allow us to settle all derivative contracts with a single counterparty on a net basis and to offset the net derivative position with the related cash collateral. Total derivative assets and liabilities include these netting adjustments.
(g)Derivative assets-hedging and derivative liabilities-hedging includes both cash flow and fair value hedges. Additional information regarding our accounting policies for cash flow and fair value hedges is provided in Note 1 (“Summary of Significant Accounting Policies”) under the heading “Derivatives and Hedging.”
We determine fair value based on assumptions pertaining to the factors that a market participant would consider in valuing the asset. A substantial portion of our fair value adjustments are related to liquidity. During 2024 and 2023, the fair values of our loan portfolios generally remained stable, primarily due to sustained liquidity in the loan markets. If we were to use different assumptions, the fair values shown in the preceding table could change. Also, because the applicable accounting guidance for financial instruments excludes certain financial instruments and all nonfinancial instruments from its disclosure requirements, the fair value amounts shown in the table above do not, by themselves, represent the underlying value of our company as a whole.
Discontinued assets - education lending business. Our discontinued assets include government-guaranteed and private education loans originated through our education lending business that was discontinued in September 2009. This portfolio consists of loans recorded at carrying value with appropriate valuation reserves and loans recorded at fair value. All of these loans were excluded from the table above as follows:
•Loans at carrying value, net of allowance, of $257 million ($192 million at fair value) at December 31, 2024, and $339 million ($264 million at fair value) at December 31, 2023
These loans are classified as Level 3 because we rely on unobservable inputs when determining fair value since observable market data is not available.
Short-term financial instruments. For financial instruments with a remaining average life to maturity of less than six months, carrying amounts were used as an approximation of fair values.
7. Securities
The amortized cost, unrealized gains and losses, and approximate fair value of our securities available for sale and held-to-maturity securities are presented in the following tables. Gross unrealized gains and losses represent the difference between the amortized cost and the fair value of securities on the balance sheet as of the dates indicated. Accordingly, the amount of these gains and losses may change in the future as market conditions change.
| | | | | | | | | | | | | | | | | | | | | | | | | | | | | |
| | 2024 | | 2023 |
December 31, Dollars in millions | Amortized Cost (a)(b) | Gross Unrealized Gains | Gross Unrealized Losses | Fair Value | | Amortized Cost(a)(b) | Gross Unrealized Gains | Gross Unrealized Losses | Fair Value |
| SECURITIES AVAILABLE FOR SALE | | | | | | | | | |
| U.S. Treasury, agencies, and corporations | $ | 8,928 | | $ | 20 | | $ | 44 | | $ | 8,904 | | | $ | 9,300 | | $ | 6 | | $ | 280 | | $ | 9,026 | |
| | | | | | | | | |
| Agency residential collateralized mortgage obligations | 11,409 | | 8 | | 2,193 | | 9,224 | | | 18,911 | | 4 | | 3,437 | | 15,478 | |
| Agency residential mortgage-backed securities | 16,038 | | 3 | | 872 | | 15,169 | | | 4,189 | | — | | 600 | | 3,589 | |
| Agency commercial mortgage-backed securities | 4,927 | | — | | 517 | | 4,410 | | | 10,295 | | — | | 1,203 | | 9,092 | |
| | | | | | | | | |
| Total securities available for sale | $ | 41,302 | | $ | 31 | | $ | 3,626 | | $ | 37,707 | | | $ | 42,695 | | $ | 10 | | $ | 5,520 | | $ | 37,185 | |
| HELD-TO-MATURITY SECURITIES | | | | | | | | | |
| | | | | | | | | |
| | | | | | | | | |
| Agency residential collateralized mortgage obligations | $ | 4,577 | | $ | 3 | | $ | 332 | | $ | 4,248 | | | $ | 5,170 | | $ | 9 | | $ | 283 | | $ | 4,896 | |
| Agency residential mortgage-backed securities | 151 | | — | | 17 | | 134 | | | 165 | | — | | 13 | | 152 | |
| Agency commercial mortgage-backed securities | 2,333 | | — | | 203 | | 2,130 | | | 2,473 | | 1 | | 204 | | 2,270 | |
Asset-backed securities(c) | 308 | | — | | 8 | | 300 | | | 738 | | — | | 29 | | 709 | |
| Other securities | 26 | | — | | 1 | | 25 | | | 29 | | — | | — | | 29 | |
| Total held-to-maturity securities | $ | 7,395 | | $ | 3 | | $ | 561 | | $ | 6,837 | | | $ | 8,575 | | $ | 10 | | $ | 529 | | $ | 8,056 | |
| | | | | | | | | |
(a)Amortized cost amounts exclude accrued interest receivable which is recorded within “other assets” on the balance sheet. At December 31, 2024, accrued interest receivable on available for sale securities and held-to-maturity securities totaled $109 million and $21 million, respectively. At December 31, 2023, accrued interest receivable on available for sale securities and held-to-maturity securities totaled $64 million and $25 million, respectively.
(b)Excluded from the amortized cost of securities available for sale are basis adjustments for securities designated in active fair value hedges. Basis adjustments totaled $(6) million and $140 million as of December 31, 2024 and December 31, 2023, respectively. The securities being hedged are primarily U.S Treasuries, Agency RMBS, and Agency CMBS.
(c)Includes $303 million of securities as of December 31, 2024, and $731 million of securities as of December 31, 2023, related to the purchase of senior notes from a securitization collateralized by sold indirect auto loans.
The following table summarizes securities in an unrealized loss position for which an allowance for credit losses has not been recorded as of December 31, 2024, and December 31, 2023:
| | | | | | | | | | | | | | | | | | | | | | | | | | |
| | Duration of Unrealized Loss Position | | | |
| | Less than 12 Months | | 12 Months or Longer | | Total |
| Dollars in millions | Fair Value | Gross Unrealized Losses | | Fair Value | Gross Unrealized Losses | | Fair Value | Gross Unrealized Losses |
| December 31, 2024 | | | | | | | | |
| Securities available for sale: | | | | | | | | |
| U.S. Treasury, agencies, and corporations | $ | 3,647 | | $ | 8 | | | $ | 508 | | $ | 36 | | | $ | 4,155 | | $ | 44 | |
| | | | | | | | |
| Agency residential collateralized mortgage obligations | 91 | | — | | | 8,108 | | 2,193 | | | 8,199 | | 2,193 | |
| Agency residential mortgage-backed securities | 11,364 | | 254 | | | 3,145 | | 618 | | | 14,509 | | 872 | |
| Agency commercial mortgage-backed securities | 50 | | 1 | | | 4,360 | | 516 | | | 4,410 | | 517 | |
| | | | | | | | |
| Held-to-maturity securities: | | | | | | | | |
| | | | | | | | |
| | | | | | | | |
| Agency residential collateralized mortgage obligations | 569 | | 18 | | | 3,387 | | 314 | | | 3,956 | | 332 | |
| Agency residential mortgage-backed securities | — | | — | | | 134 | | 17 | | | 134 | | 17 | |
| Agency commercial mortgage-backed securities | — | | — | | | 2,060 | | 203 | | | 2,060 | | 203 | |
| Asset-backed securities | — | | — | | | 300 | | 8 | | | 300 | | 8 | |
| Other securities | 7 | | — | | | 8 | | 1 | | | 15 | | 1 | |
| Total securities in an unrealized loss position | $ | 15,728 | | $ | 281 | | | $ | 22,010 | | $ | 3,906 | | | $ | 37,738 | | $ | 4,187 | |
| December 31, 2023 | | | | | | | | |
| Securities available for sale: | | | | | | | | |
| U.S. Treasury, agencies, and corporations | $ | — | | $ | — | | | $ | 8,532 | | $ | 280 | | | $ | 8,532 | | $ | 280 | |
| | | | | | | | |
| Agency residential collateralized mortgage obligations | — | | — | | | 14,979 | | 3,437 | | | 14,979 | | 3,437 | |
| Agency residential mortgage-backed securities | 24 | | — | | | 3,562 | | 600 | | | 3,586 | | 600 | |
| Agency commercial mortgage-backed securities | 891 | | 49 | | | 8,201 | | 1,154 | | | 9,092 | | 1,203 | |
| | | | | | | | |
| Held-to-maturity securities: | | | | | | | | |
| | | | | | | | |
| | | | | | | | |
| Agency residential collateralized mortgage obligations | 1,123 | | 30 | | | 3,070 | | 253 | | | 4,193 | | 283 | |
| Agency residential mortgage-backed securities | — | | — | | | 152 | | 13 | | | 152 | | 13 | |
| Agency commercial mortgage-backed securities | — | | — | | | 2,199 | | 204 | | | 2,199 | | 204 | |
| Asset-backed securities | — | | — | | | 709 | | 29 | | | 709 | | 29 | |
| Other securities | 17 | | — | | | 12 | | — | | | 29 | | — | |
| Total securities in an unrealized loss position | $ | 2,055 | | $ | 79 | | | $ | 41,416 | | $ | 5,970 | | | $ | 43,471 | | $ | 6,049 | |
| | | | | | | | |
Based on our evaluation at December 31, 2024, an allowance for credit losses has not been recorded nor have unrealized losses been recognized into income. The issuers of the securities are of high credit quality and have a history of no credit losses, management does not intend to sell and it is likely that management will not be required to sell the securities prior to their anticipated recovery, and the decline in fair value is largely attributed to changes in interest rates and other market conditions. The issuers continue to make timely principal and interest payments.
The following table presents gross realized gains and losses associated with our securities available for sale portfolio for the noted periods. Realized losses for the year ended December 31, 2024, relate primarily to the strategic repositioning completed in the third and fourth quarters of 2024.
| | | | | | | | | | | |
Year ended December 31, Dollars in millions | 2024 | 2023 | 2022 |
| Securities available for sale | | | |
| Realized gains | $ | — | | $ | 4 | | $ | — | |
| Realized (losses) | (1,863) | | (8) | | — | |
| | | |
| | | |
| | | |
| | | |
| | | |
| | | |
At December 31, 2024, securities available-for-sale and held-to-maturity securities totaling $19.1 billion were pledged to secure securities sold under repurchase agreements, to secure public and trust deposits, to facilitate access to secured funding, and for other purposes required or permitted by law.
The following table shows securities by remaining maturity. CMOs, other mortgage-backed securities, and asset-backed securities in the available for sale portfolio and held-to-maturity portfolio are presented based on their expected average lives. The remaining securities, in both the available-for-sale and held-to-maturity portfolios, are presented based on their remaining contractual maturity. Actual maturities may differ from expected or contractual maturities since borrowers have the right to prepay obligations with or without prepayment penalties.
| | | | | | | | | | | | | | | | | | | | | | | |
| | Securities
Available for Sale | | Held-to-Maturity
Securities |
| December 31, 2024 | Amortized
Cost | | Fair Value | | Amortized Cost | | Fair Value |
| Dollars in millions | | | |
| Due in one year or less | $ | 3,184 | | | $ | 3,175 | | | $ | 85 | | | $ | 82 | |
| Due after one through five years | 11,340 | | | 10,895 | | | 2,805 | | | 2,680 | |
| Due after five through ten years | 17,352 | | | 15,405 | | | 2,674 | | | 2,463 | |
| Due after ten years | 9,426 | | | 8,232 | | | 1,831 | | | 1,612 | |
| Total | $ | 41,302 | | | $ | 37,707 | | | $ | 7,395 | | | $ | 6,837 | |
| | | | | | | |
8. Derivatives and Hedging Activities
We are a party to various derivative instruments, mainly through our subsidiary, KeyBank. The primary derivatives that we use are interest rate swaps, caps, floors, forwards and futures; foreign exchange contracts; commodity derivatives; and credit derivatives. Generally, these instruments help us manage exposure to interest rate risk, mitigate the credit risk inherent in our loan portfolio, hedge against changes in foreign currency exchange rates, and meet client financing and hedging needs. As further discussed in this note:
•interest rate risk is the risk that the EVE or net interest income will be adversely affected by fluctuations in interest rates;
•credit risk is the risk of loss arising from an obligor’s inability or failure to meet contractual payment or performance terms; and
•foreign exchange risk is the risk that an exchange rate will adversely affect the fair value of a financial instrument.
At December 31, 2024, after taking into account the effects of bilateral collateral and master netting agreements, we had $(6) million of derivative assets in a negative fair value position and less than $1 million of derivative liabilities that relate to contracts designated as hedging instruments. As a result of bilateral collateral and master netting arrangements, which are applied at the counterparty level, we could have derivative contracts with negative fair values included in derivative assets and contracts with positive fair values in derivative liabilities related to counterparties with which we have both hedging and trading derivatives. As of the same date, after taking into account the effects of bilateral collateral and master netting agreements and a reserve for potential future losses, we had derivative assets of $255 million and derivative liabilities of $1.0 billion that were not designated as hedging instruments. These positions are primarily comprised of derivative contracts entered into for client accommodation purposes.
Additional information regarding our accounting policies for derivatives is provided in Note 1 (“Summary of Significant Accounting Policies”) under the heading “Derivatives and Hedging.”
Derivatives Designated in Hedge Relationships
Net interest income and the EVE change in response to changes in the mix of assets, liabilities, and off-balance sheet instruments and the associated interest rates tied to each instrument. In addition, differences in the repricing and maturity characteristics of interest-earning assets and interest-bearing liabilities cause net interest income and the EVE to fluctuate. We utilize derivatives that have been designated as part of a hedge relationship in accordance with the applicable accounting guidance to manage net interest income and EVE to within our stated risk tolerances. The primary derivative instruments used to manage interest rate risk are interest rate swaps.
We designate certain “receive fixed/pay variable” interest rate swaps as fair value hedges. These contracts convert certain fixed-rate long-term debt into variable-rate obligations, thereby modifying our exposure to changes in interest rates. As a result, we receive fixed-rate interest payments in exchange for making variable-rate payments over the lives of the contracts without exchanging the notional amounts.
Similarly, we designate certain “receive fixed/pay variable” interest rate swaps as cash flow hedges. These contracts effectively convert certain floating-rate loans into fixed-rate loans to reduce the potential adverse effect of interest rate decreases on future interest income. Again, we receive fixed-rate interest payments in exchange for making variable-rate payments over the lives of the contracts without exchanging the notional amounts.
We designate interest rate floors as cash flow hedges. Interest rate floors also reduce the potential adverse effect of interest rate decreases on future interest income. We receive interest payments when the reference rate specified in the contracts falls below a strike price or floor rate in exchange for an upfront premium.
We designate certain “pay fixed/receive variable” interest rate swaps as fair value hedges. These swaps convert certain fixed-rate securities into floating rate securities. The swaps reduce the potential adverse effects from higher interest rates on valuations and future interest income.
We designate certain “pay fixed/receive variable” interest rate swaps as cash flow hedges. These swaps convert certain floating-rate debt into fixed-rate debt. We also use these swaps to manage the interest rate risk associated with anticipated sales of certain commercial real estate loans and certain student loans originated through our Laurel Road digital brand. The swaps protect against the possible short-term decline in the value of the loans that could result from changes in interest rates between the time they are originated and the time they are sold.
Derivatives Not Designated in Hedge Relationships
We may enter into interest rate swap contracts to manage economic risks but do not designate the instruments in hedge relationships. Excluding contracts addressing customer exposures, the amount of derivatives hedging risks on an economic basis at December 31, 2024, was not significant.
Like other financial services institutions, we originate loans and extend credit, both of which expose us to credit risk. We actively manage our overall loan portfolio and the associated credit risk in a manner consistent with asset quality objectives and concentration risk tolerances to mitigate portfolio credit risk. Purchasing credit protection through default swaps enables us to transfer to a third party a portion of the credit risk associated with a particular extension of credit, including situations where there is a forecasted sale of loans. We purchase credit default swaps to reduce the credit risk associated with the debt securities held in our trading portfolio.
We also enter into derivative contracts for other purposes, including:
•interest rate swap, cap, and floor contracts entered into generally to accommodate the needs of commercial loan clients;
•energy and base metal swap and option contracts entered into to accommodate the needs of clients;
•foreign exchange forward and option contracts entered into primarily to accommodate the needs of clients; and
•futures contracts and positions with third parties that are intended to offset or mitigate the interest rate or market risk related to client positions discussed above.
Fair Values, Volume of Activity, and Gain/Loss Information Related to Derivative Instruments
The following table summarizes the fair values of our derivative instruments on a gross and net basis as of December 31, 2024, and December 31, 2023. The change in the notional amounts of these derivatives by type from December 31, 2023, to December 31, 2024, indicates the volume of our derivative transaction activity during 2024. The notional amounts are not affected by bilateral collateral and master netting agreements. The derivative asset and liability balances are presented on a gross basis, prior to the application of bilateral collateral and master netting agreements. Total derivative assets and liabilities are adjusted to take into account the impact of legally enforceable master netting agreements that allow us to settle all derivative contracts with a single counterparty on a net basis and to offset the net derivative position with the related cash collateral. Where master netting agreements are not in effect or are not enforceable under bankruptcy laws, we do not adjust those derivative assets and liabilities with counterparties. Securities collateral related to legally enforceable master netting agreements is not offset on the balance sheet. Our derivative instruments are included in “accrued income and other assets” or “accrued expenses and other liabilities” on the Consolidated Balance Sheets, as indicated in the following table:
| | | | | | | | | | | | | | | | | | | | | | | |
| | December 31, 2024 | | December 31, 2023 |
| | | Fair Value (a) | | | Fair Value (a) |
| Dollars in millions | Notional Amount | Derivative Assets | Derivative Liabilities | | Notional Amount | Derivative Assets | Derivative Liabilities |
| Derivatives designated as hedging instruments: | | | | | | | |
| Interest rate | $ | 64,701 | | $ | (4) | | $ | 3 | | | $ | 44,621 | | $ | 39 | | $ | 12 | |
| | | | | | | |
| | | | | | | |
| Derivatives not designated as hedging instruments: | | | | | | | |
| Interest rate | 72,215 | | 114 | | 962 | | | 78,051 | | 134 | | 973 | |
| Foreign exchange | 6,516 | | 124 | | 117 | | | 6,034 | | 89 | | 73 | |
| Commodity | 8,778 | | 363 | | 343 | | | 11,611 | | 721 | | 698 | |
| Credit | 60 | | — | | — | | | 121 | | — | | 1 | |
Other (b) | 3,145 | | 15 | | 14 | | | 2,683 | | 16 | | 20 | |
| Total derivatives not designated as hedging instruments: | 90,714 | | 616 | | 1,436 | | | 98,500 | | 960 | | 1,765 | |
| Total | 155,415 | | 612 | | 1,439 | | | 143,121 | | 999 | | 1,777 | |
Netting adjustments (c) | — | | (363) | | (411) | | | — | | (818) | | (473) | |
| Net derivatives in the balance sheet | 155,415 | | 249 | | 1,028 | | | 143,121 | | 181 | | 1,304 | |
Other collateral (d) | — | | — | | (1) | | | — | | (1) | | (18) | |
| Net derivative amounts | $ | 155,415 | | $ | 249 | | $ | 1,027 | | | $ | 143,121 | | $ | 180 | | $ | 1,286 | |
| | | | | | | |
(a)We take into account bilateral collateral and master netting agreements that allow us to settle all derivative contracts held with a single counterparty on a net basis, and to offset the net derivative position with the related cash collateral when recognizing derivative assets and liabilities. As a result, we could have derivative contracts with negative fair values included in derivative assets and contracts with positive fair values included in derivative liabilities.
(b)Other derivatives include interest rate lock commitments related to our residential mortgage banking activities, forward sales commitments related to our residential mortgage banking activities, forward purchase and sales contracts consisting of contractual commitments associated with “to be announced” securities and when-issued securities, and other customized derivative contracts.
(c)Netting adjustments represent the amounts recorded to convert our derivative assets and liabilities from a gross basis to a net basis in accordance with the applicable accounting guidance. As of December 31, 2024, excess collateral that has not been offset against net derivative instrument positions totaled $168 million of cash collateral and $215 million of securities collateral posted as well as $13 million of cash collateral and $32 million of securities collateral held. As of December 31, 2023, excess collateral that has not been offset against net derivative instrument positions totaled $161 million of cash collateral and $269 million of securities collateral posted as well as $16 million of cash collateral and $212 million of securities collateral held.
(d)Other collateral represents the amount that cannot be used to offset our derivative assets and liabilities from a gross basis to a net basis in accordance with the applicable accounting guidance. The other collateral consists of securities and is exchanged under bilateral collateral and master netting agreements that allow us to offset the net derivative position with the related collateral. The application of the other collateral cannot reduce the net derivative position below zero. Therefore, excess other collateral, if any, is not reflected above.
Fair value hedges. During the year ended December 31, 2024, we did not exclude any portion of these hedging instruments from the assessment of hedge effectiveness.
The following tables summarize the amounts that were recorded on the balance sheet as of December 31, 2024 and December 31, 2023, related to cumulative basis adjustments for fair value hedges.
| | | | | | | | | | | | | | |
| December 31, 2024 |
| Dollars in millions | Balance sheet line item in which the hedge item is included | Carrying amount of hedged item(a) | Hedge accounting basis adjustment - active hedges | Hedge accounting basis adjustment - discontinued hedges |
| Interest rate contracts | Long-term debt | $ | 10,249 | | $ | (490) | | $ | (4) | |
| | | | |
| | | | |
| Interest rate contracts | Securities available for sale(b) | 12,097 | | 5 | | 17 | |
| | | | |
| | | | | | | | | | | | | | |
| December 31, 2023 |
| Dollars in millions | Balance sheet line item in which the hedge item is included | Carrying amount of hedged item (a) | Hedge accounting basis adjustment - active hedges | Hedge accounting basis adjustment - discontinued hedges |
| Interest rate contracts | Long-term debt | $ | 9,919 | | $ | (432) | | $ | (5) | |
| | | | |
| | | | |
| Interest rate contracts | Securities available for sale(b) | 8,655 | | (152) | | — | |
| | | | |
(a)The carrying amount represents the portion of the asset or liability designated as the hedged item.
(b)Certain amounts are designed as fair value hedges under the portfolio layer method. The carrying amount represents the amortized costs basis of the prepayable financial assets used to designate hedging relationships in which the hedged item is the last layer expected to be remaining at the end of the relationship. At December 31, 2024 and December 31, 2023, the amortized cost of the closed portfolios used in these hedging relationships was $5 billion and $13 billion, respectively, of which $4 billion and $7 billion were designated in a portfolio layer hedging relationship. At December 31, 2024 and December 31, 2023, the cumulative basis adjustments associated with these amounts totaled $41 million and $(147) million, which is comprised of $24 million and $(147) million in active hedging relationships and $17 million and no adjustments for discontinued hedging relationships.
Cash flow hedges. During the year ended December 31, 2024, we did not exclude any portion of these hedging instruments from the assessment of hedge effectiveness.
Considering the interest rates, yield curves, and notional amounts as of December 31, 2024, we expect to reclassify an estimated $231 million of after-tax net losses on derivative instruments designated as cash flow hedges from AOCI to income during the next 12 months. In addition, we expect to reclassify approximately $4 million of pre-tax net losses related to terminated cash flow hedges from AOCI to income during the next 12 months. These reclassified amounts could differ from actual amounts recognized due to changes in interest rates hedge de-designations and the addition of other hedges subsequent to December 31, 2024. As of December 31, 2024, the maximum length of time over which we hedge forecasted transactions is 3.67 years.
The following tables summarize the effect of fair value and cash flow hedge accounting on the income statement for the years ended December 31, 2024, December 31, 2023, and December 31, 2022.
| | | | | | | | | | | | | | | | | |
| Location and amount of net gains (losses) recognized in income on fair value and cash flow hedging relationships | |
| Dollars in millions | Interest expense – long-term debt | Interest income – loans | Interest Income - securities | Investment banking and debt placement fees | | | |
| Twelve Months Ended December 31, 2024 | | | | | | | |
| Total amounts presented in the consolidated statement of income | $ | (1,187) | | $ | 6,026 | | $ | 1,142 | | $ | 688 | | | | |
| | | | | | | |
| Net gains (losses) on fair value hedging relationships | | | | | | | |
| Interest contracts | | | | | | | |
| Recognized on hedged items | 56 | | — | | (111) | | — | | | | |
| Recognized on derivatives designated as hedging instruments | (332) | | — | | 239 | | — | | | | |
| Net income (expense) recognized on fair value hedges | $ | (276) | | $ | — | | $ | 128 | | $ | — | | | | |
| Net gain (loss) on cash flow hedging relationships | | | | | | | |
| Realized gains (losses) (pre-tax) reclassified from AOCI into net income | | | | | | | |
| Interest contracts | $ | (2) | | $ | (733) | | $ | — | | $ | — | | | | |
| | | | | | | |
| Net income (expense) recognized on cash flow hedges | $ | (2) | | $ | (733) | | $ | — | | $ | — | | | | |
| | | | | | | |
| Twelve Months Ended December 31, 2023 | | | | | | | |
| Total amounts presented in the consolidated statement of income | $ | (1,305) | | $ | 6,219 | | $ | 793 | | $ | 542 | | | | |
| | | | | | | |
| Net gains (losses) on fair value hedging relationships | | | | | | | |
| Interest contracts | | | | | | | |
| Recognized on hedged items | (119) | | — | | 181 | | — | | | | |
| Recognized on derivatives designated as hedging instruments | (135) | | — | | (132) | | — | | | | |
| Net income (expense) recognized on fair value hedges | $ | (254) | | $ | — | | $ | 49 | | $ | — | | | | |
| Net gain (loss) on cash flow hedging relationships | | | | | | | |
| Realized gains (losses) (pre-tax) reclassified from AOCI into net income | | | | | | | |
| Interest contracts | $ | (2) | | $ | (956) | | $ | — | | $ | 5 | | | | |
| | | | | | | |
| Net income (expense) recognized on cash flow hedges | $ | (2) | | $ | (956) | | $ | — | | $ | 5 | | | | |
| | | | | | | |
| Twelve Months Ended December 31, 2022 | | | | | | | |
| Total amounts presented in the consolidated statement of income | $ | (475) | | $ | 4,241 | | $ | 752 | | $ | 638 | | | | |
| | | | | | | |
| Net gains (losses) on fair value hedging relationships | | | | | | | |
| Interest contracts | | | | | | | |
| Recognized on hedged items | 690 | | — | | (339) | | — | | | | |
| Recognized on derivatives designated as hedging instruments | (697) | | — | | 350 | | — | | | | |
| Net income (expense) recognized on fair value hedges | $ | (7) | | $ | — | | $ | 11 | | $ | — | | | | |
| Net gain (loss) on cash flow hedging relationships | | | | | | | |
| Realized gains (losses) (pre-tax) reclassified from AOCI into net income | | | | | | | |
| Interest contracts | $ | (3) | | $ | (146) | | $ | — | | $ | 9 | | | | |
| | | | | | | |
| Net income (expense) recognized on cash flow hedges | $ | (3) | | $ | (146) | | $ | — | | $ | 9 | | | | |
| | | | | | | |
The following table summarizes the pre-tax net gains (losses) on our cash flow hedges for the years ended December 31, 2024, December 31, 2023, and December 31, 2022, and where they are recorded on the income statement. The table includes net gains (losses) recognized in OCI during the period and net gains (losses) reclassified from AOCI into income during the current period.
| | | | | | | | | | | | |
| Dollars in millions | Net Gains (Losses)
Recognized in OCI | Income Statement Location of Net Gains (Losses)
Reclassified From OCI Into Income | Net Gains
(Losses) Reclassified
From OCI Into Income | |
| Twelve Months Ended December 31, 2024 | | | | |
| Cash Flow Hedges | | | | |
| Interest rate | $ | (450) | | Interest income — Loans | $ | (733) | | |
| Interest rate | 2 | | Interest expense — Long-term debt | (2) | | |
| Interest rate | — | | Investment banking and debt placement fees | — | | |
| | | | |
| | | | |
| Total | $ | (448) | | | $ | (735) | | |
| Twelve Months Ended December 31, 2023 | | | | |
| Cash Flow Hedges | | | | |
| Interest rate | $ | (294) | | Interest income — Loans | $ | (956) | | |
| Interest rate | — | | Interest expense — Long-term debt | (2) | | |
| Interest rate | 5 | | Investment banking and debt placement fees | 5 | | |
| | | | |
| | | | |
| Total | $ | (289) | | | $ | (953) | | |
| Twelve Months Ended December 31, 2022 | | | | |
| Cash Flow Hedges | | | | |
| Interest rate | $ | (1,660) | | Interest income — Loans | $ | (146) | | |
| Interest rate | 7 | | Interest expense — Long-term debt | (3) | | |
| Interest rate | 11 | | Investment banking and debt placement fees | 9 | | |
| | | | |
| | | | |
| Total | $ | (1,642) | | | $ | (140) | | |
| | | | |
Nonhedging instruments. The following table summarizes the pre-tax net gains (losses) on our derivatives that are not designated as hedging instruments for the years ended December 31, 2024, December 31, 2023, and December 31, 2022, and where they are recorded on the income statement.
| | | | | | | | | | | | | | | | | | | | | | | | | | | | | | | | | | | | | | | | | | | | |
| | 2024 | | 2023 | | 2022 |
Year ended December 31, Dollars in millions | Corporate
services
income | Consumer mortgage income | Other
income | Total | | Corporate
services
income | Consumer mortgage income | Other
income | Total | | Corporate
services
income | Consumer mortgage income | Other
income | Total |
| NET GAINS (LOSSES) | | | | | | | | | | | | | | |
| Interest rate | $ | 35 | | $ | — | | $ | — | | $ | 35 | | | $ | 41 | | $ | — | | $ | — | | $ | 41 | | | $ | 57 | | $ | — | | $ | 6 | | $ | 63 | |
| Foreign exchange | 50 | | — | | — | | 50 | | | 50 | | — | | — | | 50 | | | 52 | | — | | — | | 52 | |
| Commodity | 12 | | — | | — | | 12 | | | 22 | | — | | — | | 22 | | | 23 | | — | | — | | 23 | |
| Credit | 1 | | — | | (58) | | (57) | | | 2 | | — | | (52) | | (50) | | | (1) | | — | | (39) | | (40) | |
| Other | — | | 2 | | 5 | | 7 | | | — | | (1) | | (6) | | (7) | | | — | | 4 | | (2) | | 2 | |
| Total net gains (losses) | $ | 98 | | $ | 2 | | $ | (53) | | $ | 47 | | | $ | 115 | | $ | (1) | | $ | (58) | | $ | 56 | | | $ | 131 | | $ | 4 | | $ | (35) | | $ | 100 | |
| | | | | | | | | | | | | | |
Counterparty Credit Risk
We use several means to mitigate and manage exposure to credit risk on derivative contracts. We enter into bilateral collateral and master netting agreements that provide for the net settlement of all contracts with a single counterparty in the event of default. Additionally, we monitor counterparty credit risk exposure on each contract to determine appropriate limits on our total credit exposure across all product types. We review our collateral positions on a daily basis and exchange collateral with our counterparties in accordance with standard ISDA documentation, central clearing rules, and other related agreements. We hold collateral in the form of cash and highly rated securities issued by the U.S. Treasury, government-sponsored enterprises, or GNMA. Cash collateral netted against derivative assets on the balance sheet totaled $75 million at December 31, 2024, and $408 million at December 31, 2023. The cash collateral netted against derivative liabilities totaled $124 million at December 31, 2024, and $64 million at December 31, 2023.
The following table summarizes the fair value of our derivative assets by type at the dates indicated. These assets represent our net exposure to potential loss after taking into account the effects of bilateral collateral and master netting agreements and other means used to mitigate risk.
| | | | | | | | |
December 31, Dollars in millions | 2024 | 2023 |
| Interest rate | $ | 58 | | $ | 123 | |
| Foreign exchange | 81 | | 42 | |
| Commodity | 170 | | 409 | |
| Credit | — | | — | |
| Other | 15 | | 15 | |
| Derivative assets before collateral | 324 | | 589 | |
| Plus (Less): Related collateral | (75) | | (408) | |
| Total derivative assets | $ | 249 | | $ | 181 | |
| | |
We enter into derivative transactions with two primary groups: broker-dealers and banks, and clients. Since these groups have different economic characteristics, we have different methods for managing counterparty credit exposure and credit risk.
We enter into transactions with broker-dealers and banks for various risk management purposes. These types of transactions are primarily high dollar volume. We enter into bilateral collateral and master netting agreements with these counterparties. We clear certain types of derivative transactions with these counterparties, whereby central clearing organizations become the counterparties to our derivative contracts. In addition, we enter into derivative contracts through swap execution facilities. Swap clearing and swap execution facilities reduce our exposure to counterparty credit risk. At December 31, 2024, we had gross exposure of $247 million to broker-dealers and banks. We had net exposure of $42 million after the application of master netting agreements and cash collateral, where such qualifying agreements exist. We held no additional collateral in the form of securities against this net exposure.
We enter into transactions using master netting agreements with clients to accommodate their business needs. In most cases, we mitigate our credit exposure by cross-collateralizing these transactions to the underlying loan collateral. For transactions that are not clearable, we mitigate our market risk by buying and selling U.S. Treasuries and SOFR futures or entering into offsetting positions. Due to the cross-collateralization to the underlying loan, we typically do not exchange cash or marketable securities collateral in connection with these transactions. To address the risk of default associated with these contracts, we have established a CVA reserve (included in “accrued income and other assets”) in the amount of $4 million at December 31, 2024. The CVA is calculated from potential future exposures, expected recovery rates, and market-implied probabilities of default. At December 31, 2024, we had gross exposure of $239 million to client counterparties and other entities that are not broker-dealers or banks for derivatives that have associated master netting agreements. We had net exposure of $207 million on our derivatives with these counterparties after the application of master netting agreements, collateral, and the related reserve.
Credit Derivatives
We are a buyer and, under limited circumstances, may be a seller of credit protection through the credit derivative market. We purchase credit derivatives to manage the credit risk associated with specific commercial lending and swap obligations as well as exposures to debt securities. Our credit derivative portfolio was in a nominal net liability position as of December 31, 2024, and $1 million as of December 31, 2023.
Our credit derivative portfolio may consist of the following:
•Single-name credit default swap: A bilateral contract whereby the seller agrees, for a premium, to provide protection against the credit risk of a specific entity (the “reference entity”) in connection with a specific debt obligation. The protected credit risk is related to adverse credit events, such as bankruptcy, failure to make payments, and acceleration or restructuring of obligations, identified in the credit derivative contract.
•Traded credit default swap index: Represents a position on a basket or portfolio of reference entities.
•Risk participation agreement: A transaction in which the lead participant has a swap agreement with a customer. The lead participant (purchaser of protection) then enters into a risk participation agreement with a counterparty (seller of protection), under which the counterparty receives a fee to accept a portion of the lead participant’s credit risk. If the customer defaults on the swap contract, the counterparty to the risk participation agreement must reimburse the lead participant for the counterparty’s percentage of the positive fair value of the customer swap as of the default date. If the customer swap has a negative fair value, the counterparty has no reimbursement requirements. If the customer defaults on the swap contract and the seller fulfills its payment obligations under the risk participation agreement, the seller is entitled to a pro rata share of the lead participant’s claims against the customer under the terms of the swap agreement.
The following table provides information on the types of credit derivatives sold by us and held on the balance sheet at December 31, 2024, and December 31, 2023. The notional amount represents the amount that the seller could be required to pay. The payment/performance risk shown in the table represents a weighted average of the default probabilities for all reference entities in the respective portfolios. These default probabilities are implied from observed credit indices in the credit default swap market, which are mapped to reference entities based on Key’s internal risk rating.
| | | | | | | | | | | | | | | | | | | | | | | |
| | 2024 | | 2023 |
December 31, Dollars in millions | Notional
Amount | Average
Term
(Years) | Payment /
Performance
Risk | | Notional
Amount | Average
Term
(Years) | Payment /
Performance
Risk |
| | | | | | | |
| Other | $ | 2 | | 7.64 | 2.03 | % | | $ | 4 | | 10.69 | 4.86 | % |
| Total credit derivatives sold | $ | 2 | | — | | — | | | $ | 4 | | — | | — | |
| | | | | | | |
Credit Risk Contingent Features
We have entered into certain derivative contracts that require us to post collateral to the counterparties when these contracts are in a net liability position. The amount of collateral to be posted is based on the amount of the net liability and thresholds generally related to our long-term senior unsecured credit ratings with Moody’s and S&P. Collateral requirements also are based on minimum transfer amounts, which are specific to each Credit Support Annex (a component of the ISDA Master Agreement) that we have signed with the counterparties. In a limited number of instances, counterparties have the right to terminate their ISDA Master Agreements with us if our ratings fall below a certain level, usually investment-grade level (i.e., “Baa3” for Moody’s and “BBB-” for S&P). At December 31, 2024, KeyBank’s rating was “Baa1” with Moody’s and “BBB+” with S&P, and KeyCorp’s rating was “Baa2” with Moody’s and “BBB” with S&P. Refer to the table below for the aggregate fair value of all derivative contracts with credit risk contingent features held by KeyBank that were in a net liability position.
| | | | | | | | | | | |
| Dollars in millions | December 31, 2024 | | December 31, 2023 |
| | | |
| | | |
Net derivative liabilities with credit-risk contingent features
| $ | (83) | | | $ | (45) | |
| Collateral posted | 80 | | | 42 | |
As of December 31, 2024, and December 31, 2023, the fair value of additional collateral that could be required to be posted as a result of the credit risk related contingent features being triggered was immaterial to Key’s consolidated financial statements. At December 31, 2024 and December 31, 2023, only KeyBank held derivative contacts with credit risk contingent features.
9. Mortgage Servicing Assets
We originate and periodically sell commercial and residential mortgage loans but continue to service those loans for the buyers. We also may purchase the right to service commercial mortgage loans for other lenders. We record a servicing asset if we purchase or retain the right to service loans in exchange for servicing fees that exceed the going market servicing rate and are considered more than adequate compensation for servicing. Additional information pertaining to the accounting for mortgage and other servicing assets is included in Note 1 (“Summary of Significant Accounting Policies”) under the heading “Servicing Assets.”
Commercial
Changes in the carrying amount of commercial mortgage servicing assets are summarized as follows:
| | | | | | | | |
Year ended December 31, Dollars in millions | 2024 | 2023 |
| Balance at beginning of period | $ | 638 | | $ | 653 | |
| Servicing retained from loan sales | 67 | | 87 | |
| Purchases | 28 | | 21 | |
| Amortization | (124) | | (123) | |
| Temporary recoveries (impairments) | — | | — | |
| Balance at end of period | $ | 609 | | $ | 638 | |
| Fair value at end of period | $ | 819 | | $ | 911 | |
| | |
The fair value of commercial mortgage servicing assets is determined by calculating the present value of future cash flows associated with servicing the loans. This calculation uses a number of assumptions that are based on current market conditions. The range and weighted-average of the significant unobservable inputs used to determine fair value our commercial mortgage servicing assets along with the valuation techniques, are shown in the following table:
| | | | | | | | | | | | | | | | | | | | | | | |
| dollars in millions | | December 31, 2024 | December 31, 2023 |
| Valuation Technique | Significant Unobservable Input | Range | Weighted-Average | Range | Weighted-Average |
| Discounted cash flow | Expected defaults | 1.00 | % | 2.00 | % | 1.01 | % | 1.00 | % | 2.00 | % | 1.01 | % |
| Residual cash flows discount rate | 7.00 | % | 10.61 | % | 10.31 | % | 7.42 | % | 10.56 | % | 10.17 | % |
| Escrow earn rate | 4.62 | % | 4.70 | % | 4.69 | % | 5.67 | % | 5.72 | % | 5.67 | % |
| Loan assumption rate | — | % | 2.50 | % | 2.00 | % | — | % | 2.15 | % | 1.97 | % |
| | | | | | | |
If these economic assumptions change or prove incorrect, the fair value of commercial mortgage servicing assets may also change. Expected credit losses, escrow earn rates, and discount rates are critical to the valuation of commercial mortgage servicing assets. Estimates of these assumptions are based on how a market participant would view the respective rates and reflect historical data associated with the commercial mortgage loans, industry trends, and other considerations. Actual rates may differ from those estimated due to changes in a variety of economic factors. A decrease in the value assigned to the escrow earn rates would cause a decrease in the fair value of our commercial mortgage servicing assets. An increase in the assumed default rates of commercial mortgage loans or an increase in the assigned discount rates would cause a decrease in the fair value of our commercial mortgage servicing assets. Prepayment activity on commercial serviced loans does not significantly impact the valuation of our commercial mortgage servicing assets. Unlike residential mortgages, commercial mortgages experience significantly lower prepayments due to certain contractual restrictions impacting the borrower’s ability to prepay the mortgage.
The amortization of commercial mortgage servicing assets is determined in proportion to, and over the period of, the estimated net servicing income. The amortization of commercial servicing assets for each period, as shown in the table at the beginning of this note, is recorded as a reduction to contractual fee income. The contractual fee income from servicing commercial mortgage loans totaled $382 million for the year ended December 31, 2024, $314 million for the year ended December 31, 2023, and $292 million for the year ended December 31, 2022. This fee income was partially offset by $124 million of amortization for the year ended December 31, 2024, $123 million for the year ended December 31, 2023, and $125 million for the year ended December 31, 2022. Both the contractual fee income and the amortization are recorded, net, in “commercial mortgage servicing fees” on the income statement.
Residential
Changes in the carrying amount of residential mortgage servicing assets are summarized as follows:
| | | | | | | | |
| Dollars in millions | 2024 | 2023 |
| Balance at beginning of period | $ | 108 | | $ | 106 | |
| Servicing retained from loan sales | 13 | | 12 | |
| Purchases | — | | — | |
| Amortization | (11) | | (9) | |
| Temporary recoveries (impairments) | 1 | | (1) | |
| Balance at end of period | $ | 111 | | $ | 108 | |
| Fair value at end of period | $ | 138 | | $ | 132 | |
| | |
The fair value of residential mortgage servicing assets is determined by calculating the present value of future cash flows associated with servicing the loans. This calculation uses a number of assumptions that are based on current market conditions. The range and weighted-average of the significant unobservable inputs used to fair value our residential mortgage servicing assets along with the valuation techniques, are shown in the following table:
| | | | | | | | | | | | | | | | | | | | | | | |
| | December 31, 2024 | December 31, 2023 |
| Valuation Technique | Significant Unobservable Input | Range | Weighted-Average | Range | Weighted-Average |
| Discounted cash flow | Prepayment speed | 5.42 | % | 46.30 | % | 7.69 | % | 6.27 | % | 44.47 | % | 7.70 | % |
| Discount rate | 6.50 | % | 8.75 | % | 6.61 | % | 6.50 | % | 8.75 | % | 6.59 | % |
| Servicing cost | $ | 70.00 | | $ | 4,332 | | $ | 75.99 | | $ | 70.00 | | $ | 3,582 | | $ | 75.02 | |
If these economic assumptions change or prove incorrect, the fair value of residential mortgage servicing assets may also change. Prepayment speed, discount rates, and servicing cost are critical to the valuation of residential mortgage servicing assets. Estimates of these assumptions are based on how a market participant would view the respective rates and reflect historical data associated with the residential mortgage loans, industry trends, and other considerations. Actual rates may differ from those estimated due to changes in a variety of economic factors. An
increase in the prepayment speed would cause a decrease in the fair value of our residential mortgage servicing assets. An increase in the assigned discount rates and servicing cost assumptions would cause a decrease in the fair value of our residential mortgage servicing assets.
The amortization of residential mortgage servicing assets for December 31, 2024, as shown in the table above, is recorded as a reduction to contractual fee income. The contractual fee income from servicing residential mortgage loans totaled $40 million for the year ended December 31, 2024, $38 million for the year ended December 31, 2023, and $35 million for the year ended December 31, 2022. This fee income was offset by $11 million of amortization for the year ended December 31, 2024, $9 million for the year ended December 31, 2023, and $11 million for the year ended December 31, 2022. Both the contractual fee income and the amortization are recorded, net, in “consumer mortgage income” on the income statement.
10. Leases
As a lessee, we enter into leases of land, buildings, and equipment. Our real estate leases primarily relate to bank branches and office space. The leases of equipment principally relate to technology assets for data processing and data storage. As a lessor, we primarily provide financing through our equipment leasing business.
Lessee
Our leases are classified as either operating or financing and have remaining terms ranging from 1 to 20 years with the exception of certain ground leases that have terms over 30 years. For leases with initial terms greater than one year, a lease liability, measured as the present value of unpaid lease payments, and a corresponding right-of-use asset for the right to use the leased properties are reported on the balance sheet. Lease payments are discounted using Key’s incremental borrowing rate, consistent with what Key would pay to borrow on a collateralized basis over a term similar to each lease. Leases with an initial term of less than one year are not recorded on the balance sheet. The related expense is recognized on a straight-line basis over the lease term.
Certain leases contain options to extend the lease term for up to five years. Some leases give us the option to terminate, for a penalty or at the lessor's discretion. Leases with variable payments are primarily based on adjustments for inflation over the term of the lease based on a contractually defined index. Certain ATM leases include variable payments based on volume of transactions.
Operating lease expense is recognized in "net occupancy" and "equipment" on the income statement. The components of lease expense are summarized as follows:
| | | | | | | | | |
| Dollars in millions | | December 31, 2024 | December 31, 2023 |
| Operating lease cost | | $ | 118 | | $ | 122 | |
| Finance lease cost: | | | |
| Amortization of right-of-use assets | | 1 | | 1 | |
| Interest on lease liabilities | | — | | — | |
| | | |
| Variable lease cost | | 21 | | 19 | |
Total lease cost (a) | | $ | 140 | | $ | 142 | |
| | | |
| | | |
(a)Short-term lease cost was less than $1 million for both the twelve months ended December 31, 2024, and December 31, 2023
Cash flows related to leases are summarized as follows:
| | | | | | | | | |
| Dollars in millions | | December 31, 2024 | December 31, 2023 |
| | | |
| Cash paid for amounts included in the measurement of lease liabilities: | | | |
| | | |
| Operating cash flows from operating leases | | $ | 133 | | $ | 135 | |
| Financing cash flows from finance leases | | 1 | | 1 | |
Right-of-use assets obtained in exchange for lease obligations: (a) | | | |
| Operating leases | | $ | 70 | | $ | 65 | |
| | | |
| | | |
| | | |
(a)There were no right-of-use assets obtained in exchange for finance lease obligations for either the twelve months ended December 31, 2024 or December 31, 2023.
Additional balance sheet information related to leases is summarized as follows:
| | | | | | | | | | | |
| Dollars in millions | Balance sheet classification | December 31, 2024 | December 31, 2023 |
| Operating lease assets | Accrued income and other assets | $ | 453 | | $ | 479 | |
| Operating lease liabilities | Accrued expense and other liabilities | 506 | | 548 | |
| Finance leases: | | | |
| Property and equipment, gross | Premises and equipment | $ | 18 | | $ | 18 | |
| Accumulated depreciation | Premises and equipment | (16) | | (15) | |
| Property and equipment, net | | $ | 2 | | $ | 3 | |
| | | |
| Finance lease liabilities | Long-term debt | 3 | | 5 | |
| | | |
| | | |
Information pertaining to the lease term and weighted-average discount rate is summarized as follows:
| | | | | | | | |
| December 31, 2024 | December 31, 2023 |
| Weighted-average remaining lease term: | | |
| Operating leases | 5.42 | 5.69 |
| Finance leases | 2.52 | 3.53 |
| Weighted-average discount rate: | | |
| Operating leases | 3.40 | % | 3.09 | % |
| Finance leases | 4.54 | % | 4.54 | % |
| | |
Maturities of lease liabilities are summarized as follows:
| | | | | | | | | | | |
| Dollars in millions | Operating Leases | Finance Leases | Total |
| 2025 | $ | 128 | | $ | 1 | | $ | 129 | |
| 2026 | 117 | | — | | 117 | |
| 2027 | 100 | | — | | 100 | |
| 2028 | 77 | | — | | 77 | |
| 2029 | 55 | | — | | 55 | |
| Thereafter | 80 | | 3 | | 83 | |
| Total lease payments | $ | 557 | | $ | 4 | | $ | 561 | |
| Less imputed interest | 51 | | 1 | | 52 | |
| Total | $ | 506 | | $ | 3 | | $ | 509 | |
| | | |
Lessor Equipment Leasing
Leases may have fixed or floating rate terms. Variable payments are based on an index or other specified rate and are included in rental payments. Certain leases contain an option to extend the lease term or the option to terminate at the discretion of the lessee. Under certain conditions, lease agreements may also contain the option for a lessee to purchase the underlying asset.
Interest income from sales-type and direct financing leases is recognized in "interest income — loans" on the statement of income. Income related to operating leases is recognized in “operating lease income and other leasing gains” on the income statement. The components of equipment leasing income are summarized in the table below:
| | | | | | | | | | |
| Dollars in millions | | December 31, 2024 | December 31, 2023 | |
| | | | |
| Sales-type and direct financing leases | | | | |
| Interest income on lease receivable | | $ | 69 | | $ | 78 | | |
| Interest income related to accretion of unguaranteed residual asset | | 9 | | 13 | | |
| Interest income on deferred fees and costs | | 20 | | 4 | | |
| Total sales-type and direct financing lease income | | 98 | | 95 | | |
| Operating leases | | | | |
| Operating lease income related to lease payments | | 68 | | 84 | | |
| Other operating leasing gains and (losses) | | 8 | | 8 | | |
| Total operating lease income and other leasing gains | | 76 | | 92 | | |
| Total lease income | | $ | 174 | | $ | 187 | | |
| | | | |
Equipment leasing receivables relate to sales-type and direct financing leases. The composition of the net investment in sales-type and direct financing leases is as follows:
| | | | | | | | | |
| Dollars in millions | December 31, 2024 | December 31, 2023 | |
| Lease receivables | $ | 2,345 | | $ | 2,896 | | |
| Unearned income | (270) | | (286) | | |
| Unguaranteed residual value | 421 | | 468 | | |
| Deferred fees and costs | 1 | | 2 | | |
| Net investment in sales-type and direct financing leases | $ | 2,497 | | $ | 3,080 | | |
| | | |
The residual value component of a lease represents the fair value of the leased asset at the end of the lease term. We rely on industry data, historical experience, independent appraisals and the experience of the equipment leasing asset management team to value lease residuals. Relationships with a number of equipment vendors give the asset management team insight into the life cycle of the leased equipment, pending product upgrades and competing products. Key assesses net investments in leases, including residual values, for impairment and recognizes any impairment losses in accordance with the impairment guidance for financial instruments. The carrying amount of residual assets covered by residual value guarantees at December 31, 2024, and December 31, 2023, was $238 million and $258 million, respectively.
At December 31, 2024, minimum future lease payments to be received for sales-type and direct financing leases are as follows:
| | | | | |
| Dollars in millions | Sales-type and direct financing lease payments |
| 2025 | $ | 667 | |
| 2026 | 548 | |
| 2027 | 374 | |
| 2028 | 217 | |
| 2029 | 160 | |
| Thereafter | 376 | |
| Total lease payments | $ | 2,342 | |
| |
| |
| |
At December 31, 2024, minimum future lease payments to be received for operating leases are as follows:
| | | | | |
| Dollars in millions | Operating lease payments |
| 2025 | $ | 39 | |
| 2026 | 30 | |
| 2027 | 21 | |
| 2028 | 12 | |
| 2029 | 6 | |
| Thereafter | 20 | |
| Total lease payments | $ | 128 | |
| |
The carrying amount of operating lease assets at December 31, 2024 and December 31, 2023, was $224 million and $372 million, respectively.
11. Premises and Equipment
Premises and Equipment
Our premises and equipment consisted of the following:
| | | | | | | | | | | |
| | December 31, |
| Dollars in millions | Useful life (in years) | 2024 | 2023 |
| Land | Indefinite | $ | 111 | | $ | 114 | |
| Buildings and improvements | 15-40 | 644 | | 665 | |
| Leasehold improvements | 1-15 | 556 | | 535 | |
| Furniture and equipment | 2-15 | 787 | | 812 | |
| Capitalized building leases | 1-14 (a) | 18 | | 18 | |
| Construction in process | N/A | 24 | | 61 | |
| Total premises and equipment | | 2,140 | | 2,205 | |
| Less: Accumulated depreciation and amortization | | (1,526) | | (1,544) | |
| Premises and equipment, net | | $ | 614 | | $ | 661 | |
| | | |
(a)Capitalized building and equipment leases are amortized over the lesser of the useful life of asset or lease term.
Depreciation and amortization expense related to premises and equipment for the years ended December 31, 2024, December 31, 2023, and December 31, 2022 was $91 million, $89 million, and $96 million, respectively. This includes amortization of assets under capital leases.
Software
Eligible costs related to computer software developed or obtained for internal use that add functionality, improve efficiency or extend the useful life of a system are capitalized. Amortization of capitalized software begins when it is ready for its intended use, which is after all substantial testing is completed. Capitalized costs are amortized using the straight-line or accelerated method over its useful life. Balances are included in “Accrued income and other assets”.
Key had capitalized software assets, including internally-developed and purchased software and costs associated with certain cloud computing arrangements of $597 million and $520 million and related accumulated amortization of $308 million and $225 million as of December 31, 2024, and December 31, 2023, respectively. This includes in-process software that has not started amortizing. Amortization expense related to internal-use software for the years ended December 31, 2024, December 31, 2023, and December 31, 2022, was $84 million, $78 million, and $77 million, respectively.
12. Goodwill and Other Intangible Assets
Our annual goodwill impairment testing is performed as of October 1 each year, or more frequently as events occur or circumstances change that would more-likely-than-not reduce the fair value of a reporting unit below its carrying amount. The reporting units at which goodwill is tested for impairment are the Consumer Bank, Commercial Bank and Institutional Bank reporting units. The Commercial Bank and Institutional Bank reporting units are aggregated within Key’s overall Commercial Bank reporting segment. As of December 31, 2024, the Commercial Bank and Institutional Bank reporting units were allocated goodwill of $218 million and $715 million, respectively. As of December 31, 2023, the Commercial Bank and Institutional Bank reporting units were allocated goodwill of $800 million and $133 million, respectively. The reallocation of goodwill between the Commercial Bank and Institutional Bank reporting units was a result of the realignment of Key’s business described below. Additional information pertaining to our accounting policy for goodwill and other intangible assets is summarized in Note 1 (“Summary of Significant Accounting Policies”) under the heading “Goodwill and Other Intangible Assets.”
During the first quarter, Key realigned its real estate capital business from its Commercial Bank reporting unit to its Institutional Bank reporting unit. The move was done to align product-based teams to the client-facing businesses they serve with the goal of reducing overhead and complexity and creating a better client experience. This reorganization was identified as a triggering event for purposes of goodwill impairment testing. As a result, interim goodwill impairment tests were performed during the first quarter of 2024 reflecting the reporting units both immediately before and immediately after the realignment, neither of which resulted in impairment. The results of the interim impairment test reflecting the realignment indicated the fair value of each of the three reporting units, Consumer Bank, Commercial Bank, and Institutional Bank, exceeded their respective carrying values by more than 10%. We utilized a combination of market and income approaches to calculate the estimated fair values of our reporting units. We determined in our interim quantitative test that the estimated fair value of the Consumer Bank reporting unit was 18% greater than its carrying amount, the estimated fair value of the Commercial Bank reporting unit was 25% greater than its carrying amount, and the estimated fair value of the Institutional Bank reporting unit was 34% greater than its carrying amount. The carrying amounts of the reporting units represent the average equity based on blended capital for goodwill impairment testing and management reporting purposes. Based on the results of the interim quantitative test, there was no goodwill impairment.
For our annual test, we conducted a qualitative test as of October 1, 2024. This test involved reviewing updated internal forecasts, evaluating market data, assessing reasonableness of critical assumptions used in the last quantitative goodwill impairment test as of February 29, 2024 and considering recent transactions and events that could impact the goodwill at each reporting unit. Key concluded it was not more likely than not that goodwill was impaired as of October 1, 2024, our annual testing date.
Additionally, we monitored events and circumstances during the period from October 1, 2024 through December 31, 2024, including an evaluation of macroeconomic and market factors, industry and banking sector events, Key specific performance indicators and updated management forecasts. Based on these considerations, we concluded that it was not more-likely-than-not that the fair value of one or more of the reporting units is below its respective carrying value as of December 31, 2024.
Changes in the carrying amount of goodwill by reporting segment are presented in the following table:
| | | | | | | | | | | |
| Dollars in millions | Consumer Bank | Commercial Bank | Total |
| BALANCE AT DECEMBER 31, 2022 | $ | 1,819 | | $ | 933 | | $ | 2,752 | |
| | | |
| | | |
| BALANCE AT DECEMBER 31, 2023 | 1,819 | | 933 | | 2,752 | |
| | | |
| | | |
| | | |
| | | |
| | | |
| BALANCE AT DECEMBER 31, 2024 | $ | 1,819 | | $ | 933 | | $ | 2,752 | |
| | | |
As of December 31, 2024, we expect goodwill in the amount of $293 million to be deductible for tax purposes in future periods.
There were no accumulated impairment losses related to any of Key’s reporting units at December 31, 2024, December 31, 2023, and December 31, 2022.
The following table shows the gross carrying amount and the accumulated amortization of intangible assets subject to amortization:
| | | | | | | | | | | | | | | | | |
| | 2024 | | 2023 |
December 31, Dollars in millions | Gross Carrying
Amount | Accumulated
Amortization | | Gross Carrying Amount | Accumulated Amortization |
| Intangible assets subject to amortization: | | | | | |
| Core deposit intangibles | $ | 356 | | $ | 342 | | | $ | 356 | | $ | 326 | |
| PCCR intangibles | 16 | | 16 | | | 16 | | 15 | |
| Other intangible assets | 154 | | 141 | | | 80 | | 56 | |
| Total | $ | 526 | | $ | 499 | | | $ | 452 | | $ | 397 | |
| | | | | |
The following table presents estimated intangible asset amortization expense for the next five years. | | | | | | | | | | | | | | | | | |
| Estimated |
| Dollars in millions | 2025 | 2026 | 2027 | 2028 | 2029 |
| Intangible asset amortization expense | $ | 19 | | $ | 7 | | $ | 1 | | $ | — | | $ | — | |
13. Variable Interest Entities
A VIE is a partnership, limited liability company, trust, or other legal entity that meets any one of the following criteria:
•The entity does not have sufficient equity to conduct its activities without additional subordinated financial support from another party.
•The entity’s investors lack the power to direct the activities that most significantly impact the entity’s economic performance.
•The entity’s equity at risk holders do not have the obligation to absorb losses or the right to receive residual returns.
•The voting rights of some investors are not proportional to their economic interests in the entity, and substantially all of the entity’s activities involve, or are conducted on behalf of, investors with disproportionately few voting rights.
Our significant VIEs are summarized below. We define a “significant interest” in a VIE as a subordinated interest that exposes us to a significant portion, but not the majority, of the VIE’s expected losses or residual returns, even though we do not have the power to direct the activities that most significantly impact the entity’s economic performance.
LIHTC investments. Through KCDC, we have made investments directly and indirectly in LIHTC operating partnerships formed by third parties. As a limited partner in these operating partnerships, we are allocated tax credits and deductions associated with the underlying properties. We have determined that we are not the primary beneficiary of these investments because the general partners have the power to direct the activities that most significantly influence the economic performance of their respective partnerships and have the obligation to absorb expected losses and the right to receive residual returns. As we are not the primary beneficiary of these investments, we do not consolidate them.
Through KCIC, formed as a wholly-owned subsidiary of KeyBank National Association, we create funds that hold interests in LIHTC investments. KCIC is the managing member of the fund. We have determined that we are not the primary beneficiary of the fund because although we have the power to direct the activities that most significantly influence its economic performance, we do not have benefits that could potentially be deemed significant to the fund. Therefore, we do not consolidate the fund.
Our maximum exposure to loss in connection with these partnerships consists of our unamortized investment balance plus any unfunded equity commitments and tax credits claimed but subject to recapture. We had $2.5 billion and $2.3 billion of investments in LIHTC operating partnerships at December 31, 2024, and December 31, 2023, respectively. These investments are recorded in “accrued income and other assets” on our Consolidated Balance Sheets. We do not have any loss reserves recorded related to these investments because we believe the likelihood of any loss is remote. For all legally binding unfunded equity commitments, we increase our recognized investment and recognize a liability. As of December 31, 2024, and December 31, 2023, we had liabilities of $1.4 billion and $1.4 billion, respectively, related to investments in qualified affordable housing projects, which are recorded in “accrued expense and other liabilities” on our Consolidated Balance Sheets. We continue to invest in these LIHTC operating partnerships.
The assets and liabilities presented in the table below convey the size of KCDC’s direct and indirect investments at December 31, 2024, and December 31, 2023. As these investments represent unconsolidated VIEs, the assets and liabilities of the investments themselves are not recorded on our Consolidated Balance Sheets.
| | | | | | | | | | | |
| | Unconsolidated VIEs |
| Dollars in millions | Total Assets | Total Liabilities | Maximum Exposure to Loss |
| December 31, 2024 | | | |
| LIHTC investments | $ | 9,901 | | $ | 4,468 | | $ | 2,996 | |
| December 31, 2023 | | | |
| LIHTC investments | $ | 8,904 | | $ | 3,848 | | $ | 2,768 | |
We had $29 million and $25 million in NMTC investments at December 31, 2024 and December 31, 2023, respectively. These investments are recorded in “accrued income and other assets” on our Consolidated Balance Sheets.
We amortize our LIHTC and NMTC investments over the period that we expect to receive the tax benefits. During the twelve months ended December 31, 2024, we recognized $234 million of amortization, $223 million of tax credits and $56 million of other tax benefits associated with these investments within “income taxes” on our income statement. During the twelve months ended December 31, 2023, we recognized $217 million of amortization, $204 million of tax credits and $52 million of other tax benefits associated with these investments within “income taxes” on our income statement.
Principal investments. Through our principal investing entity, KCC, we have made investments in private equity funds engaged in venture- and growth-oriented investing. As a limited partner to these funds, KCC records these investments at fair value and receives distributions from the funds in accordance with the funds’ partnership agreements. We are not the primary beneficiary of these investments as we do not hold the power to direct the activities that most significantly affect the funds’ economic performance. Such power rests with the funds’ general partners. In addition, we neither have the obligation to absorb the funds’ expected losses nor the right to receive their residual returns. Our voting rights are also disproportionate to our economic interests, and substantially all of the funds’ activities are conducted on behalf of investors with disproportionately few voting rights. Because we are not the primary beneficiary of these investments, we do not consolidate them.
Our maximum exposure to loss associated with indirect principal investments consists of the investments’ fair value plus any unfunded equity commitments. The fair value of our indirect principal investments totaled $14 million and $17 million at December 31, 2024, and December 31, 2023, respectively. These investments are recorded in “other investments” on our Consolidated Balance Sheets. Additional information on indirect principal investments is provided in Note 6 (“Fair Value Measurements”). The table below reflects the size of the private equity funds in which KCC was invested as well as our maximum exposure to loss in connection with these investments at December 31, 2024.
| | | | | | | | | | | |
| | Unconsolidated VIEs |
| Dollars in millions | Total Assets | Total Liabilities | Maximum Exposure to Loss |
| December 31, 2024 | | | |
| Indirect investments | $ | 2,352 | | $ | 3 | | $ | 15 | |
| December 31, 2023 | | | |
| Indirect investments | $ | 2,741 | | $ | 91 | | $ | 18 | |
Through our principal investing entities, we have formed and funded operating entities that provide management and other related services to our investment company funds, which directly invest in portfolio companies. In return for providing services to our direct investment funds, these entities’ receive a minority equity interest in the funds. This minority equity ownership is recorded at fair value on the entities’ financial statements. Additional information on our direct principal investments is provided in Note 6 (“Fair Value Measurements”). While other equity investors manage the daily operations of these entities, we retain the power, through voting rights, to direct the activities of the entities that most significantly impact their economic performance. In addition, we have the obligation to absorb losses and the right to receive residual returns that could potentially be significant to these entities. As a result, we have determined that we are the primary beneficiary of these funds and have consolidated them since formation. The entities had no liabilities at December 31, 2024, and December 31, 2023, and other equity investors have no recourse to our general credit.
Other unconsolidated VIEs. We are involved with other various entities in the normal course of business which we have determined to be VIEs. We have determined that we are not the primary beneficiary of these VIEs because we do not have the power to direct the activities that most significantly impact their economic performance or hold a variable interest that could potentially be significant. The table below shows our assets and liabilities associated with these unconsolidated VIEs at December 31, 2024, and December 31, 2023. These assets are recorded in “accrued income and other assets,” “other investments,” “securities available for sale,” “held-to-maturity securities,” and “loans, net of unearned income” on our Consolidated Balance Sheets. These liabilities are recorded in “accrued expenses and other liabilities” on our Consolidated Balance Sheets. Of the total balance as of December 31, 2024, $303 million related to the purchase of senior notes from a securitization collateralized by sold indirect auto loans. In addition, where we only have a lending arrangement in the normal course of business with unconsolidated VIEs we present the balances related to the lending arrangements in Note 5 (“Asset Quality”).
| | | | | | | | |
| Other unconsolidated VIEs |
| Dollars in millions | Total Assets | Total Liabilities |
| December 31, 2024 | | |
| Other unconsolidated VIEs | $ | 733 | | $ | 1 | |
| December 31, 2023 | | |
| Other unconsolidated VIEs | $ | 1,149 | | $ | 1 | |
14. Income Taxes
Income taxes included in the income statement are summarized below. We file a consolidated federal income tax return.
| | | | | | | | | | | |
Year ended December 31, Dollars in millions | 2024 | 2023 | 2022 |
| Currently payable: | | | |
| Federal | $ | 211 | | $ | 257 | | $ | 368 | |
| State | (3) | | 48 | | 80 | |
| Total currently payable | $ | 208 | | $ | 305 | | $ | 448 | |
| Deferred: | | | |
| Federal | $ | (307) | | $ | (84) | | $ | (14) | |
| State | (44) | | (25) | | (12) | |
| Total deferred | (351) | | (109) | | (26) | |
Total income tax (benefit) expense (a) | $ | (143) | | $ | 196 | | $ | 422 | |
| | | |
(a)There was income tax (benefit) expense on securities transactions of $(445) million in 2024, $(3) million in 2023, and $2 million in 2022. Income tax expense excludes equity- and gross receipts-based taxes, which are assessed in lieu of an income tax in certain states in which we operate. These non-income taxes, which are recorded in “noninterest expense” on the income statement, totaled $32 million in 2024, $34 million in 2023, and $33 million in 2022.
Significant components of our deferred tax assets and liabilities included in “accrued income and other assets” on our Consolidated Balance Sheets, are as follows:
| | | | | | | | |
December 31, Dollars in millions | 2024 | 2023 |
| Allowance for loan and lease losses | $ | 411 | | $ | 422 | |
| Employee benefits | 209 | | 166 | |
| Net unrealized securities losses | 1,045 | | 1,612 | |
| Federal net operating losses and credits | 303 | | 3 | |
| | |
| Non-tax accruals | 109 | | 142 | |
Operating lease liabilities(a) | 127 | | 136 | |
| State net operating losses and credits | 20 | | 1 | |
| Partnership investments | 79 | | 78 | |
| Other | 149 | | 148 | |
| Gross deferred tax assets | 2,452 | | 2,708 | |
| Less: Valuation Allowance | 15 | | 12 | |
| Total deferred tax assets | $ | 2,437 | | $ | 2,696 | |
| | |
| Leasing transactions | $ | 378 | | $ | 446 | |
| State taxes | 76 | | 77 | |
| | |
Operating lease right-of-use assets (a) | 114 | | 119 | |
| Goodwill | 178 | | 157 | |
| Other | 68 | | 82 | |
| Total deferred tax liabilities | 814 | | 881 | |
Net deferred tax assets (liabilities) (b) | $ | 1,623 | | $ | 1,815 | |
| | |
(a)A separate deferred tax asset and liability is recognized for each operating lease item resulting from the adoption of ASC 842 in 2019.
(b)From continuing operations.
We conduct quarterly assessments of all available evidence to determine the amount of deferred tax assets that are more-likely-than-not to be realized, and therefore recorded. The available evidence used in connection with these assessments includes taxable income in prior periods, projected future taxable income, potential tax-planning strategies, and projected future reversals of deferred tax items. These assessments involve a degree of subjectivity and may undergo significant change.
At December 31, 2024, we had net capital loss carryforwards of $15 million for which we have recorded $15 million of valuation allowances. The capital loss carryforwards if not utilized, will expire beginning in 2025. Realization of this tax benefit is dependent upon Key's ability to generate sufficient capital gain in an appropriate tax year to offset the capital loss carryforward. Currently, generation of sufficient gain income is uncertain.
At December 31, 2024, we had federal net operating loss carryforwards of $420 million and federal credit carryforwards of $215 million. Federal net operating loss carryforwards of $7 million are from prior acquisitions by First Niagara and are subject to annual limitations under the tax code and if not utilized, will expire in the years beginning 2027. The remaining $413 million of net operating losses generated in 2024 do not expire. The federal credit carryforward consists of general business credits generated in 2012 of $1 million and 2024 of $214 million, which expire in 2027 and 2039, respectively, under the Internal Revenue Code. We currently expect to fully utilize these losses and credits.
We had state net operating loss carryforwards of $271 million, resulting in a net state deferred tax asset of $11 million and state credit carryforwards of $9 million. We currently expect to fully utilize these losses and credits.
The following table shows how our total income tax expense (benefit) and the resulting effective tax rate were derived: | | | | | | | | | | | | | | | | | | | | | | | | | | |
Year ended December 31, Dollars in millions | 2024 | | 2023 | | 2022 |
| Amount | Rate | | Amount | Rate | | Amount | Rate |
| Income (loss) before income taxes times 21% statutory federal tax rate | $ | (64) | | 21.0 | % | | $ | 244 | | 21.0 | % | | $ | 490 | | 21.0 | % |
| Amortization of tax-advantaged investments | 185 | | (60.6) | | | 171 | | 14.8 | | | 149 | | 6.4 | |
| | | | | | | | |
| | | | | | | | |
| Tax-exempt interest income | (27) | | 8.7 | | | (35) | | (3.1) | | | (28) | | (1.2) | |
| Corporate-owned life insurance income | (29) | | 9.5 | | | (28) | | (2.4) | | | (28) | | (1.2) | |
| | | | | | | | |
| State income tax, net of federal tax benefit | (20) | | 6.6 | | | 18 | | 1.6 | | | 53 | | 2.3 | |
| State income tax rate change, net of federal benefit | (17) | | 5.5 | | | — | | — | | | — | | — | |
| Tax credits | (211) | | 69.1 | | | (196) | | (16.9) | | | (204) | | (8.8) | |
| FDIC Insurance | 25 | | (8.3) | | | 22 | | 1.9 | | | 12 | | .5 | |
| Other | 15 | | (4.9) | | | — | | — | | | (22) | | (.9) | |
| Total income tax expense (benefit) | $ | (143) | | 46.6 | % | | $ | 196 | | 16.9 | % | | $ | 422 | | 18.1 | % |
| | | | | | | | |
Liability for Unrecognized Tax Benefits
The change in our liability for unrecognized tax benefits is as follows:
| | | | | | | | |
Year ended December 31,
Dollars in millions | 2024 | 2023 |
| Balance at beginning of year | $ | 45 | | $ | 40 | |
| Increase for other tax positions of prior years | — | | 5 | |
| Decrease for payments and settlements | (3) | | — | |
| Decrease related to tax positions taken in prior years | (3) | | — | |
| Balance at end of year | $ | 39 | | $ | 45 | |
| | |
Each quarter, we review the amount of unrecognized tax benefits recorded in accordance with the applicable accounting guidance. Any adjustment to unrecognized tax benefits is recorded in income tax expense. The amount of unrecognized tax benefits that, if recognized, would affect our effective tax rate was $39 million at December 31, 2024, and $45 million at December 31, 2023. It is reasonably possible that the balance of unrecognized tax benefits could decrease in the next twelve months due to examinations by various tax authorities or the expiration of statutes of limitations.
As permitted under the applicable accounting guidance, it is our policy to record interest and penalties related to unrecognized tax benefits in income tax expense. We recorded net interest benefit of less than $1 million, $4 million, and $1.5 million in 2024, 2023, and 2022, respectively. We did not recover any state tax penalties in 2024, 2023, or 2022. At December 31, 2024, we had $1 million accrued interest payable, compared to $0.6 million at December 31, 2023.
There were no unrecognized tax benefits presented in the financial statements as a reduction to a deferred tax asset for a net operating loss carryforward, a similar tax loss or a tax credit carryforward, at December 31, 2024 and December 31, 2023, respectively.
The BEPS 2.0/Pillar Two proposals issued by the Organization for Economic Co-operation and Development focus on global profit allocation and a global minimum tax rate. While we continue to analyze the tax implications of BEPS 2.0/Pillar Two, we do not currently anticipate that the implementation of tax laws aligned with the BEPS 2.0/Pillar Two proposals will have a material impact on KeyCorp’s income tax expense.
We file federal income tax returns, as well as returns in various state and foreign jurisdictions. We are subject to income tax examination by the IRS for the tax years 2016, and 2020 and forward. Currently, we are under IRS audit for tax year 2016. We are not subject to income tax examinations by other tax authorities for years prior to 2016.
Pre-1988 Bank Reserves acquired in a business combination
Retained earnings of KeyBank included approximately $92 million of allocated bad debt deductions for which no income taxes have been recorded. Under current federal law, these reserves are subject to recapture into taxable income if KeyBank, or any successor, fails to maintain its bank status under the Internal Revenue Code or makes non-dividend distributions or distributions greater than its accumulated earnings and profits. No deferred tax liability has been established as these events are not expected to occur in the foreseeable future.
15. Discontinued Operations
Discontinued operations includes our government-guaranteed and private education lending business. At December 31, 2024, and December 31, 2023, approximately $257 million and $339 million, respectively, of education loans are included in discontinued assets on our Consolidated Balance Sheets. Net interest income after provision for credit losses for this business is not material and is included in income (loss) from discontinued operations, net of taxes on the consolidated statements of income.
16. Securities Financing Activities
The following table summarizes our securities financing agreements at December 31, 2024, and December 31, 2023:
| | | | | | | | | | | | | | | | | | | | | | | | | | | | | |
| | December 31, 2024 | | December 31, 2023 |
| Dollars in millions | Gross Amount Presented in Balance Sheet | Netting Adjustments (a) | Collateral (b) | Net Amounts | | Gross Amount Presented in Balance Sheet | Netting Adjustments (a) | Collateral (b) | Net Amounts |
| Offsetting of financial assets: | | | | | | | | | |
| Reverse repurchase agreements | $ | 2 | | $ | (2) | | $ | — | | $ | — | | | $ | 7 | | $ | (7) | | $ | — | | $ | — | |
| Securities borrowed | — | | — | | — | | — | | | — | | — | | — | | — | |
| Total | $ | 2 | | $ | (2) | | $ | — | | $ | — | | | $ | 7 | | $ | (7) | | $ | — | | $ | — | |
| | | | | | | | | |
| Offsetting of financial liabilities: | | | | | | | | | |
Repurchase agreements (c) | $ | 14 | | $ | (2) | | $ | (12) | | $ | — | | | $ | 38 | | $ | (7) | | $ | (31) | | $ | — | |
| Total | $ | 14 | | $ | (2) | | $ | (12) | | $ | — | | | $ | 38 | | $ | (7) | | $ | (31) | | $ | — | |
| | | | | | | | | |
(a)Netting adjustments take into account the impact of master netting agreements that allow us to settle with a single counterparty on a net basis.
(b)These adjustments take into account the impact of bilateral collateral agreements that allow us to offset the net positions with the related collateral. The application of collateral cannot reduce the net position below zero. Therefore, excess collateral, if any, is not reflected above.
(c)Repurchase agreements are primarily collateralized by mortgaged-backed agency securities and are contracted on an overnight or continuous basis.
As of December 31, 2024, assets pledged as collateral against repurchase agreements totaled $14 million. Assets pledged as collateral are reported in “available for sale” and “held-to-maturity” securities on the Consolidated Balance Sheets. At December 31, 2024, the liabilities associated with collateral pledged were solely comprised of customer sweep financing activity and had a carrying value of $12 million. The collateral pledged under customer sweep repurchase agreements is posted to a third-party custodian and cannot be sold or repledged by the secured party. The risk related to a decline in the market value of collateral pledged is minimal given the collateral's high credit quality and the overnight duration of the repurchase agreements.
Like other financing transactions, securities financing agreements contain an element of credit risk. To mitigate and manage credit risk exposure, we generally enter into master netting agreements and other collateral arrangements that give us the right, in the event of default, to liquidate collateral held and to offset receivables and payables with the same counterparty. Additionally, we establish and monitor limits on our counterparty credit risk exposure by product type. For the reverse repurchase agreements, we monitor the value of the underlying securities we received from counterparties and either request additional collateral or return a portion of the collateral based on the value of those securities. We generally hold collateral in the form of highly rated securities issued by the U.S. Treasury and fixed income securities. In addition, we may need to provide collateral to counterparties under our repurchase agreements. With the exception of collateral pledged against customer sweep repurchase agreements, the collateral we pledge and receive can generally be sold or repledged by the secured parties.
17. Stock-Based Compensation
We maintain several stock-based compensation plans, which are described below. Total compensation expense for these plans was $104 million for 2024, $121 million for 2023, and $120 million for 2022. The total income tax benefit recognized in the income statement for these plans was $25 million for 2024, $29 million for 2023, and $29 million for 2022.
Our compensation plans allow us to grant stock options, stock appreciation rights, restricted stock, restricted stock units, performance shares, performance units, or other awards which may be denominated or payable in or valued by reference to our Common Shares or other factors, discounted stock purchases, and deferred compensation to eligible employees and directors. In 2019, shareholders approved the 2019 Equity Compensation Plan, under which 71,600,000 shares may be issued as equity awards. In 2023, shareholders approved an Amended and Restated 2019 Equity Compensation Plan, under which the number of shares that may be issued as equity awards was increased by 40,000,000 to 111,600,000. The Compensation and Organization Committee has authority to approve all stock option grants but may delegate some of its authority to grant awards from time to time. The committee has delegated to our Chief Executive Officer the authority to grant equity awards, including stock options, to any employee who is not designated an “officer” for purposes of Section 16 of the Exchange Act. No more than 3,000,000 Common Shares may be issued under this authority.
At December 31, 2024, we had 29,269,060 Common Shares available for future grant under our compensation plans. In accordance with a resolution adopted by the Compensation and Organization Committee of KeyCorp’s
Board of Directors, we may not grant options to purchase Common Shares, restricted stock or other shares under any long-term compensation plan in an aggregate amount that exceeds 6% of our outstanding Common Shares in any rolling three-year period.
Stock Options
Stock options granted to employees generally become exercisable at the rate of 25% per year. No option granted by KeyCorp will be exercisable less than one year after, or expire later than ten years from, the grant date. The exercise price is 100-110% of the closing price of our Common Shares on the grant date (or the prior business day if the grant date is not a business day).
We determine the fair value of options granted using the Black-Scholes option-pricing model. This model was originally developed to determine the fair value of exchange-traded equity options, which (unlike employee stock options) have no vesting period or transferability restrictions. Because of these differences, the Black-Scholes model does not precisely value an employee stock option, but it is commonly used for this purpose. The model assumes that the estimated fair value of an option is amortized as compensation expense over the option’s vesting period.
The Black-Scholes model requires several assumptions, which we developed and update based on historical trends and current market observations. Our determination of the fair value of options is only as accurate as the underlying assumptions. The assumptions pertaining to options issued during 2024, 2023, and 2022 are shown in the following table.
| | | | | | | | | | | |
| Year ended December 31, | 2024 | 2023 | 2022 |
| Average option life | 7.0 years | 6.7 years | 6.5 years |
| Future dividend yield | 5.75 | % | 4.28 | % | 3.01 | % |
| Historical share price volatility | .422 | | .347 | | .341 | |
| Weighted-average risk-free interest rate | 4.2 | % | 3.9 | % | 2.0 | % |
The following table summarizes activity, pricing and other information for our stock options for the year ended December 31, 2024:
| | | | | | | | | | | | | | |
| Number of Options | Weighted-Average Exercise Price Per Option | Weighted-Average
Remaining Life (in years) | Aggregate Intrinsic Value(a) |
| Outstanding at December 31, 2023 | 4,859,453 | | $ | 18.28 | | 4.8 | $ | 4 | |
| Granted | 611,508 | | 15.48 | | | |
| Exercised | (819,268) | | 13.54 | | | |
| Lapsed or canceled | (272,920) | | 19.08 | | | |
| Outstanding at December 31, 2024 | 4,378,773 | | $ | 18.73 | | 4.6 | $ | 5 | |
| | | | |
| Expected to vest | 1,212,875 | | 19.74 | | 7.9 | 1 | |
| Exercisable at December 31, 2024 | 3,120,163 | | $ | 18.35 | | 3.3 | $ | 4 | |
(a)The intrinsic value of a stock option is the amount by which the fair value of the underlying stock exceeds the exercise price of the option.
The weighted-average grant-date fair value of options was $3.43 for options granted during 2024, $4.23 for options granted during 2023, and $5.78 for options granted during 2022. Stock option exercises numbered 819,268 in 2024, 134,484 in 2023, and 484,521 in 2022. The aggregate intrinsic value of exercised options was $3 million for 2024, $1 million for 2023, and $5 million for 2022. As of December 31, 2024, unrecognized compensation cost related to nonvested options under the plans totaled $1 million. We expect to recognize this cost over a weighted-average period of 2.1 years.
Cash received from options exercised was $10 million, $1 million, and $6 million in 2024, 2023, and 2022, respectively. The actual tax benefit realized for the tax deductions from options exercised was less than $1 million in 2024 and less than $1 million in 2023.
Long-Term Incentive Compensation Program
Our Long-Term Incentive Compensation Program (the “Program”) rewards senior executives and other employees critical to our long-term financial success. Awards are granted annually in a variety of forms:
•deferred cash payments that generally vest and are payable at the rate of 25% per year;
•time-lapsed (service condition) restricted stock units payable in stock, which generally vest at the rate of 25% per year;
•performance units payable in stock, which vest at the end of the three-year performance cycle and will not vest unless Key attains defined performance levels and the service condition is met; and
•performance units payable in cash, which vest at the end of the three-year performance cycle and will not vest unless Key attains defined performance levels and the service condition is met.
During 2024, 30,323 performance units vested that were payable in stock and 1,556,149 performance units vested that were payable in cash. The total fair value of the performance units that vested in stock and cash during 2024 totaled $1 million and $22 million, respectively. During 2023, 28,008 performance units vested that were payable in stock and 1,778,941 performance units vested that were payable in cash. The total fair value of the performance units that vested in stock and cash during 2023 totaled $1 million and $32 million, respectively.
The following table summarizes activity and pricing information for the nonvested shares in the Program for the year ended December 31, 2024.
| | | | | | | | | | | | | | | | | | | | | | | | | | |
| | Vesting Contingent on Service Conditions | | Vesting Contingent on Performance and Service Conditions - Payable in Stock | | Vesting Contingent on Performance and Service Conditions - Payable in Cash |
| | Number of Nonvested Shares | Weighted- Average Grant-Date Fair Value | | Number of Nonvested Shares | Weighted- Average Grant-Date Fair Value | | Number of
Nonvested
Shares | Weighted-
Average
Grant-Date
Fair Value |
| Outstanding at December 31, 2023 | 12,856,041 | | $ | 20.97 | | | 30,323 | | $ | 19.07 | | | 5,583,290 | | $ | 14.67 | |
| Granted | 8,098,908 | | 14.07 | | | 1,440,087 | | — | | | 1,636,720 | | 19.52 | |
| Vested | (5,175,689) | | 20.68 | | | (30,323) | | 19.07 | | | (1,556,149) | | 14.24 | |
| Forfeited | (783,759) | | 18.47 | | | — | | — | | | (242,920) | | 15.78 | |
| Outstanding at December 31, 2024 | 14,995,501 | | $ | 17.66 | | | 1,440,087 | | $ | — | | | 5,420,941 | | $ | 19.70 | |
| | | | | | | | |
The compensation cost of time-lapsed and performance-based restricted stock or unit awards granted under the Program is calculated using the closing trading price of our Common Shares on the grant date (or the prior business day if the grant date is not a business day).
Unlike time-lapsed and performance-based restricted stock or units, we do not pay dividends during the vesting period for performance shares or units that may become payable in excess of targeted performance.
The weighted-average grant-date fair value of awards granted under the Program was $13.06 during 2024, $17.81 during 2023, and $23.39 during 2022. As of December 31, 2024, unrecognized compensation cost related to nonvested shares under the Program totaled $92 million. We expect to recognize this cost over a weighted-average period of 2.4 years. The total fair value of shares vested was $130 million in 2024, $133 million in 2023, and $144 million in 2022.
Deferred Compensation and Other Restricted Stock Awards
Our deferred compensation arrangements include voluntary and mandatory deferral programs for Common Shares awarded to certain employees and directors. Mandatory deferred incentive awards vest at the rate of 25% per year beginning one year after the deferral date. Deferrals under the voluntary programs are immediately vested.
We also may grant, upon approval by the Compensation and Organization Committee (or our Chief Executive Officer with respect to their delegated authority), other time-lapsed restricted stock or unit awards under various programs to recognize outstanding performance.
The following table summarizes activity and pricing information for the nonvested shares granted under our deferred compensation plans and these other restricted stock or unit award programs for the year ended December 31, 2024.
| | | | | | | | |
| Number of Nonvested Shares | Weighted-Average Grant-Date Fair Value |
| Outstanding at December 31, 2023 | 2,602,867 | | $ | 17.71 | |
| Granted | 632,950 | | 15.69 | |
| | |
| Vested | (910,606) | | 19.79 | |
| Forfeited | (28,948) | | 24.74 | |
| Outstanding at December 31, 2024 | 2,296,263 | | $ | 16.28 | |
| | |
The weighted-average grant-date fair value of awards granted was $15.69 during 2024, $12.93 during 2023, and $20.11 during 2022. As of December 31, 2024, unrecognized compensation cost related to nonvested shares granted under our deferred compensation plans and the other restricted stock or unit award programs totaled $10 million. We expect to recognize this cost over a weighted-average period of 2.8 years. The total fair value of shares vested was $18 million in 2024, $20 million in 2023, and $21 million in 2022.
Discounted Stock Purchase Plan
Our Discounted Stock Purchase Plan provides employees the opportunity to purchase our Common Shares at a 10% discount through payroll deductions. Purchases are limited to $10,000 in any month and $50,000 in any calendar year, and are immediately vested. To accommodate employee purchases, we issue treasury shares on or around the fifteenth day of the month following the month employee payments are received. We issued 459,778 Common Shares at a weighted-average cost to employees of $13.96 during 2024, 720,280 Common Shares at a weighted-average cost to employees of $10.62 during 2023, and 422,844 Common Shares at a weighted-average cost to employees of $17.46 during 2022.
Information pertaining to our method of accounting for stock-based compensation is included in Note 1 (“Summary of Significant Accounting Policies”) under the heading “Stock-Based Compensation.”
18. Employee Benefits
Pension Plans and Other Postretirement Benefit Plans
Key maintains a qualified cash balance pension plan and other nonqualified defined benefit plans. These plans are frozen and closed to new employees. We continue to credit participants’ existing account balances for interest until they receive their plan benefits. Plans provide benefits based upon length of service and compensation levels.
We also sponsor a retiree healthcare plan in which all employees age 55 with five years of service (or employees age 50 with 15 years of service who are terminated under conditions that entitle them to a severance benefit) are eligible to participate. Participant contributions are adjusted annually. Key may provide a subsidy toward the cost of coverage for certain employees hired before 2001 with a minimum of 15 years of service at the time of termination. We use a separate VEBA trust to fund the retiree healthcare plan.
Key utilizes its fiscal year-end as the measurement date for its pension and other postretirement employee benefit plans. Actuarial gains and losses are deferred and amortized over the future service periods of active employees. We determine the expected return on plan assets using a calculated market-related value of plan assets. Gain or loss amounts in AOCI are only amortized to the extent that they exceed 10% of the greater of the market-related value or the projected benefit obligation.
During 2024, Key did not recognize a settlement loss. In 2023, and 2022, we recognized a settlement loss for lump sum payments made under certain pension plans. In accordance with the applicable accounting guidance for defined benefit plans, we performed a remeasurement of the affected plans in conjunction with the settlement and recognized the settlement loss reflected in the following table.
Net pension cost is recorded within “other expense.” The components of net pension cost and the amount recognized in OCI for all funded and unfunded pension plans and postretirement benefit plan are as follows:
| | | | | | | | | | | | | | | | | | | | | | | |
Year ended December 31, Dollars in millions | Pension Plans | | Postretirement Benefit Plan |
| 2024 | 2023 | 2022 | | 2024 | 2023 | 2022 |
| Interest cost on PBO | $ | 41 | | $ | 45 | | $ | 27 | | | $ | 2 | | $ | 2 | | $ | 2 | |
| Expected return on plan assets | (39) | | (42) | | (27) | | | (2) | | (2) | | (2) | |
| Amortization of losses (gains) | 9 | | 9 | | 15 | | | (1) | | (1) | | (1) | |
| Amortization of prior service credit | — | | — | | — | | | (1) | | (1) | | (1) | |
| Settlement loss | — | | 18 | | 12 | | | — | | — | | — | |
| Net pension cost | $ | 11 | | $ | 30 | | $ | 27 | | | $ | (2) | | $ | (2) | | $ | (2) | |
| | | | | | | |
| Other changes in plan assets and benefit obligations recognized in OCI: | | | | | | | |
| Net (gain) loss | $ | 26 | | $ | 26 | | $ | 31 | | | $ | 1 | | $ | 1 | | $ | 1 | |
| Amortization of (gains) | 6 | | (27) | | (27) | | | — | | — | | — | |
| Amortization of prior service credit | — | | — | | — | | | 1 | | 1 | | 1 | |
| Total recognized in comprehensive income | $ | 32 | | $ | (1) | | $ | 4 | | | $ | 2 | | $ | 2 | | $ | 2 | |
| | | | | | | |
| Total recognized in net pension cost and comprehensive income | $ | 43 | | $ | 29 | | $ | 31 | | | $ | — | | $ | — | | $ | — | |
| | | | | | | |
The information related to our pension plans and postretirement benefit plan presented in the following tables is based on current actuarial reports using measurement dates of December 31, 2024, and December 31, 2023.
The following table summarizes changes in the PBO and changes in the FVA related to our pension plans and post retirement benefit plan. Actuarial gains in 2024 associated with the pension plans were primarily driven by an increase in discount rates. Actuarial losses in 2024 associated with the postretirement benefit plan are a result of asset performance.
| | | | | | | | | | | | | | | | | |
Year ended December 31, Dollars in millions | Pension Plans | | Postretirement Benefit Plan |
| 2024 | 2023 | | 2024 | 2023 |
| PBO at beginning of year | $ | 923 | | $ | 965 | | | $ | 40 | | $ | 40 | |
| Interest cost | 41 | | 45 | | | 2 | | 2 | |
| Actuarial losses (gains) | (34) | | 10 | | | 6 | | 6 | |
| Plan participants’ contributions | — | | — | | | 1 | | 1 | |
| Benefit payments | (84) | | (97) | | | (8) | | (9) | |
| | | | | |
| PBO at end of year | $ | 846 | | $ | 923 | | | $ | 41 | | $ | 40 | |
| | | | | |
| FVA at beginning of year | $ | 827 | | $ | 886 | | | $ | 40 | | $ | 40 | |
| Actual return on plan assets | 49 | | $ | 25 | | | 8 | | $ | 8 | |
| Employer contributions | 13 | | $ | 13 | | | — | | $ | — | |
| Plan participants’ contributions | — | | $ | — | | | 1 | | $ | 1 | |
| Benefit payments | (84) | | $ | (97) | | | (8) | | $ | (9) | |
| FVA at end of year | $ | 805 | | $ | 827 | | | $ | 41 | | $ | 40 | |
| | | | | |
The following table summarizes the funded status of the pension plans, which equals the amounts recognized in the balance sheets at December 31, 2024, and December 31, 2023, as well as the amount of pre-tax AOCI not yet recognized as net pension cost for the pension plans and postretirement benefit plan. The postretirement benefit plan’s PBO equaled its FVA at both December 31, 2024, and December 31, 2023. Therefore, no asset or liability was recognized on our Consolidated Balance Sheets with respect to that plan.
| | | | | | | | | | | | | | | | | |
December 31, Dollars in millions | Pension Plans | | Postretirement Benefit Plan |
| 2024 | 2023 | | 2024 | 2023 |
Funded status (a) | $ | (40) | | $ | (95) | | | | |
| | | | | |
| Net prepaid pension cost recognized consists of: | | | | | |
| Noncurrent assets | $ | 80 | | $ | 34 | | | | |
| Current liabilities | (13) | | (14) | | | | |
| Noncurrent liabilities | (107) | | (115) | | | | |
Net prepaid pension cost recognized (b) | $ | (40) | | $ | (95) | | | | |
| | | | | |
| Net unrecognized losses (gains) | $ | 415 | | $ | 384 | | | $ | (8) | | $ | (9) | |
| Net unrecognized prior service credit | — | | — | | | (9) | | (11) | |
| Total unrecognized AOCI | $ | 415 | | $ | 384 | | | $ | (17) | | $ | (20) | |
| | | | | |
(a)The shortage of the FVA under the PBO.
(b)Represents the accrued benefit liability of the pension plans.
At December 31, 2024, our primary qualified cash balance pension plan was sufficiently funded under the requirements of ERISA. Consequently, we are not required to make a minimum contribution to that plan in 2025. We also do not expect to make any significant discretionary contributions during 2025. There are no regulations that require contributions to the VEBA trust that funds our retiree healthcare plan, so there is no minimum funding
requirement. We are permitted to make discretionary contributions to the VEBA trust, subject to certain IRS restrictions and limitations. We anticipate that our discretionary contributions in 2025, if any, will be minimal.
At December 31, 2024, we expect to pay the benefits from all funded and unfunded pension plans and postretirement benefit plan as follows:
| | | | | | | | |
| Dollars in millions | Pension Plans | Postretirement Benefit Plan |
| 2025 | $ | 82 | | $ | 5 | |
| 2026 | 79 | | 5 | |
| 2027 | 78 | | 4 | |
| 2028 | 77 | | 4 | |
| 2029 | 74 | | 4 | |
| 2030-2034 | 339 | | 17 | |
The ABO for all of our pension plans was $845 million at December 31, 2024, and $922 million at December 31, 2023. As indicated in the table below, collectively our pension plans had an ABO in excess of plan assets as follows:
| | | | | | | | | | | | | | |
| December 31, | 2024 | 2023 |
| Dollars in millions | Cash Balance Pension Plan | Other Defined Benefit Plans | Cash Balance Pension Plan | Other Defined Benefit Plans |
| PBO | $ | 725 | | $ | 121 | | $ | 793 | | $ | 128 | |
| ABO | 725 | | 121 | | 793 | | 128 | |
| Fair value of plan assets | 805 | | — | | 827 | | — | |
To determine the actuarial present value of benefit obligations, we assumed the following weighted-average rates.
| | | | | | | | |
| December 31, | 2024 | 2023 |
| Pension Plans: | | |
| Discount rate | 5.33 | % | 4.68 | % |
| | |
| Weighted-average interest crediting rate | 4.74 | % | 4.09 | % |
| Postretirement Benefit Plan: | | |
| Discount rate | 4.50 | % | 4.50 | % |
To determine net pension cost, we assumed the following weighted-average rates.
| | | | | | | | | | | |
| Year ended December 31, | 2024 | 2023 | 2022 |
| Pension Plans: | | | |
| Discount rate | 4.68 | % | 4.85 | % | 2.43 | % |
| | | |
| Expected return on plan assets | 4.50 | % | 4.50 | % | 2.75 | % |
| Postretirement Benefit Plan: | | | |
| Discount rate | 4.50 | % | 4.50 | % | 4.50 | % |
| Expected return on plan assets | 4.50 | % | 4.50 | % | 4.50 | % |
We estimate that we will recognize $7 million in net pension cost for 2025 related to our pension plans. We estimate that a 25 basis point increase or decrease in the expected return on plan assets would change our net pension cost for 2025 by approximately $2.1 million. Pension cost also is affected by an assumed discount rate. We estimate that a 25 basis point change in the assumed discount rate would change net pension cost for 2025 by approximately $1 million.
We expect to recognize a $2 million credit in net postretirement benefit cost for 2025 related to our postretirement benefit plan. The realized net investment income for the postretirement healthcare plan VEBA trust is subject to federal income taxes, which are reflected in the weighted-average expected return on plan assets shown above. Assumed healthcare cost trend rates do not have a material impact on net postretirement benefit cost or obligations since the postretirement plan has cost-sharing provisions and benefit limitations
Pension Plan Assets
The expected return on plan assets for our qualified cash balance pension plan is determined by considering a number of factors, the most significant of which are:
•Our expectations for returns on plan assets over the long term, weighted for the investment mix of the assets. These expectations consider, among other factors, historical capital market returns of equity, fixed income, convertible, and other securities, and forecasted returns that are modeled under various economic scenarios.
•Historical returns on our plan assets. Based on an annual reassessment of current and expected future capital market returns, our expected return on plan assets for estimating the year-end pension benefit obligation of our qualified cash balance pension plan was 5.25% for 2024, 4.5% for 2023 and 4.5% for 2022. We deemed a rate of 4.50% to be appropriate in estimating 2024 pension cost.
The investment objectives of the pension fund are developed to reflect the characteristics of the plan, such as pension formulas, cash lump sum distribution features, and the liability profiles of the plan’s participants. An executive oversight committee reviews the plan’s investment performance at least quarterly, and compares performance against appropriate market indices. The pension fund’s investment objectives are to balance total return objectives with a continued management of plan liabilities, and to minimize the mismatch between assets and liabilities. The following table shows the asset target allocations prescribed by the pension fund’s investment policies based on the plan’s funded status at December 31, 2024. | | | | | |
| Target Allocation |
| Asset Class | 2024 |
| |
| |
| Global equity | 16 | % |
| Fixed income | 84 | |
| |
| |
| Total | 100 | % |
| | |
Investments consist of mutual funds, collective investment funds and insurance investments that invest in underlying assets in accordance with the target asset allocations shown above. Although the pension funds’ investment policies conditionally permit the use of derivative contracts, we have not entered into any such contracts, and we do not expect to employ such contracts in the future.
The valuation methodologies used to measure the fair value of pension plan assets vary depending on the type of asset, as described below. For an explanation of the fair value hierarchy, see Note 1 (“Summary of Significant Accounting Policies”) under the heading “Fair Value Measurements.”
Mutual funds. Exchange-traded mutual funds listed or traded on securities exchanges are valued at the closing price on the exchange or system where the security is principally traded. These securities are classified as Level 1 because quoted prices for identical securities in active markets are available. Non exchange-traded mutual funds are classified as Level 2.
Collective investment funds. Investments in collective investment funds are valued using the net asset value practical expedient and are not classified within the fair value hierarchy. Fair value is determined based on Key’s proportionate share of total net assets in the fund.
Insurance investment contracts and pooled separate accounts. Deposits under insurance investment contracts and pooled separate accounts with insurance companies do not have readily determinable fair values and are valued using a methodology that is consistent with accounting guidance that allows the plan to estimate fair value based upon net asset value per share (or its equivalent, such as member units or an ownership in partners’ capital to which a proportionate share of net assets is attributed); thus, these investments are not classified within the fair value hierarchy.
The following tables show the fair values of our pension plan assets by asset class at December 31, 2024, and December 31, 2023.
| | | | | | | | | | | | | | |
| December 31, 2024 | | | | |
| Dollars in millions | Level 1 | Level 2 | Level 3 | Total |
| ASSET CLASS | | | | |
| | | | |
| | | | |
| | | | |
| | | | |
| | | | |
| | | | |
| | | | |
| | | | |
| | | | |
| | | | |
| | | | |
| Mutual funds: | | | | |
| | | | |
| | | | |
| Fixed income — U.S. | $ | — | | $ | 324 | | $ | — | | $ | 324 | |
| | | | |
| | | | |
Collective investment funds (measured at NAV) (a) | — | | — | | — | | 459 | |
Insurance investment contracts and pooled separate accounts (measured at NAV) (a) | — | | — | | — | | 22 | |
| | | | |
| Total net assets at fair value | $ | — | | $ | 324 | | $ | — | | $ | 805 | |
| | | | |
(a)Certain investments that are measured at fair value using the net asset value per share (or its equivalent) practical expedient have not been classified in the fair value hierarchy. The fair value amounts presented in this table are intended to permit reconciliation of the fair value hierarchy to the fair value of plan assets presented elsewhere within this footnote.
| | | | | | | | | | | | | | |
| December 31, 2023 | | | | |
| Dollars in millions | Level 1 | Level 2 | Level 3 | Total |
| ASSET CLASS | | | | |
| | | | |
| | | | |
| | | | |
| | | | |
| | | | |
| | | | |
| | | | |
| | | | |
| | | | |
| | | | |
| | | | |
| Mutual funds: | | | | |
| | | | |
| | | | |
| Fixed income — U.S. | $ | — | | $ | 342 | | $ | — | | $ | 342 | |
| | | | |
| | | | |
Collective investment funds (measured at NAV) (a) | — | | — | | — | | 465 | |
Insurance investment contracts and pooled separate accounts (measured at NAV) (a) | — | | — | | — | | 20 | |
| | | | |
| Total net assets at fair value | $ | — | | $ | 342 | | $ | — | | $ | 827 | |
| | | | |
(a)Certain investments that are measured at fair value using the net asset value per share (or its equivalent) practical expedient have not been classified in the fair value hierarchy. The fair value amounts presented in this table are intended to permit reconciliation of the fair value hierarchy to the fair value of plan assets presented elsewhere within this footnote.
Postretirement Benefit Plan Assets
We estimate the expected returns on plan assets for the VEBA trust much the same way we estimate returns on our pension funds. The primary investment objectives of the VEBA trust are to obtain a market rate of return, take into consideration the safety and/or risk of the investment, and to diversify the portfolio in order to satisfy the trust’s anticipated liquidity requirements. The following table shows the asset target allocations prescribed by the trust’s investment policy. | | | | | |
| Target Allocation |
| Asset Class | 2024 |
| U.S. equity securities | 64 | % |
| International equity securities | 16 | |
| Fixed income securities | 20 | |
| |
| Total | 100 | % |
| | |
Investments consist of mutual funds and other assets that invest in underlying assets in accordance with the target asset allocations shown above. Exchange-traded mutual funds are valued using quoted prices and, therefore, are classified as Level 1. Investments in other assets are valued using the Net Asset Value practical expedient and are not classified within the fair value hierarchy. These investments do not have readily determinable fair values and are valued using a methodology consistent with accounting guidance that allows the plan to estimate fair value based upon net asset value per share (or its equivalent, such as member units or an ownership in partners’ capital to which a proportionate share of net assets is attributed).
The following tables show the fair values of our postretirement plan assets by asset class at December 31, 2024, and December 31, 2023.
| | | | | | | | | | | | | | |
| December 31, 2024 | | | | |
| Dollars in millions | Level 1 | Level 2 | Level 3 | Total |
| ASSET CLASS | | | | |
| Mutual funds: | | | | |
| Equity — U.S. | $ | 26 | | $ | — | | $ | — | | $ | 26 | |
| Equity — International | 6 | | — | | — | | 6 | |
| Fixed income — U.S. | 8 | | — | | — | | 8 | |
| | | | |
| | | | |
| | | | |
| | | | |
Other assets (measured at NAV)(a) | — | | — | | — | | 1 | |
| Total net assets at fair value | $ | 40 | | $ | — | | $ | — | | $ | 41 | |
| | | | |
(a)Certain investments that are measured at fair value using the net asset value per share (or its equivalent) practical expedient have not been classified in the fair value hierarchy. The fair value amounts presented in this table are intended to permit reconciliation of the fair value hierarchy to the fair value of plan assets presented elsewhere within this footnote.
| | | | | | | | | | | | | | |
| December 31, 2023 | | | | |
| Dollars in millions | Level 1 | Level 2 | Level 3 | Total |
| ASSET CLASS | | | | |
| Mutual funds: | | | | |
| Equity — U.S. | $ | 24 | | $ | — | | $ | — | | $ | 24 | |
| Equity — International | 7 | | — | | — | | 7 | |
| Fixed income — U.S. | 8 | | — | | — | | 8 | |
| | | | |
| | | | |
| | | | |
| Other assets (measured at NAV) | — | | — | | — | | 1 | |
| Total net assets at fair value | $ | 39 | | $ | — | | $ | — | | $ | 40 | |
| | | | |
(a)Certain investments that are measured at fair value using the net asset value per share (or its equivalent) practical expedient have not been classified in the fair value hierarchy. The fair value amounts presented in this table are intended to permit reconciliation of the fair value hierarchy to the fair value of plan assets presented elsewhere within this footnote.
Employee 401(k) Savings Plan
A substantial number of our employees are covered under a savings plan that is qualified under Section 401(k) of the Internal Revenue Code. The plan permits employees to contribute from 1% to 100% of eligible compensation, with up to 7% being eligible for matching contributions in 2024. The plan also permits us to provide a discretionary annual profit sharing contribution to eligible employees who have at least one year of service. We did not accrue profit sharing contributions for 2024, 2023 or 2022. We also maintain a deferred savings plan that provides certain employees with benefits they otherwise would not have been eligible to receive under the qualified plan once their compensation for the plan year reached the IRS contribution limits. Total expense associated with the above plans was $145 million in 2024, $99 million in 2023, and $82 million in 2022.
19. Short-Term Borrowings
Selected financial information pertaining to the components of our short-term borrowings is as follows:
| | | | | | | | | | | |
| December 31, | | | |
| Dollars in millions | 2024 | 2023 | 2022 |
| FEDERAL FUNDS PURCHASED | | | |
| Balance at year end | $ | — | | $ | — | | $ | 4,006 | |
| Average during the year | 67 | | 1,098 | | 1,490 | |
| Maximum month-end balance | — | | 3,020 | | 5,872 | |
| Weighted-average rate during the year | 5.29 | % | 4.83 | % | 2.04 | % |
| Weighted-average rate at December 31 | — | | — | | 4.18 | |
| SECURITIES SOLD UNDER REPURCHASE AGREEMENTS | | | |
| Balance at year end | $ | 14 | | $ | 38 | | $ | 71 | |
| Average during the year | 36 | | 549 | | 617 | |
| Maximum month-end balance | 44 | | 1,954 | | 1,090 | |
| Weighted-average rate during the year | 2.61 | % | 4.77 | % | 1.66 | % |
| Weighted-average rate at December 31 | 3.15 | | 1.63 | | 3.74 | |
| OTHER SHORT-TERM BORROWINGS | | | |
| Balance at year end | $ | 2,130 | | $ | 3,053 | | $ | 5,386 | |
| Average during the year | 2,984 | | 5,890 | | 2,963 | |
| Maximum month-end balance | 6,794 | | 1,061 | | 11,372 | |
| Weighted-average rate during the year | 5.49 | % | 5.24 | % | 1.82 | % |
| Weighted-average rate at December 31 | 4.95 | | 5.58 | | .50 | |
As described below and in Note 20 (“Long-Term Debt”), KeyCorp and KeyBank have a number of programs and facilities that support our short-term financing needs. Certain subsidiaries maintain credit facilities with third parties, which provide alternative sources of funding. KeyCorp is the guarantor of some of the third-party facilities.
Short-term credit facilities. We maintain cash on deposit in our Federal Reserve account, which can reduce our need to obtain funds through various short-term unsecured money market products. This account, which was maintained at $17.4 billion at December 31, 2024, and the unpledged securities in our investment portfolio provide a buffer to address unexpected short-term liquidity needs. We also have secured borrowing facilities at the FHLB and the Federal Reserve Bank of Cleveland to satisfy short-term liquidity requirements. As of December 31, 2024, our unused secured borrowing capacity was $36.7 billion at the Federal Reserve Bank of Cleveland and $18.9 billion at the FHLB.
20. Long-Term Debt
The following table presents the components of our long-term debt, net of unamortized discounts and adjustments related to hedging with derivative financial instruments. We use interest rate swaps and caps, which modify the repricing characteristics of certain long-term debt, to manage interest rate risk. For more information about such financial instruments, see Note 8 (“Derivatives and Hedging Activities”).
| | | | | | | | |
| December 31, | | |
| Dollars in millions | 2024 | 2023 |
Senior medium-term notes due through 2035 (a) | $ | 4,251 | | $ | 3,870 | |
2.075% Subordinated notes due 2028 (b) | 162 | | 162 | |
6.875% Subordinated notes due 2029 (b) | 89 | | 91 | |
7.75% Subordinated notes due 2029 (b) | 114 | | 117 | |
| Other variable rate notes due 2025 | 599 | | — | |
| | |
Other subordinated notes (b)(c) | 79 | | 77 | |
| Total parent company | 5,294 | | 4,317 | |
Senior medium-term notes due through 2039 (d) | 4,308 | | 5,519 | |
4.39% Senior remarketable notes due 2027 (e) | 232 | | 214 | |
| | |
3.40% Subordinated notes due 2026 (f) | 580 | | 569 | |
6.95% Subordinated notes due 2028 (f) | 285 | | 286 | |
3.90% Subordinated notes due 2029 (f) | 329 | | 333 | |
4.90% Subordinated notes due 2032 (f) | 675 | | 695 | |
Secured borrowings due through 2032 (g) | 88 | | 11 | |
Federal Home Loan Bank advances due through 2041 (h) | 79 | | 7,586 | |
Investment Fund Financing due through 2055 (i) | 24 | | 24 | |
| Revolving loans due through 2027 | 211 | | — | |
| | |
| | |
| Total subsidiaries | 6,811 | | 15,237 | |
| Total long-term debt | $ | 12,105 | | $ | 19,554 | |
| | |
(a)Senior medium-term notes had a weighted-average interest rate of 1.57% at December 31, 2024, and 2.31% at December 31, 2023. These notes had fixed interest rates at December 31, 2024, and December 31, 2023. Certain of these notes may be redeemed prior to their maturity dates.
(b)See Note 21 (“Trust Preferred Securities Issued by Unconsolidated Subsidiaries”) for a description of these notes.
(c)The First Niagara variable rate trust preferred securities had a weighted-average interest rate of 6.22% at December 31, 2024, and 7.14% at December 31, 2023. These notes may be redeemed prior to their maturity dates.
(d)Senior medium-term notes had weighted-average interest rates of 4.64% at December 31, 2024, and 4.88% at December 31, 2023. These notes are a combination of fixed and floating rates. These notes may not be redeemed prior to their maturity dates.
(e)The remarketable senior medium-term notes had a weighted-average interest rate of 4.39% at both December 31, 2024 and December 31, 2023. These notes had fixed interest rates at December 31, 2024, and December 31, 2023. These notes may not be redeemed prior to their maturity dates.
(f)These notes are all obligations of KeyBank. Only medium term notes due 2027 may be redeemed prior to maturity date.
(g)This includes $3 million of Capital Lease financing debt with maturity dates ranging from October 1, 2025 to October 1, 2032. This category of debt consists primarily of non-recourse debt collateralized by leased equipment under operating, direct financing and sales-type leases. Additional information pertaining to these commercial lease financing receivables is included in Note 4 (“Loan Portfolio”). This also includes $3 million of capital leases acquired in the First Niagara merger with a maturity range from March 2022 through October 2032.
(h)Long-term advances from the Federal Home Loan Bank had a weighted-average interest rate of 3.12% at December 31, 2024, and 5.76% at December 31, 2023. These advances, which had fixed interest rates, were secured by real estate loans and securities totaling $79 million at December 31, 2024, and $7.6 billion at December 31, 2023.
(i)Investment Fund Financing with maturity dates of September 1, 2048 and April 29, 2055, respectively.
At December 31, 2024, scheduled principal payments on long-term debt were as follows:
| | | | | | | | | | | |
| Dollars in millions | Parent | Subsidiaries | Total |
| 2025 | $ | 1,094 | | $ | 1,928 | | $ | 3,022 | |
| 2026 | — | | 1,215 | | 1,215 | |
| 2027 | 738 | | 1,303 | | 2,041 | |
| 2028 | 882 | | 296 | | 1,178 | |
| 2029 | 842 | | 340 | | 1,182 | |
| All subsequent years | 1,738 | | 1,729 | | 3,467 | |
As described below, KeyBank and KeyCorp have a number of programs that support our long-term financing needs.
Global bank note program. On December 13, 2024, KeyBank updated its Bank Note Program authorizing the issuance of up to $20 billion of notes. Under the program, KeyBank is authorized to issue notes with original maturities of seven days or more for senior notes or five years or more for subordinated notes. Notes will be denominated in U.S. dollars. Amounts outstanding under the program and any prior bank note programs are classified as “long-term debt” on our Consolidated Balance Sheets.
On January 26, 2023, KeyBank issued the following notes under the bank note program: $1.0 billion of Fixed Rate Senior Bank Notes due January 26, 2033, and $500 million of Fixed Rate Senior Bank Notes due January 26, 2026.
There were no bank note issuances during the year ended December 31, 2024.
As of December 31, 2024, $20.0 billion remained available for issuance under the Bank Note Program.
KeyCorp shelf registration, including Medium-Term Note Program. On June 9, 2023, KeyCorp updated its shelf registration statement on file with the SEC under rules that allow companies to register various types of debt and equity securities without limitations on the aggregate amounts available for issuance. KeyCorp also maintains a Medium-Term Note Program that permits KeyCorp to issue notes with original maturities of nine months or more.
On February 28, 2024, KeyCorp issued notes under the MTN program consisting of $1.0 billion of Fixed-to-Floating Senior Notes due March 6, 2035.
At December 31, 2024, KeyCorp had authorized and available for issuance up to $14 billion of additional debt securities under the Medium-Term Note Program.
Issuances of capital securities or preferred stock by KeyCorp must be approved by the Board and cannot be objected to by the Federal Reserve.
21. Trust Preferred Securities Issued by Unconsolidated Subsidiaries
We own the outstanding common stock of business trusts formed by us that issued corporation-obligated mandatorily redeemable trust preferred securities. The trusts used the proceeds from the issuance of their trust preferred securities and common stock to buy debentures issued by KeyCorp. These debentures are the trusts’ only assets; the interest payments from the debentures finance the distributions paid on the mandatorily redeemable trust preferred securities. The outstanding common stock of these business trusts is recorded in “Other Investments” on our Consolidated Balance Sheets. We unconditionally guarantee the following payments or distributions on behalf of the trusts:
•required distributions on the trust preferred securities;
•the redemption price when a capital security is redeemed; and
•the amounts due if a trust is liquidated or terminated.
The Regulatory Capital Rules require us to treat our mandatorily redeemable trust preferred securities as Tier 2 capital.
The trust preferred securities, common stock, and related debentures are summarized as follows:
| | | | | | | | | | | | | | | | | |
| Dollars in millions | Trust Preferred Securities, Net of Discount (a) | Common Stock | Principal Amount of Debentures, Net of Discount (a)(b) | Interest Rate of Trust Preferred Securities and
Debentures (c) | Maturity of Trust Preferred Securities and Debentures |
| December 31, 2024 | | | | | |
| KeyCorp Capital I | $ | 156 | | $ | 6 | | $ | 162 | | 5.595 | % | 2028 |
| KeyCorp Capital II | 85 | | 4 | | 89 | | 6.875 | | 2029 |
| KeyCorp Capital III | 110 | | 4 | | 114 | | 7.750 | | 2029 |
| HNC Statutory Trust III | 21 | | 1 | | 22 | | 6.182 | | 2035 |
| HNC Statutory Trust IV | 21 | | 1 | | 22 | | 5.930 | | 2037 |
| Willow Grove Statutory Trust I | 18 | | 1 | | 19 | | 6.131 | | 2036 |
| Westbank Capital Trust II | 8 | | — | | 8 | | 6.806 | | 2034 |
| Westbank Capital Trust III | 8 | | — | | 8 | | 6.806 | | 2034 |
| Total | $ | 427 | | $ | 17 | | $ | 444 | | 6.519 | % | — | |
| December 31, 2023 | $ | 431 | | $ | 17 | | $ | 448 | | 6.981 | % | — | |
| | | | | |
(a)The trust preferred securities must be redeemed when the related debentures mature, or earlier if provided in the governing indenture. Each issue of trust preferred securities carries an interest rate identical to that of the related debenture. The principal amount of certain debentures include debt issuance costs and basis adjustments related to fair value hedges totaling $14 million at December 31, 2024, and $15 million at December 31, 2023. See Note 8 (“Derivatives and Hedging Activities”) for an explanation of fair value hedges.
(b)We have the right to redeem these debentures. If the debentures purchased by KeyCorp Capital I, HNC Statutory Trust III, Willow Grove Statutory Trust I, HNC Statutory Trust IV, Westbank Capital Trust II, or Westbank Capital Trust III are redeemed before they mature, the redemption price will be the principal amount, plus any accrued but unpaid interest. If the debentures purchased by KeyCorp Capital II or KeyCorp Capital III are redeemed before they mature, the redemption price will be the greater of: (i) the principal amount, plus any accrued but unpaid interest, or (ii) the sum of the present values of principal and interest payments discounted at the Treasury Rate (as defined in the applicable indenture), plus 20 basis points for KeyCorp Capital II or 25 basis points for KeyCorp Capital III or 50 basis points in the case of redemption upon either a tax or a capital treatment event for either KeyCorp Capital II or KeyCorp Capital III, plus any accrued but unpaid interest.
(c)The interest rates for the trust preferred securities issued by KeyCorp Capital II and KeyCorp Capital III are fixed. The trust preferred securities issued by KeyCorp Capital I, HNC Statutory Trust III, HNC Statutory Trust IV, Willow Grove Statutory Trust I, Westbank Capital Trust II, and Westbank Capital Trust III have a floating interest rate, equal to three-month CME term SOFR plus 26.161 basis points, that reprices quarterly. The total interest rates are weighted-average rates.
22. Commitments, Contingent Liabilities, and Guarantees
Commitments to Extend Credit or Funding
Loan commitments provide for financing on predetermined terms as long as the client continues to meet specified criteria. These agreements generally carry variable rates of interest and have fixed expiration dates or termination clauses. We typically charge a fee for our loan commitments. Since a commitment may expire without resulting in a loan, our aggregate outstanding commitments may significantly exceed our eventual cash outlay.
Loan commitments involve credit risk not reflected on our Consolidated Balance Sheets. We mitigate exposure to credit risk with internal controls that guide how we review and approve applications for credit, establish credit limits and, when necessary, demand collateral. In particular, we evaluate the creditworthiness of each prospective borrower on a case-by-case basis and, when appropriate, adjust the allowance for credit losses on lending-related commitments. Additional information pertaining to this allowance is included in Note 1 (“Summary of Significant Accounting Policies”) under the heading “Liability for Credit Losses on Lending-Related Commitments,” and in Note 5 (“Asset Quality”).
We also provide financial support to private equity investments, including existing direct portfolio companies and indirect private equity funds, to satisfy unfunded commitments. These unfunded commitments are not recorded on our Consolidated Balance Sheets. Additional information on principal investing commitments is provided in Note 6 (“Fair Value Measurements”). Other unfunded equity investment commitments at December 31, 2024, and December 31, 2023, related to tax credit investments and were primarily attributable to LIHTC investments. Unfunded tax credit investment commitments are recorded on our Consolidated Balance Sheets in “other liabilities.” Additional information on LIHTC commitments is provided in Note 13 (“Variable Interest Entities”).
The following table shows the remaining contractual amount of each class of commitment related to extending credit or funding principal investments. For loan commitments and commercial letters of credit, this amount represents our maximum possible accounting loss on the unused commitment if the borrower were to draw upon the full amount of the commitment and subsequently default on payment for the total amount of the then outstanding loan.
| | | | | | | | |
December 31, Dollars in millions | 2024 | 2023 |
| Loan commitments: | | |
| Commercial and other | $ | 57,010 | | $ | 55,603 | |
| Commercial real estate and construction | 2,855 | | 3,440 | |
| Home equity | 8,360 | | 8,984 | |
| Credit cards | 6,784 | | 7,058 | |
| Total loan commitments | 75,009 | | 75,085 | |
| | |
| Commercial letters of credit | 63 | | 65 | |
| Purchase card commitments | 1,048 | | 995 | |
| Principal investing commitments | 1 | | 1 | |
| Tax credit investment commitments | 1,362 | | 1,361 | |
| | |
| | |
| Total loan and other commitments | $ | 77,483 | | $ | 77,507 | |
| | |
Legal Proceedings
Litigation. From time to time, in the ordinary course of business, we and our subsidiaries are subject to various litigation, investigations, and administrative proceedings. Private, civil litigation may range from individual actions involving a single plaintiff to putative class action lawsuits with potentially thousands of class members, as well as arbitrations and mass arbitrations. Investigations may involve both formal and informal proceedings, by both government agencies and self-regulatory bodies. These matters may involve claims for substantial monetary relief. At times, these matters may present novel claims or legal theories. Due to the complex nature of these various other matters, it may be years before some matters are resolved. While it is impossible to ascertain the ultimate resolution or range of financial liability, based on information presently known to us, we do not believe there is any matter to which we are a party, or involving any of our properties that, individually or in the aggregate, would reasonably be expected to have a material adverse effect on our financial condition. We continually monitor and reassess the potential materiality of these litigation matters. We note, however, that in light of the inherent uncertainty in legal proceedings there can be no assurance that the ultimate resolution will not exceed established reserves. As a result, the outcome of a particular matter, or a combination of matters, may be material to our results of operations for a particular period, depending upon the size of the loss or our income for that particular period.
Guarantees
We are a guarantor in various agreements with third parties. The following table shows the types of guarantees that we had outstanding at December 31, 2024. Information pertaining to the basis for determining the liabilities recorded in connection with these guarantees is included in Note 1 (“Summary of Significant Accounting Policies”) under the heading “Contingencies and Guarantees.”
| | | | | | | | |
| December 31, 2024 | Maximum Potential Undiscounted Future Payments | Liability Recorded |
| Dollars in millions |
| Financial guarantees: | | |
| Standby letters of credit | $ | 4,441 | | $ | 75 | |
| Recourse agreement with FNMA | 7,770 | | 60 | |
| Residential mortgage reserve | 3,396 | | 9 | |
Written put options (a) | 2,117 | | 79 | |
| Total | $ | 17,724 | | $ | 223 | |
| | |
(a)The maximum potential undiscounted future payments represent notional amounts of derivatives qualifying as guarantees.
We determine the payment/performance risk associated with each type of guarantee described below based on the probability that we could be required to make the maximum potential undiscounted future payments shown in the preceding table. We use a scale of low (0% to 30% probability of payment), moderate (greater than 30% to 70% probability of payment), or high (greater than 70% probability of payment) to assess the payment/performance risk, and have determined that the payment/performance risk associated with each type of guarantee outstanding at December 31, 2024, is low.
Standby letters of credit. KeyBank issues standby letters of credit to address clients’ financing needs. These instruments obligate us to pay a specified third party when a client fails to repay an outstanding loan or debt instrument or fails to perform some contractual nonfinancial obligation. Any amounts drawn under standby letters of credit are treated as loans to the client; they bear interest (generally at variable rates) and pose the same credit risk to us as a loan. At December 31, 2024, our standby letters of credit had a remaining weighted-average life of 1.4 years, with remaining actual lives ranging from less than 1 year to 9.9 years.
Recourse agreement with FNMA. At December 31, 2024, the outstanding commercial mortgage loans in this program had a weighted-average remaining term of 6.3 years, and the unpaid principal balance outstanding of loans sold by us as a participant was $24.7 billion. The maximum potential amount of undiscounted future payments that we could be required to make under this program, as shown in the preceding table, is equal to approximately 32% of the principal balance of loans outstanding at December 31, 2024. FNMA delegates responsibility for originating, underwriting, and servicing mortgages, and we assume a limited portion of the risk of loss during the remaining term on each commercial mortgage loan that we sell to FNMA. We maintain a reserve for such potential losses of $60 million that we believe approximates the fair value of our liability for the guarantee as described in Note 5 (“Asset Quality”).
Residential Mortgage Banking. We often originate and sell residential mortgage loans and retain the servicing rights. Our loan sales activity is generally conducted through loan sales in a secondary market sponsored by FNMA and FHLMC and through the issuance of GNMA mortgage backed securities. Subsequent to the sale of mortgage loans, we do not typically retain any interest in the underlying loans except through our relationship as the servicer of the loans.
As is customary in the mortgage banking industry, we, or banks we have acquired, have made certain representations and warranties related to the sale of residential mortgage loans (including loans sold with servicing rights released) and to the performance of our obligations as servicer. The breach of any such representations or warranties could result in losses for us. Our maximum exposure to loss is equal to the outstanding principal balance of the sold loans; however, any loss would be reduced by any payments received on the loans or through the sale of collateral.
At December 31, 2024, the unpaid principal balance outstanding of loans sold by us was $11.3 billion. The maximum potential amount of undiscounted future payments that we could be required to make under this program, as shown in the preceding table, is equal to approximately 30% of the principal balance of loans outstanding at December 31, 2024.
Our liability for estimated repurchase obligations on loans sold, which is included in “accrued expenses and other liabilities” on our Consolidated Balance Sheets, was $9 million at December 31, 2024.
Written put options. In the ordinary course of business, we “write” put options for clients that wish to mitigate their exposure to changes in interest rates and commodity prices. At December 31, 2024, our written put options had an average life of 1.3 years. These instruments are considered to be guarantees, as we are required to make payments to the counterparty (the client) based on changes in an underlying variable that is related to an asset, a liability, or an equity security that the client holds. We are obligated to pay the client if the applicable benchmark interest rate or commodity price is above or below a specified level (known as the “strike rate”). These written put options are accounted for as derivatives at fair value, as further discussed in Note 8 (“Derivatives and Hedging Activities”). We mitigate our potential future payment obligations by entering into offsetting positions with third parties.
Written put options where the counterparty is a broker-dealer or bank are accounted for as derivatives at fair value but are not considered guarantees since these counterparties typically do not hold the underlying instruments. In addition, we are a purchaser and seller of credit derivatives, which are further discussed in Note 8.
Other Off-Balance Sheet Risk
Other off-balance sheet risk stems from financial instruments that do not meet the definition of a guarantee as specified in the applicable accounting guidance, and from other relationships.
Indemnifications provided in the ordinary course of business. We provide certain indemnifications, primarily through representations and warranties in contracts that we execute in the ordinary course of business in connection with loan and lease sales and other ongoing activities, as well as in connection with purchases and sales of businesses. We maintain reserves, when appropriate, with respect to liability that reasonably could arise as a result of these indemnities.
Intercompany guarantees. KeyCorp, KeyBank, and certain of our affiliates are parties to various guarantees that facilitate the ongoing business activities of other affiliates. These business activities encompass issuing debt, assuming certain lease and insurance obligations, purchasing or issuing investments and securities, and engaging in certain leasing transactions involving clients.
23. Accumulated Other Comprehensive Income
The following table summarizes our changes in AOCI:
| | | | | | | | | | | | | | | |
| Dollars in millions | Unrealized gains (losses) on securities available for sale | Unrealized gains (losses) on derivative financial instruments | | Net pension and postretirement benefit costs | Total |
| Balance at December 31, 2022 | $ | (4,895) | | $ | (1,124) | | | $ | (276) | | $ | (6,295) | |
| Other comprehensive income before reclassification, net of income taxes | 702 | | (364) | | | (18) | | 320 | |
Amounts reclassified from accumulated other comprehensive income, net of income taxes (a) | 3 | | 725 | | | 18 | | 746 | |
| | | | | |
| Net current-period other comprehensive income, net of income taxes | 705 | | 361 | | | — | | 1,066 | |
| Balance at December 31, 2023 | $ | (4,190) | | $ | (763) | | | $ | (276) | | $ | (5,229) | |
| Other comprehensive income before reclassification, net of income taxes | 38 | | (230) | | | (30) | | (222) | |
Amounts reclassified from accumulated other comprehensive income, net of income taxes (a) | 1,418 | | 559 | | | 4 | | 1,981 | |
| | | | | |
| Net current-period other comprehensive income, net of income taxes | 1,456 | | 329 | | | (26) | | 1,759 | |
| Balance at December 31, 2024 | $ | (2,734) | | $ | (434) | | | $ | (302) | | $ | (3,470) | |
| | | | | |
(a)See table below for details about these reclassifications.
Our reclassifications out of AOCI, are as follows:
| | | | | | | | | | | |
| Twelve Months Ended December 31, | Affected Line Item in the Consolidated Statement of Income |
| Dollars in millions | 2024 | 2023 |
| Unrealized gains (losses) on available for sale securities | | | |
| | | |
| Realized losses | $ | (1,863) | | $ | (4) | | Other income |
| (1,863) | | (4) | | Income (loss) from continuing operations before income taxes |
| (445) | | (1) | | Income taxes |
| $ | (1,418) | | $ | (3) | | Income (loss) from continuing operations |
| Unrealized gains (losses) on derivative financial instruments | | | |
| Interest rate | $ | (733) | | $ | (956) | | Interest income — Loans |
| Interest rate | (2) | | (2) | | Interest expense — Long-term debt |
| Interest rate | — | | 5 | | Investment banking and debt placement fees |
| | | |
| (735) | | (953) | | Income (loss) from continuing operations before income taxes |
| (176) | | (228) | | Income taxes |
| $ | (559) | | $ | (725) | | Income (loss) from continuing operations |
| | | |
| | | |
| | | |
| | | |
| | | |
| Net pension and postretirement benefit costs | | | |
| Amortization of losses | $ | (8) | | $ | (8) | | Other expense |
| Settlement loss | — | | (18) | | Other expense |
| Amortization of prior service credit | 1 | | 1 | | Other expense |
| (7) | | (25) | | Income (loss) from continuing operations before income taxes |
| (3) | | (7) | | Income taxes |
| $ | (4) | | $ | (18) | | Income (loss) from continuing operations |
| | | |
24. Shareholders' Equity
Comprehensive Capital Plan
During 2024, Key did not complete any open market share repurchases. We repurchased $28 million of shares related to equity compensation programs.
Consistent with our capital plan, the Board declared a quarterly dividend of $.205 per common share for each of the four quarters in 2024. These quarterly dividend payments brought our annual dividend to $.82 per common share for 2024.
Scotiabank Investment
On August 12, 2024, we entered into an Investment Agreement with Scotiabank pursuant to which Scotiabank agreed to make a strategic minority investment in KeyCorp of approximately $2.8 billion, representing approximately 14.9% pro forma common stock ownership of KeyCorp, for a fixed price of $17.17 per share. On August 30, 2024, Scotiabank completed the initial purchase of 47,829,359 of KeyCorp’s Common Shares with an investment of approximately $821 million in gross proceeds. With this investment, Scotiabank owned approximately 4.9% of KeyCorp’s Common Shares. In connection with the completion of the initial purchase of the Scotiabank investment, we incurred $10 million in issuance costs, which are classified in shareholders’ equity and recorded against the gross proceeds received.
On December 13, 2024, we announced that all necessary bank regulatory approvals had been received for completion of Scotiabank’s strategic minority investment in KeyCorp. On December 27, 2024, Scotiabank completed the final purchase of 115,042,316 of the KeyCorp’s Common Shares, contemplated under the Investment Agreement with an investment of approximately $2.0 billion. Following the Second Closing, Scotiabank owns approximately 14.9% of our Common Shares. In connection with the completion of the Second Closing of the Scotiabank investment, we incurred $16 million in issuance costs, which are classified in shareholders’ equity and recorded against the gross proceeds received.
Preferred Stock
The following table summarizes our preferred stock at December 31, 2024:
| | | | | | | | | | | | | | | | | | | | | | | | | | |
| Preferred stock series | Amount outstanding (in millions) | Book value (net of capital surplus) | Shares authorized and outstanding | Par value | Liquidation preference | Ownership interest per depositary share | Liquidation preference per depositary share | 2024 dividends paid per depositary share |
| 5.000% Fixed-to-Floating Rate Perpetual Noncumulative Series D | $ | 525 | | $ | 519 | | 21,000 | | $ | 1 | | $ | 25,000 | | 1/25th | $ | 1,000 | | $ | 12.50 | |
| 6.125% Fixed-to-Floating Rate Perpetual Noncumulative Series E | 500 | | 490 | | 500,000 | | 1 | | 1,000 | | 1/40th | 25 | | .382813 | |
| 5.650% Fixed Rate Perpetual Noncumulative Series F | 425 | | 412 | | 425,000 | | 1 | | 1,000 | | 1/40th | 25 | | .353125 | |
| 5.625% Fixed Rate Perpetual Non-Cumulative Series G | 450 | | 435 | | 450,000 | | 1 | | 1,000 | | 1/40th | 25 | | .351563 | |
| 6.200% Fixed Rate Reset Perpetual Non-Cumulative Series H | 600 | | 590 | | 600,000 | | 1 | | 1,000 | | 1/40th | 25 | | .387500 | |
Capital Adequacy
KeyCorp and KeyBank (consolidated) must meet specific capital requirements imposed by federal banking regulators. Sanctions for failure to meet applicable capital requirements may include regulatory enforcement actions that restrict dividend payments, require the adoption of remedial measures to increase capital, terminate FDIC deposit insurance, and mandate the appointment of a conservator or receiver in severe cases. In addition, failure to maintain a “well capitalized” status affects how regulators evaluate applications for certain endeavors, including acquisitions, continuation and expansion of existing activities, and commencement of new activities, and could make clients and potential investors less confident. As of December 31, 2024, KeyCorp and KeyBank (consolidated) met all regulatory capital requirements.
KeyBank (consolidated) qualified for the “well capitalized” prompt corrective action capital category at December 31, 2024, because its capital and leverage ratios exceeded the prescribed threshold ratios for that capital category and it was not subject to any written agreement, order, or directive to meet and maintain a specific capital level for any capital measure. Since that date, we believe there has been no change in condition or event that has occurred that would cause the capital category for KeyBank (consolidated) to change.
BHCs are not assigned to any of the five prompt corrective action capital categories applicable to insured depository institutions. If, however, those categories applied to BHCs, we believe that KeyCorp would satisfy the criteria for a “well capitalized” institution at December 31, 2024, and since that date, we believe there has been no change in condition or event that has occurred that would cause such capital category to change. Additionally, KeyCorp
Because the regulatory capital categories under the prompt corrective action regulations serve a limited supervisory function, investors should not use them as a representation of the overall financial condition or prospects of KeyBank or KeyCorp.
At December 31, 2024, Key and KeyBank (consolidated) had regulatory capital in excess of all current minimum risk-based capital (including all adjustments for market risk) and leverage ratio requirements as shown in the following table.
| | | | | | | | | | | | | | | | | | | | | | |
| | Actual | | | Regulatory Minimum | Regulatory Minimum with Stress Capital Buffer | | Well Capitalized |
| Dollars in millions | Amount | Ratio | | | Ratio | Ratio | | Ratio |
| December 31, 2024 | | | | | | | | |
| Total risk-based capital | | | | | | | | |
| Key | $ | 22,336 | | 16.15 | % | | | 8.00 | % | 11.10 | % | | N/A |
| KeyBank (consolidated) | 20,518 | | 15.12 | | | | 8.00 | | 11.10 | | | 10.00 | % |
| Common equity Tier 1 risk-based capital | | | | | | | | |
| Key | $ | 16,489 | | 11.92 | % | | | 4.50 | % | 7.60 | % | | N/A |
| KeyBank (consolidated) | 17,560 | | 12.94 | | | | 4.50 | | 7.60 | | | 6.50 | % |
| Tier 1 risk-based capital | | | | | | | | |
| Key | $ | 18,934 | | 13.69 | % | | | 6.00 | % | 9.10 | % | | N/A |
| KeyBank (consolidated) | 17,560 | | 12.94 | | | | 6.00 | | 9.10 | | | 8.00 | % |
| Leverage | | | | | | | | |
| Key | $ | 18,934 | | 10.03 | % | | | 4.00 | % | 4.00 | % | | N/A |
| KeyBank (consolidated) | 17,560 | | 9.42 | | | | 4.00 | | 4.00 | | | 5.00 | % |
| December 31, 2023 | | | | | | | | |
| Total risk-based capital | | | | | | | | |
| Key | $ | 21,028 | | 14.15 | % | | | 8.00 | % | 10.50 | % | | N/A |
| KeyBank (consolidated) | 20,726 | | 14.16 | | | | 8.00 | | 10.50 | | | 10.00 | % |
| Common equity Tier 1 risk-based capital | | | | | | | | |
| Key | $ | 14,894 | | 10.02 | % | | | 4.50 | % | 7.00 | % | | N/A |
| KeyBank (consolidated) | 17,487 | | 12.15 | | | | 4.50 | | 7.00 | | | 6.50 | |
| Tier 1 risk-based capital | | | | | | | | |
| Key | $ | 17,340 | | 11.67 | % | | | 6.00 | % | 8.50 | % | | N/A |
| KeyBank (consolidated) | 17,487 | | 11.94 | | | | 6.00 | | 8.50 | | | 8.00 | % |
| Leverage | | | | | | | | |
| Key | $ | 17,340 | | 9.03 | % | | | 4.00 | % | 4.00 | % | | N/A |
| KeyBank (consolidated) | 17,487 | | 9.22 | | | | 4.00 | | 4.00 | | | 5.00 | % |
25. Business Segment Reporting
The following is a description of the segments and their primary businesses at December 31, 2024.
Consumer Bank
The Consumer Bank serves individuals and small businesses throughout our 15-state branch footprint as well as healthcare professionals nationally through our Laurel Road digital brand by offering a variety of deposit and investment products, personal finance and financial wellness services, lending, mortgage and home equity, student loan refinancing, credit card, treasury services, and business advisory services. In addition, wealth management and investment services are offered to assist institutional, non-profit, and high-net-worth clients with their banking, trust, portfolio management, charitable giving, and related needs.
Commercial Bank
The Commercial Bank is an aggregation of our Institutional and Commercial operating segments. The Commercial operating segment is a full-service corporate bank focused principally on serving the borrowing, cash management, and capital markets needs of middle market clients within Key’s 15-state branch footprint. The Institutional operating segment operates nationally in providing lending, equipment financing, and banking products and services to large corporate and institutional clients. The industry coverage and product teams have established expertise in the following sectors: Consumer, Energy, Healthcare, Industrial, Public Sector, Real Estate, and Technology. It is also a significant, national, commercial real estate lender and third-party master and special servicer of commercial mortgage loans. The operating segment also includes the KBCM platform which provides a broad suite of capital markets products and services including syndicated finance, debt and equity underwriting, fixed income and equity sales and trading, derivatives, foreign exchange, mergers & acquisition and other advisory, and public finance.
Other
Other includes various corporate treasury activities such as management of our investment securities portfolio, long-term debt, short-term liquidity and funding activities, and balance sheet risk management, our principal investing unit, and various exit portfolios as well as reconciling items, which primarily represent the unallocated portion of nonearning assets of corporate support functions. Charges related to the funding of these assets are part of net interest income and are allocated to the business segments through noninterest expense. Reconciling items also include intercompany eliminations and certain items that are not allocated to the business segments because they do not reflect their normal operations.
The table on the following page shows selected financial data for our reportable business segments for the years ended December 31, 2024, 2023, and 2022. The information was derived from the internal financial reporting system that we use to monitor and manage our financial performance. GAAP guides financial accounting, but there is no authoritative guidance for “management accounting” — the way we use our judgment and experience to make reporting decisions. Consequently, the line of business results we report may not be comparable to line of business results presented by other companies. The information from our internal financial reporting system is utilized by Key’s Chief Operating Decision Maker (“CODM”) in assessing performance of the business segments. Key’s CODM is composed of its Chief Executive Officer and Chief Financial Officer.
The selected financial data is based on internal accounting policies designed to compile results on a consistent basis and in a manner that reflects the underlying economics of the businesses. In accordance with our policies:
•Net income (loss) is the primary measure of segment profit or loss utilized by the CODM in determining segment performance and resource allocation. It is compared to both budgeted and comparative historical amounts. Drivers of any significant variations from budgeted and comparative historical amounts are assessed to determine specific areas of focus for the business as needed.
•Net interest income (TE) is determined by assigning a standard cost for funds used or a standard credit for funds provided based on their assumed maturity, prepayment, and/or repricing characteristics.
•The consolidated provision for credit losses is allocated among the lines of business primarily based on their actual net loan charge-offs, adjusted periodically for loan growth and changes in risk profile. The amount of the consolidated provision is based on the methodology that we use to estimate our consolidated ALLL. This methodology is described in Note 1 (“Summary of Significant Accounting Policies”) under the heading “Allowance for Loan and Lease Losses.”
•Other direct noninterest expense represents other noninterest expenses such as business and professional fees, marketing, equipment, and other expenses that are incurred by each segment directly.
•Support and overhead consists of indirect expenses, such as computer servicing costs and corporate overhead, and is allocated based on assumptions regarding the extent that each line of business actually uses the services.
Developing and applying the methodologies that we use to allocate items among our lines of business is a dynamic process. Accordingly, financial results may be revised periodically to reflect enhanced alignment of expense base allocation drivers, changes in the risk profile of a particular business, or changes in our organizational structure. The table below reflects our adoption of ASU 2023-07 as described in Note 1 (“Summary of Significant Accounting Policies”).
| | | | | | | | | | | | | | | | | | | | | | | |
| Year ended December 31, | Consumer Bank | | Commercial Bank |
| Dollars in millions | 2024 | 2023 | 2022 | | 2024 | 2023 | 2022 |
| SUMMARY OF OPERATIONS | | | | | | | |
| Net interest income (TE) | $ | 2,288 | | $ | 2,221 | | $ | 2,409 | | | $ | 1,805 | | $ | 1,866 | | $ | 1,863 | |
| Noninterest income | 924 | | 936 | | 995 | | | 1,629 | | 1,431 | | 1,600 | |
Total revenue (TE) (a) | 3,212 | | 3,157 | | 3,404 | | | 3,434 | | 3,297 | | 3,463 | |
| Provision for credit losses | 126 | | 111 | | 193 | | | 227 | | 379 | | 317 | |
| Personnel expense | 850 | | 833 | | 851 | | | 729 | | 697 | | 706 | |
| Other direct noninterest expense | 595 | | 691 | | 559 | | | 347 | | 436 | | 343 | |
| Support and overhead | 1,268 | | 1,256 | | 1,321 | | | 758 | | 673 | | 684 | |
| | | | | | | |
| Allocated income taxes (benefit) and TE adjustments | 90 | | 64 | | 115 | | | 282 | | 227 | | 269 | |
| Income (loss) from continuing operations | 283 | | 202 | | 365 | | | 1,091 | | 885 | | 1,144 | |
| Income (loss) from discontinued operations, net of taxes | — | | — | | — | | | — | | — | | — | |
| Net income (loss) | $ | 283 | | $ | 202 | | $ | 365 | | | $ | 1,091 | | $ | 885 | | $ | 1,144 | |
| | | | | | | |
| | | | | | | |
AVERAGE BALANCES (b) | | | | | | | |
| Loans and leases | $ | 38,744 | | $ | 41,777 | | $ | 41,315 | | | $ | 68,498 | | $ | 75,782 | | $ | 69,549 | |
Total assets (a) | 41,613 | | 44,593 | | 44,414 | | | 77,782 | | 85,542 | | 80,068 | |
| Deposits | 85,851 | | 82,793 | | 90,132 | | | 58,025 | | 55,045 | | 54,672 | |
| OTHER FINANCIAL DATA | | | | | | | |
Expenditures for additions to long-lived assets (a), (b) | $ | 75 | | $ | 72 | | $ | 52 | | | $ | — | | $ | 3 | | $ | 4 | |
| | | | | | | |
| | | | | | | |
| | | | | | | |
| | | | | | | |
| | | | | | | | | | | | | | | | | | | | | | | |
| Year ended December 31, | Other | | Key |
| Dollars in millions | 2024 | 2023 | 2022 | | 2024 | 2023 | 2022 |
| SUMMARY OF OPERATIONS | | | | | | | |
| Net interest income (TE) | $ | (283) | | $ | (144) | | $ | 282 | | | $ | 3,810 | | $ | 3,943 | | $ | 4,554 | |
| Noninterest income | (1,744) | | 103 | | 123 | | | 809 | | 2,470 | | 2,718 | |
Total revenue (TE) (a) | (2,027) | | (41) | | 405 | | | 4,619 | | 6,413 | | 7,272 | |
| Provision for credit losses | (18) | | (1) | | (8) | | | 335 | | 489 | | 502 | |
| Personnel expense | 1,135 | | 1,130 | | 1,009 | | | 2,714 | | 2,660 | | 2,566 | |
| Other direct noninterest expense | 889 | | 947 | | 942 | | | 1,831 | | 2,074 | | 1,844 | |
| Support and overhead | (2,026) | | (1,929) | | (2,005) | | | — | | — | | — | |
| | | | | | | |
| Allocated income taxes (benefit) and TE adjustments | (470) | | (65) | | 65 | | | (98) | | 226 | | 449 | |
| Income (loss) from continuing operations | (1,537) | | (123) | | 402 | | | (163) | | 964 | | 1,911 | |
| Income (loss) from discontinued operations, net of taxes | 2 | | 3 | | 6 | | | 2 | | 3 | | 6 | |
| Net income (loss) | $ | (1,535) | | $ | (120) | | $ | 408 | | | $ | (161) | | $ | 967 | | $ | 1,917 | |
| | | | | | | |
| | | | | | | |
AVERAGE BALANCES (b) | | | | | | | |
| Loans and leases | $ | 482 | | $ | 445 | | $ | 438 | | | $ | 107,724 | | $ | 118,004 | | $ | 111,302 | |
Total assets (a) | 67,420 | | 61,492 | | 61,404 | | | 186,815 | | 191,627 | | 185,886 | |
| Deposits | 2,279 | | 6,221 | | 2,058 | | | 146,155 | | 144,059 | | 146,862 | |
| OTHER FINANCIAL DATA | | | | | | | |
Expenditures for additions to long-lived assets (a), (b) | $ | 115 | | $ | 118 | | $ | 198 | | | $ | 190 | | $ | 193 | | $ | 254 | |
| | | | | | | |
| | | | | | | |
| | | | | | | |
| | | | | | | |
(a)Substantially all revenue generated by our reportable business segments is derived from clients that reside in the United States. Substantially all long-lived assets, including premises and equipment, capitalized software, and goodwill held by our reportable business segments, are located in the United States.
(b)From continuing operations.
26. Condensed Financial Information of the Parent Company
CONDENSED BALANCE SHEETS
| | | | | | | | |
December 31, Dollars in millions | 2024 | 2023 |
| ASSETS | | |
| Cash and due from banks | $ | 5,149 | | $ | 2,727 | |
| Short-term investments | 26 | | 17 | |
| Securities available for sale | — | | — | |
| Other investments | 96 | | 85 | |
| Loans to: | | |
| Banks | 300 | | 250 | |
| Nonbank subsidiaries | — | | — | |
| Total loans | 300 | | 250 | |
| Investment in subsidiaries: | | |
| Banks | 16,770 | | 14,789 | |
| Nonbank subsidiaries | 888 | | 901 | |
| Total investment in subsidiaries | 17,658 | | 15,690 | |
| Goodwill | 167 | | 167 | |
| | |
| Corporate-owned life insurance | 188 | | 197 | |
| Derivative assets | — | | 1 | |
| Accrued income and other assets | 422 | | 331 | |
| Total assets | $ | 24,006 | | $ | 19,465 | |
| LIABILITIES | | |
| Accrued expense and other liabilities | $ | 536 | | $ | 511 | |
| | |
| Long-term debt due to: | | |
| Subsidiaries | 444 | | 447 | |
Unaffiliated companies (a) | 4,850 | | 3,870 | |
| Total long-term debt | 5,294 | | 4,317 | |
| Total liabilities | 5,830 | | 4,828 | |
SHAREHOLDERS’ EQUITY (b) | 18,176 | | 14,637 | |
| Total liabilities and shareholders’ equity | $ | 24,006 | | $ | 19,465 | |
| | |
(a)See Note 20 (“Long-Term Debt”) for information regarding contractual rates and maturity dates of debt that is held by the parent company.
(b)See Key’s Consolidated Statements of Changes in Equity.
CONDENSED STATEMENTS OF INCOME
| | | | | | | | | | | |
| Year ended December 31, | | | |
| Dollars in millions | 2024 | 2023 | 2022 |
| INCOME | | | |
| Dividends from subsidiaries: | | | |
| Bank subsidiaries | $ | 750 | | $ | 675 | | $ | 475 | |
| Nonbank subsidiaries | — | | — | | 100 | |
| Interest income from subsidiaries | 20 | | 15 | | 4 | |
| Other income | 14 | | 24 | | 7 | |
| Total income | 784 | | 714 | | 586 | |
| EXPENSE | | | |
| Interest on long-term debt with subsidiary trusts | 33 | | 33 | | 19 | |
| Interest on other borrowed funds | 341 | | 273 | | 130 | |
| Personnel and other expense | 77 | | 111 | | 101 | |
| Total expense | 451 | | 417 | | 250 | |
| Income (loss) before income taxes and equity in net income (loss) less dividends from subsidiaries | 333 | | 297 | | 336 | |
| Income tax (expense) benefit | 94 | | 95 | | 60 | |
| Income (loss) before equity in net income (loss) less dividends from subsidiaries | 427 | | 392 | | 396 | |
| Equity in net income (loss) less dividends from subsidiaries | (588) | | 575 | | 1,521 | |
| NET INCOME (LOSS) | $ | (161) | | $ | 967 | | $ | 1,917 | |
| | | |
| | | |
| | | |
Total other comprehensive income (loss), net of tax (a) | 1,759 | | 1,066 | | (5,709) | |
| Comprehensive income (loss) | $ | 1,598 | | $ | 2,033 | | $ | (3,792) | |
| | | |
(a) See Key’s Consolidated Statements of Comprehensive Income.
CONDENSED STATEMENTS OF CASH FLOWS
| | | | | | | | | | | |
| Year ended December 31, | | | |
| Dollars in millions | 2024 | 2023 | 2022 |
| OPERATING ACTIVITIES | | | |
| Net income (loss) attributable to Key | $ | (161) | | $ | 967 | | $ | 1,917 | |
| Adjustments to reconcile net income (loss) to net cash provided by (used in) operating activities: | | | |
| Deferred income taxes (benefit) | 10 | | (6) | | 6 | |
| Stock-based compensation expense | 10 | | 9 | | 117 | |
| Equity in net (income) loss less dividends from subsidiaries | 588 | | (575) | | (1,521) | |
| | | |
| | | |
| Net (increase) decrease in accrued income and other assets | (91) | | 44 | | 23 | |
| Net increase (decrease) in accrued expenses and other liabilities | 25 | | 3 | | (24) | |
| Other operating activities, net | (706) | | 122 | | (480) | |
| NET CASH PROVIDED BY (USED IN) OPERATING ACTIVITIES | (325) | | 564 | | 38 | |
| INVESTING ACTIVITIES | | | |
| Net (increase) decrease in securities available for sale and in short-term and other investments | (19) | | (14) | | (26) | |
| | | |
| Cash used in acquisitions | — | | — | | — | |
| Advances to subsidiaries | (250) | | — | | — | |
| Sale or repayments of advances to subsidiaries | 200 | | 16 | | (200) | |
| NET CASH PROVIDED BY (USED IN) INVESTING ACTIVITIES | (69) | | 2 | | (226) | |
| FINANCING ACTIVITIES | | | |
| Net proceeds from issuance of long-term debt | 1,000 | | — | | 1,350 | |
| Payments on long-term debt | — | | — | | — | |
| Repurchase of Treasury Shares | (28) | | (73) | | (44) | |
| Net cash from the issuance (redemption) of Common Shares and preferred stock | — | | — | | 590 | |
| Net proceeds from Scotiabank investment | 2,771 | | — | | — | |
| Cash dividends paid | (927) | | (912) | | (855) | |
| NET CASH PROVIDED BY (USED IN) FINANCING ACTIVITIES | 2,816 | | (985) | | 1,041 | |
| NET INCREASE (DECREASE) IN CASH AND DUE FROM BANKS | 2,422 | | (419) | | 853 | |
| CASH AND DUE FROM BANKS AT BEGINNING OF YEAR | 2,727 | | 3,146 | | 2,293 | |
| CASH AND DUE FROM BANKS AT END OF YEAR | $ | 5,149 | | $ | 2,727 | | $ | 3,146 | |
| | | |
KeyCorp paid interest on borrowed funds totaling $215 million in 2024, $171 million in 2023, and $137 million in 2022.
27. Revenue from Contracts with Customers
The following table represents a disaggregation of revenue from contracts with customers, by line of business. Additional details of our revenue recognition policies and components of our noninterest income line items is provided within Note 1 (“Summary of Significant Accounting Policies”) under the heading “Revenue Recognition.”
| | | | | | | | | | | |
| Year ended December 31, | 2024 |
| Dollars in millions | Consumer Bank | Commercial Bank | Total Contract Revenue |
| NONINTEREST INCOME | | | |
| Trust and investment services income | $ | 449 | | $ | 69 | | $ | 518 | |
| Investment banking and debt placement fees | — | | 521 | | 521 | |
| Services charges on deposit accounts | 135 | | 126 | | 261 | |
| Cards and payments income | 178 | | 153 | | 331 | |
| Other noninterest income | 12 | | — | | 12 | |
| Total revenue from contracts with customers | $ | 774 | | $ | 869 | | $ | 1,643 | |
| | | |
Other noninterest income (a) | | | $ | 910 | |
Noninterest income from other segments (b) | | | (1,744) | |
| Total noninterest income | | | $ | 809 | |
| | | |
| Year ended December 31, | 2023 |
| Dollars in millions | Consumer Bank | Commercial Bank | Total Contract Revenue |
| NONINTEREST INCOME | | | |
| Trust and investment services income | $ | 410 | | $ | 68 | | $ | 478 | |
| Investment banking and debt placement fees | — | | 344 | | 344 | |
| Services charges on deposit accounts | 158 | | 111 | | 269 | |
| Cards and payments income | 187 | | 145 | | 332 | |
| Other noninterest income | 12 | | — | | 12 | |
| Total revenue from contracts with customers | $ | 767 | | $ | 668 | | $ | 1,435 | |
| | | |
Other noninterest income (a) | | | $ | 932 | |
Noninterest income from other segments (b) | | | 103 | |
| Total noninterest income | | | $ | 2,470 | |
| | | |
| Year ended December 31, | 2022 |
| Dollars in millions | Consumer Bank | Commercial Bank | Total Contract Revenue |
| NONINTEREST INCOME | | | |
| Trust and investment services income | $ | 403 | | $ | 69 | | $ | 472 | |
| Investment banking and debt placement fees | — | | 430 | | 430 | |
| Services charges on deposit accounts | 211 | | 139 | | 350 | |
| Cards and payments income | 177 | | 154 | | 331 | |
| Other noninterest income | 11 | | — | | 11 | |
| Total revenue from contracts with customers | $ | 802 | | $ | 792 | | $ | 1,594 | |
| | | |
Other noninterest income (a) | | | $ | 1,001 | |
Noninterest income from other segments (b) | | | 123 | |
| Total noninterest income | | | $ | 2,718 | |
| | | |
(a)Noninterest income considered earned outside the scope of contracts with customers.
(b)Other includes other segments that consists of corporate treasury, our principal investing unit, and various exit portfolios as well as reconciling items which primarily represents the unallocated portion of nonearning assets of corporate support functions. Charges related to the funding of these assets are part of net interest income and are allocated to the business segments through noninterest expense. Corporate treasury includes realized gains and loss from transaction associated with Key’s investment securities portfolio. Reconciling items also includes intercompany eliminations and certain items that are not allocated to the business segments because they do not reflect their normal operations. Refer to Note 25 (“Business Segment Reporting”) for more information.
We had no material contract assets or contract liabilities for the twelve months ended December 31, 2024, and December 31, 2023.
ITEM 9. CHANGES IN AND DISAGREEMENTS WITH ACCOUNTANTS ON ACCOUNTING AND FINANCIAL DISCLOSURE
None.
ITEM 9A. CONTROLS AND PROCEDURES
Evaluation of Disclosure Controls and Procedures
As of the end of the period covered by this report, KeyCorp carried out an evaluation, under the supervision and with the participation of KeyCorp’s management, including our Chief Executive Officer and Chief Financial Officer, of the effectiveness of the design and operation of KeyCorp’s disclosure controls and procedures (as defined in Rule 13a-15(e) under the Securities Exchange Act of 1934 (the “Exchange Act”)), to ensure that information required to be disclosed by KeyCorp in reports that it files or submits under the Exchange Act, is recorded, processed, summarized and reported within the time periods specified in the SEC’s rules and forms, and that such information is accumulated and communicated to KeyCorp’s management, including its Chief Executive Officer and Chief Financial Officer, as appropriate, to allow for timely decisions regarding required disclosure. Based upon that evaluation, KeyCorp’s Chief Executive Officer and Chief Financial Officer concluded that the design and operation of these disclosure controls and procedures were effective, in all material respects, as of the end of the period covered by this report. No changes were made to KeyCorp’s internal control over financial reporting (as defined in Rule 13a-15(f) under the Exchange Act) during the quarter ended December 31, 2024, that materially affected, or are reasonably likely to materially affect, KeyCorp’s internal control over financial reporting.
Reports Regarding Internal Controls
Management’s Annual Report on Internal Control over Financial Reporting, the Report of Independent Registered Public Accounting Firm on Internal Control over Financial Reporting, and the Report of Independent Registered Public Accounting Firm are included in Item 8 on pages 100, 101, and 102, respectively. ITEM 9B. OTHER INFORMATION
Insider trading arrangements
No director or officer (as defined in Rule 16a-1(f) of the Exchange Act) of KeyCorp adopted, modified,
or terminated any Rule 10b5-1 trading arrangement or any non-Rule 10b5-1 trading arrangement (as such terms
are defined in Item 408 of Regulation S-K of the Exchange Act) during the quarter ended December 31, 2024,
except as may be noted below. We do not permit the use of Rule 10b5-1 trading arrangements by our directors or
executive officers.
Certain of our directors or officers have made elections to participate in, and are participating in, our KeyCorp
Second Amended and Restated Discounted Stock Purchase Plan, our Long-Term Incentive Deferral Plan, our
Directors’ Deferred Share Sub-Plan, and the Dividend Reinvestment Plan and dividend reinvestment features under
various compensation plans and arrangements, and previously made elections to participate in KeyCorp common
stock funds that are now frozen but were previously available as an investment option under our Deferred Savings
Plan and KeyCorp 401(k) plan. By participating in these plans or stock funds, the directors or officers have made,
and/or may from time to time make, elections involving transactions in KeyCorp common shares which may be
designed to satisfy the affirmative defense conditions of Rule 10b5-1 under the Exchange Act or may constitute
non-Rule 10b5-1 trading arrangements (as such term is defined in Item 408(c) of Regulation S-K of the Exchange
Act).
ITEM 9C. DISCLOSURE REGARDING FOREIGN JURISDICTIONS THAT PREVENT INSPECTIONS
Not applicable.
PART III
ITEM 10. DIRECTORS, EXECUTIVE OFFICERS AND CORPORATE GOVERNANCE
The names of our executive officers, and biographical information for each, are set forth in Item 1. Business of this report.
The other information required by this item will be set forth in the following sections of KeyCorp’s Definitive Proxy Statement for the 2025 Annual Meeting of Shareholders to be held on May 15, 2025 (the “2025 Proxy Statement”), and these sections are incorporated herein by reference:
•“Proposal One: Election of Directors”
•“Corporate Governance Documents — Code of Business Conduct and Ethics”
•“The Board of Directors and Its Committees — Board and Committee Responsibilities — Audit Committee”
•“Insider Trading Policies and Procedures”
•“Additional Information — Other Proposals and Director Nominations for the 2026 Annual Meeting of Shareholders”
KeyCorp expects to file the 2025 Proxy Statement with the SEC on or about March 28, 2025.
Any amendment to, or waiver from a provision of, the Code of Business Conduct and Ethics that applies to KeyCorp’s Chief Executive Officer, Chief Financial Officer, and Chief Accounting Officer, or any other executive officer or director, will be promptly disclosed on KeyCorp’s website (www.key.com/ir) as required by laws, rules and regulations of the SEC.
ITEM 11. EXECUTIVE COMPENSATION
The information required by this item will be set forth in the following sections of the 2025 Proxy Statement and these sections are incorporated herein by reference:
•“Compensation Discussion and Analysis”
•“Compensation of Executive Officers and Directors”
•“Compensation and Organization Committee Report”
•“The Board of Directors and Its Committees — Oversight of Compensation Related Risks”
ITEM 12. SECURITY OWNERSHIP OF CERTAIN BENEFICIAL OWNERS AND MANAGEMENT AND RELATED STOCKHOLDER MATTERS
The information required by this item will be set forth in the section captioned “Ownership of KeyCorp Equity Securities” contained in the 2025 Proxy Statement, and is incorporated herein by reference.
ITEM 13. CERTAIN RELATIONSHIPS AND RELATED TRANSACTIONS, AND DIRECTOR INDEPENDENCE
The information required by this item will be set forth in the following sections of the 2025 Proxy Statement and these sections are incorporated herein by reference:
•“The Board of Directors and Its Committees — Director Independence”
•“The Board of Directors and Its Committees — Related Party Transactions”
ITEM 14. PRINCIPAL ACCOUNTANT FEES AND SERVICES
The information required by this item will be set forth in the sections captioned “Audit Matters — Ernst & Young’s Fees” and “Audit Matters — Pre-Approval Policies and Procedures” contained in the 2025 Proxy Statement, and is incorporated herein by reference.
PART IV
ITEM 15. EXHIBITS AND FINANCIAL STATEMENT SCHEDULES
(a) (1) Financial Statements
The following financial statements of KeyCorp and its subsidiaries, and the auditor’s report thereon are filed as part of this report under Item 8. Financial Statements and Supplementary Data:
(a) (2) Financial Statement Schedules
All financial statement schedules for KeyCorp and its subsidiaries have been included in this Form 10-K in the consolidated financial statements or the related footnotes, or they are either inapplicable or not required.
(a) (3) Exhibits*
| | | | | | | | |
| 3.1 | | |
| 3.2 | | |
| 3.3 | | |
| 4.1 | | |
| 4.2 | | |
| 4.3 | | |
| 4.4 | | |
| 4.5 | | |
| 4.6 | | |
| 4.7 | | |
| 4.8 | | |
| 4.9 | | |
| 4.10 | | |
| 4.11 | | |
| 4.12 | | |
| 4.13 | | |
| 4.14 | | |
| 4.15 | | |
| 4.16 | | |
| 10.1 | | |
| 10.2 | | |
| 10.3 | | |
| 10.4 | | |
| 10.5 | | |
| 10.6 | | |
| 10.7 | | |
| | | | | | | | |
| 10.8 | | |
| 10.9 | | |
| 10.10 | | |
| 10.11 | | |
| 10.12 | | |
| 10.13 | | |
| 10.14 | | |
| 10.15 | | |
| 10.16 | | |
| 10.17 | | |
| 10.18 | | |
| 10.19 | | |
| 10.20 | | |
| 10.21 | | |
| 10.22 | | |
| 10.23 | | |
| 10.24 | | |
| 10.25 | | |
| 10.26 | | |
| 10.27 | | |
| 10.28 | | |
| 10.29 | | |
| 10.30 | | |
| 10.31 | | |
| 10.32 | | |
| 10.33 | | |
| 10.34 | | |
| | | | | | | | |
| 10.35 | | |
| 10.36 | | |
| 10.37 | | |
| 10.38 | | |
| 10.39 | | |
| 10.40 | | |
| 10.41 | | |
| 10.42 | | |
| 10.43 | | |
| 10.44 | | |
| 10.45 | | |
| 19 | | |
| 21 | | |
| 22 | | |
| 23 | | |
| 24 | | |
| 31.1 | | |
| 31.2 | | |
| 32.1 | | |
| 32.2 | | |
| 97 | | |
| 101 | | The following materials from KeyCorp’s Form 10-K Report for the year ended December 31, 2024, formatted in inline XBRL: (i) the Consolidated Balance Sheets; (ii) the Consolidated Statements of Income and Consolidated Statements of Comprehensive Income; (iii) the Consolidated Statements of Changes in Equity; (iv) the Consolidated Statements of Cash Flows; and (v) the Notes to Consolidated Financial Statements. |
| 104 | | The cover page from KeyCorp’s Form 10-K for the year ended December 31, 2024, formatted in inline XBRL (contained in Exhibit 101). |
| | |
*Incorporated by reference. Copies of these Exhibits have been filed with
the SEC. Exhibits that are not incorporated by reference are filed with this report. Shareholders may obtain a copy of any exhibit, upon payment of reproduction costs, by writing KeyCorp Investor Relations, 127 Public Square, Mail Code OH-01-27-0737, Cleveland, OH 44114-1306.
# Schedules have been omitted pursuant to Item 601(a)(5) of Regulation S-K. KeyCorp hereby undertakes to furnish supplemental copies of any of the omitted schedules upon request by the SEC.
† Certain sensitive personally identifiable information in this exhibit was omitted by means of redacting a portion of the text and replacing it with [***]
KeyCorp hereby agrees to furnish the SEC upon request, copies of instruments, including indentures, which define the rights of long-term debt security holders. The documents listed as Exhibits 10.1 through 10.44 constitute management contracts or compensatory plans or arrangements. In addition, certain confidential portions of the forms of award agreements listed within Exhibits 10.1 through Exhibit 10.44 may be omitted by means of marking
such portions with the brackets (“[***]”) because the identified confidential portions (i) are not material and (ii) would be competitively harmful if publicly disclosed.
ITEM 16. FORM 10-K SUMMARY
Not applicable.
SIGNATURES
Pursuant to the requirements of Section 13 or 15(d) of the Securities Exchange Act of 1934, the Registrant has duly caused this report to be signed on its behalf by the undersigned, thereunto duly authorized, on the date indicated.
| | |
| KEYCORP |
|
| /s/ Clark H. Khayat |
| Clark H. Khayat |
| Chief Financial Officer (Principal Financial Officer) |
| February 21, 2025 |
|
| /s/ Stacy L. Gilbert |
| Stacy L. Gilbert |
| Chief Accounting Officer (Principal Accounting Officer) |
| February 21, 2025 |
Pursuant to the requirements of the Securities Exchange Act of 1934, this report has been signed below by the following persons on behalf of the Registrant and in the capacities and on the date indicated.
| | | | | | | | |
| Signature | | Title |
| | |
| /s/ Christopher M. Gorman | | Chairman, Chief Executive Officer and President
(Principal Executive Officer), and Director |
| Christopher M. Gorman | |
| |
| /s/ Clark H. Khayat | | Chief Financial Officer (Principal Financial Officer) |
| Clark H. Khayat | |
| |
| /s/ Stacy L. Gilbert | | Chief Accounting Officer (Principal Accounting Officer) |
| Stacy L. Gilbert | |
| |
| *Jacqueline Allard | | Director |
| *Alexander M. Cutler | | Director |
| *H. James Dallas | | Director |
| *Elizabeth R. Gile | | Director |
| *Ruth Ann M. Gillis | | Director |
| *Robin N. Hayes | | Director |
| *Carlton L. Highsmith | | Director |
| *Richard J. Hipple | | Director |
| *Somesh Khanna | | Director |
| *Devina A. Rankin | | Director |
| *Barbara R. Snyder | | Director |
| *Richard J. Tobin | | Director |
| *Todd J. Vasos | | Director |
| *David K. Wilson | | Director |
| | |
| /s/ James L. Waters |
| * By James L. Waters, attorney-in-fact |
| February 21, 2025 |