- KEY Dashboard
- Financials
- Filings
-
Holdings
- Transcripts
- ETFs
- Insider
- Institutional
- Shorts
-
8-K Filing
KeyCorp (KEY) 8-KKeycorp Reports Second Quarter 2009 Results
Filed: 22 Jul 09, 12:00am
| Second Quarter 2009 Review July 22, 2009 Speakers: Henry Meyer Jeff Weeden |

| PRIVATE SECURITIES LITIGATION REFORM ACT OF 1995 FORWARD-LOOKING STATEMENT DISCLOSURE This presentation contains forward-looking statements within the meaning of the Private Securities Litigation Reform Act of 1995, including statements about Key's financial condition, results of operations, earnings outlook, asset quality trends and profitability. Forward-looking statements are not historical facts but instead represent only management's current expectations and forecasts regarding future events, many of which, by their nature, are inherently uncertain and outside of Key's control. Key's actual results and financial condition may differ, possibly materially, from the anticipated results and financial condition indicated in these forward-looking statements. Factors that may cause actual results to differ materially include, among other things: (1) adverse capital market conditions and the ability to raise equity and other funding required by the banking regulators or otherwise; (2) further downgrades in Key's credit ratings; (3) unprecedented volatility in the stock markets, public debt markets and other capital markets, including continued disruption in the fixed income markets; (4) potential misinterpretation of the Supervisory Capital Assessment Program ("SCAP") or Key's efforts to raise the required capital could affect Key's ability to attract and retain customers and compete for new business opportunities; (5) changes in interest rates; (6) changes in trade, monetary or fiscal policy; (7) changes in foreign exchange rates, equity markets and the financial soundness of other unrelated financial companies; (8) asset price deterioration, which has had (and may continue to have) a negative effect on the valuation of certain asset categories represented on Key's balance sheet; (9) continuation of the recent deterioration in general economic conditions, or in the condition of the local economies or industries in which Key has significant operations or assets, which could, among other things, materially impact credit quality trends and Key's ability to generate loans; (10) continued disruption in the housing markets and related conditions in the financial markets; (11) increased competitive pressure among financial services companies due to the consolidation of competing financial institutions and the conversion of certain investment banks to bank holding companies; (12) heightened legal standards and regulatory practices, requirements or expectations; (13) the inability to successfully execute strategic initiatives designed to grow revenues and/or manage expenses; (14) increased FDIC deposit insurance premiums; (15) difficulty in attracting and/or retaining executives and/or relationship managers; (16) consummation of significant business combinations or divestitures; (17) operational or risk management failures due to technological or other factors; (18) changes in accounting or tax practices or requirements; (19) new legal obligations or liabilities or unfavorable resolution of litigation; and (20) disruption in the economy and general business climate as a result of terrorist activities or military actions. For additional information on KeyCorp and the factors that could cause actual results or financial condition to differ materially from those described in the forward-looking statements consult KeyCorp's Annual Report on Form 10-K for the year ended December 31, 2008, and subsequent filings with the Securities and Exchange Commission available on the Securities and Exchange Commission's website (www.sec.gov). Forward-looking statements are not guarantees of future performance and should not be relied upon as representing management's views as of any subsequent date. Key does not assume any obligation to update these forward-looking statements. |
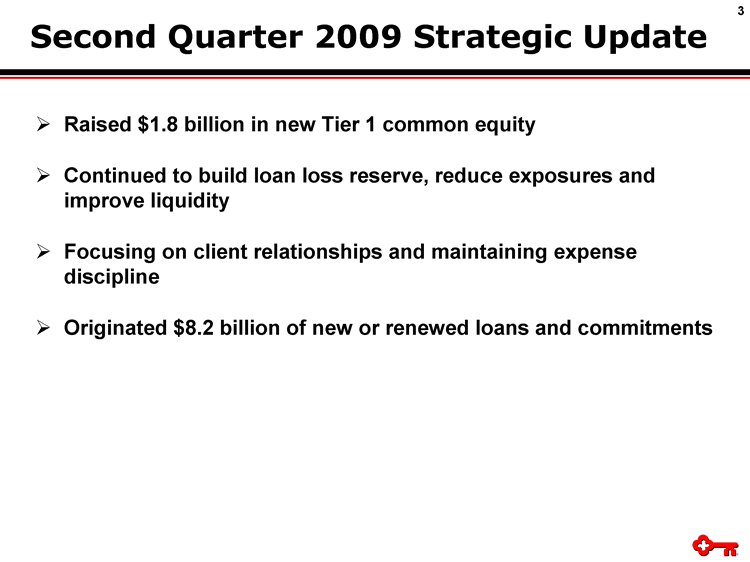
| Raised $1.8 billion in new Tier 1 common equity Continued to build loan loss reserve, reduce exposures and improve liquidity Focusing on client relationships and maintaining expense discipline Originated $8.2 billion of new or renewed loans and commitments Second Quarter 2009 Strategic Update |
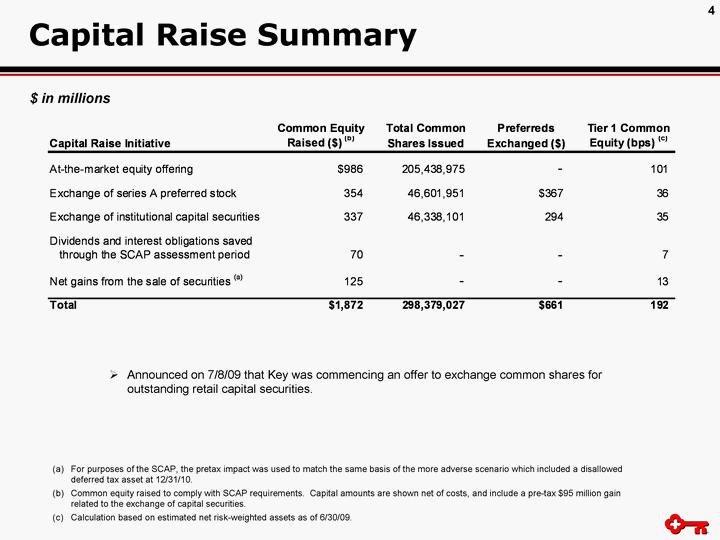
| Capital Raise Summary $ in millions Announced on 7/8/09 that Key was commencing an offer to exchange common shares for outstanding retail capital securities. For purposes of the SCAP, the pretax impact was used to match the same basis of the more adverse scenario which included a disallowed deferred tax asset at 12/31/10. Capital amounts are shown net of costs and/or gains realized. (c) Calculation based on estimated net risk-weighted assets as of 6/30/09. |
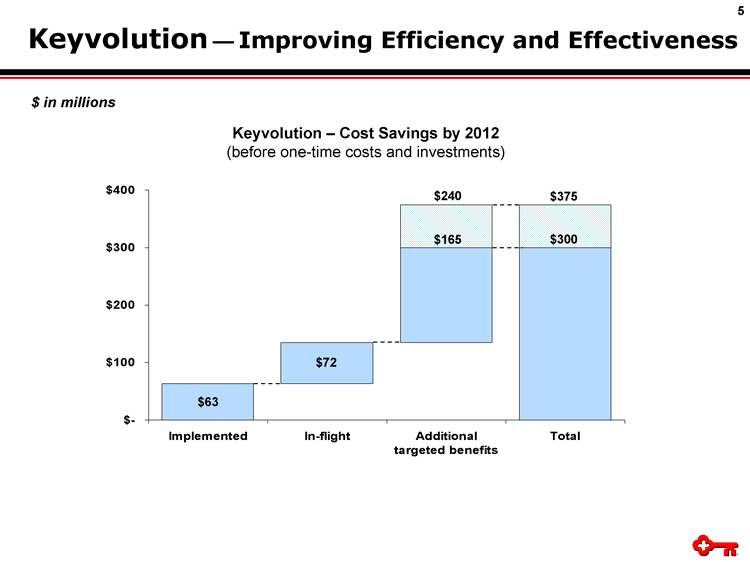
| Keyvolution ^ Improving Efficiency and Effectiveness $- $100 $200 $300 $400 Implemented In-flight Additional targeted benefits Total $ in millions Keyvolution - Cost Savings by 2012 (before one-time costs and investments) $63 $72 $375 $165 $240 $300 |
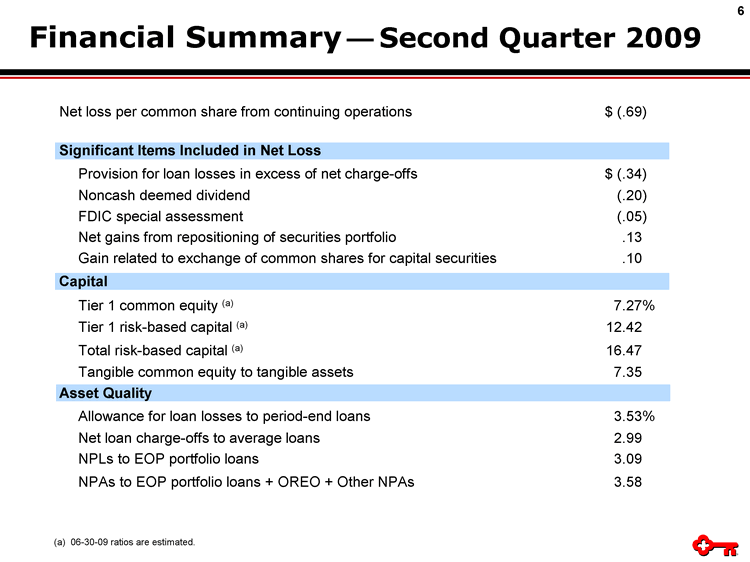
| Financial Summary ^ Second Quarter 2009 (a) 06-30-09 ratios are estimated. Net loss per common share from continuing operations $ (.69) Significant Items Included in Net Loss Provision for loan losses in excess of net charge-offs $ (.34) Noncash deemed dividend (.20) FDIC special assessment (.05) Net gains from repositioning of securities portfolio .13 Gain related to exchange of common shares for capital securities .10 Capital Tier 1 common equity (a) 7.27% Tier 1 risk-based capital (a) 12.42 Total risk-based capital (a) 16.47 Tangible common equity to tangible assets 7.35 Asset Quality Allowance for loan losses to period-end loans 3.53% Net loan charge-offs to average loans 2.99 NPLs to EOP portfolio loans 3.09 NPAs to EOP portfolio loans + OREO + Other NPAs 3.58 |
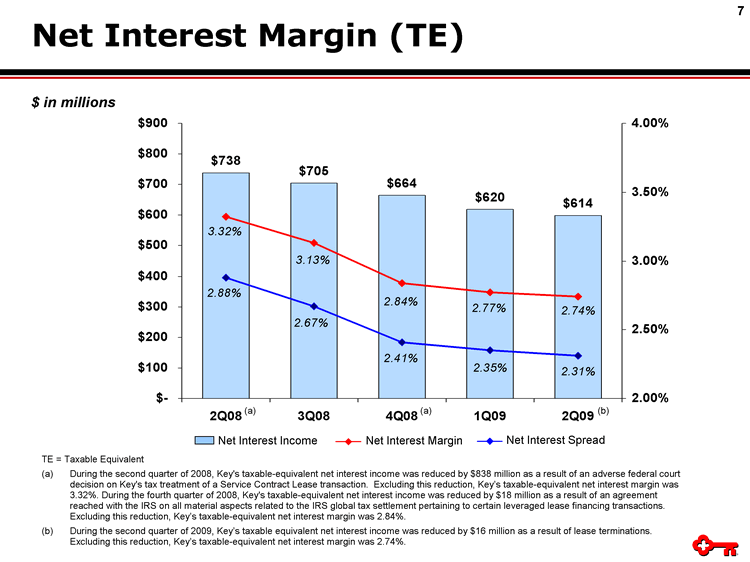
| $738 $705 $664 $620 $614 2.31% 2.35% 2.41% 2.88% 2.67% 3.13% 2.84% 3.32% 2.77% 2.74% $- $100 $200 $300 $400 $500 $600 $700 $800 $900 2Q08 3Q08 4Q08 1Q09 2Q09 2.00% 2.50% 3.00% 3.50% 4.00% $ in millions TE = Taxable Equivalent During the second quarter of 2008, Key's taxable-equivalent net interest income was reduced by $838 million as a result of an adverse federal court decision on Key's tax treatment of a Service Contract Lease transaction. Excluding this reduction, Key's taxable-equivalent net interest margin was 3.32%. During the fourth quarter of 2008, Key's taxable-equivalent net interest income was reduced by $18 million as a result of an agreement reached with the IRS on all material aspects related to the IRS global tax settlement pertaining to certain leveraged lease financing transactions. Excluding this reduction, Key's taxable-equivalent net interest margin was 2.84%. During the second quarter of 2009, Key's taxable equivalent net interest income was reduced by $16 million as a result of lease terminations. Excluding this reduction, Key's taxable-equivalent net interest margin was 2.74%. (a) (a) (b) Net Interest Margin (TE) Net Interest Margin Net Interest Spread Net Interest Income |
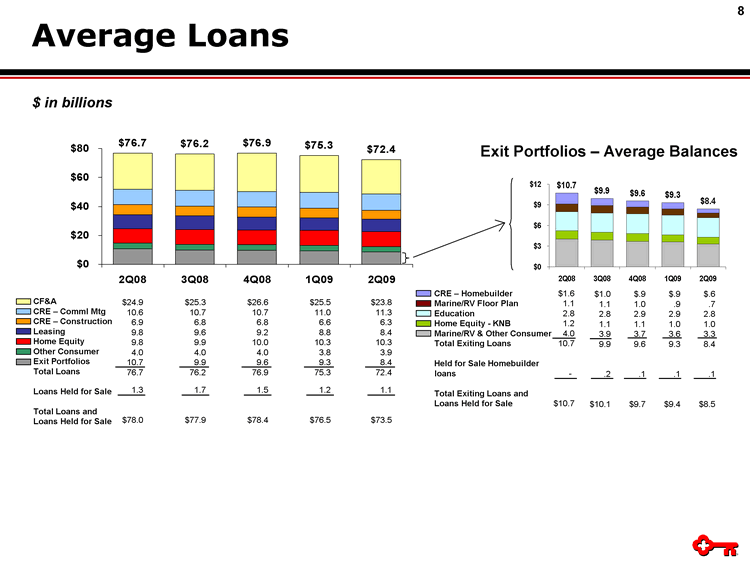
| $76.7 $76.2 $76.9 $75.3 $72.4 $0 $20 $40 $60 $80 2Q08 3Q08 4Q08 1Q09 2Q09 CF&A CRE - Comml Mtg CRE - Construction Leasing Home Equity Other Consumer Exit Portfolios Total Loans Loans Held for Sale Total Loans and Loans Held for Sale $10.7 $9.9 $9.6 $9.3 $8.4 $0 $3 $6 $9 $12 2Q08 3Q08 4Q08 1Q09 2Q09 CRE - Homebuilder Marine/RV Floor Plan Education Home Equity - KNB Marine/RV & Other Consumer Total Exiting Loans Held for Sale Homebuilder loans Total Exiting Loans and Loans Held for Sale Exit Portfolios - Average Balances $ in billions $24.9 10.6 6.9 9.8 9.8 4.0 10.7 76.7 1.3 $78.0 $25.3 10.7 6.8 9.6 9.9 4.0 9.9 76.2 1.7 $77.9 $26.6 10.7 6.8 9.2 10.0 4.0 9.6 76.9 1.5 $78.4 $1.6 1.1 2.8 1.2 4.0 10.7 - $10.7 $1.0 1.1 2.8 1.1 3.9 9.9 ..2 $10.1 $.9 1.0 2.9 1.1 3.7 9.6 ..1 $9.7 $25.5 11.0 6.6 8.8 10.3 3.8 9.3 75.3 1.2 $76.5 $.9 ..9 2.9 1.0 3.6 9.3 ..1 $9.4 $.6 ..7 2.8 1.0 3.3 8.4 ..1 $8.5 $23.8 11.3 6.3 8.4 10.3 3.9 8.4 72.4 1.1 $73.5 Average Loans |
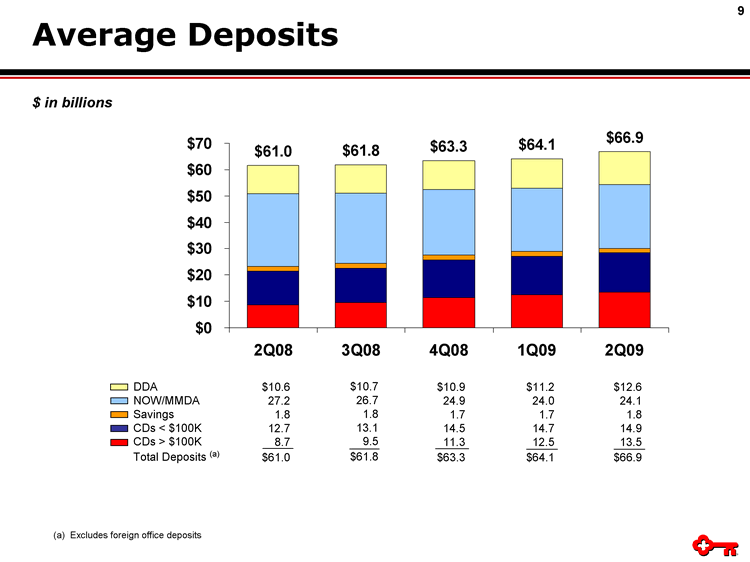
| $10.6 27.2 1.8 12.7 8.7 $61.0 $10.7 26.7 1.8 13.1 9.5 $61.8 $10.9 24.9 1.7 14.5 11.3 $63.3 $11.2 24.0 1.7 14.7 12.5 $64.1 $12.6 24.1 1.8 14.9 13.5 $66.9 $61.0 $61.8 $63.3 $64.1 $66.9 $0 $10 $20 $30 $40 $50 $60 $70 2Q08 3Q08 4Q08 1Q09 2Q09 (a) Excludes foreign office deposits DDA NOW/MMDA Savings CDs < $100K CDs > $100K Total Deposits (a) $ in billions Average Deposits |
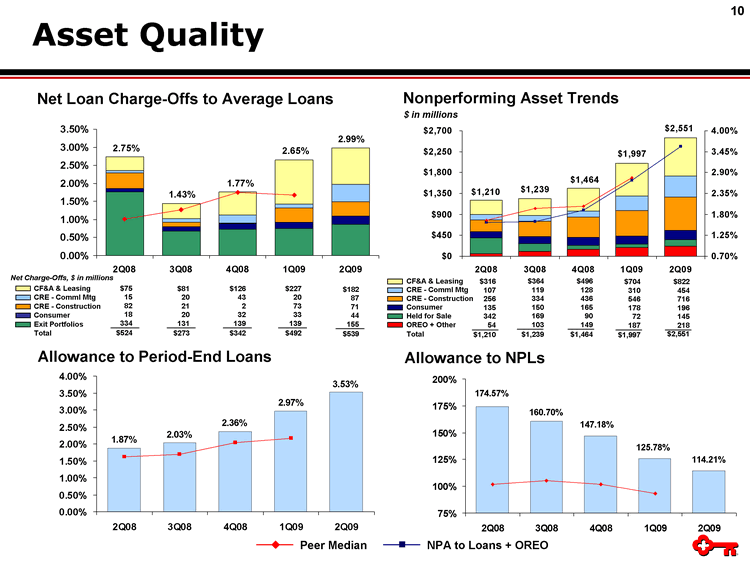
| Nonperforming Asset Trends 2.36% 2.03% 1.87% 2.97% 3.53% 0.00% 0.50% 1.00% 1.50% 2.00% 2.50% 3.00% 3.50% 4.00% 2Q08 3Q08 4Q08 1Q09 2Q09 Allowance to Period-End Loans 114.21% 125.78% 174.57% 160.70% 147.18% 75% 100% 125% 150% 175% 200% 2Q08 3Q08 4Q08 1Q09 2Q09 Allowance to NPLs Peer Median NPA to Loans + OREO $ in millions Net Loan Charge-Offs to Average Loans 2.75% 1.43% 1.77% 2.65% 0.00% 0.50% 1.00% 1.50% 2.00% 2.50% 3.00% 3.50% 2Q08 3Q08 4Q08 1Q09 2Q09 $1,210 $1,239 $1,464 $1,997 $2,551 $0 $450 $900 $1,350 $1,800 $2,250 $2,700 2Q08 3Q08 4Q08 1Q09 2Q09 0.70% 1.25% 1.80% 2.35% 2.90% 3.45% 4.00% CF&A & Leasing CRE - Comml Mtg CRE - Construction Consumer Held for Sale OREO + Other Total $704 310 546 178 72 187 $1,997 $496 128 436 165 90 149 $1,464 $364 119 334 150 169 103 $1,239 $316 107 256 135 342 54 $1,210 Net Charge-Offs, $ in millions CF&A & Leasing CRE - Comml Mtg CRE - Construction Consumer Exit Portfolios Total $75 15 82 18 334 $524 $81 20 21 20 131 $273 $126 43 2 32 139 $342 $227 20 73 33 139 $492 $822 454 716 196 145 218 $2,551 $182 87 71 44 155 $539 2.99% Asset Quality |

| Period-end loans Average loans 6/30/09 2Q09 2Q09 1Q09 6/30/09 3/31/09 Commercial, financial and agricultural $23,542 $24,468 $168 $232 2.75 % 3.56 % $700 $595 $769 3.27 % 109.86 % Real estate - commercial mortgage 11,761 11,892 87 21 2.93 ..78 454 310 465 3.95 102.42 Real estate - construction 6,119 6,264 133 104 8.52 5.62 716 546 456 7.45 63.69 Commercial leasing financing 8,263 8,432 22 18 1.05 ..83 122 109 192 2.32 157.38 Real estate - residential mortgage 1,753 1,750 4 3 ..92 ..69 46 39 19 1.08 41.30 Home equity: Community Banking 10,256 10,289 24 17 ..94 ..67 101 91 118 1.15 116.83 National Banking 934 974 18 15 7.41 5.85 20 19 91 9.74 455.00 Consumer other-Community Banking 1,199 1,207 15 13 4.98 4.30 5 3 65 5.42 N/M Consumer other-National Banking: Marine 3,095 3,178 29 32 3.66 3.90 19 21 151 4.88 794.74 Education 3,636 3,671 37 32 4.04 3.49 3 3 160 4.40 N/M Other 245 256 2 5 3.13 7.40 2 2 13 5.31 650.00 Total loans $70,803 $72,381 $539 $492 2.99 % 2.65 % $2,188 $1,738 $2,499 3.53 % 114.21 % Net loan charge-offs Net loan charge-offs (a) / average loans Nonperforming loans Allowance / period-end loans Ending allowance (b) Allowance / NPLs 2Q09 1Q09 6/30/09 6/30/09 6/30/09 Credit Quality by Portfolio-2Q09 (a) Net charge-off amounts are annualized in calculation. (b) 06-30-09 allowance by Portfolio is estimated. N/M = Not Meaningful $ in millions |
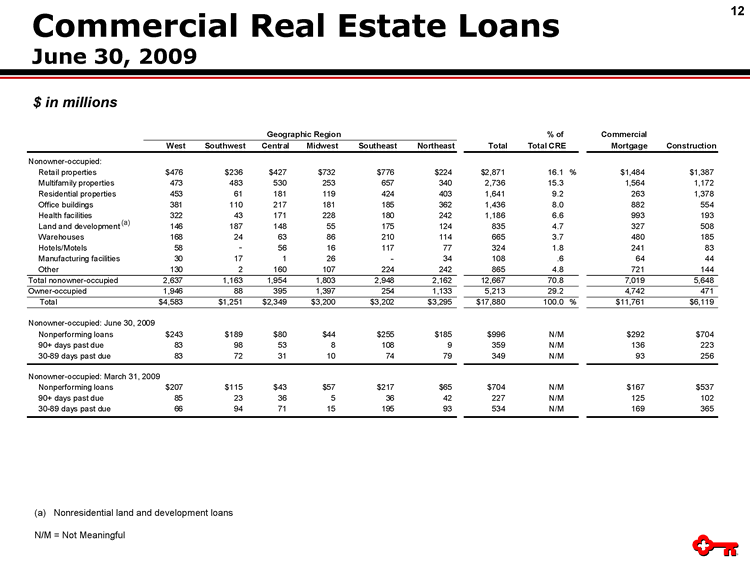
| Commercial Real Estate Loans June 30, 2009 $ in millions (a) Nonresidential land and development loans N/M = Not Meaningful Geographic Region % of Commercial West Southwest Central Midwest Southeast Northeast Total Total CRE Mortgage Construction Nonowner-occupied: Retail properties $476 $236 $427 $732 $776 $224 $2,871 16.1 % $1,484 $1,387 Multifamily properties 473 483 530 253 657 340 2,736 15.3 1,564 1,172 Residential properties 453 61 181 119 424 403 1,641 9.2 263 1,378 Office buildings 381 110 217 181 185 362 1,436 8.0 882 554 Health facilities 322 43 171 228 180 242 1,186 6.6 993 193 Land and development 146 187 148 55 175 124 835 4.7 327 508 Warehouses 168 24 63 86 210 114 665 3.7 480 185 Hotels/Motels 58 - - 56 16 117 77 324 1.8 241 83 Manufacturing facilities 30 17 1 26 - - 34 108 ..6 64 44 Other 130 2 160 107 224 242 865 4.8 721 144 Total nonowner-occupied 2,637 1,163 1,954 1,803 2,948 2,162 12,667 70.8 7,019 5,648 Owner-occupied 1,946 88 395 1,397 254 1,133 5,213 29.2 4,742 471 Total $4,583 $1,251 $2,349 $3,200 $3,202 $3,295 $17,880 100.0 % $11,761 $6,119 Nonowner-occupied: June 30, 2009 Nonperforming loans $243 $189 $80 $44 $255 $185 $996 N/M $292 $704 90+ days past due 83 98 53 8 108 9 359 N/M 136 223 30-89 days past due 83 72 31 10 74 79 349 N/M 93 256 Nonowner-occupied: March 31, 2009 Nonperforming loans $207 $115 $43 $57 $217 $65 $704 N/M $167 $537 90+ days past due 85 23 36 5 36 42 227 N/M 125 102 30-89 days past due 66 94 71 15 195 93 534 N/M 169 365 (a) |
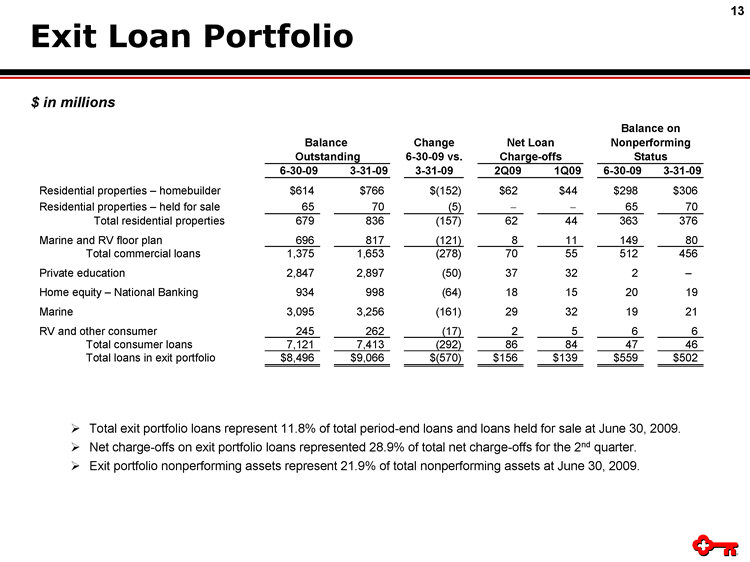
| Exit Loan Portfolio $ in millions Total exit portfolio loans represent 11.8% of total period-end loans and loans held for sale at June 30, 2009. Net charge-offs on exit portfolio loans represented 28.9% of total net charge-offs for the 2nd quarter. Exit portfolio nonperforming assets represent 21.9% of total nonperforming assets at June 30, 2009. Change 6-30-09 vs. 6-30-09 3-31-09 3-31-09 2Q09 1Q09 6-30-09 3-31-09 Residential properties - homebuilder $614 $766 $(152) $62 $44 $298 $306 Residential properties - held for sale 65 70 (5) - - 65 70 Total residential properties 679 836 (157) 62 44 363 376 Marine and RV floor plan 696 817 (121) 8 11 149 80 Total commercial loans 1,375 1,653 (278) 70 55 512 456 Private education 2,847 2,897 (50) 37 32 2 - Home equity - National Banking 934 998 (64) 18 15 20 19 Marine 3,095 3,256 (161) 29 32 19 21 RV and other consumer 245 262 (17) 2 5 6 6 Total consumer loans 7,121 7,413 (292) 86 84 47 46 Total loans in exit portfolio $8,496 $9,066 $(570) $156 $139 $559 $502 Balance on Nonperforming Status Balance Outstanding Charge-offs Net Loan |

| Fed-defined minimum for a "well capitalized" bank 6.00% 5.60% 5.58% 5.62% 5.62% 7.27% 0.59% 2.26% 2.39% 2.49% 2.34% 2.37% 2.42% 2.56% 2.36% 8.53% 8.55% 10.92% 11.22% 12.42% 0.62% 0.65% 0.30% 0.60% 0.00% 3.00% 6.00% 9.00% 12.00% 15.00% 2Q08 3Q08 4Q08 1Q09 2Q09 7.35% 6.06% 6.32% 6.29% 5.95% 0.00% 2.00% 4.00% 6.00% 8.00% 10.00% 2Q08 3Q08 4Q08 1Q09 2Q09 4.00% 10.00% Peer Median (a) 06-30-09 ratio is estimated. 5.60% 5.58% 5.62% 7.27% 0.59% 0.62% 0.65% 0.30% 2.26% 2.39% 2.49% 2.35% 2.37% 2.42% 2.56% 2.36% 1.26% 1.26% 1.28% 2.59% 2.64% 2.69% 2.77% 12.41% 12.40% 14.82% 15.18% 16.47% 5.62% 0.60% 1.27% 1.26% 2.61% 0.00% 3.00% 6.00% 9.00% 12.00% 15.00% 18.00% 2Q08 3Q08 4Q08 1Q09 2Q09 Tier 1 Risk-Based Capital (a) Total Risk-Based Capital (a) Tier 1 Common Equity (a) Tangible Common Equity To Tangible Assets Qualifying Common Convertible Preferred Capital Purchase Plan (CPP) Capital Securities Qualifying ALLL/Unfunded Comm. Qualifying LTD 5.60% 5.58% 5.62% 5.62% 7.27% 0.00% 2.00% 4.00% 6.00% 8.00% 10.00% 2Q08 3Q08 4Q08 1Q09 2Q09 Capital Ratios |
| Appendix |

| Pre-tax Amount After-tax Amount Impact on EPS Provision for loan losses in excess of net charge-offs $ (311) $ (195) $ (.34) Noncash deemed dividend - common shares exchanged for Series A Preferred Stock - - - - (.20) FDIC special assessment (44) (27) (.05) Realized and unrealized losses on loan and securities portfolios held for sale or trading (20) (13) (.02) Severance and other exit costs (14) (9) (.02) Net losses from principal investing (6) (4) (.01) Net gains from repositioning of securities portfolio 125 78 ..13 Gains related to exchange of common shares for capital securities 95 59 ..10 Gain from sale of Key's claim associated with the Lehman Brothers' bankruptcy 32 20 ..03 Significant Items Impacting 2Q09 Results $ in millions, except per share amounts (a) (a) The deemed dividend related to the exchange of Key common shares for Series A Preferred Stock is subtracted from earnings to derive the numerator used in the calculation of per share results. It is not recorded as a reduction to equity. |

| 2Q09 1Q09 2Q08 1Q09 2Q08 Trust and investment services income $119 $110 $130 $9 $(11) Service charges on deposit accounts 83 82 93 1 (10) Operating lease income 59 61 68 (2) (9) Letter of credit and loan fees 45 38 51 7 (6) Corporate-owned life insurance income 25 27 28 (2) (3) Electronic banking fees 27 24 27 3 - - Insurance income 16 18 20 (2) (4) Investment banking and capital markets income 17 18 80 (1) (63) Net securities gains (losses) 125 (14) (1) 139 126 Gain from sale of Key's claim associated with the Lehman Brothers' bankruptcy 32 - - - - 32 32 Gains on leased equipment 36 26 7 10 29 Net losses from principal investing (6) (72) (14) 66 8 Net (losses) gains from loan securitizations and sales (3) 8 33 (11) (36) Gain related to exchange of common shares for trust preferred securities 95 - - - - 95 95 Gain from sale/redemption of Visa Inc. shares - - 105 - - (105) - - Other income 45 54 25 (9) 20 Total noninterest income $715 $485 $547 $230 $168 Change 2Q09 vs. Noninterest Income $ in millions |
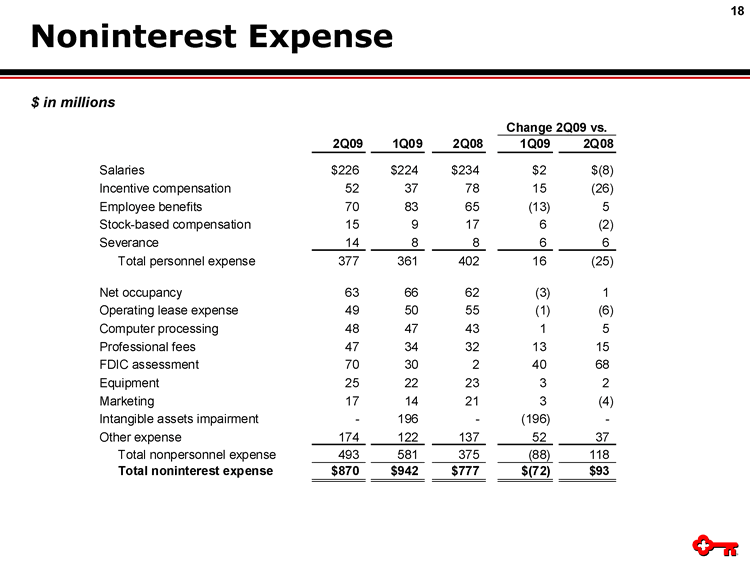
| 2Q09 1Q09 2Q08 1Q09 2Q08 Salaries $226 $224 $234 $2 $(8) Incentive compensation 52 37 78 15 (26) Employee benefits 70 83 65 (13) 5 Stock-based compensation 15 9 17 6 (2) Severance 14 8 8 6 6 Total personnel expense 377 361 402 16 (25) Net occupancy 63 66 62 (3) 1 Operating lease expense 49 50 55 (1) (6) Computer processing 48 47 43 1 5 Professional fees 47 34 32 13 15 FDIC assessment 70 30 2 40 68 Equipment 25 22 23 3 2 Marketing 17 14 21 3 (4) Intangible assets impairment - - 196 - - (196) - - Other expense 174 122 137 52 37 Total nonpersonnel expense 493 581 375 (88) 118 Total noninterest expense $870 $942 $777 $(72) $93 Change 2Q09 vs. Noninterest Expense $ in millions |
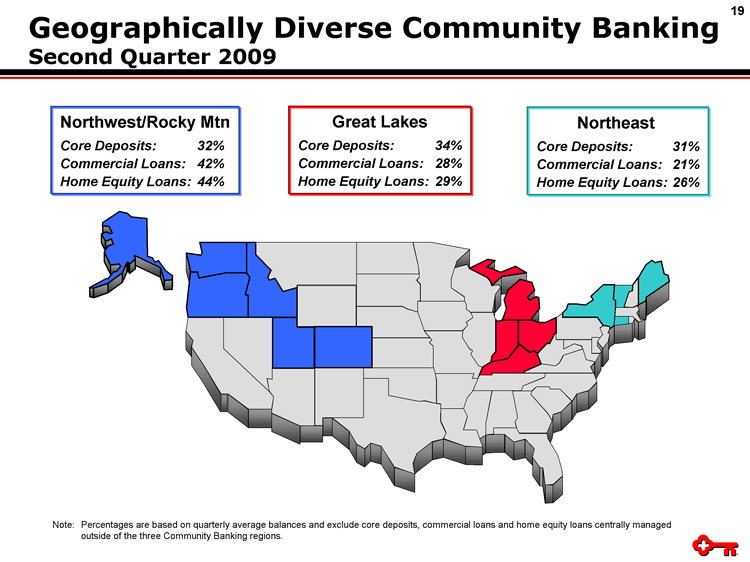
| Great Lakes Core Deposits: 34% Commercial Loans: 28% Home Equity Loans: 29% Northwest/Rocky Mtn Core Deposits: 32% Commercial Loans: 42% Home Equity Loans: 44% Northeast Core Deposits: 31% Commercial Loans: 21% Home Equity Loans: 26% Note: Percentages are based on quarterly average balances and exclude core deposits, commercial loans and home equity loans centrally managed outside of the three Community Banking regions. Geographically Diverse Community Banking Second Quarter 2009 |

| TE = Taxable Equivalent, N/A = Not Applicable, N/M = Not Meaningful Community Banking Summary of Operations $ in millions Percent Change 2Q09 vs. 2Q09 1Q09 2Q08 1Q09 2Q08 Total revenue (TE) $592 $599 $654 (1.2) % (9.5) % Provision for loan losses 187 81 44 130.9 325.0 Noninterest expense 497 470 445 5.7 11.7 Net (loss) income attributable to Key (57) 30 103 N/M N/M Average loans and leases $28,237 $28,940 $28,470 (2.4) % (.8) % Average deposits 52,689 51,560 49,944 2.2 5.5 Net loan charge-offs $87 $54 $38 61.1 % 128.9 % Net loan charge-offs to average loans 1.24 % ..76 % ..54 % N/A N/A Nonperforming assets at period end $380 $331 $218 14.8 74.3 Return on average allocated equity (6.81) % 3.72 % 13.28 % N/A N/A |
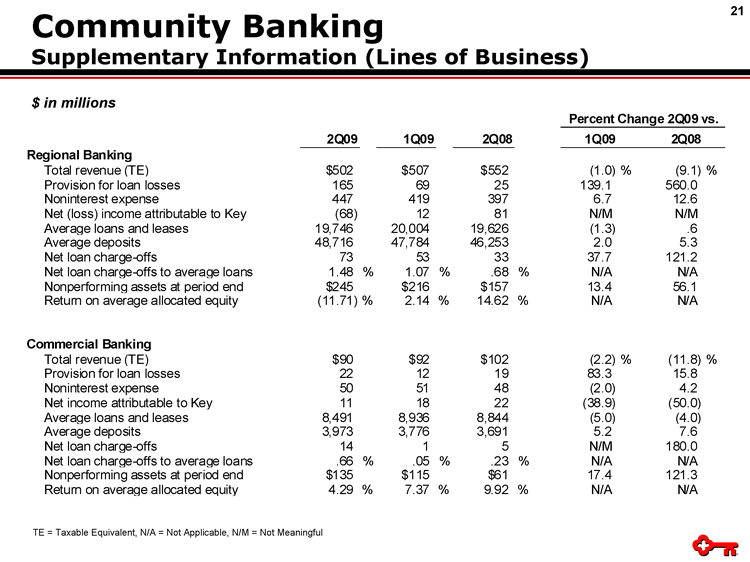
| Community Banking Supplementary Information (Lines of Business) $ in millions TE = Taxable Equivalent, N/A = Not Applicable, N/M = Not Meaningful Percent Change 2Q09 vs. 2Q09 1Q09 2Q08 1Q09 2Q08 Regional Banking Total revenue (TE) $502 $507 $552 (1.0) % (9.1) % Provision for loan losses 165 69 25 139.1 560.0 Noninterest expense 447 419 397 6.7 12.6 Net (loss) income attributable to Key (68) 12 81 N/M N/M Average loans and leases 19,746 20,004 19,626 (1.3) ..6 Average deposits 48,716 47,784 46,253 2.0 5.3 Net loan charge-offs 73 53 33 37.7 121.2 Net loan charge-offs to average loans 1.48 % 1.07 % ..68 % N/A N/A Nonperforming assets at period end $245 $216 $157 13.4 56.1 Return on average allocated equity (11.71) % 2.14 % 14.62 % N/A N/A Commercial Banking Total revenue (TE) $90 $92 $102 (2.2) % (11.8) % Provision for loan losses 22 12 19 83.3 15.8 Noninterest expense 50 51 48 (2.0) 4.2 Net income attributable to Key 11 18 22 (38.9) (50.0) Average loans and leases 8,491 8,936 8,844 (5.0) (4.0) Average deposits 3,973 3,776 3,691 5.2 7.6 Net loan charge-offs 14 1 5 N/M 180.0 Net loan charge-offs to average loans ..66 % ..05 % ..23 % N/A N/A Nonperforming assets at period end $135 $115 $61 17.4 121.3 Return on average allocated equity 4.29 % 7.37 % 9.92 % N/A N/A |
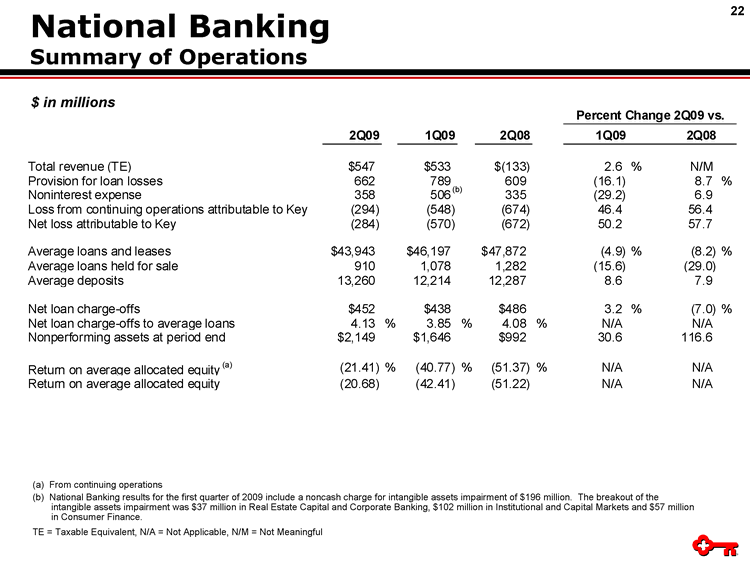
| National Banking Summary of Operations (a) From continuing operations (b) National Banking results for the first quarter of 2009 include a noncash charge for intangible assets impairment of $196 million. The breakout of the intangible assets impairment was $37 million in Real Estate Capital and Corporate Banking, $102 million in Institutional and Capital Markets and $57 million in Consumer Finance. TE = Taxable Equivalent, N/A = Not Applicable, N/M = Not Meaningful $ in millions Percent Change 2Q09 vs. 2Q09 1Q09 2Q08 1Q09 2Q08 Total revenue (TE) $547 $533 $(133) 2.6 % N/M Provision for loan losses 662 789 609 (16.1) 8.7 % Noninterest expense 358 506 335 (29.2) 6.9 Loss from continuing operations attributable to Key (294) (548) (674) 46.4 56.4 Net loss attributable to Key (284) (570) (672) 50.2 57.7 Average loans and leases $43,943 $46,197 $47,872 (4.9) % (8.2) % Average loans held for sale 910 1,078 1,282 (15.6) (29.0) Average deposits 13,260 12,214 12,287 8.6 7.9 Net loan charge-offs $452 $438 $486 3.2 % (7.0) % Net loan charge-offs to average loans 4.13 % 3.85 % 4.08 % N/A N/A Nonperforming assets at period end $2,149 $1,646 $992 30.6 116.6 Return on average allocated equity (a) (21.41) % (40.77) % (51.37) % N/A N/A Return on average allocated equity (20.68) (42.41) (51.22) N/A N/A (b) |
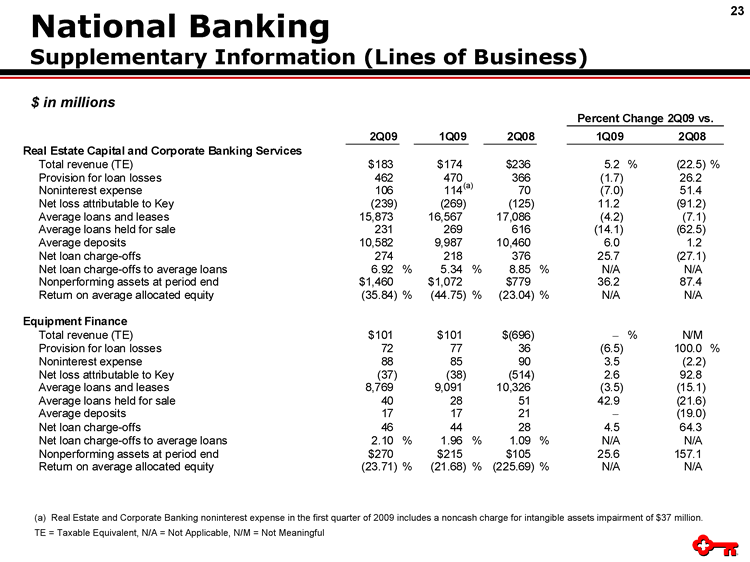
| Percent Change 2Q09 vs. 2Q09 1Q09 2Q08 1Q09 2Q08 Real Estate Capital and Corporate Banking Services Total revenue (TE) $183 $174 $236 5.2 % (22.5) % Provision for loan losses 462 470 366 (1.7) 26.2 Noninterest expense 106 114 70 (7.0) 51.4 Net loss attributable to Key (239) (269) (125) 11.2 (91.2) Average loans and leases 15,873 16,567 17,086 (4.2) (7.1) Average loans held for sale 231 269 616 (14.1) (62.5) Average deposits 10,582 9,987 10,460 6.0 1.2 Net loan charge-offs 274 218 376 25.7 (27.1) Net loan charge-offs to average loans 6.92 % 5.34 % 8.85 % N/A N/A Nonperforming assets at period end $1,460 $1,072 $779 36.2 87.4 Return on average allocated equity (35.84) % (44.75) % (23.04) % N/A N/A Equipment Finance Total revenue (TE) $101 $101 $(696) - % N/M Provision for loan losses 72 77 36 (6.5) 100.0 % Noninterest expense 88 85 90 3.5 (2.2) Net loss attributable to Key (37) (38) (514) 2.6 92.8 Average loans and leases 8,769 9,091 10,326 (3.5) (15.1) Average loans held for sale 40 28 51 42.9 (21.6) Average deposits 17 17 21 - (19.0) Net loan charge-offs 46 44 28 4.5 64.3 Net loan charge-offs to average loans 2.10 % 1.96 % 1.09 % N/A N/A Nonperforming assets at period end $270 $215 $105 25.6 157.1 Return on average allocated equity (23.71) % (21.68) % (225.69) % N/A N/A National Banking Supplementary Information (Lines of Business) $ in millions (a) Real Estate and Corporate Banking noninterest expense in the first quarter of 2009 includes a noncash charge for intangible assets impairment of $37 million. TE = Taxable Equivalent, N/A = Not Applicable, N/M = Not Meaningful (a) |
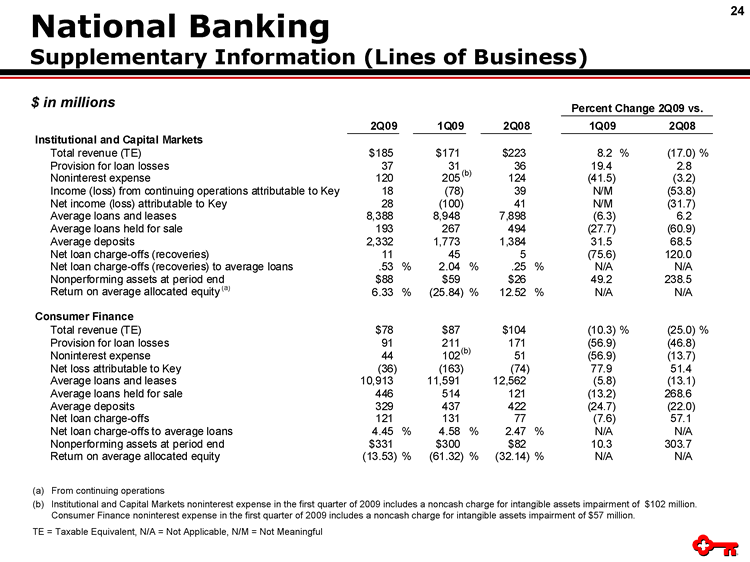
| Percent Change 2Q09 vs. 2Q09 1Q09 2Q08 1Q09 2Q08 Institutional and Capital Markets Total revenue (TE) $185 $171 $223 8.2 % (17.0) % Provision for loan losses 37 31 36 19.4 2.8 Noninterest expense 120 205 124 (41.5) (3.2) Income (loss) from continuing operations attributable to Key 18 (78) 39 N/M (53.8) Net income (loss) attributable to Key 28 (100) 41 N/M (31.7) Average loans and leases 8,388 8,948 7,898 (6.3) 6.2 Average loans held for sale 193 267 494 (27.7) (60.9) Average deposits 2,332 1,773 1,384 31.5 68.5 Net loan charge-offs (recoveries) 11 45 5 (75.6) 120.0 Net loan charge-offs (recoveries) to average loans ..53 % 2.04 % ..25 % N/A N/A Nonperforming assets at period end $88 $59 $26 49.2 238.5 Return on average allocated equity (a) 6.33 % (25.84) % 12.52 % N/A N/A Consumer Finance Total revenue (TE) $78 $87 $104 (10.3) % (25.0) % Provision for loan losses 91 211 171 (56.9) (46.8) Noninterest expense 44 102 51 (56.9) (13.7) Net loss attributable to Key (36) (163) (74) 77.9 51.4 Average loans and leases 10,913 11,591 12,562 (5.8) (13.1) Average loans held for sale 446 514 121 (13.2) 268.6 Average deposits 329 437 422 (24.7) (22.0) Net loan charge-offs 121 131 77 (7.6) 57.1 Net loan charge-offs to average loans 4.45 % 4.58 % 2.47 % N/A N/A Nonperforming assets at period end $331 $300 $82 10.3 303.7 Return on average allocated equity (13.53) % (61.32) % (32.14) % N/A N/A National Banking Supplementary Information (Lines of Business) $ in millions (a) From continuing operations (b) Institutional and Capital Markets noninterest expense in the first quarter of 2009 includes a noncash charge for intangible assets impairment of $102 million. Consumer Finance noninterest expense in the first quarter of 2009 includes a noncash charge for intangible assets impairment of $57 million. TE = Taxable Equivalent, N/A = Not Applicable, N/M = Not Meaningful (b) (b) |
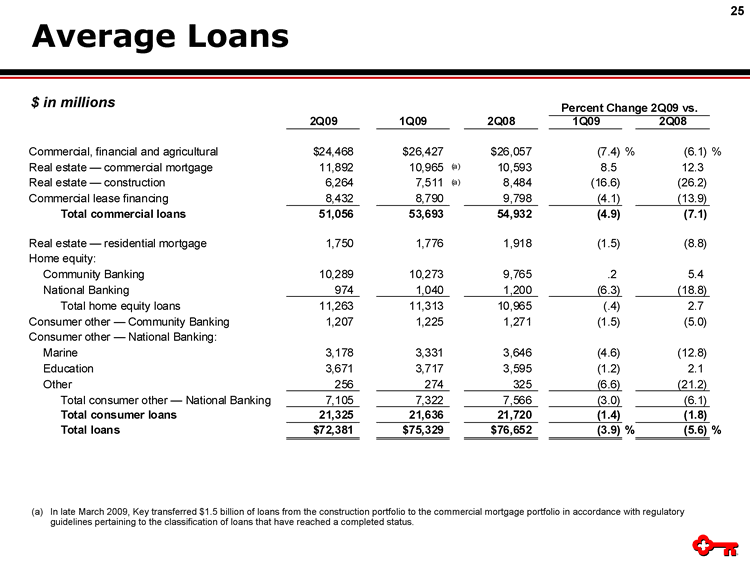
| Average Loans $ in millions (a) In late March 2009, Key transferred $1.5 billion of loans from the construction portfolio to the commercial mortgage portfolio in accordance with regulatory guidelines pertaining to the classification of loans that have reached a completed status. Percent Change 2Q09 vs. 2Q09 1Q09 2Q08 1Q09 2Q08 Commercial, financial and agricultural $24,468 $26,427 $26,057 (7.4) % (6.1) % Real estate - commercial mortgage 11,892 10,965 (a) 10,593 8.5 12.3 Real estate - construction 6,264 7,511 (a) 8,484 (16.6) (26.2) Commercial lease financing 8,432 8,790 9,798 (4.1) (13.9) Total commercial loans 51,056 53,693 54,932 (4.9) (7.1) Real estate - residential mortgage 1,750 1,776 1,918 (1.5) (8.8) Home equity: Community Banking 10,289 10,273 9,765 ..2 5.4 National Banking 974 1,040 1,200 (6.3) (18.8) Total home equity loans 11,263 11,313 10,965 (.4) 2.7 Consumer other - Community Banking 1,207 1,225 1,271 (1.5) (5.0) Consumer other - National Banking: Marine 3,178 3,331 3,646 (4.6) (12.8) Education 3,671 3,717 3,595 (1.2) 2.1 Other 256 274 325 (6.6) (21.2) Total consumer other - National Banking 7,105 7,322 7,566 (3.0) (6.1) Total consumer loans 21,325 21,636 21,720 (1.4) (1.8) Total loans $72,381 $75,329 $76,652 (3.9) % (5.6) % |
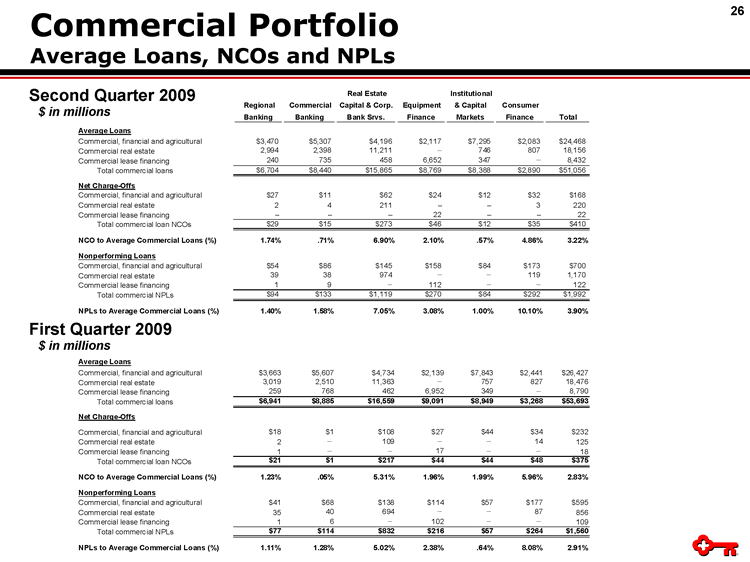
| Regional Banking Commercial Banking Real Estate Capital & Corp. Bank Srvs. Equipment Finance Institutional & Capital Markets Consumer Finance Total Average Loans Commercial, financial and agricultural $3,470 $5,307 $4,196 $2,117 $7,295 $2,083 $24,468 Commercial real estate 2,994 2,398 11,211 - 746 807 18,156 Commercial lease financing 240 735 458 6,652 347 - 8,432 Total commercial loans $6,704 $8,440 $15,865 $8,769 $8,388 $2,890 $51,056 Net Charge-Offs Commercial, financial and agricultural $27 $11 $62 $24 $12 $32 $168 Commercial real estate 2 4 211 - - 3 220 Commercial lease financing - - - 22 - - 22 Total commercial loan NCOs $29 $15 $273 $46 $12 $35 $410 NCO to Average Commercial Loans (%) 1.74% ..71% 6.90% 2.10% ..57% 4.86% 3.22% Nonperforming Loans Commercial, financial and agricultural $54 $86 $145 $158 $84 $173 $700 Commercial real estate 39 38 974 - - 119 1,170 Commercial lease financing 1 9 - 112 - - 122 Total commercial NPLs $94 $133 $1,119 $270 $84 $292 $1,992 NPLs to Average Commercial Loans (%) 1.40% 1.58% 7.05% 3.08% 1.00% 10.10% 3.90% Average Loans Commercial, financial and agricultural $3,663 $5,607 $4,734 $2,139 $7,843 $2,441 $26,427 Commercial real estate 3,019 2,510 11,363 - 757 827 18,476 Commercial lease financing 259 768 462 6,952 349 - 8,790 Total commercial loans $6,941 $8,885 $16,559 $9,091 $8,949 $3,268 $53,693 Net Charge-Offs Commercial, financial and agricultural $18 $1 $108 $27 $44 $34 $232 Commercial real estate 2 - 109 - - 14 125 Commercial lease financing 1 - - 17 - - 18 Total commercial loan NCOs $21 $1 $217 $44 $44 $48 $375 NCO to Average Commercial Loans (%) 1.23% ..05% 5.31% 1.96% 1.99% 5.96% 2.83% Nonperforming Loans Commercial, financial and agricultural $41 $68 $138 $114 $57 $177 $595 Commercial real estate 35 40 694 - - 87 856 Commercial lease financing 1 6 - 102 - - 109 Total commercial NPLs $77 $114 $832 $216 $57 $264 $1,560 NPLs to Average Commercial Loans (%) 1.11% 1.28% 5.02% 2.38% ..64% 8.08% 2.91% Commercial Portfolio Average Loans, NCOs and NPLs $ in millions Second Quarter 2009 $ in millions First Quarter 2009 |
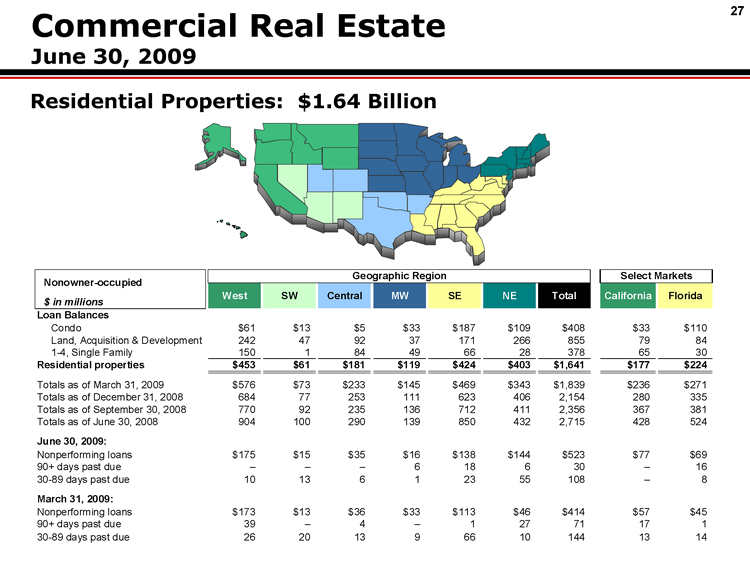
| Residential Properties: $1.64 Billion Commercial Real Estate June 30, 2009 53 $ in millions Loan Balances Condo $61 $13 $5 $33 $187 $109 $408 $33 $110 Land, Acquisition & Development 242 47 92 37 171 266 855 79 84 1-4, Single Family 150 1 84 49 66 28 378 65 30 Residential properties $453 $61 $181 $119 $424 $403 $1,641 $177 $224 Totals as of March 31, 2009 $576 $73 $233 $145 $469 $343 $1,839 $236 $271 Totals as of December 31, 2008 684 77 253 111 623 406 2,154 280 335 Totals as of September 30, 2008 770 92 235 136 712 411 2,356 367 381 Totals as of June 30, 2008 904 100 290 139 850 432 2,715 428 524 June 30, 2009: Nonperforming loans $175 $15 $35 $16 $138 $144 $523 $77 $69 90+ days past due - - - - - - 6 18 6 30 - - 16 30-89 days past due 10 13 6 1 23 55 108 - - 8 March 31, 2009: Nonperforming loans $173 $13 $36 $33 $113 $46 $414 $57 $45 90+ days past due 39 - - 4 - - 1 27 71 17 1 30-89 days past due 26 20 13 9 66 10 144 13 14 Select Markets West California Florida Central SW NE SE Geographic Region Total MW Nonowner-occupied |
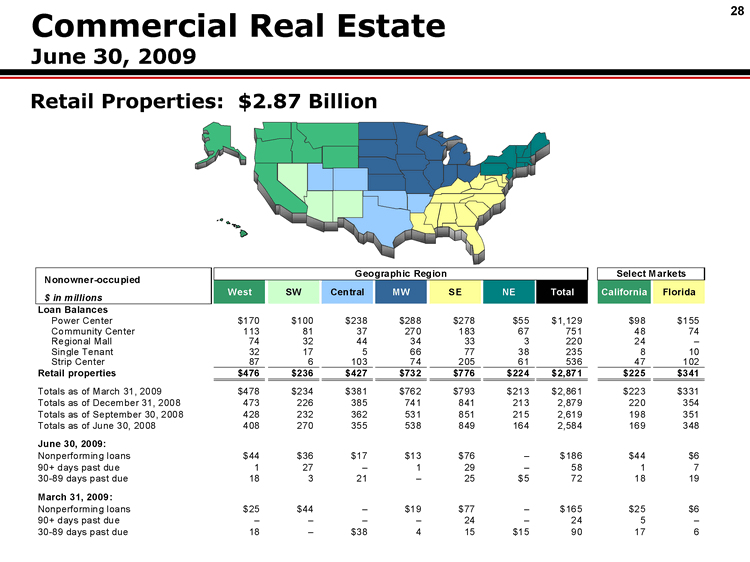
| Retail Properties: $2.87 Billion Commercial Real Estate June 30, 2009 55 $ in millions Loan Balances Power Center $170 $100 $238 $288 $278 $55 $1,129 $98 $155 Community Center 113 81 37 270 183 67 751 48 74 Regional Mall 74 32 44 34 33 3 220 24 - - Single Tenant 32 17 5 66 77 38 235 8 10 Strip Center 87 6 103 74 205 61 536 47 102 Retail properties $476 $236 $427 $732 $776 $224 $2,871 $225 $341 Totals as of March 31, 2009 $478 $234 $381 $762 $793 $213 $2,861 $223 $331 Totals as of December 31, 2008 473 226 385 741 841 213 2,879 220 354 Totals as of September 30, 2008 428 232 362 531 851 215 2,619 198 351 Totals as of June 30, 2008 408 270 355 538 849 164 2,584 169 348 June 30, 2009: Nonperforming loans $44 $36 $17 $13 $76 - - $186 $44 $6 90+ days past due 1 27 - - 1 29 - - 58 1 7 30-89 days past due 18 3 21 - - 25 $5 72 18 19 March 31, 2009: Nonperforming loans $25 $44 - - $19 $77 - - $165 $25 $6 90+ days past due - - - - - - - - 24 - - 24 5 - - 30-89 days past due 18 - - $38 4 15 $15 90 17 6 Select Markets West California Florida Central SW NE SE Geographic Region Total MW Nonowner-occupied |
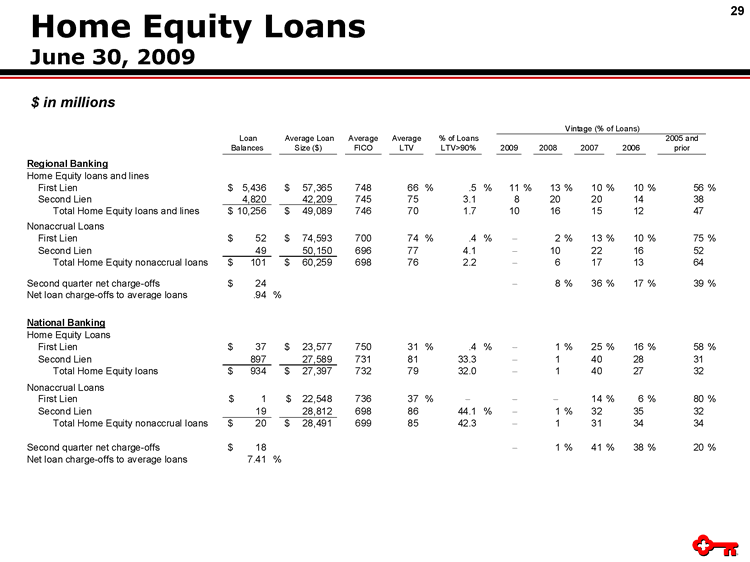
| Home Equity Loans June 30, 2009 $ in millions Loan Balances Average Loan Size ($) Average FICO Average LTV % of Loans LTV>90% 2009 2008 2007 2006 2005 and prior Regional Banking Home Equity loans and lines First Lien 5,436 $ 57,365 $ 748 66 % ..5 % 11 % 13 % 10 % 10 % 56 % Second Lien 4,820 42,209 745 75 3.1 8 20 20 14 38 Total Home Equity loans and lines 10,256 $ 49,089 $ 746 70 1.7 10 16 15 12 47 Nonaccrual Loans First Lien 52 $ 74,593 $ 700 74 % ..4 % - 2 % 13 % 10 % 75 % Second Lien 49 50,150 696 77 4.1 - 10 22 16 52 Total Home Equity nonaccrual loans 101 $ 60,259 $ 698 76 2.2 - 6 17 13 64 Second quarter net charge-offs 24 $ - 8 % 36 % 17 % 39 % Net loan charge-offs to average loans ..94 % National Banking Home Equity Loans First Lien 37 $ 23,577 $ 750 31 % ..4 % - 1 % 25 % 16 % 58 % Second Lien 897 27,589 731 81 33.3 - 1 40 28 31 Total Home Equity loans 934 $ 27,397 $ 732 79 32.0 - 1 40 27 32 Nonaccrual Loans First Lien 1 $ 22,548 $ 736 37 % - - - 14 % 6 % 80 % Second Lien 19 28,812 698 86 44.1 % - 1 % 32 35 32 Total Home Equity nonaccrual loans 20 $ 28,491 $ 699 85 42.3 - 1 31 34 34 Second quarter net charge-offs 18 $ - 1 % 41 % 38 % 20 % Net loan charge-offs to average loans 7.41 % Vintage (% of Loans) |
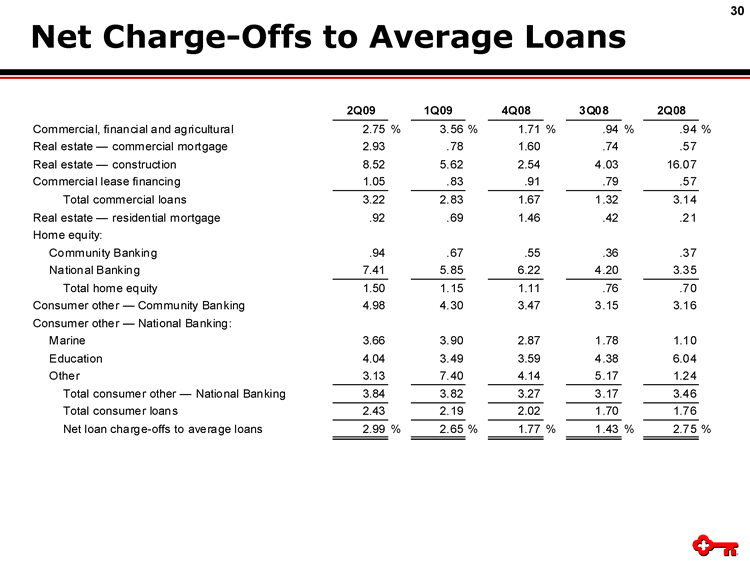
| Net Charge-Offs to Average Loans 2Q09 1Q09 4Q08 3Q08 2Q08 Commercial, financial and agricultural 2.75 % 3.56 % 1.71 % ..94 % ..94 % Real estate - commercial mortgage 2.93 ..78 1.60 ..74 ..57 Real estate - construction 8.52 5.62 2.54 4.03 16.07 Commercial lease financing 1.05 ..83 ..91 ..79 ..57 Total commercial loans 3.22 2.83 1.67 1.32 3.14 Real estate - residential mortgage ..92 ..69 1.46 ..42 ..21 Home equity: Community Banking ..94 ..67 ..55 ..36 ..37 National Banking 7.41 5.85 6.22 4.20 3.35 Total home equity 1.50 1.15 1.11 ..76 ..70 Consumer other - Community Banking 4.98 4.30 3.47 3.15 3.16 Consumer other - National Banking: Marine 3.66 3.90 2.87 1.78 1.10 Education 4.04 3.49 3.59 4.38 6.04 Other 3.13 7.40 4.14 5.17 1.24 Total consumer other - National Banking 3.84 3.82 3.27 3.17 3.46 Total consumer loans 2.43 2.19 2.02 1.70 1.76 Net loan charge-offs to average loans 2.99 % 2.65 % 1.77 % 1.43 % 2.75 % |
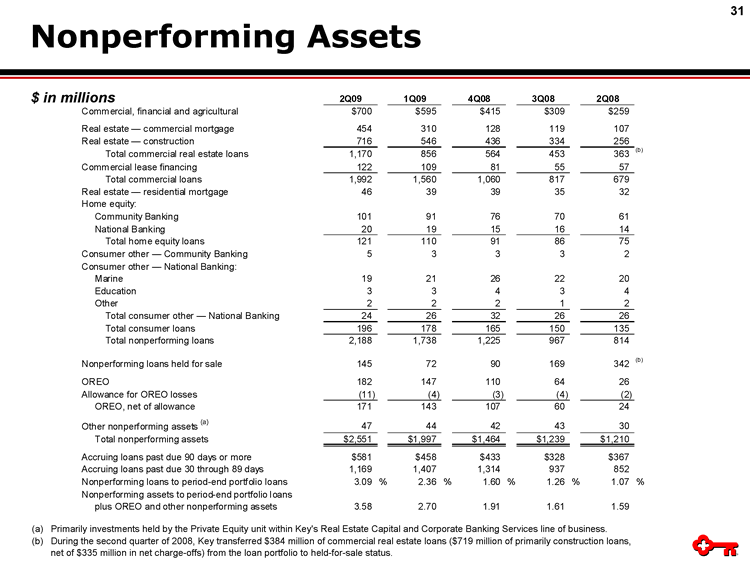
| 2Q09 1Q09 4Q08 3Q08 2Q08 Commercial, financial and agricultural $700 $595 $415 $309 $259 Real estate - commercial mortgage 454 310 128 119 107 Real estate - construction 716 546 436 334 256 Total commercial real estate loans 1,170 856 564 453 363 (b) Commercial lease financing 122 109 81 55 57 Total commercial loans 1,992 1,560 1,060 817 679 Real estate - residential mortgage 46 39 39 35 32 Home equity: Community Banking 101 91 76 70 61 National Banking 20 19 15 16 14 Total home equity loans 121 110 91 86 75 Consumer other - Community Banking 5 3 3 3 2 Consumer other - National Banking: Marine 19 21 26 22 20 Education 3 3 4 3 4 Other 2 2 2 1 2 Total consumer other - National Banking 24 26 32 26 26 Total consumer loans 196 178 165 150 135 Total nonperforming loans 2,188 1,738 1,225 967 814 Nonperforming loans held for sale 145 72 90 169 342 (b) OREO 182 147 110 64 26 Allowance for OREO losses (11) (4) (3) (4) (2) OREO, net of allowance 171 143 107 60 24 Other nonperforming assets (a) 47 44 42 43 30 Total nonperforming assets $2,551 $1,997 $1,464 $1,239 $1,210 Accruing loans past due 90 days or more $581 $458 $433 $328 $367 Accruing loans past due 30 through 89 days 1,169 1,407 1,314 937 852 Nonperforming loans to period-end portfolio loans 3.09 % 2.36 % 1.60 % 1.26 % 1.07 % Nonperforming assets to period-end portfolio loans plus OREO and other nonperforming assets 3.58 2.70 1.91 1.61 1.59 Nonperforming Assets (a) Primarily investments held by the Private Equity unit within Key's Real Estate Capital and Corporate Banking Services line of business. (b) During the second quarter of 2008, Key transferred $384 million of commercial real estate loans ($719 million of primarily construction loans, net of $335 million in net charge-offs) from the loan portfolio to held-for-sale status. $ in millions |