 Second Quarter 2011 Review July 19, 2011 Speakers: Beth Mooney Jeff Weeden Exhibit 99.2 |
 2 This presentation contains forward-looking statements within the meaning of the Private Securities Litigation Reform Act of 1995, including statements about Key’s financial condition, results of operations, earnings outlook, asset quality trends and profitability. Forward-looking statements are not historical facts but instead represent only management’s current expectations and forecasts regarding future events, many of which, by their nature, are inherently uncertain and outside of Key’s control. Key’s actual results and financial condition may differ, possibly materially, from the anticipated results and financial condition indicated in these forward-looking statements. Factors that could cause Key’s actual results to differ materially from those described in the forward-looking statements can be found in KeyCorp’s Annual Report on Form 10-K for the year ended December 31, 2010, and its Quarterly Report on Form 10-Q for the period ended March 31, 2011, which have been filed with the Securities and Exchange Commission and are available on Key’s website (www.key.com/ir) and on the Securities and Exchange Commission’s website (www.sec.gov). Forward-looking statements are not guarantees of future performance and should not be relied upon as representing management’s views as of any subsequent date. Key does not undertake any obligation to update the forward-looking statements to reflect the impact of circumstances or events that may arise after the date of the forward-looking statements. PRIVATE SECURITIES LITIGATION REFORM ACT OF 1995 FORWARD-LOOKING STATEMENT DISCLOSURE |
 3 Momentum in the business – new client acquisition and growth Leveraging strong balance sheet; growth in C&I loans Investing in the business Growing the Franchise Increased quarterly dividend to $.03 per common share Repurchased warrant issued to U.S. Treasury under TARP Positioned to meet Basel III requirements Leadership team in place Continued improvement in credit quality Well controlled expenses - driving to create positive operating leverage Execution of Business Plan Investor Highlights – Second Quarter 2011 Strategic statement: Key grows by building enduring relationships through client-focused solutions and extraordinary service Disciplined Capital Management |
 4 (a) Continuing operations, unless otherwise noted (b) Represents period-end consolidated total loans and loans held for sale (excluding education loans in the securitization trusts) divided by period-end consolidated total deposits (excluding deposits in foreign office) Executing Business Plan: Progress on Targets for Success Improve funding mix Focus on risk-adjusted returns Grow client relationships Leverage Key’s total client solutions and cross- selling capabilities >3.50% 3.19% Net interest margin Growing high quality, diverse revenue streams >40% 44% Noninterest income to total revenue Improve efficiency and effectiveness Leverage technology Change cost base to more variable from fixed $300-$375 million $320 million implemented Keyvolution cost savings Creating positive operating leverage Execute our client insight-driven relationship model Lower credit costs Improved funding mix with lower cost core deposits Keyvolution savings 1.00-1.25% 1.23% Return on average assets Executing our strategies Focus on relationship clients Exit noncore portfolios Limit concentrations Focus on risk-adjusted returns 40-50 bps 1.11% NCOs to average loans Returning to a moderate risk profile Improve risk profile of loan portfolio and grow relationships Improve deposit mix and grow deposit base 90-100% 86% Loan to deposit ratio (b) Core funded Action Plans Targets KEY 2Q11 KEY Metrics (a) KEY Business Model |
 5 Financial Summary – Second Quarter 2011 Capital (b) Asset Quality (a) Financial Performance (a) Metrics TE = Taxable equivalent, EOP = End of Period (a) From continuing operations (b) From consolidated operations (c) 6-30-11 ratios are estimated 2Q11 1Q11 2Q10 Income from continuing operations attributable to Key $.26 $.21 $.06 common shareholders Net interest margin (TE) 3.19% 3.25% 3.17% Return on average total assets 1.23 1.32 .44 Tier 1 common equity (c) 11.01% 10.74% 8.07% Tier 1 risk-based capital (c) 13.76 13.48 13.62 Tangible common equity to tangible assets 9.67 9.16 7.65 Book value per common share $9.88 $9.58 $9.19 Net loan charge-offs to average loans 1.11% 1.59% 3.18% NPLs to EOP portfolio loans 1.76 1.82 3.19 NPAs to EOP portfolio loans + OREO + Other NPAs 1.98 2.23 3.88 Allowance for loan losses to period-end loans 2.57 2.83 4.16 Allowance for loan losses to NPLs 146.08 155.03 130.30 |
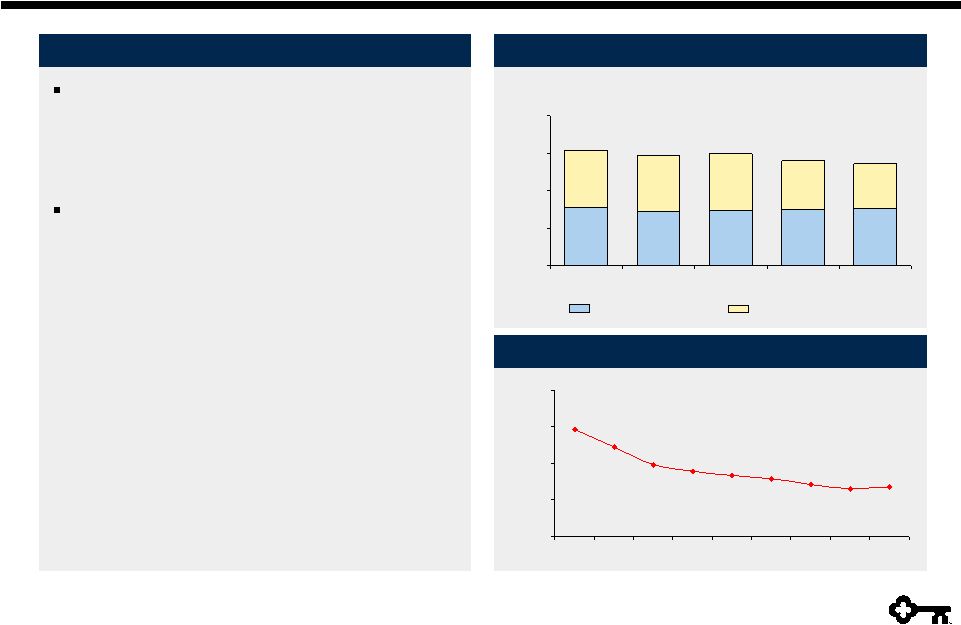
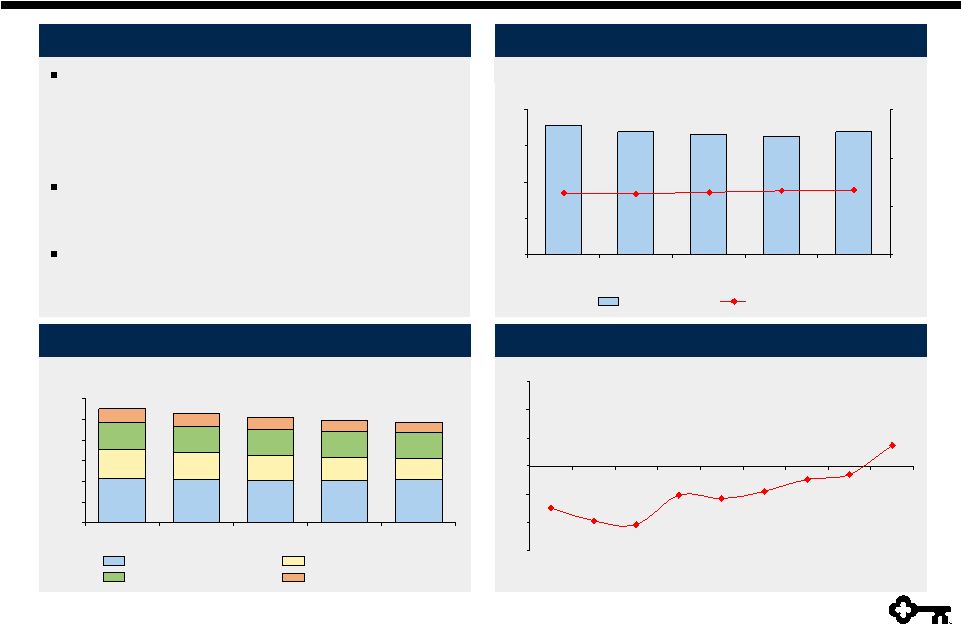 6 Stabilizing Loan Portfolio $16.9 $16.3 $16.6 $16.9 $17.7 43.4% 43.2% 42.9% 42.7% 42.9% $0 $5 $10 $15 $20 2Q10 3Q10 4Q10 1Q11 2Q11 30% 40% 50% 60% $ in billions Highlights Average Commercial, Financial & Agricultural Loans Commercial, Financial and Agricultural loans increased by 3.7% in 2Q11 compared to 1Q11 – Modest growth in Commercial Banking and industrial vertical of Corporate Bank Commercial Real Estate loans continued to decline, but at a slower pace Slower run-off in exit portfolio and focus on targeted segments positions Key for future loan growth CF&A loans Utilization rate (4.4)% 3.7% (1.5)% (2.3)% (5.7)% (5.2)% (10.3)% (9.7)% (7.4)% -15% -10% -5% 0% 5% 10% 15% 2Q09 3Q09 4Q09 1Q10 2Q10 3Q10 4Q10 1Q11 2Q11 Quarterly % Change in Average CF&A Loans Average Loans $0 $10 $20 $30 $40 $50 $60 2Q10 3Q10 4Q10 1Q11 2Q11 Exit Portfolios Home Equity & Other CF&A & Leasing Commercial Real Estate $55.0 $ in billions $52.6 $50.8 $49.3 $48.5 |
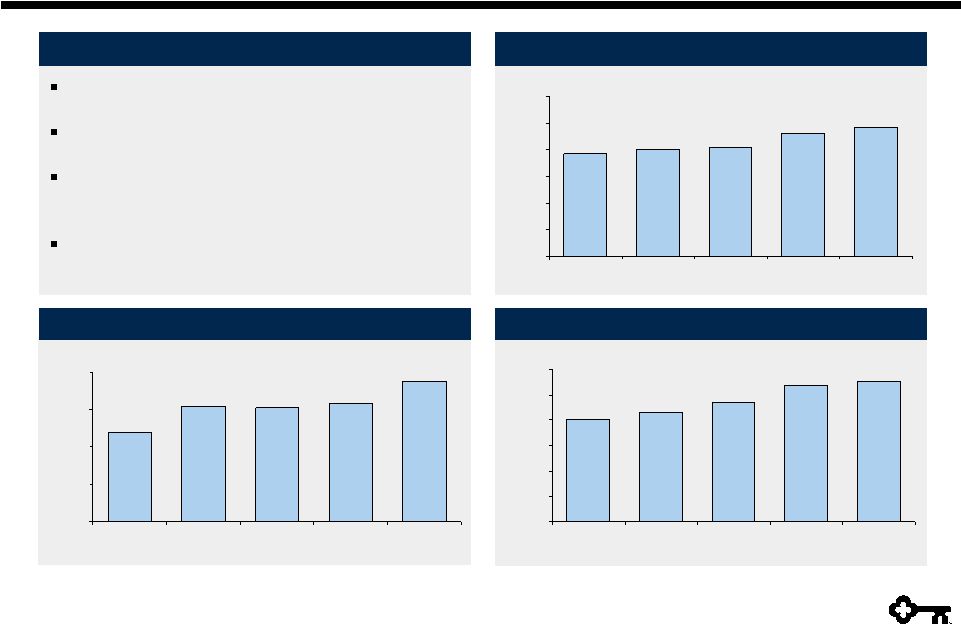
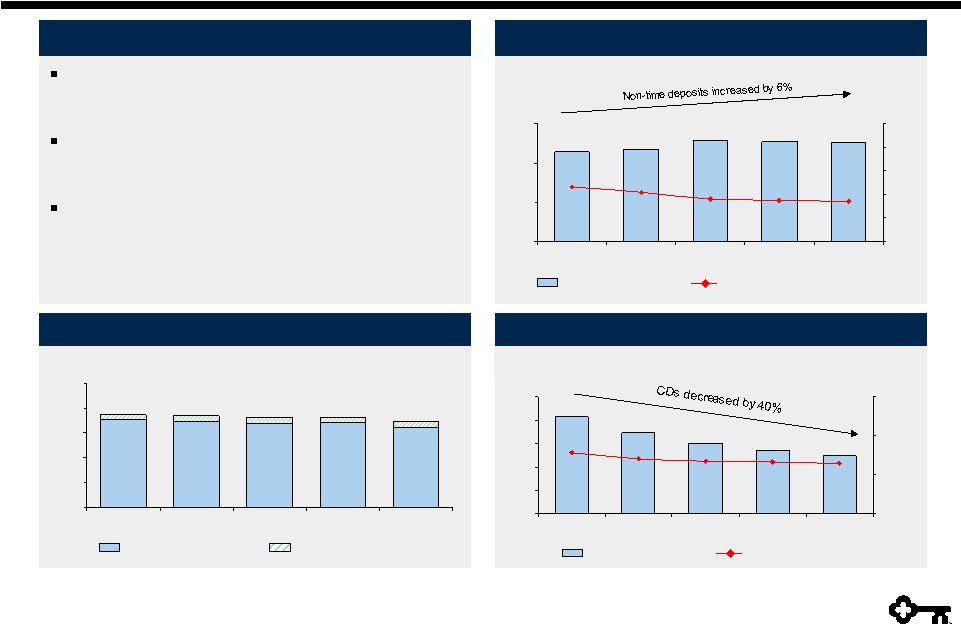 7 Improving Deposit Mix Highlights Average Non-time Deposits (a) Higher cost CDs continue to decline, while lower cost deposits have remained strong Improved funding mix has reduced the cost of deposits Total CD maturities and average cost – 2011: $4.3 billion at 1.51% – 2012: $5.1 billion at 2.69% – 2013 & beyond: $2.7 billion at 4.08% Average CD Balances $42.8 $43.6 $45.8 $45.4 $45.3 .17% .18% .23% .18% .21% $20 $30 $40 $50 2Q10 3Q10 4Q10 1Q11 2Q11 0.0% 0.1% 0.2% 0.3% 0.4% 0.5% $ in billions $ in billions $12.4 $13.6 $15.0 $17.3 $20.8 2.82% 2.69% 3.13% 2.66% 2.60% $0 $5 $10 $15 $20 $25 2Q10 3Q10 4Q10 1Q11 2Q11 0.00% 2.00% 4.00% 6.00% (a) Excludes time deposits and deposits in foreign office (b) Represents period-end consolidated total loans and loans held for sale (excluding education loans in the securitization trusts) divided by period-end consolidated total deposits (excluding deposits in foreign office) Loan to Deposit Ratio (b) 88% 86% 85% 85% 81% 0% 25% 50% 75% 100% 125% 2Q10 3Q10 4Q10 1Q11 2Q11 Continuing operations Discontinued operations 90% 93% 92% 91% Cost of non-time deposits Non-time deposits Average rate on CDs Total average CDs 86% |
 8 $950 $1,089 $1,338 $1,801 1.76% 1.82% 2.13% 2.67% 3.19% $0 $1,000 $2,000 $3,000 2Q10 3Q10 4Q10 1Q11 2Q11 0.00% 1.00% 2.00% 3.00% 4.00% 5.00% 6.00% $2,086 Nonperforming Assets Net Charge-offs & Provision for Loan Losses NPLs NPLs to period-end loans $435 $357 $256 $193 $134 $228 $94 $(97) $(40) $(8) 3.18% 2.69% 1.59% 1.11% 2.00% -$200 $0 $200 $400 $600 2Q10 3Q10 4Q10 1Q11 2Q11 -2.00% .00% 2.00% 4.00% 6.00% 8.00% NCOs Provision for loan losses NCOs to average loans Allowance for Loan Losses Allowance to Nonperforming Loans $1,230 $1,372 $1,604 $1,957 $2,219 3.81% 3.20% 4.16% 2.83% 2.57% $0 $1,000 $2,000 $3,000 2Q10 3Q10 4Q10 1Q11 2Q11 0.00% 2.00% 4.00% 6.00% Allowance for loan losses ALLL to period-end loans 146.1% 155.0% 150.2% 142.6% 130.3% 0% 50% 100% 150% 200% 2Q10 3Q10 4Q10 1Q11 2Q11 $ in millions $ in millions $ in millions NPLs held for sale, OREO & other NPAs Key expects NCOs and NPAs to continue to decline in 2011 Continued Improvement in Asset Quality |
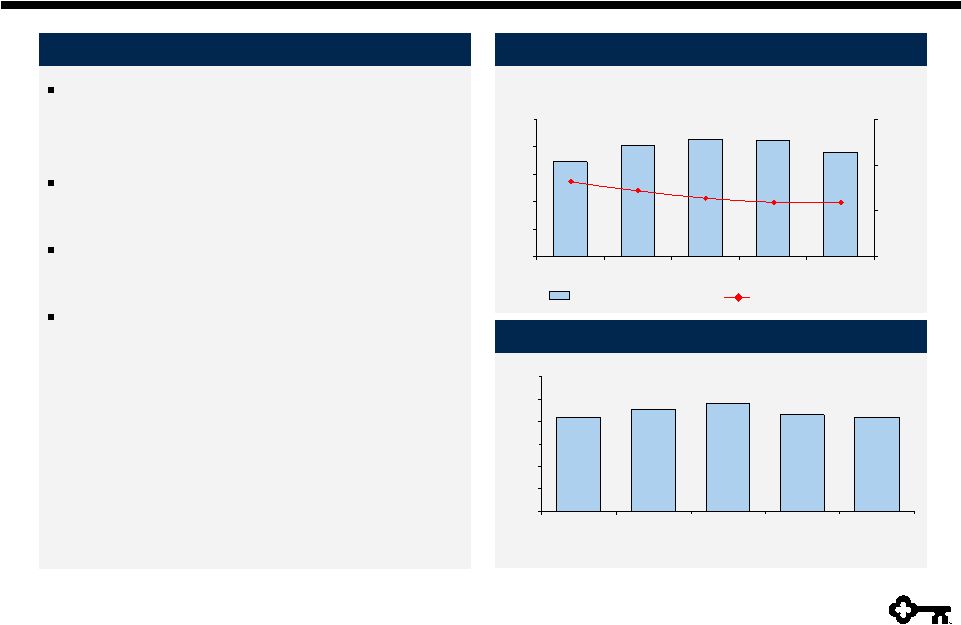
 9 Total Revenue TE = Taxable equivalent $570 $604 $635 $647 $623 3.35% 3.31% 3.17% 3.25% 3.19% $0 $200 $400 $600 $800 2Q10 3Q10 4Q10 1Q11 2Q11 0.00% 2.00% 4.00% 6.00% $ in millions Continuing Operations Net interest margin Net interest income Highlights Net Interest Margin (TE) Trend Net interest income and NIM impacted by: – Decline in earnings assets related to TARP – Movement of escrow deposits – Hedge maturities Excess liquidity and low-rate environment pressuring net interest margin New client acquisition and execution of relationship-based model provide opportunities to grow noninterest income Noninterest Income and % of Total Revenue $492 $486 $526 $457 $454 44.3% 43.1% 44.1% 45.3% 42.9% $0 $200 $400 $600 2Q10 3Q10 4Q10 1Q11 2Q11 30.0% 40.0% 50.0% 60.0% Noninterest income Noninterest income to total revenue $ in millions |
 10 Focused Expense Management Noninterest Expense Personnel expense $ in millions Highlights Noninterest expense declined by $21 million compared to 1Q11 – Sales of OREO properties resulted in net gains – Reduction in FDIC assessment expense Continuing to seek additional cost savings, having achieved Keyvolution target Average FTEs 16,436 15,301 15,973 16,937 15,772 15,665 15,584 15,424 15,349 $14,000 $15,000 $16,000 $17,000 $18,000 2Q09 3Q09 4Q09 1Q10 2Q10 3Q10 4Q10 1Q11 2Q11 $385 $359 $365 $371 $380 $384 $377 $379 $330 $300 $0 $250 $500 $750 $1,000 2Q10 3Q10 4Q10 1Q11 2Q11 Non-personnel expense $680 $701 $744 $736 $769 |
 11 2Q11 Pre-Provision Net Revenue Pre-Provision Net Revenue Trend Pre-Provision Net Revenue (a) and ROAA (b) (a) Net interest income plus taxable-equivalent adjustment and noninterest income less noninterest expense (b) From continuing operations 1.23% 1.32% 1.53% .93% .44% .0% .5% 1.0% 1.5% 2.0% 2Q10 3Q10 4Q10 1Q11 2Q11 Return on Average Assets $346 $397 $417 $360 $344 $0 $100 $200 $300 $400 $500 2Q10 3Q10 4Q10 1Q11 2Q11 $ in millions $1,024 $680 $344 Total revenue Noninterest expense PPNR $ in millions Net interest income 56% Noninterest income 44% Personnel expense 56% Non-personnel expense 44% |
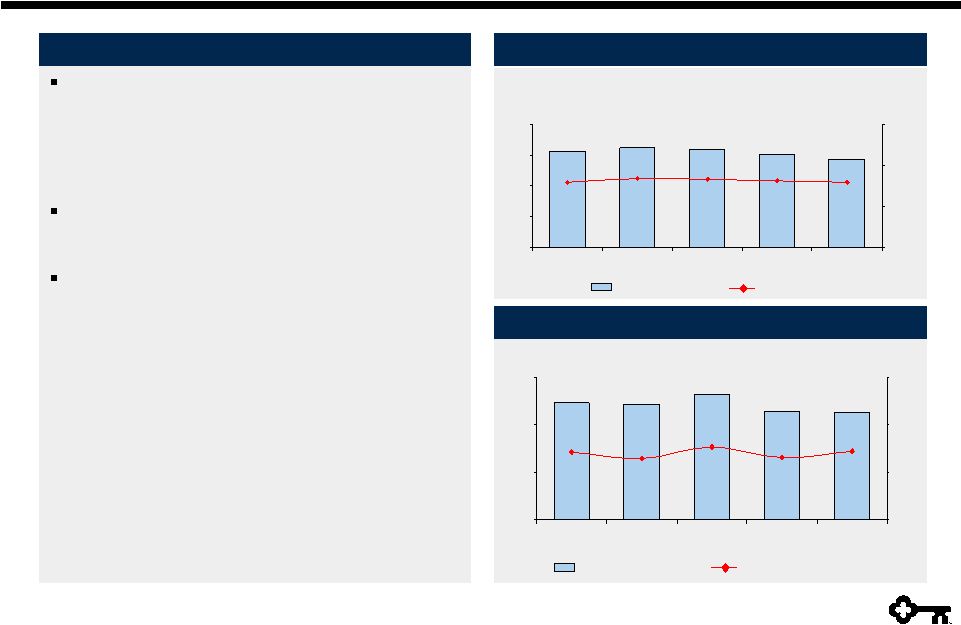
 12 9.67% 9.16% 7.65% 8.00% 8.19% 0.00% 2.00% 4.00% 6.00% 8.00% 10.00% 12.00% 2Q10 3Q10 4Q10 1Q11 2Q11 Tier 1 Common Equity Tangible Common Equity to Tangible Assets Strong Capital Ratios 11.01% 10.74% 8.07% 8.61% 9.34% 0.00% 2.00% 4.00% 6.00% 8.00% 10.00% 12.00% 2Q10 3Q10 4Q10 1Q11 2Q11 Peer leading capital position supports growth Positioned for successful transition to Basel III Continued capital generation through execution of strategy Increased quarterly common stock dividend Highlights $9.88 $9.58 $9.19 $9.54 $9.52 $8.00 $8.50 $9.00 $9.50 $10.00 2Q10 3Q10 4Q10 1Q11 2Q11 Book Value per Share |
 13 Appendix |
 14 Available for Sale Securities Highlights $17.3 $20.3 $21.3 $21.2 $19.0 3.19% 3.18% 3.63% 3.27% 3.43% $0 $5 $10 $15 $20 $25 2Q10 3Q10 4Q10 1Q11 2Q11 2.00% 3.00% 4.00% 5.00% Average AFS securities Average yield $ in billions High Quality Investment Portfolio Portfolio composed of Agency or GSE backed: GNMA, Fannie & Freddie – No private label MBS or financial paper Average portfolio maturity at June 30, 2011: 3.0 years Unrealized net gain of $563 million on available-for-sale securities portfolio at 6/30/11 Mortgage paydowns in 2Q11 were $942 million vs. $1,462 million in 1Q11 Securities to Total Assets (a) 21.1% 21.6% 21.0% 22.6% 23.9% 0% 5% 10% 15% 20% 25% 30% 2Q10 3Q10 4Q10 1Q11 2Q11 (a) Includes end of period held-to-maturity and available-for-sale securities |
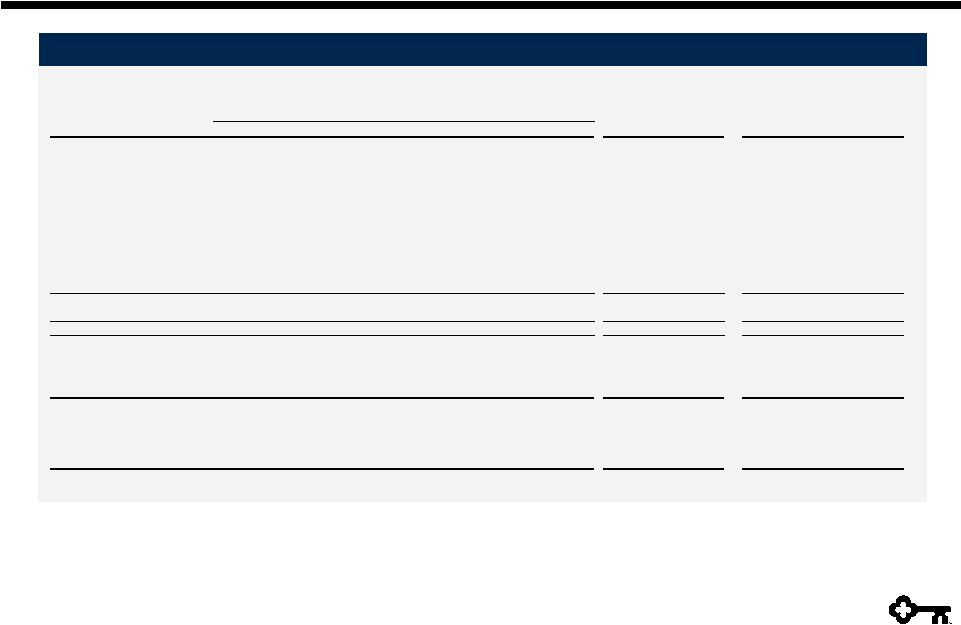
 15 N/M = Not Meaningful (a) Net charge-off amounts are annualized in calculation. NCO ratios for discontinued operations and consolidated Key exclude education loans in the securitization trusts since valued at fair-market value (b) 6-30-11 allowance by portfolio is estimated. Allowance/period loans ratios for discontinued operations and consolidated Key exclude education loans in the securitization trusts since valued at fair-market value Credit Quality Credit Quality by Portfolio $ in millions Period-end loans Average loans 6/30/11 2Q11 2Q11 1Q11 2Q11 1Q11 6/30/11 3/31/11 6/30/11 6/30/11 6/30/11 Commercial, financial and agricultural $16,883 $16,922 $36 $32 .85 % .80 % $213 $221 $395 2.34 % 185.45 % Commercial real estate: Commercial mortgage 8,069 8,460 12 43 .57 1.89 230 245 343 4.25 149.13 Construction 1,631 1,760 24 30 5.47 5.99 131 146 106 6.50 80.92 Commercial lease financing 6,105 6,094 4 11 .26 .70 41 42 107 1.75 260.98 Real estate - residential mortgage 1,838 1,818 6 9 1.32 2.02 79 84 41 2.23 51.90 Home equity: Key Community Bank 9,431 9,441 27 24 1.15 1.03 101 99 99 1.05 98.02 Other 595 611 10 14 6.56 8.78 11 13 37 6.22 336.36 Consumer — Key Community Bank 1,157 1,151 9 10 3.14 3.51 3 3 47 4.06 N/M Consumer other: Marine 1,989 2,051 4 19 .78 3.54 32 31 52 2.61 162.50 Other 142 146 2 1 5.49 2.60 1 1 3 2.11 300.00 Continuing total $47,840 $48,454 $134 $193 1.11 % 1.59 % $842 $885 $1,230 2.57 % 146.08 % Discontinued operations - education lending business 6,261 6,240 32 35 4.02 4.33 21 22 109 3.45 N/M Consolidated total $54,101 $54,694 $166 $228 1.29 % 1.76 % $863 $907 $1,339 2.63 % 155.16 % Allowance / period-end loans (b) Allowance / NPLs Net loan charge-offs Net loan charge-offs (a) / average loans Nonperforming loans Ending allowance (b) |
 16 Commercial Real Estate by Property Type and Geography (a) Nonresidential land and development loans N/M = Not Meaningful Commercial Real Estate Loans – 6/30/11 $ in millions (a) Geographic Region % of Commercial West Southwest Central Midwest Southeast Northeast Total Total CRE Mortgage Construction Nonowner-occupied: Retail properties $330 $169 $215 $241 $393 $230 $1,578 16.3 % $1,262 $316 Multifamily properties 146 143 263 220 289 260 1,321 13.6 950 371 Health facilities 194 6 149 217 202 199 967 10.0 916 51 Office buildings 142 74 109 115 51 265 756 7.8 617 139 Warehouses 229 - 43 78 74 87 511 5.3 483 28 Residential properties 85 20 56 80 67 80 388 4.0 104 284 Hotels/motels 59 - 24 5 146 33 267 2.8 225 42 Land and development 21 13 36 7 54 67 198 2.0 14 184 Manufacturing facilities 2 - 5 8 - 6 21 .2 20 1 Other 68 2 12 45 86 101 314 3.2 300 14 Total nonowner-occupied 1,276 427 912 1,016 1,362 1,328 6,321 65.2 4,891 1,430 Owner-occupied 1,398 37 315 732 139 758 3,379 34.8 3,178 201 Total $2,674 $464 $1,227 $1,748 $1,501 $2,086 $9,700 100.0 % $8,069 $1,631 Nonowner-occupied: June 30, 2011 Nonperforming loans $53 $56 $6 $50 $51 $54 $270 N/M $149 $121 90+ days past due 22 - - 2 - 12 36 N/M 8 28 30-89 days past due 15 4 1 16 36 26 98 N/M 65 33 Nonowner-occupied: March 31, 2011 Nonperforming loans $68 $27 $49 $40 $64 $54 $302 N/M $166 $136 90+ days past due 6 - 10 2 - 29 47 N/M 24 23 30-89 days past due 30 - 28 9 18 11 96 N/M 53 43 |
 17 (a) Nonresidential land and development loans Commercial Real Estate Commercial Real Estate Credit Quality $ in millions (a) Period-end loans 6-30-11 3-31-11 6-30-11 3-31-11 2Q11 1Q11 Retail properties $1,578 $1,907 $66 $69 $6 $24 Multifamily properties 1,321 1,518 47 21 (1) 11 Health facilities 967 1,056 11 35 3 - Office builldings 756 865 25 30 4 8 Warehouses 511 498 10 12 - - Residential properties 388 425 69 100 9 14 Hotels/motels 267 307 5 1 - - Land and development 198 209 18 12 6 10 Other CRE 335 355 19 22 4 4 Total nonowner-occupied 6,321 7,140 270 302 31 71 Owner-occupied 3,379 3,511 91 89 5 2 Total $9,700 $10,651 $361 $391 $36 $73 Nonperforming loans charge-offs Net loan |
 18 (a) Average LTVs are at origination. Current average LTVs for Community Bank total home equity loans and lines is approximately 79%, which compares to 79% at the end of the first quarter of 2011 Community Bank – Home Equity Exit Portfolio – Home Equity $ in millions, except average loan size $ in millions, except average loan size (a) (a) Home Equity Loans – 6/30/11 Vintage (% of Loans) Loan Balances Average Loan Size ($) Average FICO Average LTV % of Loans LTV>90% 2010 and 2011 2009 2008 2007 2006 and prior Home equity loans and lines First lien 4,968 $ 58,019 $ 751 66 % .6 % 17 11 11 8 53 % Second lie 4,463 44,671 750 75 3.4 13 8 18 17 44 Total home equity loans and lines 9,431 $ 50,831 $ 750 70 1.9 15 9 15 12 49 Nonaccrual loans First lien 56 $ 72,987 $ 716 73 % .6 % 1 % 3 % 6 % 15 % 75 % Second lie 46 55,757 706 77 3.3 - 4 11 26 59 Total home equity nonaccrual loans 102 $ 64,053 $ 712 75 1.7 1 4 8 19 68 Second quarter net charge-offs 27 $ - 1 % 23 % 28 % 48 % Net loan charge-offs to average loans 1.15 % Vintage (% of Loans) Loan Balances Average Loan Size ($) Average FICO Average LTV % of Loans LTV>90% 2010 and 2011 2009 2008 2007 2006 and prior Home equity loans First lien 26 $ 23,056 $ 747 32 % .4 % - - 1 % 24 % 75 % Second lie 569 25,404 731 82 32.6 - - 2 40 58 Total home equity loans 595 $ 25,292 $ 731 80 31.2 - - 1 40 59 Nonaccrual loans First lien 1 $ 20,612 $ 724 31 % - - - - 9 % 91 % Second lie 10 28,655 705 83 33.2 % - - 2 % 36 62 Total home equity nonaccrual loans 11 $ 27,969 $ 706 81 31.1 - - 2 34 64 Second quarter net charge-offs 10 $ - - 1 % 50 % 49 % Net loan charge-offs to average loans 6.56 % |
 19 Exit Loan Portfolio Trend (Excluding Discontinued Operations) Exit Loan Portfolio $ in millions (a) Includes the business aviation, commercial vehicle, office products, construction and industrial leases, Canadian lease financing portfolios; and all remaining balances related to lease in, lease out; sale in, sale out; service contract leases; and qualified technological equipment leases (b) Includes loans in Key’s consolidated education loan securitization trusts $4,736 $5,048 $6,357 $5,846 $5,388 $0 $2,000 $4,000 $6,000 $8,000 2Q10 3Q10 4Q10 1Q11 2Q11 $ in millions Exit Loan Portfolio Change 6-30-11 vs. 6-30-11 3-31-11 3-31-11 2Q11 1Q11 6-30-11 3-31-11 Residential properties – homebuilder $62 $87 $(25) $1 $2 $33 $44 Marine and RV floor plan 122 150 (28) 1 3 31 35 Commercial lease financing (a) 1,826 1,922 (96) 7 2 19 21 Total commercial loans 2,010 2,159 (149) 9 7 83 100 Home equity – Other 595 627 (32) 10 14 11 13 Marine 1,989 2,112 (123) 4 19 32 31 RV and other consumer 142 150 (8) 2 1 - 1 Total consumer loans 2,726 2,889 (163) 16 34 43 45 Total exit loans in loan portfolio $4,736 $5,048 $(312) $25 $41 $126 $145 Discontinued operations - education lending business (not included in exit loans above) (b) $6,261 $6,318 $(57) $32 $35 $21 $22 Balance on Nonperforming Status Balance Outstanding Charge-offs Net Loan |
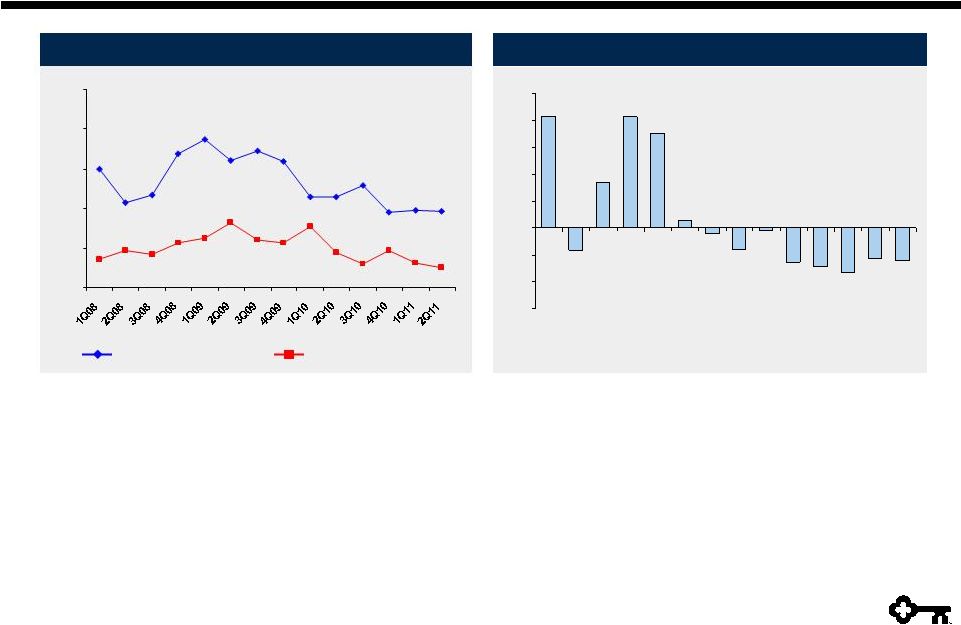 20 Credit Quality Trends Quarterly Change in Criticized Outstandings (a) Delinquencies to Period-end Total Loans (12.3)% (11.2)% (16.7)% (14.3)% (12.8)% (1.0)% (8.1)% (2.0)% 2.8% 35.1% 41.5% 17.1% (8.4)% 41.7% -30% -20% -10% 0% 10% 20% 30% 40% 50% 30 – 89 days delinquent 90+ days delinquent (a) Loans and leases outstanding 1Q08 2Q08 3Q08 4Q08 1Q09 2Q09 3Q09 4Q09 1Q10 2Q10 3Q10 4Q10 1Q11 2Q11 .97% .98% .95% 1.29% 1.14% 1.14% 1.59% 1.72% 1.61% 1.87% 1.69% 1.17% 1.07% 1.49% .25% .32% .48% .30% .45% .78% .56% .60% .82% .62% .57% .42% .47% .36% 0.00% 0.50% 1.00% 1.50% 2.00% 2.50% |