KeyCorp Bank of America Merrill Lynch 2013 Banking and Financial Services Conference Chris Gorman President, Key Corporate Bank Don Kimble Chief Financial Officer EXHIBIT 99.1 |
FORWARD-LOOKING STATEMENTS AND ADDITIONAL INFORMATION DISCLOSURE This presentation contains forward-looking statements, including statements about our financial condition, results of operations, asset quality trends, capital levels and profitability. Forward-looking statements can often be identified by words such as “outlook,” “goal,” “objective,” “plan,” “expect,” “anticipate,” “intend,” “project,” “believe,” or “estimate.” Forward-looking statements represent management’s current expectations and forecasts regarding future events. If underlying assumptions prove to be inaccurate or unknown risks or uncertainties arise, actual results could vary materially from these projections or expectations. Risks and uncertainties include but are not limited to: (1) continued strain on the global financial markets; (2) the slow progress of the U.S. economic recovery; changes in trade, monetary and fiscal policies; (3) our ability to anticipate interest rate changes correctly and manage interest rate risk; (4) changes in local, regional and international business, economic or political conditions; (5) regulatory initiatives in the U.S., including the Dodd-Frank Act, subjecting us to new and more stringent regulatory requirements; (6) the increase in unemployment or deterioration in real estate asset values or their failure to recover for an extended period of time; (7) adverse changes in credit quality trends; (8) our ability to determine accurate values of certain assets and liabilities; (9) adverse behaviors in securities, public debt, and capital markets ; (10) unanticipated changes in our liquidity position, including but not limited to, changes in the cost of liquidity, our ability to enter the financial markets and to secure alternative funding sources; (11) the soundness of other financial institutions; (12) our ability to satisfy new capital and liquidity standards such as those imposed by the Dodd-Frank Act and those adopted by the Basel Committee; (13) our ability to receive dividends from our subsidiary, KeyBank; (14) downgrades in our credit ratings and the credit ratings of KeyBank; (15) our ability to timely and effectively implement our strategic initiatives; (16) operational or risk management failures; breaches of security or failures of our technology systems due to technological or other factors and cybersecurity threats; (17) the occurrence of natural or man-made disasters or conflicts or terrorist attacks; (18) the adequacy of our risk management programs; (19) adverse judicial proceedings; (20) increased competitive pressure due to industry consolidation; (21) our ability to attract and retain talented executives and employees, to effectively sell additional products or services to new or existing customers, and to manage our reputational risks; and (22) unanticipated adverse effects of acquisitions and dispositions of assets or businesses. We provide greater detail regarding these factors in our 2012 Form 10-K and subsequent filings, which are available online at www.key.com/ir and www.sec.gov. Forward looking statements speak only as of the date they are made and Key does not undertake any obligation to update the forward- looking statements to reflect new information or future events. This presentation also includes certain Non-GAAP financial measures related to “tangible common equity,” “Tier 1 common equity,” “pre-provision net revenue,” “cash efficiency ratio,” and “adjusted cash efficiency ratio.” Management believes these ratios may assist investors, analysts and regulators in analyzing Key’s financials. Although Key has procedures in place to ensure that these measures are calculated using the appropriate GAAP or regulatory components, they have limitations as analytical tools and should not be considered in isolation, or as a substitute for analysis of results under GAAP. For more information on these calculations and to view the reconciliations to the most comparable GAAP measures, please refer to the Appendix to this presentation or our most recent earnings press release, which is accessible at www.key.com/ir. 2 |
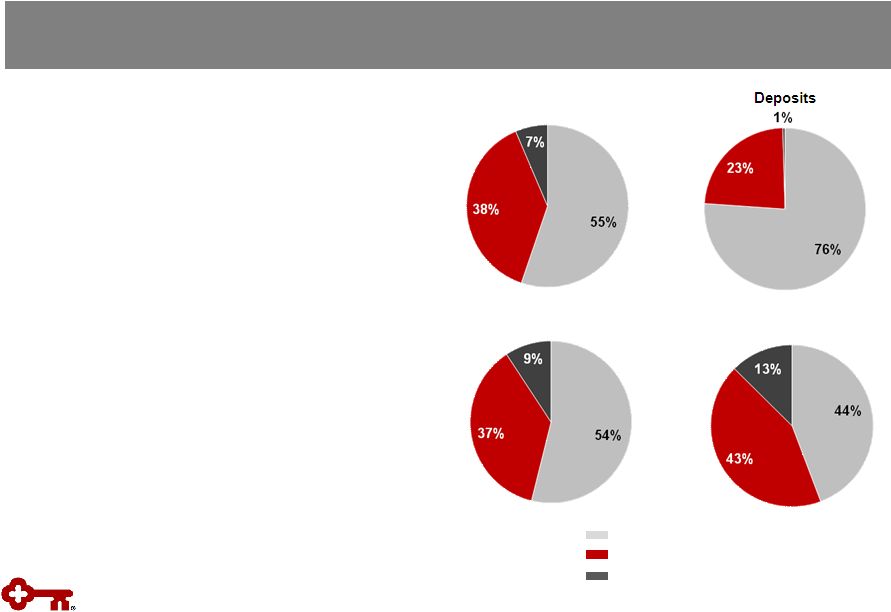 Key is a strong company that is well-positioned to leverage its distinctive capabilities Key – Who We Are Revenue Ranking based on asset size Loans and deposit balances: 3Q13 YTD average; revenue and noninterest income: YTD as of 9/30/13 Loans • 15 th largest U.S. bank-based financial services company • Two primary lines of business: Key Community Bank Key Corporate Bank • Business diversity across the franchise • Relationship-based strategy and value proposition • Local presence with industry expertise Key Corporate Bank Key Community Bank Other Noninterest Income 3 |
 Execution of strategic priorities position Key to best deliver for its clients Positioned to Win Executing on distinct capabilities and business alignment Investing in franchise Improving productivity Maintaining moderate risk profile Remaining disciplined with capital management Solutions that meet clients’ needs Broad capabilities, including on-balance sheet and capital markets alternatives Competitive businesses, positioned to grow Winning market share and investing for growth More efficient and productive with improved client focus Cash efficiency ratio (a) down to 64% in 3Q13 from 69% at the launch of the efficiency initiative (2Q12) Strong credit culture and risk management process Net charge-offs down 66% from 3Q12 Delivering shareholder value and returning capital Total payout of 79% YTD (b) Benefit to Key and Clients Strategic Priorities (a) Excludes efficiency initiative charges (b) Includes dividends and share repurchases through 9/30/13 4 |
 Business Model: Aligned and Targeted Traditional Bank Products Capital Markets Capabilities Deposits & payments Loans Wealth management & private banking Equipment finance Commercial mortgage banking Derivatives & foreign exchange Equity capital markets Equity research M&A / financial sponsors / leveraged finance Investment grade & high- yield debt Loan syndications Public finance Key’s Competitive Advantage Commercial Client Revenue Size ($MM) Local delivery of broad product set and industry expertise Community Bank Corporate Bank Targeted Industries 5 |
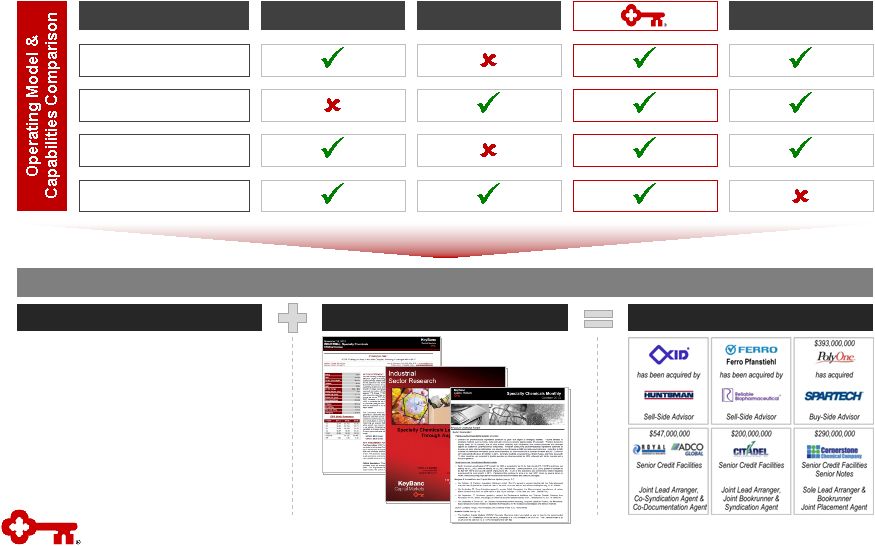 6 Key Corporate Bank Our middle market focus, industry-driven operating model and broad corporate & investment banking capability set are unique…and drive results Regional Banks Universal Banks Capability / Model Middle Market Focus Industry-driven Model Investment Banking Focused Franchise Deep Industry Knowledge Results (FY13) Case Study: Industrial (Specialty Chemicals Practice) • Four dedicated chemicals coverage bankers with aligned M&A, syndications and capital markets professionals • Leading M&A advisory practice • Strong presence across industry events • Top-rated equity research franchise (two analysts covering 36 companies) • $1B in capital committed to sector • > 50 clients and 200 prospects Commercial Banking Boutiques Note: Operating model and capabilities comparison data are illustrative and represent a typical firm within each category; some exceptions will apply. |
 7 Delivering the Distinctive Platform Key can lead transactions across markets -- this breadth and access allow us to match client needs and market conditions to deliver the best execution for our clients • In the twelve months ended 3Q13, Key Corporate Bank raised $57B in capital in > 800 transactions, less than 15% of which went to our balance sheet Healthcare Energy Consumer Industrial Public Sector Real Estate Key’s Balance Sheet Equity Capital Markets Syndicated Loans Real Estate Capital Markets Debt Capital Markets (IG/HY/Public Fin.) Private Capital Industry Verticals Capital Placement ($B) Key’s Capital Solutions Credit facility (bank or institutional) Bridge loan Direct placement (debt or equity) Equity offerings (IPOs / FOs / converts) Commercial mortgage Investment grade & high-yield debt Mezzanine capital placement Tax-exempt securities Note: Capital placement $ are LTM 3Q13 and include: in transactions where Key served as bookrunner (or equivalent) -- 100% of capital raised; in transactions where Key served as co-manager -- the proportion of capital corresponding to Key’s transaction economics (e.g., $20MM if Key were a 10% co-manager on a $200MM equity offering). Balance sheet figures represent loan commitments. Data exclude equipment finance and syndicated loan participations. $8 $36 $5 $5 $1 $2 Additional value is created as Key delivers non-capital solutions (e.g., payments, derivatives, foreign exchange, financial advisory) to clients |
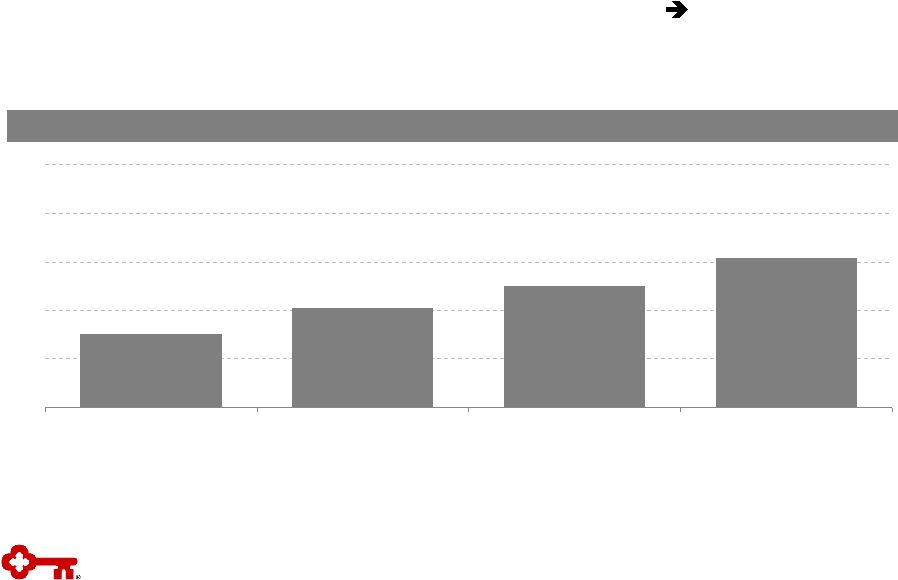 Growing Our Franchise We have taken purposeful steps to enhance our ability to acquire and expand targeted client relationships within our industry verticals the result is greater transaction activity and enhanced roles for Key • Key Corporate Bank has raised $46B of capital for our clients during the first nine months of FY13 -- more than any previous full-year period Capital Placement ($B) Note: Capital placement $ include: in transactions where Key served as bookrunner (or equivalent) -- 100% of capital raised; in transactions where Key served as co- manager -- the proportion of capital corresponding to Key’s transaction economics (e.g., $20MM if Key were a 10% co-manager on a $200MM equity offering). Data include loan commitments and exclude equipment finance and syndicated loan participations. 8 $23 $31 $37 $46 $0 $15 $30 $45 $60 $75 FY10 FY11 FY12 YTD 3Q13 |
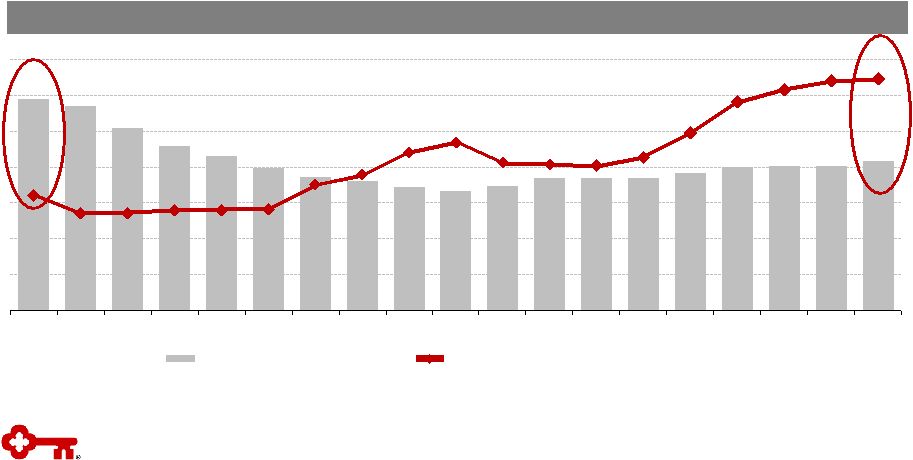 $29.4 $28.4 $25.5 $22.9 $21.5 $19.9 $18.7 $18.0 $17.2 $16.6 $17.3 $18.5 $18.5 $18.4 $19.2 $19.9 $20.1 $20.2 $20.9 $177 $149 $149 $153 $154 $155 $193 $208 $243 $258 $227 $224 $222 $235 $272 $320 $339 $352 $355 1Q09 2Q09 3Q09 4Q09 1Q10 2Q10 3Q10 4Q10 1Q11 2Q11 3Q11 4Q11 1Q12 2Q12 3Q12 4Q12 1Q13 2Q13 3Q13 Achieving Results Note: Chart depicts period-end loan balances for Key Corporate Bank only. LTM denotes the twelve month period ended 3Q13. We continue to make solid progress in growing both loans and investment banking & debt placement fees -- demonstrating the power of our model • Since 1Q09, investment banking and debt placement fees have doubled while we focused our balance sheet strategically on a more targeted client base • Loan balances up $4.3B (+26%) vs. 2Q11 trough Loan Balances ($B) & LTM Investment Banking & Debt Placement Fees ($MM) Corporate Bank Loan Balances ($B) LTM Investment Banking & Debt Placement Fees ($MM) 9 |
 External Benchmarking Our results compare favorably to external benchmarks we are gaining C&I loan share and getting paid for the risks we take Loan Growth Source: Federal Reserve H8 report dated October 25, 2013; peer SEC filings and earnings releases. Peer data are for Corporate Bank equivalent segments of peer financial institutions (e.g., PNC Corporate & Institutional Banking segment). Peer banks include BAC, CMA, FITB, JPM, PNC, STI, USB, WFC. Revenue / assets calculation is calculated based on LTM 3Q13 revenue divided by 3Q13 average assets for Key and peers. Asset Productivity Since our portfolio troughed in 2Q11, Key Corporate Bank has taken C&I loan share… …while our broad product capabilities generate peer leading asset productivity 10 |
 Note: Middle Market denotes: Public companies with market capitalization between $50MM and $1.5B + private companies and public sector entities with revenue between $50MM and $1.5B. Key clients include Key Corporate Bank + Commercial Banking business units. Source: Capital IQ; Dun & Bradstreet; U.S. Census. We have a substantial opportunity to expand our client base -- targeting middle market companies $50MM to $1.5B within our focus industry verticals • ~5,000 prospects headquartered within Key’s Community Bank franchise that align with the Corporate Bank’s focus industry verticals • On a YTD basis, Key’s new corporate & investment banking clients generate average revenue ~$300k Sizing the Opportunity U.S. Middle Market Universe (all industries and geographies) Focus Verticals (all geographies) Focus Verticals + In-Footprint ~40,000 companies & institutions ~25,000 companies & institutions ~6,000 companies & institutions Key clients Non-clients 11 |
 A clear, focused strategy executed with rigor and discipline over the cycle is the core of our risk management strategy • Net charge-offs of $21MM (10bps) over the last twelve months • Portfolio credit quality is strongest since pre-crisis across all metrics Effective Risk Management • Industry expertise & specialization – Lend to sectors we know well – Better discern risk/return trade-offs – Ability to distribute risk via syndications and capital markets solutions • Client selection – Long-term approach to client relationships and franchise building – Target clients within Key’s risk appetite • Risk culture & awareness – Strong partnership between sales and risk teams • Core principles • Willing to exit relationships – Exited > 2,000 client relationships post-crisis for risk-related reasons – Reduced construction lending by more than 75% ($2B) since crisis • Clearly defined “good business” parameters – Strong hurdles & tracking for new opportunities – Disciplined hold limits – Structural rigor – Client-level ROE thresholds – Lead with ideas and solutions, vs. balance sheet 12 |
Financial Review 13 * * * * * * * * * |
 Progress on Targets for Success Focus areas Metrics (a) KEY FY11 KEY FY12 KEY 3Q13 YTD Targets Improving balance sheet efficiency Loan to deposit ratio (b) 87% 86% 84% 90-100% Maintaining moderate risk profile NCOs to average loans 1.11% .69% .33% 40-60 bps Provision to average loans (.12)% .45% .28% Growing high quality, diverse revenue streams Net interest margin 3.16% 3.21% 3.16% >3.50% Noninterest income to total revenue 44% 46% 43% >40% Generating positive operating leverage Adj. cash efficiency ratio (ex. efficiency initiative charges) (c) 68% 67% 65% 60-65% Strengthening returns with disciplined capital management Return on average assets 1.17% 1.05% 1.02% 1.00-1.25% (a) Continuing operations, unless otherwise noted (b) Represents period-end consolidated total loans and loans held for sale (excluding education loans in the securitization trusts) divided by period-end consolidated total deposits (excluding deposits in foreign office) (c) Excludes intangible asset amortization; non-GAAP measure: see Appendix for reconciliation 14 |
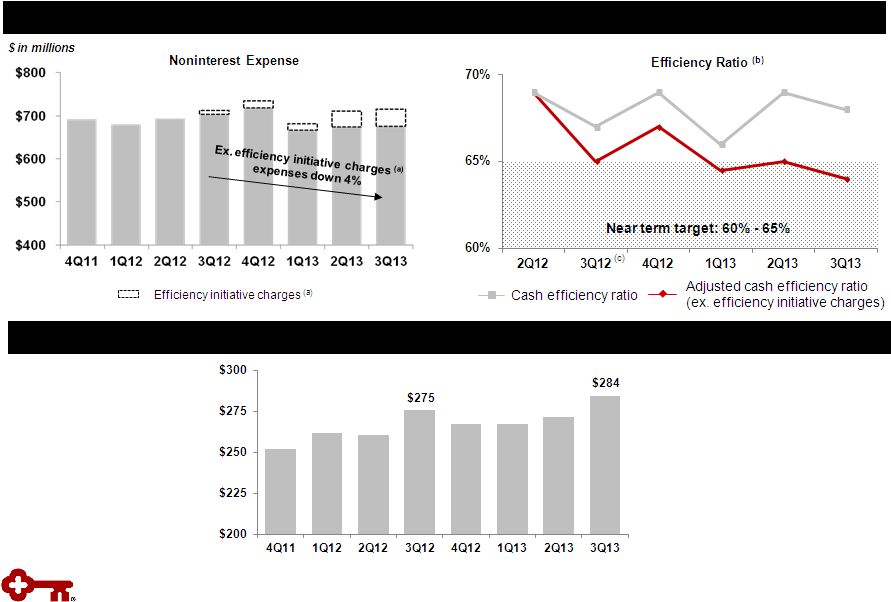 Operating Leverage: Driving Productivity and Efficiency (a) Efficiency initiative charges include pension settlement in 3Q13 (b) Non-GAAP measures: see Appendix for reconciliation (c) Excludes one-time gains of $54 million related to the redemption of trust preferred securities Achieved cost savings target; focused on further efficiency improvement Driving productivity enhancements: improving annualized revenue per FTE 15 |
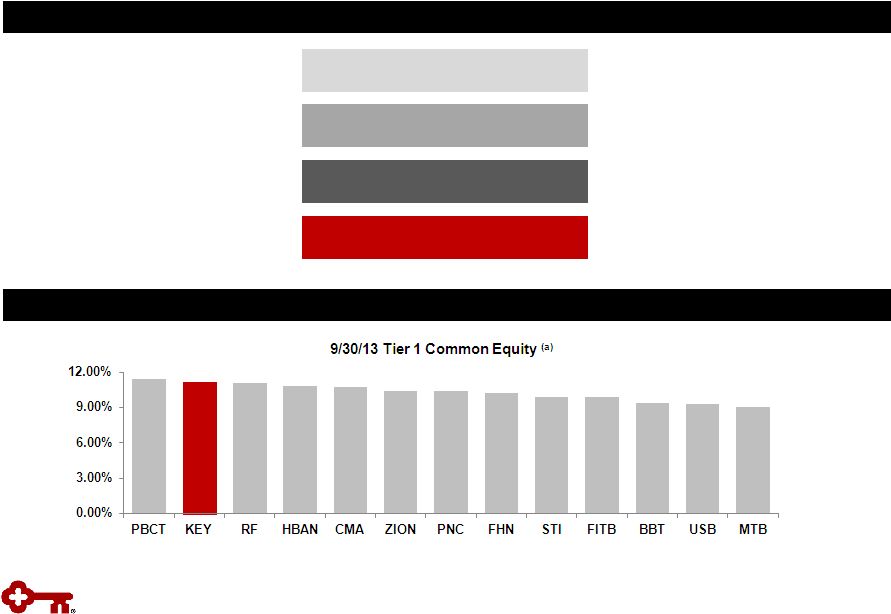 Strong Capital Position is a Competitive Strength Over Time Disciplined Capital Management Executing on Capital Priorities (a) Peer group data source: SNL; 9/30/13 ratios are estimated 1. Organic Growth 4. Opportunistic Growth 2. Dividends 3. Share Repurchases 16 |
 Focused Forward Key is well-positioned to grow and improve returns 17 |
Appendix 18 * * * * * * * * * * |
 Outlook and Expectations Loans • Mid-single digit average balance growth NIM • Relatively stable to the 3Q13 level over the next few quarters • Potential downward pressure, dependent upon level of liquidity Revenue • Net interest income relatively stable in 2H13 • Continued strength in fee income businesses Expense • $680 - $700 million for 4Q13, including one-time charges Efficiency • 60% - 65% cash efficiency NCOs / Provision • Within or below targeted range of 40 – 60 bps of average loans • Provision near the level of net charge-offs Capital • Remaining share repurchase authority of $187 million over the next two quarters Guidance provided during 3Q13 earnings call 19 |
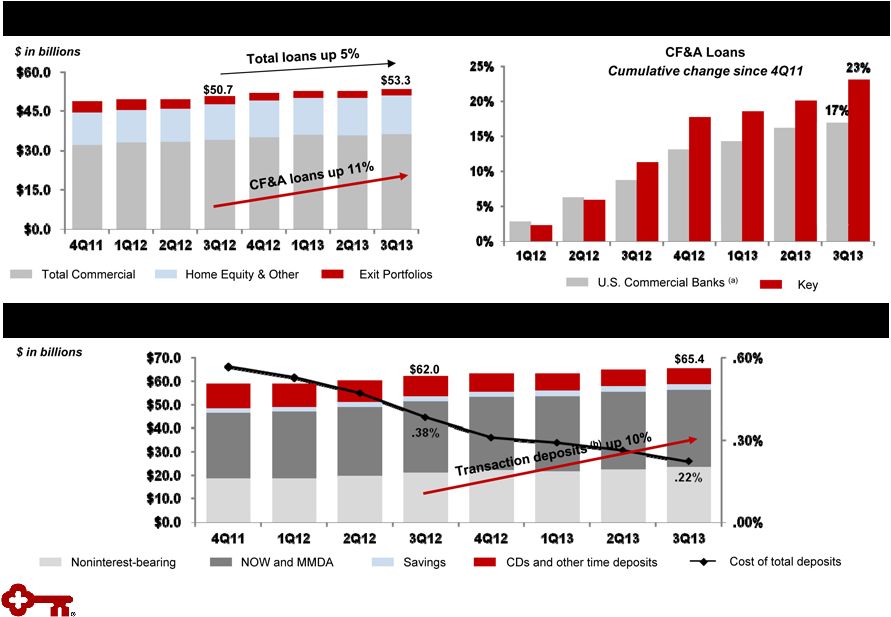 Efficient Balance Sheet: Improving Balance Sheet Mix Average Loans Continue to Increase, Driven by Commercial, Financial & Agricultural (CF&A) Growth in Non-time Deposits with Improved Funding Cost 20 Note: Loan and deposit figures represent average balances; deposits exclude deposits in foreign office (a) Source: Federal Reserve H8; industry data are not seasonally adjusted (b) Transaction deposits include noninterest-bearing, NOW, and MMDA |
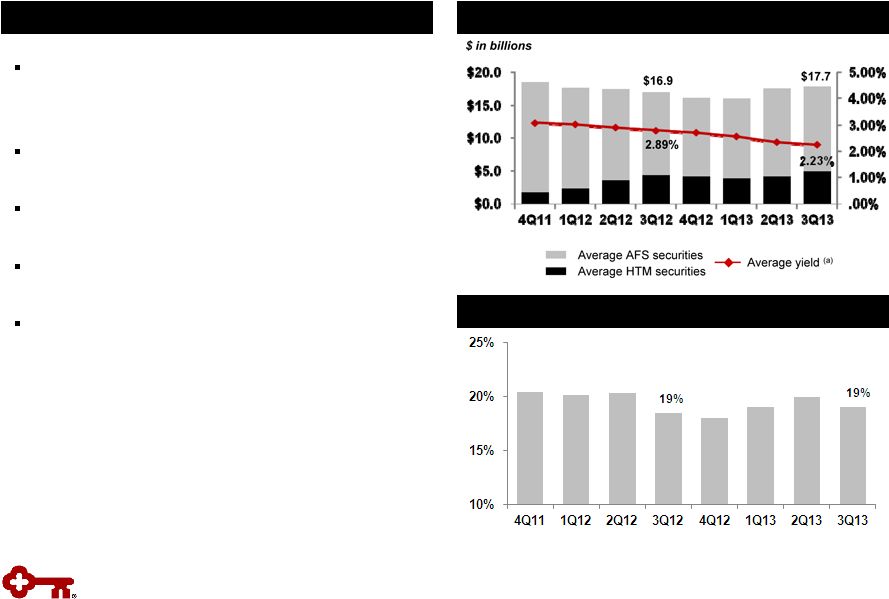 Average Total Investment Securities Highlights High Quality Investment Portfolio Portfolio composed of Agency or GSE backed CMOs: Fannie, Freddie & GNMA – No private label MBS or financial paper Average portfolio life at 9/30/13 of 3.8 years compared to 3.2 years at 6/30/13 Unrealized net gain of $3 million on available-for- sale securities portfolio at 9/30/13 Securities cash flows of $1.3 billion in 3Q13 and $1.5 billion in 2Q13 Yields on purchases were 67 bps lower than 3Q13 maturities Securities to Total Assets (b) (a) Yield is calculated on the basis of amortized cost (b) Includes end of period held-to-maturity and available-for-sale securities 21 |
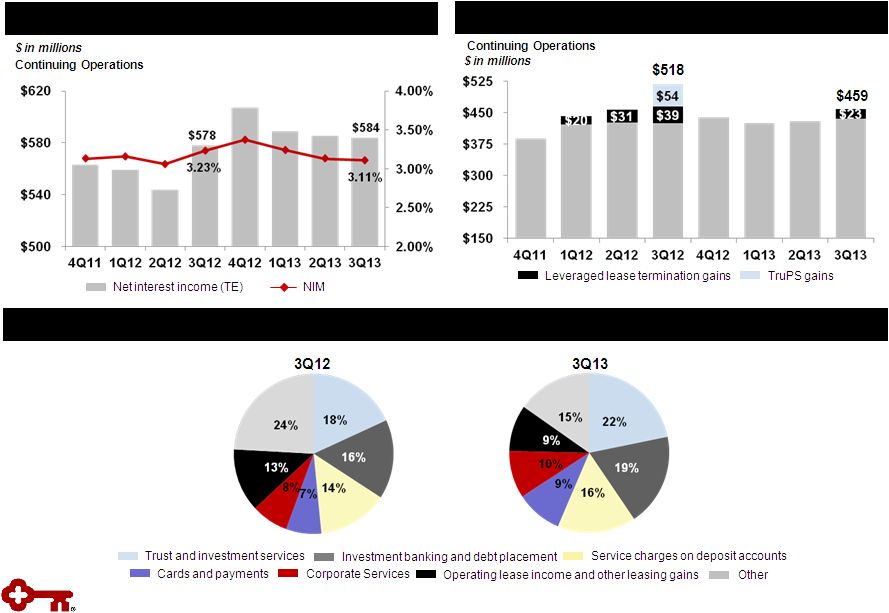 High Quality Revenue: Diverse Streams TE = Taxable equivalent (a) Excludes gains from the redemption of trust preferred securities and leveraged lease terminations Noninterest income diversity provides strength; growth in core businesses (a) Net Interest Income & Net Interest Margin (TE) Trend Noninterest Income 22 Continuing Operations |
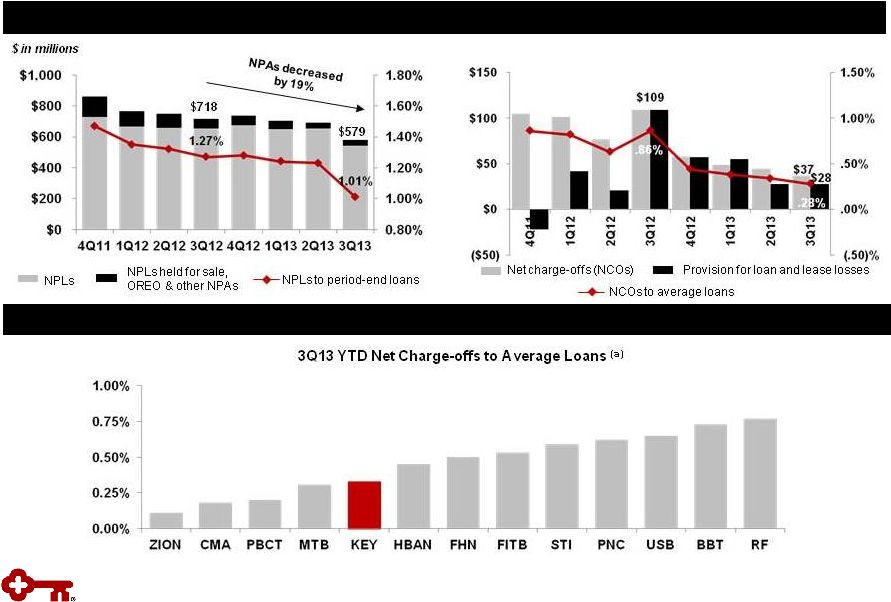 Significant Improvement in Credit Quality Trends Moderate Risk Profile: Strong Credit Quality Maintaining Moderate Risk Profile (a) Peer group data source: SNL 23 |
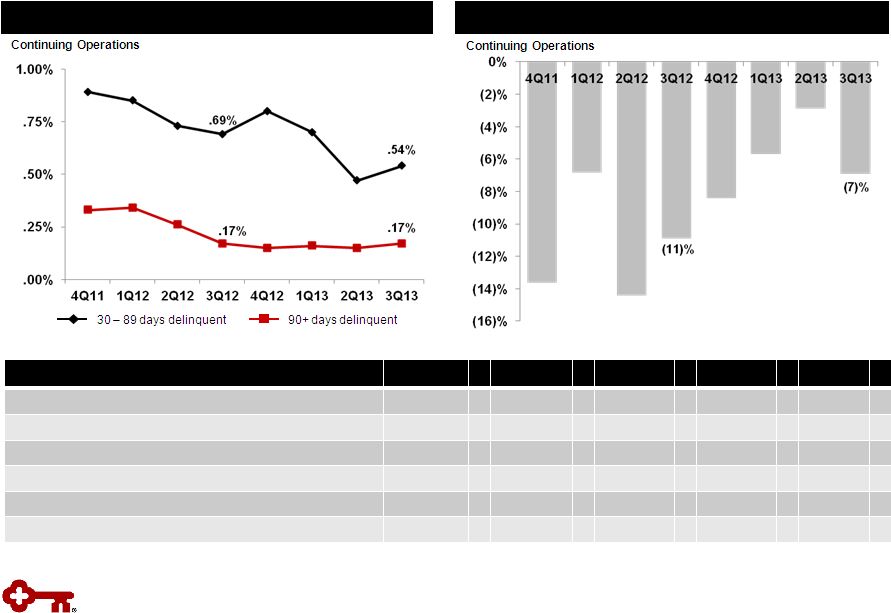 Asset Quality Trends Quarterly Change in Criticized Outstandings (a) Delinquencies to Period-end Total Loans (a) Loan and lease outstandings (b) From continuing operations Metric (b) 3Q13 2Q13 1Q13 4Q12 3Q12 Delinquencies to EOP total loans: 30-89 days .54 % .47 % .70 % .80 % .69 % Delinquencies to EOP total loans: 90+ days .17 .15 .16 .15 .17 NPLs to EOP portfolio loans 1.01 1.23 1.24 1.28 1.27 NPAs to EOP portfolio loans + OREO + Other NPAs 1.08 1.30 1.34 1.39 1.39 Allowance for loan losses to period-end loans 1.62 1.65 1.70 1.68 1.73 Allowance for loan losses to NPLs 160.4 134.4 137.4 131.8 136.0 24 |
 Period- end loans Average loans Net loan charge-offs Net loan charge-offs (b) / average loans (%) Nonperforming loans (c) Ending allowance Allowance / period-end loans (d) (%) Allowance / NPLs (%) 9/30/13 3Q13 3Q13 2Q13 3Q13 2Q13 9/30/13 6/30/13 9/30/13 9/30/13 9/30/13 Commercial, financial and agricultural (a) $24,317 $23,864 $ 4 $ 8 .07 .14 $ 102 $ 146 $ 370 1.52 362.75 Commercial real estate: Commercial Mortgage 7,544 7,575 (8) (2) (.42) (.11) 58 106 172 2.28 296.55 Construction 1,058 1,073 (6) 1 (2.22) .38 17 26 36 3.40 211.76 Commercial lease financing 4,550 4,633 15 (2) 1.28 (.17) 22 14 64 1.41 290.91 Real estate – residential mortgage 2,198 2,193 2 4 .36 .74 98 94 35 1.59 35.71 Home equity: Key Community Bank 10,285 10,247 12 14 .46 .56 198 205 82 .80 41.41 Other 353 364 2 5 2.18 5.16 13 16 14 3.97 107.69 Consumer other – Key Community Bank 1,440 1,435 7 5 1.94 1.44 2 3 27 1.88 N/M Credit cards 698 700 8 6 4.53 3.45 4 11 34 4.87 850.00 Consumer other: Marine 1,083 1,120 1 5 .35 1.66 25 30 31 2.86 124.00 Other 71 67 - 1 - 5.42 2 1 3 4.23 150.00 Continuing total (e) $53,597 $53,271 $ 37 $ 45 .28 .34 $ 541 $ 652 $ 868 1.62 160.44 Discontinued operations 4,738 4,905 9 7 1.36 1.04 23 19 38 .80 165.22 Consolidated total $58,335 $58,176 $46 $ 52 .33 .38 $ 564 $ 671 $ 906 1.55 160.64 Credit Quality by Portfolio Credit Quality (a) 9-30-13 ending loan balances include $96 million of commercial credit card balances; 9-30-13 average loan balances include $96 million of assets from commercial credit cards (b) Net loan charge-off amounts are annualized in calculation. NCO ratios for discontinued operations and consolidated Key exclude education loans in the securitization trusts since valued at fair-market value (c) 9-30-13 and 6-30-13 NPL amounts exclude $18 million and $19 million respectively of purchased credit impaired loans acquired in July 2012. (d) Allowance/period loans ratios for discontinued operations and consolidated Key exclude education loans in the securitization trusts since valued at fair-market value (e) 9-30-13 ending loan balances include purchased loans of $176 million of which $18 million were purchased credit impaired $ in millions N/M = Not Meaningful 25 |
 Vintage (% of Loans) Loan Balances Average Loan Size ($) Average FICO Average LTV (a) % of Loans LTV>90% 2012 and later 2011 2010 2009 2008 and prior Home equity loans and lines First lien $ 16 $ 23,209 744 35 % .4 % - - 1% 1% 98 % Second lien 337 23,003 729 82 32.5 - - - - 100 Total home equity loans and lines $ 353 23,013 729 80 31.0 - - - - 100 Nonaccrual loans First lien $ 1 $ 24,247 729 33 % - - - - - 100 % Second lien 12 24,712 702 82 35.1 % - - - - 100 Total home equity nonaccrual loans $ 13 24,685 703 80 33.0 - - - - 100 Exit Portfolio - Home Equity Third quarter net charge-offs $ 2 - - - - 100 % Net loan charge-offs to average loans 2.18 % Vintage (% of Loans) Loan Balances Average Loan Size ($) Average FICO Average LTV (a) % of Loans LTV>90% 2012 and later 2011 2010 2009 2008 and prior Home equity loans and lines First lien $ 5,932 $ 67,691 765 67 % .6 % 40 % 6% 4 % 4 % 46% Second lien 4,353 47,569 760 76 3.2 25 6 4 4 61 Total home equity loans and lines $ 10,285 57,525 763 71 1.8 33 6 4 4 53 Nonaccrual loans First lien $ 108 $ 58,708 713 73 % .4% 2 % 3% 3 % 5 % 87% Second lien 90 48,922 711 78 2.0 - 2 2 4 92 Total home equity nonaccrual loans $ 198 53,794 712 75 1.1 1 2 3 5 89 Community Bank - Home Equity Third quarter net charge-offs $ 12 - 3% - 4 % 93% Net loan charge-offs to average loans .46 % (a) Average LTVs are at origination. Current average LTVs for Community Bank total home equity loans and lines is approximately 74%, which compares to 75% at the end of the second quarter 2013. Community Bank – Home Equity Exit Portfolio – Home Equity $ in millions, except average loan size Home Equity Loans – 9/30/13 $ in millions, except average loan size 26 |
 Balance Outstanding Change Net Loan Charge-offs Balance on Nonperforming Status 9-30-13 6-30-13 9-30-13 vs. 6-30-13 3Q13 (c) 2Q13 (c) 9-30-13 6-30-13 Residential properties – homebuilder $ 26 $ 26 - - $ 1 $ 8 $ 8 Marine and RV floor plan 25 28 $ (3) - - 6 7 Commercial lease financing (a) 796 931 (135) $ (2) (2) 1 1 Total commercial loans 847 985 (138) (2) (1) 15 16 Home equity – Other 353 375 (22) 2 5 14 16 Marine 1,083 1,160 (77) 1 5 25 31 RV and other consumer 71 69 2 - 1 2 - Total consumer loans 1,507 1,604 (97) 3 11 41 47 Total exit loans in loan portfolio $ 2,354 $ 2,589 $ (235) $ 1 $ 10 $ 56 $ 63 Discontinued operations – education lending business (not included in exit loans above) (b) $ 4,738 $ 4,992 $ (254) $ 9 $ 7 $ 23 $ 19 (a) Includes (1) the business aviation, commercial vehicle, office products, construction and industrial leases; (2) Canadian lease financing portfolios; and (3) all remaining balances related to lease in, lease out; sale in, lease out; service contract leases; and qualified technological equipment leases (b) Includes loans in Key’s consolidated education loan securitization trusts (c) Credit amounts indicate recoveries exceeded charge-offs $ in millions Exit Loan Portfolio Exit Loan Portfolio 27 |
 Three months ended 9-30-13 6-30-13 9-30-12 Tangible common equity to tangible assets at period end Key shareholders’ equity (GAAP) $ 10,206 $ 10,229 $ 10,251 Less: Intangible assets (a) 1,017 1,021 1,031 Preferred Stock, Series A (b) 282 282 291 Tangible common equity (non-GAAP) $ 8,907 $ 8,926 $ 8,929 Total assets (GAAP) $ 90,708 $ 90,639 $ 86,950 Less: Intangible assets (a) 1,017 1,021 1,031 Tangible assets (non-GAAP) $ 89,691 $ 89,618 $ 85,919 Tangible common equity to tangible assets ratio (non-GAAP) 9.93 % 9.96 % 10.39 % Tier 1 common equity at period end Key shareholders' equity (GAAP) $ 10,206 $ 10,229 $ 10,251 Qualifying capital securities 340 339 339 Less: Goodwill 979 979 979 Accumulated other comprehensive income (loss) (c) (409) (359) (109) Other assets (d) 96 101 121 Total Tier 1 capital (regulatory) 9,880 9,847 9,599 Less: Qualifying capital securities 340 339 339 Preferred Stock, Series A (b) 282 282 291 Total Tier 1 common equity (non-GAAP) $ 9,258 $ 9,226 $ 8,969 Net risk-weighted assets (regulatory) (d) $ 82,913 $ 82,528 $ 79,363 Tier 1 common equity ratio (non-GAAP) 11.17 % 11.18 % 11.30 % Pre-provision net revenue Net interest income (GAAP) $ 578 $ 581 $ 572 Plus: Taxable-equivalent adjustment 6 5 6 Noninterest income (GAAP) 459 429 518 Less: Noninterest expense (GAAP) 716 711 712 Pre-provision net revenue from continuing operations (non-GAAP) $ 327 $ 304 $ 384 GAAP to Non-GAAP Reconciliation $ in millions (a) Three months ended September 30, 2013, June 30, 2013, and September 30, 2012 exclude $99 million, $107 million, and $130 million, respectively, of period end purchased credit card receivable intangible assets (b) Net of capital surplus for the three months ended September 30, 2013 and June 30, 2013 (c) Includes net unrealized gains or losses on securities available for sale (except for net unrealized losses on marketable equity securities), net gains or losses on cash flow hedges, and amounts resulting from the application of the applicable accounting guidance for defined benefit and other postretirement plans (d) Other assets deducted from Tier 1 capital and net risk-weighted assets consist of disallowed intangible assets (excluding goodwill) and deductible portions of nonfinancial equity investments. There were no disallowed deferred tax assets at 9-30-13, 6-30-13, and 9-30-12 28 |
 GAAP to Non-GAAP Reconciliation (continued) $ in millions (a) Three months ended September 30, 2013, June 30, 2013, and September 30, 2012 exclude $103 million, $110 million and $86 million, respectively, of average ending purchased credit card receivable intangible assets Three months ended 9-30-13 6-30-13 9-30-12 Average tangible common equity Average Key shareholders' equity (GAAP) $ 10,237 $ 10,314 $ 10,222 Less: Intangible assets (average) (a) 1,019 1,023 1,026 Preferred Stock, Series A (average) 291 291 291 Average tangible common equity (non-GAAP) $ 8,927 $ 9,000 $ 8,905 Return on average tangible common equity from continuing operations Net income (loss) from continuing operations attributable to Key common shareholders (GAAP) $ 229 $ 193 $ 211 Average tangible common equity (non-GAAP) 8,927 9,000 8,905 Return on average tangible common equity from continuing operations (non-GAAP) 10.18 % 8.60 % 9.43 % Return on average tangible common equity consolidated Net income (loss) attributable to Key common shareholders (GAAP) $ 266 $ 198 $ 214 Average tangible common equity (non-GAAP) 8,927 9,000 8,905 Return on average tangible common equity consolidated (non-GAAP) 11.82 % 8.82 % 9.56 % Cash efficiency ratio Noninterest expense (GAAP) $ 716 $ 711 $ 712 Less: Intangible asset amortization on credit cards (GAAP) 8 7 6 Other intangible asset amortization (GAAP) 4 3 3 Adjusted noninterest expense (non-GAAP) $ 704 $ 701 $ 703 Net interest income (GAAP) $ 578 $ 581 $ 572 Plus: Taxable-equivalent adjustment 6 5 6 Noninterest income (GAAP) 459 429 518 Total taxable-equivalent revenue (non-GAAP) $ 1,043 $ 1,015 $ 1,096 Cash efficiency ratio (non-GAAP) 67.5 % 69.1 % 64.1 % Adjusted cash efficiency ratio Adjusted noninterest expense (non-GAAP) $ 704 $ 701 $ 703 Less: Efficiency initiative and pension settlement charges (non-GAAP) 41 37 9 Net adjusted noninterest expense (non-GAAP) $ 663 $ 664 $ 694 Total taxable-equivalent revenue (non-GAAP) $ 1,043 $ 1,015 $ 1,096 Adjusted cash efficiency ratio (non-GAAP) 63.6 % 65.4 % 63.3 % 29 |
 Tier 1 Common Equity Under the Regulatory Capital Rules, Incorporating Basel III Guidance (estimated) (a) KeyCorp & Subsidiaries $ in billions Quarter ended Sept. 30, 2013 Tier 1 common equity under current regulatory rules $ 9.3 Adjustments from current regulatory rules to the Regulatory Capital Rules: Deferred tax assets and other (b) (.1) Tier 1 common equity anticipated under the Regulatory Capital Rules (c) $ 9.1 Total risk-weighted assets under current regulatory rules $ 82.9 Adjustments from current regulatory rules to the Regulatory Capital Rules: Loan commitments <1 year .5 Past Due Loans .2 Mortgage servicing assets (d) .6 Deferred tax assets (d) .2 Other 1.5 Total risk-weighted assets anticipated under the Regulatory Capital Rules $ 85.9 Tier 1 common equity ratio under the Regulatory Capital Rules 10.6 % (a) Tier 1 common equity is a non-generally accepted accounting principle (GAAP) financial measure that is used by investors, analysis and bank regulatory agencies to assess the capital position of financial services companies; management reviews Tier 1 common equity along with other measures of capital as part of its financial analyses (b) Includes the deferred tax asset subject to future taxable income for realization, primarily tax credit carryforwards (c) The anticipated amount of regulatory capital and risk-weighted assets is based upon the federal banking agencies’ Regulatory Capital Rules (as fully phased-in on January 1, 2019); Key is subject to the Regulatory Capital Rules under the “standardized approach” (d) Item is included in the 10%/15% exceptions bucket calculation and is risk-weighted at 250% Table may not foot due to rounding 30 |