
Exhibit 99.1 Key Overview Chris Gorman Chairman and Chief Executive Officer

Forward-looking Statements This communication contains forward-looking statements within the meaning of the Private Securities Litigation Reform Act of 1995 including, but not limited to, KeyCorp’s expectations or predictions of future financial or business performance or conditions. Forward-looking statements are typically identified by words such as “believe,” “seek,” “expect,” “anticipate,” “intend,” “target,” “estimate,” “continue,” “positions,” “plan,” “predict,” “project,” “forecast,” “guidance,” “goal,” “objective,” “prospects,” “possible,” “potential,” “strategy,” “opportunities,” or “trends,” by future conditional verbs such as “assume,” “will,” “would,” “should,” “could” or “may”, or by variations of such words or by similar expressions. These forward-looking statements are based on assumptions that involve risks and uncertainties, which are subject to change based on various important factors (some of which are beyond KeyCorp’s control.) Actual results may differ materially from current projections. Actual outcomes may differ materially from those expressed or implied as a result of the factors described under “Forward-looking Statements” and “Risk Factors” in KeyCorp’s Annual Report on Form 10-K for the year ended December 31, 2021 and in other filings of KeyCorp with the Securities and Exchange Commission (the “SEC”). Such forward-looking statements speak only as of the date they are made, and we undertake no obligation to update any forward-looking statement to reflect events or circumstances after that date or to reflect the occurrence of unanticipated events. For additional information regarding KeyCorp, please refer to our SEC filings available at www.key.com/ir. 2

Agenda Introduction & Welcome | Chris Gorman 8:30AM Relationship Banker Driven Businesses | Angela Mago & Randy Paine Enterprise Payments and Commercial Primacy | Ken Gavrity Q&A Break Driving Consumer Relationship Growth | Victor Alexander Targeted Scale Execution in Healthcare: Laurel Road | Jamie Warder & Alyssa Schaefer Q&A Entrepreneurial Partnerships | Clark Khayat & Arjun Sirrah Technology Powering Targeted Scale | Amy Brady Delivering on Our Commitments | Don Kimble Concluding Remarks | Chris Gorman Q&A Lunch: 12:45PM 3

Key Takeaways: Focus Propels Growth A new KEY built around targeted scale, driving sustainable growth and returns 1 We have a unique business model focused on targeted scale 2 We have clear strategic opportunities to accelerate growth 3 We are making targeted investments that are driving tangible results 4 We are delivering on our commitments and creating long-term value for our stakeholders We are a compelling investment 5 4
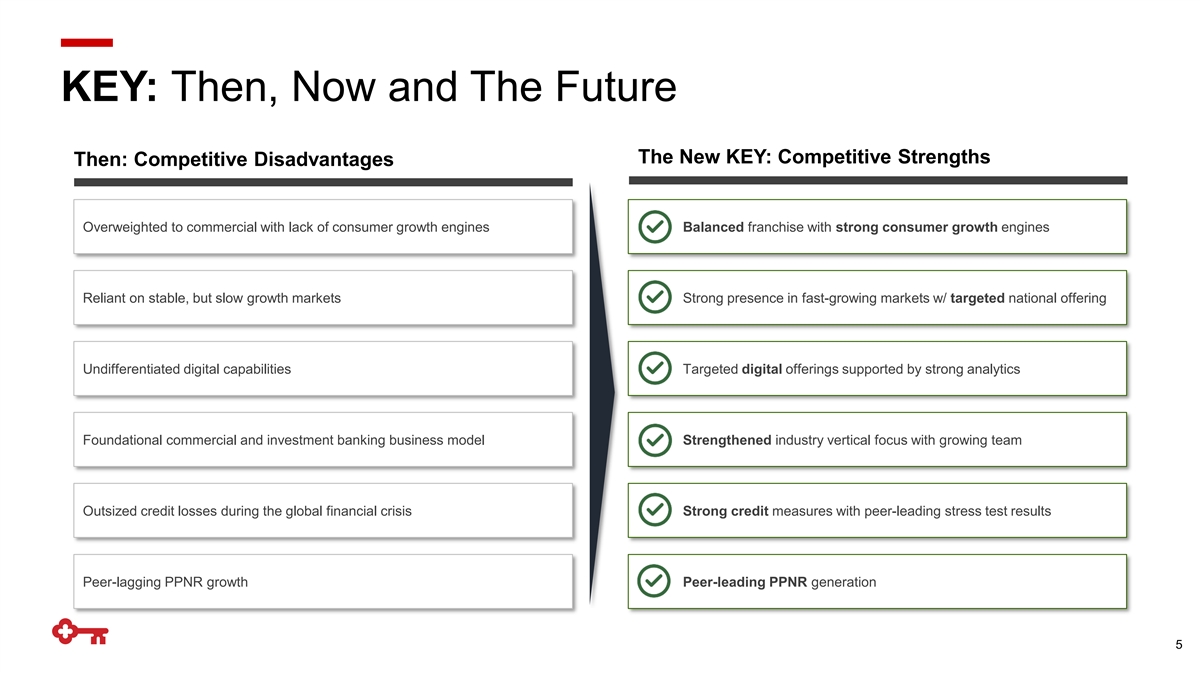
KEY: Then, Now and The Future The New KEY: Competitive Strengths Then: Competitive Disadvantages Overweighted to commercial with lack of consumer growth engines Balanced franchise with strong consumer growth engines ✓ Reliant on stable, but slow growth markets Strong presence in fast-growing markets w/ targeted national offering ✓ Undifferentiated digital capabilities Targeted digital offerings supported by strong analytics ✓ Foundational commercial and investment banking business model Strengthened industry vertical focus with growing team ✓ Outsized credit losses during the global financial crisis Strong credit measures with peer-leading stress test results ✓ Peer-lagging PPNR growth Peer-leading PPNR generation ✓ 5
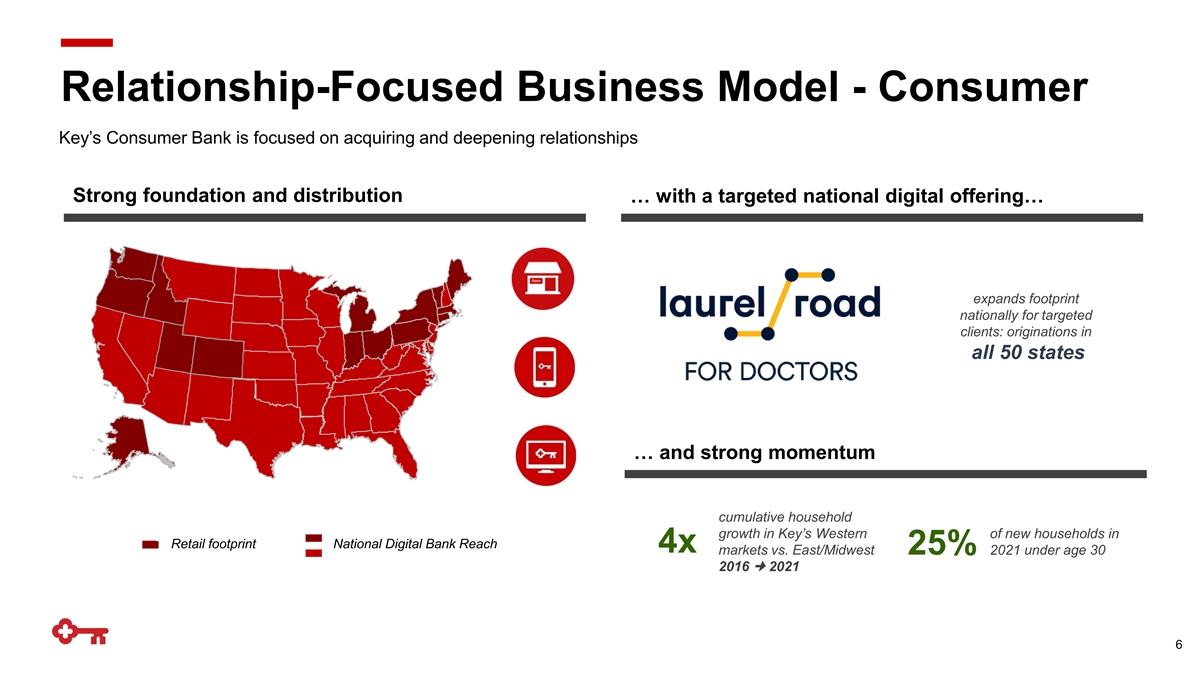
Relationship-Focused Business Model - Consumer Key’s Consumer Bank is focused on acquiring and deepening relationships Strong foundation and distribution … with a targeted national digital offering… expands footprint nationally for targeted clients: originations in all 50 states … and strong momentum cumulative household growth in Key’s Western of new households in Retail footprint National Digital Bank Reach 4x markets vs. East/Midwest 25% 2021 under age 30 2016 ¢ 2021 6
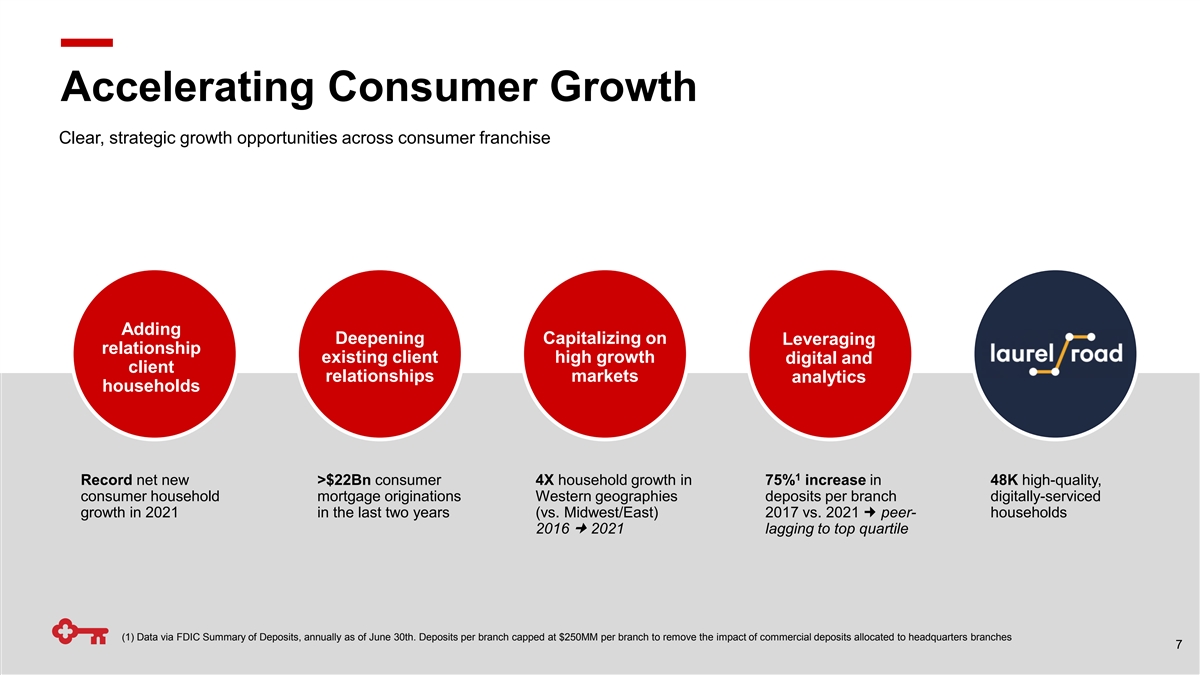
Accelerating Consumer Growth Clear, strategic growth opportunities across consumer franchise Adding Deepening Capitalizing on Leveraging relationship existing client high growth digital and client relationships markets analytics households 1 Record net new >$22Bn consumer 4X household growth in 75% increase in 48K high-quality, consumer household mortgage originations Western geographies deposits per branch digitally-serviced growth in 2021 in the last two years (vs. Midwest/East) 2017 vs. 2021 ¢ peer- households 2016 ¢ 2021 lagging to top quartile (1) Data via FDIC Summary of Deposits, annually as of June 30th. Deposits per branch capped at $250MM per branch to remove the impact of commercial deposits allocated to headquarters branches 7

Unique Business Model - Commercial We have a differentiated and targeted, full-service platform delivered through a unique, relationship-based approach …with a full set of products and capabilities… A differentiated and comprehensive platform… Commercial Derivatives & Trillionaire/ Regional Loans Payments Loan Syndications Mortgage Banking Foreign Exchange Boutiques Global Banks Banks Sponsors & Equity Capital Deposits Equity Research Loan Servicing Capital Leveraged Finance Markets ✓û✓✓ Markets Wealth Equipment Mergers & Investment Grade Public Finance Management Finance Acquisitions & High-yield Debt Commercial û✓✓✓ Banking …and deep expertise in targeted industry verticals Industry- driven ✓û✓✓ Model Middle Consumer Healthcare Technology Energy Market ✓✓✓û Focus Industrial Real Estate Public Sector 8

Accelerating Commercial Growth Commercial Compounded Annual Growth Rate (10-YR): 80 $937MM Investment Banking and Debt Placement Fees: 15% Leading full-service commercial and investment bank Commercial and Industrial Loans: 11% 900 serving middle-market clients in targeted verticals 70 700 ▪ Accelerated hiring: adding senior bankers:+10% in 2021 with 60 extensive industry expertise $51Bn 500 ▪ Client-focused execution: on- and off-balance sheet offerings 50 ▪ Leading position in high-growth niche sectors of GDP 300 40 $224MM 100 30 -100 $18Bn 20 ~80% of investment banking and debt -300 10 1 placement fees from relationship clients 0 -500 2011 2012 2013 2014 2015 2016 2017 2018 2019 2020 2021 Investment banking & debt placement fees (TTM) C&I loans (avg) (1) Dec 2021 T-36 Month; Considered a relationship client if they have two or more of the following with Key: Credit, Payments, Capital Markets 9
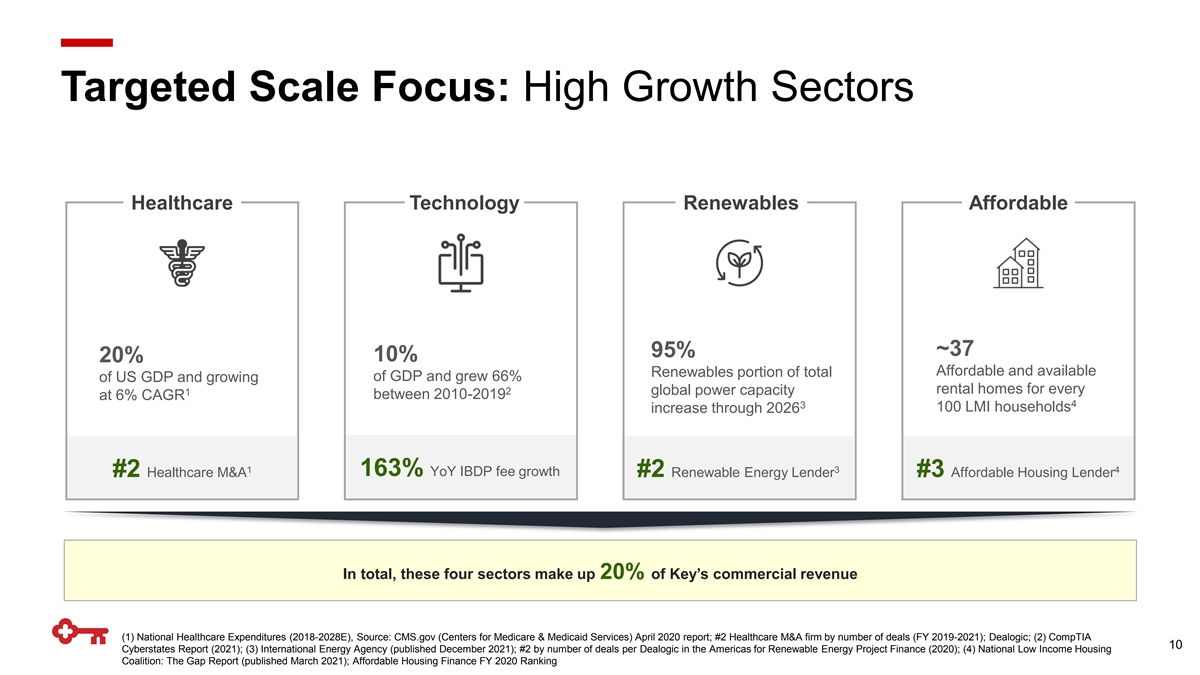
Targeted Scale Focus: High Growth Sectors Healthcare Technology Renewables Affordable ~37 95% 10% 20% Affordable and available Renewables portion of total of GDP and grew 66% of US GDP and growing rental homes for every 2 global power capacity 1 between 2010-2019 at 6% CAGR 4 3 100 LMI households increase through 2026 1 3 4 163% YoY IBDP fee growth #2 Healthcare M&A #2 Renewable Energy Lender #3 Affordable Housing Lender In total, these four sectors make up 20% of Key’s commercial revenue (1) National Healthcare Expenditures (2018-2028E), Source: CMS.gov (Centers for Medicare & Medicaid Services) April 2020 report; #2 Healthcare M&A firm by number of deals (FY 2019-2021); Dealogic; (2) CompTIA 10 Cyberstates Report (2021); (3) International Energy Agency (published December 2021); #2 by number of deals per Dealogic in the Americas for Renewable Energy Project Finance (2020); (4) National Low Income Housing Coalition: The Gap Report (published March 2021); Affordable Housing Finance FY 2020 Ranking

Investments Driving Tangible Results Investing in teammates, digital, and analytics support and accelerate growth across the enterprise Teammates Digital & Analytics ▪ Successful acquisition, integration, and retention of talent in areas ▪ Continued expansion of national digital affinity bank: Laurel Road for of focus Doctors ▪ Acquired and integrated boutique investment banking firms: Cain ▪ Successful acquisition and integration of capabilities from Brothers and Pacific Crest Securities entrepreneurial companies and fintechs in areas of focus to: (1) Enhance value proposition ▪ Accelerated hiring of senior bankers across enterprise (2) Expand expertise area ▪ Added renewable energy banker team in May 2021 (3) Add or expand targeted client segments ▪ Digital investment strategy focused on modernization of core systems and differentiation in high-growth areas ~85% +10% 163% +19 talent retained from senior bankers increase in technology increase in client 1 acquired businesses added in 2021 2 hires 2021 vs. 2019 satisfaction Proven Track Record (1) Reflects banker, engineering and analytic professional employees from acquisitions; considered retained if employee remained at Key for 2+ years post-acquisition; (2) Represents average of branch, contact center, and 11 digital NPS change from 4Q19 to 4Q21

Delivering on Commitments for All Stakeholders Teammates Clients We help our clients make better, more Together we do work that matters, have confident financial decisions opportunities for growth, and our efforts are recognized and rewarded $11Bn Shareholders ~17K originated Paycheck dedicated Protection Program teammates (PPP) loan volume Sound, profitable growth is driving strong shareholder returns 1 Communities Regulators +11% TSR outperformance relative to We are committed to strong regulatory peers since last Investor Day Through lending, investing, and volunteerism, engagement and maintaining our moderate we participate in the growth and sustainability risk profile of the communities we proudly serve 10 $40Bn consecutive expanded National “Outstanding” Community Benefits Plan CRA ratings (1) TSR = Total Shareholder Return; Calculated from 10/29/2018-1/31/2022 12
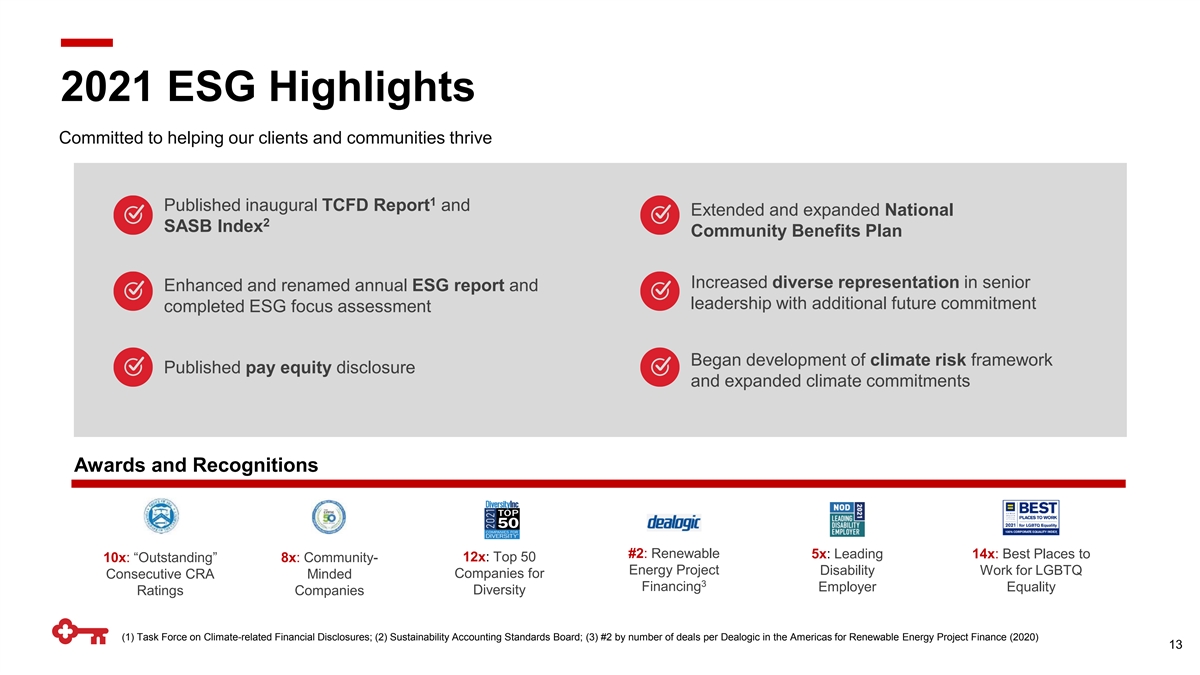
2021 ESG Highlights Committed to helping our clients and communities thrive 1 Published inaugural TCFD Report and Extended and expanded National 2 SASB Index Community Benefits Plan Increased diverse representation in senior Enhanced and renamed annual ESG report and leadership with additional future commitment completed ESG focus assessment Began development of climate risk framework Published pay equity disclosure and expanded climate commitments Awards and Recognitions #2: Renewable 5x: Leading 14x: Best Places to 12x: Top 50 10x: “Outstanding” 8x: Community- Energy Project Disability Work for LGBTQ Consecutive CRA Minded Companies for 3 Financing Employer Equality Ratings Companies Diversity (1) Task Force on Climate-related Financial Disclosures; (2) Sustainability Accounting Standards Board; (3) #2 by number of deals per Dealogic in the Americas for Renewable Energy Project Finance (2020) 13

Metrics that Matter Key is a growth story with specific, measurable targets Consumer Commercial Laurel Road +20% +25% 250K Growth in relationship Increase in senior bankers Total member households households by 2025 by 2025 by 2025 Positive operating Moderate risk profile: Cash efficiency ratio: ROTCE: leverage: Long-term Targets Net charge-offs to avg. loans 54% - 56% 16% - 19% Drives improved productivity targeted range of 40-60 bps and efficiency 14

Key is a Compelling 1 Current Valuation Investment Price / Earnings 16.0 Unique, distinctive business model and 12.9 strategy positioned for growth 12.0 11.3 8.0 4.0 High quality, diverse revenue streams 0.0 built for consistent earnings Price / Tangible Book Value Positioned to deliver through different 2.5 markets/conditions 2.0 1.8 1.5 1.7 1.0 Disciplined approach to risk and capital 0.5 management 0.0 Peer Median (1) Peers include: USB, TFC, PNC, FITB, CFG, MTB, RF, HBAN, CMA, ZION; P/E 15 ratio uses 2022 consensus estimates from Thomson Reuters; Stock price as of 12/31/21
Relationship Banker Driven Businesses Angela Mago Randy Paine Head of Commercial Bank Head of Institutional Bank
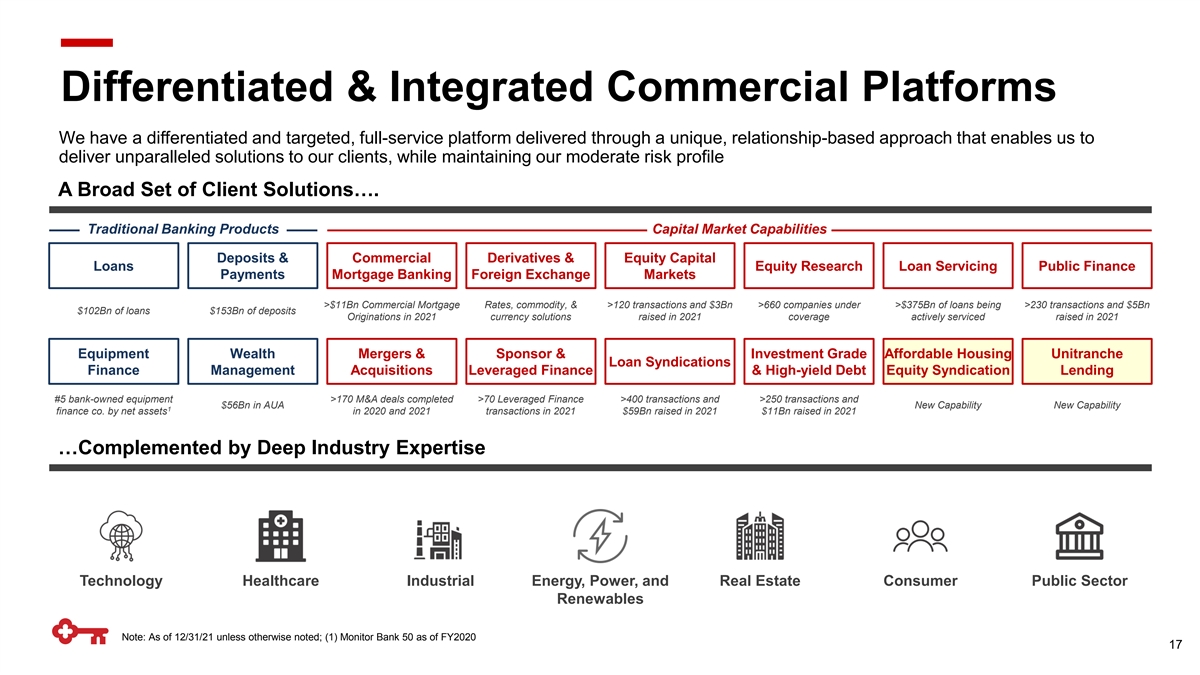
Differentiated & Integrated Commercial Platforms We have a differentiated and targeted, full-service platform delivered through a unique, relationship-based approach that enables us to deliver unparalleled solutions to our clients, while maintaining our moderate risk profile A Broad Set of Client Solutions…. Traditional Banking Products Capital Market Capabilities Deposits & Commercial Derivatives & Equity Capital Loans Equity Research Loan Servicing Public Finance Payments Mortgage Banking Foreign Exchange Markets >$11Bn Commercial Mortgage Rates, commodity, & >120 transactions and $3Bn >660 companies under >$375Bn of loans being >230 transactions and $5Bn $102Bn of loans $153Bn of deposits Originations in 2021 currency solutions raised in 2021 coverage actively serviced raised in 2021 Equipment Wealth Mergers & Sponsor & Investment Grade Affordable Housing Unitranche Loan Syndications Finance Management Acquisitions Leveraged Finance & High-yield Debt Equity Syndication Lending #5 bank-owned equipment >170 M&A deals completed >70 Leveraged Finance >400 transactions and >250 transactions and $56Bn in AUA New Capability New Capability 1 finance co. by net assets in 2020 and 2021 transactions in 2021 $59Bn raised in 2021 $11Bn raised in 2021 …Complemented by Deep Industry Expertise Technology Healthcare Industrial Energy, Power, and Real Estate Consumer Public Sector Renewables Note: As of 12/31/21 unless otherwise noted; (1) Monitor Bank 50 as of FY2020 17
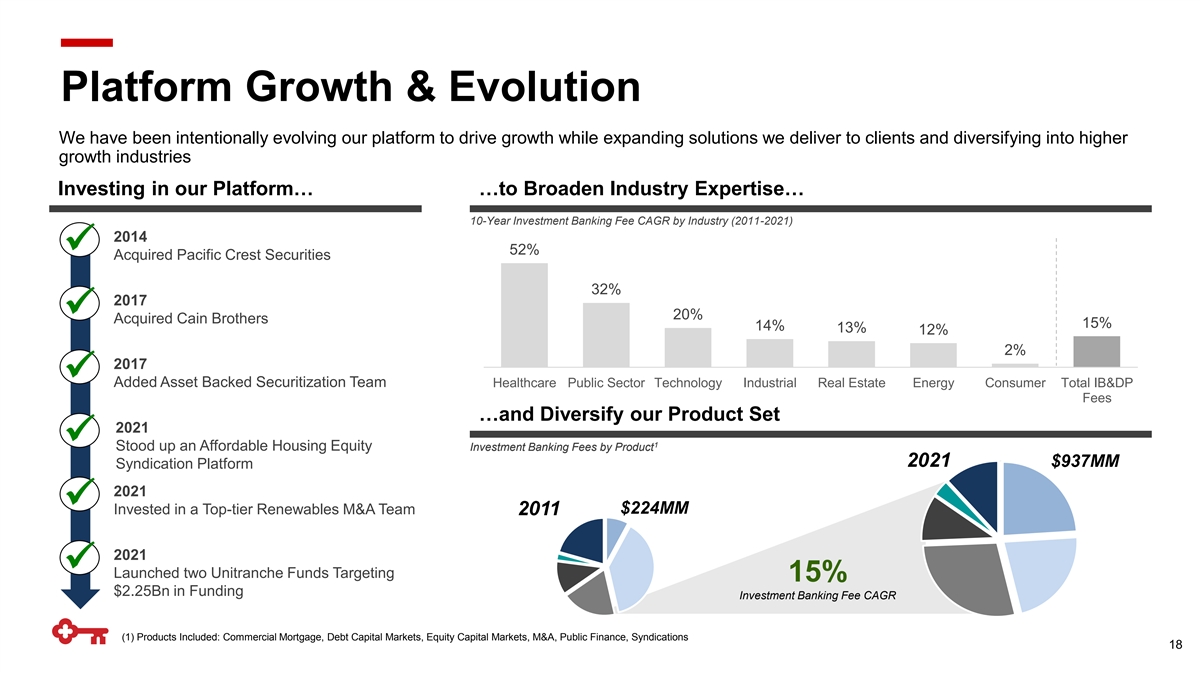
Platform Growth & Evolution We have been intentionally evolving our platform to drive growth while expanding solutions we deliver to clients and diversifying into higher growth industries Investing in our Platform… …to Broaden Industry Expertise… 10-Year Investment Banking Fee CAGR by Industry (2011-2021) 2014 ✓ 52% Acquired Pacific Crest Securities 32% 2017 ✓ 20% Acquired Cain Brothers 15% 14% 13% 12% 2% 2017 ✓ Added Asset Backed Securitization Team Healthcare Public Sector Technology Industrial Real Estate Energy Consumer Total IB&DP Fees …and Diversify our Product Set 2021 ✓ 1 1 Stood up an Affordable Housing Equity In Inv ve es stm tme en nt t Ba Ban nk kiin ng g Fe Fee es s b by y Pro Prod du uc ctt 2021 $937MM Syndication Platform 2021 ✓ $224MM Invested in a Top-tier Renewables M&A Team 2011 2021 ✓ Launched two Unitranche Funds Targeting 15% $2.25Bn in Funding Investment Banking Fee CAGR (1) Products Included: Commercial Mortgage, Debt Capital Markets, Equity Capital Markets, M&A, Public Finance, Syndications 18
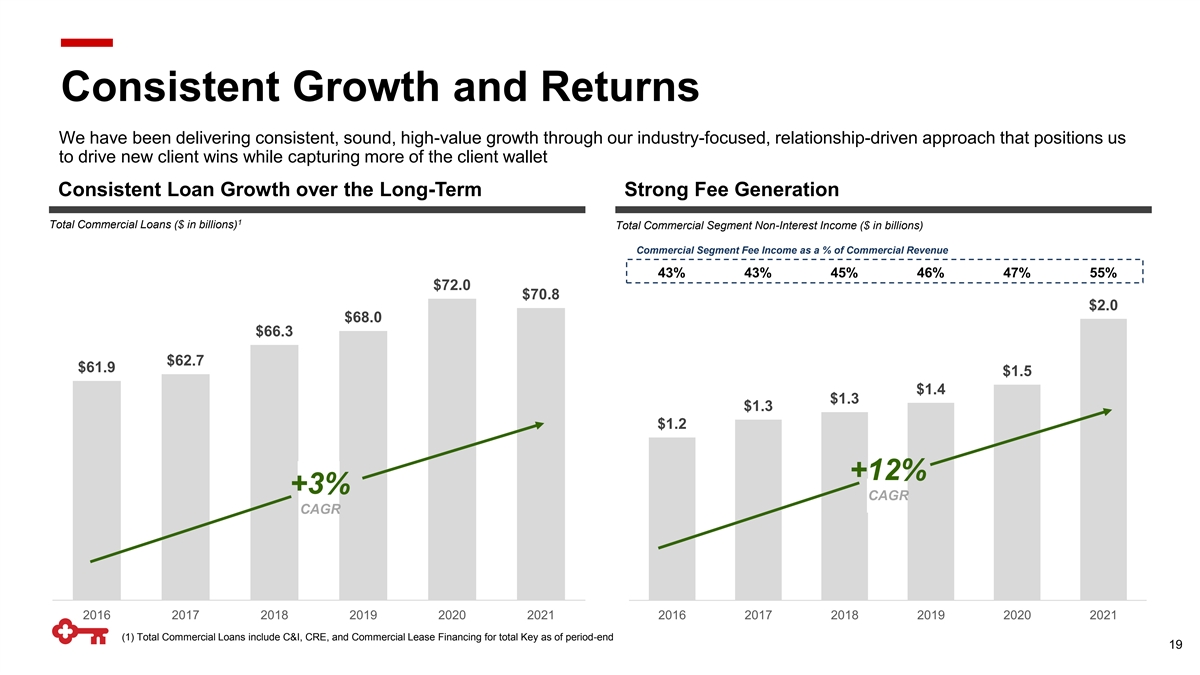
Consistent Growth and Returns We have been delivering consistent, sound, high-value growth through our industry-focused, relationship-driven approach that positions us to drive new client wins while capturing more of the client wallet Consistent Loan Growth over the Long-Term Strong Fee Generation 1 Total Commercial Loans ($ in billions) Total Commercial Segment Non-Interest Income ($ in billions) Commercial Segment Fee Income as a % of Commercial Revenue 43% 43% 45% 46% 47% 55% $72.0 $70.8 $2.0 $68.0 $66.3 $62.7 $61.9 $1.5 $1.4 $1.3 $1.3 $1.2 +12% +3% CAGR CAGR 2016 2017 2018 2019 2020 2021 2016 2017 2018 2019 2020 2021 (1) Total Commercial Loans include C&I, CRE, and Commercial Lease Financing for total Key as of period-end 19
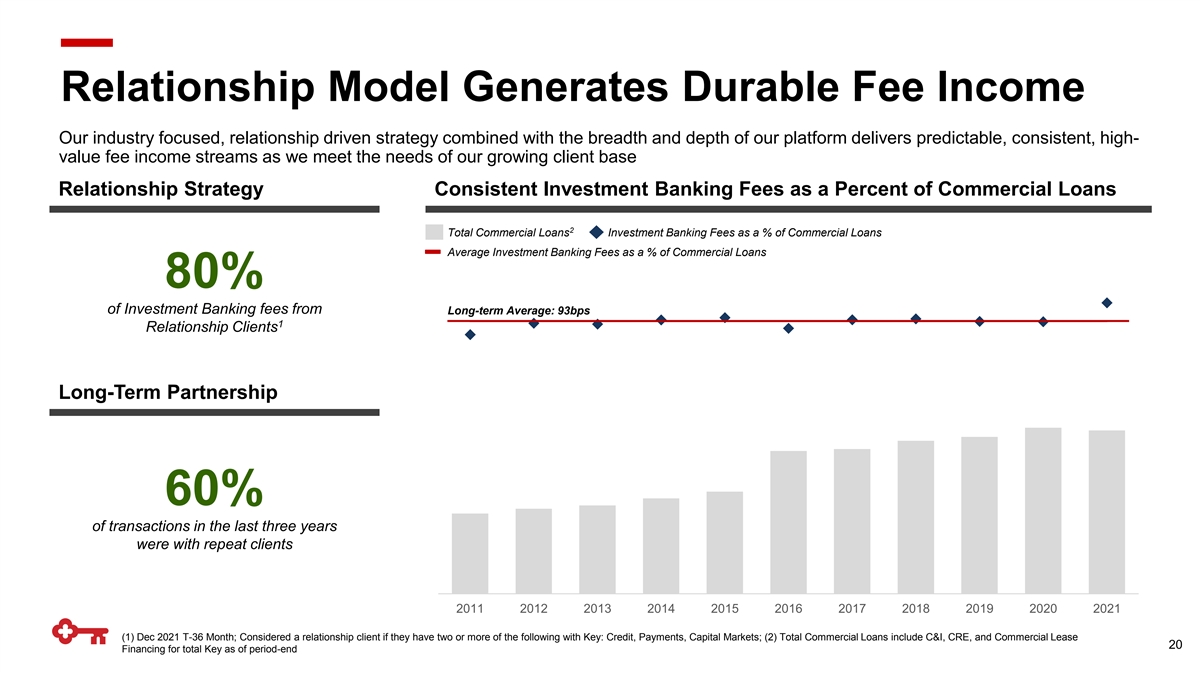
Relationship Model Generates Durable Fee Income Our industry focused, relationship driven strategy combined with the breadth and depth of our platform delivers predictable, consistent, high- value fee income streams as we meet the needs of our growing client base Relationship Strategy Consistent Investment Banking Fees as a Percent of Commercial Loans 2 Total Commercial Loans Investment Banking Fees as a % of Commercial Loans Average Investment Banking Fees as a % of Commercial Loans 80% of Investment Banking fees from Long-term Average: 93bps 1 Relationship Clients Long-Term Partnership 60% of transactions in the last three years were with repeat clients 2011 2012 2013 2014 2015 2016 2017 2018 2019 2020 2021 (1) Dec 2021 T-36 Month; Considered a relationship client if they have two or more of the following with Key: Credit, Payments, Capital Markets; (2) Total Commercial Loans include C&I, CRE, and Commercial Lease 20 Financing for total Key as of period-end
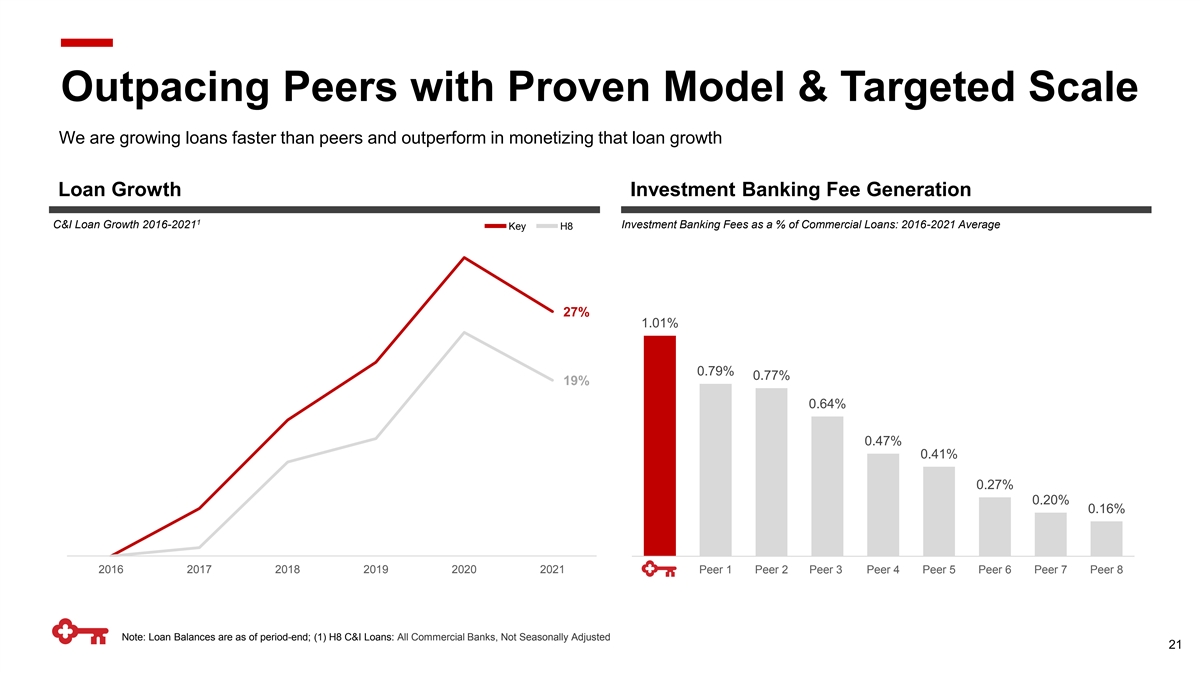
Outpacing Peers with Proven Model & Targeted Scale We are growing loans faster than peers and outperform in monetizing that loan growth Loan Growth Investment Banking Fee Generation 1 C&I Loan Growth 2016-2021 Investment Banking Fees as a % of Commercial Loans: 2016-2021 Average Key H8 27% 1.01% 0.79% 0.77% 19% 0.64% 0.47% 0.41% 0.27% 0.20% 0.16% 2016 2017 2018 2019 2020 2021 Key Peer 1 Peer 2 Peer 3 Peer 4 Peer 5 Peer 6 Peer 7 Peer 8 Note: Loan Balances are as of period-end; (1) H8 C&I Loans: All Commercial Banks, Not Seasonally Adjusted 21

Peer Leading Credit Quality While we continue to outperform peers in balance sheet and earnings growth, we remain rigorously focused on prudently managing risk – as demonstrated by peer leading stress test results and top tier credit performance Stressed Losses – Stress Test Scenario Commercial Criticized Loan Ratio 1 2 2020 Projected Stress Losses as a % of Average Loans Key Peer Average Commercial Criticized Loans as a % of Commercial Loans 16.2% 15.6% 11.6% 8.2% 7.4% 7.0% 6.7% 7.1% 5.9% 5.6% 5.9% 5.2% 4.4% 4.2% 4.0% C&I CRE (1) Source: Federal Reserve Bank December 2020 Stress Test; (2) As of 3Q21 22

Sound Credit Risk Management While we have delivered strong growth in balances, revenue, and productivity – we have also meaningfully de-risked our business by leveraging our ability to distribute risk into the capital markets ➔ In 2021, <20% of capital raised for clients came from our balance sheet Repositioning of The Portfolio Pre-Crisis (2006) 2021 Δ% Total Commercial Loans +48% Construction Balances (73%) % of Total Commercial Loans CRE (38%) Total Revenue +45% Total Revenue / FTE +70% ~50% of Commercial Bank revenue is driven by fee income, which amplifies returns and resiliency 23
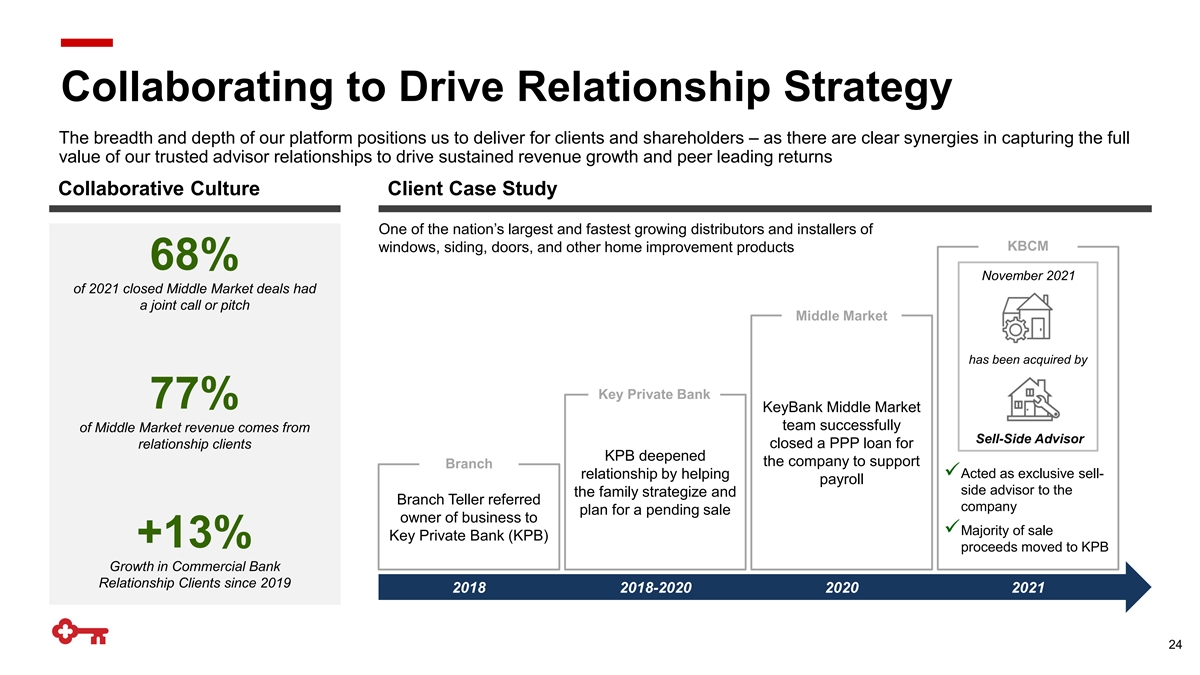
Collaborating to Drive Relationship Strategy The breadth and depth of our platform positions us to deliver for clients and shareholders – as there are clear synergies in capturing the full value of our trusted advisor relationships to drive sustained revenue growth and peer leading returns Collaborative Culture Client Case Study One of the nation’s largest and fastest growing distributors and installers of KBCM windows, siding, doors, and other home improvement products 68% November 2021 of 2021 closed Middle Market deals had a joint call or pitch Middle Market has been acquired by Key Private Bank 77% KeyBank Middle Market team successfully of Middle Market revenue comes from Sell-Side Advisor relationship clients closed a PPP loan for KPB deepened the company to support Branch relationship by helping ✓Acted as exclusive sell- payroll side advisor to the the family strategize and Branch Teller referred company plan for a pending sale owner of business to ✓Majority of sale Key Private Bank (KPB) +13% proceeds moved to KPB Growth in Commercial Bank Relationship Clients since 2019 2018 2018-2020 2020 2021 24
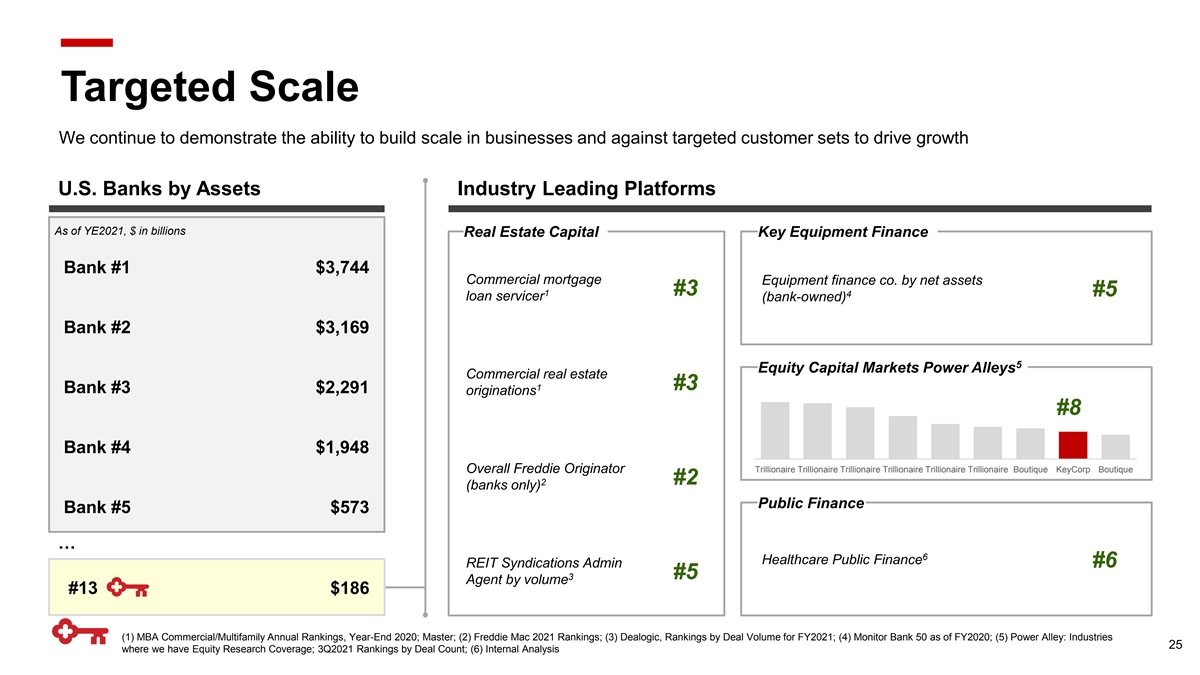
Targeted Scale We continue to demonstrate the ability to build scale in businesses and against targeted customer sets to drive growth U.S. Banks by Assets Industry Leading Platforms As of YE2021, $ in billions Real Estate Capital Key Equipment Finance Bank #1 $3,744 Commercial mortgage Equipment finance co. by net assets 1 #3 #5 4 loan servicer (bank-owned) Bank #2 $3,169 5 Equity Capital Markets Power Alleys Commercial real estate #3 1 Bank #3 $2,291 originations #8 Bank #4 $1,948 Trillionaire Trillionaire Trillionaire Trillionaire Trillionaire Trillionaire Boutique KeyCorp Boutique Overall Freddie Originator 2 #2 (banks only) Public Finance Bank #5 $573 … 6 Healthcare Public Finance REIT Syndications Admin #6 #5 3 Agent by volume #13 $186 (1) MBA Commercial/Multifamily Annual Rankings, Year-End 2020; Master; (2) Freddie Mac 2021 Rankings; (3) Dealogic, Rankings by Deal Volume for FY2021; (4) Monitor Bank 50 as of FY2020; (5) Power Alley: Industries 25 where we have Equity Research Coverage; 3Q2021 Rankings by Deal Count; (6) Internal Analysis
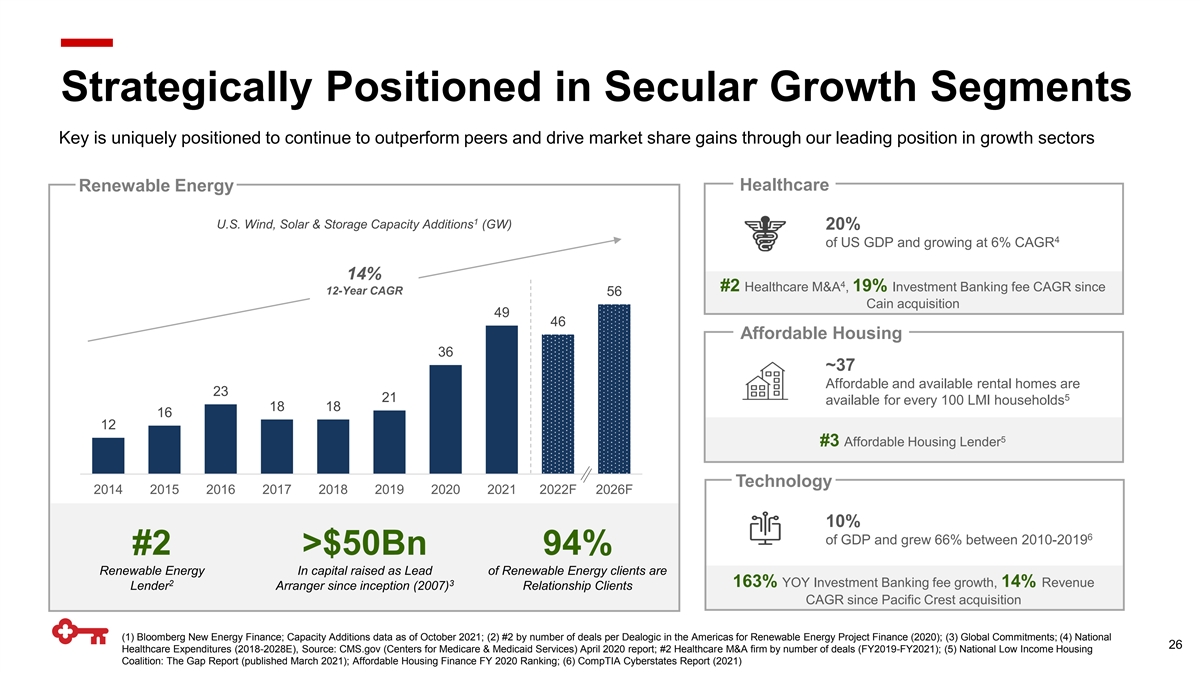
Strategically Positioned in Secular Growth Segments Key is uniquely positioned to continue to outperform peers and drive market share gains through our leading position in growth sectors Renewable Energy Healthcare 1 U.S. Wind, Solar & Storage Capacity Additions (GW) 20% 4 of US GDP and growing at 6% CAGR 14% 4 #2 Healthcare M&A , 19% Investment Banking fee CAGR since 12-Year CAGR 56 Cain acquisition 49 46 Affordable Housing 36 ~37 Affordable and available rental homes are 23 5 21 available for every 100 LMI households 18 18 16 12 5 #3 Affordable Housing Lender Technology 2014 2015 2016 2017 2018 2019 2020 2021 2022F 2026F 10% 6 of GDP and grew 66% between 2010-2019 #2 >$50Bn 94% Renewable Energy In capital raised as Lead of Renewable Energy clients are 2 3 163% YOY Investment Banking fee growth, 14% Revenue Lender Arranger since inception (2007) Relationship Clients CAGR since Pacific Crest acquisition (1) Bloomberg New Energy Finance; Capacity Additions data as of October 2021; (2) #2 by number of deals per Dealogic in the Americas for Renewable Energy Project Finance (2020); (3) Global Commitments; (4) National 26 Healthcare Expenditures (2018-2028E), Source: CMS.gov (Centers for Medicare & Medicaid Services) April 2020 report; #2 Healthcare M&A firm by number of deals (FY2019-FY2021); (5) National Low Income Housing Coalition: The Gap Report (published March 2021); Affordable Housing Finance FY 2020 Ranking; (6) CompTIA Cyberstates Report (2021)
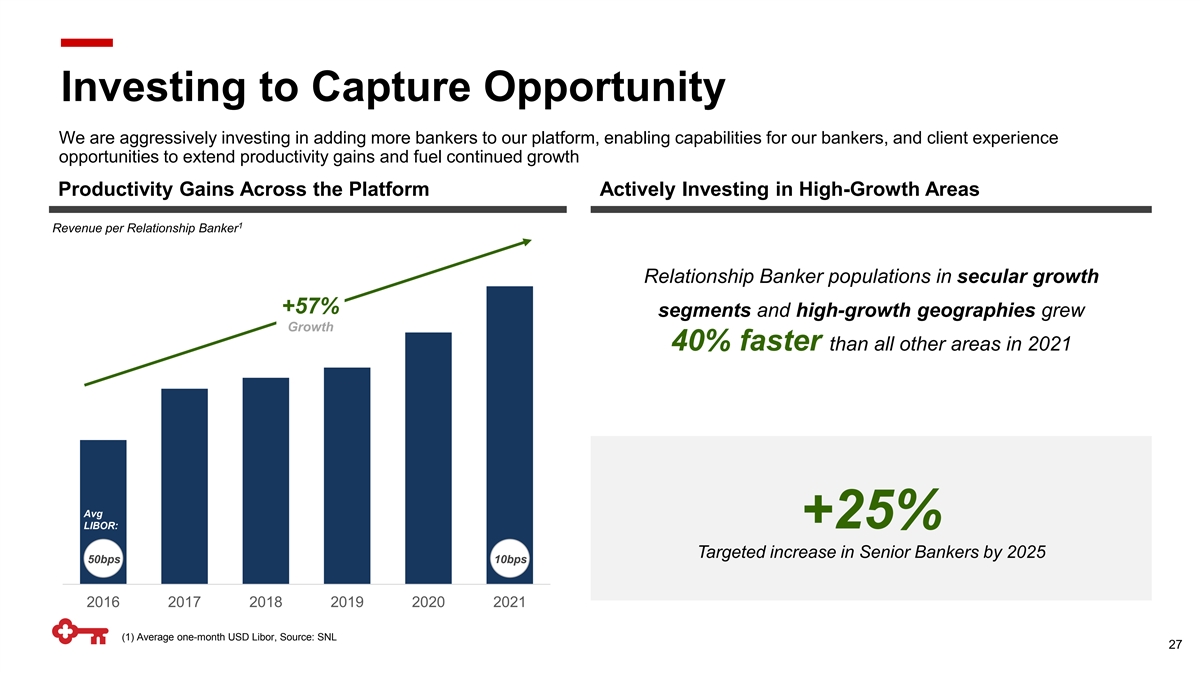
Investing to Capture Opportunity We are aggressively investing in adding more bankers to our platform, enabling capabilities for our bankers, and client experience opportunities to extend productivity gains and fuel continued growth Productivity Gains Across the Platform Actively Investing in High-Growth Areas 1 Revenue per Relationship Banker Relationship Banker populations in secular growth +57% segments and high-growth geographies grew Growth 40% faster than all other areas in 2021 Avg +25% LIBOR: Targeted increase in Senior Bankers by 2025 50bps 10bps 2016 2017 2018 2019 2020 2021 (1) Average one-month USD Libor, Source: SNL 27

Takeaways Poised for Growth We continue to strengthen and diversify our robust, expertise-driven platform that features a broad set of 1 client solutions We have been delivering consistent, durable, high-value growth through our industry-focused, relationship 2 driven approach We are growing loans faster than peers while maintaining strong credit quality, and we continue to outperform 3 on generating valuable fee income from credit relationships We are uniquely positioned for continued growth with targeted scale and leading positions in high-growth 4 industry verticals and geographies We are aggressively adding bankers to our platform while investing in supporting capabilities to drive 5 increased productivity and continued growth 28

Enterprise Payments and Commercial Primacy Ken Gavrity Head of Enterprise Payments
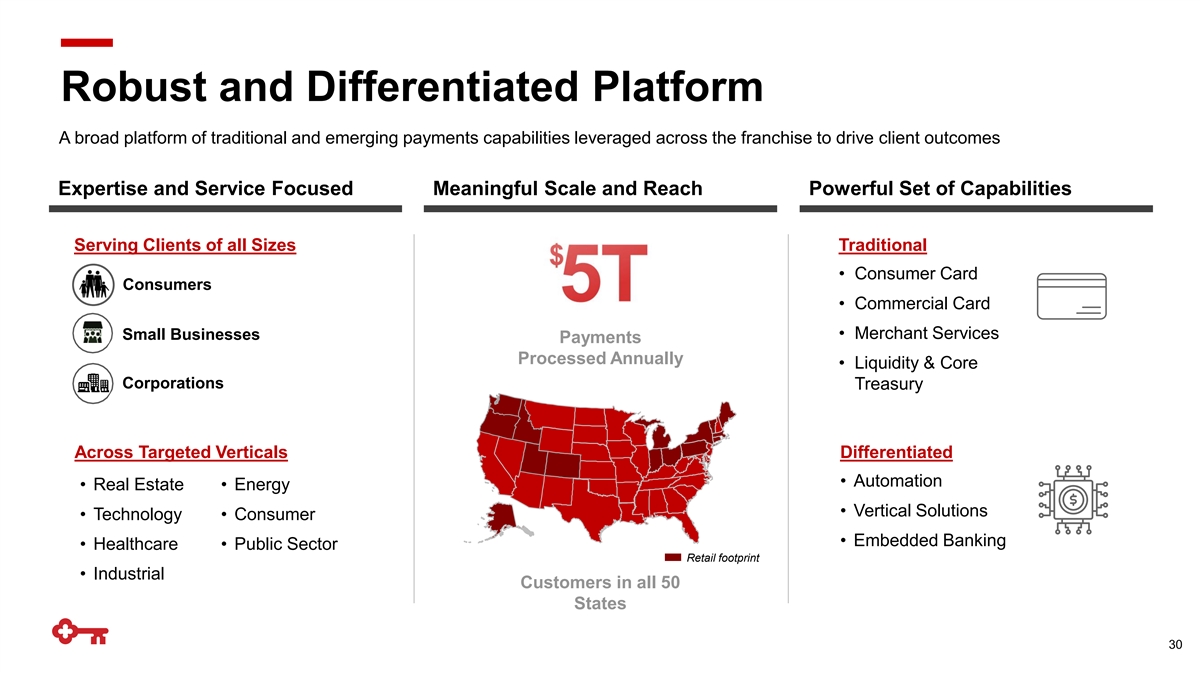
Robust and Differentiated Platform A broad platform of traditional and emerging payments capabilities leveraged across the franchise to drive client outcomes Expertise and Service Focused Meaningful Scale and Reach Powerful Set of Capabilities Serving Clients of all Sizes Traditional • Consumer Card Consumers • Commercial Card • Merchant Services Small Businesses Payments Processed Annually • Liquidity & Core Corporations Treasury Across Targeted Verticals Differentiated • Automation • Real Estate • Energy • Vertical Solutions • Technology • Consumer • Embedded Banking • Healthcare • Public Sector Retail footprint • Industrial Customers in all 50 States 30

Creating Significant Value for Key Our strategy remains consistent ➔ Primacy drives engagement, attractive returns, and the data assets that power our growth High Engagement High Value Recurring Revenue Low-Cost Deposit Base Highly engaged clients Revenue per Client Operating Deposits as % of Commercial Deposits Above Peer 73% 2.5x Business clients transact 1 Median Revenue per Client >10 times per month 82% 74% 2019 2021 Client without Payments Client with Payments 2019 2021 (1) Payments Client means over $5K in annual Payments Revenue, Commercial Clients (>$5K in T12 Revenue) Only 31
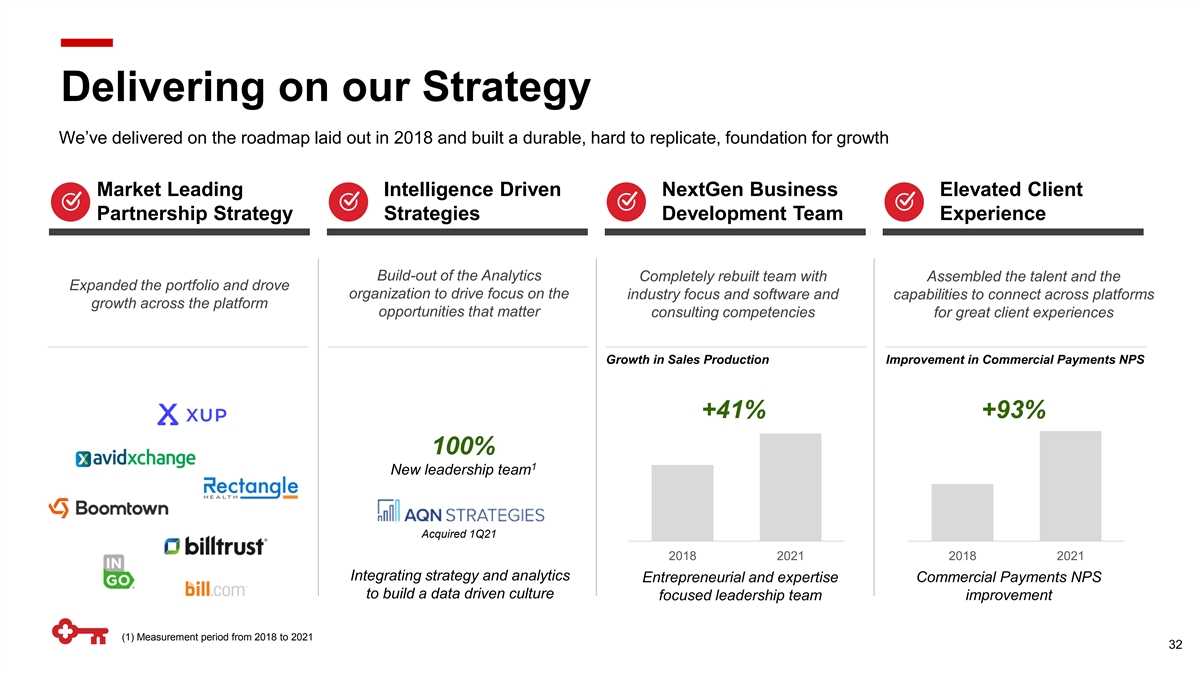
Delivering on our Strategy We’ve delivered on the roadmap laid out in 2018 and built a durable, hard to replicate, foundation for growth Market Leading Intelligence Driven NextGen Business Elevated Client Partnership Strategy Strategies Development Team Experience Build-out of the Analytics Completely rebuilt team with Assembled the talent and the Expanded the portfolio and drove organization to drive focus on the industry focus and software and capabilities to connect across platforms growth across the platform opportunities that matter consulting competencies for great client experiences Growth in Sales Production Improvement in Commercial Payments NPS +41% +93% 100% 1 New leadership team Acquired 1Q21 2018 2021 2018 2021 Integrating strategy and analytics Entrepreneurial and expertise Commercial Payments NPS to build a data driven culture focused leadership team improvement (1) Measurement period from 2018 to 2021 32

Driving Results Across the Platform We have delivered on the opportunity identified in 2018 and meaningfully outperformed industry benchmarks, and we expect to continue double-digit growth in payments fee income through 2025 Generating ~$1.5Bn in NII and Fee Income Growth Outpacing the Industry Growth in volume from 2019-2021 +14% Industry 2 Consumer Benchmarks Payments Fee Consumer Credit Card +13% +23% Revenue 2019 2021 +30% Commercial Card +3% +30% Commercial Payments Fee 1 Revenue 2019 2021 Merchant Services +16% +38% +67% Operating Deposit Balances Treasury Services +10% +17% 2019 2021 (1) Excludes Prepaid Revenue which was $18MM in 2019 and $106MM in 2021; (2) Sources: Mastercard (Consumer Credit Card, Commercial Card), Fiserv (Merchant Services), Novantas (Treasury Services) 33
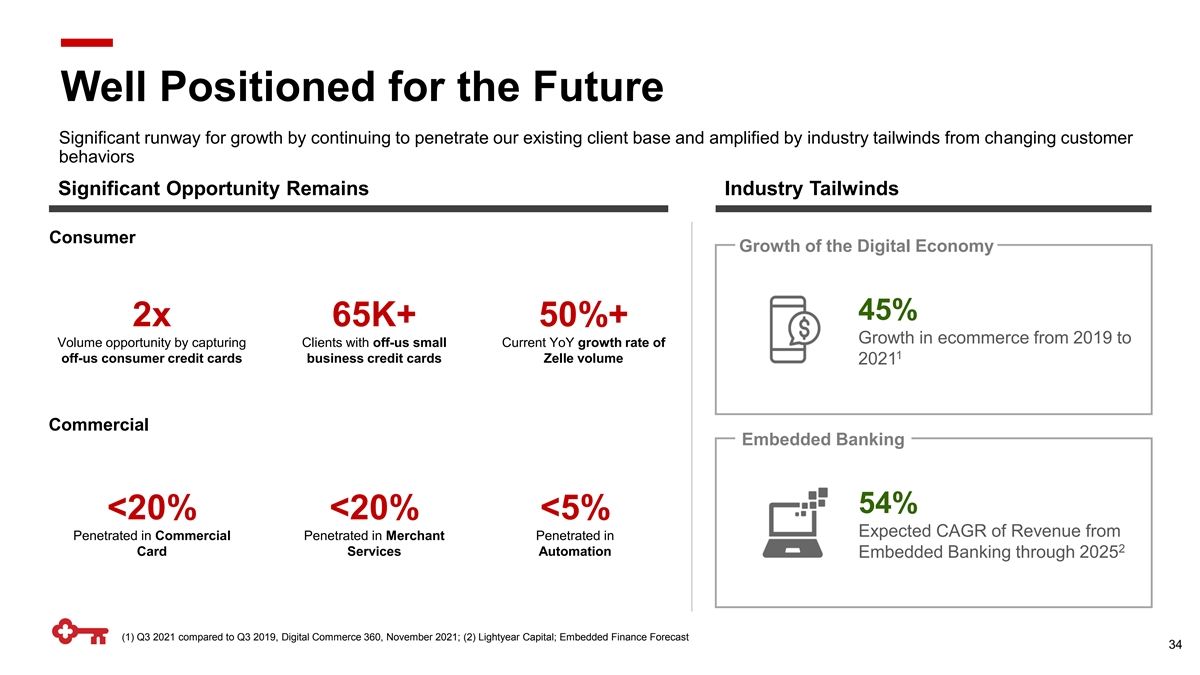
Well Positioned for the Future Significant runway for growth by continuing to penetrate our existing client base and amplified by industry tailwinds from changing customer behaviors Significant Opportunity Remains Industry Tailwinds Consumer Growth of the Digital Economy 45% 2x 65K+ 50%+ Growth in ecommerce from 2019 to Volume opportunity by capturing Clients with off-us small Current YoY growth rate of 1 off-us consumer credit cards business credit cards Zelle volume 2021 Commercial Embedded Banking 54% <20% <20% <5% Expected CAGR of Revenue from Penetrated in Commercial Penetrated in Merchant Penetrated in 2 Card Services Automation Embedded Banking through 2025 (1) Q3 2021 compared to Q3 2019, Digital Commerce 360, November 2021; (2) Lightyear Capital; Embedded Finance Forecast 34

Embedded Banking Opportunity Vertical-specialization is driving explosive growth of payments-enabled software companies, causing a shift in consumer behavior creating a massive opportunity for financial services companies Client Example: Dental Office Patient Engagement Shift in Consumer Behavior % of Total US Payment Card Volume processed on 1 Software platforms Appointment Co-Pay & +5x Digital Registration Payment Plans 8% 40% 2020 2025E Growth of Software Vendors 2 Projected Growth of Payments Enabled Software Vendors (in thousands) +5x 1,000 175 2018 2027F (1) Bain Capital Ventures, Legend: Payments Enabled Software Vendors All Other; (2) Forrester 35
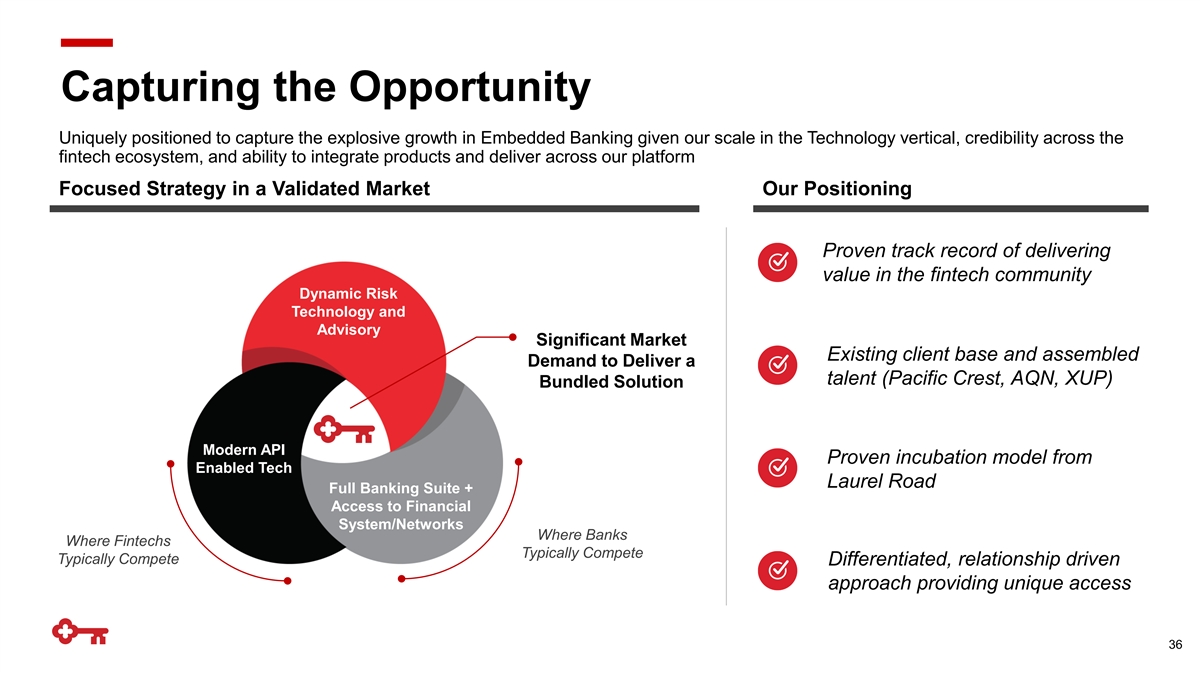
Capturing the Opportunity Uniquely positioned to capture the explosive growth in Embedded Banking given our scale in the Technology vertical, credibility across the fintech ecosystem, and ability to integrate products and deliver across our platform Focused Strategy in a Validated Market Our Positioning Proven track record of delivering value in the fintech community Dynamic Risk Technology and Advisory Significant Market Existing client base and assembled Demand to Deliver a talent (Pacific Crest, AQN, XUP) Bundled Solution Modern API Proven incubation model from Enabled Tech Laurel Road Full Banking Suite + Access to Financial System/Networks Where Banks Where Fintechs Typically Compete Typically Compete Differentiated, relationship driven approach providing unique access 36

Takeaways Poised for Growth 1 We have built a robust and differentiated platform, powered by expertise, that drives value for customers We’re creating significant value for Key as we drive customer engagement, create sticky recurring revenue 2 streams, and capture valuable data assets We’ve delivered on our strategy and our differentiators are hard to replicate – Next generation Business 3 Development, scaled enabling capabilities, and fintech partnership approach 4 Metrics across the platform show significant and above industry growth, with compelling go-forward trajectory We’re well positioned to capture growth from the fair-share opportunity with our existing customer base, the 5 strong macro tailwinds in our industry, and the massive opportunity in Embedded Banking 37

Questions

Driving Consumer Relationship Growth Victor Alexander Head of Consumer Banking
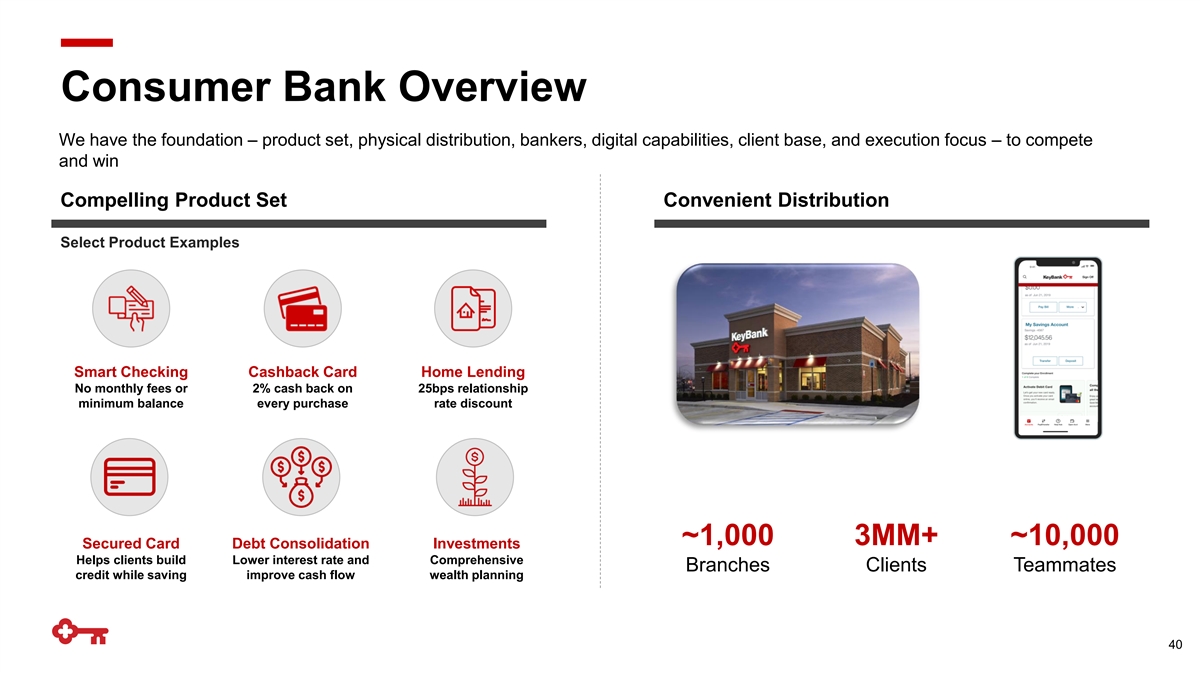
Consumer Bank Overview We have the foundation – product set, physical distribution, bankers, digital capabilities, client base, and execution focus – to compete and win Compelling Product Set Convenient Distribution Select Product Examples Smart Checking Cashback Card Home Lending No monthly fees or 2% cash back on 25bps relationship minimum balance every purchase rate discount ~1,000 3MM+ ~10,000 Secured Card Debt Consolidation Investments Helps clients build Lower interest rate and Comprehensive Branches Clients Teammates credit while saving improve cash flow wealth planning 40

Relationship Focus: High Value Revenue Streams There is nothing more valuable to Key than a relationship client and we are intensely focused on driving relationship depth and strong engagement with our client base to grow high-value revenue streams Relationship Revenue Streams Generating Attractive Returns 1 Primary Checking Checking, Payments, and Wealth Key has the client’s primary operating account are all >20% ROE 2 Payments Clients use Key’s payment solutions in their daily lives 3 Wealth Large Portion of Revenue Clients use Key to plan, save, and invest for their future Checking, Payments, th 4x 3x 1/6 and Wealth account for Revenue Credit Quality Attrition 55% of Consumer Bank Revenue 1 Relationship vs. Non-Relationship Households (1) Revenue per household and household portfolio attrition in FY2021; credit quality represents the ratio of relationship vs. non-relationship households ever 60+ days delinquent, credit loss, or bankruptcy within the first 41 three years post origination across 2017 and 2018 mortgage and home equity origination vintages (vintages with at least 3 years of performance)
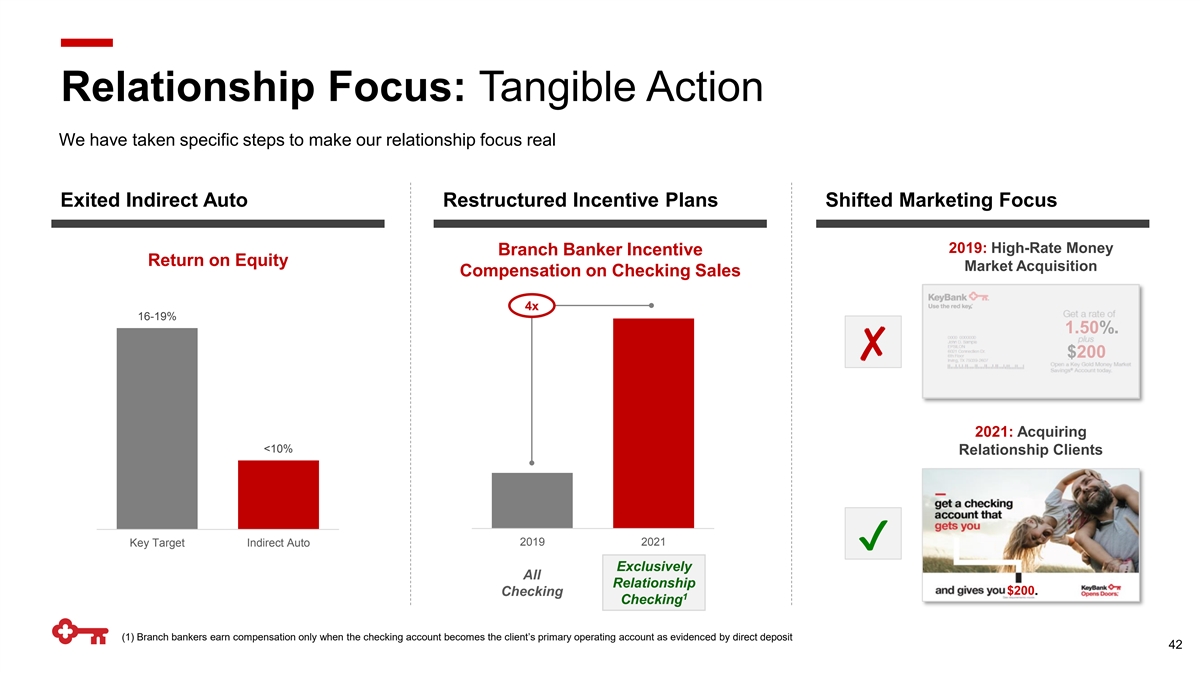
Relationship Focus: Tangible Action We have taken specific steps to make our relationship focus real Exited Indirect Auto Restructured Incentive Plans Shifted Marketing Focus 2019: High-Rate Money Branch Banker Incentive Return on Equity Market Acquisition Compensation on Checking Sales 4x 16-19% 1.50%. ✘ $200 2021: Acquiring <10% Relationship Clients Key Target Indirect Auto 2019 2021 ✔ Exclusively All Relationship $200. Checking 1 Checking (1) Branch bankers earn compensation only when the checking account becomes the client’s primary operating account as evidenced by direct deposit 42
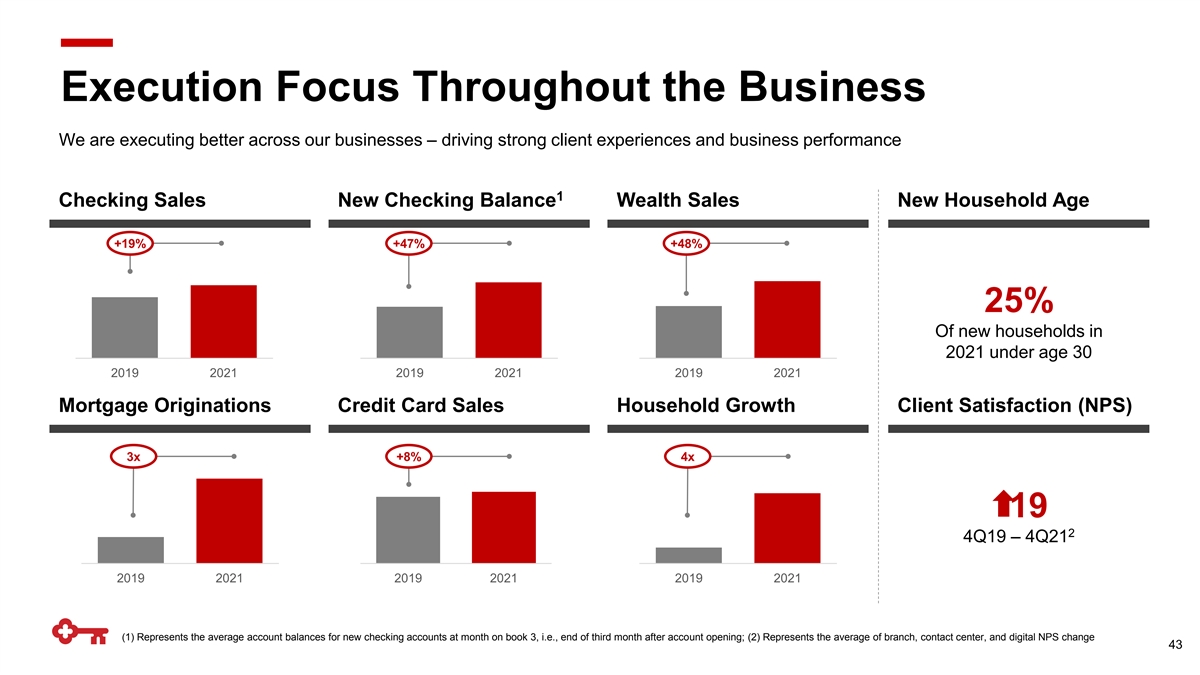
Execution Focus Throughout the Business We are executing better across our businesses – driving strong client experiences and business performance 1 Checking Sales New Checking Balance Wealth Sales New Household Age +19% +47% +48% 25% Of new households in 2021 under age 30 2019 2021 2019 2021 2019 2021 Mortgage Originations Credit Card Sales Household Growth Client Satisfaction (NPS) 3x +8% 4x 19 2 4Q19 – 4Q21 2019 2021 2019 2021 2019 2021 (1) Represents the average account balances for new checking accounts at month on book 3, i.e., end of third month after account opening; (2) Represents the average of branch, contact center, and digital NPS change 43
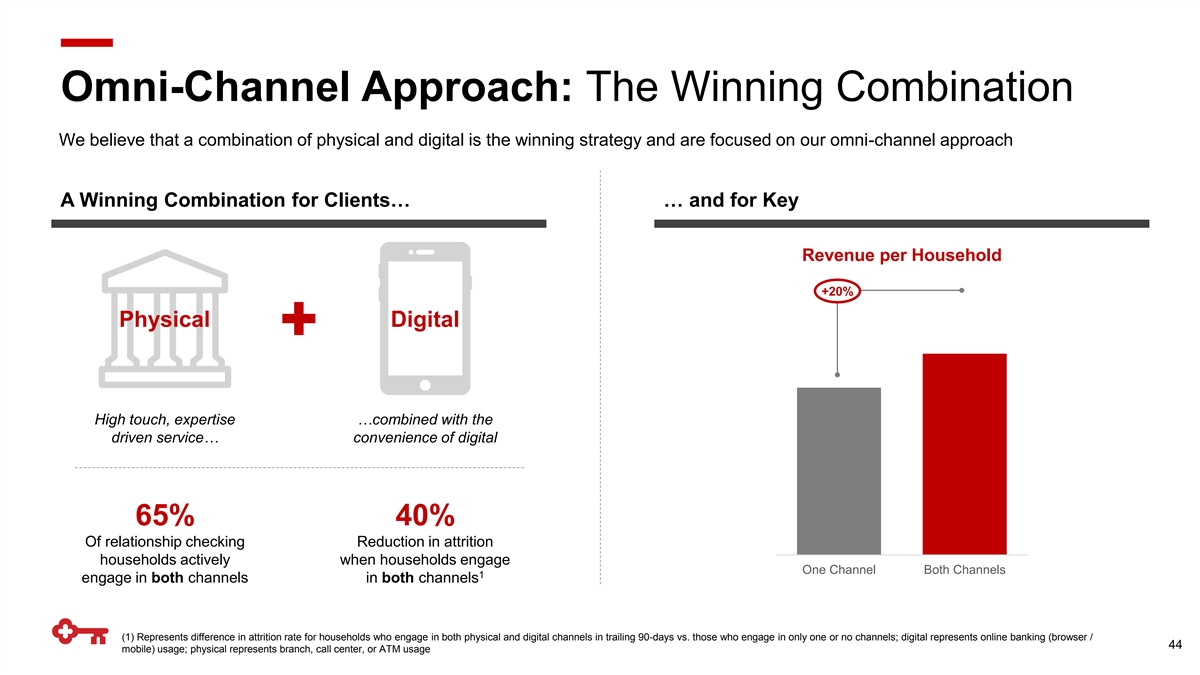
Omni-Channel Approach: The Winning Combination We believe that a combination of physical and digital is the winning strategy and are focused on our omni-channel approach A Winning Combination for Clients… … and for Key Revenue per Household +20% Physical Digital High touch, expertise …combined with the driven service… convenience of digital 65% 40% Of relationship checking Reduction in attrition households actively when households engage One Channel Both Channels 1 engage in both channels in both channels (1) Represents difference in attrition rate for households who engage in both physical and digital channels in trailing 90-days vs. those who engage in only one or no channels; digital represents online banking (browser / 44 mobile) usage; physical represents branch, call center, or ATM usage
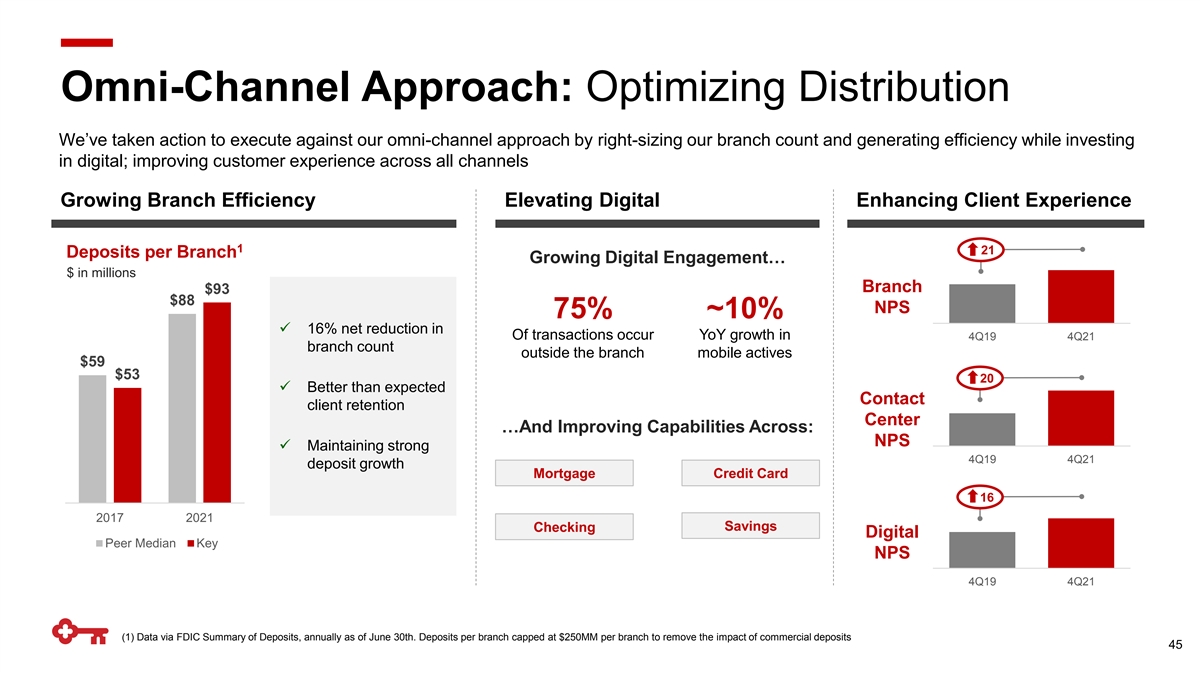
Omni-Channel Approach: Optimizing Distribution We’ve taken action to execute against our omni-channel approach by right-sizing our branch count and generating efficiency while investing in digital; improving customer experience across all channels Growing Branch Efficiency Elevating Digital Enhancing Client Experience 1 21 Deposits per Branch Growing Digital Engagement… $ in millions Branch $93 $88 NPS 75% ~10% ✓ 16% net reduction in Of transactions occur YoY growth in 4Q19 4Q21 branch count outside the branch mobile actives $59 $53 20 ✓ Better than expected Contact client retention Center …And Improving Capabilities Across: NPS ✓ Maintaining strong 4Q19 4Q21 deposit growth Mortgage Credit Card 16 2017 2021 Savings Checking Digital Peer Median Key NPS 4Q19 4Q21 (1) Data via FDIC Summary of Deposits, annually as of June 30th. Deposits per branch capped at $250MM per branch to remove the impact of commercial deposits 45
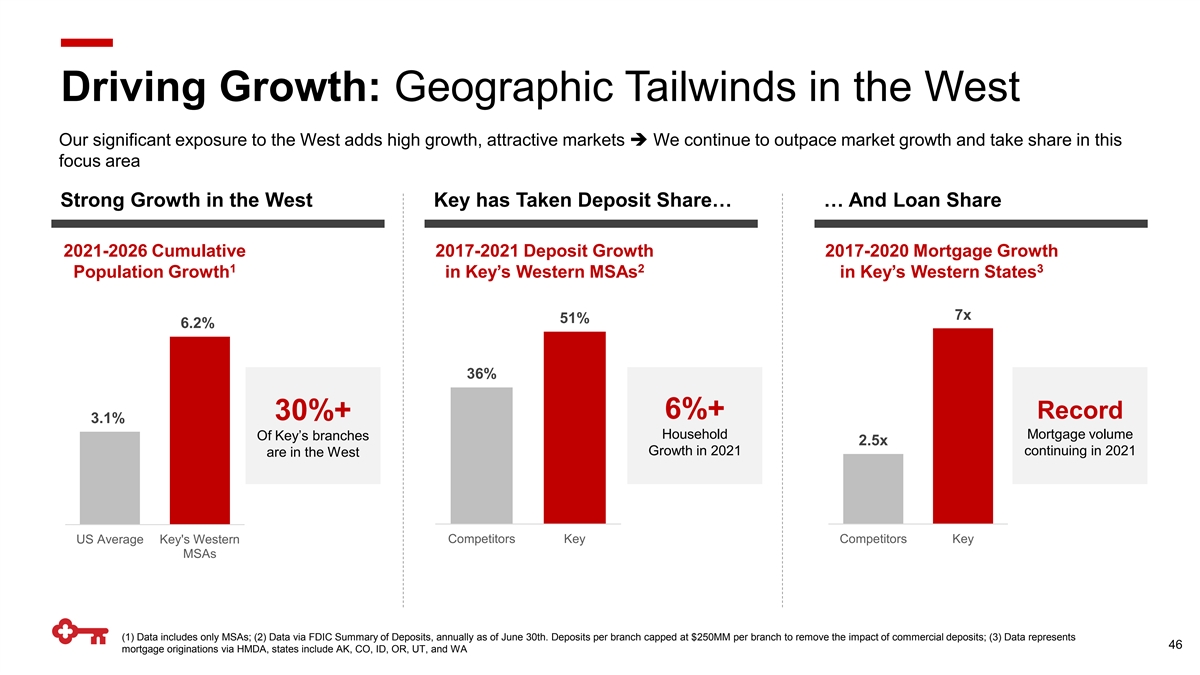
Driving Growth: Geographic Tailwinds in the West Our significant exposure to the West adds high growth, attractive markets ➔ We continue to outpace market growth and take share in this focus area Strong Growth in the West Key has Taken Deposit Share… … And Loan Share 2021-2026 Cumulative 2017-2021 Deposit Growth 2017-2020 Mortgage Growth 1 2 3 Population Growth in Key’s Western MSAs in Key’s Western States 7x 51% 6.2% 36% 6%+ Record 30%+ 3.1% Household Mortgage volume Of Key’s branches 2.5x Growth in 2021 continuing in 2021 are in the West US Average Key's Western Competitors Key Competitors Key MSAs (1) Data includes only MSAs; (2) Data via FDIC Summary of Deposits, annually as of June 30th. Deposits per branch capped at $250MM per branch to remove the impact of commercial deposits; (3) Data represents 46 mortgage originations via HMDA, states include AK, CO, ID, OR, UT, and WA
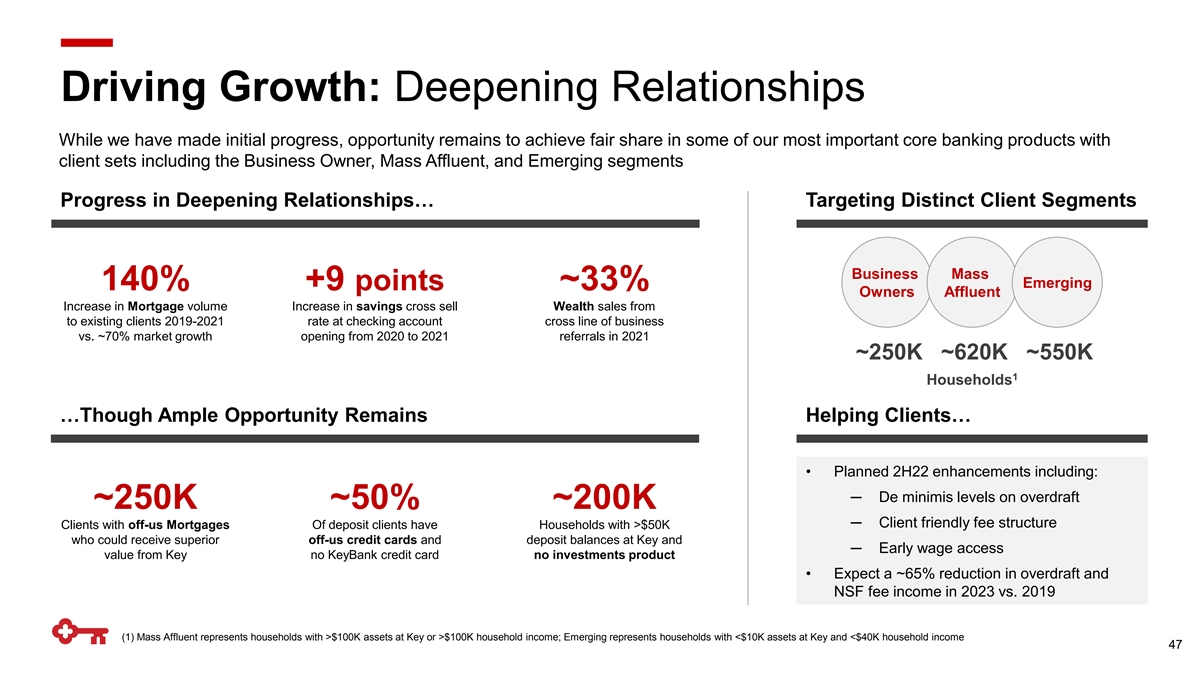
Driving Growth: Deepening Relationships While we have made initial progress, opportunity remains to achieve fair share in some of our most important core banking products with client sets including the Business Owner, Mass Affluent, and Emerging segments Progress in Deepening Relationships… Targeting Distinct Client Segments Business Mass Emerging 140% +9 points ~33% Owners Affluent Increase in Mortgage volume Increase in savings cross sell Wealth sales from to existing clients 2019-2021 rate at checking account cross line of business vs. ~70% market growth opening from 2020 to 2021 referrals in 2021 ~250K ~620K ~550K 1 Households …Though Ample Opportunity Remains Helping Clients… • Planned 2H22 enhancements including: ─ De minimis levels on overdraft ~250K ~50% ~200K ─ Client friendly fee structure Clients with off-us Mortgages Of deposit clients have Households with >$50K who could receive superior off-us credit cards and deposit balances at Key and ─ Early wage access value from Key no KeyBank credit card no investments product • Expect a ~65% reduction in overdraft and NSF fee income in 2023 vs. 2019 (1) Mass Affluent represents households with >$100K assets at Key or >$100K household income; Emerging represents households with <$10K assets at Key and <$40K household income 47
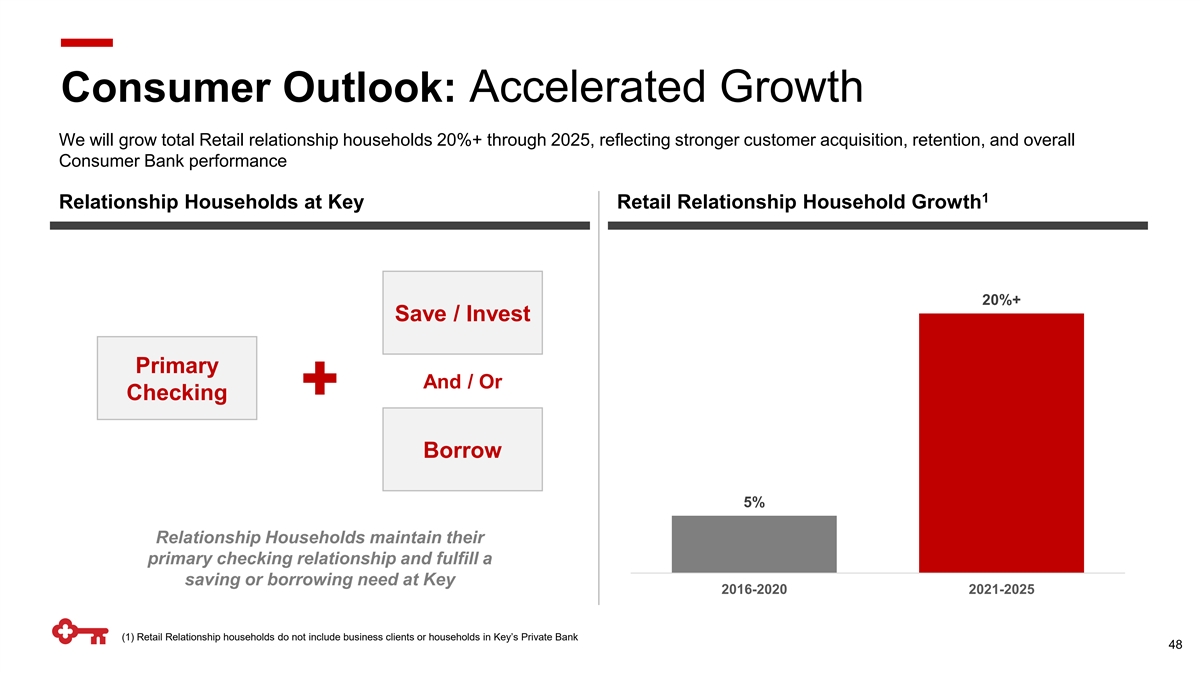
Consumer Outlook: Accelerated Growth We will grow total Retail relationship households 20%+ through 2025, reflecting stronger customer acquisition, retention, and overall Consumer Bank performance 1 Relationship Households at Key Retail Relationship Household Growth 20%+ Save / Invest Primary And / Or Checking Borrow 5% Relationship Households maintain their primary checking relationship and fulfill a saving or borrowing need at Key 2016-2020 2021-2025 (1) Retail Relationship households do not include business clients or households in Key’s Private Bank 48

Takeaways Poised for Growth Intensely focused on growing relationships that provide steady, high value revenue streams through checking, 1 payments, and wealth 2 Building momentum in execution and business performance A combination of physical and digital is the winning strategy and we have made solid progress in our omni- 3 channel approach 4 Capitalizing on geographic tailwinds by concentrating new investment in high growth markets Our existing client base is a source of strength ➔ meaningful opportunity to deepen relationships across the 5 breadth of our franchise 49

Targeted Scale Execution in Healthcare: Laurel Road, National Digital Bank Jamie Warder Alyssa Schaefer Head of Digital Head of Laurel Road
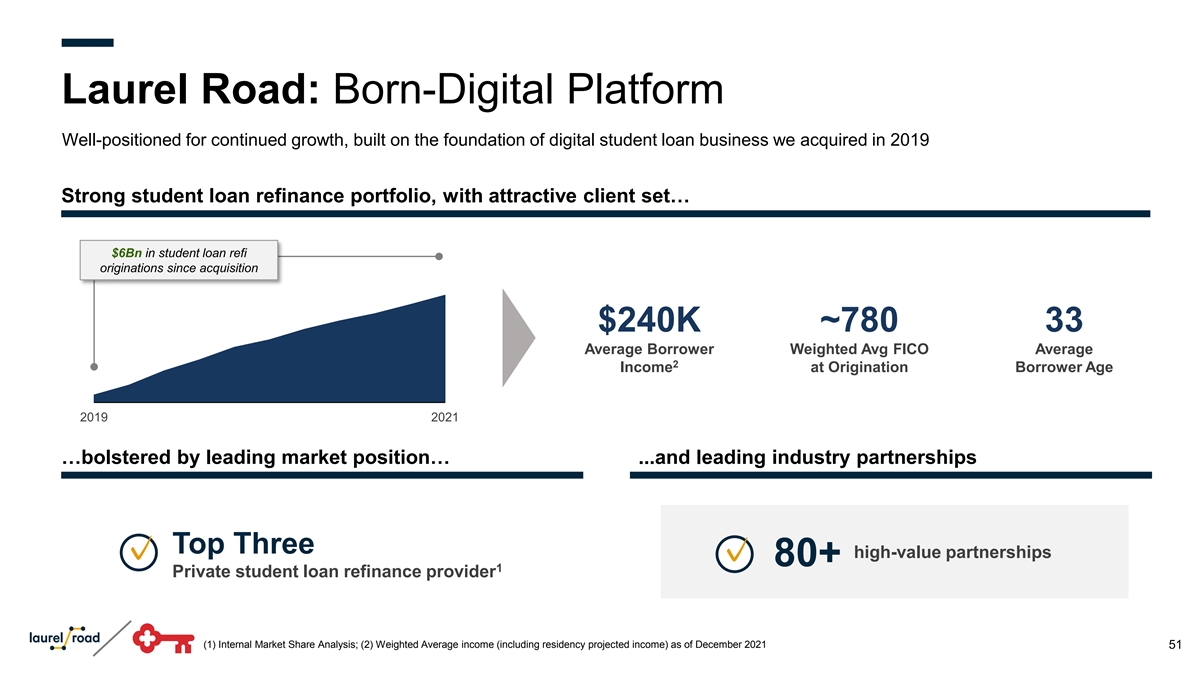
Laurel Road: Born-Digital Platform Well-positioned for continued growth, built on the foundation of digital student loan business we acquired in 2019 Strong student loan refinance portfolio, with attractive client set… $6Bn in student loan refi originations since acquisition $240K ~780 33 Average Borrower Weighted Avg FICO Average 2 Income at Origination Borrower Age 2019 2021 …bolstered by leading market position… ...and leading industry partnerships Top Three high-value partnerships ✓ ✓ 80+ 1 Private student loan refinance provider (1) Internal Market Share Analysis; (2) Weighted Average income (including residency projected income) as of December 2021 51
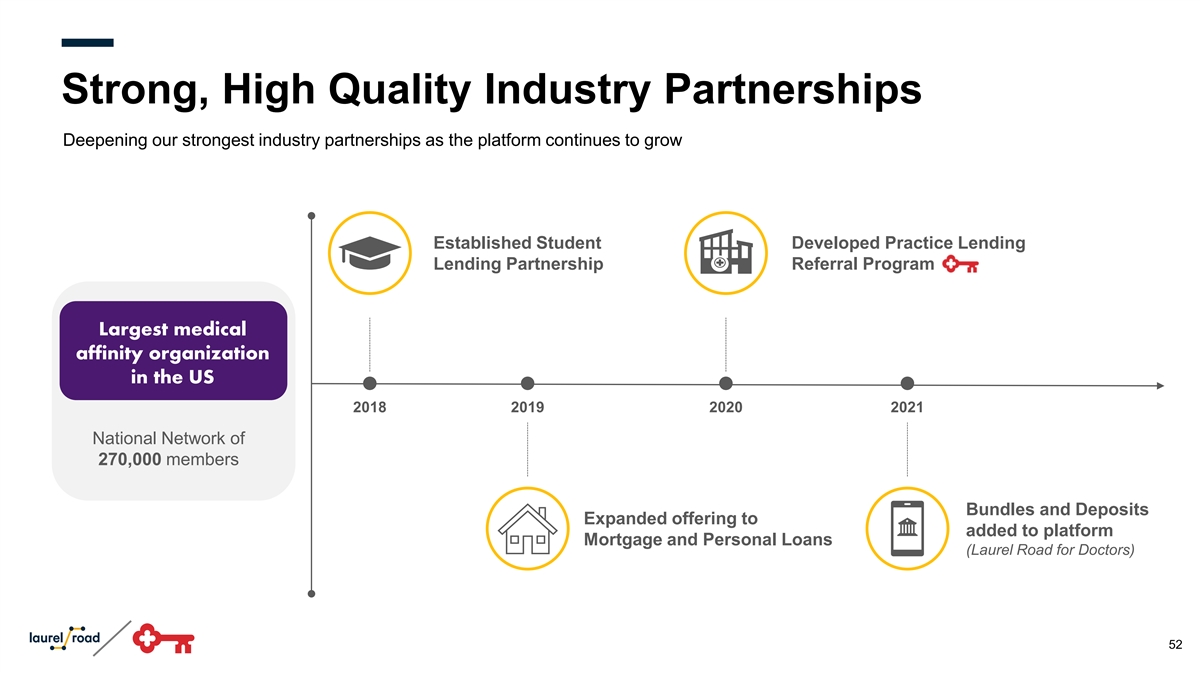
Strong, High Quality Industry Partnerships Deepening our strongest industry partnerships as the platform continues to grow Established Student Developed Practice Lending Lending Partnership Referral Program Largest medical affinity organization in the US 2018 2019 2020 2021 National Network of 270,000 members Bundles and Deposits Expanded offering to added to platform Mortgage and Personal Loans (Laurel Road for Doctors) 52

Laurel Road Evolution: National Digital Bank Launch of Laurel Road for Doctors represents a differentiated, affinity approach to targeted scale nationally Building strong, valuable, digitally-led relationships Full suite of digital banking products Since launching Laurel Road for Doctors: tailored to target segments Student Loan Refinance • Mortgage • Personal Loan • Deposit Bundle • Checking • Physician Credit Card 70+ ~35% Member Net Multi-Product Promotor Score Relationships Personalized financial insights and perks program 1 Doctor & Dentist Member Lifetime Value Doctor Dashboard • Healthcare Partner Perks & Rewards 4x Full service premium care team to accompany digital servicing Extended Hours • End to End Servicing • Human Touch Comparable Non-Healthcare Average Doctor / Dentist Client Member (1) Source: Internal Analysis 53

Targeted Growth through National Platform Continuing to gain traction nationally with targeted approach, focused on markets with high healthcare density Focused National Footprint….with a Brand that is Resonating Focus Media Regions Focus Regions 1 with OOH Advertising Key Consumer Footprint Laurel Road reaches 1 of every 3 Web Sessions up 200% since the launch Rated top “Bank for Doctors” 2 2 of Laurel Road for Doctors vs competitors doctors in the US every month (1) Out of Home Advertising includes billboards, bus shelters, projections; (2) Russell Research 54
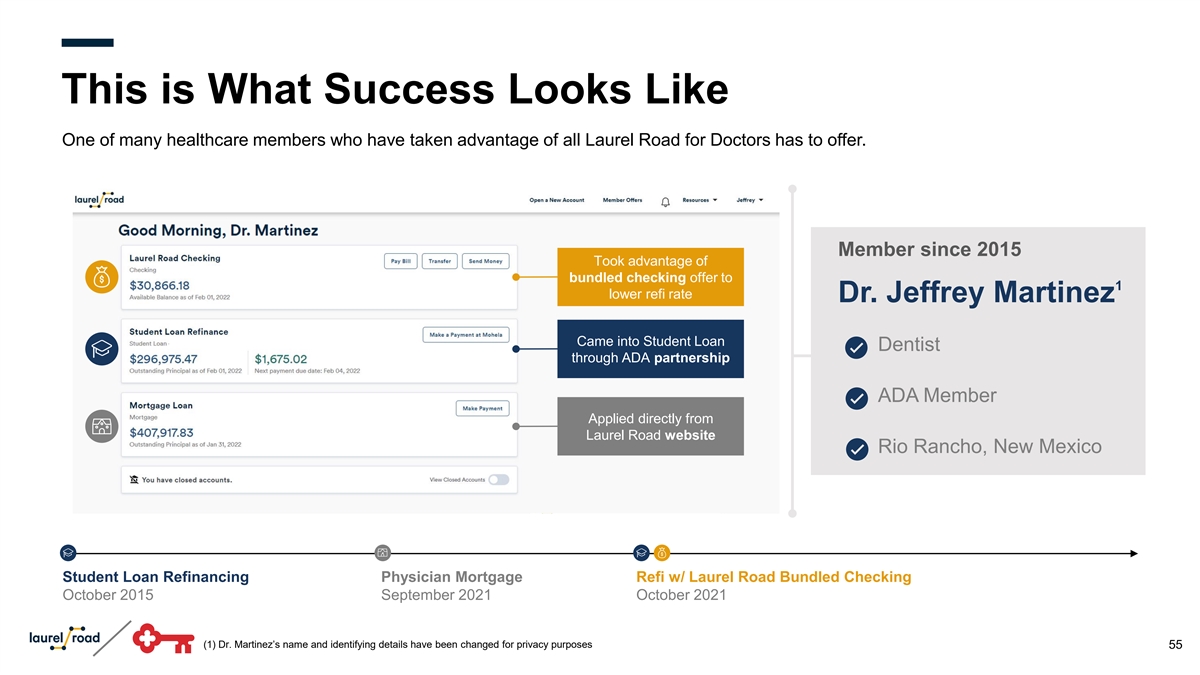
This is What Success Looks Like One of many healthcare members who have taken advantage of all Laurel Road for Doctors has to offer. Member since 2015 Took advantage of bundled checking offer to 1 lower refi rate Dr. Jeffrey Martinez Came into Student Loan Dentist through ADA partnership ADA Member Applied directly from Laurel Road website Rio Rancho, New Mexico Student Loan Refinancing Physician Mortgage Refi w/ Laurel Road Bundled Checking October 2015 September 2021 October 2021 (1) Dr. Martinez’s name and identifying details have been changed for privacy purposes 55

What our Members are Saying The fact that Laurel Road has specific A lot of banks are just like, ‘Hey ... pay us programs for doctors makes me feel your money, and that’s it.’ And to me, it heard and supported in a way that no should be more than that ... Laurel Road other bank has, including another bank puts out products and services “ that technically was offering a program for “ specifically for physicians and doctors where I felt like that was a label, dentists” but they didn’t follow through in any way” 56

Powerful Growth Vector for Franchise Leveraging strong foundation and expertise to continue focused consumer healthcare expansion Targeted segment expansion… …to drive sustainable growth U.S. Healthcare Landscape Laurel Road Member Households 250K 5x Expanded Offering Launching: 1H22 1 4MM Nurses Current Target Segment 1 1MM Doctors & Dentists 48K 1 2021 2025 Healthcare workforce expected to grow 16% by 2030 (1) U.S. Bureau of Labor Statistics – May 2020 57
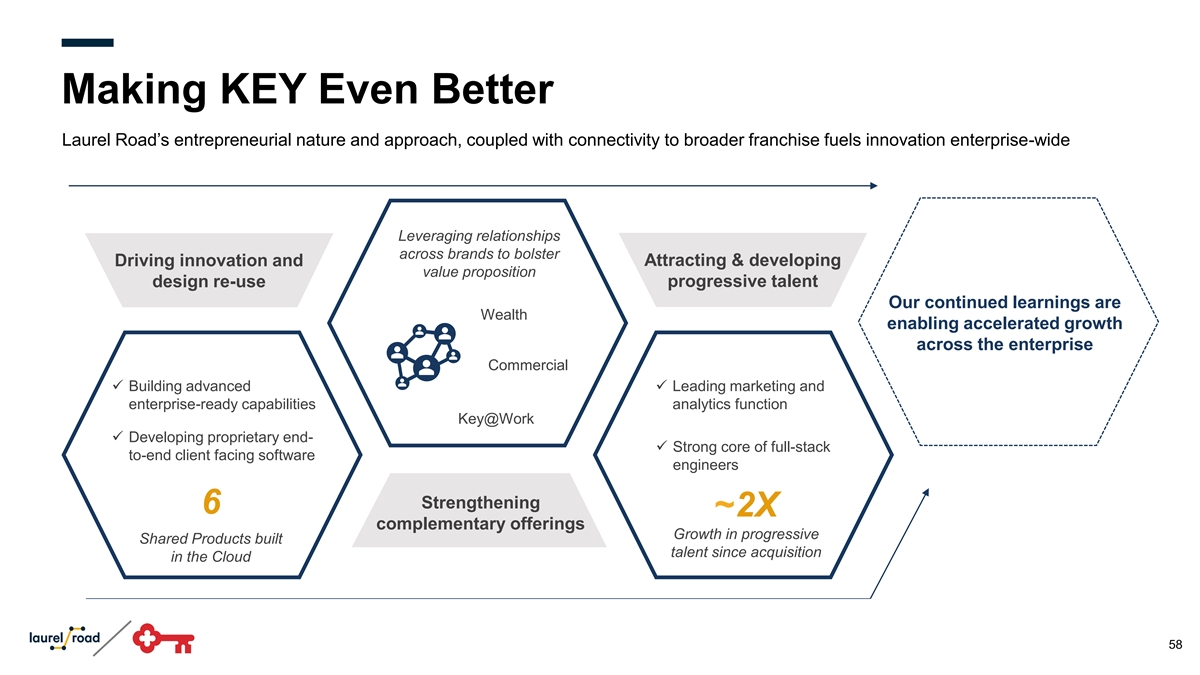
Making KEY Even Better Laurel Road’s entrepreneurial nature and approach, coupled with connectivity to broader franchise fuels innovation enterprise-wide Leveraging relationships across brands to bolster Driving innovation and Attracting & developing value proposition design re-use progressive talent Our continued learnings are Wealth enabling accelerated growth across the enterprise Commercial ✓ Building advanced ✓ Leading marketing and enterprise-ready capabilities analytics function Key@Work ✓ Developing proprietary end- ✓ Strong core of full-stack to-end client facing software engineers Strengthening 6 ~2X complementary offerings Growth in progressive Shared Products built talent since acquisition in the Cloud 58

Competing to Win: Carving a New Niche Laurel Road combines traditional and progressive capabilities, to compete in a truly differentiated manner top consumer lending full-service branch based traditional bank Capabilities traditional bank direct offering FinTech digital bank Full-Service Bank with full suite of lending and deposit products ✓✓✓ Personalized products and perks for affinity segment (e.g., Physician credit card) ✓ Custom career and financial data, advice & insights (e.g., Doctor Dashboard) ✓ Startup-like structure & speed ✓✓ ✓ Digital-first approach with national reach ✓✓✓✓ 59

Takeaways Poised for Growth Continued strength in core student lending business provides strong foundation for growth 1 2 Launch of Laurel Road for Doctors represents a differentiated, affinity approach to targeted scale nationally Continued expansion of Laurel Road represents a meaningful ongoing growth opportunity for KEY, leveraging 3 specific expertise, products, and affinity partnerships Entrepreneurial nature and innovation-centered approach at Laurel Road cultivates progressive growth and 4 epitomizes Key’s ability to integrate fintechs while enabling them to thrive 60

Questions

Entrepreneurial Partnerships Clark Khayat Arjun Sirrah Chief Strategy Officer Head of Engineering, Laurel Road
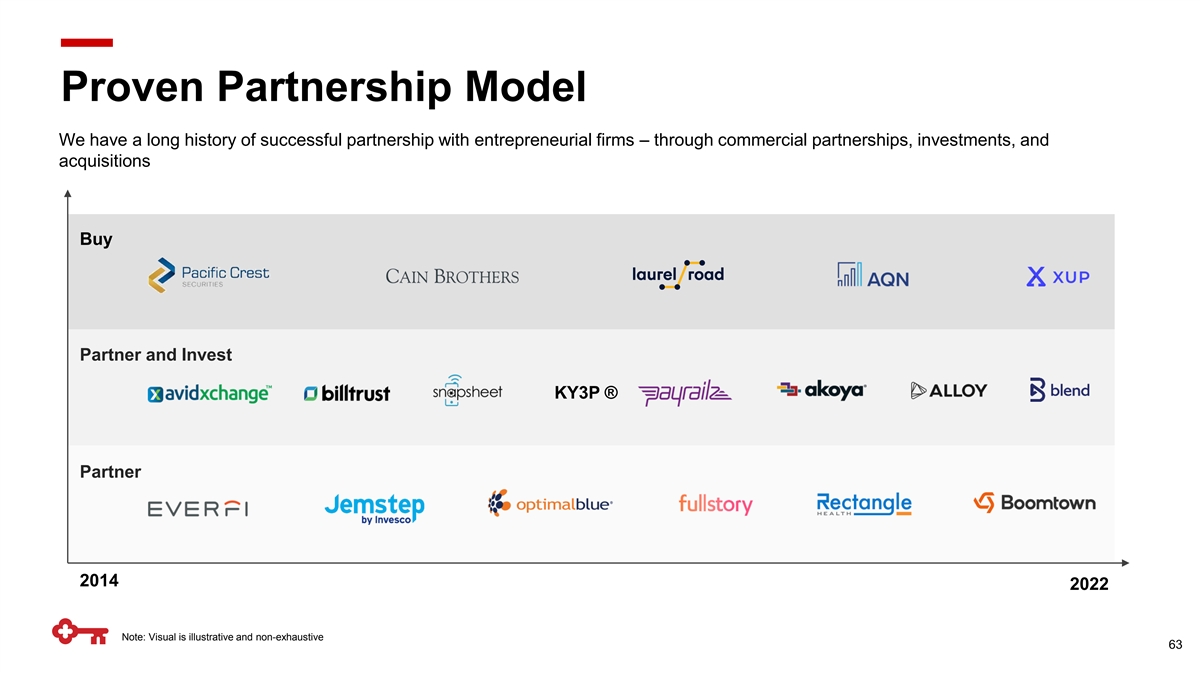
Proven Partnership Model We have a long history of successful partnership with entrepreneurial firms – through commercial partnerships, investments, and acquisitions Buy Partner and Invest KY3P ® Partner 2014 2022 Note: Visual is illustrative and non-exhaustive 63

Proven Partnership Process Deep integration with a broad ecosystem generates a significant pipeline of opportunities for rigorous evaluation Sources of Opportunities Evaluation Criteria Targeted Client Segment Venture Capital Funds Overlapping Focus Historical Co-investors Large Addressable Market Investment Banks ~200+ Capacity Annual Partnership Consultants Opportunities Cultural Fit Entrepreneurs Existing Partners 64
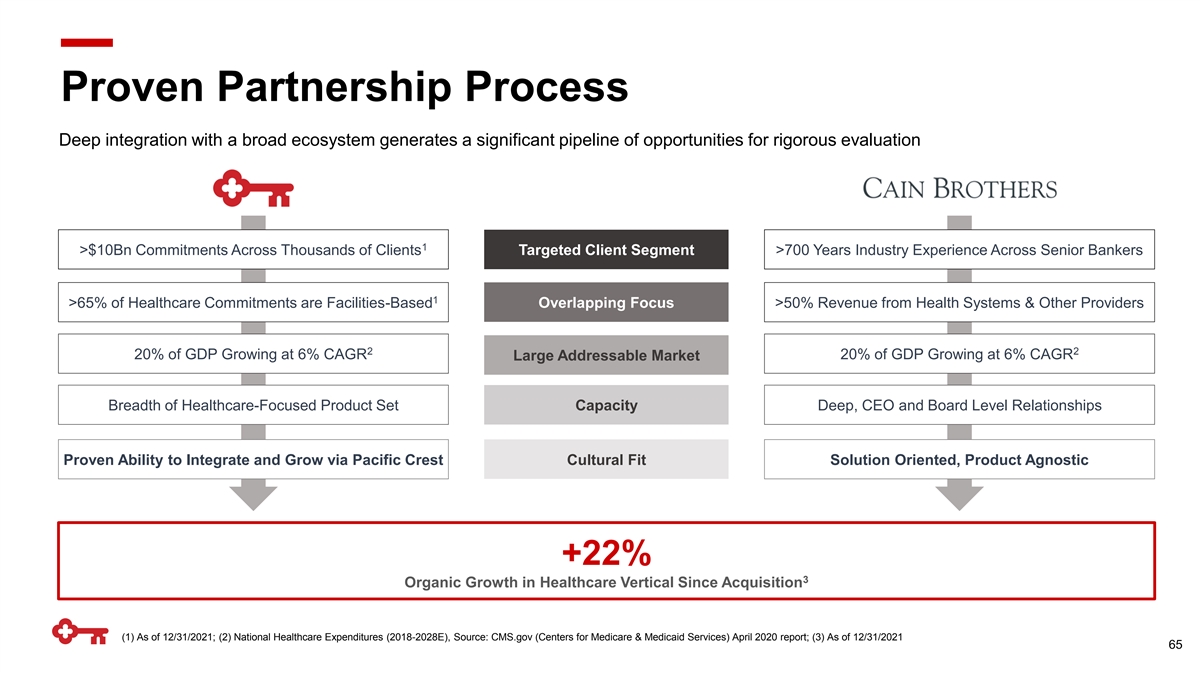
Proven Partnership Process Deep integration with a broad ecosystem generates a significant pipeline of opportunities for rigorous evaluation 1 >$10Bn Commitments Across Thousands of Clients Targeted Client Segment >700 Years Industry Experience Across Senior Bankers 1 >65% of Healthcare Commitments are Facilities-Based Overlapping Focus >50% Revenue from Health Systems & Other Providers 2 2 20% of GDP Growing at 6% CAGR 20% of GDP Growing at 6% CAGR Large Addressable Market Breadth of Healthcare-Focused Product Set Capacity Deep, CEO and Board Level Relationships Proven Ability to Integrate and Grow via Pacific Crest Cultural Fit Solution Oriented, Product Agnostic +22% 3 Organic Growth in Healthcare Vertical Since Acquisition (1) As of 12/31/2021; (2) National Healthcare Expenditures (2018-2028E), Source: CMS.gov (Centers for Medicare & Medicaid Services) April 2020 report; (3) As of 12/31/2021 65
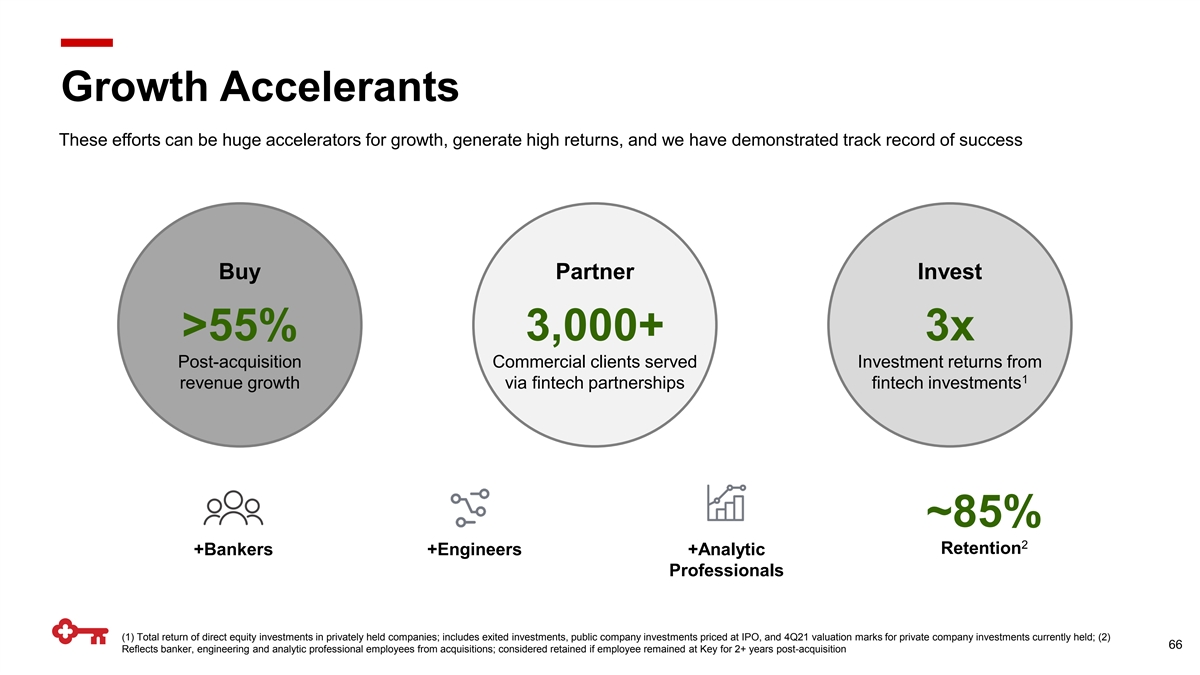
Growth Accelerants These efforts can be huge accelerators for growth, generate high returns, and we have demonstrated track record of success Buy Partner Invest >55% 3,000+ 3x Post-acquisition Commercial clients served Investment returns from 1 revenue growth via fintech partnerships fintech investments ~85% 2 Retention +Bankers +Engineers +Analytic Professionals (1) Total return of direct equity investments in privately held companies; includes exited investments, public company investments priced at IPO, and 4Q21 valuation marks for private company investments currently held; (2) 66 Reflects banker, engineering and analytic professional employees from acquisitions; considered retained if employee remained at Key for 2+ years post-acquisition

Attracting Entrepreneurial Talent We have intentionally built our platform to empower entrepreneurial leaders to scale quickly by leveraging our infrastructure and agility Solve a problem by leveraging dynamic and in an organization that values at scale… leading-edge infrastructure… talent and innovation ~10,000 5.5 years ~80% Clients served Avg time for competitors to launch Talent retention of Laurel Road teammates 1,2 pre-acquisition digital banking since acquisition ~3,000,000 0.5 years ~45% Clients served Time for Laurel Road to launch Growth of Laurel Road team since 3 post-acquisition National Digital Bank acquisition (1) Retention of Analytics, Engineering, and Business Development (excludes operations, contact center, etc.); (2) Considered retained if employee remained at Key for 2+ years post-acquisition; (3) Net of attrition in two 67 years since acquisition
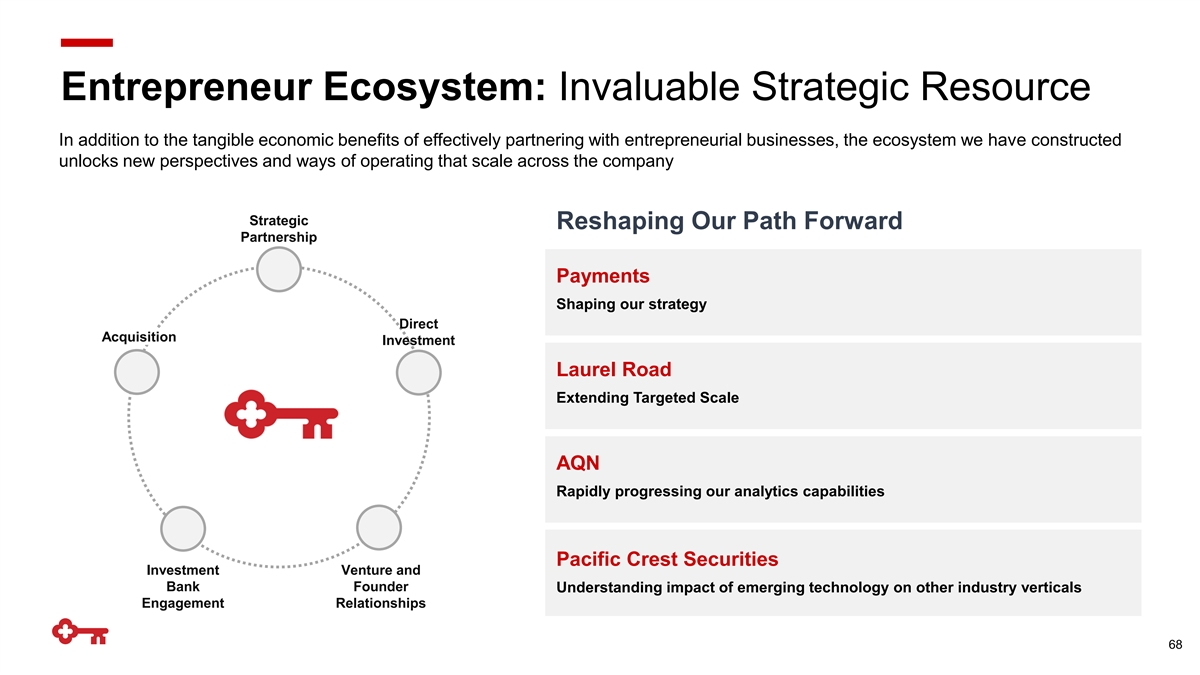
Entrepreneur Ecosystem: Invaluable Strategic Resource In addition to the tangible economic benefits of effectively partnering with entrepreneurial businesses, the ecosystem we have constructed unlocks new perspectives and ways of operating that scale across the company Examples of Entrepreneurial Partnership Strategic Reshaping Our Path Forward Partnership Payments Shaping our strategy Direct Acquisition Investment Laurel Road Extending Targeted Scale AQN Rapidly progressing our analytics capabilities Pacific Crest Securities Investment Venture and Bank Founder Understanding impact of emerging technology on other industry verticals Engagement Relationships 68
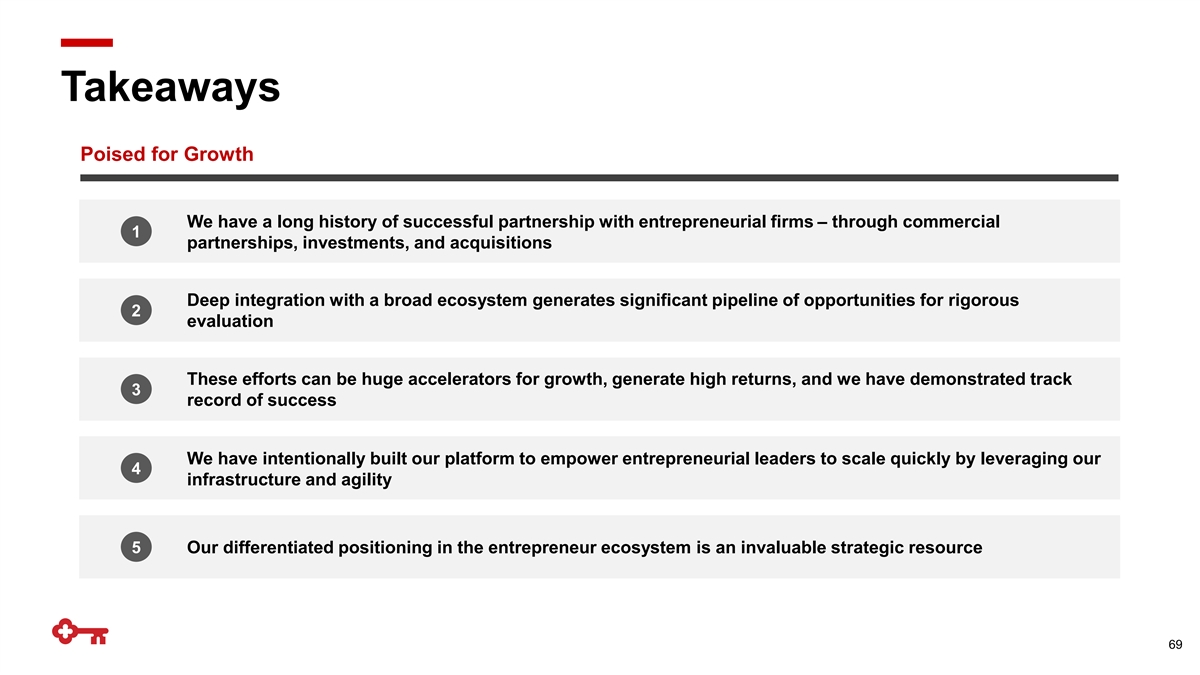
Takeaways Poised for Growth We have a long history of successful partnership with entrepreneurial firms – through commercial 1 partnerships, investments, and acquisitions Deep integration with a broad ecosystem generates significant pipeline of opportunities for rigorous 2 evaluation These efforts can be huge accelerators for growth, generate high returns, and we have demonstrated track 3 record of success We have intentionally built our platform to empower entrepreneurial leaders to scale quickly by leveraging our 4 infrastructure and agility 5 Our differentiated positioning in the entrepreneur ecosystem is an invaluable strategic resource 69

Technology Powering Targeted Scale Amy Brady Chief Information Officer
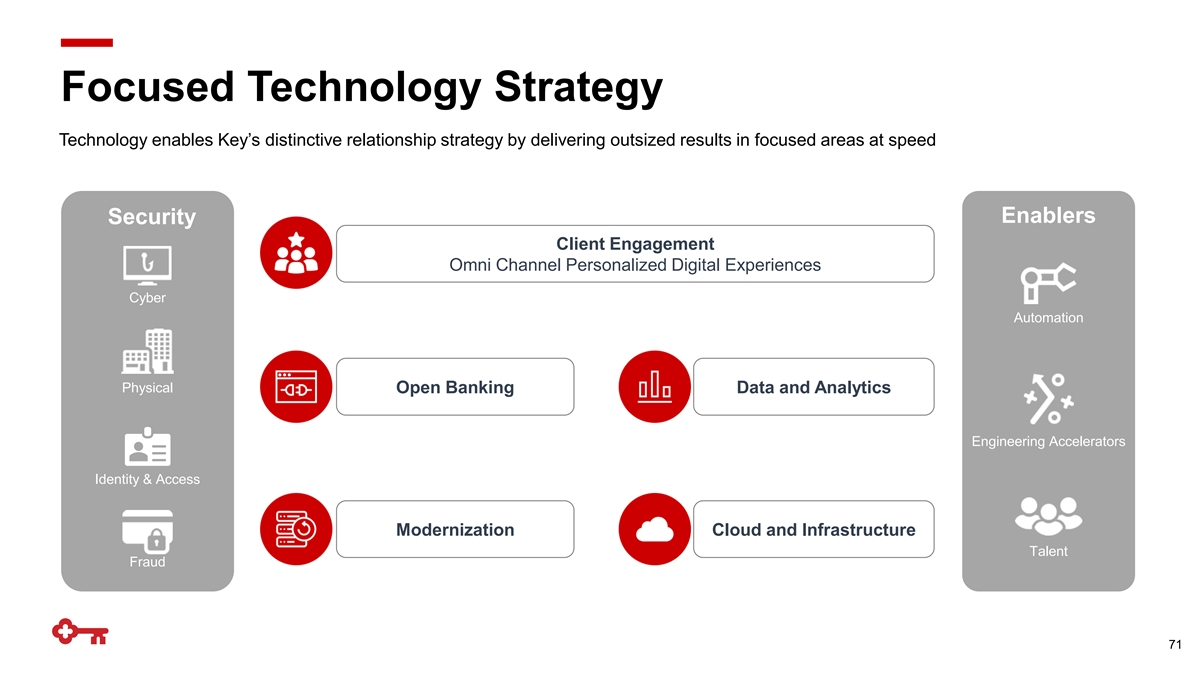
Focused Technology Strategy Technology enables Key’s distinctive relationship strategy by delivering outsized results in focused areas at speed Enablers Security Client Engagement Omni Channel Personalized Digital Experiences Cyber Automation Physical Open Banking Data and Analytics Engineering Accelerators Identity & Access Modernization Cloud and Infrastructure Talent Fraud 71

Supporting Key’s Growth Agenda: 2021 Proof Points Our agile approach combined with modern technology capabilities come together in client-centric and digital first solutions that generate powerful outcomes against targeted opportunities in real-time PPP Loan Originations and Forgiveness Consumer Collections Digital Engagement ~$11Bn 0.5 $2.5MM 6 months months Originated PPP Loan Volume Digital Collections Cost Savings Leveraged automation bots, process management, and core servicing Leveraged open banking APIs and Key’s core servicing platforms platforms Digital Mortgage Origination National Digital Affinity Bank 14,500+ 1,000+ 6 5 New Laurel Road Households months New Digital Originations months Leveraged Key’s core checking, credit card, mobile and servicing Leveraged open banking APIs, underwriting and core servicing platforms, Google Cloud, and open banking APIs platforms 72
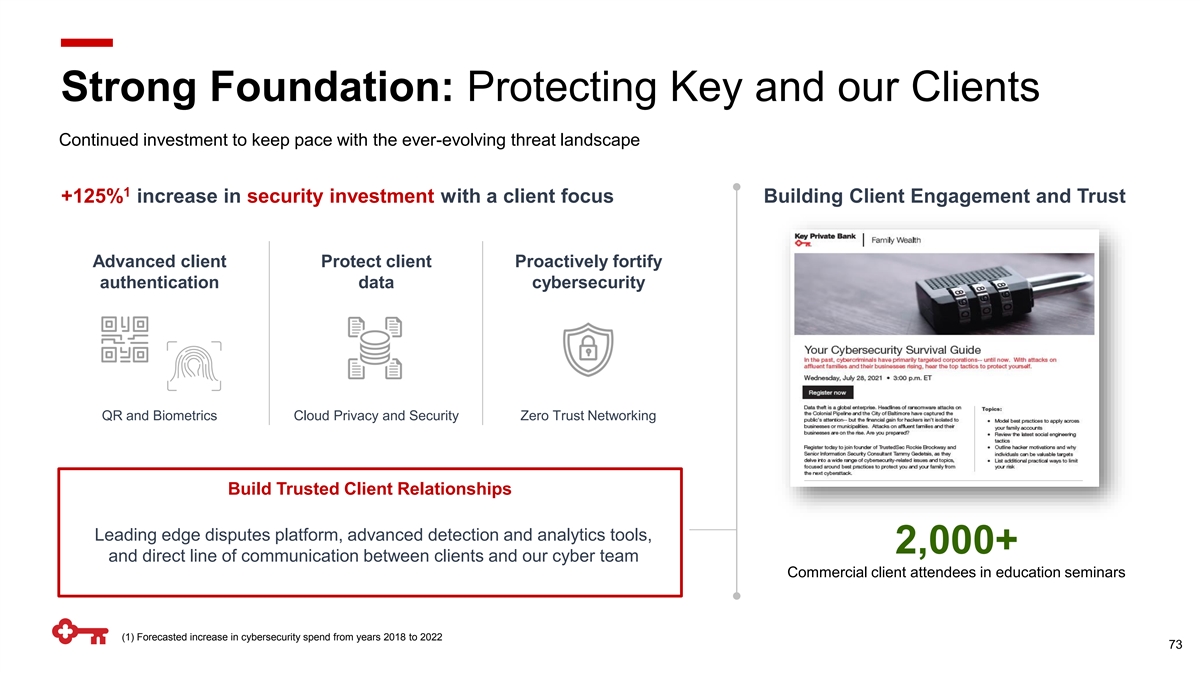
Strong Foundation: Protecting Key and our Clients Continued investment to keep pace with the ever-evolving threat landscape 1 +125% increase in security investment with a client focus Building Client Engagement and Trust Advanced client Protect client Proactively fortify authentication data cybersecurity QR and Biometrics Cloud Privacy and Security Zero Trust Networking Build Trusted Client Relationships Leading edge disputes platform, advanced detection and analytics tools, 2,000+ and direct line of communication between clients and our cyber team Commercial client attendees in education seminars (1) Forecasted increase in cybersecurity spend from years 2018 to 2022 73
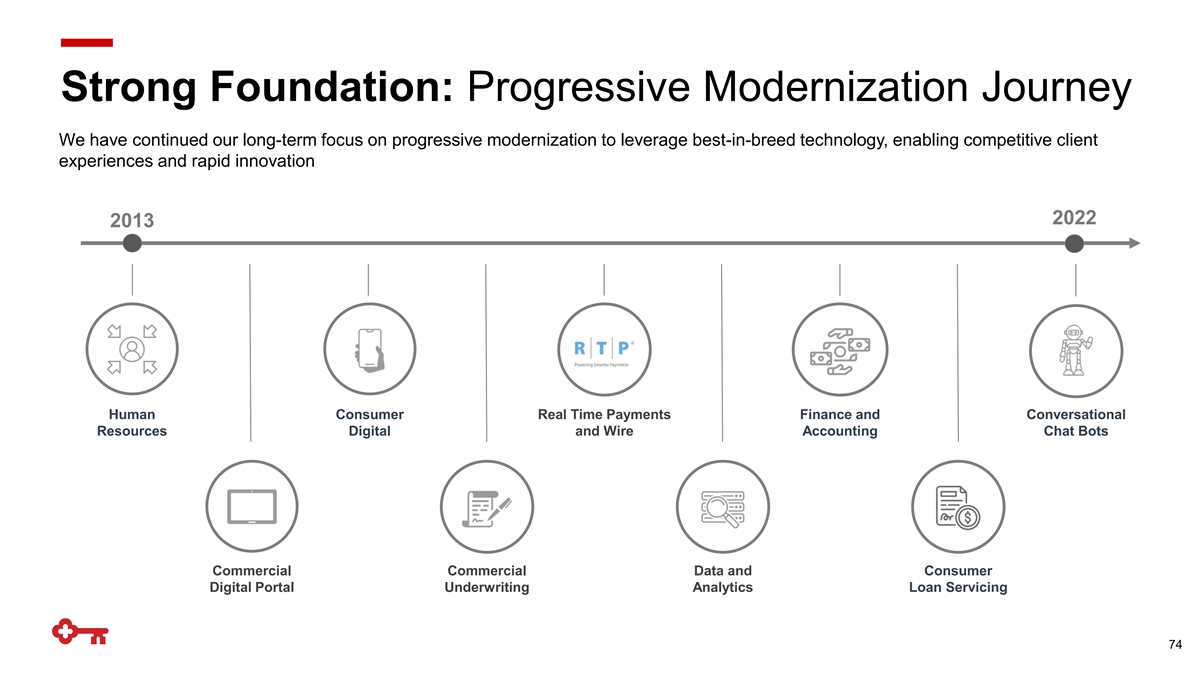
Strong Foundation: Progressive Modernization Journey We have continued our long-term focus on progressive modernization to leverage best-in-breed technology, enabling competitive client experiences and rapid innovation 2022 2013 Human Consumer Real Time Payments Finance and Conversational Resources Digital and Wire Accounting Chat Bots Commercial Commercial Data and Consumer Digital Portal Underwriting Analytics Loan Servicing 74
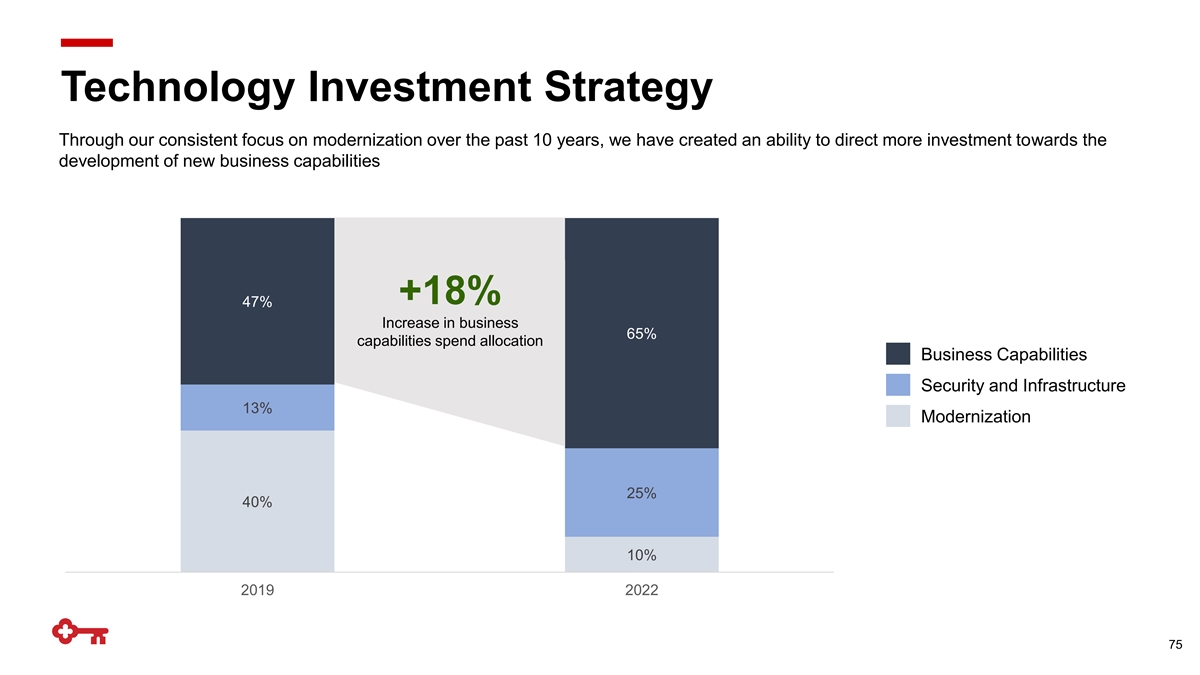
Technology Investment Strategy Through our consistent focus on modernization over the past 10 years, we have created an ability to direct more investment towards the development of new business capabilities +18% 47% Increase in business 65% capabilities spend allocation Business Capabilities Security and Infrastructure 13% Modernization 25% 40% 10% 2019 2022 75

Leveraging Leading-Edge Technologies We have a demonstrated ability to deploy targeted, differentiated capabilities in high-impact areas to accelerate and amplify business strategies Automation Intelligent Marketing Open Bank Engineering Agile Methodologies Automate tasks to generate cost Accelerates time to market and Speeds up internal development via Rapidly improving client / employee savings and optimize client personalization of client re-use and supports embedded experience via more timely experience experiences based on real-time banking and accelerated deployments insights integration strategy $40MM+ 800MM 400+ 7,000+ Cost Savings and Business Client Touchpoints per Month APIs Developed Annual Automated Deployments Re-investments 76

Cloud and Software-as-a-Service Acceleration We continue to take advantage of the benefits of cloud hosting and Software-as-a-Service Acceleration of Cloud Utilization Cloud Acceleration Benefits 100% of distributed applications migrated to cloud or SaaS by 2025 100% Innovative Digital Client Experiences 80% Software Delivery Speed and Agility 50% 40% Advanced Analytics and Modeling 2022 2023 2024 2025 Stronger Security and Reduced Fraud Best in Breed Hybrid Cloud Strategy Accelerate Sustainability and Operating Efficiency 77
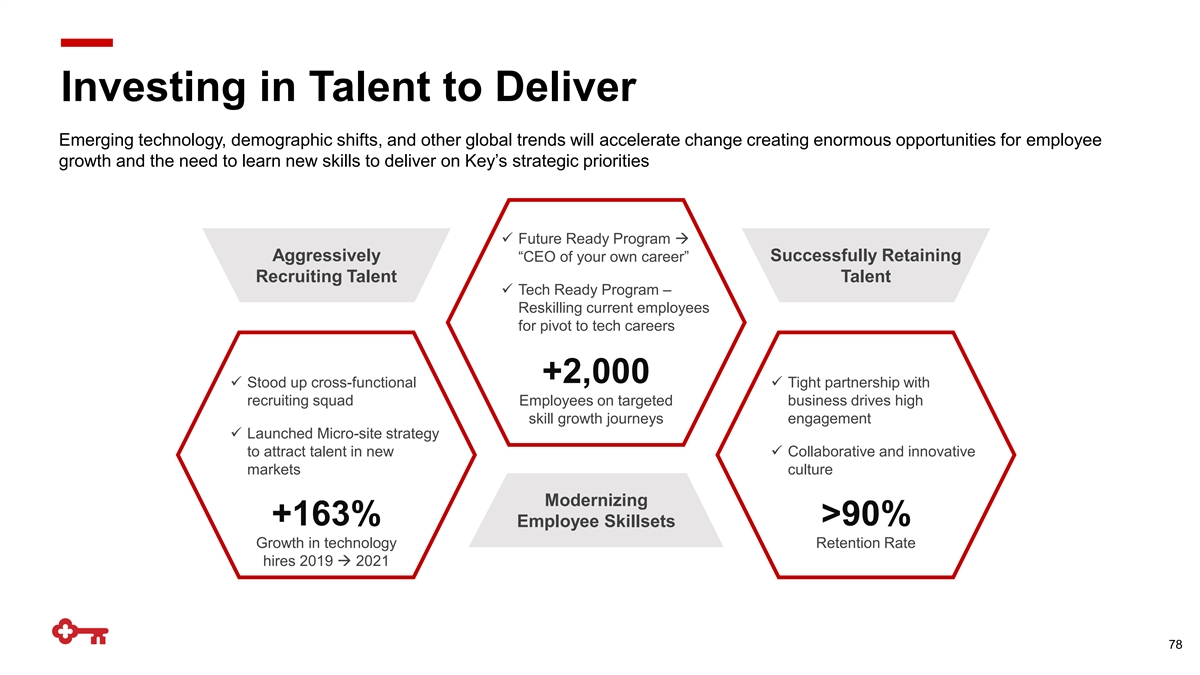
Investing in Talent to Deliver Emerging technology, demographic shifts, and other global trends will accelerate change creating enormous opportunities for employee growth and the need to learn new skills to deliver on Key’s strategic priorities ✓ Future Ready Program → Aggressively Successfully Retaining “CEO of your own career” Recruiting Talent Talent ✓ Tech Ready Program – Reskilling current employees for pivot to tech careers +2,000 ✓ Stood up cross-functional ✓ Tight partnership with recruiting squad Employees on targeted business drives high skill growth journeys engagement ✓ Launched Micro-site strategy to attract talent in new ✓ Collaborative and innovative markets culture Modernizing +163% >90% Employee Skillsets Growth in technology Retention Rate hires 2019 → 2021 78

Takeaways Positioned for Growth & Agility Focused execution of our technology strategy remains critical to enabling Key’s distinctive relationship 1 strategy and driving competitive positioning We have been progressively modernizing our platforms to provide agility and new capabilities to drive the 2 business strategy We continue to invest in our cyber and fraud technology platforms leveraging new technology that will help 3 protect our clients and Key We are accelerating our current cloud strategy that will allow us to continue to grow and innovate leveraging 4 new capabilities and security that the cloud provides We are aggressively investing in our talent strategy to attract and retain a highly skilled, diverse, and balanced 5 workforce 79
Delivering on Our Commitments Don Kimble Vice Chairman and Chief Financial Officer

Record 2021 Performance Building off a record year of financial results Delivered Positive Operating Leverage Committed to delivering positive operating leverage again in 2022 Record Revenue and PPNR Delivered record revenue, PPNR, and fee income with strength across businesses Investments Continue to Accelerate Growth Investing in teammates, digital, and analytics Strong Credit Quality Historic low net charge-offs to average loans reflect moderate risk profile and successful de-risking Delivered on Capital Priorities Returned 75% of net income to shareholders in the form of share repurchases and dividends in 2021 81
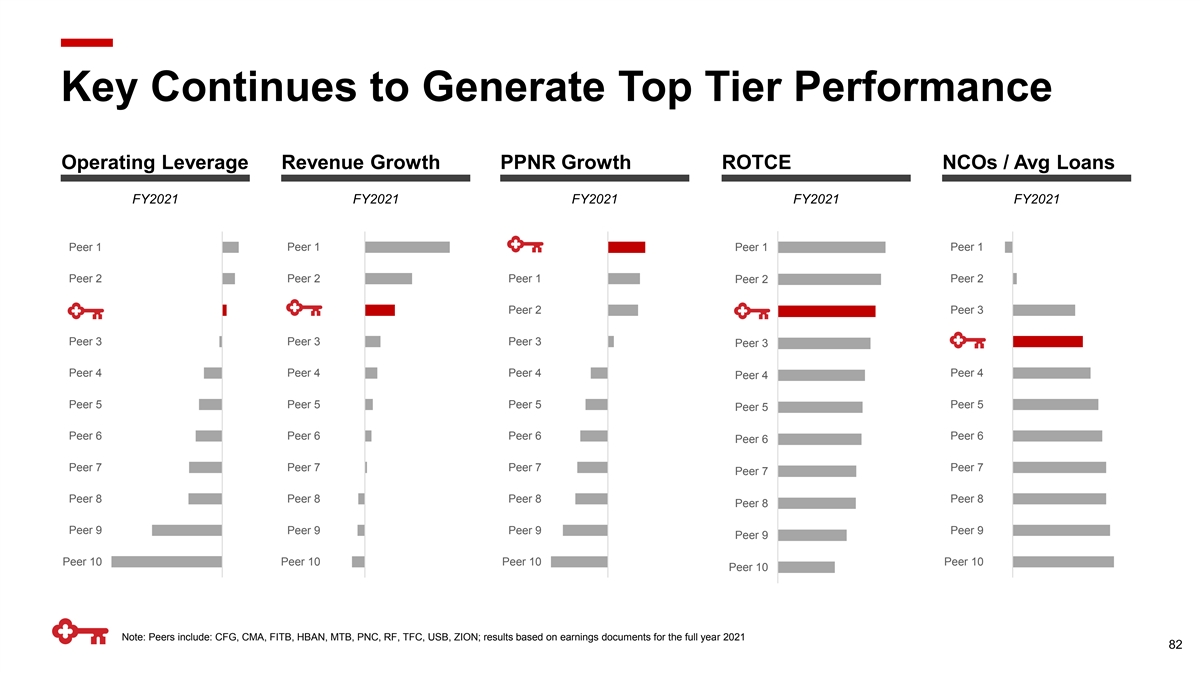
Key Continues to Generate Top Tier Performance Operating Leverage Revenue Growth PPNR Growth ROTCE NCOs / Avg Loans FY2021 FY2021 FY2021 FY2021 FY2021 Peer 1 Peer 1 Peer 1 Peer 1 Peer 2 Peer 2 Peer 1 Peer 2 Peer 2 Peer 2 Peer 3 Peer 3 Peer 3 Peer 3 Peer 3 Peer 4 Peer 4 Peer 4 Peer 4 Peer 4 Peer 5 Peer 5 Peer 5 Peer 5 Peer 5 Peer 6 Peer 6 Peer 6 Peer 6 Peer 6 Peer 7 Peer 7 Peer 7 Peer 7 Peer 7 Peer 8 Peer 8 Peer 8 Peer 8 Peer 8 Peer 9 Peer 9 Peer 9 Peer 9 Peer 9 Peer 10 Peer 10 Peer 10 Peer 10 Peer 10 Note: Peers include: CFG, CMA, FITB, HBAN, MTB, PNC, RF, TFC, USB, ZION; results based on earnings documents for the full year 2021 82
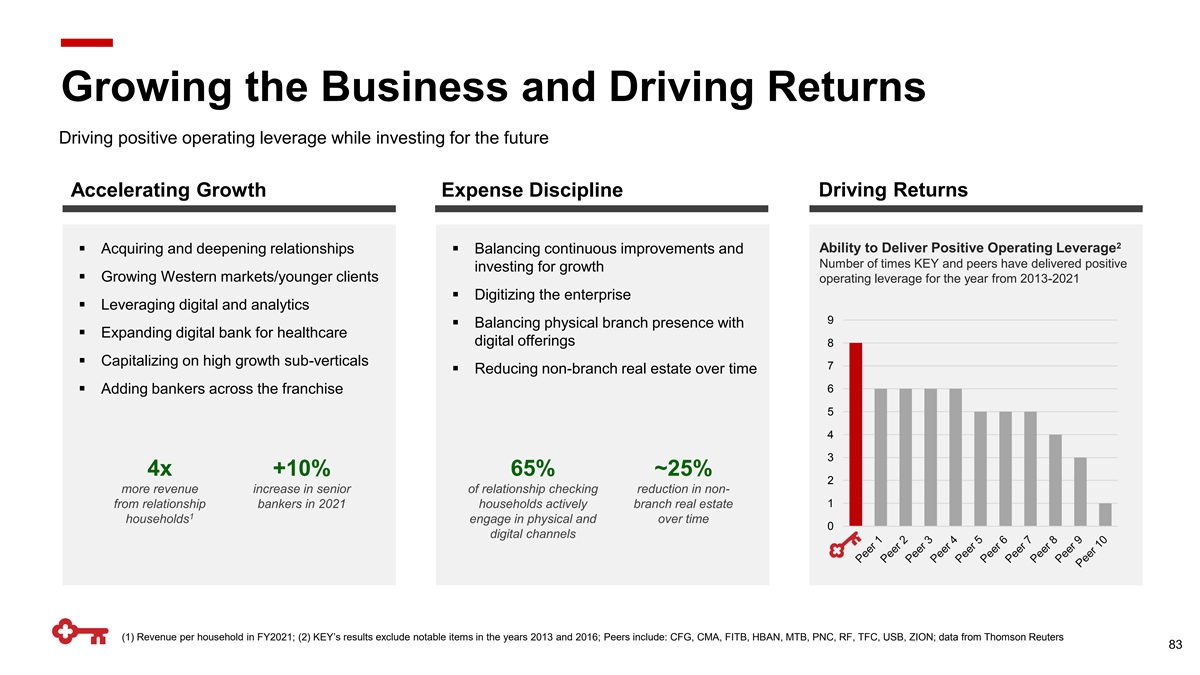
Growing the Business and Driving Returns Driving positive operating leverage while investing for the future Driving Returns Accelerating Growth Expense Discipline 2 Ability to Deliver Positive Operating Leverage ▪ Acquiring and deepening relationships▪ Balancing continuous improvements and Number of times KEY and peers have delivered positive investing for growth ▪ Growing Western markets/younger clients operating leverage for the year from 2013-2021 ▪ Digitizing the enterprise ▪ Leveraging digital and analytics 9 ▪ Balancing physical branch presence with ▪ Expanding digital bank for healthcare digital offerings 8 ▪ Capitalizing on high growth sub-verticals 7 ▪ Reducing non-branch real estate over time 6 ▪ Adding bankers across the franchise 5 4 3 4x +10% 65% ~25% 2 more revenue increase in senior of relationship checking reduction in non- 1 from relationship bankers in 2021 households actively branch real estate 1 households engage in physical and over time 0 digital channels (1) Revenue per household in FY2021; (2) KEY’s results exclude notable items in the years 2013 and 2016; Peers include: CFG, CMA, FITB, HBAN, MTB, PNC, RF, TFC, USB, ZION; data from Thomson Reuters 83
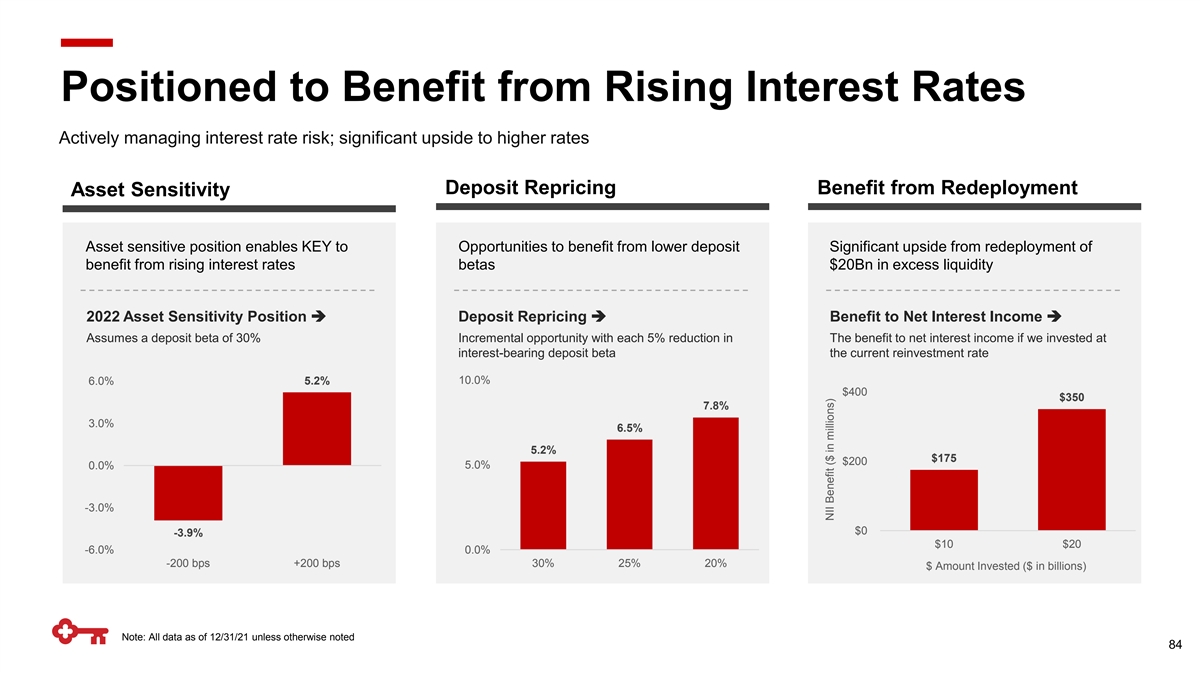
Positioned to Benefit from Rising Interest Rates Actively managing interest rate risk; significant upside to higher rates Deposit Repricing Benefit from Redeployment Asset Sensitivity Asset sensitive position enables KEY to Opportunities to benefit from lower deposit Significant upside from redeployment of benefit from rising interest rates betas $20Bn in excess liquidity 2022 Asset Sensitivity Position ➔ Deposit Repricing ➔ Benefit to Net Interest Income ➔ Assumes a deposit beta of 30% Incremental opportunity with each 5% reduction in The benefit to net interest income if we invested at interest-bearing deposit beta the current reinvestment rate 10.0% 6.0% 5.2% $400 $350 7.8% 3.0% 6.5% 5.2% $175 $200 5.0% 0.0% -3.0% $0 -3.9% $10 $20 -6.0% 0.0% -200 bps +200 bps 30% 25% 20% $ Amount Invested ($ in billions) Note: All data as of 12/31/21 unless otherwise noted 84 NII Benefit ($ in millions)
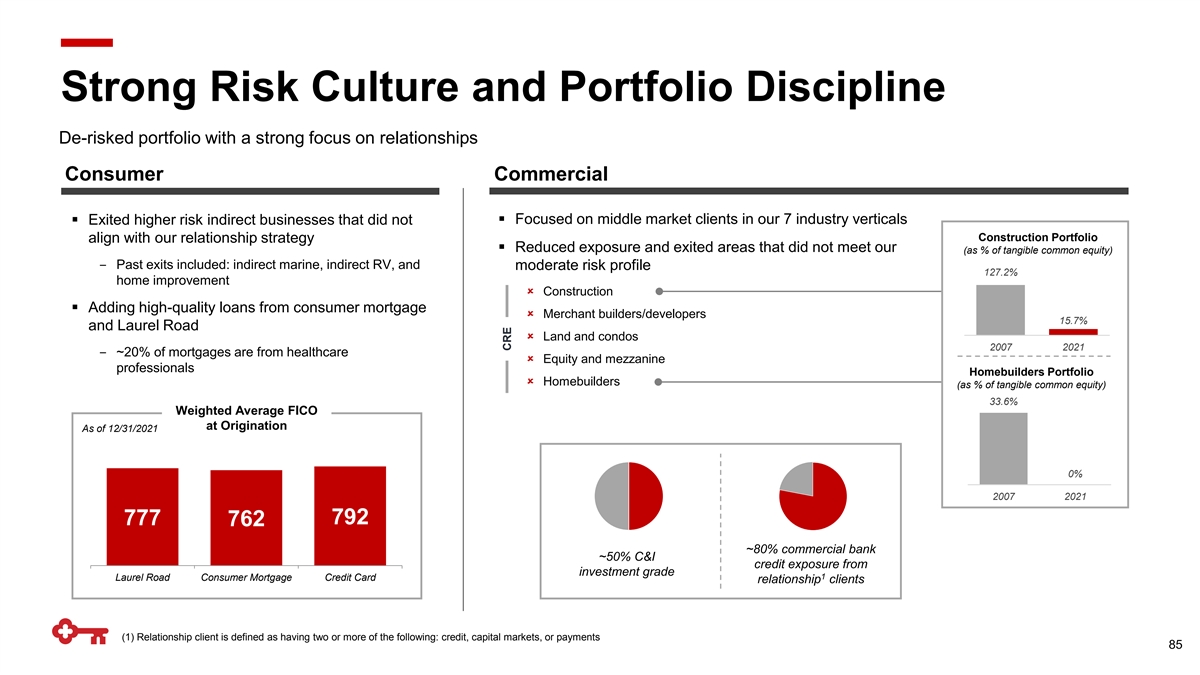
Strong Risk Culture and Portfolio Discipline De-risked portfolio with a strong focus on relationships Consumer Commercial ▪ Focused on middle market clients in our 7 industry verticals ▪ Exited higher risk indirect businesses that did not Construction Portfolio align with our relationship strategy ▪ Reduced exposure and exited areas that did not meet our (as % of tangible common equity) ‒ Past exits included: indirect marine, indirect RV, and moderate risk profile 127.2% home improvement û Construction ▪ Adding high-quality loans from consumer mortgage û Merchant builders/developers 15.7% and Laurel Road û Land and condos 2007 2021 ‒ ~20% of mortgages are from healthcare û Equity and mezzanine professionals Homebuilders Portfolio û Homebuilders (as % of tangible common equity) 33.6% Weighted Average FICO at Origination As of 12/31/2021 0% 2007 2021 777 792 762 ~80% commercial bank ~50% C&I credit exposure from investment grade 1 Laurel Road Consumer Mortgage Credit Card relationship clients (1) Relationship client is defined as having two or more of the following: credit, capital markets, or payments 85 CRE
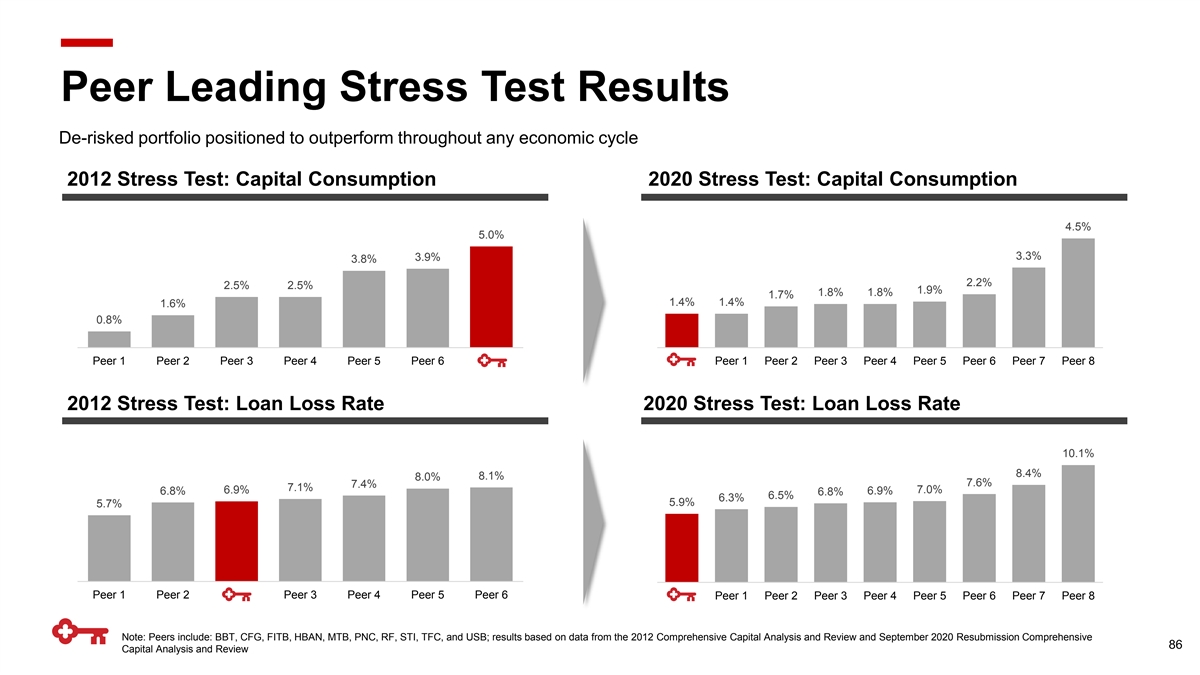
Peer Leading Stress Test Results De-risked portfolio positioned to outperform throughout any economic cycle 2012 Stress Test: Capital Consumption 2020 Stress Test: Capital Consumption 4.5% 5.0% 3.3% 3.9% 3.8% 2.2% 2.5% 2.5% 1.9% 1.8% 1.8% 1.7% 1.4% 1.4% 1.6% 0.8% Peer 1 Peer 2 Peer 3 Peer 4 Peer 5 Peer 6 KEY KEY Peer 1 Peer 2 Peer 3 Peer 4 Peer 5 Peer 6 Peer 7 Peer 8 2012 Stress Test: Loan Loss Rate 2020 Stress Test: Loan Loss Rate 10.1% 8.4% 8.1% 8.0% 7.6% 7.4% 7.1% 6.9% 7.0% 6.8% 6.9% 6.8% 6.5% 6.3% 5.9% 5.7% Peer 1 Peer 2 KEY Peer 3 Peer 4 Peer 5 Peer 6 KEY Peer 1 Peer 2 Peer 3 Peer 4 Peer 5 Peer 6 Peer 7 Peer 8 Note: Peers include: BBT, CFG, FITB, HBAN, MTB, PNC, RF, STI, TFC, and USB; results based on data from the 2012 Comprehensive Capital Analysis and Review and September 2020 Resubmission Comprehensive 86 Capital Analysis and Review

Disciplined Capital Management Consistently delivering on our capital priorities through dividend growth and share repurchases Capital Priorities Common Equity Tier 1 10.2% 9.9% 9.7% 9.4% 9.5% Annual Dividend Growth ➔ Target Range 18% 5-year CAGR Supporting Organic 9.0 – 9.5% Growth 2017 2018 2019 2020 2021 1 Total Capital Returned 2016 2017 2018 2019 2020 2021 97% 97% 100% 93% Dividends Share Repurchases ➔ ~$6Bn 75% 74% since 2012 75% Avg share price of $16.27 50% 25% Share Repurchases 0% 2017 2018 2019 2020 2021 (1) Total shareholder payout; includes share repurchases, common share dividends, and preferred stock dividends 87

Full Year 2022 Outlook Full Year 2022 (vs. Full Year 2021) • Loans: up low-double digit excluding the impact of PPP and the indirect auto portfolio sale ➢ up low-single digit on a reported basis Average Balance Sheet • Deposits: up low-single digit Revised from NII guidance provided on 1/20/22 Net Interest Income • Net interest income: up low-single digit (TE) Previous: Relatively stable New: up low-single digit • Noninterest income: down low-single digit (reflects lower prepaid card income) Noninterest Income • Noninterest expense: down low-single digit Noninterest Expense • Net charge-offs to average loans: 20 - 30 bps Credit Quality • GAAP tax rate: ~20% Taxes Note: Guidance ranges: relatively stable: +/- 2%; low-single digit: 1% - 3%; mid-single digit: 4% - 6%; high-single digit: 7% - 9%; low-double digit: 10% - 12% 88
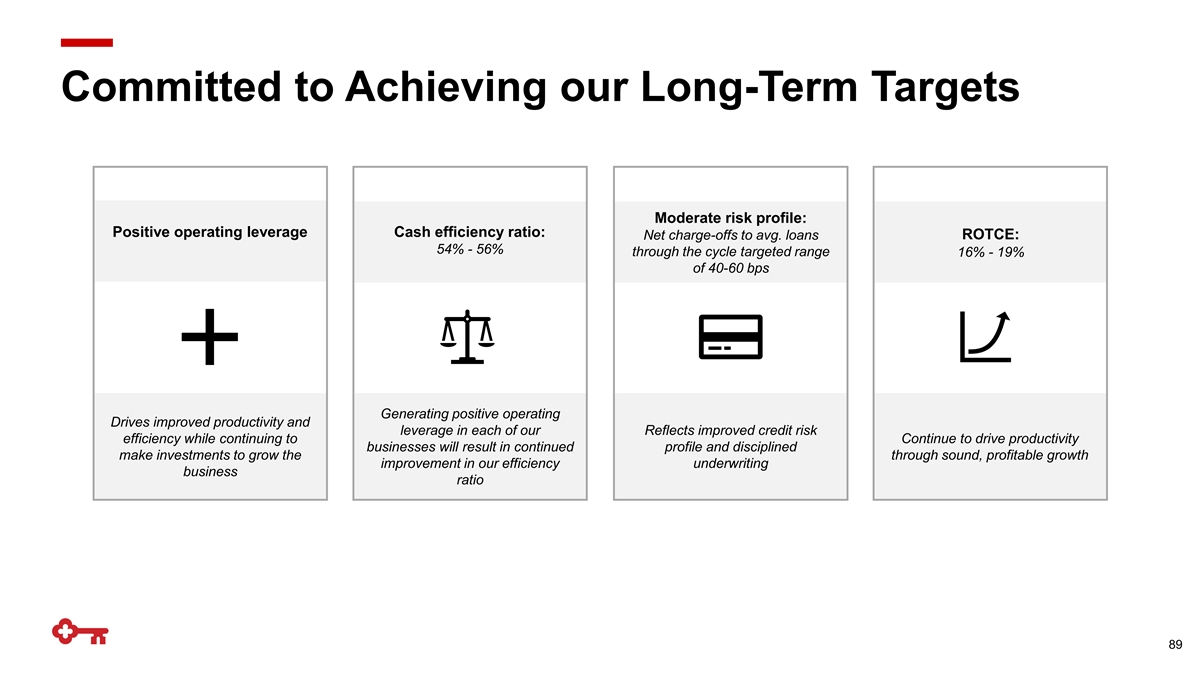
Committed to Achieving our Long-Term Targets Moderate risk profile: Positive operating leverage Cash efficiency ratio: Net charge-offs to avg. loans ROTCE: 54% - 56% through the cycle targeted range 16% - 19% of 40-60 bps Generating positive operating Drives improved productivity and leverage in each of our Reflects improved credit risk efficiency while continuing to Continue to drive productivity businesses will result in continued profile and disciplined make investments to grow the through sound, profitable growth improvement in our efficiency underwriting business ratio 89

Closing Remarks Chris Gorman Chairman and Chief Executive Officer
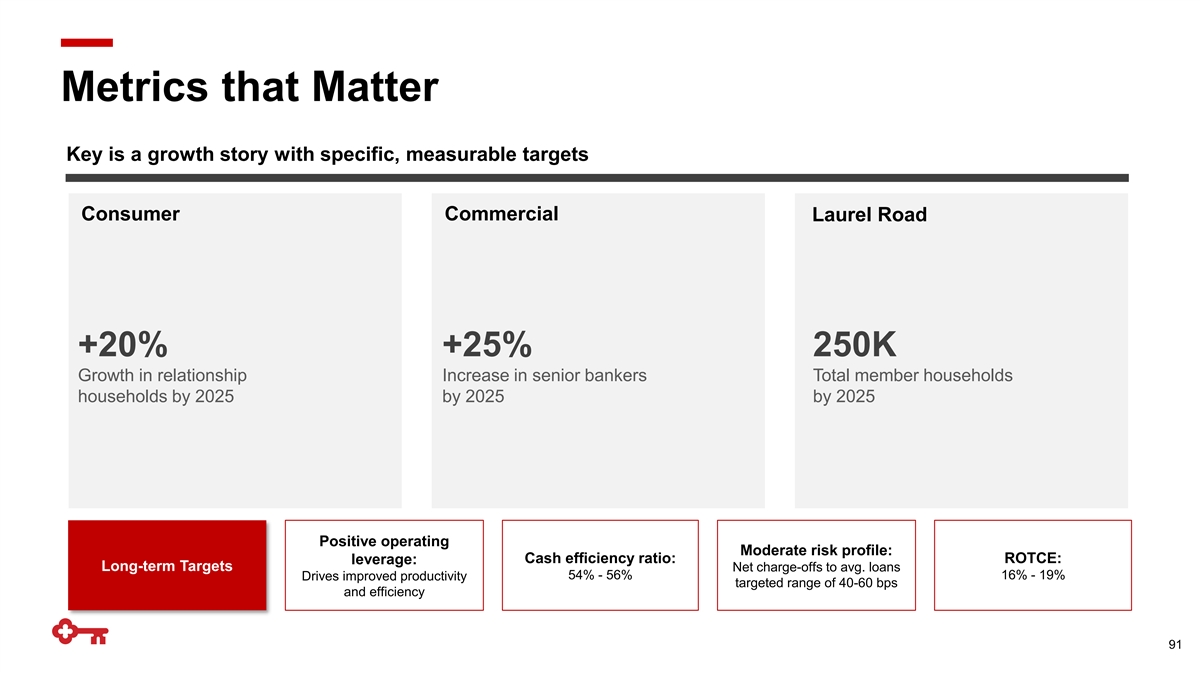
Metrics that Matter Key is a growth story with specific, measurable targets Consumer Commercial Laurel Road +20% +25% 250K Growth in relationship Increase in senior bankers Total member households households by 2025 by 2025 by 2025 Positive operating Moderate risk profile: Cash efficiency ratio: ROTCE: leverage: Long-term Targets Net charge-offs to avg. loans 54% - 56% 16% - 19% Drives improved productivity targeted range of 40-60 bps and efficiency 91
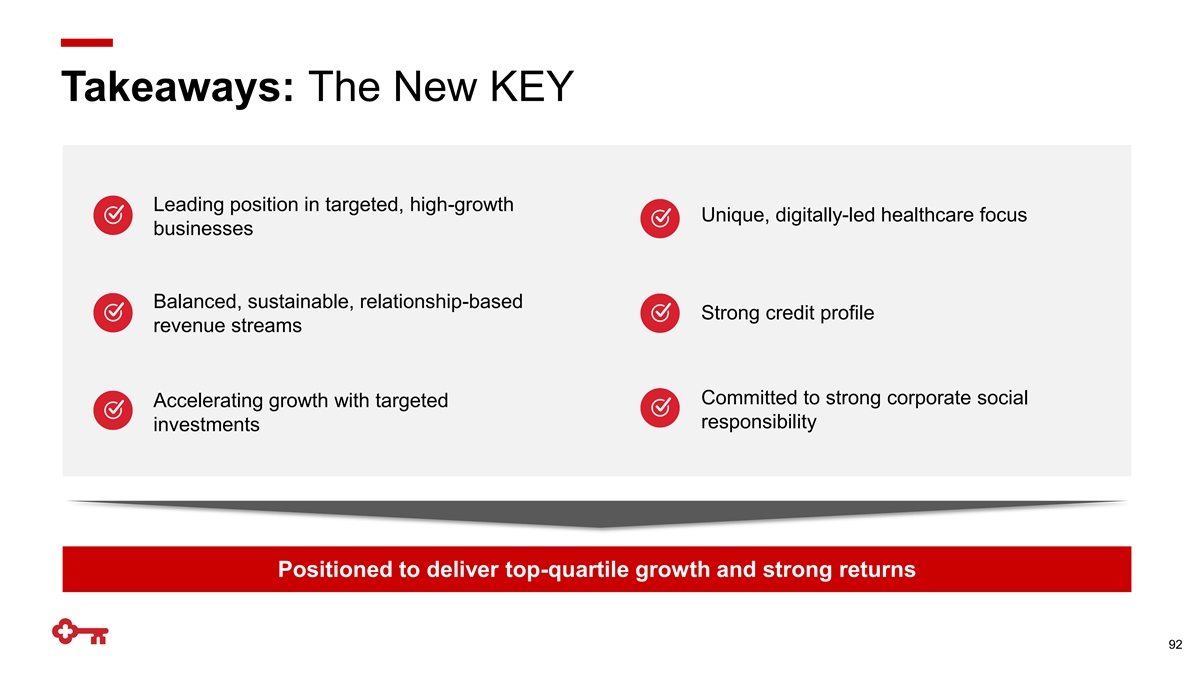
Takeaways: The New KEY Leading position in targeted, high-growth Unique, digitally-led healthcare focus businesses Balanced, sustainable, relationship-based Strong credit profile revenue streams Committed to strong corporate social Accelerating growth with targeted responsibility investments Positioned to deliver top-quartile growth and strong returns 92

Questions

Appendix
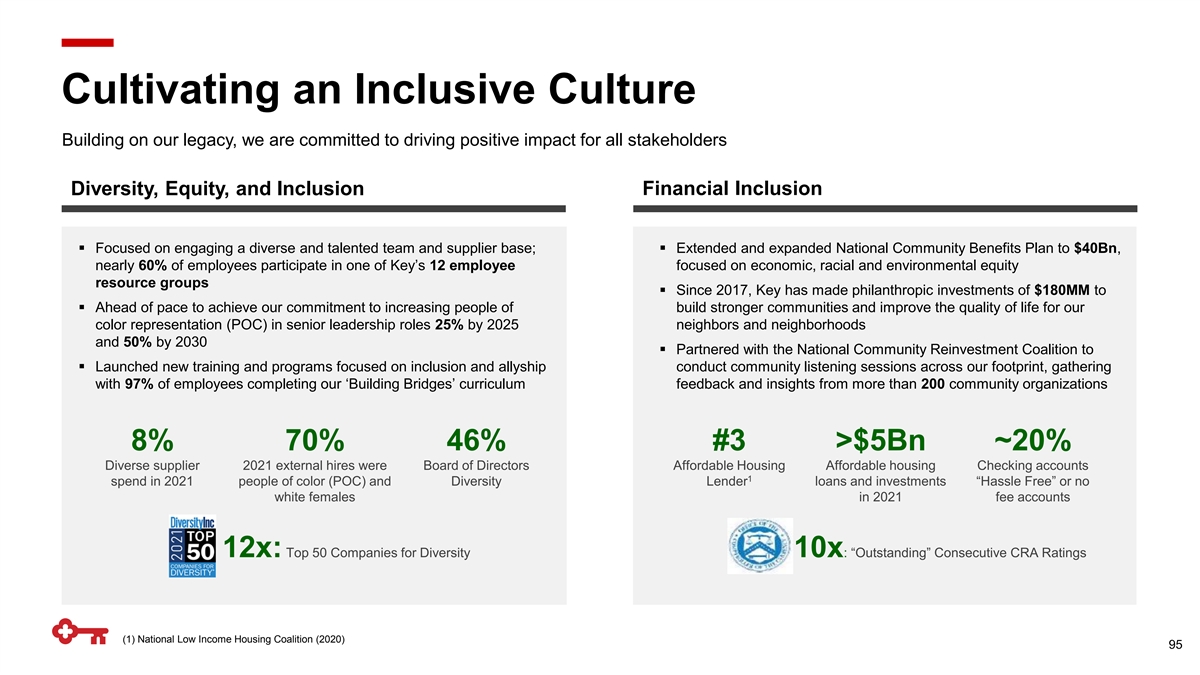
Cultivating an Inclusive Culture Building on our legacy, we are committed to driving positive impact for all stakeholders Diversity, Equity, and Inclusion Financial Inclusion ▪ Focused on engaging a diverse and talented team and supplier base; ▪ Extended and expanded National Community Benefits Plan to $40Bn, nearly 60% of employees participate in one of Key’s 12 employee focused on economic, racial and environmental equity resource groups ▪ Since 2017, Key has made philanthropic investments of $180MM to ▪ Ahead of pace to achieve our commitment to increasing people of build stronger communities and improve the quality of life for our color representation (POC) in senior leadership roles 25% by 2025 neighbors and neighborhoods and 50% by 2030 ▪ Partnered with the National Community Reinvestment Coalition to ▪ Launched new training and programs focused on inclusion and allyship conduct community listening sessions across our footprint, gathering with 97% of employees completing our ‘Building Bridges’ curriculum feedback and insights from more than 200 community organizations 8% 70% 46% #3 >$5Bn ~20% Diverse supplier 2021 external hires were Board of Directors Affordable Housing Affordable housing Checking accounts 1 spend in 2021 people of color (POC) and Diversity Lender loans and investments “Hassle Free” or no white females in 2021 fee accounts 12x: Top 50 Companies for Diversity 10x: “Outstanding” Consecutive CRA Ratings (1) National Low Income Housing Coalition (2020) 95

Responsible Operations Accelerating efforts and sharpening focus to address pressing issues facing our clients and communities Climate Stewardship Data Privacy and Security 1 ▪ Published inaugural TCFD Report▪ Enhanced client access and authentication across channels to reduce risk and to improve the client experience ▪ Initiated development of a climate risk management framework, inclusive of climate risk identification, quantification, and scenario ▪ Invested in tools and processes to protect client data analysis ▪ Proactively fortify cybersecurity ▪ Climate change considerations increasingly embedded into enterprise risk management, programs and polices, product development, corporate strategy, and procurement ▪ Ahead of pace on our greenhouse gas reduction targets and will launch expanded climate commitments in 2022 QR and Biometrics Cloud Privacy and Zero Trust Networking Security >$50Bn #2 24% Capital raised as Lead Renewable Reduction in 3 Arranger for renewable Energy lender Scope 1 and 2 4 energy clients since emissions +125% 2 inception (2007) 5 Increase in security investment with a client focus (1) Task Force on Climate-related Financial Disclosures; (2) Global commitments; (3) #2 by number of deals per Dealogic in the Americas for Renewable Energy Project Finance (2020); (4) As of 12/31/2020 compared to 2016 baseline; (5) Forecasted increase in cybersecurity spend from years 2018 to 2022 96