QuickLinks -- Click here to rapidly navigate through this document
EXHIBIT 13


Beazer Homes USA, Inc.
5775 Peachtree Dunwoody Road
Suite B 200
Atlanta, Georgia 30342
(404) 250-3420
www.beazer.com

2002 Annual Report
P O S I T I V E

I N D I C A T O R S
Business Description
Beazer Homes USA, Inc. is the sixth largest homebuilder in the country. Our operations are geographically diversified in 18 states in the Southeast, West, Central, Mid-Atlantic and Midwest U.S. Our market strategy focuses on building quality homes targeted to entry-level and first-time move-up homebuyers. We measure our financial performance using "Value Created," a variation of economic value added that measures the extent to which we beat our cost of capital. Founded in 1985, we are headquartered in Atlanta, Georgia, and have been listed on the New York Stock Exchange since 1994 under the symbol "BZH."
Financial Highlights
Beazer Homes USA, Inc.
(dollars in thousands, except per share amounts)
Year ended September 30,
| | 2002
| | 2001
| | 2000
| |
|---|
| Statements of Operations Data | | | | | | | | | | |
| Homes closed | | | 13,603 | | | 9,059 | | | 7,857 | |
| Total revenue | | $ | 2,641,173 | | $ | 1,805,177 | | $ | 1,527,865 | |
| Net income | | | 122,634 | | | 74,876 | | | 43,606 | |
| Diluted earnings per share | | | 10.74 | | | 8.18 | | | 5.05 | |
| |
| Balance Sheet at Year-End | | | | | | | | | | |
| Total assets | | $ | 1,892,847 | | $ | 995,289 | | $ | 696,228 | |
| Total debt | | | 739,100 | | | 395,238 | | | 252,349 | |
| Stockholders' equity | | | 799,515 | | | 351,195 | | | 270,538 | |
| |
| Return Data | | | | | | | | | | |
| Return on average capital (pre-tax) | | | 21.4 | % | | 24.8 | % | | 20.4 | % |
| Return on average equity | | | 21.3 | % | | 24.1 | % | | 17.3 | % |
| |
See footnotes to Selected Financial Data on page 22 for certain definitions.
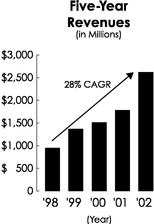 | |  |
| Revenues increased at a compound annual growth rate of 28% over the past four years, as Beazer both grew existing operations and expanded through acquisition. | | Net income grew consistently over the past four years at a significantly higher rate than revenues. Our compound annual growth rate of 52% reflects both revenue growth and steady improvements in profit margins. |
Table of Contents
Positive Indicators page 1 • Letter to Shareholders page 14 • Board of Directors page 20 •
Financial Information page 21 • Shareholder and Corporate Information page 60 •
| | | BEAZER HOMES USA, INC. |

I N M E M O R I U M
Richard (Dick) H. Crosser:
1938-2002 | | A Positive in the Community
 |
It is with much sadness that we mourn the passing of Richard (Dick) H. Crosser. Dick was the co-founder, with John B. Scheumann, of Crossmann Communities in 1971. Dick was a passionate advocate of providing homes for first-time buyers. He led Crossmann Communities' drive into providing affordable housing throughout the company's Midwest and Southeast markets. |
|
Above
Children's Receiving Home, Phase II Sacramento, CA
Right
Brighter Tomorrows, Dallas, Texas, serving women and children affected by domestic violence |
|
 |
At Beazer Homes we are honored to uphold Dick's vision as we incorporate Crossmann Communities into our Company.
Dick was also committed to providing opportunities for students to advance their education. He initiated the Crossmann Communities Scholarship Fund which currently provides college scholarships to high school graduates from communities which Crossmann builds. In recognition of Dick's commitment and achievement we have renamed this fund "The Richard H. Crosser Memorial Scholarship Fund." We will miss Dick's presence and vision and are proud to honor his contributions to our industry and to education through this scholarship fund. | | Nothing can replace the feeling of being part of a community. Unfortunately, thousands of people across this great country have lost that feeling, often due to circumstances beyond their control. This is one of the many reasons why Beazer Homes is so strongly committed to its mission of giving back to the communities in which it builds.
This mission led Beazer Homes to begin a relationship with HomeAid America in July of 1999 and join a commitment to building hope and homes for the temporarily homeless. As the first national sponsor of HomeAid, Beazer Homes has taken a leadership role with this worthy organization. The company is a national sponsor through an annual pledge to HomeAid and is actively involved with local HomeAid chapters throughout the United States. Since 1999, Beazer has assisted HomeAid in six projects. Beazer's past projects included building and renovating shelters in Dallas, Texas; Northern Virginia; Orange County, California; and Sacramento, California. Beazer's Atlanta, Denver and Houston divisions are currently working with local chapters on shelter projects.
Led by the example of President and CEO Ian McCarthy, who currently serves as Chairman of HomeAid America's Advisory Board, Beazer employees contribute their talents and time to construction projects and other fundraising events for HomeAid.
"I am extremely proud of our Beazer team and their generosity throughout the year," says Mr. McCarthy. "We feel fortunate as a company to be able to share our resources with those individuals who need them, and we continue to join our hands and hearts to build hope with HomeAid."
Beazer is now joining hands to help HomeAid establish a new Las Vegas, Nevada, chapter. Beazer has partnered with Georgia Pacific to build a shelter at the National Association of Home Builders' (NAHB) International Builders Show in Las Vegas in January of 2003 that will become a home for children who are escaping a violent or abusive environment.
According to Kent Lay, Senior Regional President of Beazer's Mountain West Region, "Our team has embraced this project and is excited about the opportunity to work with our partners to present this gift to the Las Vegas community. It has been a rewarding experience and we hope to be part of future projects as well."
Beazer Homes is honored to be associated with such a worthy organization as HomeAid America that provides a safe haven and brings hope to thousands of people while helping them reconnect with a sense of community.

Designed and produced by Corporate Reports Inc./Atlanta Printed on partially recycled paper |
More Demand

Less Supply

Expanding Share

POSITIVE INDICATORS
Our expectations for continued growth are based on three key industry trends:Increased demand due to continued strong household formation and flexible financing options,historically low levels of housing supply due to land and capital constraints, andexpanding market share for large builders who are leading industry consolidation. These indicators are amplified on the following pages. These are the same dynamics that have pushed housing into one of the top-performing sectors of the economy in recent years, and we believe they will continue to be industry growth drivers for the foreseeable future.
1
P O S I T I V E I N D I C A T O R S

More Demand
"With 24 million new households expected to form
between 2000 and 2020, the housing sector is poised
to set new records for production, sales and
aggregate home equity."
The State of the Nation's Housing 2002
Joint Center for Housing Studies of Harvard University
2
 |
Demand exceeds supply
by largest gap ever. |
- •
- Annual household formation over the next decade should be comparable to the impressive levels of the 1990s. This will continue to drive demand.
- •
- Household formation will be influenced largely by two key groups—immigrants and echo boomers—both of whom will drive the market for affordable starter homes.
- •
- A variety of financing options now available make home purchase decisions less sensitive than ever to interest rates and the economy, thereby making demand more consistent.
3

4
P O S I T I V E I N D I C A T O R S

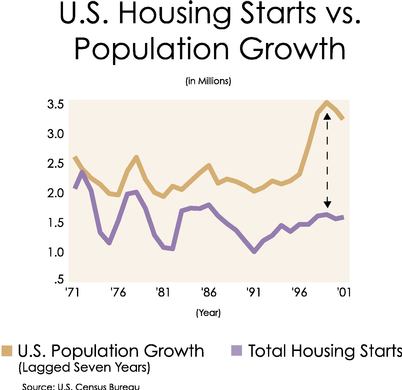
Population is likely to continue growing at 1990s rates. | | 
Immigration to the U.S. set all-time records in the 1990s. Immigrants tend to become buyers of homes within their first ten years in the U.S. and ultimately have a higher homeownership rate than native-born Americans. |
Homebuilders have enjoyed a decade of strong growth thanks to a sound economy, available financing and an expanding population. And there is every indication that this growth can continue well into the foreseeable future.
Continued household formation, fueled by record population increases during the 1990s, will be one of the biggest drivers of demand. Over the next ten years, 1.2 million new households are expected to form annually, approximately the same level experienced during the 1990s. As in the 1990s, minorities will account for a large percentage of this growth—by some estimates as much as two-thirds—mostly due to the increasing number of immigrant households. Today, more than one in ten U.S. residents is foreign born. These new U.S. immigrants and their children will remain primary drivers of household formation in the current decade as they become first-time homebuyers in increasing numbers.
Housing demand also will be influenced by a demographic that was not part of the 1990s growth surge—the echo boomers. Children of the baby boomers will begin forming new households through the rest of this decade. The effect of the echo boomers and immigrant households will drive, in particular, demand for first-time homes.
Though many attribute recent housing growth to a low interest rate environment, the actual financing dynamic is a different one. The real influence in home financing has been the explosion of flexible financing options and innovative mortgage products that have enabled millions of households to become first-time buyers. In contrast to the days when a 30-year fixed-rate loan was the primary lending instrument, today more than 100 different mortgage products are available to buyers. When interest rates rise appreciably, as they did in 1999 and early 2000, adjustable rate mortgage products, including those with rates fixed for three or five years, become even more popular. This, in turn, makes the housing sector much less cyclical than in the past.
5
P O S I T I V E I N D I C A T O R S

Less Supply
" All of these trends have hit up against mounting constraints
on new housing supply. Builders are limited by tighter
environmental and land-use regulations..."
The Wall Street Journal
May 15, 2001
6

- •
- Land constraints, due to concerns about urban sprawl and unplanned growth, are making the development process more arduous through lengthy permitting and entitlement processes.
- •
- Large builders have the professional management and capital resources to succeed in a more competitive land purchase and entitlement process. With a lower cost of capital, these builders have a pricing advantage in the marketplace.
- •
- As a result of land constraints and more fiscal discipline among builders, the inventory of new homes available for sale in the U.S. is at a historical low.
7

8
P O S I T I V E I N D I C A T O R S
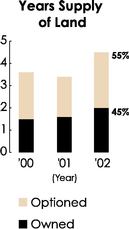 | |
Beazer controls a 4.6 year supply of land
with 55% currently under option. |
Despite a recession in the U.S. economy, new home inventory remains at a historical low. Total housing starts for the past five years have been in line with the average level of the past 30 years. And the supply of unsold homes, at four months, is at its lowest point since the early 1960s. What has kept supply in check? Quite simply, land, or actually the lack thereof.
In the past, the housing industry had a history of overbuilding during boom times. Land constraints have become a major factor in keeping inventories low in recent years. Even when land is acquired, the entitlement and permitting process presents significantly more hurdles to overcome because of tougher ordinances designed to curb growth and restrain urban sprawl. Local and state governments are more insistent that population growth be in line with infrastructure improvements and better planned zoning. As a result, the timeframe to acquire and develop land can easily extend to a three-year to seven-year period.
In an environment where development requires more investment and time, the advantage is overwhelmingly with large, national builders. These builders have better access to capital and better financing alternatives than smaller non-public builders. They also have the professional management it takes to manage the current land planning process. These factors give the largest builders a true competitive advantage.
As the sixth largest builder in the nation, Beazer is capitalizing on these benefits. The Company's land bank is sufficient to sustain growth for years to come. With 55 percent of the Company's land bank under option, this position has the flexibility to weather market fluctuations. In addition, the Company's solid balance sheet provides it with excellent access to the capital markets.
 | |
"Housing Crisis Worsens As Construction Lags Demand"
USA Today
July 22, 2002
Source: U.S. Census Bureau |
9
P O S I T I V E I N D I C A T O R S

Expanding Share
"I think one of the things that's occurring in
the country is the evolution of housing into a very
sophisticated, complex industry..."
Alan Greenspan, Chairman of the Federal Reserve
Testimony before the Senate Banking Committee
July 24, 2001
as quoted inThe New York Times
10
 | |
Public builders gain from
sustainable competitive advantages. |
- •
- Large national builders have doubled their share in the past five years to approximately 20 percent of new home sales.
- •
- Industry consolidation is expected to continue given the numerous competitive advantages that large builders have in the marketplace.
- •
- Acquisitions and expanding market share have been and will continue to be a key part of Beazer's growth strategy.
11

12
P O S I T I V E I N D I C A T O R S
Over the past decade, a new class of home-builder has emerged. These are large, national, well-financed companies — most of them public. As a group, the public homebuilders were among the top five fastest-growing industries in revenues and profits last year and have generated a higher return to shareholders than almost any other industry group over the last five years.
This performance is due in part to rapidly gaining market share. It was only about five years ago that the top-ten builders claimed less than ten percent of new home sales. Today, their share has doubled to nearly 20 percent. Even more impressive, in an environment where housing starts are relatively flat, net income for these top-ten builders has grown an average of more than 40 percent annually for the past five years.
Clearly, conditions favor big builders. Beyond access to land and capital, they have dramatic critical mass advantages. Purchasing power provides a considerable cost benefit. Beazer, for instance, has numerous national contracts with suppliers of services and materials for the thousands of homes it constructs each year. Large builders like Beazer also have the opportunity to build brand reputation among consumers — a significant selling point in a personal investment as important as a home. Large builders can pass these advantages to the buyer in the form of better quality and value than a smaller builder can offer.
In addition to organic growth in market share, the large homebuilders are in an aggressive acquisition mode. Beazer has successfully completed three major acquisitions in the past four years. Not only have these transactions grown Beazer's operations base, they also have further diversified the Company's geographic coverage. Now in 18 states across the Southeast, West, Central, Mid-Atlantic and Midwest U.S., Beazer is able to capitalize on high-growth markets while spreading its geographic reach through diverse regional economies.
| | | Major Acquisitions in Last Ten Years
| | |
| | | Name
| | Region
| | Purchase Date
| | |
| | | Watt Housing | | West | | February 1993 | | |
| | |
| | |
| | | Trendmaker Homes—Dallas | | Central | | June 1996 | | |
| | |
| | |
| | | Calton Homes—Orlando | | Southeast | | November 1997 | | |
| | |
| | |
| | | Trafalgar | | Mid-Atlantic | | December 1998 | | |
| | |
| | |
| | | Sanford Homes—Denver | | West | | August 2001 | | |
| | |
| | |
| | | Crossmann | | Midwest | | April 2002 | | |
| | |
| | |
 |
|
 |
| Net income for top-ten builders soared in a flat housing environment. | | Beazer has experienced dramatic and consistent growth in both existing and acquired divisions. |
13
BEAZER HOMES USA, INC.
Dear Shareholders
It is difficult to write this year's letter without overusing the word "strong." On every front and by every benchmark, Beazer Homes is indeed the strongest it has ever been. And, there is every reason to believe that our very strong Company will grow even stronger in the future, based on the positive demographic, economic and industry indicators before us:
- •
- Increasing Demand,
- •
- Constrained Supply, and
- •
- Increasing Market Share for Larger Builders.
This confidence in our position is particularly striking given the circumstances of the past year. In the midst of overall challenging business conditions, we achieved record earnings of $10.74 per share, exceeding our five-year target of $9.00 per share two years early. We also produced record new orders and year-end backlog. These accomplishments demonstrate how well our corporate strategies have been formulated to capitalize on the fundamentals of the housing market and the dynamic changes occurring within the industry.
14
LETTER TO SHAREHOLDERS
Perhaps the most visible indication of Beazer's strength is its ranking as the sixth largest homebuilder in the U.S. based on home closings. Just one year ago, we were in ninth position; when we became a public company eight years ago, we held the eleventh position. While much of our ability to move up in industry rankings has been through internal growth, this major jump in the past 12 months is the result of the largest acquisition that Beazer has completed to date.
Last April, Crossmann Communities (NASDAQ: CROS) became part of Beazer Homes in a stock/cash transaction valued at approximately $626 million. Founded in 1973, Crossmann was a leading regional builder of single-family homes in Indiana—its home base—with operations in Kentucky, Mississippi, North Carolina, Ohio, South Carolina and Tennessee. The Beazer-Crossmann combination is an excellent strategic fit that provides us with clear benefits, including:
• A significant increase in size,
• An enhanced presence in the first-time-buyer market,
• A strengthened land position, and
• An expanded geographical reach.
 | | These benefits encapsulate perfectly the industry trends outlined on the preceding pages and place Beazer in an excellent position to capitalize on them. In particular, with an average home sales price of under $140,000 for homes closed, Crossmann's emphasis on providing value to the first-time homebuyer complements our strategic focus.
A SIGNIFICANT INCREASE IN SIZE
This era in homebuilding clearly belongs to the big builder. With access to attractive capital, the ability to secure prime land and the critical mass to leverage costs, larger builders are simply more competitive than their smaller counterparts. These competitive factors combined with a still highly fragmented homebuilding industry should result in significant consolidation during the next several years.
In this scenario, a bigger Beazer Homes is a more competitive Beazer Homes. Our position among the nation's top-ten builders is solidified, based on more than 13,600 home closings in 2002. Our revenue base has grown to more than $2.6 billion in 2002, while shareholders' equity increased 128 percent. This expansion of our financial base strengthens our ability to further grow the Company and increases liquidity for our investors.
Brian C. Beazer(standing)
Non-Executive Chairman of the Board
Ian J. McCarthy(seated)
President and Chief Executive Officer |
15
BEAZER HOMES USA, INC.
AN ENHANCED PRESENCE IN THE FIRST-TIME-BUYER MARKET
Census data points to continued strong household formation over the next decade, largely driven by echo boomers and immigrants to the United States. Aided by today's variety of financing options, these buyers should ensure strong demand for affordable, entry-level homes for the foreseeable future.
We target the first-time buyer, which we believe to be the largest, most underserved segment of the market. Because these purchases are usually based more on need rather than discretionary choice, these buyers are among the most motivated in the market and the least likely to postpone a home purchase.
A STRENGTHENED LAND POSITION
Concern over urban sprawl issues, more stringent entitlement processes and the challenge of securing prime locations have made land availability a huge and growing competitive factor for builders today. Builders must have the financial resources to acquire ever-more-valuable land, as well as the financial flexibility to control the land during what is often a protracted approval and development process. At the end of fiscal 2002, we had a four-and-a-half-year supply of land, of which 55 percent was under option.
AN EXPANDED GEOGRAPHICAL REACH
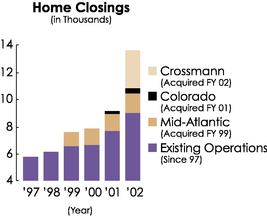
A broad and diverse geographical base has long been one of our most important assets. Beazer has historically enjoyed a strong presence across the high-growth southeastern and western sunbelts. In recent years, acquisitions have enabled us to expand into even more markets, such as the Mid-Atlantic region and Colorado. The addition of Crossmann Communities to the Beazer family of builders further broadens our geographic scope by opening the Midwest region and allowing us to further solidify our market position in the Southeast.
ANOTHER RECORD PERFORMANCE
A bit of background is helpful in putting our 2002 fiscal results into perspective. In 1999, we introduced a five-year plan with an ambitious goal: to more than double EPS to $9.00 per share by 2004. This goal was exceeded in fiscal 2002—we earned $10.74—two full years ahead of schedule.
Our fiscal 2002 performance was driven by:
- •
- Strong growth as represented by a 46 percent increase in revenues to $2.6 billion.
- •
- Improved operating profit margin of 7.3 percent, 50 basis points higher than fiscal 2001.
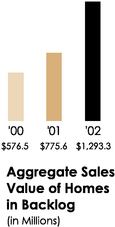
As a result of these factors, net income rose 64 percent to $122.6 million. This achievement was based on a 50 percent increase in home closings, including Crossmann, or a 20 percent increase in home closings based on existing operations. For the year, Beazer had 13,610 new orders for homes, a 36 percent increase over fiscal 2001. Perhaps most encouraging, we were able to begin fiscal 2003 with a record 6,519 homes in backlog with a sales value of $1.3 billion, up 67 percent over 2001.
Complementing an extremely positive income statement is an extremely strong balance sheet. At year-end, our ratio of debt to capitalization was 48 percent, compared to 53 percent last year, while interest coverage (earnings before interest, taxes, depreciation and amortization—or EBITDA—divided by interest incurred), for the last fiscal year was 5.0 times compared to 4.6 times at year-end for fiscal 2001. With a cash balance of $125 million at year-end, our net debt to capitalization was 43 percent. These improvements in debt to total capitalization and cash position reflect $59 million of cash flow provided by operations, as well as the successful issuance of 3.9 million shares of common stock and $350 million in 83/8 percent Senior Notes in connection with our acquisition of Crossmann Communities.
16
LETTER TO SHAREHOLDERS
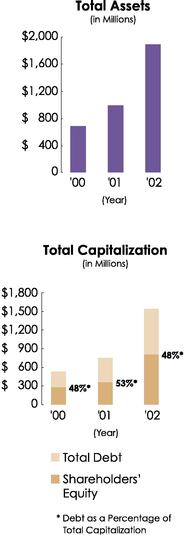
We have significantly increased our asset and capital base over the past three years while maintaining a conservative capital structure with a ratio of debt to total capitalization of 48% at September 30, 2002. | | Significant Events
• Became sixth largest homebuilder in the U.S. based on home closings.
• Completed acquisition of Crossmann Communities (NASDAQ:
CROS) — largest acquisition to date.
• Achieved five-year EPS target two years ahead of schedule.
• Set new records for revenue, gross profit margins and earnings per share.
• Reached all-time highs for number of homes closed, new orders and year-end
backlog.
• Improved credit ratings. Reduced leverage and improved financial position.
• Named top technology company byBuilder Magazine.
• Named #1 Performing Public Company in Georgia by theAtlanta
Journal-Constitution.
• Dramatically increased shareholders' equity and market capitalization.

|
17
BEAZER HOMES USA, INC.
The Company's outstanding 2002 results and overall sound financial position were recognized by the agencies that rate our debt. During a year with significant growth, a major acquisition and a challenging economic environment, Moody's reaffirmed our credit rating and Standard & Poor's upgraded us from BB- to BB.
PROFITABLE GROWTH ROOTED IN OPERATIONAL STRENGTH
While the Company's strategic and financial strength bode well for the future, it is Beazer's operational strength — the ability to execute—that is the critical part of our potential for profitable growth. Our operating profit margin increased 50 basis points to 7.3 percent for the year. This improvement is due to sales price increases during the year, as well as increased efficiency and purchasing power across an expanded base of operations.
Our passion for technology continues to be a vital part of our operational strength. Indeed, as the winner of theBuilder Magazine Top Technology Award, the Company was cited as "the builder who has done the most to advance the use of technology within the Company and the industry during the past year."
"... it is Beazer's operational strength—
the ability to execute—that is the critical part
of our potential for profitable growth."
These technology endeavors over the past year have included innovative marketing initiatives, such as auctioning homes on eBay and introducing a Spanish-language version of www.beazer.com. Another revolutionary initiative was the introduction of Advanced Home Finder as a selling tool on our Web site. With more than 60 percent of our homebuyers using the Internet during their home search process, this advanced search engine allows them to rank their priorities for home features — such as commute distance, community amenities, price or home design. Once preferences are analyzed, a list of homes is provided that best suits their criteria. By helping buyers sort through the inherent trade-offs in a home purchase, the Advanced Home Finder functions essentially as an online selling agent.
A final point on technology: perhaps one of the most exciting aspects of integrating technology throughout a business is the ability to leverage it. With every acquisition that we complete, there is the opportunity to scale our technology across an even wider base — an incremental investment that can reap substantial returns.
THE PEOPLE FACTOR
While Beazer's scale is enabling us to realize more and more efficiencies, it is important to remember that in our business, productivity ultimately happens every day on a grassroots level — at numerous construction sites and sales offices across the country. We would be remiss if we did not acknowledge the nearly 3,000 Beazer employees, and many more subcontractors and suppliers, who have produced this year's results and who are the personification of our corporate strengths. To each of them, we extend our most sincere, heartfelt gratitude.
The efforts and commitment of all Beazer employees were recognized during 2002 when Beazer Homes was named the #1 Performing Public Company in Georgia by theAtlanta Journal-Constitution's annual ranking of the top 100 public companies in the state. The criteria for this ranking include revenue, revenue growth, return on equity, profit margin improvement and return to shareholders.
THE MANAGEMENT FACTOR
As shareholders, it is important for you to know that Beazer is in good hands in management and in the boardroom. The senior management team that took the Company public in 1994 is still intact today, supplemented with additional experienced and motivated
18
managers as we have grown. The depth, quality and strength of our management team provide the foundation upon which we will build an even stronger and more productive company.
During the year, the board of directors expanded from seven to eight members. We welcomed to the board Laurent Alpert, a partner in Cleary, Gottlieb, Steen & Hamilton, a major international law firm, and Maureen O'Connell, executive vice president, chief financial officer and chief administrative officer of Gartner, Inc. George W. Mefferd, who was a director since our IPO, retired after eight years of service. We are deeply appreciative of his many contributions to the Company and years of service. With these changes, the board continues its tradition of splitting the roles of Chairman and CEO, having a majority of outside directors and an independent audit committee.
"... we are targeting 14 percent EPS growth to $12.25 per share in 2003.
Our willingness to set this target is based on all of the demographic
and industry data that we have outlined in this report..."
CONTINUED GROWTH IN 2003
Despite an economic outlook that appears to be as challenging as the past year's, we are targeting 14 percent EPS growth to $12.25 per share in 2003. Our willingness to set this target is based on all of the demographic and industry data that we have outlined in this report, as well as our internal trends, including a backlog of $1.3 billion in sales. We recognize that this target is subject to future economic uncertainties.
This target underscores our belief that the so-called housing "bubble" is, in fact, a myth. While many continue to wait for this bubble to burst, we agree with most respected economists that there has never been a national housing bubble in the U.S. The overall average price of homes in the U.S. has never gone down in any year since the Great Depression in the early 1930s. Further, the "bubble" notion ignores the fundamental dynamics of supply and demand. Strong demand is arising from dramatic population increases in the 1990s that should continue to drive household formation. Tight supply is largely a function of land constraints that have held inventories in check. Neither the demand nor the supply portions of the equation are likely to change in the foreseeable future. Combine these factors with industry consolidation and you have very strong indicators of future growth.
As we said earlier, this year's letter emphasizes the word "strong," and that includes our opinions. But more importantly it expresses the degree of confidence that we have in Beazer Homes and our level of enthusiasm about its future. We intend to maintain both, and to make a strong Beazer an even stronger performer. We appreciate your continued support.
Sincerely,

Brian C. Beazer
Non-Executive Chairman of the Board | | |

Ian J. McCarthy
President and Chief Executive Officer |
|
|
December 13, 2002
19
BEAZER HOMES USA, INC.
Board of Directors
BRIAN C. BEAZER, 67, Non-executive Chairman since IPO in 1994. He served as Chairman and Chief Executive Officer of Beazer PLC until 1991. Mr. Beazer is a Director of Beazer Japan, Ltd., Seal Mint, Ltd., Jade Technologies Singapore Pte. Ltd., FSM Europe B.V., Electronic Convergence Technology Ltd., United Pacific Industries Limited, U.S. Industries, Inc. and Numerex Corp.
LAURENT ALPERT, 55, Director since February 2002, Mr. Alpert is a partner in Cleary, Gottlieb, Steen & Hamilton. He joined Cleary Gottlieb in 1972 and became a partner in 1980. Mr. Alpert is also a Director of the International Rescue Committee.
THOMAS B. HOWARD, JR., 74, Director since 1995. He held various positions with Gifford-Hill & Company from 1969 to 1992, including Chairman and Chief Executive Officer. During the period 1957 to 1969, Mr. Howard held various positions with Vulcan Materials Company. Mr. Howard currently serves on the Board of Trustees of the Methodist Hospitals Foundation and previously served as a Director of Lennox International, Inc., Director of the Dallas Chamber of Commerce and member of the Dallas Citizens Council.
IAN J. MCCARTHY, 49, President and CEO of Beazer and has served as a Director since IPO in 1994. Mr. McCarthy has served as President of predecessors of Beazer since January 1991. During the period May 1981 to January 1991, Mr. McCarthy was employed in Hong Kong and Thailand, becoming a Director of Beazer Far East and, from January 1980 to May 1981, was employed by Kier, Ltd., which became an indirect, wholly owned subsidiary of Beazer PLC. Mr. McCarthy currently serves as Chairman of HomeAid America's National Advisory Board.
DAVID E. (NED) MUNDELL, 70, Director since IPO in 1994. Mr. Mundell is currently an advisor and Director of ORIX USA Corporation, a financial services company, and served as Chairman of ORIX from 1991 to 1999. During the period 1959 to 1990, Mr. Mundell held various positions within United States Leasing International, Inc., retiring as Chairman in 1990. He is also a Director of Stockton Holdings, Ltd.
MAUREEN E. O'CONNELL, 40, Director since May 2002. In September 2002, Ms. O'Connell joined Gartner, Inc. as its Executive Vice President, CFO and Chief Administrative Officer. Prior to joining Gartner, Ms. O'Connell was the CFO of Barnes & Noble, Inc. since 2000. She also held similar positions at Publishers Clearing House from 1998 to 2000, BMG Direct from 1997 to 1998 and Primedia, Inc. from 1990 to 1997. Ms. O'Connell was employed by Equitable Financial Companies from 1988 to 1990 and Coopers and Lybrand from 1985 to 1988.
LARRY T. SOLARI, 60, Director since IPO in 1994. From 1998 to 2001, Mr. Solari was the Chairman and CEO of BSI Holdings, Inc. in Carmel, California. Prior to joining BSI, Mr. Solari was the Chairman and CEO of Sequentia, Inc., the President of the Building Materials Group of Domtar, Inc., and the President of the Construction Products Group for Owens-Corning Fiberglas. Mr. Solari currently is a Director of Pacific Coast Building Products, Inc., and Therma-Tru, Inc. He has also been a Director of the Policy Advisory Board of the Harvard Joint Center for Housing Studies and an Advisory Board Member of the National Home Builders Association.
DAVID S. WEISS, 42, Executive Vice President and CFO of Beazer and a Director since IPO in 1994. Mr. Weiss was the Assistant Corporate Controller of Hanson Industries for the period from February 1993 to March 1994. Mr. Weiss was Manager of Financial Reporting for Colgate-Palmolive Company from November 1991 to February 1993 and was with the firm Deloitte & Touche from 1982 to November 1991.
For more complete biographies of Directors, see Beazer's Proxy Statement. | | 
(from left to right) Laurent Alpert, Thomas B. Howard, Jr.,David E. (Ned) Mundell and Brian C. Beazer

(from left to right) Ian J. McCarthy, Larry T. Solari, Maureen E. O'Connell and David S. Weiss |
20
Table of Contents
Financial Information
| 23 | | Management's Responsibility for Financial Reporting and System of Internal Controls |
24 |
|
Operations Review/Management's Discussion and Analysis |
35 |
|
Forward-Looking Statements |
36 |
|
Consolidated Statements of Income |
37 |
|
Consolidated Balance Sheets |
38 |
|
Consolidated Statements of Stockholders' Equity |
39 |
|
Consolidated Statements of Cash Flows |
40 |
|
Notes to Consolidated Financial Statements |
53 |
|
Independent Auditors' Report |
54 |
|
Summarized Quarterly Financial Information |
55 |
|
Board of Directors and Corporate Officers |
56 |
|
Selected Financial and Operating Data: 1993-2002 |
58 |
|
At-A-Glance |
60 |
|
Shareholder and Corporate Information |
21
Selected Financial Data
Beazer Homes USA, Inc.
(dollars in thousands, except per share amounts)
Year ended September 30,
| | 2002
| | 2001
| | 2000
| | 1999
| | 1998
| |
|---|
| STATEMENT OF OPERATIONS DATA: | | | | | | | | | | | | | | | | |
| | Total revenue | | $ | 2,641,173 | | $ | 1,805,177 | | $ | 1,527,865 | | $ | 1,394,074 | | $ | 977,409 | |
| | Operating income | | | 193,174 | | | 122,229 | | | 75,623 | | | 61,800 | | | 36,916 | |
| | Net income | | | 122,634 | | | 74,876 | (i) | | 43,606 | | | 36,934 | | | 23,201 | |
| | Net income per common share: | | | | | | | | | | | | | | | | |
| | | Basic | | | 11.64 | | | 9.19 | (i) | | 5.28 | | | 4.59 | | | 3.27 | |
| | | Diluted | | | 10.74 | | | 8.18 | (i) | | 5.05 | | | 4.15 | | | 2.66 | |
| BALANCE SHEET DATA (END OF YEAR): | | | | | | | | | | | | | | | | |
| | Cash | | $ | 124,989 | | $ | 41,678 | | $ | — | | $ | — | | $ | 67,608 | |
| | Inventory | | | 1,364,133 | | | 844,737 | | | 629,663 | | | 532,559 | | | 405,095 | |
| | Total assets | | | 1,892,847 | | | 995,289 | | | 696,228 | | | 594,568 | | | 525,591 | |
| | Total debt | | | 739,100 | | | 395,238 | | | 252,349 | | | 215,000 | | | 215,000 | |
| | Stockholders' equity | | | 799,515 | | | 351,195 | | | 270,538 | | | 234,662 | | | 199,224 | |
| SUPPLEMENTAL FINANCIAL DATA: | | | | | | | | | | | | | | | | |
| | Cash provided by/(used in): | | | | | | | | | | | | | | | | |
| | | Operating activities | | $ | 59,464 | | $ | (25,578 | ) | $ | (18,726 | ) | $ | 34,080 | | $ | 27,149 | |
| | | Investing activities | | | (314,633 | ) | | (72,835 | ) | | (11,805 | ) | | (98,004 | ) | | (23,741 | ) |
| | | Financing activities | | | 338,480 | | | 140,091 | | | 30,531 | | | (3,684 | ) | | 62,933 | |
| | EBIT (ii) | | | 245,060 | | | 157,185 | (i) | | 99,189 | | | 86,013 | | | 56,525 | |
| | EBITDA (ii) | | | 254,513 | | | 166,438 | (i) | | 106,041 | | | 91,521 | | | 59,794 | |
| | Interest incurred | | | 51,171 | | | 35,825 | | | 30,897 | | | 26,874 | | | 21,259 | |
| | EBIT/interest incurred | | | 4.79 | x | | 4.39 | x | | 3.21 | x | | 3.20 | x | | 2.66 | x |
| | EBITDA/interest incurred | | | 4.97 | x | | 4.65 | x | | 3.43 | x | | 3.41 | x | | 2.81 | x |
| FINANCIAL STATISTICS (iii): | | | | | | | | | | | | | | | | |
| | Total debt as a percentage of total debt and stockholders' equity | | | 48.0 | % | | 53.0 | % | | 48.3 | % | | 47.8 | % | | 51.9 | % |
| | Asset turnover | | | 1.83 | x | | 2.13 | x | | 2.37 | x | | 2.49 | x | | 2.11 | x |
| | EBIT margin | | | 9.3 | % | | 8.7 | % | | 6.5 | % | | 6.2 | % | | 5.8 | % |
| | Return on average assets (pre-tax) | | | 17.0 | % | | 18.6 | % | | 15.4 | % | | 15.4 | % | | 12.2 | % |
| | Return on average capital (pre-tax) | | | 21.4 | % | | 24.8 | % | | 20.4 | % | | 19.9 | % | | 15.3 | % |
| | Return on average equity | | | 21.3 | % | | 24.1 | % | | 17.3 | % | | 17.0 | % | | 12.3 | % |
- (i)
- Fiscal 2001 results include the effect of a $733 (net of taxes) extraordinary loss on the early extinguishment of debt. Excluding the extraordinary item, net income and diluted net income per share for fiscal 2001 are $75,609 and $8.26, respectively.
- (ii)
- EBIT and EBITDA: EBIT (earnings before interest and taxes) equals net income before (a) previously capitalized interest amortized to costs and expenses; and (b) income taxes. EBITDA (earnings before interest, taxes, depreciation and amortization) is calculated by adding depreciation and amortization for the period to EBIT. EBITDA is commonly used to analyze companies on the basis of operating performance, leverage and liquidity. EBIT and EBITDA are not intended to represent cash flows for the period nor have they been presented as an alternative to net income as an indicator of operating performance. EBITDA is a non-GAAP measure and may not be comparable to similarly titled measures reported by other companies.
- (iii)
- Asset turnover equals (total revenue divided by average total assets); EBIT margin equals (EBIT divided by total revenues); Return on average assets equals (EBIT divided by average total assets); Return on average capital equals (EBIT divided by average total debt plus stockholders' equity); Return on average equity equals (net income divided by average stockholders' equity).
22
Management's Responsibility for Financial
Reporting and System of Internal Controls
Beazer Homes USA, Inc.
FINANCIAL STATEMENTS
The accompanying consolidated financial statements are the responsibility of the Company's management. The consolidated financial statements have been prepared in accordance with accounting principles generally accepted in the United States of America and, as such, include amounts based on management's best estimates and judgments.
The Company's consolidated financial statements have been audited by Deloitte & Touche LLP, independent auditors, who were given unrestricted access to all financial records and related data. The Company believes that all representations made to the independent auditors during their audit were valid and appropriate. Deloitte & Touche LLP's audit report included on page 53 provides an independent opinion as to the fairness of presentation of the consolidated financial statements.
SYSTEM OF INTERNAL CONTROLS
The Company maintains a system of internal controls over financial recording and reporting which is designed to provide reasonable assurance that assets are safeguarded and transactions are recorded in accordance with the Company's policies and procedures and which ultimately will result in the preparation of reliable financial statements. The system contains self-monitoring mechanisms, and actions are taken to correct deficiencies as they are identified. Even an effective internal control system has inherent limitations—including the possibility of the overriding of controls—and therefore can provide only reasonable, not absolute, assurance with respect to financial statement preparation.
The Company has assessed its internal control system as of September 30, 2002, in relation to criteria for effective internal control over preparation of its published annual (and interim) financial statements described in "Internal Control—Integrated Framework," issued by the Committee of Sponsoring Organizations of the Treadway Commissions. Based on this assessment, the Company believes that, as of September 30, 2002, its system of internal controls over the preparation of its published annual (and interim) financial statements met these criteria. Deloitte & Touche LLP also reviews and tests the effectiveness of these systems to the extent they deem necessary to determine the extent of audit procedures needed in connection with their audit of the consolidated financial statements.
The Audit Committee of the Board of Directors, which is composed of Directors who are not officers or employees of the Company, provides oversight to the financial reporting process. The independent auditors have unrestricted access to the Audit Committee.

Ian J. McCarthy
President and Chief Executive Officer | | |

David S. Weiss
Executive Vice President and Chief Financial Officer |
|
|

Michael Rand
Senior Vice President, Corporate Controller |
|
|
23
Operations Review/Management's Discussion and Analysis
Beazer Homes USA, Inc.
GENERAL
Homebuilding: We design, sell and build single-family homes in the following regions and states:
Southeast
Florida
Georgia
Mississippi
North Carolina
South Carolina
Tennessee | | West
Arizona
California
Colorado
Nevada | | Central
Texas | | Mid-Atlantic
Maryland
New Jersey
Pennsylvania
Virginia | | Midwest
Indiana
Kentucky
Ohio |
We intend, subject to market conditions, to expand in our current markets and to consider entering new markets either through expansion from existing markets or through acquisitions of established regional home-builders. We seek to be one of the five largest builders in each of the markets that we serve.
Most of our homes are designed to appeal to entry-level and first time move-up homebuyers, and are generally offered for sale in advance of their construction. Once a sales contract has been signed, we classify the transaction as a "new order" and include the home in "backlog." Such sales contracts are usually subject to certain contingencies such as the buyer's ability to qualify for financing. We do not recognize revenue on homes in backlog until the sales are closed and the risk of ownership has been transferred to the buyer.
Crossmann Acquisition: On April 16, 2002, the stockholders of Beazer Homes USA, Inc. ("Beazer" or "the Company") and Crossmann Communities, Inc. ("Crossmann") approved the merger of Crossmann into a wholly owned subsidiary of Beazer, and the merger became effective on April 17, 2002. Crossmann builds single-family homes in Indiana—its home base—with operations in Kentucky, Mississippi, North Carolina, Ohio, South Carolina and Tennessee and was a leading regional builder in these markets prior to the merger. We have included Crossmann's operating results in our consolidated financial statements since April 1, 2002, less an imputed interest charge on the cash portion of the merger consideration for the period April 1, 2002 through April 16, 2002.
The aggregate merger consideration we paid consisted of approximately 3.9 million shares of Beazer common stock (approximately $308.6 million) and $191.6 million in cash. In connection with the merger, we also repaid approximately $125.4 million of Crossmann debt. The cash portion of the merger consideration and the repayment of Crossmann debt upon the merger were funded from proceeds from our issuance of $350 million 83/8% Senior Notes due 2012 in a private placement on April 17, 2002.
Ancillary Businesses: We have established several businesses to support our core homebuilding operations. We operate design centers in the majority of our markets. Through design centers, homebuyers can choose non-structural upgrades and options for their new home. We also provide mortgage origination services for our homebuyers through Beazer Mortgage Corporation ("BMC") and, subsequent to April 17, 2002, through Crossmann Mortgage Corp. ("CMC"). BMC and CMC originate, process and broker mortgages to third party investors. BMC and CMC generally do not retain or service the mortgages that they broker. We also provide title services to our homebuyers in many of our markets. We will continue to evaluate opportunities to provide other ancillary services to our homebuyers.
Critical Accounting Policies: Some of our critical accounting policies require the use of judgment in their application or require estimates of inherently uncertain matters. Although our accounting policies are in compliance with accounting principles generally accepted in the United States of America, a change in the facts and circumstances of the underlying transactions could significantly change the application of the accounting policies and the resulting financial statement impact. Listed below are those policies that we believe are critical and require the use of complex judgment in their application.
24
Impairment of Long Lived Assets: Housing projects and land held for development and sale are stated at the lower of cost (including direct construction costs, capitalized indirect costs, capitalized interest and real estate taxes) or net realizable value. Property and equipment is carried at cost less accumulated depreciation. We assess these assets for recoverability in accordance with the provisions of Statement of Financial Accounting Standards ("SFAS") No. 121, "Accounting for the Impairment of Long-Lived Assets and for Long-Lived Assets to Be Disposed Of." SFAS No. 121 requires that long-lived assets be reviewed for impairment whenever events or changes in circumstances indicate that the carrying amount of an asset may not be recoverable. Recoverability of assets is measured by comparing the carrying amount of an asset to future undiscounted net cash flows expected to be generated by the asset. These evaluations for impairment are significantly impacted by estimates of revenues, costs and expenses and other factors. If these assets are considered to be impaired, the impairment loss to be recognized is measured by the amount by which the carrying amount of the assets exceeds the fair value of the assets.
Goodwill: We adopted the provisions of SFAS No. 142, "Goodwill and Other Intangible Assets," effective October 1, 2001. Upon the adoption of SFAS No. 142, goodwill is no longer subject to amortization. Goodwill is subject to at least an annual assessment for impairment by applying a fair value-based test. If the carrying amount exceeds the fair value, goodwill is impaired. We continually evaluate whether events and circumstances have occurred that indicate the remaining balance of goodwill may not be recoverable. In evaluating impairment, we estimate the sum of the expected future cash flows derived from such goodwill. Such evaluations for impairment are significantly impacted by estimates of future revenues, costs and expenses and other factors. If the goodwill is considered to be impaired, the impairment loss to be recognized is measured by the amount by which the carrying amount of the goodwill exceeds the fair value of the expected future cash flows.
Homebuilding Revenues and Costs: Revenue from the sale of a home is recognized when the closing has occurred and the risk of ownership is transferred to the buyer. All associated homebuilding costs are charged to cost of sales in the period when the revenues from home closings are recognized. Homebuilding costs include land and land development costs (based upon an allocation of such costs, including costs to complete the development, or specific lot costs), home construction costs (including an estimate of costs, if any, to complete home construction), previously capitalized indirect costs (principally for construction supervision), capitalized interest and estimated warranty costs. Sales commissions are included in selling, general and administrative expense when the closing has occurred. All other costs are expensed as incurred.
Value Created: We evaluate our financial performance and the financial performance of our operations usingValue Created, a variation of economic profit or economic value added.Value Created measures the extent to which we exceed our cost of capital. It is calculated as earnings before interest and taxes (EBIT), less a charge for all of the capital employed multiplied by our estimate of our minimum weighted average cost of capital (currently 14%). Most of our employees receive incentive compensation based upon a combination ofValue Created and the change inValue Created during the year. For key managers a portion of the incentive is put in a bank. This portion is always at risk and may be paid out over three years. We believe that ourValue Created system encourages managers to act like owners, rewards profitable growth and focuses attention on long-term loyalty and performance.
NEW ORDERS BY FISCAL YEAR:
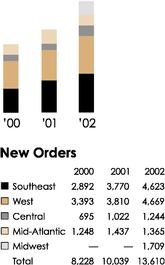
New orders increased in each of the last two fiscal years compared to the prior year. We believe that this increase in new orders was due to strong population growth fueling demand in the first-time buyer segment, our gains in market share, plus a favorable interest rate environment. New orders in the Southeast, West and Central regions were especially strong due to our commitment to the first-time buyer segment in these markets. Most of our new community openings in fiscal 2002 targeted this segment of the market. The fiscal 2002 increase also reflects the addition of our Midwest region through the April 2002 acquisition of Crossmann. The overall increase in new orders in 2001 is attributable to the growth of all our regions, especially the Southeast and Central regions.
25
The following tables present certain operating and financial data for the years discussed:
Year ended September 30,
| | 2002
| | 2001
| | 2000
|
|---|
| | Amount
| | % Change
| | Amount
| | % Change
| | Amount
|
|---|
| NUMBER OF NEW ORDERS, NET OF CANCELLATIONS(1): | | | | | | | | | | |
| | Southeast Region: | | | | | | | | | | |
| | | Florida | | 1,265 | | 16.7 | % | 1,084 | | 17.8 | % | 920 |
| | | Georgia | | 502 | | 22.4 | | 410 | | 64.7 | | 249 |
| | | North and South Carolina | | 2,177 | | 45.4 | | 1,497 | | 13.8 | | 1,316 |
| | | Tennessee/Mississippi | | 679 | | (12.8 | ) | 779 | | 91.4 | | 407 |
| | |
| |
| |
| |
| |
|
| | | | Total Southeast | | 4,623 | | 22.6 | | 3,770 | | 30.4 | | 2,892 |
| | |
| |
| |
| |
| |
|
| | West Region: | | | | | | | | | | |
| | | Arizona | | 1,294 | | 10.1 | | 1,175 | | 6.9 | | 1,099 |
| | | California | | 2,239 | | 26.7 | | 1,767 | | (4.8 | ) | 1,857 |
| | | Colorado | | 235 | | 32.8 | | 177 | | n/a | | — |
| | | Nevada | | 901 | | 30.4 | | 691 | | 58.1 | | 437 |
| | |
| |
| |
| |
| |
|
| | | | Total West | | 4,669 | | 22.5 | | 3,810 | | 12.3 | | 3,393 |
| | |
| |
| |
| |
| |
|
| | Central Region: | | | | | | | | | | |
| | | Texas | | 1,244 | | 21.7 | | 1,022 | | 47.1 | | 695 |
| | |
| |
| |
| |
| |
|
| | Mid-Atlantic Region: | | | | | | | | | | |
| | | Maryland | | 322 | | (16.4 | ) | 385 | | 18.1 | | 326 |
| | | New Jersey/Pennsylvania | | 280 | | (15.2 | ) | 330 | | 48.6 | | 222 |
| | | Virginia | | 763 | | 5.7 | | 722 | | 3.1 | | 700 |
| | |
| |
| |
| |
| |
|
| | | | Total Mid-Atlantic | | 1,365 | | (5.0 | ) | 1,437 | | 15.1 | | 1,248 |
| | |
| |
| |
| |
| |
|
| | Midwest Region: | | | | | | | | | | |
| | | Indiana | | 1,211 | | n/a | | — | | — | | — |
| | | Kentucky | | 114 | | n/a | | — | | — | | — |
| | | Ohio | | 384 | | n/a | | — | | — | | — |
| | |
| |
| |
| |
| |
|
| | | | Total Midwest | | 1,709 | | n/a | | — | | — | | — |
| | |
| |
| |
| |
| |
|
| | | | | Total | | 13,610 | | 35.6 | % | 10,039 | | 22.0 | % | 8,228 |
| | |
| |
| |
| |
| |
|
| BACKLOG AT END OF YEAR: | | | | | | | | | | |
| | Southeast Region: | | | | | | | | | | |
| | | Florida | | 670 | | 24.8 | % | 537 | | 37.0 | % | 392 |
| | | Georgia | | 149 | | 24.2 | | 120 | | 3.4 | | 116 |
| | | North and South Carolina | | 823 | | 167.2 | | 308 | | 18.5 | | 260 |
| | | Tennessee/Mississippi | | 225 | | (18.2 | ) | 275 | | 157.0 | | 107 |
| | |
| |
| |
| |
| |
|
| | | | Total Southeast | | 1,867 | | 50.6 | | 1,240 | | 41.7 | | 875 |
| | |
| |
| |
| |
| |
|
| | West Region: | | | | | | | | | | |
| | | Arizona | | 615 | | 15.6 | | 532 | | 39.6 | | 381 |
| | | California | | 733 | | 32.5 | | 553 | | (5.6 | ) | 586 |
| | | Colorado | | 54 | | (72.3 | ) | 195 | | n/a | | — |
| | | Nevada | | 431 | | 32.2 | | 326 | | 79.1 | | 182 |
| | |
| |
| |
| |
| |
|
| | | | Total West | | 1,833 | | 14.1 | | 1,606 | | 39.8 | | 1,149 |
| | |
| |
| |
| |
| |
|
| | Central Region: | | | | | | | | | | |
| | | Texas | | 507 | | 32.0 | | 384 | | 48.3 | | 259 |
| | |
| |
| |
| |
| |
|
| | Mid-Atlantic Region: | | | | | | | | | | |
| | | Maryland | | 149 | | (14.9 | ) | 175 | | 36.7 | | 128 |
| | | New Jersey/Pennsylvania | | 139 | | 2.2 | | 136 | | 23.6 | | 110 |
| | | Virginia | | 412 | | (5.5 | ) | 436 | | 6.9 | | 408 |
| | |
| |
| |
| |
| |
|
| | | | Total Mid-Atlantic | | 700 | | (6.3 | ) | 747 | | 15.6 | | 646 |
| | |
| |
| |
| |
| |
|
| | Midwest Region: | | | | | | | | | | |
| | | Indiana | | 1,079 | | n/a | | — | | — | | — |
| | | Kentucky | | 77 | | n/a | | — | | — | | — |
| | | Ohio | | 456 | | n/a | | — | | — | | — |
| | |
| |
| |
| |
| |
|
| | | | Total Midwest | | 1,612 | | n/a | | — | | — | | — |
| | |
| |
| |
| |
| |
|
| | | | | Total | | 6,519 | | 63.9 | % | 3,977 | | 35.8 | % | 2,929 |
| | |
| |
| |
| |
| |
|
- (1)
- New orders for 2002 and 2001 do not include 2,535 and 68 homes in backlog, respectively, from acquired operations.
(n/a) Percentage change is not applicable. We entered Indiana, Kentucky, Mississippi and Ohio in April 2002 when we acquired Crossmann Communities. We entered Colorado in August 2001 when we acquired Sanford Homes.
26
Year ended September 30,
| | 2002
| | 2001
| | 2000
|
|---|
| | Amount
| | % Change
| | Amount
| | % Change
| | Amount
|
|---|
| NUMBER OF CLOSINGS: | | | | | | | | | | | | | |
| | Southeast Region: | | | | | | | | | | | | | |
| | | Florida | | | 1,132 | | 19.4 | % | | 948 | | 3.4 | % | | 917 |
| | | Georgia | | | 473 | | 16.5 | | | 406 | | 110.4 | | | 193 |
| | | North and South Carolina | | | 2,103 | | 45.1 | | | 1,449 | | (2.5 | ) | | 1,486 |
| | | Tennessee/Mississippi | | | 867 | | 41.9 | | | 611 | | 45.5 | | | 420 |
| | |
| |
| |
| |
| |
|
| | | | Total Southeast | | | 4,575 | | 34.0 | | | 3,414 | | 13.2 | | | 3,016 |
| | |
| |
| |
| |
| |
|
| | West Region: | | | | | | | | | | | | | |
| | | Arizona | | | 1,211 | | 18.3 | | | 1,024 | | (13.2 | ) | | 1,180 |
| | | California | | | 2,059 | | 14.4 | | | 1,800 | | 22.0 | | | 1,475 |
| | | Colorado | | | 376 | | 817.1 | | | 41 | | n/a | | | — |
| | | Nevada | | | 796 | | 45.5 | | | 547 | | 45.9 | | | 375 |
| | |
| |
| |
| |
| |
|
| | | | Total West | | | 4,442 | | 30.2 | | | 3,412 | | 12.6 | | | 3,030 |
| | |
| |
| |
| |
| |
|
| | Central Region: | | | | | | | | | | | | | |
| | | Texas | | | 1,121 | | 25.0 | | | 897 | | 39.7 | | | 642 |
| | |
| |
| |
| |
| |
|
| Mid-Atlantic Region: | | | | | | | | | | | | | |
| | | Maryland | | | 348 | | 3.0 | | | 338 | | (4.0 | ) | | 352 |
| | | New Jersey/Pennsylvania | | | 277 | | (8.9 | ) | | 304 | | 38.2 | | | 220 |
| | | Virginia | | | 787 | | 13.4 | | | 694 | | 16.2 | | | 597 |
| | |
| |
| |
| |
| |
|
| | | | Total Mid-Atlantic | | | 1,412 | | 5.7 | | | 1,336 | | 14.3 | | | 1,169 |
| | |
| |
| |
| |
| |
|
| | Midwest Region: | | | | | | | | | | | | | |
| | | Indiana | | | 1,448 | | n/a | | | — | | — | | | — |
| | | Kentucky | | | 103 | | n/a | | | — | | — | | | — |
| | | Ohio | | | 502 | | n/a | | | — | | — | | | — |
| | |
| |
| |
| |
| |
|
| | | | Total Midwest | | | 2,053 | | n/a | | | — | | — | | | — |
| | |
| |
| |
| |
| |
|
| | | | | Total | | | 13,603 | | 50.2 | % | | 9,059 | | 15.3 | % | | 7,857 |
| | |
| |
| |
| |
| |
|
| HOMEBUILDING REVENUES (IN THOUSANDS): | | | | | | | | | | | | | |
| | Southeast Region | | $ | 759,646 | | 25.4 | % | $ | 605,860 | | 17.0 | % | $ | 517,879 |
| | West Region | | | 994,120 | | 41.4 | | | 703,196 | | 17.6 | | | 597,990 |
| | Central Region | | | 174,816 | | 22.0 | | | 143,288 | | 25.6 | | | 114,119 |
| | Mid-Atlantic Region | | | 380,296 | | 20.1 | | | 316,725 | | 18.1 | | | 268,208 |
| | Midwest Region | | | 286,032 | | n/a | | | — | | — | | | — |
| | |
| |
| |
| |
| |
|
| | | Total | | $ | 2,594,910 | | 46.7 | % | $ | 1,769,069 | | 18.1 | % | $ | 1,498,196 |
| | |
| |
| |
| |
| |
|
| AVERAGE SALES PRICE PER HOME CLOSED (IN THOUSANDS): | | | | | | | | | | | | | |
| | Southeast Region | | $ | 166.0 | | (6.5 | )% | $ | 177.5 | | 3.4 | % | $ | 171.7 |
| | West Region | | | 223.8 | | 8.6 | | | 206.1 | | 4.4 | | | 197.4 |
| | Central Region | | | 155.9 | | (2.4 | ) | | 159.7 | | (10.2 | ) | | 177.8 |
| | Mid-Atlantic Region | | | 269.3 | | 13.6 | | | 237.1 | | 3.4 | | | 229.4 |
| | Midwest Region | | | 139.3 | | n/a | | | — | | — | | | — |
| | Company Average | | | 190.8 | | (2.3 | ) | | 195.3 | | 2.4 | | | 190.7 |
| NUMBER OF ACTIVE SUBDIVISIONS AT YEAR END: | | | | | | | | | | | | | |
| | Southeast Region | | | 188 | | 51.6 | % | | 124 | | 5.1 | % | | 118 |
| | West Region | | | 73 | | (15.1 | ) | | 86 | | 26.5 | | | 68 |
| | Central Region | | | 34 | | 9.7 | | | 31 | | 10.7 | | | 28 |
| | Mid-Atlantic Region | | | 35 | | (12.5 | ) | | 40 | | (2.4 | ) | | 41 |
| | Midwest Region | | | 138 | | n/a | | | — | | — | | | — |
| | |
| |
| |
| |
| |
|
| | | Total | | | 468 | | 66.5 | % | | 281 | | 10.2 | % | | 255 |
| | |
| |
| |
| |
| |
|
27
The fundamentals that drive sales activity are numerous and varied. On a macro level, low unemployment and low mortgage interest rates each contribute to a positive general homebuilding market environment. Our ability to stay ahead of changing customer preferences and local demographic trends with our product mix and to maintain adequate product supply (as measured by the number of active subdivisions) contributes locally to new order trends.
Backlog: The increases in unit backlog in each of the past two fiscal years reflect the favorable homebuilding environment driving new order activity and our ability to gain market share. The average sales price of homes in backlog increased at September 30, 2002 to $198,400 from $195,000 at September 30, 2001. The average price of homes in backlog at September 30, 2002 for Crossmann is $141,000 and excluding Crossmann, the average price of homes in backlog is $226,800. The increase in the overall average price in backlog is due to our ability to raise prices in most markets, especially in our West and Mid-Atlantic regions and an increased percentage of homes in backlog from the higher priced regions of the West and Mid-Atlantic. The average sales price of homes in backlog at September 30, 2001 decreased as compared to September 30, 2000, due to our increased expansion in the first-time buyer segment, where sales prices are generally lower.
SEASONALITY AND QUARTERLY VARIABILITY
Beazer's homebuilding operating cycle generally reflects escalating new order activity in our second and third fiscal quarters and increased closings in our third and fourth fiscal quarters. Fiscal 2002 results include new orders and closings for Crossmann from April 1, 2002, resulting in an increase in new orders and in closings for the third and fourth fiscal quarters. We believe that the typical seasonality reflects the preference of homebuyers to shop for a new home in the spring, as well as the scheduling of construction to accommodate seasonal weather conditions.
The following chart presents certain quarterly operating data for our last twelve fiscal quarters and is indicative of this seasonality.

28
FINANCIAL RESULTS
The following table provides additional details of revenues and certain expenses included in our consolidated statements of operations (in thousands).
Year Ended September 30,
| | 2002
| | 2001
| | 2000
| |
|---|
| Revenues: | | | | | | | | | | |
| | Homebuilding | | $ | 2,594,910 | | $ | 1,769,069 | | $ | 1,498,196 | |
| | Land and lot sales | | | 18,051 | | | 18,017 | | | 19,017 | |
| | Mortgage origination | | | 41,006 | | | 26,572 | | | 17,671 | |
| | Intercompany elimination—mortgage | | | (12,794 | ) | | (8,481 | ) | | (7,019 | ) |
| | |
| |
| |
| |
| Total revenue | | $ | 2,641,173 | | $ | 1,805,177 | | $ | 1,527,865 | |
| | |
| |
| |
| |
| Cost of home construction and land sales: | | | | | | | | | | |
| | Homebuilding | | $ | 2,109,756 | | $ | 1,438,101 | | $ | 1,248,099 | |
| | Land and lot sales | | | 15,452 | | | 14,595 | | | 14,838 | |
| | Intercompany elimination—mortgage | | | (12,794 | ) | | (8,481 | ) | | (7,019 | ) |
| | |
| |
| |
| |
| Total cost of home construction and land sales | | $ | 2,112,414 | | $ | 1,444,215 | | $ | 1,255,918 | |
| | |
| |
| |
| |
| Selling, general and administrative: | | | | | | | | | | |
| | Homebuilding operations | | $ | 269,655 | | $ | 190,551 | | $ | 157,794 | |
| | Mortgage origination operations | | | 22,929 | | | 14,947 | | | 10,826 | |
| | |
| |
| |
| |
| Total selling, general and administrative | | $ | 292,584 | | $ | 205,498 | | $ | 168,620 | |
| | |
| |
| |
| |
REVENUES
The increase in homebuilding revenues for fiscal 2002 compared to fiscal 2001 is the result of the addition of the Midwest region as a result of our April 2002 acquisition of Crossmann, an increase in the number of homes closed, and increased average sales prices in most of our markets.
In fiscal 2001, we experienced revenue increases in all of our regions due to an increase in the number of home closings. The decrease in the average sales price of homes closed in the Central Region is a result of our increased focus on the first-time buyer segment in Texas.
29
COST OF HOME CONSTRUCTION AND LAND SALES

The gross margin in fiscal 2002 includes approximately $16.3 million of costs related to purchase accounting adjustments for the Crossmann acquisition. Excluding such costs, gross margin for fiscal 2002 was 20.6%. The increase in gross margins, before purchase accounting, in each of the last two fiscal years is the result of a strong housing market, where we have been able to increase sales prices in most of our markets while overall costs remained stable. Our margin improvement also reflects our increased efficiency and the improved purchasing power that we have with our new size. Mortgage origination operations also contribute to gross margin improvements by directing payment of certain mortgage closing costs and discounts to BMC and CMC rather than a third party lender.
We executed several land sales during the past three fiscal years. We realized gross profits of $2.6 million, $3.4 million and $4.2 million on these land sales in fiscal 2002, 2001 and 2000, respectively.
SELLING, GENERAL AND ADMINISTRATIVE EXPENSE

During fiscal 2002, SG&A decreased as a percentage of revenue due to increased efficiency across an expanded base of operations.
During fiscal 2001, SG&A increased as a percentage of revenue due to higher management bonuses, the determination of which is related to the increase in profits rather than the increase in revenue, and increased insurance costs.
OTHER INCOME
Fiscal 2002 other income increased by $7.2 million compared to fiscal 2001 as a result of a $3.3 million gain on the sale of a portion of our equity interest in Homebuilders Financial Network, Inc., the entity providing management services to BMC, as well as increased joint venture income and increased income from our title operations.
Fiscal 2000 other income (expense) included $6.1 million in losses from and a write-down of our investment in Premier Communities, a joint venture providing affordable housing, which has been wound down.
30
MORTGAGE ORIGINATION OPERATIONS

During fiscal 2002, our capture rate (BMC and CMC originations as a percentage of total home closings) decreased due to the inclusion of CMC, whose capture rate for the period subsequent to April 1, 2002 was 64%.
Our capture rate is based on total closings. Our capture rate for BMC excluding non-financed closings was approximately 73%.
INCOME TAXES
Income taxes for fiscal 2002 were provided at the effective rate of 39.3% (39.0% for the period prior to the Crossmann acquisition and 39.5% post acquisition). Income taxes for fiscal 2001 and 2000 were provided at the effective rate of 39.0% in each year. The principal difference between our effective rate and the U.S. Federal statutory rate is state income taxes.
DERIVATIVE INSTRUMENTS AND HEDGING ACTIVITIES
Effective October 1, 2000, we adopted SFAS No. 133, "Accounting for Derivative Instruments and Hedging Activities," as amended. Upon adoption of this statement, we held no derivative instruments and accordingly recorded no transition adjustment. SFAS No. 133 establishes accounting and reporting standards for derivative instruments and for hedging activities by requiring that all derivatives be recognized in the balance sheet and measured at fair value. Gains or losses resulting from changes in the fair value of derivatives are recognized in earnings or recorded in other comprehensive income, and recognized in the income statement when the hedged item affects earnings, depending on the purpose of the derivatives and whether they qualify for hedge accounting treatment.
We are exposed to fluctuations in interest rates. We enter into derivative agreements to manage interest costs and hedge against risks associated with fluctuating interest rates. We do not enter into or hold derivatives for trading or speculative purposes. During the year ended September 30, 2001 we entered into interest rate swap agreements (the "Swap Agreements") to effectively fix the variable interest rate on our $100 million four-year Term Loan. The Swap Agreements mature in December 2004 on the same day as our Term Loan matures.
The Swap Agreements have been designated as cash flow hedges and, accordingly, are recorded at fair value in our consolidated balance sheet and the related gains or losses are deferred in stockholders' equity, net of taxes, as a component of other comprehensive income. Amounts to be received or paid as a result of the Swap Agreements are accrued and recognized as adjustments to interest related to the designated debt. The net effect of this accounting on our operating results is that interest on the variable-rate debt is generally recorded based on fixed interest rates. No portion of these hedges was considered ineffective for the year ended September 30, 2002. We expect to reclassify $2.1 million, net of taxes of $1.3 million, from other comprehensive loss to interest expense over the next twelve months.
As a result of the Swap Agreements, we have recorded a cumulative after-tax other comprehensive loss of $4.8 million as of September 30, 2002. The estimated fair value of the Swap Agreements, based on current market rates, approximated a liability of $7.9 million at September 30, 2002 and is included in other liabilities.
31
FINANCIAL CONDITION AND LIQUIDITY
In April 2002, we acquired Crossmann for approximately $500.2 million, of which we issued 3.9 million shares of Beazer common stock (approximately $308.6 million) and $191.6 million was paid in cash. In connection with the merger, we also repaid approximately $125.4 million of Crossmann debt resulting in total consideration paid of $625.6 million. The acquisition has been accounted for as a purchase and, accordingly, the purchase price has been tentatively allocated to reflect the fair value of assets and liabilities acquired. The cash portion of the acquisition and repayment of Crossmann debt was funded with the proceeds from a senior note offering.
In August 2001, we acquired the assets of the home-building operations of Sanford Homes of Colorado for approximately $68 million, of which $59 million was paid in cash and approximately $9 million for the assumption of accounts payable and accrued expenses. The acquisition has been accounted for as a purchase and, accordingly, the purchase price has been allocated to reflect the fair value of assets and liabilities acquired. The acquisition was funded through cash generated from operations and a portion of the proceeds from a senior note offering.
At September 30, 2002, we had the following long-term debt (in thousands):
Debt
| | Due
| | Amount
| |
|---|
| 83/8% Senior Notes | | April 2012 | | $ | 350,000 | |
| 85/8% Senior Notes | | May 2011 | | | 200,000 | |
| 87/8% Senior Notes | | April 2008 | | | 100,000 | |
| Term Loan | | December 2004 | | | 100,000 | |
| Unamortized discount | | | | | (10,900 | ) |
| | | | |
| |
| Total | | | | $ | 739,100 | |
| | | | |
| |
During fiscal 2001, we renewed and extended our $250 million revolving credit facility. The facility provides for up to $250 million of unsecured borrowings and bears interest at a fluctuating rate based upon the corporate base rate of interest announced by our lead bank, the federal funds rate, or LIBOR. All outstanding borrowings under the facility will be due in September 2004. The credit facility contains various operating and financial covenants. At September 30, 2002, we had no outstanding borrowings under the revolving credit facility. We fulfill our short-term cash requirements with cash generated from our operations and funds available from our unsecured revolving credit facility. Available borrowings under this credit facility are limited to certain percentages of homes under contract, unsold homes, substantially improved lots and accounts receivable. At September 30, 2002, we had available borrowings of $177 million under the credit facility.
During fiscal 2001, we entered into a $100 million four-year term loan with a group of banks (the "Term Loan"). The Term Loan matures in December 2004 and bears interest (3.44% at September 30, 2002) based upon the corporate base rate of interest announced by our lead bank, the federal funds rate or LIBOR. The Term Loan contains various operating and financial covenants. All proceeds from the Term Loan were used to pay down then outstanding borrowings under our $250 million revolving credit facility.
During fiscal 2001, we entered into Swap Agreements to manage interest costs and hedge against risks associated with fluctuating interest rates related to the Term Loan. These swaps effectively fix the interest rate (before spread) on the $100 million Term Loan as follows: $75 million is fixed at 5.925% per annum; $10 million is fixed at 5.17% per annum; $5 million is fixed at 5.50% per annum; and $10 million is fixed at 5.055% per annum. The Swap Agreements expire in December 2004, when the Term Loan matures.
In April 2002, we issued $350 million 83/8% Senior Notes due April 2012 (the "Original Notes") in a private placement pursuant to Rule 144A and Regulation S promulgated under the Securities Act of 1933, as amended. In September 2002, we completed an offer to exchange all of the outstanding Original Notes for an equal amount of 83/8% Senior Notes due 2012 (the "83/8% Senior Notes"), which
32
were registered under the Securities Act of 1933. The terms of the 83/8% Senior Notes were substantially identical to the terms of the Original Notes. The Original Notes were issued at a price of 100% of their face amount (before underwriting discount and other issuance costs). Interest on the 83/8% Senior Notes is payable semiannually. We may, at our option, redeem the 83/8% Senior Notes in whole or in part at any time after April 2007, initially at 104.188% of the principal amount, declining to 100% of the principal amount after April 2010. A portion of such notes may also be redeemed prior to April 2005 under certain conditions. We used the proceeds from the issuance of the 83/8% Senior Notes to fund the cash portion of the Crossmann acquisition, to repay Crossmann's outstanding net indebtedness, to reduce borrowings under our revolving credit facility at the time, and to pay related fees, commissions and other expenses.
In May 2001, we issued $200 million 85/8% Senior Notes due May 2011(the "85/8% Senior Notes") at a price of 99.178% of their face amount (before underwriting discount and other issuance costs). Interest on the 85/8% Senior Notes is payable semiannually. We may, at our option, redeem the 85/8% Senior Notes in whole or in part at any time after May 2006, initially at 104.3125% of the principal amount, and declining to 100% of the principal amount after May 2009. A portion of such notes may also be redeemed prior to May 2004 under certain conditions. We used a portion of the proceeds from the issuance of the 85/8% Senior Notes to redeem $115 million of our 9% Senior Notes which were due in March 2004. As a result of this redemption of the 9% Senior Notes, we recorded a pre-tax extraordinary charge during fiscal 2001 of $1.2 million for the writeoff of associated unamortized debt issuance costs.
We have also previously issued $100 million of 87/8% Senior Notes due in April 2008 (the "87/8% Senior Notes"). Interest on the 87/8% Senior Notes is payable semiannually. We may, at our option, redeem the 87/8% Senior Notes in whole or in part at any time after March 2003, initially at 104.438% of the principal amount and declining to 100% of the principal after March 2006.
All significant subsidiaries of Beazer are full and unconditional guarantors of the Senior Notes and our obligations under the credit facility and Term Loan, and are jointly and severally liable for our obligations under the Senior Notes, credit facility and Term Loan. Each significant subsidiary is a wholly owned subsidiary of Beazer and Beazer has no independent assets or operations. Any subsidiaries of Beazer that are not guarantors are minor subsidiaries. Separate financial statements and other disclosures concerning each of the significant subsidiaries are not included, as the aggregate assets, liabilities, earnings and equity of the subsidiaries equal such amounts for Beazer on a consolidated basis and separate subsidiary financial statements are not considered material. The total assets, revenues and operating profit of the non-guarantor subsidiaries are in the aggregate immaterial to Beazer on a consolidated basis. Neither the credit facility, Term Loan nor the Senior Notes restrict distributions to Beazer by its subsidiaries. At September 30, 2002, we were in compliance with all covenants related to the credit facility, Term Loan and Senior Notes. At September 30, 2002, under the most restrictive covenants of each indenture, approximately $147.2 million of our retained earnings were available for cash dividends and for share repurchases.
Certain officers and employees transferred to us 31,072 and 6,977 shares of our common stock, during fiscal 2002 and 2001, respectively, valued at prevailing market prices. The transfers were accounted for as a stock repurchase by the Company. The common stock was transferred to us to satisfy such officers' and employees' tax obligations under certain stock incentive plans. During fiscal 2000, our Board of Directors approved a stock repurchase plan authorizing the purchase of up to 500,000 shares of our outstanding common stock. Using borrowings under our credit facility, we completed during fiscal 2000 the repurchase of 500,000 shares on the open market for an aggregate purchase price of $9.2 million.
We attempt to maintain approximately a four-year supply of land, with half or more controlled through options. At September 30, 2002, we controlled 76,778 lots (a 4.6-year supply based on pro-forma fiscal 2002 closings), with 34,791 lots owned and 41,987 lots under option. The increased land supply reflects the higher level of Crossmann's land base, which was over a six-year supply. At September 30, 2002, we had commitments with respect to option contracts with specific performance obligations of approximately $15.1 million, which is included on our consolidated balance sheet in other liabilities at
33
September 30, 2002. We expect to exercise all of our option contracts with specific performance obligations and, subject to market conditions, substantially all of our option contracts without specific performance obligations. As a result of the flexibility that these options provide us, upon a change in market conditions we may renegotiate the terms of the options prior to their ultimate exercise.

In January 2000, we filed a $300 million universal shelf registration statement on Form S-3 with the Securities and Exchange Commission. Pursuant to the filing, we may, from time to time over an extended period, offer new debt or equity securities. This shelf registration allows us to expediently access capital markets periodically. Our $200 million 85/8% Senior Notes were sold pursuant to this registration statement. The timing and amount of future offerings, if any, will depend on market and general business conditions.
We believe that our current borrowing capacity at September 30, 2002 and anticipated cash flows from operations are sufficient to meet our liquidity needs for the foreseeable future.
RECENT ACCOUNTING PRONOUNCEMENTS
In July 2001 the Financial Accounting Standards Board ("FASB") issued SFAS No. 141 "Business Combinations" and SFAS No. 142 "Goodwill and Other Intangible Assets." SFAS No. 141 requires business combinations initiated after June 30, 2001 to be accounted for using the purchase method of accounting and broadens the criteria for recording intangible assets separate from goodwill. SFAS No. 141 also prohibits the use of the pooling-of-interest method for all business combinations initiated after June 30, 2001.
SFAS No. 142 requires the use of an impairment approach to account for purchased goodwill and certain intangibles. Under an impairment approach, goodwill and certain intangibles are not amortized into results of operations, but instead are reviewed for impairment at least annually and written down and charged to results of operations only in periods in which the recorded value of goodwill and certain intangibles is more than its fair value.
SFAS No. 142 was generally effective for fiscal years beginning after December 15, 2001; however we early adopted this statement on October 1, 2001, the first day of our 2002 fiscal year, as permitted by the statement. The adoption of SFAS No. 142 resulted in the discontinuation of amortization of goodwill previously recorded of $0.8 million annually. No impairment charges were recognized from the adoption of this statement.
Net income for the years ended September 30, 2001 and 2000 would have been $75.5 million and $44.2 million, respectively, after adding back goodwill amortization expensed during each such year.
SFAS No. 144, "Accounting for the Impairment of Long-Lived Assets," issued in August 2001 addresses accounting for and reporting of the impairment or disposal of long-lived assets. We adopted SFAS No. 144 on October 1, 2002, the beginning of fiscal 2003. We expect that the adoption of SFAS No. 144 will not have a significant impact on our financial position or results of operations. However, SFAS No. 144 may modify the presentation of the operating results from abandoned or disposed markets in our statement of operations in the future.
In April 2002, SFAS No. 145 "Rescission of SFAS No. 4, 44, 64 and Amendment of SFAS No. 13 and Technical Corrections" was issued. SFAS No. 145 prevents treatment as extraordinary, gains or losses on extinguishment of debt not meeting the criteria of Accounting Principles Board Opinion No. 30. SFAS No. 145 is effective for fiscal years beginning after May 15, 2002. The adoption of SFAS No. 145
34
will affect the classification of such amounts in the financial statements of subsequent periods and comparative prior periods. We have not elected to early adopt the provisions of SFAS No. 145 for this reporting period.
In June 2002, SFAS No. 146, "Accounting for Costs Associated with Exit or Disposal Activities," was issued. SFAS No. 146 addresses financial accounting and reporting for costs associated with exit or disposal activities and nullifies Emerging Issues Task Force ("EITF") Issue No. 94-3, "Liability Recognition for Certain Employee Termination Benefits and Other Costs to Exit an Activity (including certain costs incurred in a restructuring)." SFAS No. 146 requires recognition of a liability for a cost associated with an exit or disposal activity when the liability is incurred as opposed to when the entity commits to an exit plan under EITF No. 94-3. SFAS No. 146 is effective for exit or disposal activities initiated after December 31, 2002. We believe the adoption of SFAS No. 146 will not have a significant impact on our financial position or results of operations.
MARKET RISKS FOR FINANCIAL INSTRUMENTS
We are exposed to a number of market risks in the ordinary course of business. Our primary market risk exposure relates to fluctuations in interest rates. We do not believe that our exposure in this area is material to cash flows or earnings. During fiscal 2001 we entered into interest rate swap agreements with an aggregate notional amount of $100 million to manage our exposure to fluctuations in interest rates on our $100 million variable rate Term Loan maturing in December 2004. These swaps effectively fix the rate on this debt at 5.74%. We do not enter into or hold derivatives for trading or speculative purposes.
We have formally designated these agreements as cash flow hedges as discussed in Note 3 of the consolidated financial statements. The estimated fair value of the Swap Agreements, based on current market rates, approximated a liability of $7.9 million at September 30, 2002 and is included in other liabilities.
The estimated fair value of our fixed rate debt at September 30, 2002 was $652 million, compared to a carrying value of $639 million. In addition, the effect of a hypothetical one percentage point decrease in interest rates would increase the estimated fair value of the fixed rate debt instruments from $652 million to $693 million at September 30, 2002.
OUTLOOK
We are optimistic about our prospects for fiscal 2003 and confident about our long-term prospects. As a result of increased backlog at September 30, 2002, we expect home closings to increase in fiscal 2003. Based upon these factors we currently target achieving earnings of $12.25 per share for fiscal 2003. Over the long-term, we believe that projected population growth and household formation will drive demand for housing, especially in the growth states in which we operate. We continue to refine and improve the construction process with technology, invest in our people through education and explore new ways to expand our revenue base and reduce our costs using the Internet. All the while, we are maintaining financial discipline through the framework of ourValue Created incentive plan.
Forward-Looking Statements
Beazer Homes USA, Inc.
CAUTIONARY STATEMENT PURSUANT TO SAFE HARBOR PROVISIONS OF THE PRIVATE SECURITIES LITIGATION REFORM ACT OF 1995
Certain of the statements contained in this report, including those under "Outlook" and "Financial Condition and Liquidity," constitute "forward-looking statements" within the meaning of the federal securities laws. These statements include short-term and long-term targets for home closings and earnings per share. While we believe that these statements are accurate, our business is dependent upon general economic conditions and is subject to risks and uncertainties that could cause actual results to differ materially from those expressed in, or implied by, such statements. The most significant factors that could cause actual results to differ materially from those expressed in the forward-looking statements include, but are not limited to, the following:
- •
- Economic changes nationally or in one of our local markets,
- •
- Volatility of mortgage interest rates and inflation,
- •
- Increased competition,
- •
- Shortages of skilled labor or raw materials used in the production of houses,
- •
- Increased prices for labor, land and raw materials used in the production of houses,
35
- •
- Increased land development costs on projects under development,
- •
- Availability and cost of general liability and other insurance to manage risks,
- •
- Any delays in reacting to changing consumer preference in home design,
- •
- Terrorist acts and other acts of war,
- •
- Changes in consumer confidence,
- •
- Ability to effectively integrate acquired companies, including Crossmann,
- •
- Delays or difficulties in implementing our initiatives to reduce our production and overhead cost structure,
- •
- Delays in land development or home construction resulting from adverse weather conditions,
- •
- Potential delays or increased costs in obtaining necessary permits as a result of changes to laws, regulations, or governmental policies,
- •
- Changes in accounting policies, standards, guidelines or principles, as may be adopted by regulatory agencies as well as the Financial Accounting Standards Board,
- •
- Other factors over which we have little or no control.
Consolidated Statements of Income
Beazer Homes USA, Inc.
(dollars in thousands, except per share amounts)
Year ended September 30,
| | 2002
| | 2001
| | 2000
| |
|---|
| Total revenue | | $ | 2,641,173 | | $ | 1,805,177 | | $ | 1,527,865 | |
| Costs and expenses: | | | | | | | | | | |
| | Home construction and land sales | | | 2,112,414 | | | 1,444,215 | | | 1,255,918 | |
| | Amortization of previously capitalized interest | | | 43,001 | | | 33,235 | | | 27,704 | |
| | Selling, general and administrative | | | 292,584 | | | 205,498 | | | 168,620 | |
| | |
| |
| |
| |
| Operating income | | | 193,174 | | | 122,229 | | | 75,623 | |
| Other income/(expense), net | | | 8,885 | | | 1,721 | | | (4,138 | ) |
| | |
| |
| |
| |
| Income before income taxes and extraordinary item | | | 202,059 | | | 123,950 | | | 71,485 | |
| Provision for income taxes | | | 79,425 | | | 48,341 | | | 27,879 | |
| | |
| |
| |
| |
| Net income before extraordinary item | | | 122,634 | | | 75,609 | | | 43,606 | |
| Extraordinary item—loss on early extinguishment of debt (net of taxes of $469) | | | — | | | (733 | ) | | — | |
| | |
| |
| |
| |
| Net income | | $ | 122,634 | | $ | 74,876 | | $ | 43,606 | |
| | |
| |
| |
| |
| Weighted average number of shares (in thousands): | | | | | | | | | | |
| | Basic | | | 10,535 | | | 8,145 | | | 8,254 | |
| | Diluted | | | 11,415 | | | 9,156 | | | 8,630 | |
| Basic earnings per share: | | | | | | | | | | |
| | Net income before extraordinary item | | $ | 11.64 | | $ | 9.28 | | $ | 5.28 | |
| | Extraordinary item | | | — | | | (0.09 | ) | | — | |
| | |
| |
| |
| |
| | Net earnings | | $ | 11.64 | | $ | 9.19 | | $ | 5.28 | |
| | |
| |
| |
| |
| Diluted earnings per share: | | | | | | | | | | |
| | Net income before extraordinary item | | $ | 10.74 | | $ | 8.26 | | $ | 5.05 | |
| | Extraordinary item | | | — | | | (0.08 | ) | | — | |
| | |
| |
| |
| |
| | Net earnings | | $ | 10.74 | | $ | 8.18 | | $ | 5.05 | |
| | |
| |
| |
| |
See Notes to Consolidated Financial Statements.
36
Consolidated Balance Sheets
Beazer Homes USA, Inc.
(dollars in thousands, except per share amounts)
September 30,
| | 2002
| | 2001
| |
|---|
| ASSETS: | | | | | | | |
| | Cash and cash equivalents | | $ | 124,989 | | $ | 41,678 | |
| | Accounts receivable | | | 54,329 | | | 38,921 | |
| | Inventory | | | 1,364,133 | | | 844,737 | |
| | Deferred tax asset | | | 27,099 | | | 19,640 | |
| | Property, plant and equipment, net | | | 19,096 | | | 12,586 | |
| | Goodwill | | | 251,603 | | | 14,094 | |
| | Other assets | | | 51,598 | | | 23,633 | |
| | |
| |
| |
| | | Total Assets | | $ | 1,892,847 | | $ | 995,289 | |
| | |
| |
| |
LIABILITIES AND STOCKHOLDERS' EQUITY:
LIABILITIES: |
|
|
|
|
|
|
|
| | Trade accounts payable | | $ | 108,554 | | $ | 70,893 | |
| | Other liabilities | | | 245,678 | | | 177,963 | |
| | Revolving credit facility | | | — | | | — | |
| | Term Loan | | | 100,000 | | | 100,000 | |
| | Senior Notes (net of discount of $10,900 and $4,762, respectively) | | | 639,100 | | | 295,238 | |
| | |
| |
| |
| | | Total Liabilities | | | 1,093,332 | | | 644,094 | |
| | |
| |
| |
| STOCKHOLDERS' EQUITY: | | | | | | | |
| | Preferred stock (par value $.01 per share, 5,000,000 shares authorized, no shares issued) | | | — | | | — | |
| | Common stock (par value $.01 per share, 30,000,000 shares authorized, 16,725,673 and 12,422,935 issued, 12,895,597 and 8,623,931 outstanding) | | | 167 | | | 124 | |
| | Paid-in capital | | | 535,460 | | | 202,121 | |
| | Retained earnings | | | 338,604 | | | 215,970 | |
| | Treasury stock, at cost (3,830,076 and 3,799,004 shares) | | | (63,679 | ) | | (61,510 | ) |
| | Unearned restricted stock | | | (6,260 | ) | | (2,027 | ) |
| | Accumulated other comprehensive loss | | | (4,777 | ) | | (3,483 | ) |
| | |
| |
| |
| | | Total Stockholders' Equity | | | 799,515 | | | 351,195 | |
| | |
| |
| |
| Total Liabilities and Stockholders' Equity | | $ | 1,892,847 | | $ | 995,289 | |
| | |
| |
| |
See Notes to Consolidated Financial Statements.
37
Consolidated Statements of Stockholders' Equity
Beazer Homes USA, Inc.
(dollars in thousands)
| |
Preferred
Stock
| | Common
Stock
| | Paid-in
Capital
| | Retained
Earnings
| | Treasury
Stock
| | Unearned
Restricted
Stock
| | Accumulated Other Comprehensive Loss
| | Total
| |
|---|
| Balance, September 30, 1999 | | $ | — | | $ | 123 | | $ | 194,528 | | $ | 97,488 | | $ | (51,983 | ) | $ | (5,494 | ) | $ | — | | $ | 234,662 | |
| Net income | | | | | | | | | | | | 43,606 | | | | | | | | | | | | 43,606 | |
| Amortization of unearned restricted stock | | | | | | | | | 240 | | | | | | | | | 1,140 | | | | | | 1,380 | |
| Issuance of Bonus Stock | | | | | | | | | 111 | | | | | | | | | | | | | | | 111 | |
| Purchase of treasury stock (500,000 shares) | | | | | | | | | | | | | | | (9,221 | ) | | | | | | | | (9,221 | ) |
| Other | | | | | | | | | 255 | | | | | | | | | (255 | ) | | | | | — | |
| | |
| |
| |
| |
| |
| |
| |
| |
| |
| Balance, September 30, 2000 | | | — | | | 123 | | | 195,134 | | | 141,094 | | | (61,204 | ) | | (4,609 | ) | | — | | | 270,538 | |
| Comprehensive income: | | | | | | | | | | | | | | | | | | | | | | | | | |
| | Net income | | | | | | | | | | | | 74,876 | | | | | | | | | | | | 74,876 | |
| | Unrealized loss on interest rate swaps, net of tax of $2,228 | | | | | | | | | | | | | | | | | | | | | (3,483 | ) | | (3,483 | ) |
| | | | | | | | | | | | | | | | | | | | | | | |
| |
| Total comprehensive income | | | | | | | | | | | | | | | | | | | | | | | | 71,393 | |
| Amortization of unearned restricted stock | | | | | | | | | | | | | | | | | | 2,926 | | | | | | 2,926 | |
| Exercises of stock options | | | | | | 1 | | | 2,286 | | | | | | | | | | | | | | | 2,287 | |
| Issuance of Bonus Stock | | | | | | | | | 431 | | | | | | | | | 89 | | | | | | 520 | |
| Tax benefit from stock transactions | | | | | | | | | 3,837 | | | | | | | | | | | | | | | 3,837 | |
| Purchase of treasury stock (6,977 shares) | | | | | | | | | | | | | | | (306 | ) | | | | | | | | (306 | ) |
| Other | | | | | | | | | 433 | | | | | | | | | (433 | ) | | | | | — | |
| | |
| |
| |
| |
| |
| |
| |
| |
| |
| Balance, September 30, 2001 | | | — | | | 124 | | | 202,121 | | | 215,970 | | | (61,510 | ) | | (2,027 | ) | | (3,483 | ) | | 351,195 | |
| Comprehensive income: | | | | | | | | | | | | | | | | | | | | | | | | | |
| | Net income | | | | | | | | | | | | 122,634 | | | | | | | | | | | | 122,634 | |
| | Unrealized loss on interest rate swaps, net of tax of $845 | | | | | | | | | | | | | | | | | | | | | (1,294 | ) | | (1,294 | ) |
| | | | | | | | | | | | | | | | | | | | | | | |
| |
| Total comprehensive income | | | | | | | | | | | | | | | | | | | | | | | | 121,340 | |
| Amortization of unearned restricted stock | | | | | | | | | | | | | | | | | | 2,365 | | | | | | 2,365 | |
| Exercises of stock options | | | | | | 3 | | | 5,159 | | | | | | | | | | | | | | | 5,162 | |
| Issuance of Bonus Stock | | | | | | 1 | | | 813 | | | | | | | | | | | | | | | 814 | |
| Tax benefit from stock transactions | | | | | | | | | 12,235 | | | | | | | | | | | | | | | 12,235 | |
| Issuance of restricted stock (79,337 shares) | | | | | | | | | 6,281 | | | | | | | | | (6,281 | ) | | | | | — | |
| Stock issued for Crossmann acquisition (3,857,166 shares) | | | | | | 39 | | | 308,534 | | | | | | | | | | | | | | | 308,573 | |
| Purchase of treasury stock (31,072 shares) | | | | | | | | | | | | | | | (2,169 | ) | | | | | | | | (2,169 | ) |
| Other | | | | | | | | | 317 | | | | | | | | | (317 | ) | | | | | — | |
| | |
| |
| |
| |
| |
| |
| |
| |
| |
| Balance, September 30, 2002 | | $ | — | | $ | 167 | | $ | 535,460 | | $ | 338,604 | | $ | (63,679 | ) | $ | (6,260 | ) | $ | (4,777 | ) | $ | 799,515 | |
| | |
| |
| |
| |
| |
| |
| |
| |
| |
See Notes to Consolidated Financial Statements.
38
Consolidated Statements of Cash Flows
Beazer Homes USA, Inc.
(dollars in thousands)
Year ended September 30,
| | 2002
| | 2001
| | 2000
| |
|---|
| CASH FLOWS FROM OPERATING ACTIVITIES: | | | | | | | | | | |
| | Net income | | $ | 122,634 | | $ | 74,876 | | $ | 43,606 | |
| | Adjustments to reconcile net income to net cash provided/(used) by operating activities: | | | | | | | | | | |
| | | Depreciation and amortization | | | 9,453 | | | 9,253 | | | 6,852 | |
| | | Loss on early extinguishment of debt | | | — | | | 1,202 | | | — | |
| | | Deferred income tax benefit | | | (6,613 | ) | | (7,906 | ) | | (3,792 | ) |
| | | Tax benefit from stock transactions | | | 12,235 | | | 3,837 | | | — | |
| | Changes in operating assets and liabilities, net of effects from acquisitions: | | | | | | | | | | |
| | | Increase in accounts receivable | | | (13,601 | ) | | (15,814 | ) | | (1,671 | ) |
| | | Increase in inventory | | | (152,990 | ) | | (153,668 | ) | | (97,104 | ) |
| | | Increase/(decrease) in other assets | | | 15,611 | | | (1,023 | ) | | 4,589 | |
| | | Increase/(decrease) in trade accounts payable | | | 23,481 | | | (26,676 | ) | | 28,571 | |
| | | Increase in other liabilities | | | 48,300 | | | 65,397 | | | 11,083 | |
| | | Change in book overdraft | | | — | | | 20,095 | | | (11,219 | ) |
| | | Other changes | | | 954 | | | 4,849 | | | 359 | |
| | |
| |
| |
| |
| Net cash provided/(used) by operating activities | | | 59,464 | | | (25,578 | ) | | (18,726 | ) |
| | |
| |
| |
| |
| CASH FLOWS FROM INVESTING ACTIVITIES: | | | | | | | | | | |
| | Capital expenditures | | | (8,213 | ) | | (5,906 | ) | | (3,775 | ) |
| | Proceeds from sale of fixed assets | | | 4,800 | | | — | | | — | |
| | Investment in unconsolidated joint ventures | | | (3,146 | ) | | (4,517 | ) | | (8,030 | ) |
| | Distributions from and proceeds from sale of unconsolidated joint ventures | | | 12,736 | | | — | | | — | |
| | Acquisitions, net of cash acquired | | | (320,810 | ) | | (62,412 | ) | | — | |
| | |
| |
| |
| |
| | Net cash used by investing activities | | | (314,633 | ) | | (72,835 | ) | | (11,805 | ) |
| | |
| |
| |
| |
| CASH FLOWS FROM FINANCING ACTIVITIES: | | | | | | | | | | |
| | Change in revolving credit facility | | | — | | | (40,000 | ) | | 40,000 | |
| | Proceeds from Term Loan | | | — | | | 100,000 | | | — | |
| | Proceeds from issuance of 83/8% Senior Notes | | | 343,000 | | | — | | | — | |
| | Proceeds from issuance of 85/8% Senior Notes | | | — | | | 198,356 | | | — | |
| | Redemption of 9% Senior Notes | | | — | | | (115,000 | ) | | — | |
| | Debt issuance costs | | | (7,513 | ) | | (5,246 | ) | | (248 | ) |
| | Proceeds from stock option exercises | | | 5,162 | | | 2,287 | | | — | |
| | Common share repurchases | | | (2,169 | ) | | (306 | ) | | (9,221 | ) |
| | |
| |
| |
| |
| Net cash provided by financing activities | | | 338,480 | | | 140,091 | | | 30,531 | |
| | |
| |
| |
| |
| Increase in cash and cash equivalents | | | 83,311 | | | 41,678 | | | — | |
| Cash and cash equivalents at beginning of year | | | 41,678 | | | — | | | — | |
| | |
| |
| |
| |
| Cash and cash equivalents at end of year | | $ | 124,989 | | $ | 41,678 | | $ | — | |
| | |
| |
| |
| |
| SUPPLEMENTAL CASH FLOW INFORMATION: | | | | | | | | | | |
| | Interest paid | | $ | 37,178 | | $ | 28,241 | | $ | 29,244 | |
| | Income taxes paid | | $ | 81,534 | | $ | 38,288 | | $ | 31,533 | |
| SUPPLEMENTAL DISCLOSURE OF NON-CASH ACTIVITY: | | | | | | | | | | |
| | Issuance of common stock related to acquisition | | $ | 308,573 | | $ | — | | $ | — | |
See Notes to Consolidated Financial Statements.
39
Notes To Consolidated Financial Statements
1SUMMARY OF SIGNIFICANT ACCOUNTING POLICIES
ORGANIZATION—Beazer Homes USA, Inc. is one of the ten largest single-family homebuilders in the United States based on number of homes closed. We design, sell and build single-family homes in over 35 markets located in Arizona, California, Colorado, Florida, Georgia, Indiana, Kentucky, Maryland, Mississippi, Nevada, New Jersey, North Carolina, Ohio, Pennsylvania, South Carolina, Tennessee, Texas and Virginia. We also provide mortgage origination services for our homebuyers through Beazer Mortgage Corporation ("BMC") and Crossmann Mortgage Corp. ("CMC"). In addition, we provide title services to our homebuyers in many of our markets.
PRESENTATION—Our homebuilding operations conducted across several geographic regions of the United States have similar characteristics; therefore, they have been aggregated into one reportable segment—the homebuilding segment.
The accompanying consolidated financial statements include the accounts of Beazer Homes USA, Inc., and our wholly owned subsidiaries. Intercompany balances have been eliminated in consolidation.
CASH AND CASH EQUIVALENTS—We consider investments with maturities of three months or less when purchased to be cash equivalents.
INVENTORY—Inventory consists solely of residential real estate developments. Interest, real estate taxes and development costs are capitalized in inventory during the development and construction period. Sold units are expensed on a specific identification basis, or on a relative sales value basis as cost of sales.
PROPERTY, PLANT AND EQUIPMENT—Property, plant and equipment are recorded at cost. Depreciation is computed on a straight line basis at rates based on estimated useful lives as follows:
| Buildings | | 15 years |
| Machinery and equipment | | 3—12 years |
| Information systems | | 3—5 years |
| Furniture and fixtures | | 3—5 years |
IMPAIRMENT OF LONG LIVED ASSETS—Housing projects and unimproved land held for future development (components of inventory) and property, plant and equipment are reviewed for recoverability whenever events or changes in circumstances indicate that the carrying amount of an asset may not be recoverable. Recoverability of assets is measured by comparing the carrying amount of an asset to future undiscounted net cash flows expected to be generated by the asset. If these assets are considered to be impaired, the impairment loss to be recognized is measured by the amount by which the carrying amount of the assets exceeds the fair value of the assets.
GOODWILL—Goodwill represents the excess of the purchase price over the fair value of assets acquired. We adopted Statement of Financial Accounting Standards ("SFAS") No. 142 "Goodwill and Other Intangible Assets" effective October 1, 2001, which resulted in the discontinuation of amortization of goodwill. Goodwill arising from our April 2002 and August 2001 acquisitions (Note 2) is not being amortized. Amortization expense of goodwill was $801,000 for each of the two years ended September 30, 2001 and 2000. Associated accumulated amortization was $5,588,000 at September 30, 2001. Goodwill is subject to at least an annual assessment for impairment by applying a fair value-based test. If the carrying amount exceeds the fair value, goodwill is impaired. We continually evaluate whether events and circumstances have occurred that indicate the remaining balance of goodwill may not be recoverable. In evaluating impairment, we estimate the sum of the expected future cash flows derived from such goodwill. Such evaluations for impairment are significantly impacted by estimates of future revenues, costs and expenses and other factors. If the goodwill is considered to be impaired, the
40
impairment loss to be recognized is measured by the amount by which the carrying amount of the goodwill exceeds the fair value of the expected future cash flows. We had no impairment of goodwill in fiscal 2002. Identifiable intangible assets, other than goodwill, are immaterial.
OTHER ASSETS—Other assets include prepaid expenses, debt issuance costs and investments in unconsolidated entities, including our interests in real estate development joint ventures.
INCOME TAXES—Deferred tax assets and liabilities are determined based on differences between financial reporting and tax bases of assets and liabilities and are measured using the enacted tax rates and laws that are expected to be in effect when the differences are expected to reverse.
OTHER LIABILITIES—Other liabilities include homebuyer deposits, land purchase obligations, accrued compensation, accrued warranty costs and various other accrued expenses.
INCOME RECOGNITION AND CLASSIFICATION OF COSTS—Income from the sale of residential units or land parcels is recognized when closings have occurred and the risk of ownership is transferred to the buyer. Sales commissions are included in selling, general and administrative expense.
Fees paid to BMC and CMC from third-party lenders are recognized as revenue concurrent with the closing on the sale of the residential unit. All expenses of operating BMC and CMC are included in selling, general and administrative expense in the period incurred.
Estimated future warranty costs are charged to cost of sales in the period when the revenues from home closings are recognized. Such estimated warranty costs generally range from 0.5% to 1.0% of total revenue and, based upon experience, have been sufficient to cover costs incurred.
Advertising costs of $28,237,000, $19,793,000 and $16,545,000 for fiscal years 2002, 2001 and 2000, respectively, are expensed as incurred.
EARNINGS PER SHARE—The computation of basic earnings per common share is determined by dividing net income applicable to common shareholders by the weighted average number of common shares outstanding during the period. Diluted earnings per share additionally gives effect (when dilutive) to stock options and other stock-based awards.
FAIR VALUE OF FINANCIAL INSTRUMENTS—The historical carrying amount of cash and cash equivalents and our Term Loan are reasonable estimates of their fair value. The fair value of our publicly held Senior Notes (Note 9) is estimated based on the quoted bid prices for these debt instruments and was approximately $652 million at September 30, 2002. The fair values of our interest rate swaps, based on current rates, approximated a liability of $7.9 million at September 30, 2002, and is included in other liabilities.
STOCK-BASED COMPENSATION—As described in Note 14, we have elected to follow the intrinsic value method to account for compensation expense related to the award of stock options and to furnish the pro forma disclosures required under SFAS No. 123, "Accounting for Stock-Based Compensation." Since our stock option awards are granted at prices no less than the fair-market value of the shares at the date of grant, no compensation expense is recognized for these awards. Compensation expense related to restricted stock awards is determined at the date of grant, recorded as unearned compensation expense and amortized over the vesting period of the awarded shares. The unearned compensation expense related to such awards is reflected as a reduction of stockholders' equity.
USE OF ESTIMATES—The preparation of financial statements in conformity with accounting principles generally accepted in the United States of America requires management to make estimates and assumptions that affect the reported amounts of assets and liabilities and disclosure of contingent assets and liabilities at the date of the financial statements and the reported amounts of revenues and expenses during the reporting period. Actual results could differ from those estimates.
41
RECLASSIFICATIONS—Certain items in prior-period financial statements have been reclassified to conform to the current presentation.
RECENT ACCOUNTING PRONOUNCEMENTS—In July 2001, the Financial Accounting Standards Board ("FASB") issued SFAS No. 141, "Business Combinations" and SFAS No. 142, "Goodwill and Other Intangible Assets." SFAS No. 141 requires business combinations initiated after June 30, 2001 to be accounted for using the purchase method of accounting and broadens the criteria for recording intangible assets separate from goodwill. SFAS No. 141 also prohibits the use of the pooling-of-interest method for all business combinations initiated after June 30, 2001.
SFAS No. 142 requires the use of an impairment approach to account for purchased goodwill and certain intangibles. Under an impairment approach, goodwill and certain intangibles are not amortized into results of operations, but instead are reviewed for impairment at least annually and written down and charged to results of operations only in periods in which the recorded value of goodwill and certain intangibles is more than its fair value.
SFAS No. 142 was generally effective for fiscal years beginning after December 15, 2001; however, we early adopted this statement on October 1, 2001, the first day of our 2002 fiscal year, as permitted by the statement. The adoption of SFAS No. 142 resulted in the discontinuation of amortization of goodwill previously recorded of $0.8 million annually. No impairment charges were recognized from the adoption of this statement.
Net income for the years ended September 30, 2001 and 2000 would have been $75.5 million and $44.2 million, respectively, after adding back goodwill amortization expensed during each such year.
SFAS No. 144, "Accounting for the Impairment of Long-Lived Assets," issued in August 2001, addresses accounting for and reporting of the impairment or disposal of long-lived assets. We adopted SFAS No. 144 on October 1, 2002, the beginning of fiscal 2003. We expect that the adoption of SFAS No. 144 will not have a significant impact on our financial position or results of operations. However, SFAS No. 144 may modify the presentation of the operating results from abandoned or disposed markets in our statement of operations in the future.
In April 2002, SFAS No. 145, "Rescission of SFAS No. 4, 44, 64 and Amendment of SFAS No. 13 and Technical Corrections," was issued. SFAS No. 145 prevents treatment as extraordinary, gains or losses on extinguishment of debt not meeting the criteria of Accounting Principles Board Opinion ("APB") No. 30. SFAS No. 145 is effective for fiscal years beginning after May 15, 2002. The adoption of SFAS No. 145 will affect the classification of such amounts in the financial statements of subsequent periods and comparative prior periods. We have not elected to early-adopt the provisions of SFAS No. 145 for this reporting period.
In June 2002, SFAS No. 146, "Accounting for Costs Associated with Exit or Disposal Activities," was issued. SFAS No. 146 addresses financial accounting and reporting for costs associated with exit or disposal activities and nullifies Emerging Issues Task Force ("EITF") Issue No. 94-3, "Liability Recognition for Certain Employee Termination Benefits and Other Costs to Exit an Activity (including certain costs incurred in a restructuring)." SFAS No. 146 requires recognition of a liability for a cost associated with an exit or disposal activity when the liability is incurred as opposed to when the entity commits to an exit plan under EITF No. 94-3. SFAS No. 146 is effective for exit or disposal activities initiated after December 31, 2002. We believe the adoption of SFAS No. 146 will not have a significant impact on our financial position or results of operations.
2ACQUISITIONS
Effective April 17, 2002, Beazer acquired Crossmann Communities, Inc. ("Crossmann"). Crossmann builds single-family homes in Indiana—its home base—with operations in Kentucky, Mississippi, North Carolina, Ohio, South Carolina and Tennessee. This acquisition represents our entry into the Midwest region and strengthens our focus on the first-time homebuyer segment. We have included Crossmann's operating results in our consolidated financial statements since April 1, 2002.
42
The merger consideration we paid totaled approximately $500.2 million and consisted of approximately 3.9 million shares of Beazer common stock (approximately $308.6 million) and approximately $191.6 million in cash. In connection with the merger, we also repaid approximately $125.4 million of Crossmann debt, resulting in total consideration paid of $625.6 million. The cash portion of the merger consideration and the repayment of Crossmann debt upon the merger were funded from net proceeds of our issuance of $350 million 83/8% Senior Notes due 2012 in a private placement on April 17, 2002.
The acquisition has been accounted for as a purchase; accordingly, the purchase price has been tentatively allocated to reflect the fair value of assets and liabilities acquired. Under this method, Crossmann assets acquired and liabilities assumed were recorded on our balance sheet at their fair market value as of April 1, 2002. This resulted in an inventory write-up to fair value of $26.9 million and a write-down of fixed assets to fair value of $1.1 million. This acquisition resulted in approximately $239.9 million of goodwill, none of which is deductible for income tax purposes. In accordance with SFAS No. 142, as discussed in Note 1, this goodwill will not be amortized.
The following table summarizes the estimated fair values of the assets acquired and liabilities assumed at the date of acquisition:
| Inventory | | $ | 357,801 |
| Property, plant and equipment, net | | | 9,085 |
| Goodwill | | | 239,919 |
| Other assets | | | 61,722 |
| | |
|
| | Total assets acquired | | $ | 668,527 |
| | |
|
| Accounts payable and accrued liabilities | | $ | 31,455 |
| Revolving credit facility | | | 59,600 |
| Other debt | | | 63,641 |
| | |
|
| | Total liabilities assumed | | | 154,696 |
| | |
|
| Net assets acquired | | $ | 513,831 |
| | |
|
The valuations and other studies required to determine the fair value of the Crossmann assets acquired and liabilities assumed are currently being finalized. Accordingly, the estimate of the excess of purchase price over identifiable tangible and intangible net assets of Crossmann is preliminary and subject to adjustments, which could be material, as further fair value information is obtained.
In August 2001, we acquired the assets and certain liabilities (approximately $9 million) of Sanford Homes of Colorado LLLP for approximately $59 million in cash. The acquisition has been accounted for as a purchase; accordingly the purchase price has been allocated to reflect the fair value of assets and liabilities acquired. This acquisition resulted in $4.5 million of goodwill and $1 million of other intangible assets; however, as discussed in Note 1, the goodwill recorded will not be amortized as a result of SFAS No. 142 transition provisions. Sanford's operating results have been included in our consolidated financial statements since August 1, 2001.
The following unaudited pro forma financial data (in thousands, except per share amounts) gives effect to our acquisitions of Crossmann and Sanford as if they had occurred on the first day of the fiscal year of acquisition and on the first day of the comparable prior period. The pro forma financial data is
43
provided for comparative purposes only and is not necessarily indicative of the results that would have been obtained if the acquisitions had been effected at those dates.
Year ended September 30,
| | 2002
| | 2001
| | 2000
|
|---|
| Total revenues | | $ | 3,046,841 | | $ | 2,708,587 | | $ | 1,666,026 |
| Net income before extraordinary item | | | 141,753 | | | 126,055 | | | 47,458 |
| Net income | | | 141,753 | | | 125,322 | | | 47,458 |
| Net income per share: | | | | | | | | | |
| | Basic | | $ | 11.37 | | $ | 10.45 | | $ | 5.75 |
| | Diluted | | | 10.62 | | | 9.63 | | | 5.50 |
3DERIVATIVE INSTRUMENTS AND HEDGING ACTIVITIES
Effective October 1, 2000 we adopted SFAS No. 133, "Accounting for Derivative Instruments and Hedging Activities," as amended. Upon adoption of this statement, we held no derivative instruments and accordingly recorded no transition adjustment. SFAS No. 133 establishes accounting and reporting standards for derivative instruments and for hedging activities by requiring that all derivatives be recognized in the balance sheet and measured at fair value. Gains or losses resulting from changes in the fair value of derivatives are recognized in earnings or recorded in other comprehensive income, and recognized in the income statement when the hedged item affects earnings, depending on the purpose of the derivatives and whether they qualify for hedge accounting treatment.
We are exposed to fluctuations in interest rates. We enter into derivative agreements to manage interest costs and hedge against risks associated with fluctuating interest rates. We do not enter into or hold derivatives for trading or speculative purposes. Duringthe year ended September 30, 2001 we entered into interest rate swap agreements (the "Swap Agreements") to effectively fix the variable interest rate on our $100 million four-year Term Loan. The Swap Agreements mature in December 2004, on the same day as our $100 million Term Loan matures.
The Swap Agreements have been designated as cash flow hedges, and accordingly are recorded at fair value in our consolidated balance sheet, and the related gains or losses are deferred in stockholders' equity, net of taxes, as a component of other comprehensive income. Amounts to be received or paid as a result of the Swap Agreements are accrued and recognized as adjustments to interest related to the designated debt. The net effect of this accounting on our operating results is that interest on the variable-rate debt is generally recorded based on fixed interest rates. No portion of these hedges was considered ineffective for the year ended September 30, 2002. We expect to reclassify $2.1 million, net of taxes of $1.3 million, from other comprehensive loss to inter est expense over the next 12 months.
As a result of the Swap Agreements, we have recorded a cumulative after-tax other comprehensive loss of $4.8 million as of September 30, 2002. The estimated fair value of the Swap Agreements, based on current market rates, approximated a liability of $7.9 million at September 30, 2002 and is included in other liabilities.
4INVENTORY
Inventory consists of (in thousands):
September 30,
| | 2002
| | 2001
|
|---|
| Homes under construction | | $ | 596,644 | | $ | 435,856 |
| Development projects in progress | | | 653,871 | | | 338,401 |
| Unimproved land held for future development | | | 43,829 | | | 22,417 |
| Model homes | | | 69,789 | | | 48,063 |
| | |
| |
|
| | Total | | $ | 1,364,133 | | $ | 844,737 |
| | |
| |
|
Homes under construction include homes finished and ready for delivery and homes in various stages of construction. We had 507 ($68.7 million) and 264 ($45.9 million) completed homes that were not subject to a sales contract, not including model homes, at September 30, 2002 and 2001, respectively.
44
Development projects in progress consist principally of land and land improvement costs. Certain of the fully developed lots in this category are reserved by a deposit or sales contract.
Inventory located in California, the state with our largest concentration of inventory, was $188.2 million and $203.8 million at September 30, 2002 and 2001, respectively.
We acquire certain lots by means of option contracts. Option contracts generally require the payment of cash for the right to acquire lots during a specified period of time at a certain price. Under option contracts, both with and without specific performance, purchase of the properties is contingent upon satisfaction of certain requirements by us and the sellers. Our obligation with respect to options with specific performance is included in other liabilities at September 30, 2002. Under option contracts without specific performance obligations, our liability is generally limited to forfeiture of the non-refundable deposits, letters of credit and other non-refundable amounts incurred which aggregated approximately $110.9 million at September 30, 2002. This amount includes letters of credit of approximately $33.4 million. Below is a summary of amounts (in thousands) committed under all options at September 30, 2002:
| | Aggregate Purchase
Price of Options
|
|---|
| Options with specific performance | | $ | 15,106 |
| Options without specific performance | | | 1,151,254 |
| | |
|
| | Total options | | $ | 1,166,360 |
| | |
|
5INTEREST
Information regarding interest (in thousands) is as follows:
Year Ended September 30,
| | 2002
| | 2001
| | 2000
| |
|---|
| Capitalized interest in inventory, beginning of year | | $ | 16,271 | | $ | 13,681 | | $ | 10,488 | |
| | Interest incurred and capitalized | | | 51,171 | | | 35,825 | | | 30,897 | |
| | Capitalized interest amortized to cost of sales | | | (43,001 | ) | | (33,235 | ) | | (27,704 | ) |
| | |
| |
| |
| |
| Capitalized interest in inventory, end of the year | | $ | 24,441 | | $ | 16,271 | | $ | 13,681 | |
| | |
| |
| |
| |
6PROPERTY, PLANT AND EQUIPMENT
Property, plant and equipment consists of (in thousands):
September 30,
| | 2002
| | 2001
|
|---|
| Land and buildings | | $ | 1,133 | | $ | 967 |
| Leasehold improvements | | | 4,558 | | | 2,962 |
| Machinery and equipment | | | 14,186 | | | 10,003 |
| Information systems | | | 13,190 | | | 13,009 |
| Furniture and fixtures | | | 13,986 | | | 4,915 |
| | |
| |
|
| | | | 47,053 | | | 31,856 |
| Less: Accumulated depreciation | | | 27,957 | | | 19,270 |
| | |
| |
|
| Property, plant and equipment, net | | $ | 19,096 | | $ | 12,586 |
| | |
| |
|
7REVOLVING CREDIT FACILITY
We maintain a revolving line of credit with a group of banks which provides for up to $250 million of unsecured borrowings. Borrowings under the credit facility generally bear interest at a fluctuating rate based upon the corporate base rate of interest announced by our lead bank, the federal funds rate or LIBOR. All outstanding borrowings will be due in September 2004. The credit facility contains various operating and financial covenants. Each of our significant subsidiaries is a guarantor under the credit facility.
Available borrowings under the credit facility are limited to certain percentages of homes under contract, unsold homes, substantially improved lots and accounts receivable. At September 30, 2002 we had no borrowings outstanding, and had available borrowings of $177 million under the credit facility. At September 30, 2001, we had no borrowings outstanding under the credit facility.
45
8TERM LOAN
During fiscal 2001, we entered into a $100 million four-year term loan with a group of banks (the "Term Loan"). The Term Loan matures in December 2004 and bears interest (3.44% at September 30, 2002) at a fluctuating rate based upon the corporate base rate of interest announced by our lead bank, the federal funds rate or LIBOR. The Term Loan contains various operating and financial covenants. Each of our significant subsidiaries is a guarantor under the Term Loan. All proceeds from the Term Loan were used to pay down then outstanding borrowings under our $250 million revolving credit facility.
As discussed in Note 3, we entered into Swap Agreements to manage interest costs and hedge against risks associated with fluctuating interest rates related to the Term Loan. As of September 30, 2002, we had entered into interest rate swaps to effectively fix the interest rate (before spread) on the Term Loan as follows: $75 million is fixed at 5.925% per annum; $10 million is fixed at 5.17% per annum; $5 million is fixed at 5.50% per annum; and $10 million is fixed at 5.055% per annum. The Swap Agreements expire in December 2004, when the Term Loan matures.
9SENIOR NOTES
In April 2002, we issued $350 million 83/8% Senior Notes due April 2012 (the "Original Notes") in a private placement pursuant to Rule 144A and Regulation S promulgated under the Securities Act of 1933, as amended. In September 2002, we completed an offer to exchange all of the outstanding Original Notes for an equal number of 83/8 Senior Notes due 2012 (the "83/8% Senior Notes"), which were registered under the Securities Act of 1933. The terms of the 83/8% Senior Notes were substantially identical to the terms of the Original Notes. The Original Notes were issued at a price of 100% of their face amount (before underwriting discount and other issuance costs). Interest on the 83/8% Senior Notes is payable semiannually. We may, at our option, redeem the 83/8% Senior Notes in whole or in part at any time after April 2007, initially at 104.188% of the principal amount, declining to 100% of the principal amount after April 2010. A portion of such notes may also be redeemed prior to April 2005 under certain conditions. We used the proceeds from the issuance of the 83/8% Senior Notes to fund the cash portion of the Crossmann acquisition, to repay Crossmann's outstanding net indebtedness, to reduce borrowings under our revolving credit facility at the time, and to pay related fees, commissions and other expenses.
In May 2001 we issued $200 million 85/8% Senior Notes due May 2011 (the "85/8% Senior Notes") at a price of 99.178% of their face amount (before underwriting discount and other issuance costs). Interest on the 85/8% Senior Notes is payable semiannually. We may, at our option, redeem the 85/8% Senior Notes in whole or in part at any time after May 2006, initially at 104.3125% of the principal amount, declining to 100% of the principal amount after May 2009. A portion of such notes may also be redeemed prior to May 2004 under certain conditions. We used a portion of the proceeds from the issuance of the 85/8% Senior Notes to redeem $115 million of our 9% Senior Notes which were due in March 2004. As a result of this redemption of the 9% Senior Notes, we recorded a pre-tax extraordinary charge during fiscal 2001 of $1.2 million for the write-off of associated unamortized debt issuance costs.
We also have previously issued $100 million of 87/8% Senior Notes due in April 2008 (the "87/8% Senior Notes"). Interest on the 87/8% Senior Notes is payable semiannually. We may, at our option, redeem the 87/8% Senior Notes in whole or in part at any time after March 2003, initially at 104.438% of the principal amount and declining to 100% of the principal amount after March 2006.
The 83/8% Senior Notes, the 85/8% Senior Notes and the 87/8% Senior Notes (collectively the "Senior Notes") are unsecured obligations rankingpari passu with all other existing and future senior indebtedness. All of our significant subsidiaries are full and unconditional guarantors of the Senior Notes and our obligations under the credit facility and Term Loan, and are jointly and severally liable
46
for obligations under the Senior Notes, credit facility and Term Loan. Each significant subsidiary is a wholly owned subsidiary of Beazer, and Beazer has no independent assets or operations. Any subsidiaries of Beazer that are not guarantors are minor subsidiaries.
The indentures under which the Senior Notes were issued contain certain restrictive covenants, including limitations on payment of dividends. At September 30, 2002, under the most restrictive covenants of each indenture, approximately $147.2 million of our retained earnings was available for cash dividends and for share repurchases. Each indenture provides that, in the event of defined changes in control or if our consolidated tangible net worth falls below a specified level or in certain circumstances upon sale of assets, we are required to offer to repurchase certain specified amounts of outstanding Senior Notes.
10INCOME TAXES
The provision for income taxes consists of (in thousands):
Year Ended September 30,
| | 2002
| | 2001
| | 2000
| |
|---|
| Current: | | | | | | | | | | |
| | Federal | | $ | 78,709 | | $ | 49,323 | | $ | 28,448 | |
| | State | | | 13,566 | | | 8,015 | | | 3,965 | |
| Deferred | | | (12,850 | ) | | (8,997 | ) | | (4,534 | ) |
| | |
| |
| |
| |
| | Total | | $ | 79,425 | | $ | 48,341 | | $ | 27,879 | |
| | |
| |
| |
| |
The provision for income taxes differs from the amount computed by applying the federal income tax statutory rate as follows (in thousands):
Year Ended September 30,
| | 2002
| | 2001
| | 2000
|
|---|
| Income tax computed at statutory rate | | $ | 70,721 | | $ | 43,383 | | $ | 25,020 |
| State income taxes, net of federal benefit | | | 8,524 | | | 4,734 | | | 2,615 |
| Goodwill amortization | | | — | | | 189 | | | 189 |
| Other | | | 180 | | | 35 | | | 55 |
| | |
| |
| |
|
| | Total | | $ | 79,425 | | $ | 48,341 | | $ | 27,879 |
| | |
| |
| |
|
47
Deferred tax assets and liabilities are composed of the following (in thousands):
September 30,
| | 2002
| | 2001
|
|---|
| Deferred Tax Assets: | | | | | | |
| Warranty and other reserves | | $ | 13,895 | | $ | 10,071 |
| Incentive compensation | | | 8,779 | | | 5,732 |
| Property, equipment and other assets | | | 2,376 | | | 805 |
| Interest rate swaps | | | 3,073 | | | 2,228 |
| Other | | | — | | | 804 |
| | |
| |
|
| | Total Deferred Tax Assets | | | 28,123 | | | 19,640 |
| | |
| |
|
| Deferred Tax Liabilities: | | | | | | |
| Inventory valuation | | | (825 | ) | | — |
| Other | | | (199 | ) | | — |
| | |
| |
|
| | Net Deferred Tax Assets | | $ | 27,099 | | $ | 19,640 |
| | |
| |
|
We believe that based upon our history of profitable operations, it is more likely than not that our net deferred tax assets will be realized.
11LEASES
We are obligated under various noncancelable operating leases for office facilities and equipment. Rental expense under these agreements amounted to approximately $9,654,000, $7,569,000 and $5,992,000 for the years ended September 30, 2002, 2001 and 2000, respectively. As of September 30, 2002, future minimum lease payments under non-cancelable operating lease agreements are as follows (in thousands):
Year Ending September 30,
| |
|
|---|
| 2003 | | $ | 7,868 |
| 2004 | | | 7,268 |
| 2005 | | | 5,549 |
| 2006 | | | 3,682 |
| 2007 | | | 2,515 |
| Thereafter | | | 6,102 |
| | |
|
| | Total | | $ | 32,984 |
| | |
|
12STOCKHOLDERS' EQUITY
PREFERRED STOCK—We currently have no shares of preferred stock outstanding.
COMMON STOCK REPURCHASE PLAN—In November 1999, our Board of Directors approved a stock repurchase plan authorizing the purchase of up to 500,000 shares of our outstanding common stock. During fiscal 2000 we completed the plan and repurchased 500,000 shares on the open market for an aggregate purchase price of $9.2 million (average price of $18.38 per share).
48
SHAREHOLDER RIGHTS PLAN—In June 1996, our Board of Directors adopted a Shareholder Rights Plan and distributed a dividend of one preferred share purchase right (a "Right") to purchase one one-hundredth of a share of Series B Junior Participating Preferred Stock, par value $0.01 per share (the "Junior Preferred Shares"), of Beazer. The Rights become exercisable in certain limited circumstances involving principally the acquisition of more than 20% of our outstanding common stock by any one individual or group. The Rights are initially exercisable at a price of $80 per one hundredth of a Junior Preferred Share subject to adjustment. Following certain other events after the Rights have become exercisable, each Right entitles its holder to purchase at the Right's then-current exercise price, a number of shares of our common stock having a market value of twice such price, or, in certain circumstances, securities of the acquirer, having a then-current market value of two times the exercise price of the Right.
The Rights are redeemable and may be amended at our option before they become exercisable. Until a Right is exercised, the holder of a Right has no rights as a shareholder of Beazer. The Rights expire in June 2006.
13EARNINGS PER SHARE
Basic and diluted earnings per share are calculated as follows (in thousands, except per share amounts):
Year Ended September 30,
| | 2002
| | 2001
| | 2000
|
|---|
| Earnings: | | | | | | | | | |
| Net income before extraordinary item | | $ | 122,634 | | $ | 75,609 | | $ | 43,606 |
| Extraordinary loss on early extinguishment of debt | | | — | | | (733 | ) | | — |
| | |
| |
| |
|
| Net income applicable to common stockholders | | $ | 122,634 | | $ | 74,876 | | $ | 43,606 |
| | |
| |
| |
|
| Basic: | | | | | | | | | |
| Net income applicable to common stockholders | | $ | 122,634 | | $ | 74,876 | | $ | 43,606 |
| Weighted average number of common shares outstanding | | | 10,535 | | | 8,145 | | | 8,254 |
| Basic earnings per share before extraordinary item | | $ | 11.64 | | $ | 9.28 | | $ | 5.28 |
| Extraordinary item per share | | | — | | | (0.09 | ) | | — |
| | |
| |
| |
|
| Basic earnings per share | | $ | 11.64 | | $ | 9.19 | | $ | 5.28 |
| | |
| |
| |
|
| Diluted: | | | | | | | | | |
| Net income applicable to common stockholders | | $ | 122,634 | | $ | 74,876 | | $ | 43,606 |
| Weighted average number of common shares outstanding | | | 10,535 | | | 8,145 | | | 8,254 |
| Effect of dilutive securities: | | | | | | | | | |
| | Restricted stock units | | | 364 | | | 493 | | | 298 |
| | Options to acquire common stock | | | 516 | | | 518 | | | 78 |
| | |
| |
| |
|
| Diluted weighted average number of common shares outstanding | | | 11,415 | | | 9,156 | | | 8,630 |
| Diluted earnings per share before extraordinary item | | $ | 10.74 | | $ | 8.26 | | $ | 5.05 |
| Extraordinary item per share | | | — | | | (0.08 | ) | | — |
| | |
| |
| |
|
| Diluted earnings per share | | $ | 10.74 | | $ | 8.18 | | $ | 5.05 |
| | |
| |
| |
|
Options to purchase 143,898 and 276,370 shares of common stock were not included in the computation of diluted earnings per share for the years ended September 30, 2002 and 2000, respectively, because the options' exercise price was greater than the average market price of the common shares during those years.
49
14RETIREMENT PLAN AND INCENTIVE AWARDS
401(K) RETIREMENT PLAN—We sponsor a 401(k) Plan (the "Plan"). Substantially all employees are eligible for participation in the Plan after completing one month of service with us. Participants may defer and contribute to the Plan from 1% to 80% of their salary with certain limitations on highly compensated individuals. We match 50% of the first 6% of the participant's contributions. The participant's contributions vest 100% immediately, while our contributions vest over five years. Our total contributions for the years ended September 30, 2002, 2001 and 2000 were approximately $1,851,000, $1,632,000 and $1,555,000, respectively.
DEFERRED COMPENSATION PLAN—During fiscal 2002, we adopted the Beazer Homes USA, Inc. Deferred Compensation Plan (the "DCP Plan"). The DCP Plan is a non-qualified deferred compensation plan for a select group of executives and highly compensated employees. The Plan allows the executives to defer current compensation on a pre-tax basis to a future year, up until termination of employment.
The objectives of the Plan are: 1) to assist executives with financial planning and capital accumulation, and, 2) to provide the Company with a method of attracting, rewarding and retaining highly compensated executives. Participation in the Plan is voluntary. Beazer may voluntarily make a contribution to the participants' DCP accounts. For the year ended September 30, 2002, Beazer contributed $284,000 to the Plan.
STOCK INCENTIVE PLANS—During fiscal 2000, we adopted the 1999 Stock Incentive Plan (the "1999 Plan"), because the shares reserved under the 1994 Stock Incentive Plan (the "1994 Plan") had been substantially depleted. We also have the Non-Employee Director Stock Option Plan (the "Non-Employee Director Plan"). At September 30, 2002, we had reserved 2,975,000 shares of common stock for issuance under our various stock incentive plans and have 598,758 shares available for future grants.
STOCK OPTION AWARDS—We have issued several stock option awards to officers and key employees under both the 1999 Plan and the 1994 Plan, and to non-employee directors pursuant to the Non-Employee Director Plan. Stock options are generally exercisable at the fair market value of the common stock on the grant date, vest three years after the date of grant and may be exercised thereafter until their expiration on the tenth anniversary from the date such options were granted, subject to forfeiture upon termination of employment as provided in the applicable plan.
STOCK OPTION AWARDS—Information regarding activity under our stock option plans is summarized as follows:
Year ended September 30,
| | 2002
| | 2001
| | 2000
|
|---|
| | Shares
| | Weighted Average Exercise Price
| | Shares
| | Weighted Average Exercise Price
| | Shares
| | Weighted Average Exercise Price
|
|---|
| Options outstanding at beginning of year | | 1,230,540 | | $ | 19.62 | | 1,369,290 | | $ | 19.37 | | 806,000 | | $ | 18.50 |
| | Granted | | 166,245 | | | 75.10 | | — | | | — | | 564,643 | | | 20.64 |
| | Exercised | | (298,907 | ) | | 18.46 | | (134,000 | ) | | 17.02 | | — | | | — |
| | Forfeited | | (26,998 | ) | | 27.10 | | (4,750 | ) | | 20.19 | | (1,353 | ) | | 17.75 |
| | |
| |
| |
| |
| |
| |
|
| Options outstanding at end of year | | 1,070,880 | | $ | 28.37 | | 1,230,540 | | $ | 19.62 | | 1,369,290 | | $ | 19.37 |
| | |
| |
| |
| |
| |
| |
|
| Options exercisable at end of year | | 390,537 | | $ | 19.86 | | 649,250 | | $ | 18.63 | | 540,000 | | $ | 17.53 |
| | |
| |
| |
| |
| |
| |
|
50
The following table summarizes information about stock options outstanding and exercisable at September 30, 2002:
Stock Options Outstanding
| | Stock Options Exercisable
|
|---|
Range of
Exercise Prices
| | Number
Outstanding
| | Weighted Average
Contractual Remaining Life (Years)
| | Weighted Average
Exercise Price
| | Number Exercisable
| | Weighted Average Exercise Price
|
|---|
| $ | 13-$18 | | 351,345 | | 6 | | $ | 17.32 | | 61,300 | | $ | 15.29 |
| $ | 20-$27 | | 568,698 | | 7 | | | 21.92 | | 322,298 | | | 20.28 |
| $ | 38-$44 | | 6,939 | | 7 | | | 40.48 | | 6,939 | | | 40.48 |
| $ | 74-$87 | | 143,898 | | 10 | | | 80.24 | | — | | | — |
| | | |
| | | | | | |
| | | |
| | | | 1,070,880 | | | | | | | 390,537 | | | |
| | | |
| | | | | | |
| | | |
We apply APB No. 25, "Accounting for Stock Issued to Employees," in accounting for our stock option plans and, accordingly, no compensation cost has been recognized for stock options in the accompanying financial statements. SFAS No. 123, "Accounting for Stock-Based Compensation," requires disclosure of pro forma net income and pro forma net income per share as if the fair value based method had been applied in measuring compensation expense for awards granted since 1996. Reported and such pro forma net income (in thousands) and net income per share amounts are set forth below:
Year Ended September 30,
| | 2002
| | 2001
| | 2000
|
|---|
| Reported: | | | | | | | | | |
| | Net income | | $ | 122,634 | | $ | 74,876 | | $ | 43,606 |
| | Basic net income per share | | $ | 11.64 | | $ | 9.19 | | $ | 5.28 |
| | Diluted net income per share | | | 10.74 | | | 8.18 | | | 5.05 |
| Pro forma: | | | | | | | | | |
| | Net income | | $ | 121,019 | | $ | 73,437 | | $ | 42,397 |
| | Basic net income per share | | $ | 11.49 | | $ | 9.02 | | $ | 5.14 |
| | Diluted net income per share | | | 10.60 | | | 8.02 | | | 4.91 |
The weighted average fair value of each option granted during the years ended September 30, 2002 and 2000 was $38.30 and $10.08, respectively. There were no options granted during the year ended September 30, 2001. The fair values of options granted were estimated on the date of their grant using the Black-Scholes option pricing model based on the following weighted average assumptions:
Year Ended September 30,
| | 2002
| | 2000
| |
|---|
| Expected volatility | | 40.7 | % | 33.3 | % |
| Expected dividend yield | | none | | none | |
| Risk-free interest rate | | 4.9 | % | 6.5 | % |
| Expected life (in years) | | 7.0 | | 7.0 | |
OTHER STOCK AWARDS—We have made several restricted stock awards to officers and key employees under both the 1999 Plan and the 1994 Plan. All restricted stock is awarded in the name of each participant, who has all the rights of other common stockholders subject to restrictions and forfeiture provisions. Accordingly, such restricted stock awards are considered outstanding shares. Compensation expense recognized for such awards totaled $2,365,000, $2,926,000 and $1,140,000 for the years ended September 30, 2002, 2001 and 2000 respectively.
51
Activity relating to restricted stock awards is summarized as follows:
Year Ended September 30,
| | 2002
| | 2001
| | 2000
|
|---|
| Restricted shares, beginning of year | | 134,625 | | 381,624 | | 381,624 |
| Shares awarded | | 79,337 | | — | | — |
| Shares forfeited | | — | | (4,820 | ) | — |
| Shares vested | | (125,625 | ) | (242,179 | ) | — |
| | |
| |
| |
|
| Restricted shares, end of year | | 88,337 | | 134,625 | | 381,624 |
| | |
| |
| |
|
We have an incentive compensation plan (called the Value Created Incentive Plan), modeled under the concepts of economic profit or economic value added. Participants may receive a portion of their earned annual incentive compensation under the plan in our common stock (the "Bonus Stock"). Such shares are issued after a three-year vesting period at a discount to the stock's market value at the time the bonus is earned. Should the participant's employment terminate during the vesting period, the deferred incentive compensation is settled in cash or cash and stock, depending on the cause of termination.
Activity relating to Bonus Stock is as follows:
Year Ended September 30,
| | 2002
| | 2001
| | 2000
| |
|---|
| Bonus Stock issuable, beginning of year | | 237,362 | | 227,713 | | 191,578 | |
| Shares awarded | | 28,029 | | 47,504 | | 52,128 | |
| Shares forfeited | | (2,905 | ) | (10,598 | ) | (1,867 | ) |
| Shares vested and issued | | (53,328 | ) | (27,257 | ) | (14,126 | ) |
| | |
| |
| |
| |
| Bonus Stock issuable, end of year | | 209,158 | | 237,362 | | 227,713 | |
| | |
| |
| |
| |
EMPLOYEE RECEIVABLES—Included in accounts receivable are notes receivable from certain key employees of $1.2 and $1.8 million at September 30, 2002 and 2001, respectively. The loans were made in fiscal 2001 and prior to assist these employees with their tax obligations upon vesting of certain restricted stock awards. Such notes bear interest at market rates as determined by the Board of Directors. The notes are full recourse, collateralized by shares of our stock owned by the employees, and due upon the sale of such shares, or ten years, whichever occurs first.
15CONTINGENCIES
We had outstanding letters of credit and performance bonds of approximately $37.5 million and $315.1 million, respectively, at September 30, 2002 related principally to our obligations to local governments to construct roads and other improvements in various developments in addition to outstanding letters of credit of approximately $33.4 million relating to our land option contracts discussed in Note 4. We do not believe that any such letters of credit or bonds are likely to be drawn upon.
We are a defendant or plaintiff in various legal actions which have arisen in the normal course of business, the most significant of which relate to construction defects and product liability. In our opinion, the ultimate resolution of these matters will not have a material adverse effect on our financial position or results of operations.
52
Independent Auditors' Report
Beazer Homes USA, Inc.
To the Board of Directors and Stockholders of Beazer Homes USA, Inc.
We have audited the accompanying consolidated balance sheets of Beazer Homes USA, Inc. and subsidiaries (the "Company") as of September 30, 2002 and 2001, and the related consolidated statements of income, stockholders' equity, and cash flows for each of the three years in the period ended September 30, 2002. These consolidated financial statements are the responsibility of the Company's management. Our responsibility is to express an opinion on these financial statements based on our audits.
We conducted our audits in accordance with auditing standards generally accepted in the United States of America. Those standards require that we plan and perform the audit to obtain reasonable assurance about whether the financial statements are free of material misstatement. An audit includes examining, on a test basis, evidence supporting the amounts and disclosures in the financial statements. An audit also includes assessing the accounting principles used and significant estimates made by management, as well as evaluating the overall financial statement presentation. We believe that our audits provide a reasonable basis for our opinion.
In our opinion, such consolidated financial statements present fairly, in all material respects, the financial position of Beazer Homes USA, Inc. and subsidiaries at September 30, 2002 and 2001, and the results of their operations and their cash flows for each of the three years in the period ended September 30, 2002 in conformity with accounting principles generally accepted in the United States of America.

Atlanta, Georgia
November 4, 2002
53
Summarized Quarterly Financial Information (unaudited):
Beazer Homes USA, Inc.
(dollars in thousands, except per share data)
Quarter ended
| | September 30
| | June 30
| | March 31
| | December 31
|
|---|
| FISCAL 2002: | | | | | | | | | | | | |
| Total revenue | | $ | 904,331 | | $ | 743,813 | | $ | 503,312 | | $ | 489,717 |
| Operating income | | | 64,100 | | | 53,721 | | | 38,255 | | | 37,098 |
| | Net income | | | 40,658 | | | 34,649 | | | 24,177 | | | 23,150 |
| | Net income per common share: | | | | | | | | | | | | |
| | | Basic | | $ | 3.21 | | $ | 2.76 | | $ | 2.84 | | $ | 2.76 |
| | | Diluted | | $ | 3.03 | | $ | 2.59 | | $ | 2.56 | | $ | 2.47 |
| FISCAL 2001: | | | | | | | | | | | | |
| Total revenue | | $ | 617,005 | | $ | 448,825 | | $ | 374,297 | | $ | 365,050 |
| Operating income | | | 38,278 | | | 31,885 | | | 29,074 | | | 22,992 |
| Net income before extraordinary item | | | 23,845 | | | 19,925 | | | 17,507 | | | 14,332 |
| Extraordinary item—loss on early extinguishment of debt | | | — | | | (733 | ) | | — | | | — |
| | |
| |
| |
| |
|
| Net income | | | 23,845 | | | 19,192 | | | 17,507 | | | 14,332 |
| Basic earnings per share: | | | | | | | | | | | | |
| | Net income before extraordinary item | | $ | 2.90 | | $ | 2.43 | | $ | 2.15 | | $ | 1.77 |
| | Extraordinary item | | | — | | | (0.09 | ) | | — | | | — |
| | |
| |
| |
| |
|
| | Net earnings | | $ | 2.90 | | $ | 2.34 | | $ | 2.15 | | $ | 1.77 |
| Diluted earnings per share: | | | | | | | | | | | | |
| | Net income before extraordinary item | | $ | 2.56 | | $ | 2.15 | | $ | 1.92 | | $ | 1.61 |
| | Extraordinary item | | | — | | | (0.08 | ) | | — | | | — |
| | |
| |
| |
| |
|
| | Net earnings | | $ | 2.56 | | $ | 2.07 | | $ | 1.92 | | $ | 1.61 |
QUARTERLY STOCK PRICE INFORMATION: |
|
|
|
|
|
|
|
|
|
|
|
|
2002 PERIOD: |
|
|
|
|
|
|
|
|
|
|
|
|
| High | | $ | 80.75 | | $ | 92.48 | | $ | 95.05 | | $ | 77.10 |
| Low | | $ | 54.25 | | $ | 70.91 | | $ | 66.31 | | $ | 41.00 |
2001 PERIOD: |
|
|
|
|
|
|
|
|
|
|
|
|
| High | | $ | 79.35 | | $ | 69.50 | | $ | 57.77 | | $ | 41.00 |
| Low | | $ | 41.50 | | $ | 37.75 | | $ | 33.69 | | $ | 25.69 |
54
Board of Directors and Corporate Officers
Beazer Homes USA, Inc.
BOARD OF DIRECTORS
| | CORPORATE OFFICERS
|
|---|
Brian C. Beazer
Non-Executive Chairman of the Board, | | Ian J. McCarthy
President and Chief Executive Officer |
| Beazer Homes USA, Inc. | | |
| | | David S. Weiss |
Laurent Alpert
Partner, Cleary, Gottlieb, Steen & Hamilton | | Executive Vice President
and Chief Financial Officer |
Thomas B. Howard, Jr.
Former Chairman and Chief Executive Officer,
Gifford-Hill & Company |
|
Michael H. Furlow
Executive Vice President
and Chief Operating Officer |
Ian J. McCarthy
President and Chief Executive Officer,
Beazer Homes USA, Inc. |
|
James O'Leary
Executive Vice President,
Corporate Development |
David E. (Ned) Mundell
Director, ORIX USA Corporation |
|
C. Lowell Ball, Esq.
Senior Vice President, General Counsel |
Maureen E. O'Connell
Executive Vice President, Chief Financial
and Chief Administrative Officer, Gartner, Inc. |
|
Michael T. Rand
Senior Vice President, Corporate Controller |
| | | John Skelton |
| Larry T. Solari | | Senior Vice President, Forward Planning |
Former Chairman and Chief Executive Officer,
BSI Holdings, Inc. | |
W. Mark Berry
Vice President, Risk Management |
David S. Weiss
Executive Vice President and Chief Financial
Officer, Beazer Homes USA, Inc. |
|
Cory J. Boydston
Vice President, Financial Services
and Treasurer |
|
|
Fred Fratto
Vice President, Human Resources |
|
|
J. William Montgomery
Vice President, Internal Audit |
|
|
Jonathan P. Smoke
Vice President, Chief Information Officer |
|
|
Edmond G. Snider, Jr.
Vice President, Training and Safety |
|
|
Ron J. Kuhn
President, Beazer Mortgage Corporation |
55
Selected Financial and Operating Data: 1993-2002
Beazer Homes USA, Inc.
(dollars in thousands, except per share data)
Year ended September 30,
| | 2002
| | 2001
| | 2000
| | 1999
| | 1998
| | 1997
| | 1996
| | 1995
| | 1994
| | 1993
| |
|---|
| FINANCIAL HIGHLIGHTS: | | | | | | | | | | | | | | | | | | | | | | | | | | | | | | | |
| | Statement of Operations Data— | | | | | | | | | | | | | | | | | | | | | | | | | | | | | | | |
| | | Total revenue | | $ | 2,641,173 | | $ | 1,805,177 | | $ | 1,527,865 | | $ | 1,394,074 | | $ | 977,409 | | $ | 852,110 | | $ | 866,627 | | $ | 647,828 | | $ | 536,526 | | $ | 275,054 | |
| | | Earnings before interest and taxes ("EBIT") | | | 245,060 | | | 157,185 | | | 99,189 | | | 86,013 | | | 56,525 | | | 33,051 | | | 45,327 | | | 32,188 | | | 37,169 | | | 22,713 | |
| | | Net income | | | 122,634 | | | 74,876 | | | 43,606 | | | 36,934 | | | 23,201 | | | 11,189 | | | 18,266 | | | 11,352 | | | 16,468 | | | 16,046 | |
| | | Net earnings per share: | | | | | | | | | | | | | | | | | | | | | | | | | | | | | | | |
| | | | Basic | | $ | 11.64 | | $ | 9.19 | | $ | 5.28 | | $ | 4.59 | | $ | 3.27 | | $ | 1.18 | | $ | 2.24 | | $ | 1.26 | | $ | 1.78 | (1) | | n/m | |
| | | | Diluted | | | 10.74 | | | 8.18 | | | 5.05 | | | 4.15 | | | 2.66 | | | 1.15 | | | 2.01 | | | 1.23 | | | 1.76 | (1) | | n/m | |
| | Balance Sheet Data at Year-End— | | | | | | | | | | | | | | | | | | | | | | | | | | | | | | | |
| | | Total assets | | $ | 1,892,847 | | $ | 995,289 | | $ | 696,228 | | $ | 594,568 | | $ | 525,591 | | $ | 399,595 | | $ | 356,643 | | $ | 345,240 | | $ | 314,941 | | $ | 245,349 | |
| | | Total debt | | | 739,100 | | | 395,238 | | | 252,349 | | | 215,000 | | | 215,000 | | | 145,000 | | | 115,000 | | | 115,000 | | | 115,000 | | | 119,925 | |
| | | Stockholders' equity | | | 799,515 | | | 351,195 | | | 270,538 | | | 234,662 | | | 199,224 | | | 179,286 | | | 178,701 | | | 164,544 | | | 150,406 | | | 95,595 | |
| | Return Data— | | | | | | | | | | | | | | | | | | | | | | | | | | | | | | | |
| | | Return on average assets (pre-tax) | | | 17.0 | % | | 18.6 | % | | 15.4 | % | | 15.4 | % | | 12.2 | % | | 8.7 | % | | 12.9 | % | | 9.8 | % | | 13.3 | % | | 14.6 | % |
| | | Return on average capital (pre-tax) | | | 21.4 | % | | 24.8 | % | | 20.4 | % | | 19.9 | % | | 15.3 | % | | 10.7 | % | | 15.8 | % | | 11.8 | % | | 15.5 | % | | 20.8 | % |
| | | Return on average equity | | | 21.3 | % | | 24.1 | % | | 17.3 | % | | 17.0 | % | | 12.3 | % | | 6.3 | % | | 10.6 | % | | 7.2 | % | | 13.4 | % | | 16.6 | % |
| | Book value per share(2) | | $ | 59.63 | | $ | 37.71 | | $ | 31.41 | | $ | 26.48 | | $ | 22.78 | | $ | 20.75 | | $ | 19.59 | | $ | 18.60 | | $ | 16.31 | | | n/m | |
| OPERATING DATA: | | | | | | | | | | | | | | | | | | | | | | | | | | | | | | | |
| | Number of new orders, net of cancellations—(3) | | | | | | | | | | | | | | | | | | | | | | | | | | | | | | | |
| | | Southeast Region | | | 4,623 | | | 3,770 | | | 2,892 | | | 3,041 | | | 2,888 | | | 1,969 | | | 2,048 | | | 2,083 | | | 1,726 | | | 1,392 | |
| | | West Region | | | 4,669 | | | 3,810 | | | 3,393 | | | 2,900 | | | 3,245 | | | 2,817 | | | 3,172 | | | 2,660 | | | 1,902 | | | 1,071 | |
| | | Central Region | | | 1,244 | | | 1,022 | | | 695 | | | 485 | | | 749 | | | 765 | | | 401 | | | 98 | | | — | | | — | |
| | | Mid-Atlantic Region | | | 1,365 | | | 1,437 | | | 1,248 | | | 1,109 | | | — | | | — | | | — | | | — | | | 48 | | | 80 | |
| | | Midwest Region | | | 1,709 | | | — | | | — | | | — | | | — | | | — | | | — | | | — | | | — | | | — | |
| | |
| |
| |
| |
| |
| |
| |
| |
| |
| |
| |
| | | Total | | | 13,610 | | | 10,039 | | | 8,228 | | | 7,535 | | | 6,882 | | | 5,551 | | | 5,621 | | | 4,841 | | | 3,676 | | | 2,543 | |
| | |
| |
| |
| |
| |
| |
| |
| |
| |
| |
| |
| | Backlog at end of year: | | | | | | | | | | | | | | | | | | | | | | | | | | | | | | | |
| | | Southeast Region | | | 1,867 | | | 1,240 | | | 875 | | | 999 | | | 996 | | | 505 | | | 580 | | | 708 | | | 478 | | | 437 | |
| | | West Region | | | 1,833 | | | 1,606 | | | 1,149 | | | 786 | | | 743 | | | 479 | | | 680 | | | 722 | | | 506 | | | 677 | |
| | | Central Region | | | 507 | | | 384 | | | 259 | | | 206 | | | 318 | | | 208 | | | 166 | | | 53 | | | — | | | — | |
| | | Mid-Atlantic Region | | | 700 | | | 747 | | | 646 | | | 567 | | | — | | | — | | | — | | | 1 | | | 3 | | | 74 | |
| | | Midwest Region | | | 1,612 | | | — | | | — | | | — | | | — | | | — | | | — | | | — | | | — | | | — | |
| | |
| |
| |
| |
| |
| |
| |
| |
| |
| |
| |
| | | Total | | | 6,519 | | | 3,977 | | | 2,929 | | | 2,558 | | | 2,057 | | | 1,192 | | | 1,426 | | | 1,484 | | | 987 | | | 1,188 | |
| | |
| |
| |
| |
| |
| |
| |
| |
| |
| |
| |
| | Number of closings: | | | | | | | | | | | | | | | | | | | | | | | | | | | | | | | |
| | | Southeast Region | | | 4,575 | | | 3,414 | | | 3,016 | | | 3,108 | | | 2,493 | | | 2,044 | | | 2,212 | | | 1,853 | | | 1,734 | | | 1,312 | |
| | | West Region | | | 4,442 | | | 3,412 | | | 3,030 | | | 2,857 | | | 2,981 | | | 3,018 | | | 3,343 | | | 2,444 | | | 2,073 | | | 775 | |
| | | Central Region | | | 1,121 | | | 897 | | | 642 | | | 597 | | | 639 | | | 723 | | | 379 | | | 64 | | | — | | | — | |
| | | Mid-Atlantic Region | | | 1,412 | | | 1,336 | | | 1,169 | | | 1,027 | | | — | | | — | | | 1 | | | 2 | | | 119 | | | 6 | |
| | | Midwest Region | | | 2,053 | | | — | | | — | | | — | | | — | | | — | | | — | | | — | | | — | | | — | |
| | |
| |
| |
| |
| |
| |
| |
| |
| |
| |
| |
| | | Total | | | 13,603 | | | 9,059 | | | 7,857 | | | 7,589 | | | 6,113 | | | 5,785 | | | 5,935 | | | 4,363 | | | 3,926 | | | 2,093 | |
| | |
| |
| |
| |
| |
| |
| |
| |
| |
| |
| |
| | Average sales price per home closed: | | $ | 190.8 | | $ | 195.3 | | $ | 190.7 | | $ | 181.4 | | $ | 156.4 | | $ | 146.8 | | $ | 145.8 | | $ | 148.5 | | $ | 136.7 | | $ | 131.4 | |
| | |
| |
| |
| |
| |
| |
| |
| |
| |
| |
| |
n/m—Earnings and book value per share figures for periods prior to and including the Company's initial public offering are not meaningful.
- (1)
- Pro forma to give effect to the initial public offering and related transactions, as if such transactions were effected as of October 1, 1993.
- (2)
- Book value per share is calculated as stockholders' equity divided by diluted weighted average ending shares.
- (3)
- New orders do not include homes in backlog from acquired operations.
56
At-A-Glance
Beazer Homes USA, Inc.
State
| | Backlog
at September 30, 2002
| | FY 2002
Closings
| | Active Subdivisions
at September 30, 2002
| | Average Price of Homes
Closed in FY 2002
|
|---|
| SOUTHEAST | | | | | | | | | |
| | Florida | | 670 | | 1,132 | | 53 | | $ | 223,500 |
| | Georgia | | 149 | | 473 | | 16 | | | 172,900 |
| | North and South Carolina | | 823 | | 2,103 | | 90 | | | 146,500 |
| | Tennessee/Mississippi | | 225 | | 867 | | 29 | | | 134,500 |
WEST |
|
|
|
|
|
|
|
|
|
| | Arizona | | 615 | | 1,211 | | 19 | | | 157,600 |
| | California | | 733 | | 2,059 | | 26 | | | 267,200 |
| | Colorado | | 54 | | 376 | | 12 | | | 297,300 |
| | Nevada | | 431 | | 796 | | 16 | | | 177,600 |
CENTRAL |
|
|
|
|
|
|
|
|
|
| | Texas | | 507 | | 1,121 | | 34 | | | 155,900 |
MID-ATLANTIC |
|
|
|
|
|
|
|
|
|
| | Maryland | | 149 | | 348 | | 10 | | | 269,000 |
| | New Jersey/ | | | | | | | | | |
| | Pennsylvania | | 139 | | 277 | | 6 | | | 221,200 |
| | Virginia | | 412 | | 787 | | 19 | | | 286,400 |
MIDWEST |
|
|
|
|
|
|
|
|
|
| | Indiana | | 1,079 | | 1,448 | | 100 | | | 135,100 |
| | Kentucky | | 77 | | 103 | | 5 | | | 116,300 |
| | Ohio | | 456 | | 502 | | 33 | | | 156,300 |
TOTAL |
|
6,519 |
|
13,603 |
|
468 |
|
$ |
190,800 |
58
Name
|
|
Title
|
|
Division
|
|---|
| SOUTHEAST | | | | |
| | J. Martin Shaffer, Jr.
Scott K. Thorson
H. Eddie Phillips
David G. Byrnes
Thomas C. Cross
Gilford Edwards
Jason Fabrizio
Frank L. Finlaw
Curt Hathaway
Krista Long
William J. Mazar
David McKenzie
Scott Osmond
James Parker
Louis E. Steffens
E. Edward Pate, Jr. | | Senior Regional President
Senior Regional President
Regional President
Division President
Division President
Division President
Division President
Division President
Division President
Division President
Division President
Division President
Division President
Division President
Division President
Executive Vice President and General Manager | | Southeast Region
South Atlantic Region
Nashville Division
Orlando Division
Charlotte Division—Crossmann
Myrtle Beach Division
Memphis Division
Charleston Division
Charlotte Division—Beazer
Beazer Metro
Jacksonville Division
Raleigh Division
Ft. Myers Division
Georgia Division
Tampa Division
Columbia Division |
WEST |
|
|
|
|
Kent A. Lay, Jr.
Gerald A. Gates
Joseph C. Thompson
Anthony R. Tonso
Peter H. Simons
William A. June | | Senior Regional President
Regional President
Regional President
Regional President
Senior Division President
Division President | | Mountain West Region
Southern California Division
Arizona Division
Northern California Division
Colorado Division
Nevada Division |
CENTRAL |
|
|
|
|
Kurt S. Watzek
Bruce French | | Senior Division President
Executive Vice President and General Manager | | Houston Division
Dallas Division |
MID-ATLANTIC |
|
|
|
|
Donald W. Knutson
David L. Carney
Paul R. Schneier
Glenn Johnson | | Senior Regional President
Division President
Division President
Executive Vice President and General Manager | | Mid-Atlantic Region
Maryland Division
New Jersey Division
Virginia Division |
MIDWEST |
|
|
|
|
Steven Dunn
David Dugger
Charles Giese
Larry M. Hoffmaster
Charles F. Holle
Anthony Incorvia
Robert J. Schmatz
Clifford O. White | | Senior Regional President
Senior Division President
Division President
Division President
Division President
Division President
Division President
Division President | | Midwest Region
Indianapolis Division
Fort Wayne Division
Cincinnati/Dayton Division
Lafayette Division
Lexington Division
Columbus Division
Indianapolis Division—Trinity |
59
Shareholder and Corporate Information
Beazer Homes USA, Inc.
CORPORATE HEADQUARTERS
Beazer Homes USA, Inc.
5775 Peachtree Dunwoody Road
Suite B 200
Atlanta, Georgia 30342
Telephone: (404) 250-3420
www.beazer.com
GENERAL COUNSEL
C. Lowell Ball, Esq., Senior Vice President,
General Counsel
INDEPENDENT AUDITORS
Deloitte & Touche LLP
BEAZER CONFIDENTIAL ETHICS HOTLINE
Beazer Homes is committed to the highest standards of ethical conduct in its financial affairs and reporting. To help ensure that all instances of known or suspected fraud, theft, accounting or auditing improprieties or other financial misconduct are reported, the Company has set up a confidential ethics hotline at 1-800-383-0863 or through the Investor Relations section of www.beazer.com.
All communications to the Hotline are made anonymously and then transmitted directly to the Company's Vice President of Internal Audit where they are reviewed and investigated as appropriate. Persons who in good faith report evidence of known or suspected fraud, theft, accounting or auditing improprieties or other financial misconduct will not be retaliated against because of such reports.
INQUIRIES
Individuals seeking financial data should contact David S. Weiss, Executive Vice President and Chief Financial Officer.
Others seeking information about the company and its operations should contact Ian J. McCarthy, President and Chief Executive Officer.
FORM 10-K
Copies of Beazer Homes USA, Inc.'s Annual Report on Form 10-K as filed with the United States Securities and Exchange Commission will be furnished upon written request to David S. Weiss, Executive Vice President and Chief Financial Officer or can be accessed at www.beazer.com.
TRANSFER AGENT
American Stock Transfer & Trust Company
59 Maiden Lane
New York, New York 10038
(212) 936-5100
TRADING INFORMATION
Beazer Homes USA, Inc. lists its common shares on the New York Stock Exchange (NYSE) under the symbol "BZH." On December 13, 2002, the last reported sales price of the company's common stock on the NYSE was $59.60.
ANNUAL MEETING
The Annual Stockholders' meeting will be held at 2:00 p.m. ET on February 11, 2003, at our offices at 5775 Peachtree Dunwoody Road, Suite B 200, Atlanta, Georgia 30342.
DUPLICATE MAILINGS
If you are receiving duplicate or unwanted copies of our publications please contact American Stock Transfer & Trust Company at the number listed above or contact David S. Weiss, Executive Vice President and Chief Financial Officer at Beazer Homes.
60
QuickLinks