UNITED STATES
SECURITIES AND EXCHANGE COMMISSION
WASHINGTON, D.C. 20549
FORM N-CSR
CERTIFIED SHAREHOLDER REPORT OF REGISTERED MANAGEMENT
INVESTMENT COMPANIES
Investment Company Act file number: 811-08188
ALLIANCEBERNSTEIN HIGH INCOME FUND, INC.
(Exact name of registrant as specified in charter)
1345 Avenue of the Americas, New York, New York 10105
(Address of principal executive offices) (Zip code)
Joseph J. Mantineo
AllianceBernstein L.P.
1345 Avenue of the Americas
New York, New York 10105
(Name and address of agent for service)
Registrant’s telephone number, including area code: (800) 221-5672
Date of fiscal year end: October 31, 2008
Date of reporting period: April 30, 2008
| ITEM 1. | REPORTS TO STOCKHOLDERS. |
SEMI-ANNUAL REPORT
AllianceBernstein High Income Fund
(formerly Emerging Market Debt Fund)

Semi-Annual Report
Investment Products Offered
| | • | | Are Not Bank Guaranteed |
The investment return and principal value of an investment in the Fund will fluctuate as the prices of the individual securities in which it invests fluctuate, so that your shares, when redeemed, may be worth more or less than their original cost. You should consider the investment objectives, risks, charges and expenses of the Fund carefully before investing. For a free copy of the Fund’s prospectus, which contains this and other information, visit our web site at www.alliancebernstein.com or call your financial advisor or AllianceBernstein® at (800) 227-4618. Please read the prospectus carefully before you invest.
You may obtain performance information current to the most recent month-end by visiting www.alliancebernstein.com.
This shareholder report must be preceded or accompanied by the Fund’s prospectus for individuals who are not current shareholders of the Fund.
You may obtain a description of the Fund’s proxy voting policies and procedures, and information regarding how the Fund voted proxies relating to portfolio securities during the most recent 12-month period ended June 30, without charge. Simply visit AllianceBernstein’s web site at www.alliancebernstein.com, or go to the Securities and Exchange Commission’s (the “Commission”) web site at www.sec.gov, or call AllianceBernstein at (800) 227-4618.
The Fund files its complete schedule of portfolio holdings with the Commission for the first and third quarters of each fiscal year on Form N-Q. The Fund’s Forms N-Q are available on the Commission’s web site at www.sec.gov. The Fund’s Forms N-Q may also be reviewed and copied at the Commission’s Public Reference Room in Washington, DC; information on the operation of the Public Reference Room may be obtained by calling (800) SEC-0330.
AllianceBernstein Investments, Inc. is an affiliate of AllianceBernstein L.P., the manager of the AllianceBernstein funds, and is a member of FINRA.
AllianceBernstein® and the AB Logo are registered trademarks and service marks used by permission of the owner, AllianceBernstein L.P.
June 18, 2008
Semi-Annual Report
This report provides management’s discussion of fund performance for AllianceBernstein High Income Fund (the “Fund”) for the semi-annual reporting period ended April 30, 2008. On August 2, 2007, the Board of Directors of the Fund (the “Board”) approved changing the Fund’s name from AllianceBernstein Emerging Market Debt Fund to “AllianceBernstein High Income Fund, Inc.” and certain policy changes. These changes were intended to refocus the Fund’s investment strategy on a broader range of debt securities, including corporate debt securities as well as emerging market debt securities. In addition, the Board approved the acquisi-tion of the assets and liabilities of AllianceBernstein Corporate Bond Portfolio (“Corporate Bond”), a series of AllianceBernstein Bond Fund, Inc., and AllianceBernstein High Yield Fund, Inc. (“High Yield”). Shareholders of Corporate Bond and shareholders of High Yield, respectively, approved the acquisitions of Corporate Bond and High Yield by the Fund. The acquisitions, changes to the Fund’s policies and change of the Fund’s name became effective in late January.
Investment Objectives and Policies
This open-end Fund’s investment objective is to maximize total returns from price appreciation and income. The Fund pursues income opportunities from government, corporate, emerging-market and high-yield sources. It has the flexibility to invest in a broad range of fixed-income securities
in both developed and emerging-market countries. The Fund’s investments may include U.S. and nonU.S. corporate debt securities and sovereign debt securities. The Fund may invest, without limitation, in either U.S. dollar-denominated or non-U.S. dollar-denominated fixed-income securities.
The Fund may invest in debt securities with a range of maturities from short- to long-term. Substantially all of the Fund’s assets may be invested in lower-rated securities, which may include securities having the lowest rating for non-subordinated debt instruments (i.e., rated C by Moody’s or CCC+ or lower by S&P and Fitch) and unrated securities of equivalent investment quality. The Fund also may invest in investment-grade securities and unrated securities.
The Fund may also make short sales of securities or maintain a short position. The Fund is non-diversified, meaning it may invest more of its assets in a fewer number of issuers. The Fund may invest in mortgage-related and other asset-backed securities, loan participations, inflation-protected securities, structured securities, variable, floating, and inverse floating rate instruments, preferred stock, and may use other investment techniques. The Fund may use borrowings or other leverage for investment purposes. The Fund intends, among other things, to enter into transactions such as reverse repurchase agreements and dollar rolls. The Fund may invest, without limit, in derivatives, such as options, futures, forwards or swap agreements.
| | |
| ALLIANCEBERNSTEIN HIGH INCOME FUND • | | 1 |
Investment Results
The table on page 5 shows the Fund’s performance compared with its current composite benchmark, which is composed of equal weightings of the JP Morgan Emerging Markets Bond Index Global (JPM EMBI Global), the JP Morgan Government Bond Index (GBI)—Emerging Markets (EM) (local-currency-denominated) and the Lehman Brothers (LB) U.S. Corporate High Yield (HY) 2% Issuer Capped Index for the six- and 12-month periods ended April 30, 2008. Individual performance for each of these indexes is also included for both time periods. The Fund’s previous benchmark is the JPM EMBI Global, which tracks total returns for U.S. dollar-denominated debt instruments issued by emerging market sovereign and quasi-sovereign entities.
The Fund’s Class A shares without sales charges underperformed the new composite benchmark and the previous benchmark for both the six- and 12-month periods ended April 30, 2008. As noted in the Introductory and Investment Objectives and Policies sections on page 1 of this report, the Fund is in the process of transforming from a single-sector approach (emerging markets) to a multi-sector approach, enabling the Fund to take advantage of a greater set of global investment opportunities. In the transition period, the Fund’s performance reflected its higher weighting of high-yield debt, which underperformed relative to other fixed-income asset classes due to the global flight to quality. Conversely, the best-performing asset class within the Fund’s current composite benchmark, local emerging
market debt, was underrepresented within the Fund, as it transitioned. Local emerging market debt prices benefited greatly over both the six- and 12-month periods from strengthening local currencies. The Fund’s holdings in bank loan debt also detracted from performance, as riskier assets underperformed during both periods.
The Fund’s U.S. dollar-denominated emerging market country allocation—particularly an overweight in Argentina, which underperformed—also detracted from performance for both periods. Contributing positively within the Fund’s high-yield allocation was an underweight of the lowest credit quality tier, which underperformed, as did an underweight in the beleaguered housing industry. The Fund’s use of leverage was a positive contributor.
Market Review and Investment Strategy
Fear of the spreading financial crisis and its potential impact on the global economy sharply drove fixed-income yield spreads wider during most of the semi-annual period ended April 30, 2008. Investor risk aversion significantly increased, leading to a wholesale flight from risk, with little regard for geography. In an effort to stem the financial turmoil, the U.S. Federal Reserve (the “Fed”) moved aggressively during the period to inject liquidity into the financial system and lowered official rates from 4.50% to 2.00% at the end of the reporting period.
Central banks in Europe, Canada and Australia also acted to inject liquidity
| | |
| 2 | | • ALLIANCEBERNSTEIN HIGH INCOME FUND |
into the system, though they have not matched the Fed’s interest-rate cuts, as inflation is a greater concern in many of those regions. The Fed’s larger interest-rate cuts also put more pressure on the U.S. dollar, which has fallen significantly against other major currencies. Despite aggressive central-bank action, investor sentiment remained fragile at the end of the reporting period.
A sharp reversal in market sentiment in April 2008, however, led fixed-income sector spreads to rebound against Treasuries. After nine consecutive months of gains, Treasuries recorded their largest loss in four years. Another Fed cut—as well as better-than-expected economic data—led to at least a temporary increase in investors’ appetite for risk.
For the six-month reporting period, high yield lagged most in the global flight to quality, returning -0.73%, as represented by the LB U.S. Corporate HY 2% Issuer Capped Index. High-yield spreads widened from 199 basis
points to 646 basis points over neutral-duration Treasuries. Underperforming industries included restaurants at -9.34%, building materials at -9.30%, media non-cable at -8.54% and finance at -7.75%. Outperforming industries included health care at 6.22%, utilities at 5.71% and energy at 5.13%.
Both U.S. dollar and local emerging-market debt outperformed high yield for the semi-annual period ended April 30, 2008, as the emerging markets demonstrated a reasonable level of stability in an environment of global volatility. U.S. dollar-denominated emerging market debt returned 1.90%, according to the JPM EMBI Global, with outperforming countries including Iraq at 21.17%, the Ivory Coast at 13.16% and Ecuador at 9.84%. Underperforming countries included Argentina at -18.61% and Venezuela at - -8.64%. Local emerging market debt returned 4.56%, according to the JP Morgan GBI-EM, as most currencies continued to strengthen against the U.S. dollar.
| | |
| ALLIANCEBERNSTEIN HIGH INCOME FUND • | | 3 |
HISTORICAL PERFORMANCE
An Important Note About the Value of Historical Performance
The performance shown on the following pages represents past performance and does not guarantee future results. Current performance may be lower or higher than the performance information shown. You may obtain performance information current to the most recent month-end by visiting www.alliancebernstein.com.
The investment return and principal value of an investment in the Fund will fluctuate, so that your shares, when redeemed, may be worth more or less than their original cost. You should consider the investment objectives, risks, charges and expenses of the Fund carefully before investing. For a free copy of the Fund’s prospectus, which contains this and other information, visit our website at www.alliancebernstein.com or call your financial advisor or AllianceBernstein Investments at 800.227.4618. You should read the prospectus carefully before you invest.
All fees and expenses related to the operation of the Fund have been deducted. NAV returns do not reflect sales charges; if sales charges were reflected, the Fund’s quoted performance would be lower. SEC returns reflect the applicable sales charges for each share class: a 4.25% maximum front-end sales charge for Class A shares; the applicable contingent deferred sales charge for Class B shares (3% year 1, 2% year 2, 1% year 3, 0% year 4); and a 1% 1 year contingent deferred sales charge for Class C shares. Returns for the different share classes will vary due to different expenses associated with each class. Performance assumes reinvestment of distributions and does not account for taxes.
Benchmark Disclosure
Neither the unmanaged JP Morgan Emerging Markets Bond Index Global (JPM EMBI Global), the JP Morgan Government Bond Index-Emerging Markets (GBI-EM) nor the Lehman Brothers (LB) U.S. Corporate High Yield (HY) 2% Issuer Capped Index reflects fees and expenses associated with the active management of a mutual fund portfolio. The unmanaged JPM EMBI Global tracks total returns for U.S. dollar-denominated debt instruments issued by emerging market sovereign and quasi-sovereign entities: Brady bonds, loans, eurobonds. The JP Morgan GBI-EM is the first comprehensive, global local emerging markets index, and consists of regularly traded, liquid fixed-rate, domestic currency government bonds to which international investors can gain exposure. The LB U.S. Corporate HY 2% Issuer Capped Index is the 2% Issuer Cap component of the U.S. Corporate HY Index. The LB U.S. Corporate HY Index is an unmanaged index that includes all fixed-income securities having a maximum quality rating of Ba1, a minimum amount outstanding of $150 million, and at least one year to maturity. The indexes do not reflect fees and expenses associated with the active management of a mutual fund portfolio.
A Word About Risk
A substantial amount of the Fund’s assets will be invested in foreign securities in emerging market nations, which may present market, credit, currency, liquidity, legal, political and other risks different from or greater than the risks of investing in developed foreign countries. Investment in the Fund includes risks not associated with funds that invest exclusively in U.S. issues. The Fund can invest a significant portion of its assets in the securities of a single issuer, making the Fund more susceptible to risks associated with a single economic, political or regulatory occurrence than a more diversified portfolio might be. Price fluctuation in the Fund’s portfolio securities may be caused by changes in interest rates or bond credit quality ratings. Changes in interest rates have a greater effect on bonds with longer maturities than on those with shorter maturities. Please note, as interest rates rise, existing bond prices fall and can cause the value of your investment in the Fund to decline. The Fund may invest in high-yield bonds (i.e., “junk bonds”), which involve a greater risk of default and price volatility than other bonds. Investing in below-investment grade bonds presents special risks, including credit risk. While the Fund invests principally in bonds and other fixed-income securities, in order to achieve its investment objectives, the Fund may at times use certain types of investment derivatives, such as options, futures, forwards and swaps. These instruments involve risks different from, and in certain cases, greater than, the risks presented by more traditional investments. These risks are fully discussed in the Fund’s prospectus.
(Historical Performance continued on next page)
| | |
| 4 | | • ALLIANCEBERNSTEIN HIGH INCOME FUND |
Historical Performance
HISTORICAL PERFORMANCE
(continued from previous page)
| | | | | | | |
| | | | | | | |
THE FUND VS. ITS BENCHMARKS PERIODS ENDED APRIL 30, 2008 | | Returns | | |
| | 6 Months | | | 12 Months | | |
AllianceBernstein High Income Fund | | | | | | | |
Class A | | -0.33% | | | 3.64% | | |
| | | |
Class B | | -0.57% | | | 2.86% | | |
| | | |
Class C | | -0.57% | | | 2.87% | | |
| | | |
Advisor Class* | | 0.44% | † | | N/A | | |
| | | |
Class R* | | 0.33% | † | | N/A | | |
| | | |
Class K* | | 0.39% | † | | N/A | | |
| | | |
Class I* | | 0.57% | † | | N/A | | |
| | | |
Current Composite Benchmark: 33% JP Morgan GBI – Emerging Markets / 33% JP Morgan EMBI Global / 33% Lehman Brothers U.S. Corporate High Yield 2% Issuer Capped Index | | 1.91% | | | 6.34% | | |
| | | |
Previous Benchmark: JP Morgan EMBI Global | | 1.90% | | | 4.60% | | |
| | | |
JP Morgan GBI – Emerging Markets | | 4.56% | | | 15.61% | | |
| | | |
Lehman Brothers U.S. Corporate High Yield 2% Issuer Capped Index | | -0.73% | | | -0.80% | | |
| | | |
* Please note that these share classes are for investors purchasing shares through accounts established under certain fee-based programs sponsored and maintained by certain broker-dealers and financial intermediaries, institutional pension plans and/or investment advisory clients of, and certain other persons associated with, the Adviser and its affiliates or the Funds. † This return is since the share class’s inception on 1/28/08. |
| | | | | | | |
See Historical Performance and Benchmark disclosures on previous page.
(Historical Performance continued on next page)
| | |
| ALLIANCEBERNSTEIN HIGH INCOME FUND • | | 5 |
Historical Performance
HISTORICAL PERFORMANCE
(continued from previous page)
| | | | | | | | | |
| AVERAGE ANNUAL RETURNS AS OF APRIL 30, 2008 | |
| | | NAV Returns | | | SEC Returns | | | SEC Yields* | |
| | | | | | | | | |
| Class A Shares | | | | | | | | 7.56 | % |
1 Year | | 3.64 | % | | -0.79 | % | | | |
5 Years | | 11.55 | % | | 10.60 | % | | | |
10 Years | | 10.79 | % | | 10.32 | % | | | |
| | | | | | | | | |
| Class B Shares | | | | | | | | 7.12 | % |
1 Year | | 2.86 | % | | 0.05 | % | | | |
5 Years | | 10.70 | % | | 10.70 | % | | | |
10 Years(a) | | 10.25 | % | | 10.25 | % | | | |
| | | | | | | | | |
| Class C Shares | | | | | | | | 7.10 | % |
1 Year | | 2.87 | % | | 1.93 | % | | | |
5 Years | | 10.71 | % | | 10.71 | % | | | |
10 Years | | 9.93 | % | | 9.93 | % | | | |
| | | | | | | | | |
| Advisor Class Shares‡ | | | | | | | | 8.21 | % |
Since Inception† | | 0.44 | % | | 0.44 | % | | | |
| | | | | | | | | |
| Class R Shares‡ | | | | | | | | 7.95 | % |
Since Inception† | | 0.33 | % | | 0.33 | % | | | |
| | | | | | | | | |
| Class K Shares‡ | | | | | | | | 8.17 | % |
Since Inception† | | 0.39 | % | | 0.39 | % | | | |
| | | | | | | | | |
| Class I Shares‡ | | | | | | | | 8.43 | % |
Since Inception† | | 0.57 | % | | 0.57 | % | | | |
The Fund’s current prospectus fee table shows the Fund’s total annual operating expense ratios as 1.32%, 2.04%, 2.02%, 1.02%, 1.61%, 1.30% and 0.97% for Class A, Class B, Class C, Advisor, Class R, Class K and Class I shares, respectively, gross of any fee waivers or expense reimbursements. Contractual fee waivers and/or expense reimbursements limit the Fund’s annual operating expense ratios, exclusive of interest expense, to .95%, 1.65%, 1.65%, .65%, 1.15%, .90% and .65% for Class A, Class B, Class C, Advisor, Class R, Class K and Class I shares, respectively. These waivers/ reimbursements extend through October 31, 2009, and then may be extended by the Adviser for additional one-year terms. Absent reimbursements or waivers, performance would have been lower. The Financial Highlights section of this report sets forth expense ratio data for the current reporting period; the expense ratios shown above may differ from the expense ratios in the Financial Highlights sections since they are based on different time periods.
(a) | Assumes conversion of Class B shares into Class A shares after six years. |
| * | SEC Yields are calculated based on SEC guidelines for the 30-day period ended April 30, 2008. |
| † | Inception date: 1/28/08 for Advisor Class, Class R, Class K and Class I shares. Returns for these share classes are cumulative. |
‡ | These share classes are offered at net asset value (NAV) to eligible investors and their SEC returns are the same as the NAV returns. Please note that these share classes are for investors purchasing shares through accounts established under certain fee-based programs sponsored and maintained by certain broker-dealers and financial intermediaries, institutional pension plans and/or investment advisory clients of, and certain other persons associated with, the Adviser and its affiliates or the Funds. The inception date for these share classes is listed above. |
See Historical Performance disclosures on page 4.
(Historical Performance continued on next page)
| | |
| 6 | | • ALLIANCEBERNSTEIN HIGH INCOME FUND |
Historical Performance
HISTORICAL PERFORMANCE
(continued from previous page)
| | | |
SEC AVERAGE ANNUAL RETURNS (WITH ANY APPLICABLE SALES CHARGES)
AS OF THE MOST RECENT CALENDAR QUARTER-END (MARCH 31, 2008) | |
| | | SEC Returns | |
| | | |
| Class A Shares | | | |
1 Year | | -2.03 | % |
5 Years | | 11.52 | % |
10 Years | | 9.92 | % |
| | | |
| Class B Shares | | | |
1 Year | | -1.38 | % |
5 Years | | 11.58 | % |
10 Years(a) | | 9.88 | % |
| | | |
| Class C Shares | | | |
1 Year | | 0.48 | % |
5 Years | | 11.60 | % |
10 Years | | 9.54 | % |
| | | |
| Advisor Class Shares‡ | | | |
Since Inception† | | -2.32 | % |
| | | |
| Class R Shares‡ | | | |
Since Inception† | | -2.29 | % |
| | | |
| Class K Shares‡ | | | |
Since Inception† | | -2.25 | % |
| | | |
| Class I Shares‡ | | | |
Since Inception† | | -2.21 | % |
(a) | Assumes conversion of Class B shares into Class A shares after six years. |
| † | Inception date: 1/28/08 for Advisor Class, Class R, Class K and Class I shares. Returns for these share classes are cumulative. |
‡ | Please note that these share classes are for investors purchasing shares through accounts established under certain fee-based programs sponsored and maintained by certain broker-dealers and financial intermediaries, institutional pension plans and/or investment advisory clients of, and certain other persons associated with, the Adviser and its affiliates or the Funds. The inception date for these share classes is listed above. |
See Historical Performance disclosures on page 4.
(Historical Performance continued on next page)
| | |
| ALLIANCEBERNSTEIN HIGH INCOME FUND • | | 7 |
Historical Performance
FUND EXPENSES
As a shareholder of the Fund, you incur two types of costs: (1) transaction costs, including sales charges (loads) on purchase payments, contingent deferred sales charges on redemptions and (2) ongoing costs, including management fees; distribution (12b-1) fees; and other Fund expenses. This example is intended to help you understand your ongoing costs (in dollars) of investing in the Fund and to compare these costs with the ongoing costs of investing in other mutual funds.
The Example is based on an investment of $1,000 invested at the beginning of the period and held for the entire period as indicated below.
Actual Expenses
The first line of the table below provides information about actual account values and actual expenses. You may use the information in this line, together with the amount you invested, to estimate the expenses that you paid over the period. Simply divide your account value by $1,000 (for example, an $8,600 account value divided by $1,000 = 8.6), then multiply the result by the number in the first line under the heading entitled “Expenses Paid During Period” to estimate the expenses you paid on your account during this period.
Hypothetical Example for Comparison Purposes
The second line of the table below provides information about hypothetical account values and hypothetical expenses based on the Fund’s actual expense ratio and an assumed annual rate of return of 5% before expenses, which is not the Fund’s actual return. The hypothetical account values and expenses may not be used to estimate the actual ending account balance or expenses you paid for the period. You may use this information to compare the ongoing costs of investing in the Fund and other funds by comparing this 5% hypothetical example with the 5% hypothetical examples that appear in the shareholder reports of other funds.
| | | | | | | | | | | | | | | | | | |
| | | Beginning
Account Value
November 1, 2007 | | Ending
Account Value
April 30, 2008 | | Expenses Paid
During Period* |
| | | Actual | | Hypothetical | | Actual | | Hypothetical** | | Actual | | Hypothetical |
| Class A | | $ | 1,000 | | $ | 1,000 | | $ | 996.69 | | $ | 1,019.34 | | $ | 5.51 | | $ | 5.57 |
| Class B | | $ | 1,000 | | $ | 1,000 | | $ | 994.26 | | $ | 1,015.86 | | $ | 8.97 | | $ | 9.07 |
| Class C | | $ | 1,000 | | $ | 1,000 | | $ | 994.35 | | $ | 1,015.81 | | $ | 9.02 | | $ | 9.12 |
| Advisor Class† | | $ | 1,000 | | $ | 1,000 | | $ | 1,004.38 | | $ | 1,021.63 | | $ | 1.71 | | $ | 3.27 |
| Class R† | | $ | 1,000 | | $ | 1,000 | | $ | 1,003.34 | | $ | 1,019.14 | | $ | 3.02 | | $ | 5.77 |
| Class K† | | $ | 1,000 | | $ | 1,000 | | $ | 1,003.88 | | $ | 1,020.39 | | $ | 2.37 | | $ | 4.52 |
| Class I† | | $ | 1,000 | | $ | 1,000 | | $ | 1,005.71 | | $ | 1,021.63 | | $ | 1.71 | | $ | 3.27 |
| * | With the exception of Advisor Class, Class R, Class K and Class I shares, expenses are equal to the classes’ annualized expense ratios of 1.11%, 1.81% and 1.82%, respectively multiplied by the average account value over the period, multiplied by 182/366 (to reflect the one-half year period). |
| ** | Assumes 5% return before expenses. |
† | For Advisor Class, Class R, Class K and Class I shares, expenses are equal to the classes’ annualized expense ratios of 0.65%, 1.15%, 0.90% and 0.65%, respectively. The “Actual” and “Hypothetical” expenses paid are based on the period from January 25, 2008 (commencement of distribution) to April 30, 2008. Actual expenses are equal to each class’ annualized expense ratio, multiplied by the average account value over the period, multiplied by 96/366 (to reflect the since inception period). Hypothetical expenses are equal to each class’ annualized expense ratio, multiplied by the average account value over the period, multiplied by 182/366 (to reflect the one-half year period). |
| | |
| 8 | | • ALLIANCEBERNSTEIN HIGH INCOME FUND |
Fund Expenses
PORTFOLIO SUMMARY
APRIL 30, 2008 (unaudited)
PORTFOLIO STATISTICS
Net Assets ($mil): $1,008.5
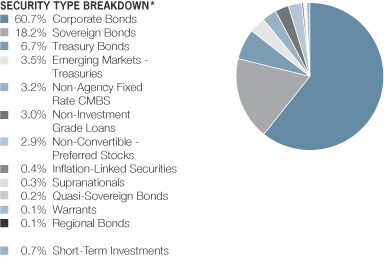
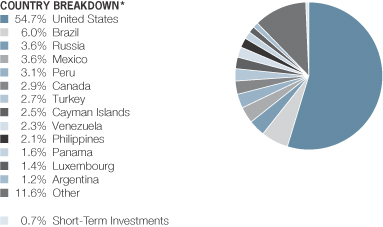
| * | All data are as of April 30, 2008. The Fund’s security type and country breakdowns are expressed as a percentage of total investments and may vary over time. ‘Other’ country weightings represent 1.2% or less in the following countries: Bermuda, Colombia, Dominican Republic, Ecuador, El Salvador, France, Hong Kong, Indonesia, Ireland, Jamaica, Japan, Kazakhstan, Lebanon, Malaysia, Multinational, Netherlands, Nigeria, Pakistan, Singapore, South Africa, South Korea, Spain, Supranational, Ukraine, United Kingdom and Uruguay. |
| | |
| ALLIANCEBERNSTEIN HIGH INCOME FUND • | | 9 |
Portfolio Summary
PORTFOLIO OF INVESTMENTS
April 30, 2008 (unaudited)
| | | | | | | |
| | | | | Principal
Amount (000) | | U.S. $ Value |
| | | | |
| | | | | | | |
CORPORATE BONDS – 60.8% | | | |
Bermuda – 0.3% | | | | | | | |
Intelsat Bermuda Ltd. | | | | | | | |
11.25%, 6/15/16(a) | | US$ | | 1,972 | | $ | 1,999,115 |
Intelsat Subsidiary Holding Co. Ltd. | | | | | | | |
8.625%, 1/15/15 | | | | 661 | | | 666,784 |
| | | | | | | |
| | | | | | | 2,665,899 |
| | | | | | | |
Brazil – 0.4% | | | | | | | |
Banco BMG SA | | | | | | | |
9.15%, 1/15/16(a)(b) | | | | 1,300 | | | 1,352,000 |
Usiminas Commercial Ltd | | | | | | | |
7.25%, 1/18/18(a)(b) | | | | 741 | | | 791,017 |
Vale Overseas Ltd. | | | | | | | |
6.875%, 11/21/36(a) | | | | 1,995 | | | 2,019,140 |
| | | | | | | |
| | | | | | | 4,162,157 |
| | | | | | | |
Canada – 2.9% | | | | | | | |
Bombardier, Inc. | | | | | | | |
6.30%, 5/01/14(a)(b) | | | | 1,415 | | | 1,415,000 |
8.00%, 11/15/14(a)(b) | | | | 1,060 | | | 1,128,900 |
Bowater Canada Finance | | | | | | | |
7.95%, 11/15/11 | | | | 1,535 | | | 951,700 |
Cascades, Inc. | | | | | | | |
7.25%, 2/15/13(a) | | | | 1,200 | | | 1,104,000 |
Celestica, Inc. | | | | | | | |
7.875%, 7/01/11(a) | | | | 1,200 | | | 1,207,500 |
Fairfax Financial Holdings Ltd. | | | | | | | |
7.75%, 6/15/17(a) | | | | 1,000 | | | 960,000 |
Inco Ltd. | | | | | | | |
5.70%, 10/15/15(a) | | | | 7,995 | | | 7,641,389 |
Nortel Networks Corp. | | | | | | | |
6.875%, 9/01/23(a) | | | | 1,000 | | | 690,000 |
Nortel Networks Ltd. | | | | | | | |
10.125%, 7/15/13(a) | | | | 537 | | | 526,260 |
Novelis, Inc. | | | | | | | |
7.25%, 2/15/15(a) | | | | 795 | | | 727,425 |
OPTI Canada, Inc. | | | | | | | |
8.25%, 12/15/14(a) | | | | 800 | | | 826,000 |
Quebecor Media, Inc. | | | | | | | |
7.75%, 3/15/16(a) | | | | 1,802 | | | 1,734,425 |
Rogers Cable, Inc. | | | | | | | |
7.875%, 5/01/12(a) | | | | 1,500 | | | 1,608,870 |
Shaw Communications, Inc. | | | | | | | |
7.20%, 12/15/11(a) | | | | 655 | | | 674,650 |
7.25%, 4/06/11(a) | | | | 1,235 | | | 1,275,137 |
Teck Cominco Ltd. | | | | | | | |
6.125%, 10/01/35(a) | | | | 5,000 | | | 4,343,985 |
| | |
| 10 | | • ALLIANCEBERNSTEIN HIGH INCOME FUND |
Portfolio of Investments
| | | | | | | |
| | | | | Principal
Amount (000) | | U.S. $ Value |
| |
| | | | | | | |
TransCanada Pipelines Ltd. | | | | | | | |
6.35%, 5/15/67(a)(c) | | US$ | | 2,500 | | $ | 2,221,923 |
| | | | | | | |
| | | | | | | 29,037,164 |
| | | | | | | |
Cayman Islands – 0.5% | | | | | | | |
Resona Preferred Global Securities | | | | | | | |
7.191%, 7/30/15(a)(b)(c) | | | | 5,000 | | | 4,445,930 |
Seagate Technology HDD Holding | | | | | | | |
6.375%, 10/01/11(a) | | | | 463 | | | 454,898 |
| | | | | | | |
| | | | | | | 4,900,828 |
| | | | | | | |
El Salvador – 0.1% | | | | | | | |
Mmg Fiduc (aes El Salv) | | | | | | | |
6.75%, 2/01/16(a)(b) | | | | 1,200 | | | 1,216,973 |
| | | | | | | |
| | | |
France - 0.4% | | | | | | | |
CIE Generale De Geophysique | | | | | | | |
7.50%, 5/15/15(a) | | | | 374 | | | 386,155 |
7.75%, 5/15/17(a) | | | | 69 | | | 71,242 |
Credit Agricole SA/London | | | | | | | |
6.637%, 5/31/17(a)(b)(c) | | | | 3,000 | | | 2,459,922 |
Lafarge SA | | | | | | | |
7.125%, 7/15/36(a) | | | | 1,500 | | | 1,397,649 |
| | | | | | | |
| | | | | | | 4,314,968 |
| | | | | | | |
Hong Kong – 0.3% | | | | | | | |
Chaoda Modern Agriculture | | | | | | | |
7.75%, 2/08/10(a)(b) | | | | 1,523 | | | 1,507,770 |
Noble Group Ltd. | | | | | | | |
6.625%, 3/17/15(a)(b) | | | | 1,768 | | | 1,597,027 |
| | | | | | | |
| | | | | | | 3,104,797 |
| | | | | | | |
Indonesia – 0.0% | | | | | | | |
Majapahit Holding BV | | | | | | | |
7.875%, 6/29/37(a)(b) | | | | 200 | | | 176,000 |
| | | | | | | |
| | | |
Ireland – 0.2% | | | | | | | |
BOI Capital Funding No 2 | | | | | | | |
5.571%, 2/01/16(a)(b)(c) | | | | 1,425 | | | 1,061,321 |
Elan Finance PLC/Elan Finance Corp. | | | | | | | |
7.75%, 11/15/11(a) | | | | 1,058 | | | 1,028,905 |
| | | | | | | |
| | | | | | | 2,090,226 |
| | | | | | | |
Jamaica – 0.2% | | | | | | | |
Digicel Ltd. | | | | | | | |
9.25%, 9/01/12(a)(b) | | | | 1,741 | | | 1,758,410 |
| | | | | | | |
| | | |
Japan – 1.1% | | | | | | | |
Aiful Corp. | | | | | | | |
6.00%, 12/12/11(a)(b) | | | | 551 | | | 524,609 |
Mizuho Financial Group Cayman Ltd. | | | | | | | |
8.375%, 4/27/09(a) | | | | 5,100 | | | 5,143,452 |
| | |
| ALLIANCEBERNSTEIN HIGH INCOME FUND • | | 11 |
Portfolio of Investments
| | | | | | | |
| | | | | Principal
Amount (000) | | U.S. $ Value |
| |
| | | | | | | |
MUFG Capital Finance 1 Ltd. | | | | | | | |
6.346%, 7/25/16(a)(c) | | US$ | | 2,400 | | $ | 2,169,153 |
ORIX Corp. | | | | | | | |
5.48%, 11/22/11(a) | | | | 3,000 | | | 2,908,920 |
| | | | | | | |
| | | | | | | 10,746,134 |
| | | | | | | |
Kazakhstan – 0.2% | | | | | | | |
ALB Finance BV | | | | | | | |
9.25%, 9/25/13(a)(b) | | | | 1,136 | | | 948,560 |
Kazkommerts International BV | | | | | | | |
8.50%, 4/16/13(a)(b) | | | | 1,150 | | | 1,022,062 |
| | | | | | | |
| | | | | | | 1,970,622 |
| | | | | | | |
Liberia – 0.1% | | | | | | | |
Royal Caribbean Cruises Ltd. | | | | | | | |
8.75%, 2/02/11(a) | | | | 727 | | | 759,715 |
| | | | | | | |
| | | |
Luxembourg – 1.3% | | | | | | | |
Basell AF SCA | | | | | | | |
8.375%, 8/15/15(a)(b) | | | | 1,924 | | | 1,394,900 |
Tyco International Group SA | | | | | | | |
6.00%, 11/15/13 | | | | 9,550 | | | 9,670,559 |
Vip Finance | | | | | | | |
8.375%, 4/30/13(b) | | | | 2,545 | | | 2,544,433 |
| | | | | | | |
| | | | | | | 13,609,892 |
| | | | | | | |
Multinational – 0.1% | | | | | | | |
MagnaChip Semiconductor SA | | | | | | | |
8.00%, 12/15/14 | | | | 1,200 | | | 696,000 |
| | | | | | | |
| | | |
Netherlands – 0.2% | | | | | | | |
NXP BV / NXP Funding LLC | | | | | | | |
5.463%, 10/15/13(a)(d) | | | | 620 | | | 570,400 |
9.50%, 10/15/15(a) | | | | 715 | | | 691,763 |
Sensata Technologies BV | | | | | | | |
8.00%, 5/01/14(a) | | | | 700 | | | 652,750 |
| | | | | | | |
| | | | | | | 1,914,913 |
| | | | | | | |
Peru – 0.1% | | | | | | | |
IIRSA Norte Finance Ltd. | | | | | | | |
8.75%, 5/30/24(a)(b) | | | | 872 | | | 1,007,455 |
| | | | | | | |
| | | |
Russia – 3.2% | | | | | | | |
Alfa Bond Issuance PLC | | | | | | | |
8.625%, 12/09/15(a)(c) | | | | 900 | | | 854,667 |
Citigroup (JSC Severstal) | | | | | | | |
9.25%, 4/19/14(a)(b) | | | | 1,570 | | | 1,674,562 |
Evraz Group SA | | | | | | | |
8.25%, 11/10/15(a)(b) | | | | 2,534 | | | 2,472,742 |
8.875%, 4/24/13(b) | | | | 843 | | | 853,538 |
| | |
| 12 | | • ALLIANCEBERNSTEIN HIGH INCOME FUND |
Portfolio of Investments
| | | | | | | |
| | | | | Principal
Amount (000) | | U.S. $ Value |
| |
| | | | | | | |
Gallery Capital SA | | | | | | | |
10.125%, 5/15/13(a)(b) | | US$
| | 960 | | $ | 785,462 |
Gaz Capital SA | | | | | | | |
6.212%, 11/22/16(a)(b) | | | | 6,374 | | | 6,032,417 |
6.51%, 3/07/22(a)(b) | | | | 9,473 | | | 8,701,602 |
GPB Eurobond (Gazprombk) | | | | | | | |
6.50%, 9/23/15(a) | | | | 750 | | | 726,563 |
Mobile Telesystems Finance SA | | | | | | | |
8.00%, 1/28/12(a)(b) | | | | 1,155 | | | 1,176,656 |
Red Arrow Intl Leasing PLC | | | | | | | |
8.375%, 6/30/12(a) | | RUB | | 46,622 | | | 1,995,806 |
RS Finance (RSB) | | | | | | | |
7.50%, 10/07/10(a)(b) | | US$ | | 2,587 | | | 2,380,040 |
TNK-BP Finance SA | | | | | | | |
7.50%, 7/18/16(a)(b) | | | | 2,308 | | | 2,236,535 |
VTB Capital SA | | | | | | | |
6.609%, 10/31/12(a)(b) | | | | 2,055 | | | 2,008,763 |
| | | | | | | |
| | | | | | | 31,899,353 |
| | | | | | | |
Singapore – 0.2% | | | | | | | |
Avago Technologies Finance | | | | | | | |
10.125%, 12/01/13(a) | | | | 963 | | | 1,025,595 |
Flextronics International Ltd. | | | | | | | |
6.50%, 5/15/13(a) | | | | 1,124 | | | 1,098,710 |
| | | | | | | |
| | | | | | | 2,124,305 |
| | | | | | | |
South Africa – 0.0% | | | | | | | |
Foodcorp Ltd. | | | | | | | |
8.875%, 6/15/12(a)(b) | | EUR | | 456 | | | 498,415 |
| | | | | | | |
| | | |
South Korea – 0.0% | | | | | | | |
C&M Finance Ltd. | | | | | | | |
8.10%, 2/01/16(a)(b) | | US$ | | 530 | | | 535,300 |
| | | | | | | |
| | | |
United Kingdom – 0.9% | | | | | | | |
BSKYB Finance UK PLC | | | | | | | |
6.50%, 10/15/35(a)(b) | | | | 2,000 | | | 1,930,308 |
Ineos Group Holdings PLC | | | | | | | |
8.50%, 2/15/16(a)(b) | | | | 2,105 | | | 1,705,050 |
Inmarsat Finance PLC | | | | | | | |
Zero Coupon, 11/15/12(a)(e) | | | | 1,165 | | | 1,148,981 |
Vodafone Group PLC | | | | | | | |
7.875%, 2/15/30(a) | | | | 3,800 | | | 4,316,188 |
| | | | | | | |
| | | | | | | 9,100,527 |
| | | | | | | |
United States – 48.1% | | | |
ACCO Brands Corp.
7.625%, 8/15/15(a) | | | | 250 | | | 227,500 |
The AES Corp.
7.75%, 3/01/14(a) | | | | 2,196 | | | 2,250,900 |
8.00%, 10/15/17(a) | | | | 360 | | | 375,300 |
| | |
| ALLIANCEBERNSTEIN HIGH INCOME FUND • | | 13 |
Portfolio of Investments
| | | | | | | |
| | | | | Principal
Amount (000) | | U.S. $ Value |
| |
| | | | | | | |
AFC Capital Trust I
Series B
8.207%, 2/03/27(a) | | US$ | | 5,000 | | $ | 3,938,525 |
Affinia Group, Inc.
9.00%, 11/30/14(a) | | | | 1,125 | | | 978,750 |
AK Steel Corp.
7.75%, 6/15/12(a) | | | | 1,050 | | | 1,072,313 |
Algoma Acquisition Corp.
9.875%, 6/15/15(a)(b) | | | | 900 | | | 819,000 |
Alion Science and Technology Corp.
10.25%, 2/01/15(a) | | | | 1,313 | | | 835,396 |
Allbritton Communications Co.
7.75%, 12/15/12(a) | | | | 1,230 | | | 1,243,838 |
Allegheny Energy Supply
7.80%, 3/15/11(a) | | | | 723 | | | 755,535 |
8.25%, 4/15/12(a)(b) | | | | 925 | | | 985,125 |
Allied Waste North America, Inc.
6.375%, 4/15/11(a) | | | | 962 | | | 966,810 |
Series B
7.125%, 5/15/16(a) | | | | 362 | | | 364,715 |
7.375%, 4/15/14(a) | | | | 1,090 | | | 1,098,175 |
Alltel Corp.
7.875%, 7/01/32(a) | | | | 1,530 | | | 1,055,700 |
AMC Entertainment, Inc.
11.00%, 2/01/16(a) | | | | 1,500 | | | 1,492,500 |
American Media Operations, Inc.
8.875%, 1/15/11(a) | | | | 1,000 | | | 741,250 |
Amkor Technology, Inc.
9.25%, 6/01/16(a) | | | | 1,910 | | | 1,905,225 |
AMR Corp.
9.00%, 8/01/12(a) | | | | 906 | | | 597,960 |
Aquila, Inc.
14.875%, 7/01/12(a) | | | | 1,000 | | | 1,215,000 |
ARAMARK Corp.
8.50%, 2/01/15(a) | | | | 1,592 | | | 1,659,660 |
Arch Western Finance LLC
6.75%, 7/01/13(a) | | | | 643 | | | 654,253 |
Asbury Automotive Group, Inc.
8.00%, 3/15/14(a) | | | | 1,125 | | | 1,018,125 |
Associated Materials, Inc.
Zero Coupon, 3/01/14(a)(e) | | | | 1,526 | | | 1,091,090 |
Avis Budget Car Rental
7.75%, 5/15/16(a) | | | | 1,838 | | | 1,622,035 |
Bausch & Lomb, Inc.
9.875%, 11/01/15(a)(b) | | | | 825 | | | 878,625 |
Bear Stearns Co., Inc.
5.35%, 2/01/12(a) | | | | 3,500 | | | 3,499,402 |
5.55%, 1/22/17(a) | | | | 482 | | | 466,373 |
| | |
| 14 | | • ALLIANCEBERNSTEIN HIGH INCOME FUND |
Portfolio of Investments
| | | | | | | |
| | | | | Principal
Amount (000) | | U.S. $ Value |
| |
| | | | | | | |
Beazer Homes USA, Inc.
6.875%, 7/15/15(a) | | US$ | | 1,000 | | $ | 785,000 |
Berry Plastics Holding Corp.
8.875%, 9/15/14(a) | | | | 877 | | | 819,995 |
10.25%, 3/01/16(a) | | | | 672 | | | 569,520 |
The Bon-Ton Dept Stores, Inc.
10.25%, 3/15/14(a) | | | | 1,600 | | | 1,248,000 |
Boston Scientific Corp.
6.00%, 6/15/11(a) | | | | 3,000 | | | 2,962,500 |
Boyd Gaming Corp.
7.75%, 12/15/12(a) | | | | 1,200 | | | 1,120,500 |
Broder Brothers Co.
Series B
11.25%, 10/15/10(a) | | | | 599 | | | 414,808 |
Burlington Coat Factory Warehouse Corp.
11.125%, 4/15/14(a) | | | | 1,026 | | | 872,100 |
CA, Inc.
4.75%, 12/01/09(a) | | | | 551 | | | 549,140 |
Cablevision Systems Corp.
Series B
8.00%, 4/15/12(a) | | | | 1,000 | | | 995,000 |
Cadbury Schweppes US Finance LLC
5.125%, 10/01/13(a)(b) | | | | 450 | | | 435,519 |
Capital One Financial Corp.
5.50%, 6/01/15(a) | | | | 3,700 | | | 3,450,280 |
Caraustar Industries, Inc.
7.375%, 6/01/09(a) | | | | 750 | | | 502,500 |
Case Corp.
7.25%, 1/15/16(a) | | | | 997 | | | 1,006,970 |
Case New Holland, Inc.
7.125%, 3/01/14(a) | | | | 1,324 | | | 1,330,620 |
CCH I Holdings LLC
11.75%, 5/15/14(a) | | | | 4,338 | | | 2,429,280 |
Centennial Communications Corp.
10.00%, 1/01/13(a) | | | | 1,450 | | | 1,464,500 |
Chaparral Energy, Inc.
8.875%, 2/01/17(a) | | | | 1,000 | | | 915,000 |
Chesapeake Energy Corp.
6.50%, 8/15/17(a) | | | | 575 | | | 566,375 |
7.50%, 9/15/13(a) | | | | 404 | | | 418,140 |
7.75%, 1/15/15(a) | | | | 1,034 | | | 1,067,605 |
Chukchansi Economic Development Authority
8.00%, 11/15/13(a)(b) | | | | 500 | | | 445,000 |
Cincinnati Bell, Inc.
8.375%, 1/15/14(a) | | | | 1,450 | | | 1,442,750 |
CIT Group Funding Co. of Canada
5.20%, 6/01/15(a) | | | | 3,600 | | | 2,992,374 |
| | |
| ALLIANCEBERNSTEIN HIGH INCOME FUND • | | 15 |
Portfolio of Investments
| | | | | | | |
| | | | | Principal
Amount (000) | | U.S. $ Value |
| |
| | | | | | | |
CIT Group, Inc.
Series MTN
5.125%, 9/30/14(a) | | US$ | | 4,200 | | $ | 3,465,013 |
Citizens Communications Co.
6.25%, 1/15/13(a) | | | | 1,222 | | | 1,157,845 |
Clear Channel Communications, Inc.
5.50%, 9/15/14(a) | | | | 1,205 | | | 837,475 |
5.75%, 1/15/13(a) | | | | 3,288 | | | 2,498,880 |
Comcast Cable Communications Holdings, Inc.
9.455%, 11/15/22(a) | | | | 2,500 | | | 3,040,785 |
Community Health Systems, Inc.
8.875%, 7/15/15(a) | | | | 1,500 | | | 1,560,000 |
Complete Production Services, Inc.
8.00%, 12/15/16(a) | | | | 1,000 | | | 1,002,500 |
Continental Airlines, Inc.
8.75%, 12/01/11(a) | | | | 703 | | | 530,765 |
Series RJO3
7.875%, 7/02/18(a) | | | | 212 | | | 175,703 |
Cooper-Standard Automotive , Inc.
7.00%, 12/15/12(a) | | | | 1,125 | | | 1,031,625 |
Couche-Tard, Inc.
7.50%, 12/15/13(a) | | | | 1,242 | | | 1,248,210 |
Countrywide Financial Corp.
6.25%, 5/15/16(a) | | | | 620 | | | 545,542 |
Series MTN
5.80%, 6/07/12(a) | | | | 696 | | | 663,511 |
Countrywide Home Loans, Inc.
Series MTNL
4.00%, 3/22/11(a) | | | | 76 | | | 69,587 |
Coventry Health Care, Inc.
5.875%, 1/15/12(a) | | | | 1,660 | | | 1,613,814 |
5.95%, 3/15/17(a) | | | | 1,415 | | | 1,295,249 |
Cricket Communications, Inc.
9.375%, 11/01/14(a) | | | | 1,707 | | | 1,674,994 |
Crown Americas
7.625%, 11/15/13(a) | | | | 1,042 | | | 1,083,680 |
Crum & Forster Holdings Corp.
7.75%, 5/01/17(a) | | | | 457 | | | 441,005 |
CSC Holdings, Inc.
6.75%, 4/15/12(a) | | | | 1,482 | | | 1,452,360 |
7.875%, 2/15/18(a) | | | | 212 | | | 208,290 |
DaVita, Inc.
7.25%, 3/15/15(a) | | | | 815 | | | 817,037 |
Dean Foods Co.
7.00%, 6/01/16(a) | | | | 1,000 | | | 935,000 |
Del Monte Corp.
6.75%, 2/15/15(a) | | | | 750 | | | 723,750 |
| | |
| 16 | | • ALLIANCEBERNSTEIN HIGH INCOME FUND |
Portfolio of Investments
| | | | | | | |
| | | | | Principal
Amount (000) | | U.S. $ Value |
| |
| | | | | | | |
Dex Media , Inc.
Zero Coupon, 11/15/13(a)(e) | | US$ | | 1,250 | | $ | 940,625 |
Dex Media West LLC
Series B
8.50%, 8/15/10(a) | | | | 326 | | | 320,295 |
DirecTV Holdings LLC
6.375%, 6/15/15(a) | | | | 5,155 | | | 4,935,912 |
Dole Food Co., Inc.
8.875%, 3/15/11(a) | | | | 900 | | | 805,500 |
Dollar General Corp.
10.625%, 7/15/15(a) | | | | 1,070 | | | 1,064,650 |
Dominion Resources, Inc.
7.50%, 6/30/66(a)(f) | | | | 4,100 | | | 3,802,496 |
Domtar Corp.
5.375%, 12/01/13 | | | | 500 | | | 455,000 |
DR Horton, Inc.
6.00%, 4/15/11(a) | | | | 1,756 | | | 1,650,640 |
Dresdner Funding Trust I
8.151%, 6/30/31(a)(b) | | | | 2,000 | | | 1,527,478 |
Duane Reade Inc.
9.75%, 8/01/11(a) | | | | 1,200 | | | 1,113,000 |
Duke Capital LLC
8.00%, 10/01/19(a) | | | | 2,000 | | | 2,213,226 |
Dynegy Holdings, Inc.
8.375%, 5/01/16(a) | | | | 3,141 | | | 3,274,492 |
Dynegy Roseton/Danskammer Pass Through Trust
Series B
7.67%, 11/08/16(a) | | | | 1,129 | | | 1,130,836 |
EchoStar DBS Corp.
6.375%, 10/01/11(a) | | | | 479 | | | 476,605 |
6.625%, 10/01/14(a) | | | | 1,299 | | | 1,269,772 |
7.00%, 10/01/13(a) | | | | 4,300 | | | 4,289,250 |
7.125%, 2/01/16(a) | | | | 184 | | | 180,780 |
Edison Mission Energy
7.00%, 5/15/17(a) | | | | 3,648 | | | 3,684,480 |
7.50%, 6/15/13(a) | | | | 1,062 | | | 1,104,480 |
7.75%, 6/15/16(a) | | | | 447 | | | 468,232 |
Education Management LLC
10.25%, 6/01/16(a) | | | | 950 | | | 798,000 |
El Paso Corp.
7.375%, 12/15/12(a) | | | | 394 | | | 414,860 |
Electronic Data Systems Corp.
Series B
6.50%, 8/01/13(a) | | | | 6,000 | | | 6,114,144 |
Embarq Corp.
6.738%, 6/01/13(a) | | | | 2,500 | | | 2,494,325 |
| | |
| ALLIANCEBERNSTEIN HIGH INCOME FUND • | | 17 |
Portfolio of Investments
| | | | | | | |
| | | | | Principal
Amount (000) | | U.S. $ Value |
| |
| | | | | | | |
Energy Future Holdings Corp.
10.875%, 11/01/17(a)(b) | | US$ | | 490 | | $ | 521,850 |
Energy Transfer Partners LP
5.95%, 2/01/15(a) | | | | 1,500 | | | 1,490,304 |
Enterprise Products Operating LP
8.375%, 8/01/66(a)(c) | | | | 1,230 | | | 1,224,266 |
Series B
5.00%, 3/01/15(a) | | | | 1,500 | | | 1,427,370 |
6.65%, 10/15/34(a) | | | | 1,500 | | | 1,444,048 |
Farmers Insurance Exchange
8.625%, 5/01/24(a)(b) | | | | 3,000 | | | 3,172,752 |
First Data Corp.
9.875%, 9/24/15(a)(b) | | | | 1,341 | | | 1,220,310 |
Fisher Scientific International, Inc.
6.125%, 7/01/15(a) | | | | 2,000 | | | 1,995,196 |
Ford Motor Co.
7.45%, 7/16/31(a) | | | | 2,265 | | | 1,693,087 |
Ford Motor Credit Co.
5.46%, 1/13/12(a)(d) | | | | 640 | | | 538,177 |
7.00%, 10/01/13(a) | | | | 974 | | | 840,354 |
8.00%, 12/15/16(a) | | | | 1,400 | | | 1,225,277 |
Forest Oil Corp.
7.25%, 6/15/19(a) | | | | 540 | | | 557,550 |
Freeport-McMoRan Copper & Gold, Inc.
8.375%, 4/01/17(a) | | | | 1,466 | | | 1,619,930 |
Freescale Semiconductor, Inc.
8.875%, 12/15/14(a) | | | | 1,480 | | | 1,302,400 |
10.125%, 12/15/16(a) | | | | 1,429 | | | 1,125,337 |
Gaylord Entertainment Co.
8.00%, 11/15/13(a) | | | | 1,000 | | | 947,500 |
General Motors Acceptance Corp.
6.75%, 12/01/14(a) | | | | 962 | | | 735,095 |
6.875%, 9/15/11(a) | | | | 1,722 | | | 1,434,982 |
8.00%, 11/01/31(a) | | | | 659 | | | 498,588 |
General Motors Corp.
8.25%, 7/15/23(a) | | | | 1,993 | | | 1,489,767 |
8.375%, 7/15/33(a) | | | | 1,503 | | | 1,144,159 |
Georgia Gulf Corp.
10.75%, 10/15/16(a) | | | | 1,500 | | | 1,087,500 |
Georgia-Pacific Corp.
7.00%, 1/15/15(a)(b) | | | | 433 | | | 428,670 |
7.125%, 1/15/17(a)(b) | | | | 517 | | | 511,830 |
8.875%, 5/15/31(a) | | | | 300 | | | 292,500 |
The Goodyear Tire & Rubber Co.
8.625%, 12/01/11(a) | | | | 175 | | | 188,125 |
9.00%, 7/01/15(a) | | | | 502 | | | 545,925 |
Graphic Packaging International Corp.
9.50%, 8/15/13(a) | | | | 1,200 | | | 1,194,000 |
| | |
| 18 | | • ALLIANCEBERNSTEIN HIGH INCOME FUND |
Portfolio of Investments
| | | | | | | |
| | | | | Principal
Amount (000) | | U.S. $ Value |
| |
| | | | | | | |
Greektown Holdings LLC
10.75%, 12/01/13(a)(b) | | US$ | | 739 | | $ | 679,880 |
GSC Holdings Corp.
8.00%, 10/01/12(a) | | | | 5,639 | | | 6,005,535 |
Hanger Orthopedic Group, Inc.
10.25%, 6/01/14(a) | | | | 413 | | | 423,325 |
Harrah’s Operating Co., Inc.
5.375%, 12/15/13(a) | | | | 5,000 | | | 3,100,000 |
5.625%, 6/01/15(a) | | | | 1,935 | | | 1,115,044 |
5.75%, 10/01/17(a) | | | | 108 | | | 60,885 |
6.50%, 6/01/16(a) | | | | 1,177 | | | 682,660 |
Hawaiian Telcom Communications, Inc.
Series B
9.75%, 5/01/13(a) | | | | 1,200 | | | 528,000 |
12.50%, 5/01/15(a) | | | | 250 | | | 63,750 |
HCA, Inc.
6.375%, 1/15/15(a) | | | | 1,267 | | | 1,127,630 |
6.50%, 2/15/16(a) | | | | 782 | | | 699,890 |
6.75%, 7/15/13(a) | | | | 816 | | | 754,800 |
9.625%, 11/15/16(a)(g) | | | | 1,007 | | | 1,081,266 |
Healthsouth Corp.
10.75%, 6/15/16(a) | | | | 1,400 | | | 1,505,000 |
Helix Energy Solutions Group, Inc.
9.50%, 1/15/16(a)(b) | | | | 500 | | | 521,250 |
Hertz Corp.
8.875%, 1/01/14(a) | | | | 947 | | | 954,102 |
10.50%, 1/01/16(a) | | | | 1,037 | | | 1,043,481 |
Hexion US Finance Corp./Hexion Nova Scotia Finance ULC
7.565%, 11/15/14(a)(d) | | | | 815 | | | 764,062 |
9.75%, 11/15/14(a) | | | | 315 | | | 342,169 |
High Yield Total Return Trust
Series 2007-1
2.638%, 7/01/08(a)(b)(d) | | | | 9,225 | | | 8,440,552 |
Hilcorp Energy I LP/Hilcorp Finance Co.
7.75%, 11/01/15(a)(b) | | | | 1,076 | | | 1,059,860 |
Hines Nurseries, Inc.
10.25%, 10/01/11 | | | | 1,000 | | | 590,000 |
Host Hotels & Resorts LP
6.875%, 11/01/14(a) | | | | 481 | | | 473,785 |
Series Q
6.75%, 6/01/16(a) | | | | 1,558 | | | 1,522,945 |
Hughes Network Systems LLC
9.50%, 4/15/14(a) | | | | 950 | | | 950,000 |
Humana, Inc.
6.45%, 6/01/16(a) | | | | 2,200 | | | 2,157,956 |
Huntsman International LLC
7.875%, 11/15/14(a) | | | | 527 | | | 555,985 |
| | |
| ALLIANCEBERNSTEIN HIGH INCOME FUND • | | 19 |
Portfolio of Investments
| | | | | | | |
| | | | | Principal
Amount (000) | | U.S. $ Value |
| |
| | | | | | | |
IASIS Healthcare Corp.
8.75%, 6/15/14(a) | | US$ | | 1,341 | | $ | 1,374,525 |
Idearc, Inc.
8.00%, 11/15/16(a)(c) | | | | 2,130 | | | 1,384,500 |
ILFC E-Capital Trust II
6.25%, 12/21/15(a)(b)(c) | | | | 1,500 | | | 1,331,598 |
Indiantown Cogeneration LP
Series A-9
9.26%, 12/15/10(a) | | | | 4,666 | | | 4,799,236 |
International Steel Group, Inc.
6.50%, 4/15/14(a) | | | | 1,565 | | | 1,603,936 |
Invacare Corp.
9.75%, 2/15/15(a) | | | | 750 | | | 751,875 |
iPayment, Inc.
9.75%, 5/15/14(a) | | | | 500 | | | 430,000 |
Iron Mountain, Inc.
6.625%, 1/01/16(a) | | | | 1,163 | | | 1,123,749 |
iStar Financial, Inc.
5.375%, 4/15/10(a) | | | | 2,500 | | | 2,250,000 |
Series 1
5.875%, 3/15/16(a) | | | | 3,700 | | | 3,108,000 |
JC Penney Corp., Inc.
7.40%, 4/01/37(a) | | | | 4,100 | | | 3,672,842 |
Jefferson Smurfit Corp. US
8.25%, 10/01/12(a) | | | | 1,100 | | | 1,001,000 |
JPMorgan Chase
7.00%, 6/28/17(a)(b) | | RUB | | 14,000 | | | 463,526 |
Kansas Gas & Electric
5.647%, 3/29/21(a) | | US$ | | 4,916 | | | 4,726,861 |
KB Home
5.875%, 1/15/15(a) | | | | 295 | | | 261,075 |
7.75%, 2/01/10 | | | | 500 | | | 491,250 |
Key Energy Services, Inc.
8.375%, 12/01/14(a)(b) | | | | 750 | | | 776,250 |
Keystone Automotive Operations, Inc.
9.75%, 11/01/13(a) | | | | 986 | | | 562,020 |
The Kroger Co.
4.95%, 1/15/15(a) | | | | 1,250 | | | 1,216,744 |
7.50%, 4/01/31(a) | | | | 1,000 | | | 1,116,925 |
L-3 Communications Corp.
5.875%, 1/15/15(a) | | | | 656 | | | 636,320 |
Lamar Media Corp.
6.625%, 8/15/15(a) | | | | 761 | | | 717,242 |
Lear Corp.
Series B
5.75%, 8/01/14(a) | | | | 1,354 | | | 1,137,360 |
8.50%, 12/01/13(a) | | | | 221 | | | 211,055 |
8.75%, 12/01/16(a) | | | | 1,098 | | | 1,032,120 |
| | |
| 20 | | • ALLIANCEBERNSTEIN HIGH INCOME FUND |
Portfolio of Investments
| | | | | | | |
| | | | | Principal
Amount (000) | | U.S. $ Value |
| |
| | | | | | | |
Lehman Brothers Holdings, Inc.
5.75%, 1/03/17(a) | | US$ | | 463 | | $ | 432,719 |
Series MTN
6.875%, 5/02/18 | | | | 1,600 | | | 1,636,387 |
Series MTNG
4.80%, 3/13/14(a) | | | | 3,600 | | | 3,352,651 |
Level 3 Financing, Inc.
8.75%, 2/15/17(a) | | | | 1,500 | | | 1,282,500 |
9.25%, 11/01/14(a) | | | | 628 | | | 571,480 |
Levi Strauss & Co.
8.875%, 4/01/16 | | | | 1,200 | | | 1,221,000 |
Liberty Media Corp.
5.70%, 5/15/13(a) | | | | 895 | | | 801,220 |
7.875%, 7/15/09(a) | | | | 233 | | | 235,168 |
8.25%, 2/01/30(a) | | | | 310 | | | 275,049 |
Liberty Mutual Group, Inc.
7.80%, 3/15/37(a)(b) | | | | 3,104 | | | 2,576,630 |
Limited Brands, Inc.
5.25%, 11/01/14(a) | | | | 3,194 | | | 2,712,565 |
6.90%, 7/15/17(a) | | | | 3,710 | | | 3,311,962 |
LIN Television Corp.
6.50%, 5/15/13(a) | | | | 1,100 | | | 1,058,750 |
Lucent Technologies, Inc.
6.50%, 1/15/28(a) | | | | 1,650 | | | 1,237,500 |
LVB Acquisition Merger Sub, Inc.
11.625%, 10/15/17(b) | | | | 1,400 | | | 1,487,500 |
M/I Homes, Inc.
6.875%, 4/01/12(a) | | | | 1,500 | | | 1,301,250 |
MacDermid, Inc.
9.50%, 4/15/17(b) | | | | 875 | | | 835,625 |
Macy’s Retail Holdings Inc.
6.625%, 4/01/11(a) | | | | 1,500 | | | 1,476,505 |
Masco Corp.
6.125%, 10/03/16 | | | | 815 | | | 760,230 |
MBIA, Inc.
5.70%, 12/01/34(a) | | | | 4,845 | | | 2,593,935 |
Merisant Co.
9.50%, 7/15/13(a) | | | | 1,000 | | | 730,000 |
Meritage Homes Corp.
6.25%, 3/15/15(a) | | | | 750 | | | 622,500 |
MetroPCS Wireless, Inc.
9.25%, 11/01/14(a) | | | | 1,200 | | | 1,179,000 |
MGM Mirage
6.625%, 7/15/15(a) | | | | 1,537 | | | 1,341,032 |
6.75%, 9/01/12(a) | | | | 2,000 | | | 1,860,000 |
7.625%, 1/15/17(a) | | | | 315 | | | 287,437 |
8.375%, 2/01/11(a) | | | | 1,241 | | | 1,234,795 |
| | |
| ALLIANCEBERNSTEIN HIGH INCOME FUND • | | 21 |
Portfolio of Investments
| | | | | | | | |
| | | | | Principal
Amount (000) | | U.S. $ Value |
| |
| | | | | | | | |
Michaels Stores, Inc.
10.00%, 11/01/14(a) | | US$ | | | 1,000 | | $ | 970,000 |
11.37%, 11/01/16(a) | | | | | 500 | | | 448,750 |
Mirant Americas Generation LLC
8.50%, 10/01/21(a) | | | | | 1,710 | | | 1,675,800 |
Mobile Satellite Ventures LP
Zero Coupon, 4/01/13(a)(b)(e) | | | | | 1,000 | | | 655,000 |
Mohegan Tribal Gaming Auth
7.125%, 8/15/14(a) | | | | | 1,769 | | | 1,516,917 |
Momentive Performance Materials, Inc.
10.125%, 12/01/14(a)(g) | | | | | 750 | | | 714,375 |
11.50%, 12/01/16(a) | | | | | 750 | | | 658,125 |
The Mosaic Co.
7.625%, 12/01/16(a)(b)(f) | | | | | 1,433 | | | 1,569,135 |
Motorola, Inc.
6.50%, 9/01/25(a) | | | | | 2,035 | | | 1,672,105 |
7.50%, 5/15/25(a) | | | | | 325 | | | 287,248 |
Multiplan, Inc.
10.375%, 4/15/16(a)(b) | | | | | 500 | | | 485,000 |
Neenah Foundary Co.
9.50%, 1/01/17(a) | | | | | 700 | | | 486,500 |
Neiman-Marcus Group, Inc.
9.00%, 10/15/15(g) | | | | | 700 | | | 728,000 |
10.375%, 10/15/15(a) | | | | | 500 | | | 525,000 |
New Albertsons, Inc.
7.45%, 8/01/29(a) | | | | | 1,989 | | | 1,885,292 |
NewMarket Corp.
7.125%, 12/15/16(a) | | | | | 700 | | | 682,500 |
NewPage Corp.
10.00%, 5/01/12(a) | | | | | 1,225 | | | 1,307,687 |
News America Holdings, Inc.
7.75%, 12/01/45(a) | | | | | 1,800 | | | 2,011,424 |
News America, Inc.
6.40%, 12/15/35(a) | | | | | 2,000 | | | 2,001,436 |
Nextel Communications, Inc.
Series D
7.375%, 8/01/15(a) | | | | | 3,000 | | | 2,400,000 |
Series E
6.875%, 10/31/13(a) | | | | | 5,000 | | | 4,125,000 |
North Front Pass Through Trust
5.81%, 12/15/24(a)(b) | | | | | 5,000 | | | 4,775,010 |
NRG Energy, Inc.
7.25%, 2/01/14(a) | | | | | 245 | | | 251,737 |
7.375%, 2/01/16 – 1/15/17(a) | | | | | 2,355 | | | 2,425,650 |
Oncor Electric Delivery Co.
7.00%, 5/01/32(a) | | | | | 3,200 | | | 3,098,669 |
Outback Steakhouse Inc.
10.00%, 6/15/15(a)(b) | | | | | 750 | | | 566,250 |
| | |
| 22 | | • ALLIANCEBERNSTEIN HIGH INCOME FUND |
Portfolio of Investments
| | | | | | | | |
| | | | | Principal
Amount (000) | | U.S. $ Value |
| |
| | | | | | | | |
Owens Brockway Glass Container, Inc.
6.75%, 12/01/14(a) | | US$ | | | 830 | | $ | 842,450 |
Owens Corning, Inc.
6.50%, 12/01/16(a) | | | | | 355 | | | 300,465 |
7.00%, 12/01/36(a) | | | | | 4,450 | | | 3,470,506 |
Packaging Corp. of America
5.75%, 8/01/13(a) | | | | | 2,825 | | | 2,760,197 |
PanAmSat Corp.
9.00%, 8/15/14 | | | | | 667 | | | 672,836 |
Peabody Energy Corp.
Series B
6.875%, 3/15/13(a) | | | | | 910 | | | 928,200 |
PetroHawk Energy Corp.
9.125%, 7/15/13(a) | | | | | 944 | | | 998,280 |
Pinnacle Entertainment, Inc.
7.50%, 6/15/15(a)(b) | | | | | 750 | | | 620,625 |
Pinnacle Foods Finance LLC
10.625%, 4/01/17(a) | | | | | 750 | | | 652,500 |
Plains Exploration & Production Co.
7.75%, 6/15/15(a) | | | | | 1,000 | | | 1,025,000 |
Plastipak Holdings, Inc.
8.50%, 12/15/15(a)(b) | | | | | 1,300 | | | 1,218,750 |
Potomac Edison Co.
5.35%, 11/15/14(a) | | | | | 3,500 | | | 3,478,839 |
Quality Distribution LLC
9.00%, 11/15/10(a) | | | | | 1,429 | | | 957,430 |
Quiksilver, Inc.
6.875%, 4/15/15(a) | | | | | 1,150 | | | 954,500 |
Qwest Capital Funding, Inc.
7.25%, 2/15/11(a) | | | | | 1,542 | | | 1,511,160 |
Qwest Corp.
7.625%, 6/15/15(a) | | | | | 1,590 | | | 1,593,975 |
Racers
Series 06-6-T
2.813%, 7/01/08(a)(b)(d) | | | | | 9,935 | | | 8,859,646 |
Rainbow National Services LLC
10.375%, 9/01/14(a)(b) | | | | | 1,158 | | | 1,244,850 |
Range Resources Corp.
7.50%, 5/15/16(a) | | | | | 500 | | | 510,000 |
RBS Global, Inc. and Rexnord Corp.
9.50%, 8/01/14(a) | | | | | 1,092 | | | 1,092,000 |
11.75%, 8/01/16(a) | | | | | 324 | | | 311,040 |
The Reader’s Digest Association, Inc.
9.00%, 2/15/17(a)(b) | | | | | 750 | | | 528,750 |
Realogy Corp.
10.50%, 4/15/14(a) | | | | | 1,232 | | | 905,520 |
12.375%, 4/15/15(a) | | | | | 500 | | | 272,500 |
| | |
| ALLIANCEBERNSTEIN HIGH INCOME FUND • | | 23 |
Portfolio of Investments
| | | | | | | | |
| | | | | Principal
Amount (000) | | U.S. $ Value |
| |
| | | | | | | | |
Regency Energy Partners
8.375%, 12/15/13(a) | | US$ | | | 590 | | $ | 615,075 |
Reliant Energy, Inc.
7.625%, 6/15/14(a) | | | | | 1,041 | | | 1,082,640 |
7.875%, 6/15/17(a) | | | | | 1,293 | | | 1,347,953 |
Residential Capital LLC
6.375%, 6/30/10(a) | | | | | 820 | | | 444,850 |
6.50%, 4/17/13(a) | | | | | 1,790 | | | 903,950 |
6.875%, 6/30/15(a) | | | | | 1,305 | | | 652,500 |
Reynolds American, Inc.
7.625%, 6/01/16(a) | | | | | 2,353 | | | 2,492,698 |
RH Donnelley Corp.
8.875%, 10/15/17(b) | | | | | 540 | | | 348,300 |
Series A-2
6.875%, 1/15/13(a) | | | | | 1,420 | | | 908,800 |
Series A-3
8.875%, 1/15/16(a) | | | | | 1,000 | | | 650,000 |
Rite Aid Corp.
6.875%, 8/15/13(a) | | | | | 546 | | | 384,930 |
9.25%, 6/01/13(a) | | | | | 1,943 | | | 1,670,980 |
9.375%, 12/15/15(a) | | | | | 50 | | | 40,625 |
9.50%, 6/15/17(a) | | | | | 69 | | | 56,408 |
RR Donnelley & Sons Co.
4.95%, 4/01/14(a) | | | | | 2,400 | | | 2,231,923 |
Russell-Stanley Holdings, Inc.
9.00%, 11/30/08(a)(h)(i)(j) | | | | | 623 | | | 78,055 |
Safeway, Inc.
7.25%, 2/01/31(a) | | | | | 2,000 | | | 2,196,828 |
Sally Holdings LLC
9.25%, 11/15/14(a) | | | | | 700 | | | 707,000 |
Sanmina Corp.
8.125%, 3/01/16(a) | | | | | 1,450 | | | 1,334,000 |
Sara Lee Corp.
6.125%, 11/01/32(a) | | | | | 1,600 | | | 1,482,784 |
Sbarro, Inc.
10.375%, 2/01/15(a) | | | | | 1,250 | | | 1,125,000 |
Select Medical Corp.
7.625%, 2/01/15(a) | | | | | 1,283 | | | 1,090,550 |
Sensus Metering Systems, Inc.
8.625%, 12/15/13(a) | | | | | 771 | | | 755,580 |
Serena Software, Inc.
10.375%, 3/15/16(a) | | | | | 419 | | | 390,194 |
Service Corp. International
6.75%, 4/01/16(a) | | | | | 700 | | | 691,250 |
Sierra Pacific Resources
8.625%, 3/15/14(a) | | | | | 527 | | | 551,413 |
Simmons Co.
Zero Coupon, 12/15/14(a) | | | | | 1,500 | | | 1,076,250 |
| | |
| 24 | | • ALLIANCEBERNSTEIN HIGH INCOME FUND |
Portfolio of Investments
| | | | | | | | |
| | | | | Principal
Amount (000) | | U.S. $ Value |
| |
| | | | | | | | |
Sirius Satellite Radio, Inc.
9.625%, 8/01/13(a) | | US$ | | | 1,249 | | $ | 1,052,283 |
Six Flags, Inc.
9.625%, 6/01/14(a) | | | | | 1,502 | | | 991,320 |
SLM Corp.
5.00%, 10/01/13(a) | | | | | 4,100 | | | 3,494,266 |
5.375%, 5/15/14(a) | | | | | 3,800 | | | 3,203,974 |
Series MTN
5.125%, 8/27/12(a) | | | | | 399 | | | 343,924 |
Series MTNA
4.50%, 7/26/10(a) | | | | | 399 | | | 355,943 |
Smurfit-Stone Container Enterprises, Inc.
8.00%, 3/15/17(a) | | | | | 1,000 | | | 845,000 |
Source Gas LLC
5.90%, 4/01/17(a)(b) | | | | | 3,000 | | | 2,876,781 |
Southern Union Co.
7.60%, 2/01/24(a) | | | | | 3,200 | | | 3,264,054 |
Spectrum Brands, Inc.
7.375%, 2/01/15(a) | | | | | 1,594 | | | 1,060,010 |
Sprint Capital Corp.
6.875%, 11/15/28(a) | | | | | 3,000 | | | 2,332,500 |
Standard Pacific Corp.
6.50%, 8/15/10(a) | | | | | 750 | | | 615,000 |
Starwood Hotels & Resorts Worldwide, Inc.
7.375%, 11/15/15(a) | | | | | 2,035 | | | 2,089,636 |
Stater Brothers Holdings
8.125%, 6/15/12(a) | | | | | 1,331 | | | 1,350,965 |
Station Casinos, Inc.
6.625%, 3/15/18(a) | | | | | 1,755 | | | 1,053,000 |
6.875%, 3/01/16(a) | | | | | 3,300 | | | 2,120,250 |
Sun Healthcare Group, Inc.
9.125%, 4/15/15(a) | | | | | 700 | | | 707,000 |
Sungard Data Systems, Inc.
9.125%, 8/15/13(a) | | | | | 1,143 | | | 1,194,435 |
10.25%, 8/15/15(a) | | | | | 200 | | | 212,500 |
Teco Finance, Inc.
6.572%, 11/01/17(a)(b) | | | | | 2,048 | | | 2,068,480 |
7.00%, 5/01/12(a)(b) | | | | | 2,952 | | | 3,112,961 |
Telcordia Technologies, Inc.
10.00%, 3/15/13(a)(b) | | | | | 950 | | | 712,500 |
Tenet Healthcare Corp.
7.375%, 2/01/13(a) | | | | | 865 | | | 802,288 |
9.875%, 7/01/14(a) | | | | | 758 | | | 775,055 |
Tenneco, Inc.
8.625%, 11/15/14 | | | | | 500 | | | 508,750 |
Terex Corp.
8.00%, 11/15/17(a) | | | | | 1,046 | | | 1,069,535 |
| | |
| ALLIANCEBERNSTEIN HIGH INCOME FUND • | | 25 |
Portfolio of Investments
| | | | | | | | |
| | | | | Principal
Amount (000) | | U.S. $ Value |
| |
| | | | | | | | |
Terrestar Networks, Inc.
15.00%, 2/15/14(a)(b)(g) | | US$ | | | 1,000 | | $ | 925,000 |
Tesoro Corp.
6.25%, 11/01/12(a) | | | | | 2,070 | | | 1,976,850 |
6.50%, 6/01/17(a) | | | | | 409 | | | 375,258 |
Texas Competitive Electric Holdings Co. LLC
10.25%, 11/01/15(a)(b) | | | | | 504 | | | 525,420 |
Time Warner Telecom Holdings, Inc.
9.25%, 2/15/14(a) | | | | | 1,196 | | | 1,237,860 |
Time Warner, Inc.
7.70%, 5/01/32(a) | | | | | 2,500 | | | 2,707,805 |
Toll Brothers Finance Corp.
5.15%, 5/15/15(a) | | | | | 1,900 | | | 1,661,656 |
Toys R US, Inc.
7.375%, 10/15/18(a) | | | | | 1,200 | | | 891,000 |
Travelport LLC
9.875%, 9/01/14(a) | | | | | 1,200 | | | 1,159,500 |
Trimas Corp.
9.875%, 6/15/12(a) | | | | | 1,250 | | | 1,090,625 |
Trinity Industries, Inc.
6.50%, 3/15/14(a) | | | | | 976 | | | 968,680 |
Tronox Worldwide LLC/Tronox Finance Corp.
9.50%, 12/01/12(a) | | | | | 1,000 | | | 860,000 |
Tropicana Entertainment LLC
9.625%, 12/15/14(a)(j) | | | | | 750 | | | 369,375 |
Trump Entertainment Resorts, Inc.
8.50%, 6/01/15 | | | | | 730 | | | 469,025 |
TRW Automotive, Inc.
7.25%, 3/15/17(a)(b) | | | | | 2,300 | | | 2,239,625 |
Turner Broadcasting System, Inc.
8.375%, 7/01/13(a) | | | | | 1,973 | | | 2,152,393 |
Turning Stone Resort Casino Enterprise
9.125%, 12/15/10 – 9/15/14(a)(b) | | | | | 754 | | | 742,690 |
TXU Corp.
Series P
5.55%, 11/15/14(a) | | | | | 1,380 | | | 1,127,333 |
Series Q
6.50%, 11/15/24(a) | | | | | 1,007 | | | 765,664 |
Tyson Foods, Inc.
6.85%, 4/01/16(a) | | | | | 4,000 | | | 3,972,992 |
Union Carbide Corp.
7.75%, 10/01/96(a) | | | | | 2,500 | | | 2,232,250 |
Unisys Corp.
8.00%, 10/15/12(a) | | | | | 1,100 | | | 1,001,000 |
United Rentals North America, Inc.
6.50%, 2/15/12(a) | | | | | 500 | | | 468,750 |
7.75%, 11/15/13(a) | | | | | 1,500 | | | 1,293,750 |
| | |
| 26 | | • ALLIANCEBERNSTEIN HIGH INCOME FUND |
Portfolio of Investments
| | | | | | | | |
| | | | | Principal
Amount (000) | | U.S. $ Value |
| |
| | | | | | | | |
United States Steel Corp.
6.65%, 6/01/37(a) | | US$ | | | 3,300 | | $ | 2,886,111 |
Universal City Development Partners
11.75%, 4/01/10(a) | | | | | 716 | | | 742,850 |
Universal Hospital Services, Inc.
8.288%, 6/01/15(a)(d) | | | | | 500 | | | 472,500 |
Univision Communications, Inc.
7.85%, 7/15/11(a) | | | | | 531 | | | 504,450 |
US Shipping Partners LP Shipping Finance Corp.
13.00%, 8/15/14(a) | | | | | 700 | | | 630,875 |
Vanguard Health Holding Co.
Zero Coupon, 10/01/15(a)(e) | | | | | 1,350 | | | 1,134,000 |
Ventas Realty LP/Ventas Capital Corp.
6.75%, 4/01/17(a) | | | | | 422 | | | 414,615 |
Verizon New York, Inc.
Series B
7.375%, 4/01/32(a) | | | | | 2,290 | | | 2,435,543 |
Verso Paper Holdings LLC and Verson Paper, Inc.
Series B
11.375%, 8/01/16(a) | | | | | 700 | | | 717,500 |
Viant Holdings, Inc.
10.125%, 7/15/17(a)(b) | | | | | 579 | | | 474,780 |
Visant Corp.
7.625%, 10/01/12(a) | | | | | 968 | | | 963,160 |
Visant Holding Corp.
8.75%, 12/01/13(a) | | | | | 500 | | | 492,500 |
Visteon Corp.
7.00%, 3/10/14(a) | | | | | 1,738 | | | 1,175,323 |
Washington Mutual Preferred Funding Trust I
6.534%, 3/15/11(a)(b)(c) | | | | | 2,700 | | | 1,552,689 |
Washington Mutual, Inc.
5.25%, 9/15/17(a) | | | | | 2,767 | | | 2,351,950 |
WCI Communities, Inc.
6.625%, 3/15/15 | | | | | 750 | | | 360,000 |
WDAC Subsidiary Corp.
8.375%, 12/01/14(a)(b) | | | | | 1,283 | | | 994,325 |
West Corp.
9.50%, 10/15/14(a) | | | | | 461 | | | 440,255 |
11.00%, 10/15/16(a) | | | | | 500 | | | 444,375 |
Weyerhaeuser Co.
7.375%, 3/15/32(a) | | | | | 2,333 | | | 2,342,152 |
William Lyon Homes, Inc.
10.75%, 4/01/13(a) | | | | | 555 | | | 355,200 |
Williams Co., Inc.
7.625%, 7/15/19(a) | | | | | 2,385 | | | 2,575,800 |
7.875%, 9/01/21(a) | | | | | 374 | | | 408,595 |
| | |
| ALLIANCEBERNSTEIN HIGH INCOME FUND • | | 27 |
Portfolio of Investments
| | | | | | | |
| | | | | Principal
Amount (000) | | U.S. $ Value |
| |
| | | | | | | |
Windstream Corp.
8.125%, 8/01/13(a) | | US$ | | 1,827 | | $ | 1,890,945 |
8.625%, 8/01/16(a) | | | | 294 | | | 307,965 |
WMG Holdings Corp.
Zero Coupon, 12/15/14(a)(e) | | | | 2,168 | | | 1,317,060 |
WR Berkley Corp.
5.60%, 5/15/15(a) | | | | 3,500 | | | 3,335,119 |
Wynn Las Vegas Capital Corp.
6.625%, 12/01/14(a) | | | | 1,319 | | | 1,286,025 |
Xcel Energy, Inc.
6.50%, 7/01/36(a) | | | | 3,300 | | | 3,307,702 |
XM Satellite Radio, Inc.
9.75%, 5/01/14(a) | | | | 776 | | | 746,900 |
ZFS Finance USA Trust I
6.15%, 12/15/65(a)(b)(c) | | | | 3,000 | | | 2,673,967 |
| | | | | | | |
| | | | | | | 485,015,621 |
| | | | | | | |
Total Corporate Bonds
(cost $651,702,939) | | | | | | | 613,305,674 |
| | | | | | | |
| | | | | | | |
SOVEREIGN BONDS – 18.2% | | | | | | | |
Argentina – 1.2% | | | | | | | |
Argentina Bonos
7.00%, 10/03/15(a) | | | | 2,453 | | | 1,760,852 |
Republic of Argentina
3.092%, 8/03/12(a)(d) | | | | 2,406 | | | 2,056,705 |
8.28%, 12/31/33(k) | | | | 8,982 | | | 7,185,574 |
Series V
7.00%, 3/28/11(a) | | | | 1,120 | | | 987,062 |
10.50%, 6/12/12(a) | | ARS | | 1,342 | | | 294,698 |
| | | | | | | |
| | | | | | | 12,284,891 |
| | | | | | | |
Brazil – 2.5% |
Republic of Brazil
6.00%, 1/17/17(a) | | US$ | | 7,615 | | | 7,852,969 |
7.125%, 1/20/37(a) | | | | 14,701 | | | 16,759,140 |
| | | | | | | |
| | | | | | | 24,612,109 |
| | | | | | | |
Colombia – 0.3% | | | | | | | |
Republic of Colombia
7.375%, 9/18/37(a) | | | | 3,056 | | | 3,392,160 |
| | | | | | | |
Dominican Republic – 0.5% | | | | | | | |
Dominican Republic
8.625%, 4/20/27(a)(b)(d) | | | | 1,223 | | | 1,301,027 |
Dominican Republic STP
Zero Coupon, 5/12/08(a)(b) | | | | 1,725 | | | 1,646,032 |
Zero Coupon, 8/04/08(a)(b) | | | | 1,583 | | | 1,467,283 |
Zero Coupon, 7/23/09(a)(b) | | | | 816 | | | 672,792 |
| | | | | | | |
| | | | | | | 5,087,134 |
| | | | | | | |
| | |
| 28 | | • ALLIANCEBERNSTEIN HIGH INCOME FUND |
Portfolio of Investments
| | | | | | | |
| | | | | Principal
Amount (000) | | U.S. $ Value |
| |
| | | | | | | |
Ecuador – 0.7% | | | | | | | |
Republic of Ecuador
9.375%, 12/15/15(a)(b) | | US$ | | 2,746 | | $ | 2,903,895 |
10.00%, 8/15/30(a)(b)(f) | | | | 4,215 | | | 4,246,612 |
| | | | | | | |
| | | | | | | 7,150,507 |
| | | | | | | |
| | | |
El Salvador – 0.3% | | | | | | | |
Republic of El Salvador
7.625%, 9/21/34(a)(b) | | | | 872 | | | 959,200 |
7.65%, 6/15/35(a)(b) | | | | 1,711 | | | 1,839,325 |
| | | | | | | |
| | | | | | | 2,798,525 |
| | | | | | | |
Indonesia – 1.2% | | | | | | | |
Indonesia – Recap Linked Note
11.00%, 10/15/14(a) | | | | 1,003 | | | 902,499 |
12.90%, 6/17/22(a)(b) | | | | 1,930 | | | 1,857,046 |
Series $IDR
11.00%, 10/22/14(a) | | | | 540 | | | 437,724 |
Republic of Indonesia
6.625%, 2/17/37(a)(b) | | | | 1,410 | | | 1,247,850 |
6.625%, 2/17/37(b)(k) | | | | 1,150 | | | 1,019,188 |
6.875%, 3/09/17 – 1/17/18(a)(b) | | | | 1,552 | | | 1,590,800 |
6.875%, 3/09/17(b)(k) | | | | 1,900 | | | 1,947,500 |
7.50%, 1/15/16(a)(b) | | | | 1,000 | | | 1,062,500 |
8.50%, 10/12/35(a)(b) | | | | 1,645 | | | 1,801,275 |
| | | | | | | |
| | | | | | | 11,866,382 |
| | | | | | | |
Jamaica – 0.1% | | | | | | | |
Government of Jamaica
9.25%, 10/17/25(a) | | | | 202 | | | 226,745 |
10.625%, 6/20/17(a) | | | | 835 | | | 995,737 |
| | | | | | | |
| | | | | | | 1,222,482 |
| | | | | | | |
Lebanon – 0.4% | | | | | | | |
Lebanese Republic
7.875%, 5/20/11(a)(b) | | | | 875 | | | 861,875 |
10.125%, 8/06/08(a)(b) | | | | 3,048 | | | 3,079,090 |
11.625%, 5/11/16(a)(b) | | | | 394 | | | 449,160 |
| | | | | | | |
| | | | | | | 4,390,125 |
| | | | | | | |
Pakistan – 0.1% | | | | | | | |
Republic of Pakistan
6.875%, 6/01/17(a)(b) | | | | 1,227 | | | 1,039,882 |
| | | | | | | |
| | | |
Panama – 1.6% | | | | | | | |
Republic of Panama
6.70%, 1/26/36(a) | | | | 1,317 | | | 1,366,387 |
7.125%, 1/29/26(a) | | | | 3,560 | | | 3,933,800 |
8.875%, 9/30/27(a) | | | | 2,709 | | | 3,521,700 |
9.375%, 4/01/29(a) | | | | 5,435 | | | 7,337,250 |
| | | | | | | |
| | | | | | | 16,159,137 |
| | | | | | | |
| | |
| ALLIANCEBERNSTEIN HIGH INCOME FUND • | | 29 |
Portfolio of Investments
| | | | | | | | |
| | | | | Principal
Amount (000) | | U.S. $ Value |
| |
| | | | | | | | |
Peru – 0.5% | | | | | | | | |
Republic of Peru
7.35%, 7/21/25(a) | | US$ | | | 1,487 | | $ | 1,737,560 |
8.75%, 11/21/33(a) | | | | | 2,738 | | | 3,627,850 |
| | | | | | | | |
| | | | | | | | 5,365,410 |
| | | | | | | | |
Philippines – 2.1% | | | | | | | | |
Republic of Philippines
7.50%, 9/25/24(a) | | | | | 3,144 | | | 3,474,120 |
7.75%, 1/14/31(a) | | | | | 2,924 | | | 3,296,810 |
9.50%, 10/21/24 – 2/02/30(a) | | | | | 2,473 | | | 3,204,354 |
9.875%, 1/15/19(k) | | | | | 1,850 | | | 2,381,875 |
10.625%, 3/16/25(a) | | | | | 6,239 | | | 8,773,282 |
| | | | | | | | |
| | | | | | | | 21,130,441 |
| | | | | | | | |
Russia – 0.3% | | | | | | | | |
Russian Federation
7.50%, 3/31/30(a)(b) | | | | | 2,405 | | | 2,753,449 |
| | | | | | | | |
| | | |
South Africa – 1.0% | | | | | | | | |
Republic of South Africa
5.875%, 5/30/22(a) | | | | | 11,002 | | | 10,410,643 |
| | | | | | | | |
| | | |
Turkey – 2.1% | | | | | | | | |
Republic of Turkey
6.875%, 3/17/36(a) | | | | | 7,016 | | | 6,490,677 |
7.00%, 6/05/20(a) | | | | | 3,400 | | | 3,421,080 |
7.375%, 2/05/25(a) | | | | | 10,649 | | | 10,795,424 |
9.50%, 1/15/14(a) | | | | | 641 | | | 738,752 |
| | | | | | | | |
| | | | | | | | 21,445,933 |
| | | | | | | | |
Ukraine – 0.4% | | | | | | | | |
Government of Ukraine | | | | | | | | |
6.385%, 6/26/12(a)(b) | | | | | 750 | | | 757,500 |
6.58%, 11/21/16(a)(b) | | | | | 1,368 | | | 1,345,770 |
7.65%, 6/11/13(a)(b) | | | | | 729 | | | 773,651 |
Ukraine Government International Bond | | | | | | | | |
6.75%, 11/14/17(a)(b) | | | | | 1,450 | | | 1,424,625 |
| | | | | | | | |
| | | | | | | | 4,301,546 |
| | | | | | | | |
Uruguay – 0.6% | | | | | | | | |
Republic of Uruguay | | | | | | | | |
7.625%, 3/21/36(a) | | | | | 550 | | | 580,250 |
7.875%, 1/15/33(a)(g) | | | | | 1,377 | | | 1,491,068 |
9.25%, 5/17/17(a) | | | | | 2,814 | | | 3,404,940 |
| | | | | | | | |
| | | | | | | | 5,476,258 |
| | | | | | | | |
Venezuela – 2.3% | | | | | | | | |
Republic of Venezuela | | | | | | | | |
5.75%, 2/26/16(a) | | | | | 5,477 | | | 4,313,138 |
6.00%, 12/09/20(a) | | | | | 6,134 | | | 4,324,117 |
| | |
| 30 | | • ALLIANCEBERNSTEIN HIGH INCOME FUND |
Portfolio of Investments
| | | | | | | |
| | | | | Principal
Amount (000) | | U.S. $ Value |
| |
| | | | | | | |
7.00%, 3/31/38(a) | | US$ | | 1,181 | | $ | 806,033 |
7.00%, 12/01/18(a)(b) | | | | 4,632 | | | 3,728,760 |
7.65%, 4/21/25(a) | | | | 5,588 | | | 4,330,700 |
9.25%, 9/15/27(k) | | | | 2,802 | | | 2,577,840 |
9.375%, 1/13/34(a) | | | | 3,019 | | | 2,721,628 |
| | | | | | | |
| | | | | | | 22,802,216 |
| | | | | | | |
Total Sovereign Bonds | | | | | | | |
(cost $180,758,094) | | | | | | | 183,689,230 |
| | | | | | | |
| | | | | | | |
TREASURY BONDS – 6.7% | | | |
Colombia – 0.2% | | | | | | | |
Republic of Colombia | | | | | | | |
12.00%, 10/22/15(a) | | COP | | 3,605,000 | | | 2,195,529 |
| | | | | | | |
| | | |
Malaysia – 0.5% | | | | | | | |
Malaysia Government Bond | | | | | | | |
Series 1/01 | | | | | | | |
3.833%, 9/28/11 | | MYR | | 15,635 | | | 5,004,907 |
| | | | | | | |
Mexico – 3.6% | | | | | | | |
Mexican Bonos | | | | | | | |
Series M | | | | | | | |
9.00%, 12/22/11(a) | | MXN | | 33,515 | | | 3,313,419 |
Series MI10 | | | | | | | |
9.00%, 12/20/12(a) | | | | 329,584 | | | 32,739,237 |
| | | | | | | |
| | | | | | | 36,052,656 |
| | | | | | | |
Peru – 2.4% | | | | | | | |
Peru Bono Soberano | | | | | | | |
6.90%, 8/12/37(a) | | PEN | | 3,145 | | | 1,097,363 |
7.84%, 8/12/20(a) | | | | 1,530 | | | 596,105 |
8.20%, 8/12/26(a) | | | | 27,770 | | | 11,165,009 |
Series 7 | | | | | | | |
8.60%, 8/12/17(a) | | | | 11,994 | | | 4,878,112 |
Peruvian Government International Bond | | | | | | | |
6.90%, 8/12/37(a)(b) | | | | 20,000 | | | 7,003,108 |
| | | | | | | |
| | | | | | | 24,739,697 |
| | | | | | | |
Total Treasury Bonds | | | | | | | |
(cost $65,369,690) | | | | | | | 67,992,789 |
| | | | | | | |
| |
EMERGING MARKETS -
TREASURIES – 3.5% | | | |
Brazil – 2.9% | | | | | | | |
Republic of Brazil | | | | | | | |
10.25%, 1/10/28(a) | | BRL | | 2,057 | | | 1,105,721 |
12.50%, 1/05/16 – 1/05/22(a) | | | | 45,562 | | | 28,369,615 |
| | | | | | | |
| | | | | | | 29,475,336 |
| | | | | | | |
| | |
| ALLIANCEBERNSTEIN HIGH INCOME FUND • | | 31 |
Portfolio of Investments
| | | | | | | |
| | | | | Principal
Amount (000) | | U.S. $ Value |
| |
| | | | | | | |
Colombia – 0.0% | | | | | | | |
Republic of Colombia | | | | | | | |
9.85%, 6/28/27(a) | | COP | | 726,000 | | $ | 388,672 |
| | | | | | | |
| | | |
Turkey – 0.6% | | | | | | | |
Turkey Government Bond | | | | | | | |
Zero Coupon, 2/04/09 | | TRY | | 5,427 | | | 3,708,257 |
Zero Coupon, 5/06/09 | | | | 903 | | | 592,053 |
16.00%, 3/07/12 | | | | 2,013 | | | 1,487,072 |
| | | | | | | |
| | | | | | | 5,787,382 |
| | | | | | | |
Total Emerging Markets - Treasuries | | | | | | | |
(cost $32,794,263) | | | | | | | 35,651,390 |
| | | | | | | |
| | | | | | | |
NON-AGENCY FIXED RATE CMBS – 3.2% | | | |
Credit Suisse Mortgage Capital Certificates | | | | | | | |
Series 2006-C4, Class A3 | | | | | | | |
5.467%, 9/15/39(a) | | US$ | | 5,320 | | | 5,223,408 |
Series 2006-C4, Class AM | | | | | | | |
5.509%, 9/15/39(a) | | | | 5,600 | | | 5,130,080 |
Series 2008-C1, Class A2 | | | | | | | |
6.219%, 2/15/41 | | | | 7,800 | | | 7,968,012 |
JP Morgan Chase Commercial Mortgage Securities | | | | | | | |
Series 2006-CB15, Class AM | | | | | | | |
5.855%, 6/12/43(a) | | | | 670 | | | 632,700 |
Merrill Lynch Countrywide Commercial Mortgage | | | | | | | |
Series 2006-4, Class AM | | | | | | | |
5.204%, 12/12/49(a)(c) | | | | 7,600 | | | 6,823,848 |
Morgan Stanley Capital I | | | | | | | |
Series 2006-IQ12, Class AM | | | | | | | |
5.37%, 12/15/43(a) | | | | 7,300 | | | 6,598,545 |
| | | | | | | |
| | | |
Total Non-Agency Fixed Rate CMBS | | | | | | | |
(cost $31,338,783) | | | | | | | 32,376,593 |
| | | | | | | |
| | | | | | | |
NON-INVESTMENT GRADE LOANS – 3.0% | | | |
United States – 3.0% | | | | | | | |
Alltel Corp. | | | | | | | |
5.55%, 5/18/15(c) | | | | 1,496 | | | 1,368,881 |
Aramark Corp. | | | | | | | |
4.571%, 1/26/14(c) | | | | 705 | | | 675,355 |
4.875%, 1/26/14(c) | | | | 45 | | | 42,897 |
Ashmore Energy International | | | | | | | |
0.00%, 3/30/12* | | | | 118 | | | 104,068 |
0.00%, 3/30/14* | | | | 872 | | | 750,006 |
Asurion Corp. | | | | | | | |
0.00%, 7/03/14* | | | | 1,000 | | | 923,440 |
| | |
| 32 | | • ALLIANCEBERNSTEIN HIGH INCOME FUND |
Portfolio of Investments
| | | | | | | | |
| | | | | Principal
Amount (000) | | U.S. $ Value |
| |
| | | | | | | | |
Cablevision Systems Corp. | | | | | | | | |
4.477%, 3/29/13(c) | | US$ | | | 1,247 | | $ | 1,199,540 |
Carestream Health Inc. | | | | | | | | |
4.69%-4.90%, 4/30/13(c) | | | | | 951 | | | 811,486 |
Celanese U.S. Holdings LLC | | | | | | | | |
4.188%, 4/02/14(c) | | | | | 997 | | | 965,243 |
Charter Communications Holding | | | | | | | | |
8.50%, 3/06/14(c) | | | | | 1,250 | | | 1,247,400 |
Charter Communications Operating, LLC | | | | | | | | |
4.90%, 3/06/14(c) | | | | | 1,000 | | | 884,130 |
Chrysler Financial Services, Inc. | | | | | | | | |
6.80%, 8/03/12(c) | | | | | 750 | | | 682,147 |
First Data Corp. | | | | | | | | |
5.35%-5.45%, 9/24/14(c) | | | | | 1,496 | | | 1,406,047 |
Firstlight Power Resources Inc. | | | | | | | | |
5.04%, 11/01/13(c) | | | | | 445 | | | 394,367 |
5.25%, 11/01/13(c) | | | | | 55 | | | 48,687 |
7.125%, 5/01/14(c) | | | | | 1,000 | | | 825,000 |
Ford Motor Co. | | | | | | | | |
5.80%, 12/16/13(c) | | | | | 1,247 | | | 1,145,014 |
Freescale Semiconductor, Inc. | | | | | | | | |
4.459%, 11/26/13(c) | | | | | 1,250 | | | 1,091,800 |
Graham Packaging | | | | | | | | |
4.88%-5.25%, 1/26/14(c) | | | | | 997 | | | 951,348 |
Graphic Packaging Holding Co. | | | | | | | | |
5.44%-5.67%, 5/16/14(c) | | | | | 1,250 | | | 1,218,437 |
Harrah’s Operating Co., Inc. | �� | | | | | | | |
5.91%-5.92%, 1/28/15(c) | | | | | 1,500 | | | 1,408,335 |
HCA, Inc. | | | | | | | | |
4.946%, 11/18/13(c) | | | | | 1,746 | | | 1,658,668 |
Hexion Specialty | | | | | | | | |
4.938%, 5/05/13(c) | | | | | 819 | | | 775,408 |
5.00%, 5/05/13(c) | | | | | 178 | | | 168,441 |
IDEARC, Inc. (Verizon) | | | | | | | | |
4.70%-4.86%, 11/17/14(c) | | | | | 1,496 | | | 1,230,634 |
Landsource Communities | | | | | | | | |
8.75%, 2/27/13(c) | | | | | 1,092 | | | 774,421 |
Sabre, Inc. | | | | | | | | |
4.86%-4.90%, 9/30/14(c) | | | | | 1,250 | | | 1,057,463 |
SunGard Data Systems Inc. | | | | | | | | |
4.877%, 2/11/13(c) | | | | | 748 | | | 707,895 |
Thomson Learning | | | | | | | | |
5.20%-5.36%, 7/04/14(c) | | | | | 1,247 | | | 1,151,968 |
TXU Corp. | | | | | | | | |
6.48%-6.60%, 10/31/14(c) | | | | | 1,746 | | | 1,672,420 |
Univision Communications Inc. | | | | | | | | |
5.11%-5.15%, 9/29/14(c) | | | | | 1,250 | | | 1,050,313 |
| | |
| ALLIANCEBERNSTEIN HIGH INCOME FUND • | | 33 |
Portfolio of Investments
| | | | | | | |
| | | | | Principal
Amount (000) | | U.S. $ Value |
| |
| | | | | | | |
West Corp. | | | | | | | |
0.00%, 10/24/13 * | | US$ | | 1,250 | | $ | 1,240,625 |
Wide Open West Finance, LLC | | | | | | | |
5.17%-5.59%, 6/30/14(c) | | | | 1,000 | | | 792,500 |
| | | | | | | |
| | | |
Total Non-Investment Grade Loans | | | | | | | |
(cost $29,551,139) | | | | | | | 30,424,384 |
| | | | | | | |
| | | |
| | | | | Shares | | |
NON-CONVERTIBLE - PREFERRED STOCKS – 2.9% | | | |
Capital One Capital II | | | | | | | |
7.50% | | | | 130,000 | | | 2,821,000 |
Centaur Funding Corp. | | | | | | | |
9.08%(b) | | | | 20,280 | | | 20,368,725 |
Federal Home Loan Mortgage Corp. | | | | | | | |
Series Z | | | | | | | |
8.375% | | | | 11,250 | | | 288,000 |
Federal National Mortgage Association | | | | | | | |
8.25% | | | | 51,350 | | | 1,285,804 |
Royal Bank of Scotland Group PLC | | | | | | | |
Series N | | | | | | | |
6.35% | | | | 100,000 | | | 2,226,000 |
Santander Finance Preferred SA Unipersonal | | | | | | | |
6.80% | | | | 67,000 | | | 1,498,120 |
Sovereign REIT | | | | | | | |
12.00%(a)(b) | | | | 501 | | | 501,000 |
| | | | | | | |
| | | |
Total Non-Convertible – Preferred Stocks | | | | | | | |
(cost $29,902,193) | | | | | | | 28,988,649 |
| | | | | | | |
| | | |
| | | | | Principal
Amount
(000) | | |
INFLATION-LINKED SECURITIES – 0.4% | | | |
Brazil – 0.2% | | | | | | | |
Unibanco Grand Cayman | | | | | | | |
8.70%, 2/11/10(a)(b) | | BRL | �� | 3,543 | | | 2,015,931 |
| | | |
Uruguay – 0.2% | | | | | | | |
Republic of Uruguay | | | | | | | |
3.70%, 6/26/37(a) | | UYU | | 43,739 | | | 1,979,959 |
| | | | | | | |
| | | |
Total Inflation-Linked Securities | | | | | | | |
(cost $3,468,784) | | | | | | | 3,995,890 |
| | | | | | | |
| | |
| 34 | | • ALLIANCEBERNSTEIN HIGH INCOME FUND |
Portfolio of Investments
| | | | | | | | |
| | | | | Principal
Amount (000) | | U.S. $ Value | |
| | |
| | | | | | | | |
SUPRANATIONALS – 0.3% | | | | |
Supranational – 0.3% | | | | | | | | |
International Finance Corp. | | | | | | | | |
11.00%, 7/01/09(a) | | | | | | | | |
(cost $2,852,908) | | ZAR | | 19,380 | | $ | 2,524,804 | |
| | | | | | | | |
| |
QUASI-SOVEREIGN BONDS – 0.2% | | | | |
Russia – 0.2% | | | | | | | | |
RSHB Capital SA for OJSC Russian Agricultural Bank | | | | | | | | |
6.299%, 5/15/17(a)(b) | | | | | | | | |
(cost $2,610,000) | | US$ | | 2,610 | | | 2,430,275 | |
| | | | | | | | |
| | | |
| | | | | Shares | | | |
WARRANTS – 0.1% | | | | |
Central Bank of Nigeria, | | | | | | | | |
expiring 11/15/20(a)(l) | | | | 2,500 | | | 575,000 | |
Republic of Venezuela,
expiring 4/15/20(l) | | | | 48,195 | | | –0 | – |
| | | | | | | | |
| | | |
Total Warrants | | | | | | | | |
(cost $0) | | | | | | | 575,000 | |
| | | | | | | | |
| | | |
| | | | | Principal
Amount
(000) | | | |
REGIONAL BONDS – 0.1% | | | | |
Colombia – 0.1% | | | | | | | | |
Bogota Distrio Capital | | | | | | | | |
9.75%, 7/26/28(a)(b) | | | | | | | | |
(cost $521,201) | | COP | | 1,142,000 | | | 560,138 | |
| | | | | | | | |
| | | |
| | | | | Shares | | | |
COMMON STOCKS – 0.0% | | | | |
United States – 0.0% | | | | | | | | |
Phase Metrics(h)(l) | | | | | | | | |
(cost $1,258,040) | | | | 126,418 | | | 1,264 | |
| | | | | | | | |
| | |
| ALLIANCEBERNSTEIN HIGH INCOME FUND • | | 35 |
Portfolio of Investments
| | | | | | | | |
| | | | | Principal
Amount (000) | | U.S. $ Value | |
| | |
| | | | | | | | |
| | | |
SHORT-TERM INVESTMENTS – 0.7% | | | | | | | | |
Time Deposit – 0.7% | | | | |
Bank of New York
1.00%, 5/01/08 | | US$ | | 540 | | $ | 540,000 | |
Societe Generale
2.263%, 5/01/08 | | | | 6,600 | | | 6,600,000 | |
| | | | | | | | |
| | | |
Total Short-Term Investments
(cost $7,140,000) | | | | | | | 7,140,000 | |
| | | | | | | | |
| | | |
Total Investments – 100.1%
(cost $1,039,268,034) | | | | | | | 1,009,656,080 | |
Other assets less liabilities – (0.1)% | | | | | | | (1,172,135 | ) |
| | | | | | | | |
| | | |
Net Assets – 100.0% | | | | | | $ | 1,008,483,945 | |
| | | | | | | | |
CREDIT DEFAULT SWAP CONTRACTS (see Note D)
| | | | | | | | | | | | |
Swap Counterparty & Referenced Obligation | | Notional
Amount
(000) | | Interest
Rate | | | Termination
Date | | Unrealized
Appreciation/ (Depreciation) | |
Sale Contracts: | | | | | | | | | | | | |
Citigroup Global Markets, Inc.
(Federal Republic of Brazil
12.25%, 3/6/30) | | $ | 7,110 | | 3.09 | % | | 8/20/10 | | $ | 436,973 | |
Citigroup Global Markets, Inc.
(Republic of Philippines
10.625%, 3/16/25) | | | 1,410 | | 4.95 | | | 3/20/09 | | | 61,066 | |
JPMorgan Chase
(OAO Gazprom
10.50%, 10/21/09) | | | 4,560 | | 1.04 | | | 10/20/10 | | | (45,915 | ) |
JPMorgan Chase
(Petroleos De Venezuela
6.62%, 4/12/37) | | | 9,370 | | 6.62 | | | 5/20/09 | | | 160,705 | |
FORWARD CURRENCY EXCHANGE CONTRACTS (see Note D)
| | | | | | | | | | | | |
| | | Contract
Amount
(000) | | U.S. $
Value on
Origination
Date | | U.S. $
Value at
April 30,
2008 | | Unrealized
Appreciation/
(Depreciation) | |
Sale Contracts: | | | | | | | | | | |
Brazilian Real settling 5/05/08 | | 8,330 | | $ | 4,733,756 | | $ | 5,004,647 | | $ | (270,890 | ) |
Brazilian Real settling 6/03/08 | | 8,330 | | | 4,903,023 | | | 4,965,594 | | | (62,572 | ) |
Brazilian Real settling 6/03/08 | | 14,558 | | | 8,480,000 | | | 8,678,351 | | | (198,351 | ) |
Mexican Nuevo Peso settling 6/25/08 | | 42,134 | | | 4,001,371 | | | 3,987,273 | | | 14,098 | |
| | |
| 36 | | • ALLIANCEBERNSTEIN HIGH INCOME FUND |
Portfolio of Investments
REVERSE REPURCHASE AGREEMENTS (see Note D)
| | | | | | | | |
| Broker | | Interest
Rate | | | Maturity | | Amount |
ABN AMRO | | 2.25 | % | | 5/05/08 | | $ | 1,977,377 |
ABN AMRO | | 2.25 | | | 5/05/08 | | | 2,680,125 |
ABN AMRO | | 2.25 | | | 5/05/08 | | | 1,058,471 |
ABN AMRO | | 2.40 | | | 5/05/08 | | | 6,558,527 |
UBS AG London | | 2.00 | | | 5/05/08 | | | 2,262,266 |
UBS AG London | | 1.75 | | | 12/31/08 | | | 2,275,500 |
| | | | | | | | |
| | | | | | | $ | 16,812,266 |
| | | | | | | | |
| (a) | Position, or a portion thereof, has been segregated to collateralize forward currency exchange contracts. The aggregate market value of these securities amounted to $872,793,109. |
| (b) | Security is exempt from registration under Rule 144A of the Securities Act of 1933. These securities are considered liquid and may be resold in transactions exempt from registration, normally to qualified institutional buyers. At April 30, 2008, the aggregate market value of these securities amounted to $202,888,307 or 20.1% of net assets. |
| (c) | Variable rate coupon, rate shown as of April 30, 2008. |
| (d) | Floating Rate Security. Stated interest rate was in effect at April 30, 2008. |
| (e) | Indicates a security that has a zero coupon that remains in effect until a predetermined date at which time the stated coupon rate becomes effective until final maturity. |
| (f) | Coupon rate adjusts periodically based upon a predetermined schedule. Stated interest rate in effect at April 30, 2008. |
| (g) | Pay-In-Kind Payments (PIK). |
| (h) | Illiquid security, valued at fair value. (See Note A) |
| (i) | Security is exempt from registration under Rule 144A of the Securities Act of 1933. This security, which represents 0.0% of net assets as of April 30, 2008, is considered illiquid and restricted (see Notes A & E). |
| | | | | | | | | | | |
| Restricted Securities | | Acquisition
Date | | Acquisition
Cost | | Market
Value | | Percentage of
Net Assets | |
Russell-Stanley Holdings, Inc.
9.00%, 11/30/08 | | 2/10/99-5/31/05 | | $ | 7,530,199 | | $ | 78,055 | | 0.01 | % |
| (j) | Security is in default and is non-income producing. |
| (k) | Position, or a portion thereof, has been segregated to collateralize reverse repurchase agreements. The aggregate market value of these securities amounted to $15,111,976. |
| (l) | Non-income producing security. |
| * | Unfunded loan commitment. The Portfolio is obligated to fund these commitments at the borrower’s discretion. |
| | |
Currency Abbreviations: ARS– Argentine Peso BRL– Brazilian Real COP– Colombian Peso EUR– Euro Dollar MXN– Mexican Peso | | MYR – Malaysian Ringgit PEN – Peruvian New Sol RUB – Russian Rouble TRY – New Turkish Lira UYU – Uruguayan Peso ZAR – South African Rand |
| See | notes to financial statements. |
| | |
| ALLIANCEBERNSTEIN HIGH INCOME FUND • | | 37 |
Portfolio of Investments
STATEMENT OF ASSETS & LIABILITIES
April 30, 2008 (unaudited)
| | | | |
| Assets | | | | |
Investments in securities, at value (cost $1,039,268,034) | | $ | 1,009,656,080 | |
Cash | | | 2,607,802 | |
Foreign cash, at value (cost $108,778) | | | 109,742 | |
Unrealized appreciation of credit default swap contracts . | | | 658,744 | |
Unrealized appreciation of forward currency exchange contracts | | | 14,098 | |
Interest receivable | | | 20,243,690 | |
Receivable for capital stock sold . | | | 4,516,755 | |
Due from broker | | | 2,275,500 | |
Receivable for investment securities sold and foreign
currency contracts | | | 1,443,124 | |
| | | | |
Total assets . | | | 1,041,525,535 | |
| | | | |
| Liabilities | | | | |
Unrealized depreciation of forward currency exchange contracts | | | 531,813 | |
Unrealized depreciation of credit default swap contracts | | | 45,915 | |
Reverse repurchase agreements | | | 16,812,266 | |
Payable for capital stock redeemed . | | | 7,624,007 | |
Payable for investment securities purchased | | | 4,833,832 | |
Dividends payable | | | 1,925,301 | |
Distribution fee payable | | | 405,262 | |
Advisory fee payable | | | 389,771 | |
Transfer Agent fee payable | | | 62,971 | |
Administrative fee payable | | | 49,394 | |
Accrued expenses | | | 361,058 | |
| | | | |
Total liabilities | | | 33,041,590 | |
| | | | |
Net Assets | | $ | 1,008,483,945 | |
| | | | |
| Composition of Net Assets | | | | |
Capital stock, at par | | $ | 119,814 | |
Additional paid-in capital | | | 1,032,189,884 | |
Distributions in excess of net investment income | | | (2,200,380 | ) |
Accumulated net realized gain on investment and foreign currency transactions | | | 7,772,474 | |
Net unrealized depreciation of investments and foreign currency denominated assets and liabilities | | | (29,397,847 | ) |
| | | | |
| | $ | 1,008,483,945 | |
| | | | |
Net Asset Value Per Share — 9 billion shares of capital stock authorized, $.001 par value
| | | | | | | | | |
| Class | | Net Assets | | Shares
Outstanding | | Net Asset
Value | |
| A | | $ | 718,725,831 | | 85,625,727 | | $ | 8.39 | * |
| | |
| B | | $ | 99,465,444 | | 11,747,897 | | $ | 8.47 | |
| | |
| C | | $ | 176,990,136 | | 20,854,808 | | $ | 8.49 | |
| | |
| Advisor | | $ | 10,433,899 | | 1,243,656 | | $ | 8.39 | |
| | |
| R | | $ | 2,004,362 | | 238,884 | | $ | 8.39 | |
| | |
| K | | $ | 576,297 | | 68,659 | | $ | 8.39 | |
| | |
| I | | $ | 287,976 | | 34,295 | | $ | 8.40 | |
| | |
| * | The maximum offering price per share for Class A shares was $8.76 which reflects a sales charge of 4.25%. |
See notes to financial statements.
| | |
| 38 | | • ALLIANCEBERNSTEIN HIGH INCOME FUND |
Statement of Assets & Liabilities
STATEMENT OF OPERATIONS
Six Months Ended April 30, 2008 (unaudited)
| | | | | | | | |
| Investment Income | | | | | | | | |
Interest (net of foreign taxes withheld of $12,110) | | $ | 28,065,907 | | | | | |
Dividends | | | 677,075 | | | $ | 28,742,982 | |
| | | | | | | | |
| Expenses | | | | | | | | |
Advisory fee (see Note B) | | | 1,764,187 | | | | | |
Distribution fee—Class A | | | 738,757 | | | | | |
Distribution fee—Class B | | | 358,764 | | | | | |
Distribution fee—Class C | | | 672,932 | | | | | |
Distribution fee—Class R | | | 2,681 | | | | | |
Distribution fee—Class K | | | 361 | | | | | |
Transfer agency—Class A | | | 218,711 | | | | | |
Transfer agency—Class B | | | 42,101 | | | | | |
Transfer agency—Class C | | | 61,143 | | | | | |
Transfer agency—Advisor Class | | | 2,424 | | | | | |
Transfer agency—Class R | | | 1,394 | | | | | |
Transfer agency—Class K | | | 289 | | | | | |
Transfer agency—Class I | | | 87 | | | | | |
Custodian . | | | 189,248 | | | | | |
Registration | | | 97,137 | | | | | |
Administrative | | | 39,756 | | | | | |
Audit | | | 39,635 | | | | | |
Legal | | | 39,114 | | | | | |
Printing . | | | 35,725 | | | | | |
Directors’ fees . | | | 19,277 | | | | | |
Miscellaneous . | | | 5,345 | | | | | |
| | | | | | | | |
Total expenses before interest expense | | | 4,329,068 | | | | | |
Interest expense . | | | 383,535 | | | | | |
| | | | | | | | |
Total expenses | | | 4,712,603 | | | | | |
Less: expenses waived by the Adviser (see Note B) | | | (57,111 | ) | | | | |
Less: expense offset arrangement (see Note B) | | | (25,052 | ) | | | | |
| | | | | | | | |
Net expenses | | | | | | | 4,630,440 | |
| | | | | | | | |
Net investment income | | | | | | | 24,112,542 | |
| | | | | | | | |
| Realized and Unrealized Gain (Loss) on Investment and Foreign Currency Transactions | | | | | | | | |
Net realized gain on: | | | | | | | | |
Investment transactions | | | | | | | 6,518,597 | |
Swap contracts | | | | | | | 367,308 | |
Foreign currency transactions | | | | | | | 1,352,438 | |
Net change in unrealized appreciation/depreciation of: | | | | | | | | |
Investments | | | | | | | (59,590,411 | ) |
Swap contracts | | | | | | | (168,356 | ) |
Foreign currency denominated assets and liabilities | | | | | | | (328,455 | ) |
| | | | | | | | |
Net loss on investment and foreign currency transactions | | | | | | | (51,848,879 | ) |
| | | | | | | | |
Net Decrease in Net Assets from Operations | | | | | | $ | (27,736,337 | ) |
| | | | | | | | |
See notes to financial statements.
| | |
| ALLIANCEBERNSTEIN HIGH INCOME FUND • | | 39 |
Statement of Operations
STATEMENT OF CHANGES IN NET ASSETS
| | | | | | | | |
| | | Six Months
Ended
April 30, 2008
(unaudited) | | | Year Ended
October 31,
2007 | |
| Increase (Decrease) in Net Assets from Operations | | | | | | | | |
Net investment income | | $ | 24,112,542 | | | $ | 23,324,784 | |
Net realized gain on investment and foreign currency transactions | | | 8,238,343 | | | | 13,992,560 | |
Net change in unrealized appreciation/ depreciation of investments and foreign currency denominated assets and liabilities | | | (60,087,222 | ) | | | 3,194,597 | |
| | | | | | | | |
Net increase (decrease) in net assets from operations | | | (27,736,337 | ) | | | 40,511,941 | |
| Dividends and Distributions to Shareholders from | | | | | | | | |
Net investment income | | | | | | | | |
Class A | | | (19,467,065 | ) | | | (16,926,254 | ) |
Class B | | | (2,538,713 | ) | | | (2,290,180 | ) |
Class C | | | (4,892,517 | ) | | | (5,041,651 | ) |
Advisor Class | | | (207,495 | ) | | | -0 | - |
Class R | | | (38,493 | ) | | | -0 | - |
Class K | | | (10,778 | ) | | | -0 | - |
Class I | | | (5,604 | ) | | | -0 | - |
Net realized gain on investment and foreign currency transactions | | | | | | | | |
Class A | | | (6,453,496 | ) | | | (9,777,229 | ) |
Class B | | | (874,556 | ) | | | (1,705,256 | ) |
Class C | | | (2,191,069 | ) | | | (3,425,008 | ) |
| Capital Stock Transactions | | | | | | | | |
Net increase | | | 669,639,531 | | | | 32,973,033 | |
| | | | | | | | |
Total increase . | | | 605,223,408 | | | | 34,319,396 | |
| Net Assets | | | | | | | | |
Beginning of period | | | 403,260,537 | | | | 368,941,141 | |
| | | | | | | | |
End of period (including undistributed/ (distributions in excess of) net investment income of ($2,200,380) and $847,743, respectively) | | $ | 1,008,483,945 | | | $ | 403,260,537 | |
| | | | | | | | |
See notes to financial statements.
| | |
| 40 | | • ALLIANCEBERNSTEIN HIGH INCOME FUND |
Statement of Changes in Net Assets
NOTES TO FINANCIAL STATEMENTS
April 30, 2008 (unaudited)
NOTE A
Significant Accounting Policies
AllianceBernstein High Income Fund, Inc. (the “Fund”), formerly known as AllianceBernstein Emerging Market Debt Fund, Inc., was incorporated in the State of Maryland on December 2, 1993, as a non-diversified, open-end management investment company. The Fund offers Class A, Class B, Class C, Advisor Class, Class R, Class K and Class I shares. Class A shares are sold with a front-end sales charge of up to 4.25% for purchases not exceeding $1,000,000. With respect to purchases of $1,000,000 or more, Class A shares redeemed within one year of purchase may be subject to a contingent deferred sales charge of 1%. Class B shares are currently sold with a contingent deferred sales charge which declines from 3% to zero depending on the period of time the shares are held. Class B shares will automatically convert to Class A shares six years after the end of the calendar month of purchase. Class C shares are subject to a contingent deferred sales charge of 1% on redemptions made within the first year after purchase. Class R and Class K shares are sold without an initial or contingent deferred sales charge. Advisor Class and Class I shares are sold without an initial or contingent deferred sales charge and are not subject to ongoing distribution expenses. All seven classes of shares have identical voting, dividend, liquidation and other rights, except that the classes bear different distribution and transfer agency expenses. Each class has exclusive voting rights with respect to its distribution plan. The financial statements have been prepared in conformity with U.S. generally accepted accounting principles, which require management to make certain estimates and assumptions that affect the reported amounts of assets and liabilities in the financial statements and amounts of income and expenses during the reporting period. Actual results could differ from those estimates. The following is a summary of significant accounting policies followed by the Fund.
1. Security Valuation
Portfolio securities are valued at their current market value determined on the basis of market quotations or, if market quotations are not readily available or are deemed unreliable, at “fair value” as determined in accordance with procedures established by and under the general supervision of the Fund’s Board of Directors.
In general, the market value of securities which are readily available and deemed reliable are determined as follows. Securities listed on a national securities exchange (other than securities listed on The NASDAQ Stock Market, Inc. (“NASDAQ”)) or on a foreign securities exchange are valued at the last sale price at the close of the exchange or foreign securities exchange. If there has been no sale on such day, the securities are valued at the mean of the closing bid and asked prices on such day. Securities listed on more than one exchange are valued by reference to the principal exchange on which the securities are traded; securities listed only on NASDAQ are valued in accordance with the NASDAQ Official Closing Price; listed put or call options are valued at the last sale price. If
| | |
| ALLIANCEBERNSTEIN HIGH INCOME FUND • | | 41 |
Notes to Financial Statements
there has been no sale on that day, such securities will be valued at the closing bid prices on that day; open futures contracts and options thereon are valued using the closing settlement price or, in the absence of such a price, the most recent quoted bid price. If there are no quotations available for the day of valuation, the last available closing settlement price is used; securities traded in the over-the-counter market, (“OTC”) are valued at the mean of the current bid and asked prices as reported by the National Quotation Bureau or other comparable sources; U.S. Government securities and other debt instruments having 60 days or less remaining until maturity are valued at amortized cost if their original maturity was 60 days or less; or by amortizing their fair value as of the 61st day prior to maturity if their original term to maturity exceeded 60 days; fixed-income securities, including mortgage backed and asset backed securities, may be valued on the basis of prices provided by a pricing service or at a price obtained from one or more of the major broker/dealers. In cases where broker/dealer quotes are obtained, AllianceBernstein L.P. (the “Adviser”) may establish procedures whereby changes in market yields or spreads are used to adjust, on a daily basis, a recently obtained quoted price on a security; and OTC and other derivatives are valued on the basis of a quoted bid price or spread from a major broker/dealer in such security.
Securities for which market quotations are not readily available (including restricted securities) or are deemed unreliable are valued at fair value. Factors considered in making this determination may include, but are not limited to, information obtained by contacting the issuer, analysts, analysis of the issuer’s financial statements or other available documents. In addition, the Fund may use fair value pricing for securities primarily traded in non-U.S. markets because, most foreign markets close well before the Fund values its securities at 4:00 p.m., Eastern Time. The earlier close of these foreign markets gives rise to the possibility that significant events, including broad market moves, may have occurred in the interim and may materially affect the value of those securities.
2. Currency Translation
Assets and liabilities denominated in foreign currencies and commitments under forward currency exchange contracts are translated into U.S. dollars at the mean of the quoted bid and asked prices of such currencies against the U.S. dollar. Purchases and sales of portfolio securities are translated into U.S. dollars at the rates of exchange prevailing when such securities were acquired or sold. Income and expenses are translated into U.S. dollars at rates of exchange prevailing when accrued.
Net realized gain or loss on foreign currency transactions represents foreign exchange gains and losses from sales and maturities of foreign fixed income investments, foreign currency exchange contracts, holding of foreign currencies, currency gains or losses realized between the trade and settlement dates on foreign investment transactions, and the difference between the amounts of dividends, interest and foreign withholding taxes recorded on the Fund’s books and
| | |
| 42 | | • ALLIANCEBERNSTEIN HIGH INCOME FUND |
Notes to Financial Statements
the U.S. dollar equivalent amounts actually received or paid. Net unrealized currency gains and losses from valuing foreign currency denominated assets and liabilities at period end exchange rates are reflected as a component of unrealized appreciation and depreciation of investments and foreign currency denominated assets and liabilities.
3. Taxes
It is the Fund’s policy to meet the requirements of the Internal Revenue Code applicable to regulated investment companies and to distribute all of its investment company taxable income and net realized gains, if any, to shareholders. Therefore, no provisions for federal income or excise taxes are required. The Fund may be subject to taxes imposed by countries in which it invests. Such taxes are generally based on income and/or capital gains earned or repatriated. Taxes are accrued and applied to net investment income, net realized gains and net unrealized appreciation/depreciation as such income and/or gains are earned.
4. Investment Income and Investment Transactions
Interest income is accrued daily. Investment transactions are accounted for on the date securities are purchased or sold. Investment gains and losses are determined on the identified cost basis. The Fund amortizes premiums and accretes discounts as adjustments to interest income.
5. Class Allocations
All income earned and expenses incurred by the Fund are borne on a pro-rata basis by each settled class of shares, based on the proportionate interest in the Fund represented by the net assets of such class, except for class specific expenses which are allocated to the respective class. Realized and unrealized gains and losses are allocated among the various share classes based on their respective net assets.
6. Dividends and Distributions
Dividends and distributions to shareholders are recorded on the ex-dividend date. Income and capital gains distributions are determined in accordance with federal tax regulations and may differ from those determined in accordance with U.S. generally accepted accounting principles. To the extent these differences are permanent, such amounts are reclassified within the capital accounts based on their federal tax basis treatment; temporary differences do not require such reclassification.
NOTE B
Advisory Fee and Other Transactions with Affiliates
Under the terms of the investment advisory agreement, the Fund pays the Adviser an advisory fee at an annual rate of .50% of the first $2.5 billion, .45% of the next $2.5 billion and .40% in excess of $5 billion, of the Fund’s average daily net assets.
| | |
| ALLIANCEBERNSTEIN HIGH INCOME FUND • | | 43 |
Notes to Financial Statements
Effective January 28, 2008, the Adviser has agreed to waive its fees and bear certain expenses to the extent necessary to limit total fund operating expenses on an annual basis to .95%, 1.65%, 1.65%, .65%, 1.15%, .90% and .65% of the average daily net assets of Class A, Class B, Class C, Advisor Class, Class R. Class K and Class I shares, respectively. This waiver extends through October 31, 2009 and then may be extended by the Adviser for additional one-year terms. For the period ended April 30, 2008, such reimbursement amounted to $57,111.
Pursuant to the advisory agreement, the Adviser provides certain legal and accounting services to the Fund. For the six months ended April 30, 2008, such fees amounted to $39,756.
The Fund compensates AllianceBernstein Investor Services, Inc. (ABIS), a wholly-owned subsidiary of the Adviser, under a Transfer Agency Agreement for providing personnel and facilities to perform transfer agency services for the Fund. ABIS may make payments to intermediaries that provide omnibus account services, sub-accounting services and/or networking services. Such compensation retained by ABIS amounted to $277,005 for the six months ended April 30, 2008.
For the six months ended April 30, 2008, the Fund’s expenses were reduced by $25,052 under an expense offset arrangement with ABIS.
AllianceBernstein Investments, Inc. (the “Distributor”), a wholly-owned subsidiary of the Adviser, serves as the distributor of the Fund’s shares. The Distributor has advised the Fund that it has retained front-end sales charges of $13,809 from the sale of Class A shares and received $5,835, $19,875 and $9,162 in contingent deferred sales charges imposed upon redemptions by shareholders of Class A, Class B and Class C shares, respectively, for the six months ended April 30, 2008.
NOTE C
Distribution Services Agreement
The Fund has adopted a Distribution Services Agreement (the “Agreement”) pursuant to Rule 12b-1 under the Investment Company Act of 1940. Under the Agreement the Fund pays a distribution fee to the Distributor at an annual rate of up to .30% of the average daily net assets attributable to Class A shares, 1% of the Fund’s average daily net assets attributable to both Class B and Class C shares, .50% of the Fund’s average daily net assets attributable to Class R shares and .25% of the Fund’s average daily net assets attributable to Class K shares. There are no distribution and servicing fees on the Advisor Class and Class I shares. The fees are accrued daily and paid monthly. The Agreement provides that the Distributor will use such payments in their entirety for distribution assistance and promotional activities. The Distributor has incurred expenses in excess of the distribution costs reimbursed by the Fund in the amounts of $37,654,102, $11,056,004, $32,752 and $5,226 for Class B, Class C, Class R and Class K shares, respectively. While such costs may be recovered from the Fund in future periods so long as the Agreement is in effect, the rate of the dis tribution and servicing fees payable under the Agreement may not be increased without a shareholder vote. In accordance with the Agreement, there is no
| | |
| 44 | | • ALLIANCEBERNSTEIN HIGH INCOME FUND |
Notes to Financial Statements
provision for recovery of unreimbursed distribution costs, incurred by the Distributor, beyond the current fiscal year for Class A shares. The Agreement also provides that the Adviser may use its own resources to finance the distribution of the Fund’s shares.
NOTE D
Investment Transactions
Purchases and sales of investment securities (excluding short-term investments) for the six months ended April 30, 2008, were as follows:
| | | | | | |
| | | Purchases | | Sales |
Investment securities (excluding
U.S. government securities) | | $ | 1,023,511,858 | | $ | 370,319,366 |
U.S. government securities | | | –0– | | | –0– |
The cost of investments for federal income tax purposes was substantially the same as the cost for financial reporting purposes. Accordingly, gross unrealized appreciation and unrealized depreciation (excluding forward currency exchange contracts and swap contracts) are as follows:
| | | | |
Gross unrealized appreciation | | $ | 27,191,118 | |
Gross unrealized depreciation | | | (56,803,072 | ) |
| | | | |
Net unrealized depreciation | | $ | (29,611,954 | ) |
| | | | |
1. Forward Currency Exchange Contracts
The Fund may enter into forward currency exchange contracts in order to hedge its exposure to changes in foreign currency exchange rates on its foreign portfolio holdings, or to hedge certain firm purchase and sale commitments denominated in foreign currencies and non-hedging purposes as a means of making direct investments in foreign currencies, as described below under “Currency Transactions”. A forward currency exchange contract is a commitment to purchase or sell a foreign currency at a future date at a negotiated forward rate. The gain or loss arising from the difference between the original contract and the closing of such contract would be included in net realized gain or loss on foreign currency transactions.
Fluctuations in the value of open forward currency exchange contracts are recorded for financial reporting purposes as unrealized appreciation or depreciation by the Fund.
The Fund’s custodian will place and maintain cash not available for investment or other liquid assets in a separate account of the Fund having a value at least equal to the aggregate amount of the Fund’s commitments under forward currency exchange contracts entered into with respect to position hedges. Risks may arise from the potential inability of the counterparty to meet the terms of a contract and from unanticipated movements in the value of foreign currency relative to the U.S. dollar. The face or contract amount, in U.S. dollars reflects the total exposure the Fund has in that particular currency contract.
| | |
| ALLIANCEBERNSTEIN HIGH INCOME FUND • | | 45 |
Notes to Financial Statements
2. Option Transactions
For hedging purposes, the Fund may purchase and write (sell) put and call options on U.S. and foreign government securities and foreign currencies that are traded on U.S. and foreign securities exchanges and over-the-counter markets. The Fund may also use options transactions for non-hedging purposes as a means of making direct investments in foreign currencies, as described below under “Currency Transactions”.
The risk associated with purchasing an option is that the Fund pays a premium whether or not the option is exercised. Additionally, the Fund bears the risk of loss of premium and change in market value should the counterparty not perform under the contract. Put and call options purchased are accounted for in the same manner as portfolio securities. The cost of securities acquired through the exercise of call options is increased by premiums paid. The proceeds from securities sold through the exercise of put options are decreased by the premiums paid.
When the Fund writes an option, the premium received by the Fund is recorded as a liability and is subsequently adjusted to the current market value of the option written. Premiums received from written options which expire unexercised are recorded by the Fund on the expiration date as realized gains from options written. The difference between the premium received and the amount paid on effecting a closing purchase transaction, including brokerage commissions, is also treated as a realized gain, or if the premium received is less than the amount paid for the closing purchase transaction, as a realized loss. If a call option is exercised, the premium received is added to the proceeds from the sale of the underlying security or currency in determining whether the Fund has realized a gain or loss. If a put option is exercised, the premium received reduces the cost basis of the security or currency purchased by the Fund. In writing an option, the Fund bears the market risk of an unfavorable change in the price of the security or currency underlying the written option. Exercise of an option written by the Fund could result in the Fund’s selling or buying a security or currency at a price different from the current market value.
For the six months ended April 30, 2008, the Fund had no transactions in written options.
3. Swap Agreements
The Fund may enter into swaps to hedge its exposure to interest rates, credit risk, or currencies. The Fund may also enter into swaps for non-hedging purposes as a means of making direct investments in foreign currencies, as described below under “Currency Transactions”. A swap is an agreement that obligates two parties to exchange a series of cash flows at specified intervals based upon or calculated by reference to changes in specified prices or rates for a specified amount of an underlying asset. The payment flows are usually netted against each other, with the difference being paid by one party to the other.
| | |
| 46 | | • ALLIANCEBERNSTEIN HIGH INCOME FUND |
Notes to Financial Statements
Risks may arise as a result of the failure of the counterparty to the swap contract to comply with the terms of the swap contract. The loss incurred by the failure of a counterparty is generally limited to the net interim payment to be received by the Fund, and/or the termination value at the end of the contract. Therefore, the Fund considers the creditworthiness of each counterparty to a swap contract in evaluating potential credit risk. Additionally, risks may arise from unanticipated movements in interest rates or in the value of the underlying securities.
As of November 1, 2003, the Fund has adopted the method of accounting for interim payments on swap contracts in accordance with Financial Accounting Standards Board Statement No. 133. The Fund accrues for the interim payments on swap contracts on a daily basis, with the net amount recorded within unrealized appreciation/depreciation of swap contracts on the statement of assets and liabilities. Once the interim payments are settled in cash, the net amount is recorded as realized gain/loss on swaps, in addition to realized gain/loss recorded upon the termination of swap contracts on the statements of operations. Prior to November 1, 2003, these interim payments were reflected within interest income/expense in the statement of operations. Fluctuations in the value of swap contracts are recorded as a component of net change in unrealized appreciation/depreciation of investments.
The Fund may enter into credit default swaps. The Fund may purchase credit protection on the referenced obligation of the credit default swap (“Buy Contract”) or provide credit protection on the referenced obligation of the credit default swap (“Sale Contract”). A sale/(buy) in a credit default swap provides upon the occurrence of a credit event, as defined in the swap agreement, for the Portfolio to buy/(sell) from/(to) the counterparty at the notional amount (the “Notional Amount”) and receive/(deliver) the principal amount of the referenced obligation. If a credit event occurs, the maximum payout amount for a Sale Contract is limited to the Notional Amount of the swap contract (“Maximum Payout Amount”). During the term of the swap agreement, the Fund receives/(pays) fixed payments from/(to) the respective counterparty, calculated at the agreed upon interest rate applied to the Notional Amount. These interim payments are recorded within unrealized appreciation/depreciation of swap contracts on the statement of assets and liabilities.
Credit default swaps may involve greater risks than if a Fund had invested in the referenced obligation directly. Credit default swaps are subject to general market risk, liquidity risk, counterparty risk and credit risk. If the Fund is a buyer and no credit event occurs, it will lose its investment. In addition, if the Fund is a seller and a credit event occurs, the value of the referenced obligation received by the Fund coupled with the periodic payments previously received, may be less than the Maximum Payout Amount it pays to the buyer, resulting in a loss to the Fund.
| | |
| ALLIANCEBERNSTEIN HIGH INCOME FUND • | | 47 |
Notes to Financial Statements
At April 30, 2008, the Fund had Sale Contracts outstanding with Maximum Payout Amounts aggregating $22,450,000, with net unrealized appreciation of $612,829 and terms ranging from 11 months to 2 years, as reflected in the portfolio of investments.
In certain circumstances, the Fund may hold Sale Contracts on the same referenced obligation and with the same counterparty from which it has purchased credit protection, which may reduce its obligation to make payments on Sale Contracts, if a credit event occurs. At April 30, 2008, the Fund did not have Buy Contracts outstanding with the same referenced obligations and same counterparty of certain Sale Contracts outstanding.
4. Currency Transactions
The Fund may invest in non-U.S. Dollar securities on a currency hedged or unhedged basis. The Fund may seek investment opportunities by taking long or short positions in currencies through the use of currency-related derivatives, including forward currency exchange contracts, futures and options on futures, swaps, and options. The Fund may enter into transactions for investment opportunities when it anticipates that a foreign currency will appreciate or depreciate in value but securities denominated in that currency are not held by the Fund and do not present attractive investment opportunities. Such transactions may also be used when the Adviser believes that it may be more efficient than a direct investment in a foreign currency-denominated security. The Fund may also conduct currency exchange contracts on a spot basis (i.e., for cash at the spot rate prevailing in the currency exchange market for buying or selling currencies).
5. Reverse Repurchase Agreements
Under a reverse repurchase agreement, the Fund sells securities and agrees to repurchase them at a mutually agreed upon date and price. At the time the Fund enters into a reverse repurchase agreement, it will establish a segregated account with the custodian containing liquid assets having a value at least equal to the repurchase price.
For the six months ended April 30, 2008, the average amount of reverse repurchase agreements outstanding was $42,994,768 and the daily weighted average interest rate was 2.95%.
| | |
| 48 | | • ALLIANCEBERNSTEIN HIGH INCOME FUND |
Notes to Financial Statements
NOTE E
Capital Stock
Each class consists of 3,000,000,000 authorized shares. Transactions in capital shares for each class were as follows:
| | | | | | | | | | | | | | | | | | |
| | | | | | | | | | | | | | | | | | |
| | | Shares | | | | | Amount | | | |
| | | Six Months
Ended April 30, 2008 (unaudited) | | | Year Ended October 31, 2007 | | | | | Six Months
Ended April 30, 2008 (unaudited) | | | Year Ended October 31,
2007 | | | |
| | | | | |
| Class A | | | | | | | | | | | | | | | | | | |
Shares sold | | 6,734,675 | | | 16,257,643 | | | | | $ | 56,934,818 | | | $ | 144,048,619 | | | |
| | | | | | | | | | | | | | | | | | | |
Shares issued in reinvestment of dividends and distributions | | 2,236,630 | | | 2,120,728 | | | | | | 18,870,161 | | | | 18,776,774 | | | |
| | | | | | | | | | | | | | | | | | | |
Shares converted from Class B | | 1,850,808 | | | 823,902 | | | | | | 15,566,452 | | | | 7,276,687 | | | |
| | | | | | | | | | | | | | | | | | | |
Shares issued in connection with the acquisition of High Yield Fund and Corporate Bond Portfolio | | 60,482,629 | | | -0- | | | | | | 524,540,361 | | | | -0- | | | |
| | | | | | | | | | | | | | | | | | | |
Shares redeemed | | (16,919,352 | ) | | (14,241,600 | ) | | | | | (144,053,975 | ) | | | (125,180,713 | ) | | |
| | | | | | | | | | | | | | | | | | | |
Net increase | | 54,385,390 | | | 4,960,673 | | | | | $ | 471,857,817 | | | $ | 44,921,367 | | | |
| | | | | | | | | | | | | | | | | | | |
| | | | | | | | | | | | | | | | | | |
| Class B | | | | | | | | | | | | | | | | | | |
Shares sold | | 366,868 | | | 562,014 | | | | | $ | 3,132,448 | | | $ | 5,019,126 | | | |
| | | | | | | | | | | | | | | | | | | |
Shares issued in reinvestment of dividends and distributions | | 290,861 | | | 290,330 | | | | | | 2,474,481 | | | | 2,592,296 | | | |
| | | | | | | | | | | | | | | | | | | |
Shares issued in connection with the acquisition of High Yield Fund and Corporate Bond Portfolio | | 10,243,982 | | | -0- | | | | | | 106,703,023 | | | | -0- | | | |
| | | | | | | | | | | | | | | | | | | |
Shares converted to Class A | | (1,834,898 | ) | | (816,644 | ) | | | | | (15,566,452 | ) | | | (7,276,687 | ) | | |
| | | | | | | | | | | | | | | | | | | |
Shares redeemed | | (1,173,919 | ) | | (1,169,028 | ) | | | | | (9,945,435 | ) | | | (10,432,639 | ) | | |
| | | | | | | | | | | | | | | | | | | |
Net increase (decrease) | | 7,892,894 | | | (1,133,328 | ) | | | | $ | 86,798,065 | | | $ | (10,097,904 | ) | | |
| | | | | | | | | | | | | | | | | | | |
| | |
| ALLIANCEBERNSTEIN HIGH INCOME FUND • | | 49 |
Notes to Financial Statements
| | | | | | | | | | | | | | | | | | |
| | | | | | | | | | | | | | | | | | |
| | | Shares | | | | | Amount | | | |
| | | Six Months Ended
April 30, 2008 (unaudited) | | | Year Ended
October 31,
2007 | | | | | Six Months Ended
April 30, 2008 (unaudited) | | | Year Ended
October 31, 2007 | | | |
| | | | | |
| Class C | | | | | | | | | | | | | | | | | | |
Shares sold | | 922,576 | | | 1,881,699 | | | | | $ | 7,965,489 | | | $ | 16,866,412 | | | |
| | | | | | | | | | | | | | | | | | | |
Shares issued in reinvestment of dividends and distributions | | 516,196 | | | 617,737 | | | | | | 4,412,158 | | | | 5,526,724 | | | |
| | | | | | | | | | | | | | | | | | | |
Shares issued in connection with the acquisition of High Yield Fund and Corporate Bond Portfolio | | 12,711,364 | | | -0- | | | | | | 122,225,103 | | | | -0- | | | |
| | | | | | | | | | | | | | | | | | | |
Shares redeemed | | (2,787,988 | ) | | (2,717,636 | ) | | | | | (23,718,455 | ) | | | (24,243,566 | ) | | |
| | | | | | | | | | | | | | | | | | | |
Net increase (decrease) | | 11,362,148 | | | (218,200 | ) | | | | $ | 110,884,295 | | | $ | (1,850,430 | ) | | |
| | | | | | | | | | | | | | | | | | | |
| | | | | | | | | | | | | | | | | | |
| | | Shares | | | | | Amount | | | |
Advisor Class | | January 25,
2008(a) to
April 30, 2008(unaudited) |
| | | | | | |
| January 25,
2008(a) to
April 30, 2008
(unaudited) |
| | | | | | |
| | | | | |
Shares sold | | 1,130,203 | | | | | | | | $ | 3,797,494 | | | | | | | |
| | | | | | | | | | | | | | | | | | | |
Shares issued in reinvestment of dividends | | 22,277 | | | | | | | | | 184,771 | | | | | | | |
| | | | | | | | | | | | | | | | | | | |
Shares issued in connection with the acquisition of High Yield Fund and Corporate Bond Portfolio | | 414,996 | | | | | | | | | (4,096,673 | ) | | | | | | |
| | | | | | | | | | | | | | | | | | | |
Shares redeemed | | (323,820 | ) | | | | | | | | (2,728,990 | ) | | | | | | |
| | | | | | | | | | | | | | | | | | | |
Net increase (decrease) | | 1,243,656 | | | | | | | | $ | (2,843,398 | ) | | | | | | |
| | | | | | | | | | | | | | | | | | | |
| | | | | | | | | | | | | | | | | | |
| Class R | | | | | | | | | | | | | | | | | | |
Shares sold | | 72,081 | | | | | | | | $ | 603,554 | | | | | | | |
| | | | | | | | | | | | | | | | | | | |
Shares issued in reinvestment of dividends | | 4,255 | | | | | | | | | 35,314 | | | | | | | |
| | | | | | | | | | | | | | | | | | | |
Shares issued in connection with the acquisition of High Yield Fund and Corporate Bond Portfolio | | 250,536 | | | | | | | | | 2,159,067 | | | | | | | |
| | | | | | | | | | | | | | | | | | | |
Shares redeemed | | (87,988 | ) | | | | | | | | (731,205 | ) | | | | | | |
| | | | | | | | | | | | | | | | | | | |
Net increase | | 238,884 | | | | | | | | $ | 2,066,730 | | | | | | | |
| | | | | | | | | | | | | | | | | | | |
| | | | | | | | | | | | | | | | | | |
| Class K | | | | | | | | | | | | | | | | | | |
Shares sold | | 2,381 | | | | | | | | $ | 19,935 | | | | | | | |
| | | | | | | | | | | | | | | | | | | |
Shares issued in reinvestment of dividends | | 1,184 | | | | | | | | | 9,830 | | | | | | | |
| | | | | | | | | | | | | | | | | | | |
Shares issued in connection with the acquisition of High Yield Fund and Corporate Bond Portfolio | | 66,772 | | | | | | | | | 561,415 | | | | | | | |
| | | | | | | | | | | | | | | | | | | |
Shares redeemed | | (1,678 | ) | | | | | | | | (14,166 | ) | | | | | | |
| | | | | | | | | | | | | | | | | | | |
Net increase | | 68,659 | | | | | | | | $ | 577,014 | | | | | | | |
| | | | | | | | | | | | | | | | | | | |
| | |
| 50 | | • ALLIANCEBERNSTEIN HIGH INCOME FUND |
Notes to Financial Statements
| | | | | | | | | | | | | | | |
| | | Shares | | | | Amount | | |
| | | January 25,
2008(a) to
April 30, 2008 (unaudited) | | | | | | | January 25,
2008(a) to
April 30, 2008 (unaudited) | | | | | |
| | | | |
| Class I | | | | | | | | | | | | | | | |
Shares sold | | 262 | | | | | | | $ | 2,194 | | | | | |
| | | | | | | | | | | | | | | | |
Shares issued in reinvestment of dividends | | 614 | | | | | | | | 5,102 | | | | | |
| | | | | | | | | | | | | | | | |
Shares issued in connection with the acquisition of High Yield Fund and Corporate Bond Portfolio | | 33,456 | | | | | | | | 292,028 | | | | | |
| | | | | | | | | | | | | | | | |
Shares redeemed | | (37 | ) | | | | | | | (316 | ) | | | | |
| | | | | | | | | | | | | | | | |
Net increase | | 34,295 | | | | | | | $ | 299,008 | | | | | |
| | | | | | | | | | | | | | | | |
| (a) | Commencement of distribution. |
NOTE F
Risks Involved in Investing in the Fund
Interest Rate Risk and Credit Risk — Interest rate risk is the risk that changes in interest rates will affect the value of the Fund’s investments in fixed-income debt securities such as bonds or notes. Increases in interest rates may cause the value of the Fund’s investments to decline. Credit risk is the risk that the issuer or guarantor of a debt security, or the counterparty to a derivative contract, will be unable or unwilling to make timely principal and/or interest payments, or to otherwise honor its obligations. The degree of risk for a particular security may be reflected in its credit risk rating. Credit risk is greater for medium quality and lower-rated securities. Lower-rated debt securities and similar unrated securities (commonly known as “junk bonds”) have speculative elements or are predominantly speculative risks.
Currency Risk — This is the risk that changes in foreign currency exchange rates may negatively affect the value of the Fund’s investments or reduce the returns of the Fund. For example, the value of the Fund’s investments in foreign currency-denominated securities or currencies may decrease if the U.S. Dollar is strong (i.e., gaining value relative to other currencies) and other currencies are weak (i.e., losing value relative to the U. S. Dollar). Currency markets are generally not as regulated as securities markets.
Foreign Securities Risk — Investing in securities of foreign companies and foreign governments involves special risks which include changes in foreign currency exchange rates the possibility of future political and economic developments which could adversely affect the value of such securities. Moreover, securities of many foreign companies and foreign governments and their markets may be less liquid and their prices more volatile than those of comparable U.S. companies and the U.S. government. The Fund invests in the Sovereign Debt Obligations of countries that are considered emerging market
| | |
| ALLIANCEBERNSTEIN HIGH INCOME FUND • | | 51 |
Notes to Financial Statements
countries at the time of purchase. Therefore, the Fund is susceptible to governmental factors and economic and debt restructuring developments adversely affecting the economies of these emerging market countries. In addition, these debt obligations may be less liquid and subject to greater volatility than debt obligations of more developed countries.
Leverage Risk — When the Fund borrows money or otherwise leverages its portfolio, it may be volatile because leverage tends to exaggerate the effect of any increase or decrease in the value of the Fund’s investments. The Fund may create leverage through the use of reverse repurchase arrangements, forward currency exchange contracts, forward commitments, dollar rolls or futures contracts or by borrowing money.
Indemnification Risk — In the ordinary course of business, the Fund enters into contracts that contain a variety of indemnifications. The Fund’s maximum exposure under these arrangements is unknown. However, the Fund has not had prior claims or losses pursuant to these indemnification provisions and expects the risk of loss thereunder to be remote.
NOTE G
Joint Credit Facility
A number of open-end mutual funds managed by the Adviser, including the Fund, participate in a $250 million revolving credit facility (the “Facility”) intended to provide short-term financing if necessary, subject to certain restrictions, in connection with abnormal redemption activity. Commitment fees related to the Facility are paid by the participating funds and are included in miscellaneous expenses in the statement of operations. The Fund did not utilize the Facility during the six months ended April 30, 2008.
NOTE H
Acquisition of AllianceBernstein High Yield Fund, Inc., and AllianceBernstein Bond Fund, Inc. — AllianceBernstein Corporate Bond Portfolio, by AllianceBernstein High Income Fund, Inc. (the “Fund”)
On January 25, 2008, the Fund acquired all of the net assets and assumed all of the liabilities of AllianceBernstein High Yield Fund, Inc. (“High Yield”), and AllianceBernstein Corporate Bond Portfolio (“Corporate Bond”) in a tax free event, pursuant to an Agreement and Plan of Acquisition and Liquidation approved by the stockholders. As a result of the acquisition, stockholders of High Yield, and Corporate Bond received shares of the Fund equivalent to the aggregate net asset value of the shares they held in their respective Funds. On January 25, 2008, the acquisition was accomplished by a tax-free exchange of 84,886,903 shares of the Fund for 17,310,493 shares of High Yield, and 67,576,410 shares of Corporate Bond. The aggregate net assets of the Fund, High Yield, and Corporate Bond immediately before the acquisition were $361,090,616, $148,024,567, and $577,044,197 (including $20,170,950 for High Yield and $7,144,610 for Corporate Bond, of net unrealized depreciation
| | |
| 52 | | • ALLIANCEBERNSTEIN HIGH INCOME FUND |
Notes to Financial Statements
of investments and foreign currency denominated assets and liabilities), respectively. Immediately after the acquisition, the combined net assets of the Fund amounted to $1,086,159,380.
NOTE I
Distributions to Shareholders
The tax character of distributions to be paid for the year ending October 31, 2008 will be determined at the end of the current fiscal year. The tax character of distributions paid during the fiscal years ended October 31, 2007 and October 31, 2006 were as follows:
| | | | | | |
| | | Year Ended
October 31,
2007 | | Year Ended
October 31,
2006 |
Distributions paid from: | | | | | | |
Ordinary income | | $ | 27,212,303 | | $ | 23,406,531 |
Net long-term capital gains | | | 11,953,275 | | | 6,067,242 |
| | | | | | |
Total taxable distributions | | | 39,165,578 | | | 29,473,773 |
| | | | | | |
Total distributions paid | | $ | 39,165,578 | | $ | 29,473,773 |
| | | | | | |
As of October 31, 2007, the components of accumulated earnings/(deficit) on a tax basis were as follows:
| | | | |
Undistributed ordinary income | | $ | 4,931,397 | |
Undistributed long-term capital gains | | | 7,054,255 | |
Accumulated capital and other losses | | | (374,383 | )(a) |
Unrealized appreciation/(depreciation) | | | 29,695,058 | (b) |
| | | | |
Total accumulated earnings/(deficit) | | $ | 41,306,327 | (c) |
| | | | |
| (a) | For the year ended October 31, 2007, the cumulative deferred loss on straddles was $374,383. |
| (b) | The differences between book-basis and tax-basis unrealized appreciation/(depreciation) are attributable primarily to the tax deferral of losses on wash sales, the difference between book and tax amortization methods for premium, the difference between book and tax treatment of swap income, and the realization for tax purposes of gain/losses on certain derivative instruments. |
| (c) | The difference between book-basis and tax-basis components of accumulated earnings/ (deficit) is attributable to dividends payable. |
NOTE J
Legal Proceedings
On October 2, 2003, a purported class action complaint entitled Hindo, et al. v. AllianceBernstein Growth & Income Fund, et al. (“Hindo Complaint”) was filed against the Adviser, Alliance Capital Management Holding L.P. (“Alliance Holding”), Alliance Capital Management Corporation, AXA Financial, Inc., the AllianceBernstein Funds, certain officers of the Adviser (“AllianceBernstein defendants”), and certain other unaffiliated defendants, as well as unnamed Doe defendants. The Hindo Complaint was filed in the United States District Court for the Southern District of New York by alleged shareholders of two of the
| | |
| ALLIANCEBERNSTEIN HIGH INCOME FUND • | | 53 |
Notes to Financial Statements
AllianceBernstein Funds. The Hindo Complaint alleges that certain of the AllianceBernstein defendants failed to disclose that they improperly allowed certain hedge funds and other unidentified parties to engage in “late trading” and “market timing” of AllianceBernstein Fund securities, violating Sections 11 and 15 of the Securities Act, Sections 10(b) and 20(a) of the Exchange Act and Sections 206 and 215 of the Advisers Act. Plaintiffs seek an unspecified amount of compensatory damages and rescission of their contracts with the Adviser, including recovery of all fees paid to the Adviser pursuant to such contracts.
Following October 2, 2003, 43 additional lawsuits making factual allegations generally similar to those in the Hindo Complaint were filed in various federal and state courts against the Adviser and certain other defendants. On September 29, 2004, plaintiffs filed consolidated amended complaints with respect to four claim types: mutual fund shareholder claims; mutual fund derivative claims; derivative claims brought on behalf of Alliance Holding; and claims brought under ERISA by participants in the Profit Sharing Plan for Employees of the Adviser. All four complaints include substantially identical factual allegations, which appear to be based in large part on the Order of the SEC dated December 18, 2003 as amended and restated January 15, 2004 (“SEC Order”) and the New York State Attorney General Assurance of Discontinuance dated September 1, 2004 (“NYAG Order”).
On April 21, 2006, the Adviser and attorneys for the plaintiffs in the mutual fund shareholder claims, mutual fund derivative claims, and ERISA claims entered into a confidential memorandum of understanding containing their agreement to settle these claims. The agreement will be documented by a stipulation of settlement and will be submitted for court approval at a later date. The settlement amount ($30 million), which the Adviser previously accrued and disclosed, has been disbursed. The derivative claims brought on behalf of Alliance Holding, in which plaintiffs seek an unspecified amount of damages, remain pending.
It is possible that these matters and/or other developments resulting from these matters could result in increased redemptions of the AllianceBernstein Mutual Funds’ shares or other adverse consequences to the AllianceBernstein Mutual Funds. This may require the AllianceBernstein Mutual Funds to sell investments held by those funds to provide for sufficient liquidity and could also have an adverse effect on the investment performance of the AllianceBernstein Mutual Funds. However, the Adviser believes that these matters are not likely to have a material adverse effect on its ability to perform advisory services relating to the AllianceBernstein Mutual Funds.
NOTE K
Recent Accounting Pronouncements
On July 13, 2006, the Financial Accounting Standards Board (“FASB”) released FASB Interpretation No. 48 “Accounting for Uncertainty in Income Taxes”
| | |
| 54 | | • ALLIANCEBERNSTEIN HIGH INCOME FUND |
Notes to Financial Statements
(“FIN 48”). FIN 48 provides guidance for how uncertain tax positions should be recognized, measured, presented and disclosed in the financial statements. FIN 48 requires the evaluation of tax positions taken or expected to be taken in the course of preparing a fund’s tax returns to determine whether the tax positions are “more-likely-than-not” of being sustained by the applicable tax authority. Tax positions not deemed to meet the more-likely-than-not threshold would be recorded in the current period. Adoption of FIN 48 is required for fiscal years beginning after December 15, 2006 and is to be applied to all open tax years as of the effective date. On April 30, 2008, the Fund implemented FIN 48 which supplements FASB 109, “Accounting for Income Taxes”. Management has analyzed the Fund’s tax positions taken on federal income tax returns for all open tax years (tax years ended October 31, 2004-2006) for purposes of implementing FIN 48, and has concluded that no provision for income tax is required in the Fund’s financial statements.
On September 20, 2006, the FASB released Statement of Financial Accounting Standards No. 157 “Fair Value Measurements” (“FAS 157”). FAS 157 establishes an authoritative definition of fair value, sets out a framework for measuring fair value, and requires additional disclosures about fair-value measurements. The application of FAS 157 is required for fiscal years beginning after November 15, 2007 and interim periods within those fiscal years. At this time, management is evaluating the implications of FAS 157 and believes the adoption of FAS 157 will have no material impact on its financial statements.
On March 19, 2008, the FASB released Statement of Financial Accounting Standards No. 161, “Disclosures about Derivative Instruments and Hedging Activities” (“FAS 161”). FAS 161 requires qualitative disclosures about objectives and strategies for using derivatives, quantitative disclosures about fair value amounts of and gains and losses on derivative instruments, and disclosures about credit-risk-related contingent features in derivative agreements. The application of FAS 161 is required for fiscal years beginning after November 15, 2008 and interim periods within those fiscal years. At this time, management is evaluating the implications of FAS 161 and believes the adoption of FAS 161 will have no material impact on its financial statements.
| | |
| ALLIANCEBERNSTEIN HIGH INCOME FUND • | | 55 |
Notes to Financial Statements
FINANCIAL HIGHLIGHTS
Selected Data For A Share Of Capital Stock Outstanding Throughout Each Period
| | | | | | | | | | | | | | | | | | | | | |
| | | Class A | |
| | | Six Months Ended April 30, 2008 | | | Year Ended October 31, | | | September 1,
2003 to
October 31, | | | Year
Ended
August 31, | |
| | | (unaudited) | | | 2007 | | | 2006 | | | 2005 | | | 2004(a) | | | 2003(b) | | | 2003 | |
| | | | | | | | | | | | | | | | | | | | | |
Net asset value, beginning of period | | $9.02 | | | $8.97 | | | $8.70 | | | $8.38 | | | $8.00 | | | $7.72 | | | $6.02 | |
| | | | | | | | | | | | | | | | | | | | | |
Income From Investment Operations | | | | | | | | | | | | | | | | | | | | | |
Net investment income(c) | | .28 | | | .56 | | | .55 | | | .53 | | | .49 | (d) | | .11 | | | .69 | |
Net realized and unrealized gain (loss) on investment transactions | | (.32 | ) | | .41 | | | .43 | | | .34 | | | .50 | | | .28 | | | 1.71 | |
| | | | | | | | | | | | | | | | | | | | | |
Net increase (decrease) in net asset value from operations | | (.04 | ) | | .97 | | | .98 | | | .87 | | | .99 | | | .39 | | | 2.40 | |
| | | | | | | | | | | | | | | | | | | | | |
Less: Dividends and Distributions | | | | | | | | | | | | | | | | | | | | | |
Dividends from net investment income | | (.36 | ) | | (.57 | ) | | (.57 | ) | | (.55 | ) | | (.61 | ) | | (.11 | ) | | (.70 | ) |
Distribution from net realized gain on investment transactions | | (.23 | ) | | (.35 | ) | | (.14 | ) | | –0 | – | | –0 | – | | –0 | – | | –0 | – |
| | | | | | | | | | | | | | | | | | | | | |
Total dividends and distributions | | (.59 | ) | | (.92 | ) | | (.71 | ) | | (.55 | ) | | (.61 | ) | | (.11 | ) | | (.70 | ) |
| | | | | | | | | | | | | | | | | | | | | |
Net asset value, end of period | | $8.39 | | | $9.02 | | | $8.97 | | | $8.70 | | | $8.38 | | | $8.00 | | | $7.72 | |
| | | |
Total Return | | | | | | | | | | | | | | | | | | | | | |
Total investment return based on net asset value(e) | | (.21 | )% | | 11.54 | % | | 11.87 | % | | 10.70 | % | | 12.82 | % | | 5.11 | % | | 41.80 | % |
Ratios/Supplemental Data | | | | | | | | | | | | | | | | | | | | | |
Net assets, end of period (000’s omitted) | | $718,726 | | | $281,677 | | | $235,763 | | | $213,652 | | | $156,469 | | | $137,709 | | | $118,669 | |
Ratio to average net assets of: | | | | | | | | | | | | | | | | | | | | | |
Expenses, net of waivers/ reimbursements | | 1.11 | %(f) | | 1.41 | %* | | 1.48 | % | | 1.20 | % | | 1.23 | % | | 1.75 | %(f) | | 1.94 | % |
Expenses, before waivers/ reimbursements | | 1.13 | %(f) | | 1.41 | %* | | 1.48 | % | | 1.20 | % | | 1.40 | % | | 1.75 | %(f) | | 1.94 | % |
Expenses, before waivers/ reimbursements excluding
interest expense | | 1.02 | %(f) | | 1.14 | %* | | 1.14 | % | | 1.19 | % | | 1.21 | % | | 1.47 | %(f) | | 1.46 | % |
Net investment income | | 7.07 | %(f) | | 6.24 | %* | | 6.32 | % | | 6.14 | % | | 6.04 | %(d) | | 7.90 | %(f) | | 9.73 | % |
Portfolio turnover rate | | 50 | % | | 67 | % | | 75 | % | | 100 | % | | 173 | % | | 20 | % | | 125 | % |
See footnote summary on page 62.
| | |
| 56 | | • ALLIANCEBERNSTEIN HIGH INCOME FUND |
Financial Highlights
Selected Data For A Share Of Capital Stock Outstanding Throughout Each Period
| | | | | | | | | | | | | | | | | | | | | |
| | | Class B | |
| | | Six Months
Ended
April 30,
2008 | | | Year Ended October 31, | | | September 1,
2003 to
October 31, | | | Year
Ended
August 31, | |
| | | (unaudited) | | | 2007 | | | 2006 | | | 2005 | | | 2004(a) | | | 2003(b) | | | 2003 | |
| | | | | | | | | | | | | | | | | | | | | |
Net asset value, beginning of period…………………. | | $9.09 | | | $9.05 | | | $8.77 | | | $8.45 | | | $8.07 | | | $7.80 | | | $6.09 | |
| | | | | | | | | | | | | | | | | | | | | |
Income From Investment Operations | | | | | | | | | | | | | | | | | | | | | |
Net investment income(c) | | .25 | | | .49 | | | .49 | | | .47 | | | .62 | (d) | | .10 | | | .64 | |
Net realized and unrealized gain (loss) on investment transactions | | (.31 | ) | | .41 | | | .44 | | | .34 | | | .32 | | | .28 | | | 1.73 | |
| | | | | | | | | | | | | | | | | | | | | |
Net increase (decrease) in net asset value from operations | | (.06 | ) | | .90 | | | .93 | | | .81 | | | .94 | | | .38 | | | 2.37 | |
| | | | | | | | | | | | | | | | | | | | | |
Less: Dividends and Distributions | | | | | | | | | | | | | | | | | | | | | |
Dividends from net investment income | | (.33 | ) | | (.51 | ) | | (.51 | ) | | (.49 | ) | | (.56 | ) | | (.11 | ) | | (.66 | ) |
Distribution from net realized gain on investment transactions | | (.23 | ) | | (.35 | ) | | (.14 | ) | | –0 | – | | –0 | – | | –0 | – | | –0 | – |
| | | | | | | | | | | | | | | | | | | | | |
Total dividends and distributions | | (.56 | ) | | (.86 | ) | | (.65 | ) | | (.49 | ) | | (.56 | ) | | (.11 | ) | | (.66 | ) |
| | | | | | | | | | | | | | | | | | | | | |
Net asset value, end of period | | $8.47 | | | $9.09 | | | $9.05 | | | $8.77 | | | $8.45 | | | $8.07 | | | $7.80 | |
| | | |
Total Return | | | | | | | | | | | | | | | | | | | | | |
Total investment return based on net asset value(e) | | (.57 | )% | | 10.51 | % | | 11.11 | % | | 9.81 | % | | 12.02 | % | | 4.84 | % | | 40.69 | % |
Ratios/Supplemental Data | | | | | | | | | | | | | | | | | | | | | |
Net assets, end of period
(000’s omitted) | | $99,465 | | | $35,058 | | | $45,133 | | | $53,629 | | | $61,715 | | | $90,443 | | | $89,571 | |
Ratio to average net assets of: | | | | | | | | | | | | | | | | | | | | | |
Expenses, net of waivers/ reimbursements | | 1.81 | %(f) | | 2.14 | %* | | 2.18 | % | | 1.89 | % | | 1.94 | % | | 2.45 | %(f) | | 2.64 | % |
Expenses, before waivers/ reimbursements | | 1.84 | %(f) | | 2.14 | %* | | 2.18 | % | | 1.90 | % | | 2.11 | % | | 2.45 | %(f) | | 2.64 | % |
Expenses, before waivers/ reimbursements excluding interest expense | | 1.74 | %(f) | | 1.87 | %* | | 1.85 | % | | 1.89 | % | | 1.92 | % | | 2.17 | %(f) | | 2.17 | % |
Net investment income | | 6.29 | %(f) | | 5.45 | %* | | 5.55 | % | | 5.39 | % | | 7.57 | %(d) | | 7.11 | %(f) | | 9.07 | % |
Portfolio turnover rate | | 50 | % | | 67 | % | | 75 | % | | 100 | % | | 173 | % | | 20 | % | | 125 | % |
See footnote summary on page 62.
| | |
| ALLIANCEBERNSTEIN HIGH INCOME FUND • | | 57 |
Financial Highlights
Selected Data For A Share Of Capital Stock Outstanding Throughout Each Period
| | | | | | | | | | | | | | | | | | | | | |
| | | Class C | |
| | | Six Months Ended April 30, 2008 | | | Year Ended October 31, | | | September 1,
2003 to
October 31, | | | Year
Ended
August 31, | |
| | | (unaudited | | | 2007 | | | 2006 | | | 2005 | | | 2004(a) | | | 2003(b) | | | 2003 | |
| | | | | | | | | | | | | | | | | | | | | |
Net asset value, beginning of period | | $9.11 | | | $9.07 | | | $8.79 | | | $8.47 | | | $8.09 | | | $7.82 | | | $6.10 | |
| | | | | | | | | | | | | | | | | | | | | |
Income From Investment Operations | | | | | | | | | | | | | | | | | | | | | |
Net investment income(c) | | .25 | | | .49 | | | .49 | | | .47 | | | .45 | (d) | | .10 | | | .63 | |
Net realized and unrealized gain (loss) on investment transactions | | (.31 | ) | | .41 | | | .44 | | | .34 | | | .49 | | | .28 | | | 1.75 | |
| | | | | | | | | | | | | | | | | | | | | |
Net increase (decrease) in net asset value from operations | | (.06 | ) | | .90 | | | .93 | | | .81 | | | .94 | | | .38 | | | 2.38 | |
| | | | | | | | | | | | | | | | | | | | | |
Less: Dividends and Distributions | | | | | | | | | | | | | | | | | | | | | |
Dividends from net investment income | | (.33 | ) | | (.51 | ) | | (.51 | ) | | (.49 | ) | | (.56 | ) | | (.11 | ) | | (.66 | ) |
Distribution from net realized gain on investment transactions | | (.23 | ) | | (.35 | ) | | (.14 | ) | | –0 | – | | –0 | – | | –0 | – | | –0 | – |
| | | | | | | | | | | | | | | | | | | | | |
Total dividends and distributions | | (.56 | ) | | (.86 | ) | | (.65 | ) | | (.49 | ) | | (.56 | ) | | (.11 | ) | | (.66 | ) |
| | | | | | | | | | | | | | | | | | | | | |
Net asset value, end of period | | $8.49 | | | $9.11 | | | $9.07 | | | $8.79 | | | $8.47 | | | $8.09 | | | $7.82 | |
| | | |
Total Return | | | | | | | | | | | | | | | | | | | | | |
Total investment return based on net asset value(e) | | (.57 | )% | | 10.50 | % | | 11.10 | % | | 9.81 | % | | 12.00 | % | | 4.83 | % | | 40.80 | % |
Ratios/Supplemental Data | | | | | | | | | | | | | | | | | | | | | |
Net assets, end of period
(000’s omitted) | | $176,990 | | | $86,525 | | | $88,046 | | | $91,662 | | | $82,876 | | | $77,657 | | | $73,477 | |
Ratio to average net assets of: | | | | | | | | | | | | | | | | | | | | | |
Expenses, net of waivers/ reimbursements | | 1.82 | %(f) | | 2.11 | %* | | 2.17 | % | | 1.89 | % | | 1.92 | % | | 2.43 | %(f) | | 2.63 | % |
Expenses, before waivers/ reimbursements | | 1.84 | %(f) | | 2.11 | %* | | 2.17 | % | | 1.89 | % | | 2.09 | % | | 2.43 | %(f) | | 2.63 | % |
Expenses, before waivers/ reimbursements excluding interest expense | | 1.72 | %(f) | | 1.85 | %* | | 1.84 | % | | 1.88 | % | | 1.90 | % | | 2.16 | %(f) | | 2.16 | % |
Net investment income | | 6.24 | %(f) | | 5.47 | %* | | 5.54 | % | | 5.38 | % | | 5.51 | %(d) | | 7.09 | %(f) | | 8.91 | % |
Portfolio turnover rate | | 50 | % | | 67 | % | | 75 | % | | 100 | % | | 173 | % | | 20 | % | | 125 | % |
See footnote summary on page 62.
| | |
| 58 | | • ALLIANCEBERNSTEIN HIGH INCOME FUND |
Financial Highlights
Selected Data For A Share Of Capital Stock Outstanding Throughout Each Period
| | | | |
| | | Advisor Class | |
| | | January 25,
2008(g) to April 30, 2008 (unaudited) | |
| | | | |
Net asset value, beginning of period | | $ | 8.52 | |
| | | | |
Income From Investment Operations | | | | |
Net investment income(c) | | | .18 | |
Net realized and unrealized loss on investment transactions | | | (.15 | ) |
| | | | |
Net increase in net asset value from operations | | | .03 | |
| | | | |
Less: Dividends | | | | |
Dividends from net investment income | | | (.16 | ) |
| | | | |
Net asset value, end of period | | $ | 8.39 | |
| | | | |
Total Return | | | | |
Total investment return based on net asset value(e) | | | .44 | % |
Ratios/Supplemental Data | | | | |
Net assets, end of period (000’s omitted) | | $ | 10,434 | |
Ratio to average net assets of: | | | | |
Expenses, net of waivers/reimbursements | | | 0.65 | %(f) |
Expenses, before waivers/reimbursements | | | .77 | %(f) |
Expenses, before waivers/reimbursements excluding interest expense | | | 0.70 | %(f) |
Net investment income | | | 7.74 | %(f) |
Portfolio turnover rate | | | 50 | % |
See footnote summary on page 62.
| | |
| ALLIANCEBERNSTEIN HIGH INCOME FUND • | | 59 |
Financial Highlights
Selected Data For A Share Of Capital Stock Outstanding Throughout Each Period
| | | | |
| | | Class R | |
| | | January 25,
2008(g) to April 30, 2008 (unaudited) | |
| | | | |
Net asset value, beginning of period | | $ | 8.52 | |
| | | | |
Income From Investment Operations | | | | |
Net investment income(c) | | | .15 | |
Net realized and unrealized loss on investment transactions | | | (.12 | ) |
| | | | |
Net increase in net asset value from operations | | | .03 | |
| | | | |
Less: Dividends | | | | |
Dividends from net investment income | | | (.16 | ) |
| | | | |
Net asset value, end of period | | $ | 8.39 | |
| | | | |
Total Return | | | | |
Total investment return based on net asset value(e) | | | .45 | % |
Ratios/Supplemental Data | | | | |
Net assets, end of period (000’s omitted) | | $ | 2,004 | |
Ratio to average net assets of: | | | | |
Expenses, net of waivers/reimbursements | | | 1.15 | %(f) |
Expenses, before waivers/reimbursements | | | 1.44 | %(f) |
Expenses, before waivers/reimbursements excluding interest expense | | | 1.38 | %(f) |
Net investment income | | | 7.05 | %(f) |
Portfolio turnover rate | | | 50 | % |
See footnote summary on page 62.
| | |
| 60 | | • ALLIANCEBERNSTEIN HIGH INCOME FUND |
Financial Highlights
Selected Data For A Share Of Capital Stock Outstanding Throughout Each Period
| | | | |
| | | Class K | |
| | | January 25,
2008(g) to April 30, 2008 (unaudited) | |
| | | | |
Net asset value, beginning of period | | $ | 8.52 | |
| | | | |
Income From Investment Operations | | | | |
Net investment income(c) | | | .16 | |
Net realized and unrealized loss on investment transactions | | | (.13 | ) |
| | | | |
Net increase in net asset value from operations | | | .03 | |
| | | | |
Less: Dividends | | | | |
Dividends from net investment income | | | (.16 | ) |
| | | | |
Net asset value, end of period | | $ | 8.39 | |
| | | | |
Total Return | | | | |
Total investment return based on net asset value(e) | | | .51 | % |
Ratios/Supplemental Data | | | | |
Net assets, end of period (000’s omitted) | | $ | 576 | |
Ratio to average net assets of: | | | | |
Expenses, net of waivers/reimbursements | | | .90 | %(f) |
Expenses, before waivers/reimbursements | | | 1.13 | %(f) |
Expenses, before waivers/reimbursements excluding interest expense | | | 1.07 | %(f) |
Net investment income | | | 7.34 | %(f) |
Portfolio turnover rate | | | 50 | % |
See footnote summary on page 62.
| | |
| ALLIANCEBERNSTEIN HIGH INCOME FUND • | | 61 |
Financial Highlights
Selected Data For A Share Of Capital Stock Outstanding Throughout Each Period
| | | |
| | | Class I | |
| | | January 25,
2008(g) to April 30, 2008 (unaudited) | |
| | | |
Net asset value, beginning of period | | $8.52 | |
| | | |
Income From Investment Operations | | | |
Net investment income(c) | | .16 | |
Net realized and unrealized loss on investment transactions | | (.11 | ) |
| | | |
Net increase in net asset value from operations | | .05 | |
| | | |
Less: Dividends | | | |
Dividends from net investment income | | (.17 | ) |
| | | |
Net asset value, end of period | | $8.40 | |
| | | |
Total Return | | | |
Total investment return based on net asset value(e) | | .57 | % |
Ratios/Supplemental Data | | | |
Net assets, end of period (000’s omitted) | | $288 | |
Ratio to average net assets of: | | | |
Expenses, net of waivers/reimbursements | | .65 | %(f) |
Expenses, before waivers/reimbursements | | .80 | %(f) |
Expenses, before waivers/reimbursements excluding interest expense | | .74 | %(f) |
Net investment income | | 7.65 | %(f) |
Portfolio turnover rate | | 50 | % |
| (a) | As of November 1, 2003, the Fund has adopted the method of accounting for interim payments on swap contracts in accordance with Financial Accounting Standards Board Statement No. 133. These interim payments are reflected within net realized and unrealized gain (loss) on swap contracts, however prior to November 1, 2003, these interim payments were reflected within interest income/expense on the statement of operations. The effect of this change for the year ended October 31, 2004, was to decrease net investment income per share by $.05, $.04 and $.05 and increase net realized and unrealized gain (loss) on investment transactions per share by $.05, $.04 and $.05 for Class A, Class B and Class C, respectively. Consequently, the ratios of net investment income to average net assets were decreased by 0.56%, 0.57% and 0.55% for Class A, Class B and Class C, respectively. |
| (b) | The Fund changed its fiscal year end from August 31 to October 31. |
| (c) | Based on average shares outstanding. |
| (d) | Net of expenses waived/reimbursed by the Adviser. |
| (e) | Total investment return is calculated assuming an initial investment made at the net asset value at the beginning of the year, reinvestment of all dividends and distributions at net asset value during the year, and redemption on the last day of the year. Initial sales charge or contingent deferred sales charge is not reflected in the calculation of total investment return. Total return does not reflect the deduction of taxes that a shareholder would pay on Fund distributions or the redemption of Fund shares. Total investment return calculated for a period of less than one year is not annualized. |
| (g) | Commencement of distribution. |
| * | The ratio includes expenses attributable to costs of proxy solicitation. |
| | |
| 62 | | • ALLIANCEBERNSTEIN HIGH INCOME FUND |
Financial Highlights
BOARD OF DIRECTORS
William H. Foulk, Jr.(1), Chairman
Marc O. Mayer, President and Chief Executive Officer
David H. Dievler(1),(2)
John H. Dobkin(1)
Michael J. Downey(1)
D. James Guzy(1)
Nancy P. Jacklin(1)
Garry L. Moody(1)
Marshall C. Turner, Jr.(1)
Earl D. Weiner(1)
OFFICERS
| | |
Philip L. Kirstein, Senior Vice President and Independent Compliance Officer Paul J. DeNoon(3), Vice President Fernando Grisales(3), Vice President Gershon M. Distenfeld(3), Vice President | | Douglas J. Peebles(3), Vice President Matthew S. Sheridan(3), Vice President Emilie D. Wrapp, Secretary Joseph J. Mantineo, Treasurer and Chief Financial Officer Vincent S. Noto, Controller |
| | |
Principal Underwriter AllianceBernstein Investments, Inc. 1345 Avenue of the Americas New York, NY 10105 Custodian and Accounting Agent The Bank of New York One Wall Street New York, NY 10286 Legal Counsel Seward & Kissel LLP One Battery Park Plaza New York, NY 10004 | | Transfer Agent AllianceBernstein Investor Services, Inc. P.O. Box 786003 San Antonio, TX 78278-6003 Toll-Free (800) 221-5672 Independent Registered Public Accounting Firm Ernst & Young LLP 5 Times Square New York, NY 10036 |
| (1) | Member of the Audit Committee, the Governance and Nominating Committee and the Independent Directors Committee. Mr. Foulk is the sole member of the Fair Value Pricing Committee. |
| (2) | Retiring effective June 30, 2008. |
| (3) | The day-to-day management of, and investment decisions for, the Fund’s portfolio are made by the Global Fixed Income: Emerging Market Investment Team. Messrs. DeNoon, Grisales, Distenfeld, Peebles, and Sheridan are the investment professionals with the most significant responsibility for the day-to-day management of the Fund’s portfolio. |
| | |
| ALLIANCEBERNSTEIN HIGH INCOME FUND • | | 63 |
Board of Directors
Information Regarding the Review and Approval of the Fund’s Advisory Agreement
The disinterested directors (the “directors”) of AllianceBernstein High Income Fund, Inc. (the “Fund”) approved the continuance of the Fund’s Advisory Agreement with the Adviser at a meeting held on October 30-November 1, 2007.
Prior to approval of the continuance of the Advisory Agreement, the directors had requested from the Adviser, and received and evaluated, extensive materials. They reviewed the proposed continuance of the Advisory Agreement with the Adviser and with experienced counsel who are independent of the Adviser who advised on the relevant legal standards. The directors also reviewed an independent evaluation prepared by the Fund’s Senior Officer (who is also the Fund’s Independent Compliance Officer) of the reasonableness of the advisory fee in the Advisory Agreement wherein the Senior Officer concluded that the contractual fee for the Fund was reasonable. The directors also discussed the proposed continuance in private sessions with counsel and the Fund’s Senior Officer.
The directors considered their knowledge of the nature and quality of the services provided by the Adviser to the Fund gained from their experience as directors or trustees of most of the registered investment companies advised by the Adviser, their overall confidence in the Adviser’s integrity and competence they have gained from that experience, the Adviser’s initiative in identifying and raising potential issues with the directors and its responsiveness, frankness and attention to concerns raised by the directors in the past, including the Adviser’s willingness to consider and implement organizational and operational changes designed to improve investment results and the services provided to the AllianceBernstein Funds. The directors noted that they have four regular meetings each year, at each of which they receive presentations from the Adviser on the investment results of the Fund and review extensive materials and information presented by the Adviser.
The directors also considered all other factors they believed relevant, including the specific matters discussed below. In their deliberations, the directors did not identify any particular information that was all-important or controlling, and different directors may have attributed different weights to the various factors. The directors determined that the selection of the Adviser to manage the Fund and the overall arrangements between the Fund and the Adviser, as provided in the Advisory Agreement, including the advisory fee, were fair and reasonable in light of the services performed, expenses incurred and such other matters as the directors considered relevant in the exercise of their business judgment. The material factors and conclusions that formed the basis for the directors’ determinations included the following:
Nature, Extent and Quality of Services Provided
The directors considered the scope and quality of services provided by the Adviser under the Advisory Agreement, including the quality of the investment
| | |
| 64 | | • ALLIANCEBERNSTEIN HIGH INCOME FUND |
research capabilities of the Adviser and the other resources it has dedicated to performing services for the Fund. They also noted the professional experience and qualifications of the Fund’s portfolio management team and other senior personnel of the Adviser. The directors also considered that the Advisory Agreement provides that the Fund will reimburse the Adviser for the cost to it of providing certain clerical, accounting, administrative and other services provided at the Fund’s request by employees of the Adviser or its affiliates. Requests for these reimbursements are approved by the directors on a quarterly basis and, to the extent requested and paid, result in a higher rate of total compensation from the Fund to the Adviser than the fee rate stated in the Fund’s Advisory Agreement. The directors noted that the methodology used to determine the reimbursement amounts had been reviewed by an independent consultant retained by the Fund’s Senior Officer. The quality of administrative and other services, including the Adviser’s role in coordinating the activities of the Fund’s other service providers, also were considered. The directors concluded that, overall, they were satisfied with the nature, extent and quality of services provided to the Fund under the Advisory Agreement.
Costs of Services Provided and Profitability
The directors reviewed a schedule of the revenues, expenses and related notes indicating the profitability of the Fund to the Adviser for calendar years 2005 and 2006 that had been prepared with an updated expense allocation methodology arrived at in consultation with an independent consultant retained by the Fund’s Senior Officer. The directors reviewed the assumptions and methods of allocation used by the Adviser in preparing fund-specific profitability data and noted that there are a number of potentially acceptable allocation methodologies for information of this type. The directors noted that the profitability information reflected all revenues and expenses of the Adviser’s relationship with the Fund, including those relating to its subsidiaries which provide transfer agency and distribution services to the Fund. The directors recognized that it is difficult to make comparisons of profitability from fund advisory contracts because comparative information is not generally publicly available and is affected by numerous factors. The directors focused on the profitability of the Adviser’s relationship with the Fund before taxes and distribution expenses. The directors concluded that they were satisfied that the Adviser’s level of profitability from its relationship with the Fund was not unreasonable.
Fall-Out Benefits
The directors considered the benefits to the Adviser and its affiliates from their relationships with the Fund other than the fees and expense reimbursements payable under the Advisory Agreement, including but not limited to benefits relating to 12b-1 fees and sales charges received by the Fund’s principal underwriter (which is a wholly owned subsidiary of the Adviser) in respect of certain classes of the Fund’s shares and transfer agency fees paid by the Fund to a wholly owned subsidiary of the Adviser. The directors recognized that the Adviser’s
| | |
| ALLIANCEBERNSTEIN HIGH INCOME FUND • | | 65 |
profitability would be somewhat lower without these benefits. The directors noted that since the Fund does not engage in brokerage transactions, the Adviser does not receive soft dollar benefits in respect of portfolio transactions of the Fund. The directors understood that the Adviser also might derive reputational and other benefits from its association with the Fund.
Investment Results
In addition to the information reviewed by the directors in connection with the meeting, the directors receive detailed performance information for the Fund at each regular Board meeting during the year. At the meeting, the directors reviewed information prepared by Lipper showing the performance of the Class A Shares of the Fund, and information prepared by the Adviser showing performance of the Class A Shares as compared to the J.P. Morgan Emerging Markets Bond Index Global (the “Index”), in each case for periods ended July 31, 2007 over the 1-, 3-, 5- and 10-year periods and (in the case of the Index) the since inception period (February 1994 inception). The directors noted that the Fund was in the 2nd quintile of the Performance Group and Performance Universe in the 1-year period, 4th quintile of the Performance Group and 3rd quintile of the Performance Universe in the 3-year period, 1st quintile of the Performance Group and Performance Universe in the 5-year period and 1 out of 3 of the Performance Group and 2nd quintile of the Performance Universe in the 10-year period, and that the Fund outperformed the Index in all periods reviewed. Based on their review, the directors concluded that the Fund’s relative performance over time had been satisfactory. The directors also noted the changes to the Fund’s investment policies approved in August 2007 and the Fund’s pending acquisitions, subject to shareholder approval, of all the assets and liabilities of each of AllianceBernstein Bond Fund, Inc. – AllianceBernstein Corporate Bond Portfolio (“Corporate Bond Portfolio”) and AllianceBernstein High Yield Fund, Inc. (“High Yield Fund”). The directors informed the Adviser that they planned to closely monitor the Fund’s performance in light of these changes.
Advisory Fees and Other Expenses
The directors considered the advisory fee rate paid by the Fund to the Adviser and information prepared by Lipper concerning fee rates paid by other funds in the same Lipper category as the Fund at a common asset level. The directors recognized that it is difficult to make comparisons of advisory fees because there are variations in the services that are included in the fees paid by other funds.
The directors also considered the fees the Adviser charges other clients with a substantially similar investment style as the Fund. For this purpose, they reviewed information in the Adviser’s Form ADV and the evaluation from the Fund’s Senior Officer disclosing the institutional fee schedule for institutional products managed by the Adviser that have a substantially similar investment style as the Fund. The directors noted that the institutional fee schedule for cli-
| | |
| 66 | | • ALLIANCEBERNSTEIN HIGH INCOME FUND |
ents with a substantially similar investment style as the Fund had breakpoints at lower asset levels than those in the fee schedule applicable to the Fund and that the application of the institutional fee schedule to the level of assets of the Fund would result in a fee rate that would be lower than that in the Fund’s Advisory Agreement. The directors noted that the Adviser may, in some cases, agree to fee rates with large institutional clients that are lower than those reviewed by the directors and that they had previously discussed with the Adviser its policies in respect of such arrangements. The directors also noted that the Adviser advises a portfolio of another AllianceBernstein fund with a substantially similar investment style as the Fund for the same fee schedule as the Fund.
The Adviser reviewed with the directors the significantly greater scope of the services it provides to the Fund relative to institutional clients. The Adviser also noted that since mutual funds are constantly issuing and redeeming shares, they are more difficult to manage than an institutional account, where the assets are relatively stable. In light of these facts, the directors did not place significant weight on these fee comparisons.
The directors also considered the total expense ratio of the Class A shares of the Fund in comparison to the fees and expenses of funds within two comparison groups created by Lipper: an Expense Group and an Expense Universe. Lipper described an Expense Group as a representative sample of funds comparable to the Fund and an Expense Universe as a broader group, consisting of all funds in the investment classification/objective with a similar load type as the Fund. The Class A expense ratio of the Fund was based on the Fund’s latest fiscal year expense ratio. The Lipper information included the pro forma expense ratio for Class A Shares provided by the Adviser assuming the new expense cap for the Fund following its acquisition of each of Corporate Bond Portfolio and High Yield Fund (anticipated effective date to be between the end of 2007 and early 2008) had been in effect throughout the Fund’s fiscal year ended in 2006. The directors recognized that the expense ratio information for the Fund potentially reflected on the Adviser’s provision of services, as the Adviser is responsible for coordinating services provided to the Fund by others. The directors noted that it was likely that the expense ratios of some funds in the Fund’s Lipper category were lowered by waivers or reimbursements by those funds’ investment advisers, which in some cases were voluntary and perhaps temporary.
The directors noted that the Fund’s at approximate current size contractual effective advisory fee rate of 50 basis points, plus the 3 basis point impact of the latest fiscal year administrative expense reimbursement by the Fund pursuant to the Advisory Agreement, was lower than the Expense Group median. The directors noted that the Fund’s total expense ratio and the Fund’s pro forma total expense ratio (the latter of which reflected the cap by the Adviser expected to be effective by early 2008 and to remain effective until at least October 31, 2009) were lower than the Expense Group and Expense Universe medians. The directors
| | |
| ALLIANCEBERNSTEIN HIGH INCOME FUND • | | 67 |
concluded that the Fund’s expense ratio and pro forma expense ratio were satisfactory.
Economies of Scale
The directors noted that the advisory fee schedule for the Fund contains breakpoints that reduce the fee rates on assets above specified levels. The directors also considered presentations by an independent consultant discussing economies of scale in the mutual fund industry and for the AllianceBernstein Funds as well as a presentation by the Adviser concerning certain of its views on economies of scale. The directors believe that economies of scale may be realized (if at all) by the Adviser across a variety of products and services, and not only in respect of a single fund. The directors noted that there is no established methodology for establishing breakpoints that give effect to the fund-specific services provided by a fund’s adviser and to the economies of scale that an adviser may realize in its overall mutual fund business or those components of it which directly or indirectly affect a fund’s operations. The directors observed that in the mutual fund industry as a whole, as well as among funds similar to the Fund, there is no uniformity or pattern in the fees and asset levels at which breakpoints (if any) apply. The directors also noted that the advisory agreements for many funds do not have breakpoints at all. Having taken these factors into account, the directors concluded that the Fund’s breakpoint arrangements would result in a sharing of economies of scale in the event the Fund’s net assets exceed a breakpoint in the future.
| | |
| 68 | | • ALLIANCEBERNSTEIN HIGH INCOME FUND |
THE FOLLOWING IS NOT PART OF THE SHAREHOLDER REPORT OR THE FINANCIAL STATEMENTS
SUMMARY OF SENIOR OFFICER’S EVALUATION OF
INVESTMENT ADVISORY AGREEMENT1
The following is a summary of the evaluation of the Investment Advisory Agreement between AllianceBernstein L.P. (the “Adviser”) and AllianceBernstein Emerging Market Debt Fund, Inc. (the “Fund”).2,3 The evaluation of the Investment Advisory Agreement was prepared by Philip L. Kirstein, the Senior Officer of the Fund for the Directors of the Fund, as required by an August 2004 agreement between the Adviser and the New York State Attorney General (the “NYAG”). The Senior Officer’s evaluation of the Investment Advisory Agreement is not meant to diminish the responsibility or authority of the Board of Directors of the Fund to perform its duties pursuant to Section 15 of the Investment Company Act of 1940 (the “40 Act”) and applicable state law. The purpose of the summary is to provide shareholders with a synopsis of the independent evaluation of the reasonableness of the advisory fees proposed to be paid by the Fund which was provided to the Directors in connection with their review of the proposed approval of the continuance of the Investment Advisory Agreement. The Senior Officer’s evaluation considered the following factors:
| | 1. | Advisory fees charged to institutional and other clients of the Adviser for like services; |
| | 2. | Advisory fees charged by other mutual fund companies for like services; |
| | 3. | Costs to the Adviser and its affiliates of supplying services pursuant to the advisory agreement, excluding any intra-corporate profit; |
| | 4. | Profit margins of the Adviser and its affiliates from supplying such services; |
| | 5. | Possible economies of scale as the Fund grows larger; and |
| | 6. | Nature and quality of the Adviser’s services including the performance of the Fund. |
FUND ADVISORY FEES, EXPENSE REIMBURSEMENTS & RATIOS
The Adviser proposed that the Fund pay the advisory fee set forth in the table below for receiving the services to be provided pursuant to the Investment Advisory Agreement. The fee schedule below, implemented in January 2004 in
| | |
| ALLIANCEBERNSTEIN HIGH INCOME FUND • | | 69 |
| 1 | It should be noted that the Senior Officer’s fee evaluation was completed on October 18, 2007. |
| 2 | Future references to the Fund do not include “AllianceBernstein.” References in the fee summary pertaining to performance and expense ratios refer to the Class A shares of the Fund. |
| 3 | The Board of Directors approved a fixed-income fund realignment pursuant to which the Fund (the surviving fund) will merge its assets with that of AllianceBernstein Corporate Bond Portfolio and AllianceBernstein High Yield Fund, Inc., expand its non-fundamental investment policies, change its name to AllianceBernstein High Income Fund, add retirement classes to the Fund and implement expense caps for the Fund’s share classes. |
consideration of the Adviser’s settlement with the NYAG in December 2003, is based on a master schedule that contemplates eight categories of funds with almost all funds in each category having the same advisory fee schedule.4 It should be noted that the Fund’s advisory fee is based on the Fund’s average daily adjusted total assets (i.e., the average daily value of total assets minus the sum of accrued liabilities other than the principal amount of money borrowed) in contrast to most of the AllianceBernstein High Income mutual funds whose advisory fees are based on each of the those funds’ average daily net assets.
| | | | | | |
| Category | | Net Assets 09/30/07 ($MIL) | | Advisory Fee Based on % of
Average Daily Adjusted Total Assets | | Fund |
| High Income | | $ 392.3 | | 50 bp on 1st $2.5 billion | | Emerging Market
Debt |
| | | | 45 bp on next $2.5 billion | |
| | | | 40 bp on the balance | | |
The Adviser is reimbursed as specified in the Investment Advisory Agreement for certain clerical, legal, accounting, administrative and other services provided to the Fund. During the Fund’s most recently completed fiscal year, the Adviser received $101,500 (0.030% of the Fund’s average daily net assets) for such services.
Set forth below are the Fund’s total expense ratios annualized for the most recent semi-annual period:
| | | | | | | |
| Fund | | Total Expense
Ratio | | | Fiscal
Year End |
| Emerging Market Debt Fund, Inc.5 | | Class A | | 1.43 | % | | October 31 |
| | Class B | | 2.16 | % | | |
| | Class C | | 2.13 | % | | |
I. ADVISORY FEES CHARGED TO INSTITUTIONAL AND OTHER CLIENTS
The advisory fees charged to investment companies which the Adviser manages and sponsors are normally higher than those charged to similar sized institutional accounts, including pension plans and sub-advised investment companies. The fee differential reflects, among other things, different services provided to such clients, and different liabilities assumed. Services provided by the Adviser to the Fund that are not provided to non-investment company clients include providing office space and personnel to serve as Fund Officers, who among other responsibilities make the certifications required under the Sarbanes–Oxley Act of 2002, and coordinating with and monitoring the Fund’s third party service
| | |
| 70 | | • ALLIANCEBERNSTEIN HIGH INCOME FUND |
| 4 | Most of the AllianceBernstein Mutual Funds, which the Adviser manages, were affected by the Adviser’s settlement with the NYAG. |
5 | Includes interest expense of 0.32%. Excluding interest expense (related to reverse repurchase agreements of the Fund), the expense ratios would be 1.11%, 1.84% and 1.81% for Classes A, B and C, respectively. The Adviser intends on implementing expense caps, effective sometime between November 2, 2007 and February 1, 2008. The expense caps would be 0.95%, 1.65%, 1.65%, 0.65%, 1.15%, 0.90% and 0.65% for classes A, B, C, Advisor (new), R (new), K (new), and I (new). |
providers such as Fund counsel, auditors, custodians, transfer agents and pricing services. The accounting, administrative, legal and compliance requirements for the Fund are more costly than those for institutional client assets due to the greater complexities and time required for investment companies, although as previously noted, a portion of these expenses are reimbursed by the Fund to the Adviser. Also, retail mutual funds managed by the Adviser are widely held. Servicing the Fund’s investors is more time consuming and labor intensive compared to institutional clients since the Adviser needs to communicate with a more extensive network of financial intermediaries and shareholders. In addition, managing the cash flow of an investment company may be more difficult than that of a stable pool of assets, such as an institutional account with little cash movement in either direction, particularly, if a fund is in net redemption and the Adviser is frequently forced to sell securities to raise cash for redemptions. However, managing a fund with positive cash flow may be easier at times than managing a stable pool of assets. Finally, in recent years, investment advisers have been sued by institutional clients and have suffered reputational damage both by the attendant publicity and outcomes other than complete victories. Accordingly, the legal and reputational risks associated with institutional accounts are greater than previously thought, although still not equal to those related to the mutual fund industry.
Notwithstanding the Adviser’s view that managing an investment company is not comparable to managing other institutional accounts because the services provided are different, it is worth considering information regarding the advisory fees charged to institutional accounts with a substantially similar investment style as the Fund.6 In addition to the AllianceBernstein Institutional fee schedule, set forth below is what would have been the effective advisory fee of the Fund had the AllianceBernstein Institutional fee schedule been applicable to the Fund versus the Fund’s advisory fees based on September 30, 2007 net assets.
| | | | | | | | |
| Fund | | Net Assets 09/30/07 ($MIL) | | AllianceBernstein (“AB”)
Institutional (“Inst.”) Fee Schedule | | Effective
AB Inst.
Adv. Fee | | Fund Advisory Fee |
| Emerging Market Debt Fund, Inc. | | $392.3 | | Emerging Market Debt Schedule 65 bp on 1st $20 million 35 bp on the balance Minimum Account Size: $25m | | 0.373% | | 0.500% |
The adviser manages the AllianceBernstein Variable Products Series Fund, Inc. (“AVPS”), which is available through variable annuity and variable life contracts offered by other financial institutions, offers policyholders the option to utilize
| | |
| ALLIANCEBERNSTEIN HIGH INCOME FUND • | | 71 |
| 6 | The Adviser has indicated that with respect to institutional accounts with assets greater than $300 million, it will negotiate a fee schedule, although it should be noted that there were no such institutional accounts that are similar in investment style as the Fund, which opened in the last three years. Discounts that are negotiated vary based upon each client relationship. |
certain AVPS portfolios as the investment option underlying their insurance contracts. Set forth below is the fee schedule of the AVPS portfolio that has a similar investment style as the Fund.7 Also shown is what would have been the effective advisory fee of the Fund had the advisory fee schedule of the AVPS portfolio been applicable to the Fund versus the Fund’s advisory fee:
| | | | | | | | |
| Fund | | AVPS
Portfolio | | Fee Schedule | | AVPS
Effective
Fee | | Fund
Advisory
Fee |
| Emerging Market Debt Fund, Inc. | | Global Dollar
Government
Portfolio | | 0.50% on first $2.5 billion 0.40% on next $2.5 billion 0.35% on the balance | | 0.500% | | 0.500% |
The Adviser also manages and sponsors retail mutual funds, which are organized in jurisdictions outside the United States, generally Luxembourg and Japan, and sold to non-United States resident investors. The Adviser charges the following fee for Emerging Market Debt, a Luxembourg fund, which has a somewhat similar investment style as the Fund:
| | | |
| Fund | | Fee8 | |
| Emerging Market Debt | | | |
Class A | | 1.10 | % |
Class I (Institutional) | | 0.55 | % |
The Alliance Capital Investment Trust Management mutual funds (“ACITM”), which are offered to investors in Japan, have an “all-in” fee to compensate the Adviser for investment advisory as well as fund accounting and administrative related services. The fee schedule of the ACITM mutual fund that has a somewhat similar investment style as the Fund is as follows:
| | | | |
| Fund | | ACITM Mutual Fund | | Fee |
| Emerging Market Debt Fund, Inc. | | Emerging Market Bond Fund | | |
| | FC/FD9 | | 0.70% |
| | P-H9 | | 0.10%10 |
The Adviser represented that it does not sub-advise any registered investment companies have a similar investment strategy as the Fund.
| | |
| 72 | | • ALLIANCEBERNSTEIN HIGH INCOME FUND |
| 7 | It should be noted that AVPS was affected by the settlement between the Adviser and the NYAG. |
| 8 | Class A shares of the fund are charged an “all-in” fee, which covers investment advisory services and distribution related services. |
| 9 | This ACITM fund is privately placed or institutional. |
| 10 | In addition to the 0.10%, the Adviser charges the institutional account an additional fee for managing the assets of the institutional account. |
| II. | MANAGEMENT FEES CHARGED BY OTHER MUTUAL FUND COMPANIES FOR LIKE SERVICES. |
Lipper, Inc. (“Lipper”), an analytical service that is not affiliated with the Adviser, compared the fees charged to the Fund with fees charged to other investment companies for similar services by other investment advisers. Lipper’s analysis included the Fund’s ranking with respect to the contractual management fee relative to the median of the Fund’s Lipper Expense Group (“EG”) at the approximate current asset level of the Fund.11
Lipper describes an EG as a representative sample of comparable funds. Lipper’s standard methodology for screening funds to be included in an EG entails the consideration of several fund criteria, including fund type, investment classification/objective, load type and similar 12b-1/non-12b-1 service fees, asset (size) comparability, and expense components and attributes.12 An EG will typically consist of seven to twenty funds.
| | | | | | |
| Fund | | Contractual
Management Fee13 | | Lipper Group Median (%) | | Lipper
Group Rank |
| Emerging Market Debt | | 0.500 | | 0.765 | | 1/8 |
Lipper also compared the Fund’s most recently completed fiscal year total expense ratio to the median of the Fund’s EG and Lipper Expense Universe (“EU”). The EU is a broader group compared to the EG, consisting of all funds that have the same investment classification/objective and load type as the subject Fund.14 Pro-forma total expense ratio information (shown in bold and italicized) is included in the table below.
| | | | | | | | | | |
| Fund | | Expense Ratio (%)15 | | Lipper Group
Median (%) | | Lipper Group Rank | | Lipper Universe Median (%) | | Lipper
Universe Rank |
| Emerging Market Debt | | 1.141 | | 1.205 | | 2/8 | | 1.374 | | 2/11 |
Pro-forma16 | | 0.950 | | 1.205 | | 1/8 | | 1.374 | | 1/11 |
| | |
| ALLIANCEBERNSTEIN HIGH INCOME FUND • | | 73 |
| 11 | The contractual management fee is calculated by Lipper using the Fund’s contractual management fee rate at a hypothetical asset level. The hypothetical asset level is based on the combined net assets of all classes of the Fund, rounded up to the next $25 million. Lipper’s total expense ratio information is based on the most recent annual report except as otherwise noted. A ranking of “1” means that the Fund has the lowest effective fee rate in the Lipper peer group. |
| 12 | Lipper does not consider average account size when constructing EGs. Funds with relatively small average account sizes tend to have higher transfer agent expense ratios than comparable sized funds that have relatively large average account sizes. Note that there are limitations on Lipper expense category data because different funds categorize expenses differently. |
| 13 | The contractual management fee does not reflect any expense reimbursements made by the Fund to the Adviser for certain clerical, legal, accounting, administrative, and other services. |
| 14 | Except for asset size comparability, Lipper uses the same criteria for selecting an EG peer when selecting an EU peer. Unlike the EG, the EU allows for the same adviser to be represented by more than just one fund. |
| 15 | Most recently completed fiscal year Class A share total expense ratio. |
| 16 | Pro-forma shows what would have been the total expense ratio of the Fund had the anticipated expense limitation undertaking been in effect for the full fiscal year. |
Based on this analysis, the Fund has a more favorable ranking on a management fee basis and on a total expense ratio basis.
| III. | COSTS TO THE ADVISER AND ITS AFFILIATES OF SUPPLYING SERVICES PURSUANT TO THE ADVISORY FEE ARRANGEMENT, EXCLUDING ANY INTRA-CORPORATE PROFIT. |
The Adviser utilizes two profitability reporting systems, which operate independently but are aligned with each other, to estimate the Adviser’s profitability in connection with investment advisory services provided to the Fund. The Senior Officer has retained a consultant to provide independent advice regarding the alignment of the two profitability systems as well as the methodologies and allocations utilized by both profitability systems. See Section IV for additional discussion.
| IV. | PROFIT MARGINS OF THE ADVISER AND ITS AFFILIATES FOR SUPPLYING SUCH SERVICES. |
The profitability information for the Fund prepared by the Adviser for the Board of Directors was reviewed by the Senior Officer and the consultant. The Adviser’s profitability from providing investment advisory services to the Fund decreased during calendar year 2006, relative to 2005.
In addition to the Adviser’s direct profits from managing the Fund, certain of the Adviser’s affiliates have business relationships with the Fund and may earn a profit from providing other services to the Fund. The courts have referred to this type of business opportunity as “fall-out benefits” to the Adviser and indicated that such benefits should be factored into the evaluation of the total relationship between the Fund and the Adviser. Neither case law nor common business practice precludes the Adviser’s affiliates from earning a reasonable profit on this type of relationship. These affiliates provide transfer agent and distribution related services to the Fund and receive transfer agent fees, Rule 12b-1 payments, front-end sales loads and contingent deferred sales charges (“CDSC”).
AllianceBernstein Investments, Inc. (“ABI”), an affiliate of the Adviser, is the Fund’s principal underwriter. ABI and the Adviser have disclosed in the Fund’s prospectus that they may make revenue sharing payments from their own resources, in addition to revenues derived from sales loads and Rule 12b-1 fees, to firms that sell shares of the Fund. In 2006, ABI paid approximately 0.044% of the average monthly assets of the AllianceBernstein Mutual Funds or approximately $20.4 million for distribution services and educational support (revenue sharing payments). For 2007, it is anticipated, ABI will pay approximately 0.04% of the average monthly assets of the AllianceBernstein Mutual Funds or
| | |
| 74 | | • ALLIANCEBERNSTEIN HIGH INCOME FUND |
approximately $20 million.17 During the Fund’s most recently completed fiscal year, ABI received from the Fund $25,959, $2,106,848 and $118,549 in front-end sales charges, Rule 12b-1 and CDSC fees, respectively.
Fees and reimbursements for out of pocket expenses charged by AllianceBernstein Investor Services, Inc. (“ABIS”), the affiliated transfer agent for the Fund, are charged on a per account basis, based on the level of service provided and the class of share held by the account. ABIS also receives a fee per shareholder sub-account for each account maintained by an intermediary on an omnibus basis. ABIS’ after-tax profitability decreased in 2006 in comparison to 2005. During the Fund’s most recently completed fiscal year, ABIS received $241,517 in fees from the Fund.18
| V. | POSSIBLE ECONOMIES OF SCALE |
The Adviser has indicated that economies of scale are being shared with shareholders through fee structures,19 subsidies and enhancement to services. Based on some of the professional literature that has considered economies of scale in the mutual fund industry, it is thought that to the extent economies of scale exist, they may more often exist across a fund family as opposed to a specific fund. This is because the costs incurred by the Adviser, such as investment research or technology for trading or compliance systems, can be spread across a greater asset base as the fund family increases in size. It is also possible that as the level of services required to operate a successful investment company has increased over time, and advisory firms have made such investments in their business to provide services, there may be a sharing of economies of scale without a reduction in advisory fees.
An independent consultant, retained by the Senior Officer, provided the Board of Directors an update of the Deli20 study on advisory fees and various fund characteristics. The preliminary results of the updated study, based on more recent data and using Lipper classifications, were found to be consistent with the results of the original study. The independent consultant observed patterns of lower
| | |
| ALLIANCEBERNSTEIN HIGH INCOME FUND • | | 75 |
| 17 | ABI currently inserts the “Advance” in quarterly account statements and pays the incremental costs associated with the mailing. The incremental cost is less than what an “independent mailing” would cost. |
| 18 | The fees disclosed are net of any expense offsets with ABIS. An expense offset is created by the interest earned on the positive cash balance that occur within the transfer agent account as there is a one day lag with regards to money movement from the shareholder’s account to the transfer agent’s account and then the transfer agent’s account to the Fund’s account. During the Fund’s most recently completed fiscal year, the fees paid by the Fund to ABIS were reduced by $9,256 under the offset agreement between the Fund and ABIS. |
| 19 | Fee structures include fee reductions, pricing at scale and breakpoints in advisory fee schedules. |
| 20 | The Deli study was originally published in 2002 based on 1997 data. |
advisory fees for funds with larger asset sizes and funds from larger family sizes compared to funds with smaller asset sizes and funds from smaller family sizes, which according to the independent consultant is indicative of a sharing of economies of scale and scope. However, in less liquid and active markets, such is not the case, as the empirical analysis showed potential for diseconomies of scale in those markets. The empirical analysis also showed diminishing economies of scale and scope as funds surpassed a certain high level of assets.
| VI. | NATURE AND QUALITY OF THE ADVISER’S SERVICES, INCLUDING THE PERFORMANCE OF THE FUND |
With assets under management of approximately $813 billion as of September 30, 2007, the Adviser has the investment experience to manage and provide non-investment services (described in Section I) to the Fund.
The information below shows the 1, 3, 5 and 10 year performance returns and rankings of the Fund 21 relative to its Lipper Performance Group (“PG”) and Lipper Performance Universe (“PU”)22 for the periods ended July 31, 2007.23
| | | | | | | | | | |
| | | Fund Return (%) | | PG Median (%) | | PU Median (%) | | PG Rank | | PU Rank |
1 year | | 10.24 | | 8.71 | | 8.64 | | 2/7 | | 7/14 |
3 year | | 11.80 | | 12.28 | | 11.77 | | 5/7 | | 5/10 |
5 year | | 18.75 | | 15.97 | | 15.97 | | 1/6 | | 1/9 |
10 year | | 10.05 | | 9.94 | | 9.89 | | 1/3 | | 2/6 |
Set forth below are the 1, 3, 5, 10 year and since inception performance returns of the Fund (in bold)24 versus its benchmarks.25 Note the Fund may utilize
| | |
| 76 | | • ALLIANCEBERNSTEIN HIGH INCOME FUND |
| 21 | The performance returns and rankings are for the Class A shares of the Fund. It should be noted that the performance returns of the Fund that is shown was provided by the Adviser. Lipper maintains its own database that includes the Fund’s performance returns. However, differences in the distribution price (ex-date versus payable date) and rounding differences may cause the Adviser’s own performance returns of the Fund to be one or two basis points different from Lipper. To maintain consistency in this evaluation, the performance returns of the Fund, as reported by the Adviser, are provided instead of Lipper. |
| 22 | The Fund’s PG/PU are not identical to the Fund’s EG/EU as the criteria for including or excluding a fund in/from a PG/PU are somewhat different than that of an EU/EG. |
| 23 | Note that the current Lipper investment classification/objective dictates the PG and PU throughout the life of the Fund even if the Fund may have had a different investment classification/objective at different points in time. |
| 24 | The performance returns and risk measures shown in the table are for the Class A shares of the Fund. |
| 25 | The benchmark’s since inception performance return is from the nearest month-end after inception date. In contrast to the benchmark, the Fund’s since inception performance return is from the Fund’s actual inception date. |
leverage in contrast to the Fund’s benchmark, which has no leverage. Fund and benchmark volatility and reward-to-variability ratio (“Sharpe Ratio”) information is also shown.26
| | | | | | | | | | | | | | | | |
| | | Periods Ending July 31, 2007 Annualized Performance |
| | | 1 Year
(%) | | 3 Year
(%) | | 5 Year
(%) | | 10 Year
(%) | | Since
Inception
(%) | | Annualized | | Risk
Period
(Year) |
| | | | | | | | Volatility
(%) | | Sharpe
(%) | |
Emerging Market Debt Fund, Inc. | | 10.24 | | 11.80 | | 18.75 | | 10.05 | | 11.88 | | 17.44 | | 0.43 | | 10 |
JP Morgan EMBI Global Index | | 7.16 | | 10.56 | | 14.94 | | 9.17 | | 11.20 | | 13.59 | | 0.45 | | 10 |
Inception Date: February 25, 1994 | | | | | | | | | | | | | | | | |
CONCLUSION:
Based on the factors discussed above the Senior Officer’s conclusion is that the proposed advisory fee for the Fund is reasonable and within the range of what would have been negotiated at arms-length in light of all the surrounding circumstances. This conclusion in respect of the Fund is based on an evaluation of all of these factors and no single factor was dispositive.
Dated: November 26, 2007
| | |
| ALLIANCEBERNSTEIN HIGH INCOME FUND • | | 77 |
| 26 | Fund volatility and Sharpe Ratio information was obtained through Lipper LANA, a database maintained by Lipper. Benchmark volatility and Share Ratio information was estimated by the Senior Officer using standard Lipper methodology. Volatility is a statistical measure of the tendency of a market price or yield to vary over time. A Sharpe Ratio is a risk adjusted measure of return that divides a fund’s return in excess of the riskless return by the fund’s standard deviation. A fund with a greater volatility would be seen as more risky than a fund with equivalent performance but lower volatility; for that reason, a greater return would be demanded for the more risky fund. A fund with a higher Sharpe Ratio would be viewed as better performing than a fund with a lower Sharpe Ratio. |
THIS PAGE IS NOT PART OF THE SHAREHOLDER REPORT OR THE FINANCIAL STATEMENTS
ALLIANCEBERNSTEIN FAMILY OF FUNDS
Wealth Strategies Funds
Balanced Wealth Strategy
Wealth Appreciation Strategy
Wealth Preservation Strategy
Tax-Managed Balanced Wealth Strategy
Tax-Managed Wealth Appreciation Strategy
Tax-Managed Wealth Preservation Strategy
Blended Style Funds
U.S. Large Cap Portfolio
International Portfolio
Tax-Managed International Portfolio
Growth Funds
Domestic
Growth Fund
Mid-Cap Growth Fund
Large Cap Growth Fund
Small Cap Growth Portfolio
Global & International
Global Health Care Fund
Global Research Growth Fund
Global Technology Fund
Greater China ‘97 Fund
International Growth Fund
International Research Growth Fund
Value Funds
Domestic
Balanced Shares
Focused Growth & Income Fund
Growth & Income Fund
Small/Mid Cap Value Fund
Utility Income Fund
Value Fund
Global & International
Global Real Estate Investment Fund
Global Value Fund
International Value Fund
Taxable Bond Funds
Diversified Yield Fund*
Global Bond Fund*
High Income Fund*
Intermediate Bond Portfolio
Short Duration Portfolio
Municipal Bond Funds
| | |
National
Insured National
Arizona
California
Insured California
Florida
Massachusetts | | Michigan
Minnesota
New Jersey
New York
Ohio
Pennsylvania
Virginia |
Intermediate Municipal Bond Funds
Intermediate California
Intermediate Diversified
Intermediate New York
Closed-End Funds
AllianceBernstein Global High Income Fund
AllianceBernstein Income Fund
AllianceBernstein National Municipal Income Fund*
ACM Managed Dollar Income Fund
California Municipal Income Fund
New York Municipal Income Fund
The Spain Fund
Retirement Strategies Funds
| | | | |
2000 Retirement Strategy | | 2020 Retirement Strategy | | 2040 Retirement Strategy |
2005 Retirement Strategy | | 2025 Retirement Strategy | | 2045 Retirement Strategy |
2010 Retirement Strategy | | 2030 Retirement Strategy | | 2050 Retirement Strategy |
2015 Retirement Strategy | | 2035 Retirement Strategy | | 2055 Retirement Strategy |
We also offer Exchange Reserves,** which serves as the money market fund exchange vehicle for the AllianceBernstein mutual funds.
You should consider the investment objectives, risks, charges and expenses of any AllianceBernstein fund/portfolio carefully before investing. For free copies of our prospectuses, which contain this and other information, visit us online at www.alliancebernstein.com or contact your financial advisor. Please read the prospectus carefully before investing.
| * | | Prior to May 18, 2007, AllianceBernstein National Municipal Income Fund was named National Municipal Income Fund. Prior to November 5, 2007, Diversified Yield Fund was named Global Strategic Income Trust and Global Bond Fund was named Global Government Income Trust. Prior to January 28, 2008, High Income Fund was named Emerging Market Debt Fund. |
| ** | An investment in the Fund is not a deposit in a bank and is not insured or guaranteed by the Federal Deposit Insurance Corporation or any other government agency. Although the Fund seeks to preserve the value of your investment at $1.00 per share, it is possible to lose money by investing in the Fund. |
| | |
| 78 | | • ALLIANCEBERNSTEIN HIGH INCOME FUND |
AllianceBernstein Family of Funds
NOTES
| | |
| ALLIANCEBERNSTEIN HIGH INCOME FUND • | | 79 |
NOTES
| | |
| 80 | | • ALLIANCEBERNSTEIN HIGH INCOME FUND |
NOTES
| | |
| ALLIANCEBERNSTEIN HIGH INCOME FUND • | | 81 |
NOTES
| | |
| 82 | | • ALLIANCEBERNSTEIN HIGH INCOME FUND |
NOTES
| | |
| ALLIANCEBERNSTEIN HIGH INCOME FUND • | | 83 |
NOTES
| | |
| 84 | | • ALLIANCEBERNSTEIN HIGH INCOME FUND |
ALLIANCEBERNSTEIN HIGH INCOME FUND
1345 Avenue of the Americas
New York, NY 10105
800.221.5672
| | |
| |
| HI-0152-0408 | |  |
Not applicable when filing a semi-annual report to shareholders.
| ITEM 3. | AUDIT COMMITTEE FINANCIAL EXPERT. |
Not applicable when filing a semi-annual report to shareholders.
| ITEM 4. | PRINCIPAL ACCOUNTANT FEES AND SERVICES. |
Not applicable when filing a semi-annual report to shareholders.
| ITEM 5. | AUDIT COMMITTEE OF LISTED REGISTRANTS. |
Not applicable to the registrant.
| ITEM 6. | SCHEDULE OF INVESTMENTS. |
Please see Schedule of Investments contained in the Report to Shareholders included under Item 1 of this Form N-CSR.
| ITEM 7. | DISCLOSURE OF PROXY VOTING POLICIES AND PROCEDURES FOR CLOSED-END MANAGEMENT INVESTMENT COMPANIES. |
Not applicable to the registrant.
| ITEM 8. | PORTFOLIO MANAGERS OF CLOSED-END MANAGEMENT INVESTMENT COMPANIES. |
Not applicable to the registrant.
| ITEM 9. | PURCHASES OF EQUITY SECURITIES BY CLOSED-END MANAGEMENT INVESTMENT COMPANY AND AFFILIATED PURCHASERS. |
Not applicable to the registrant.
| ITEM 10. | SUBMISSION OF MATTERS TO A VOTE OF SECURITY HOLDERS. |
There have been no material changes to the procedures by which shareholders may recommend nominees to the Fund’s Board of Directors since the Fund last provided disclosure in response to this item.
| ITEM 11. | CONTROLS AND PROCEDURES. |
(a) The registrant’s principal executive officer and principal financial officer have concluded that the registrant’s disclosure controls and procedures (as defined in Rule 30a-2(c) under the Investment Company Act of 1940, as amended) are effective at the reasonable assurance level based on their evaluation of these controls and procedures as of a date within 90 days of the filing date of this document.
(b) There were no changes in the registrant’s internal controls over financial reporting that occurred during the second fiscal quarter of the period that has materially affected, or is reasonably likely to materially affect, the registrant’s internal control over financial reporting.
The following exhibits are attached to this Form N-CSR:
| | |
EXHIBIT NO. | | DESCRIPTION OF EXHIBIT |
| |
| 12 (b) (1) | | Certification of Principal Executive Officer Pursuant to Section 302 of the Sarbanes-Oxley Act of 2002 |
| |
| 12 (b) (2) | | Certification of Principal Financial Officer Pursuant to Section 302 of the Sarbanes-Oxley Act of 2002 |
| |
| 12 (c) | | Certification of Principal Executive Officer and Principal Financial Officer Pursuant to Section 906 of the Sarbanes-Oxley Act of 2002 |
SIGNATURES
Pursuant to the requirements of the Securities Exchange Act of 1934 and the Investment Company Act of 1940, the registrant has duly caused this report to be signed on its behalf by the undersigned, thereunto duly authorized.
(Registrant): AllianceBernstein High Income Fund, Inc.
| | |
By: | | /s/ Marc O. Mayer |
| | Marc O. Mayer President |
| Date: | | June 30, 2008 |
Pursuant to the requirements of the Securities Exchange Act of 1934 and the Investment Company Act of 1940, this report has been signed below by the following persons on behalf of the registrant and in the capacities and on the dates indicated.
| | |
By: | | /s/ Marc O. Mayer |
| | Marc O. Mayer President |
| Date: | | June 30, 2008 |
| | |
By: | | /s/ Joseph J. Mantineo |
| | Joseph J. Mantineo Treasurer and Chief Financial Officer |
| Date: | | June 30, 2008 |