UNITED STATES
SECURITIES AND EXCHANGE COMMISSION
WASHINGTON, D.C. 20549
FORM N-CSR
CERTIFIED SHAREHOLDER REPORT OF REGISTERED
MANAGEMENT INVESTMENT COMPANIES
Investment Company Act file number: 811-08188
AB HIGH INCOME FUND, INC.
(Exact name of registrant as specified in charter)
1345 Avenue of the Americas, New York, New York 10105
(Address of principal executive offices) (Zip code)
Joseph J. Mantineo
AllianceBernstein L.P.
1345 Avenue of the Americas
New York, New York 10105
(Name and address of agent for service)
Registrant’s telephone number, including area code: (800) 221-5672
Date of fiscal year end: October 31, 2015
Date of reporting period: October 31, 2015
ITEM 1. REPORTS TO STOCKHOLDERS.
OCT 10.31.15
ANNUAL REPORT
AB HIGH INCOME FUND
Investment Products Offered
|
• Are Not FDIC Insured • May Lose Value • Are Not Bank Guaranteed |
Investors should consider the investment objectives, risks, charges and expenses of the Fund carefully before investing. For copies of our prospectus or summary prospectus, which contain this and other information, visit us online at www.abglobal.com or contact your AB representative. Please read the prospectus and/or summary prospectus carefully before investing.
This shareholder report must be preceded or accompanied by the Fund’s prospectus for individuals who are not current shareholders of the Fund.
You may obtain a description of the Fund’s proxy voting policies and procedures, and information regarding how the Fund voted proxies relating to portfolio securities during the most recent 12-month period ended June 30, without charge. Simply visit AB’s website at www.abglobal.com, or go to the Securities and Exchange Commission’s (the “Commission”) website at www.sec.gov, or call AB at (800) 227-4618.
The Fund files its complete schedule of portfolio holdings with the Commission for the first and third quarters of each fiscal year on Form N-Q. The Fund’s Forms N-Q are available on the Commission’s website at www.sec.gov. The Fund’s Forms N-Q may also be reviewed and copied at the Commission’s Public Reference Room in Washington, DC; information on the operation of the Public Reference Room may be obtained by calling (800) SEC-0330. AB publishes full portfolio holdings for the Fund monthly at www.abglobal.com.
AllianceBernstein Investments, Inc. (ABI) is the distributor of the AB family of mutual funds. ABI is a member of FINRA and is an affiliate of AllianceBernstein L.P., the Adviser of the funds.
The [A/B] logo is a registered service mark of AllianceBernstein and AllianceBernstein® is a registered service mark used by permission of the owner, AllianceBernstein L.P.
December 14, 2015
Annual Report
This report provides management’s discussion of fund performance for AB High Income Fund (the “Fund”) for the annual reporting period ended October 31, 2015. Effective January 20, 2015, the Fund’s name changed from AllianceBernstein High Income Fund to AB High Income Fund.
Investment Objectives and Policies
The Fund’s investment objective is to seek to maximize total returns from price appreciation and income. The Fund pursues income opportunities from government, corporate, emerging market and high-yield sources. It has the flexibility to invest in a broad range of fixed-income securities in both developed and emerging market countries. The Fund’s investments may include US and non-US corporate debt securities and sovereign debt securities. The Fund may invest, without limitation, in either US dollar-denominated or non-US dollar-denominated fixed-income securities.
AllianceBernstein L.P. (the “Adviser”) selects securities for purchase or sale based on its assessment of the securities’ risk and return characteristics as well as the securities’ impact on the overall risk and return characteristics of the Fund. In making this assessment, the Adviser takes into account various factors, including the credit quality and sensitivity to interest rates of the securities under consideration and of the Fund’s other holdings.
The Fund may invest in debt securities with a range of maturities from short- to long-term. Substantially all of the Fund’s assets may be invested in lower-rated securities, which may include securities
having the lowest rating for non-subordinated debt instruments—i.e., rated C by Moody’s Investors Service (“Moody’s”) or CCC+ or lower by Standard & Poor’s Ratings Services (“S&P”) and Fitch Ratings (“Fitch”)—and unrated securities of equivalent investment quality. The Fund also may invest in investment-grade securities and unrated securities.
The Fund may invest in mortgage-related and other asset-backed securities, loan participations, inflation-protected securities, structured securities, variable, floating, and inverse floating-rate instruments and preferred stock, and may use other investment techniques. The Fund may also make short sales of securities or maintain a short position. The Fund may use borrowings or other leverage for investment purposes. The Fund intends, among other things, to enter into transactions such as reverse repurchase agreements and dollar rolls. The Fund may invest, without limit, in derivatives, such as options, futures, forwards or swap agreements.
Investment Results
The table on page 7 shows the Fund’s performance compared with its blended benchmark, which is composed of equal weightings of the J.P. Morgan Emerging Markets Bond Index Global (“JPM EMBI Global”), the J.P. Morgan Government Bond Index-Emerging Markets (“JPM GBI-EM”) (local currency-denominated) and the Barclays US Corporate High Yield (“HY”) 2% Issuer Capped Index for the six- and 12-month periods ended October 31, 2015. Individual performance for each of these indices is also included for both time periods. The Fund is also compared to its
broad-based benchmark, the JPM EMBI Global, which tracks total returns for US dollar-denominated debt instruments issued by emerging market sovereign and quasi-sovereign entities.
All share classes of the Fund outperformed the blended benchmark for both periods, before sales charges. Sector positioning contributed to returns for the 12-month period, yet detracted slightly for the six-month period, relative to the benchmark. Specifically, an overweight to collateralized mortgage obligations, commercial mortgage-backed securities and the banking sector contributed for the 12-month period, and an underweight to emerging market sovereigns detracted for the six-month period. Security selection within energy and technology holdings detracted for both periods. Currency selection contributed for both periods, specifically an overweight to the US dollar and an underweight to a number of emerging market currencies including the Malaysian ringgit and South African rand. Country selection detracted for both periods, mainly from an underweight to Mexico and an overweight to the United States.
The Fund utilized derivatives including currency forwards for hedging and investment purposes and written options for hedging purposes, which added to returns for both periods, in absolute terms. Treasury futures and purchased options for hedging purposes and interest rate swaps and total return swaps for investment purposes detracted for both periods; credit default swaps for hedging and investment purposes detracted during the six-month period and added for the 12-month period.
Market Review and Investment Strategy
Bond markets were volatile for the 12-month period ended October 31, 2015, as growth trends and monetary policies in the world’s biggest economies headed in different directions. Inflation continued to fall throughout the developed world, driven primarily by decreasing commodity prices. While oil prices began to rebound in April, they again fell in August, remaining well below their price range in late 2014. These dynamics caused volatility within government bond yields, with the yield on the 10-year US Treasury ranging from 1.7% to 2.5%, ultimately ending the period at 2.2%. Adding to the volatility, the US Federal Reserve postponed its long expected interest-rate hike, alluding to emerging market turmoil as one of the reasons.
In other markets, including many in Europe where the European Central Bank implemented its quantitative easing program, some yields ended the period in negative territory. In emerging markets, political and economic instability across regions negatively affected the investment environment. Slower growth in China, Brazil and other emerging market economies caused further pressure on credit markets at the end of the 12-month period. Against this backdrop, fixed-income returns diverged between regions and sectors. Credit securities generally underperformed developed market Treasuries; developed market Treasuries generally outperformed emerging market local currency Treasuries; and investment-grade securities generally outperformed high-yield,
which posted some of the worst returns across the fixed-income market. There was significant divergence of returns in the corporate high-yield market. The metals/mining and energy sectors were
the worst performers as commodity prices continued to fall. However, consumer related sectors including food/beverages, gaming/lodging/leisure and retail posted positive returns.
DISCLOSURES AND RISKS
Benchmark Disclosure
The unmanaged JPM® EMBI Global, the JPM® GBI-EM and the Barclays US Corporate HY 2% Issuer Capped Index do not reflect fees and expenses associated with the active management of a mutual fund portfolio. The unmanaged JPM EMBI Global (market-capitalization weighted) represents the performance of US dollar-denominated Brady bonds, Eurobonds, and trade loans issued by sovereign and quasi-sovereign entities. The JPM GBI-EM represents the performance of local currency government bonds issued by emerging markets. The Barclays US Corporate HY 2% Issuer Capped Index is the 2% Issuer Capped component of the US Corporate HY Index. The Barclays US Corporate HY Index represents the performance of fixed-income securities having a maximum quality rating of Ba1, a minimum amount outstanding of $150 million and at least one year to maturity. An investor cannot invest directly in an index or average, and their results are not indicative of the performance for any specific investment, including the Fund.
A Word About Risk
Market Risk: The value of the Fund’s assets will fluctuate as the stock or bond market fluctuates. The value of its investments may decline, sometimes rapidly and unpredictably, simply because of economic changes or other events that affect large portions of the market.
Interest Rate Risk: Changes in interest rates will affect the value of investments in fixed-income securities. When interest rates rise, the value of investments in fixed-income securities tends to fall and this decrease in value may not be offset by higher income from new investments. The Fund may be subject to a greater risk of rising interest rates due to the current period of historically low rates and the effect of government fiscal policy initiatives, including Federal Reserve actions, and market reaction to these initiatives. The current period of historically low rates is expected to end and rates are expected to begin rising in the near future. Interest rate risk is generally greater for fixed-income securities with longer maturities or durations.
Duration Risk: Duration is a measure that relates the expected price volatility of a fixed-income security to changes in interest rates. The duration of a fixed-income security may be shorter than or equal to full maturity of a fixed-income security. Fixed-income securities with longer durations have more risk and will decrease in price as interest rates rise. For example, a fixed-income security with a duration of three years will decrease in value by approximately 3% if interest rates increase by 1%.
Credit Risk: An issuer or guarantor of a fixed-income security, or the counterparty to a derivatives or other contract, may be unable or unwilling to make timely payments of interest or principal, or to otherwise honor its obligations. The issuer or guarantor may default causing a loss of the full principal amount of a security. The degree of risk for a particular security may be reflected in its credit rating. There is the possibility that the credit rating of a fixed-income security may be downgraded after purchase, which may adversely affect the value of the security.
Below Investment Grade Securities Risk: Investments in fixed-income securities with lower ratings (commonly known as “junk bonds”) tend to have a higher probability that an issuer will default or fail to meet its payment obligations. These securities may be subject to greater price volatility due to such factors as specific corporate developments, interest rate sensitivity, negative perceptions of the junk bond market generally and less secondary market liquidity.
Inflation Risk: This is the risk that the value of assets or income from investments will be less in the future as inflation decreases the value of money. As inflation increases, the value of the Fund’s assets can decline as can the value of the Fund’s distributions. This risk is significantly greater if the Fund invests a significant portion of its assets in fixed-income securities with longer maturities.
(Disclosures, Risks and Note about Historical Performance continued on next page)
Disclosures and Risks
DISCLOSURES AND RISKS
(continued from previous page)
Foreign (Non-US) Risk: Investments in securities of non-US issuers may involve more risk than those of US issuers. These securities may fluctuate more widely in price and may be less liquid due to adverse market, economic, political, regulatory or other factors.
Emerging Market Risk: Investments in emerging market countries may have more risk because the markets are less developed and less liquid as well as being subject to increased economic, political, regulatory or other uncertainties.
Currency Risk: Fluctuations in currency exchange rates may negatively affect the value of the Fund’s investments or reduce its returns.
Leverage Risk: To the extent the Fund uses leveraging techniques, its net asset value (“NAV”) may be more volatile because leverage tends to exaggerate the effect of changes in interest rates and any increase or decrease in the value of the Fund’s investments.
Derivatives Risk: Derivatives may be illiquid, difficult to price, and leveraged so that small changes may produce disproportionate losses for the Fund, and may be subject to counterparty risk to a greater degree than more traditional investments.
Liquidity Risk: Liquidity risk occurs when certain investments become difficult to purchase or sell. Difficulty in selling less liquid securities may result in sales at disadvantageous prices affecting the value of your investment in the Fund. Causes of liquidity risk may include low trading volumes, large positions and heavy redemptions of Fund shares. Over recent years liquidity risk has also increased because the capacity of dealers in the secondary market for fixed-income securities to make markets in these securities has decreased, even as the overall bond market has grown significantly, due to, among other things, structural changes, additional regulatory requirements and capital and risk restraints that have led to reduced inventories. Liquidity risk may be higher in a rising interest rate environment, when the value and liquidity of fixed-income securities generally go down.
Management Risk: The Fund is subject to management risk because it is an actively-managed investment fund. The Adviser will apply its investment techniques and risk analyses in making investment decisions, but there is no guarantee that its techniques will produce the intended results.
The Fund may invest in mortgage-backed and/or other asset-backed securities, including securities backed by mortgages and assets with an international or emerging markets origination and securities backed by non-performing loans at the time of investment. Investments in mortgage-backed and other asset-backed securities are subject to certain additional risks. The value of these securities may be particularly sensitive to changes in interest rates. These risks include “extension risk”, which is the risk that, in periods of rising interest rates, issuers may delay the payment of principal, and “prepayment risk”, which is the risk that, in periods of falling interest rates, issuers may pay principal sooner than expected, exposing the Fund to a lower rate of return upon reinvestment of principal. Mortgage-backed securities offered by nongovernmental issuers and other asset-backed securities may be subject to other risks, such as higher rates of default in the mortgages or assets backing the securities or risks associated with the nature and servicing of mortgages or assets backing the securities.
These risks are fully discussed in the Fund’s prospectus. As with all investments, you may lose money by investing in the Fund.
An Important Note About Historical Performance
The investment return and principal value of an investment in the Fund will fluctuate, so that shares, when redeemed, may be worth more or less than their original cost. Performance shown on the following pages represents past performance and does not guarantee future results. Current performance may be
lower or higher than the performance information shown. You may obtain performance information current to the most recent month-end by visiting www.abglobal.com.
Disclosures and Risks
(Disclosures, Risks and Note about Historical Performance continued on next page)
DISCLOSURES AND RISKS
(continued from previous page)
All fees and expenses related to the operation of the Fund have been deducted. NAV returns do not reflect sales charges; if sales charges were reflected, the Fund’s quoted performance would be lower. SEC returns reflect the applicable sales charges for each share class: a 4.25% maximum front-end sales charge for Class A shares; the applicable contingent deferred sales charge for Class B shares (3% year 1, 2% year 2, 1% year 3); a 1% 1-year contingent deferred sales charge for Class C shares. Returns for the different share classes will vary due to different expenses associated with each class. Performance assumes reinvestment of distributions and does not account for taxes.
Disclosures and Risks
HISTORICAL PERFORMANCE
| | | | | | | | | | |
| | | | | | | | | | |
THE FUND VS. ITS BENCHMARK PERIODS ENDED OCTOBER 31, 2015 (unaudited) | | NAV Returns | | | |
| | 6 Months | | | 12 Months | | | |
| AB High Income Fund | | | | | | | | | | |
Class A | | | -2.85% | | | | -1.98% | | | |
|
Class B* | | | -3.30% | | | | -2.89% | | | |
|
Class C | | | -3.27% | | | | -2.74% | | | |
|
Advisor Class† | | | -2.70% | | | | -1.78% | | | |
|
Class R† | | | -3.15% | | | | -2.44% | | | |
|
Class K† | | | -2.97% | | | | -2.12% | | | |
|
Class I† | | | -2.79% | | | | -1.74% | | | |
|
Class Z† | | | -2.78% | | | | -1.72% | | | |
|
| Blended benchmark: 33% JPM EMBI Global / 33% JPM GBI-EM / 33% Barclays US Corporate HY 2% Issuer Capped Index | | | -5.34% | | | | -8.03% | | | |
|
| JPM EMBI Global | | | -1.19% | | | | -0.50% | | | |
|
| JPM GBI-EM | | | -11.26% | | | | -20.54% | | | |
|
| Barclays US Corporate HY 2% Issuer Capped Index | | | -3.38% | | | | -1.91% | | | |
|
* Effective January 31, 2009, Class B shares are no longer available for sale to new investors. Please see Note A for additional information. † Please note that these share classes are for investors purchasing shares through accounts established under certain fee-based programs sponsored and maintained by certain broker-dealers and financial intermediaries, institutional pension plans and/or investment advisory clients of, and certain other persons associated with, the Adviser and its affiliates or the Fund. |
| | | | | | | | | | |
See Disclosures, Risks and Note about Historical Performance on pages 4-6.
(Historical Performance continued on next page)
Historical Performance
HISTORICAL PERFORMANCE
(continued from previous page)
GROWTH OF A $10,000 INVESTMENT IN THE FUND 10/31/05 TO 10/31/15 (unaudited)
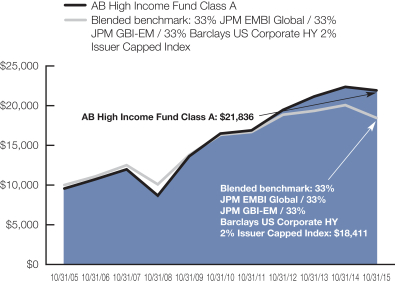
This chart illustrates the total value of an assumed $10,000 investment in AB High Income Fund Class A shares (from 10/31/05 to 10/31/15) as compared to the performance of the Fund’s blended benchmark. The chart reflects the deduction of the maximum 4.25% sales charge from the initial $10,000 investment in the Fund and assumes the reinvestment of dividends and capital gains distributions.
See Disclosures, Risks and Note about Historical Performance on pages 4-6.
(Historical Performance continued on next page)
Historical Performance
HISTORICAL PERFORMANCE
(continued from previous page)
| | | | | | | | | | | | |
| AVERAGE ANNUAL RETURNS AS OF OCTOBER 31, 2015 (unaudited) | |
| | | NAV Returns | | | SEC Returns
(reflects applicable
sales charges) | | | SEC Yields* | |
| | | | | | | | | | | | |
| Class A Shares | | | | | | | | | | | 6.77 | % |
1 Year | | | -1.98 | % | | | -6.17 | % | | | | |
5 Years | | | 5.83 | % | | | 4.91 | % | | | | |
10 Years | | | 8.60 | % | | | 8.12 | % | | | | |
| | | | | | | | | | | | |
| Class B Shares | | | | | | | | | | | 6.30 | % |
1 Year | | | -2.89 | % | | | -5.60 | % | | | | |
5 Years | | | 5.04 | % | | | 5.04 | % | | | | |
10 Years(a) | | | 8.09 | % | | | 8.09 | % | | | | |
| | | | | | | | | | | | |
| Class C Shares | | | | | | | | | | | 6.31 | % |
1 Year | | | -2.74 | % | | | -3.65 | % | | | | |
5 Years | | | 5.03 | % | | | 5.03 | % | | | | |
10 Years | | | 7.75 | % | | | 7.75 | % | | | | |
| | | | | | | | | | | | |
| Advisor Class Shares† | | | | | | | | | | | 7.36 | % |
1 Year | | | -1.78 | % | | | -1.78 | % | | | | |
5 Years | | | 6.15 | % | | | 6.15 | % | | | | |
Since Inception‡ | | | 8.52 | % | | | 8.52 | % | | | | |
| | | | | | | | | | | | |
| Class R Shares† | | | | | | | | | | | 6.73 | % |
1 Year | | | -2.44 | % | | | -2.44 | % | | | | |
5 Years | | | 5.48 | % | | | 5.48 | % | | | | |
Since Inception‡ | | | 7.88 | % | | | 7.88 | % | | | | |
| | | | | | | | | | | | |
| Class K Shares† | | | | | | | | | | | 7.12 | % |
1 Year | | | -2.12 | % | | | -2.12 | % | | | | |
5 Years | | | 5.84 | % | | | 5.84 | % | | | | |
Since Inception‡ | | | 8.22 | % | | | 8.22 | % | | | | |
| | | | | | | | | | | | |
| Class I Shares† | | | | | | | | | | | 7.40 | % |
1 Year | | | -1.74 | % | | | -1.74 | % | | | | |
5 Years | | | 6.20 | % | | | 6.20 | % | | | | |
Since Inception‡ | | | 8.55 | % | | | 8.55 | % | | | | |
| | | | | | | | | | | | |
| Class Z Shares† | | | | | | | | | | | 7.38 | % |
1 Year | | | -1.72 | % | | | -1.72 | % | | | | |
Since Inception‡ | | | 2.81 | % | | | 2.81 | % | | | | |
The Fund’s current prospectus fee table shows the Fund’s total annual operating expense ratios as 0.89%, 1.60%, 1.58%, 0.58%, 1.23%, 0.88%, 0.54% and 0.52% for Class A, Class B, Class C, Advisor Class, Class R, Class K, Class I and Class Z shares, respectively. The Financial Highlights section of this report sets forth expense ratio data for the current reporting period; the expense ratios shown above may differ from the expense ratios in the Financial Highlights sections since they are based on different time periods.
| * | | SEC yields are calculated based on SEC guidelines for the 30-day period ended October 31, 2015. |
| (a) | | Assumes conversion of Class B shares into Class A shares after six years. |
| † | | These share classes are offered at NAV to eligible investors and their SEC returns are the same as their NAV returns. Please note that these share classes are for investors purchasing shares through accounts established under certain fee-based programs sponsored and maintained by certain broker-dealers and financial intermediaries, institutional pension plans and/or investment advisory clients of and certain other persons associated with, the Adviser and its affiliates or the Fund. The inception dates for these share classes are listed below. |
| ‡ | | Inception dates: 1/28/2008 for Advisor Class, Class R, Class K and Class I shares; 10/15/2013 for Class Z shares. |
See Disclosures, Risks and Note about Historical Performance on pages 4-6.
(Historical Performance continued on next page)
Historical Performance
HISTORICAL PERFORMANCE
(continued from previous page)
| | | | |
SEC AVERAGE ANNUAL RETURNS AS OF THE MOST RECENT CALENDAR QUARTER-END SEPTEMBER 30, 2015 (unaudited) | |
| | | SEC Returns
(reflects applicable
sales charges) | |
| | | | |
| Class A Shares | | | | |
1 Year | | | -7.74 | % |
5 Years | | | 4.96 | % |
10 Years | | | 7.72 | % |
| | | | |
| Class B Shares | | | | |
1 Year | | | -6.95 | % |
5 Years | | | 5.09 | % |
10 Years(a) | | | 7.68 | % |
| | | | |
| Class C Shares | | | | |
1 Year | | | -5.14 | % |
5 Years | | | 5.07 | % |
10 Years | | | 7.35 | % |
| | | | |
| Advisor Class Shares† | | | | |
1 Year | | | -3.32 | % |
5 Years | | | 6.20 | % |
Since Inception‡ | | | 8.31 | % |
| | | | |
| Class R Shares† | | | | |
1 Year | | | -3.85 | % |
5 Years | | | 5.55 | % |
Since Inception‡ | | | 7.69 | % |
| | | | |
| Class K Shares† | | | | |
1 Year | | | -3.66 | % |
5 Years | | | 5.89 | % |
Since Inception‡ | | | 8.01 | % |
| | | | |
| Class I Shares† | | | | |
1 Year | | | -3.27 | % |
5 Years | | | 6.24 | % |
Since Inception‡ | | | 8.34 | % |
| | | | |
| Class Z Shares† | | | | |
1 Year | | | -3.26 | % |
Since Inception‡ | | | 1.79 | % |
| (a) | | Assumes conversion of Class B shares into Class A shares after six years. |
| † | | Please note that these share classes are for investors purchasing shares through accounts established under certain fee-based programs sponsored and maintained by certain broker-dealers and financial intermediaries, institutional pension plans and/or investment advisory clients of, and certain other persons associated with, the Adviser and its affiliates or the Fund. The inception dates for these share classes are listed below. |
| ‡ | | Inception dates: 1/28/2008 for Advisor Class, Class R, Class K and Class I shares; 10/15/2013 for Class Z shares. |
See Disclosures, Risks and Note about Historical Performance on pages 4-6.
Historical Performance
EXPENSE EXAMPLE
(unaudited)
As a shareholder of the Fund, you incur two types of costs: (1) transaction costs, including sales charges (loads) on purchase payments, contingent deferred sales charges on redemptions and (2) ongoing costs, including management fees; distribution (12b-1) fees; and other Fund expenses. This example is intended to help you understand your ongoing costs (in dollars) of investing in the Fund and to compare these costs with the ongoing costs of investing in other mutual funds.
The Example is based on an investment of $1,000 invested at the beginning of the period and held for the entire period as indicated below.
Actual Expenses
The first line of the table below provides information about actual account values and actual expenses. You may use the information in this line, together with the amount you invested, to estimate the expenses that you paid over the period. Simply divide your account value by $1,000 (for example, an $8,600 account value divided by $1,000 = 8.6), then multiply the result by the number in the first line under the heading entitled “Expenses Paid During Period” to estimate the expenses you paid on your account during this period.
Hypothetical Example for Comparison Purposes
The second line of the table below provides information about hypothetical account values and hypothetical expenses based on the Fund’s actual expense ratio and an assumed annual rate of return of 5% before expenses, which is not the Fund’s actual return. The hypothetical account values and expenses may not be used to estimate the actual ending account balance or expenses you paid for the period. You may use this information to compare the ongoing costs of investing in the Fund and other funds by comparing this 5% hypothetical example with the 5% hypothetical examples that appear in the shareholder reports of other funds.
| | | | | | | | | | | | | | | | |
| | | Beginning
Account Value
May 1, 2015 | | | Ending
Account Value
October 31, 2015 | | | Expenses Paid
During Period* | | | Annualized
Expense Ratio* | |
| Class A | | | | | | | | | | | | | | | | |
Actual | | $ | 1,000 | | | $ | 971.50 | | | $ | 4.52 | | | | .91 | % |
Hypothetical** | | $ | 1,000 | | | $ | 1,020.62 | | | $ | 4.63 | | | | .91 | % |
| Class B | | | | | | | | | | | | | | | | |
Actual | | $ | 1,000 | | | $ | 967.00 | | | $ | 8.13 | | | | 1.64 | % |
Hypothetical** | | $ | 1,000 | | | $ | 1,016.94 | | | $ | 8.34 | | | | 1.64 | % |
| Class C | | | | | | | | | | | | | | | | |
Actual | | $ | 1,000 | | | $ | 967.30 | | | $ | 7.93 | | | | 1.60 | % |
Hypothetical** | | $ | 1,000 | | | $ | 1,017.14 | | | $ | 8.13 | | | | 1.60 | % |
| Advisor Class | | | | | | | | | | | | | | | | |
Actual | | $ | 1,000 | | | $ | 973.00 | | | $ | 2.98 | | | | .60 | % |
Hypothetical** | | $ | 1,000 | | | $ | 1,022.18 | | | $ | 3.06 | | | | .60 | % |
| Class R | | | | | | | | | | | | | | | | |
Actual | | $ | 1,000 | | | $ | 968.50 | | | $ | 6.35 | | | | 1.28 | % |
Hypothetical** | | $ | 1,000 | | | $ | 1,018.75 | | | $ | 6.51 | | | | 1.28 | % |
| Class K | | | | | | | | | | | | | | | | |
Actual | | $ | 1,000 | | | $ | 970.30 | | | $ | 4.62 | | | | .93 | % |
Hypothetical** | | $ | 1,000 | | | $ | 1,020.52 | | | $ | 4.74 | | | | .93 | % |
| Class I | | | | | | | | | | | | | | | | |
Actual | | $ | 1,000 | | | $ | 972.10 | | | $ | 2.78 | | | | .56 | % |
Hypothetical** | | $ | 1,000 | | | $ | 1,022.38 | | | $ | 2.85 | | | | .56 | % |
| Class Z | | | | | | | | | | | | | | | | |
Actual | | $ | 1,000 | | | $ | 972.20 | | | $ | 2.68 | | | | .54 | % |
Hypothetical** | | $ | 1,000 | | | $ | 1,022.48 | | | $ | 2.75 | | | | .54 | % |
| * | | Expenses are equal to the classes’ annualized expense ratios multiplied by the average account value over the period, multiplied by 184/365 (to reflect the one-half year period). |
| ** | | Assumes 5% annual return before expenses. |
Expense Example
PORTFOLIO SUMMARY
October 31, 2015 (unaudited)
PORTFOLIO STATISTICS
Net Assets ($mil): $6,235.7
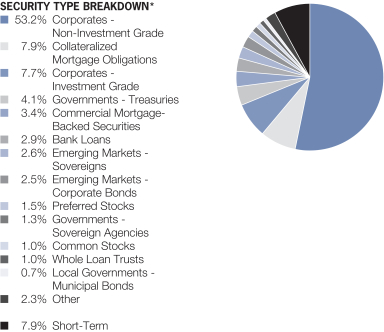
| * | | All data are as of October 31, 2015. The Fund’s security type breakdown is expressed as a percentage of total investments and may vary over time. The Fund also enters into derivative transactions, which may be used for hedging or investment purposes (see “Portfolio of Investments” section of the report for additional details). “Other” securities type weightings represents 0.6% or less in the following security types: Agencies, Asset-Backed Securities, Emerging Markets – Treasuries, Governments – Sovereign Bonds, Inflation-Linked Securities, Investment Companies, Local Governments – Regional Bonds, Options Purchased – Puts, Quasi-Sovereigns and Warrants. |
Portfolio Summary
PORTFOLIO SUMMARY
October 31, 2015 (unaudited)
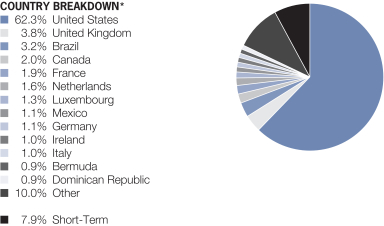
| * | | All data are as of October 31, 2015. The Fund’s country breakdown is expressed as a percentage of total investments and may vary over time. The Fund also enters into derivative transactions, which may be used for hedging or investment purposes (see “Portfolio of Investments” section of the report for additional details). “Other” country weightings represent 0.7% or less in the following countries: Argentina, Australia, Bahrain, Barbados, Belgium, Bulgaria, Cayman Islands, Chile, Colombia, Croatia, Denmark, El Salvador, Gabon, Ghana, Guatemala, Hong Kong, India, Indonesia, Israel, Ivory Coast, Jamaica, Japan, Kazakhstan, Kenya, Lebanon, Macau, Morocco, New Zealand, Norway, Pakistan, Peru, Portugal, Romania, Serbia, South Africa, Spain, Sri Lanka, Sweden, Switzerland, Trinidad & Tobago, Turkey, United Arab Emirates, Uruguay, Venezuela and Zambia. |
Portfolio Summary
PORTFOLIO OF INVESTMENTS
October 31, 2015
| | | | | | | | | | |
| | | | | Principal Amount (000) | | | U.S. $ Value | |
| |
| | | | | | | | | | |
CORPORATES – NON-INVESTMENT
GRADE – 53.8% | | | | | | | | | | |
Industrial – 44.7% | | | | | | | | | | |
Basic – 2.8% | | | | | | | | | | |
AK Steel Corp.
7.625%, 5/15/20-10/01/21 | | U.S.$ | | | 4,471 | | | $ | 2,310,258 | |
Aleris International, Inc.
7.625%, 2/15/18 | | | | | 4,336 | | | | 4,054,160 | |
7.875%, 11/01/20 | | | | | 4,671 | | | | 4,390,740 | |
ArcelorMittal
6.125%, 6/01/25 | | | | | 5,902 | | | | 5,088,586 | |
7.75%, 10/15/39 | | | | | 7,105 | | | | 6,057,012 | |
Ashland, Inc.
4.75%, 8/15/22 | | | | | 1,800 | | | | 1,800,990 | |
Axalta Coating Systems US Holdings, Inc./Axalta Coating Systems Dutch Holding B
7.375%, 5/01/21(a) | | | | | 3,053 | | | | 3,228,548 | |
Chemours Co. (The)
7.00%, 5/15/25(a) | | | | | 1,557 | | | | 1,159,965 | |
Cliffs Natural Resources, Inc.
7.75%, 3/31/20(a) | | | | | 4,112 | | | | 1,665,360 | |
8.25%, 3/31/20(a) | | | | | 6,486 | | | | 5,804,970 | |
Commercial Metals Co.
4.875%, 5/15/23 | | | | | 3,249 | | | | 2,875,365 | |
6.50%, 7/15/17 | | | | | 3,844 | | | | 3,988,150 | |
Consolidated Energy Finance SA
6.75%, 10/15/19(a) | | | | | 14,954 | | | | 14,879,230 | |
Constellium NV
5.75%, 5/15/24(a) | | | | | 9,890 | | | | 7,120,800 | |
Emeco Pty Ltd.
9.875%, 3/15/19(a) | | | | | 9,097 | | | | 5,117,062 | |
Ephios Holdco II PLC
8.25%, 7/01/23(a) | | EUR | | | 2,619 | | | | 2,933,465 | |
FMG Resources August 206 Pty Ltd.
9.75%, 3/01/22(a)(b) | | U.S.$ | | | 1,561 | | | | 1,553,195 | |
Ineos Finance PLC
4.00%, 5/01/23(a) | | EUR | | | 5,160 | | | | 5,447,226 | |
INEOS Group Holdings SA
5.75%, 2/15/19(a) | | | | | 1,266 | | | | 1,387,980 | |
5.875%, 2/15/19(a)(b) | | U.S.$ | | | 7,329 | | | | 7,329,000 | |
JMC Steel Group, Inc.
8.25%, 3/15/18(a) | | | | | 2,760 | | | | 1,876,800 | |
Joseph T. Ryerson & Son, Inc.
9.00%, 10/15/17 | | | | | 5,511 | | | | 4,808,348 | |
Lundin Mining Corp.
7.50%, 11/01/20(a) | | | | | 4,977 | | | | 5,026,770 | |
7.875%, 11/01/22(a) | | | | | 4,001 | | | | 4,010,202 | |
Portfolio of Investments
| | | | | | | | | | |
| | | | |
Principal Amount (000) | | | U.S. $ Value | |
| |
| | | | | | | | | | |
Magnetation LLC/Mag Finance Corp.
11.00%, 5/15/18(c)(d) | | U.S.$ | | | 16,121 | | | $ | 3,546,620 | |
Momentive Performance Materials, Inc.
3.88%, 10/24/21 | | | | | 13,331 | | | | 10,664,800 | |
8.875%, 10/15/20(e)(f)(g) | | | | | 13,331 | | | | – 0 | –*** |
Novacap International SAS
4.932%, 5/01/19(a)(h) | | EUR | | | 1,388 | | | | 1,534,633 | |
Novelis, Inc.
8.375%, 12/15/17 | | U.S.$ | | | 1,452 | | | | 1,462,890 | |
8.75%, 12/15/20(b) | | | | | 8,920 | | | | 8,942,300 | |
Peabody Energy Corp.
6.00%, 11/15/18 | | | | | 11,292 | | | | 1,976,100 | |
PQ Corp.
8.75%, 11/01/18(a) | | | | | 8,961 | | | | 9,039,409 | |
Smurfit Kappa Acquisitions
4.875%, 9/15/18(a) | | | | | 4,234 | | | | 4,445,700 | |
Smurfit Kappa Treasury Funding Ltd.
7.50%, 11/20/25 | | | | | 1,073 | | | | 1,309,060 | |
SPCM SA
6.00%, 1/15/22(a) | | | | | 1,298 | | | | 1,304,490 | |
Steel Dynamics, Inc.
5.125%, 10/01/21 | | | | | 1,007 | | | | 999,448 | |
6.125%, 8/15/19 | | | | | 800 | | | | 828,000 | |
6.375%, 8/15/22 | | | | | 4,749 | | | | 4,879,597 | |
Teck Resources Ltd.
5.40%, 2/01/43 | | | | | 1,350 | | | | 722,250 | |
6.125%, 10/01/35 | | | | | 5,000 | | | | 2,875,000 | |
6.25%, 7/15/41 | | | | | 1,323 | | | | 747,495 | |
Thompson Creek Metals Co., Inc.
7.375%, 6/01/18 | | | | | 9,836 | | | | 4,131,120 | |
9.75%, 12/01/17 | | | | | 5,195 | | | | 4,909,275 | |
Univar USA, Inc.
6.75%, 7/15/23(a) | | | | | 6,281 | | | | 6,218,190 | |
| | | | | | | | | | |
| | | | | | | | | 174,450,559 | |
| | | | | | | | | | |
Capital Goods – 3.8% | | | | | | | | | | |
Accudyne Industries Borrower/Accudyne Industries LLC
7.75%, 12/15/20(a) | | | | | 3,293 | | | | 2,856,678 | |
Apex Tool Group LLC
7.00%, 2/01/21(a) | | | | | 7,065 | | | | 5,687,325 | |
Ardagh Finance Holdings SA
8.625%, 6/15/19(a)(i) | | | | | 2,122 | | | | 2,222,819 | |
Ardagh Packaging Finance PLC
9.25%, 10/15/20(a) | | EUR | | | 2,758 | | | | 3,183,718 | |
Ardagh Packaging Finance PLC/Ardagh Holdings USA, Inc.
6.00%, 6/30/21(a)(b) | | U.S.$ | | | 15,575 | | | | 15,263,500 | |
Portfolio of Investments
| | | | | | | | | | |
| | | | |
Principal Amount (000) | | | U.S. $ Value | |
| |
| | | | | | | | | | |
Ashtead Capital, Inc.
5.625%, 10/01/24(a) | | U.S.$ | | | 2,075 | | | $ | 2,158,000 | |
Berry Plastics Corp.
5.125%, 7/15/23 | | | | | 2,843 | | | | 2,814,570 | |
5.50%, 5/15/22 | | | | | 5,352 | | | | 5,512,560 | |
6.00%, 10/15/22(a) | | | | | 1,320 | | | | 1,379,400 | |
Beverage Packaging Holdings Luxembourg II SA/Beverage Packaging Holdings II Issuer
6.00%, 6/15/17(a) | | | | | 3,009 | | | | 3,024,045 | |
Bombardier, Inc.
5.75%, 3/15/22(a) | | | | | 4,685 | | | | 3,621,505 | |
6.00%, 10/15/22(a) | | | | | 6,375 | | | | 4,908,750 | |
6.125%, 1/15/23(a) | | | | | 4,952 | | | | 3,837,800 | |
7.45%, 5/01/34(a) | | | | | 1,440 | | | | 1,000,800 | |
7.50%, 3/15/25(a) | | | | | 1,970 | | | | 1,531,675 | |
7.75%, 3/15/20(a) | | | | | 2,558 | | | | 2,231,855 | |
Building Materials Corp. of America
6.00%, 10/15/25(a) | | | | | 5,285 | | | | 5,628,525 | |
Clean Harbors, Inc.
5.125%, 6/01/21 | | | | | 3,417 | | | | 3,507,551 | |
5.25%, 8/01/20 | | | | | 800 | | | | 832,000 | |
CNH Industrial America LLC
7.25%, 1/15/16 | | | | | 997 | | | | 1,006,970 | |
CNH Industrial Capital LLC
3.25%, 2/01/17 | | | | | 1,425 | | | | 1,428,634 | |
EnerSys
5.00%, 4/30/23(a) | | | | | 4,046 | | | | 4,106,690 | |
EnPro Industries, Inc.
5.875%, 9/15/22 | | | | | 5,800 | | | | 5,843,500 | |
Gardner Denver, Inc.
6.875%, 8/15/21(a) | | | | | 4,396 | | | | 3,802,540 | |
GCL Holdings SCA
9.375%, 4/15/18(a) | | EUR | | | 1,174 | | | | 1,344,818 | |
HD Supply, Inc.
7.50%, 7/15/20 | | U.S.$ | | | 10,438 | | | | 11,116,470 | |
11.50%, 7/15/20 | | | | | 1,700 | | | | 1,923,125 | |
Huntington Ingalls Industries, Inc.
7.125%, 3/15/21 | | | | | 1,287 | | | | 1,344,915 | |
KLX, Inc.
5.875%, 12/01/22(a) | | | | | 6,848 | | | | 6,989,240 | |
KraussMaffei Group GmbH
8.75%, 12/15/20(a) | | EUR | | | 538 | | | | 629,598 | |
Manitowoc Co., Inc. (The)
5.875%, 10/15/22 | | U.S.$ | | | 5,413 | | | | 5,588,922 | |
8.50%, 11/01/20 | | | | | 5,474 | | | | 5,699,912 | |
Masco Corp.
5.95%, 3/15/22 | | | | | 2,800 | | | | 3,101,000 | |
6.125%, 10/03/16 | | | | | 2,315 | | | | 2,410,494 | |
Portfolio of Investments
| | | | | | | | | | |
| | | | |
Principal Amount (000) | | | U.S. $ Value | |
| |
| | | | | | | | | | |
Milacron LLC/Mcron Finance Corp.
7.75%, 2/15/21(a) | | U.S.$ | | | 3,458 | | | $ | 3,544,450 | |
Moog, Inc.
5.25%, 12/01/22(a) | | | | | 2,097 | | | | 2,138,940 | |
Oshkosh Corp.
5.375%, 3/01/22 | | | | | 3,301 | | | | 3,375,273 | |
Owens-Brockway Glass Container, Inc.
5.875%, 8/15/23(a) | | | | | 6,290 | | | | 6,675,262 | |
Pactiv LLC
7.95%, 12/15/25 | | | | | 8,358 | | | | 8,086,365 | |
Plastipak Holdings, Inc.
6.50%, 10/01/21(a) | | | | | 6,079 | | | | 6,018,210 | |
Rexam PLC
6.75%, 6/29/67(a) | | EUR | | | 2,660 | | | | 2,925,069 | |
Rexel SA
5.25%, 6/15/20(a) | | U.S.$ | | | 6,432 | | | | 6,690,888 | |
Reynolds Group Issuer, Inc./Reynolds Group Issuer LLC/Reynolds Group Issuer Lu
7.125%, 4/15/19 | | | | | 520 | | | | 529,425 | |
7.875%, 8/15/19 | | | | | 4,653 | | | | 4,821,671 | |
9.875%, 8/15/19 | | | | | 6,304 | | | | 6,634,960 | |
Sealed Air Corp.
4.875%, 12/01/22(a) | | | | | 2,616 | | | | 2,687,940 | |
6.875%, 7/15/33(a) | | | | | 14,904 | | | | 15,202,080 | |
SIG Combibloc Holdings SCA
7.75%, 2/15/23(a) | | EUR | | | 3,835 | | | | 4,451,210 | |
Summit Materials LLC/Summit Materials Finance Corp.
10.50%, 1/31/20 | | U.S.$ | | | 1,356 | | | | 1,437,360 | |
Terex Corp.
6.00%, 5/15/21 | | | | | 3,836 | | | | 3,798,407 | |
Textron Financial Corp.
6.00%, 2/15/67(a) | | | | | 125 | | | | 92,500 | |
TransDigm, Inc.
6.00%, 7/15/22 | | | | | 7,000 | | | | 7,070,000 | |
6.50%, 7/15/24 | | | | | 6,341 | | | | 6,451,967 | |
United Rentals North America, Inc.
5.50%, 7/15/25 | | | | | 2,383 | | | | 2,377,043 | |
5.75%, 11/15/24 | | | | | 6,833 | | | | 6,935,495 | |
7.625%, 4/15/22 | | | | | 4,820 | | | | 5,230,230 | |
| | | | | | | | | | |
| | | | | | | | | 234,714,649 | |
| | | | | | | | | | |
Communications - Media – 5.8% | | | | | | | | | | |
Activision Blizzard, Inc.
5.625%, 9/15/21(a) | | | | | 2,747 | | | | 2,905,502 | |
6.125%, 9/15/23(a) | | | | | 2 | | | | 2,178 | |
Altice Financing SA
6.625%, 2/15/23(a) | | | | | 11,942 | | | | 11,971,855 | |
Portfolio of Investments
| | | | | | | | | | |
| | | | |
Principal Amount (000) | | | U.S. $ Value | |
| |
| | | | | | | | | | |
Altice US Finance II Corp.
7.75%, 7/15/25(a) | | U.S.$ | | | 3,464 | | | $ | 3,334,100 | |
Arqiva Broadcast Finance PLC
9.50%, 3/31/20(a) | | GBP | | | 6,766 | | | | 11,330,093 | |
CCO Holdings LLC/CCO Holdings Capital Corp.
5.375%, 5/01/25(a) | | U.S.$ | | | 732 | | | | 724,680 | |
5.75%, 1/15/24(b) | | | | | 1,639 | | | | 1,663,585 | |
5.875%, 5/01/27(a) | | | | | 4,402 | | | | 4,402,000 | |
6.50%, 4/30/21 | | | | | 690 | | | | 724,069 | |
Cequel Communications Holdings I LLC/Cequel Capital Corp.
5.125%, 12/15/21(a) | | | | | 15,318 | | | | 14,716,615 | |
6.375%, 9/15/20(a) | | | | | 5,197 | | | | 5,203,496 | |
Clear Channel Worldwide Holdings, Inc.
6.50%, 11/15/22 | | | | | 2,230 | | | | 2,296,900 | |
Series A
7.625%, 3/15/20 | | | | | 1,575 | | | | 1,598,625 | |
Series B
6.50%, 11/15/22 | | | | | 6,270 | | | | 6,536,475 | |
7.625%, 3/15/20 | | | | | 5,330 | | | | 5,529,875 | |
CSC Holdings LLC
6.75%, 11/15/21 | | | | | 8,000 | | | | 7,764,000 | |
DISH DBS Corp.
5.00%, 3/15/23 | | | | | 2,925 | | | | 2,705,625 | |
5.875%, 11/15/24 | | | | | 11,172 | | | | 10,686,018 | |
6.75%, 6/01/21 | | | | | 1,500 | | | | 1,548,750 | |
7.875%, 9/01/19 | | | | | 520 | | | | 570,591 | |
Hughes Satellite Systems Corp.
7.625%, 6/15/21 | | | | | 9,325 | | | | 10,164,250 | |
iHeartCommunications, Inc.
6.875%, 6/15/18 | | | | | 10,579 | | | | 9,097,940 | |
9.00%, 12/15/19-3/01/21 | | | | | 5,922 | | | | 4,980,332 | |
10.00%, 1/15/18 | | | | | 9,285 | | | | 4,921,050 | |
14.00% (12.00% Cash and 2.00% PIK), 2/01/21(i) | | | | | 5,373 | | | | 2,202,938 | |
Intelsat Jackson Holdings SA
5.50%, 8/01/23 | | | | | 7,443 | | | | 6,135,823 | |
LGE HoldCo VI BV
7.125%, 5/15/24(a) | | EUR | | | 3,158 | | | | 3,771,694 | |
Liberty Interactive LLC
3.75%, 2/15/30(j) | | U.S.$ | | | 2,240 | | | | 1,321,538 | |
McClatchy Co. (The)
9.00%, 12/15/22(b) | | | | | 5,524 | | | | 5,282,325 | |
Mediacom Broadband LLC/Mediacom Broadband Corp.
6.375%, 4/01/23 | | | | | 8,000 | | | | 7,720,000 | |
Portfolio of Investments
| | | | | | | | | | |
| | | | |
Principal Amount (000) | | | U.S. $ Value | |
| |
| | | | | | | | | | |
Mediacom LLC/Mediacom Capital Corp.
7.25%, 2/15/22 | | U.S.$ | | | 965 | | | $ | 977,063 | |
Neptune Finco Corp.
6.625%, 10/15/25(a) | | | | | 2,744 | | | | 2,898,350 | |
10.125%, 1/15/23(a) | | | | | 3,053 | | | | 3,213,282 | |
10.875%, 10/15/25(a) | | | | | 2,160 | | | | 2,305,800 | |
Nexstar Broadcasting, Inc.
6.875%, 11/15/20 | | | | | 6,331 | | | | 6,544,671 | |
Nielsen Finance LLC/Nielsen Finance Co.
5.00%, 4/15/22(a) | | | | | 4,820 | | | | 4,898,325 | |
Outfront Media Capital LLC/Outfront Media Capital Corp.
5.25%, 2/15/22 | | | | | 2,935 | | | | 3,015,712 | |
5.875%, 3/15/25 | | | | | 2,925 | | | | 3,034,687 | |
Quebecor Media, Inc.
5.75%, 1/15/23 | | | | | 2,000 | | | | 2,050,000 | |
Radio One, Inc.
7.375%, 4/15/22(a) | | | | | 7,700 | | | | 7,199,500 | |
9.25%, 2/15/20(a) | | | | | 9,972 | | | | 8,226,900 | |
Sinclair Television Group, Inc.
5.375%, 4/01/21 | | | | | 7,468 | | | | 7,486,670 | |
5.625%, 8/01/24(a) | | | | | 7,000 | | | | 6,860,000 | |
6.125%, 10/01/22 | | | | | 9,854 | | | | 10,124,985 | |
6.375%, 11/01/21 | | | | | 3,500 | | | | 3,605,000 | |
Sirius XM Radio, Inc.
5.375%, 4/15/25(a) | | | | | 2,646 | | | | 2,708,975 | |
6.00%, 7/15/24(a) | | | | | 12,147 | | | | 12,824,803 | |
Starz LLC/Starz Finance Corp.
5.00%, 9/15/19 | | | | | 1,540 | | | | 1,574,843 | |
TEGNA, Inc.
4.875%, 9/15/21(a) | | | | | 1,071 | | | | 1,060,290 | |
5.50%, 9/15/24(a) | | | | | 1,480 | | | | 1,502,200 | |
6.375%, 10/15/23 | | | | | 5,474 | | | | 5,911,920 | |
Time, Inc.
5.75%, 4/15/22(a)(b) | | | | | 7,772 | | | | 7,772,000 | |
Townsquare Media, Inc.
6.50%, 4/01/23(a) | | | | | 6,801 | | | | 6,528,960 | |
Unitymedia GmbH
6.125%, 1/15/25(a) | | | | | 9,740 | | | | 9,971,325 | |
Unitymedia Hessen GmbH & Co. KG/Unitymedia NRW GmbH
5.50%, 9/15/22(a) | | EUR | | | 2,700 | | | | 3,175,107 | |
5.50%, 1/15/23(a) | | U.S.$ | | | 8,392 | | | | 8,625,298 | |
Univision Communications, Inc.
5.125%, 5/15/23-2/15/25(a) | | | | | 11,849 | | | | 11,685,435 | |
6.75%, 9/15/22(a) | | | | | 3,335 | | | | 3,522,594 | |
8.50%, 5/15/21(a) | | | | | 4,450 | | | | 4,650,250 | |
UPCB Finance IV Ltd.
5.375%, 1/15/25(a) | | | | | 9,391 | | | | 9,402,739 | |
Portfolio of Investments
| | | | | | | | | | |
| | | | |
Principal Amount (000) | | | U.S. $ Value | |
| |
| | | | | | | | | | |
UPCB Finance VI Ltd.
6.875%, 1/15/22(a) | | U.S.$ | | | 426 | | | $ | 450,178 | |
Virgin Media Finance PLC
4.875%, 2/15/22 | | | | | 5,429 | | | | 4,953,962 | |
5.25%, 2/15/22 | | | | | 941 | | | | 875,130 | |
5.75%, 1/15/25(a) | | | | | 3,070 | | | | 3,016,275 | |
6.00%, 10/15/24(a) | | | | | 7,381 | | | | 7,436,357 | |
6.375%, 4/15/23(a) | | | | | 3,360 | | | | 3,460,800 | |
Virgin Media Secured Finance PLC
5.50%, 1/15/25(a) | | GBP | | | 2,070 | | | | 3,159,201 | |
Wave Holdco LLC/Wave Holdco Corp.
8.25% (8.25% Cash or 9.00% PIK), 7/15/19(a)(i) | | U.S.$ | | | 4,606 | | | | 4,606,000 | |
WideOpenWest Finance LLC/WideOpenWest Capital Corp.
10.25%, 7/15/19 | | | | | 8,720 | | | | 8,709,100 | |
13.375%, 10/15/19 | | | | | 2,375 | | | | 2,416,562 | |
Ziggo Bond Finance BV
5.875%, 1/15/25(a) | | | | | 6,178 | | | | 5,884,545 | |
| | | | | | | | | | |
| | | | | | | | | 360,138,716 | |
| | | | | | | | | | |
Communications - Telecommunications – 4.1% | | | | | | | | | | |
Altice Luxembourg SA
7.25%, 5/15/22(a) | | EUR | | | 6,390 | | | | 6,815,960 | |
7.625%, 2/15/25(a) | | U.S.$ | | | 1,941 | | | | 1,780,868 | |
CenturyLink, Inc.
Series P
7.60%, 9/15/39 | | | | | 4,000 | | | | 3,420,000 | |
Series V
5.625%, 4/01/20 | | | | | 2,500 | | | | 2,502,850 | |
Series W
6.75%, 12/01/23 | | | | | 1,850 | | | | 1,835,940 | |
Cincinnati Bell, Inc.
8.375%, 10/15/20 | | | | | 1,600 | | | | 1,668,000 | |
Columbus International, Inc.
7.375%, 3/30/21(a) | | | | | 18,972 | | | | 19,730,880 | |
CommScope Technologies Finance LLC
6.00%, 6/15/25(a) | | | | | 3,182 | | | | 3,229,730 | |
CommScope, Inc.
5.50%, 6/15/24(a) | | | | | 5,481 | | | | 5,426,190 | |
Communications Sales & Leasing, Inc./CSL Capital LLC
6.00%, 4/15/23(a) | | | | | 7,539 | | | | 7,312,830 | |
8.25%, 10/15/23 | | | | | 15,715 | | | | 14,528,517 | |
Frontier Communications Corp.
6.25%, 9/15/21 | | | | | 5,502 | | | | 4,913,286 | |
7.125%, 1/15/23 | | | | | 100 | | | | 89,250 | |
7.625%, 4/15/24 | | | | | 10,222 | | | | 9,148,690 | |
Portfolio of Investments
| | | | | | | | | | |
| | | | |
Principal Amount (000) | | | U.S. $ Value | |
| |
| | | | | | | | | | |
7.875%, 1/15/27 | | U.S.$ | | | 4,058 | | | $ | 3,449,300 | |
9.00%, 8/15/31 | | | | | 4,350 | | | | 3,934,575 | |
10.50%, 9/15/22(a) | | | | | 22 | | | | 22,825 | |
11.00%, 9/15/25(a) | | | | | 1,772 | | | | 1,857,269 | |
InterXion Holding NV
6.00%, 7/15/20(a) | | EUR | | | 12,930 | | | | 15,027,079 | |
Level 3 Financing, Inc.
5.375%, 1/15/24(a) | | U.S.$ | | | 2,601 | | | | 2,633,512 | |
6.125%, 1/15/21 | | | | | 2,690 | | | | 2,834,587 | |
8.625%, 7/15/20 | | | | | 3,465 | | | | 3,659,906 | |
Millicom International Cellular SA
6.00%, 3/15/25(a) | | | | | 2,963 | | | | 2,437,067 | |
Numericable-SFR SAS
5.375%, 5/15/22(a) | | EUR | | | 622 | | | | 707,922 | |
5.625%, 5/15/24(a) | | | | | 1,981 | | | | 2,229,163 | |
6.00%, 5/15/22(a) | | U.S.$ | | | 5,028 | | | | 5,040,570 | |
6.25%, 5/15/24(a) | | | | | 8,130 | | | | 8,130,000 | |
Sable International Finance Ltd.
6.875%, 8/01/22(a) | | | | | 2,219 | | | | 2,257,833 | |
SBA Communications Corp.
5.625%, 10/01/19 | | | | | 3,846 | | | | 4,019,070 | |
SBA Telecommunications, Inc.
5.75%, 7/15/20 | | | | | 2,174 | | | | 2,269,113 | |
Sprint Capital Corp.
6.875%, 11/15/28 | | | | | 37 | | | | 30,710 | |
8.75%, 3/15/32 | | | | | 5,865 | | | | 5,278,500 | |
Sprint Communications, Inc.
6.00%, 11/15/22 | | | | | 1,925 | | | | 1,644,893 | |
Sprint Corp.
7.125%, 6/15/24 | | | | | 8,710 | | | | 7,648,469 | |
7.625%, 2/15/25 | | | | | 4,788 | | | | 4,249,350 | |
7.875%, 9/15/23 | | | | | 2,752 | | | | 2,545,600 | |
T-Mobile USA, Inc.
6.00%, 3/01/23 | | | | | 3,547 | | | | 3,535,916 | |
6.125%, 1/15/22 | | | | | 1,460 | | | | 1,485,550 | |
6.375%, 3/01/25 | | | | | 6,710 | | | | 6,726,775 | |
6.542%, 4/28/20 | | | | | 967 | | | | 991,175 | |
6.625%, 11/15/20 | | | | | 1,488 | | | | 1,532,640 | |
6.731%, 4/28/22 | | | | | 607 | | | | 626,728 | |
6.836%, 4/28/23 | | | | | 4,673 | | | | 4,824,872 | |
Telecom Italia Capital SA
7.20%, 7/18/36 | | | | | 7,680 | | | | 7,910,400 | |
7.721%, 6/04/38 | | | | | 4,700 | | | | 5,005,500 | |
Telecom Italia SpA
5.303%, 5/30/24(a) | | | | | 5,639 | | | | 5,667,195 | |
WaveDivision Escrow LLC/WaveDivision Escrow Corp.
8.125%, 9/01/20(a) | | | | | 5,008 | | | | 4,870,280 | |
Portfolio of Investments
| | | | | | | | | | |
| | | | |
Principal Amount (000) | | | U.S. $ Value | |
| |
| | | | | | | | | | |
Wind Acquisition Finance SA
4.75%, 7/15/20(a) | | U.S.$ | | | 5,894 | | | $ | 5,997,145 | |
7.375%, 4/23/21(a) | | | | | 17,254 | | | | 17,383,405 | |
Windstream Services LLC
6.375%, 8/01/23 | | | | | 12,858 | | | | 10,189,965 | |
7.75%, 10/01/21 | | | | | 2,780 | | | | 2,390,800 | |
Zayo Group LLC/Zayo Capital, Inc.
6.00%, 4/01/23(a) | | | | | 10,130 | | | | 10,327,535 | |
6.375%, 5/15/25(a) | | | | | 3,000 | | | | 3,037,500 | |
| | | | | | | | | | |
| | | | | | | | | 256,813,685 | |
| | | | | | | | | | |
Consumer Cyclical - Automotive – 2.2% | | | | | | | | |
Affinia Group, Inc.
7.75%, 5/01/21 | | | | | 7,248 | | | | 7,519,800 | |
American Axle & Manufacturing, Inc.
6.625%, 10/15/22 | | | | | 2,925 | | | | 3,107,813 | |
Banque PSA Finance SA
4.375%, 4/04/16(a) | | | | | 1,500 | | | | 1,516,020 | |
Commercial Vehicle Group, Inc.
7.875%, 4/15/19(b) | | | | | 16,020 | | | | 16,260,300 | |
Dana Holding Corp.
6.00%, 9/15/23 | | | | | 3,683 | | | | 3,811,905 | |
6.75%, 2/15/21 | | | | | 638 | | | | 663,520 | |
Exide Technologies
Zero Coupon, 2/01/18(f)(k) | | | | | 10,401 | | | | – 0 | – *** |
Series AI
7.00%, 4/30/25(f)(i)(j)(k) | | | | | 16,455 | | | | 12,604,794 | |
11.00%, 4/30/20(g)(i) | | | | | 21,458 | | | | 17,487,954 | |
Gates Global LLC/Gates Global Co.
5.75%, 7/15/22(a) | | EUR | | | 710 | | | | 632,565 | |
6.00%, 7/15/22(a) | | U.S.$ | | | 19,149 | | | | 15,367,072 | |
Goodyear Tire & Rubber Co. (The)
7.00%, 3/15/28 | | | | | 700 | | | | 763,000 | |
8.75%, 8/15/20 | | | | | 2,829 | | | | 3,352,365 | |
LKQ Corp.
4.75%, 5/15/23 | | | | | 10,086 | | | | 9,909,495 | |
Meritor, Inc.
6.25%, 2/15/24 | | | | | 2,087 | | | | 1,993,085 | |
6.75%, 6/15/21 | | | | | 4,325 | | | | 4,270,938 | |
Navistar International Corp.
8.25%, 11/01/21 | | | | | 10,185 | | | | 7,944,300 | |
Schaeffler Holding Finance BV
6.75%, 11/15/22(a)(i) | | | | | 4,484 | | | | 4,898,770 | |
6.875% (6.875% Cash or 7.625% PIK), 8/15/18(a)(i) | | | | | 2,200 | | | | 2,277,000 | |
6.875%, 8/15/18(a)(i) | | EUR | | | 3,174 | | | | 3,621,175 | |
Titan International, Inc.
6.875%, 10/01/20(b) | | U.S.$ | | | 9,000 | | | | 7,605,000 | |
Portfolio of Investments
| | | | | | | | | | |
| | | | |
Principal Amount (000) | | | U.S. $ Value | |
| |
| | | | | | | | | | |
ZF North America Capital, Inc.
4.75%, 4/29/25(a) | | U.S.$ | | | 11,017 | | | $ | 10,810,431 | |
| | | | | | | | | | |
| | | | | | | | | 136,417,302 | |
| | | | | | | | | | |
Consumer Cyclical - Entertainment – 0.6% | | | | | | | | | | |
AMC Entertainment, Inc.
5.75%, 6/15/25 | | | | | 6,515 | | | | 6,563,862 | |
Carlson Travel Holdings, Inc.
7.50%, 8/15/19(a)(i) | | | | | 7,910 | | | | 7,949,504 | |
Carlson Wagonlit BV
6.875%, 6/15/19(a) | | | | | 3,275 | | | | 3,434,656 | |
Cedar Fair LP/Canada’s Wonderland Co./Magnum Management Corp.
5.375%, 6/01/24 | | | | | 2,923 | | | | 2,988,768 | |
Live Nation Entertainment, Inc.
7.00%, 9/01/20(a) | | | | | 3,073 | | | | 3,257,380 | |
Pinnacle Entertainment, Inc.
8.75%, 5/15/20 | | | | | 271 | | | | 282,179 | |
Regal Entertainment Group
5.75%, 6/15/23-2/01/25 | | | | | 7,694 | | | | 7,654,800 | |
Royal Caribbean Cruises Ltd.
7.25%, 3/15/18 | | | | | 1,000 | | | | 1,095,000 | |
7.50%, 10/15/27 | | | | | 3,000 | | | | 3,495,000 | |
| | | | | | | | | | |
| | | | | | | | | 36,721,149 | |
| | | | | | | | | | |
Consumer Cyclical - Other – 3.3% | | | | | | | | | | |
Beazer Homes USA, Inc.
5.75%, 6/15/19 | | | | | 6,055 | | | | 5,827,937 | |
7.50%, 9/15/21 | | | | | 3,353 | | | | 3,269,175 | |
Boyd Gaming Corp.
9.00%, 7/01/20 | | | | | 6,649 | | | | 7,164,297 | |
Caesars Entertainment Operating Co., Inc.
10.00%, 12/15/18(c) | | | | | 1,935 | | | | 570,825 | |
11.25%, 6/01/17(c) | | | | | 1,350 | | | | 1,069,875 | |
Caesars Entertainment Resort Properties LLC/Caesars Entertainment Resort Prope
8.00%, 10/01/20 | | | | | 6,600 | | | | 6,550,500 | |
Caesars Growth Properties Holdings LLC/Caesars Growth Properties Finance, Inc.
9.375%, 5/01/22 | | | | | 5,320 | | | | 4,402,300 | |
CalAtlantic Group, Inc.
6.625%, 5/01/20 | | | | | 7,280 | | | | 8,062,600 | |
8.375%, 5/15/18 | | | | | 3,250 | | | | 3,737,500 | |
10.75%, 9/15/16 | | | | | 1,667 | | | | 1,787,858 | |
DR Horton, Inc.
4.75%, 5/15/17 | | | | | 2,000 | | | | 2,070,000 | |
6.50%, 4/15/16 | | | | | 1,000 | | | | 1,017,500 | |
Portfolio of Investments
| | | | | | | | | | |
| | | | |
Principal Amount (000) | | | U.S. $ Value | |
| |
| | | | | | | | | | |
Eldorado Resorts, Inc.
7.00%, 8/01/23(a) | | U.S.$ | | | 4,493 | | | $ | 4,549,163 | |
International Game Technology PLC
6.25%, 2/15/22(a) | | | | | 12,305 | | | | 11,997,375 | |
6.50%, 2/15/25(a) | | | | | 10,375 | | | | 9,752,500 | |
Isle of Capri Casinos, Inc.
5.875%, 3/15/21 | | | | | 266 | | | | 279,965 | |
K. Hovnanian Enterprises, Inc.
5.00%, 11/01/21 | | | | | 12,319 | | | | 8,623,300 | |
7.25%, 10/15/20(a) | | | | | 1,741 | | | | 1,636,540 | |
KB Home
4.75%, 5/15/19 | | | | | 3,513 | | | | 3,454,667 | |
7.00%, 12/15/21 | | | | | 3,656 | | | | 3,701,700 | |
7.25%, 6/15/18 | | | | | 1,000 | | | | 1,070,000 | |
7.50%, 9/15/22 | | | | | 1,266 | | | | 1,297,650 | |
9.10%, 9/15/17 | | | | | 1,300 | | | | 1,436,500 | |
Lennar Corp.
6.95%, 6/01/18 | | | | | 2,780 | | | | 3,026,725 | |
Series B
6.50%, 4/15/16 | | | | | 3,200 | | | | 3,256,000 | |
M/I Homes, Inc.
8.625%, 11/15/18 | | | | | 5,325 | | | | 5,438,156 | |
MCE Finance Ltd.
5.00%, 2/15/21(a) | | | | | 9,295 | | | | 8,714,062 | |
MDC Holdings, Inc.
5.50%, 1/15/24 | | | | | 964 | | | | 983,280 | |
6.00%, 1/15/43 | | | | | 6,107 | | | | 4,946,670 | |
Meritage Homes Corp.
6.00%, 6/01/25 | | | | | 4,696 | | | | 4,813,400 | |
7.00%, 4/01/22 | | | | | 3,817 | | | | 4,179,615 | |
7.15%, 4/15/20 | | | | | 2,500 | | | | 2,725,000 | |
NAI Entertainment Holdings/NAI Entertainment Holdings Finance Corp.
5.00%, 8/01/18(a) | | | | | 1,806 | | | | 1,864,695 | |
New Cotai LLC/New Cotai Capital Corp.
10.625%, 5/01/19(a)(b)(i) | | | | | 7,462 | | | | 6,193,315 | |
PulteGroup, Inc.
7.875%, 6/15/32 | | | | | 7,600 | | | | 8,797,000 | |
Safari Holding Verwaltungs GmbH
8.25%, 2/15/21(a) | | EUR | | | 1,752 | | | | 1,994,210 | |
Scientific Games International, Inc.
7.00%, 1/01/22(a) | | U.S.$ | | | 13,291 | | | | 13,357,455 | |
Shea Homes LP/Shea Homes Funding Corp.
5.875%, 4/01/23(a) | | | | | 2,423 | | | | 2,535,064 | |
6.125%, 4/01/25(a) | | | | | 4,677 | | | | 4,899,158 | |
Studio City Finance Ltd.
8.50%, 12/01/20(a)(b) | | | | | 6,480 | | | | 6,496,200 | |
Portfolio of Investments
| | | | | | | | | | |
| | | | |
Principal Amount (000) | | | U.S. $ Value | |
| |
| | | | | | | | | | |
Taylor Morrison Communities, Inc./Monarch Communities, Inc.
5.625%, 3/01/24(a) | | U.S.$ | | | 11,952 | | | $ | 11,772,720 | |
5.875%, 4/15/23(a) | | | | | 4,950 | | | | 4,999,500 | |
Wynn Las Vegas LLC/Wynn Las Vegas Capital Corp.
5.50%, 3/01/25(a) | | | | | 4,515 | | | | 4,237,553 | |
Wynn Macau Ltd.
5.25%, 10/15/21(a)(b) | | | | | 8,100 | | | | 7,411,500 | |
| | | | | | | | | | |
| | | | | | | | | 205,971,005 | |
| | | | | | | | | | |
Consumer Cyclical -
Restaurants – 0.4% | | | | | | | | | | |
1011778 BC ULC/New Red Finance, Inc.
4.625%, 1/15/22(a) | | | | | 6,363 | | | | 6,458,445 | |
6.00%, 4/01/22(a) | | | | | 10,455 | | | | 10,938,544 | |
Pizzaexpress Financing 1 PLC
8.625%, 8/01/22(a) | | GBP | | | 751 | | | | 1,220,314 | |
Pizzaexpress Financing 2 PLC
6.625%, 8/01/21(a) | | | | | 2,879 | | | | 4,615,056 | |
Stonegate Pub Co. Financing PLC
5.75%, 4/15/19(a) | | | | | 2,206 | | | | 3,418,895 | |
| | | | | | | | | | |
| | | | | | | | | 26,651,254 | |
| | | | | | | | | | |
Consumer Cyclical - Retailers – 2.6% | | | | | | | | | | |
American Tire Distributors, Inc.
10.25%, 3/01/22(a) | | U.S.$ | | | 14,380 | | | | 14,523,800 | |
Argos Merger Sub, Inc.
7.125%, 3/15/23(a) | | | | | 16,637 | | | | 17,510,442 | |
Asbury Automotive Group, Inc.
6.00%, 12/15/24(a) | | | | | 1,507 | | | | 1,593,653 | |
Brighthouse Group PLC
7.875%, 5/15/18(a) | | GBP | | | 4,319 | | | | 6,237,494 | |
Cash America International, Inc.
5.75%, 5/15/18 | | U.S.$ | | | 7,214 | | | | 7,268,105 | |
Dollar Tree, Inc.
5.75%, 3/01/23(a) | | | | | 10,697 | | | | 11,271,964 | |
Dufry Finance SCA
4.50%, 8/01/23(a) | | EUR | | | 6,912 | | | | 7,961,818 | |
Group 1 Automotive, Inc.
5.00%, 6/01/22 | | U.S.$ | | | 2,143 | | | | 2,164,430 | |
JC Penney Corp., Inc.
6.375%, 10/15/36 | | | | | 1,169 | | | | 832,913 | |
7.40%, 4/01/37 | | | | | 4,492 | | | | 3,413,920 | |
L Brands, Inc.
6.875%, 11/01/35(a) | | | | | 9,230 | | | | 9,587,662 | |
6.90%, 7/15/17 | | | | | 2,401 | | | | 2,593,080 | |
6.95%, 3/01/33 | | | | | 3,500 | | | | 3,648,750 | |
Levi Strauss & Co.
5.00%, 5/01/25 | | | | | 7,819 | | | | 7,916,738 | |
Portfolio of Investments
| | | | | | | | | | |
| | | | |
Principal Amount (000) | | | U.S. $ Value | |
| |
| | | | | | | | | | |
Men’s Wearhouse, Inc. (The)
7.00%, 7/01/22 | | U.S.$ | | | 3,449 | | | $ | 3,586,960 | |
Murphy Oil USA, Inc.
6.00%, 8/15/23 | | | | | 3,166 | | | | 3,340,130 | |
Neiman Marcus Group Ltd. LLC
8.75% (8.75% Cash or 9.5% PIK),
10/15/21(a)(i) | | | | | 10,810 | | | | 11,228,347 | |
Party City Holdings, Inc.
6.125%, 8/15/23(a) | | | | | 6,058 | | | | 6,239,740 | |
Rite Aid Corp.
6.125%, 4/01/23(a) | | | | | 13,761 | | | | 14,827,477 | |
Sally Holdings LLC/Sally Capital, Inc.
5.75%, 6/01/22 | | | | | 5,376 | | | | 5,671,680 | |
Serta Simmons Bedding LLC
8.125%, 10/01/20(a) | | | | | 9,414 | | | | 9,943,537 | |
Sonic Automotive, Inc.
5.00%, 5/15/23 | | | | | 8,953 | | | | 8,706,792 | |
Wolverine World Wide, Inc.
6.125%, 10/15/20 | | | | | 1,999 | | | | 2,098,950 | |
| | | | | | | | | | |
| | | | | | | | | 162,168,382 | |
| | | | | | | | | | |
Consumer Non-Cyclical – 7.9% | | | | | | | | | | |
Air Medical Merger Sub Corp.
6.375%, 5/15/23(a) | | | | | 11,200 | | | | 10,192,000 | |
Alere, Inc.
6.375%, 7/01/23(a) | | | | | 1,482 | | | | 1,541,280 | |
7.25%, 7/01/18 | | | | | 3,046 | | | | 3,175,455 | |
AMAG Pharmaceuticals, Inc.
7.875%, 9/01/23(a) | | | | | 6,466 | | | | 6,029,545 | |
Amsurg Corp.
5.625%, 7/15/22 | | | | | 10,840 | | | | 10,650,300 | |
Aramark Services, Inc.
5.75%, 3/15/20 | | | | | 2,684 | | | | 2,801,425 | |
BI-LO LLC/BI-LO Finance Corp.
8.625%, 9/15/18(a)(i) | | | | | 10,936 | | | | 10,006,440 | |
9.25%, 2/15/19(a) | | | | | 6,528 | | | | 6,707,520 | |
Boparan Finance PLC
5.25%, 7/15/19(a) | | GBP | | | 5,799 | | | | 8,537,450 | |
5.50%, 7/15/21(a) | | | | | 6,175 | | | | 8,662,636 | |
Capsugel SA
7.00%, 5/15/19(a)(i) | | U.S.$ | | | 15,989 | | | | 16,108,917 | |
Care UK Health & Social Care PLC
5.579%, 7/15/19(a)(h) | | GBP | | | 1,357 | | | | 1,925,641 | |
8.079%, 1/15/20(a)(h) | | | | | 2,000 | | | | 2,774,880 | |
Cerba European Lab SAS
7.00%, 2/01/20(a) | | EUR | | | 4,950 | | | | 5,674,606 | |
Cerberus Nightingale 1 SARL
8.25%, 2/01/20(a) | | | | | 1,000 | | | | 1,116,145 | |
Portfolio of Investments
| | | | | | | | | | |
| | | | |
Principal Amount (000) | | | U.S. $ Value | |
| |
| | | | | | | | | | |
CHS/Community Health Systems, Inc.
6.875%, 2/01/22 | | U.S.$ | | | 8,522 | | | $ | 8,585,915 | |
Concordia Healthcare Corp.
7.00%, 4/15/23(a) | | | | | 1,245 | | | | 1,083,150 | |
9.50%, 10/21/22(a)(b) | | | | | 3,909 | | | | 3,830,820 | |
ConvaTec Healthcare E SA
10.50%, 12/15/18(a) | | | | | 8,448 | | | | 8,733,120 | |
DaVita HealthCare Partners, Inc.
5.00%, 5/01/25 | | | | | 10,922 | | | | 10,842,248 | |
Elior Finance & Co. SCA
6.50%, 5/01/20(a) | | EUR | | | 658 | | | | 771,520 | |
Endo Finance LLC
5.75%, 1/15/22(a) | | U.S.$ | | | 3,100 | | | | 3,030,250 | |
Endo Finance LLC/Endo Finco, Inc.
7.25%, 12/15/20(a) | | | | | 3,140 | | | | 3,245,975 | |
7.75%, 1/15/22(a) | | | | | 3,035 | | | | 3,148,812 | |
Endo Ltd./Endo Finance LLC/Endo Finco, Inc.
6.00%, 7/15/23-2/01/25(a) | | | | | 11,151 | | | | 11,097,945 | |
Envision Healthcare Corp.
5.125%, 7/01/22(a) | | | | | 8,481 | | | | 8,226,570 | |
Ephios Bondco PLC
6.25%, 7/01/22(a) | | EUR | | | 9,492 | | | | 10,907,582 | |
First Quality Finance Co., Inc.
4.625%, 5/15/21(a) | | U.S.$ | | | 16,738 | | | | 15,524,495 | |
Galaxy Bidco Ltd.
6.375%, 11/15/20(a) | | GBP | | | 4,512 | | | | 7,199,149 | |
Grifols Worldwide Operations Ltd.
5.25%, 4/01/22 | | U.S.$ | | | 4,914 | | | | 5,085,990 | |
HCA, Inc.
4.25%, 10/15/19 | | | | | 3,274 | | | | 3,372,056 | |
5.375%, 2/01/25 | | | | | 441 | | | | 452,576 | |
5.875%, 3/15/22 | | | | | 2,450 | | | | 2,695,000 | |
6.50%, 2/15/16 | | | | | 782 | | | | 792,166 | |
HealthSouth Corp.
7.75%, 9/15/22 | | | | | 317 | | | | 329,680 | |
Hill-Rom Holdings, Inc.
5.75%, 9/01/23(a) | | | | | 1,473 | | | | 1,502,460 | |
Holding Medi-Partenaires SAS
7.00%, 5/15/20(a) | | EUR | | | 6,584 | | | | 7,726,070 | |
Horizon Pharma Financing, Inc.
6.625%, 5/01/23(a) | | U.S.$ | | | 9,168 | | | | 7,930,320 | |
HRG Group, Inc.
7.875%, 7/15/19(a) | | | | | 2,942 | | | | 3,118,520 | |
7.875%, 7/15/19 | | | | | 11,061 | | | | 11,738,486 | |
IASIS Healthcare LLC/IASIS Capital Corp.
8.375%, 5/15/19 | | | | | 7,753 | | | | 7,927,442 | |
Portfolio of Investments
| | | | | | | | | | |
| | | | |
Principal Amount (000) | | | U.S. $ Value | |
| |
| | | | | | | | | | |
IDH Finance PLC
6.00%, 12/01/18(a) | | GBP | | | 2,145 | | | $ | 3,336,493 | |
Immucor, Inc.
11.125%, 8/15/19 | | U.S.$ | | | 7,400 | | | | 7,585,000 | |
Jaguar Holding Co. II/Pharmaceutical Product Development LLC
6.375%, 8/01/23(a) | | | | | 4,401 | | | | 4,406,501 | |
Kindred Healthcare, Inc.
8.00%, 1/15/20(a) | | | | | 12,720 | | | | 13,197,000 | |
Kinetic Concepts, Inc./KCI USA, Inc.
10.50%, 11/01/18 | | | | | 14,959 | | | | 15,795,208 | |
Mallinckrodt International Finance SA/Mallinckrodt CB LLC
5.50%, 4/15/25(a) | | | | | 11,782 | | | | 10,717,968 | |
5.625%, 10/15/23(a) | | | | | 1,441 | | | | 1,359,944 | |
5.75%, 8/01/22(a) | | | | | 6,054 | | | | 5,755,053 | |
MPH Acquisition Holdings LLC
6.625%, 4/01/22(a) | | | | | 6,322 | | | | 6,448,440 | |
Post Holdings, Inc.
6.00%, 12/15/22(a) | | | | | 2,096 | | | | 2,106,480 | |
7.375%, 2/15/22 8.00%, 7/15/25(a) | | | |
| 17,141
1,130 |
| |
| 18,059,758
1,226,050 |
|
PRA Holdings, Inc.
9.50%, 10/01/23(a) | | | | | 10,606 | | | | 11,958,265 | |
Priory Group No. 3 PLC
7.00%, 2/15/18(a) | | GBP | | | 3,955 | | | | 6,278,145 | |
Quintiles Transnational Corp.
4.875%, 5/15/23(a) | | U.S.$ | | | 6,600 | | | | 6,785,592 | |
R&R Ice Cream PLC
5.50%, 5/15/20(a) | | GBP | | | 4,939 | | | | 7,813,829 | |
8.25%, 5/15/20(a) | | AUD | | | 3,910 | | | | 2,857,926 | |
R&R PIK PLC
9.25%, 5/15/18(a)(i) | | EUR | | | 4,332 | | | | 4,811,559 | |
Rivers Pittsburgh Borrower LP/Rivers Pittsburgh Finance Corp.
9.50%, 6/15/19(a) | | U.S.$ | | | 1,568 | | | | 1,630,720 | |
RSI Home Products, Inc.
6.50%, 3/15/23(a) | | | | | 12,063 | | | | 12,455,047 | |
Smithfield Foods, Inc.
5.25%, 8/01/18(a) | | | | | 3,549 | | | | 3,602,235 | |
5.875%, 8/01/21(a) | | | | | 5,820 | | | | 6,111,000 | |
6.625%, 8/15/22 | | | | | 1,516 | | | | 1,622,120 | |
Spectrum Brands, Inc.
5.75%, 7/15/25(a) | | | | | 4,374 | | | | 4,663,777 | |
6.125%, 12/15/24(a) | | | | | 2,311 | | | | 2,490,103 | |
6.375%, 11/15/20 | | | | | 2,586 | | | | 2,760,555 | |
6.625%, 11/15/22 | | | | | 2,624 | | | | 2,866,720 | |
Portfolio of Investments
| | | | | | | | | | |
| | | | |
Principal Amount (000) | | | U.S. $ Value | |
| |
| | | | | | | | | | |
Sterigenics-Nordion Holdings LLC
6.50%, 5/15/23(a) | | U.S.$ | | | 1,448 | | | $ | 1,457,050 | |
Sun Products Corp. (The)
7.75%, 3/15/21(a) | | | | | 16,271 | | | | 15,254,062 | |
Surgical Care Affiliates, Inc.
6.00%, 4/01/23(a) | | | | | 2,748 | | | | 2,768,610 | |
TeamSystem Holding SpA
7.375%, 5/15/20(a) | | EUR | | | 5,692 | | | | 6,521,156 | |
Tenet Healthcare Corp.
6.875%, 11/15/31 | | U.S.$ | | | 20,258 | | | | 18,232,200 | |
8.125%, 4/01/22 | | | | | 4,631 | | | | 4,897,282 | |
Valeant Pharmaceuticals International, Inc.
5.50%, 3/01/23(a) | | | | | 1,466 | | | | 1,231,440 | |
5.875%, 5/15/23(a) | | | | | 2,975 | | | | 2,513,875 | |
6.125%, 4/15/25(a) | | | | | 14,408 | | | | 12,174,760 | |
6.75%, 8/15/21(a) | | | | | 2,100 | | | | 1,869,000 | |
7.25%, 7/15/22(a) | | | | | 5,402 | | | | 4,807,780 | |
Voyage Care Bondco PLC
6.50%, 8/01/18(a) | | GBP | | | 4,750 | | | | 7,469,052 | |
| | | | | | | | | | |
| | | | | | | | | 492,700,312 | |
| | | | | | | | | | |
Energy – 5.4% | | | | | | | | | | |
Antero Resources Corp.
5.125%, 12/01/22 | | U.S.$ | | | 2,653 | | | | 2,381,068 | |
5.375%, 11/01/21 | | | | | 9,000 | | | | 8,280,000 | |
5.625%, 6/01/23(a) | | | | | 2,422 | | | | 2,228,240 | |
6.00%, 12/01/20 | | | | | 1,911 | | | | 1,834,560 | |
BreitBurn Energy Partners LP/BreitBurn Finance Corp.
7.875%, 4/15/22 | | | | | 4,006 | | | | 1,502,250 | |
California Resources Corp.
6.00%, 11/15/24 | | | | | 9,704 | | | | 6,598,720 | |
Carrizo Oil & Gas, Inc.
7.50%, 9/15/20 | | | | | 1,394 | | | | 1,390,515 | |
Chaparral Energy, Inc.
7.625%, 11/15/22 | | | | | 9,723 | | | | 3,208,590 | |
8.25%, 9/01/21 | | | | | 2,000 | | | | 680,000 | |
CHC Helicopter SA
9.25%, 10/15/20 | | | | | 13,049 | | | | 7,437,987 | |
Chesapeake Energy Corp.
2.50%, 5/15/37(j) | | | | | 5,299 | | | | 4,530,645 | |
3.571%, 4/15/19(h) | | | | | 4,428 | | | | 2,856,060 | |
4.875%, 4/15/22 | | | | | 4,915 | | | | 3,047,300 | |
7.25%, 12/15/18 | | | | | 411 | | | | 330,855 | |
Cobalt International Energy, Inc.
2.625%, 12/01/19(j) | | | | | 4,083 | | | | 2,939,760 | |
Crestwood Midstream Partners LP/Crestwood Midstream Finance Corp.
6.25%, 4/01/23(a) | | | | | 5,809 | | | | 4,937,650 | |
Portfolio of Investments
| | | | | | | | | | |
| | | | |
Principal Amount (000) | | | U.S. $ Value | |
| |
| | | | | | | | | | |
DCP Midstream Operating LP
3.875%, 3/15/23 | | U.S.$ | | | 7,360 | | | $ | 6,232,912 | |
4.95%, 4/01/22 | | | | | 2,685 | | | | 2,450,404 | |
5.60%, 4/01/44 | | | | | 10,432 | | | | 8,098,122 | |
Denbury Resources, Inc.
4.625%, 7/15/23 | | | | | 21,079 | | | | 14,070,232 | |
5.50%, 5/01/22 | | | | | 1,380 | | | | 966,000 | |
Diamondback Energy, Inc.
7.625%, 10/01/21 | | | | | 3,235 | | | | 3,445,275 | |
Energy Transfer Equity LP
5.875%, 1/15/24 | | | | | 8,866 | | | | 8,589,159 | |
7.50%, 10/15/20 | | | | | 2,657 | | | | 2,856,806 | |
Energy XXI Gulf Coast, Inc.
7.75%, 6/15/19 | | | | | 3,500 | | | | 717,500 | |
11.00%, 3/15/20(a) | | | | | 4,905 | | | | 2,575,125 | |
EP Energy LLC/Everest Acquisition Finance, Inc.
9.375%, 5/01/20 | | | | | 5,679 | | | | 4,940,730 | |
EXCO Resources, Inc.
7.50%, 9/15/18 | | | | | 2,195 | | | | 603,625 | |
8.50%, 4/15/22 | | | | | 2,404 | | | | 552,920 | |
Global Partners LP/GLP Finance Corp.
6.25%, 7/15/22 | | | | | 16,442 | | | | 15,126,640 | |
Golden Energy Offshore Services AS
8.41%, 5/28/17(d)(h) | | NOK | | | 33,357 | | | | 1,511,454 | |
Holly Energy Partners LP/Holly Energy Finance Corp.
6.50%, 3/01/20 | | U.S.$ | | | 3,948 | | | | 3,928,260 | |
Hornbeck Offshore Services, Inc.
5.00%, 3/01/21 | | | | | 5,000 | | | | 3,825,000 | |
5.875%, 4/01/20 | | | | | 4,695 | | | | 3,779,475 | |
Jones Energy Holdings LLC/Jones Energy Finance Corp.
6.75%, 4/01/22 | | | | | 8,316 | | | | 6,673,590 | |
Jupiter Resources, Inc.
8.50%, 10/01/22(a) | | | | | 14,828 | | | | 7,710,560 | |
Laredo Petroleum, Inc.
7.375%, 5/01/22 | | | | | 4,656 | | | | 4,597,800 | |
Legacy Reserves LP/Legacy Reserves Finance Corp.
6.625%, 12/01/21 | | | | | 12,363 | | | | 8,159,580 | |
8.00%, 12/01/20 | | | | | 3,554 | | | | 2,523,340 | |
Linn Energy LLC/Linn Energy Finance Corp.
6.25%, 11/01/19 | | | | | 2,788 | | | | 655,180 | |
6.50%, 9/15/21 | | | | | 655 | | | | 144,100 | |
8.625%, 4/15/20 | | | | | 4,190 | | | | 1,089,400 | |
MarkWest Energy Partners LP/MarkWest Energy Finance Corp.
4.875%, 12/01/24 | | | | | 3,895 | | | | 3,675,906 | |
Portfolio of Investments
| | | | | | | | | | |
| | | | |
Principal Amount (000) | | | U.S. $ Value | |
| |
| | | | | | | | | | |
Memorial Resource Development Corp.
5.875%, 7/01/22 | | U.S.$ | | | 14,440 | | | $ | 13,609,700 | |
Newfield Exploration Co.
5.625%, 7/01/24 | | | | | 4,116 | | | | 4,074,840 | |
Northern Blizzard Resources, Inc.
7.25%, 2/01/22(a) | | | | | 4,001 | | | | 3,280,820 | |
Northern Oil and Gas, Inc.
8.00%, 6/01/20 | | | | | 3,075 | | | | 2,543,025 | |
Oasis Petroleum, Inc.
6.875%, 3/15/22 | | | | | 4,137 | | | | 3,526,792 | |
Offshore Group Investment Ltd.
7.125%, 4/01/23 | | | | | 8,325 | | | | 2,445,469 | |
7.50%, 11/01/19 | | | | | 8,860 | | | | 2,602,625 | |
Pacific Drilling SA
5.375%, 6/01/20(a) | | | | | 12,449 | | | | 6,629,092 | |
Paragon Offshore PLC
6.75%, 7/15/22(a) | | | | | 17,781 | | | | 2,711,603 | |
7.25%, 8/15/24(a) | | | | | 6,607 | | | | 1,007,568 | |
PHI, Inc.
5.25%, 3/15/19 | | | | | 7,518 | | | | 6,653,430 | |
Precision Drilling Corp.
6.50%, 12/15/21 | | | | | 1,870 | | | | 1,626,900 | |
QEP Resources, Inc.
5.25%, 5/01/23 | | | | | 3,628 | | | | 3,219,850 | |
6.875%, 3/01/21 | | | | | 2,453 | | | | 2,379,410 | |
Sabine Pass Liquefaction LLC
5.625%, 3/01/25(a) | | | | | 9,090 | | | | 8,715,037 | |
5.75%, 5/15/24 | | | | | 7,426 | | | | 7,166,090 | |
6.25%, 3/15/22 | | | | | 3,000 | | | | 2,977,500 | |
Sabine Pass LNG LP
6.50%, 11/01/20 | | | | | 2,949 | | | | 2,971,117 | |
Sanchez Energy Corp.
6.125%, 1/15/23 | | | | | 5,546 | | | | 4,020,850 | |
SandRidge Energy, Inc.
7.50%, 2/15/23 | | | | | 1,970 | | | | 458,025 | |
8.125%, 10/15/22 | | | | | 3,164 | | | | 743,540 | |
Seitel, Inc.
9.50%, 4/15/19 | | | | | 2,574 | | | | 2,162,160 | |
Seven Generations Energy Ltd.
6.75%, 5/01/23(a) | | | | | 2,564 | | | | 2,333,240 | |
8.25%, 5/15/20(a) | | | | | 7,367 | | | | 7,145,990 | |
SM Energy Co.
5.625%, 6/01/25 | | | | | 3,563 | | | | 3,242,330 | |
6.50%, 1/01/23 | | | | | 2,737 | | | | 2,697,029 | |
Southern Star Central Corp.
5.125%, 7/15/22(a) | | | | | 6,100 | | | | 5,917,000 | |
Portfolio of Investments
| | | | | | | | | | |
| | | | |
Principal Amount (000) | | | U.S. $ Value | |
| |
| | | | | | | | | | |
Targa Resources Partners LP/Targa Resources Partners Finance Corp.
5.25%, 5/01/23 | | U.S.$ | | | 8,186 | | | $ | 7,612,980 | |
6.375%, 8/01/22 | | | | | 2,736 | | | | 2,653,920 | |
6.875%, 2/01/21 | | | | | 3,250 | | | | 3,266,250 | |
Tervita Corp.
8.00%, 11/15/18(a) | | | | | 6,093 | | | | 4,478,355 | |
9.75%, 11/01/19(a) | | | | | 4,592 | | | | 2,296,000 | |
10.875%, 2/15/18(a) | | | | | 2,648 | | | | 1,324,000 | |
Transocean, Inc.
6.80%, 3/15/38 | | | | | 7,616 | | | | 4,836,160 | |
7.50%, 4/15/31 | | | | | 1,800 | | | | 1,215,000 | |
Triangle USA Petroleum Corp.
6.75%, 7/15/22(a) | | | | | 16,846 | | | | 7,917,620 | |
Whiting Petroleum Corp.
1.25%, 4/01/20(a)(j) | | | | | 2,925 | | | | 2,575,828 | |
5.75%, 3/15/21 | | | | | 5,080 | | | | 4,718,050 | |
6.25%, 4/01/23 | | | | | 10,995 | | | | 10,225,350 | |
WPX Energy, Inc.
8.25%, 8/01/23 | | | | | 3,355 | | | | 3,153,700 | |
| | | | | | | | | | |
| | | | | | | | | 336,817,540 | |
| | | | | | | | | | |
Other Industrial – 1.1% | | | | | | | | | | |
Algeco Scotsman Global Finance PLC
8.50%, 10/15/18(a) | | | | | 2,260 | | | | 1,971,850 | |
9.00%, 10/15/18(a) | | EUR | | | 1,810 | | | | 1,771,426 | |
10.75%, 10/15/19(a) | | U.S.$ | | | 11,200 | | | | 6,160,000 | |
B456 Systems, Inc.
3.75%, 4/15/16(e)(j)(k) | | | | | 3,985 | | | | 169,363 | |
Belden, Inc.
5.25%, 7/15/24(a) | | | | | 3,975 | | | | 3,716,625 | |
Briggs & Stratton Corp.
6.875%, 12/15/20 | | | | | 737 | | | | 805,173 | |
General Cable Corp.
4.50%, 11/15/29(j)(l) | | | | | 5,909 | | | | 4,036,586 | |
5.75%, 10/01/22 | | | | | 9,213 | | | | 7,946,212 | |
Laureate Education, Inc.
10.00%, 9/01/19(a) | | | | | 18,519 | | | | 14,722,605 | |
Liberty Tire Recycling LLC
11.00%, 3/31/21(d)(f)(i) | | | | | 2,058 | | | | 986,361 | |
Modular Space Corp.
10.25%, 1/31/19(a) | | | | | 8,276 | | | | 4,944,910 | |
New Enterprise Stone & Lime Co., Inc.
11.00%, 9/01/18 | | | | | 5,748 | | | | 4,885,800 | |
13.00% (6.00% Cash and 7.00% PIK), 3/15/18(i) | | | | | 5,366 | | | | 5,580,231 | |
Safway Group Holding LLC/Safway Finance Corp.
7.00%, 5/15/18(a) | | | | | 11,622 | | | | 11,941,605 | |
| | | | | | | | | | |
| | | | | | | | | 69,638,747 | |
| | | | | | | | | | |
Portfolio of Investments
| | | | | | | | | | |
| | | | |
Principal Amount (000) | | | U.S. $ Value | |
| |
| | | | | | | | | | |
Services – 0.5% | | | | | | | | | | |
ADT Corp. (The)
4.125%, 4/15/19 | | U.S.$ | | | 7,422 | | | $ | 7,588,995 | |
6.25%, 10/15/21(b) | | | | | 4,207 | | | | 4,543,560 | |
Cerved Group SpA
8.00%, 1/15/21(a) | | EUR | | | 1,081 | | | | 1,267,415 | |
Geo Debt Finance SCA
7.50%, 8/01/18(a)(b) | | | | | 1,635 | | | | 1,699,042 | |
IHS, Inc.
5.00%, 11/01/22 | | U.S.$ | | | 3,524 | | | | 3,559,240 | |
Mobile Mini, Inc.
7.875%, 12/01/20 | | | | | 2,320 | | | | 2,412,800 | |
Monitronics International, Inc.
9.125%, 4/01/20 | | | | | 2,267 | | | | 1,972,290 | |
Realogy Group LLC
9.00%, 1/15/20(a)(b) | | | | | 3,500 | | | | 3,692,500 | |
Service Corp. International/US
7.50%, 4/01/27 | | | | | 1,575 | | | | 1,842,750 | |
| | | | | | | | | | |
| | | | | | | | | 28,578,592 | |
| | | | | | | | | | |
Technology – 3.1% | | | | | | | | | | |
Alcatel-Lucent USA, Inc.
8.875%, 1/01/20(a) | | | | | 2,881 | | | | 3,115,081 | |
Amkor Technology, Inc.
6.375%, 10/01/22 | | | | | 10,924 | | | | 10,608,733 | |
Avaya, Inc.
7.00%, 4/01/19(a) | | | | | 4,469 | | | | 3,631,063 | |
10.50%, 3/01/21(a) | | | | | 17,549 | | | | 6,800,238 | |
Blackboard, Inc.
7.75%, 11/15/19(a) | | | | | 2,129 | | | | 1,830,940 | |
BMC Software Finance, Inc.
8.125%, 7/15/21(a) | | | | | 4,410 | | | | 3,412,238 | |
Brightstar Corp.
9.50%, 12/01/16(a) | | | | | 6,166 | | | | 6,198,063 | |
CDW LLC/CDW Finance Corp.
5.00%, 9/01/23 | | | | | 4,154 | | | | 4,309,775 | |
5.50%, 12/01/24 | | | | | 3,786 | | | | 3,965,835 | |
6.00%, 8/15/22 | | | | | 4,481 | | | | 4,809,188 | |
Ceridian HCM Holding, Inc.
11.00%, 3/15/21(a) | | | | | 9,690 | | | | 8,527,200 | |
CommScope Holding Co., Inc.
6.625% (6.625% Cash or 7.375% PIK), 6/01/20(a)(i) | | | | | 3,300 | | | | 3,432,000 | |
Compiler Finance Sub, Inc.
7.00%, 5/01/21(a) | | | | | 1,945 | | | | 1,040,575 | |
CPI International, Inc.
8.75%, 2/15/18 | | | | | 6,323 | | | | 6,354,615 | |
Dell, Inc.
6.50%, 4/15/38 | | | | | 8,360 | | | | 7,085,100 | |
Portfolio of Investments
| | | | | | | | | | |
| | | | |
Principal Amount (000) | | | U.S. $ Value | |
| |
| | | | | | | | | | |
Energizer Holdings, Inc.
5.50%, 6/15/25(a) | | U.S.$ | | | 4,473 | | | $ | 4,562,460 | |
Ensemble S Merger Sub, Inc.
9.00%, 9/30/23(a) | | | | | 7,957 | | | | 7,976,892 | |
First Data Corp.
6.75%, 11/01/20(a) | | | | | 1,058 | | | | 1,114,868 | |
7.00%, 12/01/23(a) | | | | | 6,785 | | | | 6,903,737 | |
8.25%, 1/15/21(a) | | | | | 3,924 | | | | 4,115,295 | |
11.75%, 8/15/21 | | | | | 7,441 | | | | 8,482,740 | |
12.625%, 1/15/21 | | | | | 6,761 | | | | 7,749,796 | |
Freescale Semiconductor, Inc.
5.00%, 5/15/21(a) | | | | | 4,637 | | | | 4,787,703 | |
6.00%, 1/15/22(a) | | | | | 3,529 | | | | 3,758,385 | |
Goodman Networks, Inc.
12.125%, 7/01/18 | | | | | 8,670 | | | | 3,034,500 | |
Infor Software Parent LLC/Infor
Software Parent, Inc.
7.125% (7.125% Cash or 7.875% PIK), 5/01/21(a)(i) | | | | | 5,493 | | | | 4,754,851 | |
Infor US, Inc.
5.75%, 8/15/20(a) | | | | | 2,606 | | | | 2,658,120 | |
6.50%, 5/15/22(a) | | | | | 12,441 | | | | 11,787,847 | |
Iron Mountain, Inc.
5.75%, 8/15/24 | | | | | 3,155 | | | | 3,170,775 | |
Micron Technology, Inc.
5.25%, 8/01/23(a) | | | | | 3,279 | | | | 3,203,550 | |
5.50%, 2/01/25 | | | | | 12,971 | | | | 12,354,877 | |
MSCI, Inc.
5.25%, 11/15/24(a) | | | | | 2,872 | | | | 3,022,780 | |
5.75%, 8/15/25(a) | | | | | 4,809 | | | | 5,071,091 | |
NXP BV/NXP Funding LLC
5.75%, 2/15/21-3/15/23(a) | | | | | 8,374 | | | | 8,779,555 | |
Open Text Corp.
5.625%, 1/15/23(a) | | | | | 2,491 | | | | 2,515,910 | |
Sabre GLBL, Inc.
5.375%, 4/15/23(a) | | | | | 4,041 | | | | 4,101,615 | |
SunGard Data Systems, Inc.
7.625%, 11/15/20 | | | | | 6,170 | | | | 6,432,842 | |
Syniverse Holdings, Inc.
9.125%, 1/15/19 | | | | | 1,598 | | | | 1,338,325 | |
| | | | | | | | | | |
| | | | | | | | | 196,799,158 | |
| | | | | | | | | | |
Transportation - Airlines – 0.3% | | | | | | | | | | |
Air Canada
6.75%, 10/01/19(a) | | | | | 6,910 | | | | 7,324,600 | |
8.75%, 4/01/20(a) | | | | | 11,145 | | | | 12,175,912 | |
Northwest Airlines Pass-Through Trust
Series 2000-1, Class G
7.15%, 10/01/19 | | | | | 500 | | | | 525,257 | |
Portfolio of Investments
| | | | | | | | | | |
| | | | |
Principal Amount (000) | | | U.S. $ Value | |
| |
| | | | | | | | | | |
UAL Pass-Through Trust
Series 2007-1A
6.636%, 7/02/22 | | U.S.$ | | | 1,668 | | | $ | 1,776,575 | |
| | | | | | | | | | |
| | | | | | | | | 21,802,344 | |
| | | | | | | | | | |
Transportation - Services – 0.8% | | | | | | | | | | |
Avis Budget Car Rental LLC/Avis
Budget Finance, Inc.
5.25%, 3/15/25(a) | | | | | 3,500 | | | | 3,486,875 | |
5.50%, 4/01/23 | | | | | 2,587 | | | | 2,677,545 | |
Avis Budget Finance PLC
6.00%, 3/01/21(a) | | EUR | | | 2,070 | | | | 2,390,089 | |
CEVA Group PLC
9.00%, 9/01/21(a) | | U.S.$ | | | 8,022 | | | | 6,858,810 | |
Con-way, Inc.
6.70%, 5/01/34 | | | | | 7,354 | | | | 4,885,137 | |
EC Finance PLC
5.125%, 7/15/21(a) | | EUR | | | 4,232 | | | | 4,839,868 | |
Europcar Groupe SA
5.75%, 6/15/22(a) | | | | | 2,550 | | | | 2,916,272 | |
Hapag-Lloyd AG
9.75%, 10/15/17(a) | | U.S.$ | | | 1,903 | | | | 1,950,575 | |
Hertz Corp. (The)
5.875%, 10/15/20 | | | | | 8,854 | | | | 9,163,890 | |
7.50%, 10/15/18 | | | | | 1,900 | | | | 1,942,750 | |
LBC Tank Terminals Holding Netherlands BV
6.875%, 5/15/23(a) | | | | | 5,914 | | | | 6,061,850 | |
| | | | | | | | | | |
| | | | | | | | | 47,173,661 | |
| | | | | | | | | | |
| | | | | | | | | 2,787,557,055 | |
| | | | | | | | | | |
Financial Institutions – 7.2% | | | | | | | | | | |
Banking – 4.5% | | | | | | | | | | |
ABN AMRO Bank NV
4.31%, 3/10/16(m) | | EUR | | | 5,396 | | | | 5,948,546 | |
5.00%, 2/17/16(m) | | GBP | | | 1,698 | | | | 2,618,791 | |
Ally Financial, Inc.
4.125%, 3/30/20 | | U.S.$ | | | 505 | | | | 521,413 | |
8.00%, 11/01/31 | | | | | 6,078 | | | | 7,425,095 | |
Baggot Securities Ltd.
10.24%, 11/30/15(a)(m) | | EUR | | | 5,912 | | | | 6,566,142 | |
Bank of America Corp.
Series AA
6.10%, 3/17/25(m) | | U.S.$ | | | 7,966 | | | | 8,037,694 | |
Series X
6.25%, 9/05/24(m) | | | | | 521 | | | | 528,320 | |
Series Z
6.50%, 10/23/24(m) | | | | | 4,009 | | | | 4,189,445 | |
Portfolio of Investments
| | | | | | | | | | |
| | | | |
Principal Amount (000) | | | U.S. $ Value | |
| |
| | | | | | | | | | |
Bank of Ireland
10.00%, 2/12/20 | | EUR | | | 2,270 | | | $ | 3,093,854 | |
10.00%, 7/30/16(a) | | | | | 1,419 | | | | 1,638,595 | |
Barclays Bank PLC
6.86%, 6/15/32(a)(m) | | U.S.$ | | | 838 | | | | 959,510 | |
7.625%, 11/21/22 | | | | | 6,508 | | | | 7,431,323 | |
7.70%, 4/25/18(a)(m) | | | | | 4,629 | | | | 5,015,721 | |
7.75%, 4/10/23 | | | | | 6,059 | | | | 6,581,589 | |
Barclays PLC
8.00%, 12/15/20(m) | | EUR | | | 622 | | | | 745,773 | |
8.25%, 12/15/18(m) | | U.S.$ | | | 1,464 | | | | 1,564,284 | |
BBVA International Preferred SAU
1.613%, 12/22/15(h)(m) | | EUR | | | 3,030 | | | | 3,247,895 | |
4.952%, 9/20/16(a)(b)(m) | | | | | 8,900 | | | | 9,772,204 | |
BNP Paribas SA
7.195%, 6/25/37(a)(m) | | U.S.$ | | | 6,900 | | | | 7,900,500 | |
7.375%, 8/19/25(a)(m) | | | | | 7,706 | | | | 7,975,710 | |
Citigroup, Inc.
5.95%, 1/30/23(m) | | | | | 14,778 | | | | 14,667,165 | |
Series M
6.30%, 5/15/24(m) | | | | | 7,000 | | | | 6,923,350 | |
Commerzbank AG
8.125%, 9/19/23(a) | | | | | 12,894 | | | | 14,930,220 | |
Countrywide Capital III
Series B
8.05%, 6/15/27 | | | | | 11,735 | | | | 14,625,225 | |
Credit Agricole SA
6.625%, 9/23/19(a)(m) | | | | | 3,723 | | | | 3,667,155 | |
7.589%, 1/30/20(m) | | GBP | | | 4,950 | | | | 8,279,548 | |
7.875%, 1/23/24(a)(m) | | U.S.$ | | | 2,098 | | | | 2,150,450 | |
Credit Suisse Group AG
7.50%, 12/11/23(a)(m) | | | | | 19,414 | | | | 20,481,770 | |
Danske Bank A/S
5.684%, 2/15/17(m) | | GBP | | | 5,500 | | | | 8,605,982 | |
Dresdner Funding Trust I
8.151%, 6/30/31(a) | | U.S.$ | | | 816 | | | | 1,005,720 | |
HBOS Capital Funding LP
4.939%, 5/23/16(m) | | EUR | | | 3,901 | | | | 4,332,632 | |
HT1 Funding GmbH
6.352%, 6/30/17(m) | | | | | 2,700 | | | | 2,969,055 | |
ING Groep NV
6.00%, 4/16/20(m) | | U.S.$ | | | 3,967 | | | | 3,962,041 | |
6.50%, 4/16/25(m) | | | | | 7,086 | | | | 6,908,850 | |
Intesa Sanpaolo SpA
5.017%, 6/26/24(a) | | | | | 10,206 | | | | 10,222,452 | |
LBG Capital No.1 PLC
8.00%, 6/15/20(a)(m) | | | | | 3,820 | | | | 4,297,500 | |
Portfolio of Investments
| | | | | | | | | | |
| | | | |
Principal Amount (000) | | | U.S. $ Value | |
| |
| | | | | | | | | | |
Lloyds Banking Group PLC
6.413%, 10/01/35(a)(m) | | U.S.$ | | | 3,709 | | | $ | 4,135,535 | |
6.657%, 5/21/37(a)(m) | | | | | 1,801 | | | | 2,017,120 | |
7.50%, 6/27/24(m) | | | | | 11,389 | | | | 12,100,812 | |
Royal Bank of Scotland PLC (The)
9.50%, 3/16/22(a) | | | | | 896 | | | | 978,880 | |
Skandinaviska Enskilda Banken AB
5.75%, 5/13/20(a)(m) | | | | | 13,500 | | | | 13,263,750 | |
Societe Generale SA
7.875%, 12/18/23(a)(m) | | | | | 3,061 | | | | 3,076,305 | |
8.00%, 9/29/25(a)(m) | | | | | 19,069 | | | | 19,338,178 | |
UniCredit Luxembourg Finance SA
6.00%, 10/31/17(a) | | | | | 1,870 | | | | 1,968,085 | |
UT2 Funding PLC
5.321%, 6/30/16 | | EUR | | | 1,293 | | | | 1,437,340 | |
Zions Bancorporation
5.65%, 11/15/23(b) | | U.S.$ | | | 2,289 | | | | 2,371,976 | |
5.80%, 6/15/23(m) | | | | | 2,500 | | | | 2,475,000 | |
| | | | | | | | | | |
| | | | | | | | | 282,954,500 | |
| | | | | | | | | | |
Brokerage – 0.1% | | | | | | | | | | |
E*TRADE Financial Corp.
5.375%, 11/15/22 | | | | | 4,281 | | | | 4,577,237 | |
Lehman Brothers Holdings, Inc.
4.80%, 3/13/14(e)(n) | | | | | 1,800 | | | | 133,560 | |
6.875%, 5/02/18(e) | | | | | 1,600 | | | | 122,080 | |
| | | | | | | | | | |
| | | | | | | | | 4,832,877 | |
| | | | | | | | | | |
Finance – 1.2% | | | | | | | | | | |
Artsonig Pty Ltd.
11.50%, 4/01/19(a)(i) | | | | | 8,952 | | | | 671,375 | |
Creditcorp
12.00%, 7/15/18(a) | | | | | 6,205 | | | | 4,560,675 | |
Enova International, Inc.
9.75%, 6/01/21 | | | | | 12,138 | | | | 10,286,955 | |
ILFC E-Capital Trust II
6.25%, 12/21/65(a) | | | | | 1,500 | | | | 1,410,000 | |
International Lease Finance Corp.
5.875%, 4/01/19 | | | | | 2,300 | | | | 2,467,739 | |
8.25%, 12/15/20 | | | | | 10,200 | | | | 12,189,000 | |
8.75%, 3/15/17 | | | | | 2,375 | | | | 2,562,031 | |
8.875%, 9/01/17 | | | | | 2,210 | | | | 2,453,100 | |
Molycorp, Inc.
3.25%, 6/15/16(c)(j) | | | | | 2,229 | | | | 13,931 | |
Navient Corp.
4.875%, 6/17/19 | | | | | 5,837 | | | | 5,647,297 | |
5.50%, 1/15/19-1/25/23 | | | | | 2,213 | | | | 2,179,096 | |
5.875%, 10/25/24 | | | | | 4,505 | | | | 4,020,713 | |
6.125%, 3/25/24 | | | | | 1,255 | | | | 1,132,638 | |
7.25%, 1/25/22 | | | | | 1,638 | | | | 1,613,430 | |
8.00%, 3/25/20 | | | | | 3,466 | | | | 3,673,960 | |
Portfolio of Investments
| | | | | | | | | | |
| | | | |
Principal Amount (000) | | | U.S. $ Value | |
| |
| | | | | | | | | | |
Oxford Finance LLC/Oxford
Finance Co-Issuer, Inc.
7.25%, 1/15/18(a) | | U.S.$ | | | 1,492 | | | $ | 1,529,300 | |
Peninsula Gaming LLC/Peninsula Gaming Corp.
8.375%, 2/15/18(a) | | | | | 3,759 | | | | 3,909,360 | |
TMX Finance LLC/TitleMax Finance Corp.
8.50%, 9/15/18(a) | | | | | 18,725 | | | | 14,699,125 | |
| | | | | | | | | | |
| | | | | | | | | 75,019,725 | |
| | | | | | | | | | |
Insurance – 0.8% | | | | | | | | | | |
American Equity Investment Life Holding Co.
6.625%, 7/15/21 | | | | | 3,087 | | | | 3,272,220 | |
Genworth Holdings, Inc.
6.15%, 11/15/66 | | | | | 2,535 | | | | 1,128,075 | |
7.625%, 9/24/21 | | | | | 4,725 | | | | 4,407,551 | |
HUB International Ltd.
7.875%, 10/01/21(a) | | | | | 5,630 | | | | 5,615,925 | |
Liberty Mutual Group, Inc.
7.80%, 3/15/37(a) | | | | | 14,759 | | | | 17,304,927 | |
USI, Inc./NY
7.75%, 1/15/21(a) | | | | | 10,918 | | | | 10,918,000 | |
Wayne Merger Sub LLC
8.25%, 8/01/23(a) | | | | | 9,105 | | | | 9,048,094 | |
| | | | | | | | | | |
| | | | | | | | | 51,694,792 | |
| | | | | | | | | | |
Other Finance – 0.5% | | | | | | | | | | |
ACE Cash Express, Inc.
11.00%, 2/01/19(a) | | | | | 4,467 | | | | 1,474,110 | |
CNG Holdings, Inc.
9.375%, 5/15/20(a) | | | | | 5,987 | | | | 3,030,919 | |
Flexpath Wh I LLC – Series B
12.00%, 4/01/21 | | | | | 286 | | | | 277,147 | |
FTI Consulting, Inc.
6.00%, 11/15/22 | | | | | 3,000 | | | | 3,180,000 | |
iPayment, Inc.
9.50%, 12/15/19(a) | | | | | 2,809 | | | | 2,900,669 | |
Series AI
9.50%, 12/15/19 | | | | | 7,558 | | | | 7,804,018 | |
Speedy Cash Intermediate Holdings Corp.
10.75%, 5/15/18(a) | | | | | 6,062 | | | | 4,364,640 | |
Speedy Group Holdings Corp.
12.00%, 11/15/17(a) | | | | | 7,281 | | | | 5,242,320 | |
| | | | | | | | | | |
| | | | | | | | | 28,273,823 | |
| | | | | | | | | | |
REITS – 0.1% | | | | | | | | | | |
FelCor Lodging LP
5.625%, 3/01/23 | | | | | 7,213 | | | | 7,465,455 | |
| | | | | | | | | | |
| | | | | | | | | 450,241,172 | |
| | | | | | | | | | |
Portfolio of Investments
| | | | | | | | | | |
| | | | |
Principal Amount (000) | | | U.S. $ Value | |
| |
| | | | | | | | | | |
Utility – 1.8% | | | | | | | | | | |
Electric – 1.8% | | | | | | | | | | |
AES Corp./VA
4.875%, 5/15/23 | | U.S.$ | | | 1,500 | | | $ | 1,391,250 | |
5.50%, 3/15/24 | | | | | 3,250 | | | | 3,071,250 | |
Calpine Corp.
5.50%, 2/01/24 | | | | | 5,320 | | | | 5,054,000 | |
5.75%, 1/15/25 | | | | | 10,549 | | | | 9,995,177 | |
5.875%, 1/15/24(a) | | | | | 3,988 | | | | 4,167,460 | |
7.875%, 1/15/23(a) | | | | | 2,422 | | | | 2,600,623 | |
DPL, Inc.
6.75%, 10/01/19 | | | | | 2,450 | | | | 2,511,250 | |
7.25%, 10/15/21 | | | | | 4,251 | | | | 4,266,941 | |
Dynegy, Inc.
7.375%, 11/01/22 | | | | | 7,755 | | | | 7,774,387 | |
7.625%, 11/01/24 | | | | | 12,140 | | | | 12,170,350 | |
FirstEnergy Corp.
Series C
7.375%, 11/15/31 | | | | | 4,551 | | | | 5,430,858 | |
GenOn Energy, Inc.
7.875%, 6/15/17 | | | | | 825 | | | | 765,188 | |
9.50%, 10/15/18 | | | | | 8,571 | | | | 7,542,480 | |
NRG Energy, Inc.
6.25%, 7/15/22 | | | | | 1,631 | | | | 1,500,520 | |
6.625%, 3/15/23 | | | | | 10,296 | | | | 9,575,280 | |
Series WI
6.25%, 5/01/24 | | | | | 14,161 | | | | 12,674,095 | |
NRG Yield Operating LLC
5.375%, 8/15/24 | | | | | 4,311 | | | | 3,944,565 | |
Talen Energy Supply LLC
4.60%, 12/15/21 | | | | | 12,404 | | | | 10,646,043 | |
Texas Competitive/TCEH
11.50%, 10/01/20(o) | | | | | 2,679 | | | | 904,163 | |
Viridian Group FundCo II Ltd.
7.50%, 3/01/20(a) | | EUR | | | 7,830 | | | | 8,577,971 | |
| | | | | | | | | | |
| | | | | | | | | 114,563,851 | |
| | | | | | | | | | |
Non Corporate Sectors – 0.1% | | | | | | | | | | |
Agencies - Not Government
Guaranteed – 0.1% | | | | | | | | | | |
NOVA Chemicals Corp.
5.00%, 5/01/25(a) | | U.S.$ | | | 2,349 | | | | 2,349,000 | |
| | | | | | | | | | |
| | | |
Total Corporates – Non-Investment Grade
(cost $3,626,771,652) | | | | | | | | | 3,354,711,078 | |
| | | | | | | | | | |
| | | | | | | | | | |
Portfolio of Investments
| | | | | | | | | | |
| | | | |
Principal Amount (000) | | | U.S. $ Value | |
| |
| | | | | | | | | | |
COLLATERALIZED MORTGAGE OBLIGATIONS – 8.0% | | | | | | | | | | |
GSE Risk Share Floating Rate – 3.5% | | | | | | | | | | |
Bellemeade Re Ltd.
Series 2015-1A, Class M2
4.497%, 7/25/25(a)(h) | | U.S.$ | | | 6,730 | | | $ | 6,679,525 | |
Federal Home Loan Mortgage Corp. Structured Agency Credit Risk Debt Notes
Series 2013-DN1, Class M2
7.347%, 7/25/23(h) | | | | | 8,995 | | | | 10,376,427 | |
Series 2013-DN2, Class M2
4.447%, 11/25/23(h) | | | | | 7,100 | | | | 7,081,715 | |
Series 2014-DN1, Class M3
4.697%, 2/25/24(h) | | | | | 13,021 | | | | 12,877,128 | |
Series 2014-DN2, Class M3
3.797%, 4/25/24(h) | | | | | 5,376 | | | | 4,996,932 | |
Series 2014-DN3, Class M3
4.197%, 8/25/24(h) | | | | | 10,000 | | | | 9,642,369 | |
Series 2014-DN4, Class M3
4.747%, 10/25/24(h) | | | | | 1,900 | | | | 1,893,314 | |
Series 2014-HQ2, Class M3
3.947%, 9/25/24(h) | | | | | 3,045 | | | | 2,838,664 | |
Series 2014-HQ3, Class M3
4.947%, 10/25/24(h) | | | | | 8,520 | | | | 8,490,470 | |
Series 2015-DN1, Class M3
4.347%, 1/25/25(h) | | | | | 4,007 | | | | 3,959,760 | |
Series 2015-DNA1, Class M3
3.497%, 10/25/27(h) | | | | | 1,760 | | | | 1,660,675 | |
Series 2015-DNA2, Class B
7.747%, 12/25/27(h) | | | | | 5,280 | | | | 5,118,690 | |
Series 2015-HQ1, Class M3
3.997%, 3/25/25(h) | | | | | 3,380 | | | | 3,242,209 | |
Series 2015-HQA1, Class B
8.994%, 3/25/28(h) | | | | | 5,450 | | | | 5,310,043 | |
Series 2015-HQA1, Class M3
4.894%, 3/25/28(h) | | | | | 6,335 | | | | 6,287,014 | |
Federal National Mortgage Association Connecticut Avenue Securities
Series 2013-C01, Class M2
5.447%, 10/25/23(h) | | | | | 7,285 | | | | 7,615,923 | |
Series 2014-C01, Class M2
4.597%, 1/25/24(h) | | | | | 9,535 | | | | 9,536,662 | |
Series 2014-C02, Class 1M2
2.797%, 5/25/24(h) | | | | | 3,410 | | | | 2,972,718 | |
Series 2014-C03, Class 1M2
3.197%, 7/25/24(h) | | | | | 11,973 | | | | 10,794,632 | |
Series 2014-C04, Class 1M2
5.097%, 11/25/24(h) | | | | | 23,605 | | | | 23,671,247 | |
Portfolio of Investments
| | | | | | | | | | |
| | | | |
Principal Amount (000) | | | U.S. $ Value | |
| |
| | | | | | | | | | |
Series 2014-C04, Class 2M2
5.197%, 11/25/24(h) | | U.S.$ | | | 3,828 | | | $ | 3,846,483 | |
Series 2015-C01, Class 1M2
4.497%, 2/25/25(h) | | | | | 16,455 | | | | 15,945,899 | |
Series 2015-C02, Class 2M2
4.197%, 5/25/25(h) | | | | | 11,991 | | | | 11,398,366 | |
Series 2015-C03, Class 1M2
5.197%, 7/25/25(h) | | | | | 3,696 | | | | 3,669,787 | |
Series 2015-C03, Class 2M2
5.197%, 7/25/25(h) | | | | | 14,908 | | | | 14,839,400 | |
Series 2015-C04, Class 1M2
5.894%, 4/25/28(h) | | | | | 4,442 | | | | 4,523,669 | |
Series 2015-C04, Class 2M2
5.744%, 4/25/28(h) | | | | | 6,732 | | | | 6,830,497 | |
JPMorgan Madison Avenue Securities Trust Series 2015-1
Series 2015-CH1, Class M2
5.696%, 10/25/25(a)(h) | | | | | 7,785 | | | | 7,721,249 | |
Wells Fargo Credit Risk Transfer Securities Trust
Series 2015-WF1, Class 2M2
5.697%, 11/25/25(a)(h) | | | | | 3,351 | | | | 3,334,826 | |
| | | | | | | | | | |
| | | | | | | | | 217,156,293 | |
| | | | | | | | | | |
Non-Agency Fixed Rate – 2.9% | | | | | | | | | | |
BCAP LLC Trust
Series 2009-RR13, Class 17A3
6.039%, 4/26/37(a) | | | | | 3,099 | | | | 2,583,548 | |
Bear Stearns ARM Trust
Series 2007-3, Class 1A1
2.778%, 5/25/47 | | | | | 1,922 | | | | 1,682,304 | |
Series 2007-4, Class 22A1
4.809%, 6/25/47 | | | | | 6,603 | | | | 5,875,627 | |
BNPP Mortgage Securities LLC Trust
Series 2009-1, Class B1
6.00%, 8/27/37(a) | | | | | 4,623 | | | | 3,905,769 | |
ChaseFlex Trust
Series 2007-1, Class 1A3
6.50%, 2/25/37 | | | | | 977 | | | | 725,385 | |
Citigroup Mortgage Loan Trust
Series 2006-4, Class 2A1A
6.00%, 12/25/35 | | | | | 9,940 | | | | 9,221,873 | |
Series 2006-AR3, Class 1A2A
5.22%, 6/25/36 | | | | | 3,953 | | | | 3,764,720 | |
Series 2007-AR4, Class 1A1A
5.37%, 3/25/37 | | | | | 1,695 | | | | 1,608,208 | |
Series 2010-3, Class 2A2
7.063%, 8/25/37(a) | | | | | 2,760 | | | | 2,408,858 | |
Portfolio of Investments
| | | | | | | | | | |
| | | | |
Principal Amount (000) | | | U.S. $ Value | |
| |
| | | | | | | | | | |
CitiMortgage Alternative Loan Trust
Series 2007-A3, Class 1A4
5.75%, 3/25/37 | | U.S.$ | | | 2,175 | | | $ | 1,899,156 | |
Countrywide Alternative Loan Trust
Series 2005-11CB, Class 2A7
5.50%, 6/25/35 | | | | | 6,218 | | | | 6,184,946 | |
Series 2005-46CB, Class A2
5.50%, 10/25/35 | | | | | 321 | | | | 300,091 | |
Series 2005-46CB, Class A20
5.50%, 10/25/35 | | | | | 251 | | | | 234,861 | |
Series 2005-46CB, Class A3
5.50%, 10/25/35 | | | | | 784 | | | | 733,189 | |
Series 2005-46CB, Class A4
5.25%, 10/25/35 | | | | | 345 | | | | 318,171 | |
Series 2005-46CB, Class A7
5.50%, 10/25/35 | | | | | 608 | | | | 568,480 | |
Series 2005-J14, Class A8
5.50%, 12/25/35 | | | | | 4,938 | | | | 4,437,532 | |
Series 2006-19CB, Class A15
6.00%, 8/25/36 | | | | | 778 | | | | 710,647 | |
Series 2006-19CB, Class A24
6.00%, 8/25/36 | | | | | 500 | | | | 462,788 | |
Series 2006-24CB, Class A15
5.75%, 6/25/36 | | | | | 5,295 | | | | 4,738,273 | |
Series 2006-24CB, Class A16
5.75%, 6/25/36 | | | | | 1,012 | | | | 905,926 | |
Series 2006-26CB, Class A6
6.25%, 9/25/36 | | | | | 442 | | | | 378,768 | |
Series 2006-26CB, Class A8
6.25%, 9/25/36 | | | | | 1,670 | | | | 1,431,327 | |
Series 2006-2CB, Class A11
6.00%, 3/25/36 | | | | | 2,062 | | | | 1,825,967 | |
Series 2006-41CB, Class 2A13
5.75%, 1/25/37 | | | | | 4,618 | | | | 4,141,495 | |
Series 2006-42, Class 1A6
6.00%, 1/25/47 | | | | | 1,855 | | | | 1,679,407 | |
Series 2006-HY12, Class A5
3.579%, 8/25/36 | | | | | 10,239 | | | | 9,705,189 | |
Series 2006-J1, Class 1A10
5.50%, 2/25/36 | | | | | 2,653 | | | | 2,384,588 | |
Series 2006-J5, Class 1A1
6.50%, 9/25/36 | | | | | 1,682 | | | | 1,510,798 | |
Series 2007-13, Class A2
6.00%, 6/25/47 | | | | | 6,461 | | | | 5,406,634 | |
Series 2007-15CB, Class A19
5.75%, 7/25/37 | | | | | 1,040 | | | | 951,911 | |
Series 2007-16CB, Class 1A7
6.00%, 8/25/37 | | | | | 1,283 | | | | 1,238,524 | |
Portfolio of Investments
| | | | | | | | | | |
| | | | |
Principal Amount (000) | | | U.S. $ Value | |
| |
| | | | | | | | | | |
Countrywide Home Loan Mortgage Pass-Through Trust
Series 2006-17, Class A2
6.00%, 12/25/36 | | U.S.$ | | | 4,911 | | | $ | 4,524,193 | |
Series 2007-4, Class 1A39
6.00%, 5/25/37 | | | | | 3,292 | | | | 2,964,571 | |
Series 2007-HY4, Class 1A1
2.723%, 9/25/47 | | | | | 1,991 | | | | 1,780,446 | |
Credit Suisse Mortgage Trust
Series 2009-8R, Class 6A2
6.00%, 1/26/38(a) | | | | | 650 | | | | 486,981 | |
Series 2010-13R, Class 1A2
5.50%, 12/26/35(a) | | | | | 255 | | | | 242,114 | |
Series 2010-9R, Class 1A5
4.00%, 8/27/37(a) | | | | | 3,558 | | | | 3,492,376 | |
Credit Suisse Mortgage-Backed Trust
Series 2006-7, Class 3A12
6.25%, 8/25/36 | | | | | 3,590 | | | | 3,123,545 | |
First Horizon Alternative Mortgage Securities Trust
Series 2005-AA3, Class 3A1
2.376%, 5/25/35 | | | | | 1,443 | | | | 1,389,959 | |
Series 2006-AA3, Class A1
2.34%, 6/25/36 | | | | | 1,679 | | | | 1,370,081 | |
Series 2006-AA5, Class A1
2.239%, 9/25/36 | | | | | 4,700 | | | | 3,834,498 | |
Series 2006-FA1, Class 1A3
5.75%, 4/25/36 | | | | | 2,697 | | | | 2,146,182 | |
Series 2006-FA3, Class A9
6.00%, 7/25/36 | | | | | 2,254 | | | | 1,859,174 | |
IndyMac Index Mortgage Loan Trust
Series 2005-AR15, Class A1
2.583%, 9/25/35 | | | | | 4,107 | | | | 3,427,959 | |
Series 2006-AR37, Class 2A1
4.347%, 2/25/37 | | | | | 1,657 | | | | 1,324,643 | |
Series 2007-AR1, Class 2A1
2.698%, 4/25/37 | | | | | 4,917 | | | | 3,999,956 | |
Morgan Stanley Mortgage Loan Trust
Series 2005-10, Class 4A1
5.50%, 12/25/35 | | | | | 2,411 | | | | 2,201,837 | |
Series 2006-2, Class 6A
6.50%, 2/25/36 | | | | | 2,419 | | | | 2,028,999 | |
Series 2007-12, Class 3A22
6.00%, 8/25/37 | | | | | 622 | | | | 561,857 | |
New Century Alternative Mortgage Loan Trust
Series 2006-ALT2, Class AF6A
5.457%, 10/25/36 | | | | | 8,830 | | | | 5,543,870 | |
Portfolio of Investments
| | | | | | | | | | |
| | | | |
Principal Amount (000) | | | U.S. $ Value | |
| |
| | | | | | | | | | |
Nomura Resecuritization Trust
Series 2010-5RA, Class 1A7
6.50%, 10/26/37(a) | | U.S.$ | | | 6,965 | | | $ | 6,115,077 | |
Residential Accredit Loans, Inc., Trust
Series 2005-QA10, Class A31
3.663%, 9/25/35 | | | | | 4,695 | | | | 3,913,045 | |
Series 2005-QS14, Class 3A1
6.00%, 9/25/35 | | | | | 3,471 | | | | 3,171,201 | |
Residential Asset Securitization Trust
Series 2006-A8, Class 3A4
6.00%, 8/25/36 | | | | | 1,188 | | | | 978,189 | |
Series 2007-A1, Class A8
6.00%, 3/25/37 | | | | | 1,469 | | | | 1,032,336 | |
Series 2007-A5, Class 2A3
6.00%, 5/25/37 | | | | | 559 | | | | 484,003 | |
Structured Adjustable Rate Mortgage Loan Trust
Series 2005-18, Class 8A1
2.739%, 9/25/35 | | | | | 2,595 | | | | 2,406,776 | |
Series 2006-9, Class 4A1
5.138%, 10/25/36 | | | | | 2,070 | | | | 1,799,314 | |
Washington Mutual Alternative Mortgage Pass-Through Certificates Trust
Series 2006-7, Class A3
4.572%, 9/25/36 | | | | | 2,616 | | | | 1,428,319 | |
Series 2006-7, Class A4
4.572%, 9/25/36 | | | | | 2,508 | | | | 1,369,259 | |
Series 2006-9, Class A4
5.003%, 10/25/36 | | | | | 2,569 | | | | 1,402,418 | |
Series 2006-9, Class A6
5.003%, 10/25/36 | | | | | 2,649 | | | | 1,445,648 | |
Washington Mutual Mortgage Pass-Through Certificates Trust
Series 2007-HY3, Class 4A1
2.424%, 3/25/37 | | | | | 4,600 | | | | 4,329,956 | |
Wells Fargo Alternative Loan Trust
Series 2007-PA3, Class 2A1
6.00%, 7/25/37 | | | | | 3,694 | | | | 3,566,348 | |
Series 2007-PA3, Class 3A1
6.25%, 7/25/37 | | | | | 2,269 | | | | 2,102,962 | |
Wells Fargo Mortgage Backed Securities Trust
Series 2007-10, Class 1A8
6.00%, 7/25/37 | | | | | 2,392 | | | | 2,386,630 | |
Series 2007-AR7, Class A1
2.745%, 12/28/37 | | | | | 9,730 | | | | 8,982,587 | |
Series 2007-AR8, Class A1
2.777%, 11/25/37 | | | | | 3,904 | | | | 3,433,209 | |
| | | | | | | | | | |
| | | | | | | | | 180,575,478 | |
| | | | | | | | | | |
Portfolio of Investments
| | | | | | | | | | |
| | | | |
Principal Amount (000) | | | U.S. $ Value | |
| |
| | | | | | | | | | |
Non-Agency Floating Rate – 1.6% | | | | | | | | | | |
Chevy Chase Funding LLC Mortgage-Backed Certificates
Series 2006-2A, Class A2
0.377%, 4/25/47(a)(h) | | U.S.$ | | | 9,835 | | | $ | 7,298,101 | |
Countrywide Alternative Loan Trust
Series 2005-82, Class A1
0.467%, 2/25/36(h) | | | | | 895 | | | | 734,490 | |
Series 2007-7T2, Class A3
0.797%, 4/25/37(h) | | | | | 3,916 | | | | 1,930,796 | |
Countrywide Home Loan Mortgage Pass-Through Trust
Series 2007-13, Class A7
0.797%, 8/25/37(h) | | | | | 1,147 | | | | 875,113 | |
Deutsche Alt-A Securities Mortgage Loan Trust
Series 2007-OA3, Class A1
0.337%, 7/25/47(h) | | | | | 7,459 | | | | 6,045,265 | |
First Horizon Alternative Mortgage Securities Trust
Series 2007-FA2, Class 1A10
0.447%, 4/25/37(h) | | | | | 2,498 | | | | 1,318,759 | |
Series 2007-FA2, Class 1A5
0.497%, 4/25/37(h) | | | | | 2,829 | | | | 1,504,027 | |
HarborView Mortgage Loan Trust
Series 2006-10, Class 2A1A
0.377%, 11/19/36(h) | | | | | 5,140 | | | | 4,235,471 | |
Series 2007-4, Class 2A1
0.417%, 7/19/47(h) | | | | | 15,316 | | | | 12,511,884 | |
Series 2007-7, Class 2A1A
1.197%, 10/25/37(h) | | | | | 2,539 | | | | 2,232,740 | |
Impac Secured Assets Trust
Series 2007-1, Class A2
0.357%, 3/25/37(h) | | | | | 2,562 | | | | 2,043,761 | |
Lehman Mortgage Trust
Series 2007-1, Class 3A1
0.447%, 2/25/37(h) | | | | | 3,308 | | | | 667,796 | |
Series 2007-1, Class 3A2
7.053%, 2/25/37(h)(p) | | | | | 3,308 | | | | 1,025,128 | |
Lehman XS Trust
Series 2007-15N, Class 4A1
1.097%, 8/25/47(h) | | | | | 1,032 | | | | 703,909 | |
Series 2007-16N, Class 2A2
1.047%, 9/25/47(h) | | | | | 1,365 | | | | 1,108,877 | |
Morgan Stanley Mortgage Loan Trust
Series 2006-9AR, Class A2
0.347%, 8/25/36(h) | | | | | 11,449 | | | | 5,769,962 | |
NovaStar Mortgage Funding Trust
Series 2006-MTA1, Class 2A1A
0.387%, 9/25/46(h) | | | | | 2,108 | | | | 1,798,075 | |
Portfolio of Investments
| | | | | | | | | | |
| | | | |
Principal Amount (000) | | | U.S. $ Value | |
| |
| | | | | | | | | | |
PHH Alternative Mortgage Trust
Series 2007-1, Class 1A1
0.357%, 2/25/37(h) | | U.S.$ | | | 1,455 | | | $ | 1,226,801 | |
Series 2007-2, Class 1A3
0.527%, 5/25/37(h) | | | | | 1,688 | | | | 1,425,235 | |
Residential Accredit Loans, Inc., Trust
Series 2006-QA4, Class A
0.377%, 5/25/36(h) | | | | | 6,179 | | | | 4,999,608 | |
Series 2006-QO2, Class A1
0.417%, 2/25/46(h) | | | | | 2,016 | | | | 888,072 | |
Series 2007-QH6, Class A1
0.387%, 7/25/37(h) | | | | | 1,197 | | | | 983,075 | |
Structured Asset Mortgage Investments II Trust
Series 2007-AR6, Class A1
1.722%, 8/25/47(h) | | | | | 3,256 | | | | 2,699,202 | |
Washington Mutual Mortgage Pass-Through Certificates Trust
Series 2006-AR3, Class A1A
1.222%, 2/25/46(h) | | | | | 1,367 | | | | 1,253,271 | |
Series 2006-AR5, Class A1A
1.212%, 6/25/46(h) | | | | | 1,681 | | | | 1,465,314 | |
Series 2007-OA1, Class A1A
0.922%, 2/25/47(h) | | | | | 12,059 | | | | 9,620,173 | |
Series 2007-OA3, Class 2A1A
0.982%, 4/25/47(h) | | | | | 1,705 | | | | 1,437,183 | |
Series 2007-OA4, Class A1A
0.982%, 4/25/47(h) | | | | | 14,216 | | | | 10,746,010 | |
Series 2007-OA5, Class 1A
0.972%, 6/25/47(h) | | | | | 10,818 | | | | 8,891,053 | |
| | | | | | | | | | |
| | | | | | | | | 97,439,151 | |
| | | | | | | | | | |
Agency Fixed Rate – 0.0% | | | | | | | | | | |
Countrywide Home Loan Mortgage Pass-Through Trust
Series 2007-HYB2, Class 3A1
2.621%, 2/25/47 | | | | | 2,258 | | | | 2,001,976 | |
| | | | | | | | | | |
| | | |
Total Collateralized Mortgage Obligations
(cost $495,653,395) | | | | | | | | | 497,172,898 | |
| | | | | | | | | | |
| | | | | | | | | | |
CORPORATES – INVESTMENT
GRADE – 7.8% | | | | | | | | | | |
Financial Institutions – 3.9% | | | | | | | | | | |
Banking – 1.4% | | | | | | | | | | |
American Express Co.
6.80%, 9/01/66 | | | | | 4,555 | | | | 4,584,608 | |
BPCE SA
5.70%, 10/22/23(a) | | | | | 241 | | | | 258,014 | |
Portfolio of Investments
| | | | | | | | | | |
| | | | |
Principal Amount (000) | | | U.S. $ Value | |
| |
| | | | | | | | | | |
Cooperatieve Centrale Raiffeisen-Boerenleenbank BA/Netherlands
8.375%, 7/26/16(a)(m) | | U.S.$ | | | 5,750 | | | $ | 5,980,104 | |
8.40%, 6/29/17(a)(m) | | | | | 5,500 | | | | 5,955,400 | |
Credit Suisse Group Guernsey I Ltd.
7.875%, 2/24/41(a) | | | | | 3,191 | | | | 3,308,837 | |
HSBC Capital Funding LP/Jersey
10.176%, 6/30/30(a)(m) | | | | | 1,590 | | | | 2,400,900 | |
ICICI Bank Ltd./Dubai
4.80%, 5/22/19(a) | | | | | 5,980 | | | | 6,354,701 | |
ING Groep NV
5.775%, 12/08/15(m) | | | | | 6,869 | | | | 6,817,482 | |
JPMorgan Chase & Co.
Series R
6.00%, 8/01/23(m) | | | | | 10,893 | | | | 11,050,948 | |
Series S
6.75%, 2/01/24(m) | | | | | 2,209 | | | | 2,380,198 | |
MUFG Capital Finance 5 Ltd.
6.299%, 1/25/17(m) | | GBP | | | 1,225 | | | | 1,952,668 | |
Nordea Bank AB
6.125%, 9/23/24(a)(m) | | U.S.$ | | | 8,440 | | | | 8,334,500 | |
PNC Financial Services Group, Inc. (The)
Series R
4.85%, 6/01/23(m) | | | | | 3,888 | | | | 3,654,331 | |
Regions Bank/Birmingham AL
6.45%, 6/26/37 | | | | | 5,300 | | | | 6,356,030 | |
Santander Bank NA
8.75%, 5/30/18 | | | | | 3,800 | | | | 4,339,376 | |
Standard Chartered PLC
5.20%, 1/26/24(a)(b) | | | | | 5,722 | | | | 5,988,639 | |
6.409%, 1/30/17(a)(b)(m) | | | | | 3,500 | | | | 3,535,000 | |
Wells Fargo & Co.
Series S
5.90%, 6/15/24(m) | | | | | 2,482 | | | | 2,537,845 | |
| | | | | | | | | | |
| | | | | | | | | 85,789,581 | |
| | | | | | | | | | |
Brokerage – 0.2% | | | | | | | | | | |
Charles Schwab Corp. (The)
7.00%, 2/01/22(m) | | | | | 6,830 | | | | 7,939,875 | |
GFI Group, Inc.
8.625%, 7/19/18 | | | | | 2,367 | | | | 2,568,195 | |
| | | | | | | | | | |
| | | | | | | | | 10,508,070 | |
| | | | | | | | | | |
Finance – 0.4% | | | | | | | | | | |
Aviation Capital Group Corp.
4.625%, 1/31/18(a) | | | | | 2,367 | | | | 2,440,969 | |
GE Capital Trust II
5.50%, 9/15/67(a) | | EUR | | | 4,000 | | | | 4,596,959 | |
Portfolio of Investments
| | | | | | | | | | |
| | | | |
Principal Amount (000) | | | U.S. $ Value | |
| |
| | | | | | | | | | |
General Electric Capital Corp.
Series A
7.125%, 6/15/22(m) | | U.S.$ | | | 4,200 | | | $ | 4,935,000 | |
Series B
6.25%, 12/15/22(m) | | | | | 4,800 | | | | 5,350,080 | |
HSBC Finance Capital Trust IX
5.911%, 11/30/35 | | | | | 6,765 | | | | 6,771,765 | |
| | | | | | | | | | |
| | | | | | | | | 24,094,773 | |
| | | | | | | | | | |
Insurance – 1.6% | | | | | | | | | | |
AAI Ltd.
Series 5
6.75%, 10/06/26 | | AUD | | | 500 | | | | 365,576 | |
American International Group, Inc.
6.82%, 11/15/37 | | U.S.$ | | | 1,938 | | | | 2,381,077 | |
8.175%, 5/15/58 | | | | | 7,301 | | | | 9,637,320 | |
Aon Corp.
8.205%, 1/01/27 | | | | | 2,495 | | | | 3,140,581 | |
Assured Guaranty Municipal Holdings, Inc.
6.40%, 12/15/66(a) | | | | | 1,801 | | | | 1,314,730 | |
Coventry Health Care, Inc.
5.95%, 3/15/17 | | | | | 1,415 | | | | 1,500,954 | |
Lincoln National Corp.
8.75%, 7/01/19 | | | | | 604 | | | | 738,318 | |
MetLife Capital Trust IV
7.875%, 12/15/37(a) | | | | | 1,765 | | | | 2,188,600 | |
MetLife, Inc.
6.40%, 12/15/36 | | | | | 3,700 | | | | 4,057,420 | |
10.75%, 8/01/39 | | | | | 3,495 | | | | 5,504,625 | |
Series C
5.25%, 6/15/20(m) | | | | | 8,977 | | | | 9,061,159 | |
Mitsui Sumitomo Insurance Co., Ltd.
7.00%, 3/15/72(a) | | | | | 3,554 | | | | 4,130,242 | |
Nationwide Mutual Insurance Co.
2.627%, 12/15/24(a)(h) | | | | | 5,000 | | | | 4,791,415 | |
9.375%, 8/15/39(a) | | | | | 4,546 | | | | 6,872,288 | |
Pacific Life Insurance Co.
9.25%, 6/15/39(a) | | | | | 3,000 | | | | 4,427,991 | |
Prudential Financial, Inc.
5.625%, 6/15/43 | | | | | 13,000 | | | | 13,604,500 | |
Swiss Re Capital I LP
6.854%, 5/25/16(a)(m) | | | | | 6,435 | | | | 6,526,699 | |
Transatlantic Holdings, Inc.
8.00%, 11/30/39 | | | | | 2,836 | | | | 3,677,368 | |
XLIT Ltd.
5.50%, 3/31/45 | | | | | 7,198 | | | | 6,904,480 | |
Series E
6.50%, 4/15/17(m) | | | | | 7,233 | | | | 5,769,764 | |
Portfolio of Investments
| | | | | | | | | | |
| | | | |
Principal Amount (000) | | | U.S. $ Value | |
| |
| | | | | | | | | | |
ZFS Finance USA Trust II
6.45%, 12/15/65(a) | | U.S.$ | | | 1,695 | | | $ | 1,719,578 | |
ZFS Finance USA Trust V
6.50%, 5/09/37(a) | | | | | 3,010 | | | | 3,077,725 | |
| | | | | | | | | | |
| | | | | | | | | 101,392,410 | |
| | | | | | | | | | |
Other Finance – 0.1% | | | | | | | | | | |
SUAM Finance BV
4.875%, 4/17/24(a) | | | | | 4,867 | | | | 5,001,258 | |
| | | | | | | | | | |
| | | |
REITS – 0.2% | | | | | | | | | | |
EPR Properties
5.75%, 8/15/22 | | | | | 3,445 | | | | 3,656,020 | |
7.75%, 7/15/20 | | | | | 3,036 | | | | 3,566,079 | |
Senior Housing Properties Trust
6.75%, 12/15/21 | | | | | 4,500 | | | | 4,990,509 | |
| | | | | | | | | | |
| | | | | | | | | 12,212,608 | |
| | | | | | | | | | |
| | | | | | | | | 238,998,700 | |
| | | | | | | | | | |
Industrial – 3.2% | | | | | | | | | | |
Basic – 1.1% | | | | | | | | | | |
Braskem America Finance Co.
7.125%, 7/22/41(a) | | | | | 3,672 | | | | 2,919,240 | |
Braskem Finance Ltd.
5.75%, 4/15/21(a) | | | | | 200 | | | | 187,500 | |
6.45%, 2/03/24 | | | | | 4,416 | | | | 3,974,356 | |
7.00%, 5/07/20(a) | | | | | 208 | | | | 209,040 | |
CF Industries, Inc.
6.875%, 5/01/18 | | | | | 1,100 | | | | 1,217,344 | |
7.125%, 5/01/20 | | | | | 1,100 | | | | 1,281,778 | |
Freeport-McMoran Oil & Gas LLC/FCX Oil & Gas, Inc.
6.125%, 6/15/19 | | | | | 1,298 | | | | 1,226,610 | |
6.50%, 11/15/20 | | | | | 3,362 | | | | 3,046,812 | |
6.625%, 5/01/21 | | | | | 649 | | | | 585,723 | |
6.75%, 2/01/22 | | | | | 1,566 | | | | 1,380,037 | |
Freeport-McMoRan, Inc.
5.45%, 3/15/43 | | | | | 1,120 | | | | 799,400 | |
Glencore Funding LLC
2.125%, 4/16/18(a) | | | | | 560 | | | | 488,600 | |
GTL Trade Finance, Inc.
5.893%, 4/29/24(a) | | | | | 11,823 | | | | 9,910,039 | |
7.25%, 4/16/44(a) | | | | | 249 | | | | 186,750 | |
MeadWestvaco Corp
8.20%, 1/15/30 | | | | | 2,940 | | | | 3,890,361 | |
Minsur SA
6.25%, 2/07/24(a)(b) | | | | | 10,297 | | | | 10,816,185 | |
Samarco Mineracao SA
4.125%, 11/01/22(a) | | | | | 740 | | | | 615,125 | |
5.75%, 10/24/23(a) | | | | | 11,205 | | | | 10,028,475 | |
Portfolio of Investments
| | | | | | | | | | |
| | | | |
Principal Amount (000) | | | U.S. $ Value | |
| |
| | | | | | | | | | |
Southern Copper Corp.
7.50%, 7/27/35 | | U.S.$ | | | 1,500 | | | $ | 1,554,843 | |
Vale Overseas Ltd.
6.875%, 11/21/36 | | | | | 8,495 | | | | 6,915,779 | |
Weyerhaeuser Co.
7.375%, 3/15/32 | | | | | 3,308 | | | | 4,130,954 | |
8.50%, 1/15/25 | | | | | 1,000 | | | | 1,340,833 | |
| | | | | | | | | | |
| | | | | | | | | 66,705,784 | |
| | | | | | | | | | |
Capital Goods – 0.3% | | | | | | | | | | |
Lafarge SA
7.125%, 7/15/36 | | | | | 2,640 | | | | 3,144,826 | |
Odebrecht Finance Ltd.
5.25%, 6/27/29(a) | | | | | 6,710 | | | | 3,866,638 | |
7.125%, 6/26/42(a) | | | | | 6,600 | | | | 3,927,000 | |
8.25%, 4/25/18(a) | | BRL | | | 5,903 | | | | 853,333 | |
Owens Corning
6.50%, 12/01/16(h) | | U.S.$ | | | 21 | | | | 22,290 | |
7.00%, 12/01/36(h) | | | | | 4,450 | | | | 5,059,210 | |
| | | | | | | | | | |
| | | | | | | | | 16,873,297 | |
| | | | | | | | | | |
Communications - Media – 0.5% | | | | | | | | | | |
CCO Safari II LLC
4.908%, 7/23/25(a) | | | | | 6,755 | | | | 6,866,342 | |
6.484%, 10/23/45(a) | | | | | 9,890 | | | | 10,255,851 | |
Comcast Cable Communications Holdings, Inc.
9.455%, 11/15/22 | | | | | 2,500 | | | | 3,475,300 | |
Myriad International Holdings BV
6.00%, 7/18/20(a) | | | | | 6,983 | | | | 7,490,008 | |
NBCUniversal Enterprise, Inc.
5.25%, 3/19/21(a)(m) | | | | | 6,975 | | | | 7,428,375 | |
| | | | | | | | | | |
| | | | | | | | | 35,515,876 | |
| | | | | | | | | | |
Communications - Telecommunications – 0.1% | | | | | | | | | | |
Qwest Corp.
6.75%, 12/01/21 | | | | | 1,000 | | | | 1,074,500 | |
6.875%, 9/15/33 | | | | | 4,249 | | | | 4,215,921 | |
| | | | | | | | | | |
| | | | | | | | | 5,290,421 | |
| | | | | | | | | | |
Consumer Cyclical - Other – 0.1% | | | | | | | | | | |
Seminole Tribe of Florida, Inc.
6.535%, 10/01/20(a) | | | | | 2,925 | | | | 3,100,500 | |
Starwood Hotels & Resorts Worldwide, Inc.
7.375%, 11/15/15 | | | | | 2,035 | | | | 2,038,972 | |
| | | | | | | | | | |
| | | | | | | | | 5,139,472 | |
| | | | | | | | | | |
Consumer Cyclical - Retailers – 0.0% | | | | | | | | | | |
AutoNation, Inc.
6.75%, 4/15/18 | | | | | 349 | | | | 386,501 | |
| | | | | | | | | | |
Portfolio of Investments
| | | | | | | | | | |
| | | | |
Principal Amount (000) | | | U.S. $ Value | |
| |
| | | | | | | | | | |
Consumer Non-Cyclical – 0.1% | | | | | | | | | | |
BRF SA
4.75%, 5/22/24(a) | | U.S.$ | | | 2,447 | | | $ | 2,423,019 | |
Bunge Ltd. Finance Corp.
8.50%, 6/15/19 | | | | | 332 | | | | 392,628 | |
Forest Laboratories LLC
5.00%, 12/15/21(a) | | | | | 3,997 | | | | 4,319,790 | |
| | | | | | | | | | |
| | | | | | | | | 7,135,437 | |
| | | | | | | | | | |
Energy – 0.7% | | | | | | | | | | |
Anadarko Petroleum Corp.
8.70%, 3/15/19 | | | | | 2,000 | | | | 2,358,046 | |
Cimarex Energy Co.
5.875%, 5/01/22 | | | | | 1,906 | | | | 2,012,515 | |
Energy Transfer Partners LP
7.60%, 2/01/24 | | | | | 3,200 | | | | 3,596,435 | |
Ensco PLC
4.70%, 3/15/21 | | | | | 2,000 | | | | 1,799,748 | |
Enterprise Products Operating LLC
Series A
8.375%, 8/01/66 | | | | | 1,619 | | | | 1,590,668 | |
Kinder Morgan Finance Co. LLC
5.70%, 1/05/16 | | | | | 470 | | | | 473,510 | |
Kinder Morgan, Inc./DE
5.55%, 6/01/45 | | | | | 2,915 | | | | 2,453,996 | |
7.00%, 6/15/17 | | | | | 275 | | | | 291,150 | |
Series G
7.75%, 1/15/32 | | | | | 2,969 | | | | 3,004,993 | |
7.80%, 8/01/31 | | | | | 2,662 | | | | 2,697,040 | |
Noble Energy, Inc.
5.875%, 6/01/22-6/01/24 | | | | | 14,791 | | | | 14,858,412 | |
Pioneer Natural Resources Co.
5.875%, 7/15/16 | | | | | 500 | | | | 515,066 | |
Regency Energy Partners LP/Regency Energy Finance Corp.
4.50%, 11/01/23 | | | | | 2,301 | | | | 2,111,883 | |
5.00%, 10/01/22 | | | | | 971 | | | | 943,662 | |
5.50%, 4/15/23 | | | | | 5,015 | | | | 4,863,547 | |
TransCanada PipeLines Ltd.
6.35%, 5/15/67 | | | | | 2,500 | | | | 2,075,000 | |
| | | | | | | | | | |
| | | | | | | | | 45,645,671 | |
| | | | | | | | | | |
Other Industrial – 0.2% | | | | | | | | | | |
Fresnillo PLC
5.50%, 11/13/23(a) | | | | | 10,414 | | | | 10,934,700 | |
| | | | | | | | | | |
| | | |
Technology – 0.1% | | | | | | | | | | |
Seagate HDD Cayman
4.75%, 6/01/23 | | | | | 5,000 | | | | 4,639,345 | |
| | | | | | | | | | |
Portfolio of Investments
| | | | | | | | | | |
| | | | |
Principal Amount (000) | | | U.S. $ Value | |
| |
| | | | | | | | | | |
Transportation - Airlines – 0.0% | | | | | | | | | | |
America West Airlines Pass-Through Trust
Series 1999-1, Class G
7.93%, 1/02/19 | | U.S.$ | | | 1,083 | | | $ | 1,159,192 | |
Delta Air Lines Pass-Through Trust
Series 2007-1A
6.821%, 8/10/22 | | | | | 855 | | | | 996,552 | |
| | | | | | | | | | |
| | | | | | | | | 2,155,744 | |
| | | | | | | | | | |
| | | | | | | | | 200,422,248 | |
| | | | | | | | | | |
Utility – 0.7% | | | | | | | | | | |
Electric – 0.5% | | | | | | | | | | |
Consorcio Transmantaro SA
4.375%, 5/07/23(a)(b) | | | | | 14,103 | | | | 13,820,940 | |
EDP Finance BV
4.90%, 10/01/19(a) | | | | | 416 | | | | 432,130 | |
6.00%, 2/02/18(a) | | | | | 10,232 | | | | 10,876,616 | |
PPL Capital Funding, Inc.
Series A
6.70%, 3/30/67 | | | | | 5,125 | | | | 4,330,625 | |
Southern California Edison Co.
Series E
6.25%, 2/01/22(m) | | | | | 3,300 | | | | 3,671,250 | |
| | | | | | | | | | |
| | | | | | | | | 33,131,561 | |
| | | | | | | | | | |
Natural Gas – 0.2% | | | | | | | | | | |
Empresa de Energia de Bogota SA ESP
6.125%, 11/10/21(a) | | | | | 7,654 | | | | 8,040,557 | |
SourceGas LLC
5.90%, 4/01/17(a) | | | | | 3,000 | | | | 3,145,842 | |
| | | | | | | | | | |
| | | | | | | | | 11,186,399 | |
| | | | | | | | | | |
| | | | | | | | | 44,317,960 | |
| | | | | | | | | | |
Total Corporates – Investment Grade
(cost $471,256,884) | | | | | | | | | 483,738,908 | |
| | | | | | | | | | |
| | | | | | | | | | |
GOVERNMENTS – TREASURIES – 4.1% | | | | | | | | | | |
Brazil – 1.5% | | | | | | | | | | |
Brazil Notas do Tesouro Nacional
Series B
6.00%, 8/15/50 | | BRL | | | 36,400 | | | | 21,960,072 | |
Series F
10.00%, 1/01/17-1/01/25 | | | | | 289,255 | | | | 64,245,756 | |
Series NTNB
6.00%, 5/15/45 | | | | | 8,100 | | | | 4,894,455 | |
| | | | | | | | | | |
| | | | | | | | | 91,100,283 | |
| | | | | | | | | | |
Portfolio of Investments
| | | | | | | | | | |
| | | | |
Principal Amount (000) | | | U.S. $ Value | |
| |
| | | | | | | | | | |
Colombia – 0.1% | | | | | | | | | | |
Colombia Government International Bond
7.75%, 4/14/21 | | COP | | | 12,390,000 | | | $ | 4,351,897 | |
Colombian TES
Series B
10.00%, 7/24/24 | | | | | 7,000,000 | | | | 2,745,314 | |
| | | | | | | | | | |
| | | | | | | | | 7,097,211 | |
| | | | | | | | | | |
| | | |
South Africa – 0.2% | | | | | | | | | | |
South Africa Government Bond
Series R204
8.00%, 12/21/18 | | ZAR | | | 16,800 | | | | 1,233,809 | |
Series R207
7.25%, 1/15/20 | | | | | 120,490 | | | | 8,568,990 | |
Series R208
6.75%, 3/31/21 | | | | | 21,565 | | | | 1,482,779 | |
| | | | | | | | | | |
| | | | | | | | | 11,285,578 | |
| | | | | | | | | | |
United States – 2.3% | | | | | | | | | | |
U.S. Treasury Bonds
6.125%, 11/15/27(q) | | U.S.$ | | | 78,500 | | | | 110,253,642 | |
U.S. Treasury Notes
1.625%, 8/31/19(q) | | | | | 7,012 | | | | 7,093,627 | |
2.125%, 8/31/20(q)(r) | | | | | 11,300 | | | | 11,611,044 | |
2.50%, 8/15/23(q) | | | | | 16,550 | | | | 17,173,637 | |
| | | | | | | | | | |
| | | | | | | | | 146,131,950 | |
| | | | | | | | | | |
Total Governments – Treasuries
(cost $317,589,972) | | | | | | | | | 255,615,022 | |
| | | | | | | | | | |
| | | | | | | | | | |
COMMERCIAL MORTGAGE-BACKED SECURITIES – 3.4% | | | | | | | | | | |
Non-Agency Fixed Rate CMBS – 3.4% | | | | | | | | | | |
Banc of America Commercial Mortgage Trust
Series 2007-3, Class AJ
5.562%, 6/10/49 | | | | | 14,989 | | | | 15,466,997 | |
Series 2007-5, Class AM
5.772%, 2/10/51 | | | | | 6,877 | | | | 7,204,845 | |
Banc of America Re-REMIC Trust
Series 2009-UB1, Class A4B
5.589%, 6/24/50(d)(f) | | | | | 3,500 | | | | 3,688,650 | |
Bear Stearns Commercial Mortgage Securities Trust
Series 2006-PW13, Class AJ
5.611%, 9/11/41 | | | | | 2,409 | | | | 2,428,271 | |
Portfolio of Investments
| | | | | | | | | | |
| | | | |
Principal Amount (000) | | | U.S. $ Value | |
| |
| | | | | | | | | | |
Series 2007-T26, Class AJ
5.566%, 1/12/45 | | U.S.$ | | | 1,550 | | | $ | 1,560,557 | |
Citigroup Commercial Mortgage Trust
Series 2013-GC11, Class XA
1.866%, 4/10/46(p) | | | | | 11,735 | | | | 864,059 | |
Series 2015-GC31, Class D
4.20%, 6/10/48 | | | | | 1,416 | | | | 1,120,857 | |
Commercial Mortgage Pass Through Certificates
Series 2012-CR3, Class XA
2.118%, 10/15/45 (p) | | | | | 59,083 | | | | 5,674,946 | |
Commercial Mortgage Trust
Series 2007-GG9, Class AM
5.475%, 3/10/39 | | | | | 3,469 | | | | 3,589,353 | |
Series 2012-CR1, Class XA
2.083%, 5/15/45(p) | | | | | 24,523 | | | | 2,218,585 | |
Series 2012-CR5, Class XA
1.868%, 12/10/45(p) | | | | | 12,347 | | | | 1,010,340 | |
Series 2012-LC4, Class XA
2.399%, 12/10/44(a)(p) | | | | | 35,727 | | | | 3,571,806 | |
Series 2013-LC6, Class XA
1.747%, 1/10/46(p) | | | | | 65,021 | | | | 4,648,605 | |
Series 2014-CR15, Class XA
1.329%, 2/10/47(p) | | | | | 13,075 | | | | 790,274 | |
Series 2014-LC15, Class D
4.944%, 4/10/47(a) | | | | | 8,500 | | | | 7,627,237 | |
Series 2014-LC17, Class D
3.687%, 10/10/47(a) | | | | | 7,603 | | | | 6,109,501 | |
Series 2014-UBS5, Class D
3.495%, 9/10/47(a) | | | | | 3,542 | | | | 2,779,188 | |
Series 2015-DC1, Class D
4.354%, 2/10/48(a) | | | | | 4,500 | | | | 3,778,519 | |
Credit Suisse Commercial Mortgage Trust
Series 2006-C4, Class A3
5.467%, 9/15/39 | | | | | 4,223 | | | | 4,302,783 | |
Credit Suisse First Boston Mortgage Securities Corp.
Series 2003-C5, Class J
5.226%, 12/15/36(a) | | | | | 2,529 | | | | 2,601,226 | |
DBUBS Mortgage Trust
Series 2011-LC2A, Class D
5.458%, 7/10/44(a) | | | | | 2,500 | | | | 2,630,548 | |
GS Mortgage Securities Corp. II
Series 2012-GCJ9, Class XA
2.335%, 11/10/45(p) | | | | | 9,039 | | | | 920,371 | |
Series 2013-GC10, Class XA
1.627%, 2/10/46(p) | | | | | 4,991 | | | | 428,446 | |
GS Mortgage Securities Trust
Series 2006-GG6, Class AJ
5.522%, 4/10/38 | | | | | 11,756 | | | | 11,787,890 | |
Series 2011-GC5, Class C
5.308%, 8/10/44(a) | | | | | 7,937 | | | | 8,667,381 | |
Portfolio of Investments
| | | | | | | | | | |
| | | | |
Principal Amount (000) | | | U.S. $ Value | |
| |
| | | | | | | | | | |
Series 2012-GCJ7, Class XA
2.526%, 5/10/45(p) | | U.S.$ | | | 35,411 | | | $ | 3,309,841 | |
Series 2013-GC13, Class D
4.069%, 7/10/46(a) | | | | | 1,500 | | | | 1,335,587 | |
Series 2014-GC18, Class D
4.948%, 1/10/47(a) | | | | | 4,503 | | | | 4,062,082 | |
Series 2014-GC20, Class D
4.867%, 4/10/47(a) | | | | | 995 | | | | 877,616 | |
JPMorgan Chase Commercial Mortgage Securities Trust
Series 2007-CB19, Class AM
5.695%, 2/12/49 | | | | | 10,321 | | | | 10,830,215 | |
Series 2012-CBX, Class D
5.238%, 6/15/45(a) | | | | | 5,000 | | | | 5,118,373 | |
Series 2012-CBX, Class E
5.238%, 6/15/45(a) | | | | | 6,521 | | | | 6,417,965 | |
Series 2014-C23, Class D
3.96%, 9/15/47(a) | | | | | 4,859 | | | | 4,057,262 | |
Series 2015-C32, Class C
4.819%, 11/15/48 | | | | | 5,050 | | | | 4,663,125 | |
LB-UBS Commercial Mortgage Trust
Series 2006-C1, Class AJ
5.276%, 2/15/41 | | | | | 1,977 | | | | 1,981,897 | |
Series 2007-C2, Class AM
5.493%, 2/15/40 | | | | | 3,927 | | | | 4,075,763 | |
Morgan Stanley Bank of America Merrill Lynch Trust
Series 2012-C5, Class XA
1.809%, 8/15/45(a)(p) | | | | | 21,557 | | | | 1,531,915 | |
Series 2012-C6, Class XA
2.086%, 11/15/45(a)(p) | | | | | 49,321 | | | | 3,904,346 | |
Series 2014-C19, Class D
3.25%, 12/15/47(a) | | | | | 8,153 | | | | 6,387,293 | |
Morgan Stanley Capital I Trust
Series 2015-MS1, Class D
4.029%, 5/15/48(a) | | | | | 2,790 | | | | 2,287,435 | |
UBS-Barclays Commercial Mortgage Trust
Series 2012-C4, Class XA
1.822%, 12/10/45(a)(p) | | | | | 3,846 | | | | 344,407 | |
Wachovia Bank Commercial Mortgage Trust
Series 2005-C22, Class AJ
5.398%, 12/15/44 | | | | | 3,000 | | | | 2,996,440 | |
Wells Fargo Commercial Mortgage Trust
Series 2010-C1, Class XA
1.352%, 11/15/43(a)(p) | | | | | 9,544 | | | | 515,302 | |
Series 2014-LC18, Class D
3.957%, 12/15/47(a) | | | | | 5,000 | | | | 4,070,360 | |
Series 2015-LC20, Class D
4.366%, 4/15/50(a) | | | | | 2,643 | | | | 2,162,758 | |
Portfolio of Investments
| | | | | | | | | | |
| | | | |
Principal Amount (000) | | | U.S. $ Value | |
| |
| | | | | | | | | | |
WF-RBS Commercial Mortgage Trust
Series 2011-C4, Class D
5.265%, 6/15/44(a)(s) | | U.S.$ | | | 2,576 | | | $ | 2,701,862 | |
Series 2012-C6, Class D
5.561%, 4/15/45(a) | | | | | 1,350 | | | | 1,394,407 | |
Series 2012-C7, Class XA
1.528%, 6/15/45(a)(p) | | | | | 7,800 | | | | 585,045 | |
Series 2012-C8, Class E
4.875%, 8/15/45(a) | | | | | 3,400 | | | | 3,375,988 | |
Series 2014-C20, Class D
3.986%, 5/15/47(a) | | | | | 10,906 | | | | 8,933,198 | |
Series 2014-C21, Class D
3.497%, 8/15/47(a) | | | | | 10,000 | | | | 7,793,000 | |
Series 2014-C23, Class D
3.992%, 10/15/57(a) | | | | | 13,722 | | | | 11,275,692 | |
| | | | | | | | | | |
| | | |
Total Commercial Mortgage-Backed Securities
(cost $208,638,887) | | | | | | | | | 212,460,409 | |
| | | | | | | | | | |
| | | | | | | | | | |
BANK LOANS – 2.9% | | | | | | | | | | |
| Industrial – 2.7% | | | | | | | | | | |
Basic – 0.4% | | | | | | | | | | |
FMG Resources (August 2006) Pty LTD (FMG America Finance, Inc.)
3.75%, 6/30/19(h) | | | | | 13,901 | | | | 11,731,810 | |
Magnetation LLC
12.00% 3/07/16(f)(i)(k) | | | | | 17,809 | | | | 15,903,850 | |
| | | | | | | | | | |
| | | | | | | | | 27,635,660 | |
| | | | | | | | | | |
Capital Goods – 0.2% | | | | | | | | | | |
Berry Plastics Corporation
3.75%, 1/06/21(h) | | | | | 5,056 | | | | 5,049,361 | |
Serta Simmons Holdings, LLC
4.25%, 10/01/19(h) | | | | | 5,092 | | | | 5,091,556 | |
| | | | | | | | | | |
| | | | | | | | | 10,140,917 | |
| | | | | | | | | | |
Communications - Media – 0.1% | | | | | | | | | | |
Advantage Sales & Marketing, Inc.
7.50%, 7/25/22(h) | | | | | 5,978 | | | | 5,495,849 | |
TWCC Holding Corp.
7.00%, 6/26/20(h) | | | | | 3,525 | | | | 3,517,280 | |
| | | | | | | | | | |
| | | | | | | | | 9,013,129 | |
| | | | | | | | | | |
Consumer Cyclical - Automotive – 0.2% | | | | | | | | | | |
Affinia Group Inc.
4.75%-5.75%, 4/27/20(h) | | | | | 5,987 | | | | 5,987,394 | |
Navistar, Inc.
6.50%, 8/07/20(h) | | | | | 3,605 | | | | 3,388,700 | |
| | | | | | | | | | |
| | | | | | | | | 9,376,094 | |
| | | | | | | | | | |
Portfolio of Investments
| | | | | | | | | | |
| | | | |
Principal Amount (000) | | | U.S. $ Value | |
| |
| | | | | | | | | | |
Consumer Cyclical - Entertainment – 0.2% | | | | | | | | | | |
Kasima, LLC (Digital Cinema Implementation Partners, LLC)
3.25%, 5/17/21(h) | | U.S.$ | | | 2,675 | | | $ | 2,663,479 | |
NCL Corporation Ltd.
(aka Norwegian Cruise Lines)
4.00%, 11/19/21(h) | | | | | 1,368 | | | | 1,364,851 | |
Station Casinos LLC
4.25%, 3/02/20(h) | | | | | 6,797 | | | | 6,796,965 | |
| | | | | | | | | | |
| | | | | | | | | 10,825,295 | |
| | | | | | | | | | |
Consumer Cyclical - Other – 0.2% | | | | | | | | | | |
CityCenter Holdings, LLC
4.25%, 10/16/21(h) | | | | | 9,547 | | | | 9,552,053 | |
ClubCorp Club Operations, Inc.
4.25%, 7/24/20(h) | | | | | 2,348 | | | | 2,345,422 | |
La Quinta Intermediate Holdings L.L.C.
3.75%, 4/14/21(h) | | | | | 2,837 | | | | 2,808,497 | |
| | | | | | | | | | |
| | | | | | | | | 14,705,972 | |
| | | | | | | | | | |
Consumer Cyclical - Retailers – 0.5% | | | | | | | | | | |
Burlington Coat Factory Warehouse Corporation
4.25%, 8/13/21(h) | | | | | 579 | | | | 579,589 | |
Dollar Tree, Inc.
3.50%, 7/06/22(h) | | | | | 209 | | | | 209,274 | |
Harbor Freight Tools USA, Inc.
4.75%, 7/26/19(h) | | | | | 2,227 | | | | 2,232,337 | |
J. Crew Group, Inc.
4.00%, 3/05/21(h) | | | | | 5,510 | | | | 4,038,607 | |
J.C. Penney Corporation, Inc.
6.00%, 5/22/18(h)(t) | | | | | 12,565 | | | | 12,517,632 | |
Men’s Wearhouse, Inc., (The)
5.00%, 6/18/21 | | | | | 2,755 | | | | 2,757,529 | |
Michaels Stores, Inc.
4.00%, 1/28/20(h) | | | | | 3,096 | | | | 3,100,982 | |
Rite Aid Corporation
5.75%, 8/21/20(h) | | | | | 3,000 | | | | 3,002,490 | |
| | | | | | | | | | |
| | | | | | | | | 28,438,440 | |
| | | | | | | | | | |
Consumer Non-Cyclical – 0.3% | | | | | | | | | | |
Acadia Healthcare Company, Inc.
4.25%, 2/11/22(h) | | | | | 521 | | | | 521,063 | |
Concordia Healthcare Corp.
10/21/21(t) | | | | | 5,072 | | | | 4,864,431 | |
Grifols Worldwide Operations Limited
3.188%, 2/27/21(h) | | | | | 3,201 | | | | 3,193,695 | |
Ortho-Clinical Diagnostics Holdings Luxembourg S.À R.L.
4.75%, 6/30/21(h) | | | | | 3,980 | | | | 3,917,262 | |
Portfolio of Investments
| | | | | | | | | | |
| | | | |
Principal Amount (000) | | | U.S. $ Value | |
| |
| | | | | | | | | | |
Pharmedium Healthcare Corporation
7.75%, 1/28/22(h) | | U.S.$ | | | 6,656 | | | $ | 6,669,457 | |
| | | | | | | | | | |
| | | | | | | | | 19,165,908 | |
| | | | | | | | | | |
Energy – 0.0% | | | | | | | | | | |
Seadrill Operating LP (Seadrill Partners Finco LLC)
4.00%, 2/21/21(h) | | | | | 5,178 | | | | 3,007,977 | |
| | | | | | | | | | |
| | | |
Other Industrial – 0.3% | | | | | | | | | | |
Education Management II LLC
2.00%-6.50%, 7/02/20(h) | | | | | 1,248 | | | | 131,085 | |
5.50%, 7/02/20(h) | | | | | 713 | | | | 183,613 | |
Gardner Denver, Inc.
4.25%, 7/30/20(h) | | | | | 5,439 | | | | 5,094,711 | |
Laureate Education, Inc.
5.00%, 6/15/18(h) | | | | | 2,687 | | | | 2,286,370 | |
Travelport Finance (Luxembourg) S.A.r.l.
5.75%, 9/02/21(h) | | | | | 10,103 | | | | 10,012,107 | |
Unifrax Holding Co.
4.50%, 11/28/18(h) | | EUR | | | 2,730 | | | | 2,988,993 | |
| | | | | | | | | | |
| | | | | | | | | 20,696,879 | |
| | | | | | | | | | |
Technology – 0.3% | | | | | | | | | | |
Avaya Inc.
4.82%, 10/26/17(h) | | U.S.$ | | | 2,061 | | | | 1,721,147 | |
6.50%, 6/16/18(h) | | | | | 371 | | | | 308,176 | |
BMC Software Finance Inc.
5.00%, 9/10/20(h) | | | | | 10,840 | | | | 9,745,588 | |
Smart Modular Technologies (Global), Inc.
8.25%, 8/26/17(h) | | | | | 4,418 | | | | 4,153,384 | |
| | | | | | | | | | |
| | | | | | | | | 15,928,295 | |
| | | | | | | | | | |
| | | | | | | | | 168,934,566 | |
| | | | | | | | | | |
| Utility – 0.1% | | | | | | | | | | |
Electric – 0.1% | | | | | | | | | | |
Energy Future Intermediate Holding Company LLC (EFIH Finance Inc.)
4.25%, 6/19/16(h) | | | | | 9,316 | | | | 9,310,373 | |
| | | | | | | | | | |
| | | |
| Financial Institutions – 0.1% | | | | | | | | | | |
Insurance – 0.1% | | | | | | | | | | |
Hub International Limited
4.00%, 10/02/20(h) | | | | | 4,410 | | | | 4,289,980 | |
| | | | | | | | | | |
| | | |
Total Bank Loans
(cost $192,430,904) | | | | | | | | | 182,534,919 | |
| | | | | | | | | | |
| | | | | | | | | | |
Portfolio of Investments
| | | | | | | | | | |
| | | | |
Principal Amount (000) | | | U.S. $ Value | |
| |
| | | | | | | | | | |
EMERGING MARKETS – SOVEREIGNS – 2.7% | | | | | | | | | | |
Dominican Republic – 0.3% | | | | | | | | | | |
Dominican Republic International Bond
7.45%, 4/30/44(a) | | U.S.$ | | | 5,621 | | | $ | 5,930,155 | |
8.625%, 4/20/27(a) | | | | | 9,061 | | | | 10,691,980 | |
| | | | | | | | | | |
| | | | | | | | | 16,622,135 | |
| | | | | | | | | | |
El Salvador – 0.2% | | | | | | | | | | |
El Salvador Government International Bond
7.375%, 12/01/19(a) | | | | | 1,495 | | | | 1,530,506 | |
7.625%, 9/21/34(a) | | | | | 872 | | | | 833,850 | |
7.65%, 6/15/35(a) | | | | | 11,545 | | | | 10,462,657 | |
7.75%, 1/24/23(a) | | | | | 700 | | | | 710,500 | |
| | | | | | | | | | |
| | | | | | | | | 13,537,513 | |
| | | | | | | | | | |
Gabon – 0.1% | | | | | | | | | | |
Gabon Government International Bond
6.375%, 12/12/24(a) | | | | | 3,785 | | | | 3,255,479 | |
| | | | | | | | | | |
| | | |
Ghana – 0.4% | | | | | | | | | | |
Republic of Ghana
7.875%, 8/07/23(a) | | | | | 7,168 | | | | 6,148,727 | |
8.125%, 1/18/26(a) | | | | | 1,383 | | | | 1,174,513 | |
8.50%, 10/04/17(a) | | | | | 2,928 | | | | 2,946,505 | |
10.75%, 10/14/30(a) | | | | | 14,127 | | | | 14,903,985 | |
| | | | | | | | | | |
| | | | | | | | | 25,173,730 | |
| | | | | | | | | | |
Ivory Coast – 0.7% | | | | | | | | | | |
Ivory Coast Government International Bond
5.75%, 12/31/32(a) | | | | | 37,847 | | | | 33,683,830 | |
6.375%, 3/03/28(a) | | | | | 9,923 | | | | 9,141,564 | |
| | | | | | | | | | |
| | | | | | | | | 42,825,394 | |
| | | | | | | | | | |
Jamaica – 0.2% | | | | | | | | | | |
Jamaica Government International Bond
7.625%, 7/09/25 | | | | | 2,302 | | | | 2,509,180 | |
7.875%, 7/28/45 | | | | | 7,519 | | | | 7,594,190 | |
| | | | | | | | | | |
| | | | | | | | | 10,103,370 | |
| | | | | | | | | | |
Kenya – 0.0% | | | | | | | | | | |
Kenya Government International Bond
5.875%, 6/24/19(a) | | | | | 3,124 | | | | 3,023,720 | |
| | | | | | | | | | |
| | | |
Lebanon – 0.1% | | | | | | | | | | |
Lebanon Government International Bond
6.00%, 1/27/23(a) | | | | | 3,813 | | | | 3,770,866 | |
Series E
6.10%, 10/04/22(a) | | | | | 2,900 | | | | 2,882,600 | |
| | | | | | | | | | |
| | | | | | | | | 6,653,466 | |
| | | | | | | | | | |
Pakistan – 0.1% | | | | | | | | | | |
Pakistan Government International Bond
7.25%, 4/15/19(a) | | | | | 7,468 | | | | 7,747,191 | |
| | | | | | | | | | |
Portfolio of Investments
| | | | | | | | | | |
| | | | |
Principal Amount (000) | | | U.S. $ Value | |
| |
| | | | | | | | | | |
| | | |
Serbia – 0.0% | | | | | | | | | | |
Republic of Serbia
6.75%, 11/01/24(a) | | U.S.$ | | | 613 | | | $ | 626,024 | |
| | | | | | | | | | |
| | | |
Sri Lanka – 0.1% | | | | | | | | | | |
Sri Lanka Government International Bond
6.00%, 1/14/19(a) | | | | | 3,825 | | | | 3,840,667 | |
6.125%, 6/03/25(a) | | | | | 2,800 | | | | 2,639,000 | |
| | | | | | | | | | |
| | | | | | | | | 6,479,667 | |
| | | | | | | | | | |
Venezuela – 0.4% | | | | | | | | | | |
Venezuela Government International Bond
7.65%, 4/21/25 | | | | | 6,636 | | | | 2,505,090 | |
9.00%, 5/07/23(a) | | | | | 4,555 | | | | 1,787,877 | |
9.25%, 9/15/27 | | | | | 35,750 | | | | 15,640,625 | |
9.25%, 5/07/28(a) | | | | | 1,500 | | | | 588,750 | |
11.75%, 10/21/26(a) | | | | | 2,372 | | | | 1,049,654 | |
11.95%, 8/05/31(a) | | | | | 1,704 | | | | 766,710 | |
| | | | | | | | | | |
| | | | | | | | | 22,338,706 | |
| | | | | | | | | | |
Zambia – 0.1% | | | | | | | | | | |
Zambia Government International Bond
8.50%, 4/14/24(a) | | | | | 9,236 | | | | 7,790,658 | |
| | | | | | | | | | |
| | | |
Total Emerging Markets – Sovereigns
(cost $175,198,888) | | | | | | | | | 166,177,053 | |
| | | | | | | | | | |
| | | | | | | | | | |
EMERGING MARKETS – CORPORATE BONDS – 2.5% | | | | | | | | | | |
Industrial – 2.1% | | | | | | | | | | |
Basic – 0.3% | | | | | | | | | | |
Elementia SAB de CV
5.50%, 1/15/25(a) | | | | | 2,208 | | | | 2,158,320 | |
Sappi Papier Holding GmbH
6.625%, 4/15/21(a) | | | | | 2,295 | | | | 2,306,475 | |
7.75%, 7/15/17(a) | | | | | 6,184 | | | | 6,431,360 | |
Tupy Overseas SA
6.625%, 7/17/24(a) | | | | | 2,638 | | | | 2,357,712 | |
Vedanta Resources PLC
6.00%, 1/31/19(a) | | | | | 2,391 | | | | 1,916,387 | |
8.25%, 6/07/21(a)(b) | | | | | 3,455 | | | | 2,764,000 | |
9.50%, 7/18/18(a)(b) | | | | | 1,943 | | | | 1,826,420 | |
| | | | | | | | | | |
| | | | | | | | | 19,760,674 | |
| | | | | | | | | | |
Capital Goods – 0.6% | | | | | | | | | | |
CEMEX Espana SA/Luxembourg
9.875%, 4/30/19(a) | | | | | 10,290 | | | | 10,971,712 | |
Cemex Finance LLC
9.375%, 10/12/22(a) | | | | | 4,406 | | | | 4,802,540 | |
Portfolio of Investments
| | | | | | | | | | |
| | | | |
Principal Amount (000) | | | U.S. $ Value | |
| |
| | | | | | | | | | |
Cemex SAB de CV
5.70%, 1/11/25(a) | | U.S.$ | | | 7,161 | | | $ | 6,623,925 | |
Ferreycorp SAA
4.875%, 4/26/20(a) | | | | | 4,418 | | | | 4,198,081 | |
Grupo Cementos de Chihuahua SAB de CV
8.125%, 2/08/20(a) | | | | | 830 | | | | 867,350 | |
Grupo KUO SAB De CV
6.25%, 12/04/22(a) | | | | | 696 | | | | 664,680 | |
Servicios Corporativos Javer SAPI de CV
9.875%, 4/06/21(a) | | | | | 6,414 | | | | 6,558,315 | |
| | | | | | | | | | |
| | | | | | | | | 34,686,603 | |
| | | | | | | | | | |
Communications - Telecommunications – 0.3% | | | | | | | | | | |
Comcel Trust via Comunicaciones Celulares SA
6.875%, 2/06/24(a) | | | | | 6,131 | | | | 4,889,473 | |
Digicel Group Ltd.
8.25%, 9/30/20(a) | | | | | 9,000 | | | | 8,122,500 | |
Digicel Ltd.
6.00%, 4/15/21(a) | | | | | 3,750 | | | | 3,375,000 | |
6.75%, 3/01/23(a) | | | | | 3,270 | | | | 2,943,000 | |
| | | | | | | | | | |
| | | | | | | | | 19,329,973 | |
| | | | | | | | | | |
Consumer Cyclical - Other – 0.1% | | | | | | | | | | |
Theta Capital Pte Ltd.
7.00%, 5/16/19-4/11/22(a) | | | | | 3,529 | | | | 3,489,629 | |
| | | | | | | | | | |
| | | |
Consumer Cyclical - Retailers – 0.3% | | | | | | | | | | |
Edcon Ltd.
9.50%, 3/01/18(a) | | EUR | | | 5,250 | | | | 3,626,426 | |
9.50%, 3/01/18(a) | | U.S.$ | | | 2,820 | | | | 1,748,400 | |
Office Depot de Mexico SA de CV
6.875%, 9/20/20(a) | | | | | 12,250 | | | | 12,433,750 | |
| | | | | | | | | | |
| | | | | | | | | 17,808,576 | |
| | | | | | | | | | |
Consumer Non-Cyclical – 0.3% | | | | | | | | | | |
Cosan Luxembourg SA
9.50%, 3/14/18(a) | | BRL | | | 13,070 | | | | 2,758,000 | |
Marfrig Overseas Ltd.
9.50%, 5/04/20(a) | | U.S.$ | | | 3,859 | | | | 3,859,000 | |
Minerva Luxembourg SA
7.75%, 1/31/23(a) | | | | | 10,488 | | | | 10,356,900 | |
Tonon Luxembourg SA
7.25%, 1/24/20(a)(i) | | | | | 6,585 | | | | 2,239,025 | |
USJ Acucar e Alcool SA
9.875%, 11/09/19(a) | | | | | 1,670 | | | | 651,300 | |
Virgolino de Oliveira Finance SA
10.50%, 1/28/18(c)(d) | | | | | 13,674 | | | | 177,762 | |
Portfolio of Investments
| | | | | | | | | | |
| Company | | | |
Principal Amount (000) | | | U.S. $ Value | |
| |
| | | | | | | | | | |
10.875%, 1/13/20(c)(d) | | U.S.$ | | | 2,500 | | | $ | 450,000 | |
11.75%, 2/09/22(c)(d) | | | | | 13,613 | | | | 176,969 | |
| | | | | | | | | | |
| | | | | | | | | 20,668,956 | |
| | | | | | | | | | |
Transportation - Airlines – 0.2% | | | | | | | | | | |
Guanay Finance Ltd.
6.00%, 12/15/20(a) | | | | | 5,082 | | | | 5,132,820 | |
TAM Capital 3, Inc.
8.375%, 6/03/21(a) | | | | | 12,957 | | | | 10,430,385 | |
| | | | | | | | | | |
| | | | | | | | | 15,563,205 | |
| | | | | | | | | | |
| | | | | | | | | 131,307,616 | |
| | | | | | | | | | |
Financial Institutions – 0.3% | | | | | | | | | | |
Banking – 0.2% | | | | | | | | | | |
Turkiye Vakiflar Bankasi T.A.O.
6.00%, 11/01/22(a)(b) | | | | | 12,500 | | | | 11,893,750 | |
| | | | | | | | | | |
| | | |
Finance – 0.1% | | | | | | | | | | |
CIMPOR Financial Operations BV
5.75%, 7/17/24(a) | | | | | 7,640 | | | | 5,032,850 | |
| | | | | | | | | | |
| | | | | | | | | 16,926,600 | |
| | | | | | | | | | |
Utility – 0.1% | | | | | | | | | | |
Electric – 0.1% | | | | | | | | | | |
AES El Salvador Trust II
6.75%, 3/28/23(a) | | | | | 3,050 | | | | 2,745,000 | |
ContourGlobal Power Holdings SA
7.125%, 6/01/19(a) | | | | | 6,556 | | | | 6,506,830 | |
| | | | | | | | | | |
| | | | | | | | | 9,251,830 | |
| | | | | | | | | | |
Total Emerging Markets – Corporate Bonds
(cost $201,054,813) | | | | | | | | | 157,486,046 | |
| | | | | | | | | | |
| | | |
| | | | | Shares | | | | |
PREFERRED STOCKS – 1.5% | | | | | | | | | | |
Financial Institutions – 1.4% | | | | | | | | | | |
Banking – 0.7% | | | | | | | | | | |
GMAC Capital Trust I
8.125% | | | | | 310,800 | | | | 8,027,964 | |
Goldman Sachs Group, Inc. (The)
Series J
5.50% | | | | | 299,200 | | | | 7,447,088 | |
Morgan Stanley
6.875% | | | | | 277,200 | | | | 7,498,260 | |
Santander Finance Preferred SAU
6.80% | | | | | 67,000 | | | | 1,723,240 | |
State Street Corp.
Series D
5.90% | | | | | 82,375 | | | | 2,192,823 | |
US Bancorp
Series F
6.50% | | | | | 270,000 | | | | 7,824,600 | |
Portfolio of Investments
| | | | | | | | | | |
| Company | | | |
Shares | | | U.S. $ Value | |
| |
| | | | | | | | | | |
Wells Fargo & Co.
5.85% | | | | | 30,500 | | | $ | 792,695 | |
Wells Fargo & Co.
6.625% | | | | | 297,650 | | | | 8,375,871 | |
Zions Bancorporation
Series G
6.30% | | | | | 73,100 | | | | 1,910,103 | |
| | | | | | | | | | |
| | | | | | | | | 45,792,644 | |
| | | | | | | | | | |
Finance – 0.2% | | | | | | | | | | |
RBS Capital Funding Trust V
Series E
5.90% | | | | | 427,925 | | | | 10,548,351 | |
| | | | | | | | | | |
| | | |
Insurance – 0.1% | | | | | | | | | | |
Hartford Financial Services Group, Inc. (The)
7.875% | | | | | 170,000 | | | | 5,236,000 | |
XLIT Ltd.
Series D
3.441%(h) | | | | | 3,750 | | | | 3,093,750 | |
| | | | | | | | | | |
| | | | | | | | | 8,329,750 | |
| | | | | | | | | | |
REITS – 0.4% | | | | | | | | | | |
Brandywine Realty Trust
Series E
6.90% | | | | | 31,700 | | | | 819,762 | |
Digital Realty Trust, Inc.
6.35%(e) | | | | | 385,600 | | | | 9,674,704 | |
Hersha Hospitality Trust
Series C
6.875% | | | | | 91,100 | | | | 2,325,901 | |
National Retail Properties, Inc.
Series E
5.70% | | | | | 81,225 | | | | 2,043,621 | |
Public Storage
Series W
5.20% | | | | | 86,650 | | | | 2,141,121 | |
Public Storage
Series X
5.20% | | | | | 7,000 | | | | 173,810 | |
Sabra Health Care REIT, Inc.
Series A
7.125% | | | | | 80,050 | | | | 2,071,294 | |
Sovereign Real Estate Investment Trust
12.00%(a) | | | | | 501 | | | | 636,270 | |
Welltower, Inc.
6.50% | | | | | 51,650 | | | | 1,371,308 | |
| | | | | | | | | | |
| | | | | | | | | 21,257,791 | |
| | | | | | | | | | |
| | | | | | | | | 85,928,536 | |
| | | | | | | | | | |
Portfolio of Investments
| | | | | | | | | | |
| Company | | | |
Shares | | | U.S. $ Value | |
| |
| | | | | | | | | | |
Industrial – 0.1% | | | | | | | | | | |
Communications - Telecommunications – 0.1% | | | | | | | | | | |
Centaur Funding Corp.
9.08%(a) | | | | | 6,280 | | | $ | 7,755,800 | |
| | | | | | | | | | |
| | | |
Services – 0.0% | | | | | | | | | | |
Education Management LLC
0.00%(e)(k) | | | | | 9,507 | | | | 142,605 | |
| | | | | | | | | | |
| | | | | | | | | 7,898,405 | |
| | | | | | | | | | |
Utility – 0.0% | | | | | | | | | | |
Electric – 0.0% | | | | | | | | | | |
SCE Trust III
5.75% | | | | | 60,000 | | | | 1,671,000 | |
| | | | | | | | | | |
| | | |
Total Preferred Stocks
(cost $86,401,894) | | | | | | | | | 95,497,941 | |
| | | | | | | | | | |
| | | |
| | | | | Principal
Amount
(000) | | | | |
GOVERNMENTS – SOVEREIGN
AGENCIES – 1.3% | | | | | | | | | | |
Brazil – 0.4% | | | | | | | | | | |
Banco do Brasil SA/Cayman
9.00%, 6/18/24(a)(m) | | U.S.$ | | | 10,500 | | | | 7,245,000 | |
Petrobras Global Finance BV
4.875%, 3/17/20 | | | | | 7,385 | | | | 6,037,237 | |
5.375%, 1/27/21 | | | | | 8,624 | | | | 7,017,780 | |
5.75%, 1/20/20 | | | | | 1,011 | | | | 862,838 | |
6.85%, 6/05/15 | | | | | 2,958 | | | | 2,029,780 | |
| | | | | | | | | | |
| | | | | | | | | 23,192,635 | |
| | | | | | | | | | |
Colombia – 0.1% | | | | | | | | | | |
Ecopetrol SA
5.875%, 5/28/45 | | | | | 6,355 | | | | 5,179,325 | |
Empresas Publicas de Medellin ESP
7.625%, 7/29/19(a) | | | | | 1,277 | | | | 1,455,397 | |
| | | | | | | | | | |
| | | | | | | | | 6,634,722 | |
| | | | | | | | | | |
Dominican Republic – 0.1% | | | | | | | | | | |
Banco de Reservas de la Republica Dominicana
7.00%, 2/01/23(a) | | | | | 7,253 | | | | 7,221,051 | |
| | | | | | | | | | |
Israel – 0.1% | | | | | | | | | | |
Israel Electric Corp., Ltd.
5.00%, 11/12/24(a) | | | | | 5,373 | | | | 5,577,711 | |
| | | | | | | | | | |
| | | |
Morocco – 0.1% | | | | | | | | | | |
OCP SA
5.625%, 4/25/24(a) | | | | | 2,708 | | | | 2,828,506 | |
| | | | | | | | | | |
Portfolio of Investments
| | | | | | | | | | |
| | | | |
Principal Amount (000) | | | U.S. $ Value | |
| |
| | | | | | | | | | |
Netherlands – 0.0% | | | | | | | | | | |
SNS Bank NV
11.25%, 12/31/49(e)(f)(k) | | EUR | | | 1,001 | | | $ | – 0 | –*** |
| | | | | | | | | | |
| | | |
Spain – 0.0% | | | | | | | | | | |
Instituto de Credito Oficial
4.53%, 3/17/16 | | CAD | | | 2,700 | | | | 2,085,769 | |
| | | | | | | | | | |
| | | |
United Arab Emirates – 0.3% | | | | | | | | | | |
Dubai Holding Commercial Operations MTN Ltd.
6.00%, 2/01/17 | | GBP | | | 10,900 | | | | 16,997,687 | |
| | | | | | | | | | |
| | | |
United Kingdom – 0.2% | | | | | | | | | | |
Royal Bank of Scotland Group PLC
8.00%, 8/10/25(m) | | U.S.$ | | | 13,300 | | | | 13,898,500 | |
| | | | | | | | | | |
| | | |
Total Governments – Sovereign Agencies
(cost $86,595,969) | | | | | | | | | 78,436,581 | |
| | | | | | | | | | |
| | | |
| | | | | Shares | | | | |
COMMON STOCKS – 1.1% | | | | | | | | | | |
Education Management Corp.(e)(k) | | | | | 8,544,418 | | | | 42,722 | |
Exide Corp.(e)(f)(g) | | | | | 332,502 | | | | 950,956 | |
iPayment, Inc.(e) | | | | | 576,195 | | | | 2,967,402 | |
Liberty Tire Recycling LLC(e)(f)(k) | | | | | 128,591 | | | | – 0 | –*** |
Mt. Logan Re Ltd.
(Preference Shares)(e)(g)(u) | | | | | 29,452 | | | | 31,262,400 | |
Mt. Logan Re Ltd. (Preference
Shares)(e)(u) | | | | | 25,000 | | | | 26,295,557 | |
Neenah Enterprises, Inc.(e)(f)(k) | | | | | 49,578 | | | | 234,504 | |
New Cotai LLC/New Cotai Capital Corp.(e)(f)(k) | | | | | 13 | | | | 65,910 | |
Travelport Worldwide Ltd. | | | | | 292,343 | | | | 3,961,248 | |
| | | | | | | | | | |
| | | |
Total Common Stocks
(cost $63,348,585) | | | | | | | | | 65,780,699 | |
| | | | | | | | | | |
| | | |
| | | | | Principal
Amount
(000) | | | | |
WHOLE LOAN TRUSTS – 1.0% | | | | | | | | | | |
Performing Asset – 1.0% | | | | | | | | | | |
AlphaCredit Capital, SA de CV
17.25%, 7/19/19(f)(k) | | MXN | | | 52,483 | | | | 3,177,355 | |
Alpha Credit Debt Fund LLC
15.00%, 12/31/17(f)(k) | | U.S.$ | | | 1,801 | | | | 1,801,173 | |
Cara Aircraft Leasing 28548, Inc.
8.00%, 12/02/19(f)(k) | | | | | 1,042 | | | | 1,042,422 | |
Portfolio of Investments
| | | | | | | | | | |
| | | | |
Principal Amount (000) | | | U.S. $ Value | |
| |
| | | | | | | | | | |
Cara Aircraft Leasing 28563, Inc.
8.00%, 6/11/19(f)(k) | | U.S.$ | | | 1,515 | | | $ | 1,514,540 | |
Cara Aircraft Leasing 28868, Inc.
8.00%, 12/02/19(f)(k) | | | | | 1,209 | | | | 1,209,265 | |
Deutsche Bank Mexico SA
8.00%, 10/31/34(f)(k)(s) | | MXN | | | 47,006 | | | | 2,120,402 | |
8.00%, 10/31/34(f)(k) | | | | | 100,002 | | | | 4,510,965 | |
Ede Del Este SA (DPP)
12.00%, 3/31/16(f)(k) | | U.S.$ | | | 353 | | | | 356,622 | |
Ede Del Este SA (ITABO)
12.00%, 3/31/16(f)(k) | | | | | 749 | | | | 756,316 | |
Flexpath Capital, Inc.
12.00%, 10/01/19(f)(k) | | | | | 4,888 | | | | 4,887,552 | |
Flexpath Wh I LLC
13.00%, 10/23/20(f)(k) | | | | | 9,308 | | | | 8,869,433 | |
Recife Funding Zero Coupon,
11/05/29(f)(k) | | | | | 9,586 | | | | 9,970,380 | |
Sheridan Auto Loan Holdings I LLC
10.00%, 12/31/20-6/30/21(f)(k) | | | | | 7,395 | | | | 7,346,122 | |
Sheridan Consumer Finance Trust
10.86%, 4/01/20(f)(h)(k) | | | | | 15,248 | | | | 15,142,329 | |
| | | | | | | | | | |
| | | |
Total Whole Loan Trusts
(cost $63,936,534) | | | | | | | | | 62,704,876 | |
| | | | | | | | | | |
| | | | | | | | | | |
LOCAL GOVERNMENTS – MUNICIPAL BONDS – 0.7% | | | | | | | | | | |
United States – 0.7% | | | | | | | | | | |
Buckeye Tobacco Settlement Financing Authority
Series 2007A-2
5.875%, 6/01/47 | | | | | 12,175 | | | | 10,414,617 | |
Golden State Tobacco Securitization Corp.
Series 2007A-1
5.125%, 6/01/47 | | | | | 7,145 | | | | 6,025,593 | |
Iowa Tobacco Settlement Authority
Series 2005C
5.625%, 6/01/46 | | | | | 5,220 | | | | 4,940,051 | |
Michigan Tobacco Settlement Finance Authority
Series 2007A
6.00%, 6/01/48 | | | | | 6,825 | | | | 6,055,959 | |
State of California
Series 2010
7.60%, 11/01/40 | | | | | 1,200 | | | | 1,796,808 | |
7.625%, 3/01/40 | | | | | 1,250 | | | | 1,839,038 | |
7.95%, 3/01/36 | | | | | 2,235 | | | | 2,670,713 | |
State of Illinois
Series 2010
7.35%, 7/01/35 | | | | | 4,120 | | | | 4,467,646 | |
Portfolio of Investments
| | | | | | | | | | |
| | | | |
Principal Amount (000) | | | U.S. $ Value | |
| |
| | | | | | | | | | |
Tobacco Settlement Financing Corp./NJ
Series 20071A
5.00%, 6/01/41 | | U.S.$ | | | 3,855 | | | $ | 3,100,808 | |
Tobacco Settlement Financing Corp/VA
Series 2007B1
5.00%, 6/01/47 | | | | | 4,520 | | | | 3,398,226 | |
| | | | | | | | | | |
| | | |
Total Local Governments – Municipal Bonds
(cost $42,620,170) | | | | | | | | | 44,709,459 | |
| | | | | | | | | | |
| | | | | | | | | | |
EMERGING MARKETS – TREASURIES – 0.7% | | | | | | | | | | |
Dominican Republic – 0.5% | | | | | | | | | | |
Dominican Republic International Bond
10.50%, 1/17/20(d) | | DOP | | | 347,740 | | | | 7,585,864 | |
12.00%, 1/20/22(d) | | | | | 347,740 | | | | 7,854,251 | |
15.95%, 6/04/21(d) | | | | | 52,700 | | | | 1,445,403 | |
16.00%, 7/10/20(d) | | | | | 563,400 | | | | 15,118,380 | |
| | | | | | | | | | |
| | | | | | | | | 32,003,898 | |
| | | | | | | | | | |
Indonesia – 0.2% | | | | | | | | | | |
Indonesia – Recap Linked Note (JPMC)
9.50%, 5/17/41 | | IDR | | | 68,280,000 | | | | 5,070,230 | |
Indonesia – Recap Linked Note (JPMC)
10.00%, 7/18/17 | | | | | 63,808,000 | | | | 4,767,244 | |
| | | | | | | | | | |
| | | |
Total Emerging Markets – Treasuries
(cost $48,765,847) | | | | | | | | | 41,841,372 | |
| | | | | | | | | | |
| | | | | | | | | | |
GOVERNMENTS – SOVEREIGN BONDS – 0.6% | | | | | | | | | | |
Bahrain – 0.1% | | | | | | | | | | |
Bahrain Government International Bond
6.00%, 9/19/44(a) | | U.S.$ | | | 4,827 | | | | 3,988,309 | |
| | | | | | | | | | |
| | | |
Brazil – 0.0% | | | | | | | | | | |
Brazilian Government International Bond
4.25%, 1/07/25 | | | | | 744 | | | | 660,300 | |
| | | | | | | | | | |
| | | |
Croatia – 0.1% | | | | | | | | | | |
Croatia Government International Bond
6.625%, 7/14/20(a) | | | | | 5,350 | | | | 5,814,647 | |
| | | | | | | | | | |
| | | |
Indonesia – 0.0% | | | | | | | | | | |
Indonesia Government International Bond
8.50%, 10/12/35(a) | | | | | 1,645 | | | | 2,156,924 | |
| | | | | | | | | | |
| | | |
Romania – 0.1% | | | | | | | | | | |
Romanian Government International Bond
4.875%, 1/22/24(a) | | | | | 6,000 | | | | 6,525,000 | |
| | | | | | | | | | |
Portfolio of Investments
| | | | | | | | | | |
| | | | |
Principal Amount (000) | | | U.S. $ Value | |
Turkey – 0.1% | | | | | | | | | | |
Turkey Government International Bond
5.625%, 3/30/21 | | U.S.$ | | | 6,615 | | | $ | 7,111,125 | |
7.375%, 2/05/25 | | | | | 1,649 | | | | 1,972,319 | |
| | | | | | | | | | |
| | | | | | | | | 9,083,444 | |
| | | | | | | | | | |
United Arab Emirates – 0.2% | | | | | | | | | | |
Emirate of Dubai Government International Bonds
7.75%, 10/05/20(a) | | | | | 7,645 | | | | 9,409,084 | |
| | | | | | | | | | |
| | | |
Total Governments – Sovereign Bonds
(cost $34,863,854) | | | | | | | | | 37,637,708 | |
| | | | | | | | | | |
| | | | | | | | | | |
QUASI-SOVEREIGNS – 0.4% | | | | | | | | | | |
Quasi-Sovereign Bonds – 0.4% | | | | | | | | | | |
Indonesia – 0.2% | | | | | | | | | | |
Majapahit Holding BV
7.875%, 6/29/37(a) | | | | | 5,600 | | | | 6,279,000 | |
Pertamina Persero PT
6.00%, 5/03/42(a) | | | | | 720 | | | | 621,000 | |
Perusahaan Listrik Negara PT
5.25%, 10/24/42(a) | | | | | 11,216 | | | | 9,225,160 | |
| | | | | | | | | | |
| | | | | | | | | 16,125,160 | |
| | | | | | | | | | |
Kazakhstan – 0.0% | | | | | | | | | | |
KazMunayGas National Co. JSC
6.00%, 11/07/44(a) | | | | | 1,600 | | | | 1,250,432 | |
| | | | | | | | | | |
| | | |
South Africa – 0.1% | | | | | | | | | | |
Eskom Holdings SOC Ltd.
7.125%, 2/11/25(a)(b) | | | | | 3,760 | | | | 3,487,400 | |
| | | | | | | | | | |
| | | |
Venezuela – 0.1% | | | | | | | | | | |
Petroleos de Venezuela SA
6.00%, 5/16/24-11/15/26(a) | | | | | 15,000 | | | | 5,354,500 | |
| | | | | | | | | | |
| | | |
Total Quasi-Sovereigns
(cost $31,248,441) | | | | | | | | | 26,217,492 | |
| | | | | | | | | | |
| | | | | | | | | | |
ASSET-BACKED SECURITIES – 0.3% | | | | | | | | | | |
Home Equity Loans - Fixed Rate – 0.2% | | | | | | | | |
CSAB Mortgage-Backed Trust
Series 2006-2, Class A6A
5.72%, 9/25/36 | | | | | 1,249 | | | | 850,682 | |
CWABS Asset-Backed Certificates Trust
Series 2005-7, Class AF5W
5.054%, 10/25/35 | | | | | 2,108 | | | | 2,095,122 | |
GSAA Home Equity Trust
Series 2005-12, Class AF5
5.659%, 9/25/35 | | | | | 2,259 | | | | 2,009,387 | |
Series 2006-10, Class AF3
5.985%, 6/25/36 | | | | | 1,877 | | | | 1,015,844 | |
Portfolio of Investments
| | | | | | | | | | |
| | | | |
Principal Amount (000) | | | U.S. $ Value | |
| |
| | | | | | | | | | |
Lehman XS Trust
Series 2006-17, Class WF32
5.55%, 11/25/36 | | U.S.$ | | | 1,607 | | | $ | 1,469,903 | |
Morgan Stanley Mortgage Loan Trust
Series 2006-15XS, Class A3
5.988%, 11/25/36 | | | | | 1,754 | | | | 928,462 | |
Series 2007-8XS, Class A2
6.00%, 4/25/37 | | | | | 5,636 | | | | 3,391,828 | |
| | | | | | | | | | |
| | | | | | | | | 11,761,228 | |
| | | | | | | | | | |
Home Equity Loans - Floating Rate – 0.1% | | | | | | | | | | |
GSAA Home Equity Trust
Series 2006-6, Class AF4
6.121%, 3/25/36(h) | | | | | 4,695 | | | | 2,646,963 | |
Series 2006-6, Class AF5
6.241%, 3/25/36(h) | | | | | 3,799 | | | | 2,141,519 | |
Lehman XS Trust
Series 2007-6, Class 3A5
5.075%, 5/25/37(s) | | | | | 653 | | | | 815,360 | |
| | | | | | | | | | |
| | | | | | | | | 5,603,842 | |
| | | | | | | | | | |
Total Asset-Backed Securities
(cost $17,854,981) | | | | | | | | | 17,365,070 | |
| | | | | | | | | | |
| | | | | | | | | | |
AGENCIES – 0.1% | | | | | | | | | | |
Agency Subordinated – 0.1% | | | | | | | | | | |
CITGO Petroleum Corp.
6.25%, 8/15/22(a)
(cost $8,618,894) | | | | | 8,609 | | | | 8,436,820 | |
| | | | | | | | | | |
| | | | | | | | | | |
INFLATION-LINKED SECURITIES – 0.1% | | | | | | | | | | |
Uruguay – 0.1% | | | | | | | | | | |
Uruguay Government International Bond
5.00%, 9/14/18
(cost $9,180,706) | | UYU | | | 221,480 | | | | 7,479,033 | |
| | | | | | | | | | |
| | | | | | | | | | |
LOCAL GOVERNMENTS – REGIONAL BONDS – 0.1% | | | | | | | | | | |
Argentina – 0.1% | | | | | | | | | | |
Provincia de Cordoba
12.375%, 8/17/17(a)
(cost $4,288,807) | | U.S.$ | | | 4,226 | | | | 4,405,605 | |
| | | | | | | | | | |
| | | |
| | | | | Shares | | | | |
INVESTMENT COMPANIES – 0.0% | | | | | | | | | | |
Funds and Investment Trusts – 0.0% | | | | | | | | | | |
OCL Opportunities Fund II(e)(f)(k)
(cost $1,490,950) | | | | | 11,474 | | | | 1,763,004 | |
| | | | | | | | | | |
| | | | | | | | | | |
Portfolio of Investments
| | | | | | | | | | |
| Company | | | |
Shares | | | U.S. $ Value | |
| |
| | | | | | | | | | |
WARRANTS – 0.0% | | | | | | | | | | |
FairPoint Communications, Inc.,
expiring 1/24/18(e)(k) | | | | | 6,740 | | | $ | 202 | |
iPayment Holdings, Inc.,
expiring 12/29/22(e)(f)(k) | | | | | 1,515,784 | | | | 1,515,784 | |
Talon Equity Co. NV,
expiring 11/24/15(e)(f)(k) | | | | | 877 | | | | – 0 | – |
| | | | | | | | | | |
| | | |
Total Warrants
(cost $0) | | | | | | | | | 1,515,986 | |
| | | | | | | | | | |
| | | |
| | | | | Notional
Amount
(000) | | | | |
OPTIONS PURCHASED – PUTS – 0.0% | | | | | | | | | | |
Swaptions – 0.0% | | | | | | | | | | |
CDX-NAHY Series 25, 5 Year Index RTP,
Barclays Bank PLC,
NA (Buy Protection)
Expiration: Nov 2015,
Exercise Rate: 101.00%(e)
(premiums paid $849,450) | | | | | 202,250 | | | | 391,263 | |
| | | | | | | | | | |
| | | |
| | | | | Shares | | | | |
SHORT-TERM INVESTMENTS – 8.0% | | | | | | | | | | |
Investment Companies – 7.4% | | | | | | | | | | |
AB Fixed-Income Shares, Inc. – Government STIF Portfolio,
0.13%(v)(w)
(cost $462,732,201) | | | | | 462,732,201 | | | | 462,732,201 | |
| | | | | | | | | | |
| | | |
| | | | | Principal
Amount
(000) | | | | |
Time Deposits – 0.6% | | | | | | | | | | |
ANZ, London
0.03%, 11/02/15 | | U.S.$ | | | 12,752 | | | | 12,751,625 | |
BBH, Grand Cayman
0.005%, 11/02/15 | | JPY | | | – 0 | –** | | | 1 | |
0.854%, 11/02/15 | | AUD | | | 17 | | | | 12,267 | |
5.25%, 11/02/15 | | ZAR | | | – 0 | –** | | | – 0 | –*** |
Credit Suisse AG, Zurich
(1.00)%, 11/02/15 | | CHF | | | 65 | | | | 65,505 | |
DNB, Oslo
(0.237)%, 11/02/15 | | EUR | | | 17,315 | | | | 19,040,401 | |
0.08%, 11/02/15 | | GBP | | | 488 | | | | 751,859 | |
0.121%, 11/02/15 | | NOK | | | 1,104 | | | | 129,896 | |
Portfolio of Investments
| | | | | | | | | | |
| | | | |
Principal Amount (000) | | | U.S. $ Value | |
| |
| | | | | | | | | | |
Royal Bank of Canada, Toronto
0.05%, 11/02/15 | | CAD | | | 2,544 | | | $ | 1,945,231 | |
| | | | | | | | | | |
| | | |
Total Time Deposits
(cost $34,730,600) | | | | | | | | | 34,696,785 | |
| | | | | | | | | | |
| | | |
Total Short-Term Investments
(cost $497,462,801) | | | | | | | | | 497,428,986 | |
| | | | | | | | | | |
| | | |
Total Investments – 101.1%
(cost $6,686,123,278) | | | | | | | | | 6,301,508,228 | |
Other assets less liabilities – (1.1)% | | | | | | | | | (65,848,352 | ) |
| | | | | | | | | | |
| | | |
Net Assets – 100.0% | | | | | | | | $ | 6,235,659,876 | |
| | | | | | | | | | |
FORWARD CURRENCY EXCHANGE CONTRACTS (see Note D)
| | | | | | | | | | | | | | | | | | | | | | | | |
| Counterparty | | Contracts to
Deliver (000) | | | In Exchange
For
(000) | | | Settlement
Date | | | Unrealized
Appreciation/
(Depreciation) | |
Barclays Bank PLC | | | SEK | | | | 575,000 | | | | EUR | | | | 61,560 | | | | 11/05/15 | | | $ | 391,686 | |
Barclays Bank PLC | | | USD | | | | 74,464 | | | | INR | | | | 4,886,865 | | | | 12/04/15 | | | | (106,317 | ) |
BNP Paribas SA | | | MXN | | | | 152,306 | | | | USD | | | | 8,908 | | | | 11/20/15 | | | | (300,264 | ) |
BNP Paribas SA | | | USD | | | | 5,509 | | | | EUR | | | | 5,000 | | | | 12/03/15 | | | | (8,801 | ) |
Brown Brothers Harriman & Co. | | | NOK | | | | 28,882 | | | | USD | | | | 3,524 | | | | 11/05/15 | | | | 124,685 | |
Brown Brothers Harriman & Co. | | | NOK | | | | 545 | | | | USD | | | | 64 | | | | 11/05/15 | | | | (564 | ) |
Brown Brothers Harriman & Co. | | | GBP | | | | 2,841 | | | | USD | | | | 4,333 | | | | 11/10/15 | | | | (45,847 | ) |
Brown Brothers Harriman & Co. | | | USD | | | | 723 | | | | EUR | | | | 654 | | | | 12/03/15 | | | | (2,661 | ) |
Brown Brothers Harriman & Co. | | | USD | | | | 118,112 | | | | JPY | | | | 14,153,970 | | | | 12/11/15 | | | | (754,688 | ) |
Brown Brothers Harriman & Co. | | | AUD | | | | 45,740 | | | | USD | | | | 32,550 | | | | 12/18/15 | | | | 8,460 | |
Citibank, NA | | | USD | | | | 1,887 | | | | CAD | | | | 2,500 | | | | 11/19/15 | | | | 24,386 | |
Citibank, NA | | | USD | | | | 29,332 | | | | JPY | | | | 3,528,067 | | | | 12/11/15 | | | | (79,120 | ) |
Goldman Sachs Bank USA | | | BRL | | | | 118,562 | | | | USD | | | | 31,449 | | | | 11/04/15 | | | | 715,915 | |
Goldman Sachs Bank USA | | | BRL | | | | 255,345 | | | | USD | | | | 62,914 | | | | 11/04/15 | | | | (3,274,361 | ) |
Goldman Sachs Bank USA | | | USD | | | | 96,895 | | | | BRL | | | | 373,907 | | | | 11/04/15 | | | | 27,101 | |
Goldman Sachs Bank USA | | | USD | | | | 69,757 | | | | SEK | | | | 574,928 | | | | 11/05/15 | | | | (2,460,429 | ) |
Goldman Sachs Bank USA | | | CAD | | | | 7,421 | | | | USD | | | | 5,539 | | | | 11/19/15 | | | | (135,583 | ) |
Goldman Sachs Bank USA | | | IDR | | | | 130,203,537 | | | | USD | | | | 9,017 | | | | 11/20/15 | | | | (438,460 | ) |
Portfolio of Investments
| | | | | | | | | | | | | | | | | | | | | | | | |
| Counterparty | | Contracts to
Deliver (000) | | | In Exchange
For
(000) | | | Settlement
Date | | | Unrealized
Appreciation/
(Depreciation) | |
Goldman Sachs Bank USA | | | TWD | | | | 897,083 | | | | USD | | | | 27,566 | | | | 12/04/15 | | | $ | (53,272 | ) |
HSBC Bank USA | | | SGD | | | | 85,365 | | | | USD | | | | 59,885 | | | | 11/06/15 | | | | (1,043,840 | ) |
Morgan Stanley Capital Services LLC | | | BRL | | | | 373,907 | | | | USD | | | | 96,895 | | | | 11/04/15 | | | | (27,101 | ) |
Morgan Stanley Capital Services LLC | | | USD | | | | 95,482 | | | | BRL | | | | 373,907 | | | | 11/04/15 | | | | 1,439,942 | |
Morgan Stanley Capital Services LLC | | | COP | | | | 24,347,085 | | | | USD | | | | 8,332 | | | | 11/17/15 | | | | (56,958 | ) |
Morgan Stanley Capital Services LLC | | | BRL | | | | 373,907 | | | | USD | | | | 94,507 | | | | 12/02/15 | | | | (1,481,383 | ) |
Royal Bank of Scotland PLC | | | GBP | | | | 77,308 | | | | USD | | | | 118,671 | | | | 11/10/15 | | | | (501,760 | ) |
Royal Bank of Scotland PLC | | | USD | | | | 31,455 | | | | TRY | | | | 91,925 | | | | 11/24/15 | | | | (118,698 | ) |
Royal Bank of Scotland PLC | | | EUR | | | | 345,726 | | | | USD | | | | 385,173 | | | | 12/03/15 | | | | 4,853,165 | |
Royal Bank of Scotland PLC | | | TWD | | | | 1,061,030 | | | | USD | | | | 32,642 | | | | 12/04/15 | | | | (25,293 | ) |
Standard Chartered Bank | | | ZAR | | | | 150,476 | | | | USD | | | | 11,113 | | | | 11/27/15 | | | | 284,624 | |
| | | | | | | | | | | | | | | | | | | | | | | | |
| | | | | | | | | | | | | | | | | | | | | | $ | (3,045,436 | ) |
| | | | | | | | | | | | | | | | | | | | | | | | |
CREDIT DEFAULT SWAPTIONS WRITTEN (see Note D)
| | | | | | | | | | | | | | | | | | | | | | | | | | |
| Description | | Counterparty | | Buy/Sell
Protection | | | Strike
Rate | | | Expiration
Date | | | Notional
Amount
(000) | | | Premiums
Received | | | Market
Value | |
Put – CDX-NAHY
Series 25,
5 Year Index | | Barclays
Bank PLC | | | Sell | | | | 98.00 | % | | | 11/18/15 | | | $ | 202,250 | | | $ | 182,025 | | | $ | (84,575 | ) |
CENTRALLY CLEARED CREDIT DEFAULT SWAPS (see Note D)
| | | | | | | | | | | | | | | | | | | | |
Clearing Broker/(Exchange)
& Referenced Obligation | | Fixed
Rate
(Pay)
Receive | | | Implied
Credit
Spread at
October 31,
2015 | | | Notional
Amount
(000) | | | Market Value | | | Unrealized
Appreciation/
(Depreciation) | |
Buy Contracts | | | | | | | | | | | | | | | | | | | | |
Citigroup Global Markets, Inc./(INTRCONX): | | | | | | | | | | | | | | | | | | | | |
iTraxx Europe Crossover Series 23, 5 Year Index, 6/20/20* | | | (5.00 | )% | | | 3.13 | % | | EUR | 23,660 | | | $ | (2,171,631 | ) | | $ | (121,505 | ) |
| | | | | |
Sale Contracts | | | | | | | | | | | | | | | | | | | | |
Citigroup Global Markets, Inc./(INTRCONX): | | | | | | | | | | | | | | | | | | | | |
CDX-NAHY Series 21, 5 Year Index, 12/20/18* | | | 5.00 | | | | 2.57 | | | $ | 28,272 | | | | 2,191,982 | | | | 863,032 | |
CDX-NAHY Series 24, 5 Year Index, 6/20/20* | | | 5.00 | | | | 3.59 | | | | 94,540 | | | | 5,981,145 | | | | 1,618,444 | |
CDX-NAHY Series 25, 5 Year Index, 12/20/20* | | | 5.00 | | | | 4.27 | | | | 21,806 | | | | 810,249 | | | | 902,443 | |
CDX-NAHY Series 25, 5 Year Index, 12/20/20* | | | 5.00 | | | | 4.27 | | | | 21,810 | | | | 810,397 | | | | 863,980 | |
CDX-NAHY Series 25, 5 Year Index, 12/20/20* | | | 5.00 | | | | 4.27 | | | | 31,549 | | | | 1,172,271 | | | | 1,231,178 | |
CDX-NAHY Series 25, 5 Year Index, 12/20/20* | | | 5.00 | | | | 4.27 | | | | 31,528 | | | | 1,171,490 | | | | 1,152,901 | |
Portfolio of Investments
| | | | | | | | | | | | | | | | | | | | |
Clearing Broker/(Exchange)
& Referenced Obligation | | Fixed
Rate
(Pay)
Receive | | | Implied
Credit
Spread at
October 31,
2015 | | | Notional
Amount
(000) | | | Market Value | | | Unrealized
Appreciation/
(Depreciation) | |
CDX-NAHY Series 25, 5 Year Index, 12/20/20* | | | 5.00 | % | | | 4.27 | % | | $ | 31,528 | | | $ | 1,171,490 | | | $ | 1,109,524 | |
CDX-NAHY Series 25,
5 Year Index, 12/20/20* | | | 5.00 | | | | 4.27 | | | | 31,521 | | | | 1,171,230 | | | | 1,143,352 | |
CDX-NAHY Series 25,
5 Year Index, 12/20/20* | | | 5.00 | | | | 4.27 | | | | 21,806 | | | | 810,249 | | | | 239,084 | |
CDX-NAHY Series 25,
5 Year Index, 12/20/20* | | | 5.00 | | | | 4.27 | | | | 21,806 | | | | 810,249 | | | | 842,443 | |
CDX-NAIG Series 20,
5 Year Index, 6/20/18* | | | 1.00 | | | | 0.43 | | | | 51,660 | | | | 836,130 | | | | 325,054 | |
iTraxx Europe Crossover
Series 21, 5 Year Index, 6/20/19* | | | 5.00 | | | | 2.05 | | | EUR | 5 | | | | 552 | | | | (44 | ) |
| | | | | | | | | | | | | | | | | | | | |
| | | | | | | | | | | | | | $ | 14,765,803 | | | $ | 10,169,886 | |
| | | | | | | | | | | | | | | | | | | | |
CREDIT DEFAULT SWAPS (see Note D)
| | | | | | | | | | | | | | | | | | | | | | | | |
Swap Counterparty
& Referenced
Obligation | | Fixed Rate (Pay) Receive | | | Implied Credit Spread at October 31, 2015 | | | Notional Amount (000) | | | Market Value | | | Upfront Premiums Paid (Received) | | | Unrealized Appreciation/ (Depreciation) | |
Buy Contracts | | | | | | | | | | | | | | | | | | | | | | | | |
Barclays Bank PLC: | | | | | | | | | | | | | | | | | | | | | | | | |
Beazer Homes USA, Inc.,
9.125%, 6/15/18, 3/20/17* | | | (5.00 | )% | | | 1.85 | % | | $ | 17,972 | | | $ | (837,051 | ) | | $ | (721,200 | ) | | $ | (115,851 | ) |
K. Hovnanian Enterprises, Inc.,
8.625%, 1/15/17, 3/20/17* | | | (5.00 | ) | | | 7.87 | | | | 16,829 | | | | 627,534 | | | | (482,681 | ) | | | 1,110,215 | |
Tenet Healthcare Corporation,
6.875%, 11/15/31, 6/20/17* | | | (5.00 | ) | | | 1.27 | | | | 18,869 | | | | (1,223,835 | ) | | | (1,033,466 | ) | | | (190,369 | ) |
Citibank, NA: | | | | | | | | | | | | | | | | | | | | | | | | |
Bombardier Inc.,
7.450%, 5/01/34, 3/20/17* | | | (5.00 | ) | | | 5.68 | | | | 9,416 | | | | 74,398 | | | | (467,325 | ) | | | 541,723 | |
Bombardier Inc.,
7.450%, 5/01/34, 3/20/17* | | | (5.00 | ) | | | 5.68 | | | | 9,474 | | | | 74,856 | | | | (455,381 | ) | | | 530,237 | |
United States Steel Corp.,
6.650%, 6/01/37, 3/20/17* | | | (5.00 | ) | | | 8.42 | | | | 17,494 | | | | 864,350 | | | | (653,671 | ) | | | 1,518,021 | |
Portfolio of Investments
| | | | | | | | | | | | | | | | | | | | | | | | |
Swap Counterparty
& Referenced
Obligation | | Fixed Rate (Pay) Receive | | | Implied Credit Spread at October 31, 2015 | | | Notional Amount (000) | | | Market Value | | | Upfront Premiums Paid (Received) | | | Unrealized Appreciation/ (Depreciation) | |
Credit Suisse International: | | | | | | | | | | | | | | | | | | | | | | | | |
Western Union Co.,
3.650% 8/22/18, 9/20/17* | | | (1.00 | )% | | | 0.32 | % | | $ | 10,400 | | | $ | (140,674 | ) | | $ | (87,195 | ) | | $ | (53,479 | ) |
Western Union Co.,
3.650%, 8/22/18, 3/20/17* | | | (1.00 | ) | | | 0.22 | | | | 9,445 | | | | (108,825 | ) | | | (16,714 | ) | | | (92,111 | ) |
Deutsche Bank AG: | | | | | | | | | | | | | | | | | | | | | | | | |
iHeartCommunications, Inc.,
6.875%, 6/15/18, 6/20/18* | | | (5.00 | ) | | | 36.39 | | | | 977 | | | | 524,042 | | | | 71,504 | | | | 452,538 | |
Goldman Sachs Bank USA: | | | | | | | | | | | | | | | | | | | | | | | | |
Community Health Systems, Inc.,
8.000%, 11/15/19, 3/20/17* | | | (5.00 | ) | | | 1.00 | | | | 18,722 | | | | (1,125,081 | ) | | | (837,273 | ) | | | (287,808 | ) |
Dell, Inc.,
7.100%, 4/15/28, 3/20/17* | | | (1.00 | ) | | | 0.88 | | | | 17,016 | | | | (29,392 | ) | | | 187,699 | | | | (217,091 | ) |
First Data Corp.,
12.625%, 1/15/21, 3/20/17* | | | (5.00 | ) | | | 0.82 | | | | 17,596 | | | | (1,100,591 | ) | | | (611,769 | ) | | | (488,822 | ) |
Newmont Mining Corp.,
5.875%, 4/01/35, 3/20/17* | | | (1.00 | ) | | | 0.24 | | | | 18,890 | | | | (208,077 | ) | | | (48,929 | ) | | | (159,148 | ) |
Nine West Holdings, Inc.,
6.875%, 3/15/19, 3/20/17* | | | (5.00 | ) | | | 12.51 | | | | 17,442 | | | | 2,107,898 | | | | (702,416 | ) | | | 2,810,314 | |
Morgan Stanley Capital Services LLC: | | | | | | | | | | | | | | | | | | | | | | | | |
iHeartCommunications, Inc.,
6.875%, 6/15/18, 6/20/18* | | | (5.00 | ) | | | 36.39 | | | | 1,099 | | | | 589,607 | | | | 80,450 | | | | 509,157 | |
UBS AG: | | | | | | | | | | | | | | | | | | | | | | | | |
J.C. Penney Company, Inc.,
6.375%, 10/15/36, 6/20/16* | | | (5.00 | ) | | | 0.06 | | | | 3,300 | | | | (94,869 | ) | | | 47,930 | | | | (142,799 | ) |
Sale Contracts | | | | | | | | | | | | | | | | | | | | | | | | |
Bank of America, NA: | | | | | | | | | | | | | | | | | | | | | | | | |
United States Steel Corporation,
6.650%, 6/01/37, 9/20/19* | | | 5.00 | | | | 13.96 | | | | 2,700 | | | | (638,443 | ) | | | 96,169 | | | | (734,612 | ) |
Portfolio of Investments
| | | | | | | | | | | | | | | | | | | | | | | | |
Swap Counterparty &
Referenced Obligation | | Fixed Rate (Pay) Receive | | | Implied Credit Spread at October 31, 2015 | | | Notional Amount (000) | | | Market Value | | | Upfront Premiums Paid (Received) | | | Unrealized Appreciation/ (Depreciation) | |
Barclays Bank PLC: | | | | | | | | | | | | | | | | | | | | | | | | |
AK Steel Corp.,
7.625%, 5/15/20, 6/20/17* | | | 5.00 | % | | | 18.96 | % | | $ | 5,150 | | | $ | (984,629 | ) | | $ | (211,943 | ) | | $ | (772,686 | ) |
Beazer Homes USA, Inc., 9.125%,
6/15/18, 3/20/19* | | | 5.00 | | | | 4.31 | | | | 12,238 | | | | 288,459 | | | | 438,651 | | | | (150,192 | ) |
Cablevision Systems Corp.,
7.75%, 4/15/18, 3/20/16* | | | 5.00 | | | | 0.32 | | | | 3,000 | | | | 73,575 | | | | 64,653 | | | | 8,922 | |
CCO Holdings, LLC, 7.250%, 10/30/17, 6/20/19* | | | 5.00 | | | | 1.58 | | | | 6,192 | | | | 764,401 | | | | 505,960 | | | | 258,441 | |
K. Hovnanian Enterprises, Inc., 8.625%, 1/15/17, 12/20/18* | | | 5.00 | | | | 11.82 | | | | 12,238 | | | | (2,102,175 | ) | | | 192,406 | | | | (2,294,581 | ) |
K. Hovnanian Enterprises, Inc., 8.625%, 1/15/17, 9/20/20* | | | 5.00 | | | | 12.23 | | | | 2,917 | | | | (717,084 | ) | | | (813,149 | ) | | | 96,065 | |
K. Hovnanian Enterprises, Inc., 8.625%, 1/15/17, 9/20/20* | | | 5.00 | | | | 12.23 | | | | 7,293 | | | | (1,792,833 | ) | | | (2,029,735 | ) | | | 236,902 | |
MGM Resorts International, 7.625%, 1/15/17, 6/20/18* | | | 5.00 | | | | 1.21 | | | | 4,691 | | | | 481,335 | | | | 159,725 | | | | 321,610 | |
Tenet Healthcare Corporation, 6.875%, 11/15/31, 6/20/19* | | | 5.00 | | | | 3.54 | | | | 12,770 | | | | 635,674 | | | | 793,101 | | | | (157,427 | ) |
Citibank, NA: | | | | | | | | | | | | | | | | | | | | | | | | |
Advanced Micro Devices, Inc., 7.750%, 8/01/20, 3/20/19* | | | 5.00 | | | | 9.62 | | | | 3,720 | | | | (457,576 | ) | | | (647,627 | ) | | | 190,051 | |
Bombardier Inc., 7.450%, 5/01/34, 3/20/19* | | | 5.00 | | | | 8.70 | | | | 6,299 | | | | (613,829 | ) | | | 433,116 | | | | (1,046,945 | ) |
Bombardier Inc., 7.450%, 5/01/34, 3/20/19* | | | 5.00 | | | | 8.70 | | | | 6,291 | | | | (613,049 | ) | | | 441,695 | | | | (1,054,744 | ) |
CMBX.NA.BBB 7, 1/17/47* | | | 3.00 | | | | 3.53 | | | | 5,000 | | | | (172,976 | ) | | | (62,913 | ) | | | (110,063 | ) |
CMBX.NA.BBB 7, 1/17/47* | | | 3.00 | | | | 3.53 | | | | 25,000 | | | | (864,881 | ) | | | (297,210 | ) | | | (567,671 | ) |
MGM Resorts International, 7.625%, 1/15/17, 3/20/20* | | | 5.00 | | | | 2.09 | | | | 3,450 | | | | 430,370 | | | | 261,661 | | | | 168,709 | |
Portfolio of Investments
| | | | | | | | | | | | | | | | | | | | | | | | |
Swap Counterparty &
Referenced
Obligation | | Fixed Rate (Pay) Receive | | | Implied Credit Spread at October 31, 2015 | | | Notional Amount (000) | | | Market Value | | | Upfront Premiums Paid (Received) | | | Unrealized Appreciation/ (Depreciation) | |
MGM Resorts International, 7.625%, 1/15/17, 6/20/18* | | | 5.00 | % | | | 1.21 | % | | $ | 6,177 | | | $ | 633,811 | | | $ | 216,306 | | | $ | 417,505 | |
United States Steel Corp., 6.650%, 6/1/37, 3/20/19* | | | 5.00 | | | | 13.55 | | | | 12,590 | | | | (2,625,376 | ) | | | 283,753 | | | | (2,909,129 | ) |
Credit Suisse International: | | | | | | | | | | | | | | | | | | | | | | | | |
CMBX.NA.BBB 7,
1/17/47* | | | 3.00 | | | | 3.53 | | | | 5,000 | | | | (172,976 | ) | | | (116,963 | ) | | | (56,013 | ) |
CMBX.NA.BBB 7,
1/17/47* | | | 3.00 | | | | 3.53 | | | | 5,000 | | | | (172,976 | ) | | | (96,068 | ) | | | (76,908 | ) |
MGM Resorts International,
7.625%, 1/15/17, 6/20/18* | | | 5.00 | | | | 1.21 | | | | 2,252 | | | | 231,074 | | | | 82,115 | | | | 148,959 | |
Western Union Co.,
3.650% 8/22/18, 9/20/19* | | | 1.00 | | | | 0.89 | | | | 6,950 | | | | 27,357 | | | | (75,244 | ) | | | 102,601 | |
Western Union Co.,
3.650%, 8/22/18, 3/20/19* | | | 1.00 | | | | 0.72 | | | | 6,291 | | | | 58,708 | | | | (146,557 | ) | | | 205,265 | |
Goldman Sachs Bank USA: | | | | | | | | | | | | | | | | | | | | | | | | |
CDX-NAIG Series 9,
10 Year Index, 12/20/17* | | | 5.00 | | | | 2.04 | | | | 5,700 | | | | 391,310 | | | | (370,975 | ) | | | 762,285 | |
Community Health Systems, Inc.,
8.000%, 11/15/19, 3/20/19* | | | 5.00 | | | | 2.86 | | | | 12,590 | | | | 880,511 | | | | 711,782 | | | | 168,729 | |
ConvaTec Healthcare E S.A.,
10.875%, 12/15/18, 6/20/17* | | | 5.00 | | | | 0.46 | | | EUR | 3,870 | | | | 340,094 | | | | (255,052 | ) | | | 595,146 | |
Dell, Inc.,
7.100%, 4/15/28, 3/20/19* | | | 1.00 | | | | 2.05 | | | $ | 12,590 | | | | (441,354 | ) | | | (960,468 | ) | | | 519,114 | |
First Data Corp.,
12.625%, 1/15/21, 3/20/19* | | | 5.00 | | | | 2.23 | | | | 12,590 | | | | 1,169,885 | | | | 211,158 | | | | 958,727 | |
K. Hovnanian Enterprises, Inc.,
8.625%, 1/15/17, 9/20/20* | | | 5.00 | | | | 12.23 | | | | 3,110 | | | | (764,529 | ) | | | (815,500 | ) | | | 50,971 | |
Newmont Mining Corp.,
5.875%, 4/01/35, 3/20/19* | | | 1.00 | | | | 0.86 | | | | 12,590 | | | | 55,484 | | | | (323,535 | ) | | | 379,019 | |
Portfolio of Investments
| | | | | | | | | | | | | | | | | | | | | | | | |
Swap Counterparty &
Referenced
Obligation | | Fixed Rate (Pay) Receive | | | Implied Credit Spread at October 31, 2015 | | | Notional Amount (000) | | | Market Value | | | Upfront Premiums Paid (Received) | | | Unrealized Appreciation/ (Depreciation) | |
Nine West Holdings, Inc.,
6.875%, 3/15/19, 3/20/19* | | | 5.00 | % | | | 24.18 | % | | $ | 12,590 | | | $ | (5,248,227 | ) | | $ | 283,752 | | | $ | (5,531,979 | ) |
Morgan Stanley Capital Services LLC: | | | | | | | | | | | | | | | | | | | | | | | | |
AK Steel Corp.,
7.625%, 5/15/20, 3/20/16* | | | 5.00 | | | | 15.84 | | | | 3,000 | | | | (105,193 | ) | | | 10,175 | | | | (115,368 | ) |
AK Steel Corp.,
7.625%, 5/15/20, 3/20/20* | | | 5.00 | | | | 23.15 | | | | 3,500 | | | | (1,488,733 | ) | | | (420,901 | ) | | | (1,067,832 | ) |
Bombardier, Inc.,
7.45%, 5/1/34, 6/20/21* | | | 5.00 | | | | 9.60 | | | | 5,000 | | | | (841,613 | ) | | | 283,876 | | | | (1,125,489 | ) |
United States Steel Corp.,
6.650%, 6/1/37, 9/20/19* | | | 5.00 | | | | 13.96 | | | | 3,820 | | | | (903,313 | ) | | | 168,649 | | | | (1,071,962 | ) |
| | | | | | | | | | | | | | | | | | | | | | | | |
| | | | | | | | | | | | | | $ | (15,265,427 | ) | | $ | (7,735,574 | ) | | $ | (7,529,853 | ) |
| | | | | | | | | | | | | | | | | | | | | | | | |
TOTAL RETURN SWAPS (see Note D)
| | | | | | | | | | | | | | | | | | | | |
Counterparty & Referenced Obligation | | # of Shares
or Units | | | Rate Paid/
Received | | | Notional
Amount
(000) | | | Maturity
Date | | | Unrealized
Appreciation/
(Depreciation) | |
Receive Total Return on Reference Obligation | | | | | | | | | |
Goldman Sachs International: | | | | | | | | | | | | | | | | | | | | |
Markit iBoxx USD Liquid High Yield Index | | | 57,469 | | | | LIBOR | | | $ | 13,006 | | | | 12/28/15 | | | $ | 293,438 | |
Markit iBoxx USD Liquid High Yield Index | | | 54,281 | | | | LIBOR | | | | 24,848 | | | | 12/28/15 | | | | 282,552 | |
Markit iBoxx USD Liquid High Yield Index | | | 108,595 | | | | LIBOR | | | | 12,471 | | | | 12/28/15 | | | | 90,276 | |
JPMorgan Chase Bank, NA: | | | | | | | | | | | | | | | | | | | | |
Markit iBoxx USD Liquid High Yield Index | | | 139,821 | | | | LIBOR | | | | 31,949 | | | | 12/28/15 | | | | 408,436 | |
Morgan Stanley Capital Services LLC: | | | | | | | | | | | | | | | | | | | | |
iBoxx $ Liquid High Yield Total Return Index | | | 110,945 | | | | LIBOR | | | | 25,362 | | | | 12/28/15 | | | | 312,253 | |
iBoxx $ Liquid High Yield Total Return Index | | | 110,098 | | | | LIBOR | | | | 25,284 | | | | 12/28/15 | | | | 194,114 | |
| | | | | | | | | | | | | | | | | | | | |
| | | | | | | | | | | | | | | | | | $ | 1,581,069 | |
| | | | | | | | | | | | | | | | | | | | |
Portfolio of Investments
REVERSE REPURCHASE AGREEMENTS (see Note D)
| | | | | | | | | | | | | | | | | | | | |
| Broker | | Principal
Amount (000) | | | Currency | | | Interest Rate | | | Maturity | | | U.S. $ Value at
October 31,
2015 | |
Barclays Capital Inc.† | | | 5,879 | | | | USD | | | | (0.50 | )%* | | | — | | | $ | 5,848,291 | |
Barclays Capital Inc.† | | | 1,111 | | | | USD | | | | (1.75 | )%* | | | — | | | | 1,110,676 | |
Barclays Capital Inc.† | | | 1,569 | | | | USD | | | | (1.75 | )%* | | | — | | | | 1,568,347 | |
Barclays Capital Inc.† | | | 1,060 | | | | USD | | | | (1.50 | )%* | | | — | | | | 1,059,735 | |
Barclays Capital Inc.† | | | 2,569 | | | | USD | | | | (1.50 | )%* | | | — | | | | 2,563,184 | |
Barclays Capital Inc.† | | | 3,894 | | | | USD | | | | (1.50 | )%* | | | — | | | | 3,892,627 | |
Barclays Capital Inc.† | | | 991 | | | | USD | | | | (1.25 | )%* | | | — | | | | 989,942 | |
Barclays Capital Inc.† | | | 1,840 | | | | USD | | | | (0.75 | )%* | | | — | | | | 1,838,058 | |
Barclays Capital Inc.† | | | 3,742 | | | | USD | | | | (1.00 | )%* | | | — | | | | 3,737,601 | |
Barclays Capital Inc.† | | | 3,772 | | | | USD | | | | (0.75 | )%* | | | — | | | | 3,769,092 | |
Barclays Capital Inc.† | | | 1,324 | | | | USD | | | | (0.75 | )%* | | | — | | | | 1,323,033 | |
Barclays Capital Inc.† | | | 466 | | | | USD | | | | (0.25 | )%* | | | — | | | | 465,606 | |
Barclays Capital Inc.† | | | 1,363 | | | | USD | | | | (0.75 | )%* | | | — | | | | 1,362,642 | |
Barclays Capital Inc.† | | | 6,534 | | | | USD | | | | (0.25 | )%* | | | — | | | | 6,530,914 | |
Credit Suisse Securities (USA) LLC† | | | 1,542 | | | | EUR | | | | (4.31 | )%* | | | — | | | | 1,695,660 | |
Credit Suisse Securities (USA) LLC† | | | 2,875 | | | | USD | | | | (2.00 | )%* | | | — | | | | 2,875,005 | |
Credit Suisse Securities (USA) LLC† | | | 1,264 | | | | USD | | | | (1.25 | )%* | | | — | | | | 1,262,916 | |
Credit Suisse Securities (USA) LLC† | | | 1,218 | | | | USD | | | | (1.25 | )%* | | | — | | | | 1,216,647 | |
Credit Suisse Securities (USA) LLC† | | | 2,564 | | | | USD | | | | (1.25 | )%* | | | — | | | | 2,563,433 | |
Credit Suisse Securities (USA) LLC† | | | 336 | | | | USD | | | | (1.00 | )%* | | | — | | | | 335,394 | |
Credit Suisse Securities (USA) LLC† | | | 1,432 | | | | USD | | | | (1.00 | )%* | | | — | | | | 1,431,017 | |
Credit Suisse Securities (USA) LLC† | | | 2,055 | | | | USD | | | | (1.00 | )%* | | | — | | | | 2,052,774 | |
Credit Suisse Securities (USA) LLC† | | | 2,010 | | | | EUR | | | | (1.00 | )%* | | | — | | | | 2,210,112 | |
Credit Suisse Securities (USA) LLC† | | | 5,025 | | | | EUR | | | | (1.00 | )%* | | | — | | | | 5,525,434 | |
Credit Suisse Securities (USA) LLC† | | | 1,668 | | | | USD | | | | (0.75 | )%* | | | — | | | | 1,667,896 | |
Credit Suisse Securities (USA) LLC | | | 1,305 | | | | USD | | | | (0.75 | )%* | | | — | | | | 1,304,755 | |
Credit Suisse Securities (USA) LLC† | | | 600 | | | | USD | | | | (0.50 | )%* | | | — | | | | 600,067 | |
Credit Suisse Securities (USA) LLC† | | | 2,974 | | | | USD | | | | (0.50 | )%* | | | — | | | | 2,972,220 | |
Credit Suisse Securities (USA) LLC† | | | 1,023 | | | | USD | | | | 0.00 | % | | | — | | | | 1,022,500 | |
Credit Suisse Securities (USA) LLC† | | | 2,413 | | | | USD | | | | 0.00 | % | | | — | | | | 2,413,440 | |
Credit Suisse Securities (USA) LLC† | | | 3,002 | | | | USD | | | | 0.00 | % | | | — | | | | 3,002,475 | |
ING Financial Markets LLC† | | | 143 | | | | USD | | | | (2.00 | )%* | | | — | | | | 142,663 | |
ING Financial Markets LLC† | | | 610 | | | | USD | | | | (2.00 | )%* | | | — | | | | 609,906 | |
ING Financial Markets LLC† | | | 2,286 | | | | USD | | | | (2.00 | )%* | | | — | | | | 2,277,665 | |
ING Financial Markets LLC† | | | 1,139 | | | | USD | | | | (1.75 | )%* | | | — | | | | 1,135,872 | |
ING Financial Markets LLC† | | | 2,472 | | | | USD | | | | (1.38 | )%* | | | — | | | | 2,471,967 | |
ING Financial Markets LLC† | | | 1,233 | | | | USD | | | | (1.25 | )%* | | | — | | | | 1,232,990 | |
ING Financial Markets LLC† | | | 322 | | | | USD | | | | (1.00 | )%* | | | — | | | | 321,785 | |
ING Financial Markets LLC† | | | 2,970 | | | | USD | | | | (0.25 | )%* | | | — | | | | 2,969,938 | |
ING Financial Markets LLC† | | | 764 | | | | USD | | | | (0.15 | )%* | | | — | | | | 763,586 | |
RBC Capital Markets† | | | 6,008 | | | | USD | | | | (0.25 | )%* | | | — | | | | 6,007,683 | |
| | | | | | | | | | | | | | | | | | | | |
| | | | | | | | | | | | | | | | | | $ | 88,145,548 | |
| | | | | | | | | | | | | | | | | | | | |
| † | | The reverse repurchase agreement matures on demand. Interest rate resets daily and the rate shown is the rate in effect on October 31, 2015 |
| * | | Interest payment due from counterparty. |
Portfolio of Investments
The type of underlying collateral and the remaining maturity of open reverse repurchase agreements in relation to the reverse repurchase agreements on the Statement of Assets and Liabilities is as follows:
Remaining Contracted Maturity of the Agreements
Reverse Repurchase Agreements
| | | | | | | | | | | | | | | | | | | | |
| | | Overnight and Continuous | | | Up to 30 Days | | | 31-90 Days | | | Greater than
90 Days | | | Total | |
Corporates – Non-Investment Grade | | $ | 58,987,478 | | | $ | –0 | – | | $ | – 0 | – | | $ | – 0 | – | | $ | 58,987,478 | |
Emerging Markets – Corporate Bonds | | | 3,002,724 | | | | – 0 | – | | | – 0 | – | | | – 0 | – | | | 3,002,724 | |
Corporates – Investment Grade | | | 22,583,059 | | | | – 0 | – | | | – 0 | – | | | – 0 | – | | | 22,583,059 | |
Quasi-Sovereigns | | | 3,572,287 | | | | – 0 | – | | | – 0 | – | | | – 0 | – | | | 3,572,287 | |
| | | | | | | | | | | | | | | | | | | | |
Total | | $ | 88,145,548 | | | $ | – 0 | – | | $ | – 0 | – | | $ | – 0 | – | | $ | 88,145,548 | |
| | | | | | | | | | | | | | | | | | | | |
| ** | | Principal amount less than 500. |
| (a) | | Security is exempt from registration under Rule 144A of the Securities Act of 1933. These securities are considered liquid and may be resold in transactions exempt from registration, normally to qualified institutional buyers. At October 31, 2015, the aggregate market value of these securities amounted to $2,514,745,161 or 40.3% of net assets. |
| (b) | | Position, or a portion thereof, has been segregated to collateralize reverse repurchase agreements. |
| (c) | | Security is in default and is non-income producing. |
| (d) | | Security is exempt from registration under Rule 144A of the Securities Act of 1933. These securities, which represent 0.68% of net assets as of October 31, 2015, are considered illiquid and restricted. |
| | | | | | | | | | | | | | | | |
| Restricted Securities | | Acquisition
Date | | | Cost | | | Market Value | | | Percentage of
Net Assets | |
Banc of America Re-REMIC Trust Series 2009-UB1, Class A4B
5.589%, 6/24/50 | | | 10/06/09 | | | $ | 2,720,828 | | | $ | 3,688,650 | | | | 0.06 | % |
Dominican Republic International Bond
10.50%, 1/17/20 | | | 1/23/15 | | | | 7,749,550 | | | | 7,585,864 | | | | 0.12 | % |
Dominican Republic International Bond
12.00%, 1/20/22 | | | 1/23/15 | | | | 7,899,038 | | | | 7,854,251 | | | | 0.13 | % |
Dominican Republic International Bond
15.95%, 6/04/21 | | | 1/11/13 | | | | 1,507,191 | | | | 1,445,403 | | | | 0.02 | % |
Dominican Republic International Bond 16.00%, 7/10/20 | | | 12/08/10 | | | | 15,871,329 | | | | 15,118,380 | | | | 0.24 | % |
Golden Energy Offshore Services AS
8.41%, 5/28/17 | | | 5/14/14 | | | | 4,986,057 | | | | 1,511,454 | | | | 0.02 | % |
Portfolio of Investments
| | | | | | | | | | | | | | | | |
| Restricted Securities | | Acquisition
Date | | | Cost | | | Market Value | | | Percentage of
Net Assets | |
Liberty Tire Recycling LLC
11.00%, 3/31/21 | | | 9/23/10 | | | $ | 2,537,144 | | | $ | 986,361 | | | | 0.02 | % |
Magnetation LLC/Mag Finance Corp.
11.00%, 5/15/18 | | | 5/15/13 | | | | 12,955,188 | | | | 3,546,620 | | | | 0.06 | % |
Virgolino de Oliveira Finance SA
10.50%, 1/28/18 | | | 2/12/14 | | | | 5,618,897 | | | | 124,696 | | | | 0.00 | % |
Virgolino de Oliveira Finance SA
10.50%, 1/28/18 | | | 10/19/12 | | | | 2,931,444 | | | | 53,066 | | | | 0.00 | % |
Virgolino de Oliveira Finance SA
10.875%, 1/13/20 | | | 6/09/14 | | | | 2,486,550 | | | | 450,000 | | | | 0.01 | % |
Virgolino de Oliveira Finance SA
11.75%, 2/09/22 | | | 7/26/12 | | | | 11,383,331 | | | | 176,969 | | | | 0.00 | % |
| (e) | | Non-income producing security. |
| (f) | | Fair valued by the Adviser. |
| (g) | | Restricted and illiquid security. |
| | | | | | | | | | | | | | | | |
| Restricted Securities | | Acquisition
Date | | | Cost | | | Market Value | | | Percentage of
Net Assets | |
Exide Corp. | | | 1/13/11 | | | $ | 630,678 | | | $ | 950,956 | | | | 0.02 | % |
Exide Technologies Series AI
11.00%, 4/30/20 | | | 6/10/13 | | | | 19,826,081 | | | | 17,487,954 | | | | 0.28 | % |
Momentive Performance Materials, Inc. | | | 10/11/12 | | | | – 0 | – | | | – 0 | – | | | 0.00 | % |
Mt. Logan Re Ltd. (Preference Shares) | | | 12/30/14 | | | | 29,452,000 | | | | 31,262,400 | | | | 0.50 | % |
| (h) | | Floating Rate Security. Stated interest rate was in effect at October 31, 2015. |
| (i) | | Pay-In-Kind Payments (PIK). The issuer may pay cash interest and/or interest in additional debt securities. Rates shown are the rates in effect at October 31, 2015. |
| (j) | | Convertible security. |
| (l) | | Coupon rate adjusts periodically based upon a predetermined schedule. Stated interest rate in effect at October 31, 2015. |
| (m) | | Securities are perpetual and, thus, do not have a predetermined maturity date. The date shown, if applicable, reflects the next call date. |
| (n) | | Defaulted matured security. |
| (q) | | Position, or a portion thereof, has been segregated to collateralize OTC derivatives outstanding. |
| (r) | | Position, or a portion thereof, has been segregated to collateralize margin requirements for exchange-traded derivatives. |
| (s) | | Variable rate coupon, rate shown as of October 31, 2015. |
| (t) | | This position or a portion of this position represents an unsettled loan purchase. The coupon rate will be determined at the time of settlement and will be based upon the London-Interbank Offered Rate (“LIBOR”) plus a premium which was determined at the time of purchase. |
Portfolio of Investments
| (u) | | The security is subject to a 12 month lock-up period, after which semi-annual redemptions are permitted. |
| (v) | | Investment in affiliated money market mutual fund. The rate shown represents the 7-day yield as of period end. |
| (w) | | To obtain a copy of the fund’s financial statements, please go to the Securities and Exchange Commission’s website at www.sec.gov, or call AB at (800) 227-4618. |
| | |
Currency Abbreviations: AUD – Australian Dollar BRL – Brazilian Real CAD – Canadian Dollar CHF – Swiss Franc COP – Colombian Peso DOP – Dominican Peso EUR – Euro GBP – Great British Pound IDR – Indonesian Rupiah INR – Indian Rupee JPY – Japanese Yen MXN – Mexican Peso NOK – Norwegian Krone SEK – Swedish Krona SGD – Singapore Dollar TRY – Turkish Lira TWD – New Taiwan Dollar USD – United States Dollar UYU – Uruguayan Peso ZAR – South African Rand | | |
Glossary:
CDX-CMBX.NA – North American Commercial Mortgage-Backed Index
CDX-NAHY – North American High Yield Credit Default Swap Index
CDX-NAIG – North American Investment Grade Credit Default Swap Index
CMBS – Commercial Mortgage-Backed Securities
GSE – Government-Sponsored Enterprise
INTRCONX – Inter-Continental Exchange
JSC – Joint Stock Company
LIBOR – London Interbank Offered Rates
MTN – Medium Term Note
REIT – Real Estate Investment Trust
RTP – Right to Pay
See notes to financial statements.
Portfolio of Investments
STATEMENT OF ASSETS & LIABILITIES
October 31, 2015
| | | | |
| Assets | | | | |
Investments in securities, at value | | | | |
Unaffiliated issuers (cost $6,223,391,077) | | $ | 5,838,776,027 | |
Affiliated issuers (cost $462,732,201) | | | 462,732,201 | |
Cash | | | 17,237 | |
Foreign currencies, at value (cost $277,927) | | | 279,369 | |
Dividends and interest receivable | | | 98,409,911 | |
Receivable for capital stock sold | | | 31,600,346 | |
Cash collateral due from broker | | | 18,891,167 | |
Receivable for investment securities sold | | | 17,225,374 | |
Unrealized appreciation on credit default swaps | | | 13,061,226 | |
Unrealized appreciation on forward currency exchange contracts | | | 7,869,964 | |
Upfront premiums paid on credit default swaps | | | 6,026,286 | |
Receivable for unsettled reverse repurchase agreements | | | 1,695,661 | |
Unrealized appreciation on total return swaps | | | 1,581,069 | |
Receivable for newly entered credit default swaps | | | 628,525 | |
Receivable for variation margin on exchange-traded derivatives | | | 392,896 | |
| | | | |
Total assets | | | 6,499,187,259 | |
| | | | |
| Liabilities | | | | |
Payable for investment securities purchased | | | 97,379,380 | |
Payable for reverse repurchase agreements | | | 88,145,548 | |
Payable for capital stock redeemed | | | 21,181,592 | |
Unrealized depreciation on credit default swaps | | | 20,591,079 | |
Upfront premiums received on credit default swaps | | | 13,761,860 | |
Unrealized depreciation on forward currency exchange contracts | | | 10,915,400 | |
Dividends payable | | | 4,648,060 | |
Advisory fee payable | | | 2,380,710 | |
Distribution fee payable | | | 1,648,000 | |
Payable for unsettled reverse repurchase agreements | | | 1,620,884 | |
Transfer Agent fee payable | | | 130,650 | |
Swaptions written, at value (premiums received $182,025) | | | 84,575 | |
Administrative fee payable | | | 14,041 | |
Accrued expenses and other liabilities | | | 1,025,604 | |
| | | | |
Total liabilities | | | 263,527,383 | |
| | | | |
Net Assets | | $ | 6,235,659,876 | |
| | | | |
| Composition of Net Assets | | | | |
Capital stock, at par | | $ | 731,713 | |
Additional paid-in capital | | | 6,647,917,818 | |
Undistributed net investment income | | | 47,476,132 | |
Accumulated net realized loss on investment and foreign currency transactions | | | (76,833,357 | ) |
Net unrealized depreciation of investments and foreign currency denominated assets and liabilities | | | (383,632,430 | ) |
| | | | |
| | $ | 6,235,659,876 | |
| | | | |
See notes to financial statements.
Statement of Assets & Liabilities
Net Asset Value Per Share—24 billion shares of capital stock authorized, $.001 par value
| | | | | | | | | | | | |
| Class | | Net Assets | | | Shares
Outstanding | | | Net Asset
Value | |
| |
| A | | $ | 2,059,111,487 | | | | 242,330,330 | | | $ | 8.50 | * |
| |
| B | | $ | 3,551,178 | | | | 414,238 | | | $ | 8.57 | |
| |
| C | | $ | 1,283,191,822 | | | | 149,291,415 | | | $ | 8.60 | |
| |
| Advisor | | $ | 2,362,066,298 | | | | 277,629,809 | | | $ | 8.51 | |
| |
| R | | $ | 76,875,740 | | | | 9,049,796 | | | $ | 8.49 | |
| |
| K | | $ | 95,293,692 | | | | 11,212,545 | | | $ | 8.50 | |
| |
| I | | $ | 277,654,005 | | | | 32,628,597 | | | $ | 8.51 | |
| |
| Z | | $ | 77,915,654 | | | | 9,156,255 | | | $ | 8.51 | |
| |
| * | | The maximum offering price per share for Class A shares was $8.88 which reflects a sales charge of 4.25%. |
See notes to financial statements.
Statement of Assets & Liabilities
STATEMENT OF OPERATIONS
Year Ended October 31, 2015
| | | | | | | | |
Investment Income | | | | | | | | |
Interest (net of foreign taxes withheld of $137,364) | | $ | 432,556,873 | | | | | |
Dividends | | | | | | | | |
Unaffiliated issuers | | | 6,678,384 | | | | | |
Affiliated issuers | | | 539,148 | | | | | |
Other income | | | 424,828 | | | $ | 440,199,233 | |
| | | | | | | | |
| Expenses | | | | | | | | |
Advisory fee (see Note B) | | | 30,237,026 | | | | | |
Distribution fee—Class A | | | 6,604,834 | | | | | |
Distribution fee—Class B | | | 52,067 | | | | | |
Distribution fee—Class C | | | 13,998,614 | | | | | |
Distribution fee—Class R | | | 399,723 | | | | | |
Distribution fee—Class K | | | 230,604 | | | | | |
Transfer agency—Class A | | | 2,067,046 | | | | | |
Transfer agency—Class B | | | 6,428 | | | | | |
Transfer agency—Class C | | | 1,310,550 | | | | | |
Transfer agency—Advisor Class | | | 2,330,466 | | | | | |
Transfer agency—Class R | | | 207,856 | | | | | |
Transfer agency—Class K | | | 166,239 | | | | | |
Transfer agency—Class I | | | 100,448 | | | | | |
Transfer agency—Class Z | | | 11,528 | | | | | |
Printing | | | 569,453 | | | | | |
Custodian | | | 445,899 | | | | | |
Registration fees | | | 289,940 | | | | | |
Audit and tax | | | 190,137 | | | | | |
Legal | | | 48,837 | | | | | |
Administrative | | | 45,695 | | | | | |
Directors’ fees | | | 27,923 | | | | | |
Miscellaneous | | | 234,326 | | | | | |
| | | | | | | | |
Total expenses before interest expense | | | 59,575,639 | | | | | |
Interest expense | | | 1,464,922 | | | | | |
| | | | | | | | |
Total expenses | | | | | | | 61,040,561 | |
| | | | | | | | |
Net investment income | | | | | | | 379,158,672 | |
| | | | | | | | |
| Realized and Unrealized Gain (Loss) on Investment and Foreign Currency Transactions | | | | | | | | |
Net realized gain (loss) on: | | | | | | | | |
Investment transactions | | | | | | | (51,048,682 | ) |
Swaps | | | | | | | (15,254,650 | ) |
Futures | | | | | | | (5,941,489 | ) |
Options written | | | | | | | 2,122,826 | |
Swaptions written | | | | | | | 2,374,824 | |
Foreign currency transactions | | | | | | | 60,356,982 | |
Net change in unrealized appreciation/depreciation on: | | | | | | | | |
Investments | | | | | | | (500,739,208 | ) |
Swaps | | | | | | | 1,776,377 | |
Swaptions written | | | | | | | 97,450 | |
Foreign currency denominated assets and liabilities | | | | | | | (14,416,782 | ) |
| | | | | | | | |
Net loss on investment and foreign currency transactions | | | | | | | (520,672,352 | ) |
| | | | | | | | |
Net Decrease in Net Assets from Operations | | | | | | $ | (141,513,680 | ) |
| | | | | | | | |
See notes to financial statements.
Statement of Operations
STATEMENT OF CHANGES IN NET ASSETS
| | | | | | | | |
| | | Year Ended
October 31, 2015 | | | Year Ended
October 31, 2014 | |
| Increase (Decrease) in Net Assets from Operations | | | | | | | | |
Net investment income | | $ | 379,158,672 | | | $ | 365,776,222 | |
Net realized gain (loss) on investment and foreign currency transactions | | | (7,390,189 | ) | | | 133,575,939 | |
Net change in unrealized appreciation/depreciation of investments and foreign currency denominated assets and liabilities | | | (513,282,163 | ) | | | (164,627,490 | ) |
| | | | | | | | |
Net increase (decrease) in net assets from operations | | | (141,513,680 | ) | | | 334,724,671 | |
| Dividends and Distributions to Shareholders from | | | | | | | | |
Net investment income | | | | | | | | |
Class A | | | (159,269,974 | ) | | | (163,561,730 | ) |
Class B | | | (355,001 | ) | | | (581,691 | ) |
Class C | | | (90,909,251 | ) | | | (78,907,674 | ) |
Advisor Class | | | (186,090,158 | ) | | | (132,867,955 | ) |
Class R | | | (5,436,719 | ) | | | (4,252,209 | ) |
Class K | | | (6,503,464 | ) | | | (4,313,667 | ) |
Class I | | | (20,536,101 | ) | | | (6,006,076 | ) |
Class Z | | | (4,202,430 | ) | | | (2,403,069 | ) |
Net realized gain on investment and foreign currency transactions | | | | | | | | |
Class A | | | (19,181,694 | ) | | | (14,587,925 | ) |
Class B | | | (56,650 | ) | | | (68,016 | ) |
Class C | | | (12,392,523 | ) | | | (7,662,861 | ) |
Advisor Class | | | (20,548,170 | ) | | | (9,880,453 | ) |
Class R | | | (660,870 | ) | | | (376,162 | ) |
Class K | | | (718,571 | ) | | | (313,050 | ) |
Class I | | | (1,998,684 | ) | | | (439,770 | ) |
Class Z | | | (393,422 | ) | | | (142,838 | ) |
Capital Stock Transactions | | | | | | | | |
Net increase | | | 277,283,670 | | | | 763,987,460 | |
Capital Contributions | | | | | | | | |
Proceeds from third party regulatory settlement (see Note E) | | | – 0 | – | | | 15,077 | |
| | | | | | | | |
Total increase (decrease) | | | (393,483,692 | ) | | | 672,362,062 | |
| Net Assets | | | | | | | | |
Beginning of period | | | 6,629,143,568 | | | | 5,956,781,506 | |
| | | | | | | | |
End of period (including undistributed net investment income of $47,476,132 and $76,841,145, respectively) | | $ | 6,235,659,876 | | | $ | 6,629,143,568 | |
| | | | | | | | |
See notes to financial statements.
Statement of Changes in Net Assets
STATEMENT OF CASH FLOWS
Year Ended October 31, 2015
| | | | | | | | |
Net decrease in net assets from operations | | | | | | $ | (141,513,680 | ) |
| Reconciliation of Net Increase in Net Assets from Operations to Net Increase in Cash from Operating Activities: | | | | | | | | |
Decrease in interest and dividends receivable. | | $ | 8,381,852 | | | | | |
Net accretion of bond discount and amortization of bond premium. | | | 361,647 | | | | | |
Inflation index adjustment | | | (550,672 | ) | | | | |
Decrease in accrued expenses | | | (774,721 | ) | | | | |
Increase in cash collateral due from broker | | | (16,862,556 | ) | | | | |
Increase in receivable for investment securities sold. | | | (3,355,833 | ) | | | | |
Increase in payable for investment securities purchased. | | | 82,696,856 | | | | | |
Purchases of long-term investments | | | (3,636,397,338 | ) | | | | |
Proceeds from disposition of long-term investments | | | 4,256,504,861 | | | | | |
Purchases of short-term investments, net | | | (78,145,258 | ) | | | | |
Payments on swaps, net | | | (8,108,917 | ) | | | | |
Proceeds from written options, net | | | 4,679,675 | | | | | |
Payments for futures settlements | | | (5,941,489 | ) | | | | |
Variation margin received on exchange-traded derivatives | | | 18,726,418 | | | | | |
Decrease in cash collateral received from broker | | | (4,193,000 | ) | | | | |
Net realized loss on investment and foreign currency transactions | | | 7,390,189 | | | | | |
Net change in unrealized appreciation/depreciation on investments and foreign currency denominated assets and liabilities | | | 513,282,163 | | | | | |
| | | | | | | | |
Total adjustments | | | | | | | 1,137,693,877 | |
| | | | | | | | |
Net increase in cash from operating activities | | | | | | $ | 996,180,197 | |
| | | | | | | | |
| Financing Activities: | | | | | | | | |
Cash dividends paid (net of dividend reinvestments)* | | | (183,978,929 | ) | | | | |
Redemptions of capital stock, net. | | | (62,478,084 | ) | | | | |
Decrease in reverse repurchase agreements | | | (836,630,060 | ) | | | | |
| | | | | | | | |
Net decrease in cash from financing activities | | | | | | | (1,083,087,073 | ) |
| | | | | | | | |
Effect of exchange rate on cash. | | | | | | | 86,993,814 | |
| | | | | | | | |
Net increase in cash | | | | | | | 86,938 | |
Cash at beginning of period | | | | | | | 209,668 | |
| | | | | | | | |
Cash at end of period. | | | | | | $ | 296,606 | |
| | | | | | | | |
*Reinvestment of dividends | | $ | 345,574,761 | | | | | |
| Supplemental disclosure of cash flow information: | | | | | | | | |
Interest expense paid during the year. | | | | | | $ | 1,464,922 | |
In accordance with U.S. GAAP, the Fund has included a Statement of Cash Flows as a result of its significant investments in Level 3 securities throughout the period.
See notes to financial statements.
Statement of Cash Flows
NOTES TO FINANCIAL STATEMENTS
October 31, 2015
NOTE A
Significant Accounting Policies
AB High Income Fund, Inc. (the “Fund”), was incorporated in the State of Maryland on December 2, 1993, and is registered under the Investment Company Act of 1940 as a diversified, open-end management investment company. Prior to January 20, 2015, the Fund was known as AllianceBernstein High Income Fund, Inc. The Fund offers Class A, Class B, Class C, Advisor Class, Class R, Class K, Class I and Class Z shares. Effective October 15, 2013, the Fund commenced offering of Class Z shares. Class A shares are sold with a front-end sales charge of up to 4.25% for purchases not exceeding $1,000,000. With respect to purchases of $1,000,000 or more, Class A shares redeemed within one year of purchase may be subject to a contingent deferred sales charge of 1%. Class B shares are currently sold with a contingent deferred sales charge which declines from 3% to zero depending on the period of time the shares are held. Effective January 31, 2009, sales of Class B shares of the Fund to new investors were suspended. Class B shares will only be issued (i) upon the exchange of Class B shares from another AllianceBernstein Mutual Fund, (ii) for purposes of dividend reinvestment, (iii) through the Fund’s Automatic Investment Program (the “Program”) for accounts that established the Program prior to January 31, 2009, and (iv) for purchases of additional shares by Class B shareholders as of January 31, 2009. The ability to establish a new Program for accounts containing Class B shares was suspended as of January 31, 2009. Class B shares will automatically convert to Class A shares six years after the end of the calendar month of purchase. Class C shares are subject to a contingent deferred sales charge of 1% on redemptions made within the first year after purchase. Class R and Class K shares are sold without an initial or contingent deferred sales charge. Advisor Class, Class I and Class Z shares are sold without an initial or contingent deferred sales charge and are not subject to ongoing distribution expenses. All eight classes of shares have identical voting, dividend, liquidation and other rights, except that the classes bear different distribution and transfer agency expenses. Each class has exclusive voting rights with respect to its distribution plan. The financial statements have been prepared in conformity with U.S. generally accepted accounting principles (“U.S. GAAP”), which require management to make certain estimates and assumptions that affect the reported amounts of assets and liabilities in the financial statements and amounts of income and expenses during the reporting period. Actual results could differ from those estimates. The Fund is an investment company under U.S. GAAP and follows the accounting and reporting guidance applicable to investment companies. The following is a summary of significant accounting policies followed by the Fund.
1. Security Valuation
Portfolio securities are valued at their current market value determined on the basis of market quotations or, if market quotations are not readily available or are deemed unreliable, at “fair value” as determined in accordance with procedures established by and under the general supervision of the Fund’s Board of Directors (the “Board”).
Notes to Financial Statements
In general, the market values of securities which are readily available and deemed reliable are determined as follows: securities listed on a national securities exchange (other than securities listed on the NASDAQ Stock Market, Inc. (“NASDAQ”)) or on a foreign securities exchange are valued at the last sale price at the close of the exchange or foreign securities exchange. If there has been no sale on such day, the securities are valued at the last traded price from the previous day. Securities listed on more than one exchange are valued by reference to the principal exchange on which the securities are traded; securities listed only on NASDAQ are valued in accordance with the NASDAQ Official Closing Price; listed or over the counter (“OTC”) market put or call options are valued at the mid level between the current bid and ask prices. If either a current bid or current ask price is unavailable, AllianceBernstein L.P. (the “Adviser”) will have discretion to determine the best valuation (e.g. last trade price in the case of listed options); open futures contracts are valued using the closing settlement price or, in the absence of such a price, the most recent quoted bid price. If there are no quotations available for the day of valuation, the last available closing settlement price is used; U.S. Government securities and any other debt instruments having 60 days or less remaining until maturity are generally valued at market by an independent pricing vendor, if a market price is available. If a market price is not available, the securities are valued at amortized cost. This methodology is commonly used for short-term securities that have an original maturity of 60 days or less, as well as short-term securities that had an original term to maturity that exceeded 60 days. In instances when amortized cost is utilized, the Valuation Committee (the “Committee”) must reasonably conclude that the utilization of amortized cost is approximately the same as the fair value of the security. Such factors the Committee will consider include, but are not limited to, an impairment of the creditworthiness of the issuer or material changes in interest rates. Fixed-income securities, including mortgage-backed and asset-backed securities, may be valued on the basis of prices provided by a pricing service or at a price obtained from one or more of the major broker-dealers. In cases where broker-dealer quotes are obtained, the Adviser may establish procedures whereby changes in market yields or spreads are used to adjust, on a daily basis, a recently obtained quoted price on a security. Swaps and other derivatives are valued daily, primarily using independent pricing services, independent pricing models using market inputs, as well as third party broker-dealers or counterparties. Investment companies are valued at their net asset value each day.
Securities for which market quotations are not readily available (including restricted securities) or are deemed unreliable are valued at fair value. Factors considered in making this determination may include, but are not limited to, information obtained by contacting the issuer, analysts, analysis of the issuer’s financial statements or other available documents. In addition, the Fund may use fair value pricing for securities primarily traded in non-U.S. markets because most foreign markets close well before the Fund values its securities at 4:00 p.m., Eastern Time. The earlier close of these foreign markets gives rise to
Notes to Financial Statements
the possibility that significant events, including broad market moves, may have occurred in the interim and may materially affect the value of those securities. To account for this, the Fund may frequently value many of its foreign equity securities using fair value prices based on third party vendor modeling tools to the extent available.
2. Fair Value Measurements
In accordance with U.S. GAAP regarding fair value measurements, fair value is defined as the price that the Fund would receive to sell an asset or pay to transfer a liability in an orderly transaction between market participants at the measurement date. U.S. GAAP establishes a framework for measuring fair value, and a three-level hierarchy for fair value measurements based upon the transparency of inputs to the valuation of an asset or liability (including those valued based on their market values as described in Note A.1 above). Inputs may be observable or unobservable and refer broadly to the assumptions that market participants would use in pricing the asset or liability. Observable inputs reflect the assumptions market participants would use in pricing the asset or liability based on market data obtained from sources independent of the Fund. Unobservable inputs reflect the Fund’s own assumptions about the assumptions that market participants would use in pricing the asset or liability based on the best information available in the circumstances. Each investment is assigned a level based upon the observability of the inputs which are significant to the overall valuation. The three-tier hierarchy of inputs is summarized below.
| | • | | Level 1—quoted prices in active markets for identical investments |
| | • | | Level 2—other significant observable inputs (including quoted prices for similar investments, interest rates, prepayment speeds, credit risk, etc.) |
| | • | | Level 3—significant unobservable inputs (including the Fund’s own assumptions in determining the fair value of investments) |
The fair value of debt instruments, such as bonds, and over-the-counter derivatives is generally based on market price quotations, recently executed market transactions (where observable) or industry recognized modeling techniques and are generally classified as Level 2. Pricing vendor inputs to Level 2 valuations may include quoted prices for similar investments in active markets, interest rate curves, coupon rates, currency rates, yield curves, option adjusted spreads, default rates, credit spreads and other unique security features in order to estimate the relevant cash flows which is then discounted to calculate fair values. If these inputs are unobservable and significant to the fair value, these investments will be classified as Level 3. In addition, non-agency rated investments are classified as Level 3.
Where readily available market prices or relevant bid prices are not available for certain equity investments, such investments may be valued based on similar publicly traded investments, movements in relevant indices since last available prices or based upon underlying company fundamentals and comparable company
Notes to Financial Statements
data (such as multiples to earnings or other multiples to equity). Where an investment is valued using an observable input, such as another publicly traded security, the investment will be classified as Level 2. If management determines that an adjustment is appropriate based on restrictions on resale, illiquidity or uncertainty, and such adjustment is a significant component of the valuation, the investment will be classified as Level 3. An investment will also be classified as Level 3 where management uses company fundamentals and other significant inputs to determine the valuation.
Valuations of mortgage-backed or other asset-backed securities, by pricing vendors, are based on both proprietary and industry recognized models and discounted cash flow techniques. Significant inputs to the valuation of these instruments are value of the collateral, the rates and timing of delinquencies, the rates and timing of prepayments, and default and loss expectations, which are driven in part by housing prices for residential mortgages. Significant inputs are determined based on relative value analyses, which incorporate comparisons to instruments with similar collateral and risk profiles, including relevant indices. Mortgage and asset backed securities for which management has collected current observable data through pricing services are generally categorized within Level 2. Those investments for which current observable data has not been provided are classified as Level 3.
Options are valued using market-based inputs to models, broker or dealer quotations, or alternative pricing sources with reasonable levels of price transparency, where such inputs and models are available. Alternatively the values may be obtained through unobservable management determined inputs and/or management’s proprietary models. Where models are used, the selection of a particular model to value an option depends upon the contractual terms of, and specific risks inherent in, the option as well as the availability of pricing information in the market. Valuation models require a variety of inputs, including contractual terms, market prices, measures of volatility and correlations of such inputs. Exchange traded options generally will be classified as Level 2. For options that do not trade on exchange but trade in liquid markets, inputs can generally be verified and model selection does not involve significant management judgment. Options are classified within Level 2 on the fair value hierarchy when all of the significant inputs can be corroborated to market evidence. Otherwise such instruments are classified as Level 3.
Bank loan prices are provided by third party pricing services and consist of a composite of the quotes received by the vendor into a consensus price. Bank loans are classified as Level 3, as significant input used in the fair value measurement of these instruments is the market quotes that are received by the vendor and these inputs are not observable.
Other fixed income investments, including non-U.S. government and corporate debt, are generally valued using quoted market prices, if available, which are
Notes to Financial Statements
typically impacted by current interest rates, maturity dates and any perceived credit risk of the issuer. Additionally, in the absence of quoted market prices, these inputs are used by pricing vendors to derive a valuation based upon industry or proprietary models which incorporate issuer specific data with relevant yield/spread comparisons with more widely quoted bonds with similar key characteristics. Those investments for which there are observable inputs are classified as Level 2. Where the inputs are not observable, the investments are classified as Level 3.
The following table summarizes the valuation of the Fund’s investments by the above fair value hierarchy levels as of October 31, 2015:
| | | | | | | | | | | | | | | | |
Investments in Securities | | Level 1 | | | Level 2 | | | Level 3 | | | Total | |
Assets: | | | | | | | | | | | | | | | | |
Corporates – Non-Investment Grade | | $ | – 0 | – | | $ | 3,298,834,114 | | | $ | 55,876,964 | # | | $ | 3,354,711,078 | |
Collateralized Mortgage Obligations | | | – 0 | – | | | – 0 | – | | | 497,172,898 | | | | 497,172,898 | |
Corporates – Investment Grade | | | – 0 | – | | | 483,738,908 | | | | – 0 | – | | | 483,738,908 | |
Governments – Treasuries | | | – 0 | – | | | 255,615,022 | | | | – 0 | – | | | 255,615,022 | |
Commercial Mortgage-Backed Securities | | | – 0 | – | | | 34,621,071 | | | | 177,839,338 | | | | 212,460,409 | |
Bank Loans | | | – 0 | – | | | – 0 | – | | | 182,534,919 | | | | 182,534,919 | |
Emerging Markets – Sovereigns | | | – 0 | – | | | 166,177,053 | | | | – 0 | – | | | 166,177,053 | |
Emerging Markets – Corporate Bonds | | | – 0 | – | | | 157,486,046 | | | | – 0 | – | | | 157,486,046 | |
Preferred Stocks | | | 83,869,516 | | | | 11,628,425 | | | | – 0 | – | | | 95,497,941 | |
Governments – Sovereign Agencies | | | – 0 | – | | | 78,436,581 | | | | – 0 | –# | | | 78,436,581 | |
Common Stocks | | | 3,961,248 | | | | – 0 | – | | | 61,819,451 | # | | | 65,780,699 | |
Whole Loan Trusts | | | – 0 | – | | | 1,514,540 | | | | 61,190,336 | | | | 62,704,876 | |
Local Governments – Municipal Bonds | | | – 0 | – | | | 44,709,459 | | | | – 0 | – | | | 44,709,459 | |
Emerging Markets – Treasuries | | | – 0 | – | | | 9,837,474 | | | | 32,003,898 | | | | 41,841,372 | |
Governments – Sovereign Bonds | | | – 0 | – | | | 37,637,708 | | | | – 0 | – | | | 37,637,708 | |
Quasi-Sovereigns | | | – 0 | – | | | 26,217,492 | | | | – 0 | – | | | 26,217,492 | |
Asset-Backed Securities | | | – 0 | – | | | – 0 | – | | | 17,365,070 | | | | 17,365,070 | |
Agencies | | | – 0 | – | | | 8,436,820 | | | | – 0 | – | | | 8,436,820 | |
Inflation-Linked Securities | | | – 0 | – | | | 7,479,033 | | | | – 0 | – | | | 7,479,033 | |
Local Governments – Regional Bonds | | | – 0 | – | | | 4,405,605 | | | | – 0 | – | | | 4,405,605 | |
Investment Companies | | | – 0 | – | | | – 0 | – | | | 1,763,004 | | | | 1,763,004 | |
Warrants | | | 202 | | | | – 0 | – | | | 1,515,784 | # | | | 1,515,986 | |
Options Purchased – Puts | | | – 0 | – | | | 391,263 | | | | – 0 | – | | | 391,263 | |
Notes to Financial Statements
| | | | | | | | | | | | | | | | |
Investments in Securities | | Level 1 | | | Level 2 | | | Level 3 | | | Total | |
Short-Term Investments: | | | | | | | | | | | | | | | | |
Investment Companies | | $ | 462,732,201 | | | $ | – 0 | – | | $ | – 0 | – | | $ | 462,732,201 | |
Time Deposits | | | – 0 | – | | | 34,696,785 | # | | | – 0 | – | | | 34,696,785 | |
| | | | | | | | | | | | | | | | |
Total Investments in Securities | | | 550,563,167 | | | | 4,661,863,399 | | | | 1,089,081,662 | | | | 6,301,508,228 | |
Other Financial Instruments*: | | | | | | | | | | | | | | | | |
Assets | | | | | | | | | | | | | | | | |
Forward Currency Exchange Contracts | | | – 0 | – | | | 7,869,964 | | | | – 0 | – | | | 7,869,964 | |
Centrally Cleared Credit Default Swaps | | | – 0 | – | | | 10,291,435 | | | | – 0 | – | | | 10,291,435 | † |
Credit Default Swaps | | | – 0 | – | | | 13,061,226 | | | | – 0 | – | | | 13,061,226 | |
Total Return Swaps | | | – 0 | – | | | 1,581,069 | | | | – 0 | – | | | 1,581,069 | |
Liabilities | | | | | | | | | | | | | | | | |
Forward Currency Exchange Contracts | | | – 0 | – | | | (10,915,400 | ) | | | – 0 | – | | | (10,915,400 | ) |
Credit Default Swaptions Written | | | – 0 | – | | | (84,575 | ) | | | – 0 | – | | | (84,575 | ) |
Centrally Cleared Credit Default Swaps | | | – 0 | – | | | (121,549 | ) | | | – 0 | – | | | (121,549 | )† |
Credit Default Swaps | | | – 0 | – | | | (20,591,079 | ) | | | – 0 | – | | | (20,591,079 | ) |
| | | | | | | | | | | | | | | | |
Total^ | | $ | 550,563,167 | | | $ | 4,662,954,490 | | | $ | 1,089,081,662 | | | $ | 6,302,599,319 | |
| | | | | | | | | | | | | | | | |
| # | | The Fund held securities with zero market value at period end. |
| * | | Other financial instruments are derivative instruments, such as futures, forwards and swap contracts which are valued at the unrealized appreciation/depreciation on the instrument. Other financial instruments may also include written options and swaptions which are valued at market value. |
| † | | Only variation margin receivable/payable at period end is reported within the statements of assets and liabilities. This amount reflects cumulative appreciation/depreciation of exchange-traded derivatives as reported in the portfolio of investments. |
| ^ | | There were de minimis transfers between Level 1 and Level 2 during the reporting period. |
The Fund recognizes all transfers between levels of the fair value hierarchy assuming the financial instrument was transferred at the beginning of the reporting period.
Notes to Financial Statements
Following is a reconciliation of investments in which significant unobservable inputs (Level 3) were used in determining fair value.
| | | | | | | | | | | | | | | | |
| | | Corporates -
Non-Investment
Grade# | | | Collateralized
Mortgage
Obligations | | | Corporates -
Investment
Grade | | | Commercial
Mortgage-
Backed
Securities | |
Balance as of 10/31/14 | | $ | 40,126,149 | | | $ | 394,486,916 | | | $ | 19,377,046 | | | $ | 157,503,872 | |
Accrued discounts/(premiums) | | | 398,606 | | | | 3,400,083 | | | | – 0 | – | | | 794,961 | |
Realized gain (loss) | | | (509,794 | ) | | | 8,769,281 | | | | – 0 | – | | | 811,105 | |
Change in unrealized appreciation/depreciation | | | (15,578,818 | ) | | | (16,657,688 | ) | | | – 0 | – | | | (8,524,161 | ) |
Purchases/Payups | | | 47,165,544 | | | | 197,823,272 | | | | – 0 | – | | | 45,094,880 | |
Sales/Paydowns | | | (23,570,454 | ) | | | (90,648,966 | ) | | | – 0 | – | | | (17,841,319 | ) |
Settlements | | | – 0 | – | | | – 0 | – | | | – 0 | – | | | – 0 | – |
Reclassification | | | 7,845,731 | | | | – 0 | – | | | (7,845,731 | ) | | | – 0 | – |
Transfers into level 3 | | | – 0 | – | | | – 0 | – | | | – 0 | – | | | – 0 | – |
Transfers out of level 3 | | | – 0 | – | | | – 0 | – | | | (11,531,315 | ) | | | – 0 | – |
| | | | | | | | | | | | | | | | |
Balance as of 10/31/15 | | $ | 55,876,964 | | | $ | 497,172,898 | | | $ | – 0 | – | | $ | 177,839,338 | |
| | | | | | | | | | | | | | | | |
Net change in unrealized appreciation/depreciation from investments held as of 10/31/15** | | $ | (15,475,789 | ) | | $ | (12,771,658 | ) | | $ | – 0 | – | | $ | (7,689,764 | ) |
| | | | | | | | | | | | | | | | |
| | | | |
| | | Bank Loans | | | Governments-
Sovereign
Agencies | | | Common
Stocks# | | | Whole Loan
Trusts | |
Balance as of 10/31/14 | | $ | 243,384,389 | | | $ | – 0 | – | | $ | 4,983,972 | | | $ | 16,044,166 | |
Accrued discounts/(premiums) | | | 2,321,902 | | | | (57 | ) | | | – 0 | – | | | 24,894 | |
Realized gain (loss) | | | (4,012,377 | ) | | | – 0 | – | | | (87,188 | ) | | | (217,183 | ) |
Change in unrealized appreciation/depreciation | | | (4,443,720 | ) | | | 57 | | | | 5,664,379 | | | | (1,154,876 | ) |
Purchases/Payups | | | 73,204,654 | | | | – 0 | – | | | 56,785,347 | | | | 58,852,281 | |
Sales/Paydowns | | | (124,919,929 | ) | | | – 0 | – | | | (5,948,472 | ) | | | (15,358,946 | ) |
Settlements | | | – 0 | – | | | – 0 | – | | | – 0 | – | | | – 0 | – |
Reclassification | | | (3,000,000 | ) | | | – 0 | – | | | – 0 | – | | | 3,000,000 | |
Transfers into level 3 | | | – 0 | – | | | – 0 | – | | | 421,413 | | | | – 0 | – |
Transfers out of level 3 | | | – 0 | – | | | – 0 | – | | | – 0 | – | | | – 0 | – |
| | | | | | | | | | | | | | | | |
Balance as of 10/31/15 | | $ | 182,534,919 | | | $ | – 0 | – | | $ | 61,819,451 | | | $ | 61,190,336 | |
| | | | | | | | | | | | | | | | |
Net change in unrealized appreciation/depreciation from investments held as of 10/31/15** | | $ | (9,154,715 | ) | | $ | 57 | | | $ | 4,250,797 | | | $ | (1,154,876 | ) |
| | | | | | | | | | | | | | | | |
Notes to Financial Statements
| | | | | | | | | | | | | | | | |
| | | Emerging
Markets -
Treasuries | | | Asset-Backed
Securities | | | Investment
Companies | | | Warrants# | |
Balance as of 10/31/14 | | $ | 27,009,644 | | | $ | 16,734,646 | | | $ | 7,369,023 | | | $ | – 0 | – |
Accrued discounts/(premiums) | | | (167,143 | ) | | | 355,259 | | | | – 0 | – | | | – 0 | – |
Realized gain (loss) | | | (665,868 | ) | | | 490,412 | | | | (1,122,856 | ) | | | 4,253 | |
Change in unrealized appreciation/depreciation | | | (94,851 | ) | | | (984,963 | ) | | | 505,506 | | | | 1,515,790 | |
Purchases/Payups | | | 15,645,299 | | | | 2,487,180 | | | | 942,444 | | | | – 0 | – |
Sales/Paydowns | | | (9,723,183 | ) | | | (1,717,464 | ) | | | (5,931,113 | ) | | | (4,259 | ) |
Settlements | | | – 0 | – | | | – 0 | – | | | – 0 | – | | | – 0 | – |
Reclassification | | | – 0 | – | | | – 0 | – | | | – 0 | – | | | – 0 | – |
Transfers into level 3 | | | – 0 | – | | | – 0 | – | | | – 0 | – | | | – 0 | – |
Transfers out of level 3 | | | – 0 | – | | | – 0 | – | | | – 0 | – | | | – 0 | – |
| | | | | | | | | | | | | | | | |
Balance as of 10/31/15 | | $ | 32,003,898 | | | $ | 17,365,070 | | | $ | 1,763,004 | | | $ | 1,515,784 | |
| | | | | | | | | | | | | | | | |
Net change in unrealized appreciation/depreciation from investments held as of 10/31/15** | | $ | (753,915 | ) | | $ | (984,963 | ) | | $ | 305,378 | | | $ | 1,515,784 | |
| | | | | | | | | | | | | | | | |
| | | | |
| | | Total | | | | | | | | | | |
Balance as of 10/31/14 | | $ | 927,019,823 | | | | | | | | | | | | | |
Accrued discounts/(premiums) | | | 7,128,505 | | | | | | | | | | | | | |
Realized gain (loss) | | | 3,459,785 | | | | | | | | | | | | | |
Change in unrealized appreciation/depreciation | | | (39,753,345 | ) | | | | | | | | | | | | |
Purchases | | | 498,000,901 | | | | | | | | | | | | | |
Sales/Paydowns | | | (295,664,105 | ) | | | | | | | | | | | | |
Settlements | | | – 0 | – | | | | | | | | | | | | |
Reclassification | | | – 0 | – | | | | | | | | | | | | |
Transfers into level 3 | | | 421,413 | | | | | | | | | | | | | |
Transfers out of level 3 | | | (11,531,315 | ) | | | | | | | | | | | | |
| | | | | | | | | | | | | | | | |
Balance as of 10/31/15 | | $ | 1,089,081,662 | + | | | | | | | | | | | | |
| | | | | | | | | | | | | | | | |
Net change in unrealized appreciation/depreciation from investments held as of 10/31/15** | | $ | (41,913,664 | ) | | | | | | | | | | | | |
| | | | | | | | | | | | | | | | |
| # | | The Fund held securities with zero market value during the reporting period. |
| ** | | The unrealized appreciation/depreciation is included in net change in unrealized appreciation/depreciation of investments and other financial instruments in the accompanying statement of operations. |
| + | | There were de minimis transfers under 1% of net assets during the reporting period. |
Notes to Financial Statements
The following presents information about significant unobservable inputs related to the Fund’s material categories of Level 3 investments at October 31, 2015. Securities priced (i) at net asset value, (ii) by third party vendors, or (iii) using prior transaction prices, which approximates fair value, are excluded from the following table.
| | | | | | | | | | | | |
| | | Quantitative Information about Level 3 Fair
Value Measurements | | | |
| | | Fair Value at
10/31/2015 | | | Valuation
Technique | | Unobservable
Input | | Range/Weighted
Average | |
Corporates Non-Investment Grade | | $ | 12,604,794 | | | Market
Approach | | Implied Enterprise
Value | | $
$ | 512mm-
596mm/ N/A |
|
| | | | |
| | $ | 986,361 | | | Market
Approach | | EBITDA Projection* | | $
| 38 mm/
N/A |
|
| | | | |
| | | | | | | | EBITDA Multiples* | |
| 5.5X-7.5X/
N/A |
|
| | | | |
| | $ | 277,147 | | | Discounted
Cashflow | | Loss Severity
Total Projected Loss | |
| 60%/NA
16%/NA |
|
| | | | |
| | $ | 0 | | | Qualitative
Assessment | | | | $
| 0.00/
N/A |
|
| | | | |
Bank Loans | | $ | 15,903,850 | | | Market
Approach | | EBITDA Projection* | | $
$ | 28 mm-
70mm/N/A |
|
| | | | |
| | | | | | | | EBITDA Multiple* | |
| 6X/
N/A |
|
| | | | |
| | | | | | | | Scrap Value | | $
| 154mm/
N/A |
|
| | | | |
Governments – Sovereign Agencies | |
$ |
0 |
| |
Qualitative
Assessment | | | |
$ |
0.00/N/A |
|
| | | | |
Common Stocks | | $ | 950,956 | | | Option Pricing
Model | | Enterprise Value | | $
$ | 512mm-
596mm/N/A |
|
| | | | |
| | | | | | | | Exercise Price | | $
$ | 730mm-
830mm/N/A |
|
| | | | |
| | | | | | | | Years to Expiration | |
| 2.75yrs-
4.75yrs/
N/A |
|
| | | | |
| | | | | | | | EV Volatility % | |
| 22.2%-
24.3%/
N/A |
|
| | | | |
| | | | | | | | Risk Free Rate | |
| 0.99%-
1.52%/
N/A |
|
| | | | |
| | $ | 234,504 | | | Market
Approach | | EBITDA Projection* | | $
| 48.7mm/
N/A |
|
| | | | |
| | $ | 65,910 | | | Market
Approach | | EBITDA Projection* | | $
| 309mm/
N/A |
|
Notes to Financial Statements
| | | | | | | | | | | | |
| | | Quantitative Information about Level 3
Fair Value Measurements | | | |
| | | Fair Value at
10/31/2015 | | | Valuation
Technique | | Unobservable
Input | | Range/Weighted
Average | |
| | | | |
Whole Loan Trusts | | $ | 15,142,329 | | | Discounted
Cashflow | | Loss Severity
Total Projected
Loss | |
| 45%/NA
15%/NA |
|
| | | | |
| | $ | 9,970,380 | | | Market
Approach | | Underlying
NAV of the
Collateral | | $
| 104.01/
N/A |
|
| | | | |
| | $ | 8,869,433 | | | Discounted
Cashflow | | Loss Severity
Total Projected
Loss | |
| 60%/NA
16%/NA |
|
| | | | |
| | $ | 6,631,367 | | | Projected
Cashflow | | Prepayment
Multiple | | | 2X/NA | |
| | | | |
| | $ | 4,039,631 | | | Discounted
Cashflow | | | |
| 45%/NA
15%/NA |
|
| | | | |
| | $ | 1,112,938 | | | Projected
Cashflow | | Internal Rate of
Return | |
| 9.57%/
N/A |
|
| * | | Earnings Before Interest, Taxes, Depreciation and Amortization. |
The Adviser established the Committee to oversee the pricing and valuation of all securities held in the Portfolios. The Committee operates under pricing and valuation policies and procedures established by the Adviser and approved by the Board, including Pricing Policies which set forth the mechanisms and processes to be employed on a daily basis to implement these policies and procedures. In particular, the Pricing Policies describe how to determine market quotations for securities and other instruments. The Committee’s responsibilities include: 1) fair value and liquidity determinations (and oversight of any third parties to whom any responsibility for fair value and liquidity determinations is delegated), and 2) regular monitoring of the Adviser’s pricing and valuation policies and procedures and modification or enhancement of these policies and procedures (or recommendation of the modification of these policies and procedures) as the Committee believes appropriate.
The Committee is also responsible for monitoring the implementation of the Pricing Policies by the Adviser’s Pricing Group (the “Pricing Group”) and a third party which performs certain pricing functions in accordance with the Pricing Policies. The Pricing Group is responsible for the oversight of the third party on a day-to-day basis. The Committee and the Pricing Group perform a series of activities to provide reasonable assurance of the accuracy of prices including: 1) periodic vendor due diligence meetings, review of methodologies, new developments, process at vendors, 2) daily and monthly multi-source pricing compares, reviewed and submitted to the Committee, and 3) daily review of unpriced, stale, and variance reports with exceptions reviewed by senior management and the Committee.
Notes to Financial Statements
In addition, several processes outside of the pricing process are used to monitor valuation issues including: 1) performance and performance attribution reports are monitored for anomalous impacts based upon benchmark performance, and 2) portfolio managers review all portfolios for performance and analytics (which are generated using the Adviser’s prices).
3. Currency Translation
Assets and liabilities denominated in foreign currencies and commitments under forward currency exchange contracts are translated into U.S. dollars at the mean of the quoted bid and ask prices of such currencies against the U.S. dollar. Purchases and sales of portfolio securities are translated into U.S. dollars at the rates of exchange prevailing when such securities were acquired or sold. Income and expenses are translated into U.S. dollars at the rates of exchange prevailing when accrued.
Net realized gain or loss on foreign currency transactions represents foreign exchange gains and losses from sales and maturities of foreign fixed income investments, foreign currency exchange contracts, holding of foreign currencies, currency gains or losses realized between the trade and settlement dates on foreign investment transactions, and the difference between the amounts of dividends, interest and foreign withholding taxes recorded on the Fund’s books and the U.S. dollar equivalent amounts actually received or paid. Net unrealized currency gains and losses from valuing foreign currency denominated assets and liabilities at period end exchange rates are reflected as a component of net unrealized appreciation and depreciation of foreign currency denominated assets and liabilities.
4. Taxes
It is the Fund’s policy to meet the requirements of the Internal Revenue Code applicable to regulated investment companies and to distribute all of its investment company taxable income and net realized gains, if any, to shareholders. Therefore, no provisions for federal income or excise taxes are required. The Fund may be subject to taxes imposed by countries in which it invests. Such taxes are generally based on income and/or capital gains earned or repatriated. Taxes are accrued and applied to net investment income, net realized gains and net unrealized appreciation/depreciation as such income and/or gains are earned.
In accordance with U.S. GAAP requirements regarding accounting for uncertainties in income taxes, management has analyzed the Fund’s tax positions taken or expected to be taken on federal and state income tax returns for all open tax years (the current and the prior three tax years) and has concluded that no provision for income tax is required in the Fund’s financial statements.
5. Investment Income and Investment Transactions
Dividend income is recorded on the ex-dividend date or as soon as the Fund is informed of the dividend. Interest income is accrued daily. Investment transactions
Notes to Financial Statements
are accounted for on the date securities are purchased or sold. Investment gains or losses are determined on the identified cost basis. The Fund amortizes premiums and accretes discounts as adjustments to interest income.
6. Class Allocations
All income earned and expenses incurred by the Fund are borne on a pro-rata basis by each settled class of shares, based on the proportionate interest in the Fund represented by the net assets of such class, except for class specific expenses which are allocated to the respective class. Realized and unrealized gains and losses are allocated among the various share classes based on their respective net assets.
7. Dividends and Distributions
Dividends and distributions to shareholders, if any, are recorded on the ex-dividend date. Income dividends and capital gains distributions are determined in accordance with federal tax regulations and may differ from those determined in accordance with U.S. GAAP. To the extent these differences are permanent, such amounts are reclassified within the capital accounts based on their federal tax basis treatment; temporary differences do not require such reclassification.
NOTE B
Advisory Fee and Other Transactions with Affiliates
Under the terms of the investment advisory agreement, the Fund pays the Adviser an advisory fee at an annual rate of .50% of the first $2.5 billion, .45% of the next $2.5 billion and .40% in excess of $5 billion, of the Fund’s average daily net assets. The fee is accrued daily and paid monthly.
Pursuant to the investment advisory agreement, the Fund may reimburse the Adviser for certain legal and accounting services provided to the Fund by the Adviser. For the year ended October 31, 2015, such fee amounted to $45,695.
The Fund compensates AllianceBernstein Investor Services, Inc. (“ABIS”), a wholly-owned subsidiary of the Adviser, under a Transfer Agency Agreement for providing personnel and facilities to perform transfer agency services for the Fund. ABIS may make payments to intermediaries that provide omnibus account services, sub-accounting services and/or networking services. The compensation retained by ABIS amounted to $1,738,166 for the year ended October 31, 2015.
For the year ended October 31, 2015, there was no reduction for the expenses of Class A, Class B, Class C and Advisor Class shares under an expense offset arrangement with ABIS.
AllianceBernstein Investments, Inc. (the “Distributor”), a wholly-owned subsidiary of the Adviser, serves as the distributor of the Fund’s shares. The Distributor has advised the Fund that it has retained front-end sales charges of $236,245 from the sale of Class A shares and received $24,220, $424 and $179,035 in contingent deferred sales charges imposed upon redemptions by shareholders of Class A, Class B and Class C shares, respectively, for the year ended October 31, 2015.
Notes to Financial Statements
The Fund may invest in the AB Fixed-Income Shares, Inc.—Government STIF Portfolio (“Government STIF Portfolio”), an open-end management investment company managed by the Adviser. The Government STIF Portfolio is offered as a cash management option to mutual funds and other institutional accounts of the Adviser, and is not available for direct purchase by members of the public. The Government STIF Portfolio pays no investment management fees but does bear its own expenses. A summary of the Fund’s transactions in shares of the Government STIF Portfolio for the year ended October 31, 2015 is as follows:
| | | | | | | | | | | | | | | | | | |
Market Value
October 31, 2014
(000) | | | Purchases
at Cost
(000) | | | Sales
Proceeds
(000) | | | Market Value
October 31, 2015
(000) | | | Dividend
Income
(000) | |
| $ | 418,693 | | | $ | 2,008,048 | | | $ | 1,964,009 | | | $ | 462,732 | | | $ | 539 | |
Brokerage commissions paid on investment transactions for the year ended October 31, 2015 amounted to $16,496, none of which was paid to Sanford C. Bernstein & Co. LLC and Sanford C. Bernstein Limited, respectively, affiliates of the Adviser.
NOTE C
Distribution Services Agreement
The Fund has adopted a Distribution Services Agreement (the “Agreement”) pursuant to Rule 12b-1 under the Investment Company Act of 1940. Under the Agreement the Fund pays distribution and servicing fees to the Distributor at an annual rate of up to .30% of the Fund’s average daily net assets attributable to Class A shares, 1% of the Fund’s average daily net assets attributable to both Class B and Class C shares, .50% of the Fund’s average daily net assets attributable to Class R shares and .25% of the Fund’s average daily net assets attributable to Class K shares. There are no distribution and servicing fees on Advisor Class, Class I and Class Z shares. The fees are accrued daily and paid monthly. The Agreement provides that the Distributor will use such payments in their entirety for distribution assistance and promotional activities. Since the commencement of the Fund’s operations, the Distributor has incurred expenses in excess of the distribution costs reimbursed by the Fund in the amounts of $5,749,755, $12,710,592, $507,712 and $393,256 for Class B, Class C, Class R, and Class K shares, respectively. While such costs may be recovered from the Fund in future periods so long as the Agreement is in effect, the rate of the distribution and servicing fees payable under the Agreement may not be increased without a shareholder vote. In accordance with the Agreement, there is no provision for recovery of unreimbursed distribution costs incurred by the Distributor beyond the current fiscal year for Class A shares. The Agreement also provides that the Adviser may use its own resources to finance the distribution of the Fund’s shares.
Notes to Financial Statements
NOTE D
Investment Transactions
Purchases and sales of investment securities (excluding short-term investments) for the year ended October 31, 2015, were as follows:
| | | | | | | | |
| | | Purchases | | | Sales | |
Investment securities (excluding
U.S. government securities) | | $ | 2,393,009,217 | | | $ | 2,312,086,217 | |
U.S. government securities | | | 1,227,944,813 | | | | 1,938,469,243 | |
The cost of investments for federal income tax purposes, gross unrealized appreciation and unrealized depreciation (excluding foreign currency exchange contracts and swap contracts) are as follows:
| | | | |
Cost | | $ | 6,693,048,478 | |
| | | | |
Gross unrealized appreciation | | $ | 160,916,935 | |
Gross unrealized depreciation | | | (552,457,185 | ) |
| | | | |
Net unrealized depreciation | | $ | (391,540,250 | ) |
| | | | |
1. Derivative Financial Instruments
The Fund may use derivatives in an effort to earn income and enhance returns, to replace more traditional direct investments, to obtain exposure to otherwise inaccessible markets (collectively, “investment purposes”), or to hedge or adjust the risk profile of its portfolio.
The principal types of derivatives utilized by the Fund, as well as the methods in which they may be used are:
| | • | | Forward Currency Exchange Contracts |
The Fund may enter into forward currency exchange contracts in order to hedge its exposure to changes in foreign currency exchange rates on its foreign portfolio holdings, to hedge certain firm purchase and sales commitments denominated in foreign currencies and for non-hedging purposes as a means of making direct investments in foreign currencies, as described below under “Currency Transactions”.
A forward currency exchange contract is a commitment to purchase or sell a foreign currency at a future date at a negotiated forward rate. The gain or loss arising from the difference between the original contract and the closing of such contract would be included in net realized gain or loss on foreign currency transactions. Fluctuations in the value of open forward currency exchange contracts are recorded for financial reporting purposes as unrealized appreciation and/or depreciation by the Fund.
Risks may arise from the potential inability of a counterparty to meet the terms of a contract and from unanticipated movements in the value of a foreign currency relative to the U.S. dollar.
| | |
| 100 | | • AB HIGH INCOME FUND |
Notes to Financial Statements
During the year ended October 31, 2015, the Fund held foreign-currency exchange contracts for hedging and non-hedging purposes.
The Fund may buy or sell futures for investment purposes or for the purpose of hedging its portfolio against adverse effects of potential movements in the market. The Fund bears the market risk that arises from changes in the value of these instruments and the imperfect correlation between movements in the price of the futures and movements in the price of the assets, reference rates or indices which they are designed to track. Among other things, the Fund may purchase or sell futures for foreign currencies or options thereon for non-hedging purposes as a means of making direct investment in foreign currencies, as described below under “Currency Transactions”.
At the time the Fund enters into a future, the Fund deposits and maintains as collateral an initial margin with the broker, as required by the exchange on which the transaction is effected. Such amount of shown as due from broker on the statement of assets and liabilities. Pursuant to the contract, the Fund agrees to receive from or pay to the broker an amount of cash equal to the daily fluctuation in the value of the contract. Such receipts or payments are known as variation margin and are recorded by the Fund as unrealized gains or losses. Risks may arise from the potential inability of a counter party to meet the terms of the contract. The credit/counterparty risk for exchange-traded futures is generally less than privately negotiated futures, since the clearinghouse, which is the issuer or counterparty to each exchange-traded future, has robust risk mitigation standards, including the requirement to provide initial and variation margin. When the contract is closed, the Fund records realized gain or loss equal to the difference between the value of the contract at the time it was opened and the time it was closed.
Use of long futures subjects the Fund to risk of loss in excess of the amounts shown on the statement of assets and liabilities, up to the notional value of the future. Use of short futures subjects the Fund to unlimited risk of loss. Under some circumstances, futures exchanges may establish daily limits on the amount that the price of a future can vary from the previous day’s settlement price, which could effectively prevent liquidation of unfavorable positions.
During the year ended October 31, 2015, the Fund held futures for hedging purposes.
For hedging and investment purposes, the Fund may purchase and write (sell) put and call options on U.S. and foreign securities, including government securities, and foreign currencies that are traded on U.S. and foreign securities exchanges and over-the-counter markets. Among other things, the Fund may use options transactions for non-hedging purposes as
| | | | |
| AB HIGH INCOME FUND • | | | 101 | |
Notes to Financial Statements
a means of making direct investments in foreign currencies, as described below under “Currency Transactions” and may use options strategies involving the purchase and/or writing of various combinations of call and/or put options, for hedging and investment purposes.
The risk associated with purchasing an option is that the Fund pays a premium whether or not the option is exercised. Additionally, the Fund bears the risk of loss of the premium and change in market value should the counterparty not perform under the contract. Put and call options purchased are accounted for in the same manner as portfolio securities. The cost of securities acquired through the exercise of call options is increased by premiums paid. The proceeds from securities sold through the exercise of put options are decreased by the premiums paid.
When the Fund writes an option, the premium received by the Fund is recorded as a liability and is subsequently adjusted to the current market value of the option written. Premiums received from written options which expire unexercised are recorded by the Fund on the expiration date as realized gains from options written. The difference between the premium received and the amount paid on effecting a closing purchase transaction, including brokerage commissions, is also treated as a realized gain, or if the premium received is less than the amount paid for the closing purchase transaction, as a realized loss. If a call option is exercised, the premium received is added to the proceeds from the sale of the underlying security or currency in determining whether the Fund has realized a gain or loss. If a put option is exercised, the premium received reduces the cost basis of the security or currency purchased by the Fund. In writing an option, the Fund bears the market risk of an unfavorable change in the price of the security or currency underlying the written option. Exercise of an option written by the Fund could result in the Fund selling or buying a security or currency at a price different from the current market value.
The Fund may also invest in options on swap agreements, also called “swaptions”. A swaption is an option that gives the buyer the right, but not the obligation, to enter into a swap on a future date in exchange for paying a market-based “premium”. A receiver swaption gives the owner the right to receive the total return of a specified asset, reference rate, or index. A payer swaption gives the owner the right to pay the total return on a specified asset, reference rate, or index. Swaptions also include options that allow an existing swap to be terminated or extended by one of the counterparties.
During the year ended October 31, 2015, the Fund held purchased options for hedging purposes.
During the year ended October 31, 2015, the Fund held written options for hedging purposes.
| | |
| 102 | | • AB HIGH INCOME FUND |
Notes to Financial Statements
For the year ended October 31, 2015, the Fund had the following transactions in written options:
| | | | | | | | |
| | | Contracts | | | Premiums
Received | |
Options written outstanding as of 10/31/14 | | | – 0 | – | | $ | – 0 | – |
Options written | | | 401,101,200 | | | | 2,412,714 | |
Options expired | | | (310,391,200 | ) | | | (1,663,326 | ) |
Options bought back | | | (90,710,000 | ) | | | (749,388 | ) |
Options exercised | | | – 0 | – | | | – 0 | – |
| | | | | | | | |
Options written outstanding as of 10/31/15 | | | – 0 | – | | $ | – 0 | – |
| | | | | | | | |
For the year ended October 31, 2015, the Fund had the following transactions in written swaptions:
| | | | | | | | |
| | | Notional
Amount | | | Premiums
Received | |
Swaptions written outstanding as of 10/31/14 | | $ | – 0 | – | | $ | – 0 | – |
Swaptions written | | | 2,055,254,000 | | | | 2,556,849 | |
Swaptions expired | | | (1,853,004,000 | ) | | | (2,374,824 | ) |
Swaptions bought back | | | – 0 | – | | | – 0 | – |
Swaptions exercised | | | – 0 | – | | | – 0 | – |
| | | | | | | | |
Swaptions written outstanding as of 10/31/15 | | $ | 202,250,000 | | | $ | 182,025 | |
| | | | | | | | |
The Fund may enter into swaps to hedge its exposure to interest rates, credit risk, or currencies. The Fund may also enter into swaps for non-hedging purposes as a means of gaining market exposures including by making direct investments in foreign currencies, as described below under “Currency Transactions”. A swap is an agreement that obligates two parties to exchange a series of cash flows at specified intervals based upon or calculated by reference to changes in specified prices or rates for a specified amount of an underlying asset. The payment flows are usually netted against each other, with the difference being paid by one party to the other. In addition, collateral may be pledged or received by the Fund in accordance with the terms of the respective swaps to provide value and recourse to the Fund or its counterparties in the event of default, bankruptcy or insolvency by one of the parties to the swap.
Risks may arise as a result of the failure of the counterparty to the swap to comply with the terms of the swap. The loss incurred by the failure of a counterparty is generally limited to the net interim payment to be received by the Fund, and/or the termination value at the end of the contract. Therefore, the Fund considers the creditworthiness of each counterparty to a swap in evaluating potential counterparty risk. This risk is mitigated by having a netting arrangement between the Fund and the counterparty and by the posting of collateral by the counterparty to the Fund to cover the Fund’s exposure to the counterparty. Additionally, risks may arise from unanticipated movements in interest rates or in the value of the underlying
| | | | |
| AB HIGH INCOME FUND • | | | 103 | |
Notes to Financial Statements
securities. The Fund accrues for the interim payments on swaps on a daily basis, with the net amount recorded within unrealized appreciation/depreciation of swaps on the statement of assets and liabilities, where applicable. Once the interim payments are settled in cash, the net amount is recorded as realized gain/(loss) on swaps on the statement of operations, in addition to any realized gain/(loss) recorded upon the termination of swaps. Upfront premiums paid or received are recognized as cost or proceeds on the statement of assets and liabilities and are amortized on a straight line basis over the life of the contract. Amortized upfront premiums are included in net realized gain/(loss) from swaps on the statement of operations. Fluctuations in the value of swaps are recorded as a component of net change in unrealized appreciation/depreciation of swaps on the statement of operations.
Certain standardized swaps, including certain interest rate swaps and credit default swaps, are (or soon will be) subject to mandatory central clearing. Cleared swaps are transacted through futures commission merchants (“FCMs”) that are members of central clearinghouses, with the clearinghouse serving as central counterparty, similar to transactions in futures contracts. Centralized clearing will be required for additional categories of swaps on a phased-in basis based on requirements published by the Securities Exchange Commission and Commodity Futures Trading Commission.
At the time the Fund enters into a centrally cleared swap, the Fund deposits and maintains as collateral an initial margin with the broker, as required by the clearinghouse on which the transaction is effected. Such amount is shown as cash collateral due from broker on the statement of assets and liabilities. Pursuant to the contract, the Fund agrees to receive from or pay to the broker an amount of cash equal to the daily fluctuation in the value of the contract. Such receipts or payments are known as variation margin and are recorded by the Fund as unrealized gains or losses. Risks may arise from the potential inability of a counterparty to meet the terms of the contract. The credit/counterparty risk for centrally cleared swaps is generally less than non-centrally cleared swaps, since the clearinghouse, which is the issuer or counterparty to each centrally cleared swap, has robust risk mitigation standards, including the requirement to provide initial and variation margin. When the contract is closed, the Fund records a realized gain or loss equal to the difference between the value of the contract at the time it was opened and the time it was closed.
Interest Rate Swaps:
The Fund is subject to interest rate risk exposure in the normal course of pursuing its investment objectives. Because the Fund holds fixed rate bonds, the value of these bonds may decrease if interest rates rise. To help hedge against this risk and to maintain its ability to generate income at prevailing market rates, the Fund may enter into interest rate swaps.
| | |
| 104 | | • AB HIGH INCOME FUND |
Notes to Financial Statements
Interest rate swaps are agreements between two parties to exchange cash flows based on a notional amount. The Fund may elect to pay a fixed rate and receive a floating rate, or, receive a fixed rate and pay a floating rate on a notional amount.
In addition, the Fund may also enter into interest rate swap transactions to preserve a return or spread on a particular investment or portion of its portfolio, or protecting against an increase in the price of securities the Fund anticipates purchasing at a later date. Interest rate swaps involve the exchange by a Fund with another party of their respective commitments to pay or receive interest (e.g., an exchange of floating rate payments for fixed rate payments) computed based on a contractually-based principal (or “notional”) amount. Interest rate swaps are entered into on a net basis (i.e., the two payment streams are netted out, with the Fund receiving or paying, as the case may be, only the net amount of the two payments).
During the year ended October 31, 2015, the Fund held interest rate swaps for non-hedging purposes.
Credit Default Swaps:
The Fund may enter into credit default swaps, including to manage its exposure to the market or certain sectors of the market, to reduce its risk exposure to defaults by corporate and sovereign issuers held by the Fund, or to create exposure to corporate or sovereign issuers to which it is not otherwise exposed. The Fund may purchase credit protection (“Buy Contract”) or provide credit protection (“Sale Contract”) on the referenced obligation of the credit default swap. During the term of the swap agreement, the Fund receives/(pays) fixed payments from/(to) the respective counterparty, calculated at the agreed upon interest rate applied to the notional amount. If the Fund is a buyer/(seller) of protection and a credit event occurs, as defined under the terms of the swap agreement, the Fund will either (i) receive from the seller/(pay to the buyer) of protection an amount equal to the notional amount of the swap contract (the “Maximum Payout Amount”) and deliver/(take delivery of) the referenced obligation or (ii) receive/(pay) a net settlement amount in the form of cash or securities equal to the notional amount of the swap less the recovery value of the referenced obligation.
In certain circumstances Maximum Payout Amounts may be partially offset by recovery values of the respective referenced obligations, upfront premium received upon entering into the agreement, or net amounts received from settlement of buy protection credit default swap agreements entered into by the Fund for the same reference obligation with the same counterparty. As of October 31, 2015, the Fund had Buy Contracts outstanding with respect to the same referenced obligation and counterparty as certain Sale Contracts which may partially offset the Maximum Payout Amount in the amount of $143,208,000.
Credit default swaps may involve greater risks than if the Fund had invested in the referenced obligation directly. Credit default swaps are subject to general market risk, liquidity risk, counterparty risk and credit risk. If the
| | | | |
| AB HIGH INCOME FUND • | | | 105 | |
Notes to Financial Statements
Fund is a buyer of protection and no credit event occurs, it will lose its investment. If the Fund is a seller of protection and a credit event occurs, the value of the referenced obligation received by the Fund coupled with the periodic payments previously received may be less than the Maximum Payout Amount it pays to the buyer, resulting in a net loss to the Fund.
Implied credit spreads over Treasuries of comparable maturity utilized in determining the market value of credit default swaps on issuers as of period end are disclosed in the portfolio of investments. The implied spreads serve as an indicator of the current status of the payment/performance risk and typically reflect the market’s assessment of the likelihood of default by the issuer of the referenced obligation. The implied credit spread of a particular reference entity reflects the cost of buying/selling protection and may include upfront payments required to be made to enter into the agreement. Widening credit spreads typically represent a deterioration of the referenced entity’s credit soundness and greater likelihood of default or other credit event occurring as defined under the terms of the agreement. A credit spread identified as “Defaulted” indicates a credit event has occurred for the referenced entity or obligation.
During the year ended October 31, 2015, the Fund held credit default swaps for hedging and non-hedging purposes.
Total Return Swaps:
The Fund may enter into total return swaps in order take a “long” or “short” position with respect to an underlying referenced asset. The Fund is subject to market price volatility of the underlying referenced asset. A total return swap involves commitments to pay interest in exchange for a market linked return based on a notional amount. To the extent that the total return of the security, group of securities or index underlying the transaction exceeds or falls short of the offsetting interest obligation, the Fund will receive a payment from or make a payment to the counterparty.
During the year ended October 31, 2015, the Fund held total return swaps for non-hedging purposes.
The Fund typically enters into International Swaps and Derivatives Association, Inc. Master Agreements (“ISDA Master Agreement”) or similar master agreements (collectively, “Master Agreements”) with its derivative contract counterparties in order to, among other things, reduce its credit risk to counterparties. ISDA Master Agreements include provisions for general obligations, representations, collateral and events of default or termination. Under an ISDA Master Agreement, the Fund typically may offset with the counterparty certain derivative financial instrument’s payables and/or receivables with collateral held and/or posted and create one single net payment (close-out netting) in the event of default or termination.
Various Master Agreements govern the terms of certain transactions with counterparties, including transactions such as derivative transactions, repurchase and reverse repurchase agreements. These Master Agreements typically attempt to
| | |
| 106 | | • AB HIGH INCOME FUND |
Notes to Financial Statements
reduce the counterparty risk associated with such transactions by specifying credit protection mechanisms and providing standardization that improves legal certainty. Cross-termination provisions under Master Agreements typically provide that a default in connection with one transaction between the Fund and a counterparty gives the non-defaulting party the right to terminate any other transactions in place with the defaulting party to create one single net payment due to/due from the defaulting party. In the event of a default by a Master Agreements counterparty, the return of collateral with market value in excess of the Fund’s net liability, held by the defaulting party, may be delayed or denied.
The Fund’s Master Agreements may contain provisions for early termination of derivative transactions in the event the net assets of the Fund decline below specific levels (“net asset contingent features”). If these levels are triggered, the Fund’s counterparty has the right to terminate such transaction and require the Fund to pay or receive a settlement amount in connection with the terminated transaction. For additional details, please refer to netting arrangements by counterparty tables below.
At October 31, 2015 the Fund had entered into the following derivatives:
| | | | | | | | | | | | |
| | | Asset Derivatives | | | Liability Derivatives | |
Derivative
Type | | Statement of
Assets and
Liabilities
Location | | Fair Value | | | Statement of
Assets and
Liabilities
Location | | Fair Value | |
Interest rate contracts | | Unrealized appreciation on total return swaps | |
$ |
1,581,069 |
| | | | | | |
| | | | |
Foreign exchange contracts | | Unrealized appreciation on forward currency exchange contracts | | | 7,869,964 | | | Unrealized depreciation on forward currency exchange contracts | | $ | 10,915,400 | |
| | | | |
Credit contracts | | Unrealized appreciation on credit default swaps | |
|
13,061,226 |
| | Unrealized depreciation on credit default swaps | |
|
20,591,079 |
|
| | | | |
Credit contracts | | Receivable\Payable for variation margin on exchange-traded derivatives | |
|
10,291,435 |
* | | Receivable\Payable for variation margin on exchange-traded derivatives | |
|
121,549 |
* |
| | | | |
Credit contracts | | Investments in securities, at value | | | 391,263 | | | | | | | |
| | | | |
Credit contracts | | | | | | | | Swaptions written, at value | | | 84,575 | |
| | | | | | | | | | | | |
Total | | | | $ | 33,194,957 | | | | | $ | 31,712,603 | |
| | | | | | | | | | | | |
| * | | Only variation margin receivable/payable at period end is reported within the statement of assets and liabilities. This amount reflects cumulative appreciation/(depreciation) of exchange-traded derivative contracts as reported in the portfolio of investments. |
| | | | |
| AB HIGH INCOME FUND • | | | 107 | |
Notes to Financial Statements
The effect of derivative instruments on the statement of operations for the year ended October 31, 2015:
| | | | | | | | | | |
Derivative Type | | Location of Gain
or (Loss) on
Derivatives | | Realized Gain
or (Loss) on
Derivatives | | | Change in
Unrealized
Appreciation or
(Depreciation) | |
Interest rate contracts | | Net realized gain/(loss) on swaps; Net change in unrealized appreciation/depreciation of swaps | | $ | (27,587,409 | ) | | $ | 7,994,329 | |
| | | |
Interest rate contracts | | Net realized gain/(loss) on futures; Net change in unrealized appreciation/depreciation of futures | | | (5,941,489 | ) | | | – 0 | – |
| | | |
Foreign exchange contracts | | Net realized gain/(loss) on foreign currency transactions; Net change in unrealized appreciation/depreciation of foreign currency denominated assets and liabilities | | | 75,825,849 | | | | (14,630,614 | ) |
| | | |
Foreign exchange contracts | | Net realized gain/(loss) on investment transactions; Net change in unrealized appreciation/depreciation of investment transactions | | | 1,443,680 | | | | – 0 | – |
| | | |
Foreign exchange contracts | | Net realized gain/(loss) on options written; Net change in unrealized appreciation/depreciation of options written | | | 2,122,826 | | | | – 0 | – |
| | | |
Credit contracts | | Net realized gain/(loss) on investment transactions; Net change in unrealized appreciation/depreciation of investment transactions | | | (6,217,675 | ) | | | (458,187 | ) |
| | | |
Credit contracts | | Net realized gain/(loss) on swaps; Net change in unrealized appreciation/ depreciation of swaps | | | 12,332,759 | | | | (6,217,952 | ) |
| | | |
Credit Contracts | | Net realized gain/(loss) on swaptions written; Net change in unrealized appreciation/depreciation of swaptions written | | | 2,374,824 | | | | 97,450 | |
| | |
| 108 | | • AB HIGH INCOME FUND |
Notes to Financial Statements
| | | | | | | | | | |
Derivative Type | | Location of Gain
or (Loss) on
Derivatives | | Realized Gain
or (Loss) on
Derivatives | | | Change in
Unrealized
Appreciation or
(Depreciation) | |
| | | |
Equity contracts | | Net realized gain/(loss) on investment transactions; Net change in unrealized appreciation/depreciation of investment transactions | | $ | (5,332,595 | ) | | $ | 5,035,448 | |
| | | | | | | | | | |
Total | | | | $ | 49,020,770 | | | $ | (8,179,526 | ) |
| | | | | | | | | | |
The following table represents the average monthly volume of the Fund’s derivative transactions during the year ended October 31, 2015.
| | | | |
Centrally Cleared Credit Default Swaps: | | | | |
Average notional amount of buy contracts | | $ | 548,312,072 | |
Average notional amount of sale contracts | | $ | 403,729,292 | |
| |
Centrally Cleared Interest Rate Swaps: | | | | |
Average notional amount | | $ | 781,441,818 | (a) |
| |
Credit Default Swaps: | | | | |
Average notional amount of buy contracts | | $ | 238,751,353 | |
Average notional amount of sale contracts | | $ | 247,370,017 | |
| |
Forward Currency Exchange Contracts: | | | | |
Average principal amount of buy contracts | | $ | 659,436,120 | |
Average principal amount of sale contracts | | $ | 1,198,095,274 | |
| |
Futures: | | | | |
Average original value of sale contracts | | $ | 727,776,938 | (b) |
| |
Total Return Swaps: | | | | |
Average notional amount | | $ | 106,258,462 | |
| |
Purchased Options Contracts: | | | | |
Average cost | | $ | 1,524,703 | (c) |
| (a) | | Positions were open ten months during the reporting period. |
| (b) | | Positions were open one month during the reporting period. |
| (c) | | Positions were open nine months during the reporting period. |
For financial reporting purposes, the Fund does not offset derivative assets and derivative liabilities that are subject to netting arrangements in the statement of assets and liabilities.
| | | | |
| AB HIGH INCOME FUND • | | | 109 | |
Notes to Financial Statements
All derivatives held at year end were subject to netting arrangements. The following tables present the Fund’s derivative assets and liabilities by counterparty net of amounts available for offset under Master Agreements (“MA”) and net of the related collateral received/pledged by the Fund as of October 31, 2015:
| | | | | | | | | | | | | | | | | | | | |
Counterparty | | Derivative
Assets
Subject to a
MA | | | Derivatives
Available for
Offset | | | Cash
Collateral
Received* | | | Security
Collateral
Received* | | | Net Amount
of Derivatives
Assets | |
Exchange-Traded Derivatives: | | | | | | | | | | | | | | | | | | | | |
Citibank, N.A.** | | $ | 392,744 | | | $ | – 0 | – | | $ | – 0 | – | | $ | – 0 | – | | $ | 392,744 | |
Morgan Stanley & Co. LLC** | | | 152 | | | | – 0 | – | | | – 0 | – | | | – 0 | – | | | 152 | |
| | | | | | | | | | | | | | | | | | | | |
Total | | $ | 392,896 | | | $ | – 0 | – | | $ | – 0 | – | | $ | – 0 | – | | $ | 392,896 | |
| | | | | | | | | | | | | | | | | | | | |
OTC Derivatives: | | | | | | | | | | | | | | | | | |
Barclays Bank PLC | | $ | 3,653,927 | | | $ | (3,653,927 | ) | | $ | – 0 | – | | $ | – 0 | – | | $ | – 0 | – |
Brown Brothers Harriman & Co. | | | 133,145 | | | | (133,145 | ) | | | – 0 | – | | | – 0 | – | | | – 0 | – |
Citibank, N.A. | | | 2,102,171 | | | | (2,102,171 | ) | | | – 0 | – | | | – 0 | – | | | – 0 | – |
Credit Suisse International | | | 317,139 | | | | (317,139 | ) | | | – 0 | – | | | – 0 | – | | | – 0 | – |
Deutsche Bank AG | | | 524,042 | | | | – 0 | – | | | – 0 | – | | | (524,042 | ) | | | – 0 | – |
Goldman Sachs Bank USA/ Goldman Sachs International | | | 6,354,464 | | | | (6,354,464 | ) | | | – 0 | – | | | – 0 | – | | | – 0 | – |
HSBC Bank USA | | | – 0 | – | | | – 0 | – | | | – 0 | – | | | – 0 | – | | | – 0 | – |
JPMorgan Chase Bank, N.A. | | | 408,436 | | | | – 0 | – | | | – 0 | – | | | – 0 | – | | | 408,436 | |
Morgan Stanley Capital Services LLC | | | 2,535,916 | | | | (2,535,916 | ) | | | – 0 | – | | | – 0 | – | | | – 0 | – |
Royal Bank of Scotland PLC | | | 4,853,165 | | | | (645,751 | ) | | | – 0 | – | | | – 0 | – | | | 4,207,414 | |
Standard Chartered Bank | | | 284,624 | | | | – 0 | – | | | – 0 | – | | | – 0 | – | | | 284,624 | |
| | | | | | | | | | | | | | | | | | | | |
Total | | $ | 21,167,029 | | | $ | (15,742,513 | ) | | $ | – 0 | – | | $ | (524,042 | ) | | $ | 4,900,474 | ^ |
| | | | | | | | | | | | | | | | | | | | |
| | | | | |
Counterparty | | Derivative
Liabilities
Subject to a
MA | | | Derivatives
Available for
Offset | | | Cash
Collateral
Pledged* | | | Security
Collateral
Pledged* | | | Net Amount
of Derivatives
Liabilities | |
OTC Derivatives: | | | | | | | | | | | | | | | | | |
Bank of America, N.A. | | $ | 638,443 | | | $ | – 0 | – | | $ | – 0 | – | | $ | (529,493 | ) | | $ | 108,950 | |
Barclays Bank PLC | | | 7,848,499 | | | | (3,653,927 | ) | | | – 0 | – | | | (3,924,468 | ) | | | 270,104 | |
BNP Paribas | | | 309,065 | | | | – 0 | – | | | – 0 | – | | | – 0 | – | | | 309,065 | |
Brown Brothers Harriman & Co. | | | 803,760 | | | | (133,145 | ) | | | – 0 | – | | | – 0 | – | | | 670,615 | |
Citibank, N.A. | | | 5,426,807 | | | | (2,102,171 | ) | | | – 0 | – | | | (3,324,636 | ) | | | – 0 | – |
| | |
| 110 | | • AB HIGH INCOME FUND |
Notes to Financial Statements
| | | | | | | | | | | | | | | | | | | | |
Counterparty | | Derivative
Liabilities
Subject to a
MA | | | Derivatives
Available for
Offset | | | Cash
Collateral
Pledged* | | | Security
Collateral
Pledged* | | | Net Amount
of Derivatives
Liabilities | |
Credit Suisse International | | $ | 595,451 | | | $ | (317,139 | ) | | $ | – 0 | – | | $ | (278,312 | ) | | $ | – 0 | – |
Goldman Sachs Bank USA/ Goldman Sachs International | | | 15,279,356 | | | | (6,354,464 | ) | | | – 0 | – | | | (8,273,102 | ) | | | 651,790 | |
HSBC Bank USA | | | 1,043,840 | | | | – 0 | – | | | – 0 | – | | | (964,193 | ) | | | 79,647 | |
Morgan Stanley Capital Services LLC | | | 4,904,294 | | | | (2,535,916 | ) | | | – 0 | – | | | (2,368,378 | ) | | | – 0 | – |
Royal Bank of Scotland PLC | | | 645,751 | | | | (645,751 | ) | | | – 0 | – | | | – 0 | – | | | – 0 | – |
UBS AG | | | 94,869 | | | | – 0 | – | | | – 0 | – | | | (94,869 | ) | | | – 0 | – |
| | | | | | | | | | | | | | | | | | | | |
Total | | $ | 37,590,135 | | | $ | (15,742,513 | ) | | $ | – 0 | – | | $ | (19,757,451 | ) | | $ | 2,090,171 | ^ |
| | | | | | | | | | | | | | | | | | | | |
| * | | The actual collateral received/pledged may be more than the amount reported due to overcollateralization. |
| ** | | Cash and securities have been posted for initial margin requirements for exchange-traded derivatives outstanding at October 31, 2015. |
| ^ | | Net amount represents the net receivable/payable that would be due from/to the counterparty in the event of default or termination. The net amount from OTC financial derivative instruments can only be netted across transactions governed under the same master agreement with the same counterparty. |
See Note D.3 for additional disclosure of netting arrangements regarding reverse repurchase agreements.
2. Currency Transactions
The Fund may invest in non-U.S. dollar securities on a currency hedged or unhedged basis. The Fund may seek investment opportunities by taking long or short positions in currencies through the use of currency-related derivatives, including forward currency exchange contracts, futures and options on futures, swaps, and other options. The Fund may enter into transactions for investment opportunities when it anticipates that a foreign currency will appreciate or depreciate in value but securities denominated in that currency are not held by the Fund and do not present attractive investment opportunities. Such transactions may also be used when the Adviser believes that it may be more efficient than a direct investment in a foreign currency-denominated security. The Fund may also conduct currency exchange contracts on a spot basis (i.e., for cash at the spot rate prevailing in the currency exchange market for buying or selling currencies).
3. Reverse Repurchase Agreements
The Fund may enter into reverse repurchase transactions (“RVP”) in accordance with the terms of a Master Repurchase Agreement (“MRA”), under which the Fund sells securities and agrees to repurchase them at a mutually agreed upon date and price. At the time the Fund enters into a reverse repurchase agreement, it will establish a segregated account with the custodian containing liquid assets having a value comparable to the repurchase price. Under the MRA and other Master Agreements,
| | | | |
| AB HIGH INCOME FUND • | | | 111 | |
Notes to Financial Statements
the Fund is permitted to offset payables and/or receivables with collateral held and/ or posted to the counterparty and create one single net payment due to or from the Fund in the event of a default. In the event of a default by a MRA counterparty, the Fund may be considered an unsecured creditor with respect to any excess collateral (collateral with a market value in excess of the repurchase price) held by and/or posted to the counterparty, and as such the return of such excess collateral may be delayed or denied. For the year ended October 31, 2015, the average amount of reverse repurchase agreements outstanding was $835,182,518 and the daily weighted average interest rate was (0.01)%. During the period, the Fund received net interest payments from counterparties. At October 31, 2015, the Fund had reverse repurchase agreements outstanding in the amount of $88,145,548 as reported in the statement of assets and liabilities.
The following table presents the Fund’s RVP liabilities by counterparty net of the related collateral pledged by the Fund as of October 31, 2015:
| | | | | | | | | | | | |
Counterparty | | RVP Liabilities
Subject to a
MRA | | | Securities
Collateral
Pledged†* | | | Net Amount of
RVP Liabilities | |
Barclays Capital, Inc. | | $ | 36,059,748 | | | $ | (36,059,748 | ) | | $ | – 0 | – |
Credit Suisse Securities (USA) LLC | | | 34,151,745 | | | | (34,151,745 | ) | | | – 0 | – |
ING Financial Markets LLC | | | 11,926,372 | | | | (11,853,637 | ) | | | 72,735 | |
RBC Capital Markets | | | 6,007,683 | | | | (6,007,683 | ) | | | – 0 | – |
| | | | | | | | | | | | |
Total | | $ | 88,145,548 | | | $ | (88,072,813 | ) | | $ | 72,735 | |
| | | | | | | | | | | | |
| † | | Including accrued interest. |
| * | | The actual collateral pledged may be more than the amount reported due to overcollateralization. |
4. Loan Participations and Assignments
The Fund may invest in direct debt instruments which are interests in amounts owed to lenders or lending syndicates by corporate, governmental, or other borrowers, either in the form of participations at the time the loan is originated (“Participations”) or by buying an interest in the loan in the secondary market from a financial institution or institutional investor (“Assignments”). A loan is often administered by a bank or other financial institution (the “Lender”) that acts as agent for all holders. The agent administers the terms of the loan as specified in the loan agreement. When investing in Participations, the Fund generally has no right to enforce compliance with the terms of the loan agreement with the borrower. In addition, when investing in Participations, the Fund has the right to receive payments of principal, interest and any fees to which it is entitled only from the Lender and only upon receipt of payments by the Lender from the borrower. As a result, the Fund may be subject to the credit risk of both the borrower and the Lender. When the Fund purchases Assignments from Lenders, it will typically acquire direct rights against the borrower on the loan. These loans may include participations in “bridge loans”, which are loans taken out by borrowers for a short period (typically less than six months) pending arrangement of more permanent financing through, for example, the issuance of bonds, frequently high-yield bonds
| | |
| 112 | | • AB HIGH INCOME FUND |
Notes to Financial Statements
issued for the purpose of acquisitions. The Fund may also participate in unfunded loan commitments, which are contractual obligations for investing in future Participations, and may receive a commitment fee based on the amount of the commitment. Under these arrangements, the Fund may receive a fixed rate commitment fee and, if and to the extent the borrower borrows under the facility, the Fund may receive an additional funding fee.
Unfunded loan commitments and funded loans are marked to market daily.
As of October 31, 2015, the Fund had the following unfunded loan commitment which could be extended at the option of the borrower pursuant to the following loan agreement:
| | | | |
| Borrower | | Unfunded Loan
Commitment | |
Sheridan Auto Loan Holdings I LLC,
10.00%, 12/31/15 | | $ | 1,976,635 | |
Flexpath WH I LLC, Series B,
8/01/16 | | $ | 4,280,313 | |
As of October 31, 2015, the Fund had no bridge loan commitments outstanding.
During the year ended October 31, 2015, the Fund received commitment fees or additional funding fees in the amount of $246,508.
NOTE E
Capital Stock
Each class consists of 3,000,000,000 authorized shares. Transactions in capital shares for each class were as follows:
| | | | | | | | | | | | | | | | | | | | |
| | | | | | | | | | | | | | | | | | | | |
| | | Shares | | | | | Amount | | | |
| | | Year Ended
October 31,
2015 | | | Year Ended
October 31,
2014 | | | | | Year Ended
October 31,
2015 | | | Year Ended
October 31, 2014 | | | |
| | | | | | |
| Class A | | | | | | | | | | | | | | | | | | | | |
Shares sold | | | 75,899,455 | | | | 87,307,051 | | | | | $ | 672,250,691 | | | $ | 830,411,869 | | | |
| | | |
Shares issued in reinvestment of dividends and distributions | | | 12,577,261 | | | | 12,075,398 | | | | | | 112,089,171 | | | | 114,501,692 | | | |
| | | |
Shares converted from Class B | | | 367,530 | | | | 554,399 | | | | | | 3,292,669 | | | | 5,276,183 | | | |
| | | |
Shares redeemed | | | (93,300,211 | ) | | | (124,596,419 | ) | | | | | (826,787,579 | ) | | | (1,186,768,425 | ) | | |
| | | |
Net decrease | | | (4,455,965 | ) | | | (24,659,571 | ) | | | | $ | (39,155,048 | ) | | $ | (236,578,681 | ) | | |
| | | |
| | | | |
| AB HIGH INCOME FUND • | | | 113 | |
Notes to Financial Statements
| | | | | | | | | | | | | | | | | | | | |
| | | | | | | | | | | | | | | | | | | | |
| | | Shares | | | | | Amount | | | |
| | | Year Ended
October 31,
2015 | | | Year Ended
October 31,
2014 | | | | | Year Ended
October 31, 2015 | | | Year Ended
October 31, 2014 | | | |
| | | | | | |
| Class B | | | | | | | | | | | | | | | | | | | | |
Shares sold | | | 29,420 | | | | 106,753 | | | | | $ | 262,100 | | | $ | 1,022,841 | | | |
| | | |
Shares issued in reinvestment of dividends and distributions | | | 37,071 | | | | 51,497 | | | | | | 334,527 | | | | 492,010 | | | |
| | | |
Shares converted to Class A | | | (364,292 | ) | | | (549,532 | ) | | | | | (3,292,669 | ) | | | (5,276,183 | ) | | |
| | | |
Shares redeemed | | | (81,362 | ) | | | (168,223 | ) | | | | | (731,686 | ) | | | (1,609,573 | ) | | |
| | | |
Net decrease | | | (379,163 | ) | | | (559,505 | ) | | | | $ | (3,427,728 | ) | | $ | (5,370,905 | ) | | |
| | | |
| | | | | | | | | | | | | | | | | | | | |
| Class C | | | | | | | | | | | | | | | | | | | | |
Shares sold | | | 20,960,241 | | | | 35,123,544 | | | | | $ | 189,239,400 | | | $ | 338,023,122 | | | |
| | | |
Shares issued in reinvestment of dividends and distributions | | | 7,206,215 | | | | 5,621,318 | | | | | | 64,986,365 | | | | 53,876,676 | | | |
| | | |
Shares redeemed | | | (37,067,012 | ) | | | (25,689,155 | ) | | | | | (332,193,487 | ) | | | (246,958,938 | ) | | |
| | | |
Net increase (decrease) | | | (8,900,556 | ) | | | 15,055,707 | | | | | $ | (77,967,722 | ) | | $ | 144,940,860 | | | |
| | | |
| | | | | | | | | | | | | | | | | | | | |
Advisor Class | | | | | | | | | | | | | | | | | | | | |
Shares sold | | | 147,810,753 | | | | 175,039,436 | | | | | $ | 1,316,444,960 | | | $ | 1,669,260,687 | | | |
| | | |
Shares issued in reinvestment of dividends and distributions | | | 14,534,688 | | | | 9,842,445 | | | | | | 129,624,171 | | | | 93,422,235 | | | |
| | | |
Shares redeemed | | | (147,422,070 | ) | | | (105,997,870 | ) | | | | | (1,302,335,697 | ) | | | (1,007,365,434 | ) | | |
| | | |
Net increase | | | 14,923,371 | | | | 78,884,011 | | | | | $ | 143,733,434 | | | $ | 755,317,488 | | | |
| | | |
| | | | | | | | | | | | | | | | | | | | |
Class R | | | | | | | | | | | | | | | | | | | | |
Shares sold | | | 2,820,487 | | | | 3,209,249 | | | | | $ | 25,140,859 | | | $ | 30,502,848 | | | |
| | | |
Shares issued in reinvestment of dividends and distributions | | | 679,101 | | | | 484,748 | | | | | | 6,041,414 | | | | 4,595,479 | | | |
| | | |
Shares redeemed | | | (2,714,978 | ) | | | (2,293,805 | ) | | | | | (23,977,691 | ) | | | (21,785,556 | ) | | |
| | | |
Net increase | | | 784,610 | | | | 1,400,192 | | | | | $ | 7,204,582 | | | $ | 13,312,771 | | | |
| | | |
| | | | | | | | | | | | | | | | | | | | |
Class K | | | | | | | | | | | | | | | | | | | | |
Shares sold | | | 2,922,954 | | | | 3,799,201 | | | | | $ | 26,116,852 | | | $ | 36,144,211 | | | |
| | | |
Shares issued in reinvestment of dividends and distributions | | | 810,873 | | | | 489,614 | | | | | | 7,208,893 | | | | 4,647,102 | | | |
| | | |
Shares redeemed | | | (1,413,042 | ) | | | (864,432 | ) | | | | | (12,527,265 | ) | | | (8,196,223 | ) | | |
| | | |
Net increase | | | 2,320,785 | | | | 3,424,383 | | | | | $ | 20,798,480 | | | $ | 32,595,090 | | | |
| | | |
| | |
| 114 | | • AB HIGH INCOME FUND |
Notes to Financial Statements
| | | | | | | | | | | | | | | | | | | | |
| | | | | | | | | | | | | | | | | | | | |
| | | Shares | | | | | Amount | | | |
| | | Year Ended
October 31,
2015 | | | Year Ended
October 31,
2014 | | | | | Year Ended
October 31,
2015 | | | Year Ended
October 31, 2014 | | | |
| | | | | | |
Class I | | | | | | | | | | | | | | | | | | | | |
Shares sold | | | 28,263,974 | | | | 11,360,141 | | | | | $ | 258,176,615 | | | $ | 108,349,828 | | | |
| | | |
Shares issued in reinvestment of dividends and distributions | | | 2,327,495 | | | | 527,260 | | | | | | 20,698,998 | | | | 5,008,537 | | | |
| | | |
Shares redeemed | | | (10,131,179 | ) | | | (10,625,038 | ) | | | | | (88,980,740 | ) | | | (100,918,390 | ) | | |
| | | |
Net increase | | | 20,460,290 | | | | 1,262,363 | | | | | $ | 189,894,873 | | | $ | 12,439,975 | | | |
| | | |
| | | | | | | | | | | | | | | | | | | | |
Class Z | | | | | | | | | | | | | | | | | | | | |
Shares sold | | | 4,365,710 | | | | 4,986,678 | | | | | $ | 37,956,266 | | | $ | 47,208,479 | | | |
| | | |
Shares issued in reinvestment of dividends and distributions | | | 516,939 | | | | 268,944 | | | | | | 4,591,222 | | | | 2,558,971 | | | |
| | | |
Shares redeemed | | | (723,628 | ) | | | (259,448 | ) | | | | | (6,344,689 | ) | | | (2,436,588 | ) | | |
| | | |
Net increase | | | 4,159,021 | | | | 4,996,174 | | | | | $ | 36,202,799 | | | $ | 47,330,862 | | | |
| | | |
For the year ended October 31, 2014, the Fund received $15,077 related to a third-party’s settlement of regulatory proceedings involving allegations of improper trading. This amount is presented in the Fund’s statement of changes in net assets. Neither the Fund nor its affiliates were involved in the proceedings or the calculation of the payment.
NOTE F
Risks Involved in Investing in the Fund
Interest Rate Risk and Credit Risk—Interest rate risk is the risk that changes in interest rates will affect the value of the Fund’s investments in fixed-income debt securities such as bonds or notes. Increases in interest rates may cause the value of the Fund’s investments to decline. Credit risk is the risk that the issuer or guarantor of a debt security, or the counterparty to a derivative contract, will be unable or unwilling to make timely principal and/or interest payments, or to otherwise honor its obligations. The degree of risk for a particular security may be reflected in its credit rating. Credit risk is greater for medium quality and lower-rated securities. Lower-rated debt securities and similar unrated securities (commonly known as “junk bonds”) have speculative elements or are predominantly speculative risks.
Duration Risk—Duration is a measure that relates the expected price volatility of a fixed-income security to changes in interest rates. The duration of a fixed-income security may be shorter than or equal to full maturity of a fixed-income security. Fixed-income securities with longer durations have more risk and will decrease in price as interest rates rise. For example, a fixed-income security with a duration of three years will decrease in value by approximately 3% if interest rates increase by 1%.
Below Investment Grade Securities Risk—Investments in fixed-income securities with lower ratings (commonly known as “junk bonds”) tend to have a higher probability that an issuer will default or fail to meet its payment obligations.
| | | | |
| AB HIGH INCOME FUND • | | | 115 | |
Notes to Financial Statements
These securities may be subject to greater price volatility due to such factors as specific corporate developments, interest rate sensitivity, negative perceptions of the junk bond market generally and less secondary market liquidity.
Inflation Risk—This is the risk that the value of assets or income from investments will be less in the future as inflation decreases the value of money. As inflation increases, the value of the Fund’s assets can decline as can the value of the Fund’s distributions. This risk is significantly greater if the Fund invests a significant portion of its assets in fixed-income securities with longer maturities.
Foreign (Non-U.S.)Risk—Investments in securities of non-U.S. issuers may involve more risk than those of U.S. issuers. These securities may fluctuate more widely in price and may be less liquid due to adverse market, economic, political, regulatory or other factors.
Emerging Market Risk—Investments in emerging market countries may have more risk because the markets are less developed and less liquid as well as being subject to increased economic, political, regulatory or other uncertainties.
Currency Risk—Fluctuations in currency exchange rates may negatively affect the value of the Fund’s investments or reduce its returns.
Leverage Risk—When the Fund borrows money or otherwise leverages its investments, its performance may be volatile because leverage tends to exaggerate the effect of any increase or decrease in the value of the Fund’s investments. The Fund may create leverage through the use of reverse repurchase arrangements, forward currency exchange contracts, forward commitments, dollar rolls or futures contracts or by borrowing money. The use of derivative instruments by the Fund, such as forwards, futures, options and swaps, may also result in a form of leverage. Leverage may result in higher returns to the Fund than if the Fund were not leveraged, but may also adversely affect returns, particularly if the market is declining.
Derivatives Risk—The Fund may enter into derivative transactions such as forwards, options, futures and swaps. Derivatives may be illiquid, difficult to price, and leveraged so that small changes may produce disproportionate losses for the Fund, and subject to counterparty risk to a greater degree than more traditional investments. Derivatives may result in significant losses, including losses that are far greater than the value of the derivatives reflected on the statement of assets and liabilities.
Liquidity Risk—Liquidity risk occurs when certain investments become difficult to purchase or sell. Difficulty in selling less liquid securities may result in sales at disadvantageous prices affecting the value of your investment in the Fund. Causes of liquidity risk may include low trading volumes, large positions and heavy redemptions of fixed-income mutual fund shares. Over recent years, liquidity risk has also increased because the capacity of dealers in the secondary market for fixed-income securities to make markets in these securities has decreased, even as the overall bond market has grown significantly, due to,
| | |
| 116 | | • AB HIGH INCOME FUND |
Notes to Financial Statements
among other things, structural changes, additional regulatory requirements and capital and risk restraints that have led to reduced inventories. Liquidity risk may be higher in an rising interest rate environment, when the value and liquidity of fixed-income securities generally go down.
Indemnification Risk—In the ordinary course of business, the Fund enters into contracts that contain a variety of indemnifications. The Fund’s maximum exposure under these arrangements is unknown. However, the Fund has not had prior claims or losses pursuant to these indemnification provisions and expects the risk of loss thereunder to be remote. Therefore, the Fund has not accrued any liability in connection with these indemnification provisions.
NOTE G
Joint Credit Facility
A number of open-end mutual funds managed by the Adviser, including the Fund, participate in a $280 million revolving credit facility (the “Facility”) intended to provide short-term financing if necessary, subject to certain restrictions, in connection with abnormal redemption activity. Commitment fees related to the Facility are paid by the participating funds and are included in miscellaneous expenses in the statement of operations. The Fund did not utilize the Facility during the year ended October 31, 2015.
NOTE H
Distributions to Shareholders
The tax character of distributions paid during the fiscal years ended October 31, 2015 and October 31, 2014 were as follows:
| | | | | | | | |
| | | 2015 | | | 2014 | |
Distributions paid from: | | | | | | | | |
Ordinary income | | $ | 474,509,861 | | | $ | 392,894,071 | |
Long-term capital gains | | | 54,743,821 | | | | 33,471,075 | |
| | | | | | | | |
Total taxable distributions paid | | $ | 529,253,682 | | | $ | 426,365,146 | |
| | | | | | | | |
As of October 31, 2015, the components of accumulated earnings/(deficit) on a tax basis were as follows:
| | | | |
Undistributed ordinary income | | $ | 68,968,993 | |
Accumulated capital and other losses | | | (73,829,684 | )(a) |
Unrealized appreciation/(depreciation) | | | (396,679,237 | )(b) |
| | | | |
Total accumulated earnings/(deficit) | | $ | (401,539,928 | )(c) |
| | | | |
| (a) | | As of October 31, 2015, the Fund had a net capital loss carryforward of $73,306,781. As of that date, the Fund had cumulative deferred loss on straddles of $522,903. |
| (b) | | The differences between book-basis and tax-basis unrealized appreciation/(depreciation) are attributable primarily to the tax deferral of losses on wash sales, the difference between book and tax amortization methods for premium, the tax treatment of swaps, passive foreign investment companies (PFICs) and partnerships, and the realization for tax purposes of gains/losses on certain derivative instruments. |
| (c) | | The differences between book-basis and tax-basis components of accumulated earnings/(deficit) are attributable primarily to the tax treatment of interest on defaulted securities and dividends payable. |
| | | | |
| AB HIGH INCOME FUND • | | | 117 | |
Notes to Financial Statements
For tax purposes, net capital losses may be carried over to offset future capital gains, if any. Funds are permitted to carry forward capital losses incurred in taxable years beginning after December 22, 2010 for an indefinite period, and such losses will retain their character as either short-term or long-term capital losses. As of October 31, 2015, the Fund had a net short-term capital loss carryforward of $42,423,012 and a net long-term capital loss carryforward of $30,883,769 which may be carried forward for an indefinite period.
During the current fiscal year, permanent differences primarily due to reclassifications of foreign currency, the tax treatment of swaps and options, reclassifications of paydown gains/losses, the tax treatment of proceeds from the sale of defaulted securities, the redesignation of dividends and the tax treatment of clearing fees resulted in a net decrease in distributions in excess of net investment income and a net increase in accumulated net realized loss on investment and foreign currency transactions. These reclassifications had no effect on net assets.
NOTE I
New Accounting Pronouncement
In May 2015, the Financial Accounting Standards Board issued an Accounting Standards Update (“ASU”), ASU 2015-07, which removes the requirement to categorize within the fair value hierarchy all investments for which fair value is measured using the net asset value per share practical expedient. The ASU also removes the disclosure requirement for investments not valued at net asset value. The ASU is effective for annual periods beginning after December 15, 2015 and interim periods within those annual periods. At this time, management is evaluating the implications of these changes on the financial statements.
NOTE J
Subsequent Events
Management has evaluated subsequent events for possible recognition or disclosure in the financial statements through the date the financial statements are issued. Management has determined that there are no material events that would require disclosure in the Fund’s financial statements through this date.
| | |
| 118 | | • AB HIGH INCOME FUND |
Notes to Financial Statements
FINANCIAL HIGHLIGHTS
Selected Data For A Share Of Capital Stock Outstanding Throughout Each Period
| | | | | | | | | | | | | | | | | | | | |
| | | Class A | |
| | | Year Ended October 31, | |
| | | 2015 | | | 2014 | | | 2013 | | | 2012 | | | 2011 | |
| | | | |
| | | | | | | | | | | | | | | | | | | | |
Net asset value, beginning of period | | | $ 9.40 | | | | $ 9.53 | | | | $ 9.38 | | | | $ 8.73 | | | | $ 9.19 | |
| | | | |
Income From Investment Operations | | | | | | | | | | | | | | | | | | | | |
Net investment income(a) | | | .51 | | | | .55 | | | | .60 | | | | .56 | | | | .64 | (b) |
Net realized and unrealized gain (loss) on investment and foreign currency transactions | | | (.69 | ) | | | (.03 | ) | | | .20 | | | | .70 | | | | (.44 | ) |
Contributions from Affiliates | | | – 0 | – | | | – 0 | – | | | – 0 | – | | | – 0 | – | | | .00 | (c) |
| | | | |
Net increase (decrease) in net asset value from operations | | | (.18 | ) | | | .52 | | | | .80 | | | | 1.26 | | | | .20 | |
| | | | |
Less: Dividends and Distributions | | | | | | | | | | | | | | | | | | | | |
Dividends from net investment income | | | (.64 | ) | | | (.60 | ) | | | (.65 | ) | | | (.61 | ) | | | (.66 | ) |
Distributions from net realized gain on investment and foreign currency transactions | | | (.08 | ) | | | (.05 | ) | | | – 0 | – | | | – 0 | – | | | – 0 | – |
| | | | |
Total dividends and distributions | | | (.72 | ) | | | (.65 | ) | | | (.65 | ) | | | (.61 | ) | | | (.66 | ) |
| | | | |
Net asset value, end of period | | | $ 8.50 | | | | $ 9.40 | | | | $ 9.53 | | | | $ 9.38 | | | | $ 8.73 | |
| | | | |
Total Return | | | | | | | | | | | | | | | | | | | | |
Total investment return based on net asset value(d) | | | (1.98 | )% | | | 5.62 | % | | | 8.78 | %† | | | 15.03 | %* | | | 2.48 | %* |
Ratios/Supplemental Data | | | | | | | | | | | | | | | | | | | | |
Net assets, end of period (000’s omitted) | | | $2,059,111 | | | | $2,320,748 | | | | $2,587,763 | | | | $2,464,634 | | | | $1,686,591 | |
Ratio to average net assets of: | | | | | | | | | | | | | | | | | | | | |
Expenses, net of waivers/reimbursements(e) | | | .90 | % | | | .89 | % | | | .90 | % | | | .91 | % | | | .95 | % |
Expenses, before waivers/reimbursements(e) | | | .90 | % | | | .89 | % | | | .90 | % | | | .91 | % | | | .96 | % |
Net investment income | | | 5.77 | % | | | 5.80 | % | | | 6.25 | % | | | 6.22 | % | | | 7.05 | %(b) |
Portfolio turnover rate | | | 53 | % | | | 38 | % | | | 38 | % | | | 42 | % | | | 29 | % |
See footnote summary on page 127.
| | | | |
| AB HIGH INCOME FUND • | | | 119 | |
Financial Highlights
Selected Data For A Share Of Capital Stock Outstanding Throughout Each Period
| | | | | | | | | | | | | | | | | | | | |
| | | Class B | |
| | | Year Ended October 31, | |
| | | 2015 | | | 2014 | | | 2013 | | | 2012 | | | 2011 | |
| | | | |
| | | | | | | | | | | | | | | | | | | | |
Net asset value, beginning of period | | | $ 9.49 | | | | $ 9.62 | | | | $ 9.46 | | | | $ 8.80 | | | | $ 9.26 | |
| | | | |
Income From Investment Operations | | | | | | | | | | | | | | | | | | | | |
Net investment income(a) | | | .45 | | | | .48 | | | | .53 | | | | .50 | | | | .57 | |
Net realized and unrealized gain (loss) on investment and foreign currency transactions | | | (.71 | ) | | | (.03 | ) | | | .21 | | | | .71 | | | | (.43 | ) |
Contributions from Affiliates | | | – 0 | – | | | – 0 | – | | | – 0 | – | | | – 0 | – | | | .00 | (c) |
| | | | |
Net increase (decrease) in net asset value from operations | | | (.26 | ) | | | .45 | | | | .74 | | | | 1.21 | | | | .14 | |
| | | | |
Less: Dividends and Distributions | | | | | | | | | | | | | | | | | | | | |
Dividends from net investment income | | | (.58 | ) | | | (.53 | ) | | | (.58 | ) | | | (.55 | ) | | | (.60 | ) |
Distributions from net realized gain on investment and foreign currency transactions | | | (.08 | ) | | | (.05 | ) | | | – 0 | – | | | – 0 | – | | | – 0 | – |
| | | | |
Total dividends and distributions | | | (.66 | ) | | | (.58 | ) | | | (.58 | ) | | | (.55 | ) | | | (.60 | ) |
| | | | |
Net asset value, end of period | | | $ 8.57 | | | | $ 9.49 | | | | $ 9.62 | | | | $ 9.46 | | | | $ 8.80 | |
| | | | |
Total Return | | | | | | | | | | | | | | | | | | | | |
Total investment return based on net asset value(d) | | | (2.89 | )% | | | 4.82 | % | | | 8.06 | %† | | | 14.26 | %* | | | 1.75 | %* |
Ratios/Supplemental Data | | | | | | | | | | | | | | | | | | | | |
Net assets, end of period (000’s omitted) | | | $3,551 | | | | $7,526 | | | | $13,008 | | | | $19,591 | | | | $26,192 | |
Ratio to average net assets of: | | | | | | | | | | | | | | | | | | | | |
Expenses, net of waivers/reimbursements(e) | | | 1.63 | % | | | 1.60 | % | | | 1.61 | % | | | 1.64 | % | | | 1.65 | % |
Expenses, before waivers/reimbursements(e) | | | 1.63 | % | | | 1.60 | % | | | 1.61 | % | | | 1.64 | % | | | 1.69 | % |
Net investment income | | | 4.95 | % | | | 5.05 | % | | | 5.50 | % | | | 5.51 | % | | | 6.28 | % |
Portfolio turnover rate | | | 53 | % | | | 38 | % | | | 38 | % | | | 42 | % | | | 29 | % |
See footnote summary on page 127.
| | |
| 120 | | • AB HIGH INCOME FUND |
Financial Highlights
Selected Data For A Share Of Capital Stock Outstanding Throughout Each Period
| | | | | | | | | | | | | | | | | | | | |
| | | Class C | |
| | | Year Ended October 31, | |
| | | 2015 | | | 2014 | | | 2013 | | | 2012 | | | 2011 | |
| | | | |
| | | | | | | | | | | | | | | | | | | | |
Net asset value, beginning of period | | | $ 9.51 | | | | $ 9.64 | | | | $ 9.48 | | | | $ 8.83 | | | | $ 9.29 | |
| | | | |
Income From Investment Operations | | | | | | | | | | | | | | | | | | | | |
Net investment income(a) | | | .45 | | | | .48 | | | | .53 | | | | .49 | | | | .57 | (b) |
Net realized and unrealized gain (loss) on investment and foreign currency transactions | | | (.70 | ) | | | (.03 | ) | | | .21 | | | | .71 | | | | (.44 | ) |
Contributions from Affiliates | | | – 0 | – | | | – 0 | – | | | – 0 | – | | | – 0 | – | | | .00 | (c) |
| | | | |
Net increase (decrease) in net asset value from operations | | | (.25 | ) | | | .45 | | | | .74 | | | | 1.20 | | | | .13 | |
| | | | |
Less: Dividends and Distributions | | | | | | | | | | | | | | | | | | | | |
Dividends from net investment income | | | (.58 | ) | | | (.53 | ) | | | (.58 | ) | | | (.55 | ) | | | (.59 | ) |
Distributions from net realized gain on investment and foreign currency transactions | | | (.08 | ) | | | (.05 | ) | | | – 0 | – | | | – 0 | – | | | – 0 | – |
| | | | |
Total dividends and distributions | | | (.66 | ) | | | (.58 | ) | | | (.58 | ) | | | (.55 | ) | | | (.59 | ) |
| | | | |
Net asset value, end of period | | | $ 8.60 | | | | $ 9.51 | | | | $ 9.64 | | | | $ 9.48 | | | | $ 8.83 | |
| | | | |
Total Return | | | | | | | | | | | | | | | | | | | | |
Total investment return based on net asset value(d) | | | (2.74 | )% | | | 4.82 | % | | | 8.04 | %† | | | 14.05 | %* | | | 1.73 | %* |
Ratios/Supplemental Data | | | | | | | | | | | | | | | | | | | | |
Net assets, end of period (000’s omitted) | | | $1,283,192 | | | | $1,504,398 | | | | $1,379,727 | | | | $1,213,954 | | | | $760,234 | |
Ratio to average net assets of: | | | | | | | | | | | | | | | | | | | | |
Expenses, net of waivers/reimbursements(e) | | | 1.60 | % | | | 1.58 | % | | | 1.60 | % | | | 1.61 | % | | | 1.65 | % |
Expenses, before waivers/reimbursements(e) | | | 1.60 | % | | | 1.58 | % | | | 1.60 | % | | | 1.61 | % | | | 1.66 | % |
Net investment income | | | 5.00 | % | | | 5.03 | % | | | 5.48 | % | | | 5.42 | % | | | 6.25 | %(b) |
Portfolio turnover rate | | | 53 | % | | | 38 | % | | | 38 | % | | | 42 | % | | | 29 | % |
See footnote summary on page 127.
| | | | |
| AB HIGH INCOME FUND • | | | 121 | |
Financial Highlights
Selected Data For A Share Of Capital Stock Outstanding Throughout Each Period
| | | | | | | | | | | | | | | | | | | | |
| | | Advisor Class | |
| | | Year Ended October 31, | |
| | | 2015 | | | 2014 | | | 2013 | | | 2012 | | | 2011 | |
| | | | |
| | | | | | | | | | | | | | | | | | | | |
Net asset value, beginning of period | | | $ 9.42 | | | | $ 9.55 | | | | $ 9.39 | | | | $ 8.74 | | | | $ 9.20 | |
| | | | |
Income From Investment Operations | | | | | | | | | | | | | | | | | | | | |
Net investment income(a) | | | .54 | | | | .58 | | | | .62 | | | | .58 | | | | .66 | (b) |
Net realized and unrealized gain (loss) on investment and foreign currency transactions | | | (.70 | ) | | | (.03 | ) | | | .22 | | | | .71 | | | | (.43 | ) |
Contributions from Affiliates | | | – 0 | – | | | – 0 | – | | | – 0 | – | | | – 0 | – | | | .00 | (c) |
| | | | |
Net increase (decrease) in net asset value from operations | | | (.16 | ) | | | .55 | | | | .84 | | | | 1.29 | | | | .23 | |
| | | | |
Less: Dividends and Distributions | | | | | | | | | | | | | | | | | | | | |
Dividends from net investment income | | | (.67 | ) | | | (.63 | ) | | | (.68 | ) | | | (.64 | ) | | | (.69 | ) |
Distributions from net realized gain on investment and foreign currency transactions | | | (.08 | ) | | | (.05 | ) | | | – 0 | – | | | – 0 | – | | | – 0 | – |
| | | | |
Total dividends and distributions | | | (.75 | ) | | | (.68 | ) | | | (.68 | ) | | | (.64 | ) | | | (.69 | ) |
| | | | |
Net asset value, end of period | | | $ 8.51 | | | | $ 9.42 | | | | $ 9.55 | | | | $ 9.39 | | | | $ 8.74 | |
| | | | |
Total Return | | | | | | | | | | | | | | | | | | | | |
Total investment return based on net asset value(d) | | | (1.78 | )% | | | 5.93 | % | | | 9.23 | %† | | | 15.37 | %* | | | 2.79 | %* |
Ratios/Supplemental Data | | | | | | | | | | | | | | | | | | | | |
Net assets, end of period (000’s omitted) | | | $2,362,066 | | | | $2,473,475 | | | | $1,754,585 | | | | $1,346,510 | | | | $662,874 | |
Ratio to average net assets of: | | | | | | | | | | | | | | | | | | | | |
Expenses, net of waivers/reimbursements(e) | | | .60 | % | | | .58 | % | | | .61 | % | | | .60 | % | | | .65 | % |
Expenses, before waivers/reimbursements(e) | | | .60 | % | | | .58 | % | | | .61 | % | | | .60 | % | | | .66 | % |
Net investment income | | | 6.05 | % | | | 6.06 | % | | | 6.54 | % | | | 6.46 | % | | | 7.34 | %(b) |
Portfolio turnover rate | | | 53 | % | | | 38 | % | | | 38 | % | | | 42 | % | | | 29 | % |
See footnote summary on page 127.
| | |
| 122 | | • AB HIGH INCOME FUND |
Financial Highlights
Selected Data For A Share Of Capital Stock Outstanding Throughout Each Period
| | | | | | | | | | | | | | | | | | | | |
| | | Class R | |
| | | Year Ended October 31, | |
| | | 2015 | | | 2014 | | | 2013 | | | 2012 | | | 2011 | |
| | | | |
| | | | | | | | | | | | | | | | | | | | |
Net asset value, beginning of period | | | $ 9.40 | | | | $ 9.53 | | | | $ 9.38 | | | | $ 8.73 | | | | $ 9.19 | |
| | | | |
Income From Investment Operations | | | | | | | | | | | | | | | | | | | | |
Net investment income(a) | | | .48 | | | | .52 | | | | .56 | | | | .53 | | | | .62 | |
Net realized and unrealized gain (loss) on investment and foreign currency transactions | | | (.70 | ) | | | (.03 | ) | | | .21 | | | | .71 | | | | (.44 | ) |
Contributions from Affiliates | | | – 0 | – | | | – 0 | – | | | – 0 | – | | | – 0 | – | | | .00 | (c) |
| | | | |
Net increase (decrease) in net asset value from operations | | | (.22 | ) | | | .49 | | | | .77 | | | | 1.24 | | | | .18 | |
| | | | |
Less: Dividends and Distributions | | | | | | | | | | | | | | | | | | | | |
Dividends from net investment income | | | (.61 | ) | | | (.57 | ) | | | (.62 | ) | | | (.59 | ) | | | (.64 | ) |
Distributions from net realized gain on investment and foreign currency transactions | | | (.08 | ) | | | (.05 | ) | | | – 0 | – | | | – 0 | – | | | – 0 | – |
| | | | |
Total dividends and distributions | | | (.69 | ) | | | (.62 | ) | | | (.62 | ) | | | (.59 | ) | | | (.64 | ) |
| | | | |
Net asset value, end of period | | | $ 8.49 | | | | $ 9.40 | | | | $ 9.53 | | | | $ 9.38 | | | | $ 8.73 | |
| | | | |
Total Return | | | | | | | | | | | | | | | | | | | | |
Total investment return based on net asset value(d) | | | (2.44 | )% | | | 5.27 | % | | | 8.42 | %† | | | 14.66 | %* | | | 2.29 | %* |
Ratios/Supplemental Data | | | | | | | | | | | | | | | | | | | | |
Net assets, end of period (000’s omitted) | | | $76,876 | | | | $77,706 | | | | $65,429 | | | | $46,615 | | | | $20,935 | |
Ratio to average net assets of: | | | | | | | | | | | | | | | | | | | | |
Expenses, net of waivers/reimbursements(e) | | | 1.27 | % | | | 1.23 | % | | | 1.25 | % | | | 1.24 | % | | | 1.15 | % |
Expenses, before waivers/reimbursements(e) | | | 1.27 | % | | | 1.23 | % | | | 1.25 | % | | | 1.26 | % | | | 1.28 | % |
Net investment income | | | 5.41 | % | | | 5.46 | % | | | 5.92 | % | | | 5.87 | % | | | 6.87 | % |
Portfolio turnover rate | | | 53 | % | | | 38 | % | | | 38 | % | | | 42 | % | | | 29 | % |
See footnote summary on page 127.
| | | | |
| AB HIGH INCOME FUND • | | | 123 | |
Financial Highlights
Selected Data For A Share Of Capital Stock Outstanding Throughout Each Period
| | | | | | | | | | | | | | | | | | | | |
| | | Class K | |
| | | Year Ended October 31, | |
| | | 2015 | | | 2014 | | | 2013 | | | 2012 | | | 2011 | |
| | | | |
| | | | | | | | | | | | | | | | | | | | |
Net asset value, beginning of period | | | $ 9.41 | | | | $ 9.54 | | | | $ 9.38 | | | | $ 8.73 | | | | $ 9.19 | |
| | | | |
Income From Investment Operations | | | | | | | | | | | | | | | | | | | | |
Net investment income(a) | | | .51 | | | | .55 | | | | .60 | | | | .55 | (b) | | | .64 | (b) |
Net realized and unrealized gain (loss) on investment and foreign currency transactions | | | (.70 | ) | | | (.03 | ) | | | .22 | | | | .71 | | | | (.44 | ) |
Contributions from Affiliates | | | – 0 | – | | | – 0 | – | | | – 0 | – | | | – 0 | – | | | .00 | (c) |
| | | | |
Net increase (decrease) in net asset value from operations | | | (.19 | ) | | | .52 | | | | .82 | | | | 1.26 | | | | .20 | |
| | | | |
Less: Dividends and Distributions | | | | | | | | | | | | | | | | | | | | |
Dividends from net investment income | | | (.64 | ) | | | (.60 | ) | | | (.66 | ) | | | (.61 | ) | | | (.66 | ) |
Distributions from net realized gain on investment and foreign currency transactions | | | (.08 | ) | | | (.05 | ) | | | – 0 | – | | | – 0 | – | | | – 0 | – |
| | | | |
Total dividends and distributions | | | (.72 | ) | | | (.65 | ) | | | (.66 | ) | | | (.61 | ) | | | (.66 | ) |
| | | | |
Net asset value, end of period | | | $ 8.50 | | | | $ 9.41 | | | | $ 9.54 | | | | $ 9.38 | | | | $ 8.73 | |
| | | | |
Total Return | | | | | | | | | | | | | | | | | | | | |
Total investment return based on net asset value(d) | | | (2.12 | )% | | | 5.63 | % | | | 8.93 | %† | | | 15.02 | %* | | | 2.55 | %* |
Ratios/Supplemental Data | | | | | | | | | | | | | | | | | | | | |
Net assets, end of period (000’s omitted) | | | $95,294 | | | | $83,634 | | | | $52,132 | | | | $19,161 | | | | $4,159 | |
Ratio to average net assets of: | | | | | | | | | | | | | | | | | | | | |
Expenses, net of waivers/reimbursements(e) | | | .94 | % | | | .88 | % | | | .89 | % | | | .91 | % | | | .90 | % |
Expenses, before waivers/reimbursements(e) | | | .94 | % | | | .88 | % | | | .89 | % | | | .93 | % | | | 1.01 | % |
Net investment income | | | 5.74 | % | | | 5.79 | % | | | 6.28 | % | | | 6.09 | % | | | 7.13 | % |
Portfolio turnover rate | | | 53 | % | | | 38 | % | | | 38 | % | | | 42 | % | | | 29 | % |
See footnote summary on page 127.
| | |
| 124 | | • AB HIGH INCOME FUND |
Financial Highlights
Selected Data For A Share Of Capital Stock Outstanding Throughout Each Period
| | | | | | | | | | | | | | | | | | | | |
| | | Class I | |
| | | Year Ended October 31, | |
| | | 2015 | | | 2014 | | | 2013 | | | 2012 | | | 2011 | |
| | | | |
| | | | | | | | | | | | | | | | | | | | |
Net asset value, beginning of period | | | $ 9.42 | | | | $ 9.55 | | | | $ 9.39 | | | | $ 8.74 | | | | $ 9.20 | |
| | | | |
Income From Investment Operations | | | | | | | | | | | | | | | | | | | | |
Net investment income(a) | | | .54 | | | | .58 | | | | .63 | | | | .59 | | | | .66 | |
Net realized and unrealized gain (loss) on investment and foreign currency transactions | | | (.70 | ) | | | (.03 | ) | | | .22 | | | | .71 | | | | (.43 | ) |
Contributions from Affiliates | | | – 0 | – | | | – 0 | – | | | – 0 | – | | | – 0 | – | | | .00 | (c) |
| | | | |
Net increase (decrease) in net asset value from operations | | | (.16 | ) | | | .55 | | | | .85 | | | | 1.30 | | | | .23 | |
| | | | |
Less: Dividends and Distributions | | | | | | | | | | | | | | | | | | | | |
Dividends from net investment income | | | (.67 | ) | | | (.63 | ) | | | (.69 | ) | | | (.65 | ) | | | (.69 | ) |
Distributions from net realized gain on investment and foreign currency transactions | | | (.08 | ) | | | (.05 | ) | | | – 0 | – | | | – 0 | – | | | – 0 | – |
| | | | |
Total dividends and distributions | | | (.75 | ) | | | (.68 | ) | | | (.69 | ) | | | (.65 | ) | | | (.69 | ) |
| | | | |
Net asset value, end of period | | | $ 8.51 | | | | $ 9.42 | | | | $ 9.55 | | | | $ 9.39 | | | | $ 8.74 | |
| | | | |
Total Return | | | | | | | | | | | | | | | | | | | | |
Total investment return based on net asset value(d) | | | (1.74 | )% | | | 5.97 | % | | | 9.30 | %† | | | 15.42 | %* | | | 2.81 | %* |
Ratios/Supplemental Data | | | | | | | | | | | | | | | | | | | | |
Net assets, end of period (000’s omitted) | | | $277,654 | | | | $114,598 | | | | $104,128 | | | | $66,608 | | | | $41,617 | |
Ratio to average net assets of: | | | | | | | | | | | | | | | | | | | | |
Expenses, net of waivers/reimbursements(e) | | | .54 | % | | | .54 | % | | | .53 | % | | | .56 | % | | | .63 | % |
Expenses, before waivers/reimbursements(e) | | | .54 | % | | | .54 | % | | | .53 | % | | | .56 | % | | | .63 | % |
Net investment income | | | 6.11 | % | | | 6.08 | % | | | 6.61 | % | | | 6.55 | % | | | 7.36 | % |
Portfolio turnover rate | | | 53 | % | | | 38 | % | | | 38 | % | | | 42 | % | | | 29 | % |
See footnote summary on page 127.
| | | | |
| AB HIGH INCOME FUND • | | | 125 | |
Financial Highlights
Selected Data For A Share Of Capital Stock Outstanding Throughout Each Period
| | | | | | | | | | | | |
| | | Class Z | |
| | | Year Ended October 31, | | | October 15,
2013(f) to
October 31,
2013 | |
| | | 2015 | | | 2014 | | |
| | | | |
| | | | | | | | | | | | |
Net asset value, beginning of period | | | $ 9.42 | | | | $ 9.55 | | | | $ 9.43 | |
| | | | |
Income From Investment Operations | | | | | | | | | | | | |
Net investment income (loss)(a) | | | .55 | | | | .58 | | | | (.02 | ) |
Net realized and unrealized gain (loss) on investment and foreign currency transactions | | | (.71 | ) | | | (.03 | ) | | | .17 | |
| | | | |
Net increase (decrease) in net asset value from operations | | | (.16 | ) | | | .55 | | | | .15 | |
| | | | |
Less: Dividends and Distributions | | | | | | | | | | | | |
Dividends from net investment income | | | (.67 | ) | | | (.63 | ) | | | (.03 | ) |
Distributions from net realized gain on investment and foreign currency transactions | | | (.08 | ) | | | (.05 | ) | | | – 0 | – |
| | | | |
Total dividends and distributions | | | (.75 | ) | | | (.68 | ) | | | (.03 | ) |
| | | | |
Net asset value, end of period | | | $ 8.51 | | | | $ 9.42 | | | | $ 9.55 | |
| | | | |
Total Return | | | | | | | | | | | | |
Total investment return based on net asset value(d) | | | (1.72 | )% | | | 6.00 | % | | | 1.59 | % |
Ratios/Supplemental Data | | | | | | | | | | | | |
Net assets, end of period (000’s omitted) | | | $77,916 | | | | $47,059 | | | | $10 | |
Ratio to average net assets of: | | | | | | | | | | | | |
Expenses, net of waivers/reimbursements(e) | | | .53 | % | | | .52 | % | | | .56 | %(g) |
Expenses, before waivers/reimbursements(e) | | | .53 | % | | | .52 | % | | | .56 | %(g) |
Net investment income (loss) | | | 6.15 | % | | | 6.13 | % | | | (3.74 | )%(g) |
Portfolio turnover rate | | | 53 | % | | | 38 | % | | | 38 | % |
See footnote summary on page 127.
| | |
| 126 | | • AB HIGH INCOME FUND |
Financial Highlights
| (a) | | Based on average shares outstanding. |
| (b) | | Net of expenses waived/reimbursed by the Adviser. |
| (c) | | Amount less than $0.005. |
| (d) | | Total investment return is calculated assuming an initial investment made at the net asset value at the beginning of the period, reinvestment of all dividends and distributions at net asset value during the period, and redemption on the last day of the period. Initial sales charges or contingent deferred sales charges are not reflected in the calculation of total investment return. Total return does not reflect the deduction of taxes that a shareholder would pay on fund distributions or the redemption of fund shares. Total investment return calculated for a period of less than one year is not annualized. |
| (e) | | The expense ratios presented below exclude interest expense and term asset-backed securities loan facility administration fees, where applicable: |
| | | | | | | | | | | | | | | | | | | | |
| | | Year Ended October 31, | |
| | | 2015 | | | 2014 | | | 2013 | | | 2012 | | | 2011 | |
| | | | |
Class A | | | | | | | | | | | | | | | | | | | | |
Net of waivers/reimbursements | | | 88 | % | | | .88 | % | | | .90 | % | | | .90 | % | | | .95 | % |
Before waivers/reimbursements | | | .88 | % | | | .88 | % | | | .90 | % | | | .90 | % | | | .96 | % |
Class B | | | | | | | | | | | | | | | | | | | | |
Net of waivers/reimbursements . | | | 1.61 | % | | | 1.60 | % | | | 1.61 | % | | | 1.64 | % | | | 1.65 | % |
Before waivers/reimbursements | | | 1.61 | % | | | 1.60 | % | | | 1.61 | % | | | 1.64 | % | | | 1.69 | % |
Class C | | | | | | | | | | | | | | | | | | | | |
Net of waivers/reimbursements . | | | 1.58 | % | | | 1.58 | % | | | 1.60 | % | | | 1.60 | % | | | 1.65 | % |
Before waivers/reimbursements | | | 1.58 | % | | | 1.58 | % | | | 1.60 | % | | | 1.60 | % | | | 1.66 | % |
Advisor Class | | | | | | | | | | | | | | | | | | | | |
Net of waivers/reimbursements | | | 58 | % | | | .58 | % | | | .60 | % | | | .60 | % | | | .65 | % |
Before waivers/reimbursements | | | .58 | % | | | .58 | % | | | .60 | % | | | .60 | % | | | .66 | % |
Class R | | | | | | | | | | | | | | | | | | | | |
Net of waivers/reimbursements . | | | 1.25 | % | | | 1.23 | % | | | 1.25 | % | | | 1.24 | % | | | 1.15 | % |
Before waivers/reimbursements | | | 1.25 | % | | | 1.23 | % | | | 1.25 | % | | | 1.26 | % | | | 1.28 | % |
Class K | | | | | | | | | | | | | | | | | | | | |
Net of waivers/reimbursements | | | 92 | % | | | .88 | % | | | .89 | % | | | .91 | % | | | .90 | % |
Before waivers/reimbursements | | | .92 | % | | | .88 | % | | | .89 | % | | | .93 | % | | | 1.01 | % |
Class I | | | | | | | | | | | | | | | | | | | | |
Net of waivers/reimbursements | | | 52 | % | | | .54 | % | | | .53 | % | | | .56 | % | | | .63 | % |
Before waivers/reimbursements | | | .52 | % | | | .54 | % | | | .53 | % | | | .56 | % | | | .63 | % |
| | | | | | | | | | | | |
| | | Year Ended October 31, | | | October 15,
2013(f) to
October 31,
2013 | |
| | | 2015 | | | 2014 | | |
| | | | |
Class Z | | | | | | | | | | | | |
Net of waivers/reimbursements | | | 51 | % | | | .51 | % | | | .56 | %(g) |
Before waivers/reimbursements | | | .51 | % | | | .51 | % | | | .56 | %(g) |
| (f) | | Commencement of distribution. |
| * | | Includes the impact of proceeds received, and credited to the Fund resulting from class action settlements, which enhanced the performance of each share class, for the years ended October 31, 2012 and October 31, 2011 by .06 and .03%, respectively. |
| † | | Includes the impact of proceeds received and credited to the Fund resulting from third party regulatory settlements, which enhanced the Fund’s performance for the year ended October 31, 2013 by 0.01%. |
See notes to financial statements.
| | | | |
| AB HIGH INCOME FUND • | | | 127 | |
Financial Highlights
REPORT OF INDEPENDENT REGISTERED
PUBLIC ACCOUNTING FIRM
To the Board of Directors and Shareholders of
AB High Income Fund, Inc.
We have audited the accompanying statement of assets and liabilities, including the portfolio of investments, of AB High Income Fund, Inc. (the “Fund”), (formerly known as AllianceBernstein High Income Fund, Inc.) as of October 31, 2015, and the related statements of operations and cash flows for the year then ended, the statements of changes in net assets for each of the two years in the period then ended, and the financial highlights for the periods indicated therein. These financial statements and financial highlights are the responsibility of the Fund’s management. Our responsibility is to express an opinion on these financial statements and financial highlights based on our audits.
We conducted our audits in accordance with the standards of the Public Company Accounting Oversight Board (United States). Those standards require that we plan and perform the audit to obtain reasonable assurance about whether the financial statements and financial highlights are free of material misstatement. We were not engaged to perform an audit of the Fund’s internal control over financial reporting. Our audits included consideration of internal control over financial reporting as a basis for designing audit procedures that are appropriate in the circumstances, but not for the purpose of expressing an opinion on the effectiveness of the Fund’s internal control over financial reporting. Accordingly, we express no such opinion. An audit also includes examining, on a test basis, evidence supporting the amounts and disclosures in the financial statements and financial highlights, assessing the accounting principles used and significant estimates made by management, and evaluating the overall financial statement presentation. Our procedures included confirmation of securities owned as of October 31, 2015, by correspondence with the custodian and others, or by other appropriate auditing procedures where replies from others were not received. We believe that our audits provide a reasonable basis for our opinion.
In our opinion, the financial statements and financial highlights referred to above present fairly, in all material respects, the financial position of AB High Income Fund, Inc. at October 31, 2015, the results of its operations and its cash flows for the year then ended, the changes in its net assets for each of the two years in the period then ended, and the financial highlights for the periods indicated therein, in conformity with U.S. generally accepted accounting principles.

New York, New York
December 30, 2015
| | | | |
| AB HIGH INCOME FUND • | | | 128 | |
Report of Independent Registered Public Accounting Firm
2015 FEDERAL TAX INFORMATION
(unaudited)
For Federal income tax purposes, the following information is furnished with respect to the distributions paid by the Fund during the taxable year ended October 31, 2015.
For foreign shareholders, 51.91% of ordinary income dividends paid may be considered to be qualifying to be taxed as interest-related dividends.
Shareholders should not use the above information to prepare their income tax returns. The information necessary to complete your income tax returns will be included with your Form 1099-DIV which will be sent to you separately in January 2016.
| | | | |
| AB HIGH INCOME FUND • | | | 129 | |
BOARD OF DIRECTORS
| | |
Marshall C. Turner, Jr.(1), Chairman John H. Dobkin(1) Michael J. Downey(1) William H. Foulk, Jr.(1) D. James Guzy(1) | | Nancy P. Jacklin(1) Robert M. Keith, President and Chief Executive Officer Garry L. Moody(1) Earl D. Weiner(1) |
OFFICERS
| | |
Philip L. Kirstein, Senior Vice President and Independent Compliance Officer Paul J. DeNoon(2), Vice President Gershon M. Distenfeld(2), Vice President Douglas J. Peebles(2), Vice President Marco G. Santamaria(2), Vice President | | Matthew S. Sheridan(2) , Vice President Emilie D. Wrapp, Secretary Joseph J. Mantineo, Treasurer and Chief Financial Officer Stephen M. Woetzel, Controller Vincent S. Noto, Chief Compliance Officer |
| | |
Principal Underwriter AllianceBernstein Investments, Inc. 1345 Avenue of the Americas New York, NY 10105 Custodian and Accounting Agent Brown Brothers Harriman & Co. 50 Post Office Square Boston, MA 02110 Legal Counsel Seward & Kissel LLP One Battery Park Plaza New York, NY 10004 | | Transfer Agent AllianceBernstein Investor Services, Inc. P.O. Box 786003 San Antonio, TX 78278-6003 Toll-Free (800) 221-5672 Independent Registered Public Accounting Firm Ernst & Young LLP 5 Times Square New York, NY 10036 |
| (1) | | Member of the Audit Committee, the Governance and Nominating Committee and the Independent Directors Committee. |
| (2) | | The day-to-day management of, and investment decisions for, the Fund’s portfolio are made by the Global Fixed Income Team and Global Credit Investment Team. Messrs. DeNoon, Distenfeld, Peebles, Santamaria and Sheridan are the investment professionals with the most significant responsibility for the day-to-day management of the Fund’s portfolio. |
| | |
| 130 | | • AB HIGH INCOME FUND |
Board of Directors
MANAGEMENT OF THE FUND
Board of Directors Information
The business and affairs of the Fund are managed under the direction of the Board of Directors. Certain information concerning the Fund’s Directors is set forth below.
| | | | | | | | |
NAME,
ADDRESS*, AGE,
(YEAR FIRST ELECTED**) | | PRINCIPAL
OCCUPATION(S)
DURING PAST FIVE YEARS
AND OTHER RELEVANT
QUALIFICATIONS*** | | PORTFOLIOS
IN FUND
COMPLEX
OVERSEEN BY
DIRECTOR | | | OTHER PUBLIC
DIRECTORSHIPS
CURRENTLY HELD
BY DIRECTOR |
| INTERESTED DIRECTOR | | | | | | |
Robert M. Keith, +
1345 Avenue of the Americas
New York, NY 10105
55
(2010) | | Senior Vice President of AllianceBernstein L.P. (the “Adviser”) and the head of AllianceBernstein Investments, Inc. (“ABI”) since July 2008; Director of ABI and President of the AB Mutual Funds. Previously, he served as Executive Managing Director of ABI from December 2006 to June 2008. Prior to joining ABI in 2006, Executive Managing Director of Bernstein Global Wealth Management, and prior thereto, Senior Managing Director and Global Head of Client Service and Sales of the Adviser’s institutional investment management business since 2004. Prior thereto, he was Managing Director and Head of North American Client Service and Sales in the Adviser’s institutional investment management business, with which he had been associated since prior to 2004. | | | 110 | | | None |
| | | | |
| AB HIGH INCOME FUND • | | | 131 | |
Management of the Fund
| | | | | | | | |
NAME,
ADDRESS*, AGE,
(YEAR FIRST ELECTED**) | | PRINCIPAL
OCCUPATION(S)
DURING PAST FIVE YEARS
AND OTHER RELEVANT
QUALIFICATIONS*** | | PORTFOLIOS
IN FUND
COMPLEX
OVERSEEN BY
DIRECTOR | | | OTHER PUBLIC
DIRECTORSHIPS
CURRENTLY HELD
BY DIRECTOR |
| DISINTERESTED DIRECTORS | | | | | | |
Marshall C. Turner, Jr. ++ Chairman of the Board 74
(2014) | | Private Investor since prior to 2010. Former Chairman and CEO of Dupont Photomasks, Inc. (components of semiconductor manufacturing). He has extensive operating leadership and venture capital investing experience, including five interim or full-time CEO roles, and prior service as general partner of institutional venture capital partnerships. He also has extensive nonprofit board leadership experience, and currently serves on the boards of two education and science-related non-profit organizations. He has served as a director of one AB fund since 1992, and director or trustee of multiple AB funds since 2005. He has been Chairman of the AB Funds since January 2014, and the Chairman of the Independent Directors Committees of such Funds since February 2014. | | | 110 | | | Xilinx, Inc. (programmable logic semi-conductors) since 2007 |
| | | | | | | | |
John H. Dobkin, ++ 73 (1993) | | Independent Consultant since prior to 2010. Formerly, President of Save Venice, Inc. (preservation organization) from 2001-2002; Senior Advisor from June 1999-June 2000 and President of Historic Hudson Valley (historic preservation) from December 1989-May 1999. Previously, Director of the National Academy of Design. He has served as a director or trustee of various AB Funds since 1992, and as Chairman of the Audit Committees of a number of such Funds from 2001-2008. | | | 110 | | | None |
| | |
| 132 | | • AB HIGH INCOME FUND |
Management of the Fund
| | | | | | | | |
NAME,
ADDRESS*, AGE,
(YEAR FIRST ELECTED**) | | PRINCIPAL
OCCUPATION(S)
DURING PAST FIVE YEARS
AND OTHER RELEVANT
QUALIFICATIONS*** | | PORTFOLIOS
IN FUND
COMPLEX
OVERSEEN BY
DIRECTOR | | | OTHER PUBLIC
DIRECTORSHIPS
CURRENTLY HELD
BY DIRECTOR |
DISINTERESTED DIRECTORS
(continued) | | | | | | |
Michael J. Downey, ++ 71 (2005) | | Private Investor since prior to 2010. Formerly, managing partner of Lexington Capital, LLC (investment advisory firm) from December 1997 until December 2003. He served as a Director of The Merger Fund (registered investment company) since prior to 2010 until 2013. He was a Director of Prospect Acquisition (financial services) Corp. from 2007 until 2009. From 1987 until 1993, Chairman and CEO of Prudential Mutual Fund Management, director of the Prudential mutual funds, and member of the Executive Committee of Prudential Securities Inc. He has served as a director or trustee of the AB Funds since 2005 and is a director and Chairman of one other registered investment company. | | | 110 | | | Asia Pacific Fund, Inc. (registered investment company) since prior to 2010 |
| | | | | | | | |
William H. Foulk, Jr., ++ 83 (1993) | | Investment Adviser and an Independent Consultant since prior to 2010. Previously, he was Senior Manager of Barrett Associates, Inc., a registered investment adviser. He was formerly Deputy Comptroller and Chief Investment Officer of the State of New York and, prior thereto, Chief Investment Officer of the New York Bank for Savings. He has served as a director or trustee of various AB Funds since 1983, and was Chairman of the Independent Directors Committees of the AB Funds from 2003 until early February 2014. He served as Chairman of such Funds from 2003 through December 2013. He is also active in a number of mutual fund related organizations and committees. | | | 110 | | | None |
| | | | |
| AB HIGH INCOME FUND • | | | 133 | |
Management of the Fund
| | | | | | | | |
NAME,
ADDRESS*, AGE,
(YEAR FIRST ELECTED**) | | PRINCIPAL
OCCUPATION(S)
DURING PAST FIVE YEARS
AND OTHER RELEVANT
QUALIFICATIONS*** | | PORTFOLIOS
IN FUND
COMPLEX
OVERSEEN BY
DIRECTOR | | | OTHER PUBLIC
DIRECTORSHIPS
CURRENTLY HELD
BY DIRECTOR |
DISINTERESTED DIRECTORS
(continued) | | | | | | |
D. James Guzy, ++
79
(2005) | | Chairman of the Board of SRC Computers, Inc. (semi-conductors), with which he has been associated since prior to 2010. He served as Chairman of the Board of PLX Technology (semi-conductors) since prior to 2010 until November 2013. He was a Director of Cirrus Logic Corporation (semi-conductors) from 1984 until July 2011. He was a director of Intel Corporation (semi-conductors) from 1969 until 2008, and served as Chairman of the Finance Committee of such company for several years until May 2008. He has served as a director or trustee of one or more of the AB Funds since 1982. | | | 110 | | | None |
| | | | | | | | |
Nancy P. Jacklin, ++
67
(2006) | | Professorial Lecturer at the Johns Hopkins School of Advanced International Studies (2008-2015). U.S. Executive Director of the International Monetary Fund (which is responsible for ensuring the stability of the international monetary system), (December 2002-May 2006); Partner, Clifford Chance (1992-2002); Sector Counsel, International Banking and Finance, and Associate General Counsel, Citicorp (1985-1992); Assistant General Counsel (International), Federal Reserve Board of Governors (1982-1985); and Attorney Advisor, U.S. Department of the Treasury (1973-1982). Member of the Bar of the District of Columbia and of New York; and member of the Council on Foreign Relations. She has served as a director or trustee of the AB Funds since 2006 and has been Chairman of the Governance and Nominating Committees of the Funds since August 2014. | | | 110 | | | None |
| | |
| 134 | | • AB HIGH INCOME FUND |
Management of the Fund
| | | | | | | | |
NAME,
ADDRESS*, AGE,
(YEAR FIRST ELECTED**) | | PRINCIPAL
OCCUPATION(S)
DURING PAST FIVE YEARS
AND OTHER RELEVANT
QUALIFICATIONS*** | | PORTFOLIOS
IN FUND
COMPLEX
OVERSEEN BY
DIRECTOR | | | OTHER PUBLIC
DIRECTORSHIPS
CURRENTLY HELD
BY DIRECTOR |
DISINTERESTED DIRECTORS
(continued) | | | | | | |
Garry L. Moody, ++
63
(2008) | | Independent Consultant. Formerly, Partner, Deloitte & Touche LLP (1995-2008) where he held a number of senior positions, including Vice Chairman, and U.S. and Global Investment Management Practice Managing Partner; President, Fidelity Accounting and Custody Services Company (1993-1995); and Partner, Ernst & Young LLP (1975-1993), where he served as the National Director of Mutual Fund Tax Services and Managing Partner of its Chicago Office Tax department. He is a member of the Trustee Advisory Board of BoardIQ, a biweekly publication focused on issues and news affecting directors of mutual funds. He has served as a director or trustee, and as Chairman of the Audit Committees, of the AB Funds since 2008. | | | 110 | | | None |
| | | | | | | | |
Earl D. Weiner, ++
76
(2007) | | Of Counsel, and Partner prior to January 2007, of the law firm Sullivan & Cromwell LLP and is a former member of the ABA Federal Regulation of Securities Committee Task Force to draft editions of the Fund Director’s Guidebook. He also serves as a director or trustee of various non-profit organizations and has served as Chairman or Vice Chairman of a number of them. He has served as a director or trustee of the AB Funds since 2007 and served as Chairman of the Governance and Nominating Committees of the AB Funds from 2007 until August 2014. | | | 110 | | | None |
| | | | |
| AB HIGH INCOME FUND • | | | 135 | |
Management of the Fund
| * | | The address for each of the Fund’s disinterested Directors is c/o AllianceBernstein L.P., Attention: Philip L. Kirstein, 1345 Avenue of the Americas, New York, NY 10105. |
| ** | | There is no stated term of office for the Fund’s Directors. |
| *** | | The information above includes each Director’s principal occupation during the last five years and other information relating to the experience, attributes and skills relevant to each Director’s qualifications to serve as a Director, which led to the conclusion that each Director should serve as a Director for the Fund. |
| + | | Mr. Keith is an “interested director of the Fund”, as defined in the 1940 Act, due to his position as a Senior Vice President of the Adviser. |
| ++ | | Member of the Audit Committee, the Governance and Nominating Committee and the Independent Directors Committee. |
| | |
| 136 | | • AB HIGH INCOME FUND |
Management of the Fund
Officers of the Fund
Certain information concerning the Fund’s Officers is listed below.
| | | | |
NAME, ADDRESS*
AGE | | PRINCIPAL POSITION(S)
HELD WITH FUND | | PRINCIPAL OCCUPATION
DURING PAST FIVE YEARS |
Robert M. Keith,
55 | | President and Chief Executive Officer | | See biography above. |
| | | | |
Philip L. Kirstein,
70 | | Senior Vice President and Independent Compliance Officer | | Senior Vice President and Independent Compliance Officer of the AB Funds, with which he has been associated since October 2004. Prior thereto, he was Of Counsel to Kirkpatrick & Lockhart, LLP from October 2003 to October 2004, and General Counsel of Merrill Lynch Investment Managers, L.P. since prior to March 2003. |
| | | | |
Paul J. DeNoon,
53 | | Vice President | | Senior Vice President of the Adviser**, with which he has been associated since prior to 2010. |
| | | | |
Gershon Distenfeld,
39 | | Vice President | | Senior Vice President of the Adviser**, with which he has been associated since prior to 2010. |
| | | | |
Douglas J. Peebles,
50 | | Vice President | | Senior Vice President of the Adviser**, with which he has been associated since prior to 2010. |
| | | | |
Marco G. Santamaria,
49 | | Vice President | | Senior Vice President of the Adviser**, with which he has been associated since 2010. |
| | | | |
Matthew S. Sheridan,
40 | | Vice President | | Senior Vice President of the Adviser**, with which he has been associated since prior to 2010. |
| | | | |
Emilie D. Wrapp,
59 | | Secretary | | Senior Vice President, Assistant General Counsel and Assistant Secretary of ABI**, with which she has been associated since prior to 2010. |
| | | | |
Joseph J. Mantineo,
56 | | Treasurer and Chief Financial Officer | | Senior Vice President of AllianceBernstein Investor Services, Inc. (“ABIS”)**, with which he has been associated since prior to 2010. |
| | | | |
Stephen M. Woetzel,
44 | | Controller | | Vice President of ABIS**, with which he has been associated since prior to 2010. |
| | | | |
Vincent S. Noto,
50 | | Chief Compliance Officer | | Senior Vice President since 2015 and Mutual Fund Chief Compliance Officer of the Adviser** since 2014. Prior thereto, he was Vice President and Director of Mutual Fund Compliance of the Adviser** since prior to 2010. |
| * | | The address for each of the Fund’s Officers is 1345 Avenue of the Americas, New York, NY 10105. |
| ** | | The Adviser, ABI and ABIS are affiliates of the Fund. |
| | | The Fund’s Statement of Additional Information (“SAI”) has additional information about the Fund’s Directors and Officers and is available without charge upon request. Contact your financial representative or AB at (800) 227-4618, or visit www.ABglobal.com, for a free prospectus or SAI. |
| | | | |
| AB HIGH INCOME FUND • | | | 137 | |
Management of the Fund
THE FOLLOWING IS NOT PART OF THE SHAREHOLDER REPORT OR THE FINANCIAL STATEMENTS
SUMMARY OF SENIOR OFFICER’S EVALUATION OF INVESTMENT ADVISORY AGREEMENT1
The following is a summary of the evaluation of the Investment Advisory Agreement between AllianceBernstein L.P. (the “Adviser”) and AB High Income Fund, Inc. (the “Fund”),2 prepared by Philip L. Kirstein, the Senior Officer of the Fund, for the Directors of the Fund, as required by the August 2004 agreement between the Adviser and the New York State Attorney General (the “NYAG”). The Senior Officer’s evaluation of the Investment Advisory Agreement is not meant to diminish the responsibility or authority of the Board of Directors to perform its duties pursuant to Section 15 of the Investment Company Act of 1940 (the “40 Act”) and applicable state law. The purpose of this summary is to provide shareholders with a synopsis of the independent evaluation of the reasonableness of the advisory fees proposed to be paid by the Fund which was provided to the Directors in connection with their review of the proposed approval of the continuance of the Investment Advisory Agreement.
The Senior Officer’s evaluation considered the following factors:
| | 1. | Advisory fees charged to institutional and other clients of the Adviser for like services; |
| | 2. | Advisory fees charged by other mutual fund companies for like services; |
| | 3. | Costs to the Adviser and its affiliates of supplying services pursuant to the advisory agreement, excluding any intra-corporate profit; |
| | 4. | Profit margins of the Adviser and its affiliates from supplying such services; |
| | 5. | Possible economies of scale as the Fund grows larger; and |
| | 6. | Nature and quality of the Adviser’s services including the performance of the Fund. |
These factors, with the exception of the first factor, are generally referred to as the “Gartenberg factors,” which were articulated by the United States Court of Appeals for the Second Circuit in 1982. Gartenberg v. Merrill Lynch Asset Management, Inc., 694 F. 2d 923 (2d Cir. 1982). On March 30, 2010, the Supreme Court held the Gartenberg decision was correct in its basic formulation of what Section 36(b) requires: to face liability under Section 36(b), “an investment adviser must charge a fee that is so disproportionately large that it bears no
| 1 | | The information in the fee evaluation was completed on October 22, 2015 and discussed with the Board of Directors on November 3-5, 2015. |
| 2 | | Future references to the Fund do not include “AB.” References in the fee summary pertaining to performance and expense ratios refer to Class A shares of the Fund. |
| | |
| 138 | | • AB HIGH INCOME FUND |
reasonable relationship to the services rendered and could not have been the product of arm’s length bargaining.” Jones v. Harris Associates L.P., 130 S. Ct. 1418 (2010). In Jones, the Court stated the Gartenberg approach fully incorporates the correct understanding of fiduciary duty within the context of Section 36(b) and noted with approval that “Gartenberg insists that all relevant circumstances be taken into account” and “uses the range of fees that might result from arm’s length bargaining as the benchmark for reviewing challenged fees.”3
INVESTMENT ADVISORY FEES, NET ASSETS & EXPENSE RATIOS
The Adviser proposed that the Fund pays the advisory fee set forth in the table below for receiving the services to be provided pursuant to the Investment Advisory Agreement. The fee schedule below, implemented in January 2004 in consideration of the Adviser’s settlement with the NYAG in December 2003, is based on a master schedule that contemplates eight categories of funds with almost all funds in each category having the same advisory fee schedule.4 Also shown are the Fund’s net assets on September 30, 2015.
| | | | |
| Category | | Advisory Fee Based on the Fund’s
Average Daily Adjusted Total Assets5 | | September 30, 2015 Net Assets ($MM) |
| High Income | | 0.50% on 1st $2.5 billion
0.45% on next $2.5 billion
0.40% on the balance | | $5,993.3 |
The Fund’s Investment Advisory Agreement provides for the Adviser to be reimbursed for certain clerical, legal, accounting, administrative and other services provided to the Fund. During the fiscal year ended October 31, 2014, the Adviser received $60,462 (0.001% of the Fund’s average daily net assets) for providing such services.
| 3 | | Jones v. Harris at 1427. |
| 4 | | Most of the AB Mutual Funds, which the Adviser manages, were affected by the Adviser’s settlement with the NYAG. |
| 5 | | Average daily value of total assets minus the sum of accrued liabilities other than the principal amount of money borrowed. |
| | | | |
| AB HIGH INCOME FUND • | | | 139 | |
Set forth below are the total expense ratios of the Fund for the most recent semi-annual period:6
| | | | | | | | |
| Fund | | Total Expense
Ratio7 | | | Fiscal
Year |
| High Income Fund, Inc.8, 9 | | Advisor | | | 0.60 | % | | Oct. 31 (ratios as of Apr. 30, 2015) |
| | Class A | | | 0.90 | % | |
| | Class B | | | 1.62 | % | |
| | Class C | | | 1.59 | % | |
| | Class R | | | 1.26 | % | |
| | Class K | | | 0.95 | % | |
| | Class I | | | 0.53 | % | |
| | Class Z | | | 0.52 | % | |
| I. | ADVISORY FEES CHARGED TO INSTITUTIONAL AND OTHER CLIENTS |
The advisory fees charged to investment companies which the Adviser manages and sponsors are normally higher than those charged to similar sized institutional accounts, including pension plans and sub-advised investment companies. The fee differential reflects, among other things, different services provided to such clients, and different liabilities assumed. Services provided by the Adviser to the Fund that are not provided to non-investment company clients and sub-advised investment companies include providing office space and personnel to serve as Fund Officers, who among other responsibilities make the certifications required under the Sarbanes–Oxley Act of 2002, and coordinating with and monitoring the Fund’s third party service providers such as Fund counsel, auditors, custodians, transfer agents and pricing services. The accounting, administrative, legal and compliance requirements for the Fund are more costly than those for institutional assets due to the greater complexities and time required for investment companies, although as previously noted, the Adviser is reimbursed for providing such services. Also, retail mutual funds managed by the Adviser are widely held. Servicing the Fund’s investors is more time consuming and labor intensive compared to institutional clients since the Adviser needs to communicate with a more extensive network of financial intermediaries and shareholders. The Adviser also believes that it incurs substantial entrepreneurial risk when offering a new mutual fund since establishing a new mutual fund requires a large upfront investment and it may take a long time for the fund to achieve profitability since the fund must be priced to scale from inception in order to be competitive and assets are acquired one account at a time. In addition, managing the cash flow of an investment company may be more difficult than managing that of a stable pool of assets, such as an institutional account with little cash movement in either direction, particularly, if a fund is in net
| 6 | | Semi-annual total expense ratios are unaudited. |
| 8 | | The Rule 12b-1 fee for Class A shares will bill reduced from 0.30% to 0.25%, effective on February 1, 2016. |
| 9 | | The Fund’s expense ratios exclude interest expense of 0.02% for Advisor Class and Class Z shares, and 0.01% for Class A, Class B, Class C, Class R, Class K, Class I shares |
| | |
| 140 | | • AB HIGH INCOME FUND |
redemption and the Adviser is frequently forced to sell securities to raise cash for redemptions. However, managing a fund with positive cash flow may be easier at times than managing a stable pool of assets. Finally, in recent years, investment advisers have been sued by institutional clients and have suffered reputational damage both by the attendant publicity and outcomes other than complete victories. Accordingly, the legal and reputational risks associated with institutional accounts are greater than previously thought, although still not equal to those related to the mutual fund industry.
Notwithstanding the Adviser’s view that managing an investment company is not comparable to managing other institutional accounts because the services provided are different, the Supreme Court has indicated consideration should be given to the advisory fees charged to institutional accounts with a similar investment style as the Fund.10 In addition to the AB Institutional fee schedule, set forth below is what would have been the effective advisory fee of the Fund had the AB Institutional fee schedule been applicable to the Fund versus the Fund’s advisory fee based on September 30, 2015 net assets.11
| | | | | | | | | | | | | | |
| Fund | | Net Assets 9/30/15 ($MM) | | | AB Institutional Fee Schedule | | Effective
AB Inst.
Adv. Fee (%) | | | Fund Advisory Fee (%) | |
| High Income Fund, Inc. | | | $5,993.3 | | | Global High Income 0.55% on 1st $50 million 0.35% on the balance Minimum account size: $100 m | | | 0.352% | | | | 0.463% | |
The Adviser also manages and sponsors retail mutual funds, which are organized in jurisdictions outside the United States, generally Luxembourg, Japan, Taiwan, and South Korea, and sold to non-United States resident investors. The Adviser charges the following fee for Global High Yield, a Luxembourg fund, which has a somewhat similar investment style as the Fund:
| | | | |
| Fund | | Luxembourg Fund | | Fee12 |
| High Income Fund, Inc. | | Global High Yield Class A | | 1.55% on 1st $5 billion |
| | | | 1.50% on the balance |
| | |
| | Class I (Institutional) | | 1.00% on 1st $5 billion 0.95% on the balance |
| 10 | | The Supreme Court stated that “courts may give such comparisons the weight that they merit in light of the similarities and differences between the services that the clients in question require, but the courts must be wary of inapt comparisons.” Among the significant differences the Supreme Court noted that may exist between services provided to mutual funds and institutional accounts are “higher marketing costs.” Jones v. Harris at 1428. |
| 11 | | The Adviser has indicated that with respect to institutional accounts with assets greater than $300 million, it will negotiate a fee schedule. Discounts that are negotiated vary based upon each client relationship. |
| 12 | | Class A2 shares of the Luxembourg fund are charged an “all-in” fee, which covers investment advisory and distribution related services, unlike Class I2 shares, whose fee is for investment advisory services only. |
| | | | |
| AB HIGH INCOME FUND • | | | 141 | |
The AB Investment Trust Management mutual funds (“ITM”), which are offered to investors in Japan, have an “all-in” fee to compensate the Adviser for investment advisory as well as fund accounting and administrative related services. The fee schedule of the ITM mutual fund that has a somewhat similar investment style as the Fund is as follows:
| | | | |
| Fund | | ITM Mutual Fund | | Fee13 |
| High Income Fund, Inc. | | AB Global High Income Open A/B (Hedged/Unhedged) | | 0.70% on the 1st ¥30 billion 0.60% on next ¥20 billion 0.50% on next ¥450 billion 0.45% on the balance |
The AB Investments Taiwan Limited mutual funds (“ITL”), which are offered to investors in Taiwan, have an “all-in” fee to compensate the Adviser for investment advisory as well as custody related services. The fee schedule of the ITL mutual fund that has a somewhat similar investment style as the Fund is set forth in the table below:
| | | | | | | | | | | | |
| Fund | | ITL Fund | | Advisory
Fee | | | Custodian Fee | | Management
Fee14 | |
| High Income Fund, Inc. | | Global High Yield Fund | | | 1.70% | | | 0.17% on first NT$20 billion 0.145% on next NT$20 billion 0.135% on next NT$20 billion 0.125% on next NT$20 billion 0.10% on the balance | | | 1.818% | |
The Adviser represented that it does not provide any sub-advisory investment services to other investment companies that have a substantially similar investment style as the Fund.
| II. | MANAGEMENT FEES CHARGED BY OTHER MUTUAL FUND COMPANIES FOR LIKE SERVICES. |
Broadridge Financial Solutions, Inc. (“Broadridge”), an analytical service that is not affiliated with the Adviser, compared the fees charged to the Fund with fees charged to other investment companies for similar services offered by other
| 13 | | The Japanese Yen-U.S. dollar currency exchange rate quoted at 4 p.m. on September 30, 2015 by Reuters was ¥119.88 per $1. At that currency exchange rate, ¥30 billion would be equivalent to approximately $250.3 million; ¥20 billion would be equivalent to approximately $166.8 million; and ¥450 billion would be equivalent to approximately $3.75 billion. |
| 14 | | The Taiwanese dollar-U.S. dollar (USD) currency exchange rate quoted at 4 p.m. on September 30, 2015 by Reuters was NT$32.99 per $1 (USD). At that currency exchange rate, NT$20 billion would be equivalent to approximately $606.2 million (USD). |
| | |
| 142 | | • AB HIGH INCOME FUND |
investment advisers.15, 16 Broadridge’s analysis included the comparison of the Fund’s contractual management fee, estimated at the approximate current asset level of the Fund, to the median of the Fund’s Broadridge Expense Group (“EG”)17 and the Fund’s contractual management fee ranking.18
Broadridge describes an EG as a representative sample of comparable funds. Broadridge’s standard methodology for screening funds to be included in an EG entails the consideration of several fund criteria, including fund type, Lipper investment classification/objective, load type and similar 12b-1/non-12b-1 service fees, asset (size) comparability, expense components and attributes. An EG will typically consist of seven to twenty funds.
| | | | | | | | | | | | |
| Fund | | Contractual
Management Fee (%)19 | | | Broadridge EG Median (%) | | | Broadridge EG Rank | |
| High Income Fund, Inc. | | | 0.457 | | | | 0.536 | | | | 2/14 | |
| 15 | | The Supreme Court cautioned against accepting mutual fund fee comparisons without careful scrutiny since “these comparisons are problematic because these fees, like those challenged, may not be the product of negotiations conducted at arm’s length.” Jones v. Harris at 1429. |
| 16 | | On June 5, 2015, Broadridge acquired the Fiduciary Services and Competitive Intelligence unit, i.e., the group responsible for providing the Fund’s 15(c) reports, from Thomson Reuters’ Lipper division. The group that maintains Lipper’s expense and performance databases and investment classification/objective remains a part of Thomson Reuters’ Lipper division. Accordingly, the Fund’s investment classification/objective continued to be determined by Lipper. |
| 17 | | Broadridge does not consider average account size when constructing EGs. Funds with relatively small average account sizes tend to have higher transfer agent expense ratios than comparable sized funds that have relatively large average account sizes. There are limitations to Lipper expense category data because different funds categorize expenses differently. |
| 18 | | The contractual management fee is calculated by Broadridge using the Fund’s contractual management fee rate at a hypothetical asset level. The hypothetical asset level is based on the combined net assets of all classes of the Fund, rounded up to the next $25 million. Broadridge’s total expense ratio information is based on the most recent annual report except as otherwise noted. A ranking of “1” would mean that Fund had the lowest effective fee rate in the Broadridge peer group. |
| 19 | | The contractual management fee does not reflect any expense reimbursements made by the Fund to the Adviser for certain clerical, legal, accounting, administrative, and other services. In addition, the contractual management fee does not reflect any advisory fee waivers or expense reimbursements made by the Adviser that would effectively reduce the actual effective management fee. |
| | | | |
| AB HIGH INCOME FUND • | | | 143 | |
Broadridge also compared the Fund’s total expense ratio to the medians of the Fund’s EG and Broadridge Expense Universe (“EU”). The EU is a broader group compared to the EG, consisting of all funds that have the same investment classifications/objective and load type as the subject Fund.20 Pro-forma total expense ratio (italicized) is shown to reflect the Fund’s anticipated 12b-1 fee reduction.
| | | | | | | | | | | | | | | | | | | | |
| Fund | | Total
Expense Ratio (%)21 | | | Broadridge EG Median (%) | | | Broadridg EG Rank | | | Broadridge
EU Median (%) | | | Broadridge
EU Rank | |
| High Income Fund, Inc. | | | 0.882 | | | | 0.948 | | | | 2/14 | | | | 1.039 | | | | 5/55 | |
Pro-forma | | | 0.832 | | | | 0.948 | | | | 2/14 | | | | 1.039 | | | | 4/55 | |
Based on this analysis, considering pro-forma information where available, the Fund has equally favorable rankings on a contractual management fee basis and on a total expense ratio basis.
| III. | COSTS TO THE ADVISER AND ITS AFFILIATES OF SUPPLYING SERVICES PURSUANT TO THE MANAGEMENT FEE ARRANGEMENT, EXCLUDING ANY INTRA-CORPORATE PROFIT. |
The Adviser utilizes two profitability reporting systems, which operate independently but are aligned with each other, to estimate the Adviser’s profitability in connection with investment advisory services provided to the Fund. The Senior Officer has retained a consultant to provide independent advice regarding the alignment of the two profitability systems as well as the methodologies and allocations utilized by both profitability systems. See Section IV for additional discussion.
| IV. | PROFIT MARGINS OF THE ADVISER AND ITS AFFILIATES FOR SUPPLYING SUCH SERVICES. |
The Fund’s profitability information, prepared by the Adviser for the Board of Directors, was reviewed by the Senior Officer and the consultant. The Adviser’s profitability from providing investment advisory services to the Fund decreased during calendar year 2014, relative to 2013.
In addition to the Adviser’s direct profits from managing the Fund, certain of the Adviser’s affiliates have business relationships with the Fund and may earn a profit from providing other services to the Fund. The courts have referred to this type of business opportunity as “fall-out benefits” to the Adviser and indicated that such benefits should be factored into the evaluation of the total relationship
| 20 | | Except for asset (size) comparability, Broadridge uses the same criteria for selecting an EG when selecting an EU. Unlike the EG, the EU allows for the same adviser to be represented by more than just one fund. |
| 21 | | Most recently completed fiscal year Class A share total expense ratio. |
| | |
| 144 | | • AB HIGH INCOME FUND |
between the Fund and the Adviser. Neither case law nor common business practice precludes the Adviser’s affiliates from earning a reasonable profit on this type of relationship provided the affiliates’ charges and services are competitive and the relationship otherwise complies with the 40 Act restrictions. These affiliates provide transfer agent and distribution services to the Fund and receive transfer agent fees, Rule 12b-1 payments, front-end sales loads and contingent deferred sales charges (“CDSC”). During the Fund’s most recently completed fiscal year, ABI received from the Fund $340,237 $22,901,079 and $198,744 in front-end sales charges, Rule 12b-1 and CDSC fees, respectively.22
AllianceBernstein Investments, Inc. (“ABI”), an affiliate of the Adviser, is the Fund’s principal underwriter. ABI and the Adviser have disclosed in the Fund’s prospectus that they may make revenue sharing payments from their own resources, in addition to resources derived from sales loads and Rule 12b-1 fees, to firms that sell shares of the Fund. In 2014, ABI paid approximately 0.05% of the average monthly assets of the AB Mutual Funds or approximately $20.4 million for distribution services and educational support (revenue sharing payments).
Fees and reimbursements for out of pocket expenses charged by AllianceBernstein Investor Services, Inc. (“ABIS”), the affiliated transfer agent for the Fund, are based on the level of the network account and the class of shares held by the account. ABIS also receives a fee per shareholder sub-account for each account maintained by an intermediary on an omnibus basis. ABIS received $1,654,853 in fees from the Fund during the Fund’s most recently completed fiscal year:
| V. | POSSIBLE ECONOMIES OF SCALE |
The Adviser has indicated that economies of scale are being shared with shareholders through pricing to scale, breakpoints, fee reductions/waivers and enhancement to services.
In May 2012, an independent consultant, retained by the Senior Officer, provided the Board of Directors information on the Adviser’s firm-wide average costs from 2005 through 2011 and the potential economies of scale. The independent consultant noted that from 2005 through 2007 the Adviser experienced significant growth in assets under management (“AUM”). During this period, operating expenses increased, in part to keep up with growth, and in part reflecting market returns. However, from 2008 through the first quarter of 2009, AUM rapidly and significantly decreased due to declines in market value and client withdrawals. When AUM rapidly decreased, some operating expenses
| 22 | | As a result of discussions between the Board and the Adviser, ABI will reduce the Fund’s Class A distribution service fee payment rate from 0.30% to 0.25% effective February 1, 2016. |
| | | | |
| AB HIGH INCOME FUND • | | | 145 | |
categories, including base compensation and office space, adjusted more slowly during this period, resulting in an increase in average costs. Since 2009, AUM has experienced less significant changes. The independent consultant noted that changes in operating expenses reflect changes in business composition and business practices in response to changes in financial markets. Finally, the independent consultant concluded that the increase in average cost and the decline in net operating margin across the Adviser since late 2008 are inconsistent with the view that there are currently reductions in average costs due to economies of scale that can be shared with the AB Mutual Funds managed by the Adviser through lower fees.
Previously, in February 2008, the independent consultant provided the Board of Directors an update of the Deli23 study on advisory fees and various fund characteristics.24 The independent consultant first reiterated the results of his previous two dimensional comparison analysis (fund size and family size) with the Board of Directors.25 The independent consultant then discussed the results of the regression model that was utilized to study the effects of various factors on advisory fees. The regression model output indicated that the bulk of the variation in fees predicted were explained by various factors, but substantially by fund AUM, family AUM, index fund indicator and investment style. The independent consultant also compared the advisory fees of the AB Mutual Funds to similar funds managed by 19 other large asset managers, regardless of the fund size and each Adviser’s proportion of mutual fund assets to non-mutual fund assets.
| VI. | NATURE AND QUALITY OF THE ADVISER’S SERVICES, INCLUDING THE PERFORMANCE OF THE FUND |
With assets under management of approximately $463 billion as of September 30, 2015, the Adviser has the investment experience to manage and provide non-investment services (described in Section I) to the Fund.
| 23 | | The Deli study, originally published in 2002 based on 1997 data and updated for the February 2008 Presentation, may be of diminished value due to the age of the data used in the presentation and the changes experienced in the industry since 2008. |
| 24 | | As mentioned previously, the Supreme Court cautioned against accepting mutual fund fee comparisons without careful scrutiny since the fees may not be the product of negotiations conducted at arm’s length. See Jones v. Harris at 1429. |
| 25 | | The two dimensional analysis showed patterns of lower advisory fees for funds with larger asset sizes and funds from larger family sizes compared to funds with smaller asset sizes and funds from smaller family sizes, which according to the independent consultant is indicative of a sharing of economies of scale and scope. However, in less liquid and active markets, such is not the case, as the empirical analysis showed potential for diseconomies of scale in those markets. The empirical analysis also showed diminishing economies of scale and scope as funds surpassed a certain high level of assets. |
| | |
| 146 | | • AB HIGH INCOME FUND |
The information prepared by Broadridge shows the 1, 3, 5 and 10 year performance returns and rankings26 of the Fund relative to its Broadridge Performance Group (“PG”) and Broadridge Performance Universe (“PU”)27 for the period ended July 31, 2015.28
| | | | | | | | | | | | | | | | |
| | | Fund Return (%) | | | PG Median (%) | | | PU Median (%) | | | PG Rank | | PU Rank |
| High Income Fund, Inc.29 | | | | | | | | | | | | | | | | |
1 year | | | -0.64 | | | | -0.33 | | | | 0.09 | | | 9/14 | | 77/119 |
3 year | | | 6.18 | | | | 5.79 | | | | 5.31 | | | 5/14 | | 19/95 |
5 year | | | 7.45 | | | | 7.39 | | | | 6.87 | | | 5/13 | | 17/82 |
10 year | | | 8.97 | | | | 6.86 | | | | 6.40 | | | 1/11 | | 1/62 |
| 26 | | The performance returns and rankings of the Fund are for the Fund’s Class A shares. The performance returns of the Fund were provided by Broadridge. |
| 27 | | The Fund’s PG is identical to the Fund’s EG. The Fund’s PU is not identical to the Fund’s EU as the criteria for including/excluding a fund from a PU is somewhat different from that of an EU. |
| 28 | | The current Lipper investment classification/objective dictates the PG and PU throughout the life of the Fund even if a Fund had a different investment classification/objective at a different point in time. |
| 29 | | During the third quarter of 2008, the Fund’s Lipper classification changed from Emerging Market Debt Fund to High Yield Fund. |
| | | | |
| AB HIGH INCOME FUND • | | | 147 | |
Set forth below are the 1, 3, 5, 10 year and since inception performance returns of the Fund (in bold)30 versus its benchmarks.31 Fund and benchmark volatility and reward-to-variability ratio (“Sharpe Ratio”) information is also shown.32
| | | | | | | | | | | | | | | | | | | | | | | | | | | | | | | | |
| | | Period Ending July 31, 2015 | |
| | | Annualized Performance | | | | | | | | | | |
| | | 1 Year
(%) | | | 3 Year
(%) | | | 5 Year
(%) | | | 10 Year
(%) | | | Since
Inception
(%) | | | Volatility (%) | | | Sharpe (%) | | | Risk Period (Year) | |
| High Income Fund, Inc.33 | | | -0.64 | | | | 6.19 | | | | 7.45 | | | | 8.98 | | | | 10.76 | | | | 5.99 | | | | 1.21 | | | | 5 | |
| 33% JP Morgan EMBI Index / 33% JP Morgan GBI EM / 33% Barclays Capital High Yield 2% Constrained Index | | | -6.81 | | | | 1.17 | | | | 4.31 | | | | 6.56 | | | | N/A | | | | 7.95 | | | | 0.56 | | | | 5 | |
| JP Morgan EMBI Global Index | | | -1.28 | | | | 2.23 | | | | 5.75 | | | | 7.41 | | | | 9.80 | | | | N/A | | | | N/A | | | | N/A | |
| JP Morgan GBI EM | | | -18.57 | | | | -4.63 | | | | -0.72 | | | | 4.22 | | | | N/A | | | | N/A | | | | N/A | | | | N/A | |
| Barclays Capital High Yield 2% Constrained Index | | | 0.37 | | | | 5.94 | | | | 7.71 | | | | 7.67 | | | | N/A | | | | N/A | | | | N/A | | | | N/A | |
| Inception Date: February 25, 1994 | |
CONCLUSION:
Based on the factors discussed above the Senior Officer’s conclusion is that the proposed advisory fee for the Fund is reasonable and within the range of what would have been negotiated at arm’s length in light of all the surrounding circumstances. This conclusion in respect of the Fund is based on an evaluation of all of these factors and no single factor was dispositive.
Dated: November 25, 2015
| 30 | | The performance returns and risk measures shown in the table are for the Class A shares of the Fund. |
| 31 | | The Adviser provided Fund and benchmark performance return information for periods through July 31, 2015. |
| 32 | | Fund volatility and Sharpe Ratio information was obtained through Lipper LANA, a database maintained by Lipper. Benchmark volatility and Sharpe Ratio information was calculated by the Senior Officer using standard Lipper methodology. Volatility is a statistical measure of the tendency of a market price or yield to vary over time. A Sharpe Ratio is a risk adjusted measure of return that divides a fund’s return in excess of the riskless return by the fund’s standard deviation. A fund with a greater volatility would be viewed as more risky than a fund with equivalent performance but lower volatility; for that reason, a greater return would be demanded for the more risky fund. A fund with a higher Sharpe Ratio would be viewed as better performing than a fund with a lower Sharpe Ratio. |
| 33 | | On or around January 25, 2008, the Fund merged with AB Corporate Debt Portfolio and AB High Yield Fund, Inc. Also at this time, the Fund changed its name from Emerging Markets Debt Fund, Inc. and its investment strategy. The Fund’s benchmark changed from JP Morgan EMBI Global Index to 33% JP Morgan EMBI Index / 33% JP Morgan GBI EM / 33% Barclays Capital High Yield 2% Constrained Index. |
| | |
| 148 | | • AB HIGH INCOME FUND |
THIS PAGE IS NOT PART OF THE SHAREHOLDER REPORT OR THE FINANCIAL STATEMENTS
AB FAMILY OF FUNDS
US EQUITY
US Core
Core Opportunities Fund
Select US Equity Portfolio
US Growth
Concentrated Growth Fund
Discovery Growth Fund
Growth Fund
Large Cap Growth Fund
Small Cap Growth Portfolio
US Value
Discovery Value Fund
Equity Income Fund
Growth & Income Fund
Small Cap Value Portfolio
Value Fund
INTERNATIONAL/ GLOBAL EQUITY
International/Global Core
Global Core Equity Portfolio
Global Equity & Covered Call Strategy Fund
Global Thematic Growth Fund
International Portfolio
Tax-Managed International Portfolio
International/Global Growth
International Growth Fund
International/Global Value
Asia ex-Japan Equity Portfolio
International Value Fund
FIXED INCOME
Municipal
High Income Municipal Portfolio
Intermediate California Municipal Portfolio
Intermediate Diversified Municipal Portfolio
Intermediate New York Municipal Portfolio
Municipal Bond Inflation Strategy
FIXED INCOME (continued)
Tax-Aware Fixed Income Portfolio
National Portfolio
Arizona Portfolio
California Portfolio
Massachusetts Portfolio
Michigan Portfolio
Minnesota Portfolio
New Jersey Portfolio
New York Portfolio
Ohio Portfolio
Pennsylvania Portfolio
Virginia Portfolio
Taxable
Bond Inflation Strategy
Global Bond Fund
High Income Fund
High Yield Portfolio
Intermediate Bond Portfolio
Limited Duration High Income Portfolio
Short Duration Portfolio
ALTERNATIVES
All Market Real Return Portfolio*
Credit Long/Short Portfolio
Global Real Estate Investment Fund
Long/Short Multi-Manager Fund
Multi-Manager Alternative Strategies Fund
Select US Long/Short Portfolio
Unconstrained Bond Fund
MULTI-ASSET
All Market Growth Portfolio*
All Market Income Portfolio
Emerging Markets Multi-Asset Portfolio
Global Risk Allocation Fund
MULTI-ASSET (continued)
Target-Date
Multi-Manager Select Retirement Allocation Fund
Multi-Manager Select 2010 Fund
Multi-Manager Select 2015 Fund
Multi-Manager Select 2020 Fund
Multi-Manager Select 2025 Fund
Multi-Manager Select 2030 Fund
Multi-Manager Select 2035 Fund
Multi-Manager Select 2040 Fund
Multi-Manager Select 2045 Fund
Multi-Manager Select 2050 Fund
Multi-Manager Select 2055 Fund
Wealth Strategies
Balanced Wealth Strategy
Conservative Wealth Strategy
Wealth Appreciation Strategy
Tax-Managed Balanced Wealth Strategy
Tax-Managed Conservative Wealth Strategy
Tax-Managed Wealth Appreciation Strategy
CLOSED-END FUNDS
AB Multi-Manager Alternative Fund
Alliance California Municipal Income Fund
AllianceBernstein Global High Income Fund
AllianceBernstein Income Fund
AllianceBernstein National Municipal Income Fund
We also offer Exchange Reserves, which serves as the money market fund exchange vehicle for the AB mutual funds. An investment in Exchange Reserves is not a deposit in a bank and is not insured or guaranteed by the Federal Deposit Insurance Corporation or any other government agency. Although the Fund seeks to preserve the value of your investment at $1.00 per share, it is possible to lose money by investing in the Fund.
Investors should consider the investment objectives, risks, charges and expenses of the Fund carefully before investing. For copies of our prospectus or summary prospectus, which contain this and other information, visit us online at www.abglobal.com or contact your AB representative. Please read the prospectus and/or summary prospectus carefully before investing.
* Prior to December 15, 2014, All Market Growth Portfolio was named Dynamic All Market Fund; All Market Real Return Portfolio was named Real Asset Strategy.
| | | | |
| AB HIGH INCOME FUND • | | | 149 | |
AB Family of Funds
NOTES
| | |
| 150 | | • AB HIGH INCOME FUND |
NOTES
| | | | |
| AB HIGH INCOME FUND • | | | 151 | |
NOTES
| | |
| 152 | | • AB HIGH INCOME FUND |

AB HIGH INCOME FUND
1345 Avenue of the Americas
New York, NY 10105
800.221.5672
HI-0151-1015 
ITEM 2. CODE OF ETHICS.
(a) The registrant has adopted a code of ethics that applies to its principal executive officer, principal financial officer and principal accounting officer. A copy of the registrant’s code of ethics is filed herewith as Exhibit 12(a)(1).
(b) During the period covered by this report, no material amendments were made to the provisions of the code of ethics adopted in
2(a) above.
(c) During the period covered by this report, no implicit or explicit waivers to the provisions of the code of ethics adopted in
2(a) above were granted.
ITEM 3. AUDIT COMMITTEE FINANCIAL EXPERT.
The registrant’s Board of Directors has determined that independent directors Garry L. Moody, William H. Foulk, Jr. and Marshall C. Turner, Jr. qualify as audit committee financial experts.
ITEM 4. PRINCIPAL ACCOUNTANT FEES AND SERVICES.
(a) - (c) The following table sets forth the aggregate fees billed by the independent registered public accounting firm Ernst & Young LLP, for the Fund’s last two fiscal years for professional services rendered for: (i) the audit of the Fund’s annual financial statements included in the Fund’s annual report to stockholders; (ii) assurance and related services that are reasonably related to the performance of the audit of the Fund’s financial statements and are not reported under (i), which include advice and education related to accounting and auditing issues and quarterly press release review (for those Funds which issue press releases), and preferred stock maintenance testing (for those Funds that issue preferred stock); and (iii) tax compliance, tax advice and tax return preparation.
| | | | | | | | | | | | | | | | |
| | | | | | Audit Fees | | | Audit - Related
Fees | | | Tax Fees | |
AB High Income | | | 2014 | | | $ | 151,938 | | | $ | — | | | $ | 20,076 | |
| | | 2015 | | | $ | 156,542 | | | $ | — | | | $ | 41,046 | |
(d) Not applicable.
(e) (1) Beginning with audit and non-audit service contracts entered into on or after May 6, 2003, the Fund’s Audit Committee policies and procedures require the pre-approval of all audit and non-audit services provided to the Fund by the Fund’s independent registered public accounting firm. The Fund’s Audit Committee policies and procedures also require pre-approval of all audit and non-audit services provided to the Adviser and Service Affiliates to the extent that these services are directly related to the operations or financial reporting of the Fund.
(e) (2) All of the amounts for Audit Fees, Audit-Related Fees and Tax Fees in the table under Item 4 (a) – (c) are for services pre-approved by the Fund’s Audit Committee.
(f) Not applicable.
(g) The following table sets forth the aggregate non-audit services provided to the Fund, the Fund’s Adviser and entities that control, are controlled by or under common control with the Adviser that provide ongoing services to the Fund:
| | | | | | | | | | | | |
| | | | | | All Fees for
Non-Audit Services
Provided to the
Portfolio, the Adviser
and Service
Affiliates | | | Pre-approved by the
Audit Committee
(Portion Comprised of
Audit Related Fees)
(Portion Comprised of
Tax Fees) | |
AB High Income | | | 2014 | | | $ | 430,731 | | | $ | 20,076 | |
| | | | | | | | | | $ | — | |
| | | | | | | | | | $ | (20,076 | ) |
| | | 2015 | | | $ | 459,121 | | | $ | 41,046 | |
| | | | | | | | | | $ | — | |
| | | | | | | | | | $ | (41,046 | ) |
(h) The Audit Committee of the Fund has considered whether the provision of any non-audit services not pre-approved by the Audit Committee provided by the Fund’s independent registered public accounting firm to the Adviser and Service Affiliates is compatible with maintaining the auditor’s independence.
ITEM 5. AUDIT COMMITTEE OF LISTED REGISTRANTS.
Not applicable to the registrant.
ITEM 6. SCHEDULE OF INVESTMENTS.
Please see Schedule of Investments contained in the Report to Shareholders included under Item 1 of this Form N-CSR.
ITEM 7. DISCLOSURE OF PROXY VOTING POLICIES AND PROCEDURES FOR CLOSED-END MANAGEMENT INVESTMENT COMPANIES.
Not applicable to the registrant.
ITEM 8. PORTFOLIO MANAGERS OF CLOSED-END MANAGEMENT INVESTMENT COMPANIES.
Not applicable to the registrant.
ITEM 9. PURCHASES OF EQUITY SECURITIES BY CLOSED-END MANAGEMENT INVESTMENT COMPANY AND AFFILIATED PURCHASERS.
Not applicable to the registrant.
ITEM 10. SUBMISSION OF MATTERS TO A VOTE OF SECURITY HOLDERS.
There have been no material changes to the procedures by which shareholders may recommend nominees to the Fund’s Board of Directors since the Fund last provided disclosure in response to this item.
ITEM 11. CONTROLS AND PROCEDURES.
(a) The registrant’s principal executive officer and principal financial officer have concluded that the registrant’s disclosure controls and procedures (as defined in Rule 30a-3 (c) under the Investment Company Act of 1940, as amended) are effective at the reasonable assurance level based on their evaluation of these controls and procedures as of a date within 90 days of the filing date of this document.
(b) There were no changes in the registrant’s internal controls over financial reporting that occurred during the second fiscal quarter of the period that has materially affected, or is reasonably likely to materially affect, the registrant’s internal control over financial reporting.
ITEM 12. EXHIBITS.
The following exhibits are attached to this Form N-CSR:
| | |
EXHIBIT NO. | | DESCRIPTION OF EXHIBIT |
| |
| 12(a)(1) | | Code of Ethics that is subject to the disclosure of Item 2 hereof |
| |
| 12(b)(1) | | Certification of Principal Executive Officer Pursuant to Section 302 of the Sarbanes-Oxley Act of 2002 |
| |
| 12(b)(2) | | Certification of Principal Financial Officer Pursuant to Section 302 of the Sarbanes-Oxley Act of 2002 |
| |
| 12(c) | | Certification of Principal Executive Officer and Principal Financial Officer Pursuant to Section 906 of the Sarbanes-Oxley Act of 2002 |
SIGNATURES
Pursuant to the requirements of the Securities Exchange Act of 1934 and the Investment Company Act of 1940, the registrant has duly caused this report to be signed on its behalf by the undersigned, thereunto duly authorized.
(Registrant): AB High Income Fund, Inc.
| | |
By: | | /s/ Robert M. Keith |
| | Robert M. Keith |
| | President |
| |
| Date: | | December 21, 2015 |
Pursuant to the requirements of the Securities Exchange Act of 1934 and the Investment Company Act of 1940, this report has been signed below by the following persons on behalf of the registrant and in the capacities and on the dates indicated.
| | |
| By: | | /s/ Robert M. Keith |
| | Robert M. Keith |
| | President |
| |
| Date: | | December 21, 2015 |
| |
| By: | | /s/ Joseph J. Mantineo |
| | Joseph J. Mantineo |
| | Treasurer and Chief Financial Officer |
| |
| Date: | | December 21, 2015 |