UNITED STATES
SECURITIES AND EXCHANGE COMMISSION
WASHINGTON, D.C. 20549
FORM N-CSR
CERTIFIED SHAREHOLDER REPORT OF REGISTERED
MANAGEMENT INVESTMENT COMPANIES
Investment Company Act file number: 811-08188
AB HIGH INCOME FUND, INC.
(Exact name of registrant as specified in charter)
1345 Avenue of the Americas, New York, New York 10105
(Address of principal executive offices) (Zip code)
Joseph J. Mantineo
AllianceBernstein L.P.
1345 Avenue of the Americas
New York, New York 10105
(Name and address of agent for service)
Registrant’s telephone number, including area code: (800) 221-5672
Date of fiscal year end: October 31, 2017
Date of reporting period: April 30, 2017
ITEM 1. REPORTS TO STOCKHOLDERS.
APR 04.30.17
SEMI-ANNUAL REPORT
AB HIGH INCOME FUND

| | |
| |
| Investment Products Offered | | • Are Not FDIC Insured • May Lose Value • Are Not Bank Guaranteed |
Investors should consider the investment objectives, risks, charges and expenses of the Fund carefully before investing. For copies of our prospectus or summary prospectus, which contain this and other information, visit us online at www.abfunds.com or contact your AB representative. Please read the prospectus and/or summary prospectus carefully before investing.
This shareholder report must be preceded or accompanied by the Fund’s prospectus for individuals who are not current shareholders of the Fund.
You may obtain a description of the Fund’s proxy voting policies and procedures, and information regarding how the Fund voted proxies relating to portfolio securities during the most recent 12-month period ended June 30, without charge. Simply visit AB’s website at www.abfunds.com, or go to the Securities and Exchange Commission’s (the “Commission”) website at www.sec.gov, or call AB at (800) 227 4618.
The Fund files its complete schedule of portfolio holdings with the Commission for the first and third quarters of each fiscal year on Form N-Q. The Fund’s Forms N-Q are available on the Commission’s website at www.sec.gov. The Fund’s Forms N-Q may also be reviewed and copied at the Commission��s Public Reference Room in Washington, DC; information on the operation of the Public Reference Room may be obtained by calling (800) SEC 0330. AB publishes full portfolio holdings for the Fund monthly at www.abfunds.com.
AllianceBernstein Investments, Inc. (ABI) is the distributor of the AB family of mutual funds. ABI is a member of FINRA and is an affiliate of AllianceBernstein L.P., the Adviser of the funds.
The [A/B] logo is a registered service mark of AllianceBernstein and AllianceBernstein® is a registered service mark used by permission of the owner, AllianceBernstein L.P.
| | |
| FROM THE PRESIDENT | |  |
Dear Shareholder,
We are pleased to provide this report for AB High Income Fund (the “Fund”). Please review the discussion of Fund performance, the market conditions during the reporting period and the Fund’s investment strategy.
As always, AB strives to keep clients ahead of what’s next by:
| + | | Transforming uncommon insights into uncommon knowledge with a global research scope |
| + | | Navigating markets with seasoned investment experience and sophisticated solutions |
| + | | Providing thoughtful investment insights and actionable ideas |
Whether you’re an individual investor or a multi-billion-dollar institution, we put knowledge and experience to work for you.
AB’s global research organization connects and collaborates across platforms and teams to deliver impactful insights and innovative products. Better insights lead to better opportunities—anywhere in the world.
For additional information about AB’s range of products and shareholder resources, please log on to www.abfunds.com.
Thank you for your investment in the AB Mutual Funds.
Sincerely,

Robert M. Keith
President and Chief Executive Officer, AB Mutual Funds
| | |
| abfunds.com | | AB HIGH INCOME FUND | 1 |
SEMI-ANNUAL REPORT
June 15, 2017
This report provides management’s discussion of fund performance for AB High Income Fund for the semi-annual reporting period ended April 30, 2017.
The Fund’s investment objective is to seek to maximize total returns from price appreciation and income.
NAV RETURNS AS OF APRIL 30, 2017 (unaudited)
| | | | | | | | |
| | | 6 Months | | | 12 Months | |
| AB HIGH INCOME FUND1 | | | | | | | | |
| Class A Shares | | | 6.43% | | | | 13.08% | |
| Class B Shares2 | | | 6.08% | | | | 12.21% | |
| Class C Shares | | | 6.08% | | | | 12.21% | |
| Advisor Class Shares3 | | | 6.55% | | | | 13.35% | |
| Class R Shares3 | | | 6.35% | | | | 12.64% | |
| Class K Shares3 | | | 6.39% | | | | 13.03% | |
| Class I Shares3 | | | 6.57% | | | | 13.38% | |
| Class Z Shares3 | | | 6.58% | | | | 13.41% | |
Primary benchmark:4
Bloomberg Barclays Global High Yield Index (USD hedged) | | | 5.23% | | | | 12.94% | |
| Blended benchmark: 33% JPM EMBI Global / 33% JPM GBI-EM / 33% Bloomberg Barclays US Corporate HY 2% Issuer Capped Index | | | 3.54% | | | | 9.21% | |
| JPM EMBI Global | | | 2.65% | | | | 8.51% | |
| JPM GBI-EM | | | 2.50% | | | | 5.48% | |
| Bloomberg Barclays US Corporate HY 2% Issuer Capped Index | | | 5.30% | | | | 13.29% | |
| 1 | Includes the impact of proceeds received and credited to the Fund resulting from class-action settlements, which enhanced the performance of the Fund for the six- and 12-month periods ended April 30, 2017, by 0.01% and 0.01%, respectively. Also includes the impact of proceeds received and credited to the Fund in connection with a residual distribution relating to regulatory settlements, which enhanced the performance of all share classes of the Fund for the six- and 12-month periods ended April 30, 2017, by 0.00% and 0.01%, respectively. |
| 2 | Effective January 31, 2009, Class B shares are no longer available for sale to new investors. Please see Note A for additional information. |
| 3 | Please note that these share classes are for investors purchasing shares through accounts established under certain fee-based programs sponsored and maintained by certain broker-dealers and financial intermediaries, institutional pension plans and/or investment advisory clients of, and certain other persons associated with, the Adviser and its affiliates or the Fund. |
| 4 | The Fund’s broad-based index used for comparison purposes has changed from the JPM EMBI Global to the Bloomberg Barclays Global High Yield Index (USD hedged) because the new index more closely reflects the Fund’s investments. |
| | |
| 2 | AB HIGH INCOME FUND | | abfunds.com |
INVESTMENT RESULTS
The preceding table shows the Fund’s performance compared with its primary broad-based benchmark, the Bloomberg Barclays Global High Yield Index (US dollar hedged), which tracks the performance of non-investment grade fixed-income securities in the US and developed and emerging markets. It also shows the performance of its blended benchmark, which is composed of equal weightings of the J.P. Morgan Emerging Markets Bond Index Global (“JPM EMBI Global”), the J.P. Morgan Government Bond Index-Emerging Markets (“JPM GBI-EM”) (local currency-denominated) and the Bloomberg Barclays US Corporate High Yield (“HY”) 2% Issuer Capped Index, for the six- and 12-month periods ended April 30, 2017. Individual performance for each of these indices is also included for both time periods.
During the six-month period, all share classes of the Fund outperformed the primary benchmark, before sales charges. Currency selection contributed most to performance, relative to the benchmark. Gains from overweight positions in the Russian ruble, Brazilian real, Argentine peso, Indian rupee and Colombian peso more than offset losses from an underweight in the offshore Chinese renminbi. Country allocation (a result of bottom-up security analysis combined with fundamental research) bolstered returns further, primarily because of overweights to Brazil and Canada and an underweight in the eurozone. Security selection also contributed to performance. Gains from selections within the energy, sovereigns and banking sectors outweighed losses from selections in transportation services and retailers. Yield-curve positioning contributed as well, particularly the Fund’s positioning along the intermediate portion of the US yield curve. Industry allocation detracted, primarily because of an exposure to Treasuries. The Fund’s exposure to collateralized mortgage obligations offset some of these losses.
During the 12-month period, all share classes except Class B, C and R shares outperformed the primary benchmark, before sales charges. Country allocation contributed most to relative performance on the back of gains from an underweight in the eurozone and exposures to Brazil and Canada. Security selection added to returns, as selections within the energy, basics, technology and sovereigns sectors contributed, outweighing losses from selections in transportation services and consumer non-cyclicals. Currency selection was similarly positive, helped most by overweights in the Brazilian real, Russian ruble and Argentine peso. Overweight positions in the Mexican peso and Swedish krona took back some of these gains. Industry allocation detracted, as negative returns from an exposure to Treasuries and underweight in energy more than offset positive returns from an exposure to collateralized mortgage obligations and an underweight in consumer non-cyclicals. Yield-curve positioning did not have a significant impact on overall returns in the period.
| | |
| abfunds.com | | AB HIGH INCOME FUND | 3 |
During both periods, the Fund utilized derivatives in the form of interest rate swaps, futures and interest rate swaptions to manage and hedge duration risk and/or take active yield-curve positioning. Currency forwards and currency options, both written and purchased, were used to hedge foreign currency exposure and to take active currency risk. Credit default swaps, both single name and index, were used to take active exposures as well as to hedge investment grade and high-yield credit risk taken through cash bonds. Total return swaps were used to create synthetic high-yield exposure in the Fund. Variance swaps were used to add alpha by capturing risk premiums that are similar to high-yield exposure elsewhere in the Fund.
MARKET REVIEW AND INVESTMENT STRATEGY
Bond markets rallied over the 12-month period, but were volatile in the latter half of the period. Political events had a significant impact on bond markets during both periods. In the US, Donald Trump’s presidential election victory and the promise of fiscal stimulus, a retreat from globalization and relaxed regulation were treated as positive developments by financial markets, though uncertainty regarding the specific details remained high. UK Prime Minister Theresa May surprised investors when she called for a snap parliamentary election three years ahead of schedule, in an effort to firm up the country’s mandate going into Brexit negotiations. The benign first-round outcome of the French presidential elections quelled some geopolitical uncertainty and renewed appetite for risk assets. Markets, especially in Europe, rallied on the news. The 10-year US Treasury yield rose almost half a percent to end higher at 2.28%. The 10-year German bund yield also rose through both periods, though only modestly in the latter, ending at 0.32%.
European central banks generally maintained an easing bias through the 12-month period, while the US Federal Reserve raised interest rates for the second and third time since the financial crisis in 2008. Accelerating trade and waning inflationary pressures contributed to a rally in emerging-market debt. Yields in developed markets had varying performance in both periods, generally rising in the US, Japan and Canada, and moving in different directions elsewhere, though longer maturities broadly rose. Developed-market treasuries, investment-grade credit securities and emerging-market local-currency government bonds rebounded over the 12-month period, but experienced volatility in the latter half. Global high yield rallied in both periods, during which sector performance was almost uniformly positive; energy and basics were the best performers in each period, benefiting from oil price increases. Consumer-related sectors generally lagged the rising markets, with pharmaceuticals one of the few sectors to fall in both periods.
| | |
| 4 | AB HIGH INCOME FUND | | abfunds.com |
INVESTMENT POLICIES
The Fund pursues income opportunities from government, corporate, emerging-market and high-yield sources. It has the flexibility to invest in a broad range of fixed-income securities in both developed and emerging-market countries. The Fund’s investments may include US and non-US corporate debt securities and sovereign debt securities. The Fund may invest, without limitation, in either US dollar-denominated or non-US dollar-denominated fixed-income securities.
The Adviser selects securities for purchase or sale based on its assessment of the securities’ risk and return characteristics as well as the securities’ impact on the overall risk and return characteristics of the Fund. In making this assessment, the Adviser takes into account various factors, including the credit quality and sensitivity to interest rates of the securities under consideration and of the Fund’s other holdings.
The Fund may invest in debt securities with a range of maturities from short- to long-term. Substantially all of the Fund’s assets may be invested in lower-rated securities, which may include securities having the lowest rating for non-subordinated debt instruments—i.e., rated C by Moody’s Investors Service or CCC+ or lower by S&P Global Ratings and Fitch Ratings—and unrated securities of equivalent investment quality. The Fund also may invest in investment-grade securities and unrated securities.
The Fund may invest in mortgage-related and other asset-backed securities, loan participations, inflation-indexed securities, structured securities, variable, floating, and inverse floating-rate instruments and preferred stock, and may use other investment techniques. The Fund may also make short sales of securities or maintain a short position. The Fund may use borrowings or other leverage for investment purposes. The Fund intends, among other things, to enter into transactions such as reverse repurchase agreements and dollar rolls. The Fund may invest, without limit, in derivatives, such as options, futures contracts, forwards or swap agreements.
| | |
| abfunds.com | | AB HIGH INCOME FUND | 5 |
DISCLOSURES AND RISKS
Benchmark Disclosure
All indices are unmanaged and do not reflect fees and expenses associated with the active management of a mutual fund portfolio. The Bloomberg Barclays Global High Yield Index (USD hedged) represents non-investment grade fixed-income securities of companies in the US, developed and emerging markets. The JPM® EMBI Global (market-capitalization weighted) represents the performance of US dollar-denominated Brady bonds, Eurobonds, and trade loans issued by sovereign and quasi-sovereign entities. The JPM® GBI-EM represents the performance of local currency government bonds issued by emerging markets. The Bloomberg Barclays US Corporate HY 2% Issuer Capped Index is the 2% Issuer Capped component of the US Corporate HY Index. The Bloomberg Barclays US Corporate HY Index represents the performance of fixed-income securities having a maximum quality rating of Ba1, a minimum amount outstanding of $150 million and at least one year to maturity. An investor cannot invest directly in an index or average, and their results are not indicative of the performance for any specific investment, including the Fund.
A Word About Risk
Market Risk: The value of the Fund’s assets will fluctuate as the stock or bond market fluctuates. The value of its investments may decline, sometimes rapidly and unpredictably, simply because of economic changes or other events that affect large portions of the market.
Interest Rate Risk: Changes in interest rates will affect the value of investments in fixed-income securities. When interest rates rise, the value of existing investments in fixed-income securities tends to fall and this decrease in value may not be offset by higher income from new investments. The Fund may be subject to heightened interest rate risk due to rising rates as the current period of historically low interest rates may be ending. Interest rate risk is generally greater for fixed-income securities with longer maturities or durations.
Credit Risk: An issuer or guarantor of a fixed-income security, or the counterparty to a derivatives or other contract, may be unable or unwilling to make timely payments of interest or principal, or to otherwise honor its obligations. The issuer or guarantor may default, causing a loss of the full principal amount of a security and accrued interest. The degree of risk for a particular security may be reflected in its credit rating. There is the possibility that the credit rating of a fixed-income security may be downgraded after purchase, which may adversely affect the value of the security.
Below Investment Grade Securities Risk: Investments in fixed-income securities with lower ratings (commonly known as “junk bonds”) tend to have a higher probability that an issuer will default or fail to meet its payment
| | |
| 6 | AB HIGH INCOME FUND | | abfunds.com |
DISCLOSURES AND RISKS (continued)
obligations. These securities may be subject to greater price volatility due to such factors as specific corporate developments, negative perceptions of the junk bond market generally and less secondary market liquidity.
Duration Risk: Duration is a measure that relates the expected price volatility of a fixed-income security to changes in interest rates. The duration of a fixed-income security may be shorter than or equal to full maturity of a fixed-income security. Fixed-income securities with longer durations have more risk and will decrease in price as interest rates rise. For example, a fixed-income security with a duration of three years will decrease in value by approximately 3% if interest rates increase by 1%.
Inflation Risk: This is the risk that the value of assets or income from investments will be less in the future as inflation decreases the value of money. As inflation increases, the value of the Fund’s assets can decline as can the value of the Fund’s distributions. This risk is significantly greater if the Fund invests a significant portion of its assets in fixed-income securities with longer maturities.
Foreign (Non-US) Risk: Investments in securities of non-US issuers may involve more risk than those of US issuers. These securities may fluctuate more widely in price and may be less liquid due to adverse market, economic, political, regulatory or other factors.
Emerging Market Risk: Investments in emerging-market countries may have more risk because the markets are less developed and less liquid, and because these investments may be subject to increased economic, political, regulatory or other uncertainties.
Currency Risk: Fluctuations in currency exchange rates may negatively affect the value of the Fund’s investments or reduce its returns.
Leverage Risk: To the extent the Fund uses leveraging techniques, its net asset value (“NAV”) may be more volatile because leverage tends to exaggerate the effect of changes in interest rates and any increase or decrease in the value of the Fund’s investments.
Derivatives Risk: Derivatives may be illiquid, difficult to price and leveraged so that small changes may produce disproportionate losses for the Fund, and may be subject to counterparty risk to a greater degree than more traditional investments.
Liquidity Risk: Liquidity risk occurs when certain investments become difficult to purchase or sell. Difficulty in selling less liquid securities may result in sales at disadvantageous prices affecting the value of your investment in the Fund. Causes of liquidity risk may include low trading
| | |
| abfunds.com | | AB HIGH INCOME FUND | 7 |
DISCLOSURES AND RISKS (continued)
volumes, large positions and heavy redemptions of Fund shares. Over recent years liquidity risk has also increased because the capacity of dealers in the secondary market for fixed-income securities to make markets in these securities has decreased, even as the overall bond market has grown significantly, due to, among other things, structural changes, additional regulatory requirements and capital and risk restraints that have led to reduced inventories. Liquidity risk may be higher in a rising interest rate environment, when the value and liquidity of fixed-income securities generally decline.
Management Risk: The Fund is subject to management risk because it is an actively managed investment fund. The Adviser will apply its investment techniques and risk analyses in making investment decisions, but there is no guarantee that its techniques will produce the intended results.
The Fund may invest in mortgage-backed and/or other asset-backed securities, including securities backed by mortgages and assets with an international or emerging-markets origination and securities backed by non-performing loans at the time of investment. Investments in mortgage-backed and other asset-backed securities are subject to certain additional risks. The value of these securities may be particularly sensitive to changes in interest rates. These risks include “extension risk”, which is the risk that, in periods of rising interest rates, issuers may delay the payment of principal, and “prepayment risk”, which is the risk that, in periods of falling interest rates, issuers may pay principal sooner than expected, exposing the Fund to a lower rate of return upon reinvestment of principal. Mortgage-backed securities offered by nongovernmental issuers and other asset-backed securities may be subject to other risks, such as higher rates of default in the mortgages or assets backing the securities or risks associated with the nature and servicing of mortgages or assets backing the securities.
These risks are fully discussed in the Fund’s prospectus. As with all investments, you may lose money by investing in the Fund.
An Important Note About Historical Performance
The investment return and principal value of an investment in the Fund will fluctuate, so that shares, when redeemed, may be worth more or less than their original cost. Performance shown in this report represents past performance and does not guarantee future results. Current performance may be lower or higher than the performance information shown. You may obtain performance information current to the most recent month-end by visiting www.abfunds.com.
| | |
| 8 | AB HIGH INCOME FUND | | abfunds.com |
DISCLOSURES AND RISKS (continued)
All fees and expenses related to the operation of the Fund have been deducted. NAV returns do not reflect sales charges; if sales charges were reflected, the Fund’s quoted performance would be lower. SEC returns reflect the applicable sales charges for each share class: a 4.25% maximum front-end sales charge for Class A shares; the applicable contingent deferred sales charge for Class B shares (3% year 1, 2% year 2, 1% year 3); a 1% 1-year contingent deferred sales charge for Class C shares. Returns for the different share classes will vary due to different expenses associated with each class. Performance assumes reinvestment of distributions and does not account for taxes.
| | |
| abfunds.com | | AB HIGH INCOME FUND | 9 |
HISTORICAL PERFORMANCE
AVERAGE ANNUAL RETURNS AS OF APRIL 30, 2017 (unaudited)
| | | | | | | | | | | | |
| | | NAV Returns | | | SEC Returns
(reflects applicable
sales charges) | | | SEC
Yields1 | |
| CLASS A SHARES | | | | | | | | | | | 5.10% | |
| 1 Year | | | 13.08% | | | | 8.30% | | | | | |
| 5 Years | | | 7.08% | | | | 6.16% | | | | | |
| 10 Years | | | 8.27% | | | | 7.80% | | | | | |
| CLASS B SHARES | | | | | | | | | | | 4.50% | |
| 1 Year | | | 12.21% | | | | 9.21% | | | | | |
| 5 Years | | | 6.24% | | | | 6.24% | | | | | |
| 10 Years2 | | | 7.78% | | | | 7.78% | | | | | |
| CLASS C SHARES | | | | | | | | | | | 4.52% | |
| 1 Year | | | 12.21% | | | | 11.21% | | | | | |
| 5 Years | | | 6.27% | | | | 6.27% | | | | | |
| 10 Years | | | 7.42% | | | | 7.42% | | | | | |
| ADVISOR CLASS SHARES3 | | | | | | | | | | | 5.57% | |
| 1 Year | | | 13.35% | | | | 13.35% | | | | | |
| 5 Years | | | 7.36% | | | | 7.36% | | | | | |
| Since Inception4 | | | 8.91% | | | | 8.91% | | | | | |
| CLASS R SHARES3 | | | | | | | | | | | 4.90% | |
| 1 Year | | | 12.64% | | | | 12.64% | | | | | |
| 5 Years | | | 6.70% | | | | 6.70% | | | | | |
| Since Inception4 | | | 8.28% | | | | 8.28% | | | | | |
| CLASS K SHARES3 | | | | | | | | | | | 5.21% | |
| 1 Year | | | 13.03% | | | | 13.03% | | | | | |
| 5 Years | | | 7.05% | | | | 7.05% | | | | | |
| Since Inception4 | | | 8.62% | | | | 8.62% | | | | | |
| CLASS I SHARES3 | | | | | | | | | | | 5.61% | |
| 1 Year | | | 13.38% | | | | 13.38% | | | | | |
| 5 Years | | | 7.41% | | | | 7.41% | | | | | |
| Since Inception4 | | | 8.95% | | | | 8.95% | | | | | |
| CLASS Z SHARES3 | | | | | | | | | | | 5.63% | |
| 1 Year | | | 13.41% | | | | 13.41% | | | | | |
| Since Inception4 | | | 6.22% | | | | 6.22% | | | | | |
The Fund’s current prospectus fee table shows the Fund’s total annual operating expense ratios as 0.86%, 1.63%, 1.58%, 0.58%, 1.22%, 0.85%, 0.53% and 0.51% for Class A, Class B, Class C, Advisor Class, Class R, Class K, Class I and Class Z shares, respectively, gross of any fee waivers or expense reimbursements. Contractual fee waivers and/or expense reimbursements limited the Fund’s annual operating expenses to 0.85% for Class A shares. Absent reimbursements or waivers, performance would have been lower. The Financial Highlights section of this report sets forth expense ratio data for the current reporting period; the expense ratios shown above may differ from the expense ratios in the Financial Highlights sections since they are based on different time periods.
(footnotes continued on next page)
| | |
| 10 | AB HIGH INCOME FUND | | abfunds.com |
HISTORICAL PERFORMANCE (continued)
| 1 | SEC yields are calculated based on SEC guidelines for the 30-day period ended April 30, 2017. |
| 2 | Assumes conversion of Class B shares into Class A shares after six years. |
| 3 | These share classes are offered at NAV to eligible investors and their SEC returns are the same as their NAV returns. Please note that these share classes are for investors purchasing shares through accounts established under certain fee-based programs sponsored and maintained by certain broker-dealers and financial intermediaries, institutional pension plans and/or investment advisory clients of and certain other persons associated with, the Adviser and its affiliates or the Fund. |
| 4 | Inception dates: 1/28/2008 for Advisor Class, Class R, Class K and Class I shares; 10/15/2013 for Class Z shares. |
| | |
| abfunds.com | | AB HIGH INCOME FUND | 11 |
HISTORICAL PERFORMANCE (continued)
SEC AVERAGE ANNUAL RETURNS
AS OF THE MOST RECENT CALENDAR QUARTER-END
MARCH 31, 2017 (unaudited)
| | | | |
| | | SEC Returns (reflects applicable sales charges) | |
| CLASS A SHARES | | | | |
| 1 Year | | | 10.39% | |
| 5 Years | | | 6.05% | |
| 10 Years | | | 7.81% | |
| CLASS B SHARES | | | | |
| 1 Year | | | 11.36% | |
| 5 Years | | | 6.16% | |
| 10 Years1 | | | 7.78% | |
| CLASS C SHARES | | | | |
| 1 Year | | | 13.35% | |
| 5 Years | | | 6.16% | |
| 10 Years | | | 7.43% | |
| ADVISOR CLASS SHARES2 | | | | |
| 1 Year | | | 15.53% | |
| 5 Years | | | 7.28% | |
| Since Inception3 | | | 8.84% | |
| CLASS R SHARES2 | | | | |
| 1 Year | | | 14.81% | |
| 5 Years | | | 6.60% | |
| Since Inception3 | | | 8.21% | |
| CLASS K SHARES2 | | | | |
| 1 Year | | | 15.22% | |
| 5 Years | | | 6.97% | |
| Since Inception3 | | | 8.55% | |
| CLASS I SHARES2 | | | | |
| 1 Year | | | 15.57% | |
| 5 Years | | | 7.33% | |
| Since Inception3 | | | 8.88% | |
| CLASS Z SHARES2 | | | | |
| 1 Year | | | 15.59% | |
| Since Inception3 | | | 5.97% | |
| 1 | Assumes conversion of Class B shares into Class A shares after six years. |
| 2 | Please note that these share classes are for investors purchasing shares through accounts established under certain fee-based programs sponsored and maintained by certain broker-dealers and financial intermediaries, institutional pension plans and/or investment advisory clients of, and certain other persons associated with, the Adviser and its affiliates or the Fund. |
| 3 | Inception dates: 1/28/2008 for Advisor Class, Class R, Class K and Class I shares; 10/15/2013 for Class Z shares. |
| | |
| 12 | AB HIGH INCOME FUND | | abfunds.com |
EXPENSE EXAMPLE
(unaudited)
As a shareholder of the Fund, you incur two types of costs: (1) transaction costs, including sales charges (loads) on purchase payments, contingent deferred sales charges on redemptions and (2) ongoing costs, including management fees; distribution (12b-1) fees; and other Fund expenses. This example is intended to help you understand your ongoing costs (in dollars) of investing in the Fund and to compare these costs with the ongoing costs of investing in other mutual funds.
The Example is based on an investment of $1,000 invested at the beginning of the period and held for the entire period as indicated below.
Actual Expenses
The first line of the table below provides information about actual account values and actual expenses. You may use the information in this line, together with the amount you invested, to estimate the expenses that you paid over the period. Simply divide your account value by $1,000 (for example, an $8,600 account value divided by $1,000 = 8.6), then multiply the result by the number in the first line under the heading entitled “Expenses Paid During Period” to estimate the expenses you paid on your account during this period.
Hypothetical Example for Comparison Purposes
The second line of the table below provides information about hypothetical account values and hypothetical expenses based on the Fund’s actual expense ratio and an assumed annual rate of return of 5% before expenses, which is not the Fund’s actual return. The hypothetical account values and expenses may not be used to estimate the actual ending account balance or expenses you paid for the period. You may use this information to compare the ongoing costs of investing in the Fund and other funds by comparing this 5% hypothetical example with the 5% hypothetical examples that appear in the shareholder reports of other funds.
| | | | | | | | | | | | | | | | | | | | | | | | |
| | | Beginning
Account
Value
11/1/2016 | | | Ending
Account
Value
4/30/2017 | | | Expenses
Paid
During
Period* | | | Annualized
Expense
Ratio* | | | Effective
Expenses
Paid
During
Period+ | | | Effective
Annualized
Expense
Ratio+ | |
| Class A | | | | | | | | | | | | | | | | | | | | | | | | |
Actual | | $ | 1,000 | | | $ | 1,064.30 | | | $ | 4.09 | | | | 0.80 | % | | $ | 4.09 | | | | 0.80 | % |
Hypothetical** | | $ | 1,000 | | | $ | 1,020.83 | | | $ | 4.01 | | | | 0.80 | % | | $ | 4.01 | | | | 0.80 | % |
| Class B | | | | | | | | | | | | | | | | | | | | | | | | |
Actual | | $ | 1,000 | | | $ | 1,060.80 | | | $ | 8.07 | | | | 1.58 | % | | $ | 8.07 | | | | 1.58 | % |
Hypothetical** | | $ | 1,000 | | | $ | 1,016.96 | | | $ | 7.90 | | | | 1.58 | % | | $ | 7.90 | | | | 1.58 | % |
| Class C | | | | | | | | | | | | | | | | | | | | | | | | |
Actual | | $ | 1,000 | | | $ | 1,060.80 | | | $ | 7.87 | | | | 1.54 | % | | $ | 7.92 | | | | 1.55 | % |
Hypothetical** | | $ | 1,000 | | | $ | 1,017.16 | | | $ | 7.70 | | | | 1.54 | % | | $ | 7.75 | | | | 1.55 | % |
| | |
| abfunds.com | | AB HIGH INCOME FUND | 13 |
EXPENSE EXAMPLE (continued)
| | | | | | | | | | | | | | | | | | | | | | | | |
| | | Beginning
Account
Value
11/1/2016 | | | Ending
Account
Value
4/30/2017 | | | Expenses
Paid
During
Period* | | | Annualized
Expense
Ratio* | | | Effective
Expenses
Paid
During
Period+ | | | Effective
Annualized
Expense
Ratio+ | |
| Advisor Class | | | | | | | | | | | | | | | | | | | | | | | | |
Actual | | $ | 1,000 | | | $ | 1,065.50 | | | $ | 2.82 | | | | 0.55 | % | | $ | 2.82 | | | | 0.55 | % |
Hypothetical** | | $ | 1,000 | | | $ | 1,022.07 | | | $ | 2.76 | | | | 0.55 | % | | $ | 2.76 | | | | 0.55 | % |
| Class R | | | | | | | | | | | | | | | | | | | | | | | | |
Actual | | $ | 1,000 | | | $ | 1,063.50 | | | $ | 6.09 | | | | 1.19 | % | | $ | 6.14 | | | | 1.20 | % |
Hypothetical** | | $ | 1,000 | | | $ | 1,018.89 | | | $ | 5.96 | | | | 1.19 | % | | $ | 6.01 | | | | 1.20 | % |
| Class K | | | | | | | | | | | | | | | | | | | | | | | | |
Actual | | $ | 1,000 | | | $ | 1,063.90 | | | $ | 4.45 | | | | 0.87 | % | | $ | 4.45 | | | | 0.87 | % |
Hypothetical** | | $ | 1,000 | | | $ | 1,020.48 | | | $ | 4.36 | | | | 0.87 | % | | $ | 4.36 | | | | 0.87 | % |
| Class I | | | | | | | | | | | | | | | | | | | | | | | | |
Actual | | $ | 1,000 | | | $ | 1,065.70 | | | $ | 2.66 | | | | 0.52 | % | | $ | 2.71 | | | | 0.53 | % |
Hypothetical** | | $ | 1,000 | | | $ | 1,022.22 | | | $ | 2.61 | | | | 0.52 | % | | $ | 2.66 | | | | 0.53 | % |
| Class Z | | | | | | | | | | | | | | | | | | | | | | | | |
Actual | | $ | 1,000 | | | $ | 1,065.80 | | | $ | 2.51 | | | | 0.49 | % | | $ | 2.51 | | | | 0.49 | % |
Hypothetical** | | $ | 1,000 | | | $ | 1,022.36 | | | $ | 2.46 | | | | 0.49 | % | | $ | 2.46 | | | | 0.49 | % |
| * | Expenses are equal to the classes’ annualized expense ratios multiplied by the average account value over the period, multiplied by 181/365 (to reflect the one-half year period). |
| ** | Assumes 5% annual return before expenses. |
| + | The Fund’s investments in affiliated/unaffiliated underlying portfolios incur no direct expenses, but bear proportionate shares of the acquired fund fees (i.e., operating, administrative and investment advisory fee) of the affiliated/unaffiliated underlying portfolios. Currently the Adviser has voluntarily agreed to waive its investment advisory fee from the Fund in an amount equal to the Fund’s share of the advisory fees of the affiliated underlying portfolios, as borne indirectly by the Fund as an acquired fund fee and expense. The Fund’s effective expenses are equal to the classes’ annualized expense ratio plus the Fund’s pro-rata share of the weighted average expense ratio of the affiliated/unaffiliated underlying portfolios in which it invests, multiplied by the average account value over the period, multiplied by 181/365 (to reflect the one-half year period). |
| | |
| 14 | AB HIGH INCOME FUND | | abfunds.com |
PORTFOLIO SUMMARY
April 30, 2017 (unaudited)
PORTFOLIO STATISTICS
Net Assets ($mil): $8,149.1
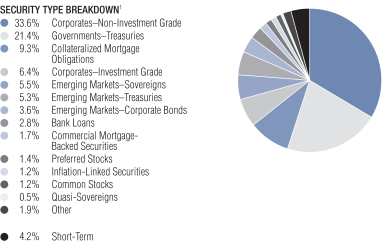
| 1 | All data are as of April 30, 2017. The Fund’s security type breakdown is expressed as a percentage of total investments and may vary over time. The Fund also enters into derivative transactions, which may be used for hedging or investment purposes (see “Portfolio of Investments” section of the report for additional details). “Other” securities type weightings represents 0.5% or less in the following security types: Asset-Backed Securities, Collateralized Loan Obligations, Governments–Sovereign Bonds, Local Governments–US Municipal Bonds, Local Governments–Regional Bonds, Options Purchased–Calls, Options Purchased–Puts, Warrants and Whole Loan Trusts. |
| | |
| abfunds.com | | AB HIGH INCOME FUND | 15 |
PORTFOLIO SUMMARY (continued)
April 30, 2017 (unaudited)
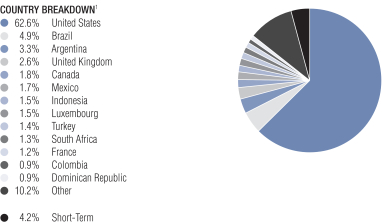
| 1 | All data are as of April 30, 2017. The Fund’s country breakdown is expressed as a percentage of total investments and may vary over time. The Fund also enters into derivative transactions, which may be used for hedging or investment purposes (see “Portfolio of Investments” section of the report for additional details). “Other” country weightings represent 0.9% or less in the following countries or regions: Angola, Australia, Bahamas, Bahrain, Barbados, Bermuda, Cameroon, Cayman Islands, Chile, Croatia, Ecuador, Egypt, El Salvador, Ethiopia, Eurozone, Gabon, Germany, Guatemala, Honduras, India, Iraq, Ireland, Israel, Italy, Ivory Coast, Jamaica, Japan, Jordan, Kazakhstan, Kenya, Lebanon, Macau, Mongolia, Netherlands, New Zealand, Nigeria, Norway, Pakistan, Peru, Portugal, Romania, Russia, Serbia, Spain, Sri Lanka, Switzerland, Trinidad & Tobago, Ukraine, Venezuela and Zambia. |
| | |
| 16 | AB HIGH INCOME FUND | | abfunds.com |
PORTFOLIO OF INVESTMENTS
April 30, 2017 (unaudited)
| | | | | | | | | | | | |
| | | | | | Principal Amount (000) | | | U.S. $ Value | |
| |
| | | | | | | | | | | | |
CORPORATES – NON-INVESTMENT GRADE – 33.8% | | | | | | | | | | | | |
Industrial – 28.1% | | | | | | | | | | | | |
Basic – 3.1% | | | | | | | | | | | | |
AK Steel Corp.
7.625%, 10/01/21 | | | U.S.$ | | | | 3,745 | | | $ | 3,904,649 | |
Aleris International, Inc.
7.875%, 11/01/20 | | | | | | | 4,671 | | | | 4,629,699 | |
Anglo American Capital PLC
4.125%, 4/15/21(a) | | | | | | | 780 | | | | 799,640 | |
4.75%, 4/10/27(a) | | | | | | | 4,031 | | | | 4,153,417 | |
4.875%, 5/14/25(a) | | | | | | | 1,287 | | | | 1,341,575 | |
ArcelorMittal
7.50%, 3/01/41 | | | | | | | 6,623 | | | | 7,447,431 | |
7.75%, 10/15/39 | | | | | | | 11,307 | | | | 12,938,137 | |
Ashland LLC
4.75%, 8/15/22 | | | | | | | 1,800 | | | | 1,875,121 | |
Axalta Coating Systems LLC
4.875%, 8/15/24(a) | | | | | | | 2,893 | | | | 2,996,312 | |
Berry Plastics Corp.
5.50%, 5/15/22 | | | | | | | 1,590 | | | | 1,659,650 | |
CF Industries, Inc.
4.95%, 6/01/43 | | | | | | | 3,911 | | | | 3,255,395 | |
5.375%, 3/15/44 | | | | | | | 3,218 | | | | 2,793,897 | |
6.875%, 5/01/18 | | | | | | | 1,100 | | | | 1,145,964 | |
Commercial Metals Co.
4.875%, 5/15/23 | | | | | | | 3,249 | | | | 3,294,538 | |
Constellium NV
5.75%, 5/15/24(a) | | | | | | | 9,890 | | | | 9,222,554 | |
ERP Iron Ore, LLC
9.039%, 12/31/19(b)(c)(d) | | | | | | | 2,924 | | | | 2,923,775 | |
First Quantum Minerals Ltd.
7.00%, 2/15/21(a) | | | | | | | 1,371 | | | | 1,417,796 | |
7.25%, 5/15/22-4/01/23(a) | | | | | | | 9,687 | | | | 9,956,920 | |
Freeport-McMoRan, Inc.
5.40%, 11/14/34 | | | | | | | 3,333 | | | | 2,967,333 | |
5.45%, 3/15/43 | | | | | | | 8,300 | | | | 7,070,280 | |
6.125%, 6/15/19(a) | | | | | | | 1,298 | | | | 1,318,553 | |
6.50%, 11/15/20(a) | | | | | | | 3,362 | | | | 3,446,440 | |
6.625%, 5/01/21(a) | | | | | | | 649 | | | | 663,249 | |
6.75%, 2/01/22(a) | | | | | | | 1,566 | | | | 1,638,943 | |
Grinding Media, Inc./MC Grinding Media Canada, Inc.
7.375%, 12/15/23(a) | | | | | | | 7,199 | | | | 7,670,103 | |
Ineos Finance PLC
4.00%, 5/01/23(a) | | | EUR | | | | 5,160 | | | | 5,839,375 | |
| | |
| abfunds.com | | AB HIGH INCOME FUND | 17 |
PORTFOLIO OF INVESTMENTS (continued)
| | | | | | | | | | | | |
| | | | | | Principal Amount (000) | | | U.S. $ Value | |
| |
| | | | | | | | | | | | |
Joseph T Ryerson & Son, Inc.
11.00%, 5/15/22(a) | | | U.S.$ | | | | 20,167 | | | $ | 22,755,051 | |
Lecta SA
6.50%, 8/01/23(a) | | | EUR | | | | 1,106 | | | | 1,266,711 | |
Lundin Mining Corp.
7.50%, 11/01/20(a) | | | U.S.$ | | | | 2,459 | | | | 2,605,193 | |
7.875%, 11/01/22(a) | | | | | | | 4,001 | | | | 4,392,226 | |
Magnetation LLC/Mag Finance Corp.
11.00%, 5/15/18(e)(f)(g) | | | | | | | 16,121 | | | | 1,612 | |
Momentive Performance Materials, Inc.
3.88%, 10/24/21 | | | | | | | 22,931 | | | | 22,818,661 | |
8.875%, 10/15/20(b)(f)(h) | | | | | | | 22,931 | | | | – 0 | – |
NOVA Chemicals Corp.
5.00%, 5/01/25(a) | | | | | | | 2,349 | | | | 2,401,329 | |
Novelis Corp.
5.875%, 9/30/26(a) | | | | | | | 8,210 | | | | 8,428,386 | |
6.25%, 8/15/24(a) | | | | | | | 2,634 | | | | 2,770,209 | |
Pactiv LLC
7.95%, 12/15/25 | | | | | | | 6,261 | | | | 6,915,581 | |
Peabody Energy Corp.
6.00%, 11/15/18 | | | | | | | 28,941 | | | | – 0 | – |
6.00%, 3/31/22(a) | | | | | | | 1,509 | | | | 1,538,137 | |
Plastipak Holdings, Inc.
6.50%, 10/01/21(a) | | | | | | | 2,949 | | | | 3,033,262 | |
Reynolds Group Issuer, Inc./Reynolds Group Issuer LLC/Reynolds Group Issuer Lu
5.125%, 7/15/23(a) | | | | | | | 4,552 | | | | 4,732,064 | |
Sealed Air Corp.
6.875%, 7/15/33(a) | | | | | | | 14,904 | | | | 16,200,872 | |
SIG Combibloc Holdings SCA
7.75%, 2/15/23(a) | | | EUR | | | | 3,835 | | | | 4,475,231 | |
Smurfit Kappa Acquisitions Unltd Co.
4.875%, 9/15/18(a) | | | U.S.$ | | | | 4,234 | | | | 4,348,974 | |
Smurfit Kappa Treasury Funding Ltd.
7.50%, 11/20/25 | | | | | | | 1,073 | | | | 1,270,305 | |
SPCM SA
4.875%, 9/15/25(a) | | | | | | | 8,220 | | | | 8,319,840 | |
Steel Dynamics, Inc.
5.125%, 10/01/21 | | | | | | | 1,007 | | | | 1,040,114 | |
6.375%, 8/15/22 | | | | | | | 3,790 | | | | 3,941,793 | |
Teck Resources Ltd.
5.40%, 2/01/43 | | | | | | | 8,166 | | | | 7,906,681 | |
6.125%, 10/01/35 | | | | | | | 5,000 | | | | 5,278,440 | |
6.25%, 7/15/41 | | | | | | | 1,323 | | | | 1,404,178 | |
| | |
| 18 | AB HIGH INCOME FUND | | abfunds.com |
PORTFOLIO OF INVESTMENTS (continued)
| | | | | | | | | | | | |
| | | | | | Principal Amount (000) | | | U.S. $ Value | |
| |
| | | | | | | | | | | | |
United States Steel Corp.
8.375%, 7/01/21(a) | | | U.S.$ | | | | 5,453 | | | $ | 6,003,022 | |
Valvoline, Inc.
5.50%, 7/15/24(a) | | | | | | | 1,738 | | | | 1,844,426 | |
| | | | | | | | | | | | |
| | | | | | | | | | | 252,063,044 | |
| | | | | | | | | | | | |
Capital Goods – 1.4% | | | | | | | | | | | | |
Accudyne Industries Borrower/Accudyne Industries LLC
7.75%, 12/15/20(a) | | | | | | | 3,293 | | | | 3,292,206 | |
Apex Tool Group LLC
7.00%, 2/01/21(a) | | | | | | | 7,737 | | | | 7,179,371 | |
ARD Finance SA
6.625% (6.62% Cash or 7.375% PIK), 9/15/23(a)(d) | | | EUR | | | | 10,431 | | | | 11,811,920 | |
Ardagh Packaging Finance PLC/Ardagh Holdings USA, Inc.
6.75%, 5/15/24(a) | | | | | | | 9,883 | | | | 11,828,909 | |
B456 Systems, Inc.
3.75%, 4/15/16(c)(f)(i) | | | U.S.$ | | | | 3,985 | | | | 239,100 | |
Bombardier, Inc.
7.50%, 3/15/25(a) | | | | | | | 5,805 | | | | 6,042,802 | |
7.75%, 3/15/20(a) | | | | | | | 2,558 | | | | 2,770,368 | |
8.75%, 12/01/21(a) | | | | | | | 7,024 | | | | 7,810,709 | |
BWAY Holding Co.
5.50%, 4/15/24(a) | | | | | | | 7,810 | | | | 7,895,223 | |
Clean Harbors, Inc.
5.125%, 6/01/21 | | | | | | | 3,417 | | | | 3,497,898 | |
5.25%, 8/01/20 | | | | | | | 800 | | | | 815,178 | |
Energizer Holdings, Inc.
5.50%, 6/15/25(a) | | | | | | | 6,119 | | | | 6,364,494 | |
EnPro Industries, Inc.
5.875%, 9/15/22 | | | | | | | 5,800 | | | | 6,086,253 | |
Gardner Denver, Inc.
6.875%, 8/15/21(a) | | | | | | | 3,462 | | | | 3,593,650 | |
Gates Global LLC/Gates Global Co.
5.75%, 7/15/22(a) | | | EUR | | | | 710 | | | | 793,058 | |
6.00%, 7/15/22(a) | | | U.S.$ | | | | 7,870 | | | | 7,924,547 | |
GFL Environmental, Inc.
7.875%, 4/01/20(a) | | | | | | | 1,770 | | | | 1,836,729 | |
9.875%, 2/01/21(a) | | | | | | | 6,191 | | | | 6,691,542 | |
KLX, Inc.
5.875%, 12/01/22(a) | | | | | | | 5,387 | | | | 5,654,621 | |
Liberty Tire Recycling LLC
11.00%, 3/31/21(d)(e) | | | | | | | 2,416 | | | | 1,380,422 | |
Textron Financial Corp.
2.774% (LIBOR 3 Month + 1.74%),
2/15/42(a)(j) | | | | | | | 125 | | | | 99,902 | |
| | |
| abfunds.com | | AB HIGH INCOME FUND | 19 |
PORTFOLIO OF INVESTMENTS (continued)
| | | | | | | | | | | | |
| | | | | | Principal Amount (000) | | | U.S. $ Value | |
| |
| | | | | | | | | | | | |
TransDigm, Inc.
6.375%, 6/15/26 | | | U.S.$ | | | | 9,896 | | | $ | 9,984,559 | |
6.50%, 7/15/24 | | | | | | | 3,170 | | | | 3,263,775 | |
| | | | | | | | | | | | |
| | | | | | | | | | | 116,857,236 | |
| | | | | | | | | | | | |
Communications - Media – 3.4% | | | | | | | | | | | | |
Altice Financing SA
6.625%, 2/15/23(a) | | | | | | | 13,760 | | | | 14,561,754 | |
7.50%, 5/15/26(a) | | | | | | | 11,970 | | | | 12,928,797 | |
Altice Luxembourg SA
7.25%, 5/15/22(a) | | | EUR | | | | 6,390 | | | | 7,359,457 | |
CCO Holdings LLC/CCO Holdings Capital Corp.
5.375%, 5/01/25(a) | | | U.S.$ | | | | 732 | | | | 763,177 | |
5.75%, 1/15/24 | | | | | | | 500 | | | | 526,359 | |
5.875%, 5/01/27(a) | | | | | | | 2,868 | | | | 3,040,046 | |
Cequel Communications Holdings I LLC/Cequel Capital Corp.
7.75%, 7/15/25(a) | | | | | | | 5,014 | | | | 5,578,075 | |
Clear Channel Worldwide Holdings, Inc.
Series A
6.50%, 11/15/22 | | | | | | | 2,230 | | | | 2,277,945 | |
Series B
6.50%, 11/15/22 | | | | | | | 6,270 | | | | 6,498,767 | |
CSC Holdings LLC
10.125%, 1/15/23(a) | | | | | | | 3,053 | | | | 3,537,664 | |
DISH DBS Corp.
5.875%, 11/15/24 | | | | | | | 5,603 | | | | 5,874,947 | |
6.75%, 6/01/21 | | | | | | | 1,500 | | | | 1,633,018 | |
7.75%, 7/01/26 | | | | | | | 2,915 | | | | 3,412,774 | |
7.875%, 9/01/19 | | | | | | | 520 | | | | 577,065 | |
Gray Television, Inc.
5.125%, 10/15/24(a) | | | | | | | 7,217 | | | | 7,250,256 | |
iHeartCommunications, Inc.
6.875%, 6/15/18 | | | | | | | 10,579 | | | | 7,202,226 | |
9.00%, 12/15/19-3/01/21 | | | | | | | 15,846 | | | | 12,433,806 | |
10.625%, 3/15/23 | | | | | | | 1,507 | | | | 1,139,521 | |
11.25%, 3/01/21(a) | | | | | | | 2,444 | | | | 1,886,348 | |
14.00% (12.00% Cash and 2.00% PIK), 2/01/21(d) | | | | | | | 1,386 | | | | 401,858 | |
LGE HoldCo VI BV
7.125%, 5/15/24(a) | | | EUR | | | | 3,158 | | | | 3,901,404 | |
Liberty Interactive LLC
3.75%, 2/15/30(i) | | | U.S.$ | | | | 2,233 | | | | 1,356,659 | |
McClatchy Co. (The)
9.00%, 12/15/22(k) | | | | | | | 5,524 | | | | 5,769,614 | |
| | |
| 20 | AB HIGH INCOME FUND | | abfunds.com |
PORTFOLIO OF INVESTMENTS (continued)
| | | | | | | | | | | | |
| | | | | | Principal Amount (000) | | | U.S. $ Value | |
| |
| | | | | | | | | | | | |
McGraw-Hill Global Education Holdings LLC/McGraw-Hill Global Education Finance
7.875%, 5/15/24(a)(k) | | | U.S.$ | | | | 10,000 | | | $ | 9,726,280 | |
NAI Entertainment Holdings/NAI Entertainment Holdings Finance Corp.
5.00%, 8/01/18(a) | | | | | | | 1,806 | | | | 1,819,393 | |
Netflix, Inc.
4.375%, 11/15/26(a) | | | | | | | 10,284 | | | | 10,157,229 | |
Radio One, Inc.
7.375%, 4/15/22(a) | | | | | | | 7,700 | | | | 8,008,000 | |
9.25%, 2/15/20(a)(k) | | | | | | | 9,972 | | | | 9,845,326 | |
SFR Group SA
5.375%, 5/15/22(a) | | | EUR | | | | 622 | | | | 705,907 | |
5.625%, 5/15/24(a) | | | | | | | 1,981 | | | | 2,328,634 | |
6.00%, 5/15/22(a) | | | U.S.$ | | | | 821 | | | | 855,848 | |
7.375%, 5/01/26(a) | | | | | | | 18,406 | | | | 19,373,677 | |
Sinclair Television Group, Inc.
5.625%, 8/01/24(a) | | | | | | | 2,436 | | | | 2,531,184 | |
6.125%, 10/01/22 | | | | | | | 2,204 | | | | 2,301,285 | |
TEGNA, Inc.
4.875%, 9/15/21(a) | | | | | | | 1,071 | | | | 1,104,095 | |
5.50%, 9/15/24(a) | | | | | | | 719 | | | | 738,047 | |
6.375%, 10/15/23 | | | | | | | 3,966 | | | | 4,210,480 | |
Time, Inc.
5.75%, 4/15/22(a) | | | | | | | 7,772 | | | | 7,957,790 | |
Townsquare Media, Inc.
6.50%, 4/01/23(a) | | | | | | | 5,674 | | | | 5,736,170 | |
Unitymedia Hessen GmbH & Co. KG/Unitymedia NRW GmbH
5.50%, 9/15/22(a) | | | EUR | | | | 2,430 | | | | 2,759,735 | |
5.50%, 1/15/23(a) | | | U.S.$ | | | | 8,392 | | | | 8,739,303 | |
Univision Communications, Inc.
5.125%, 5/15/23-2/15/25(a) | | | | | | | 9,363 | | | | 9,378,203 | |
UPCB Finance IV Ltd.
5.375%, 1/15/25(a) | | | | | | | 5,668 | | | | 5,775,426 | |
Virgin Media Finance PLC
4.875%, 2/15/22 | | | | | | | 8,905 | | | | 7,992,309 | |
5.25%, 2/15/22 | | | | | | | 941 | | | | 853,846 | |
Virgin Media Receivables Financing Notes I DAC
5.50%, 9/15/24(a) | | | GBP | | | | 445 | | | | 607,079 | |
Virgin Media Secured Finance PLC
5.50%, 1/15/25(a) | | | | | | | 2,070 | | | | 2,836,887 | |
Wave Holdco LLC/Wave Holdco Corp.
8.25% (8.25% Cash or 9.00 % PIK), 7/15/19(a)(d) | | | U.S.$ | | | | 5,030 | | | | 5,055,016 | |
| | |
| abfunds.com | | AB HIGH INCOME FUND | 21 |
PORTFOLIO OF INVESTMENTS (continued)
| | | | | | | | | | | | |
| | | | | | Principal Amount (000) | | | U.S. $ Value | |
| |
| | | | | | | | | | | | |
WaveDivision Escrow LLC/WaveDivision Escrow Corp.
8.125%, 9/01/20(a) | | | U.S.$ | | | | 2,612 | | | $ | 2,692,909 | |
WideOpenWest Finance LLC/WideOpenWest Capital Corp.
10.25%, 7/15/19 | | | | | | | 16,473 | | | | 17,134,111 | |
Ziggo Bond Finance BV
5.875%, 1/15/25(a) | | | | | | | 6,178 | | | | 6,348,680 | |
Ziggo Secured Finance BV
5.50%, 1/15/27(a) | | | | | | | 8,360 | | | | 8,563,792 | |
| | | | | | | | | | | | |
| | | | | | | | | | | 276,048,178 | |
| | | | | | | | | | | | |
Communications - Telecommunications – 2.5% | | | | | | | | | | | | |
Arqiva Broadcast Finance PLC
9.50%, 3/31/20(a) | | | GBP | | | | 6,207 | | | | 8,671,686 | |
CenturyLink, Inc.
Series W
6.75%, 12/01/23 | | | U.S.$ | | | | 1,850 | | | | 1,979,474 | |
Clear Channel Communications, Inc.
12.00%, 8/01/21(f) | | | | | | | 2,737 | | | | 4,927 | |
Embarq Corp.
7.995%, 6/01/36 | | | | | | | 12,200 | | | | 12,422,260 | |
Frontier Communications Corp.
6.875%, 1/15/25 | | | | | | | 244 | | | | 203,252 | |
7.125%, 1/15/23 | | | | | | | 100 | | | | 87,808 | |
7.625%, 4/15/24 | | | | | | | 7,921 | | | | 6,889,923 | |
7.875%, 1/15/27 | | | | | | | 4,058 | | | | 3,279,059 | |
8.75%, 4/15/22 | | | | | | | 5,502 | | | | 5,315,152 | |
9.00%, 8/15/31 | | | | | | | 4,350 | | | | 3,718,976 | |
10.50%, 9/15/22 | | | | | | | 2,308 | | | | 2,320,424 | |
11.00%, 9/15/25 | | | | | | | 1,463 | | | | 1,411,502 | |
Hughes Satellite Systems Corp.
7.625%, 6/15/21 | | | | | | | 4,508 | | | | 5,080,439 | |
Intelsat Jackson Holdings SA
5.50%, 8/01/23 | | | | | | | 9,915 | | | | 8,464,931 | |
7.25%, 4/01/19-10/15/20 | | | | | | | 6,860 | | | | 6,519,427 | |
7.50%, 4/01/21 | | | | | | | 3,615 | | | | 3,305,889 | |
8.00%, 2/15/24(a) | | | | | | | 1,212 | | | | 1,304,051 | |
9.50%, 9/30/22(a) | | | | | | | 2,861 | | | | 3,381,751 | |
Intelsat Luxembourg SA
7.75%, 6/01/21 | | | | | | | 1,667 | | | | 962,693 | |
Level 3 Financing, Inc.
5.375%, 1/15/24 | | | | | | | 2,601 | | | | 2,703,399 | |
6.125%, 1/15/21 | | | | | | | 2,690 | | | | 2,777,941 | |
| | |
| 22 | AB HIGH INCOME FUND | | abfunds.com |
PORTFOLIO OF INVESTMENTS (continued)
| | | | | | | | | | | | |
| | | | | | Principal Amount (000) | | | U.S. $ Value | |
| |
| | | | | | | | | | | | |
Sable International Finance Ltd.
6.875%, 8/01/22(a) | | | U.S.$ | | | | 2,219 | | | $ | 2,383,270 | |
Sprint Capital Corp.
8.75%, 3/15/32 | | | | | | | 5,865 | | | | 7,209,328 | |
Sprint Corp.
7.125%, 6/15/24 | | | | | | | 4,993 | | | | 5,435,585 | |
7.625%, 2/15/25 | | | | | | | 6,134 | | | | 6,841,361 | |
7.875%, 9/15/23 | | | | | | | 685 | | | | 768,189 | |
T-Mobile USA, Inc.
6.00%, 3/01/23 | | | | | | | 3,547 | | | | 3,787,895 | |
6.125%, 1/15/22 | | | | | | | 1,460 | | | | 1,543,392 | |
6.836%, 4/28/23 | | | | | | | 3,010 | | | | 3,231,211 | |
Telecom Italia Capital SA
7.20%, 7/18/36 | | | | | | | 7,680 | | | | 8,472,392 | |
7.721%, 6/04/38 | | | | | | | 4,700 | | | | 5,364,646 | |
Telecom Italia SpA/Milano
5.303%, 5/30/24(a) | | | | | | | 5,639 | | | | 5,865,096 | |
Uniti Group, Inc./CSL Capital LLC
6.00%, 4/15/23(a) | | | | | | | 7,539 | | | | 7,844,201 | |
8.25%, 10/15/23 | | | | | | | 15,715 | | | | 16,780,948 | |
Wind Acquisition Finance SA
4.75%, 7/15/20(a) | | | | | | | 4,138 | | | | 4,204,270 | |
7.375%, 4/23/21(a) | | | | | | | 11,197 | | | | 11,648,015 | |
Windstream Services LLC
6.375%, 8/01/23 | | | | | | | 12,858 | | | | 11,341,566 | |
7.75%, 10/01/21(k) | | | | | | | 2,780 | | | | 2,793,414 | |
Zayo Group LLC/Zayo Capital, Inc.
5.75%, 1/15/27(a) | | | | | | | 1,953 | | | | 2,073,625 | |
6.00%, 4/01/23 | | | | | | | 3,305 | | | | 3,521,910 | |
6.375%, 5/15/25 | | | | | | | 8,198 | | | | 8,870,375 | |
| | | | | | | | | | | | |
| | | | | | | | | | | 200,785,653 | |
| | | | | | | | | | | | |
Consumer Cyclical -
Automotive – 1.3% | | | | | | | | | | | | |
Adient Global Holdings Ltd.
4.875%, 8/15/26(a) | | | | | | | 8,034 | | | | 8,046,734 | |
BCD Acquisition, Inc.
9.625%, 9/15/23(a) | | | | | | | 14,012 | | | | 15,088,962 | |
Commercial Vehicle Group, Inc.
7.875%, 4/15/19 | | | | | | | 9,012 | | | | 9,020,742 | |
Cooper-Standard Automotive, Inc.
5.625%, 11/15/26(a) | | | | | | | 7,290 | | | | 7,414,827 | |
Dana Financing Luxembourg SARL
5.75%, 4/15/25(a) | | | | | | | 4,059 | | | | 4,152,933 | |
6.50%, 6/01/26(a) | | | | | | | 10,848 | | | | 11,345,153 | |
Exide Technologies
7.00%, 4/30/25(b)(d)(e)(i) | | | | | | | 794 | | | | 394,887 | |
| | |
| abfunds.com | | AB HIGH INCOME FUND | 23 |
PORTFOLIO OF INVESTMENTS (continued)
| | | | | | | | | | | | |
| | | | | | Principal Amount (000) | | | U.S. $ Value | |
| |
| | | | | | | | | | | | |
Series AI
7.00%, 4/30/25(c)(d)(i) | | | U.S.$ | | | | 18,351 | | | $ | 9,129,417 | |
11.00% (11.00% Cash or 7.00% PIK),
4/30/20(d)(h) | | | | | | | 23,929 | | | | 18,515,463 | |
Goodyear Tire & Rubber Co. (The)
7.00%, 3/15/28 | | | | | | | 700 | | | | 757,001 | |
8.75%, 8/15/20 | | | | | | | 924 | | | | 1,090,880 | |
IHO Verwaltungs GmbH
4.125% (4.125% Cash or 4.875% PIK), 9/15/21(a)(d) | | | | | | | 5,807 | | | | 5,889,644 | |
Meritor, Inc.
6.25%, 2/15/24 | | | | | | | 6,786 | | | | 7,033,784 | |
ZF North America Capital, Inc.
4.75%, 4/29/25(a) | | | | | | | 6,260 | | | | 6,524,504 | |
| | | | | | | | | | | | |
| | | | | | | | | | | 104,404,931 | |
| | | | | | | | | | | | |
Consumer Cyclical -
Entertainment – 0.1% | | | | | | | | | | | | |
AMC Entertainment Holdings, Inc.
5.875%, 11/15/26(a) | | | | | | | 8,694 | | | | 8,836,573 | |
ClubCorp Club Operations, Inc.
8.25%, 12/15/23(a) | | | | | | | 2,963 | | | | 3,237,907 | |
| | | | | | | | | | | | |
| | | | | | | | | | | 12,074,480 | |
| | | | | | | | | | | | |
Consumer Cyclical - Other – 2.4% | | | | | | | | | | | | |
Beazer Homes USA, Inc.
6.75%, 3/15/25(a) | | | | | | | 7,010 | | | | 7,134,070 | |
8.75%, 3/15/22 | | | | | | | 3,405 | | | | 3,782,025 | |
Caesars Entertainment Operating Co., Inc.
10.00%, 12/15/18(f)(g) | | | | | | | 1,935 | | | | 1,676,194 | |
Caesars Entertainment Resort Properties LLC/Caesars Entertainment Resort Prope
8.00%, 10/01/20 | | | | | | | 6,600 | | | | 6,885,866 | |
CalAtlantic Group, Inc.
6.625%, 5/01/20 | | | | | | | 5,393 | | | | 5,933,632 | |
8.375%, 5/15/18 | | | | | | | 3,250 | | | | 3,454,149 | |
Cirsa Funding Luxembourg SA
5.75%, 5/15/21(a) | | | EUR | | | | 2,058 | | | | 2,391,028 | |
Diamond Resorts International, Inc.
7.75%, 9/01/23(a) | | | U.S.$ | | | | 7,479 | | | | 7,931,532 | |
Eagle II Acquisition Co. LLC
6.00%, 4/01/25(a) | | | | | | | 4,963 | | | | 5,130,447 | |
GLP Capital LP/GLP Financing II, Inc.
5.375%, 4/15/26 | | | | | | | 2,300 | | | | 2,422,650 | |
| | |
| 24 | AB HIGH INCOME FUND | | abfunds.com |
PORTFOLIO OF INVESTMENTS (continued)
| | | | | | | | | | | | |
| | | | | | Principal Amount (000) | | | U.S. $ Value | |
| |
| | | | | | | | | | | | |
International Game Technology PLC
6.50%, 2/15/25(a) | | | U.S.$ | | | | 7,309 | | | $ | 8,007,667 | |
Isle of Capri Casinos, Inc.
5.875%, 3/15/21 | | | | | | | 238 | | | | 245,594 | |
K. Hovnanian Enterprises, Inc.
5.00%, 11/01/21 | | | | | | | 12,319 | | | | 9,763,867 | |
7.25%, 10/15/20(a) | | | | | | | 5,715 | | | | 5,542,156 | |
KB Home
7.00%, 12/15/21 | | | | | | | 6,936 | | | | 7,734,105 | |
7.25%, 6/15/18 | | | | | | | 1,000 | | | | 1,051,637 | |
7.50%, 9/15/22 | | | | | | | 2,741 | | | | 3,103,242 | |
9.10%, 9/15/17 | | | | | | | 809 | | | | 828,364 | |
Lennar Corp.
4.50%, 6/15/19 | | | | | | | 1,690 | | | | 1,751,648 | |
6.95%, 6/01/18 | | | | | | | 2,780 | | | | 2,917,549 | |
MDC Holdings, Inc.
5.50%, 1/15/24 | | | | | | | 4,397 | | | | 4,552,517 | |
6.00%, 1/15/43 | | | | | | | 17,203 | | | | 15,549,482 | |
Meritage Homes Corp.
6.00%, 6/01/25 | | | | | | | 4,696 | | | | 5,001,226 | |
7.15%, 4/15/20 | | | | | | | 2,500 | | | | 2,754,378 | |
Pinnacle Entertainment, Inc.
5.625%, 5/01/24(a) | | | | | | | 4,736 | | | | 4,875,504 | |
PulteGroup, Inc.
5.00%, 1/15/27 | | | | | | | 1,470 | | | | 1,488,654 | |
6.00%, 2/15/35 | | | | | | | 932 | | | | 926,843 | |
6.375%, 5/15/33 | | | | | | | 2,695 | | | | 2,791,120 | |
7.875%, 6/15/32 | | | | | | | 7,600 | | | | 8,648,952 | |
RSI Home Products, Inc.
6.50%, 3/15/23(a) | | | | | | | 14,852 | | | | 15,424,871 | |
Safari Holding Verwaltungs GmbH
8.25%, 2/15/21(a) | | | EUR | | | | 1,157 | | | | 1,306,924 | |
Shea Homes LP/Shea Homes Funding Corp.
5.875%, 4/01/23(a) | | | U.S.$ | | | | 6,743 | | | | 6,827,840 | |
6.125%, 4/01/25(a) | | | | | | | 4,677 | | | | 4,747,249 | |
Standard Industries, Inc./NJ
6.00%, 10/15/25(a) | | | | | | | 5,285 | | | | 5,641,737 | |
Sugarhouse HSP Gaming Prop Mezz LP/Sugarhouse HSP Gaming Finance Corp.
5.875%, 5/15/25(a) | | | | | | | 4,253 | | | | 4,272,402 | |
Taylor Morrison Communities, Inc./Taylor Morrison Holdings II, Inc.
5.625%, 3/01/24(a) | | | | | | | 7,725 | | | | 8,129,867 | |
5.875%, 4/15/23(a) | | | | | | | 4,950 | | | | 5,284,125 | |
| | |
| abfunds.com | | AB HIGH INCOME FUND | 25 |
PORTFOLIO OF INVESTMENTS (continued)
| | | | | | | | | | | | |
| | | | | | Principal Amount (000) | | | U.S. $ Value | |
| |
| | | | | | | | | | | | |
Toll Brothers Finance Corp.
4.875%, 3/15/27 | | | U.S.$ | | | | 8,180 | | | $ | 8,295,240 | |
Wynn Las Vegas LLC/Wynn Las Vegas Capital Corp.
5.50%, 3/01/25(a) | | | | | | | 4,515 | | | | 4,684,827 | |
| | | | | | | | | | | | |
| | | | | | | | | | | 198,891,180 | |
| | | | | | | | | | | | |
Consumer Cyclical -
Restaurants – 0.2% | | | | | | | | | | | | |
1011778 BC ULC/New Red Finance, Inc.
6.00%, 4/01/22(a) | | | | | | | 5,350 | | | | 5,571,057 | |
Landry’s, Inc.
6.75%, 10/15/24(a) | | | | | | | 2,549 | | | | 2,663,822 | |
Pizzaexpress Financing 2 PLC
6.625%, 8/01/21(a) | | | GBP | | | | 2,879 | | | | 3,861,644 | |
| | | | | | | | | | | | |
| | | | | | | | | | | 12,096,523 | |
| | | | | | | | | | | | |
Consumer Cyclical -
Retailers – 0.8% | | | | | | | | | | | | |
Group 1 Automotive, Inc.
5.00%, 6/01/22 | | | U.S.$ | | | | 2,143 | | | | 2,167,833 | |
JC Penney Corp., Inc.
6.375%, 10/15/36 | | | | | | | 1,169 | | | | 892,087 | |
7.40%, 4/01/37 | | | | | | | 4,492 | | | | 3,641,251 | |
L Brands, Inc.
6.875%, 11/01/35 | | | | | | | 11,730 | | | | 11,573,510 | |
6.95%, 3/01/33 | | | | | | | 3,500 | | | | 3,354,166 | |
Levi Strauss & Co.
5.00%, 5/01/25 | | | | | | | 7,819 | | | | 8,118,695 | |
Neiman Marcus Group Ltd. LLC
8.00%, 10/15/21(a) | | | | | | | 14,081 | | | | 8,249,819 | |
8.75% (8.75% Cash or 9.50% PIK),
10/15/21(a)(d) | | | | | | | 17 | | | | 9,182 | |
New Look Secured Issuer PLC
6.50%, 7/01/22(a) | | | GBP | | | | 1,404 | | | | 1,597,545 | |
Penske Automotive Group, Inc.
5.50%, 5/15/26 | | | U.S.$ | | | | 5,857 | | | | 5,807,321 | |
PetSmart, Inc.
7.125%, 3/15/23(a) | | | | | | | 3,069 | | | | 2,801,794 | |
Rite Aid Corp.
6.125%, 4/01/23(a) | | | | | | | 3,912 | | | | 3,877,727 | |
Sally Holdings LLC/Sally Capital, Inc.
5.625%, 12/01/25 | | | | | | | 2,086 | | | | 2,153,910 | |
5.75%, 6/01/22 | | | | | | | 5,376 | | | | 5,536,205 | |
Sonic Automotive, Inc.
5.00%, 5/15/23 | | | | | | | 3,494 | | | | 3,350,246 | |
| | |
| 26 | AB HIGH INCOME FUND | | abfunds.com |
PORTFOLIO OF INVESTMENTS (continued)
| | | | | | | | | | | | |
| | | | | | Principal Amount (000) | | | U.S. $ Value | |
| |
| | | | | | | | | | | | |
6.125%, 3/15/27(a) | | | U.S.$ | | | | 5,939 | | | $ | 5,966,509 | |
| | | | | | | | | | | | |
| | | | | | | | | | | 69,097,800 | |
| | | | | | | | | | | | |
Consumer Non-Cyclical – 4.5% | | | | | | | | | | | | |
Acadia Healthcare Co., Inc.
6.50%, 3/01/24 | | | | | | | 4,040 | | | | 4,279,156 | |
Air Medical Group Holdings, Inc.
6.375%, 5/15/23(a) | | | | | | | 11,200 | | | | 10,901,666 | |
Albertsons Cos. LLC/Safeway, Inc./New Albertson’s, Inc./Albertson’s LLC
5.75%, 3/15/25(a) | | | | | | | 3,777 | | | | 3,666,391 | |
6.625%, 6/15/24(a) | | | | | | | 11,094 | | | | 11,332,377 | |
Alere, Inc.
6.375%, 7/01/23(a) | | | | | | | 1,482 | | | | 1,612,908 | |
7.25%, 7/01/18 | | | | | | | 3,046 | | | | 3,074,514 | |
BI-LO LLC/BI-LO Finance Corp.
8.625% (8.625% Cash or 9.375% PIK), 9/15/18(a)(d) | | | | | | | 12,017 | | | | 6,156,778 | |
9.25%, 2/15/19(a) | | | | | | | 6,688 | | | | 5,864,139 | |
Boparan Finance PLC
5.50%, 7/15/21(a)(k) | | | GBP | | | | 9,185 | | | | 11,924,225 | |
Catalent Pharma Solutions, Inc.
4.75%, 12/15/24(a) | | | EUR | | | | 2,223 | | | | 2,575,699 | |
CHS/Community Health Systems, Inc.
6.875%, 2/01/22 | | | U.S.$ | | | | 29,150 | | | | 24,117,019 | |
8.00%, 11/15/19 | | | | | | | 2,614 | | | | 2,547,649 | |
Concordia International Corp.
7.00%, 4/15/23(a) | | | | | | | 1,245 | | | | 199,200 | |
9.50%, 10/21/22(a) | | | | | | | 20,366 | | | | 3,945,912 | |
DaVita, Inc.
5.00%, 5/01/25 | | | | | | | 2,600 | | | | 2,622,534 | |
Eagle Holding Company II, LLC
7.625% (7.625% Cash or 8.375% PIK), 5/15/22(d) | | | | | | | 1,276 | | | | 1,299,198 | |
Endo Dac/Endo Finance LLC/Endo Finco, Inc.
6.00%, 7/15/23-2/01/25(a) | | | | | | | 21,129 | | | | 18,003,648 | |
Endo Finance LLC/Endo Finco, Inc.
7.25%, 1/15/22(a) | | | | | | | 3,035 | | | | 2,988,853 | |
Envision Healthcare Corp.
5.625%, 7/15/22 | | | | | | | 5,163 | | | | 5,338,212 | |
6.25%, 12/01/24(a) | | | | | | | 5,755 | | | | 6,056,338 | |
First Quality Finance Co., Inc.
4.625%, 5/15/21(a) | | | | | | | 16,738 | | | | 16,467,614 | |
| | |
| abfunds.com | | AB HIGH INCOME FUND | 27 |
PORTFOLIO OF INVESTMENTS (continued)
| | | | | | | | | | | | |
| | | | | | Principal Amount (000) | | | U.S. $ Value | |
| |
| | | | | | | | | | | | |
HCA, Inc.
4.25%, 10/15/19 | | | U.S.$ | | | | 3,274 | | | $ | 3,400,216 | |
4.50%, 2/15/27 | | | | | | | 1,002 | | | | 1,012,496 | |
5.25%, 6/15/26 | | | | | | | 1,744 | | | | 1,866,607 | |
5.875%, 3/15/22 | | | | | | | 2,450 | | | | 2,716,526 | |
Hill-Rom Holdings, Inc.
5.75%, 9/01/23(a) | | | | | | | 1,473 | | | | 1,543,069 | |
Holding Medi-Partenaires SAS
7.00%, 5/15/20(a) | | | EUR | | | | 6,584 | | | | 7,428,977 | |
Horizon Pharma, Inc.
6.625%, 5/01/23(k) | | | U.S.$ | | | | 9,168 | | | | 8,973,244 | |
Horizon Pharma, Inc./Horizon Pharma USA, Inc.
8.75%, 11/01/24(a) | | | | | | | 4,526 | | | | 4,719,722 | |
Lamb Weston Holdings, Inc.
4.625%, 11/01/24(a) | | | | | | | 2,904 | | | | 2,996,466 | |
4.875%, 11/01/26(a) | | | | | | | 2,903 | | | | 2,991,301 | |
LifePoint Health, Inc.
5.375%, 5/01/24(a) | | | | | | | 2,417 | | | | 2,437,066 | |
5.875%, 12/01/23 | | | | | | | 7,809 | | | | 8,059,825 | |
Mallinckrodt International Finance SA/Mallinckrodt CB LLC
5.50%, 4/15/25(a) | | | | | | | 10,965 | | | | 10,003,095 | |
5.625%, 10/15/23(a) | | | | | | | 5,736 | | | | 5,407,975 | |
5.75%, 8/01/22(a) | | | | | | | 54 | | | | 52,871 | |
MEDNAX, Inc.
5.25%, 12/01/23(a) | | | | | | | 2,302 | | | | 2,368,816 | |
MPH Acquisition Holdings LLC
7.125%, 6/01/24(a) | | | | | | | 9,919 | | | | 10,648,324 | |
Nature’s Bounty Co. (The)
7.625%, 5/15/21(a) | | | | | | | 14,338 | | | | 15,243,086 | |
Post Holdings, Inc.
5.00%, 8/15/26(a) | | | | | | | 11,791 | | | | 11,744,367 | |
5.50%, 3/01/25(a) | | | | | | | 6,937 | | | | 7,240,681 | |
6.00%, 12/15/22(a) | | | | | | | 2,096 | | | | 2,234,751 | |
8.00%, 7/15/25(a) | | | | | | | 374 | | | | 424,946 | |
Revlon Consumer Products Corp.
6.25%, 8/01/24 | | | | | | | 3,601 | | | | 3,504,749 | |
Spectrum Brands, Inc.
4.00%, 10/01/26(a) | | | EUR | | | | 3,459 | | | | 3,917,625 | |
6.125%, 12/15/24 | | | U.S.$ | | | | 1,915 | | | | 2,037,100 | |
6.625%, 11/15/22 | | | | | | | 2,624 | | | | 2,765,525 | |
Surgical Care Affiliates, Inc.
6.00%, 4/01/23(a) | | | | | | | 2,748 | | | | 2,974,710 | |
Synlab Bondco PLC
6.25%, 7/01/22(a) | | | EUR | | | | 9,492 | | | | 11,197,329 | |
| | |
| 28 | AB HIGH INCOME FUND | | abfunds.com |
PORTFOLIO OF INVESTMENTS (continued)
| | | | | | | | | | | | |
| | | | | | Principal Amount (000) | | | U.S. $ Value | |
| |
| | | | | | | | | | | | |
Synlab Unsecured Bondco PLC
8.25%, 7/01/23(a) | | | EUR | | | | 3,869 | | | $ | 4,698,567 | |
Tenet Healthcare Corp.
6.75%, 6/15/23(k) | | | U.S.$ | | | | 8,125 | | | | 7,754,394 | |
6.875%, 11/15/31 | | | | | | | 16,407 | | | | 14,026,410 | |
8.00%, 8/01/20 | | | | | | | 2,244 | | | | 2,288,842 | |
8.125%, 4/01/22 | | | | | | | 4,631 | | | | 4,704,313 | |
Valeant Pharmaceuticals International
6.75%, 8/15/21(a) | | | | | | | 2,100 | | | | 1,741,834 | |
7.25%, 7/15/22(a) | | | | | | | 5,402 | | | | 4,344,634 | |
Valeant Pharmaceuticals International, Inc.
5.375%, 3/15/20(a) | | | | | | | 4,358 | | | | 3,730,064 | |
5.50%, 3/01/23(a) | | | | | | | 1,466 | | | | 1,081,883 | |
5.875%, 5/15/23(a) | | | | | | | 1,590 | | | | 1,180,575 | |
6.125%, 4/15/25(a) | | | | | | | 17,151 | | | | 12,681,741 | |
6.50%, 3/15/22(a) | | | | | | | 2,085 | | | | 2,133,591 | |
Vizient, Inc.
10.375%, 3/01/24(a) | | | | | | | 2,066 | | | | 2,361,779 | |
Voyage Care Bondco PLC
5.875%, 5/01/23 | | | GBP | | | | 7,223 | | | | 9,521,752 | |
6.50%, 8/01/18(a) | | | | | | | 4,750 | | | | 6,237,925 | |
| | | | | | | | | | | | |
| | | | | | | | | | | 363,373,799 | |
| | | | | | | | | | | | |
Energy – 3.4% | | | | | | | | | | | | |
Alta Mesa Holdings LP/Alta Mesa Finance Services Corp.
7.875%, 12/15/24(a) | | | U.S.$ | | | | 6,153 | | | | 6,455,986 | |
Berry Petroleum Co. LLC
6.375%, 9/15/22(b)(c) | | | | | | | 16,461 | | | | – 0 | – |
Bill Barrett Corp.
8.75%, 6/15/25(a) | | | | | | | 5,430 | | | | 5,444,444 | |
California Resources Corp.
5.50%, 9/15/21 | | | | | | | 1,846 | | | | 1,310,396 | |
6.00%, 11/15/24 | | | | | | | 1,594 | | | | 1,045,342 | |
8.00%, 12/15/22(a) | | | | | | | 5,980 | | | | 4,583,269 | |
Carrizo Oil & Gas, Inc.
7.50%, 9/15/20 | | | | | | | 1,394 | | | | 1,436,281 | |
Cheniere Corpus Christi Holdings LLC
7.00%, 6/30/24(a) | | | | | | | 7,043 | | | | 7,887,202 | |
Chesapeake Energy Corp.
4.875%, 4/15/22(k) | | | | | | | 10,996 | | | | 10,102,839 | |
6.125%, 2/15/21(k) | | | | | | | 2,417 | | | | 2,386,394 | |
8.00%, 1/15/25(a)(k) | | | | | | | 12,681 | | | | 12,516,578 | |
Continental Resources, Inc./OK
3.80%, 6/01/24 | | | | | | | 517 | | | | 486,483 | |
4.90%, 6/01/44 | | | | | | | 2,314 | | | | 1,999,981 | |
5.00%, 9/15/22 | | | | | | | 715 | | | | 721,904 | |
| | |
| abfunds.com | | AB HIGH INCOME FUND | 29 |
PORTFOLIO OF INVESTMENTS (continued)
| | | | | | | | | | | | |
| | | | | | Principal Amount (000) | | | U.S. $ Value | |
| |
| | | | | | | | | | | | |
Covey Park Energy LLC/FI
7.50%, 5/15/25 | | | U.S.$ | | | | 3,519 | | | $ | 3,519,000 | |
DCP Midstream Operating LP
3.875%, 3/15/23 | | | | | | | 4,357 | | | | 4,233,470 | |
5.60%, 4/01/44 | | | | | | | 10,432 | | | | 9,827,987 | |
Denbury Resources, Inc.
4.625%, 7/15/23 | | | | | | | 2,703 | | | | 1,854,885 | |
5.50%, 5/01/22 | | | | | | | 1,295 | | | | 965,741 | |
Diamond Offshore Drilling, Inc.
4.875%, 11/01/43 | | | | | | | 8,521 | | | | 6,189,612 | |
5.70%, 10/15/39 | | | | | | | 3,966 | | | | 3,217,374 | |
Energy Transfer Equity LP
7.50%, 10/15/20 | | | | | | | 3,398 | | | | 3,833,814 | |
Ensco PLC
4.50%, 10/01/24 | | | | | | | 1,712 | | | | 1,413,941 | |
5.20%, 3/15/25 | | | | | | | 2,567 | | | | 2,174,139 | |
EP Energy LLC/Everest Acquisition Finance, Inc.
6.375%, 6/15/23 | | | | | | | 1,899 | | | | 1,430,190 | |
7.75%, 9/01/22 | | | | | | | 1,866 | | | | 1,513,113 | |
8.00%, 2/15/25(a) | | | | | | | 15,115 | | | | 13,523,315 | |
9.375%, 5/01/20 | | | | | | | 901 | | | | 853,694 | |
Golden Energy Offshore Services AS
5.00%, 12/31/17(e) | | | NOK | | | | 33,602 | | | | 1,565,454 | |
Gulfport Energy Corp.
6.375%, 5/15/25(a) | | | U.S.$ | | | | 5,433 | | | | 5,402,928 | |
Hilcorp Energy I LP/Hilcorp Finance Co.
5.00%, 12/01/24(a) | | | | | | | 2,555 | | | | 2,414,314 | |
5.75%, 10/01/25(a) | | | | | | | 10,781 | | | | 10,440,105 | |
Murphy Oil Corp.
6.875%, 8/15/24 | | | | | | | 1,315 | | | | 1,394,880 | |
Murphy Oil USA, Inc.
5.625%, 5/01/27 | | | | | | | 503 | | | | 513,612 | |
6.00%, 8/15/23 | | | | | | | 3,166 | | | | 3,321,185 | |
Noble Holding International Ltd.
5.25%, 3/15/42 | | | | | | | 1,180 | | | | 769,950 | |
6.20%, 8/01/40 | | | | | | | 1,090 | | | | 776,625 | |
7.70%, 4/01/25(l) | | | | | | | 2,289 | | | | 2,068,187 | |
8.70%, 4/01/45 | | | | | | | 1,842 | | | | 1,610,481 | |
Northern Oil and Gas, Inc.
8.00%, 6/01/20 | | | | | | | 3,075 | | | | 2,531,811 | |
Oasis Petroleum, Inc.
6.875%, 3/15/22 | | | | | | | 2,147 | | | | 2,177,865 | |
Pacific Drilling SA
5.375%, 6/01/20(a) | | | | | | | 12,449 | | | | 6,084,449 | |
| | |
| 30 | AB HIGH INCOME FUND | | abfunds.com |
PORTFOLIO OF INVESTMENTS (continued)
| | | | | | | | | | | | |
| | | | | | Principal Amount (000) | | | U.S. $ Value | |
| |
| | | | | | | | | | | | |
Paragon Offshore PLC
6.75%, 7/15/22(a)(f)(g) | | | U.S.$ | | | | 17,781 | | | $ | 2,911,639 | |
7.25%, 8/15/24(a)(f)(g) | | | | | | | 6,607 | | | | 1,081,896 | |
PDC Energy, Inc.
6.125%, 9/15/24(a) | | | | | | | 3,203 | | | | 3,289,917 | |
PHI, Inc.
5.25%, 3/15/19 | | | | | | | 7,518 | | | | 7,029,330 | |
QEP Resources, Inc.
5.25%, 5/01/23 | | | | | | | 4,020 | | | | 3,948,854 | |
5.375%, 10/01/22 | | | | | | | 1,061 | | | | 1,052,608 | |
6.875%, 3/01/21 | | | | | | | 3,871 | | | | 4,094,426 | |
Range Resources Corp.
5.00%, 3/15/23(a)(k) | | | | | | | 5,789 | | | | 5,736,285 | |
Rowan Cos., Inc.
5.40%, 12/01/42 | | | | | | | 3,688 | | | | 2,742,603 | |
7.375%, 6/15/25 | | | | | | | 6,234 | | | | 6,171,055 | |
Sanchez Energy Corp.
6.125%, 1/15/23 | | | | | | | 5,546 | | | | 5,098,416 | |
SandRidge Energy, Inc.
7.50%, 2/15/23(b)(c)(f) | | | | | | | 1,970 | | | | – 0 | – |
8.125%, 10/15/22(b)(c)(f) | | | | | | | 15,534 | | | | – 0 | – |
Seitel, Inc.
9.50%, 4/15/19 | | | | | | | 2,574 | | | | 2,589,913 | |
SM Energy Co.
5.625%, 6/01/25 | | | | | | | 4,119 | | | | 3,936,821 | |
6.50%, 1/01/23 | | | | | | | 2,737 | | | | 2,775,526 | |
Southern Star Central Corp.
5.125%, 7/15/22(a) | | | | | | | 6,100 | | | | 6,168,466 | |
Targa Resources Partners LP/Targa Resources Partners Finance Corp.
4.25%, 11/15/23 | | | | | | | 1,674 | | | | 1,656,487 | |
6.375%, 8/01/22 | | | | | | | 2,736 | | | | 2,828,682 | |
Transocean Phoenix 2 Ltd.
7.75%, 10/15/24(a) | | | | | | | 7,600 | | | | 8,227,000 | |
Transocean, Inc.
5.80%, 10/15/22 | | | | | | | 6,595 | | | | 6,136,911 | |
6.80%, 3/15/38 | | | | | | | 11,478 | | | | 9,181,734 | |
7.50%, 4/15/31 | | | | | | | 1,800 | | | | 1,603,598 | |
9.00%, 7/15/23(a) | | | | | | | 6,110 | | | | 6,534,052 | |
Vantage Drilling International
7.125%, 4/01/23(b)(c)(f) | | | | | | | 8,325 | | | | – 0 | – |
7.50%, 11/01/19(b)(c)(f) | | | | | | | 8,860 | | | | – 0 | – |
10.00%, 12/31/20(c) | | | | | | | 521 | | | | 505,370 | |
10.00%, 12/31/20(e) | | | | | | | 431 | | | | 418,070 | |
Weatherford International Ltd.
5.95%, 4/15/42 | | | | | | | 2,757 | | | | 2,402,036 | |
6.50%, 8/01/36 | | | | | | | 4,003 | | | | 3,743,954 | |
| | |
| abfunds.com | | AB HIGH INCOME FUND | 31 |
PORTFOLIO OF INVESTMENTS (continued)
| | | | | | | | | | | | |
| | | | | | Principal Amount (000) | | | U.S. $ Value | |
| |
| | | | | | | | | | | | |
6.75%, 9/15/40 | | | U.S.$ | | | | 4,691 | | | $ | 4,418,373 | |
7.00%, 3/15/38 | | | | | | | 4,190 | | | | 3,988,327 | |
9.875%, 2/15/24(a) | | | | | | | 4,623 | | | | 5,388,218 | |
Whiting Petroleum Corp.
1.25%, 4/01/20(i) | | | | | | | 2,925 | | | | 2,584,969 | |
5.00%, 3/15/19 | | | | | | | 5,131 | | | | 5,180,088 | |
WPX Energy, Inc.
8.25%, 8/01/23 | | | | | | | 1,315 | | | | 1,469,832 | |
| | | | | | | | | | | | |
| | | | | | | | | | | 276,894,676 | |
| | | | | | | | | | | | |
Other Industrial – 1.1% | | | | | | | | | | | | |
Algeco Scotsman Global Finance PLC
8.50%, 10/15/18(a) | | | | | | | 7,510 | | | | 7,061,661 | |
9.00%, 10/15/18(a) | | | EUR | | | | 1,810 | | | | 1,846,714 | |
American Builders & Contractors Supply Co., Inc.
5.75%, 12/15/23(a) | | | U.S.$ | | | | 3,425 | | | | 3,638,840 | |
American Tire Distributors, Inc.
10.25%, 3/01/22(a)(k) | | | | | | | 15,100 | | | | 15,517,289 | |
General Cable Corp.
4.50%, 11/15/29(i)(m) | | | | | | | 5,909 | | | | 4,627,486 | |
5.75%, 10/01/22 | | | | | | | 7,591 | | | | 7,522,529 | |
Global Partners LP/GLP Finance Corp.
6.25%, 7/15/22 | | | | | | | 16,442 | | | | 16,181,098 | |
HRG Group, Inc.
7.875%, 7/15/19 | | | | | | | 12,371 | | | | 12,844,512 | |
Laureate Education, Inc.
8.25%, 5/01/25(a) | | | | | | | 8,033 | | | | 8,254,590 | |
9.25%, 9/01/19(a) | | | | | | | 1,183 | | | | 1,241,891 | |
9.25%, 9/01/19 | | | | | | | 10,786 | | | | 11,327,446 | |
| | | | | | | | | | | | |
| | | | | | | | | | | 90,064,056 | |
| | | | | | | | | | | | |
Services – 1.4% | | | | | | | | | | | | |
APX Group, Inc.
7.875%, 12/01/22 | | | | | | | 11,855 | | | | 12,950,698 | |
8.75%, 12/01/20 | | | | | | | 9,846 | | | | 10,233,007 | |
Aramark Services, Inc.
5.125%, 1/15/24 | | | | | | | 1,484 | | | | 1,565,620 | |
Carlson Travel, Inc.
6.75%, 12/15/23(a) | | | | | | | 797 | | | | 819,903 | |
Ceridian HCM Holding, Inc.
11.00%, 3/15/21(a) | | | | | | | 7,458 | | | | 7,854,863 | |
eDreams ODIGEO SA
8.50%, 8/01/21(a) | | | EUR | | | | 10,411 | | | | 12,378,558 | |
Gartner, Inc.
5.125%, 4/01/25(a) | | | U.S.$ | | | | 3,489 | | | | 3,612,231 | |
| | |
| 32 | AB HIGH INCOME FUND | | abfunds.com |
PORTFOLIO OF INVESTMENTS (continued)
| | | | | | | | | | | | |
| | | | | | Principal Amount (000) | | | U.S. $ Value | |
| |
| | | | | | | | | | | | |
GEO Group, Inc. (The)
5.125%, 4/01/23 | | | U.S.$ | | | | 1,054 | | | $ | 1,053,297 | |
5.875%, 1/15/22-10/15/24 | | | | | | | 4,401 | | | | 4,547,897 | |
6.00%, 4/15/26 | | | | | | | 3,549 | | | | 3,633,211 | |
IHS Markit Ltd.
5.00%, 11/01/22(a) | | | | | | | 3,524 | | | | 3,777,728 | |
iPayment, Inc.
10.75%, 4/15/24(a) | | | | | | | 5,950 | | | | 6,443,356 | |
Nielsen Finance LLC/Nielsen Finance Co.
5.00%, 4/15/22(a) | | | | | | | 1,840 | | | | 1,890,466 | |
Prime Security Services Borrower LLC/Prime Finance, Inc.
9.25%, 5/15/23(a) | | | | | | | 21,208 | | | | 23,157,418 | |
Ritchie Bros Auctioneers, Inc.
5.375%, 1/15/25(a) | | | | | | | 2,521 | | | | 2,607,264 | |
Sabre GLBL, Inc.
5.25%, 11/15/23(a) | | | | | | | 1,648 | | | | 1,705,629 | |
5.375%, 4/15/23(a) | | | | | | | 4,041 | | | | 4,162,440 | |
Service Corp. International/US
7.50%, 4/01/27 | | | | | | | 1,575 | | | | 1,834,968 | |
Team Health Holdings, Inc.
6.375%, 2/01/25(a)(k) | | | | | | | 5,939 | | | | 5,739,978 | |
| | | | | | | | | | | | |
| | | | | | | | | | | 109,968,532 | |
| | | | | | | | | | | | |
Technology – 1.4% | | | | | | | | | | | | |
Amkor Technology, Inc.
6.375%, 10/01/22 | | | | | | | 10,924 | | | | 11,394,311 | |
Avaya, Inc.
10.50%, 3/01/21(e)(f)(g) | | | | | | | 24,822 | | | | 3,754,328 | |
BMC Software Finance, Inc.
8.125%, 7/15/21(a) | | | | | | | 15,535 | | | | 15,787,832 | |
BMC Software, Inc.
7.25%, 6/01/18 | | | | | | | 223 | | | | 227,049 | |
Boxer Parent Co., Inc.
9.00% (9.00% Cash or 9.75% PIK),
10/15/19(a)(d) | | | | | | | 5,529 | | | | 5,529,757 | |
CDW LLC/CDW Finance Corp.
5.50%, 12/01/24 | | | | | | | 1,272 | | | | 1,357,527 | |
Compiler Finance Sub, Inc.
7.00%, 5/01/21(a) | | | | | | | 1,945 | | | | 957,913 | |
Conduent Finance, Inc./Xerox Business Services LLC
10.50%, 12/15/24(a) | | | | | | | 9,021 | | | | 10,462,646 | |
CURO Financial Technologies Corp.
12.00%, 3/01/22(a) | | | | | | | 4,786 | | | | 4,977,785 | |
| | |
| abfunds.com | | AB HIGH INCOME FUND | 33 |
PORTFOLIO OF INVESTMENTS (continued)
| | | | | | | | | | | | |
| | | | | | Principal Amount (000) | | | U.S. $ Value | |
| |
| | | | | | | | | | | | |
Dell International LLC/EMC Corp.
7.125%, 6/15/24(a) | | | U.S.$ | | | | 2,133 | | | $ | 2,353,855 | |
Dell, Inc.
6.50%, 4/15/38 | | | | | | | 8,083 | | | | 7,973,629 | |
Goodman Networks, Inc.
12.125%, 7/01/18(f)(g) | | | | | | | 8,670 | | | | 3,272,925 | |
Infor US, Inc.
6.50%, 5/15/22 | | | | | | | 7,478 | | | | 7,775,767 | |
Micron Technology, Inc.
5.25%, 8/01/23-1/15/24(a) | | | | | | | 5,769 | | | | 5,959,142 | |
5.50%, 2/01/25 | | | | | | | 3,367 | | | | 3,518,407 | |
Quintiles IMS, Inc.
3.25%, 3/15/25(a) | | | EUR | | | | 5,672 | | | | 6,208,469 | |
Radiate Holdco LLC/Radiate Finance, Inc.
6.625%, 2/15/25(a) | | | U.S.$ | | | | 7,526 | | | | 7,520,280 | |
Solera LLC/Solera Finance, Inc.
10.50%, 3/01/24(a) | | | | | | | 6,460 | | | | 7,381,164 | |
Symantec Corp.
5.00%, 4/15/25(a) | | | | | | | 4,918 | | | | 5,077,643 | |
Western Digital Corp.
10.50%, 4/01/24 | | | | | | | 4,967 | | | | 5,842,469 | |
| | | | | | | | | | | | |
| | | | | | | | | | | 117,332,898 | |
| | | | | | | | | | | | |
Transportation - Airlines – 0.0% | | | | | | | | | | | | |
UAL Pass-Through Trust
Series 2007-1A
6.636%, 7/02/22 | | | | | | | 1,456 | | | | 1,568,967 | |
| | | | | | | | | | | | |
| | | |
Transportation - Services – 1.1% | | | | | | | | | | | | |
Avis Budget Car Rental LLC/Avis Budget Finance, Inc.
5.25%, 3/15/25(a)(k) | | | | | | | 5,359 | | | | 5,055,557 | |
5.50%, 4/01/23(k) | | | | | | | 4,745 | | | | 4,653,142 | |
CEVA Group PLC
9.00%, 9/01/21(a) | | | | | | | 10,987 | | | | 8,339,188 | |
EC Finance PLC
5.125%, 7/15/21(a) | | | EUR | | | | 4,232 | | | | 4,763,778 | |
Europcar Groupe SA
5.75%, 6/15/22(a)(k) | | | | | | | 5,802 | | | | 6,634,639 | |
Herc Rentals, Inc.
7.75%, 6/01/24(a) | | | U.S.$ | | | | 12,774 | | | | 13,945,427 | |
Hertz Corp. (The)
5.50%, 10/15/24(a)(k) | | | | | | | 20,340 | | | | 17,515,933 | |
Hornbeck Offshore Services, Inc.
5.00%, 3/01/21 | | | | | | | 5,000 | | | | 3,200,000 | |
5.875%, 4/01/20 | | | | | | | 4,695 | | | | 3,004,800 | |
| | |
| 34 | AB HIGH INCOME FUND | | abfunds.com |
PORTFOLIO OF INVESTMENTS (continued)
| | | | | | | | | | | | |
| | | | | | Principal Amount (000) | | | U.S. $ Value | |
| |
| | | | | | | | | | | | |
Loxam SAS
3.50%, 4/15/22(a) | | | EUR | | | | 1,102 | | | $ | 1,243,546 | |
4.25%, 4/15/24(a) | | | | | | | 540 | | | | 609,450 | |
United Rentals North America, Inc.
5.50%, 5/15/27 | | | U.S.$ | | | | 5,208 | | | | 5,348,710 | |
5.875%, 9/15/26 | | | | | | | 2,375 | | | | 2,506,012 | |
XPO CNW, Inc.
6.70%, 5/01/34 | | | | | | | 13,854 | | | | 13,003,517 | |
XPO Logistics, Inc.
6.125%, 9/01/23(a) | | | | | | | 2,430 | | | | 2,553,879 | |
| | | | | | | | | | | | |
| | | | | | | | | | | 92,377,578 | |
| | | | | | | | | | | | |
| | | | | | | | | | | 2,293,899,531 | |
| | | | | | | | | | | | |
Financial Institutions – 4.7% | | | | | | | | | | | | |
Banking – 3.1% | | | | | | | | | | | | |
Ally Financial, Inc.
4.125%, 3/30/20 | | | | | | | 505 | | | | 516,097 | |
8.00%, 11/01/31 | | | | | | | 6,998 | | | | 8,321,300 | |
Banco Bilbao Vizcaya Argentaria SA
6.75%, 2/18/20(a)(n) | | | EUR | | | | 1,800 | | | | 2,028,080 | |
8.875%, 4/14/21(a)(n) | | | | | | | 9,400 | | | | 11,647,340 | |
Banco Santander SA
6.25%, 3/12/19(a)(n) | | | | | | | 2,100 | | | | 2,314,004 | |
Bank of America Corp.
Series AA
6.10%, 3/17/25(n) | | | U.S.$ | | | | 7,966 | | | | 8,533,976 | |
Series X
6.25%, 9/05/24(n) | | | | | | | 521 | | | | 558,370 | |
Series Z
6.50%, 10/23/24(n) | | | | | | | 4,009 | | | | 4,451,718 | |
Bank of Ireland
7.375%, 6/18/20(a)(n) | | | EUR | | | | 7,811 | | | | 9,287,052 | |
Barclays Bank PLC
6.86%, 6/15/32(a)(n) | | | U.S.$ | | | | 838 | | | | 955,670 | |
7.70%, 4/25/18(a)(n) | | | | | | | 10,164 | | | | 10,672,220 | |
Barclays PLC
8.00%, 12/15/20(n) | | | EUR | | | | 10,737 | | | | 12,894,635 | |
Citigroup, Inc.
5.95%, 1/30/23(n) | | | U.S.$ | | | | 14,778 | | | | 15,548,377 | |
Series M
6.30%, 5/15/24(n) | | | | | | | 7,000 | | | | 7,380,828 | |
Countrywide Capital III
Series B
8.05%, 6/15/27 | | | | | | | 11,735 | | | | 14,630,365 | |
Credit Agricole SA
7.589%, 1/30/20(n) | | | GBP | | | | 4,950 | | | | 7,140,730 | |
| | |
| abfunds.com | | AB HIGH INCOME FUND | 35 |
PORTFOLIO OF INVESTMENTS (continued)
| | | | | | | | | | | | |
| | | | | | Principal Amount (000) | | | U.S. $ Value | |
| |
| | | | | | | | | | | | |
8.125%, 12/23/25(a)(n) | | | U.S.$ | | | | 9,082 | | | $ | 10,058,315 | |
Credit Suisse Group AG
6.25%, 12/18/24(a)(n) | | | | | | | 7,786 | | | | 8,127,003 | |
7.50%, 12/11/23(a)(n) | | | | | | | 14,916 | | | | 16,556,760 | |
Dresdner Funding Trust I
8.151%, 6/30/31(a) | | | | | | | 816 | | | | 971,349 | |
Intesa Sanpaolo SpA
5.017%, 6/26/24(a) | | | | | | | 3,834 | | | | 3,665,243 | |
5.71%, 1/15/26(a) | | | | | | | 5,445 | | | | 5,360,047 | |
Lloyds Banking Group PLC
6.413%, 10/01/35(a)(n) | | | | | | | 3,709 | | | | 4,038,630 | |
6.657%, 5/21/37(a)(n) | | | | | | | 1,801 | | | | 1,982,849 | |
7.50%, 6/27/24(n) | | | | | | | 3,535 | | | | 3,820,794 | |
Macquarie Bank Ltd./London
6.125%, 3/08/27(a)(n) | | | | | | | 256 | | | | 259,649 | |
Royal Bank of Scotland Group PLC
7.50%, 8/10/20(n) | | | | | | | 2,900 | | | | 3,007,425 | |
8.00%, 8/10/25(n) | | | | | | | 1,847 | | | | 1,924,578 | |
8.625%, 8/15/21(n) | | | | | | | 20,279 | | | | 21,902,050 | |
Series U
7.64%, 9/30/17(n) | | | | | | | 1,200 | | | | 1,122,368 | |
Societe Generale SA
7.375%, 9/13/21(a)(n) | | | | | | | 7,501 | | | | 7,932,307 | |
8.00%, 9/29/25(a)(n) | | | | | | | 11,901 | | | | 12,734,070 | |
Standard Chartered PLC
2.68% (LIBOR 3 Month + 1.51%),
1/30/27(a)(j)(n) | | | | | | | 3,500 | | | | 2,940,063 | |
7.50%, 4/02/22(a)(n) | | | | | | | 4,541 | | | | 4,842,068 | |
7.75%, 4/02/23(a)(n) | | | | | | | 1,988 | | | | 2,117,918 | |
Suntrust Banks, Inc.
Series G
5.05%, 6/15/22(n) | | | | | | | 6,334 | | | | 6,352,495 | |
UBS Group AG
7.00%, 2/19/25(a)(n) | | | | | | | 11,235 | | | | 12,369,589 | |
Zions Bancorporation
5.65%, 11/15/23 | | | | | | | 2,289 | | | | 2,358,549 | |
| | | | | | | | | | | | |
| | | | | | | | | | | 251,324,881 | |
| | | | | | | | | | | | |
Brokerage – 0.1% | | | | | | | | | | | | |
Lehman Brothers Holdings, Inc.
6.87%, 5/02/18(f) | | | | | | | 1,600 | | | | 88,640 | |
Series G
4.80%, 3/13/14(f)(o) | | | | | | | 1,800 | | | | 97,020 | |
LPL Holdings, Inc.
5.75%, 9/15/25(a) | | | | | | | 11,023 | | | | 11,170,598 | |
| | | | | | | | | | | | |
| | | | | | | | | | | 11,356,258 | |
| | | | | | | | | | | | |
| | |
| 36 | AB HIGH INCOME FUND | | abfunds.com |
PORTFOLIO OF INVESTMENTS (continued)
| | | | | | | | | | | | |
| | | | | | Principal Amount (000) | | | U.S. $ Value | |
| |
| | | | | | | | | | | | |
Finance – 0.8% | | | | | | | | | | | | |
Artsonig Pty Ltd.
11.50% (11.50% Cash or 12.00% PIK), 4/01/19(d)(e) | | | U.S.$ | | | | 17,037 | | | $ | 511,106 | |
Enova International, Inc.
9.75%, 6/01/21 | | | | | | | 11,193 | | | | 11,401,503 | |
ILFC E-Capital Trust II
4.91% (H15T 30 Year + 1.80%), 12/21/65(a)(j) | | | | | | | 1,500 | | | | 1,438,125 | |
Lincoln Finance Ltd.
6.875%, 4/15/21(a) | | | EUR | | | | 6,507 | | | | 7,624,146 | |
Navient Corp.
4.875%, 6/17/19 | | | U.S.$ | | | | 5,837 | | | | 6,029,545 | |
5.50%, 1/15/19-1/25/23 | | | | | | | 2,213 | | | | 2,289,098 | |
5.875%, 3/25/21 | | | | | | | 3,619 | | | | 3,742,129 | |
6.50%, 6/15/22 | | | | | | | 2,343 | | | | 2,421,634 | |
6.625%, 7/26/21 | | | | | | | 4,403 | | | | 4,664,331 | |
7.25%, 1/25/22 | | | | | | | 1,638 | | | | 1,748,781 | |
8.00%, 3/25/20 | | | | | | | 8,274 | | | | 9,112,156 | |
SLM Corp.
5.125%, 4/05/22 | | | | | | | 3,828 | | | | 3,894,990 | |
TMX Finance LLC/TitleMax Finance Corp.
8.50%, 9/15/18(a) | | | | | | | 12,384 | | | | 11,674,335 | |
| | | | | | | | | | | | |
| | | | | | | | | | | 66,551,879 | |
| | | | | | | | | | | | |
Insurance – 0.4% | | | | | | | | | | | | |
American Equity Investment Life Holding Co.
6.625%, 7/15/21 | | | | | | | 3,087 | | | | 3,212,008 | |
Galaxy Bidco Ltd.
6.375%, 11/15/20(a) | | | GBP | | | | 4,512 | | | | 6,010,255 | |
Genworth Holdings, Inc.
3.042% (LIBOR 3 Month + 2.00%), 11/15/66(j) | | | U.S.$ | | | | 809 | | | | 381,242 | |
7.625%, 9/24/21 | | | | | | | 4,725 | | | | 4,511,926 | |
Liberty Mutual Group, Inc.
7.80%, 3/15/37(a) | | | | | | | 14,759 | | | | 17,104,692 | |
| | | | | | | | | | | | |
| | | | | | | | | | | 31,220,123 | |
| | | | | | | | | | | | |
Other Finance – 0.2% | | | | | | | | | | | | |
Creditcorp
12.00%, 7/15/18(e) | | | | | | | 6,205 | | | | 5,336,300 | |
Intelsat Connect Finance SA
12.50%, 4/01/22(a) | | | | | | | 2,158 | | | | 1,897,926 | |
SNS Bank NV
Series E
11.25%, 12/31/49(b)(c)(f)(g)(n) | | | EUR | | | | 1,001 | | | | – 0 | – |
| | |
| abfunds.com | | AB HIGH INCOME FUND | 37 |
PORTFOLIO OF INVESTMENTS (continued)
| | | | | | | | | | | | |
| | | | | | Principal Amount (000) | | | U.S. $ Value | |
| |
| | | | | | | | | | | | |
Tempo Acquisition LLC/Tempo Acquisition
Finance Corp.
6.75%, 6/01/25(a) | | | U.S.$ | | | | 8,240 | | | $ | 8,453,070 | |
| | | | | | | | | | | | |
| | | | | | | | | | | 15,687,296 | |
| | | | | | | | | | | | |
REITS – 0.1% | | | | | | | | | | | | |
FelCor Lodging LP
5.625%, 3/01/23 | | | | | | | 5,333 | | | | 5,611,911 | |
MPT Operating Partnership LP/MPT Finance Corp.
5.25%, 8/01/26 | | | | | | | 971 | | | | 996,335 | |
5.50%, 5/01/24 | | | | | | | 1,696 | | | | 1,762,524 | |
| | | | | | | | | | | | |
| | | | | | | | | | | 8,370,770 | |
| | | | | | | | | | | | |
| | | | | | | | | | | 384,511,207 | |
| | | | | | | | | | | | |
Utility – 1.0% | | | | | | | | | | | | |
Electric – 1.0% | | | | | | | | | | | | |
AES Corp./VA
4.875%, 5/15/23 | | | | | | | 826 | | | | 833,100 | |
Calpine Corp.
5.50%, 2/01/24 | | | | | | | 5,320 | | | | 5,117,861 | |
5.75%, 1/15/25 | | | | | | | 6,017 | | | | 5,845,871 | |
ContourGlobal Power Holdings SA
5.125%, 6/15/21(a) | | | EUR | | | | 8,608 | | | | 9,941,171 | |
DPL, Inc.
6.75%, 10/01/19 | | | U.S.$ | | | | 1,280 | | | | 1,341,039 | |
Dynegy, Inc.
7.375%, 11/01/22 | | | | | | | 5,633 | | | | 5,407,387 | |
7.625%, 11/01/24 | | | | | | | 5,105 | | | | 4,702,578 | |
Emera, Inc.
Series 2016-A
6.75%, 6/15/76 | | | | | | | 6,938 | | | | 7,664,901 | |
GenOn Energy, Inc.
7.875%, 6/15/17 | | | | | | | 825 | | | | 571,349 | |
9.50%, 10/15/18 | | | | | | | 8,571 | | | | 5,339,707 | |
NRG Energy, Inc.
6.25%, 7/15/22-5/01/24 | | | | | | | 5,426 | | | | 5,440,702 | |
6.625%, 3/15/23 | | | | | | | 5,121 | | | | 5,203,402 | |
NRG Yield Operating LLC
5.375%, 8/15/24 | | | | | | | 4,311 | | | | 4,403,109 | |
Talen Energy Supply LLC
4.60%, 12/15/21(k) | | | | | | | 8,074 | | | | 6,312,835 | |
Texas Competitive/TCEH
11.50%, 10/01/20(a)(b)(c)(f)(o) | | | | | | | 2,679 | | | | – 0 | – |
Viridian Group FundCo II Ltd.
7.50%, 3/01/20(a) | | | EUR | | | | 7,830 | | | | 8,988,569 | |
| | | | | | | | | | | | |
| | | | | | | | | | | 77,113,581 | |
| | | | | | | | | | | | |
| | |
| 38 | AB HIGH INCOME FUND | | abfunds.com |
PORTFOLIO OF INVESTMENTS (continued)
| | | | | | | | | | | | |
| | | | | | Principal Amount (000) | | | U.S. $ Value | |
| |
| | | | | | | | | | | | |
Natural Gas – 0.0% | | | | | | | | | | | | |
NGL Energy Partners LP/NGL Energy
Finance Corp.
7.50%, 11/01/23(a) | | | U.S.$ | | | | 1,722 | | | $ | 1,722,093 | |
| | | | | | | | | | | | |
| | | | | | | | | | | 78,835,674 | |
| | | | | | | | | | | | |
Total Corporates – Non-Investment Grade
(cost $2,782,965,593) | | | | | | | | | | | 2,757,246,412 | |
| | | | | | | | | | | | |
| | | | | | | | | | | | |
GOVERNMENTS – TREASURIES – 21.6% | | | | | | | | | | | | |
Colombia – 0.5% | | | | | | | | | | | | |
Colombia Government International Bond
7.75%, 4/14/21 | | | COP | | | | 12,390,000 | | | | 4,539,476 | |
Colombian TES
Series B
7.00%, 5/04/22 | | | | | | | 84,097,200 | | | | 29,978,279 | |
10.00%, 7/24/24 | | | | | | | 7,000,000 | | | | 2,909,830 | |
| | | | | | | | | | | | |
| | | | | | | | | | | 37,427,585 | |
| | | | | | | | | | | | |
Indonesia – 1.1% | | | | | | | | | | | | |
Indonesia Treasury Bond
Series FR53
8.25%, 7/15/21 | | | IDR | | | | 314,387,000 | | | | 24,786,428 | |
Series FR70
8.375%, 3/15/24 | | | | | | | 349,361,000 | | | | 28,036,030 | |
Series FR73
8.75%, 5/15/31 | | | | | | | 280,537,000 | | | | 23,237,068 | |
JPMorgan Chase Bank, NA
9.50%, 5/17/41(a) | | | | | | | 68,280,000 | | | | 5,942,291 | |
Series E
10.00%, 7/18/17(a) | | | | | | | 63,808,000 | | | | 4,823,059 | |
| | | | | | | | | | | | |
| | | | | | | | | | | 86,824,876 | |
| | | | | | | | | | | | |
Mexico – 1.0% | | | | | | | | | | | | |
Mexican Bonos
Series M
6.50%, 6/10/21 | | | MXN | | | | 1,599,554 | | | | 83,215,876 | |
| | | | | | | | | | | | |
| | | |
Russia – 0.8% | | | | | | | | | | | | |
Russian Federal Bond – OFZ
Series 6209
7.60%, 7/20/22 | | | RUB | | | | 254,534 | | | | 4,479,906 | |
Series 6212
7.05%, 1/19/28 | | | | | | | 1,271,800 | | | | 21,479,661 | |
| | |
| abfunds.com | | AB HIGH INCOME FUND | 39 |
PORTFOLIO OF INVESTMENTS (continued)
| | | | | | | | | | | | |
| | | | | | Principal Amount (000) | | | U.S. $ Value | |
| |
| | | | | | | | | | | | |
Series 6217
7.50%, 8/18/21 | | | RUB | | | | 2,509,448 | | | $ | 43,843,792 | |
| | | | | | | | | | | | |
| | | | | | | | | | | 69,803,359 | |
| | | | | | | | | | | | |
South Africa – 1.2% | | | | | | | | | | | | |
Republic of South Africa Government Bond
Series R186
10.50%, 12/21/26 | | | ZAR | | | | 1,152,637 | | | | 96,240,866 | |
Series R204
8.00%, 12/21/18 | | | | | | | 16,800 | | | | 1,266,446 | |
| | | | | | | | | | | | |
| | | | | | | | | | | 97,507,312 | |
| | | | | | | | | | | | |
United States – 17.0% | | | | | | | | | | | | |
U.S. Treasury Bonds
6.125%, 11/15/27(k)(p)(q) | | | U.S.$ | | | | 403,500 | | | | 547,246,875 | |
6.125%, 8/15/29 | | | | | | | 50,000 | | | | 69,898,440 | |
6.25%, 5/15/30 | | | | | | | 68,350 | | | | 97,772,542 | |
7.25%, 8/15/22 | | | | | | | 26,000 | | | | 32,995,625 | |
8.00%, 11/15/21 | | | | | | | 100,000 | | | | 127,062,500 | |
8.75%, 8/15/20 | | | | | | | 130,000 | | | | 159,981,250 | |
U.S. Treasury Notes
0.875%, 3/31/18 | | | | | | | 127,032 | | | | 126,754,118 | |
0.875%, 4/15/19(q) | | | | | | | 120,680 | | | | 119,774,900 | |
1.25%, 3/31/21 | | | | | | | 78,671 | | | | 77,417,181 | |
2.125%, 8/31/20(q) | | | | | | | 6,300 | | | | 6,416,156 | |
2.50%, 8/15/23(q) | | | | | | | 16,550 | | | | 17,012,884 | |
| | | | | | | | | | | | |
| | | | | | | | | | | 1,382,332,471 | |
| | | | | | | | | | | | |
Total Governments – Treasuries
(cost $1,751,569,703) | | | | | | | | | | | 1,757,111,479 | |
| | | | | | | | | | | | |
| | | | | | | | | | | | |
COLLATERALIZED MORTGAGE OBLIGATIONS – 9.3% | | | | | | | | | | | | |
Risk Share Floating Rate – 7.8% | | | | | | | | | | | | |
Bellemeade Re II Ltd.
Series 2016-1A, Class B1
12.991% (LIBOR 1 Month + 12.00%),
4/25/26(e)(j) | | | | | | | 2,331 | | | | 2,534,301 | |
Series 2016-1A, Class M2B
7.491% (LIBOR 1 Month + 6.50%),
4/25/26(e)(j) | | | | | | | 21,264 | | | | 21,833,522 | |
Bellemeade Re Ltd.
Series 2015-1A, Class M2
5.291% (LIBOR 1 Month + 4.30%),
7/25/25(e)(j) | | | | | | | 5,898 | | | | 6,018,389 | |
| | |
| 40 | AB HIGH INCOME FUND | | abfunds.com |
PORTFOLIO OF INVESTMENTS (continued)
| | | | | | | | | | | | |
| | | | | | Principal Amount (000) | | | U.S. $ Value | |
| |
| | | | | | | | | | | | |
Federal Home Loan Mortgage Corp. Structured Agency Credit Risk Debt Notes
Series 2013-DN1, Class M2
8.141% (LIBOR 1 Month + 7.15%),
7/25/23(j) | | | U.S.$ | | | | 8,995 | | | $ | 11,090,234 | |
Series 2013-DN2, Class M2
5.241% (LIBOR 1 Month + 4.25%),
11/25/23(j) | | | | | | | 7,100 | | | | 7,828,376 | |
Series 2014-DN1, Class M3
5.491% (LIBOR 1 Month + 4.50%),
2/25/24(j) | | | | | | | 13,021 | | | | 14,996,588 | |
Series 2014-DN2, Class M3
4.591% (LIBOR 1 Month + 3.60%),
4/25/24(j) | | | | | | | 5,376 | | | | 5,883,457 | |
Series 2014-DN3, Class M3
4.991% (LIBOR 1 Month + 4.00%),
8/25/24(j) | | | | | | | 10,000 | | | | 10,881,102 | |
Series 2014-DN4, Class M3
5.541% (LIBOR 1 Month + 4.55%),
10/25/24(j) | | | | | | | 1,900 | | | | 2,094,288 | |
Series 2014-HQ1, Class M3
5.091% (LIBOR 1 Month + 4.10%),
8/25/24(j) | | | | | | | 9,416 | | | | 10,367,831 | |
Series 2014-HQ2, Class M3
4.741% (LIBOR 1 Month + 3.75%),
9/25/24(j) | | | | | | | 3,045 | | | | 3,303,758 | |
Series 2014-HQ3, Class M3
5.741% (LIBOR 1 Month + 4.75%),
10/25/24(j) | | | | | | | 9,550 | | | | 10,647,656 | |
Series 2015-DN1, Class B
12.491% (LIBOR 1 Month + 11.50%),
1/25/25(j) | | | | | | | 6,186 | | | | 8,019,239 | |
Series 2015-DN1, Class M3
5.141% (LIBOR 1 Month + 4.15%),
1/25/25(j) | | | | | | | 8,572 | | | | 9,326,677 | |
Series 2015-DNA1, Class M3
4.291% (LIBOR 1 Month + 3.30%),
10/25/27(j) | | | | | | | 1,760 | | | | 1,909,412 | |
Series 2015-DNA2, Class B
8.541% (LIBOR 1 Month + 7.55%),
12/25/27(j) | | | | | | | 16,219 | | | | 18,307,136 | |
Series 2015-DNA3, Class B
10.341% (LIBOR 1 Month + 9.35%),
4/25/28(j) | | | | | | | 7,579 | | | | 8,945,205 | |
| | |
| abfunds.com | | AB HIGH INCOME FUND | 41 |
PORTFOLIO OF INVESTMENTS (continued)
| | | | | | | | | | | | |
| | | | | | Principal Amount (000) | | | U.S. $ Value | |
| |
| | | | | | | | | | | | |
Series 2015-DNA3, Class M3
5.691% (LIBOR 1 Month + 4.70%),
4/25/28(j) | | | U.S.$ | | | | 3,021 | | | $ | 3,447,388 | |
Series 2015-HQ1, Class M3
4.791% (LIBOR 1 Month + 3.80%),
3/25/25(j) | | | | | | | 3,380 | | | | 3,666,643 | |
Series 2015-HQ2, Class B
8.941% (LIBOR 1 Month + 7.95%),
5/25/25(j) | | | | | | | 296 | | | | 332,199 | |
Series 2015-HQA1, Class B
9.791% (LIBOR 1 Month + 8.80%),
3/25/28(j) | | | | | | | 9,165 | | | | 10,364,075 | |
Series 2015-HQA1, Class M3
5.691% (LIBOR 1 Month + 4.70%),
3/25/28(j) | | | | | | | 8,335 | | | | 9,441,895 | |
Series 2015-HQA2, Class B
11.491% (LIBOR 1 Month + 10.50%),
5/25/28(j) | | | | | | | 6,982 | | | | 8,545,054 | |
Series 2015-HQA2, Class M3
5.791% (LIBOR 1 Month + 4.80%),
5/25/28(j) | | | | | | | 1,740 | | | | 1,989,542 | |
Series 2016-DNA1, Class M3
6.541% (LIBOR 1 Month + 5.55%),
7/25/28(j) | | | | | | | 7,042 | | | | 8,123,013 | |
Series 2016-DNA2, Class B
11.491% (LIBOR 1 Month + 10.50%),
10/25/28(j) | | | | | | | 5,073 | | | | 6,090,496 | |
Series 2016-DNA2, Class M3
5.641% (LIBOR 1 Month + 4.65%),
10/25/28(j) | | | | | | | 3,862 | | | | 4,272,870 | |
Series 2016-DNA3, Class B
12.241% (LIBOR 1 Month + 11.25%),
12/25/28(j) | | | | | | | 3,873 | | | | 4,832,899 | |
Series 2016-DNA3, Class M3
5.991% (LIBOR 1 Month + 5.00%),
12/25/28(j) | | | | | | | 1,998 | | | | 2,259,037 | |
Series 2016-DNA4, Class B
9.591% (LIBOR 1 Month + 8.60%),
3/25/29(j) | | | | | | | 1,836 | | | | 2,008,723 | |
Series 2016-DNA4, Class M3
4.791% (LIBOR 1 Month + 3.80%),
3/25/29(j) | | | | | | | 2,224 | | | | 2,362,644 | |
Series 2016-HQA1, Class B
13.741% (LIBOR 1 Month + 12.75%),
9/25/28(j) | | | | | | | 2,998 | | | | 3,976,265 | |
| | |
| 42 | AB HIGH INCOME FUND | | abfunds.com |
PORTFOLIO OF INVESTMENTS (continued)
| | | | | | | | | | | | |
| | | | | | Principal Amount (000) | | | U.S. $ Value | |
| |
| | | | | | | | | | | | |
Series 2016-HQA1, Class M3
7.341% (LIBOR 1 Month + 6.35%),
9/25/28(j) | | | U.S.$ | | | | 18,443 | | | $ | 22,211,356 | |
Series 2016-HQA2, Class B
12.491% (LIBOR 1 Month + 11.50%),
11/25/28(j) | | | | | | | 2,957 | | | | 3,677,648 | |
Series 2017-DNA2, Class M2
4.436% (LIBOR 1 Month + 3.45%),
10/25/29(j) | | | | | | | 9,201 | | | | 9,388,126 | |
Federal National Mortgage Association Connecticut Avenue Securities
Series 2013-C01, Class M2
6.241% (LIBOR 1 Month + 5.25%),
10/25/23(j) | | | | | | | 7,285 | | | | 8,421,703 | |
Series 2014-C01, Class M2
5.391% (LIBOR 1 Month + 4.40%),
1/25/24(j) | | | | | | | 9,535 | | | | 10,724,586 | |
Series 2014-C03, Class 1M2
3.991% (LIBOR 1 Month + 3.00%),
7/25/24(j) | | | | | | | 10,103 | | | | 10,626,915 | |
Series 2014-C04, Class 1M2
5.891% (LIBOR 1 Month + 4.90%),
11/25/24(j) | | | | | | | 23,605 | | | | 26,928,896 | |
Series 2014-C04, Class 2M2
5.991% (LIBOR 1 Month + 5.00%),
11/25/24(j) | | | | | | | 3,545 | | | | 3,978,007 | |
Series 2015-C01, Class 1M2
5.291% (LIBOR 1 Month + 4.30%),
2/25/25(j) | | | | | | | 20,452 | | | | 22,327,319 | |
Series 2015-C01, Class 2M2
5.541% (LIBOR 1 Month + 4.55%),
2/25/25(j) | | | | | | | 5,856 | | | | 6,354,317 | |
Series 2015-C02, Class 1M2
4.991% (LIBOR 1 Month + 4.00%),
5/25/25(j) | | | | | | | 5,420 | | | | 5,874,241 | |
Series 2015-C02, Class 2M2
4.991% (LIBOR 1 Month + 4.00%),
5/25/25(j) | | | | | | | 11,720 | | | | 12,568,184 | |
Series 2015-C03, Class 1M2
5.991% (LIBOR 1 Month + 5.00%),
7/25/25(j) | | | | | | | 20,274 | | | | 22,491,193 | |
Series 2015-C03, Class 2M2
5.991% (LIBOR 1 Month + 5.00%),
7/25/25(j) | | | | | | | 14,908 | | | | 16,598,714 | |
| | |
| abfunds.com | | AB HIGH INCOME FUND | 43 |
PORTFOLIO OF INVESTMENTS (continued)
| | | | | | | | | | | | |
| | | | | | Principal Amount (000) | | | U.S. $ Value | |
| |
| | | | | | | | | | | | |
Series 2015-C04, Class 1M2
6.691% (LIBOR 1 Month + 5.70%),
4/25/28(j) | | | U.S.$ | | | | 13,295 | | | $ | 15,174,227 | |
Series 2015-C04, Class 2M2
6.541% (LIBOR 1 Month + 5.55%),
4/25/28(j) | | | | | | | 7,247 | | | | 8,171,050 | |
Series 2016-C01, Class 1B
12.741% (LIBOR 1 Month + 11.75%),
8/25/28(j) | | | | | | | 4,069 | | | | 5,301,261 | |
Series 2016-C01, Class 1M2
7.741% (LIBOR 1 Month + 6.75%),
8/25/28(j) | | | | | | | 11,933 | | | | 14,324,411 | |
Series 2016-C01, Class 2M2
7.941% (LIBOR 1 Month + 6.95%),
8/25/28(j) | | | | | | | 3,870 | | | | 4,642,373 | |
Series 2016-C02, Class 1B
13.241% (LIBOR 1 Month + 12.25%),
9/25/28(j) | | | | | | | 2,900 | | | | 3,881,210 | |
Series 2016-C02, Class 1M2
6.991% (LIBOR 1 Month + 6.00%),
9/25/28(j) | | | | | | | 22,977 | | | | 26,802,289 | |
Series 2016-C03, Class 1B
12.741% (LIBOR 1 Month + 11.75%),
10/25/28(j) | | | | | | | 7,144 | | | | 9,316,938 | |
Series 2016-C03, Class 1M2
6.291% (LIBOR 1 Month + 5.30%),
10/25/28(j) | | | | | | | 2,497 | | | | 2,860,095 | |
Series 2016-C03, Class 2B
13.741% (LIBOR 1 Month + 12.75%),
10/25/28(j) | | | | | | | 4,793 | | | | 6,451,316 | |
Series 2016-C03, Class 2M2
6.891% (LIBOR 1 Month + 5.90%),
10/25/28(j) | | | | | | | 22,833 | | | | 26,505,371 | |
Series 2016-C04, Class 1B
11.241% (LIBOR 1 Month + 10.25%),
1/25/29(j) | | | | | | | 10,778 | | | | 13,043,278 | |
Series 2016-C04, Class 1M2
5.241% (LIBOR 1 Month + 4.25%),
1/25/29(j) | | | | | | | 6,797 | | | | 7,391,321 | |
Series 2016-C05, Class 2B
11.74% (LIBOR 1 Month + 10.75%),
1/25/29(j) | | | | | | | 11,318 | | | | 13,707,234 | |
Series 2016-C05, Class 2M2
5.441% (LIBOR 1 Month + 4.45%),
1/25/29(j) | | | | | | | 15,479 | | | | 16,888,028 | |
| | |
| 44 | AB HIGH INCOME FUND | | abfunds.com |
PORTFOLIO OF INVESTMENTS (continued)
| | | | | | | | | | | | |
| | | | | | Principal Amount (000) | | | U.S. $ Value | |
| |
| | | | | | | | | | | | |
Series 2016-C06, Class 1B
10.241% (LIBOR 1 Month + 9.25%),
4/25/29(j) | | | U.S.$ | | | | 8,528 | | | $ | 9,507,994 | |
Series 2016-C07, Class 2B
10.491% (LIBOR 1 Month + 9.50%),
4/25/29(j) | | | | | | | 10,061 | | | | 11,253,188 | |
Series 2016-C07, Class 2M2
5.341% (LIBOR 1 Month + 4.35%),
4/25/29(j) | | | | | | | 4,949 | | | | 5,318,461 | |
Series 2017-C02, Class 2M2
4.641% (LIBOR 1 Month + 3.65%),
9/25/29(j) | | | | | | | 8,339 | | | | 8,592,783 | |
JP Morgan Madison Avenue Securities Trust
Series 2015-CH1, Class M2
6.491% (LIBOR 1 Month + 5.50%),
10/25/25(a)(j) | | | | | | | 7,776 | | | | 8,284,998 | |
Wells Fargo Credit Risk Transfer Securities Trust
Series 2015-WF1, Class 1M2 6.241% (LIBOR 1 Month + 5.25%), 11/25/25(e)(j) | | | | | | | 6,018 | | | | 6,323,001 | |
Series 2015-WF1, Class 2M2
6.491% (LIBOR 1 Month + 5.50%), 11/25/25(e)(j) | | | | | | | 3,333 | | | | 3,653,420 | |
| | | | | | | | | | | | |
| | | | | | | | | | | 635,265,366 | |
| | | | | | | | | | | | |
Non-Agency Fixed Rate – 1.3% | | | | | | | | | | | | |
Alternative Loan Trust
Series 2005-11CB, Class 2A7
5.50%, 6/25/35 | | | | | | | 4,368 | | | | 4,257,660 | |
Series 2005-46CB, Class A2
5.50%, 10/25/35 | | | | | | | 238 | | | | 223,059 | |
Series 2005-46CB, Class A20
5.50%, 10/25/35 | | | | | | | 186 | | | | 174,573 | |
Series 2005-46CB, Class A3
5.50%, 10/25/35 | | | | | | | 581 | | | | 544,982 | |
Series 2005-46CB, Class A4
5.25%, 10/25/35 | | | | | | | 256 | | | | 236,403 | |
Series 2005-46CB, Class A7
5.50%, 10/25/35 | | | | | | | 451 | | | | 422,554 | |
Series 2005-J14, Class A8
5.50%, 12/25/35 | | | | | | | 3,601 | | | | 3,032,889 | |
Series 2006-2CB, Class A11
6.00%, 3/25/36 | | | | | | | 1,615 | | | | 1,312,873 | |
| | |
| abfunds.com | | AB HIGH INCOME FUND | 45 |
PORTFOLIO OF INVESTMENTS (continued)
| | | | | | | | | | | | |
| | | | | | Principal Amount (000) | | | U.S. $ Value | |
| |
| | | | | | | | | | | | |
Series 2006-19CB, Class A15
6.00%, 8/25/36 | | | U.S.$ | | | | 590 | | | $ | 513,495 | |
Series 2006-19CB, Class A24
6.00%, 8/25/36 | | | | | | | 379 | | | | 330,082 | |
Series 2006-24CB, Class A15
5.75%, 6/25/36 | | | | | | | 4,107 | | | | 3,412,832 | |
Series 2006-24CB, Class A16
5.75%, 6/25/36 | | | | | | | 785 | | | | 652,511 | |
Series 2006-26CB, Class A6
6.25%, 9/25/36 | | | | | | | 341 | | | | 274,844 | |
Series 2006-26CB, Class A8
6.25%, 9/25/36 | | | | | | | 1,287 | | | | 1,038,608 | |
Series 2006-41CB, Class 2A13
5.75%, 1/25/37 | | | | | | | 3,576 | | | | 2,875,268 | |
Series 2006-42, Class 1A6
6.00%, 1/25/47 | | | | | | | 1,566 | | | | 1,316,669 | |
Series 2006-HY12, Class A5
3.018%, 8/25/36 | | | | | | | 7,304 | | | | 7,137,477 | |
Series 2006-J1, Class 1A10
5.50%, 2/25/36 | | | | | | | 1,943 | | | | 1,734,044 | |
Series 2006-J5, Class 1A1
6.50%, 9/25/36 | | | | | | | 1,348 | | | | 1,110,198 | |
Series 2007-13, Class A2
6.00%, 6/25/47 | | | | | | | 5,179 | | | | 4,424,331 | |
Series 2007-15CB, Class A19
5.75%, 7/25/37 | | | | | | | 812 | | | | 701,800 | |
Series 2007-16CB, Class 1A7
6.00%, 8/25/37 | | | | | | | 1,001 | | | | 980,328 | |
BCAP LLC Trust
Series 2009-RR13, Class 17A3
5.877%, 4/26/37(a) | | | | | | | 3,094 | | | | 2,442,518 | |
Bear Stearns ARM Trust
Series 2007-3, Class 1A1
3.408%, 5/25/47 | | | | | | | 1,413 | | | | 1,326,283 | |
Series 2007-4, Class 22A1
4.471%, 6/25/47 | | | | | | | 4,847 | | | | 4,610,382 | |
BNPP Mortgage Securities LLC Trust
Series 2009-1, Class B1
6.00%, 8/27/37(a) | | | | | | | 4,623 | | | | 3,549,208 | |
ChaseFlex Trust
Series 2007-1, Class 1A3
6.50%, 2/25/37 | | | | | | | 818 | | | | 586,787 | |
Citigroup Mortgage Loan Trust
Series 2006-4, Class 2A1A
6.00%, 12/25/35 | | | | | | | 7,116 | | | | 6,407,037 | |
| | |
| 46 | AB HIGH INCOME FUND | | abfunds.com |
PORTFOLIO OF INVESTMENTS (continued)
| | | | | | | | | | | | |
| | | | | | Principal Amount (000) | | | U.S. $ Value | |
| |
| | | | | | | | | | | | |
Series 2007-AR4, Class 1A1A
3.302%, 3/25/37 | | | U.S.$ | | | | 1,105 | | | $ | 942,065 | |
CitiMortgage Alternative Loan Trust
Series 2007-A3, Class 1A4
5.75%, 3/25/37 | | | | | | | 1,619 | | | | 1,427,479 | |
Countrywide Home Loan Mortgage Pass-Through Trust
Series 2006-17, Class A2
6.00%, 12/25/36 | | | | | | | 3,528 | | | | 3,047,717 | |
Series 2007-4, Class 1A39
6.00%, 5/25/37 | | | | | | | 2,421 | | | | 2,003,672 | |
Series 2007-HY4, Class 1A1
3.148%, 9/25/47 | | | | | | | 1,554 | | | | 1,433,440 | |
Credit Suisse Mortgage Trust
Series 2009-8R, Class 6A2
6.00%, 1/26/38(a) | | | | | | | 681 | | | | 509,652 | |
Series 2010-9R, Class 1A5
4.00%, 8/27/37(a) | | | | | | | 3,558 | | | | 3,500,223 | |
CSMC Mortgage-Backed Trust
Series 2006-7, Class 3A12
6.25%, 8/25/36 | | | | | | | 2,129 | | | | 1,774,515 | |
First Horizon Alternative Mortgage Securities Trust
Series 2006-AA3, Class A1
3.14%, 6/25/36 | | | | | | | 1,258 | | | | 1,023,229 | |
Series 2006-FA1, Class 1A3
5.75%, 4/25/36 | | | | | | | 2,035 | | | | 1,670,595 | |
Series 2006-FA3, Class A9
6.00%, 7/25/36 | | | | | | | 1,586 | | | | 1,289,487 | |
Morgan Stanley Mortgage Loan Trust
Series 2005-10, Class 4A1
5.50%, 12/25/35 | | | | | | | 1,790 | | | | 1,571,821 | |
Series 2007-12, Class 3A22
6.00%, 8/25/37 | | | | | | | 476 | | | | 395,719 | |
New Century Alternative Mortgage Loan Trust
Series 2006-ALT2, Class AF6A
5.243%, 10/25/36 | | | | | | | 7,348 | | | | 4,358,405 | |
Nomura Resecuritization Trust
Series 2010-5RA, Class 1A7
6.50%, 10/26/37(a) | | | | | | | 7,008 | | | | 5,776,714 | |
Residential Accredit Loans, Inc. Trust
Series 2005-QA10, Class A31
4.11%, 9/25/35 | | | | | | | 3,554 | | | | 2,994,443 | |
Series 2005-QS14, Class 3A1
6.00%, 9/25/35 | | | | | | | 2,666 | | | | 2,505,341 | |
| | |
| abfunds.com | | AB HIGH INCOME FUND | 47 |
PORTFOLIO OF INVESTMENTS (continued)
| | | | | | | | | | | | |
| | | | | | Principal Amount (000) | | | U.S. $ Value | |
| |
| | | | | | | | | | | | |
Residential Asset Securitization Trust
Series 2006-A8, Class 3A4
6.00%, 8/25/36 | | | U.S.$ | | | | 965 | | | $ | 788,875 | |
Series 2007-A1, Class A8
6.00%, 3/25/37 | | | | | | | 1,226 | | | | 783,427 | |
Series 2007-A5, Class 2A3
6.00%, 5/25/37 | | | | | | | 404 | | | | 350,690 | |
Structured Adjustable Rate Mortgage Loan Trust
Series 2006-9, Class 4A1
3.129%, 10/25/36 | | | | | | | 1,388 | | | | 1,233,161 | |
Washington Mutual Mortgage Pass-Through Certificates Trust
Series 2006-7, Class A4
4.386%, 9/25/36 | | | | | | | 2,218 | | | | 1,147,854 | |
Series 2006-9, Class A4
4.834%, 10/25/36 | | | | | | | 2,297 | | | | 1,129,542 | |
Wells Fargo Alternative Loan Trust
Series 2007-PA3, Class 3A1
6.25%, 7/25/37 | | | | | | | 1,669 | | | | 1,569,582 | |
Wells Fargo Mortgage Backed Securities Trust
Series 2007-10, Class 1A8
6.00%, 7/25/37 | | | | | | | 1,503 | | | | 1,481,797 | |
Series 2007-AR7, Class A1
3.156%, 12/28/37 | | | | | | | 7,393 | | | | 6,802,119 | |
| | | | | | | | | | | | |
| | | | | | | | | | | 107,141,259 | |
| | | | | | | | | | | | |
Non-Agency Floating Rate – 0.2% | | | | | | | | | | | | |
Alternative Loan Trust
Series 2007-7T2, Class A3
1.591% (LIBOR 1 Month + 0.60%),
4/25/37(j) | | | | | | | 3,267 | | | | 1,431,317 | |
Citigroup Mortgage Loan Trust
Series 2010-3, Class 2A2
6.00%, 8/25/37(a)(l) | | | | | | | 2,542 | | | | 2,211,519 | |
Countrywide Home Loan Mortgage Pass-Through Trust
Series 2007-13, Class A7
1.591% (LIBOR 1 Month + 0.60%),
8/25/37(j) | | | | | | | 829 | | | | 586,506 | |
First Horizon Alternative Mortgage Securities Trust
Series 2007-FA2, Class 1A10
1.241% (LIBOR 1 Month + 0.25%),
4/25/37(j) | | | | | | | 1,939 | | | | 909,511 | |
| | |
| 48 | AB HIGH INCOME FUND | | abfunds.com |
PORTFOLIO OF INVESTMENTS (continued)
| | | | | | | | | | | | |
| | | | | | Principal Amount (000) | | | U.S. $ Value | |
| |
| | | | | | | | | | | | |
Lehman Mortgage Trust
Series 2007-1, Class 3A1
1.241% (LIBOR 1 Month + 0.25%),
2/25/37(j) | | | U.S.$ | | | | 3,001 | | | $ | 497,214 | |
Series 2007-1, Class 3A2
6.259% (7.25% – LIBOR 1 Month),
2/25/37(j)(r) | | | | | | | 3,001 | | | | 995,822 | |
Lehman XS Trust
Series 2007-16N, Class 2A2
1.841% (LIBOR 1 Month + 0.85%),
9/25/47(j) | | | | | | | 1,174 | | | | 1,081,389 | |
Morgan Stanley Mortgage Loan Trust
Series 2006-9AR, Class A2
1.141% (LIBOR 1 Month + 0.15%),
8/25/36(j) | | | | | | | 9,980 | | | | 4,826,649 | |
PHH Alternative Mortgage Trust
Series 2007-1, Class 1A1
1.151% (LIBOR 1 Month + 0.16%),
2/25/37(j) | | | | | | | 1,169 | | | | 982,225 | |
Series 2007-2, Class 1A3
1.321% (LIBOR 1 Month + 0.33%),
5/25/37(j) | | | | | | | 1,335 | | | | 1,231,303 | |
Structured Asset Mortgage Investments II Trust
Series 2007-AR6, Class A1
2.162% (12MTA + 1.50%),
8/25/47(j) | | | | | | | 2,859 | | | | 2,597,453 | |
| | | | | | | | | | | | |
| | | | | | | | | | | 17,350,908 | |
| | | | | | | | | | | | |
Total Collateralized Mortgage Obligations
(cost $694,872,060) | | | | | | | | | | | 759,757,533 | |
| | | | | | | | | | | | |
| | | | | | | | | | | | |
CORPORATES – INVESTMENT GRADE – 6.5% | | | | | | | | | | | | |
Industrial – 3.2% | |
Basic – 0.4% | |
Braskem Finance Ltd.
6.45%, 2/03/24 | | | | | | | 4,037 | | | | 4,299,405 | |
FMG Resources (August 2006) Pty Ltd.
9.75%, 3/01/22(a) | | | | | | | 3,420 | | | | 3,942,005 | |
Fresnillo PLC
5.50%, 11/13/23(a) | | | | | | | 3,774 | | | | 4,113,660 | |
Glencore Finance Canada Ltd.
6.00%, 11/15/41(a) | | | | | | | 1,464 | | | | 1,605,576 | |
Glencore Funding LLC
4.625%, 4/29/24(a) | | | | | | | 1,733 | | | | 1,817,057 | |
| | |
| abfunds.com | | AB HIGH INCOME FUND | 49 |
PORTFOLIO OF INVESTMENTS (continued)
| | | | | | | | | | | | |
| | | | | | Principal Amount (000) | | | U.S. $ Value | |
| |
| | | | | | | | | | | | |
Minsur SA
6.25%, 2/07/24(a) | | | U.S.$ | | | | 10,297 | | | $ | 11,053,284 | |
Mosaic Co. (The)
5.625%, 11/15/43 | | | | | | | 1,170 | | | | 1,209,442 | |
Southern Copper Corp.
7.50%, 7/27/35 | | | | | | | 1,500 | | | | 1,822,500 | |
WestRock MWV LLC
8.20%, 1/15/30 | | | | | | | 2,940 | | | | 4,044,473 | |
| | | | | | | | | | | | |
| | | | 33,907,402 | |
| | | | | | | | | | | | |
Capital Goods – 0.2% | | | | | | | | | | | | |
General Electric Co.
Series D
5.00%, 1/21/21(n) | | | | | | | 12,108 | | | | 12,804,828 | |
Lafarge SA
7.125%, 7/15/36 | | | | | | | 2,640 | | | | 3,336,725 | |
Masco Corp.
5.95%, 3/15/22 | | | | | | | 2,800 | | | | 3,173,906 | |
| | | | | | | | | | | | |
| | | | | | | | | | | 19,315,459 | |
| | | | | | | | | | | | |
Communications - Media – 0.5% | | | | | | | | | | | | |
Charter Communications Operating LLC/Charter Communications Operating Capital
4.464%, 7/23/22 | | | | | | | 5,865 | | | | 6,234,208 | |
4.908%, 7/23/25 | | | | | | | 6,755 | | | | 7,226,492 | |
6.484%, 10/23/45 | | | | | | | 2,993 | | | | 3,504,016 | |
Comcast Cable Communications Holdings, Inc.
9.455%, 11/15/22 | | | | | | | 2,500 | | | | 3,370,525 | |
Cox Communications, Inc.
4.50%, 6/30/43(a) | | | | | | | 882 | | | | 771,889 | |
4.70%, 12/15/42(a) | | | | | | | 1,692 | | | | 1,513,612 | |
Viacom, Inc.
4.375%, 3/15/43 | | | | | | | 18,000 | | | | 15,972,336 | |
| | | | | | | | | | | | |
| | | | | | | | | | | 38,593,078 | |
| | | | | | | | | | | | |
Communications - Telecommunications – 0.3% | | | | | | | | | | | | |
AT&T, Inc.
5.45%, 3/01/47 | | | | | | | 15,428 | | | | 15,924,504 | |
Qwest Corp.
6.75%, 12/01/21 | | | | | | | 1,000 | | | | 1,107,265 | |
Sprint Spectrum Co. LLC/Sprint Spectrum Co. II LLC/Sprint Spectrum Co. III LLC
3.36%, 9/20/21(a) | | | | | | | 10,842 | | | | 10,937,409 | |
| | | | | | | | | | | | |
| | | | | | | | | | | 27,969,178 | |
| | | | | | | | | | | | |
| | |
| 50 | AB HIGH INCOME FUND | | abfunds.com |
PORTFOLIO OF INVESTMENTS (continued)
| | | | | | | | | | | | |
| | | | | | Principal Amount (000) | | | U.S. $ Value | |
| |
| | | | | | | | | | | | |
Consumer Cyclical - Automotive – 0.2% | | | | | | | | | | | | |
General Motors Co.
5.20%, 4/01/45 | | | U.S.$ | | | | 2,490 | | | $ | 2,417,675 | |
6.25%, 10/02/43 | | | | | | | 852 | | | | 936,989 | |
6.75%, 4/01/46 | | | | | | | 7,041 | | | | 8,249,278 | |
General Motors Financial Co., Inc.
4.00%, 1/15/25 | | | | | | | 3,873 | | | | 3,902,590 | |
| | | | | | | | | | | | |
| | | | | | | | | | | 15,506,532 | |
| | | | | | | | | | | | |
Consumer Cyclical - Entertainment – 0.1% | | | | | | | | | | | | |
Royal Caribbean Cruises Ltd.
7.25%, 3/15/18 | | | | | | | 1,000 | | | | 1,044,783 | |
7.50%, 10/15/27 | | | | | | | 3,000 | | | | 3,889,683 | |
| | | | | | | | | | | | |
| | | | | | | | | | | 4,934,466 | |
| | | | | | | | | | | | |
Consumer Cyclical - Other – 0.1% | | | | | | | | | | | | |
DR Horton, Inc.
4.75%, 5/15/17 | | | | | | | 2,000 | | | | 2,002,112 | |
Owens Corning
7.00%, 12/01/36(j)(l) | | | | | | | 4,450 | | | | 5,559,963 | |
Seminole Tribe of Florida, Inc.
6.535%, 10/01/20(a) | | | | | | | 2,425 | | | | 2,456,632 | |
| | | | | | | | | | | | |
| | | | | | | | | | | 10,018,707 | |
| | | | | | | | | | | | |
Consumer Cyclical - Retailers – 0.0% | | | | | | | | | | | | |
AutoNation, Inc.
6.75%, 4/15/18 | | | | | | | 349 | | | | 364,966 | |
| | | | | | | | | | | | |
| | | |
Consumer Non-Cyclical – 0.0% | | | | | | | | | | | | |
BRF SA
4.75%, 5/22/24(a) | | | | | | | 2,447 | | | | 2,404,177 | |
Bunge Ltd. Finance Corp.
8.50%, 6/15/19 | | | | | | | 332 | | | | 374,921 | |
| | | | | | | | | | | | |
| | | | | | | | | | | 2,779,098 | |
| | | | | | | | | | | | |
Energy – 0.8% | | | | | | | | | | | | |
Anadarko Petroleum Corp.
8.70%, 3/15/19 | | | | | | | 2,000 | | | | 2,235,490 | |
Cenovus Energy, Inc.
3.00%, 8/15/22 | | | | | | | 495 | | | | 486,774 | |
3.80%, 9/15/23 | | | | | | | 280 | | | | 281,682 | |
4.45%, 9/15/42 | | | | | | | 4,289 | | | | 3,695,295 | |
6.75%, 11/15/39 | | | | | | | 373 | | | | 417,420 | |
Ecopetrol SA
5.375%, 6/26/26 | | | | | | | 1,886 | | | | 1,924,663 | |
5.875%, 5/28/45 | | | | | | | 6,355 | | | | 5,819,909 | |
| | |
| abfunds.com | | AB HIGH INCOME FUND | 51 |
PORTFOLIO OF INVESTMENTS (continued)
| | | | | | | | | | | | |
| | | | | | Principal Amount (000) | | | U.S. $ Value | |
| |
| | | | | | | | | | | | |
Energy Transfer Partners LP/old
7.60%, 2/01/24 | | | U.S.$ | | | | 3,200 | | | $ | 3,661,299 | |
Husky Energy, Inc.
6.15%, 6/15/19 | | | | | | | 5,000 | | | | 5,402,710 | |
Kinder Morgan, Inc./DE
7.00%, 6/15/17 | | | | | | | 275 | | | | 276,741 | |
Series G
7.75%, 1/15/32 | | | | | | | 2,969 | | | | 3,758,600 | |
7.80%, 8/01/31 | | | | | | | 2,662 | | | | 3,377,788 | |
Marathon Petroleum Corp.
4.75%, 9/15/44 | | | | | | | 437 | | | | 402,613 | |
Nabors Industries, Inc.
5.50%, 1/15/23(a) | | | | | | | 7,354 | | | | 7,440,388 | |
Regency Energy Partners LP/Regency Energy Finance Corp.
4.50%, 11/01/23 | | | | | | | 2,301 | | | | 2,393,983 | |
5.00%, 10/01/22 | | | | | | | 971 | | | | 1,035,870 | |
5.50%, 4/15/23 | | | | | | | 5,015 | | | | 5,221,663 | |
TransCanada PipeLines Ltd.
6.35%, 5/15/67 | | | | | | | 2,500 | | | | 2,315,005 | |
Williams Partners LP
5.10%, 9/15/45 | | | | | | | 4,227 | | | | 4,314,321 | |
Williams Partners LP/ACMP Finance Corp.
4.875%, 5/15/23 | | | | | | | 7,379 | | | | 7,588,512 | |
| | | | | | | | | | | | |
| | | | | | | | | | | 62,050,726 | |
| | | | | | | | | | | | |
Services – 0.1% | | | | | | | | | | | | |
Verisk Analytics, Inc.
5.50%, 6/15/45 | | | | | | | 4,150 | | | | 4,530,447 | |
| | | | | | | | | | | | |
| | | |
Technology – 0.5% | | | | | | | | | | | | |
Activision Blizzard, Inc.
6.125%, 9/15/23(a) | | | | | | | 2 | | | | 2,168 | |
Dell International LLC/EMC Corp.
6.02%, 6/15/26(a) | | | | | | | 7,586 | | | | 8,343,796 | |
8.35%, 7/15/46(a) | | | | | | | 2,793 | | | | 3,613,514 | |
Hewlett Packard Enterprise Co.
6.35%, 10/15/45(l) | | | | | | | 1,573 | | | | 1,635,078 | |
Seagate HDD Cayman
4.75%, 1/01/25 | | | | | | | 9,684 | | | | 9,447,672 | |
4.875%, 6/01/27 | | | | | | | 11,626 | | | | 11,216,300 | |
Western Digital Corp.
7.375%, 4/01/23(a) | | | | | | | 5,989 | | | | 6,549,055 | |
| | | | | | | | | | | | |
| | | | | | | | | | | 40,807,583 | |
| | | | | | | | | | | | |
| | |
| 52 | AB HIGH INCOME FUND | | abfunds.com |
PORTFOLIO OF INVESTMENTS (continued)
| | | | | | | | | | | | |
| | | | | | Principal Amount (000) | | | U.S. $ Value | |
| |
| | | | | | | | | | | | |
Transportation - Airlines – 0.0% | | | | | | | | | | | | |
America West Airlines Pass-Through Trust
Series 1999-1G, Class G
7.93%, 1/02/19 | | | U.S.$ | | | | 648 | | | $ | 684,789 | |
Northwest Airlines Pass-Through Trust
Series 2000-1, Class G
7.15%, 10/01/19 | | | | | | | 389 | | | | 412,188 | |
| | | | | | | | | | | | |
| | | | | | | | | | | 1,096,977 | |
| | | | | | | | | | | | |
| | | | | | | | | | | 261,874,619 | |
| | | | | | | | | | | | |
Financial Institutions – 2.8% | | | | | | | | | | | | |
Banking – 1.1% | | | | | | | | | | | | |
ABN AMRO Bank NV
Series E
6.25%, 4/27/22(a) | | | | | | | 1,122 | | | | 1,268,658 | |
BNP Paribas SA
7.195%, 6/25/37(a)(n) | | | | | | | 6,900 | | | | 7,675,429 | |
7.625%, 3/30/21(a)(n) | | | | | | | 873 | | | | 952,206 | |
BPCE SA
5.70%, 10/22/23(a) | | | | | | | 241 | | | | 261,149 | |
DNB Bank ASA
6.50%, 3/26/22(a)(n) | | | | | | | 11,090 | | | | 11,821,851 | |
HSBC Holdings PLC
3.60%, 5/25/23 | | | | | | | 3,652 | | | | 3,750,834 | |
6.00%, 9/29/23(a)(n) | | | EUR | | | | 6,152 | | | | 7,401,955 | |
ICICI Bank Ltd./Dubai
4.80%, 5/22/19(a) | | | U.S.$ | | | | 5,980 | | | | 6,240,776 | |
JPMorgan Chase & Co.
Series V
5.00%, 7/01/19(n) | | | | | | | 2,638 | | | | 2,678,274 | |
Morgan Stanley
4.10%, 5/22/23 | | | | | | | 10,912 | | | | 11,333,280 | |
Nationwide Building Society
4.00%, 9/14/26(a) | | | | | | | 15,300 | | | | 15,132,128 | |
PNC Financial Services Group, Inc. (The)
Series R
4.85%, 6/01/23(n) | | | | | | | 3,888 | | | | 3,906,254 | |
Regions Bank/Birmingham AL
6.45%, 6/26/37 | | | | | | | 5,300 | | | | 6,168,103 | |
Santander Bank NA
8.75%, 5/30/18 | | | | | | | 3,800 | | | | 4,060,118 | |
US Bancorp
Series J
5.30%, 4/15/27(n) | | | | | | | 4,924 | | | | 5,103,628 | |
| | | | | | | | | | | | |
| | | | | | | | | | | 87,754,643 | |
| | | | | | | | | | | | |
| | |
| abfunds.com | | AB HIGH INCOME FUND | 53 |
PORTFOLIO OF INVESTMENTS (continued)
| | | | | | | | | | | | |
| | | | | | Principal Amount (000) | | | U.S. $ Value | |
| |
| | | | | | | | | | | | |
Brokerage – 0.2% | | | | | | | | | | | | |
E*TRADE Financial Corp.
5.375%, 11/15/22 | | | U.S.$ | | | | 4,281 | | | $ | 4,522,114 | |
GFI Group, Inc.
8.375%, 7/19/18 | | | | | | | 2,367 | | | | 2,513,766 | |
SUAM Finance BV
4.875%, 4/17/24(a) | | | | | | | 4,867 | | | | 5,110,350 | |
| | | | | | | | | | | | |
| | | | | | | | | | | 12,146,230 | |
| | | | | | | | | | | | |
Finance – 0.1% | | | | | | | | | | | | |
International Lease Finance Corp.
5.875%, 4/01/19 | | | | | | | 2,300 | | | | 2,449,220 | |
8.25%, 12/15/20 | | | | | | | 5,011 | | | | 5,914,824 | |
| | | | | | | | | | | | |
| | | | | | | | | | | 8,364,044 | |
| | | | | | | | | | | | |
Insurance – 1.2% | | | | | | | | | | | | |
Allstate Corp. (The)
6.50%, 5/15/57 | | | | | | | 10,811 | | | | 12,380,768 | |
American International Group, Inc.
6.82%, 11/15/37 | | | | | | | 1,938 | | | | 2,461,752 | |
8.175%, 5/15/58 | | | | | | | 7,301 | | | | 9,403,206 | |
Aon Corp.
8.205%, 1/01/27 | | | | | | | 2,495 | | | | 3,214,099 | |
Assured Guaranty Municipal Holdings, Inc.
6.40%, 12/15/66(a) | | | | | | | 1,801 | | | | 1,620,178 | |
Chubb Corp. (The)
3.408% (LIBOR 3 Month + 2.25%),
4/15/37(j) | | | | | | | 10,937 | | | | 10,813,456 | |
Lincoln National Corp.
8.75%, 7/01/19 | | | | | | | 186 | | | | 211,252 | |
MetLife Capital Trust IV
7.875%, 12/15/37(a) | | | | | | | 1,765 | | | | 2,250,668 | |
MetLife, Inc.
6.40%, 12/15/36 | | | | | | | 9,700 | | | | 10,900,986 | |
10.75%, 8/01/39 | | | | | | | 3,495 | | | | 5,597,714 | |
Nationwide Mutual Insurance Co.
3.421% (LIBOR 3 Month + 2.29%),
12/15/24(a)(j) | | | | | | | 5,000 | | | | 4,968,015 | |
9.375%, 8/15/39(a) | | | | | | | 4,546 | | | | 7,413,867 | |
Pacific Life Insurance Co.
9.25%, 6/15/39(a) | | | | | | | 3,000 | | | | 4,714,356 | |
Prudential Financial, Inc.
5.625%, 6/15/43 | | | | | | | 13,000 | | | | 14,160,250 | |
Transatlantic Holdings, Inc.
8.00%, 11/30/39 | | | | | | | 2,836 | | | | 3,706,837 | |
| | |
| 54 | AB HIGH INCOME FUND | | abfunds.com |
PORTFOLIO OF INVESTMENTS (continued)
| | | | | | | | | | | | |
| | | | | | Principal Amount (000) | | | U.S. $ Value | |
| |
| | | | | | | | | | | | |
ZFS Finance USA Trust V
6.50%, 5/09/37(a) | | | U.S.$ | | | | 3,010 | | | $ | 3,010,632 | |
| | | | | | | | | | | | |
| | | | | | | | | | | 96,828,036 | |
| | | | | | | | | | | | |
REITS – 0.2% | |
EPR Properties
5.75%, 8/15/22 | | | | | | | 3,445 | | | | 3,782,476 | |
7.75%, 7/15/20 | | | | | | | 3,036 | | | | 3,452,864 | |
Senior Housing Properties Trust
6.75%, 12/15/21 | | | | | | | 4,500 | | | | 5,041,017 | |
VEREIT Operating Partnership LP
4.875%, 6/01/26 | | | | | | | 1,847 | | | | 1,959,903 | |
Weyerhaeuser Co.
7.375%, 3/15/32 | | | | | | | 3,308 | | | | 4,428,453 | |
8.50%, 1/15/25 | | | | | | | 1,000 | | | | 1,314,562 | |
| | | | | | | | | | | | |
| | | | | | | | | | | 19,979,275 | |
| | | | | | | | | | | | |
| | | | | | | | | | | 225,072,228 | |
| | | | | | | | | | | | |
Utility – 0.5% | | | | | | | | | | | | |
Electric – 0.5% | | | | | | | | | | | | |
Consorcio Transmantaro SA
4.375%, 5/07/23(a) | | | | | | | 14,103 | | | | 14,314,545 | |
EDP Finance BV
4.90%, 10/01/19(a) | | | | | | | 416 | | | | 436,679 | |
Empresa de Energia de Bogota SA ESP
6.125%, 11/10/21(a) | | | | | | | 7,654 | | | | 7,915,782 | |
Empresas Publicas de Medellin ESP
7.625%, 7/29/19(a) | | | | | | | 1,277 | | | | 1,430,240 | |
FirstEnergy Corp.
Series C
7.375%, 11/15/31 | | | | | | | 4,551 | | | | 5,998,600 | |
Israel Electric Corp., Ltd.
Series 6
5.00%, 11/12/24(a) | | | | | | | 5,373 | | | | 5,802,840 | |
PPL Capital Funding, Inc.
Series A
3.817% (LIBOR 3 Month + 2.67%),
3/30/67(j) | | | | | | | 5,125 | | | | 4,980,039 | |
Southern California Edison Co.
Series E
6.25%, 2/01/22(n) | | | | | | | 3,300 | | | | 3,670,577 | |
| | | | | | | | | | | | |
| | | | | | | | | | | 44,549,302 | |
| | | | | | | | | | | | |
Total Corporates – Investment Grade
(cost $484,785,927) | | | | | | | | | | | 531,496,149 | |
| | | | | | | | | | | | |
| | |
| abfunds.com | | AB HIGH INCOME FUND | 55 |
PORTFOLIO OF INVESTMENTS (continued)
| | | | | | | | | | | | |
| | | | | | Principal Amount (000) | | | U.S. $ Value | |
| |
| | | | | | | | | | | | |
EMERGING MARKETS – SOVEREIGNS – 5.5% | | | | | | | | | | | | |
Angola – 0.2% | | | | | | | | | | | | |
Angolan Government International Bond
9.50%, 11/12/25(a) | | | U.S.$ | | | | 12,366 | | | $ | 12,946,537 | |
Republic of Angola Via Northern Lights III BV
7.00%, 8/17/19(a) | | | | | | | 3,346 | | | | 3,454,358 | |
| | | | | | | | | | | | |
| | | | 16,400,895 | |
| | | | | | | | | | | | |
Argentina – 1.2% | |
Argentine Republic Government International Bond
6.25%, 4/22/19 | | | | | | | 5,009 | | | | 5,297,018 | |
6.875%, 4/22/21-1/26/27 | | | | | | | 56,063 | | | | 59,431,267 | |
7.82%, 12/31/33 | | | EUR | | | | 24,935 | | | | 29,267,078 | |
| | | | | | | | | | | | |
| | | | 93,995,363 | |
| | | | | | | | | | | | |
Bahrain – 0.1% | |
Bahrain Government International Bond
7.00%, 10/12/28(a) | | | U.S.$ | | | | 7,504 | | | | 7,794,780 | |
| | | | | | | | | | | | |
|
Cameroon – 0.1% | |
Republic of Cameroon International Bond
9.50%, 11/19/25(a) | | | | | | | 7,229 | | | | 8,222,988 | |
| | | | | | | | | | | | |
|
Croatia – 0.1% | |
Croatia Government International Bond
6.625%, 7/14/20(a) | | | | | | | 5,350 | | | | 5,885,000 | |
| | | | | | | | | | | | |
|
Dominican Republic – 0.5% | |
Dominican Republic International Bond
5.95%, 1/25/27(a) | | | | | | | 9,637 | | | | 10,082,711 | |
6.85%, 1/27/45(a) | | | | | | | 9,000 | | | | 9,573,750 | |
6.875%, 1/29/26(a) | | | | | | | 652 | | | | 726,980 | |
7.45%, 4/30/44(a) | | | | | | | 5,621 | | | | 6,365,783 | |
8.625%, 4/20/27(a) | | | | | | | 12,151 | | | | 14,490,067 | |
| | | | | | | | | | | | |
| | | | 41,239,291 | |
| | | | | | | | | | | | |
Ecuador – 0.1% | |
Ecuador Government International Bond
7.95%, 6/20/24(a) | | | | | | | 4,350 | | | | 4,154,250 | |
9.65%, 12/13/26(a) | | | | | | | 2,405 | | | | 2,447,088 | |
10.75%, 3/28/22(a) | | | | | | | 3,700 | | | | 4,005,250 | |
| | | | | | | | | | | | |
| | | | 10,606,588 | |
| | | | | | | | | | | | |
| | |
| 56 | AB HIGH INCOME FUND | | abfunds.com |
PORTFOLIO OF INVESTMENTS (continued)
| | | | | | | | | | | | |
| | | | | | Principal Amount (000) | | | U.S. $ Value | |
| |
| | | | | | | | | | | | |
Egypt – 0.3% | |
Egypt Government International Bond
6.125%, 1/31/22(a) | | | U.S.$ | | | | 22,826 | | | $ | 23,767,572 | |
| | | | | | | | | | | | |
|
El Salvador – 0.1% | |
El Salvador Government International Bond
6.375%, 1/18/27(a) | | | | | | | 145 | | | | 127,963 | |
7.375%, 12/01/19(a) | | | | | | | 1,495 | | | | 1,498,737 | |
7.625%, 9/21/34(a) | | | | | | | 872 | | | | 885,080 | |
7.65%, 6/15/35(a) | | | | | | | 263 | | | | 238,673 | |
7.75%, 1/24/23(a) | | | | | | | 700 | | | | 703,500 | |
8.625%, 2/28/29(a) | | | | | | | 759 | | | | 766,590 | |
| | | | | | | | | | | | |
| | | | 4,220,543 | |
| | | | | | | | | | | | |
Ethiopia – 0.0% | |
Ethiopia International Bond
6.625%, 12/11/24(a) | | | | | | | 2,303 | | | | 2,268,455 | |
| | | | | | | | | | | | |
|
Gabon – 0.2% | |
Gabon Government International Bond
6.375%, 12/12/24(a) | | | | | | | 14,182 | | | | 13,893,234 | |
6.95%, 6/16/25(a) | | | | | | | 5,600 | | | | 5,530,000 | |
| | | | | | | | | | | | |
| | | | 19,423,234 | |
| | | | | | | | | | | | |
Honduras – 0.1% | |
Honduras Government International Bond
6.25%, 1/19/27(a) | | | | | | | 10,233 | | | | 10,616,737 | |
| | | | | | | | | | | | |
|
Iraq – 0.0% | |
Iraq International Bond
5.80%, 1/15/28(a) | | | | | | | 533 | | | | 475,036 | |
| | | | | | | | | | | | |
|
Ivory Coast – 0.6% | |
Ivory Coast Government International Bond
5.75%, 12/31/32(a) | | | | | | | 26,454 | | | | 25,462,090 | |
6.375%, 3/03/28(a) | | | | | | | 20,691 | | | | 20,794,455 | |
| | | | | | | | | | | | |
| | | | 46,256,545 | |
| | | | | | | | | | | | |
Jamaica – 0.1% | |
Jamaica Government International Bond
7.625%, 7/09/25 | | | | | | | 2,302 | | | | 2,661,688 | |
7.875%, 7/28/45 | | | | | | | 7,519 | | | | 8,712,641 | |
| | | | | | | | | | | | |
| | | | 11,374,329 | |
| | | | | | | | | | | | |
Jordan – 0.1% | |
Jordan Government International Bond
5.75%, 1/31/27(a) | | | | | | | 4,536 | | | | 4,479,300 | |
| | | | | | | | | | | | |
| | |
| abfunds.com | | AB HIGH INCOME FUND | 57 |
PORTFOLIO OF INVESTMENTS (continued)
| | | | | | | | | | | | |
| | | | | | Principal Amount (000) | | | U.S. $ Value | |
| |
| | | | | | | | | | | | |
Kenya – 0.0% | |
Kenya Government International Bond
5.875%, 6/24/19(a) | | | U.S.$ | | | | 3,124 | | | $ | 3,233,340 | |
| | | | | | | | | | | | |
|
Lebanon – 0.0% | |
Lebanon Government International Bond
Series G
6.60%, 11/27/26(a) | | | | | | | 3,840 | | | | 3,878,400 | |
| | | | | | | | | | | | |
|
Mongolia – 0.2% | |
Mongolia Government International Bond
5.125%, 12/05/22(a) | | | | | | | 14,564 | | | | 13,908,620 | |
| | | | | | | | | | | | |
|
Nigeria – 0.0% | |
Nigeria Government International Bond
7.875%, 2/16/32(a) | | | | | | | 2,864 | | | | 3,103,860 | |
| | | | | | | | | | | | |
|
Pakistan – 0.1% | |
Pakistan Government International Bond
7.25%, 4/15/19(a) | | | | | | | 7,468 | | | | 7,893,676 | |
| | | | | | | | | | | | |
|
Serbia – 0.0% | |
Serbia International Bond
6.75%, 11/01/24(a) | | | | | | | 342 | | | | 346,942 | |
| | | | | | | | | | | | |
|
Sri Lanka – 0.1% | |
Sri Lanka Government International Bond
6.00%, 1/14/19(a) | | | | | | | 3,825 | | | | 3,958,875 | |
6.125%, 6/03/25(a) | | | | | | | 2,800 | | | | 2,852,500 | |
| | | | | | | | | | | | |
| | | | 6,811,375 | |
| | | | | | | | | | | | |
Turkey – 0.6% | |
Turkey Government International Bond
4.875%, 10/09/26-4/16/43 | | | | | | | 25,240 | | | | 23,461,837 | |
5.625%, 3/30/21 | | | | | | | 6,615 | | | | 7,003,631 | |
6.00%, 3/25/27 | | | | | | | 15,457 | | | | 16,538,990 | |
7.375%, 2/05/25 | | | | | | | 1,649 | | | | 1,916,963 | |
| | | | | | | | | | | | |
| | | | 48,921,421 | |
| | | | | | | | | | | | |
Ukraine – 0.3% | |
Ukraine Government International Bond
7.75%, 9/01/23-9/01/27(a) | | | | | | | 21,758 | | | | 20,939,988 | |
| | | | | | | | | | | | |
|
Venezuela – 0.3% | |
Venezuela Government International Bond
7.00%, 3/31/38(a) | | | | | | | 538 | | | | 239,410 | |
| | |
| 58 | AB HIGH INCOME FUND | | abfunds.com |
PORTFOLIO OF INVESTMENTS (continued)
| | | | | | | | | | | | |
| | | | | | Principal Amount (000) | | | U.S. $ Value | |
| |
| | | | | | | | | | | | |
7.65%, 4/21/25(a) | | | U.S.$ | | | | 6,636 | | | $ | 3,085,795 | |
9.25%, 9/15/27 | | | | | | | 34,020 | | | | 18,030,760 | |
9.25%, 5/07/28(a) | | | | | | | 1,500 | | | | 712,500 | |
9.375%, 1/13/34 | | | | | | | 5,472 | | | | 2,653,859 | |
| | | | | | | | | | | | |
| | | | 24,722,324 | |
| | | | | | | | | | | | |
Zambia – 0.1% | |
Zambia Government International Bond
8.50%, 4/14/24(a) | | | | | | | 9,236 | | | | 9,709,345 | |
| | | | | | | | | | | | |
| | | |
Total Emerging Markets – Sovereigns
(cost $433,190,647) | | | | | | | | | | | 450,495,947 | |
| | | | | | | | | | | | |
| | | | | | | | | | | | |
EMERGING MARKETS – TREASURIES – 5.3% | | | | | | | | | | | | |
Argentina – 1.6% | |
Argentine Bonos del Tesoro
15.50%, 10/17/26 | | | ARS | | | | 401,373 | | | | 28,851,147 | |
16.00%, 10/17/23 | | | | | | | 595,534 | | | | 41,503,177 | |
18.20%, 10/03/21 | | | | | | | 701,137 | | | | 49,634,439 | |
21.20%, 9/19/18 | | | | | | | 216,687 | | | | 14,370,330 | |
| | | | | | | | | | | | |
| | | | 134,359,093 | |
| | | | | | | | | | | | |
Brazil – 2.8% | |
Brazil Letras do Tesouro Nacional
Series LTN
Zero Coupon, 1/01/19 | | | BRL | | | | 99,500 | | | | 27,008,495 | |
Brazil Notas do Tesouro Nacional
Series F
10.00%, 1/01/21-1/01/27 | | | | | | | 636,150 | | | | 199,089,120 | |
| | | | | | | | | | | | |
| | | | | | | | | | | 226,097,615 | |
| | | | | | | | | | | | |
Dominican Republic – 0.4% | | | | | | | | | | | | |
Dominican Republic International Bond
10.50%, 1/17/20(e) | | | DOP | | | | 347,740 | | | | 7,443,486 | |
12.00%, 1/20/22(e) | | | | | | | 347,740 | | | | 7,563,363 | |
15.95%, 6/04/21(e) | | | | | | | 52,700 | | | | 1,330,016 | |
16.00%, 7/10/20(e) | | | | | | | 563,400 | | | | 13,744,248 | |
| | | | | | | | | | | | |
| | | | | | | | | | | 30,081,113 | |
| | | | | | | | | | | | |
Turkey – 0.5% | | | | | | | | | | | | |
Turkey Government Bond
10.60%, 2/11/26 | | | TRY | | | | 34,355 | | | | 9,846,177 | |
11.00%, 2/24/27 | | | | | | | 105,295 | | | | 31,485,916 | |
| | | | | | | | | | | | |
| | | | | | | | | | | 41,332,093 | |
| | | | | | | | | | | | |
Total Emerging Markets – Treasuries
(cost $402,936,999) | | | | | | | | | | | 431,869,914 | |
| | | | | | | | | | | | |
| | | | | | | | | | | | |
| | |
| abfunds.com | | AB HIGH INCOME FUND | 59 |
PORTFOLIO OF INVESTMENTS (continued)
| | | | | | | | | | | | |
| | | | | | Principal Amount (000) | | | U.S. $ Value | |
| |
| | | | | | | | | | | | |
EMERGING MARKETS – CORPORATE BONDS – 3.6% | | | | | | | | | | | | |
Industrial – 3.1% | | | | | | | | | | | | |
Basic – 0.5% | | | | | | | | | | | | |
Consolidated Energy Finance SA
6.75%, 10/15/19(a) | | | U.S.$ | | | | 18,654 | | | $ | 19,048,346 | |
Elementia SAB de CV
5.50%, 1/15/25(a) | | | | | | | 2,208 | | | | 2,249,400 | |
Petra Diamonds US Treasury PLC
7.25%, 5/01/22(a) | | | | | | | 2,899 | | | | 3,028,785 | |
Samarco Mineracao SA
4.125%, 11/01/22(a)(f)(g) | | | | | | | 2,015 | | | | 1,299,675 | |
5.375%, 9/26/24(a)(f)(g) | | | | | | | 900 | | | | 576,000 | |
5.75%, 10/24/23(a)(f)(g) | | | | | | | 8,416 | | | | 5,393,210 | |
Vedanta Resources PLC
6.375%, 7/30/22(a) | | | | | | �� | 12,566 | | | | 12,723,075 | |
| | | | | | | | | | | | |
| | | | | | | | | | | 44,318,491 | |
| | | | | | | | | | | | |
Capital Goods – 0.3% | | | | | | | | | | | | |
CIMPOR Financial Operations BV
5.75%, 7/17/24(a) | | | | | | | 7,640 | | | | 6,707,920 | |
Ferreycorp SAA
4.875%, 4/26/20(a) | | | | | | | 2,131 | | | | 2,152,084 | |
Grupo Cementos de Chihuahua SAB de CV
8.125%, 2/08/20(a) | | | | | | | 830 | | | | 860,316 | |
Odebrecht Finance Ltd.
4.375%, 4/25/25(a) | | | | | | | 537 | | | | 241,650 | |
5.25%, 6/27/29(a) | | | | | | | 9,173 | | | | 4,007,454 | |
7.125%, 6/26/42(a) | | | | | | | 17,280 | | | | 7,850,250 | |
8.25%, 4/25/18(a) | | | BRL | | | | 5,903 | | | | 1,134,459 | |
| | | | | | | | | | | | |
| | | | | | | | | | | 22,954,133 | |
| | | | | | | | | | | | |
Communications -
Telecommunications – 0.7% | | | | | | | | | | | | |
Columbus Cable Barbados Ltd.
7.375%, 3/30/21(a) | | | U.S.$ | | | | 18,972 | | | | 20,323,755 | |
Comcel Trust via Comunicaciones Celulares SA
6.875%, 2/06/24(a) | | | | | | | 6,131 | | | | 6,528,166 | |
Digicel Group Ltd.
7.125%, 4/01/22(a) | | | | | | | 1,134 | | | | 946,890 | |
8.25%, 9/30/20(a) | | | | | | | 14,000 | | | | 12,827,500 | |
Digicel Ltd.
6.00%, 4/15/21(a) | | | | | | | 3,750 | | | | 3,562,500 | |
6.75%, 3/01/23(a) | | | | | | | 3,270 | | | | 3,098,325 | |
Millicom International Cellular SA
6.00%, 3/15/25(a) | | | | | | | 2,963 | | | | 3,118,558 | |
| | |
| 60 | AB HIGH INCOME FUND | | abfunds.com |
PORTFOLIO OF INVESTMENTS (continued)
| | | | | | | | | | | | |
| | | | | | Principal Amount (000) | | | U.S. $ Value | |
| |
| | | | | | | | | | | | |
MTN Mauritius Investment Ltd.
6.50%, 10/13/26(a) | | | U.S.$ | | | | 5,701 | | | $ | 5,864,904 | |
| | | | | | | | | | | | |
| | | | | | | | | | | 56,270,598 | |
| | | | | | | | | | | | |
Consumer Cyclical -
Entertainment – 0.1% | | | | | | | | | | | | |
Silversea Cruise Finance Ltd.
7.25%, 2/01/25(a) | | | | | | | 9,700 | | | | 10,279,730 | |
| | | | | | | | | | | | |
| | | |
Consumer Cyclical - Other – 0.2% | | | | | | | | | | | | |
Servicios Corporativos Javer SAB de CV
9.875%, 4/06/21(a) | | | | | | | 2,594 | | | | 2,683,442 | |
Studio City Co., Ltd.
5.875%, 11/30/19(a) | | | | | | | 5,102 | | | | 5,350,722 | |
Wynn Macau Ltd.
5.25%, 10/15/21(a) | | | | | | | 8,100 | | | | 8,292,375 | |
| | | | | | | | | | | | |
| | | | | | | | | | | 16,326,539 | |
| | | | | | | | | | | | |
Consumer Cyclical -
Retailers – 0.0% | | | | | | | | | | | | |
K2016470219 (South Africa) Ltd.
3.00%, 12/31/22(a)(d) | | | | | | | 4,785 | | | | 497,485 | |
K2016470260 (South Africa) Ltd.
25.00%, 12/31/22(a)(d) | | | | | | | 1,100 | | | | 1,483,717 | |
| | | | | | | | | | | | |
| | | | | | | | | | | 1,981,202 | |
| | | | | | | | | | | | |
Consumer Non-Cyclical – 0.4% | | | | | | | | | | | | |
Central American Bottling Corp.
5.75%, 1/31/27(a) | | | | | | | 5,759 | | | | 6,105,116 | |
Marfrig Holdings Europe BV
6.875%, 6/24/19(a) | | | | | | | 5,432 | | | | 5,637,465 | |
8.00%, 6/08/23(a) | | | | | | | 4,150 | | | | 4,383,396 | |
Minerva Luxembourg SA
6.50%, 9/20/26(a) | | | | | | | 10,492 | | | | 10,373,860 | |
Tonon Luxembourg SA
7.25%, 1/24/20(d)(e)(f)(g) | | | | | | | 6,585 | | | | 724,390 | |
USJ Acucar e Alcool SA
9.875% (9.875% Cash or 12.00% PIK), 11/09/21(a)(d) | | | | | | | 1,415 | | | | 1,140,612 | |
Virgolino de Oliveira Finance SA
10.50%, 1/28/18(e)(f)(g) | | | | | | | 13,674 | | | | 1,076,828 | |
10.875%, 1/13/20(e)(f)(g) | | | | | | | 2,500 | | | | 675,000 | |
11.75%, 2/09/22(e)(f)(g) | | | | | | | 13,613 | | | | 1,072,024 | |
| | | | | | | | | | | | |
| | | | | | | | | | | 31,188,691 | |
| | | | | | | | | | | | |
Energy – 0.5% | | | | | | | | | | | | |
CHC Group LLC/CHC Finance Ltd.
Series AI
Zero Coupon, 10/01/20(b)(h) | | | | | | | 14,659 | | | | 22,721,163 | |
| | |
| abfunds.com | | AB HIGH INCOME FUND | 61 |
PORTFOLIO OF INVESTMENTS (continued)
| | | | | | | | | | | | |
| | | | | | Principal Amount (000) | | | U.S. $ Value | |
| |
| | | | | | | | | | | | |
Petrobras Global Finance BV
5.375%, 1/27/21 | | | U.S.$ | | | | 8,624 | | | $ | 8,859,866 | |
6.125%, 1/17/22 | | | | | | | 5,208 | | | | 5,446,006 | |
6.85%, 6/05/15 | | | | | | | 2,958 | | | | 2,604,519 | |
8.375%, 5/23/21 | | | | | | | 5,310 | | | | 5,996,397 | |
| | | | | | | | | | | | |
| | | | | | | | | | | 45,627,951 | |
| | | | | | | | | | | | |
Other Industrial – 0.0% | | | | | | | | | | | | |
Grupo KUO SAB De CV
6.25%, 12/04/22(a) | | | | | | | 696 | | | | 717,924 | |
| | | | | | | | | | | | |
| | | |
Technology – 0.1% | | | | | | | | | | | | |
IHS Netherlands Holdco BV
9.50%, 10/27/21(a) | | | | | | | 4,200 | | | | 4,362,750 | |
| | | | | | | | | | | | |
| | | |
Transportation - Airlines – 0.2% | | | | | | | | | | | | |
TAM Capital 3, Inc.
8.375%, 6/03/21(a) | | | | | | | 12,957 | | | | 13,361,906 | |
| | | | | | | | | | | | |
| | | |
Transportation - Services – 0.1% | | | | | | | | | | | | |
Rumo Luxembourg Sarl
7.375%, 2/09/24(a) | | | | | | | 5,242 | | | | 5,435,954 | |
| | | | | | | | | | | | |
| | | | | | | | | | | 252,825,869 | |
| | | | | | | | | | | | |
Financial Institutions – 0.5% | | | | | | | | | | | | |
Banking – 0.4% | | | | | | | | | | | | |
Akbank TAS
7.20%, 3/16/27(a) | | | | | | | 4,012 | | | | 4,237,675 | |
Banco do Brasil SA/Cayman
9.00%, 6/18/24(a)(n) | | | | | | | 8,303 | | | | 8,751,362 | |
Turkiye Vakiflar Bankasi TAO
5.50%, 10/27/21(a) | | | | | | | 5,964 | | | | 6,001,275 | |
8.00%, 11/01/27(a) | | | | | | | 12,500 | | | | 13,000,000 | |
| | | | | | | | | | | | |
| | | | | | | | | | | 31,990,312 | |
| | | | | | | | | | | | |
Insurance – 0.0% | | | | | | | | | | | | |
XLIT Ltd.
Series E
3.616% (LIBOR 3 Month + 2.46%),
6/12/17(j)(n) | | | | | | | 3,254 | | | | 2,767,026 | |
| | | | | | | | | | | | |
| | | |
Other Finance – 0.1% | | | | | | | | | | | | |
Guanay Finance Ltd.
6.00%, 12/15/20(a) | | | | | | | 3,951 | | | | 4,023,876 | |
| | | | | | | | | | | | |
| | | | | | | | | | | 38,781,214 | |
| | | | | | | | | | | | |
| | |
| 62 | AB HIGH INCOME FUND | | abfunds.com |
PORTFOLIO OF INVESTMENTS (continued)
| | | | | | | | | | | | |
| | | | | | Principal Amount (000) | | | U.S. $ Value | |
| |
| | | | | | | | | | | | |
Utility – 0.0% | | | | | | | | | | | | |
Electric – 0.0% | | | | | | | | | | | | |
AES El Salvador Trust II
6.75%, 3/28/23(a) | | | U.S.$ | | | | 1,220 | | | $ | 1,105,625 | |
| | | | | | | | | | | | |
| | | |
Total Emerging Markets – Corporate Bonds
(cost $315,506,440) | | | | | | | | | | | 292,712,708 | |
| | | | | | | | | | | | |
| | | | | | | | | | | | |
BANK LOANS – 2.9% | | | | | | | | | | | | |
Industrial – 2.7% | | | | | | | | | | | | |
Basic – 0.2% | | | | | | | | | | | | |
Berry Global Group, Inc. (fka Berry Plastics Corporation)
3.239% (LIBOR 1 Month + 2.25%),
1/06/21(s) | | | | | | | 5,056 | | | | 5,082,425 | |
FMG Resources (August 2006) Pty LTD (FMG America Finance, Inc.)
3.75% (LIBOR 3 Month + 2.75%),
6/30/19(s) | | | | | | | 3,682 | | | | 3,705,508 | |
Foresight Energy LLC
6.75% (LIBOR 3 Month + 5.75%),
3/28/22(s) | | | | | | | 4,170 | | | | 4,025,343 | |
Magnetation LLC
12.00%, 3/07/17(b)(c)(d)(o) | | | | | | | 17,605 | | | | – 0 | – |
Unifrax I LLC
4.90% (LIBOR 3 Month + 3.75%),
4/04/24(s) | | | | | | | 3,350 | | | | 3,355,594 | |
| | | | | | | | | | | | |
| | | | | | | | | | | 16,168,870 | |
| | | | | | | | | | | | |
Capital Goods – 0.2% | | | | | | | | | | | | |
Avolon TLB Borrower 1 (US) LLC
3.743% (LIBOR 1 Month + 2.75%),
3/21/22(s) | | | | | | | 6,972 | | | | 7,073,385 | |
Gardner Denver, Inc.
4.25%-4.57% (LIBOR 6 Month + 3.25%), 7/30/20(s) | | | | | | | 5,356 | | | | 5,351,305 | |
GFL Environmental Inc.
3.897% (LIBOR 3 Month + 2.75%),
9/29/23(s) | | | | | | | 2,301 | | | | 2,310,708 | |
Transdigm Inc.
3.993% (LIBOR 1 Month + 3.00%),
6/09/23(s) | | | | | | | 2,345 | | | | 2,342,154 | |
Welbilt, Inc. (fka Manitowoc Foodservice, Inc.)
4.00% (LIBOR 3 Month + 3.00%),
3/03/23(s) | | | | | | | 589 | | | | 594,386 | |
| | | | | | | | | | | | |
| | | | | | | | | | | 17,671,938 | |
| | | | | | | | | | | | |
| | |
| abfunds.com | | AB HIGH INCOME FUND | 63 |
PORTFOLIO OF INVESTMENTS (continued)
| | | | | | | | | | | | |
| | | | | | Principal Amount (000) | | | U.S. $ Value | |
| |
| | | | | | | | | | | | |
Consumer Cyclical -
Automotive – 0.0% | | | | | | | | | | | | |
Navistar, Inc.
5.00% (LIBOR 3 Month + 4.00%),
8/07/20(s) | | | U.S.$ | | | | 3,560 | | | $ | 3,602,942 | |
| | | | | | | | | | | | |
| | | |
Consumer Cyclical -
Entertainment – 0.1% | | | | | | | | | | | | |
ClubCorp Club Operations, Inc.
4.00% (LIBOR 3 Month + 3.00%),
12/15/22(s) | | | | | | | 2,264 | | | | 2,275,478 | |
Seaworld Parks & Entertainment, Inc. (fka SW Acquisitions Co., Inc.)
4.147% (LIBOR 3 Month + 3.00%),
4/01/24(s) | | | | | | | 4,944 | | | | 4,931,167 | |
| | | | | | | | | | | | |
| | | | | | | | | | | 7,206,645 | |
| | | | | | | | | | | | |
Consumer Cyclical - Other – 0.2% | | | | | | | | | | | | |
La Quinta Intermediate Holdings L.L.C.
3.908% (LIBOR 3 Month + 2.75%),
4/14/21(s) | | | | | | | 8,210 | | | | 8,273,928 | |
Scientific Games International, Inc.
4.994% (LIBOR 1 Month + 4.00%),
10/01/21(s) | | | | | | | 5,014 | | | | 5,086,578 | |
| | | | | | | | | | | | |
| | | | | | | | | | | 13,360,506 | |
| | | | | | | | | | | | |
Consumer Cyclical - Retailers – 0.4% | | | | | | | | | | | | |
Burlington Coat Factory Warehouse Corporation
3.75% (LIBOR 3 Month + 2.75%),
8/13/21(s) | | | | | | | 579 | | | | 580,511 | |
Harbor Freight Tools USA, Inc.
4.243% (LIBOR 1 Month + 3.25%),
8/18/23(s) | | | | | | | 2,045 | | | | 2,038,596 | |
J.C. Penney Corporation, Inc.
5.304% (LIBOR 3 Month + 4.25%),
6/23/23(s) | | | | | | | 6,859 | | | | 6,846,111 | |
Michaels Stores, Inc.
3.75% (LIBOR 3 Month + 2.75%),
1/30/23(s) | | | | | | | 2,498 | | | | 2,492,867 | |
Neiman Marcus Group Inc., The
4.25% (LIBOR 3 Month + 3.25%),
10/25/20(s) | | | | | | | 1,337 | | | | 1,064,932 | |
Rite Aid Corporation
5.75% (LIBOR 3 Month + 4.75%), 8/21/20(s) | | | | | | | 3,000 | | | | 3,004,680 | |
Serta Simmons Bedding, LLC
9.038% (LIBOR 3 Month + 8.00%),
11/08/24(s) | | | | | | | 15,912 | | | | 16,110,900 | |
| | | | | | | | | | | | |
| | | | | | | | | | | 32,138,597 | |
| | | | | | | | | | | | |
| | |
| 64 | AB HIGH INCOME FUND | | abfunds.com |
PORTFOLIO OF INVESTMENTS (continued)
| | | | | | | | | | | | |
| | | | | | Principal Amount (000) | | | U.S. $ Value | |
| |
| | | | | | | | | | | | |
Consumer Non-Cyclical – 0.5% | | | | | | | | | | | | |
Acadia Healthcare Company, Inc.
3.98% (LIBOR 1 Month + 3.00%), 2/11/22(s) | | | U.S.$ | | | | 513 | | | $ | 513,188 | |
Acadia Healthcare Company, Inc.
3.98% (LIBOR 1 Month + 3.00%), 2/16/23(s) | | | | | | | 2,559 | | | | 2,559,144 | |
Air Medical Group Holdings, Inc.
5.00% (LIBOR 3 Month + 4.00%), 4/28/22(s) | | | | | | | 3,752 | | | | 3,737,581 | |
Arbor Pharmaceuticals, LLC
6.147% (LIBOR 3 Month + 5.00%),
7/05/23(s) | | | | | | | 7,265 | | | | 7,396,753 | |
DJO Finance LLC
4.25% (LIBOR 3 Month + 3.25%),
6/08/20(s) | | | | | | | 4,937 | | | | 4,818,693 | |
Immucor, Inc. (fka IVD Acquisition Corporation)
5.00% (LIBOR 3 Month + 3.75%),
8/17/18(s) | | | | | | | 5,247 | | | | 5,225,522 | |
Mallinckrodt International Finance S.A.
3.897% (LIBOR 3 Month + 2.75%),
9/24/24(s) | | | | | | | 6,297 | | | | 6,293,371 | |
Ortho-Clinical Diagnostics Holdings Luxembourg SARL
4.75% (LIBOR 3 Month + 3.75%),
6/30/21(s) | | | | | | | 3,920 | | | | 3,898,604 | |
Vizient, Inc.
5.00% (LIBOR 3 Month + 4.00%),
2/13/23(s) | | | | | | | 2,519 | | | | 2,526,462 | |
| | | | | | | | | | | | |
| | | | | | | | | | | 36,969,318 | |
| | | | | | | | | | | | |
Energy – 0.2% | | | | | | | | | | | | |
California Resources Corporation
11.375% (LIBOR 3 Month + 10.38%),
12/31/21(s) | | | | | | | 12,618 | | | | 13,863,544 | |
Chesapeake Energy Corporation
8.553% (LIBOR 3 Month + 7.50%),
8/23/21(s) | | | | | | | 4,080 | | | | 4,405,135 | |
| | | | | | | | | | | | |
| | | | | | | | | | | 18,268,679 | |
| | | | | | | | | | | | |
Other Industrial – 0.1% | | | | | | | | | | | | |
Travelport Finance (Luxembourg) SARL
4.289% (LIBOR 3 Month + 3.25%),
9/02/21(s) | | | | | | | 9,736 | | | | 9,805,454 | |
| | | | | | | | | | | | |
| | |
| abfunds.com | | AB HIGH INCOME FUND | 65 |
PORTFOLIO OF INVESTMENTS (continued)
| | | | | | | | | | | | |
| | | | | | Principal Amount (000) | | | U.S. $ Value | |
| |
| | | | | | | | | | | | |
Services – 0.1% | | | | | | | | | | | | |
Sedgwick Claims Management Services, Inc.
3.75% (LIBOR 3 Month + 2.75%),
3/01/21(s) | | | U.S.$ | | | | 5,163 | | | $ | 5,164,751 | |
| | | | | | | | | | | | |
| | | |
Technology – 0.7% | | | | | | | | | | | | |
Avaya Inc.
6.417% (LIBOR 3 Month + 5.25%),
5/29/20(c)(f)(g)(t) | | | | | | | 24,285 | | | | 20,247,272 | |
6.67% (LIBOR 3 Month + 5.50%),
3/31/18(c)(s) | | | | | | | 371 | | | | 308,061 | |
8.50% (LIBOR 3 Month + 7.50%),
1/24/18(c)(s) | | | | | | | 2,738 | | | | 2,808,270 | |
Conduent Incorporated
6.486% (LIBOR 1 Month + 5.50%),
12/07/23(s) | | | | | | | 1,509 | | | | 1,534,376 | |
Smart Modular Technologies (Global), Inc.
9.25% (LIBOR 3 Month + 8.00%),
8/26/17(c)(s) | | | | | | | 4,114 | | | | 3,990,229 | |
Solera, LLC (Solera Finance, Inc.)
4.25% (LIBOR 3 Month + 3.25%),
3/03/23(s) | | | | | | | 13,934 | | | | 14,028,864 | |
Veritas US Inc.
6.772% (LIBOR 3 Month + 5.63%),
1/27/23(s) | | | | | | | 12,128 | | | | 12,057,413 | |
| | | | | | | | | | | | |
| | | | | | | | | | | 54,974,485 | |
| | | | | | | | | | | | |
| | | | | | | | | | | 215,332,185 | |
| | | | | | | | | | | | |
Utility – 0.1% | | | | | | | | | | | | |
Electric – 0.1% | | | | | | | | | | | | |
Energy Future Intermediate Holding Company LLC (EFIH Finance Inc.)
4.304% (LIBOR 3 Month + 3.25%),
6/30/17(s) | | | | | | | 9,316 | | | | 9,361,053 | |
| | | | | | | | | | | | |
| | | |
Financial Institutions – 0.1% | | | | | | | | | | | | |
Insurance – 0.1% | | | | | | | | | | | | |
Hub International Limited
4.035% (LIBOR 3 Month + 3.00%),
10/02/20(s) | | | | | | | 4,343 | | | | 4,363,501 | |
| | | | | | | | | | | | |
| | | |
Other Finance – 0.0% | | | | | | | | | | | | |
iPayment, Inc.
4/06/23(t) | | | | | | | 3,695 | | | | 3,708,856 | |
| | | | | | | | | | | | |
| | | | | | | | | | | 8,072,357 | |
| | | | | | | | | | | | |
Total Bank Loans
(cost $244,381,258) | | | | | | | | | | | 232,765,595 | |
| | | | | | | | | | | | |
| | | | | | | | | | | | |
| | |
| 66 | AB HIGH INCOME FUND | | abfunds.com |
PORTFOLIO OF INVESTMENTS (continued)
| | | | | | | | | | | | |
| | | | | | Principal Amount (000) | | | U.S. $ Value | |
| |
| | | | | | | | | | | | |
COMMERCIAL MORTGAGE-BACKED SECURITIES – 1.7% | | | | | | | | | | | | |
Non-Agency Fixed Rate
CMBS – 1.6% | | | | | | | | | | | | |
225 Liberty Street Trust
Series 2016-225L, Class E
4.804%, 2/10/36(a) | | | U.S.$ | | | | 5,344 | | | $ | 5,222,868 | |
Banc of America Commercial Mortgage Trust
Series 2007-3, Class AJ
5.85%, 6/10/49 | | | | | | | 8,320 | | | | 8,368,369 | |
Banc of America Re-REMIC Trust
Series 2009-UB1, Class A4B
5.90%, 6/24/50(b)(e) | | | | | | | 1,362 | | | | 1,367,334 | |
Bear Stearns Commercial Mortgage
Securities Trust
Series 2006-PW13, Class AJ
5.611%, 9/11/41 | | | | | | | 192 | | | | 191,383 | |
Series 2007-T26, Class AJ
5.566%, 1/12/45 | | | | | | | 1,550 | | | | 1,502,443 | |
Citigroup Commercial Mortgage Trust
Series 2013-GC11, Class XA
1.949%, 4/10/46(u) | | | | | | | 11,346 | | | | 588,614 | |
Series 2015-GC31, Class D
4.199%, 6/10/48 | | | | | | | 1,416 | | | | 1,081,944 | |
Commercial Mortgage Pass Through Certificates
Series 2012-CR3, Class XA
2.229%, 10/15/45(u) | | | | | | | 57,152 | | | | 4,144,020 | |
Commercial Mortgage Trust
Series 2012-CR1, Class XA
2.062%, 5/15/45(u) | | | | | | | 20,396 | | | | 1,578,125 | |
Series 2012-CR5, Class XA
1.879%, 12/10/45(u) | | | | | | | 11,458 | | | | 726,576 | |
Series 2012-LC4, Class XA
2.388%, 12/10/44(a)(u) | | | | | | | 30,657 | | | | 2,446,221 | |
Series 2013-LC6, Class XA
1.811%, 1/10/46(u) | | | | | | | 62,370 | | | | 3,249,850 | |
Series 2014-CR15, Class XA
1.432%, 2/10/47(u) | | | | | | | 12,819 | | | | 563,448 | |
Series 2014-CR20, Class XA
1.328%, 11/10/47(u) | | | | | | | 53,587 | | | | 3,215,635 | |
Series 2014-LC15, Class D
5.109%, 4/10/47(a) | | | | | | | 8,500 | | | | 7,208,792 | |
Series 2014-LC17, Class D
3.687%, 10/10/47(a) | | | | | | | 7,603 | | | | 5,285,370 | |
| | |
| abfunds.com | | AB HIGH INCOME FUND | 67 |
PORTFOLIO OF INVESTMENTS (continued)
| | | | | | | | | | | | |
| | | | | | Principal Amount (000) | | | U.S. $ Value | |
| |
| | | | | | | | | | | | |
Series 2014-UBS5, Class D
3.495%, 9/10/47(a) | | | U.S.$ | | | | 3,542 | | | $ | 2,592,897 | |
Series 2015-DC1, Class D
4.498%, 2/10/48(a) | | | | | | | 4,500 | | | | 3,712,232 | |
DBUBS Mortgage Trust
Series 2011-LC2A, Class D
5.727%, 7/10/44(a) | | | | | | | 2,500 | | | | 2,648,445 | |
GS Mortgage Securities Corp. II
Series 2013-GC10, Class XA
1.735%, 2/10/46(u) | | | | | | | 4,836 | | | | 335,191 | |
GS Mortgage Securities Trust
Series 2011-GC5, Class C
5.566%, 8/10/44(a) | | | | | | | 7,937 | | | | 8,520,866 | |
Series 2013-GC13, Class D
4.201%, 7/10/46(a) | | | | | | | 1,500 | | | | 1,370,102 | |
Series 2014-GC18, Class D
5.11%, 1/10/47(a) | | | | | | | 4,503 | | | | 3,846,148 | |
Series 2014-GC20, Class D
5.02%, 4/10/47(a) | | | | | | | 995 | | | | 764,471 | |
JP Morgan Chase Commercial Mortgage Securities Trust
Series 2012-CBX, Class D
5.388%, 6/15/45(a) | | | | | | | 5,000 | | | | 5,076,786 | |
Series 2012-CBX, Class E
5.388%, 6/15/45(a) | | | | | | | 6,521 | | | | 6,519,283 | |
JPMBB Commercial Mortgage Securities Trust
Series 2015-C32, Class C
4.818%, 11/15/48 | | | | | | | 5,050 | | | | 4,851,025 | |
LB-UBS Commercial Mortgage Trust
Series 2006-C1, Class AJ
5.276%, 2/15/41(l) | | | | | | | 1,404 | | | | 1,405,044 | |
Morgan Stanley Bank of America Merrill Lynch Trust
Series 2012-C6, Class XA
2.126%, 11/15/45(a)(u) | | | | | | | 40,439 | | | | 2,431,833 | |
Series 2014-C19, Class D
3.25%, 12/15/47(a) | | | | | | | 4,130 | | | | 3,268,413 | |
UBS-Barclays Commercial Mortgage Trust
Series 2012-C4, Class XA
1.893%, 12/10/45(a)(u) | | | | | | | 3,706 | | | | 257,480 | |
Wells Fargo Commercial Mortgage Trust
Series 2014-LC18, Class D
3.957%, 12/15/47(a) | | | | | | | 5,000 | | | | 4,047,661 | |
| | |
| 68 | AB HIGH INCOME FUND | | abfunds.com |
PORTFOLIO OF INVESTMENTS (continued)
| | | | | | | | | | | | |
| | | | | | Principal Amount (000) | | | U.S. $ Value | |
| |
| | | | | | | | | | | | |
WF-RBS Commercial Mortgage Trust
Series 2012-C6, Class D
5.761%, 4/15/45(a) | | | U.S.$ | | | | 3,450 | | | $ | 3,486,218 | |
Series 2012-C7, Class XA
1.634%, 6/15/45(a)(u) | | | | | | | 7,473 | | | | 421,862 | |
Series 2012-C8, Class E
5.063%, 8/15/45(a) | | | | | | | 6,905 | | | | 6,638,663 | |
Series 2014-C20, Class D
3.986%, 5/15/47(a) | | | | | | | 10,906 | | | | 8,376,977 | |
Series 2014-C21, Class D
3.497%, 8/15/47(a) | | | | | | | 10,000 | | | | 7,625,273 | |
Series 2014-C23, Class D
4.137%, 10/15/57(a) | | | | | | | 13,722 | | | | 10,873,172 | |
| | | | | | | | | | | | |
| | | | | | | | | | | 135,811,034 | |
| | | | | | | | | | | | |
Non-Agency Floating Rate
CMBS – 0.1% | | | | | | | | | | | | |
Morgan Stanley Capital I Trust
Series 2015-MS1, Class D
4.164%, 5/15/48(a)(l) | | | | | | | 2,790 | | | | 2,341,540 | |
WF-RBS Commercial Mortgage Trust
Series 2011-C4, Class D
5.415%, 6/15/44(a)(l) | | | | | | | 2,576 | | | | 2,659,557 | |
| | | | | | | | | | | | |
| | | | | | | | | | | 5,001,097 | |
| | | | | | | | | | | | |
| |
Total Commercial Mortgage-Backed Securities
(cost $145,708,330) | | | | 140,812,131 | |
| | | | | | | | | | | | |
| | | |
| | | | | | Shares | | | | |
PREFERRED STOCKS – 1.4% | | | | | | | | | | | | |
Industrial – 1.0% | | | | | | | | | | | | |
Basic – 0.1% | | | | | | | | | | | | |
Peabody Energy Corp.
8.50%(c)(f) | | | | | | | 143,581 | | | | 7,896,955 | |
| | | | | | | | | | | | |
| | | |
Capital Goods – 0.6% | | | | | | | | | | | | |
Tervita Corp.
0.00%(b)(c)(f) | | | | | | | 7,165,266 | | | | 51,834,733 | |
| | | | | | | | | | | | |
| | | |
Communications -
Telecommunications – 0.1% | | | | | | | | | | | | |
Centaur Funding Corp.
9.08%(a) | | | | | | | 6,280 | | | | 7,290,687 | |
| | | | | | | | | | | | |
| | | |
Energy – 0.1% | | | | | | | | | | | | |
Berry Petroleum Co. LLC
0.00%(b)(c)(f) | | | | | | | 538,628 | | | | 7,271,478 | |
| | | | | | | | | | | | |
| | |
| abfunds.com | | AB HIGH INCOME FUND | 69 |
PORTFOLIO OF INVESTMENTS (continued)
| | | | | | | | | | | | |
| Company | | | | | Shares | | | U.S. $ Value | |
| |
| | | | | | | | | | | | |
Services – 0.1% | | | | | | | | | | | | |
iPayment Holdings, Inc.
0.00%(f) | | | | | | | 61,912 | | | $ | 6,191,200 | |
| | | | | | | | | | | | |
| | | | | | | | | | | 80,485,053 | |
| | | | | | | | | | | | |
Financial Institutions – 0.4% | | | | | | | | | | | | |
Banking – 0.3% | | | | | | | | | | | | |
GMAC Capital Trust I
6.824% | | | | | | | 51,850 | | | | 1,320,101 | |
Morgan Stanley
5.85% | | | | | | | 635,775 | | | | 16,771,744 | |
Santander Finance Preferred SAU
6.80% | | | | | | | 67,000 | | | | 1,735,367 | |
US Bancorp
Series F
6.50% | | | | | | | 175,125 | | | | 5,138,168 | |
| | | | | | | | | | | | |
| | | | | | | | | | | 24,965,380 | |
| | | | | | | | | | | | |
Insurance – 0.1% | | | | | | | | | | | | |
Hartford Financial Services Group, Inc. (The)
7.875% | | | | | | | 102,401 | | | | 3,168,287 | |
XLIT Ltd.
Series D
4.278% (LIBOR 3 Month + 3.12%)(j) | | | | | | | 3,750 | | | | 3,244,922 | |
| | | | | | | | | | | | |
| | | | | | | | | | | 6,413,209 | |
| | | | | | | | | | | | |
REITS – 0.0% | | | | | | | | | | | | |
Hersha Hospitality Trust
6.875% | | | | | | | 64,000 | | | | 1,615,360 | |
Sovereign Real Estate Investment Trust
12.00%(a) | | | | | | | 501 | | | | 623,119 | |
| | | | | | | | | | | | |
| | | | | | | | | | | 2,238,479 | |
| | | | | | | | | | | | |
| | | | | | | | | | | 33,617,068 | |
| | | | | | | | | | | | |
Utility – 0.0% | | | | | | | | | | | | |
Electric – 0.0% | | | | | | | | | | | | |
SCE Trust III
5.75% | | | | | | | 60,000 | | | | 1,698,000 | |
| | | | | | | | | | | | |
| | | |
Total Preferred Stocks
(cost $95,754,625) | | | | | | | | | | | 115,800,121 | |
| | | | | | | | | | | | |
| | |
| 70 | AB HIGH INCOME FUND | | abfunds.com |
PORTFOLIO OF INVESTMENTS (continued)
| | | | | | | | | | | | |
| | | | | | Principal
Amount
(000) | | | U.S. $ Value | |
| |
| | | | | | | | | | | | |
INFLATION-LINKED SECURITIES – 1.2% | | | | | | | | | | | | |
Brazil – 0.8% | | | | | | | | | | | | |
Brazil Notas do Tesouro Nacional
Series B
6.00%, 5/15/45-8/15/50 | | | BRL | | | | 62,125 | | | $ | 64,011,295 | |
| | | | | | | | | | | | |
| | | |
Colombia – 0.2% | | | | | | | | | | | | |
Fideicomiso PA Costera
6.25%, 1/15/34(a) | | | COP | | | | 7,580,000 | | | | 2,602,243 | |
Fideicomiso PA Pacifico Tres
7.00%, 1/15/35(e) | | | | | | | 36,247,335 | | | | 12,659,462 | |
| | | | | | | | | | | | |
| | | | | | | | | | | 15,261,705 | |
| | | | | | | | | | | | |
Mexico – 0.2% | | | | | | | | | | | | |
Mexican Udibonos
Series S
4.00%, 11/30/28 | | | MXN | | | | 241,214 | | | | 13,801,363 | |
4.50%, 12/04/25 | | | | | | | 117,119 | | | | 6,812,385 | |
| | | | | | | | | | | | |
| | | | | | | | | | | 20,613,748 | |
| | | | | | | | | | | | |
Total Inflation-Linked Securities
(cost $88,357,686) | | | | | | | | | | | 99,886,748 | |
| | | | | | | | | | | | |
| | | |
| | | | | | Shares | | | | |
COMMON STOCKS – 1.2% | | | | | | | | | | | | |
Financials – 0.5% | | | | | | | | | | | | |
Insurance – 0.4% | | | | | | | | | | | | |
Mt. Logan Re Ltd. (Preference Shares)(f)(h)(v)(w) | | | | | | | 12,695 | | | | 13,014,805 | |
Mt. Logan Re Ltd. (Preference Shares)(f)(h)(w)(x) | | | | | | | 25,000 | | | | 25,070,175 | |
| | | | | | | | | | | | |
| | | | | | | | | | | 38,084,980 | |
| | | | | | | | | | | | |
Diversified Financial Services – 0.1% | | | | | | | | | | | | |
iPayment, Inc.(f) | | | | | | | 10,243,837 | | | | 6,556,056 | |
| | | | | | | | | | | | |
| | | | | | | | | | | 44,641,036 | |
| | | | | | | | | | | | |
Energy – 0.5% | | | | | | | | | | | | |
Oil, Gas & Consumable Fuels – 0.5% | | | | | | | | | | | | |
Berry Petroleum Co. LLC(c)(f) | | | | | | | 651,423 | | | | 7,491,364 | |
CHC Group LLC(b)(f)(h) | | | | | | | 255,317 | | | | 2,936,145 | |
Halcon Resources Corp.(f) | | | | | | | 67,837 | | | | 454,508 | |
Linn Energy, Inc.(f) | | | | | | | 138,471 | | | | 3,881,342 | |
Peabody Energy Corp.(f) | | | | | | | 430,034 | | | | 10,927,164 | |
Peabody Energy Corp.(b)(c)(f) | | | | | | | 20,062 | | | | 509,575 | |
SandRidge Energy, Inc.(f) | | | | | | | 141,947 | | | | 2,614,664 | |
Tervita Corp.(b)(c)(f) | | | | | | | 125,625 | | | | 908,792 | |
Vantage Drilling International(c)(f) | | | | | | | 30,215 | | | | 4,985,475 | |
| | |
| abfunds.com | | AB HIGH INCOME FUND | 71 |
PORTFOLIO OF INVESTMENTS (continued)
| | | | | | | | | | | | |
| Company | | | | |
Shares | | | U.S. $ Value | |
| |
| | | | | | | | | | | | |
Whiting Petroleum Corp.(f) | | | | | | | 323,999 | | | $ | 2,689,192 | |
| | | | | | | | | | | | |
| | | | | | | | | | | 37,398,221 | |
| | | | | | | | | | | | |
Consumer Discretionary – 0.1% | | | | | | | | | | | | |
Automobiles – 0.0% | | | | | | | | | | | | |
Liberty Tire Recycling LLC(b)(c)(f) | | | | | | | 128,591 | | | | – 0 | – |
| | | | | | | | | | | | |
| | | |
Internet & Direct Marketing Retail – 0.1% | | | | | | | | | | | | |
Travelport Worldwide Ltd. | | | | | | | 543,898 | | | | 7,163,137 | |
| | | | | | | | | | | | |
| | | |
Auto Components – 0.0% | | | | | | | | | | | | |
Exide Technologies(b)(f)(h) | | | | | | | 332,502 | | | | 249,376 | |
| | | | | | | | | | | | |
| | | |
Multiline Retail – 0.0% | | | | | | | | | | | | |
K201640219 (South Africa) Ltd. A Shares(b)(c)(f) | | | | | | | 64,873,855 | | | | 65 | |
K201640219 (South Africa) Ltd. B Shares(b)(c)(f) | | | | | | | 10,275,684 | | | | 10 | |
| | | | | | | | | | | | |
| | | | | | | | | | | 75 | |
| | | | | | | | | | | | |
| | | | | | | | | | | 7,412,588 | |
| | | | | | | | | | | | |
Industrials – 0.1% | | | | | | | | | | | | |
Building Products – 0.0% | | | | | | | | | | | | |
New Cotai LLC/New Cotai Capital Corp.(b)(c)(f) | | | | | | | 13 | | | | 142,155 | |
| | | | | | | | | | | | |
| | | |
Machinery – 0.1% | | | | | | | | | | | | |
Modular Space Corp.(b)(e) | | | | | | | 518,216 | | | | 6,736,808 | |
| | | | | | | | | | | | |
| | | | | | | | | | | 6,878,963 | |
| | | | | | | | | | | | |
Materials – 0.0% | | | | | | | | | | | | |
Metals & Mining – 0.0% | | | | | | | | | | | | |
Neenah Enterprises, Inc.(b)(c)(f) | | | | | | | 49,578 | | | | 111,055 | |
| | | | | | | | | | | | |
| | | |
Total Common Stocks
(cost $131,439,491) | | | | | | | | | | | 96,441,863 | |
| | | | | | | | | | | | |
| | | |
| | | | | | Principal
Amount
(000) | | | | |
QUASI-SOVEREIGNS – 0.6% | | | | | | | | | | | | |
Quasi-Sovereign Bonds – 0.6% | | | | | | | | | | | | |
Indonesia – 0.2% | | | | | | | | | | | | |
Majapahit Holding BV
7.875%, 6/29/37(a) | | | U.S.$ | | | | 5,600 | | | | 7,216,440 | |
Pertamina Persero PT
6.00%, 5/03/42(a) | | | | | | | 720 | | | | 764,100 | |
Perusahaan Listrik Negara PT
5.25%, 10/24/42(a) | | | | | | | 11,216 | | | | 11,107,653 | |
| | | | | | | | | | | | |
| | | | | | | | | | | 19,088,193 | |
| | | | | | | | | | | | |
| | |
| 72 | AB HIGH INCOME FUND | | abfunds.com |
PORTFOLIO OF INVESTMENTS (continued)
| | | | | | | | | | | | |
| | | | | | Principal
Amount
(000) | | | U.S. $ Value | |
| |
| | | | | | | | | | | | |
Kazakhstan – 0.1% | | | | | | | | | | | | |
KazMunayGas National Co. JSC
4.40%, 4/30/23(a) | | | U.S.$ | | | | 6,200 | | | $ | 6,238,750 | |
| | | | | | | | | | | | |
| | | |
Mexico – 0.2% | | | | | | | | | | | | |
Petroleos Mexicanos
4.625%, 9/21/23 | | | | | | | 6,359 | | | | 6,395,882 | |
5.375%, 3/13/22(a) | | | | | | | 3,805 | | | | 3,985,738 | |
5.50%, 1/21/21 | | | | | | | 4,910 | | | | 5,204,600 | |
| | | | | | | | | | | | |
| | | | 15,586,220 | |
| | | | | | | | | | | | |
Venezuela – 0.1% | | | | | | | | | | | | |
Petroleos de Venezuela SA
6.00%, 11/15/26(a) | | | | | | | 5,000 | | | | 1,897,500 | |
9.75%, 5/17/35(a) | | | | | | | 4,449 | | | | 2,113,131 | |
| | | | | | | | | | | | |
| | | | | | | | | | | 4,010,631 | |
| | | | | | | | | | | | |
Total Quasi-Sovereigns
(cost $43,689,867) | | | | | | | | | | | 44,923,794 | |
| | | | | | | | | | | | |
| | | | | | | | | | | | |
WHOLE LOAN TRUSTS – 0.5% | | | | | | | | | | | | |
Performing Asset – 0.5% | | | | | | | | | | | | |
Alpha Credit Debt Fund LLC
15.00%, 12/31/17(b)(c) | | | | | | | 531 | | | | 531,452 | |
16.00%, 1/01/21(b)(c) | | | MXN | | | | 104,444 | | | | 5,548,088 | |
Deutsche Bank Mexico SA
8.00%, 10/31/34(b)(c)(l) | | | | | | | 38,926 | | | | 1,323,366 | |
8.00%, 10/31/34(b)(c) | | | | | | | 82,812 | | | | 2,815,343 | |
Finalam, S.A. de C.V.
17.25%, 8/06/19(b)(c) | | | | | | | 32,624 | | | | 1,732,966 | |
Flexpath Wh I LLC
Series B
11.00%, 4/01/21(b)(c) | | | U.S.$ | | | | 3,103 | | | | 2,513,679 | |
Series B2
11.00%, 1/01/22(b)(c) | | | | | | | 4,510 | | | | 3,833,094 | |
Series B3
11.00%, 9/01/22(b)(c) | | | | | | | 474 | | | | 417,665 | |
13.00%, 10/23/20(b)(c) | | | | | | | 4,295 | | | | 3,603,466 | |
Recife Funding
Zero Coupon, 11/05/29(b)(c) | | | | | | | 9,586 | | | | 8,082,900 | |
Sheridan Auto Loan Holdings I LLC
10.00%, 12/31/20(b)(c) | | | | | | | 2,669 | | | | 1,749,696 | |
Sheridan Auto Loan Holdings I LLC
10.00%, 9/30/21(b)(c) | | | | | | | 6,350 | | | | 5,470,482 | |
Sheridan Consumer Finance Trust
10.86%, 3/01/21(b)(c) | | | | | | | 6,946 | | | | 6,485,168 | |
| | | | | | | | | | | | |
| | | |
Total Whole Loan Trusts
(cost $52,657,350) | | | | | | | | | | | 44,107,365 | |
| | | | | | | | | | | | |
| | |
| abfunds.com | | AB HIGH INCOME FUND | 73 |
PORTFOLIO OF INVESTMENTS (continued)
| | | | | | | | | | | | |
| | | | | | Principal
Amount
(000) | | | U.S. $ Value | |
| |
| | | | | | | | | | | | |
LOCAL GOVERNMENTS – REGIONAL BONDS – 0.5% | | | | | | | | | | | | |
Argentina – 0.5% | | | | | | | | | | | | |
Provincia de Buenos Aires/Argentina
5.75%, 6/15/19(a) | | | U.S.$ | | | | 8,149 | | | $ | 8,413,842 | |
9.125%, 3/16/24(a) | | | | | | | 23,904 | | | | 27,071,280 | |
Provincia de Cordoba
7.125%, 6/10/21(a) | | | | | | | 4,503 | | | | 4,750,665 | |
12.375%, 8/17/17(a) | | | | | | | 2,185 | | | | 2,245,088 | |
| | | | | | | | | | | | |
| | | |
Total Local Governments – Regional Bonds
(cost $38,725,349) | | | | | | | | | | | 42,480,875 | |
| | | | | | | | | | | | |
| | | | | | | | | | | | |
ASSET-BACKED SECURITIES – 0.3% | | | | | | | | | | | | |
Home Equity Loans - Fixed Rate – 0.1% | | | | | | | | | | | | |
CSAB Mortgage-Backed Trust
Series 2006-2, Class A6A
5.72%, 9/25/36 | | | | | | | 1,025 | | | | 603,810 | |
CWABS Asset-Backed Certificates Trust
Series 2005-7, Class AF5W
5.054%, 10/25/35 | | | | | | | 2,108 | | | | 2,090,491 | |
GSAA Home Equity Trust
Series 2005-12, Class AF5
5.659%, 9/25/35 | | | | | | | 1,877 | | | | 1,579,143 | |
Series 2006-10, Class AF3
5.985%, 6/25/36 | | | | | | | 1,700 | | | | 871,849 | |
Series 2006-6, Class AF4
6.121%, 3/25/36 | | | | | | | 4,120 | | | | 2,071,856 | |
Series 2006-6, Class AF5
6.241%, 3/25/36 | | | | | | | 3,333 | | | | 1,624,691 | |
Lehman XS Trust
Series 2006-17, Class WF32
5.55%, 11/25/36 | | | | | | | 675 | | | | 661,099 | |
Morgan Stanley Mortgage Loan Trust
Series 2006-15XS, Class A3
5.988%, 11/25/36 | | | | | | | 1,603 | | | | 723,287 | |
Series 2007-8XS, Class A2
6.00%, 4/25/37 | | | | | | | 5,043 | | | | 2,920,741 | |
| | | | | | | | | | | | |
| | | | | | | | | | | 13,146,967 | |
| | | | | | | | | | | | |
Autos - Fixed Rate – 0.1% | | | | | | | | | | | | |
CPS Auto Receivables Trust
Series 2017-B, Class E
5.75%, 12/15/23(a) | | | | | | | 2,055 | | | | 2,054,602 | |
| | |
| 74 | AB HIGH INCOME FUND | | abfunds.com |
PORTFOLIO OF INVESTMENTS (continued)
| | | | | | | | | | | | |
| | | | | | Principal
Amount
(000) | | | U.S. $ Value | |
| |
| | | | | | | | | | | | |
Exeter Automobile Receivables Trust
Series 2016-1A, Class D
8.20%, 2/15/23(a) | | | U.S.$ | | | | 3,890 | | | $ | 4,144,365 | |
| | | | | | | | | | | | |
| | | | | | | | | | | 6,198,967 | |
| | | | | | | | | | | | |
Other ABS - Fixed Rate – 0.1% | | | | | | | | | | | | |
Taco Bell Funding LLC
Series 2016-1A, Class A23
4.97%, 5/25/46(a) | | | | | | | 4,728 | | | | 4,925,044 | |
| | | | | | | | | | | | |
| | | |
Home Equity Loans - Floating Rate – 0.0% | | | | | | | | | | | | |
Lehman XS Trust
Series 2007-6, Class 3A5
4.924%, 5/25/37(l) | | | | | | | 423 | | | | 627,510 | |
| | | | | | | | | | | | |
| | | |
Total Asset-Backed Securities
(cost $26,386,467) | | | | | | | | | | | 24,898,488 | |
| | | | | | | | | | | | |
| | | | | | | | | | | | |
COLLATERALIZED LOAN
OBLIGATIONS – 0.2% | | | | | | | | | | | | |
CLO - Floating Rate – 0.2% | | | | | | | | | | | | |
ALM XII Ltd.
Series 2015-12A, Class D
6.658% (LIBOR 3 Month + 5.50%),
4/16/27(a)(j) | | | | | | | 5,985 | | | | 5,951,598 | |
Carlyle Global Market Strategies CLO Ltd.
Series 2014-3A, Class D1
6.137% (LIBOR 3 Month + 5.10%),
7/27/26(a)(j) | | | | | | | 1,000 | | | | 996,314 | |
Series 2016-1A, Class C
6.056% (LIBOR 3 Month + 4.90%),
4/20/27(a)(j) | | | | | | | 1,800 | | | | 1,825,618 | |
OZLM VIII Ltd.
Series 2014-8A, Class D
6.108% (LIBOR 3 Month + 4.95%),
10/17/26(a)(j) | | | | | | | 3,450 | | | | 3,365,899 | |
Tryon Park CLO Ltd.
Series 2013-1A, Class D
5.42% (LIBOR 3 Month + 4.40%),
7/15/25(a)(j) | | | | | | | 2,750 | | | | 2,645,307 | |
| | | | | | | | | | | | |
| | | |
Total Collateralized Loan Obligations
(cost $13,275,047) | | | | | | | | | | | 14,784,736 | |
| | | | | | | | | | | | |
| | | | | | | | | | | | |
| | |
| abfunds.com | | AB HIGH INCOME FUND | 75 |
PORTFOLIO OF INVESTMENTS (continued)
| | | | | | | | | | | | |
| | | | | | Principal
Amount
(000) | | | U.S. $ Value | |
| |
| | | | | | | | | | | | |
LOCAL GOVERNMENTS – US MUNICIPAL BONDS – 0.1% | | | | | | | | | | | | |
United States – 0.1% | | | | | | | | | | | | |
State of California
Series 2010
7.60%, 11/01/40 | | | U.S.$ | | | | 1,200 | | | $ | 1,802,256 | |
7.625%, 3/01/40 | | | | | | | 1,250 | | | | 1,848,075 | |
7.95%, 3/01/36 | | | | | | | 2,235 | | | | 2,579,302 | |
State of Illinois
Series 2010
7.35%, 7/01/35 | | | | | | | 4,120 | | | | 4,313,310 | |
| | | | | | | | | | | | |
| | | |
Total Local Governments – US Municipal Bonds
(cost $8,856,482) | | | | | | | | | | | 10,542,943 | |
| | | | | | | | | | | | |
| | | | | | | | | | | | |
GOVERNMENTS – SOVEREIGN
BONDS – 0.1% | | | | | | | | | | | | |
Indonesia – 0.0% | | | | | | | | | | | | |
Indonesia Government International Bond
8.50%, 10/12/35(a) | | | | | | | 1,645 | | | | 2,358,519 | |
| | | | | | | | | | | | |
| | | |
Romania – 0.1% | | | | | | | | | | | | |
Romanian Government International Bond
4.875%, 1/22/24(a) | | | | | | | 6,000 | | | | 6,532,500 | |
| | | | | | | | | | | | |
| | | |
Total Governments – Sovereign Bonds
(cost $7,813,469) | | | | | | | | | | | 8,891,019 | |
| | | | | | | | | | | | |
| | | |
| | | | | | Contracts | | | | |
OPTIONS PURCHASED – CALLS – 0.1% | | | | | | | | | | | | |
Options on Forward Contracts – 0.1% | | | | | | | | | | | | |
RUB/USD
Expiration: Jun 2017,
Exercise Price: RUB 57.20(f)(y) | | | | | | | 2,230,800,000 | | | | 596,448 | |
RUB/USD
Expiration: Jun 2017,
Exercise Price: 57.20(f)(y) | | | | | | | 2,230,800,000 | | | | 596,447 | |
TRY/USD
Expiration: Jun 2017,
Exercise Price: TRY 3.70(f)(y) | | | | | | | 143,151,300 | | | | 1,414,969 | |
| | |
| 76 | AB HIGH INCOME FUND | | abfunds.com |
PORTFOLIO OF INVESTMENTS (continued)
| | | | | | | | | | | | |
| Company | | | | |
Contracts | | | U.S. $ Value | |
| |
| | | | | | | | | | | | |
ZAR/USD
Expiration: Jul 2017,
Exercise Price: ZAR 13.25(f)(y) | | | | | | | 1,583,375,000 | | | $ | 2,219,894 | |
| | | | | | | | | | | | |
| | | |
Total Options Purchased – Calls
(premiums paid $3,763,710) | | | | | | | | | | | 4,827,758 | |
| | | | | | | | | | | | |
| | | |
| | | | | | Shares | | | | |
WARRANTS – 0.0% | | | | | | | | | | | | |
Encore Automotive Acceptance,
expiring 7/05/31(b)(c)(f) | | | | | | | 44 | | | | – 0 | – |
FairPoint Communications, Inc.,
expiring 1/24/18(c)(f) | | | | | | | 6,740 | | | | 67 | |
Flexpath Capital, Inc.,
expiring 4/15/31(b)(c)(f) | | | | | | | 189,795 | | | | – 0 | – |
iPayment Holdings, Inc.,
expiring 12/29/22(b)(c)(f) | | | | | | | 1,515,784 | | | | 803,366 | |
Midstates Petroleum Co., Inc.,
expiring 4/21/20(b)(c)(f) | | | | | | | 259,925 | | | | 1,169,663 | |
Peabody Energy Corp.,
expiring 7/03/17(b)(c)(f) | | | | | | | 20,146 | | | | 511,708 | |
Peabody Energy Corp.,
expiring 7/03/17(b)(c)(f) | | | | | | | 1,142 | | | | 29,007 | |
SandRidge Energy, Inc., A-CW22,
expiring 10/04/22(f) | | | | | | | 302,868 | | | | 302,868 | |
SandRidge Energy, Inc., B-CW22,
expiring 10/04/22(f) | | | | | | | 130,363 | | | | 73,003 | |
Smart Modular Technologies, Inc.,
expiring 11/05/21(b)(c)(f) | | | | | | | 88,048 | | | | – 0 | – |
Smart Modular Technologies, Inc.,
expiring 11/05/22(b)(c)(f) | | | | | | | 110,060 | | | | – 0 | – |
| | | | | | | | | | | | |
| | | |
Total Warrants
(cost $4,527,301) | | | | | | | | | | | 2,889,682 | |
| | | | | | | | | | | | |
| | | |
| | | | | | Contracts | | | | |
OPTIONS PURCHASED – PUTS – 0.0% | | | | | | | | | | | | |
Options on Forward Contracts – 0.0% | | | | | | | | | | | | |
EUR/JPY/AUD
Expiration: Jun 2017,
Exercise Price: EUR 1.00(f)(y) | | | | | | | 319,280,000 | | | | 19,476 | |
JPY/EUR
Expiration: May 2017,
Exercise Price: JPY 121.35(f)(y) | | | | | | | 4,550,625,000 | | | | 463,778 | |
| | |
| abfunds.com | | AB HIGH INCOME FUND | 77 |
PORTFOLIO OF INVESTMENTS (continued)
| | | | | | | | | | | | |
| Company | | | | |
Contracts | | | U.S. $ Value | |
| |
| | | | | | | | | | | | |
JPY/EUR
Expiration: May 2017,
Exercise Price: JPY 121.35(f)(y) | | | | | | | 9,095,182,500 | | | $ | 926,938 | |
| | | | | | | | | | | | |
| | | | | | | | | | | 1,410,192 | |
| | | | | | | | | | | | |
Options on Funds and Investment Trusts – 0.0% | | | | | | | | | | | | |
iShares MSCI EAFE ETF
Expiration: May 2017,
Exercise Price: $ 60.00(f)(y) | | | | | | | 2,097,800 | | | | 193,281 | |
iShares MSCI EAFE ETF
Expiration: May 2017,
Exercise Price: $ 60.00(f)(y) | | | | | | | 2,097,800 | | | | 193,281 | |
iShares MSCI Emerging Markets ETF
Expiration: May 2017,
Exercise Price: $ 37.00(f)(y) | | | | | | | 9,565,900 | | | | 305,257 | |
iShares MSCI Emerging Markets ETF
Expiration: May 2017,
Exercise Price: $ 37.00(f)(z) | | | | | | | 37,201 | | | | 130,203 | |
| | | | | | | | | | | | |
| | | | | | | | | | | 822,022 | |
| | | | | | | | | | | | |
Options on Indices – 0.0% | | | | | | | | | | | | |
S&P 500 Index 3M5Y
Expiration: Jul 2017,
Exercise Price: $ 2,303.75(f)(y) | | | | | | | 215,200,000 | | | | 136,222 | |
S&P 500 Index 3M5Y
Expiration: Jul 2017,
Exercise Price: $ 2,303.75(f)(y) | | | | | | | 380,000,000 | | | | 240,540 | |
| | | | | | | | | | | | |
| | | | | | | | | | | 376,762 | |
| | | | | | | | | | | | |
Total Options Purchased – Puts
(premiums paid $7,639,683) | | | | | | | | | | | 2,608,976 | |
| | | | | | | | | | | | |
| | | |
| | | | | | Shares | | | | |
SHORT-TERM INVESTMENTS – 4.4% | | | | | | | | | | | | |
Investment Companies – 3.5% | | | | | | | | | | | | |
AB Fixed Income Shares, Inc. – Government Money Market Portfolio – Class AB, 0.57%(aa)(ab)
(cost $284,756,833) | | | | | | | 284,756,833 | | | | 284,756,833 | |
| | | | | | | | | | | | |
| | |
| 78 | AB HIGH INCOME FUND | | abfunds.com |
PORTFOLIO OF INVESTMENTS (continued)
| | | | | | | | | | | | |
| | | | | | Principal
Amount
(000) | | | U.S. $ Value | |
| |
| | | | | | | | | | | | |
GOVERNMENTS – SOVEREIGN BONDS – 0.4% | | | | | | | | | | | | |
Egypt – 0.4% | | | | | | | | | | | | |
Citigroup Global Markets Holdings, Inc./United States
Series E
Zero Coupon, 1/25/18-3/08/18(a) | | | EGP | | | | 288,593 | | | $ | 13,835,920 | |
Series G
Zero Coupon, 1/25/18(a) | | | | | | | 313,900 | | | | 15,251,192 | |
| | | | | | | | | | | | |
| | | |
Total Governments – Sovereign Bonds
(cost $28,083,165) | | | | | | | | | | | 29,087,112 | |
| | | | | | | | | | | | |
| | | |
Time Deposits – 0.4% | | | | | | | | | | | | |
ANZ, London
0.50%, 5/01/17 | | | AUD | | | | 1,169 | | | | 875,698 | |
Barclays, London
0.42%, 5/01/17 | | | U.S.$ | | | | 16,410 | | | | 16,409,955 | |
BBH, Grand Cayman
(0.95)%, 5/02/17 | | | SEK | | | | – 0 | –** | | | 6 | |
(0.22)%, 5/01/17 | | | JPY | | | | 62,721 | | | | 562,642 | |
0.005%, 5/02/17 | | | HKD | | | | 12,946 | | | | 1,664,403 | |
0.01%, 5/02/17 | | | SGD | | | | 8 | | | | 5,498 | |
0.05%, 5/01/17 | | | CAD | | | | – 0 | –** | | | 1 | |
0.05%, 5/02/17 | | | NOK | | | | 838 | | | | 97,633 | |
DNB, Oslo
(0.575)%, 5/02/17 | | | EUR | | | | 594 | | | | 646,882 | |
Sumitomo, Tokyo
0.05%, 5/02/17 | | | GBP | | | | 5,979 | | | | 7,744,524 | |
| | | | | | | | | | | | |
| | | |
Total Time Deposits
(cost $27,985,818) | | | | | | | | | | | 28,007,242 | |
| | | | | | | | | | | | |
| | | | | | | | | | | | |
CORPORATES – INVESTMENT GRADE – 0.1% | | | | | | | | | | | | |
Financial Institutions – 0.1% | | | | | | | | | | | | |
Banking – 0.1% | | | | | | | | | | | | |
HSBC Bank PLC
Zero Coupon, 11/02/17
(cost $6,557,441) | | | EGP | | | | 129,050 | | | | 6,538,295 | |
| | | | | | | | | | | | |
| | | |
Total Short-Term Investments
(cost $347,383,257) | | | | | | | | | | | 348,389,482 | |
| | | | | | | | | | | | |
| | | |
Total Investments – 100.8%
(cost $8,126,186,741) | | | | | | | | | | | 8,215,741,718 | |
Other assets less liabilities – (0.8)% | | | | | | | | | | | (66,611,553 | ) |
| | | | | | | | | | | | |
| | | |
Net Assets – 100.0% | | | | | | | | | | $ | 8,149,130,165 | |
| | | | | | | | | | | | |
| | |
| abfunds.com | | AB HIGH INCOME FUND | 79 |
PORTFOLIO OF INVESTMENTS (continued)
FUTURES (see Note D)
| | | | | | | | | | | | | | | | | | | | |
| Type | | Number of
Contracts | | | Expiration
Month | | | Original
Value | | | Value at
April 30,
2017 | | | Unrealized
Appreciation/
(Depreciation) | |
Purchased Contracts | |
Euro STOXX
50 Index
Futures | | | 556 | | | | June 2017 | | | $ | 20,179,592 | | | $ | 21,248,669 | | | $ | 1,069,077 | |
U.S. T-Note
5 Yr (CBT)
Futures | | | 2,810 | | | | June 2017 | | | | 330,306,550 | | | | 332,721,562 | | | | 2,415,012 | |
|
Sold Contracts | |
Euro-OAT
Futures | | | 1,262 | | | | June 2017 | | | | 202,803,618 | | | | 205,984,537 | | | | (3,180,919 | ) |
U.S. Long Bond (CBT) Futures | | | 1,018 | | | | June 2017 | | | | 152,731,813 | | | | 155,722,188 | | | | (2,990,375 | ) |
U.S. T-Note
10 Yr (CBT)
Futures | | | 573 | | | | June 2017 | | | | 71,257,922 | | | | 72,036,844 | | | | (778,922 | ) |
| | | | | | | | | | | | | | | | | | | | |
| | | | | | | | | | | | | | | | | | $ | (3,466,127 | ) |
| | | | | | | | | | | | | | | | | | | | |
FORWARD CURRENCY EXCHANGE CONTRACTS (see Note D)
| | | | | | | | | | | | | | | | | | | | |
| Counterparty | | Contracts to
Deliver (000) | | | In Exchange
For
(000) | | | Settlement
Date | | | Unrealized
Appreciation/
(Depreciation) | |
Australia and
New Zealand Banking Group Ltd. | | NOK | | | 203,904 | | | USD | | | 23,716 | | | | 5/11/17 | | | $ | (35,536 | ) |
Australia and
New Zealand Banking Group Ltd. | | CNH | | | 1,437,418 | | | USD | | | 207,371 | | | | 5/15/17 | | | | (737,966 | ) |
Australia and
New Zealand Banking Group Ltd. | | USD | | | 69,788 | | | CNY | | | 481,250 | | | | 5/25/17 | | | | (178,760 | ) |
Australia and
New Zealand Banking Group Ltd. | | AUD | | | 156,269 | | | USD | | | 118,001 | | | | 7/10/17 | | | | 1,129,594 | |
Bank of America, NA | | MXN | | | 815,480 | | | USD | | | 43,049 | | | | 6/16/17 | | | | 67,786 | |
Bank of America, NA | | USD | | | 39,452 | | | MXN | | | 739,204 | | | | 6/16/17 | | | | (490,471 | ) |
Bank of America, NA | | CAD | | | 106,598 | | | USD | | | 79,147 | | | | 6/22/17 | | | | 994,466 | |
Bank of America, NA | | USD | | | 30,906 | | | RUB | | | 1,752,193 | | | | 6/22/17 | | | | (489,015 | ) |
Bank of America, NA | | ZAR | | | 843,392 | | | USD | | | 61,413 | | | | 7/10/17 | | | | (946,719 | ) |
Barclays Bank PLC | | NOK | | | 9,266 | | | USD | | | 1,109 | | | | 5/11/17 | | | | 29,331 | |
Barclays Bank PLC | | KRW | | | 45,619,222 | | | USD | | | 40,198 | | | | 5/18/17 | | | | 92,086 | |
BNP Paribas SA | | GBP | | | 33,724 | | | USD | | | 41,278 | | | | 5/18/17 | | | | (2,421,430 | ) |
BNP Paribas SA | | USD | | | 85,598 | | | GBP | | | 66,745 | | | | 5/18/17 | | | | 891,125 | |
BNP Paribas SA | | USD | | | 24,509 | | | IDR | | | 328,991,000 | | | | 5/19/17 | | | | 131,414 | |
BNP Paribas SA | | USD | | | 79,096 | | | TRY | | | 285,040 | | | | 6/08/17 | | | | 280,662 | |
BNP Paribas SA | | USD | | | 45,611 | | | CHF | | | 45,858 | | | | 6/14/17 | | | | 607,750 | |
BNP Paribas SA | | USD | | | 38,323 | | | CLP | | | 25,045,149 | | | | 6/14/17 | | | | (878,483 | ) |
BNP Paribas SA | | USD | | | 19,425 | | | PEN | | | 63,306 | | | | 6/14/17 | | | | (4,666 | ) |
BNP Paribas SA | | USD | | | 78,005 | | | MXN | | | 1,489,934 | | | | 6/16/17 | | | | 524,717 | |
| | |
| 80 | AB HIGH INCOME FUND | | abfunds.com |
PORTFOLIO OF INVESTMENTS (continued)
| | | | | | | | | | | | | | | | | | | | |
| Counterparty | | Contracts to
Deliver (000) | | | In Exchange
For
(000) | | | Settlement
Date | | | Unrealized
Appreciation/
(Depreciation) | |
BNP Paribas SA | | USD | | | 2,917 | | | ARS | | | 52,896 | | | | 7/05/17 | | | $ | 412,837 | |
Citibank, NA | | GBP | | | 71,187 | | | USD | | | 86,946 | | | | 5/18/17 | | | | (5,298,102 | ) |
Citibank, NA | | USD | | | 7,715 | | | GBP | | | 5,979 | | | | 5/18/17 | | | | 33,222 | |
Citibank, NA | | IDR | | | 67,643,842 | | | USD | | | 5,033 | | | | 5/19/17 | | | | (33,394 | ) |
Citibank, NA | | TRY | | | 139,627 | | | EUR | | | 34,714 | | | | 6/08/17 | | | | (995,331 | ) |
Citibank, NA | | TWD | | | 1,210,315 | | | USD | | | 39,676 | | | | 6/13/17 | | | | (459,841 | ) |
Citibank, NA | | CHF | | | 116,217 | | | USD | | | 116,168 | | | | 6/14/17 | | | | (961,575 | ) |
Citibank, NA | | USD | | | 160,793 | | | INR | | | 10,537,270 | | | | 6/15/17 | | | | 2,320,579 | |
Citibank, NA | | CAD | | | 75,599 | | | USD | | | 56,515 | | | | 6/22/17 | | | | 1,089,641 | |
Citibank, NA | | EUR | | | 340,515 | | | USD | | | 362,255 | | | | 7/13/17 | | | | (10,063,675 | ) |
Credit Suisse International | | USD | | | 7,439 | | | ZAR | | | 96,183 | | | | 5/03/17 | | | | (242,454 | ) |
Credit Suisse International | | NOK | | | 326,365 | | | USD | | | 38,130 | | | | 5/11/17 | | | | 113,905 | |
Credit Suisse International | | NOK | | | 333,798 | | | USD | | | 38,835 | | | | 5/11/17 | | | | (46,850 | ) |
Credit Suisse International | | AUD | | | 26,156 | | | CAD | | | 26,159 | | | | 5/12/17 | | | | (415,248 | ) |
Credit Suisse International | | ZAR | | | 151,574 | | | USD | | | 11,286 | | | | 5/24/17 | | | | (9,088 | ) |
Credit Suisse International | | USD | | | 21,672 | | | TRY | | | 82,900 | | | | 6/16/17 | | | | 1,359,516 | |
Credit Suisse International | | RUB | | | 1,199,368 | | | USD | | | 20,346 | | | | 6/20/17 | | | | (483,948 | ) |
Credit Suisse International | | USD | | | 7,243 | | | TRY | | | 27,453 | | | | 9/22/17 | | | | 174,123 | |
Credit Suisse International | | USD | | | 7,420 | | | TRY | | | 28,951 | | | | 12/21/17 | | | | 209,278 | |
Deutsche Bank AG | | BRL | | | 636,291 | | | USD | | | 201,965 | | | | 5/03/17 | | | | 1,551,274 | |
Deutsche Bank AG | | USD | | | 198,940 | | | BRL | | | 636,291 | | | | 5/03/17 | | | | 1,473,403 | |
Deutsche Bank AG | | RUB | | | 1,188,149 | | | USD | | | 20,155 | | | | 6/20/17 | | | | (479,421 | ) |
Deutsche Bank AG | | USD | | | 8,554 | | | EUR | | | 7,961 | | | | 7/13/17 | | | | 150,800 | |
Deutsche Bank AG | | TRY | | | 26,964 | | | USD | | | 7,339 | | | | 7/26/17 | | | | (66,243 | ) |
Goldman Sachs Bank USA | | ZAR | | | 96,183 | | | USD | | | 7,439 | | | | 5/04/17 | | | | 243,725 | |
Goldman Sachs Bank USA | | JPY | | | 4,585,156 | | | USD | | | 40,022 | | | | 5/11/17 | | | | (1,123,221 | ) |
Goldman Sachs Bank USA | | USD | | | 77,263 | | | TRY | | | 292,941 | | | | 6/08/17 | | | | 4,314,623 | |
HSBC Bank USA | | SEK | | | 20,264 | | | USD | | | 2,264 | | | | 5/11/17 | | | | (24,729 | ) |
HSBC Bank USA | | ZAR | | | 356,616 | | | USD | | | 28,231 | | | | 5/24/17 | | | | 1,655,588 | |
JPMorgan Chase Bank, NA | | CAD | | | 26,159 | | | AUD | | | 26,156 | | | | 5/12/17 | | | | 415,171 | |
JPMorgan Chase Bank, NA | | MXN | | | 221,587 | | | USD | | | 11,802 | | | | 6/16/17 | | | | 122,688 | |
JPMorgan Chase Bank, NA | | TRY | | | 82,900 | | | USD | | | 21,672 | | | | 6/16/17 | | | | (1,359,319 | ) |
JPMorgan Chase Bank, NA | | USD | | | 7,339 | | | TRY | | | 26,868 | | | | 7/26/17 | | | | 40,038 | |
JPMorgan Chase Bank, NA | | USD | | | 15,778 | | | ZAR | | | 207,946 | | | | 7/26/17 | | | | (445,042 | ) |
JPMorgan Chase Bank, NA | | ZAR | | | 207,946 | | | USD | | | 15,778 | | | | 7/26/17 | | | | 445,056 | |
JPMorgan Chase Bank, NA | | TRY | | | 27,453 | | | USD | | | 7,243 | | | | 9/22/17 | | | | (174,007 | ) |
JPMorgan Chase Bank, NA | | TRY | | | 28,951 | | | USD | | | 7,420 | | | | 12/21/17 | | | | (209,237 | ) |
Morgan Stanley & Co. LLC | | NZD | | | 163,284 | | | USD | | | 113,630 | | | | 7/10/17 | | | | 1,714,405 | |
Royal Bank of Scotland PLC | | USD | | | 201,390 | | | BRL | | | 636,291 | | | | 5/03/17 | | | | (975,966 | ) |
| | |
| abfunds.com | | AB HIGH INCOME FUND | 81 |
PORTFOLIO OF INVESTMENTS (continued)
| | | | | | | | | | | | | | | | | | | | | | | | |
| Counterparty | | Contracts to
Deliver (000) | | | In Exchange
For
(000) | | | Settlement
Date | | | Unrealized
Appreciation/
(Depreciation) | |
Royal Bank of Scotland PLC | | | BRL | | | | 636,291 | | | | USD | | | | 198,940 | | | | 5/03/17 | | | $ | (1,473,403 | ) |
Royal Bank of Scotland PLC | | | JPY | | | | 6,551,714 | | | | USD | | | | 58,817 | | | | 5/11/17 | | | | 24,553 | |
Royal Bank of Scotland PLC | | | USD | | | | 57,884 | | | | JPY | | | | 6,394,861 | | | | 5/11/17 | | | | (498,946 | ) |
Royal Bank of Scotland PLC | | | BRL | | | | 636,291 | | | | USD | | | | 199,812 | | | | 6/02/17 | | | | 1,028,856 | |
Royal Bank of Scotland PLC | | | USD | | | | 82,559 | | | | COP | | | | 238,967,000 | | | | 6/14/17 | | | | (1,892,756 | ) |
Royal Bank of Scotland PLC | | | EUR | | | | 1,718 | | | | USD | | | | 1,828 | | | | 7/13/17 | | | | (49,943 | ) |
| | | | | | | | | | | | | | | | | | | | | | | | |
| | | | | | | | | | | | | | | | | | | | | | $ | (10,322,573 | ) |
| | | | | | | | | | | | | | | | | | | | | | | | |
PUT OPTIONS WRITTEN (see Note D)
| | | | | | | | | | | | | | | | | | | | |
| Description | | Contracts | | | Exercise
Price | | | Expiration
Month | | | Premiums
Received | | | U.S. $ Value | |
iShares MSCI EAFE ETF(y) | | | 2,097,800 | | | $ | 57.00 | | | | May 2017 | | | $ | 388,093 | | | $ | (56,044 | ) |
iShares MSCI EAFE ETF(y) | | | 2,097,800 | | | | 57.00 | | | | May 2017 | | | | 356,626 | | | | (56,045 | ) |
iShares MSCI Emerging Markets ETF(z) | | | 37,201 | | | | 36.50 | | | | May 2017 | | | | 519,198 | | | | (111,603 | ) |
iShares MSCI Emerging Markets ETF(y) | | | 9,565,900 | | | | 36.50 | | | | May 2017 | | | | 1,434,885 | | | | (211,110 | ) |
| | | | | | | | | | | | | | | | | | | | |
| | | | | | | | | | | | | | $ | 2,698,802 | | | $ | (434,802 | ) |
| | | | | | | | | | | | | | | | | | | | |
CREDIT DEFAULT SWAPTIONS WRITTEN (see Note D)
| | | | | | | | | | | | | | | | | | | | | | | | | | | | |
| Description | | Counterparty | | | Buy/Sell
Protection | | | Strike
Rate | | | Expiration
Month | | | Notional
Amount
(000) | | | Premiums
Received | | | Market
Value | |
Call – CDX-NAHY Series 28, 5 Year Index | |
| Goldman Sachs
International |
| | | Sell | | | | 107.00 | % | | | May, 2017 | | | $ | 40,146 | | | $ | 157,573 | | | $ | (255,053 | ) |
Put – CDX-NAHY Series 28, 5 Year Index | |
| Goldman Sachs
International |
| | | Sell | | | | 106.50 | | | | May, 2017 | | | | 40,146 | | | | 264,964 | | | | (61,932 | ) |
| | | | | | | | | | | | | | | | | | | | | | | | | | | | |
| | | | | | | | | | | | | | | | | | | | | | $ | 422,537 | | | $ | (316,985 | ) |
| | | | | | | | | | | | | | | | | | | | | | | | | | | | |
CURRENCY OPTIONS WRITTEN (see Note D)
| | | | | | | | | | | | | | | | | | | | |
| Description | | Exercise
Price | | | Expiration
Date | | | Contracts
(000) | | | Premiums
Received | | | U.S. $ Value | |
Call – CHF vs. EUR | | CHF | 1.044 | | | | 5/04/17 | | | CHF | 74,326 | | | $ | 376,484 | | | $ | (4,631 | ) |
Call – CHF vs. EUR | | CHF | 1.040 | | | | 5/05/17 | | | | 74,734 | | | | 455,355 | | | | (5,708 | ) |
Call – GBP vs. EUR | | GBP | 0.846 | | | | 5/22/17 | | | GBP | 61,186 | | | | 465,710 | | | | (850,972 | ) |
Call – JPY vs. CAD | | JPY | 76.000 | | | | 9/27/17 | | | JPY | 3,982,400 | | | | 298,752 | | | | (311,590 | ) |
Call – JPY vs. EUR | | JPY | 115.000 | | | | 5/18/17 | | | | 4,191,750 | | | | 241,076 | | | | (29,744 | ) |
Call – JPY vs. EUR | | JPY | 112.000 | | | | 5/22/17 | | | | 4,200,000 | | | | 301,679 | | | | (19,554 | ) |
Call – JPY vs. EUR | | JPY | 112.000 | | | | 5/22/17 | | | | 8,394,400 | | | | 574,317 | | | | (39,082 | ) |
| | |
| 82 | AB HIGH INCOME FUND | | abfunds.com |
PORTFOLIO OF INVESTMENTS (continued)
| | | | | | | | | | | | | | | | | | | | |
| Description | | Exercise
Price | | | Expiration
Date | | | Contracts
(000) | | | Premiums
Received | | | U.S. $ Value | |
Call – TRY vs. USD | | TRY | 3.600 | | | | 5/12/17 | | | TRY | 140,220 | | | $ | 169,043 | | | $ | (604,234 | ) |
Put – BRL vs. USD | | BRL | 3.335 | | | | 5/31/17 | | | BRL | 134,651 | | | | 277,780 | | | | (187,507 | ) |
Put – CAD vs. AUD | | CAD | 1.013 | | | | 5/10/17 | | | CAD | 107,946 | | | | 260,838 | | | | (836,020 | ) |
Put – CAD vs. USD | | CAD | 1.387 | | | | 5/30/17 | | | | 56,035 | | | | 143,218 | | | | (127,254 | ) |
Put – CNH vs. USD | | CNH | 7.082 | | | | 6/13/17 | | | CNH | 551,688 | | | | 303,810 | | | | (35,037 | ) |
Put – KRW vs. USD | | KRW | 1,167.000 | | | | 5/17/17 | | | KRW | 46,796,700 | | | | 242,605 | | | | (120,169 | ) |
Put – KRW vs. USD | | KRW | 1,178.100 | | | | 5/18/17 | | | | 47,241,810 | | | | 286,715 | | | | (85,483 | ) |
Put – NOK vs. EUR | | NOK | 9.100 | | | | 5/04/17 | | | NOK | 648,694 | | | | 392,634 | | | | (2,131,184 | ) |
Put – NZD vs. AUD | | NZD | 1.150 | | | | 9/14/17 | | | NZD | 117,933 | | | | 380,959 | | | | (175,953 | ) |
Put – RUB vs. USD | | RUB | 62.200 | | | | 6/19/17 | | | RUB | 2,425,800 | | | | 427,050 | | | | (118,629 | ) |
Put – RUB vs. USD | | RUB | 62.200 | | | | 6/19/17 | | | | 2,425,800 | | | | 424,281 | | | | (118,629 | ) |
Put – RUB vs. USD | | RUB | 77.616 | | | | 10/16/17 | | | | 3,003,739 | | | | 1,196,217 | | | | (71,811 | ) |
Put – TRY vs. USD | | TRY | 4.050 | | | | 6/15/17 | | | TRY | 156,735 | | | | 532,129 | | | | (30,624 | ) |
Put – TRY vs. USD | | TRY | 3.860 | | | | 7/25/17 | | | | 154,979 | | | | 421,976 | | | | (348,140 | ) |
Put – TRY vs. USD | | TRY | 4.100 | | | | 9/21/17 | | | | 160,515 | | | | 716,445 | | | | (361,028 | ) |
Put – TRY vs. USD | | TRY | 4.300 | | | | 12/20/17 | | | | 167,915 | | | | 956,725 | | | | (560,623 | ) |
Put – ZAR vs. USD | | ZAR | 13.505 | | | | 5/02/17 | | | ZAR | 528,721 | | | | 309,285 | | | | (108,761 | ) |
Put – ZAR vs. USD | | ZAR | 14.750 | | | | 7/06/17 | | | | 1,762,625 | | | | 1,825,960 | | | | (814,721 | ) |
Put – ZAR vs. USD | | ZAR | 14.050 | | | | 7/24/17 | | | | 1,131,025 | | | | 1,029,595 | | | | (1,564,118 | ) |
| | | | | | | | | | | | | | | | | | | | |
| | | | | | | | | | | | | | $ | 13,010,638 | | | $ | (9,661,206 | ) |
| | | | | | | | | | | | | | | | | | | | |
CENTRALLY CLEARED CREDIT DEFAULT SWAPS (see Note D)
| | | | | | | | | | | | | | | | | | | | |
Clearing Broker/(Exchange)
& Referenced Obligation | | Fixed
Rate
(Pay)
Receive | | | Implied
Credit
Spread at
April 30,
2017 | | | Notional
Amount
(000) | | | Market
Value | | | Unrealized
Appreciation/
(Depreciation) | |
Buy Contracts | | | | | | | | | | | | | | | | | | | | |
Citigroup Global Markets, Inc./INTRCONX | | | | | | | | | | | | | | | | | | | | |
iTraxx Europe Crossover Series 23, 5 Year Index, 6/20/20* | | | (5.00 | )% | | | 1.56 | % | | EUR | 22,398 | | | $ | (2,708,246 | ) | | $ | (1,388,610 | ) |
Morgan Stanley & Co. LLC/INTRCONX | | | | | | | | | | | | | | | | | | | | |
CDX-NAHY Series 27, 5 Year Index, 12/20/21* | | | (5.00 | ) | | | 3.01 | | | $ | 214,280 | | | | (18,733,607 | ) | | | (3,344,423 | ) |
| | | | | |
Sale Contracts | | | | | | | | | | | | | | | | | | | | |
Citigroup Global Markets, Inc./INTRCONX | | | | | | | | | | | | | | | | | | | | |
CDX-NAHY Series 21, 5 Year Index, 12/20/18* | | | 5.00 | | | | 1.46 | | | | 27,978 | | | | 1,765,532 | | | | 1,078,767 | |
CDX-NAIG Series 20, 5 Year Index, 6/20/18* | | | 1.00 | | | | 0.09 | | | | 51,660 | | | | 599,578 | | | | 378,802 | |
iTraxx Europe Crossover Series 21, 5 Year Index, 6/20/19* | | | 5.00 | | | | 0.57 | | | EUR | 4 | | | | 487 | | | | 154 | |
Morgan Stanley & Co. LLC/INTRCONX | | | | | | | | | | | | | | | | | | | | |
CDX-NAHY Series 28, 5 Year Index, 6/20/22* | | | 5.00 | | | | 3.28 | | | $ | 6,174 | | | | 505,471 | | | | 96,588 | |
| | |
| abfunds.com | | AB HIGH INCOME FUND | 83 |
PORTFOLIO OF INVESTMENTS (continued)
| | | | | | | | | | | | | | | | | | | | |
Clearing Broker/(Exchange)
& Referenced Obligation | | Fixed
Rate
(Pay)
Receive | | | Implied
Credit
Spread at
April 30,
2017 | | | Notional
Amount
(000) | | | Market
Value | | | Unrealized
Appreciation/
(Depreciation) | |
iTraxx Europe Crossover Series 23, 5 Year Index, 6/20/20* | | | 5.00 | % | | | 1.56 | % | | EUR | 22,398 | | | $ | 2,711,635 | | | $ | 986,527 | |
iTraxx Europe Crossover Series 27, 5 Year Index, 6/20/22* | | | 5.00 | | | | 2.66 | | | | 80,611 | | | | 10,072,245 | | | | 1,997,535 | |
| | | | | | | | | | | | | | | | | | | | |
| | | $ | (5,786,905 | ) | | $ | (194,660 | ) |
| | | | | | | | | | | | | | | | | | | | |
CENTRALLY CLEARED INTEREST RATE SWAPS (see Note D)
| | | | | | | | | | | | | | | | | | | | |
| | | | | | | | | Rate Type | | | | |
Clearing Broker
/(Exchange) | | Notional
Amount
(000) | | | Termination
Date | | | Payments
made
by the Fund | | | Payments
received
by the
Fund | | | Unrealized
Appreciation/
(Depreciation) | |
Morgan Stanley & Co. LLC/(CME Group) | | CAD | 303,955 | | | | 11/14/21 | | | | 3 Month CDOR | | | | 1.323% | | | $ | 429,068 | |
Morgan Stanley & Co. LLC/(CME Group) | | | 303,955 | | | | 11/15/21 | | | | 3 Month CDOR | | | | 1.318% | | | | 376,713 | |
Morgan Stanley & Co. LLC/(CME Group) | | EUR | 364,390 | | | | 3/17/22 | | | | 0.259% | | | | 6 Month EURIBOR | | | | (1,939,105 | ) |
Morgan Stanley & Co. LLC/(CME Group) | | $ | 215,190 | | | | 3/17/22 | | | | 3 Month LIBOR | | | | 2.227% | | | | 3,238,336 | |
Morgan Stanley & Co. LLC/(CME Group) | | CAD | 61,033 | | | | 11/14/46 | | | | 2.223% | | | | 3 Month CDOR | | | | 493,823 | |
Morgan Stanley & Co. LLC/(CME Group) | | | 61,047 | | | | 11/15/46 | | | | 2.234% | | | | 3 Month CDOR | | | | 380,130 | |
| | | | | | | | | | | | | | | | | | | | |
| | | | | | | | | | | | | | $ | 2,978,965 | |
| | | | | | | | | | | | | | | | | | | | |
CREDIT DEFAULT SWAPS (see Note D)
| | | | | | | | | | | | | | | | | | | | | | | | |
Swap Counterparty
& Referenced
Obligation | | Fixed
Rate
(Pay)
Receive | | | Implied
Credit
Spread at
April 30,
2017 | | | Notional
Amount
(000) | | | Market
Value | | | Upfront
Premiums
Paid
(Received) | | | Unrealized
Appreciation/
(Depreciation) | |
Buy Contracts | | | | | | | | | | | | | | | | | | | | | | | | |
Barclays Bank PLC | | | | | | | | | | | | | | | | | | | | | | | | |
Tenet Healthcare Corp., 6.875%, 11/15/31, 6/20/17* | | | (5.00 | )% | | | 0.70 | % | | $ | 18,869 | | | $ | (223,905 | ) | | $ | (88,138 | ) | | $ | (135,767 | ) |
| | |
| 84 | AB HIGH INCOME FUND | | abfunds.com |
PORTFOLIO OF INVESTMENTS (continued)
| | | | | | | | | | | | | | | | | | | | | | | | |
Swap Counterparty
& Referenced
Obligation | | Fixed
Rate
(Pay)
Receive | | | Implied
Credit
Spread at
April 30,
2017 | | | Notional
Amount
(000) | | | Market
Value | | | Upfront
Premiums
Paid
(Received) | | | Unrealized
Appreciation/
(Depreciation) | |
Sale Contracts | | | | | | | | | | | | | | | | | | | | | | | | |
Barclays Bank PLC | | | | | | | | | | | | | | | | | | | | | | | | |
CCO Holdings, LLC, 7.250%, 10/30/17, 6/20/19* | | | 5.00 | % | | | 0.34 | % | | $ | 6,192 | | | $ | 648,461 | | | $ | 297,556 | | | $ | 350,905 | |
K. Hovnanian Enterprises, Inc., 7.000%, 1/15/19, 9/20/20* | | | 5.00 | | | | 17.04 | | | | 2,917 | | | | (838,535 | ) | | | (564,105 | ) | | | (274,430 | ) |
K. Hovnanian Enterprises, Inc., 7.000%, 1/15/19, 9/20/20* | | | 5.00 | | | | 17.04 | | | | 7,293 | | | | (2,096,481 | ) | | | (1,408,086 | ) | | | (688,395 | ) |
Tenet Healthcare Corp., 6.875%, 11/15/31, 6/20/19* | | | 5.00 | | | | 2.58 | | | | 12,770 | | | | 710,284 | | | | 466,425 | | | | 243,859 | |
Citibank, NA | | | | | | | | | | | | | | | | | | | | | | | | |
CDX-CMBX.NA.BBB Series 7, 1/17/47* | | | 3.00 | | | | 4.53 | | | | 5,000 | | | | (402,001 | ) | | | (59,895 | ) | | | (342,106 | ) |
CDX-CMBX.NA.BBB Series 7, 1/17/47* | | | 3.00 | | | | 4.53 | | | | 25,000 | | | | (2,010,000 | ) | | | (282,951 | ) | | | (1,727,049 | ) |
Credit Suisse International | | | | | | | | | | | | | | | | | |
CDX-CMBX.NA.BB Series 6, 5/11/63* | | | 5.00 | | | | 9.75 | | | | 547 | | | | (102,818 | ) | | | (85,918 | ) | | | (16,900 | ) |
CDX-CMBX.NA.BB Series 6, 5/11/63* | | | 5.00 | | | | 9.75 | | | | 1,368 | | | | (257,138 | ) | | | (214,873 | ) | | | (42,265 | ) |
CDX-CMBX.NA.BB Series 6, 5/11/63* | | | 5.00 | | | | 9.75 | | | | 1,368 | | | | (257,709 | ) | | | (209,565 | ) | | | (48,144 | ) |
CDX-CMBX.NA.BB Series 6, 5/11/63* | | | 5.00 | | | | 9.75 | | | | 2,735 | | | | (515,228 | ) | | | (418,563 | ) | | | (96,665 | ) |
CDX-CMBX.NA.BB Series 6, 5/11/63* | | | 5.00 | | | | 9.75 | | | | 14,000 | | | | (2,631,533 | ) | | | (1,946,750 | ) | | | (684,783 | ) |
CDX-CMBX.NA.BB Series 6, 5/11/63* | | | 5.00 | | | | 9.75 | | | | 15,000 | | | | (2,823,667 | ) | | | (1,863,139 | ) | | | (960,528 | ) |
CDX-CMBX.NA.BB Series 6, 5/11/63* | | | 5.00 | | | | 9.75 | | | | 15,000 | | | | (2,819,500 | ) | | | (1,788,240 | ) | | | (1,031,260 | ) |
CDX-CMBX.NA.BBB Series 7, 1/17/47* | | | 3.00 | | | | 4.53 | | | | 5,000 | | | | (402,000 | ) | | | (111,351 | ) | | | (290,649 | ) |
| | |
| abfunds.com | | AB HIGH INCOME FUND | 85 |
PORTFOLIO OF INVESTMENTS (continued)
| | | | | | | | | | | | | | | | | | | | | | | | |
Swap Counterparty
& Referenced
Obligation | | Fixed
Rate
(Pay)
Receive | | | Implied
Credit
Spread at
April 30,
2017 | | | Notional
Amount
(000) | | | Market
Value | | | Upfront
Premiums
Paid
(Received) | | | Unrealized
Appreciation/
(Depreciation) | |
CDX-CMBX.NA.BBB Series 7, 1/17/47* | | | 3.00 | % | | | 4.53 | % | | $ | 5,000 | | | $ | (402,000 | ) | | $ | (91,459 | ) | | $ | (310,541 | ) |
Deutsche Bank AG | | | | | | | | | | | | | | | | | | | | | | | | |
CDX-CMBX.NA.BBB Series 6, 5/11/63* | | | 3.00 | | | | 5.54 | | | | 2,395 | | | | (266,723 | ) | | | (297,875 | ) | | | 31,152 | |
Goldman Sachs Bank USA | | | | | | | | | | | | | | | | | | | | | | | | |
CDX-NAIG Series 9, 10 Year Index, 12/20/17* | | | 5.00 | | | | 0.16 | | | | 5,700 | | | | 213,132 | | | | (111,150 | ) | | | 324,282 | |
K. Hovnanian Enterprises, Inc., 7.000%, 1/15/19, 9/20/20* | | | 5.00 | | | | 17.04 | | | | 3,110 | | | | (894,016 | ) | | | (565,736 | ) | | | (328,280 | ) |
Nine West Holdings, Inc., 6.875%, 3/15/19, 3/20/19* | | | 5.00 | | | | 58.78 | | | | 12,590 | | | | (8,417,250 | ) | | | 158,176 | | | | (8,575,426 | ) |
Goldman Sachs International | | | | | | | | | | | | | | | | | | | | | | | | |
Avis Budget Car Rental LLC, 5.250%, 3/15/25, 6/20/22* | | | 5.00 | | | | 4.65 | | | | 11,500 | | | | 243,601 | | | | 788,086 | | | | (544,485 | ) |
CDX-CMBX.NA.BB Series 6, 5/11/63* | | | 5.00 | | | | 9.75 | | | | 17,700 | | | | (3,327,010 | ) | | | (3,659,012 | ) | | | 332,002 | |
CDX-CMBX.NA.BB Series 6, 5/11/63* | | | 5.00 | | | | 9.75 | | | | 20,000 | | | | (3,759,333 | ) | | | (3,686,757 | ) | | | (72,576 | ) |
CDX-CMBX.NA.BB Series 6, 5/11/63* | | | 5.00 | | | | 9.75 | | | | 643 | | | | (121,130 | ) | | | (95,868 | ) | | | (25,262 | ) |
CDX-CMBX.NA.BB Series 6, 5/11/63* | | | 5.00 | | | | 9.75 | | | | 1,368 | | | | (257,708 | ) | | | (213,745 | ) | | | (43,963 | ) |
CDX-CMBX.NA.BB Series 6, 5/11/63* | | | 5.00 | | | | 9.75 | | | | 1,368 | | | | (257,708 | ) | | | (213,745 | ) | | | (43,963 | ) |
CDX-CMBX.NA.BB Series 6, 5/11/63* | | | 5.00 | | | | 9.75 | | | | 1,368 | | | | (257,709 | ) | | | (211,359 | ) | | | (46,350 | ) |
CDX-CMBX.NA.BB Series 6, 5/11/63* | | | 5.00 | | | | 9.75 | | | | 12,300 | | | | (2,311,990 | ) | | | (2,138,556 | ) | | | (173,434 | ) |
CDX-CMBX.NA.BB Series 6, 5/11/63* | | | 5.00 | | | | 9.75 | | | | 5,000 | | | | (941,917 | ) | | | (694,657 | ) | | | (247,260 | ) |
| | |
| 86 | AB HIGH INCOME FUND | | abfunds.com |
PORTFOLIO OF INVESTMENTS (continued)
| | | | | | | | | | | | | | | | | | | | | | | | |
Swap Counterparty
& Referenced
Obligation | | Fixed
Rate
(Pay)
Receive | | | Implied
Credit
Spread at
April 30,
2017 | | | Notional
Amount
(000) | | | Market
Value | | | Upfront
Premiums
Paid
(Received) | | | Unrealized
Appreciation/
(Depreciation) | |
CDX-CMBX.NA.BB Series 6, 5/11/63* | | | 5.00 | % | | | 9.75 | % | | $ | 5,000 | | | $ | (941,916 | ) | | $ | (690,195 | ) | | $ | (251,721 | ) |
CDX-CMBX.NA.BB Series 6, 5/11/63* | | | 5.00 | | | | 9.75 | | | | 5,000 | | | | (941,917 | ) | | | (685,729 | ) | | | (256,188 | ) |
CDX-CMBX.NA.BB Series 6, 5/11/63* | | | 5.00 | | | | 9.75 | | | | 10,000 | | | | (1,883,834 | ) | | | (1,380,391 | ) | | | (503,443 | ) |
CDX-CMBX.NA.BB Series 6, 5/11/63* | | | 5.00 | | | | 9.75 | | | | 8,871 | | | | (1,669,957 | ) | | | (1,101,887 | ) | | | (568,070 | ) |
CDX-CMBX.NA.BB Series 6, 5/11/63* | | | 5.00 | | | | 9.75 | | | | 5,000 | | | | (941,917 | ) | | | (119,635 | ) | | | (822,282 | ) |
CDX-CMBX.NA.BB Series 6, 5/11/63* | | | 5.00 | | | | 9.75 | | | | 10,000 | | | | (1,883,833 | ) | | | (213,023 | ) | | | (1,670,810 | ) |
CDX-CMBX.NA.BB Series 6, 5/11/63* | | | 5.00 | | | | 9.75 | | | | 10,000 | | | | (1,883,834 | ) | | | (210,394 | ) | | | (1,673,440 | ) |
CDX-CMBX.NA.BBB Series 6, 5/11/63* | | | 3.00 | | | | 5.54 | | | | 4,740 | | | | (527,877 | ) | | | (542,935 | ) | | | 15,058 | |
CDX-CMBX.NA.BBB Series 6, 5/11/63* | | | 3.00 | | | | 5.54 | | | | 2,370 | | | | (263,939 | ) | | | (248,371 | ) | | | (15,568 | ) |
CDX-CMBX.NA.BBB Series 6, 5/11/63* | | | 3.00 | | | | 5.54 | | | | 1,185 | | | | (131,969 | ) | | | (112,674 | ) | | | (19,295 | ) |
CDX-CMBX.NA.BBB Series 6, 5/11/63* | | | 3.00 | | | | 5.54 | | | | 2,370 | | | | (263,939 | ) | | | (229,523 | ) | | | (34,416 | ) |
CDX-CMBX.NA.BBB Series 6, 5/11/63* | | | 3.00 | | | | 5.54 | | | | 2,443 | | | | (272,069 | ) | | | (218,854 | ) | | | (53,215 | ) |
CDX-CMBX.NA.BBB Series 6, 5/11/63* | | | 3.00 | | | | 5.54 | | | | 14,221 | | | | (1,583,745 | ) | | | (1,303,831 | ) | | | (279,914 | ) |
United States Steel Corp., 6.650%, 6/01/37, 12/20/21* | | | 5.00 | | | | 5.08 | | | | 4,590 | | | | (7,644 | ) | | | (343,789 | ) | | | 336,145 | |
Morgan Stanley Capital Services LLC | | | | | | | | | | | | | | | | | | | | | | | | |
Bombardier, Inc., 7.450%, 5/01/34, 6/20/21* | | | 5.00 | | | | 3.21 | | | | 5,000 | | | | 363,959 | | | | 208,461 | | | | 155,498 | |
| | | | | | | | | | | | | | | | | | | | | | | | |
| | | | | | | | | | | | | | $ | (47,613,962 | ) | | $ | (26,504,020 | ) | | $ | (21,109,942 | ) |
| | | | | | | | | | | | | | | | | | | | | | | | |
| | |
| abfunds.com | | AB HIGH INCOME FUND | 87 |
PORTFOLIO OF INVESTMENTS (continued)
TOTAL RETURN SWAPS (see Note D)
| | | | | | | | | | | | | | | | | | | | |
Counterparty &
Referenced Obligation | | # of Shares
or Units | | | Rate Paid/
Received | | | Notional
Amount
(000) | | | Maturity
Date | | | Unrealized
Appreciation/
(Depreciation) | |
Receive Total Return on Reference Obligation | | | | | |
Citibank, NA | | | | | | | | | | | | | | | | | | | | |
iBoxx $ Liquid High Yield Index | | | 103,953 | | | | LIBOR | | | $ | 26,638 | | | | 6/20/17 | | | $ | 495,255 | |
iBoxx $ Liquid High Yield Index | | | 68,723 | | | | LIBOR | | | | 17,782 | | | | 6/20/17 | | | | 155,623 | |
iBoxx $ Liquid High Yield Index | | | 27,514 | | | | LIBOR | | | | 7,071 | | | | 6/20/17 | | | | 110,448 | |
iBoxx $ Liquid High Yield Index | | | 34,164 | | | | LIBOR | | | | 8,840 | | | | 6/20/17 | | | | 77,365 | |
Goldman Sachs International | | | | | | | | | | | | | | | | | | | | |
iBoxx $ Liquid High Yield Index | | | 147,321 | | | | LIBOR | | | | 37,880 | | | | 6/20/17 | | | | 572,979 | |
iBoxx $ Liquid High Yield Index | | | 156,933 | | | | LIBOR | | | | 40,420 | | | | 6/20/17 | | | | 541,711 | |
iBoxx $ Liquid High Yield Index | | | 104,355 | | | | LIBOR | | | | 27,028 | | | | 6/20/17 | | | | 210,226 | |
iBoxx $ Liquid High Yield Index | | | 102,227 | | | | LIBOR | | | | 26,515 | | | | 6/20/17 | | | | 167,607 | |
iBoxx $ Liquid High Yield Index | | | 68,152 | | | | LIBOR | | | | 17,677 | | | | 6/20/17 | | | | 111,740 | |
JPMorgan Chase Bank, NA | | | | | | | | | | | | | | | | | | | | |
iBoxx $ Liquid High Yield Index | | | 66,036 | | | | LIBOR | | | | 17,095 | | | | 6/20/17 | | | | 141,284 | |
iBoxx $ Liquid High Yield Index | | | 39,892 | | | | LIBOR | | | | 10,327 | | | | 6/20/17 | | | | 85,349 | |
Morgan Stanley Capital Services LLC | | | | | | | | | | | | | | | | | |
iBoxx $ Liquid High Yield Index | | | 47,048 | | | | LIBOR | | | | 12,103 | | | | 6/20/17 | | | | 177,103 | |
iBoxx $ Liquid High Yield Index | | | 31,999 | | | | LIBOR | | | | 8,219 | | | | 6/20/17 | | | | 133,254 | |
iBoxx $ Liquid High Yield Index | | | 32,986 | | | | LIBOR | | | | 8,535 | | | | 6/20/17 | | | | 74,697 | |
| | | | | | | | | | | | | | | | | | | | |
| | | | | | | | | | | | | | | | | | $ | 3,054,641 | |
| | | | | | | | | | | | | | | | | | | | |
VARIANCE SWAPS (see Note D)
| | | | | | | | | | | | | | | | | | | | |
Swap Counterparty &
Referenced Obligation | | Volatility
Strike
Price | | | Notional
Amount
(000) | | | Market
Value | | | Upfront
Premiums
(Paid)
Received | | | Unrealized
Appreciation/
(Depreciation) | |
Sale Contracts | | | | | | | | | | | | | | | | | | | | |
Barclays Bank PLC | | | | | | | | | | | | | | | | | | | | |
iShares Russell 2000 Index 5/5/17* | | | 13.00 | % | | $ | 514 | | | $ | – 0 | – | | $ | – 0 | – | | $ | – 0 | – |
Deutsche Bank AG | | | | | | | | | | | | | | | | | | | | |
S&P 500 Index 5/5/17* | | | 8.45 | | | | 1,140 | | | | 226,031 | | | | – 0 | – | | | 226,031 | |
Goldman Sachs International | | | | | | | | | | | | | | | | | | | | |
PowerShares QQQ Trust, Series 1 5/5/17* | | | 9.65 | | | | 561 | | | | 75,990 | | | | – 0 | – | | | 75,990 | |
| | | | | | | | | | | | | | | | | | | | |
| | | | | | | | | | $ | 302,021 | | | $ | – 0 | – | | $ | 302,021 | |
| | | | | | | | | | | | | | | | | | | | |
REVERSE REPURCHASE AGREEMENTS (see Note D)
| | | | | | | | | | | | | | | | | | | | |
| Broker | | Principal
Amount
(000) | | | Currency | | | Interest Rate | | | Maturity | | | U.S. $
Value at
April 30, 2017 | |
Barclays Capital, Inc. | | | 9,063 | | | | USD | | | | (5.50 | )%* | | | 5/02/17 | | | $ | 9,007,118 | |
Barclays Capital, Inc. | | | 3,852 | | | | USD | | | | (3.00 | )%* | | | 5/04/17 | | | | 3,849,273 | |
Barclays Capital, Inc.† | | | 3,520 | | | | USD | | | | (7.00 | )%* | | | — | | | | 3,515,893 | |
Barclays Capital, Inc.† | | | 3,693 | | | | USD | | | | (7.00 | )%* | | | — | | | | 3,689,051 | |
Barclays Capital, Inc.† | | | 2,512 | | | | USD | | | | (4.00 | )%* | | | — | | | | 2,509,909 | |
Barclays Capital, Inc.† | | | 499 | | | | USD | | | | (3.00 | )%* | | | — | | | | 498,689 | |
| | |
| 88 | AB HIGH INCOME FUND | | abfunds.com |
PORTFOLIO OF INVESTMENTS (continued)
| | | | | | | | | | | | | | | | | | | | |
| Broker | | Principal
Amount
(000) | | | Currency | | | Interest Rate | | | Maturity | | | U.S. $
Value at
April 30, 2017 | |
Barclays Capital, Inc.† | | | 2,038 | | | | USD | | | | (3.00 | )%* | | | — | | | $ | 2,035,462 | |
Barclays Capital, Inc.† | | | 2,405 | | | | USD | | | | (3.00 | )%* | | | — | | | | 2,403,913 | |
Barclays Capital, Inc.† | | | 2,465 | | | | USD | | | | (3.00 | )%* | | | — | | | | 2,463,902 | |
Barclays Capital, Inc.† | | | 4,080 | | | | USD | | | | (3.00 | )%* | | | — | | | | 4,077,620 | |
Barclays Capital, Inc.† | | | 1,071 | | | | USD | | | | (2.75 | )%* | | | — | | | | 1,066,662 | |
Barclays Capital, Inc.† | | | 6,026 | | | | USD | | | | (2.25 | )%* | | | — | | | | 6,007,735 | |
Barclays Capital, Inc.† | | | 2,029 | | | | USD | | | | (2.00 | )%* | | | — | | | | 2,027,560 | |
Barclays Capital, Inc.† | | | 1,443 | | | | USD | | | | (1.50 | )%* | | | — | | | | 1,442,468 | |
Barclays Capital, Inc.† | | | 3,039 | | | | USD | | | | (1.00 | )%* | | | — | | | | 3,038,134 | |
Barclays Capital, Inc.† | | | 3,149 | | | | USD | | | | (1.00 | )%* | | | — | | | | 3,145,652 | |
Barclays Capital, Inc.† | | | 4,733 | | | | USD | | | | (1.00 | )%* | | | — | | | | 4,728,010 | |
Barclays Capital, Inc.† | | | 2,691 | | | | USD | | | | (0.50 | )%* | | | — | | | | 2,690,918 | |
Barclays Capital, Inc.† | | | 5,345 | | | | USD | | | | (0.25 | )%* | | | — | | | | 5,342,771 | |
Barclays Capital, Inc.† | | | 1,741 | | | | USD | | | | 0.00 | % | | | — | | | | 1,741,174 | |
Barclays Capital, Inc.† | | | 2,940 | | | | USD | | | | 0.00 | % | | | — | | | | 2,940,333 | |
Barclays Capital, Inc.† | | | 3,701 | | | | USD | | | | 0.00 | % | | | — | | | | 3,701,250 | |
Barclays Capital, Inc.† | | | 1,920 | | | | USD | | | | 0.25 | % | | | — | | | | 1,920,653 | |
Barclays Capital, Inc.† | | | 1,952 | | | | USD | | | | 0.25 | % | | | — | | | | 1,952,560 | |
Credit Suisse Securities (USA) LLC | | | 4,677 | | | | GBP | | | | (4.00 | )%* | | | 5/05/17 | | | | 6,035,762 | |
Credit Suisse Securities (USA) LLC | | | 4,894 | | | | USD | | | | (1.00 | )%* | | | 5/03/17 | | | | 4,892,255 | |
Credit Suisse Securities (USA) LLC† | | | 526 | | | | EUR | | | | (1.50 | )%* | | | — | | | | 571,000 | |
Credit Suisse Securities (USA) LLC† | | | 2,722 | | | | EUR | | | | (1.25 | )%* | | | — | | | | 2,958,724 | |
Credit Suisse Securities (USA) LLC† | | | 2,780 | | | | USD | | | | (1.00 | )%* | | | — | | | | 2,779,228 | |
Deutsche Bank Securities Inc.† | | | 2,161 | | | | USD | | | | (0.25 | )%* | | | — | | | | 2,159,524 | |
ING Financial Markets LLC | | | 679 | | | | USD | | | | 0.00 | % | | | 5/01/17 | | | | 679,000 | |
ING Financial Markets LLC† | | | 990 | | | | USD | | | | 0.25 | % | | | — | | | | 990,234 | |
ING Financial Markets LLC† | | | 2,175 | | | | USD | | | | 0.25 | % | | | — | | | | 2,176,353 | |
Jefferies & Company, Inc.† | | | 3,812 | | | | USD | | | | (0.10 | )%* | | | — | | | | 3,810,780 | |
JPMorgan Chase Bank, NA† | | | 2,691 | | | | USD | | | | 0.25 | % | | | — | | | | 2,691,392 | |
Merrill Lynch, Pierce, Fenner & Smith, Inc. | | | 20,588 | | | | USD | | | | 1.05 | % | | | 7/13/17 | | | | 20,598,308 | |
| | | | | | | | | | | | | | | | | | | | |
| | | | | | | | | | | | | | | | | | $ | 126,139,270 | |
| | | | | | | | | | | | | | | | | | | | |
| † | The reverse repurchase agreement matures on demand. Interest rate resets daily and the rate shown is the rate in effect on April 30, 2017 |
| * | Interest payment due from counterparty. |
| | |
| abfunds.com | | AB HIGH INCOME FUND | 89 |
PORTFOLIO OF INVESTMENTS (continued)
The type of underlying collateral and the remaining maturity of open reverse repurchase agreements is as follows:
| | | | | | | | | | | | | | | | | | | | |
| | | Overnight
and
Continuous | | | Up to 30 Days | | | 31-90 Days | | | Greater than
90 Days | | | Total | |
Corporates – Non-Investment Grade | | $ | 81,077,554 | | | $ | 24,463,408 | | | $ | – 0 | – | | $ | – 0 | – | | $ | 105,540,962 | |
Governments – Treasuries | | | – 0 | – | | | – 0 | – | | | 20,598,308 | | | | – 0 | – | | | 20,598,308 | |
| | | | | | | | | | | | | | | | | | | | |
Total | | $ | 81,077,554 | | | $ | 24,463,408 | | | $ | 20,598,308 | | | $ | – 0 | – | | $ | 126,139,270 | |
| | | | | | | | | | | | | | | | | | | | |
| ** | Principal amount less than 500. |
| (a) | Security is exempt from registration under Rule 144A of the Securities Act of 1933. These securities are considered restricted, but liquid and may be resold in transactions exempt from registration, normally to qualified institutional buyers. At April 30, 2017, the aggregate market value of these securities amounted to $2,491,980,141 or 30.6% of net assets. |
| (b) | Fair valued by the Adviser. |
| (d) | Pay-In-Kind Payments (PIK). The issuer may pay cash interest and/or interest in additional debt securities. Rates shown are the rates in effect at April 30, 2017. |
| (e) | Security is exempt from registration under Rule 144A of the Securities Act of 1933. These securities, which represent 1.34% of net assets as of April 30, 2017, are considered illiquid and restricted. Additional information regarding such securities follows: |
| | | | | | | | | | | | | | | | |
144A/Restricted &
Illiquid Securities | | Acquisition
Date | | | Cost | | | Market
Value | | | Percentage of
Net Assets | |
Artsonig Pty Ltd.
11.50%, 4/01/19 | | | 3/13/14 | | | $ | 11,351,337 | | | $ | 511,106 | | | | 0.01 | % |
Avaya, Inc.
10.50%, 3/01/21 | | | 7/25/13 | | | | 10,750,111 | | | | 3,754,328 | | | | 0.05 | % |
Banc of America Re-REMIC Trust Series 2009-UB1, Class A4B
5.90%, 6/24/50 | | | 10/06/09 | | | | 1,069,457 | | | | 1,367,334 | | | | 0.02 | % |
Bellemeade Re II Ltd. Series 2016-1A, Class M2B
7.491%, 4/25/26 | | | 4/29/16 | | | | 21,264,120 | | | | 21,833,522 | | | | 0.27 | % |
Bellemeade Re II Ltd. Series 2016-1A, Class B1
12.991%, 4/25/26 | | | 4/29/16 | | | | 2,330,884 | | | | 2,534,301 | | | | 0.03 | % |
Bellemeade Re Ltd. Series 2015-1A, Class M2
5.291%, 7/25/25 | | | 7/27/15 | | | | 5,897,819 | | | | 6,018,389 | | | | 0.07 | % |
Creditcorp
12.00%, 7/15/18 | | | 6/28/13 | | | | 6,190,361 | | | | 5,336,300 | | | | 0.07 | % |
Dominican Republic International Bond
10.50%, 1/17/20 | | | 1/23/15 | | | | 7,768,711 | | | | 7,443,486 | | | | 0.09 | % |
Dominican Republic International Bond
12.00%, 1/20/22 | | | 1/23/15 | | | | 7,884,308 | | | | 7,563,363 | | | | 0.09 | % |
| | |
| 90 | AB HIGH INCOME FUND | | abfunds.com |
PORTFOLIO OF INVESTMENTS (continued)
| | | | | | | | | | | | | | | | |
144A/Restricted &
Illiquid Securities | | Acquisition
Date | | | Cost | | | Market
Value | | | Percentage of
Net Assets | |
Dominican Republic International Bond
15.95%, 6/04/21 | | | 1/11/13 | | | $ | 1,469,658 | | | $ | 1,330,016 | | | | 0.02 | % |
Dominican Republic International Bond
16.00%, 7/10/20 | | | 12/14/10 | | | | 15,674,248 | | | | 13,744,248 | | | | 0.17 | % |
Exide Technologies
7.00%, 4/30/25 | | | 11/10/16 | | | | 452,010 | | | | 394,887 | | | | 0.00 | % |
Fideicomiso PA Pacifico Tres
7.00%, 1/15/35 | | | 3/04/16 | | | | 10,603,492 | | | | 12,659,462 | | | | 0.16 | % |
Golden Energy Offshore Services AS
5.00%, 12/31/17 | | | 5/14/14 | | | | 5,209,084 | | | | 1,565,454 | | | | 0.02 | % |
Liberty Tire Recycling LLC
11.00%, 3/31/21 | | | 9/23/10 | | | | 2,777,654 | | | | 1,380,422 | | | | 0.02 | % |
Magnetation LLC/Mag Finance Corp.
11.00%, 5/15/18 | | | 5/15/13 | | | | 12,955,187 | | | | 1,612 | | | | 0.00 | % |
Modular Space Corp. | | | 2/23/17 | | | | 7,676,909 | | | | 6,736,808 | | | | 0.08 | % |
Tonon Luxembourg SA
7.25%, 1/24/20 | | | 1/16/13 | | | | 6,562,439 | | | | 724,390 | | | | 0.01 | % |
Vantage Drilling International
10.00%, 12/31/20 | | | 2/10/16 | | | | 408,332 | | | | 418,070 | | | | 0.01 | % |
Virgolino de Oliveira Finance SA
10.50%, 1/28/18 | | | 10/19/12 | | | | 2,931,444 | | | | 321,458 | | | | 0.00 | % |
Virgolino de Oliveira Finance SA
10.50%, 1/28/18 | | | 2/24/14 | | | | 5,618,897 | | | | 755,370 | | | | 0.01 | % |
Virgolino de Oliveira Finance SA
10.875%, 1/13/20 | | | 6/09/14 | | | | 2,486,550 | | | | 675,000 | | | | 0.01 | % |
Virgolino de Oliveira Finance SA
11.75%, 2/09/22 | | | 7/26/12 | | | | 11,383,331 | | | | 1,072,024 | | | | 0.01 | % |
Wells Fargo Credit Risk Transfer Securities Trust Series 2015-WF1, Class 1M2
6.241%, 11/25/25 | | | 9/06/16 | | | | 6,098,866 | | | | 6,323,001 | | | | 0.08 | % |
Wells Fargo Credit Risk Transfer Securities Trust Series 2015-WF1, Class 2M2
6.491%, 11/25/25 | | | 9/28/15 | | | | 3,332,630 | | | | 3,653,420 | | | | 0.04 | % |
| (f) | Non-income producing security. |
| (h) | Restricted and illiquid security. |
| | | | | | | | | | | | | | | | |
Restricted & Illiquid
Securities | | Acquisition
Date | | | Cost | | | Market
Value | | | Percentage of
Net Assets | |
CHC Group LLC, | | | 3/10/17 | | | $ | 18,385,445 | | | $ | 2,936,145 | | | | 0.04 | % |
CHC Group LLC/CHC Finance Ltd. Series AI
10/01/2020 | | | 3/10/17 | | | | 9,227,875 | | | | 22,721,163 | | | | 0.28 | % |
Exide Technologies Series AI
11.00%, 04/30/2020 | | | 4/30/15 | | | | 22,741,497 | | | | 18,515,463 | | | | 0.23 | % |
| | |
| abfunds.com | | AB HIGH INCOME FUND | 91 |
PORTFOLIO OF INVESTMENTS (continued)
| | | | | | | | | | | | | | | | |
Restricted & Illiquid
Securities | | Acquisition
Date | | | Cost | | | Market
Value | | | Percentage of
Net Assets | |
Exide Technologies | | | 4/30/15 | | | $ | 630,678 | | | $ | 249,376 | | | | 0.00 | % |
Momentive Performance Materials, Inc.
9.00%, 10/15/2020 | | | 10/11/12 | | | | 10 | | | | – 0 | – | | | 0.00 | % |
Mt. Logan Re Ltd. (Preference Shares) | | | 4/01/15 | | | | 25,000,000 | | | | 25,070,175 | | | | 0.31 | % |
Mt. Logan Re Ltd. (Preference Shares) | | | 12/30/14 | | | | 12,695,000 | | | | 13,014,805 | | | | 0.16 | % |
| (j) | Floating Rate Security. Stated interest/floor rate was in effect at April 30, 2017. |
| (k) | Position, or a portion thereof, has been segregated to collateralize reverse repurchase agreements. |
| (l) | Variable rate coupon, rate shown as of April 30, 2017. |
| (m) | Coupon rate adjusts periodically based upon a predetermined schedule. Stated interest rate in effect at April 30, 2017. |
| (n) | Securities are perpetual and, thus, do not have a predetermined maturity date. The date shown, if applicable, reflects the next call date. |
| (o) | Defaulted matured security. |
| (p) | Position, or a portion thereof, has been segregated to collateralize margin requirements for open futures contracts. |
| (q) | Position, or a portion thereof, has been segregated to collateralize OTC derivatives outstanding. |
| (r) | Inverse interest only security. |
| (s) | The stated coupon rate represents the greater of the LIBOR or the LIBOR floor rate plus a spread at April 30, 2017. |
| (t) | This position or a portion of this position represents an unsettled loan purchase. The coupon rate will be determined at the time of settlement and will be based upon the London-Interbank Offered Rate (“LIBOR”) plus a premium which was determined at the time of purchase. |
| (v) | Effective prepayment date of April 2017. |
| (w) | The security is subject to a 12 month lock-up period, after which semi-annual redemptions are permitted. |
| (x) | Effective prepayment date of December 2016. |
| (y) | One contract relates to 1 share. |
| (z) | One contract relates to 100 shares. |
| (aa) | To obtain a copy of the fund’s shareholder report, please go to the Securities and Exchange Commission’s website at www.sec.gov, or call AB at
(800) 227-4618. |
| (ab) | Investment in affiliated money market mutual fund. The rate shown represents the 7-day yield as of period end. |
Currency Abbreviations:
ARS – Argentine Peso
AUD – Australian Dollar
BRL – Brazilian Real
CAD – Canadian Dollar
CHF – Swiss Franc
CLP – Chilean Peso
CNH – Chinese Yuan Renminbi (Offshore)
CNY – Chinese Yuan Renminbi
COP – Colombian Peso
DOP – Dominican Peso
EGP – Egyptian Pound
| | |
| 92 | AB HIGH INCOME FUND | | abfunds.com |
PORTFOLIO OF INVESTMENTS (continued)
EUR – Euro
GBP – Great British Pound
HKD – Hong Kong Dollar
IDR – Indonesian Rupiah
INR – Indian Rupee
JPY – Japanese Yen
KRW – South Korean Won
MXN – Mexican Peso
NOK – Norwegian Krone
NZD – New Zealand Dollar
PEN – Peruvian Sol
RUB – Russian Ruble
SEK – Swedish Krona
SGD – Singapore Dollar
TRY – Turkish Lira
TWD – New Taiwan Dollar
USD – United States Dollar
ZAR – South African Rand
Glossary:
12MTA – 12 Month Treasury Average
ABS – Asset-Backed Securities
CBT – Chicago Board of Trade
CDOR – Canadian Dealer Offered Rate
CDX-CMBX.NA – North American Commercial Mortgage-Backed Index
CDX-NAHY – North American High Yield Credit Default Swap Index
CDX-NAIG – North American Investment Grade Credit Default Swap Index
CMBS – Commercial Mortgage-Backed Securities
CME – Chicago Mercantile Exchange
EAFE – Europe, Australia, and Far East
ETF – Exchange Traded Fund
EURIBOR – Euro Interbank Offered Rate
H15T – U.S. Treasury Yield Curve Rate T Note Constant Maturity
INTRCONX – Inter-Continental Exchange
JSC – Joint Stock Company
LIBOR – London Interbank Offered Rates
MSCI – Morgan Stanley Capital International
MTN – Medium Term Note
OAT – Obligations Assimilables du Trésor
REIT – Real Estate Investment Trust
REMICs – Real Estate Mortgage Investment Conduits
See notes to financial statements.
| | |
| abfunds.com | | AB HIGH INCOME FUND | 93 |
STATEMENT OF ASSETS & LIABILITIES
April 30, 2017 (unaudited)
| | | | |
| Assets | | | | |
Investments in securities, at value
Unaffiliated issuers (cost $7,841,429,908) | | $ | 7,930,984,885 | |
Affiliated issuers (cost $284,756,833) | | | 284,756,833 | |
Cash | | | 165,785 | |
Cash collateral due from broker | | | 31,850,289 | |
Foreign currencies, at value (cost $24,021,022) | | | 24,168,433 | |
Dividends and interest receivable | | | 117,680,654 | |
Receivable for investment securities sold | | | 47,076,464 | |
Receivable for capital stock sold and foreign
currency transactions | | | 32,372,063 | |
Unrealized appreciation on forward currency exchange contracts | | | 23,642,212 | |
Receivable for newly entered credit default swaps | | | 19,910,953 | |
Unrealized appreciation of total return swaps | | | 3,054,641 | |
Upfront premiums paid on credit default swaps | | | 1,918,703 | |
Unrealized appreciation on credit default swaps | | | 1,788,901 | |
Receivable for terminated variance swaps | | | 1,601,026 | |
Receivable for variation margin on exchange-traded derivatives | | | 684,739 | |
Unrealized appreciation on variance swaps | | | 302,021 | |
Affiliated dividends receivable | | | 106,961 | |
| | | | |
Total assets | | | 8,522,065,563 | |
| | | | |
| Liabilities | | | | |
Options written, at value (premiums received $15,709,440) | | | 10,096,008 | |
Swaptions written, at value (premiums received $422,537) | | | 316,985 | |
Payable for reverse repurchase agreements | | | 126,139,270 | |
Payable for investment securities purchased | | | 98,444,090 | |
Unrealized depreciation on forward currency exchange contracts | | | 33,964,785 | |
Upfront premiums received on credit default swaps | | | 28,422,723 | |
Unrealized depreciation on credit default swaps | | | 22,898,843 | |
Payable for capital stock redeemed | | | 21,319,957 | |
Payable for terminated credit default swaps | | | 19,951,109 | |
Dividends payable | | | 6,154,188 | |
Advisory fee payable | | | 2,727,298 | |
Distribution fee payable | | | 1,400,145 | |
Cash collateral received from broker | | | 820,000 | |
Transfer Agent fee payable | | | 69,327 | |
Administrative fee payable | | | 17,524 | |
Accrued expenses and other liabilities | | | 193,146 | |
| | | | |
Total liabilities | | | 372,935,398 | |
| | | | |
Net Assets | | $ | 8,149,130,165 | |
| | | | |
| Composition of Net Assets | | | | |
Capital stock, at par | | $ | 911,103 | |
Additional paid-in capital | | | 8,153,492,387 | |
Distributions in excess of net investment income | | | (44,244,644 | ) |
Accumulated net realized loss on investment and foreign currency transactions | | | (27,295,168 | ) |
Net unrealized appreciation on investments and foreign currency denominated assets and liabilities | | | 66,266,487 | |
| | | | |
| | $ | 8,149,130,165 | |
| | | | |
See notes to financial statements.
| | |
| 94 | AB HIGH INCOME FUND | | abfunds.com |
STATEMENT OF ASSETS & LIABILITIES (continued)
Net Asset Value Per Share—24 billion shares of capital stock authorized, $.001 par value
| | | | | | | | | | | | |
| Class | | Net Assets | | | Shares
Outstanding | | | Net Asset
Value | |
| |
| A | | $ | 1,901,383,143 | | | | 213,135,340 | | | $ | 8.92 | * |
| |
| B | | $ | 2,089,165 | | | | 232,093 | | | $ | 9.00 | |
| |
| C | | $ | 1,277,230,954 | | | | 141,507,512 | | | $ | 9.03 | |
| |
| Advisor | | $ | 4,310,264,752 | | | | 482,526,613 | | | $ | 8.93 | |
| |
| R | | $ | 89,061,300 | | | | 9,986,068 | | | $ | 8.92 | |
| |
| K | | $ | 121,000,315 | | | | 13,560,882 | | | $ | 8.92 | |
| |
| I | | $ | 303,153,871 | | | | 33,931,427 | | | $ | 8.93 | |
| |
| Z | | $ | 144,946,665 | | | | 16,223,233 | | | $ | 8.93 | |
| |
| * | The maximum offering price per share for Class A shares was $9.32 which reflects a sales charge of 4.25%. |
See notes to financial statements.
| | |
| abfunds.com | | AB HIGH INCOME FUND | 95 |
STATEMENT OF OPERATIONS
Six Months Ended April 30, 2017 (unaudited)
| | | | | | | | |
| Investment Income | | | | | | | | |
Interest (net of foreign taxes withheld of $176,448) | | $ | 229,500,156 | | | | | |
Dividends | | | | | | | | |
Unaffiliated issuers (net of foreign taxes withheld of $27,890) | | | 3,549,127 | | | | | |
Affiliated issuers | | | 430,548 | | | $ | 233,479,831 | |
| | | | | | | | |
| Expenses | | | | | | | | |
Advisory fee (see Note B) | | | 17,209,077 | | | | | |
Distribution fee—Class A | | | 2,443,782 | | | | | |
Distribution fee—Class B | | | 10,974 | | | | | |
Distribution fee—Class C | | | 6,353,071 | | | | | |
Distribution fee—Class R | | | 215,020 | | | | | |
Distribution fee—Class K | | | 136,784 | | | | | |
Transfer agency—Class A | | | 790,512 | | | | | |
Transfer agency—Class B | | | 1,243 | | | | | |
Transfer agency—Class C | | | 511,252 | | | | | |
Transfer agency—Advisor Class | | | 1,547,881 | | | | | |
Transfer agency—Class R | | | 97,148 | | | | | |
Transfer agency—Class K | | | 81,919 | | | | | |
Transfer agency—Class I | | | 77,933 | | | | | |
Transfer agency—Class Z | | | 12,218 | | | | | |
Custodian | | | 215,550 | | | | | |
Printing | | | 192,336 | | | | | |
Registration fees | | | 116,326 | | | | | |
Audit and tax | | | 90,558 | | | | | |
Administrative | | | 24,251 | | | | | |
Legal | | | 20,616 | | | | | |
Directors’ fees | | | 12,951 | | | | | |
Miscellaneous | | | 89,199 | | | | | |
| | | | | | | | |
Total expenses before interest expense | | | 30,250,601 | | | | | |
Interest expense | | | 136,999 | | | | | |
| | | | | | | | |
Total expenses | | | 30,387,600 | | | | | |
Less: expenses waived and reimbursed by the Adviser (see Note B) | | | (214,600 | ) | | | | |
| | | | | | | | |
Net expenses | | | | | | | 30,173,000 | |
| | | | | | | | |
Net investment income | | | | | | | 203,306,831 | |
| | | | | | | | |
See notes to financial statements.
| | |
| 96 | AB HIGH INCOME FUND | | abfunds.com |
STATEMENT OF OPERATIONS (continued)
| | | | | | | | |
| Realized and Unrealized Gain (Loss) on Investment and Foreign Currency Transactions | | | | | | | | |
Net realized gain (loss) on: | | | | | | | | |
Investment transactions | | | | | | $ | 13,182,495 | |
Swaps | | | | | | | 76,312,101 | |
Futures | | | | | | | 2,475,179 | |
Options written | | | | | | | 31,960,947 | |
Swaptions written | | | | | | | 7,648,821 | |
Foreign currency transactions | | | | | | | (3,496,983 | ) |
Net change in unrealized appreciation/depreciation on: | | | | | | | | |
Investments | | | | | | | 183,844,578 | |
Swaps | | | | | | | (8,108,956 | ) |
Futures | | | | | | | (4,813,129 | ) |
Options written | | | | | | | 3,523,599 | |
Swaptions written | | | | | | | (44,347 | ) |
Foreign currency denominated assets and liabilities | | | | | | | (21,570,365 | ) |
| | | | | | | | |
Net gain on investment and foreign currency transactions | | | | | | | 280,913,940 | |
| | | | | | | | |
Net Increase in Net Assets from Operations | | | | | | $ | 484,220,771 | |
| | | | | | | | |
See notes to financial statements.
| | |
| abfunds.com | | AB HIGH INCOME FUND | 97 |
STATEMENT OF CHANGES IN NET ASSETS
| | | | | | | | |
| | | Six Months Ended
April 30, 2017
(unaudited) | | | Year ended
October 31,
2016 | |
| Increase (Decrease) in Net Assets from Operations | | | | | | | | |
Net investment income | | $ | 203,306,831 | | | $ | 373,538,879 | |
Net realized gain (loss) on investment and foreign currency transactions | | | 128,082,560 | | | | (39,954,270 | ) |
Net change in unrealized appreciation/depreciation on investments and foreign currency denominated assets and liabilities | | | 152,831,380 | | | | 297,067,537 | |
Contributions from Affiliates (see Note B) | | | – 0 | – | | | 7,328 | |
| | | | | | | | |
Net increase in net assets from operations | | | 484,220,771 | | | | 630,659,474 | |
| Dividends to Shareholders from | | | | | | | | |
Net investment income | | | | | | | | |
Class A | | | (62,472,346 | ) | | | (139,212,546 | ) |
Class B | | | (61,125 | ) | | | (187,830 | ) |
Class C | | | (35,397,225 | ) | | | (78,131,802 | ) |
Advisor Class | | | (126,460,641 | ) | | | (204,670,690 | ) |
Class R | | | (2,581,781 | ) | | | (5,662,042 | ) |
Class K | | | (3,455,784 | ) | | | (7,086,782 | ) |
Class I | | | (9,674,525 | ) | | | (20,996,466 | ) |
Class Z | | | (4,054,635 | ) | | | (7,057,695 | ) |
| Capital Stock Transactions | | | | | | | | |
Net increase | | | 118,735,491 | | | | 1,386,295,762 | |
Proceeds from regulatory settlement (see Note E) | | | – 0 | – | | | 722,706 | |
| | | | | | | | |
Total increase | | | 358,798,200 | | | | 1,554,672,089 | |
| Net Assets | | | | | | | | |
Beginning of period | | | 7,790,331,965 | | | | 6,235,659,876 | |
| | | | | | | | |
End of period (including distributions in excess of net investment income of $(44,244,644) and $(3,393,413), respectively) | | $ | 8,149,130,165 | | | $ | 7,790,331,965 | |
| | | | | | | | |
See notes to financial statements.
| | |
| 98 | AB HIGH INCOME FUND | | abfunds.com |
NOTES TO FINANCIAL STATEMENTS
April 30, 2017 (unaudited)
NOTE A
Significant Accounting Policies
AB High Income Fund, Inc. (the “Fund”), was incorporated in the State of Maryland on December 2, 1993, and is registered under the Investment Company Act of 1940 as a diversified, open-end management investment company. The Fund offers Class A, Class B, Class C, Advisor Class, Class R, Class K, Class I and Class Z shares. Effective October 15, 2013, the Fund commenced offering of Class Z shares. Class A shares are sold with a front-end sales charge of up to 4.25% for purchases not exceeding $1,000,000. With respect to purchases of $1,000,000 or more, Class A shares redeemed within one year of purchase may be subject to a contingent deferred sales charge of 1%. Class B shares are currently sold with a contingent deferred sales charge which declines from 3% to zero depending on the period of time the shares are held. Effective January 31, 2009, sales of Class B shares of the Fund to new investors were suspended. Class B shares will only be issued (i) upon the exchange of Class B shares from another AllianceBernstein Mutual Fund, (ii) for purposes of dividend reinvestment, (iii) through the Fund’s Automatic Investment Program (the “Program”) for accounts that established the Program prior to January 31, 2009, and (iv) for purchases of additional shares by Class B shareholders as of January 31, 2009. The ability to establish a new Program for accounts containing Class B shares was suspended as of January 31, 2009. Class B shares will automatically convert to Class A shares six years after the end of the calendar month of purchase. Class C shares are subject to a contingent deferred sales charge of 1% on redemptions made within the first year after purchase, and 0% after the first year of purchase. Effective April 10, 2017, Class C shares will automatically convert to Class A shares ten years after the end of the calendar month of purchase. Class R and Class K shares are sold without an initial or contingent deferred sales charge. Advisor Class, Class I and Class Z shares are sold without an initial or contingent deferred sales charge and are not subject to ongoing distribution expenses. All eight classes of shares have identical voting, dividend, liquidation and other rights, except that the classes bear different distribution and transfer agency expenses. Each class has exclusive voting rights with respect to its distribution plan. The financial statements have been prepared in conformity with U.S. generally accepted accounting principles (“U.S. GAAP”), which require management to make certain estimates and assumptions that affect the reported amounts of assets and liabilities in the financial statements and amounts of income and expenses during the reporting period. Actual results could differ from those estimates. The Fund is an investment company under U.S. GAAP and follows the accounting and reporting guidance applicable to investment companies. The following is a summary of significant accounting policies followed by the Fund.
| | |
| abfunds.com | | AB HIGH INCOME FUND | 99 |
NOTES TO FINANCIAL STATEMENTS (continued)
1. Security Valuation
Portfolio securities are valued at their current market value determined on the basis of market quotations or, if market quotations are not readily available or are deemed unreliable, at “fair value” as determined in accordance with procedures established by and under the general supervision of the Fund’s Board of Directors (the “Board”).
In general, the market values of securities which are readily available and deemed reliable are determined as follows: securities listed on a national securities exchange (other than securities listed on the NASDAQ Stock Market, Inc. (“NASDAQ”)) or on a foreign securities exchange are valued at the last sale price at the close of the exchange or foreign securities exchange. If there has been no sale on such day, the securities are valued at the last traded price from the previous day. Securities listed on more than one exchange are valued by reference to the principal exchange on which the securities are traded; securities listed only on NASDAQ are valued in accordance with the NASDAQ Official Closing Price; listed or over the counter (“OTC”) market put or call options are valued at the mid level between the current bid and ask prices. If either a current bid or current ask price is unavailable, AllianceBernstein L.P. (the “Adviser”) will have discretion to determine the best valuation (e.g. last trade price in the case of listed options); open futures contracts are valued using the closing settlement price or, in the absence of such a price, the most recent quoted bid price. If there are no quotations available for the day of valuation, the last available closing settlement price is used; U.S. Government securities and any other debt instruments having 60 days or less remaining until maturity are generally valued at market by an independent pricing vendor, if a market price is available. If a market price is not available, the securities are valued at amortized cost. This methodology is commonly used for short-term securities that have an original maturity of 60 days or less, as well as short-term securities that had an original term to maturity that exceeded 60 days. In instances when amortized cost is utilized, the Valuation Committee (the “Committee”) must reasonably conclude that the utilization of amortized cost is approximately the same as the fair value of the security. Such factors the Committee will consider include, but are not limited to, an impairment of the creditworthiness of the issuer or material changes in interest rates. Fixed-income securities, including mortgage-backed and asset-backed securities, may be valued on the basis of prices provided by a pricing service or at a price obtained from one or more of the major broker-dealers. In cases where broker-dealer quotes are obtained, the Adviser may establish procedures whereby changes in market yields or spreads are used to adjust, on a daily basis, a recently obtained quoted price on a security. Swaps and other derivatives are valued daily, primarily using independent pricing services, independent pricing
| | |
| 100 | AB HIGH INCOME FUND | | abfunds.com |
NOTES TO FINANCIAL STATEMENTS (continued)
models using market inputs, as well as third party broker-dealers or counterparties. Open end mutual funds are valued at the closing net asset value per share, while exchange traded funds are valued at the closing market price per share.
Securities for which market quotations are not readily available (including restricted securities) or are deemed unreliable are valued at fair value as deemed appropriate by the Adviser. Factors considered in making this determination may include, but are not limited to, information obtained by contacting the issuer, analysts, analysis of the issuer’s financial statements or other available documents. In addition, the Fund may use fair value pricing for securities primarily traded in non-U.S. markets because most foreign markets close well before the Fund values its securities at 4:00 p.m., Eastern Time. The earlier close of these foreign markets gives rise to the possibility that significant events, including broad market moves, may have occurred in the interim and may materially affect the value of those securities. To account for this, the Fund may frequently value many of its foreign equity securities using fair value prices based on third party vendor modeling tools to the extent available.
2. Fair Value Measurements
In accordance with U.S. GAAP regarding fair value measurements, fair value is defined as the price that the Fund would receive to sell an asset or pay to transfer a liability in an orderly transaction between market participants at the measurement date. U.S. GAAP establishes a framework for measuring fair value, and a three-level hierarchy for fair value measurements based upon the transparency of inputs to the valuation of an asset or liability (including those valued based on their market values as described in Note A.1 above). Inputs may be observable or unobservable and refer broadly to the assumptions that market participants would use in pricing the asset or liability. Observable inputs reflect the assumptions market participants would use in pricing the asset or liability based on market data obtained from sources independent of the Fund. Unobservable inputs reflect the Fund’s own assumptions about the assumptions that market participants would use in pricing the asset or liability based on the best information available in the circumstances. Each investment is assigned a level based upon the observability of the inputs which are significant to the overall valuation. The three-tier hierarchy of inputs is summarized below.
| | • | | Level 1—quoted prices in active markets for identical investments |
| | • | | Level 2—other significant observable inputs (including quoted prices for similar investments, interest rates, prepayment speeds, credit risk, etc.) |
| | • | | Level 3—significant unobservable inputs (including the Fund’s own assumptions in determining the fair value of investments) |
| | |
| abfunds.com | | AB HIGH INCOME FUND | 101 |
NOTES TO FINANCIAL STATEMENTS (continued)
The fair value of debt instruments, such as bonds, and over-the-counter derivatives is generally based on market price quotations, recently executed market transactions (where observable) or industry recognized modeling techniques and are generally classified as Level 2. Pricing vendor inputs to Level 2 valuations may include quoted prices for similar investments in active markets, interest rate curves, coupon rates, currency rates, yield curves, option adjusted spreads, default rates, credit spreads and other unique security features in order to estimate the relevant cash flows which is then discounted to calculate fair values. If these inputs are unobservable and significant to the fair value, these investments will be classified as Level 3. In addition, non-agency rated investments are classified as Level 3.
Where readily available market prices or relevant bid prices are not available for certain equity investments, such investments may be valued based on similar publicly traded investments, movements in relevant indices since last available prices or based upon underlying company fundamentals and comparable company data (such as multiples to earnings or other multiples to equity). Where an investment is valued using an observable input, such as another publicly traded security, the investment will be classified as Level 2. If management determines that an adjustment is appropriate based on restrictions on resale, illiquidity or uncertainty, and such adjustment is a significant component of the valuation, the investment will be classified as Level 3. An investment will also be classified as Level 3 where management uses company fundamentals and other significant inputs to determine the valuation.
Valuations of mortgage-backed or other asset-backed securities, by pricing vendors, are based on both proprietary and industry recognized models and discounted cash flow techniques. Significant inputs to the valuation of these instruments are value of the collateral, the rates and timing of delinquencies, the rates and timing of prepayments, and default and loss expectations, which are driven in part by housing prices for residential mortgages. Significant inputs are determined based on relative value analyses, which incorporate comparisons to instruments with similar collateral and risk profiles, including relevant indices. Mortgage and asset backed securities for which management has collected current observable data through pricing services are generally categorized within Level 2. Those investments for which current observable data has not been provided are classified as Level 3.
Options are valued using market-based inputs to models, broker or dealer quotations, or alternative pricing sources with reasonable levels of price transparency, where such inputs and models are available. Alternatively
| | |
| 102 | AB HIGH INCOME FUND | | abfunds.com |
NOTES TO FINANCIAL STATEMENTS (continued)
the values may be obtained through unobservable management determined inputs and/or management’s proprietary models. Where models are used, the selection of a particular model to value an option depends upon the contractual terms of, and specific risks inherent in, the option as well as the availability of pricing information in the market. Valuation models require a variety of inputs, including contractual terms, market prices, measures of volatility and correlations of such inputs. Exchange traded options generally will be classified as Level 2. For options that do not trade on exchange but trade in liquid markets, inputs can generally be verified and model selection does not involve significant management judgment. Options are classified within Level 2 on the fair value hierarchy when all of the significant inputs can be corroborated to market evidence. Otherwise such instruments are classified as Level 3.
Bank loan prices are provided by third party pricing services and consist of a composite of the quotes received by the vendor into a consensus price. Certain bank loans are classified as Level 3, as significant input used in the fair value measurement of these instruments is the market quotes that are received by the vendor and these inputs are not observable.
Other fixed income investments, including non-U.S. government and corporate debt, are generally valued using quoted market prices, if available, which are typically impacted by current interest rates, maturity dates and any perceived credit risk of the issuer. Additionally, in the absence of quoted market prices, these inputs are used by pricing vendors to derive a valuation based upon industry or proprietary models which incorporate issuer specific data with relevant yield/spread comparisons with more widely quoted bonds with similar key characteristics. Those investments for which there are observable inputs are classified as Level 2. Where the inputs are not observable, the investments are classified as Level 3.
The following table summarizes the valuation of the Fund’s investments by the above fair value hierarchy levels as of April 30, 2017:
| | | | | | | | | | | | | | | | |
Investments in Securities | | Level 1 | | | Level 2 | | | Level 3 | | | Total | |
Assets: | | | | | | | | | | | | | | | | |
Corporates – Non-Investment Grade | | $ | – 0 | – | | $ | 2,709,285,273 | | | $ | 47,961,139 | # | | $ | 2,757,246,412 | |
Governments – Treasuries | | | – 0 | – | | | 1,757,111,479 | | | | – 0 | – | | | 1,757,111,479 | |
Collateralized Mortgage Obligations | | | – 0 | – | | | 759,757,533 | | | | – 0 | – | | | 759,757,533 | |
Corporates – Investment Grade | | | – 0 | – | | | 531,496,149 | | | | – 0 | – | | | 531,496,149 | |
Emerging Markets – Sovereigns | | | – 0 | – | | | 450,495,947 | | | | – 0 | – | | | 450,495,947 | |
Emerging Markets – Treasuries | | | – 0 | – | | | 431,869,914 | | | | – 0 | – | | | 431,869,914 | |
Emerging Markets – Corporate Bonds | | | – 0 | – | | | 290,007,115 | | | | 2,705,593 | | | | 292,712,708 | |
| | |
| abfunds.com | | AB HIGH INCOME FUND | 103 |
NOTES TO FINANCIAL STATEMENTS (continued)
| | | | | | | | | | | | | | | | |
Investments in Securities | | Level 1 | | | Level 2 | | | Level 3 | | | Total | |
Bank Loans | | $ | – 0 | – | | $ | 199,555,445 | | | $ | 33,210,150 | # | | $ | 232,765,595 | |
Commercial Mortgage-Backed Securities | | | – 0 | – | | | 19,958,855 | | | | 120,853,276 | | | | 140,812,131 | |
Preferred Stocks | | | 31,447,027 | | | | 62,993,461 | | | | 21,359,633 | | | | 115,800,121 | |
Inflation-Linked Securities | | | – 0 | – | | | 87,227,286 | | | | 12,659,462 | | | | 99,886,748 | |
Common Stocks | | | 33,225,057 | | | | 2,936,145 | | | | 60,280,661 | # | | | 96,441,863 | |
Quasi-Sovereigns | | | – 0 | – | | | 44,923,794 | | | | – 0 | – | | | 44,923,794 | |
Whole Loan Trusts | | | – 0 | – | | | – 0 | – | | | 44,107,365 | | | | 44,107,365 | |
Local Governments – Regional Bonds | | | – 0 | – | | | 42,480,875 | | | | – 0 | – | | | 42,480,875 | |
Asset-Backed Securities | | | – 0 | – | | | 6,198,967 | | | | 18,699,521 | | | | 24,898,488 | |
Collateralized Loan Obligations | | | – 0 | – | | | – 0 | – | | | 14,784,736 | | | | 14,784,736 | |
Local Governments – US Municipal Bonds | | | – 0 | – | | | 10,542,943 | | | | – 0 | – | | | 10,542,943 | |
Governments – Sovereign Bonds | | | – 0 | – | | | 8,891,019 | | | | – 0 | – | | | 8,891,019 | |
Options Purchased – Calls | | | – 0 | – | | | 4,827,758 | | | | – 0 | – | | | 4,827,758 | |
Warrants | | | 1,545,601 | | | | – 0 | – | | | 1,344,081 | # | | | 2,889,682 | |
Options Purchased – Puts | | | – 0 | – | | | 2,608,976 | | | | – 0 | – | | | 2,608,976 | |
Short-Term Investments: | | | | | | | | | | | | | | | | |
Investment Companies | | | 284,756,833 | | | | – 0 | – | | | – 0 | – | | | 284,756,833 | |
Governments – Sovereign Bonds | | | – 0 | – | | | 29,087,112 | | | | – 0 | – | | | 29,087,112 | |
Time Deposits | | | – 0 | – | | | 28,007,242 | | | | – 0 | – | | | 28,007,242 | |
Corporates – Investment Grade | | | – 0 | – | | | 6,538,295 | | | | – 0 | – | | | 6,538,295 | |
| | | | | | | | | | | | | | | | |
Total Investments in Securities | | | 350,974,518 | | | | 7,486,801,583 | | | | 377,965,617 | | | | 8,215,741,718 | |
Other Financial Instruments*: | | | | | | | | | | | | | | | | |
Assets | | | | | | | | | | | | | | | | |
Futures | | | 2,415,012 | | | | 1,069,077 | | | | – 0 | – | | | 3,484,089 | † |
Forward Currency Exchange Contracts | | | – 0 | – | | | 23,642,212 | | | | – 0 | – | | | 23,642,212 | |
Centrally Cleared Credit Default Swaps | | | – 0 | – | | | 4,538,373 | | | | – 0 | – | | | 4,538,373 | † |
Centrally Cleared Interest Rate Swaps | | | – 0 | – | | | 4,918,070 | | | | – 0 | – | | | 4,918,070 | † |
Credit Default Swaps | | | – 0 | – | | | 1,788,901 | | | | – 0 | – | | | 1,788,901 | |
Total Return Swaps | | | – 0 | – | | | 3,054,641 | | | | – 0 | – | | | 3,054,641 | |
Variance Swaps | | | – 0 | – | | | 302,021 | | | | – 0 | – | | | 302,021 | |
Liabilities | | | | | | | | | | | | | | | | |
Futures | | | (6,950,216 | ) | | | – 0 | – | | | – 0 | – | | | (6,950,216 | )† |
Forward Currency Exchange Contracts | | | – 0 | – | | | (33,964,785 | ) | | | – 0 | – | | | (33,964,785 | ) |
Put Options Written | | | – 0 | – | | | (434,802 | ) | | | – 0 | – | | | (434,802 | ) |
| | |
| 104 | AB HIGH INCOME FUND | | abfunds.com |
NOTES TO FINANCIAL STATEMENTS (continued)
| | | | | | | | | | | | | | | | |
Investments in Securities | | Level 1 | | | Level 2 | | | Level 3 | | | Total | |
Credit Default Swaptions Written | | $ | – 0 | – | | $ | (316,985 | ) | | $ | – 0 | – | | $ | (316,985 | ) |
Currency Options Written | | | – 0 | – | | | (9,661,206 | ) | | | – 0 | – | | | (9,661,206 | ) |
Centrally Cleared Credit Default Swaps | | | – 0 | – | | | (4,733,033 | ) | | | – 0 | – | | | (4,733,033 | )† |
Centrally Cleared Interest Rate Swaps | | | – 0 | – | | | (1,939,105 | ) | | | – 0 | – | | | (1,939,105 | )† |
Credit Default Swaps | | | – 0 | – | | | (22,898,843 | ) | | | – 0 | – | | | (22,898,843 | ) |
| | | | | | | | | | | | | | | | |
Total^ | | $ | 346,439,314 | | | $ | 7,452,166,119 | | | $ | 377,965,617 | | | $ | 8,176,571,050 | |
| | | | | | | | | | | | | | | | |
| # | The Fund held securities with zero market value at period end. |
| * | Other financial instruments are derivative instruments, such as futures, forwards and swap contracts which are valued at the unrealized appreciation/depreciation on the instrument. Other financial instruments may also include options written and swaptions written which are valued at market value. |
| † | Only variation margin receivable/payable at period end is reported within the statements of assets and liabilities. This amount reflects cumulative unrealized appreciation/depreciation of exchange-traded derivatives as reported in the portfolio of investments. |
| ^ | There were no transfers between Level 1 and Level 2 during the reporting period. |
The Fund recognizes all transfers between levels of the fair value hierarchy assuming the financial instrument was transferred at the beginning of the reporting period.
Following is a reconciliation of investments in which significant unobservable inputs (Level 3) were used in determining fair value.
| | | | | | | | | | | | | | | | |
| | | Corporates -
Non-Investment
Grade# | | | Collateralized
Mortgage
Obligations | | | Emerging
Markets -
Corporate
Bonds | | | Bank Loans# | |
Balance as of 10/31/16 | | $ | 38,539,513 | | | $ | 30,693,761 | | | $ | 1,251,220 | | | $ | 36,930,151 | |
Accrued discounts/ (premiums) | | | 218,051 | | | | – 0 | – | | | (119,844 | ) | | | 82,618 | |
Realized gain (loss) | | | 11,967 | | | | – 0 | – | | | – 0 | – | | | 16,732 | |
Change in unrealized appreciation/ depreciation | | | (7,456,111 | ) | | | – 0 | – | | | (6,777,074 | ) | | | 701,845 | |
Purchases | | | 7,926,379 | | | | – 0 | – | | | 8,351,291 | | | | 4,148,375 | |
Sales/Paydowns | | | (6,398,653 | ) | | | – 0 | – | | | – 0 | – | | | (29,500,515 | ) |
Reclassification | | | – 0 | – | | | – 0 | – | | | – 0 | – | | | – 0 | – |
Transfers into level 3 | | | 15,119,993 | | | | – 0 | – | | | – 0 | – | | | 21,479,184 | |
Transfers out of level 3 | | | – 0 | – | | | (30,693,761 | ) | | | – 0 | – | | | (648,240 | ) |
| | | | | | | | | | | | | | | | |
Balance as of 4/30/17 | | $ | 47,961,139 | | | $ | – 0 | – | | $ | 2,705,593 | | | $ | 33,210,150 | |
| | | | | | | | | | | | | | | | |
Net change in unrealized appreciation/ depreciation from investments held as of 4/30/17** | | $ | (7,305,863 | ) | | $ | – 0 | – | | $ | (6,777,074 | ) | | $ | 1,103,647 | |
| | | | | | | | | | | | | | | | |
| | |
| abfunds.com | | AB HIGH INCOME FUND | 105 |
NOTES TO FINANCIAL STATEMENTS (continued)
| | | | | | | | | | | | | | | | |
| | | Commercial
Mortgage-
Backed
Securities | | | Preferred
Stocks | | | Inflation-
Linked
Securities | | | Common
Stocks# | |
Balance as of 10/31/16 | | $ | 135,006,871 | | | $ | – 0 | – | | $ | 11,964,786 | | | $ | 49,234,743 | |
Accrued discounts/ (premiums) . | | | 237,233 | | | | – 0 | – | | | 13,295 | | | | – 0 | – |
Realized gain (loss) | | | (193,381 | ) | | | – 0 | – | | | – 0 | – | | | (1,064,372 | ) |
Change in unrealized appreciation/ depreciation | | | 955,171 | | | | 6,192,628 | | | | 681,381 | | | | 2,193,972 | |
Purchases | | | – 0 | – | | | 15,167,005 | | | | – 0 | – | | | 18,475,760 | |
Sales/Paydowns | | | (15,152,618 | ) | | | – 0 | – | | | – 0 | – | | | (8,559,442 | ) |
Reclassification | | | – 0 | – | | | – 0 | – | | | – 0 | – | | | – 0 | – |
Transfers into level 3 | | | – 0 | – | | | – 0 | – | | | – 0 | – | | | – 0 | – |
Transfers out of level 3 | | | – 0 | – | | | – 0 | – | | | – 0 | – | | | – 0 | – |
| | | | | | | | | | | | | | | | |
Balance as of 4/30/17 | | $ | 120,853,276 | | | $ | 21,359,633 | | | $ | 12,659,462 | | | $ | 60,280,661 | |
| | | | | | | | | | | | | | | | |
Net change in unrealized appreciation/ depreciation from investments held as of 4/30/17** | | $ | 306,296 | | | $ | 6,192,628 | | | $ | 681,381 | | | $ | 2,530,354 | |
| | | | | | | | | | | | | | | | |
| | | | | | | | | | | | | | | | |
| | | Whole Loan
Trusts | | | Asset-Backed
Securities | | | Collateralized
Loan
Obligations | | | Warrants# | |
Balance as of 10/31/16 | | $ | 59,778,271 | | | $ | 30,569,026 | | | $ | – 0 | – | | $ | 2,232,953 | |
Accrued discounts/ (premiums) | | | 47,815 | | | | 180,212 | | | | 136,747 | | | | – 0 | – |
Realized gain (loss) | | | (7,843,820 | ) | | | 320,820 | | | | – 0 | – | | | – 0 | – |
Change in unrealized appreciation/ depreciation | | | 1,135,152 | | | | (234,303 | ) | | | 1,054,487 | | | | 540,716 | |
Purchases | | | 1,266,175 | | | | – 0 | – | | | – 0 | – | | | – 0 | – |
Sales/Paydowns | | | (10,276,228 | ) | | | (1,254,482 | ) | | | – 0 | – | | | – 0 | – |
Reclassification | | | – 0 | – | | | (10,881,752 | ) | | | 10,881,752 | | | | – 0 | – |
Transfers into level 3 | | | – 0 | – | | | – 0 | – | | | 2,711,750 | | | | – 0 | – |
Transfers out of level 3 | | | – 0 | – | | | – 0 | – | | | – 0 | – | | | (1,429,588 | ) |
| | | | | | | | | | | | | | | | |
Balance as of 4/30/17 | | $ | 44,107,365 | | | $ | 18,699,521 | | | $ | 14,784,736 | | | $ | 1,344,081 | |
| | | | | | | | | | | | | | | | |
Net change in unrealized appreciation/depreciation from investments held as of 4/30/17** | | $ | (3,282,420 | ) | | $ | (234,303 | ) | | $ | 1,054,487 | | | $ | 540,715 | |
| | | | | | | | | | | | | | | | |
| | |
| 106 | AB HIGH INCOME FUND | | abfunds.com |
NOTES TO FINANCIAL STATEMENTS (continued)
| | | | | | | | | | | | | | | | |
| | | Total | | | | | | | | | | |
Balance as of 10/31/16 | | $ | 396,201,295 | | | | | | | | | | | | | |
Accrued discounts/ (premiums) | | | 796,127 | | | | | | | | | | | | | |
Realized gain (loss) | | | (8,752,054 | ) | | | | | | | | | | | | |
Change in unrealized appreciation/ depreciation | | | (1,012,136 | ) | | | | | | | | | | | | |
Purchases | | | 55,334,985 | | | | | | | | | | | | | |
Sales/Paydowns | | | (71,141,938 | ) | | | | | | | | | | | | |
Reclassification | | | – 0 | – | | | | | | | | | | | | |
Transfers into level 3 | | | 39,310,927 | | | | | | | | | | | | | |
Transfers out of level 3 | | | (32,771,589 | ) | | | | | | | | | | | | |
| | | | | | | | | | | | | | | | |
Balance as of 4/30/17 | | $ | 377,965,617 | + | | | | | | | | | | | | |
| | | | | | | | | | | | | | | | |
Net change in unrealized appreciation/depreciation from investments held as of 4/30/17** | | $ | (5,190,152 | ) | | | | | | | | | | | | |
| | | | | | | | | | | | | | | | |
| # | The Fund held securities with zero market value during the reporting period. |
| ** | The unrealized appreciation/depreciation is included in net change in unrealized appreciation/depreciation of investments and other financial instruments in the accompanying statement of operations. |
| + | There were de minimis transfers during the reporting period. |
The following presents information about significant unobservable inputs related to the Fund’s material categories of Level 3 investments at April 30, 2017. Securities priced by third party vendors and NAV equivalent are excluded from the following table.
Quantitative Information about Level 3 Fair Value Measurements
| | | | | | | | | | |
| | | Fair
Value at
4/30/2017 | | | Valuation
Technique | | Unobservable
Input | | Range/
Weighted
Average |
Corporates – Non-Investment
Grade | |
$ |
4,927
|
| | Projected Cash
Flow | | Terms of
Escrow | |
$1.80 per
$1,000 Principal |
Bank Loans | | $ | – 0 | – | | Qualitative
Assessment | | | | $0.00/ N/A |
Common
Stocks | |
$ |
142,155 |
| |
Market Approach | |
EBITDA*
Projection | |
$345mm/ N/A |
| | | | | | | | EBITDA*
Multiples | | 13.3X/ N/A |
| | $ | 111,055 | | | Market Approach | | EBITDA*
Projection | | $33mm/ N/A |
| | | | | | | | EBITDA*
Multiples | | 4.6X-6.6X/ 5.6X |
| | | | | | | | | | |
| | $ | 253,210 | | | | | | | |
| | | | | | | | | | |
| | |
| abfunds.com | | AB HIGH INCOME FUND | 107 |
NOTES TO FINANCIAL STATEMENTS (continued)
| | | | | | | | | | |
| | | Fair
Value at
4/30/2017 | | | Valuation
Technique | | Unobservable
Input | | Range/
Weighted
Average |
Whole Loan Trusts | |
$ |
8,082,900 |
| |
Market
Approach | |
Underlying
NAV of the
Collateral | |
$94.91/ N/A |
| | $ | 7,220,178 | | | Recovery
Analysis | | Cumulative
Loss | | <20%/ N/A |
| | $ | 6,485,168 | | | Discounted
Cash Flow | | Cash Flow
Yield | | 93.60%/ N/A |
| | | | | | | | Discount Rate | | 7.47%/ N/A |
| | $ | 6,079,540 | | | Recovery
Analysis | | Delinquency
Rate | | <4%/ N/A |
| | $ | 3,603,466 | | | Discounted
Cash Flow | | Cash Flow
Yield | | 83.89%/ N/A |
| | $ | 1,732,966 | | | Recovery
Analysis | | Delinquency
Rate | | <5% / N/A |
| | | | | | | | Collateralization | | 1.1X / N/A |
| | $ | 417,665 | | | Discounted
Cash Flow | | Cash Flow
Yield | | 88.20% |
| | | | | | | | | | |
| | $ | 33,621,883 | | | | | | | |
| | | | | | | | | | |
Warrants | | $ | 803,366 | | | Option Pricing
Model | | Exercise Price | | $6.64/ N/A |
| | | | | | | | Expiration Date | | June, 2019/ N/A |
| | | | | | | | EV Volatility % | | 50%/ N/A |
| * | Earnings Before Interest, Taxes, Depreciation and Amortization. |
Generally, a change in the assumptions used in any input in isolation may be accompanied by a change in another input. Significant changes in any of the unobservable inputs may significantly impact the fair value measurement. Significant increases (decreases) in Underlying NAV of the Collateral, Collateralization, Exercise Price, Expiration Date, EBITDA projections and EBITDA Multiple in isolation would be expected to result in a significantly higher (lower) fair value measurement. A significant increase (decrease) in Discount Rate, Cumulative Loss, Delinquency Rate, Cash Flow Yield and EV Volatility % in isolation would be expected to result in a significant lower (higher) fair value measurement.
The Committee oversees the pricing and valuation of all securities held in the Portfolios. The Committee operates under pricing and valuation policies and procedures established by the Adviser and approved by the Board, including Pricing Policies which set forth the mechanisms and processes to be employed on a daily basis to implement these policies and procedures. In particular, the Pricing Policies describe how to determine market quotations for securities and other instruments. The Committee’s responsibilities include: 1) fair value and liquidity determinations (and oversight of any third parties to whom any responsibility for
| | |
| 108 | AB HIGH INCOME FUND | | abfunds.com |
NOTES TO FINANCIAL STATEMENTS (continued)
fair value and liquidity determinations is delegated), and 2) regular monitoring of the Adviser’s pricing and valuation policies and procedures and modification or enhancement of these policies and procedures (or recommendation of the modification of these policies and procedures) as the Committee believes appropriate.
The Committee is also responsible for monitoring the implementation of the Pricing Policies by the Adviser’s Pricing Group (the “Pricing Group”) and any third party which performs certain pricing functions in accordance with the Pricing Policies. The Pricing Group is responsible for the oversight of the third party on a day-to-day basis. The Committee and the Pricing Group perform a series of activities to provide reasonable assurance of the accuracy of prices including: 1) periodic vendor due diligence meetings, review of methodologies, new developments, process at vendors, 2) daily and monthly multi-source pricing compares, reviewed and submitted to the Committee, and 3) daily review of unpriced, stale, and variance reports with exceptions reviewed by senior management and the Committee.
In addition, several processes outside of the pricing process are used to monitor valuation issues including: 1) performance and performance attribution reports are monitored for anomalous impacts based upon benchmark performance, and 2) portfolio managers review all portfolios for performance and analytics (which are generated using the Adviser’s prices).
3. Currency Translation
Assets and liabilities denominated in foreign currencies and commitments under forward currency exchange contracts are translated into U.S. dollars at the mean of the quoted bid and ask prices of such currencies against the U.S. dollar. Purchases and sales of portfolio securities are translated into U.S. dollars at the rates of exchange prevailing when such securities were acquired or sold. Income and expenses are translated into U.S. dollars at the rates of exchange prevailing when accrued.
Net realized gain or loss on foreign currency transactions represents foreign exchange gains and losses from sales and maturities of foreign fixed income investments, foreign currency exchange contracts, holding of foreign currencies, currency gains or losses realized between the trade and settlement dates on foreign investment transactions, and the difference between the amounts of dividends, interest and foreign withholding taxes recorded on the Fund’s books and the U.S. dollar equivalent amounts actually received or paid. Net unrealized currency gains and losses from valuing foreign currency denominated assets and liabilities at period end exchange rates are reflected as a component of net unrealized appreciation and depreciation of foreign currency denominated assets and liabilities.
| | |
| abfunds.com | | AB HIGH INCOME FUND | 109 |
NOTES TO FINANCIAL STATEMENTS (continued)
4. Taxes
It is the Fund’s policy to meet the requirements of the Internal Revenue Code applicable to regulated investment companies and to distribute all of its investment company taxable income and net realized gains, if any, to shareholders. Therefore, no provisions for federal income or excise taxes are required. The Fund may be subject to taxes imposed by countries in which it invests. Such taxes are generally based on income and/or capital gains earned or repatriated. Taxes are accrued and applied to net investment income, net realized gains and net unrealized appreciation/depreciation as such income and/or gains are earned.
In accordance with U.S. GAAP requirements regarding accounting for uncertainties in income taxes, management has analyzed the Fund’s tax positions taken or expected to be taken on federal and state income tax returns for all open tax years (the current and the prior three tax years) and has concluded that no provision for income tax is required in the Fund’s financial statements.
5. Investment Income and Investment Transactions
Dividend income is recorded on the ex-dividend date or as soon as the Fund is informed of the dividend. Interest income is accrued daily. Investment transactions are accounted for on the date securities are purchased or sold. Investment gains or losses are determined on the identified cost basis. The Fund amortizes premiums and accretes discounts as adjustments to interest income.
6. Class Allocations
All income earned and expenses incurred by the Fund are borne on a pro-rata basis by each settled class of shares, based on the proportionate interest in the Fund represented by the net assets of such class, except for class specific expenses which are allocated to the respective class. Realized and unrealized gains and losses are allocated among the various share classes based on their respective net assets.
7. Dividends and Distributions
Dividends and distributions to shareholders, if any, are recorded on the ex-dividend date. Income dividends and capital gains distributions are determined in accordance with federal tax regulations and may differ from those determined in accordance with U.S. GAAP. To the extent these differences are permanent, such amounts are reclassified within the capital accounts based on their federal tax basis treatment; temporary differences do not require such reclassification.
| | |
| 110 | AB HIGH INCOME FUND | | abfunds.com |
NOTES TO FINANCIAL STATEMENTS (continued)
NOTE B
Advisory Fee and Other Transactions with Affiliates
Under the terms of the investment advisory agreement, the Fund pays the Adviser an advisory fee at an annual rate of .50% of the first $2.5 billion, .45% of the next $2.5 billion and .40% in excess of $5 billion, of the Fund’s average daily net assets. The fee is accrued daily and paid monthly.
Pursuant to the investment advisory agreement, the Fund may reimburse the Adviser for certain legal and accounting services provided to the Fund by the Adviser. For the six months ended April 30, 2017, such fee amounted to $24,251.
During the year ended October 31, 2016, the Adviser reimbursed the Fund in the amount of $7,328 for trading losses incurred due to trade entry errors.
The Fund compensates AllianceBernstein Investor Services, Inc. (“ABIS”), a wholly-owned subsidiary of the Adviser, under a Transfer Agency Agreement for providing personnel and facilities to perform transfer agency services for the Fund. ABIS may make payments to intermediaries that provide omnibus account services, sub-accounting services and/or networking services. The compensation retained by ABIS amounted to $976,804 for the six months ended April 30, 2017.
AllianceBernstein Investments, Inc. (the “Distributor”), a wholly-owned subsidiary of the Adviser, serves as the distributor of the Fund’s shares. The Distributor has advised the Fund that it has retained front-end sales charges of $105,908 from the sale of Class A shares and received $43,844, $316 and $67,604 in contingent deferred sales charges imposed upon redemptions by shareholders of Class A, Class B and Class C shares, respectively, for the six months ended April 30, 2017.
The AB Fixed-Income Shares, Inc.—Government STIF Portfolio (the “Government STIF Portfolio”), prior to June 1, 2016, was offered as a cash management option to mutual funds and other institutional accounts of the Adviser, and was not available for direct purchase by members of the public. Prior to June 1, 2016, the Government STIF Portfolio paid no advisory fees but did bear its own expenses. As of June 1, 2016, the Government STIF Portfolio, which was renamed “AB Government Money Market Portfolio” (the “Government Money Market Portfolio”), has a contractual annual advisory fee rate of .20% of the Portfolio’s average daily net assets and bears its own expenses. In connection with the investment by the Fund in the Government Money Market Portfolio, the Adviser has agreed to waive its advisory fee from the Fund in an amount equal to the Fund’s pro rata
| | |
| abfunds.com | | AB HIGH INCOME FUND | 111 |
NOTES TO FINANCIAL STATEMENTS (continued)
share of the effective advisory fees of Government Money Market Portfolio, as borne indirectly by the Fund as an acquired fund fee and expense. For the six months ended April 30, 2017 such waiver amounted to $214,600. A summary of the Fund’s transactions in shares of the Government Money Market Portfolio for the six months ended April 30, 2017 is as follows:
| | | | | | | | | | | | | | | | | | |
Market Value
October 31, 2016
(000) | | | Purchases
at Cost
(000) | | | Sales
Proceeds
(000) | | | Market Value
April 30, 2017
(000) | | | Dividend
Income
(000) | |
| $ | 437,100 | | | $ | 1,419,752 | | | $ | 1,572,095 | | | $ | 284,757 | | | $ | 431 | |
Brokerage commissions paid on investment transactions for the six months ended April 30, 2017 amounted to $223,027, none of which was paid to Sanford C. Bernstein & Co. LLC and Sanford C. Bernstein Limited, respectively, affiliates of the Adviser.
NOTE C
Distribution Services Agreement
The Fund has adopted a Distribution Services Agreement (the “Agreement”) pursuant to Rule 12b-1 under the Investment Company Act of 1940. Under the Agreement the Fund pays distribution and servicing fees to the Distributor at an annual rate of up to .30% of the Fund’s average daily net assets attributable to Class A shares, 1% of the Fund’s average daily net assets attributable to both Class B and Class C shares, .50% of the Fund’s average daily net assets attributable to Class R shares and .25% of the Fund’s average daily net assets attributable to Class K shares. There are no distribution and servicing fees on Advisor Class, Class I and Class Z shares. Effective January 29, 2016, payments under the Agreement in respect of Class A shares are limited to an annual rate of .25% of Class A shares’ average daily net assets. The fees are accrued daily and paid monthly. The Agreement provides that the Distributor will use such payments in their entirety for distribution assistance and promotional activities. Since the commencement of the Fund’s operations, the Distributor has incurred expenses in excess of the distribution costs reimbursed by the Fund in the amounts of $5,727,433, $16,812,441, $825,266 and $684,643 for Class B, Class C, Class R, and Class K shares, respectively. While such costs may be recovered from the Fund in future periods so long as the Agreement is in effect, the rate of the distribution and servicing fees payable under the Agreement may not be increased without a shareholder vote. In accordance with the Agreement, there is no provision for recovery of unreimbursed distribution costs incurred by the Distributor beyond the current fiscal year for Class A shares. The Agreement also provides that the Adviser may use its own resources to finance the distribution of the Fund’s shares.
| | |
| 112 | AB HIGH INCOME FUND | | abfunds.com |
NOTES TO FINANCIAL STATEMENTS (continued)
NOTE D
Investment Transactions
Purchases and sales of investment securities (excluding short-term investments) for the six months ended April 30, 2017, were as follows:
| | | | | | | | |
| | | Purchases | | | Sales | |
Investment securities (excluding U.S. government securities) | | $ | 1,741,879,212 | | | $ | 1,454,635,636 | |
U.S. government securities | | | 982,482,537 | | | | 935,061,263 | |
The cost of investments for federal income tax purposes was substantially the same as cost for financial reporting purposes. Accordingly, gross unrealized appreciation and unrealized depreciation (excluding foreign currency exchange contracts, futures, swaps, options written and swaptions written) are as follows:
| | | | |
Gross unrealized appreciation | | $ | 438,450,629 | |
Gross unrealized depreciation | | | (348,895,652 | ) |
| | | | |
Net unrealized appreciation | | $ | 89,554,977 | |
| | | | |
1. Derivative Financial Instruments
The Fund may use derivatives in an effort to earn income and enhance returns, to replace more traditional direct investments, to obtain exposure to otherwise inaccessible markets (collectively, “investment purposes”), or to hedge or adjust the risk profile of its portfolio.
The principal types of derivatives utilized by the Fund, as well as the methods in which they may be used are:
| | • | | Forward Currency Exchange Contracts |
The Fund may enter into forward currency exchange contracts in order to hedge its exposure to changes in foreign currency exchange rates on its foreign portfolio holdings, to hedge certain firm purchase and sales commitments denominated in foreign currencies and for non-hedging purposes as a means of making direct investments in foreign currencies, as described below under “Currency Transactions”.
A forward currency exchange contract is a commitment to purchase or sell a foreign currency at a future date at a negotiated forward rate. The gain or loss arising from the difference between the original contract and the closing of such contract would be included in net realized gain or loss on foreign currency transactions. Fluctuations in the value of open forward currency exchange contracts are recorded for financial reporting purposes as unrealized appreciation and/or depreciation by the Fund.
| | |
| abfunds.com | | AB HIGH INCOME FUND | 113 |
NOTES TO FINANCIAL STATEMENTS (continued)
Risks may arise from the potential inability of a counterparty to meet the terms of a contract and from unanticipated movements in the value of a foreign currency relative to the U.S. dollar.
During the six months ended April 30, 2017, the Fund held foreign-currency exchange contracts for hedging and non-hedging purposes.
The Fund may buy or sell futures for investment purposes or for the purpose of hedging its portfolio against adverse effects of potential movements in the market. The Fund bears the market risk that arises from changes in the value of these instruments and the imperfect correlation between movements in the price of the futures and movements in the price of the assets, reference rates or indices which they are designed to track. Among other things, the Fund may purchase or sell futures for foreign currencies or options thereon for non-hedging purposes as a means of making direct investment in foreign currencies, as described below under “Currency Transactions”.
At the time the Fund enters into a future, the Fund deposits and maintains as collateral an initial margin with the broker, as required by the exchange on which the transaction is effected. Such amount of shown as due from broker on the statement of assets and liabilities. Pursuant to the contract, the Fund agrees to receive from or pay to the broker an amount of cash equal to the daily fluctuation in the value of the contract. Such receipts or payments are known as variation margin and are recorded by the Fund as unrealized gains or losses. Risks may arise from the potential inability of a counter party to meet the terms of the contract. The credit/counterparty risk for exchange-traded futures is generally less than privately negotiated futures, since the clearinghouse, which is the issuer or counterparty to each exchange-traded future, has robust risk mitigation standards, including the requirement to provide initial and variation margin. When the contract is closed, the Fund records realized gain or loss equal to the difference between the value of the contract at the time it was opened and the time it was closed.
Use of long futures subjects the Fund to risk of loss in excess of the amounts shown on the statement of assets and liabilities, up to the notional value of the future. Use of short futures subjects the Fund to unlimited risk of loss. Under some circumstances, futures exchanges may establish daily limits on the amount that the price of a future can vary from the previous day’s settlement price, which could effectively prevent liquidation of unfavorable positions.
| | |
| 114 | AB HIGH INCOME FUND | | abfunds.com |
NOTES TO FINANCIAL STATEMENTS (continued)
During the six months ended April 30, 2017, the Fund held futures for hedging and non-hedging purposes.
For hedging and investment purposes, the Fund may purchase and write (sell) put and call options on U.S. and foreign securities, including government securities, and foreign currencies that are traded on U.S. and foreign securities exchanges and over-the-counter markets. Among other things, the Fund may use options transactions for non-hedging purposes as a means of making direct investments in foreign currencies, as described below under “Currency Transactions” and may use options strategies involving the purchase and/or writing of various combinations of call and/or put options, for hedging and investment purposes.
The risk associated with purchasing an option is that the Fund pays a premium whether or not the option is exercised. Additionally, the Fund bears the risk of loss of the premium and change in market value should the counterparty not perform under the contract. If a put or call option purchased by the Fund were permitted to expire without being sold or exercised, its premium would represent a loss to the Fund. Put and call options purchased are accounted for in the same manner as portfolio securities. The cost of securities acquired through the exercise of call options is increased by premiums paid. The proceeds from securities sold through the exercise of put options are decreased by the premiums paid.
When the Fund writes an option, the premium received by the Fund is recorded as a liability and is subsequently adjusted to the current market value of the option written. At April 30, 2017 the maximum payment for written put options amounted to $724,088,200. In certain circumstances maximum payout amounts may be partially offset by recovery values of the respective referenced assets and upfront premium received upon entering into the contract. Premiums received from written options which expire unexercised are recorded by the Fund on the expiration date as realized gains from options written. The difference between the premium received and the amount paid on effecting a closing purchase transaction, including brokerage commissions, is also treated as a realized gain, or if the premium received is less than the amount paid for the closing purchase transaction, as a realized loss. If a call option is exercised, the premium received is added to the proceeds from the sale of the underlying security or currency in determining whether the Fund has realized a gain or loss. If a put option is exercised, the premium
| | |
| abfunds.com | | AB HIGH INCOME FUND | 115 |
NOTES TO FINANCIAL STATEMENTS (continued)
received reduces the cost basis of the security or currency purchased by the Fund. In writing an option, the Fund bears the market risk of an unfavorable change in the price of the security or currency underlying the written option. Exercise of an option written by the Fund could result in the Fund selling or buying a security or currency at a price different from the current market value.
The Fund may also invest in options on swap agreements, also called “swaptions”. A swaption is an option that gives the buyer the right, but not the obligation, to enter into a swap on a future date in exchange for paying a market-based “premium”. A receiver swaption gives the owner the right to receive the total return of a specified asset, reference rate, or index. A payer swaption gives the owner the right to pay the total return on a specified asset, reference rate, or index. Swaptions also include options that allow an existing swap to be terminated or extended by one of the counterparties.
During the six months ended April 30, 2017, the Fund held purchased options for hedging and non-hedging purposes.
During the six months ended April 30, 2017, the Fund held written options for hedging and non-hedging purposes.
During the six months ended April 30, 2017, the Fund held written swaptions for hedging purposes.
During the six months ended April 30, 2017, the Fund held purchased swaptions for hedging purposes.
For the six months ended April 30, 2017, the Fund had the following transactions in written options:
| | | | | | | | |
| | | Number of
Contracts | | | Premiums
Received | |
Options written outstanding as of 10/31/16 | | | 5,260,451,444 | | | $ | 5,416,155 | |
Options written | | | 184,561,829,568 | | | | 58,193,864 | |
Options expired | | | (60,219,925,589 | ) | | | (38,973,800 | ) |
Options bought back | | | (896,230,744 | ) | | | (8,926,779 | ) |
Options exercised | | | – 0 | – | | | – 0 | – |
| | | | | | | | |
Options written outstanding as of 4/30/17 | | | 128,706,124,679 | | | $ | 15,709,440 | |
| | | | | | | | |
| | |
| 116 | AB HIGH INCOME FUND | | abfunds.com |
NOTES TO FINANCIAL STATEMENTS (continued)
For the six months ended April 30, 2017, the Fund had the following transactions in written swaptions:
| | | | | | | | |
| | | Notional
Amount | | | Premiums
Received | |
Swaptions written outstanding as of 10/31/16 | | $ | 154,320,000 | | | $ | 810,180 | |
Swaptions written | | | 1,725,708,339 | | | | 8,005,398 | |
Swaptions expired | | | (1,084,236,339 | ) | | | (5,034,439 | ) |
Swaptions bought back | | | (715,500,000 | ) | | | (3,358,602 | ) |
Swaptions exercised | | | – 0 | – | | | – 0 | – |
| | | | | | | | |
Swaptions written outstanding as of 4/30/17 | | $ | 80,292,000 | | | $ | 422,537 | |
| | | | | | | | |
The Fund may enter into swaps to hedge its exposure to interest rates, credit risk, or currencies. The Fund may also enter into swaps for non-hedging purposes as a means of gaining market exposures including by making direct investments in foreign currencies, as described below under “Currency Transactions” or in order to take a “long” or “short” position with respect to an underlying referenced asset described below under “Total Return Swaps”. A swap is an agreement that obligates two parties to exchange a series of cash flows at specified intervals based upon or calculated by reference to changes in specified prices or rates for a specified amount of an underlying asset. The payment flows are usually netted against each other, with the difference being paid by one party to the other. In addition, collateral may be pledged or received by the Fund in accordance with the terms of the respective swaps to provide value and recourse to the Fund or its counterparties in the event of default, bankruptcy or insolvency by one of the parties to the swap.
Risks may arise as a result of the failure of the counterparty to the swap to comply with the terms of the swap. The loss incurred by the failure of a counterparty is generally limited to the net interim payment to be received by the Fund, and/or the termination value at the end of the contract. Therefore, the Fund considers the creditworthiness of each counterparty to a swap in evaluating potential counterparty risk. This risk is mitigated by having a netting arrangement between the Fund and the counterparty and by the posting of collateral by the counterparty to the Fund to cover the Fund’s exposure to the counterparty. Additionally, risks may arise from unanticipated movements in interest rates or in the value of the underlying securities. The Fund accrues for the interim payments on swaps on a daily basis, with the net amount recorded within unrealized appreciation/depreciation of swaps on the statement of assets and liabilities, where applicable. Once the interim payments are settled in cash, the net amount is recorded as realized gain/(loss) on swaps on the statement
| | |
| abfunds.com | | AB HIGH INCOME FUND | 117 |
NOTES TO FINANCIAL STATEMENTS (continued)
of operations, in addition to any realized gain/(loss) recorded upon the termination of swaps. Upfront premiums paid or received are recognized as cost or proceeds on the statement of assets and liabilities and are amortized on a straight line basis over the life of the contract. Amortized upfront premiums are included in net realized gain/(loss) from swaps on the statement of operations. Fluctuations in the value of swaps are recorded as a component of net change in unrealized appreciation/depreciation of swaps on the statement of operations.
Certain standardized swaps, including certain interest rate swaps and credit default swaps, are (or soon will be) subject to mandatory central clearing. Cleared swaps are transacted through futures commission merchants (“FCMs”) that are members of central clearinghouses, with the clearinghouse serving as central counterparty, similar to transactions in futures contracts. Centralized clearing will be required for additional categories of swaps on a phased-in basis based on requirements published by the Securities and Exchange Commission and Commodity Futures Trading Commission.
At the time the Fund enters into a centrally cleared swap, the Fund deposits and maintains as collateral an initial margin with the broker, as required by the clearinghouse on which the transaction is effected. Such amount is shown as cash collateral due from broker on the statement of assets and liabilities. Pursuant to the contract, the Fund agrees to receive from or pay to the broker an amount of cash equal to the daily fluctuation in the value of the contract. Such receipts or payments are known as variation margin and are recorded by the Fund as unrealized gains or losses. Risks may arise from the potential inability of a counterparty to meet the terms of the contract. The credit/counterparty risk for centrally cleared swaps is generally less than non-centrally cleared swaps, since the clearinghouse, which is the issuer or counterparty to each centrally cleared swap, has robust risk mitigation standards, including the requirement to provide initial and variation margin. When the contract is closed, the Fund records a realized gain or loss equal to the difference between the value of the contract at the time it was opened and the time it was closed.
Interest Rate Swaps:
The Fund is subject to interest rate risk exposure in the normal course of pursuing its investment objectives. Because the Fund holds fixed rate bonds, the value of these bonds may decrease if interest rates rise. To help hedge against this risk and to maintain its ability to generate income at prevailing market rates, the Fund may enter into interest rate swaps. Interest rate swaps are agreements between two
| | |
| 118 | AB HIGH INCOME FUND | | abfunds.com |
NOTES TO FINANCIAL STATEMENTS (continued)
parties to exchange cash flows based on a notional amount. The Fund may elect to pay a fixed rate and receive a floating rate, or, receive a fixed rate and pay a floating rate on a notional amount.
In addition, the Fund may also enter into interest rate swap transactions to preserve a return or spread on a particular investment or portion of its portfolio, or protecting against an increase in the price of securities the Fund anticipates purchasing at a later date. Interest rate swaps involve the exchange by the Fund with another party of their respective commitments to pay or receive interest (e.g., an exchange of floating rate payments for fixed rate payments) computed based on a contractually-based principal (or “notional”) amount. Interest rate swaps are entered into on a net basis (i.e., the two payment streams are netted out, with the Fund receiving or paying, as the case may be, only the net amount of the two payments).
During the six months ended April 30, 2017, the Fund held interest rate swaps for hedging and non-hedging purposes.
Credit Default Swaps:
The Fund may enter into credit default swaps, including to manage its exposure to the market or certain sectors of the market, to reduce its risk exposure to defaults by corporate and sovereign issuers held by the Fund, or to create exposure to corporate or sovereign issuers to which it is not otherwise exposed. The Fund may purchase credit protection (“Buy Contract”) or provide credit protection (“Sale Contract”) on the referenced obligation of the credit default swap. During the term of the swap agreement, the Fund receives/(pays) fixed payments from/(to) the respective counterparty, calculated at the agreed upon interest rate applied to the notional amount. If the Fund is a buyer/(seller) of protection and a credit event occurs, as defined under the terms of the swap agreement, the Fund will either (i) receive from the seller/(pay to the buyer) of protection an amount equal to the notional amount of the swap contract (the “Maximum Payout Amount”) and deliver/(take delivery of) the referenced obligation or (ii) receive/(pay) a net settlement amount in the form of cash or securities equal to the notional amount of the swap less the recovery value of the referenced obligation.
In certain circumstances Maximum Payout Amounts may be partially offset by recovery values of the respective referenced obligations, upfront premium received upon entering into the agreement, or net amounts received from settlement of buy protection credit default swap agreements entered into by the Fund for the same reference
| | |
| abfunds.com | | AB HIGH INCOME FUND | 119 |
NOTES TO FINANCIAL STATEMENTS (continued)
obligation with the same counterparty. As of April 30, 2017, the Fund had Buy Contracts outstanding with respect to the same referenced obligation and counterparty as certain Sale Contracts which may partially offset the Maximum Payout Amount in the amount of $12,770,000.
Credit default swaps may involve greater risks than if the Fund had invested in the referenced obligation directly. Credit default swaps are subject to general market risk, liquidity risk, counterparty risk and credit risk. If the Fund is a buyer of protection and no credit event occurs, it will lose the payments it made to its counterpart. If the Fund is a seller of protection and a credit event occurs, the value of the referenced obligation received by the Fund coupled with the periodic payments previously received may be less than the Maximum Payout Amount it pays to the buyer, resulting in a net loss to the Fund.
Implied credit spreads over Treasuries of comparable maturity utilized in determining the market value of credit default swaps on issuers as of period end are disclosed in the portfolio of investments. The implied spreads serve as an indicator of the current status of the payment/performance risk and typically reflect the market’s assessment of the likelihood of default by the issuer of the referenced obligation. The implied credit spread of a particular reference entity reflects the cost of buying/selling protection and may include upfront payments required to be made to enter into the agreement. Widening credit spreads typically represent a deterioration of the referenced entity’s credit soundness and greater likelihood of default or other credit event occurring as defined under the terms of the agreement. A credit spread identified as “Defaulted” indicates a credit event has occurred for the referenced entity or obligation.
During the six months ended April 30, 2017, the Fund held credit default swaps for hedging and non-hedging purposes.
Total Return Swaps:
The Fund may enter into total return swaps in order take a “long” or “short” position with respect to an underlying referenced asset. The Fund is subject to market price volatility of the underlying referenced asset. A total return swap involves commitments to pay interest in exchange for a market linked return based on a notional amount. To the extent that the total return of the security, group of securities or index underlying the transaction exceeds or falls short of the offsetting interest obligation, the Fund will receive a payment from or make a payment to the counterparty.
| | |
| 120 | AB HIGH INCOME FUND | | abfunds.com |
NOTES TO FINANCIAL STATEMENTS (continued)
During the six months ended April 30, 2017, the Fund held total return swaps for non-hedging purposes.
Variance Swaps:
The Fund may enter into variance swaps to hedge equity market risk or adjust exposure to the equity markets. Variance swaps are contracts in which two parties agree to exchange cash payments based on the difference between the stated level of variance and the actual variance realized on underlying asset(s) or index(es). Actual “variance” as used here is defined as the sum of the square of the returns on the reference asset(s) or index(es) (which in effect is a measure of its “volatility”) over the length of the contract term. So the parties to a variance swap can be said to exchange actual volatility for a contractually stated rate of volatility.
During the six months ended April 30, 2017, the Fund held variance swaps for non-hedging purposes.
The Fund typically enters into International Swaps and Derivatives Association, Inc. Master Agreements (“ISDA Master Agreement”) or similar master agreements (collectively, “Master Agreements”) with its derivative contract counterparties in order to, among other things, reduce its credit risk to counterparties. ISDA Master Agreements include provisions for general obligations, representations, collateral and events of default or termination. Under an ISDA Master Agreement, the Fund typically may offset with the counterparty certain derivative financial instruments’ payables and/or receivables with collateral held and/or posted and create one single net payment (close-out netting) in the event of default or termination.
Various Master Agreements govern the terms of certain transactions with counterparties, including transactions such as derivative transactions, repurchase and reverse repurchase agreements. These Master Agreements typically attempt to reduce the counterparty risk associated with such transactions by specifying credit protection mechanisms and providing standardization that improves legal certainty. Cross-termination provisions under Master Agreements typically provide that a default in connection with one transaction between the Fund and a counterparty gives the non-defaulting party the right to terminate any other transactions in place with the defaulting party to create one single net payment due to/due from the defaulting party. In the event of a default by a Master Agreements counterparty, the return of collateral with market value in excess of the Fund’s net liability, held by the defaulting party, may be delayed or denied.
The Fund’s Master Agreements may contain provisions for early termination of OTC derivative transactions in the event the net assets of the
| | |
| abfunds.com | | AB HIGH INCOME FUND | 121 |
NOTES TO FINANCIAL STATEMENTS (continued)
Fund decline below specific levels (“net asset contingent features”). If these levels are triggered, the Fund’s counterparty has the right to terminate such transaction and require the Fund to pay or receive a settlement amount in connection with the terminated transaction. For additional details, please refer to netting arrangements by counterparty tables below.
During the six months ended April 30, 2017 the Fund had entered into the following derivatives:
| | | | | | | | | | | | |
| | | Asset Derivatives | | | Liability Derivatives | |
Derivative Type | | Statement of
Assets and
Liabilities
Location | | Fair Value | | | Statement of
Assets and
Liabilities
Location | | Fair Value | |
Interest rate contracts | |
Receivable/Payable for variation margin on exchange-traded derivatives | |
$ |
7,333,082 |
* | |
Receivable/Payable for variation margin on exchange-traded derivatives | |
$ |
8,889,321 |
* |
| | | | |
Interest rate contracts | |
Unrealized appreciation on total return swaps | |
|
3,054,641 |
| |
Unrealized depreciation on total return swaps | |
|
– 0 |
– |
| | | | |
Foreign exchange contracts | |
Unrealized appreciation on forward currency exchange contracts | |
|
23,642,212 |
| |
Unrealized depreciation on forward currency exchange contracts | |
|
33,964,785 |
|
Foreign exchange contracts | |
Investments in securities, at value | |
|
6,237,950 |
| |
Options written, at value | |
|
9,661,206 |
|
| | | | |
Credit contracts | | Unrealized appreciation on credit default swaps | | | 1,788,901 | | | Unrealized depreciation on credit default swaps | | | 22,898,843 | |
| | | | |
Credit contracts | | Receivable/Payable for variation margin on exchange-traded derivatives | | | 4,538,373 | * | | Receivable/Payable for variation margin on exchange-traded derivatives | | | 4,733,033 | * |
| | | | |
Credit contracts | | | | | – 0 | – | | Swaptions written, at value | | | 316,985 | |
| | | | |
Equity contracts | | Unrealized appreciation on variance swaps | | | 302,021 | | | Unrealized depreciation on variance swaps | | | – 0 | – |
| | |
| 122 | AB HIGH INCOME FUND | | abfunds.com |
NOTES TO FINANCIAL STATEMENTS (continued)
| | | | | | | | | | | | |
Derivative Type | | Statement of
Assets and
Liabilities
Location | | Fair Value | | | Statement of
Assets and
Liabilities
Location | | Fair Value | |
| | | | |
Equity contracts | | Receivable/Payable for variation margin on exchange-traded derivatives | | $ | 1,069,077 | * | | Receivable/Payable for variation margin on exchange-traded derivatives | | $ | – 0 | – |
| | | | |
Equity contracts | | Investment in securities, at value | | | 1,198,784 | | | Options written, at value | | | 434,802 | |
| | | | | | | | | | | | |
Total | | | | $ | 49,165,041 | | | | | $ | 80,898,975 | |
| | | | | | | | | | | | |
| * | Only variation margin receivable/payable at period end is reported within the statement of assets and liabilities. This amount reflects cumulative unrealized appreciation/(depreciation) of exchange-traded derivative contracts as reported in the portfolio of investments. |
| | | | | | | | | | |
Derivative Type | | Location of
Gain or (Loss) on
Derivatives Within
Statement of
Operations | | Realized Gain
or (Loss) on
Derivatives | | | Change in
Unrealized
Appreciation or
(Depreciation) | |
Interest rate contracts | | Net realized gain/(loss) on swaps; Net change in unrealized appreciation/ depreciation on swaps | | $ | 9,478,354 | | | $ | 4,396,213 | |
| | | |
Interest rate contracts | | Net realized gain/(loss) on futures; Net change in unrealized appreciation/ depreciation on futures | | | (917,495 | ) | | | (5,701,875 | ) |
| | | |
Interest rate contracts | | Net realized gain/(loss) on investment transactions; Net change in unrealized appreciation/depreciation on investment transactions | | | 3,477,986 | | | | (815,629 | ) |
| | | |
Interest rate contracts | | Net realized gain/(loss) on swaptions written; Net change in unrealized appreciation/depreciation on swaptions written | | | 4,053,971 | | | | – 0 | – |
| | | |
Foreign exchange contracts | |
Net realized gain/(loss) on foreign currency transactions; Net change in unrealized appreciation/depreciation on foreign currency denominated assets and liabilities | |
|
37,950,963 |
| |
|
(20,880,263 |
) |
| | |
| abfunds.com | | AB HIGH INCOME FUND | 123 |
NOTES TO FINANCIAL STATEMENTS (continued)
| | | | | | | | | | |
Derivative Type | | Location of
Gain or (Loss) on
Derivatives Within
Statement of
Operations | | Realized Gain
or (Loss) on
Derivatives | | | Change in
Unrealized
Appreciation or
(Depreciation) | |
Foreign exchange contracts | |
Net realized gain/(loss) on investment transactions; Net change in unrealized appreciation/depreciation on investment transactions | |
$ |
(10,202,015 |
) | |
$ |
1,140,623 |
|
| | | |
Foreign exchange contracts | |
Net realized gain/(loss) on options written; Net change in unrealized appreciation/depreciation on options written | |
|
28,844,323 |
| |
|
1,619,674 |
|
| | | |
Credit contracts | | Net realized gain/(loss) on swaps; Net change in unrealized appreciation/ depreciation on swaps | | | 21,390,406 | | | | (12,349,317 | ) |
| | | |
Credit contracts | | Net realized gain/(loss) on swaptions written; Net change in unrealized appreciation/depreciation on swaptions written | | | 3,594,850 | | | | (44,347 | ) |
| | | |
Equity contracts | | Net realized gain/(loss) on swaps; Net change in unrealized appreciation/ depreciation on swaps | | | 45,443,341 | | | | (155,852 | ) |
| | | |
Equity contracts | | Net realized gain/(loss) on futures; Net change in unrealized appreciation/depreciation on futures | | | 3,392,674 | | | | 888,746 | |
| | | |
Equity contracts | | Net realized gain/(loss) on investment transactions; Net change in unrealized appreciation/depreciation on investment transactions | | | (8,341,150 | ) | | | (5,107,282 | ) |
| | | |
Equity contracts | | Net realized gain/(loss) on options written; Net change in unrealized appreciation/depreciation on options written | | | 3,116,624 | | | | 1,903,925 | |
| | | | | | | | | | |
Total | | | | $ | 141,282,832 | | | $ | (35,105,384 | ) |
| | | | | | | | | | |
| | |
| 124 | AB HIGH INCOME FUND | | abfunds.com |
NOTES TO FINANCIAL STATEMENTS (continued)
The following table represents the average monthly volume of the Fund’s derivative transactions during the six months ended April 30, 2017.
| | | | |
Centrally Cleared Credit Default Swaps: | | | | |
Average notional amount of buy contracts | | $ | 390,063,108 | |
Average notional amount of sale contracts | | $ | 513,855,740 | |
Centrally Cleared Interest Rate Swaps: | | | | |
Average notional amount | | $ | 892,520,687 | (a) |
Credit Default Swaps: | | | | |
Average notional amount of buy contracts | | $ | 98,484,573 | |
Average notional amount of sale contracts | | $ | 304,810,804 | |
Forward Currency Exchange Contracts: | | | | |
Average principal amount of buy contracts | | $ | 1,515,489,675 | |
Average principal amount of sale contracts | | $ | 2,361,113,762 | |
Futures: | | | | |
Average original value of buy contracts | | $ | 363,134,024 | |
Average original value of sale contracts | | $ | 330,318,067 | (b) |
Interest Rate Swaps: | | | | |
Average notional amount | | $ | 176,603,048 | (c) |
Total Return Swaps: | | | | |
Average notional amount | | $ | 296,092,662 | |
Variance Swaps: | | | | |
Average notional amount | | $ | 7,110,218 | |
Purchased Options Contracts: | | | | |
Average monthly cost | | $ | 8,011,019 | |
| (a) | Positions were open six months during the reporting period. |
| (b) | Positions were open two months during the reporting period. |
| (c) | Position was open one month during the reporting period. |
For financial reporting purposes, the Fund does not offset derivative assets and derivative liabilities that are subject to netting arrangements in the statement of assets and liabilities.
All derivatives held at year end were subject to netting arrangements. The following tables present the Fund’s derivative assets and liabilities by counterparty net of amounts available for offset under Master Agreements (“MA”) and net of the related collateral received/pledged by the Fund as of April 30, 2017:
| | | | | | | | | | | | | | | | | | | | |
Counterparty | | Derivative
Assets
Subject
to a MA | | | Derivatives
Available
for Offset | | | Cash
Collateral
Received* | | | Security
Collateral
Received* | | | Net
Amount of
Derivatives
Assets | |
Exchange-Traded Derivatives: | | | | | | | | | | | | | | | | | | | | |
Citibank, N.A ** | | $ | 114,316 | | | $ | – 0 | – | | $ | – 0 | – | | $ | – 0 | – | | $ | 114,316 | |
Goldman Sachs & Co.** | | | 43,034 | | | | – 0 | – | | | – 0 | – | | | – 0 | – | | | 43,034 | |
Morgan Stanley & Co. LLC** | | | 657,592 | | | | (111,603 | ) | | | – 0 | – | | | – 0 | – | | | 545,989 | |
| | | | | | | | | | | | | | | | | | | | |
Total | | $ | 814,942 | | | $ | (111,603 | ) | | $ | – 0 | – | | $ | – 0 | – | | $ | 703,339 | |
| | | | | | | | | | | | | | | | | | | | |
| | |
| abfunds.com | | AB HIGH INCOME FUND | 125 |
NOTES TO FINANCIAL STATEMENTS (continued)
| | | | | | | | | | | | | | | | | | | | |
Counterparty | | Derivative
Assets
Subject
to a MA | | | Derivatives
Available
for Offset | | | Cash
Collateral
Received* | | | Security
Collateral
Received* | | | Net
Amount of
Derivatives
Assets | |
OTC Derivatives: | | | | | | | | | | | | | | | | | |
Australia & New Zealand Bank Group Ltd. | | $ | 1,129,594 | | | $ | (952,262 | ) | | $ | – 0 | – | | $ | – 0 | – | | $ | 177,332 | |
Bank of America, N.A. | | | 3,522,686 | | | | (3,522,686 | ) | | | – 0 | – | | | – 0 | – | | | – 0 | – |
Barclays Bank PLC | | | 1,480,162 | | | | (1,480,162 | ) | | | – 0 | – | | | – 0 | – | | | – 0 | – |
BNP Paribas | | | 2,848,505 | | | | (2,848,505 | ) | | | – 0 | – | | | – 0 | – | | | – 0 | – |
Citibank, N.A. | | | 4,804,917 | | | | (4,804,917 | ) | | | – 0 | – | | | – 0 | – | | | – 0 | – |
Credit Suisse International | | | 2,453,269 | | | | (2,453,269 | ) | | | – 0 | – | | | – 0 | – | | | – 0 | – |
Deutsche Bank AG | | | 4,322,689 | | | | (1,490,266 | ) | | | – 0 | – | | | – 0 | – | | | 2,832,423 | |
Goldman Sachs Bank USA/ Goldman Sachs International | | | 6,695,334 | | | | (6,695,334 | ) | | | – 0 | – | | | – 0 | – | | | – 0 | – |
HSBC Bank USA | | | 1,655,588 | | | | (24,729 | ) | | | – 0 | – | | | – 0 | – | | | 1,630,859 | |
JPMorgan Chase Bank, N.A. | | | 4,055,271 | | | | (4,055,271 | ) | | | – 0 | – | | | – 0 | – | | | – 0 | – |
Morgan Stanley Capital Services LLC/ Morgan Stanley & Co. International PLC. | | | 2,463,418 | | | | – 0 | – | | | (820,000 | ) | | | – 0 | – | | | 1,643,418 | |
Royal Bank of Scotland PLC | | | 1,053,409 | | | | (1,053,409 | ) | | | – 0 | – | | | – 0 | – | | | – 0 | – |
| | | | | | | | | | | | | | | | | | | | |
Total | | $ | 36,484,842 | | | $ | (29,380,810 | ) | | $ | (820,000 | ) | | $ | – 0 | – | | $ | 6,284,032 | ^ |
| | | | | | | | | | | | | | | | | | | | |
| | | | | |
Counterparty | | Derivative
Liabilities
Subject
to a MA | | | Derivatives
Available
for Offset | | | Cash
Collateral
Pledged* | | | Security
Collateral
Pledged* | | | Net
Amount of
Derivatives
Liabilities | |
Exchange-Traded Derivatives: | | | | | | | | | | | | | | | | | | | | |
Morgan Stanley & Co. LLC** | | $ | 111,603 | | | $ | (111,603 | ) | | $ | – 0 | – | | $ | – 0 | – | | $ | – 0 | – |
| | | | | | | | | | | | | | | | | | | | |
Total | | $ | 111,603 | | | $ | (111,603 | ) | | $ | – 0 | – | | $ | – 0 | – | | $ | – 0 | – |
| | | | | | | | | | | | | | | | | | | | |
| | | | | |
OTC Derivatives: | | | | | | | | | | | | | | | | | | | | |
Australia & New Zealand Bank Group Ltd. | | $ | 952,262 | | | $ | (952,262 | ) | | $ | – 0 | – | | $ | – 0 | – | | $ | – 0 | – |
Bank of America, N.A. | | | 4,877,818 | | | | (3,522,686 | ) | | | – 0 | – | | | (459,130 | ) | | | 896,002 | |
| | |
| 126 | AB HIGH INCOME FUND | | abfunds.com |
NOTES TO FINANCIAL STATEMENTS (continued)
| | | | | | | | | | | | | | | | | | | | |
Counterparty | | Derivative
Liabilities
Subject
to a MA | | | Derivatives
Available
for Offset | | | Cash
Collateral
Pledged* | | | Security
Collateral
Pledged* | | | Net
Amount of
Derivatives
Liabilities | |
Barclays Bank PLC | | $ | 3,158,921 | | | $ | (1,480,162 | ) | | $ | – 0 | – | | $ | (1,678,759 | ) | | $ | – 0 | – |
BNP Paribas | | | 3,304,579 | | | | (2,848,505 | ) | | | – 0 | – | | | (456,074 | ) | | | – 0 | – |
Citibank, N.A. | | | 20,557,732 | | | | (4,804,917 | ) | | | – 0 | – | | | (4,794,615 | ) | | | 10,958,200 | |
Credit Suisse International | | | 12,259,298 | | | | (2,453,269 | ) | | | – 0 | – | | | (9,806,029 | ) | | | – 0 | – |
Deutsche Bank AG | | | 1,490,266 | | | | (1,490,266 | ) | | | – 0 | – | | | – 0 | – | | | – 0 | – |
Goldman Sachs Bank USA/ Goldman Sachs International | | | 36,460,321 | | | | (6,695,334 | ) | | | – 0 | – | | | (29,764,987 | ) | | | – 0 | – |
HSBC Bank USA | | | 24,729 | | | | (24,729 | ) | | | – 0 | – | | | – 0 | – | | | – 0 | – |
JPMorgan Chase Bank, N.A. | | | 6,082,634 | | | | (4,055,271 | ) | | | – 0 | – | | | – 0 | – | | | 2,027,363 | |
Royal Bank of Scotland PLC | | | 4,891,014 | | | | (1,053,409 | ) | | | – 0 | – | | | – 0 | – | | | 3,837,605 | |
| | | | | | | | | | | | | | | | | | | | |
Total | | $ | 94,059,574 | | | $ | (29,380,810 | ) | | $ | – 0 | – | | $ | (46,959,594 | ) | | $ | 17,719,170 | ^ |
| | | | | | | | | | | | | | | | | | | | |
| * | The actual collateral received/pledged may be more than the amount reported due to overcollateralization. |
| ** | Cash and securities have been posted for initial margin requirements for exchange-traded derivatives outstanding at April 30, 2017. |
| ^ | Net amount represents the net unrealized receivable/payable that would be due from/to the counterparty in the event of default or termination. The net from OTC financial derivative instruments can only be netted across transactions governed under the same master agreement with the same counterparty. See Note D.3 for additional disclosure of netting arrangements regarding reverse repurchase agreements. |
2. Currency Transactions
The Fund may invest in non-U.S. Dollar-denominated securities on a currency hedged or unhedged basis. The Fund may seek investment opportunities by taking long or short positions in currencies through the use of currency-related derivatives, including forward currency exchange contracts, futures and options on futures, swaps, and other options. The Fund may enter into transactions for investment opportunities when it anticipates that a foreign currency will appreciate or depreciate in value but securities denominated in that currency are not held by the Fund and do not present attractive investment opportunities. Such transactions may also be used when the Adviser believes that it may be more efficient than a direct investment in a foreign currency-denominated security. The Fund may also conduct currency exchange contracts on a spot basis (i.e., for cash at the spot rate prevailing in the currency exchange market for buying or selling currencies).
| | |
| abfunds.com | | AB HIGH INCOME FUND | 127 |
NOTES TO FINANCIAL STATEMENTS (continued)
3. Reverse Repurchase Agreements
The Fund may enter into reverse repurchase transactions (“RVP”) in accordance with the terms of a Master Repurchase Agreement (“MRA”), under which the Fund sells securities and agrees to repurchase them at a mutually agreed upon date and price. At the time the Fund enters into a reverse repurchase agreement, it will establish a segregated account with the custodian containing liquid assets having a value comparable to the repurchase price. Under the MRA and other Master Agreements, the Fund is permitted to offset payables and/or receivables with collateral held and/ or posted to the counterparty and create one single net payment due to or from the Fund in the event of a default. In the event of a default by a MRA counterparty, the Fund may be considered an unsecured creditor with respect to any excess collateral (collateral with a market value in excess of the repurchase price) held by and/or posted to the counterparty, and as such the return of such excess collateral may be delayed or denied. For the six months ended April 30, 2017, the average amount of reverse repurchase agreements outstanding was $101,788,251 and the daily weighted average interest rate was (0.79)%. During the period, the Fund received net interest payments from counterparties. At April 30, 2017, the Fund had reverse repurchase agreements outstanding in the amount of $126,139,270 as reported in the statement of assets and liabilities.
The following table presents the Fund’s RVP liabilities by counterparty net of the related collateral pledged by the Fund as of April 30, 2017:
| | | | | | | | | | | | |
Counterparty | | RVP Liabilities
Subject to a
MRA | | | Securities
Collateral
Pledged†* | | | Net Amount of
RVP Liabilities | |
Barclays Capital, Inc. | | $ | 75,796,710 | | | $ | (75,796,710 | ) | | $ | – 0 | – |
Credit Suisse Securities (USA) LLC. | | | 17,236,969 | | | | (17,236,969 | ) | | | – 0 | – |
Merrill Lynch, Pierce, Fenner & Smith Inc. | | | 20,598,308 | | | | (20,598,308 | ) | | | – 0 | – |
ING Financial Markets LLC | | | 3,845,587 | | | | (3,845,587 | ) | | | – 0 | – |
Deutsche Bank Securities Inc. | | | 2,159,524 | | | | (2,159,524 | ) | | | – 0 | – |
Jefferies & Company, Inc. | | | 3,810,780 | | | | (3,810,780 | ) | | | – 0 | – |
JPMorgan Chase Bank, N.A. | | | 2,691,392 | | | | (2,691,392 | ) | | | – 0 | – |
| | | | | | | | | | | | |
Total | | $ | 126,139,270 | | | $ | (126,139,270 | ) | | $ | – 0 | – |
| | | | | | | | | | | | |
| † | Including accrued interest. |
| * | The actual collateral pledged may be more than the amount reported due to overcollateralization. |
4. Loan Participations and Assignments
The Fund may invest in direct debt instruments which are interests in amounts owed to lenders or lending syndicates by corporate, governmental, or other borrowers, either in the form of participations at the time the loan is originated (“Participations”) or by buying an interest in the loan in the secondary market from a financial institution or institutional
| | |
| 128 | AB HIGH INCOME FUND | | abfunds.com |
NOTES TO FINANCIAL STATEMENTS (continued)
investor (“Assignments”). A loan is often administered by a bank or other financial institution (the “Lender”) that acts as agent for all holders. The agent administers the terms of the loan as specified in the loan agreement. When investing in Participations, the Fund generally has no right to enforce compliance with the terms of the loan agreement with the borrower. In addition, when investing in Participations, the Fund has the right to receive payments of principal, interest and any fees to which it is entitled only from the Lender and only upon receipt of payments by the Lender from the borrower. As a result, the Fund may be subject to the credit risk of both the borrower and the Lender. When the Fund purchases Assignments from Lenders, it will typically acquire direct rights against the borrower on the loan. These loans may include participations in “bridge loans”, which are loans taken out by borrowers for a short period (typically less than six months) pending arrangement of more permanent financing through, for example, the issuance of bonds, frequently high-yield bonds issued for the purpose of acquisitions. The Fund may also participate in unfunded loan commitments, which are contractual obligations for investing in future Participations, and may receive a commitment fee based on the amount of the commitment. Under these arrangements, the Fund may receive a fixed rate commitment fee and, if and to the extent the borrower borrows under the facility, the Fund may receive an additional funding fee.
Unfunded loan commitments and funded loans are marked to market daily.
As of April 30, 2017, the Fund had the following unfunded loan commitment which could be extended at the option of the borrower pursuant to the following loan agreement:
| | |
| Borrower | | Unfunded Loan
Commitment |
Flexpath WH I LLC, Series B3, 9/1/17 | | $ 1,069,909 |
As of April 30, 2017, the Fund had no bridge loan commitments outstanding.
During the six months ended April 30, 2017, the Fund received no commitment fees or additional funding fees.
| | |
| abfunds.com | | AB HIGH INCOME FUND | 129 |
NOTES TO FINANCIAL STATEMENTS (continued)
NOTE E
Capital Stock
Each class consists of 3,000,000,000 authorized shares. Transactions in capital shares for each class were as follows:
| | | | | | | | | | | | | | | | | | | | | | | | |
| | | | | | | | | | | | | | | | | | | | | | | | |
| | | Shares | | | | | | Amount | | | | |
| | | Six Months Ended
April 30, 2017
(unaudited) | | | Year Ended
October 31,
2016 | | | | | | Six Months Ended
April 30, 2017
(unaudited) | | | Year Ended
October 31, 2016 | | | | |
| | | | | | | | |
| Class A | | | | | | | | | | | | | | | | | | | | | | | | |
Shares sold | | | 36,684,278 | | | | 92,509,470 | | | | | | | $ | 320,355,341 | | | $ | 764,584,475 | | | | | |
| | | | | |
Shares issued in reinvestment of dividends | | | 4,467,091 | | | | 10,267,961 | | | | | | | | 39,030,928 | | | | 84,864,368 | | | | | |
| | | | | |
Shares converted from Class B | | | 37,834 | | | | 135,615 | | | | | | | | 330,094 | | | | 1,123,802 | | | | | |
| | | | | |
Shares redeemed | | | (66,432,217 | ) | | | (106,865,022 | ) | | | | | | | (579,061,501 | ) | | | (882,893,379 | ) | | | | |
| | | | | |
Net decrease | | | (25,243,014 | ) | | | (3,951,976 | ) | | | | | | $ | (219,345,138 | ) | | $ | (32,320,734 | ) | | | | |
| | | | | |
| | | | | | | | | | | | | | | | | | | | | | | | |
| Class B | | | | | | | | | | | | | | | | | | | | | | | | |
Shares sold | | | 11,508 | | | | 26,545 | | | | | | | $ | 101,198 | | | $ | 221,766 | | | | | |
| | | | | |
Shares issued in reinvestment of dividends | | | 6,247 | | | | 19,289 | | | | | | | | 55,037 | | | | 160,177 | | | | | |
| | | | | |
Shares converted to Class A | | | (37,490 | ) | | | (134,395 | ) | | | | | | | (330,094 | ) | | | (1,123,801 | ) | | | | |
| | | | | |
Shares redeemed | | | (18,298 | ) | | | (55,551 | ) | | | | | | | (161,951 | ) | | | (467,337 | ) | | | | |
| | | | | |
Net decrease | | | (38,033 | ) | | | (144,112 | ) | | | | | | $ | (335,810 | ) | | $ | (1,209,195 | ) | | | | |
| | | | | |
| | | | | | | | | | | | | | | | | | | | | | | | |
| Class C | | | | | | | | | | | | | | | | | | | | | | | | |
Shares sold | | | 9,697,718 | | | | 30,428,390 | | | | | | | $ | 85,666,569 | | | $ | 255,668,922 | | | | | |
| | | | | |
Shares issued in reinvestment of dividends | | | 2,357,477 | | | | 5,584,459 | | | | | | | | 20,840,298 | | | | 46,633,880 | | | | | |
| | | | | |
Shares redeemed | | | (18,963,618 | ) | | | (36,888,329 | ) | | | | | | | (167,498,648 | ) | | | (307,146,600 | ) | | | | |
| | | | | |
Net decrease | | | (6,908,423 | ) | | | (875,480 | ) | | | | | | $ | (60,991,781 | ) | | $ | (4,843,798 | ) | | | | |
| | | | | |
| | | | | | | | | | | | | | | | | | | | | | | | |
| Advisor Class | | | | | | | | | | | | | | | | | | | | | | | | |
Shares sold | | | 153,356,378 | | | | 289,929,303 | | | | | | | $ | 1,342,438,966 | | | $ | 2,399,740,979 | | | | | |
| | | | | |
Shares issued in reinvestment of dividends | | | 8,199,983 | | | | 14,636,190 | | | | | | | | 71,819,164 | | | | 121,956,110 | | | | | |
| | | | | |
Shares redeemed | | | (121,162,214 | ) | | | (140,062,836 | ) | | | | | | | (1,053,303,801 | ) | | | (1,156,766,613 | ) | | | | |
| | | | | |
Net increase | | | 40,394,147 | | | | 164,502,657 | | | | | | | $ | 360,954,329 | | | $ | 1,364,930,476 | | | | | |
| | | | | |
| | | | | | | | | | | | | | | | | | | | | | | | |
| Class R | | | | | | | | | | | | | | | | | | | | | | | | |
Shares sold | | | 1,384,775 | | | | 3,805,845 | | | | | | | $ | 12,092,807 | | | $ | 31,214,630 | | | | | |
| | | | | |
Shares issued in reinvestment of dividends | | | 293,670 | | | | 674,021 | | | | | | | | 2,566,047 | | | | 5,565,632 | | | | | |
| | | | | |
Shares redeemed | | | (1,648,017 | ) | | | (3,574,022 | ) | | | | | | | (14,386,740 | ) | | | (29,857,922 | ) | | | | |
| | | | | |
Net increase | | | 30,428 | | | | 905,844 | | | | | | | $ | 272,114 | | | $ | 6,922,340 | | | | | |
| | | | | |
| | |
| 130 | AB HIGH INCOME FUND | | abfunds.com |
NOTES TO FINANCIAL STATEMENTS (continued)
| | | | | | | | | | | | | | | | | | | | | | | | |
| | | | | | | | | | | | | | | | | | | | | | | | |
| | | Shares | | | | | | Amount | | | | |
| | | Six Months Ended
April 30, 2017
(unaudited) | | | Year Ended
October 31,
2016 | | | | | | Six Months Ended
April 30, 2017
(unaudited) | | | Year Ended
October 31, 2016 | | | | |
| | | | | | | | |
| Class K | | | | | | | | | | | | | | | | | | | | | | | | |
Shares sold | | | 2,277,847 | | | | 2,492,200 | | | | | | | $ | 19,993,803 | | | $ | 20,729,172 | | | | | |
| | | | | |
Shares issued in reinvestment of dividends | | | 395,072 | | | | 855,500 | | | | | | | | 3,454,203 | | | | 7,069,521 | | | | | |
| | | | | |
Shares redeemed | | | (1,465,722 | ) | | | (2,206,560 | ) | | | | | | | (12,738,766 | ) | | | (18,374,792 | ) | | | | |
| | | | | |
Net increase | | | 1,207,197 | | | | 1,141,140 | | | | | | | $ | 10,709,240 | | | $ | 9,423,901 | | | | | |
| | | | | |
| | | | | | | | | | | | | | | | | | | | | | | | |
| Class I | | | | | | | | | | | | | | | | | | | | | | | | |
Shares sold | | | 2,999,171 | | | | 9,768,594 | | | | | | | $ | 26,245,906 | | | $ | 79,219,657 | | | | | |
| | | | | |
Shares issued in reinvestment of dividends | | | 1,029,394 | | | | 2,315,904 | | | | | | | | 9,013,474 | | | | 19,168,128 | | | | | |
| | | | | |
Shares redeemed | | | (4,128,577 | ) | | | (10,681,656 | ) | | | | | | | (35,928,936 | ) | | | (88,488,832 | ) | | | | |
| | | | | |
Net increase (decrease) | | | (100,012 | ) | | | 1,402,842 | | | | | | | $ | (669,556 | ) | | $ | 9,898,953 | | | | | |
| | | | | |
| | | | | | | | | | | | | | | | | | | | | | | | |
| Class Z | | | | | | | | | | | | | | | | | | | | | | | | |
Shares sold | | | 3,986,654 | | | | 9,472,128 | | | | | | | $ | 35,093,508 | | | $ | 79,652,387 | | | | | |
| | | | | |
Shares issued in reinvestment of dividends | | | 462,575 | | | | 850,531 | | | | | | | | 4,054,144 | | | | 7,041,249 | | | | | |
| | | | | |
Shares redeemed | | | (1,257,865 | ) | | | (6,447,045 | ) | | | | | | | (11,005,559 | ) | | | (53,199,817 | ) | | | | |
| | | | | |
Net increase | | | 3,191,364 | | | | 3,875,614 | | | | | | | $ | 28,142,093 | | | $ | 33,493,819 | | | | | |
| | | | | |
For the year ended October 31, 2016, the Fund received proceeds of $722,706 in connection with a residual distribution from the Alliance Fair Fund relating to regulatory settlements in 2004. This amount is presented in the Fund’s statement of changes in net assets.
NOTE F
Risks Involved in Investing in the Fund
Interest Rate Risk and Credit Risk—Interest rate risk is the risk that changes in interest rates will affect the value of the Fund’s investments in fixed-income debt securities such as bonds or notes. Increases in interest rates may cause the value of the Fund’s investments to decline. Credit risk is the risk that the issuer or guarantor of a debt security, or the counterparty to a derivative contract, will be unable or unwilling to make timely principal and/or interest payments, or to otherwise honor its obligations. The degree of risk for a particular security may be reflected in its credit rating. Credit risk is greater for medium quality and lower-rated securities. Lower-rated debt securities and similar unrated securities (commonly
| | |
| abfunds.com | | AB HIGH INCOME FUND | 131 |
NOTES TO FINANCIAL STATEMENTS (continued)
known as “junk bonds”) have speculative elements or are predominantly speculative risks.
Below Investment Grade Securities Risk—Investments in fixed-income securities with lower ratings (commonly known as “junk bonds”) tend to have a higher probability that an issuer will default or fail to meet its payment obligations. These securities may be subject to greater price volatility due to such factors as specific corporate developments, negative perceptions of the junk bond market generally and less secondary market liquidity.
Duration Risk—Duration is a measure that relates the expected price volatility of a fixed-income security to changes in interest rates. The duration of a fixed-income security may be shorter than or equal to full maturity of a fixed-income security. Fixed-income securities with longer durations have more risk and will decrease in price as interest rates rise. For example, a fixed-income security with a duration of three years will decrease in value by approximately 3% if interest rates increase by 1%.
Inflation Risk—This is the risk that the value of assets or income from investments will be less in the future as inflation decreases the value of money. As inflation increases, the value of the Fund’s assets can decline as can the value of the Fund’s distributions. This risk is significantly greater if the Fund invests a significant portion of its assets in fixed-income securities with longer maturities.
Foreign (Non-U.S.) Risk—Investments in securities of non-U.S. issuers may involve more risk than those of U.S. issuers. These securities may fluctuate more widely in price and may be less liquid due to adverse market, economic, political, regulatory or other factors.
Emerging Market Risk—Investments in emerging market countries may have more risk because the markets are less developed and less liquid, and because these investments may be subject to increased economic, political, regulatory or other uncertainties.
Currency Risk—Fluctuations in currency exchange rates may negatively affect the value of the Fund’s investments or reduce its returns.
Leverage Risk—When the Fund borrows money or otherwise leverages its investments, its performance may be volatile because leverage tends to exaggerate the effect of any increase or decrease in the value of the Fund’s investments. The Fund may create leverage through the use of reverse repurchase arrangements, forward currency exchange contracts, forward commitments, dollar rolls or futures contracts or by borrowing
| | |
| 132 | AB HIGH INCOME FUND | | abfunds.com |
NOTES TO FINANCIAL STATEMENTS (continued)
money. The use of other types of derivative instruments by the Fund, such as options and swaps, may also result in a form of leverage. Leverage may result in higher returns to the Fund than if the Fund were not leveraged, but may also adversely affect returns, particularly if the market is declining.
Derivatives Risk—The Fund may enter into derivative transactions such as forwards, options, futures and swaps. Derivatives may be illiquid, difficult to price, and leveraged so that small changes may produce disproportionate losses for the Fund, and subject to counterparty risk to a greater degree than more traditional investments. Derivatives may result in significant losses, including losses that are far greater than the value of the derivatives reflected on the statement of assets and liabilities.
Liquidity Risk—Liquidity risk occurs when certain investments become difficult to purchase or sell. Difficulty in selling less liquid securities may result in sales at disadvantageous prices affecting the value of your investment in the Fund. Causes of liquidity risk may include low trading volumes, large positions and heavy redemptions of Fund Shares. Over recent years, liquidity risk has also increased because the capacity of dealers in the secondary market for fixed-income securities to make markets in these securities has decreased, even as the overall bond market has grown significantly, due to, among other things, structural changes, additional regulatory requirements and capital and risk restraints that have led to reduced inventories. Liquidity risk may be higher in a rising interest rate environment, when the value and liquidity of fixed-income securities generally decline.
Indemnification Risk—In the ordinary course of business, the Fund enters into contracts that contain a variety of indemnifications. The Fund’s maximum exposure under these arrangements is unknown. However, the Fund has not had prior claims or losses pursuant to these indemnification provisions and expects the risk of loss thereunder to be remote. Therefore, the Fund has not accrued any liability in connection with these indemnification provisions.
NOTE G
Joint Credit Facility
A number of open-end mutual funds managed by the Adviser, including the Fund, participate in a $280 million revolving credit facility (the “Facility”) intended to provide short-term financing if necessary, subject to certain restrictions, in connection with abnormal redemption activity. Commitment fees related to the Facility are paid by the participating funds and are included in miscellaneous expenses in the statement of operations. The Fund did not utilize the Facility during the six months ended April 30, 2017.
| | |
| abfunds.com | | AB HIGH INCOME FUND | 133 |
NOTES TO FINANCIAL STATEMENTS (continued)
NOTE H
Distributions to Shareholders
The tax character of distributions paid for the year ending October 31, 2017 will be determined at the end of the current fiscal year.
The tax character of distributions paid during the fiscal years ended October 31, 2016 and October 31, 2015 were as follows:
| | | | | | | | |
| | | 2016 | | | 2015 | |
Distributions paid from: | | | | | | | | |
Ordinary income | | $ | 463,005,853 | | | $ | 474,509,861 | |
Long-term capital gains | | | – 0 | – | | | 54,743,821 | |
| | | | | | | | |
Total taxable distributions paid | | $ | 463,005,853 | | | $ | 529,253,682 | |
| | | | | | | | |
As of October 31, 2016, the components of accumulated earnings/(deficit) on a tax basis were as follows:
| | | | |
Undistributed ordinary income | | $ | 35,013,890 | |
Accumulated capital and other losses | | | (148,861,647 | )(a) |
Unrealized appreciation/(depreciation) | | | (99,402,440 | )(b) |
| | | | |
Total accumulated earnings/(deficit) | | $ | (213,250,197 | )(c) |
| | | | |
| (a) | As of October 31, 2016, the Fund had a net capital loss carryforward of $148,861,647. |
| (b) | The differences between book-basis and tax-basis unrealized appreciation/(depreciation) are attributable primarily to the tax deferral of losses on wash sales, the difference between book and tax amortization methods for premium, the tax treatment of swaps, passive foreign investment companies (PFICs) and partnerships, and the realization for tax purposes of gains/losses on certain derivative instruments. |
| (c) | The difference between book-basis and tax-basis components of accumulated earnings/(deficit) is attributable primarily to the tax treatment of interest on defaulted securities and dividends payable. |
For tax purposes, net capital losses may be carried over to offset future capital gains, if any. Funds are permitted to carry forward capital losses for an indefinite period, and such losses will retain their character as either short-term or long-term capital losses. As of October 31, 2016, the Fund had a net short-term capital loss carryforward of $34,048,746 and a net long-term capital loss carryforward of $114,812,901 which may be carried forward for an indefinite period.
NOTE I
Other
In October 2016, the U.S. Securities and Exchange Commission adopted new rules and amended existing rules (together, “final rules”) intended to modernize the reporting and disclosure of information by registered investment companies. In part, the final rules amend Regulation S-X and require standardized, enhanced disclosure about derivatives in investment company financial statements, as well as other amendments. The compliance date for the amendments to Regulation S-X is August 1, 2017.
| | |
| 134 | AB HIGH INCOME FUND | | abfunds.com |
NOTES TO FINANCIAL STATEMENTS (continued)
Management is currently evaluating the impact that the adoption of the amendments to Regulation S-X will have on the financial statements and related disclosures.
NOTE J
Recent Accounting Pronouncements
In March 2017, the Financial Accounting Standards Board issued an Accounting Standards Update, ASU 2017-08, Receivables—Nonrefundable Fees and Other Costs (Subtopic 310-20), Premium Amortization on Purchased Callable Debt Securities (the “ASU”) which amends the amortization period for certain purchased callable debt securities held at a premium, shortening such period to the earliest call date. The ASU does not require any accounting change for debt securities held at a discount; the discount continues to be amortized to maturity. The ASU is effective for fiscal years, and interim periods within those fiscal years, beginning after December 15, 2018. At this time, management is evaluating the implications of these changes on the financial statements.
NOTE K
Subsequent Events
Management has evaluated subsequent events for possible recognition or disclosure in the financial statements through the date the financial statements are issued. Management has determined that there are no material events that would require disclosure in the Fund’s financial statements through this date.
| | |
| abfunds.com | | AB HIGH INCOME FUND | 135 |
FINANCIAL HIGHLIGHTS
Selected Data For A Share Of Capital Stock Outstanding Throughout Each Period
| | | | | | | | | | | | | | | | | | | | | | | | |
| | | Class A | |
| | | Six Months
Ended
April 30,
2017
(unaudited) | | | Year Ended October 31, | |
| | | | 2016 | | | 2015 | | | 2014 | | | 2013 | | | 2012 | |
| | | | |
| | | | | | | | | | | | | | | | | | | | | | | | |
Net asset value, beginning of period | | | $ 8.65 | | | | $ 8.50 | | | | $ 9.40 | | | | $ 9.53 | | | | $ 9.38 | | | | $ 8.73 | |
| | | | |
Income From Investment Operations | | | | | | | | | | | | | | | | | | | | | | | | |
Net investment income(a) | | | .23 | (b) | | | .48 | (b) | | | .51 | | | | .55 | | | | .60 | | | | .56 | |
Net realized and unrealized gain (loss) on investment and foreign currency transactions | | | .32 | | | | .27 | | | | (.69 | ) | | | (.03 | ) | | | .20 | | | | .70 | |
Contributions from Affiliates | | | – 0 | – | | | .00 | (c) | | | – 0 | – | | | – 0 | – | | | – 0 | – | | | – 0 | – |
Capital Contributions | | | – 0 | – | | | .00 | (c) | | | – 0 | – | | | – 0 | – | | | – 0 | – | | | – 0 | – |
| | | | |
Net increase (decrease) in net asset value from operations | | | .55 | | | | .75 | | | | (.18 | ) | | | .52 | | | | .80 | | | | 1.26 | |
| | | | |
Less: Dividends and Distributions | | | | | | | | | | | | | | | | | | | | | | | | |
Dividends from net investment income | | | (.28 | ) | | | (.60 | ) | | | (.64 | ) | | | (.60 | ) | | | (.65 | ) | | | (.61 | ) |
Distributions from net realized gain on investment and foreign currency transactions | | | – 0 | – | | | – 0 | – | | | (.08 | ) | | | (.05 | ) | | | – 0 | – | | | – 0 | – |
| | | | |
Total dividends and distributions | | | (.28 | ) | | | (.60 | ) | | | (.72 | ) | | | (.65 | ) | | | (.65 | ) | | | (.61 | ) |
| | | | |
Net asset value, end of period | | | $ 8.92 | | | | $ 8.65 | | | | $ 8.50 | | | | $ 9.40 | | | | $ 9.53 | | | | $ 9.38 | |
| | | | |
Total Return | | | | | | | | | | | | | | | | | | | | | | | | |
Total investment return based on net asset value(d) | | | 6.43 | %* | | | 9.41 | %* | | | (1.98 | )% | | | 5.62 | % | | | 8.78 | %† | | | 15.03 | %* |
Ratios/Supplemental Data | | | | | | | | | | | | | | | | | | | | | | | | |
Net assets, end of period (000’s omitted) | | | $1,901,383 | | | | $2,061,177 | | | | $2,059,111 | | | | $2,320,748 | | | | $2,587,763 | | | | $2,464,634 | |
Ratio to average net assets of: | | | | | | | | | | | | | | | | | | | | | | | | |
Expenses, net of waivers/reimbursements(e)(f) | | | .80 | %(g) | | | .84 | % | | | .90 | % | | | .89 | % | | | .90 | % | | | .91 | % |
Expenses, before waivers/reimbursements(e)(f) | | | .80 | %(g) | | | .85 | % | | | .90 | % | | | .89 | % | | | .90 | % | | | .91 | % |
Net investment income | | | 5.30 | %(b)(g) | | | 5.75 | %(b) | | | 5.77 | % | | | 5.80 | % | | | 6.25 | % | | | 6.22 | % |
Portfolio turnover rate | | | 32 | % | | | 45 | % | | | 53 | % | | | 38 | % | | | 38 | % | | | 42 | % |
See footnote summary on pages 144-145.
| | |
| 136 | AB HIGH INCOME FUND | | abfunds.com |
FINANCIAL HIGHLIGHTS (continued)
Selected Data For A Share Of Capital Stock Outstanding Throughout Each Period
| | | | | | | | | | | | | | | | | | | | | | | | |
| | | Class B | |
| | | Six Months
Ended
April 30,
2017
(unaudited) | | | Year Ended October 31, | |
| | | 2016 | | | 2015 | | | 2014 | | | 2013 | | | 2012 | |
| | | | |
| | | | | | | | | | | | | | | | | | | | | | | | |
Net asset value, beginning of period | | | $ 8.72 | | | | $ 8.57 | | | | $ 9.49 | | | | $ 9.62 | | | | $ 9.46 | | | | $ 8.80 | |
| | | | |
Income From Investment Operations | | | | | | | | | | | | | | | | | | | | | | | | |
Net investment income(a) | | | .20 | (b) | | | .42 | (b) | | | .45 | | | | .48 | | | | .53 | | | | .50 | |
Net realized and unrealized gain (loss) on investment and foreign currency transactions | | | .32 | | | | .26 | | | | (.71 | ) | | | (.03 | ) | | | .21 | | | | .71 | |
Contributions from Affiliates | | | – 0 | – | | | .00 | (c) | | | – 0 | – | | | – 0 | – | | | – 0 | – | | | – 0 | – |
Capital Contributions | | | – 0 | – | | | .00 | (c) | | | – 0 | – | | | – 0 | – | | | – 0 | – | | | – 0 | – |
| | | | |
Net increase (decrease) in net asset value from operations | | | .52 | | | | .68 | | | | (.26 | ) | | | .45 | | | | .74 | | | | 1.21 | |
| | | | |
Less: Dividends and Distributions | | | | | | | | | | | | | | | | | | | | | | | | |
Dividends from net investment income | | | (.24 | ) | | | (.53 | ) | | | (.58 | ) | | | (.53 | ) | | | (.58 | ) | | | (.55 | ) |
Distributions from net realized gain on investment and foreign currency transactions | | | – 0 | – | | | – 0 | – | | | (.08 | ) | | | (.05 | ) | | | – 0 | – | | | – 0 | – |
| | | | |
Total dividends and distributions | | | (.24 | ) | | | (.53 | ) | | | (.66 | ) | | | (.58 | ) | | | (.58 | ) | | | (.55 | ) |
| | | | |
Net asset value, end of period | | | $ 9.00 | | | | $ 8.72 | | | | $ 8.57 | | | | $ 9.49 | | | | $ 9.62 | | | | $ 9.46 | |
| | | | |
Total Return | | | | | | | | | | | | | | | | | | | | | | | | |
Total investment return based on net asset value(d) | | | 6.08 | %* | | | 8.48 | %* | | | (2.89 | )% | | | 4.82 | % | | | 8.06 | %† | | | 14.26 | %* |
Ratios/Supplemental Data | | | | | | | | | | | | | | | | | | | | | | | | |
Net assets, end of period (000’s omitted) | | | $2,089 | | | | $2,357 | | | | $3,551 | | | | $7,526 | | | | $13,008 | | | | $19,591 | |
Ratio to average net assets of: | | | | | | | | | | | | | | | | | | | | | | | | |
Expenses, net of waivers/reimbursements(e)(f) | | | 1.58 | %(g) | | | 1.63 | % | | | 1.63 | % | | | 1.60 | % | | | 1.61 | % | | | 1.64 | % |
Expenses, before waivers/reimbursements(e)(f) | | | 1.58 | %(g) | | | 1.63 | % | | | 1.63 | % | | | 1.60 | % | | | 1.61 | % | | | 1.64 | % |
Net investment income | | | 4.47 | %(b)(g) | | | 5.01 | %(b) | | | 4.95 | % | | | 5.05 | % | | | 5.50 | % | | | 5.51 | % |
Portfolio turnover rate | | | 32 | % | | | 45 | % | | | 53 | % | | | 38 | % | | | 38 | % | | | 42 | % |
See footnote summary on pages 144-145.
| | |
| abfunds.com | | AB HIGH INCOME FUND | 137 |
FINANCIAL HIGHLIGHTS (continued)
Selected Data For A Share Of Capital Stock Outstanding Throughout Each Period
| | | | | | | | | | | | | | | | | | | | | | | | |
| | | Class C | |
| | | Six Months
Ended
April 30,
2017
(unaudited) | | | Year Ended October 31, | |
| | | 2016 | | | 2015 | | | 2014 | | | 2013 | | | 2012 | |
| | | | |
| | | | | | | | | | | | | | | | | | | | | | | | |
Net asset value, beginning of period | | | $ 8.75 | | | | $ 8.60 | | | | $ 9.51 | | | | $ 9.64 | | | | $ 9.48 | | | | $ 8.83 | |
| | | | |
Income From Investment Operations | | | | | | | | | | | | | | | | | | | | | | | | |
Net investment income(a) | | | .20 | (b) | | | .42 | (b) | | | .45 | | | | .48 | | | | .53 | | | | .49 | |
Net realized and unrealized gain (loss) on investment and foreign currency transactions | | | .32 | | | | .27 | | | | (.70 | ) | | | (.03 | ) | | | .21 | | | | .71 | |
Contributions from Affiliates | | | – 0 | – | | | .00 | (c) | | | – 0 | – | | | – 0 | – | | | – 0 | – | | | – 0 | – |
Capital Contributions | | | – 0 | – | | | .00 | (c) | | | – 0 | – | | | – 0 | – | | | – 0 | – | | | – 0 | – |
| | | | |
Net increase (decrease) in net asset value from operations | | | .52 | | | | .69 | | | | (.25 | ) | | | .45 | | | | .74 | | | | 1.20 | |
| | | | |
Less: Dividends and Distributions | | | | | | | | | | | | | | | | | | | | | | | | |
Dividends from net investment income | | | (.24 | ) | | | (.54 | ) | | | (.58 | ) | | | (.53 | ) | | | (.58 | ) | | | (.55 | ) |
Distributions from net realized gain on investment and foreign currency transactions | | | – 0 | – | | | – 0 | – | | | (.08 | ) | | | (.05 | ) | | | – 0 | – | | | – 0 | – |
| | | | |
Total dividends and distributions | | | (.24 | ) | | | (.54 | ) | | | (.66 | ) | | | (.58 | ) | | | (.58 | ) | | | (.55 | ) |
| | | | |
Net asset value, end of period | | | $ 9.03 | | | | $ 8.75 | | | | $ 8.60 | | | | $ 9.51 | | | | $ 9.64 | | | | $ 9.48 | |
| | | | |
Total Return | | | | | | | | | | | | | | | | | | | | | | | | |
Total investment return based on net asset value(d) | | | 6.08 | %* | | | 8.50 | %* | | | (2.74 | )% | | | 4.82 | % | | | 8.04 | %† | | | 14.05 | %* |
Ratios/Supplemental Data | | | | | | | | | | | | | | | | | | | | | | | | |
Net assets, end of period (000’s omitted) | | | $1,277,231 | | | | $1,298,312 | | | | $1,283,192 | | | | $1,504,398 | | | | $1,379,727 | | | | $1,213,954 | |
Ratio to average net assets of: | | | | | | | | | | | | | | | | | | | | | | | | |
Expenses, net of waivers/reimbursements(e)(f) | | | 1.54 | %(g) | | | 1.58 | % | | | 1.60 | % | | | 1.58 | % | | | 1.60 | % | | | 1.61 | % |
Expenses, before waivers/reimbursements(e)(f) | | | 1.55 | %(g) | | | 1.58 | % | | | 1.60 | % | | | 1.58 | % | | | 1.60 | % | | | 1.61 | % |
Net investment income | | | 4.49 | %(b)(g) | | | 4.94 | %(b) | | | 5.00 | % | | | 5.03 | % | | | 5.48 | % | | | 5.42 | % |
Portfolio turnover rate | | | 32 | % | | | 45 | % | | | 53 | % | | | 38 | % | | | 38 | % | | | 42 | % |
See footnote summary on pages 144-145.
| | |
| 138 | AB HIGH INCOME FUND | | abfunds.com |
FINANCIAL HIGHLIGHTS (continued)
Selected Data For A Share Of Capital Stock Outstanding Throughout Each Period
| | | | | | | | | | | | | | | | | | | | | | | | |
| | | Advisor Class | |
| | | Six Months
Ended
April 30,
2017
(unaudited) | | | Year Ended October 31, | |
| | | 2016 | | | 2015 | | | 2014 | | | 2013 | | | 2012 | |
| | | | |
| | | | | | | | | | | | | | | | | | | | | | | | |
Net asset value, beginning of period | | | $ 8.66 | | | | $ 8.51 | | | | $ 9.42 | | | | $ 9.55 | | | | $ 9.39 | | | | $ 8.74 | |
| | | | |
Income From Investment Operations | | | | | | | | | | | | | | | | | | | | | | | | |
Net investment income(a) | | | .24 | (b) | | | .49 | (b) | | | .54 | | | | .58 | | | | .62 | | | | .58 | |
Net realized and unrealized gain (loss) on investment and foreign currency transactions | | | .32 | | | | .28 | | | | (.70 | ) | | | (.03 | ) | | | .22 | | | | .71 | |
Contributions from Affiliates | | | – 0 | – | | | .00 | (c) | | | – 0 | – | | | – 0 | – | | | – 0 | – | | | – 0 | – |
Capital Contributions | | | – 0 | – | | | .00 | (c) | | | – 0 | – | | | – 0 | – | | | – 0 | – | | | – 0 | – |
| | | | |
Net increase (decrease) in net asset value from operations | | | .56 | | | | .77 | | | | (.16 | ) | | | .55 | | | | .84 | | | | 1.29 | |
| | | | |
Less: Dividends and Distributions | | | | | | | | | | | | | | | | | | | | | | | | |
Dividends from net investment income | | | (.29 | ) | | | (.62 | ) | | | (.67 | ) | | | (.63 | ) | | | (.68 | ) | | | (.64 | ) |
Distributions from net realized gain on investment and foreign currency transactions | | | – 0 | – | | | – 0 | – | | | (.08 | ) | | | (.05 | ) | | | – 0 | – | | | – 0 | – |
| | | | |
Total dividends and distributions | | | (.29 | ) | | | (.62 | ) | | | (.75 | ) | | | (.68 | ) | | | (.68 | ) | | | (.64 | ) |
| | | | |
Net asset value, end of period | | | $ 8.93 | | | | $ 8.66 | | | | $ 8.51 | | | | $ 9.42 | | | | $ 9.55 | | | | $ 9.39 | |
| | | | |
Total Return | | | | | | | | | | | | | | | | | | | | | | | | |
Total investment return based on net asset value(d) | | | 6.55 | %* | | | 9.69 | %* | | | (1.78 | )% | | | 5.93 | % | | | 9.23 | %† | | | 15.37 | %* |
Ratios/Supplemental Data | | | | | | | | | | | | | | | | | | | | | | | | |
Net assets, end of period (000’s omitted) | | | $4,310,265 | | | | $3,828,042 | | | | $2,362,066 | | | | $2,473,475 | | | | $1,754,585 | | | | $1,346,510 | |
Ratio to average net assets of: | | | | | | | | | | | | | | | | | | | | | | | | |
Expenses, net of waivers/reimbursements(e)(f) | | | .55 | %(g) | | | .58 | % | | | .60 | % | | | .58 | % | | | .61 | % | | | .60 | % |
Expenses, before waivers/reimbursements(e)(f) | | | .55 | %(g) | | | .58 | % | | | .60 | % | | | .58 | % | | | .61 | % | | | .60 | % |
Net investment income | | | 5.54 | %(b)(g) | | | 5.87 | %(b) | | | 6.05 | % | | | 6.06 | % | | | 6.54 | % | | | 6.46 | % |
Portfolio turnover rate | | | 32 | % | | | 45 | % | | | 53 | % | | | 38 | % | | | 38 | % | | | 42 | % |
See footnote summary on pages 144-145.
| | |
| abfunds.com | | AB HIGH INCOME FUND | 139 |
FINANCIAL HIGHLIGHTS (continued)
Selected Data For A Share Of Capital Stock Outstanding Throughout Each Period
| | | | | | | | | | | | | | | | | | | | | | | | |
| | | Class R | |
| | | Six Months
Ended
April 30,
2017
(unaudited) | | | Year Ended October 31, | |
| | | 2016 | | | 2015 | | | 2014 | | | 2013 | | | 2012 | |
| | | | |
| | | | | | | | | | | | | | | | | | | | | | | | |
Net asset value, beginning of period | | | $ 8.64 | | | | $ 8.49 | | | | $ 9.40 | | | | $ 9.53 | | | | $ 9.38 | | | | $ 8.73 | |
| | | | |
Income From Investment Operations | | | | | | | | | | | | | | | | | | | | | | | | |
Net investment income(a) | | | .21 | (b) | | | .45 | (b) | | | .48 | | | | .52 | | | | .56 | | | | .53 | |
Net realized and unrealized gain (loss) on investment and foreign currency transactions | | | .33 | | | | .27 | | | | (.70 | ) | | | (.03 | ) | | | .21 | | | | .71 | |
Contributions from Affiliates | | | – 0 | – | | | .00 | (c) | | | – 0 | – | | | – 0 | – | | | – 0 | – | | | – 0 | – |
Capital Contributions | | | – 0 | – | | | .00 | (c) | | | – 0 | – | | | – 0 | – | | | – 0 | – | | | – 0 | – |
| | | | |
Net increase (decrease) in net asset value from operations | | | .54 | | | | .72 | | | | (.22 | ) | | | .49 | | | | .77 | | | | 1.24 | |
| | | | |
Less: Dividends and Distributions | | | | | | | | | | | | | | | | | | | | | | | | |
Dividends from net investment income | | | (.26 | ) | | | (.57 | ) | | | (.61 | ) | | | (.57 | ) | | | (.62 | ) | | | (.59 | ) |
Distributions from net realized gain on investment and foreign currency transactions | | | – 0 | – | | | – 0 | – | | | (.08 | ) | | | (.05 | ) | | | – 0 | – | | | – 0 | – |
| | | | |
Total dividends and distributions | | | (.26 | ) | | | (.57 | ) | | | (.69 | ) | | | (.62 | ) | | | (.62 | ) | | | (.59 | ) |
| | | | |
Net asset value, end of period | | | $ 8.92 | | | | $ 8.64 | | | | $ 8.49 | | | | $ 9.40 | | | | $ 9.53 | | | | $ 9.38 | |
| | | | |
Total Return | | | | | | | | | | | | | | | | | | | | | | | | |
Total investment return based on net asset value(d) | | | 6.35 | %* | | | 9.01 | %* | | | (2.44 | )% | | | 5.27 | % | | | 8.42 | %† | | | 14.66 | %* |
Ratios/Supplemental Data | | | | | | | | | | | | | | | | | | | | | | | | |
Net assets, end of period (000’s omitted) | | | $89,061 | | | | $86,059 | | | | $76,876 | | | | $77,706 | | | | $65,429 | | | | $46,615 | |
Ratio to average net assets of: | | | | | | | | | | | | | | | | | | | | | | | | |
Expenses, net of waivers/reimbursements(e)(f) | | | 1.19 | %(g) | | | 1.22 | % | | | 1.27 | % | | | 1.23 | % | | | 1.25 | % | | | 1.24 | % |
Expenses, before waivers/reimbursements(e)(f) | | | 1.20 | %(g) | | | 1.22 | % | | | 1.27 | % | | | 1.23 | % | | | 1.25 | % | | | 1.26 | % |
Net investment income | | | 4.92 | %(b)(g) | | | 5.39 | %(b) | | | 5.41 | % | | | 5.46 | % | | | 5.92 | % | | | 5.87 | % |
Portfolio turnover rate | | | 32 | % | | | 45 | % | | | 53 | % | | | 38 | % | | | 38 | % | | | 42 | % |
See footnote summary on pages 144-145.
| | |
| 140 | AB HIGH INCOME FUND | | abfunds.com |
FINANCIAL HIGHLIGHTS (continued)
Selected Data For A Share Of Capital Stock Outstanding Throughout Each Period
| | | | | | | | | | | | | | | | | | | | | | | | |
| | | Class K | |
| | | Six Months
Ended
April 30,
2017
(unaudited) | | | Year Ended October 31, | |
| | | 2016 | | | 2015 | | | 2014 | | | 2013 | | | 2012 | |
| | | | |
| | | | | | | | | | | | | | | | | | | | | | | | |
Net asset value, beginning of period | | | $ 8.65 | | | | $ 8.50 | | | | $ 9.41 | | | | $ 9.54 | | | | $ 9.38 | | | | $ 8.73 | |
| | | | |
Income From Investment Operations | | | | | | | | | | | | | | | | | | | | | | | | |
Net investment income(a) | | | .23 | (b) | | | .48 | (b) | | | .51 | | | | .55 | | | | .60 | | | | .55 | (b) |
Net realized and unrealized gain (loss) on investment and foreign currency transactions | | | .31 | | | | .27 | | | | (.70 | ) | | | (.03 | ) | | | .22 | | | | .71 | |
Contributions from Affiliates | | | – 0 | – | | | .00 | (c) | | | – 0 | – | | | – 0 | – | | | – 0 | – | | | – 0 | – |
Capital Contributions | | | – 0 | – | | | .00 | (c) | | | – 0 | – | | | – 0 | – | | | – 0 | – | | | – 0 | – |
| | | | |
Net increase (decrease) in net asset value from operations | | | .54 | | | | .75 | | | | (.19 | ) | | | .52 | | | | .82 | | | | 1.26 | |
| | | | |
Less: Dividends and Distributions | | | | | | | | | | | | | | | | | | | | | | | | |
Dividends from net investment income | | | (.27 | ) | | | (.60 | ) | | | (.64 | ) | | | (.60 | ) | | | (.66 | ) | | | (.61 | ) |
Distributions from net realized gain on investment and foreign currency transactions | | | – 0 | – | | | – 0 | – | | | (.08 | ) | | | (.05 | ) | | | – 0 | – | | | – 0 | – |
| | | | |
Total dividends and distributions | | | (.27 | ) | | | (.60 | ) | | | (.72 | ) | | | (.65 | ) | | | (.66 | ) | | | (.61 | ) |
| | | | |
Net asset value, end of period | | | $ 8.92 | | | | $ 8.65 | | | | $ 8.50 | | | | $ 9.41 | | | | $ 9.54 | | | | $ 9.38 | |
| | | | |
Total Return | | | | | | | | | | | | | | | | | | | | | | | | |
Total investment return based on net asset value(d) | | | 6.39 | %* | | | 9.41 | %* | | | (2.12 | )% | | | 5.63 | % | | | 8.93 | %† | | | 15.02 | %* |
Ratios/Supplemental Data | | | | | | | | | | | | | | | | | | | | | | | | |
Net assets, end of period (000’s omitted) | | | $121,000 | | | | $106,841 | | | | $95,294 | | | | $83,634 | | | | $52,132 | | | | $19,161 | |
Ratio to average net assets of: | | | | | | | | | | | | | | | | | | | | | | | | |
Expenses, net of waivers/reimbursements(e)(f) | | | .87 | %(g) | | | .85 | % | | | .94 | % | | | .88 | % | | | .89 | % | | | .91 | % |
Expenses, before waivers/reimbursements(e)(f) | | | .87 | %(g) | | | .85 | % | | | .94 | % | | | .88 | % | | | .89 | % | | | .93 | % |
Net investment income | | | 5.24 | %(b)(g) | | | 5.75 | %(b) | | | 5.74 | % | | | 5.79 | % | | | 6.28 | % | | | 6.09 | % |
Portfolio turnover rate | | | 32 | % | | | 45 | % | | | 53 | % | | | 38 | % | | | 38 | % | | | 42 | % |
See footnote summary on pages 144-145.
| | |
| abfunds.com | | AB HIGH INCOME FUND | 141 |
FINANCIAL HIGHLIGHTS (continued)
Selected Data For A Share Of Capital Stock Outstanding Throughout Each Period
| | | | | | | | | | | | | | | | | | | | | | | | |
| | | Class I | |
| | | Six Months
Ended
April 30,
2017
(unaudited) | | | Year Ended October 31, | |
| | | 2016 | | | 2015 | | | 2014 | | | 2013 | | | 2012 | |
| | | | |
| | | | | | | | | | | | | | | | | | | | | | | | |
Net asset value, beginning of period | | | $ 8.66 | | | | $ 8.51 | | | | $ 9.42 | | | | $ 9.55 | | | | $ 9.39 | | | | $ 8.74 | |
| | | | |
Income From Investment Operations | | | | | | | | | | | | | | | | | | | | | | | | |
Net investment income(a) | | | .24 | (b) | | | .50 | (b) | | | .54 | | | | .58 | | | | .63 | | | | .59 | |
Net realized and unrealized gain (loss) on investment and foreign currency transactions | | | .32 | | | | .28 | | | | (.70 | ) | | | (.03 | ) | | | .22 | | | | .71 | |
Contributions from Affiliates | | | – 0 | – | | | .00 | (c) | | | – 0 | – | | | – 0 | – | | | – 0 | – | | | – 0 | – |
Capital Contributions | | | – 0 | – | | | .00 | (c) | | | – 0 | – | | | – 0 | – | | | – 0 | – | | | – 0 | – |
| | | | |
Net increase (decrease) in net asset value from operations | | | .56 | | | | .78 | | | | (.16 | ) | | | .55 | | | | .85 | | | | 1.30 | |
| | | | |
Less: Dividends and Distributions | | | | | | | | | | | | | | | | | | | | | | | | |
Dividends from net investment income | | | (.29 | ) | | | (.63 | ) | | | (.67 | ) | | | (.63 | ) | | | (.69 | ) | | | (.65 | ) |
Distributions from net realized gain on investment and foreign currency transactions | | | – 0 | – | | | – 0 | – | | | (.08 | ) | | | (.05 | ) | | | – 0 | – | | | – 0 | – |
| | | | |
Total dividends and distributions | | | (.29 | ) | | | (.63 | ) | | | (.75 | ) | | | (.68 | ) | | | (.69 | ) | | | (.65 | ) |
| | | | |
Net asset value, end of period | | | $ 8.93 | | | | $ 8.66 | | | | $ 8.51 | | | | $ 9.42 | | | | $ 9.55 | | | | $ 9.39 | |
| | | | |
Total Return | | | | | | | | | | | | | | | | | | | | | | | | |
Total investment return based on net asset value(d) | | | 6.57 | %* | | | 9.74 | %* | | | (1.74 | )% | | | 5.97 | % | | | 9.30 | %† | | | 15.42 | %* |
Ratios/Supplemental
Data | | | | | | | | | | | | | | | | | | | | | | | | |
Net assets, end of period
(000’s omitted) | | | $303,154 | | | | $294,693 | | | | $277,654 | | | | $114,598 | | | | $104,128 | | | | $66,608 | |
Ratio to average net assets of: | | | | | | | | | | | | | | | | | | | | | | | | |
Expenses, net of waivers/reimbursements(e)(f) | | | .52 | %(g) | | | .53 | % | | | .54 | % | | | .54 | % | | | .53 | % | | | .56 | % |
Expenses, before waivers/reimbursements(e)(f) | | | .53 | %(g) | | | .53 | % | | | .54 | % | | | .54 | % | | | .53 | % | | | .56 | % |
Net investment income | | | 5.58 | %(b)(g) | | | 6.06 | %(b) | | | 6.11 | % | | | 6.08 | % | | | 6.61 | % | | | 6.55 | % |
Portfolio turnover rate | | | 32 | % | | | 45 | % | | | 53 | % | | | 38 | % | | | 38 | % | | | 42 | % |
| See | footnote summary on pages 144-145. |
| | |
| 142 | AB HIGH INCOME FUND | | abfunds.com |
FINANCIAL HIGHLIGHTS (continued)
Selected Data For A Share Of Capital Stock Outstanding Throughout Each Period
| | | | | | | | | | | | | | | | | | | | |
| | | Class Z | |
| | | Six Months
Ended
April 30,
2017
(unaudited) | | | Year Ended October 31, | | | October 15,
2013(h) to
October 31,
2013 | |
| | | | 2016 | | | 2015 | | | 2014 | | |
| | | | |
| | | | | | | | | | | | | | | | | | | | |
Net asset value, beginning of period | | | $ 8.66 | | | | $ 8.51 | | | | $ 9.42 | | | | $ 9.55 | | | | $ 9.43 | |
| | | | |
Income From Investment Operations | | | | | | | | | | | | | | | | | | | | |
Net investment income (loss)(a) | | | .24 | (b) | | | .50 | (b) | | | .55 | | | | .58 | | | | (.02 | ) |
Net realized and unrealized gain (loss) on investment and foreign currency transactions | | | .32 | | | | .28 | | | | (.71 | ) | | | (.03 | ) | | | .17 | |
Contributions from Affiliates | | | – 0 | – | | | .00 | (c) | | | – 0 | – | | | – 0 | – | | | – 0 | – |
Capital Contributions | | | – 0 | – | | | .00 | (c) | | | – 0 | – | | | – 0 | – | | | – 0 | – |
| | | | |
Net increase (decrease) in net asset value from operations | | | .56 | | | | .78 | | | | (.16 | ) | | | .55 | | | | .15 | |
| | | | |
Less: Dividends and Distributions | | | | | | | | | | | | | | | | | | | | |
Dividends from net investment income | | | (.29 | ) | | | (.63 | ) | | | (.67 | ) | | | (.63 | ) | | | (.03 | ) |
Distributions from net realized gain on investment and foreign currency transactions | | | – 0 | – | | | – 0 | – | | | (.08 | ) | | | (.05 | ) | | | – 0 | – |
| | | | |
Total dividends and distributions | | | (.29 | ) | | | (.63 | ) | | | (.75 | ) | | | (.68 | ) | | | (.03 | ) |
| | | | |
Net asset value, end of period | | | $ 8.93 | | | | $ 8.66 | | | | $ 8.51 | | | | $ 9.42 | | | | $ 9.55 | |
| | | | |
Total Return | | | | | | | | | | | | | | | | | | | | |
Total investment return based on net asset value(d) | | | 6.58 | %* | | | 9.76 | %* | | | (1.72 | )% | | | 6.00 | % | | | 1.59 | % |
Ratios/Supplemental
Data | | | | | | | | | | | | | | | | | | | | |
Net assets, end of period
(000’s omitted) | | | $144,947 | | | | $112,852 | | | | $77,916 | | | | $47,059 | | | | $10 | |
Ratio to average net assets of: | | | | | | | | | | | | | | | | | | | | |
Expenses, net of waivers/reimbursements(e)(f) | | | .49 | %(g) | | | .51 | % | | | .53 | % | | | .52 | % | | | .56 | %(g) |
Expenses, before waivers/reimbursements(e)(f) | | | .49 | %(g) | | | .51 | % | | | .53 | % | | | .52 | % | | | .56 | %(g) |
Net investment income (loss) | | | 5.61 | %(b)(g) | | | 6.07 | %(b) | | | 6.15 | % | | | 6.13 | % | | | (3.74 | )%(g) |
Portfolio turnover rate | | | 32 | % | | | 45 | % | | | 53 | % | | | 38 | % | | | 38 | % |
See footnote summary on pages 144-145.
| | |
| abfunds.com | | AB HIGH INCOME FUND | 143 |
FINANCIAL HIGHLIGHTS (continued)
| (a) | Based on average shares outstanding. |
| (b) | Net of expenses waived/reimbursed by the Adviser. |
| (c) | Amount is less than $0.005. |
| (d) | Total investment return is calculated assuming an initial investment made at the net asset value at the beginning of the period, reinvestment of all dividends and distributions at net asset value during the period, and redemption on the last day of the period. Initial sales charge or contingent deferred sales charge is not reflected in the calculation of total investment return. Total investment return does not reflect the deduction of taxes that a shareholder would pay on fund distributions or the redemption of fund shares. Total investment return for a period of less than one year is not annualized. |
| (e) | In connection with the Fund’s investments in affiliated underlying portfolios, the Fund incurs no direct expenses but bears proportionate shares of the acquired fund fees and expenses (i.e. operating, administrative and investment advisory fees) of the affiliated underlying portfolios. The Adviser has contractually agreed to waive its fees from the Fund in an amount equal to the Fund’s pro rata share of certain acquired fund fees and expenses, and for the six months ended April 30, 2017, such waiver amounted to 0.01% annualized for the Fund. |
| (f) | The expense ratios presented below exclude interest expense: |
| | | | | | | | | | | | | | | | | | | | | | | | |
| | | Six Months
Ended
April 30,
2017 (unaudited) | | | Year Ended October 31, | |
| | | | 2016 | | | 2015 | | | 2014 | | | 2013 | | | 2012 | |
| | | | |
Class A | | | | | | | | | | | | | | | | | | | | | | | | |
Net of waivers/reimbursements | | | .79 | % | | | .84 | % | | | .88 | % | | | .88 | % | | | .90 | % | | | .90 | % |
Before waivers/reimbursements | | | .80 | % | | | .85 | % | | | .88 | % | | | .88 | % | | | .90 | % | | | .90 | % |
Class B | | | | | | | | | | | | | | | | | | | | | | | | |
Net of waivers/reimbursements | | | 1.57 | % | | | 1.63 | % | | | 1.61 | % | | | 1.60 | % | | | 1.61 | % | | | 1.64 | % |
Before waivers/reimbursements | | | 1.58 | % | | | 1.63 | % | | | 1.61 | % | | | 1.60 | % | | | 1.61 | % | | | 1.64 | % |
Class C | | | | | | | | | | | | | | | | | | | | | | | | |
Net of waivers/reimbursements | | | 1.54 | % | | | 1.58 | % | | | 1.58 | % | | | 1.58 | % | | | 1.60 | % | | | 1.60 | % |
Before waivers/reimbursements | | | 1.55 | % | | | 1.58 | % | | | 1.58 | % | | | 1.58 | % | | | 1.60 | % | | | 1.60 | % |
Advisor Class | | | | | | | | | | | | | | | | | | | | | | | | |
Net of waivers/reimbursements | | | .54 | % | | | .58 | % | | | .58 | % | | | .58 | % | | | .60 | % | | | .60 | % |
Before waivers/reimbursements | | | .55 | % | | | .58 | % | | | .58 | % | | | .58 | % | | | .60 | % | | | .60 | % |
Class R | | | | | | | | | | | | | | | | | | | | | | | | |
Net of waivers/reimbursements | | | 1.19 | % | | | 1.22 | % | | | 1.25 | % | | | 1.23 | % | | | 1.25 | % | | | 1.24 | % |
Before waivers/reimbursements | | | 1.20 | % | | | 1.22 | % | | | 1.25 | % | | | 1.23 | % | | | 1.25 | % | | | 1.26 | % |
Class K | | | | | | | | | | | | | | | | | | | | | | | | |
Net of waivers/reimbursements | | | .86 | % | | | .85 | % | | | .92 | % | | | .88 | % | | | .89 | % | | | .91 | % |
Before waivers/reimbursements | | | .87 | % | | | .85 | % | | | .92 | % | | | .88 | % | | | .89 | % | | | .93 | % |
Class I | | | | | | | | | | | | | | | | | | | | | | | | |
Net of waivers/reimbursements | | | .52 | % | | | .53 | % | | | .52 | % | | | .54 | % | | | .53 | % | | | .56 | % |
Before waivers/reimbursements | | | .52 | % | | | .53 | % | | | .52 | % | | | .54 | % | | | .53 | % | | | .56 | % |
| | | | | | | | | | | | | | | | | | | | |
| | | Six Months
Ended
April 30, 2017
(unaudited) | | | Year Ended October 31, | | | October 15,
2013(h) to
October 31, 2013 | |
| | | | 2016 | | | 2015 | | | 2014 | | |
| | | | |
Class Z | | | | | | | | | | | | | | | | | | | | |
Net of waivers/reimbursements | | | .48 | % | | | .51 | % | | | .51 | % | | | .51 | % | | | .56 | %(g) |
Before waivers/reimbursements | | | .49 | % | | | .51 | % | | | .51 | % | | | .51 | % | | | .56 | %(g) |
| | |
| 144 | AB HIGH INCOME FUND | | abfunds.com |
FINANCIAL HIGHLIGHTS (continued)
| (h) | Commencement of distribution. |
| † | Includes the impact of proceeds received and credited to the Fund resulting from third party regulatory settlements, which enhanced the Fund’s performance for the year ended October 31, 2013 by 0.01%. |
| * | Includes the impact of proceeds received, and credited to the Fund resulting from class action settlements, which enhanced the performance of each share class, for the six months ended April 30, 2017 and the year ended October 31, 2012 by 0.01% and 0.06%, respectively. |
| | Includes the impact of proceeds received and credited to the Fund in connection with a residual distribution relating to regulatory settlements, which enhanced the Fund’s performance for the year ended October 31, 2016 by 0.01%. |
See notes to financial statements.
| | |
| abfunds.com | | AB HIGH INCOME FUND | 145 |
BOARD OF DIRECTORS
| | |
Marshall C. Turner, Jr.(1), Chairman John H. Dobkin(1) Michael J. Downey(1) William H. Foulk, Jr.(1) D. James Guzy(1) | | Nancy P. Jacklin(1) Robert M. Keith, President and Chief Executive Officer Garry L. Moody(1) Carol C. McMullen(1) Earl D. Weiner(1) |
OFFICERS
| | |
Philip L. Kirstein, Senior Vice President and Independent Compliance Officer Paul J. DeNoon(2), Vice President Gershon M. Distenfeld(2), Vice President Douglas J. Peebles(2), Vice President | | Matthew S. Sheridan(2) , Vice President Emilie D. Wrapp, Secretary Joseph J. Mantineo, Treasurer and Chief Financial Officer Stephen M. Woetzel, Controller Vincent S. Noto, Chief Compliance Officer |
| | |
Principal Underwriter AllianceBernstein Investments, Inc. 1345 Avenue of the Americas New York, NY 10105 Custodian and Accounting Agent Brown Brothers Harriman & Co. 50 Post Office Square Boston, MA 02110 Legal Counsel Seward & Kissel LLP One Battery Park Plaza New York, NY 10004 | | Transfer Agent AllianceBernstein Investor Services, Inc. P.O. Box 786003 San Antonio, TX 78278-6003 Toll-Free (800) 221-5672 Independent Registered Public Accounting Firm Ernst & Young LLP 5 Times Square New York, NY 10036 |
| 1 | Member of the Audit Committee, the Governance and Nominating Committee and the Independent Directors Committee. |
| 2 | The day-to-day management of, and investment decisions for, the Fund’s portfolio are made by the Global Fixed Income Team and Global Credit Investment Team. Messrs. DeNoon, Distenfeld, Peebles and Sheridan are the investment professionals with the most significant responsibility for the day-to-day management of the Fund’s portfolio. |
| | |
| 146 | AB HIGH INCOME FUND | | abfunds.com |
Information Regarding the Review and Approval of the Fund’s Advisory Agreement
The disinterested directors (the “directors”) of AB High Income Fund, Inc. (the “Fund”) unanimously approved the continuance of the Fund’s Advisory Agreement with the Adviser at a meeting held on November 1-3, 2016 (the “Meeting”).
Prior to approval of the continuance of the Advisory Agreement, the directors had requested from the Adviser, and received and evaluated, extensive materials. They reviewed the proposed continuance of the Advisory Agreement with the Adviser and with experienced counsel who are independent of the Adviser, who advised on the relevant legal standards. The directors also reviewed an independent evaluation prepared by the Fund’s Senior Officer (who is also the Fund’s Independent Compliance Officer) of the reasonableness of the advisory fee, in which the Senior Officer concluded that the contractual fee for the Fund was reasonable. The directors also discussed the proposed continuance in private sessions with counsel and the Fund’s Senior Officer.
The directors considered their knowledge of the nature and quality of the services provided by the Adviser to the Fund gained from their experience as directors or trustees of most of the registered investment companies advised by the Adviser, their overall confidence in the Adviser’s integrity and competence they have gained from that experience, the Adviser’s initiative in identifying and raising potential issues with the directors and its responsiveness, frankness and attention to concerns raised by the directors in the past, including the Adviser’s willingness to consider and implement organizational and operational changes designed to improve investment results and the services provided to the AB Funds. The directors noted that they have four regular meetings each year, at each of which they receive presentations from the Adviser on the investment results of the Fund and review extensive materials and information presented by the Adviser.
The directors also considered all other factors they believed relevant, including the specific matters discussed below. In their deliberations, the directors did not identify any particular information that was all-important or controlling, and different directors may have attributed different weights to the various factors. The directors determined that the selection of the Adviser to manage the Fund and the overall arrangements between the Fund and the Adviser, as provided in the Advisory Agreement, including the advisory fee, were fair and reasonable in light of the services performed, expenses incurred and such other matters as the directors considered relevant in the exercise of their business judgment. The
| | |
| abfunds.com | | AB HIGH INCOME FUND | 147 |
material factors and conclusions that formed the basis for the directors’ determinations included the following:
Nature, Extent and Quality of Services Provided
The directors considered the scope and quality of services provided by the Adviser under the Advisory Agreement, including the quality of the investment research capabilities of the Adviser and the other resources it has dedicated to performing services for the Fund. They also noted the professional experience and qualifications of the Fund’s portfolio management team and other senior personnel of the Adviser. The directors also considered that the Advisory Agreement provides that the Fund will reimburse the Adviser for the cost to it of providing certain clerical, accounting, administrative and other services to the Fund by employees of the Adviser or its affiliates. Requests for these reimbursements are made on a quarterly basis and subject to approval by the directors. Reimbursements, to the extent requested and paid, result in a higher rate of total compensation from the Fund to the Adviser than the fee rate stated in the Advisory Agreement. The directors noted that the methodology used to determine the reimbursement amounts had been reviewed by an independent consultant retained by the Fund’s Senior Officer. The quality of administrative and other services, including the Adviser’s role in coordinating the activities of the Fund’s other service providers, also was considered. The directors concluded that, overall, they were satisfied with the nature, extent and quality of services provided to the Fund under the Advisory Agreement.
Costs of Services Provided and Profitability
The directors reviewed a schedule of the revenues and expenses and related notes indicating the profitability of the Fund to the Adviser for calendar years 2014 and 2015 that had been prepared with an expense allocation methodology arrived at in consultation with an independent consultant retained by the Fund’s Senior Officer. The directors noted the assumptions and methods of allocation used by the Adviser in preparing fund-specific profitability data and understood that there are a number of potentially acceptable allocation methodologies for information of this type. The directors noted that the profitability information reflected all revenues and expenses of the Adviser’s relationship with the Fund, including those relating to its subsidiaries that provide transfer agency and distribution services to the Fund. The directors recognized that it is difficult to make comparisons of the profitability of the Advisory Agreement with the profitability of fund advisory contracts for unaffiliated funds because comparative information is not generally publicly available and is affected by numerous factors. The directors focused on the profitability of the Adviser’s relationship with the Fund before taxes and distribution expenses. The directors concluded that the Adviser’s level of profitability from its relationship with the Fund was not unreasonable.
| | |
| 148 | AB HIGH INCOME FUND | | abfunds.com |
Fall-Out Benefits
The directors considered the other benefits to the Adviser and its affiliates from their relationships with the Fund, including, but not limited to, benefits relating to 12b-1 fees and sales charges received by the Fund’s principal underwriter (which is a wholly owned subsidiary of the Adviser) in respect of certain classes of the Fund’s shares; and transfer agency fees paid by the Fund to a wholly owned subsidiary of the Adviser. The directors recognized that the Adviser’s profitability would be somewhat lower without these benefits. The directors understood that the Adviser also might derive reputational and other benefits from its association with the Fund.
Investment Results
In addition to the information reviewed by the directors in connection with the Meeting, the directors receive detailed performance information for the Fund at each regular Board meeting during the year.
At the Meeting, the directors reviewed information prepared by Broadridge Financial Solutions, Inc. (“Broadridge”), an analytical service that is not affiliated with the Adviser, showing the performance of the Class A Shares of the Fund against a peer group and a peer universe selected by Broadridge, and information prepared by the Adviser showing performance of the Class A Shares against a broad-based securities market index, in each case for the 1-, 3-, 5- and 10-year periods ended July 31, 2016 and (in the case of comparisons with the broad-based securities market index) for the period from inception. Based on their review, the directors concluded that the Fund’s investment performance was acceptable.
Advisory Fees and Other Expenses
The directors considered the advisory fee rate paid by the Fund to the Adviser and information prepared by Broadridge concerning advisory fee rates paid by other funds in the same Broadridge category as the Fund at a common asset level. The directors recognized that it is difficult to make comparisons of advisory fees because there are variations in the services that are included in the fees paid by other funds. The directors compared the Fund’s contractual effective advisory fee rate with a peer group median and took into account the impact on the advisory fee rate of the administrative expense reimbursement paid to the Adviser in the latest fiscal year.
The directors also considered the Adviser’s fee schedule for institutional clients pursuing a similar investment style. For this purpose, they reviewed the relevant advisory fee information from the Adviser’s Form ADV and the evaluation from the Fund’s Senior Officer and noted the differences between the Fund’s fee schedule, on the one hand, and the institutional fee schedule and the schedule of fees charged to any offshore funds and any sub-advised funds, on the other. The directors noted that the Adviser may,
| | |
| abfunds.com | | AB HIGH INCOME FUND | 149 |
in some cases, agree to fee rates with large institutional clients that are lower than those reviewed by the directors and that they had previously discussed with the Adviser its policies in respect of such arrangements.
The Adviser reviewed with the directors the significantly greater scope of the services it provides to the Fund relative to institutional, offshore fund and sub-advised fund clients. In light of the substantial differences in services rendered by the Adviser to institutional, offshore fund and sub-advised fund clients as compared to funds such as the Fund, the directors considered these fee comparisons inapt and did not place significant weight on them in their deliberations.
The directors also considered the total expense ratio of the Class A shares of the Fund in comparison to a peer group and a peer universe selected by Broadridge. The Class A expense ratio of the Fund was based on the Fund’s latest fiscal year and the information included the pro forma expense ratio to reflect a reduction in the 12b-1 fee effective February 1, 2016. The directors noted that it was likely that the expense ratios of some of the other funds in the Fund’s Broadridge category were lowered by waivers or reimbursements by those funds’ investment advisers, which in some cases might be voluntary or temporary. The directors view expense ratio information as relevant to their evaluation of the Adviser’s services because the Adviser is responsible for coordinating services provided to the Fund by others. Based on their review, the directors concluded that the Fund’s pro forma expense ratio was acceptable.
Economies of Scale
The directors noted that the advisory fee schedule for the Fund contains breakpoints and that the Fund’s net assets were higher than the breakpoint levels. Accordingly, the Fund’s current effective advisory fee rate reflected a reduction due to the breakpoints and would be further reduced to the extent the net assets of the Fund increase. The directors took into consideration prior presentations by an independent consultant on economies of scale in the mutual fund industry and for the AB Funds, and by the Adviser concerning certain of its views on economies of scale. The directors also had requested and received from the Adviser certain updates on economies of scale in advance of the Meeting. The directors believe that economies of scale may be realized (if at all) by the Adviser across a variety of products and services, and not only in respect of a single fund. The directors noted that there is no established methodology for setting breakpoints that give effect to the fund-specific services provided by a fund’s adviser and to the economies of scale that an adviser may realize in its overall mutual fund business or those components of it which directly or indirectly affect a fund’s operations. The directors observed that in the mutual fund industry as a whole, as well as among funds similar to the Fund, there is no uniformity or pattern in the fees and asset levels at
| | |
| 150 | AB HIGH INCOME FUND | | abfunds.com |
which breakpoints (if any) apply. The directors also noted that the advisory agreements for many funds do not have breakpoints at all. Having taken these factors into account, the directors concluded that the Fund’s breakpoint arrangements were acceptable and provide a means for sharing of any economies of scale.
| | |
| abfunds.com | | AB HIGH INCOME FUND | 151 |
This page is not part of the Shareholder Report or the Financial Statements
AB FAMILY OF FUNDS
US EQUITY
US CORE
Core Opportunities Fund
Select US Equity Portfolio
US GROWTH
Concentrated Growth Fund
Discovery Growth Fund
Growth Fund
Large Cap Growth Fund
Small Cap Growth Portfolio
US VALUE
Discovery Value Fund
Equity Income Fund
Relative Value Fund1
Small Cap Value Portfolio
Value Fund
INTERNATIONAL/ GLOBAL EQUITY
INTERNATIONAL/ GLOBAL CORE
Global Core Equity Portfolio
International Portfolio
International Strategic Core Portfolio
Sustainable Global Thematic Fund1
Tax-Managed International Portfolio
INTERNATIONAL/ GLOBAL GROWTH
Concentrated International Growth Portfolio
International Growth Fund
INTERNATIONAL/ GLOBAL VALUE
Asia ex-Japan Equity Portfolio
International Value Fund
FIXED INCOME
MUNICIPAL
High Income Municipal Portfolio
Intermediate California Municipal Portfolio
Intermediate Diversified Municipal Portfolio
Intermediate New York Municipal Portfolio
Municipal Bond Inflation Strategy
Tax-Aware Fixed Income Portfolio
National Portfolio
Arizona Portfolio
California Portfolio
Massachusetts Portfolio
Minnesota Portfolio
New Jersey Portfolio
New York Portfolio
Ohio Portfolio
Pennsylvania Portfolio
Virginia Portfolio
TAXABLE
Bond Inflation Strategy
Global Bond Fund
High Income Fund
High Yield Portfolio
Income Fund
Intermediate Bond Portfolio
Limited Duration High Income Portfolio
Short Duration Portfolio
ALTERNATIVES
All Market Real Return Portfolio
Credit Long/Short Portfolio
Global Real Estate Investment Fund
Select US Long/Short Portfolio
Unconstrained Bond Fund
MULTI-ASSET
All Market Income Portfolio
All Market Total Return Portfolio1
Conservative Wealth Strategy
Emerging Markets Multi-Asset Portfolio
Global Risk Allocation Fund
Tax-Managed All Market Income Portfolio1
Tax-Managed Wealth Appreciation Strategy
Wealth Appreciation Strategy
TARGET-DATE
Multi-Manager Select Retirement Allocation Fund
Multi-Manager Select 2010 Fund
Multi-Manager Select 2015 Fund
Multi-Manager Select 2020 Fund
Multi-Manager Select 2025 Fund
Multi-Manager Select 2030 Fund
Multi-Manager Select 2035 Fund
Multi-Manager Select 2040 Fund
Multi-Manager Select 2045 Fund
Multi-Manager Select 2050 Fund
Multi-Manager Select 2055 Fund
CLOSED-END FUNDS
Alliance California Municipal Income Fund
AllianceBernstein Global High Income Fund
AllianceBernstein National Municipal Income Fund
We also offer Government Exchange Reserves, which serves as the money market fund exchange vehicle for the AB mutual funds. An investment in Government Exchange Reserves is not a deposit in a bank and is not insured or guaranteed by the Federal Deposit Insurance Corporation or any other government agency. Although the Fund seeks to preserve the value of your investment at $1.00 per share, it is possible to lose money by investing in the Fund.
Investors should consider the investment objectives, risks, charges and expenses of the Fund carefully before investing. For copies of our prospectus or summary prospectus, which contain this and other information, visit us online at www.abfunds.com or contact your AB representative. Please read the prospectus and/or summary prospectus carefully before investing.
| 1 | Prior to November 1, 2016, Sustainable Global Thematic Fund was named Global Thematic Growth Fund; prior to January 9, 2017, Relative Value Fund was named Growth & Income Fund; prior to April 17, 2017, Tax-Managed All Market Income Portfolio was named Tax-Managed Balanced Wealth Strategy; prior to April 24, 2017, All Market Total Return Portfolio was named Balanced Wealth Strategy. |
| | |
| 152 | AB HIGH INCOME FUND | | abfunds.com |

AB HIGH INCOME FUND
1345 Avenue of the Americas
New York, NY 10105
800 221 5672
HI-0152-0417 
ITEM 2. CODE OF ETHICS.
Not applicable when filing a semi-annual report to shareholders.
ITEM 3. AUDIT COMMITTEE FINANCIAL EXPERT.
Not applicable when filing a semi-annual report to shareholders.
ITEM 4. PRINCIPAL ACCOUNTANT FEES AND SERVICES.
Not applicable when filing a semi-annual report to shareholders.
ITEM 5. AUDIT COMMITTEE OF LISTED REGISTRANTS.
Not applicable to the registrant.
ITEM 6. SCHEDULE OF INVESTMENTS.
Please see Schedule of Investments contained in the Report to Shareholders included under Item 1 of this Form N-CSR.
ITEM 7. DISCLOSURE OF PROXY VOTING POLICIES AND PROCEDURES FOR CLOSED-END MANAGEMENT INVESTMENT COMPANIES.
Not applicable to the registrant.
ITEM 8. PORTFOLIO MANAGERS OF CLOSED-END MANAGEMENT INVESTMENT COMPANIES.
Not applicable to the registrant.
ITEM 9. PURCHASES OF EQUITY SECURITIES BY CLOSED-END MANAGEMENT INVESTMENT COMPANY AND AFFILIATED PURCHASERS.
Not applicable to the registrant.
ITEM 10. SUBMISSION OF MATTERS TO A VOTE OF SECURITY HOLDERS.
There have been no material changes to the procedures by which shareholders may recommend nominees to the Fund’s Board of Directors since the Fund last provided disclosure in response to this item.
ITEM 11. CONTROLS AND PROCEDURES.
(a) The registrant’s principal executive officer and principal financial officer have concluded that the registrant’s disclosure controls and procedures (as defined in Rule 30a-2(c) under the Investment Company Act of 1940, as amended) are effective at the reasonable assurance level based on their evaluation of these controls and procedures as of a date within 90 days of the filing date of this document.
(b) There were no changes in the registrant’s internal controls over financial reporting that occurred during the second fiscal quarter of the period that has materially affected, or is reasonably likely to materially affect, the registrant’s internal control over financial reporting.
ITEM 12. EXHIBITS.
The following exhibits are attached to this Form N-CSR:
| | |
EXHIBIT NO. | | DESCRIPTION OF EXHIBIT |
| 12 (b) (1) | | Certification of Principal Executive Officer Pursuant to Section 302 of the Sarbanes-Oxley Act of 2002 |
| |
| 12 (b) (2) | | Certification of Principal Financial Officer Pursuant to Section 302 of the Sarbanes-Oxley Act of 2002 |
| |
| 12 (c) | | Certification of Principal Executive Officer and Principal Financial Officer Pursuant to Section 906 of the Sarbanes-Oxley Act of 2002 |
SIGNATURES
Pursuant to the requirements of the Securities Exchange Act of 1934 and the Investment Company Act of 1940, the registrant has duly caused this report to be signed on its behalf by the undersigned, thereunto duly authorized.
| | |
| (Registrant): AB High Income Fund, Inc. |
| |
| By: | | /s/ Robert M. Keith |
| | Robert M. Keith President |
Date: June 26, 2017
Pursuant to the requirements of the Securities Exchange Act of 1934 and the Investment Company Act of 1940, this report has been signed below by the following persons on behalf of the registrant and in the capacities and on the dates indicated.
| | |
| By: | | /s/ Robert M. Keith |
| | Robert M. Keith President |
Date: June 26, 2017
| | |
| By: | | /s/ Joseph J. Mantineo |
| | Joseph J. Mantineo Treasurer and Chief Financial Officer |
Date: June 26, 2017