UNITED STATES
SECURITIES AND EXCHANGE COMMISSION
WASHINGTON, D.C. 20549
FORM N-CSR
CERTIFIED SHAREHOLDER REPORT OF REGISTERED
MANAGEMENT INVESTMENT COMPANIES
Investment Company Act file number: 811-08188
AB HIGH INCOME FUND, INC.
(Exact name of registrant as specified in charter)
1345 Avenue of the Americas, New York, New York 10105
(Address of principal executive offices) (Zip code)
Joseph J. Mantineo
AllianceBernstein L.P.
1345 Avenue of the Americas
New York, New York 10105
(Name and address of agent for service)
Registrant’s telephone number, including area code: (800) 221-5672
Date of fiscal year end: October 31, 2020
Date of reporting period: October 31, 2020
ITEM 1. REPORTS TO STOCKHOLDERS.
OCT 10.31.20

ANNUAL REPORT
AB HIGH INCOME FUND

Beginning January 1, 2021, as permitted by new regulations adopted by the Securities and Exchange Commission, the Fund’s annual and semi-annual shareholder reports will no longer be sent by mail, unless you specifically request paper copies of the reports. Instead, the reports will be made available on a website, and you will be notified by mail each time a report is posted and provided with a website address to access the report.
If you already elected to receive shareholder reports electronically, you will not be affected by this change and you need not take any action. You may elect to receive shareholder reports and other communications from the Fund electronically at any time by contacting your financial intermediary (such as a broker-dealer or bank) or, if you are a direct investor, by calling the Fund at (800) 221 5672.
You may elect to receive all future reports in paper form free of charge. If you invest through a financial intermediary, you can contact your financial intermediary to request that you continue to receive paper copies of your shareholder reports; if you invest directly with the Fund, you can call the Fund at (800) 221 5672. Your election to receive reports in paper form will apply to all funds held in your account with your financial intermediary or, if you invest directly, to all AB Mutual Funds you hold.
| | |
| |
| Investment Products Offered | | • Are Not FDIC Insured • May Lose Value • Are Not Bank Guaranteed |
Investors should consider the investment objectives, risks, charges and expenses of the Fund carefully before investing. For copies of our prospectus or summary prospectus, which contain this and other information, visit us online at www.abfunds.com or contact your AB representative. Please read the prospectus and/or summary prospectus carefully before investing.
This shareholder report must be preceded or accompanied by the Fund’s prospectus for individuals who are not current shareholders of the Fund.
You may obtain a description of the Fund’s proxy voting policies and procedures, and information regarding how the Fund voted proxies relating to portfolio securities during the most recent 12-month period ended June 30, without charge. Simply visit AB’s website at www.abfunds.com, or go to the Securities and Exchange Commission’s (the “Commission”) website at www.sec.gov, or call AB at (800) 227 4618.
The Fund files its complete schedule of portfolio holdings with the Commission for the first and third quarters of each fiscal year as an exhibit to its reports on Form N-PORT. The Fund’s Form N-PORT reports are available on the Commission’s website at www.sec.gov. The Fund’s Forms N-PORT may also be reviewed and copied at the Commission’s Public Reference Room in Washington, DC; information on the operation of the Public Reference Room may be obtained by calling (800) SEC 0330. AB publishes full portfolio holdings for the Fund monthly at www.abfunds.com.
AllianceBernstein Investments, Inc. (ABI) is the distributor of the AB family of mutual funds. ABI is a member of FINRA and is an affiliate of AllianceBernstein L.P., the Adviser of the funds.
The [A/B] logo is a registered service mark of AllianceBernstein and AllianceBernstein® is a registered service mark used by permission of the owner, AllianceBernstein L.P.
| | |
| FROM THE PRESIDENT | |  |
Dear Shareholder,
We are pleased to provide this report for AB High Income Fund (the “Fund”). Please review the discussion of Fund performance, the market conditions during the reporting period and the Fund’s investment strategy.
As always, AB strives to keep clients ahead of what’s next by:
| + | | Transforming uncommon insights into uncommon knowledge with a global research scope |
| + | | Navigating markets with seasoned investment experience and sophisticated solutions |
| + | | Providing thoughtful investment insights and actionable ideas |
Whether you’re an individual investor or a multi-billion-dollar institution, we put knowledge and experience to work for you.
AB’s global research organization connects and collaborates across platforms and teams to deliver impactful insights and innovative products. Better insights lead to better opportunities—anywhere in the world.
For additional information about AB’s range of products and shareholder resources, please log on to www.abfunds.com.
Thank you for your investment in the AB Mutual Funds.
Sincerely,

Robert M. Keith
President and Chief Executive Officer, AB Mutual Funds
| | |
| |
| abfunds.com | | AB HIGH INCOME FUND | 1 |
ANNUAL REPORT
December 14, 2020
This report provides management’s discussion of fund performance for AB High Income Fund for the annual reporting period ended October 31, 2020.
The Fund’s investment objective is to seek to maximize total returns from price appreciation and income.
NAV RETURNS AS OF OCTOBER 31, 2020 (unaudited)
| | | | | | | | |
| | |
| | | 6 Months | | | 12 Months | |
| | |
| AB HIGH INCOME FUND1 | | | | | | | | |
| | |
| Class A Shares | | | 13.77% | | | | -2.15% | |
| | |
| Class C Shares | | | 13.32% | | | | -2.99% | |
| | |
| Advisor Class Shares2 | | | 13.91% | | | | -1.89% | |
| | |
| Class R Shares2 | | | 13.48% | | | | -2.62% | |
| | |
| Class K Shares2 | | | 13.66% | | | | -2.28% | |
| | |
| Class I Shares2 | | | 13.85% | | | | -1.94% | |
| | |
| Class Z Shares2 | | | 13.88% | | | | -1.89% | |
| | |
Primary Benchmark:
Bloomberg Barclays Global High Yield Index (USD hedged) | | | 11.16% | | | | 1.76% | |
| | |
| Blended Benchmark: 33% JPM EMBI Global / 33% JPM GBI-EM / 33% Bloomberg Barclays US Corporate HY 2% Issuer Capped Index | | | 9.49% | | | | -0.45% | |
| 1 | The returns shown are based on net asset values calculated for shareholder transactions and may differ from the returns shown in the Financial Highlights, which reflect adjustments made to the net asset values in accordance with accounting principles generally accepted in the United States of America. |
| 2 | Please note that these share classes are for investors purchasing shares through accounts established under certain fee-based programs sponsored and maintained by certain broker-dealers and financial intermediaries, institutional pension plans and/or investment advisory clients of, and certain other persons associated with, the Adviser and its affiliates or the Fund. |
INVESTMENT RESULTS
The table above shows the Fund’s performance compared to its primary benchmark, the Bloomberg Barclays Global High Yield Index (USD hedged), and its blended benchmark, which is composed of equal weightings of the JPMorgan Emerging Markets Bond Index Global (“JPM EMBI Global”), the JPMorgan Government Bond Index-Emerging Markets (“JPM GBI-EM”) (local currency-denominated) and the Bloomberg Barclays US Corporate High Yield (“HY”) 2% Issuer Capped Index, for the six- and 12-month periods ended October 31, 2020.
During the 12-month period, all share classes underperformed the primary benchmark, before sales charges. Industry allocation was the main
| | |
| |
2 | AB HIGH INCOME FUND | | abfunds.com |
detractor, relative to the benchmark, because of exposures in high-yield credit default swaps and commercial mortgage-backed securities (“CMBS”), which were partially offset by gains in sovereign bonds and collateralized mortgage obligations. Yield-curve positioning and currency decisions were minor detractors. Country positioning contributed due to off-benchmark exposures to Brazil, the eurozone, Indonesia and Russia, more than offsetting positioning in Canada. Security selection also added to performance, mainly in the sovereign bonds, consumer noncyclical, technology and basic sectors, while selection within consumer cyclical–automotive, energy and transportation services detracted.
During the six-month period, all share classes outperformed the primary benchmark, before sales charges. Security selection contributed most, due to gains in sovereign bonds, consumer noncyclical, technology, banking, basic and insurance, while selection within transportation services detracted. Industry allocation also contributed, mostly within collateralized mortgage obligations, high-yield credit default swaps and CMBS, although allocations to US Treasuries, energy and cash took back some of these gains. Yield-curve positioning in the US added to performance. Country allocations due to off-benchmark exposures in the eurozone contributed, more than offsetting exposures to Russia and Brazil. Currency decisions were a minor contributor.
During both periods, the Fund utilized derivatives in the form of futures, interest rate swaps and interest rate swaptions to manage and hedge duration risk and/or to take active yield-curve positioning. Currency forwards were used to hedge foreign currency exposure and to take active currency risk. Credit default swaps, both single-name and index, were used to take active exposure and to hedge investment-grade and high-yield credit risk. Total return swaps were used to create synthetic high-yield exposure in the Fund.
MARKET REVIEW AND INVESTMENT STRATEGY
Global fixed-income market returns were positive over the 12-month period ended October 31, 2020. Central banks and governments enacted an unprecedented amount of monetary and fiscal stimulus to combat market illiquidity and cushion the negative economic impact of COVID-19, which set the stage for a rebound in risk assets following the sell-off that started in March. Government bonds rallied as interest rates were slashed. Emerging- and developed-market investment-grade corporate bonds led gains, followed by developed-market high-yield corporate bonds, as investors searched for higher yields in a period of falling interest rates. Corporate bonds in the US outperformed their European counterparts. Securitized assets also advanced, while emerging-market sovereign bonds were slightly positive and emerging-market local bonds fell during the period. The US dollar declined against most major developed-market currencies and gained against a majority of emerging-market currencies.
| | |
| |
| abfunds.com | | AB HIGH INCOME FUND | 3 |
Brent crude oil prices fell almost 34% as demand slowed sharply and the oil industry outlook was uncertain.
The Fund’s Senior Investment Management Team (the “Team”) continues to seek to maximize total return, utilizing a high-income strategy with a global, multi-sector approach. The Team pursues an attractive risk/return profile by managing currency exposure, and invests in treasury inflation-protected securities, while also seeking to enhance returns with other selective investments in global fixed income and high yield.
INVESTMENT POLICIES
The Fund pursues income opportunities from government, corporate, emerging-market and high-yield sources. It has the flexibility to invest in a broad range of fixed-income securities in both developed- and emerging-market countries. The Fund’s investments may include US and non-US corporate debt securities and sovereign debt securities. The Fund may invest, without limitation, in either US dollar-denominated or non-US dollar-denominated fixed-income securities.
The Adviser selects securities for purchase or sale based on its assessment of the securities’ risk and return characteristics as well as the securities’ impact on the overall risk and return characteristics of the Fund. In making this assessment, the Adviser takes into account various factors, including the credit quality and sensitivity to interest rates of the securities under consideration and of the Fund’s other holdings.
The Fund may invest in debt securities with a range of maturities from short- to long-term. Substantially all of the Fund’s assets may be invested in lower-rated securities, which may include securities having the lowest rating for non-subordinated debt instruments—i.e., rated C by Moody’s Investors Service or CCC+ or lower by S&P Global Ratings and Fitch Ratings—and unrated securities of equivalent investment quality. The Fund also may invest in investment-grade securities and unrated securities.
The Fund may invest in mortgage-related and other asset-backed securities, loan participations and assignments, inflation-indexed securities, structured securities, variable, floating, and inverse floating-rate instruments and preferred stock, and may use other investment techniques. The Fund may also make short sales of securities or maintain a short position. The Fund may use borrowings or other leverage for investment purposes. The Fund intends, among other things, to enter into transactions such as reverse repurchase agreements and dollar rolls. The Fund may invest, without limit, in derivatives, such as options, futures contracts, forwards or swap agreements.
| | |
| |
4 | AB HIGH INCOME FUND | | abfunds.com |
DISCLOSURES AND RISKS
Benchmark Disclosure
All indices are unmanaged and do not reflect fees and expenses associated with the active management of a mutual fund portfolio. The Bloomberg Barclays Global High Yield Index (USD hedged) represents non-investment grade fixed-income securities of companies in the US, and developed and emerging markets, hedged to the US dollar. The JPM® EMBI Global (market-capitalization weighted) represents the performance of US dollar-denominated Brady bonds, Eurobonds and trade loans issued by sovereign and quasi-sovereign entities. The JPM GBI-EM represents the performance of local-currency government bonds issued by emerging markets. The Bloomberg Barclays US Corporate HY 2% Issuer Capped Index is the 2% Issuer Capped component of the US Corporate HY Index. The Bloomberg Barclays US Corporate HY Index represents the performance of fixed-income securities having a maximum quality rating of Ba1, a minimum amount outstanding of $150 million and at least one year to maturity. An investor cannot invest directly in an index or average, and their results are not indicative of the performance for any specific investment, including the Fund.
A Word About Risk
Market Risk: The value of the Fund’s assets will fluctuate as the stock or bond market fluctuates. The value of its investments may decline, sometimes rapidly and unpredictably, simply because of economic changes or other events, including public health crises (including the occurrence of a contagious disease or illness), that affect large portions of the market.
Interest-Rate Risk: Changes in interest rates will affect the value of investments in fixed-income securities. When interest rates rise, the value of existing investments in fixed-income securities tends to fall and this decrease in value may not be offset by higher income from new investments. Interest-rate risk is generally greater for fixed-income securities with longer maturities or durations.
Credit Risk: An issuer or guarantor of a fixed-income security, or the counterparty to a derivatives or other contract, may be unable or unwilling to make timely payments of interest or principal, or to otherwise honor its obligations. The issuer or guarantor may default, causing a loss of the full principal amount of a security and accrued interest. The degree of risk for a particular security may be reflected in its credit rating. There is the possibility that the credit rating of a fixed-income security may be downgraded after purchase, which may adversely affect the value of the security.
Below Investment-Grade Securities Risk: Investments in fixed-income securities with lower ratings (commonly known as “junk bonds”) tend to have a higher probability that an issuer will default or fail to meet its payment obligations. These securities may be subject to greater price volatility
| | |
| |
| abfunds.com | | AB HIGH INCOME FUND | 5 |
DISCLOSURES AND RISKS (continued)
due to such factors as specific corporate developments and negative perceptions of the junk bond market generally and may be more difficult to trade than other types of securities.
Duration Risk: Duration is a measure that relates the expected price volatility of a fixed-income security to changes in interest rates. The duration of a fixed-income security may be shorter than or equal to full maturity of a fixed-income security. Fixed-income securities with longer durations have more risk and will decrease in price as interest rates rise.
Inflation Risk: This is the risk that the value of assets or income from investments will be less in the future as inflation decreases the value of money. As inflation increases, the value of the Fund’s assets can decline as can the value of the Fund’s distributions. This risk is significantly greater for fixed-income securities with longer maturities.
Foreign (Non-US) Risk: Investments in securities of non-US issuers may involve more risk than those of US issuers. These securities may fluctuate more widely in price and may be more difficult to trade due to adverse market, economic, political, regulatory or other factors.
Emerging-Market Risk: Investments in emerging-market countries may have more risk because the markets are less developed and less liquid as well as being subject to increased economic, political, regulatory or other uncertainties.
Currency Risk: Fluctuations in currency exchange rates may negatively affect the value of the Fund’s investments or reduce its returns.
Mortgage-Related and/or Other Asset-Backed Securities Risk: Investments in mortgage-related and other asset-backed securities are subject to certain additional risks. The value of these securities may be particularly sensitive to changes in interest rates. These risks include “extension risk”, which is the risk that, in periods of rising interest rates, issuers may delay the payment of principal, and “prepayment risk”, which is the risk that in periods of falling interest rates, issuers may pay principal sooner than expected, exposing the Fund to a lower rate of return upon reinvestment of principal. Mortgage-backed securities offered by non-governmental issuers and other asset-backed securities may be subject to other risks, such as higher rates of default in the mortgages or assets backing the securities or risks associated with the nature and servicing of mortgages or assets backing the securities.
Loan Participations and Assignments Risk: When the Fund purchases loan participations and assignments, it is subject to the credit risk associated with the underlying corporate borrower. In addition, the lack of a
| | |
| |
6 | AB HIGH INCOME FUND | | abfunds.com |
DISCLOSURES AND RISKS (continued)
liquid secondary market for loan participations and assignments may have an adverse impact on the value of such investments and the Fund’s ability to dispose of particular assignments or participations when necessary to meet the Fund’s liquidity needs or in response to a specific economic event such as a deterioration in the creditworthiness of the borrower.
Leverage Risk: To the extent the Fund uses leveraging techniques, its net asset value (“NAV”) may be more volatile because leverage tends to exaggerate the effect of changes in interest rates and any increase or decrease in the value of the Fund’s investments.
Derivatives Risk: Derivatives may be difficult to price or unwind and leveraged so that small changes may produce disproportionate losses for the Fund. Derivatives, especially over-the-counter derivatives, are also subject to counterparty risk.
Illiquid Investments Risk: Illiquid investments risk exists when certain investments become difficult to purchase or sell. Difficulty in selling such investments may result in sales at disadvantageous prices affecting the value of your investment in the Fund. Causes of illiquid investments risk may include low trading volumes, large positions and heavy redemptions of Fund shares. Illiquid investments risk may be higher in a rising interest-rate environment, when the value and liquidity of fixed-income securities generally decline.
Management Risk: The Fund is subject to management risk because it is an actively managed investment fund. The Adviser will apply its investment techniques and risk analyses in making investment decisions, but there is no guarantee that its techniques will produce the intended results. Some of these techniques may incorporate, or rely upon, quantitative models, but there is no guarantee that these models will generate accurate forecasts, reduce risk or otherwise perform as expected.
The Fund may invest in mortgage-backed and/or other asset-backed securities, including securities backed by mortgages and assets with an international or emerging-markets origination and securities backed by non-performing loans at the time of investment. Investments in mortgage-backed and other asset-backed securities are subject to certain additional risks. The value of these securities may be particularly sensitive to changes in interest rates. These risks include “extension risk”, which is the risk that, in periods of rising interest rates, issuers may delay the payment of principal, and “prepayment risk”, which is the risk that, in periods of falling interest rates, issuers may pay principal sooner than expected, exposing the Fund to a lower rate of return upon reinvestment of principal. Mortgage-backed securities offered by nongovernmental issuers and other asset-backed securities may be subject to other risks, such as higher rates of
| | |
| |
| abfunds.com | | AB HIGH INCOME FUND | 7 |
DISCLOSURES AND RISKS (continued)
default in the mortgages or assets backing the securities or risks associated with the nature and servicing of mortgages or assets backing the securities.
These risks are fully discussed in the Fund’s prospectus. As with all investments, you may lose money by investing in the Fund.
An Important Note About Historical Performance
The investment return and principal value of an investment in the Fund will fluctuate, so that shares, when redeemed, may be worth more or less than their original cost. Performance shown in this report represents past performance and does not guarantee future results. Current performance may be lower or higher than the performance information shown. You may obtain performance information current to the most recent month-end by visiting www.abfunds.com. Class B shares are no longer being offered. Effective November 7, 2019, all outstanding Class B shares were converted to Class A shares. Please see Note A for more information.
All fees and expenses related to the operation of the Fund have been deducted. NAV returns do not reflect sales charges; if sales charges were reflected, the Fund’s quoted performance would be lower. SEC returns reflect the applicable sales charges for each share class: a 4.25% maximum front-end sales charge for Class A shares and a 1% 1-year contingent deferred sales charge for Class C shares. Returns for the different share classes will vary due to different expenses associated with each class. Performance assumes reinvestment of distributions and does not account for taxes.
| | |
| |
8 | AB HIGH INCOME FUND | | abfunds.com |
HISTORICAL PERFORMANCE
GROWTH OF A $10,000 INVESTMENT IN THE FUND (unaudited)
10/31/2010 TO 10/31/2020
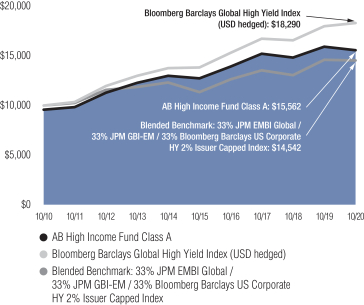
This chart illustrates the total value of an assumed $10,000 investment in AB High Income Fund Class A shares (from 10/31/2010 to 10/31/2020) as compared to the performance of the Fund’s benchmarks. The chart reflects the deduction of the maximum 4.25% sales charge from the initial $10,000 investment in the Fund and assumes the reinvestment of dividends and capital gains distributions.
| | |
| |
| abfunds.com | | AB HIGH INCOME FUND | 9 |
HISTORICAL PERFORMANCE (continued)
AVERAGE ANNUAL RETURNS AS OF OCTOBER 31, 2020 (unaudited)
| | | | | | | | | | | | |
| | | |
| | | NAV Returns | | | SEC Returns
(reflects applicable
sales charges) | | | SEC
Yields1 | |
| | | |
| CLASS A SHARES | | | | | | | | | | | 5.21% | |
| | | |
| 1 Year | | | -2.15% | | | | -6.27% | | | | | |
| | | |
| 5 Years | | | 4.13% | | | | 3.23% | | | | | |
| | | |
| 10 Years | | | 4.98% | | | | 4.52% | | | | | |
| | | |
| CLASS C SHARES | | | | | | | | | | | 4.61% | |
| | | |
| 1 Year | | | -2.99% | | | | -3.90% | | | | | |
| | | |
| 5 Years | | | 3.28% | | | | 3.28% | | | | | |
| | | |
| 10 Years | | | 4.15% | | | | 4.15% | | | | | |
| | | |
| ADVISOR CLASS SHARES2 | | | | | | | | | | | 5.69% | |
| | | |
| 1 Year | | | -1.89% | | | | -1.89% | | | | | |
| | | |
| 5 Years | | | 4.39% | | | | 4.39% | | | | | |
| | | |
| 10 Years | | | 5.27% | | | | 5.27% | | | | | |
| | | |
| CLASS R SHARES2 | | | | | | | | | | | 4.92% | |
| | | |
| 1 Year | | | -2.62% | | | | -2.62% | | | | | |
| | | |
| 5 Years | | | 3.73% | | | | 3.73% | | | | | |
| | | |
| 10 Years | | | 4.60% | | | | 4.60% | | | | | |
| | | |
| CLASS K SHARES2 | | | | | | | | | | | 5.23% | |
| | | |
| 1 Year | | | -2.28% | | | | -2.28% | | | | | |
| | | |
| 5 Years | | | 4.06% | | | | 4.06% | | | | | |
| | | |
| 10 Years | | | 4.95% | | | | 4.95% | | | | | |
| | | |
| CLASS I SHARES2 | | | | | | | | | | | 5.59% | |
| | | |
| 1 Year | | | -1.94% | | | | -1.94% | | | | | |
| | | |
| 5 Years | | | 4.41% | | | | 4.41% | | | | | |
| | | |
| 10 Years | | | 5.30% | | | | 5.30% | | | | | |
| | | |
| CLASS Z SHARES2 | | | | | | | | | | | 5.67% | |
| | | |
| 1 Year | | | -1.89% | | | | -1.89% | | | | | |
| | | |
| 5 Years | | | 4.45% | | | | 4.45% | | | | | |
| | | |
| Since Inception3 | | | 3.97% | | | | 3.97% | | | | | |
The Fund’s current prospectus fee table shows the Fund’s total annual operating expense ratios as 0.88%, 1.62%, 0.63%, 1.28%, 0.94%, 0.60% and 0.54% for Class A, Class C, Advisor Class, Class R, Class K, Class I and Class Z shares, respectively. The Financial Highlights section of this report sets forth expense ratio data for the current reporting period; the expense ratios shown above may differ from the expense ratios in the Financial Highlights section since they are based on different time periods.
| 1 | SEC yields are calculated based on SEC guidelines for the 30-day period ended October 31, 2020. |
| 2 | These share classes are offered at NAV to eligible investors and their SEC returns are the same as their NAV returns. Please note that these share classes are for investors purchasing shares through accounts established under certain fee-based programs sponsored and maintained by certain broker-dealers and financial intermediaries, institutional pension plans and/or investment advisory clients of and certain other persons associated with, the Adviser and its affiliates or the Fund. |
| 3 | Inception date: 10/15/2013. |
| | |
| |
10 | AB HIGH INCOME FUND | | abfunds.com |
HISTORICAL PERFORMANCE (continued)
SEC AVERAGE ANNUAL RETURNS
AS OF THE MOST RECENT CALENDAR QUARTER-END
SEPTEMBER 30, 2020 (unaudited)
| | | | |
| |
| | | SEC Returns
(reflects applicable
sales charges) | |
| |
| CLASS A SHARES | | | | |
| |
| 1 Year | | | -6.08% | |
| |
| 5 Years | | | 3.62% | |
| |
| 10 Years | | | 4.74% | |
| |
| CLASS C SHARES | | | | |
| |
| 1 Year | | | -3.71% | |
| |
| 5 Years | | | 3.66% | |
| |
| 10 Years | | | 4.37% | |
| |
| ADVISOR CLASS SHARES1 | | | | |
| |
| 1 Year | | | -1.81% | |
| |
| 5 Years | | | 4.78% | |
| |
| 10 Years | | | 5.49% | |
| |
| CLASS R SHARES1 | | | | |
| |
| 1 Year | | | -2.40% | |
| |
| 5 Years | | | 4.10% | |
| |
| 10 Years | | | 4.82% | |
| |
| CLASS K SHARES1 | | | | |
| |
| 1 Year | | | -2.19% | |
| |
| 5 Years | | | 4.45% | |
| |
| 10 Years | | | 5.17% | |
| |
| CLASS I SHARES1 | | | | |
| |
| 1 Year | | | -1.85% | |
| |
| 5 Years | | | 4.80% | |
| |
| 10 Years | | | 5.52% | |
| |
| CLASS Z SHARES1 | | | | |
| |
| 1 Year | | | -1.80% | |
| |
| 5 Years | | | 4.85% | |
| |
| Since Inception2 | | | 3.98% | |
| 1 | Please note that these share classes are for investors purchasing shares through accounts established under certain fee-based programs sponsored and maintained by certain broker-dealers and financial intermediaries, institutional pension plans and/or investment advisory clients of, and certain other persons associated with, the Adviser and its affiliates or the Fund. |
| 2 | Inception date: 10/15/2013. |
| | |
| |
| abfunds.com | | AB HIGH INCOME FUND | 11 |
EXPENSE EXAMPLE
(unaudited)
As a shareholder of the Fund, you incur two types of costs: (1) transaction costs, including sales charges (loads) on purchase payments, contingent deferred sales charges on redemptions and (2) ongoing costs, including management fees; distribution (12b-1) fees; and other Fund expenses. This example is intended to help you understand your ongoing costs (in dollars) of investing in the Fund and to compare these costs with the ongoing costs of investing in other mutual funds.
The Example is based on an investment of $1,000 invested at the beginning of the period and held for the entire period as indicated below.
Actual Expenses
The first line of the table below provides information about actual account values and actual expenses. You may use the information in this line, together with the amount you invested, to estimate the expenses that you paid over the period. Simply divide your account value by $1,000 (for example, an $8,600 account value divided by $1,000 = 8.6), then multiply the result by the number in the first line under the heading entitled “Expenses Paid During Period” to estimate the expenses you paid on your account during this period.
Hypothetical Example for Comparison Purposes
The second line of the table below provides information about hypothetical account values and hypothetical expenses based on the Fund’s actual expense ratio and an assumed annual rate of return of 5% before expenses, which is not the Fund’s actual return. The hypothetical account values and expenses may not be used to estimate the actual ending account balance or expenses you paid for the period. You may use this information to compare the ongoing costs of investing in the Fund and other funds by comparing this 5% hypothetical example with the 5% hypothetical examples that appear in the shareholder reports of other funds.
| | | | | | | | | | | | | | | | |
| | | Beginning
Account Value
5/1/2020 | | | Ending
Account Value
10/31/2020 | | | Expenses Paid
During Period* | | | Annualized
Expense Ratio* | |
| Class A | | | | | | | | | | | | | | | | |
Actual | | $ | 1,000 | | | $ | 1,139.20 | | | $ | 4.52 | | | | 0.84 | % |
Hypothetical** | | $ | 1,000 | | | $ | 1,020.91 | | | $ | 4.27 | | | | 0.84 | % |
| Class C | | | | | | | | | | | | | | | | |
Actual | | $ | 1,000 | | | $ | 1,134.70 | | | $ | 8.53 | | | | 1.59 | % |
Hypothetical** | | $ | 1,000 | | | $ | 1,017.14 | | | $ | 8.06 | | | | 1.59 | % |
| Advisor Class | | | | | | | | | | | | | | | | |
Actual | | $ | 1,000 | | | $ | 1,140.60 | | | $ | 3.17 | | | | 0.59 | % |
Hypothetical** | | $ | 1,000 | | | $ | 1,022.17 | | | $ | 3.00 | | | | 0.59 | % |
Class R | | | | | | | | | | | | | | | | |
Actual | | $ | 1,000 | | | $ | 1,136.30 | | | $ | 7.25 | | | | 1.35 | % |
Hypothetical** | | $ | 1,000 | | | $ | 1,018.35 | | | $ | 6.85 | | | | 1.35 | % |
| | |
| |
| 12 | AB HIGH INCOME FUND | | abfunds.com |
EXPENSE EXAMPLE (continued)
| | | | | | | | | | | | | | | | |
| | | Beginning
Account Value
5/1/2020 | | | Ending
Account Value
10/31/2020 | | | Expenses Paid
During Period* | | | Annualized
Expense Ratio* | |
| Class K | | | | | | | | | | | | | | | | |
Actual | | $ | 1,000 | | | $ | 1,138.10 | | | $ | 5.54 | | | | 1.03 | % |
Hypothetical** | | $ | 1,000 | | | $ | 1,019.96 | | | $ | 5.23 | | | | 1.03 | % |
| Class I | | | | | | | | | | | | | | | | |
Actual | | $ | 1,000 | | | $ | 1,140.00 | | | $ | 3.55 | | | | 0.66 | % |
Hypothetical** | | $ | 1,000 | | | $ | 1,021.82 | | | $ | 3.35 | | | | 0.66 | % |
| Class Z | | | | | | | | | | | | | | | | |
Actual | | $ | 1,000 | | | $ | 1,140.30 | | | $ | 3.28 | | | | 0.61 | % |
Hypothetical** | | $ | 1,000 | | | $ | 1,022.07 | | | $ | 3.10 | | | | 0.61 | % |
| * | Expenses are equal to the classes’ annualized expense ratios multiplied by the average account value over the period, multiplied by 184/366 (to reflect the one-half year period). |
| ** | Assumes 5% annual return before expenses. |
| | |
| |
| abfunds.com | | AB HIGH INCOME FUND | 13 |
PORTFOLIO SUMMARY
October 31, 2020 (unaudited)
PORTFOLIO STATISTICS
Net Assets ($mil): $5,223.6
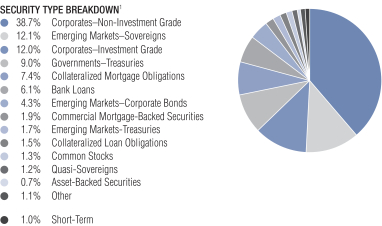
| 1 | All data are as of October 31, 2020. The Fund’s security type breakdown is expressed as a percentage of total investments and may vary over time. The Fund also enters into derivative transactions, which may be used for hedging or investment purposes (see “Portfolio of Investments” section of the report for additional details). “Other” securities type weightings represent 0.3% or less in the following security types: Governments–Sovereign Bonds, Inflation-Linked Securities, Local Governments–US Municipal Bonds, Options Purchased–Puts, Preferred Stocks, Rights, Warrants and Whole Loan Trusts. |
| | |
| |
14 | AB HIGH INCOME FUND | | abfunds.com |
PORTFOLIO SUMMARY (continued)
October 31, 2020 (unaudited)
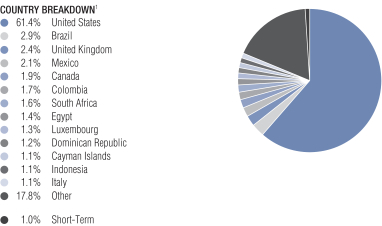
| 1 | All data are as of October 31, 2020. The Fund’s country breakdown is expressed as a percentage of total investments and may vary over time. The Fund also enters into derivative transactions, which may be used for hedging or investment purposes (see “Portfolio of Investments” section of the report for additional details). “Other” country weightings represent 1.0% or less in the following: Angola, Argentina, Australia, Bahrain, Bermuda, Chile, China, Costa Rica, Denmark, Ecuador, El Salvador, France, Gabon, Germany, Ghana, Guatemala, Honduras, Hong Kong, Iraq, Ireland, Israel, Ivory Coast, Jamaica, Japan, Kenya, Kuwait, Lebanon, Macau, Mauritius, Mongolia, Morocco, Netherlands, Nigeria, Norway, Oman, Pakistan, Peru, Russia, Senegal, Spain, Sri Lanka, Sweden, Switzerland, Trinidad & Tobago, Turkey, Ukraine, United Arab Emirates, Venezuela and Zambia. |
| | |
| |
| abfunds.com | | AB HIGH INCOME FUND | 15 |
PORTFOLIO OF INVESTMENTS
October 31, 2020
| | | | | | | | | | | | |
| | | | | | Principal
Amount
(000) | | | U.S. $ Value | |
| |
CORPORATES – NON-INVESTMENT GRADE – 39.2% | | | | | | | | | | | | |
Industrial – 32.3% | | | | | | | | | | | | |
Basic – 3.0% | | | | | | | | | | | | |
Advanced Drainage Systems, Inc.
5.00%, 09/30/2027(a) | | | U.S.$ | | | | 759 | | | $ | 796,756 | |
Arconic Corp.
6.125%, 02/15/2028(a) | | | | | | | 1,749 | | | | 1,842,930 | |
Axalta Coating Systems LLC/Axalta Coating Systems Dutch Holding B BV
4.75%, 06/15/2027(a) | | | | | | | 1,485 | | | | 1,555,537 | |
Big River Steel LLC/BRS Finance Corp.
6.625%, 01/31/2029(a) | | | | | | | 7,786 | | | | 8,009,269 | |
CF Industries, Inc.
3.45%, 06/01/2023 | | | | | | | 2,000 | | | | 2,044,681 | |
4.95%, 06/01/2043 | | | | | | | 2,746 | | | | 3,286,967 | |
5.375%, 03/15/2044 | | | | | | | 2,873 | | | | 3,535,166 | |
Cleveland-Cliffs, Inc.
6.75%, 03/15/2026(a) | | | | | | | 532 | | | | 558,401 | |
9.875%, 10/17/2025(a) | | | | | | | 11,882 | | | | 13,586,318 | |
Commercial Metals Co.
4.875%, 05/15/2023 | | | | | | | 3,249 | | | | 3,396,871 | |
Crown Americas LLC/Crown Americas Capital Corp. VI
4.75%, 02/01/2026 | | | | | | | 1,285 | | | | 1,332,313 | |
Element Solutions, Inc.
3.875%, 09/01/2028(a) | | | | | | | 6,415 | | | | 6,332,963 | |
ERP Iron Ore, LLC
9.039%, 12/31/2019(b)(c)(d)(e)(f) | | | | | | | 1,355 | | | | 1,153,032 | |
Flex Acquisition Co., Inc.
7.875%, 07/15/2026(a) | | | | | | | 7,141 | | | | 7,224,080 | |
FMG Resources August 2006 Pty Ltd.
4.50%, 09/15/2027(a) | | | | | | | 5,475 | | | | 5,861,293 | |
4.75%, 05/15/2022(a) | | | | | | | 2,000 | | | | 2,047,046 | |
Freeport-McMoRan, Inc.
5.40%, 11/14/2034 | | | | | | | 2,033 | | | | 2,319,666 | |
5.45%, 03/15/2043 | | | | | | | 5,095 | | | | 5,803,141 | |
Graham Packaging Co., Inc.
7.125%, 08/15/2028(a) | | | | | | | 1,653 | | | | 1,730,937 | |
Grinding Media, Inc./Moly-Cop AltaSteel Ltd.
7.375%, 12/15/2023(a) | | | | | | | 6,956 | | | | 7,017,210 | |
Hecla Mining Co.
7.25%, 02/15/2028 | | | | | | | 6,570 | | | | 7,062,854 | |
Illuminate Buyer LLC/Illuminate Holdings IV, Inc.
9.00%, 07/01/2028(a) | | | | | | | 5,122 | | | | 5,478,245 | |
| | |
| |
16 | AB HIGH INCOME FUND | | abfunds.com |
PORTFOLIO OF INVESTMENTS (continued)
| | | | | | | | | | | | |
| | | | | | Principal
Amount
(000) | | | U.S. $ Value | |
| |
Intelligent Packaging Ltd. Finco, Inc./Intelligent Packaging Ltd. Co-Issuer LLC
6.00%, 09/15/2028(a) | | | U.S.$ | | | | 5,830 | | | $ | 5,935,891 | |
Joseph T Ryerson & Son, Inc.
8.50%, 08/01/2028(a) | | | | | | | 3,281 | | | | 3,519,385 | |
Kaiser Aluminum Corp.
6.50%, 05/01/2025(a) | | | | | | | 1,282 | | | | 1,361,686 | |
Kraton Polymers LLC/Kraton Polymers Capital Corp.
5.25%, 05/15/2026(a) | | | EUR | | | | 5,940 | | | | 7,022,152 | |
Magnetation LLC/Mag Finance Corp.
11.00%, 05/15/2018(b)(c)(d)(e)(g) | | | U.S.$ | | | | 16,121 | | | | – 0 | – |
Nouryon Holding BV
6.50%, 10/01/2026(a) | | | EUR | | | | 3,669 | | | | 4,340,004 | |
8.00%, 10/01/2026(a) | | | U.S.$ | | | | 2,825 | | | | 2,980,471 | |
Novelis Corp.
5.875%, 09/30/2026(a) | | | | | | | 4,196 | | | | 4,330,012 | |
Olin Corp.
5.625%, 08/01/2029 | | | | | | | 5,624 | | | | 5,806,416 | |
Peabody Energy Corp.
6.00%, 03/31/2022(g) | | | | | | | 1,028 | | | | 470,008 | |
Smurfit Kappa Treasury Funding DAC
7.50%, 11/20/2025 | | | | | | | 1,073 | | | | 1,288,225 | |
SPCM SA
4.875%, 09/15/2025(a) | | | | | | | 3,290 | | | | 3,392,444 | |
United States Steel Corp.
12.00%, 06/01/2025(a) | | | | | | | 7,828 | | | | 8,688,033 | |
Valvoline, Inc.
4.25%, 02/15/2030(a) | | | | | | | 10,847 | | | | 11,073,545 | |
WR Grace & Co-Conn
4.875%, 06/15/2027(a) | | | | | | | 2,472 | | | | 2,576,164 | |
| | | | | | | | | | | | |
| | | | | | | | | | | 154,760,112 | |
| | | | | | | | | | | | |
Capital Goods – 2.8% | | | | | | | | | | | | |
ARD Finance SA
5.00% (5.00% Cash or 5.75% PIK), 06/30/2027(a)(f) | | | EUR | | | | 5,094 | | | | 5,725,805 | |
6.50% (6.50% Cash or 7.25% PIK), 06/30/2027(a)(f) | | | U.S.$ | | | | 5,642 | | | | 5,715,454 | |
Ardagh Packaging Finance PLC/Ardagh Holdings USA, Inc.
4.125%, 08/15/2026(a) | | | | | | | 4,072 | | | | 4,167,276 | |
5.25%, 04/30/2025(a) | | | | | | | 2,000 | | | | 2,092,660 | |
6.00%, 02/15/2025(a) | | | | | | | 333 | | | | 344,655 | |
Bombardier, Inc.
6.125%, 01/15/2023(a) | | | | | | | 1,553 | | | | 1,338,335 | |
7.50%, 12/01/2024-03/15/2025(a) | | | | | | | 11,779 | | | | 8,571,375 | |
7.875%, 04/15/2027(a) | | | | | | | 7,148 | | | | 5,205,745 | |
| | |
| |
| abfunds.com | | AB HIGH INCOME FUND | 17 |
PORTFOLIO OF INVESTMENTS (continued)
| | | | | | | | | | |
| | | | | Principal
Amount
(000) | | | U.S. $ Value | |
| |
Clean Harbors, Inc.
4.875%, 07/15/2027(a) | | U.S.$ | | | 2,468 | | | $ | 2,579,260 | |
Cleaver-Brooks, Inc.
7.875%, 03/01/2023(a) | | | | | 3,893 | | | | 3,771,957 | |
Colfax Corp.
6.375%, 02/15/2026(a) | | | | | 1,170 | | | | 1,244,776 | |
Energizer Holdings, Inc.
4.75%, 06/15/2028(a) | | | | | 2,071 | | | | 2,138,855 | |
EnerSys
4.375%, 12/15/2027(a) | | | | | 5,050 | | | | 5,192,657 | |
F-Brasile SpA/F-Brasile US LLC
Series XR
7.375%, 08/15/2026(a) | | | | | 5,660 | | | | 4,913,555 | |
Gates Global LLC/Gates Corp.
6.25%, 01/15/2026(a) | | | | | 6,532 | | | | 6,760,620 | |
GFL Environmental, Inc.
4.25%, 06/01/2025(a) | | | | | 333 | | | | 340,623 | |
5.125%, 12/15/2026(a) | | | | | 4,000 | | | | 4,197,466 | |
7.00%, 06/01/2026(a) | | | | | 2,024 | | | | 2,113,476 | |
8.50%, 05/01/2027(a) | | | | | 2,685 | | | | 2,931,087 | |
Granite US Holdings Corp.
11.00%, 10/01/2027(a) | | | | | 2,757 | | | | 2,854,769 | |
Griffon Corp.
5.75%, 03/01/2028 | | | | | 8,205 | | | | 8,599,227 | |
JELD-WEN, Inc.
4.625%, 12/15/2025(a) | | | | | 1,036 | | | | 1,051,738 | |
Liberty Tire Recycling LLC
9.50%, 01/15/2023(b)(c) | | | | | 1,057 | | | | 1,056,844 | |
Mauser Packaging Solutions Holding Co.
5.50%, 04/15/2024(a) | | | | | 4,836 | | | | 4,840,619 | |
7.25%, 04/15/2025(a) | | | | | 863 | | | | 832,372 | |
Moog, Inc.
4.25%, 12/15/2027(a) | | | | | 2,347 | | | | 2,406,237 | |
RBS Global, Inc./Rexnord LLC
4.875%, 12/15/2025(a) | | | | | 333 | | | | 339,874 | |
Rebecca Bidco GmbH
5.75%, 07/15/2025(a) | | EUR | | | 2,035 | | | | 2,370,574 | |
Signature Aviation US Holdings, Inc.
4.00%, 03/01/2028(a) | | U.S.$ | | | 333 | | | | 322,181 | |
5.375%, 05/01/2026(a) | | | | | 510 | | | | 516,523 | |
Summit Materials LLC/Summit Materials Finance Corp.
5.25%, 01/15/2029(a) | | | | | 2,050 | | | | 2,111,571 | |
Terex Corp.
5.625%, 02/01/2025(a) | | | | | 3,744 | | | | 3,803,149 | |
TransDigm, Inc.
6.25%, 03/15/2026(a) | | | | | 555 | | | | 578,761 | |
| | |
| |
18 | AB HIGH INCOME FUND | | abfunds.com |
PORTFOLIO OF INVESTMENTS (continued)
| | | | | | | | | | | | |
| | | | | | Principal
Amount
(000) | | | U.S. $ Value | |
| |
6.50%, 07/15/2024 | | | U.S.$ | | | | 12,885 | | | $ | 12,923,881 | |
8.00%, 12/15/2025(a) | | | | | | | 3,335 | | | | 3,611,075 | |
Triumph Group, Inc.
6.25%, 09/15/2024(a) | | | | | | | 1,966 | | | | 1,699,289 | |
7.75%, 08/15/2025 | | | | | | | 4,578 | | | | 2,975,858 | |
8.875%, 06/01/2024(a) | | | | | | | 4,005 | | | | 4,263,546 | |
Trivium Packaging Finance BV
3.75%, 08/15/2026(a) | | | EUR | | | | 132 | | | | 151,949 | |
8.50%, 08/15/2027(a) | | | U.S.$ | | | | 3,683 | | | | 3,943,234 | |
Vertical Holdco GmbH
7.625%, 07/15/2028(a) | | | | | | | 2,285 | | | | 2,374,548 | |
Vertical US Newco, Inc.
5.25%, 07/15/2027(a) | | | | | | | 5,028 | | | | 5,174,190 | |
Wesco Distribution, Inc.
7.125%, 06/15/2025(a) | | | | | | | 4,007 | | | | 4,323,392 | |
7.25%, 06/15/2028(a) | | | | | | | 2,962 | | | | 3,240,885 | |
| | | | | | | | | | | | |
| | | | | | | | | | | 145,711,923 | |
| | | | | | | | | | | | |
Communications - Media – 3.2% | | | | | | | | | | | | |
Advantage Sales & Marketing, Inc.
6.50%, 11/15/2028(a) | | | | | | | 8,830 | | | | 8,630,731 | |
Altice Financing SA
7.50%, 05/15/2026(a) | | | | | | | 17,748 | | | | 18,502,843 | |
Banijay Entertainment SASU
3.50%, 03/01/2025(a) | | | EUR | | | | 815 | | | | 930,206 | |
5.375%, 03/01/2025(a) | | | U.S.$ | | | | 2,260 | | | | 2,286,230 | |
CCO Holdings LLC/CCO Holdings Capital Corp.
5.75%, 02/15/2026(a) | | | | | | | 135 | | | | 139,935 | |
Clear Channel Worldwide Holdings, Inc.
5.125%, 08/15/2027(a) | | | | | | | 4,940 | | | | 4,837,041 | |
CSC Holdings LLC
5.375%, 02/01/2028(a) | | | | | | | 8,139 | | | | 8,642,922 | |
5.50%, 05/15/2026(a) | | | | | | | 2,000 | | | | 2,080,553 | |
7.50%, 04/01/2028(a) | | | | | | | 4,326 | | | | 4,738,567 | |
DISH DBS Corp.
5.00%, 03/15/2023 | | | | | | | 1,148 | | | | 1,156,983 | |
5.875%, 11/15/2024 | | | | | | | 1,199 | | | | 1,206,692 | |
6.75%, 06/01/2021 | | | | | | | 1,332 | | | | 1,358,787 | |
7.375%, 07/01/2028 | | | | | | | 6,580 | | | | 6,622,009 | |
7.75%, 07/01/2026 | | | | | | | 335 | | | | 355,268 | |
DISH Network Corp.
3.375%, 08/15/2026(h) | | | | | | | 4,275 | | | | 3,807,639 | |
iHeartCommunications, Inc.
5.25%, 08/15/2027(a) | | | | | | | 1,888 | | | | 1,864,351 | |
6.375%, 05/01/2026 | | | | | | | 758 | | | | 790,081 | |
8.375%, 05/01/2027 | | | | | | | 3,375 | | | | 3,291,173 | |
| | |
| |
| abfunds.com | | AB HIGH INCOME FUND | 19 |
PORTFOLIO OF INVESTMENTS (continued)
| | | | | | | | | | | | |
| | | | | | Principal
Amount
(000) | | | U.S. $ Value | |
| |
Lamar Media Corp.
4.875%, 01/15/2029 | | | U.S.$ | | | | 1,559 | | | $ | 1,621,468 | |
5.75%, 02/01/2026 | | | | | | | 2,000 | | | | 2,068,984 | |
LCPR Senior Secured Financing DAC
6.75%, 10/15/2027(a) | | | | | | | 14,893 | | | | 15,616,733 | |
Liberty Interactive LLC
3.75%, 02/15/2030(h) | | | | | | | 2,216 | | | | 1,628,118 | |
Meredith Corp.
6.875%, 02/01/2026 | | | | | | | 13,214 | | | | 10,953,395 | |
National CineMedia LLC
5.875%, 04/15/2028(a) | | | | | | | 3,387 | | | | 2,362,544 | |
Netflix, Inc.
4.875%, 04/15/2028 | | | | | | | 183 | | | | 205,783 | |
Outfront Media Capital LLC/Outfront Media Capital Corp.
4.625%, 03/15/2030(a) | | | | | | | 3,403 | | | | 3,126,500 | |
Scripps Escrow, Inc.
5.875%, 07/15/2027(a) | | | | | | | 3,449 | | | | 3,345,726 | |
Sinclair Television Group, Inc.
5.50%, 03/01/2030(a) | | | | | | | 4,371 | | | | 4,112,620 | |
Sirius XM Radio, Inc.
5.50%, 07/01/2029(a) | | | | | | | 110 | | | | 119,698 | |
Summer BC Holdco B SARL
5.75%, 10/31/2026(a) | | | EUR | | | | 7,605 | | | | 8,735,425 | |
TEGNA, Inc.
4.75%, 03/15/2026(a) | | | U.S.$ | | | | 1,900 | | | | 1,962,142 | |
5.00%, 09/15/2029 | | | | | | | 4,970 | | | | 5,031,360 | |
5.50%, 09/15/2024(a) | | | | | | | 301 | | | | 306,931 | |
Univision Communications, Inc.
5.125%, 02/15/2025(a) | | | | | | | 1,398 | | | | 1,374,185 | |
6.625%, 06/01/2027(a) | | | | | | | 5,134 | | | | 5,184,761 | |
9.50%, 05/01/2025(a) | | | | | | | 836 | | | | 913,017 | |
UPC Holding BV
5.50%, 01/15/2028(a) | | | | | | | 11,047 | | | | 11,426,438 | |
Virgin Media Finance PLC
5.00%, 07/15/2030(a) | | | | | | | 4,000 | | | | 3,980,020 | |
Virgin Media Secured Finance PLC
4.50%, 08/15/2030(a) | | | | | | | 3,734 | | | | 3,810,763 | |
5.50%, 05/15/2029(a) | | | | | | | 333 | | | | 355,945 | |
Ziggo Bond Co. BV
5.125%, 02/28/2030(a) | | | | | | | 985 | | | | 1,013,983 | |
Ziggo BV
4.875%, 01/15/2030(a) | | | | | | | 811 | | | | 840,212 | |
5.50%, 01/15/2027(a) | | | | | | | 5,375 | | | | 5,575,164 | |
| | | | | | | | | | | | |
| | | | | | | | | | | 166,913,926 | |
| | | | | | | | | | | | |
| | |
| |
20 | AB HIGH INCOME FUND | | abfunds.com |
PORTFOLIO OF INVESTMENTS (continued)
| | | | | | | | | | | | |
| | | | | | Principal
Amount
(000) | | | U.S. $ Value | |
| |
Communications -
Telecommunications – 1.9% | | | | | | | | | | | | |
Altice France SA/France
7.375%, 05/01/2026(a) | | | U.S.$ | | | | 2,771 | | | $ | 2,895,695 | |
C&W Senior Financing DAC
6.875%, 09/15/2027(a) | | | | | | | 9,576 | | | | 10,172,470 | |
7.50%, 10/15/2026(a) | | | | | | | 333 | | | | 350,766 | |
CenturyLink, Inc. Series Y
7.50%, 04/01/2024 | | | | | | | 2,262 | | | | 2,493,290 | |
Connect Finco SARL/Connect US Finco LLC
6.75%, 10/01/2026(a) | | | | | | | 8,020 | | | | 8,060,100 | |
Consolidated Communications, Inc.
6.50%, 10/01/2028(a) | | | | | | | 6,659 | | | | 6,841,794 | |
DKT Finance ApS
7.00%, 06/17/2023(a) | | | EUR | | | | 3,874 | | | | 4,536,302 | |
9.375%, 06/17/2023(a) | | | U.S.$ | | | | 3,093 | | | | 3,170,615 | |
Frontier Communications Corp.
5.875%, 10/15/2027(a) | | | | | | | 4,240 | | | | 4,324,735 | |
Intelsat Jackson Holdings SA
5.50%, 08/01/2023(e)(i) | | | | | | | 7,915 | | | | 4,657,129 | |
9.75%, 07/15/2025(a)(e)(i) | | | | | | | 1,446 | | | | 895,066 | |
Intrado Corp.
8.50%, 10/15/2025(a) | | | | | | | 2,520 | | | | 2,267,540 | |
Level 3 Financing, Inc.
4.25%, 07/01/2028(a) | | | | | | | 2,458 | | | | 2,470,641 | |
5.25%, 03/15/2026 | | | | | | | 5,865 | | | | 6,057,145 | |
Nexstar Broadcasting, Inc.
5.625%, 07/15/2027(a) | | | | | | | 1,746 | | | | 1,820,560 | |
Sprint Capital Corp.
8.75%, 03/15/2032 | | | | | | | 1,344 | | | | 2,011,074 | |
Sprint Corp.
7.25%, 09/15/2021 | | | | | | | 2,000 | | | | 2,083,484 | |
7.625%, 02/15/2025-03/01/2026 | | | | | | | 1,454 | | | | 1,722,093 | |
7.875%, 09/15/2023 | | | | | | | 1,622 | | | | 1,848,685 | |
T-Mobile USA, Inc.
6.00%, 03/01/2023 | | | | | | | 2,547 | | | | 2,549,165 | |
Telecom Italia Capital SA
7.20%, 07/18/2036 | | | | | | | 7,713 | | | | 9,770,827 | |
7.721%, 06/04/2038 | | | | | | | 6,995 | | | | 9,505,273 | |
Zayo Group Holdings, Inc.
6.125%, 03/01/2028(a) | | | | | | | 7,870 | | | | 7,966,857 | |
| | | | | | | | | | | | |
| | | | | | | | | | | 98,471,306 | |
| | | | | | | | | | | | |
Consumer Cyclical -
Automotive – 2.3% | | | | | |
Adient US LLC
9.00%, 04/15/2025(a) | | | | | | | 3,859 | | | | 4,242,702 | |
Allison Transmission, Inc.
5.875%, 06/01/2029(a) | | | | | | | 913 | | | | 998,461 | |
| | |
| |
| abfunds.com | | AB HIGH INCOME FUND | 21 |
PORTFOLIO OF INVESTMENTS (continued)
| | | | | | | | | | | | |
| | �� | | | | Principal
Amount
(000) | | | U.S. $ Value | |
| |
American Axle & Manufacturing, Inc.
6.875%, 07/01/2028 | | | U.S.$ | | | | 11,770 | | | $ | 11,961,759 | |
Aston Martin Capital Ltd.
10.50%, 11/30/2025 | | | | | | | 6,401 | | | | 6,401,000 | |
Clarios Global LP/Clarios US Finance Co.
6.25%, 05/15/2026(a) | | | | | | | 4,201 | | | | 4,372,892 | |
8.50%, 05/15/2027(a) | | | | | | | 10,313 | | | | 10,764,104 | |
Dana Financing Luxembourg SARL
5.75%, 04/15/2025(a) | | | | | | | 656 | | | | 678,950 | |
Dana, Inc.
5.375%, 11/15/2027 | | | | | | | 651 | | | | 676,143 | |
5.625%, 06/15/2028 | | | | | | | 983 | | | | 1,032,292 | |
Dealer Tire LLC/DT Issuer LLC
8.00%, 02/01/2028(a) | | | | | | | 3,633 | | | | 3,722,277 | |
Exide Technologies
11.00%, 10/31/2024(c) | | | | | | | 26,083 | | | | – 0 | – |
Ford Motor Co.
8.50%, 04/21/2023 | | | | | | | 10,431 | | | | 11,511,777 | |
9.00%, 04/22/2025 | | | | | | | 2,901 | | | | 3,417,707 | |
Ford Motor Credit Co. LLC
5.125%, 06/16/2025 | | | | | | | 1,455 | | | | 1,516,483 | |
Garrett LX I SARL/Garrett Borrowing LLC
5.125%, 10/15/2026(a)(e)(i) | | | EUR | | | | 7,242 | | | | 8,309,210 | |
IHO Verwaltungs GmbH | | | | | | | | | | | | |
3.625% (3.625% Cash or 4.375% PIK), 05/15/2025(a)(f) | | | | | | | 1,336 | | | | 1,554,566 | |
3.875% (3.875% Cash or 4.625% PIK), 05/15/2027(a)(f) | | | | | | | 1,742 | | | | 2,028,624 | |
Jaguar Land Rover Automotive PLC
5.875%, 11/15/2024(a) | | | | | | | 107 | | | | 114,457 | |
7.75%, 10/15/2025(a) | | | U.S.$ | | | | 6,597 | | | | 6,662,328 | |
Meritor, Inc.
6.25%, 02/15/2024 | | | | | | | 3,393 | | | | 3,454,161 | |
6.25%, 06/01/2025(a) | | | | | | | 2,099 | | | | 2,148,177 | |
PM General Purchaser LLC
9.50%, 10/01/2028(a) | | | | | | | 3,152 | | | | 3,293,526 | |
Tenneco, Inc.
4.875%, 04/15/2022(a) | | | EUR | | | | 7,710 | | | | 8,800,586 | |
5.00%, 07/15/2024(a) | | | | | | | 1,600 | | | | 1,730,846 | |
5.00%, 07/15/2026 | | | U.S.$ | | | | 4,571 | | | | 3,548,297 | |
Titan International, Inc.
6.50%, 11/30/2023 | | | | | | | 5,307 | | | | 4,092,658 | |
Truck Hero, Inc.
8.50%, 04/21/2024(a) | | | | | | | 4,563 | | | | 4,815,140 | |
ZF North America Capital, Inc.
4.50%, 04/29/2022(a) | | | | | | | 178 | | | | 183,268 | |
4.75%, 04/29/2025(a) | | | | | | | 9,455 | | | | 9,765,371 | |
| | | | | | | | | | | | |
| | | | | | | | | | | 121,797,762 | |
| | | | | | | | | | | | |
| | |
| |
22 | AB HIGH INCOME FUND | | abfunds.com |
PORTFOLIO OF INVESTMENTS (continued)
| | | | | | | | | | | | |
| | | | | | Principal
Amount
(000) | | | U.S. $ Value | |
| |
Consumer Cyclical -
Entertainment – 1.4% | | | | | | | | | | | | |
AMC Entertainment Holdings, Inc.
5.75%, 06/15/2025 | | | U.S.$ | | | | 1,036 | | | $ | 50,666 | |
5.875%, 11/15/2026 | | | | | | | 6,227 | | | | 249,080 | |
Carnival Corp.
9.875%, 08/01/2027(a) | | | | | | | 3,689 | | | | 3,825,013 | |
11.50%, 04/01/2023(a) | | | | | | | 9,028 | | | | 9,936,214 | |
Cedar Fair LP/Canada’s Wonderland Co./Magnum Management Corp./Millennium Op
5.50%, 05/01/2025(a) | | | | | | | 12,465 | | | | 12,619,754 | |
Mattel, Inc.
5.875%, 12/15/2027(a) | | | | | | | 815 | | | | 885,286 | |
6.75%, 12/31/2025(a) | | | | | | | 634 | | | | 665,882 | |
Royal Caribbean Cruises Ltd.
10.875%, 06/01/2023(a) | | | | | | | 7,068 | | | | 7,698,890 | |
11.50%, 06/01/2025(a) | | | | | | | 12,746 | | | | 14,578,237 | |
SeaWorld Parks & Entertainment, Inc.
8.75%, 05/01/2025(a) | | | | | | | 4,914 | | | | 5,162,196 | |
9.50%, 08/01/2025(a) | | | | | | | 4,530 | | | | 4,754,887 | |
Silversea Cruise Finance Ltd.
7.25%, 02/01/2025(a) | | | | | | | 7,400 | | | | 7,438,184 | |
Six Flags Theme Parks, Inc.
7.00%, 07/01/2025(a) | | | | | | | 1,901 | | | | 2,012,902 | |
Vail Resorts, Inc.
6.25%, 05/15/2025(a) | | | | | | | 1,447 | | | | 1,527,345 | |
Viking Cruises Ltd.
5.875%, 09/15/2027(a) | | | | | | | 1,856 | | | | 1,433,433 | |
VOC Escrow Ltd.
5.00%, 02/15/2028(a) | | | | | | | 1,018 | | | | 882,658 | |
| | | | | | | | | | | | |
| | | | | | | | | | | 73,720,627 | |
| | | | | | | | | | | | |
Consumer Cyclical - Other – 3.3% | | | | | | | | | | | | |
Adams Homes, Inc.
7.50%, 02/15/2025(a) | | | | | | | 4,216 | | | | 4,247,057 | |
Beazer Homes USA, Inc.
5.875%, 10/15/2027 | | | | | | | 4,131 | | | | 4,213,376 | |
6.75%, 03/15/2025 | | | | | | | 6,147 | | | | 6,343,574 | |
Boyd Gaming Corp.
4.75%, 12/01/2027 | | | | | | | 2,105 | | | | 2,045,775 | |
8.625%, 06/01/2025(a) | | | | | | | 2,735 | | | | 2,991,759 | |
Brookfield Residential Properties, Inc./Brookfield Residential US Corp.
4.875%, 02/15/2030(a) | | | | | | | 5,889 | | | | 5,595,616 | |
6.25%, 09/15/2027(a) | | | | | | | 7,295 | | | | 7,470,476 | |
Caesars Entertainment, Inc.
6.25%, 07/01/2025(a) | | | | | | | 6,507 | | | | 6,693,259 | |
| | |
| |
| abfunds.com | | AB HIGH INCOME FUND | 23 |
PORTFOLIO OF INVESTMENTS (continued)
| | | | | | | | | | |
| | | | | Principal
Amount
(000) | | | U.S. $ Value | |
| |
Caesars Holdings, Inc.
5.00%, 10/01/2024(h) | | U.S.$ | | | 333 | | | $ | 635,985 | |
Five Point Operating Co. LP/Five Point Capital Corp.
7.875%, 11/15/2025(a) | | | | | 8,001 | | | | 7,991,711 | |
Forestar Group, Inc.
5.00%, 03/01/2028(a) | | | | | 2,032 | | | | 2,015,765 | |
8.00%, 04/15/2024(a) | | | | | 3,410 | | | | 3,573,035 | |
Forterra Finance LLC/FRTA Finance Corp.
6.50%, 07/15/2025(a) | | | | | 1,671 | | | | 1,768,411 | |
Hilton Domestic Operating Co., Inc.
4.25%, 09/01/2024 | | | | | 2,000 | | | | 1,991,247 | |
5.375%, 05/01/2025(a) | | | | | 1,173 | | | | 1,218,659 | |
5.75%, 05/01/2028(a) | | | | | 1,263 | | | | 1,324,713 | |
Installed Building Products, Inc.
5.75%, 02/01/2028(a) | | | | | 1,588 | | | | 1,671,421 | |
International Game Technology PLC
5.25%, 01/15/2029(a) | | | | | 6,212 | | | | 6,186,413 | |
K. Hovnanian Enterprises, Inc.
10.00%, 07/15/2022(a) | | | | | 2,531 | | | | 2,447,815 | |
KB Home
7.00%, 12/15/2021 | | | | | 6,936 | | | | 7,226,052 | |
7.50%, 09/15/2022 | | | | | 2,741 | | | | 2,999,778 | |
Marriott Ownership Resorts, Inc.
6.125%, 09/15/2025(a) | | | | | 6,752 | | | | 7,038,058 | |
Marriott Ownership Resorts, Inc./ILG LLC
6.50%, 09/15/2026 | | | | | 6,380 | | | | 6,568,610 | |
Mattamy Group Corp.
4.625%, 03/01/2030(a) | | | | | 6,691 | | | | 6,836,030 | |
5.25%, 12/15/2027(a) | | | | | 4,540 | | | | 4,801,050 | |
Scientific Games International, Inc.
5.00%, 10/15/2025(a) | | | | | 4,999 | | | | 5,014,228 | |
7.00%, 05/15/2028(a) | | | | | 892 | | | | 886,314 | |
7.25%, 11/15/2029(a) | | | | | 893 | | | | 885,322 | |
Shea Homes LP/Shea Homes Funding Corp.
4.75%, 02/15/2028-04/01/2029(a) | | | | | 7,822 | | | | 7,941,955 | |
Stars Group Holdings BV/Stars Group US Co-Borrower LLC
7.00%, 07/15/2026(a) | | | | | 5,888 | | | | 6,228,960 | |
Sugarhouse HSP Gaming Prop Mezz LP/Sugarhouse HSP Gaming Finance Corp.
5.875%, 05/15/2025(a) | | | | | 8,781 | | | | 8,514,663 | |
Taylor Morrison Communities, Inc.
5.75%, 01/15/2028(a) | | | | | 2,782 | | | | 3,079,137 | |
5.875%, 06/15/2027(a) | | | | | 3,493 | | | | 3,873,637 | |
| | |
| |
24 | AB HIGH INCOME FUND | | abfunds.com |
PORTFOLIO OF INVESTMENTS (continued)
| | | | | | | | | | | | |
| | | | | | Principal
Amount
(000) | | | U.S. $ Value | |
| |
Taylor Morrison Communities, Inc./Taylor Morrison Holdings II, Inc.
5.875%, 04/15/2023(a) | | | U.S.$ | | | | 4,950 | | | $ | 5,209,875 | |
Twin River Worldwide Holdings, Inc.
6.75%, 06/01/2027(a) | | | | | | | 5,908 | | | | 5,984,039 | |
Wyndham Destinations, Inc.
4.625%, 03/01/2030(a) | | | | | | | 4,506 | | | | 4,392,604 | |
6.625%, 07/31/2026(a) | | | | | | | 3,533 | | | | 3,759,955 | |
Wyndham Hotels & Resorts, Inc.
5.375%, 04/15/2026(a) | | | | | | | 135 | | | | 138,379 | |
Wynn Las Vegas LLC/Wynn Las Vegas Capital Corp.
4.25%, 05/30/2023(a) | | | | | | | 333 | | | | 317,478 | |
5.50%, 03/01/2025(a) | | | | | | | 2,020 | | | | 1,933,495 | |
Wynn Resorts Finance LLC/Wynn Resorts Capital Corp.
5.125%, 10/01/2029(a) | | | | | | | 3,075 | | | | 2,953,637 | |
7.75%, 04/15/2025(a) | | | | | | | 6,444 | | | | 6,781,519 | |
| | | | | | | | | | | | |
| | | | | | | | | | | 173,790,842 | |
| | | | | | | | | | | | |
Consumer Cyclical -
Restaurants – 0.4% | | | | | | | | | | | | |
1011778 BC ULC/New Red Finance, Inc.
4.25%, 05/15/2024(a) | | | | | | | 2,000 | | | | 2,040,952 | |
4.375%, 01/15/2028(a) | | | | | | | 83 | | | | 83,997 | |
5.75%, 04/15/2025(a) | | | | | | | 2,614 | | | | 2,787,448 | |
Golden Nugget, Inc.
6.75%, 10/15/2024(a) | | | | | | | 4,858 | | | | 4,111,957 | |
IRB Holding Corp.
6.75%, 02/15/2026(a) | | | | | | | 3,291 | | | | 3,317,969 | |
7.00%, 06/15/2025(a) | | | | | | | 2,922 | | | | 3,115,588 | |
KFC Holding Co/Pizza Hut Holdings LLC/Taco Bell of America LLC
4.75%, 06/01/2027(a) | | | | | | | 2,000 | | | | 2,070,970 | |
Yum! Brands, Inc.
7.75%, 04/01/2025(a) | | | | | | | 2,006 | | | | 2,203,094 | |
| | | | | | | | | | | | |
| | | | | | | | | | | 19,731,975 | |
| | | | | | | | | | | | |
Consumer Cyclical - Retailers – 1.8% | | | | | | | | | | | | |
Burlington Coat Factory Warehouse Corp.
6.25%, 04/15/2025(a) | | | | | | | 640 | | | | 672,433 | |
Dufry One BV
2.50%, 10/15/2024(a) | | | EUR | | | | 5,467 | | | | 5,744,168 | |
FirstCash, Inc.
4.625%, 09/01/2028(a) | | | U.S.$ | | | | 1,378 | | | | 1,402,801 | |
L Brands, Inc. | | | | | | | | | | | | |
5.25%, 02/01/2028 | | | | | | | 531 | | | | 522,450 | |
6.625%, 10/01/2030(a) | | | | | | | 5,212 | | | | 5,469,206 | |
6.75%, 07/01/2036 | | | | | | | 1,479 | | | | 1,497,453 | |
| | |
| |
| abfunds.com | | AB HIGH INCOME FUND | 25 |
PORTFOLIO OF INVESTMENTS (continued)
| | | | | | | | | | | | |
| | | | | | Principal
Amount
(000) | | | U.S. $ Value | |
| |
6.875%, 07/01/2025(a) | | | U.S.$ | | | | 397 | | | $ | 425,422 | |
6.875%, 11/01/2035 | | | | | | | 7,429 | | | | 7,553,007 | |
7.50%, 06/15/2029 | | | | | | | 492 | | | | 526,628 | |
9.375%, 07/01/2025(a) | | | | | | | 685 | | | | 794,941 | |
Murphy Oil USA, Inc.
5.625%, 05/01/2027 | | | | | | | 503 | | | | 530,439 | |
Penske Automotive Group, Inc.
3.50%, 09/01/2025 | | | | | | | 6,620 | | | | 6,638,940 | |
5.50%, 05/15/2026 | | | | | | | 845 | | | | 871,988 | |
PetSmart, Inc.
7.125%, 03/15/2023(a) | | | | | | | 13,658 | | | | 13,431,451 | |
Rite Aid Corp.
7.50%, 07/01/2025(a) | | | | | | | 6,759 | | | | 6,760,539 | |
Sonic Automotive, Inc.
6.125%, 03/15/2027 | | | | | | | 5,939 | | | | 6,131,799 | |
Specialty Building Products Holdings LLC/SBP Finance Corp.
6.375%, 09/30/2026(a) | | | | | | | 8,390 | | | | 8,576,139 | |
Staples, Inc.
7.50%, 04/15/2026(a) | | | | | | | 6,746 | | | | 6,299,576 | |
10.75%, 04/15/2027(a) | | | | | | | 6,383 | | | | 5,080,754 | |
TPro Acquisition Corp.
11.00%, 10/15/2024(a) | | | | | | | 1,780 | | | | 1,782,551 | |
White Cap Buyer LLC
6.875%, 10/15/2028(a) | | | | | | | 8,674 | | | | 8,891,819 | |
William Carter Co. (The)
5.50%, 05/15/2025(a) | | | | | | | 4,156 | | | | 4,364,811 | |
5.625%, 03/15/2027(a) | | | | | | | 2,000 | | | | 2,098,449 | |
| | | | | | | | | | | | |
| | | | | | | | | | | 96,067,764 | |
| | | | | | | | | | | | |
Consumer Non-Cyclical – 3.3% | | | | | | | | | | | | |
Acadia Healthcare Co., Inc.
5.50%, 07/01/2028(a) | | | | | | | 5,204 | | | | 5,438,332 | |
AdaptHealth LLC
6.125%, 08/01/2028(a) | | | | | | | 1,532 | | | | 1,595,585 | |
Albertsons Cos., Inc./Safeway, Inc./New Albertsons LP/Albertsons LLC
3.25%, 03/15/2026(a) | | | | | | | 345 | | | | 338,432 | |
3.50%, 02/15/2023(a) | | | | | | | 2,000 | | | | 2,031,994 | |
4.625%, 01/15/2027(a) | | | | | | | 3,290 | | | | 3,393,043 | |
4.875%, 02/15/2030(a) | | | | | | | 2,263 | | | | 2,402,582 | |
5.75%, 03/15/2025 | | | | | | | 1,604 | | | | 1,657,386 | |
7.50%, 03/15/2026(a) | | | | | | | 333 | | | | 368,499 | |
Bausch Health Americas, Inc.
8.50%, 01/31/2027(a) | | | | | | | 3,828 | | | | 4,183,022 | |
Bausch Health Cos., Inc.
5.50%, 11/01/2025(a) | | | | | | | 2,000 | | | | 2,053,214 | |
5.75%, 08/15/2027(a) | | | | | | | 333 | | | | 356,930 | |
| | |
| |
26 | AB HIGH INCOME FUND | | abfunds.com |
PORTFOLIO OF INVESTMENTS (continued)
| | | | | | | | | | |
| | | | | Principal
Amount
(000) | | | U.S. $ Value | |
| |
6.125%, 04/15/2025(a) | | U.S.$ | | | 2,422 | | | $ | 2,485,182 | |
6.25%, 02/15/2029(a) | | | | | 2,900 | | | | 2,987,806 | |
7.25%, 05/30/2029(a) | | | | | 1,211 | | | | 1,302,909 | |
9.00%, 12/15/2025(a) | | | | | 1,937 | | | | 2,116,162 | |
Catalent Pharma Solutions, Inc.
4.875%, 01/15/2026(a) | | | | | 3,111 | | | | 3,178,299 | |
CD&R Smokey Buyer, Inc.
6.75%, 07/15/2025(a) | | | | | 419 | | | | 445,382 | |
CHS/Community Health Systems, Inc.
6.25%, 03/31/2023 | | | | | 5,121 | | | | 5,075,433 | |
6.625%, 02/15/2025(a) | | | | | 3,740 | | | | 3,669,325 | |
Coty, Inc.
4.00%, 04/15/2023(a) | | EUR | | | 454 | | | | 432,586 | |
6.50%, 04/15/2026(a) | | U.S.$ | | | 5,326 | | | | 4,164,589 | |
DaVita, Inc.
3.75%, 02/15/2031(a) | | | | | 5,645 | | | | 5,426,894 | |
4.625%, 06/01/2030(a) | | | | | 333 | | | | 338,209 | |
Emergent BioSolutions, Inc.
3.875%, 08/15/2028(a) | | | | | 709 | | | | 712,592 | |
Endo Dac/Endo Finance LLC/Endo Finco, Inc.
6.00%, 06/30/2028(a) | | | | | 4,779 | | | | 3,691,653 | |
9.50%, 07/31/2027(a) | | | | | 4,292 | | | | 4,604,071 | |
Envision Healthcare Corp.
8.75%, 10/15/2026(a) | | | | | 6,978 | | | | 3,307,205 | |
Global Medical Response, Inc.
6.50%, 10/01/2025(a) | | | | | 2,750 | | | | 2,715,625 | |
HCA, Inc.
5.875%, 05/01/2023 | | | | | 2,000 | | | | 2,176,094 | |
IQVIA, Inc.
3.25%, 03/15/2025(a) | | EUR | | | 5,672 | | | | 6,639,483 | |
5.00%, 10/15/2026(a) | | U.S.$ | | | 2,333 | | | | 2,420,392 | |
Kronos Acquisition Holdings, Inc.
9.00%, 08/15/2023(a) | | | | | 7,943 | | | | 8,077,217 | |
Legacy LifePoint Health LLC
6.75%, 04/15/2025(a) | | | | | 333 | | | | 352,516 | |
Mallinckrodt International Finance SA/Mallinckrodt CB LLC
5.50%, 04/15/2025(a)(e)(i) | | | | | 2,552 | | | | 898,719 | |
MEDNAX, Inc.
5.25%, 12/01/2023(a) | | | | | 315 | | | | 317,042 | |
6.25%, 01/15/2027(a) | | | | | 589 | | | | 607,523 | |
Par Pharmaceutical, Inc.
7.50%, 04/01/2027(a) | | | | | 1,545 | | | | 1,636,513 | |
Post Holdings, Inc.
4.625%, 04/15/2030(a) | | | | | 6,624 | | | | 6,806,469 | |
5.50%, 12/15/2029(a) | | | | | 4,151 | | | | 4,485,378 | |
5.75%, 03/01/2027(a) | | | | | 333 | | | | 348,877 | |
| | |
| |
| abfunds.com | | AB HIGH INCOME FUND | 27 |
PORTFOLIO OF INVESTMENTS (continued)
| | | | | | | | | | | | |
| | | | | | Principal
Amount
(000) | | | U.S. $ Value | |
| |
Providence Service Corp. (The)
5.875%, 11/15/2025(a) | | | U.S.$ | | | | 999 | | | $ | 1,016,780 | |
Radiology Partners, Inc.
9.25%, 02/01/2028(a) | | | | | | | 6,950 | | | | 7,405,804 | |
RegionalCare Hospital Partners Holdings, Inc./LifePoint Health, Inc.
9.75%, 12/01/2026(a) | | | | | | | 15,964 | | | | 17,197,892 | |
Spectrum Brands, Inc.
4.00%, 10/01/2026(a) | | | EUR | | | | 3,459 | | | | 4,082,224 | |
5.75%, 07/15/2025 | | | U.S.$ | | | | 598 | | | | 615,688 | |
Sunshine Mid BV
6.50%, 05/15/2026(a) | | | EUR | | | | 5,784 | | | | 6,743,673 | |
Synlab Unsecured Bondco PLC
8.25%, 07/01/2023(a) | | | | | | | 3,869 | | | | 4,578,806 | |
Tenet Healthcare Corp.
4.875%, 01/01/2026(a) | | | U.S.$ | | | | 295 | | | | 299,160 | |
5.125%, 05/01/2025 | | | | | | | 3,026 | | | | 2,994,320 | |
6.75%, 06/15/2023 | | | | | | | 4,155 | | | | 4,381,443 | |
7.00%, 08/01/2025 | | | | | | | 766 | | | | 785,154 | |
7.50%, 04/01/2025(a) | | | | | | | 3,623 | | | | 3,903,108 | |
US Renal Care, Inc.
10.625%, 07/15/2027(a) | | | | | | | 4,233 | | | | 4,516,979 | |
Vizient, Inc.
6.25%, 05/15/2027(a) | | | | | | | 1,274 | | | | 1,343,001 | |
West Street Merger Sub, Inc.
6.375%, 09/01/2025(a) | | | | | | | 4,934 | | | | 5,007,970 | |
| | | | | | | | | | | | |
| | | | | | | | | | | 170,111,166 | |
| | | | | | | | | | | | |
Energy – 3.4% | | | | | | | | | | | | |
AI Candelaria Spain SLU
7.50%, 12/15/2028(a) | | | | | | | 3,655 | | | | 3,951,987 | |
Antero Resources Corp.
5.125%, 12/01/2022 | | | | | | | 1,413 | | | | 1,309,330 | |
Apache Corp.
4.625%, 11/15/2025 | | | | | | | 520 | | | | 492,364 | |
4.875%, 11/15/2027 | | | | | | | 955 | | | | 894,991 | |
Berry Petroleum Co. LLC
7.00%, 02/15/2026(a) | | | | | | | 736 | | | | 500,717 | |
Blue Racer Midstream LLC/Blue Racer Finance Corp.
6.625%, 07/15/2026(a) | | | | | | | 1,586 | | | | 1,432,248 | |
Callon Petroleum, Co.
6.25%, 04/15/2023 | | | | | | | 3,636 | | | | 1,411,352 | |
8.25%, 07/15/2025 | | | | | | | 253 | | | | 73,805 | |
Cheniere Energy Partners LP
4.50%, 10/01/2029 | | | | | | | 2,089 | | | | 2,129,471 | |
Citgo Holding, Inc.
9.25%, 08/01/2024(a) | | | | | | | 2,595 | | | | 2,175,252 | |
| | |
| |
28 | AB HIGH INCOME FUND | | abfunds.com |
PORTFOLIO OF INVESTMENTS (continued)
| | | | | | | | | | |
| | | | | Principal
Amount
(000) | | | U.S. $ Value | |
| |
CITGO Petroleum Corp.
6.25%, 08/15/2022(a) | | U.S.$ | | | 3,482 | | | $ | 3,351,070 | |
7.00%, 06/15/2025(a) | | | | | 9,430 | | | | 8,733,747 | |
Comstock Resources, Inc.
7.50%, 05/15/2025(a) | | | | | 2,892 | | | | 2,874,275 | |
9.75%, 08/15/2026 | | | | | 1,973 | | | | 2,079,159 | |
Diamond Offshore Drilling, Inc.
4.875%, 11/01/2043(e)(i) | | | | | 8,521 | | | | 554,385 | |
5.75%, 10/15/2039(e)(i) | | | | | 3,966 | | | | 272,983 | |
7.875%, 08/15/2025(e)(i) | | | | | 4,441 | | | | 304,113 | |
EnLink Midstream Partners LP
4.15%, 06/01/2025 | | | | | 9,849 | | | | 8,515,239 | |
4.40%, 04/01/2024 | | | | | 2,333 | | | | 2,127,244 | |
EQT Corp.
3.90%, 10/01/2027 | | | | | 6,480 | | | | 6,221,805 | |
Genesis Energy LP/Genesis Energy Finance Corp.
6.25%, 05/15/2026 | | | | | 2,898 | | | | 2,321,482 | |
7.75%, 02/01/2028 | | | | | 4,524 | | | | 3,756,276 | |
Global Partners LP/GLP Finance Corp.
6.875%, 01/15/2029(a) | | | | | 2,289 | | | | 2,358,493 | |
7.00%, 08/01/2027 | | | | | 2,652 | | | | 2,736,274 | |
Gulfport Energy Corp.
6.00%, 10/15/2024 | | | | | 2,096 | | | | 1,161,279 | |
6.375%, 05/15/2025-01/15/2026 | | | | | 18,625 | | | | 10,299,248 | |
Hess Midstream Operations LP
5.625%, 02/15/2026(a) | | | | | 5,376 | | | | 5,373,278 | |
HighPoint Operating Corp.
7.00%, 10/15/2022 | | | | | 1,645 | | | | 365,967 | |
Hilcorp Energy I LP/Hilcorp Finance Co.
5.75%, 10/01/2025(a) | | | | | 5,626 | | | | 5,186,019 | |
Indigo Natural Resources LLC
6.875%, 02/15/2026(a) | | | | | 3,805 | | | | 3,767,033 | |
Ithaca Energy North Sea PLC
9.375%, 07/15/2024(a) | | | | | 3,759 | | | | 3,300,287 | |
Nabors Industries Ltd.
7.25%, 01/15/2026(a) | | | | | 2,551 | | | | 1,060,973 | |
7.50%, 01/15/2028(a) | | | | | 2,586 | | | | 1,034,441 | |
New Fortress Energy, Inc.
6.75%, 09/15/2025(a) | | | | | 7,162 | | | | 7,384,102 | |
NGL Energy Partners LP/NGL Energy Finance Corp.
7.50%, 11/01/2023 | | | | | 8,840 | | | | 4,763,596 | |
Occidental Petroleum Corp.
2.70%, 02/15/2023 | | | | | 5,613 | | | | 5,028,873 | |
2.90%, 08/15/2024 | | | | | 1,755 | | | | 1,460,592 | |
3.125%, 02/15/2022 | | | | | 333 | | | | 316,983 | |
| | |
| |
| abfunds.com | | AB HIGH INCOME FUND | 29 |
PORTFOLIO OF INVESTMENTS (continued)
| | | | | | | | | | |
| | | | | Principal
Amount
(000) | | | U.S. $ Value | |
| |
3.40%, 04/15/2026 | | U.S.$ | | | 421 | | | $ | 329,050 | |
3.50%, 06/15/2025 | | | | | 2,366 | | | | 1,901,097 | |
5.875%, 09/01/2025 | | | | | 1,346 | | | | 1,184,099 | |
8.00%, 07/15/2025 | | | | | 2,108 | | | | 2,055,915 | |
8.50%, 07/15/2027 | | | | | 558 | | | | 535,697 | |
8.875%, 07/15/2030 | | | | | 558 | | | | 546,076 | |
Parkland Corp./Canada
6.00%, 04/01/2026(a) | | | | | 3,646 | | | | 3,767,265 | |
PDC Energy, Inc.
5.75%, 05/15/2026 | | | | | 3,847 | | | | 3,625,152 | |
6.125%, 09/15/2024 | | | | | 7,221 | | | | 6,920,071 | |
QEP Resources, Inc.
5.25%, 05/01/2023 | | | | | 4,768 | | | | 3,765,374 | |
Range Resources Corp.
5.00%, 03/15/2023 | | | | | 271 | | | | 263,330 | |
SandRidge Energy, Inc.
7.50%, 02/15/2023(b)(c) | | | | | 1,970 | | | | – 0 | – |
8.125%, 10/15/2022(b)(c) | | | | | 15,534 | | | | – 0 | – |
SM Energy Co.
5.00%, 01/15/2024 | | | | | 3,387 | | | | 1,697,160 | |
5.625%, 06/01/2025 | | | | | 2,653 | | | | 1,054,165 | |
Southwestern Energy Co.
8.375%, 09/15/2028 | | | | | 2,391 | | | | 2,501,784 | |
Sunoco LP/Sunoco Finance Corp.
5.50%, 02/15/2026 | | | | | 6,830 | | | | 6,861,810 | |
5.875%, 03/15/2028 | | | | | 2,917 | | | | 3,026,756 | |
Transocean Phoenix 2 Ltd.
7.75%, 10/15/2024(a) | | | | | 2,100 | | | | 1,927,551 | |
Transocean Poseidon Ltd.
6.875%, 02/01/2027(a) | | | | | 1,918 | | | | 1,444,959 | |
Transocean, Inc.
7.25%, 11/01/2025(a) | | | | | 2,072 | | | | 692,821 | |
7.50%, 01/15/2026(a) | | | | | 4,613 | | | | 1,019,081 | |
11.50%, 01/30/2027(a) | | | | | 2,001 | | | | 665,590 | |
Vantage Drilling International
7.125%, 04/01/2023(b)(c) | | | | | 8,325 | | | | – 0 | – |
7.50%, 11/01/2019(b)(c)(e) | | | | | 8,860 | | | | – 0 | – |
Vine Oil & Gas LP/Vine Oil & Gas Finance Corp.
8.75%, 04/15/2023(a) | | | | | 13,924 | | | | 10,218,740 | |
Western Midstream Operating LP
3.95%, 06/01/2025 | | | | | 1,219 | | | | 1,128,911 | |
4.00%, 07/01/2022 | | | | | 3,397 | | | | 3,400,409 | |
4.10%, 02/01/2025 | | | | | 2,891 | | | | 2,732,621 | |
4.50%, 03/01/2028 | | | | | 1,652 | | | | 1,541,747 | |
4.75%, 08/15/2028 | | | | | 1,563 | | | | 1,466,074 | |
5.05%, 02/01/2030 | | | | | 2,516 | | | | 2,386,391 | |
| | |
| |
30 | AB HIGH INCOME FUND | | abfunds.com |
PORTFOLIO OF INVESTMENTS (continued)
| | | | | | | | | | | | |
| | | | | | Principal
Amount
(000) | | | U.S. $ Value | |
| |
5.45%, 04/01/2044 | | | U.S.$ | | | | 916 | | | $ | 776,604 | |
| | | | | | | | | | | | |
| | | | | | | | | | | 180,517,033 | |
| | | | | | | | | | | | |
Other Industrial – 0.3% | | | | | | | | | | | | |
American Builders & Contractors Supply Co., Inc.
4.00%, 01/15/2028(a) | | | | | | | 6,917 | | | | 7,033,601 | |
5.875%, 05/15/2026(a) | | | | | | | 333 | | | | 345,938 | |
Avient Corp.
5.75%, 05/15/2025(a) | | | | | | | 1,878 | | | | 1,972,740 | |
H&E Equipment Services, Inc.
5.625%, 09/01/2025 | | | | | | | 333 | | | | 345,167 | |
IAA, Inc.
5.50%, 06/15/2027(a) | | | | | | | 1,742 | | | | 1,828,418 | |
KAR Auction Services, Inc.
5.125%, 06/01/2025(a) | | | | | | | 1,590 | | | | 1,612,915 | |
Laureate Education, Inc.
8.25%, 05/01/2025(a) | | | | | | | 3,401 | | | | 3,622,429 | |
| | | | | | | | | | | | |
| | | | | | | | | | | 16,761,208 | |
| | | | | | | | | | | | |
Services – 2.6% | | | | | | | | | | | | |
Allied Universal Holdco LLC/Allied
Universal Finance Corp.
6.625%, 07/15/2026(a) | | | | | | | 1,699 | | | | 1,779,309 | |
9.75%, 07/15/2027(a) | | | | | | | 11,333 | | | | 12,119,281 | |
ANGI Group LLC
3.875%, 08/15/2028(a) | | | | | | | 12,814 | | | | 12,664,738 | |
Aptim Corp.
7.75%, 06/15/2025(a) | | | | | | | 8,390 | | | | 5,142,798 | |
APX Group, Inc.
6.75%, 02/15/2027(a) | | | | | | | 2,701 | | | | 2,828,680 | |
7.875%, 12/01/2022 | | | | | | | 4,135 | | | | 4,129,511 | |
Aramark Services, Inc.
5.00%, 02/01/2028(a) | | | | | | | 696 | | | | 702,536 | |
6.375%, 05/01/2025(a) | | | | | | | 4,892 | | | | 5,134,111 | |
Carlson Travel, Inc.
6.75%, 12/15/2025(a) | | | | | | | 3,434 | | | | 2,433,737 | |
8.50%, 03/31/2025(g) | | | | | | | 608 | | | | 607,974 | |
Carriage Services, Inc.
6.625%, 06/01/2026(a) | | | | | | | 2,900 | | | | 3,047,096 | |
Cars.com, Inc.
6.375%, 11/01/2028(a) | | | | | | | 2,795 | | | | 2,780,600 | |
eDreams ODIGEO SA
5.50%, 09/01/2023(a) | | | EUR | | | | 3,335 | | | | 3,249,442 | |
Garda World Security Corp.
9.50%, 11/01/2027(a) | | | U.S.$ | | | | 8,008 | | | | 8,599,686 | |
Gartner, Inc.
4.50%, 07/01/2028(a) | | | | | | | 3,059 | | | | 3,192,494 | |
| | |
| |
| abfunds.com | | AB HIGH INCOME FUND | 31 |
PORTFOLIO OF INVESTMENTS (continued)
| | | | | | | | | | | | |
| | | | | | Principal
Amount
(000) | | | U.S. $ Value | |
| |
Korn Ferry
4.625%, 12/15/2027(a) | | | U.S.$ | | | | 3,154 | | | $ | 3,209,195 | |
Monitronics International, Inc.
0.00%, 04/01/2020(b)(c)(e) | | | | | | | 6,914 | | | | – 0 | – |
MPH Acquisition Holdings LLC
5.75%, 11/01/2028(a) | | | | | | | 14,241 | | | | 13,995,391 | |
Nielsen Co. Luxembourg SARL (The)
5.00%, 02/01/2025(a) | | | | | | | 2,333 | | | | 2,394,885 | |
Prime Security Services Borrower LLC/Prime Finance, Inc.
5.25%, 04/15/2024(a) | | | | | | | 135 | | | | 141,168 | |
6.25%, 01/15/2028(a) | | | | | | | 10,851 | | | | 10,963,146 | |
Refinitiv US Holdings, Inc.
8.25%, 11/15/2026(a) | | | | | | | 7,186 | | | | 7,808,125 | |
Sabre GLBL, Inc.
7.375%, 09/01/2025(a) | | | | | | | 5,580 | | | | 5,685,276 | |
9.25%, 04/15/2025(a) | | | | | | | 2,673 | | | | 2,958,745 | |
Service Corp. International/US
3.375%, 08/15/2030 | | | | | | | 8,414 | | | | 8,530,589 | |
TripAdvisor, Inc.
7.00%, 07/15/2025(a) | | | | | | | 2,089 | | | | 2,172,531 | |
Verscend Escrow Corp.
9.75%, 08/15/2026(a) | | | | | | | 9,176 | | | | 9,863,483 | |
| | | | | | | | | | | | |
| | | | | | | | | | | 136,134,527 | |
| | | | | | | | | | | | |
Technology – 1.7% | | | | | | | | | | | | |
Avaya, Inc.
6.125%, 09/15/2028(a) | | | | | | | 8,069 | | | | 8,288,806 | |
Banff Merger Sub, Inc.
9.75%, 09/01/2026(a) | | | | | | | 13,822 | | | | 14,525,241 | |
Cablevision Lightpath LLC
5.625%, 09/15/2028(a) | | | | | | | 4,374 | | | | 4,419,441 | |
CDK Global, Inc.
5.00%, 10/15/2024 | | | | | | | 333 | | | | 360,288 | |
CDW LLC/CDW Finance Corp.
4.125%, 05/01/2025 | | | | | | | 3,505 | | | | 3,634,867 | |
CommScope Technologies LLC
6.00%, 06/15/2025(a) | | | | | | | 289 | | | | 286,599 | |
CommScope, Inc.
5.50%, 03/01/2024(a) | | | | | | | 3,688 | | | | 3,766,256 | |
6.00%, 03/01/2026(a) | | | | | | | 1,846 | | | | 1,914,427 | |
8.25%, 03/01/2027(a) | | | | | | | 4,130 | | | | 4,276,482 | |
EMC Corp.
3.375%, 06/01/2023 | | | | | | | 2,000 | | | | 2,041,286 | |
Logan Merger Sub, Inc.
5.50%, 09/01/2027(a) | | | | | | | 3,076 | | | | 3,118,534 | |
Microchip Technology, Inc.
4.25%, 09/01/2025(a) | | | | | | | 3,341 | | | | 3,462,965 | |
| | |
| |
32 | AB HIGH INCOME FUND | | abfunds.com |
PORTFOLIO OF INVESTMENTS (continued)
| | | | | | | | | | | | |
| | | | | | Principal
Amount
(000) | | | U.S. $ Value | |
| |
NCR Corp.
5.75%, 09/01/2027(a) | | | U.S.$ | | | | 1,558 | | | $ | 1,606,046 | |
6.125%, 09/01/2029(a) | | | | | | | 1,207 | | | | 1,273,602 | |
8.125%, 04/15/2025(a) | | | | | | | 1,684 | | | | 1,851,544 | |
Presidio Holdings, Inc.
4.875%, 02/01/2027(a) | | | | | | | 515 | | | | 529,009 | |
8.25%, 02/01/2028(a) | | | | | | | 819 | | | | 869,044 | |
Science Applications International Corp.
4.875%, 04/01/2028(a) | | | | | | | 493 | | | | 516,424 | |
Sensata Technologies, Inc.
3.75%, 02/15/2031(a) | | | | | | | 5,780 | | | | 5,721,933 | |
Solera LLC/Solera Finance, Inc.
10.50%, 03/01/2024(a) | | | | | | | 7,758 | | | | 8,053,046 | |
Veritas US, Inc./Veritas Bermuda Ltd.
7.50%, 02/01/2023-09/01/2025(a) | | | | | | | 15,464 | | | | 15,583,086 | |
10.50%, 02/01/2024(a)(j) | | | | | | | 2,933 | | | | 2,720,134 | |
| | | | | | | | | | | | |
| | | | | | | | | | | 88,819,060 | |
| | | | | | | | | | | | |
Transportation - Airlines – 0.2% | | | | | | | | | | | | |
Spirit Loyalty Cayman Ltd./Spirit IP Cayman Ltd.
8.00%, 09/20/2025(a) | | | | | | | 9,426 | | | | 9,993,528 | |
| | | | | | | | | | | | |
| | | |
Transportation - Services – 0.7% | | | | | | | | | | | | |
AerCap Global Aviation Trust
6.50%, 06/15/2045(a) | | | | | | | 2,000 | | | | 1,772,186 | |
Algeco Global Finance PLC
8.00%, 02/15/2023(a) | | | | | | | 10,171 | | | | 10,107,957 | |
Avis Budget Car Rental LLC/Avis Budget Finance, Inc.
5.25%, 03/15/2025(a) | | | | | | | 1,519 | | | | 1,447,523 | |
5.75%, 07/15/2027(a) | | | | | | | 1,477 | | | | 1,392,866 | |
10.50%, 05/15/2025(a) | | | | | | | 7,546 | | | | 8,694,560 | |
Herc Holdings, Inc.
5.50%, 07/15/2027(a) | | | | | | | 6,789 | | | | 6,980,396 | |
XPO Logistics, Inc.
6.75%, 08/15/2024(a) | | | | | | | 5,875 | | | | 6,213,407 | |
| | | | | | | | | | | | |
| | | | | | | | | | | 36,608,895 | |
| | | | | | | | | | | | |
| | | | | | | | | | | 1,689,911,654 | |
| | | | | | | | | | | | |
Financial Institutions – 6.3% | | | | | | | | | | | | |
Banking – 2.4% | | | | | | | | | | | | |
Alliance Data Systems Corp.
4.75%, 12/15/2024(a) | | | | | | | 6,719 | | | | 6,255,149 | |
7.00%, 01/15/2026(a) | | | | | | | 6,934 | | | | 6,953,415 | |
Ally Financial, Inc.
5.75%, 11/20/2025 | | | | | | | 4,000 | | | | 4,545,961 | |
Banco Bilbao Vizcaya Argentaria SA
5.875%, 05/24/2022(a)(k) | | | EUR | | | | 10,200 | | | | 11,671,540 | |
| | |
| |
| abfunds.com | | AB HIGH INCOME FUND | 33 |
PORTFOLIO OF INVESTMENTS (continued)
| | | | | | | | | | | | |
| | | | | | Principal
Amount
(000) | | | U.S. $ Value | |
| |
Series 9
6.50%, 03/05/2025(k) | | | U.S.$ | | | | 14,000 | | | $ | 13,801,446 | |
Banco Santander SA
6.75%, 04/25/2022(a)(k) | | | EUR | | | | 8,100 | | | | 9,741,803 | |
Credit Suisse Group AG
6.25%, 12/18/2024(a)(k) | | | U.S.$ | | | | 7,786 | | | | 8,303,414 | |
6.375%, 08/21/2026(a)(k) | | | | | | | 8,766 | | | | 9,476,751 | |
7.50%, 07/17/2023(a)(k) | | | | | | | 8,027 | | | | 8,480,904 | |
Discover Financial Services
Series D
6.125%, 06/23/2025(k) | | | | | | | 19,736 | | | | 21,131,706 | |
Dresdner Funding Trust I
8.151%, 06/30/2031(a) | | | | | | | 816 | | | | 1,193,485 | |
Intesa Sanpaolo SpA
5.017%, 06/26/2024(a) | | | | | | | 3,198 | | | | 3,375,667 | |
5.71%, 01/15/2026(a) | | | | | | | 860 | | | | 937,073 | |
Societe Generale SA
8.00%, 09/29/2025(a)(k) | | | | | | | 6,149 | | | | 6,891,335 | |
UniCredit SpA
9.25%, 06/03/2022(a)(k) | | | EUR | | | | 11,605 | | | | 14,478,215 | |
| | | | | | | | | | | | |
| | | | | | | | | | | 127,237,864 | |
| | | | | | | | | | | | |
Brokerage – 0.5% | | | | | | | | | | | | |
Lehman Brothers Holdings, Inc.
6.875%, 05/02/2018(e) | | | U.S.$ | | | | 1,600 | | | | 18,400 | |
Series G
4.80%, 03/13/2014(e) | | | | | | | 1,800 | | | | 20,700 | |
LPL Holdings, Inc.
5.75%, 09/15/2025(a) | | | | | | | 9,158 | | | | 9,482,732 | |
NFP Corp.
6.875%, 08/15/2028(a) | | | | | | | 15,715 | | | | 15,273,194 | |
7.00%, 05/15/2025(a) | | | | | | | 2,605 | | | | 2,768,035 | |
| | | | | | | | | | | | |
| | | | | | | | | | | 27,563,061 | |
| | | | | | | | | | | | |
Finance – 0.8% | | | | | | | | | | | | |
CNG Holdings, Inc.
12.50%, 06/15/2024(a) | | | | | | | 4,791 | | | | 4,202,700 | |
Curo Group Holdings Corp.
8.25%, 09/01/2025(a) | | | | | | | 9,472 | | | | 7,836,289 | |
Enova International, Inc.
8.50%, 09/01/2024-09/15/2025(a) | | | | | | | 8,322 | | | | 7,679,414 | |
goeasy Ltd.
5.375%, 12/01/2024(a) | | | | | | | 4,377 | | | | 4,430,047 | |
ILFC E-Capital Trust II
3.23% (H15T 30 Year + 1.80%), 12/21/2065(a)(l) | | | | | | | 1,500 | | | | 840,000 | |
Jefferies Finance LLC/JFIN Co-Issuer Corp. 6.25%, 06/03/2026(a) | | | | | | | 3,034 | | | | 3,096,807 | |
| | |
| |
34 | AB HIGH INCOME FUND | | abfunds.com |
PORTFOLIO OF INVESTMENTS (continued)
| | | | | | | | | | | | |
| | | | | | Principal
Amount
(000) | | | U.S. $ Value | |
| |
Lincoln Financing SARL
3.625%, 04/01/2024(a) | | | EUR | | | | 1,573 | | | $ | 1,742,256 | |
Navient Corp. | | | | | | | | | | | | |
5.50%, 01/25/2023 | | | U.S.$ | | | | 2,000 | | | | 1,995,697 | |
6.50%, 06/15/2022 | | | | | | | 1,903 | | | | 1,954,575 | |
SLM Corp.
5.125%, 04/05/2022 | | | | | | | 3,828 | | | | 3,930,825 | |
TMX Finance LLC/TitleMax Finance Corp.
11.125%, 04/01/2023(a) | | | | | | | 6,227 | | | | 5,702,790 | |
| | | | | | | | | | | | |
| | | | | | | | | | | 43,411,400 | |
| | | | | | | | | | | | |
Insurance – 0.9% | | | | | | | | | | | | |
Acrisure LLC/Acrisure Finance, Inc. | | | | | | | | | | | | |
7.00%, 11/15/2025(a) | | | | | | | 8,362 | | | | 8,349,285 | |
8.125%, 02/15/2024(a) | | | | | | | 2,000 | | | | 2,093,996 | |
10.125%, 08/01/2026(a) | | | | | | | 5,867 | | | | 6,497,093 | |
Alliant Holdings Intermediate LLC/Alliant Holdings Co-Issuer
6.75%, 10/15/2027(a) | | | | | | | 14,733 | | | | 15,469,650 | |
Ardonagh Midco 2 PLC
11.50%, 01/15/2027(a) | | | | | | | 9,060 | | | | 9,009,857 | |
Genworth Holdings, Inc.
7.625%, 09/24/2021 | | | | | | | 3,542 | | | | 3,532,767 | |
HUB International Ltd.
7.00%, 05/01/2026(a) | | | | | | | 1,573 | | | | 1,612,372 | |
| | | | | | | | | | | | |
| | | | | | | | | | | 46,565,020 | |
| | | | | | | | | | | | |
Other Finance – 0.6% | | | | | | | | | | | | |
Altice France Holding SA
10.50%, 05/15/2027(a) | | | | | | | 7,099 | | | | 7,843,783 | |
Intrum AB | | | | | | | | | | | | |
2.75%, 07/15/2022(a) | | | EUR | | | | 405 | | | | 468,043 | |
3.00%, 09/15/2027(a) | | | | | | | 3,250 | | | | 3,279,792 | |
3.50%, 07/15/2026(a) | | | | | | | 4,776 | | | | 4,950,471 | |
4.875%, 08/15/2025 | | | | | | | 4,189 | | | | 4,753,659 | |
Tempo Acquisition LLC/Tempo Acquisition Finance Corp.
6.75%, 06/01/2025(a) | | | U.S.$ | | | | 7,538 | | | | 7,650,939 | |
| | | | | | | | | | | | |
| | | | | | | | | | | 28,946,687 | |
| | | | | | | | | | | | |
REITS – 1.1% | | | | | | | | | | | | |
Brookfield Property REIT, Inc./BPR Cumulus LLC/BPR Nimbus LLC/GGSI Sellco LL
5.75%, 05/15/2026(a) | | | | | | | 14,529 | | | | 12,046,918 | |
Diversified Healthcare Trust | | | | | |
6.75%, 12/15/2021 | | | | | | | 4,500 | | | | 4,581,908 | |
9.75%, 06/15/2025 | | | | | | | 5,638 | | | | 6,194,949 | |
| | |
| |
| abfunds.com | | AB HIGH INCOME FUND | 35 |
PORTFOLIO OF INVESTMENTS (continued)
| | | | | | | | | | | | |
| | | | | | Principal
Amount
(000) | | | U.S. $ Value | |
| |
GEO Group, Inc. (The)
6.00%, 04/15/2026 | | | U.S.$ | | | | 995 | | | $ | 646,495 | |
Iron Mountain, Inc. | | | | | |
4.875%, 09/15/2027(a) | | | | | | | 135 | | | | 137,636 | |
5.25%, 03/15/2028(a) | | | | | | | 10,718 | | | | 11,054,391 | |
MGM Growth Properties Operating
Partnership LP/MGP Finance Co-Issuer, Inc. | | | | | | | | | | | | |
4.625%, 06/15/2025(a) | | | | | | | 1,279 | | | | 1,302,293 | |
5.625%, 05/01/2024 | | | | | | | 4,333 | | | | 4,558,564 | |
5.75%, 02/01/2027 | | | | | | | 4,572 | | | | 4,933,378 | |
Realogy Group LLC/Realogy Co-Issuer Corp.
9.375%, 04/01/2027(a) | | | | | | | 10,691 | | | | 11,332,135 | |
| | | | | | | | | | | | |
| | | | | | | | | | | 56,788,667 | |
| | | | | | | | | | | | |
| | | | | | | | | | | 330,512,699 | |
| | | | | | | | | | | | |
Utility – 0.6% | | | | | | | | | | | | |
Electric – 0.6% | | | | | | | | | | | | |
Calpine Corp.
5.125%, 03/15/2028(a) | | | | | | | 8,057 | | | | 8,309,806 | |
NRG Energy, Inc.
6.625%, 01/15/2027 | | | | | | | 135 | | | | 142,027 | |
Talen Energy Supply LLC | | | | | |
6.50%, 06/01/2025 | | | | | | | 8,459 | | | | 5,035,712 | |
7.25%, 05/15/2027(a) | | | | | | | 1,791 | | | | 1,769,295 | |
10.50%, 01/15/2026(a) | | | | | | | 5,936 | | | | 4,054,029 | |
Texas Competitive/TCEH
11.50%, 10/01/2020(b)(c)(e) | | | | | | | 2,679 | | | | – 0 | – |
Vistra Operations Co. LLC
5.625%, 02/15/2027(a) | | | | | | | 9,170 | | | | 9,582,650 | |
| | | | | | | | | | | | |
| | | | | | | | | | | 28,893,519 | |
| | | | | | | | | | | | |
Total Corporates – Non-Investment Grade
(cost $2,077,283,458) | | | | | | | | | | | 2,049,317,872 | |
| | | | | | | | | | | | |
| | | | | | | | | | | | |
EMERGING MARKETS –
SOVEREIGNS – 12.2% | | | | | | | | | | | | |
Angola – 0.5% | |
Angolan Government International Bond | | | | | |
8.00%, 11/26/2029(a) | | | | | | | 13,030 | | | | 10,016,812 | |
9.125%, 11/26/2049(a) | | | | | | | 1,286 | | | | 975,752 | |
9.375%, 05/08/2048(a) | | | | | | | 298 | | | | 227,598 | |
9.50%, 11/12/2025(a) | | | | | | | 16,192 | | | | 13,823,920 | |
| | | | | | | | | | | | |
| | | | | | | | | | | 25,044,082 | |
| | | | | | | | | | | | |
Argentina – 0.9% | | | | | | | | | | | | |
Argentine Republic Government International Bond | | | | | | | | | | | | |
0.125%, 07/09/2030-07/09/2041 | | | | | | | 135,205 | | | | 45,908,901 | |
1.00%, 07/09/2029 | | | | | | | 6,275 | | | | 2,572,917 | |
| | | | | | | | | | | | |
| | | | | | | | | | | 48,481,818 | |
| | | | | | | | | | | | |
| | |
| |
36 | AB HIGH INCOME FUND | | abfunds.com |
PORTFOLIO OF INVESTMENTS (continued)
| | | | | | | | | | | | |
| | | | | | Principal
Amount
(000) | | | U.S. $ Value | |
| |
Bahrain – 0.6% | | | | | | | | | | | | |
Bahrain Government International Bond | | | | | | | | | | | | |
5.45%, 09/16/2032(a) | | | U.S.$ | | | | 4,147 | | | $ | 4,054,988 | |
6.75%, 09/20/2029(a) | | | | | | | 8,215 | | | | 8,890,170 | |
7.00%, 10/12/2028(a) | | | | | | | 7,504 | | | | 8,270,815 | |
7.375%, 05/14/2030(a) | | | | | | | 2,814 | | | | 3,115,626 | |
CBB International Sukuk Programme Co. SPC
6.25%, 11/14/2024(a) | | | | | | | 8,519 | | | | 9,184,547 | |
| | | | | | | | | | | | |
| | | | | | | | | | | 33,516,146 | |
| | | | | | | | | | | | |
Brazil – 0.2% | | | | | | | | | | | | |
Brazilian Government International Bond
3.875%, 06/12/2030 | | | | | | | 12,576 | | | | 12,733,200 | |
| | | | | | | | | | | | |
| | | |
Costa Rica – 0.3% | | | | | | | | | | | | |
Costa Rica Government International Bond
6.125%, 02/19/2031(a) | | | | | | | 17,268 | | | | 14,262,289 | |
| | | | | | | | | | | | |
| | | |
Dominican Republic – 1.0% | | | | | | | | | | | | |
Dominican Republic International Bond | | | | | | | | | | | | |
4.875%, 09/23/2032(a) | | | | | | | 3,246 | | | | 3,307,877 | |
5.50%, 01/27/2025(a) | | | | | | | 1,018 | | | | 1,087,669 | |
5.875%, 01/30/2060(a) | | | | | | | 5,200 | | | | 4,990,375 | |
5.95%, 01/25/2027(a) | | | | | | | 9,637 | | | | 10,513,365 | |
6.40%, 06/05/2049(a) | | | | | | | 2,497 | | | | 2,540,698 | |
6.85%, 01/27/2045(a) | | | | | | | 9,000 | | | | 9,658,125 | |
6.875%, 01/29/2026(a) | | | | | | | 652 | | | | 735,741 | |
7.45%, 04/30/2044(a) | | | | | | | 5,621 | | | | 6,421,992 | |
8.625%, 04/20/2027(a) | | | | | | | 12,151 | | | | 14,417,921 | |
| | | | | | | | | | | | |
| | | | | | | | | | | 53,673,763 | |
| | | | | | | | | | | | |
Ecuador – 0.3% | | | | | | | | | | | | |
Ecuador Government International Bond Zero Coupon, 07/31/2030(a) | | | | | | | 1,718 | | | | 773,845 | |
0.50%, 07/31/2030-07/31/2040(a) | | | | | | | 26,786 | | | | 15,003,870 | |
| | | | | | | | | | | | |
| | | | | | | | | | | 15,777,715 | |
| | | | | | | | | | | | |
Egypt – 1.4% | | | | | | | | | | | | |
Egypt Government International Bond | | | | | | | | | | | | |
5.75%, 05/29/2024(a) | | | | | | | 11,852 | | | | 12,126,077 | |
6.125%, 01/31/2022(a) | | | | | | | 22,826 | | | | 23,453,715 | |
6.20%, 03/01/2024(a) | | | | | | | 12,299 | | | | 12,760,213 | |
7.625%, 05/29/2032(a) | | | | | | | 11,844 | | | | 11,988,349 | |
8.50%, 01/31/2047(a) | | | | | | | 2,540 | | | | 2,520,950 | |
8.70%, 03/01/2049(a) | | | | | | | 3,170 | | | | 3,184,859 | |
8.875%, 05/29/2050(a) | | | | | | | 5,976 | | | | 6,033,893 | |
| | | | | | | | | | | | |
| | | | | | | | | | | 72,068,056 | |
| | | | | | | | | | | | |
| | |
| |
| abfunds.com | | AB HIGH INCOME FUND | 37 |
PORTFOLIO OF INVESTMENTS (continued)
| | | | | | | | | | | | |
| | | | | | Principal
Amount
(000) | | | U.S. $ Value | |
| |
El Salvador – 0.5% | | | | | | | | | | | | |
El Salvador Government International Bond | | | | | | | | | | | | |
5.875%, 01/30/2025(a) | | | U.S.$ | | | | 991 | | | $ | 818,814 | |
6.375%, 01/18/2027(a) | | | | | | | 6,513 | | | | 5,314,201 | |
7.125%, 01/20/2050(a) | | | | | | | 10,598 | | | | 7,991,554 | |
7.625%, 09/21/2034(a) | | | | | | | 872 | | | | 676,345 | |
7.65%, 06/15/2035(a) | | | | | | | 6,224 | | | | 4,936,410 | |
7.75%, 01/24/2023(a) | | | | | | | 3,494 | | | | 3,179,540 | |
8.625%, 02/28/2029(a) | | | | | | | 759 | | | | 658,195 | |
| | | | | | | | | | | | |
| | | | | | | | | | | 23,575,059 | |
| | | | | | | | | | | | |
Gabon – 0.4% | | | | | | | | | | | | |
Gabon Government International Bond | | | | | | | | | | | | |
6.375%, 12/12/2024(a) | | | | | | | 5,450 | | | | 5,183,939 | |
6.625%, 02/06/2031(a) | | | | | | | 12,920 | | | | 11,527,062 | |
6.95%, 06/16/2025(a) | | | | | | | 5,600 | | | | 5,290,250 | |
| | | | | | | | | | | | |
| | | | | | | | | | | 22,001,251 | |
| | | | | | | | | | | | |
Ghana – 0.5% | | | | | | | | | | | | |
Ghana Government International Bond | | | | | | | | | | | | |
6.375%, 02/11/2027(a) | | | | | | | 11,876 | | | | 11,007,567 | |
8.627%, 06/16/2049(a) | | | | | | | 260 | | | | 227,500 | |
8.95%, 03/26/2051(a) | | | | | | | 1,752 | | | | 1,569,683 | |
10.75%, 10/14/2030(a) | | | | | | | 9,035 | | | | 11,050,934 | |
| | | | | | | | | | | | |
| | | | | | | | | | | 23,855,684 | |
| | | | | | | | | | | | |
Guatemala – 0.0% | | | | | | | | | | | | |
Guatemala Government Bond | | | | | | | | | | | | |
5.375%, 04/24/2032(a) | | | | | | | 247 | | | | 291,074 | |
6.125%, 06/01/2050(a) | | | | | | | 1,232 | | | | 1,520,365 | |
| | | | | | | | | | | | |
| | | | | | | | | | | 1,811,439 | |
| | | | | | | | | | | | |
Honduras – 0.4% | | | | | | | | | | | | |
Honduras Government International Bond | | | | | | | | | | | | |
5.625%, 06/24/2030(a) | | | | | | | 1,072 | | | | 1,182,885 | |
6.25%, 01/19/2027(a) | | | | | | | 11,553 | | | | 12,917,698 | |
7.50%, 03/15/2024(a) | | | | | | | 4,025 | | | | 4,430,016 | |
8.75%, 12/16/2020(a) | | | | | | | 1,870 | | | | 1,881,103 | |
| | | | | | | | | | | | |
| | | | | | | | | | | 20,411,702 | |
| | | | | | | | | | | | |
Iraq – 0.2% | |
Iraq International Bond | | | | | | | | | | | | |
5.80%, 01/15/2028(a) | | | | | | | 500 | | | | 430,824 | |
6.752%, 03/09/2023(a) | | | | | | | 13,445 | | | | 12,508,052 | |
| | | | | | | | | | | | |
| | | | | | | | | | | 12,938,876 | |
| | | | | | | | | | | | |
Ivory Coast – 0.7% | | | | | | | | | | | | |
Ivory Coast Government International Bond | | | | | | | | | | | | |
5.125%, 06/15/2025(a) | | | EUR | | | | 588 | | | | 711,565 | |
| | |
| |
38 | AB HIGH INCOME FUND | | abfunds.com |
PORTFOLIO OF INVESTMENTS (continued)
| | | | | | | | | | | | |
| | | | | | Principal
Amount
(000) | | | U.S. $ Value | |
| |
5.875%, 10/17/2031(a) | | | U.S.$ | | | | 6,714 | | | $ | 7,650,853 | |
6.125%, 06/15/2033(a) | | | | | | | 5,888 | | | | 5,932,160 | |
6.375%, 03/03/2028(a) | | | | | | | 20,691 | | | | 21,680,288 | |
6.625%, 03/22/2048(a) | | | EUR | | | | 1,429 | | | | 1,564,948 | |
| | | | | | | | | | | | |
| | | | | | | | | | | 37,539,814 | |
| | | | | | | | | | | | |
Jamaica – 0.1% | | | | | | | | | | | | |
Jamaica Government International Bond
6.75%, 04/28/2028 | | | U.S.$ | | | | 5,560 | | | | 6,395,738 | |
| | | | | | | | | | | | |
| | | |
Kenya – 0.6% | | | | | | | | | | | | |
Kenya Government International Bond | | | | | | | | | | | | |
6.875%, 06/24/2024(a) | | | | | | | 13,375 | | | | 14,118,984 | |
7.00%, 05/22/2027(a) | | | | | | | 4,272 | | | | 4,429,530 | |
7.25%, 02/28/2028(a) | | | | | | | 11,786 | | | | 12,316,370 | |
| | | | | | | | | | | | |
| | | | | | | | | | | 30,864,884 | |
| | | | | | | | | | | | |
Lebanon – 0.0% | | | | | | | | | | | | |
Lebanon Government International Bond | | | | | | | | | | | | |
6.65%, 04/22/2024(a)(e)(i) | | | | | | | 2,476 | | | | 341,224 | |
6.85%, 03/23/2027(a)(e)(i) | | | | | | | 2,181 | | | | 300,569 | |
Series G | | | | | | | | | | | | |
1.00%, 11/27/2026(a)(e)(i) | | | | | | | 8,942 | | | | 1,232,319 | |
| | | | | | | | | | | | |
| | | | | | | | | | | 1,874,112 | |
| | | | | | | | | | | | |
Mongolia – 0.2% | | | | | | | | | | | | |
Mongolia Government International Bond | | | | | | | | | | | | |
5.125%, 12/05/2022(a) | | | | | | | 9,478 | | | | 9,717,912 | |
10.875%, 04/06/2021(a) | | | | | | | 2,400 | | | | 2,481,750 | |
| | | | | | | | | | | | |
| | | | | | | | | | | 12,199,662 | |
| | | | | | | | | | | | |
Nigeria – 0.9% | | | | | | | | | | | | |
Nigeria Government International Bond | | | | | | | | | | | | |
6.375%, 07/12/2023(a) | | | | | | | 4,303 | | | | 4,467,052 | |
6.50%, 11/28/2027(a) | | | | | | | 2,246 | | | | 2,173,005 | |
6.75%, 01/28/2021(a) | | | | | | | 3,327 | | | | 3,347,794 | |
7.625%, 11/21/2025-11/28/2047(a) | | | | | | | 28,304 | | | | 29,126,710 | |
7.696%, 02/23/2038(a) | | | | | | | 2,903 | | | | 2,672,574 | |
7.875%, 02/16/2032(a) | | | | | | | 2,864 | | | | 2,775,395 | |
| | | | | | | | | | | | |
| | | | | | | | | | | 44,562,530 | |
| | | | | | | | | | | | |
Oman – 0.3% | | | | | | | | | | | | |
Oman Government International Bond | | | | | | | | | | | | |
4.75%, 06/15/2026(a) | | | | | | | 12,837 | | | | 11,717,774 | |
4.875%, 02/01/2025(a) | | | | | | | 1,562 | | | | 1,501,473 | |
| | | | | | | | | | | | |
| | | | | | | | | | | 13,219,247 | |
| | | | | | | | | | | | |
Pakistan – 0.0% | | | | | | | | | | | | |
Pakistan Government International Bond
6.875%, 12/05/2027(a) | | | | | | | 395 | | | | 383,767 | |
| | | | | | | | | | | | |
| | |
| |
| abfunds.com | | AB HIGH INCOME FUND | 39 |
PORTFOLIO OF INVESTMENTS (continued)
| | | | | | | | | | | | |
| | | | | | Principal
Amount
(000) | | | U.S. $ Value | |
| |
Senegal – 0.5% | |
Senegal Government International Bond | | | | | |
6.25%, 05/23/2033(a) | | | U.S.$ | | | | 11,075 | | | $ | 11,261,890 | |
6.75%, 03/13/2048(a) | | | | | | | 13,314 | | | | 12,981,150 | |
8.75%, 05/13/2021(a) | | | | | | | 1,137 | | | | 1,173,953 | |
| | | | | | | | | | | | |
| | | | | | | | | | | 25,416,993 | |
| | | | | | | | | | | | |
South Africa – 0.5% | | | | | | | | | | | | |
Republic of South Africa Government International Bond | | | | | | | | | | | | |
4.30%, 10/12/2028 | | | | | | | 5,950 | | | | 5,771,500 | |
4.875%, 04/14/2026 | | | | | | | 3,040 | | | | 3,153,050 | |
5.65%, 09/27/2047 | | | | | | | 3,608 | | | | 3,252,838 | |
5.75%, 09/30/2049 | | | | | | | 10,201 | | | | 9,193,651 | |
5.875%, 06/22/2030 | | | | | | | 5,978 | | | | 6,314,262 | |
6.30%, 06/22/2048 | | | | | | | 557 | | | | 536,461 | |
| | | | | | | | | | | | |
| | | | | | | | | | | 28,221,762 | |
| | | | | | | | | | | | |
Sri Lanka – 0.1% | | | | | | | | | | | | |
Sri Lanka Government International Bond | | | | | | | | | | | | |
6.125%, 06/03/2025(a) | | | | | | | 2,800 | | | | 1,555,750 | |
6.20%, 05/11/2027(a) | | | | | | | 4,509 | | | | 2,423,588 | |
| | | | | | | | | | | | |
| | | | | | | | | | | 3,979,338 | |
| | | | | | | | | | | | |
Ukraine – 1.0% | | | | | | | | | | | | |
Ukraine Government International Bond | | | | | | | | | | | | |
7.253%, 03/15/2033(a) | | | | | | | 6,725 | | | | 6,321,500 | |
7.375%, 09/25/2032(a) | | | | | | | 10,461 | | | | 10,016,407 | |
7.75%, 09/01/2023-09/01/2024(a) | | | | | | | 32,497 | | | | 33,723,883 | |
| | | | | | | | | | | | |
| | | | | | | | | | | 50,061,790 | |
| | | | | | | | | | | | |
Venezuela – 0.1% | | | | | | | | | | | | |
Venezuela Government International Bond | | | | | | | | | | | | |
7.65%, 04/21/2025(a)(e)(i) | | | | | | | 6,636 | | | | 580,650 | |
9.00%, 05/07/2023(a)(e)(i) | | | | | | | 538 | | | | 47,075 | |
9.25%, 09/15/2027(e)(i) | | | | | | | 34,020 | | | | 2,976,750 | |
9.25%, 05/07/2028(a)(e)(i) | | | | | | | 1,500 | | | | 131,250 | |
| | | | | | | | | | | | |
| | | | | | | | | | | 3,735,725 | |
| | | | | | | | | | | | |
Total Emerging Markets – Sovereigns
(cost $676,505,791) | | | | | | | | | | | 638,606,442 | |
| | | | | | | | | | | | |
| | | | | | | | | | | | |
CORPORATES – INVESTMENT
GRADE – 12.2% | | | | | | | | | | | | |
Financial Institutions – 7.7% | | | | | | | | | | | | |
Banking – 4.4% | | | | | | | | | | | | |
Banco Santander Mexico SA Institucion de Banca Multiple Grupo Financiero Santand
5.375%, 04/17/2025(a) | | | | | | | 4,163 | | | | 4,657,356 | |
| | |
| |
40 | AB HIGH INCOME FUND | | abfunds.com |
PORTFOLIO OF INVESTMENTS (continued)
| | | | | | | | | | | | |
| | | | | | Principal
Amount
(000) | | | U.S. $ Value | |
| |
Bank of America Corp.
Series AA
6.10%, 03/17/2025(k) | | U.S.$ | | | | | 7,966 | | | $ | 8,764,990 | |
Series B
8.05%, 06/15/2027 | | | | | | | 11,735 | | | | 15,267,860 | |
Series X
6.25%, 09/05/2024(k) | | | | | | | 521 | | | | 565,856 | |
Series Z
6.50%, 10/23/2024(k) | | | | | | | 4,009 | | | | 4,456,290 | |
Bank of New York Mellon Corp. (The)
Series G
4.70%, 09/20/2025(k) | | | | | | | 1,082 | | | | 1,158,208 | |
Barclays Bank PLC
6.86%, 06/15/2032(a)(k) | | | | | | | 838 | | | | 1,130,735 | |
Barclays PLC
7.125%, 06/15/2025(k) | | | GBP | | | | 317 | | | | 430,254 | |
7.25%, 03/15/2023(a)(k) | | | | | | | 3,808 | | | | 5,064,982 | |
BNP Paribas SA
6.75%, 03/14/2022(a)(k) | | U.S.$ | | | | | 1,253 | | | | 1,287,914 | |
7.625%, 03/30/2021(a)(k) | | | | | | | 1,591 | | | | 1,612,837 | |
CIT Group, Inc.
3.929%, 06/19/2024 | | | | | | | 1,974 | | | | 2,056,092 | |
5.00%, 08/15/2022 | | | | | | | 2,000 | | | | 2,107,978 | |
Citigroup, Inc.
5.95%, 01/30/2023(k) | | | | | | | 14,778 | | | | 15,250,441 | |
Series M
6.30%, 05/15/2024(k) | | | | | | | 7,000 | | | | 7,255,114 | |
Comerica, Inc.
5.625%, 07/01/2025(k) | | | | | | | 11,418 | | | | 12,281,878 | |
Credit Agricole SA
6.50%, 06/23/2021(a)(k) | | | EUR | | | | 3,556 | | | | 4,218,601 | |
8.125%, 12/23/2025(a)(k) | | U.S.$ | | | | | 13,944 | | | | 16,380,075 | |
Fifth Third Bancorp
Series L
4.50%, 09/30/2025(k) | | | | | | | 1,315 | | | | 1,327,589 | |
Goldman Sachs Group, Inc. (The)
Series O
5.30%, 11/10/2026(k) | | | | | | | 1,173 | | | | 1,248,514 | |
Series P
5.00%, 11/10/2022(k) | | | | | | | 10,561 | | | | 10,161,932 | |
HSBC Holdings PLC | | | | | |
6.00%, 09/29/2023(a)(k) | | | EUR | | | | 5,708 | | | | 7,046,691 | |
6.375%, 03/30/2025(k) | | U.S.$ | | | | | 961 | | | | 1,004,245 | |
ING Groep NV | | | | | |
6.50%, 04/16/2025(k) | | | | | | | 1,847 | | | | 1,957,713 | |
6.875%, 04/16/2022(a)(k) | | | | | | | 1,142 | | | | 1,183,289 | |
| | |
| |
| abfunds.com | | AB HIGH INCOME FUND | 41 |
PORTFOLIO OF INVESTMENTS (continued)
| | | | | | | | | | | | |
| | | | | | Principal
Amount
(000) | | | U.S. $ Value | |
| |
JPMorgan Chase & Co.
Series V
3.545% (LIBOR 3 Month + 3.32%), 01/01/2021(k)(l) | | U.S.$ | | | | | 2,638 | | | $ | 2,467,248 | |
Lloyds Banking Group PLC | | | | | |
6.413%, 10/01/2035(a)(k) | | | | | | | 3,709 | | | | 4,374,805 | |
6.657%, 05/21/2037(a)(k) | | | | | | | 1,801 | | | | 2,181,035 | |
Natwest Group PLC | | | | | |
8.625%, 08/15/2021(k) | | | | | | | 21,538 | | | | 22,254,222 | |
Series U | | | | | | | | | | | | |
2.54% (LIBOR 3 Month + 2.32%), 09/30/2027(k)(l) | | | | | | | 6,400 | | | | 6,153,485 | |
Regions Bank/Birmingham AL
6.45%, 06/26/2037 | | | | | | | 5,300 | | | | 7,266,944 | |
Santander Holdings USA, Inc.
4.40%, 07/13/2027 | | | | | | | 5,543 | | | | 6,171,185 | |
Skandinaviska Enskilda Banken AB
5.625%, 05/13/2022(a)(k) | | | | | | | 200 | | | | 204,795 | |
Standard Chartered PLC | | | | | |
1.724% (LIBOR 3 Month + 1.51%), 01/30/2027(a)(k)(l) | | | | | | | 3,500 | | | | 3,107,790 | |
7.50%, 04/02/2022(a)(k) | | | | | | | 8,455 | | | | 8,722,579 | |
7.75%, 04/02/2023(a)(k) | | | | | | | 1,988 | | | | 2,112,926 | |
Truist Financial Corp. | | | | | |
Series P | | | | | |
4.95%, 09/01/2025(k) | | | | | | | 12,568 | | | | 13,426,081 | |
Series Q | | | | | |
5.10%, 03/01/2030(k) | | | | | | | 4,138 | | | | 4,521,569 | |
UBS Group AG
7.00%, 02/19/2025(a)(k) | | | | | | | 14,430 | | | | 16,115,494 | |
| | | | | | | | | | | | |
| | | | | | | | | | | 226,957,592 | |
| | | | | | | | | | | | |
Brokerage – 0.1% | | | | | | | | | | | | |
Charles Schwab Corp. (The)
Series G
5.375%, 06/01/2025(k) | | | | | | | 6,900 | | | | 7,559,353 | |
| | | | | | | | | | | | |
|
Finance – 0.6% | |
AerCap Ireland Capital DAC/AerCap
Global Aviation Trust | | | | | | | | | | | | |
2.875%, 08/14/2024 | | | | | | | 583 | | | | 576,296 | |
3.30%, 01/23/2023 | | | | | | | 150 | | | | 151,563 | |
3.65%, 07/21/2027 | | | | | | | 2,514 | | | | 2,375,949 | |
3.875%, 01/23/2028 | | | | | | | 2,307 | | | | 2,181,553 | |
4.125%, 07/03/2023 | | | | | | | 693 | | | | 712,129 | |
4.45%, 10/01/2025 | | | | | | | 2,273 | | | | 2,308,068 | |
4.50%, 09/15/2023 | | | | | | | 2,075 | | | | 2,155,673 | |
4.875%, 01/16/2024 | | | | | | | 5,332 | | | | 5,578,048 | |
| | |
| |
42 | AB HIGH INCOME FUND | | abfunds.com |
PORTFOLIO OF INVESTMENTS (continued)
| | | | | | | | | | | | |
| | | | | | Principal
Amount
(000) | | | U.S. $ Value | |
| |
6.50%, 07/15/2025 | | | U.S.$ | | | | 737 | | | $ | 810,994 | |
Aircastle Ltd. | | | | | |
4.125%, 05/01/2024 | | | | | | | 674 | | | | 663,446 | |
4.40%, 09/25/2023 | | | | | | | 1,545 | | | | 1,554,462 | |
5.00%, 04/01/2023 | | | | | | | 139 | | | | 141,728 | |
5.25%, 08/11/2025(a) | | | | | | | 11,202 | | | | 11,115,899 | |
| | | | | | | | | | | | |
| | | | | | | | | | | 30,325,808 | |
| | | | | | | | | | | | |
Insurance – 2.1% | | | | | | | | | | | | |
Allstate Corp. (The)
6.50%, 05/15/2057 | | | | | | | 10,811 | | | | 13,960,633 | |
Assicurazioni Generali SpA
Series E
5.50%, 10/27/2047(a) | | | EUR | | | | 10,305 | | | | 13,985,675 | |
Caisse Nationale de Reassurance Mutuelle Agricole Groupama
6.00%, 01/23/2027 | | | | | | | 9,800 | | | | 13,848,617 | |
Centene Corp.
4.625%, 12/15/2029 | | | U.S.$ | | | | 498 | | | | 542,190 | |
5.375%, 06/01/2026-08/15/2026(a) | | | | | | | 468 | | | | 492,983 | |
Liberty Mutual Group, Inc.
7.80%, 03/15/2037(a) | | | | | | | 14,459 | | | | 17,799,760 | |
MetLife Capital Trust IV
7.875%, 12/15/2037(a) | | | | | | | 9,269 | | | | 12,774,497 | |
MetLife, Inc.
6.40%, 12/15/2036 | | | | | | | 1,679 | | | | 2,101,332 | |
10.75%, 08/01/2039 | | | | | | | 3,495 | | | | 5,762,708 | |
Nationwide Mutual Insurance Co.
2.54% (LIBOR 3 Month + 2.29%), 12/15/2024(a)(l) | | | | | | | 5,000 | | | | 4,988,352 | |
9.375%, 08/15/2039(a) | | | | | | | 4,546 | | | | 7,711,638 | |
Prudential Financial, Inc.
5.20%, 03/15/2044 | | | | | | | 3,080 | | | | 3,250,329 | |
5.625%, 06/15/2043 | | | | | | | 9,892 | | | | 10,559,643 | |
SCOR SE
3.00%, 06/08/2046(a) | | | EUR | | | | 200 | | | | 257,232 | |
| | | | | | | | | | | | |
| | | | | | | | | | | 108,035,589 | |
| | | | | | | | | | | | |
Other Finance – 0.0% | | | | | | | | | | | | |
AerCap Ireland Capital DAC/AerCap Global Aviation Trust
4.45%, 04/03/2026 | | | U.S.$ | | | | 1,128 | | | | 1,136,758 | |
| | | | | | | | | | | | |
| | | |
REITS – 0.5% | | | | | | | | | | | | |
GLP Capital LP/GLP Financing II, Inc. | | | | | | | | | | | | |
5.25%, 06/01/2025 | | | | | | | 783 | | | | 857,460 | |
5.375%, 04/15/2026 | | | | | | | 5,156 | | | | 5,732,569 | |
| | |
| |
| abfunds.com | | AB HIGH INCOME FUND | 43 |
PORTFOLIO OF INVESTMENTS (continued)
| | | | | | | | | | | | |
| | | | | | Principal
Amount
(000) | | | U.S. $ Value | |
| |
MPT Operating Partnership LP/MPT
Finance Corp. | | | | | | | | | | | | |
4.625%, 08/01/2029 | | U.S.$ | | | | | 2,646 | | | $ | 2,771,728 | |
5.00%, 10/15/2027 | | | | | | | 135 | | | | 140,641 | |
5.50%, 05/01/2024 | | | | | | | 1,696 | | | | 1,733,569 | |
Sabra Health Care LP
4.80%, 06/01/2024 | | | | | | | 3,800 | | | | 4,014,192 | |
Spirit Realty LP
4.45%, 09/15/2026 | | | | | | | 1,180 | | | | 1,276,220 | |
Trust Fibra Uno | | | | | | | | | | | | |
4.869%, 01/15/2030(a) | | | | | | | 7,433 | | | | 7,730,320 | |
6.39%, 01/15/2050(a) | | | | | | | 324 | | | | 336,555 | |
6.95%, 01/30/2044(a) | | | | | | | 947 | | | | 1,037,882 | |
| | | | | | | | | | | | |
| | | | | | | | | | | 25,631,136 | |
| | | | | | | | | | | | |
| | | | | | | | | | | 399,646,236 | |
| | | | | | | | | | | | |
Industrial – 4.5% | |
Basic – 0.7% | |
ArcelorMittal SA | | | | | | | | | | | | |
7.00%, 03/01/2041 | | | | | | | 4,782 | | | | 5,764,489 | |
7.25%, 10/15/2039 | | | | | | | 3,241 | | | | 3,959,208 | |
Arconic Corp.
6.00%, 05/15/2025(a) | | | | | | | 3,466 | | | | 3,667,204 | |
Glencore Finance Canada Ltd.
6.00%, 11/15/2041(a) | | | | | | | 1,464 | | | | 1,764,985 | |
GUSAP III LP
4.25%, 01/21/2030 (a) | | | | | | | 1,700 | | | | 1,782,981 | |
Industrias Penoles SAB de CV
5.65%, 09/12/2049(a) | | | | | | | 1,525 | | | | 1,804,266 | |
MEGlobal Canada ULC | | | | | | | | | | | | |
5.00%, 05/18/2025(a) | | | | | | | 2,164 | | | | 2,362,451 | |
5.875%, 05/18/2030(a) | | | | | | | 1,157 | | | | 1,378,713 | |
Nexa Resources SA
6.50%, 01/18/2028(a) | | | | | | | 6,419 | | | | 7,143,941 | |
OCP SA
5.625%, 04/25/2024(a) | | | | | | | 3,133 | | | | 3,406,158 | |
Suzano Austria GmbH
7.00%, 03/16/2047(a) | | | | | | | 3,254 | | | | 3,929,205 | |
Vale Overseas Ltd.
3.75%, 07/08/2030 | | | | | | | 1,114 | | | | 1,169,682 | |
| | | | | | | | | | | | |
| | | | | | | | | | | 38,133,283 | |
| | | | | | | | | | | | |
Capital Goods – 0.2% | | | | | | | | | | | | |
General Electric Co.
Series D
5.00%, 01/21/2021(k) | | | | | | | 12,108 | | | | 9,896,613 | |
Howmet Aerospace, Inc.
5.90%, 02/01/2027 | | | | | | | 805 | | | | 889,068 | |
| | |
| |
44 | AB HIGH INCOME FUND | | abfunds.com |
PORTFOLIO OF INVESTMENTS (continued)
| | | | | | | | | | | | |
| | | | | | Principal
Amount
(000) | | | U.S. $ Value | |
| |
Textron Financial Corp.
2.015% (LIBOR 3 Month + 1.74%), 02/15/2042(a)(l) | | U.S.$ | | | | | 125 | | | $ | 87,573 | |
| | | | | | | | | | | | |
| | | | | | | | | | | 10,873,254 | |
| | | | | | | | | | | | |
Communications - Media – 0.0% | | | | | | | | | | | | |
Prosus NV
4.027%, 08/03/2050(a) | | | | | | | 1,341 | | | | 1,398,955 | |
| | | | | | | | | | | | |
| | | |
Communications - Telecommunications – 0.0% | | | | | | | | | | | | |
Hughes Satellite Systems Corp.
5.25%, 08/01/2026 | | | | | | | 333 | | | | 357,324 | |
| | | | | | | | | | | | |
| | |
Consumer Cyclical -
Automotive – 0.3% | | | | | | | | | |
General Motors Co.
6.80%, 10/01/2027 | | | | | | | 1,540 | | | | 1,893,627 | |
General Motors Financial Co., Inc.
5.25%, 03/01/2026 | | | | | | | 141 | | | | 160,928 | |
Lear Corp.
3.50%, 05/30/2030 | | | | | | | 1,212 | | | | 1,262,100 | |
3.80%, 09/15/2027 | | | | | | | 2,909 | | | | 3,109,155 | |
4.25%, 05/15/2029 | | | | | | | 876 | | | | 961,282 | |
Nissan Motor Acceptance Corp.
2.60%, 09/28/2022(a) | | | | | | | 298 | | | | 301,290 | |
3.45%, 03/15/2023(a) | | | | | | | 434 | | | | 445,968 | |
Nissan Motor Co., Ltd.
4.345%, 09/17/2027(a) | | | | | | | 5,586 | | | | 5,600,059 | |
| | | | | | | | | | | | |
| | | | | | | | | | | 13,734,409 | |
| | | | | | | | | | | | |
Consumer Cyclical - Other – 1.2% | | | | | | | | | | | | |
James Hardie International Finance DAC
4.75%, 01/15/2025(a) | | | | | | | 2,497 | | | | 2,559,425 | |
5.00%, 01/15/2028(a) | | | | | | | 2,181 | | | | 2,333,362 | |
Lennar Corp.
4.75%, 11/29/2027 | | | | | | | 135 | | | | 154,006 | |
Marriott International, Inc./MD
Series EE
5.75%, 05/01/2025 | | | | | | | 1,583 | | | | 1,762,536 | |
MDC Holdings, Inc.
6.00%, 01/15/2043 | | | | | | | 11,963 | | | | 14,988,986 | |
PulteGroup, Inc.
5.50%, 03/01/2026 | | | | | | | 2,000 | | | | 2,304,437 | |
6.00%, 02/15/2035 | | | | | | | 932 | | | | 1,159,849 | |
6.375%, 05/15/2033 | | | | | | | 2,695 | | | | 3,440,018 | |
7.875%, 06/15/2032 | | | | | | | 10,968 | | | | 15,546,912 | |
Standard Industries, Inc./NJ
4.375%, 07/15/2030(a) | | | | | | | 5,011 | | | | 5,176,849 | |
| | |
| |
| abfunds.com | | AB HIGH INCOME FUND | 45 |
PORTFOLIO OF INVESTMENTS (continued)
| | | | | | | | | | | | |
| | | | | | Principal
Amount
(000) | | | U.S. $ Value | |
| |
4.75%, 01/15/2028(a) | | U.S.$ | | | | | 2,079 | | | $ | 2,171,954 | |
Toll Brothers Finance Corp.
4.875%, 03/15/2027 | | | | | | | 8,180 | | | | 9,238,768 | |
| | | | | | | | | | | | |
| | | | | | | | | | | 60,837,102 | |
| | | | | | | | | | | | |
Consumer Non-Cyclical – 0.0% | | | | | | | | | | | | |
Kraft Heinz Foods Co.
4.875%, 10/01/2049(a) | | | | | | | 2,000 | | | | 2,113,544 | |
| | | | | | | | | | | | |
| | | |
Energy – 0.9% | | | | | | | | | | | | |
Cenovus Energy, Inc.
5.375%, 07/15/2025 | | | | | | | 3,480 | | | | 3,671,146 | |
6.75%, 11/15/2039 | | | | | | | 706 | | | | 784,834 | |
Ecopetrol SA
5.875%, 05/28/2045 | | | | | | | 5,418 | | | | 5,880,494 | |
6.875%, 04/29/2030 | | | | | | | 3,044 | | | | 3,658,888 | |
Energy Transfer Operating LP
4.75%, 01/15/2026 | | | | | | | 3,189 | | | | 3,424,732 | |
7.60%, 02/01/2024 | | | | | | | 3,200 | | | | 3,570,899 | |
Oleoducto Central SA
4.00%, 07/14/2027(a) | | | | | | | 610 | | | | 636,047 | |
ONEOK, Inc.
2.20%, 09/15/2025 | | | | | | | 1,926 | | | | 1,900,435 | |
5.85%, 01/15/2026 | | | | | | | 3,943 | | | | 4,489,484 | |
Parsley Energy LLC/Parsley Finance Corp.
5.625%, 10/15/2027(a) | | | | | | | 1,983 | | | | 2,108,498 | |
PBF Holding Co. LLC/PBF Finance Corp.
9.25%, 05/15/2025(a) | | | | | | | 7,457 | | | | 6,662,951 | |
Plains All American Pipeline LP/PAA Finance Corp.
3.60%, 11/01/2024 | | | | | | | 1,161 | | | | 1,194,030 | |
4.50%, 12/15/2026 | | | | | | | 1,795 | | | | 1,906,081 | |
Raizen Fuels Finance SA
5.30%, 01/20/2027(a) | | | | | | | 1,798 | | | | 1,946,996 | |
Southern Star Central Corp.
5.125%, 07/15/2022(a) | | | | | | | 1,150 | | | | 1,149,892 | |
Sunoco Logistics Partners Operations LP
3.90%, 07/15/2026 | | | | | | | 471 | | | | 487,343 | |
TransCanada PipeLines Ltd.
2.49% (LIBOR 3 Month + 2.21%), 05/15/2067(l) | | | | | | | 2,500 | | | | 1,722,710 | |
| | | | | | | | | | | | |
| | | | | | | | | | | 45,195,460 | |
| | | | | | | | | | | | |
Services – 0.0% | | | | | | | | | | | | |
Expedia Group, Inc.
6.25%, 05/01/2025(a) | | | | | | | 1,905 | | | | 2,094,723 | |
| | | | | | | | | | | | |
| | |
| |
46 | AB HIGH INCOME FUND | | abfunds.com |
PORTFOLIO OF INVESTMENTS (continued)
| | | | | | | | | | | | |
| | | | | | Principal
Amount
(000) | | | U.S. $ Value | |
| |
Technology – 0.2% | | | | | | | | | | | | |
Dell International LLC/EMC Corp.
8.35%, 07/15/2046(a) | | | U.S.$ | | | | 2,793 | | | $ | 3,794,384 | |
Western Digital Corp.
4.75%, 02/15/2026 | | | | | | | 6,542 | | | | 7,043,666 | |
| | | | | | | | | | | | |
| | | | | | | | | | | 10,838,050 | |
| | | | | | | | | | | | |
Transportation - Airlines – 0.6% | | | | | | | | | | | | |
Delta Air Lines, Inc.
7.00%, 05/01/2025(a) | | | | | | | 7,534 | | | | 8,220,904 | |
Delta Air Lines, Inc./SkyMiles IP Ltd.
4.50%, 10/20/2025(a) | | | | | | | 2,558 | | | | 2,596,560 | |
4.75%, 10/20/2028(a) | | | | | | | 2,971 | | | | 3,030,420 | |
Mileage Plus Holdings LLC/Mileage Plus Intellectual Property Assets Ltd.
6.50%, 06/20/2027(a) | | | | | | | 14,434 | | | | 15,053,488 | |
| | | | | | | | | | | | |
| | | | | | | | | | | 28,901,372 | |
| | | | | | | | | | | | |
Transportation - Services – 0.4% | | | | | | | | | | | | |
Aviation Capital Group LLC
2.875%, 01/20/2022(a) | | | | | | | 4,793 | | | | 4,785,495 | |
3.50%, 11/01/2027(a) | | | | | | | 892 | | | | 788,007 | |
3.875%, 05/01/2023(a) | | | | | | | 3,574 | | | | 3,574,506 | |
4.125%, 08/01/2025(a) | | | | | | | 2,077 | | | | 1,999,259 | |
4.375%, 01/30/2024(a) | | | | | | | 1,640 | | | | 1,651,632 | |
4.875%, 10/01/2025(a) | | | | | | | 1,585 | | | | 1,564,512 | |
5.50%, 12/15/2024(a) | | | | | | | 4,572 | | | | 4,761,000 | |
United Rentals North America, Inc.
3.875%, 11/15/2027 | | | | | | | 333 | | | | 345,312 | |
| | | | | | | | | | | | |
| | | | | | | | | | | 19,469,723 | |
| | | | | | | | | | | | |
| | | | | | | | | | | 233,947,199 | |
| | | | | | | | | | | | |
Utility – 0.0% | | | | | | | | | | | | |
Electric – 0.0% | | | | | | | | | | | | |
Infraestructura Energetica Nova SAB de CV
3.75%, 01/14/2028(a) | | | | | | | 1,427 | | | | 1,423,879 | |
| | | | | | | | | | | | |
| | | |
Total Corporates – Investment Grade
(cost $581,373,704) | | | | | | | | | | | 635,017,314 | |
| | | | | | | | | | | | |
| | | | | | | | | | | | |
GOVERNMENTS – TREASURIES – 9.1% | | | | | | | | | |
Colombia – 1.0% | | | | | | | | | | | | |
Colombian TES
Series B
5.75%, 11/03/2027 | | | COP | | | | 89,600,000 | | | | 23,860,151 | |
7.00%, 05/04/2022 | | | | | | | 11,183,200 | | | | 3,076,431 | |
10.00%, 07/24/2024 | | | | | | | 79,950,000 | | | | 25,121,035 | |
| | | | | | | | | | | | |
| | | | | | | | | | | 52,057,617 | |
| | | | | | | | | | | | |
| | |
| |
| abfunds.com | | AB HIGH INCOME FUND | 47 |
PORTFOLIO OF INVESTMENTS (continued)
| | | | | | | | | | | | |
| | | | | | Principal
Amount
(000) | | | U.S. $ Value | |
| |
Indonesia – 0.8% | | | | | | | | | | | | |
Indonesia Treasury Bond
Series FR78
8.25%, 05/15/2029 | | | IDR | | | | 534,688,000 | | | $ | 40,362,089 | |
| | | | | | | | | | | | |
| | | |
Mexico – 0.8% | | | | | | | | | | | | |
Mexican Bonos
Series M
20 8.50%, 05/31/2029 | | | MXN | | | | 555,178 | | | | 30,500,241 | |
10.00%, 12/05/2024 | | | | | | | 197,847 | | | | 11,017,916 | |
| | | | | | | | | | | | |
| | | | | | | | | | | 41,518,157 | |
| | | | | | | | | | | | |
Russia – 0.8% | | | | | | | | | | | | |
Russian Federal Bond – OFZ
Series 6209
7.60%, 07/20/2022 | | | RUB | | | | 254,534 | | | | 3,362,869 | |
Series 6212
7.05%, 01/19/2028 | | | | | | | 1,270,000 | | | | 17,169,129 | |
Series 6217
7.50%, 08/18/2021 | | | | | | | 1,919,448 | | | | 24,757,874 | |
| | | | | | | | | | | | |
| | | | | | | | | | | 45,289,872 | |
| | | | | | | | | | | | |
United States – 5.7% | | | | | | | | | | | | |
U.S. Treasury Bonds
1.25%, 05/15/2050 | | | U.S.$ | | | | 61,716 | | | | 56,103,610 | |
6.125%, 11/15/2027(m)(n)(o) | | | | | | | 63,500 | | | | 87,620,081 | |
8.00%, 11/15/2021 | | | | | | | 6,600 | | | | 7,132,125 | |
U.S. Treasury Notes
2.375%, 05/15/2029(n)(o) | | | | | | | 106,863 | | | | 121,122,305 | |
2.625%, 02/15/2029 | | | | | | | 1,000 | | | | 1,151,250 | |
3.125%, 11/15/2028(n) | | | | | | | 21,000 | | | | 24,944,063 | |
| | | | | | | | | | | | |
| | | | | | | | | | | 298,073,434 | |
| | | | | | | | | | | | |
Total Governments – Treasuries
(cost $464,431,345) | | | | | | | | | | | 477,301,169 | |
| | | | | | | | | | | | |
| | | | | | | | | | | | |
COLLATERALIZED MORTGAGE OBLIGATIONS – 7.5% | | | | | | | | | |
Risk Share Floating Rate – 6.9% | | | | | | | | | | | | |
Bellemeade Re Ltd.
Series 2017-1, Class M2
3.499% (LIBOR 1 Month + 3.35%), 10/25/2027(a)(l) | | | | | | | 765 | | | | 763,916 | |
Series 2018-1A, Class B1
4.399% (LIBOR 1 Month + 4.25%), 04/25/2028(a)(l) | | | | | | | 230 | | | | 224,956 | |
Series 2018-1A, Class M1B
1.749% (LIBOR 1 Month + 1.60%), 04/25/2028(a)(l) | | | | | | | 433 | | | | 428,836 | |
| | |
| |
48 | AB HIGH INCOME FUND | | abfunds.com |
PORTFOLIO OF INVESTMENTS (continued)
| | | | | | | | | | | | |
| | | | | | Principal
Amount
(000) | | | U.S. $ Value | |
| |
Series 2018-1A, Class M2
3.049% (LIBOR 1 Month + 2.90%), 04/25/2028(a)(l) | | | U.S.$ | | | | 246 | | | $ | 237,636 | |
Series 2018-2A, Class B1
2.799% (LIBOR 1 Month + 2.65%), 08/25/2028(a)(l) | | | | | | | 250 | | | | 240,459 | |
Series 2018-3A, Class M2
2.899% (LIBOR 1 Month + 2.75%), 10/25/2028(a)(l) | | | | | | | 6,640 | | | | 6,464,885 | |
Series 2019-2A, Class M2
3.249% (LIBOR 1 Month + 3.10%), 04/25/2029(a)(l) | | | | | | | 6,000 | | | | 5,733,167 | |
Series 2019-3A, Class M1B
1.749% (LIBOR 1 Month + 1.60%), 07/25/2029(a)(l) | | | | | | | 1,063 | | | | 1,041,459 | |
Series 2019-3A, Class M1C
2.099% (LIBOR 1 Month + 1.95%), 07/25/2029(a)(l) | | | | | | | 8,472 | | | | 8,057,085 | |
Series 2019-4A, Class B1
3.999% (LIBOR 1 Month + 3.85%), 10/25/2029(g)(l) | | | | | | | 1,607 | | | | 1,402,251 | |
Series 2019-4A, Class M2
2.999% (LIBOR 1 Month + 2.85%), 10/25/2029(a)(l) | | | | | | | 2,367 | | | | 2,214,262 | |
Series 2020-2A, Class M2
6.149% (LIBOR 1 Month + 6.00%), 08/26/2030(a)(l) | | | | | | | 3,250 | | | | 3,328,023 | |
Connecticut Avenue Securities Trust
| | | | | | | | | | | | |
Series 2018-R07, Class 1B1
4.499% (LIBOR 1 Month + 4.35%), 04/25/2031(a)(l) | | | | | | | 2,685 | | | | 2,616,078 | |
Series 2019-R05, Class 1M2
2.149% (LIBOR 1 Month + 2.00%), 07/25/2039(a)(l) | | | | | | | 2,880 | | | | 2,868,115 | |
Series 2020-SBT1, Class 1M2
3.799% (LIBOR 1 Month + 3.65%), 02/25/2040(a)(l) | | | | | | | 10,079 | | | | 9,360,283 | |
Series 2020-SBT1, Class 2M2
3.799% (LIBOR 1 Month + 3.65%), 02/25/2040(a)(l) | | | | | | | 4,981 | | | | 4,731,271 | |
Eagle Re Ltd.
Series 2018-1, Class M2
3.149% (LIBOR 1 Month + 3.00%), 11/25/2028(a)(l) | | | | | | | 1,084 | | | | 1,041,201 | |
Series 2019-1, Class M1B
1.949% (LIBOR 1 Month + 1.80%), 04/25/2029(a)(l) | | | | | | | 234 | | | | 232,832 | |
| | |
| |
| abfunds.com | | AB HIGH INCOME FUND | 49 |
PORTFOLIO OF INVESTMENTS (continued)
| | | | | | | | | | |
| | | | | Principal
Amount
(000) | | | U.S. $ Value | |
| |
Series 2019-1, Class M2
3.449% (LIBOR 1 Month + 3.30%), 04/25/2029(a)(l) | | U.S.$ | | | 929 | | | $ | 885,241 | |
Series 2020-1, Class M2
2.149% (LIBOR 1 Month + 2.00%), 01/25/2030(a)(l) | | | | | 2,785 | | | | 2,505,334 | |
Federal Home Loan Mortgage Corp. Structured Agency Credit Risk Debt Notes
Series 2013-DN2, Class M2
4.399% (LIBOR 1 Month + 4.25%), 11/25/2023(l)
| | | | | 907 | | | | 831,813 | |
Series 2014-DN3, Class M3
4.149% (LIBOR 1 Month + 4.00%), 08/25/2024(l) | | | | | 664 | | | | 669,056 | |
Series 2015-DN1, Class B
11.649% (LIBOR 1 Month + 11.50%), 01/25/2025(l) | | | | | 16,541 | | | | 18,511,426 | |
Series 2015-DNA1, Class B
9.349% (LIBOR 1 Month + 9.20%), 10/25/2027(l) | | | | | 898 | | | | 1,001,881 | |
Series 2015-DNA2, Class B
7.699% (LIBOR 1 Month + 7.55%), 12/25/2027(l) | | | | | 16,072 | | | | 16,094,363 | |
Series 2015-DNA3, Class B
9.499% (LIBOR 1 Month + 9.35%), 04/25/2028(l) | | | | | 7,481 | | | | 8,691,194 | |
Series 2015-HQ2, Class B
8.099% (LIBOR 1 Month + 7.95%), 05/25/2025(l) | | | | | 289 | | | | 303,445 | |
Series 2015-HQA1, Class B
8.949% (LIBOR 1 Month + 8.80%), 03/25/2028(l) | | | | | 12,437 | | | | 13,301,499 | |
Series 2015-HQA2, Class B
10.649% (LIBOR 1 Month + 10.50%), 05/25/2028(l) | | | | | 6,963 | | | | 7,717,289 | |
Series 2016-DNA2, Class B
10.649% (LIBOR 1 Month + 10.50%), 10/25/2028(l) | | | | | 5,025 | | | | 5,766,967 | |
Series 2016-DNA3, Class B
11.399% (LIBOR 1 Month + 11.25%), 12/25/2028(l) | | | | | 4,461 | | | | 5,107,505 | |
Series 2016-DNA4, Class B
8.749% (LIBOR 1 Month + 8.60%), 03/25/2029(l) | | | | | 1,823 | | | | 1,830,264 | |
Series 2016-HQA1, Class B
12.899% (LIBOR 1 Month + 12.75%), 09/25/2028(l) | | | | | 2,988 | | | | 3,638,658 | |
| | |
| |
50 | AB HIGH INCOME FUND | | abfunds.com |
PORTFOLIO OF INVESTMENTS (continued)
| | | | | | | | | | |
| | | | | Principal
Amount
(000) | | | U.S. $ Value | |
| |
Series 2016-HQA2, Class B
11.649% (LIBOR 1 Month + 11.50%), 11/25/2028(l) | | U.S.$ | | | 3,921 | | | $ | 4,571,362 | |
Series 2017-DNA1, Class B1
5.099% (LIBOR 1 Month + 4.95%), 07/25/2029(l) | | | | | 3,134 | | | | 3,204,540 | |
Series 2017-DNA2, Class B1
5.299% (LIBOR 1 Month + 5.15%), 10/25/2029(l) | | | | | 8,410 | | | | 8,725,439 | |
Series 2017-DNA3, Class B1
4.599% (LIBOR 1 Month + 4.45%), 03/25/2030(l) | | | | | 4,124 | | | | 4,061,922 | |
Series 2017-HQA1, Class B1
5.149% (LIBOR 1 Month + 5.00%), 08/25/2029(l) | | | | | 416 | | | | 418,078 | |
Series 2017-HQA2, Class B1
4.899% (LIBOR 1 Month + 4.75%), 12/25/2029(l) | | | | | 2,340 | | | | 2,304,903 | |
Series 2017-HQA3, Class B1
4.599% (LIBOR 1 Month + 4.45%), 04/25/2030(l) | | | | | 1,245 | | | | 1,208,739 | |
Series 2018-DNA1, Class B1
3.299% (LIBOR 1 Month + 3.15%), 07/25/2030(l) | | | | | 1,445 | | | | 1,296,955 | |
Series 2018-HQA1, Class M2
2.449% (LIBOR 1 Month + 2.30%), 09/25/2030(l) | | | | | 635 | | | | 620,728 | |
Series 2018-HQA2, Class M2
2.449% (LIBOR 1 Month + 2.30%), 10/25/2048(a)(l) | | | | | 161 | | | | 156,144 | |
Series 2019-DNA1, Class B1
4.799% (LIBOR 1 Month + 4.65%), 01/25/2049(a)(l) | | | | | 970 | | | | 941,054 | |
Series 2019-DNA1, Class M2
2.799% (LIBOR 1 Month + 2.65%), 01/25/2049(a) (l) | | | | | 2,133 | | | | 2,111,582 | |
Series 2019-DNA2, Class M2
2.599% (LIBOR 1 Month + 2.45%), 03/25/2049(a)(l) | | | | | 308 | | | | 302,985 | |
Series 2019-DNA3, Class M2
2.199% (LIBOR 1 Month + 2.05%), 07/25/2049(a)(l) | | | | | 2,320 | | | | 2,273,266 | |
Series 2019-FTR2, Class M2 2.299% (LIBOR 1 Month + 2.15%), 11/25/2048(a)(l) | | | | | 1,757 | | | | 1,650,756 | |
Series 2019-FTR3, Class B2
4.948% (LIBOR 1 Month + 4.80%), 09/25/2047(l) | | | | | 1,160 | | | | 870,129 | |
| | |
| |
| abfunds.com | | AB HIGH INCOME FUND | 51 |
PORTFOLIO OF INVESTMENTS (continued)
| | | | | | | | | | |
| | | | | Principal
Amount
(000) | | | U.S. $ Value | |
| |
Series 2019-HQA1, Class M2
2.499% (LIBOR 1 Month + 2.35%), 02/25/2049(a)(l) | | U.S.$ | | | 131 | | | $ | 128,699 | |
Series 2019-HQA2, Class B1
4.249% (LIBOR 1 Month + 4.10%), 04/25/2049(a)(l) | | | | | 1,078 | | | | 1,024,575 | |
Series 2019-HQA3, Class B1
3.149% (LIBOR 1 Month + 3.00%), 09/25/2049(a)(l) | | | | | 1,900 | | | | 1,728,926 | |
Series 2020-HQA2, Class M2
3.249% (LIBOR 1 Month + 3.10%), 03/25/2050(a)(l) | | | | | 3,722 | | | | 3,663,204 | |
Federal National Mortgage Association Connecticut Avenue Securities
Series 2014-C01, Class M2
4.549% (LIBOR 1 Month + 4.40%), 01/25/2024(l) | | | | | 475 | | | | 450,036 | |
Series 2014-C03, Class 2M2
3.049% (LIBOR 1 Month + 2.90%), 07/25/2024(l) | | | | | 436 | | | | 433,614 | |
Series 2015-C01, Class 1M2
4.449% (LIBOR 1 Month + 4.30%), 02/25/2025(l) | | | | | 4,374 | | | | 4,439,685 | |
Series 2015-C02, Class 1M2
4.149% (LIBOR 1 Month + 4.00%), 05/25/2025(l) | | | | | 2,917 | | | | 2,937,698 | |
Series 2015-C03, Class 1M2
5.149% (LIBOR 1 Month + 5.00%), 07/25/2025(l) | | | | | 9,808 | | | | 9,980,238 | |
Series 2016-C01, Class 1B
11.899% (LIBOR 1 Month + 11.75%), 08/25/2028(l) | | | | | 4,023 | | | | 4,745,135 | |
Series 2016-C02, Class 1B
12.399% (LIBOR 1 Month + 12.25%), 09/25/2028(l) | | | | | 2,884 | | | | 3,466,369 | |
Series 2016-C03, Class 1B
11.899% (LIBOR 1 Month + 11.75%), 10/25/2028(l) | | | | | 7,101 | | | | 8,390,788 | |
Series 2016-C03, Class 2B
12.899% (LIBOR 1 Month + 12.75%), 10/25/2028(l) | | | | | 3,934 | | | | 4,774,653 | |
Series 2016-C04, Class 1B
10.399% (LIBOR 1 Month + 10.25%), 01/25/2029(l) | | | | | 13,299 | | | | 14,903,710 | |
Series 2016-C05, Class 2B
11.244% (LIBOR 1 Month + 10.75%), 01/25/2029(l) | | | | | 11,995 | | | | 13,585,869 | |
| | |
| |
52 | AB HIGH INCOME FUND | | abfunds.com |
PORTFOLIO OF INVESTMENTS (continued)
| | | | | | | | | | | | |
| | | | | | Principal
Amount
(000) | | | U.S. $ Value | |
| |
Series 2016-C06, Class 1B
9.399% (LIBOR 1 Month + 9.25%), 04/25/2029(l) | | | U.S.$ | | | | 8,498 | | | $ | 9,096,711 | |
Series 2016-C07, Class 2B
9.649% (LIBOR 1 Month + 9.50%), 05/25/2029(l) | | | | | | | 10,272 | | | | 10,963,858 | |
Series 2017-C01, Class 1B1
5.899% (LIBOR 1 Month + 5.75%), 07/25/2029(l) | | | | | | | 2,248 | | | | 2,310,314 | |
Series 2017-C02, Class 2B1
5.649% (LIBOR 1 Month + 5.50%), 09/25/2029(l) | | | | | | | 416 | | | | 428,623 | |
Series 2017-C03, Class 1B1
4.999% (LIBOR 1 Month + 4.85%), 10/25/2029(l) | | | | | | | 3,966 | | | | 3,985,736 | |
Series 2017-C04, Class 2B1
5.199% (LIBOR 1 Month + 5.05%), 11/25/2029(l) | | | | | | | 974 | | | | 979,478 | |
Series 2017-C05, Class 1B1
3.749% (LIBOR 1 Month + 3.60%), 01/25/2030(l) | | | | | | | 3,145 | | | | 2,955,883 | |
Series 2017-C06, Class 1B1
4.299% (LIBOR 1 Month + 4.15%), 02/25/2030(l) | | | | | | | 1,702 | | | | 1,600,086 | |
Series 2017-C06, Class 1M2 2.799% (LIBOR 1 Month + 2.65%), 02/25/2030(l) | | | | | | | 694 | | | | 688,711 | |
Series 2017-C06, Class 2B1
4.599% (LIBOR 1 Month + 4.45%), 02/25/2030(l) | | | | | | | 272 | | | | 268,057 | |
Series 2018-C01, Class 1B1
3.699% (LIBOR 1 Month + 3.55%), 07/25/2030(l) | | | | | | | 10,247 | | | | 9,477,471 | |
Series 2018-C01, Class 1M2
2.399% (LIBOR 1 Month + 2.25%), 07/25/2030(l) | | | | | | | 8,066 | | | | 7,945,389 | |
Series 2018-C03, Class 1M2
2.299% (LIBOR 1 Month + 2.15%), 10/25/2030(l) | | | | | | | 609 | | | | 596,076 | |
Series 2018-C04, Class 2M2
2.699% (LIBOR 1 Month + 2.55%), 12/25/2030(l) | | | | | | | 1,119 | | | | 1,097,604 | |
Series 2018-C05, Class 1B1
4.399% (LIBOR 1 Month + 4.25%), 01/25/2031(l) | | | | | | | 7,500 | | | | 7,030,777 | |
Home Re Ltd. Series 2018-1, Class M2
3.149% (LIBOR 1 Month + 3.00%), 10/25/2028(a)(l) | | | | | | | 6,235 | | | | 5,764,115 | |
| | |
| |
| abfunds.com | | AB HIGH INCOME FUND | 53 |
PORTFOLIO OF INVESTMENTS (continued)
| | | | | | | | | | | | |
| | | | | | Principal
Amount
(000) | | | U.S. $ Value | |
| |
Series 2019-1, Class M2
3.399% (LIBOR 1 Month + 3.25%), 05/25/2029(a)(l) | | | U.S.$ | | | | 3,500 | | | $ | 3,287,619 | |
JP Morgan Madison Avenue Securities Trust
Series 2015-CH1, Class M2
5.649% (LIBOR 1 Month + 5.50%), 10/25/2025(g)(l) | | | | | | | 5,626 | | | | 5,120,713 | |
Oaktown Re III Ltd.
Series 2019-1A, Class M2
2.699% (LIBOR 1 Month + 2.55%), 07/25/2029(a)(l) | | | | | | | 560 | | | | 529,444 | |
Radnor Re Ltd.
Series 2018-1, Class M2
2.849% (LIBOR 1 Month + 2.70%), 03/25/2028(a)(l) | | | | | | | 8,032 | | | | 7,693,108 | |
Series 2019-1, Class M2
3.349% (LIBOR 1 Month + 3.20%), 02/25/2029(a)(l) | | | | | | | 7,096 | | | | 6,811,602 | |
Series 2019-2, Class B1
2.849% (LIBOR 1 Month + 2.70%), 06/25/2029(l) | | | | | | | 2,600 | | | | 2,479,786 | |
Series 2020-1, Class B1
3.149% (LIBOR 1 Month + 3.00%), 02/25/2030(l) | | | | | | | 488 | | | | 400,510 | |
Series 2020-1, Class M2A
2.149% (LIBOR 1 Month + 2.00%), 02/25/2030(a)(l) | | | | | | | 2,931 | | | | 2,628,401 | |
Series 2020-1, Class M2B
2.399% (LIBOR 1 Month + 2.25%), 02/25/2030(a)(l) | | | | | | | 2,494 | | | | 2,108,168 | |
STACR Trust
Series 2018-DNA2, Class B1
3.849% (LIBOR 1 Month + 3.70%), 12/25/2030(a)(l) | | | | | | | 1,631 | | | | 1,522,273 | |
Series 2018-DNA2, Class M2
2.299% (LIBOR 1 Month + 2.15%), 12/25/2030(a)(l) | | | | | | | 525 | | | | 514,014 | |
Series 2018-DNA3, Class M2
2.249% (LIBOR 1 Month + 2.10%), 09/25/2048(a)(l) | | | | | | | 8,722 | | | | 8,511,605 | |
Traingle Re Ltd.
Series 2020-1, Class M2
5.747% (LIBOR 1 Month + 5.60%), 10/25/2030(a)(l) | | | | | | | 1,000 | | | | 998,898 | |
Wells Fargo Credit Risk Transfer Securities Trust
Series 2015-WF1, Class 1M2
5.399% (LIBOR 1 Month + 5.25%), 11/25/2025(g)(l) | | | | | | | 3,578 | | | | 3,490,745 | |
| | |
| |
54 | AB HIGH INCOME FUND | | abfunds.com |
PORTFOLIO OF INVESTMENTS (continued)
| | | | | | | | | | | | |
| | | | | | Principal
Amount
(000) | | | U.S. $ Value | |
| |
Series 2015-WF1, Class 2M2
5.649% (LIBOR 1 Month + 5.50%), 11/25/2025(g)(l) | | | U.S.$ | | | | 2,182 | | | $ | 2,146,035 | |
| | | | | | | | | | | | |
| | | | | | | | | | | 360,646,241 | |
| | | | | | | | | | | | |
Non-Agency Fixed Rate – 0.5% | | | | | | | | | | | | |
Alternative Loan Trust
Series 2006-24CB, Class A15
5.75%, 08/25/2036 | | | | | | | 2,623 | | | | 2,103,353 | |
Series 2006-24CB, Class A16
5.75%, 08/25/2036 | | | | | | | 502 | | | | 402,147 | |
Series 2006-26CB, Class A6
6.25%, 09/25/2036 | | | | | | | 217 | | | | 157,327 | |
Series 2006-26CB, Class A8
6.25%, 09/25/2036 | | | | | | | 821 | | | | 594,521 | |
Series 2006-42, Class 1A6
6.00%, 01/25/2047 | | | | | | | 1,049 | | | | 834,914 | |
Series 2006-HY12, Class A5
3.227%, 08/25/2036 | | | | | | | 3,725 | | | | 3,875,535 | |
Series 2006-J1, Class 1A10
5.50%, 02/25/2036 | | | | | | | 1,051 | | | | 945,368 | |
Series 2006-J5, Class 1A1
6.50%, 09/25/2036 | | | | | | | 891 | | | | 729,821 | |
Series 2007-15CB, Class A19
5.75%, 07/25/2037 | | | | | | | 498 | | | | 410,456 | |
Series 2007-16CB, Class 1A7
6.00%, 08/25/2037 | | | | | | | 552 | | | | 513,819 | |
Bear Stearns ARM Trust
Series 2007-3, Class 1A1
3.874%, 05/25/2047 | | | | | | | 617 | | | | 597,178 | |
Series 2007-4, Class 22A1
3.604%, 06/25/2047 | | | | | | | 2,545 | | | | 2,464,888 | |
ChaseFlex Trust
Series 2007-1, Class 1A3
6.50%, 02/25/2037 | | | | | | | 555 | | | | 292,412 | |
CHL Mortgage Pass-Through Trust
Series 2007-HY4, Class 1A1
3.021%, 09/25/2047 | | | | | | | 592 | | | | 551,923 | |
Citigroup Mortgage Loan Trust
Series 2007-AR4, Class 1A1A
3.933%, 03/25/2037 | | | | | | | 446 | | | | 430,855 | |
CitiMortgage Alternative Loan Trust
Series 2007-A3, Class 1A4
5.75%, 03/25/2037 | | | | | | | 934 | | | | 927,102 | |
CSMC Mortgage-Backed Trust
Series 2006-7, Class 3A12
6.25%, 08/25/2036 | | | | | | | 1,044 | | | | 699,033 | |
| | |
| |
| abfunds.com | | AB HIGH INCOME FUND | 55 |
PORTFOLIO OF INVESTMENTS (continued)
| | | | | | | | | | | | |
| | | | | | Principal
Amount
(000) | | | U.S. $ Value | |
| |
First Horizon Alternative Mortgage
Securities Trust
Series 2006-AA3, Class A1
3.226%, 06/25/2036 | | | U.S.$ | | | | 562 | | | $ | 508,137 | |
Series 2006-FA3, Class A9
6.00%, 07/25/2036 | | | | | | | 881 | | | | 612,689 | |
Residential Accredit Loans, Inc. Trust
Series 2005-QA10, Class A31
4.031%, 09/25/2035 | | | | | | | 1,752 | | | | 1,468,334 | |
Series 2005-QS14, Class 3A1
6.00%, 09/25/2035 | | | | | | | 1,343 | | | | 1,309,312 | |
Residential Asset Securitization Trust
Series 2006-A8, Class 3A4
6.00%, 08/25/2036 | | | | | | | 634 | | | | 450,805 | |
Series 2007-A1, Class A8
6.00%, 03/25/2037 | | | | | | | 936 | | | | 533,409 | |
Series 2007-A5, Class 2A3
6.00%, 05/25/2037 | | | | | | | 275 | | | | 223,585 | |
Washington Mutual Mortgage Pass-Through Certificates Trust
Series 2006-9, Class A4
4.521%, 10/25/2036 | | | | | | | 1,778 | | | | 698,639 | |
Wells Fargo Mortgage Backed Securities Trust
Series 2007-AR7, Class A1
3.009%, 12/28/2037 | | | | | | | 2,377 | | | | 2,211,386 | |
| | | | | | | | | | | | |
| | | | | | | | | | | 24,546,948 | |
| | | | | | | | | | | | |
Non-Agency Floating Rate – 0.1% | | | | | | | | | | | | |
Alternative Loan Trust
Series 2007-7T2, Class A3
0.749% (LIBOR 1 Month + 0.60%), 04/25/2037(l) | | | | | | | 2,452 | | | | 731,714 | |
Countrywide Home Loan Mortgage Pass-Through Trust
Series 2007-13, Class A7
0.749% (LIBOR 1 Month + 0.60%), 08/25/2037(l) | | | | | | | 448 | | | | 205,891 | |
First Horizon Alternative Mortgage Securities Trust
Series 2007-FA2, Class 1A10
0.399% (LIBOR 1 Month + 0.25%), 04/25/2037(l) | | | | | | | 1,174 | | | | 333,220 | |
Lehman Mortgage Trust
Series 2007-1, Class 3A1
0.399% (LIBOR 1 Month + 0.25%), 02/25/2037(l) | | | | | | | 2,846 | | | | 189,612 | |
| | |
| |
56 | AB HIGH INCOME FUND | | abfunds.com |
PORTFOLIO OF INVESTMENTS (continued)
| | | | | | | | | | | | |
| | | | | | Principal
Amount
(000) | | | U.S. $ Value | |
| |
Series 2007-1, Class 3A2
7.101% (7.25% - LIBOR 1 Month), 02/25/2037(l) (p) | | | U.S.$ | | | | 2,846 | | | $ | 879,760 | |
Lehman XS Trust
Series 2007-16N, Class 2A2
0.999% (LIBOR 1 Month + 0.85%), 09/25/2047(l) | | | | | | | 597 | | | | 583,799 | |
PHH Alternative Mortgage Trust
Series 2007-1, Class 1A1
0.309% (LIBOR 1 Month + 0.16%), 02/25/2037(l) | | | | | | | 631 | | | | 492,350 | |
Series 2007-2, Class 1A3
0.479% (LIBOR 1 Month + 0.33%), 05/25/2037(l) | | | | | | | 559 | | | | 532,239 | |
| | | | | | | | | | | | |
| | | | | | | | | | | 3,948,585 | |
| | | | | | | | | | | | |
Total Collateralized Mortgage Obligations
(cost $364,795,207) | | | | | | | | | | | 389,141,774 | |
| | | | | | | | | | | | |
| | | | | | | | | | | | |
BANK LOANS – 6.2% | | | | | | | | | | | | |
Industrial – 5.7% | | | | | | | | | | | | |
Basic – 0.1% | | | | | | | | | | | | |
Illuminate Buyer, LLC
4.148% (LIBOR 1 Month + 4.00%), 06/30/2027(q) | | | | | | | 3,210 | | | | 3,152,316 | |
Nouryon Finance B.V. (fka AkzoNobel)
3.145% (LIBOR 1 Month + 3.00%), 10/01/2025(q) | | | | | | | 2,879 | | | | 2,783,958 | |
| | | | | | | | | | | | |
| | | | | | | | | | | 5,936,274 | |
| | | | | | | | | | | | |
Capital Goods – 0.7% | | | | | | | | | | | | |
Apex Tool Group, LLC
6.500% (LIBOR 1 Month + 5.25%), 08/01/2024(q) | | | | | | | 15,988 | | | | 15,099,152 | |
Brookfield WEC Holdings Inc. (fka Westinghouse Electric Company LLC)
3.750% (LIBOR 1 Month + 3.00%), 08/01/2025(q) | | | | | | | 8,615 | | | | 8,400,994 | |
BWay Holding Company
3.480% (LIBOR 3 Month + 3.25%), 04/03/2024(q) | | | | | | | 5,114 | | | | 4,769,006 | |
Granite US Holdings Corporation
5.470% (LIBOR 3 Month + 5.25%), 09/30/2026(c)(q) | | | | | | | 8,386 | | | | 7,841,181 | |
TransDigm Inc.
2.398% (LIBOR 1 Month + 2.25%), 12/09/2025(q) | | | | | | | 2,264 | | | | 2,126,637 | |
| | |
| |
| abfunds.com | | AB HIGH INCOME FUND | 57 |
PORTFOLIO OF INVESTMENTS (continued)
| | | | | | | | | | | | |
| | | | | | Principal
Amount
(000) | | | U.S. $ Value | |
| |
Welbilt, Inc. (fka Manitowoc Foodservice, Inc.) 2.648% (LIBOR 1 Month + 2.50%), 10/23/2025(q) | | | U.S.$ | | | | 560 | | | $ | 510,442 | |
| | | | | | | | | | | | |
| | | | | | | | | | | 38,747,412 | |
| | | | | | | | | | | | |
Communications - Media – 0.5% | | | | | | | | | | | | |
Advantage Sales & Marketing Inc.
10/28/2027(c)(r) | | | | | | | 9,500 | | | | 9,280,360 | |
Clear Channel Outdoor Holdings, Inc.
3.666% (LIBOR 2 Month + 3.50%), 08/21/2026(q) | | | | | | | 4 | | | | 4,022 | |
3.714% (LIBOR 3 Month + 3.50%), 08/21/2026(q) | | | | | | | 1,749 | | | | 1,588,740 | |
iHeartCommunications, Inc. (fka Clear Channel Communications, Inc.)
3.148% (LIBOR 1 Month + 3.00%), 05/01/2026(q) | | | | | | | 2,670 | | | | 2,502,481 | |
LCPR Loan Financing LLC
5.148% (LIBOR 1 Month + 5.00%), 10/15/2026(q) | | | | | | | 3,139 | | | | 3,135,276 | |
Nielsen Finance LLC
4.750% (LIBOR 1 Month + 3.75%), 06/04/2025(q) | | | | | | | 2,517 | | | | 2,507,281 | |
Univision Communications Inc.
3.750% (LIBOR 1 Month + 2.75%), 03/15/2024(q) | | | | | | | 4,838 | | | | 4,672,897 | |
| | | | | | | | | | | | |
| | | | | | | | | | | 23,691,057 | |
| | | | | | | | | | | | |
Communications -
Telecommunications – 0.2% | | | | | | | | | | | | |
Intrado Corporation
5.000% (LIBOR 1 Month + 4.00%), 10/10/2024(q) | | | | | | | 21 | | | | 19,729 | |
5.000% (LIBOR 3 Month + 4.00%), 10/10/2024(q) | | | | | | | 8,241 | | | | 7,654,915 | |
| | | | | | | | | | | | |
| | | | | | | | | | | 7,674,644 | |
| | | | | | | | | | | | |
Consumer Cyclical -
Automotive – 0.1% | | | | | | | | | | | | |
Clarios Global LP
3.648% (LIBOR 1 Month + 3.50%), 04/30/2026(q) | | | | | | | 2,868 | | | | 2,781,070 | |
Navistar, Inc.
3.650% (LIBOR 1 Month + 3.50%), 11/06/2024(q) | | | | | | | 2,655 | | | | 2,625,475 | |
| | | | | | | | | | | | |
| | | | | | | | | | | 5,406,545 | |
| | | | | | | | | | | | |
| | |
| |
58 | AB HIGH INCOME FUND | | abfunds.com |
PORTFOLIO OF INVESTMENTS (continued)
| | | | | | | | | | | | |
| | | | | | Principal
Amount
(000) | | | U.S. $ Value | |
| |
Consumer Cyclical -
Entertainment – 0.1% | | | | | | | | | | | | |
Seaworld Parks & Entertainment, Inc. (fka SW Acquisitions Co., Inc.)
3.750% (LIBOR 1 Month + 3.00%), 04/01/2024(q) | | | U.S.$ | | | | 4,771 | | | $ | 4,447,634 | |
| | | | | | | | | | | | |
| | | |
Consumer Cyclical - Other – 0.6% | | | | | | | | | | | | |
Caesars Resort Collection, LLC
2.898% (LIBOR 1 Month + 2.75%), 12/23/2024(q) | | | | | | | 10,355 | | | | 9,685,014 | |
Flutter Entertainment PLC
3.720% (LIBOR 3 Month + 3.50%), 07/10/2025(q) | | | | | | | 845 | | | | 844,051 | |
Golden Nugget Online Gaming, Inc.
13.000% (LIBOR 3 Month + 12.00%), 10/04/2023(c)(q) | | | | | | | 132 | | | | 148,642 | |
13.000% (LIBOR 2 Month + 12.00%), 10/04/2023(c)(q) | | | | | | | 1,618 | | | | 1,852,466 | |
Playtika Holding Corp.
7.000% (LIBOR 3 Month + 6.00%), 12/10/2024(q) | | | | | | | 16,143 | | | | 16,132,073 | |
Scientific Games International, Inc.
2.898% (LIBOR 1 Month + 2.75%), 08/14/2024(q) | | | | | | | 4,836 | | | | 4,490,230 | |
| | | | | | | | | | | | |
| | | | | | | | | | | 33,152,476 | |
| | | | | | | | | | | | |
Consumer Cyclical -
Restaurants – 0.1% | | | | | | | | | | | | |
IRB Holding Corp. (fka Arby’s/Buffalo Wild Wings)
3.750% (LIBOR 3 Month + 2.75%), 02/05/2025(q) | | | | | | | 5,151 | | | | 4,887,444 | |
Whatabrands LLC
2.897% (LIBOR 1 Month + 2.75%), 07/31/2026(q) | | | | | | | 2,159 | | | | 2,100,083 | |
| | | | | | | | | | | | |
| | | | | | | | | | | 6,987,527 | |
| | | | | | | | | | | | |
Consumer Cyclical - Retailers – 0.2% | | | | | | | | | | | | |
Bass Pro Group, LLC
5.750% (LIBOR 3 Month + 5.00%), 09/25/2024(q) | | | | | | | 2,648 | | | | 2,636,889 | |
PetSmart, Inc.
4.500% (LIBOR 3 Month + 3.50%), 03/11/2022(q) | | | | | | | 4,432 | | | | 4,378,663 | |
Serta Simmons Bedding, LLC
9.000% (LIBOR 3 Month + 8.00%), 11/08/2024(q) | | | | | | | 8,741 | | | | 2,993,790 | |
| | | | | | | | | | | | |
| | | | | | | | | | | 10,009,342 | |
| | | | | | | | | | | | |
| | |
| |
| abfunds.com | | AB HIGH INCOME FUND | 59 |
PORTFOLIO OF INVESTMENTS (continued)
| | | | | | | | | | | | |
| | | | | | Principal
Amount
(000) | | | U.S. $ Value | |
| |
Consumer Non-Cyclical – 1.0% | | | | | | | | | | | | |
Acadia Healthcare Company, Inc.
2.648% (LIBOR 1 Month + 2.50%), 02/16/2023(q) | | | U.S.$ | | | | 2,375 | | | $ | 2,351,901 | |
Aldevron, L.L.C.
5.250% (LIBOR 1 Month + 4.25%), 10/12/2026(q) | | | | | | | 4,448 | | | | 4,442,090 | |
Alphabet Holding Company, Inc. (fka Nature’s Bounty)
7.898% (LIBOR 1 Month + 7.75%), 09/26/2025(q) | | | | | | | 9,497 | | | | 9,123,543 | |
Arbor Pharmaceuticals, LLC
6.000% (LIBOR 3 Month + 5.00%), 07/05/2023(c)(q) | | | | | | | 6,253 | | | | 5,315,432 | |
Froneri International Limited
5.898% (LIBOR 1 Month + 5.75%), 01/31/2028(c)(q) | | | | | | | 830 | | | | 818,588 | |
Global Medical Response, Inc. (fka Air Medical)
5.250% (LIBOR 3 Month + 4.25%), 03/14/2025(q) | | | | | | | 5,260 | | | | 5,077,970 | |
LifePoint Health, Inc. (fka Regionalcare Hospital Partners Holdings, Inc.)
3.898% (LIBOR 1 Month + 3.75%), 11/16/2025(q) | | | | | | | 5,947 | | | | 5,761,625 | |
Mallinckrodt International Finance S.A.
5.500% (LIBOR 3 Month + 4.75%), 09/24/2024(q) | | | | | | | 5,082 | | | | 4,677,999 | |
Milano Acquisition Corp.
4.750% (LIBOR 3 Month + 4.00%), 10/01/2027(q) | | | | | | | 6,970 | | | | 6,842,240 | |
U.S. Renal Care, Inc.
5.188% (LIBOR 1 Month + 5.00%), 06/26/2026(q) | | | | | | | 8,326 | | | | 7,990,283 | |
| | | | | | | | | | | | |
| | | | | | | | | | | 52,401,671 | |
| | | | | | | | | | | | |
Energy – 0.2% | | | | | | | | | | | | |
CITGO Petroleum Corporation
6.000% (LIBOR 3 Month + 5.00%), 03/28/2024(q) | | | | | | | 2,825 | | | | 2,629,680 | |
Triton Solar US Acquisition Co.
6.220% (LIBOR 3 Month + 6.00%), 10/29/2024(q) | | | | | | | 11,873 | | | | 10,151,008 | |
| | | | | | | | | | | | |
| | | | | | | | | | | 12,780,688 | |
| | | | | | | | | | | | |
Other Industrial – 0.2% | | | | | | | | | | | | |
American Tire Distributors, Inc.
7.000% (LIBOR 3 Month + 6.00%), 09/01/2023(q) | | | | | | | 1,711 | | | | 1,572,132 | |
| | |
| |
60 | AB HIGH INCOME FUND | | abfunds.com |
PORTFOLIO OF INVESTMENTS (continued)
| | | | | | | | | | | | |
| | | | | | Principal
Amount
(000) | | | U.S. $ Value | |
| |
8.500% (LIBOR 1 Month + 7.50%), 09/02/2024(q) | | | U.S.$ | | | | 4,544 | | | $ | 3,836,729 | |
8.500% (LIBOR 3 Month + 7.50%), 09/02/2024(q) | | | | | | | 548 | | | | 462,408 | |
Core & Main LP
3.750% (LIBOR 3 Month + 2.75%), 08/01/2024(c)(q) | | | | | | | 1,460 | | | | 1,411,500 | |
Dealer Tire, LLC
4.398% (LIBOR 1 Month + 4.25%), 12/12/2025(q) | | | | | | | 1,628 | | | | 1,584,973 | |
Rockwood Service Corporation
4.398% (LIBOR 1 Month + 4.25%), 01/23/2027(c)(q) | | | | | | | 520 | | | | 511,439 | |
| | | | | | | | | | | | |
| | | | | | | | | | | 9,379,181 | |
| | | | | | | | | | | | |
Services – 0.8% | | | | | | | | | | | | |
Allied Universal Holdco LLC (fka USAGM Holdco, LLC)
4.398% (LIBOR 1 Month + 4.25%), 07/10/2026(q) | | | | | | | 1,548 | | | | 1,514,841 | |
Amentum Government Services Holdings LLC
3.648% (LIBOR 1 Month + 3.50%), 01/29/2027(q) | | | | | | | 1,656 | | | | 1,585,476 | |
Garda World Security Corporation
4.900% (LIBOR 1 Month + 4.75%), 10/30/2026(q) | | | | | | | 565 | | | | 561,605 | |
Parexel International Corporation
2.898% (LIBOR 1 Month + 2.75%), 09/27/2024(q) | | | | | | | 1,287 | | | | 1,233,139 | |
Pi Lux Finco SARL
8.250% (LIBOR 3 Month + 7.25%), 01/01/2026(c)(q) | | | | | | | 21,800 | | | | 20,274,000 | |
Refinitiv US Holdings Inc. (fka Financial & Risk US Holdings, Inc.)
3.398% (LIBOR 1 Month + 3.25%), 10/01/2025(q) | | | | | | | 5,538 | | | | 5,448,695 | |
Team Health Holdings, Inc.
3.750% (LIBOR 1 Month + 2.75%), 02/06/2024(q) | | | | | | | 4,894 | | | | 3,976,317 | |
Verscend Holding Corp.
4.648% (LIBOR 1 Month + 4.50%), 08/27/2025(q) | | | | | | | 7,821 | | | | 7,662,222 | |
| | | | | | | | | | | | |
| | | | | | | | | | | 42,256,295 | |
| | | | | | | | | | | | |
| | |
| |
| abfunds.com | | AB HIGH INCOME FUND | 61 |
PORTFOLIO OF INVESTMENTS (continued)
| | | | | | | | | | | | |
| | | | | | Principal
Amount
(000) | | | U.S. $ Value | |
| |
Technology – 0.9% | | | | | | | | | | | | |
athenahealth, Inc.
4.750% (LIBOR 3 Month + 4.50%), 02/11/2026(c)(q) | | | U.S.$ | | | | 11,015 | | | $ | 10,767,112 | |
Avaya Inc.
4.398% (LIBOR 1 Month + 4.25%), 12/15/2024(q) | | | | | | | 234 | | | | 229,761 | |
Boxer Parent Company Inc. (fka BMC Software, Inc.)
4.398% (LIBOR 1 Month + 4.25%), 10/02/2025(q) | | | | | | | 8,858 | | | | 8,594,984 | |
Pitney Bowes Inc.
5.650% (LIBOR 1 Month + 5.50%), 01/07/2025(q) | | | | | | | 5,959 | | | | 5,866,833 | |
Presidio Holdings Inc.
3.720% (LIBOR 3 Month + 3.50%), 01/22/2027(q) | | | | | | | 2,161 | | | | 2,110,179 | |
Solera, LLC (Solera Finance, Inc.)
2.916% (LIBOR 2 Month + 2.75%), 03/03/2023(q) | | | | | | | 13,442 | | | | 13,060,017 | |
Veritas Us Inc.
6.500% (LIBOR 3 Month + 5.50%), 09/01/2025(q) | | | | | | | 3,632 | | | | 3,552,042 | |
| | | | | | | | | | | | |
| | | | | | | | | | | 44,180,928 | |
| | | | | | | | | | | | |
Transportation - Airlines – 0.0% | | | | | | | | | | | | |
Delta Air Lines, Inc.
4.964% (LIBOR 3 Month + 4.75%), 04/29/2023(q) | | | | | | | 848 | | | | 843,110 | |
| | | | | | | | | | | | |
| | | | | | | | | | | 297,894,784 | |
| | | | | | | | | | | | |
| | | | | | | | | | | | |
Financial Institutions – 0.3% | | | | | | | | | | | | |
Finance – 0.0% | | | | | | | | | | | | |
Jefferies Finance LLC
3.188% (LIBOR 1 Month + 3.00%), 06/03/2026(q) | | | | | | | 1,683 | | | | 1,630,822 | |
| | | | | | | | | | | | |
| | | |
Insurance – 0.3% | | | | | | | | | | | | |
Hub International Limited | | | | | | | | | | | | |
5.000% (LIBOR 2 Month + 4.00%), 04/25/2025(q) | | | | | | | 1,042 | | | | 1,035,039 | |
5.000% (LIBOR 3 Month + 4.00%), 04/25/2025(q) | | | | | | | 5,252 | | | | 5,218,561 | |
Sedgwick Claims Management Services, Inc. (Lightning Cayman Merger Sub, Ltd.)
4.148% (LIBOR 1 Month + 4.00%), 09/03/2026(q) | | | | | | | 7,588 | | | | 7,361,185 | |
| | | | | | | | | | | | |
| | | | | | | | | | | 13,614,785 | |
| | | | | | | | | | | | |
| | | | | | | | | | | 15,245,607 | |
| | | | | | | | | | | | |
| | |
| |
62 | AB HIGH INCOME FUND | | abfunds.com |
PORTFOLIO OF INVESTMENTS (continued)
| | | | | | | | | | | | |
| | | | | | Principal
Amount
(000) | | | U.S. $ Value | |
| |
Utility – 0.2% | | | | | | | | | | | | |
Electric – 0.2% | | | | | | | | | | | | |
Granite Generation LLC | | | | | | | | | | | | |
4.750% (LIBOR 1 Month + 3.75%), 11/09/2026(q) | | | U.S.$ | | | | 6,909 | | | $ | 6,828,810 | |
4.750% (LIBOR 3 Month + 3.75%), 11/09/2026(q) | | | | | | | 1,270 | | | | 1,255,517 | |
| | | | | | | | | | | | |
| | | | | | | | | | | 8,084,327 | |
| | | | | | | | | | | | |
Total Bank Loans
(cost $336,846,512) | | | | | | | | | | | 321,224,718 | |
| | | | | | | | | | | | |
| | | | | | | | | | | | |
EMERGING MARKETS – CORPORATE BONDS – 4.4% | | | | | | | | | | | | |
Industrial – 3.9% | | | | | | | | | | | | |
Basic – 1.6% | | | | | | | | | | | | |
Braskem America Finance Co.
7.125%, 07/22/2041(a) | | | | | | | 7,719 | | | | 8,230,384 | |
Braskem Netherlands Finance BV
4.50%, 01/31/2030(a) | | | | | | | 9,264 | | | | 8,583,003 | |
Consolidated Energy Finance SA
6.875%, 06/15/2025(a) | | | | | | | 8,033 | | | | 7,445,415 | |
CSN Islands XI Corp.
6.75%, 01/28/2028(a) | | | | | | | 1,276 | | | | 1,259,412 | |
CSN Resources SA
7.625%, 02/13/2023-04/17/2026(a) | | | | | | | 17,334 | | | | 17,864,648 | |
Eldorado Gold Corp.
9.50%, 06/01/2024(a) | | | | | | | 8,627 | | | | 9,425,709 | |
First Quantum Minerals Ltd. | | | | | | | | | | | | |
6.875%, 10/15/2027(a) | | | | | | | 8,370 | | | | 8,345,161 | |
7.25%, 04/01/2023(a) | | | | | | | 7,452 | | | | 7,491,589 | |
HTA Group Ltd/.Mauritius
7.00%, 12/18/2025(a) | | | | | | | 4,000 | | | | 4,194,863 | |
Indika Energy Capital IV Pte Ltd.
8.25%, 10/22/2025(a) | | | | | | | 9,827 | | | | 9,777,865 | |
| | | | | | | | | | | | |
| | | | | | | | | | | 82,618,049 | |
| | | | | | | | | | | | |
Capital Goods – 0.3% | | | | | | | | | | | | |
Cemex SAB de CV | | | | | | | | | | | | |
5.20%, 09/17/2030(a) | | | | | | | 1,100 | | | | 1,166,154 | |
7.375%, 06/05/2027(a) | | | | | | | 1,733 | | | | 1,910,633 | |
Embraer Netherlands Finance BV | | | | | | | | | | | | |
5.40%, 02/01/2027 | | | | | | | 8,145 | | | | 7,712,460 | |
6.95%, 01/17/2028(a) | | | | | | | 2,712 | | | | 2,737,034 | |
Odebrecht Finance Ltd. | | | | | | | | | | | | |
4.375%, 04/25/2025(a)(e)(i) | | | | | | | 537 | | | | 18,795 | |
5.25%, 06/27/2029(a)(e)(i) | | | | | | | 9,173 | | | | 321,055 | |
7.125%, 06/26/2042(a)(e)(i) | | | | | | | 17,280 | | | | 604,800 | |
| | | | | | | | | | | | |
| | | | | | | | | | | 14,470,931 | |
| | | | | | | | | | | | |
| | |
| |
| abfunds.com | | AB HIGH INCOME FUND | 63 |
PORTFOLIO OF INVESTMENTS (continued)
| | | | | | | | | | | | |
| | | | | | Principal
Amount
(000) | | | U.S. $ Value | |
| |
Communications - Media – 0.0% | | | | | | | | | | | | |
Globo Comunicacao e Participacoes SA
4.875%, 01/22/2030(a) | | | U.S.$ | | | | 1,071 | | | $ | 1,062,633 | |
VTR Finance NV
6.375%, 07/15/2028(a) | | | | | | | 1,308 | | | | 1,397,997 | |
| | | | | | | | | | | | |
| | | | | | | | | | | 2,460,630 | |
| | | | | | | | | | | | |
Communications -
Telecommunications – 0.4% | | | | | | | | | | | | |
Comunicaciones Celulares SA Via Comcel Trust
6.875%, 02/06/2024(a) | | | | | | | 3,473 | | | | 3,551,142 | |
Digicel Group 0.5 Ltd. | | | | | | | | | | | | |
7.00%, 11/16/2020(f)(g)(k) | | | | | | | 603 | | | | 81,401 | |
8.00% (5.00% Cash and 3.00% PIK), 04/01/2025(a)(f) | | | | | | | 2,698 | | | | 917,995 | |
10.00% (8.00% Cash and 2.00% PIK), 04/01/2024(f) | | | | | | | 7,161 | | | | 5,429,975 | |
Digicel International Finance Ltd./Digicel Holdings Bermuda Ltd.
8.75%, 05/25/2024(a) | | | | | | | 1,816 | | | | 1,825,331 | |
MTN Mauritius Investments Ltd.
6.50%, 10/13/2026(a) | | | | | | | 1,282 | | | | 1,426,225 | |
Sable International Finance Ltd.
5.75%, 09/07/2027(a) | | | | | | | 5,930 | | | | 6,251,646 | |
VTR Comunicaciones SpA
5.125%, 01/15/2028(a) | | | | | | | 2,132 | | | | 2,247,928 | |
| | | | | | | | | | | | |
| | | | | | | | | | | 21,731,643 | |
| | | | | | | | | | | | |
Consumer Cyclical - Other – 0.5% | | | | | | | | | | | | |
Melco Resorts Finance Ltd.
5.375%, 12/04/2029(a) | | | | | | | 2,624 | | | | 2,528,880 | |
5.625%, 07/17/2027(a) | | | | | | | 3,599 | | | | 3,652,717 | |
MGM China Holdings Ltd.
5.25%, 06/18/2025(a) | | | | | | | 937 | | | | 940,472 | |
5.375%, 05/15/2024(a) | | | | | | | 2,104 | | | | 2,155,039 | |
5.875%, 05/15/2026(a) | | | | | | | 1,895 | | | | 1,916,319 | |
Studio City Finance Ltd.
6.00%, 07/15/2025(a) | | | | | | | 3,011 | | | | 3,014,764 | |
6.50%, 01/15/2028(a) | | | | | | | 2,724 | | | | 2,683,685 | |
Wynn Macau Ltd.
4.875%, 10/01/2024(a) | | | | | | | 1,845 | | | | 1,798,875 | |
5.125%, 12/15/2029(a) | | | | | | | 2,333 | | | | 2,158,025 | |
5.50%, 01/15/2026-10/01/2027(a) | | | | | | | 3,925 | | | | 3,701,205 | |
5.625%, 08/26/2028(a) | | | | | | | 2,442 | | | | 2,342,282 | |
| | | | | | | | | | | | |
| | | | | | | | | | | 26,892,263 | |
| | | | | | | | | | | | |
| | |
| |
64 | AB HIGH INCOME FUND | | abfunds.com |
PORTFOLIO OF INVESTMENTS (continued)
| | | | | | | | | | | | |
| | | | | | Principal
Amount
(000) | | | U.S. $ Value | |
| |
Consumer Cyclical - Retailers – 0.0% | | | | | | | | | | | | |
K2016470219 (South Africa) Ltd.
3.00%, 12/31/2022(c)(f)(g) | | | U.S.$ | | | | 5,297 | | | $ | – 0 | – |
K2016470260 (South Africa) Ltd.
25.00%, 12/31/2022(c)(f)(g) | | | | | | | 2,461 | | | | – 0 | – |
| | | | | | | | | | | | |
| | | | | | | | | | | – 0 | – |
| | | | | | | | | | | | |
Consumer Non-Cyclical – 0.4% | | | | | | | | | | | | |
BRF GmbH
4.35%, 09/29/2026(a)
| | | | | | | 2,211 | | | | 2,239,391 | |
BRF SA | | | | | | | | | | | | |
4.875%, 01/24/2030(a) | | | | | | | 4,103 | | | | 4,109,237 | |
5.75%, 09/21/2050(a) | | | | | | | 941 | | | | 894,538 | |
Cosan Ltd.
5.50%, 09/20/2029(a) | | | | | | | 2,027 | | | | 2,094,144 | |
Minerva Luxembourg SA
6.50%, 09/20/2026(a) | | | | | | | 3,255 | | | | 3,385,200 | |
Teva Pharmaceutical Finance Netherlands III BV
7.125%, 01/31/2025 | | | | | | | 5,610 | | | | 5,813,362 | |
Tonon Luxembourg SA
6.50% (0.50% Cash and 6.00% PIK), 10/31/2024(b)(c)(f)(g) | | | | | | | 2,413 | | | | 72,627 | |
Ulker Biskuvi Sanayi AS
6.95%, 10/30/2025(a) | | | | | | | 1,248 | | | | 1,239,463 | |
USJ Acucar e Alcool SA
9.875%, 11/09/2023(a)(e)(i) | | | | | | | 1,866 | | | | 597,855 | |
Virgolino de Oliveira Finance SA
10.50%, 01/28/2018(d)(e)(g) | | | | | | | 13,674 | | | | 131,959 | |
10.875%, 01/13/2020(d)(e)(g) | | | | | | | 2,500 | | | | 500,000 | |
11.75%, 02/09/2022(e)(g)(i) | | | | | | | 13,613 | | | | 68,235 | |
| | | | | | | | | | | | |
| | | | | | | | | | | 21,146,011 | |
| | | | | | | | | | | | |
Energy – 0.6% | | | | | | | | | | | | |
Geopark Ltd.
5.50%, 01/17/2027(a) | | | | | | | 463 | | | | 403,244 | |
Leviathan Bond Ltd.
6.125%, 06/30/2025(a) | | | | | | | 2,565 | | | | 2,643,998 | |
6.50%, 06/30/2027(a) | | | | | | | 3,495 | | | | 3,622,416 | |
Medco Oak Tree Pte Ltd.
7.375%, 05/14/2026(a) | | | | | | | 559 | | | | 541,357 | |
Medco Platinum Road Pte Ltd.
6.75%, 01/30/2025(a) | | | | | | | 3,365 | | | | 3,266,153 | |
MV24 Capital BV
6.748%, 06/01/2034(a) | | | | | | | 3,095 | | | | 3,114,439 | |
Peru LNG Srl
5.375%, 03/22/2030(a) | | | | | | | 900 | | | | 684,281 | |
Petrobras Global Finance BV
5.093%, 01/15/2030 | | | | | | | 995 | | | | 1,040,173 | |
| | |
| |
| abfunds.com | | AB HIGH INCOME FUND | 65 |
PORTFOLIO OF INVESTMENTS (continued)
| | | | | | | | | | | | |
| | | | | | Principal
Amount
(000) | | | U.S. $ Value | |
| |
5.60%, 01/03/2031 | | | U.S.$ | | | | 14,086 | | | $ | 15,176,397 | |
| | | | | | | | | | | | |
| | | | | | | | | | | 30,492,458 | |
| | | | | | | | | | | | |
Transportation - Services – 0.1% | | | | | | | | | | | | |
Rumo Luxembourg SARL
7.375%, 02/09/2024(a) | | | | | | | 2,510 | | | | 2,620,597 | |
| | | | | | | | | | | | |
| | | | | | | | | | | 202,432,582 | |
| | | | | | | | | | | | |
Utility – 0.4% | | | | | | | | | | | | |
Electric – 0.4% | | | | | | | | | | | | |
AES El Salvador Trust II
6.75%, 03/28/2023(a) | | | | | | | 1,220 | | | | 1,098,000 | |
AES Gener SA
6.35%, 10/07/2079(a) | | | | | | | 2,632 | | | | 2,641,212 | |
Cemig Geracao e Transmissao SA
9.25%, 12/05/2024(a) | | | | | | | 9,085 | | | | 10,220,625 | |
Light Servicos de Eletricidade SA/Light Energia SA
7.25%, 05/03/2023(a) | | | | | | | 4,813 | | | | 5,038,609 | |
Star Energy Geothermal Wayang Windu Ltd.
6.75%, 04/24/2033(a) | | | | | | | 1,553 | | | | 1,705,151 | |
Terraform Global Operating LLC
6.125%, 03/01/2026(g) | | | | | | | 871 | | | | 883,132 | |
| | | | | | | | | | | | |
| | | | | | | | | | | 21,586,729 | |
| | | | | | | | | | | | |
Financial Institutions – 0.1% | | | | | | | | | | | | |
Insurance – 0.1% | | | | | | | | | | | | |
Ambac LSNI LLC
6.00% (LIBOR 3 Month + 5.00%), 02/12/2023(a)(l) | | | | | | | 80 | | | | 80,035 | |
Highlands Holdings Bond Issuer Ltd./Highlands Holdings Bond Co-Issuer, Inc.
7.625% (7.625% Cash or 8.375% PIK), 10/15/2025(a)(f) | | | | | | | 3,606 | | | | 3,583,778 | |
| | | | | | | | | | | | |
| | | | | | | | | | | 3,663,813 | |
| | | | | | | | | | | | |
Total Emerging Markets – Corporate
Bonds (cost $283,800,465) | | | | | | | | | | | 227,683,124 | |
| | | | | | | | | | | | |
| | | | | | | | | | | | |
COMMERCIAL MORTGAGE-BACKED SECURITIES – 1.9% | | | | | | | | | | | | |
Non-Agency Fixed Rate CMBS – 1.8% | | | | | | | | | | | | |
225 Liberty Street Trust
Series 2016-225L, Class E
4.649%, 02/10/2036(a) | | | | | | | 4,027 | | | | 4,094,847 | |
BANK
Series 2020-BN25, Class XA
0.887%, 01/15/2063(s) | | | | | | | 80,870 | | | | 5,545,105 | |
| | |
| |
66 | AB HIGH INCOME FUND | | abfunds.com |
PORTFOLIO OF INVESTMENTS (continued)
| | | | | | | | | | | | |
| | | | | | Principal
Amount
(000) | | | U.S. $ Value | |
| |
Benchmark Mortgage Trust
Series 2019-B13, Class XA
1.132%, 08/15/2057(s) | | | U.S.$ | | | | 54,095 | | | $ | 4,121,468 | |
Citigroup Commercial Mortgage Trust
Series 2013-GC11, Class XA
1.37%, 04/10/2046(s) | | | | | | | 6,768 | | | | 179,789 | |
Series 2020-GC46, Class XA
0.988%, 02/15/2053(s) | | | | | | | 68,813 | | | | 5,004,840 | |
Commercial Mortgage Trust
Series 2012-CR3, Class F 4.75%, 10/15/2045(a) | | | | | | | 1,000 | | | | 270,045 | |
Series 2012-CR3, Class XA
1.849%, 10/15/2045(s) | | | | | | | 44,692 | | | | 1,177,748 | |
Series 2012-CR5, Class XA
1.516%, 12/10/2045(s) | | | | | | | 8,754 | | | | 232,030 | |
Series 2013-LC6, Class XA
1.328%, 01/10/2046(s) | | | | | | | 29,232 | | | | 641,483 | |
Series 2014-CR15, Class XA
0.932%, 02/10/2047(s) | | | | | | | 8,426 | | | | 199,832 | |
Series 2014-CR20, Class XA
1.023%, 11/10/2047(s) | | | | | | | 44,862 | | | | 1,508,011 | |
DBUBS Mortgage Trust
Series 2011-LC1A, Class C
5.594%, 11/10/2046(a) | | | | | | | 800 | | | | 800,270 | |
Series 2011-LC2A, Class D
5.487%, 07/10/2044(a) | | | | | | | 2,500 | | | | 2,327,673 | |
GS Mortgage Securities Corp. II
Series 2013-GC10, Class XA
1.491%, 02/10/2046(s) | | | | | | | 3,817 | | | | 113,376 | |
GS Mortgage Securities Trust
Series 2011-GC5, Class C
5.388%, 08/10/2044(a) | | | | | | | 7,937 | | | | 7,411,406 | |
Series 2012-GC6, Class C
5.651%, 01/10/2045(a) | | | | | | | 1,177 | | | | 1,088,809 | |
Series 2013-GC13, Class D
4.084%, 07/10/2046(a) | | | | | | | 1,500 | | | | 1,169,443 | |
Series 2014-GC18, Class D
4.989%, 01/10/2047(a) | | | | | | | 2,261 | | | | 618,061 | |
Series 2019-GC38, Class XA
0.961%, 02/10/2052(s) | | | | | | | 14,574 | | | | 959,653 | |
Series 2019-GC39, Class XA
1.14%, 05/10/2052(s) | | | | | | | 17,145 | | | | 1,226,511 | |
Series 2019-GC42, Class XA
0.811%, 09/01/2052(s) | | | | | | | 29,920 | | | | 1,747,354 | |
JP Morgan Chase Commercial Mortgage Securities Trust
Series 2012-CBX, Class D
5.132%, 06/15/2045(a) | | | | | | | 5,000 | | | | 3,628,864 | |
| | |
| |
| abfunds.com | | AB HIGH INCOME FUND | 67 |
PORTFOLIO OF INVESTMENTS (continued)
| | | | | | | | | | | | |
| | | | | | Principal
Amount
(000) | | | U.S. $ Value | |
| |
Series 2012-CBX, Class E
5.132%, 06/15/2045(a) | | | U.S.$ | | | | 6,521 | | | $ | 2,492,728 | |
Series 2012-LC9, Class B
3.812%, 12/15/2047(a) | | | | | | | 5,500 | | | | 5,230,094 | |
JPMCC Commercial Mortgage Securities Trust
Series 2017-JP6, Class XA
1.136%, 07/15/2050(s) | | | | | | | 32,156 | | | | 1,644,183 | |
JPMDB Commercial Mortgage Securities Trust
Series 2019-COR6, Class XA
0.944%, 11/13/2052(s) | | | | | | | 112,057 | | | | 7,521,137 | |
Morgan Stanley Bank of America Merrill Lynch Trust
Series 2012-C6, Class XA
1.607%, 11/15/2045(a)(s) | | | | | | | 25,402 | | | | 560,206 | |
Series 2014-C19, Class D
3.25%, 12/15/2047(a) | | | | | | | 4,130 | | | | 3,370,892 | |
UBS Commercial Mortgage Trust
Series 2019-C16, Class XA
1.558%, 04/15/2052(s) | | | | | | | 17,874 | | | | 1,775,279 | |
Series 2019-C18, Class XA
1.044%, 12/15/2052(s) | | | | | | | 70,778 | | | | 4,951,581 | |
UBS-Barclays Commercial Mortgage Trust
Series 2012-C4, Class XA
1.605%, 12/10/2045(a)(s) | | | | | | | 3,100 | | | | 74,848 | |
Wells Fargo Commercial Mortgage Trust
Series 2020-C55, Class XA
1.311%, 02/15/2053(s) | | | | | | | 94,923 | | | | 9,063,741 | |
WF-RBS Commercial Mortgage Trust
Series 2011-C4, Class D
5.221%, 06/15/2044(a) | | | | | | | 2,576 | | | | 2,216,348 | |
Series 2012-C7, Class XA
1.312%, 06/15/2045(a)(s) | | | | | | | 6,571 | | | | 88,078 | |
Series 2012-C8, Class E
4.885%, 08/15/2045(a) | | | | | | | 6,905 | | | | 5,994,501 | |
Series 2014-C20, Class D
3.986%, 05/15/2047(a) | | | | | | | 3,701 | | | | 1,197,282 | |
Series 2014-C21, Class D
3.497%, 08/15/2047(a) | | | | | | | 4,786 | | | | 3,302,240 | |
| | | | | | | | | | | | |
| | | | | | | | | | | 93,549,756 | |
| | | | | | | | | | | | |
Non-Agency Floating Rate
CMBS – 0.1% | | | | | |
DBWF Mortgage Trust
Series 2018-GLKS, Class E
3.166% (LIBOR 1 Month + 3.02%), 12/19/2030(a)(l) | | | | | | | 4,707 | | | | 4,229,814 | |
| | |
| |
68 | AB HIGH INCOME FUND | | abfunds.com |
PORTFOLIO OF INVESTMENTS (continued)
| | | | | | | | | | | | |
| | | | | | Principal
Amount
(000) | | | U.S. $ Value | |
| |
Morgan Stanley Capital I Trust
Series 2019-BPR, Class E
4.898% (LIBOR 1 Month + 4.75%), 05/15/2036(a)(l) | | | U.S.$ | | | | 1,702 | | | $ | 1,257,934 | |
| | | | | | | | | | | | |
| | | | | | | | | | | 5,487,748 | |
| | | | | | | | | | | | |
Total Commercial Mortgage-Backed Securities
(cost $110,277,585) | | | | | | | | | | | 99,037,504 | |
| | | | | | | | | | | | |
| | | | | | | | | | | | |
EMERGING MARKETS –
TREASURIES – 1.8% | | | | | | | | | | | | |
Brazil – 0.6% | | | | | | | | | | | | |
Brazil Letras do Tesouro Nacional
Series LTN
Zero Coupon, 07/01/2023 | | | BRL | | | | 66,416 | | | | 9,933,154 | |
Brazil Notas do Tesouro Nacional
Series F
10.00%, 01/01/2021 | | | | | | | 132,114 | | | | 23,314,285 | |
| | | | | | | | | | | | |
| | | | | | | | | | | 33,247,439 | |
| | | | | | | | | | | | |
Dominican Republic – 0.2% | | | | | | | | | | | | |
Dominican Republic International Bond
12.00%, 01/20/2022(a) | | | DOP | | | | 347,740 | | | | 6,238,047 | |
15.95%, 06/04/2021(a) | | | | | | | 52,700 | | | | 951,162 | |
| | | | | | | | | | | | |
| | | | | | | | | | | 7,189,209 | |
| | | | | | | | | | | | |
South Africa – 1.0% | | | | | | | | | | | | |
Republic of South Africa Government Bond
Series 2023
7.75%, 02/28/2023 | | | ZAR | | | | 133,000 | | | | 8,800,667 | |
Series 2030
8.00%, 01/31/2030 | | | | | | | 767,911 | | | | 43,395,627 | |
| | | | | | | | | | | | |
| | | | | | | | | | | 52,196,294 | |
| | | | | | | | | | | | |
Total Emerging Markets - Treasuries
(cost $106,182,489) | | | | | | | | | | | 92,632,942 | |
| | | | | | | | | | | | |
| | | | | | | | | | | | |
COLLATERALIZED LOAN OBLIGATIONS – 1.5% | | | | | | | | | | | | |
CLO - Floating Rate – 1.5% | | | | | | | | | | | | |
Ares XXXIV CLO Ltd.
Series 2015-2A, Class CR
2.218% (LIBOR 3 Month + 2.00%), 04/17/2033(a)(l) | | U.S.$ | | | | | 11,494 | | | | 11,033,498 | |
Bristol Park CLO Ltd.
Series 2016-1A, Class DR
3.187% (LIBOR 3 Month + 2.95%), 04/15/2029(a)(l) | | | | | | | 5,000 | | | | 4,719,945 | |
| | |
| |
| abfunds.com | | AB HIGH INCOME FUND | 69 |
PORTFOLIO OF INVESTMENTS (continued)
| | | | | | | | | | | | |
| | | | | | Principal
Amount
(000) | | | U.S. $ Value | |
| |
Dryden CLO Ltd.
Series 2018-57A, Class E
5.48% (LIBOR 3 Month + 5.20%), 05/15/2031(a)(l) | | U.S.$ | | | | | 1,741 | | | $ | 1,481,190 | |
Series 2020-78A, Class C
2.168% (LIBOR 3 Month + 1.95%), 04/17/2033(a)(l) | | | | | | | 2,270 | | | | 2,212,632 | |
Series 2020-78A, Class D
3.218% (LIBOR 3 Month + 3.00%), 04/17/2033(a)(l) | | | | | | | 11,286 | | | | 10,539,277 | |
Dryden Senior Loan Fund
Series 2017-49A, Class E
6.518% (LIBOR 3 Month + 6.30%), 07/18/2030(a)(l) | | | | | | | 2,424 | | | | 2,171,089 | |
Elevation CLO Ltd.
Series 2020-11A, Class C
2.437% (LIBOR 3 Month + 2.20%), 04/15/2033(a)(l) | | | | | | | 3,505 | | | | 3,343,004 | |
Series 2020-11A, Class D1
4.087% (LIBOR 3 Month + 3.85%), 04/15/2033(a)(l) | | | | | | | 5,438 | | | | 5,109,380 | |
Kayne CLO 7 Ltd.
Series 2020-7A, Class A1
1.418% (LIBOR 3 Month + 1.20%), 04/17/2033(a)(l) | | | | | | | 2,639 | | | | 2,605,568 | |
Kayne CLO Ltd.
Series 2020-7A, Class C
2.218% (LIBOR 3 Month + 2.00%), 04/17/2033(a)(l) | | | | | | | 2,940 | | | | 2,887,112 | |
Octagon Investment Partners 29 Ltd.
Series 2016-1A, Class CR
2.165% (LIBOR 3 Month + 1.95%), 01/24/2033(a)(l) | | | | | | | 8,719 | | | | 8,213,770 | |
Series 2016-1A, Class DR
3.315% (LIBOR 3 Month + 3.10%), 01/24/2033(a)(l) | | | | | | | 7,987 | | | | 7,226,118 | |
OZLM Ltd.
Series 2018-22A, Class D
5.518% (LIBOR 3 Month + 5.30%), 01/17/2031(a)(l) | | | | | | | 968 | | | | 753,622 | |
Rockford Tower CLO 2019-2 Ltd.
Series 2019-2A, Class B
2.183% (LIBOR 3 Month + 1.93%), 08/20/2032(a)(l) | | | | | | | 2,743 | | | | 2,688,680 | |
SCFF I Ltd.
Series 2020-1A, Class A2B
4.237% (LIBOR 3 Month + 4.00%), 04/15/2031(a)(l) | | | | | | | 1,923 | | | | 1,938,746 | |
| | |
| |
70 | AB HIGH INCOME FUND | | abfunds.com |
PORTFOLIO OF INVESTMENTS (continued)
| | | | | | | | | | | | |
| | | | | | Principal
Amount
(000) | | | U.S. $ Value | |
| |
Series 2020-1A, Class B
4.987% (LIBOR 3 Month + 4.75%), 04/15/2031(a)(l) | | U.S.$ | | | | | 1,077 | | | $ | 1,086,468 | |
THL Credit Wind River CLO Ltd.
Series 2017-1A, Class AR
1.358% (LIBOR 3 Month + 1.14%), 04/18/2029(a)(l) | | | | | | | 11,850 | | | | 11,725,753 | |
| | | | | | | | | | | | |
| | | |
Total Collateralized Loan Obligations
(cost $82,090,894) | | | | | | | | | | | 79,735,852 | |
| | | | | | | | | | | | |
| | | |
| | | | | | Shares | | | | |
COMMON STOCKS – 1.3% | | | | | | | | | | | | |
Financials – 0.4% | | | | | | | | | | | | |
Consumer Finance – 0.0% | | | | | | | | | | | | |
Paysafe Group Ltd. – Class B(b)(c)(e) | | | | | | | 17,342 | | | | 157,986 | |
| | | | | | | | | | | | |
| | | |
Insurance – 0.4% | | | | | | | | | | | | |
Mt. Logan Re Ltd. (Preference Shares) (Series 4)(b)(c)(e)(t) | | | | | | | 19,500 | | | | 20,589,287 | |
| | | | | | | | | | | | |
| | | | | | | | | | | 20,747,273 | |
| | | | | | | | | | | | |
Consumer Staples – 0.4% | | | | | | | | | | | | |
Food & Staples Retailing – 0.4% | | | | | | | | | | | | |
Southeastern Grocers, Inc. Npv(b)(c)(e) | | | | | | | 252,989 | | | | 18,341,702 | |
| | | | | | | | | | | | |
| | | |
Energy – 0.2% | | | | | | | | | | | | |
Energy Equipment & Services – 0.1% | | | | | | | | | | | | |
Tervita Corp.(e) | | | | | | | 2,204,064 | | | | 2,895,078 | |
| | | | | | | | | | | | |
| | | |
Oil, Gas & Consumable Fuels – 0.1% | | | | | | | | | | | | |
Battalion Oil Corp.(e) | | | | | | | 135 | | | | 911 | |
Berry Corp. | | | | | | | 745,325 | | | | 1,952,752 | |
CHC Group LLC(e)(t) | | | | | | | 2,087,668 | | | | 20,877 | |
Denbury, Inc.(e) | | | | | | | 204,498 | | | | 3,392,622 | |
Golden Energy Offshore Services AS(e) | | | | | | | 3,360,247 | | | | 242,867 | |
K201640219 (South Africa) Ltd. A Shares(b)(c)(e) | | | | | | | 64,873,855 | | | | 65 | |
K201640219 (South Africa) Ltd. B Shares(b)(c)(e) | | | | | | | 10,275,684 | | | | 10 | |
Paragon Offshore Ltd. – Class A(c)(e) | | | | | | | 62,040 | | | | 6,204 | |
Paragon Offshore Ltd. – Class B(c)(e) | | | | | | | 93,060 | | | | 604,890 | |
Vantage Drilling International(e) | | | | | | | 93,534 | | | | 233,835 | |
Whiting Petroleum Corp.(e) | | | | | | | 48,817 | | | | 712,728 | |
| | | | | | | | | | | | |
| | | | | | | | | | | 7,167,761 | |
| | | | | | | | | | | | |
| | | | | | | | | | | 10,062,839 | |
| | | | | | | | | | | | |
| | |
| |
| abfunds.com | | AB HIGH INCOME FUND | 71 |
PORTFOLIO OF INVESTMENTS (continued)
| | | | | | | | | | | | |
| Company | | | | |
Shares | | | U.S. $ Value | |
| |
Consumer Discretionary – 0.1% | | | | | | | | | | | | |
Auto Components – 0.1% | | | | | | | | | | | | |
ATD New Holdings, Inc.(c)(e) | | U.S.$ | | | | | 161,762 | | | $ | 1,617,620 | |
Exide Corp.(b)(c)(e) | | | | | | | 4,045 | | | | 3,943,875 | |
Exide Technologies(b)(c)(e) | | | | | | | 4,726,787 | | | | 5 | |
Exide Technologies/Old(b)(c)(e) | | | | | | | 270,867 | | | | – 0 | – |
| | | | | | | | | | | | |
| | | | | | | | | | | 5,561,500 | |
| | | | | | | | | | | | |
Automobiles – 0.0% | | | | | |
Liberty Tire Recycling LLC(b)(c)(e) | | | | | | | 12,278 | | | | 891,739 | |
| | | | | | | | | | | | |
| | | |
Hotels, Restaurants & Leisure – 0.0% | | | | | | | | | | | | |
Carlson Travel, Inc.(c)(e) | | | | | | | 608 | | | | 216,813 | |
| | | | | | | | | | | | |
| | | | | | | | | | | 6,670,052 | |
| | | | | | | | | | | | |
Information Technology – 0.1% | | | | | | | | | | | | |
Software – 0.1% | | | | | | | | | | | | |
Avaya Holdings Corp.(e) | | | | | | | 250,660 | | | | 4,311,352 | |
Monitronics International, Inc.(b)(c)(e) | | | | | | | 129,032 | | | | 420,796 | |
Monitronics International, Inc.(e) | | | | | | | 128,497 | | | | 435,605 | |
| | | | | | | | | | | | |
| | | | | | | | | | | 5,167,753 | |
| | | | | | | | | | | | |
Materials – 0.1% | | | | | | | | | | | | |
Metals & Mining – 0.1% | | | | | | | | | | | | |
BIS Industries Holdings Ltd.(b)(c)(e) | | | | | | | 5,004,988 | | | | 5 | |
Constellium SE(e) | | | | | | | 234,212 | | | | 2,063,408 | |
Neenah Enterprises, Inc.(b)(c)(e) | | | | | | | 49,578 | | | | – 0 | – |
| | | | | | | | | | | | |
| | | | | | | | | | | 2,063,413 | |
| | | | | | | | | | | | |
Industrials – 0.0% | | | | | | | | | | | | |
Building Products – 0.0% | | | | | | | | | | | | |
New Cotai LLC/New Cotai Capital Corp.(b)(c)(e) | | | | | | | 14 | | | | – 0 | – |
| | | | | | | | | | | | |
| | | |
Construction & Engineering – 0.0% | | | | | | | | | | | | |
Willscot Corp.(e) | | | | | | | 109,384 | | | | 2,032,355 | |
| | | | | | | | | | | | |
| | | | | | | | | | | 2,032,355 | |
| | | | | | | | | | | | |
Communication Services – 0.0% | | | | | | | | | | | | |
Media – 0.0% | | | | | | | | | | | | |
iHeartMedia, Inc. - Class A(e) | | | | | | | 163,002 | | | | 1,339,876 | |
| | | | | | | | | | | | |
| | | |
Total Common Stocks
(cost $158,888,102) | | | | | | | | | | | 66,425,263 | |
| | | | | | | | | | | | |
| | |
| |
72 | AB HIGH INCOME FUND | | abfunds.com |
PORTFOLIO OF INVESTMENTS (continued)
| | | | | | | | | | | | |
| | | | | | Principal
Amount
(000) | | | U.S. $ Value | |
| |
QUASI-SOVEREIGNS – 1.2% | | | | | | | | | | | | |
Quasi-Sovereign Bonds – 1.2% | | | | | | | | | | | | |
Bahrain – 0.2% | | | | | | | | | | | | |
Oil and Gas Holding Co. BSCC (The)
7.625%, 11/07/2024(a) | | | U.S.$ | | | | 2,974 | | | $ | 3,163,593 | |
8.375%, 11/07/2028(a) | | | | | | | 7,879 | | | | 8,644,740 | |
| | | | | | | | | | | | |
| | | | | | | | | | | 11,808,333 | |
| | | | | | | | | | | | |
Indonesia – 0.1% | | | | | | | | | | | | |
Indonesia Asahan Aluminium Persero PT
4.75%, 05/15/2025(a) | | | | | | | 1,062 | | | | 1,153,598 | |
5.45%, 05/15/2030(a) | | | | | | | 725 | | | | 822,875 | |
| | | | | | | | | | | | |
| | | | | | | | | | | 1,976,473 | |
| | | | | | | | | | | | |
Mexico – 0.8% | | | | | | | | | | | | |
Petroleos Mexicanos
5.95%, 01/28/2031 | | | | | | | 16,526 | | | | 13,811,604 | |
6.49%, 01/23/2027 | | | | | | | 2,418 | | | | 2,249,345 | |
6.50%, 01/23/2029 | | | | | | | 1,952 | | | | 1,741,379 | |
6.75%, 09/21/2047 | | | | | | | 10,747 | | | | 8,323,551 | |
6.84%, 01/23/2030 | | | | | | | 5,550 | | | | 4,962,221 | |
7.69%, 01/23/2050 | | | | | | | 14,028 | | | | 11,642,539 | |
| | | | | | | | | | | | |
| | | | | | | | | | | 42,730,639 | |
| | | | | | | | | | | | |
South Africa – 0.1% | | | | | | | | | | | | |
Eskom Holdings SOC Ltd.
6.35%, 08/10/2028(a) | | | | | | | 2,540 | | | | 2,618,581 | |
| | | | | | | | | | | | |
| | | |
Trinidad & Tobago – 0.0% | | | | | | | | | | | | |
Trinidad Generation UnLtd.
5.25%, 11/04/2027(a) | | | | | | | 703 | | | | 722,552 | |
| | | | | | | | | | | | |
| | | |
United Arab Emirates – 0.0% | | | | | | | | | | | | |
DP World Crescent Ltd.
3.875%, 07/18/2029(a) | | | | | | | 375 | | | | 390,469 | |
DP World PLC
5.625%, 09/25/2048(a) | | | | | | | 1,098 | | | | 1,250,347 | |
| | | | | | | | | | | | |
| | | | | | | | | | | 1,640,816 | |
| | | | | | | | | | | | |
Venezuela – 0.0% | | | | | | | | | | | | |
Petroleos de Venezuela SA
6.00%, 11/15/2026(a)(e)(i) | | | | | | | 5,000 | | | | 142,500 | |
| | | | | | | | | | | | |
| | | |
Total Quasi-Sovereigns
(cost $60,787,347) | | | | | | | | | | | 61,639,894 | |
| | | | | | | | | | | | |
| | | | | | | | | | | | |
| | |
| |
| abfunds.com | | AB HIGH INCOME FUND | 73 |
PORTFOLIO OF INVESTMENTS (continued)
| | | | | | | | | | | | |
| | | | | | Principal
Amount
(000) | | | U.S. $ Value | |
| |
ASSET-BACKED SECURITIES – 0.7% | | | | | | | | | | | | |
Other ABS - Fixed Rate – 0.5% | | | | | | | | | | | | |
Consumer Loan Underlying Bond
Certificate Issuer Trust I
Series 2018-7, Class PT
9.684%, 06/15/2043(g) | | | U.S.$ | | | | 1,283 | | | $ | 1,179,839 | |
Series 2019-24, Class PT
10.482%, 08/15/2044(g) | | | | | | | 1,899 | | | | 1,716,495 | |
Series 2019-36, Class PT
13.317%, 10/17/2044(g) | | | | | | | 2,423 | | | | 2,163,274 | |
Series 2019-43, Class PT
6.564%, 11/15/2044(g) | | | | | | | 1,623 | | | | 1,526,742 | |
Consumer Loan Underlying Bond Club Certificate Issuer Trust I
Series 2018-12, Class PT
11.384%, 06/15/2043(g) | | | | | | | 1,165 | | | | 1,070,831 | |
Series 2018-4, Class PT
9.708%, 05/15/2043(g) | | | | | | | 1,292 | | | | 1,217,736 | |
Consumer Loan Underlying Bond Credit Trust
Series 2018-3, Class PT
10.963%, 03/16/2043(g) | | | | | | | 291 | | | | 269,079 | |
SoFi Consumer Loan Program LLC
Series 2016-1, Class R
Zero Coupon, 08/25/2025(b)(c) | | | | | | | 3,200 | | | | 714,235 | |
Series 2016-5, Class R
Zero Coupon, 09/25/2028(b)(c) | | | | | | | 73 | | | | 1,220,790 | |
Series 2017-2, Class R
Zero Coupon, 02/25/2026(b)(c) | | | | | | | 45 | | | | 1,210,761 | |
Series 2017-3, Class R
Zero Coupon, 05/25/2026(b)(c) | | | | | | | 56 | | | | 1,876,000 | |
Series 2017-5, Class R1
Zero Coupon, 09/25/2026(b)(c) | | | | | | | 80 | | | | 2,000,000 | |
SoFi Consumer Loan Program Trust
Series 2018-1, Class R1
Zero Coupon, 02/25/2027(b)(c) | | | | | | | 114 | | | | 4,574,920 | |
Taco Bell Funding LLC
Series 2016-1A, Class A23
4.97%, 05/25/2046(a) | | | | | | | 4,597 | | | | 4,972,492 | |
| | | | | | | | | | | | |
| | | | | | | | | | | 25,713,194 | |
| | | | | | | | | | | | |
Autos - Fixed Rate – 0.1% | | | | | | | | | | | | |
Exeter Automobile Receivables Trust
Series 2019-2A, Class E
4.68%, 05/15/2026(a) | | | | | | | 6,065 | | | | 6,314,459 | |
Flagship Credit Auto Trust
Series 2019-1, Class E
5.06%, 06/15/2026(a) | | | | | | | 791 | | | | 824,641 | |
| | | | | | | | | | | | |
| | | | | | | | | | | 7,139,100 | |
| | | | | | | | | | | | |
| | |
| |
74 | AB HIGH INCOME FUND | | abfunds.com |
PORTFOLIO OF INVESTMENTS (continued)
| | | | | | | | | | | | |
| | | | | | Principal
Amount
(000) | | | U.S. $ Value | |
| |
Home Equity Loans - Fixed
Rate – 0.1% | | | | | | | | | | | | |
CSAB Mortgage-Backed Trust
Series 2006-2, Class A6A
5.72%, 09/25/2036 | | | U.S.$ | | | | 725 | | | $ | 333,729 | |
CWABS Asset-Backed Certificates Trust
Series 2005-7, Class AF5W
5.054%, 10/25/2035 | | | | | | | 1,535 | | | | 1,549,155 | |
GSAA Home Equity Trust
Series 2005-12, Class AF5
6.159%, 09/25/2035 | | | | | | | 1,157 | | | | 946,188 | |
Series 2006-10, Class AF3
5.985%, 06/25/2036 | | | | | | | 1,369 | | | | 553,632 | |
Series 2006-6, Class AF4
6.121%, 03/25/2036 | | | | | | | 3,374 | | | | 1,415,905 | |
Series 2006-6, Class AF5
6.241%, 03/25/2036 | | | | | | | 2,730 | | | | 1,145,467 | |
| | | | | | | | | | | | |
| | | | | | | | | | | 5,944,076 | |
| | | | | | | | | | | | |
Home Equity Loans - Floating
Rate – 0.0% | | | | | | | | | | | | |
Lehman XS Trust
Series 2007-6, Class 3A5
4.585%, 05/25/2037 | | | | | | | 126 | | | | 123,177 | |
| | | | | | | | | | | | |
| | | |
Total Asset-Backed Securities
(cost $64,645,276) | | | | | | | | | | | 38,919,547 | |
| | | | | | | | | | | | |
| | | | | | | | | | | | |
INFLATION-LINKED
SECURITIES – 0.3% | | | | | | | | | | | | |
Colombia – 0.3% | | | | | | | | | | | | |
Fideicomiso PA Concesion Ruta al Mar
6.75%, 02/15/2044(a) | | | COP | | | | 14,562,910 | | | | 3,245,317 | |
Fideicomiso PA Costera
6.25%, 01/15/2034(a) | | | | | | | 7,580,000 | | | | 2,234,503 | |
Fideicomiso PA Pacifico Tres
7.00%, 01/15/2035(g) | | | | | | | 36,247,335 | | | | 10,200,782 | |
| | | | | | | | | | | | |
| | | |
Total Inflation-Linked Securities
(cost $17,954,509) | | | | | | | | | | | 15,680,602 | |
| | | | | | | | | | | | |
| | | | | | | | | | | | |
GOVERNMENTS – SOVEREIGN
BONDS – 0.3% | | | | | | | | | | | | |
Colombia – 0.2% | | | | | | | | | | | | |
Colombia Government International Bond
3.125%, 04/15/2031 | | | U.S.$ | | | | 1,913 | | | | 1,962,738 | |
4.125%, 05/15/2051 | | | | | | | 6,682 | | | | 6,999,395 | |
| | | | | | | | | | | | |
| | | | | | | | | | | 8,962,133 | |
| | | | | | | | | | | | |
| | |
| |
| abfunds.com | | AB HIGH INCOME FUND | 75 |
PORTFOLIO OF INVESTMENTS (continued)
| | | | | | | | | | | | |
| | | | | | Principal
Amount
(000) | | | U.S. $ Value | |
| |
Mexico – 0.1% | | | | | | | | | | | | |
Mexico Government International Bond
4.75%, 04/27/2032 | | | U.S.$ | | | | 2,842 | | | $ | 3,248,761 | |
5.00%, 04/27/2051 | | | | | | | 2,265 | | | | 2,588,895 | |
| | | | | | | | | | | | |
| | | | | | | | | | | 5,837,656 | |
| | | | | | | | | | | | |
Netherlands – 0.0% | | | | | | | | | | | | |
SNS Bank NV
Series E
11.25%, 12/31/2049 (b)(c)(k) | | | EUR | | | | 1,001 | | | | – 0 | – |
| | | | | | | | | | | | |
| | | |
Total Governments – Sovereign Bonds
(cost $14,752,481) | | | | | | | | | | | 14,799,789 | |
| | | | | | | | | | | | |
| | | |
| | | | | | Shares | | | | |
PREFERRED STOCKS – 0.3% | | | | | | | | | | | | |
Financial Institutions – 0.2% | | | | | | | | | | | | |
Banking – 0.1% | | | | | | | | | | | | |
Paysafe Holdings UK Ltd.
0.00%,(b)(c)(e) | | | | | | | 5,431,939 | | | | 5,431,939 | |
| | | | | | | | | | | | |
| | | |
Insurance – 0.1% | | | | | | | | | | | | |
Hartford Financial Services Group, Inc.
(The)
7.875% | | | | | | | 95,901 | | | | 2,633,441 | |
| | | | | | | | | | | | |
| | | | | | | | | | | 8,065,380 | |
| | | | | | | | | | | | |
Industrial – 0.1% | | | | | | | | | | | | |
Industrial Conglomerates – 0.1% | | | | | | | | | | | | |
WESCO International, Inc.
Series A
10.625% | | | | | | | 211,900 | | | | 6,140,862 | |
| | | | | | | | | | | | |
| | | |
Total Preferred Stocks
(cost $13,546,175) | | | | | | | | | | | 14,206,242 | |
| | | | | | | | | | | | |
| | | |
| | | | | | Principal
Amount
(000) | | | | |
LOCAL GOVERNMENTS – US MUNICIPAL BONDS – 0.2% | | | | | | | | | | | | |
United States – 0.2% | | | | | | | | | | | | |
State of California Series 2010
7.60%, 11/01/2040 | | | U.S.$ | | | | 1,200 | | | | 2,125,224 | |
7.625%, 03/01/2040 | | | | | | | 1,250 | | | | 2,130,150 | |
7.95%, 03/01/2036 | | | | | | | 0 | ** | | | 215 | |
State of Illinois
Series 2010
7.35%, 07/01/2035 | | | | | | | 4,120 | | | | 4,672,203 | |
| | |
| |
76 | AB HIGH INCOME FUND | | abfunds.com |
PORTFOLIO OF INVESTMENTS (continued)
| | | | | | | | | | | | |
| | | | | | Principal
Amount
(000) | | | U.S. $ Value | |
| |
Tobacco Settlement Finance Authority/WV
Series 2007A
7.467%, 06/01/2047 | | | U.S.$ | | | | 1,985 | | | $ | 2,147,472 | |
| | | | | | | | | | | | |
| | | |
Total Local Governments – US Municipal Bonds
(cost $8,663,561) | | | | | | | | | | | 11,075,264 | |
| | | | | | | | | | | | |
| | | |
| | | | | | Shares | | | | |
WARRANTS – 0.0% | | | | | | | | | | | | |
Avaya Holdings Corp.,
expiring 12/15/2022(e) | | | | | | | 385,763 | | | | 945,119 | |
Battalion Oil Corp.,
expiring 10/08/2022(b)(c)(e) | | | | | | | 815 | | | | – 0 | – |
Battalion Oil Corp.,
expiring 10/08/2022(b)(c)(e) | | | | | | | 652 | | | | – 0 | – |
Battalion Oil Corp.,
expiring 10/08/2022(b)(c)(e) | | | | | | | 1,048 | | | | – 0 | – |
Encore Automotive Acceptance,
expiring 07/05/2031(b)(c)(e) | | | | | | | 44 | | | | – 0 | – |
Flexpath Capital, Inc.,
expiring 04/15/2031(b)(c)(e) | | | | | | | 189,795 | | | | – 0 | – |
iHeartMedia, Inc.,
expiring 05/01/2039(e) | | | | | | | 1,797 | | | | 13,433 | |
SandRidge Energy, Inc., A-CW22, expiring 10/04/2022(e) | | | | | | | 302,868 | | | | 3,029 | |
SandRidge Energy, Inc., B-CW22,
expiring 10/04/2022(e) | | | | | | | 130,363 | | | | 834 | |
Willscot Corp.,
expiring 11/29/2022(b)(c)(e) | | | | | | | 169,364 | | | | 954,044 | |
| | | | | | | | | | | | |
| | | |
Total Warrants
(cost $3,641,850) | | | | | | | | | | | 1,916,459 | |
| | | | | | | | | | | | |
| | | |
| | | | | | Notional
Amount | | | | |
OPTIONS PURCHASED –
PUTS – 0.0% | | | | | | | | | | | | |
Swaptions – 0.0% | | | | | | | | | | | | |
IRS Swaption
Expiration: Jan 2021; Contracts: 21,732,000; Exercise Rate: 1.52%; Counterparty: JPMorgan Chase Bank, NA(e) | | | USD | | | | 21,732,000 | | | | 500,206 | |
IRS Swaption
Expiration: Nov 2020; Contracts: 5,993,000; Exercise Rate: 1.28%;
Counterparty: Goldman Sachs International(e) | | | | | | | 5,993,000 | | | | 151,524 | |
| | |
| |
| abfunds.com | | AB HIGH INCOME FUND | 77 |
PORTFOLIO OF INVESTMENTS (continued)
| | | | | | | | | | | | |
| | | | | |
Notional
Amount | | | U.S. $ Value | |
| |
IRS Swaption
Expiration: Dec 2020; Contracts: 11,452,000; Exercise Rate: 1.32%;
Counterparty: Deutsche Bank AG(e) | | | USD | | | | 11,452,000 | | | $ | 355,415 | |
IRS Swaption
Expiration: Nov 2020; Contracts: 4,611,000; Exercise Rate: 1.28%;
Counterparty: Goldman Sachs International(e) | | | | | | | 4,611,000 | | | | 107,102 | |
IRS Swaption
Expiration: Nov 2020; Contracts: 5,994,000; Exercise Rate: 1.28%;
Counterparty: Goldman Sachs International(e) | | | | | | | 5,994,000 | | | | 151,549 | |
| | | | | | | | | | | | |
| | | |
Total Options Purchased – Puts
(premiums paid $1,002,848) | | | | | | | | | | | 1,265,796 | |
| | | | | | | | | | | | |
| | | |
| | | | | | Principal
Amount
(000) | | | | |
WHOLE LOAN TRUSTS – 0.0% | | | | | | | | | | | | |
Performing Asset – 0.0% | | | | | | | | | | | | |
Sheridan Auto Loan Holdings I LLC
10.00%, 12/31/2020-09/30/2021(b)(c)
(cost $6,120,177) | | | U.S.$ | | | | 6,120 | | | | 330,713 | |
| | | | | | | | | | | | |
| | | |
| | | | | | Shares | | | | |
RIGHTS – 0.0% | | | | | | | | | | | | |
Vistra Energy Corp.,
expiring 12/31/2049(c)(e)
(cost $0) | | | | | | | 45,881 | | | | 48,955 | |
| | | | | | | | | | | | |
| | | |
SHORT-TERM INVESTMENTS – 1.0% | | | | | | | | | | | | |
Investment Companies – 0.4% | | | | | | | | | | | | |
AB Fixed Income Shares, Inc. – Government Money Market Portfolio – Class AB, 0.03%(u)(v)(w)
(cost $22,537,225) | | | | | | | 22,537,225 | | | | 22,537,225 | |
| | | | | | | | | | | | |
| | | |
| | | | | | Principal
Amount
(000) | | | | |
Time Deposits – 0.3% | | | | | | | | | | | | |
BBH, Grand Cayman
3.15%, 11/02/2020 | | | ZAR | | | | 14 | | | | 833 | |
Citibank, London
(0.70)%, 11/02/2020 | | | EUR | | | | 1,600 | | | | 1,863,547 | |
JPMorgan Chase, New York
0.01%, 11/02/2020 | | | U.S.$ | | | | 14,349 | | | | 14,349,045 | |
| | | | | | | | | | | | |
| | | |
Total Time Deposits
(cost $16,213,425) | | | | | | | | | | | 16,213,425 | |
| | | | | | | | | | | | |
| | |
| |
78 | AB HIGH INCOME FUND | | abfunds.com |
PORTFOLIO OF INVESTMENTS (continued)
| | | | | | | | | | | | |
| | | | | | Principal
Amount
(000) | | | U.S. $ Value | |
| |
Governments – Treasuries – 0.3% | | | | | | | | | |
Egypt – 0.3% | | | | | | | | | |
Egypt Treasury Bills
Zero Coupon, 11/17/2020-03/23/2021
(cost $14,419,510) | | | EGP | | | | 236,800 | | | $ | 14,499,067 | |
| | | | | | | | | | | | |
| | |
Total Short-Term Investments
(cost $53,170,160) | | | | | | | 53,249,717 | |
| | | | | | | | | | | | |
| | | |
Total Investments – 101.3%
(cost $5,486,759,936) | | | | | | | | | | | 5,289,256,952 | |
Other assets less liabilities – (1.3)% | | | | | | | | | | | (65,685,581 | ) |
| | | | | | | | | | | | |
| | | |
Net Assets – 100.0% | | | | | | | | | | $ | 5,223,571,371 | |
| | | | | | | | | | | | |
FUTURES (see Note D)
| | | | | | | | | | | | | | | | |
| Description | | Number of
Contracts | | | Expiration
Month | | | Current
Notional | | | Value and
Unrealized
Appreciation/
(Depreciation) | |
Purchased Contracts | | | | | | | | | | | | | | | | |
U.S. Long Bond (CBT) Futures | | | 77 | | | | December 2020 | | | $ | 13,280,094 | | | $ | (402,680 | ) |
U.S. T-Note 10 Yr (CBT) Futures | | | 1,223 | | | | December 2020 | | | | 169,041,531 | | | | (1,506,703 | ) |
| | | | | | | | | | | | | | | | |
Sold Contracts | | | | | | | | | | | | | | | | |
U.S. T-Note 5 Yr (CBT) Futures | | | 8 | | | | December 2020 | | | | 1,004,813 | | | | 2,141 | |
U.S. Ultra Bond (CBT) Futures | | | 40 | | | | December 2020 | | | | 8,600,000 | | | | 366,055 | |
| | | | | | | | | | | | | | | | |
| | | | | | | | | | | | | | $ | (1,541,187 | ) |
| | | | | | | | | | | | | | | | |
FORWARD CURRENCY EXCHANGE CONTRACTS (see Note D)
| | | | | | | | | | | | | | | | | | | | |
| Counterparty | | Contracts to
Deliver
(000) | | | In Exchange
For
(000) | | | Settlement
Date | | | Unrealized
Appreciation/
(Depreciation) | |
Bank of America, NA | | ZAR | | | 811,709 | | | USD | | | 48,543 | | | | 11/27/2020 | | | $ | (1,196,157 | ) |
BNP Paribas SA | | BRL | | | 203,250 | | | USD | | | 36,673 | | | | 11/04/2020 | | | | 1,252,669 | |
BNP Paribas SA | | USD | | | 35,214 | | | BRL | | | 203,250 | | | | 11/04/2020 | | | | 205,846 | |
BNP Paribas SA | | CAD | | | 8,407 | | | USD | | | 6,329 | | | | 12/10/2020 | | | | 17,759 | |
Citibank, NA | | BRL | | | 203,250 | | | USD | | | 35,214 | | | | 11/04/2020 | | | | (205,846 | ) |
Citibank, NA | | USD | | | 35,453 | | | BRL | | | 203,250 | | | | 11/04/2020 | | | | (32,479 | ) |
Citibank, NA | | BRL | | | 203,250 | | | USD | | | 35,421 | | | | 12/02/2020 | | | | 49,757 | |
Citibank, NA | | AUD | | | 18,700 | | | USD | | | 13,149 | | | | 01/12/2021 | | | | (731 | ) |
Goldman Sachs Bank USA | | RUB | | | 3,906,074 | | | USD | | | 50,734 | | | | 11/19/2020 | | | | 1,652,246 | |
Goldman Sachs Bank USA | | AUD | | | 37,795 | | | USD | | | 26,638 | | | | 01/12/2021 | | | | 61,640 | |
Goldman Sachs Bank USA | | IDR | | | 581,634,052 | | | USD | | | 38,804 | | | | 01/15/2021 | | | | (235,612 | ) |
| | |
| |
| abfunds.com | | AB HIGH INCOME FUND | 79 |
PORTFOLIO OF INVESTMENTS (continued)
| | | | | | | | | | | | | | | | | | | | | | |
| Counterparty | | Contracts to
Deliver
(000) | | | In Exchange
For
(000) | | | Settlement
Date | | | Unrealized
Appreciation/
(Depreciation) | |
JPMorgan Chase Bank, NA | | ZAR | | | 59,542 | | | | USD | | | | 3,499 | | | | 11/27/2020 | | | $ | (149,508 | ) |
JPMorgan Chase Bank, NA | | MXN | | | 863,661 | | | | USD | | | | 40,253 | | | | 12/11/2020 | | | | (289,161 | ) |
Morgan Stanley Capital Services LLC | | GBP | | | 3,585 | | | | USD | | | | 4,660 | | | | 11/19/2020 | | | | 16,063 | |
Morgan Stanley Capital Services LLC | | EUR | | | 68,303 | | | | USD | | | | 80,337 | | | | 12/18/2020 | | | | 699,636 | |
Morgan Stanley Capital Services LLC | | NZD | | | 19,845 | | | | USD | | | | 13,140 | | | | 12/22/2020 | | | | 18,484 | |
Royal Bank of Scotland PLC | | COP | | | 266,938,943 | | | | USD | | | | 71,625 | | | | 11/13/2020 | | | | 2,686,814 | |
Royal Bank of Scotland PLC | | USD | | | 13,204 | | | | EUR | | | | 11,164 | | | | 12/18/2020 | | | | (187,399 | ) |
UBS AG | | COP | | | 21,901,350 | | | | USD | | | | 5,859 | | | | 11/13/2020 | | | | 202,993 | |
UBS AG | | RUB | | | 1,062,196 | | | | USD | | | | 13,417 | | | | 11/19/2020 | | | | 69,495 | |
UBS AG | | USD | | | 3,294 | | | | RUB | | | | 260,503 | | | | 11/19/2020 | | | | (20,129 | ) |
UBS AG | | EUR | | | 99,942 | | | | USD | | | | 118,205 | | | | 12/04/2020 | | | | 1,727,205 | |
| | | | | | | | | | | | | | | | | | | | | | |
| | | | | | | | | | | | | | | | | | | | $ | 6,343,585 | |
| | | | | | | | | | | | | | | | | | | | | | |
CENTRALLY CLEARED CREDIT DEFAULT SWAPS (see Note D)
| | | | | | | | | | | | | | | | | | | | | | | | | | | | | | | | |
| Description | | Fixed
Rate
(Pay)
Receive | | | Payment
Frequency | | | Implied
Credit
Spread at
October 31,
2020 | | | Notional
Amount
(000) | | | Market
Value | | | Upfront
Premiums
Paid
(Received) | | | Unrealized
Appreciation/
(Depreciation) | |
Buy Contracts | |
CDX-NAHY
Series 29, 5 Year Index, 12/20/2022* | | | (5.00 | )% | | | Quarterly | | | | 3.15 | % | | | USD | | | | 73,398 | | | $ | (3,208,959 | ) | | $ | (2,420,896 | ) | | $ | (788,063 | ) |
iTraxx Europe Crossover Series 27, 5 Year Index, 06/20/2022* | | | (5.00 | ) | | | Quarterly | | | | 2.44 | | | | EUR | | | | 73,087 | | | | (4,007,299 | ) | | | (3,972,964 | ) | | | (34,335 | ) |
Sale Contracts | |
Brazilian Government International Bond, 4.250% 01/07/2025, 06/20/2025* | | | 1.00 | | | | Quarterly | | | | 2.02 | | | | USD | | | | 18,614 | | | | (837,629 | ) | | | (1,334,885 | ) | | | 497,256 | |
CDX-NAHY
Series 34, 5 Year Index, 06/20/2025* | | | 5.00 | | | | Quarterly | | | | 3.96 | | | | USD | | | | 603,221 | | | | 29,217,838 | | | | 559,572 | | | | 28,658,266 | |
Ford Motor Company, 4.346% 12/08/2026, 06/20/2023* | | | 5.00 | | | | Quarterly | | | | 2.54 | | | | USD | | | | 4,420 | | | | 294,356 | | | | (343,021 | ) | | | 637,377 | |
iTraxx Europe Crossover Series 27, 5 Year Index, 06/20/2022* | | | 5.00 | | | | Quarterly | | | | 2.44 | | | | EUR | | | | 73,088 | | | | 4,007,349 | | | | 1,802,625 | | | | 2,204,724 | |
iTraxx Europe Crossover Series 33, 5 Year Index, 06/20/2025* | | | 5.00 | % | | | Quarterly | | | | 3.54 | | | | EUR | | | | 114,143 | | | | 8,856,465 | | | | (848,795 | ) | | | 9,705,260 | |
| | |
| |
80 | AB HIGH INCOME FUND | | abfunds.com |
PORTFOLIO OF INVESTMENTS (continued)
| | | | | | | | | | | | | | | | | | | | | | | | | | | | | | | | |
| Description | | Fixed
Rate
(Pay)
Receive | | | Payment
Frequency | | | Implied
Credit
Spread at
October 31,
2020 | | | Notional
Amount
(000) | | | Market
Value | | | Upfront
Premiums
Paid
(Received) | | | Unrealized
Appreciation/
(Depreciation) | |
South Africa Government International Bond, 5.875% 09/16/2025, 06/20/2025* | | | 1.00 | % | | | Quarterly | | | | 2.63 | % | | | USD | | | | 19,270 | | | $ | (1,370,056 | ) | | $ | (2,368,769 | ) | | $ | 998,713 | |
| | | | | | | | | | | | | | | | | | | | | | | | | | | | | | | | |
| | | | | | | | | | | | | | | | | | | | | | $ | 32,952,065 | | | $ | (8,927,133 | ) | | $ | 41,879,198 | |
| | | | | | | | | | | | | | | | | | | | | | | | | | | | | | | | |
CREDIT DEFAULT SWAPS (see Note D)
| | | | | | | | | | | | | | | | | | | | | | | | | | | | | | | | |
Swap
Counterparty
& Referenced
Obligation | | Fixed
Rate
(Pay)
Receive | | | Payment
Frequency | | | Implied
Credit
Spread at
October 31,
2020 | | | Notional
Amount (000) | | | Market Value | | | Upfront
Premiums
Paid
(Received) | | | Unrealized
Appreciation/
(Depreciation) | |
Sale Contracts | | | | | | | | | | | | | | | | | | | | | | | | | | | | | | | | |
Citigroup Global Markets, Inc. | | | | | | | | | | | | | | | | | | | | | | | | | | | | | | | | |
CDX-CMBX.NA.BB Series 6, 05/11/2063* | | | 5.00 | % | | | Monthly | | | | 25.00 | % | | | USD | | | | 1,490 | | | $ | (746,349 | ) | | $ | (737,508 | ) | | $ | (8,841 | ) |
CDX-CMBX.NA.BB Series 6, 05/11/2063* | | | 5.00 | | | | Monthly | | | | 25.00 | | | | USD | | | | 3,028 | | | | (1,516,742 | ) | | | (1,522,712 | ) | | | 5,970 | |
CDX-CMBX.NA.BBB- Series 6, 05/11/2063* | | | 3.00 | | | | Monthly | | | | 25.00 | | | | USD | | | | 3,750 | | | | (1,213,500 | ) | | | (1,364,103 | ) | | | 150,603 | |
CDX-CMBX.NA.BBB- Series 6, 05/11/2063* | | | 3.00 | | | | Monthly | | | | 25.00 | | | | USD | | | | 40,000 | | | | (12,940,667 | ) | | | (4,654,420 | ) | | | (8,286,247 | ) |
CDX-CMBX.NA.BBB- Series 6, 05/11/2063* | | | 3.00 | | | | Monthly | | | | 25.00 | | | | USD | | | | 8,746 | | | | (2,830,206 | ) | | | (1,077,802 | ) | | | (1,752,404 | ) |
CDX-CMBX.NA.BBB- Series 6, 05/11/2063* | | | 3.00 | | | | Monthly | | | | 25.00 | | | | USD | | | | 6,122 | | | | (1,981,079 | ) | | | (757,286 | ) | | | (1,223,793 | ) |
CDX-CMBX.NA.BBB- Series 6, 05/11/2063* | | | 3.00 | | | | Monthly | | | | 25.00 | | | | USD | | | | 15,706 | | | | (5,082,462 | ) | | | (1,952,854 | ) | | | (3,129,608 | ) |
CDX-CMBX.NA.BBB- Series 6, 05/11/2063* | | | 3.00 | | | | Monthly | | | | 25.00 | | | | USD | | | | 3,714 | | | | (1,201,850 | ) | | | (468,730 | ) | | | (733,120 | ) |
Credit Suisse International | | | | | | | | | | | | | | | | | | | | | | | | | | | | | | | | |
CDX-CMBX.NA.BB Series 6, 05/11/2063* | | | 5.00 | % | | | Monthly | | | | 25.00 | % | | | USD | | | | 1,368 | | | | (684,859 | ) | | | (198,514 | ) | | | (486,345 | ) |
CDX-CMBX.NA.BB Series 6, 05/11/2063* | | | 5.00 | | | | Monthly | | | | 25.00 | | | | USD | | | | 547 | | | | (273,843 | ) | | | (79,376 | ) | | | (194,467 | ) |
CDX-CMBX.NA.BB Series 6, 05/11/2063* | | | 5.00 | | | | Monthly | | | | 25.00 | | | | USD | | | | 1,368 | | | | (685,429 | ) | | | (193,609 | ) | | | (491,820 | ) |
CDX-CMBX.NA.BB Series 6, 05/11/2063* | | | 5.00 | | | | Monthly | | | | 25.00 | | | | USD | | | | 2,735 | | | | (1,370,357 | ) | | | (386,696 | ) | | | (983,661 | ) |
CDX-CMBX.NA.BB Series 6, 05/11/2063* | | | 5.00 | | | | Monthly | | | | 25.00 | | | | USD | | | | 44,000 | | | | (22,033,733 | ) | | | (6,699,316 | ) | | | (15,334,417 | ) |
CDX-CMBX.NA.BBB- Series 6, 05/11/2063* | | | 3.00 | | | | Monthly | | | | 25.00 | | | | USD | | | | 7,560 | | | | (2,446,416 | ) | | | (919,284 | ) | | | (1,527,132 | ) |
CDX-CMBX.NA.BBB- Series 6, 05/11/2063* | | | 3.00 | | | | Monthly | | | | 25.00 | | | | USD | | | | 247 | | | | (79,929 | ) | | | (30,231 | ) | | | (49,698 | ) |
| | |
| |
| abfunds.com | | AB HIGH INCOME FUND | 81 |
PORTFOLIO OF INVESTMENTS (continued)
| | | | | | | | | | | | | | | | | | | | | | | | | | | | | | | | |
Swap
Counterparty
& Referenced
Obligation | | Fixed
Rate
(Pay)
Receive | | | Payment
Frequency | | | Implied
Credit
Spread at
October 31,
2020 | | | Notional
Amount (000) | | | Market Value | | | Upfront
Premiums
Paid
(Received) | | | Unrealized
Appreciation/
(Depreciation) | |
International Game Technology, 4.750%, 02/15/2023, 06/20/2022* | | | 5.00 | % | | | Quarterly | | | | 1.79 | % | | | EUR | | | | 1,640 | | | $ | 104,167 | | | $ | 60,900 | | | $ | 43,267 | |
Deutsche Bank AG | |
CDX-CMBX.NA.BBB- Series 6, 05/11/2063* | | | 3.00 | | | | Monthly | | | | 25.00 | | | | USD | | | | 2,395 | | | | (775,222 | ) | | | (275,196 | ) | | | (500,026 | ) |
Goldman Sachs International | |
Avis Budget Car Rental LLC, 5.250%, 03/15/25, 12/20/2023* | | | 5.00 | | | | Quarterly | | | | 5.04 | | | | USD | | | | 1,300 | | | | 5,742 | | | | 52,476 | | | | (46,734 | ) |
Avis Budget Car Rental LLC, 5.250%, 03/15/25, 12/20/2023* | | | 5.00 | | | | Quarterly | | | | 5.04 | | | | USD | | | | 1,440 | | | | 6,361 | | | | 90,969 | | | | (84,608 | ) |
CDX-CMBX.NA.BB Series 6, 05/11/2063* | | | 5.00 | | | | Monthly | | | | 25.00 | | | | USD | | | | 298 | | | | (149,270 | ) | | | (147,308 | ) | | | (1,962 | ) |
CDX-CMBX.NA.BB Series 6, 05/11/2063* | | | 5.00 | | | | Monthly | | | | 25.00 | | | | USD | | | | 298 | | | | (149,270 | ) | | | (147,308 | ) | | | (1,962 | ) |
CDX-CMBX.NA.BB Series 6, 05/11/2063* | | | 5.00 | | | | Monthly | | | | 25.00 | | | | USD | | | | 113,618 | | | | (56,896,214 | ) | | | (25,855,703 | ) | | | (31,040,511 | ) |
CDX-CMBX.NA.BBB- Series 6, 05/11/2063* | | | 3.00 | | | | Monthly | | | | 25.00 | | | | USD | | | | 27,329 | | | | (8,843,664 | ) | | | (3,870,435 | ) | | | (4,973,229 | ) |
CDX-CMBX.NA.BBB- Series 6, 05/11/2063* | | | 3.00 | | | | Monthly | | | | 25.00 | | | | USD | | | | 561 | | | | (181,493 | ) | | | (149,364 | ) | | | (32,129 | ) |
CDX-CMBX.NA.BBB- Series 6, 05/11/2063* | | | 3.00 | | | | Monthly | | | | 25.00 | | | | USD | | | | 1,122 | | | | (363,173 | ) | | | (257,254 | ) | | | (105,919 | ) |
CDX-CMBX.NA.BBB- Series 6, 05/11/2063* | | | 3.00 | | | | Monthly | | | | 25.00 | | | | USD | | | | 1,122 | | | | (363,173 | ) | | | (257,254 | ) | | | (105,919 | ) |
CDX-CMBX.NA.BBB- Series 6, 05/11/2063* | | | 3.00 | | | | Monthly | | | | 25.00 | | | | USD | | | | 561 | | | | (181,586 | ) | | | (124,502 | ) | | | (57,084 | ) |
CDX-CMBX.NA.BBB- Series 6, 05/11/2063* | | | 3.00 | | | | Monthly | | | | 25.00 | | | | USD | | | | 1,433 | | | | (463,719 | ) | | | (180,120 | ) | | | (283,599 | ) |
United States Steel Corp., 6.650%, 06/01/2037, 12/20/2021* | | | 5.00 | | | | Quarterly | | | | 5.98 | | | | USD | | | | 4,590 | | | | (23,984 | ) | | | (84,173 | ) | | | 60,189 | |
JPMorgan Chase Bank, NA | |
Rolls-Royce PLC, 2.125%,06/18/2021, 06/20/2025* | | | 1.00 | | | | Quarterly | | | | 4.32 | | | | EUR | | | | 4,274 | | | | (680,708 | ) | | | (790,032 | ) | | | 109,324 | |
Rolls-Royce PLC, 2.125%,06/18/2021, 06/20/2025* | | | 1.00 | | | | Quarterly | | | | 4.32 | | | | EUR | | | | 4,546 | | | | (724,029 | ) | | | (845,077 | ) | | | 121,048 | |
| | |
| |
82 | AB HIGH INCOME FUND | | abfunds.com |
PORTFOLIO OF INVESTMENTS (continued)
| | | | | | | | | | | | | | | | | | | | | | | | | | | | | | | | |
Swap
Counterparty
& Referenced
Obligation | | Fixed
Rate
(Pay)
Receive | | | Payment
Frequency | | | Implied
Credit
Spread at
October 31,
2020 | | | Notional
Amount (000) | | | Market Value | | | Upfront
Premiums
Paid
(Received) | | | Unrealized
Appreciation/
(Depreciation) | |
JPMorgan Securities, LLC | |
CDX-CMBX.NA.BBB- Series 6, 05/11/2063* | | | 3.00 | % | | | Monthly | | | | 25.00 | % | | | USD | | | | 6,340 | | | $ | (2,051,624 | ) | | $ | (792,852 | ) | | $ | (1,258,772 | ) |
Morgan Stanley & Co. International PLC | | | | | | | | | | | | | | | | | | | | | | | | | | | | | | | | |
CDX-CMBX.NA.BB Series 6, 05/11/2063* | | | 5.00 | | | | Monthly | | | | 25.00 | | | | USD | | | | 2,019 | | | | (1,011,328 | ) | | | (741,856 | ) | | | (269,472 | ) |
CDX-CMBX.NA.BB Series 6, 05/11/2063* | | | 5.00 | | | | Monthly | | | | 25.00 | | | | USD | | | | 1,847 | | | | (925,173 | ) | | | (779,307 | ) | | | (145,866 | ) |
CDX-CMBX.NA.BB Series 6, 05/11/2063* | | | 5.00 | | | | Monthly | | | | 25.00 | | | | USD | | | | 1,847 | | | | (925,173 | ) | | | (770,192 | ) | | | (154,981 | ) |
CDX-CMBX.NA.BB Series 6, 05/11/2063* | | | 5.00 | | | | Monthly | | | | 25.00 | | | | USD | | | | 1,847 | | | | (925,173 | ) | | | (774,749 | ) | | | (150,424 | ) |
CDX-CMBX.NA.BB Series 6, 05/11/2063* | | | 5.00 | | | | Monthly | | | | 25.00 | | | | USD | | | | 1,847 | | | | (925,173 | ) | | | (765,635 | ) | | | (159,538 | ) |
CDX-CMBX.NA.BB Series 6, 05/11/2063* | | | 5.00 | | | | Monthly | | | | 25.00 | | | | USD | | | | 1,847 | | | | (925,173 | ) | | | (843,324 | ) | | | (81,849 | ) |
CDX-CMBX.NA.BB Series 6, 05/11/2063* | | | 5.00 | | | | Monthly | | | | 25.00 | | | | USD | | | | 596 | | | | (298,540 | ) | | | (288,346 | ) | | | (10,194 | ) |
CDX-CMBX.NA.BB Series 6, 05/11/2063* | | | 5.00 | | | | Monthly | | | | 25.00 | | | | USD | | | | 5,500 | | | | (2,754,217 | ) | | | (2,937,284 | ) | | | 183,067 | |
CDX-CMBX.NA.BB Series 6, 05/11/2063* | | | 5.00 | | | | Monthly | | | | 25.00 | | | | USD | | | | 1,009 | | | | (505,414 | ) | | | (437,815 | ) | | | (67,599 | ) |
CDX-CMBX.NA.BB Series 6, 05/11/2063* | | | 5.00 | | | | Monthly | | | | 25.00 | | | | USD | | | | 2,019 | | | | (1,011,328 | ) | | | (746,788 | ) | | | (264,540 | ) |
CDX-CMBX.NA.BBB- Series 6, 05/11/2063* | | | 3.00 | | | | Monthly | | | | 25.00 | | | | USD | | | | 2,805 | | | | (907,932 | ) | | | (760,602 | ) | | | (147,330 | ) |
CDX-CMBX.NA.BBB- Series 6, 05/11/2063* | | | 3.00 | | | | Monthly | | | | 25.00 | | | | USD | | | | 2,805 | | | | (907,464 | ) | | | (705,330 | ) | | | (202,134 | ) |
| | | | | | | | | | | | | | | | | | | | | | | | | | | | | | | | |
| | | | | | | | | | | | | | | | | | | | | | $ | (138,840,368 | ) | | $ | (65,165,902 | ) | | $ | (73,674,466 | ) |
| | | | | | | | | | | | | | | | | | | | | | | | | | | | | | | | |
TOTAL RETURN SWAPS (see Note D)
| | | | | | | | | | | | | | | | | | |
Counterparty &
Referenced Obligation | | Rate Paid/
Received | | Payment
Frequency | | | Current
Notional
(000) | | | Maturity
Date | | | Unrealized
Appreciation/
(Depreciation) | |
Receive Total Return on Reference Obligation | |
Goldman Sachs International iBoxx EUR Contingent Convertible Liquid Developed Market AT1 | | 3 Month
EURIBOR | | | Maturity | | | | EUR 35,866 | | | | 12/20/2020 | | | $ | 11,275,159 | |
| | |
| |
| abfunds.com | | AB HIGH INCOME FUND | 83 |
PORTFOLIO OF INVESTMENTS (continued)
REVERSE REPURCHASE AGREEMENTS (see Note D)
| | | | | | | | | | | | |
| Broker | | Interest Rate | | | Maturity | | | U.S. $
Value at
October 31,
2020 | |
Barclays Capital, Inc.† | | | (0.25 | )%* | | | — | | | $ | 2,903,217 | |
| † | The reverse repurchase agreement matures on demand. Interest rate resets daily and the rate shown is the rate in effect on October 31, 2020. |
| * | Interest payment due from counterparty. |
The type of underlying collateral and the remaining maturity of open reverse repurchase agreements on the statements of assets and liabilities is as follows:
| | | | | | | | | | | | | | | | | | | | |
| | | Overnight
and
Continuous | | | Up to 30 Days | | | 31-90 Days | | | Greater than
90 Days | | | Total | |
Corporates – Non-Investment Grade | | $ | 2,903,217 | | | $ | – 0 – | | | $ | – 0 – | | | $ | – 0 – | | | $ | 2,903,217 | |
| ** | Principal amount less than 500. |
| (a) | Security is exempt from registration under Rule 144A of the Securities Act of 1933. These securities are considered restricted, but liquid and may be resold in transactions exempt from registration, normally to qualified institutional buyers. At October 31, 2020, the aggregate market value of these securities amounted to $2,859,497,518 or 54.7% of net assets. |
| (b) | Fair valued by the Adviser. |
| (c) | Security in which significant unobservable inputs (Level 3) were used in determining fair value. |
| (d) | Defaulted matured security. |
| (e) | Non-income producing security. |
| (f) | Pay-In-Kind Payments (PIK). The issuer may pay cash interest and/or interest in additional debt securities. Rates shown are the rates in effect at October 31, 2020. |
| (g) | Security is exempt from registration under Rule 144A of the Securities Act of 1933. These securities, which represent 0.66% of net assets as of October 31, 2020, are considered illiquid and restricted. Additional information regarding such securities follows: |
| | | | | | | | | | | | | | | | |
144A/Restricted &
Illiquid Securities | | Acquisition
Date | | | Cost | | | Market
Value | | | Percentage of
Net Assets | |
Bellemeade Re Ltd.Series 2019-4A, Class B1
3.999%, 10/25/2029 | | | 04/16/2020 | | | $ | 1,045,494 | | | $ | 1,402,251 | | | | 0.03 | % |
Carlson Travel, Inc.
8.50%, 03/31/2025 | | | 08/18/2020 | | | | 590,264 | | | | 607,974 | | | | 0.01 | % |
Consumer Loan Underlying Bond Certificate Issuer Trust I Series 2018-7, Class PT 9.684%, 06/15/2043 | | | 04/25/2018 | | | | 1,285,016 | | | | 1,179,839 | | | | 0.02 | % |
Consumer Loan Underlying Bond Certificate Issuer Trust I Series 2019-24, Class PT
10.482%, 08/15/2044 | | | 06/27/2019 | | | | 1,850,755 | | | | 1,716,495 | | | | 0.03 | % |
| | |
| |
84 | AB HIGH INCOME FUND | | abfunds.com |
PORTFOLIO OF INVESTMENTS (continued)
| | | | | | | | | | | | | | | | |
144A/Restricted &
Illiquid Securities | | Acquisition
Date | | | Cost | | | Market
Value | | | Percentage of
Net Assets | |
Consumer Loan Underlying Bond Certificate Issuer Trust I Series 2019-36, Class PT
13.317%, 10/17/2044 | | | 09/04/2019 | | | $ | 2,399,196 | | | $ | 2,163,274 | | | | 0.04 | % |
Consumer Loan Underlying Bond Certificate Issuer Trust I Series 2019-43, Class PT
6.564%, 11/15/2044 | | | 10/09/2019 | | | | 1,608,509 | | | | 1,526,742 | | | | 0.03 | % |
Consumer Loan Underlying Bond Club Certificate Issuer Trust I Series 2018-12, Class PT
11.384%, 06/15/2043 | | | 06/26/2018 | | | | 1,169,130 | | | | 1,070,831 | | | | 0.02 | % |
Consumer Loan Underlying Bond Club Certificate Issuer Trust I Series 2018-4, Class PT 9.708%, 05/15/2043 | | | 03/27/2018 | | | | 1,299,254 | | | | 1,217,736 | | | | 0.02 | % |
Consumer Loan Underlying Bond Credit Trust Series 2018-3, Class PT
10.963%, 03/16/2043 | | | 03/07/2018 | | | | 292,564 | | | | 269,079 | | | | 0.01 | % |
Digicel Group 0.5 Ltd.
7.00%, 11/16/2020 | | | 11/28/2016 | | | | 653,988 | | | | 81,401 | | | | 0.00 | % |
Fideicomiso PA Pacifico Tres
7.00%, 01/15/2035 | | | 03/04/2016 | | | | 10,697,739 | | | | 10,200,782 | | | | 0.20 | % |
JP Morgan Madison Avenue Securities Trust Series 2015-CH1, Class M2
5.649%, 10/25/2025 | | | 09/18/2015 | | | | 5,614,718 | | | | 5,120,713 | | | | 0.10 | % |
K2016470219 (South Africa) Ltd.
3.00%, 12/31/2022 | | | 01/31/2017 | | | | 5,412,492 | | | | – 0 | – | | | 0.00 | % |
K2016470260 (South Africa) Ltd.
25.00%, 12/31/2022 | | | 01/31/2017 | | | | 2,459,645 | | | | – 0 | – | | | 0.00 | % |
Magnetation LLC/Mag Finance Corp.
11.00%, 05/15/2018 | | | 05/15/2013 | | | | 12,955,187 | | | | – 0 | – | | | 0.00 | % |
Peabody Energy Corp.
6.00%, 03/31/2022 | | | 08/19/2019 | | | | 986,405 | | | | 470,008 | | | | 0.01 | % |
Terraform Global Operating LLC
6.125%, 03/01/2026 | | | 02/08/2018 | | | | 871,000 | | | | 883,132 | | | | 0.02 | % |
| | |
| |
| abfunds.com | | AB HIGH INCOME FUND | 85 |
PORTFOLIO OF INVESTMENTS (continued)
| | | | | | | | | | | | | | | | |
144A/Restricted &
Illiquid Securities | | Acquisition
Date | | | Cost | | | Market
Value | | | Percentage of
Net Assets | |
Tonon Luxembourg SA
6.50%, 10/31/2024 | | | 05/03/2019 | | | $ | 4,705,827 | | | $ | 72,627 | | | | 0.00 | % |
Virgolino de Oliveira Finance SA
10.50%, 01/28/2018 | | | 10/19/2012 | | | | 8,550,341 | | | | 131,959 | | | | 0.00 | % |
Virgolino de Oliveira Finance SA
10.875%, 01/13/2020 | | | 07/26/2012 | | | | 2,486,550 | | | | 500,000 | | | | 0.01 | % |
Virgolino de Oliveira Finance SA
11.75%, 02/09/2022 | | | 07/26/2012 | | | | 11,383,331 | | | | 68,235 | | | | 0.00 | % |
Wells Fargo Credit Risk Transfer Securities Trust
Series 2015-WF1, Class 1M2 5.399%, 11/25/2025 | | | 09/06/2016 | | | | 3,585,194 | | | | 3,490,745 | | | | 0.07 | % |
Wells Fargo Credit Risk Transfer Securities Trust
Series 2015-WF1, Class 2M2
5.649%, 11/25/2025 | | | 02/26/2018 | | | | 2,182,080 | | | | 2,146,035 | | | | 0.04 | % |
| (j) | Position, or a portion thereof, has been segregated to collateralize reverse repurchase agreements. |
| (k) | Securities are perpetual and, thus, do not have a predetermined maturity date. The date shown, if applicable, reflects the next call date. |
| (l) | Floating Rate Security. Stated interest/floor/ceiling rate was in effect at October 31, 2020. |
| (m) | Position, or a portion thereof, has been segregated to collateralize margin requirements for open exchange-traded derivatives. |
| (n) | Position, or a portion thereof, has been segregated to collateralize margin requirements for open centrally cleared swaps. |
| (o) | Position, or a portion thereof, has been segregated to collateralize OTC derivatives outstanding. |
| (p) | Inverse interest only security. |
| (q) | The stated coupon rate represents the greater of the LIBOR or the LIBOR floor rate plus a spread at October 31, 2020. |
| (r) | This position or a portion of this position represents an unsettled loan purchase. The coupon rate will be determined at the time of settlement and will be based upon the London-Interbank Offered Rate (“LIBOR”) plus a premium which was determined at the time of purchase. |
| (t) | Restricted and illiquid security. |
| | | | | | | | | | | | | | | | |
Restricted & Illiquid
Securities | | Acquisition
Date | | | Cost | | | Market
Value | | | Percentage of
Net Assets | |
CHC Group LLC | | | 03/10/2017 | | | $ | 33,044,260 | | | $ | 20,877 | | | | 0.00 | % |
Mt. Logan Re Ltd. (Preference Shares)
(Series 4) | | | 04/01/2015 | | | | 19,500,000 | | | | 20,589,287 | | | | 0.39 | % |
| (u) | Affiliated investments. |
| | |
| |
86 | AB HIGH INCOME FUND | | abfunds.com |
PORTFOLIO OF INVESTMENTS (continued)
| (v) | The rate shown represents the 7-day yield as of period end. |
| (w) | To obtain a copy of the fund’s shareholder report, please go to the Securities and Exchange Commission’s website at www.sec.gov, or call AB at (800) 227-4618. |
Currency Abbreviations:
AUD – Australian Dollar
BRL – Brazilian Real
CAD – Canadian Dollar
COP – Colombian Peso
DOP – Dominican Peso
EGP – Egyptian Pound
EUR – Euro
GBP – Great British Pound
IDR – Indonesian Rupiah
MXN – Mexican Peso
NZD – New Zealand Dollar
RUB – Russian Ruble
USD – United States Dollar
ZAR – South African Rand
Glossary:
ABS – Asset-Backed Securities
CBT – Chicago Board of Trade
CDX-CMBX.NA – North American Commercial Mortgage-Backed Index
CDX-NAHY – North American High Yield Credit Default Swap Index
CLO – Collateralized Loan Obligations
CMBS – Commercial Mortgage-Backed Securities
EURIBOR – Euro Interbank Offered Rate
H15T – U.S. Treasury Yield Curve Rate T Note Constant Maturity
IRS – Interest Rate Swaption
LIBOR – London Interbank Offered Rate
REIT – Real Estate Investment Trust
See notes to financial statements.
| | |
| |
| abfunds.com | | AB HIGH INCOME FUND | 87 |
STATEMENT OF ASSETS & LIABILITIES
October 31, 2020
| | | | |
| Assets | | | | |
Investments in securities, at value | | | | |
Unaffiliated issuers (cost $5,464,222,711) | | $ | 5,266,719,727 | |
Affiliated issuers (cost $22,537,225) | | | 22,537,225 | |
Cash | | | 119 | |
Cash collateral due from broker | | | 31,925,781 | |
Foreign currencies, at value (cost $8,810,365) | | | 6,956,879 | |
Unaffiliated interest receivable | | | 75,749,386 | |
Receivable for investment securities sold | | | 35,480,146 | |
Unrealized appreciation on total return swaps | | | 11,275,159 | |
Unrealized appreciation on forward currency exchange contracts | | | 8,660,607 | |
Receivable for capital stock sold | | | 5,195,245 | |
Market value of credit default swaps (net premiums paid $204,345) | | | 116,270 | |
Receivable from Affiliates | | | 3,152 | |
Affiliated dividends receivable | | | 879 | |
| | | | |
Total assets | | | 5,464,620,575 | |
| | | | |
| Liabilities | | | | |
Market value of credit default swaps (net premiums received $65,370,247) | | | 138,956,638 | |
Payable for capital stock redeemed | | | 44,118,632 | |
Payable for investment securities purchased | | | 34,412,466 | |
Cash collateral due to broker | | | 4,692,000 | |
Payable for reverse repurchase agreements | | | 2,903,217 | |
Dividends payable | | | 2,764,610 | |
Payable for unsettled reverse repurchase agreements | | | 2,320,880 | |
Unrealized depreciation on forward currency exchange contracts | | | 2,317,022 | |
Advisory fee payable | | | 2,129,231 | |
Payable for variation margin on centrally cleared swaps | | | 810,192 | |
Distribution fee payable | | | 672,334 | |
Payable for variation margin on futures | | | 236,560 | |
Transfer Agent fee payable | | | 99,227 | |
Administrative fee payable | | | 25,484 | |
Directors’ fee payable | | | 8,407 | |
Accrued expenses and other liabilities | | | 4,582,304 | |
| | | | |
Total liabilities | | | 241,049,204 | |
| | | | |
Net Assets | | $ | 5,223,571,371 | |
| | | | |
| Composition of Net Assets | | | | |
Capital stock, at par | | $ | 692,605 | |
Additional paid-in capital | | | 6,024,891,629 | |
Accumulated loss | | | (802,012,863 | ) |
| | | | |
| | $ | 5,223,571,371 | |
| | | | |
See notes to financial statements.
| | |
| |
88 | AB HIGH INCOME FUND | | abfunds.com |
STATEMENT OF ASSETS & LIABILITIES (continued)
Net Asset Value Per Share—27 billion shares of capital stock authorized, $.001 par value
| | | | | | | | | | | | |
| Class | | Net Assets | | | Shares
Outstanding | | | Net Asset
Value | |
| |
| A | | $ | 1,143,142,811 | | | | 151,872,436 | | | $ | 7.53 | * |
| |
| C | | $ | 456,374,805 | | | | 59,924,251 | | | $ | 7.62 | |
| |
| Advisor | | $ | 3,077,869,171 | | | | 408,335,052 | | | $ | 7.54 | |
| |
| R | | $ | 38,435,430 | | | | 5,107,306 | | | $ | 7.53 | |
| |
| K | | $ | 68,252,792 | | | | 9,064,537 | | | $ | 7.53 | |
| |
| I | | $ | 131,549,916 | | | | 17,450,004 | | | $ | 7.54 | |
| |
| Z | | $ | 307,946,446 | | | | 40,851,039 | | | $ | 7.54 | |
| |
| * | The maximum offering price per share for Class A shares was $7.86 which reflects a sales charge of 4.25%. |
See notes to financial statements.
| | |
| |
| abfunds.com | | AB HIGH INCOME FUND | 89 |
STATEMENT OF OPERATIONS
Year Ended October 31, 2020
| | | | | | | | |
| Investment Income | | | | | | | | |
Interest (net of foreign taxes withheld of $1,630,174) | | $ | 320,385,137 | | | | | |
Dividends | | | | | | | | |
Unaffiliated issuers | | | 6,224,709 | | | | | |
Affiliated issuers | | | 895,952 | | | $ | 327,505,798 | |
| | | | | | | | |
| Expenses | | | | | | | | |
Advisory fee (see Note B) | | | 24,854,712 | | | | | |
Distribution fee—Class A | | | 2,970,785 | | | | | |
Distribution fee—Class B | | | 163 | | | | | |
Distribution fee—Class C | | | 5,471,284 | | | | | |
Distribution fee—Class R | | | 231,263 | | | | | |
Distribution fee—Class K | | | 203,235 | | | | | |
Transfer agency—Class A | | | 1,160,915 | | | | | |
Transfer agency—Class B | | | 25 | | | | | |
Transfer agency—Class C | | | 540,361 | | | | | |
Transfer agency—Advisor Class | | | 2,805,704 | | | | | |
Transfer agency—Class R | | | 143,331 | | | | | |
Transfer agency—Class K | | | 174,595 | | | | | |
Transfer agency—Class I | | | 206,044 | | | | | |
Transfer agency—Class Z | | | 231,688 | | | | | |
Custody and accounting | | | 518,598 | | | | | |
Printing | | | 384,036 | | | | | |
Registration fees | | | 370,823 | | | | | |
Audit and tax | | | 196,060 | | | | | |
Legal | | | 135,454 | | | | | |
Directors’ fees | | | 83,134 | | | | | |
Administrative | | | 78,596 | | | | | |
Miscellaneous | | | 231,760 | | | | | |
| | | | | | | | |
Total expenses before interest expense | | | 40,992,566 | | | | | |
Interest expense | | | 274,751 | | | | | |
| | | | | | | | |
Total expenses | | | 41,267,317 | | | | | |
Less: expenses waived and reimbursed by the Adviser (see Note B) | | | (138,969 | ) | | | | |
| | | | | | | | |
Net expenses | | | | | | | 41,128,348 | |
| | | | | | | | |
Net investment income | | | | | | | 286,377,450 | |
| | | | | | | | |
See notes to financial statements.
| | |
| |
90 | AB HIGH INCOME FUND | | abfunds.com |
STATEMENT OF OPERATIONS (continued)
| | | | | | | | |
| Realized and Unrealized Gain (Loss) on Investment and Foreign Currency Transactions | | | | | | | | |
Net realized gain (loss) on: | | | | | | | | |
Investment transactions | | | | | | $ | (70,490,352 | )(a) |
Forward currency exchange contracts | | | | | | | 37,159,111 | |
Futures | | | | | | | (3,527,320 | ) |
Swaps | | | | | | | (132,851,917 | ) |
Foreign currency transactions | | | | | | | (74,450,029 | ) |
Net change in unrealized appreciation/depreciation on: | | | | | | | | |
Investments | | | | | | | (43,833,931 | )(b) |
Forward currency exchange contracts | | | | | | | 20,055,897 | |
Futures | | | | | | | (1,974,992 | ) |
Swaps | | | | | | | (44,896,775 | ) |
Foreign currency denominated assets and liabilities | | | | | | | (1,768,894 | ) |
| | | | | | | | |
Net loss on investment and foreign currency transactions | | | | | | | (316,579,202 | ) |
| | | | | | | | |
Contributions from Affiliates (see Note B) | | | | | | | 5,401 | |
| | | | | | | | |
Net Decrease in Net Assets from Operations | | | | | | $ | (30,196,351 | ) |
| | | | | | | | |
| (a) | Net of foreign capital gains taxes of $970,972. |
| (b) | Net of increase in accrued foreign capital gains taxes of $223,826. |
See notes to financial statements.
| | |
| |
| abfunds.com | | AB HIGH INCOME FUND | 91 |
STATEMENT OF CHANGES IN NET ASSETS
| | | | | | | | |
| | | Year Ended
October 31,
2020 | | | Year Ended
October 31,
2019 | |
| Increase (Decrease) in Net Assets from Operations | | | | | | | | |
Net investment income | | $ | 286,377,450 | | | $ | 333,315,653 | |
Net realized loss on investment and foreign currency transactions | | | (244,160,507 | ) | | | (168,255,572 | ) |
Net change in unrealized appreciation/depreciation on investments and foreign currency denominated assets and liabilities | | | (72,418,695 | ) | | | 228,247,731 | |
Contributions from Affiliates (see Note B) | | | 5,401 | | | | 31,592 | |
| | | | | | | | |
Net increase (decrease) in net assets from operations | | | (30,196,351 | ) | | | 393,339,404 | |
| Distributions to Shareholders | | | | | | | | |
Class A | | | (75,095,657 | ) | | | (64,612,497 | ) |
Class B | | | (825 | ) | | | (40,818 | ) |
Class C | | | (30,051,043 | ) | | | (31,986,029 | ) |
Advisor Class | | | (191,483,973 | ) | | | (152,419,233 | ) |
Class R | | | (2,712,684 | ) | | | (2,938,119 | ) |
Class K | | | (5,037,742 | ) | | | (5,617,251 | ) |
Class I | | | (10,410,617 | ) | | | (9,124,482 | ) |
Class Z | | | (20,917,585 | ) | | | (17,263,797 | ) |
Return of Capital | | | | | | | | |
Class A | | | – 0 | – | | | (19,578,715 | ) |
Class B | | | – 0 | – | | | (12,368 | ) |
Class C | | | – 0 | – | | | (9,692,326 | ) |
Advisor Class | | | – 0 | – | | | (46,185,691 | ) |
Class R | | | – 0 | – | | | (890,301 | ) |
Class K | | | – 0 | – | | | (1,702,125 | ) |
Class I | | | – 0 | – | | | (2,764,878 | ) |
Class Z | | | – 0 | – | | | (5,231,232 | ) |
| Capital Stock Transactions | | | | | | | | |
Net decrease | | | (31,394,997 | ) | | | (526,320,297 | ) |
| | | | | | | | |
Total decrease | | | (397,301,474 | ) | | | (503,040,755 | ) |
| Net Assets | | | | | | | | |
Beginning of period | | | 5,620,872,845 | | | | 6,123,913,600 | |
| | | | | | | | |
End of period | | $ | 5,223,571,371 | | | $ | 5,620,872,845 | |
| | | | | | | | |
See notes to financial statements.
| | |
| |
92 | AB HIGH INCOME FUND | | abfunds.com |
NOTES TO FINANCIAL STATEMENTS
October 31, 2020
NOTE A
Significant Accounting Policies
AB High Income Fund, Inc. (the “Fund”) is organized as a Maryland corporation and is registered under the Investment Company Act of 1940 as a diversified, open-end management investment company. The Fund offers Class A, Class C, Advisor Class, Class R, Class K, Class I and Class Z shares. Class B and Class T shares have been authorized but currently are not offered. Effective August 2, 2019, sales of Class B shares were suspended. On November 7, 2019, all remaining outstanding Class B shares of the Fund were converted to Class A shares. Class A shares are sold with a front-end sales charge of up to 4.25% for purchases not exceeding $1,000,000. With respect to purchases of $1,000,000 or more, Class A shares redeemed within one year of purchase may be subject to a contingent deferred sales charge of 1%. Class C shares are subject to a contingent deferred sales charge of 1% on redemptions made within the first year after purchase, and 0% after the first year of purchase. Class C shares will automatically convert to Class A shares ten years after the end of the calendar month of purchase. Class R and Class K shares are sold without an initial or contingent deferred sales charge. Advisor Class, Class I and Class Z shares are sold without an initial or contingent deferred sales charge and are not subject to ongoing distribution expenses. All nine classes of shares have identical voting, dividend, liquidation and other rights, except that the classes bear different distribution and transfer agency expenses. Each class has exclusive voting rights with respect to its distribution plan. The financial statements have been prepared in conformity with U.S. generally accepted accounting principles (“U.S. GAAP”), which require management to make certain estimates and assumptions that affect the reported amounts of assets and liabilities in the financial statements and amounts of income and expenses during the reporting period. Actual results could differ from those estimates. The Fund is an investment company under U.S. GAAP and follows the accounting and reporting guidance applicable to investment companies. The following is a summary of significant accounting policies followed by the Fund.
1. Security Valuation
Portfolio securities are valued at their current market value determined on the basis of market quotations or, if market quotations are not readily available or are deemed unreliable, at “fair value” as determined in accordance with procedures established by and under the general supervision of the Fund’s Board of Directors (the “Board”).
In general, the market values of securities which are readily available and deemed reliable are determined as follows: securities listed on a national securities exchange (other than securities listed on the NASDAQ Stock Market, Inc. (“NASDAQ”)) or on a foreign securities exchange are valued at
| | |
| |
| abfunds.com | | AB HIGH INCOME FUND | 93 |
NOTES TO FINANCIAL STATEMENTS (continued)
the last sale price at the close of the exchange or foreign securities exchange. If there has been no sale on such day, the securities are valued at the last traded price from the previous day. Securities listed on more than one exchange are valued by reference to the principal exchange on which the securities are traded; securities listed only on NASDAQ are valued in accordance with the NASDAQ Official Closing Price; listed or over the counter (“OTC”) market put or call options are valued at the mid level between the current bid and ask prices. If either a current bid or current ask price is unavailable, AllianceBernstein L.P. (the “Adviser”) will have discretion to determine the best valuation (e.g., last trade price in the case of listed options); open futures are valued using the closing settlement price or, in the absence of such a price, the most recent quoted bid price. If there are no quotations available for the day of valuation, the last available closing settlement price is used; U.S. Government securities and any other debt instruments having 60 days or less remaining until maturity are generally valued at market by an independent pricing vendor, if a market price is available. If a market price is not available, the securities are valued at amortized cost. This methodology is commonly used for short term securities that have an original maturity of 60 days or less, as well as short term securities that had an original term to maturity that exceeded 60 days. In instances when amortized cost is utilized, the Valuation Committee (the “Committee”) must reasonably conclude that the utilization of amortized cost is approximately the same as the fair value of the security. Such factors the Committee will consider include, but are not limited to, an impairment of the creditworthiness of the issuer or material changes in interest rates. Fixed-income securities, including mortgage-backed and asset-backed securities, may be valued on the basis of prices provided by a pricing service or at a price obtained from one or more of the major broker-dealers. In cases where broker-dealer quotes are obtained, the Adviser may establish procedures whereby changes in market yields or spreads are used to adjust, on a daily basis, a recently obtained quoted price on a security. Swaps and other derivatives are valued daily, primarily using independent pricing services, independent pricing models using market inputs, as well as third party broker-dealers or counterparties. Open-end mutual funds are valued at the closing net asset value per share, while exchange traded funds are valued at the closing market price per share.
Securities for which market quotations are not readily available (including restricted securities) or are deemed unreliable are valued at fair value as deemed appropriate by the Adviser. Factors considered in making this determination may include, but are not limited to, information obtained by contacting the issuer, analysts, analysis of the issuer’s financial statements or other available documents. In addition, the Fund may use fair value pricing for securities primarily traded in non-U.S. markets because most
| | |
| |
94 | AB HIGH INCOME FUND | | abfunds.com |
NOTES TO FINANCIAL STATEMENTS (continued)
foreign markets close well before the Fund values its securities at 4:00 p.m., Eastern Time. The earlier close of these foreign markets gives rise to the possibility that significant events, including broad market moves, may have occurred in the interim and may materially affect the value of those securities. To account for this, the Fund generally values many of its foreign equity securities using fair value prices based on third party vendor modeling tools to the extent available.
2. Fair Value Measurements
In accordance with U.S. GAAP regarding fair value measurements, fair value is defined as the price that the Fund would receive to sell an asset or pay to transfer a liability in an orderly transaction between market participants at the measurement date. U.S. GAAP establishes a framework for measuring fair value, and a three-level hierarchy for fair value measurements based upon the transparency of inputs to the valuation of an asset or liability (including those valued based on their market values as described in Note A.1 above). Inputs may be observable or unobservable and refer broadly to the assumptions that market participants would use in pricing the asset or liability. Observable inputs reflect the assumptions market participants would use in pricing the asset or liability based on market data obtained from sources independent of the Fund. Unobservable inputs reflect the Fund’s own assumptions about the assumptions that market participants would use in pricing the asset or liability based on the best information available in the circumstances. Each investment is assigned a level based upon the observability of the inputs which are significant to the overall valuation. The three-tier hierarchy of inputs is summarized below.
| | • | | Level 1—quoted prices in active markets for identical investments |
| | • | | Level 2—other significant observable inputs (including quoted prices for similar investments, interest rates, prepayment speeds, credit risk, etc.) |
| | • | | Level 3—significant unobservable inputs (including the Fund’s own assumptions in determining the fair value of investments) |
The fair value of debt instruments, such as bonds, and over-the-counter derivatives is generally based on market price quotations, recently executed market transactions (where observable) or industry recognized modeling techniques and are generally classified as Level 2. Pricing vendor inputs to Level 2 valuations may include quoted prices for similar investments in active markets, interest rate curves, coupon rates, currency rates, yield curves, option adjusted spreads, default rates, credit spreads and other unique security features in order to estimate the relevant cash flows which are then discounted to calculate fair values. If these inputs are unobservable and significant to the fair value, these investments will be classified as Level 3.
| | |
| |
| abfunds.com | | AB HIGH INCOME FUND | 95 |
NOTES TO FINANCIAL STATEMENTS (continued)
Where readily available market prices or relevant bid prices are not available for certain equity investments, such investments may be valued based on similar publicly traded investments, movements in relevant indices since last available prices or based upon underlying company fundamentals and comparable company data (such as multiples to earnings or other multiples to equity). Where an investment is valued using an observable input, such as another publicly traded security, the investment will be classified as Level 2. If management determines that an adjustment is appropriate based on restrictions on resale, illiquidity or uncertainty, and such adjustment is a significant component of the valuation, the investment will be classified as Level 3. An investment will also be classified as Level 3 where management uses company fundamentals and other significant inputs to determine the valuation.
Options are valued using market-based inputs to models, broker or dealer quotations, or alternative pricing sources with reasonable levels of price transparency, where such inputs and models are available. Alternatively, the values may be obtained through unobservable management determined inputs and/or management’s proprietary models. Where models are used, the selection of a particular model to value an option depends upon the contractual terms of, and specific risks inherent in, the option as well as the availability of pricing information in the market. Valuation models require a variety of inputs, including contractual terms, market prices, measures of volatility and correlations of such inputs. Exchange traded options generally will be classified as Level 2. For options that do not trade on exchange but trade in liquid markets, inputs can generally be verified and model selection does not involve significant management judgment. Options are classified within Level 2 on the fair value hierarchy when all of the significant inputs can be corroborated to market evidence. Otherwise such instruments are classified as Level 3.
Valuations of mortgage-backed or other asset-backed securities, by pricing vendors, are based on both proprietary and industry recognized models and discounted cash flow techniques. Significant inputs to the valuation of these instruments are value of the collateral, the rates and timing of delinquencies, the rates and timing of prepayments, and default and loss expectations, which are driven in part by housing prices for residential mortgages. Significant inputs are determined based on relative value analyses, which incorporate comparisons to instruments with similar collateral and risk profiles, including relevant indices. Mortgage and asset-backed securities for which management has collected current observable data through pricing services are generally categorized within Level 2. Those investments for which current observable data has not been provided are classified as Level 3.
| | |
| |
96 | AB HIGH INCOME FUND | | abfunds.com |
NOTES TO FINANCIAL STATEMENTS (continued)
Bank loan prices are provided by third party pricing services and consist of a composite of the quotes received by the vendor into a consensus price. Certain bank loans are classified as Level 3, as a significant input used in the fair value measurement of these instruments is the market quotes that are received by the vendor and these inputs are not observable.
Other fixed income investments, including non-U.S. government and corporate debt, are generally valued using quoted market prices, if available, which are typically impacted by current interest rates, maturity dates and any perceived credit risk of the issuer. Additionally, in the absence of quoted market prices, these inputs are used by pricing vendors to derive a valuation based upon industry or proprietary models which incorporate issuer specific data with relevant yield/spread comparisons with more widely quoted bonds with similar key characteristics. Those investments for which there are observable inputs are classified as Level 2. Where the inputs are not observable, the investments are classified as Level 3.
The following table summarizes the valuation of the Fund’s investments by the above fair value hierarchy levels as of October 31, 2020:
| | | | | | | | | | | | | | | | |
Investments in
Securities | | Level 1 | | | Level 2 | | | Level 3 | | | Total | |
Assets: | | | | | | | | | | | | | | | | |
Corporates – Non-Investment Grade | | $ | – 0 | – | | $ | 2,047,107,996 | | | $ | 2,209,876 | # | | $ | 2,049,317,872 | |
Emerging Markets – Sovereigns | | | – 0 | – | | | 638,606,442 | | | | – 0 | – | | | 638,606,442 | |
Corporates – Investment Grade | | | – 0 | – | | | 635,017,314 | | | | – 0 | – | | | 635,017,314 | |
Governments – Treasuries | | | – 0 | – | | | 477,301,169 | | | | – 0 | – | | | 477,301,169 | |
Collateralized Mortgage Obligations | | | – 0 | – | | | 389,141,774 | | | | – 0 | – | | | 389,141,774 | |
Bank Loans | | | – 0 | – | | | 263,003,998 | | | | 58,220,720 | | | | 321,224,718 | |
Emerging Markets – Corporate Bonds | | | – 0 | – | | | 227,610,497 | | | | 72,627 | # | | | 227,683,124 | |
Commercial Mortgage-Backed Securities | | | – 0 | – | | | 99,037,504 | | | | – 0 | – | | | 99,037,504 | |
Emerging Markets – Treasuries | | | – 0 | – | | | 92,632,942 | | | | – 0 | – | | | 92,632,942 | |
Collateralized Loan Obligations | | | – 0 | – | | | 79,735,852 | | | | – 0 | – | | | 79,735,852 | |
Common Stocks | | | 19,613,389 | | | | 20,877 | | | | 46,790,997 | # | | | 66,425,263 | |
Quasi-Sovereigns | | | – 0 | – | | | 61,639,894 | | | | – 0 | – | | | 61,639,894 | |
Asset-Backed Securities | | | – 0 | – | | | 27,322,841 | | | | 11,596,706 | | | | 38,919,547 | |
Inflation-Linked Securities | | | – 0 | – | | | 15,680,602 | | | | – 0 | – | | | 15,680,602 | |
Governments – Sovereign Bonds | | | – 0 | – | | | 14,799,789 | | | | 0 | # | | | 14,799,789 | |
Preferred Stocks | | | 8,774,303 | | | | – 0 | – | | | 5,431,939 | | | | 14,206,242 | |
Local Governments – US Municipal Bonds | | | – 0 | – | | | 11,075,264 | | | | – 0 | – | | | 11,075,264 | |
| | |
| |
| abfunds.com | | AB HIGH INCOME FUND | 97 |
NOTES TO FINANCIAL STATEMENTS (continued)
| | | | | | | | | | | | | | | | |
Investments in
Securities | | Level 1 | | | Level 2 | | | Level 3 | | | Total | |
Warrants | | $ | 962,415 | | | $ | – 0 | – | | $ | 954,044 | # | | $ | 1,916,459 | |
Options Purchased – Puts | | | – 0 | – | | | 1,265,796 | | | | – 0 | – | | | 1,265,796 | |
Whole Loan Trusts | | | – 0 | – | | | – 0 | – | | | 330,713 | | | | 330,713 | |
Rights | | | – 0 | – | | | – 0 | – | | | 48,955 | | | | 48,955 | |
Short-Term Investments: | | | | | | | | | | | | | | | | |
Investment Companies | | | 22,537,225 | | | | – 0 | – | | | – 0 | – | | | 22,537,225 | |
Time Deposits | | | – 0 | – | | | 16,213,425 | | | | – 0 | – | | | 16,213,425 | |
Governments – Treasuries | | | – 0 | – | | | 14,499,067 | | | | – 0 | – | | | 14,499,067 | |
| | | | | | | | | | | | | | | | |
Total Investments in Securities | | | 51,887,332 | | | | 5,111,713,043 | | | | 125,656,577 | | | | 5,289,256,952 | |
Other Financial Instruments*: | | | | | | | | | | | | | | | | |
Assets | | | | | | | | | | | | | | | | |
Futures | | | 368,196 | | | | – 0 | – | | | – 0 | – | | | 368,196 | † |
Forward Currency Exchange Contracts | | | – 0 | – | | | 8,660,607 | | | | – 0 | – | | | 8,660,607 | |
Centrally Cleared Credit Default Swaps | | | – 0 | – | | | 42,376,008 | | | | – 0 | – | | | 42,376,008 | † |
Credit Default Swaps | | | – 0 | – | | | 116,270 | | | | – 0 | – | | | 116,270 | |
Total Return Swaps | | | – 0 | – | | | 11,275,159 | | | | – 0 | – | | | 11,275,159 | |
Liabilities | | | | | | | | | | | | | | | | |
Futures | | | (1,909,383 | ) | | | – 0 | – | | | – 0 | – | | | (1,909,383 | )† |
Forward Currency Exchange Contracts | | | – 0 | – | | | (2,317,022 | ) | | | – 0 | – | | | (2,317,022 | ) |
Centrally Cleared Credit Default Swaps | | | – 0 | – | | | (9,423,943 | ) | | | – 0 | – | | | (9,423,943 | )† |
Credit Default Swaps | | | – 0 | – | | | (138,956,638 | ) | | | – 0 | – | | | (138,956,638 | ) |
Reverse Repurchase Agreements | | | (2,903,217 | ) | | | – 0 | – | | | – 0 | – | | | (2,903,217 | ) |
| | | | | | | | | | | | | | | | |
Total | | $ | 47,442,928 | | | $ | 5,023,443,484 | | | $ | 125,656,577 | | | $ | 5,196,542,989 | |
| | | | | | | | | | | | | | | | |
| # | The Fund held securities with zero market value at period end. |
| * | Other financial instruments are derivative instruments, such as futures, forwards and swaps, which are valued at the unrealized appreciation/(depreciation) on the instrument. Other financial instruments may also include swaps with upfront premiums, options written and swaptions written which are valued at market value. |
| † | Only variation margin receivable/payable at period end is reported within the statement of assets and liabilities. This amount reflects cumulative unrealized appreciation/(depreciation) on futures and centrally cleared swaps as reported in the portfolio of investments. Where applicable, centrally cleared swaps with upfront premiums are presented here at market value. |
| | |
| |
98 | AB HIGH INCOME FUND | | abfunds.com |
NOTES TO FINANCIAL STATEMENTS (continued)
The following is a reconciliation of investments in which significant unobservable inputs (Level 3) were used in determining fair value.
| | | | | | | | | | | | | | | | |
| | | Corporates -
Non-Investment
Grade# | | | Bank Loans | | | Emerging
Markets-
Corporate
Bonds# | | | Collateralized
Loan
Obligations | |
Balance as of 10/31/19 | | $ | 32,908,573 | | | $ | 52,206,132 | | | $ | 61,746 | | | $ | 4,535,367 | |
Accrued discounts/ (premiums) | | | 37,269 | | | | 45,321 | | | | (1,737,004 | ) | | | – 0 | – |
Realized gain (loss) | | | (43,493,955 | ) | | | 14,612 | | | | – 0 | – | | | – 0 | – |
Change in unrealized appreciation/ depreciation | | | 21,529,757 | | | | (1,348,480 | ) | | | 667,040 | | | | – 0 | – |
Purchases/Payups | | | 1,785,076 | | | | 12,495,313 | | | | 1,026,551 | | | | – 0 | – |
Sales | | | (10,556,844 | ) | | | (585,812 | ) | | | – 0 | – | | | – 0 | – |
Transfers into level 3 | | | – 0 | – | | | 17,059,626 | | | | 54,294 | | | | – 0 | – |
Transfers out of level 3 | | | – 0 | – | | | (21,665,992 | ) | | | – 0 | – | | | (4,535,367 | ) |
| | | | | | | | | | | | | | | | |
Balance as of 10/31/20 | | $ | 2,209,876 | | | $ | 58,220,720 | | | $ | 72,627 | | | $ | – 0 | – |
| | | | | | | | | | | | | | | | |
Net change in unrealized appreciation/depreciation from investments held as of 10/31/20** | | $ | (202,043 | ) | | $ | (1,348,480 | ) | | $ | 667,040 | | | $ | – 0 | – |
| | | | | | | | | | | | | | | | |
| | | | |
| | | Common
Stocks# | | | Asset-
Backed
Securities | | | Governments -
Sovereign
Bonds# | | | Preferred
Stocks | |
Balance as of 10/31/19 | | $ | 62,796,850 | | | $ 50,991,289 | | | | $ | – 0 | – | | $ | 4,967,032 | |
Accrued discounts/ (premiums) | | | – 0 | – | | | 497,027 | | | | – 0 | – | | | – 0 | – |
Realized gain (loss) | | | (179,713 | ) | | | 1,605,464 | | | | – 0 | – | | | (254 | ) |
Change in unrealized appreciation/ depreciation…. | | | 9,811,566 | | | | (3,134,023 | ) | | | – 0 | – | | | – 0 | – |
Purchases | | | 10,087,504 | | | | – 0 | – | | | – 0 | – | | | 595,060 | |
Sales/Paydowns | | | (35,725,210 | ) | | | (5,853,660 | ) | | | – 0 | – | | | (129,899 | ) |
Transfers into level 3 | | | – 0 | – | | | – 0 | – | | | – 0 | – | | | – 0 | – |
Transfers out of level 3 | | | – 0 | – | | | (32,509,391 | ) | | | – 0 | – | | | – 0 | – |
| | | | | | | | | | | | | | | | |
Balance as of 10/31/20 | | $ | 46,790,997 | | | $ | 11,596,706 | | | $ | – 0 | – | | $ | 5,431,939 | |
| | | | | | | | | | | | | | | | |
Net change in unrealized appreciation/depreciation from investments held as of 10/31/20** | | $ | (2,940,363 | ) | | $ | (3,071,037 | ) | | $ | – 0 | – | | $ | – 0 | – |
| | | | | | | | | | | | | | | | |
| | |
| |
| abfunds.com | | AB HIGH INCOME FUND | 99 |
NOTES TO FINANCIAL STATEMENTS (continued)
| | | | | | | | | | | | | | | | |
| | | | |
| | | Warrants# | | | Whole Loan
Trusts | | | Rights | | | Total | |
Balance as of 10/31/19 | | $ | 663,907 | | | $ | 1,391,396 | | | $ | – 0 | – | | $ | 210,522,292 | |
Accrued discounts/ (premiums) | | | – 0 | – | | | – 0 | – | | | – 0 | – | | | (1,157,387 | ) |
Realized gain (loss)……… | | | – 0 | – | | | 26,293 | | | | – 0 | – | | | (42,027,553 | ) |
Change in unrealized appreciation/ depreciation | | | 290,137 | | | | (693,046 | ) | | | 9,497 | | | | 27,132,448 | |
Purchases/Payups | | | – 0 | – | | | – 0 | – | | | – 0 | – | | | 25,989,504 | |
Sales/Paydowns | | | – 0 | – | | | (393,930 | ) | | | – 0 | – | | | (53,245,355 | ) |
Transfers into level 3 | | | – 0 | – | | | – 0 | – | | | 39,458 | | | | 17,153,378 | |
Transfers out of level 3 | | | – 0 | – | | | – 0 | – | | | – 0 | – | | | (58,710,750 | ) |
| | | | | | | | | | | | | | | | |
Balance as of 10/31/20 | | $ | 954,044 | | | $ | 330,713 | | | $ | 48,955 | | | $ | 125,656,577 | + |
| | | | | | | | | | | | | | | | |
Net change in unrealized appreciation/depreciation from investments held as of 10/31/20** | | $ | 290,137 | | | $ | (693,046 | ) | | $ | 9,497 | | | $ | (7,288,295 | ) |
| | | | | | | | | | | | | | | | |
| # | The Fund held securities with zero market value that were sold/expired/written off during the reporting period. |
| ** | The unrealized appreciation/depreciation is included in net change in unrealized appreciation/depreciation on investments and other financial instruments in the accompanying statement of operations. |
| + | An amount of $21,665,992, $4,535,367 and $32,509,391 for Bank Loans, Collateralized Loan Obligations and Asset-Backed Securities, respectively, were transferred out of Level 3 into Level 2 as improved transparency of price inputs has increased the observability during the reporting period. |
The following presents information about significant unobservable inputs related to the Fund’s Level 3 investments at October 31, 2020. Securities priced (i) by third party vendors, (ii) by brokers or (iii) using prior transaction prices, which approximates fair value, are excluded from the following table.
Quantitative Information about Level 3 Fair Value Measurements
| | | | | | | | | | |
| | | Fair
Value at
10/31/20 | | | Valuation
Technique | | Unobservable
Input | | Input |
Corporates – Non-Investment Grade | |
$ |
1,153,032 |
| |
Recovery
Analysis | |
Collateral
Value | |
$85.10 |
| | $ | 1,056,844 | | | Qualitative
Assessment | | Par Value | | $100.00 |
| | $ | – 0 | – | | Qualitative
Assessment | | | | $0.00 |
| | | | | | | | | | |
| | $ | 2,209,876 | | | | | | | |
| | | | | | | | | | |
Common Stocks | | $ | 20,589,287 | | | Market
Approach | | NAV
Equivalent | | $1,055.86 |
| | $ | 3,943,880 | | | Market
Approach | | Projected
Enterprise
Value | | $476.8mm
to
$529.0 mm |
| | $ | 891,739 | | | Market
Approach | | EBITDA*
Projection | | $57mm |
| | |
| |
100 | AB HIGH INCOME FUND | | abfunds.com |
NOTES TO FINANCIAL STATEMENTS (continued)
| | | | | | | | | | |
| | | Fair
Value at
10/31/20 | | | Valuation
Technique | | Unobservable
Input | | Input |
| | | | | | | | EBITDA*
Multiples | | 7.4X |
| | $ | 420,796 | | | Market
Approach | | 3.8%
Haircut to
Last | | $3.26 |
| | | | | | | | Traded
Price | | |
| | $ | 216,813 | | | Market
Approach | | EBITDA*
Projection | | $203mm |
| | | | | | | | EBITDA*
Multiples | | 7.9X |
| | $ | 157,986 | | | Market
Approach | | EBITDA*
Projection | | $400mm |
| | | | | | | | EBITDA*
Multiples | | 15.5X |
| | $ | 5 | | | Qualitative
Assessment | | | | $0.00 |
| | $ | – 0 | – | | Qualitative
Assessment | | | | $0.00 |
| | | | | | | | | | |
| | $ | 26,220,506 | | | | | | | |
| | | | | | | | | | |
Governments – Sovereign Bonds | |
$ |
– 0 |
– | |
Qualitative
Assessment | | | |
$0.00 |
Preferred Stocks | | $ | 5,431,939 | | | Market
Approach | | EBITDA*
Projection | | $400mm |
| | | | | | | | EBITDA*
Multiples | | 15.5X |
Warrants. | | $ | 954,044 | | | Option
Pricing
Model | | Exercise
Price | | $5.63 |
| | $ | – 0 | – | | Qualitative
Assessment | | | | $0.00 |
| | | | | | | | | | |
| | $ | 954,044 | | | | | | | |
| | | | | | | | | | |
Whole Loan Trusts | | $ | 330,713 | | | Recovery
Analysis | | Cumulative
Loss | | 35% |
| * | Earnings Before Interest, Taxes, Depreciation and Amortization. |
Generally, a change in the assumptions used in any input in isolation may be accompanied by a change in another input. Significant changes in any of the unobservable inputs may significantly impact the fair value measurement. Significant increases (decreases) in Collateral Value, NAV Equivalent, Projected Enterprise Value, Last Traded Price, Exercise Price, EBITDA projections and EBITDA Multiple in isolation would be expected to result in a significantly higher (lower) fair value measurement. A significant increase (decrease) in Cumulative Loss in isolation would be expected to result in a significantly lower (higher) fair value measurement.
| | |
| |
| abfunds.com | | AB HIGH INCOME FUND | 101 |
NOTES TO FINANCIAL STATEMENTS (continued)
3. Currency Translation
Assets and liabilities denominated in foreign currencies and commitments under forward currency exchange contracts are translated into U.S. dollars at the mean of the quoted bid and ask prices of such currencies against the U.S. dollar. Purchases and sales of portfolio securities are translated
into U.S. dollars at the rates of exchange prevailing when such securities were acquired or sold. Income and expenses are translated into U.S. dollars at the rates of exchange prevailing when accrued.
Net realized gain or loss on foreign currency transactions represents foreign exchange gains and losses from sales and maturities of foreign fixed income investments, holding of foreign currencies, currency gains or losses realized between the trade and settlement dates on foreign investment transactions, and the difference between the amounts of dividends, interest and foreign withholding taxes recorded on the Fund’s books and the U.S. dollar equivalent amounts actually received or paid. Net unrealized currency gains and losses from valuing foreign currency denominated assets and liabilities at period end exchange rates are reflected as a component of net unrealized appreciation or depreciation of foreign currency denominated assets and liabilities.
4. Taxes
It is the Fund’s policy to meet the requirements of the Internal Revenue Code applicable to regulated investment companies and to distribute all of its investment company taxable income and net realized gains, if any, to shareholders. Therefore, no provisions for federal income or excise taxes are required. The Fund may be subject to taxes imposed by countries in which it invests. Such taxes are generally based on income and/or capital gains earned or repatriated. Taxes are accrued and applied to net investment income, net realized gains and net unrealized appreciation/ depreciation as such income and/or gains are earned.
In accordance with U.S. GAAP requirements regarding accounting for uncertainties in income taxes, management has analyzed the Fund’s tax positions taken or expected to be taken on federal and state income tax returns for all open tax years (the current and the prior three tax years) and has concluded that no provision for income tax is required in the Fund’s financial statements.
5. Investment Income and Investment Transactions
Dividend income is recorded on the ex-dividend date or as soon as the Fund is informed of the dividend. Interest income is accrued daily. Investment gains or losses are determined on the identified cost basis. The Fund amortizes premiums and accretes discounts as adjustments to interest income. Investment transactions are accounted for on the date the securities are purchased or sold. The Fund accounts for distributions received
| | |
| |
102 | AB HIGH INCOME FUND | | abfunds.com |
NOTES TO FINANCIAL STATEMENTS (continued)
from REIT investments or from regulated investment companies as dividend income, realized gain, or return of capital based on information provided by the REIT or the investment company.
6. Class Allocations
All income earned and expenses incurred by the Fund are borne on a pro-rata basis by each settled class of shares, based on the proportionate interest in the Fund represented by the net assets of such class, except for class specific expenses which are allocated to the respective class.
Realized and unrealized gains and losses are allocated among the various share classes based on respective net assets.
7. Dividends and Distributions
Dividends and distributions to shareholders, if any, are recorded on the ex-dividend date. Income dividends and capital gains distributions are determined in accordance with federal tax regulations and may differ from those determined in accordance with U.S. GAAP. To the extent these differences are permanent, such amounts are reclassified within the capital accounts based on their federal tax basis treatment; temporary differences do not require such reclassification.
NOTE B
Advisory Fee and Other Transactions with Affiliates
Under the terms of the investment advisory agreement, the Fund pays the Adviser an advisory fee at an annual rate of .50% of the first $2.5 billion, .45% of the next $2.5 billion and .40% in excess of $5 billion, of the Fund’s average daily net assets. The fee is accrued daily and paid monthly.
Pursuant to the investment advisory agreement, the Fund may reimburse the Adviser for certain legal and accounting services provided to the Fund by the Adviser. For the year ended October 31, 2020, the reimbursement for such services amounted to $78,596.
The Fund compensates AllianceBernstein Investor Services, Inc. (“ABIS”), a wholly-owned subsidiary of the Adviser, under a Transfer Agency Agreement for providing personnel and facilities to perform transfer agency services for the Fund. ABIS may make payments to intermediaries that provide omnibus account services, sub-accounting services and/or networking services. Such compensation retained by ABIS amounted to $1,462,209 for the year ended October 31, 2020.
AllianceBernstein Investments, Inc. (the “Distributor”), a wholly-owned subsidiary of the Adviser, serves as the distributor of the Fund’s shares. The Distributor has advised the Fund that it has retained front-end sales charges of $102,204 from the sale of Class A shares and received
| | |
| |
| abfunds.com | | AB HIGH INCOME FUND | 103 |
NOTES TO FINANCIAL STATEMENTS (continued)
$21,186, $0 and $37,532 in contingent deferred sales charges imposed upon redemptions by shareholders of Class A, Class B and Class C shares, respectively, for the year ended October 31, 2020.
The Fund may invest in AB Government Money Market Portfolio (the “Government Money Market Portfolio”) which has a contractual annual advisory fee rate of .20% of the portfolio’s average daily net assets and bears its own expenses. The Adviser has contractually agreed to waive .10% of the advisory fee of Government Money Market Portfolio (resulting in a net advisory fee of .10%) until August 31, 2021. In connection with the investment by the Fund in Government Money Market Portfolio, the Adviser has contractually agreed to waive its advisory fee from the Fund in an amount equal to the Fund’s pro rata share of the effective advisory fee of Government Money Market Portfolio, as borne indirectly by the Fund as an acquired fund fee and expense. For the year ended October 31, 2020, such waiver amounted to $138,969.
A summary of the Fund’s transactions in AB mutual funds for the year ended October 31, 2020 is as follows:
| | | | | | | | | | | | | | | | | | | | |
Fund | | Market Value
10/31/19
(000) | | | Purchases
at Cost
(000) | | | Sales
Proceeds
(000) | | | Market Value
10/31/20
(000) | | | Dividend
Income
(000) | |
Government Money Market Portfolio | | $ | 269,142 | | | $ | 1,947,095 | | | $ | 2,193,700 | | | $ | 22,537 | | | $ | 896 | |
During the year ended October 31, 2020 and the year ended October 31, 2019, the Adviser reimbursed the Fund $5,401 and $31,592, respectively, for trading losses incurred due to trade entry errors.
During the second quarter of 2018, AXA S.A. (“AXA”), a French holding company for the AXA Group, completed the sale of a minority stake in its subsidiary, AXA Equitable Holdings, Inc. (now named Equitable Holdings, Inc.)(“Equitable”), through an initial public offering. Equitable is the holding company for a diverse group of financial services companies, including an approximate 65% economic interest in the Adviser and a 100% interest in AllianceBernstein Corporation, the general partner of the Adviser. Since the initial sale, AXA has completed additional offerings, most recently during the fourth quarter of 2019. As a result, AXA currently owns less than 10% of the outstanding shares of common stock of Equitable, and no longer owns a controlling interest in Equitable. AXA previously announced its intention to sell its entire interest in Equitable over time, subject to market conditions and other factors (the “Plan”). Most of AXA’s remaining Equitable shares are to be delivered on redemption of AXA bonds mandatorily
| | |
| |
104 | AB HIGH INCOME FUND | | abfunds.com |
NOTES TO FINANCIAL STATEMENTS (continued)
exchangeable into Equitable shares and maturing in May 2021. AXA retains sole discretion to determine the timing of any future sales of its remaining shares of Equitable common stock.
Sales under the Plan that were completed on November 13, 2019 resulted in the indirect transfer of a “controlling block” of voting securities of the Adviser (a “Change of Control Event”) and may have been deemed to have been an “assignment” causing a termination of the Fund’s investment advisory and administration agreements. In order to ensure that investment advisory and administration services could continue uninterrupted in the event of a Change of Control Event, the Board previously approved new investment advisory and administration agreements with the Adviser, and shareholders of the Fund subsequently approved the new investment advisory agreement. These agreements became effective on November 13, 2019.
NOTE C
Distribution Services Agreement
The Fund has adopted a Distribution Services Agreement (the “Agreement”) pursuant to Rule 12b-1 under the Investment Company Act of 1940. Under the Agreement, the Fund pays distribution and servicing fees to the Distributor at an annual rate of up to .30% of the Fund’s average daily net assets attributable to Class A shares, 1% of the Fund’s average daily net assets attributable to both Class B and Class C shares, .50% of the Fund’s average daily net assets attributable to Class R shares and .25% of the Fund’s average daily net assets attributable to Class K shares. There are no distribution and servicing fees on Advisor Class, Class I and Class Z shares. Payments under the Agreement in respect of Class A shares are currently limited to an annual rate of .25% of Class A shares’ average daily net assets. The fees are accrued daily and paid monthly. The Agreement provides that the Distributor will use such payments in their entirety for distribution assistance and promotional activities. Since the commencement of the Fund’s operations, the Distributor has incurred expenses in excess of the distribution costs reimbursed by the Fund in the amounts of $19,523,616, $1,243,368 and $1,342,473 for Class C, Class R and Class K shares, respectively. While such costs may be recovered from the Fund in future periods so long as the Agreement is in effect, the rate of the distribution and servicing fees payable under the Agreement may not be increased without a shareholder vote. In accordance with the Agreement, there is no provision for recovery of unreimbursed distribution costs incurred by the Distributor beyond the current fiscal year for Class A shares. The Agreement also provides that the Adviser may use its own resources to finance the distribution of the Fund’s shares.
| | |
| |
| abfunds.com | | AB HIGH INCOME FUND | 105 |
NOTES TO FINANCIAL STATEMENTS (continued)
NOTE D
Investment Transactions
Purchases and sales of investment securities (excluding short-term investments) for the year ended October 31, 2020, were as follows:
| | | | | | | | |
| | | Purchases | | | Sales | |
Investment securities (excluding U.S. government securities) | | $ | 2,586,586,125 | | | $ | 1,952,591,470 | |
U.S. government securities | | | 308,643,845 | | | | 756,528,972 | |
The cost of investments for federal income tax purposes, gross unrealized appreciation and unrealized depreciation are as follows:
| | | | |
Cost | | $ | 5,478,948,154 | |
| | | | |
Gross unrealized appreciation | | $ | 359,532,302 | |
Gross unrealized depreciation | | | (550,877,711 | ) |
| | | | |
Net unrealized depreciation | | $ | (191,345,409 | ) |
| | | | |
1. Derivative Financial Instruments
The Fund may use derivatives in an effort to earn income and enhance returns, to replace more traditional direct investments, to obtain exposure to otherwise inaccessible markets (collectively, “investment purposes”), or to hedge or adjust the risk profile of its portfolio.
The principal types of derivatives utilized by the Fund, as well as the methods in which they may be used are:
| | • | | Forward Currency Exchange Contracts |
The Fund may enter into forward currency exchange contracts in order to hedge its exposure to changes in foreign currency exchange rates on its foreign portfolio holdings, to hedge certain firm purchase and sale commitments denominated in foreign currencies and for non-hedging purposes as a means of making direct investments in foreign currencies, as described below under “Currency Transactions”.
A forward currency exchange contract is a commitment to purchase or sell a foreign currency at a future date at a negotiated forward rate. The gain or loss arising from the difference between the original contract and the closing of such contract would be included in net realized gain or loss on forward currency exchange contracts. Fluctuations in the value of open forward currency exchange contracts are recorded for financial reporting purposes as unrealized appreciation and/or depreciation by the Fund. Risks may arise from the potential inability of a counterparty to meet the terms of a contract and from unanticipated movements in the value of a foreign currency relative to the U.S. dollar.
| | |
| |
106 | AB HIGH INCOME FUND | | abfunds.com |
NOTES TO FINANCIAL STATEMENTS (continued)
During the year ended October 31, 2020, the Fund held forward currency exchange contracts for hedging and non-hedging purposes.
The Fund may buy or sell futures for investment purposes or for the purpose of hedging its portfolio against adverse effects of potential movements in the market. The Fund bears the market risk that arises from changes in the value of these instruments and the imperfect correlation between movements in the price of the futures and movements in the price of the assets, reference rates or indices which they are designed to track. Among other things, the Fund may purchase or sell futures for foreign currencies or options thereon for non-hedging purposes as a means of making direct investment in foreign currencies, as described below under “Currency Transactions”.
At the time the Fund enters into futures, the Fund deposits and maintains as collateral an initial margin with the broker, as required by the exchange on which the transaction is effected. Such amount is shown as cash collateral due from broker on the statement of assets and liabilities. Pursuant to the contract, the Fund agrees to receive from or pay to the broker an amount of cash equal to the daily fluctuation in the value of the contract. Such receipts or payments are known as variation margin and are recorded by the Fund as unrealized gains or losses. Risks may arise from the potential inability of a counterparty to meet the terms of the contract. The credit/ counterparty risk for exchange-traded futures is generally less than privately negotiated futures, since the clearinghouse, which is the issuer or counterparty to each exchange-traded future, has robust risk mitigation standards, including the requirement to provide initial and variation margin. When the contract is closed, the Fund records a realized gain or loss equal to the difference between the value of the contract at the time it was opened and the time it was closed.
Use of long futures subjects the Fund to risk of loss in excess of the amounts shown on the statement of assets and liabilities, up to the notional value of the futures. Use of short futures subjects the Fund to unlimited risk of loss. Under some circumstances, futures exchanges may establish daily limits on the amount that the price of futures can vary from the previous day’s settlement price, which could effectively prevent liquidation of unfavorable positions.
During the year ended October 31, 2020, the Fund held futures for hedging and non-hedging purposes.
For hedging and investment purposes, the Fund may purchase and write (sell) put and call options on U.S. and foreign securities, including government securities, and foreign currencies that are
| | |
| |
| abfunds.com | | AB HIGH INCOME FUND | 107 |
NOTES TO FINANCIAL STATEMENTS (continued)
traded on U.S. and foreign securities exchanges and over-the-counter markets. Among other things, the Fund may use options transactions for non-hedging purposes as a means of making direct investments in foreign currencies, as described below under “Currency Transactions” and may use options strategies involving the purchase and/or writing of various combinations of call and/or put options, for hedging and investment purposes.
The risk associated with purchasing an option is that the Fund pays a premium whether or not the option is exercised. Additionally, the Fund bears the risk of loss of the premium and change in market value should the counterparty not perform under the contract. If a put or call option purchased by the Fund were permitted to expire without being sold or exercised, its premium would represent a loss to the Fund. Put and call options purchased are accounted for in the same manner as portfolio securities. The cost of securities acquired through the exercise of call options is increased by premiums paid. The proceeds from securities sold through the exercise of put options are decreased by the premiums paid.
When the Fund writes an option, the premium received by the Fund is recorded as a liability and is subsequently adjusted to the current market value of the option written. The Fund’s maximum payment for written put options equates to the number of shares multiplied by the strike price. In certain circumstances maximum payout amounts may be partially offset by recovery values of the respective referenced assets and upfront premium received upon entering into the contract. Premiums received from written options which expire unexercised are recorded by the Fund on the expiration date as realized gains from options written. The difference between the premium received and the amount paid on effecting a closing purchase transaction, including brokerage commissions, is also treated as a realized gain, or if the premium received is less than the amount paid for the closing purchase transaction, as a realized loss. If a call option is exercised, the premium received is added to the proceeds from the sale of the underlying security or currency in determining whether the Fund has realized a gain or loss. If a put option is exercised, the premium received reduces the cost basis of the security or currency purchased by the Fund. In writing an option, the Fund bears the market risk of an unfavorable change in the price of the security or currency underlying the written option. Exercise of an option written by the Fund could result in the Fund selling or buying a security or currency at a price different from the current market value.
The Fund may also invest in options on swap agreements, also called “swaptions”. A swaption is an option that gives the buyer the right, but not the obligation, to enter into a swap on a future date in
| | |
| |
108 | AB HIGH INCOME FUND | | abfunds.com |
NOTES TO FINANCIAL STATEMENTS (continued)
exchange for paying a market-based “premium”. A receiver swaption gives the owner the right to receive the total return of a specified asset, reference rate, or index. A payer swaption gives the owner the right to pay the total return of a specified asset, reference rate, or index. Swaptions also include options that allow an existing swap to be terminated or extended by one of the counterparties. The Fund’s maximum payment for written put swaptions equates to the notional amount of the underlying swap. In certain circumstances maximum payout amounts may be partially offset by recovery values of the respective referenced assets and upfront premium received upon entering into the contract.
During the year ended October 31, 2020, the Fund held purchased swaptions for hedging and non-hedging purposes.
The Fund may enter into swaps to hedge its exposure to interest rates, credit risk or currencies. The Fund may also enter into swaps for non-hedging purposes as a means of gaining market exposures including by making direct investments in foreign currencies, as described below under “Currency Transactions” or in order to take a “long” or “short” position with respect to an underlying referenced asset described below under “Total Return Swaps”. A swap is an agreement that obligates two parties to exchange a series of cash flows at specified intervals based upon or calculated by reference to changes in specified prices or rates for a specified amount of an underlying asset. The payment flows are usually netted against each other, with the difference being paid by one party to the other. In addition, collateral may be pledged or received by the Fund in accordance with the terms of the respective swaps to provide value and recourse to the Fund or its counterparties in the event of default, bankruptcy or insolvency by one of the parties to the swap.
Risks may arise as a result of the failure of the counterparty to the swap to comply with the terms of the swap. The loss incurred by the failure of a counterparty is generally limited to the net interim payment to be received by the Fund, and/or the termination value at the end of the contract. Therefore, the Fund considers the creditworthiness of each counterparty to a swap in evaluating potential counterparty risk. This risk is mitigated by having a netting arrangement between the Fund and the counterparty and by the posting of collateral by the counterparty to the Fund to cover the Fund’s exposure to the counterparty. Additionally, risks may arise from unanticipated movements in interest rates or in the value of the underlying securities. The Fund accrues for the interim payments on swaps on a daily basis, with the net amount recorded within unrealized appreciation/ depreciation of swaps on the statement of assets and liabilities, where
| | |
| |
| abfunds.com | | AB HIGH INCOME FUND | 109 |
NOTES TO FINANCIAL STATEMENTS (continued)
applicable. Once the interim payments are settled in cash, the net amount is recorded as realized gain/(loss) on swaps on the statement of operations, in addition to any realized gain/(loss) recorded upon the termination of swaps. Upfront premiums paid or received for OTC swaps are recognized as cost or proceeds on the statement of assets and liabilities and are amortized on a straight line basis over the life of the contract. Amortized upfront premiums are included in net realized gain/(loss) from swaps on the statement of operations. Fluctuations in the value of swaps are recorded as a component of net change in unrealized appreciation/depreciation of swaps on the statement of operations.
Certain standardized swaps, including certain interest rate swaps and credit default swaps, are (or soon will be) subject to mandatory central clearing. Cleared swaps are transacted through futures commission merchants (“FCMs”) that are members of central clearinghouses, with the clearinghouse serving as central counterparty, similar to transactions in futures contracts. Centralized clearing will be required for additional categories of swaps on a phased-in basis based on requirements published by the Securities and Exchange Commission and Commodity Futures Trading Commission.
At the time the Fund enters into a centrally cleared swap, the Fund deposits and maintains as collateral an initial margin with the broker, as required by the clearinghouse on which the transaction is effected. Such amount is shown as cash collateral due from broker on the statement of assets and liabilities. Pursuant to the contract, the Fund agrees to receive from or pay to the broker an amount of cash equal to the daily fluctuation in the value of the contract. Such receipts or payments are known as variation margin and are recorded by the Fund as unrealized gains or losses. Risks may arise from the potential inability of a counterparty to meet the terms of the contract. The credit/counterparty risk for centrally cleared swaps is generally less than non-centrally cleared swaps, since the clearinghouse, which is the issuer or counterparty to each centrally cleared swap, has robust risk mitigation standards, including the requirement to provide initial and variation margin. When the contract is closed, the Fund records a realized gain or loss equal to the difference between the value of the contract at the time it was opened and the time it was closed.
Interest Rate Swaps:
The Fund is subject to interest rate risk exposure in the normal course of pursuing its investment objectives. Because the Fund holds fixed rate bonds, the value of these bonds may decrease if interest rates rise. To help hedge against this risk and to maintain its ability to generate income at prevailing market rates, the Fund may enter into interest rate swaps. Interest rate swaps are agreements between two
| | |
| |
110 | AB HIGH INCOME FUND | | abfunds.com |
NOTES TO FINANCIAL STATEMENTS (continued)
parties to exchange cash flows based on a notional amount. The Fund may elect to pay a fixed rate and receive a floating rate, or, receive a fixed rate and pay a floating rate on a notional amount.
In addition, the Fund may also enter into interest rate swap transactions to preserve a return or spread on a particular investment or portion of its portfolio, or protecting against an increase in the price of securities the Fund anticipates purchasing at a later date. Interest rate swaps involve the exchange by a Fund with another party of their respective commitments to pay or receive interest (e.g., an exchange of floating rate payments for fixed rate payments) computed based on a contractually-based principal (or “notional”) amount. Interest rate swaps are entered into on a net basis (i.e., the two payment streams are netted out, with the Fund receiving or paying, as the case may be, only the net amount of the two payments).
During the year ended October 31, 2020, the Fund held interest rate swaps for hedging and non-hedging purposes.
Credit Default Swaps:
The Fund may enter into credit default swaps, including to manage its exposure to the market or certain sectors of the market, to reduce its risk exposure to defaults by corporate and sovereign issuers held by the Fund, or to create exposure to corporate or sovereign issuers to which it is not otherwise exposed. The Fund may purchase credit protection (“Buy Contract”) or provide credit protection (“Sale Contract”) on the referenced obligation of the credit default swap. During the term of the swap, the Fund receives/(pays) fixed payments from/(to) the respective counterparty, calculated at the agreed upon rate applied to the notional amount. If the Fund is a buyer/(seller) of protection and a credit event occurs, as defined under the terms of the swap, the Fund will either (i) receive from the seller/(pay to the buyer) of protection an amount equal to the notional amount of the swap (the “Maximum Payout Amount”) and deliver/(take delivery of) the referenced obligation or (ii) receive/(pay) a net settlement amount in the form of cash or securities equal to the notional amount of the swap less the recovery value of the referenced obligation. In certain circumstances Maximum Payout Amounts may be partially offset by recovery values of the respective referenced obligations, upfront premium received upon entering into the agreement, or net amounts received from settlement of buy protection credit default swaps entered into by the Fund for the same referenced obligation with the same counterparty.
Credit default swaps may involve greater risks than if the Fund had invested in the referenced obligation directly. Credit default swaps are subject to general market risk, liquidity risk, counterparty risk and
| | |
| |
| abfunds.com | | AB HIGH INCOME FUND | 111 |
NOTES TO FINANCIAL STATEMENTS (continued)
credit risk. If the Fund is a buyer of protection and no credit event occurs, it will lose the payments it made to its counterparty. If the Fund is a seller of protection and a credit event occurs, the value of the referenced obligation received by the Fund coupled with the periodic payments previously received may be less than the Maximum Payout Amount it pays to the buyer, resulting in a net loss to the Fund.
Implied credit spreads over U.S. Treasuries of comparable maturity utilized in determining the market value of credit default swaps on issuers as of period end are disclosed in the portfolio of investments. The implied spreads serve as an indicator of the current status of the payment/ performance risk and typically reflect the likelihood of default by the issuer of the referenced obligation. The implied credit spread of a particular reference obligation also reflects the cost of buying/selling protection and may reflect upfront payments required to be made to enter into the agreement. Widening credit spreads typically represent a deterioration of the referenced obligation’s credit soundness and greater likelihood of default or other credit event occurring as defined under the terms of the agreement. A credit spread identified as “Defaulted” indicates a credit event has occurred for the referenced obligation.
During the year ended October 31, 2020, the Fund held credit default swaps for hedging and non-hedging purposes.
Total Return Swaps:
The Fund may enter into total return swaps in order to take a “long” or “short” position with respect to an underlying referenced asset. The Fund is subject to market price volatility of the underlying referenced asset. A total return swap involves commitments to pay interest in exchange for a market linked return based on a notional amount. To the extent that the total return of the security, group of securities or index underlying the transaction exceeds or falls short of the offsetting interest obligation, the Fund will receive a payment from or make a payment to the counterparty.
During the year ended October 31, 2020, the Fund held total return swaps for non-hedging purposes.
The Fund typically enters into International Swaps and Derivatives Association, Inc. Master Agreements (“ISDA Master Agreement”) with its OTC derivative contract counterparties in order to, among other things, reduce its credit risk to OTC counterparties. ISDA Master Agreements include provisions for general obligations, representations, collateral and events of default or termination. Under an ISDA Master Agreement, the Fund typically may offset with the OTC counterparty certain derivative financial
| | |
| |
112 | AB HIGH INCOME FUND | | abfunds.com |
NOTES TO FINANCIAL STATEMENTS (continued)
instruments’ payables and/or receivables with collateral held and/or posted and create one single net payment (close-out netting) in the event of default or termination. In the event of a default by an OTC counterparty, the return of collateral with market value in excess of the Fund’s net liability, held by the defaulting party, may be delayed or denied.
The Fund’s ISDA Master Agreements may contain provisions for early termination of OTC derivative transactions in the event the net assets of the Fund decline below specific levels (“net asset contingent features”). If these levels are triggered, the Fund’s OTC counterparty has the right to terminate such transaction and require the Fund to pay or receive a settlement amount in connection with the terminated transaction. If OTC derivatives were held at period end, please refer to netting arrangements by the OTC counterparty tables below for additional details.
During the year ended October 31, 2020, the Fund had entered into the following derivatives:
| | | | | | | | | | | | |
| | | Asset Derivatives | | | Liability Derivatives | |
Derivative Type | | Statement of
Assets and
Liabilities
Location | | Fair Value | | | Statement of
Assets and
Liabilities
Location | | Fair Value | |
Interest rate contracts | |
Receivable/Payable
for variation margin
on futures | |
$ |
368,196 |
* | |
Receivable/Payable
for variation margin
on futures | |
$ |
1,909,383 |
* |
| | | | |
Interest rate
contracts | |
Investments in
securities, at value | | | 1,265,796 | | | | | | | |
| | | | |
Foreign currency
contracts | |
Unrealized
appreciation on
forward currency
exchange contracts | |
|
8,660,607 |
| |
Unrealized
depreciation on
forward currency
exchange contracts | |
|
2,317,022 |
|
| | | | |
Credit contracts | | Market value of credit default swaps | | | 116,270 | | | Market value of credit
default swaps | | | 138,956,638 | |
| | | | |
Credit contracts | | Receivable/Payable for variation margin on centrally cleared swaps | | | 42,701,596 | * | | Receivable/Payable for variation margin on centrally cleared swaps | | | 822,398 | * |
| | | | |
Credit contracts | | Unrealized
appreciation on
total return
swaps | | | 11,275,159 | | | | | | | |
| | | | | | | | | | | | |
Total | | | | $ | 64,387,624 | | | | | $ | 144,005,441 | |
| | | | | | | | | | | | |
| * | Only variation margin receivable/payable at period end is reported within the statement of assets and liabilities. This amount reflects cumulative unrealized appreciation/depreciation on futures and centrally cleared swaps as reported in the portfolio of investments. |
| | |
| |
| abfunds.com | | AB HIGH INCOME FUND | 113 |
NOTES TO FINANCIAL STATEMENTS (continued)
| | | | | | | | | | |
Derivative Type | | Location of Gain or
(Loss) on Derivatives
Within Statement of Operations | | Realized
Gain or
(Loss) on
Derivatives | | | Change in
Unrealized
Appreciation or
(Depreciation) | |
Interest rate contracts | | Net realized gain/(loss) on swaps; Net change in unrealized appreciation/depreciation on swaps | | $ | 209,164 | | | $ | – 0 | – |
Interest rate contracts | | Net realized gain/(loss) on futures; Net change in unrealized appreciation/depreciation on futures | | | (3,527,320 | ) | | | (1,974,992 | ) |
Interest rate contracts | | Net realized gain/(loss) on investment transactions; Net change in unrealized appreciation/depreciation on investments | | | (625,166 | ) | | | 262,948 | |
Foreign currency
contracts | | Net realized gain/(loss) on forward currency exchange contracts; Net change in unrealized appreciation/depreciation
on forward currency exchange contracts | | | 37,159,111 | | | | 20,055,897 | |
Credit contracts | | Net realized gain/(loss) on swaps; Net change in unrealized appreciation/depreciation on swaps | | | (133,061,081 | ) | | | (44,896,775 | ) |
| | | | | | | | | | |
Total | | | | $ | (99,845,292 | ) | | $ | (26,552,922 | ) |
| | | | | | | | | | |
The following table represents the average monthly volume of the Fund’s derivative transactions during the year ended October 31, 2020:
| | | | |
| |
Centrally Cleared Credit Default Swaps: | | | | |
Average notional amount of buy contracts | | $ | 173,139,223 | |
Average notional amount of sale contracts | | $ | 963,388,652 | |
| |
Centrally Cleared Interest Rate Swaps | | | | |
Average notional amount | | $ | 7,990,000 | (a) |
| |
Credit Default Swaps: | | | | |
Average notional amount of sale contracts | | $ | 317,816,611 | |
| |
Forward Currency Exchange Contracts: | | | | |
Average principal amount of buy contracts | | $ | 213,193,759 | |
Average principal amount of sale contracts | | $ | 808,714,096 | |
| |
Futures: | | | | |
Average notional amount of buy contracts | | $ | 121,969,415 | (b) |
Average notional amount of sale contracts | | $ | 47,845,647 | |
| | |
| |
114 | AB HIGH INCOME FUND | | abfunds.com |
NOTES TO FINANCIAL STATEMENTS (continued)
| | | | |
Total Return Swaps: | | | | |
Average notional amount | | $ | 29,610,836 | |
| |
Purchased Swaptions: | | | | |
Average notional amount | | $ | 103,327,667 | (c) |
| (a) | Positions were open for one month during the reporting period. |
| (b) | Positions were open for seven months during the reporting period. |
| (c) | Positions were open for six months during the reporting period. |
For financial reporting purposes, the Fund does not offset derivative assets and derivative liabilities that are subject to netting arrangements in the statement of assets and liabilities.
All OTC derivatives held at period end were subject to netting arrangements. The following table presents the Fund’s derivative assets and liabilities by OTC counterparty net of amounts available for offset under ISDA Master Agreements (“MA”) and net of the related collateral received/pledged by the Fund as of October 31, 2020. Exchange-traded derivatives and centrally cleared swaps are not subject to netting arrangements and as such are excluded from the tables.
| | | | | | | | | | | | | | | | | | | | |
Counterparty | | Derivative
Assets
Subject
to a MA | | | Derivatives
Available for
Offset | | | Cash
Collateral
Received* | | | Security
Collateral
Received* | | | Net Amount
of Derivative
Assets | |
BNP Paribas SA | | $ | 1,476,274 | | | $ | – 0 | – | | $ | (1,252,000 | ) | | $ | – 0 | – | | $ | 224,274 | |
Citibank, NA./Citigroup Global Markets, Inc. | | | 49,757 | | | | (49,757 | ) | | | – 0 | – | | | – 0 | – | | | – 0 | – |
Credit Suisse International | | | 104,167 | | | | (104,167 | ) | | | – 0 | – | | | – 0 | – | | | – 0 | – |
Deutsche Bank AG | | | 355,415 | | | | (355,415 | ) | | | – 0 | – | | | – 0 | – | | | – 0 | – |
Goldman Sachs Bank USA/ Goldman Sachs International | | | 13,411,323 | | | | (13,411,323 | ) | | | – 0 | – | | | – 0 | – | | | – 0 | – |
JPMorgan Chase Bank, NA/ JPMorgan Securties, LLC | | | 500,206 | | | | (500,206 | ) | | | – 0 | – | | | – 0 | – | | | – 0 | – |
Morgan Stanley Capital Services LLC/ Morgan Stanley & Co. International PLC | | | 734,183 | | | | (734,183 | ) | | | – 0 | – | | | – 0 | – | | | – 0 | – |
Royal Bank of Scotland PLC | | | 2,686,814 | | | | (187,399 | ) | | | (2,450,000 | ) | | | – 0 | – | | | 49,415 | |
UBS AG | | | 1,999,693 | | | | (20,129 | ) | | | – 0 | – | | | – 0 | – | | | 1,979,564 | |
| | | | | | | | | | | | | | | | | | | | |
Total | | $ | 21,317,832 | | | $ | (15,362,579 | ) | | $ | (3,702,000 | ) | | $ | – 0 | – | | $ | 2,253,253 | ^ |
| | | | | | | | | | | | | | | | | | | | |
| | |
| |
| abfunds.com | | AB HIGH INCOME FUND | 115 |
NOTES TO FINANCIAL STATEMENTS (continued)
| | | | | | | | | | | | | | | | | | | | |
Counterparty | | Derivative
Liabilities
Subject
to a MA | | | Derivatives
Available for
Offset | | | Cash
Collateral
Pledged* | | | Security
Collateral
Pledged* | | | Net Amount
of Derivative
Liabilities | |
Bank of America, NA. | | $ | 1,196,157 | | | $ | – 0 | – | | $ | – 0 | – | | $ | – 0 | – | | $ | 1,196,157 | |
Citibank, NA./Citigroup Global Markets, Inc. | | | 27,751,911 | | | | (49,757 | ) | | | (23,532,075 | ) | | | (3,993,506 | ) | | | 176,573 | |
Credit Suisse International | | | 27,574,566 | | | | (104,167 | ) | | | – 0 | – | | | (27,470,399 | ) | | | – 0 | – |
Deutsche Bank AG | | | 775,222 | | | | (355,415 | ) | | | – 0 | – | | | (419,807 | ) | | | – 0 | – |
Goldman Sachs Bank USA/ Goldman Sachs International | | | 67,851,158 | | | | (13,411,323 | ) | | | (810,000 | ) | | | (53,629,835 | ) | | | – 0 | – |
JPMorgan Chase Bank, NA/ JPMorgan Securties, LLC. | | | 3,895,030 | | | | (500,206 | ) | | | (275,000 | ) | | | (2,809,294 | ) | | | 310,530 | |
Morgan Stanley Capital Services LLC/ Morgan Stanley & Co. International PLC | | | 12,022,088 | | | | (734,183 | ) | | | – 0 | – | | | (11,287,905 | ) | | | – 0 | – |
Royal Bank of Scotland PLC | | | 187,399 | | | | (187,399 | ) | | | – 0 | – | | | – 0 | – | | | – 0 | – |
UBS AG | | | 20,129 | | | | (20,129 | ) | | | – 0 | – | | | – 0 | – | | | – 0 | – |
| | | | | | | | | | | | | | | | | | | | |
Total | | $ | 141,273,660 | | | $ | (15,362,579 | ) | | $ | (24,617,075 | ) | | $ | (99,610,746 | ) | | $ | 1,683,260 | ^ |
| | | | | | | | | | | | | | | | | | | | |
| * | The actual collateral received/pledged may be more than the amount reported due to overcollateralization. |
| ^ | Net amount represents the net receivable/payable that would be due from/to the counterparty in the event of default or termination. The net amount from OTC financial derivative instruments can only be netted across transactions governed under the same master agreement with the same counterparty. |
See Note D.3 for additional disclosure of netting arrangements regarding reverse repurchase agreements.
2. Currency Transactions
The Fund may invest in non-U.S. Dollar-denominated securities on a currency hedged or unhedged basis. The Fund may seek investment opportunities by taking long or short positions in currencies through the use of currency-related derivatives, including forward currency exchange contracts, futures and options on futures, swaps, and other options. The Fund may enter into transactions for investment opportunities when it anticipates that a foreign currency will appreciate or depreciate in value but securities denominated in that currency are not held by the Fund and do not present attractive investment opportunities. Such transactions may also be used when the Adviser believes that it may be more efficient than a direct investment in a foreign currency-denominated security. The Fund may also
| | |
| |
116 | AB HIGH INCOME FUND | | abfunds.com |
NOTES TO FINANCIAL STATEMENTS (continued)
conduct currency exchange contracts on a spot basis (i.e., for cash at the spot rate prevailing in the currency exchange market for buying or selling currencies).
3. Reverse Repurchase Agreements
The Fund may enter into reverse repurchase transactions (“RVP”) in accordance with the terms of a Master Repurchase Agreement (“MRA”), under which the Fund sells securities and agrees to repurchase them at a mutually agreed upon date and price. At the time the Fund enters into a reverse repurchase agreement, it will establish a segregated account with the custodian containing liquid assets having a value comparable to the repurchase price. Under the MRA and other Master Agreements, the Fund is permitted to offset payables and/or receivables with collateral held and/or posted to the counterparty and create one single net payment due to or from the Fund in the event of a default. In the event of a default by a MRA counterparty, the Fund may be considered an unsecured creditor with respect to any excess collateral (collateral with a market value in excess of the repurchase price) held by and/or posted to the counterparty, and as such the return of such excess collateral may be delayed or denied. For the year ended October 31, 2020, the average amount of reverse repurchase agreements outstanding was $34,826,912 and the daily weighted average interest rate was 0.03%. At October 31, 2020, the Fund had reverse repurchase agreements outstanding in the amount of $2,903,217 as reported in the statement of assets and liabilities.
The following table presents the Fund’s RVP liabilities by counterparty net of the related collateral pledged by the Fund as of October 31, 2020:
| | | | | | | | | | | | |
Counterparty | | RVP Liabilities
Subject to a
MRA | | | Securities
Collateral
Pledged†* | | | Net Amount of
RVP Liabilities | |
Barclays Capital, Inc. | | $ | 2,903,217 | | | $ | (2,797,125 | ) | | $ | 106,092 | |
| † | Including accrued interest. |
| * | The actual collateral pledged may be more than the amount reported due to overcollateralization. |
| | |
| |
| abfunds.com | | AB HIGH INCOME FUND | 117 |
NOTES TO FINANCIAL STATEMENTS (continued)
NOTE E
Capital Stock
Each class consists of 3,000,000,000 authorized shares. Transactions in capital shares for each class were as follows:
| | | | | | | | | | | | | | | | | | | | | | | | |
| | | | | | | | | | | | | | | | | | | | | | | | |
| | | Shares | | | | | | Amount | | | | |
| | | Year Ended
October 31,
2020 | | | Year Ended October 31,
2019 | | | | | | Year Ended
October 31, 2020 | | | Year Ended October 31, 2019 | | | | |
| | | | | | | | |
| Class A | | | | | | | | | | | | | | | | | | | | | | | | |
Shares sold | | | 32,982,337 | | | | 34,484,458 | | | | | | | $ | 246,238,865 | | | $ | 279,491,371 | | | | | |
| | | | | |
Shares issued in reinvestment of dividends | | | 6,143,528 | | | | 6,531,547 | | | | | | | | 46,584,501 | | | | 53,010,534 | | | | | |
| | | | | |
Shares converted from Class B | | | 104,386 | | | | 41,441 | | | | | | | | 855,964 | | | | 335,581 | | | | | |
| | | | | |
Shares converted from Class C | | | 10,303,954 | | | | 9,247,679 | | | | | | | | 77,721,522 | | | | 75,579,599 | | | | | |
| | | | | |
Shares redeemed | | | (59,938,889 | ) | | | (53,905,912 | ) | | | | | | | (455,510,924 | ) | | | (436,047,880 | ) | | | | |
| | | | | |
Net decrease | | | (10,404,684 | ) | | | (3,600,787 | ) | | | | | | $ | (84,110,072 | ) | | $ | (27,630,795 | ) | | | | |
| | | | | |
| | | | | | | | | | | | | | | | | | | | | | | | |
| Class B | | | | | | | | | | | | | | | | | | | | | | | | |
Shares sold | | | – 0 | – | | | 11,597 | | | | | | | $ | 38 | | | $ | 94,709 | | | | | |
| | | | | |
Shares issued in reinvestment of dividends | | | 4 | | | | 6,407 | | | | | | | | – 0 | – | | | 52,409 | | | | | |
| | | | | |
Shares converted to Class A | | | (103,502 | ) | | | (41,080 | ) | | | | | | | (855,964 | ) | | | (335,581 | ) | | | | |
| | | | | |
Shares redeemed | |
| – 0
| –
| | | (13,824 | ) | | | | | | | (7 | ) | | | (112,716 | ) | | | | |
| | | | | |
Net decrease | | | (103,498 | ) | | | (36,900 | ) | | | | | | $ | (855,933 | ) | | $ | (301,179 | ) | | | | |
| | | | | |
| | | | | | | | | | | | | | | | | | | | | | | | |
| Class C | | | | | | | | | | | | | | | | | | | | | | | | |
Shares sold | | | 9,396,426 | | | | 6,829,548 | | | | | | | $ | 69,982,274 | | | $ | 56,130,894 | | | | | |
| | | | | |
Shares issued in reinvestment of dividends | | | 2,140,910 | | | | 2,770,681 | | | | | | | | 16,398,052 | | | | 22,727,630 | | | | | |
| | | | | |
Shares converted to Class A | | | (10,182,346 | ) | | | (9,138,554 | ) | | | | | | | (77,721,522 | ) | | | (75,579,599 | ) | | | | |
| | | | | |
Shares redeemed | | | (19,761,700 | ) | | | (24,359,491 | ) | | | | | | | (150,856,254 | ) | | | (198,992,619 | ) | | | | |
| | | | | |
Net decrease | | | (18,406,710 | ) | | | (23,897,816 | ) | | | | | | $ | (142,197,450 | ) | | $ | (195,713,694 | ) | | | | |
| | | | | |
| | | | | | | | | | | | | | | | | | | | | | | | |
| | |
| |
118 | AB HIGH INCOME FUND | | abfunds.com |
NOTES TO FINANCIAL STATEMENTS (continued)
| | | | | | | | | | | | | | | | | | | | | | | | |
| | | | | | | | | | | | | | | | | | | | | | | | |
| | | Shares | | | | | | Amount | | | | |
| | | Year Ended
October 31,
2020 | | | Year Ended October 31,
2019 | | | | | | Year Ended
October 31, 2020 | | | Year Ended October 31, 2019 | | | | |
| | | | | | | | |
| Advisor Class | | | | | | | | | | | | | | | | | | | | | | | | |
Shares sold | | | 300,143,915 | | | | 193,790,462 | | | | | | | $ | 2,185,801,706 | | | $ | 1,571,793,503 | | | | | |
| | | | | |
Shares issued in reinvestment of dividends | | | 14,949,924 | | | | 14,597,426 | | | | | | | | 113,488,157 | | | | 118,661,726 | | | | | |
| | | | | |
Shares redeemed | | | (269,674,525 | ) | | | (236,255,241 | ) | | | | | | | (2,034,432,046 | ) | | | (1,911,319,429 | ) | | | | |
| | | | | |
Net increase (decrease) | | | 45,419,314 | | | | (27,867,353 | ) | | | | | | $ | 264,857,817 | | | $ | (220,864,200 | ) | | | | |
| | | | | |
| | | | | | | | | | | | | | | | | | | | | | | | |
| Class R | | | | | | | | | | | | | | | | | | | | | | | | |
Shares sold | | | 1,189,713 | | | | 1,418,731 | | | | | | | $ | 9,087,432 | | | $ | 11,494,095 | | | | | |
| | | | | |
Shares issued in reinvestment of dividends | | | 357,257 | | | | 469,784 | | | | | | | | 2,708,506 | | | | 3,810,256 | | | | | |
| | | | | |
Shares redeemed | | | (3,428,286 | ) | | | (3,431,556 | ) | | | | | | | (26,069,265 | ) | | | (27,774,790 | ) | | | | |
| | | | | |
Net decrease | | | (1,881,316 | ) | | | (1,543,041 | ) | | | | | | $ | (14,273,327 | ) | | $ | (12,470,439 | ) | | | | |
| | | | | |
| | | | | | | | | | | | | | | | | | | | | | | | |
| Class K | | | | | | | | | | | | | | | | | | | | | | | | |
Shares sold | | | 2,586,142 | | | | 1,903,243 | | | | | | | $ | 19,605,736 | | | $ | 15,469,421 | | | | | |
| | | | | |
Shares issued in reinvestment of dividends | | | 660,196 | | | | 901,710 | | | | | | | | 5,003,848 | | | | 7,316,240 | | | | | |
| | | | | |
Shares redeemed | | | (7,625,157 | ) | | | (4,346,608 | ) | | | | | | | (58,552,060 | ) | | | (35,228,609 | ) | | | | |
| | | | | |
Net decrease | | | (4,378,819 | ) | | | (1,541,655 | ) | | | | | | $ | (33,942,476 | ) | | $ | (12,442,948 | ) | | | | |
| | | | | |
| | | | | | | | | | | | | | | | | | | | | | | | |
| Class I | | | | | | | | | | | | | | | | | | | | | | | | |
Shares sold | | | 7,064,910 | | | | 4,109,541 | | | | | | | $ | 51,381,403 | | | $ | 33,366,973 | | | | | |
| | | | | |
Shares issued in reinvestment of dividends | | | 1,332,722 | | | | 1,397,944 | | | | | | | | 10,094,835 | | | | 11,356,613 | | | | | |
| | | | | |
Shares redeemed | | | (11,370,317 | ) | | | (8,749,503 | ) | | | | | | | (86,202,432 | ) | | | (70,836,826 | ) | | | | |
| | | | | |
Net decrease | | | (2,972,685 | ) | | | (3,242,018 | ) | | | | | | $ | (24,726,194 | ) | | $ | (26,113,240 | ) | | | | |
| | | | | |
| | | | | | | | | | | | | | | | | | | | | | | | |
| Class Z | | | | | | | | | | | | | | | | | | | | | | | | |
Shares sold | | | 23,216,834 | | | | 14,232,950 | | | | | | | $ | 172,593,165 | | | $ | 115,291,143 | | | | | |
| | | | | |
Shares issued in reinvestment of dividends | | | 2,727,864 | | | | 2,680,918 | | | | | | | | 20,657,731 | | | | 21,781,197 | | | | | |
| | | | | |
Shares redeemed | | | (25,389,031 | ) | | | (20,760,467 | ) | | | | | | | (189,398,258 | ) | | | (167,856,142 | ) | | | | |
| | | | | |
Net increase (decrease) | | | 555,667 | | | | (3,846,599 | ) | | | | | | $ | 3,852,638 | | | $ | (30,783,802 | ) | | | | |
| | | | | |
| | |
| |
| abfunds.com | | AB HIGH INCOME FUND | 119 |
NOTES TO FINANCIAL STATEMENTS (continued)
NOTE F
Risks Involved in Investing in the Fund
Market Risk—The value of the Fund’s assets will fluctuate as the stock or bond market fluctuates. The value of its investments may decline, sometimes rapidly and unpredictably, simply because of economic changes or other events, including public health crises (including the occurrence of a contagious disease or illness), that affect large portions of the market.
Interest Rate Risk—Changes in interest rates will affect the value of investments in fixed-income securities. When interest rates rise, the value of existing investments in fixed-income securities tends to fall and this decrease in value may not be offset by higher income from new investments. Interest rate risk is generally greater for fixed-income securities with longer maturities or durations.
Credit Risk—An issuer or guarantor of a fixed-income security, or the counterparty to a derivatives or other contract, may be unable or unwilling to make timely payments of interest or principal, or to otherwise honor its obligations. The issuer or guarantor may default, causing a loss of the full principal amount of a security and accrued interest. The degree of risk for a particular security may be reflected in its credit rating. There is the possibility that the credit rating of a fixed-income security may be downgraded after purchase, which may adversely affect the value of the security.
Below Investment Grade Securities Risk—Investments in fixed-income securities with lower ratings (commonly known as “junk bonds”) tend to have a higher probability that an issuer will default or fail to meet its payment obligations. These securities may be subject to greater price volatility due to such factors as specific corporate developments and negative perceptions of the junk bond market generally and may be more difficult to trade than other types of securities.
Duration Risk—Duration is a measure that relates the expected price volatility of a fixed-income security to changes in interest rates. The duration of a fixed-income security may be shorter than or equal to full maturity of a fixed-income security. Fixed-income securities with longer durations have more risk and will decrease in price as interest rates rise.
Inflation Risk—This is the risk that the value of assets or income from investments will be less in the future as inflation decreases the value of money. As inflation increases, the value of the Fund’s assets can decline as can the value of the Fund’s distributions. This risk is significantly greater for fixed-income securities with longer maturities.
Foreign (Non-U.S.) Risk—Investments in securities of non-U.S. issuers may involve more risk than those of U.S. issuers. These securities may
| | |
| |
120 | AB HIGH INCOME FUND | | abfunds.com |
NOTES TO FINANCIAL STATEMENTS (continued)
fluctuate more widely in price and may be more difficult to trade due to adverse market, economic, political, regulatory or other factors.
Emerging Market Risk—Investments in emerging market countries may have more risk because the markets are less developed and less liquid as well as being subject to increased economic, political, regulatory or other uncertainties.
Currency Risk—Fluctuations in currency exchange rates may negatively affect the value of the Fund’s investments or reduce its returns.
Mortgage-Related and/or Other Asset-Backed Securities Risk—Investments in mortgage-related and other asset-backed securities are subject to certain additional risks. The value of these securities may be particularly sensitive to changes in interest rates. These risks include “extension risk”, which is the risk that, in periods of rising interest rates, issuers may delay the payment of principal, and “prepayment risk”, which is the risk that in periods of falling interest rates, issuers may pay principal sooner than expected, exposing the Fund to a lower rate of return upon reinvestment of principal. Mortgage-backed securities offered by non-governmental issuers
and other asset-backed securities may be subject to other risks, such as higher rates of default in the mortgages or assets backing the securities or risks associated with the nature and servicing of mortgages or assets backing the securities.
Loan Participations and Assignments Risk—When the Fund purchases loan participations and assignments, it is subject to the credit risk associated with the underlying corporate borrower. In addition, the lack of a liquid secondary market for loan participations and assignments may have an adverse impact on the value of such investments and the Fund’s ability to dispose of particular assignments or participations when necessary to meet the Fund’s liquidity needs or in response to a specific economic event such as a deterioration in the creditworthiness of the borrower.
Leverage Risk—When the Fund borrows money or otherwise leverages its investments, its performance may be volatile because leverage tends to exaggerate the effect of any increase or decrease in the value of the Fund’s investments. The Fund may create leverage through the use of reverse repurchase arrangements, forward currency exchange contracts, forward commitments, dollar rolls or futures contracts or by borrowing money. The use of other types of derivative instruments by the Fund, such as options and swaps, may also result in a form of leverage. Leverage may result in higher returns to the Fund than if the Fund were not leveraged, but may also adversely affect returns, particularly if the market is declining.
| | |
| |
| abfunds.com | | AB HIGH INCOME FUND | 121 |
NOTES TO FINANCIAL STATEMENTS (continued)
Derivatives Risk—The Fund may enter into derivative transactions such as forwards, options, futures and swaps. Derivatives may be illiquid, difficult to price, and leveraged so that small changes may produce disproportionate losses for the Fund, and subject to counterparty risk to a greater degree than more traditional investments. Derivatives may result in significant losses, including losses that are far greater than the value of the derivatives reflected on the statement of assets and liabilities.
Illiquid Investments Risk—Illiquid investments risk exists when certain investments become difficult to purchase or sell. Difficulty in selling such investments may result in sales at disadvantageous prices affecting the value of your investment in the Fund. Causes of illiquid investments risk may include low trading volumes, large positions and heavy redemptions of Fund shares. Illiquid investments risk may be higher in a rising interest rate environment, when the value and liquidity of fixed-income securities generally decline.
LIBOR Risk—The Fund may invest in certain debt securities, derivatives or other financial instruments that utilize the London Interbank Offered Rate, or “LIBOR,” as a “benchmark” or “reference rate” for various interest rate calculations. In July 2017, the United Kingdom Financial Conduct Authority, which regulates LIBOR, announced a desire to phase out the use of LIBOR by the end of 2021. Although financial regulators and industry working groups have suggested alternative reference rates, such as European Interbank Offer Rate (“EURIBOR”), Sterling Overnight Interbank Average Rate (“SONIA”) and Secured Overnight Financing Rate (“SOFR”), global consensus on alternative rates is lacking and the process for amending existing contracts or instruments to transition away from LIBOR is underway but remains unclear. The elimination of LIBOR or changes to other reference rates or any other changes or reforms to the determination or supervision of reference rates could have an adverse impact on the market for, or value of, any securities or payments linked to those reference rates, which may adversely affect the Fund’s performance and/or net asset value. Uncertainty and risk also remain regarding the willingness and ability of issuers and lenders to include revised provisions in new and existing contracts or instruments. Consequently, the transition away from LIBOR to other reference rates may lead to increased volatility and illiquidity in markets that are tied to LIBOR, fluctuations in values of LIBOR-related investments or investments in issuers that utilize LIBOR, increased difficulty in borrowing or refinancing and diminished effectiveness of hedging strategies, adversely affecting the Fund’s performance. Furthermore, the risks associated with the expected discontinuation of LIBOR and transition may be exacerbated if the work necessary to effect an orderly transition to an alternative reference rate is not completed in a
| | |
| |
122 | AB HIGH INCOME FUND | | abfunds.com |
NOTES TO FINANCIAL STATEMENTS (continued)
timely manner. Because the usefulness of LIBOR as a benchmark could deteriorate during the transition period, these effects could occur prior to the end of 2021.
Indemnification Risk—In the ordinary course of business, the Fund enters into contracts that contain a variety of indemnifications. The Fund’s maximum exposure under these arrangements is unknown. However, the Fund has not had prior claims or losses pursuant to these indemnification provisions and expects the risk of loss thereunder to be remote. Therefore, the Fund has not accrued any liability in connection with these indemnification provisions.
Management Risk—The Fund is subject to management risk because it is an actively managed investment fund. The Adviser will apply its investment techniques and risk analyses in making investment decisions for the Fund, but there is no guarantee that its techniques will produce the intended results.
NOTE G
Joint Credit Facility
A number of open-end mutual funds managed by the Adviser, including the Fund, participate in a $325 million revolving credit facility (the “Facility”) intended to provide short-term financing, if necessary, subject to certain restrictions in connection with abnormal redemption activity. Commitment fees related to the Facility are paid by the participating funds and are included in miscellaneous expenses in the statement of operations. The Fund did not utilize the Facility during the year ended October 31, 2020.
NOTE H
Distributions to Shareholders
The tax character of distributions paid during the fiscal years ended October 31, 2020 and October 31, 2019 were as follows:
| | | | | | | | |
| | | 2020 | | | 2019 | |
Distributions paid from: | | | | | | | | |
Ordinary income | | $ | 335,710,126 | | | $ | 284,002,226 | |
| | | | | | | | |
Total taxable distributions paid | | | 335,710,126 | | | | 284,002,226 | |
Return of Capital | | | – 0 | – | | | 86,057,636 | |
| | | | | | | | |
Total distributions paid | | $ | 335,710,126 | | | $ | 370,059,862 | |
| | | | | | | | |
| | |
| |
| abfunds.com | | AB HIGH INCOME FUND | 123 |
NOTES TO FINANCIAL STATEMENTS (continued)
As of October 31, 2020, the components of accumulated earnings/(deficit) on a tax basis were as follows:
| | | | |
Accumulated capital and other losses | | $ | (579,769,870 | )(a) |
Unrealized appreciation/(depreciation) | | | (194,163,471 | )(b) |
| | | | |
Total accumulated earnings/(deficit) | | $ | (773,933,341 | )(c) |
| | | | |
| (a) | As of October 31, 2020, the Fund had a net capital loss carryforward of $572,526,632. As of October 31, 2020, the cumulative deferred loss on straddles was $7,243,238. |
| (b) | The differences between book-basis and tax-basis unrealized appreciation/(depreciation) are attributable primarily to the recognition for tax purposes of unrealized gains/losses on certain derivative instruments, the tax treatment of passive foreign investment companies (PFICs), the tax treatment of swaps, the tax deferral of losses on wash sales, the tax treatment of partnership investments, and the amortization on callable bonds. |
| (c) | The differences between book-basis and tax-basis components of accumulated earnings/(deficit) are attributable primarily to the accrual of foreign capital gains tax, the tax treatment of defaulted securities, and dividends payable. |
For tax purposes, net realized capital losses may be carried over to offset future capital gains, if any. Funds are permitted to carry forward capital losses for an indefinite period, and such losses will retain their character as either short-term or long-term capital losses. As of October 31, 2020, the Fund had a net short-term capital loss carryforward of $243,273,843 and a net long-term capital loss carryforward of $329,252,789, which may be carried forward for an indefinite period.
During the current fiscal year, permanent differences primarily due to contributions from the Adviser and the tax treatment of swaps resulted in a net decrease in accumulated loss and a net decrease in additional paid-in capital. These reclassifications had no effect on net assets.
NOTE I
Recent Accounting Pronouncements
In March 2017, the Financial Accounting Standards Board issued an Accounting Standards Update, ASU 2017-08, Receivables – Nonrefundable Fees and Other Costs (Subtopic 310-20), Premium Amortization on Purchased Callable Debt Securities which amends the amortization period for certain purchased callable debt securities held at a premium, shortening such period to the earliest call date. ASU 2017-08 does not require any accounting change for debt securities held at a discount; the discount continues to be amortized to maturity. ASU 2017-08 is effective for fiscal years, and interim periods within those fiscal years, beginning after December 15, 2018. The Fund has adopted ASU 2017-08, which did not have a material impact on the Fund’s financial position or the results of its operations, and had no impact on the Fund’s net assets.
| | |
| |
124 | AB HIGH INCOME FUND | | abfunds.com |
NOTES TO FINANCIAL STATEMENTS (continued)
NOTE J
Subsequent Events
Management has evaluated subsequent events for possible recognition or disclosure in the financial statements through the date the financial statements are issued. Management has determined that there are no material events that would require disclosure in the Fund’s financial statements through this date.
| | |
| |
| abfunds.com | | AB HIGH INCOME FUND | 125 |
FINANCIAL HIGHLIGHTS
Selected Data For A Share Of Capital Stock Outstanding Throughout Each Period
| | | | | | | | | | | | | | | | | | | | |
| | | Class A | |
| | | Year Ended October 31, | |
| | | 2020 | | | 2019 | | | 2018 | | | 2017 | | | 2016 | |
| | | | |
Net asset value, beginning
of period | | | $ 8.19 | | | | $ 8.14 | | | | $ 8.91 | | | | $ 8.65 | | | | $ 8.50 | |
| | | | |
Income From Investment Operations | | | | | | | | | | | | | | | | | | | | |
| | | | | |
Net investment income(a)(b) | | | .41 | | | | .47 | | | | .50 | | | | .45 | | | | .48 | |
| | | | | |
Net realized and unrealized gain (loss) on investment and foreign currency transactions | | | (.59 | ) | | | .11 | | | | (.71 | ) | | | .34 | | | | .27 | |
| | | | | |
Contributions from Affiliates | | | .00 | (c) | | | .00 | (c) | | | .00 | (c) | | | – 0 | – | | | .00 | (c) |
| | | | | |
Capital Contributions | | | – 0 | – | | | – 0 | – | | | – 0 | – | | | – 0 | – | | | .00 | (c) |
| | | | |
Net increase (decrease) in net asset value from operations | | | (.18 | ) | | | .58 | | | | (.21 | ) | | | .79 | | | | .75 | |
| | | | |
Less: Dividends and Distributions | | | | | | | | | | | | | | | | | | | | |
| | | | | |
Dividends from net investment income | | | (.48 | ) | | | (.41 | ) | | | (.49 | ) | | | (.53 | ) | | | (.60 | ) |
| | | | | |
Return of capital | | | – 0 | – | | | (.12 | ) | | | (.07 | ) | | | – 0 | – | | | – 0 | – |
| | | | |
Total dividends and distributions | | | (.48 | ) | | | (.53 | ) | | | (.56 | ) | | | (.53 | ) | | | (.60 | ) |
| | | | |
Net asset value, end of period | | | $ 7.53 | | | | $ 8.19 | | | | $ 8.14 | | | | $ 8.91 | | | | $ 8.65 | |
| | | | |
| | | | | |
Total Return | | | | | | | | | | | | | | | | | | | | |
| | | | | |
Total investment return based on net asset value(d) | | | (2.02 | )%^ | | | 7.33 | % | | | (2.51 | )% | | | 9.30 | % | | | 9.41 | %* |
| | | | | |
Ratios/Supplemental Data | | | | | | | | | | | | | | | | | | | | |
| | | | | |
Net assets, end of period
(000’s omitted) | | | $1,143,143 | | | | $1,329,150 | | | | $1,350,517 | | | | $1,869,052 | | | | $2,061,177 | |
| | | | | |
Ratio to average net assets of: | | | | | | | | | | | | | | | | | | | | |
| | | | | |
Expenses, net of waivers/reimbursements(e)† | | | .86 | % | | | .87 | % | | | .84 | % | | | .81 | % | | | .84 | % |
| | | | | |
Expenses, before waivers/reimbursements(e)† | | | .86 | % | | | .88 | % | | | .85 | % | | | .82 | % | | | .85 | % |
| | | | | |
Net investment income(b) | | | 5.43 | % | | | 5.82 | % | | | 5.86 | % | | | 5.15 | % | | | 5.75 | % |
| | | | | |
Portfolio turnover rate | | | 54 | % | | | 49 | % | | | 35 | % | | | 51 | % | | | 45 | % |
| | | | | | | | | | | | | | | | | | | | |
| |
† Expense ratios exclude the estimated acquired fund fees of affiliated/unaffiliated underlying | |
portfolios | | | .00 | % | | | .01 | % | | | .00 | % | | | .00 | % | | | .00 | % |
See footnote summary on page 133.
| | |
| |
126 | AB HIGH INCOME FUND | | abfunds.com |
FINANCIAL HIGHLIGHTS (continued)
Selected Data For A Share Of Capital Stock Outstanding Throughout Each Period
| | | | | | | | | | | | | | | | | | | | |
| | | Class C | |
| | | Year Ended October 31, | |
| | | 2020 | | | 2019 | | | 2018 | | | 2017 | | | 2016 | |
| | | | |
Net asset value, beginning of period | | | $ 8.29 | | | | $ 8.24 | | | | $ 9.01 | | | | $ 8.75 | | | | $ 8.60 | |
| | | | |
Income From Investment Operations | | | | | | | | | | | | | | | | | | | | |
| | | | | |
Net investment income(a)(b) | | | .35 | | | | .41 | | | | .44 | | | | .39 | | | | .42 | |
| | | | | |
Net realized and unrealized gain (loss) on investment and foreign currency transactions | | | (.60 | ) | | | .10 | | | | (.72 | ) | | | .33 | | | | .27 | |
| | | | | |
Contributions from Affiliates | | | .00 | (c) | | | .00 | (c) | | | .00 | (c) | | | – 0 | – | | | .00 | (c) |
| | | | | |
Capital Contributions | | | – 0 | – | | | – 0 | – | | | – 0 | – | | | – 0 | – | | | .00 | (c) |
| | | | |
Net increase (decrease) in net asset value from operations | | | (.25 | ) | | | .51 | | | | (.28 | ) | | | .72 | | | | .69 | |
| | | | |
Less: Dividends and Distributions | | | | | | | | | | | | | | | | | | | | |
| | | | | |
Dividends from net investment income | | | (.42 | ) | | | (.35 | ) | | | (.43 | ) | | | (.46 | ) | | | (.54 | ) |
| | | | | |
Return of capital | | | – 0 | – | | | (.11 | ) | | | (.06 | ) | | | – 0 | – | | | – 0 | – |
| | | | |
Total dividends and distributions | | | (.42 | ) | | | (.46 | ) | | | (.49 | ) | | | (.46 | ) | | | (.54 | ) |
| | | | |
Net asset value, end of period | | | $ 7.62 | | | | $ 8.29 | | | | $ 8.24 | | | | $ 9.01 | | | | $ 8.75 | |
| | | | |
| | | | | |
Total Return | | | | | | | | | | | | | | | | | | | | |
| | | | | |
Total investment return based on net asset value(d) | | | (2.86 | )%^ | | | 6.43 | % | | | (3.21 | )% | | | 8.37 | % | | | 8.50 | %* |
| | | | | |
Ratios/Supplemental Data | | | | | | | | | | | | | | | | | | | | |
| | | | | |
Net assets, end of period
(000’s omitted) | | | $456,375 | | | | $649,108 | | | | $842,095 | | | | $1,139,390 | | | | $1,298,312 | |
| | | | | |
Ratio to average net assets of: | | | | | | | | | | | | | | | | | | | | |
| | | | | |
Expenses, net of waivers/reimbursements(e)† | | | 1.61 | % | | | 1.62 | % | | | 1.59 | % | | | 1.56 | % | | | 1.58 | % |
| | | | | |
Expenses, before waivers/reimbursements(e)† | | | 1.61 | % | | | 1.62 | % | | | 1.59 | % | | | 1.56 | % | | | 1.58 | % |
| | | | | |
Net investment income(b) | | | 4.56 | % | | | 5.00 | % | | | 5.04 | % | | | 4.33 | % | | | 4.94 | % |
| | | | | |
Portfolio turnover rate | | | 54 | % | | | 49 | % | | | 35 | % | | | 51 | % | | | 45 | % |
| | | | | | | | | | | | | | | | | | | | |
| |
† Expense ratios exclude the estimated acquired fund fees of affiliated/unaffiliated underlying | |
portfolios | | | .00 | % | | | .01 | % | | | .00 | % | | | .00 | % | | | .00 | % |
See footnote summary on page 133.
| | |
| |
| abfunds.com | | AB HIGH INCOME FUND | 127 |
FINANCIAL HIGHLIGHTS (continued)
Selected Data For A Share Of Capital Stock Outstanding Throughout Each Period
| | | | | | | | | | | | | | | | | | | | |
| | | Advisor Class | |
| | | Year Ended October 31, | |
| | | 2020 | | | 2019 | | | 2018 | | | 2017 | | | 2016 | |
| | | | |
Net asset value, beginning of period | | | $ 8.20 | | | | $ 8.15 | | | | $ 8.92 | | | | $ 8.66 | | | | $ 8.51 | |
| | | | |
Income From Investment Operations | | | | | | | | | | | | | | | | | | | | |
| | | | | |
Net investment income(a)(b) | | | .43 | | | | .49 | | | | .52 | | | | .48 | | | | .49 | |
| | | | | |
Net realized and unrealized gain (loss) on investment and foreign currency transactions | | | (.59 | ) | | | .11 | | | | (.71 | ) | | | .33 | | | | .28 | |
| | | | | |
Contributions from Affiliates | | | .00 | (c) | | | .00 | (c) | | | .00 | (c) | | | – 0 | – | | | .00 | (c) |
| | | | | |
Capital Contributions | | | – 0 | – | | | – 0 | – | | | – 0 | – | | | – 0 | – | | | .00 | (c) |
| | | | |
Net increase (decrease) in net asset value from operations | | | (.16 | ) | | | .60 | | | | (.19 | ) | | | .81 | | | | .77 | |
| | | | |
Less: Dividends and Distributions | | | | | | | | | | | | | | | | | | | | |
| | | | | |
Dividends from net investment income | | | (.50 | ) | | | (.42 | ) | | | (.50 | ) | | | (.55 | ) | | | (.62 | ) |
| | | | | |
Return of capital | | | – 0 | – | | | (.13 | ) | | | (.08 | ) | | | – 0 | – | | | – 0 | – |
| | | | |
Total dividends and distributions | | | (.50 | ) | | | (.55 | ) | | | (.58 | ) | | | (.55 | ) | | | (.62 | ) |
| | | | |
Net asset value, end of period | | | $ 7.54 | | | | $ 8.20 | | | | $ 8.15 | | | | $ 8.92 | | | | $ 8.66 | |
| | | | |
| | | | | |
Total Return | | | | | | | | | | | | | | | | | | | | |
| | | | | |
Total investment return based on net asset value(d) | | | (1.77 | )%^ | | | 7.58 | % | | | (2.26 | )% | | | 9.56 | % | | | 9.69 | %* |
| | | | | |
Ratios/Supplemental Data | | | | | | | | | | | | | | | | | | | | |
| | | | | |
Net assets, end of period
(000’s omitted) | | | $3,077,869 | | | | $2,976,343 | | | | $3,185,833 | | | | $4,351,171 | | | | $3,828,042 | |
| | | | | |
Ratio to average net assets of: | | | | | | | | | | | | | | | | | | | | |
| | | | | |
Expenses, net of waivers/reimbursements(e)† | | | .61 | % | | | .62 | % | | | .59 | % | | | .56 | % | | | .58 | % |
| | | | | |
Expenses, before waivers/reimbursements(e)† | | | .61 | % | | | .63 | % | | | .60 | % | | | .57 | % | | | .58 | % |
| | | | | |
Net investment income(b) | | | 5.57 | % | | | 6.05 | % | | | 6.10 | % | | | 5.38 | % | | | 5.87 | % |
| | | | | |
Portfolio turnover rate | | | 54 | % | | | 49 | % | | | 35 | % | | | 51 | % | | | 45 | % |
| | | | | | | | | | | | | | | | | | | | |
| |
† Expense ratios exclude the estimated acquired fund fees of affiliated/unaffiliated underlying | |
portfolios | | | .00 | % | | | .01 | % | | | .00 | % | | | .00 | % | | | .00 | % |
See footnote summary on page 133.
| | |
| |
128 | AB HIGH INCOME FUND | | abfunds.com |
FINANCIAL HIGHLIGHTS (continued)
Selected Data For A Share Of Capital Stock Outstanding Throughout Each Period
| | | | | | | | | | | | | | | | | | | | |
| | | Class R | |
| | | Year Ended October 31, | |
| | | 2020 | | | 2019 | | | 2018 | | | 2017 | | | 2016 | |
| | | | |
Net asset value, beginning of period | | | $ 8.19 | | | | $ 8.14 | | | | $ 8.90 | | | | $ 8.64 | | | | $ 8.49 | |
| | | | |
Income From Investment Operations | | | | | | | | | | | | | | | | | | | | |
| | | | | |
Net investment income(a)(b) | | | .38 | | | | .44 | | | | .47 | | | | .42 | | | | .45 | |
| | | | | |
Net realized and unrealized gain (loss) on investment and foreign currency transactions | | | (.59 | ) | | | .10 | | | | (.71 | ) | | | .33 | | | | .27 | |
| | | | | |
Contributions from Affiliates | | | .00 | (c) | | | .00 | (c) | | | .00 | (c) | | | – 0 | – | | | .00 | (c) |
| | | | | |
Capital Contributions | | | – 0 | – | | | – 0 | – | | | – 0 | – | | | – 0 | – | | | .00 | (c) |
| | | | |
Net increase (decrease) in net asset value from operations | | | (.21 | ) | | | .54 | | | | (.24 | ) | | | .75 | | | | .72 | |
| | | | |
Less: Dividends and Distributions | | | | | | | | | | | | | | | | | | | | |
| | | | | |
Dividends from net investment income | | | (.45 | ) | | | (.38 | ) | | | (.45 | ) | | | (.49 | ) | | | (.57 | ) |
| | | | | |
Return of capital | | | – 0 | – | | | (.11 | ) | | | (.07 | ) | | | – 0 | – | | | – 0 | – |
| | | | |
Total dividends and distributions | | | (.45 | ) | | | (.49 | ) | | | (.52 | ) | | | (.49 | ) | | | (.57 | ) |
| | | | |
Net asset value, end of period | | | $ 7.53 | | | | $ 8.19 | | | | $ 8.14 | | | | $ 8.90 | | | | $ 8.64 | |
| | | | |
| | | | | |
Total Return | | | | | | | | | | | | | | | | | | | | |
| | | | | |
Total investment return based on net asset value(d) | | | (2.49 | )%^ | | | 6.89 | % | | | (2.80 | )%^ | | | 8.88 | %^ | | | 9.01 | %* |
| | | | | |
Ratios/Supplemental Data | | | | | | | | | | | | | | | | | | | | |
| | | | | |
Net assets, end of period
(000’s omitted) | | | $38,435 | | | | $57,226 | | | | $69,442 | | | | $87,602 | | | | $86,059 | |
| | | | | |
Ratio to average net assets of: | | | | | | | | | | | | | | | | | | | | |
| | | | | |
Expenses, net of waivers/reimbursements(e)† | | | 1.32 | % | | | 1.28 | % | | | 1.26 | % | | | 1.20 | % | | | 1.22 | % |
| | | | | |
Expenses, before waivers/reimbursements(e)† | | | 1.33 | % | | | 1.28 | % | | | 1.26 | % | | | 1.21 | % | | | 1.22 | % |
| | | | | |
Net investment income(b) | | | 4.93 | % | | | 5.43 | % | | | 5.47 | % | | | 4.77 | % | | | 5.39 | % |
| | | | | |
Portfolio turnover rate | | | 54 | % | | | 49 | % | | | 35 | % | | | 51 | % | | | 45 | % |
| | | | | | | | | | | | | | | | | | | | |
| |
† Expense ratios exclude the estimated acquired fund fees of affiliated/unaffiliated underlying | |
portfolios | | | .00 | % | | | .01 | % | | | .00 | % | | | .00 | % | | | .00 | % |
See footnote summary on page 133.
| | |
| |
| abfunds.com | | AB HIGH INCOME FUND | 129 |
FINANCIAL HIGHLIGHTS (continued)
Selected Data For A Share Of Capital Stock Outstanding Throughout Each Period
| | | | | | | | | | | | | | | | | | | | |
| | | Class K | |
| | | Year Ended October 31, | |
| | | 2020 | | | 2019 | | | 2018 | | | 2017 | | | 2016 | |
| | | | |
Net asset value, beginning of period | | | $ 8.19 | | | | $ 8.14 | | | | $ 8.91 | | | | $ 8.65 | | | | $ 8.50 | |
| | | | |
Income From Investment Operations | | | | | | | | | | | | | | | | | | | | |
| | | | | |
Net investment income(a)(b) | | | .40 | | | | .47 | | | | .50 | | | | .45 | | | | .48 | |
| | | | | |
Net realized and unrealized gain (loss) on investment and foreign currency transactions | | | (.59 | ) | | | .10 | | | | (.72 | ) | | | .33 | | | | .27 | |
| | | | | |
Contributions from Affiliates | | | .00 | (c) | | | .00 | (c) | | | .00 | (c) | | | – 0 | – | | | .00 | (c) |
| | | | | |
Capital Contributions | | | – 0 | – | | | – 0 | – | | | – 0 | – | | | – 0 | – | | | .00 | (c) |
| | | | |
Net increase (decrease) in net asset value from operations | | | (.19 | ) | | | .57 | | | | (.22 | ) | | | .78 | | | | .75 | |
| | | | |
Less: Dividends and Distributions | | | | | | | | | | | | | | | | | | | | |
| | | | | |
Dividends from net investment income | | | (.47 | ) | | | (.40 | ) | | | (.48 | ) | | | (.52 | ) | | | (.60 | ) |
| | | | | |
Return of capital | | | – 0 | – | | | (.12 | ) | | | (.07 | ) | | | – 0 | – | | | – 0 | – |
| | | | |
Total dividends and distributions | | | (.47 | ) | | | (.52 | ) | | | (.55 | ) | | | (.52 | ) | | | (.60 | ) |
| | | | |
Net asset value, end of period | | | $ 7.53 | | | | $ 8.19 | | | | $ 8.14 | | | | $ 8.91 | | | | $ 8.65 | |
| | | | |
| | | | | |
Total Return | | | | | | | | | | | | | | | | | | | | |
| | | | | |
Total investment return based on net asset value(d) | | | (2.15 | )%^ | | | 7.25 | % | | | (2.58 | )% | | | 9.22 | % | | | 9.41 | %* |
| | | | | |
Ratios/Supplemental Data | | | | | | | | | | | | | | | | | | | | |
| | | | | |
Net assets, end of period
(000’s omitted) | | | $68,253 | | | | $110,135 | | | | $122,030 | | | | $126,399 | | | | $106,841 | |
| | | | | |
Ratio to average net assets of: | | | | | | | | | | | | | | | | | | | | |
| | | | | |
Expenses, net of waivers/reimbursements(e)† | | | .98 | % | | | .94 | % | | | .91 | % | | | .89 | % | | | .85 | % |
| | | | | |
Expenses, before waivers/reimbursements(e)† | | | .98 | % | | | .94 | % | | | .91 | % | | | .89 | % | | | .85 | % |
| | | | | |
Net investment income(b) | | | 5.27 | % | | | 5.76 | % | | | 5.83 | % | | | 5.08 | % | | | 5.75 | % |
| | | | | |
Portfolio turnover rate | | | 54 | % | | | 49 | % | | | 35 | % | | | 51 | % | | | 45 | % |
| | | | | | | | | | | | | | | | | | | | |
| |
† Expense ratios exclude the estimated acquired fund fees of affiliated/unaffiliated underlying | |
portfolios | | | .00 | % | | | .01 | % | | | .00 | % | | | .00 | % | | | .00 | % |
See footnote summary on page 133.
| | |
| |
130 | AB HIGH INCOME FUND | | abfunds.com |
FINANCIAL HIGHLIGHTS (continued)
Selected Data For A Share Of Capital Stock Outstanding Throughout Each Period
| | | | | | | | | | | | | | | | | | | | |
| | | Class I | |
| | | Year Ended October 31, | |
| | | 2020 | | | 2019 | | | 2018 | | | 2017 | | | 2016 | |
| | | | |
Net asset value, beginning of period | | | $ 8.20 | | | | $ 8.15 | | | | $ 8.92 | | | | $ 8.66 | | | | $ 8.51 | |
| | | | |
Income From Investment Operations | | | | | | | | | | | | | | | | | | | | |
| | | | | |
Net investment income(a)(b) | | | .42 | | | | .50 | | | | .53 | | | | .48 | | | | .50 | |
| | | | | |
Net realized and unrealized gain (loss) on investment and foreign currency transactions | | | (.58 | ) | | | .10 | | | | (.72 | ) | | | .33 | | | | .28 | |
| | | | | |
Contributions from Affiliates | | | .00 | (c) | | | .00 | (c) | | | .00 | (c) | | | – 0 | – | | | .00 | (c) |
| | | | | |
Capital Contributions | | | – 0 | – | | | – 0 | – | | | – 0 | – | | | – 0 | – | | | .00 | (c) |
| | | | |
Net increase (decrease) in net asset value from operations | | | (.16 | ) | | | .60 | | | | (.19 | ) | | | .81 | | | | .78 | |
| | | | |
Less: Dividends and Distributions | | | | | | | | | | | | | | | | | | | | |
| | | | | |
Dividends from net investment income | | | (.50 | ) | | | (.42 | ) | | | (.50 | ) | | | (.55 | ) | | | (.63 | ) |
| | | | | |
Return of capital | | | – 0 | – | | | (.13 | ) | | | (.08 | ) | | | – 0 | – | | | – 0 | – |
| | | | |
Total dividends and distributions | | | (.50 | ) | | | (.55 | ) | | | (.58 | ) | | | (.55 | ) | | | (.63 | ) |
| | | | |
Net asset value, end of period | | | $ 7.54 | | | | $ 8.20 | | | | $ 8.15 | | | | $ 8.92 | | | | $ 8.66 | |
| | | | |
| | | | | |
Total Return | | | | | | | | | | | | | | | | | | | | |
| | | | | |
Total investment return based on net asset value(d) | | | (1.81 | )%^ | | | 7.61 | % | | | (2.23 | )% | | | 9.60 | % | | | 9.74 | %* |
| | | | | |
Ratios/Supplemental Data | | | | | | | | | | | | | | | | | | | | |
| | | | | |
Net assets, end of period
(000’s omitted) | | | $131,550 | | | | $167,518 | | | | $192,941 | | | | $276,909 | | | | $294,693 | |
| | | | | |
Ratio to average net assets of: | | | | | | | | | | | | | | | | | | | | |
| | | | | |
Expenses, net of waivers/reimbursements(e)† | | | .64 | % | | | .60 | % | | | .56 | % | | | .52 | % | | | .53 | % |
| | | | | |
Expenses, before waivers/reimbursements(e)† | | | .64 | % | | | .60 | % | | | .56 | % | | | .53 | % | | | .53 | % |
| | | | | |
Net investment income(b) | | | 5.57 | % | | | 6.09 | % | | | 6.15 | % | | | 5.43 | % | | | 6.06 | % |
| | | | | |
Portfolio turnover rate | | | 54 | % | | | 49 | % | | | 35 | % | | | 51 | % | | | 45 | % |
| | | | | | | | | | | | | | | | | | | | |
| |
† Expense ratios exclude the estimated acquired fund fees of affiliated/unaffiliated underlying | |
portfolios | | | .00 | % | | | .01 | % | | | .00 | % | | | .00 | % | | | .00 | % |
See footnote summary on page 133.
| | |
| |
| abfunds.com | | AB HIGH INCOME FUND | 131 |
FINANCIAL HIGHLIGHTS (continued)
Selected Data For A Share Of Capital Stock Outstanding Throughout Each Period
| | | | | | | | | | | | | | | | | | | | |
| | | Class Z | |
| | | Year Ended October 31, | |
| | | 2020 | | | 2019 | | | 2018 | | | 2017 | | | 2016 | |
| | | | |
Net asset value, beginning of period | | | $ 8.20 | | | | $ 8.15 | | | | $ 8.92 | | | | $ 8.66 | | | | $ 8.51 | |
| | | | |
Income From Investment Operations | | | | | | | | | | | | | | | | | | | | |
| | | | | |
Net investment income(a)(b) | | | .43 | | | | .50 | | | | .54 | | | | .49 | | | | .50 | |
| | | | | |
Net realized and unrealized gain (loss) on investment and foreign currency transactions | | | (.59 | ) | | | .10 | | | | (.73 | ) | | | .32 | | | | .28 | |
| | | | | |
Contributions from Affiliates | | | .00 | (c) | | | .00 | (c) | | | .00 | (c) | | | – 0 | – | | | .00 | (c) |
| | | | | |
Capital Contributions | | | – 0 | – | | | – 0 | – | | | – 0 | – | | | – 0 | – | | | .00 | (c) |
| | | | |
Net increase (decrease) in net asset value from operations | | | (.16 | ) | | | .60 | | | | (.19 | ) | | | .81 | | | | .78 | |
| | | | |
Less: Dividends and Distributions | | | | | | | | | | | | | | | | | | | | |
| | | | | |
Dividends from net investment income | | | (.50 | ) | | | (.42 | ) | | | (.50 | ) | | | (.55 | ) | | | (.63 | ) |
| | | | | |
Return of capital | | | – 0 | – | | | (.13 | ) | | | (.08 | ) | | | – 0 | – | | | – 0 | – |
| | | | |
Total dividends and distributions | | | (.50 | ) | | | (.55 | ) | | | (.58 | ) | | | (.55 | ) | | | (.63 | ) |
| | | | |
Net asset value, end of period | | | $ 7.54 | | | | $ 8.20 | | | | $ 8.15 | | | | $ 8.92 | | | | $ 8.66 | |
| | | | |
| | | | | |
Total Return | | | | | | | | | | | | | | | | | | | | |
| | | | | |
Total investment return based on net asset value(d) | | | (1.76 | )%^ | | | 7.68 | % | | | (2.18 | )% | | | 9.62 | % | | | 9.76 | %* |
| | | | | |
Ratios/Supplemental Data | | | | | | | | | | | | | | | | | | | | |
| | | | | |
Net assets, end of period
(000’s omitted) | | | $307,946 | | | | $330,538 | | | | $359,903 | | | | $236,247 | | | | $112,852 | |
| | | | | |
Ratio to average net assets of: | | | | | | | | | | | | | | | | | | | | |
| | | | | |
Expenses, net of waivers/reimbursements(e)† | | | .59 | % | | | .54 | % | | | .52 | % | | | .50 | % | | | .51 | % |
| | | | | |
Expenses, before waivers/reimbursements(e)† | | | .59 | % | | | .54 | % | | | .52 | % | | | .50 | % | | | .51 | % |
| | | | | |
Net investment income(b) | | | 5.66 | % | | | 6.16 | % | | | 6.27 | % | | | 5.47 | % | | | 6.07 | % |
| | | | | |
Portfolio turnover rate | | | 54 | % | | | 49 | % | | | 35 | % | | | 51 | % | | | 45 | % |
| | | | | | | | | | | | | | | | | | | | |
| |
† Expense ratios exclude the estimated acquired fund fees of affiliated/unaffiliated underlying | |
portfolios | | | .00 | % | | | .01 | % | | | .00 | % | | | .00 | % | | | .00 | % |
See footnote summary on page 133.
| | |
| |
132 | AB HIGH INCOME FUND | | abfunds.com |
FINANCIAL HIGHLIGHTS (continued)
Selected Data For A Share Of Capital Stock Outstanding Throughout Each Period
| (a) | Based on average shares outstanding. |
| (b) | Net of expenses waived/reimbursed by the Adviser. |
| (c) | Amount is less than $0.005. |
| (d) | Total investment return is calculated assuming an initial investment made at the net asset value at the beginning of the period, reinvestment of all dividends and distributions at net asset value during the period, and redemption on the last day of the period. Initial sales charge or contingent deferred sales charge is not reflected in the calculation of total investment return. Total investment return does not reflect the deduction of taxes that a shareholder would pay on fund distributions or the redemption of fund shares. Total investment return for a period of less than one year is not annualized. |
| (e) | The expense ratios presented below exclude interest expense: |
| | | | | | | | | | | | | | | | | | | | |
| | | Year Ended October 31, | |
| | | 2020 | | | 2019 | | | 2018 | | | 2017 | | | 2016 | |
| | | | |
Class A | | | | | | | | | | | | | | | | | | | | |
Net of waivers/reimbursements | | | .86 | % | | | .85 | % | | | .82 | % | | | .81 | % | | | .84 | % |
Before waivers/reimbursements | | | .86 | % | | | .86 | % | | | .83 | % | | | .82 | % | | | .85 | % |
Class C | | | | | | | | | | | | | | | | | | | | |
Net of waivers/reimbursements | | | 1.60 | % | | | 1.60 | % | | | 1.57 | % | | | 1.56 | % | | | 1.58 | % |
Before waivers/reimbursements | | | 1.60 | % | | | 1.60 | % | | | 1.57 | % | | | 1.56 | % | | | 1.58 | % |
Advisor Class | | | | | | | | | | | | | | | | | | | | |
Net of waivers/reimbursements | | | .60 | % | | | .60 | % | | | .57 | % | | | .56 | % | | | .58 | % |
Before waivers/reimbursements | | | .60 | % | | | .61 | % | | | .58 | % | | | .57 | % | | | .58 | % |
Class R | | | | | | | | | | | | | | | | | | | | |
Net of waivers/reimbursements | | | 1.32 | % | | | 1.26 | % | | | 1.24 | % | | | 1.20 | % | | | 1.22 | % |
Before waivers/reimbursements | | | 1.33 | % | | | 1.26 | % | | | 1.24 | % | | | 1.21 | % | | | 1.22 | % |
Class K | | | | | | | | | | | | | | | | | | | | |
Net of waivers/reimbursements | | | .97 | % | | | .92 | % | | | .89 | % | | | .89 | % | | | .85 | % |
Before waivers/reimbursements | | | .97 | % | | | .92 | % | | | .89 | % | | | .89 | % | | | .85 | % |
Class I | | | | | | | | | | | | | | | | | | | | |
Net of waivers/reimbursements | | | .64 | % | | | .58 | % | | | .54 | % | | | .52 | % | | | .53 | % |
Before waivers/reimbursements | | | .64 | % | | | .58 | % | | | .54 | % | | | .53 | % | | | .53 | % |
Class Z | | | | | | | | | | | | | | | | | | | | |
Net of waivers/reimbursements | | | .58 | % | | | .52 | % | | | .50 | % | | | .50 | % | | | .51 | % |
Before waivers/reimbursements | | | .58 | % | | | .52 | % | | | .50 | % | | | .50 | % | | | .51 | % |
| * | Includes the impact of proceeds received and credited to the Fund in connection with a residual distribution relating to regulatory settlements, which enhanced the Fund’s performance for the year ended October 31, 2016 by 0.01%. |
| ^ | The net asset value and total return include adjustments in accordance with accounting principles generally accepted in the United States of America for financial reporting purposes. As such, the net asset value and total return for shareholder transactions may differ from financial statements. |
See notes to financial statements.
| | |
| |
| abfunds.com | | AB HIGH INCOME FUND | 133 |
REPORT OF INDEPENDENT REGISTERED
PUBLIC ACCOUNTING FIRM
To the Board of Directors and Shareholders of
AB High Income Fund, Inc.
Opinion on the Financial Statements
We have audited the accompanying statement of assets and liabilities of AB High Income Fund, Inc. (the “Fund”), including the portfolio of investments, as of October 31, 2020, and the related statement of operations for the year then ended, the statements of changes in net assets for each of the two years in the period then ended, the financial highlights for each of the five years in the period then ended, and the related notes (collectively referred to as the “financial statements”). In our opinion, the financial statements present fairly, in all material respects, the financial position of the Fund at October 31, 2020, the results of its operations for the year then ended, the changes in its net assets for each of the two years in the period then ended and its financial highlights for each of the five years in the period then ended, in conformity with U.S. generally accepted accounting principles.
Basis for Opinion
These financial statements are the responsibility of the Fund’s management. Our responsibility is to express an opinion on the Fund’s financial statements based on our audits. We are a public accounting firm registered with the Public Company Accounting Oversight Board (United States) (“PCAOB”) and are required to be independent with respect to the Fund in accordance with the U.S. federal securities laws and the applicable rules and regulations of the Securities and Exchange Commission and the PCAOB.
We conducted our audits in accordance with the standards of the PCAOB. Those standards require that we plan and perform the audit to obtain reasonable assurance about whether the financial statements are free of material misstatement, whether due to error or fraud. The Fund is not required to have, nor were we engaged to perform, an audit of the Fund’s internal control over financial reporting. As part of our audits we are required to obtain an understanding of internal control over financial reporting but not for the purpose of expressing an opinion on the effectiveness of the Fund’s internal control over financial reporting. Accordingly, we express no such opinion.
Our audits included performing procedures to assess the risks of material misstatement of the financial statements, whether due to error or fraud, and performing procedures that respond to those risks. Such procedures included examining, on a test basis, evidence regarding the amounts and disclosures in the financial statements. Our procedures included
| | |
| |
134 | AB HIGH INCOME FUND | | abfunds.com |
REPORT OF INDEPENDENT REGISTERED
PUBLIC ACCOUNTING FIRM (continued)
confirmation of securities owned as of October 31, 2020, by correspondence with the custodian and others or by other appropriate auditing procedures where replies from others were not received. Our audits also included evaluating the accounting principles used and significant estimates made by management, as well as evaluating the overall presentation of the financial statements. We believe that our audits provide a reasonable basis for our opinion.

We have served as the auditor of one or more of the AB investment companies since 1968.
New York, New York
December 29, 2020
| | |
| |
| abfunds.com | | AB HIGH INCOME FUND | 135 |
2020 FEDERAL TAX INFORMATION
(unaudited)
For Federal income tax purposes, the following information is furnished with respect to the distributions paid by the Fund during the taxable year ended October 31, 2020.
For corporate shareholders, 1.52% of dividends paid qualify for the dividends received deduction.
For foreign shareholders, 46.29% of ordinary income dividends paid may be considered to be qualifying to be taxed as interest-related dividends.
Shareholders should not use the above information to prepare their income tax returns. The information necessary to complete your income tax returns will be included with your Form 1099-DIV which will be sent to you separately in January 2021.
| | |
| |
136 | AB HIGH INCOME FUND | | abfunds.com |
BOARD OF DIRECTORS
| | |
Marshall C. Turner, Jr.(1), Chairman Jorge A. Bermudez(1) Michael J. Downey(1) Nancy P. Jacklin(1) | | Robert M. Keith, President and Chief Executive Officer Jeanette Loeb(1) Carol C. McMullen(1) Garry L. Moody(1) Earl D. Weiner(1) |
OFFICERS
| | |
Gershon M. Distenfeld(2), Vice President Shamaila Khan(2), Vice President Douglas J. Peebles(2)(3), Vice President Matthew S. Sheridan(2), Vice President | | Emilie D. Wrapp, Secretary Michael B. Reyes, Senior Analyst Joseph J. Mantineo, Treasurer and Chief Financial Officer Stephen M. Woetzel, Controller Vincent S. Noto, Chief Compliance Officer |
| | |
Principal Underwriter AllianceBernstein Investments, Inc. 1345 Avenue of the Americas New York, NY 10105 Custodian and Accounting Agent Brown Brothers Harriman & Co. 50 Post Office Square Boston, MA 02110 Legal Counsel Seward & Kissel LLP One Battery Park Plaza New York, NY 10004 | | Transfer Agent AllianceBernstein Investor Services, Inc. P.O. Box 786003 San Antonio, TX 78278-6003 Toll-Free (800) 221-5672 Independent Registered Public Accounting Firm Ernst & Young LLP 5 Times Square New York, NY 10036 |
| 1 | Member of the Audit Committee, the Governance and Nominating Committee, and the Independent Directors Committee. |
| 2 | The day-to-day management of, and investment decisions for, the Fund’s portfolio are made by the Adviser’s Global High Income Investment Team. Messrs. Distenfeld, Peebles, Sheridan and Ms. Khan are the investment professionals with the most significant responsibility for the day-to-day management of the Fund’s portfolio. |
| 3 | Mr. Peebles is expected to retire from the Adviser effective December 30, 2020. |
| | |
| |
| abfunds.com | | AB HIGH INCOME FUND | 137 |
MANAGEMENT OF THE FUND
Board of Directors Information
The business and affairs of the Fund are managed under the direction of the Board of Directors. Certain information concerning the Fund’s Directors is set forth below.
| | | | | | | | |
NAME,
ADDRESS*, AGE,
(YEAR FIRST ELECTED**) | | PRINCIPAL
OCCUPATION(S)
DURING PAST FIVE YEARS
AND OTHER
INFORMATION*** | | PORTFOLIOS
IN AB FUND
COMPLEX
OVERSEEN BY
DIRECTOR | | | OTHER PUBLIC
DIRECTORSHIPS
CURRENTLY HELD
BY DIRECTOR |
| INTERESTED DIRECTOR | | | | | | |
| | | |
Robert M. Keith,+
1345 Avenue of the Americas
New York, NY 10105
60
(2010) | | Senior Vice President of AllianceBernstein L.P. (the “Adviser”) and the head of AllianceBernstein Investments, Inc. (“ABI”) since July 2008; Director of ABI and President of the AB Mutual Funds. Previously, he served as Executive Managing Director of ABI from December 2006 to June 2008. Prior to joining ABI in 2006, Executive Managing Director of Bernstein Global Wealth Management, and prior thereto, Senior Managing Director and Global Head of Client Service and Sales of the Adviser’s institutional investment management business since 2004. Prior thereto, he was Managing Director and Head of North American Client Service and Sales in the Adviser’s institutional investment management business, with which he had been associated since prior to 2004. | | | 77 | | | None |
| | |
| |
138 | AB HIGH INCOME FUND | | abfunds.com |
MANAGEMENT OF THE FUND (continued)
| | | | | | | | |
NAME,
ADDRESS*, AGE,
(YEAR FIRST ELECTED**) | | PRINCIPAL
OCCUPATION(S)
DURING PAST FIVE YEARS
AND OTHER INFORMATION*** | | PORTFOLIOS
IN AB FUND
COMPLEX
OVERSEEN BY
DIRECTOR | | | OTHER PUBLIC
DIRECTORSHIPS
CURRENTLY HELD
BY DIRECTOR |
| DISINTERESTED DIRECTORS | | | | | | |
| | | |
Marshall C. Turner, Jr.,++ Chairman of the Board 79
(2005) | | Private Investor since prior to 2015. Former Chairman and CEO of Dupont Photomasks, Inc. (components of semi-conductor manufacturing). He was a Director of Xilinx, Inc. (programmable logic semi-conductors and adaptable, intelligent computing) from 2007 through August 2020, and is a former director of 33 other companies and organizations. He has extensive operating leadership, and venture capital investing experience, including five interim or full-time CEO roles, and prior service as general partner of institutional venture capital partnerships. He also has extensive non-profit board leadership experience, and currently serves on the boards of two education and science-related non-profit organizations. He has served as a director of one AB Fund since 1992, and director or trustee of all AB Funds since 2005. He has been Chairman of the AB Funds since January 2014, and the Chairman of the Independent Directors Committees of the AB Funds since February 2014. | | | 77 | | | None |
| | |
| |
| abfunds.com | | AB HIGH INCOME FUND | 139 |
MANAGEMENT OF THE FUND (continued)
| | | | | | | | |
NAME,
ADDRESS*, AGE,
(YEAR FIRST ELECTED**) | | PRINCIPAL
OCCUPATION(S)
DURING PAST FIVE YEARS
AND OTHER INFORMATION*** | | PORTFOLIOS
IN AB FUND
COMPLEX
OVERSEEN BY
DIRECTOR | | | OTHER PUBLIC
DIRECTORSHIPS
CURRENTLY HELD
BY DIRECTOR |
DISINTERESTED DIRECTORS
(continued) | | | | | | |
| | | |
Jorge A. Bermudez,++ 69 (2020) | | Private Investor since prior to 2015. Formerly, Chief Risk Officer of Citigroup, Inc., a global financial services company, from November 2007 to March 2008, Chief Executive Officer of Citigroup’s Commercial Business Group in North America and Citibank Texas from 2005 to 2007, and a variety of other executive and leadership roles at various businesses within Citigroup prior to then; Chairman (2018) of the Texas A&M Foundation Board of Trustees (Trustee since 2013) and Chairman of the Smart Grid Center Board at Texas A&M University since 2012; director of, among others, Citibank N.A. from 2005 to 2008, the Federal Reserve Bank of Dallas, Houston Branch from 2009 to 2011, the Federal Reserve Bank of Dallas from 2011 to 2017, and the Electric Reliability Council of Texas from 2010 to 2016. He has served as director or trustee of the AB Funds since January 2020. | | | 77 | | | Moody’s Corporation since April 2011 |
| | | | | | | | |
| | | |
Michael J. Downey,++
76 (2005) | | Private Investor since prior to 2015. Formerly, Chairman of The Asia Pacific Fund, Inc. (registered investment company) since prior to 2015 until January 2019. From 1987 until 1993, Chairman and CEO of Prudential Mutual Fund Management, director of the Prudential mutual funds, and member of the Executive Committee of Prudential Securities, Inc. He has served as a director or trustee of the AB Funds since 2005. | | | 77 | | | None |
| | |
| |
140 | AB HIGH INCOME FUND | | abfunds.com |
MANAGEMENT OF THE FUND (continued)
| | | | | | | | |
NAME,
ADDRESS*, AGE,
(YEAR FIRST ELECTED**) | | PRINCIPAL
OCCUPATION(S)
DURING PAST FIVE YEARS
AND OTHER
INFORMATION*** | | PORTFOLIOS
IN AB FUND
COMPLEX
OVERSEEN BY
DIRECTOR | | | OTHER PUBLIC
DIRECTORSHIPS
CURRENTLY HELD
BY DIRECTOR |
DISINTERESTED DIRECTORS
(continued) | | | | | | |
| | | |
Nancy P. Jacklin,++
72
(2006) | | Private Investor since prior to 2015. Professorial Lecturer at the Johns Hopkins School of Advanced International Studies (2008-2015). U.S. Executive Director of the International Monetary Fund (which is responsible for ensuring the stability of the international monetary system), (December 2002-May 2006); Partner, Clifford Chance (1992-2002); Sector Counsel, International Banking and Finance, and Associate General Counsel, Citicorp (1985-1992); Assistant General Counsel (International), Federal Reserve Board of Governors (1982-1985); and Attorney Advisor, U.S. Department of the Treasury (1973-1982). Member of the Bar of the District of Columbia and of New York; and member of the Council on Foreign Relations. She has served as a director or trustee of the AB Funds since 2006 and has been Chair of the Governance and Nominating Committees of the AB Funds since August 2014. | | | 77 | | | None |
| | | | | | | | |
| | | |
Jeanette Loeb,++ 68 (2020) | | Chief Executive Officer of PetCareRx (e-commerce pet pharmacy) from 2002 to 2011 and 2015 to present. Director of New York City Center since 2005. She was a director of AB Multi-Manager Alternative Fund, Inc. (fund of hedge funds) from 2012 to 2018. Formerly, affiliated with Goldman Sachs Group, Inc. (financial services) from 1977 to 1994, including as a partner thereof from 1986 to 1994. She has served as director or trustee of the AB Funds since April 2020. | | | 77 | | | Apollo Investment Corp. (business development company) since August 2011 |
| | |
| |
| abfunds.com | | AB HIGH INCOME FUND | 141 |
MANAGEMENT OF THE FUND (continued)
| | | | | | | | |
NAME,
ADDRESS*, AGE,
(YEAR FIRST ELECTED**) | | PRINCIPAL
OCCUPATION(S)
DURING PAST FIVE YEARS
AND OTHER
INFORMATION*** | | PORTFOLIOS
IN AB FUND
COMPLEX
OVERSEEN BY
DIRECTOR | | | OTHER PUBLIC
DIRECTORSHIPS
CURRENTLY HELD
BY DIRECTOR |
DISINTERESTED DIRECTORS
(continued) | | | | | | |
| | | |
Carol C. McMullen,++
65 (2016) | | Managing Director of Slalom Consulting (consulting) since 2014, private investor and a member of the Advisory Board of Butcher Box (since 2018). Formerly, member, Partners Healthcare Investment Committee (2010-2019); Director of Norfolk & Dedham Group (mutual property and casualty insurance) from 2011 until November 2016; Director of Partners Community Physicians Organization (healthcare) from 2014 until December 2016; and Managing Director of The Crossland Group (consulting) from 2012 until 2013. She has held a number of senior positions in the asset and wealth management industries, including at Eastern Bank (where her roles included President of Eastern Wealth Management), Thomson Financial (Global Head of Sales for Investment Management), and Putnam Investments (where her roles included Chief Investment Officer, Core and Growth and Head of Global Investment Research). She has served on a number of private company and non-profit boards, and as a director or trustee of the AB Funds since June 2016. | | | 77 | | | None |
| | |
| |
| 142 | AB HIGH INCOME FUND | | abfunds.com |
MANAGEMENT OF THE FUND (continued)
| | | | | | | | |
NAME,
ADDRESS*, AGE,
(YEAR FIRST ELECTED**) | | PRINCIPAL
OCCUPATION(S)
DURING PAST FIVE YEARS
AND OTHER
INFORMATION*** | | PORTFOLIOS
IN AB FUND
COMPLEX
OVERSEEN BY
DIRECTOR | | | OTHER PUBLIC
DIRECTORSHIPS
CURRENTLY HELD
BY DIRECTOR |
DISINTERESTED DIRECTORS
(continued) | | | | | | |
| | | |
Garry L. Moody,++
68
(2008) | | Private Investor since prior to 2015. Formerly, Partner, Deloitte & Touche LLP (1995-2008) where he held a number of senior positions, including Vice Chairman, and U.S. and Global Investment Management Practice Managing Partner; President, Fidelity Accounting and Custody Services Company (1993-1995), where he was responsible for accounting, pricing, custody and reporting for the Fidelity mutual funds; and Partner, Ernst & Young LLP (1975-1993), where he served as the National Director of Mutual Fund Tax Services and Managing Partner of its Chicago Office Tax department. He is a member of the Trustee Advisory Board of BoardIQ, a biweekly publication focused on issues and news affecting directors of mutual funds. He is also a member of the Investment Company Institute’s Board of Governors and the Independent Directors Council’s Governing Council. He has served as a director or trustee, and as Chairman of the Audit Committees, of the AB Funds since 2008. | | | 77 | | | None |
| | |
| |
| abfunds.com | | AB HIGH INCOME FUND | 143 |
MANAGEMENT OF THE FUND (continued)
| | | | | | | | |
NAME,
ADDRESS*, AGE,
(YEAR FIRST ELECTED**) | | PRINCIPAL
OCCUPATION(S)
DURING PAST FIVE YEARS
AND OTHER
INFORMATION*** | | PORTFOLIOS
IN AB FUND
COMPLEX
OVERSEEN BY
DIRECTOR | | | OTHER PUBLIC
DIRECTORSHIPS
CURRENTLY HELD
BY DIRECTOR |
DISINTERESTED DIRECTORS
(continued) | | | | | | |
| | | |
Earl D. Weiner,++
81 (2007) | | Senior Counsel since 2017, Of Counsel from 2007 to 2016, and Partner prior to then, of the law firm Sullivan & Cromwell LLP. He is a former member of the ABA Federal Regulation of Securities Committee Task Force to draft editions of the Fund Director’s Guidebook. He also serves as a director or trustee of various non-profit organizations and has served as Chairman or Vice Chairman of a number of them. He has served as a director or trustee of the AB Funds since 2007 and served as Chairman of the Governance and Nominating Committees of the AB Funds from 2007 until August 2014. | | | 77 | | | None |
| * | The address for each of the Fund’s disinterested Directors is c/o AllianceBernstein L.P., Attention: Legal and Compliance Department—Mutual Fund Legal, 1345 Avenue of the Americas, New York, NY 10105. |
| ** | There is no stated term of office for the Fund’s Directors. |
| *** | The information above includes each Director’s principal occupation during the last five years and other information relating to the experience, attributes and skills relevant to each Director’s qualifications to serve as a Director, which led to the conclusion that each Director should serve as a Director for the Fund. |
| + | Mr. Keith is an “interested director of the Fund”, as defined in the 1940 Act, due to his position as a Senior Vice President of the Adviser. |
| ++ | Member of the Audit Committee, the Governance and Nominating Committee, and the Independent Directors Committee. |
| | |
| |
| 144 | AB HIGH INCOME FUND | | abfunds.com |
MANAGEMENT OF THE FUND (continued)
Officers of the Fund
Certain information concerning the Fund’s Officers is listed below.
| | | | |
NAME, ADDRESS*
AGE | | PRINCIPAL POSITION(S)
HELD WITH FUND | | PRINCIPAL OCCUPATION
DURING PAST FIVE YEARS |
Robert M. Keith,
60 | | President and Chief Executive Officer | | See biography above. |
| | | | |
Gershon M. Distenfeld,
45 | | Vice President | | Senior Vice President of the Adviser**, with which he has been associated since prior to 2015. He is also Co-Head of Fixed Income. |
| | | | |
Shamaila Khan,
49 | | Vice President | | Senior Vice President of the Adviser**, with which she has been associated since prior to 2015. She is also Director of Emerging Market Debt. |
| | | | |
Douglas J. Peebles,
55 | | Senior Vice President | | Senior Vice President of the Adviser**, with which he has been associated since prior to 2015. He is also Chief Investment Officer of Fixed Income. |
| | | | |
Matthew S. Sheridan,
45 | | Vice President | | Senior Vice President of the Adviser**, with which he has been associated since prior to 2015. |
| | | | |
Emilie D. Wrapp,
65 | | Secretary | | Senior Vice President, Assistant General Counsel and Assistant Secretary of ABI**, with which she has been associated since prior to 2015. |
| | | | |
Michael B. Reyes, 44 | | Senior Analyst | | Vice President of the Adviser**, with which he has been associated since prior to 2015. |
| | | | |
Joseph J. Mantineo,
61 | | Treasurer and Chief Financial Officer | | Senior Vice President of AllianceBernstein Investor Services, Inc. (“ABIS”)**, with which he has been associated since prior to 2015. |
| | | | |
Stephen M. Woetzel,
48 | | Controller | | Senior Vice President of ABIS**, with which he has been associated since prior to 2015. |
| | | | |
Vincent S. Noto,
56 | | Chief Compliance Officer | | Senior Vice President since 2015 and Mutual Fund Chief Compliance Officer of the Adviser** since prior to 2015. |
| * | The address for each of the Fund’s Officers is 1345 Avenue of the Americas, New York, NY 10105. |
| ** | The Adviser, ABI and ABIS are affiliates of the Fund. |
The Fund’s Statement of Additional Information (“SAI”) has additional information about the Fund’s Directors and Officers and is available without charge upon request. Contact your financial representative or AB at (800) 227-4618, or visit www.abfunds.com, for a free prospectus or SAI.
| | |
| |
| abfunds.com | | AB HIGH INCOME FUND | 145 |
Operation and Effectiveness of the Funds’ Liquidity Risk Management Program:
In October 2016, the Securities and Exchange Commission (“SEC”) adopted the open-end fund liquidity rule (the “Liquidity Rule”). In June 2018 the SEC adopted a requirement that funds disclose information about the operation and effectiveness of their Liquidity Risk Management Program (“LRMP”) in their reports to shareholders.
One of the requirements of the Liquidity Rule is for the Fund to designate an Administrator of the Fund’s Liquidity Risk Management Program. The Administrator of the Fund’s LRMP is AllianceBernstein L.P., the Fund’s investment adviser (the “Adviser”). The Adviser has delegated the responsibility to its Liquidity Risk Management Committee (the “Committee”). Another requirement of the Liquidity Rule is for the Fund’s Board of Directors/Trustees (the “Fund Board”) to receive an annual written report from the Administrator of the LRMP, which addresses the operation of the fund’s LRMP and assesses its adequacy and effectiveness. The Adviser provided the Fund Board with such annual report during the first quarter of 2020, which covered the period December 1, 2018 through December 31, 2019 (the “Program Reporting Period”).
The LRMP’s principal objectives include supporting the Fund’s compliance with limits on investments in illiquid assets and mitigating the risk that the Fund will be unable to meet its redemption obligations in a timely manner. Pursuant to the LRMP, the Fund classifies the liquidity of its portfolio investments into one of the four categories defined by the SEC: Highly Liquid, Moderately Liquid, Less Liquid, and Illiquid. These classifications are reported to the SEC on Form N-PORT.
During the Program Reporting Period, the Committee reviewed whether the Fund’s strategy is appropriate for an open-end structure, taking into account any holdings of less liquid and illiquid assets. The Committee also performed an analysis to determine whether the Fund is required to maintain a Highly Liquid Investment Minimum (“HLIM”). If the Fund participated in derivative transactions, the exposure from such transactions were considered in the LRMP. The Committee also incorporated the following information when determining the Fund’s reasonably anticipated trading size for purposes of liquidity monitoring: historical net redemption activity, a Fund’s concentration in an issuer, shareholder concentration, investment performance, total net assets, and distribution channels.
The Adviser informed the Fund Board that the Committee believes the Fund’s LRMP is adequately designed, has been implemented as intended, and has operated effectively since its inception. No material exceptions have been noted since the implementation of the LRMP, and there were no liquidity events that impacted the Fund or its ability to timely meet redemptions during the Program Reporting Period.
| | |
| |
146 | AB HIGH INCOME FUND | | abfunds.com |
Information Regarding the Review and Approval of the Fund’s Advisory Agreement
The disinterested directors (the “directors”) of AB High Income Fund, Inc. (the “Fund”) unanimously approved the continuance of the Fund’s Advisory Agreement with the Adviser at a meeting held on November 4-6, 2019 (the “Meeting”.)*
Prior to approval of the continuance of the Advisory Agreement, the directors had requested from the Adviser, and received and evaluated, extensive materials. They reviewed the proposed continuance of the Advisory Agreement with the Adviser and with experienced counsel who are independent of the Adviser, who advised on the relevant legal standards. The directors also reviewed additional materials, including comparative analytical data prepared by the Senior Analyst for the Fund. The directors also discussed the proposed continuance in private sessions with counsel.
The directors considered their knowledge of the nature and quality of the services provided by the Adviser to the Fund gained from their experience as directors or trustees of most of the registered investment companies advised by the Adviser, their overall confidence in the Adviser’s integrity and competence they have gained from that experience, the Adviser’s initiative in identifying and raising potential issues with the directors and its responsiveness, frankness and attention to concerns raised by the directors in the past, including the Adviser’s willingness to consider and implement organizational and operational changes designed to improve investment results and the services provided to the AB Funds. The directors noted that they have four regular meetings each year, at each of which they review extensive materials and information from the Adviser, including information on the investment performance of the Fund and the underlying fund advised by the Adviser in which the Fund invests.
The directors also considered all factors they believed relevant, including the specific matters discussed below. During the course of their deliberations, the directors evaluated, among other things, the reasonableness of the advisory fee. The directors did not identify any particular information that was all-important or controlling, and different directors may have attributed different weights to the various factors. The directors determined that the selection of the Adviser to manage the Fund and the overall arrangements between the Fund and the Adviser, as provided in the Advisory Agreement, including the advisory fee, were fair and reasonable in light of the services performed, expenses incurred and such other matters as the directors considered relevant in the exercise of their business
| | |
| |
| abfunds.com | | AB HIGH INCOME FUND | 147 |
| * | Following transactions completed on November 13, 2019 that may have been deemed to have been an “assignment” causing termination of the Fund’s investment advisory agreement, a new investment advisory agreement, having the same terms as the prior one, was entered into by the Fund and the Adviser. |
judgment. The material factors and conclusions that formed the basis for the directors’ determinations included the following:
Nature, Extent and Quality of Services Provided
The directors considered the scope and quality of services provided by the Adviser under the Advisory Agreement, including the quality of the investment research capabilities of the Adviser and the other resources it has dedicated to performing services for the Fund. The directors noted that the Adviser from time to time reviews the Fund’s investment strategies and from time to time proposes changes intended to improve the Fund’s relative or absolute performance for the directors’ consideration. They also noted the professional experience and qualifications of the Fund’s portfolio management team and other senior personnel of the Adviser. The directors also considered that the Advisory Agreement provides that the Fund will reimburse the Adviser for the cost to it of providing certain clerical, accounting, administrative and other services to the Fund by employees of the Adviser or its affiliates. Requests for these reimbursements are made on a quarterly basis and subject to approval by the directors. Reimbursements, to the extent requested and paid, result in a higher rate of total compensation from the Fund to the Adviser than the fee rate stated in the Advisory Agreement. The directors noted that the methodology used to determine the reimbursement amounts had been reviewed by an independent consultant retained by the Fund’s former Senior Officer/Independent Compliance Officer. The quality of administrative and other services, including the Adviser’s role in coordinating the activities of the Fund’s other service providers, also was considered. The directors concluded that, overall, they were satisfied with the nature, extent and quality of services provided to the Fund under the Advisory Agreement.
Costs of Services Provided and Profitability
The directors reviewed a schedule of the revenues and expenses and related notes indicating the profitability of the Fund to the Adviser for calendar years 2017 and 2018 that had been prepared with an expense allocation methodology arrived at in consultation with an independent consultant retained by the Fund’s former Senior Officer/Independent Compliance Officer. The directors noted the assumptions and methods of allocation used by the Adviser in preparing fund-specific profitability data and understood that there are a number of potentially acceptable allocation methodologies for information of this type. The directors noted that the profitability information reflected all revenues and expenses of the Adviser’s relationship with the Fund, including those relating to its subsidiaries that provide transfer agency and distribution services to the Fund. The directors recognized that it is difficult to make comparisons of the profitability of the Advisory Agreement with the profitability of fund advisory contracts for unaffiliated funds because comparative information is not generally publicly available and is affected by numerous factors. The directors focused on the profitability of the Adviser’s relationship with the Fund before taxes and
| | |
| |
148 | AB HIGH INCOME FUND | | abfunds.com |
distribution expenses. The directors concluded that the Adviser’s level of profitability from its relationship with the Fund was not unreasonable.
Fall-Out Benefits
The directors considered the other benefits to the Adviser and its affiliates from their relationships with the Fund and the underlying fund advised by the Adviser in which the Fund invests, including, but not limited to, benefits relating to 12b-1 fees and sales charges received by the Fund’s principal underwriter (which is a wholly owned subsidiary of the Adviser) in respect of certain classes of the Fund’s shares; and transfer agency fees paid by the Fund to a wholly owned subsidiary of the Adviser. The directors recognized that the Adviser’s profitability would be somewhat lower without these benefits. The directors understood that the Adviser also might derive reputational and other benefits from its association with the Fund.
Investment Results
In addition to the information reviewed by the directors in connection with the Meeting, the directors receive detailed performance information for the Fund at each regular Board meeting during the year.
At the Meeting, the directors reviewed performance information prepared by an independent service provider (the “15(c) service provider”), showing the performance of the Class A Shares of the Fund against a group of similar funds (“peer group”) and a larger group of similar funds (“peer universe”), each selected by the 15(c) service provider, and information prepared by the Adviser showing performance of the Class A Shares against a broad-based securities market index, in each case for the 1-, 3-, 5- and 10-year periods ended July 31, 2019. Based on their review and their discussion with the Adviser of the reasons for the Fund’s underperformance in the periods reviewed, the directors concluded that the Fund’s investment performance was acceptable.
Advisory Fees and Other Expenses
The directors considered the advisory fee rate payable by the Fund to the Adviser and information prepared by the 15(c) service provider concerning advisory fee rates payable by other funds in the same category as the Fund. The directors recognized that it is difficult to make comparisons of advisory fees because there are variations in the services that are included in the fees payable by other funds. The directors compared the Fund’s contractual effective advisory fee rate with a peer group median and took into account the impact on the advisory fee rate of the administrative expense reimbursement paid to the Adviser in the latest fiscal year.
The directors also considered the Adviser’s fee schedule for other clients utilizing investment strategies similar to those of the Fund. For this purpose, they reviewed the relevant advisory fee information from the Adviser’s Form ADV and in a report from the Fund’s Senior Analyst and
| | |
| |
| abfunds.com | | AB HIGH INCOME FUND | 149 |
noted the differences between the Fund’s fee schedule, on the one hand, and the Adviser’s institutional fee schedule and the schedule of fees charged by the Adviser to any offshore funds and for services to any sub-advised funds utilizing investment strategies similar to those of the Fund, on the other. The directors noted that the Adviser may, in some cases, agree to fee rates with large institutional clients that are lower than those reviewed by the directors and that they had previously discussed with the Adviser its policies in respect of such arrangements. The directors previously discussed these matters with an independent fee consultant.
The Adviser reviewed with the directors the significantly greater scope of the services it provides to the Fund relative to institutional, offshore fund and sub-advised fund clients. In this regard, the Adviser noted, among other things, that, compared to institutional and offshore or sub-advisory accounts, the Fund (i) demands considerably more portfolio management, research and trading resources due to significantly higher daily cash flows; (ii) has more tax and regulatory restrictions and compliance obligations; (iii) must prepare and file or distribute regulatory and other communications about fund operations; and (iv) must provide shareholder servicing to retail investors. The Adviser also reviewed the greater legal risks presented by the large and changing population of Fund shareholders who may assert claims against the Adviser in individual or class actions, and the greater entrepreneurial risk in offering new fund products, which require substantial investment to launch, may not succeed, and generally must be priced to compete with larger, more established funds resulting in lack of profitability to the Adviser until a new fund achieves scale. In light of the substantial differences in services rendered by the Adviser to institutional, offshore fund and sub-advised fund clients as compared to the Fund, and the different risk profile, the directors considered these fee comparisons inapt and did not place significant weight on them in their deliberations.
In connection with their review of the Fund’s advisory fee, the directors also considered the total expense ratio of the Class A shares of the Fund in comparison to a peer group and a peer universe selected by the 15(c) service provider. The Class A expense ratio of the Fund was based on the Fund’s latest fiscal year. The directors noted that it was likely that the expense ratios of some of the other funds in the Fund’s category were lowered by waivers or reimbursements by those funds’ investment advisers, which in some cases might be voluntary or temporary. The directors view expense ratio information as relevant to their evaluation of the Adviser’s services because the Adviser is responsible for coordinating services provided to the Fund by others. Based on their review, the directors concluded that the Fund’s expense ratio was acceptable.
Economies of Scale
The directors noted that the advisory fee schedule for the Fund contains breakpoints and that the Fund’s net assets were above the last breakpoint
| | |
| |
150 | AB HIGH INCOME FUND | | abfunds.com |
level. Accordingly, the Fund’s current effective advisory fee rate reflected a reduction due to the breakpoints and would be further reduced to the extent the net assets of the Fund increase. The directors took into consideration prior presentations by an independent consultant on economies of scale in the mutual fund industry and for the AB Funds, and presentations from time to time by the Adviser concerning certain of its views on economies of scale. The directors also previously discussed economies of scale with an independent fee consultant. The directors also had requested and received from the Adviser certain updates on economies of scale in advance of the Meeting. The directors believe that economies of scale may be realized (if at all) by the Adviser across a variety of products and services, and not only in respect of a single fund. The directors noted that there is no established methodology for setting breakpoints that give effect to the fund-specific services provided by a fund’s adviser and to the economies of scale that an adviser may realize in its overall mutual fund business or those components of it which directly or indirectly affect a fund’s operations. The directors observed that in the mutual fund industry as a whole, as well as among funds similar to the Fund, there is no uniformity or pattern in the fees and asset levels at which breakpoints (if any) apply. The directors also noted that the advisory agreements for many funds do not have breakpoints at all. Having taken these factors into account, the directors concluded that the Fund’s breakpoint arrangements were acceptable and provide a means for sharing of economies of scale. The directors also informed the Adviser that they would continue to monitor the Fund’s asset levels and consider whether additional breakpoints should be imposed in the future if circumstances warranted doing so.
| | |
| |
| abfunds.com | | AB HIGH INCOME FUND | 151 |
This page is not part of the Shareholder Report or the Financial Statements.
AB FAMILY OF FUNDS
US EQUITY
CORE
Core Opportunities Fund
FlexFee™ US Thematic Portfolio
Select US Equity Portfolio
GROWTH
Concentrated Growth Fund
Discovery Growth Fund
FlexFee™ Large Cap Growth Portfolio
Growth Fund
Large Cap Growth Fund
Small Cap Growth Portfolio
VALUE
Discovery Value Fund
Equity Income Fund
Relative Value Fund
Small Cap Value Portfolio
Value Fund
INTERNATIONAL/ GLOBAL EQUITY
CORE
Global Core Equity Portfolio
International Portfolio
International Strategic Core Portfolio
Sustainable Global Thematic Fund
Tax-Managed International Portfolio
Tax-Managed Wealth Appreciation Strategy
Wealth Appreciation Strategy
INTERNATIONAL/ GLOBAL EQUITY (continued)
GROWTH
Concentrated International Growth Portfolio
Sustainable International Thematic Fund
VALUE
All China Equity Portfolio
International Value Fund
FIXED INCOME
MUNICIPAL
High Income Municipal Portfolio
Intermediate California Municipal Portfolio
Intermediate Diversified Municipal Portfolio
Intermediate New York Municipal Portfolio
Municipal Bond Inflation Strategy
Tax-Aware Fixed Income Opportunities Portfolio1
National Portfolio
Arizona Portfolio
California Portfolio
Massachusetts Portfolio
Minnesota Portfolio
New Jersey Portfolio
New York Portfolio
Ohio Portfolio
Pennsylvania Portfolio
Virginia Portfolio
FIXED INCOME (continued)
TAXABLE
Bond Inflation Strategy
FlexFee™ High Yield Portfolio
Global Bond Fund
High Income Fund
Income Fund
Intermediate Duration Portfolio
Limited Duration High Income Portfolio
Short Duration Income Portfolio
Short Duration Portfolio
Total Return Bond Portfolio
ALTERNATIVES
All Market Real Return Portfolio
Global Real Estate Investment Fund
Select US Long/Short Portfolio
MULTI-ASSET
All Market Income Portfolio
All Market Total Return Portfolio
Conservative Wealth Strategy
Emerging Markets Multi-Asset Portfolio
Global Risk Allocation Fund
Tax-Managed All Market Income Portfolio
CLOSED-END FUNDS
AllianceBernstein Global High Income Fund
AllianceBernstein National Municipal Income Fund
We also offer Government Money Market Portfolio, which serves as the money market fund exchange vehicle for the AB mutual funds. You could lose money by investing in the Fund. Although the Fund seeks to preserve the value of your investment at $1.00 per share, it cannot guarantee it will do so. The Fund may impose a fee upon sale of your shares or may temporarily suspend your ability to sell shares if the Fund’s liquidity falls below required minimums because of market conditions or other factors. An investment in the Fund is not insured or guaranteed by the Federal Deposit Insurance Corporation or any other government agency. The Fund’s sponsor has no legal obligation to provide financial support to the Fund, and you should not expect that the sponsor will provide financial support to the Fund at any time.
Investors should consider the investment objectives, risks, charges and expenses of the Fund carefully before investing. For copies of our prospectus or summary prospectus, which contain this and other information, visit us online at www.abfunds.com or contact your AB representative. Please read the prospectus and/or summary prospectus carefully before investing.
| 1 | Prior to February 5, 2020, Tax-Aware Fixed Income Opportunities Portfolio was named Tax-Aware Fixed Income Portfolio. |
| | |
| |
152 | AB HIGH INCOME FUND | | abfunds.com |
AB HIGH INCOME FUND
1345 Avenue of the Americas
New York, NY 10105
800 221 5672
HI-0151-1020 
ITEM 2. CODE OF ETHICS.
(a) The registrant has adopted a code of ethics that applies to its principal executive officer, principal financial officer and principal accounting officer. A copy of the registrant’s code of ethics is filed herewith as Exhibit 12(a)(1).
(b) During the period covered by this report, no material amendments were made to the provisions of the code of ethics adopted in 2(a) above.
(c) During the period covered by this report, no implicit or explicit waivers to the provisions of the code of ethics adopted in 2(a) above were granted.
ITEM 3. AUDIT COMMITTEE FINANCIAL EXPERT.
The registrant’s Board of Directors has determined that independent directors Garry L. Moody, Marshall C. Turner, Jr. and Jorge A. Bermudez qualify as audit committee financial experts.
ITEM 4. PRINCIPAL ACCOUNTANT FEES AND SERVICES.
(a) - (c) The following table sets forth the aggregate fees billed by the independent registered public accounting firm Ernst & Young LLP, for the Fund’s last two fiscal years for professional services rendered for: (i) the audit of the Fund’s annual financial statements included in the Fund’s annual report to stockholders; (ii) assurance and related services that are reasonably related to the performance of the audit of the Fund’s financial statements and are not reported under (i), which include advice and education related to accounting and auditing issues and quarterly press release review (for those Funds which issue press releases), and preferred stock maintenance testing (for those Funds that issue preferred stock); and (iii) tax compliance, tax advice and tax return preparation.
| | | | | | | | | | | | | | | | |
| | | | | | Audit Fees | | | Audit-Related
Fees | | | Tax Fees | |
AB High Income | | | 2019 | | | $ | 161,146 | | | $ | — | | | $ | 29,487 | |
| | | 2020 | | | $ | 161,146 | | | $ | 1,020 | | | $ | 18,183 | |
(d) Not applicable.
(e) (1) Beginning with audit and non-audit service contracts entered into on or after May 6, 2003, the Fund’s Audit Committee policies and procedures require the pre-approval of all audit and non-audit services provided to the Fund by the Fund’s independent registered public accounting firm. The Fund’s Audit Committee policies and procedures also require pre-approval of all audit and non-audit services provided to the Adviser and Service Affiliates to the extent that these services are directly related to the operations or financial reporting of the Fund.
(e) (2) All of the amounts for Audit Fees, Audit-Related Fees and Tax Fees in the table under Item 4 (a) – (c) are for services pre-approved by the Fund’s Audit Committee.
(f) Not applicable.
(g) The following table sets forth the aggregate non-audit services provided to the Fund, the Fund’s Adviser and entities that control, are controlled by or under common control with the Adviser that provide ongoing services to the Fund:
| | | | | | | | | | | | |
| | | | | | All Fees for
Non-Audit Services
Provided to the
Portfolio, the Adviser
and Service Affiliates | | | Total Amount of
Foregoing Column Pre-
approved by the Audit
Committee
(Portion Comprised of
Audit Related Fees)
(Portion Comprised of
Tax Fees) | |
AB High Income | | | 2019 | | | $ | 767,242 | | | $ | 29,487 | |
| | | | | | | | | | $ | — | |
| | | | | | | | | | $ | (29,487 | ) |
| | | 2020 | | | $ | 1,032,640 | | | $ | 19,203 | |
| | | | | | | | | | $ | (1,020 | ) |
| | | | | | | | | | $ | (18,183 | ) |
(h) The Audit Committee of the Fund has considered whether the provision of any non-audit services not pre-approved by the Audit Committee provided by the Fund’s independent registered public accounting firm to the Adviser and Service Affiliates is compatible with maintaining the auditor’s independence.
ITEM 5. AUDIT COMMITTEE OF LISTED REGISTRANTS.
Not applicable to the registrant.
ITEM 6. INVESTMENTS.
Please see Schedule of Investments contained in the Report to Shareholders included under Item 1 of this Form N-CSR.
ITEM 7. DISCLOSURE OF PROXY VOTING POLICIES AND PROCEDURES FOR CLOSED-END MANAGEMENT INVESTMENT COMPANIES.
Not applicable to the registrant.
ITEM 8. PORTFOLIO MANAGERS OF CLOSED-END MANAGEMENT INVESTMENT COMPANIES.
Not applicable to the registrant.
ITEM 9. PURCHASES OF EQUITY SECURITIES BY CLOSED-END MANAGEMENT INVESTMENT COMPANY AND AFFILIATED PURCHASERS.
Not applicable to the registrant.
ITEM 10. SUBMISSION OF MATTERS TO A VOTE OF SECURITY HOLDERS.
There have been no material changes to the procedures by which shareholders may recommend nominees to the Fund’s Board of Directors since the Fund last provided disclosure in response to this item.
ITEM 11. CONTROLS AND PROCEDURES.
(a) The registrant’s principal executive officer and principal financial officer have concluded that the registrant’s disclosure controls and procedures (as defined in Rule 30a-3 (c) under the Investment Company Act of 1940, as amended) are effective at the reasonable assurance level based on their evaluation of these controls and procedures as of a date within 90 days of the filing date of this document.
(b) There were no changes in the registrant’s internal controls over financial reporting that occurred during the second fiscal quarter of the period that has materially affected, or is reasonably likely to materially affect, the registrant’s internal control over financial reporting.
ITEM 12. DISCLOSURE OF SECURITIES LENDING ACTIVITIES FOR CLOSED-END MANAGEMENT INVESTMENT COMPANIES.
Not applicable to the registrant.
ITEM 13. EXHIBITS.
The following exhibits are attached to this Form N-CSR:
SIGNATURES
Pursuant to the requirements of the Securities Exchange Act of 1934 and the Investment Company Act of 1940, the registrant has duly caused this report to be signed on its behalf by the undersigned, thereunto duly authorized.
(Registrant): AB High Income Fund, Inc.
| | |
| By: | | /s/ Robert M. Keith |
| | Robert M. Keith |
| | President |
| |
Date: | | December 30, 2020 |
Pursuant to the requirements of the Securities Exchange Act of 1934 and the Investment Company Act of 1940, this report has been signed below by the following persons on behalf of the registrant and in the capacities and on the dates indicated.
| | |
| By: | | /s/ Robert M. Keith |
| | Robert M. Keith |
| | President |
| |
Date: | | December 30, 2020 |
| | |
| By: | | /s/ Joseph J. Mantineo |
| | Joseph J. Mantineo |
| | Treasurer and Chief Financial Officer |
| |
Date: | | December 30, 2020 |