UNITED STATES
SECURITIES AND EXCHANGE COMMISSION
WASHINGTON, D.C. 20549
FORM N-CSR
CERTIFIED SHAREHOLDER REPORT OF REGISTERED
MANAGEMENT INVESTMENT COMPANIES
Investment Company Act file number: 811-08188
AB HIGH INCOME FUND, INC.
(Exact name of registrant as specified in charter)
66 Hudson Boulevard East
New York, New York 10005
(Address of principal executive offices) (Zip code)
Stephen M. Woetzel
AllianceBernstein L.P.
66 Hudson Boulevard East
New York, New York 10005
(Name and address of agent for service)
Registrant’s telephone number, including area code: (800) 221-5672
Date of fiscal year end: October 31, 2024
Date of reporting period: October 31, 2024
ITEM 1. REPORTS TO STOCKHOLDERS.
Please scan QR code for Fund Information
Annual Shareholder Report
This annual shareholder report contains important information about the AB High Income Fund (the “Fund”) for the period of November 1, 2023 to October 31, 2024. You can find additional information about the Fund at https://www.abfunds.com/link/AB/AGDAX-A. You can also request this information by contacting us at (800) 227 4618.
What were the Fund costs for the last year?
(Based on a hypothetical $10,000 investment)
| Class Name | Cost of a $10,000 investment | Costs paid as a percentage of a $10,000 investment |
|---|
| Class A | $98 | 0.90% |
How Did the Fund Perform Last Year? What Affected the Fund's Performance?
Over the 12-month period, all share classes outperformed the Bloomberg Global Aggregate Bond Index (the "benchmark”). Security selection added the most to relative outperformance, mainly due to selections in US asset-backed securities, investment-grade corporate bonds, US agency mortgage-backed securities and US commercial mortgage-backed securities. Sector allocation also contributed, namely off-benchmark exposure to agency risk sharing securities and an underweight to US Treasuries, which offset losses from an underweight to US investment-grade corporates and off-benchmark positioning in US inflation-linked securities. Yield-curve positioning also contributed to results, mainly from an overweight to the six-month part of the US curve and an underweight to the 30-year part of the US curve, partially offset by losses from overweights to the two- and 20-year parts of the curve. Country allocation and currency decisions were minor detractors to performance.
During the 12-month period, the Fund used derivatives in the form of interest rate futures to manage and hedge duration risk and/or take active yield-curve positioning. Currency forwards were used to hedge foreign currency exposure and to take active currency risk. Credit default swaps were also utilized to effectively obtain high-yield credit/sector exposure. Total return swaps were used to create synthetic high-yield exposure in the Fund. Purchased options and written options were utilized as part of put spread for downside protection.
Top contributors to performance:
Top detractors from performance:
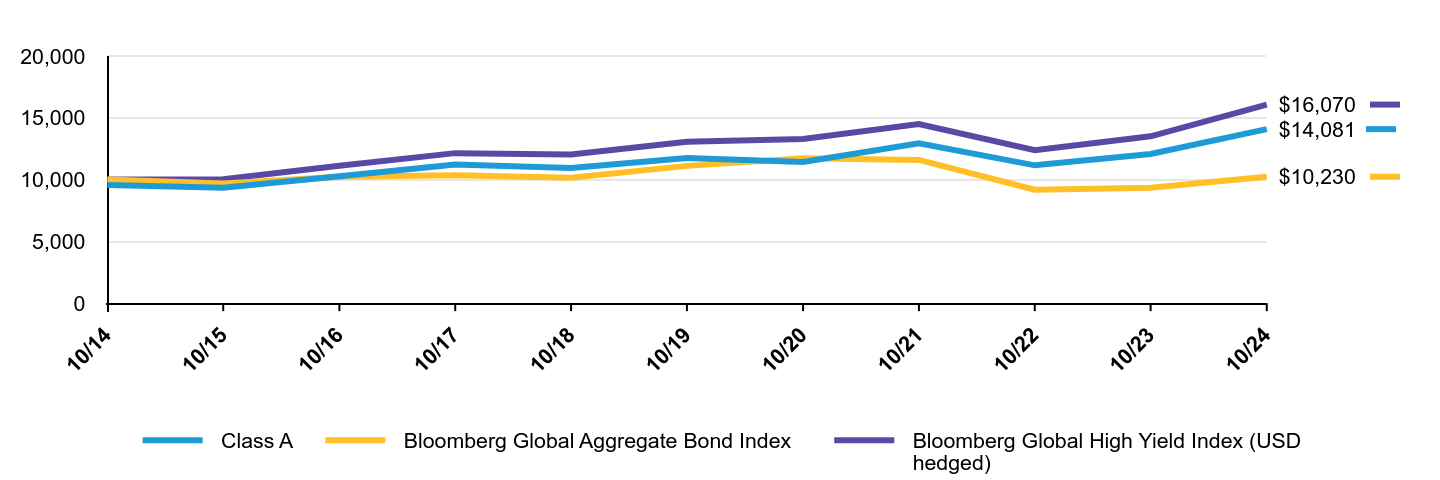
The following graph shows the performance of hypothetical $10,000 investments in the Fund, a broad-based securities market index and an additional index that corresponds to the Fund’s investment strategies, over the most recently completed 10 fiscal years of the Fund, or since inception, if shorter. The Fund's performance reflects applicable sales charges and assumes the reinvestment of dividends.
| Class A | Bloomberg Global Aggregate Bond Index | Bloomberg Global High Yield Index (USD hedged) |
|---|
| 10/14 | $9,572 | $10,000 | $10,000 |
| 10/15 | $9,336 | $9,693 | $10,026 |
| 10/16 | $10,267 | $10,234 | $11,122 |
| 10/17 | $11,222 | $10,355 | $12,141 |
| 10/18 | $10,940 | $10,143 | $12,026 |
| 10/19 | $11,741 | $11,110 | $13,052 |
| 10/20 | $11,425 | $11,736 | $13,282 |
| 10/21 | $12,944 | $11,590 | $14,487 |
| 10/22 | $11,154 | $9,181 | $12,381 |
| 10/23 | $12,070 | $9,339 | $13,503 |
| 10/24 | $14,081 | $10,230 | $16,070 |
Average Annual Total Returns
| Class Name | 1 Year | 5 Years | 10 Years |
|---|
| Class A (without sales charges) | 16.67% | 3.70% | 3.94% |
| Class A (with sales charges) | 11.65% | 2.81% | 3.48% |
| Bloomberg Global Aggregate Bond Index | 9.54% | -1.64% | 0.23% |
| Bloomberg Global High Yield Index (USD hedged) | 19.02% | 4.25% | 4.86% |
| The addition of the Bloomberg Global Aggregate Bond Index broad-based benchmark provides a comparison of the Fund's performance against the broader market as a regulatorily required. |
The Fund’s past performance is not a good predictor of the Fund’s future performance.
The graph and table do not reflect the deduction of taxes that a shareholder would pay on Fund distributions or the redemption or sale of Fund shares.
Visit https://www.abfunds.com/link/AB/AGDAX-A for the most recent performance information.
| Net Assets | $3,214,629,464 |
| # of Portfolio Holdings | 1,018 |
| Portfolio Turnover Rate | 50% |
| Total Advisory Fees Paid | $15,311,275 |
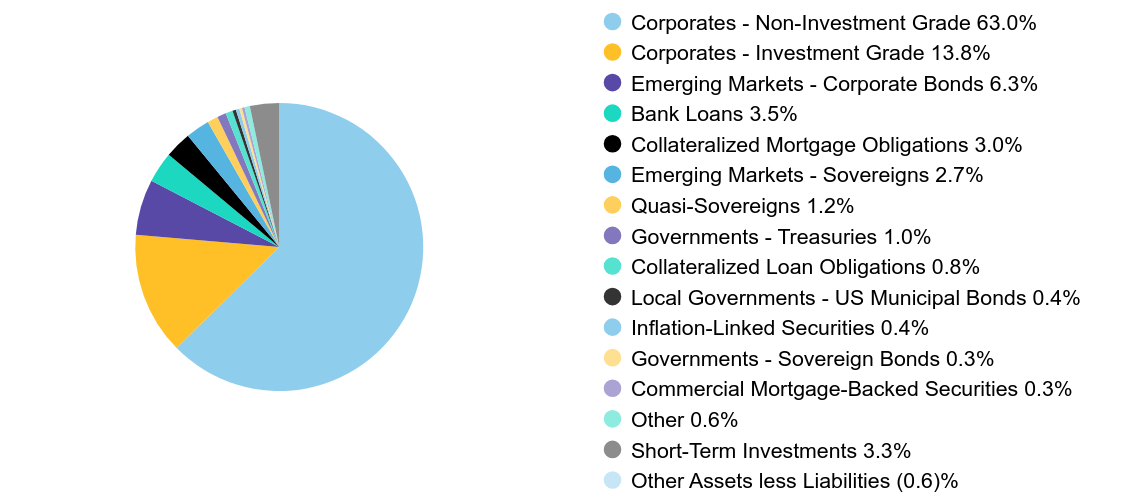
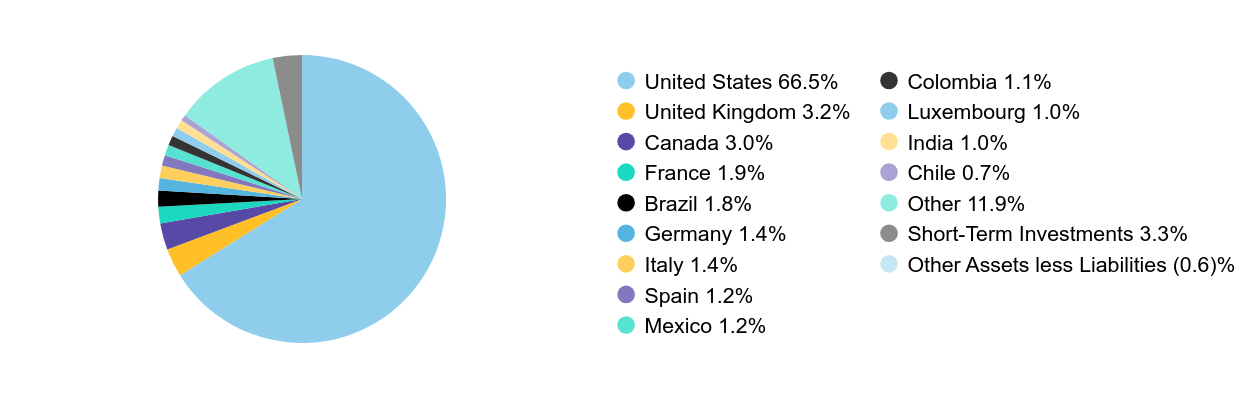
Graphical Representation of Holdings
| Value | Value |
|---|
| Corporates - Non-Investment Grade | 63.0% |
| Corporates - Investment Grade | 13.8% |
| Emerging Markets - Corporate Bonds | 6.3% |
| Bank Loans | 3.5% |
| Collateralized Mortgage Obligations | 3.0% |
| Emerging Markets - Sovereigns | 2.7% |
| Quasi-Sovereigns | 1.2% |
| Governments - Treasuries | 1.0% |
| Collateralized Loan Obligations | 0.8% |
| Local Governments - US Municipal Bonds | 0.4% |
| Inflation-Linked Securities | 0.4% |
| Governments - Sovereign Bonds | 0.3% |
| Commercial Mortgage-Backed Securities | 0.3% |
| Other | 0.6% |
| Short-Term Investments | 3.3% |
| Other Assets less Liabilities | (0.6)% |
| Value | Value |
|---|
| United States | 66.5% |
| United Kingdom | 3.2% |
| Canada | 3.0% |
| France | 1.9% |
| Brazil | 1.8% |
| Germany | 1.4% |
| Italy | 1.4% |
| Spain | 1.2% |
| Mexico | 1.2% |
| Colombia | 1.1% |
| Luxembourg | 1.0% |
| India | 1.0% |
| Chile | 0.7% |
| Other | 11.9% |
| Short-Term Investments | 3.3% |
| Other Assets less Liabilities | (0.6)% |
Availability of Additional Information
You can find additional information at https://www.abfunds.com/link/AB/AGDAX-A, including the Fund's:
• Prospectus
• Financial information
• Fund holdings
• Proxy voting information
You can also request this information by contacting us at (800) 227 4618.
Shareholders who have consented to receive a single annual or semi-annual shareholder report at a shared address may revoke this consent by contacting us at (800) 227 4618.
Information Regarding the Review and Approval of the Fund’s Advisory Agreement
Information regarding the Fund’s Board of Directors’/Trustees’ review of the advisory agreement is available on the Fund’s website https://www.abfunds.com/link/AB/AGDAX-A. You can request this information, free of charge, by contacting us at (800) 227 4618 or by scanning the QR code below.
The [A/B] logo and AllianceBernstein® are registered trademarks used by permission of the owner, AllianceBernstein L.P.
Please scan QR code for Fund Information
Please scan QR code for Fund Information
Annual Shareholder Report
This annual shareholder report contains important information about the AB High Income Fund (the “Fund”) for the period of November 1, 2023 to October 31, 2024. You can find additional information about the Fund at https://www.abfunds.com/link/AB/AGDYX-A. You can also request this information by contacting us at (800) 227 4618.
What were the Fund costs for the last year?
(Based on a hypothetical $10,000 investment)
| Class Name | Cost of a $10,000 investment | Costs paid as a percentage of a $10,000 investment |
|---|
| Advisor Class | $71 | 0.65% |
How Did the Fund Perform Last Year? What Affected the Fund's Performance?
Over the 12-month period, all share classes outperformed the Bloomberg Global Aggregate Bond Index (the "benchmark”). Security selection added the most to relative outperformance, mainly due to selections in US asset-backed securities, investment-grade corporate bonds, US agency mortgage-backed securities and US commercial mortgage-backed securities. Sector allocation also contributed, namely off-benchmark exposure to agency risk sharing securities and an underweight to US Treasuries, which offset losses from an underweight to US investment-grade corporates and off-benchmark positioning in US inflation-linked securities. Yield-curve positioning also contributed to results, mainly from an overweight to the six-month part of the US curve and an underweight to the 30-year part of the US curve, partially offset by losses from overweights to the two- and 20-year parts of the curve. Country allocation and currency decisions were minor detractors to performance.
During the 12-month period, the Fund used derivatives in the form of interest rate futures to manage and hedge duration risk and/or take active yield-curve positioning. Currency forwards were used to hedge foreign currency exposure and to take active currency risk. Credit default swaps were also utilized to effectively obtain high-yield credit/sector exposure. Total return swaps were used to create synthetic high-yield exposure in the Fund. Purchased options and written options were utilized as part of put spread for downside protection.
Top contributors to performance:
Top detractors from performance:
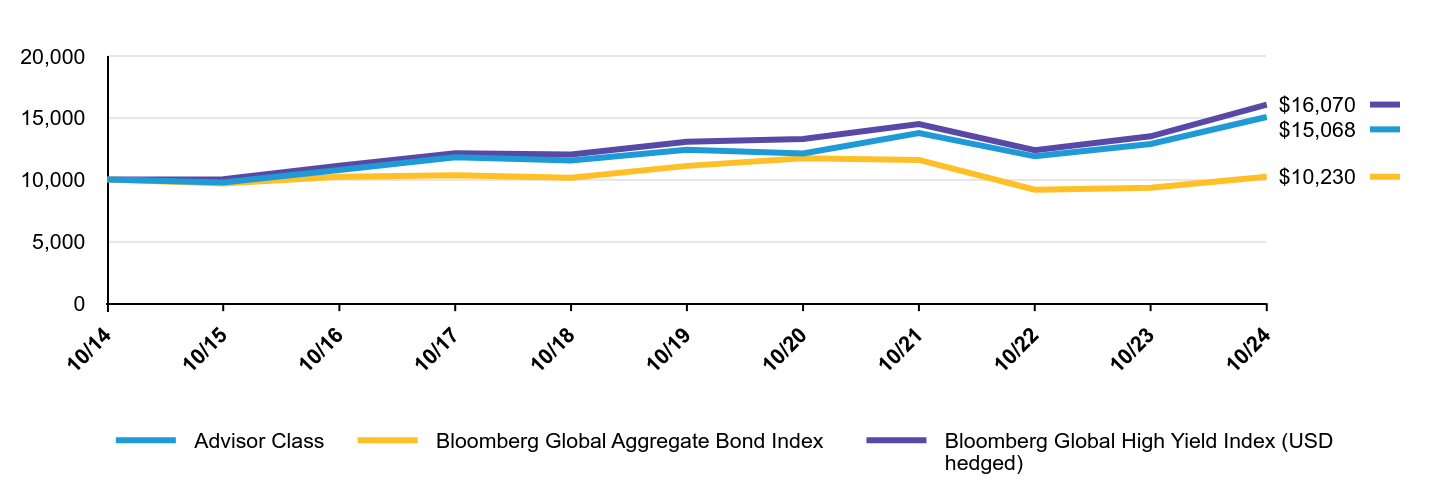
The following graph shows the performance of hypothetical $10,000 investments in the Fund, a broad-based securities market index and an additional index that corresponds to the Fund’s investment strategies, over the most recently completed 10 fiscal years of the Fund, or since inception, if shorter. The Fund's performance reflects applicable sales charges and assumes the reinvestment of dividends.
| Advisor Class | Bloomberg Global Aggregate Bond Index | Bloomberg Global High Yield Index (USD hedged) |
|---|
| 10/14 | $10,000 | $10,000 | $10,000 |
| 10/15 | $9,770 | $9,693 | $10,026 |
| 10/16 | $10,773 | $10,234 | $11,122 |
| 10/17 | $11,803 | $10,355 | $12,141 |
| 10/18 | $11,536 | $10,143 | $12,026 |
| 10/19 | $12,410 | $11,110 | $13,052 |
| 10/20 | $12,105 | $11,736 | $13,282 |
| 10/21 | $13,767 | $11,590 | $14,487 |
| 10/22 | $11,881 | $9,181 | $12,381 |
| 10/23 | $12,886 | $9,339 | $13,503 |
| 10/24 | $15,068 | $10,230 | $16,070 |
Average Annual Total Returns
| Class Name | 1 Year | 5 Years | 10 Years |
|---|
| Advisor Class | 16.94% | 3.96% | 4.18% |
| Bloomberg Global Aggregate Bond Index | 9.54% | -1.64% | 0.23% |
| Bloomberg Global High Yield Index (USD hedged) | 19.02% | 4.25% | 4.86% |
| The addition of the Bloomberg Global Aggregate Bond Index broad-based benchmark provides a comparison of the Fund's performance against the broader market as a regulatorily required. |
The Fund’s past performance is not a good predictor of the Fund’s future performance.
The graph and table do not reflect the deduction of taxes that a shareholder would pay on Fund distributions or the redemption or sale of Fund shares.
Visit https://www.abfunds.com/link/AB/AGDYX-A for the most recent performance information.
| Net Assets | $3,214,629,464 |
| # of Portfolio Holdings | 1,018 |
| Portfolio Turnover Rate | 50% |
| Total Advisory Fees Paid | $15,311,275 |
Graphical Representation of Holdings
| Value | Value |
|---|
| Corporates - Non-Investment Grade | 63.0% |
| Corporates - Investment Grade | 13.8% |
| Emerging Markets - Corporate Bonds | 6.3% |
| Bank Loans | 3.5% |
| Collateralized Mortgage Obligations | 3.0% |
| Emerging Markets - Sovereigns | 2.7% |
| Quasi-Sovereigns | 1.2% |
| Governments - Treasuries | 1.0% |
| Collateralized Loan Obligations | 0.8% |
| Local Governments - US Municipal Bonds | 0.4% |
| Inflation-Linked Securities | 0.4% |
| Governments - Sovereign Bonds | 0.3% |
| Commercial Mortgage-Backed Securities | 0.3% |
| Other | 0.6% |
| Short-Term Investments | 3.3% |
| Other Assets less Liabilities | (0.6)% |
| Value | Value |
|---|
| United States | 66.5% |
| United Kingdom | 3.2% |
| Canada | 3.0% |
| France | 1.9% |
| Brazil | 1.8% |
| Germany | 1.4% |
| Italy | 1.4% |
| Spain | 1.2% |
| Mexico | 1.2% |
| Colombia | 1.1% |
| Luxembourg | 1.0% |
| India | 1.0% |
| Chile | 0.7% |
| Other | 11.9% |
| Short-Term Investments | 3.3% |
| Other Assets less Liabilities | (0.6)% |
Availability of Additional Information
You can find additional information at https://www.abfunds.com/link/AB/AGDYX-A, including the Fund's:
• Prospectus
• Financial information
• Fund holdings
• Proxy voting information
You can also request this information by contacting us at (800) 227 4618.
Shareholders who have consented to receive a single annual or semi-annual shareholder report at a shared address may revoke this consent by contacting us at (800) 227 4618.
Information Regarding the Review and Approval of the Fund’s Advisory Agreement
Information regarding the Fund’s Board of Directors’/Trustees’ review of the advisory agreement is available on the Fund’s website https://www.abfunds.com/link/AB/AGDYX-A. You can request this information, free of charge, by contacting us at (800) 227 4618 or by scanning the QR code below.
The [A/B] logo and AllianceBernstein® are registered trademarks used by permission of the owner, AllianceBernstein L.P.
Please scan QR code for Fund Information
Please scan QR code for Fund Information
Annual Shareholder Report
This annual shareholder report contains important information about the AB High Income Fund (the “Fund”) for the period of November 1, 2023 to October 31, 2024. You can find additional information about the Fund at https://www.abfunds.com/link/AB/AGDCX-A. You can also request this information by contacting us at (800) 227 4618.
What were the Fund costs for the last year?
(Based on a hypothetical $10,000 investment)
| Class Name | Cost of a $10,000 investment | Costs paid as a percentage of a $10,000 investment |
|---|
| Class C | $177 | 1.64% |
How Did the Fund Perform Last Year? What Affected the Fund's Performance?
Over the 12-month period, all share classes outperformed the Bloomberg Global Aggregate Bond Index (the "benchmark”). Security selection added the most to relative outperformance, mainly due to selections in US asset-backed securities, investment-grade corporate bonds, US agency mortgage-backed securities and US commercial mortgage-backed securities. Sector allocation also contributed, namely off-benchmark exposure to agency risk sharing securities and an underweight to US Treasuries, which offset losses from an underweight to US investment-grade corporates and off-benchmark positioning in US inflation-linked securities. Yield-curve positioning also contributed to results, mainly from an overweight to the six-month part of the US curve and an underweight to the 30-year part of the US curve, partially offset by losses from overweights to the two- and 20-year parts of the curve. Country allocation and currency decisions were minor detractors to performance.
During the 12-month period, the Fund used derivatives in the form of interest rate futures to manage and hedge duration risk and/or take active yield-curve positioning. Currency forwards were used to hedge foreign currency exposure and to take active currency risk. Credit default swaps were also utilized to effectively obtain high-yield credit/sector exposure. Total return swaps were used to create synthetic high-yield exposure in the Fund. Purchased options and written options were utilized as part of put spread for downside protection.
Top contributors to performance:
Top detractors from performance:
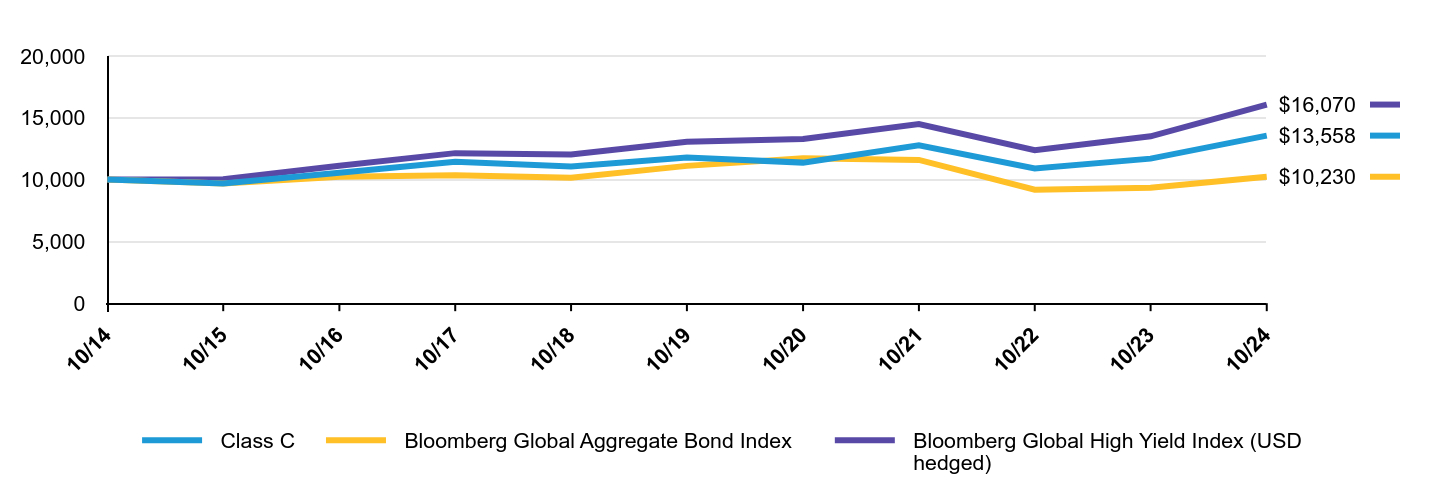
The following graph shows the performance of hypothetical $10,000 investments in the Fund, a broad-based securities market index and an additional index that corresponds to the Fund’s investment strategies, over the most recently completed 10 fiscal years of the Fund, or since inception, if shorter. The Fund's performance reflects applicable sales charges and assumes the reinvestment of dividends.
| Class C | Bloomberg Global Aggregate Bond Index | Bloomberg Global High Yield Index (USD hedged) |
|---|
| 10/14 | $10,000 | $10,000 | $10,000 |
| 10/15 | $9,683 | $9,693 | $10,026 |
| 10/16 | $10,552 | $10,234 | $11,122 |
| 10/17 | $11,436 | $10,355 | $12,141 |
| 10/18 | $11,069 | $10,143 | $12,026 |
| 10/19 | $11,780 | $11,110 | $13,052 |
| 10/20 | $11,373 | $11,736 | $13,282 |
| 10/21 | $12,777 | $11,590 | $14,487 |
| 10/22 | $10,900 | $9,181 | $12,381 |
| 10/23 | $11,695 | $9,339 | $13,503 |
| 10/24 | $13,558 | $10,230 | $16,070 |
Average Annual Total Returns
| Class Name | 1 Year | 5 Years | 10 Years |
|---|
| Class C (without sales charges) | 15.93% | 2.85% | 3.09% |
| Class C (with sales charges) | 14.93% | 2.85% | 3.09% |
| Bloomberg Global Aggregate Bond Index | 9.54% | -1.64% | 0.23% |
| Bloomberg Global High Yield Index (USD hedged) | 19.02% | 4.25% | 4.86% |
| The addition of the Bloomberg Global Aggregate Bond Index broad-based benchmark provides a comparison of the Fund's performance against the broader market as a regulatorily required. |
The Fund’s past performance is not a good predictor of the Fund’s future performance.
The graph and table do not reflect the deduction of taxes that a shareholder would pay on Fund distributions or the redemption or sale of Fund shares.
Visit https://www.abfunds.com/link/AB/AGDCX-A for the most recent performance information.
| Net Assets | $3,214,629,464 |
| # of Portfolio Holdings | 1,018 |
| Portfolio Turnover Rate | 50% |
| Total Advisory Fees Paid | $15,311,275 |
Graphical Representation of Holdings
| Value | Value |
|---|
| Corporates - Non-Investment Grade | 63.0% |
| Corporates - Investment Grade | 13.8% |
| Emerging Markets - Corporate Bonds | 6.3% |
| Bank Loans | 3.5% |
| Collateralized Mortgage Obligations | 3.0% |
| Emerging Markets - Sovereigns | 2.7% |
| Quasi-Sovereigns | 1.2% |
| Governments - Treasuries | 1.0% |
| Collateralized Loan Obligations | 0.8% |
| Local Governments - US Municipal Bonds | 0.4% |
| Inflation-Linked Securities | 0.4% |
| Governments - Sovereign Bonds | 0.3% |
| Commercial Mortgage-Backed Securities | 0.3% |
| Other | 0.6% |
| Short-Term Investments | 3.3% |
| Other Assets less Liabilities | (0.6)% |
| Value | Value |
|---|
| United States | 66.5% |
| United Kingdom | 3.2% |
| Canada | 3.0% |
| France | 1.9% |
| Brazil | 1.8% |
| Germany | 1.4% |
| Italy | 1.4% |
| Spain | 1.2% |
| Mexico | 1.2% |
| Colombia | 1.1% |
| Luxembourg | 1.0% |
| India | 1.0% |
| Chile | 0.7% |
| Other | 11.9% |
| Short-Term Investments | 3.3% |
| Other Assets less Liabilities | (0.6)% |
Availability of Additional Information
You can find additional information at https://www.abfunds.com/link/AB/AGDCX-A, including the Fund's:
• Prospectus
• Financial information
• Fund holdings
• Proxy voting information
You can also request this information by contacting us at (800) 227 4618.
Shareholders who have consented to receive a single annual or semi-annual shareholder report at a shared address may revoke this consent by contacting us at (800) 227 4618.
Information Regarding the Review and Approval of the Fund’s Advisory Agreement
Information regarding the Fund’s Board of Directors’/Trustees’ review of the advisory agreement is available on the Fund’s website https://www.abfunds.com/link/AB/AGDCX-A. You can request this information, free of charge, by contacting us at (800) 227 4618 or by scanning the QR code below.
The [A/B] logo and AllianceBernstein® are registered trademarks used by permission of the owner, AllianceBernstein L.P.
Please scan QR code for Fund Information
Please scan QR code for Fund Information
Annual Shareholder Report
This annual shareholder report contains important information about the AB High Income Fund (the “Fund”) for the period of November 1, 2023 to October 31, 2024. You can find additional information about the Fund at https://www.abfunds.com/link/AB/AGDIX-A. You can also request this information by contacting us at (800) 227 4618.
What were the Fund costs for the last year?
(Based on a hypothetical $10,000 investment)
| Class Name | Cost of a $10,000 investment | Costs paid as a percentage of a $10,000 investment |
|---|
| Class I | $71 | 0.65% |
How Did the Fund Perform Last Year? What Affected the Fund's Performance?
Over the 12-month period, all share classes outperformed the Bloomberg Global Aggregate Bond Index (the "benchmark”). Security selection added the most to relative outperformance, mainly due to selections in US asset-backed securities, investment-grade corporate bonds, US agency mortgage-backed securities and US commercial mortgage-backed securities. Sector allocation also contributed, namely off-benchmark exposure to agency risk sharing securities and an underweight to US Treasuries, which offset losses from an underweight to US investment-grade corporates and off-benchmark positioning in US inflation-linked securities. Yield-curve positioning also contributed to results, mainly from an overweight to the six-month part of the US curve and an underweight to the 30-year part of the US curve, partially offset by losses from overweights to the two- and 20-year parts of the curve. Country allocation and currency decisions were minor detractors to performance.
During the 12-month period, the Fund used derivatives in the form of interest rate futures to manage and hedge duration risk and/or take active yield-curve positioning. Currency forwards were used to hedge foreign currency exposure and to take active currency risk. Credit default swaps were also utilized to effectively obtain high-yield credit/sector exposure. Total return swaps were used to create synthetic high-yield exposure in the Fund. Purchased options and written options were utilized as part of put spread for downside protection.
Top contributors to performance:
Top detractors from performance:
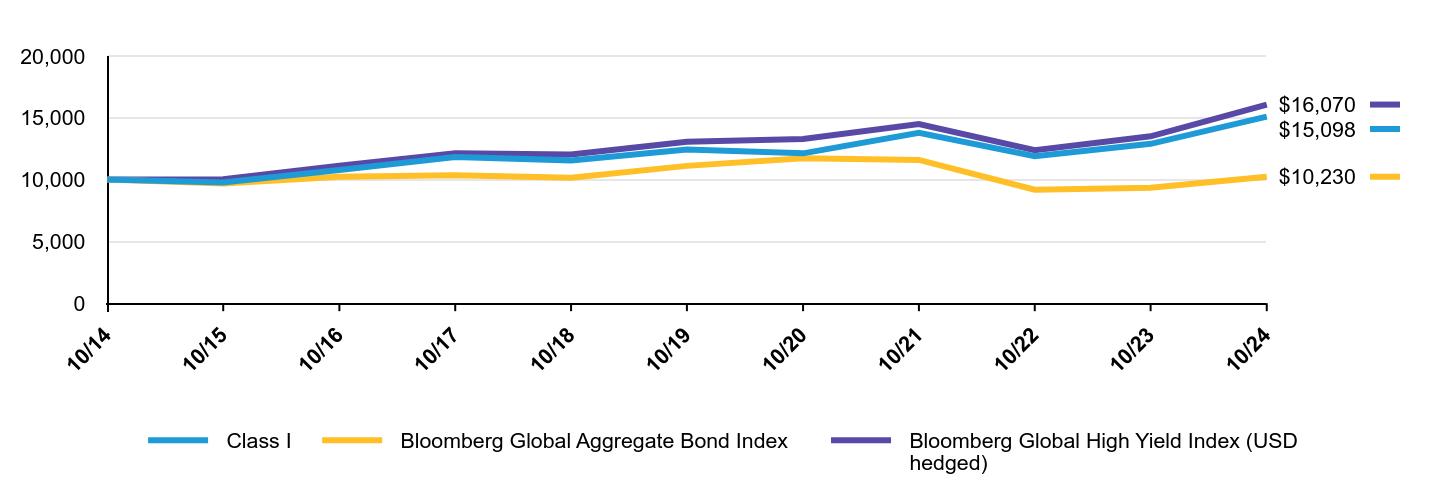
The following graph shows the performance of hypothetical $10,000 investments in the Fund, a broad-based securities market index and an additional index that corresponds to the Fund’s investment strategies, over the most recently completed 10 fiscal years of the Fund, or since inception, if shorter. The Fund's performance reflects applicable sales charges and assumes the reinvestment of dividends.
| Class I | Bloomberg Global Aggregate Bond Index | Bloomberg Global High Yield Index (USD hedged) |
|---|
| 10/14 | $10,000 | $10,000 | $10,000 |
| 10/15 | $9,774 | $9,693 | $10,026 |
| 10/16 | $10,783 | $10,234 | $11,122 |
| 10/17 | $11,819 | $10,355 | $12,141 |
| 10/18 | $11,555 | $10,143 | $12,026 |
| 10/19 | $12,434 | $11,110 | $13,052 |
| 10/20 | $12,123 | $11,736 | $13,282 |
| 10/21 | $13,785 | $11,590 | $14,487 |
| 10/22 | $11,894 | $9,181 | $12,381 |
| 10/23 | $12,895 | $9,339 | $13,503 |
| 10/24 | $15,098 | $10,230 | $16,070 |
Average Annual Total Returns
| Class Name | 1 Year | 5 Years | 10 Years |
|---|
| Class I | 17.08% | 3.96% | 4.21% |
| Bloomberg Global Aggregate Bond Index | 9.54% | -1.64% | 0.23% |
| Bloomberg Global High Yield Index (USD hedged) | 19.02% | 4.25% | 4.86% |
| The addition of the Bloomberg Global Aggregate Bond Index broad-based benchmark provides a comparison of the Fund's performance against the broader market as a regulatorily required. |
The Fund’s past performance is not a good predictor of the Fund’s future performance.
The graph and table do not reflect the deduction of taxes that a shareholder would pay on Fund distributions or the redemption or sale of Fund shares.
Visit https://www.abfunds.com/link/AB/AGDIX-A for the most recent performance information.
| Net Assets | $3,214,629,464 |
| # of Portfolio Holdings | 1,018 |
| Portfolio Turnover Rate | 50% |
| Total Advisory Fees Paid | $15,311,275 |
Graphical Representation of Holdings
| Value | Value |
|---|
| Corporates - Non-Investment Grade | 63.0% |
| Corporates - Investment Grade | 13.8% |
| Emerging Markets - Corporate Bonds | 6.3% |
| Bank Loans | 3.5% |
| Collateralized Mortgage Obligations | 3.0% |
| Emerging Markets - Sovereigns | 2.7% |
| Quasi-Sovereigns | 1.2% |
| Governments - Treasuries | 1.0% |
| Collateralized Loan Obligations | 0.8% |
| Local Governments - US Municipal Bonds | 0.4% |
| Inflation-Linked Securities | 0.4% |
| Governments - Sovereign Bonds | 0.3% |
| Commercial Mortgage-Backed Securities | 0.3% |
| Other | 0.6% |
| Short-Term Investments | 3.3% |
| Other Assets less Liabilities | (0.6)% |
| Value | Value |
|---|
| United States | 66.5% |
| United Kingdom | 3.2% |
| Canada | 3.0% |
| France | 1.9% |
| Brazil | 1.8% |
| Germany | 1.4% |
| Italy | 1.4% |
| Spain | 1.2% |
| Mexico | 1.2% |
| Colombia | 1.1% |
| Luxembourg | 1.0% |
| India | 1.0% |
| Chile | 0.7% |
| Other | 11.9% |
| Short-Term Investments | 3.3% |
| Other Assets less Liabilities | (0.6)% |
Availability of Additional Information
You can find additional information at https://www.abfunds.com/link/AB/AGDIX-A, including the Fund's:
• Prospectus
• Financial information
• Fund holdings
• Proxy voting information
You can also request this information by contacting us at (800) 227 4618.
Shareholders who have consented to receive a single annual or semi-annual shareholder report at a shared address may revoke this consent by contacting us at (800) 227 4618.
Information Regarding the Review and Approval of the Fund’s Advisory Agreement
Information regarding the Fund’s Board of Directors’/Trustees’ review of the advisory agreement is available on the Fund’s website https://www.abfunds.com/link/AB/AGDIX-A. You can request this information, free of charge, by contacting us at (800) 227 4618 or by scanning the QR code below.
The [A/B] logo and AllianceBernstein® are registered trademarks used by permission of the owner, AllianceBernstein L.P.
Please scan QR code for Fund Information
Please scan QR code for Fund Information
Annual Shareholder Report
This annual shareholder report contains important information about the AB High Income Fund (the “Fund”) for the period of November 1, 2023 to October 31, 2024. You can find additional information about the Fund at https://www.abfunds.com/link/AB/AGDZX-A. You can also request this information by contacting us at (800) 227 4618.
What were the Fund costs for the last year?
(Based on a hypothetical $10,000 investment)
| Class Name | Cost of a $10,000 investment | Costs paid as a percentage of a $10,000 investment |
|---|
| Class Z | $64 | 0.59% |
How Did the Fund Perform Last Year? What Affected the Fund's Performance?
Over the 12-month period, all share classes outperformed the Bloomberg Global Aggregate Bond Index (the "benchmark”). Security selection added the most to relative outperformance, mainly due to selections in US asset-backed securities, investment-grade corporate bonds, US agency mortgage-backed securities and US commercial mortgage-backed securities. Sector allocation also contributed, namely off-benchmark exposure to agency risk sharing securities and an underweight to US Treasuries, which offset losses from an underweight to US investment-grade corporates and off-benchmark positioning in US inflation-linked securities. Yield-curve positioning also contributed to results, mainly from an overweight to the six-month part of the US curve and an underweight to the 30-year part of the US curve, partially offset by losses from overweights to the two- and 20-year parts of the curve. Country allocation and currency decisions were minor detractors to performance.
During the 12-month period, the Fund used derivatives in the form of interest rate futures to manage and hedge duration risk and/or take active yield-curve positioning. Currency forwards were used to hedge foreign currency exposure and to take active currency risk. Credit default swaps were also utilized to effectively obtain high-yield credit/sector exposure. Total return swaps were used to create synthetic high-yield exposure in the Fund. Purchased options and written options were utilized as part of put spread for downside protection.
Top contributors to performance:
Top detractors from performance:
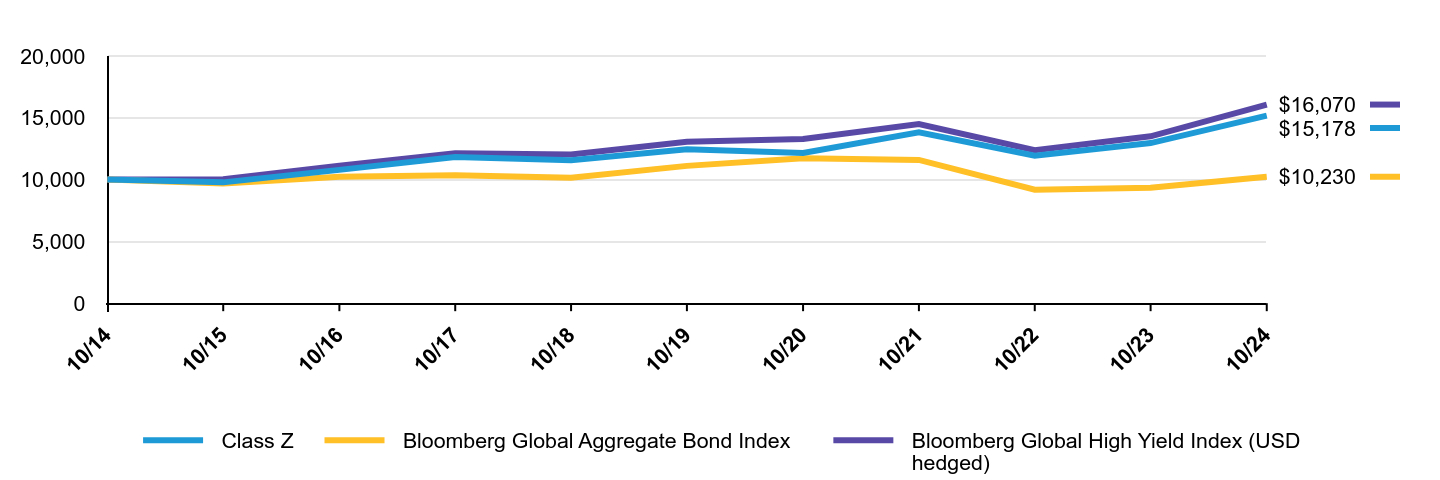
The following graph shows the performance of hypothetical $10,000 investments in the Fund, a broad-based securities market index and an additional index that corresponds to the Fund’s investment strategies, over the most recently completed 10 fiscal years of the Fund, or since inception, if shorter. The Fund's performance reflects applicable sales charges and assumes the reinvestment of dividends.
| Class Z | Bloomberg Global Aggregate Bond Index | Bloomberg Global High Yield Index (USD hedged) |
|---|
| 10/14 | $10,000 | $10,000 | $10,000 |
| 10/15 | $9,775 | $9,693 | $10,026 |
| 10/16 | $10,787 | $10,234 | $11,122 |
| 10/17 | $11,825 | $10,355 | $12,141 |
| 10/18 | $11,566 | $10,143 | $12,026 |
| 10/19 | $12,455 | $11,110 | $13,052 |
| 10/20 | $12,149 | $11,736 | $13,282 |
| 10/21 | $13,824 | $11,590 | $14,487 |
| 10/22 | $11,939 | $9,181 | $12,381 |
| 10/23 | $12,954 | $9,339 | $13,503 |
| 10/24 | $15,178 | $10,230 | $16,070 |
Average Annual Total Returns
| Class Name | 1 Year | 5 Years | 10 Years |
|---|
| Class Z | 17.16% | 4.03% | 4.26% |
| Bloomberg Global Aggregate Bond Index | 9.54% | -1.64% | 0.23% |
| Bloomberg Global High Yield Index (USD hedged) | 19.02% | 4.25% | 4.86% |
| The addition of the Bloomberg Global Aggregate Bond Index broad-based benchmark provides a comparison of the Fund's performance against the broader market as a regulatorily required. |
The Fund’s past performance is not a good predictor of the Fund’s future performance.
The graph and table do not reflect the deduction of taxes that a shareholder would pay on Fund distributions or the redemption or sale of Fund shares.
Visit https://www.abfunds.com/link/AB/AGDZX-A for the most recent performance information.
| Net Assets | $3,214,629,464 |
| # of Portfolio Holdings | 1,018 |
| Portfolio Turnover Rate | 50% |
| Total Advisory Fees Paid | $15,311,275 |
Graphical Representation of Holdings
| Value | Value |
|---|
| Corporates - Non-Investment Grade | 63.0% |
| Corporates - Investment Grade | 13.8% |
| Emerging Markets - Corporate Bonds | 6.3% |
| Bank Loans | 3.5% |
| Collateralized Mortgage Obligations | 3.0% |
| Emerging Markets - Sovereigns | 2.7% |
| Quasi-Sovereigns | 1.2% |
| Governments - Treasuries | 1.0% |
| Collateralized Loan Obligations | 0.8% |
| Local Governments - US Municipal Bonds | 0.4% |
| Inflation-Linked Securities | 0.4% |
| Governments - Sovereign Bonds | 0.3% |
| Commercial Mortgage-Backed Securities | 0.3% |
| Other | 0.6% |
| Short-Term Investments | 3.3% |
| Other Assets less Liabilities | (0.6)% |
| Value | Value |
|---|
| United States | 66.5% |
| United Kingdom | 3.2% |
| Canada | 3.0% |
| France | 1.9% |
| Brazil | 1.8% |
| Germany | 1.4% |
| Italy | 1.4% |
| Spain | 1.2% |
| Mexico | 1.2% |
| Colombia | 1.1% |
| Luxembourg | 1.0% |
| India | 1.0% |
| Chile | 0.7% |
| Other | 11.9% |
| Short-Term Investments | 3.3% |
| Other Assets less Liabilities | (0.6)% |
Availability of Additional Information
You can find additional information at https://www.abfunds.com/link/AB/AGDZX-A, including the Fund's:
• Prospectus
• Financial information
• Fund holdings
• Proxy voting information
You can also request this information by contacting us at (800) 227 4618.
Shareholders who have consented to receive a single annual or semi-annual shareholder report at a shared address may revoke this consent by contacting us at (800) 227 4618.
Information Regarding the Review and Approval of the Fund’s Advisory Agreement
Information regarding the Fund’s Board of Directors’/Trustees’ review of the advisory agreement is available on the Fund’s website https://www.abfunds.com/link/AB/AGDZX-A. You can request this information, free of charge, by contacting us at (800) 227 4618 or by scanning the QR code below.
The [A/B] logo and AllianceBernstein® are registered trademarks used by permission of the owner, AllianceBernstein L.P.
Please scan QR code for Fund Information
ITEM 2. CODE OF ETHICS.
(a) The registrant has adopted a code of ethics that applies to its principal executive officer, principal financial officer and principal accounting officer. A copy of the registrant’s code of ethics is filed herewith as Exhibit 19(a)(1).
(b) During the period covered by this report, no material amendments were made to the provisions of the code of ethics adopted in 2(a) above.
(c) During the period covered by this report, no implicit or explicit waivers to the provisions of the code of ethics adopted in 2(a) above were granted.
ITEM 3. AUDIT COMMITTEE FINANCIAL EXPERT.
The registrant’s Board of Directors has determined that independent directors Garry L. Moody, Marshall C. Turner, Jr., Jorge A. Bermudez and Carol C. McMullen qualify as audit committee financial experts.
ITEM 4. PRINCIPAL ACCOUNTANT FEES AND SERVICES.
(a)—(c) The following table sets forth the aggregate fees billed* by the independent registered public accounting firm Ernst & Young LLP, for the Fund’s last two fiscal years, for professional services rendered for: (i) the audit of the Fund’s annual financial statements included in the Fund’s annual report to stockholders; (ii) assurance and related services that are reasonably related to the performance of the audit of the Fund’s financial statements and are not reported under (i), which include advice and education related to accounting and auditing issues, quarterly press release review (for those Funds that issue quarterly press releases), and preferred stock maintenance testing (for those Funds that issue preferred stock); and (iii) tax compliance, tax advice and tax return preparation.
| | | | | | | | | | | | | | | | |
| | | | | | Audit Fees | | | Audit-Related
Fees | | | Tax Fees | |
AB High Income | | | 2023 | | | $ | 169,203 | | | $ | - | | | $ | 37,079 | |
| | | 2024 | | | $ | 169,203 | | | $ | - | | | $ | 34,553 | |
(d) Not applicable.
(e) (1) Beginning with audit and non-audit service contracts entered into on or after May 6, 2003, the Fund’s Audit Committee policies and procedures require the pre-approval of all audit and non-audit services provided to the Fund by the Fund’s independent registered public accounting firm. The Fund’s Audit Committee policies and procedures also require pre-approval of all audit and non-audit services provided to the Adviser and Service Affiliates to the extent that these services are directly related to the operations or financial reporting of the Fund.
(e) (2) No percentage of services addressed by (b) and (c) of this Item 4 were approved pursuant to the waiver provision of paragraph (c)(7)(i)(C) of Rule 2-01 of Regulation S-X. No amounts are reported for Item 4 (d).
(f) Not applicable.
(g) The following table sets forth the aggregate non-audit services provided to the Fund, the Fund’s Adviser and entities that control, are controlled by or under common control with the Adviser that provide ongoing services to the Fund: (“Service Affiliates”):
| | | | | | | | | | | | |
| | | | | | All Fees for
Non-Audit Services
Provided to the
Portfolio, the Adviser
and Service Affiliates | | | Total Amount of
Foregoing Column Pre-
approved by the Audit
Committee
(Portion Comprised of
Audit Related Fees)
(Portion Comprised of
Tax Fees) | |
| | | | | | | | | | | | |
AB High Income | | | 2023 | | | $ | 1,798,109 | | | $ | 37,079 | |
| | | | | | | | | | $ | - | |
| | | | | | | | | | $ | (37,079 | ) |
| | | 2024 | | | $ | 2,058,859 | | | $ | 34,553 | |
| | | | | | | | | | $ | - | |
| | | | | | | | | | $ | (34,553 | ) |
(h) The Audit Committee of the Fund has considered whether the provision of any non-audit services not pre-approved by the Audit Committee provided by the Fund’s independent registered public accounting firm to the Adviser and Service Affiliates is compatible with maintaining the auditor’s independence.
(i) Not applicable.
(j) Not applicable.
ITEM 5. AUDIT COMMITTEE OF LISTED REGISTRANTS.
Not applicable to the registrant.
ITEM 6. INVESTMENTS.
Please see Schedule of Investments contained in the Report to Shareholders included under Item 7 of this Form N-CSR.
ITEM 7. FINANCIAL STATEMENTS AND FINANCIAL HIGHLIGHTS FOR OPEN-END MANAGEMENT INVESTMENT COMPANIES.
OCT 10.31.24

ANNUAL FINANCIAL STATEMENTS AND ADDITIONAL INFORMATION
AB HIGH INCOME FUND

| | |
| |
| Investment Products Offered | | • Are Not FDIC Insured • May Lose Value • Are Not Bank Guaranteed |
Investors should consider the investment objectives, risks, charges and expenses of the Fund carefully before investing. For copies of our prospectus or summary prospectus, which contain this and other information, visit us online at www.abfunds.com or contact your AB representative. Please read the prospectus and/or summary prospectus carefully before investing.
This shareholder report must be preceded or accompanied by the Fund’s prospectus for individuals who are not current shareholders of the Fund.
You may obtain a description of the Fund’s proxy voting policies and procedures, and information regarding how the Fund voted proxies relating to portfolio securities during the most recent 12-month period ended June 30, without charge. Simply visit AB’s website at www.abfunds.com, or go to the Securities and Exchange Commission’s (the “Commission”) website at www.sec.gov, or call AB at (800) 227 4618.
The Fund files its complete schedule of portfolio holdings with the Commission for the first and third quarters of each fiscal year as an exhibit to its reports on Form N-PORT. The Fund’s Form N-PORT reports are available on the Commission’s website at www.sec.gov. AB publishes full portfolio holdings for the Fund monthly at www.abfunds.com.
AllianceBernstein Investments, Inc. (ABI) is the distributor of the AB family of mutual funds. ABI is a member of FINRA and is an affiliate of AllianceBernstein L.P., the Adviser of the funds.
The [A/B] logo and AllianceBernstein® are registered trademarks used by permission of the owner, AllianceBernstein L.P.
PORTFOLIO OF INVESTMENTS
October 31, 2024
| | | | | | | | | | | | |
| | | | | | Principal
Amount
(000) | | | U.S. $ Value | |
| |
CORPORATES - NON-INVESTMENT GRADE – 63.0% | | | | | | | | | | | | |
Industrial – 55.4% | | | | | | | | | | | | |
Basic – 4.4% | | | | | | | | | | | | |
Alcoa Nederland Holding BV
7.125%, 03/15/2031(a) | | | U.S.$ | | | | 3,049 | | | $ | 3,180,914 | |
Arsenal AIC Parent LLC
8.00%, 10/01/2030(a) | | | | | | | 2,679 | | | | 2,818,564 | |
ASP Unifrax Holdings, Inc.
7.10% (7.10% Cash or 5.85% Cash and 1.25% PIK), 09/30/2029(a)(b) | | | | | | | 7,888 | | | | 4,679,870 | |
10.425% (10.425% Cash and 11.175% PIK), 09/30/2029(a)(b) | | | | | | | 11,494 | | | | 11,517,199 | |
Cleveland-Cliffs, Inc.
7.00%, 03/15/2032(a) | | | | | | | 10,852 | | | | 10,864,498 | |
Constellium SE
3.125%, 07/15/2029(a) | | | EUR | | | | 4,303 | | | | 4,381,113 | |
3.75%, 04/15/2029(a) | | | U.S.$ | | | | 1,336 | | | | 1,208,999 | |
CVR Partners LP/CVR Nitrogen Finance Corp.
6.125%, 06/15/2028(a) | | | | | | | 3,051 | | | | 2,918,462 | |
Element Solutions, Inc.
3.875%, 09/01/2028(a) | | | | | | | 8,518 | | | | 8,204,574 | |
ERP Iron Ore LLC
9.04%, 12/31/2019(b)(c)(d)(e)(f) | | | | | | | 1,355 | | | | – 0 | – |
FMG Resources August 2006 Pty Ltd.
4.375%, 04/01/2031(a) | | | | | | | 12,398 | | | | 11,279,922 | |
4.50%, 09/15/2027(a) | | | | | | | 1,475 | | | | 1,437,243 | |
5.875%, 04/15/2030(a) | | | | | | | 308 | | | | 306,503 | |
6.125%, 04/15/2032(a) | | | | | | | 8,694 | | | | 8,719,432 | |
Graphic Packaging International LLC
3.50%, 03/15/2028(a) | | | | | | | 4,133 | | | | 3,862,198 | |
6.375%, 07/15/2032(a) | | | | | | | 5,973 | | | | 6,030,628 | |
INEOS Finance PLC
6.375%, 04/15/2029(a)
| | | EUR | | | | 4,341 | | | | 4,883,194 | |
7.50%, 04/15/2029(a) | | | U.S.$ | | | | 3,563 | | | | 3,683,113 | |
INEOS Quattro Finance 2 PLC
8.50%, 03/15/2029 (a) | | | EUR | | | | 6,160 | | | | 7,112,993 | |
9.625%, 03/15/2029(a) | | | U.S.$ | | | | 600 | | | | 636,060 | |
INEOS Styrolution Ludwigshafen GmbH
2.25%, 01/16/2027(a) | | | EUR | | | | 111 | | | | 117,099 | |
Ingevity Corp.
3.875%, 11/01/2028(a) | | | U.S.$ | | | | 3,288 | | | | 3,029,905 | |
Intelligent Packaging Ltd. Finco, Inc./Intelligent Packaging Ltd. Co-Issuer LLC
6.00%, 09/15/2028(a) | | | | | | | 7,119 | | | | 7,021,707 | |
| | |
| |
| abfunds.com | | AB HIGH INCOME FUND | 1 |
PORTFOLIO OF INVESTMENTS (continued)
| | | | | | | | | | | | |
| | | | | | Principal
Amount
(000) | | | U.S. $ Value | |
| |
Magnetation LLC/Mag Finance Corp.
11.00%, 05/15/2023(c)(d)(e)(f)(g) | | | U.S.$ | | | | 16,121 | | | $ | – 0 | – |
Olympus Water US Holding Corp.
9.75%, 11/15/2028(a) | | | | | | | 6,092 | | | | 6,465,200 | |
Pactiv Evergreen Group Issuer, Inc./Pactiv Evergreen Group Issuer LLC
4.00%, 10/15/2027(a) | | | | | | | 2,090 | | | | 1,996,797 | |
Reno de Medici SpA
8.48% (EURIBOR 3 Month + 5.00%),
04/15/2029(a)(h) | | | EUR | | | | 2,400 | | | | 2,373,874 | |
SCIL IV LLC/SCIL USA Holdings LLC
4.375%, 11/01/2026(a) | | | | | | | 554 | | | | 599,600 | |
5.375%, 11/01/2026(a) | | | U.S.$ | | | | 7,442 | | | | 7,356,182 | |
SNF Group SACA
3.125%, 03/15/2027(a) | | | | | | | 1,487 | | | | 1,413,904 | |
Vallourec SACA
7.50%, 04/15/2032(a) | | | | | | | 2,315 | | | | 2,426,499 | |
Vibrantz Technologies, Inc.
9.00%, 02/15/2030(a) | | | | | | | 5,197 | | | | 4,868,327 | |
WR Grace Holdings LLC
4.875%, 06/15/2027(a) | | | | | | | 4,674 | | | | 4,584,115 | |
5.625%, 08/15/2029(a) | | | | | | | 1,965 | | | | 1,814,401 | |
| | | | | | | | | | | | |
| | | | | | | | | | | 141,793,089 | |
| | | | | | | | | | | | |
Capital Goods – 5.0% | | | | | | | | | | | | |
Arcosa, Inc.
6.875%, 08/15/2032(a) | | | | | | | 4,465 | | | | 4,579,917 | |
ARD Finance SA
5.00% (5.00% Cash or 5.75% PIK),
06/30/2027(a)(b) | | | EUR | | | | 5,856 | | | | 1,259,826 | |
Ardagh Metal Packaging Finance USA LLC/Ardagh Metal Packaging Finance PLC
4.00%, 09/01/2029(a) | | | U.S.$ | | | | 5,355 | | | | 4,698,666 | |
Ardagh Packaging Finance PLC/Ardagh Holdings USA, Inc.
2.125%, 08/15/2026(a) | | | EUR | | | | 3,208 | | | | 2,948,629 | |
Ball Corp.
2.875%, 08/15/2030 | | | U.S.$ | | | | 2,910 | | | | 2,531,426 | |
6.00%, 06/15/2029 | | | | | | | 5,894 | | | | 5,986,504 | |
Bombardier, Inc.
7.25%, 07/01/2031(a) | | | | | | | 3,007 | | | | 3,108,807 | |
7.50%, 02/01/2029(a) | | | | | | | 5,184 | | | | 5,401,488 | |
7.875%, 04/15/2027(a) | | | | | | | 1,643 | | | | 1,645,366 | |
8.75%, 11/15/2030(a) | | | | | | | 5,839 | | | | 6,329,632 | |
Calderys Financing LLC
11.25%, 06/01/2028(a) | | | | | | | 7,661 | | | | 8,189,019 | |
Crown Americas LLC
5.25%, 04/01/2030 | | | | | | | 890 | | | | 875,660 | |
| | |
| |
2 | AB HIGH INCOME FUND | | abfunds.com |
PORTFOLIO OF INVESTMENTS (continued)
| | | | | | | | | | | | |
| | | | | | Principal
Amount
(000) | | | U.S. $ Value | |
| |
Eco Material Technologies, Inc.
7.875%, 01/31/2027(a) | | | U.S.$ | | | | 9,570 | | | $ | 9,633,405 | |
EnerSys
4.375%, 12/15/2027(a) | | | | | | | 5,050 | | | | 4,873,088 | |
6.625%, 01/15/2032(a) | | | | | | | 2,704 | | | | 2,777,208 | |
Enviri Corp.
5.75%, 07/31/2027(a) | | | | | | | 5,339 | | | | 5,143,346 | |
Esab Corp.
6.25%, 04/15/2029(a) | | | | | | | 2,372 | | | | 2,413,888 | |
F-Brasile SpA/F-Brasile US LLC Series XR
7.375%, 08/15/2026(a) | | | | | | | 5,660 | | | | 5,665,113 | |
GFL Environmental, Inc.
6.75%, 01/15/2031(a) | | | | | | | 1,891 | | | | 1,946,983 | |
Griffon Corp.
5.75%, 03/01/2028 | | | | | | | 300 | | | | 294,557 | |
Husky Injection Molding Systems Ltd./Titan Co-Borrower LLC
9.00%, 02/15/2029(a) | | | | | | | 1,345 | | | | 1,380,430 | |
IMA Industria Macchine Automatiche SpA
6.93% (EURIBOR 3 Month + 3.75%),
04/15/2029(a)(h) | | | EUR | | | | 2,560 | | | | 2,804,813 | |
LSB Industries, Inc.
6.25%, 10/15/2028(a)(i) | | | U.S.$ | | | | 5,922 | | | | 5,734,735 | |
Madison IAQ LLC
5.875%, 06/30/2029(a) | | | | | | | 1,225 | | | | 1,161,562 | |
MIWD Holdco II LLC/MIWD Finance Corp.
5.50%, 02/01/2030(a) | | | | | | | 6,823 | | | | 6,515,860 | |
Paprec Holding SA
7.25%, 11/17/2029(a) | | | EUR | | | | 1,797 | | | | 2,063,034 | |
Summit Materials LLC/Summit Materials Finance Corp.
7.25%, 01/15/2031(a) | | | U.S.$ | | | | 1,910 | | | | 1,985,712 | |
Terex Corp.
6.25%, 10/15/2032(a) | | | | | | | 3,104 | | | | 3,089,101 | |
TransDigm, Inc.
4.625%, 01/15/2029 | | | | | | | 3,591 | | | | 3,410,850 | |
4.875%, 05/01/2029 | | | | | | | 3,750 | | | | 3,576,607 | |
6.00%, 01/15/2033(a) | | | | | | | 14,975 | | | | 14,842,697 | |
6.75%, 08/15/2028(a) | | | | | | | 13,090 | | | | 13,384,065 | |
6.875%, 12/15/2030(a) | | | | | | | 4,009 | | | | 4,113,094 | |
7.125%, 12/01/2031(a) | | | | | | | 3,530 | | | | 3,658,859 | |
Trinity Industries, Inc.
7.75%, 07/15/2028(a) | | | | | | | 5,072 | | | | 5,248,309 | |
Triumph Group, Inc.
9.00%, 03/15/2028(a) | | | | | | | 7,505 | | | | 7,825,775 | |
| | | | | | | | | | | | |
| | | | | | | | | | | 161,098,031 | |
| | | | | | | | | | | | |
| | |
| |
| abfunds.com | | AB HIGH INCOME FUND | 3 |
PORTFOLIO OF INVESTMENTS (continued)
| | | | | | | | | | | | |
| | | | | | Principal
Amount
(000) | | | U.S. $ Value | |
| |
Communications - Media – 6.7% | | | | | | | | | | | | |
AMC Networks, Inc.
4.25%, 02/15/2029 | | | U.S.$ | | | | 4,017 | | | $ | 2,769,359 | |
10.25%, 01/15/2029(a) | | | | | | | 6,140 | | | | 6,321,145 | |
Arches Buyer, Inc.
6.125%, 12/01/2028(a) | | | | | | | 1,056 | | | | 930,217 | |
Banijay Entertainment SAS
7.00%, 05/01/2029(a) | | | EUR | | | | 2,077 | | | | 2,367,075 | |
8.125%, 05/01/2029(a) | | | U.S.$ | | | | 2,903 | | | | 3,006,190 | |
CCO Holdings LLC/CCO Holdings Capital Corp.
4.25%, 02/01/2031(a) | | | | | | | 2,542 | | | | 2,205,987 | |
4.25%, 01/15/2034(a) | | | | | | | 995 | | | | 796,439 | |
4.50%, 08/15/2030(a) | | | | | | | 23,087 | | | | 20,605,107 | |
4.50%, 05/01/2032 | | | | | | | 2,750 | | | | 2,337,503 | |
4.50%, 06/01/2033(a) | | | | | | | 14,442 | | | | 12,008,608 | |
4.75%, 03/01/2030(a) | | | | | | | 1,939 | | | | 1,764,441 | |
4.75%, 02/01/2032(a) | | | | | | | 25,772 | | | | 22,305,829 | |
6.375%, 09/01/2029(a) | | | | | | | 5,119 | | | | 5,069,109 | |
Clear Channel Outdoor Holdings, Inc.
5.125%, 08/15/2027(a) | | | | | | | 583 | | | | 566,387 | |
CSC Holdings LLC
4.625%, 12/01/2030(a) | | | | | | | 4,460 | | | | 2,240,753 | |
5.00%, 11/15/2031(a) | | | | | | | 330 | | | | 160,910 | |
5.375%, 02/01/2028(a) | | | | | | | 7,472 | | | | 6,394,285 | |
5.50%, 04/15/2027(a) | | | | | | | 4,961 | | | | 4,415,305 | |
5.75%, 01/15/2030(a) | | | | | | | 17,196 | | | | 9,099,243 | |
7.50%, 04/01/2028(a) | | | | | | | 2,183 | | | | 1,438,474 | |
11.25%, 05/15/2028(a) | | | | | | | 2,417 | | | | 2,356,574 | |
11.75%, 01/31/2029(a) | | | | | | | 2,095 | | | | 2,043,403 | |
DISH DBS Corp.
5.125%, 06/01/2029 | | | | | | | 10,429 | | | | 6,926,820 | |
5.25%, 12/01/2026(a) | | | | | | | 11,885 | | | | 11,000,679 | |
5.75%, 12/01/2028(a) | | | | | | | 10,549 | | | | 9,232,380 | |
7.375%, 07/01/2028(j) | | | | | | | 6,580 | | | | 4,818,388 | |
DISH Network Corp.
3.375%, 08/15/2026(k) | | | | | | | 4,275 | | | | 3,562,766 | |
Gray Television, Inc.
5.375%, 11/15/2031(a) | | | | | | | 2,960 | | | | 1,773,532 | |
LCPR Senior Secured Financing DAC
5.125%, 07/15/2029(a)(j) | | | | | | | 4,643 | | | | 3,902,090 | |
6.75%, 10/15/2027(a) | | | | | | | 8,724 | | | | 8,177,772 | |
McGraw-Hill Education, Inc.
5.75%, 08/01/2028(a) | | | | | | | 4,558 | | | | 4,470,238 | |
Paramount Global
6.25%, 02/28/2057 | | | | | | | 1,211 | | | | 1,086,399 | |
6.375%, 03/30/2062 | | | | | | | 4,680 | | | | 4,334,088 | |
| | |
| |
4 | AB HIGH INCOME FUND | | abfunds.com |
PORTFOLIO OF INVESTMENTS (continued)
| | | | | | | | | | | | |
| | | | | | Principal
Amount
(000) | | | U.S. $ Value | |
| |
Radiate Holdco LLC/Radiate Finance, Inc.
4.50%, 09/15/2026(a) | | | U.S.$ | | | | 5,030 | | | $ | 4,363,941 | |
Sinclair Television Group, Inc.
5.50%, 03/01/2030(a) | | | | | | | 1,549 | | | | 1,066,950 | |
Sirius XM Radio, Inc.
4.00%, 07/15/2028(a) | | | | | | | 9,796 | | | | 9,161,355 | |
Univision Communications, Inc.
4.50%, 05/01/2029(a) | | | | | | | 5,716 | | | | 5,078,079 | |
7.375%, 06/30/2030(a) | | | | | | | 8,775 | | | | 8,421,283 | |
8.50%, 07/31/2031(a) | | | | | | | 4,216 | | | | 4,143,653 | |
Urban One, Inc.
7.375%, 02/01/2028(a) | | | | | | | 1,724 | | | | 1,279,108 | |
Virgin Media Secured Finance PLC
4.50%, 08/15/2030(a) | | | | | | | 3,049 | | | | 2,670,411 | |
VZ Secured Financing BV
5.00%, 01/15/2032(a) | | | | | | | 5,961 | | | | 5,367,284 | |
Ziggo Bond Co. BV
5.125%, 02/28/2030(a)(j) | | | | | | | 4,106 | | | | 3,716,310 | |
Ziggo BV
4.875%, 01/15/2030(a) | | | | | | | 900 | | | | 834,833 | |
| | | | | | | | | | | | |
| | | | | | | | | | | 216,590,702 | |
| | | | | | | | | | | | |
Communications - Telecommunications – 3.0% | | | | | | | | | | | | |
Altice Financing SA
5.75%, 08/15/2029(a) | | | | | | | 11,729 | | | | 9,575,986 | |
Altice France Holding SA
4.00%, 02/15/2028(a) | | | EUR | | | | 1,210 | | | | 314,509 | |
6.00%, 02/15/2028(a) | | | U.S.$ | | | | 1,308 | | | | 353,923 | |
10.50%, 05/15/2027(a) | | | | | | | 9,715 | | | | 2,946,245 | |
Altice France SA
5.125%, 01/15/2029(a) | | | | | | | 1,214 | | | | 911,280 | |
5.125%, 07/15/2029(a) | | | | | | | 18,806 | | | | 14,070,024 | |
5.50%, 01/15/2028(a) | | | | | | | 1,537 | | | | 1,188,872 | |
5.50%, 10/15/2029(a) | | | | | | | 6,460 | | | | 4,878,326 | |
8.125%, 02/01/2027(a) | | | | | | | 1,968 | | | | 1,629,339 | |
Frontier Communications Holdings LLC
8.625%, 03/15/2031(a) | | | | | | | 2,925 | | | | 3,140,719 | |
Level 3 Financing, Inc.
10.75%, 12/15/2030(a) | | | | | | | 7,606 | | | | 8,522,551 | |
11.00%, 11/15/2029(a) | | | | | | | 6,411 | | | | 7,235,286 | |
Lorca Telecom Bondco SA
4.00%, 09/18/2027(a) | | | EUR | | | | 2,680 | | | | 2,909,987 | |
Optics Bidco SpA
7.72%, 06/04/2038(a) | | | U.S.$ | | | | 4,715 | | | | 5,007,506 | |
Telecom Italia Capital SA
7.72%, 06/04/2038 | | | | | | | 2,280 | | | | 2,377,876 | |
| | |
| |
| abfunds.com | | AB HIGH INCOME FUND | 5 |
PORTFOLIO OF INVESTMENTS (continued)
| | | | | | | | | | | | |
| | | | | | Principal
Amount
(000) | | | U.S. $ Value | |
| |
United Group BV
3.625%, 02/15/2028(a) | | | EUR | | | | 752 | | | $ | 788,537 | |
4.00%, 11/15/2027(a) | | | | | | | 1,816 | | | | 1,946,565 | |
4.625%, 08/15/2028(a) | | | | | | | 344 | | | | 366,765 | |
6.75%, 02/15/2031(a) | | | | | | | 2,127 | | | | 2,349,290 | |
7.79% (EURIBOR 3 Month + 4.25%),
02/01/2029(a)(h) | | | | | | | 1,531 | | | | 1,659,871 | |
Vmed O2 UK Financing I PLC
4.25%, 01/31/2031(a) | | | U.S.$ | | | | 1,405 | | | | 1,207,597 | |
4.75%, 07/15/2031(a) | | | | | | | 12,630 | | | | 10,937,809 | |
7.75%, 04/15/2032(a) | | | | | | | 9,196 | | | | 9,229,162 | |
Windstream Services LLC/Windstream Escrow Finance Corp.
8.25%, 10/01/2031(a) | | | | | | | 3,091 | | | | 3,129,412 | |
| | | | | | | | | | | | |
| | | | | | | | | | | 96,677,437 | |
| | | | | | | | | | | | |
Consumer Cyclical - Automotive – 2.6% | | | | | | | | | | | | |
Allison Transmission, Inc.
3.75%, 01/30/2031(a) | | | | | | | 3,049 | | | | 2,700,894 | |
5.875%, 06/01/2029(a) | | | | | | | 3,279 | | | | 3,272,799 | |
Aston Martin Capital Holdings Ltd.
10.00%, 03/31/2029(a) | | | | | | | 7,323 | | | | 7,103,019 | |
Dana, Inc.
4.25%, 09/01/2030 | | | | | | | 3,854 | | | | 3,361,667 | |
Exide Technologies (Exchange Priority)
11.00%, 10/31/2024(c)(e)(f)(g)(l) | | | | | | | 18,493 | | | | – 0 | – |
Exide Technologies (First Lien)
11.00%, 10/31/2024(c)(e)(f)(g)(l) | | | | | | | 7,590 | | | | – 0 | – |
Garrett Motion Holdings, Inc./Garrett LX I SARL
7.75%, 05/31/2032(a) | | | | | | | 6,597 | | | | 6,582,295 | |
Goodyear Tire & Rubber Co. (The)
5.25%, 04/30/2031 | | | | | | | 978 | | | | 859,370 | |
5.25%, 07/15/2031 | | | | | | | 2,865 | | | | 2,515,549 | |
IHO Verwaltungs GmbH
6.375% (6.375% Cash or 7.125% PIK),
05/15/2029(a)(b) | | | | | | | 200 | | | | 193,362 | |
6.75% (6.75% Cash or 7.50% PIK),
11/15/2029(a)(b) | | | EUR | | | | 2,189 | | | | 2,416,801 | |
7.00% (7.00% Cash or 7.75% PIK),
11/15/2031(a)(b) | | | | | | | 2,285 | | | | 2,505,892 | |
7.75% (7.75% Cash or 8.50% PIK),
11/15/2030(a)(b) | | | U.S.$ | | | | 2,652 | | | | 2,645,291 | |
8.00% (8.00% Cash or 8.75% PIK),
11/15/2032(a)(b) | | | | | | | 1,652 | | | | 1,658,707 | |
8.75% (8.75% Cash or 9.50% PIK),
05/15/2028(a)(b) | | | EUR | | | | 1,751 | | | | 2,021,109 | |
| | |
| |
6 | AB HIGH INCOME FUND | | abfunds.com |
PORTFOLIO OF INVESTMENTS (continued)
| | | | | | | | | | | | |
| | | | | | Principal
Amount
(000) | | | U.S. $ Value | |
| |
Mclaren Finance PLC
7.50%, 08/01/2026(a) | | | U.S.$ | | | | 9,232 | | | $ | 9,009,669 | |
PM General Purchaser LLC
9.50%, 10/01/2028(a) | | | | | | | 5,980 | | | | 6,067,253 | |
Real Hero Merger Sub 2, Inc.
6.25%, 02/01/2029(a) | | | | | | | 5,613 | | | | 4,896,328 | |
Tenneco, Inc.
8.00%, 11/17/2028(a) | | | | | | | 8,316 | | | | 7,694,824 | |
Titan International, Inc.
7.00%, 04/30/2028 | | | | | | | 7,168 | | | | 6,945,974 | |
ZF Finance GmbH Series E
3.75%, 09/21/2028(a) | | | EUR | | | | 100 | | | | 103,434 | |
ZF North America Capital, Inc.
6.75%, 04/23/2030(a) | | | U.S.$ | | | | 3,974 | | | | 3,917,706 | |
6.875%, 04/14/2028(a) | | | | | | | 4,588 | | | | 4,627,167 | |
6.875%, 04/23/2032(a) | | | | | | | 883 | | | | 862,633 | |
7.125%, 04/14/2030(a) | | | | | | | 1,539 | | | | 1,545,434 | |
| | | | | | | | | | | | |
| | | | | | | | | | | 83,507,177 | |
| | | | | | | | | | | | |
Consumer Cyclical - Entertainment – 2.5% | | | | | | | | | | | | |
Carnival Corp.
5.75%, 03/01/2027(a) | | | | | | | 1,522 | | | | 1,526,313 | |
5.75%, 01/15/2030(a) | | | EUR | | | | 892 | | | | 1,030,032 | |
Cedar Fair LP/Canada’s Wonderland Co./Magnum Management Corp./Millennium Op
5.25%, 07/15/2029 | | | U.S.$ | | | | 30 | | | | 28,896 | |
Lindblad Expeditions LLC
6.75%, 02/15/2027(a) | | | | | | | 1,512 | | | | 1,518,545 | |
Loarre Investments SARL
6.50%, 05/15/2029(a) | | | EUR | | | | 2,240 | | | | 2,508,136 | |
Merlin Entertainments Group US Holdings, Inc.
7.375%, 02/15/2031(a) | | | U.S.$ | | | | 2,218 | | | | 2,175,995 | |
Motion Bondco DAC
4.50%, 11/15/2027(a) | | | EUR | | | | 2,973 | | | | 2,939,117 | |
Motion Finco SARL
7.375%, 06/15/2030(a) | | | | | | | 1,092 | | | | 1,187,182 | |
NCL Corp., Ltd.
5.875%, 03/15/2026(a) | | | U.S.$ | | | | 4,909 | | | | 4,902,320 | |
5.875%, 02/15/2027(a) | | | | | | | 3,375 | | | | 3,371,444 | |
8.125%, 01/15/2029(a) | | | | | | | 3,062 | | | | 3,241,327 | |
Royal Caribbean Cruises Ltd.
5.375%, 07/15/2027(a) | | | | | | | 6,220 | | | | 6,207,655 | |
5.50%, 08/31/2026(a) | | | | | | | 5,098 | | | | 5,102,578 | |
5.50%, 04/01/2028(a) | | | | | | | 20,172 | | | | 20,172,700 | |
| | |
| |
| abfunds.com | | AB HIGH INCOME FUND | 7 |
PORTFOLIO OF INVESTMENTS (continued)
| | | | | | | | | | | | |
| | | | | | Principal
Amount
(000) | | | U.S. $ Value | |
| |
SeaWorld Parks & Entertainment, Inc.
5.25%, 08/15/2029(a) | | | U.S.$ | | | | 4,269 | | | $ | 4,102,497 | |
Six Flags Entertainment Corp./DE
7.25%, 05/15/2031(a) | | | | | | | 3,967 | | | | 4,065,860 | |
Viking Cruises Ltd.
5.875%, 09/15/2027(a) | | | | | | | 2,430 | | | | 2,415,008 | |
7.00%, 02/15/2029(a) | | | | | | | 6,171 | | | | 6,217,283 | |
9.125%, 07/15/2031(a) | | | | | | | 3,056 | | | | 3,301,848 | |
VOC Escrow Ltd.
5.00%, 02/15/2028(a) | | | | | | | 3,618 | | | | 3,519,462 | |
| | | | | | | | | | | | |
| | | | | | | | | | | 79,534,198 | |
| | | | | | | | | | | | |
Consumer Cyclical - Other – 4.1% | | | | | | | | | | | | |
Brookfield Residential Properties, Inc./Brookfield Residential US LLC
4.875%, 02/15/2030(a) | | | | | | | 5,889 | | | | 5,483,091 | |
6.25%, 09/15/2027(a) | | | | | | | 6,404 | | | | 6,356,042 | |
Builders FirstSource, Inc.
4.25%, 02/01/2032(a) | | | | | | | 2,040 | | | | 1,825,800 | |
6.375%, 06/15/2032(a) | | | | | | | 2,339 | | | | 2,355,518 | |
6.375%, 03/01/2034(a) | | | | | | | 4,668 | | | | 4,701,453 | |
CD&R Smokey Buyer, Inc./Radio Systems Corp.
9.50%, 10/15/2029(a) | | | | | | | 2,238 | | | | 2,266,833 | |
Churchill Downs, Inc.
4.75%, 01/15/2028(a) | | | | | | | 2,523 | | | | 2,447,025 | |
5.75%, 04/01/2030(a) | | | | | | | 2,035 | | | | 2,002,772 | |
Cirsa Finance International SARL
6.50%, 03/15/2029(a) | | | EUR | | | | 1,375 | | | | 1,571,752 | |
Forestar Group, Inc.
3.85%, 05/15/2026(a) | | | U.S.$ | | | | 2,881 | | | | 2,808,841 | |
Great Canadian Gaming Corp.
8.75%, 11/15/2029(a) | | | | | | | 2,882 | | | | 2,889,205 | |
Hilton Domestic Operating Co., Inc.
3.625%, 02/15/2032(a) | | | | | | | 6,167 | | | | 5,418,003 | |
5.875%, 04/01/2029(a) | | | | | | | 4,497 | | | | 4,535,490 | |
5.875%, 03/15/2033(a) | | | | | | | 6,091 | | | | 6,098,029 | |
6.125%, 04/01/2032(a) | | | | | | | 2,576 | | | | 2,602,579 | |
Hilton Grand Vacations Borrower Escrow LLC/Hilton Grand Vacations Borrower Esc
4.875%, 07/01/2031(a) | | | | | | | 1,162 | | | | 1,038,331 | |
5.00%, 06/01/2029(a) | | | | | | | 6,848 | | | | 6,417,625 | |
6.625%, 01/15/2032(a) | | | | | | | 2,352 | | | | 2,351,840 | |
Installed Building Products, Inc.
5.75%, 02/01/2028(a) | | | | | | | 838 | | | | 832,401 | |
Marriott Ownership Resorts, Inc.
4.50%, 06/15/2029(a) | | | | | | | 1,338 | | | | 1,240,772 | |
| | |
| |
8 | AB HIGH INCOME FUND | | abfunds.com |
PORTFOLIO OF INVESTMENTS (continued)
| | | | | | | | | | | | |
| | | | | | Principal
Amount
(000) | | | U.S. $ Value | |
| |
Masterbrand, Inc.
7.00%, 07/15/2032(a) | | | U.S.$ | | | | 3,776 | | | $ | 3,867,846 | |
Mattamy Group Corp.
4.625%, 03/01/2030(a) | | | | | | | 5,478 | | | | 5,126,502 | |
MGM Resorts International
4.75%, 10/15/2028 | | | | | | | 3,315 | | | | 3,202,699 | |
5.50%, 04/15/2027 | | | | | | | 4,584 | | | | 4,573,613 | |
Miller Homes Group Finco PLC
7.00%, 05/15/2029(a) | | | GBP | | | | 2,900 | | | | 3,648,560 | |
8.79% (EURIBOR 3 Month + 5.25%),
05/15/2028(a)(h) | | | EUR | | | | 2,233 | | | | 2,459,308 | |
Miter Brands Acquisition Holdco, Inc./MIWD Borrower LLC
6.75%, 04/01/2032(a) | | | U.S.$ | | | | 1,314 | | | | 1,336,665 | |
Shea Homes LP/Shea Homes Funding Corp.
4.75%, 02/15/2028 | | | | | | | 3,292 | | | | 3,143,106 | |
4.75%, 04/01/2029 | | | | | | | 4,530 | | | | 4,294,449 | |
Standard Industries, Inc./NY
4.75%, 01/15/2028(a) | | | | | | | 2,310 | | | | 2,227,651 | |
Sugarhouse HSP Gaming Prop Mezz LP/Sugarhouse HSP Gaming Finance Corp.
5.875%, 05/15/2025(a) | | | | | | | 4,781 | | | | 4,769,102 | |
Taylor Morrison Communities, Inc.
5.125%, 08/01/2030(a) | | | | | | | 328 | | | | 317,817 | |
5.75%, 01/15/2028(a) | | | | | | | 304 | | | | 303,920 | |
5.875%, 06/15/2027(a) | | | | | | | 294 | | | | 295,628 | |
Thor Industries, Inc.
4.00%, 10/15/2029(a) | | | | | | | 2,054 | | | | 1,874,220 | |
Travel & Leisure Co.
4.50%, 12/01/2029(a) | | | | | | | 3,509 | | | | 3,277,792 | |
4.625%, 03/01/2030(a) | | | | | | | 10,068 | | | | 9,387,452 | |
6.625%, 07/31/2026(a) | | | | | | | 3,533 | | | | 3,560,405 | |
Wynn Las Vegas LLC/Wynn Las Vegas Capital Corp.
5.25%, 05/15/2027(a) | | | | | | | 2,353 | | | | 2,335,798 | |
Wynn Resorts Finance LLC/Wynn Resorts Capital Corp.
5.125%, 10/01/2029(a) | | | | | | | 5,631 | | | | 5,466,829 | |
| | | | | | | | | | | | |
| | | | | | | | | | | 130,712,764 | |
| | | | | | | | | | | | |
Consumer Cyclical -
Restaurants – 0.5% | | | | | | | | | | | | |
1011778 BC ULC/New Red Finance, Inc.
3.875%, 01/15/2028(a) | | | | | | | 4,965 | | | | 4,729,668 | |
4.00%, 10/15/2030(a) | | | | | | | 4,938 | | | | 4,462,364 | |
4.375%, 01/15/2028(a) | | | | | | | 3,132 | | | | 3,014,982 | |
6.125%, 06/15/2029(a) | | | | | | | 5,000 | | | | 5,082,711 | |
| | | | | | | | | | | | |
| | | | | | | | | | | 17,289,725 | |
| | | | | | | | | | | | |
| | |
| |
| abfunds.com | | AB HIGH INCOME FUND | 9 |
PORTFOLIO OF INVESTMENTS (continued)
| | | | | | | | | | | | |
| | | | | | Principal
Amount
(000) | | | U.S. $ Value | |
| |
Consumer Cyclical - Retailers – 3.3% | | | | | | | | | | | | |
Arko Corp.
5.125%, 11/15/2029(a) | | | U.S.$ | | | | 4,612 | | | $ | 4,251,600 | |
Asbury Automotive Group, Inc.
4.50%, 03/01/2028 | | | | | | | 3,049 | | | | 2,945,844 | |
4.625%, 11/15/2029(a) | | | | | | | 5,503 | | | | 5,153,057 | |
5.00%, 02/15/2032(a) | | | | | | | 340 | | | | 312,936 | |
Bath & Body Works, Inc.
6.625%, 10/01/2030(a) | | | | | | | 1,243 | | | | 1,245,195 | |
6.75%, 07/01/2036 | | | | | | | 1,479 | | | | 1,482,830 | |
6.875%, 11/01/2035 | | | | | | | 9,394 | | | | 9,530,923 | |
Beacon Roofing Supply, Inc.
6.50%, 08/01/2030(a) | | | | | | | 1,082 | | | | 1,099,905 | |
Carvana Co.
5.50%, 04/15/2027(a) | | | | | | | 1,469 | | | | 1,365,395 | |
13.00% (11.00% Cash or 13.00% PIK),
06/01/2030(a)(b)(i) | | | | | | | 7,229 | | | | 7,894,615 | |
Cougar JV Subsidiary LLC
8.00%, 05/15/2032(a) | | | | | | | 7,797 | | | | 8,148,315 | |
CT Investment GmbH
6.375%, 04/15/2030(a) | | | EUR | | | | 1,681 | | | | 1,886,184 | |
FirstCash, Inc.
6.875%, 03/01/2032(a) | | | U.S.$ | | | | 6,830 | | | | 6,921,588 | |
Foundation Building Materials, Inc.
6.00%, 03/01/2029(a)(j) | | | | | | | 1,246 | | | | 1,103,592 | |
Global Auto Holdings Ltd/AAG FH UK Ltd.
8.375%, 01/15/2029(a) | | | | | | | 4,213 | | | | 3,946,602 | |
8.75%, 01/15/2032(a) | | | | | | | 3,363 | | | | 3,068,456 | |
Group 1 Automotive, Inc.
4.00%, 08/15/2028(a) | | | | | | | 3,468 | | | | 3,249,914 | |
6.375%, 01/15/2030(a) | | | | | | | 1,276 | | | | 1,281,116 | |
Hanesbrands, Inc.
4.875%, 05/15/2026(a) | | | | | | | 2,095 | | | | 2,070,760 | |
Kontoor Brands, Inc.
4.125%, 11/15/2029(a) | | | | | | | 3,885 | | | | 3,617,210 | |
LCM Investments Holdings II LLC
4.875%, 05/01/2029(a) | | | | | | | 5,229 | | | | 4,939,782 | |
Michaels Cos., Inc. (The)
7.875%, 05/01/2029(a) | | | | | | | 3,047 | | | | 1,624,314 | |
Penske Automotive Group, Inc.
3.75%, 06/15/2029 | | | | | | | 1,215 | | | | 1,109,602 | |
PetSmart, Inc./PetSmart Finance Corp.
7.75%, 02/15/2029(a) | | | | | | | 3,529 | | | | 3,427,475 | |
Sonic Automotive, Inc.
4.625%, 11/15/2029(a) | | | | | | | 9,350 | | | | 8,583,983 | |
4.875%, 11/15/2031(a) | | | | | | | 525 | | | | 471,333 | |
| | |
| |
10 | AB HIGH INCOME FUND | | abfunds.com |
PORTFOLIO OF INVESTMENTS (continued)
| | | | | | | | | | | | |
| | | | | | Principal
Amount
(000) | | | U.S. $ Value | |
| |
Staples, Inc.
10.75%, 09/01/2029(a) | | | U.S.$ | | | | 9,047 | | | $ | 8,755,738 | |
12.75%, 01/15/2030(a) | | | | | | | 2,487 | | | | 1,980,356 | |
White Cap Buyer LLC
6.875%, 10/15/2028(a) | | | | | | | 2,257 | | | | 2,266,856 | |
Wolverine World Wide, Inc.
4.00%, 08/15/2029(a) | | | | | | | 798 | | | | 682,253 | |
| | | | | | | | | | | | |
| | | | | | | | | | | 104,417,729 | |
| | | | | | | | | | | | |
Consumer Non-Cyclical – 7.8% | | | | | | | | | | | | |
1375209 BC Ltd.
9.00%, 01/30/2028(a) | | | | | | | 2,355 | | | | 2,348,020 | |
AdaptHealth LLC
5.125%, 03/01/2030(a) | | | | | | | 2,000 | | | | 1,833,977 | |
Albertsons Cos., Inc./Safeway, Inc./New Albertsons LP/Albertsons LLC
4.625%, 01/15/2027(a) | | | | | | | 3,290 | | | | 3,225,067 | |
4.875%, 02/15/2030(a) | | | | | | | 2,263 | | | | 2,211,909 | |
5.875%, 02/15/2028(a) | | | | | | | 1,997 | | | | 2,000,362 | |
6.50%, 02/15/2028(a) | | | | | | | 6,117 | | | | 6,222,075 | |
Bausch & Lomb Corp.
8.375%, 10/01/2028(a) | | | | | | | 11,521 | | | | 12,106,162 | |
Bausch Health Cos., Inc.
4.875%, 06/01/2028(a) | | | | | | | 18,590 | | | | 14,338,003 | |
5.75%, 08/15/2027(a) | | | | | | | 255 | | | | 211,650 | |
6.25%, 02/15/2029(a) | | | | | | | 4,386 | | | | 2,732,791 | |
7.25%, 05/30/2029(a) | | | | | | | 1,562 | | | | 983,993 | |
11.00%, 09/30/2028(a) | | | | | | | 1,156 | | | | 1,063,878 | |
CAB SELAS
3.375%, 02/01/2028(a) | | | EUR | | | | 4,859 | | | | 4,891,173 | |
Cheplapharm Arzneimittel GmbH
7.50%, 05/15/2030(a) | | | | | | | 3,400 | | | | 3,920,762 | |
CHS/Community Health Systems, Inc.
4.75%, 02/15/2031(a) | | | U.S.$ | | | | 1,291 | | | | 1,077,275 | |
5.625%, 03/15/2027(a) | | | | | | | 697 | | | | 679,565 | |
6.00%, 01/15/2029(a) | | | | | | | 11,502 | | | | 10,830,930 | |
6.125%, 04/01/2030(a) | | | | | | | 7,452 | | | | 5,832,116 | |
6.875%, 04/01/2028(a) | | | | | | | 1,066 | | | | 882,167 | |
DaVita, Inc.
3.75%, 02/15/2031(a) | | | | | | | 2,393 | | | | 2,082,357 | |
4.625%, 06/01/2030(a) | | | | | | | 17,477 | | | | 16,075,986 | |
Elanco Animal Health, Inc.
6.65%, 08/28/2028(i) | | | | | | | 8,293 | | | | 8,518,661 | |
Embecta Corp.
5.00%, 02/15/2030(a) | | | | | | | 6,541 | | | | 5,929,692 | |
Emergent BioSolutions, Inc.
3.875%, 08/15/2028(a) | | | | | | | 5,910 | | | | 4,754,981 | |
| | |
| |
| abfunds.com | | AB HIGH INCOME FUND | 11 |
PORTFOLIO OF INVESTMENTS (continued)
| | | | | | | | | | |
| | | | | Principal
Amount
(000) | | | U.S. $ Value | |
| |
Endo Finance Holdings, Inc.
8.50%, 04/15/2031(a) | | U.S.$ | | | 3,735 | | | $ | 3,994,553 | |
Fortrea Holdings, Inc.
7.50%, 07/01/2030(a) | | | | | 1,476 | | | | 1,453,060 | |
Grifols SA
3.875%, 10/15/2028(a) | | EUR | | | 8,212 | | | | 8,086,762 | |
7.50%, 05/01/2030(a) | | | | | 1,900 | | | | 2,156,004 | |
Gruenenthal GmbH
6.75%, 05/15/2030(a) | | | | | 3,233 | | | | 3,744,175 | |
Iceland Bondco PLC
9.04% (EURIBOR 3 Month + 5.50%),
12/15/2027(a)(h) | | | | | 1,447 | | | | 1,601,000 | |
10.875%, 12/15/2027(a) | | GBP | | | 430 | | | | 594,066 | |
IQVIA, Inc.
2.25%, 03/15/2029(a) | | EUR | | | 3,082 | | | | 3,156,775 | |
6.50%, 05/15/2030(a) | | U.S.$ | | | 898 | | | | 926,083 | |
Lamb Weston Holdings, Inc.
4.125%, 01/31/2030(a) | | | | | 3,671 | | | | 3,408,226 | |
Medline Borrower LP
3.875%, 04/01/2029(a) | | | | | 6,982 | | | | 6,535,526 | |
5.25%, 10/01/2029(a) | | | | | 14,103 | | | | 13,667,792 | |
ModivCare, Inc.
5.00%, 10/01/2029(a)(j) | | | | | 3,280 | | | | 2,239,831 | |
MPH Acquisition Holdings LLC
5.50%, 09/01/2028(a) | | | | | 3,721 | | | | 2,540,823 | |
5.75%, 11/01/2028(a) | | | | | 12,657 | | | | 5,727,676 | |
Neogen Food Safety Corp.
8.625%, 07/20/2030(a) | | | | | 3,395 | | | | 3,675,882 | |
Neopharmed Gentili SpA
7.125%, 04/08/2030(a) | | EUR | | | 1,890 | | | | 2,152,625 | |
Newell Brands, Inc.
4.875%, 06/01/2025 | | U.S.$ | | | 748 | | | | 748,000 | |
5.70%, 04/01/2026(i) | | | | | 2,156 | | | | 2,161,146 | |
6.375%, 09/15/2027 | | | | | 1,346 | | | | 1,362,455 | |
6.375%, 05/15/2030 | | | | | 614 | | | | 617,324 | |
6.625%, 05/15/2032 | | | | | 800 | | | | 802,887 | |
7.00%, 04/01/2046(i) | | | | | 1,969 | | | | 1,825,169 | |
Organon & Co./Organon Foreign Debt Co-Issuer BV
4.125%, 04/30/2028(a) | | | | | 9,089 | | | | 8,611,221 | |
5.125%, 04/30/2031(a) | | | | | 7,607 | | | | 6,936,077 | |
6.75%, 05/15/2034(a) | | | | | 1,123 | | | | 1,126,720 | |
7.875%, 05/15/2034(a) | | | | | 714 | | | | 736,733 | |
Owens & Minor, Inc.
4.50%, 03/31/2029(a) | | | | | 42 | | | | 37,833 | |
6.625%, 04/01/2030(a) | | | | | 5,879 | | | | 5,615,937 | |
| | |
| |
12 | AB HIGH INCOME FUND | | abfunds.com |
PORTFOLIO OF INVESTMENTS (continued)
| | | | | | | | | | | | |
| | | | | | Principal
Amount
(000) | | | U.S. $ Value | |
| |
Performance Food Group, Inc.
4.25%, 08/01/2029(a) | | | U.S.$ | | | | 328 | | | $ | 306,940 | |
Post Holdings, Inc.
4.50%, 09/15/2031(a) | | | | | | | 5,969 | | | | 5,435,876 | |
4.625%, 04/15/2030(a) | | | | | | | 414 | | | | 387,123 | |
5.50%, 12/15/2029(a) | | | | | | | 2,155 | | | | 2,101,947 | |
6.25%, 02/15/2032(a) | | | | | | | 1,216 | | | | 1,231,139 | |
6.25%, 10/15/2034(a) | | | | | | | 2,495 | | | | 2,466,356 | |
Primo Water Holdings, Inc.
4.375%, 04/30/2029(a) | | | | | | | 9,327 | | | | 8,778,500 | |
Sotera Health Holdings LLC
7.375%, 06/01/2031(a) | | | | | | | 4,522 | | | | 4,626,211 | |
Spectrum Brands, Inc.
3.875%, 03/15/2031(a) | | | | | | | 683 | | | | 600,501 | |
Surgery Center Holdings, Inc.
7.25%, 04/15/2032(a) | | | | | | | 3,065 | | | | 3,154,583 | |
Tenet Healthcare Corp.
6.125%, 06/15/2030 | | | | | | | 1,026 | | | | 1,029,336 | |
Triton Water Holdings, Inc.
6.25%, 04/01/2029(a) | | | | | | | 3,651 | | | | 3,606,661 | |
US Acute Care Solutions LLC
9.75%, 05/15/2029(a) | | | | | | | 218 | | | | 222,396 | |
US Foods, Inc.
4.75%, 02/15/2029(a) | | | | | | | 314 | | | | 302,595 | |
5.75%, 04/15/2033(a) | | | | | | | 1,278 | | | | 1,258,882 | |
6.875%, 09/15/2028(a) | | | | | | | 282 | | | | 290,355 | |
Viking Baked Goods Acquisition Corp.
8.625%, 11/01/2031(a) | | | | | | | 3,095 | | | | 3,084,515 | |
| | | | | | | | | | | | |
| | | | | | | | | | | 249,879,829 | |
| | | | | | | | | | | | |
Energy – 7.7% | | | | | | | | | | | | |
Antero Midstream Partners LP/Antero Midstream Finance Corp.
5.375%, 06/15/2029(a) | | | | | | | 290 | | | | 283,121 | |
5.75%, 03/01/2027(a) | | | | | | | 280 | | | | 279,371 | |
5.75%, 01/15/2028(a) | | | | | | | 350 | | | | 348,193 | |
Berry Petroleum Co. LLC
7.00%, 02/15/2026(a) | | | | | | | 1,215 | | | | 1,185,566 | |
Blue Racer Midstream LLC/Blue Racer Finance Corp.
7.00%, 07/15/2029(a) | | | | | | | 1,816 | | | | 1,860,362 | |
7.25%, 07/15/2032(a) | | | | | | | 1,608 | | | | 1,660,105 | |
Buckeye Partners LP
3.95%, 12/01/2026 | | | | | | | 30 | | | | 28,829 | |
4.125%, 03/01/2025(a) | | | | | | | 21 | | | | 20,874 | |
6.875%, 07/01/2029(a) | | | | | | | 6,006 | | | | 6,101,355 | |
CITGO Petroleum Corp.
6.375%, 06/15/2026(a) | | | | | | | 2,387 | | | | 2,390,028 | |
| | |
| |
| abfunds.com | | AB HIGH INCOME FUND | 13 |
PORTFOLIO OF INVESTMENTS (continued)
| | | | | | | | | | |
| | | | | Principal
Amount
(000) | | | U.S. $ Value | |
| |
7.00%, 06/15/2025(a) | | U.S.$ | | | 9,430 | | | $ | 9,440,096 | |
Civitas Resources, Inc.
5.00%, 10/15/2026(a) | | | | | 6,160 | | | | 6,051,033 | |
8.375%, 07/01/2028(a) | | | | | 5,582 | | | | 5,771,611 | |
8.625%, 11/01/2030(a) | | | | | 1,307 | | | | 1,373,418 | |
8.75%, 07/01/2031(a) | | | | | 4,169 | | | | 4,367,919 | |
CNX Resources Corp.
6.00%, 01/15/2029(a) | | | | | 4,714 | | | | 4,673,505 | |
7.25%, 03/01/2032(a) | | | | | 2,660 | | | | 2,739,679 | |
7.375%, 01/15/2031(a) | | | | | 350 | | | | 360,129 | |
Comstock Resources, Inc.
6.75%, 03/01/2029(a) | | | | | 1,289 | | | | 1,234,834 | |
Crescent Energy Finance LLC
7.375%, 01/15/2033(a) | | | | | 705 | | | | 683,661 | |
7.625%, 04/01/2032(a) | | | | | 2,034 | | | | 2,008,943 | |
9.25%, 02/15/2028(a) | | | | | 3,557 | | | | 3,735,213 | |
Encino Acquisition Partners Holdings LLC
8.50%, 05/01/2028(a) | | | | | 2,570 | | | | 2,583,464 | |
Genesis Energy LP/Genesis Energy Finance Corp.
7.75%, 02/01/2028 | | | | | 5,793 | | | | 5,849,521 | |
Global Partners LP/GLP Finance Corp.
6.875%, 01/15/2029 | | | | | 6,162 | | | | 6,150,330 | |
7.00%, 08/01/2027 | | | | | 2,149 | | | | 2,153,904 | |
Hess Midstream Operations LP
4.25%, 02/15/2030(a) | | | | | 4,243 | | | | 3,962,361 | |
5.125%, 06/15/2028(a) | | | | | 2,208 | | | | 2,161,703 | |
Hilcorp Energy I LP/Hilcorp Finance Co.
5.75%, 02/01/2029(a) | | | | | 1,324 | | | | 1,270,355 | |
6.00%, 02/01/2031(a) | | | | | 1,772 | | | | 1,676,172 | |
6.25%, 04/15/2032(a) | | | | | 318 | | | | 298,384 | |
7.25%, 02/15/2035(a) | | | | | 4,398 | | | | 4,315,120 | |
8.375%, 11/01/2033(a) | | | | | 5,423 | | | | 5,670,132 | |
Howard Midstream Energy Partners LLC
7.375%, 07/15/2032(a) | | | | | 2,060 | | | | 2,100,457 | |
8.875%, 07/15/2028(a) | | | | | 2,565 | | | | 2,706,510 | |
ITT Holdings LLC
6.50%, 08/01/2029(a) | | | | | 10,492 | | | | 9,696,107 | |
Kodiak Gas Services LLC
7.25%, 02/15/2029(a) | | | | | 6,018 | | | | 6,191,485 | |
Matador Resources Co.
6.25%, 04/15/2033(a) | | | | | 1,927 | | | | 1,886,926 | |
6.50%, 04/15/2032(a) | | | | | 2,445 | | | | 2,422,496 | |
Moss Creek Resources Holdings, Inc.
8.25%, 09/01/2031(a) | | | | | 3,473 | | | | 3,406,298 | |
Murphy Oil Corp.
6.00%, 10/01/2032 | | | | | 2,693 | | | | 2,592,419 | |
| | |
| |
14 | AB HIGH INCOME FUND | | abfunds.com |
PORTFOLIO OF INVESTMENTS (continued)
| | | | | | | | | | |
| | | | | Principal
Amount
(000) | | | U.S. $ Value | |
| |
Nabors Industries Ltd.
7.50%, 01/15/2028(a)(j) | | U.S.$ | | | 3,831 | | | $ | 3,646,877 | |
Nabors Industries, Inc.
7.375%, 05/15/2027(a) | | | | | 2,304 | | | | 2,307,767 | |
New Fortress Energy, Inc.
6.50%, 09/30/2026(a) | | | | | 7,070 | | | | 6,539,370 | |
6.75%, 09/15/2025(a) | | | | | 4,202 | | | | 4,191,085 | |
8.75%, 03/15/2029(a) | | | | | 7,202 | | | | 6,015,762 | |
NGL Energy Operating LLC/NGL Energy Finance Corp.
8.125%, 02/15/2029(a) | | | | | 4,536 | | | | 4,567,255 | |
8.375%, 02/15/2032(a) | | | | | 4,536 | | | | 4,578,721 | |
NuStar Logistics LP
5.625%, 04/28/2027 | | | | | 3,349 | | | | 3,321,079 | |
6.00%, 06/01/2026 | | | | | 300 | | | | 300,067 | |
6.375%, 10/01/2030 | | | | | 873 | | | | 883,437 | |
PBF Holding Co. LLC/PBF Finance Corp.
6.00%, 02/15/2028 | | | | | 1,872 | | | | 1,819,371 | |
7.875%, 09/15/2030(a) | | | | | 7,974 | | | | 7,950,596 | |
Permian Resources Operating LLC
6.25%, 02/01/2033(a) | | | | | 3,429 | | | | 3,404,414 | |
Summit Midstream Holdings LLC
8.625%, 10/31/2029(a) | | | | | 1,634 | | | | 1,688,140 | |
Sunoco LP 7.00%, 05/01/2029(a) | | | | | 6,315 | | | | 6,521,592 | |
7.25%, 05/01/2032(a) | | | | | 3,600 | | | | 3,750,586 | |
Sunoco LP/Sunoco Finance Corp.
4.50%, 05/15/2029 | | | | | 2,908 | | | | 2,764,046 | |
4.50%, 04/30/2030 | | | | | 1,602 | | | | 1,503,458 | |
5.875%, 03/15/2028 | | | | | 1,917 | | | | 1,909,482 | |
7.00%, 09/15/2028(a) | | | | | 283 | | | | 291,026 | |
Tallgrass Energy Partners LP/Tallgrass Energy Finance Corp.
6.00%, 12/31/2030(a) | | | | | 614 | | | | 576,281 | |
6.00%, 09/01/2031(a) | | | | | 269 | | | | 249,571 | |
Talos Production, Inc.
9.00%, 02/01/2029(a) | | | | | 1,792 | | | | 1,845,174 | |
9.375%, 02/01/2031(a) | | | | | 2,128 | | | | 2,191,112 | |
Transocean Aquila Ltd.
8.00%, 09/30/2028(a) | | | | | 3,547 | | | | 3,639,268 | |
Transocean, Inc.
8.75%, 02/15/2030(a) | | | | | 3,457 | | | | 3,579,112 | |
Venture Global Calcasieu Pass LLC
3.875%, 08/15/2029(a) | | | | | 332 | | | | 306,651 | |
3.875%, 11/01/2033(a) | | | | | 3,171 | | | | 2,753,183 | |
4.125%, 08/15/2031(a) | | | | | 3,394 | | | | 3,089,882 | |
6.25%, 01/15/2030(a) | | | | | 4,175 | | | | 4,268,406 | |
| | |
| |
| abfunds.com | | AB HIGH INCOME FUND | 15 |
PORTFOLIO OF INVESTMENTS (continued)
| | | | | | | | | | | | |
| | | | | | Principal
Amount
(000) | | | U.S. $ Value | |
| |
Venture Global LNG, Inc.
7.00%, 01/15/2030(a) | | | U.S.$ | | | | 2,856 | | | $ | 2,873,129 | |
8.125%, 06/01/2028(a) | | | | | | | 6,837 | | | | 7,094,796 | |
8.375%, 06/01/2031(a) | | | | | | | 5,455 | | | | 5,661,967 | |
9.00%, 09/30/2029(a)(m) | | | | | | | 6,650 | | | | 6,647,201 | |
9.50%, 02/01/2029(a) | | | | | | | 2,769 | | | | 3,061,524 | |
9.875%, 02/01/2032(a) | | | | | | | 8,379 | | | | 9,145,276 | |
| | | | | | | | | | | | |
| | | | | | | | | | | 248,628,653 | |
| | | | | | | | | | | | |
Other Industrial – 0.5% | | | | | | | | | | | | |
Dealer Tire LLC/DT Issuer LLC
8.00%, 02/01/2028(a) | | | | | | | 4,369 | | | | 4,307,580 | |
Gates Corp./DE
6.875%, 07/01/2029(a) | | | | | | | 1,249 | | | | 1,284,939 | |
Pachelbel Bidco SpA
7.125%, 05/17/2031(a) | | | EUR | | | | 2,585 | | | | 2,993,358 | |
7.30% (EURIBOR 3 Month + 4.25%),
05/17/2031(a)(h) | | | | | | | 627 | | | | 687,794 | |
Resideo Funding, Inc.
6.50%, 07/15/2032(a) | | | U.S.$ | | | | 3,631 | | | | 3,657,243 | |
Ritchie Bros Holdings, Inc.
7.75%, 03/15/2031(a) | | | | | | | 2,629 | | | | 2,773,772 | |
Velocity Vehicle Group LLC
8.00%, 06/01/2029(a) | | | | | | | 1,349 | | | | 1,387,404 | |
| | | | | | | | | | | | |
| | | | | | | | | | | 17,092,090 | |
| | | | | | | | | | | | |
Services – 2.8% | | | | | | | | | | | | |
ADT Security Corp. (The)
4.125%, 08/01/2029(a) | | | | | | | 2,190 | | | | 2,047,813 | |
Allied Universal Holdco LLC/Allied Universal Finance Corp.
6.00%, 06/01/2029(a) | | | | | | | 1,397 | | | | 1,278,398 | |
9.75%, 07/15/2027(a) | | | | | | | 4,763 | | | | 4,773,530 | |
Allied Universal Holdco LLC/Allied Universal Finance Corp./Atlas Luxco 4 SARL
3.625%, 06/01/2028(a) | | | EUR | | | | 1,105 | | | | 1,127,604 | |
4.625%, 06/01/2028(a) | | | U.S.$ | | | | 13,022 | | | | 12,210,686 | |
4.875%, 06/01/2028(a) | | | GBP | | | | 3,580 | | | | 4,222,719 | |
ANGI Group LLC
3.875%, 08/15/2028(a) | | | U.S.$ | | | | 8,847 | | | | 8,012,430 | |
APCOA Group GmbH
6.00%, 04/15/2031(a) | | | EUR | | | | 3,023 | | | | 3,277,044 | |
Aramark Services, Inc.
5.00%, 02/01/2028(a) | | | U.S.$ | | | | 3,832 | | | | 3,764,079 | |
Belron UK Finance PLC
4.625%, 10/15/2029(a) | | | EUR | | | | 1,184 | | | | 1,304,463 | |
5.75%, 10/15/2029(a) | | | U.S.$ | | | | 909 | | | | 911,277 | |
| | |
| |
16 | AB HIGH INCOME FUND | | abfunds.com |
PORTFOLIO OF INVESTMENTS (continued)
| | | | | | | | | | | | |
| | | | | | Principal
Amount
(000) | | | U.S. $ Value | |
| |
Cars.com, Inc.
6.375%, 11/01/2028(a) | | | U.S.$ | | | | 4,403 | | | $ | 4,401,268 | |
Garda World Security Corp.
4.625%, 02/15/2027(a) | | | | | | | 1,684 | | | | 1,639,404 | |
7.75%, 02/15/2028(a) | | | | | | | 4,912 | | | | 5,071,973 | |
8.25%, 08/01/2032(a) | | | | | | | 3,046 | | | | 3,029,675 | |
8.375%, 11/15/2032(a) | | | | | | | 2,643 | | | | 2,642,013 | |
9.50%, 11/01/2027(a) | | | | | | | 495 | | | | 495,160 | |
Korn Ferry
4.625%, 12/15/2027(a) | | | | | | | 2,404 | | | | 2,343,954 | |
Matthews International Corp.
8.625%, 10/01/2027(a) | | | | | | | 1,494 | | | | 1,539,481 | |
Millennium Escrow Corp.
6.625%, 08/01/2026(a) | | | | | | | 5,653 | | | | 3,619,502 | |
Monitronics International, Inc.
9.125%, 04/01/2020(c)(d)(e)(f)(l) | | | | | | | 6,914 | | | | – 0 | – |
Prime Security Services Borrower LLC/Prime Finance, Inc.
3.375%, 08/31/2027(a) | | | | | | | 760 | | | | 714,744 | |
6.25%, 01/15/2028 (a) | | | | | | | 12,261 | | | | 12,248,718 | |
Raven Acquisition Holdings LLC
6.875%, 11/15/2031(a) | | | | | | | 4,706 | | | | 4,695,957 | |
Techem Verwaltungsgesellschaft 675 mbH
5.375%, 07/15/2029(a) | | | EUR | | | | 3,382 | | | | 3,689,568 | |
WASH Multifamily Acquisition, Inc.
5.75%, 04/15/2026(a) | | | U.S.$ | | | | 108 | | | | 107,747 | |
| | | | | | | | | | | | |
| | | | | | | | | | | 89,169,207 | |
| | | | | | | | | | | | |
Technology – 2.4% | | | | | | | | | | | | |
Almaviva-The Italian Innovation Co. SpA
5.00%, 10/30/2030(a) | | | EUR | | | | 4,266 | | | | 4,633,084 | |
Amentum Holdings, Inc.
7.25%, 08/01/2032(a) | | | U.S.$ | | | | 1,267 | | | | 1,313,365 | |
AthenaHealth Group, Inc.
6.50%, 02/15/2030(a) | | | | | | | 7,398 | | | | 6,994,528 | |
Entegris, Inc.
5.95%, 06/15/2030(a) | | | | | | | 7,475 | | | | 7,464,906 | |
Fortress Intermediate 3, Inc.
7.50%, 06/01/2031(a) | | | | | | | 3,778 | | | | 3,928,831 | |
Gen Digital, Inc.
6.75%, 09/30/2027(a) | | | | | | | 4,989 | | | | 5,075,937 | |
7.125%, 09/30/2030(a) | | | | | | | 2,161 | | | | 2,237,038 | |
GoTo Group, Inc.
5.50%, 05/01/2028(a) | | | | | | | 4,547 | | | | 2,338,772 | |
Imola Merger Corp.
4.75%, 05/15/2029(a) | | | | | | | 2,868 | | | | 2,788,973 | |
| | |
| |
| abfunds.com | | AB HIGH INCOME FUND | 17 |
PORTFOLIO OF INVESTMENTS (continued)
| | | | | | | | | | | | |
| | | | | | Principal
Amount
(000) | | | U.S. $ Value | |
| |
Playtika Holding Corp.
4.25%, 03/15/2029(a) | | | U.S.$ | | | | 5,315 | | | $ | 4,795,202 | |
Rackspace Finance LLC
3.50%, 05/15/2028(a) | | | | | | | 11,101 | | | | 6,606,517 | |
Rocket Software, Inc.
9.00%, 11/28/2028(a) | | | | | | | 5,150 | | | | 5,365,979 | |
Seagate HDD Cayman
8.25%, 12/15/2029 | | | | | | | 5,469 | | | | 5,881,041 | |
9.625%, 12/01/2032 | | | | | | | 4,754 | | | | 5,418,603 | |
Veritas US, Inc./Veritas Bermuda Ltd.
7.50%, 09/01/2025(a) | | | | | | | 4,430 | | | | 4,214,194 | |
Virtusa Corp.
7.125%, 12/15/2028(a) | | | | | | | 3,521 | | | | 3,417,571 | |
Western Digital Corp.
4.75%, 02/15/2026 | | | | | | | 4,600 | | | | 4,542,696 | |
| | | | | | | | | | | | |
| | | | | | | | | | | 77,017,237 | |
| | | | | | | | | | | | |
Transportation - Airlines – 0.9% | | | | | | | | | | | | |
American Airlines, Inc./AAdvantage Loyalty IP Ltd.
5.50%, 04/20/2026(a) | | | | | | | 5,379 | | | | 5,366,099 | |
5.75%, 04/20/2029(a) | | | | | | | 8,815 | | | | 8,734,970 | |
JetBlue Airways Corp./JetBlue Loyalty LP
9.875%, 09/20/2031(a) | | | | | | | 4,946 | | | | 5,120,347 | |
Spirit Loyalty Cayman Ltd./Spirit IP Cayman Ltd.
8.00%, 09/20/2025(a)(j) | | | | | | | 5,914 | | | | 3,699,164 | |
United Airlines, Inc.
4.375%, 04/15/2026(a) | | | | | | | 5,509 | | | | 5,412,607 | |
4.625%, 04/15/2029(a) | | | | | | | 1,152 | | | | 1,103,115 | |
| | | | | | | | | | | | |
| | | | | | | | | | | 29,436,302 | |
| | | | | | | | | | | | |
Transportation - Services – 1.2% | | | | | | | | | | | | |
Avis Budget Car Rental LLC/Avis Budget Finance, Inc.
4.75%, 04/01/2028(a) | | | | | | | 6,655 | | | | 6,248,910 | |
5.375%, 03/01/2029(a) | | | | | | | 1,323 | | | | 1,231,931 | |
5.75%, 07/15/2027(a) | | | | | | | 1,477 | | | | 1,451,125 | |
8.25%, 01/15/2030(a) | | | | | | | 446 | | | | 455,333 | |
Avis Budget Finance PLC
7.25%, 07/31/2030(a) | | | EUR | | | | 568 | | | | 619,013 | |
BCP V Modular Services Finance PLC
6.75%, 11/30/2029(a) | | | | | | | 5,428 | | | | 5,100,707 | |
BCP V Modular Services Finance II PLC
4.75%, 11/30/2028(a) | | | | | | | 538 | | | | 565,532 | |
Boels Topholding BV
5.75%, 05/15/2030(a) | | | | | | | 2,472 | | | | 2,773,473 | |
6.25%, 02/15/2029(a) | | | | | | | 2,623 | | | | 2,968,235 | |
| | |
| |
18 | AB HIGH INCOME FUND | | abfunds.com |
PORTFOLIO OF INVESTMENTS (continued)
| | | | | | | | | | | | |
| | | | | | Principal
Amount
(000) | | | U.S. $ Value | |
| |
Dcli Bidco LLC
7.75%, 11/15/2029(a) | | | U.S.$ | | | | 1,697 | | | $ | 1,725,968 | |
Edge Finco PLC
8.125%, 08/15/2031(a) | | | GBP | | | | 1,631 | | | | 2,122,780 | |
Hertz Corp. (The)
4.625%, 12/01/2026(a)(j) | | | U.S.$ | | | | 4,749 | | | | 3,585,276 | |
5.00%, 12/01/2029(a)(j) | | | | | | | 10,055 | | | | 6,511,441 | |
12.625%, 07/15/2029(a) | | | | | | | 1,606 | | | | 1,702,571 | |
Loxam SAS
6.375%, 05/31/2029(a) | | | EUR | | | | 1,153 | | | | 1,310,996 | |
| | | | | | | | | | | | |
| | | | | | | | | | | 38,373,291 | |
| | | | | | | | | | | | |
| | | | | | | | | | | 1,781,217,461 | |
| | | | | | | | | | | | |
Financial Institutions – 6.1% | | | | | | | | | | | | |
Banking – 0.4% | | | | | | | | | | | | |
Ally Financial, Inc.
Series C 4.70%, 05/15/2028(m) | | | U.S.$ | | | | 993 | | | | 806,942 | |
Bread Financial Holdings, Inc.
7.00%, 01/15/2026(a)(j) | | | | | | | 1,577 | | | | 1,574,223 | |
9.75%, 03/15/2029(a) | | | | | | | 8,708 | | | | 9,187,787 | |
Synchrony Financial
7.25%, 02/02/2033 | | | | | | | 3,049 | | | | 3,118,081 | |
| | | | | | | | | | | | |
| | | | | | | | | | | 14,687,033 | |
| | | | | | | | | | | | |
Brokerage – 1.2% | | | | | | | | | | | | |
AG Issuer LLC
6.25%, 03/01/2028(a) | | | | | | | 6,370 | | | | 6,227,643 | |
AG TTMT Escrow Issuer LLC
8.625%, 09/30/2027(a) | | | | | | | 1,167 | | | | 1,205,276 | |
Aretec Group, Inc.
7.50%, 04/01/2029(a) | | | | | | | 2,319 | | | | 2,232,356 | |
10.00%, 08/15/2030(a) | | | | | | | 6,737 | | | | 7,342,851 | |
Focus Financial Partners LLC
6.75%, 09/15/2031(a) | | | | | | | 4,368 | | | | 4,339,902 | |
Hightower Holding LLC
9.125%, 01/31/2030(a) | | | | | | | 5,609 | | | | 5,917,392 | |
Osaic Holdings, Inc.
10.75%, 08/01/2027(a) | | | | | | | 6,141 | | | | 6,337,183 | |
VFH Parent LLC/Valor Co-Issuer, Inc.
7.50%, 06/15/2031(a) | | | | | | | 3,609 | | | | 3,711,562 | |
| | | | | | | | | | | | |
| | | | | | | | | | | 37,314,165 | |
| | | | | | | | | | | | |
Finance – 2.0% | | | | | | | | | | | | |
Castlelake Aviation Finance DAC
5.00%, 04/15/2027(a) | | | | | | | 4,612 | | | | 4,640,955 | |
CNG Holdings, Inc.
14.50%, 06/30/2026(a) | | | | | | | 4,422 | | | | 3,681,338 | |
Curo SPV LLC
18.00%, 08/02/2027(c)(e) | | | | | | | 8,102 | | | | 8,405,970 | |
| | |
| |
| abfunds.com | | AB HIGH INCOME FUND | 19 |
PORTFOLIO OF INVESTMENTS (continued)
| | | | | | | | | | | | |
| | | | | | Principal
Amount
(000) | | | U.S. $ Value | |
| |
Enova International, Inc.
9.125%, 08/01/2029(a) | | | U.S.$ | | | | 5,072 | | | $ | 5,215,453 | |
11.25%, 12/15/2028(a) | | | | | | | 2,594 | | | | 2,793,305 | |
GGAM Finance Ltd.
7.75%, 05/15/2026(a) | | | | | | | 2,431 | | | | 2,476,553 | |
8.00%, 02/15/2027(a) | | | | | | | 4,139 | | | | 4,276,486 | |
8.00%, 06/15/2028(a) | | | | | | | 3,918 | | | | 4,139,515 | |
goeasy Ltd.
7.625%, 07/01/2029(a) | | | | | | | 1,862 | | | | 1,913,536 | |
9.25%, 12/01/2028(a) | | | | | | | 3,755 | | | | 4,004,802 | |
Jefferies Finance LLC/JFIN Co-Issuer Corp.
5.00%, 08/15/2028(a) | | | | | | | 6,174 | | | | 5,699,073 | |
Navient Corp.
4.875%, 03/15/2028 | | | | | | | 6,959 | | | | 6,628,196 | |
5.00%, 03/15/2027 | | | | | | | 1,471 | | | | 1,446,731 | |
5.625%, 08/01/2033 | | | | | | | 1,834 | | | | 1,583,093 | |
6.75%, 06/25/2025 | | | | | | | 2,395 | | | | 2,410,003 | |
11.50%, 03/15/2031 | | | | | | | 3,049 | | | | 3,423,694 | |
SLM Corp.
3.125%, 11/02/2026 | | | | | | | 1,440 | | | | 1,363,706 | |
| | | | | | | | | | | | |
| | | | | | | | | | | 64,102,409 | |
| | | | | | | | | | | | |
Insurance – 1.0% | | | | | | | | | | | | |
Acrisure LLC/Acrisure Finance, Inc.
4.25%, 02/15/2029(a) | | | | | | | 328 | | | | 308,585 | |
7.50%, 11/06/2030(a) | | | | | | | 1,502 | | | | 1,525,467 | |
8.25%, 02/01/2029(a) | | | | | | | 3,788 | | | | 3,850,545 | |
8.50%, 06/15/2029(a) | | | | | | | 3,814 | | | | 3,916,074 | |
Alliant Holdings Intermediate LLC/Alliant Holdings Co-Issuer
6.50%, 10/01/2031(a) | | | | | | | 3,448 | | | | 3,420,980 | |
6.75%, 04/15/2028(a) | | | | | | | 1,165 | | | | 1,171,762 | |
AmWINS Group, Inc.
6.375%, 02/15/2029(a) | | | | | | | 1,743 | | | | 1,752,776 | |
Ardonagh Finco Ltd.
6.875%, 02/15/2031(a) | | | EUR | | | | 1,299 | | | | 1,426,487 | |
7.75%, 02/15/2031(a) | | | U.S.$ | | | | 2,171 | | | | 2,226,141 | |
Ardonagh Group Finance Ltd.
8.875%, 02/15/2032(a) | | | | | | | 1,519 | | | | 1,555,198 | |
AssuredPartners, Inc.
5.625%, 01/15/2029(a) | | | | | | | 1,000 | | | | 946,509 | |
Howden UK Refinance PLC/Howden UK Refinance 2 PLC/Howden US Refinance LLC
7.25%, 02/15/2031(a) | | | | | | | 1,999 | | | | 2,040,039 | |
8.125%, 02/15/2032(a) | | | | | | | 646 | | | | 654,208 | |
HUB International Ltd.
7.25%, 06/15/2030(a) | | | | | | | 5,570 | | | | 5,764,177 | |
| | |
| |
20 | AB HIGH INCOME FUND | | abfunds.com |
PORTFOLIO OF INVESTMENTS (continued)
| | | | | | | | | | | | |
| | | | | | Principal
Amount
(000) | | | U.S. $ Value | |
| |
7.375%, 01/31/2032(a) | | | U.S.$ | | | | 2,719 | | | $ | 2,774,425 | |
| | | | | | | | | | | | |
| | | | | | | | | | | 33,333,373 | |
| | | | | | | | | | | | |
Other Finance – 0.7% | | | | | | | | | | | | |
Armor Holdco, Inc.
8.50%, 11/15/2029(a) | | | | | | | 8,586 | | | | 8,414,197 | |
Coinbase Global, Inc.
3.375%, 10/01/2028(a) | | | | | | | 5,564 | | | | 4,968,734 | |
3.625%, 10/01/2031(a) | | | | | | | 2,379 | | | | 1,983,697 | |
Encore Capital Group, Inc.
8.50%, 05/15/2030(a) | | | | | | | 2,489 | | | | 2,623,970 | |
9.25%, 04/01/2029(a) | | | | | | | 3,332 | | | | 3,550,212 | |
Titanium 2l Bondco SARL
6.25%, 01/14/2031(b) | | | EUR | | | | 1,310 | | | | 508,417 | |
| | | | | | | | | | | | |
| | | | | | | | | | | 22,049,227 | |
| | | | | | | | | | | | |
REITs – 0.8% | | | | | | | | | | | | |
Aedas Homes Opco SL
4.00%, 08/15/2026(a) | | | | | | | 8,700 | | | | 9,428,647 | |
Brookfield Property REIT, Inc./BPR Cumulus LLC/BPR Nimbus LLC/GGSI Sellco LL
4.50%, 04/01/2027(a) | | | U.S.$ | | | | 4,380 | | | | 4,221,135 | |
Five Point Operating Co. LP/Five Point Capital Corp.
10.50%, 01/15/2028(a)(i) | | | | | | | 3,985 | | | | 4,079,438 | |
Iron Mountain, Inc.
4.875%, 09/15/2027(a) | | | | | | | 602 | | | | 590,927 | |
Office Properties Income Trust
9.00%, 09/30/2029(a) | | | | | | | 1,999 | | | | 1,690,144 | |
Service Properties Trust
8.375%, 06/15/2029 | | | | | | | 2,265 | | | | 2,205,603 | |
8.625%, 11/15/2031(a) | | | | | | | 3,569 | | | | 3,768,315 | |
Vivion Investments SARL Series E
8.00%, 02/28/2029(a)(b)(i) | | | EUR | | | | 17 | | | | 18,077 | |
| | | | | | | | | | | | |
| | | | | | | | | | | 26,002,286 | |
| | | | | | | | | | | | |
| | | | | | | | | | | 197,488,493 | |
| | | | | | | | | | | | |
Utility – 1.5% | | | | | | | | | | | | |
Electric – 1.5% | | | | | | | | | | | | |
Alpha Generation LLC
6.75%, 10/15/2032(a) | | | U.S.$ | | | | 1,864 | | | | 1,891,490 | |
Calpine Corp.
3.75%, 03/01/2031(a) | | | | | | | 1,345 | | | | 1,211,894 | |
4.50%, 02/15/2028(a) | | | | | | | 3,063 | | | | 2,950,351 | |
Lightning Power LLC
7.25%, 08/15/2032(a) | | | | | | | 4,426 | | | | 4,606,638 | |
NRG Energy, Inc.
3.375%, 02/15/2029(a) | | | | | | | 3,389 | | | | 3,094,989 | |
| | |
| |
| abfunds.com | | AB HIGH INCOME FUND | 21 |
PORTFOLIO OF INVESTMENTS (continued)
| | | | | | | | | | | | |
| | | | | | Principal
Amount
(000) | | | U.S. $ Value | |
| |
3.625%, 02/15/2031(a) | | | U.S.$ | | | | 2,240 | | | $ | 1,983,911 | |
3.875%, 02/15/2032(a) | | | | | | | 694 | | | | 615,392 | |
5.25%, 06/15/2029(a) | | | | | | | 300 | | | | 293,198 | |
5.75%, 07/15/2029 | | | | | | | 7,963 | | | | 7,864,646 | |
6.00%, 02/01/2033(a) | | | | | | | 1,603 | | | | 1,593,391 | |
6.25%, 11/01/2034(a) | | | | | | | 1,608 | | | | 1,606,239 | |
10.25%, 03/15/2028(a)(m) | | | | | | | 3,572 | | | | 3,944,135 | |
PG&E Corp.
5.00%, 07/01/2028 | | | | | | | 1,880 | | | | 1,838,262 | |
Vistra Corp.
7.00%, 12/15/2026(a)(m) | | | | | | | 3,713 | | | | 3,748,974 | |
8.00%, 10/15/2026(a)(m) | | | | | | | 4,495 | | | | 4,622,736 | |
Vistra Operations Co. LLC
4.375%, 05/01/2029(a) | | | | | | | 326 | | | | 310,590 | |
5.00%, 07/31/2027(a) | | | | | | | 300 | | | | 296,227 | |
5.625%, 02/15/2027(a) | | | | | | | 300 | | | | 299,208 | |
7.75%, 10/15/2031(a) | | | | | | | 3,230 | | | | 3,412,397 | |
| | | | | | | | | | | | |
| | | | | | | | | | | 46,184,668 | |
| | | | | | | | | | | | |
Natural Gas – 0.0% | | | | | | | | | | | | |
AmeriGas Partners LP/AmeriGas Finance Corp.
5.75%, 05/20/2027 | | | | | | | 710 | | | | 684,582 | |
| | | | | | | | | | | | |
| | | | | | | | | | | 46,869,250 | |
| | | | | | | | | | | | |
Total Corporates - Non-Investment Grade
(cost $2,096,114,097) | | | | | | | | | | | 2,025,575,204 | |
| | | | | | | | | | | | |
| | | | | | | | | | | | |
CORPORATES - INVESTMENT GRADE – 13.8% | | | | | | | | | | | | |
Industrial – 7.0% | | | | | | | | | | | | |
Basic – 0.6% | | | | | | | | | | | | |
AngloGold Ashanti Holdings PLC
3.375%, 11/01/2028 | | | | | | | 1,945 | | | | 1,800,350 | |
Freeport Indonesia PT
4.76%, 04/14/2027(a) | | | | | | | 696 | | | | 692,520 | |
Inversiones CMPC SA
6.125%, 02/26/2034(a) | | | | | | | 675 | | | | 689,939 | |
Nexa Resources SA
6.50%, 01/18/2028(a) | | | | | | | 2,179 | | | | 2,222,580 | |
6.75%, 04/09/2034(a) | | | | | | | 2,633 | | | | 2,716,866 | |
OCP SA
6.75%, 05/02/2034(a) | | | | | | | 1,492 | | | | 1,556,342 | |
Olin Corp.
5.125%, 09/15/2027 | | | | | | | 540 | | | | 532,480 | |
5.625%, 08/01/2029 | | | | | | | 1,167 | | | | 1,150,398 | |
Sociedad Quimica y Minera de Chile SA
4.25%, 05/07/2029(a) | | | | | | | 764 | | | | 735,350 | |
| | |
| |
22 | AB HIGH INCOME FUND | | abfunds.com |
PORTFOLIO OF INVESTMENTS (continued)
| | | | | | | | | | | | |
| | | | | | Principal
Amount
(000) | | | U.S. $ Value | |
| |
6.50%, 11/07/2033(a) | | | U.S.$ | | | | 1,223 | | | $ | 1,276,800 | |
Suzano Austria GmbH
6.00%, 01/15/2029 | | | | | | | 6,000 | | | | 6,073,125 | |
| | | | | | | | | | | | |
| | | | | | | | | | | 19,446,750 | |
| | | | | | | | | | | | |
Capital Goods – 0.5% | |
Boeing Co. (The)
3.25%, 02/01/2028 | | | | | | | 1,112 | | | | 1,044,244 | |
5.15%, 05/01/2030 | | | | | | | 1,801 | | | | 1,779,217 | |
6.53%, 05/01/2034(a) | | | | | | | 7,768 | | | | 8,189,288 | |
Embraer Netherlands Finance BV
5.40%, 02/01/2027 | | | | | | | 5,645 | | | | 5,710,256 | |
St. Marys Cement, Inc. Canada
5.75%, 04/02/2034(a) | | | | | | | 665 | | | | 667,969 | |
Textron Financial Corp.
7.115% (CME Term SOFR 3 Month + 2.00%), 02/15/2042(a)(h) | | | | | | | 125 | | | | 112,289 | |
| | | | | | | | | | | | |
| | | | | | | | | | | 17,503,263 | |
| | | | | | | | | | | | |
Communications - Media – 1.2% | | | | | | | | | | | | |
DIRECTV Financing LLC
8.875%, 02/01/2030(a) | | | | | | | 2,829 | | | | 2,795,212 | |
DIRECTV Financing LLC/Directv Financing Co-Obligor, Inc.
5.875%, 08/15/2027(a) | | | | | | | 9,671 | | | | 9,313,185 | |
Grupo Televisa SAB
4.625%, 01/30/2026(j) | | | | | | | 1,527 | | | | 1,497,208 | |
6.625%, 03/18/2025 | | | | | | | 232 | | | | 231,886 | |
Paramount Global
4.20%, 05/19/2032 | | | | | | | 3,016 | | | | 2,625,236 | |
4.95%, 01/15/2031 | | | | | | | 2,053 | | | | 1,906,552 | |
5.50%, 05/15/2033 | | | | | | | 1,847 | | | | 1,712,390 | |
6.875%, 04/30/2036 | | | | | | | 2,053 | | | | 2,051,925 | |
Prosus NV
3.06%, 07/13/2031(a) | | | | | | | 6,509 | | | | 5,540,786 | |
4.03%, 08/03/2050(a) | | | | | | | 1,341 | | | | 934,100 | |
Warnermedia Holdings, Inc.
4.28%, 03/15/2032 | | | | | | | 7,289 | | | | 6,393,947 | |
Weibo Corp.
3.375%, 07/08/2030 | | | | | | | 5,742 | | | | 5,152,297 | |
| | | | | | | | | | | | |
| | | | | | | | | | | 40,154,724 | |
| | | | | | | | | | | | |
Consumer Cyclical - Automotive – 1.2% | | | | | | | | | | | | |
Ford Motor Co.
3.25%, 02/12/2032 | | | | | | | 14,888 | | | | 12,466,964 | |
Ford Motor Credit Co. LLC
6.80%, 05/12/2028 | | | | | | | 4,854 | | | | 5,029,971 | |
Harley-Davidson Financial Services, Inc.
5.95%, 06/11/2029(a) | | | | | | | 383 | | | | 383,816 | |
| | |
| |
| abfunds.com | | AB HIGH INCOME FUND | 23 |
PORTFOLIO OF INVESTMENTS (continued)
| | | | | | | | | | | | |
| | | | | | Principal
Amount
(000) | | | U.S. $ Value | |
| |
6.50%, 03/10/2028(a) | | | U.S.$ | | | | 5,790 | | | $ | 5,939,727 | |
Jaguar Land Rover Automotive PLC
5.875%, 01/15/2028(a) | | | | | | | 4,095 | | | | 4,050,605 | |
Nissan Motor Acceptance Co. LLC
1.85%, 09/16/2026(a) | | | | | | | 393 | | | | 365,800 | |
2.45%, 09/15/2028(a) | | | | | | | 3,310 | | | | 2,900,019 | |
2.75%, 03/09/2028(a) | | | | | | | 5,326 | | | | 4,796,699 | |
5.30%, 09/13/2027(a) | | | | | | | 2,285 | | | | 2,247,171 | |
Nissan Motor Co., Ltd.
4.81%, 09/17/2030(a) | | | | | | | 434 | | | | 400,092 | |
| | | | | | | | | | | | |
| | | | | | | | | | | 38,580,864 | |
| | | | | | | | | | | | |
Consumer Cyclical - Entertainment – 0.4% | | | | | | | | | | | | |
Carnival Corp.
4.00%, 08/01/2028(a) | | | | | | | 11,881 | | | | 11,331,164 | |
| | | | | | | | | | | | |
| | | |
Consumer Cyclical - Other – 0.7% | | | | | | | | | | | | |
Flutter Treasury DAC
5.00%, 04/29/2029(a) | | | EUR | | | | 297 | | | | 331,287 | |
GENM Capital Labuan Ltd.
3.88%, 04/19/2031(a) | | | U.S.$ | | | | 2,056 | | | | 1,835,623 | |
MDC Holdings, Inc.
6.00%, 01/15/2043 | | | | | | | 9,963 | | | | 10,200,371 | |
Resorts World Las Vegas LLC/RWLV Capital, Inc.
4.625%, 04/16/2029(a) | | | | | | | 2,700 | | | | 2,380,980 | |
4.625%, 04/06/2031(a) | | | | | | | 5,800 | | | | 4,916,405 | |
8.45%, 07/27/2030(a) | | | | | | | 900 | | | | 932,783 | |
Sands China Ltd.
2.85%, 03/08/2029(i) | | | | | | | 810 | | | | 726,639 | |
3.25%, 08/08/2031(i)(j) | | | | | | | 675 | | | | 583,116 | |
4.375%, 06/18/2030(i) | | | | | | | 1,740 | | | | 1,638,976 | |
| | | | | | | | | | | | |
| | | | | | | | | | | 23,546,180 | |
| | | | | | | | | | | | |
Consumer Cyclical - Retailers – 0.3% | | | | | | | | | | | | |
Macy’s Retail Holdings LLC
5.875%, 03/15/2030(a) | | | | | | | 4,253 | | | | 4,106,925 | |
6.125%, 03/15/2032(a) | | | | | | | 2,121 | | | | 2,020,876 | |
VF Corp.
2.95%, 04/23/2030 | | | | | | | 1,565 | | | | 1,350,605 | |
Zhongsheng Group Holdings Ltd.
5.98%, 01/30/2028(a) | | | | | | | 657 | | | | 646,831 | |
| | | | | | | | | | | | |
| | | | | | | | | | | 8,125,237 | |
| | | | | | | | | | | | |
Consumer Non-Cyclical – 0.5% | | | | | | | | | | | | |
Cencosud SA
5.95%, 05/28/2031(a) | | | | | | | 1,567 | | | | 1,586,744 | |
Charles River Laboratories International, Inc.
3.75%, 03/15/2029(a) | | | | | | | 3,048 | | | | 2,794,509 | |
| | |
| |
24 | AB HIGH INCOME FUND | | abfunds.com |
PORTFOLIO OF INVESTMENTS (continued)
| | | | | | | | | | | | |
| | | | | | Principal
Amount
(000) | | | U.S. $ Value | |
| |
4.00%, 03/15/2031(a) | | | U.S.$ | | | | 2,554 | | | $ | 2,284,915 | |
Imperial Brands Finance PLC
5.875%, 07/01/2034(a) | | | | | | | 3,440 | | | | 3,469,755 | |
Jazz Securities DAC
4.375%, 01/15/2029(a) | | | | | | | 5,930 | | | | 5,606,386 | |
| | | | | | | | | | | | |
| | | | | | | | | | | 15,742,309 | |
| | | | | | | | | | | | |
Energy – 1.2% | | | | | | | | | | | | |
Continental Resources, Inc./OK
5.75%, 01/15/2031(a) | | | | | | | 788 | | | | 788,277 | |
Energy Transfer LP
8.00%, 05/15/2054 | | | | | | | 4,164 | | | | 4,413,630 | |
EQM Midstream Partners LP
4.50%, 01/15/2029(a) | | | | | | | 4,253 | | | | 4,093,799 | |
6.375%, 04/01/2029(a) | | | | | | | 1,154 | | | | 1,172,159 | |
Expand Energy Corp.
8.375%, 09/15/2028 | | | | | | | 153 | | | | 157,418 | |
Hunt Oil Co. of Peru LLC Sucursal Del Peru
8.55%, 09/18/2033(a) | | | | | | | 1,452 | | | | 1,586,310 | |
KazMunayGas National Co. JSC
5.375%, 04/24/2030(a) | | | | | | | 6,280 | | | | 6,189,757 | |
ONEOK, Inc.
3.95%, 03/01/2050 | | | | | | | 1,424 | | | | 1,047,180 | |
5.70%, 11/01/2054 | | | | | | | 3,486 | | | | 3,360,579 | |
Raizen Fuels Finance SA
6.45%, 03/05/2034(a) | | | | | | | 2,410 | | | | 2,459,026 | |
Tengizchevroil Finance Co. International Ltd.
3.25%, 08/15/2030(a) | | | | | | | 5,979 | | | | 5,074,676 | |
TransCanada PipeLines Ltd.
7.59% (CME Term SOFR 3 Month + 2.47%), 05/15/2067(h) | | | | | | | 2,500 | | | | 2,308,821 | |
Var Energi ASA
7.50%, 01/15/2028(a) | | | | | | | 2,151 | | | | 2,284,859 | |
8.00%, 11/15/2032(a) | | | | | | | 4,260 | | | | 4,829,314 | |
| | | | | | | | | | | | |
| | | | | | | | | | | 39,765,805 | |
| | | | | | | | | | | | |
Other Industrial – 0.0% | | | | | | | | | | | | |
American Builders & Contractors Supply Co., Inc.
4.00%, 01/15/2028(a) | | | | | | | 361 | | | | 343,140 | |
| | | | | | | | | | | | |
| | | |
Services – 0.0% | | | | | | | | | | | | |
Boost Newco Borrower LLC/GTCR W Dutch Finance Sub BV
8.50%, 01/15/2031(a) | | | GBP | | | | 369 | | | | 510,303 | |
| | | | | | | | | | | | |
| | | |
Technology – 0.1% | | | | | | | | | | | | |
Lenovo Group Ltd.
3.42%, 11/02/2030(a) | | | U.S.$ | | | | 735 | | | | 666,323 | |
| | |
| |
| abfunds.com | | AB HIGH INCOME FUND | 25 |
PORTFOLIO OF INVESTMENTS (continued)
| | | | | | | | | | | | |
| | | | | | Principal
Amount
(000) | | | U.S. $ Value | |
| |
5.83%, 01/27/2028(a) | | | U.S.$ | | | | 2,591 | | | $ | 2,636,343 | |
Western Digital Corp.
2.85%, 02/01/2029 | | | | | | | 102 | | | | 90,291 | |
| | | | | | | | | | | | |
| | | | | | | | | | | 3,392,957 | |
| | | | | | | | | | | | |
Transportation - Airlines – 0.1% | | | | | | | | | | | | |
AS Mileage Plan IP Ltd.
5.02%, 10/20/2029(a) | | | | | | | 615 | | | | 596,740 | |
5.31%, 10/20/2031(a) | | | | | | | 1,242 | | | | 1,200,100 | |
| | | | | | | | | | | | |
| | | | | | | | | | | 1,796,840 | |
| | | | | | | | | | | | |
Transportation - Railroads – 0.0% | | | | | | | | | | | | |
Lima Metro Line 2 Finance Ltd.
4.35%, 04/05/2036(a) | | | | | | | 1,608 | | | | 1,471,453 | |
| | | | | | | | | | | | |
| | | |
Transportation - Services – 0.2% | | | | | | | | | | | | |
Adani Ports & Special Economic Zone Ltd.
4.375%, 07/03/2029(a) | | | | | | | 3,847 | | | | 3,568,092 | |
AerCap Global Aviation Trust
6.50%, 06/15/2045(a) | | | | | | | 1,371 | | | | 1,368,627 | |
| | | | | | | | | | | | |
| | | | | | | | | | | 4,936,719 | |
| | | | | | | | | | | | |
| | | | | | | | | | | 226,647,708 | |
| | | | | | | | | | | | |
Financial Institutions – 5.5% | | | | | | | | | | | | |
Banking – 3.4% | | | | | | | | | | | | |
Ally Financial, Inc.
6.70%, 02/14/2033 | | | | | | | 3,049 | | | | 3,056,807 | |
Series B
4.70%, 05/15/2026(m) | | | | | | | 10,614 | | | | 9,562,758 | |
Banco de Credito del Peru SA
5.85%, 01/11/2029(a) | | | | | | | 2,106 | | | | 2,149,566 | |
Banco Santander SA
3.225%, 11/22/2032 | | | | | | | 200 | | | | 172,936 | |
6.35%, 03/14/2034 | | | | | | | 2,200 | | | | 2,286,168 | |
6.92%, 08/08/2033 | | | | | | | 7,200 | | | | 7,755,028 | |
9.625%, 05/21/2033(m) | | | | | | | 5,000 | | | | 5,777,869 | |
Bank Leumi Le-Israel BM
7.13%, 07/18/2033(a) | | | | | | | 1,500 | | | | 1,501,841 | |
Bank of America Corp.
Series B
8.05%, 06/15/2027 | | | | | | | 2,750 | | | | 2,935,233 | |
Barclays PLC
7.12%, 06/27/2034 | | | | | | | 2,695 | | | | 2,918,741 | |
BBVA Bancomer SA/Texas
5.25%, 09/10/2029(a) | | | | | | | 1,458 | | | | 1,442,691 | |
BNP Paribas SA
4.625%, 02/25/2031(a)(m) | | | | | | | 6,256 | | | | 5,267,898 | |
BPCE SA
6.51%, 01/18/2035(a) | | | | | | | 4,495 | | | | 4,623,391 | |
| | |
| |
26 | AB HIGH INCOME FUND | | abfunds.com |
PORTFOLIO OF INVESTMENTS (continued)
| | | | | | | | | | | | |
| | | | | | Principal
Amount
(000) | | | U.S. $ Value | |
| |
Series E
0.75%, 03/03/2031(a) | | | EUR | | | | 2,300 | | | $ | 2,107,697 | |
4.125%, 03/08/2033(a) | | | | | | | 500 | | | | 554,659 | |
Capital One Financial Corp.
6.05%, 02/01/2035 | | | U.S.$ | | | | 2,379 | | | | 2,445,005 | |
Citigroup, Inc.
Series AA
7.625%, 11/15/2028(m) | | | | | | | 1,231 | | | | 1,309,502 | |
Deutsche Bank AG/New York NY
7.08%, 02/10/2034 | | | | | | | 4,299 | | | | 4,510,918 | |
HSBC Holdings PLC
4.60%, 12/17/2030(m) | | | | | | | 986 | | | | 871,377 | |
Intesa Sanpaolo SpA
4.20%, 06/01/2032(a) | | | | | | | 3,439 | | | | 3,011,824 | |
4.95%, 06/01/2042(a) | | | | | | | 1,000 | | | | 769,875 | |
5.71%, 01/15/2026(a) | | | | | | | 1,145 | | | | 1,147,050 | |
6.625%, 06/20/2033(a) | | | | | | | 3,768 | | | | 4,012,453 | |
7.20%, 11/28/2033(a) | | | | | | | 2,389 | | | | 2,641,356 | |
Lloyds Banking Group PLC
7.50%, 09/27/2025(m) | | | | | | | 4,748 | | | | 4,775,881 | |
NatWest Group PLC
6.475%, 06/01/2034 | | | | | | | 1,166 | | | | 1,206,163 | |
8.125%, 11/10/2033(m) | | | | | | | 1,100 | | | | 1,177,170 | |
PNC Financial Services Group, Inc. (The)
Series R
8.32% (CME Term SOFR 3 Month + 3.30%), 12/02/2024(h)(m) | | | | | | | 985 | | | | 986,465 | |
Santander Holdings USA, Inc.
5.35%, 09/06/2030 | | | | | | | 4,543 | | | | 4,496,984 | |
6.17%, 01/09/2030 | | | | | | | 1,187 | | | | 1,215,072 | |
6.565%, 06/12/2029 | | | | | | | 481 | | | | 498,981 | |
Standard Chartered PLC
6.36% (CME Term SOFR 3 Month + 1.51%), 01/30/2027(a)(h)(m) | | | | | | | 3,500 | | | | 3,219,540 | |
Synchrony Financial
5.935%, 08/02/2030(j) | | | | | | | 2,928 | | | | 2,969,671 | |
Truist Financial Corp.
Series L
8.31% (CME Term SOFR 3 Month + 3.36%), 12/15/2024(h)(m) | | | | | | | 5,127 | | | | 5,128,337 | |
UBS Group AG
3.875%, 06/02/2026(a)(m) | | | | | | | 1,913 | | | | 1,813,001 | |
7.00%, 02/19/2025(a)(m) | | | | | | | 3,965 | | | | 3,969,260 | |
9.25%, 11/13/2028(a)(m) | | | | | | | 895 | | | | 974,954 | |
9.25%, 11/13/2033(a)(m) | | | | | | | 812 | | | | 939,289 | |
UniCredit SpA
5.86%, 06/19/2032(a) | | | | | | | 3,049 | | | | 3,034,804 | |
| | | | | | | | | | | | |
| | | | | | | | | | | 109,238,215 | |
| | | | | | | | | | | | |
| | |
| |
| abfunds.com | | AB HIGH INCOME FUND | 27 |
PORTFOLIO OF INVESTMENTS (continued)
| | | | | | | | | | | | |
| | | | | | Principal
Amount
(000) | | | U.S. $ Value | |
| |
Finance – 0.7% | | | | | | | | | | | | |
Air Lease Corp.
Series B
4.65%, 06/15/2026(m) | | | U.S.$ | | | | 5,818 | | | $ | 5,642,200 | |
Aircastle Ltd.
5.25%, 06/15/2026(a)(m) | | | | | | | 2,705 | | | | 2,664,537 | |
Huarong Finance 2017 Co., Ltd.
4.75%, 04/27/2027(a) | | | | | | | 1,151 | | | | 1,127,980 | |
Series E
4.25%, 11/07/2027(a) | | | | | | | 270 | | | | 259,211 | |
Huarong Finance 2019 Co., Ltd.
Series E
3.25%, 11/13/2024(a) | | | | | | | 708 | | | | 707,221 | |
Huarong Finance II Co., Ltd.
Series E
4.625%, 06/03/2026(a) | | | | | | | 2,519 | | | | 2,474,917 | |
4.875%, 11/22/2026(a) | | | | | | | 310 | | | | 305,641 | |
5.50%, 01/16/2025(a) | | | | | | | 3,149 | | | | 3,144,276 | |
ILFC E-Capital Trust II
6.815% (CME Term SOFR 3 Month + 2.06%), 12/21/2065(a)(h) | | | | | | | 1,500 | | | | 1,215,170 | |
Jefferies Finance LLC/JFIN Co-Issuer Corp.
6.625%, 10/15/2031(a) | | | | | | | 2,594 | | | | 2,580,964 | |
| | | | | | | | | | | | |
| | | | | | | | | | | 20,122,117 | |
| | | | | | | | | | | | |
Insurance – 1.0% | | | | | | | | | | | | |
Athene Global Funding
5.53%, 07/11/2031(a) | | | | | | | 7,141 | | | | 7,232,671 | |
Liberty Mutual Group, Inc.
7.80%, 03/15/2037(a) | | | | | | | 12,355 | | | | 13,678,982 | |
MetLife Capital Trust IV
7.875%, 12/15/2037(a) | | | | | | | 9,269 | | | | 10,208,894 | |
MetLife, Inc.
10.75%, 08/01/2039 | | | | | | | 1,256 | | | | 1,748,831 | |
| | | | | | | | | | | | |
| | | | | | | | | | | 32,869,378 | |
| | | | | | | | | | | | |
REITs – 0.4% | | | | | | | | | | | | |
Newmark Group, Inc.
7.50%, 01/12/2029 | | | | | | | 7,691 | | | | 8,141,363 | |
Trust Fibra Uno
4.87%, 01/15/2030(a) | | | | | | | 4,333 | | | | 3,890,601 | |
5.25%, 01/30/2026(a) | | | | | | | 989 | | | | 985,538 | |
| | | | | | | | | | | | |
| | | | | | | | | | | 13,017,502 | |
| | | | | | | | | | | | |
| | | | | | | | | | | 175,247,212 | |
| | | | | | | | | | | | |
Utility – 1.3% | | | | | | | | | | | | |
Electric – 1.3% | | | | | | | | | | | | |
Adani Electricity Mumbai Ltd.
3.87%, 07/22/2031(a) | | | | | | | 357 | | | | 301,444 | |
| | |
| |
28 | AB HIGH INCOME FUND | | abfunds.com |
PORTFOLIO OF INVESTMENTS (continued)
| | | | | | | | | | | | |
| | | | | | Principal
Amount
(000) | | | U.S. $ Value | |
| |
3.95%, 02/12/2030(a) | | | U.S.$ | | | | 3,475 | | | $ | 3,058,000 | |
AES Andes SA
6.30%, 03/15/2029(a) | | | | | | | 1,849 | | | | 1,884,242 | |
Alexander Funding Trust II
7.47%, 07/31/2028(a) | | | | | | | 1,615 | | | | 1,708,903 | |
American Electric Power Co., Inc.
6.95%, 12/15/2054 | | | | | | | 1,858 | | | | 1,940,746 | |
Buffalo Energy Mexico Holdings/Buffalo Energy Infrastructure/Buffalo Energy
7.875%, 02/15/2039(a) | | | | | | | 1,958 | | | | 2,018,463 | |
Cometa Energia SA de CV
6.375%, 04/24/2035(a) | | | | | | | 2,193 | | | | 2,150,922 | |
Electricite de France SA
9.125%, 03/15/2033(a)(m) | | | | | | | 1,365 | | | | 1,550,819 | |
Empresas Publicas de Medellin ESP
4.25%, 07/18/2029(a) | | | | | | | 5,114 | | | | 4,477,409 | |
Engie Energia Chile SA
6.375%, 04/17/2034(a) | | | | | | | 2,849 | | | | 2,903,558 | |
FIEMEX Energia - Banco Actinver SA Institucion de Banca Multiple
7.25%, 01/31/2041(a) | | | | | | | 472 | | | | 471,823 | |
Israel Electric Corp., Ltd.
7.75%, 12/15/2027(a) | | | | | | | 1,347 | | | | 1,416,489 | |
Series G
4.25%, 08/14/2028(a) | | | | | | | 5,820 | | | | 5,488,260 | |
Kallpa Generacion SA
4.125%, 08/16/2027(a) | | | | | | | 1,067 | | | | 1,035,990 | |
Minejesa Capital BV
4.625%, 08/10/2030(a) | | | | | | | 4,160 | | | | 4,059,052 | |
NextEra Energy Capital Holdings, Inc.
6.70%, 09/01/2054 | | | | | | | 1,221 | | | | 1,252,985 | |
Niagara Energy SAC
5.75%, 10/03/2034(a) | | | | | | | 1,563 | | | | 1,531,740 | |
NRG Energy, Inc.
7.00%, 03/15/2033(a) | | | | | | | 1,192 | | | | 1,291,672 | |
Palomino Funding Trust I
7.23%, 05/17/2028(a) | | | | | | | 2,549 | | | | 2,682,964 | |
| | | | | | | | | | | | |
| | | | | | | | | | | 41,225,481 | |
| | | | | | | | | | | | |
Other Utility – 0.0% | | | | | | | | | | | | |
Buffalo Energy Mexico Holdings/Buffalo Energy Infrastructure/Buffalo Energy
7.875%, 02/15/2039(a) | | | | | | | 743 | | | | 765,944 | |
| | | | | | | | | | | | |
| | | | | | | | | | | 41,991,425 | |
| | | | | | | | | | | | |
Total Corporates - Investment Grade
(cost $436,467,560) | | | | | | | | | | | 443,886,345 | |
| | | | | | | | | | | | |
| | |
| |
| abfunds.com | | AB HIGH INCOME FUND | 29 |
PORTFOLIO OF INVESTMENTS (continued)
| | | | | | | | | | | | |
| | | | | | Principal
Amount
(000) | | | U.S. $ Value | |
| |
EMERGING MARKETS - CORPORATE BONDS – 6.3% | | | | | | | | | | | | |
Industrial – 5.6% | | | | | | | | | | | | |
Basic – 2.0% | | | | | | | | | | | | |
Aris Mining Corp.
8.00%, 10/31/2029(a) | | | U.S.$ | | | | 1,157 | | | $ | 1,161,209 | |
Braskem Idesa SAPI
7.45%, 11/15/2029(a)(j) | | | | | | | 6,736 | | | | 5,321,440 | |
Braskem Netherlands Finance BV
4.50%, 01/10/2028(a) | | | | | | | 4,671 | | | | 4,368,786 | |
4.50%, 01/31/2030(a) | | | | | | | 3,773 | | | | 3,274,021 | |
8.00%, 10/15/2034(a) | | | | | | | 559 | | | | 557,366 | |
Cia de Minas Buenaventura SAA
5.50%, 07/23/2026(a) | | | | | | | 3,245 | | | | 3,194,313 | |
CSN Inova Ventures
6.75%, 01/28/2028(a) | | | | | | | 10,378 | | | | 9,920,719 | |
Eregli Demir ve Celik Fabrikalari TAS
8.375%, 07/23/2029(a) | | | | | | | 1,682 | | | | 1,724,050 | |
First Quantum Minerals Ltd.
6.875%, 10/15/2027(a) | | | | | | | 8,370 | | | | 8,272,824 | |
9.375%, 03/01/2029(a) | | | | | | | 859 | | | | 913,729 | |
Indika Energy Tbk PT
8.75%, 05/07/2029(a) | | | | | | | 1,398 | | | | 1,434,698 | |
JSW Steel Ltd.
3.95%, 04/05/2027(a) | | | | | | | 813 | | | | 779,210 | |
5.05%, 04/05/2032(a) | | | | | | | 2,171 | | | | 1,968,066 | |
Navoi Mining & Metallurgical Combinat
6.70%, 10/17/2028(a) | | | | | | | 833 | | | | 837,923 | |
Sasol Financing USA LLC
5.50%, 03/18/2031 | | | | | | | 1,785 | | | | 1,536,774 | |
8.75%, 05/03/2029(a) | | | | | | | 5,777 | | | | 5,958,042 | |
Stillwater Mining Co.
4.00%, 11/16/2026(a) | | | | | | | 3,148 | | | | 2,961,072 | |
4.50%, 11/16/2029(a) | | | | | | | 1,878 | | | | 1,535,265 | |
UPL Corp., Ltd.
4.50%, 03/08/2028(a) | | | | | | | 1,707 | | | | 1,545,368 | |
4.625%, 06/16/2030(a) | | | | | | | 2,376 | | | | 2,030,743 | |
Vedanta Resources Finance II PLC
10.875%, 09/17/2029(a) | | | | | | | 3,000 | | | | 3,083,184 | |
Volcan Cia Minera SAA
8.75%, 01/24/2030(a) | | | | | | | 2,483 | | | | 2,268,221 | |
| | | | | | | | | | | | |
| | | | | | | | | | | 64,647,023 | |
| | | | | | | | | | | | |
Capital Goods – 0.2% | | | | | | | | | | | | |
Cemex SAB de CV
5.125%, 06/08/2026(a)(m) | | | | | | | 4,107 | | | | 3,986,295 | |
9.125%, 03/14/2028(a)(m) | | | | | | | 473 | | | | 503,892 | |
IHS Holding Ltd.
6.25%, 11/29/2028(a) | | | | | | | 537 | | | | 503,330 | |
| | |
| |
30 | AB HIGH INCOME FUND | | abfunds.com |
PORTFOLIO OF INVESTMENTS (continued)
| | | | | | | | | | | | |
| | | | | | Principal
Amount
(000) | | | U.S. $ Value | |
| |
Usiminas International SARL
5.875%, 07/18/2026(a) | | | U.S.$ | | | | 1,676 | | | $ | 1,656,910 | |
| | | | | | | | | | | | |
| | | | | | | | | | | 6,650,427 | |
| | | | | | | | | | | | |
Communications - Media – 0.1% | | | | | | | | | | | | |
Globo Comunicacao e Participacoes SA
4.875%, 01/22/2030(a) | | | | | | | 1,869 | | | | 1,710,135 | |
Telecomunicaciones Digitales SA
4.50%, 01/30/2030(a) | | | | | | | 443 | | | | 405,482 | |
| | | | | | | | | | | | |
| | | | | | | | | | | 2,115,617 | |
| | | | | | | | | | | | |
Communications - Telecommunications – 0.3% | | | | | | | | | | | | |
CT Trust
5.125%, 02/03/2032(a) | | | | | | | 1,688 | | | | 1,529,750 | |
Digicel Group Holdings Ltd.
Zero Coupon, 12/31/2030(c)(e)(g) | | | | | | | 690 | | | | 9,623 | |
HTA Group Ltd./Mauritius
7.50%, 06/04/2029(a) | | | | | | | 1,500 | | | | 1,524,150 | |
Millicom International Cellular SA
7.375%, 04/02/2032(a) | | | | | | | 931 | | | | 949,061 | |
Sable International Finance Ltd.
7.125%, 10/15/2032(a) | | | | | | | 2,467 | | | | 2,480,846 | |
Turk Telekomunikasyon AS
7.375%, 05/20/2029(a) | | | | | | | 1,509 | | | | 1,534,834 | |
| | | | | | | | | | | | |
| | | | | | | | | | | 8,028,264 | |
| | | | | | | | | | | | |
Consumer Cyclical - Automotive – 0.0% | | | | | | | | | | | | |
Ford Otomotiv Sanayi AS
7.125%, 04/25/2029(a) | | | | | | | 724 | | | | 733,050 | |
| | | | | | | | | | | | |
| | | |
Consumer Cyclical - Other – 1.1% | | | | | | | | | | | | |
Allwyn International AS
3.875%, 02/15/2027(a) | | | EUR | | | | 744 | | | | 804,228 | |
Melco Resorts Finance Ltd.
5.375%, 12/04/2029(a) | | | U.S.$ | | | | 6,251 | | | | 5,747,013 | |
5.625%, 07/17/2027(a) | | | | | | | 3,599 | | | | 3,489,905 | |
5.75%, 07/21/2028(a) | | | | | | | 3,277 | | | | 3,134,647 | |
MGM China Holdings Ltd.
4.75%, 02/01/2027(a) | | | | | | | 8,457 | | | | 8,163,373 | |
5.25%, 06/18/2025(a) | | | | | | | 437 | | | | 434,542 | |
Studio City Co., Ltd.
7.00%, 02/15/2027(a) | | | | | | | 1,338 | | | | 1,342,181 | |
Studio City Finance Ltd.
6.00%, 07/15/2025(a) | | | | | | | 671 | | | | 669,323 | |
Wynn Macau Ltd.
5.125%, 12/15/2029(a) | | | | | | | 2,333 | | | | 2,162,726 | |
5.50%, 01/15/2026(a) | | | | | | | 5,020 | | | | 4,961,768 | |
5.50%, 10/01/2027(a) | | | | | | | 1,100 | | | | 1,063,563 | |
5.625%, 08/26/2028(a) | | | | | | | 2,442 | | | | 2,344,442 | |
| | | | | | | | | | | | |
| | | | | | | | | | | 34,317,711 | |
| | | | | | | | | | | | |
| | |
| |
| abfunds.com | | AB HIGH INCOME FUND | 31 |
PORTFOLIO OF INVESTMENTS (continued)
| | | | | | | | | | | | |
| | | | | | Principal
Amount
(000) | | | U.S. $ Value | |
| |
Consumer Cyclical - Retailers – 0.1% | | | | | | | | | | | | |
Falabella SA
3.375%, 01/15/2032(a) | | | U.S.$ | | | | 3,073 | | | $ | 2,527,542 | |
3.75%, 10/30/2027(a) | | | | | | | 1,675 | | | | 1,580,363 | |
K201640219 South Africa Ltd.
Zero Coupon, 06/25/2023(c)(d)(e)(f) | | | ZAR | | | | 230 | | | | – 0 | – |
K2016470219 South Africa Ltd.
3.00%, 12/31/2022(c)(d)(e)(f)(g) | | | U.S.$ | | | | 5,622 | | | | – 0 | – |
K2016470260 South Africa Ltd.
25.00%, 12/31/2022(c)(d)(e)(f)(g) | | | | | | | 3,942 | | | | – 0 | – |
| | | | | | | | | | | | |
| | | | | | | | | | | 4,107,905 | |
| | | | | | | | | | | | |
Consumer Non-Cyclical – 0.6% | | | | | | | | | | | | |
BBFI Liquidating Trust
Zero Coupon, 12/30/2099(c)(e)(g) | | | | | | | 2,174 | | | | 629,466 | |
BRF SA
4.875%, 01/24/2030(a) | | | | | | | 1,952 | | | | 1,820,240 | |
MARB BondCo PLC
3.95%, 01/29/2031(a) | | | | | | | 5,583 | | | | 4,818,129 | |
Natura &Co Luxembourg Holdings SARL
4.125%, 05/03/2028(a) | | | | | | | 2,205 | | | | 2,064,326 | |
Rede D’or Finance SARL
4.50%, 01/22/2030(a) | | | | | | | 1,018 | | | | 940,378 | |
4.95%, 01/17/2028(a) | | | | | | | 1,237 | | | | 1,204,529 | |
Teva Pharmaceutical Finance Netherlands II BV
3.75%, 05/09/2027 | | | EUR | | | | 1,768 | | | | 1,909,218 | |
Teva Pharmaceutical Finance Netherlands III BV
4.75%, 05/09/2027 | | | U.S.$ | | | | 2,251 | | | | 2,182,772 | |
5.125%, 05/09/2029(j) | | | | | | | 2,251 | | | | 2,191,213 | |
7.875%, 09/15/2029 | | | | | | | 2,840 | | | | 3,066,182 | |
Virgolino de Oliveira Finance SA
10.50%, 01/28/2025(c)(e)(f)(g)(n) | | | | | | | 13,579 | | | | 1,358 | |
10.875%, 01/13/2020(c)(d)(e)(f)(g) | | | | | | | 2,500 | | | | 250 | |
11.75%, 02/09/2025(c)(e)(f)(g)(n) | | | | | | | 13,518 | | | | 1,352 | |
| | | | | | | | | | | | |
| | | | | | | | | | | 20,829,413 | |
| | | | | | | | | | | | |
Energy – 1.1% | | | | | | | | | | | | |
Acu Petroleo Luxembourg SARL
7.50%, 01/13/2032(a) | | | | | | | 2,026 | | | | 2,032,727 | |
Azure Power Energy Ltd.
3.575%, 08/19/2026(a) | | | | | | | 1,701 | | | | 1,609,235 | |
Canacol Energy Ltd.
5.75%, 11/24/2028(a) | | | | | | | 2,107 | | | | 1,093,006 | |
Cosan Luxembourg SA
5.50%, 09/20/2029(a) | | | | | | | 2,027 | | | | 1,954,798 | |
Ecopetrol SA
4.625%, 11/02/2031 | | | | | | | 2,197 | | | | 1,810,328 | |
| | |
| |
32 | AB HIGH INCOME FUND | | abfunds.com |
PORTFOLIO OF INVESTMENTS (continued)
| | | | | | | | | | | | |
| | | | | | Principal
Amount
(000) | | | U.S. $ Value | |
| |
8.625%, 01/19/2029 | | | U.S.$ | | | | 6,145 | | | $ | 6,495,880 | |
Geopark Ltd.
5.50%, 01/17/2027(a) | | | | | | | 985 | | | | 928,057 | |
Gran Tierra Energy, Inc.
9.50%, 10/15/2029(a) | | | | | | | 3,100 | | | | 2,852,000 | |
Greenko Solar Mauritius Ltd.
5.55%, 01/29/2025(a)(j) | | | | | | | 348 | | | | 346,737 | |
Greenko Wind Projects Mauritius Ltd.
5.50%, 04/06/2025(a) | | | | | | | 4,218 | | | | 4,200,242 | |
Leviathan Bond Ltd.
6.125%, 06/30/2025(a) | | | | | | | 2,742 | | | | 2,707,306 | |
6.50%, 06/30/2027(a) | | | | | | | 3,495 | | | | 3,305,378 | |
Medco Maple Tree Pte Ltd.
8.96%, 04/27/2029(a) | | | | | | | 1,686 | | | | 1,772,408 | |
MV24 Capital BV
6.75%, 06/01/2034(a) | | | | | | | 2,502 | | | | 2,433,858 | |
Oleoducto Central SA
4.00%, 07/14/2027(a) | | | | | | | 610 | | | | 578,951 | |
SierraCol Energy Andina LLC
6.00%, 06/15/2028(a) | | | | | | | 1,325 | | | | 1,201,934 | |
| | | | | | | | | | | | |
| | | | | | | | | | | 35,322,845 | |
| | | | | | | | | | | | |
Other Industrial – 0.0% | | | | | | | | | | | | |
Telecommunications co Telekom Srbija AD Belgrade
7.00%, 10/28/2029(a) | | | | | | | 623 | | | | 623,716 | |
| | | | | | | | | | | | |
| | | |
Services – 0.0% | | | | | | | | | | | | |
Bidvest Group UK PLC (The)
3.625%, 09/23/2026(a) | | | | | | | 666 | | | | 646,020 | |
| | | | | | | | | | | | |
| | | |
Transportation - Services – 0.1% | | | | | | | | | | | | |
JSW Infrastructure Ltd.
4.95%, 01/21/2029(a) | | | | | | | 564 | | | | 544,260 | |
Kingston Airport Revenue Finance Ltd.
6.75%, 12/15/2036(a) | | | | | | | 1,545 | | | | 1,564,112 | |
| | | | | | | | | | | | |
| | | | | | | | | | | 2,108,372 | |
| | | | | | | | | | | | |
| | | | | | | | | | | 180,130,363 | |
| | | | | | | | | | | | |
Utility – 0.6% | | | | | | | | | | | | |
Electric – 0.5% | | | | | | | | | | | | |
AES Andes SA
6.35%, 10/07/2079(a) | | | | | | | 1,521 | | | | 1,507,372 | |
8.15%, 06/10/2055(a) | | | | | | | 1,654 | | | | 1,688,818 | |
Continuum Energy Aura Pte Ltd.
9.50%, 02/24/2027(a) | | | | | | | 1,269 | | | | 1,329,674 | |
Continuum Green Energy India Pvt./Co-Issuers
7.50%, 06/26/2033(a) | | | | | | | 1,505 | | | | 1,552,031 | |
| | |
| |
| abfunds.com | | AB HIGH INCOME FUND | 33 |
PORTFOLIO OF INVESTMENTS (continued)
| | | | | | | | | | | | |
| | | | | | Principal
Amount
(000) | | | U.S. $ Value | |
| |
Diamond II Ltd.
7.95%, 07/28/2026(a) | | | U.S.$ | | | | 2,614 | | | $ | 2,646,484 | |
India Clean Energy Holdings
4.50%, 04/18/2027(a) | | | | | | | 2,606 | | | | 2,457,458 | |
Investment Energy Resources Ltd.
6.25%, 04/26/2029(a) | | | | | | | 1,321 | | | | 1,274,051 | |
Sorik Marapi Geothermal Power PT
7.75%, 08/05/2031(a) | | | | | | | 1,520 | | | | 1,498,629 | |
Zorlu Enerji Elektrik Uretim AS
11.00%, 04/23/2030(a) | | | | | | | 2,310 | | | | 2,307,967 | |
| | | | | | | | | | | | |
| | | | | | | | | | | 16,262,484 | |
| | | | | | | | | | | | |
Other Utility – 0.1% | |
Aegea Finance SARL
6.75%, 05/20/2029(a) | | | | | | | 613 | | | | 608,811 | |
9.00%, 01/20/2031(a) | | | | | | | 1,375 | | | | 1,460,452 | |
| | | | | | | | | | | | |
| | | | | | | | | | | 2,069,263 | |
| | | | | | | | | | | | |
| | | | | | | | | | | 18,331,747 | |
| | | | | | | | | | | | |
Financial Institutions – 0.1% | | | | | | | | | | | | |
Banking – 0.1% | | | | | | | | | | | | |
Akbank TAS
7.50%, 01/20/2030(a) | | | | | | | 1,051 | | | | 1,068,751 | |
Turkiye Vakiflar Bankasi TAO
9.00%, 10/12/2028(a) | | | | | | | 1,411 | | | | 1,515,245 | |
Yapi ve Kredi Bankasi AS
9.25%, 10/16/2028(a) | | | | | | | 1,500 | | | | 1,631,250 | |
| | | | | | | | | | | | |
| | | | | | | | | | | 4,215,246 | |
| | | | | | | | | | | | |
Total Emerging Markets - Corporate Bonds
(cost $236,692,244) | | | | | | | | | | | 202,677,356 | |
| | | | | | | | | | | | |
| | | | | | | | | | | | |
BANK LOANS – 3.5% | | | | | | | | | | | | |
Industrial – 3.1% | | | | | | | | | | | | |
Capital Goods – 0.1% | | | | | | | | | | | | |
ACProducts Holdings, Inc.
9.115% (CME Term SOFR 3 Month + 4.25%), 05/17/2028(o) | | | | | | | 5,140 | | | | 4,273,408 | |
| | | | | | | | | | | | |
| | | |
Communications - Media – 0.4% | | | | | | | | | | | | |
Advantage Sales & Marketing, Inc.
9.12% (CME Term SOFR 3 Month + 4.25%), 10/28/2027(o) | | | | | | | 2,995 | | | | 2,939,417 | |
DIRECTV Financing, LLC
10.10% (CME Term SOFR 3 Month + 5.25%), 08/02/2029(o) | | | | | | | 2,298 | | | | 2,232,583 | |
Gray Television, Inc.
7.96% (CME Term SOFR 1 Month + 3.00%), 12/01/2028(o) | | | | | | | 8,260 | | | | 7,749,450 | |
| | | | | | | | | | | | |
| | | | | | | | | | | 12,921,450 | |
| | | | | | | | | | | | |
| | |
| |
34 | AB HIGH INCOME FUND | | abfunds.com |
PORTFOLIO OF INVESTMENTS (continued)
| | | | | | | | | | | | |
| | | | | | Principal
Amount
(000) | | | U.S. $ Value | |
| |
Communications - Telecommunications – 0.5% | | | | | | | | | | | | |
Crown Subsea Communications Holding, Inc.
8.685% (CME Term SOFR 1 Month + 4.00%), 01/30/2031(o) | | | U.S.$ | | | | 6,893 | | | $ | 6,925,052 | |
Lumen Technologies, Inc.
04/15/2029(p) | | | | | | | 1,340 | | | | 1,215,380 | |
Zacapa SARL
8.60% (CME Term SOFR 3 Month + 4.00%), 03/22/2029(o) | | | | | | | 7,514 | | | | 7,515,521 | |
| | | | | | | | | | | | |
| | | | | | | | | | | 15,655,953 | |
| | | | | | | | | | | | |
Consumer Non-Cyclical – 0.9% | | | | | | | | | | | | |
Agiliti Health, Inc.
05/01/2030(c)(p) | | | | | | | 4,719 | | | | 4,648,215 | |
Gainwell Acquisition Corp.
8.70% (CME Term SOFR 3 Month + 4.00%), 10/01/2027(o) | | | | | | | 6,709 | | | | 6,433,572 | |
Neptune Bidco US, Inc.
9.76% (CME Term SOFR 3 Month + 5.00%), 04/11/2029(o) | | | | | | | 7,737 | | | | 7,137,717 | |
PetSmart LLC
8.535% (CME Term SOFR 1 Month + 3.75%), 02/11/2028(o) | | | | | | | 5,648 | | | | 5,610,419 | |
US Radiology Specialists, Inc.
9.35% (CME Term SOFR 3 Month + 4.75%), 12/15/2027(o) | | | | | | | 4,631 | | | | 4,646,572 | |
| | | | | | | | | | | | |
| | | | | | | | | | | 28,476,495 | |
| | | | | | | | | | | | |
Energy – 0.2% | | | | | | | | | | | | |
GIP II Blue Holding LP
8.595% (CME Term SOFR 1 Month + 3.75%), 09/29/2028(o) | | | | | | | 6,773 | | | | 6,786,518 | |
| | | | | | | | | | | | |
| | | |
Other Industrial – 0.1% | | | | | | | | | | | | |
American Tire Distributors, Inc.
11.16% (CME Term SOFR 3 Month + 6.25%), 10/20/2028(d)(o) | | | | | | | 4,992 | | | | 559,759 | |
Dealer Tire Financial LLC
8.185% (CME Term SOFR 1 Month + 3.50%), 07/02/2031(o) | | | | | | | 1,571 | | | | 1,570,569 | |
| | | | | | | | | | | | |
| | | | | | | | | | | 2,130,328 | |
| | | | | | | | | | | | |
Technology – 0.6% | | | | | | | | | | | | |
Ascend Learning LLC
10.535% (CME Term SOFR 1 Month + 5.75%), 12/10/2029(o) | | | | | | | 2,940 | | | | 2,886,110 | |
| | |
| |
| abfunds.com | | AB HIGH INCOME FUND | 35 |
PORTFOLIO OF INVESTMENTS (continued)
| | | | | | | | | | | | |
| | | | | | Principal
Amount
(000) | | | U.S. $ Value | |
| |
Boxer Parent Co., Inc.
8.335% (CME Term SOFR 3 Month + 3.75%), 07/30/2031(o) | | | U.S.$ | | | | 8,451 | | | $ | 8,422,056 | |
FINThrive Software Intermediate Holdings, Inc.
11.55% (CME Term SOFR 1 Month + 6.75%), 12/17/2029(o) | | | | | | | 2,810 | | | | 1,166,150 | |
Loyalty Ventures, Inc.
14.00% (PRIME 3 Month + 5.50%), 11/03/2027(c)(e)(f)(n)(o) | | | | | | | 5,905 | | | | 44,284 | |
Polaris Newco, LLC
06/02/2028(p) | | | | | | | 4,664 | | | | 4,628,554 | |
Veritas US, Inc.
9.80% (CME Term SOFR 1 Month + 5.00%), 09/01/2025(o) | | | | | | | 3,487 | | | | 3,316,490 | |
| | | | | | | | | | | | |
| | | | | | | | | | | 20,463,644 | |
| | | | | | | | | | | | |
Transportation - Airlines – 0.3% | | | | | | | | | | | | |
AS Mileage Plan IP Ltd.
6.66% (CME Term SOFR 3 Month + 2.00%), 10/01/2031(o) | | | | | | | 2,420 | | | | 2,412,933 | |
Delta Air Lines, Inc.
8.37% (CME Term SOFR 3 Month + 3.75%), 10/20/2027(o) | | | | | | | 755 | | | | 768,821 | |
JetBlue Airways Corp.
10.27% (CME Term SOFR 6 Month + 5.50%), 08/27/2029(o) | | | | | | | 4,946 | | | | 4,911,378 | |
| | | | | | | | | | | | |
| | | | | | | | | | | 8,093,132 | |
| | | | | | | | | | | | |
| | | | | | | | | | | 98,800,928 | |
| | | | | | | | | | | | |
Financial Institutions – 0.4% | | | | | | | | | | | | |
Finance – 0.0% | | | | | | | | | | | | |
Orbit Private Holdings I Ltd.
10.01% (CME Term SOFR 6 Month + 4.50%), 12/11/2028(c)(o) | | | | | | | 875 | | | | 875,250 | |
| | | | | | | | | | | | |
| | | |
Insurance – 0.4% | | | | | | | | | | | | |
Asurion LLC
9.035% (CME Term SOFR 1 Month + 4.25%), 08/19/2028(o) | | | | | | | 6,137 | | | | 6,098,197 | |
Truist Insurance Holdings
9.35% (CME Term SOFR 3 Month + 4.75%), 05/06/2032(o) | | | | | | | 5,540 | | | | 5,607,865 | |
| | | | | | | | | | | | |
| | | | | | | | | | | 11,706,062 | |
| | | | | | | | | | | | |
| | | | | | | | | | | 12,581,312 | |
| | | | | | | | | | | | |
Total Bank Loans
(cost $123,799,399) | | | | | | | | | | | 111,382,240 | |
| | | | | | | | | | | | |
| | |
| |
36 | AB HIGH INCOME FUND | | abfunds.com |
PORTFOLIO OF INVESTMENTS (continued)
| | | | | | | | | | | | |
| | | | | | Principal
Amount
(000) | | | U.S. $ Value | |
| |
COLLATERALIZED MORTGAGE OBLIGATIONS – 3.0% | | | | | | | | | | | | |
Risk Share Floating Rate – 2.6% | | | | | | | | | | | | |
Federal Home Loan Mortgage Corp.
Structured Agency Credit Risk Debt Notes Debt Notes 2015-DNA1
Series 2015-DNA1, Class B
14.17% (CME Term SOFR + 9.31%), 10/25/2027(h) | | | U.S.$ | | | | 895 | | | $ | 927,214 | |
Federal Home Loan Mortgage Corp.
Structured Agency Credit Risk Debt Notes Debt Notes 2015-DNA2
Series 2015-DNA2, Class B
12.52% (CME Term SOFR + 7.66%), 12/25/2027(h) | | | | | | | 12,655 | | | | 13,113,845 | |
Federal Home Loan Mortgage Corp.
Structured Agency Credit Risk Debt Notes Debt Notes 2015-DNA3
Series 2015-DNA3, Class B
14.32% (CME Term SOFR + 9.46%), 04/25/2028(h) | | | | | | | 7,428 | | | | 7,961,512 | |
Federal Home Loan Mortgage Corp.
Structured Agency Credit Risk Debt Notes Debt Notes 2015-HQA1
Series 2015-HQA1, Class B
13.77% (CME Term SOFR + 8.91%), 03/25/2028(h) | | | | | | | 12,375 | | | | 12,870,361 | |
Federal Home Loan Mortgage Corp.
Structured Agency Credit Risk Debt Notes Debt Notes 2015-HQA2
Series 2015-HQA2, Class B
15.47% (CME Term SOFR + 10.61%), 05/25/2028(h) | | | | | | | 6,931 | | | | 7,241,152 | |
Federal Home Loan Mortgage Corp.
Structured Agency Credit Risk Debt Notes Debt Notes 2015-HQ2
Series 2015-HQ2, Class B
12.92% (CME Term SOFR + 8.06%), 05/25/2025(h) | | | | | | | 282 | | | | 291,944 | |
Federal Home Loan Mortgage Corp. Structured Agency Credit Risk Debt Notes Debt Notes 2016-DNA4
Series 2016-DNA4, Class B
13.57% (CME Term SOFR + 8.71%), 03/25/2029(h) | | | | | | | 1,800 | | | | 1,966,863 | |
| | |
| |
| abfunds.com | | AB HIGH INCOME FUND | 37 |
PORTFOLIO OF INVESTMENTS (continued)
| | | | | | | | | | | | |
| | | | | | Principal
Amount
(000) | | | U.S. $ Value | |
| |
Federal National Mortgage Association Connecticut Avenue Securities
Series 2016-C01, Class 1B
16.72% (CME Term SOFR + 11.86%), 08/25/2028(h) | | | U.S.$ | | | | 3,989 | | | $ | 4,459,406 | |
Series 2016-C02, Class 1B
17.22% (CME Term SOFR + 12.36%), 09/25/2028(h) | | | | | | | 2,869 | | | | 3,265,471 | |
Series 2016-C03, Class 2B
17.72% (CME Term SOFR + 12.86%), 10/25/2028(h) | | | | | | | 3,929 | | | | 4,517,507 | |
Series 2016-C04, Class 1B
15.22% (CME Term SOFR + 10.36%), 01/25/2029(h) | | | | | | | 3,333 | | | | 3,794,426 | |
Series 2016-C05, Class 2B
15.72% (CME Term SOFR + 10.86%), 01/25/2029(h) | | | | | | | 4,989 | | | | 5,669,235 | |
Series 2016-C06, Class 1B
14.22% (CME Term SOFR + 9.36%), 04/25/2029(h) | | | | | | | 8,421 | | | | 9,410,816 | |
Series 2016-C07, Class 2B
14.47% (CME Term SOFR + 9.61%), 05/25/2029(h) | | | | | | | 4,009 | | | | 4,554,210 | |
JP Morgan Madison Avenue Securities Trust
Series 2015-CH1, Class M2
10.47% (CME Term SOFR + 5.61%), 10/25/2025(a)(h) | | | | | | | 1,866 | | | | 1,915,926 | |
Wells Fargo Credit Risk Transfer Securities Trust
Series 2015-WF1, Class 1M2
10.22% (CME Term SOFR + 5.36%), 11/25/2025(a)(h) | | | | | | | 1,241 | | | | 1,286,025 | |
Series 2015-WF1, Class 2M2
10.47% (CME Term SOFR + 5.61%), 11/25/2025(a)(h) | | | | | | | 596 | | | | 621,444 | |
| | | | | | | | | | | | |
| | | | | | | | | | | 83,867,357 | |
| | | | | | | | | | | | |
| | | |
Non-Agency Fixed Rate – 0.3% | | | | | | | | | | | | |
Alternative Loan Trust
Series 2006-42, Class 1A6
6.00%, 01/25/2047 | | | | | | | 819 | | | | 430,235 | |
Series 2006-24CB, Class A15
5.75%, 08/25/2036 | | | | | | | 1,855 | | | | 939,445 | |
Series 2006-24CB, Class A16
5.75%, 08/25/2036 | | | | | | | 355 | | | | 179,615 | |
| | |
| |
38 | AB HIGH INCOME FUND | | abfunds.com |
PORTFOLIO OF INVESTMENTS (continued)
| | | | | | | | | | |
| | | | | Principal
Amount
(000) | | | U.S. $ Value | |
| |
Series 2006-26CB, Class A6
6.25%, 09/25/2036 | | U.S.$ | | | 187 | | | $ | 91,008 | |
Series 2006-26CB, Class A8
6.25%, 09/25/2036 | | | | | 707 | | | | 343,911 | |
Series 2006-HY12, Class A5
4.46%, 08/25/2036 | | | | | 1,643 | | | | 1,510,246 | |
Series 2006-J1, Class 1A10
5.50%, 02/25/2036 | | | | | 605 | | | | 409,656 | |
Series 2006-J5, Class 1A1
6.50%, 09/25/2036 | | | | | 575 | | | | 300,700 | |
Series 2007-15CB, Class A19
5.75%, 07/25/2037 | | | | | 346 | | | | 196,730 | |
Series 2007-16CB, Class 1A7
6.00%, 08/25/2037 | | | | | 328 | | | | 243,525 | |
Bear Stearns ARM Trust
Series 2007-3, Class 1A1
4.30%, 05/25/2047 | | | | | 286 | | | | 254,397 | |
Series 2007-4, Class 22A1
4.43%, 06/25/2047 | | | | | 1,198 | | | | 1,074,785 | |
ChaseFlex Trust
Series 2007-1, Class 1A3
6.50%, 02/25/2037 | | | | | 472 | | | | 165,521 | |
CHL Mortgage Pass-Through Trust
Series 2007-HY4, Class 1A1
4.99%, 09/25/2047 | | | | | 309 | | | | 279,186 | |
Citigroup Mortgage Loan Trust
Series 2007-AR4, Class 1A1A
4.71%, 03/25/2037 | | | | | 191 | | | | 158,263 | |
CitiMortgage Alternative Loan Trust
Series 2007-A3, Class 1A4
5.75%, 03/25/2037 | | | | | 506 | | | | 449,305 | |
First Horizon Alternative Mortgage Securities Trust
Series 2006-AA3, Class A1
5.64%, 06/25/2036 | | | | | 225 | | | | 173,680 | |
Residential Accredit Loans, Inc. Trust
Series 2005-QA10, Class A31
5.42%, 09/25/2035 | | | | | 1,137 | | | | 774,916 | |
Series 2005-QS14, Class 3A1
6.00%, 09/25/2035 | | | | | 654 | | | | 540,078 | |
Residential Asset Securitization Trust
Series 2006-A8, Class 3A4
6.00%, 08/25/2036 | | | | | 493 | | | | 220,211 | |
Series 2007-A1, Class A8
6.00%, 03/25/2037 | | | | | 857 | | | | 259,643 | |
Series 2007-A5, Class 2A3
6.00%, 05/25/2037 | | | | | 213 | | | | 110,718 | |
| | |
| |
| abfunds.com | | AB HIGH INCOME FUND | 39 |
PORTFOLIO OF INVESTMENTS (continued)
| | | | | | | | | | | | |
| | | | | | Principal
Amount
(000) | | | U.S. $ Value | |
| |
Washington Mutual Mortgage Pass-Through Certificates WMALT Trust
Series 2006-9, Class A4
4.21%, 10/25/2036 | | | U.S.$ | | | | 1,547 | | | $ | 422,301 | |
Wells Fargo Mortgage Backed Securities Trust
Series 2007-AR7, Class A1
6.66%, 12/28/2037 | | | | | | | 952 | | | | 833,959 | |
| | | | | | | | | | | | |
| | | | | | | | | | | 10,362,034 | |
| | | | | | | | | | | | |
Non-Agency Floating Rate – 0.1% | | | | | | | | | | | | |
Alternative Loan Trust
Series 2007-7T2, Class A3
5.45% (CME Term SOFR 1 Month + 0.71%), 04/25/2037(h) | | | | | | | 2,051 | | | | 696,155 | |
CHL Mortgage Pass-Through Trust
Series 2007-13, Class A7
5.45% (CME Term SOFR 1 Month + 0.71%), 08/25/2037(h) | | | | | | | 306 | | | | 105,282 | |
First Horizon Alternative Mortgage Securities Trust
Series 2007-FA2, Class 1A10
5.10% (CME Term SOFR 1 Month + 0.36%), 04/25/2037(h) | | | | | | | 900 | | | | 208,652 | |
Lehman Mortgage Trust
Series 2007-1, Class 3A1
5.10% (CME Term SOFR 1 Month + 0.36%), 02/25/2037(h) | | | | | | | 2,853 | | | | 385,394 | |
Series 2007-1, Class 3A2
2.40% (7.14% - CME Term SOFR 1 Month), 02/25/2037(h)(q) | | | | | | | 2,853 | | | | 208,879 | |
Lehman XS Trust
Series 2007-16N, Class 2A2
6.55% (CME Term SOFR 1 Month + 1.81%), 09/25/2047(h) | | | | | | | 318 | | | | 283,315 | |
PHH Alternative Mortgage Trust
Series 2007-1, Class 1A1
5.17% (CME Term SOFR 1 Month + 0.43%), 02/25/2037(h) | | | | | | | 323 | | | | 236,176 | |
Series 2007-2, Class 1A3
5.51% (CME Term SOFR 1 Month + 0.77%), 05/25/2037(h) | | | | | | | 174 | | | | 153,785 | |
| | | | | | | | | | | | |
| | | | | | | | | | | 2,277,638 | |
| | | | | | | | | | | | |
Total Collateralized Mortgage Obligations
(cost $97,958,633) | | | | | | | | | | | 96,507,029 | |
| | | | | | | | | | | | |
| | |
| |
40 | AB HIGH INCOME FUND | | abfunds.com |
PORTFOLIO OF INVESTMENTS (continued)
| | | | | | | | | | | | |
| | | | | | Principal
Amount
(000) | | | U.S. $ Value | |
| |
EMERGING MARKETS - SOVEREIGNS – 2.7% | | | | | | | | | | | | |
Angola – 0.4% | |
Angolan Government International Bond
8.00%, 11/26/2029(a) | | | U.S.$ | | | | 6,204 | | | $ | 5,672,782 | |
9.125%, 11/26/2049(a) | | | | | | | 286 | | | | 238,696 | |
9.50%, 11/12/2025(a) | | | | | | | 5,861 | | | | 5,945,047 | |
| | | | | | | | | | | | |
| | | | | | | | | | | 11,856,525 | |
| | | | | | | | | | | | |
Argentina – 0.1% | |
Argentine Republic Government International Bond
0.75%, 07/09/2030(i) | | | | | | | 1,619 | | | | 1,085,838 | |
4.125%, 07/09/2035(i)(j) | | | | | | | 781 | | | | 431,474 | |
| | | | | | | | | | | | |
| | | | | | | | | | | 1,517,312 | |
| | | | | | | | | | | | |
Bahrain – 0.1% | |
Bahrain Government International Bond
5.45%, 09/16/2032(a) | | | | | | | 468 | | | | 436,700 | |
6.75%, 09/20/2029(a) | | | | | | | 1,973 | | | | 2,017,393 | |
7.00%, 10/12/2028(a) | | | | | | | 1,673 | | | | 1,738,874 | |
| | | | | | | | | | | | |
| | | | | | | | | | | 4,192,967 | |
| | | | | | | | | | | | |
Cote D’Ivoire – 0.4% | |
Ivory Coast Government International Bond
4.875%, 01/30/2032(a) | | | EUR | | | | 7,815 | | | | 7,419,554 | |
5.75%, 12/31/2032(a)(i) | | | U.S.$ | | | | 1,267 | | | | 1,199,052 | |
6.375%, 03/03/2028(a) | | | | | | | 3,087 | | | | 3,065,792 | |
6.625%, 03/22/2048(a) | | | EUR | | | | 732 | | | | 641,216 | |
| | | | | | | | | | | | |
| | | | | | | | | | | 12,325,614 | |
| | | | | | | | | | | | |
Dominican Republic – 0.6% | |
Dominican Republic Central Bank Notes
10.50%, 01/17/2025(a) | | | DOP | | | | 455,000 | | | | 7,527,022 | |
Dominican Republic International Bond
8.625%, 04/20/2027(a) | | | U.S.$ | | | | 12,746 | | | | 13,172,991 | |
| | | | | | | | | | | | |
| | | | | | | | | | | 20,700,013 | |
| | | | | | | | | | | | |
Ecuador – 0.1% | |
Ecuador Government International Bond
5.50%, 07/31/2035(a)(i) | | | | | | | 5,449 | | | | 3,007,686 | |
| | | | | | | | | | | | |
|
Egypt – 0.2% | |
Egypt Government International Bond
5.875%, 02/16/2031(a) | | | | | | | 3,699 | | | | 3,063,253 | |
8.70%, 03/01/2049(a) | | | | | | | 612 | | | | 489,600 | |
8.875%, 05/29/2050(a) | | | | | | | 4,471 | | | | 3,627,098 | |
| | | | | | | | | | | | |
| | | | | | | | | | | 7,179,951 | |
| | | | | | | | | | | | |
El Salvador – 0.1% | |
El Salvador Government International Bond
6.375%, 01/18/2027(a) | | | | | | | 750 | | | | 721,875 | |
| | |
| |
| abfunds.com | | AB HIGH INCOME FUND | 41 |
PORTFOLIO OF INVESTMENTS (continued)
| | | | | | | | | | | | |
| | | | | | Principal
Amount
(000) | | | U.S. $ Value | |
| |
8.625%, 02/28/2029(a) | | | U.S.$ | | | | 3,002 | | | $ | 2,949,465 | |
| | | | | | | | | | | | |
| | | | | | | | | | | 3,671,340 | |
| | | | | | | | | | | | |
Guatemala – 0.0% | |
Guatemala Government Bond
6.05%, 08/06/2031(a) | | | | | | | 1,520 | | | | 1,510,880 | |
| | | | | | | | | | | | |
| | | |
Nigeria – 0.5% | | | | | | | | | | | | |
Nigeria Government International Bond
6.125%, 09/28/2028(a) | | | | | | | 8,820 | | | | 7,954,538 | |
6.50%, 11/28/2027(a) | | | | | | | 2,200 | | | | 2,074,875 | |
7.14%, 02/23/2030(a) | | | | | | | 5,188 | | | | 4,678,927 | |
7.70%, 02/23/2038(a) | | | | | | | 671 | | | | 544,139 | |
| | | | | | | | | | | | |
| | | | | | | | | | | 15,252,479 | |
| | | | | | | | | | | | |
Senegal – 0.1% | |
Senegal Government International Bond
4.75%, 03/13/2028(a) | | | EUR | | | | 1,709 | | | | 1,720,123 | |
6.25%, 05/23/2033(a) | | | U.S.$ | | | | 395 | | | | 325,658 | |
6.75%, 03/13/2048(a) | | | | | | | 3,641 | | | | 2,562,354 | |
| | | | | | | | | | | | |
| | | | | | | | | | | 4,608,135 | |
| | | | | | | | | | | | |
Ukraine – 0.1% | |
Ukraine Government International Bond | | | | | | | | | | | | |
Zero Coupon, 02/01/2030(a)(i) | | | | | | | 112 | | | | 53,425 | |
Zero Coupon, 02/01/2034(a)(i) | | | | | | | 417 | | | | 152,913 | |
Zero Coupon, 02/01/2035(a)(i) | | | | | | | 353 | | | | 171,003 | |
Zero Coupon, 02/01/2036(a)(i) | | | | | | | 294 | | | | 141,768 | |
1.75%, 02/01/2029(a)(i) | | | | | | | 702 | | | | 420,187 | |
1.75%, 02/01/2034(a)(i) | | | | | | | 599 | | | | 280,690 | |
1.75%, 02/01/2035(a)(i) | | | | | | | 306 | | | | 139,927 | |
1.75%, 02/01/2036(a)(i) | | | | | | | 437 | | | | 196,619 | |
| | | | | | | | | | | | |
| | | | | | | | | | | 1,556,532 | |
| | | | | | | | | | | | |
Total Emerging Markets - Sovereigns
(cost $87,777,138) | | | | | | | | | | | 87,379,434 | |
| | | | | | | | | | | | |
| | | | | | | | | | | | |
QUASI-SOVEREIGNS – 1.2% | | | | | | | | | | | | |
Quasi-Sovereign Bonds – 1.2% | | | | | | | | | | | | |
Azerbaijan – 0.1% | | | | | | | | | | | | |
Southern Gas Corridor CJSC
6.875%, 03/24/2026(a) | | | | | | | 3,785 | | | | 3,859,527 | |
| | | | | | | | | | | | |
| | | |
Chile – 0.2% | | | | | | | | | | | | |
Corp. Nacional del Cobre de Chile
3.00%, 09/30/2029(a) | | | | | | | 3,020 | | | | 2,710,450 | |
5.95%, 01/08/2034(a) | | | | | | | 3,223 | | | | 3,262,280 | |
6.44%, 01/26/2036(a) | | | | | | | 1,317 | | | | 1,369,680 | |
| | | | | | | | | | | | |
| | | | | | | | | | | 7,342,410 | |
| | | | | | | | | | | | |
Mexico – 0.5% | | | | | | | | | | | | |
Comision Federal de Electricidad
3.35%, 02/09/2031(a) | | | | | | | 2,528 | | | | 2,130,472 | |
| | |
| |
42 | AB HIGH INCOME FUND | | abfunds.com |
PORTFOLIO OF INVESTMENTS (continued)
| | | | | | | | | | | | |
| | | | | | Principal
Amount
(000) | | | U.S. $ Value | |
| |
4.69%, 05/15/2029(a) | | | U.S.$ | | | | 5,319 | | | $ | 5,039,752 | |
4.75%, 02/23/2027(a) | | | | | | | 434 | | | | 426,288 | |
Petroleos Mexicanos
6.49%, 01/23/2027 | | | | | | | 1,276 | | | | 1,257,996 | |
6.50%, 01/23/2029 | | | | | | | 1,644 | | | | 1,543,042 | |
7.69%, 01/23/2050 | | | | | | | 2,298 | | | | 1,785,316 | |
8.75%, 06/02/2029 | | | | | | | 4,483 | | | | 4,529,720 | |
| | | | | | | | | | | | |
| | | | | | | | | | | 16,712,586 | |
| | | | | | | | | | | | |
South Africa – 0.3% | | | | | | | | | | | | |
Eskom Holdings SOC Ltd.
7.125%, 02/11/2025(a) | | | | | | | 3,957 | | | | 3,950,827 | |
Transnet SOC Ltd.
8.25%, 02/06/2028(a) | | | | | | | 4,870 | | | | 4,959,791 | |
| | | | | | | | | | | | |
| | | | | | | | | | | 8,910,618 | |
| | | | | | | | | | | | |
Trinidad and Tobago – 0.0% | | | | | | | | | | | | |
Trinidad Generation UnLtd.
5.25%, 11/04/2027(a) | | | | | | | 202 | | | | 198,023 | |
| | | | | | | | | | | | |
| | | |
Turkey – 0.1% | | | | | | | | | | | | |
TC Ziraat Bankasi AS
8.00%, 01/16/2029(a) | | | | | | | 1,389 | | | | 1,448,044 | |
Turkiye Ihracat Kredi Bankasi AS
9.00%, 01/28/2027(a)(j) | | | | | | | 612 | | | | 645,660 | |
| | | | | | | | | | | | |
| | | | | | | | | | | 2,093,704 | |
| | | | | | | | | | | | |
Total Quasi-Sovereigns
(cost $38,679,198) | | | | | | | | | | | 39,116,868 | |
| | | | | | | | | | | | |
| | | | | | | | | | | | |
GOVERNMENTS - TREASURIES – 1.0% | | | | | | | | | | | | |
United States – 1.0% | | | | | | | | | | | | |
U.S. Treasury Bonds
6.125%, 11/15/2027(r) | | | | | | | 9,763 | | | | 10,299,859 | |
U.S. Treasury Notes
2.375%, 05/15/2029 | | | | | | | 5,542 | | | | 5,135,195 | |
3.125%, 11/15/2028(s) | | | | | | | 12,054 | | | | 11,586,715 | |
4.00%, 02/29/2028 | | | | | | | 4,978 | | | | 4,955,643 | |
| | | | | | | | | | | | |
| | | |
Total Governments - Treasuries
(cost $33,603,296) | | | | | | | | | | | 31,977,412 | |
| | | | | | | | | | | | |
| | | | | | | | | | | | |
COLLATERALIZED LOAN OBLIGATIONS – 0.8% | | | | | | | | | | | | |
CLO - Floating Rate – 0.8% | | | | | | | | | | | | |
Ares XXXIV CLO Ltd.
Series 2015-2A, Class CR
6.91% (CME Term SOFR 3 Month + 2.26%), 04/17/2033(a)(h) | | | | | | | 11,494 | | | | 11,509,909 | |
| | |
| |
| abfunds.com | | AB HIGH INCOME FUND | 43 |
PORTFOLIO OF INVESTMENTS (continued)
| | | | | | | | | | | | |
| | | | | | Principal
Amount
(000) | | | U.S. $ Value | |
| |
Ballyrock CLO 15 Ltd.
Series 2021-1A, Class D
11.14% (CME Term SOFR 3 Month + 6.48%), 04/15/2034(a)(h) | | | U.S.$ | | | | 2,000 | | | $ | 2,004,692 | |
Bristol Park CLO Ltd.
Series 2016-1A, Class DR
7.87% (CME Term SOFR 3 Month + 3.21%), 04/15/2029(a)(h) | | | | | | | 5,000 | | | | 5,020,280 | |
LCM 28 Ltd.
Series 28A, Class D
7.83% (CME Term SOFR 3 Month + 3.21%), 10/20/2030(a)(h) | | | | | | | 500 | | | | 493,143 | |
OCP CLO Ltd.
Series 2021-21A, Class E
11.16% (CME Term SOFR 3 Month + 6.54%), 07/20/2034(a)(h) | | | | | | | 2,250 | | | | 2,254,174 | |
Rad CLO 10 Ltd.
Series 2021-10A, Class E
10.74% (CME Term SOFR 3 Month + 6.11%), 04/23/2034(a)(h) | | | | | | | 3,793 | | | | 3,800,659 | |
| | | | | | | | | | | | |
| | | |
Total Collateralized Loan Obligations
(cost $24,984,289) | | | | | | | | | | | 25,082,857 | |
| | | | | | | | | | | | |
| | | | | | | | | | | | |
LOCAL GOVERNMENTS - US MUNICIPAL BONDS – 0.4% | | | | | | | | | | | | |
United States – 0.4% | | | | | | | | | | | | |
State of California
Series 2010
7.60%, 11/01/2040 | | | | | | | 1,200 | | | | 1,466,232 | |
7.625%, 03/01/2040 | | | | | | | 1,250 | | | | 1,508,396 | |
State of Illinois
Series 2010
7.35%, 07/01/2035 | | | | | | | 3,237 | | | | 3,513,387 | |
Wisconsin Public Finance Authority
Series 2021
5.75%, 07/25/2041(g) | | | | | | | 7,240 | | | | 6,549,602 | |
| | | | | | | | | | | | |
| | | |
Total Local Governments - US Municipal Bonds
(cost $12,969,365) | | | | | | | | | | | 13,037,617 | |
| | | | | | | | | | | | |
| | | | | | | | | | | | |
INFLATION-LINKED SECURITIES – 0.4% | | | | | | | | | | | | |
Colombia – 0.4% | | | | | | | | | | | | |
Fideicomiso PA Pacifico Tres
7.00%, 01/15/2035(g)
(cost $16,738,982) | | | | | | | 58,568,586 | | | | 11,812,319 | |
| | | | | | | | | | | | |
| | |
| |
44 | AB HIGH INCOME FUND | | abfunds.com |
PORTFOLIO OF INVESTMENTS (continued)
| | | | | | | | | | | | |
| | | | | | Principal
Amount
(000) | | | U.S. $ Value | |
| |
GOVERNMENTS - SOVEREIGN BONDS – 0.3% | | | | | | | | | | | | |
Colombia – 0.0% | | | | | | | | | | | | |
Colombia Government International Bond
8.00%, 11/14/2035 | | | U.S.$ | | | | 1,923 | | | $ | 1,946,076 | |
| | | | | | | | | | | | |
| | | |
Panama – 0.1% | | | | | | | | | | | | |
Panama Government International Bond
7.50%, 03/01/2031 | | | | | | | 1,416 | | | | 1,486,800 | |
Panama Notas del Tesoro
3.75%, 04/17/2026 | | | | | | | 1,503 | | | | 1,462,239 | |
| | | | | | | | | | | | |
| | | | | | | | | | | 2,949,039 | |
| | | | | | | | | | | | |
Romania – 0.2% | |
Romanian Government International Bond
5.75%, 03/24/2035(a) | | | | | | | 4,980 | | | | 4,684,686 | |
6.375%, 01/30/2034(a) | | | | | | | 1,114 | | | | 1,111,911 | |
| | | | | | | | | | | | |
| | | | | | | | | | | 5,796,597 | |
| | | | | | | | | | | | |
Trinidad and Tobago – 0.0% | | | | | | | | | | | | |
Trinidad & Tobago Government International Bond
4.50%, 08/04/2026(a) | | | | | | | 558 | | | | 544,608 | |
| | | | | | | | | | | | |
| | | |
Total Governments - Sovereign Bonds
(cost $11,339,788) | | | | | | | | | | | 11,236,320 | |
| | | | | | | | | | | | |
| | | | | | | | | | | | |
COMMERCIAL MORTGAGE-BACKED SECURITIES – 0.3% | | | | | | | | | | | | |
Non-Agency Fixed Rate CMBS – 0.3% | | | | | | | | | | | | |
Commercial Mortgage Trust
Series 2012-CR3, Class F
4.435%, 10/15/2045(a) | | | | | | | 225 | | | | 12,660 | |
GS Mortgage Securities Trust
Series 2011-GC5, Class C
5.15%, 08/10/2044(a) | | | | | | | 7,937 | | | | 6,140,013 | |
Series 2013-GC13, Class D
3.87%, 07/10/2046(a) | | | | | | | 1,500 | | | | 944,554 | |
WFRBS Commercial Mortgage Trust
Series 2011-C4, Class D
4.98%, 06/15/2044(a) | | | | | | | 1,891 | | | | 1,738,597 | |
Series 2014-C20, Class D
3.99%, 05/15/2047(a) | | | | | | | 2,713 | | | | 271,281 | |
| | | | | | | | | | | | |
| | | |
Total Commercial Mortgage-Backed Securities
(cost $13,079,439) | | | | | | | | | | | 9,107,105 | |
| | | | | | | | | | | | |
| | | | | | | | | | | | |
ASSET-BACKED SECURITIES – 0.2% | | | | | | | | | | | | |
Other ABS - Floating Rate – 0.2% | | | | | | | | | | | | |
Pagaya AI Debt
Series 2024-S1, Class ABC
7.24%, 09/15/2031(a)(c) | | | | | | | 7,109 | | | | 7,224,290 | |
| | |
| |
| abfunds.com | | AB HIGH INCOME FUND | 45 |
PORTFOLIO OF INVESTMENTS (continued)
| | | | | | | | | | | | |
| Company | | | | | Principal
Amount
(000) | | | U.S. $ Value | |
| |
Pagaya AI Debt Trust
Series 2022-6, Class A4
24.50%, 05/15/2030(a)(c) | | | U.S.$ | | | | 169 | | | $ | 175,762 | |
| | | | | | | | | | | | |
| | | | | | | | | | | 7,400,052 | |
| | | | | | | | | | | | |
Other ABS - Fixed Rate – 0.0% | | | | | | | | | | | | |
Consumer Loan Underlying Bond Certificate Issuer Trust I
Series 2019-24, Class PT Zero Coupon,
08/15/2044(g) | | | | | | | 3 | | | | 1,876 | |
Series 2019-36, Class PT
4.86%, 10/17/2044(g) | | | | | | | 10 | | | | 10,083 | |
| | | | | | | | | | | | |
| | | | | | | | | | | 11,959 | |
| | | | | | | | | | | | |
Total Asset-Backed Securities
(cost $7,291,923) | | | | | | | | | | | 7,412,011 | |
| | | | | | | | | | | | |
| | | |
| | | | | | Shares | | | | |
PREFERRED STOCKS – 0.2% | | | | | | | | | | | | |
Industrials – 0.2% | | | | | | | | | | | | |
Trading Companies & Distributors – 0.2% | | | | | | | | | | | | |
WESCO International, Inc.
Series A
10.625%
(cost $5,716,711) | | | | | | | 211,900 | | | | 5,509,400 | |
| | | | | | | | | | | | |
| | | | | | | | | | | | |
COMMON STOCKS – 0.2% | | | | | | | | | | | | |
Financial Institutions – 0.1% | | | | | | | | | | | | |
Other Finance – 0.1% | | | | | | | | | | | | |
Curo Group Holdings LLC(c)(e)(f) | | | | | | | 610,655 | | | | 2,848,550 | |
| | | | | | | | | | | | |
| | | |
Industrials – 0.1% | | | | | | | | | | | | |
Electrical Equipment – 0.1% | | | | | | | | | | | | |
Exide Technologies(c)(e)(f) | | | | | | | 4,045 | | | | 1,164,960 | |
| | | | | | | | | | | | |
| | | |
Consumer Discretionary – 0.0% | | | | | | | | | | | | |
Broadline Retail – 0.0% | | | | | | | | | | | | |
ATD New Holdings, Inc.(c)(f) | | | | | | | 161,762 | | | | 113,234 | |
K201640219 South Africa Ltd. – Class A(c)(e)(f) | | | | | | | 64,873,855 | | | | 65 | |
K201640219 South Africa Ltd. – Class B(c)(e)(f) | | | | | | | 10,275,684 | | | | 10 | |
| | | | | | | | | | | | |
| | | | | | | | | | | 113,309 | |
| | | | | | | | | | | | |
Diversified Consumer Services – 0.0% | | | | | | | | | | | | |
AG Tracker(c)(e)(f) | | | | | | | 297,893 | | | | – 0 | – |
Paysafe Ltd.(f) | | | | | | | 46,899 | | | | 996,135 | |
| | | | | | | | | | | | |
| | | | | | | | | | | 996,135 | |
| | | | | | | | | | | | |
Leisure Products – 0.0% | | | | | | | | | | | | |
New Cotai LLC/New Cotai Capital Corp.(c)(e)(f) | | | | | | | 14 | | | | – 0 | – |
| | | | | | | | | | | | |
| | | | | | | | | | | 1,109,444 | |
| | | | | | | | | | | | |
| | |
| |
46 | AB HIGH INCOME FUND | | abfunds.com |
PORTFOLIO OF INVESTMENTS (continued)
| | | | | | | | | | | | |
| Company | | | | |
Shares | | | U.S. $ Value | |
| |
Consumer Staples – 0.0% | | | | | | | | | | | | |
Household Products – 0.0% | | | | | | | | | | | | |
Southeastern Grocers, Inc.(c)(e)(f) | | | | | | | 508,189 | | | $ | 190,571 | |
| | | | | | | | | | | | |
| | | |
Energy – 0.0% | | | | | | | | | | | | |
Energy Equipment & Services – 0.0% | | | | | | | | | | | | |
BIS Industries Holdings Ltd.(c)(e)(f) | | | | | | | 5,004,988 | | | | 5 | |
CHC Group LLC(c)(e)(f) | | | | | | | 104,383 | | | | 21 | |
| | | | | | | | | | | | |
| | | | | | | | | | | 26 | |
| | | | | | | | | | | | |
Oil, Gas & Consumable Fuels – 0.0% | | | | | | | | | | | | |
Battalion Oil Corp.(f) | | | | | | | 135 | | | | 904 | |
SandRidge Energy, Inc. | | | | | | | 1,446 | | | | 16,036 | |
| | | | | | | | | | | | |
| | | | | | | | | | | 16,940 | |
| | | | | | | | | | | | |
| | | | | | | | | | | 16,966 | |
| | | | | | | | | | | | |
Total Common Stocks
(cost $69,748,750) | | | | | | | | | | | 5,330,491 | |
| | | | | | | | | | | | |
| | | | | | | | | | | | |
RIGHTS – 0.0% | | | | | | | | | | | | |
Vistra Energy Corp., expiring 12/31/2049(c)(f)
(cost $0) | | | | | | | 45,881 | | | | 56,204 | |
| | | | | | | | | | | | |
| | | | | | | | | | | | |
SHORT-TERM INVESTMENTS – 3.3% | | | | | | | | | | | | |
Investment Companies – 2.5% | | | | | | | | | | | | |
AB Fixed Income Shares, Inc. – Government Money Market Portfolio – Class AB, 4.72%(t)(u)(v)
(cost $82,120,850) | | | | | | | 82,120,850 | | | | 82,120,850 | |
| | | | | | | | | | | | |
| | | |
| | | | | | Principal
Amount
(000) | | | | |
Time Deposits – 0.8% | |
BBH, New York
2.60%, 11/01/2024 | | | CAD | | | | 3,865 | | | | 2,775,587 | |
3.24%, 11/01/2024 | | | NOK | | | | 6,237 | | | | 566,950 | |
6.19%, 11/01/2024 | | | ZAR | | | | 116 | | | | 6,559 | |
Citibank, London
2.09%, 11/01/2024 | | | EUR | | | | 980 | | | | 1,065,456 | |
JPMorgan Chase, New York
4.18%, 11/01/2024 | | | U.S.$ | | | | 20,158 | | | | 20,158,127 | |
| | |
| |
| abfunds.com | | AB HIGH INCOME FUND | 47 |
PORTFOLIO OF INVESTMENTS (continued)
| | | | | | | | | | | | |
| | | | | | Principal
Amount
(000) | | | U.S. $ Value | |
| |
Royal Bank of Canada, London
3.92%, 11/01/2024 | | | GBP | | | | 23 | | | $ | 29,231 | |
| | | | | | | | | | | | |
| | | |
Total Time Deposits
(cost $24,601,910) | | | | | | | | | | | 24,601,910 | |
| | | | | | | | | | | | |
| | | |
Total Short-Term Investments
(cost $106,722,760) | | | | | | | | | | | 106,722,760 | |
| | | | | | | | | | | | |
| | | |
Total Investments – 100.6%
(cost $3,419,683,572) | | | | | | | | | | | 3,233,808,972 | |
Other assets less liabilities – (0.6)% | | | | | | | | | | | (19,179,508 | ) |
| | | | | | | | | | | | |
| | | |
Net Assets – 100.0% | | | | | | | | | | $ | 3,214,629,464 | |
| | | | | | | | | | | | |
FUTURES (see Note D)
| | | | | | | | | | | | | | | | |
| Description | | Number of
Contracts | | | Expiration
Month | | | Current
Notional | | | Value and
Unrealized
Appreciation
(Depreciation) | |
Purchased Contracts | |
U.S. T-Note 5 Yr (CBT) Futures | | | 1,984 | | | | December 2024 | | | $ | 212,753,000 | | | $ | (4,493,141 | ) |
U.S. Ultra Bond (CBT) Futures | | | 142 | | | | December 2024 | | | | 17,838,750 | | | | (1,111,953 | ) |
|
Sold Contracts | |
U.S. Long Bond (CBT) Futures | | | 175 | | | | December 2024 | | | | 20,644,532 | | | | 1,116,992 | |
U.S. T-Note 10 Yr (CBT) Futures | | | 1,083 | | | | December 2024 | | | | 119,637,656 | | | | 4,011,039 | |
| | | | | | | | | | | | | | | | |
| | | | | | | | | | | | | | $ | (477,063 | ) |
| | | | | | | | | | | | | | | | |
FORWARD CURRENCY EXCHANGE CONTRACTS (see Note D)
| | | | | | | | | | | | | | | | |
| Counterparty | | Contracts to
Deliver
(000) | | | In Exchange
For
(000) | | | Settlement
Date | | | Unrealized
Appreciation
(Depreciation) | |
Bank of America NA | | GBP | 11,922 | | | USD | 15,786 | | | | 11/08/2024 | | | $ | 414,078 | |
Bank of America NA | | USD | 6,942 | | | GBP | 5,242 | | | | 11/08/2024 | | | | (182,078 | ) |
Bank of America NA | | DOP | 330,629 | | | USD | 5,432 | | | | 01/17/2025 | | | | (8,316 | ) |
Citibank NA | | GBP | 1,631 | | | USD | 2,132 | | | | 11/08/2024 | | | | 29,371 | |
Deutsche Bank AG | | EUR | 3,259 | | | USD | 3,531 | | | | 12/20/2024 | | | | (21,597 | ) |
Morgan Stanley Capital Services LLC | | COP | 52,080,005 | | | USD | 12,408 | | | | 11/08/2024 | | | | 645,385 | |
Morgan Stanley Capital Services LLC | | USD | 11,823 | | | COP | 52,080,005 | | | | 11/08/2024 | | | | (60,337 | ) |
Morgan Stanley Capital Services LLC | | COP | 52,080,005 | | | USD | 11,720 | | | | 01/16/2025 | | | | 66,251 | |
NatWest Markets PLC | | EUR | 126,904 | | | USD | 137,165 | | | | 12/20/2024 | | | | (1,156,425 | ) |
| | | | | | | | | | | | | | | | |
| | | | | | | | | | | | | | $ | (273,668 | ) |
| | | | | | | | | | | | | | | | |
| | |
| |
48 | AB HIGH INCOME FUND | | abfunds.com |
PORTFOLIO OF INVESTMENTS (continued)
CENTRALLY CLEARED CREDIT DEFAULT SWAPS (see Note D)
| | | | | | | | | | | | | | | | | | | | | | | | | | | | |
| Description | | Fixed Rate (Pay) Receive | | | Payment
Frequency | | | Implied
Credit
Spread at
October 31,
2024 | | | Notional
Amount
(000) | | | Market
Value | | | Upfront
Premiums
Paid
(Received) | | | Unrealized
Appreciation
(Depreciation) | |
Buy Contracts | | | | | | | | | | | | | | | | | | | | | | | | | | | | |
Qatar Government International Bond,
9.75%, 06/15/2030, 12/20/2029* | | | 1.00 | % | | | Quarterly | | | | 0.42 | % | | USD | 22,481 | | | $ | (634,389 | ) | | $ | (587,168 | ) | | $ | (47,221 | ) |
Saudi Government International Bond,
4.00%, 04/17/2025, 12/20/2029* | | | 1.00 | | | | Quarterly | | | | 0.62 | | | USD | 16,230 | | | | (303,618 | ) | | | (265,720 | ) | | | (37,898 | ) |
Sale Contracts | | | | | | | | | | | | | | | | | | | | | | | | | | | | |
CDX-NAHY
Series 43, 5 Year Index, 12/20/2029* | | | 5.00 | | | | Quarterly | | | | 3.36 | | | USD | 86,530 | | | | 6,441,081 | | | | 6,048,892 | | | | 392,189 | |
Hertz Corp. (The), 5.000%, 12/01/2029, 06/20/2029* | | | 5.00 | | | | Quarterly | | | | 25.07 | | | USD | 1,300 | | | | (582,725 | ) | | | (173,790 | ) | | | (408,935 | ) |
iTraxx-XOVER Series 42, 5 Year Index, 12/20/2029* | | | 5.00 | | | | Quarterly | | | | 3.14 | | | EUR | 14,870 | | | | 1,392,751 | | | | 1,315,179 | | | | 77,572 | |
| | | | | | | | | | | | | | | | | | | | | | | | | | | | |
| | | | | | | | | | | | | | | | | | $ | 6,313,100 | | | $ | 6,337,393 | | | $ | (24,293 | ) |
| | | | | | | | | | | | | | | | | | | | | | | | | | | | |
REVERSE REPURCHASE AGREEMENTS (see Note D)
| | | | | | | | | | | | | | | | | | | | |
| Broker | | Currency | | | Principal
Amount
(000) | | | Interest
Rate | | | Maturity | | | U.S. $
Value at
October 31,
2024 | |
Barclays Capital, Inc.† | | | USD | | | | 738 | | | | (1.50 | %)* | | | — | | | $ | 736,996 | |
Barclays Capital, Inc.† | | | USD | | | | 501 | | | | 0.25 | | | | — | | | | 501,382 | |
Barclays Capital, Inc.† | | | USD | | | | 294 | | | | 1.75 | | | | — | | | | 295,819 | |
Barclays Capital, Inc.† | | | USD | | | | 1,733 | | | | 3.00 | | | | — | | | | 1,745,012 | |
Barclays Capital, Inc.† | | | USD | | | | 2,985 | | | | 3.50 | | | | — | | | | 3,006,558 | |
Barclays Capital, Inc.† | | | USD | | | | 3,877 | | | | 4.50 | | | | — | | | | 3,895,934 | |
Barclays Capital, Inc.† | | | USD | | | | 2,007 | | | | 4.50 | | | | — | | | | 2,025,583 | |
Clear Street LLC† | | | USD | | | | 220 | | | | (1.50 | )* | | | — | | | | 219,863 | |
Clear Street LLC† | | | USD | | | | 187 | | | | (1.50 | )* | | | — | | | | 187,210 | |
Clear Street LLC† | | | USD | | | | 688 | | | | 1.00 | | | | — | | | | 693,589 | |
Clear Street LLC† | | | USD | | | | 927 | | | | 1.00 | | | | — | | | | 927,366 | |
Clear Street LLC† | | | USD | | | | 2,280 | | | | 1.75 | | | | — | | | | 2,292,011 | |
Clear Street LLC† | | | USD | | | | 2,274 | | | | 4.25 | | | | — | | | | 2,281,717 | |
Clear Street LLC | | | USD | | | | 516 | | | | 4.25 | | | | 11/01/2024 | | | | 517,591 | |
Jefferies LLC† | | | USD | | | | 583 | | | | (3.50 | )* | | | — | | | | 582,831 | |
Jefferies LLC† | | | USD | | | | 6,611 | | | | (2.50 | )* | | | — | | | | 6,607,031 | |
Jefferies LLC† | | | USD | | | | 547 | | | | 3.50 | | | | — | | | | 557,509 | |
| | |
| |
| abfunds.com | | AB HIGH INCOME FUND | 49 |
PORTFOLIO OF INVESTMENTS (continued)
| | | | | | | | | | | | | | | | | | | | |
| Broker | | Currency | | | Principal
Amount
(000) | | | Interest
Rate | | | Maturity | | | U.S. $
Value at
October 31,
2024 | |
Jefferies LLC† | | | USD | | | | 322 | | | | 3.75 | % | | | — | | | $ | 322,516 | |
Jefferies LLC† | | | USD | | | | 581 | | | | 4.35 | | | | — | | | | 586,678 | |
Jefferies LLC† | | | USD | | | | 350 | | | | 4.50 | | | | — | | | | 351,270 | |
Nomura UK† | | | USD | | | | 5,145 | | | | 2.50 | | | | — | | | | 5,145,715 | |
Nomura UK† | | | USD | | | | 626 | | | | 2.50 | | | | — | | | | 625,687 | |
Standard Chartered Bank† | | | USD | | | | 794 | | | | 4.50 | | | | — | | | | 796,978 | |
Standard Chartered Bank† | | | USD | | | | 413 | | | | 4.50 | | | | — | | | | 414,537 | |
| | | | | | | | | | | | | | | | | | | | |
| | | | | | | | | | | | | | | | | | $ | 35,317,383 | |
| | | | | | | | | | | | | | | | | | | | |
| † | The reverse repurchase agreement matures on demand. Interest rate resets daily and the rate shown is the rate in effect on October 31, 2024. |
| * | Interest payment due from counterparty. |
The type of underlying collateral and the remaining maturity of open reverse repurchase agreements on statements of assets and liabilities is as follows:
| | | | | | | | | | | | | | | | | | | | |
| | | Overnight
and
Continuous | | | Up to 30 Days | | | 31-90 Days | | | Greater than
90 Days | | | Total | |
Corporates – Non-Investment Grade | | $ | 23,743,882 | | | $ | – 0 | – | | $ | – 0 | – | | $ | – 0 | – | | $ | 23,743,882 | |
Corporates – Investment Grade | | | 3,665,373 | | | | 517,591 | | | | – 0 | – | | | – 0 | – | | | 4,182,964 | |
Emerging Markets – Corporate Bonds | | | 6,418,491 | | | | – 0 | – | | | – 0 | – | | | – 0 | – | | | 6,418,491 | |
Emerging Markets – Sovereigns | | | 414,537 | | | | – 0 | – | | | – 0 | – | | | – 0 | – | | | 414,537 | |
Quasi-Sovereigns | | | 557,509 | | | | – 0 | – | | | – 0 | – | | | – 0 | – | | | 557,509 | |
| | | | | | | | | | | | | | | | | | | | |
Total | | $ | 34,799,792 | | | $ | 517,591 | | | $ | – 0 | – | | $ | – 0 | – | | $ | 35,317,383 | |
| | | | | | | | | | | | | | | | | | | | |
| (a) | Security is exempt from registration under Rule 144A or Regulation S of the Securities Act of 1933. These securities are considered restricted, but liquid and may be resold in transactions exempt from registration. At October 31, 2024, the aggregate market value of these securities amounted to $2,458,748,244 or 76.49% of net assets. |
| (b) | Pay-In-Kind Payments (PIK). The issuer may pay cash interest and/or interest in additional debt securities. Rates shown are the rates in effect at October 31, 2024. |
| (c) | Security in which significant unobservable inputs (Level 3) were used in determining fair value. |
| (d) | Defaulted matured security. |
| (e) | Fair valued by the Adviser. |
| (f) | Non-income producing security. |
| (g) | Security is exempt from registration under Rule 144A or Regulation S of the Securities Act of 1933. These securities, which represent 0.59% of net assets as of October 31, 2024, are considered illiquid and restricted. Additional information regarding such securities follows: |
| | | | | | | | | | | | | | | | |
144A/Restricted &
Illiquid Securities | | Acquisition
Date | | | Cost | | | Market
Value | | | Percentage of
Net Assets | |
BBFI Liquidating Trust
Zero Coupon, 12/30/2099 | |
| 02/04/2013 -
11/12/2019 |
| | $ | 1,862,799 | | | $ | 629,466 | | | | 0.02 | % |
Consumer Loan Underlying Bond Certificate Issuer Trust I Series 2019-24, Class PT
Zero Coupon, 08/15/2044 | | | 06/27/2019 | | | | 2,651 | | | | 1,876 | | | | 0.00 | % |
| | |
| |
50 | AB HIGH INCOME FUND | | abfunds.com |
PORTFOLIO OF INVESTMENTS (continued)
| | | | | | | | | | | | | | | | |
144A/Restricted &
Illiquid Securities | | Acquisition
Date | | | Cost | | | Market
Value | | | Percentage of
Net Assets | |
Consumer Loan Underlying Bond Certificate Issuer Trust I Series 2019-36, Class PT 4.86%, 10/17/2044 | | | 09/04/2019 | | | $ | 10,436 | | | $ | 10,083 | | | | 0.00 | % |
Digicel Group Holdings Ltd. Zero Coupon, 12/31/2030 | | | 11/14/2023 | | | | 75,240 | | | | 9,623 | | | | 0.00 | % |
Exide Technologies (Exchange Priority)
11.00%, 10/31/2024 | | | 10/29/2020 | | | | – 0 | – | | | – 0 | – | | | 0.00 | % |
Exide Technologies (First Lien) 11.00%, 10/31/2024 | | | 10/29/2020 | | | | – 0 | – | | | – 0 | – | | | 0.00 | % |
Fideicomiso PA Pacifico Tres 7.00%, 01/15/2035 | | | 03/04/2016 | | | | 16,738,982 | | | | 11,812,319 | | | | 0.37 | % |
K2016470219 South Africa Ltd. 3.00%, 12/31/2022 | |
| 01/31/2017 -
06/30/2022 |
| | | 5,622,018 | | | | – 0 | – | | | 0.00 | % |
K2016470260 South Africa Ltd. 25.00%, 12/31/2022 | |
| 01/31/2017 -
06/30/2022 |
| | | 3,941,905 | | | | – 0 | – | | | 0.00 | % |
Magnetation LLC/Mag Finance Corp.
11.00%, 05/15/2023 | |
| 05/15/2013 -
02/19/2015 |
| | | 12,955,187 | | | | – 0 | – | | | 0.00 | % |
Virgolino de Oliveira Finance SA 10.50%, 01/28/2025 | |
| 10/19/2012 -
01/27/2014 |
| | | 8,490,973 | | | | 1,358 | | | | 0.00 | % |
Virgolino de Oliveira Finance SA 10.875%, 01/13/2020 | | | 06/09/2014 | | | | 2,486,550 | | | | 250 | | | | 0.00 | % |
Virgolino de Oliveira Finance SA 11.75%, 02/09/2025 | |
| 07/26/2012 -
02/05/2014 |
| | | 11,304,293 | | | | 1,352 | | | | 0.00 | % |
Wisconsin Public Finance Authority
Series 2021
5.75%, 07/25/2041 | | | 08/03/2021 | | | | 7,240,000 | | | | 6,549,602 | | | | 0.20 | % |
| (h) | Floating Rate Security. Stated interest/floor/ceiling rate was in effect at October 31, 2024. |
| (i) | Coupon rate adjusts periodically based upon a predetermined schedule. Stated interest rate in effect at October 31, 2024. |
| (j) | Position, or a portion thereof, has been segregated to collateralize reverse repurchase agreements. |
| (m) | Securities are perpetual and, thus, do not have a predetermined maturity date. The date shown, if applicable, reflects the next call date. |
| (o) | The stated coupon rate represents the greater of the SOFR or an alternate base rate such as the PRIME or the SOFR/PRIME floor rate plus a spread at October 31, 2024. |
| (p) | This position or a portion of this position represents an unsettled loan purchase. The coupon rate will be determined at the time of settlement and will be based upon the Secured Overnight Financing Rate (“SOFR”) plus a premium which was determined at the time of purchase. |
| (q) | Inverse interest only security. |
| (r) | Position, or a portion thereof, has been segregated to collateralize margin requirements for open futures contracts. |
| (s) | Position, or a portion thereof, has been segregated to collateralize margin requirements for open centrally cleared swaps. |
| (t) | The rate shown represents the 7-day yield as of period end. |
| | |
| |
| abfunds.com | | AB HIGH INCOME FUND | 51 |
PORTFOLIO OF INVESTMENTS (continued)
| (u) | To obtain a copy of the fund’s shareholder report, please go to the Securities and Exchange Commission’s website at www.sec.gov, or call AB at (800) 227-4618. |
| (v) | Affiliated investments. |
Currency Abbreviations:
CAD – Canadian Dollar
COP – Colombian Peso
DOP – Dominican Peso
EUR – Euro
GBP – Great British Pound
NOK – Norwegian Krone
USD – United States Dollar
ZAR – South African Rand
Glossary:
ABS – Asset-Backed Securities
AD – Assessment District
CBT – Chicago Board of Trade
CDX-NAHY – North American High Yield Credit Default Swap Index
CJSC – Closed Joint Stock Company
CLO – Collateralized Loan Obligations
CMBS – Commercial Mortgage-Backed Securities
CME – Chicago Mercantile Exchange
EURIBOR – Euro Interbank Offered Rate
JSC – Joint Stock Company
REIT – Real Estate Investment Trust
SOFR – Secured Overnight Financing Rate
See notes to financial statements.
| | |
| |
52 | AB HIGH INCOME FUND | | abfunds.com |
STATEMENT OF ASSETS & LIABILITIES
October 31, 2024
| | | | |
| Assets | | | | |
Investments in securities, at value | | | | |
Unaffiliated issuers (cost $3,337,562,722) | | $ | 3,151,688,122 | |
Affiliated issuers (cost $82,120,850) | | | 82,120,850 | |
Cash | | | 41,982 | |
Cash collateral due from broker | | | 818 | |
Foreign currencies, at value (cost $2,867,958) | | | 167,658 | |
Unaffiliated interest receivable | | | 50,191,109 | |
Receivable for investment securities sold | | | 10,782,601 | |
Receivable for capital stock sold | | | 2,089,691 | |
Unrealized appreciation on forward currency exchange contracts | | | 1,155,085 | |
Affiliated dividends receivable | | | 183,088 | |
Receivable due from Adviser | | | 7,568 | |
Receivable for variation margin on futures | | | 110 | |
| | | | |
Total assets | | | 3,298,428,682 | |
| | | | |
| Liabilities | | | | |
Payable for reverse repurchase agreements | | | 35,317,383 | |
Payable for investment securities purchased | | | 29,122,480 | |
Payable for capital stock redeemed | | | 8,616,555 | |
Payable for capital gains taxes | | | 2,590,567 | |
Dividends payable | | | 1,679,399 | |
Unrealized depreciation on forward currency exchange contracts | | | 1,428,753 | |
Payable for unsettled reverse repurchase agreements | | | 1,410,605 | |
Advisory fee payable | | | 1,334,074 | |
Cash collateral due to broker | | | 610,000 | |
Payable for variation margin on centrally cleared swaps | | | 311,168 | |
Distribution fee payable | | | 305,266 | |
Transfer Agent fee payable | | | 101,972 | |
Administrative fee payable | | | 49,397 | |
Accrued expenses | | | 921,599 | |
| | | | |
Total liabilities | | | 83,799,218 | |
| | | | |
Net Assets | | $ | 3,214,629,464 | |
| | | | |
| Composition of Net Assets | | | | |
Capital stock, at par | | $ | 458,331 | |
Additional paid-in capital | | | 4,195,929,043 | |
Accumulated loss | | | (981,757,910 | ) |
| | | | |
| | $ | 3,214,629,464 | |
| | | | |
See notes to financial statements.
| | |
| |
| abfunds.com | | AB HIGH INCOME FUND | 53 |
STATEMENT OF ASSETS & LIABILITIES (continued)
Net Asset Value Per Share—27 billion shares of capital stock authorized, $.001 par value
| | | | | | | | | | | | |
| Class | | Net Assets | | | Shares
Outstanding | | | Net Asset
Value | |
| |
| A | | $ | 861,583,804 | | | | 123,039,324 | | | $ | 7.00 | * |
| | | | | | | | | | | | |
| C | | $ | 142,635,101 | | | | 20,128,865 | | | $ | 7.09 | |
| | | | | | | | | | | | |
| Advisor | | $ | 2,034,535,113 | | | | 290,107,834 | | | $ | 7.01 | |
| | | | | | | | | | | | |
| I | | $ | 43,393,045 | | | | 6,181,323 | | | $ | 7.02 | |
| | | | | | | | | | | | |
| Z | | $ | 132,482,401 | | | | 18,873,989 | | | $ | 7.02 | |
| | | | | | | | | | | | |
| * | The maximum offering price per share for Class A shares was $7.31 which reflects a sales charge of 4.25%. |
See notes to financial statements.
| | |
| |
54 | AB HIGH INCOME FUND | | abfunds.com |
STATEMENT OF OPERATIONS
Year Ended October 31, 2024
| | | | | | | | |
| Investment Income | | | | | | | | |
Interest | | $ | 249,237,050 | | | | | |
Dividends | | | | | | | | |
Unaffiliated issuers | | | 3,260,388 | | | | | |
Affiliated issuers | | | 1,537,193 | | | $ | 254,034,631 | |
| | | | | | | | |
| Expenses | | | | | | | | |
Advisory fee (see Note B) | | | 15,359,262 | | | | | |
Distribution fee—Class A | | | 2,132,582 | | | | | |
Distribution fee—Class C | | | 1,551,232 | | | | | |
Distribution fee—Class R | | | 47,380 | | | | | |
Distribution fee—Class K | | | 5,340 | | | | | |
Transfer agency—Class A | | | 675,541 | | | | | |
Transfer agency—Class C | | | 122,996 | | | | | |
Transfer agency—Advisor Class | | | 1,520,192 | | | | | |
Transfer agency—Class R | | | 23,414 | | | | | |
Transfer agency—Class K | | | 4,272 | | | | | |
Transfer agency—Class I | | | 54,111 | | | | | |
Transfer agency—Class Z | | | 28,856 | | | | | |
Printing | | | 371,014 | | | | | |
Custody and accounting | | | 255,673 | | | | | |
Audit and tax | | | 189,948 | | | | | |
Registration fees | | | 171,392 | | | | | |
Administrative | | | 97,866 | | | | | |
Legal | | | 68,246 | | | | | |
Directors’ fees | | | 61,105 | | | | | |
Miscellaneous | | | 135,612 | | | | | |
| | | | | | | | |
Total expenses before interest expense | | | 22,876,034 | | | | | |
Interest expense | | | 1,212,528 | | | | | |
| | | | | | | | |
Total expenses | | | 24,088,562 | | | | | |
Less: expenses waived and reimbursed by the Adviser (see Note B) | | | (47,987 | ) | | | | |
| | | | | | | | |
Net expenses | | | | | | | 24,040,575 | |
| | | | | | | | |
Net investment income | | | | | | | 229,994,056 | |
| | | | | | | | |
See notes to financial statements.
| | |
| |
| abfunds.com | | AB HIGH INCOME FUND | 55 |
STATEMENT OF OPERATIONS (continued)
| | | | | | | | |
| Realized and Unrealized Gain (Loss) on Investment and Foreign Currency Transactions | | | | | | | | |
Net realized gain (loss) on: | | | | | | | | |
Investment transactions(a) | | | | | | $ | (65,504,223 | ) |
Forward currency exchange contracts | | | | | | | (1,654,676 | ) |
Futures | | | | | | | (264,611 | ) |
Written options | | | | | | | 326,561 | |
Swaps | | | | | | | 16,913,633 | |
Foreign currency transactions | | | | | | | (4,262,570 | ) |
Net change in unrealized appreciation (depreciation) on: | | | | | | | | |
Investments(b) | | | | | | | 297,623,617 | |
Forward currency exchange contracts | | | | | | | (1,013,371 | ) |
Futures | | | | | | | 7,424,014 | |
Written options | | | | | | | (167,936 | ) |
Swaps | | | | | | | 1,240,919 | |
Foreign currency denominated assets and liabilities | | | | | | | 642,857 | |
| | | | | | | | |
Net gain on investment and foreign currency transactions | | | | | | | 251,304,214 | |
| | | | | | | | |
Net Increase in Net Assets from Operations | | | | | | $ | 481,298,270 | |
| | | | | | | | |
| (a) | Net of foreign realized capital gains taxes of $681,693. |
| (b) | Net of increase in accrued foreign capital gains taxes on unrealized gains of $47,787. |
See notes to financial statements.
| | |
| |
56 | AB HIGH INCOME FUND | | abfunds.com |
STATEMENT OF CHANGES IN NET ASSETS
| | | | | | | | |
| | | Year Ended
October 31,
2024 | | | Year Ended
October 31,
2023 | |
| Increase (Decrease) in Net Assets from Operations | | | | | | | | |
Net investment income | | $ | 229,994,056 | | | $ | 220,219,275 | |
Net realized loss on investment and foreign currency transactions | | | (54,445,886 | ) | | | (196,666,382 | ) |
Net change in unrealized appreciation on investments and foreign currency denominated assets and liabilities | | | 305,750,100 | | | | 221,149,206 | |
Contributions from Affiliates (see Note B) | | | – 0 | – | | | 43,795 | |
| | | | | | | | |
Net increase in net assets from operations | | | 481,298,270 | | | | 244,745,894 | |
| Distributions to Shareholders | | | | | | | | |
Class A | | | (61,961,552 | ) | | | (60,992,538 | ) |
Class C | | | (9,975,261 | ) | | | (11,910,730 | ) |
Advisor Class | | | (144,132,663 | ) | | | (135,100,836 | ) |
Class R | | | (656,131 | ) | | | (1,299,539 | ) |
Class K | | | (154,886 | ) | | | (377,633 | ) |
Class I | | | (4,800,800 | ) | | | (5,067,240 | ) |
Class Z | | | (9,831,637 | ) | | | (9,512,312 | ) |
| Return of Capital | | | | | | | | |
Class A | | | – 0 | – | | | (4,232,866 | ) |
Class C | | | – 0 | – | | | (826,602 | ) |
Advisor Class | | | – 0 | – | | | (9,375,963 | ) |
Class R | | | – 0 | – | | | (90,188 | ) |
Class K | | | – 0 | – | | | (26,208 | ) |
Class I | | | – 0 | – | | | (351,665 | ) |
Class Z | | | – 0 | – | | | (660,152 | ) |
| Capital Stock Transactions | | | | | | | | |
Net increase (decrease) | | | 108,453,772 | | | | (205,504,306 | ) |
| | | | | | | | |
Total increase (decrease) | | | 358,239,112 | | | | (200,582,884 | ) |
| Net Assets | | | | | | | | |
Beginning of period | | | 2,856,390,352 | | | | 3,056,973,236 | |
| | | | | | | | |
End of period | | $ | 3,214,629,464 | | | $ | 2,856,390,352 | |
| | | | | | | | |
See notes to financial statements.
| | |
| |
| abfunds.com | | AB HIGH INCOME FUND | 57 |
NOTES TO FINANCIAL STATEMENTS
October 31, 2024
NOTE A
Significant Accounting Policies
AB High Income Fund, Inc. (the “Fund”) is organized as a Maryland corporation and is registered under the Investment Company Act of 1940 (the “1940 Act”) as a diversified, open-end management investment company. The Fund offers Class A, Class C, Advisor Class, Class I and Class Z shares. Class B, Class R, Class K and Class T shares have been authorized but currently are not offered. Effective May 20, 2024 Class R and Class K were liquidated. Class A shares are sold with a front-end sales charge of up to 4.25% for purchases not exceeding $1,000,000. With respect to purchases of $1,000,000 or more, Class A shares redeemed within one year of purchase may be subject to a contingent deferred sales charge of 1%. Class C shares are subject to a contingent deferred sales charge of 1% on redemptions made within the first year after purchase, and 0% after the first year of purchase. Class C shares automatically convert to Class A shares eight years after the end of the calendar month of purchase. Advisor Class, Class I and Class Z shares are sold without an initial or contingent deferred sales charge and are not subject to ongoing distribution expenses. All nine classes of shares have identical voting, dividend, liquidation and other rights, except that the classes bear different distribution and transfer agency expenses. Each class has exclusive voting rights with respect to its distribution plan. The financial statements have been prepared in conformity with U.S. generally accepted accounting principles (“U.S. GAAP”), which require management to make certain estimates and assumptions that affect the reported amounts of assets and liabilities in the financial statements and amounts of income and expenses during the reporting period. Actual results could differ from those estimates. The Fund is an investment company under U.S. GAAP and follows the accounting and reporting guidance applicable to investment companies. The following is a summary of significant accounting policies followed by the Fund.
1. Security Valuation
Portfolio securities are valued at market value determined on the basis of market quotations or, if market quotations are not readily available or are unreliable, at “fair value” as determined in accordance with procedures approved by and under the oversight of the Fund’s Board of Directors (the “Board”). Pursuant to these procedures, AllianceBernstein L.P. (the “Adviser”) serves as the Fund’s valuation designee pursuant to Rule 2a-5 of the 1940 Act. In this capacity, the Adviser is responsible, among other things, for making all fair value determinations relating to the Fund’s portfolio investments, subject to the Board’s oversight.
In general, the market values of securities which are readily available and deemed reliable are determined as follows: securities listed on a national
| | |
| |
58 | AB HIGH INCOME FUND | | abfunds.com |
NOTES TO FINANCIAL STATEMENTS (continued)
securities exchange (other than securities listed on the NASDAQ Stock Market, Inc. (“NASDAQ”)) or on a foreign securities exchange are valued at the last sale price at the close of the exchange or foreign securities exchange. If there has been no sale on such day, the securities are valued at the last traded price from the previous day. Securities listed on more than one exchange are valued by reference to the principal exchange on which the securities are traded; securities listed only on NASDAQ are valued in accordance with the NASDAQ Official Closing Price; listed or over the counter (“OTC”) market put or call options are valued at the mid level between the current bid and ask prices. If either a current bid or current ask price is unavailable, the Adviser will have discretion to determine the best valuation (e.g., last trade price in the case of listed options); open futures are valued using the closing settlement price or, in the absence of such a price, the most recent quoted bid price. If there are no quotations available for the day of valuation, the last available closing settlement price is used; U.S. Government securities and any other debt instruments having 60 days or less remaining until maturity are generally valued at market by an independent pricing vendor, if a market price is available. If a market price is not available, the securities are valued at amortized cost. This methodology is commonly used for short term securities that have an original maturity of 60 days or less, as well as short term securities that had an original term to maturity that exceeded 60 days. In instances when amortized cost is utilized, the Valuation Committee (the “Committee”) must reasonably conclude that the utilization of amortized cost is approximately the same as the fair value of the security. Factors the Committee will consider include, but are not limited to, an impairment of the creditworthiness of the issuer or material changes in interest rates. Fixed-income securities, including mortgage-backed and asset-backed securities, may be valued on the basis of prices provided by a pricing service or at a price obtained from one or more of the major broker-dealers. In cases where broker-dealer quotes are obtained, the Adviser may establish procedures whereby changes in market yields or spreads are used to adjust, on a daily basis, a recently obtained quoted price on a security. Swaps and other derivatives are valued daily, primarily using independent pricing services, independent pricing models using market inputs, as well as third party broker-dealers or counterparties. Open-end mutual funds are valued at the closing net asset value per share, while exchange traded funds are valued at the closing market price per share.
Securities for which market quotations are not readily available (including restricted securities) or are deemed unreliable are valued at fair value as deemed appropriate by the Adviser. Factors considered in making this determination may include, but are not limited to, information obtained by contacting the issuer, analysts, analysis of the issuer’s financial statements
| | |
| |
| abfunds.com | | AB HIGH INCOME FUND | 59 |
NOTES TO FINANCIAL STATEMENTS (continued)
or other available documents. In addition, the Fund may use fair value pricing for securities primarily traded in non-U.S. markets because most foreign markets close well before the Fund values its securities at 4:00 p.m., Eastern Time. The earlier close of these foreign markets gives rise to the possibility that significant events, including broad market moves, may have occurred in the interim and may materially affect the value of those securities. To account for this, the Fund generally values many of its foreign equity securities using fair value prices based on third party vendor modeling tools to the extent available.
2. Fair Value Measurements
In accordance with U.S. GAAP regarding fair value measurements, fair value is defined as the price that the Fund would receive to sell an asset or pay to transfer a liability in an orderly transaction between market participants at the measurement date. U.S. GAAP establishes a framework for measuring fair value, and a three-level hierarchy for fair value measurements based upon the transparency of inputs to the valuation of an asset or liability (including those valued based on their market values as described in Note A.1 above). Inputs may be observable or unobservable and refer broadly to the assumptions that market participants would use in pricing the asset or liability. Observable inputs reflect the assumptions market participants would use in pricing the asset or liability based on market data obtained from sources independent of the Fund. Unobservable inputs reflect the Fund’s own assumptions about the assumptions that market participants would use in pricing the asset or liability based on the best information available in the circumstances. Each investment is assigned a level based upon the observability of the inputs which are significant to the overall valuation. The three-tier hierarchy of inputs is summarized below.
| | • | | Level 1—quoted prices in active markets for identical investments |
| | • | | Level 2—other significant observable inputs (including quoted prices for similar investments, interest rates, prepayment speeds, credit risk, etc.) |
| | • | | Level 3—significant unobservable inputs (including the Fund’s own assumptions in determining the fair value of investments) |
The fair value of debt instruments, such as bonds, and over-the-counter derivatives is generally based on market price quotations, recently executed market transactions (where observable) or industry recognized modeling techniques and are generally classified as Level 2. Pricing vendor inputs to Level 2 valuations may include quoted prices for similar investments in active markets, interest rate curves, coupon rates, currency rates, yield curves, option adjusted spreads, default rates, credit spreads and other unique security features in order to estimate the relevant cash flows
| | |
| |
60 | AB HIGH INCOME FUND | | abfunds.com |
NOTES TO FINANCIAL STATEMENTS (continued)
which are then discounted to calculate fair values. If these inputs are unobservable and significant to the fair value, these investments will be classified as Level 3.
Where readily available market prices or relevant bid prices are not available for certain equity investments, such investments may be valued based on similar publicly traded investments, movements in relevant indices since last available prices or based upon underlying company fundamentals and comparable company data (such as multiples to earnings or other multiples to equity). Where an investment is valued using an observable input, such as another publicly traded security, the investment will be classified as Level 2. If management determines that an adjustment is appropriate based on restrictions on resale, illiquidity or uncertainty, and such adjustment is a significant component of the valuation, the investment will be classified as Level 3. An investment will also be classified as Level 3 where management uses company fundamentals and other significant inputs to determine the valuation.
Valuations of mortgage-backed or other asset-backed securities, by pricing vendors, are based on both proprietary and industry recognized models and discounted cash flow techniques. Significant inputs to the valuation of these instruments are value of the collateral, the rates and timing of delinquencies, the rates and timing of prepayments, and default and loss expectations, which are driven in part by housing prices for residential mortgages. Significant inputs are determined based on relative value analyses, which incorporate comparisons to instruments with similar collateral and risk profiles, including relevant indices. Mortgage and asset-backed securities for which management has collected current observable data through pricing services are generally categorized within Level 2. Those investments for which current observable data has not been provided are classified as Level 3.
Bank loan prices are provided by third party pricing services and consist of a composite of the quotes received by the vendor into a consensus price. Certain bank loans are classified as Level 3, as a significant input used in the fair value measurement of these instruments is the market quotes that are received by the vendor and these inputs are not observable.
Other fixed income investments, including non-U.S. government and corporate debt, are generally valued using quoted market prices, if available, which are typically impacted by current interest rates, maturity dates and any perceived credit risk of the issuer. Additionally, in the absence of quoted market prices, these inputs are used by pricing vendors to derive a valuation based upon industry or proprietary models which incorporate issuer specific data with relevant yield/spread comparisons with more
| | |
| |
| abfunds.com | | AB HIGH INCOME FUND | 61 |
NOTES TO FINANCIAL STATEMENTS (continued)
widely quoted bonds with similar key characteristics. Those investments for which there are observable inputs are classified as Level 2. Where the inputs are not observable, the investments are classified as Level 3.
The following table summarizes the valuation of the Fund’s investments by the above fair value hierarchy levels as of October 31, 2024:
| | | | | | | | | | | | | | | | |
Investments in
Securities | | Level 1 | | | Level 2 | | | Level 3 | | | Total | |
Assets: | | | | | | | | | | | | | | | | |
Corporates – Non-Investment Grade | | $ | – 0 | – | | $ | 2,017,169,234 | | | $ | 8,405,970 | # | | $ | 2,025,575,204 | |
Corporates – Investment Grade | | | – 0 | – | | | 443,886,345 | | | | – 0 | – | | | 443,886,345 | |
Emerging Markets – Corporate Bonds | | | – 0 | – | | | 202,035,307 | | | | 642,049 | # | | | 202,677,356 | |
Bank Loans | | | – 0 | – | | | 105,814,491 | | | | 5,567,749 | | | | 111,382,240 | |
Collateralized Mortgage Obligations | | | – 0 | – | | | 96,507,029 | | | | – 0 | – | | | 96,507,029 | |
Emerging Markets – Sovereigns | | | – 0 | – | | | 87,379,434 | | | | – 0 | – | | | 87,379,434 | |
Quasi-Sovereigns | | | – 0 | – | | | 39,116,868 | | | | – 0 | – | | | 39,116,868 | |
Governments – Treasuries | | | – 0 | – | | | 31,977,412 | | | | – 0 | – | | | 31,977,412 | |
Collateralized Loan Obligations | | | – 0 | – | | | 25,082,857 | | | | – 0 | – | | | 25,082,857 | |
Local Governments – US Municipal Bonds | | | – 0 | – | | | 13,037,617 | | | | – 0 | – | | | 13,037,617 | |
Inflation-Linked Securities | | | – 0 | – | | | 11,812,319 | | | | – 0 | – | | | 11,812,319 | |
Governments – Sovereign Bonds | | | – 0 | – | | | 11,236,320 | | | | – 0 | – | | | 11,236,320 | |
Commercial Mortgage-Backed Securities | | | – 0 | – | | | 9,107,105 | | | | – 0 | – | | | 9,107,105 | |
Asset-Backed Securities | | | – 0 | – | | | 11,959 | | | | 7,400,052 | | | | 7,412,011 | |
Preferred Stocks | | | 5,509,400 | | | | – 0 | – | | | – 0 | – | | | 5,509,400 | |
Common Stocks | | | 1,013,075 | | | | – 0 | – | | | 4,317,416 | # | | | 5,330,491 | |
Rights | | | – 0 | – | | | – 0 | – | | | 56,204 | | | | 56,204 | |
Short-Term Investments: | | | | | | | | | | | | | | | | |
Investment Companies | | | 82,120,850 | | | | – 0 | – | | | – 0 | – | | | 82,120,850 | |
Time Deposits | | | 24,601,910 | | | | – 0 | – | | | – 0 | – | | | 24,601,910 | |
| | | | | | | | | | | | | | | | |
Total Investments in Securities | | | 113,245,235 | | | | 3,094,174,297 | | | | 26,389,440 | | | | 3,233,808,972 | |
Other Financial Instruments*: | | | | | | | | | | | | | | | | |
Assets | | | | | | | | | | | | | | | | |
Futures | | | 5,128,031 | | | | – 0 | – | | | – 0 | – | | | 5,128,031 | † |
Forward Currency Exchange Contracts | | | – 0 | – | | | 1,155,085 | | | | – 0 | – | | | 1,155,085 | |
Centrally Cleared Credit Default Swaps | | | – 0 | – | | | 7,833,832 | | | | – 0 | – | | | 7,833,832 | † |
| | |
| |
62 | AB HIGH INCOME FUND | | abfunds.com |
NOTES TO FINANCIAL STATEMENTS (continued)
| | | | | | | | | | | | | | | | |
Investments in
Securities | | Level 1 | | | Level 2 | | | Level 3 | | | Total | |
Liabilities | | | | | | | | | | | | | | | | |
Futures | | $ | (5,605,094 | ) | | $ | – 0 | – | | $ | – 0 | – | | $ | (5,605,094 | )† |
Forward Currency Exchange Contracts | | | – 0 | – | | | (1,428,753 | ) | | | – 0 | – | | | (1,428,753 | ) |
Centrally Cleared Credit Default Swaps | | | – 0 | – | | | (1,520,732 | ) | | | – 0 | – | | | (1,520,732 | )† |
| | | | | | | | | | | | | | | | |
Total | | $ | 112,768,172 | | | $ | 3,100,213,729 | | | $ | 26,389,440 | | | $ | 3,239,371,341 | |
| | | | | | | | | | | | | | | | |
| # | The Fund held securities with zero market value at period end. |
| * | Other financial instruments include derivative instruments, such as futures, forwards and swaps. Derivative instruments are valued at the unrealized appreciation (depreciation) on the instrument. Other financial instruments may also include swaps with upfront premiums, written options and written swaptions which are valued at market value. |
| † | Only variation margin receivable (payable) at period end is reported within the statement of assets and liabilities. This amount reflects cumulative unrealized appreciation (depreciation) on futures and centrally cleared swaps as reported in the portfolio of investments. Where applicable, centrally cleared swaps with upfront premiums are presented here at market value. |
3. Currency Translation
Assets and liabilities denominated in foreign currencies and commitments under forward currency exchange contracts are translated into U.S. dollars at the mean of the quoted bid and ask prices of such currencies against the U.S. dollar. Purchases and sales of portfolio securities are translated into U.S. dollars at the rates of exchange prevailing when such securities were acquired or sold. Income and expenses are translated into U.S. dollars at the rates of exchange prevailing when accrued.
Net realized gain or loss on foreign currency transactions represents foreign exchange gains and losses from sales and maturities of foreign fixed income investments, holding of foreign currencies, currency gains or losses realized between the trade and settlement dates on foreign investment transactions, and the difference between the amounts of dividends, interest and foreign withholding taxes recorded on the Fund’s books and the U.S. dollar equivalent amounts actually received or paid. Net unrealized currency gains and losses from valuing foreign currency denominated assets and liabilities at period end exchange rates are reflected as a component of net unrealized appreciation or depreciation of foreign currency denominated assets and liabilities.
4. Taxes
It is the Fund’s policy to meet the requirements of the Internal Revenue Code applicable to regulated investment companies and to distribute all of its investment company taxable income and net realized gains, if any, to shareholders. Therefore, no provisions for federal income or excise taxes are required. The Fund may be subject to taxes imposed by countries in which it invests. Such taxes are generally based on income and/or capital gains earned or repatriated. Taxes are accrued and applied to net investment
| | |
| |
| abfunds.com | | AB HIGH INCOME FUND | 63 |
NOTES TO FINANCIAL STATEMENTS (continued)
income, net realized gains and net unrealized appreciation/depreciation as such income and/or gains are earned.
In accordance with U.S. GAAP requirements regarding accounting for uncertainties in income taxes, management has analyzed the Fund’s tax positions taken or expected to be taken on federal and state income tax returns for all open tax years (the current and the prior three tax years) and has concluded that no provision for income tax is required in the Fund’s financial statements.
5. Investment Income and Investment Transactions
Dividend income is recorded on the ex-dividend date or as soon as the Fund is informed of the dividend. Interest income is accrued daily. Investment transactions are accounted for on the date the securities are purchased or sold. Investment gains or losses are determined on the identified cost basis. Non-cash dividends, if any, are recorded on the ex-dividend date at the fair value of the securities received. The Fund amortizes premiums and accretes discounts as adjustments to interest income. The Fund accounts for distributions received from real estate investment trust (“REIT”) investments or from regulated investment companies as dividend income, realized gain, or return of capital based on information provided by the REIT or the investment company.
6. Class Allocations
All income earned and expenses incurred by the Fund are borne on a pro-rata basis by each settled class of shares, based on the proportionate interest in the Fund represented by the net assets of such class, except for class specific expenses which are allocated to the respective class. Realized and unrealized gains and losses are allocated among the various share classes based on respective net assets.
7. Dividends and Distributions
Dividends and distributions to shareholders, if any, are recorded on the ex-dividend date. Income dividends and capital gains distributions are determined in accordance with federal tax regulations and may differ from those determined in accordance with U.S. GAAP. To the extent these differences are permanent, such amounts are reclassified within the capital accounts based on their federal tax basis treatment; temporary differences do not require such reclassification.
8. Cash and Short-Term Investments
Cash and short-term investments include cash on hand and short-term investments with maturities of less than one year when purchased.
| | |
| |
64 | AB HIGH INCOME FUND | | abfunds.com |
NOTES TO FINANCIAL STATEMENTS (continued)
NOTE B
Advisory Fee and Other Transactions with Affiliates
Under the terms of the investment advisory agreement, the Fund pays the Adviser an advisory fee at an annual rate of .50% of the first $2.5 billion, .45% of the next $2.5 billion and .40% in excess of $5 billion, of the Fund’s average daily net assets. The fee is accrued daily and paid monthly.
Pursuant to the investment advisory agreement, the Fund may reimburse the Adviser for certain legal and accounting services provided to the Fund by the Adviser. For the year ended October 31, 2024, the reimbursement for such services amounted to $97,866.
The Fund compensates AllianceBernstein Investor Services, Inc. (“ABIS”), a wholly-owned subsidiary of the Adviser, under a Transfer Agency Agreement for providing personnel and facilities to perform transfer agency services for the Fund. ABIS may make payments to intermediaries that provide omnibus account services, sub-accounting services and/or networking services. Such compensation retained by ABIS amounted to $660,257 for the year ended October 31, 2024.
AllianceBernstein Investments, Inc. (the “Distributor”), a wholly-owned subsidiary of the Adviser, serves as the distributor of the Fund’s shares. The Distributor has advised the Fund that it has retained front-end sales charges of $38,661 from the sale of Class A shares and received $531 and $5,049 in contingent deferred sales charges imposed upon redemptions by shareholders of Class A and Class C shares, respectively, for the year ended October 31, 2024.
The Fund may invest in AB Government Money Market Portfolio (the “Government Money Market Portfolio”) which has a contractual annual advisory fee rate of .20% of the portfolio’s average daily net assets and bears its own expenses. The Adviser had contractually agreed to waive .10% of the advisory fee of Government Money Market Portfolio (resulting in a net advisory fee of .10%) until August 31, 2023. Effective September 1, 2023, the Adviser has contractually agreed to waive .05% of the advisory fee of Government Money Market Portfolio (resulting in a net advisory fee of .15%) until August 31, 2024. In connection with the investment by the Fund in Government Money Market Portfolio, the Adviser has contractually agreed to waive its advisory fee from the Fund in an amount equal to the Fund’s pro rata share of the effective advisory fee of Government Money Market Portfolio, as borne indirectly by the Fund as an acquired fund fee and expense. For the year ended October 31, 2024, such waiver amounted to $47,987.
| | |
| |
| abfunds.com | | AB HIGH INCOME FUND | 65 |
NOTES TO FINANCIAL STATEMENTS (continued)
A summary of the Fund’s transactions in AB mutual funds for the year ended October 31, 2024 is as follows:
| | | | | | | | | | | | | | | | | | | | |
Fund | | Market Value
10/31/23
(000) | | | Purchases
at Cost
(000) | | | Sales
Proceeds
(000) | | | Market Value
10/31/24
(000) | | | Dividend
Income
(000) | |
Government Money Market Portfolio | | $ | 78,576 | | | $ | 803,420 | | | $ | 799,875 | | | $ | 82,121 | | | $ | 1,537 | |
During the year ended October 31, 2023, the Adviser reimbursed the Fund $43,795 for trading losses incurred due to an expense accrual error.
NOTE C
Distribution Services Agreement
The Fund has adopted a Distribution Services Agreement (the “Agreement”) pursuant to Rule 12b-1 under the 1940 Act. Under the Agreement, the Fund pays distribution and servicing fees to the Distributor at an annual rate of up to .30% of the Fund’s average daily net assets attributable to Class A shares, 1% of the Fund’s average daily net assets attributable to Class C shares, .50% of the Fund’s average daily net assets attributable to Class R shares and .25% of the Fund’s average daily net assets attributable to Class K shares. There are no distribution and servicing fees on Advisor Class, Class I and Class Z shares. Payments under the Agreement in respect of Class A shares are currently limited to an annual rate of .25% of Class A shares’ average daily net assets. The fees are accrued daily and paid monthly. The Agreement provides that the Distributor will use such payments in their entirety for distribution assistance and promotional activities. Since the commencement of the Fund’s operations, the Distributor has incurred expenses in excess of the distribution costs reimbursed by the Fund in the amounts of $20,247,159, $1,374,327 and $1,442,209 for Class C, Class R and Class K shares, respectively. While such costs may be recovered from the Fund in future periods so long as the Agreement is in effect, and the share class is active, the rate of the distribution and servicing fees payable under the Agreement may not be increased without a shareholder vote. In accordance with the Agreement, there is no provision for recovery of unreimbursed distribution costs incurred by the Distributor beyond the current fiscal year for Class A shares. The Agreement also provides that the Adviser may use its own resources to finance the distribution of the Fund’s shares.
| | |
| |
66 | AB HIGH INCOME FUND | | abfunds.com |
NOTES TO FINANCIAL STATEMENTS (continued)
NOTE D
Investment Transactions
Purchases and sales of investment securities (excluding short-term investments) for the year ended October 31, 2024, were as follows:
| | | | | | | | |
| | | Purchases | | | Sales | |
Investment securities (excluding
U.S. government securities) | | $ | 1,635,550,172 | | | $ | 1,536,375,098 | |
U.S. government securities | | | – 0 | – | | | 11,604,395 | |
The cost of investments for federal income tax purposes, gross unrealized appreciation and unrealized depreciation are as follows:
| | | | |
Cost | | $ | 3,421,826,818 | |
| | | | |
Gross unrealized appreciation | | $ | 76,149,883 | |
Gross unrealized depreciation | | | (264,111,333 | ) |
| | | | |
Net unrealized depreciation | | $ | (187,961,450 | ) |
| | | | |
1. Derivative Financial Instruments
The Fund may use derivatives in an effort to earn income and enhance returns, to replace more traditional direct investments, to obtain exposure to otherwise inaccessible markets (collectively, “investment purposes”), or to hedge or adjust the risk profile of its portfolio.
The principal types of derivatives utilized by the Fund, as well as the methods in which they may be used are:
| | • | | Forward Currency Exchange Contracts |
The Fund may enter into forward currency exchange contracts in order to hedge its exposure to changes in foreign currency exchange rates on its foreign portfolio holdings, to hedge certain firm purchase and sale commitments denominated in foreign currencies and for non-hedging purposes as a means of making direct investments in foreign currencies, as described below under “Currency Transactions”.
A forward currency exchange contract is a commitment to purchase or sell a foreign currency at a future date at a negotiated forward rate. The gain or loss arising from the difference between the original contract and the closing of such contract would be included in net realized gain or loss on forward currency exchange contracts. Fluctuations in the value of open forward currency exchange contracts are recorded for financial reporting purposes as unrealized appreciation and/or depreciation by the Fund. Risks may arise from the potential inability of a counterparty to meet the terms of a contract and from unanticipated movements in the value of a foreign currency relative to the U.S. dollar.
| | |
| |
| abfunds.com | | AB HIGH INCOME FUND | 67 |
NOTES TO FINANCIAL STATEMENTS (continued)
During the year ended October 31, 2024, the Fund held forward currency exchange contracts for hedging and non-hedging purposes.
The Fund may buy or sell futures for investment purposes or for the purpose of hedging its portfolio against adverse effects of potential movements in the market. The Fund bears the market risk that arises from changes in the value of these instruments and the imperfect correlation between movements in the price of the futures and movements in the price of the assets, reference rates or indices which they are designed to track. Among other things, the Fund may purchase or sell futures for foreign currencies or options thereon for non-hedging purposes as a means of making direct investment in foreign currencies, as described below under “Currency Transactions”.
At the time the Fund enters into futures, the Fund deposits with the broker or segregates at its custodian cash or securities as collateral to satisfy initial margin requirements set by the exchange on which the transaction is effected. Pursuant to the contract, with respect to cash collateral, the Fund agrees to receive from or pay to the broker an amount of cash equal to the daily fluctuation in the value of the contract; in the case of securities collateral, the Fund agrees to adjust the securities position held in the segregated account accordingly. Such receipts, payments or adjustments are known as variation margin and are recorded by the Fund as unrealized gains or losses. Risks may arise from the potential inability of a counterparty to meet the terms of the contract. The credit/counterparty risk for exchange-traded futures is generally less than privately negotiated futures, since the clearinghouse, which is the issuer or counterparty to each exchange-traded future, has robust risk mitigation standards, including the requirement to provide initial and variation margin. When the contract is closed, the Fund records a realized gain or loss equal to the difference between the value of the contract at the time it was opened and the time it was closed.
Use of long futures subjects the Fund to risk of loss in excess of the amounts shown on the statement of assets and liabilities, up to the notional value of the futures. Use of short futures subjects the Fund to unlimited risk of loss. Under some circumstances, futures exchanges may establish daily limits on the amount that the price of futures can vary from the previous day’s settlement price, which could effectively prevent liquidation of unfavorable positions.
During the year ended October 31, 2024, the Fund held futures for hedging and non-hedging purposes.
| | |
| |
68 | AB HIGH INCOME FUND | | abfunds.com |
NOTES TO FINANCIAL STATEMENTS (continued)
For hedging and investment purposes, the Fund may purchase and write (sell) put and call options on U.S. and foreign securities, including government securities, and foreign currencies that are traded on U.S. and foreign securities exchanges and over-the-counter markets. Among other things, the Fund may use options transactions for non-hedging purposes as a means of making direct investments in foreign currencies, as described below under “Currency Transactions” and may use options strategies involving the purchase and/or writing of various combinations of call and/or put options, for hedging and investment purposes.
The risk associated with purchasing an option is that the Fund pays a premium whether or not the option is exercised. Additionally, the Fund bears the risk of loss of the premium and change in market value should the counterparty not perform under the contract. If a put or call purchased option by the Fund were permitted to expire without being sold or exercised, its premium would represent a loss to the Fund. Put and call purchased options are accounted for in the same manner as portfolio securities. The cost of securities acquired through the exercise of call options is increased by premiums paid. The proceeds from securities sold through the exercise of put options are decreased by the premiums paid.
When the Fund writes an option, the premium received by the Fund is recorded as a liability and is subsequently adjusted to the current market value of the written option. The Fund’s maximum payment for written put options equates to the number of shares multiplied by the strike price. In certain circumstances maximum payout amounts may be partially offset by recovery values of the respective referenced assets and upfront premium received upon entering into the contract. Premiums received from written options which expire unexercised are recorded by the Fund on the expiration date as realized gains from written options. The difference between the premium received and the amount paid on effecting a closing purchase transaction, including brokerage commissions, is also treated as a realized gain, or if the premium received is less than the amount paid for the closing purchase transaction, as a realized loss. If a call option is exercised, the premium received is added to the proceeds from the sale of the underlying security or currency in determining whether the Fund has realized a gain or loss. If a put option is exercised, the premium received reduces the cost basis of the security or currency purchased by the Fund. In writing an option, the Fund bears the market risk of an unfavorable change in the price of the security or currency underlying the written option. Exercise of a written option by the Fund could
| | |
| |
| abfunds.com | | AB HIGH INCOME FUND | 69 |
NOTES TO FINANCIAL STATEMENTS (continued)
result in the Fund selling or buying a security or currency at a price different from the current market value.
The Fund may also invest in options on swap agreements, also called “swaptions”. A swaption is an option that gives the buyer the right, but not the obligation, to enter into a swap on a future date in exchange for paying a market-based “premium”. A receiver swaption gives the owner the right to receive the total return of a specified asset, reference rate, or index. A payer swaption gives the owner the right to pay the total return of a specified asset, reference rate, or index. Swaptions also include options that allow an existing swap to be terminated or extended by one of the counterparties. The Fund’s maximum payment for written put swaptions equates to the notional amount of the underlying swap. In certain circumstances maximum payout amounts may be partially offset by recovery values of the respective referenced assets and upfront premium received upon entering into the contract.
During the year ended October 31, 2024, the Fund held purchased options for hedging purposes.
During the year ended October 31, 2024, the Fund held written options for hedging purposes.
The Fund may enter into swaps for investment purposes or to hedge its exposure to interest rates, credit risk or inflation. The Fund may also enter into swaps for non-hedging purposes as a means of gaining market exposures including by making direct investments in foreign currencies, as described below under “Currency Transactions” or in order to take a “long” or “short” position with respect to an underlying referenced asset described below under “Total Return Swaps”. A swap is an agreement that obligates two parties to exchange a series of cash flows at specified intervals based upon or calculated by reference to changes in specified prices, rates or indexes for a specified amount of an underlying asset or inflation. The payment flows are usually netted against each other, with the difference being paid by one party to the other. In addition, collateral may be pledged or received by the Fund in accordance with the terms of the respective swaps to provide value and recourse to the Fund or its counterparties in the event of default, bankruptcy or insolvency by one of the parties to the swap.
Risks may arise as a result of the failure of the counterparty to the swap to comply with the terms of the swap. The loss incurred by the failure of a counterparty is generally limited to the net interim payment to be received by the Fund, and/or the termination value at the end of
| | |
| |
70 | AB HIGH INCOME FUND | | abfunds.com |
NOTES TO FINANCIAL STATEMENTS (continued)
the contract. Therefore, the Fund considers the creditworthiness of each counterparty to a swap in evaluating potential counterparty risk. This risk is mitigated by having a netting arrangement between the Fund and the counterparty and by the posting of collateral by the counterparty to the Fund to cover the Fund’s exposure to the counterparty. Additionally, risks may arise from unanticipated movements in interest rates, inflation or in the value of the underlying securities. The Fund accrues for the interim payments on swaps on a daily basis, with the net amount recorded within unrealized appreciation/depreciation of swaps on the statement of assets and liabilities, where applicable. Once the interim payments are settled in cash, the net amount is recorded as realized gain/(loss) on swaps on the statement of operations, in addition to any realized gain/(loss) recorded upon the termination of swaps. Upfront premiums paid or received for swaps are recognized as cost or proceeds on the statement of assets and liabilities and are amortized on a straight line basis over the life of the contract. Amortized upfront premiums are included in net realized gain/(loss) from swaps on the statement of operations. Fluctuations in the value of swaps are recorded as a component of net change in unrealized appreciation/depreciation of swaps on the statement of operations.
Certain standardized swaps, including certain interest rate swaps and credit default swaps, are subject to mandatory central clearing. Cleared swaps are transacted through futures commission merchants (“FCMs”) that are members of central clearinghouses, with the clearinghouse serving as central counterparty, similar to transactions in futures contracts. Centralized clearing will be required for additional categories of swaps on a phased-in basis based on requirements published by the Securities and Exchange Commission and Commodity Futures Trading Commission.
At the time the Fund enters into a centrally cleared swap, the Fund deposits with the broker or segregates at its custodian cash or securities as collateral to satisfy initial margin requirements set by the clearinghouse on which the transaction is effected. Pursuant to the contract, with respect to cash collateral, the Fund agrees to receive from or pay to the broker an amount of cash equal to the daily fluctuation in the value of the contract; in the case of securities collateral, the Fund agrees to adjust the securities position held in the segregated account accordingly. Such receipts, payments or adjustments are known as variation margin and are recorded by the Fund as unrealized gains or losses. Risks may arise from the potential inability of a counterparty to meet the terms of the contract. The credit/counterparty risk for centrally cleared swaps is generally less than non-centrally cleared swaps, since the clearinghouse, which is
| | |
| |
| abfunds.com | | AB HIGH INCOME FUND | 71 |
NOTES TO FINANCIAL STATEMENTS (continued)
the issuer or counterparty to each centrally cleared swap, has robust risk mitigation standards, including the requirement to provide initial and variation margin. When the contract is closed, the Fund records a realized gain or loss equal to the difference between the value of the contract at the time it was opened and the time it was closed.
Credit Default Swaps:
The Fund may enter into credit default swaps, including to manage its exposure to the market or certain sectors of the market, to reduce its risk exposure to defaults by corporate and sovereign issuers held by the Fund, or to create exposure to corporate or sovereign issuers to which it is not otherwise exposed. The Fund may purchase credit protection (“Buy Contract”) or provide credit protection (“Sale Contract”) on the referenced obligation of the credit default swap. During the term of the swap, the Fund receives/(pays) fixed payments from/(to) the respective counterparty, calculated at the agreed upon rate applied to the notional amount. If the Fund is a buyer/(seller) of protection and a credit event occurs, as defined under the terms of the swap, the Fund will either (i) receive from the seller/(pay to the buyer) of protection an amount equal to the notional amount of the swap (the “Maximum Payout Amount”) and deliver/(take delivery of) the referenced obligation or (ii) receive/(pay) a net settlement amount in the form of cash or securities equal to the notional amount of the swap less the recovery value of the referenced obligation. In certain circumstances Maximum Payout Amounts may be partially offset by recovery values of the respective referenced obligations, upfront premium received upon entering into the agreement, or net amounts received from settlement of buy protection credit default swaps entered into by the Fund for the same referenced obligation with the same counterparty.
Credit default swaps may involve greater risks than if the Fund had invested in the referenced obligation directly. Credit default swaps are subject to general market risk, liquidity risk, counterparty risk and credit risk. If the Fund is a buyer of protection and no credit event occurs, it will lose the payments it made to its counterparty. If the Fund is a seller of protection and a credit event occurs, the value of the referenced obligation received by the Fund coupled with the periodic payments previously received may be less than the Maximum Payout Amount it pays to the buyer, resulting in a net loss to the Fund.
Implied credit spreads over U.S. Treasuries of comparable maturity utilized in determining the market value of credit default swaps on issuers as of period end are disclosed in the portfolio of investments. The implied spreads serve as an indicator of the current status of the payment/performance risk and typically reflect the likelihood of default by
| | |
| |
72 | AB HIGH INCOME FUND | | abfunds.com |
NOTES TO FINANCIAL STATEMENTS (continued)
the issuer of the referenced obligation. The implied credit spread of a particular reference obligation also reflects the cost of buying/selling protection and may reflect upfront payments required to be made to enter into the agreement. Widening credit spreads typically represent a deterioration of the referenced obligation’s credit soundness and greater likelihood of default or other credit event occurring as defined under the terms of the agreement. A credit spread identified as “Defaulted” indicates a credit event has occurred for the referenced obligation.
During the year ended October 31, 2024, the Fund held credit default swaps for hedging purposes.
Total Return Swaps:
The Fund may enter into total return swaps in order to take a “long” or “short” position with respect to an underlying referenced asset. The Fund is subject to market price volatility of the underlying referenced asset. A total return swap involves commitments to pay interest in exchange for a market linked return based on a notional amount. To the extent that the total return of the security, group of securities or index underlying the transaction exceeds or falls short of the offsetting interest obligation, the Fund will receive a payment from or make a payment to the counterparty.
During the year ended October 31, 2024, the Fund held total return swaps for hedging purposes.
The Fund typically enters into International Swaps and Derivatives Association, Inc. Master Agreements (“ISDA Master Agreement”) with its OTC derivative contract counterparties in order to, among other things, reduce its credit risk to OTC counterparties. ISDA Master Agreements include provisions for general obligations, representations, collateral and events of default or termination. Under an ISDA Master Agreement, the Fund typically may offset with the OTC counterparty certain derivative financial instruments’ payables and/or receivables with collateral held and/or posted and create one single net payment (close-out netting) in the event of default or termination. In the event of a default by an OTC counterparty, the return of collateral with market value in excess of the Fund’s net liability, held by the defaulting party, may be delayed or denied.
The Fund’s ISDA Master Agreements may contain provisions for early termination of OTC derivative transactions in the event the net assets of the Fund decline below specific levels (“net asset contingent features”). If these levels are triggered, the Fund’s OTC counterparty has the right to terminate such transaction and require the Fund to pay or receive a settlement amount in connection with the terminated transaction. If OTC derivatives were held at period end, please refer to netting arrangements by the OTC counterparty tables below for additional details.
| | |
| |
| abfunds.com | | AB HIGH INCOME FUND | 73 |
NOTES TO FINANCIAL STATEMENTS (continued)
During the year ended October 31, 2024, the Fund had entered into the following derivatives:
| | | | | | | | | | | | |
| | | Asset Derivatives | | | Liability Derivatives | |
Derivative Type | | Statement of
Assets and
Liabilities
Location | | Fair Value | | | Statement of
Assets and
Liabilities
Location | | Fair Value | |
Interest rate contracts | |
Receivable for variation margin on futures | |
$ |
5,128,031 |
* | |
Payable for variation margin on futures | |
$ |
5,605,094 |
* |
| | | | |
Foreign currency contracts | |
Unrealized appreciation on forward currency
exchange contracts | |
|
1,155,085 |
| |
Unrealized depreciation on forward currency
exchange contracts | |
|
1,428,753 |
|
| | | | |
Credit contracts | | Receivable for variation margin on centrally cleared swaps | | | 469,761 | * | | Payable for variation margin on centrally cleared swaps | | | 494,054 | * |
| | | | | | | | | | | | |
Total | | | | $ | 6,752,877 | | | | | $ | 7,527,901 | |
| | | | | | | | | | | | |
| * | Only variation margin receivable (payable) at period end is reported within the statement of assets and liabilities. This amount reflects cumulative unrealized appreciation (depreciation) on futures and centrally cleared swaps as reported in the portfolio of investments. |
| | | | | | | | | | |
Derivative Type | | Location of Gain
or (Loss) on Derivatives Within Statement of Operations | | Realized Gain
or (Loss) on
Derivatives | | | Change in
Unrealized
Appreciation or
(Depreciation) | |
Interest rate
contracts | |
Net realized gain/(loss)
on futures; Net change
in unrealized appreciation (depreciation) on futures | |
$ |
(264,611 |
) | |
$ |
7,424,014 |
|
| | | |
Foreign currency
contracts | |
Net realized gain/(loss) on forward currency exchange contracts; Net change in unrealized appreciation (depreciation) on forward currency exchange contracts | |
|
(1,654,676 |
) | |
|
(1,013,371 |
) |
| | | |
Credit contracts | | Net realized gain/(loss) on swaps; Net change in unrealized appreciation (depreciation) on swaps | | | 16,913,633 | | | | 1,240,919 | |
| | |
| |
74 | AB HIGH INCOME FUND | | abfunds.com |
NOTES TO FINANCIAL STATEMENTS (continued)
| | | | | | | | | | |
Derivative Type | | Location of Gain
or (Loss) on Derivatives Within Statement of Operations | | Realized Gain
or (Loss) on
Derivatives | | | Change in
Unrealized
Appreciation or
(Depreciation) | |
| | | |
Equity contracts | | Net realized gain/(loss) on investment transactions; Net change in unrealized appreciation (depreciation) on investments | | $ | (563,359 | ) | | $ | (434,291 | ) |
| | | |
Equity contracts | | Net realized gain/(loss) on written options; Net change in unrealized appreciation (depreciation) on written options | | | 326,561 | | | | (167,936 | ) |
| | | | | | | | | | |
Total | | | | $ | 14,757,548 | | | $ | 7,049,335 | |
| | | | | | | | | | |
The following table represents the average monthly volume of the Fund’s derivative transactions during the year ended October 31, 2024:
| | | | |
Centrally Cleared Credit Default Swaps: | | | | |
Average notional amount of buy contracts | | $ | 40,398,940 | (a) |
Average notional amount of sale contracts | | $ | 108,932,462 | |
Credit Default Swaps: | | | | |
Average notional amount of sale contracts | | $ | 60,590,042 | (b) |
Forward Currency Exchange Contracts: | | | | |
Average principal amount of buy contracts | | $ | 11,953,404 | |
Average principal amount of sale contracts | | $ | 163,363,785 | |
Futures: | | | | |
Average notional amount of buy contracts | | $ | 255,916,866 | |
Average notional amount of sale contracts | | $ | 143,132,602 | (b) |
Total Return Swaps: | | | | |
Average notional amount | | $ | 28,359,142 | (c) |
Written Options: | | | | |
Average notional amount | | $ | 53,730,000 | (d) |
Purchased Options: | | | | |
Average notional amount | | $ | 56,970,000 | (d) |
| (a) | Positions were open for two months during the reporting period. |
| (b) | Positions were open for nine months during the reporting period. |
| (c) | Positions were open for four months during the reporting period. |
| (d) | Positions were open for less than one month during the reporting period. |
For financial reporting purposes, the Fund does not offset derivative assets and derivative liabilities that are subject to netting arrangements in the statement of assets and liabilities.
All OTC derivatives held at period end were subject to netting arrangements. The following table presents the Fund’s derivative assets and liabilities by OTC counterparty net of amounts available for offset under
| | |
| |
| abfunds.com | | AB HIGH INCOME FUND | 75 |
NOTES TO FINANCIAL STATEMENTS (continued)
ISDA Master Agreements (“MA”) and net of the related collateral received/pledged by the Fund as of October 31, 2024. Exchange-traded derivatives and centrally cleared swaps are not subject to netting arrangements and as such are excluded from the tables.
| | | | | | | | | | | | | | | | | | | | |
Counterparty | | Derivative
Assets
Subject to a
MA | | | Derivatives
Available
for Offset | | | Cash
Collateral
Received* | | | Security
Collateral
Received* | | | Net Amount
of Derivative
Assets | |
Bank of America NA | | $ | 414,078 | | | $ | (190,394 | ) | | $ | – 0 | – | | $ | – 0 | – | | $ | 223,684 | |
Citibank NA | | | 29,371 | | | | – 0 | – | | | – 0 | – | | | – 0 | – | | | 29,371 | |
Morgan Stanley Capital Services LLC | | | 711,636 | | | | (60,337 | ) | | | (610,000 | ) | | | – 0 | – | | | 41,299 | |
| | | | | | | | | | | | | | | | | | | | |
Total | | $ | 1,155,085 | | | $ | (250,731 | ) | | $ | (610,000 | ) | | $ | – 0 | – | | $ | 294,354 | ^ |
| | | | | | | | | | | | | | | | | | | | |
| | | | | | | | | | | | | | | | | | | | |
Counterparty | | Derivative
Liabilities
Subject to a
MA | | | Derivatives
Available
for Offset | | | Cash
Collateral
Pledged* | | | Security
Collateral
Pledged* | | | Net Amount
of Derivative
Liabilities | |
Bank of America NA | | $ | 190,394 | | | $ | (190,394 | ) | | $ | – 0 | – | | $ | – 0 | – | | $ | – 0 | – |
Deutsche Bank AG | | | 21,597 | | | | – 0 | – | | | – 0 | – | | | – 0 | – | | | 21,597 | |
Morgan Stanley Capital Services LLC | | | 60,337 | | | | (60,337 | ) | | | – 0 | – | | | – 0 | – | | | – 0 | – |
NatWest Markets PLC | | | 1,156,425 | | | | – 0 | – | | | – 0 | – | | | – 0 | – | | | 1,156,425 | |
| | | | | | | | | | | | | | | | | | | | |
Total | | $ | 1,428,753 | | | $ | (250,731 | ) | | $ | – 0 | – | | $ | – 0 | – | | $ | 1,178,022 | ^ |
| | | | | | | | | | | | | | | | | | | | |
| * | The actual collateral received/pledged may be more than the amount reported due to overcollateralization. |
| ^ | Net amount represents the net receivable (payable) that would be due from/to the counterparty in the event of default or termination. The net amount from OTC financial derivative instruments can only be netted across transactions governed under the same master agreement with the same counterparty. |
| | See Note D.3 for additional disclosure of netting arrangements regarding reverse repurchase agreements. |
2. Currency Transactions
The Fund may invest in non-U.S. Dollar-denominated securities on a currency hedged or unhedged basis. The Fund may seek investment opportunities by taking long or short positions in currencies through the use of currency-related derivatives, including forward currency exchange contracts, futures and options on futures, swaps, and other options. The Fund may enter into transactions for investment opportunities when it anticipates that a foreign currency will appreciate or depreciate in value but securities denominated in that currency are not held by the Fund and do not present attractive investment opportunities. Such transactions may also be used when the Adviser believes that it may be more efficient than a direct
| | |
| |
76 | AB HIGH INCOME FUND | | abfunds.com |
NOTES TO FINANCIAL STATEMENTS (continued)
investment in a foreign currency-denominated security. The Fund may also conduct currency exchange contracts on a spot basis (i.e., for cash at the spot rate prevailing in the currency exchange market for buying or selling currencies).
3. Reverse Repurchase Agreements
The Fund may enter into reverse repurchase transactions (“RVP”) in accordance with the terms of a Master Repurchase Agreement (“MRA”), under which the Fund sells securities and agrees to repurchase them at a mutually agreed upon date and price. At the time the Fund enters into a reverse repurchase agreement, it will establish a segregated account with the custodian containing liquid assets having a value comparable to the repurchase price. Under the MRA and other master agreements, the Fund is permitted to offset payables and/or receivables with collateral held and/or posted to the counterparty and create one single net payment due to or from the Fund in the event of a default. In the event of a default by a MRA counterparty, the Fund may be considered an unsecured creditor with respect to any excess collateral (collateral with a market value in excess of the repurchase price) held by and/or posted to the counterparty, and as such the return of such excess collateral may be delayed or denied. For the year ended October 31, 2024, the carrying value of the payable for the reverse repurchase agreements approximated its fair value. If measured at fair value, borrowings under the reverse repurchase agreements would have been considered as a Level 1 investment. For the year ended October 31, 2024, the average amount of reverse repurchase agreements outstanding was $34,245,055 and the daily weighted average interest rate was 2.46%. At October 31, 2024, the Fund had reverse repurchase agreements outstanding in the amount of $35,317,383 as reported in the statement of assets and liabilities.
The following table presents the Fund’s RVP liabilities by counterparty net of the related collateral pledged by the Fund as of October 31, 2024:
| | | | | | | | | | | | |
Counterparty | | RVP Liabilities
Subject to a MRA | | | Securities
Collateral
Pledged†* | | | Net Amount of
RVP Liabilities | |
Barclays Capital, Inc. | | $ | 12,207,284 | | | $ | (12,207,284 | ) | | $ | – 0 | – |
Clear Street LLC | | | 7,119,347 | | | | (7,119,347 | ) | | | – 0 | – |
Jefferies LLC | | | 9,007,835 | | | | (9,007,835 | ) | | | – 0 | – |
Nomura UK | | | 5,771,402 | | | | (5,552,840 | ) | | | 218,562 | |
Standard Chartered Bank | | | 1,211,515 | | | | (1,211,515 | ) | | | – 0 | – |
| | | | | | | | | | | | |
| | $ | 35,317,383 | | | $ | (35,098,821 | ) | | $ | 218,562 | |
| | | | | | | | | | | | |
| † | Including accrued interest. |
| * | The actual collateral pledged may be more than the amount reported due to overcollateralization. |
| | |
| |
| abfunds.com | | AB HIGH INCOME FUND | 77 |
NOTES TO FINANCIAL STATEMENTS (continued)
NOTE E
Capital Stock
Each class consists of 3,000,000,000 authorized shares. Transactions in capital shares for each class were as follows:
| | | | | | | | | | | | | | | | | | | | | | | | |
| | | | | | | | | | | | | | | | | | | | | | | | |
| | | Shares | | | | | | Amount | | | | |
| | | Year Ended
October 31, 2024 | | | Year Ended
October 31, 2023 | | | | | | Year Ended
October 31, 2024 | | | Year Ended
October 31, 2023 | | | | |
| | | | | | | | |
| Class A | | | | | | | | | | | | | | | | | | | | | | | | |
Shares sold | | | 12,851,520 | | | | 12,458,971 | | | | | | | $ | 88,119,297 | | | $ | 82,394,648 | | | | | |
| | | | | |
Shares issued in reinvestment of dividends | | | 5,315,276 | | | | 5,881,608 | | | | | | | | 36,713,012 | | | | 38,845,296 | | | | | |
| | | | | |
Shares converted from Class C | | | 4,616,939 | | | | 4,394,554 | | | | | | | | 31,701,492 | | | | 28,944,816 | | | | | |
| | | | | |
Shares redeemed | | | (23,209,316 | ) | | | (31,972,273 | ) | | | | | | | (159,531,794 | ) | | | (210,896,689 | ) | | | | |
| | | | | |
Net decrease | | | (425,581 | ) | | | (9,237,140 | ) | | | | | | $ | (2,997,993 | ) | | $ | (60,711,929 | ) | | | | |
| | | | | |
| | | | | | | | | | | | | | | | | | | | | | | | |
| Class C | | | | | | | | | | | | | | | | | | | | | | | | |
Shares sold | | | 2,820,522 | | | | 2,166,738 | | | | | | | $ | 19,655,182 | | | $ | 14,482,876 | | | | | |
| | | | | |
Shares issued in reinvestment of dividends | | | 720,362 | | | | 979,489 | | | | | | | | 5,033,336 | | | | 6,548,705 | | | | | |
| | | | | |
Shares converted to Class A | | | (4,563,313 | ) | | | (4,342,602 | ) | | | | | | | (31,701,492 | ) | | | (28,944,816 | ) | | | | |
| | | | | |
Shares redeemed | | | (3,486,627 | ) | | | (4,849,930 | ) | | | | | | | (24,315,514 | ) | | | (32,400,097 | ) | | | | |
| | | | | |
Net decrease | | | (4,509,056 | ) | | | (6,046,305 | ) | | | | | | $ | (31,328,488 | ) | | $ | (40,313,332 | ) | | | | |
| | | | | |
| | | | | | | | | | | | | | | | | | | | | | | | |
| Advisor Class | | | | | | | | | | | | | | | | | | | | | | | | |
Shares sold | | | 90,110,622 | | | | 98,904,270 | | | | | | | $ | 619,380,920 | | | $ | 656,464,588 | | | | | |
| | | | | |
Shares issued in reinvestment of dividends | | | 11,748,546 | | | | 11,956,423 | | | | | | | | 81,289,328 | | | | 79,079,235 | | | | | |
| | | | | |
Shares redeemed | | | (75,254,373 | ) | | | (119,438,185 | ) | | | | | | | (517,899,733 | ) | | | (787,957,627 | ) | | | | |
| | | | | |
Net increase (decrease) | | | 26,604,795 | | | | (8,577,492 | ) | | | | | | $ | 182,770,515 | | | $ | (52,413,804 | ) | | | | |
| | | | | |
| | | | | | | | | | | | | | | | | | | | | | | | |
| Class R | | | | | | | | | | | | | | | | | | | | | | | | |
Shares sold | | | 346,889 | | | | 460,012 | | | | | | | $ | 2,377,196 | | | $ | 3,044,770 | | | | | |
| | | | | |
Shares issued in reinvestment of dividends | | | 88,590 | | | | 209,620 | | | | | | | | 607,347 | | | | 1,384,983 | | | | | |
| | | | | |
Shares redeemed | | | (3,002,426 | ) | | | (1,244,857 | ) | | | | | | | (20,644,797 | ) | | | (8,230,010 | ) | | | | |
| | | | | |
Net decrease | | | (2,566,947 | ) | | | (575,225 | ) | | | | | | $ | (17,660,254 | ) | | $ | (3,800,257 | ) | | | | |
| | | | | |
| | | | | | | | | | | | | | | | | | | | | | | | |
| Class K | | | | | | | | | | | | | | | | | | | | | | | | |
Shares sold | | | 137,246 | | | | 241,851 | | | | | | | $ | 941,798 | | | $ | 1,600,397 | | | | | |
| | | | | |
Shares issued in reinvestment of dividends | | | 21,224 | | | | 60,908 | | | | | | | | 145,391 | | | | 402,649 | | | | | |
| | | | | |
Shares redeemed | | | (841,642 | ) | | | (518,534 | ) | | | | | | | (5,764,885 | ) | | | (3,443,015 | ) | | | | |
| | | | | |
Net decrease | | | (683,172 | ) | | | (215,775 | ) | | | | | | $ | (4,677,696 | ) | | $ | (1,439,969 | ) | | | | |
| | | | | |
| | |
| |
78 | AB HIGH INCOME FUND | | abfunds.com |
NOTES TO FINANCIAL STATEMENTS (continued)
| | | | | | | | | | | | | | | | | | | | | | | | |
| | | | | | | | | | | | | | | | | | | | | | | | |
| | | Shares | | | | | | Amount | | | | |
| | | Year Ended
October 31, 2024 | | | Year Ended
October 31, 2023 | | | | | | Year Ended
October 31, 2024 | | | Year Ended
October 31, 2023 | | | | |
| | | | | |
| Class I | | | | | | | | | | | | | | | | | | | | | | | | |
Shares sold | | | 2,175,748 | | | | 1,831,650 | | | | | | | $ | 15,054,722 | | | $ | 12,122,854 | | | | | |
| | | | | |
Shares issued in reinvestment of dividends | | | 661,455 | | | | 790,933 | | | | | | | | 4,573,217 | | | | 5,236,818 | | | | | |
| | | | | |
Shares redeemed | | | (6,684,270 | ) | | | (3,093,462 | ) | | | | | | | (46,267,697 | ) | | | (20,457,067 | ) | | | | |
| | | | | |
Net decrease | | | (3,847,067 | ) | | | (470,879 | ) | | | | | | $ | (26,639,758 | ) | | $ | (3,097,395 | ) | | | | |
| | | | | |
| | | | | | | | | | | | | | | | | | | | | | | | |
| Class Z | | | | | | | | | | | | | | | | | | | | | | | | |
Shares sold | | | 12,021,662 | | | | 18,765,251 | | | | | | | $ | 81,975,128 | | | $ | 124,164,250 | | | | | |
| | | | | |
Shares issued in reinvestment of dividends | | | 1,298,394 | | | | 1,425,384 | | | | | | | | 8,990,771 | | | | 9,436,408 | | | | | |
| | | | | |
Shares redeemed | | | (11,889,071 | ) | | | (26,773,451 | ) | | | | | | | (81,978,453 | ) | | | (177,328,278 | ) | | | | |
| | | | | |
Net increase (decrease) | | | 1,430,985 | | | | (6,582,816 | ) | | | | | | $ | 8,987,446 | | | $ | (43,727,620 | ) | | | | |
| | | | | |
NOTE F
Risks Involved in Investing in the Fund
Market Risk—The value of the Fund’s assets will fluctuate as the market or markets in which the Fund invests fluctuate. The value of the Fund’s investments may decline, sometimes rapidly and unpredictably, simply because of economic changes or other events, including public health crises (including the occurrence of a contagious disease or illness) and regional and global conflicts, that affect large portions of the market.
Interest-Rate Risk—Changes in interest rates will affect the value of investments in fixed-income securities. When interest rates rise, the value of existing investments in fixed-income securities tends to fall and this decrease in value may not be offset by higher income from new investments. Interest rate risk is generally greater for fixed-income securities with longer maturities or durations. The Fund may be subject to a greater risk of rising interest rates than would normally be the case due to the recent end of a period of historically low rates and the effects of potential central bank monetary policy, and government fiscal policy, initiatives and market reactions to those initiatives.
Credit Risk—An issuer or guarantor of a fixed-income security, or the counterparty to a derivatives or other contract, may be unable or unwilling to make timely payments of interest or principal, or to otherwise honor its obligations. The issuer or guarantor may default, causing a loss of the full principal amount of a security and accrued interest. The degree of risk for a particular security may be reflected in its credit rating. There is the
| | |
| |
| abfunds.com | | AB HIGH INCOME FUND | 79 |
NOTES TO FINANCIAL STATEMENTS (continued)
possibility that the credit rating of a fixed-income security may be downgraded after purchase, which may adversely affect the value of the security.
Below Investment-Grade Securities Risk—Investments in fixed-income securities with lower ratings (commonly known as “junk bonds”) tend to have a higher probability that an issuer will default or fail to meet its payment obligations. These securities may be subject to greater price volatility due to such factors as specific corporate developments and negative perceptions of the junk bond market generally and may be more difficult to trade than other types of securities.
Duration Risk—Duration is a measure that relates the expected price volatility of a fixed-income security to changes in interest rates. The duration of a fixed-income security may be shorter than or equal to full maturity of a fixed-income security. Fixed-income securities with longer durations have more risk and will decrease in price as interest rates rise.
Inflation Risk—This is the risk that the value of assets or income from investments will be less in the future as inflation decreases the value of money. As inflation increases, the value of the Fund’s assets can decline as can the value of the Fund’s distributions. This risk is significantly greater for fixed-income securities with longer maturities.
Foreign (Non-U.S.) Risk—Investments in securities of non-U.S. issuers may involve more risk than those of U.S. issuers. These securities may fluctuate more widely in price and may be more difficult to trade due to adverse market, economic, political, regulatory or other factors.
Emerging-Market Risk—Investments in emerging market countries may have more risk because the markets are less developed and less liquid and are subject to increased economic, political, regulatory or other uncertainties.
Currency Risk— Fluctuations in currency exchange rates may negatively affect the value of the Fund’s investments or reduce its returns.
Mortgage-Related and/or Other Asset-Backed Securities Risk—Investments in mortgage-related and other asset-backed securities are subject to certain additional risks. The value of these securities may be particularly sensitive to changes in interest rates. These risks include “extension risk”, which is the risk that, in periods of rising interest rates, issuers may delay the payment of principal, and “prepayment risk”, which is the risk that in periods of falling interest rates, issuers may pay principal sooner than expected, exposing the Fund to a lower rate of return upon
| | |
| |
80 | AB HIGH INCOME FUND | | abfunds.com |
NOTES TO FINANCIAL STATEMENTS (continued)
reinvestment of principal. Mortgage-backed securities offered by non-governmental issuers and other asset-backed securities may be subject to other risks, such as higher rates of default in the mortgages or assets backing the securities or risks associated with the nature and servicing of mortgages or assets backing the securities.
Loan Participations and Assignments Risk—When the Fund purchases loan participations and assignments, it is subject to the credit risk associated with the underlying corporate borrower. In addition, the lack of a liquid secondary market for loan participations and assignments may have an adverse impact on the value of such investments and the Fund’s ability to dispose of particular assignments or participations when necessary to meet the Fund’s liquidity needs or in response to a specific economic event such as a deterioration in the creditworthiness of the borrower.
Leverage Risk—When the Fund borrows money or otherwise leverages its investments, its performance may be volatile because leverage tends to exaggerate the effect of any increase or decrease in the value of the Fund’s investments. The Fund may create leverage through the use of reverse repurchase arrangements, forward currency exchange contracts, forward commitments, dollar rolls or futures or by borrowing money. The use of other types of derivative instruments by the Fund, such as options and swaps, may also result in a form of leverage. Leverage may result in higher returns to the Fund than if the Fund were not leveraged, but may also adversely affect returns, particularly if the market is declining.
Derivatives Risk—Derivatives may be difficult to price or unwind and leveraged so that small changes may produce disproportionate losses for the Fund. A short position in a derivative instrument involves the risk of a theoretically unlimited increase in the value of the underlying asset, reference rate or index, which could cause the Fund to suffer a potentially unlimited loss. Derivatives, especially over-the-counter derivatives, are also subject to counterparty risk, which is the risk that the counterparty (the party on the other side of the transaction) on a derivative transaction will be unable or unwilling to honor its contractual obligations to the Fund.
Illiquid Investments Risk—Illiquid investments risk exists when certain investments become difficult to purchase or sell. Difficulty in selling such investments may result in sales at disadvantageous prices affecting the value of your investment in the Fund. Causes of illiquid investments risk may include low trading volumes, large positions and heavy redemptions of Fund shares. Illiquid investments risk may be higher in a rising interest rate environment, when the value and liquidity of fixed-income securities generally decline.
| | |
| |
| abfunds.com | | AB HIGH INCOME FUND | 81 |
NOTES TO FINANCIAL STATEMENTS (continued)
Indemnification Risk—In the ordinary course of business, the Fund enters into contracts that contain a variety of indemnifications. The Fund’s maximum exposure under these arrangements is unknown. However, the Fund has not had prior claims or losses pursuant to these indemnification provisions and expects the risk of loss thereunder to be remote. Therefore, the Fund has not accrued any liability in connection with these indemnification provisions.
Management Risk—The Fund is subject to management risk because it is an actively-managed investment fund. The Adviser will apply its investment techniques and risk analyses in making investment decisions, but there is no guarantee that its techniques will produce the intended results. Some of these techniques may incorporate, or rely upon, quantitative models, but there is no guarantee that these models will generate accurate forecasts, reduce risk or otherwise perform as expected.
NOTE G
Joint Credit Facility
A number of open-end mutual funds managed by the Adviser, including the Fund, participate in a $325 million revolving credit facility (the “Facility”) intended to provide short-term financing related to redemptions and other short term liquidity requirements, subject to certain restrictions. Commitment fees related to the Facility are paid by the participating funds and are included in miscellaneous expenses in the statement of operations. The Fund did not utilize the Facility during the year ended October 31, 2024.
NOTE H
Distributions to Shareholders
The tax character of distributions paid during the fiscal years ended October 31, 2024 and October 31, 2023 were as follows:
| | | | | | | | |
| | | 2024 | | | 2023 | |
Distributions paid from: | | | | | | | | |
Ordinary income | | $ | 231,512,930 | | | $ | 224,260,828 | |
| | | | | | | | |
Total taxable distributions paid | | $ | 231,512,930 | | | $ | 224,260,828 | |
Return of Capital | | | – 0 | – | | | 15,563,644 | |
| | | | | | | | |
Total distributions paid | | $ | 231,512,930 | | | $ | 239,824,472 | |
| | | | | | | | |
As of October 31, 2024, the components of accumulated earnings (deficit) on a tax basis were as follows:
| | | | |
Undistributed ordinary income | | $ | 1,723,150 | |
Accumulated capital and other losses | | | (747,342,497 | )(a) |
Unrealized appreciation (depreciation) | | | (215,907,339 | )(b) |
| | | | |
Total accumulated earnings (deficit) | | $ | (961,526,686 | )(c) |
| | | | |
| (a) | As of October 31, 2024, the Fund had a net capital loss carryforward of $747,342,497. |
| | |
| |
82 | AB HIGH INCOME FUND | | abfunds.com |
NOTES TO FINANCIAL STATEMENTS (continued)
| (b) | The differences between book-basis and tax-basis unrealized appreciation (depreciation) are attributable primarily to the recognition for tax purposes of unrealized gains/losses on certain derivative instruments, the tax treatment of hyperinflationary currency contracts, the tax treatment of callable bonds, the tax treatment of swaps, the tax deferral of losses on wash sales, and the tax treatment of partnership investments. |
| (c) | The differences between book-basis and tax-basis components of accumulated earnings (deficit) are attributable primarily to the accrual of foreign capital gains tax, the tax treatment of defaulted securities, and dividends payable. |
For tax purposes, net realized capital losses may be carried over to offset future capital gains, if any. Funds are permitted to carry forward capital losses for an indefinite period, and such losses will retain their character as either short-term or long-term capital losses. As of October 31, 2024, the Fund had a net short-term capital loss carryforward of $152,771,345 and a net long-term capital loss carryforward of $594,571,152, which may be carried forward for an indefinite period.
During the current fiscal year, permanent differences primarily due to prior year true-up resulted in a net decrease in accumulated loss and a net decrease in additional paid-in capital. These reclassifications had no effect on net assets.
NOTE I
Recent Accounting Pronouncements
In December 2022, the Financial Accounting Standards Board issued an Accounting Standards Update, ASU 2022-06, “Reference Rate Reform (Topic 848) – Deferral of the Sunset Date of Topic 848”. ASU 2022-06 is an amendment to ASU 2020-04, which provided optional guidance to ease the potential accounting burden due to the discontinuation of the LIBOR and other interbank-offered based reference rates and which was effective as of March 12, 2020 through December 31, 2022. ASU 2022-06 extends the effective period through December 31, 2024. Management is currently evaluating the impact, if any, of applying ASU 2022-06.
In November 2023, the Financial Accounting Standards Board issued Accounting Standards Update, ASU 2023-07, “Segment Reporting (Topic 280)”. ASU 2023-07 requires public entities to provide disclosure of significant segment expenses that are regularly provided to the chief operating decision maker (“CODM”). ASU 2023-07, among other things, (i) requires a single segment public entity to provide all necessary disclosures required by Topic 280 it, (ii) requires a public entity to disclose the title and position of the CODM and an explanation of how the CODM uses the reported measure(s) of segment profit and loss in assessing segment performance and deciding how to allocate resources and (iii) provides the ability for a public entity to elect more than one performance measure. ASU 2023-07 is effective for fiscal years beginning after December 15, 2023, and interim periods within fiscal years beginning after December 15,
| | |
| |
| abfunds.com | | AB HIGH INCOME FUND | 83 |
NOTES TO FINANCIAL STATEMENTS (continued)
2024. Early adoption of ASU 2023-07 is permitted. Management is currently evaluating the impact, if any, of applying ASU 2023-07.
NOTE J
Subsequent Events
Management has evaluated subsequent events for possible recognition or disclosure in the financial statements through the date the financial statements are issued. Management has determined that there are no material events that would require disclosure in the Fund’s financial statements through this date.
| | |
| |
84 | AB HIGH INCOME FUND | | abfunds.com |
FINANCIAL HIGHLIGHTS
Selected Data For A Share Of Capital Stock Outstanding Throughout Each Period
| | | | | | | | | | | | | | | | | | | | |
| | | Class A | |
| | | Year Ended October 31, | |
| | 2024 | | | 2023 | | | 2022 | | | 2021 | | | 2020 | |
| | | | | | | | | | | | | | | | | | | | |
| | | | |
Net asset value, beginning of period | | | $ 6.45 | | | | $ 6.44 | | | | $ 7.98 | | | | $ 7.53 | | | | $ 8.19 | |
| | | | |
Income From Investment Operations | | | | | | | | | | | | | | | | | | | | |
| | | | | |
Net investment income(a)(b) | | | .50 | | | | .47 | | | | .41 | | | | .40 | | | | .41 | |
| | | | | |
Net realized and unrealized gain (loss) on investment and foreign currency transactions | | | .55 | | | | .05 | | | | (1.48 | ) | | | .53 | | | | (.59 | ) |
| | | | | |
Contributions from Affiliates | | | – 0 | – | | | – 0 | – | | | .00 | (c) | | | .00 | (c) | | | .00 | (c) |
| | | | |
Net increase (decrease) in net asset value from operations | | | 1.05 | | | | .52 | | | | (1.07 | ) | | | .93 | | | | (.18 | ) |
| | | | |
Less: Dividends and Distributions | | | | | | | | | | | | | | | | | | | | |
| | | | | |
Dividends from net investment income | | | (.50 | ) | | | (.48 | ) | | | (.47 | ) | | | (.44 | ) | | | (.48 | ) |
| | | | | |
Return of capital | | | – 0 | – | | | (.03 | ) | | | – 0 | – | | | (.04 | ) | | | – 0 | – |
| | | | |
Total dividends and distributions | | | (.50 | ) | | | (.51 | ) | | | (.47 | ) | | | (.48 | ) | | | (.48 | ) |
| | | | |
Net asset value, end of period | | | $ 7.00 | | | | $ 6.45 | | | | $ 6.44 | | | | $ 7.98 | | | | $ 7.53 | |
| | | | |
Total Return | | | | | | | | | | | | | | | | | | | | |
| | | | | |
Total investment return based on net asset value(d) | | | 16.67 | % | | | 8.21 | % | | | (13.83 | )% | | | 12.52 | %^ | | | (2.02 | )%^ |
| | | | | |
Ratios/Supplemental Data | | | | | | | | | | | | | | | | | | | | |
| | | | | |
Net assets, end of period (000’s omitted) | | | $861,584 | | | | $795,930 | | | | $854,235 | | | | $1,157,302 | | | | $1,143,143 | |
| | | | | |
Ratio to average net assets of: | | | | | | | | | | | | | | | | | | | | |
| | | | | |
Expenses, net of waivers/ reimbursements(e) | | | .90 | % | | | .90 | % | | | .90 | % | | | .84 | % | | | .86 | % |
| | | | | |
Expenses, before waivers/ reimbursements(e) | | | .90 | % | | | .90 | % | | | .90 | % | | | .84 | % | | | .86 | % |
| | | | | |
Net investment income(b) | | | 7.22 | % | | | 7.11 | % | | | 5.69 | % | | | 4.95 | % | | | 5.43 | % |
| | | | | |
Portfolio turnover rate | | | 50 | % | | | 34 | % | | | 28 | % | | | 48 | % | | | 54 | % |
| See | footnote summary on page 90. |
| | |
| |
| abfunds.com | | AB HIGH INCOME FUND | 85 |
FINANCIAL HIGHLIGHTS (continued)
Selected Data For A Share Of Capital Stock Outstanding Throughout Each Period
| | | | | | | | | | | | | | | | | | | | |
| | | Class C | |
| | | Year Ended October 31, | |
| | | 2024 | | | 2023 | | | 2022 | | | 2021 | | | 2020 | |
| | | | | | | | | | | | | | | | | | | | |
| | | | |
Net asset value, beginning of period | | | $ 6.52 | | | | $ 6.51 | | | | $ 8.07 | | | | $ 7.62 | | | | $ 8.29 | |
| | | | |
Income From Investment Operations | | | | | | | | | | | | | | | | | | | | |
| | | | | |
Net investment income(a)(b) | | | .44 | | | | .42 | | | | .35 | | | | .33 | | | | .35 | |
| | | | | |
Net realized and unrealized gain (loss) on investment and foreign currency transactions | | | .58 | | | | .05 | | | | (1.50 | ) | | | .54 | | | | (.60 | ) |
| | | | | |
Contributions from Affiliates | | | – 0 | – | | | – 0 | – | | | .00 | (c) | | | .00 | (c) | | | .00 | (c) |
| | | | |
Net increase (decrease) in net asset value from operations | | | 1.02 | | | | .47 | | | | (1.15 | ) | | | .87 | | | | (.25 | ) |
| | | | |
Less: Dividends and Distributions | | | | | | | | | | | | | | | | | | | | |
| | | | | |
Dividends from net investment income | | | (.45 | ) | | | (.43 | ) | | | (.41 | ) | | | (.38 | ) | | | (.42 | ) |
| | | | | |
Return of capital | | | – 0 | – | | | (.03 | ) | | | – 0 | – | | | (.04 | ) | | | – 0 | – |
| | | | |
Total dividends and distributions | | | (.45 | ) | | | (.46 | ) | | | (.41 | ) | | | (.42 | ) | | | (.42 | ) |
| | | | |
Net asset value, end of period | | | $ 7.09 | | | | $ 6.52 | | | | $ 6.51 | | | | $ 8.07 | | | | $ 7.62 | |
| | | | |
Total Return | | | | | | | | | | | | | | | | | | | | |
| | | | | |
Total investment return based on net asset value(d) | | | 15.93 | % | | | 7.29 | %^ | | | (14.69 | )% | | | 11.65 | %^ | | | (2.86 | )%^ |
| | | | | |
Ratios/Supplemental Data | | | | | | | | | | | | | | | | | | | | |
| | | | | |
Net assets, end of period (000’s omitted) | | | $142,635 | | | | $160,725 | | | | $199,870 | | | | $324,644 | | | | $456,375 | |
| | | | | |
Ratio to average net assets of: | | | | | | | | | | | | | | | | | | | | |
| | | | | |
Expenses, net of waivers/ reimbursements(e) | | | 1.64 | % | | | 1.64 | % | | | 1.64 | % | | | 1.58 | % | | | 1.61 | % |
| | | | | |
Expenses, before waivers/ reimbursements(e) | | | 1.64 | % | | | 1.64 | % | | | 1.64 | % | | | 1.59 | % | | | 1.61 | % |
| | | | | |
Net investment income(b) | | | 6.38 | % | | | 6.26 | % | | | 4.81 | % | | | 4.14 | % | | | 4.56 | % |
| | | | | |
Portfolio turnover rate | | | 50 | % | | | 34 | % | | | 28 | % | | | 48 | % | | | 54 | % |
| See | footnote summary on page 90. |
| | |
| |
86 | AB HIGH INCOME FUND | | abfunds.com |
FINANCIAL HIGHLIGHTS (continued)
Selected Data For A Share Of Capital Stock Outstanding Throughout Each Period
| | | | | | | | | | | | | | | | | | | | |
| | | Advisor Class | |
| | | Year Ended October 31, | |
| | | 2024 | | | 2023 | | | 2022 | | | 2021 | | | 2020 | |
| | | | | | | | | | | | | | | | | | | | |
| | | | |
Net asset value, beginning of period | | | $ 6.46 | | | | $ 6.45 | | | | $ 7.99 | | | | $ 7.54 | | | | $ 8.20 | |
| | | | |
Income From Investment Operations | | | | | | | | | | | | | | | | | | | | |
| | | | | |
Net investment income(a)(b) | | | .51 | | | | .49 | | | | .43 | | | | .42 | | | | .43 | |
| | | | | |
Net realized and unrealized gain (loss) on investment and foreign currency transactions | | | .56 | | | | .05 | | | | (1.49 | ) | | | .53 | | | | (.59 | ) |
| | | | | |
Contributions from Affiliates | | | – 0 | – | | | – 0 | – | | | .00 | (c) | | | .00 | (c) | | | .00 | (c) |
| | | | |
Net increase (decrease) in net asset value from operations | | | 1.07 | | | | .54 | | | | (1.06 | ) | | | .95 | | | | (.16 | ) |
| | | | |
Less: Dividends and Distributions | | | | | | | | | | | | | | | | | | | | |
| | | | | |
Dividends from net investment income | | | (.52 | ) | | | (.50 | ) | | | (.48 | ) | | | (.46 | ) | | | (.50 | ) |
| | | | | |
Return of capital | | | – 0 | – | | | (.03 | ) | | | – 0 | – | | | (.04 | ) | | | – 0 | – |
| | | | |
Total dividends and distributions | | | (.52 | ) | | | (.53 | ) | | | (.48 | ) | | | (.50 | ) | | | (.50 | ) |
| | | | |
Net asset value, end of period | | | $ 7.01 | | | | $ 6.46 | | | | $ 6.45 | | | | $ 7.99 | | | | $ 7.54 | |
| | | | |
Total Return | | | | | | | | | | | | | | | | | | | | |
| | | | | |
Total investment return based on net asset value(d) | | | 16.94 | % | | | 8.46 | % | | | (13.70 | )% | | | 12.92 | %^ | | | (1.77 | )%^ |
| | | | | |
Ratios/Supplemental Data | | | | | | | | | | | | | | | | | | | | |
| | | | | |
Net assets, end of period (000’s omitted) | | | $2,034,535 | | | | $1,701,261 | | | | $1,754,072 | | | | $2,579,006 | | | | $3,077,869 | |
| | | | | |
Ratio to average net assets of: | | | | | | | | | | | | | | | | | | | | |
| | | | | |
Expenses, net of waivers/ reimbursements(e) | | | .65 | % | | | .64 | % | | | .64 | % | | | .59 | % | | | .61 | % |
| | | | | |
Expenses, before waivers/ reimbursements(e) | | | .65 | % | | | .65 | % | | | .65 | % | | | .59 | % | | | .61 | % |
| | | | | |
Net investment income(b) | | | 7.45 | % | | | 7.34 | % | | | 5.90 | % | | | 5.20 | % | | | 5.57 | % |
| | | | | |
Portfolio turnover rate | | | 50 | % | | | 34 | % | | | 28 | % | | | 48 | % | | | 54 | % |
| See | footnote summary on page 90. |
| | |
| |
| abfunds.com | | AB HIGH INCOME FUND | 87 |
FINANCIAL HIGHLIGHTS (continued)
Selected Data For A Share Of Capital Stock Outstanding Throughout Each Period
| | | | | | | | | | | | | | | | | | | | |
| | | Class I | |
| | | Year Ended October 31, | |
| | | 2024 | | | 2023 | | | 2022 | | | 2021 | | | 2020 | |
| | | | | | | | | | | | | | | | | | | | |
| | | | |
Net asset value, beginning of period | | | $ 6.46 | | | | $ 6.45 | | | | $ 8.00 | | | | $ 7.54 | | | | $ 8.20 | |
| | | | |
Income From Investment Operations | | | | | | | | | | | | | | | | | | | | |
| | | | | |
Net investment income(a)(b) | | | .52 | | | | .48 | | | | .43 | | | | .42 | | | | .42 | |
| | | | | |
Net realized and unrealized gain (loss) on investment and foreign currency transactions | | | .56 | | | | .06 | | | | (1.50 | ) | | | .54 | | | | (.58 | ) |
| | | | | |
Contributions from Affiliates | | | – 0 | – | | | – 0 | – | | | .00 | (c) | | | .00 | (c) | | | .00 | (c) |
| | | | |
Net increase (decrease) in net asset value from operations | | | 1.08 | | | | .54 | | | | (1.07 | ) | | | .96 | | | | (.16 | ) |
| | | | |
Less: Dividends and Distributions | | | | | | | | | | | | | | | | | | | | |
| | | | | |
Dividends from net investment income | | | (.52 | ) | | | (.50 | ) | | | (.48 | ) | | | (.46 | ) | | | (.50 | ) |
| | | | | |
Return of capital | | | – 0 | – | | | (.03 | ) | | | – 0 | – | | | (.04 | ) | | | – 0 | – |
| | | | |
Total dividends and distributions | | | (.52 | ) | | | (.53 | ) | | | (.48 | ) | | | (.50 | ) | | | (.50 | ) |
| | | | |
Net asset value, end of period | | | $ 7.02 | | | | $ 6.46 | | | | $ 6.45 | | | | $ 8.00 | | | | $ 7.54 | |
| | | | |
Total Return | | | | | | | | | | | | | | | | | | | | |
| | | | | |
Total investment return based on net asset value(d) | | | 17.08 | % | | | 8.42 | % | | | (13.72 | )% | | | 12.91 | %^ | | | (1.81 | )%^ |
| | | | | |
Ratios/Supplemental Data | | | | | | | | | | | | | | | | | | | | |
| | | | | |
Net assets, end of period (000’s omitted) | | | $43,393 | | | | $64,806 | | | | $67,757 | | | | $90,893 | | | | $131,550 | |
| | | | | |
Ratio to average net assets of: | | | | | | | | | | | | | | | | | | | | |
| | | | | |
Expenses, net of waivers/ reimbursements(e) | | | .65 | % | | | .69 | % | | | .66 | % | | | .59 | % | | | .64 | % |
| | | | | |
Expenses, before waivers/ reimbursements(e) | | | .65 | % | | | .69 | % | | | .66 | % | | | .59 | % | | | .64 | % |
| | | | | |
Net investment income(b) | | | 7.49 | % | | | 7.30 | % | | | 5.91 | % | | | 5.21 | % | | | 5.57 | % |
| | | | | |
Portfolio turnover rate | | | 50 | % | | | 34 | % | | | 28 | % | | | 48 | % | | | 54 | % |
| See | footnote summary on page 90. |
| | |
| |
88 | AB HIGH INCOME FUND | | abfunds.com |
FINANCIAL HIGHLIGHTS (continued)
Selected Data For A Share Of Capital Stock Outstanding Throughout Each Period
| | | | | | | | | | | | | | | | | | | | |
| | | Class Z | |
| | | Year Ended October 31, | |
| | | 2024 | | | 2023 | | | 2022 | | | 2021 | | | 2020 | |
| | | | | | | | | | | | | | | | | | | | |
| | | | |
Net asset value, beginning of period | | | $ 6.46 | | | | $ 6.45 | | | | $ 8.00 | | | | $ 7.54 | | | | $ 8.20 | |
| | | | |
Income From Investment Operations | | | | | | | | | | | | | | | | | | | | |
| | | | | |
Net investment income(a)(b) | | | .52 | | | | .49 | | | | .43 | | | | .42 | | | | .43 | |
| | | | | |
Net realized and unrealized gain (loss) on investment and foreign currency transactions | | | .56 | | | | .05 | | | | (1.49 | ) | | | .55 | | | | (.59 | ) |
| | | | | |
Contributions from Affiliates | | | – 0 | – | | | – 0 | – | | | .00 | (c) | | | .00 | (c) | | | .00 | (c) |
| | | | |
Net increase (decrease) in net asset value from operations | | | 1.08 | | | | .54 | | | | (1.06 | ) | | | .97 | | | | (.16 | ) |
| | | | |
Less: Dividends and Distributions | | | | | | | | | | | | | | | | | | | | |
| | | | | |
Dividends from net investment income | | | (.52 | ) | | | (.50 | ) | | | (.49 | ) | | | (.47 | ) | | | (.50 | ) |
| | | | | |
Return of capital | | | – 0 | – | | | (.03 | ) | | | – 0 | – | | | (.04 | ) | | | – 0 | – |
| | | | |
Total dividends and distributions | | | (.52 | ) | | | (.53 | ) | | | (.49 | ) | | | (.51 | ) | | | (.50 | ) |
| | | | |
Net asset value, end of period | | | $ 7.02 | | | | $ 6.46 | | | | $ 6.45 | | | | $ 8.00 | | | | $ 7.54 | |
| | | | |
Total Return | | | | | | | | | | | | | | | | | | | | |
| | | | | |
Total investment return based on net asset value(d) | | | 17.16 | % | | | 8.51 | % | | | (13.64 | )% | | | 12.99 | %^ | | | (1.76 | )%^ |
| | | | | |
Ratios/Supplemental Data | | | | | | | | | | | | | | | | | | | | |
| | | | | |
Net assets, end of period (000’s omitted) | | | $132,482 | | | | $112,725 | | | | $155,009 | | | | $266,052 | | | | $307,946 | |
| | | | | |
Ratio to average net assets of: | | | | | | | | | | | | | | | | | | | | |
| | | | | |
Expenses, net of waivers/ reimbursements(e) | | | .59 | % | | | .59 | % | | | .57 | % | | | .53 | % | | | .59 | % |
| | | | | |
Expenses, before waivers/ reimbursements(e) | | | .59 | % | | | .59 | % | | | .57 | % | | | .53 | % | | | .59 | % |
| | | | | |
Net investment income(b) | | | 7.53 | % | | | 7.37 | % | | | 5.96 | % | | | 5.26 | % | | | 5.66 | % |
| | | | | |
Portfolio turnover rate | | | 50 | % | | | 34 | % | | | 28 | % | | | 48 | % | | | 54 | % |
| See | footnote summary on page 90. |
| | |
| |
| abfunds.com | | AB HIGH INCOME FUND | 89 |
FINANCIAL HIGHLIGHTS (continued)
Selected Data For A Share Of Capital Stock Outstanding Throughout Each Period
| (a) | Based on average shares outstanding. |
| (b) | Net of expenses waived/reimbursed by the Adviser. |
| (c) | Amount is less than $0.005. |
| (d) | Total investment return is calculated assuming an initial investment made at the net asset value at the beginning of the period, reinvestment of all dividends and distributions at net asset value during the period, and redemption on the last day of the period. Initial sales charge or contingent deferred sales charge is not reflected in the calculation of total investment return. Total investment return does not reflect the deduction of taxes that a shareholder would pay on fund distributions or the redemption of fund shares. Total investment return for a period of less than one year is not annualized. |
| (e) | The expense ratios presented below exclude interest expense: |
| | | | | | | | | | | | | | | | | | | | |
| | | Year Ended October 31, | |
| | | 2024 | | | 2023 | | | 2022 | | | 2021 | | | 2020 | |
| | | | |
Class A | | | | | | | | | | | | | | | | | | | | |
Net of waivers/reimbursements | | | .86 | % | | | .85 | % | | | .87 | % | | | .84 | % | | | .86 | % |
Before waivers/reimbursements | | | .86 | % | | | .85 | % | | | .87 | % | | | .84 | % | | | .86 | % |
Class C | | | | | | | | | | | | | | | | | | | | |
Net of waivers/reimbursements | | | 1.60 | % | | | 1.60 | % | | | 1.61 | % | | | 1.58 | % | | | 1.60 | % |
Before waivers/reimbursements | | | 1.61 | % | | | 1.60 | % | | | 1.61 | % | | | 1.59 | % | | | 1.60 | % |
Advisor Class | | | | | | | | | | | | | | | | | | | | |
Net of waivers/reimbursements | | | .61 | % | | | .60 | % | | | .62 | % | | | .59 | % | | | .60 | % |
Before waivers/reimbursements | | | .61 | % | | | .61 | % | | | .63 | % | | | .59 | % | | | .60 | % |
Class I | | | | | | | | | | | | | | | | | | | | |
Net of waivers/reimbursements | | | .61 | % | | | .64 | % | | | .63 | % | | | .59 | % | | | .64 | % |
Before waivers/reimbursements | | | .62 | % | | | .64 | % | | | .63 | % | | | .59 | % | | | .64 | % |
Class Z | | | | | | | | | | | | | | | | | | | | |
Net of waivers/reimbursements | | | .55 | % | | | .55 | % | | | .54 | % | | | .53 | % | | | .58 | % |
Before waivers/reimbursements | | | .56 | % | | | .55 | % | | | .54 | % | | | .53 | % | | | .58 | % |
| ^ | The net asset value and total return include adjustments in accordance with accounting principles generally accepted in the United States of America for financial reporting purposes. As such, the net asset value and total return for shareholder transactions may differ from financial statements. |
See notes to financial statements.
| | |
| |
90 | AB HIGH INCOME FUND | | abfunds.com |
REPORT OF INDEPENDENT REGISTERED
PUBLIC ACCOUNTING FIRM
To the Board of Directors and Shareholders of
AB High Income Fund, Inc.
Opinion on the Financial Statements
We have audited the accompanying statement of assets and liabilities of AB High Income Fund, Inc. (the “Fund”), including the portfolio of investments, as of October 31, 2024, and the related statement of operations for the year then ended, the statements of changes in net assets for each of the two years in the period then ended, the financial highlights for each of the five years in the period then ended and the related notes (collectively referred to as the “financial statements”). In our opinion, the financial statements present fairly, in all material respects, the financial position of the Fund at October 31, 2024, the results of its operations for the year then ended, the changes in its net assets for each of the two years in the period then ended and its financial highlights for each of the five years in the period then ended, in conformity with U.S. generally accepted accounting principles.
Basis for Opinion
These financial statements are the responsibility of the Fund’s management. Our responsibility is to express an opinion on the Fund’s financial statements based on our audits. We are a public accounting firm registered with the Public Company Accounting Oversight Board (United States) (“PCAOB”) and are required to be independent with respect to the Fund in accordance with the U.S. federal securities laws and the applicable rules and regulations of the Securities and Exchange Commission and the PCAOB.
We conducted our audits in accordance with the standards of the PCAOB. Those standards require that we plan and perform the audit to obtain reasonable assurance about whether the financial statements are free of material misstatement, whether due to error or fraud. The Fund is not required to have, nor were we engaged to perform, an audit of the Fund’s internal control over financial reporting. As part of our audits, we are required to obtain an understanding of internal control over financial reporting but not for the purpose of expressing an opinion on the effectiveness of the Fund’s internal control over financial reporting. Accordingly, we express no such opinion.
Our audits included performing procedures to assess the risks of material misstatement of the financial statements, whether due to error or fraud, and performing procedures that respond to those risks. Such procedures included examining, on a test basis, evidence regarding the amounts and disclosures in the financial statements. Our procedures included
| | |
| |
| abfunds.com | | AB HIGH INCOME FUND | 91 |
REPORT OF INDEPENDENT REGISTERED
PUBLIC ACCOUNTING FIRM (continued)
confirmation of securities owned as of October 31, 2024, by correspondence with the custodian, brokers and others; when replies were not received from brokers or others, we performed other auditing procedures. Our audits also included evaluating the accounting principles used and significant estimates made by management, as well as evaluating the overall presentation of the financial statements. We believe that our audits provide a reasonable basis for our opinion.
We have served as the auditor of one or more of the AB investment companies since 1968.
New York, New York
December 27, 2024
| | |
| |
92 | AB HIGH INCOME FUND | | abfunds.com |
2024 FEDERAL TAX INFORMATION
(unaudited)
For Federal income tax purposes, the following information is furnished with respect to the distributions paid by the Fund during the taxable year ended October 31, 2024.
For foreign shareholders, 59.05% of ordinary income dividends paid may be considered to be qualifying to be taxed as interest-related dividends.
Shareholders should not use the above information to prepare their income tax returns. The information necessary to complete your income tax returns will be included with your Form 1099-DIV which will be sent to you separately in January 2025.
| | |
| |
| abfunds.com | | AB HIGH INCOME FUND | 93 |
Information Regarding the Review and Approval of the Fund’s Advisory Agreement
The disinterested directors (the “directors”) of AB High Income Fund, Inc. (the “Fund”) unanimously approved the continuance of the Fund’s Advisory Agreement with the Adviser at a meeting held in-person on July 30-31, 2024 (the “Meeting”).
Prior to approval of the continuance of the Advisory Agreement, the directors had requested from the Adviser, and received and evaluated, extensive materials. They reviewed the proposed continuance of the Advisory Agreement with the Adviser and with experienced counsel who are independent of the Adviser, who advised on the relevant legal standards. The directors also reviewed additional materials, including comparative analytical data prepared by the Senior Vice President of the Fund. The directors also discussed the proposed continuance in private sessions with counsel.
The directors considered their knowledge of the nature and quality of the services provided by the Adviser to the Fund gained from their experience as directors or trustees of most of the registered investment companies advised by the Adviser, their overall confidence in the Adviser’s integrity and competence they have gained from that experience, the Adviser’s initiative in identifying and raising potential issues with the directors and its responsiveness, frankness and attention to concerns raised by the directors in the past, including the Adviser’s willingness to consider and implement organizational and operational changes designed to improve investment results and the services provided to the AB Funds. The directors noted that they have four regular meetings each year, at each of which they review extensive materials and information from the Adviser, including information on the investment performance of the Fund and the money market fund advised by the Adviser in which the Fund invests a portion of its assets.
The directors also considered all factors they believed relevant, including the specific matters discussed below. During the course of their deliberations, the directors evaluated, among other things, the reasonableness of the advisory fee. The directors did not identify any particular information that was all-important or controlling, and different directors may have attributed different weights to the various factors. The directors determined that the selection of the Adviser to manage the Fund and the overall arrangements between the Fund and the Adviser, as provided in the Advisory Agreement, including the advisory fee, were fair and reasonable in light of the services performed, expenses incurred and such other matters as the directors considered relevant in the exercise of their business
| | |
| |
94 | AB HIGH INCOME FUND | | abfunds.com |
judgment. The material factors and conclusions that formed the basis for the directors’ determinations included the following:
Nature, Extent and Quality of Services Provided
The directors considered the scope and quality of services provided by the Adviser under the Advisory Agreement, including the quality of the investment research capabilities of the Adviser and the other resources it has dedicated to performing services for the Fund. The directors noted that the Adviser from time to time reviews the Fund’s investment strategies and from time to time proposes changes intended to improve the Fund’s relative or absolute performance for the directors’ consideration. They also noted the professional experience and qualifications of the Fund’s portfolio management team and other senior personnel of the Adviser. The directors also considered that the Advisory Agreement provides that the Fund will reimburse the Adviser for the cost to it of providing certain clerical, accounting, administrative and other services to the Fund by employees of the Adviser or its affiliates. Requests for these reimbursements are made on a quarterly basis and subject to approval by the directors. Reimbursements, to the extent requested and paid, result in a higher rate of total compensation from the Fund to the Adviser than the fee rate stated in the Advisory Agreement. The directors noted that the methodology used to determine the reimbursement amounts had been reviewed by an independent consultant at the request of the directors. The quality of administrative and other services, including the Adviser’s role in coordinating the activities of the Fund’s other service providers, also was considered. The directors concluded that, overall, they were satisfied with the nature, extent and quality of services provided to the Fund under the Advisory Agreement.
Costs of Services Provided and Profitability
The directors reviewed a schedule of the revenues and expenses and related notes indicating the profitability of the Fund to the Adviser for calendar years 2022 and 2023 that had been prepared with an expense allocation methodology arrived at in consultation with an independent consultant at the request of the directors. The directors noted the assumptions and methods of allocation used by the Adviser in preparing fund-specific profitability data and understood that there are a number of potentially acceptable allocation methodologies for information of this type. The directors noted that the profitability information reflected all revenues and expenses of the Adviser’s relationship with the Fund, including those relating to its subsidiaries that provide transfer agency and distribution services to the Fund. The directors recognized that it is difficult to make comparisons of the profitability of the Advisory Agreement with the profitability of fund advisory contracts for unaffiliated funds because comparative information is not generally publicly available and is affected by numerous factors. The directors focused on the profitability of the Adviser’s relationship with the Fund before taxes and distribution expenses. The directors concluded that the
| | |
| |
| abfunds.com | | AB HIGH INCOME FUND | 95 |
Adviser’s level of profitability from its relationship with the Fund was not unreasonable.
Fall-Out Benefits
The directors considered the other benefits to the Adviser and its affiliates from their relationships with the Fund and the money market fund advised by the Adviser in which the Fund invests, including, but not limited to, benefits relating to 12b-1 fees and sales charges received by the Fund’s principal underwriter (which is a wholly owned subsidiary of the Adviser) in respect of certain classes of the Fund’s shares; and transfer agency fees paid by the Fund to a wholly owned subsidiary of the Adviser. The directors recognized that the Adviser’s profitability would be somewhat lower without these benefits. The directors understood that the Adviser also might derive reputational and other benefits from its association with the Fund.
Investment Results
In addition to the information reviewed by the directors in connection with the Meeting, the directors receive detailed performance information for the Fund at each regular Board meeting during the year.
At the Meeting, the directors reviewed performance information prepared by an independent service provider (the “15(c) service provider”), showing the performance of the Advisor Class shares of the Fund against a group of similar funds (“peer group”) and a larger group of similar funds (“peer universe”), each selected by the 15(c) service provider, and information prepared by the Adviser showing performance of the Advisor Class shares against a broad-based securities market index, in each case for the 1-, 3-, 5- and 10-year periods ended May 31, 2024 and (in the case of comparisons with the broad-based securities market index) for the period from inception. Based on their review, the directors concluded that the Fund’s investment performance was acceptable.
Advisory Fees and Other Expenses
The directors considered the advisory fee rate payable by the Fund to the Adviser and information prepared by the 15(c) service provider concerning advisory fee rates payable by other funds in the same category as the Fund. The directors recognized that it is difficult to make comparisons of advisory fees because there are variations in the services that are included in the fees payable by other funds. The directors compared the Fund’s contractual effective advisory fee rate with a peer group median and noted that it was lower than the median. They also noted that the Adviser’s total rate of compensation, taking into account the impact of the administrative expense reimbursement paid to the Adviser in the latest fiscal year, was lower than the median.
| | |
| |
96 | AB HIGH INCOME FUND | | abfunds.com |
The directors also considered the Adviser’s fee schedule for other clients utilizing investment strategies similar to those of the Fund. For this purpose, they reviewed the relevant advisory fee information from the Adviser’s Form ADV and in a report from the Fund’s Vice President and noted the differences between the Fund’s fee schedule, on the one hand, and the Adviser’s institutional fee schedule and the schedule of fees charged by the Adviser to any offshore funds and for services to any sub-advised funds utilizing investment strategies similar to those of the Fund, on the other. The directors noted that the Adviser may, in some cases, agree to fee rates with large institutional clients that are lower than those reviewed by the directors and that they had previously discussed with the Adviser its policies in respect of such arrangements.
The Adviser reviewed with the directors the significantly greater scope of the services it provides to the Fund relative to institutional, offshore fund and sub-advised fund clients. In this regard, the Adviser noted, among other things, that, compared to institutional and offshore or sub-advisory accounts, the Fund (i) demands considerably more portfolio management, research and trading resources due to significantly higher daily cash flows; (ii) has more tax and regulatory restrictions and compliance obligations; (iii) must prepare and file or distribute regulatory and other communications about fund operations; and (iv) must provide shareholder servicing to retail investors. The Adviser also reviewed the greater legal risks presented by the large and changing population of Fund shareholders who may assert claims against the Adviser in individual or class actions, and the greater entrepreneurial risk in offering new fund products, which require substantial investment to launch, may not succeed, and generally must be priced to compete with larger, more established funds resulting in lack of profitability to the Adviser until a new fund achieves scale. In light of the substantial differences in services rendered by the Adviser to institutional, offshore fund and sub-advised fund clients as compared to the Fund, and the different risk profile, the directors considered these fee comparisons inapt and did not place significant weight on them in their deliberations.
In connection with their review of the Fund’s advisory fee, the directors also considered the total expense ratio of the Advisor Class shares of the Fund in comparison to the medians for a peer group and a peer universe selected by the 15(c) service provider. The Advisor Class expense ratio of the Fund was based on the Fund’s latest fiscal year. The directors noted that it was likely that the expense ratios of some of the other funds in the Fund’s category were lowered by waivers or reimbursements by those funds’ investment advisers, which in some cases might be voluntary or temporary. The directors view expense ratio information as relevant to their evaluation of the Adviser’s services because the Adviser is responsible for coordinating services provided to the Fund by others. The directors noted that the Fund’s expense ratio was lower than the medians. Based on their review, the directors concluded that the Fund’s expense ratio was acceptable.
| | |
| |
| abfunds.com | | AB HIGH INCOME FUND | 97 |
Economies of Scale
The directors noted that the advisory fee schedule for the Fund contains breakpoints and that the Fund’s net assets were higher than the first breakpoint level. Accordingly, the Fund’s current effective advisory fee rate reflected a reduction due to the breakpoint and would be further reduced to the extent the net assets of the Fund increase. The directors took into consideration prior presentations by an independent consultant on economies of scale in the mutual fund industry and for the AB Funds, and presentations from time to time by the Adviser concerning certain of its views on economies of scale. The directors also had requested and received from the Adviser certain updates on economies of scale in advance of the Meeting. The directors believe that economies of scale may be realized (if at all) by the Adviser across a variety of products and services, and not only in respect of a single fund. The directors noted that there is no established methodology for setting breakpoints that give effect to the fund-specific services provided by a fund’s adviser and to the economies of scale that an adviser may realize in its overall mutual fund business or those components of it which directly or indirectly affect a fund’s operations. The directors observed that in the mutual fund industry as a whole, as well as among funds similar to the Fund, there is no uniformity or pattern in the fees and asset levels at which breakpoints (if any) apply. The directors also noted that the advisory agreements for many funds do not have breakpoints at all. Having taken these factors into account, the directors concluded that the Fund’s breakpoint arrangements were acceptable and provide a means for sharing any economies of scale.
| | |
| |
98 | AB HIGH INCOME FUND | | abfunds.com |
NOTES
| | |
| |
| abfunds.com | | AB HIGH INCOME FUND | 99 |
NOTES
| | |
| |
100 | AB HIGH INCOME FUND | | abfunds.com |
AB HIGH INCOME FUND
66 Hudson Boulevard East
New York, NY 10001
800 221 5672
HI-0151-1024 
ITEM 8. CHANGES IN AND DISAGREEMENTS WITH ACCOUNTANTS FOR OPEN-END MANAGEMENT INVESTMENT COMPANIES.
There were no disagreements with accountants during the reporting period.
ITEM 9. PROXY DISCLOSURES FOR OPEN-END MANAGEMENT INVESTMENT COMPANIES
AHIF
At a Special Meeting held on July 18, 2024, shareholders of AB High Income Fund, Inc. (the “Fund”), elected Directors in connection with the establishment of a single, unitary board (“Unitary Board”) responsible for overseeing mutual funds, exchange-traded funds and certain closed-end investment companies sponsored and advised by the Adviser. In connection with the establishment of the Unitary Board, Ms. Jacklin and Messrs. Downey and Turner will retire as Directors effective December 31, 2024, and Mr. Erzan will resign as a Director effective December 31, 2024, but will continue to serve as President and Chief Executive Officer of the AB Funds. Shareholders of the Fund elected four individuals to serve as Directors effective January 1, 2025 (the “Directors-Elect”), who will serve on the Unitary Board with current Directors Mses. Loeb and McMullen and Messrs. Bermudez and Moody. The number of votes cast for and withheld, as well as the number of abstentions and broker non-votes with respect to the election of each nominee for office is included below.
| | | | | | | | | | | | |
Director: | | Voted For | | | Withheld
Authority | | | Abstained | | Broker
Non-Votes |
Jorge A. Bermudez | | | 312,389,247.372 | | | | 5,280,299.658 | | | 47,126.020 | | N/A |
Alexander Chaloff | | | 313,509,590.753 | | | | 4,159,956.277 | | | N/A | | N/A |
R. Jay Gerken | | | 312,631,926.920 | | | | 5,037,620.110 | | | 47,126.020 | | N/A |
Jeffrey R. Holland | | | 313,074,044.906 | | | | 4,595,502.124 | | | N/A | | N/A |
Jeanette W. Loeb | | | 301,754,601.283 | | | | 15,914,945.747 | | | N/A | | N/A |
Carol C. McMullen | | | 313,539,230.239 | | | | 4,130,316.791 | | | N/A | | N/A |
Garry L. Moody | | | 312,861,632.896 | | | | 4,807,914.134 | | | N/A | | N/A |
Emilie D. Wrapp | | | 313,508,283.330 | | | | 4,161,263.700 | | | N/A | | N/A |
ITEM 10. REMUNERATION PAID TO DIRECTORS, OFFICERS, AND OTHERS OF OPEN-END MANAGEMENT INVESTMENT COMPANIES.
Aggregate remuneration paid to all Directors and advisory board members are included within the Financial Statements under Item 7 of this Form N-CSR.
ITEM 11. STATEMENT REGARDING BASIS FOR APPROVAL OF INVESTMENT ADVISORY CONTRACT.
Statement regarding basis for Approval of Investment Advisory Contract included within the Financial Statements under Item 7 of this Form N-CSR.
ITEM 12. DISCLOSURE OF PROXY VOTING POLICIES AND PROCEDURES FOR CLOSED-END MANAGEMENT INVESTMENT COMPANIES.
Not applicable to the registrant.
ITEM 13. PORTFOLIO MANAGERS OF CLOSED END MANAGEMENT INVESTMENT COMPANIES.
Not applicable to the registrant.
ITEM 14. PURCHASES OF EQUITY SECURITIES BY CLOSED-END MANAGEMENT INVESTMENT COMPANY OF AND AFFILIDATED PURCHASERS.
Not applicable to the registrant.
ITEM 15. SUBMISSION OF MATTERS TO A VOTE OF SECURITY HOLDERS.
There have been no material changes to the procedures by which shareholders may recommend nominees to the Fund’s Board of Directors since the Fund last provided disclosure in response to this item.
ITEM 16. CONTROLS AND PROCEDURES.
(a) The registrant’s principal executive officer and principal financial officer have concluded that the registrant’s disclosure controls and procedures (as defined in Rule 30a-2(c) under the Investment Company Act of 1940, as amended) are effective at the reasonable assurance level based on their evaluation of these controls and procedures as of a date within 90 days of the filing date of this document.
(b) There were no changes in the registrant’s internal controls over financial reporting that occurred during the period covered by this report that has materially affected, or is reasonably likely to materially affect, the registrant’s internal control over financial reporting.
ITEM 17. DISCLOSURE OF SECURITIES LENDING ACTIVITIES FOR CLOSED-END MANAGEMENT INVESTMENT COMPANIES.
Not applicable to the registrant.
ITEM 18. RECOVERY OF ERRONEOUSLY AWARDED COMPENSATION.
Not applicable to the registrant
ITEM 19. EXHIBITS.
The following exhibits are attached to this Form N-CSR:
SIGNATURES
Pursuant to the requirements of the Securities Exchange Act of 1934 and the Investment Company Act of 1940, the registrant has duly caused this report to be signed on its behalf by the undersigned, thereunto duly authorized.
| | |
| (Registrant): AB High Income Fund, Inc. |
| |
| By: | | /s/ Onur Erzan |
| | Onur Erzan |
| | President |
| |
| Date: | | December 30, 2024 |
Pursuant to the requirements of the Securities Exchange Act of 1934 and the Investment Company Act of 1940, this report has been signed below by the following persons on behalf of the registrant and in the capacities and on the dates indicated.
| | |
| By: | | /s/ Onur Erzan |
| | Onur Erzan |
| | President |
| |
| Date: | | December 30, 2024 |
| |
| By: | | /s/ Stephen M. Woetzel |
| | Stephen M. Woetzel |
| | Treasurer and Chief Financial Officer |
| |
| Date: | | December 30, 2024 |