
The Pantry, Inc.
Morgan Keegan 2008 Equity Conference
September 5, 2008
0

Safe Harbor Statement
Some of the statements in this presentation constitute “forward-looking
statements” within the meaning of the Private Securities Litigation Reform Act
of 1995. All statements other than those of historical facts included herein,
including those related to the company’s financial outlook, goals, business
strategy, projected plans and objectives of management for future operations
and liquidity, are forward-looking statements. These forward-looking
statements are based on the company’s plans and expectations and involve a
number of risks and uncertainties that could cause actual results to vary
materially from the results and events anticipated or implied by such forward-
looking statements. Please refer to the company’s Annual Report on Form
10-K and its other filings with the SEC for a discussion of significant risk
factors applicable to the company. In addition, the forward-looking
statements included in this presentation are based on the company’s
estimates and plans as of the date of this presentation. While the company
may elect to update these forward-looking statements at some point in the
future, it specifically disclaims any obligation to do so.
1
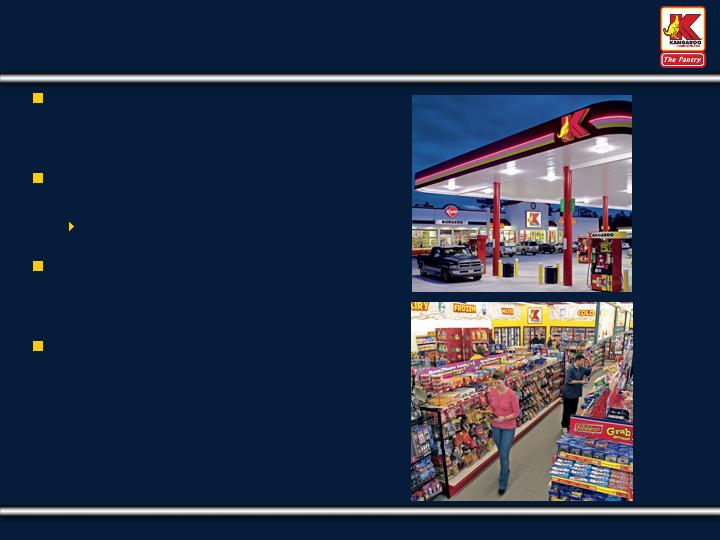
Our Business
Leading independently operated
convenience store chain in the
Southeast and 3 rd largest in the U.S.
1,660 stores located across 11
states
Primarily branded Kangaroo Express
Last twelve months as of June 26,
2008 sales of $8.5 billion and LTM
EBITDA of $218 million
Stores offer a broad selection of
merchandise, motor fuel and food
service offerings designed to meet
convenience needs of consumers
2

Leading market positions in attractive Southeastern markets
Significant scale advantages vs. primary competitors
Benefiting from consumer trends toward convenience formats
Leveraging infrastructure to drive profitability and future growth
Attractive sector growth and consolidation potential
Key Investment Highlights
Strong Cash Flow Generation to Reinvest in Our Business, De-lever and Drive Earnings Growth
3
4
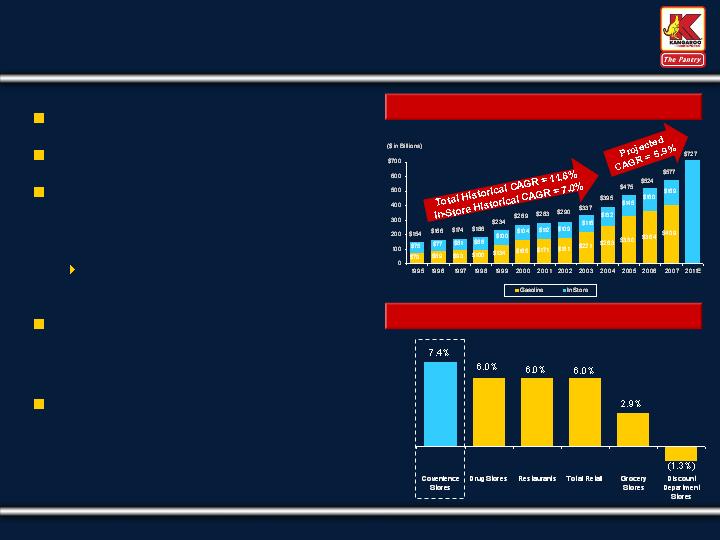
5-Year In-Store Sales CAGR vs. Other Sectors (1)(2)
Large and rapidly growing sector
Defensive growth characteristics
Increasing consumer demand for
smaller-box, fill-in convenience
shopping
Relative to hypermarkets, large
supermarkets, etc.
Increasing amount of food
consumed away-from-home and
on-the-run
Highly fragmented market with
ample consolidation opportunities
Attractive Industry Fundamentals
_____________________
(1) Source: NACS 2007 NACS State of the Industry Report and Retail Forward, Inc.
(2) Source: Retail Forward, Inc. CAGR for 5-year period from 2001-2006.
U.S. C-Store Sales and Growth (1)
PA0021GM_1.WOR
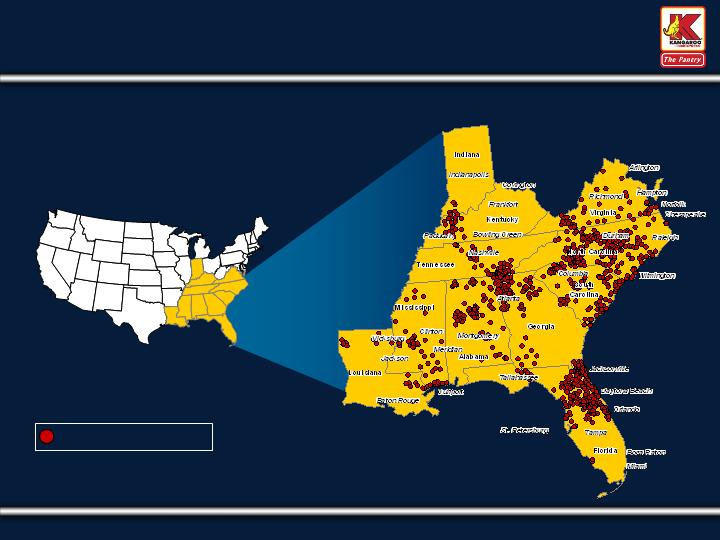
1,660 Stores Located in Eleven Southeastern States as of June 26, 2008
Leading Convenience Store Retailer Concentrated in
the Southeastern United States
NY0010DP_1.WOR
Pantry Store Locations
_____________________
Note: Map as of fiscal year ended September 27, 2007.
5
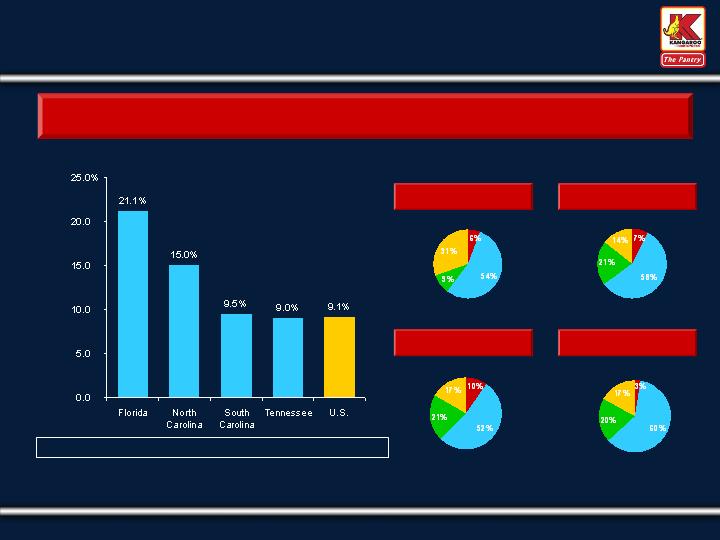
Key Markets Possess Highly Attractive Growth
Characteristics
_____________________
(1) Source: U.S. Census Bureau and 2007 NACS State of the Industry Report.
(2) Note: Pantry’s store counts as of quarter ended June 26, 2008.
Core Markets Projected to Experience Rapid Growth Throughout Next Several Years;
High Degree of Fragmentation Provides Continued Consolidation Opportunities
Pantry
1 Store
Operators
2-50 Store
Operators
>50 Store
Operators
Pantry
1 Store
Operators
2-50 Store
Operators
>50 Store
Operators
Pantry
1 Store
Operators
2-50 Store
Operators
>50 Store
Operators
Pantry
1 Store
Operators
2-50 Store
Operators
>50 Store
Operators
Florida
(7,356 stores)
North Carolina
(5,447 stores)
South Carolina
(2,872 stores)
Tennessee
(3,697 stores)
Population Growth CAGRs (2005-2015) (1)
(2) Pantry Stores: 455 388 282 104 1,660
Market Fragmentation (1)
6
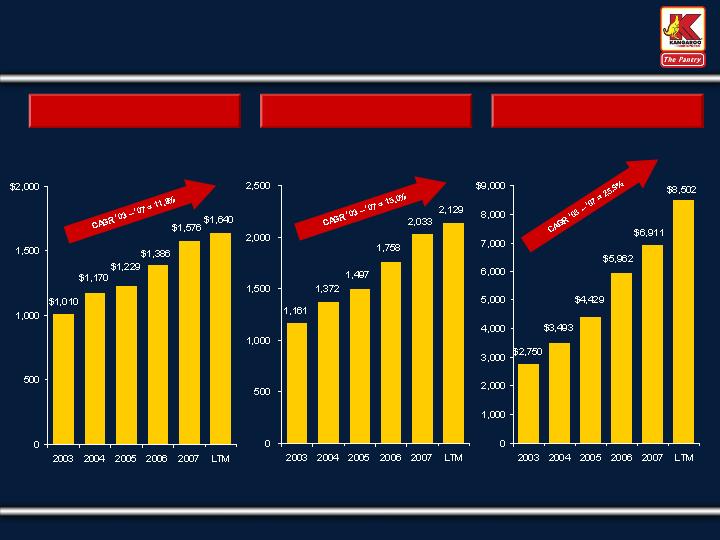
Merchandise Revenue
($ in mm)
(Gallons in mm)
Fiscal Year
Fiscal Year
_____________________
Note: Fiscal year ends in September. Last twelve months as of June 26, 2008.
($ in mm)
Retail Gas Gallons Sold
Total Revenue
Fiscal Year
Strong Track Record of Top Line Growth…
7

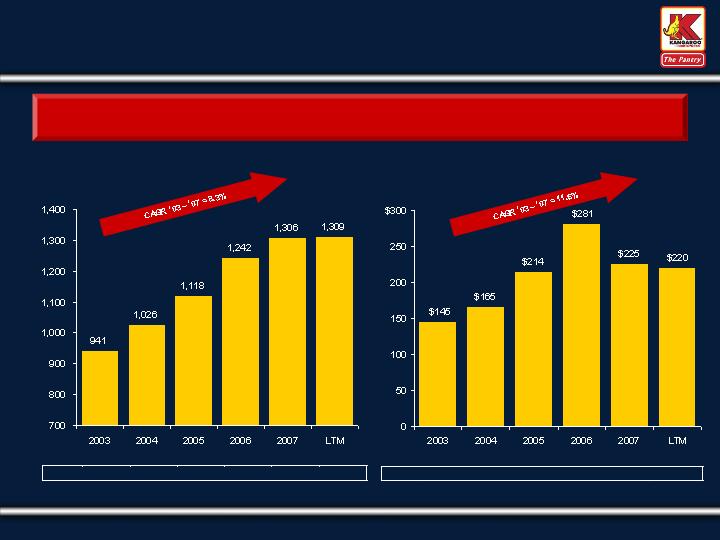
Reported EBITDA
Gross Profit
$511
$591
$663
$779
$811
$826
Fiscal Year
Fiscal Year
_____________________
Note: Fiscal year ends in September. Last twelve months as of June 26, 2008.
($ in mm)
($ in mm)
…And Substantial EBITDA Generation
’03-’07
CAGR
11.6%
12.5%
8
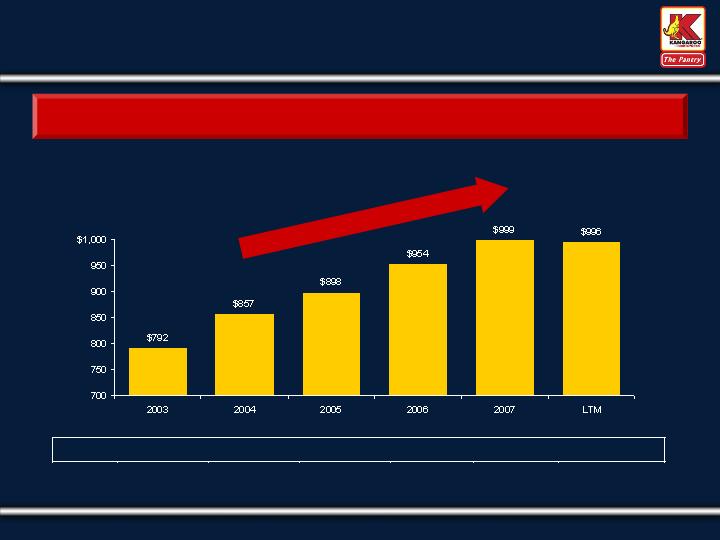
Average Merchandise Sales per Store
($ in Thousands)
Improved Store Portfolio and Stronger Consumer Offering
Have Driven Increased Average Merchandise Sales per Store
_____________________
Note: Fiscal year ends in September. Last twelve months for the quarter ending June 26, 2008.
Fiscal Year
Strong Growth in Merchandise Sales Per Store
9
Stores
1,258
1,361
1,400
1,493
1,644
1,6
60

Merchandise Gross Margin
Fiscal Year
Superior Merchandise Offering Leads to Above Average Margins
Industry
Avg.(1):
30.6%
_____________________
Note: Fiscal year ends in September. Last twelve months for the quarter ending June 26, 2008.
(1) Industry average for 2007 based on the 2008 NACS State of the Industry Report.
Consistently Strong Merchandise Margins
Proprietary branded offerings
Private label products in high velocity
categories
Selective expansion of nationally branded
quick service restaurants (QSRs)
Leveraging scale with merchandise
vendors
10
Merch. Comps
2.1%
3.4%
5.3%
4.9%
2.3%
N
/
A
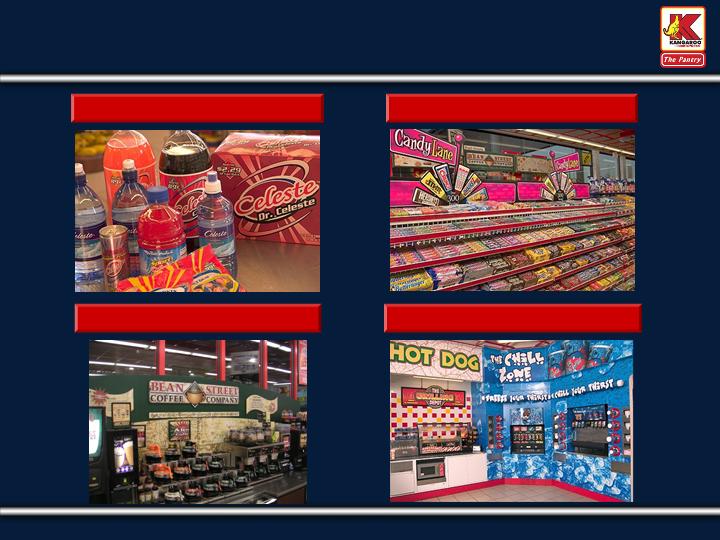
Celeste
Bean Street Coffee
Proprietary Merchandise and Food Service Concepts
Drive Revenue and Margins
Candy Lane
Grilling Depot & Chill Zone
11
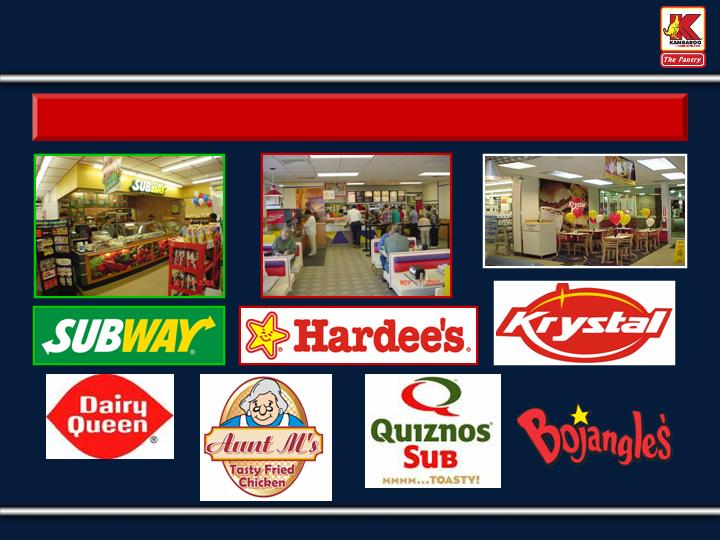
We Currently Operate 236 Nationally Branded and
Proprietary Quick Service Restaurants
QSR Food Service Offering Differentiates Our
Stores and Drives Traffic and Margins
12
We Balance Average Gallons Sold Per Store and Gasoline Margins
to Maximize Overall Gross Profit Dollars
Gasoline Strategy Maximizes Fuel Gross Profit Dollars
Average Gallons Sold per Store
Retail Gasoline Gross Profit $
Fiscal Year
Fiscal Year
_____________________
Note: Fiscal year ends in September. Last twelve months for the quarter ending June 26, 2008.
(1) Net of credit card fees and repairs and maintenance. Last twelve months excludes per gallon loss on hedging operations in Q2 and Q3 of 1.6¢ and 0.3¢, respectively.
(Gallons in Thousands)
($ in mm)
13
A
/
N
1.0%
3.1%
4.7%
2.0%
0.7%
Comps
CPG
(1)
12.5
¢
12.0
¢
14.3
¢
15.9
¢
10.9
¢
10.
7
¢

Note: Fiscal year ends in September. Graph updated through September 2, 2008.
Source: FactSet. Data represent average futures contract price per barrel of light sweet crude and national average retail price per gasoline gallon.
FY2005
FY2006
FY2007
(Peak)
Avg. Crude Oil Price per Barrel
Avg. Retail Price per Gasoline Gallon
14
FY2008
Recent Inflation and Volatility in Oil and Gas Prices
%
3 Month
s
Prior to Peak
Since
Peak
Oil
+
33
%
(2
5
%)
Gas
+23%
(
1
2
%)
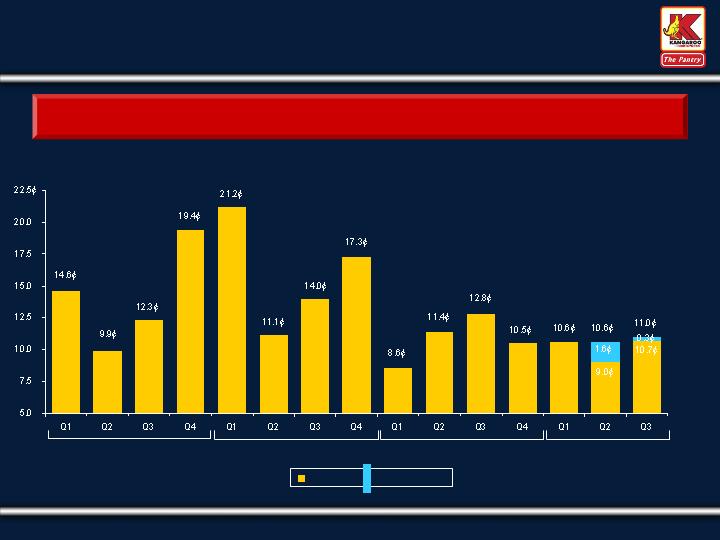
Recent Margins Impacted by Higher Credit Card Fees and Fuel Maintenance Expenses,
As Well As Losses on Fuel Hedging Activities in Q2 and Q3 2008
Our Quarterly Retail Gasoline CPG (Net of Credit Card Fees and Repairs and Maintenance)
FY2005
FY2006
FY2007
FY2008
_____________________
Note: Fiscal year ends September.
(1) Q2 and Q3 include per gallon loss on hedging operations of 1.6¢ and 0.3¢, respectively.
Gasoline CPG Can Be Volatile on a Quarterly Basis…
(1)
Net CPG
Hedging Loss
(1)
15

Fiscal Year
_____________________
Note: Fiscal year ends in September. Shaded area represents average historical CPG range.
CPG is net of credit card fees and repairs and maintenance
…But Annual CPG Tends to Remain Relatively Stable
Annual Net CPG Margins Typically Range from 10¢ – 13¢
16
Current Operating Initiatives Intended to Address Challenging
Environment and Improving Strategic Flexibility
Return to Growth Focus
Collectively, We Believe These Actions Have Better Positioned Us to Leverage Our Operating
Model and Drive Top-line and Earnings Growth when the Market Environment Improves
Consumer
Headwinds
Increasing vendor-supported promotional activity
Focusing promotions on high-velocity, high-return categories
Margin / Profitability
Pressure
Financial Flexibility
Accelerated ethanol roll-out
Fuel price strategy maximizing total gross profit dollars
Meaningfully reducing store level and corporate overhead
Bolstered liquidity by accessing delayed draw on term loan
Substantially reduced non-essential capex
Temporarily suspended share repurchases
Challenge
Key Initiatives / Action Taken
17

Reorganized field management structure to streamline operations
Improved overall quality / efficiency of staffing
Improved store-level controllable expenses
Reduced bad check expense
Lowered cash over and short by moving to prepaid on gasoline
Tangible financial results achieved, more expected throughout the year
Reduced store operating expenses in Q3 by $6.4 million or 4.8%
Reduced corporate overhead spend in Q3 by $4.8 million or 17.6% despite adding 16
stores
Lowered FY08 OG&A guidance by $28mm-$33mm from our original FY08 guidance
Initiative Maximizes Operating Expense Leverage and Better Positions Us for Profitable Growth
as Market Conditions Improve
Focus on Reducing Operating Expenses
18

Lease Finance Obligations Cause Valuation and
Leverage Confusion
Adjusting EBITDA by Treating Sale-Leasebacks as Operating Leases and Subtracting Sale-
Leaseback Rent Allows for Better Comparison to Other Retailers
Balance Sheet Data as of 6/26/08
19
Reported
Adjustments
Adjusted
Total Debt
(ex. Lease Finance Obligations)
$848
$84
8
Cash
($1
62
)
($1
62
)
Net Debt
(ex. Lease Finance Obligations)
$
686
$
686
Lease Finance Obligations
$4
6
2
($4
6
2
)
–
Total Net Debt
$1,
148
($46
2
)
$
686
Market Cap
8
/
19
/08
$
408
$
408
Enterprise Value
$1,
55
6
($46
2
)
$
1,094
L
TM EBITDA as o
f
6
/2
6
/
08
$2
1
8
($4
6
)
$1
7
3
EV /
EBITDA Multiple
7
.
1
x
6
.
3
x
Total Net Debt/EBITDA
5.
3
x
4
.
0
x

Meaningful liquidity
$162 million in cash-on-hand
$225 million revolver – $0 drawn, over $142 million available after LOCs
Long-term debt profile; earliest maturity is the convertible debt in November 2012
Covenant-light bank facility – financial flexibility (1)
6.5x Adj. Net Debt / EBITDAR Leverage – Currently 5.8x
2.25x Interest Coverage – Currently 2.53x
_____________________
Note: Balance Sheet data as of June 26, 2008.
(1) Per credit facility covenant calculations (8x rent methodology).
Meaningful Liquidity / Financial Flexibility
20

Merchandise revenues expected to grow to $1.62 – $1.65 billion
Merchandise gross margin expected to be between 36.8% and 37.0%
Retail gas gallons sold expected to be approximately 2.1 billion gallons
Retail gas margin expected between 10 and 12 cents per gallon
Operating, general and administrative expenses expected between $605 –
$610 million
Capital expenditures expected to be $90 million
Full Year Impact of 2007 Acquisitions Driving Revenue Growth in 2008;
Continuing Discipline on Expenses Should Lower OG&A and Drive Earnings
Fiscal 2008 Financial Outlook Unchanged
21

Leading market positions in attractive Southeastern markets
Significant scale advantages vs. primary competitors
Benefiting from consumer trends toward convenience formats
Leveraging infrastructure to drive profitability and future growth
Attractive sector growth and consolidation potential
Key Investment Highlights
Strong Cash Flow Generation to Reinvest in Our Business, De-lever and Drive Earnings Growth
22

23
Reconciliation of Non-GAAP Measures
_____________________
Note: Fiscal year ends in September. Last twelve months as of June 26, 2008.
Adjusted EBITDA/EBITDA Reconciled to Net Income
($ in mm)
LTM
Jun
-
08
2007
2006
2005
2004
2003
Adjusted EBITDA
$173
$178
$254
$189
$150
$127
Payments made for lease finance obligations
46
36
25
24
23
13
Cumulative effect adjustment
-
-
-
-
-
(3)
Reported EBITDA
$218
$214
$279
$214
$173
$136
Interest
expense, net and loss on extinguishment of debt
(88)
(
74
)
(
56
)
(
54
)
(
87
)
(
60
)
Depreciation and amortization
(108)
(
96
)
(
76
)
(
64
)
(
61
)
(
56
)
Provision for income taxes
(8)
(
17
)
(
57
)
(
37
)
(
9
)
(
9
)
Net income
$15
$27
$89
$58
$16
$11

24
Reconciliation of Non-GAAP Measures
_____________________
Note: Fiscal year ends in September. Last twelve months as of June 26, 2008.
Adjusted EBITDA/EBITDA Reconciled to Cash Flows
($ in mm)
L
TM
Jun
-
08
2007
2006
2005
2004
2003
Adjusted EBITDA
$
173
$
178
$254
$189
$150
$127
Payments made for lease finance obligations
4
6
36
25
24
23
13
Cumulative effect adjustment
-
-
-
-
-
(3)
Reported EBITDA
$
218
$214
$279
$214
$173
$136
Interest
expense, net and loss on extinguishment of debt
(88)
(
74
)
(
56
)
(
54
)
(
87
)
(
60
)
Provision for income taxes
(
8
)
(17)
(57)
(37)
(9)
(9)
Non
-
cash stock based compensation
3
4
3
-
-
-
Changes in operating assets and liabilities
8
8
(13)
(7)
-
(20)
Non
-
cash
loss on extinguishment of debt
-
2
2
-
23
3
Other
6
4
(3)
19
17
19
Net cash provided by operating activities
$
140
$141
$154
$134
$117
$69
Net cash used in investing activities
($150)
($529)
($219)
($166)
($227)
($24)
Net cash provided by (used in) fina
ncing activities
$94
$339
$74
$36
$145
(
$14
)
The Pantry, Inc.
Morgan Keegan 2008 Equity Conference
September 5, 2008
25