Selling Fund | Acquiring Fund | |||||
MassMutual Growth Opportunities Fund (a series of MassMutual Select Funds) | ⇒ | MassMutual Blue Chip Growth Fund (a series of MassMutual Select Funds) | ||||
MassMutual Fundamental Value Fund (a series of MassMutual Select Funds) | ⇒ | MassMutual Diversified Value Fund (a series of MassMutual Select Funds) | ||||
MassMutual Strategic Bond Fund (a series of MassMutual Select Funds) | ⇒ | MassMutual Core Bond Fund (a series of MassMutual Premier Funds) | ||||
SECURITIES AND EXCHANGE COMMISSION
Washington, D.C. 20549
FORM N-14
REGISTRATION STATEMENT UNDER THE SECURITIES ACT OF 1933 | ||
Pre-Effective Amendment No. ☐ | ||
Post-Effective Amendment No. ☐ |
MASSMUTUAL SELECT FUNDS
(Exact Name of Registrant as Specified in Declaration of Trust)
1295 State Street, Springfield, MA 01111-0001
(413) 744-1000
Name and Address of Agent for Service
Andrew M. Goldberg, Esq.
Vice President, Secretary, and Chief Legal Officer
MassMutual Select Funds
1295 State Street
Springfield, MA 01111-0001
Copy to:
Brian McCabe, Esq.
Ropes & Gray LLP
Prudential Tower
800 Boylston Street
Boston, MA 02199-3600
TITLE OF SECURITIES BEING REGISTERED:
Classes I, R5, Service Class, Administrative Class, R4, A, R3, and Y of the MassMutual Blue Chip Growth Fund, a series of the Registrant.
Classes I, R5, Service Class, Administrative Class, R4, A, R3, and Y of the MassMutual Diversified Value Fund, a series of the Registrant.
Approximate date of proposed public offering: As soon as practicable after this Registration Statement becomes effective.
It is proposed that this filing will become effective on August 3, 2024 pursuant to Rule 488.
An indefinite amount of the Registrant’s securities has been registered under the Securities Act of 1933 pursuant to Rule 24f-2 under the Investment Company Act of 1940. In reliance upon such Rule, no filing fee is being paid at this time.
Selling Fund | Acquiring Fund | |||||
MassMutual Growth Opportunities Fund | ⇒ | MassMutual Blue Chip Growth Fund | ||||
MassMutual Fundamental Value Fund | ⇒ | MassMutual Diversified Value Fund | ||||
MassMutual Strategic Bond Fund | ⇒ | MassMutual Core Bond Fund | ||||
Selling Fund | Acquiring Fund | |||||
MassMutual Growth Opportunities Fund | ⇒ | MassMutual Blue Chip Growth Fund | ||||
MassMutual Fundamental Value Fund | ⇒ | MassMutual Diversified Value Fund | ||||
MassMutual Strategic Bond Fund | ⇒ | MassMutual Core Bond Fund | ||||
• | the prospectus of each Selling Fund, dated February 1, 2024, as supplemented to date (the “Selling Fund Prospectus”); |
• | the Statement of Additional Information of each Selling Fund, dated February 1, 2024, as supplemented to date (the “Selling Fund SAI”); and |
• | the Report of the Independent Registered Public Accounting Firm and the audited financial statements included in the Annual Report to Shareholders of each Selling Fund for the year ended September 30, 2023, and the unaudited financial statements included in the Semiannual Report to Shareholders of each Selling Fund for the period ended March 31, 2024. |
• | Each Selling Fund will transfer all of its assets to the corresponding Acquiring Fund in exchange for shares of that Acquiring Fund (“Merger Shares”) and the assumption by that Acquiring Fund of all of the Selling Fund’s liabilities. |
• | Each Acquiring Fund will issue Merger Shares with an aggregate net asset value equal to the aggregate value of the assets that it receives from its corresponding Selling Fund, less the liabilities it assumes from that corresponding Selling Fund. Shareholders of each class of each Selling Fund will receive a proportional distribution of shares of the same class of the corresponding Acquiring Fund. For example, holders of Class I shares of MassMutual Growth Opportunities Fund will receive Class I shares of MassMutual Blue Chip Growth Fund with the same aggregate net asset value as the aggregate net asset value of their MassMutual Growth Opportunities Fund Class I shares at the time of the Reorganizations. While the aggregate net asset value of your shares will not change as a result of the Reorganization, the number of shares you hold may differ (based upon the net asset value per share of the class of shares you receive). |
• | Each Reorganization is expected to qualify as a tax-free reorganization for U.S. federal income tax purposes assuming certain conditions are satisfied. Although each Reorganization is expected to be tax-free, i.e., no gains or losses are expected to be recognized by any of the Funds or their shareholders, fund mergers still have tax consequences, as a fund merger may affect how and when shareholders are taxed after a merger. The tax consequences of the Reorganizations are described in more detail in the section of the Combined Information Statement/Prospectus entitled “ADDITIONAL INFORMATION ABOUT EACH REORGANIZATION—Tax Status of the Reorganizations.” |
• | After a Reorganization is completed, Selling Fund shareholders will be shareholders of the corresponding Acquiring Fund, and the Selling Fund will be dissolved and will cease to operate as a series of a registered investment company. |
1 |
2 |
3 |
4 |
MassMutual Growth Opportunities Fund | MassMutual Blue Chip Growth Fund | ||
This Fund seeks long-term capital appreciation. | This Fund seeks growth of capital over the long term. | ||
5 |
6 |
MassMutual Growth Opportunities Fund (Current) (Selling Fund) | Class I | Class R5 | Service Class | Administrative Class | Class R4 | Class A | Class R3 | Class Y | ||||||||||||||||||
Maximum Sales Charge (Load) Imposed on Purchases (as a % of offering price) | None | None | None | None | None | 5.50% | None | None | ||||||||||||||||||
Maximum Deferred Sales Charge (Load) (as a % of the lower of the original offering price or redemption proceeds) | None | None | None | None | None | 1.00%(1) | None | None | ||||||||||||||||||
(1) | Applies only to certain redemptions of shares bought with no front-end sales charge. Class A shares purchased without a front-end sales charge in accounts aggregating $1 million or more may be subject to a 1.00% contingent deferred sales charge if the shares are tendered and accepted for repurchase within 18 months of purchase. The 18-month period begins on the day on which the purchase is made. |
MassMutual Blue Chip Growth Fund (Current) (Acquiring Fund) | Class I | Class R5 | Service Class | Administrative Class | Class R4 | Class A | Class R3 | Class Y | ||||||||||||||||||
Maximum Sales Charge (Load) Imposed on Purchases (as a % of offering price) | None | None | None | None | None | 5.50% | None | None | ||||||||||||||||||
Maximum Deferred Sales Charge (Load) (as a % of the lower of the original offering price or redemption proceeds) | None | None | None | None | None | 1.00%(1) | None | None | ||||||||||||||||||
(1) | Applies only to certain redemptions of shares bought with no front-end sales charge. Class A shares purchased without a front-end sales charge in accounts aggregating $1 million or more may be subject to a 1.00% contingent deferred sales charge if the shares are tendered and accepted for repurchase within 18 months of purchase. The 18-month period begins on the day on which the purchase is made. |
MassMutual Blue Chip Growth Fund (Pro Forma) (Combined Fund) | Class I | Class R5 | Service Class | Administrative Class | Class R4 | Class A | Class R3 | Class Y | ||||||||||||||||||
Maximum Sales Charge (Load) Imposed on Purchases (as a % of offering price) | None | None | None | None | None | 5.50% | None | None | ||||||||||||||||||
Maximum Deferred Sales Charge (Load) (as a % of the lower of the original offering price or redemption proceeds) | None | None | None | None | None | 1.00%(1) | None | None | ||||||||||||||||||
(1) | Applies only to certain redemptions of shares bought with no front-end sales charge. Class A shares purchased without a front-end sales charge in accounts aggregating $1 million or more may be subject to a 1.00% contingent deferred sales charge if the shares are tendered and accepted for repurchase within 18 months of purchase. The 18-month period begins on the day on which the purchase is made. |
7 |
MassMutual Growth Opportunities Fund (Current) | Class I | Class R5 | Service Class | Administrative Class | Class R4 | Class A | Class R3 | Class Y | ||||||||||||||||||
Management Fees | 0.71% | 0.71% | 0.71% | 0.71% | 0.71% | 0.71% | 0.71% | 0.71% | ||||||||||||||||||
Distribution and/or Service (12b-1) Fees | None | None | None | None | 0.25% | 0.25% | 0.50% | None | ||||||||||||||||||
Other Expenses | 0.14% | 0.24% | 0.34% | 0.44% | 0.34% | 0.39% | 0.34% | 0.24% | ||||||||||||||||||
Total Annual Fund Operating Expenses | 0.85% | 0.95% | 1.05% | 1.15% | 1.30% | 1.35% | 1.55% | 0.95% | ||||||||||||||||||
MassMutual Blue Chip Growth Fund (Current) | Class I | Class R5 | Service Class | Administrative Class | Class R4 | Class A | Class R3 | Class Y | ||||||||||||||||||
Management Fees | 0.62% | 0.62% | 0.62% | 0.62% | 0.62% | 0.62% | 0.62% | 0.62% | ||||||||||||||||||
Distribution and/or Service (12b-1) Fees | None | None | None | None | 0.25% | 0.25% | 0.50% | None | ||||||||||||||||||
Other Expenses | 0.03% | 0.13% | 0.23% | 0.33% | 0.23% | 0.28% | 0.23% | 0.13% | ||||||||||||||||||
Total Annual Fund Operating Expenses | 0.65% | 0.75% | 0.85% | 0.95% | 1.10% | 1.15% | 1.35% | 0.75% | ||||||||||||||||||
MassMutual Blue Chip Growth Fund (Pro Forma) (Combined Fund) | Class I | Class R5 | Service Class | Administrative Class | Class R4 | Class A | Class R3 | Class Y | ||||||||||||||||||
Management Fees | 0.61% | 0.61% | 0.61% | 0.61% | 0.61% | 0.61% | 0.61% | 0.61% | ||||||||||||||||||
Distribution and/or Service (12b-1) Fees | None | None | None | None | 0.25% | 0.25% | 0.50% | None | ||||||||||||||||||
Other Expenses | 0.03% | 0.13% | 0.23% | 0.33% | 0.23% | 0.28% | 0.23% | 0.13% | ||||||||||||||||||
Total Annual Fund Operating Expenses | 0.64% | 0.74% | 0.84% | 0.94% | 1.09% | 1.14% | 1.34% | 0.74% | ||||||||||||||||||
8 |
CLASS | 1 YEAR | 3 YEARS | 5 YEARS | 10 YEARS | ||||||||||
CLASS I | $87 | $ 271 | $471 | $ 1,049 | ||||||||||
CLASS R5 | $97 | $ 303 | $525 | $ 1,166 | ||||||||||
SERVICE CLASS | $ 107 | $ 334 | $579 | $ 1,283 | ||||||||||
ADMINISTRATIVE CLASS | $117 | $ 365 | $633 | $ 1,398 | ||||||||||
CLASS R4 | $ 132 | $ 412 | $713 | $ 1,568 | ||||||||||
CLASS A | $680 | $954 | $1,249 | $2,085 | ||||||||||
CLASS R3 | $158 | $490 | $845 | $1,845 | ||||||||||
CLASS Y | $97 | $303 | $525 | $1,166 | ||||||||||
CLASS | 1 YEAR | 3 YEARS | 5 YEARS | 10 YEARS | ||||||||||
CLASS I | $66 | $ 208 | $362 | $810 | ||||||||||
CLASS R5 | $77 | $ 240 | $417 | $930 | ||||||||||
SERVICE CLASS | $87 | $ 271 | $471 | $ 1,049 | ||||||||||
ADMINISTRATIVE CLASS | $97 | $ 303 | $525 | $ 1,166 | ||||||||||
CLASS R4 | $112 | $ 350 | $606 | $ 1,340 | ||||||||||
CLASS A | $ 661 | $ 895 | $ 1,148 | $ 1,871 | ||||||||||
CLASS R3 | $ 137 | $ 428 | $739 | $ 1,624 | ||||||||||
CLASS Y | $77 | $ 240 | $417 | $930 | ||||||||||
CLASS | 1 YEAR | 3 YEARS | 5 YEARS | 10 YEARS | ||||||||||
CLASS I | $65 | $ 205 | $357 | $798 | ||||||||||
CLASS R5 | $76 | $ 237 | $411 | $918 | ||||||||||
SERVICE CLASS | $86 | $ 268 | $466 | $ 1,037 | ||||||||||
ADMINISTRATIVE CLASS | $96 | $ 300 | $520 | $ 1,155 | ||||||||||
CLASS R4 | $111 | $ 347 | $601 | $ 1,329 | ||||||||||
CLASS A | $ 660 | $ 892 | $ 1,143 | $ 1,860 | ||||||||||
CLASS R3 | $ 136 | $ 425 | $734 | $ 1,613 | ||||||||||
CLASS Y | $76 | $ 237 | $411 | $918 | ||||||||||
9 |
Fund | Portfolio Turnover Rate |
MassMutual Growth Opportunities Fund | 29% |
MassMutual Blue Chip Growth Fund | 16% |
Risk | MassMutual Growth Opportunities Fund | MassMutual Blue Chip Growth Fund | ||||||
Cash Position Risk | ✔ | ✔ | ||||||
Convertible Securities Risk | ✔ | ✔ | ||||||
Equity Securities Risk | ✔ | ✔ | ||||||
Foreign Investment Risk; Emerging Markets Risk; Currency Risk | ✔ | ✔ | ||||||
Growth Company Risk | ✔ | ✔ | ||||||
Large Company Risk | ✔ | ✔ | ||||||
Liquidity Risk | ✔ | ✔ | ||||||
Management and Operational Risk | ✔ | ✔ | ||||||
Market Risk | ✔ | ✔ | ||||||
Non-Diversification Risk | ✔ | ✔ | ||||||
Preferred Stock Risk | ✔ | ✔ | ||||||
Sector Risk | ✔ | ✔ | ||||||
Small and Mid-Cap Company Risk | ✔ | ✔ | ||||||
Valuation Risk | ✔ | ✔ | ||||||
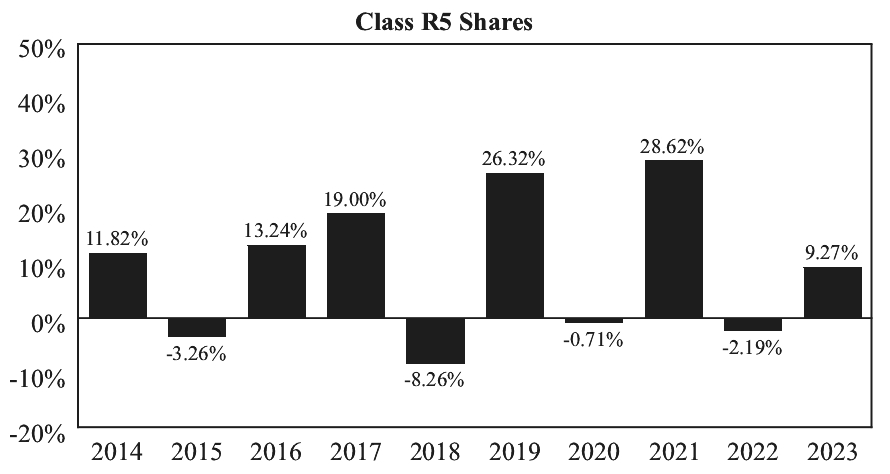
• | How the Acquiring Fund’s and the Selling Fund’s performance has varied for each full calendar year shown in the bar chart; and |
• | How the Acquiring Fund’s and the Selling Fund’s average annual total returns compare to certain measures of market performance shown in the table. |
10 |
1 YEAR | 5 YEARS | 10 YEARS | |||||||||
Class R5 | |||||||||||
Return Before Taxes | 48.00% | 12.47% | 10.05% | ||||||||
Return After Taxes on Distributions | 48.00% | 7.94% | 6.18% | ||||||||
Return After Taxes on Distributions and Sale of Fund Shares | 28.42% | 9.61% | 7.44% | ||||||||
Class I | |||||||||||
Return Before Taxes | 47.72% | 12.55% | 10.14% | ||||||||
Service Class | |||||||||||
Return Before Taxes | 47.78% | 12.35% | 9.93% | ||||||||
Administrative Class | |||||||||||
Return Before Taxes | 47.74% | 12.23% | 9.83% | ||||||||
Class R4 | |||||||||||
Return Before Taxes | 47.35% | 12.09% | 9.68% | ||||||||
Class A | |||||||||||
Return Before Taxes | 39.56% | 10.71% | 8.94% | ||||||||
Class R3 | |||||||||||
Return Before Taxes | 47.58% | 11.88% | 9.42% | ||||||||
Class Y | |||||||||||
Return Before Taxes | 47.75% | 12.43% | 10.03% | ||||||||
Russell 1000® Growth Index (reflects no deduction for fees, expenses, or taxes) | 42.68% | 19.50% | 14.86% | ||||||||
11 |
1 YEAR | 5 YEARS | 10 YEARS | |||||||||
Class R5 | |||||||||||
Return Before Taxes | 50.55% | 15.30% | 13.08% | ||||||||
Return After Taxes on Distributions | 43.74% | 11.86% | 10.33% | ||||||||
Return After Taxes on Distributions and Sale of Fund Shares | 34.63% | 12.00% | 10.24% | ||||||||
Class I | |||||||||||
Return Before Taxes | 50.60% | 15.41% | 13.18% | ||||||||
Service Class | |||||||||||
Return Before Taxes | 50.36% | 15.18% | 12.97% | ||||||||
Administrative Class | |||||||||||
Return Before Taxes | 50.25% | 15.08% | 12.86% | ||||||||
12 |
1 YEAR | 5 YEARS | 10 YEARS | |||||||||
Class R4 | |||||||||||
Return Before Taxes | 50.03% | 14.89% | 12.69% | ||||||||
Class A | |||||||||||
Return Before Taxes | 41.64% | 13.48% | 11.94% | ||||||||
Class R3 | |||||||||||
Return Before Taxes | 49.66% | 14.62% | 12.41% | ||||||||
Class Y | |||||||||||
Return Before Taxes | 50.61% | 15.31% | 13.08% | ||||||||
Russell 1000® Growth Index (reflects no deduction for fees, expenses, or taxes) | 42.68% | 19.50% | 14.86% | ||||||||
S&P 500 Index (reflects no deduction for fees, expenses, or taxes) | 26.29% | 15.69% | 12.03% | ||||||||
MassMutual Fundamental Value Fund | MassMutual Diversified Value Fund | ||
The Fund seeks long-term total return. | This Fund seeks to achieve long-term growth of capital and income by investing primarily in a diversified portfolio of equity securities of larger, well-established companies. | ||
13 |
14 |
15 |
MassMutual Fundamental Value Fund (Current) (Selling Fund) | Class I | Class R5 | Service Class | Administrative Class | Class R4 | Class A | Class R3 | Class Y | ||||||||||||||||||
Maximum Sales Charge (Load) Imposed on Purchases (as a % of offering price) | None | None | None | None | None | 5.50% | None | None | ||||||||||||||||||
Maximum Deferred Sales Charge (Load) (as a % of the lower of the original offering price or redemption proceeds) | None | None | None | None | None | 1.00%(1) | None | None | ||||||||||||||||||
(1) | Applies only to certain redemptions of shares bought with no front-end sales charge. Class A shares purchased without a front-end sales charge in accounts aggregating $1 million or more may be subject to a 1.00% contingent deferred sales charge if the shares are tendered and accepted for repurchase within 18 months of purchase. The 18-month period begins on the day on which the purchase is made. |
MassMutual Diversified Value Fund (Current) (Acquiring Fund) | Class I | Class R5 | Service Class | Administrative Class | Class R4 | Class A | Class R3 | Class Y | ||||||||||||||||||
Maximum Sales Charge (Load) Imposed on Purchases (as a % of offering price) | None | None | None | None | None | 5.50% | None | None | ||||||||||||||||||
Maximum Deferred Sales Charge (Load) (as a % of the lower of the original offering price or redemption proceeds) | None | None | None | None | None | 1.00%(1) | None | None | ||||||||||||||||||
(1) | Applies only to certain redemptions of shares bought with no front-end sales charge. Class A shares purchased without a front-end sales charge in accounts aggregating $1 million or more may be subject to a 1.00% contingent deferred sales charge if the shares are tendered and accepted for repurchase within 18 months of purchase. The 18-month period begins on the day on which the purchase is made. |
16 |
MassMutual Diversified Value Fund (Pro Forma) (Combined Fund) | Class I | Class R5 | Service Class | Administrative Class | Class R4 | Class A | Class R3 | Class Y | ||||||||||||||||||
Maximum Sales Charge (Load) Imposed on Purchases (as a % of offering price) | None | None | None | None | None | 5.50% | None | None | ||||||||||||||||||
Maximum Deferred Sales Charge (Load) (as a % of the lower of the original offering price or redemption proceeds) | None | None | None | None | None | 1.00%(1) | None | None | ||||||||||||||||||
(1) | Applies only to certain redemptions of shares bought with no front-end sales charge. Class A shares purchased without a front-end sales charge in accounts aggregating $1 million or more may be subject to a 1.00% contingent deferred sales charge if the shares are tendered and accepted for repurchase within 18 months of purchase. The 18-month period begins on the day on which the purchase is made. |
MassMutual Fundamental Value Fund (Current) | Class I | Class R5 | Service Class | Administrative Class | Class R4 | Class A | Class R3 | Class Y | ||||||||||||||||||
Management Fees | 0.60% | 0.60% | 0.60% | 0.60% | 0.60% | 0.60% | 0.60% | 0.60% | ||||||||||||||||||
Distribution and/or Service (12b-1) Fees | None | None | None | None | 0.25% | 0.25% | 0.50% | None | ||||||||||||||||||
Other Expenses | 0.08% | 0.18% | 0.28% | 0.38% | 0.28% | 0.33% | 0.28% | 0.18% | ||||||||||||||||||
Total Annual Fund Operating Expenses | 0.68% | 0.78% | 0.88% | 0.98% | 1.13% | 1.18% | 1.38% | 0.78% | ||||||||||||||||||
MassMutual Diversified Value Fund (Current) | Class I | Class R5 | Service Class | Administrative Class | Class R4 | Class A | Class R3 | Class Y | ||||||||||||||||||
Management Fees | 0.50% | 0.50% | 0.50% | 0.50% | 0.50% | 0.50% | 0.50% | 0.50% | ||||||||||||||||||
Distribution and/or Service (12b-1) Fees | None | None | None | None | 0.25% | 0.25% | 0.50% | None | ||||||||||||||||||
Other Expenses | 0.11% | 0.21% | 0.31% | 0.41% | 0.31% | 0.36% | 0.31% | 0.21% | ||||||||||||||||||
Total Annual Fund Operating Expenses | 0.61% | 0.71% | 0.81% | 0.91% | 1.06% | 1.11% | 1.31% | 0.71% | ||||||||||||||||||
MassMutual Diversified Value Fund (Pro Forma) (Combined Fund) | Class I | Class R5 | Service Class | Administrative Class | Class R4 | Class A | Class R3 | Class Y | ||||||||||||||||||
Management Fees | 0.49% | 0.49% | 0.49% | 0.49% | 0.49% | 0.49% | 0.49% | 0.49% | ||||||||||||||||||
Distribution and/or Service (12b-1) Fees | None | None | None | None | 0.25% | 0.25% | 0.50% | None | ||||||||||||||||||
Other Expenses | 0.10% | 0.20% | 0.30% | 0.40% | 0.30% | 0.35% | 0.30% | 0.20% | ||||||||||||||||||
Total Annual Fund Operating Expenses | 0.59% | 0.69% | 0.79% | 0.89% | 1.04% | 1.09% | 1.29% | 0.69% | ||||||||||||||||||
17 |
CLASS | 1 YEAR | 3 YEARS | 5 YEARS | 10 YEARS | ||||||||||
CLASS I | $69 | $ 218 | $379 | $847 | ||||||||||
CLASS R5 | $80 | $ 249 | $433 | $966 | ||||||||||
SERVICE CLASS | $90 | $ 281 | $488 | $ 1,084 | ||||||||||
ADMINISTRATIVE CLASS | $ 100 | $ 312 | $542 | $ 1,201 | ||||||||||
CLASS R4 | $115 | $ 359 | $622 | $ 1,375 | ||||||||||
CLASS A | $ 664 | $ 904 | $ 1,163 | $ 1,903 | ||||||||||
CLASS R3 | $ 140 | $ 437 | $755 | $ 1,657 | ||||||||||
CLASS Y | $80 | $249 | $433 | $966 | ||||||||||
CLASS | 1 YEAR | 3 YEARS | 5 YEARS | 10 YEARS | ||||||||||
CLASS I | $62 | $ 195 | $340 | $762 | ||||||||||
CLASS R5 | $73 | $ 227 | $395 | $883 | ||||||||||
SERVICE CLASS | $83 | $ 259 | $450 | $ 1,002 | ||||||||||
ADMINISTRATIVE CLASS | $93 | $ 290 | $504 | $ 1,120 | ||||||||||
CLASS R4 | $ 108 | $ 337 | $585 | $ 1,294 | ||||||||||
CLASS A | $ 657 | $ 883 | $ 1,128 | $ 1,827 | ||||||||||
CLASS R3 | $ 133 | $ 415 | $718 | $ 1,579 | ||||||||||
CLASS Y | $73 | $ 227 | $395 | $883 | ||||||||||
CLASS | 1 YEAR | 3 YEARS | 5 YEARS | 10 YEARS | ||||||||||
CLASS I | $60 | $ 189 | $329 | $738 | ||||||||||
CLASS R5 | $70 | $ 221 | $384 | $859 | ||||||||||
SERVICE CLASS | $81 | $ 252 | $439 | $978 | ||||||||||
ADMINISTRATIVE CLASS | $91 | $ 284 | $493 | $ 1,096 | ||||||||||
CLASS R4 | $ 106 | $ 331 | $574 | $ 1,271 | ||||||||||
CLASS A | $ 655 | $ 878 | $ 1,118 | $ 1,806 | ||||||||||
CLASS R3 | $ 131 | $ 409 | $708 | $ 1,556 | ||||||||||
CLASS Y | $70 | $ 221 | $384 | $859 | ||||||||||
18 |
Fund | Portfolio Turnover Rate |
MassMutual Fundamental Value Fund | 34% |
MassMutual Diversified Value Fund | 45% |
Risk | MassMutual Fundamental Value Fund | MassMutual Diversified Value Fund | ||||||
Cash Position Risk | ✔ | ✔ | ||||||
Convertible Securities Risk | ✔ | ✔ | ||||||
Derivatives Risk | ✔ | |||||||
Equity Securities Risk | ✔ | ✔ | ||||||
Foreign Investment Risk; Emerging Markets Risk; Currency Risk | ✔ | ✔ | ||||||
Hedging Risk | ✔ | |||||||
Large Company Risk | ✔ | ✔ | ||||||
Liquidity Risk | ✔ | ✔ | ||||||
Management and Operational Risk | ✔ | ✔ | ||||||
Market Risk | ✔ | ✔ | ||||||
Preferred Stock Risk | ✔ | |||||||
Quantitative Models Risk | ✔ | |||||||
Restricted Securities Risk | ✔ | |||||||
Sector Risk | ✔ | ✔ | ||||||
Small and Mid-Cap Company Risk | ✔ | |||||||
Valuation Risk | ✔ | ✔ | ||||||
Value Company Risk | ✔ | ✔ | ||||||
19 |
• | How the Acquiring Fund’s and the Selling Fund’s performance has varied for each full calendar year shown in the bar chart; and |
• | How the Acquiring Fund’s and the Selling Fund’s average annual total returns compare to certain measures of market performance shown in the table. |
20 |
1 YEAR | 5 YEARS | 10 YEARS | |||||||||
Class R5 | |||||||||||
Return Before Taxes | 11.58% | 11.84% | 8.19% | ||||||||
Return After Taxes on Distributions | 9.19% | 8.81% | 5.16% | ||||||||
Return After Taxes on Distributions and Sale of Fund Shares | 8.50% | 9.06% | 5.92% | ||||||||
Class I | |||||||||||
Return Before Taxes | 11.60% | 11.95% | 8.30% | ||||||||
Service Class | |||||||||||
Return Before Taxes | 11.34% | 11.71% | 8.08% | ||||||||
Administrative Class | |||||||||||
Return Before Taxes | 11.34% | 11.62% | 7.98% | ||||||||
Class R4 | |||||||||||
Return Before Taxes | 11.17% | 11.45% | 7.82% | ||||||||
Class A | |||||||||||
Return Before Taxes | 4.90% | 10.10% | 7.10% | ||||||||
Class R3 | |||||||||||
Return Before Taxes | 10.82% | 11.17% | 7.55% | ||||||||
Class Y | |||||||||||
Return Before Taxes | 11.50% | 11.83% | 8.19% | ||||||||
Russell 1000 Value Index (reflects no deduction for fees, expenses, or taxes) | 11.46% | 10.91% | 8.40% | ||||||||
21 |
1 YEAR | 5 YEARS | 10 YEARS | |||||||||
Class R5 | |||||||||||
Return Before Taxes | 9.27% | 11.51% | 8.71% | ||||||||
Return After Taxes on Distributions | 7.99% | 9.44% | 6.28% | ||||||||
Return After Taxes on Distributions and Sale of Fund Shares | 6.37% | 8.90% | 6.53% | ||||||||
Class I | |||||||||||
Return Before Taxes | 9.43% | 11.61% | 8.81% | ||||||||
Service Class | |||||||||||
Return Before Taxes | 9.17% | 11.39% | 8.60% | ||||||||
Administrative Class | |||||||||||
Return Before Taxes | 9.16% | 11.29% | 8.50% | ||||||||
Class R4 | |||||||||||
Return Before Taxes | 8.94% | 11.12% | 8.34% | ||||||||
Class A | |||||||||||
Return Before Taxes | 2.90% | 9.76% | 7.62% | ||||||||
Class R3 | |||||||||||
Return Before Taxes | 8.67% | 10.83% | 8.05% | ||||||||
Class Y | |||||||||||
Return Before Taxes | 9.30% | 11.52% | 8.71% | ||||||||
Russell 1000 Value Index (reflects no deduction for fees, expenses, or taxes) | 11.46% | 10.91% | 8.40% | ||||||||
22 |
MassMutual Strategic Bond Fund | MassMutual Core Bond Fund | ||
This Fund seeks a superior total rate of return by investing in fixed income instruments. | This Fund seeks to achieve a high total rate of return consistent with prudent investment risk and the preservation of capital by investing primarily in a diversified portfolio of investment grade fixed income securities. | ||
23 |
24 |
• | MassMutual Strategic Bond Fund may invest up to 25% of the portfolio in below investment grade debt securities, while the MassMutual Core Bond Fund is limited to 5%. MassMutual Strategic Bond Fund’s exposure to below investment grade debt securities as of March 31, 2024 was 6.6% of total assets. |
• | MassMutual Strategic Bond Fund’s effective duration is normally expected to be between three and nine years, while MassMutual Core Bond Fund’s effective duration is normally expected to generally match (within 10%) the average duration of the Bloomberg U.S. Aggregate Bond Index. As of March 31, 2024, the MassMutual Strategic Bond Fund’s effective duration was 7.71 years, while the MassMutual Core Bond Fund’s effective duration was 5.92 years. |
25 |
26 |
MassMutual Strategic Bond Fund (Current) (Selling Fund) | Class I | Class R5 | Service Class | Administrative Class | Class R4 | Class A | Class R3 | Class Y | ||||||||||||||||||
Maximum Sales Charge (Load) Imposed on Purchases (as a % of offering price) | None | None | None | None | None | 4.25% | None | None | ||||||||||||||||||
Maximum Deferred Sales Charge (Load) (as a % of the lower of the original offering price or redemption proceeds) | None | None | None | None | None | 1.00%(1) | None | None | ||||||||||||||||||
(1) | Applies only to certain redemptions of shares bought with no front-end sales charge. Class A shares purchased without a front-end sales charge in accounts aggregating $1 million or more may be subject to a 1.00% contingent deferred sales charge if the shares are tendered and accepted for repurchase within 18 months of purchase. The 18-month period begins on the day on which the purchase is made. |
MassMutual Core Bond Fund (Current) (Acquiring Fund) | Class I | Class R5 | Service Class | Administrative Class | Class R4 | Class A | Class R3 | Class Y | ||||||||||||||||||
Maximum Sales Charge (Load) Imposed on Purchases (as a % of offering price) | None | None | None | None | None | 4.25% | None | None | ||||||||||||||||||
Maximum Deferred Sales Charge (Load) (as a % of the lower of the original offering price or redemption proceeds) | None | None | None | None | None | 1.00%(1) | None | None | ||||||||||||||||||
(1) | Applies only to certain redemptions of shares bought with no front-end sales charge. Class A shares purchased without a front-end sales charge in accounts aggregating $1 million or more may be subject to a 1.00% contingent deferred sales charge if the shares are tendered and accepted for repurchase within 18 months of purchase. The 18-month period begins on the day on which the purchase is made. |
MassMutual Core Bond Fund (Pro Forma) (Combined Fund) | Class I | Class R5 | Service Class | Administrative Class | Class R4 | Class A | Class R3 | Class Y | ||||||||||||||||||
Maximum Sales Charge (Load) Imposed on Purchases (as a % of offering price) | None | None | None | None | None | 4.25% | None | None | ||||||||||||||||||
Maximum Deferred Sales Charge (Load) (as a % of the lower of the original offering price or redemption proceeds) | None | None | None | None | None | 1.00%(1) | None | None | ||||||||||||||||||
(1) | Applies only to certain redemptions of shares bought with no front-end sales charge. Class A shares purchased without a front-end sales charge in accounts aggregating $1 million or more may be subject to a 1.00% contingent deferred sales charge if the shares are tendered and accepted for repurchase within 18 months of purchase. The 18-month period begins on the day on which the purchase is made. |
27 |
MassMutual Strategic Bond Fund (Current) | Class I | Class R5 | Service Class | Administrative Class | Class R4 | Class A | Class R3 | Class Y | ||||||||||||||||||
Management Fees | 0.40% | 0.40% | 0.40% | 0.40% | 0.40% | 0.40% | 0.40% | 0.40% | ||||||||||||||||||
Distribution and/or Service (12b-1) Fees | None | None | None | None | 0.25% | 0.25% | 0.50% | None | ||||||||||||||||||
Other Expenses | 0.16% | 0.26% | 0.36% | 0.46% | 0.36% | 0.41% | 0.36% | 0.26% | ||||||||||||||||||
Total Annual Fund Operating Expenses | 0.56% | 0.66% | 0.76% | 0.86% | 1.01% | 1.06% | 1.26% | 0.66% | ||||||||||||||||||
MassMutual Core Bond Fund (Current) | Class I | Class R5 | Service Class | Administrative Class | Class R4 | Class A | Class R3 | Class Y | ||||||||||||||||||
Management Fees | 0.38% | 0.38% | 0.38% | 0.38% | 0.38% | 0.38% | 0.38% | 0.38% | ||||||||||||||||||
Distribution and/or Service (12b-1) Fees | None | None | None | None | 0.25% | 0.25% | 0.50% | None | ||||||||||||||||||
Other Expenses | 0.07% | 0.17% | 0.27% | 0.37% | 0.27% | 0.32% | 0.27% | 0.17% | ||||||||||||||||||
Total Annual Fund Operating Expenses | 0.45% | 0.55% | 0.65% | 0.75% | 0.90% | 0.95% | 1.15% | 0.55% | ||||||||||||||||||
Expense Reimbursement | (0.03%) | (0.03%) | (0.03%) | (0.03%) | (0.03%) | (0.03%) | (0.03%) | (0.03%) | ||||||||||||||||||
Total Annual Fund Operating Expenses after Expense Reimbursement | 0.42% | 0.52% | 0.62% | 0.72% | 0.87% | 0.92% | 1.12% | 0.52% | ||||||||||||||||||
MassMutual Core Bond Fund (Pro Forma) (Combined Fund) | Class I | Class R5 | Service Class | Administrative Class | Class R4 | Class A | Class R3 | Class Y | ||||||||||||||||||
Management Fees | 0.38% | 0.38% | 0.38% | 0.38% | 0.38% | 0.38% | 0.38% | 0.38% | ||||||||||||||||||
Distribution and/or Service (12b-1) Fees | None | None | None | None | 0.25% | 0.25% | 0.50% | None | ||||||||||||||||||
Other Expenses | 0.07% | 0.17% | 0.27% | 0.37% | 0.27% | 0.32% | 0.27% | 0.17% | ||||||||||||||||||
Total Annual Fund Operating Expenses | 0.45% | 0.55% | 0.65% | 0.75% | 0.90% | 0.95% | 1.15% | 0.55% | ||||||||||||||||||
Expense Reimbursement | (0.03%) | (0.03%) | (0.03%) | (0.03%) | (0.03%) | (0.03%) | (0.03%) | (0.03%) | ||||||||||||||||||
Total Annual Fund Operating Expenses after Expense Reimbursement | 0.42% | 0.52% | 0.62% | 0.72% | 0.87% | 0.92% | 1.12% | 0.52% | ||||||||||||||||||
28 |
CLASS | 1 YEAR | 3 YEARS | 5 YEARS | 10 YEARS | ||||||||||
CLASS I | $57 | $ 179 | $ 313 | $701 | ||||||||||
CLASS R5 | $67 | $211 | $ 368 | $822 | ||||||||||
SERVICE CLASS | $78 | $ 243 | $ 422 | $942 | ||||||||||
ADMINISTRATIVE CLASS | $88 | $ 274 | $ 477 | $ 1,061 | ||||||||||
CLASS R4 | $ 103 | $ 322 | $ 558 | $ 1,236 | ||||||||||
CLASS A | $ 528 | $ 748 | $ 985 | $ 1,664 | ||||||||||
CLASS R3 | $ 128 | $ 400 | $ 692 | $ 1,523 | ||||||||||
CLASS Y | $67 | $211 | $ 368 | $822 | ||||||||||
CLASS | 1 YEAR | 3 YEARS | 5 YEARS | 10 YEARS | ||||||||||
CLASS I | $43 | $ 141 | $ 249 | $564 | ||||||||||
CLASS R5 | $53 | $ 173 | $ 304 | $686 | ||||||||||
SERVICE CLASS | $63 | $ 205 | $ 359 | $808 | ||||||||||
ADMINISTRATIVE CLASS | $74 | $ 237 | $ 414 | $928 | ||||||||||
CLASS R4 | $89 | $ 284 | $ 496 | $ 1,105 | ||||||||||
CLASS A | $ 515 | $ 712 | $ 925 | $ 1,539 | ||||||||||
CLASS R3 | $114 | $ 362 | $ 630 | $ 1,395 | ||||||||||
CLASS Y | $53 | $ 173 | $ 304 | $686 | ||||||||||
29 |
Fund | Portfolio Turnover Rate |
MassMutual Strategic Bond Fund | 175% |
MassMutual Core Bond Fund | 206% |
Risk | MassMutual Strategic Bond Fund | MassMutual Core Bond Fund | ||||||
Bank Loans Risk | ✔ | |||||||
Below Investment Grade Debt Securities Risk | ✔ | |||||||
Cash Position Risk | ✔ | ✔ | ||||||
Credit Risk | ✔ | ✔ | ||||||
Defaulted and Distressed Securities Risk | ✔ | ✔ | ||||||
Derivatives Risk | ✔ | ✔ | ||||||
Dollar Roll and Reverse Repurchase AgreementTransaction Risk | ✔ | |||||||
Fixed Income Securities Risk | ✔ | ✔ | ||||||
Foreign Investment Risk; Emerging Markets Risk; Currency Risk | ✔ | ✔ | ||||||
Frequent Trading/Portfolio Turnover Risk | ✔ | ✔ | ||||||
Hedging Risk | ✔ | ✔ | ||||||
Inflation Risk | ✔ | ✔ | ||||||
Leveraging Risk | ✔ | ✔ | ||||||
LIBOR Transition and Other Reference Benchmarks Risk | ✔ | ✔ | ||||||
Liquidity Risk | ✔ | ✔ | ||||||
Management and Operational Risk | ✔ | ✔ | ||||||
Market Risk | ✔ | ✔ | ||||||
Mortgage- and Asset-Backed Securities Risk | ✔ | ✔ | ||||||
Reinvestment Risk | ✔ | ✔ | ||||||
Repurchase Agreement Risk | ✔ | |||||||
Restricted Securities Risk | ✔ | |||||||
Risk of Investment in Other Funds or Pools | ✔ | |||||||
Sector Risk | ✔ | ✔ | ||||||
30 |
Risk | MassMutual Strategic Bond Fund | MassMutual Core Bond Fund | ||||||
Sovereign Debt Obligations Risk | ✔ | |||||||
U.S. Government Securities Risk | ✔ | ✔ | ||||||
Valuation Risk | ✔ | ✔ | ||||||
When-Issued, Delayed Delivery, TBA, and Forward Commitment Transaction Risk | ✔ | ✔ | ||||||
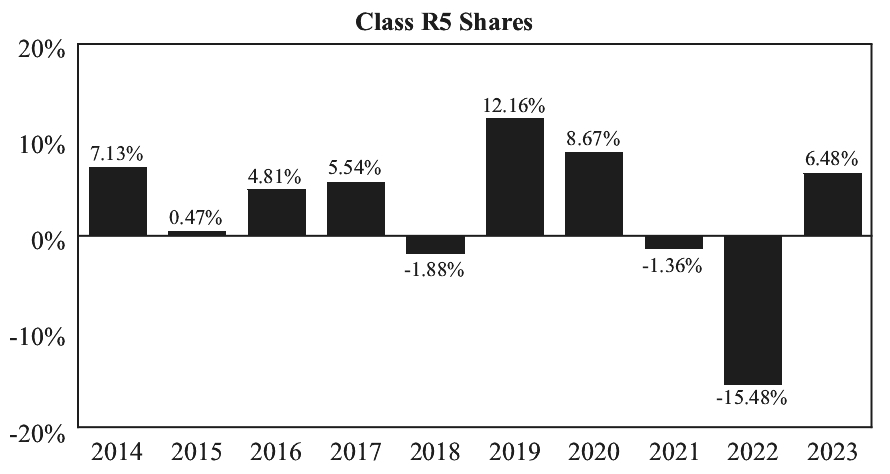
• | How the Acquiring Fund’s and the Selling Fund’s performance has varied for each full calendar year shown in the bar chart; and |
• | How the Acquiring Fund’s and the Selling Fund’s average annual total returns compare to certain measures of market performance shown in the table. |
31 |
1 YEAR | 5 YEARS | 10 YEARS | |||||||||
Class R5 | |||||||||||
Return Before Taxes | 6.48% | 1.59% | 2.37% | ||||||||
Return After Taxes on Distributions | 4.69% | 0.02% | 0.97% | ||||||||
Return After Taxes on Distributions and Sale of Fund Shares | 3.82% | 0.69% | 1.28% | ||||||||
Class I | |||||||||||
Return Before Taxes | 6.73% | 1.70% | 2.47% | ||||||||
Service Class | |||||||||||
Return Before Taxes | 6.44% | 1.48% | 2.27% | ||||||||
Administrative Class | |||||||||||
Return Before Taxes | 6.25% | 1.38% | 2.16% | ||||||||
Class R4 | |||||||||||
Return Before Taxes | 6.12% | 1.23% | 2.01% | ||||||||
Class A | |||||||||||
Return Before Taxes | 1.62% | 0.26% | 1.47% | ||||||||
Class R3 | |||||||||||
Return Before Taxes | 5.95% | 0.98% | 1.75% | ||||||||
Class Y | |||||||||||
Return Before Taxes | 6.44% | 1.59% | 2.37% | ||||||||
Bloomberg U.S. Aggregate Bond Index (reflects no deduction for fees, expenses, or taxes) | 5.53% | 1.10% | 1.81% | ||||||||
32 |
1 YEAR | 5 YEARS | 10 YEARS | |||||||||
Class R5 | |||||||||||
Return Before Taxes | 6.63% | 1.55% | 1.98% | ||||||||
Return After Taxes on Distributions | 4.65% | -0.11% | 0.44% | ||||||||
Return After Taxes on Distributions and Sale of Fund Shares | 3.89% | 0.56% | 0.89% | ||||||||
Class I | |||||||||||
Return Before Taxes | 6.72% | 1.65% | 2.08% | ||||||||
Service Class | |||||||||||
Return Before Taxes | 6.58% | 1.45% | 1.88% | ||||||||
Administrative Class | |||||||||||
Return Before Taxes | 6.39% | 1.33% | 1.77% | ||||||||
Class R4 | |||||||||||
Return Before Taxes | 6.28% | 1.18% | 1.62% | ||||||||
Class A | |||||||||||
Return Before Taxes | 1.54% | 0.21% | 1.08% | ||||||||
Class R3 | |||||||||||
Return Before Taxes | 6.00% | 0.95% | 1.38% | ||||||||
Class Y | |||||||||||
Return Before Taxes | 6.46% | 1.53% | 1.96% | ||||||||
Bloomberg U.S. Aggregate Bond Index (reflects no deduction for fees, expenses, or taxes) | 5.53% | 1.10% | 1.81% | ||||||||
33 |
34 |
• | Each Reorganization is expected to occur on or around September 23, 2024, subject to receipt of any necessary third-party consents and regulatory approvals and satisfaction of any other conditions to closing. However, following such approvals, each Reorganization may happen at any time agreed to by the applicable Selling Fund and the corresponding Acquiring Fund. |
• | Each Selling Fund will transfer all of its assets to the corresponding Acquiring Fund and, in exchange, the corresponding Acquiring Fund will assume all of the Selling Fund’s liabilities and will issue Merger Shares to the Selling Fund. The value of each Selling Fund’s assets, as well as the number of Merger Shares to be issued to the Selling Fund, will be determined in accordance with the Agreement. The Merger Shares will have a net asset value per share computed as of the close of business on the New York Stock Exchange on the business day immediately preceding the closing date, using the valuation procedures of the Acquiring Fund in a manner consistent with the Acquiring Fund’s then-current prospectus and statement of additional information. On or soon after the closing date of the applicable Reorganization, each Selling Fund will liquidate, and shareholders of each class of each Selling Fund will receive a proportional distribution of Merger Shares of the same class of the corresponding Acquiring Fund. As a result, shareholders of the Selling Fund will become shareholders of the Acquiring Fund. No shareholders of any Selling Fund will pay any sales charges, commissions, or transaction fees in connection with its Reorganization. Each Selling Fund is expected to bear the direct merger costs, legal fees, audit fees, Form N-14 printing and mailing costs, as well as similar expenses incurred in connection with the consummation of the Reorganization and transaction costs (if any) associated with repositioning the Selling Fund prior to the Reorganization. Each Acquiring Fund will bear a one-time cost for administratively processing the Reorganization. |
• | The net asset value of each Selling Fund and the corresponding Acquiring Fund will be computed as of the close of regular trading on the New York Stock Exchange on the business day immediately preceding the closing date of the applicable Reorganization. |
• | The Selling Fund in each Reorganization will have declared a dividend or dividends, which, together with all previous such dividends, shall have the effect of distributing to the Selling Fund shareholders (a) (i) all of the excess of (x) the Selling Fund’s interest income excludable from gross income under Section 103 of the Code over (y) the Selling Fund’s deductions disallowed under Sections 265 and 171 of the Code, (ii) all of the Selling Fund’s investment company taxable income as defined in Section 852 of the Code (computed without regard to any deduction for dividends paid), and (iii) all of the Selling Fund’s net capital gain realized (after reduction for any capital loss carryover), in each case for both the current year (which will end on the closing date) and, if still timely under Section 855 of the Code, the immediately preceding taxable year; and (b) such additional amount, if any, as is necessary to eliminate any liability of the Selling Fund for excise tax under Section 4982 of the Code. |
• | The Selling Fund and the corresponding Acquiring Fund will have received all required consents of other parties and all other consents, orders, and permits of federal, state, and local regulatory authorities to permit consummation of the Reorganization, except where failure to obtain any such consent, order, or permit would not involve a risk of a material adverse effect on the assets or properties of the Acquiring Fund or the Selling Fund. |
35 |
• | A registration statement on Form N-14 relating to the Reorganization will have been filed with the SEC and become effective. |
• | The Selling Fund and the corresponding Acquiring Fund will have received an opinion of counsel to the effect that the Merger Shares are duly authorized and upon transfer and delivery to the Selling Fund’s shareholders will be validly issued and, assuming receipt by the Acquiring Fund of all of the assets of the Selling Fund, fully paid and nonassessable shares in the Acquiring Fund. |
• | The Selling Fund and the corresponding Acquiring Fund will have received an opinion of tax counsel substantially to the effect that, as described in more detail in the section entitled “Tax Status of the Reorganizations,” the shareholders of the Selling Fund will not recognize gain or loss for U.S. federal income tax purposes upon the exchange of their Selling Fund shares for the Merger Shares of the corresponding Acquiring Fund in connection with the Reorganization, and the Selling Fund generally will not recognize gain or loss as a direct result of the Reorganization. |
• | The transfer of all of the assets of the Selling Fund (the “acquired assets”) in exchange for Merger Shares and the assumption by the Acquiring Fund of all of the liabilities of the Selling Fund (the “assumed liabilities”) followed by the distribution of the Merger Shares pro rata to the Selling Fund shareholders will constitute a “reorganization” within the meaning of Section 368(a) of the Code, and the Acquiring Fund and the Selling Fund will each be a “party to a reorganization” within the meaning of Section 368(b) of the Code. |
• | Under Section 1032 of the Code, no gain or loss will be recognized by the Acquiring Fund upon the receipt of the assets of the Selling Fund solely in exchange for the Merger Shares and the assumption by the Acquiring Fund of the assumed liabilities. |
• | Under Sections 361 and 357 of the Code, no gain or loss will be recognized by the Selling Fund with respect to the acquired assets in connection with the transfer of the acquired assets to the Acquiring Fund in exchange for the Merger Shares and the assumption by the Acquiring Fund of the assumed liabilities, or with respect to the distribution of the Merger Shares to Selling Fund shareholders as consideration for their shares of the Selling Fund, except for (A) any gain or loss recognized on (1) “Section 1256 contracts” as defined in Section 1256(b) of the Code or (2) stock in a “passive foreign investment company” as defined in Section 1297(a) of the Code, and (B) any other gain or loss required to be recognized by reason of the Reorganization (1) as a result of the closing, if any, of the tax year of the Selling Fund, (2) upon the termination of a position, or (3) upon the transfer of such asset regardless of whether such a transfer would otherwise be a nontaxable transaction under the Code. |
• | Under Section 354 of the Code, no gain or loss will be recognized by the Selling Fund shareholders upon their receipt of the Merger Shares solely in exchange for Selling Fund shares. |
• | Under Section 358 of the Code, the aggregate tax basis for the Merger Shares received by each Selling Fund shareholder will be the same as the aggregate tax basis of the Selling Fund shares held by such shareholder |
36 |
• | Under Section 362(b) of the Code, the tax basis of the Selling Fund assets acquired by the Acquiring Fund will be the same as the tax basis of such assets to the Selling Fund immediately prior to the Reorganization, adjusted for any gain or loss required to be recognized as described above, and under Section 1223(2) of the Code the holding period of the assets of the Selling Fund in the hands of the Acquiring Fund, other than certain assets with respect to which gain or loss is required to be recognized as described above, will include the period during which those assets were held by the Selling Fund. |
• | The Acquiring Fund will succeed to and take into account the items of the Selling Fund described in Section 381(c) of the Code, subject to the conditions and limitations specified in Sections 381, 382, 383, and 384 of the Code and the Treasury Regulations thereunder. |
37 |
Reorganization | Capital loss carryforwards (as of 3/31/24) | Capital loss carryforwards as % of net assets (as of 3/31/24) | Net unrealized gains (losses) (as of 3/31/24) | Net unrealized gains (losses) as % of net assets (as of 3/31/24) | |||||||||||||
#1. Reorganization of MassMutual Growth Opportunities Fund into MassMutual Blue Chip Growth Fund | Selling Fund | N/A* | N/A | $47,157,715 | 31% | ||||||||||||
Acquiring Fund | N/A* | N/A | $1,131,391,402 | 43% | |||||||||||||
#2. Reorganization of MassMutual Fundamental Value Fund into MassMutual Diversified Value Fund | Selling Fund | N/A* | N/A | $114,529,595 | 25% | ||||||||||||
Acquiring Fund | N/A* | N/A | $47,958,141 | 22% | |||||||||||||
38 |
Reorganization | Capital loss carryforwards (as of 3/31/24) | Capital loss carryforwards as % of net assets (as of 3/31/24) | Net unrealized gains (losses) (as of 3/31/24) | Net unrealized gains (losses) as % of net assets (as of 3/31/24) | |||||||||||||
#3. Reorganization of MassMutual Strategic Bond Fund into MassMutual Core Bond Fund | Selling Fund | $(65,511,139) | -16% | ($17,132,651) | -4% | ||||||||||||
Acquiring Fund | $(101,794,631) | -16% | ($51,276,844) | -8% | |||||||||||||
* | Funds are in an overall gain position as of 3/31/24, and there are no capital loss carryforwards from 9/30/23. |
1. | the potential benefits of the Reorganization to the shareholders of the Selling Fund; |
2. | the Reorganization as part of MML Advisers’ overall commitment to streamline and improve its fund offerings for the benefit of Fund shareholders; |
3. | the continuity of the investment program of the Selling Fund in light of the comparable or substantially similar investment objectives, and comparable or substantially similar investment strategies of the Selling Fund and the corresponding Acquiring Fund; |
4. | the operating expenses that shareholders of each class of shares of the Selling Fund and Acquiring Fund are expected to experience as shareholders of the combined Fund after the Reorganization relative to the operating |
39 |
5. | MML Advisers’ representation that the Selling Funds are too small to be economically viable and have limited prospects to grow to sufficient size in the near term, absent the Reorganization, as well as the Acquiring Fund’s gross expenses and relative prospects for attracting additional assets after the Reorganization; |
6. | the current assets of the Selling Fund and the Acquiring Fund, and that the shareholders of the Selling Fund may benefit from the opportunity to be a shareholder in a larger, combined Fund, bringing administrative efficiencies that will reduce gross expenses; |
7. | the fact that the existing investment adviser, subadviser(s), sub-subadviser (if any), and portfolio management team of the Acquiring Fund is expected to remain responsible for the Acquiring Fund; |
8. | the historical performance of the Selling Fund and corresponding Acquiring Fund, recognizing that no assurances can be given that the Acquiring Fund will achieve any particular level of performance after the Reorganization; |
9. | the anticipated tax-free nature of the exchange of shares in the Reorganization, and other expected U.S. federal income tax consequences of the Reorganization, including potential limitations on the Combined Fund’s use of a Fund’s pre-acquisition losses for U.S. federal income tax purposes after the Reorganization and the potential diminution of the Combined Fund’s ability to use those losses to offset future gains (see the section above entitled “ADDITIONAL INFORMATION ABOUT EACH REORGANIZATION—Tax Status of the Reorganizations”); |
10. | the potential benefits of the Reorganization to MassMutual and its affiliates; |
11. | the class structure of and services provided to the Selling Fund and the Acquiring Fund; |
12. | that the Selling Fund is expected to bear the direct merger costs, legal fees, audit fees, Form N-14 printing and mailing costs, as well as similar expenses incurred in connection with the consummation of the Reorganization and transaction costs (if any) associated with repositioning the Selling Fund prior to the Reorganization, and that the Acquiring Fund would bear a one-time cost for administratively processing the Reorganization; and |
13. | MML Advisers’ representation that the Reorganization is not expected to result in the diminution in the level or quality of services that the Selling Fund shareholder currently receive. |
40 |
Reorganization #1 - MassMutual Growth Opportunities Fund into MassMutual Blue Chip Growth Fund | Reorganization #2 - MassMutual Fundamental Value Fund into MassMutual Diversified Value Fund | Reorganization #3 - MassMutual Strategic Bond Fund into MassMutual Core Bond Fund | |||||||||
Printing and Mailing Combined Information Statement/Prospectus* | $22,965 | $22,965 | $22,965 | ||||||||
Legal* | $200,000 | $200,000 | $200,000 | ||||||||
Accounting/Audit* | $27,105 | $27,105 | $35,105 | ||||||||
Custodian Services** | $10,000 | $10,000 | $10,000 | ||||||||
Total Expenses | $260,070 | $260,070 | $268,070 | ||||||||
* | Costs borne by Selling Fund |
** | Costs borne by Acquiring Fund |
41 |
• | The Selling Fund may invest up to 25% of the portfolio in below investment grade debt securities, while the Acquiring Fund is limited to 5%. The Selling Fund’s exposure to below investment grade debt securities as of March 31, 2024 was 6.6% of total assets. |
• | The Selling Fund’s effective duration is normally expected to be between three and nine years, while the Acquiring Fund’s effective duration is normally expected to generally match (within 10%) the average duration of the Bloomberg U.S. Aggregate Bond Index. As of March 31, 2024, the Selling Fund’s effective duration was 7.71 years, while the Acquiring Fund’s effective duration was 5.92 years. |
42 |
43 |
Net Assets ($) (Unaudited) | MassMutual Growth Opportunities Fund | MassMutual Blue Chip Growth Fund | Pro Forma Adjustment | Combined Fund - Pro Forma | ||||||||||
Class I | $71,043,259 | $1,784,758,791 | 0 | $1,855,802,050 | ||||||||||
Class R5 | $25,204,696 | $298,738,728 | 0 | $323,943,424 | ||||||||||
Service Class | $8,346,682 | $166,305,670 | 0 | $174,652,352 | ||||||||||
Administrative Class | $28,497,212 | $178,219,973 | 0 | $206,717,185 | ||||||||||
Class R4 | $1,086,104 | $54,201,445 | 0 | $55,287,549 | ||||||||||
Class A | $16,376,202 | $92,975,289 | 0 | $109,351,491 | ||||||||||
Class R3 | $2,411,364 | $43,582,929 | 0 | $45,994,293 | ||||||||||
Class Y | $147,378 | $121,468 | 0 | $268,846 | ||||||||||
Total | $153,112,897 | $2,618,904,293 | $0 | $2,772,017,190 | ||||||||||
Net Asset Value Per Share ($) (Unaudited)(a) | ||||||||||||||
Class I | $7.07 | $22.51 | $(7.07) | $22.51 | ||||||||||
Class R5 | $6.78 | $22.36 | $(6.78) | $22.36 | ||||||||||
Service Class | $6.10 | $21.87 | $(6.10) | $21.87 | ||||||||||
Administrative Class | $5.25 | $21.13 | $(5.25) | $21.13 | ||||||||||
Class R4 | $3.81 | $19.00 | $(3.81) | $19.00 | ||||||||||
Class A | $3.65* | $18.93** | $(3.65) | $18.93 | ||||||||||
Class R3 | $2.09 | $15.93 | $(2.09) | $15.93 | ||||||||||
Class Y | $6.78 | $22.36 | $(6.78) | $22.36 | ||||||||||
Shares Outstanding (Unaudited)(b) | ||||||||||||||
Class I | 10,051,235 | 79,285,350 | (6,895,240) | 82,441,345 | ||||||||||
Class R5 | 3,718,074 | 13,362,001 | (2,590,717) | 14,489,358 | ||||||||||
Service Class | 1,368,470 | 7,603,743 | (986,847) | 7,985,366 | ||||||||||
Administrative Class | 5,428,735 | 8,435,440 | (4,079,916) | 9,784,259 | ||||||||||
Class R4 | 285,030 | 2,853,353 | (227,854) | 2,910,529 | ||||||||||
Class A | 4,487,251 | 4,910,286 | (3,622,378) | 5,775,159 | ||||||||||
Class R3 | 1,153,344 | 2,736,317 | (1,001,949) | 2,887,712 | ||||||||||
Class Y | 21,739 | 5,432 | (15,148) | 12,023 | ||||||||||
Total | 26,513,878 | 119,191,922 | (19,420,049) | 126,285,751 |
(a) | To adjust Net Asset Value and Offering Price Per Share of the Pro Forma Fund based on combining the MassMutual Growth Opportunities Fund at the MassMutual Blue Chip Growth Fund’s net asset value. |
(b) | To adjust Shares Outstanding of the Pro Forma Fund based on combining the Fund at the MassMutual Growth Opportunities Fund at the MassMutual Blue Chip Growth Fund’s net asset value. |
* | $3.86 is Offering price per share (100/[100-maximum sales charge] of net asset value) |
** | $20.03 is Offering price per share (100/[100-maximum sales charge] of net asset value) |
44 |
Net Assets ($) (Unaudited) | MassMutual Fundamenta l Value Fund | MassMutual Diversified Value Fund | Pro Forma Adjustment | Combined Fund - Pro Forma | ||||||||||
Class I | $336,365,264 | $95,688,942 | 0 | $432,054,206 | ||||||||||
Class R5 | $46,825,468 | $48,823,085 | 0 | $95,648,553 | ||||||||||
Service Class | $29,040,573 | $13,287,989 | 0 | $42,328,562 | ||||||||||
Administrative Class | $20,387,822 | $21,522,215 | 0 | $41,910,037 | ||||||||||
Class R4 | $5,397,560 | $11,296,112 | 0 | $16,693,672 | ||||||||||
Class A | $24,914,818 | $25,553,677 | 0 | $50,468,495 | ||||||||||
Class R3 | $1,384,512 | $491,901 | 0 | $1,876,413 | ||||||||||
Class Y | $106,975 | $109,115 | 0 | $216,090 | ||||||||||
Total | $464,422,992 | $216,773,036 | $0 | $681,196,028 | ||||||||||
Net Asset Value Per Share ($) (Unaudited)(a) | ||||||||||||||
Class I | $9.29 | $12.67 | $(9.29) | $12.67 | ||||||||||
Class R5 | $9.41 | $12.72 | $(9.41) | $12.72 | ||||||||||
Service Class | $9.33 | $12.73 | $(9.33) | $12.73 | ||||||||||
Administrative Class | $9.48 | $12.87 | $(9.48) | $12.87 | ||||||||||
Class R4 | $8.97 | $12.42 | $(8.97) | $12.42 | ||||||||||
Class A | $9.26* | $12.71** | $(9.26) | $12.71 | ||||||||||
Class R3 | $8.91 | $12.61 | $(8.91) | $12.61 | ||||||||||
Class Y | $9.40 | $12.72 | $(9.40) | $12.72 | ||||||||||
Shares Outstanding (Unaudited)(b) | ||||||||||||||
Class I | 36,193,291 | 7,552,210 | (9,645,802) | 34,099,699 | ||||||||||
Class R5 | 4,975,911 | 3,837,165 | (1,295,745) | 7,517,331 | ||||||||||
Service Class | 3,114,246 | 1,043,812 | (833,021) | 3,325,037 | ||||||||||
Administrative Class | 2,150,115 | 1,672,423 | (565,842) | 3,256,696 | ||||||||||
Class R4 | 601,732 | 909,695 | (167,057) | 1,344,370 | ||||||||||
Class A | 2,691,726 | 2,010,922 | (731,078) | 3,971,570 | ||||||||||
Class R3 | 155,471 | 39,013 | (45,664) | 148,820 | ||||||||||
Class Y | 11,377 | 8,576 | (2,969) | 16,984 | ||||||||||
Total | 49,893,869 | 17,073,816 | (13,287,178) | 53,680,507 |
(a) | To adjust Net Asset Value and Offering Price Per Share of the Pro Forma Fund based on combining the MassMutual Fundamental Value Fund at the MassMutual Diversified Value Fund’s net asset value. |
(b) | To adjust Shares Outstanding of the Pro Forma Fund based on combining the MassMutual Fundamental Value Fund at the MassMutual Diversified Value Fund’s net asset value. |
* | $9.80 is Offering price per share (100/[100-maximum sales charge] of net asset value) |
** | $13.45 is Offering price per share (100/[100-maximum sales charge] of net asset value) |
45 |
Net Assets ($) (Unaudited) | MassMutual Strategic Bond Fund | MassMutual Core Bond Fund | Pro Forma Adjustment | Combined Fund - Pro Forma | ||||||||||
Class I | $295,161,793 | $473,368,504 | 0 | $768,530,297 | ||||||||||
Class R5 | $48,015,538 | $97,094,761 | 0 | $145,110,299 | ||||||||||
Service Class | $9,483,827 | $24,736,447 | 0 | $34,220,274 | ||||||||||
Administrative Class | $13,489,116 | $33,561,366 | 0 | $47,050,482 | ||||||||||
Class R4 | $15,656,713 | $1,412,840 | 0 | $17,069,553 | ||||||||||
Class A | $10,959,376 | $20,757,362 | 0 | $31,716,738 | ||||||||||
Class R3 | $4,359,417 | $165,657 | 0 | $4,525,074 | ||||||||||
Class Y | $94,755 | $96,745 | 0 | $191,500 | ||||||||||
Total | $397,220,535 | $651,193,682 | $0 | $1,048,414,217 | ||||||||||
Net Asset Value Per Share ($) (Unaudited)(a) | ||||||||||||||
Class I | $8.50 | $8.99 | $(8.50) | $8.99 | ||||||||||
Class R5 | $8.51 | $9.02 | $(8.51) | $9.02 | ||||||||||
Service Class | $8.52 | $8.97 | $(8.52) | $8.97 | ||||||||||
Administrative Class | $8.51 | $8.88 | $(8.51) | $8.88 | ||||||||||
Class R4 | $8.45 | $8.79 | $(8.45) | $8.79 | ||||||||||
Class A | $8.51* | $8.84** | $(8.51) | $8.84 | ||||||||||
Class R3 | $8.39 | $9.14 | $(8.39) | $9.14 | ||||||||||
Class Y | $8.51 | $9.03 | $(8.51) | $9.03 | ||||||||||
Shares Outstanding (Unaudited)(b) | ||||||||||||||
Class I | 34,729,941 | 52,674,983 | (1,885,251) | 85,519,673 | ||||||||||
Class R5 | 5,641,642 | 10,758,514 | (321,315) | 16,078,841 | ||||||||||
Service Class | 1,112,477 | 2,756,736 | (55,558) | 3,813,655 | ||||||||||
Administrative Class | 1,585,910 | 3,778,901 | (67,079) | 5,297,732 | ||||||||||
Class R4 | 1,852,349 | 160,730 | (71,182) | 1,941,897 | ||||||||||
Class A | 1,287,774 | 2,347,695 | (48,249) | 3,587,220 | ||||||||||
Class R3 | 519,292 | 18,118 | (42,500) | 494,910 | ||||||||||
Class Y | 11,136 | 10,718 | (638) | 21,216 | ||||||||||
Total | 46,740,521 | 72,506,395 | (2,491,772) | 116,755,144 | ||||||||||
(a) | To adjust Net Asset Value and Offering Price Per Share of the Pro Forma Fund based on combining the MassMutual Strategic Bond Fund at the MassMutual Core Bond Fund’s net asset value. |
(b) | To adjust Shares Outstanding of the Pro Forma Fund based on combining the MassMutual Strategic Bond Fund at the MassMutual Core Bond Fund’s net asset value. |
* | $8.89 is Offering price per share (100/[100-maximum sales charge] of net asset value) |
** | $9.23 is Offering price per share (100/[100-maximum sales charge] of net asset value) |
46 |
Share Class | Shareholder Name and Address | % Ownership of Share Class (current) | ||||
I | Massachusetts Mutual Life Insurance Company, 1295 State Street, Springfield, MA 01111 | 31.94% | ||||
Empower Trust Company, LLC, FBO Recordkeeping For Employee Benefits, 8515 E Orchard Rd 2T2, Greenwood Village, CO 80111 | 14.45.% | |||||
Oltrust & Co. - Reinvest/Reinvest, P.O. Box 966, Evansville, IN 47706 | 7.13% | |||||
MassMutual RetireSMARTSM by JPMorgan 2040 Fund, Attn: MML Client Operations, 1 Iron Street, Boston, MA 02210 | 6.66% | |||||
Massmutual Retiresmart 2050 Fund, Attn: Mml Client Operations, 200 Clarendon Street, Jht0515, Boston, MA 02116 | 5.78% | |||||
R5 | Massachusetts Mutual Life Insurance Company, 1295 State Street, Springfield, MA 01111 | 70.99% | ||||
Empower Trust Company, LLC, FBO Recordkeeping For Employee Benefits, 8515 E Orchard Rd 2T2, Greenwood Village, CO 80111 | 26.23% | |||||
Service | Empower Trust Company, LLC, FBO Recordkeeping For Employee Benefits, 8515 E Orchard Rd 2T2, Greenwood Village, CO 80111 | 63.92% | ||||
Massachusetts Mutual Life Insurance Company, 1295 State Street, Springfield, MA 01111 | 35.89% | |||||
Administrative | Massachusetts Mutual Life Insurance Company, 1295 State Street, Springfield, MA 01111 | 89.88% | ||||
Empower Trust Company, LLC, FBO Recordkeeping For Employee Benefits, 8515 E Orchard Rd 2T2, Greenwood Village, CO 80111 | 10.12% | |||||
R4 | Tiaa, Fsb Cust/Ttee FBO Retirement Plans, For Which Tiaa Acts As Recordkeeper, Attn: Trust Operations, 211 North Broadway, Suite 1000, Saint Louis, MO 63102 | 60.14% | ||||
Massachusetts Mutual Life Insurance Company, 1295 State Street, Springfield, MA 01111 | 25.94% | |||||
A | Talcott Resolution Life Insurance Company, 1 Griffin Road North, Windsor, CT 06095 | 7.37% | ||||
47 |
Share Class | Shareholder Name and Address | % Ownership of Share Class (current) | ||||
Empower Trust Company, LLC, FBO Recordkeeping For Employee Benefits, 8515 E Orchard Rd 2T2, Greenwood Village, CO 80111 | 6.55% | |||||
R3 | Massachusetts Mutual Life Insurance Company, 1295 State Street, Springfield, MA 01111 | 86.88% | ||||
Talcott Resolution Life Insurance Company, 1 Griffin Road North, Windsor, CT 06095 | 13.12% | |||||
Y | Massachusetts Mutual Life Insurance Co. Investment Operations - Class Y Seed, ATTN: RS Mutual Fund Administration, 1295 State Street, Springfield, MA 01111 | 100.00% | ||||
Share Class | Shareholder Name and Address | % Ownership of Share Class (current) | ||||
I | National Financial Services LLC, 499 Washington Boulevard, Jersey City, NJ 07310 | 67.62% | ||||
Empower Trust Company, LLC, FBO Recordkeeping For Employee Benefits, 8515 E Orchard Rd 2T2, Greenwood Village, CO 80111 | 8.42% | |||||
Massachusetts Mutual Life Insurance Company, 1295 State Street, Springfield, MA 01111 | 8.05% | |||||
R5 | Massachusetts Mutual Life Insurance Company, 1295 State Street, Springfield, MA 01111 | 85.19% | ||||
Empower Trust Company, LLC, FBO Recordkeeping For Employee Benefits, 8515 E Orchard Rd 2T2, Greenwood Village, CO 80111 | 14.70% | |||||
Service | Empower Trust Company, LLC, FBO Recordkeeping For Employee Benefits, 8515 E Orchard Rd 2T2, Greenwood Village, CO 80111 | 66.99% | ||||
Administrative | Massachusetts Mutual Life Insurance Company, 1295 State Street, Springfield, MA 01111 | 94.98% | ||||
R4 | Massachusetts Mutual Life Insurance Company, 1295 State Street, Springfield, MA 01111 | 99.08% | ||||
A | Massachusetts Mutual Life Insurance Company, 1295 State Street, Springfield, MA 01111 | 66.86% | ||||
Empower Trust Company, LLC, FBO Recordkeeping For Employee Benefits, 8515 E Orchard Rd 2T2, Greenwood Village, CO 80111 | 19.91% | |||||
Pershing LLC, P.O. Box 2052, Jersey City, NJ 07303 | 11.59% | |||||
R3 | Talcott Resolution Life Insurance Company, 1 Griffin Road North, Windsor, CT 06095 | 50.28% | ||||
Massachusetts Mutual Life Insurance Company, 1295 State Street, Springfield, MA 01111 | 32.13% | |||||
48 |
Share Class | Shareholder Name and Address | % Ownership of Share Class (current) | ||||
Empower Trust Company, LLC, FBO Recordkeeping For Employee Benefits, 8515 E Orchard Rd 2T2, Greenwood Village, CO 80111 | 17.59% | |||||
Y | Massachusetts Mutual Life Insurance Co. Investment Operations - Class Y Seed, ATTN: RS Mutual Fund Administration, 1295 State Street, Springfield, MA 01111 | 100.00% | ||||
Share Class | Shareholder Name and Address | % Ownership of Share Class (current) | ||||
I | Massachusetts Mutual Life Insurance Company, 1295 State Street, Springfield, MA 01111 | 22.74% | ||||
Empower Trust Company, LLC, FBO Recordkeeping For Employee Benefits, 8515 E Orchard Rd 2T2, Greenwood Village, CO 80111 | 17.66% | |||||
MassMutual 20/80 Allocation Fund, 1 Iron Street, Boston, MA 02210 | 12.26% | |||||
MassMutual 40/60 Allocation Fund, 1 Iron Street, Boston, MA 02211 | 9.07% | |||||
MassMutual RetireSMARTSM by JPMorgan 2030 Fund, Attn: MML Client Operations, 1 Iron Street, Boston, MA 02210 | 5.37% | |||||
MassMutual 60/40 Allocation Fund, 1 Iron Street, Boston, MA 02210 | 5.37% | |||||
MassMutual RetireSMARTSM by JPMorgan 2035 Fund, Attn: MML Client Operations, 1 Iron Street, Boston, MA 02210 | 5.23% | |||||
R5 | Massachusetts Mutual Life Insurance Company, 1295 State Street, Springfield, MA 01111 | 37.51% | ||||
Talcott Resolution Life Insurance Company, 1 Griffin Road North, Windsor, CT 06095 | 35.92% | |||||
Empower Trust Company, LLC, FBO Recordkeeping For Employee Benefits, 8515 E Orchard Rd 2T2, Greenwood Village, CO 80111 | 23.95% | |||||
Service | Empower Trust Company, LLC, FBO Recordkeeping For Employee Benefits, 8515 E Orchard Rd 2T2, Greenwood Village, CO 80111 | 52.08% | ||||
Massachusetts Mutual Life Insurance Company, 1295 State Street, Springfield, MA 01111 | 47.91% | |||||
Administrative | Massachusetts Mutual Life Insurance Company, 1295 State Street, Springfield, MA 01111 | 72.50% | ||||
Empower Trust Company, LLC, FBO Recordkeeping For Employee Benefits, 8515 E Orchard Rd 2T2, Greenwood Village, CO 80111 | 24.05% | |||||
R4 | Massachusetts Mutual Life Insurance Company, 1295 State Street, Springfield, MA 01111 | 58.92% | ||||
49 |
Share Class | Shareholder Name and Address | % Ownership of Share Class (current) | ||||
Empower Trust Company, LLC, FBO Recordkeeping For Employee Benefits, 8515 E Orchard Rd 2T2, Greenwood Village, CO 80111 | 35.79% | |||||
A | Massachusetts Mutual Life Insurance Company, 1295 State Street, Springfield, MA 01111 | 76.15% | ||||
Empower Trust Company, LLC, FBO Recordkeeping For Employee Benefits, 8515 E Orchard Rd 2T2, Greenwood Village, CO 80111 | 9.43% | |||||
Pershing LLC, P.O. Box 2052, Jersey City, NJ 07303 | 9.22% | |||||
R3 | Massachusetts Mutual Life Insurance Company, 1295 State Street, Springfield, MA 01111 | 47.38% | ||||
Talcott Resolution Life Insurance Company, 1 Griffin Road North, Windsor, CT 06095 | 40.11% | |||||
Empower Trust Company, LLC, FBO Recordkeeping For Employee Benefits, 8515 E Orchard Rd 2T2, Greenwood Village, CO 80111 | 12.51% | |||||
Y | Massachusetts Mutual Life Insurance Co. Investment Operations - Class Y Seed, ATTN: RS Mutual Fund Administration, 1295 State Street, Springfield, MA 01111 | 100.00% | ||||
1 | As of May 31, 2024, MassMutual, 1295 State Street, Springfield, MA 01111, owned 54.88% of MassMutual Growth Opportunities Fund and therefore may be presumed to “control” the Fund, as that term is defined in the 1940 Act. However, such ownership may be beneficially held by individuals or entities other than MassMutual. MassMutual is organized under the laws of Massachusetts. |
2 | As of May 31, 2024, National Financial Services, 499 Washington Blvd., Jersey City, NJ 07310, and MassMutual, 1295 State Street, Springfield, MA 01111, owned 48.99% and 25.36%, respectively, of MassMutual Fundamental Value Fund and therefore may be presumed to “control” the Fund, as that term is defined in the 1940 Act. However, such ownership may be beneficially held by individuals or entities other than National Financial Services and MassMutual. National Financial Services is organized under the laws of Delaware and MassMutual is organized under the laws of Massachusetts. |
3 | As of May 31, 2024, MassMutual, 1295 State Street, Springfield, MA 01111, owned 29.82% of MassMutual Strategic Bond Fund and therefore may be presumed to “control” the Fund, as that term is defined in the 1940 Act. However, such ownership may be beneficially held by individuals or entities other than MassMutual. MassMutual is organized under the laws of Massachusetts. |
50 |
Share Class | Shareholder Name and Address | % Ownership of Share Class (current) | ||||
I | Empower Trust Company, LLC, FBO Recordkeeping For Employee Benefits, 8515 E Orchard Rd 2T2, Greenwood Village, CO 80111 | 29.82% | ||||
National Financial Services LLC, 499 Washington Boulevard, Jersey City, NJ 07310 | 28.03% | |||||
Massachusetts Mutual Life Insurance Company, 1295 State Street, Springfield, MA 01111 | 26.28% | |||||
R5 | Talcott Resolution Life Insurance Company, 1 Griffin Road North, Windsor, CT 06095 | 48.60% | ||||
Massachusetts Mutual Life Insurance Company, 1295 State Street, Springfield, MA 01111 | 36.11% | |||||
Empower Trust Company, LLC, FBO Recordkeeping For Employee Benefits, 8515 E Orchard Rd 2T2, Greenwood Village, CO 80111 | 13.00% | |||||
Service | Empower Trust Company, LLC, FBO Recordkeeping For Employee Benefits, 8515 E Orchard Rd 2T2, Greenwood Village, CO 80111 | 59.95% | ||||
Massachusetts Mutual Life Insurance Company, 1295 State Street, Springfield, MA 01111 | 29.93% | |||||
The Hartford, One Hartford Plaza, Hartford, CT 06155 | 9.75% | |||||
Administrative | Massachusetts Mutual Life Insurance Company, 1295 State Street, Springfield, MA 01111 | 79.78% | ||||
Empower Trust Company, LLC, FBO Recordkeeping For Employee Benefits, 8515 E Orchard Rd 2T2, Greenwood Village, CO 80111 | 17.30% | |||||
R4 | Massachusetts Mutual Life Insurance Company, 1295 State Street, Springfield, MA 01111 | 38.53% | ||||
Empower Trust Company, LLC, FBO Recordkeeping For Employee Benefits, 8515 E Orchard Rd 2T2, Greenwood Village, CO 80111 | 36.97% | |||||
Talcott Resolution Life Insurance Company, 1 Griffin Road North, Windsor, CT 06095 | 24.27% | |||||
A | Massachusetts Mutual Life Insurance Company, 1295 State Street, Springfield, MA 01111 | 66.60% | ||||
Empower Trust Company, LLC, FBO Recordkeeping For Employee Benefits, 8515 E Orchard Rd 2T2, Greenwood Village, CO 80111 | 23.79% | |||||
Pershing LLC, P.O. Box 2052, Jersey City, NJ 07303 | 5.98% | |||||
R3 | Massachusetts Mutual Life Insurance Company, 1295 State Street, Springfield, MA 01111 | 51.02% | ||||
Talcott Resolution Life Insurance Company, 1 Griffin Road North, Windsor, CT 06095 | 23.75% | |||||
51 |
Share Class | Shareholder Name and Address | % Ownership of Share Class (current) | ||||
Sammons Financial Network 4546 Corporate Drive Suite 100 West Des Moines IA 50392 | 16.44% | |||||
Empower Trust Company, LLC, FBO Recordkeeping For Employee Benefits, 8515 E Orchard Rd 2T2, Greenwood Village, CO 80111 | 8.30% | |||||
Y | Massachusetts Mutual Life Insurance Co. Investment Operations - Class Y Seed, ATTN: RS Mutual Fund Administration, 1295 State Street, Springfield, MA 01111 | 100.00% | ||||
Share Class | Shareholder Name and Address | % Ownership of Share Class (current) | ||||
I | Massachusetts Mutual Life Insurance Company, 1295 State Street, Springfield, MA 01111 | 21.68% | ||||
Empower Trust Company, LLC, FBO Recordkeeping For Employee Benefits, 8515 E Orchard Rd 2T2, Greenwood Village, CO 80111 | 15.75% | |||||
Talcott Resolution Life Insurance Company, 1 Griffin Road North, Windsor, CT 06095 | 10.29% | |||||
Massmutual Retiresmart Growth Fund, 1 Iron Street, Boston, MA 02210 | 6.78% | |||||
MassMutual 60/40 Allocation Fund, 1 Iron Street, Boston, MA 02210 | 6.45% | |||||
MassMutual RetireSMARTSM by JPMorgan 2040 Fund, Attn: MML Client Operations, 1 Iron Street, Boston, MA 02210 | 5.69% | |||||
MassMutual RetireSMARTSM by JPMorgan 2030 Fund, Attn: MML Client Operations, 1 Iron Street, Boston, MA 02210 | 5.34% | |||||
R5 | Massachusetts Mutual Life Insurance Company, 1295 State Street, Springfield, MA 01111 | 95.15% | ||||
Service | Empower Trust Company, LLC, FBO Recordkeeping For Employee Benefits, 8515 E Orchard Rd 2T2, Greenwood Village, CO 80111 | 65.00% | ||||
Massachusetts Mutual Life Insurance Company, 1295 State Street, Springfield, MA 01111 | 33.90% | |||||
Administrative | Empower Trust Company, LLC, FBO Recordkeeping For Employee Benefits, 8515 E Orchard Rd 2T2, Greenwood Village, CO 80111 | 60.55% | ||||
Massachusetts Mutual Life Insurance Company, 1295 State Street, Springfield, MA 01111 | 39.45% | |||||
R4 | Empower Trust Company, LLC, FBO Recordkeeping For Employee Benefits, 8515 E Orchard Rd 2T2, Greenwood Village, CO 80111 | 43.34% | ||||
Massachusetts Mutual Life Insurance Company, 1295 State Street, Springfield, MA 01111 | 35.62% | |||||
52 |
Share Class | Shareholder Name and Address | % Ownership of Share Class (current) | ||||
Talcott Resolution Life Insurance Company, 1 Griffin Road North, Windsor, CT 06095 | 21.03% | |||||
A | Massachusetts Mutual Life Insurance Company, 1295 State Street, Springfield, MA 01111 | 76.72% | ||||
Pershing LLC, P.O. Box 2052, Jersey City, NJ 07303 | 18.93% | |||||
R3 | Talcott Resolution Life Insurance Company, 1 Griffin Road North, Windsor, CT 06095 | 68.41% | ||||
Massachusetts Mutual Life Insurance Company, 1295 State Street, Springfield, MA 01111 | 31.02% | |||||
Y | Massachusetts Mutual Life Insurance Co. Investment Operations - Class Y Seed, ATTN: RS Mutual Fund Administration, 1295 State Street, Springfield, MA 01111 | 100.00% | ||||
Share Class | Shareholder Name and Address | % Ownership of Share Class (current) | ||||
I | Massachusetts Mutual Life Insurance Company, 1295 State Street, Springfield, MA 01111 | 26.81% | ||||
National Financial Services LLC, 499 Washington Boulevard, Jersey City, NJ 07310 | 21.33% | |||||
MassMutual RetireSMARTSM by JPMorgan 2030 Fund, Attn: MML Client Operations, 1 Iron Street, Boston, MA 02210 | 10.00% | |||||
MassMutual 20/80 Allocation Fund, 1 Iron Street, Boston, MA 02210 | 6.41% | |||||
MassMutual RetireSMARTSM by JPMorgan 2025 Fund, Attn: MML Client Operations, 1 Iron Street, Boston, MA 02211 | 5.90% | |||||
MassMutual RetireSMARTSM by JPMorgan 2020 Fund, Attn: MML Client Operations, 1 Iron Street, Boston, MA 02212 | 5.05% | |||||
R5 | Massachusetts Mutual Life Insurance Company, 1295 State Street, Springfield, MA 01111 | 89.84% | ||||
Empower Trust Company, LLC, FBO Recordkeeping For Employee Benefits, 8515 E Orchard Rd 2T2, Greenwood Village, CO 80111 | 7.88% | |||||
Service | Empower Trust Company, LLC, FBO Recordkeeping For Employee Benefits, 8515 E Orchard Rd 2T2, Greenwood Village, CO 80111 | 65.62% | ||||
Massachusetts Mutual Life Insurance Company, 1295 State Street, Springfield, MA 01111 | 33.86% | |||||
Administrative | Massachusetts Mutual Life Insurance Company, 1295 State Street, Springfield, MA 01111 | 73.54% | ||||
53 |
Share Class | Shareholder Name and Address | % Ownership of Share Class (current) | ||||
Empower Trust Company, LLC, FBO Recordkeeping For Employee Benefits, 8515 E Orchard Rd 2T2, Greenwood Village, CO 80111 | 26.46% | |||||
R4 | Massachusetts Mutual Life Insurance Company, 1295 State Street, Springfield, MA 01111 | 77.45% | ||||
Talcott Resolution Life Insurance Company, 1 Griffin Road North, Windsor, CT 06095 | 12.06% | |||||
Empower Trust Company, LLC, FBO Recordkeeping For Employee Benefits, 8515 E Orchard Rd 2T2, Greenwood Village, CO 80111 | 8.43% | |||||
A | Massachusetts Mutual Life Insurance Company, 1295 State Street, Springfield, MA 01111 | 64.81% | ||||
Empower Trust Company, LLC, FBO Recordkeeping For Employee Benefits, 8515 E Orchard Rd 2T2, Greenwood Village, CO 80111 | 16.96% | |||||
Matrix Trust Company, FBO Kayser-Roth Corporation Supplemental Retirement Plan, P.O. Box 52129, Phoenix, AZ 85072 | 10.45% | |||||
Pershing LLC, P.O. Box 2052, Jersey City, NJ 07303 | 5.81% | |||||
R3 | Massachusetts Mutual Life Insurance Company, 1295 State Street, Springfield, MA 01111 | 47.69% | ||||
Empower Trust Company, LLC, FBO Recordkeeping For Employee Benefits, 8515 E Orchard Rd 2T2, Greenwood Village, CO 80111 | 47.06% | |||||
Mid Atlantic Trust Company FBO Eastwind Women’s Health 401(K) Prof, 1251 Waterfront Place, Suite 525, Pittsburgh, PA 15222 | 5.18% | |||||
Y | Massachusetts Mutual Life Insurance Co. Investment Operations - Class Y Seed, ATTN: RS Mutual Fund Administration, 1295 State Street, Springfield, MA 01111 | 100.00% | ||||
1 | As of May 31, 2024, MassMutual, 1295 State Street, Springfield, MA 01111, and Empower Trust Company, LLC, 8515 East Orchard Road, Greenwood Village, CO 80111, owned 33.39% and 28.58%, respectively, of MassMutual Blue Chip Growth Fund and therefore may be presumed to “control” the Fund, as that term is defined in the 1940 Act. However, such ownership may be beneficially held by individuals or entities other than MassMutual and Empower Trust Company, LLC. MassMutual is organized under the laws of Massachusetts and Empower Trust Company, LLC is organized under the laws of Colorado. |
2 | As of May 31, 2024, MassMutual, 1295 State Street, Springfield, MA 01111, owned 47.32% of MassMutual Diversified Value Fund and therefore may be presumed to “control” the Fund, as that term is defined in the 1940 Act. However, such ownership may be beneficially held by individuals or entities other than MassMutual. Empower Trust Company, LLC is organized under the laws of MassMutual is organized under the laws of Massachusetts. |
3 | As of May 31, 2024, MassMutual, 1295 State Street, Springfield, MA 01111, owned 40.10% of MassMutual Core Bond Fund and therefore may be presumed to “control” the Fund, as that term is defined in the 1940 Act. However, such ownership may be beneficially held by individuals or entities other than MassMutual. MassMutual is organized under the laws of Massachusetts. |
54 |
Share Class | Shareholder Name and Address | % Ownership of Combined Fund Share Class (pro forma) | ||||
I | Empower Trust Company, LLC, FBO Recordkeeping For Employee Benefits, 8515 E Orchard Rd 2T2, Greenwood Village, CO 80111 | 29.29% | ||||
National Financial Services LLC, 499 Washington Boulevard, Jersey City, NJ 07310 | 27.07% | |||||
Massachusetts Mutual Life Insurance Company, 1295 State Street, Springfield, MA 01111 | 26.47% | |||||
R5 | Talcott Resolution Life Insurance Company, 1 Griffin Road North, Windsor, CT 06095 | 45.20% | ||||
Massachusetts Mutual Life Insurance Company, 1295 State Street, Springfield, MA 01111 | 38.67% | |||||
Empower Trust Company, LLC, FBO Recordkeeping For Employee Benefits, 8515 E Orchard Rd 2T2, Greenwood Village, CO 80111 | 13.97% | |||||
Service | Empower Trust Company, LLC, FBO Recordkeeping For Employee Benefits, 8515 E Orchard Rd 2T2, Greenwood Village, CO 80111 | 60.13% | ||||
Massachusetts Mutual Life Insurance Company, 1295 State Street, Springfield, MA 01111 | 30.21% | |||||
The Hartford, One Hartford Plaza, Hartford, CT 06155 | 9.29% | |||||
Administrative | Massachusetts Mutual Life Insurance Company, 1295 State Street, Springfield, MA 01111 | 81.11% | ||||
Empower Trust Company, LLC, FBO Recordkeeping For Employee Benefits, 8515 E Orchard Rd 2T2, Greenwood Village, CO 80111 | 16.36% | |||||
R4 | Massachusetts Mutual Life Insurance Company, 1295 State Street, Springfield, MA 01111 | 38.31% | ||||
Empower Trust Company, LLC, FBO Recordkeeping For Employee Benefits, 8515 E Orchard Rd 2T2, Greenwood Village, CO 80111 | 36.42% | |||||
Talcott Resolution Life Insurance Company, 1 Griffin Road North, Windsor, CT 06095 | 23.96% | |||||
A | Massachusetts Mutual Life Insurance Company, 1295 State Street, Springfield, MA 01111 | 67.89% | ||||
Empower Trust Company, LLC, FBO Recordkeeping For Employee Benefits, 8515 E Orchard Rd 2T2, Greenwood Village, CO 80111 | 21.48% | |||||
Pershing LLC, P.O. Box 2052, Jersey City, NJ 07303 | 7.17% | |||||
R3 | Massachusetts Mutual Life Insurance Company, 1295 State Street, Springfield, MA 01111 | 52.26% | ||||
Talcott Resolution Life Insurance Company, 1 Griffin Road North, Windsor, CT 06095 | 23.38% | |||||
55 |
Share Class | Shareholder Name and Address | % Ownership of Combined Fund Share Class (pro forma) | ||||
Sammons Financial Network 4546 Corporate Drive Suite 100 West Des Moines IA 50392 | 15.87% | |||||
Empower Trust Company, LLC, FBO Recordkeeping For Employee Benefits, 8515 E Orchard Rd 2T2, Greenwood Village, CO 80111 | 8.01% | |||||
Y | Massachusetts Mutual Life Insurance Co. Investment Operations - Class Y Seed, ATTN: RS Mutual Fund Administration, 1295 State Street, Springfield, MA 01111 | 100.00% | ||||
Share Class | Shareholder Name and Address | % Ownership of Combined Fund Share Class (pro forma) | ||||
I | National Financial Services LLC, 499 Washington Boulevard, Jersey City, NJ 07310 | 53.01% | ||||
Massachusetts Mutual Life Insurance Company, 1295 State Street, Springfield, MA 01111 | 10.99% | |||||
Empower Trust Company, LLC, FBO Recordkeeping For Employee Benefits, 8515 E Orchard Rd 2T2, Greenwood Village, CO 80111 | 10.00% | |||||
R5 | Massachusetts Mutual Life Insurance Company, 1295 State Street, Springfield, MA 01111 | 90.02% | ||||
Empower Trust Company, LLC, FBO Recordkeeping For Employee Benefits, 8515 E Orchard Rd 2T2, Greenwood Village, CO 80111 | 9.42% | |||||
Service | Empower Trust Company, LLC, FBO Recordkeeping For Employee Benefits, 8515 E Orchard Rd 2T2, Greenwood Village, CO 80111 | 66.37% | ||||
Massachusetts Mutual Life Insurance Company, 1295 State Street, Springfield, MA 01111 | 32.85% | |||||
Administrative | Massachusetts Mutual Life Insurance Company, 1295 State Street, Springfield, MA 01111 | 66.49% | ||||
Empower Trust Company, LLC, FBO Recordkeeping For Employee Benefits, 8515 E Orchard Rd 2T2, Greenwood Village, CO 80111 | 33.37% | |||||
R4 | Massachusetts Mutual Life Insurance Company, 1295 State Street, Springfield, MA 01111 | 53.43% | ||||
Empower Trust Company, LLC, FBO Recordkeeping For Employee Benefits, 8515 E Orchard Rd 2T2, Greenwood Village, CO 80111 | 31.39% | |||||
Talcott Resolution Life Insurance Company, 1 Griffin Road North, Windsor, CT 06095 | 15.17% | |||||
A | Massachusetts Mutual Life Insurance Company, 1295 State Street, Springfield, MA 01111 | 68.75% | ||||
56 |
Share Class | Shareholder Name and Address | % Ownership of Combined Fund Share Class (pro forma) | ||||
Empower Trust Company, LLC, FBO Recordkeeping For Employee Benefits, 8515 E Orchard Rd 2T2, Greenwood Village, CO 80111 | 14.34% | |||||
Pershing LLC, P.O. Box 2052, Jersey City, NJ 07303 | 7.00% | |||||
Matrix Trust Company, FBO Kayser-Roth Corporation Supplemental Retirement Plan, P.O. Box 52129, Phoenix, AZ 85072 | 6.82% | |||||
R3 | Massachusetts Mutual Life Insurance Company, 1295 State Street, Springfield, MA 01111 | 71.83% | ||||
Pershing LLC, P.O. Box 2052, Jersey City, NJ 07303 | 15.29% | |||||
Empower Trust Company, LLC, FBO Recordkeeping For Employee Benefits, 8515 E Orchard Rd 2T2, Greenwood Village, CO 80111 | 10.48% | |||||
Y | Massachusetts Mutual Life Insurance Co. Investment Operations - Class Y Seed, ATTN: RS Mutual Fund Administration, 1295 State Street, Springfield, MA 01111 | 100.00% | ||||
Share Class | Shareholder Name and Address | % Ownership of Combined Fund Share Class (pro forma) | ||||
I | Massachusetts Mutual Life Insurance Company, 1295 State Street, Springfield, MA 01111 | 25.25% | ||||
National Financial Services LLC, 499 Washington Boulevard, Jersey City, NJ 07310 | 13.57% | |||||
Empower Trust Company, LLC, FBO Recordkeeping For Employee Benefits, 8515 E Orchard Rd 2T2, Greenwood Village, CO 80111 | 9.47% | |||||
MassMutual 20/80 Allocation Fund, 1 Iron Street, Boston, MA 02210 | 8.65% | |||||
MassMutual RetireSMARTSM by JPMorgan 2030 Fund, Attn: MML Client Operations, 1 Iron Street, Boston, MA 02210 | 8.23% | |||||
MassMutual 40/60 Allocation Fund, 1 Iron Street, Boston, MA 02211 | 6.40% | |||||
R5 | Massachusetts Mutual Life Insurance Company, 1295 State Street, Springfield, MA 01111 | 72.37% | ||||
Empower Trust Company, LLC, FBO Recordkeeping For Employee Benefits, 8515 E Orchard Rd 2T2, Greenwood Village, CO 80111 | 13.24% | |||||
Talcott Resolution Life Insurance Company, 1 Griffin Road North, Windsor, CT 06095 | 11.99% | |||||
Service | Empower Trust Company, LLC, FBO Recordkeeping For Employee Benefits, 8515 E Orchard Rd 2T2, Greenwood Village, CO 80111 | 61.78% | ||||
Massachusetts Mutual Life Insurance Company, 1295 State Street, Springfield, MA 01111 | 37.84% | |||||
57 |
Share Class | Shareholder Name and Address | % Ownership of Combined Fund Share Class (pro forma) | ||||
Administrative | Massachusetts Mutual Life Insurance Company, 1295 State Street, Springfield, MA 01111 | 73.27% | ||||
Empower Trust Company, LLC, FBO Recordkeeping For Employee Benefits, 8515 E Orchard Rd 2T2, Greenwood Village, CO 80111 | 25.85% | |||||
R4 | Massachusetts Mutual Life Insurance Company, 1295 State Street, Springfield, MA 01111 | 60.46% | ||||
Empower Trust Company, LLC, FBO Recordkeeping For Employee Benefits, 8515 E Orchard Rd 2T2, Greenwood Village, CO 80111 | 33.52% | |||||
A | Massachusetts Mutual Life Insurance Company, 1295 State Street, Springfield, MA 01111 | 68.75% | ||||
Empower Trust Company, LLC, FBO Recordkeeping For Employee Benefits, 8515 E Orchard Rd 2T2, Greenwood Village, CO 80111 | 14.34% | |||||
Pershing LLC, P.O. Box 2052, Jersey City, NJ 07303 | 7.00% | |||||
Matrix Trust Company, FBO Kayser-Roth Corporation Supplemental Retirement Plan, P.O. Box 52129, Phoenix, AZ 85072 | 6.82% | |||||
R3 | Massachusetts Mutual Life Insurance Company, 1295 State Street, Springfield, MA 01111 | 47.39% | ||||
Talcott Resolution Life Insurance Company, 1 Griffin Road North, Windsor, CT 06095 | 38.57% | |||||
Empower Trust Company, LLC, FBO Recordkeeping For Employee Benefits, 8515 E Orchard Rd 2T2, Greenwood Village, CO 80111 | 13.84% | |||||
Y | Massachusetts Mutual Life Insurance Co. Investment Operations - Class Y Seed, ATTN: RS Mutual Fund Administration, 1295 State Street, Springfield, MA 01111 | 100.00% | ||||
1 | As of May 31, 2024, MassMutual, 1295 State Street, Springfield, MA 01111, and Empower Trust Company, LLC, 8515 East Orchard Road, Greenwood Village, CO 80111, owned 34.46% and 28.02%, respectively, of MassMutual Blue Chip Growth Fund and therefore may be presumed to “control” the Fund, as that term is defined in the 1940 Act. However, such ownership may be beneficially held by individuals or entities other than MassMutual and Empower Trust Company, LLC. MassMutual is organized under the laws of Massachusetts and Empower Trust Company, LLC is organized under the laws of Colorado. |
2 | As of May 31, 2024, National Financial Services, 499 Washington Blvd., Jersey City, NJ 07310, and MassMutual, 1295 State Street, Springfield, MA 01111, owned 33.79% and 32.19%, respectively, of MassMutual Diversified Value Fund and therefore may be presumed to “control” the Fund, as that term is defined in the 1940 Act. However, such ownership may be beneficially held by individuals or entities other than National Financial Services and MassMutual. National Financial Services is organized under the laws of Delaware and MassMutual is organized under the laws of Massachusetts. |
3 | As of May 31, 2024, MassMutual, 1295 State Street, Springfield, MA 01111, owned 36.22% of MassMutual Core Bond Fund and therefore may be presumed to “control” the Fund, as that term is defined in the 1940 Act. However, such ownership may be beneficially held by individuals or entities other than MassMutual. MassMutual is organized under the laws of Massachusetts. |
58 |
Income (loss) from investment operations | Less distributions to shareholders | Ratios / Supplemental Data | ||||||||||||||||||||||||||||||||||||
Net asset value beginning of the period | Net investment income (loss)(c) | Net realized and unrealized gain (loss) on investments | Total income (loss) from investment operations | From net investment income | From net realized gains | Total distributions | Net asset value, end of the period | Total return(l),(m) | Net assets, end of the period (000’s) | Ratio of expenses to average daily net assets(q) | Net investment income (loss) to average daily net assets | |||||||||||||||||||||||||||
Class I | ||||||||||||||||||||||||||||||||||||||
3/31/24(r) | $21.48 | $(0.01) | $5.59 | $5.58 | $— | $(4.55) | $(4.55) | $22.51 | 29.22%(b) | $1,784,759 | 0.65%(a) | (0.06%)(a) | ||||||||||||||||||||||||||
9/30/2023 | 18.74 | (0.02) | 5.76 | 5.74 | (0.09) | (2.91) | (3.00) | 21.48 | 34.60% | 1,436,141 | 0.65% | (0.09%) | ||||||||||||||||||||||||||
9/30/2022 | 33.66 | (0.04) | (8.56) | (8.60) | — | (6.32) | (6.32) | 18.74 | (31.96%) | 1,748,402 | 0.64% | (0.15%) | ||||||||||||||||||||||||||
9/30/2021 | 28.98 | (0.05) | 6.11 | 6.06 | — | (1.38) | (1.38) | 33.66 | 21.60% | 2,790,281 | 0.63% | (0.15%) | ||||||||||||||||||||||||||
9/30/2022 | 22.73 | 0.01 | 7.59 | 7.60 | (0.09) | (1.26) | (1.35) | 28.98 | 34.96% | 2,729,246 | 0.64% | 0.06% | ||||||||||||||||||||||||||
9/30/2019 | 23.37 | 0.07 | 0.59 | 0.66 | (0.11) | (1.19) | (1.30) | 22.73 | 3.82% | 1,947,695 | 0.64% | 0.34% | ||||||||||||||||||||||||||
Class R5 | ||||||||||||||||||||||||||||||||||||||
3/31/24(r) | $21.37 | $(0.02) | $5.56 | $5.54 | $— | $(4.55) | $(4.55) | $22.36 | 29.18%(b) | $298,739 | 0.75%(a) | (0.16%)(a) | ||||||||||||||||||||||||||
9/30/2023 | 18.65 | (0.04) | 5.74 | 5.70 | (0.07) | (2.91) | (2.98) | 21.37 | 34.48% | 272,965 | 0.75% | (0.19%) | ||||||||||||||||||||||||||
9/30/2022 | 33.56 | (0.06) | (8.53) | (8.59) | — | (6.32) | (6.32) | 18.65 | (32.04%) | 333,396 | 0.74% | (0.25%) | ||||||||||||||||||||||||||
9/30/2021 | 28.93 | (0.08) | 6.09 | 6.01 | — | (1.38) | (1.38) | 33.56 | 21.46% | 616,307 | 0.73% | (0.25%) | ||||||||||||||||||||||||||
9/30/2022 | 22.69 | (0.01) | 7.58 | 7.57 | (0.07) | (1.26) | (1.33) | 28.93 | 34.84% | 604,630 | 0.74% | (0.04%) | ||||||||||||||||||||||||||
9/30/2019 | 23.32 | 0.05 | 0.59 | 0.64 | (0.08) | (1.19) | (1.27) | 22.69 | 3.75% | 456,222 | 0.74% | 0.24% | ||||||||||||||||||||||||||
Service Class | ||||||||||||||||||||||||||||||||||||||
3/31/24(r) | $21.00 | $(0.03) | $5.45 | $5.42 | $— | $(4.55) | $(4.55) | $21.87 | 29.10%(b) | $166,306 | 0.85%(a) | (0.26%)(a) | ||||||||||||||||||||||||||
9/30/2023 | 18.37 | (0.06) | 5.65 | 5.59 | (0.05) | (2.91) | (2.96) | 21.00 | 34.34% | 132,292 | 0.85% | (0.29%) | ||||||||||||||||||||||||||
9/30/2022 | 33.18 | (0.09) | (8.40) | (8.49) | — | (6.32) | (6.32) | 18.37 | (32.12%) | 121,094 | 0.84% | (0.35%) | ||||||||||||||||||||||||||
9/30/2021 | 28.64 | (0.11) | 6.03 | 5.92 | — | (1.38) | (1.38) | 33.18 | 21.36% | 207,565 | 0.83% | (0.35%) | ||||||||||||||||||||||||||
9/30/2022 | 22.47 | (0.04) | 7.51 | 7.47 | (0.04) | (1.26) | (1.30) | 28.64 | 34.72% | 184,567 | 0.84% | (0.17%) | ||||||||||||||||||||||||||
9/30/2019 | 23.10 | 0.03 | 0.58 | 0.61 | (0.05) | (1.19) | (1.24) | 22.47 | 3.61% | 114,021 | 0.84% | 0.14% | ||||||||||||||||||||||||||
Administrative Class | ||||||||||||||||||||||||||||||||||||||
3/31/24(r) | $20.43 | $(0.04) | $5.29 | $5.25 | $— | $(4.55) | $(4.55) | $21.13 | 29.08%(b) | $178,220 | 0.95%(a) | (0.36%)(a) | ||||||||||||||||||||||||||
9/30/2023 | 17.95 | (0.07) | 5.48 | 5.41 | (0.02) | (2.91) | (2.93) | 20.43 | 34.14% | 152,817 | 0.95% | (0.39%) | ||||||||||||||||||||||||||
9/30/2022 | 32.58 | (0.11) | (8.20) | (8.31) | — | (6.32) | (6.32) | 17.95 | (32.16)% | 171,168 | 0.94% | (0.46%) | ||||||||||||||||||||||||||
9/30/2021 | 28.18 | (0.14) | 5.92 | 5.78 | — | (1.38) | (1.38) | 32.58 | 21.21% | 347,256 | 0.93% | (0.45%) | ||||||||||||||||||||||||||
9/30/2022 | 22.13 | (0.06) | 7.40 | 7.34 | (0.03) | (1.26) | (1.29) | 28.18 | 34.60% | 388,847 | 0.94% | (0.24%) | ||||||||||||||||||||||||||
9/30/2019 | 22.78 | 0.01 | 0.57 | 0.58 | (0.04) | (1.19) | (1.23) | 22.13 | 3.51% | 312,815 | 0.94% | 0.04% | ||||||||||||||||||||||||||
59 |
Income (loss) from investment operations | Less distributions to shareholders | Ratios / Supplemental Data | ||||||||||||||||||||||||||||||||||||
Net asset value beginning of the period | Net investment income (loss)(c) | Net realized and unrealized gain (loss) on investments | Total income (loss) from investment operations | From net investment income | From net realized gains | Total distributions | Net asset value, end of the period | Total return(l),(m) | Net assets, end of the period (000’s) | Ratio of expenses to average daily net assets(q) | Net investment income (loss) to average daily net assets | |||||||||||||||||||||||||||
Class R4 | ||||||||||||||||||||||||||||||||||||||
3/31/24(r) | $18.79 | $(0.05) | $4.81 | $4.76 | $— | $(4.55) | $(4.55) | $19.00 | 29.01%(b) | $54,201 | 1.10%(a) | (0.51%)(a) | ||||||||||||||||||||||||||
9/30/2023 | 16.73 | (0.09) | 5.06 | 4.97 | — | (2.91) | (2.91) | 18.79 | 33.92% | 45,784 | 1.10% | (0.54%) | ||||||||||||||||||||||||||
9/30/2022 | 30.82 | (0.14) | (7.63) | (7.77) | — | (6.32) | (6.32) | 16.73 | (32.26%) | 48,674 | 1.08% | (0.59%) | ||||||||||||||||||||||||||
9/30/2021 | 26.76 | (0.17) | 5.61 | 5.44 | — | (1.38) | (1.38) | 30.82 | 21.05% | 128,730 | 1.08% | (0.60%) | ||||||||||||||||||||||||||
9/30/2020 | 21.09 | (0.09) | 7.02 | 6.93 | — | (1.26) | (1.26) | 26.76 | 34.34% | 121,843 | 1.09% | (0.38%) | ||||||||||||||||||||||||||
9/30/2019 | 21.78 | (0.02) | 0.54 | 0.52 | (0.02) | (1.19) | (1.21) | 21.09 | 3.38% | 106,445 | 1.09% | (0.11%) | ||||||||||||||||||||||||||
Class A | ||||||||||||||||||||||||||||||||||||||
3/31/24(r) | $18.75 | $(0.05) | $4.78 | $4.73 | $— | $(4.55) | $(4.55) | $18.93 | 28.90%(b) | $92,975 | 1.18%(a) | (0.59%)(a) | ||||||||||||||||||||||||||
9/30/2023 | 16.71 | (0.11) | 5.06 | 4.95 | — | (2.91) | (2.91) | 18.75 | 33.82% | 81,524 | 1.20% | (0.64%) | ||||||||||||||||||||||||||
9/30/2022 | 30.82 | (0.16) | (7.63) | (7.79) | — | (6.32) | (6.32) | 16.71 | (32.34%) | 80,084 | 1.19% | (0.70%) | ||||||||||||||||||||||||||
9/30/2021 | 26.79 | (0.20) | 5.61 | 5.41 | — | (1.38) | (1.38) | 30.82 | 20.91% | 142,265 | 1.18% | (0.69%) | ||||||||||||||||||||||||||
9/30/2020 | 21.13 | (0.11) | 7.03 | 6.92 | — | (1.26) | (1.26) | 26.79 | 34.23% | 202,794 | 1.18% | (0.48%) | ||||||||||||||||||||||||||
9/30/2019 | 21.82 | (0.04) | 0.54 | 0.50 | — | (1.19) | (1.19) | 21.13 | 3.27% | 181,457 | 1.19% | (0.21%) | ||||||||||||||||||||||||||
Class R3 | ||||||||||||||||||||||||||||||||||||||
3/31/24(r) | $16.43 | $(0.06) | $4.11 | $4.05 | $— | $(4.55) | $(4.55) | $15.93 | 28.82%(b) | $43,583 | 1.35%(a) | (0.75%)(a) | ||||||||||||||||||||||||||
9/30/2023 | 15.00 | (0.12) | 4.46 | 4.34 | — | (2.91) | (2.91) | 16.43 | 33.59% | 34,246 | 1.35% | (0.80%) | ||||||||||||||||||||||||||
9/30/2022 | 28.32 | (0.18) | (6.82) | (7.00) | — | (6.32) | (6.32) | 15.00 | (32.41%) | 30,331 | 1.34% | (0.85%) | ||||||||||||||||||||||||||
9/30/2021 | 24.76 | (0.23) | 5.17 | 4.94 | — | (1.38) | (1.38) | 28.32 | 20.72% | 55,690 | 1.33% | (0.85%) | ||||||||||||||||||||||||||
9/30/2020 | 19.64 | (0.13) | 6.51 | 6.38 | — | (1.26) | (1.26) | 24.76 | 34.06% | 60,548 | 1.33% | (0.62%) | ||||||||||||||||||||||||||
9/30/2019 | 20.41 | (0.07) | 0.49 | 0.42 | — | (1.19) | (1.19) | 19.64 | 3.10% | 61,141 | 1.34% | (0.36%) | ||||||||||||||||||||||||||
Class Y | ||||||||||||||||||||||||||||||||||||||
3/31/24(r) | $21.37 | $(0.02) | $5.56 | $5.54 | $— | $(4.55) | $(4.55) | $22.36 | 29.17%(b) | $121 | 0.75%(a) | (0.15%)(a) | ||||||||||||||||||||||||||
9/30/23(g) | 18.41 | (0.03) | 2.99 | 2.96 | — | — | — | 21.37 | 16.08%(b) | 116 | 0.76%(a) | (0.20%)(a) | ||||||||||||||||||||||||||
Six Months Ended March 31, 2024(b),(r) | Year Ended September 30 | |||||||||||||||||||
2023 | 2022 | 2021 | 2020 | 2019 | ||||||||||||||||
Portfolio turnover rate | 5% | 16% | 16% | 20% | 28% | 25% | ||||||||||||||
(a) | Annualized. |
(b) | Percentage represents the results for the period and is not annualized. |
(c) | Per share amount calculated on the average shares method. |
(g) | For the period February 1, 2023 (commencement of operations) through September 30, 2023. |
(l) | Employee retirement benefit plans that invest plan assets in the Separate Investment Accounts (SIAs) may be subject to certain charges as set forth in their respective Plan Documents. Total return figures would be lower for the periods presented if they reflected these charges. |
(m) | Total return excludes sales charges, if any, and would be lower for the period presented if it reflected these charges. |
(q) | Excludes fees and expenses incurred indirectly as a result of investments in underlying funds, as applicable. |
(r) | Unaudited. |
60 |
Income (loss) from investment operations | Less distributions to shareholders | Ratios / Supplemental Data | ||||||||||||||||||||||||||||||||||||
Net asset value beginning of the period | Net investment income (loss)(c) | Net realized and unrealized gain (loss) on investments | Total income (loss) from investment operations | From net investment income | From net realized gains | Total distributions | Net asset value, end of the period | Total return(l),(m) | Net assets, end of the period (000’s) | Ratio of expenses to average daily net assets(q) | Net investment income (loss) to average daily net assets | |||||||||||||||||||||||||||
Class I | ||||||||||||||||||||||||||||||||||||||
3/31/24(r) | $11.03 | $0.11 | $2.13 | $2.24 | $(0.26) | $(0.34) | $(0.60) | $12.67 | 20.98% (b) | $95,689 | 0.61% (a) | 2.05% (a) | ||||||||||||||||||||||||||
9/30/2023 | 10.87 | 0.26 | 1.39 | 1.65 | (0.26) | (1.23) | (1.49) | 11.03 | 14.93% | 174,006 | 0.61% | 2.31% | ||||||||||||||||||||||||||
9/30/2022 | 13.48 | 0.25 | (1.15) | (0.90) | (0.26) | (1.45) | (1.71) | 10.87 | (8.47%) | 168,929 | 0.58% | 1.97% | ||||||||||||||||||||||||||
9/30/2021 | 9.87 | 0.23 | 3.62 | 3.85 | (0.24) | — | (0.24) | 13.48 | 39.59% | 230,230 | 0.57% | 1.84% | ||||||||||||||||||||||||||
9/30/2022 | 11.48 | 0.25 | (1.01) | (0.76) | (0.28) | (0.57) | (0.85) | 9.87 | (7.64%) | 197,915 | 0.58% | 2.42% | ||||||||||||||||||||||||||
9/30/2019 | 13.48 | 0.26 | (0.33) | (0.07) | (0.26) | (1.67) | (1.93) | 11.48 | 1.59% | 210,652 | 0.58% | 2.31% | ||||||||||||||||||||||||||
Class R5 | ||||||||||||||||||||||||||||||||||||||
3/31/24(r) | $11.06 | $0.11 | $2.14 | $2.25 | $(0.25) | $(0.34) | $(0.59) | $12.72 | 20.97% (b) | $48,823 | 0.71% (a) | 1.96% (a) | ||||||||||||||||||||||||||
9/30/2023 | 10.90 | 0.25 | 1.39 | 1.64 | (0.25) | (1.23) | (1.48) | 11.06 | 14.76% | 46,196 | 0.71% | 2.21% | ||||||||||||||||||||||||||
9/30/2022 | 13.50 | 0.24 | (1.15) | (0.91) | (0.24) | (1.45) | (1.69) | 10.90 | (8.48%) | 48,259 | 0.68% | 1.86% | ||||||||||||||||||||||||||
9/30/2021 | 9.89 | 0.22 | 3.62 | 3.84 | (0.23) | — | (0.23) | 13.50 | 39.38% | 70,251 | 0.67% | 1.74% | ||||||||||||||||||||||||||
9/30/2022 | 11.50 | 0.24 | (1.02) | (0.78) | (0.26) | (0.57) | (0.83) | 9.89 | (7.75%) | 62,821 | 0.68% | 2.33% | ||||||||||||||||||||||||||
9/30/2019 | 13.50 | 0.25 | (0.33) | (0.08) | (0.25) | (1.67) | (1.92) | 11.50 | 1.48% | 74,403 | 0.68% | 2.19% | ||||||||||||||||||||||||||
Service Class | ||||||||||||||||||||||||||||||||||||||
3/31/24(r) | $11.06 | $0.11 | $2.14 | $2.25 | $(0.24) | $(0.34) | $(0.58) | $12.73 | 20.97%(b) | $13,288 | 0.81% (a) | 1.87% (a) | ||||||||||||||||||||||||||
9/30/2023 | 10.90 | 0.24 | 1.38 | 1.62 | (0.23) | (1.23) | (1.46) | 11.06 | 14.60% | 11,363 | 0.81% | 2.10% | ||||||||||||||||||||||||||
9/30/2022 | 13.50 | 0.23 | (1.15) | (0.92) | (0.23) | (1.45) | (1.68) | 10.90 | (8.57%) | 11,979 | 0.78% | 1.77% | ||||||||||||||||||||||||||
9/30/2021 | 9.89 | 0.20 | 3.63 | 3.83 | (0.22) | — | (0.22) | 13.50 | 39.28% | 15,170 | 0.77% | 1.65% | ||||||||||||||||||||||||||
9/30/2022 | 11.51 | 0.23 | (1.02) | (0.79) | (0.26) | (0.57) | (0.83) | 9.89 | (7.88%) | 13,967 | 0.78% | 2.25% | ||||||||||||||||||||||||||
9/30/2019 | 13.49 | 0.24 | (0.32) | (0.08) | (0.23) | (1.67) | (1.90) | 11.51 | 1.40% | 10,046 | 0.78% | 2.08% | ||||||||||||||||||||||||||
Administrative Class | ||||||||||||||||||||||||||||||||||||||
3/31/24(r) | $11.17 | $0.10 | $2.17 | $2.27 | $(0.23) | $(0.34) | $(0.57) | $12.87 | 20.91% (b) | $21,522 | 0.91% (a) | 1.77% (a) | ||||||||||||||||||||||||||
9/30/2023 | 10.99 | 0.23 | 1.40 | 1.63 | (0.22) | (1.23) | (1.45) | 11.17 | 14.56% | 17,730 | 0.91% | 2.01% | ||||||||||||||||||||||||||
9/30/2022 | 13.61 | 0.21 | (1.17) | (0.96) | (0.21) | (1.45) | (1.66) | 10.99 | (8.76%) | 16,695 | 0.88% | 1.66% | ||||||||||||||||||||||||||
9/30/2021 | 9.96 | 0.19 | 3.67 | 3.86 | (0.21) | — | (0.21) | 13.61 | 39.24% | 21,354 | 0.87% | 1.54% | ||||||||||||||||||||||||||
9/30/2022 | 11.59 | 0.22 | (1.03) | (0.81) | (0.25) | (0.57) | (0.82) | 9.96 | (7.99%) | 16,359 | 0.88% | 2.12% | ||||||||||||||||||||||||||
9/30/2019 | 13.58 | 0.23 | (0.33) | (0.10) | (0.22) | (1.67) | (1.89) | 11.59 | 1.29% | 20,346 | 0.88% | 2.01% | ||||||||||||||||||||||||||
Class R4 | ||||||||||||||||||||||||||||||||||||||
3/31/24(r) | $10.79 | $0.09 | $2.09 | $2.18 | $(0.21) | $(0.34) | $(0.55) | $12.42 | 20.82% (b) | $11,296 | 1.07% (a) | 1.62% (a) | ||||||||||||||||||||||||||
9/30/2023 | 10.66 | 0.21 | 1.35 | 1.56 | (0.20) | (1.23) | (1.43) | 10.79 | 14.35% | 9,562 | 1.06% | 1.87% | ||||||||||||||||||||||||||
9/30/2022 | 13.24 | 0.19 | (1.12) | (0.93) | (0.20) | (1.45) | (1.65) | 10.66 | (8.83%) | 8,853 | 1.03% | 1.51% | ||||||||||||||||||||||||||
9/30/2021 | 9.70 | 0.17 | 3.57 | 3.74 | (0.20) | — | (0.20) | 13.24 | 39.00% | 12,608 | 1.02% | 1.39% | ||||||||||||||||||||||||||
9/30/2020 | 11.31 | 0.20 | (1.01) | (0.81) | (0.23) | (0.57) | (0.80) | 9.70 | (8.14%) | 9,823 | 1.03% | 2.00% | ||||||||||||||||||||||||||
9/30/2019 | 13.32 | 0.21 | (0.32) | (0.11) | (0.23) | (1.67) | (1.90) | 11.31 | 1.18% | 6,570 | 1.03% | 1.88% | ||||||||||||||||||||||||||
Class A | ||||||||||||||||||||||||||||||||||||||
3/31/24(r) | $11.02 | $0.09 | $2.13 | $2.22 | $(0.19) | $(0.34) | $(0.53) | $12.71 | 20.78% (b) | $25,554 | 1.15% (a) | 1.54% (a) | ||||||||||||||||||||||||||
9/30/2023 | 10.86 | 0.20 | 1.38 | 1.58 | (0.19) | (1.23) | (1.42) | 11.02 | 14.25% | 22,250 | 1.16% | 1.77% | ||||||||||||||||||||||||||
9/30/2022 | 13.45 | 0.18 | (1.15) | (0.97) | (0.17) | (1.45) | (1.62) | 10.86 | (8.93%) | 21,805 | 1.13% | 1.42% | ||||||||||||||||||||||||||
9/30/2021 | 9.85 | 0.16 | 3.63 | 3.79 | (0.19) | — | (0.19) | 13.45 | 38.84% | 26,835 | 1.12% | 1.29% | ||||||||||||||||||||||||||
9/30/2020 | 11.46 | 0.19 | (1.02) | (0.83) | (0.21) | (0.57) | (0.78) | 9.85 | (8.22%) | 27,575 | 1.13% | 1.87% | ||||||||||||||||||||||||||
9/30/2019 | 13.45 | 0.20 | (0.32) | (0.12) | (0.20) | (1.67) | (1.87) | 11.46 | 1.03% | 37,170 | 1.13% | 1.75% | ||||||||||||||||||||||||||
61 |
Income (loss) from investment operations | Less distributions to shareholders | Ratios / Supplemental Data | ||||||||||||||||||||||||||||||||||||
Net asset value beginning of the period | Net investment income (loss)(c) | Net realized and unrealized gain (loss) on investments | Total income (loss) from investment operations | From net investment income | From net realized gains | Total distributions | Net asset value, end of the period | Total return(l),(m) | Net assets, end of the period (000’s) | Ratio of expenses to average daily net assets(q) | Net investment income (loss) to average daily net assets | |||||||||||||||||||||||||||
Class R3 | ||||||||||||||||||||||||||||||||||||||
3/31/24(r) | $10.91 | $0.08 | $2.11 | $2.19 | $(0.15) | $(0.34) | $(0.49) | $12.61 | 20.64%(b) | $492 | 1.31%(a) | 1.39%(a) | ||||||||||||||||||||||||||
9/30/2023 | 10.78 | 0.18 | 1.37 | 1.55 | (0.19) | (1.23) | (1.42) | 10.91 | 14.07% | 684 | 1.31% | 1.60% | ||||||||||||||||||||||||||
9/30/2022 | 13.35 | 0.16 | (1.14) | (0.98) | (0.14) | (1.45) | (1.59) | 10.78 | (9.09%) | 1,395 | 1.28% | 1.31% | ||||||||||||||||||||||||||
9/30/2021 | 9.77 | 0.14 | 3.61 | 3.75 | (0.17) | — | (0.17) | 13.35 | 38.73% | 1,082 | 1.27% | 1.14% | ||||||||||||||||||||||||||
9/30/2020 | 11.39 | 0.18 | (1.02) | (0.84) | (0.21) | (0.57) | (0.78) | 9.77 | (8.38%) | 1,492 | 1.28% | 1.76% | ||||||||||||||||||||||||||
9/30/2019 | 13.37 | 0.18 | (0.31) | (0.13) | (0.18) | (1.67) | (1.85) | 11.39 | 0.91% | 1,387 | 1.28% | 1.59% | ||||||||||||||||||||||||||
Class Y | ||||||||||||||||||||||||||||||||||||||
3/31/24(r) | $11.06 | $0.11 | $2.14 | $2.25 | $(0.25) | $(0.34) | $(0.59) | $12.72 | 21.00%(b) | $109 | 0.72%(a) | 1.97%(a) | ||||||||||||||||||||||||||
9/30/23(g) | 11.66 | 0.17 | (0.77)(aa) | (0.60) | — | — | — | 11.06 | (5.15%)(b) | 95 | 0.71%(a) | 2.26%(a) | ||||||||||||||||||||||||||
Six Months Ended March 31, 2024(b),(r) | Year Ended September 30 | |||||||||||||||||||
2023 | 2022 | 2021 | 2020 | 2019 | ||||||||||||||||
Portfolio turnover rate | 25% | 45% | 43% | 60% | 52% | 42% | ||||||||||||||
(a) | Annualized. |
(b) | Percentage represents the results for the period and is not annualized. |
(c) | Per share amount calculated on the average shares method. |
(g) | For the period February 1, 2023 (commencement of operations) through September 30, 2023. |
(l) | Employee retirement benefit plans that invest plan assets in the Separate Investment Accounts (SIAs) may be subject to certain charges as set forth in their respective Plan Documents. Total return figures would be lower for the periods presented if they reflected these charges. |
(m) | Total return excludes sales charges, if any, and would be lower for the period presented if it reflected these charges. |
(q) | Excludes fees and expenses incurred indirectly as a result of investments in underlying funds, as applicable. |
(r) | Unaudited. |
(aa) | The amount shown for a share outstanding does not correspond with the aggregate net realized and unrealized gain (loss) for the period due to the timing of purchases and redemptions of Fund shares in relation to the fluctuating market values of the Fund. |
62 |
Income (loss) from investment operations | Less distributions to shareholders | Ratios / Supplemental Data | |||||||||||||||||||||||||||||||||||||||
Net asset value beginning of the period | Net investment income (loss)(c) | Net realized and unrealized gain (loss) on investments | Total income (loss) from investment operations | From net investment income | From net realized gains | Total distributions | Net asset value, end of the period | Total return(l),(m) | Net assets, end of the period (000’s) | Ratio of expenses to average daily net assets before expense waivers(q) | Ratio of expenses to average daily net assets after expense waivers(q) | Net investment income (loss) to average daily net assets | |||||||||||||||||||||||||||||
Class I | |||||||||||||||||||||||||||||||||||||||||
3/31/24(r) | $8.84 | $0.22 | $0.45 | $0.67 | $(0.52) | $— | $(0.52) | $8.99 | 7.71%(b) | $473,369 | 0.45%(a) | 0.44%(a) | 4.95%(a) | ||||||||||||||||||||||||||||
9/30/2023 | 9.10 | 0.41 | (0.32) | 0.09 | (0.35) | — | (0.35) | 8.84 | 0.92% | 492,575 | 0.45% | N/A | 4.53% | ||||||||||||||||||||||||||||
9/30/2022 | 11.33 | 0.27 | (2.07) | (1.80) | (0.26) | (0.17) | (0.43) | 9.10 | (16.47%) | 485,216 | 0.42% | N/A | 2.62% | ||||||||||||||||||||||||||||
9/30/2021 | 11.64 | 0.27 | 0.11 | 0.38 | (0.43) | (0.26) | (0.69) | 11.33 | 3.31% | 679,036 | 0.42% | N/A | 2.39% | ||||||||||||||||||||||||||||
9/30/2022 | 11.33 | 0.37 | 0.32 | 0.69 | (0.38) | — | (0.38) | 11.64 | 6.28% | 786,360 | 0.42% | N/A | 3.27% | ||||||||||||||||||||||||||||
9/30/2019 | 10.66 | 0.37 | 0.66 | 1.03 | (0.36) | — | (0.36) | 11.33 | 9.98% | 847,736 | 0.43% | N/A | 3.42% | ||||||||||||||||||||||||||||
Class R5 | |||||||||||||||||||||||||||||||||||||||||
3/31/24(r) | $8.88 | $0.21 | $0.44 | $0.65 | $(0.51) | $— | $(0.51) | $9.02 | 7.47%(b) | $97,095 | 0.55%(a) | 0.54%(a) | 4.86%(a) | ||||||||||||||||||||||||||||
9/30/2023 | 9.13 | 0.40 | (0.31) | 0.09 | (0.34) | — | (0.34) | 8.88 | 0.91% | 92,389 | 0.55% | N/A | 4.41% | ||||||||||||||||||||||||||||
9/30/2022 | 11.37 | 0.25 | (2.07) | (1.82) | (0.25) | (0.17) | (0.42) | 9.13 | (16.60%) | 135,050 | 0.52% | N/A | 2.43% | ||||||||||||||||||||||||||||
9/30/2021 | 11.68 | 0.26 | 0.11 | 0.37 | (0.42) | (0.26) | (0.68) | 11.37 | 3.19% | 306,648 | 0.52% | N/A | 2.29% | ||||||||||||||||||||||||||||
9/30/2022 | 11.37 | 0.36 | 0.32 | 0.68 | (0.37) | — | (0.37) | 11.68 | 6.16% | 316,359 | 0.52% | N/A | 3.17% | ||||||||||||||||||||||||||||
9/30/2019 | 10.69 | 0.36 | 0.67 | 1.03 | (0.35) | — | (0.35) | 11.37 | 9.92% | 317,805 | 0.53% | N/A | 3.32% | ||||||||||||||||||||||||||||
Service Class | |||||||||||||||||||||||||||||||||||||||||
3/31/24(r) | $8.82 | $0.21 | $0.44 | $0.65 | $(0.50) | $— | $(0.50) | $8.97 | 7.53%(b) | $24,736 | 0.65%(a) | 0.64%(a) | 4.76%(a) | ||||||||||||||||||||||||||||
9/30/2023 | 9.07 | 0.39 | (0.31) | 0.08 | (0.33) | — | (0.33) | 8.82 | 0.81% | 29,605 | 0.65% | N/A | 4.31% | ||||||||||||||||||||||||||||
9/30/2022 | 11.30 | 0.25 | (2.07) | (1.82) | (0.24) | (0.17) | (0.41) | 9.07 | (16.72%) | 36,797 | 0.62% | N/A | 2.40% | ||||||||||||||||||||||||||||
9/30/2021 | 11.60 | 0.25 | 0.10 | 0.35 | (0.39) | (0.26) | (0.65) | 11.30 | 3.11% | 58,047 | 0.62% | N/A | 2.19% | ||||||||||||||||||||||||||||
9/30/2022 | 11.29 | 0.35 | 0.31 | 0.66 | (0.35) | — | (0.35) | 11.60 | 6.06% | 83,876 | 0.62% | N/A | 3.08% | ||||||||||||||||||||||||||||
9/30/2019 | 10.63 | 0.35 | 0.64 | 0.99 | (0.33) | — | (0.33) | 11.29 | 9.67% | 86,988 | 0.63% | N/A | 3.22% | ||||||||||||||||||||||||||||
Administrative Class | |||||||||||||||||||||||||||||||||||||||||
3/31/24(r) | $8.74 | $0.20 | $0.44 | $0.64 | $(0.50) | $— | $(0.50) | $8.88 | 7.42%(b) | $33,561 | 0.75%(a) | 0.74%(a) | 4.67%(a) | ||||||||||||||||||||||||||||
9/30/2023 | 8.99 | 0.38 | (0.31) | 0.07 | (0.32) | — | (0.32) | 8.74 | 0.70% | 30,750 | 0.75% | N/A | 4.22% | ||||||||||||||||||||||||||||
9/30/2022 | 11.19 | 0.24 | (2.05) | (1.81) | (0.22) | (0.17) | (0.39) | 8.99 | (16.75%) | 35,207 | 0.72% | N/A | 2.30% | ||||||||||||||||||||||||||||
9/30/2021 | 11.51 | 0.24 | 0.10 | 0.34 | (0.40) | (0.26) | (0.66) | 11.19 | 2.97% | 55,178 | 0.72% | N/A | 2.11% | ||||||||||||||||||||||||||||
9/30/2022 | 11.21 | 0.33 | 0.32 | 0.65 | (0.35) | — | (0.35) | 11.51 | 5.94% | 76,597 | 0.72% | N/A | 2.97% | ||||||||||||||||||||||||||||
9/30/2019 | 10.55 | 0.33 | 0.66 | 0.99 | (0.33) | — | (0.33) | 11.21 | 9.65% | 67,239 | 0.73% | N/A | 3.13% | ||||||||||||||||||||||||||||
Class R4 | |||||||||||||||||||||||||||||||||||||||||
3/31/24(r) | $8.62 | $0.19 | $0.44 | $0.63 | $(0.46) | $— | $(0.46) | $8.79 | 7.40%(b) | $1,413 | 0.90%(a) | 0.89%(a) | 4.51%(a) | ||||||||||||||||||||||||||||
9/30/2023 | 8.84 | 0.36 | (0.30) | 0.06 | (0.28) | — | (0.28) | 8.62 | 0.57% | 1,420 | 0.90% | N/A | 4.05% | ||||||||||||||||||||||||||||
9/30/2022 | 11.01 | 0.20 | ��� | (2.00) | (1.80) | (0.20) | (0.17) | (0.37) | 8.84 | (16.92%) | 2,295 | 0.87% | N/A | 1.99% | |||||||||||||||||||||||||||
9/30/2021 | 11.33 | 0.21 | 0.10 | 0.31 | (0.37) | (0.26) | (0.63) | 11.01 | 2.82% | 8,557 | 0.87% | N/A | 1.95% | ||||||||||||||||||||||||||||
9/30/2020 | 11.04 | 0.31 | 0.31 | 0.62 | (0.33) | — | (0.33) | 11.33 | 5.80% | 10,444 | 0.87% | N/A | 2.80% | ||||||||||||||||||||||||||||
9/30/2019 | 10.39 | 0.31 | 0.64 | 0.95 | (0.30) | — | (0.30) | 11.04 | 9.47% | 14,011 | 0.88% | N/A | 2.98% | ||||||||||||||||||||||||||||
Class A | |||||||||||||||||||||||||||||||||||||||||
3/31/24(r) | $8.66 | $0.19 | $0.44 | $0.63 | $(0.45) | $— | $(0.45) | $8.84 | 7.28%(b) | $20,757 | 0.98%(a) | 0.97%(a) | 4.43%(a) | ||||||||||||||||||||||||||||
9/30/2023 | 8.91 | 0.35 | (0.31) | 0.04 | (0.29) | — | (0.29) | 8.66 | 0.34% | 21,761 | 1.00% | N/A | 3.97% | ||||||||||||||||||||||||||||
9/30/2022 | 11.09 | 0.20 | (2.01) | (1.81) | (0.20) | (0.17) | (0.37) | 8.91 | (16.91%) | 23,746 | 0.97% | N/A | 1.97% | ||||||||||||||||||||||||||||
9/30/2021 | 11.40 | 0.21 | 0.09 | 0.30 | (0.35) | (0.26) | (0.61) | 11.09 | 2.70% | 57,351 | 0.97% | N/A | 1.83% | ||||||||||||||||||||||||||||
9/30/2020 | 11.10 | 0.30 | 0.32 | 0.62 | (0.32) | — | (0.32) | 11.40 | 5.70% | 58,572 | 0.97% | N/A | 2.72% | ||||||||||||||||||||||||||||
9/30/2019 | 10.45 | 0.30 | 0.65 | 0.95 | (0.30) | — | (0.30) | 11.10 | 9.32% | 97,070 | 0.98% | N/A | 2.87% | ||||||||||||||||||||||||||||
63 |
Income (loss) from investment operations | Less distributions to shareholders | Ratios / Supplemental Data | |||||||||||||||||||||||||||||||||||||||
Net asset value beginning of the period | Net investment income (loss)(c) | Net realized and unrealized gain (loss) on investments | Total income (loss) from investment operations | From net investment income | From net realized gains | Total distributions | Net asset value, end of the period | Total return(l),(m) | Net assets, end of the period (000’s) | Ratio of expenses to average daily net assets before expense waivers(q) | Ratio of expenses to average daily net assets after expense waivers(q) | Net investment income (loss) to average daily net assets | |||||||||||||||||||||||||||||
Class R3 | |||||||||||||||||||||||||||||||||||||||||
3/31/24(r) | $8.94 | $0.19 | $0.45 | $0.64 | $(0.44) | $— | $(0.44) | $9.14 | 7.29%(b) | $166 | 1.15%(a) | 1.14%(a) | 4.26%(a) | ||||||||||||||||||||||||||||
9/30/2023 | 9.18 | 0.35 | (0.32) | 0.03 | (0.27) | — | (0.27) | 8.94 | 0.23% | 169 | 1.15% | N/A | 3.81% | ||||||||||||||||||||||||||||
9/30/2022 | 11.34 | 0.20 | (2.09) | (1.89) | (0.10) | (0.17) | (0.27) | 9.18 | (17.05%) | 177 | 1.12% | N/A | 1.88% | ||||||||||||||||||||||||||||
9/30/2021 | 11.63 | 0.19 | 0.10 | 0.29 | (0.32) | (0.26) | (0.58) | 11.34 | 2.54% | 352 | 1.12% | N/A | 1.70% | ||||||||||||||||||||||||||||
9/30/2020 | 11.34 | 0.29 | 0.32 | 0.61 | (0.32) | — | (0.32) | 11.63 | 5.54% | 867 | 1.12% | N/A | 2.57% | ||||||||||||||||||||||||||||
9/30/2019 | 10.67 | 0.29 | 0.67 | 0.96 | (0.29) | — | (0.29) | 11.34 | 9.24% | 1,225 | 1.13% | N/A | 2.72% | ||||||||||||||||||||||||||||
Class Y | |||||||||||||||||||||||||||||||||||||||||
3/31/24(r) | $8.87 | $0.21 | $0.46 | $0.67 | $(0.51) | $— | $(0.51) | $9.03 | 7.68%(b) | $97 | 0.55%(a) | 0.54%(a) | 4.86%(a) | ||||||||||||||||||||||||||||
9/30/23(g) | 9.33 | 0.28 | (0.74) | (0.46) | — | — | — | 8.87 | (4.93%)(b) | $95 | 0.55%(a) | N/A | 4.59%(a) | ||||||||||||||||||||||||||||
Six Months Ended March 31, 2024(b),(r) | Year Ended September 30 | |||||||||||||||||||
2023 | 2022 | 2021 | 2020 | 2019 | ||||||||||||||||
Portfolio turnover rate | 115% | 206% | 239% | 256% | 231% | 261% | ||||||||||||||
(a) | Annualized. |
(b) | Percentage represents the results for the period and is not annualized. |
(c) | Per share amount calculated on the average shares method. |
(g) | For the period February 1, 2023 (commencement of operations) through September 30, 2023. |
(l) | Employee retirement benefit plans that invest plan assets in the Separate Investment Accounts (SIAs) may be subject to certain charges as set forth in their respective Plan Documents. Total return figures would be lower for the periods presented if they reflected these charges. |
(m) | Total return excludes sales charges, if any, and would be lower for the period presented if it reflected these charges. |
(q) | Excludes fees and expenses incurred indirectly as a result of investments in underlying funds, as applicable. |
(r) | Unaudited. |
64 |
(1) | with the exception of the MassMutual Blue Chip Growth Fund and MassMutual Growth Opportunities Fund,1 purchase securities (other than securities issued, guaranteed or sponsored by the U.S. Government or its agencies or instrumentalities or securities issued by investment companies) of any one issuer if, as a result, more than 5% of a Fund’s total assets would be invested in the securities of such issuer or the Fund would own more than 10% of the outstanding voting securities of such issuer, except that up to 25% of the Fund’s total assets may be invested without regard to these limitations. |
(2) | purchase commodities or commodity contracts, except that a Fund may enter into futures contracts, options, options on futures, and other financial or commodity transactions to the extent consistent with applicable law and the Fund’s Prospectus and SAI at the time. |
(3) | purchase or sell real estate except that it may dispose of real estate acquired as a result of the ownership of securities or other instruments. (This restriction does not prohibit a Fund from investing in securities or other instruments backed by real estate or in securities of companies engaged in the real estate business.) |
(4) | participate in the underwriting of securities, except to the extent that a Fund may be deemed an underwriter under federal securities laws by reason of acquisitions or distributions of portfolio securities (e.g., investments in restricted securities and instruments subject to such limits as imposed by the Board and/or law). |
(5) | make loans, except to the extent permitted by the 1940 Act, the rules and regulations thereunder (as such statute, rules or regulations may be amended from time to time) or by guidance regarding or interpretations of, or exemptive orders under, the 1940 Act or the rules or regulations thereunder published by appropriate regulatory authorities. |
(6) | borrow money or issue senior securities, except to the extent permitted by the 1940 Act, the rules and regulations thereunder (as such statute, rules or regulations may be amended from time to time) or by guidance regarding or interpretations of, or exemptive orders under, the 1940 Act or the rules or regulations thereunder published by appropriate regulatory authorities. |
(7) | concentrate its investments in any one industry, as determined by the Board, and in this connection a Fund will not acquire securities of companies in any one industry if, immediately after giving effect to any such acquisition, 25% or more of the value of the total assets of the Fund would be invested in such industry, with the following exceptions: |
a. | There is no limitation for securities issued or guaranteed by the U.S. Government or its agencies or instrumentalities. |
b. | There is no limitation for securities issued by other investment companies. |
1 | The MassMutual Growth Opportunities Fund will merge into the MassMutual Blue Chip Growth Fund. |
A-1 |
(1) | to the extent required by applicable law at the time, purchase additional securities when its borrowings, less amounts receivable on sales of portfolio securities, exceed 5% of its total assets. |
(2) | sell securities short, but reserves the right to sell securities short against the box. |
(3) | invest more than 15% of its net assets in illiquid securities. This restriction does not limit the purchase of securities eligible for resale to qualified institutional buyers pursuant to Rule 144A under the Securities Act of 1933, as amended, provided that such securities are determined to be liquid by MML Advisers or the subadviser pursuant to Board approved guidelines. |
(4) | to the extent that shares of the Fund are purchased or otherwise acquired by other series of the Trust, acquire any securities of registered open-end investment companies or registered unit investment trusts in reliance on Section 12(d)(1)(F) or Section 12(d)(1)(G) of the 1940 Act. |
A-2 |
B-1 |
B-2 |
B-3 |
B-4 |
B-5 |
C-1 |
2 | Prior to March 26, 2024, T. Rowe Price typically employed a “value” approach in selecting investments, using internal research to identify companies that appeared to be undervalued by various measures and may have been temporarily out of favor but had good prospects for capital appreciation and dividend growth. T. Rowe Price generally looked for companies with one or more of the following: an established operating history; above-average dividend yield and low price/earnings ratio relative to the Russell 1000® Value Index; a sound balance sheet and other positive financial characteristics; and low stock price relative to T. Rowe Price’s view of the company’s underlying value as measured by assets, cash flow, or business franchises. T. Rowe Price generally sought investments in large-capitalization companies and the yield of the portion of the Fund managed by T. Rowe Price was expected to normally exceed the yield of the Russell 1000 Value Index. T. Rowe Price may have sold assets for a variety of reasons, including in response to a change in the original investment considerations or to limit losses, adjust the characteristics of the overall portfolio, or redeploy assets into different opportunities. |
C-2 |
C-3 |
C-4 |
(i) | the issuer is organized under the laws of the country or a country within the geographic region suggested by the Relevant Language or maintains its principal place of business in that country or region; or |
(ii) | the securities are traded principally in the country or region suggested by the Relevant Language; or |
(iii) | the issuer, during its most recent fiscal year, derived at least 50% of its revenues or profits from goods produced or sold, investments made, or services performed in the country or region suggested by the Relevant Language or has at least 50% of its assets in that country or region. |
C-5 |
PORTFOLIO MANAGER | MANAGED THE FUND SINCE | TITLE | ||||||
Paul D. Greene II | October 2021 | Portfolio Manager at T. Rowe Price | ||||||
Aziz V. Hamzaogullari, CFA | January 2015 | Chief Investment Officer and Founder of the Growth Equity Strategies Team and a member of the Board of Directors at Loomis Sayles | ||||||
PORTFOLIO MANAGER | MANAGED THE FUND SINCE | TITLE | ||||||
John D. Linehan, CFA | September 2017 | Vice President and Portfolio Manager at T. Rowe Price | ||||||
Joseph J. Kirby | January 2010 | Portfolio Manager at Brandywine Global | ||||||
Henry F. Otto | January 2010 | Managing Director and Portfolio Manager at Brandywine Global | ||||||
Steven M. Tonkovich | January 2010 | Managing Director and Portfolio Manager at Brandywine Global | ||||||
PORTFOLIO MANAGER | MANAGED THE FUND SINCE | TITLE | ||||||
Yulia Alekseeva, CFA | December 2020 | Managing Director, the Head of Securitized Credit Research, and a portfolio manager for Barings’ Investment Grade Fixed Income Group | ||||||
Stephen Ehrenberg, CFA | February 2019 | Managing Director and portfolio manager for Barings’ Investment Grade Fixed Income Group | ||||||
Charles Sanford | December 2020. Previously managed the Fund from June 2006 to November 2017 | Managing Director and the Head of, and a portfolio manager for, Barings’ Investment Grade Credit Group | ||||||
Douglas Trevallion, II, CFA | October 2008 | Managing Director, the Head of Global Securitized and Liquid Products, and a portfolio manager for Barings’ Investment Grade Fixed Income Group | ||||||
D-1 |
D-2 |
D-3 |
D-4 |
• | Administrative and Shareholder Services Fee: Shares of all classes, except Class I shares, are subject to an administrative and shareholder services fee. This fee is described above under “Management of the Funds - Investment Adviser.” |
• | Servicing or Distribution Fees: Class R4, Class A, and Class R3 shares are subject to servicing or distribution fees paid under a Rule 12b-1 Plan. These fees are described below in “Distribution Plan, Shareholder Servicing, and Payments to Intermediaries.” |
• | Financial Intermediaries: Class I, Class R5, Service Class, Administrative Class, Class R4, and Class R3 shares are offered primarily through various financial intermediaries, such as retirement plan recordkeepers, broker-dealers, financial institutions, and insurance companies. |
E-1 |
• | Investment Accounts and Plans: Class I, Class R5, Service Class, Administrative Class, Class R4, Class A, and Class R3 shares are available for purchase by insurance company separate investment accounts, qualified plans under Sections 401(a) and 401(k) of the Code, Code Section 403(b) and 457 plans, Code Section 501(c)(9 ) associations, non-qualified deferred compensation plans, and other institutional investors, including, but not limited to, endowments and foundations. |
• | Funds: Class I, Class R5, and Service Class shares are available for purchase by mutual funds and collective trust funds. |
• | Individual Retirement Accounts: Class A shares of any Fund may be purchased by individual retirement accounts described in Code Section 408. |
E-2 |
Price Breakpoints | General Equity | General Taxable Bond | Shorter- Term Bond | Municipal Bond | ||||||||||
Less than $25,000 | 5.50%/ | 4.25%/ | 2.50%/ | 2.50%/ | ||||||||||
5.82%/ | 4.44%/ | 2.56%/ | 2.56%/ | |||||||||||
4.50% | 3.50% | 2.00% | 2.00% | |||||||||||
$25,000 - $49,999 | 5.25%/ | 4.25%/ | 2.25%/ | 2.25%/ | ||||||||||
5.54%/ | 4.44%/ | 2.30%/ | 2.30%/ | |||||||||||
4.25% | 3.50% | 1.75% | 1.75% | |||||||||||
$50,000 - $99,999 | 4.50%/ | 4.00%/ | 2.00%/ | 2.00%/ | ||||||||||
4.71%/ | 4.17%/ | 2.04%/ | 2.04%/ | |||||||||||
3.50% | 3.25% | 1.50% | 1.50% | |||||||||||
$100,000 - $249,999 | 3.50%/ | 3.00%/ | 1.75%/ | 1.75%/ | ||||||||||
3.63%/ | 3.09%/ | 1.78%/ | 1.78%/ | |||||||||||
2.50% | 2.25% | 1.25% | 1.25% | |||||||||||
$250,000 - $499,999 | 2.25%/ | 1.75%/ | 1.50%/ | None/ | ||||||||||
2.30%/ | 1.78%/ | 1.52%/ | None/ | |||||||||||
1.75% | 1.50% | 1.00% | 1.00% | |||||||||||
$500,000 - $999,999 | 1.75%/ | 1.25%/ | 1.25%/ | None/ | ||||||||||
1.78%/ | 1.27%/ | 1.27%/ | None/ | |||||||||||
1.10% | 1.00% | 1.00% | 1.00% | |||||||||||
$1,000,000 - $4,999,999 | None/ | None/ | None/ | None/ | ||||||||||
None/ | None/ | None/ | None/ | |||||||||||
1.00% | 1.00% | 0.50% | 1.00% | |||||||||||
$5,000,000 or more | None/ | None/ | None/ | None/ | ||||||||||
None/ | None/ | None/ | None/ | |||||||||||
0.50% | 0.50% | 0.50% | 0.50% | |||||||||||
E-3 |
• | the amount of your account value represented by an increase in NAV over the initial purchase price, |
• | shares purchased by the reinvestment of dividends or capital gains distributions, or |
• | shares redeemed in the special circumstances described below. |
1. | shares acquired by reinvestment of dividends and capital gains distributions, and |
2. | shares held the longest. |
• | Purchases into insurance company separate investment accounts. |
• | Purchases into retirement plans or other employee benefit plans. |
• | Purchases of Class A shares aggregating $250,000 or more or $1 million or more, as shown in the table above in the previous section, of any one or more of the Funds. |
• | Purchases into accounts for which the broker-dealer of record has entered into a special agreement with the Distributor allowing this waiver. |
• | Purchases into accounts for which no sales concession is paid to any broker-dealer or other financial intermediary at the time of sale. |
• | Shares sold to MassMutual or its affiliates. |
• | Shares sold to registered management investment companies or separate accounts of insurance companies having an agreement with MassMutual, MML Advisers, or the Distributor for that purpose. |
• | Shares issued in plans of reorganization to which the Fund is a party. |
E-4 |
• | Shares sold to present or former officers, directors, trustees, or employees (and their “immediate families3”) of the Fund, MassMutual, and its affiliates. |
• | Shares sold to a portfolio manager of the Fund. |
• | Redemptions from insurance company separate investment accounts. |
• | Redemptions from retirement plans or other employee benefit plans. |
• | Redemptions from accounts other than retirement plans following the death or disability of the last surviving shareholder, including a trustee of a grantor trust or revocable living trust for which the trustee is also the sole beneficiary. The death or disability must have occurred after the account was established, and for disability you must provide evidence of a determination of disability by the Social Security Administration. |
• | Redemptions from accounts for which the broker-dealer of record has entered into a special agreement with the Distributor allowing this waiver. |
• | Redemptions from accounts for which no sales concession was paid to any broker-dealer or other financial intermediary at the time of sale. |
• | Redemptions of Class A shares under an automatic withdrawal plan from an account other than a retirement plan if the aggregate value of the redeemed shares does not exceed 10% of the account’s value annually. |
• | In the case of an IRA, to make distributions required under a divorce or separation agreement described in Section 71(b) of the Code. |
• | Shares sold to MassMutual or its affiliates. |
• | Shares sold to registered management investment companies or separate accounts of insurance companies having an agreement with MassMutual, MML Advisers, or the Distributor for that purpose. |
• | Shares issued in plans of reorganization to which the Fund is a party. |
• | Shares sold to present or former officers, directors, trustees, or employees (and their “immediate families1”) of the Fund, MassMutual, and its affiliates. |
• | Shares sold to a present or former portfolio manager of the Fund. |
3 | The term “immediate family” refers to one’s spouse, children, grandchildren, grandparents, parents, parents-in-law, brothers and sisters, sons- and daughters-in-law, a sibling’s spouse, a spouse’s siblings, aunts, uncles, nieces, and nephews; relatives by virtue of a remarriage (step-children, step-parents, etc.) are included. |
E-5 |
E-6 |
• | Payments to administrative service providers that provide enrollment, recordkeeping, and other services to pension plans; |
• | Cash and non-cash benefits, such as bonuses and allowances or prizes and awards, for certain broker-dealers, administrative service providers, and MassMutual insurance agents; |
• | Payments to intermediaries for, among other things, training of sales personnel, conference support, marketing, or other services provided to promote awareness of MassMutual’s products; |
• | Payments to broker-dealers and other intermediaries that enter into agreements providing the Distributor with access to representatives of those firms or with other marketing or administrative services; and |
• | Payments under agreements with MassMutual not directly related to the sale of specific variable annuity contracts or the Funds, such as educational seminars and training or pricing services. |
E-7 |
E-8 |
E-9 |
• | you have engaged in excessive trading; |
• | a Fund receives or expects simultaneous orders affecting significant portions of the Fund’s assets; |
• | a pattern of exchanges occurs which coincides with a market timing strategy; or |
• | the Fund would be unable to invest the funds effectively based on its investment objectives and policies or if the Fund would be adversely affected. |
• | A letter of instruction signed by an authorized signer of the account detailing the fund name, account number, and trade details; including the trade type (purchase or redemption), and the dollar or share amount. The trade will be processed upon receiving the request in good order. |
• | The signature on the letter of instructions must be guaranteed by an acceptable financial institution (such as a bank, broker, or savings and loan association) as defined under Rule 17Ad-15 of the Securities Exchange Act of 1934, as amended. If your financial institution belongs to one of the medallion guarantee programs, it must use the actual “Medallion Guaranteed” stamp. |
• | If applicable, a corporate resolution which states that the extract of the by-laws is true and complete and is in full force and effect. |
E-10 |
• | The resolution must be signed by the secretary. It must have a corporate seal or state that no seal exists. If there is no seal, the corporate resolution must be signed by an authorized signer with a medallion guaranteed stamp and must be dated within sixty (60) days of presentment to State Street. |
Method | Instructions | ||||
Through your financial intermediary | Your financial intermediary can help you establish your account and buy shares on your behalf. To receive the current trading day’s price, your financial intermediary must receive your request in good order prior to the close of regular trading on the New York Stock Exchange, usually 4:00 p.m., Eastern time. Your financial intermediary may charge you fees for executing the purchase for you. | ||||
By exchange | You or your financial intermediary may acquire shares of a Fund for your account by exchanging shares you own in certain other funds advised by MML Advisers for shares of the same class of a Fund, subject to the conditions described in “Exchanges” above. In addition, you or your financial intermediary may exchange shares of a class of a Fund you own for shares of a different class of the same Fund, subject to the conditions described in “Exchanges.” To exchange, send written instructions to the applicable Fund, at the address noted below(1) or call 1-800-860-2232. | ||||
By wire | You may purchase shares of a Fund by wiring money from your bank account to your Fund account. Prior to sending wire transfers, please contact Shareholder Services at 1-800-860-2232 for specific wiring instructions and to facilitate prompt and accurate credit upon receipt of your wire. | ||||
To receive the current trading day’s price, your wire, along with a valid account number, must be received in your Fund account prior to the close of regular trading on the New York Stock Exchange, usually 4:00 p.m., Eastern time. | |||||
If your initial purchase of shares is by wire, you must first complete a new account application and promptly mail it to MassMutual Select Funds or MassMutual Premier Funds, as applicable - (Fund Name), at the address noted below.(1) After completing a new account application, please call 1-800-860-2232 to obtain your account number. Please include your account number on the wire. | |||||
By check | To purchase shares of a Fund by check, make your check payable to ‘MassMutual Select Funds’ or ‘MassMutual Premier Funds,’ as applicable. Your checks should include the fund name which you would like to purchase along with your account number (if previously established). Your request should be mailed to the address listed below.(1) The Funds will accept purchases only in U.S. dollars drawn from U.S. financial institutions. Cashier’s checks, third party checks, money orders, credit card convenience checks, cash or equivalents, or payments in foreign currencies are not acceptable forms of payment. | ||||
(1) | Regular Mail: State Street Bank and Trust Company, Attn: MassMutual Transfer Agency, Mail Code JAB0321, Box 5493, Boston, MA 02206 |
| Overnight Mail: State Street Bank and Trust Company, Attn: MassMutual Transfer Agency, Mail Code JAB0321, 1776 Heritage Drive, No. Quincy, MA 02171 |
E-11 |
E-12 |
E-13 |
E-14 |
E-15 |
• | Employer-sponsored retirement, deferred compensation and employee benefit plans (including health savings accounts) and trusts used to fund those plans, provided that the shares are not held in a commission-based brokerage account and shares are held for the benefit of the plan. |
• | Shares purchased by a 529 Plan (does not include 529 Plan units or 529-specific share classes or equivalents). |
• | Shares exchanged due to the holdings moving from a Merrill Lynch affiliated investment advisory program to a Merrill Lynch brokerage (non-advisory) account pursuant to Merrill Lynch’s policies relating to sales load discounts and waivers. |
• | Shares purchased by third party investment advisors on behalf of their advisory clients through Merrill Lynch’s platform. |
• | Shares of funds purchased through the Merrill Edge Self-Directed platform (if applicable). |
• | Shares purchased through reinvestment of capital gains distributions and dividend reinvestment when purchasing shares of the same fund (but not any other fund within the fund family). |
• | Employees and registered representatives of Merrill Lynch or its affiliates and their family members. |
• | Directors or Trustees of the Fund, and employees of the Fund’s investment adviser or any of its affiliates, as described in the prospectus. |
• | Eligible shares purchased from the proceeds of redemptions within the same fund family, provided (1) the repurchase occurs within 90 days following the redemption, (2) the redemption and purchase occur in the same account, and (3) redeemed shares were subject to a front-end or deferred sales load (known as Rights of Reinstatement). Automated transactions (i.e. systematic purchases and withdrawals) and purchases made after shares are automatically sold to pay Merrill Lynch’s account maintenance fees are not eligible for reinstatement. |
• | Death or disability of the shareholder. |
• | Shares sold as part of a systematic withdrawal plan as described in this Prospectus. |
• | Return of excess contributions from an IRA Account. |
• | Shares sold as part of a required minimum distribution for IRA and retirement accounts pursuant to the Internal Revenue Code. |
• | Shares sold to pay Merrill Lynch fees but only if the transaction is initiated by Merrill Lynch. |
• | Shares acquired through a right of reinstatement. |
F-1 |
• | Shares held in retirement brokerage accounts, that are exchanged for a lower cost share class due to transfer to certain fee-based accounts or platforms (applicable to Class A shares only). |
• | Shares received through an exchange due to the holdings moving from a Merrill Lynch affiliated investment advisory program to a Merrill Lynch brokerage (non-advisory) account pursuant to Merrill Lynch’s policies relating to sales load discounts and waivers. |
• | Breakpoints as described in this Prospectus. |
• | Rights of Accumulation (ROA) which entitle shareholders to breakpoint discounts as described in the Fund’s prospectus will be automatically calculated based on the aggregated holding of fund family assets held by accounts (including 529 program holdings, where applicable) within the purchaser’s household at Merrill Lynch. Eligible fund family assets not held at Merrill Lynch may be included in the ROA calculation only if the shareholder notifies his or her financial advisor about such assets. |
• | Letters of Intent (LOI) which allow for breakpoint discounts based on anticipated purchases within a fund family, through Merrill Lynch, over a 13-month period of time (if applicable). |
• | Employer-sponsored retirement plans (e.g., 401(k) plans, 457 plans, employer-sponsored 403(b) plans, profit sharing and money purchase pension plans and defined benefit plans). For purposes of this provision, employer-sponsored retirement plans do not include SEP IRAs, Simple IRAs, SAR-SEPs, or Keogh plans |
• | Morgan Stanley employee and employee-related accounts according to Morgan Stanley’s account linking rules |
• | Shares purchased through reinvestment of dividends and capital gains distributions when purchasing shares of the same fund |
• | Shares purchased through a Morgan Stanley self-directed brokerage account |
• | Shares purchased from the proceeds of redemptions within the same fund family, provided (i) the repurchase occurs within 90 days following the redemption, (ii) the redemption and purchase occur in the same account, and (iii) redeemed shares were subject to a front-end or deferred sales charge. |
F-2 |
• | Shares purchased in an investment advisory program. |
• | Shares purchased within the same fund family through a systematic reinvestment of capital gains and dividend distributions. |
• | Employees and registered representatives of Raymond James or its affiliates and their family members as designated by Raymond James. |
• | Shares purchased from the proceeds of redemptions within the same fund family, provided (1) the repurchase occurs within 90 days following the redemption, (2) the redemption and purchase occur in the same account, and (3) redeemed shares were subject to a front-end or deferred sales load (known as Rights of Reinstatement). |
• | Death or disability of the shareholder. |
• | Shares sold as part of a systematic withdrawal plan as described in the fund’s prospectus. |
• | Return of excess contributions from an IRA Account. |
• | Shares sold as part of a required minimum distribution for IRA and retirement accounts due to the shareholder reaching the qualified age based on applicable IRS regulations as described in the fund’s prospectus. |
• | Shares sold to pay Raymond James fees but only if the transaction is initiated by Raymond James. |
• | Shares acquired through a right of reinstatement. |
• | Breakpoints as described in this prospectus. |
• | Rights of accumulation which entitle shareholders to breakpoint discounts will be automatically calculated based on the aggregated holding of fund family assets held by accounts within the purchaser’s household at Raymond James. Eligible fund family assets not held at Raymond James may be included in the calculation of rights of accumulation only if the shareholder notifies his or her financial advisor about such assets. |
• | Letters of intent which allow for breakpoint discounts based on anticipated purchases within a fund family, over a 13-month time period. Eligible fund family assets not held at Raymond James may be included in the calculation of letters of intent only if the shareholder notifies his or her financial advisor about such assets. |
F-3 |
MASSMUTUAL SELECT FUNDS
MASSMUTUAL PREMIER FUNDS
STATEMENT OF ADDITIONAL INFORMATION
[ ], 2024
This Statement of Additional Information (the “SAI”) relates to the reorganization of each series of MassMutual Select Funds listed below (each, a “Selling Fund,” and together, the “Selling Funds”) with and into the corresponding series of the MassMutual Select Funds or MassMutual Premier Funds, as identified below under the heading “Acquiring Funds” (each, an “Acquiring Fund”), which is listed opposite the Selling Fund in the table below (each, a “Reorganization,” and together, the “Reorganizations”).
Selling Funds | Acquiring Funds |
MassMutual Growth Opportunities Fund (a series of MassMutual Select Funds)
| MassMutual Blue Chip Growth Fund (a series of MassMutual Select Funds)
|
MassMutual Fundamental Value Fund (a series of MassMutual Select Funds)
| MassMutual Diversified Value Fund (a series of MassMutual Select Funds)
|
MassMutual Strategic Bond Fund (a series of MassMutual Select Funds) | MassMutual Core Bond Fund (a series of MassMutual Premier Funds) |
This SAI contains information which may be of interest to shareholders of the Selling Funds but which is not included in the combined information statement/prospectus dated [ ], 2024 (the “Combined Information Statement/Prospectus”) relating to the Reorganizations. As described in the Combined Information Statement/Prospectus, each of the Reorganizations involves the transfer of all of the assets of a Selling Fund to, and the assumption of all of the liabilities of the Selling Fund by, an Acquiring Fund, in exchange for a number of shares of equivalent value of the Acquiring Fund. This transfer will occur following the satisfaction of all conditions to the Reorganization. Each Selling Fund would distribute the Acquiring Fund shares it receives to its shareholders in complete liquidation of each Selling Fund.
This SAI is not a prospectus and should be read in conjunction with the Combined Information Statement/Prospectus. The Combined Information Statement/Prospectus has been filed with the Securities and Exchange Commission (the “SEC”) and is available upon request and without charge by writing to the Acquiring Funds at MassMutual Funds, c/o Massachusetts Mutual Life Insurance Company, 1295 State Street, Springfield, Massachusetts 01111-0001, Attention: Investment Management Solutions, or call 1-888-309-3539.
ADDITIONAL INFORMATION ABOUT THE ACQUIRING FUNDS
Attached hereto as Appendix A is the Statement of Additional Information of MassMutual Blue Chip Growth Fund and MassMutual Diversified Value Fund dated February 1, 2024, as supplemented to date (the “MassMutual Select Funds SAI”).
Attached hereto as Appendix B is the Statement of Additional Information of MassMutual Core Bond Fund dated February 1, 2024, as supplemented to date (the “MassMutual Premier Funds SAI”).
Attached hereto as Appendix C is the pro forma financial information for the Acquiring Funds for the period ended March 31, 2024.
SUPPLEMENTAL FINANCIAL INFORMATION
Rule 6-11(d)(2) under Regulation S-X requires that, with respect to any fund acquisition, registered investment companies must provide certain supplemental financial information in lieu of pro forma financial statements required by Regulation S-X. Supplemental pro forma financial information for the Selling Funds for the period ended March 31, 2024, is included in this SAI.
Tables showing the fees of the Selling Funds and the Acquiring Funds, and the fees and expenses of the Acquiring Funds on a pro forma basis after giving effect to the proposed Reorganizations, are included in the “Comparison of Fees and Expenses” sub-sections of each “Synopsis of Reorganization” section in the Combined Information Statement/Prospectus.
The Reorganization will not result in a material change to the Selling Funds’ investment portfolios due to the investment restrictions of the corresponding Acquiring Funds. As a result, a schedule of investments of each of the Selling Funds modified to show the effects of the change is not required and is not included. Notwithstanding the foregoing, changes may be made to the Selling Funds’ portfolios in advance of the Reorganizations and/or the Acquiring Funds’ portfolios following the Reorganizations.
There are no material differences in accounting policies of the Selling Funds as compared to those of the Acquiring Funds.
Deloitte & Touche LLP (“Deloitte”), 200 Berkeley Street, Boston, Massachusetts 02116, is the independent registered public accounting firm for each Selling Fund and each Acquiring Fund. Deloitte conducts annual audits of the financial statements of each series of the MassMutual Select Funds and MassMutual Premier Funds (each, a “Trust” and together, the “Trusts”), consults with each Trust as to accounting matters, provides assistance in connection with the preparation of various SEC filings, and consults with each Trust as to certain non-U.S. tax matters.
The following documents, each of which has been filed with the SEC and will be sent to any shareholder requesting this SAI, are incorporated by reference into this SAI.
MassMutual Select Funds (SEC file nos. 811-08274 and 033-73824)
• | the Report of the Independent Registered Public Accounting Firm and the audited financial statements included in the Annual Report to Shareholders of each Selling Fund, the MassMutual Blue Chip Growth Fund, and the MassMutual Diversified Value Fund for the year ended September 30, 2023. |
• | the unaudited financial statements included in the unaudited Semiannual Report to Shareholders of each Selling Fund, the MassMutual Blue Chip Growth Fund, and the MassMutual Diversified Value Fund for the six months ended March 31, 2024. |
MassMutual Premier Funds (SEC file nos. 811-08690 and 033-82366)
• | the Report of the Independent Registered Public Accounting Firm and the audited financial statements included in the Annual Report to Shareholders of the MassMutual Core Bond Fund for the year ended September 30, 2024. |
• | the unaudited financial statements included in the unaudited Semiannual Report to Shareholders of the MassMutual Core Bond Fund for the six months ended March 31, 2024. |
Back to Table of Contents |
APPENDIX A
STATEMENT OF ADDITIONAL INFORMATION OF MASSMUTUAL SELECT FUNDS
MASSMUTUAL FUNDS
MassMutual Total Return Bond Fund
MassMutual Strategic Bond Fund
MassMutual Diversified Value Fund
MassMutual Fundamental Value Fund
MM S&P 500® Index Fund
MassMutual Equity Opportunities Fund
MassMutual Blue Chip Growth Fund
MassMutual Growth Opportunities Fund
MassMutual Mid Cap Value Fund
MassMutual Small Cap Value Equity Fund
MassMutual Small Company Value Fund
MassMutual Mid Cap Growth Fund
MassMutual Small Cap Growth Equity Fund
MassMutual Overseas Fund
MassMutual Select T. Rowe Price International Equity Fund
Supplement dated July 1, 2024 to the
Statement of Additional Information dated February 1, 2024
This supplement provides new and additional information beyond that contained in the Statement of Additional Information (“SAI”) and any previous supplements. It should be retained and read in conjunction with the SAI and any previous supplements.
Effective immediately, the following information replaces similar information found on page B-54 under the heading Interested Trustees in the section titled Management of the Trust:
Paul LaPiana2 | Trustee of the Trust | |
1295 State Street Springfield, MA 01111-0001 Year of birth: 1969 Trustee of the Trust since 2023 Trustee 108 portfolios in fund complex |
Director (since 2023), President (2021-2023; since 2023), MML Advisers; Head of Brand, Product, and Affiliated Distribution (since 2023), Head of MassMutual U.S. Product (2019-2023), Head of Field Management (2016-2019), MassMutual; Trustee (since 2023), President (2021-2024), MassMutual Select Funds (open-end investment company); Trustee (since 2023), President (2021-2024), MassMutual Premier Funds (open-end investment company); Trustee (since 2023), President (2021-2024, MassMutual Advantage Funds (open-end investment company); Trustee (since 2023), President (2021-2024), MML Series Investment Fund (open-end investment company); Trustee (since 2023), President (2021-2024), MML Series Investment Fund II (open-end investment company).
Effective immediately, the following information replaces similar information found on pages B-55 and B-56 under the heading Principal Officers in the section titled Management of the Trust:
Douglas Steele | President of the Trust | |
1295 State Street Springfield, MA 01111-0001 Year of birth: 1975 Officer of the Trust since 2016 Officer of 108 portfolios in fund complex |
Head of MassMutual Investments (since 2024), Vice President (since 2017), Interim Head of MassMutual Investments (2023-2024), Head of Product Management (2021-2024), Head of Manager Research (2021), Head of Investment Management (2017-2021), MML Advisers; Head of MassMutual Investments (since 2024), Interim Head of MassMutual Investments (2023-2024), Head of Product Management (2021-2024), Head of Manager Research (2021), Head of Investment Management (2017-2021), MassMutual; President (since 2024), Vice President (2016-2024), MassMutual Select Funds (open-end investment company); President
(since 2024),Vice President (2016-2024), MassMutual Premier Funds (open-end investment company); President (since 2024), Vice President (2021-2024), MassMutual Advantage Funds (open-end investment company); President (since 2024),Vice President (2016-2024), MML Series Investment Fund (open-end investment company); President (since 2024),Vice President (2016-2024), MML Series Investment Fund II (open-end investment company).
Effective immediately, the following information supplements the information beginning on page B-55 under the heading Principal Officers in the section titled Management of the Trust:
Oludare Adedokun | Vice President of the Trust | |
1295 State Street Springfield, MA 01111-0001 Year of birth: 1986 Officer of the Trust since 2024 Officer of 108 portfolios in fund complex |
Head of Manager Research (since 2022), MassMutual; Head of Manager Research (since 2022), MML Advisers; Manager Research Senior Research Analyst (2018-2022), Franklin Templeton; Vice President (since 2024), MassMutual Select Funds (open-end investment company); Vice President (since 2024), MassMutual Premier Funds (open-end investment company); Vice President (since 2024), MassMutual Advantage Funds (open-end investment company); Vice President (since 2024), MML Series Investment Fund (open-end investment company); Vice President (since 2024), MML Series Investment Fund II (open-end investment company).
Meredith Ulrich | Vice President of the Trust | |
1295 State Street Springfield, MA 01111-0001 Year of birth: 1986 Officer of the Trust since 2021 Officer of 108 portfolios in fund complex |
Product Manager (since 2018), MassMutual; Product Manager (since 2018), MML Advisers; Vice President (since 2024), Assistant Vice President (2021-2024), MassMutual Select Funds (open-end investment company); Vice President (since 2024), Assistant Vice President (2021-2024), MassMutual Premier Funds (open-end investment company); Vice President (since 2024), Assistant Vice President (2021-2024), MassMutual Advantage Funds (open-end investment company); Vice President (since 2024), Assistant Vice President (2021-2024), MML Series Investment Fund (open-end investment company); Vice President (since 2024), Assistant Vice President (2021-2024), MML Series Investment Fund II (open-end investment company).
PLEASE RETAIN THIS SUPPLEMENT FOR FUTURE REFERENCE
SAI B3001M-24-05
MASSMUTUAL FUNDS
MassMutual Total Return Bond Fund
MassMutual Strategic Bond Fund
MassMutual Diversified Value Fund
MassMutual Fundamental Value Fund
MM S&P 500® Index Fund
MassMutual Equity Opportunities Fund
MassMutual Blue Chip Growth Fund
MassMutual Growth Opportunities Fund
MassMutual Mid Cap Value Fund
MassMutual Small Cap Value Equity Fund
MassMutual Small Company Value Fund
MassMutual Mid Cap Growth Fund
MassMutual Small Cap Growth Equity Fund
MassMutual Overseas Fund
MassMutual Select T. Rowe Price International Equity Fund
Supplement dated May 3, 2024 to the
Statement of Additional Information dated February 1, 2024
This supplement provides new and additional information beyond that contained in the Statement of Additional Information (“SAI”) and any previous supplements. It should be retained and read in conjunction with the SAI and any previous supplements.
The following information supplements the information found on page B-50 under the heading Fundamental Investment Restrictions of the Funds in the section titled Investment Restrictions of the Funds:
With respect to limitation (1) above, each state and each separate political subdivision, agency, authority, or instrumentality of such state, each multi-state agency or authority, and each guarantor, if any, are treated as separate issues of municipal bonds.
PLEASE RETAIN THIS SUPPLEMENT FOR FUTURE REFERENCE
SAI B3001M-24-04
MASSMUTUAL FUNDS
MassMutual Strategic Bond Fund
MassMutual Fundamental Value Fund
Supplement dated May 1, 2024 to the
Statement of Additional Information dated February 1, 2024
This supplement provides new and additional information beyond that contained in the Statement of Additional Information (“SAI”) and any previous supplements. It should be retained and read in conjunction with the SAI and any previous supplements.
The following information supplements the information for Lewis Ropp found on page B-304 in the section titled Appendix C — Additional Portfolio Manager Information:
Mr. Ropp is expected to retire from Barrow Hanley on June 30, 2024.
The information for John L. Bellows found on page B-346 in the section titled Appendix C — Additional Portfolio Manager Information is hereby removed.
PLEASE RETAIN THIS SUPPLEMENT FOR FUTURE REFERENCE
SAI B3001M-24-03
MASSMUTUAL FUNDS
MassMutual Diversified Value Fund
(the “Fund”)
Supplement dated March 25, 2024 to the
Statement of Additional Information dated February 1, 2024
This supplement provides new and additional information beyond that contained in the Statement of Additional Information (“SAI”) and any previous supplements. It should be retained and read in conjunction with the SAI and any previous supplements.
Effective March 26, 2024, T. Rowe Price Associates, Inc. (“T. Rowe Price”) will be removed as a subadviser to the Fund. All references to T. Rowe Price in the SAI will, therefore, be deleted.
PLEASE RETAIN THIS SUPPLEMENT FOR FUTURE REFERENCE
SAI B3001M-24-02
MASSMUTUAL FUNDS
MassMutual Select T. Rowe Price International Equity Fund
(the “Fund”)
Supplement dated March 8, 2024 to the
Statement of Additional Information dated February 1, 2024
This supplement provides new and additional information beyond that contained in the Statement of Additional Information (“SAI”). It should be retained and read in conjunction with the SAI.
The following information replaces similar information for the Fund found on page B-338 in the section titled Appendix C — Additional Portfolio Manager Information:
The portfolio managers of the MM Select T. Rowe Price International Equity Fund are Richard N. Clattenburg, Colin McQueen, Raymond A. Mills, Eric Moffett, and Ernest C. Yeung. Mr. Mills is expected to retire from T. Rowe Price on January 1, 2025. Elias Chrysostomou will become a portfolio manager of the Fund effective April 1, 2024.
Effective April 1, 2024, the following information supplements the information for the Fund found on page B-339 under the headings Other Accounts Managed and Ownership of Securities in the section titled Appendix C — Additional Portfolio Manager Information:
Other Accounts Managed:
Number of Accounts Managed* | Total Assets* | Number of Accounts Managed for which Advisory Fee is Performance-Based* | Total Assets* | |||||
Elias Chrysostomou | ||||||||
Registered investment companies** | 0 | $0 | 0 | $0 | ||||
Other pooled investment vehicles | 0 | $0 | 0 | $0 | ||||
Other accounts | 0 | $0 | 0 | $0 |
* The information provided is as of December 31, 2023.
** Does not include the MM Select T. Rowe Price International Equity Fund.
Ownership of Securities:
As of December 31, 2023, Mr. Chrysostomou did not own any shares of the MM Select T. Rowe Price International Equity Fund.
PLEASE RETAIN THIS SUPPLEMENT FOR FUTURE REFERENCE
SAI B3001M–24-01
SPRINGFIELD, MASSACHUSETTS 01111-0001
| Fund Name | | | Class I | | | Class R5 | | | Service Class | | | Administrative Class | | | Class R4 | | | Class A | | | Class R3 | | | Class Y | | ||||||||||||||||||||||||
| MassMutual Total Return Bond Fund | | | | | MSPZX | | | | | | MSPSX | | | | | | MSPHX | | | | | | MSPLX | | | | | | MSPGX | | | | | | MPTRX | | | | | | MSPNX | | | | | | MMNNX | | |
| MassMutual Strategic Bond Fund | | | | | MSBZX | | | | | | MBSSX | | | | | | MBSYX | | | | | | MSBLX | | | | | | MSBRX | | | | | | MSBAX | | | | | | MSBNX | | | | | | MMNMX | | |
| MassMutual Diversified Value Fund | | | | | MDDIX | | | | | | MDVSX | | | | | | MDVYX | | | | | | MDDLX | | | | | | MDDRX | | | | | | MDDAX | | | | | | MDVNX | | | | | | MMNBX | | |
| MassMutual Fundamental Value Fund | | | | | MFUZX | | | | | | MVUSX | | | | | | MFUYX | | | | | | MFULX | | | | | | MFUFX | | | | | | MFUAX | | | | | | MFUNX | | | | | | MMNEX | | |
| MM S&P 500® Index Fund | | | | | MMIZX | | | | | | MIEZX | | | | | | MMIEX | | | | | | MIEYX | | | | | | MIEAX | | | | | | MMFFX | | | | | | MMINX | | | | | | | | |
| MassMutual Equity Opportunities Fund | | | | | MFVZX | | | | | | MFVSX | | | | | | MMFYX | | | | | | MMFVX | | | | | | MFVFX | | | | | | MFVAX | | | | | | MFVNX | | | | | | MMZOX | | |
| MassMutual Fundamental Growth Fund | | | | | MOTZX | | | | | | MOTCX | | | | | | MOTYX | | | | | | MOTLX | | | | | | MFGFX | | | | | | MOTAX | | | | | | MOTNX | | | | | | MMNDX | | |
| MassMutual Blue Chip Growth Fund | | | | | MBCZX | | | | | | MBCSX | | | | | | MBCYX | | | | | | MBCLX | | | | | | MBGFX | | | | | | MBCGX | | | | | | MBCNX | | | | | | MMZMX | | |
| MassMutual Growth Opportunities Fund | | | | | MMAZX | | | | | | MGRSX | | | | | | MAGYX | | | | | | MAGLX | | | | | | MMGFX | | | | | | MMAAX | | | | | | MMANX | | | | | | MMNFX | | |
| MassMutual Mid Cap Value Fund | | | | | MLUZX | | | | | | MLUSX | | | | | | MLUYX | | | | | | MLULX | | | | | | MLUFX | | | | | | MLUAX | | | | | | MLUNX | | | | | | MMNHX | | |
| MassMutual Small Cap Value Equity Fund | | | | | MMQIX | | | | | | MMQSX | | | | | | MMQYX | | | | | | MMQLX | | | | | | MMQFX | | | | | | MMQAX | | | | | | MMQTX | | | | | | MMNKX | | |
| MassMutual Small Company Value Fund | | | | | MSVZX | | | | | | MSVSX | | | | | | MMVYX | | | | | | MMYLX | | | | | | MMVFX | | | | | | MMYAX | | | | | | MSVNX | | | | | | MMNLX | | |
| MassMutual Mid Cap Growth Fund | | | | | MEFZX | | | | | | MGRFX | | | | | | MEFYX | | | | | | MMELX | | | | | | MEFFX | | | | | | MEFAX | | | | | | MEFNX | | | | | | MMNGX | | |
| MassMutual Small Cap Growth Equity Fund | | | | | MSGZX | | | | | | MSGSX | | | | | | MSCYX | | | | | | MSGLX | | | | | | MSERX | | | | | | MMGEX | | | | | | MSGNX | | | | | | MMNJX | | |
| MassMutual Overseas Fund | | | | | MOSZX | | | | | | MOSSX | | | | | | MOSYX | | | | | | MOSLX | | | | | | MOSFX | | | | | | MOSAX | | | | | | MOSNX | | | | | | MMOJX | | |
| MassMutual Select T. Rowe Price International Equity Fund | | | | | MMIUX | | | | | | | | | | | | | | | | | | | | | | | | | | | | | | | | | | | | | | | | | | | | |
| | | Page | | |||
| | | | A-3 | | | |
| | | | A-3 | | | |
| | | | A-49 | | | |
| | | | A-50 | | | |
| | | | A-52 | | | |
| | | | A-62 | | | |
| | | | A-85 | | | |
| | | | A-97 | | | |
| | | | A-100 | | | |
| | | | A-101 | | | |
| | | | A-102 | | | |
| | | | A-102 | | | |
| | | | A-102 | | | |
| | | | A-102 | | | |
| | | | A-106 | | | |
| | | | A-108 | | | |
| | | | A-110 | | | |
| | | | A-112 | | | |
| | | | A-112 | | | |
| | | | A-113 | | | |
| | | | A-124 | | | |
| | | | A-125 | | | |
| | | | A-129 | | | |
| | | | A-297 | | |
A-2
A-3
A-4
A-5
A-6
A-7
A-8
A-9
A-10
A-11
A-12
A-13
A-14
A-15
A-16
A-17
A-18
A-19
A-20
A-21
A-22
A-23
A-24
A-25
A-26
A-27
A-28
A-29
A-30
A-31
A-32
A-33
A-34
A-35
A-36
A-37
A-38
A-39
A-40
(SI 2019/657) and other statutory instruments. Following the implementation of these reforms, the manner of administration of benchmarks has changed and may further change in the future, with the result that relevant benchmarks may perform differently than in the past, the use of benchmarks that are not compliant with the new standards set by certain supervised entities may be restricted, and certain benchmarks may be eliminated entirely. Additionally, there could be other consequences which cannot be predicted.
A-41
A-42
A-43
A-44
A-45
A-46
A-47
A-48
A-49
A-50
A-51
| Nabil N. El‑Hage 1295 State Street Springfield, MA 01111‑0001 Year of birth: 1958 Trustee of the Trust since 2012 Trustee of 113 portfolios in fund complex | | | Trustee of the Trust | |
| Maria D. Furman 1295 State Street Springfield, MA 01111‑0001 Year of birth: 1954 Trustee of the Trust since 2012 Trustee of 113 portfolios in fund complex | | | Trustee of the Trust | |
A-52
| R. Bradford Malt 1295 State Street Springfield, MA 01111‑0001 Year of birth: 1954 Trustee of the Trust since 2022 Trustee of 113 portfolios in fund complex | | | Trustee of the Trust | |
| C. Ann Merrifield 1295 State Street Springfield, MA 01111‑0001 Year of birth: 1951 Trustee of the Trust since 2012 Trustee of 113 portfolios in fund complex | | | Trustee of the Trust | |
| Cynthia R. Plouché 1295 State Street Springfield, MA 01111‑0001 Year of birth: 1957 Trustee of the Trust since 2022 Trustee of 113 portfolios in fund complex | | | Trustee of the Trust | |
| Jason J. Price 1295 State Street Springfield, MA 01111‑0001 Year of birth: 1973 Trustee of the Trust since 2022 Trustee of 113 portfolios in fund complex | | | Trustee of the Trust | |
A-53
| Susan B. Sweeney 1295 State Street Springfield, MA 01111‑0001 Year of birth: 1952 Chairperson of the Trust since 2022 Trustee of the Trust since 2009 Trustee of 115 portfolios in fund complex1 | | | Chairperson and Trustee of the Trust | |
| Paul LaPiana2 1295 State Street Springfield, MA 01111‑0001 Year of birth: 1969 Trustee of the Trust since 2023 Officer of the Trust 2021‑2023; since 2023 Trustee and Officer of 113 portfolios in fund complex | | | Trustee and President of the Trust | |
| Clifford M. Noreen3 1295 State Street Springfield, MA 01111‑0001 Year of birth: 1957 Trustee of the Trust since 2021 Trustee of 115 portfolios in fund complex4 | | | Trustee of the Trust | |
A-54
| Andrew M. Goldberg 1295 State Street Springfield, MA 01111‑0001 Year of birth: 1966 Officer of the Trust since 2001 Officer of 113 portfolios in fund complex | | | Vice President, Secretary, and Chief Legal Officer of the Trust | |
| Renee Hitchcock 1295 State Street Springfield, MA 01111‑0001 Year of birth: 1970 Officer of the Trust since 2007 Officer of 113 portfolios in fund complex | | | Chief Financial Officer and Treasurer of the Trust | |
| Jill Nareau Robert 1295 State Street Springfield, MA 01111‑0001 Year of birth: 1972 Officer of the Trust since 2008 Officer of 113 portfolios in fund complex | | | Vice President and Assistant Secretary of the Trust | |
| Douglas Steele 1295 State Street Springfield, MA 01111‑0001 Year of birth: 1975 Officer of the Trust since 2016 Officer of 113 portfolios in fund complex | | | Vice President of the Trust | |
A-55
| Philip S. Wellman 1295 State Street Springfield, MA 01111‑0001 Year of birth: 1964 Officer of the Trust since 2007 Officer of 113 portfolios in fund complex | | | Vice President and Chief Compliance Officer of the Trust | |
A-56
A-57
A-58
A-59
Name of Trustee | | | The Dollar Range of Equity Securities Beneficially Owned in the Trust | | | Aggregate Dollar Range of Equity Securities in All Registered Investment Companies Overseen by Trustee in Family of Investment Companies | |
Independent Trustees | | | | | | | |
Nabil N. El-Hage | | | None | | | None | |
Maria D. Furman | | | None | | | None | |
R. Bradford Malt | | | None | | | None | |
C. Ann Merrifield | | | None | | | None | |
Cynthia R. Plouché | | | None | | | None | |
Jason J. Price | | | None | | | None | |
Susan B. Sweeney | | | None | | | None | |
Interested Trustees | | | | | | | |
Paul LaPiana | | | None | | | None | |
Clifford M. Noreen | | | None | | | $10,001-$50,000 | |
A-60
Name of Trustee | | | Aggregate Compensation from the Trust | | | Total Compensation from the Trust and Fund Complex Paid to Trustees | | ||||||
Allan W. Blair 1 | | | | $ | 189,063 | | | | | $ | 288,600 | | |
Nabil N. El-Hage | | | | $ | 194,174 2 | | | | | $ | 296,400 | | |
Michael R. Fanning 3 | | | | $ | 0 | | | | | $ | 0 | | |
Maria D. Furman | | | | $ | 177,138 | | | | | $ | 270,400 | | |
Paul LaPiana 4 | | | | $ | 0 | | | | | $ | 0 | | |
R. Bradford Malt | | | | $ | 177,138 | | | | | $ | 270,400 | | |
C. Ann Merrifield | | | | $ | 189,050 | | | | | $ | 288,600 | | |
Clifford M. Noreen | | | | $ | 0 | | | | | $ | 0 | | |
Cynthia R. Plouché | | | | $ | 177,138 | | | | | $ | 270,400 | | |
Jason J. Price | | | | $ | 177,138 | | | | | $ | 270,400 | | |
Susan B. Sweeney | | | | $ | 238,469 | | | | | $ | 490,150 | | |
A-61
Class | | | Name and Address of Owner | | | Percent of Class | | |||
Class I | | | Massachusetts Mutual Life Insurance Company 1295 State Street Springfield, MA 01111 | | | | | 26.38% | | |
| | | Empower Trust Company, LLC 8515 East Orchard Road Greenwood Village, CO 80111 | | | | | 15.49% | | |
| | | The Northern Trust Company FBO MassMutual Total Return Bond CIT 333 South Wabash Avenue Chicago, IL 60604 | | | | | 13.21% | | |
| | | National Financial Services LLC 499 Washington Boulevard Jersey City, NJ 07310 | | | | | 6.76% | | |
| | | MassMutual 20/80 Allocation Fund 1295 State Street Springfield, MA 01111 | | | | | 6.00% | | |
| | | Charles Schwab & Co., Inc. 211 Main Street San Francisco, CA 94105 | | | | | 5.46% | | |
Class R5 | | | Massachusetts Mutual Life Insurance Company 1295 State Street Springfield, MA 01111 | | | | | 77.11% | | |
| | | Empower Trust Company, LLC 8515 East Orchard Road Greenwood Village, CO 80111 | | | | | 22.38% | | |
Service Class | | | Massachusetts Mutual Life Insurance Company 1295 State Street Springfield, MA 01111 | | | | | 84.52% | | |
| | | Empower Trust Company, LLC 8515 East Orchard Road Greenwood Village, CO 80111 | | | | | 15.35% | | |
Administrative Class | | | Massachusetts Mutual Life Insurance Company 1295 State Street Springfield, MA 01111 | | | | | 52.53% | | |
| | | Charles Schwab & Co., Inc. 211 Main Street San Francisco, CA 94105 | | | | | 37.65% | | |
A-62
Class | | | Name and Address of Owner | | | Percent of Class | | |||
| | | Empower Trust Company, LLC 8515 East Orchard Road Greenwood Village, CO 80111 | | | | | 9.83% | | |
Class R4 | | | Massachusetts Mutual Life Insurance Company 1295 State Street Springfield, MA 01111 | | | | | 88.63% | | |
| | | Empower Trust Company, LLC 8515 East Orchard Road Greenwood Village, CO 80111 | | | | | 8.22% | | |
Class A | | | Empower Trust Company, LLC 8515 East Orchard Road Greenwood Village, CO 80111 | | | | | 73.92% | | |
| | | Massachusetts Mutual Life Insurance Company 1295 State Street Springfield, MA 01111 | | | | | 24.11% | | |
Class R3 | | | Massachusetts Mutual Life Insurance Company 1295 State Street Springfield, MA 01111 | | | | | 74.89% | | |
| | | Empower Trust Company, LLC 8515 East Orchard Road Greenwood Village, CO 80111 | | | | | 17.39% | | |
| | | Talcott Resolution Life Insurance Company 1 Griffin Road North Windsor, CT 06095 | | | | | 7.63% | | |
Class | | | Name and Address of Owner | | | Percent of Class | | |||
Class I | | | Massachusetts Mutual Life Insurance Company 1295 State Street Springfield, MA 01111 | | | | | 25.02% | | |
| | | Empower Trust Company, LLC 8515 East Orchard Road Greenwood Village, CO 80111 | | | | | 17.90% | | |
| | | MassMutual 20/80 Allocation Fund 1295 State Street Springfield, MA 01111 | | | | | 11.80% | | |
| | | MassMutual 40/60 Allocation Fund 1295 State Street Springfield, MA 01111 | | | | | 8.94% | | |
| | | MassMutual 60/40 Allocation Fund 1295 State Street Springfield, MA 01111 | | | | | 5.47% | | |
| | | MassMutual RetireSMART by JPMorgan 2030 Fund 1295 State Street Springfield, MA 01111 | | | | | 5.24% | | |
A-63
Class | | | Name and Address of Owner | | | Percent of Class | | |||
Class R5 | | | Massachusetts Mutual Life Insurance Company 1295 State Street Springfield, MA 01111 | | | | | 40.86% | | |
| | | Talcott Resolution Life Insurance Company 1 Griffin Road North Windsor, CT 06095 | | | | | 33.66% | | |
| | | Empower Trust Company, LLC 8515 East Orchard Road Greenwood Village, CO 80111 | | | | | 22.75% | | |
Service Class | | | Empower Trust Company, LLC 8515 East Orchard Road Greenwood Village, CO 80111 | | | | | 50.50% | | |
| | Massachusetts Mutual Life Insurance Company 1295 State Street Springfield, MA 01111 | | | | | 49.49% | | | |
Administrative Class | | | Massachusetts Mutual Life Insurance Company 1295 State Street Springfield, MA 01111 | | | | | 60.25% | | |
| | | Empower Trust Company, LLC 8515 East Orchard Road Greenwood Village, CO 80111 | | | | | 37.10% | | |
Class R4 | | | Massachusetts Mutual Life Insurance Company 1295 State Street Springfield, MA 01111 | | | | | 59.92% | | |
| | | Empower Trust Company, LLC 8515 East Orchard Road Greenwood Village, CO 80111 | | | | | 35.01% | | |
Class A | | | Massachusetts Mutual Life Insurance Company 1295 State Street Springfield, MA 01111 | | | | | 75.21% | | |
| | | Pershing LLC P.O. Box 2052 Jersey City, NJ 07303 | | | | | 9.77% | | |
| | | Empower Trust Company, LLC 8515 East Orchard Road Greenwood Village, CO 80111 | | | | | 9.52% | | |
Class R3 | | | Talcott Resolution Life Insurance Company 1 Griffin Road North Windsor, CT 06095 | | | | | 46.35% | | |
| | | Massachusetts Mutual Life Insurance Company 1295 State Street Springfield, MA 01111 | | | | | 42.37% | | |
| | | Empower Trust Company, LLC 8515 East Orchard Road Greenwood Village, CO 80111 | | | | | 11.02% | | |
A-64
Class | | | Name and Address of Owner | | | Percent of Class | | |||
Class Y | | | Massachusetts Mutual Life Insurance Company 1295 State Street Springfield, MA 01111 | | | | | 100.00% | | |
Class | | | Name and Address of Owner | | | Percent of Class | | |||
Class I | | | Empower Trust Company, LLC 8515 East Orchard Road Greenwood Village, CO 80111 | | | | | 60.65% | | |
| | | Massachusetts Mutual Life Insurance Company 1295 State Street Springfield, MA 01111 | | | | | 10.03% | | |
Class R5 | | | Massachusetts Mutual Life Insurance Company 1295 State Street Springfield, MA 01111 | | | | | 95.49% | | |
Service Class | | | Empower Trust Company, LLC 8515 East Orchard Road Greenwood Village, CO 80111 | | | | | 63.23% | | |
| | | Massachusetts Mutual Life Insurance Company 1295 State Street Springfield, MA 01111 | | | | | 35.55% | | |
Administrative Class | | | Empower Trust Company, LLC 8515 East Orchard Road Greenwood Village, CO 80111 | | | | | 60.79% | | |
| | | Massachusetts Mutual Life Insurance Company 1295 State Street Springfield, MA 01111 | | | | | 39.21% | | |
Class R4 | | | Empower Trust Company, LLC 8515 East Orchard Road Greenwood Village, CO 80111 | | | | | 42.42% | | |
| | | Massachusetts Mutual Life Insurance Company 1295 State Street Springfield, MA 01111 | | | | | 37.27% | | |
| | | Talcott Resolution Life Insurance Company 1 Griffin Road North Windsor, CT 06095 | | | | | 20.30% | | |
Class A | | | Massachusetts Mutual Life Insurance Company 1295 State Street Springfield, MA 01111 | | | | | 74.19% | | |
| | | Pershing LLC P.O. Box 2052 Jersey City, NJ 07303 | | | | | 18.65% | | |
Class R3 | | | Talcott Resolution Life Insurance Company 1 Griffin Road North Windsor, CT 06095 | | | | | 52.18% | | |
A-65
Class | | | Name and Address of Owner | | | Percent of Class | | |||
| | | Massachusetts Mutual Life Insurance Company 1295 State Street Springfield, MA 01111 | | | | | 47.44% | | |
Class Y | | | Massachusetts Mutual Life Insurance Company 1295 State Street Springfield, MA 01111 | | | | | 100.00% | | |
Class | | | Name and Address of Owner | | | Percent of Class | | |||
Class I | | | National Financial Services LLC 499 Washington Boulevard Jersey City, NJ 07310 | | | | | 66.67% | | |
| | | Massachusetts Mutual Life Insurance Company 1295 State Street Springfield, MA 01111 | | | | | 8.89% | | |
| | | Empower Trust Company, LLC 8515 East Orchard Road Greenwood Village, CO 80111 | | | | | 8.29% | | |
Class R5 | | | Massachusetts Mutual Life Insurance Company 1295 State Street Springfield, MA 01111 | | | | | 85.05% | | |
| | | Empower Trust Company, LLC 8515 East Orchard Road Greenwood Village, CO 80111 | | | | | 14.83% | | |
Service Class | | | Empower Trust Company, LLC 8515 East Orchard Road Greenwood Village, CO 80111 | | | | | 65.24% | | |
| | | Massachusetts Mutual Life Insurance Company 1295 State Street Springfield, MA 01111 | | | | | 34.04% | | |
Administrative Class | | | Massachusetts Mutual Life Insurance Company 1295 State Street Springfield, MA 01111 | | | | | 93.90% | | |
| | | Empower Trust Company, LLC 8515 East Orchard Road Greenwood Village, CO 80111 | | | | | 5.83% | | |
Class R4 | | | Massachusetts Mutual Life Insurance Company 1295 State Street Springfield, MA 01111 | | | | | 99.33% | | |
Class A | | | Massachusetts Mutual Life Insurance Company 1295 State Street Springfield, MA 01111 | | | | | 67.54% | | |
| | | Empower Trust Company, LLC 8515 East Orchard Road Greenwood Village, CO 80111 | | | | | 19.14% | | |
A-66
Class | | | Name and Address of Owner | | | Percent of Class | | |||
| | | Pershing LLC P.O. Box 2052 Jersey City, NJ 07303 | | | | | 11.80% | | |
Class R3 | | | Talcott Resolution Life Insurance Company 1 Griffin Road North Windsor, CT 06095 | | | | | 43.74% | | |
| | | Massachusetts Mutual Life Insurance Company 1295 State Street Springfield, MA 01111 | | | | | 34.88% | | |
| | | Empower Trust Company, LLC 8515 East Orchard Road Greenwood Village, CO 80111 | | | | | 21.38% | | |
Class Y | | | Massachusetts Mutual Life Insurance Company 1295 State Street Springfield, MA 01111 | | | | | 100.00% | | |
Class | | | Name and Address of Owner | | | Percent of Class | | |||
Class I | | | Empower Trust Company, LLC 8515 East Orchard Road Greenwood Village, CO 80111 | | | | | 23.71% | | |
| | | Massachusetts Mutual Life Insurance Company 1295 State Street Springfield, MA 01111 | | | | | 19.36% | | |
| | | MassMutual Select T. Rowe Price Retirement 2040 Fund 1295 State Street Springfield, MA 01111 | | | | | 11.02% | | |
| | | MassMutual Select T. Rowe Price Retirement 2050 Fund 1295 State Street Springfield, MA 01111 | | | | | 8.93% | | |
| | | MassMutual Select T. Rowe Price Retirement 2030 Fund 1295 State Street Springfield, MA 01111 | | | | | 7.43% | | |
| | | MassMutual Select T. Rowe Price Retirement 2045 Fund 1295 State Street Springfield, MA 01111 | | | | | 5.95% | | |
| | | MassMutual Select T. Rowe Price Retirement 2035 Fund 1295 State Street Springfield, MA 01111 | | | | | 5.65% | | |
Class R5 | | | Empower Trust Company, LLC 8515 East Orchard Road Greenwood Village, CO 80111 | | | | | 53.39% | | |
| | | Massachusetts Mutual Life Insurance Company 1295 State Street Springfield, MA 01111 | | | | | 41.06% | | |
A-67
Class | | | Name and Address of Owner | | | Percent of Class | | |||
Service Class | | | Massachusetts Mutual Life Insurance Company 1295 State Street Springfield, MA 01111 | | | | | 60.58% | | |
| | | Empower Trust Company, LLC 8515 East Orchard Road Greenwood Village, CO 80111 | | | | | 34.65% | | |
Administrative Class | | | Massachusetts Mutual Life Insurance Company 1295 State Street Springfield, MA 01111 | | | | | 48.27% | | |
| | | Empower Trust Company, LLC 8515 East Orchard Road Greenwood Village, CO 80111 | | | | | 44.99% | | |
Class R4 | | | Massachusetts Mutual Life Insurance Company 1295 State Street Springfield, MA 01111 | | | | | 51.48% | | |
| | | Empower Trust Company, LLC 8515 East Orchard Road Greenwood Village, CO 80111 | | | | | 27.77% | | |
| | | Talcott Resolution Life Insurance Company 1 Griffin Road North Windsor, CT 06095 | | | | | 12.65% | | |
Class A | | | Millennium Trust Company, LLC 2001 Spring Road, Suite 700 Oak Brook, IL 60523 | | | | | 48.70% | | |
| | Massachusetts Mutual Life Insurance Company 1295 State Street Springfield, MA 01111 | | | | | 25.01% | | | |
| | | Empower Trust Company, LLC 8515 East Orchard Road Greenwood Village, CO 80111 | | | | | 19.10% | | |
| | | Reliance Trust Company P.O. Box 28004 Atlanta, GA 30358 | | | | | 6.41% | | |
Class R3 | | | Massachusetts Mutual Life Insurance Company 1295 State Street Springfield, MA 01111 | | | | | 46.70% | | |
| | | Talcott Resolution Life Insurance Company 1 Griffin Road North Windsor, CT 06095 | | | | | 21.49% | | |
| | | Sammons Financial Network, LLC 4546 Corporate Drive, Suite 100 West Des Moines, IA 50266 | | | | | 14.46% | | |
A-68
Class | | | Name and Address of Owner | | | Percent of Class | | |||
Class I | | | National Financial Services LLC 499 Washington Boulevard Jersey City, NJ 07310 | | | | | 30.05% | | |
| | | Empower Trust Company, LLC 8515 East Orchard Road Greenwood Village, CO 80111 | | | | | 20.37% | | |
| | | Empower Trust Company, LLC FBO State of Iowa 457B Plan 8515 East Orchard Road Greenwood Village, CO 80111 | | | | | 11.99% | | |
| | | Massachusetts Mutual Life Insurance Company 1295 State Street Springfield, MA 01111 | | | | | 8.24% | | |
Class R5 | | | Massachusetts Mutual Life Insurance Company 1295 State Street Springfield, MA 01111 | | | | | 75.33% | | |
| | | Talcott Resolution Life Insurance Company 1 Griffin Road North Windsor, CT 06095 | | | | | 17.36% | | |
| | | Capinco c/o U.S. Bank N.A. 1555 North Rivercenter Drive, Suite 302 Milwaukee, WI 53212 | | | | | 5.89% | | |
Service Class | | | Empower Trust Company, LLC 8515 East Orchard Road Greenwood Village, CO 80111 | | | | | 81.71% | | |
| | | Massachusetts Mutual Life Insurance Company 1295 State Street Springfield, MA 01111 | | | | | 17.05% | | |
Administrative Class | | | Massachusetts Mutual Life Insurance Company 1295 State Street Springfield, MA 01111 | | | | | 65.28% | | |
| | | Empower Trust Company, LLC 8515 East Orchard Road Greenwood Village, CO 80111 | | | | | 20.71% | | |
| | | Talcott Resolution Life Insurance Company 1 Griffin Road North Windsor, CT 06095 | | | | | 13.74% | | |
Class R4 | | | Talcott Resolution Life Insurance Company 1 Griffin Road North Windsor, CT 06095 | | | | | 57.69% | | |
| | | Empower Trust Company, LLC 8515 East Orchard Road Greenwood Village, CO 80111 | | | | | 26.91% | | |
A-69
Class | | | Name and Address of Owner | | | Percent of Class | | |||
| | | Massachusetts Mutual Life Insurance Company 1295 State Street Springfield, MA 01111 | | | | | 7.89% | | |
| | | FIIOC FBO Atlas Minerals & Chemicals, Inc. Union 401(K) PS Plan 100 Magellan Way Covington, KY 41015 | | | | | 5.85% | | |
Class A | | | Massachusetts Mutual Life Insurance Company 1295 State Street Springfield, MA 01111 | | | | | 54.71% | | |
| | | Empower Trust Company, LLC 8515 East Orchard Road Greenwood Village, CO 80111 | | | | | 25.54% | | |
| | | Pershing LLC P.O. Box 2052 Jersey City, NJ 07303 | | | | | 17.36% | | |
Class R3 | | | Sammons Financial Network, LLC 4546 Corporate Drive, Suite 100 West Des Moines, IA 50266 | | | | | 75.08% | | |
| | | Massachusetts Mutual Life Insurance Company 1295 State Street Springfield, MA 01111 | | | | | 15.30% | | |
| | | Talcott Resolution Life Insurance Company 1 Griffin Road North Windsor, CT 06095 | | | | | 7.12% | | |
Class Y | | | Massachusetts Mutual Life Insurance Company 1295 State Street Springfield, MA 01111 | | | | | 100.00% | | |
Class | | | Name and Address of Owner | | | Percent of Class | | |||
Class I | | | Empower Trust Company, LLC 8515 East Orchard Road Greenwood Village, CO 80111 | | | | | 53.44% | | |
| | Massachusetts Mutual Life Insurance Company 1295 State Street Springfield, MA 01111 | | | | | 45.94% | | | |
Class R5 | | | Empower Trust Company, LLC 8515 East Orchard Road Greenwood Village, CO 80111 | | | | | 60.88% | | |
| | | Massachusetts Mutual Life Insurance Company 1295 State Street Springfield, MA 01111 | | | | | 39.12% | | |
Service Class | | | Empower Trust Company, LLC 8515 East Orchard Road Greenwood Village, CO 80111 | | | | | 81.48% | | |
A-70
Class | | | Name and Address of Owner | | | Percent of Class | | |||
| | | Reliance Trust Company P.O. Box 28004 Atlanta, GA 30358 | | | | | 14.91% | | |
Administrative Class | | | Massachusetts Mutual Life Insurance Company 1295 State Street Springfield, MA 01111 | | | | | 78.97% | | |
| | | Empower Trust Company, LLC 8515 East Orchard Road Greenwood Village, CO 80111 | | | | | 21.03% | | |
Class R4 | | | Massachusetts Mutual Life Insurance Company 1295 State Street Springfield, MA 01111 | | | | | 98.62% | | |
Class A | | | Massachusetts Mutual Life Insurance Company 1295 State Street Springfield, MA 01111 | | | | | 83.41% | | |
| | | Pershing LLC P.O. Box 2052 Jersey City, NJ 07303 | | | | | 10.41% | | |
| | | Empower Trust Company, LLC 8515 East Orchard Road Greenwood Village, CO 80111 | | | | | 5.43% | | |
Class R3 | | | Massachusetts Mutual Life Insurance Company 1295 State Street Springfield, MA 01111 | | | | | 81.40% | | |
| | | Empower Trust Company, LLC 8515 East Orchard Road Greenwood Village, CO 80111 | | | | | 18.21% | | |
Class Y | | | Massachusetts Mutual Life Insurance Company 1295 State Street Springfield, MA 01111 | | | | | 100.00% | | |
Class | | | Name and Address of Owner | | | Percent of Class | | |||
Class I | | | Empower Trust Company, LLC 8515 East Orchard Road Greenwood Village, CO 80111 | | | | | 30.16% | | |
| | | National Financial Services LLC 499 Washington Boulevard Jersey City, NJ 07310 | | | | | 27.19% | | |
| | Massachusetts Mutual Life Insurance Company 1295 State Street Springfield, MA 01111 | | | | | 26.98% | | | |
Class R5 | | | Talcott Resolution Life Insurance Company 1 Griffin Road North Windsor, CT 06095 | | | | | 47.37% | | |
A-71
Class | | | Name and Address of Owner | | | Percent of Class | | |||
| | | Massachusetts Mutual Life Insurance Company 1295 State Street Springfield, MA 01111 | | | | | 35.02% | | |
| | | Empower Trust Company, LLC 8515 East Orchard Road Greenwood Village, CO 80111 | | | | | 15.36% | | |
Service Class | | | Empower Trust Company, LLC 8515 East Orchard Road Greenwood Village, CO 80111 | | | | | 59.83% | | |
| | | Massachusetts Mutual Life Insurance Company 1295 State Street Springfield, MA 01111 | | | | | 29.90% | | |
| | | The Hartford One Hartford Plaza Hartford, CT 06155 | | | | | 9.92% | | |
Administrative Class | | | Massachusetts Mutual Life Insurance Company 1295 State Street Springfield, MA 01111 | | | | | 79.11% | | |
| | | Empower Trust Company, LLC 8515 East Orchard Road Greenwood Village, CO 80111 | | | | | 17.94% | | |
Class R4 | | | Massachusetts Mutual Life Insurance Company 1295 State Street Springfield, MA 01111 | | | | | 39.12% | | |
| | | Empower Trust Company, LLC 8515 East Orchard Road Greenwood Village, CO 80111 | | | | | 36.65% | | |
| | | Talcott Resolution Life Insurance Company 1 Griffin Road North Windsor, CT 06095 | | | | | 24.04% | | |
Class A | | | Massachusetts Mutual Life Insurance Company 1295 State Street Springfield, MA 01111 | | | | | 63.85% | | |
| | | Empower Trust Company, LLC 8515 East Orchard Road Greenwood Village, CO 80111 | | | | | 25.31% | | |
| | | Pershing LLC P.O. Box 2052 Jersey City, NJ 07303 | | | | | 6.60% | | |
Class R3 | | | Massachusetts Mutual Life Insurance Company 1295 State Street Springfield, MA 01111 | | | | | 50.50% | | |
| | | Talcott Resolution Life Insurance Company 1 Griffin Road North Windsor, CT 06095 | | | | | 23.04% | | |
A-72
Class | | | Name and Address of Owner | | | Percent of Class | | |||
| | | Sammons Financial Network, LLC 4546 Corporate Drive, Suite 100 West Des Moines, IA 50266 | | | | | 17.86% | | |
| | | Empower Trust Company, LLC 8515 East Orchard Road Greenwood Village, CO 80111 | | | | | 8.15% | | |
Class Y | | | Massachusetts Mutual Life Insurance Company 1295 State Street Springfield, MA 01111 | | | | | 100.00% | | |
Class | | | Name and Address of Owner | | | Percent of Class | | |||
Class I | | | Massachusetts Mutual Life Insurance Company 1295 State Street Springfield, MA 01111 | | | | | 30.65% | | |
| | Empower Trust Company, LLC 8515 East Orchard Road Greenwood Village, CO 80111 | | | | | 20.40% | | | |
| | | Oltrust & Co. P.O. Box 966 Evansville, IN 47706 | | | | | 6.10% | | |
| | | MassMutual RetireSMART by JPMorgan 2040 Fund 1295 State Street Springfield, MA 01111 | | | | | 6.07% | | |
| | | MassMutual RetireSMART by JPMorgan 2050 Fund 1295 State Street Springfield, MA 01111 | | | | | 5.04% | | |
Class R5 | | | Massachusetts Mutual Life Insurance Company 1295 State Street Springfield, MA 01111 | | | | | 74.78% | | |
| | | Empower Trust Company, LLC 8515 East Orchard Road Greenwood Village, CO 80111 | | | | | 22.70% | | |
Service Class | | | Empower Trust Company, LLC 8515 East Orchard Road Greenwood Village, CO 80111 | | | | | 58.53% | | |
| | Massachusetts Mutual Life Insurance Company 1295 State Street Springfield, MA 01111 | | | | | 41.12% | | | |
Administrative Class | | | Massachusetts Mutual Life Insurance Company 1295 State Street Springfield, MA 01111 | | | | | 91.16% | | |
| | | Empower Trust Company, LLC 8515 East Orchard Road Greenwood Village, CO 80111 | | | | | 8.84% | | |
A-73
Class | | | Name and Address of Owner | | | Percent of Class | | |||
Class R4 | | | TIAA, FSB 211 North Broadway, Suite 1000 Saint Louis, MO 63102 | | | | | 61.71% | | |
| | | Massachusetts Mutual Life Insurance Company 1295 State Street Springfield, MA 01111 | | | | | 25.12% | | |
| | | Talcott Resolution Life Insurance Company 1 Griffin Road North Windsor, CT 06095 | | | | | 6.77% | | |
| | | Empower Trust Company, LLC 8515 East Orchard Road Greenwood Village, CO 80111 | | | | | 6.40% | | |
Class A | | | Massachusetts Mutual Life Insurance Company 1295 State Street Springfield, MA 01111 | | | | | 82.90% | | |
| | | Pershing LLC P.O. Box 2052 Jersey City, NJ 07303 | | | | | 12.25% | | |
Class R3 | | | Massachusetts Mutual Life Insurance Company 1295 State Street Springfield, MA 01111 | | | | | 53.18% | | |
| | | Talcott Resolution Life Insurance Company 1 Griffin Road North Windsor, CT 06095 | | | | | 46.82% | | |
Class Y | | | Massachusetts Mutual Life Insurance Company 1295 State Street Springfield, MA 01111 | | | | | 100.00% | | |
Class | | | Name and Address of Owner | | | Percent of Class | | |||
Class I | | | Massachusetts Mutual Life Insurance Company 1295 State Street Springfield, MA 01111 | | | | | 32.20% | | |
| | | Empower Trust Company, LLC 8515 East Orchard Road Greenwood Village, CO 80111 | | | | | 28.85% | | |
Class R5 | | | Massachusetts Mutual Life Insurance Company 1295 State Street Springfield, MA 01111 | | | | | 96.28% | | |
Service Class | | | Massachusetts Mutual Life Insurance Company 1295 State Street Springfield, MA 01111 | | | | | 95.94% | | |
Administrative Class | | | Massachusetts Mutual Life Insurance Company 1295 State Street Springfield, MA 01111 | | | | | 88.87% | | |
A-74
Class | | | Name and Address of Owner | | | Percent of Class | | |||
| | | The Hartford One Hartford Plaza Hartford, CT 06155 | | | | | 11.13% | | |
Class R4 | | | Massachusetts Mutual Life Insurance Company 1295 State Street Springfield, MA 01111 | | | | | 57.62% | | |
| | | Empower Trust Company, LLC 8515 East Orchard Road Greenwood Village, CO 80111 | | | | | 34.67% | | |
| | | Talcott Resolution Life Insurance Company 1 Griffin Road North Windsor, CT 06095 | | | | | 7.72% | | |
Class A | | | Massachusetts Mutual Life Insurance Company 1295 State Street Springfield, MA 01111 | | | | | 78.58% | | |
| | | Empower Trust Company, LLC 8515 East Orchard Road Greenwood Village, CO 80111 | | | | | 12.30% | | |
| | | Reliance Trust Company P.O. Box 28004 Atlanta, GA 30358 | | | | | 6.55% | | |
Class R3 | | | Talcott Resolution Life Insurance Company 1 Griffin Road North Windsor, CT 06095 | | | | | 81.20% | | |
| | | Matrix Trust Company FBO Craft Health 401K Plan 717 17th Street, Suite 1300 Denver, CO 80202 | | | | | 16.86% | | |
Class Y | | | Massachusetts Mutual Life Insurance Company 1295 State Street Springfield, MA 01111 | | | | | 100.00% | | |
Class | | | Name and Address of Owner | | | Percent of Class | | |||
Class I | | | Empower Trust Company, LLC 8515 East Orchard Road Greenwood Village, CO 80111 | | | | | 22.64% | | |
| | MassMutual RetireSMART by JPMorgan 2040 Fund 1295 State Street Springfield, MA 01111 | | | | | 10.09% | | | |
| | | MassMutual RetireSMART by JPMorgan 2030 Fund 1295 State Street Springfield, MA 01111 | | | | | 9.91% | | |
| | | Massachusetts Mutual Life Insurance Company 1295 State Street Springfield, MA 01111 | | | | | 8.97% | | |
A-75
Class | | | Name and Address of Owner | | | Percent of Class | | |||
| | | MassMutual RetireSMART by JPMorgan 2050 Fund 1295 State Street Springfield, MA 01111 | | | | | 8.40% | | |
| | | MassMutual RetireSMART by JPMorgan 2035 Fund 1295 State Street Springfield, MA 01111 | | | | | 7.07% | | |
| | | MassMutual RetireSMART by JPMorgan 2045 Fund 1295 State Street Springfield, MA 01111 | | | | | 6.70% | | |
Class R5 | | | Massachusetts Mutual Life Insurance Company 1295 State Street Springfield, MA 01111 | | | | | 100.00% | | |
Service Class | | | Massachusetts Mutual Life Insurance Company 1295 State Street Springfield, MA 01111 | | | | | 55.52% | | |
| | | Empower Trust Company, LLC 8515 East Orchard Road Greenwood Village, CO 80111 | | | | | 44.48% | | |
Administrative Class | | | Massachusetts Mutual Life Insurance Company 1295 State Street Springfield, MA 01111 | | | | | 96.75% | | |
Class R4 | | | Massachusetts Mutual Life Insurance Company 1295 State Street Springfield, MA 01111 | | | | | 52.31% | | |
| | Talcott Resolution Life Insurance Company 1 Griffin Road North Windsor, CT 06095 | | | | | 34.23% | | | |
| | | Empower Trust Company, LLC 8515 East Orchard Road Greenwood Village, CO 80111 | | | | | 13.46% | | |
Class A | | | Massachusetts Mutual Life Insurance Company 1295 State Street Springfield, MA 01111 | | | | | 64.54% | | |
| | | Empower Trust Company, LLC 8515 East Orchard Road Greenwood Village, CO 80111 | | | | | 26.99% | | |
| | | Reliance Trust Company P.O. Box 28004 Atlanta, GA 30358 | | | | | 5.56% | | |
Class R3 | | | Talcott Resolution Life Insurance Company 1 Griffin Road North Windsor, CT 06095 | | | | | 43.68% | | |
| | | Massachusetts Mutual Life Insurance Company 1295 State Street Springfield, MA 01111 | | | | | 31.01% | | |
A-76
Class | | | Name and Address of Owner | | | Percent of Class | | |||
| | | Empower Trust Company, LLC 8515 East Orchard Road Greenwood Village, CO 80111 | | | | | 25.32% | | |
Class Y | | | Massachusetts Mutual Life Insurance Company 1295 State Street Springfield, MA 01111 | | | | | 100.00% | | |
Class | | | Name and Address of Owner | | | Percent of Class | | |||
Class I | | | Empower Trust Company, LLC 8515 East Orchard Road Greenwood Village, CO 80111 | | | | | 51.80% | | |
| | | National Financial Services LLC 499 Washington Boulevard Jersey City, NJ 07310 | | | | | 36.30% | | |
| | | Massachusetts Mutual Life Insurance Company 1295 State Street Springfield, MA 01111 | | | | | 11.04% | | |
Class R5 | | | Massachusetts Mutual Life Insurance Company 1295 State Street Springfield, MA 01111 | | | | | 57.79% | | |
| | | Empower Trust Company, LLC 8515 East Orchard Road Greenwood Village, CO 80111 | | | | | 42.21% | | |
Service Class | | | Empower Trust Company, LLC 8515 East Orchard Road Greenwood Village, CO 80111 | | | | | 85.53% | | |
| | | Massachusetts Mutual Life Insurance Company 1295 State Street Springfield, MA 01111 | | | | | 13.82% | | |
Administrative Class | | | Massachusetts Mutual Life Insurance Company 1295 State Street Springfield, MA 01111 | | | | | 82.28% | | |
| | | Empower Trust Company, LLC 8515 East Orchard Road Greenwood Village, CO 80111 | | | | | 16.46% | | |
Class R4 | | | Massachusetts Mutual Life Insurance Company 1295 State Street Springfield, MA 01111 | | | | | 72.28% | | |
| | | Talcott Resolution Life Insurance Company 1 Griffin Road North Windsor, CT 06095 | | | | | 21.27% | | |
| | | Empower Trust Company, LLC 8515 East Orchard Road Greenwood Village, CO 80111 | | | | | 6.45% | | |
A-77
Class | | | Name and Address of Owner | | | Percent of Class | | |||
Class A | | | Massachusetts Mutual Life Insurance Company 1295 State Street Springfield, MA 01111 | | | | | 46.63% | | |
| | | Pershing LLC P.O. Box 2052 Jersey City, NJ 07303 | | | | | 30.98% | | |
| | | Empower Trust Company, LLC 8515 East Orchard Road Greenwood Village, CO 80111 | | | | | 19.41% | | |
Class R3 | | | Massachusetts Mutual Life Insurance Company 1295 State Street Springfield, MA 01111 | | | | | 82.05% | | |
| | | Talcott Resolution Life Insurance Company 1 Griffin Road North Windsor, CT 06095 | | | | | 17.95% | | |
Class Y | | | Massachusetts Mutual Life Insurance Company 1295 State Street Springfield, MA 01111 | | | | | 100.00% | | |
Class | | | Name and Address of Owner | | | Percent of Class | | |||
Class I | | | National Financial Services LLC 499 Washington Boulevard Jersey City, NJ 07310 | | | | | 34.46% | | |
| | | Empower Trust Company, LLC 8515 East Orchard Road Greenwood Village, CO 80111 | | | | | 20.59% | | |
| | | Massachusetts Mutual Life Insurance Company 1295 State Street Springfield, MA 01111 | | | | | 8.05% | | |
| | | TIAA, FSB 211 North Broadway, Suite 1000 Saint Louis, MO 63102 | | | | | 7.93% | | |
| | | DCGT FBO PLIC Various Retirement Plans Omnibus 711 High Street Des Moines, IA 50392 | | | | | 6.47% | | |
Class R5 | | | National Financial Services LLC 499 Washington Boulevard Jersey City, NJ 07310 | | | | | 25.16% | | |
| | | Charles Schwab & Co., Inc. 211 Main Street San Francisco, CA 94105 | | | | | 19.90% | | |
| | | Empower Trust Company, LLC 8515 East Orchard Road Greenwood Village, CO 80111 | | | | | 18.20% | | |
A-78
Class | | | Name and Address of Owner | | | Percent of Class | | |||
| | | Massachusetts Mutual Life Insurance Company 1295 State Street Springfield, MA 01111 | | | | | 13.76% | | |
| | | DCGT FBO PLIC Various Retirement Plans Omnibus 711 High Street Des Moines, IA 50392 | | | | | 6.43% | | |
Service Class | | | National Financial Services LLC 499 Washington Boulevard Jersey City, NJ 07310 | | | | | 35.25% | | |
| | | Empower Trust Company, LLC 8515 East Orchard Road Greenwood Village, CO 80111 | | | | | 25.18% | | |
| | | Massachusetts Mutual Life Insurance Company 1295 State Street Springfield, MA 01111 | | | | | 15.95% | | |
Administrative Class | | | Massachusetts Mutual Life Insurance Company 1295 State Street Springfield, MA 01111 | | | | | 67.61% | | |
| | | Empower Trust Company, LLC 8515 East Orchard Road Greenwood Village, CO 80111 | | | | | 24.89% | | |
Class R4 | | | National Financial Services LLC 499 Washington Boulevard Jersey City, NJ 07310 | | | | | 24.18% | | |
| | | Empower Trust Company, LLC 8515 East Orchard Road Greenwood Village, CO 80111 | | | | | 22.05% | | |
| | | Massachusetts Mutual Life Insurance Company 1295 State Street Springfield, MA 01111 | | | | | 20.16% | | |
| | | DCGT FBO PLIC Various Retirement Plans Omnibus 711 High Street Des Moines, IA 50392 | | | | | 9.35% | | |
| | | Talcott Resolution Life Insurance Company 1 Griffin Road North Windsor, CT 06095 | | | | | 7.91% | | |
Class A | | | Massachusetts Mutual Life Insurance Company 1295 State Street Springfield, MA 01111 | | | | | 66.28% | | |
| | | Empower Trust Company, LLC 8515 East Orchard Road Greenwood Village, CO 80111 | | | | | 18.83% | | |
A-79
Class | | | Name and Address of Owner | | | Percent of Class | | |||
| | | Pershing LLC P.O. Box 2052 Jersey City, NJ 07303 | | | | | 9.95% | | |
Class R3 | | | Massachusetts Mutual Life Insurance Company 1295 State Street Springfield, MA 01111 | | | | | 60.02% | | |
| | | Talcott Resolution Life Insurance Company 1 Griffin Road North Windsor, CT 06095 | | | | | 23.28% | | |
| | | Empower Trust Company, LLC 8515 East Orchard Road Greenwood Village, CO 80111 | | | | | 7.98% | | |
Class Y | | | Massachusetts Mutual Life Insurance Company 1295 State Street Springfield, MA 01111 | | | | | 100.00% | | |
Class | | | Name and Address of Owner | | | Percent of Class | | |||
Class I | | | National Financial Services LLC 499 Washington Boulevard Jersey City, NJ 07310 | | | | | 29.22% | | |
| | | Empower Trust Company, LLC 8515 East Orchard Road Greenwood Village, CO 80111 | | | | | 28.55% | | |
| | | Massachusetts Mutual Life Insurance Company 1295 State Street Springfield, MA 01111 | | | | | 12.60% | | |
| | | TIAA, FSB 211 North Broadway, Suite 1000 Saint Louis, MO 63102 | | | | | 5.67% | | |
Class R5 | | | Massachusetts Mutual Life Insurance Company 1295 State Street Springfield, MA 01111 | | | | | 42.62% | | |
| | | Charles Schwab & Co., Inc. 211 Main Street San Francisco, CA 94105 | | | | | 27.55% | | |
| | | Empower Trust Company, LLC 8515 East Orchard Road Greenwood Village, CO 80111 | | | | | 13.64% | | |
| | | National Financial Services LLC 499 Washington Boulevard Jersey City, NJ 07310 | | | | | 9.20% | | |
| | | TIAA, FSB 211 North Broadway, Suite 1000 Saint Louis, MO 63102 | | | | | 5.10% | | |
A-80
Class | | | Name and Address of Owner | | | Percent of Class | | |||
Service Class | | | Empower Trust Company, LLC 8515 East Orchard Road Greenwood Village, CO 80111 | | | | | 49.62% | | |
| | Massachusetts Mutual Life Insurance Company 1295 State Street Springfield, MA 01111 | | | | | 48.15% | | | |
Administrative Class | | | Massachusetts Mutual Life Insurance Company 1295 State Street Springfield, MA 01111 | | | | | 67.09% | | |
| | | Empower Trust Company, LLC 8515 East Orchard Road Greenwood Village, CO 80111 | | | | | 29.29% | | |
Class R4 | | | Empower Trust Company, LLC 8515 East Orchard Road Greenwood Village, CO 80111 | | | | | 66.26% | | |
| | | Talcott Resolution Life Insurance Company 1 Griffin Road North Windsor, CT 06095 | | | | | 22.50% | | |
| | | Massachusetts Mutual Life Insurance Company 1295 State Street Springfield, MA 01111 | | | | | 5.72% | | |
| | | Ascensus Trust Company FBO Construction Resources Holdings P.O. Box 10758 Fargo, ND 58106 | | | | | 5.49% | | |
Class A | | | Massachusetts Mutual Life Insurance Company 1295 State Street Springfield, MA 01111 | | | | | 72.35% | | |
| | | Pershing LLC P.O. Box 2052 Jersey City, NJ 07303 | | | | | 19.42% | | |
| | | Empower Trust Company, LLC 8515 East Orchard Road Greenwood Village, CO 80111 | | | | | 6.03% | | |
Class R3 | | | Talcott Resolution Life Insurance Company 1 Griffin Road North Windsor, CT 06095 | | | | | 52.20% | | |
| | | Massachusetts Mutual Life Insurance Company 1295 State Street Springfield, MA 01111 | | | | | 38.78% | | |
| | | State Street Bank FBO ADP Access Product 1 Lincoln Street Boston, MA 02111 | | | | | 5.55% | | |
A-81
Class | | | Name and Address of Owner | | | Percent of Class | | |||
Class Y | | | Massachusetts Mutual Life Insurance Company 1295 State Street Springfield, MA 01111 | | | | | 100.00% | | |
Class | | | Name and Address of Owner | | | Percent of Class | | |||
Class I | | | Massachusetts Mutual Life Insurance Company 1295 State Street Springfield, MA 01111 | | | | | 33.16% | | |
| | | Empower Trust Company, LLC 8515 East Orchard Road Greenwood Village, CO 80111 | | | | | 17.20% | | |
| | | MassMutual RetireSMART by JPMorgan 2040 Fund 1295 State Street Springfield, MA 01111 | | | | | 5.92% | | |
Class R5 | | | Massachusetts Mutual Life Insurance Company 1295 State Street Springfield, MA 01111 | | | | | 55.02% | | |
| | | PIMS/Prudential Retirement FBO Power Profit Sharing 401(K) Plan 2041 South Cobalt Point Way Meridian, ID 83642 | | | | | 29.63% | | |
| | | Empower Trust Company, LLC 8515 East Orchard Road Greenwood Village, CO 80111 | | | | | 12.90% | | |
Service Class | | | Empower Trust Company, LLC 8515 East Orchard Road Greenwood Village, CO 80111 | | | | | 86.47% | | |
| | | Massachusetts Mutual Life Insurance Company 1295 State Street Springfield, MA 01111 | | | | | 12.33% | | |
Administrative Class | | | Massachusetts Mutual Life Insurance Company 1295 State Street Springfield, MA 01111 | | | | | 72.69% | | |
| | | Empower Trust Company, LLC 8515 East Orchard Road Greenwood Village, CO 80111 | | | | | 27.16% | | |
Class R4 | | | Massachusetts Mutual Life Insurance Company 1295 State Street Springfield, MA 01111 | | | | | 50.73% | | |
| | | Empower Trust Company, LLC 8515 East Orchard Road Greenwood Village, CO 80111 | | | | | 37.94% | | |
| | | Talcott Resolution Life Insurance Company 1 Griffin Road North Windsor, CT 06095 | | | | | 10.88% | | |
A-82
Class | | | Name and Address of Owner | | | Percent of Class | | |||
Class A | | | Massachusetts Mutual Life Insurance Company 1295 State Street Springfield, MA 01111 | | | | | 63.96% | | |
| | | Empower Trust Company, LLC 8515 East Orchard Road Greenwood Village, CO 80111 | | | | | 13.58% | | |
| | | Reliance Trust Company P.O. Box 28004 Atlanta, GA 30358 | | | | | 12.16% | | |
| | | Pershing LLC P.O. Box 2052 Jersey City, NJ 07303 | | | | | 7.39% | | |
Class R3 | | | Talcott Resolution Life Insurance Company 1 Griffin Road North Windsor, CT 06095 | | | | | 49.32% | | |
| | | Massachusetts Mutual Life Insurance Company 1295 State Street Springfield, MA 01111 | | | | | 37.56% | | |
| | | State Street Bank FBO ADP Access Product 1 Lincoln Street Boston, MA 02111 | | | | | 8.99% | | |
Class Y | | | Massachusetts Mutual Life Insurance Company 1295 State Street Springfield, MA 01111 | | | | | 100.00% | | |
Class | | | Name and Address of Owner | | | Percent of Class | | |||
Class I | | | MassMutual Select T. Rowe Price Retirement 2040 Fund 1295 State Street Springfield, MA 01111 | | | | | 20.85% | | |
| | | MassMutual Select T. Rowe Price Retirement 2050 Fund 1295 State Street Springfield, MA 01111 | | | | | 16.53% | | |
| | | MassMutual Select T. Rowe Price Retirement 2030 Fund 1295 State Street Springfield, MA 01111 | | | | | 16.23% | | |
| | | MassMutual Select T. Rowe Price Retirement 2045 Fund 1295 State Street Springfield, MA 01111 | | | | | 10.99% | | |
| | | MassMutual Select T. Rowe Price Retirement 2035 Fund 1295 State Street Springfield, MA 01111 | | | | | 10.91% | | |
| | | MassMutual Select T. Rowe Price Retirement 2055 Fund 1295 State Street Springfield, MA 01111 | | | | | 7.63% | | |
A-83
Class | | | Name and Address of Owner | | | Percent of Class | | |||
| | | MassMutual Select T. Rowe Price Retirement 2025 Fund 1295 State Street Springfield, MA 01111 | | | | | 5.09% | | |
A-84
A-85
Fund | | | | |
Total Return Bond Fund | | | 0.30% on the first $2 billion; and 0.27% on assets over $2 billion | |
Strategic Bond Fund | | | 0.45% on the first $200 million; and 0.35% on assets over $200 million | |
Diversified Value Fund | | | 0.50% on the first $400 million; and 0.475% on assets over $400 million | |
Fundamental Value Fund | | | 0.60% on the first $1.25 billion; 0.575% on the next $250 million; and 0.55% on assets over $1.5 billion | |
S&P 500 Index Fund | | | 0.10% on the first $2.5 billion; 0.08% on the next $2.5 billion; and 0.05% on assets over $5 billion | |
Equity Opportunities Fund | | | 0.69% on the first $1 billion; and 0.64% on assets over $1 billion | |
Fundamental Growth Fund | | | 0.65% on the first $300 million; and 0.60% on assets over $300 million | |
Blue Chip Growth Fund | | | 0.65% on the first $750 million; and 0.60% on assets over $750 million | |
Growth Opportunities Fund | | | 0.71% on the first $500 million; and 0.68% on assets over $500 million | |
Mid Cap Value Fund | | | 0.70% on the first $300 million; and 0.65% on assets over $300 million | |
Small Cap Value Equity Fund | | | 0.75% on the first $300 million; and 0.70% on assets over $300 million | |
Small Company Value Fund | | | 0.85% on the first $750 million; and 0.80% on assets over $750 million | |
Mid Cap Growth Fund | | | 0.67% on the first $2 billion; and 0.62% on assets over $2 billion | |
A-86
Fund | | | | |
Small Cap Growth Equity Fund | | | 0.80% on the first $1 billion; and 0.78% on assets over $1 billion | |
Overseas Fund | | | 0.80% on the first $750 million; 0.775% on the next $500 million; and 0.75% on assets over $1.25 billion | |
MM Select T. Rowe Price International Equity Fund | | | 0.00% | |
A-87
A-88
A-89
A-90
A-91
A-92
| | | | Class I | | | Class R5 | | | Service Class | | | Administrative Class | | | Class R4 | | | Class A | | | Class R3 | | | Class Y | | ||||||||||||||||||||||||
| Total Return Bond Fund | | | | | None | | | | | | 0.10% | | | | | | 0.20% | | | | | | 0.30% | | | | | | 0.20% | | | | | | 0.25% | | | | | | 0.20% | | | | | | 0.10% | | |
| Strategic Bond Fund | | | | | None | | | | | | 0.10% | | | | | | 0.20% | | | | | | 0.30% | | | | | | 0.20% | | | | | | 0.25% | | | | | | 0.20% | | | | | | 0.10% | | |
| Diversified Value Fund | | | | | None | | | | | | 0.10% | | | | | | 0.20% | | | | | | 0.30% | | | | | | 0.20% | | | | | | 0.25% | | | | | | 0.20% | | | | | | 0.10% | | |
| Fundamental Value Fund | | | | | None | | | | | | 0.10% | | | | | | 0.20% | | | | | | 0.30% | | | | | | 0.20% | | | | | | 0.25% | | | | | | 0.20% | | | | | | 0.10% | | |
| S&P 500 Index Fund | | | | | None | | | | | | 0.10% | | | | | | 0.25% | | | | | | 0.35% | | | | | | 0.25% | | | | | | 0.35% | | | | | | 0.25% | | | | N/A | | |||
| Equity Opportunities Fund | | | | | None | | | | | | 0.10% | | | | | | 0.20% | | | | | | 0.30% | | | | | | 0.20% | | | | | | 0.25% | | | | | | 0.20% | | | | | | 0.10% | | |
| Fundamental Growth Fund | | | | | None | | | | | | 0.10% | | | | | | 0.20% | | | | | | 0.30% | | | | | | 0.20% | | | | | | 0.25% | | | | | | 0.20% | | | | | | 0.10% | | |
| Blue Chip Growth Fund | | | | | None | | | | | | 0.10% | | | | | | 0.20% | | | | | | 0.30% | | | | | | 0.20% | | | | | | 0.25% | | | | | | 0.20% | | | | | | 0.10% | | |
| Growth Opportunities Fund | | | | | None | | | | | | 0.10% | | | | | | 0.20% | | | | | | 0.30% | | | | | | 0.20% | | | | | | 0.25% | | | | | | 0.20% | | | | | | 0.10% | | |
| Mid Cap Value Fund | | | | | None | | | | | | 0.10% | | | | | | 0.20% | | | | | | 0.30% | | | | | | 0.20% | | | | | | 0.25% | | | | | | 0.20% | | | | | | 0.10% | | |
| Small Cap Value Equity Fund | | | | | None | | | | | | 0.10% | | | | | | 0.20% | | | | | | 0.30% | | | | | | 0.20% | | | | | | 0.25% | | | | | | 0.20% | | | | | | 0.10% | | |
| Small Company Value Fund | | | | | None | | | | | | 0.10% | | | | | | 0.20% | | | | | | 0.30% | | | | | | 0.20% | | | | | | 0.25% | | | | | | 0.20% | | | | | | 0.10% | | |
| Mid Cap Growth Fund | | | | | None | | | | | | 0.10% | | | | | | 0.20% | | | | | | 0.30% | | | | | | 0.20% | | | | | | 0.25% | | | | | | 0.20% | | | | | | 0.10% | | |
| Small Cap Growth Equity Fund | | | | | None | | | | | | 0.10% | | | | | | 0.20% | | | | | | 0.30% | | | | | | 0.20% | | | | | | 0.25% | | | | | | 0.20% | | | | | | 0.10% | | |
| Overseas Fund | | | | | None | | | | | | 0.10% | | | | | | 0.20% | | | | | | 0.30% | | | | | | 0.20% | | | | | | 0.25% | | | | | | 0.20% | | | | | | 0.10% | | |
| MM Select T. Rowe Price International Equity Fund | | | | | None | | | | N/A | | | N/A | | | N/A | | | N/A | | | N/A | | | N/A | | | N/A | |
| | | Fiscal Year Ended September 30, 2023 | | |||||||||||||||||||||||||||
| | | Advisory Fees Paid | | | Subadvisory Fees Paid | | | Advisory Fees Waived | | | Administrative Fees Paid | | | Other Expenses Reimbursed | | |||||||||||||||
Total Return Bond Fund 1 | | | | $ | 2,300,480 | | | | | $ | 1,051,200 | | | | | $ | (169,172) | | | | | $ | 328,854 | | | | | $ | (109,409) | | |
Strategic Bond Fund 2 | | | | | 1,681,880 | | | | | | 704,956 | | | | | | (211,697) | | | | | | 233,710 | | | | | | — | | |
Diversified Value Fund | | | | | 1,513,928 | | | | | | 674,927 | | | | | | — | | | | | | 221,311 | | | | | | — | | |
Fundamental Value Fund | | | | | 2,756,686 | | | | | | 1,264,604 | | | | | | — | | | | | | 286,397 | | | | | | — | | |
S&P 500 Index Fund | | | | | 2,439,912 | | | | | | 202,549 | | | | | | — | | | | | | 3,379,693 | | | | | | — | | |
Equity Opportunities Fund | | | | | 4,335,475 | | | | | | 1,929,170 | | | | | | — | | | | | | 423,471 | | | | | | — | | |
Fundamental Growth Fund 3 | | | | | 184,350 | | | | | | 123,262 | | | | | | (14,181) | | | | | | 59,146 | | | | | | — | | |
Blue Chip Growth Fund | | | | | 14,970,707 | | | | | | 7,308,177 | | | | | | — | | | | | | 1,535,589 | | | | | | — | | |
Growth Opportunities Fund 4 | | | | | 1,558,824 | | | | | | 733,012 | | | | | | (43,908) | | | | | | 183,477 | | | | | | — | | |
Mid Cap Value Fund 5 | | | | | 778,501 | | | | | | 359,783 | | | | | | — | | | | | | 9,655 | | | | | | (425,568) | | |
A-93
| | | Fiscal Year Ended September 30, 2023 | | |||||||||||||||||||||||||||
| | | Advisory Fees Paid | | | Subadvisory Fees Paid | | | Advisory Fees Waived | | | Administrative Fees Paid | | | Other Expenses Reimbursed | | |||||||||||||||
Small Cap Value Equity Fund | | | | | 407,265 | | | | | | 267,904 | | | | | | — | | | | | | 38,406 | | | | | | — | | |
Small Company Value Fund 6 | | | | | 1,803,056 | | | | | | 1,006,063 | | | | | | — | | | | | | 116,807 | | | | | | (326,560) | | |
Mid Cap Growth Fund 7 | | | | | 35,937,804 | | | | | | 21,497,747 | | | | | | (1,990,475) | | | | | | 2,062,894 | | | | | | — | | |
Small Cap Growth Equity Fund | | | | | 5,690,379 | | | | | | 3,652,530 | | | | | | — | | | | | | 292,177 | | | | | | — | | |
Overseas Fund 8 | | | | | 3,758,538 | | | | | | 2,181,611 | | | | | | — | | | | | | 310,379 | | | | | | (575,877) | | |
MM Select T. Rowe Price International Equity Fund9 | | | | | — | | | | | | — | | | | | | — | | | | | | | | | | | | (1,181,072) | | |
A-94
| | | Fiscal Year Ended September 30, 2022 | | |||||||||||||||||||||||||||
| | | Advisory Fees Paid | | | Subadvisory Fees Paid | | | Advisory Fees Waived | | | Administrative Fees Paid | | | Other Expenses Reimbursed | | |||||||||||||||
Total Return Bond Fund 1 | | | | $ | 2,433,628 | | | | | $ | 1,088,619 | | | | | $ | (243,363) | | | | | $ | 399,344 | | | | | $ | — | | |
Strategic Bond Fund 2 | | | | | 1,966,150 | | | | | | 869,178 | | | | | | (252,307) | | | | | | 355,494 | | | | | | — | | |
Diversified Value Fund | | | | | 1,802,361 | | | | | | 802,075 | | | | | | — | | | | | | 256,901 | | | | | | — | | |
Fundamental Value Fund | | | | | 3,333,973 | | | | | | 1,483,298 | | | | | | — | | | | | | 388,987 | | | | | | — | | |
S&P 500 Index Fund | | | | | 2,966,050 | | | | | | 250,502 | | | | | | — | | | | | | 4,159,740 | | | | | | — | | |
Equity Opportunities Fund | | | | | 4,925,333 | | | | | | 2,175,135 | | | | | | — | | | | | | 532,181 | | | | | | — | | |
Fundamental Growth Fund 3 | | | | | 271,192 | | | | | | 180,454 | | | | | | (3,775) | | | | | | 73,579 | | | | | | — | | |
Blue Chip Growth Fund | | | | | 21,544,826 | | | | | | 10,621,148 | | | | | | — | | | | | | 2,227,677 | | | | | | — | | |
Growth Opportunities Fund 4 | | | | | 2,594,889 | | | | | | 1,215,251 | | | | | | (73,133) | | | | | | 290,168 | | | | | | — | | |
Mid Cap Value Fund 5 | | | | | 835,677 | | | | | | 384,450 | | | | | | — | | | | | | 9,974 | | | | | | (378,927) | | |
Small Cap Value Equity Fund | | | | | 449,998 | | | | | | 294,824 | | | | | | — | | | | | | 43,295 | | | | | | — | | |
Small Company Value Fund 6 | | | | | 2,207,447 | | | | | | 1,230,662 | | | | | | — | | | | | | 153,485 | | | | | | (240,158) | | |
Mid Cap Growth Fund 7 | | | | | 48,463,244 | | | | | | 29,674,666 | | | | | | (1,497,063) | | | | | | 2,889,026 | | | | | | — | | |
Small Cap Growth Equity Fund | | | | | 5,226,397 | | | | | | 3,367,581 | | | | | | — | | | | | | 355,630 | | | | | | — | | |
Overseas Fund 8 | | | | | 4,456,361 | | | | | | 2,528,164 | | | | | | — | | | | | | 367,605 | | | | | | (641,568) | | |
MM Select T. Rowe Price International Equity Fund9 | | | | | — | | | | | | — | | | | | | — | | | | | | — | | | | | | (1,278,606) | | |
A-95
| | | | Fiscal Year Ended September 30, 2021 | | |||||||||||||||||||||||||||||||||
| | | | Advisory Fees Paid | | | Subadvisory Fees Paid | | | Advisory Fees Waived | | | Administrative Fees Paid | | | Supplemental Shareholder Services Fees Paid | | | Other Expenses Reimbursed | | ||||||||||||||||||
| Total Return Bond Fund 1 | | | | $ | 2,736,139 | | | | | $ | 1,200,332 | | | | | $ | (236,008) | | | | | $ | 509,955 | | | | | $ | 23,573 | | | | | $ | — | | |
| Strategic Bond Fund 2 | | | | | 2,763,689 | | | | | | 1,225,656 | | | | | | (47,321) | | | | | | 585,747 | | | | | | 56,463 | | | | | | — | | |
| Diversified Value Fund | | | | | 1,956,501 | | | | | | 866,306 | | | | | | — | | | | | | 259,176 | | | | | | 19,660 | | | | | | — | | |
| Fundamental Value Fund | | | | | 3,624,144 | | | | | | 1,588,499 | | | | | | — | | | | | | 449,770 | | | | | | 39,041 | | | | | | — | | |
| S&P 500 Index Fund | | | | | 3,276,380 | | | | | | 279,719 | | | | | | — | | | | | | 4,717,662 | | | | | | 205,119 | | | | | | — | | |
| Equity Opportunities Fund | | | | | 5,349,429 | | | | | | 2,355,624 | | | | | | — | | | | | | 570,252 | | | | | | 45,221 | | | | | | — | | |
| Fundamental Growth Fund | | | | | 420,446 | | | | | | 277,854 | | | | | | — | | | | | | 104,246 | | | | | | 12,334 | | | | | | — | | |
| Blue Chip Growth Fund | | | | | 27,410,846 | | | | | | 13,628,378 | | | | | | — | | | | | | 2,914,100 | | | | | | 254,096 | | | | | | — | | |
| Growth Opportunities Fund 3 | | | | | 3,750,207 | | | | | | 1,784,532 | | | | | | (105,900) | | | | | | 426,134 | | | | | | 42,413 | | | | | | — | | |
| Mid Cap Value Fund 4 | | | | | 844,752 | | | | | | 433,438 | | | | | | — | | | | | | 15,897 | | | | | | 1,667 | | | | | | (271,653) | | |
| Small Cap Value Equity Fund | | | | | 642,117 | | | | | | 417,682 | | | | | | — | | | | | | 52,092 | | | | | | 3,903 | | | | | | — | | |
| Small Company Value Fund 5 | | | | | 2,152,369 | | | | | | 1,202,906 | | | | | | — | | | | | | 161,648 | | | | | | 11,183 | | | | | | (63,681) | | |
| Mid Cap Growth Fund | | | | | 65,355,447 | | | | | | 43,834,282 | | | | | | — | | | | | | 4,008,134 | | | | | | 225,608 | | | | | | — | | |
| Small Cap Growth Equity Fund | | | | | 5,948,196 | | | | | | 3,812,722 | | | | | | — | | | | | | 470,077 | | | | | | 31,523 | | | | | | — | | |
| Overseas Fund 6 | | | | | 5,600,920 | | | | | | 3,122,376 | | | | | | — | | | | | | 431,368 | | | | | | 25,752 | | | | | | (664,788) | | |
| MM Select T. Rowe Price International Equity Fund7 | | | | | — | | | | | | — | | | | | | — | | | | | | — | | | | | | — | | | | | | (1,204,393) | | |
A-96
| | | | | | | | | | Sales Charge Revenue | | | | | | CDSC Revenue | | ||||||||||||||||||||||||||||||
| | | | Fiscal Year Ended | | | Amount Paid to Distributor | | | Amount Reallowed to Dealers | | | Amount Retained by Distributor | | | | | | Amount Paid to Distributor | | | Amount Reallowed to Dealers | | | Amount Retained by Distributor | | |||||||||||||||||||||
| Diversified Value Fund – Class A | | | | | 2023 | | | | | $ | 2,384 | | | | | $ | 1,863 | | | | | $ | 522 | | | | | | | | $ | 0 | | | | | $ | 0 | | | | | $ | 0 | | |
| | | | | | 2022 | | | | | $ | 936 | | | | | $ | 730 | | | | | $ | 205 | | | | | | | | $ | 0 | | | | | $ | 0 | | | | | $ | 0 | | |
| | | | | | 2021 | | | | | $ | 58 | | | | | $ | 47 | | | | | $ | 11 | | | | | | | | $ | 0 | | | | | $ | 0 | | | | | $ | 0 | | |
A-97
| | | | | | | | | | Sales Charge Revenue | | | | | | CDSC Revenue | | ||||||||||||||||||||||||||||||
| | | | Fiscal Year Ended | | | Amount Paid to Distributor | | | Amount Reallowed to Dealers | | | Amount Retained by Distributor | | | | | | Amount Paid to Distributor | | | Amount Reallowed to Dealers | | | Amount Retained by Distributor | | |||||||||||||||||||||
| Fundamental Value Fund – Class A | | | | | 2023 | | | | | $ | 0 | | | | | $ | 0 | | | | | $ | 0 | | | | | | | | $ | 0 | | | | | $ | 0 | | | | | $ | 0 | | |
| | | | | | 2022 | | | | | $ | 944 | | | | | $ | 730 | | | | | $ | 214 | | | | | | | | $ | 0 | | | | | $ | 0 | | | | | $ | 0 | | |
| | | | | | 2021 | | | | | $ | 0 | | | | | $ | 0 | | | | | $ | 0 | | | | | | | | $ | 0 | | | | | $ | 0 | | | | | $ | 0 | | |
| S&P 500 Index Fund – Class A | | | | | 2023 | | | | | $ | 0 | | | | | $ | 0 | | | | | $ | 0 | | | | | | | | $ | 0 | | | | | $ | 0 | | | | | $ | 0 | | |
| | | | | | 2022 | | | | | $ | 88 | | | | | $ | 72 | | | | | $ | 16 | | | | | | | | $ | 0 | | | | | $ | 0 | | | | | $ | 0 | | |
| | | | | | 2021 | | | | | $ | 0 | | | | | $ | 0 | | | | | $ | 0 | | | | | | | | $ | 0 | | | | | $ | 0 | | | | | $ | 0 | | |
| Equity Opportunities Fund – Class A | | | | | 2023 | | | | | $ | 1,466 | | | | | $ | 1,132 | | | | | $ | 335 | | | | | | | | $ | 0 | | | | | $ | 0 | | | | | $ | 0 | | |
| | | | | | 2022 | | | | | $ | 1,216 | | | | | $ | 948 | | | | | $ | 267 | | | | | | | | $ | 0 | | | | | $ | 0 | | | | | $ | 0 | | |
| | | | | | 2021 | | | | | $ | 58 | | | | | $ | 47 | | | | | $ | 10 | | | | | | | | $ | 0 | | | | | $ | 0 | | | | | $ | 0 | | |
| Blue Chip Growth Fund – Class A | | | | | 2023 | | | | | $ | 1,048 | | | | | $ | 858 | | | | | $ | 190 | | | | | | | | $ | 0 | | | | | $ | 0 | | | | | $ | 0 | | |
| | | | | | 2022 | | | | | $ | 3,122 | | | | | $ | 2,541 | | | | | $ | 581 | | | | | | | | $ | 0 | | | | | $ | 0 | | | | | $ | 0 | | |
| | | | | | 2021 | | | | | $ | 3,851 | | | | | $ | 3,131 | | | | | $ | 720 | | | | | | | | $ | 0 | | | | | $ | 0 | | | | | $ | 0 | | |
| Growth Opportunities Fund – Class A | | | | | 2023 | | | | | $ | 350 | | | | | $ | 282 | | | | | $ | 68 | | | | | | | | $ | 0 | | | | | $ | 0 | | | | | $ | 0 | | |
| | | | | | 2022 | | | | | $ | 0 | | | | | $ | 0 | | | | | $ | 0 | | | | | | | | $ | 0 | | | | | $ | 0 | | | | | $ | 0 | | |
| | | | | | 2021 | | | | | $ | 0 | | | | | $ | 0 | | | | | $ | 0 | | | | | | | | $ | 0 | | | | | $ | 0 | | | | | $ | 0 | | |
| Small Company Value Fund – Class A | | | | | 2023 | | | | | $ | 0 | | | | | $ | 0 | | | | | $ | 0 | | | | | | | | $ | 0 | | | | | $ | 0 | | | | | $ | 0 | | |
| | | | | | 2022 | | | | | $ | 0 | | | | | $ | 0 | | | | | $ | 0 | | | | | | | | $ | 0 | | | | | $ | 0 | | | | | $ | 0 | | |
| | | | | | 2021 | | | | | $ | 11 | | | | | $ | 9 | | | | | $ | 2 | | | | | | | | $ | 0 | | | | | $ | 0 | | | | | $ | 0 | | |
| Mid Cap Growth Fund – Class A | | | | | 2023 | | | | | $ | 0 | | | | | $ | 0 | | | | | $ | 0 | | | | | | | | $ | 0 | | | | | $ | 0 | | | | | $ | 0 | | |
| | | | | | 2022 | | | | | $ | 449 | | | | | $ | 353 | | | | | $ | 96 | | | | | | | | $ | 0 | | | | | $ | 0 | | | | | $ | 0 | | |
| | | | | | 2021 | | | | | $ | 49 | | | | | $ | 41 | | | | | $ | 8 | | | | | | | | $ | 0 | | | | | $ | 0 | | | | | $ | 0 | | |
| Small Cap Growth Equity Fund – Class A | | | | | 2023 | | | | | $ | 0 | | | | | $ | 0 | | | | | $ | 0 | | | | | | | | $ | 0 | | | | | $ | 0 | | | | | $ | 0 | | |
| | | | | | 2022 | | | | | $ | 258 | | | | | $ | 204 | | | | | $ | 55 | | | | | | | | $ | 0 | | | | | $ | 0 | | | | | $ | 0 | | |
| | | | | | 2021 | | | | | $ | 1,579 | | | | | $ | 1,225 | | | | | $ | 354 | | | | | | | | $ | 0 | | | | | $ | 0 | | | | | $ | 0 | | |
A-98
Amount of Purchase | | | Front-End Sales Charge as a Percentage of Offering Price | | | Front-End Sales Charge as a Percentage of Net Amount Invested | | | Commission as a Percentage of Offering Price | | |||
Less than $25,000 | | | 4.25% | | | 4.44% | | | | | 3.50% | | |
$25,000-$49,999 | | | 4.25% | | | 4.44% | | | | | 3.50% | | |
$50,000-$99,999 | | | 4.00% | | | 4.17% | | | | | 3.25% | | |
$100,000-$249,999 | | | 3.00% | | | 3.09% | | | | | 2.25% | | |
$250,000-$499,999 | | | 1.75% | | | 1.78% | | | | | 1.50% | | |
$500,000-$999,999 | | | 1.25% | | | 1.27% | | | | | 1.00% | | |
$1,000,000-$4,999,999 1 | | | None | | | None | | | | | 1.00% | | |
$5,000,000 or more 1 | | | None | | | None | | | | | 0.50% | | |
Amount of Purchase | | | Front-End Sales Charge as a Percentage of Offering Price | | | Front-End Sales Charge as a Percentage of Net Amount Invested | | | Commission as a Percentage of Offering Price | | |||
Less than $25,000 | | | 5.50% | | | 5.82% | | | | | 4.50% | | |
$25,000-$49,999 | | | 5.25% | | | 5.54% | | | | | 4.25% | | |
$50,000-$99,999 | | | 4.50% | | | 4.71% | | | | | 3.50% | | |
$100,000-$249,999 | | | 3.50% | | | 3.63% | | | | | 2.50% | | |
$250,000-$499,999 | | | 2.25% | | | 2.30% | | | | | 1.75% | | |
$500,000-$999,999 | | | 1.75% | | | 1.78% | | | | | 1.10% | | |
$1,000,000-$4,999,999 1 | | | None | | | None | | | | | 1.00% | | |
$5,000,000 or more 1 | | | None | | | None | | | | | 0.50% | | |
A-99
| | | Class R4 12b-1 Fees | | | Class A 12b-1 Fees | | | Class R3 12b-1 Fees | | |||||||||
Total Return Bond Fund | | | | $ | 133,157 | | | | | $ | 28,213 | | | | | $ | 75,452 | | |
Strategic Bond Fund | | | | | 45,929 | | | | | | 30,726 | | | | | | 24,128 | | |
Diversified Value Fund | | | | | 24,885 | | | | | | 59,628 | | | | | | 5,868 | | |
Fundamental Value Fund | | | | | 10,545 | | | | | | 62,438 | | | | | | 6,564 | | |
S&P 500 Index Fund | | | | | 913,698 | | | | | | 46,339 | | | | | | 1,186,860 | | |
Equity Opportunities Fund | | | | | 19,363 | | | | | | 101,457 | | | | | | 29,588 | | |
Fundamental Growth Fund | | | | | 3,529 | | | | | | 19,970 | | | | | | 6,420 | | |
Blue Chip Growth Fund | | | | | 127,740 | | | | | | 211,746 | | | | | | 164,106 | | |
Growth Opportunities Fund | | | | | 1,878 | | | | | | 40,525 | | | | | | 8,422 | | |
Mid Cap Value Fund | | | | | 812 | | | | | | 3,890 | | | | | | 796 | | |
Small Cap Value Equity Fund | | | | | 3,431 | | | | | | 11,960 | | | | | | 3,316 | | |
Small Company Value Fund | | | | | 1,733 | | | | | | 26,763 | | | | | | 1,904 | | |
Mid Cap Growth Fund | | | | | 135,822 | | | | | | 229,294 | | | | | | 101,496 | | |
Small Cap Growth Equity Fund | | | | | 31,454 | | | | | | 47,490 | | | | | | 18,752 | | |
Overseas Fund | | | | | 49,092 | | | | | | 39,421 | | | | | | 25,288 | | |
A-100
| | | Class R4 12b-1 Fees | | | Class A 12b-1 Fees | | | Class R3 12b-1 Fees | | |||||||||
| | | | $ | 1,503,068 | | | | | $ | 959,860 | | | | | $ | 1,658,960 | | |
|
A-101
A-102
| | | Fiscal Year ended September 30, 2023 | | | Fiscal Year ended September 30, 2022 | | | Fiscal Year ended September 30, 2021 | | |||||||||
Total Return Bond Fund | | | | $ | 22,354 | | | | | $ | 33,155 | | | | | $ | 1,860 | | |
A-103
| | | Fiscal Year ended September 30, 2023 | | | Fiscal Year ended September 30, 2022 | | | Fiscal Year ended September 30, 2021 | | |||||||||
Strategic Bond Fund | | | | $ | 139,998 | | | | | $ | 122,651 | | | | | $ | 85,217 | | |
Diversified Value Fund | | | | $ | 76,467 | | | | | $ | 79,157 | | | | | $ | 55,552 | | |
Fundamental Value Fund | | | | $ | 141,017 | | | | | $ | 146,684 | | | | | $ | 171,582 | | |
S&P 500 Index Fund | | | | $ | 34,764 | | | | | $ | 83,998 | | | | | $ | 176,026 | | |
Equity Opportunities Fund | | | | $ | 46,642 | | | | | $ | 61,908 | | | | | $ | 57,991 | | |
Fundamental Growth Fund | | | | $ | 8,228 | | | | | $ | 17,101 | | | | | $ | 78,531 | | |
Blue Chip Growth Fund | | | | $ | 272,493 | | | | | $ | 240,994 | | | | | $ | 154,023 | | |
Growth Opportunities Fund | | | | $ | 69,360 | | | | | $ | 43,393 | | | | | $ | 66,783 | | |
Mid Cap Value Fund | | | | $ | 59,713 | | | | | $ | 59,625 | | | | | $ | 155,984 | | |
Small Cap Value Equity Fund | | | | $ | 31,687 | | | | | $ | 34,942 | | | | | $ | 178,851 | | |
Small Company Value Fund | | | | $ | 88,782 | | | | | $ | 104,551 | | | | | $ | 129,755 | | |
Mid Cap Growth Fund | | | | $ | 1,277,718 | | | | | $ | 1,431,221 | | | | | $ | 279,341 | | |
Small Cap Growth Equity Fund | | | | $ | 462,701 | | | | | $ | 437,873 | | | | | $ | 243,394 | | |
Overseas Fund | | | | $ | 75,776 | | | | | $ | 119,365 | | | | | $ | 249,233 | | |
MM Select T. Rowe Price International Equity Fund | | | | $ | 552,811 | | | | | $ | 642,373 | | | | | $ | 690,962 | | |
| | | Fiscal Year ended September 30, 2023 | | | Fiscal Year ended September 30, 2022 | | | Fiscal Year ended September 30, 2021 | | |||||||||||||||||||||
Affiliated Broker/Dealer | | | Aggregate Commissions Paid | | | Percentage Paid to Affiliates | | | Percentage of Dollar Amount of Transactions Involving Payment of Commissions to Affiliates | | | Aggregate Commissions Paid | | | Aggregate Commissions Paid | | |||||||||||||||
Jefferies LLC | | ||||||||||||||||||||||||||||||
Diversified Value Fund 1 | | | | $ | 890 | | | | | | 1.16% | | | | | | 3.40% | | | | | $ | 753 | | | | | $ | 1,029 | | |
Equity Opportunities Fund 1 | | | | $ | 1,406 | | | | | | 3.01% | | | | | | 5.01% | | | | | $ | 1,437 | | | | | $ | 1,259 | | |
Fundamental Growth Fund 1 | | | | $ | 211 | | | | | | 2.56% | | | | | | 1.52% | | | | | $ | 64 | | | | | $ | 102 | | |
Blue Chip Growth Fund 1 | | | | $ | 2,349 | | | | | | 0.86% | | | | | | 2.28% | | | | | $ | 1,070 | | | | | $ | 4,452 | | |
Mid Cap Value Fund 1 | | | | $ | — | | | | | | —% | | | | | | —% | | | | | $ | 62 | | | | | $ | 24 | | |
Mid Cap Growth Fund 1 | | | | $ | 12,790 | | | | | | 1.00% | | | | | | 3.03% | | | | | $ | 15,260 | | | | | $ | 29,978 | | |
Small Cap Growth Equity Fund 1 | | | | $ | 36 | | | | | | —% | | | | | | —% | | | | | $ | — | | | | | $ | — | | |
MM Select T. Rowe Price International Equity Fund1 | | | | $ | 24,053 | | | | | | 4.35% | | | | | | 13.65% | | | | | $ | 29,930 | | | | | $ | 21,158 | | |
A-104
| | | Dollar Value of Those Transactions | | | Amount of Commissions | | ||||||
Diversified Value Fund | | | | $ | 44,209,913 | | | | | $ | 15,322 | | |
Fundamental Value Fund | | | | $ | 222,603,687 | | | | | $ | 101,152 | | |
Equity Opportunities Fund | | | | $ | 170,180,382 | | | | | $ | 6,990 | | |
Fundamental Growth Fund | | | | $ | 28,457,882 | | | | | $ | 2,797 | | |
Blue Chip Growth Fund | | | | $ | 1,032,187,199 | | | | | $ | 118,615 | | |
Growth Opportunities Fund 1 | | | | $ | 122,050,296 | | | | | $ | 31,402 | | |
Mid Cap Value Fund | | | | $ | 179,395,059 | | | | | $ | 68,961 | | |
Small Cap Value Equity Fund | | | | $ | 34,550,474 | | | | | $ | 9,464 | | |
Small Company Value Fund | | | | $ | 74,973,230 | | | | | $ | 46,245 | | |
Mid Cap Growth Fund | | | | $ | 526,971,768 | | | | | $ | 93,882 | | |
Small Cap Growth Equity Fund | | | | $ | 761,758,501 | | | | | $ | 257,533 | | |
Overseas Fund | | | | $ | 39,128,735 | | | | | $ | 55,984 | | |
MM Select T. Rowe Price International Equity Fund | | | | $ | 227,840,984 | | | | | $ | 145,142 | | |
Fund | | | Regular Broker or Dealer | | | Aggregate Value of Securities Held | | |||
Total Return Bond Fund | | | Bank of America Corp. | | | | $ | 11,598,314 | | |
| | | UBS AG | | | | | 10,844,684 | | |
| | | JPMorgan Chase & Co. | | | | | 8,037,743 | | |
| | | The Goldman Sachs Group, Inc. | | | | | 7,691,708 | | |
| | | Wells Fargo & Company | | | | | 7,658,785 | | |
| | | Morgan Stanley | | | | | 5,975,904 | | |
| | | Citigroup, Inc. | | | | | 5,261,158 | | |
| | | | | | $ | 57,068,296 | | | |
Strategic Bond Fund | | | Bank of America Corp. | | | | $ | 4,283,642 | | |
| | | Wells Fargo & Company | | | | | 3,336,783 | | |
| | | Citigroup, Inc. | | | | | 2,661,615 | | |
| | | The Goldman Sachs Group, Inc. | | | | | 2,319,400 | | |
| | | JPMorgan Chase & Co. | | | | | 2,173,512 | | |
| | | UBS AG | | | | | 2,146,867 | | |
| | | Morgan Stanley | | | | | 1,132,161 | | |
| | | Barclays plc | | | | | 455,781 | | |
| | | | | | | $ | 18,509,761 | | |
Diversified Value Fund | | | JPMorgan Chase & Co. | | | | $ | 8,454,666 | | |
| | | Wells Fargo & Company | | | | | 4,380,151 | | |
| | | Morgan Stanley | | | | | 2,744,112 | | |
| | | Bank of America Corp. | | | | | 2,256,112 | | |
| | | The Goldman Sachs Group, Inc. | | | | | 2,167,919 | | |
A-105
Fund | | | Regular Broker or Dealer | | | Aggregate Value of Securities Held | | |||
| | | Citigroup, Inc. | | | | | 1,472,454 | | |
| | | State Street Corp. | | | | | 462,024 | | |
| | | T. Rowe Price Group, Inc. | | | | | 450,941 | | |
| | | | | | | $ | 22,388,379 | | |
Fundamental Value Fund | | | JPMorgan Chase & Co. | | | | $ | 10,802,105 | | |
| | | Wells Fargo & Company | | | | | 8,517,390 | | |
| | | Morgan Stanley | | | | | 3,855,477 | | |
| | | The Goldman Sachs Group, Inc. | | | | | 2,671,394 | | |
| | | | | | | $ | 25,846,366 | | |
S&P 500 Index Fund | | | JPMorgan Chase & Co. | | | | $ | 27,998,866 | | |
| | | Bank of America Corp. | | | | | 12,565,695 | | |
| | | Wells Fargo & Company | | | | | 9,920,032 | | |
| | | The Goldman Sachs Group, Inc. | | | | | 7,072,917 | | |
| | | Morgan Stanley | | | | | 6,909,119 | | |
| | | Citigroup, Inc. | | | | | 5,246,707 | | |
| | | T. Rowe Price Group, Inc. | | | | | 1,578,294 | | |
| | | State Street Corp. | | | | | 1,400,200 | | |
| | | | | | | $ | 72,691,830 | | |
Equity Opportunities Fund | | | Wells Fargo & Company | | | | $ | 7,747,056 | | |
| | | | | | $ | 7,747,056 | | | |
Blue Chip Growth Fund | | | Morgan Stanley | | | | $ | 5,928,834 | | |
| | The Goldman Sachs Group, Inc. | | | | | 3,169,368 | | | |
| | | | | | | $ | 9,098,202 | | |
Mid Cap Value Fund | | | T. Rowe Price Group, Inc. | | | | $ | 501,279 | | |
| | | | | | | $ | 501,279 | | |
Overseas Fund | | | UBS AG | | | | $ | 5,409,729 | | |
| | | | | | $ | 5,409,729 | | | |
MM Select T. Rowe Price International Equity Fund | | | UBS AG | | | | $ | 3,581,084 | | |
| | | Barclays plc | | | | | 2,005,304 | | |
| | | | | | | $ | 5,586,388 | | |
|
A-106
A-107
A-108
A-109
A-110
| FUND | | | Gross income earned by the Fund from securities lending activities | | | Fees paid to securities lending agent from a revenue split | | | Fees paid for any cash collateral management service (including fees deducted from a pooled cash collateral reinvestment vehicle) that are not included in a revenue split | | | Administrative fees not included in a revenue split | | | Indemnification fees not included in a revenue split | | | Rebate (paid to borrower) | | | Other fees not included in a revenue split, if applicable, including a description of those other fees | | | Aggregate fees/compensation paid by the Fund for securities lending activities | | | Net income from securities lending activities | | |||||||||||||||||||||||||||
| Total Return Bond Fund | | | | $ | 1,199,834 | | | | | $ | 36,656 | | | | | $ | 8,081 | | | | | $ | — | | | | | $ | — | | | | | $ | 947,378 | | | | | $ | — | | | | | $ | 992,116 | | | | | $ | 207,718 | | |
| Strategic Bond Fund | | | | $ | 162,236 | | | | | $ | 5,730 | | | | | $ | 1,126 | | | | | $ | — | | | | | $ | — | | | | | $ | 122,913 | | | | | $ | — | | | | | $ | 129,768 | | | | | $ | 32,468 | | |
| Diversified Value Fund | | | | $ | 30,534 | | | | | $ | 1,202 | | | | | $ | 175 | | | | | $ | — | | | | | $ | — | | | | | $ | 22,344 | | | | | $ | — | | | | | $ | 23,721 | | | | | $ | 6,813 | | |
| Fundamental Value Fund | | | | $ | 150,595 | | | | | $ | 4,290 | | | | | $ | 950 | | | | | $ | — | | | | | $ | — | | | | | $ | 121,043 | | | | | $ | — | | | | | $ | 126,283 | | | | | $ | 24,312 | | |
| S&P 500 Index Fund | | | | $ | 8,658 | | | | | $ | 890 | | | | | $ | 34 | | | | | $ | — | | | | | $ | — | | | | | $ | 2,687 | | | | | $ | — | | | | | $ | 3,612 | | | | | $ | 5,046 | | |
| Equity Opportunities Fund | | | | $ | 54,775 | | | | | $ | 2,057 | | | | | $ | 335 | | | | | $ | — | | | | | $ | — | | | | | $ | 40,728 | | | | | $ | — | | | | | $ | 43,120 | | | | | $ | 11,655 | | |
| Fundamental Growth Fund | | | | $ | 5,914 | | | | | $ | 129 | | | | | $ | 40 | | | | | $ | — | | | | | $ | — | | | | | $ | 5,017 | | | | | $ | — | | | | | $ | 5,185 | | | | | $ | 729 | | |
| Blue Chip Growth Fund | | | | $ | 151,659 | | | | | $ | 3,997 | | | | | $ | 981 | | | | | $ | — | | | | | $ | — | | | | | $ | 124,035 | | | | | $ | — | | | | | $ | 129,012 | | | | | $ | 22,647 | | |
| Growth Opportunities Fund | | | | $ | 37,599 | | | | | $ | 703 | | | | | $ | 257 | | | | | $ | — | | | | | $ | — | | | | | $ | 32,658 | | | | | $ | — | | | | | $ | 33,617 | | | | | $ | 3,982 | | |
| Mid Cap Value Fund | | | | $ | 13,748 | | | | | $ | 895 | | | | | $ | 64 | | | | | $ | — | | | | | $ | — | | | | | $ | 7,719 | | | | | $ | — | | | | | $ | 8,678 | | | | | $ | 5,070 | | |
| Small Cap Value Equity Fund | | | | $ | 10,442 | | | | | $ | 254 | | | | | $ | 66 | | | | | $ | — | | | | | $ | — | | | | | $ | 8,681 | | | | | $ | — | | | | | $ | 9,002 | | | | | $ | 1,440 | | |
| Small Company Value Fund | | | | $ | 66,343 | | | | | $ | 4,475 | | | | | $ | 309 | | | | | $ | — | | | | | $ | — | | | | | $ | 36,201 | | | | | $ | — | | | | | $ | 40,985 | | | | | $ | 25,358 | | |
| Mid Cap Growth Fund | | | | $ | 1,104,168 | | | | | $ | 69,253 | | | | | $ | 5,465 | | | | | $ | — | | | | | $ | — | | | | | $ | 637,019 | | | | | $ | — | | | | | $ | 711,736 | | | | | $ | 392,432 | | |
| Small Cap Growth Equity Fund | | | | $ | 447,344 | | | | | $ | 15,540 | | | | | $ | 2,717 | | | | | $ | — | | | | | $ | — | | | | | $ | 341,027 | | | | | $ | — | | | | | $ | 359,284 | | | | | $ | 88,060 | | |
| Overseas Fund | | | | $ | 223,094 | | | | | $ | 11,036 | | | | | $ | 1,252 | | | | | $ | — | | | | | $ | — | | | | | $ | 148,271 | | | | | $ | — | | | | | $ | 160,559 | | | | | $ | 62,535 | | |
| MM Select T. Rowe Price International Equity Fund | | | | $ | 812,728 | | | | | $ | 60,677 | | | | | $ | 3,510 | | | | | $ | — | | | | | $ | — | | | | | $ | 404,705 | | | | | $ | — | | | | | $ | 468,892 | | | | | $ | 343,836 | | |
A-112
A-113
A-114
A-115
A-116
A-117
A-118
A-119
A-120
A-121
A-122
A-123
A-124
A-125
A-126
A-127
A-128
A-129
MassMutual Advantage Funds, MML Series Investment Fund, and MML Series Investment Fund II
(October 25, 2023)
A-130
A-131
A-132
| | | | | A-135 | | | |
| | | | | A-135 | | | |
| | | | | A-136 | | | |
| | | | | A-137 | | | |
| | | | | A-140 | | | |
| | | | | A-143 | | | |
| | | | | A-146 | | | |
| | | | | A-147 | | | |
| | | | | A-150 | | | |
| | | | | A-153 | | | |
| | | | | A-153 | | | |
| | | | | A-153 | | | |
| | | | | A-153 | | | |
| | | | | A-153 | | | |
| | | | | A-154 | | | |
| | | | | A-154 | | | |
| | | | | A-155 | | | |
| | | | | A-155 | | | |
| | | | | A-155 | | | |
| | | | | A-155 | | | |
| | | | | A-155 | | | |
| | | | | A-156 | | | |
| | | | | A-156 | | | |
| | | | | A-156 | | | |
| | | | | A-156 | | | |
| 6.6 DOCUMENTS PREPARED BY AB THAT ARE MATERIAL TO | | ||||||
| | | | | A-156 | | | |
| | | | | A-156 | | | |
| | | | | A-156 | | | |
| | | | | A-156 | | | |
| | | | | A-157 | | |
A-134
A-135
A-136
A-137
A-138
A-139
A-140
A-141
A-142
A-143
A-144
A-145
A-146
A-147
A-148
A-149
A-150
A-151
A-152
A-153
A-154
A-155
A-156
A-157
| Shareholder Proposal | | | | | | For | | | Against | | | Case-by- Case | |
| Board and Director Proposals | | ||||||||||||
| | | | Board Diversity | �� | | | | | | | | + | |
| + | | | Establish New Board Committees and Elect Board Members with Specific Expertise | | | | | | | | | + | |
| | | | Changes in Board Structure and Amending the Articles of Incorporation | | | + | | | | | | | |
| | | | Classified Boards | | | | | | + | | | | |
| | | | Director Liability and Indemnification | | | | | | | | | + | |
| + | | | Disclose CEO Succession Plan | | | + | | | | | | | |
| | | | Election of Directors | | | + | | | | | | | |
| | | | Controlled Company Exemption | | | | | | | | | + | |
| | | | Voting for Director Nominees in a Contested Election | | | | | | | | | + | |
| + | | | Independent Lead Director | | | + | | | | | | | |
| + | | | Limit Term of Directorship | | | | | | | | | + | |
| + | | | Majority of Independent Directors | | | + | | | | | | | |
| + | | | Majority of Independent Directors on Key Committees | | | + | | | | | | | |
| + | | | Majority Votes for Directors | | | + | | | | | | | |
| + | | | Removal of Directors Without Cause | | | + | | | | | | | |
| + | | | Require Independent Board Chairman | | | | | | | | | + | |
| + | | | Require Two Candidates for Each Board Seat | | | | | | + | | | | |
| | | | Cross-Shareholding (Japan) | | | | | | + | | | | |
| Compensation Proposals | | ||||||||||||
| + | | | Elimination of Single Trigger Change-in-Control Agreements | | | + | | | | | | | |
| + | | | Pro Rata Vesting of Equity Compensation Awards-Change of Control | | | | | | | | | + | |
| + | | | Adopt Policies to Prohibit any Death Benefits to Senior Executives | | | | | | + | | | | |
| + | | | Advisory Vote to Ratify Directors’ Compensation | | | + | | | | | | | |
| + | | | Amend Executive Compensation Plan Tied to Performance (Bonus Banking) | | | | | | + | | | | |
| | | | Approve Remuneration for Directors and Auditors | | | | | | | | | + | |
| | | | Approve Remuneration Reports | | | | | | | | | + | |
| | | | Approve Retirement Bonuses for Directors (Japan and South Korea) | | | | | | | | | + | |
| | | | Approve Special Payments to Continuing Directors and Auditors (Japan) | | | | | | | | | + | |
| + | | | Disclose Executive and Director Pay | | | | | | | | | + | |
| + | | | Exclude Pension Income from Performance-Based Compensation | | | + | | | | | | | |
| | | | Executive and Employee Compensation Plans | | | | | | | | | + | |
| + | | | Limit Dividend Payments to Executives | | | | | | + | | | | |
| + | | | Limit Executive Pay | | | | | | | | | + | |
| + | | | Mandatory Holding Periods | | | | | | + | | | | |
| + | | | Performance-Based Stock Option Plans | | | | | | | | | + | |
| + | | | Prohibit Relocation Benefits to Senior Executives | | | | | | + | | | | |
| + | | | Recovery of Performance-Based Compensation | | | + | | | | | | | |
| + | | | Submit Golden Parachutes/Severance Plans to a Shareholder Vote | | | | | | + | | | | |
| + | | | Submit Golden Parachutes/Severance Plans to a Shareholder Vote prior to their being Negotiated by Management | | | | | | | | | + | |
| + | | | Submit Survivor Benefit Compensation Plans to a Shareholder Vote | | | + | | | | | | | |
A-158
| Shareholder Proposal | | | | | | For | | | Against | | | Case-by- Case | |
| Capital Changes and Anti-Take Over Proposals | | ||||||||||||
| + | | | Amend Exclusive Forum Bylaw | | | | | | + | | | | |
| | | | Amend Net Operating Loss (“NOL”) Rights Plans | | | + | | | | | | | |
| | | | Authorize Share Repurchase | | | + | | | | | | | |
| | | | Blank Check Preferred Stock | | | | | | + | | | | |
| | | | Corporate Restructurings, Merger Proposals and Spin-Offs | | | | | | | | | + | |
| | | | Elimination of Preemptive Rights | | | | | | | | | + | |
| + | | | Expensing Stock Options | | | + | | | | | | | |
| | | | Fair Price Provisions | | | | | | | | | + | |
| | | | Increase Authorized Common Stock | | | | | | | | | + | |
| | | | Issuance of Equity without Preemptive Rights | | | + | | | | | | | |
| | | | Issuance of Stock with Unequal Voting Rights | | | | | | | | | + | |
| | | | Net Long Position Requirement | | | + | | | | | | | |
| | | | Reincorporation | | | | | | | | | + | |
| + | | | Reincorporation to Another jurisdiction to Permit Majority Voting or Other Changes in Corporate Governance | | | | | | | | | + | |
| | | | Stock Splits | | | + | | | | | | | |
| + | | | Submit Company’s Shareholder Rights Plan to a Shareholder Vote | | | + | | | | | | | |
| | | | Transferrable Stock Options | | | | | | | | | + | |
| Auditor Proposals | | ||||||||||||
| | | | Appointment of Auditors | | | + | | | | | | | |
| | | | Approval of Financial Statements | | | + | | | | | | | |
| | | | Approval of Internal Statutory Auditors | | | + | | | | | | | |
| + | | | Limit Compensation Consultant Services | | | | | | + | | | | |
| | | | Limitation of Liability of External Statutory Auditors (Japan) | | | | | | | | | + | |
| + | | | Separating Auditors and Consultants | | | | | | | | | + | |
| Shareholder Access & Voting Proposals | | ||||||||||||
| + | | | A Shareholder’s Right to Call Special Meetings | | | + | | | | | | | |
| + | | | Adopt Cumulative Voting | | | | | | | | | + | |
| + | | | Adopt Cumulative Voting in Dual Shareholder Class Structures | | | + | | | | | | | |
| + | | | Early Disclosure of Voting Results | | | | | | + | | | | |
| + | | | Implement Confidential Voting | | | + | | | | | | | |
| | | | Limiting a Shareholder’s Right to Call Special Meetings | | | | | | + | | | | |
| + | | | Permit a Shareholder’s Right to Act by Written Consent | | | | | | | | | + | |
| + | | | Proxy Access for Annual Meetings | | | + | | | | | | | |
| | | | Reduce Meeting Notification from 21 Days to 14 Days (UK) | | | + | | | | | | | |
| + | | | Rotation of Locale for Annual Meeting | | | | | | + | | | | |
| + | | | Shareholder Proponent Engagement Process | | | + | | | | | | | |
| | | | Supermajority Vote Requirements | | | | | | + | | | | |
| Environmental & Social, Disclosure Proposals | | ||||||||||||
| + | | | Animal Welfare | | | | | | | | | + | |
| + | | | Climate Change | | | | | | | | | + | |
| + | | | Say on Climate | | | | | | | | + | | |
| + | | | Charitable Contributions | | | | | | | | | + | |
| + | | | Environmental Proposals | | | | | | | | | + | |
| + | | | Genetically Altered or Engineered Food and Pesticides | | | | | | | | | + | |
| + | | | Health Proposals | | | | | | | | | + | |
A-159
| Shareholder Proposal | | | | | | For | | | Against | | | Case-by- Case | |
| + | | | Pharmaceutical Pricing (US) | | | | | | | | | + | |
| + | | | Human Rights Policies and Reports | | | | | | | | | + | |
| + | | | Include Sustainability as a Performance Measure (SHP) | | | | | | | | | + | |
| + | | | Lobbying and Political Spending | | | + | | | | | | | |
| + | | | Other Business | | | | | | + | | | | |
| + | | | Reimbursement of Shareholder Expenses | | | | | | + | | | | |
| + | | | Sustainability Report | | | | | | | | | + | |
| + | | | Work Place: Diversity | | | + | | | | | | | |
| + | | | Work Place: Pay Disparity | | | | | | | | | + | |
A-160
| Name of Security | | | Date of Shareholder Meeting | |
| 1. | | | Is our proposed vote on all issues explicitly addressed by, and consistent with our stated proxy voting policy? If yes, stop here and sign below as no further review is necessary. | | | ☐ Yes ☐ No | |
| 2. | | | Is our proposed vote on consistent with our client’s recommended vote? Leave blank if not applicable; if yes, continue to question 3; if no, provide a memo reflecting the guidelines provided below. | | | ☐ Yes ☐ No | |
| 3. | | | Is our proposed vote consistent with the views of Institutional Shareholder Services? Leave blank if not applicable. | | | ☐ Yes ☐ No | |
| AB Conflicts Officer Approval (if necessary. Email approval is acceptable.): | | | Prepared by: | |
| I hereby confirm that the proxy voting decision referenced on this form is reasonable. | | | | |
| | | | Print Name: | |
| AB Conflicts Officer | | | Date: | |
| Date: | | | | |
A-161
A-162
A-163
A-164
A-165
A-166
A-167
A-168
A-169
A-170
A-171
A-172
A-173
A-174
A-175
A-176
A-177
A-178
A-179
A-180
A-181
A-182
Proxy Voting Guidelines
A-183
Proxy Voting Guidelines
A-184
Proxy Voting Guidelines
A-185
A-186
A-187
A-188
A-189
A-190
A-191
A-192
A-193
A-194
A-195
A-196
A-197
A-198
A-199
Invesco%20FSC%20Proxy%20Voting%20Record%20Reporting%20Jul’20-Jun’21.pdf.
A-200
A-201
A-202
A-203
A-204
A-205
A-206
A-207
A-208
A-209
A-210
A-211
Proxy Voting Policy
A-212
A-213
A-214
A-215
A-216
A-217
A-218
A-219
A-220
A-221
A-222
A-223
A-224
A-225
A-226
A-227
A-228
A-229
A-230
A-231
A-232
A-233
A-234
A-235
A-236
A-237
A-238
A-239
A-240
A-241
A-242
October 2023
A-243
A-244
A-245
A-246
A-247
A-248
A-249
A-250
January 2023
A-251
A-252
Most Recent Amendment: July 2023
Implementation Date: November 2006
A-253
A-254
A-255
A-256
A-257
A-258
A-259
A-260
A-261
A-262
A-263
A-264
A-266
A-267
A-268
A-269
A-270
A-271
A-272
A-273
A-274
A-275
A-276
A-277
A-278
A-279
A-280
A-281
A-282
A-283
A-284
A-285
A-286
A-287
A-288
A-289
A-290
A-291
A-292
A-293
A-294
A-295
A-296
| | | | Number of Accounts Managed* | | | Total Assets* | | | Number of Accounts Managed for which Advisory Fee is Performance- Based * | | | Total Assets* | | ||||||
| James W. MacGregor | | ||||||||||||||||||
| Registered investment companies** | | | | | 21 | | | | $6,194 million | | | | | 0 | | | | $0 | |
| Other pooled investment vehicles | | | | | 47 | | | | $1,805 million | | | | | 0 | | | | $0 | |
| Other accounts | | | | | 49 | | | | $2,932 million | | | | | 4 | | | | $436 million | |
| Erik A. Turenchalk | | ||||||||||||||||||
| Registered investment companies** | | | | | 17 | | | | $6,137 million | | | | | 0 | | | | $0 | |
| Other pooled investment vehicles | | | | | 45 | | | | $1,647 million | | | | | 0 | | | | $0 | |
| Other accounts | | | | | 45 | | | | $2,612 million | | | | | 2 | | | | $277 million | |
A-297
A-298
A-299
| | | | Number of Accounts Managed* | | | Total Assets* | | | Number of Accounts Managed for which Advisory Fee is Performance- Based* | | | Total Assets* | | ||||||
| Michael Liss | | ||||||||||||||||||
| Registered investment companies** | | | | | 17 | | | | $27,064,525,635 | | | | | 0 | | | | $0 | |
| Other pooled investment vehicles | | | | | 4 | | | | $2,403,133,954 | | | | | 0 | | | | $0 | |
| Other accounts | | | | | 12 | | | | $1,677,735,249 | | | | | 0 | | | | $0 | |
| Nathan Rawlins | | ||||||||||||||||||
| Registered investment companies** | | | | | 9 | | | | $11,418,892,850 | | | | | 0 | | | | $0 | |
| Other pooled investment vehicles | | | | | 1 | | | | $1,057,405,558 | | | | | 0 | | | | $0 | |
| Other accounts | | | | | 3 | | | | $335,861,913 | | | | | 0 | | | | $0 | |
| Kevin Toney | | ||||||||||||||||||
| Registered investment companies** | | | | | 17 | | | | $27,064,252,635 | | | | | 0 | | | | $0 | |
| Other pooled investment vehicles | | | | | 4 | | | | $2,403,133,954 | | | | | 0 | | | | $0 | |
| Other accounts | | | | | 12 | | | | $1,677,735,249 | | | | | 0 | | | | $0 | |
| Brian Woglom | | ||||||||||||||||||
| Registered investment companies** | | | | | 21 | | | | $28,419,616,439 | | | | | 0 | | | | $0 | |
| Other pooled investment vehicles | | | | | 4 | | | | $2,403,133,954 | | | | | 0 | | | | $0 | |
| Other accounts | | | | | 10 | | | | $1,674,422,332 | | | | | 0 | | | | $0 | |
A-300
| | | | Number of Accounts Managed* | | | Total Assets* | | | Number of Accounts Managed for which Advisory Fee is Performance- Based* | | | Total Assets* | | ||||||
| Ryan Cope | | ||||||||||||||||||
| Registered investment companies** | | | | | 8 | | | | $5,868,395,919 | | | | | 0 | | | | $0 | |
| Other pooled investment vehicles | | | | | 1 | | | | $707,117,273 | | | | | 0 | | | | $0 | |
| Other accounts | | | | | 6 | | | | $449,122,917 | | | | | 0 | | | | $0 | |
| Jeff John | | ||||||||||||||||||
| Registered investment companies** | | | | | 8 | | | | $5,868,395,919 | | | | | 0 | | | | $0 | |
| Other pooled investment vehicles | | | | | 1 | | | | $707,117,273 | | | | | 0 | | | | $0 | |
| Other accounts | | | | | 6 | | | | $449,122,917 | | | | | 0 | | | | $0 | |
A-301
A-302
A-303
| | | | Number of Accounts Managed 1 | | | Total Assets 1 | | | Number of Accounts Managed for which Advisory Fee is Performance- Based 1 | | | Total Assets 1 | | ||||||
| Mark Giambrone 3 | | ||||||||||||||||||
| Registered investment companies 2 | | | | | 7 | | | | $3,733.1 million | | | | | 0 | | | | $0 | |
| Other pooled investment vehicles | | | | | 1 | | | | $170.5 million | | | | | 0 | | | | $0 | |
| Other accounts | | | | | 29 | | | | $5,317.2 million | | | | | 0 | | | | $0 | |
| Brad Kinkelaar 4 | | ||||||||||||||||||
| Registered investment companies 2 | | | | | 3 | | | | $784.0 million | | | | | 1 | | | | $87.7 million | |
| Other pooled investment vehicles | | | | | 1 | | | | $151.4 million | | | | | 0 | | | | $0 | |
| Other accounts | | | | | 5 | | | | $1,652.3 million | | | | | 0 | | | | $0 | |
| Pranay Laharia | | ||||||||||||||||||
| Registered investment companies 2 | | | | | 1 | | | | $183.0 million | | | | | 0 | | | | $0 | |
| Other pooled investment vehicles | | | | | 0 | | | | $0 | | | | | 0 | | | | $0 | |
| Other accounts | | | | | 4 | | | | $324.0 million | | | | | 0 | | | | $0 | |
| Michael B. Nayfa 5 | | ||||||||||||||||||
| Registered investment companies 2 | | | | | 2 | | | | $1,470.5 million | | | | | 0 | | | | $0 | |
| Other pooled investment vehicles | | | | | 0 | | | | $0 | | | | | 0 | | | | $0 | |
| Other accounts | | | | | 4 | | | | $1,073.9 million | | | | | 0 | | | | $0 | |
| Terry L. Pelzel 6 | | ||||||||||||||||||
| Registered investment companies 2 | | | | | 2 | | | | $1,470.5 million | | | | | 0 | | | | $0 | |
| Other pooled investment vehicles | | | | | 0 | | | | $0 | | | | | 0 | | | | $0 | |
| Other accounts | | | | | 5 | | | | $1,299.8 million | | | | | 0 | | | | $0 | |
| Brian F. Quinn | | ||||||||||||||||||
| Registered investment companies 2 | | | | | 1 | | | | $183.0 million | | | | | 0 | | | | $0 | |
| Other pooled investment vehicles | | | | | 0 | | | | $0 | | | | | 0 | | | | $0 | |
| Other accounts | | | | | 4 | | | | $324.0 million | | | | | 0 | | | | $0 | |
| Lewis Ropp 7 | | ||||||||||||||||||
| Registered investment companies 2 | | | | | 1 | | | | $744.4 million | | | | | 0 | | | | $0 | |
| Other pooled investment vehicles | | | | | 1 | | | | $170.5 million | | | | | 0 | | | | $0 | |
| Other accounts | | | | | 31 | | | | $3,433.8 million | | | | | 1 | | | | $342.4 million | |
A-304
A-305
| | | | Number of Accounts Managed* | | | Total Assets* | | | Number of Accounts Managed for which Advisory Fee is Performance- Based* | | | Total Assets* | | ||||||
| Coleman Hubbard | | ||||||||||||||||||
| Registered investment companies** | | | | | 1 | | | | $291.6 million | | | | | 0 | | | | $0 | |
| Other pooled investment vehicles | | | | | 1 | | | | $38.2 million | | | | | 0 | | | | $0 | |
| Other accounts | | | | | 8 | | | | $297.3 million | | | | | 0 | | | | $0 | |
| James S. McClure | | ||||||||||||||||||
| Registered investment companies** | | | | | 1 | | | | $291.6 million | | | | | 0 | | | | $0 | |
| Other pooled investment vehicles | | | | | 1 | | | | $38.2 million | | | | | 0 | | | | $0 | |
| Other accounts | | | | | 8 | | | | $297.3 million | | | | | 0 | | | | $0 | |
| DJ Taylor | | ||||||||||||||||||
| Registered investment companies** | | | | | 1 | | | | $291.6 million | | | | | 0 | | | | $0 | |
| Other pooled investment vehicles | | | | | 1 | | | | $38.2 million | | | | | 0 | | | | $0 | |
| Other accounts | | | | | 8 | | | | $297.3 million | | | | | 0 | | | | $0 | |
A-306
| | | | Number of Accounts Managed* | | | Total Assets* | | | Number of Accounts Managed for which Advisory Fee is Performance- Based* | | | Total Assets* | | ||||||
| David T. Cohen | | | | | | | | | | | | | | | | | | | |
| Registered investment companies** | | | | | 3 | | | | $12,584,320,732 | | | | | 0 | | | | $0 | |
| Other pooled investment vehicles | | | | | 1 | | | | $1,472,962,790 | | | | | 0 | | | | $0 | |
| Other accounts | | | | | 199 | | | | $14,089,498,778 | | | | | 4 | | | | $997,972,161 | |
| Mark E. Donovan | | ||||||||||||||||||
| Registered investment companies** | | | | | 3 | | | | $12,584,320,732 | | | | | 0 | | | | $0 | |
| Other pooled investment vehicles | | | | | 1 | | | | $1,472,962,790 | | | | | 0 | | | | $0 | |
| Other accounts | | | | | 199 | | | | $14,089,498,778 | | | | | 4 | | | | $997,972,161 | |
| David J. Pyle | | ||||||||||||||||||
| Registered investment companies** | | | | | 3 | | | | $12,584,320,732 | | | | | 0 | | | | $0 | |
| Other pooled investment vehicles | | | | | 1 | | | | $1,472,962,790 | | | | | 0 | | | | $0 | |
| Other accounts | | | | | 199 | | | | $14,089,498,778 | | | | | 4 | | | | $997,972,161 | |
| Joshua White | | ||||||||||||||||||
| Registered investment companies** | | | | | 3 | | | | $12,584,320,732 | | | | | 0 | | | | $0 | |
| Other pooled investment vehicles | | | | | 1 | | | | $1,472,962,790 | | | | | 0 | | | | $0 | |
| Other accounts | | | | | 199 | | | | $14,089,498,778 | | | | | 4 | | | | $997,972,161 | |
A-307
A-308
A-309
A-310
A-311
| | | | Number of Accounts Managed* | | | Total Assets* | | | Number of Accounts Managed for which Advisory Fee is Performance- Based* | | | Total Assets* | | ||||||
| Tracy Chen | | ||||||||||||||||||
| Registered investment companies** | | | | | 16 | | | | $4,764 million | | | | | 0 | | | | $0 | |
| Other pooled investment vehicles | | | | | 48 | | | | $10,932 million | | | | | 2 | | | | $347 million | |
| Other accounts | | | | | 64 | | | | $21,441 million | | | | | 13 | | | | $7,128 million | |
| Brian Kloss | | ||||||||||||||||||
| Registered investment companies** | | | | | 16 | | | | $4,764 million | | | | | 0 | | | | $0 | |
| Other pooled investment vehicles | | | | | 48 | | | | $10,932 million | | | | | 2 | | | | $347 million | |
| Other accounts | | | | | 64 | | | | $21,441 million | | | | | 13 | | | | $7,128 million | |
| Jack McIntyre | | ||||||||||||||||||
| Registered investment companies** | | | | | 15 | | | | $4,683 million | | | | | 0 | | | | $0 | |
| Other pooled investment vehicles | | | | | 51 | | | | $11,092 million | | | | | 2 | | | | $347 million | |
| Other accounts | | | | | 65 | | | | $22,199 million | | | | | 13 | | | | $7,128 million | |
| Anujeet Sareen | | ||||||||||||||||||
| Registered investment companies** | | | | | 15 | | | | $4,683 million | | | | | 0 | | | | $0 | |
| Other pooled investment vehicles | | | | | 51 | | | | $11,092 million | | | | | 2 | | | | $347 million | |
| Other accounts | | | | | 65 | | | | $22,199 million | | | | | 13 | | | | $7,128 million | |
A-312
| | | | Number of Accounts Managed* | | | Total Assets* | | | Number of Accounts Managed for which Advisory Fee is Performance- Based* | | | Total Assets* | | ||||||
| Joseph J. Kirby | | ||||||||||||||||||
| Registered investment companies** | | | | | 6 | | | | $4,661 million | | | | | 0 | | | | $0 | |
| Other pooled investment vehicles | | | | | 3 | | | | $57 million | | | | | 0 | | | | $0 | |
| Other accounts | | | | | 6 | | | | $12 million | | | | | 0 | | | | $0 | |
| Henry F. Otto | | ||||||||||||||||||
| Registered investment companies** | | | | | 8 | | | | $5,717 million | | | | | 0 | | | | $0 | |
| Other pooled investment vehicles | | | | | 8 | | | | $234 million | | | | | 0 | | | | $0 | |
| Other accounts | | | | | 44 | | | | $1,801 million | | | | | 2 | | | | $956 million | |
| Steven M. Tonkovich | | ||||||||||||||||||
| Registered investment companies** | | | | | 8 | | | | $5,717 million | | | | | 0 | | | | $0 | |
| Other pooled investment vehicles | | | | | 8 | | | | $234 million | | | | | 0 | | | | $0 | |
| Other accounts | | | | | 44 | | | | $1,801 million | | | | | 2 | | | | $956 million | |
A-313
| | | | Number of Accounts Managed* | | | Total Assets* | | | Number of Accounts Managed for which Advisory Fee is Performance- Based* | | | Total Assets* | | ||||||
| Ravi Dabas | | ||||||||||||||||||
| Registered investment companies** | | | | | 2 | | | | $2.571 billion | | | | | 1 | | | | $1.606 billion | |
| Other pooled investment vehicles | | | | | 1 | | | | $105.0 million | | | | | 0 | | | | $0 | |
| Other accounts | | | | | 9 | | | | $125.9 million | | | | | 0 | | | | $0 | |
| Christopher J. Scarpa | | ||||||||||||||||||
| Registered investment companies** | | | | | 2 | | | | $2.571 billion | | | | | 1 | | | | $1.606 billion | |
| Other pooled investment vehicles | | | | | 1 | | | | $105.0 million | | | | | 0 | | | | $0 | |
| Other accounts | | | | | 9 | | | | $125.9 million | | | | | 0 | | | | $0 | |
A-314
| | | | Number of Accounts Managed* | | | Total Assets* | | | Number of Accounts Managed for which Advisory Fee is Performance- Based* | | | Total Assets* | | ||||||
| David G. Herro | | ||||||||||||||||||
| Registered investment companies** | | | | | 12 | | | | $26.9 billion | | | | | 0 | | | | $0 | |
| Other pooled investment vehicles | | | | | 39 | | | | $17.6 billion | | | | | 5 | | | | $994.6 million | |
| Other accounts | | | | | 24 | | | | $4.6 billion | | | | | 0 | | | | $0 | |
| Eric Liu | | ||||||||||||||||||
| Registered investment companies** | | | | | 9 | | | | $24.4 billion | | | | | 0 | | | | $0 | |
| Other pooled investment vehicles | | | | | 24 | | | | $9.5 billion | | | | | 3 | | | | $271.4 million | |
| Other accounts | | | | | 16 | | | | $2.5 billion | | | | | 0 | | | | $0 | |
| Michael L. Manelli | | ||||||||||||||||||
| Registered investment companies** | | | | | 8 | | | | $23.9 billion | | | | | 0 | | | | $0 | |
| Other pooled investment vehicles | | | | | 8 | | | | $1.9 billion | | | | | 0 | | | | $0 | |
| Other accounts | | | | | 12 | | | | $1.5 billion | | | | | 0 | | | | $0 | |
A-315
A-316
| | | | Number of Accounts Managed* | | | Total Assets* | | | Number of Accounts Managed for which Advisory Fee is Performance- Based* | | | Total Assets* | | ||||||
| Ash Shah | | ||||||||||||||||||
| Registered investment companies** | | | | | 7 | | | | $9,910.1 million | | | | | 0 | | | | $0 | |
| Other pooled investment vehicles | | | | | 1 | | | | $81.0 million | | | | | 0 | | | | $0 | |
| Other accounts | | | | | 0 | | | | $0 | | | | | 0 | | | | $0 | |
| Ronald Zibelli, Jr. | | ||||||||||||||||||
| Registered investment companies** | | | | | 10 | | | | $29,681.9 million | | | | | 0 | | | | $0 | |
| Other pooled investment vehicles | | | | | 5 | | | | $931.3 million | | | | | 0 | | | | $0 | |
| Other accounts | | | | | 0 | | | | $0 | | | | | 0 | | | | $0 | |
A-317
Sub-Adviser | | | Performance time period 1 | |
Invesco Advisers 2 | | | One-, Three- and Five-year performance against fund peer group. | |
A-318
| | | | Number of Accounts Managed* | | | Total Assets* | | | Number of Accounts Managed for which Advisory Fee is Performance- Based* | | | Total Assets* | | ||||||
| William Montana | | ||||||||||||||||||
| Registered investment companies** | | | | | 1 | | | | $191.61 million | | | | | 0 | | | | $0 | |
| Other pooled investment vehicles | | | | | 1 | | | | $4.55 million | | | | | 0 | | | | $0 | |
| Other accounts | | | | | 0 | | | | $0 | | | | | 0 | | | | $0 | |
| Brian Tolles | | ||||||||||||||||||
| Registered investment companies** | | | | | 1 | | | | $191.61 million | | | | | 0 | | | | $0 | |
| Other pooled investment vehicles | | | | | 1 | | | | $4.55 million | | | | | 0 | | | | $0 | |
| Other accounts | | | | | 4 | | | | $2.35 million | | | | | 0 | | | | $0 | |
A-319
A-320
| | | | Number of Accounts Managed* | | | Total Assets* | | | Number of Accounts Managed for which Advisory Fee is Performance- Based* | | | Total Assets* | | ||||||
| Aziz V. Hamzaogullari | | ||||||||||||||||||
| Registered investment companies** | | | | | 29 | | | | $21,742,047,318 | | | | | 0 | | | | $0 | |
| Other pooled investment vehicles | | | | | 19 | | | | $12,300,954,803 | | | | | 3 | | | | $604,658,390 | |
| Other accounts | | | | | 131 | | | | $26,342,555,018 | | | | | 1 | | | | $337,214,212 | |
A-321
A-322
| | | | Number of Accounts Managed* | | | Total Assets* | | | Number of Accounts Managed for which Advisory Fee is Performance- Based* | | | Total Assets* | | ||||||
| Filipe Benzinho | | ||||||||||||||||||
| Registered investment companies** | | | | | 6 | | | | $16.8 billion | | | | | 0 | | | | $0 | |
| Other pooled investment vehicles | | | | | 6 | | | | $6.9 billion | | | | | 0 | | | | $0 | |
| Other accounts | | | | | 29 | | | | $5.7 billion | | | | | 0 | | | | $0 | |
| Daniel Ling | | ||||||||||||||||||
| Registered investment companies** | | | | | 6 | | | | $16.8 billion | | | | | 0 | | | | $0 | |
| Other pooled investment vehicles | | | | | 6 | | | | $6.9 billion | | | | | 0 | | | | $0 | |
| Other accounts | | | | | 29 | | | | $5.7 billion | | | | | 0 | | | | $0 | |
A-323
Portfolio Manager | | | Benchmark(s) | |
Filipe Benzinho | | | MSCI EAFE Index (net div) | |
Daniel Ling | | | MSCI EAFE Index (net div) | |
A-324
| | | | Number of Accounts Managed* | | | Total Assets* | | | Number of Accounts Managed for which Advisory Fee is Performance- Based* | | | Total Assets* | | ||||||
| Jerry Cudzil | | ||||||||||||||||||
| Registered investment companies** | | | | | 29 | | | | $89,825.0 million | | | | | 0 | | | | $0 | |
| Other pooled investment vehicles | | | | | 31 | | | | $19,678.0 million | | | | | 10 | | | | $3,441.5 million | |
| Other accounts | | | | | 191 | | | | $47,550.7 million | | | | | 6 | | | | $3,012.2 million | |
| Ruben Hovhannisyan | | | | | | | | | | | | | | | | | | | |
| Registered investment companies** | | | | | 28 | | | | $89,145.4 million | | | | | 0 | | | | $0 | |
| Other pooled investment vehicles | | | | | 19 | | | | $14,484.7 million | | | | | 3 | | | | $432.1 million | |
| Other accounts | | | | | 175 | | | | $42,527.9 million | | | | | 6 | | | | $3,012.2 million | |
| Stephen M. Kane | | ||||||||||||||||||
| Registered investment companies** | | | | | 30 | | | | $89,547.4 million | | | | | 0 | | | | $0 | |
| Other pooled investment vehicles | | | | | 23 | | | | $15,581.0 million | | | | | 3 | | | | $432.1 million | |
| Other accounts | | | | | 179 | | | | $44,391.7 million | | | | | 9 | | | | $3,967.5 million | |
| Bryan T. Whalen | | ||||||||||||||||||
| Registered investment companies** | | | | | 29 | | | | $91,611.9 million | | | | | 0 | | | | $0 | |
| Other pooled investment vehicles | | | | | 32 | | | | $17,440.5 million | | | | | 6 | | | | $518.8 million | |
| Other accounts | | | | | 222 | | | | $58,734.7 million | | | | | 11 | | | | $6,479.0 million | |
A-325
A-326
A-327
| | | | Number of Accounts Managed* | | | Total Assets* | | | Number of Accounts Managed for which Advisory Fee is Performance- Based* | | | Total Assets* | | ||||||
| Brent Reeder | | ||||||||||||||||||
| Registered investment companies** | | | | | 15 | | | | $28,360,198,533 | | | | | 0 | | | | $0 | |
| Other pooled investment vehicles | | | | | 0 | | | | $0 | | | | | 0 | | | | $0 | |
| Other accounts | | | | | 0 | | | | $0 | | | | | 0 | | | | $0 | |
A-328
| | | | Number of Accounts Managed* | | | Total Assets* | | | Number of Accounts Managed for which Advisory Fee is Performance- Based* | | | Total Assets* | | ||||||
| George D. Mussalli | | ||||||||||||||||||
| Registered investment companies** | | | | | 3 | | | | $313,445,054 | | | | | 0 | | | | $0 | |
| Other pooled investment vehicles | | | | | 13 | | | | $10,136,698,948 | | | | | 0 | | | | $0 | |
| Other accounts | | | | | 55 | | | | $8,220,121,136 | | | | | 9 | | | | $3,440,354,157 | |
| Richard Tan | | ||||||||||||||||||
| Registered investment companies** | | | | | 2 | | | | $146,894,373 | | | | | 0 | | | | $0 | |
| Other pooled investment vehicles | | | | | 6 | | | | $6,159,933,358 | | | | | 0 | | | | $0 | |
| Other accounts | | | | | 35 | | | | $3,325,553,019 | | | | | 4 | | | | $862,303,504 | |
A-329
A-330
| | | | Number of Accounts Managed* | | | Total Assets* | | | Number of Accounts Managed for which Advisory Fee is Performance- Based* | | | Total Assets* | | ||||||
| Wesley A. Johnston | | | | | | | | | | | | | | | | | | | |
| Registered investment companies** | | | | | 2 | | | | $2,369.4 million | | | | | 0 | | | | $0 | |
| Other pooled investment vehicles | | | | | 8 | | | | $965.7 million | | | | | 0 | | | | $0 | |
| Other accounts | | | | | 258 | | | | $8,835.8 million | | | | | 12 | | | | $525.2 million | |
| Frank M. Sands | | ||||||||||||||||||
| Registered investment companies** | | | | | 2 | | | | $2,369.4 million | | | | | 0 | | | | $0 | |
| Other pooled investment vehicles | | | | | 7 | | | | $965.2 million | | | | | 0 | | | | $0 | |
| Other accounts | | | | | 247 | | | | $8,741.4 million | | | | | 4 | | | | $454.9 million | |
| Thomas H. Trentman | | ||||||||||||||||||
| Registered investment companies** | | | | | 2 | | | | $2,369.4 million | | | | | 0 | | | | $0 | |
| Other pooled investment vehicles | | | | | 10 | | | | $977.6 million | | | | | 0 | | | | $0 | |
| Other accounts | | | | | 264 | | | | $9,836.2 million | | | | | 13 | | | | $629.0 million | |
A-331
A-332
| | | | Number of Accounts Managed* | | | Total Assets* | | | Number of Accounts Managed for which Advisory Fee is Performance- Based* | | | Total Assets* | | ||||||
| R. Michael Creager | | ||||||||||||||||||
| Registered investment companies** | | | | | 4 | | | | $2,143.9 million | | | | | 0 | | | | $0 | |
| Other pooled investment vehicles | | | | | 1 | | | | $134.2 million | | | | | 0 | | | | $0 | |
| Other accounts | | | | | 19 | | | | $1,398.7 million | | | | | 0 | | | | $0 | |
| Brett P. Hawkins | | ||||||||||||||||||
| Registered investment companies** | | | | | 5 | | | | $2,179.0 million | | | | | 0 | | | | $0 | |
| Other pooled investment vehicles | | | | | 3 | | | | $234.2 million | | | | | 0 | | | | $0 | |
| Other accounts | | | | | 30 | | | | $2,314.7 million | | | | | 0 | | | | $0 | |
A-333
A-334
A-335
A-336
T. Rowe Price Hong Kong Limited
T. Rowe Price International Ltd
T. Rowe Price Investment Management, Inc.
| | | | Number of Accounts Managed* | | | Total Assets* | | | Number of Accounts Managed for which Advisory Fee is Performance- Based* | | | Total Assets* | | ||||||
| John D. Linehan | | | | | | | | | | | | | | | | | | | |
| Registered investment companies** | | | | | 17 | | | | $33,508,232,164 | | | | | 0 | | | | $0 | |
| Other pooled investment vehicles | | | | | 33 | | | | $20,407,973,878 | | | | | 0 | | | | $0 | |
| Other accounts | | | | | 13 | | | | $2,258,363,445 | | | | | 0 | | | | $0 | |
| | | | Number of Accounts Managed* | | | Total Assets* | | | Number of Accounts Managed for which Advisory Fee is Performance- Based* | | | Total Assets* | | ||||||
| John D. Linehan | | | | | | | | | | | | | | | | | | | |
| Registered investment companies** | | | | | 17 | | | | $33,427,838,186 | | | | | 0 | | | | $0 | |
| Other pooled investment vehicles | | | | | 33 | | | | $20,407,973,878 | | | | | 0 | | | | $0 | |
| Other accounts | | | | | 13 | | | | $2,258,363,445 | | | | | 0 | | | | $0 | |
A-337
| | | | Number of Accounts Managed* | | | Total Assets* | | | Number of Accounts Managed for which Advisory Fee is Performance- Based* | | | Total Assets* | | ||||||
| Paul D. Greene II | | | | | | | | | | | | | | | | | | | |
| Registered investment companies** | | | | | 8 | | | | $62,021,313,150 | | | | | 0 | | | | $0 | |
| Other pooled investment vehicles | | | | | 26 | | | | $25,879,804,784 | | | | | 0 | | | | $0 | |
| Other accounts | | | | | 5 | | | | $1,691,822,103 | | | | | 0 | | | | $0 | |
| | | | Number of Accounts Managed* | | | Total Assets* | | | Number of Accounts Managed for which Advisory Fee is Performance- Based* | | | Total Assets* | | ||||||
| Brian W. H. Berghuis | | | | | | | | | | | | | | | | | | | |
| Registered investment companies** | | | | | 8 | | | | $41,961,724,885 | | | | | 0 | | | | $0 | |
| Other pooled investment vehicles | | | | | 6 | | | | $10,634,064,670 | | | | | 0 | | | | $0 | |
| Other accounts | | | | | 3 | | | | $397,885,615 | | | | | 0 | | | | $0 | |
A-338
| | | | Number of Accounts Managed* | | | Total Assets* | | | Number of Accounts Managed for which Advisory Fee is Performance- Based* | | | Total Assets* | | ||||||
| Richard N. Clattenburg | | | | | | | | | | | | | | | | | | | |
| Registered investment companies** | | | | | 3 | | | | $14,002,029,326 | | | | | 0 | | | | $0 | |
| Other pooled investment vehicles | | | | | 3 | | | | $10,441,274,830 | | | | | 0 | | | | $0 | |
| Other accounts | | | | | 0 | | | | $0 | | | | | 0 | | | | $0 | |
| Colin McQueen | | | | | | | | | | | | | | | | | | ||
| Registered investment companies** | | | | | 2 | | | | $10,227,599,008 | | | | | 0 | | | | $0 | |
| Other pooled investment vehicles | | | | | 1 | | | | $10,411,566,088 | | | | | 0 | | | | $0 | |
| Other accounts | | | | | 0 | | | | $0 | | | | | 0 | | | | $0 | |
| Raymond A. Mills | | ||||||||||||||||||
| Registered investment companies** | | | | | 3 | | | | $22,934,281,017 | | | | | 0 | | | | $0 | |
| Other pooled investment vehicles | | | | | 2 | | | | $12,506,479,053 | | | | | 1 | | | | $170,099,005 | |
| Other accounts | | | | | 4 | | | | $1,370,231,354 | | | | | 1 | | | | $480,277,328 | |
| Eric Moffett | | ||||||||||||||||||
| Registered investment companies** | | | | | 4 | | | | $6,659,551,416 | | | | | 0 | | | | $0 | |
| Other pooled investment vehicles | | | | | 8 | | | | $7,342,488,118 | | | | | 0 | | | | $0 | |
| Other accounts | | | | | 2 | | | | $226,394,794 | | | | | 0 | | | | $0 | |
| Ernest C. Yeung | | ||||||||||||||||||
| Registered investment companies** | | | | | 2 | | | | $4,322,414,595 | | | | | 0 | | | | $0 | |
| Other pooled investment vehicles | | | | | 5 | | | | $5,148,097,883 | | | | | 0 | | | | $0 | |
| Other accounts | | | | | 0 | | | | $0 | | | | | 0 | | | | $0 | |
A-339
A-340
A-341
| | | | Number of Accounts Managed* | | | Total Assets* | | | Number of Accounts Managed for which Advisory Fee is Performance- Based* | | | Total Assets* | | ||||||
| Donald J. Kilbride | | | | | | | | | | | | | | | | | | | |
| Registered investment companies** | | | | | 10 | | | | $60,117,151,941 | | | | | 2 | | | | $49,762,777,880 | |
| Other pooled investment vehicles | | | | | 9 | | | | $1,969,069,169 | | | | | 3 | | | | $1,837,231,379 | |
| Other accounts | | | | | 19 | | | | $2,848,723,130 | | | | | 3 | | | | $637,689,612 | |
| | | | Number of Accounts Managed* | | | Total Assets* | | | Number of Accounts Managed for which Advisory Fee is Performance- Based* | | | Total Assets* | | ||||||
| Timothy N. Manning | | | | | | | | | | | | | | | | | | | |
| Registered investment companies** | | | | | 5 | | | | $2,872,828,340 | | | | | 1 | | | | $1,076,719,339 | |
| Other pooled investment vehicles | | | | | 4 | | | | $2,421,675,946 | | | | | 0 | | | | $0 | |
| Other accounts | | | | | 4 | | | | $1,552,874,420 | | | | | 0 | | | | $0 | |
A-342
| | | | Number of Accounts Managed* | | | Total Assets* | | | Number of Accounts Managed for which Advisory Fee is Performance- Based* | | | Total Assets* | | ||||||
| Edmond C. Griffin | | ||||||||||||||||||
| Registered investment companies** | | | | | 3 | | | | $938,332,169 | | | | | 0 | | | | $0 | |
| Other pooled investment vehicles | | | | | 5 | | | | $716,562,205 | | | | | 1 | | | | $128,850,012 | |
| Other accounts | | | | | 15 | | | | $1,270,295,841 | | | | | 0 | | | | $0 | |
| Shaun F. Pedersen | | ||||||||||||||||||
| Registered investment companies** | | | | | 3 | | | | $938,332,169 | | | | | 0 | | | | $0 | |
| Other pooled investment vehicles | | | | | 5 | | | | $716,562,205 | | | | | 1 | | | | $128,850,012 | |
| Other accounts | | | | | 15 | | | | $1,270,295,841 | | | | | 0 | | | | $0 | |
| Danielle S. Williams | | ||||||||||||||||||
| Registered investment companies** | | | | | 3 | | | | $938,332,169 | | | | | 0 | | | | $0 | |
| Other pooled investment vehicles | | | | | 5 | | | | $716,562,205 | | | | | 1 | | | | $128,850,012 | |
| Other accounts | | | | | 15 | | | | $1,270,295,841 | | | | | 0 | | | | $0 | |
| | | | Number of Accounts Managed* | | | Total Assets* | | | Number of Accounts Managed for which Advisory Fee is Performance- Based* | | | Total Assets* | | ||||||
| Daniel J. Fitzpatrick | | | | | | | | | | | | | | | | | | | |
| Registered investment companies** | | | | | 2 | | | | $7,694,655,758 | | | | | 1 | | | | $7,626,059,113 | |
| Other pooled investment vehicles | | | | | 5 | | | | $824,698,145 | | | | | 1 | | | | $44,962,157 | |
| Other accounts | | | | | 7 | | | | $2,279,426,143 | | | | | 0 | | | | $0 | |
| Ranjit Ramachandran | | ||||||||||||||||||
| Registered investment companies** | | | | | 6 | | | | $1,408,035,884 | | | | | 0 | | | | $0 | |
| Other pooled investment vehicles | | | | | 6 | | | | $542,596,352 | | | | | 0 | | | | $0 | |
| Other accounts | | | | | 5 | | | | $317,075,976 | | | | | 0 | | | | $0 | |
A-343
A-344
Fund | | | Benchmark and/or Peer Group | |
Equity Opportunities Fund | | | Russell 1000 Index | |
Fundamental Growth Fund | | | Russell Midcap Growth Index | |
Small Cap Value Equity Fund | | | Russell 2500 Value Index | |
Small Cap Growth Equity Fund (portfolio managed by Mr. Fitzpatrick) | | | Russell 2000 Index | |
Small Cap Growth Equity Fund (portfolio managed by Mr. Ramachandran) | | | Russell 2000 Growth Index | |
A-345
| | | | Number of Accounts Managed* | | | Total Assets* | | | Number of Accounts Managed for which Advisory Fee is Performance- Based* | | | Total Assets* | | ||||||
| John L. Bellows | | ||||||||||||||||||
| Registered investment companies** | | | | | 23 | | | | $46,497,156,454 | | | | | 0 | | | | $0 | |
| Other pooled investment vehicles | | | | | 23 | | | | $11,505,361,434 | | | | | 0 | | | | $0 | |
| Other accounts | | | | | 179 | | | | $52,287,703,089 | | | | | 4 | | | | $2,194,198,144 | |
| S. Kenneth Leech | | ||||||||||||||||||
| Registered investment companies** | | | | | 97 | | | | $124,795,939,330 | | | | | 0 | | | | $0 | |
| Other pooled investment vehicles | | | | | 310 | | | | $66,076,853,306 | | | | | 24 | | | | $2,611,589,209 | |
| Other accounts | | | | | 642 | | | | $178,267,457,299 | | | | | 22 | | | | $12,421,588,733 | |
| Mark S. Lindbloom | | ||||||||||||||||||
| Registered investment companies** | | | | | 28 | | | | $51,672,259,965 | | | | | 0 | | | | $0 | |
| Other pooled investment vehicles | | | | | 30 | | | | $13,287,612,532 | | | | | 0 | | | | $0 | |
| Other accounts | | | | | 199 | | | | $57,527,804,652 | | | | | 6 | | | | $4,615,265,694 | |
| Frederick R. Marki | | ||||||||||||||||||
| Registered investment companies** | | | | | 27 | | | | $49,062,800,737 | | | | | 0 | | | | $0 | |
| Other pooled investment vehicles | | | | | 25 | | | | $12,476,212,509 | | | | | 0 | | | | $0 | |
| Other accounts | | | | | 187 | | | | $55,499,463,329 | | | | | 6 | | | | $4,615,265,694 | |
| Julien A. Scholnick | | ||||||||||||||||||
| Registered investment companies** | | | | | 26 | | | | $50,973,418,060 | | | | | 0 | | | | $0 | |
| Other pooled investment vehicles | | | | | 22 | | | | $11,451,812,590 | | | | | 0 | | | | $0 | |
| Other accounts | | | | | 175 | | | | $51,274,973,355 | | | | | 4 | | | | $2,194,198,144 | |
A-346
A-347
A-348
| | | | Number of Accounts Managed* | | | Total Assets* | | | Number of Accounts Managed for which Advisory Fee is Performance- Based* | | | Total Assets* | | ||||||
| Richard D. Lee | | ||||||||||||||||||
| Registered investment companies** | | | | | 8 | | | | $3,265,939,153 | | | | | 0 | | | | $0 | |
| Other pooled investment vehicles | | | | | 6 | | | | $1,838,882,199 | | | | | 0 | | | | $0 | |
| Other accounts | | | | | 218 | | | | $8,619,301,938 | | | | | 22 | | | | $1,811,715,296 | |
| Ethan J. Meyers | | ||||||||||||||||||
| Registered investment companies** | | | | | 8 | | | | $3,265,939,153 | | | | | 0 | | | | $0 | |
| Other pooled investment vehicles | | | | | 6 | | | | $1,838,882,199 | | | | | 0 | | | | $0 | |
| Other accounts | | | | | 218 | | | | $8,619,301,938 | | | | | 22 | | | | $1,811,715,296 | |
| William D. Muggia | | ||||||||||||||||||
| Registered investment companies** | | | | | 10 | | | | $3,476,435,186 | | | | | 0 | | | | $0 | |
| Other pooled investment vehicles | | | | | 9 | | | | $1,890,664,707 | | | | | 1 | | | | $30,043,066 | |
| Other accounts | | | | | 264 | | | | $9,641,342,203 | | | | | 25 | | | | $2,351,860,431 | |
A-349
A-350
A-351
Back to Table of Contents |
APPENDIX B
STATEMENT OF ADDITIONAL INFORMATION OF MASSMUTUAL PREMIER FUNDS
MASSMUTUAL FUNDS
MassMutual U.S. Government Money Market Fund
MassMutual Inflation-Protected and Income Fund
MassMutual Core Bond Fund
MassMutual Diversified Bond Fund
MassMutual Balanced Fund
MassMutual Disciplined Value Fund
MassMutual Main Street Fund
MassMutual Disciplined Growth Fund
MassMutual Small Cap Opportunities Fund
MassMutual Global Fund
MassMutual International Equity Fund
MassMutual Strategic Emerging Markets Fund
Supplement dated July 1, 2024 to the
Statement of Additional Information dated February 1, 2024
This supplement provides new and additional information beyond that contained in the Statement of Additional Information (“SAI”) and any previous supplements. It should be retained and read in conjunction with the SAI and any previous supplements.
Effective immediately, the following information replaces similar information found on page B-53 under the heading Interested Trustees in the section titled Management of the Trust:
Paul LaPiana2 | Trustee of the Trust | |
1295 State Street Springfield, MA 01111-0001 Year of birth: 1969 Trustee of the Trust since 2023 Trustee 108 portfolios in fund complex |
Director (since 2023), President (2021-2023; since 2023), MML Advisers; Head of Brand, Product, and Affiliated Distribution (since 2023), Head of MassMutual U.S. Product (2019-2023), Head of Field Management (2016-2019), MassMutual; Trustee (since 2023), President (2021-2024), MassMutual Select Funds (open-end investment company); Trustee (since 2023), President (2021-2024), MassMutual Premier Funds (open-end investment company); Trustee (since 2023), President (2021-2024, MassMutual Advantage Funds (open-end investment company); Trustee (since 2023), President (2021-2024), MML Series Investment Fund (open-end investment company); Trustee (since 2023), President (2021-2024), MML Series Investment Fund II (open-end investment company).
Effective immediately, the following information replaces similar information found on pages B-54 and B-55 under the heading Principal Officers in the section titled Management of the Trust:
Douglas Steele | President of the Trust | |
1295 State Street Springfield, MA 01111-0001 Year of birth: 1975 Officer of the Trust since 2016 Officer of 108 portfolios in fund complex |
Head of MassMutual Investments (since 2024), Vice President (since 2017), Interim Head of MassMutual Investments (2023-2024), Head of Product Management (2021-2024), Head of Manager Research (2021), Head of Investment Management (2017-2021), MML Advisers; Head of MassMutual Investments (since 2024), Interim Head of MassMutual Investments (2023-2024), Head of Product Management (2021-2024), Head of Manager Research (2021), Head of Investment Management (2017-2021), MassMutual; President (since 2024), Vice President (2016-2024), MassMutual Select Funds (open-end investment company); President (since 2024),Vice President (2016-2024), MassMutual Premier Funds (open-end investment company); President (since 2024), Vice President (2021-2024), MassMutual Advantage Funds (open-end investment company); President (since 2024),Vice President (2016-2024), MML Series Investment Fund (open-end
investment company); President (since 2024),Vice President (2016-2024), MML Series Investment Fund II (open-end investment company).
Effective immediately, the following information supplements the information beginning on page B-54 under the heading Principal Officers in the section titled Management of the Trust:
Oludare Adedokun | Vice President of the Trust | |
1295 State Street Springfield, MA 01111-0001 Year of birth: 1986 Officer of the Trust since 2024 Officer of 108 portfolios in fund complex |
Head of Manager Research (since 2022), MassMutual; Head of Manager Research (since 2022), MML Advisers; Manager Research Senior Research Analyst (2018-2022), Franklin Templeton; Vice President (since 2024), MassMutual Select Funds (open-end investment company); Vice President (since 2024), MassMutual Premier Funds (open-end investment company); Vice President (since 2024), MassMutual Advantage Funds (open-end investment company); Vice President (since 2024), MML Series Investment Fund (open-end investment company); Vice President (since 2024), MML Series Investment Fund II (open-end investment company).
Meredith Ulrich | Vice President of the Trust | |
1295 State Street Springfield, MA 01111-0001 Year of birth: 1986 Officer of the Trust since 2021 Officer of 108 portfolios in fund complex |
Product Manager (since 2018), MassMutual; Product Manager (since 2018), MML Advisers; Vice President (since 2024), Assistant Vice President (2021-2024), MassMutual Select Funds (open-end investment company); Vice President (since 2024), Assistant Vice President (2021-2024), MassMutual Premier Funds (open-end investment company); Vice President (since 2024), Assistant Vice President (2021-2024), MassMutual Advantage Funds (open-end investment company); Vice President (since 2024), Assistant Vice President (2021-2024), MML Series Investment Fund (open-end investment company); Vice President (since 2024), Assistant Vice President (2021-2024), MML Series Investment Fund II (open-end investment company).
PLEASE RETAIN THIS SUPPLEMENT FOR FUTURE REFERENCE
SAI B3000M-24-02
MASSMUTUAL FUNDS
MassMutual U.S. Government Money Market Fund
MassMutual Inflation-Protected and Income Fund
MassMutual Core Bond Fund
MassMutual Diversified Bond Fund
MassMutual Balanced Fund
MassMutual Disciplined Value Fund
MassMutual Main Street Fund
MassMutual Disciplined Growth Fund
MassMutual Small Cap Opportunities Fund
MassMutual Global Fund
MassMutual International Equity Fund
MassMutual Strategic Emerging Markets Fund
Supplement dated May 3, 2024 to the
Statement of Additional Information dated February 1, 2024
This supplement provides new and additional information beyond that contained in the Statement of Additional Information (“SAI”) and any previous supplements. It should be retained and read in conjunction with the SAI and any previous supplements.
The following information supplements the information found on page B-50 under the heading Fundamental Investment Restrictions of the Funds in the section titled Investment Restrictions of the Funds:
With respect to limitation (1) above, each state and each separate political subdivision, agency, authority, or instrumentality of such state, each multi-state agency or authority, and each guarantor, if any, are treated as separate issues of municipal bonds.
PLEASE RETAIN THIS SUPPLEMENT FOR FUTURE REFERENCE
SAI B3000M-24-01
SPRINGFIELD, MASSACHUSETTS 01111-0001
STATEMENT OF ADDITIONAL INFORMATION
| Fund Name | | | Class I | | | Class R5 | | | Service Class | | | Administrative Class | | | Class R4 | | | Class A | | | Class R3 | | | Class Y | | ||||||||||||||||||||||||
| MassMutual U.S. Government Money Market Fund | | | | | | | | | | | MKSXX | | | | | | | | | | | | | | | | | | | | | | | | | | | | | | | | | | | | | | |
| MassMutual Inflation- Protected and Income Fund | | | | | MIPZX | | | | | | MIPSX | | | | | | MIPYX | | | | | | MIPLX | | | | | | MIPRX | | | | | | MPSAX | | | | | | MIPNX | | | | | | MMODX | | |
| MassMutual Core Bond Fund | | | | | MCZZX | | | | | | MCBDX | | | | | | MCBYX | | | | | | MCBLX | | | | | | MCZRX | | | | | | MMCBX | | | | | | MCBNX | | | | | | MMNWX | | |
| MassMutual Diversified Bond Fund | | | | | MDBZX | | | | | | MDBSX | | | | | | MDBYX | | | | | | MDBLX | | | | | | MDBFX | | | | | | MDVAX | | | | | | MDBNX | | | | | | MMOBX | | |
| MassMutual Balanced Fund | | | | | MBBIX | | | | | | MBLDX | | | | | | MBAYX | | | | | | MMBLX | | | | | | MBBRX | | | | | | MMBDX | | | | | | MMBRX | | | | | | MMNVX | | |
| MassMutual Disciplined Value Fund | | | | | MPIVX | | | | | | MEPSX | | | | | | DENVX | | | | | | MPILX | | | | | | MPIRX | | | | | | MEPAX | | | | | | MPINX | | | | | | MMOAX | | |
| MassMutual Main Street Fund | | | | | MSZIX | | | | | | MMSSX | | | | | | MMSYX | | | | | | MMSLX | | | | | | MSSRX | | | | | | MSSAX | | | | | | MMSNX | | | | | | MMOFX | | |
| MassMutual Disciplined Growth Fund | | | | | MPDIX | | | | | | MPGSX | | | | | | DEIGX | | | | | | MPGLX | | | | | | MPDGX | | | | | | MPGAX | | | | | | MPDRX | | | | | | MMNYX | | |
| MassMutual Small Cap Opportunities Fund | | | | | MSOOX | | | | | | MSCDX | | | | | | MSVYX | | | | | | MSCLX | | | | | | MOORX | | | | | | DLBMX | | | | | | MCCRX | | | | | | MMOGX | | |
| MassMutual Global Fund | | | | | MGFZX | | | | | | MGFSX | | | | | | MGFYX | | | | | | MGFLX | | | | | | MGFRX | | | | | | MGFAX | | | | | | MGFNX | | | | | | MMOCX | | |
| MassMutual International Equity Fund | | | | | MIZIX | | | | | | MIEDX | | | | | | MYIEX | | | | | | MIELX | | | | | | MEIRX | | | | | | MMIAX | | | | | | MEERX | | | | | | MMOEX | | |
| MassMutual Strategic Emerging Markets Fund | | | | | MPZSX | | | | | | MPSMX | | | | | | MPEYX | | | | | | MPLSX | | | | | | MPRSX | | | | | | MPASX | | | | | | MPZRX | | | | | | MMOHX | | |
| | | Page | | |||
| | | | B-3 | | | |
| | | | B-3 | | | |
| | | | B-48 | | | |
| | | | B-50 | | | |
| | | | B-51 | | | |
| | | | B-60 | | | |
| | | | B-76 | | | |
| | | | B-83 | | | |
| | | | B-85 | | | |
| | | | B-86 | | | |
| | | | B-87 | | | |
| | | | B-87 | | | |
| | | | B-87 | | | |
| | | | B-87 | | | |
| | | | B-91 | | | |
| | | | B-92 | | | |
| | | | B-94 | | | |
| | | | B-95 | | | |
| | | | B-96 | | | |
| | | | B-98 | | | |
| | | | B-108 | | | |
| | | | B-109 | | | |
| | | | B-113 | | | |
| | | | B-150 | | |
B-2
B-3
B-4
B-5
B-6
B-7
B-8
B-9
B-10
B-11
Because foreign currency transactions occurring in the interbank market involve substantially larger amounts than those that may be involved in the use of foreign currency options, investors may be disadvantaged by having to deal in an odd lot market (generally consisting of transactions of less than $1 million) for the underlying foreign currencies at prices that are less favorable than for round lots.
B-12
B-13
B-14
B-15
B-16
B-17
By writing a put option, the Fund assumes the risk that it may be required to purchase the underlying security for an exercise price higher than its then current market value, resulting in a potential capital loss unless the security later appreciates in value. A Fund may terminate a put option that it has written before it expires by entering into a closing purchase transaction. Any loss from this transaction may be partially or entirely offset by the premium received on the terminated option.
B-18
B-19
B-20
Bonds issued with warrants attached to purchase equity securities have many characteristics of convertible bonds and their prices may, to some degree, reflect the performance of the underlying stock. Bonds also may be issued with warrants attached to purchase additional fixed income securities.
B-21
B-22
B-23
B-24
B-25
B-26
B-27
B-28
B-29
B-30
B-31
B-32
B-33
B-34
B-35
B-36
B-37
B-38
B-39
B-40
(SI 2019/657) and other statutory instruments. Following the implementation of these reforms, the manner of administration of benchmarks has changed and may further change in the future, with the result that relevant benchmarks may perform differently than in the past, the use of benchmarks that are not compliant with the new standards set by certain supervised entities may be restricted, and certain benchmarks may be eliminated entirely. Additionally, there could be other consequences which cannot be predicted.
B-41
B-42
B-43
B-44
B-45
B-46
B-47
B-48
B-49
B-50
| Nabil N. El‑Hage 1295 State Street Springfield, MA 01111‑0001 Year of birth: 1958 Trustee of the Trust since 2003 Trustee of 113 portfolios in fund complex | | | Trustee of the Trust | |
| Maria D. Furman 1295 State Street Springfield, MA 01111‑0001 Year of birth: 1954 Trustee of the Trust since 2004 Trustee of 113 portfolios in fund complex | | | Trustee of the Trust | |
B-51
| R. Bradford Malt 1295 State Street Springfield, MA 01111‑0001 Year of birth: 1954 Trustee of the Trust since 2022 Trustee of 113 portfolios in fund complex | | | Trustee of the Trust | |
| C. Ann Merrifield 1295 State Street Springfield, MA 01111‑0001 Year of birth: 1951 Trustee of the Trust since 2004 Trustee of 113 portfolios in fund complex | | | Trustee of the Trust | |
| Cynthia R. Plouché 1295 State Street Springfield, MA 01111‑0001 Year of birth: 1957 Trustee of the Trust since 2022 Trustee of 113 portfolios in fund complex | | | Trustee of the Trust | |
| Jason J. Price 1295 State Street Springfield, MA 01111‑0001 Year of birth: 1973 Trustee of the Trust since 2022 Trustee of 113 portfolios in fund complex | | | Trustee of the Trust | |
B-52
| Susan B. Sweeney 1295 State Street Springfield, MA 01111‑0001 Year of birth: 1952 Chairperson of the Trust since 2022 Trustee of the Trust since 2012 Trustee of 115 portfolios in fund complex1 | | | Chairperson and Trustee of the Trust | |
| Paul LaPiana2 1295 State Street Springfield, MA 01111‑0001 Year of birth: 1969 Trustee of the Trust since 2023 Officer of the Trust 2021‑2023; since 2023 Trustee and Officer of 113 portfolios in fund complex | | | Trustee and President of the Trust | |
| Clifford M. Noreen3 1295 State Street Springfield, MA 01111‑0001 Year of birth: 1957 Trustee of the Trust since 2021 Trustee of 115 portfolios in fund complex4 | | | Trustee of the Trust | |
Barings Participation Investors and Barings Corporate Investors are deemed to be a part of the Fund Complex, because they are managed by Barings LLC, an affiliate of MML Advisers.
B-53
| Andrew M. Goldberg 1295 State Street Springfield, MA 01111‑0001 Year of birth: 1966 Officer of the Trust since 2004 Officer of 113 portfolios in fund complex | | | Vice President, Secretary, and Chief Legal Officer of the Trust | |
| Renee Hitchcock 1295 State Street Springfield, MA 01111‑0001 Year of birth: 1970 Officer of the Trust since 2007 Officer of 113 portfolios in fund complex | | | Chief Financial Officer and Treasurer of the Trust | |
| Jill Nareau Robert 1295 State Street Springfield, MA 01111‑0001 Year of birth: 1972 Officer of the Trust since 2008 Officer of 113 portfolios in fund complex | | | Vice President and Assistant Secretary of the Trust | |
| Douglas Steele 1295 State Street Springfield, MA 01111‑0001 Year of birth: 1975 Officer of the Trust since 2016 Officer of 113 portfolios in fund complex | | | Vice President of the Trust | |
B-54
| Philip S. Wellman 1295 State Street Springfield, MA 01111‑0001 Year of birth: 1964 Officer of the Trust since 2007 Officer of 113 portfolios in fund complex | | | Vice President and Chief Compliance Officer of the Trust | |
B-55
B-56
B-57
B-58
Name of Trustee | | | The Dollar Range of Equity Securities Beneficially Owned in the Trust | | | Aggregate Dollar Range of Equity Securities in All Registered Investment Companies Overseen by Trustee in Family of Investment Companies | |
Independent Trustees | | | | | | | |
Nabil N. El-Hage | | | None | | | None | |
Maria D. Furman | | | None | | | None | |
R. Bradford Malt | | | None | | | None | |
C. Ann Merrifield | | | None | | | None | |
Cynthia R. Plouché | | | None | | | None | |
Jason J. Price | | | None | | | None | |
Susan B. Sweeney | | | None | | | None | |
Interested Trustees | | | | | | | |
Paul LaPiana | | | None | | | None | |
Clifford M. Noreen | | | None | | | $10,001-$50,000 | |
B-59
Name of Trustee | | | Aggregate Compensation from the Trust | | | Total Compensation from the Trust and Fund Complex Paid to Trustees | | ||||||
Allan W. Blair 1 | | | | $ | 20,342 | | | | | $ | 288,600 | | |
Nabil N. El-Hage | | | | $ | 20,892 2 | | | | | $ | 296,400 | | |
Michael R. Fanning 3 | | | | $ | 0 | | | | | $ | 0 | | |
Maria D. Furman | | | | $ | 19,059 | | | | | $ | 270,400 | | |
Paul LaPiana 4 | | | | $ | 0 | | | | | $ | 0 | | |
R. Bradford Malt | | | | $ | 19,059 | | | | | $ | 270,400 | | |
C. Ann Merrifield | | | | $ | 20,341 | | | | | $ | 288,600 | | |
Clifford M. Noreen | | | | $ | 0 | | | | | $ | 0 | | |
Cynthia R. Plouché | | | | $ | 19,059 | | | | | $ | 270,400 | | |
Jason J. Price | | | | $ | 19,059 | | | | | $ | 270,400 | | |
Susan B. Sweeney | | | | $ | 25,658 | | | | | $ | 490,150 | | |
Class | | | Name and Address of Owner | | | Percent of Class | | |||
Class R5 | | | Massachusetts Mutual Life Insurance Company 1295 State Street Springfield, MA 01111 | | | | | 31.81% | | |
| | | Empower Trust Company, LLC 8515 East Orchard Road Greenwood Village, CO 80111 | | | | | 28.45% | | |
B-60
Class | | | Name and Address of Owner | | | Percent of Class | | |||
| | | Reliance Trust Company P.O. Box 28004 Atlanta, GA 30358 | | | | | 21.23% | | |
| | | Principal Trust Company FBO The Buckle Inc. DC Plan 1013 Centre Road Wilmington, DE 19805 | | | | | 5.48% | | |
Class | | | Name and Address of Owner | | | Percent of Class | | |||
Class I | | | Empower Trust Company, LLC 8515 East Orchard Road Greenwood Village, CO 80111 | | | | | 26.82% | | |
| | National Financial Services LLC 499 Washington Boulevard Jersey City, NJ 07310 | | | | | 25.98% | | | |
| | | Massachusetts Mutual Life Insurance Company 1295 State Street Springfield, MA 01111 | | | | | 15.02% | | |
| | | Matrix Trust Company FBO GoalPath 2020 Conservative Enhanced Index P.O. Box 52129 Phoenix, AZ 85072 | | | | | 5.40% | | |
Class R5 | | | Massachusetts Mutual Life Insurance Company 1295 State Street Springfield, MA 01111 | | | | | 82.00% | | |
| | | National Financial Services LLC 499 Washington Boulevard Jersey City, NJ 07310 | | | | | 7.08% | | |
Service Class | | | Massachusetts Mutual Life Insurance Company 1295 State Street Springfield, MA 01111 | | | | | 64.77% | | |
| | | Empower Trust Company, LLC 8515 East Orchard Road Greenwood Village, CO 80111 | | | | | 26.98% | | |
| | | TIAA, FSB 211 North Broadway, Suite 1000 Saint Louis, MO 63102 | | | | | 5.03% | | |
Administrative Class | | | Massachusetts Mutual Life Insurance Company 1295 State Street Springfield, MA 01111 | | | | | 65.30% | | |
| | | Empower Trust Company, LLC 8515 East Orchard Road Greenwood Village, CO 80111 | | | | | 32.57% | | |
Class R4 | | | Massachusetts Mutual Life Insurance Company 1295 State Street Springfield, MA 01111 | | | | | 40.10% | | |
B-61
Class | | | Name and Address of Owner | | | Percent of Class | | |||
| | | Empower Trust Company, LLC 8515 East Orchard Road Greenwood Village, CO 80111 | | | | | 22.72% | | |
| | | Talcott Resolution Life Insurance Company 1 Griffin Road North Windsor, CT 06095 | | | | | 12.79% | | |
| | | VRSCO FBO AIG FSB FBO Compass Behavioral Health 401K 2727-A Allen Parkway, 4-D1 Houston, TX 77019 | | | | | 9.91% | | |
| | | State Street Bank FBO ADP Access Product 1 Lincoln Street Boston, MA 02111 | | | | | 8.23% | | |
Class A | | | Massachusetts Mutual Life Insurance Company 1295 State Street Springfield, MA 01111 | | | | | 45.46% | | |
| | | Empower Trust Company, LLC 8515 East Orchard Road Greenwood Village, CO 80111 | | | | | 31.08% | | |
| | | Pershing LLC P.O. Box 2052 Jersey City, NJ 07303 | | | | | 18.33% | | |
Class R3 | | | Massachusetts Mutual Life Insurance Company 1295 State Street Springfield, MA 01111 | | | | | 60.74% | | |
| | | Talcott Resolution Life Insurance Company 1 Griffin Road North Windsor, CT 06095 | | | | | 32.90% | | |
| | | State Street Bank FBO ADP Access Product 1 Lincoln Street Boston, MA 02111 | | | | | 5.63% | | |
Class Y | | | Massachusetts Mutual Life Insurance Company 1295 State Street Springfield, MA 01111 | | | | | 100.00% | | |
Class | | | Name and Address of Owner | | | Percent of Class | | |||
Class I | | | Massachusetts Mutual Life Insurance Company 1295 State Street Springfield, MA 01111 | | | | | 23.90% | | |
| | | National Financial Services LLC 499 Washington Boulevard Jersey City, NJ 07310 | | | | | 18.33% | | |
B-62
Class | | | Name and Address of Owner | | | Percent of Class | | |||
| | | Empower Trust Company, LLC 8515 East Orchard Road Greenwood Village, CO 80111 | | | | | 15.54% | | |
| | | MassMutual RetireSMART by JPMorgan 2030 Fund 1295 State Street Springfield, MA 01111 | | | | | 8.74% | | |
| | | MassMutual 20/80 Allocation Fund 1295 State Street Springfield, MA 01111 | | | | | 5.52% | | |
| | | MassMutual RetireSMART by JPMorgan 2025 Fund 1295 State Street Springfield, MA 01111 | | | | | 5.41% | | |
| | | MassMutual RetireSMART by JPMorgan 2020 Fund 1295 State Street Springfield, MA 01111 | | | | | 5.18% | | |
Class R5 | | | Massachusetts Mutual Life Insurance Company 1295 State Street Springfield, MA 01111 | | | | | 89.45% | | |
| | | Empower Trust Company, LLC 8515 East Orchard Road Greenwood Village, CO 80111 | | | | | 8.92% | | |
Service Class | | | Empower Trust Company, LLC 8515 East Orchard Road Greenwood Village, CO 80111 | | | | | 61.20% | | |
| | Massachusetts Mutual Life Insurance Company 1295 State Street Springfield, MA 01111 | | | | | 38.36% | | | |
Administrative Class | | | Massachusetts Mutual Life Insurance Company 1295 State Street Springfield, MA 01111 | | | | | 72.83% | | |
| | | Empower Trust Company, LLC 8515 East Orchard Road Greenwood Village, CO 80111 | | | | | 27.17% | | |
Class R4 | | | Massachusetts Mutual Life Insurance Company 1295 State Street Springfield, MA 01111 | | | | | 73.89% | | |
| | | Talcott Resolution Life Insurance Company 1 Griffin Road North Windsor, CT 06095 | | | | | 10.68% | | |
| | | Empower Trust Company, LLC 8515 East Orchard Road Greenwood Village, CO 80111 | | | | | 8.07% | | |
B-63
Class | | | Name and Address of Owner | | | Percent of Class | | |||
| | | Matrix Trust Company FBO Advisor Trust, Inc. Rhinebeck CSD (NY) 403(B) Plan 717 17th Street, Suite 1300 Denver, CO 80202 | | | | | 5.41% | | |
Class A | | | Massachusetts Mutual Life Insurance Company 1295 State Street Springfield, MA 01111 | | | | | 65.81% | | |
| | | Empower Trust Company, LLC 8515 East Orchard Road Greenwood Village, CO 80111 | | | | | 15.97% | | |
| | | Matrix Trust Company FBO Kayser-Roth Corporation Supplemental Retirement Plan P.O. Box 52129 Phoenix, AZ 85072 | | | | | 10.42% | | |
| | | Pershing LLC P.O. Box 2052 Jersey City, NJ 07303 | | | | | 5.87% | | |
Class R3 | | | Empower Trust Company, LLC 8515 East Orchard Road Greenwood Village, CO 80111 | | | | | 49.84% | | |
| | | Massachusetts Mutual Life Insurance Company 1295 State Street Springfield, MA 01111 | | | | | 45.82% | | |
Class Y | | | Massachusetts Mutual Life Insurance Company 1295 State Street Springfield, MA 01111 | | | | | 100.00% | | |
Class | | | Name and Address of Owner | | | Percent of Class | | |||
Class I | | | Empower Trust Company, LLC 8515 East Orchard Road Greenwood Village, CO 80111 | | | | | 63.68% | | |
| | Massachusetts Mutual Life Insurance Company 1295 State Street Springfield, MA 01111 | | | | | 29.89% | | | |
| | | The Hartford One Hartford Plaza Hartford, CT 06155 | | | | | 6.23% | | |
Class R5 | | | Empower Trust Company, LLC 8515 East Orchard Road Greenwood Village, CO 80111 | | | | | 74.78% | | |
| | | Massachusetts Mutual Life Insurance Company 1295 State Street Springfield, MA 01111 | | | | | 12.96% | | |
B-64
Class | | | Name and Address of Owner | | | Percent of Class | | |||
| | | Capinco c/o U.S. Bank N.A. 1555 North Rivercenter Drive, Suite 302 Milwaukee, WI 53212 | | | | | 10.53% | | |
Service Class | | | Massachusetts Mutual Life Insurance Company 1295 State Street Springfield, MA 01111 | | | | | 39.92% | | |
| | | John Hancock Trust Company LLC 690 Canton Street, Suite 100 Westwood, MA 02091 | | | | | 31.86% | | |
| | | Empower Trust Company, LLC 8515 East Orchard Road Greenwood Village, CO 80111 | | | | | 28.22% | | |
Administrative Class | | | Massachusetts Mutual Life Insurance Company 1295 State Street Springfield, MA 01111 | | | | | 70.23% | | |
| | | Empower Trust Company, LLC 8515 East Orchard Road Greenwood Village, CO 80111 | | | | | 29.77% | | |
Class R4 | | | Empower Trust Company, LLC 8515 East Orchard Road Greenwood Village, CO 80111 | | | | | 57.68% | | |
| | | Massachusetts Mutual Life Insurance Company 1295 State Street Springfield, MA 01111 | | | | | 22.27% | | |
| | | Talcott Resolution Life Insurance Company 1 Griffin Road North Windsor, CT 06095 | | | | | 20.06% | | |
Class A | | | Massachusetts Mutual Life Insurance Company 1295 State Street Springfield, MA 01111 | | | | | 45.49% | | |
| | | Reliance Trust Company P.O. Box 28004 Atlanta, GA 30358 | | | | | 30.39% | | |
| | | Empower Trust Company, LLC 8515 East Orchard Road Greenwood Village, CO 80111 | | | | | 19.59% | | |
Class R3 | | | Massachusetts Mutual Life Insurance Company 1295 State Street Springfield, MA 01111 | | | | | 97.83% | | |
Class Y | | | Massachusetts Mutual Life Insurance Company 1295 State Street Springfield, MA 01111 | | | | | 100.00% | | |
B-65
Class | | | Name and Address of Owner | | | Percent of Class | | |||
Class I | | | Massachusetts Mutual Life Insurance Company 1295 State Street Springfield, MA 01111 | | | | | 51.83% | | |
| | | The Hartford One Hartford Plaza Hartford, CT 06155 | | | | | 25.40% | | |
| | | Empower Trust Company, LLC 8515 East Orchard Road Greenwood Village, CO 80111 | | | | | 22.66% | | |
Class R5 | | | Massachusetts Mutual Life Insurance Company 1295 State Street Springfield, MA 01111 | | | | | 96.04% | | |
Service Class | | | Empower Trust Company, LLC 8515 East Orchard Road Greenwood Village, CO 80111 | | | | | 60.29% | | |
| | | Massachusetts Mutual Life Insurance Company 1295 State Street Springfield, MA 01111 | | | | | 38.65% | | |
Administrative Class | | | Massachusetts Mutual Life Insurance Company 1295 State Street Springfield, MA 01111 | | | | | 90.06% | | |
| | | Empower Trust Company, LLC 8515 East Orchard Road Greenwood Village, CO 80111 | | | | | 9.94% | | |
Class R4 | | | Massachusetts Mutual Life Insurance Company 1295 State Street Springfield, MA 01111 | | | | | 55.72% | | |
| | | Talcott Resolution Life Insurance Company 1 Griffin Road North Windsor, CT 06095 | | | | | 36.39% | | |
| | | Empower Trust Company, LLC 8515 East Orchard Road Greenwood Village, CO 80111 | | | | | 7.90% | | |
Class A | | | Massachusetts Mutual Life Insurance Company 1295 State Street Springfield, MA 01111 | | | | | 49.61% | | |
| | | Empower Trust Company, LLC 8515 East Orchard Road Greenwood Village, CO 80111 | | | | | 37.06% | | |
| | | Pershing LLC P.O. Box 2052 Jersey City, NJ 07303 | | | | | 7.86% | | |
Class R3 | | | Talcott Resolution Life Insurance Company 1 Griffin Road North Windsor, CT 06095 | | | | | 52.34% | | |
B-66
Class | | | Name and Address of Owner | | | Percent of Class | | |||
| | | Massachusetts Mutual Life Insurance Company 1295 State Street Springfield, MA 01111 | | | | | 40.30% | | |
| | | Empower Trust Company, LLC 8515 East Orchard Road Greenwood Village, CO 80111 | | | | | 6.98% | | |
Class Y | | | Massachusetts Mutual Life Insurance Company 1295 State Street Springfield, MA 01111 | | | | | 100.00% | | |
Class | | | Name and Address of Owner | | | Percent of Class | | |||
Class I | | | Massachusetts Mutual Life Insurance Company 1295 State Street Springfield, MA 01111 | | | | | 50.29% | | |
| | | Empower Trust Company, LLC 8515 East Orchard Road Greenwood Village, CO 80111 | | | | | 48.87% | | |
Class R5 | | | Massachusetts Mutual Life Insurance Company 1295 State Street Springfield, MA 01111 | | | | | 100.00% | | |
Service Class | | | Massachusetts Mutual Life Insurance Company 1295 State Street Springfield, MA 01111 | | | | | 97.69% | | |
Administrative Class | | | Massachusetts Mutual Life Insurance Company 1295 State Street Springfield, MA 01111 | | | | | 100.00% | | |
Class R4 | | | Massachusetts Mutual Life Insurance Company 1295 State Street Springfield, MA 01111 | | | | | 95.34% | | |
Class A | | | Massachusetts Mutual Life Insurance Company 1295 State Street Springfield, MA 01111 | | | | | 86.33% | | |
| | | Empower Trust Company, LLC 8515 East Orchard Road Greenwood Village, CO 80111 | | | | | 10.10% | | |
Class R3 | | | Massachusetts Mutual Life Insurance Company 1295 State Street Springfield, MA 01111 | | | | | 94.23% | | |
| | | Talcott Resolution Life Insurance Company 1 Griffin Road North Windsor, CT 06095 | | | | | 5.63% | | |
Class Y | | | Massachusetts Mutual Life Insurance Company 1295 State Street Springfield, MA 01111 | | | | | 100.00% | | |
B-67
Class | | | Name and Address of Owner | | | Percent of Class | | |||
Class I | | | Massachusetts Mutual Life Insurance Company 1295 State Street Springfield, MA 01111 | | | | | 71.73% | | |
| | | Empower Trust Company, LLC 8515 East Orchard Road Greenwood Village, CO 80111 | | | | | 25.58% | | |
Class R5 | | | Massachusetts Mutual Life Insurance Company 1295 State Street Springfield, MA 01111 | | | | | 96.88% | | |
Service Class | | | Massachusetts Mutual Life Insurance Company 1295 State Street Springfield, MA 01111 | | | | | 100.00% | | |
Administrative Class | | | Massachusetts Mutual Life Insurance Company 1295 State Street Springfield, MA 01111 | | | | | 90.76% | | |
| | | Empower Trust Company, LLC 8515 East Orchard Road Greenwood Village, CO 80111 | | | | | 9.24% | | |
Class R4 | | | Talcott Resolution Life Insurance Company 1 Griffin Road North Windsor, CT 06095 | | | | | 77.26% | | |
| | | Massachusetts Mutual Life Insurance Company 1295 State Street Springfield, MA 01111 | | | | | 21.57% | | |
Class A | | | Massachusetts Mutual Life Insurance Company 1295 State Street Springfield, MA 01111 | | | | | 54.58% | | |
| | | Pershing LLC P.O. Box 2052 Jersey City, NJ 07303 | | | | | 28.69% | | |
| | | Reliance Trust Company P.O. Box 28004 Atlanta, GA 30358 | | | | | 9.28% | | |
Class R3 | | | Massachusetts Mutual Life Insurance Company 1295 State Street Springfield, MA 01111 | | | | | 57.35% | | |
| | | Talcott Resolution Life Insurance Company 1 Griffin Road North Windsor, CT 06095 | | | | | 42.65% | | |
Class | | | Name and Address of Owner | | | Percent of Class | | |||
Class I | | | Empower Trust Company, LLC 8515 East Orchard Road Greenwood Village, CO 80111 | | | | | 78.02% | | |
B-68
Class | | | Name and Address of Owner | | | Percent of Class | | |||
| | | Massachusetts Mutual Life Insurance Company 1295 State Street Springfield, MA 01111 | | | | | 20.30% | | |
Class R5 | | | Massachusetts Mutual Life Insurance Company 1295 State Street Springfield, MA 01111 | | | | | 82.99% | | |
| | | Empower Trust Company, LLC 8515 East Orchard Road Greenwood Village, CO 80111 | | | | | 17.01% | | |
Service Class | | | Massachusetts Mutual Life Insurance Company 1295 State Street Springfield, MA 01111 | | | | | 59.28% | | |
| | | FIIOC FBO Stavig Industries LLC 401(K) Plan 100 Magellan Way Covington, KY 41015 | | | | | 20.63% | | |
| | | Empower Trust Company, LLC 8515 East Orchard Road Greenwood Village, CO 80111 | | | | | 18.65% | | |
Administrative Class | | | Massachusetts Mutual Life Insurance Company 1295 State Street Springfield, MA 01111 | | | | | 64.33% | | |
| | | Empower Trust Company, LLC 8515 East Orchard Road Greenwood Village, CO 80111 | | | | | 35.31% | | |
Class R4 | | | Massachusetts Mutual Life Insurance Company 1295 State Street Springfield, MA 01111 | | | | | 94.62% | | |
| | | Empower Trust Company, LLC 8515 East Orchard Road Greenwood Village, CO 80111 | | | | | 5.38% | | |
Class A | | | Massachusetts Mutual Life Insurance Company 1295 State Street Springfield, MA 01111 | | | | | 63.44% | | |
| | Empower Trust Company, LLC 8515 East Orchard Road Greenwood Village, CO 80111 | | | | | 23.59% | | | |
Class R3 | | | Massachusetts Mutual Life Insurance Company 1295 State Street Springfield, MA 01111 | | | | | 92.76% | | |
Class Y | | | Massachusetts Mutual Life Insurance Company 1295 State Street Springfield, MA 01111 | | | | | 100.00% | | |
B-69
Class | | | Name and Address of Owner | | | Percent of Class | | |||
Class I | | | National Financial Services LLC 499 Washington Boulevard Jersey City, NJ 07310 | | | | | 15.04% | | |
| | | Reliance Trust Company FBO Salem Trust EB P.O. Box 78446 Atlanta, GA 30357 | | | | | 15.00% | | |
| | | Empower Trust Company, LLC 8515 East Orchard Road Greenwood Village, CO 80111 | | | | | 14.56% | | |
| | | TIAA, FSB 211 North Broadway, Suite 1000 Saint Louis, MO 63102 | | | | | 13.35% | | |
| | | Massachusetts Mutual Life Insurance Company 1295 State Street Springfield, MA 01111 | | | | | 8.41% | | |
| | | SEI Private Trust Company One Freedom Valley Drive Oaks, PA 19456 | | | | | 7.98% | | |
| | | Mid Atlantic Trust Company 1251 Waterfront Place, Suite 525 Pittsburgh, PA 15222 | | | | | 6.61% | | |
Class R5 | | | Massachusetts Mutual Life Insurance Company 1295 State Street Springfield, MA 01111 | | | | | 57.57% | | |
| | | National Financial Services LLC 499 Washington Boulevard Jersey City, NJ 07310 | | | | | 18.55% | | |
| | | Empower Trust Company, LLC 8515 East Orchard Road Greenwood Village, CO 80111 | | | | | 8.02% | | |
| | | T. Rowe Price Retirement Plan Services, Inc. 4515 Painters Mill Road Owings Mills, MD 21117 | | | | | 6.81% | | |
Service Class | | | Massachusetts Mutual Life Insurance Company 1295 State Street Springfield, MA 01111 | | | | | 62.23% | | |
| | | John Hancock Trust Company LLC 690 Canton Street, Suite 100 Westwood, MA 02095 | | | | | 19.73% | | |
| | | National Financial Services LLC 499 Washington Boulevard Jersey City, NJ 07310 | | | | | 5.47% | | |
B-70
Class | | | Name and Address of Owner | | | Percent of Class | | |||
Administrative Class | | | Empower Trust Company, LLC 8515 East Orchard Road Greenwood Village, CO 80111 | | | | | 42.59% | | |
| | | Massachusetts Mutual Life Insurance Company 1295 State Street Springfield, MA 01111 | | | | | 34.17% | | |
| | | Talcott Resolution Life Insurance Company 1 Griffin Road North Windsor, CT 06095 | | | | | 12.21% | | |
| | | National Financial Services LLC 499 Washington Boulevard Jersey City, NJ 07310 | | | | | 10.96% | | |
Class R4 | | | Massachusetts Mutual Life Insurance Company 1295 State Street Springfield, MA 01111 | | | | | 38.86% | | |
| | Talcott Resolution Life Insurance Company 1 Griffin Road North Windsor, CT 06095 | | | | | 35.62% | | | |
| | | FIIOC FBO Scheurer Hospital Employees Retirement Plan 100 Magellan Way Covington, KY 41015 | | | | | 10.12% | | |
| | | Empower Trust Company, LLC 8515 East Orchard Road Greenwood Village, CO 80111 | | | | | 7.63% | | |
Class A | | | Massachusetts Mutual Life Insurance Company 1295 State Street Springfield, MA 01111 | | | | | 76.59% | | |
| | | Empower Trust Company, LLC 8515 East Orchard Road Greenwood Village, CO 80111 | | | | | 9.14% | | |
| | | Investors Bank & Trust Company Supplemental Pension Plan 1 Iron Street Boston, MA 02210 | | | | | 5.89% | | |
Class R3 | | | Talcott Resolution Life Insurance Company 1 Griffin Road North Windsor, CT 06095 | | | | | 46.61% | | |
| | | Massachusetts Mutual Life Insurance Company 1295 State Street Springfield, MA 01111 | | | | | 31.32% | | |
| | | Empower Trust Company, LLC 8515 East Orchard Road Greenwood Village, CO 80111 | | | | | 9.64% | | |
B-71
Class | | | Name and Address of Owner | | | Percent of Class | | |||
| | | State Street Bank FBO ADP Access Product 1 Lincoln Street Boston, MA 02111 | | | | | 9.17% | | |
Class Y | | | Massachusetts Mutual Life Insurance Company 1295 State Street Springfield, MA 01111 | | | | | 100.00% | | |
Class | | | Name and Address of Owner | | | Percent of Class | | |||
Class I | | | Massachusetts Mutual Life Insurance Company 1295 State Street Springfield, MA 01111 | | | | | 50.29% | | |
| | | Empower Trust Company, LLC 8515 East Orchard Road Greenwood Village, CO 80111 | | | | | 26.74% | | |
| | | National Financial Services LLC 499 Washington Boulevard Jersey City, NJ 07310 | | | | | 14.74% | | |
| | | Talcott Resolution Life Insurance Company 1 Griffin Road North Windsor, CT 06095 | | | | | 8.21% | | |
Class R5 | | | Massachusetts Mutual Life Insurance Company 1295 State Street Springfield, MA 01111 | | | | | 98.51% | | |
Service Class | | | Empower Trust Company, LLC 8515 East Orchard Road Greenwood Village, CO 80111 | | | | | 53.07% | | |
| | Massachusetts Mutual Life Insurance Company 1295 State Street Springfield, MA 01111 | | | | | 45.71% | | | |
Administrative Class | | | Massachusetts Mutual Life Insurance Company 1295 State Street Springfield, MA 01111 | | | | | 97.38% | | |
Class R4 | | | Talcott Resolution Life Insurance Company 1 Griffin Road North Windsor, CT 06095 | | | | | 41.30% | | |
| | | Massachusetts Mutual Life Insurance Company 1295 State Street Springfield, MA 01111 | | | | | 35.28% | | |
| | | Empower Trust Company, LLC 8515 East Orchard Road Greenwood Village, CO 80111 | | | | | 22.30% | | |
Class A | | | Massachusetts Mutual Life Insurance Company 1295 State Street Springfield, MA 01111 | | | | | 65.37% | | |
B-72
Class | | | Name and Address of Owner | | | Percent of Class | | |||
| | | Pershing LLC P.O. Box 2052 Jersey City, NJ 07303 | | | | | 25.13% | | |
| | | Empower Trust Company, LLC 8515 East Orchard Road Greenwood Village, CO 80111 | | | | | 5.47% | | |
Class R3 | | | Massachusetts Mutual Life Insurance Company 1295 State Street Springfield, MA 01111 | | | | | 53.20% | | |
| | | Talcott Resolution Life Insurance Company 1 Griffin Road North Windsor, CT 06095 | | | | | 41.60% | | |
| | | Empower Trust Company, LLC 8515 East Orchard Road Greenwood Village, CO 80111 | | | | | 5.20% | | |
Class | | | Name and Address of Owner | | | Percent of Class | | |||
Class I | | | MassMutual RetireSMART by JPMorgan 2040 Fund 1295 State Street Springfield, MA 01111 | | | | | 14.46% | | |
| | | MassMutual RetireSMART by JPMorgan 2050 Fund 1295 State Street Springfield, MA 01111 | | | | | 11.97% | | |
| | | MassMutual RetireSMART by JPMorgan 2030 Fund 1295 State Street Springfield, MA 01111 | | | | | 11.02% | | |
| | | MassMutual RetireSMART by JPMorgan 2035 Fund 1295 State Street Springfield, MA 01111 | | | | | 9.93% | | |
| | | MassMutual RetireSMART by JPMorgan 2045 Fund 1295 State Street Springfield, MA 01111 | | | | | 9.56% | | |
| | | Massachusetts Mutual Life Insurance Company 1295 State Street Springfield, MA 01111 | | | | | 6.33% | | |
| | | MassMutual RetireSMART by JPMorgan 2055 Fund 1295 State Street Springfield, MA 01111 | | | | | 5.51% | | |
| | | MassMutual 80/20 Allocation Fund 1295 State Street Springfield, MA 01111 | | | | | 5.03% | | |
Class R5 | | | Massachusetts Mutual Life Insurance Company 1295 State Street Springfield, MA 01111 | | | | | 98.05% | | |
B-73
Class | | | Name and Address of Owner | | | Percent of Class | | |||
Service Class | | | Massachusetts Mutual Life Insurance Company 1295 State Street Springfield, MA 01111 | | | | | 68.28% | | |
| | | Empower Trust Company, LLC 8515 East Orchard Road Greenwood Village, CO 80111 | | | | | 31.72% | | |
Administrative Class | | | Massachusetts Mutual Life Insurance Company 1295 State Street Springfield, MA 01111 | | | | | 84.81% | | |
| | | Empower Trust Company, LLC 8515 East Orchard Road Greenwood Village, CO 80111 | | | | | 15.19% | | |
Class R4 | | | Massachusetts Mutual Life Insurance Company 1295 State Street Springfield, MA 01111 | | | | | 84.72% | | |
| | | Empower Trust Company, LLC 8515 East Orchard Road Greenwood Village, CO 80111 | | | | | 14.65% | | |
Class A | | | Massachusetts Mutual Life Insurance Company 1295 State Street Springfield, MA 01111 | | | | | 45.03% | | |
| | | Pershing LLC P.O. Box 2052 Jersey City, NJ 07303 | | | | | 42.95% | | |
Class R3 | | | Massachusetts Mutual Life Insurance Company 1295 State Street Springfield, MA 01111 | | | | | 85.38% | | |
| | | Talcott Resolution Life Insurance Company 1 Griffin Road North Windsor, CT 06095 | | | | | 10.82% | | |
Class Y | | | Massachusetts Mutual Life Insurance Company 1295 State Street Springfield, MA 01111 | | | | | 100.00% | | |
Class | | | Name and Address of Owner | | | Percent of Class | | |||
Class I | | | National Financial Services LLC 499 Washington Boulevard Jersey City, NJ 07310 | | | | | 33.46% | | |
| | | Massachusetts Mutual Life Insurance Company 1295 State Street Springfield, MA 01111 | | | | | 26.20% | | |
| | | MassMutual RetireSMART by JPMorgan 2030 Fund 1295 State Street Springfield, MA 01111 | | | | | 8.86% | | |
B-74
Class | | | Name and Address of Owner | | | Percent of Class | | |||
Class R5 | | | Massachusetts Mutual Life Insurance Company 1295 State Street Springfield, MA 01111 | | | | | 100.00% | | |
Service Class | | | Massachusetts Mutual Life Insurance Company 1295 State Street Springfield, MA 01111 | | | | | 75.92% | | |
| | | Empower Trust Company, LLC 8515 East Orchard Road Greenwood Village, CO 80111 | | | | | 24.00% | | |
Administrative Class | | | Massachusetts Mutual Life Insurance Company 1295 State Street Springfield, MA 01111 | | | | | 50.23% | | |
| | | Talcott Resolution Life Insurance Company 1 Griffin Road North Windsor, CT 06095 | | | | | 27.05% | | |
| | | Empower Trust Company, LLC 8515 East Orchard Road Greenwood Village, CO 80111 | | | | | 22.73% | | |
Class R4 | | | Massachusetts Mutual Life Insurance Company 1295 State Street Springfield, MA 01111 | | | | | 91.61% | | |
| | | Talcott Resolution Life Insurance Company 1 Griffin Road North Windsor, CT 06095 | | | | | 6.87% | | |
Class A | | | Reliance Trust Company P.O. Box 28004 Atlanta, GA 30358 | | | | | 51.30% | | |
| | | Millennium Trust Company, LLC 2001 Spring Road, Suite 700 Oak Brook, IL 60523 | | | | | 48.70% | | |
Class R3 | | | Massachusetts Mutual Life Insurance Company 1295 State Street Springfield, MA 01111 | | | | | 99.13% | | |
B-75
B-76
Fund | | | | |
U.S. Government Money Market Fund | | | 0.35% on the first $1 billion; and 0.33% on assets over $1 billion | |
Inflation-Protected and Income Fund | | | 0.38% on the first $350 million; and 0.33% on assets over $350 million | |
B-77
Fund | | | | |
Core Bond Fund | | | 0.38% on the first $1.5 billion; 0.33% on the next $500 million; and 0.28% on assets over $2 billion | |
Diversified Bond Fund | | | 0.40% on the first $150 million; and 0.30% on assets over $150 million | |
Balanced Fund | | | 0.48% on the first $300 million; and 0.43% on assets over $300 million | |
Disciplined Value Fund | | | 0.45% on the first $400 million; and 0.40% on assets over $400 million | |
Main Street Fund | | | 0.55% on the first $300 million; and 0.50% on assets over $300 million | |
Disciplined Growth Fund | | | 0.45% on the first $400 million; and 0.40% on assets over $400 million | |
Small Cap Opportunities Fund | | | 0.58% on the first $300 million; and 0.53% on assets over $300 million | |
Global Fund | | | 0.75% on the first $400 million; and 0.70% on assets over $400 million | |
International Equity Fund | | | 0.83% on the first $500 million; 0.78% on the next $500 million; and 0.73% on assets over $1 billion | |
Strategic Emerging Markets Fund | | | 1.00% on the first $350 million; and 0.95% on assets over $350 million | |
| U.S. Government Money Market Fund | | | 0.05% | |
| Inflation-Protected and Income Fund | | | 0.08% | |
| Core Bond Fund | | | 0.10% | |
| Diversified Bond Fund | | | 0.10% | |
Barings also provides subadvisory services for the MassMutual Short-Duration Bond Fund and MassMutual High Yield Fund, each of which is a series of the Trust, for the MassMutual Global Floating Rate Fund, MassMutual Global Credit Income Opportunities Fund, MassMutual Emerging Markets Debt Blended Total Return Fund, and MassMutual Global Emerging Markets Equity Fund, each of which is a series of MassMutual Advantage Funds, a registered, open-end investment company for which MML Advisers serves as investment adviser, and for the MML High Yield Fund, MML Inflation-Protected and Income Fund, MML Managed Bond Fund, MML Short-Duration Bond Fund, and MML U.S. Government Money Market Fund, each of which is a series of MML Series Investment Fund II, a registered, open-end investment company for which MML Advisers serves as investment adviser.
B-78
B-79
| | | | Class I | | | Class R5 | | | Service Class | | | Administrative Class | | | Class R4 | | | Class A | | | Class R3 | | | Class Y | | ||||||||||||||||||||||||
| U.S. Government Money Market Fund | | | | | N/A | | | | | | 0.10% | | | | N/A | | | N/A | | | N/A | | | N/A | | | N/A | | | N/A | | ||||||||||||||||||
| Inflation-Protected and Income Fund | | | | | None | | | | | | 0.10% | | | | | | 0.20% | | | | | | 0.30% | | | | | | 0.20% | | | | | | 0.25% | | | | | | 0.20% | | | | | | 0.10% | | |
| Core Bond Fund | | | | | None | | | | | | 0.10% | | | | | | 0.20% | | | | | | 0.30% | | | | | | 0.20% | | | | | | 0.25% | | | | | | 0.20% | | | | | | 0.10% | | |
| Diversified Bond Fund | | | | | None | | | | | | 0.10% | | | | | | 0.20% | | | | | | 0.30% | | | | | | 0.20% | | | | | | 0.25% | | | | | | 0.20% | | | | | | 0.10% | | |
| Balanced Fund | | | | | None | | | | | | 0.10% | | | | | | 0.20% | | | | | | 0.30% | | | | | | 0.20% | | | | | | 0.25% | | | | | | 0.20% | | | | | | 0.10% | | |
| Disciplined Value Fund | | | | | None | | | | | | 0.10% | | | | | | 0.20% | | | | | | 0.30% | | | | | | 0.20% | | | | | | 0.25% | | | | | | 0.20% | | | | | | 0.10% | | |
| Main Street Fund | | | | | None | | | | | | 0.10% | | | | | | 0.20% | | | | | | 0.30% | | | | | | 0.20% | | | | | | 0.25% | | | | | | 0.20% | | | | | | 0.10% | | |
| Disciplined Growth Fund | | | | | None | | | | | | 0.10% | | | | | | 0.20% | | | | | | 0.30% | | | | | | 0.20% | | | | | | 0.25% | | | | | | 0.20% | | | | | | 0.10% | | |
| Small Cap Opportunities Fund | | | | | None | | | | | | 0.10% | | | | | | 0.20% | | | | | | 0.30% | | | | | | 0.20% | | | | | | 0.25% | | | | | | 0.20% | | | | | | 0.10% | | |
| Global Fund | | | | | None | | | | | | 0.10% | | | | | | 0.20% | | | | | | 0.30% | | | | | | 0.20% | | | | | | 0.25% | | | | | | 0.20% | | | | | | 0.10% | | |
| International Equity Fund | | | | | None | | | | | | 0.10% | | | | | | 0.20% | | | | | | 0.30% | | | | | | 0.20% | | | | | | 0.25% | | | | | | 0.20% | | | | | | 0.10% | | |
| Strategic Emerging Markets Fund | | | | | None | | | | | | 0.10% | | | | | | 0.20% | | | | | | 0.30% | | | | | | 0.20% | | | | | | 0.25% | | | | | | 0.20% | | | | | | 0.10% | | |
B-80
| | | Fiscal Year Ended September 30, 2023 | | |||||||||||||||||||||||||||
| | | Advisory Fees Paid | | | Subadvisory Fees Paid | | | Advisory Fees Waived | | | Administrative Fees Paid | | | Other Expenses Reimbursed | | |||||||||||||||
U.S. Government Money Market Fund | | | | $ | 681,356 | | | | | $ | 97,001 | | | | | $ | — | | | | | $ | 194,667 | | | | | $ | — | | |
Inflation-Protected and Income Fund | | | | | 1,100,110 | | | | | | 229,966 | | | | | | — | | | | | | 188,925 | | | | | | — | | |
Core Bond Fund | | | | | 2,791,091 | | | | | | 732,180 | | | | | | — | | | | | | 382,220 | | | | | | — | | |
Diversified Bond Fund | | | | | 629,767 | | | | | | 157,269 | | | | | | — | | | | | | 114,819 | | | | | | — | | |
Balanced Fund | | | | | 557,495 | | | | | | 139,336 | | | | | | — | | | | | | 130,545 | | | | | | — | | |
Disciplined Value Fund | | | | | 324,670 | | | | | | 115,421 | | | | | | — | | | | | | 73,713 | | | | | | — | | |
Main Street Fund | | | | | 396,603 | | | | | | 180,287 | | | | | | — | | | | | | 130,033 | | | | | | — | | |
Disciplined Growth Fund | | | | | 724,758 | | | | | | 257,720 | | | | | | — | | | | | | 231,030 | | | | | | — | | |
Small Cap Opportunities Fund | | | | | 1,881,887 | | | | | | 1,307,539 | | | | | | — | | | | | | 375,919 | | | | | | — | | |
Global Fund | | | | | 1,578,840 | | | | | | 786,743 | | | | | | — | | | | | | 302,299 | | | | | | — | | |
International Equity Fund 1 | | | | | 1,093,166 | | | | | | 464,876 | | | | | | (65,857) | | | | | | 85,389 | | | | | | — | | |
Strategic Emerging Markets Fund 2 | | | | | 1,167,328 | | | | | | 816,796 | | | | | | — | | | | | | 6,475 | | | | | | (266,815) | | |
| | | Fiscal Year Ended September 30, 2022 | | |||||||||||||||||||||||||||
| | | Advisory Fees Paid | | | Subadvisory Fees Paid | | | Advisory Fees Waived | | | Administrative Fees Paid | | | Other Expenses Reimbursed | | |||||||||||||||
U.S. Government Money Market Fund 1 | | | | $ | 749,721 | | | | | $ | 106,136 | | | | | $ | (579,463) | | | | | $ | 214,206 | | | | | $ | — | | |
Inflation-Protected and Income Fund | | | | | 1,306,626 | | | | | | 273,960 | | | | | | — | | | | | | 250,070 | | | | | | — | | |
Core Bond Fund | | | | | 3,605,606 | | | | | | 944,744 | | | | | | — | | | | | | 554,959 | | | | | | — | | |
Diversified Bond Fund | | | | | 743,083 | | | | | | 194,666 | | | | | | — | | | | | | 147,206 | | | | | | — | | |
Balanced Fund | | | | | 676,064 | | | | | | 168,892 | | | | | | — | | | | | | 163,789 | | | | | | — | | |
Disciplined Value Fund | | | | | 391,217 | | | | | | 137,806 | | | | | | — | | | | | | 92,006 | | | | | | — | | |
Main Street Fund | | | | | 578,977 | | | | | | 262,809 | | | | | | — | | | | | | 158,201 | | | | | | — | | |
Disciplined Growth Fund | | | | | 963,176 | | | | | | 339,059 | | | | | | — | | | | | | 327,262 | | | | | | — | | |
Small Cap Opportunities Fund | | | | | 1,923,907 | | | | | | 1,338,280 | | | | | | — | | | | | | 431,368 | | | | | | — | | |
Global Fund | | | | | 2,142,324 | | | | | | 1,044,977 | | | | | | — | | | | | | 398,854 | | | | | | — | | |
International Equity Fund 2 | | | | | 1,165,318 | | | | | | 491,959 | | | | | | (70,200) | | | | | | 96,422 | | | | | | — | | |
Strategic Emerging Markets Fund 3 | | | | | 1,409,379 | | | | | | 985,692 | | | | | | — | | | | | | 11,539 | | | | | | (288,468) | | |
B-81
| | | | Fiscal Year Ended September 30, 2021 | | |||||||||||||||||||||||||||||||||
| | | | Advisory Fees Paid | | | Subadvisory Fees Paid | | | Advisory Fees Waived | | | Administrative Fees Paid | | | Supplemental Shareholder Services Fees Paid | | | Other Expenses Reimbursed | | ||||||||||||||||||
| U.S. Government Money Market Fund1 | | | | $ | 1,094,819 | | | | | $ | 155,911 | | | | | $ | — | | | | | $ | 312,805 | | | | | $ | — | | | | | $ | (1,404,777) | | |
| Inflation-Protected and Income Fund | | | | | 1,415,825 | | | | | | 297,836 | | | | | | — | | | | | | 300,407 | | | | | | 21,150 | | | | | | — | | |
| Core Bond Fund | | | | | 4,857,081 | | | | | | 1,272,101 | | | | | | — | | | | | | 816,098 | | | | | | 60,700 | | | | | | — | | |
| Diversified Bond Fund | | | | | 831,304 | | | | | | 224,424 | | | | | | — | | | | | | 180,354 | | | | | | 12,826 | | | | | | — | | |
| Balanced Fund | | | | | 740,458 | | | | | | 193,464 | | | | | | — | | | | | | 177,778 | | | | | | 13,745 | | | | | | — | | |
| Disciplined Value Fund | | | | | 433,001 | | | | | | 154,218 | | | | | | — | | | | | | 103,021 | | | | | | 5,519 | | | | | | — | | |
| Main Street Fund | | | | | 665,817 | | | | | | 302,457 | | | | | | — | | | | | | 158,147 | | | | | | 12,793 | | | | | | — | | |
| Disciplined Growth Fund | | | | | 1,161,514 | | | | | | 415,021 | | | | | | — | | | | | | 379,870 | | | | | | 28,139 | | | | | | — | | |
| Small Cap Opportunities Fund | | | | | 1,876,820 | | | | | | 1,308,490 | | | | | | — | | | | | | 433,945 | | | | | | 28,556 | | | | | | — | | |
| Global Fund | | | | | 2,715,742 | | | | | | 1,309,024 | | | | | | — | | | | | | 482,317 | | | | | | 41,886 | | | | | | — | | |
| International Equity Fund 2 | | | | | 1,457,862 | | | | | | 608,191 | | | | | | (47,899) | | | | | | 126,065 | | | | | | 9,066 | | | | | | — | | |
| Strategic Emerging Markets Fund 3 | | | | | 1,888,082 | | | | | | 1,320,436 | | | | | | — | | | | | | 20,674 | | | | | | 1,561 | | | | | | (136,442) | | |
B-82
| | | | | | | | | | Sales Charge Revenue | | | | | | CDSC Revenue | | ||||||||||||||||||||||||||||||
| | | | Fiscal Year Ended | | | Amount Paid to Distributor | | | Amount Reallowed to Dealers | | | Amount Retained by Distributor | | | | | | Amount Paid to Distributor | | | Amount Reallowed to Dealers | | | Amount Retained by Distributor | | |||||||||||||||||||||
| Inflation-Protected and Income Fund – Class A | | | | | 2023 | | | | | $ | 0 | | | | | $ | 0 | | | | | $ | 0 | | | | | | | | $ | 0 | | | | | $ | 0 | | | | | $ | 0 | | |
| | | | | | 2022 | | | | | $ | 138 | | | | | $ | 113 | | | | | $ | 25 | | | | | | | | $ | 0 | | | | | $ | 0 | | | | | $ | 0 | | |
| | | | | | 2021 | | | | | $ | 0 | | | | | $ | 0 | | | | | $ | 0 | | | | | | | | $ | 0 | | | | | $ | 0 | | | | | $ | 0 | | |
| Core Bond Fund – Class A | | | | | 2023 | | | | | $ | 0 | | | | | $ | 0 | | | | | $ | 0 | | | | | | | | $ | 0 | | | | | $ | 0 | | | | | $ | 0 | | |
| | | | | | 2022 | | | | | $ | 0 | | | | | $ | 0 | | | | | $ | 0 | | | | | | | | $ | 0 | | | | | $ | 0 | | | | | $ | 0 | | |
| | | | | | 2021 | | | | | $ | 1,053 | | | | | $ | 875 | | | | | $ | 178 | | | | | | | | $ | 0 | | | | | $ | 0 | | | | | $ | 0 | | |
| Main Street Fund – Class A | | | | | 2023 | | | | | $ | 0 | | | | | $ | 0 | | | | | $ | 0 | | | | | | | | $ | 0 | | | | | $ | 0 | | | | | $ | 0 | | |
| | | | | | 2022 | | | | | $ | 268 | | | | | $ | 209 | | | | | $ | 59 | | | | | | | | $ | 0 | | | | | $ | 0 | | | | | $ | 0 | | |
| | | | | | 2021 | | | | | $ | 58 | | | | | $ | 47 | | | | | $ | 10 | | | | | | | | $ | 0 | | | | | $ | 0 | | | | | $ | 0 | | |
| Disciplined Growth Fund – Class A | | | | | 2023 | | | | | $ | 0 | | | | | $ | 0 | | | | | $ | 0 | | | | | | | | $ | 0 | | | | | $ | 0 | | | | | $ | 0 | | |
| | | | | | 2022 | | | | | $ | 7 | | | | | $ | 6 | | | | | $ | 1 | | | | | | | | $ | 0 | | | | | $ | 0 | | | | | $ | 0 | | |
| | | | | | 2021 | | | | | $ | 0 | | | | | $ | 0 | | | | | $ | 0 | | | | | | | | $ | 0 | | | | | $ | 0 | | | | | $ | 0 | | |
| Small Cap Opportunities Fund – Class A | | | | | 2023 | | | | | $ | 0 | | | | | $ | 0 | | | | | $ | 0 | | | | | | | | $ | 0 | | | | | $ | 0 | | | | | $ | 0 | | |
| | | | | | 2022 | | | | | $ | 122 | | | | | $ | 100 | | | | | $ | 22 | | | | | | | | $ | 0 | | | | | $ | 0 | | | | | $ | 0 | | |
| | | | | | 2021 | | | | | $ | 169 | | | | | $ | 138 | | | | | $ | 31 | | | | | | | | $ | 0 | | | | | $ | 0 | | | | | $ | 0 | | |
| Global Fund – Class A | | | | | 2023 | | | | | $ | 0 | | | | | $ | 0 | | | | | $ | 0 | | | | | | | | $ | 0 | | | | | $ | 0 | | | | | $ | 0 | | |
| | | | | | 2022 | | | | | $ | 223 | | | | | $ | 174 | | | | | $ | 49 | | | | | | | | $ | 0 | | | | | $ | 0 | | | | | $ | 0 | | |
| | | | | | 2021 | | | | | $ | 58 | | | | | $ | 47 | | | | | $ | 10 | | | | | | | | $ | 0 | | | | | $ | 0 | | | | | $ | 0 | | |
| International Equity Fund – Class A | | | | | 2023 | | | | | $ | 464 | | | | | $ | 368 | | | | | $ | 96 | | | | | | | | $ | 0 | | | | | $ | 0 | | | | | $ | 0 | | |
| | | | | | 2022 | | | | | $ | 0 | | | | | $ | 0 | | | | | $ | 0 | | | | | | | | $ | 0 | | | | | $ | 0 | | | | | $ | 0 | | |
| | | | | | 2021 | | | | | $ | 0 | | | | | $ | 0 | | | | | $ | 0 | | | | | | | | $ | 0 | | | | | $ | 0 | | | | | $ | 0 | | |
B-83
Amount of Purchase | | | Front-End Sales Charge as a Percentage of Offering Price | | | Front-End Sales Charge as a Percentage of Net Amount Invested | | | Commission as a Percentage of Offering Price | | |||
Less than $25,000 | | | 4.25% | | | 4.44% | | | | | 3.50% | | |
$25,000-$49,999 | | | 4.25% | | | 4.44% | | | | | 3.50% | | |
$50,000-$99,999 | | | 4.00% | | | 4.17% | | | | | 3.25% | | |
$100,000-$249,999 | | | 3.00% | | | 3.09% | | | | | 2.25% | | |
$250,000-$499,999 | | | 1.75% | | | 1.78% | | | | | 1.50% | | |
$500,000-$999,999 | | | 1.25% | | | 1.27% | | | | | 1.00% | | |
$1,000,000-$4,999,999 1 | | | None | | | None | | | | | 1.00% | | |
$5,000,000 or more 1 | | | None | | | None | | | | | 0.50% | | |
Amount of Purchase | | | Front-End Sales Charge as a Percentage of Offering Price | | | Front-End Sales Charge as a Percentage of Net Amount Invested | | | Commission as a Percentage of Offering Price | | |||
Less than $25,000 | | | 5.50% | | | 5.82% | | | | | 4.50% | | |
$25,000-$49,999 | | | 5.25% | | | 5.54% | | | | | 4.25% | | |
$50,000-$99,999 | | | 4.50% | | | 4.71% | | | | | 3.50% | | |
$100,000-$249,999 | | | 3.50% | | | 3.63% | | | | | 2.50% | | |
$250,000-$499,999 | | | 2.25% | | | 2.30% | | | | | 1.75% | | |
$500,000-$999,999 | | | 1.75% | | | 1.78% | | | | | 1.10% | | |
$1,000,000-$4,999,999 1 | | | None | | | None | | | | | 1.00% | | |
$5,000,000 or more 1 | | | None | | | None | | | | | 0.50% | | |
B-84
| | | Class R4 12b-1 Fees | | | Class A 12b-1 Fees | | | Class R3 12b-1 Fees | | |||||||||
Inflation-Protected and Income Fund | | | | $ | 10,582 | | | | | $ | 21,848 | | | | | $ | 10,936 | | |
Core Bond Fund | | | | | 4,916 | | | | | | 60,997 | | | | | | 868 | | |
Diversified Bond Fund | | | | | 10,136 | | | | | | 12,516 | | | | | | 6,894 | | |
Balanced Fund | | | | | 12,343 | | | | | | 33,471 | | | | | | 49,682 | | |
Disciplined Value Fund | | | | | 3,156 | | | | | | 11,044 | | | | | | 19,256 | | |
Main Street Fund | | | | | 15,417 | | | | | | 21,248 | | | | | | 3,920 | | |
Disciplined Growth Fund | | | | | 15,820 | | | | | | 32,725 | | | | | | 21,498 | | |
Small Cap Opportunities Fund | | | | | 33,381 | | | | | | 101,435 | | | | | | 39,868 | | |
Global Fund | | | | | 24,333 | | | | | | 26,029 | | | | | | 42,288 | | |
International Equity Fund | | | | | 1,566 | | | | | | 25,742 | | | | | | 11,922 | | |
B-85
| | | Class R4 12b-1 Fees | | | Class A 12b-1 Fees | | | Class R3 12b-1 Fees | | |||||||||
Strategic Emerging Markets Fund | | | | | 940 | | | | | | 396 | | | | | | 2,822 | | |
| | | | $ | 132,590 | | | | | $ | 347,451 | | | | | $ | 209,954 | | |
|
B-86
B-87
Brokerage and research services provided by brokers are used for the benefit of all of the investment adviser’s or subadviser’s clients and not solely or necessarily for the benefit of the Trust. The investment adviser or subadvisers attempt to evaluate the quality of brokerage and research services provided by brokers. Results of this effort are sometimes used by the investment adviser or subadvisers as a consideration in the selection of brokers to execute portfolio transactions.
| | | Fiscal Year ended September 30, 2023 | | | Fiscal Year ended September 30, 2022 | | | Fiscal Year ended September 30, 2021 | | |||||||||
Inflation-Protected and Income Fund | | | | $ | 14,897 | | | | | $ | 12,038 | | | | | $ | 9,089 | | |
B-88
| | | Fiscal Year ended September 30, 2023 | | | Fiscal Year ended September 30, 2022 | | | Fiscal Year ended September 30, 2021 | | |||||||||
Core Bond Fund | | | | $ | 39,924 | | | | | $ | 44,041 | | | | | $ | 57,254 | | |
Diversified Bond Fund | | | | $ | 9,634 | | | | | $ | 10,950 | | | | | $ | 10,340 | | |
Balanced Fund | | | | $ | 6,098 | | | | | $ | 8,872 | | | | | $ | 49,757 | | |
Disciplined Value Fund | | | | $ | 16,389 | | | | | $ | 8,738 | | | | | $ | 46,898 | | |
Main Street Fund | | | | $ | 28,896 | | | | | $ | 28,310 | | | | | $ | 35,511 | | |
Disciplined Growth Fund | | | | $ | 18,692 | | | | | $ | 20,220 | | | | | $ | 38,403 | | |
Small Cap Opportunities Fund | | | | $ | 252,184 | | | | | $ | 207,614 | | | | | $ | 180,932 | | |
Global Fund | | | | $ | 64,803 | | | | | $ | 48,490 | | | | | $ | 42,261 | | |
International Equity Fund | | | | $ | 22,878 | | | | | $ | 28,751 | | | | | $ | 54,015 | | |
Strategic Emerging Markets Fund | | | | $ | 131,533 | | | | | $ | 168,689 | | | | | $ | 197,941 | | |
| | | Fiscal Year ended September 30, 2023 | | | Fiscal Year ended September 30, 2022 | | | Fiscal Year ended September 30, 2021 | | |||||||||||||||||||||||
Affiliated Broker/Dealer | | | Aggregate Commissions Paid | | | Percentage Paid to Affiliates | | | Percentage of Dollar Amount of Transactions Involving Payment of Commissions to Affiliates | | | Aggregate Commissions Paid | | | Aggregate Commissions Paid | | |||||||||||||||||
Jefferies LLC | | ||||||||||||||||||||||||||||||||
Disciplined Value Fund 1 | | | | $ | — | | | | | | | —% | | | | | | | —% | | | | | $ | — | | | | | $ | 6,067 | | |
Main Street Fund 1 | | | | $ | 138 | | | | | | 0.48% | | | | | | | 0.79% | | | | | | $ | 73 | | | | | $ | 925 | | |
Small Cap Opportunities Fund 1 | | | | $ | 531 | | | | | | 0.21% | | | | | | | 0.21% | | | | | | $ | 4,291 | | | | | $ | 3,908 | | |
Global Fund 1 | | | | $ | 7,077 | | | | | | 10.92% | | | | | | | 13.71% | | | | | | $ | 2,967 | | | | | $ | 2,301 | | |
International Equity Fund 1 | | | | $ | — | | | | | | | —% | | | | | | | —% | | | | | $ | 31 | | | | | $ | — | | |
Strategic Emerging Markets Fund 1 | | | | $ | 12,939 | | | | | | 9.84% | | | | | | | 10.08% | | | | | | $ | 9,198 | | | | | $ | 7,131 | | |
B-89
| | | Dollar Value of Those Transactions | | | Amount of Commissions | | ||||||
Disciplined Value Fund | | | | $ | 107,876,204 | | | | | $ | 3,133 | | |
Main Street Fund | | | | $ | 125,644,856 | | | | | $ | 34,175 | | |
Disciplined Growth Fund | | | | $ | 91,298,297 | | | | | $ | 2,737 | | |
Small Cap Opportunities Fund | | | | $ | 248,297,055 | | | | | $ | 226,700 | | |
Global Fund | | | | $ | 91,654,615 | | | | | $ | 61,194 | | |
International Equity Fund | | | | $ | 42,941,858 | | | | | $ | 7,838 | | |
Strategic Emerging Markets Fund | | | | $ | 88,963,896 | | | | | $ | 116,227 | | |
Fund | | | Regular Broker or Dealer | | | Aggregate Value of Securities Held | | |||
U.S. Government Money Market Fund | | | HSBC Securities, Inc. | | | | $ | 25,000,000 | | |
| | | | | | | $ | 25,000,000 | | |
Core Bond Fund | | | Bank of America Corp. | | | | $ | 7,109,940 | | |
| | | UBS AG | | | | | 4,000,762 | | |
| | | Morgan Stanley | | | | | 3,394,308 | | |
| | | HSBC Securities, Inc. | | | | | 2,943,278 | | |
| | | The Goldman Sachs Group, Inc. | | | | | 2,824,339 | | |
| | | JPMorgan Chase & Co. | | | | | 2,274,800 | | |
| | | Barclays plc | | | | | 1,929,422 | | |
| | | Citigroup, Inc. | | | | | 863,349 | | |
| | | | | | | $ | 25,340,198 | | |
Diversified Bond Fund | | | Bank of America Corp. | | | | $ | 1,381,602 | | |
| | | Morgan Stanley | | | | | 976,475 | | |
| | | UBS AG | | | | | 861,330 | | |
| | | JPMorgan Chase & Co. | | | | | 732,474 | | |
| | | HSBC Securities, Inc. | | | | | 522,817 | | |
| | | Barclays plc | | | | | 520,524 | | |
| | | The Goldman Sachs Group, Inc. | | | | | 415,593 | | |
| | Citigroup, Inc. | | | | | 184,647 | | | |
| | | | | | | $ | 5,595,462 | | |
Balanced Fund | | | Bank of America Corp | | | | $ | 486,027 | | |
| | | The Goldman Sachs Group, Inc. | | | | | 438,287 | | |
| | | JPMorgan Chase & Co. | | | | | 374,673 | | |
| | | Morgan Stanley | | | | | 318,637 | | |
| | | Citigroup, Inc. | | | | | 258,639 | | |
| | | Wells Fargo | | | | | 144,016 | | |
| | | State Street Corp. | | | | | 151,650 | | |
| | | Truist Financial Corp. | | | | | 145,042 | | |
| | | | | | | $ | 2,316,971 | | |
Disciplined Value Fund | | | JPMorgan Chase & Co. | | | | $ | 1,929,346 | | |
| | | State Street Corp. | | | | | 456,801 | | |
| | | Citigroup, Inc. | | | | | 179,861 | | |
| | | | | | | $ | 2,566,008 | | |
B-90
Fund | | | Regular Broker or Dealer | | | Aggregate Value of Securities Held | | |||
Main Street Fund | | | JPMorgan Chase & Co. | | | | $ | 2,285,660 | | |
| | | | | | | $ | 2,285,660 | | |
Strategic Emerging Markets Fund | | | Kotak Securities Limited | | | | $ | 5,671,255 | | |
| | | | | | | $ | 5,671,255 | | |
|
B-91
B-92
B-93
B-94
| FUND | | | Gross income earned by the Fund from securities lending activities | | | Fees paid to securities lending agent from a revenue split | | | Fees paid for any cash collateral management service (including fees deducted from a pooled cash collateral reinvestment vehicle) that are not included in a revenue split | | | Administrative fees not included in a revenue split | | | Indemnification fees not included in a revenue split | | | Rebate (paid to borrower) | | | Other fees not included in a revenue split, if applicable, including a description of those other fees | | | Aggregate fees/ compensation paid by the Fund for securities lending activities | | | Net income from securities lending activities | | |||||||||||||||||||||||||||
| Inflation-Protected and Income Fund | | | | $ | 28,367 | | | | | $ | 1,230 | | | | | $ | 215 | | | | | $ | — | | | | | $ | — | | | | | $ | 19,951 | | | | | $ | — | | | | | $ | 21,396 | | | | | $ | 6,971 | | |
| Core Bond Fund | | | | $ | 216,582 | | | | | $ | 3,496 | | | | | $ | 1,449 | | | | | $ | — | | | | | $ | — | | | | | $ | 191,826 | | | | | $ | — | | | | | $ | 196,772 | | | | | $ | 19,810 | | |
| Diversified Bond Fund | | | | $ | 115,744 | | | | | $ | 2,635 | | | | | $ | 758 | | | | | $ | — | | | | | $ | — | | | | | $ | 97,418 | | | | | $ | — | | | | | $ | 100,811 | | | | | $ | 14,933 | | |
| Balanced Fund | | | | $ | — | | | | | $ | — | | | | | $ | — | | | | | $ | — | | | | | $ | — | | | | | $ | — | | | | | $ | — | | | | | $ | — | | | | | $ | — | | |
| Disciplined Value Fund | | | | $ | 4,397 | | | | | $ | 156 | | | | | $ | 29 | | | | | $ | — | | | | | $ | — | | | | | $ | 3,330 | | | | | $ | — | | | | | $ | 3,515 | | | | | $ | 882 | | |
| Main Street Fund | | | | $ | 16,463 | | | | | $ | 1,861 | | | | | $ | 50 | | | | | $ | — | | | | | $ | — | | | | | $ | 4,004 | | | | | $ | — | | | | | $ | 5,915 | | | | | $ | 10,548 | | |
| Disciplined Growth Fund | | | | $ | 20,160 | | | | | $ | 1,588 | | | | | $ | 89 | | | | | $ | — | | | | | $ | — | | | | | $ | 9,486 | | | | | $ | — | | | | | $ | 11,163 | | | | | $ | 8,997 | | |
| Small Cap Opportunities Fund | | | | $ | 55,771 | | | | | $ | 2,836 | | | | | $ | 343 | | | | | $ | — | | | | | $ | — | | | | | $ | 36,519 | | | | | $ | — | | | | | $ | 39,698 | | | | | $ | 16,073 | | |
| Global Fund | | | | $ | 89,163 | | | | | $ | 1,812 | | | | | $ | 582 | | | | | $ | — | | | | | $ | — | | | | | $ | 76,500 | | | | | $ | — | | | | | $ | 78,894 | | | | | $ | 10,269 | | |
| International Equity Fund | | | | $ | 140,007 | | | | | $ | 5,743 | | | | | $ | 760 | | | | | $ | — | | | | | $ | — | | | | | $ | 100,963 | | | | | $ | — | | | | | $ | 107,465 | | | | | $ | 32,542 | | |
| Strategic Emerging Markets Fund | | | | $ | 25,659 | | | | | $ | 1,134 | | | | | $ | 170 | | | | | $ | — | | | | | $ | — | | | | | $ | 17,930 | | | | | $ | — | | | | | $ | 19,234 | | | | | $ | 6,425 | | |
B-95
B-96
B-97
B-98
B-99
B-100
B-101
B-102
B-103
B-104
B-105
B-106
Beneficial holders that are foreign persons with respect to whom income from a Fund is effectively connected with a trade or business conducted by the foreign shareholder within the United States will in general be subject to U.S. federal income tax on the income derived from the Fund at the graduated rates applicable to U.S. citizens, residents, or domestic corporations, whether such income is received in cash or reinvested in shares of the Fund and, in the case of a foreign corporation, may also be subject to a branch profits tax. If a foreign shareholder is eligible for the benefits of a tax treaty, any effectively connected income or gain will generally be subject to U.S. federal income tax on a net basis only if it is also attributable to a permanent establishment maintained by the shareholder in the United States. More generally, foreign shareholders who are residents in a country with an income tax treaty with the United States may obtain different tax results than those described herein, and are urged to consult their tax advisers.
Beneficial holders that are foreign persons should consult their tax advisers and, if holding shares through intermediaries, their intermediaries, concerning the application of these rules to their investment in the Funds.
B-107
B-108
Broad margins in earnings coverage of fixed financial charges and high internal cash generation.
B-109
B-110
B-111
B-112
B-113
MassMutual Advantage Funds, MML Series Investment Fund, and MML Series Investment Fund II
(October 25, 2023)
B-114
B-115
B-116
Barings LLC (“Barings”) has established a Proxy Voting Policy to establish the manner in which Barings fulfills its proxy voting responsibilities and complies with applicable regulations
Barings has a responsibility to oversee any service providers it may engage to facilitate proxy voting on behalf of its clients
Barings engages a proxy voting service provider (“Service Provider”) responsible for processing and maintaining records of proxy votes. In addition, the Service Provider, a recognized authority on proxy voting and corporate governance, provides research and recommendations (including environmental, social and governance topics) on proxies to Barings as its research provider (“Research Provider”). Barings’ policy is to generally vote all Client proxies for which it has proxy voting discretion in accordance with the recommendations of the Research Provider or with the Research Provider’s proxy voting guidelines (“Guidelines”), in the absence of a recommendation. In circumstances where the Research Provider has not provided a recommendation, the proxy will be analyzed on a case-by-case basis.
Barings recognizes that there may be times when it is in the best interests of Clients to vote proxies: (i) against the Research Provider’s recommendations; or (ii) in instances where the Research Provider has not provided a
B-117
Barings should consider requiring the Research Provider to update Barings regarding business changes Barings considers relevant (i.e., with respect to the Research Provider’s capacity and competency to provide independent proxy voting advice or carry out voting instructions), and should consider whether the Research Provider appropriately updates its methodologies, guidelines, and voting recommendations on an ongoing basis, including in response to feedback from issuers and their shareholders.
Barings is not given enough time to process the vote (i.e., receives a meeting notice and proxy from the issuer too late to permit voting);
Barings may hold shares on a company’s record date, but sells them prior to the company’s meeting date;
B-118
Barings has outstanding sell orders on a particular security and the decision to refrain from voting may be made in order to facilitate such sale;
Barings has designated the Proxy Voting Team to ensure the responsibilities set forth in this Policy are satisfied.
B-119
Barings will include a summary of this Policy in the Form ADV Part 2A for its US registered investment advisers, as well as provide instructions as to how a Client may request a copy of this Policy and/or a record of how Barings voted the Client’s proxies. Requests will be directed to the Proxy Voting Team, who will provide the information to the appropriate client service representative in order to respond to the Client in a timely manner.
| Description/Requirement | | | Barings Record | | | Creator | | | Owner | | | Retention Period | | | Source | |
| The Compliance review and any approvals needed by GCC of Policy, proxy activity, and approval of Proxy Voting Forms | | | Compliance and GCC meeting materials | | | Proxy Voting Team and Compliance | | | GCC Representative | | | 7 Years | | | Barings Policy Requirement and Investment Advisers Act of 1940, Rule 206(4)-6 Barings Policy requirement for Barings US regulated Advisers | |
| Proxy statements, research, recommendations, and records of votes cast | | | Proxy Records | | | Service Provider or Proxy Voting Team | | | Service Provider or Proxy Voting Team | | | 7 Years | | | Barings Policy Requirement and Investment Advisers Act of 1940, Rule 206(4)-6 Barings Policy requirement for Barings US regulated Advisers | |
| Proxy Voting Forms (including supporting documentation used in deciding how to vote) | | | Proxy Voting Forms | | | Proxy Voting Team and/or Proxy Analyst | | | Proxy Voting Team | | | 7 Years | | | Barings Policy Requirement and Investment Advisers Act of 1940, Rule 206(4)-6 Barings Policy requirement for Barings US regulated Advisers | |
B-120
| Description/Requirement | | | Barings Record | | | Creator | | | Owner | | | Retention Period | | | Source | |
| Client written requests for proxy voting information and responses thereto | | | Client Proxy Requests | | | Proxy Voting Team | | | Proxy Voting Team | | | 7 Years | | | Barings Policy Requirement and Investment Advisers Act of 1940, Rule 206(4)-6 Barings Policy requirement for Barings US regulated Advisers | |
| Form N-PX, for proxies voted on behalf of an investment company for which Barings serves as investment adviser and is responsible for making such filing on behalf of its Clients | | | Form N-PX | | | Proxy Voting Team | | | Legal Department | | | 7 Years | | | Barings Policy requirement and Investment Advisers Act of 1940, Rule 206(4)‑6 for Barings US regulated Advisers Rule 30b1‑4 | |
| The Proxy Voting Policy, associated procedures and any amendments thereto | | | Proxy Voting Policy | | | Compliance Department | | | Compliance Department | | | 7 Years | | | Barings Policy requirement | |
| A copy of the Research Provider’s proxy voting guidelines | | | Research Provider’s Proxy Voting Guidelines | | | Research Provider | | | Proxy Voting Team | | | 7 Years | | | Barings Policy requirement | |
October 2004 (Barings)
August 2023
August 2023
B-121
B-122
B-123
Invesco%20FSC%20Proxy%20Voting%20Record%20Reporting%20Jul’20-Jun’21.pdf.
B-124
B-125
B-126
B-127
B-128
B-129
B-130
B-131
B-132
B-133
B-134
Board of Directors
B-135
B-136
B-137
B-138
B-139
B-140
B-141
B-142
Boards should offer transparency around their process to evaluate director performance and independence, conducting a rigorous regular evaluation of the board, key committees as well as individual directors, which is responsive to shareholder input. We believe externally facilitated board evaluations may contribute to companies retaining an appropriate mix of skills, experience and diversity on their boards over time.
B-143
Because we believe the election of directors by a majority of votes cast is the appropriate standard, we will generally support proposals that seek to adopt such a standard. Our support will typically extend to situations where the relevant company has an existing resignation policy for directors that receive a majority of “withhold” votes. We believe majority voting should be defined in the company’s charter and not simply in its corporate governance policy.
B-144
B-145
Because boards generally have the authority to adopt shareholder rights plans without shareholder approval, we are equally vigilant in our assessment of requests for authorization of blank-check preferred shares.
B-146
B-147
B-148
B-149
| | | | Number of Accounts Managed* | | | Total Assets* | | | Number of Accounts Managed for which Advisory Fee is Performance- Based* | | | Total Assets* | | ||||||
| Adam Cash | | | | | | | | | | | | | | | | | | | |
| Registered investment companies** | | | | | 2 | | | | $1,123 million | | | | | 0 | | | | $0 | |
| Other pooled investment vehicles | | | | | 0 | | | | $0 | | | | | 0 | | | | $0 | |
| Other accounts | | | | | 13 | | | | $8,349 million | | | | | 0 | | | | $0 | |
| Scott Simler | | | | | | | | | | | | | | | | | | | |
| Registered investment companies** | | | | | 2 | | | | $1,123 million | | | | | 0 | | | | $0 | |
| Other pooled investment vehicles | | | | | 0 | | | | $0 | | | | | 0 | | | | $0 | |
| Other accounts | | | | | 15 | | | | $14,419 million | | | | | 0 | | | | $0 | |
| | | | Number of Accounts Managed* | | | Total Assets* | | | Number of Accounts Managed for which Advisory Fee is Performance- Based* | | | Total Assets* | | ||||||
| Yulia Alekseeva | | | | | | | | | | | | | | | | | | | |
| Registered investment companies** | | | | | 6 | | | | $1,999 million | | | | | 0 | | | | $0 | |
| Other pooled investment vehicles | | | | | 2 | | | | $171 million | | | | | 0 | | | | $0 | |
| Other accounts | | | | | 30 | | | | $21,342 million | | | | | 0 | | | | $0 | |
| Douglas Trevallion, II | | | | | | | | | | | | | | | | | | | |
| Registered investment companies** | | | | | 6 | | | | $1,999 million | | | | | 0 | | | | $0 | |
| Other pooled investment vehicles | | | | | 1 | | | | $0.093 million | | | | | 0 | | | | $0 | |
| Other accounts | | | | | 36 | | | | $20,962 million | | | | | 0 | | | | $0 | |
B-150
| | | | Number of Accounts Managed* | | | Total Assets* | | | Number of Accounts Managed for which Advisory Fee is Performance- Based* | | | Total Assets* | | ||||||
| Yulia Alekseeva | | | | | | | | | | | | | | | | | | | |
| Registered investment companies** | | | | | 6 | | | | $1,585 million | | | | | 0 | | | | $0 | |
| Other pooled investment vehicles | | | | | 2 | | | | $171 million | | | | | 0 | | | | $0 | |
| Other accounts | | | | | 30 | | | | $21,342 million | | | | | 0 | | | | $0 | |
| Stephen Ehrenberg | | | | | | | | | | | | | | | | | | | |
| Registered investment companies** | | | | | 4 | | | | $1,136 million | | | | | 0 | | | | $0 | |
| Other pooled investment vehicles | | | | | 2 | | | | $372 million | | | | | 0 | | | | $0 | |
| Other accounts | | | | | 37 | | | | $38,312 million | | | | | 0 | | | | $0 | |
| Charles Sanford | | | | | | | | | | | | | | | | | | | |
| Registered investment companies** | | | | | 4 | | | | $1,136 million | | | | | 0 | | | | $0 | |
| Other pooled investment vehicles | | | | | 1 | | | | $171 million | | | | | 0 | | | | $0 | |
| Other accounts | | | | | 90 | | | | $58,505 million | | | | | 0 | | | | $0 | |
| Douglas Trevallion, II | | | | | | | | | | | | | | | | | | | |
| Registered investment companies** | | | | | 6 | | | | $1,585 million | | | | | 0 | | | | $0 | |
| Other pooled investment vehicles | | | | | 1 | | | | $0.093 million | | | | | 0 | | | | $0 | |
| Other accounts | | | | | 36 | | | | $20,962 million | | | | | 0 | | | | $0 | |
B-151
| | | | Number of Accounts Managed* | | | Total Assets* | | | Number of Accounts Managed for which Advisory Fee is Performance- Based* | | | Total Assets* | | ||||||
| Yulia Alekseeva | | | | | | | | | | | | | | | | | | | |
| Registered investment companies** | | | | | 6 | | | | $2,108 million | | | | | 0 | | | | $0 | |
| Other pooled investment vehicles | | | | | 2 | | | | $171 million | | | | | 0 | | | | $0 | |
| Other accounts | | | | | 30 | | | | $21,342 million | | | | | 0 | | | | $0 | |
| Stephen Ehrenberg | | | | | | | | | | | | | | | | | | | |
| Registered investment companies** | | | | | 4 | | | | $1,659 million | | | | | 0 | | | | $0 | |
| Other pooled investment vehicles | | | | | 2 | | | | $372 million | | | | | 0 | | | | $0 | |
| Other accounts | | | | | 37 | | | | $38,312 million | | | | | 0 | | | | $0 | |
| Charles Sanford | | | | | | | | | | | | | | | | | | | |
| Registered investment companies** | | | | | 4 | | | | $1,659 million | | | | | 0 | | | | $0 | |
| Other pooled investment vehicles | | | | | 1 | | | | $171 million | | | | | 0 | | | | $0 | |
| Other accounts | | | | | 90 | | | | $58,505 million | | | | | 0 | | | | $0 | |
| Douglas Trevallion, II | | | | | | | | | | | | | | | | | | | |
| Registered investment companies** | | | | | 6 | | | | $2,108 million | | | | | 0 | | | | $0 | |
| Other pooled investment vehicles | | | | | 1 | | | | $0.093 million | | | | | 0 | | | | $0 | |
| Other accounts | | | | | 36 | | | | $20,962 million | | | | | 0 | | | | $0 | |
B-152
B-153
| | | | Number of Accounts Managed* | | | Total Assets* | | | Number of Accounts Managed for which Advisory Fee is Performance- Based* | | | Total Assets* | | ||||||
| Jeffrey Bennett | | | | | | | | | | | | | | | | | | | |
| Registered investment companies** | | | | | 8 | | | | $7,114.9 million | | | | | 0 | | | | $0 | |
| Other pooled investment vehicles | | | | | 28 | | | | $2,042.9 million | | | | | 0 | | | | $0 | |
| Other accounts | | | | | 742*** | | | | $58.5 million | | | | | 0 | | | | $0 | |
| Matt Brill | | | | | | | | | | | | | | | | | | | |
| Registered investment companies** | | | | | 8 | | | | $12,558.7 million | | | | | 0 | | | | $0 | |
| Other pooled investment vehicles | | | | | 19 | | | | $5,112.7 million | | | | | 0 | | | | $0 | |
| Other accounts | | | | | 1 | | | | $256.6 million | | | | | 0 | | | | $0 | |
| Alessio de Longis | | | | | | | | | | | | | | | | | | | |
| Registered investment companies** | | | | | 8 | | | | $7,114.9 million | | | | | 0 | | | | $0 | |
| Other pooled investment vehicles | | | | | 26 | | | | $1,749.8 million | | | | | 0 | | | | $0 | |
| Other accounts | | | | | 744*** | | | | $774.4 million | | | | | 0 | | | | $0 | |
| Pratik Doshi | | | | | | | | | | | | | | | | | | | |
| Registered investment companies** | | | | | 153 | | | | $159,084.9 million | | | | | 0 | | | | $0 | |
| Other pooled investment vehicles | | | | | 115 | | | | $218,183.4 million | | | | | 0 | | | | $0 | |
| Other accounts | | | | | 42 | | | | $57,176.4 million | | | | | 0 | | | | $0 | |
| Peter Hubbard | | | | | | | | | | | | | | | | | | | |
| Registered investment companies** | | | | | 209 | | | | $204,072.2 million | | | | | 0 | | | | $0 | |
| Other pooled investment vehicles | | | | | 115 | | | | $218,183.4 million | | | | | 0 | | | | $0 | |
| Other accounts | | | | | 42 | | | | $57,176.4 million | | | | | 0 | | | | $0 | |
| Michael D. Hyman | | | | | | | | | | | | | | | | | | | |
| Registered investment companies** | | | | | 10 | | | | $12,815.2 million | | | | | 0 | | | | $0 | |
| Other pooled investment vehicles | | | | | 21 | | | | $4,967.0 million | | | | | 0 | | | | $0 | |
| Other accounts | | | | | 1*** | | | | $0.2 million | | | | | 0 | | | | $0 | |
| Michael Jeanette | | | | | | | | | | | | | | | | | | | |
| Registered investment companies** | | | | | 154 | | | | $159,178.8 million | | | | | 0 | | | | $0 | |
| Other pooled investment vehicles | | | | | 115 | | | | $218,183.4 million | | | | | 0 | | | | $0 | |
| Other accounts | | | | | 42 | | | | $57,176.4 million | | | | | 0 | | | | $0 | |
| Todd Schomberg | | | | | | | | | | | | | | | | | | | |
| Registered investment companies** | | | | | 7 | | | | $11,585.2 million | | | | | 0 | | | | $0 | |
| Other pooled investment vehicles | | | | | 21 | | | | $5,193.1 million | | | | | 0 | | | | $0 | |
| Other accounts | | | | | 0 | | | | $0 | | | | | 0 | | | | $0 | |
| Tony Seisser | | | | | | | | | | | | | | | | | | | |
| Registered investment companies** | | | | | 154 | | | | $159,178.8 million | | | | | 0 | | | | $0 | |
| Other pooled investment vehicles | | | | | 115 | | | | $218,183.4 million | | | | | 0 | | | | $0 | |
B-154
| | | | Number of Accounts Managed* | | | Total Assets* | | | Number of Accounts Managed for which Advisory Fee is Performance- Based* | | | Total Assets* | | ||||||
| Other accounts | | | | | 42 | | | | $57,176.4 million | | | | | 0 | | | | $0 | |
| | | | Number of Accounts Managed* | | | Total Assets* | | | Number of Accounts Managed for which Advisory Fee is Performance- Based* | | | Total Assets* | | ||||||
| Manind Govil | | | | | | | | | | | | | | | | | | | |
| Registered investment companies** | | | | | 3 | | | | $9,690.1 million | | | | | 0 | | | | $0 | |
| Other pooled investment vehicles | | | | | 1 | | | | $239.8 million | | | | | 0 | | | | $0 | |
| Other accounts | | | | | 0 | | | | $0 | | | | | 0 | | | | $0 | |
| Benjamin Ram | | | | | | | | | | | | | | | | | | | |
| Registered investment companies** | | | | | 4 | | | | $13,075.8 million | | | | | 0 | | | | $0 | |
| Other pooled investment vehicles | | | | | 1 | | | | $239.8 million | | | | | 0 | | | | $0 | |
| Other accounts | | | | | 0 | | | | $0 | | | | | 0 | | | | $0 | |
B-155
| | | | Number of Accounts Managed* | | | Total Assets* | | | Number of Accounts Managed for which Advisory Fee is Performance- Based* | | | Total Assets* | | ||||||
| Joy Budzinski | | | | | | | | | | | | | | | | | | | |
| Registered investment companies** | | | | | 6 | | | | $5,931.3 million | | | | | 0 | | | | $0 | |
| Other pooled investment vehicles | | | | | 1 | | | | $84.1 million | | | | | 0 | | | | $0 | |
| Other accounts | | | | | 47*** | | | | $11.4 million | | | | | 0 | | | | $0 | |
| Magnus Krantz | | | | | | | | | | | | | | | | | | | |
| Registered investment companies** | | | | | 9 | | | | $9,625.6 million | | | | | 0 | | | | $0 | |
| Other pooled investment vehicles | | | | | 1 | | | | $84.1 million | | | | | 0 | | | | $0 | |
| Other accounts | | | | | 47*** | | | | $11.4 million | | | | | 0 | | | | $0 | |
| Raman Vardharaj | | | | | | | | | | | | | | | | | | | |
| Registered investment companies** | | | | | 6 | | | | $7,504.3 million | | | | | 0 | | | | $0 | |
| Other pooled investment vehicles | | | | | 1 | | | | $84.1 million | | | | | 0 | | | | $0 | |
| Other accounts | | | | | 47*** | | | | $11.4 million | | | | | 0 | | | | $0 | |
| Adam Weiner | | | | | | | | | | | | | | | | | | | |
| Registered investment companies** | | | | | 5 | | | | $4,791.1 million | | | | | 0 | | | | $0 | |
| Other pooled investment vehicles | | | | | 1 | | | | $84.1 million | | | | | 0 | | | | $0 | |
| Other accounts | | | | | 199*** | | | | $113.8 million | | | | | 0 | | | | $0 | |
| Matthew P. Ziehl | | | | | | | | | | | | | | | | | | | |
| Registered investment companies** | | | | | 5 | | | | $4,791.1 million | | | | | 0 | | | | $0 | |
| Other pooled investment vehicles | | | | | 1 | | | | $84.1 million | | | | | 0 | | | | $0 | |
| Other accounts | | | | | 199*** | | | | $113.8 million | | | | | 0 | | | | $0 | |
B-156
| | | | Number of Accounts Managed* | | | Total Assets* | | | Number of Accounts Managed for which Advisory Fee is Performance- Based* | | | Total Assets* | | ||||||
| John Delano | | | | | | | | | | | | | | | | | | | |
| Registered investment companies** | | | | | 9 | | | | $14,904.8 million | | | | | 0 | | | | $0 | |
| Other pooled investment vehicles | | | | | 7 | | | | $1,706.5 million | | | | | 0 | | | | $0 | |
| Other accounts | | | | | 3 | | | | $4.8 million | | | | | 0 | | | | $0 | |
| | | | Number of Accounts Managed* | | | Total Assets* | | | Number of Accounts Managed for which Advisory Fee is Performance- Based* | | | Total Assets* | | ||||||
| Justin Leverenz | | | | | | | | | | | | | | | | | | | |
| Registered investment companies** | | | | | 3 | | | | $23,550.6 million | | | | | 0 | | | | $0 | |
| Other pooled investment vehicles | | | | | 6 | | | | $1,894.0 million | | | | | 0 | | | | $0 | |
| Other accounts | | | | | 0 | | | | $0 | | | | | 0 | | | | $0 | |
B-157
| Sub-Adviser | | | Performance time period 1 | |
| Invesco Advisers 2 | | | One-, Three- and Five-year performance against fund peer group. | |
| ICM 2, 3 | | | Not applicable | |
B-158
B-159
| | | Number of Accounts Managed* | | | Total Assets* | | | Number of Accounts Managed for which Advisory Fee is Performance- Based* | | | Total Assets* | |
Brandon H. Harrell | | ||||||||||||
Registered investment companies** | | | 6 | | | $7,123.6 million | | | 0 | | | $0 | |
Other pooled investment vehicles | | | 5 | | | $1,759.9 million | | | 0 | | | $0 | |
Other accounts | | | 13 | | | $3,418.0 million | | | 0 | | | $0 | |
B-160
B-161
B-162
B-163
| | | Number of Accounts Managed* | | | Total Assets* | | | Number of Accounts Managed for which Advisory Fee is Performance- Based* | | | Total Assets* | |
Matt J. Kyller | | | | | | | | | | | | | |
Registered investment companies** | | | 7 | | | $1,062,886,365 | | | 0 | | | $0 | |
Other pooled investment vehicles | | | 9 | | | $72,489,200 | | | 0 | | | $0 | |
Other accounts | | | 1 | | | $93,503,845 | | | 0 | | | $0 | |
Tom S. Simon | | | | | | | | | | | | | |
Registered investment companies** | | | 10 | | | $10,701,062,123 | | | 0 | | | $0 | |
Other pooled investment vehicles | | | 7 | | | $91,262,475 | | | 0 | | | $0 | |
Other accounts | | | 3 | | | $1,439,429,117 | | | 0 | | | $0 | |
| | | Number of Accounts Managed* | | | Total Assets* | | | Number of Accounts Managed for which Advisory Fee is Performance- Based* | | | Total Assets* | |
Matt J. Kyller | | | | | | | | | | | | | |
Registered investment companies** | | | 7 | | | $985,796,329 | | | 0 | | | $0 | |
Other pooled investment vehicles | | | 9 | | | $72,489,200 | | | 0 | | | $0 | |
Other accounts | | | 1 | | | $93,503,845 | | | 0 | | | $0 | |
Tom S. Simon | | | | | | | | | | | | | |
Registered investment companies** | | | 10 | | | $10,561,571,017 | | | 0 | | | $0 | |
Other pooled investment vehicles | | | 7 | | | $91,262,475 | | | 0 | | | $0 | |
Other accounts | | | 3 | | | $1,439,429,117 | | | 0 | | | $0 | |
B-164
| | | Number of Accounts Managed* | | | Total Assets* | | | Number of Accounts Managed for which Advisory Fee is Performance- Based* | | | Total Assets* | |
Peter C. Fisher | | ||||||||||||
Registered investment companies** | | | 6 | | | $53,145,478,818 | | | 1 | | | $49,273,992,747 | |
Other pooled investment vehicles | | | 5 | | | $512,494,028 | | | 1 | | | $72,659,726 | |
Other accounts | | | 5 | | | $395,679,113 | | | 1 | | | $42,093,778 | |
B-165
Fund | | | Benchmark and/or Peer Group | |
Disciplined Value Fund | | | Russell 1000 Value Index | |
Disciplined Growth Fund | | | Russell 1000 Growth Index | |
International Equity Fund | | | MSCI EAFE Index | |
B-166
Back to Table of Contents |
APPENDIX C
Pro forma financial statements of MassMutual Blue Chip Growth Fund, MassMutual Diversified Value Fund, and MassMutual Core Bond Fund
NARRATIVE DESCRIPTION OF THE PRO FORMA EFFECTS OF THE REORGANIZATIONS
The unaudited pro forma information set forth below for the six month periods ended on the dates indicated is intended to present supplemental data as if the reorganizations of one or more funds (each a “Selling Fund” and together, the “Selling Funds”) into other corresponding funds (each an “Acquiring Fund” and together, the “Acquiring Funds” and together with the Selling Fund, each a “Fund” and collectively, the “Funds”), as noted in Table 1 below (the “Reorganizations”), had occurred as of the beginning of the period (unless otherwise noted). The Reorganization of each Selling Fund is not conditioned upon the Reorganization of any other Selling Fund.
Table 1 – Reorganizations
Selling Fund | Acquiring Fund | Period Ended | ||
MassMutual Growth Opportunities Fund | MassMutual Blue Chip Growth Fund | 3/31/2024 | ||
MassMutual Fundamental Value Fund | MassMutual Diversified Value Fund | 3/31/2024 | ||
MassMutual Strategic Bond Fund | MassMutual Core Bond Fund | 3/31/2024 |
Basis of Combination
In June 2024, the Board of Trustees of the Selling Funds approved an Agreement and Plan of Reorganization (the “Agreement”) pursuant to which each Selling Fund will transfer all of its assets to the corresponding Acquiring Fund in exchange for shares of that Acquiring Fund (“Merger Shares”) and the assumption by that Acquiring Fund of the Selling Fund’s liabilities. Each Selling Fund and each Acquiring Fund offers Class I, Class R5, Service Class, Administrative Class, Class R4, Class A, Class R3, and Class Y shares. Selling Fund shareholders of each class will receive the same class of Merger Shares. Each Acquiring Fund will issue Merger Shares with an aggregate net asset value equal to the aggregate value of the assets that it receives from its corresponding Selling Fund, less the liabilities it assumes from that corresponding Selling Fund and any expenses of the Reorganization payable by the Selling Fund. No shareholders of any Selling Fund will pay any sales charges, commissions, or transaction fees in connection with acquiring Merger Shares. Immediately following the transfer, shareholders of each class of each Selling Fund will receive a proportional distribution of shares of the same class of the corresponding Acquiring Fund.
Each Reorganization is expected to be tax-free for U.S. federal income tax purposes. Accordingly, it is expected that Selling Fund shareholders will not, and each Selling Fund generally will not, recognize gain or loss as a direct result of a Reorganization. Following each Reorganization, the Acquiring Fund will be the accounting successor of each Reorganization. In accordance with accounting principles generally accepted in the United States, the historical cost of investment securities will be carried forward to the Acquiring Fund and the results of operations for pre-Reorganization periods will not be restated. Each Selling Fund is expected to bear the direct merger costs, legal fees, audit fees, Form N-14 printing and mailing costs, as well as similar expenses incurred in connection with the consummation of the Reorganization and transaction costs (if any) associated with repositioning the Selling Fund prior to the Reorganization. Each Selling Fund’s repositioning costs are discussed in the respective “Comparison of Fees and Expenses” sub-section of its respective Synopsis of the Reorganization section of the Combined Information Statement/Prospectus. Each Acquiring Fund will bear a one-time cost for administratively processing the Reorganization. If a Reorganization is not consummated, MML Investment Advisers, LLC (“MML Advisers”) will bear the costs associated with that Reorganization. The pro forma information provided herein should be read in conjunction with the audited financial statements of each Fund included in its most recent annual report, in each case dated as of September 30, 2023, and, as applicable, the unaudited financial statements of the Fund included in its most recent semiannual report, in each case dated as of March 31, 2024.
Table 2 below presents the net assets of each Fund as of March 31, 2024.
Table 2 – Selling Funds and Acquiring Funds’ Net Assets as of March 31, 2024
Fund | Net Assets | ||
MassMutual Growth Opportunities Fund (Selling Fund) | $ | 153,112,897 | |
MassMutual Blue Chip Growth Fund (Acquiring Fund) | $ | 2,618,904,293 | |
MassMutual Fundamental Value Fund (Selling Fund) | $ | 464,422,992 | |
MassMutual Diversified Value Fund (Acquiring Fund) | $ | 216,773,036 | |
MassMutual Strategic Bond Fund (Selling Fund) | $ | 397,220,535 | |
MassMutual Core Bond Fund (Acquiring Fund) | $ | 651,193,682 |
Table 3 presents the estimated Reorganization costs (exclusive of any transaction costs associated with any portfolio realignment); the net assets as of March 31, 2024 with respect to each Acquiring Fund assuming the indicated Reorganization occurred on that date, after accounting for the estimated Reorganization costs to be borne by the Acquiring Fund and the corresponding Selling Fund; and, on a pro forma basis, the estimated relative increases or decreases in combined operating expenses that would have been incurred during the one-year period ended on March 31, 2024. The pro forma increases and decreases represent the differences between (i) the combined expenses actually charged to the Acquiring Fund and the Selling Fund during the period and (ii) the expenses that would have been charged to the Acquiring Fund and the Selling Fund, based on the combined assets of the Funds, if the Reorganizations and any contractual changes had occurred at the beginning of the year.
The unaudited pro forma information set forth in Table 3 below reflects adjustments made to expenses for differences in contractual rates, duplicate services, and other services that would not have occurred if the Reorganizations had taken place on the first day of the period described in Table 1 above. The pro forma information has been derived from the books and records of the Funds utilized in calculating daily net asset value for the Funds and has been prepared in accordance with accounting principles generally accepted in the United States, which require the use of management estimates. Actual results could differ from those estimates.
Table 3 – Estimated Reorganization Costs, Combined Fund Net Assets, and Pro Forma Increases or Decreases in Expenses(1)
Reorganization 1 – MassMutual Growth Opportunities Fund into MassMutual Blue Chip Growth Fund | |||
Estimated Reorganization Costs | $ | 260,070 | |
Combined Fund Net Assets as of March 31, 2024 | $ | 2,772,017,190 |
Increase (Decrease) | |||
Management fees (3) | $ | 918,677 | |
Custodian fees (2) | $ | (65,645) | |
Professional fees (2) | $ | (56,771) | |
Registration fees (2) | $ | (103,990) | |
Reports to shareholders (2) | $ | (22,152) | |
Other (2) | $ | (2,980) |
(Increase) Decrease | |||
Waiver and/or reimbursement of fund expenses (4) | $ | 43,908 |
Reorganization 2 – MassMutual Fundamental Value Fund into MassMutual Diversified Value Fund | |||
Estimated Reorganization Costs | $ | 260,070 | |
Combined Fund Net Assets as of March 31, 2024 | $ | 681,196,028 |
Increase (Decrease) | |||
Management fees (3) | $ | 2,251,816 | |
Custodian fees (2) | $ | (65,896) | |
Professional fees (2) | $ | (65,894) | |
Registration fees (2) | $ | (106,800) | |
Reports to shareholders (2) | $ | (45,429) | |
Other (2) | $ | (2,980) |
(Increase) Decrease | |||
Waiver and/or reimbursement of fund expenses (4) | $ | N/A | |
Reorganization 3 – MassMutual Strategic Bond Fund into MassMutual Core Bond Fund | |||
Estimated Reorganization Costs | $ | 268,070 | |
Combined Fund Net Assets as of March 31, 2024 | $ | 1,048,414,217 |
Increase (Decrease) | |||
Management fees (3) | $ | 1,509,438 | |
Custodian fees (2) | $ | (226,281) | |
Professional fees (2) | $ | (82,172) | |
Registration fees (2) | $ | (103,929) | |
Reports to shareholders (2) | $ | (47,161) | |
Other (2) | $ | (2,980) |
(Increase) Decrease | |||
Waiver and/or reimbursement of fund expenses (4) | $ | 211,697 |
(1) | See the “Comparison of Fees and Expenses” sub-section of each respective Synopsis of Reorganization section in the Combined Information Statement/Prospectus for more information. |
(2) | Adjustment reflects the elimination of duplicate services. |
(3) | Management fees Pro Forma reflects an adjusted management fee rate, effective upon the closing of the Reorganization. |
(4) | Adjustment reflects the aggregate (increase) decrease in expense reimbursements and/or waivers by MML Advisers and its affiliates. |
Table 4 – Management Fees (Combined Investment Management and Administration Fees)
Pursuant to a Management Agreement with MML Advisers, each Trust, on behalf of each respective Fund, pays MML Advisers an investment advisory fee monthly, at an annual rate based upon the average daily net assets of that Fund, as shown in the tables below. Each Acquiring Fund’s management fee schedule will apply following completion of the Reorganization. The tables below show the current contractual management fee schedule for each of the Funds.
MassMutual Growth Opportunities Fund | MassMutual Blue Chip Growth Fund | |||||||||
Assets (in $ millions of average annual net assets) | Fee | Assets (in $ millions of average annual net assets) | Fee | |||||||
$0-$500 | 0.710 | % | $0-$750 | 0.650 | % | |||||
>$500 | 0.680 | % | >$750 | 0.600 | % | |||||
MassMutual Fundamental Value Fund | MassMutual Diversified Value Fund | |||||||||
Assets (in $ millions of average annual net assets) | Fee | Assets (in $ millions of average annual net assets) | Fee | |||||||
$0-$1,250 | 0.600 | % | $0-$400 | 0.500 | % | |||||
>$1,250-$1,500 | 0.575 | % | >$400 | 0.475 | % | |||||
>$1,500 | 0.550 | % | ||||||||
MassMutual Strategic Bond Fund | MassMutual Core Bond Fund | |||||||||
Assets (in $ millions of average annual net assets) | Fee | Assets (in $ millions of average annual net assets) | Fee | |||||||
$0-$200 | 0.450 | % | $0-$1,500 | 0.380 | % | |||||
>$200 | 0.350 | % | >$1,500-2,000 | 0.330 | % | |||||
>$2,000 | 0.280 | % |
State Street Bank and Trust Company is the transfer agent for each Fund. MML Distributors, LLC, an affiliate of MML Advisers, is the distributor for each Fund.
No significant accounting policies will change as the result of the proposed Reorganizations.
The estimated costs of the Reorganizations shown in Table 3 above do not reflect any brokerage commissions incurred by a Fund in connection with any portfolio realignment. MML Advisers expects that, subsequent to the Reorganizations, there may be some portfolio realignment of the Acquiring Funds. However, MML Advisers expects that any such portfolio realignment will not result in any significant increase in an Acquiring Fund’s portfolio turnover rate, relative to its historical portfolio turnover rates. MML Advisers also does not expect any incremental trading costs to be significant.
Federal Income Taxes
Please see “Tax Status of the Reorganizations” in the Combined Information Statement/Prospectus for a discussion of the tax effects of each Reorganization.
It is each Fund’s policy to comply with the requirements of the Internal Revenue Code of 1986, as amended, applicable to regulated investment companies and to eliminate a fund-level tax, and therefore to distribute at least annually all of its investment company taxable income (generally taxable ordinary income and the excess, if any, of net short-term capital gains over net long-term capital losses), its net-tax exempt interest income, if any, and its net realized capital gains, if any, to shareholders. After the Reorganizations, the Acquiring Funds intend to continue to comply with these requirements to qualify as regulated investment companies that pay no fund-level tax.
MASSMUTUAL SELECT FUNDS
PART C.
OTHER INFORMATION
Item 15. | Indemnification |
Article VIII, Sections 1, 2, 3, 4, and 5 of the Amended and Restated Agreement and Declaration of Trust of the MassMutual Select Funds (the “Trust” or “Registrant”), which is incorporated by reference to Exhibit A(1) of the Trust’s Post-Effective Amendment No. 65 to the Registration Statement filed via EDGAR on February 1, 2012, provides as follows with respect to indemnification of the Trustees and officers of the Trust against liabilities which may be incurred by them in such capacities:
Amended and Restated Declaration of Trust
Section 1. Trustees, Officers, Etc. The Trust shall indemnify every person who is or has been a Trustee or officer (including persons who serve at the Trust’s request as directors, officers or trustees of another organization in which the Trust has any interest as a shareholder, creditor or otherwise) (hereinafter referred to as a “Covered Person”) against all liabilities and expenses, including but not limited to amounts paid in satisfaction of judgments, in compromise or as fines and penalties, and counsel fees, reasonably incurred or paid by any Covered Person in connection with the defense or disposition of any claim, action, suit or other proceeding, whether civil, criminal, or other, including appeals, before any court or administrative or legislative body, in which such Covered Person may be or may have been involved as a party or otherwise or with which such Covered Person may be or may have been threatened, while in office or thereafter, by reason of being or having been such a Covered Person except with respect to any matter as to which such Covered Person shall have been finally adjudicated in a decision on the merits in any such action, suit or other proceeding to be liable to the Trust or its Shareholders by reason of willful misfeasance, bad faith, gross negligence or reckless disregard of the duties involved in the conduct of such Covered Person’s office. Expenses, including counsel fees so incurred by any such Covered Person (but excluding amounts paid in satisfaction of judgments, in compromise or as fines or penalties), shall be paid from time to time by the Trust in advance of the final disposition of any such action, suit or proceeding upon receipt of an undertaking by or on behalf of such Covered Person to repay amounts so paid to the Trust if it is ultimately determined that indemnification of such expenses is not authorized under this Article, provided, however, that either (a) such Covered Person shall have provided appropriate security for such undertaking, (b) the Trust shall be insured against losses arising from any such advance payments or (c) either a majority of the disinterested Trustees acting on the matter (provided that a majority of the disinterested Trustees then in office act on the matter), or independent legal counsel, in a written opinion, shall have determined, based upon a review of readily available facts (as opposed to a full trial type inquiry) that there is reason to believe that such Covered Person will be found entitled to indemnification under this Article.
Section 2. Compromise Payment. As to any matter disposed of (whether by a compromise payment, pursuant to a consent decree or otherwise) without an adjudication on the merits by a court, or by any other body before which the proceeding was brought, that such Covered Person is liable to the Trust or its Shareholders by reason of willful misfeasance, bad faith, gross negligence or reckless disregard of the duties involved in the conduct of his or her office, indemnification shall be provided if (a) approved, after notice that it involves such indemnification, by at least a majority of the disinterested Trustees acting on the matter (provided that a majority of the disinterested Trustees then in office act on the matter) upon a determination, based upon a review of readily available facts (as opposed to a full trial type inquiry) that such Covered Person is not liable to the Trust or its Shareholders by reason of willful misfeasance, bad faith, gross negligence or reckless disregard of the duties involved in the conduct of his or her office (the disinterested Trustees to take final action on the consideration of such approval within 60 days of a request thereof by a Covered Person), or (b) there has been obtained an opinion in writing of independent legal counsel, based upon a review of readily available facts (as opposed to a full trial type inquiry), to the effect that such indemnification would not protect such Covered Person against any liability to the Trust to which he or she would otherwise be subject by reason of willful misfeasance, bad faith, gross negligence or reckless disregard of the duties involved in the conduct of his or her office (which opinion the Trustees shall use reasonable diligence to obtain within 60 days of a request therefor by a Covered Person). Any approval pursuant to this Section shall not prevent the recovery from any Covered Person of any amount paid to such Covered Person in accordance with this Section as indemnification if such Covered Person is subsequently adjudicated by a court of competent jurisdiction to have been liable to the Trust or its Shareholders by reason of willful misfeasance, bad faith, gross negligence or reckless disregard of the duties involved in the conduct of such Covered Person’s office.
Section 3. Rebuttable Presumption. For purposes of the determination or opinion referred to in clause (c) of Section 1 of this Article VIII or clauses (a) or (b) of Section 2 of this Article VIII, the majority of disinterested Trustees acting on the matter or independent legal counsel, as the case may be, shall be entitled to rely upon a rebuttable presumption that the Covered Person has not engaged in willful misfeasance, bad faith, gross negligence, or reckless disregard of the duties involved in the conduct of such Covered Person’s office.
Section 4. Indemnification Not Exclusive. The right of indemnification hereby provided shall not be exclusive of or affect any other rights to which such Covered Person may be entitled. As used in this Article VIII, the term “Covered Person” shall include such person’s heirs, executors and administrators and a “disinterested Trustee” is a Trustee who is not an “interested person” of the Trust as defined in Section 2(a)(19) of the 1940 Act (or who has been exempted from being an “interested person” by any rule, regulation or order of the Commission), and against whom none of such actions, suits or other proceedings or another action, suit or other proceeding on the same or similar grounds is then or has been pending. Nothing contained in this Article shall affect any rights to indemnification to which personnel of the Trust, other than Trustees or officers, and other persons may be entitled by contract or otherwise under law, nor the power of the Trust to purchase and maintain liability insurance on behalf of any such person.
Section 5. No Presumption. The termination of any proceeding by judgment, order, settlement, conviction or upon a plea of nolo contendere or its equivalent shall not of itself create a presumption that a Covered Person did not act in good faith and in a manner which the person reasonably believed to be in the best interests of the Trust or that the person had reasonable cause to believe that the person’s conduct was lawful.
Trustees and officers of the Trust are also indemnified by MassMutual pursuant to its by-laws. No indemnification is provided with respect to any liability to any entity which is registered as an investment company under the Investment Company Act of 1940, as amended (the “1940 Act”) or to the security holders thereof, where the basis for such liability is willful misfeasance, bad faith, gross negligence or reckless disregard of the duties involved in the conduct of office.
MassMutual’s directors’ and officers’ liability insurance program, which covers the Trust’s Trustees and officers, consists of two distinct coverages. The first coverage reimburses MassMutual, subject to specified limitations, for amounts which MassMutual is legally obligated to pay out under its indemnification by-law, discussed above. The second coverage directly protects a Trustee or officer of the Trust against liability from shareholder derivative and similar lawsuits which are not indemnifiable under the law. There are, however, specific acts giving rise to liability which are excluded from this coverage. For example, no Trustee or officer is insured against personal liability for libel or slander, acts of deliberate dishonesty, fines or penalties, illegal personal profit or advantage at the expense of the Trust or its shareholders, violation of employee benefit plans, regulatory statutes, and similar acts which would traditionally run contrary to public policy and hence reimbursement by insurance.
Insofar as indemnification for liabilities arising under the Securities Act of 1933, as amended (the “1933 Act”) may be permitted to trustees, officers and controlling persons of the Trust pursuant to the foregoing provisions, or otherwise, the Trust has been advised that in the opinion of the Securities and Exchange Commission such indemnification is against public policy as expressed in the 1933 Act, and is, therefore, unenforceable. In the event that a claim for indemnification against such liabilities (other than the payment by the Trust of expenses incurred or paid by a Trustee, officer or controlling person of the Trust in the successful defense of any action, suit or proceeding) is asserted by such Trustee, officer or controlling person in connection with the securities being registered, the Trust will, unless in the opinion of its counsel the matter has been settled by controlling precedent, submit to a court of appropriate jurisdiction the question whether such indemnification by it is against public policy as expressed in the 1933 Act and will be governed by the final adjudication of such issue.
Item 16. | Exhibits |
(1) | Intentionally omitted. |
(2) | Intentionally omitted. |
(3) | Incorporated by reference to Registrant’s Post-Effective Amendment No. 35 to the Registration Statement filed via EDGAR on March 31, 2006. |
(4) | Intentionally omitted. |
(5) | Intentionally omitted. |
(6) | Intentionally omitted. |
(7) | Intentionally omitted. |
(8) | Incorporated by reference to Registrant’s Post-Effective Amendment No. 44 to the Registration Statement filed via EDGAR on January 25, 2008. |
(9) | Intentionally omitted. |
(10) | Incorporated by reference to Registrant’s Post-Effective Amendment No. 46 to the Registration Statement filed via EDGAR on January 26, 2009. |
(11) | Intentionally omitted. |
(12) | Intentionally omitted. |
(13) | Intentionally omitted. |
(14) | Intentionally omitted. |
(15) | Intentionally omitted. |
(16) | Intentionally omitted. |
(17) | Intentionally omitted. |
(18) | Intentionally omitted. |
(19) | Intentionally omitted. |
(20) | Intentionally omitted. |
(21) | Intentionally omitted. |
(22) | Intentionally omitted. |
(23) | Incorporated by reference to Registrant’s Post-Effective Amendment No. 60 to the Registration Statement filed via EDGAR on June 20, 2011. |
(24) | Incorporated by reference to Registrant’s Post-Effective Amendment No. 62 to the Registration Statement filed via EDGAR on October 7, 2011. |
(25) | Intentionally omitted. |
(26) | Incorporated by reference to Registrant’s Post-Effective Amendment No. 65 to the Registration Statement filed via EDGAR on February 1, 2012. |
(27) | Intentionally omitted. |
(28) | Incorporated by reference to Registrant’s Post-Effective Amendment No. 70 to the Registration Statement filed via EDGAR on July 25, 2012. |
(29) | Intentionally omitted. |
(30) | Intentionally omitted. |
(31) | Intentionally omitted. |
(32) | Incorporated by reference to Registrant’s Post-Effective Amendment No. 76 to the Registration Statement filed via EDGAR on September 16, 2013. |
(33) | Intentionally omitted. |
(34) | Incorporated by reference to Registrant’s Post-Effective Amendment No. 79 to the Registration Statement filed via EDGAR on April 1, 2014. |
(35) | Incorporated by reference to Registrant’s Post-Effective Amendment No. 81 to the Registration Statement filed via EDGAR on January 30, 2015. |
(36) | Intentionally omitted. |
(37) | Incorporated by reference to Registrant’s Post-Effective Amendment No. 84 to the Registration Statement filed via EDGAR on September 9, 2015. |
(38) | Intentionally omitted. |
(39) | Intentionally omitted. |
(40) | Intentionally omitted. |
(41) | Intentionally omitted. |
(42) | Intentionally omitted. |
(43) | Incorporated by reference to Registrant’s Post-Effective Amendment No. 96 to the Registration Statement filed via EDGAR on October 27, 2017. |
(44) | Incorporated by reference to Registrant’s Post-Effective Amendment No. 97 to the Registration Statement filed via EDGAR on December 1, 2017. |
(45) | Intentionally omitted. |
(46) | Incorporated by reference to Registrant’s Post-Effective Amendment No. 100 to the Registration Statement filed via EDGAR on January 31, 2018. |
(47) | Intentionally omitted. |
(48) | Incorporated by reference to Registrant’s Post-Effective Amendment No. 103 to the Registration Statement filed via EDGAR on January 31, 2019. |
(49) | Incorporated by reference to Registrant’s Post-Effective Amendment No. 105 to the Registration Statement filed via EDGAR on December 3, 2019. |
(50) | Intentionally omitted. |
(51) | Incorporated by reference to Registrant’s Post-Effective Amendment No. 108 to the Registration Statement filed via EDGAR on December 3, 2020. |
(52) | Incorporated by reference to Registrant’s Post-Effective Amendment No. 109 to the Registration Statement filed via EDGAR on January 29, 2021. |
(53) | Incorporated by reference to Registrant’s Post-Effective Amendment No. 110 to the Registration Statement filed via EDGAR on December 3, 2021. |
(54) | Incorporated by reference to Registrant’s Post-Effective Amendment No. 111 to the Registration Statement filed via EDGAR on January 31, 2022. |
(55) | Intentionally omitted. |
(56) | Incorporated by reference to Registrant’s Post-Effective Amendment No. 113 to the Registration Statement filed via EDGAR on January 31, 2023. |
(57) | Incorporated by reference to Registrant’s Post-Effective Amendment No. 114 to the Registration Statement filed via EDGAR on February 2, 2024. |
Item 17. | Undertakings |
(1) The undersigned Registrant agrees that prior to any public reoffering of the securities registered through the use of a prospectus which is a part of this registration statement by any person or party who is deemed to be an underwriter within the meaning of Rule 145(c) under the Securities Act, the reoffering prospectus will contain the information called for by the applicable registration form for reofferings by persons who may be deemed underwriters, in addition to the information called for by the other items of the applicable form.
(2) The undersigned Registrant agrees that every prospectus that is filed under paragraph (1) above will be filed as a part of an amendment to the registration statement and will not be used until the amendment is effective, and that, in determining any liability under the Securities Act, each post-effective amendment shall be deemed to be a new registration statement for the securities offered therein, and the offering of the securities at that time shall be deemed to be the initial bona fide offering of them.
(3) The undersigned Registrant agrees to file an opinion of counsel supporting the tax consequences of the proposed reorganization as an amendment to this registration statement within a reasonable time after receipt of such opinion.
(4) The undersigned Registrant agrees to file any additional material contracts of the Registrant with an amendment to this registration statement within a reasonable time after the execution of such contracts.
NOTICE
A copy of MassMutual Select Funds’ Amended and Restated Agreement and Declaration of Trust is on file with the Secretary of The Commonwealth of Massachusetts and notice is hereby given that this instrument is executed on behalf of the Registrant by an officer of the Registrant as an officer and not individually and the obligations of or arising out of this instrument are not binding upon any of the Trustees, officers or shareholders individually but are binding only upon the assets and property of the relevant series of the Registrant.
SIGNATURES
As required by the Securities Act of 1933, this registration statement has been signed on behalf of the Registrant, in the City of Springfield and Commonwealth of Massachusetts, on the 3rd day of July, 2024.
MassMutual Select Funds | By: | /s/ Douglas Steele | |
Registrant | Douglas Steele | ||
President |
As required by the Securities Act of 1933, this registration statement has been signed by the following persons in the capacities as indicated as of the 3rd day of July, 2024.
Signature | Title | |
* | President | |
Douglas Steele | (Principal Executive Officer) | |
* | Chief Financial Officer and Treasurer | |
Renee Hitchcock | (Principal Financial Officer) | |
* | Chairperson and Trustee | |
Susan B. Sweeney | ||
* | Trustee | |
Nabil N. El-Hage | ||
* | Trustee | |
Maria D. Furman | ||
* | Trustee | |
Paul LaPiana | ||
* | Trustee | |
R. Bradford Malt | ||
* | Trustee | |
C. Ann Merrifield | ||
* | Trustee | |
Clifford M. Noreen | ||
* | Trustee | |
Cynthia R. Plouché | ||
* | Trustee | |
Jason J. Price |
*By: | /s/ Andrew M. Goldberg | |
Andrew M. Goldberg | ||
Attorney-in-Fact |
INDEX TO EXHIBITS