Exhibit 99.1

Exhibit 99.1
Health Net, Inc.
2012 Investor Day
February 16, 2012
Cautionary Statements
Health Net, Inc. and its representatives may from time to time make written and oral forward-looking statements within the meaning of the Private Securities Litigation Reform Act (“PSLRA”) of 1995, including statements in this and other presentations, in press releases, filings with the Securities and Exchange Commission (“SEC”), reports to stockholders and in meetings with investors and analysts. All statements in this presentation, other than statements of historical information provided herein, including the guidance for future periods and the assumptions underlying such projections, may be deemed to be forward-looking statements and as such are intended to be covered by the safe harbor for “forward-looking statements” provided by PSLRA. These statements are based on management’s analysis, judgment, belief and expectation only as of the date hereof, and are subject to changes in circumstances and a number of risks and uncertainties. Without limiting the foregoing, the guidance as to expected future period results and statements including the words “believes,” “anticipates,” “plans,” “expects,” “may,” “should,” “could,” “estimate,” “intend,” “feels,” “will,” “projects” and other similar expressions are intended to identify forward-looking statements. Actual results could differ materially from those expressed in, or implied or projected by the forward-looking information and statements due to, among other things, health care reform and other increased government participation in and regulation of health benefits and managed care operations, including the ultimate impact of the Affordable Care Act, which could materially adversely affect Health Net’s financial condition, results of operations and cash flows through, among other things, reduced revenues, new taxes, expanded liability, and increased costs (including medical, administrative, technology or other costs), or require changes to the ways in which Health Net does business; rising health care costs; continued slow economic growth or a further decline in the economy; negative prior period claims reserve developments; trends in medical care ratios; membership declines; unexpected utilization patterns or unexpectedly severe or widespread illnesses; rate cuts and other risks and uncertainties affecting Health Net’s Medicare or Medicaid businesses; litigation costs; regulatory issues with federal and state agencies including, but not limited to, the California Department of Managed Health Care, the Centers for Medicare & Medicaid Services, the Office of Civil Rights of the U.S. Department of Health and Human Services and state departments of insurance; operational issues; failure to effectively oversee our third party vendors; noncompliance by Health Net or Health Net’s business associates with any privacy laws or any security breach involving the misappropriation, loss or other unauthorized use or disclosure of confidential information; any liabilities of the Northeast business that were incurred prior to the closing of its sale as well as those liabilities incurred through the winding-up and running-out period of the Northeast business; Health Net’s ability to complete proposed dispositions on a timely basis or at all; investment portfolio impairment charges; volatility in the financial markets; and general business and market conditions.
Additional factors that could cause actual results to differ materially from those reflected in the forward-looking statements include, but are not limited to, the risks discussed in the “Risk Factors” section included within Health Net’s most recent Annual Report on Form 10-K and subsequent Quarterly Reports on Form 10-Q filed with the SEC and the risks discussed in Health Net’s other filings with the SEC. Audience members are cautioned not to place undue reliance on these forward-looking statements. Except as may be required by law, Health Net undertakes no obligation to address or publicly update its guidance, the assessment of the underlying assumptions or any of its forward-looking statements to reflect events or circumstances that arise after the date of these presentations.
Health Net, Inc. | 2012 Investor Day | February 16, 2012
2 |
|

Agenda
8.30 a.m. – 9.00 a.m. Welcoming Remarks
Angeline McCabe, Vice President, Investor Relations
Introduction and Strategic Overview
Jay Gellert, President and Chief Executive Officer
9.00 a.m. – 9.45 a.m. Commercial
Steven Sell, President, Western Region Health Plan
Underwriting and Actuarial Review
Richard Hall, Chief Actuarial Officer
9.45 a.m. – 11.00 a.m. Government Contracts
Thomas Carrato, President, Health Net Federal Services
Medicare
Scott Law, Chief Medicare Officer
Medicaid
Steven Tough, President, Government Programs
11.00 a.m. – 11.45 a.m. Operations Review
James Woys, Chief Operating Officer
Financial Review
Joseph Capezza, Chief Financial Officer
Closing Remarks
Jay Gellert, President and Chief Executive Officer
Health Net, Inc. | 2012 Investor Day | February 16, 2012
Note: Presentation times are subject to change.
3

Setting the Stage
Jay Gellert
President and Chief Executive Officer
Health Net, Inc. | 2012 Investor Day | February 16, 2012

Today’s Agenda
• Setting the stage
• Three panels
– Commercial businesses
– Government businesses
– Operations and financial review
• Summary and outlook
Health Net, Inc. | 2012 Investor Day | February 16, 2012
2
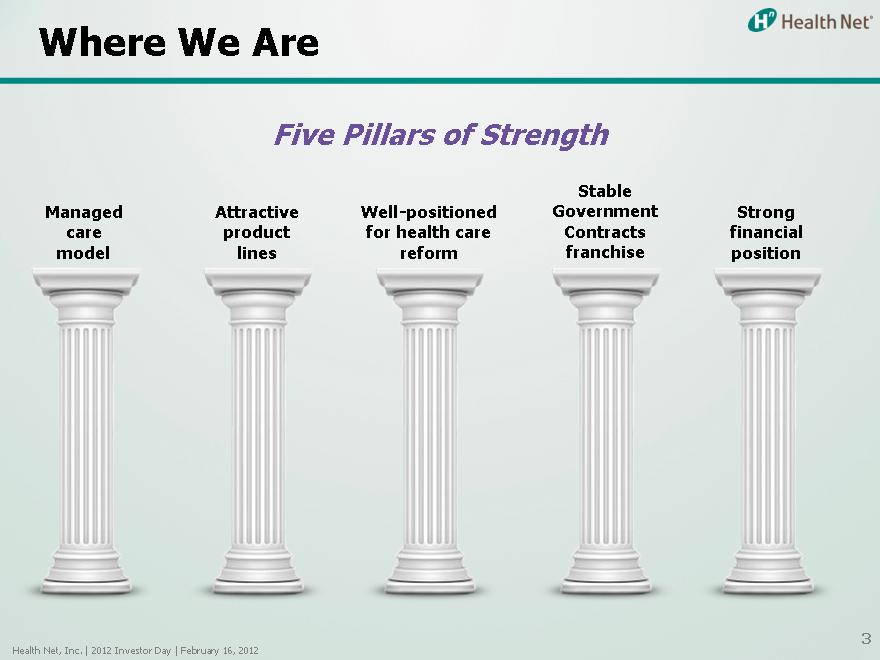
Where We Are
Five Pillars of Strength
Stable
Managed Attractive Well-positioned Government Strong care product for health care Contracts financial model lines reform franchise position
Health Net, Inc. | 2012 Investor Day | February 16, 2012
3 |
|
The Environment
• Economy driving change, focused on cost
• Commercial customers need affordable products with adequate coverage
• Government customers facing increasing budget pressures
• Providers seeking opportunities to transform
• Health care reform implementation and timetable still uncertain
Health Net, Inc. | 2012 Investor Day | February 16, 2012
4
The Pace of Change is Intensifying
• Commercial customers
• State efforts
• Federal initiatives
• Providers and other partners
Health Net, Inc. | 2012 Investor Day | February 16, 2012
5
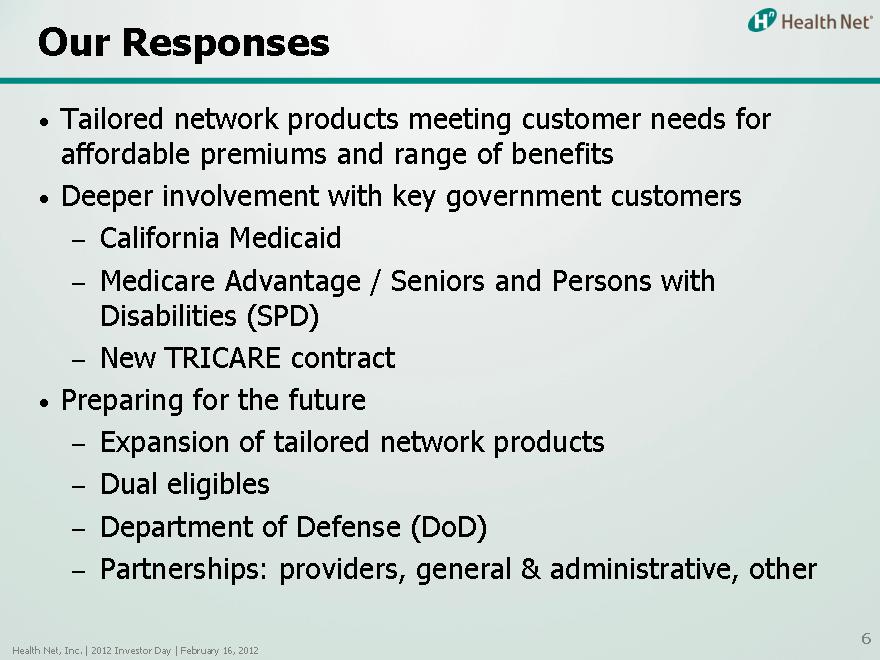
Our Responses
• Tailored network products meeting customer needs for affordable premiums and range of benefits
• Deeper involvement with key government customers
– California Medicaid
– Medicare Advantage / Seniors and Persons with Disabilities (SPD)
– New TRICARE contract
• Preparing for the future
– Expansion of tailored network products
– Dual eligibles
– Department of Defense (DoD)
– Partnerships: providers, general & administrative, other
Health Net, Inc. | 2012 Investor Day | February 16, 2012
6

Today’s Agenda
• Setting the stage
• Three panels
– Commercial business
– Government businesses
– Operations and financial review
• Summary and outlook
Health Net, Inc. | 2012 Investor Day | February 16, 2012
7
A Sustainable Commercial Strategy
Steve Sell
President, Western Region Health Plan
Health Net, Inc. | 2012 Investor Day | February 16, 2012
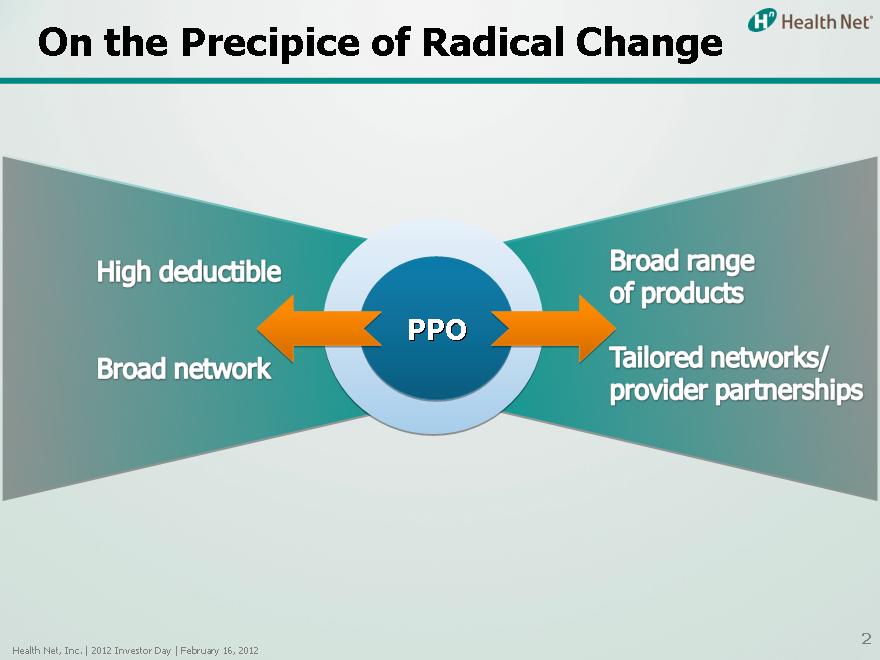
On the Precipice of Radical Change
High deductible
Broad network
Broad range of products
Tailored networks/provider partners
PPO
Health Net, Inc. | 2012 Investor Day | February 16, 2012
2 |
|
Why the Change?
Economy
Buyer choice, comfort with managed care
Regulatory reform, standardized products Exchanges Provider transformation
Health Net, Inc. | 2012 Investor Day | February 16, 2012
3 |
|
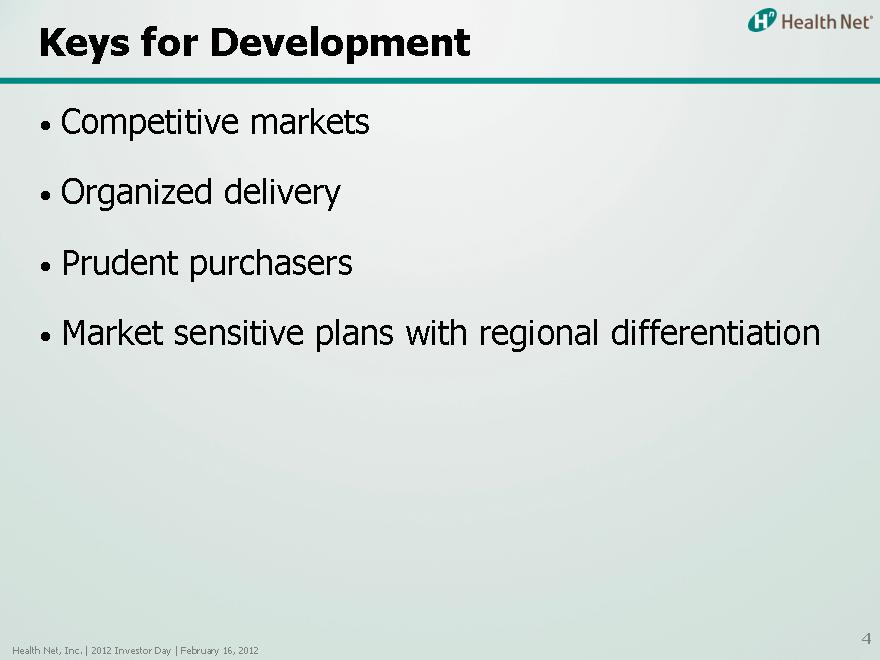
Keys for Development
Competitive markets Organized delivery Prudent purchasers
Market sensitive plans with regional differentiation
Health Net, Inc. | 2012 Investor Day | February 16, 2012
4 |
|
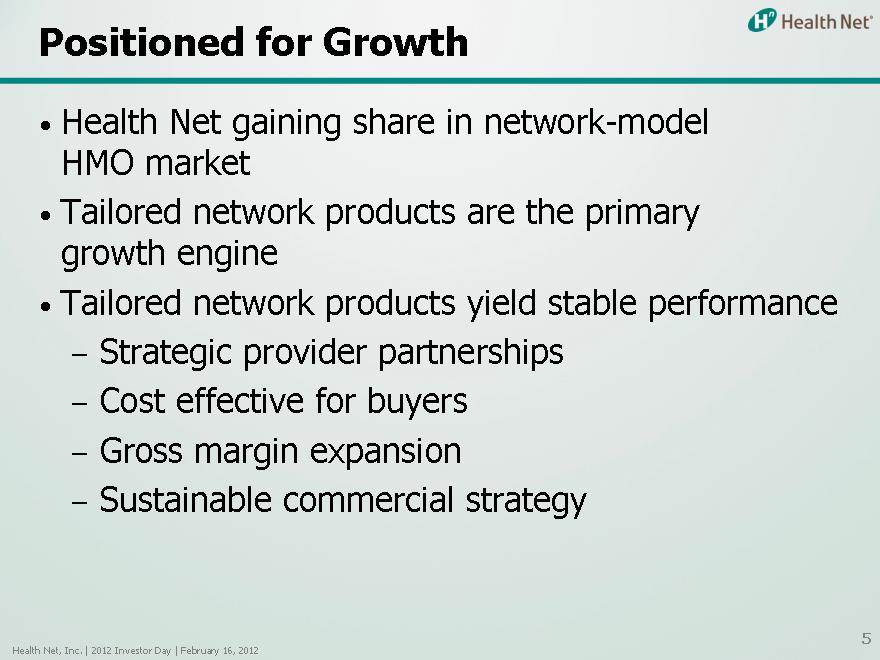
Positioned for Growth
Health Net gaining share in network-model HMO market Tailored network products are the primary growth engine Tailored network products yield stable performance
Strategic provider partnerships Cost effective for buyers Gross margin expansion Sustainable commercial strategy
Health Net, Inc. | 2012 Investor Day | February 16, 2012
5 |
|
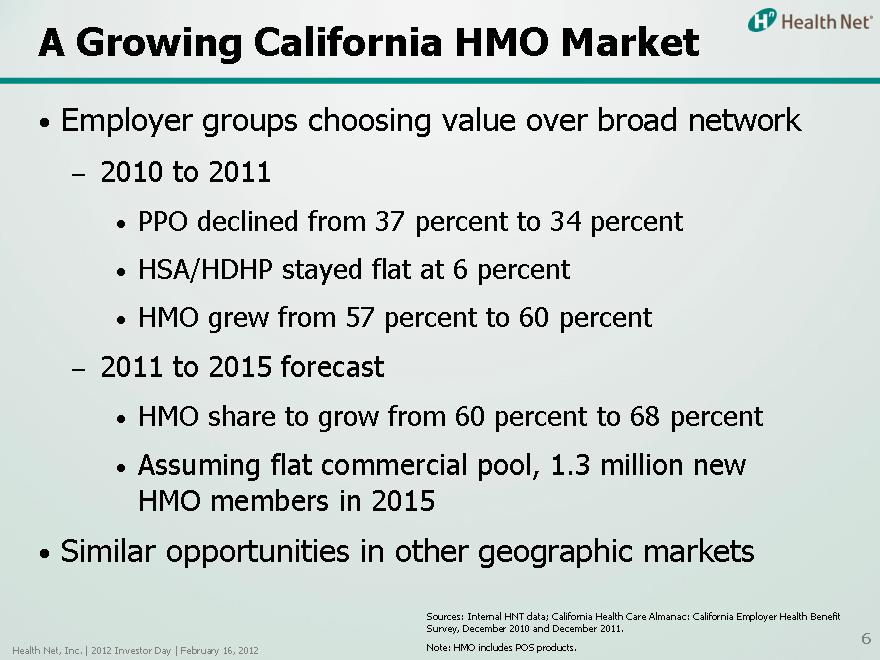
A Growing California HMO Market
Employer groups choosing value over broad network
– 2010 to 2011
• PPO declined from 37 percent to 34 percent
• HSA/HDHP stayed flat at 6 percent
• HMO grew from 57 percent to 60 percent
– 2011 to 2015 forecast
• HMO share to grow from 60 percent to 68 percent
• Assuming flat commercial pool, 1.3 million new HMO members in 2015 Similar opportunities in other geographic markets
Health Net, Inc. | 2012 Investor Day | February 16, 2012
Sources: Internal HNT data; California Health Care Almanac: California Employer Health Benefit Survey, December 2010 and December 2011.
Note: HMO includes POS products.
6 |
|
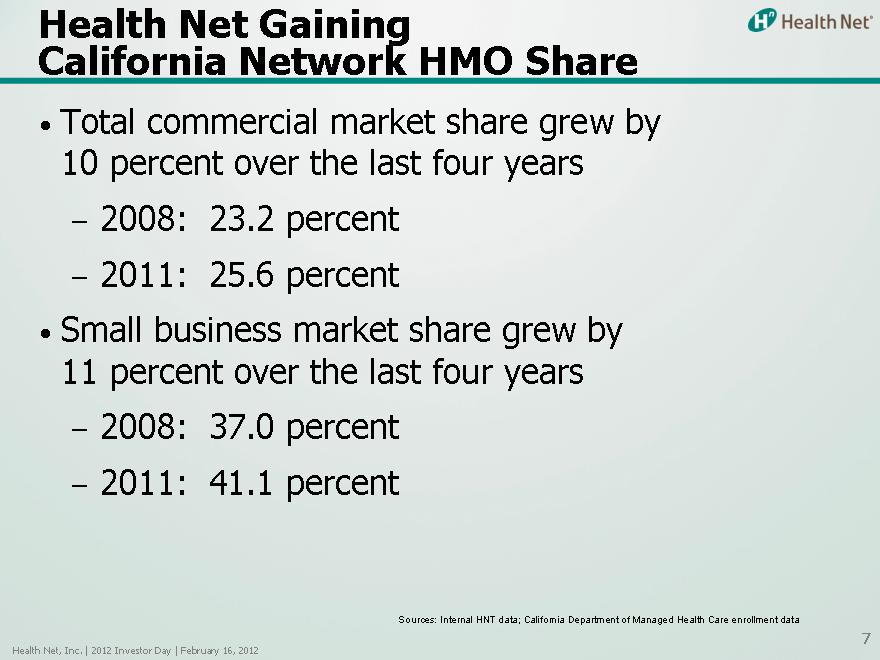
Health Net Gaining
California Network HMO Share
Total commercial market share grew by 10 percent over the last four years
2008: 23.2 percent 2011: 25.6 percent
Small business market share grew by 11 percent over the last four years
2008: 37.0 percent 2011: 41.1 percent
Health Net, Inc. | 2012 Investor Day | February 16, 2012
Sources: Internal HNT data; California Department of Managed Health Care enrollment data
7 |
|
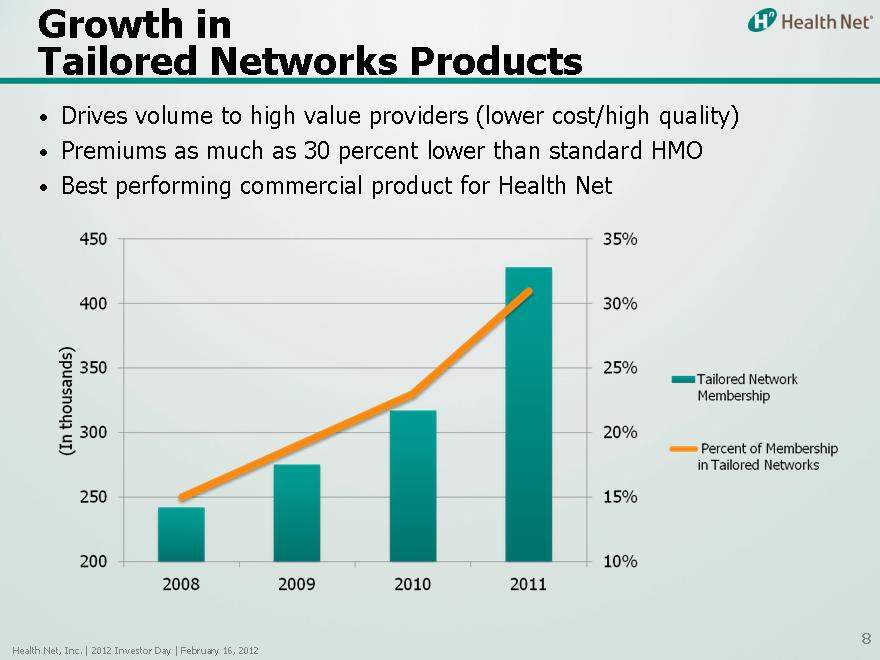
Growth in
Tailored Networks Products
Drives volume to high value providers (lower cost/high quality) Premiums as much as 30 percent lower than standard HMO
Best performing commercial product for Health Net
450
400
n ds) 350 thousa 300 (In
250
200
2008 2009 2010 2011
35% 30% 25% 20% 15%
10%
Tailored Network Membership
Percent of Membership in Tailored Networks
Health Net, Inc. | 2012 Investor Day | February 16, 2012
8 |
|

Evolution of
Tailored Network Products
Providers tiered based on cost and quality
Tailored to targeted populations
• Market segments, key employers, geography
Sustained growth through strategic provider partnerships
• Banner, Sutter, Legacy, more to come …
Health Net, Inc. | 2012 Investor Day | February 16, 2012
9
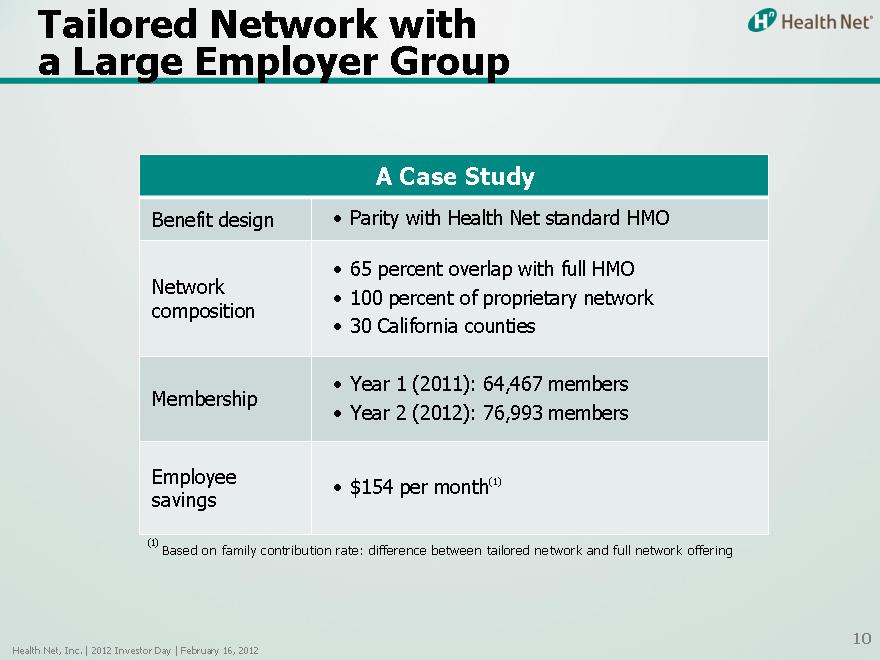
Tailored Network with a Large Employer Group
A Case Study
Benefit design • Parity with Health Net standard HMO
• 65 percent overlap with full HMO
Network
• 100 percent of proprietary network composition
• 30 California counties
• Year 1 (2011): 64,467 members Membership
• Year 2 (2012): 76,993 members
Employee (1)
• $154 per month savings
(1) |
| Based on family contribution rate: difference between tailored network and full network offering |
Health Net, Inc. | 2012 Investor Day | February 16, 2012
10
Creating Virtual Staff Models
Founded on HNT’s managed care capability
Market driven (access, affordability, quality)
Service-focused (personal, simple, local) Sustained through provider partnerships
Health Net, Inc. | 2012 Investor Day | February 16, 2012
11
A Sustainable Commercial Strategy
Move from PPO to tailored networks and strategic partnerships
Alignment with customers and delivery system partners
Multiple-year deals
Fixed budget vs. fee-for service
Shared growth and savings goals
Targeted segment, regional and product expansion Continued underwriting and pricing discipline Continued gross margin expansion
Health Net, Inc. | 2012 Investor Day | February 16, 2012
12

Underwriting and Actuarial Review
Richard Hall, FSA, MAAA Chief Actuarial Officer
Health Net, Inc. | 2012 Investor Day | February 16, 2012
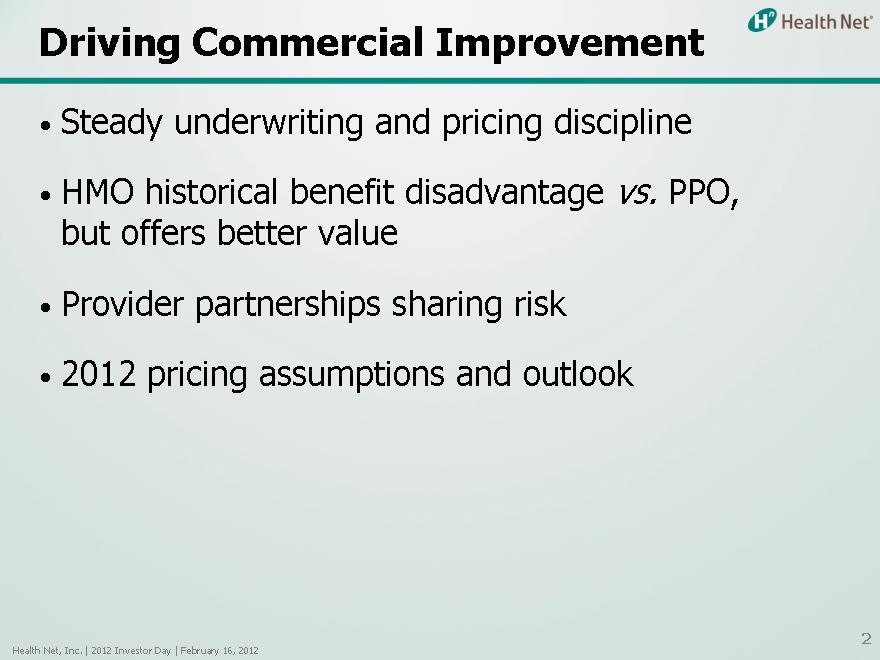
Driving Commercial Improvement
Steady underwriting and pricing discipline
HMO historical benefit disadvantage vs. PPO, but offers better value Provider partnerships sharing risk
2012 pricing assumptions and outlook
Health Net, Inc. | 2012 Investor Day | February 16, 2012
2 |
|
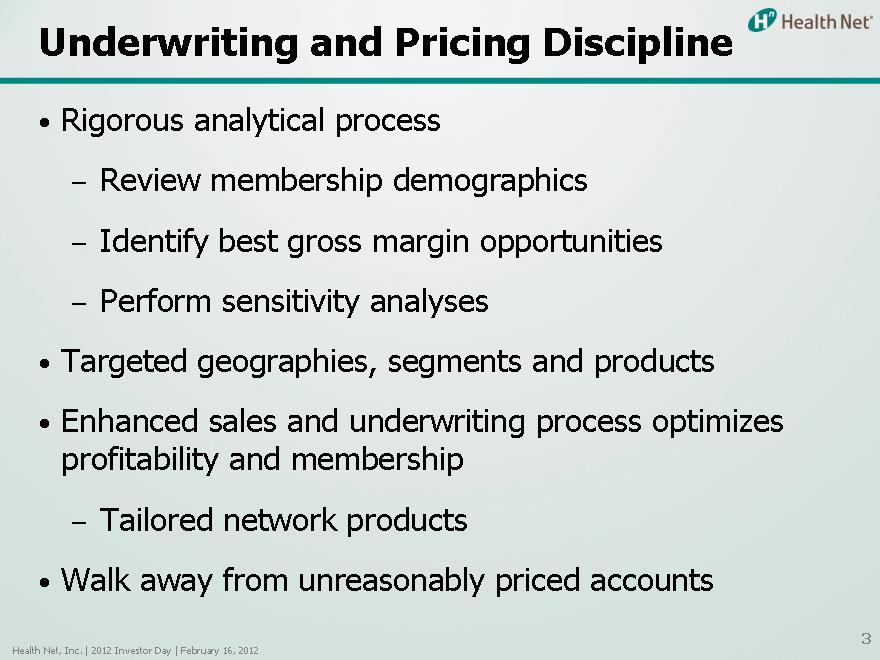
Underwriting and Pricing Discipline
Rigorous analytical process
Review membership demographics
Identify best gross margin opportunities Perform sensitivity analyses
Targeted geographies, segments and products Enhanced sales and underwriting process optimizes profitability and membership
Tailored network products
Walk away from unreasonably priced accounts
Health Net, Inc. | 2012 Investor Day | February 16, 2012
3 |
|
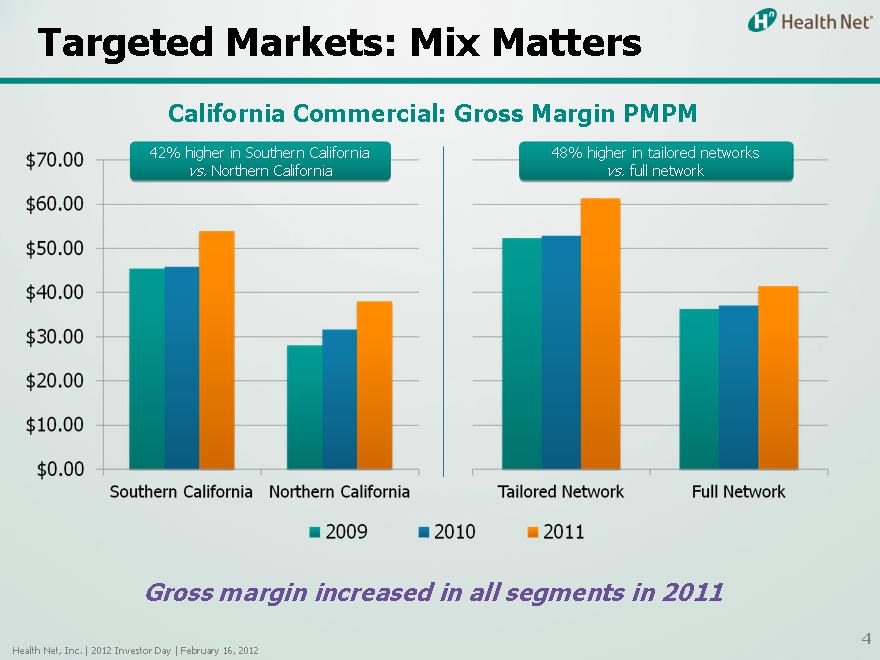
Targeted Markets: Mix Matters
California Commercial: Gross Margin PMPM
$70.00
$60.00
$50.00
$40.00
$30.00
$20.00
$10.00
$0.00
42% higher in Southern California vs. Northern California
Southern California Northern California
48% higher in tailored networks vs. full network
Tailored Network Full Network
2009
2010
2011
Gross margin increased in all segments in 2011
Health Net, Inc. | 2012 Investor Day | February 16, 2012
4 |
|
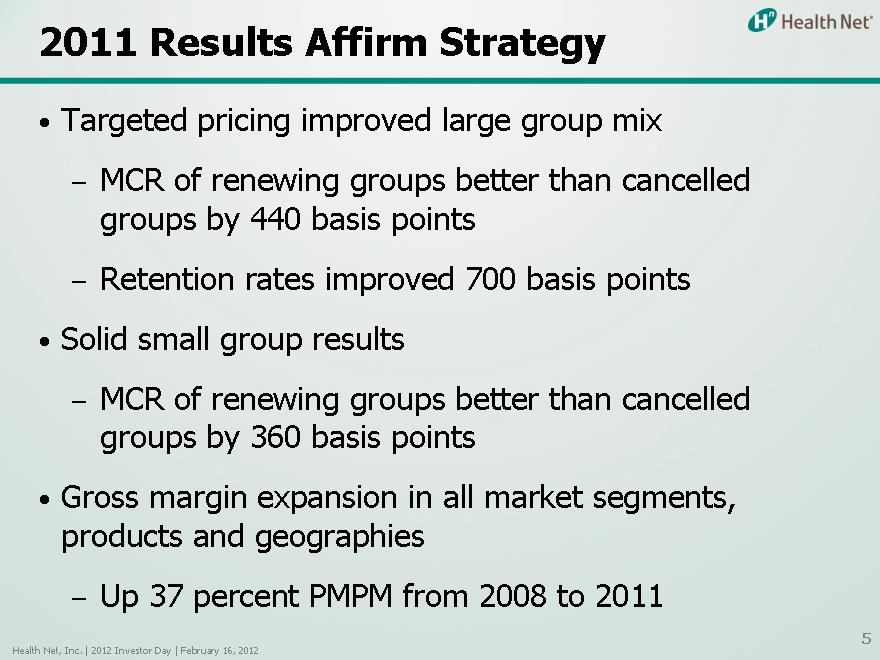
2011 Results Affirm Strategy
Targeted pricing improved large group mix
– MCR of renewing groups better than cancelled groups by 440 basis points
– Retention rates improved 700 basis points
Solid small group results
– MCR of renewing groups better than cancelled groups by 360 basis points Gross margin expansion in all market segments, products and geographies
– Up 37 percent PMPM from 2008 to 2011
Health Net, Inc. | 2012 Investor Day | February 16, 2012
5 |
|
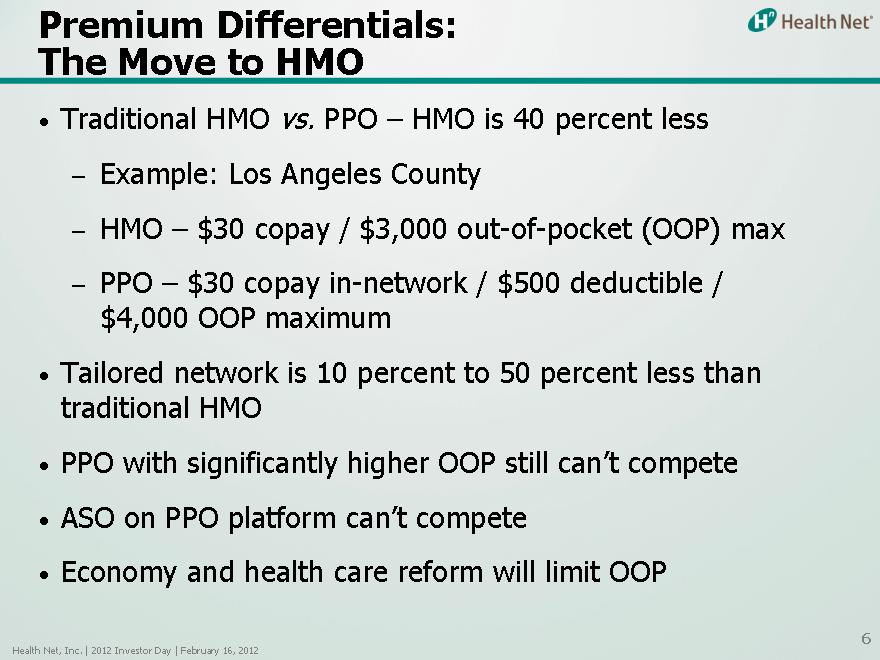
The Premium Move Differentials: to HMO
Traditional HMO vs. PPO – HMO is 40 percent less
– Example: Los Angeles County
– HMO – $30 copay / $3,000 out-of-pocket (OOP) max
– PPO – $30 copay in-network / $500 deductible / $4,000 OOP maximum
Tailored network is 10 percent to 50 percent less than traditional HMO
PPO with significantly higher OOP still can’t compete ASO on PPO platform can’t compete Economy and health care reform will limit OOP
Health Net, Inc. | 2012 Investor Day | February 16, 2012
6 |
|
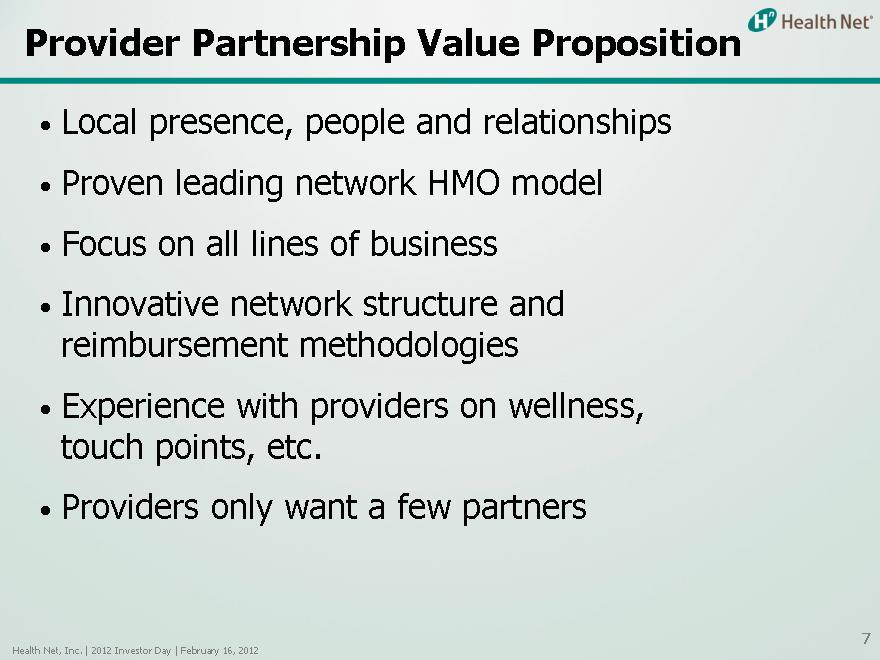
Provider Partnership Value Proposition
Local presence, people and relationships Proven leading network HMO model
Focus on all lines of business Innovative network structure and reimbursement methodologies Experience with providers on wellness, touch points, etc.
Providers only want a few partners
Health Net, Inc. | 2012 Investor Day | February 16, 2012
7 |
|
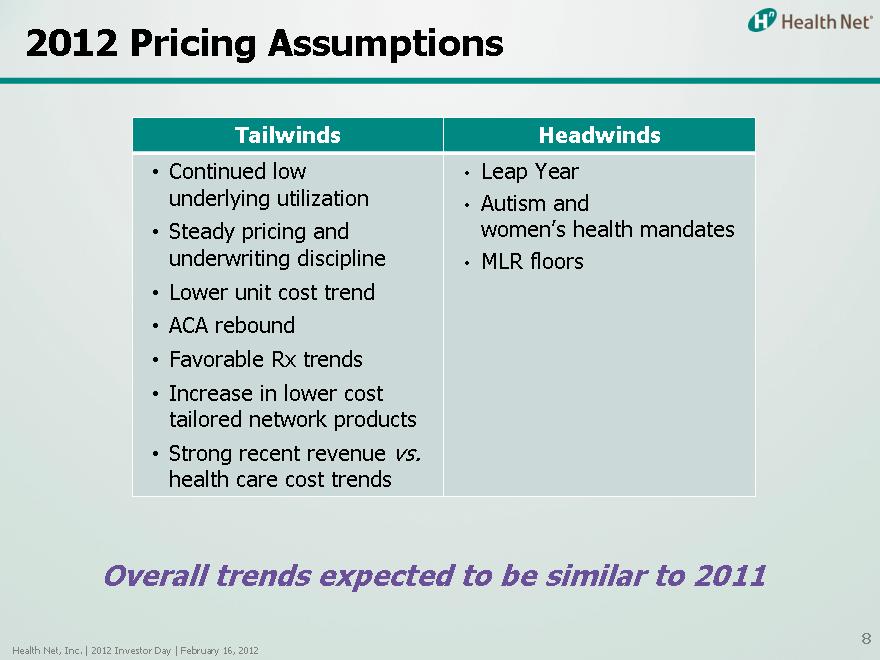
2012 Pricing Assumptions
Tailwinds
Continued low underlying utilization Steady pricing and underwriting discipline Lower unit cost trend ACA rebound Favorable Rx trends Increase in lower cost tailored network products Strong recent revenue vs. health care cost trends
Headwinds
Leap Year Autism and women’s health mandates MLR floors
Overall trends expected to be similar to 2011
Health Net, Inc. | 2012 Investor Day | February 16, 2012
8 |
|
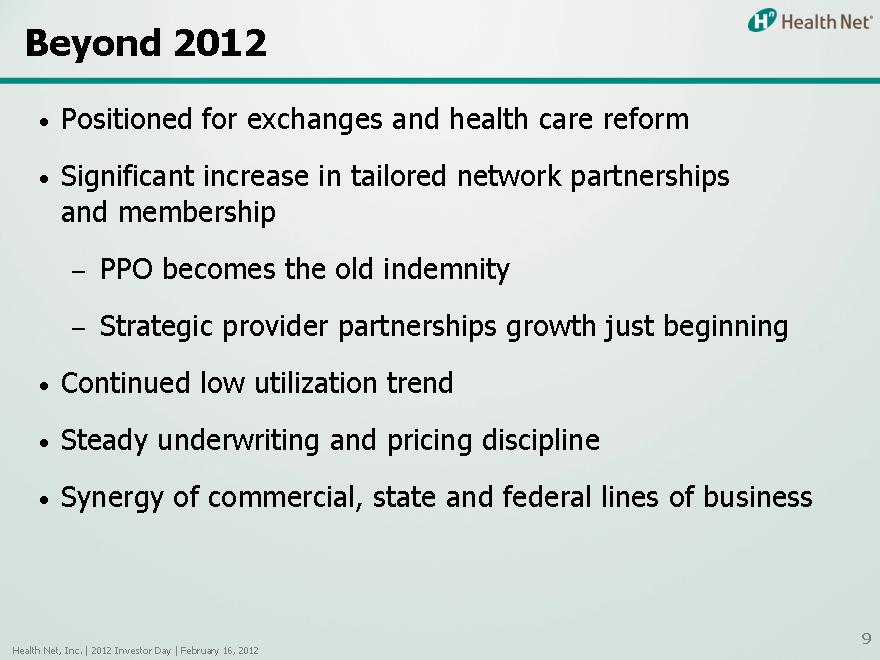
Beyond 2012
Positioned for exchanges and health care reform Significant increase in tailored network partnerships and membership
– PPO becomes the old indemnity
– Strategic provider partnerships growth just beginning
Continued low utilization trend
Steady underwriting and pricing discipline
Synergy of commercial, state and federal lines of business
Health Net, Inc. | 2012 Investor Day | February 16, 2012
9

Government Programs
Steve Tough
President, Government Programs
Health Net, Inc. | 2012 Investor Day | February 16, 2012

Government Programs
Government Programs include:
– Department of Defense (DoD)
• TRICARE
• Behavioral health
– Department of Veterans Affairs (VA)
– Medicare
– Medicaid
Health Net, Inc. | 2012 Investor Day | February 16, 2012
2 |
|
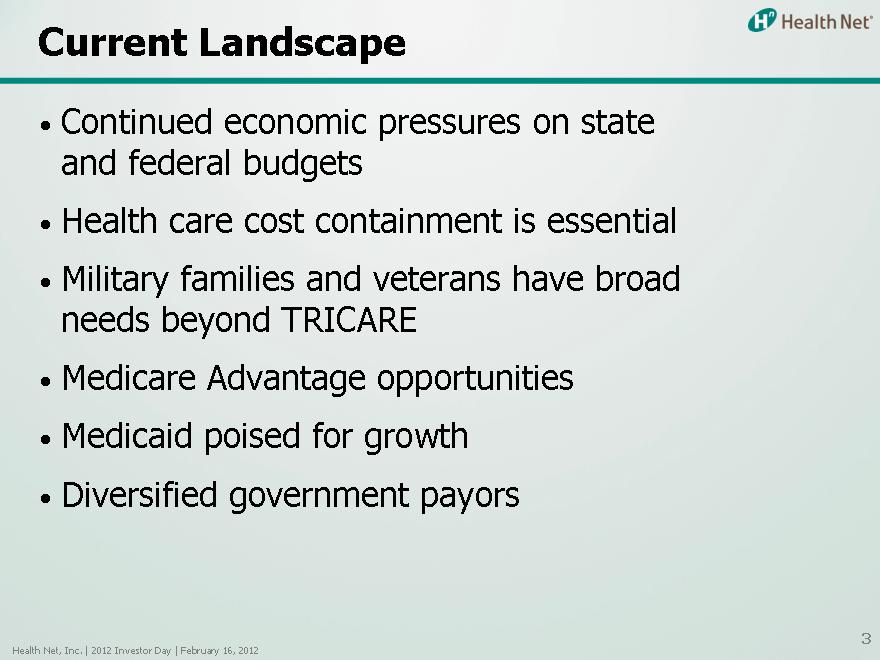
Current Landscape
Continued economic pressures on state and federal budgets Health care cost containment is essential
Military families and veterans have broad needs beyond TRICARE
Medicare Advantage opportunities
Medicaid poised for growth Diversified government payors
Health Net, Inc. | 2012 Investor Day | February 16, 2012
3 |
|
Government Contracts
Tom Carrato
President, Health Net Federal Services
Health Net, Inc. | 2012 Investor Day | February 16, 2012

Time of Change
Historical view of DoD and VA health Impact of budget pressures Role for the private sector
Health Net, Inc. | 2012 Investor Day | February 16, 2012
5 |
|
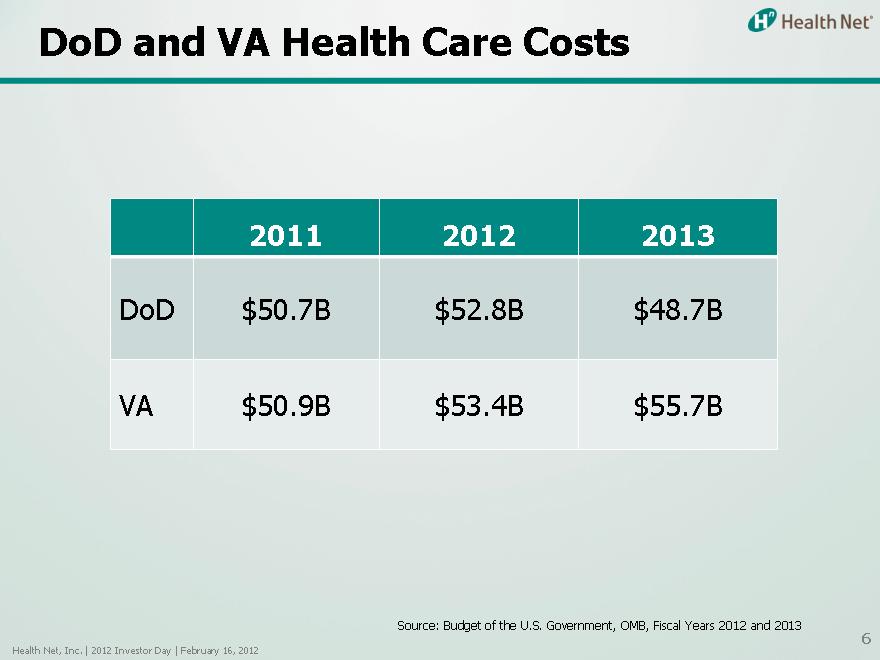
DoD and VA Health Care Costs
2011 2012 2013
DoD $50.7B $52.8B $48.7B
VA $50.9B $53.4B $55.7B
Source: Budget of the U.S. Government, OMB, Fiscal Years 2012 and 2013
Health Net, Inc. | 2012 Investor Day | February 16, 2012
6 |
|
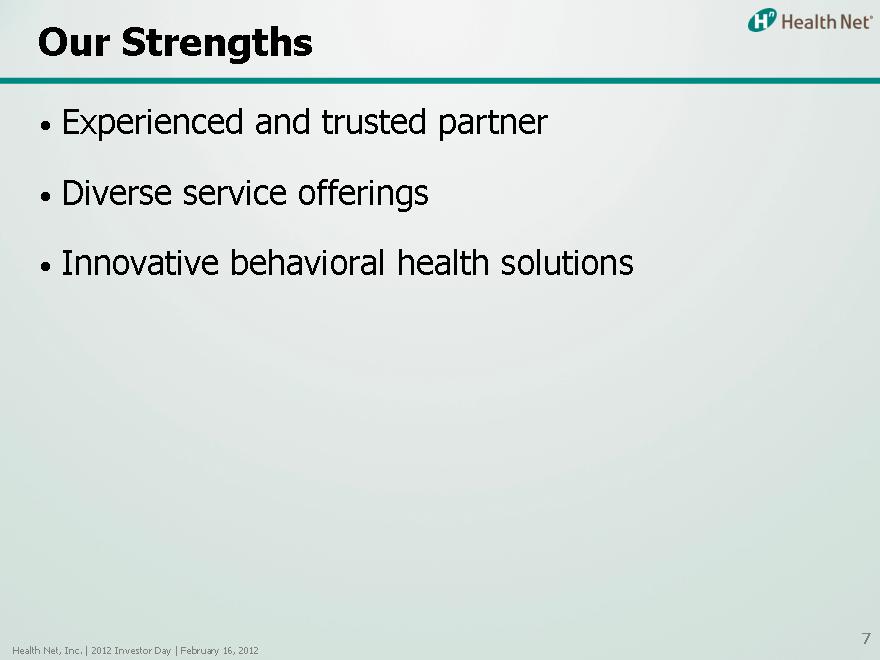
Our Strengths
Experienced and trusted partner Diverse service offerings
Innovative behavioral health solutions
Health Net, Inc. | 2012 Investor Day | February 16, 2012
7 |
|
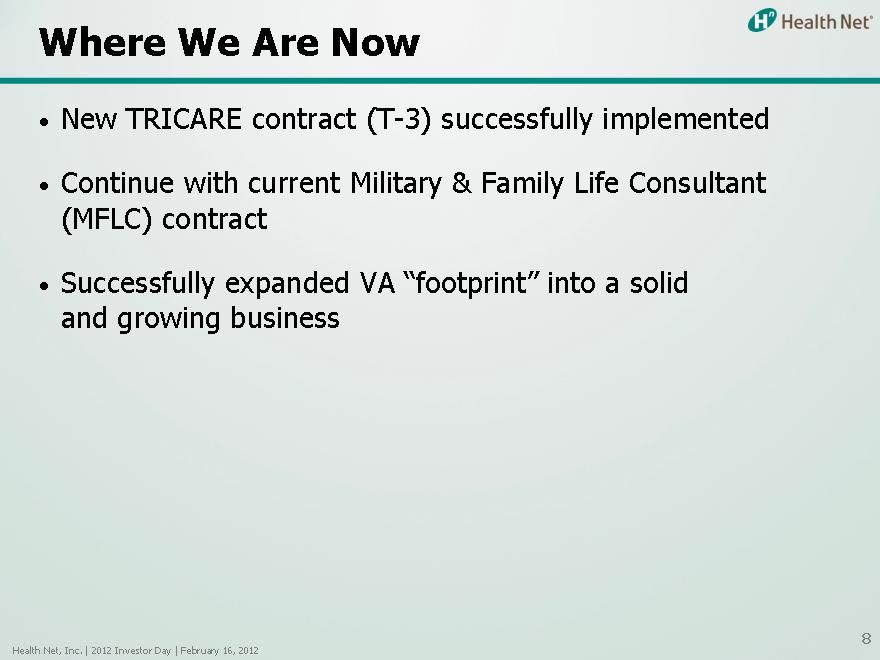
Where We Are Now
New TRICARE contract (T-3) successfully implemented
Continue with current Military & Family Life Consultant (MFLC) contract
Successfully expanded VA “footprint” into a solid and growing business
Health Net, Inc. | 2012 Investor Day | February 16, 2012
8 |
|
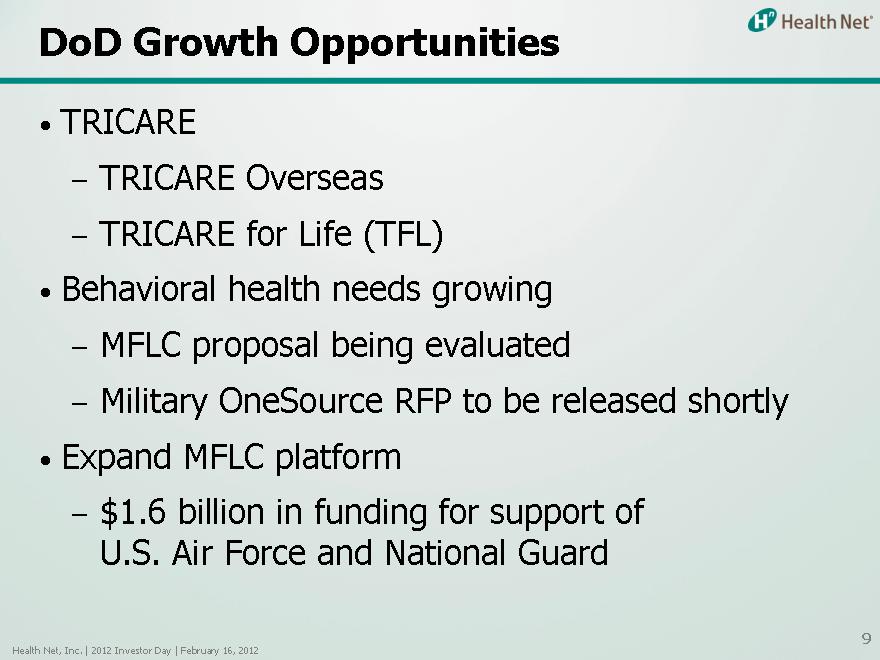
DoD Growth Opportunities
TRICARE
– TRICARE Overseas
– TRICARE for Life (TFL)
Behavioral health needs growing
– MFLC proposal being evaluated
– Military OneSource RFP to be released shortly Expand MFLC platform
– $1.6 billion in funding for support of U.S. Air Force and National Guard
Health Net, Inc. | 2012 Investor Day | February 16, 2012
9
TRICARE for Life
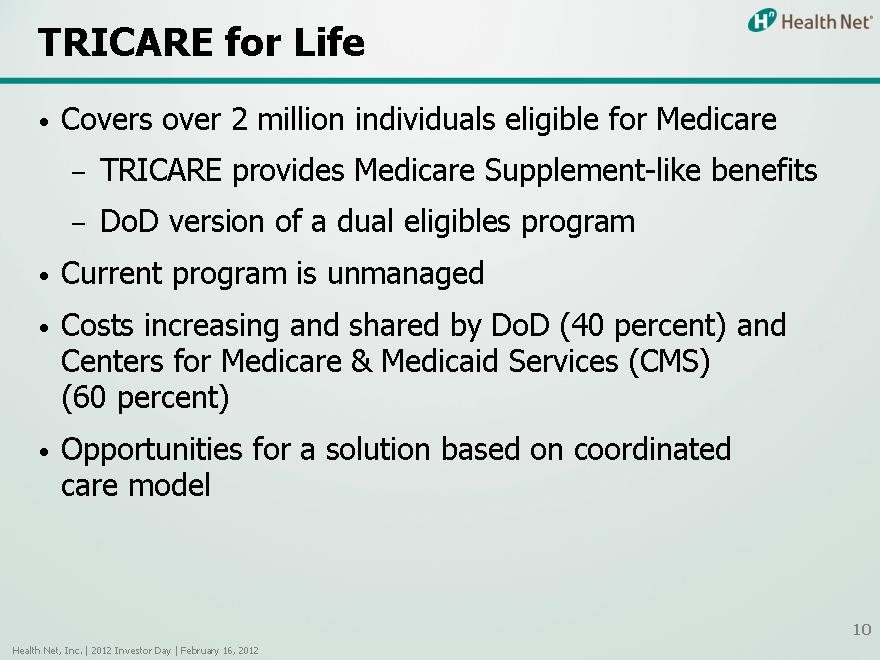
Covers over 2 million individuals eligible for Medicare
– TRICARE provides Medicare Supplement-like benefits
– DoD version of a dual eligibles program
Current program is unmanaged
Costs increasing and shared by DoD (40 percent) and Centers for Medicare & Medicaid Services (CMS) (60 percent) Opportunities for a solution based on coordinated care model
Health Net, Inc. | 2012 Investor Day | February 16, 2012
10
Veterans Affairs Growth Opportunities
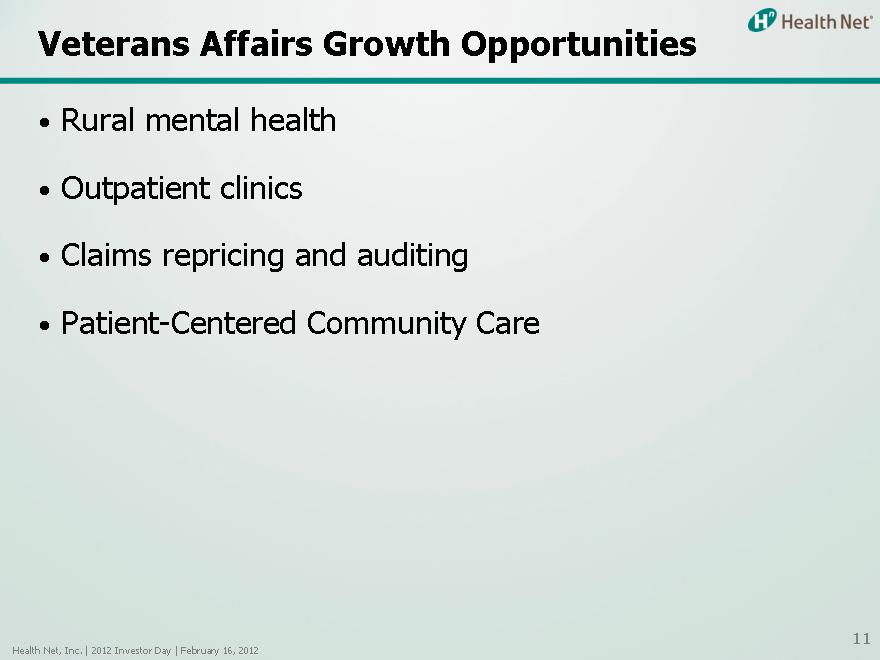
Rural mental health
Outpatient clinics
Claims repricing and auditing Patient-Centered Community Care
Health Net, Inc. | 2012 Investor Day | February 16, 2012
11
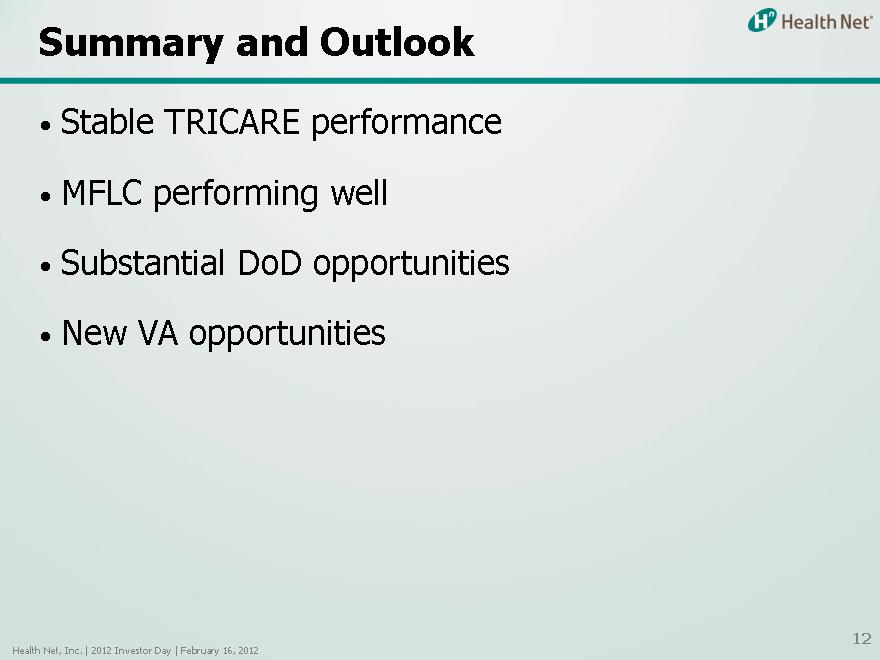
Summary and Outlook
Stable TRICARE performance
MFLC performing well
Substantial DoD opportunities New VA opportunities
Health Net, Inc. | 2012 Investor Day | February 16, 2012
12

Medicare
Scott Law
Chief Medicare Officer
Health Net, Inc. | 2012 Investor Day | February 16, 2012
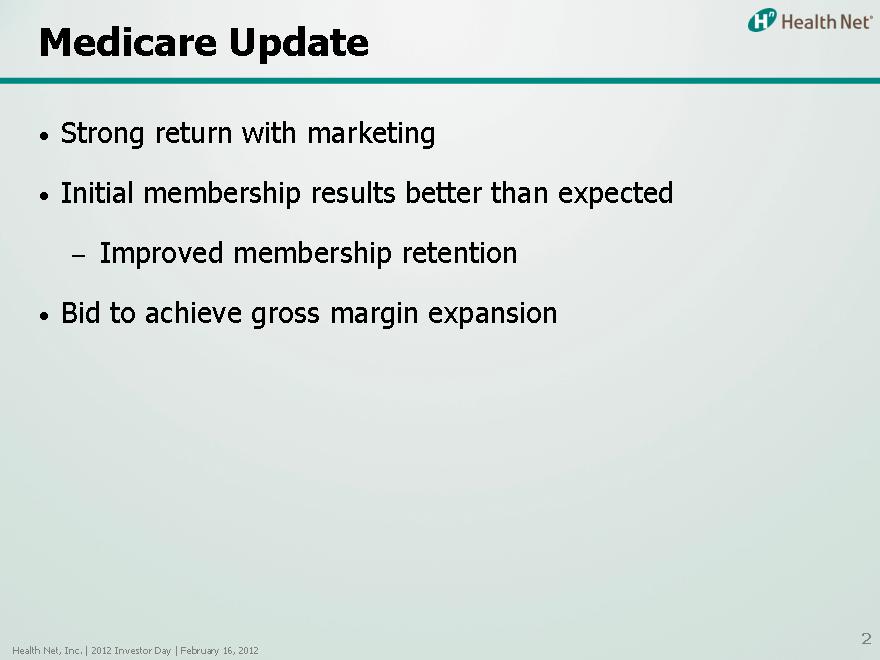
Medicare Update
Strong return with marketing
Initial membership results better than expected
– Improved membership retention Bid to achieve gross margin expansion
Health Net, Inc. | 2012 Investor Day | February 16, 2012
2 |
|
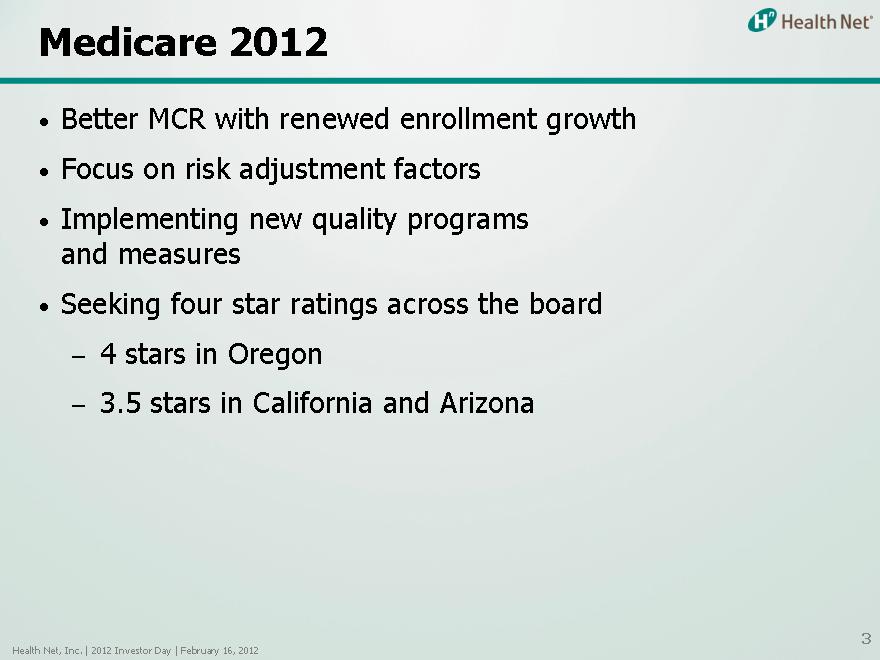
Medicare 2012
Better MCR with renewed enrollment growth Focus on risk adjustment factors Implementing new quality programs and measures Seeking four star ratings across the board
4 stars in Oregon
3.5 stars in California and Arizona
Health Net, Inc. | 2012 Investor Day | February 16, 2012
3 |
|

Medicare Advantage Outlook
Anticipate Medicare Advantage (MA) improvement in 2012
– Enrollment growth
– Better margins Preparing 2013 bid Planning new markets
Apply tailored network strategy to MA
Health Net, Inc. | 2012 Investor Day | February 16, 2012
4 |
|

Medicaid
Steve Tough
President, Government Programs
Health Net, Inc. | 2012 Investor Day | February 16, 2012
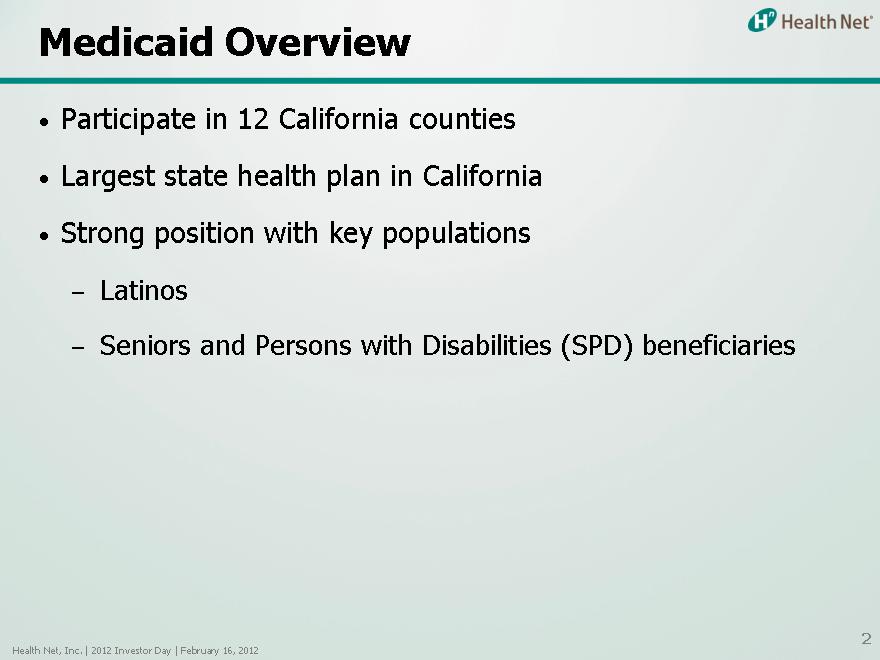
Medicaid Overview
Participate in 12 California counties Largest state health plan in California Strong position with key populations
Latinos
Seniors and Persons with Disabilities (SPD) beneficiaries
Health Net, Inc. | 2012 Investor Day | February 16, 2012
2 |
|
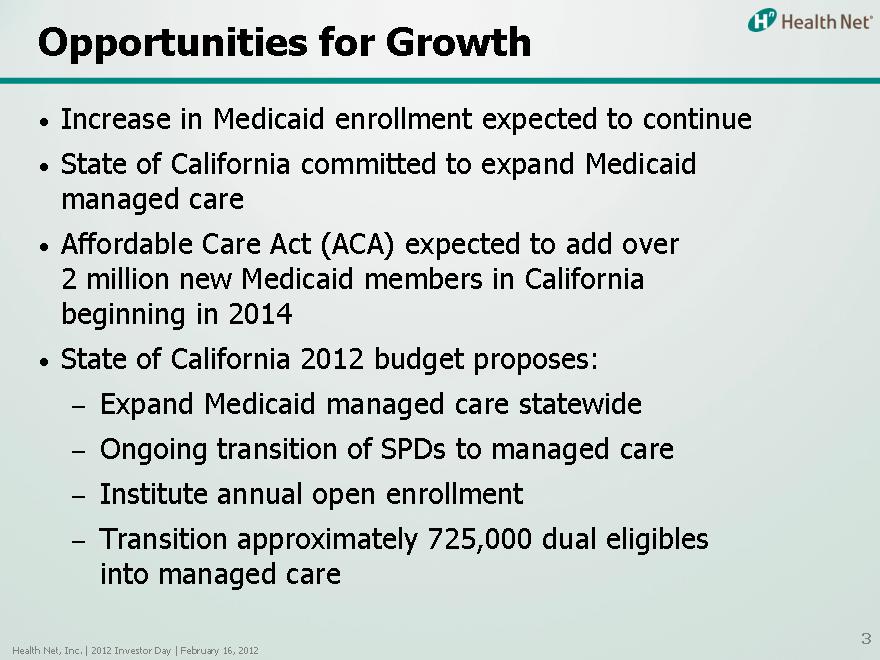
Opportunities for Growth
Increase in Medicaid enrollment expected to continue State of California committed to expand Medicaid managed care Affordable Care Act (ACA) expected to add over 2 million new Medicaid members in California beginning in 2014 State of California 2012 budget proposes:
Expand Medicaid managed care statewide Ongoing transition of SPDs to managed care Institute annual open enrollment Transition approximately 725,000 dual eligibles into managed care
Health Net, Inc. | 2012 Investor Day | February 16, 2012
3 |
|
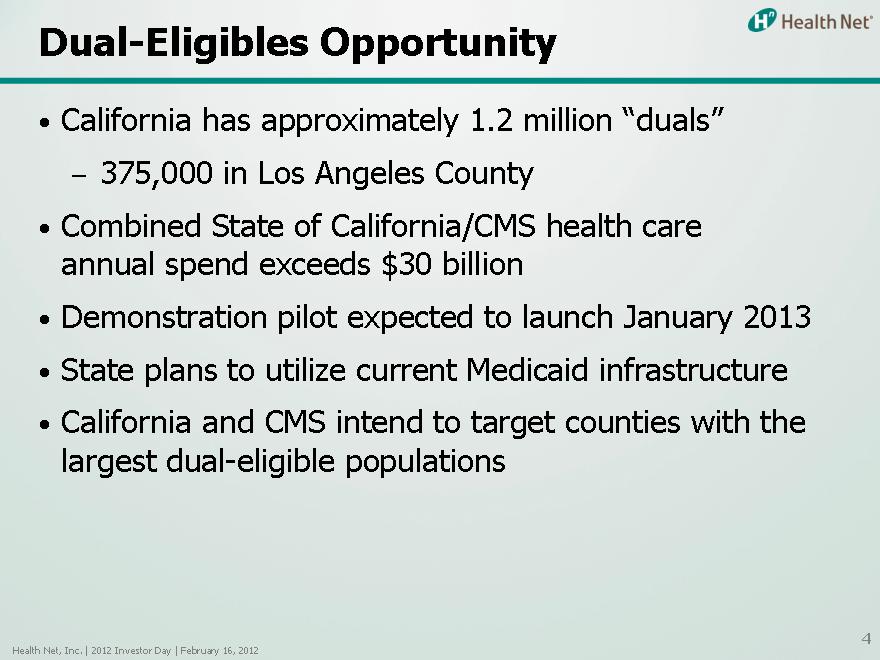
Dual-Eligibles Opportunity
California has approximately 1.2 million “duals”
– 375,000 in Los Angeles County
Combined State of California/CMS health care annual spend exceeds $30 billion Demonstration pilot expected to launch January 2013
State plans to utilize current Medicaid infrastructure
California and CMS intend to target counties with the largest dual-eligible populations
Health Net, Inc. | 2012 Investor Day | February 16, 2012
4 |
|
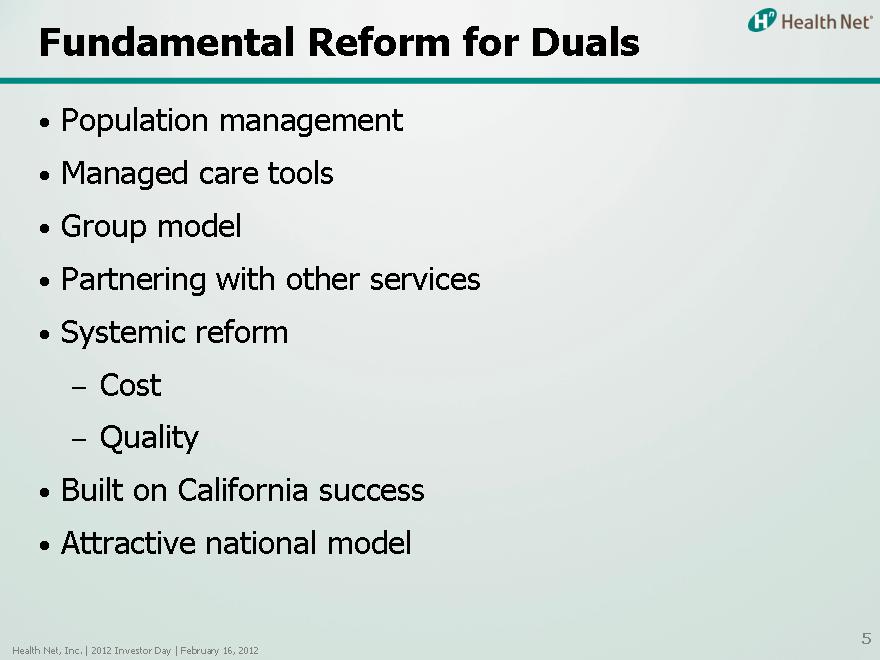
Fundamental Reform for Duals
Population management
Managed care tools
Group model
Partnering with other services
Systemic reform
Cost
Quality
Built on California success
Attractive national model
Health Net, Inc. | 2012 Investor Day | February 16, 2012
5 |
|
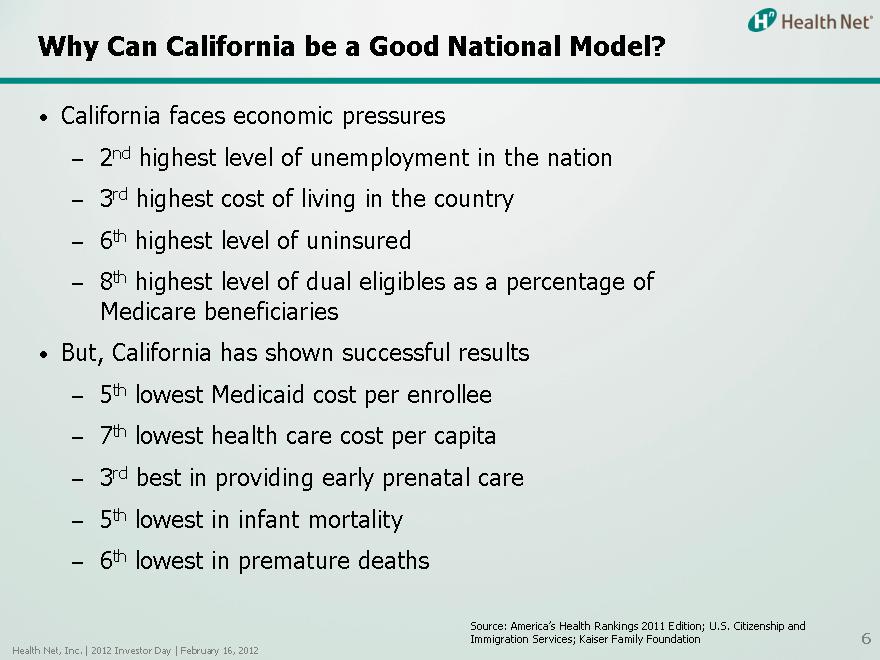
Why Can California be a Good National Model?
California faces economic pressures
– 2nd highest level of unemployment in the nation
– 3rd highest cost of living in the country
– 6th highest level of uninsured
– 8th highest level of dual eligibles as a percentage of Medicare beneficiaries But, California has shown successful results
– 5th lowest Medicaid cost per enrollee
– 7th lowest health care cost per capita
– 3rd best in providing early prenatal care
– 5th lowest in infant mortality
– 6th lowest in premature deaths
Health Net, Inc. | 2012 Investor Day | February 16, 2012
Source: America’s Health Rankings 2011 Edition; U.S. Citizenship and Immigration Services; Kaiser Family Foundation
6 |
|
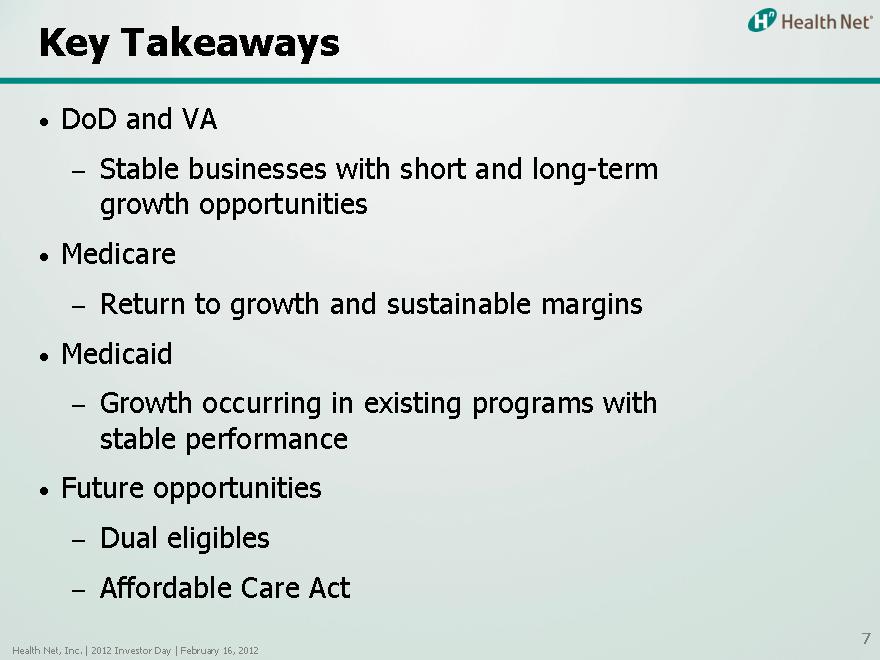
Key Takeaways
DoD and VA
– Stable businesses with short and long-term growth opportunities Medicare
– Return to growth and sustainable margins Medicaid
– Growth occurring in existing programs with stable performance Future opportunities
– Dual eligibles
– Affordable Care Act
Health Net, Inc. | 2012 Investor Day | February 16, 2012
7 |
|
Operations Review:
Lower Cost, Strong Results
Jim Woys
Chief Operating Officer
Health Net, Inc. | 2012 Investor Day | February 16, 2012
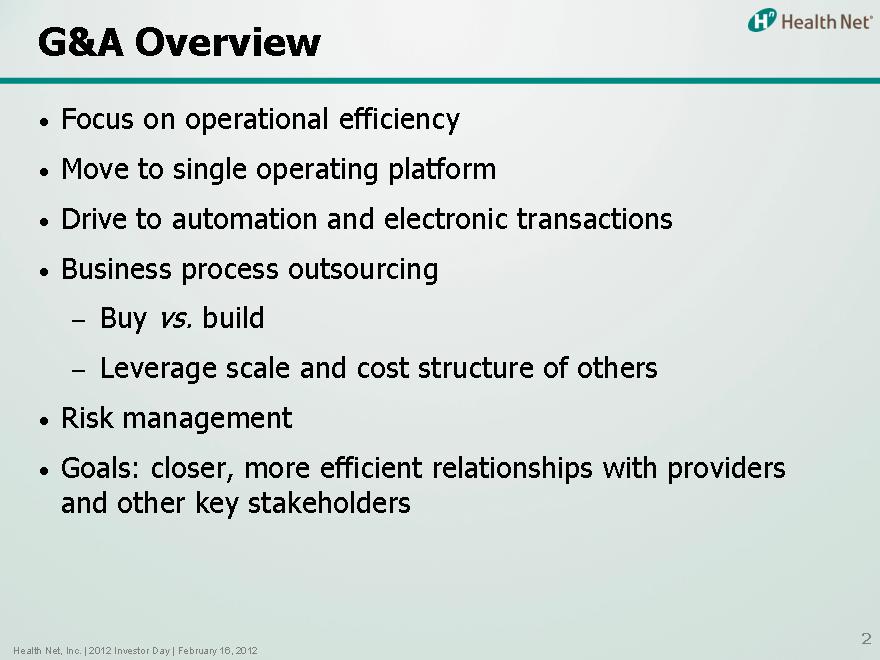
G&A Overview
Focus on operational efficiency Move to single operating platform
Drive to automation and electronic transactions Business process outsourcing
Buy vs. build
Leverage scale and cost structure of others
Risk management
Goals: closer, more efficient relationships with providers and other key stakeholders
Health Net, Inc. | 2012 Investor Day | February 16, 2012
2 |
|
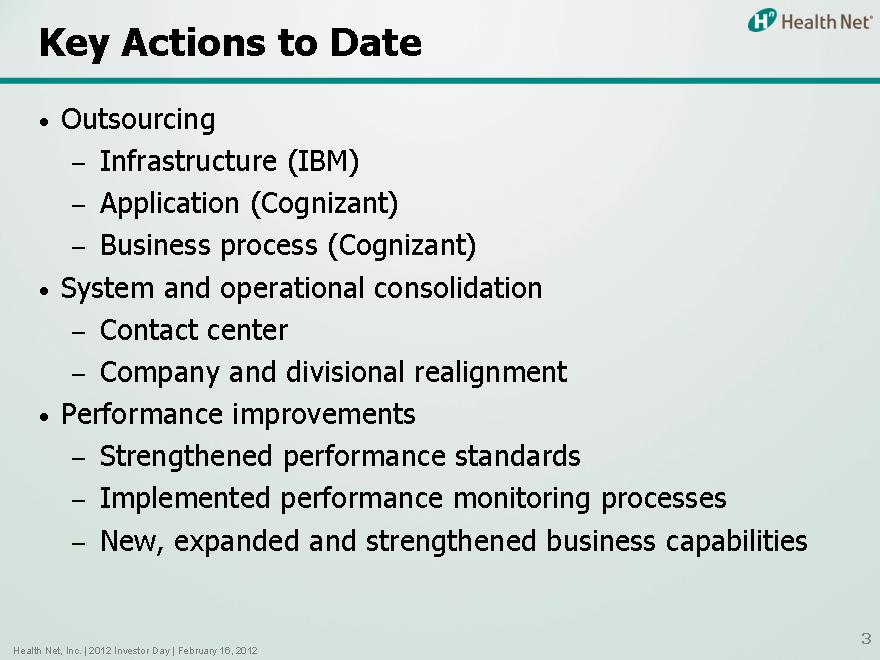
Key Actions to Date
Outsourcing
– Infrastructure (IBM)
– Application (Cognizant)
– Business process (Cognizant)
System and operational consolidation
– Contact center
– Company and divisional realignment
Performance improvements
– Strengthened performance standards
– Implemented performance monitoring processes
– New, expanded and strengthened business capabilities
Health Net, Inc. | 2012 Investor Day | February 16, 2012
3 |
|
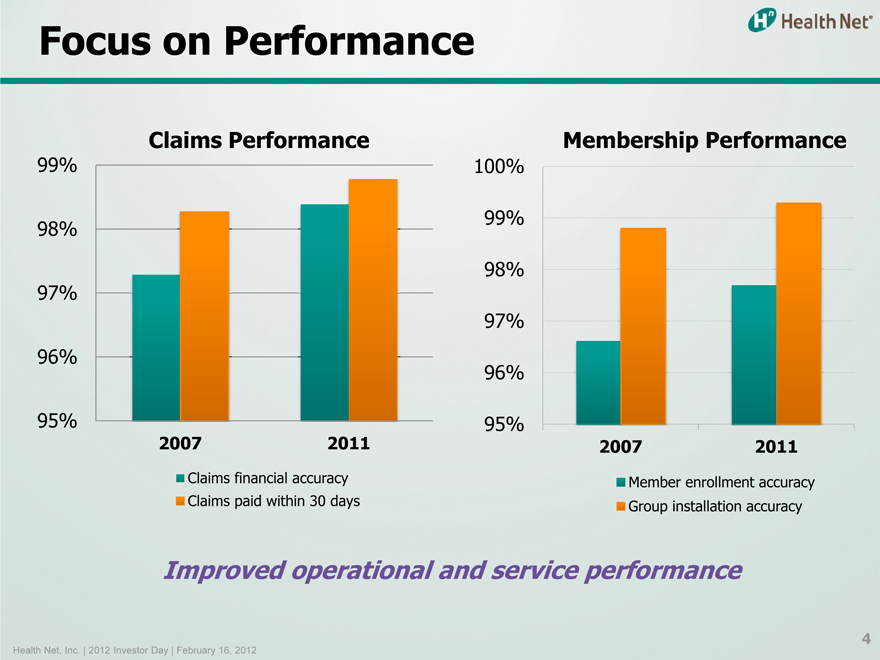
Focus on Performance
Claims Performance
99% 98% 97% 96% 95%
2007 2008
Claims financial accuracy Claims paid within 30 days
Membership Performance
100% 99% 98% 97%
96%
95%
2007 2008
Member enrollment accuracy Group installation accuracy
Improved operational and service performance
Health Net, Inc. | 2012 Investor Day | February 16, 2012
4 |
|
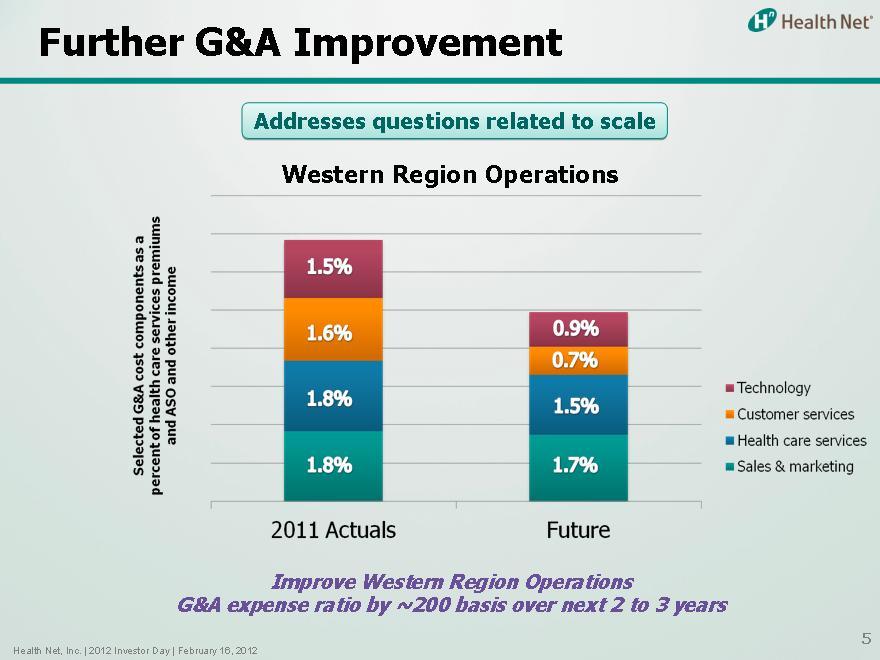
Further G&A Improvement
Addresses questions related to scale
Western Region Operations
Selected G&A cost components as a percent of health care services premiums and ASO and other income
2011 Actuals Future
Technology Customer services Health care services
Sales & marketing
Improve Western Region Operations G&A expense ratio by ~200 basis over next 2 to 3 years
1.5% 1.6% 18% 1.8% 0.9% 0.7% 1.5% 1.7%
Health Net, Inc. | 2012 Investor Day | February 16, 2012
5 |
|
Next Steps
Application, infrastructure and business process outsourcing
– Consider incremental strategic outsourcing, especially IT
System and operational consolidation
– Further rationalize IT platforms
– Modernize call center technology and operations Performance improvements
– Improved delivery of strategic initiatives
– Leverage opportunities from ICD-10 and health care reform activities
Health Net, Inc. | 2012 Investor Day | February 16, 2012
6 |
|

Financial Review
Joseph Capezza Chief Financial Officer
Health Net, Inc. | 2012 Investor Day | February 16, 2012
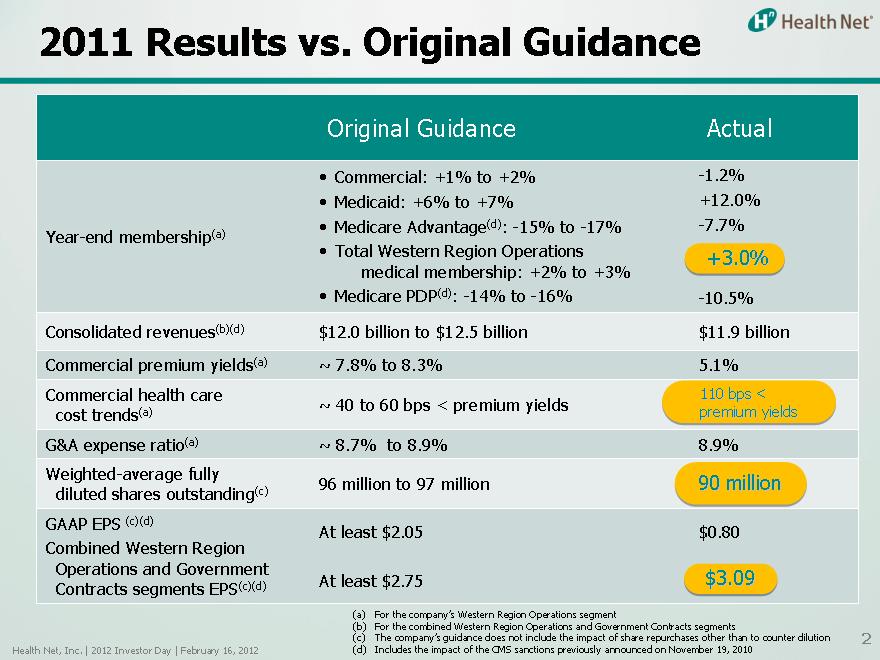
2011 Results vs. Original Guidance
Original Guidance Actual
• Commercial: +1% to +2% -1.2%
• Medicaid: +6% to +7% +12.0%
• Medicare Advantage(d): -15% to -17% -7.7% Year-end membership(a)
• Total Western Region Operations +3.0% medical membership: +2% to +3%
• Medicare PDP(d): -14% to -16% -10.5% Consolidated revenues(b)(d) $12.0 billion to $12.5 billion $11.9 billion Commercial premium yields(a) ~ 7.8% to 8.3% 5.1% Commercial health care 110 bps < (a) ~ 40 to 60 bps < premium yields premium yields cost trends G&A expense ratio(a) ~ 8.7% to 8.9% 8.9% Weighted-average fully 90 million (c) 96 million to 97 million diluted shares outstanding GAAP EPS (c)(d) At least $2.05 $0.80 Combined Western Region Operations and Government $3.09 Contracts segments EPS(c)(d) At least $2.75
(a) |
| For the company’s Western Region Operations segment |
(b) |
| For the combined Western Region Operations and Government Contracts segments |
(c) The company’s guidance does not include the impact of share repurchases other than to counter dilution (d) Includes the impact of the CMS sanctions previously announced on November 19, 2010
Health Net, Inc. | 2012 Investor Day | February 16, 2012
2 |
|
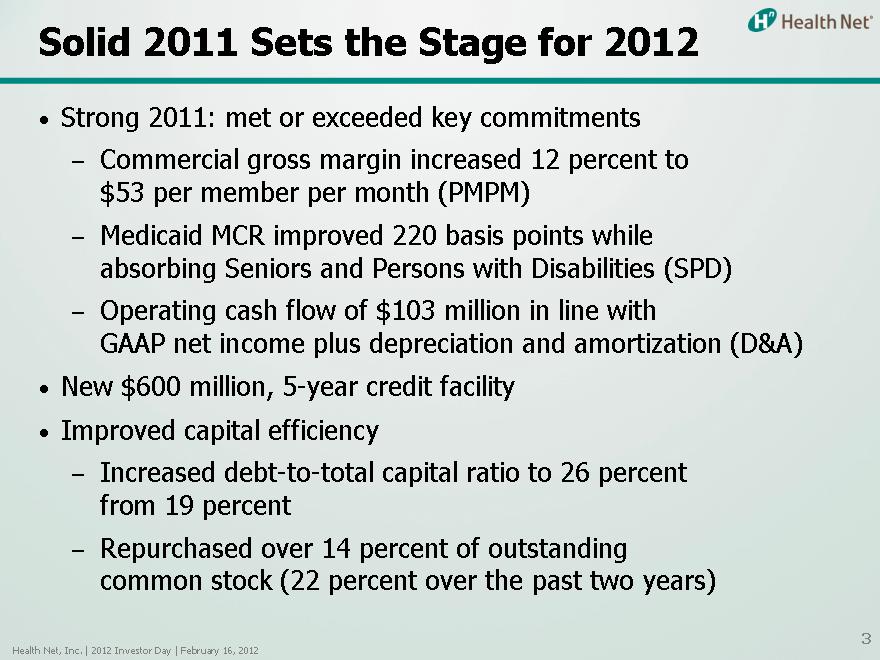
Solid 2011 Sets the Stage for 2012
• Strong 2011: met or exceeded key commitments
– Commercial gross margin increased 12 percent to $53 per member per month (PMPM)
– Medicaid MCR improved 220 basis points while absorbing Seniors and Persons with Disabilities (SPD)
– Operating cash flow of $103 million in line with
GAAP net income plus depreciation and amortization (D&A)
• New $600 million, 5-year credit facility
• Improved capital efficiency
– Increased debt-to-total capital ratio to 26 percent from 19 percent
– Repurchased over 14 percent of outstanding common stock (22 percent over the past two years)
Health Net, Inc. | 2012 Investor Day | February 16, 2012
3 |
|
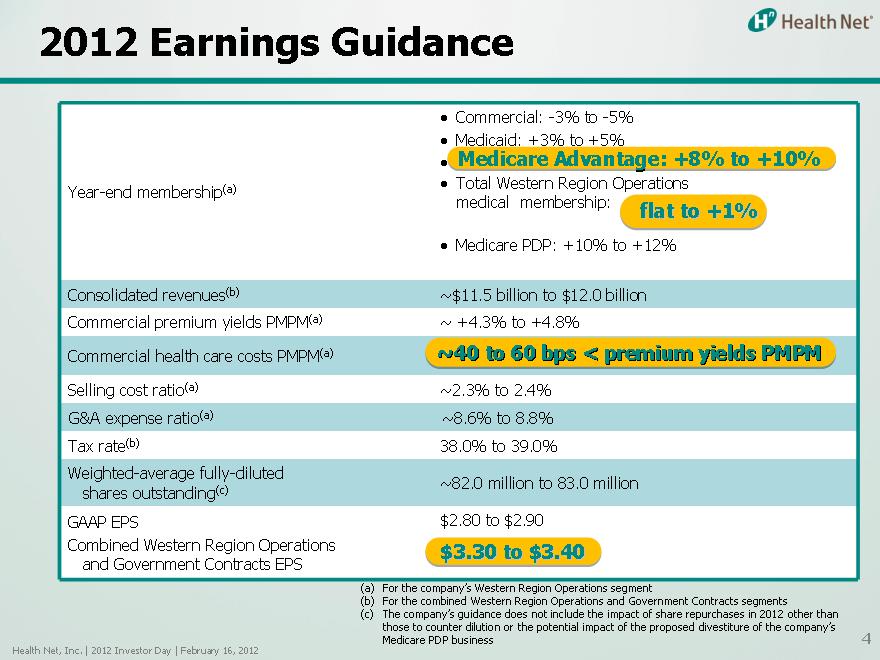
2012 Earnings Guidance
• Commercial: -3% to -5%
• Medicaid: Medicare +3% Advantage: to +5% +8% to +10%
(a) Total Western Region Operations Year-end membership medical membership: flat to +1%
• Medicare PDP: +10% to +12%
Consolidated revenues(b) ~$11.5 billion to $12.0 billion Commercial premium yields PMPM(a) ~ +4.3% to +4.8%
Commercial health care costs PMPM(a) ~40 to 60 bps < premium yields PMPM
Selling cost ratio(a) ~2.3% to 2.4% G&A expense ratio(a) ~8.6% to 8.8% Tax rate(b) 38.0% to 39.0% Weighted-average fully-diluted
(c) ~82.0 million to 83.0 million shares outstanding GAAP EPS $2.80 to $2.90 Combined Western Region Operations $3.30 to $3.40 and Government Contracts EPS
(a) |
| For the company’s Western Region Operations segment |
(b) |
| For the combined Western Region Operations and Government Contracts segments |
(c) The company’s guidance does not include the impact of share repurchases in 2012 other than those to counter dilution or the potential impact of the proposed divestiture of the company’s Medicare PDP business Health Net, Inc. | 2012 Investor Day | February 16, 2012
4 |
|
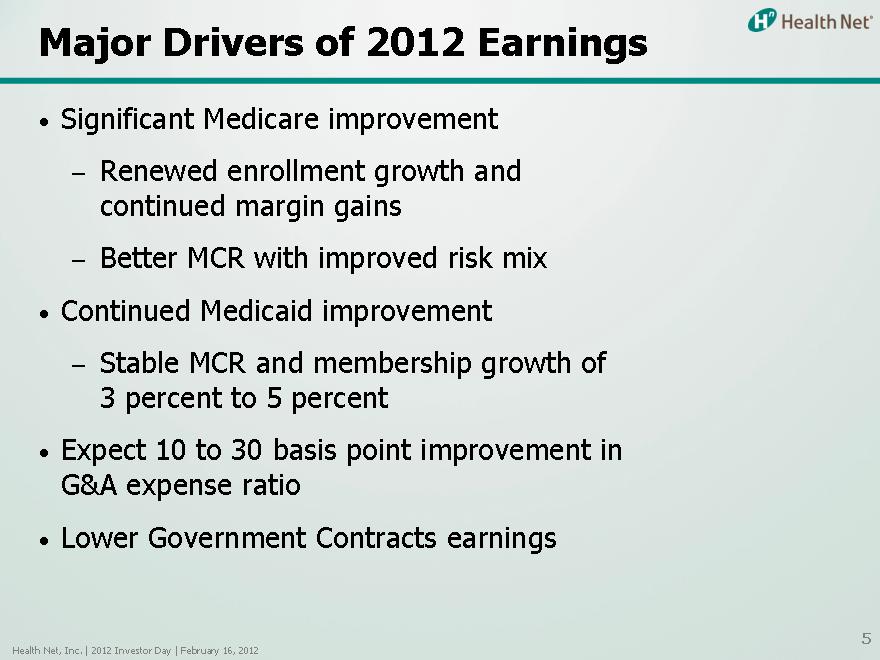
Major Drivers of 2012 Earnings
• Significant Medicare improvement
– Renewed enrollment growth and continued margin gains
– Better MCR with improved risk mix
• Continued Medicaid improvement
– Stable MCR and membership growth of 3 percent to 5 percent
• Expect 10 to 30 basis point improvement in G&A expense ratio
• Lower Government Contracts earnings
Health Net, Inc. | 2012 Investor Day | February 16, 2012
5 |
|
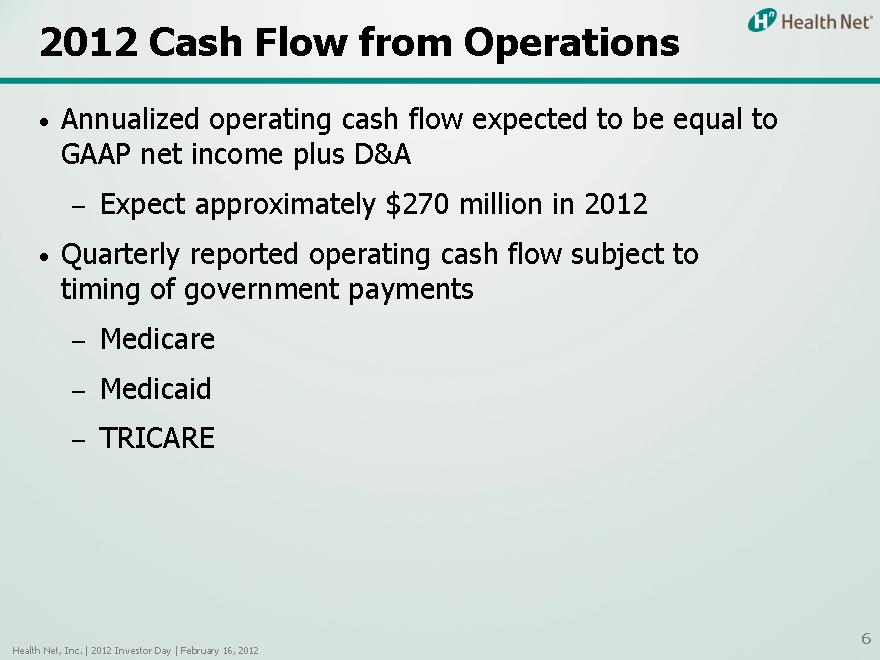
2012 Cash Flow from Operations
• Annualized operating cash flow expected to be equal to GAAP net income plus D&A
– Expect approximately $270 million in 2012
• Quarterly reported operating cash flow subject to timing of government payments
– Medicare
– Medicaid
– TRICARE
Health Net, Inc. | 2012 Investor Day | February 16, 2012
6 |
|
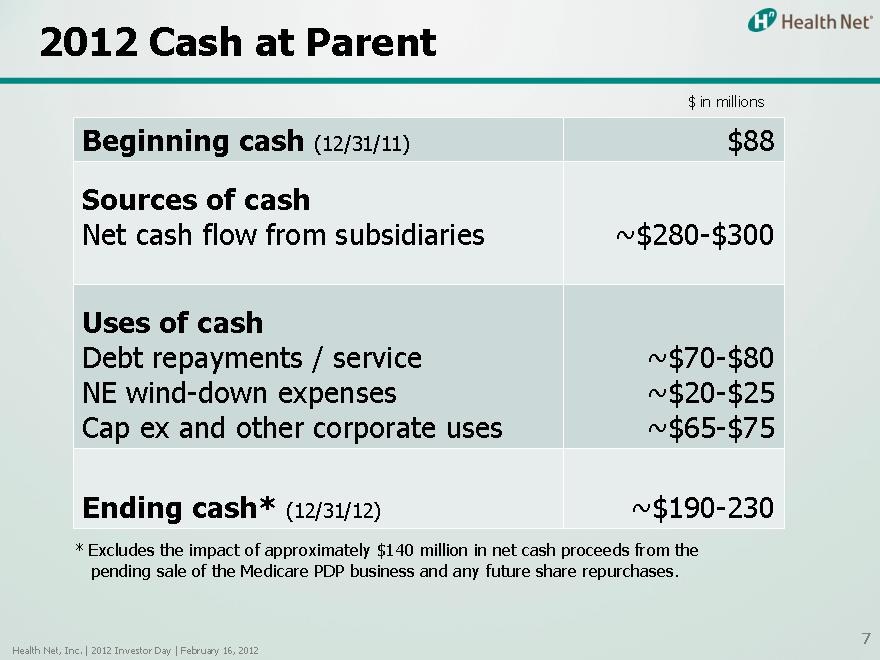
2012 Cash at Parent
$ in millions
Beginning cash (12/31/11) $88 Sources of cash
Net cash flow from subsidiaries ~$280-$300
Uses of cash
Debt repayments / service ~$70-$80 NE wind-down expenses ~$20-$25 Cap ex and other corporate uses ~$65-$75
Ending cash* (12/31/12) ~$190-230
* Excludes the impact of approximately $140 million in net cash proceeds from the pending sale of the Medicare PDP business and any future share repurchases.
Health Net, Inc. | 2012 Investor Day | February 16, 2012
7 |
|

Uses of Cash
• Organic growth
• Share repurchase
Health Net, Inc. | 2012 Investor Day | February 16, 2012
8 |
|
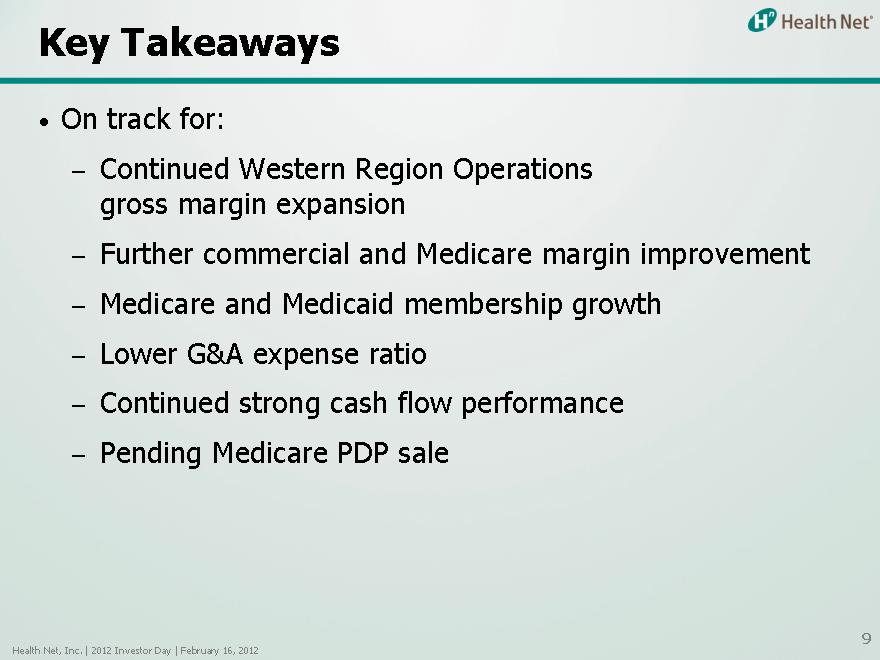
Key Takeaways
• On track for:
– Continued Western Region Operations gross margin expansion
– Further commercial and Medicare margin improvement
– Medicare and Medicaid membership growth
– Lower G&A expense ratio
– Continued strong cash flow performance
– Pending Medicare PDP sale
Health Net, Inc. | 2012 Investor Day | February 16, 2012
9
Summary and Outlook
Jay Gellert
President and Chief Executive Officer
Health Net, Inc. | 2012 Investor Day | February 16, 2012

Today’s Agenda
• Setting the stage
• Three panels
– Commercial business
– Government businesses
– Operations and financial review
• Summary and outlook
Health Net, Inc. | 2012 Investor Day | February 16, 2012
2 |
|

Building Shareholder Value
• Strategic response to changing environment
• Diverse book of businesses a real strength
• Several key growth opportunities
• Growing operational efficiency
• Stable and predictable financial performance
• Prudent use of cash
Health Net, Inc. | 2012 Investor Day | February 16, 2012
3 |
|
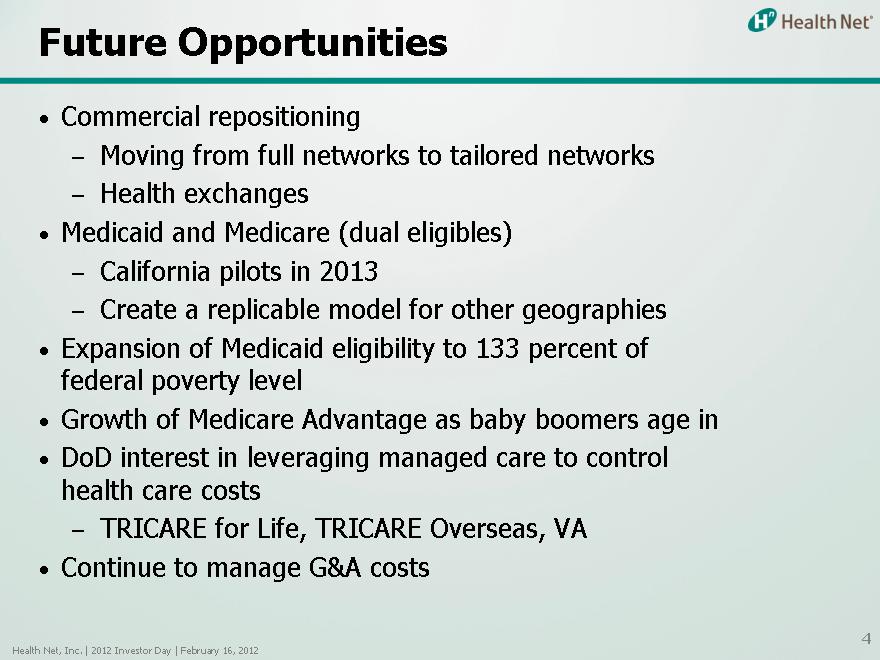
Future Opportunities
• Commercial repositioning
– Moving from full networks to tailored networks
– Health exchanges
• Medicaid and Medicare (dual eligibles)
– California pilots in 2013
– Create a replicable model for other geographies
• Expansion of Medicaid eligibility to 133 percent of federal poverty level
• Growth of Medicare Advantage as baby boomers age in
• DoD interest in leveraging managed care to control health care costs
– TRICARE for Life, TRICARE Overseas, VA
• Continue to manage G&A costs
Health Net, Inc. | 2012 Investor Day | February 16, 2012
4 |
|

2012
Investor Day