UNITED STATES
SECURITIES AND EXCHANGE COMMISSION
Washington, D.C. 20549
FORM N-CSR
CERTIFIED SHAREHOLDER REPORT OF REGISTERED
MANAGEMENT INVESTMENT COMPANIES
Investment Company Act file number 811-08216
PIMCO Strategic Global Government Fund, Inc.
(Exact name of registrant as specified in charter)
1633 Broadway, New York, New York 10019
(Address of principal executive offices) (Zip code)
Lawrence G. Altadonna
1633 Broadway,
New York, New York 10019
(Name and address of agent for service)
Registrant’s telephone number, including area code: 212-739-3371
Date of fiscal year end: January 31, 2014
Date of reporting period: July 31, 2013
ITEM. 1 REPORT TO SHAREHOLDERS
PIMCO Strategic Global Government Fund, Inc.
Semiannual Report
July 31, 2013


Table of Contents
Letter from Chairman of the Board &
President

Hans W. Kertess
Chairman

Brian S. Shlissel
President & CEO
Dear Stockholder:
The US economy continued to expand during the six-month fiscal reporting period ended July 31, 2013. The housing market showed continued signs of strength and the unemployment rate moderated. These positive developments were partially offset by higher tax rates and government spending reductions. Bond yields rose sharply, while stocks reached record highs on several occasions during the reporting period.
Six Months in Review through July 31, 2013
For the fiscal six-month period ended July 31, 2013, PIMCO Strategic Global Government Fund, Inc. (the “Fund”) returned 1.79% on net asset value (“NAV”) and -6.75% on market price. In contrast, US government bonds, as measured by the Barclays Intermediate-Term US Treasury Index, declined 0.76% and the Barclays US Credit Index, which reflects corporate bond performance, fell 2.06%. The Barclays US Aggregate Bond Index, a measure of the broad US bond market, dropped 1.62% and the Barclays US Intermediate Aggregate Bond Index, a broad measure of intermediate-term bonds, decreased 1.06%. Mortgage-backed securities, as represented by the Barclays Fixed Rate Mortgaged-Backed Securities Index, were down 1.62%. US stocks, as measured by the Standard & Poor’s 500 Index, advanced 13.73%.
Gross domestic product (“GDP”), the value of goods and services produced in the country, the broadest measure of economic activity and the principal indicator of economic performance, grew at an annual pace of 1.1% during the first quarter of 2013, partially due to stronger consumer spending. According to the second estimate released from the US Commerce Department, GDP growth increased to a 2.5% annual pace during the second quarter of 2013.
Although US economic data was mixed, there were continuing signs of the long-awaited recovery in the housing market. Unemployment remained elevated, however, the unemployment rate declined from 7.9% in January 2013 to 7.4% in July 2013 as new job growth trended higher. Elsewhere, despite concerns related to higher tax rates, the “fiscal cliff” and sequestration, consumer spending held up relatively well during the six-month period ended July 31, 2013.
Economic growth outside the US was mixed during the reporting period. After six consecutive quarters of negative growth, the euro zone finally emerged from its recession in the second quarter of 2013, with GDP growth of 0.3% versus the first three months of the year. However, growth in many peripheral counties continued to contract and unemployment in the region remained elevated. Elsewhere, aggressive actions by the Bank of Japan (“BoJ”) and the Japanese government have produced encouraging results thus far. GDP growth in Japan was an annualized 3.8% and 2.6% during the first and second quarters of 2013, respectively. This was among the strongest growth rates among developed countries.
| | | | |
| 2 | | July 31, 2013 | | | Semiannual Report |
Outlook
Market volatility increased sharply during the end of the reporting period. This was not triggered by economic concerns, but rather uncertainties surrounding the Federal Reserve Board’s (the “Fed”) tapering its asset purchases. We expect the Fed’s policy stance to remain accommodative, even if it begins to taper its purchase program toward the end of the year. Tapering of the Fed’s purchase program is likely to create higher volatility, but we believe the Fed will only raise interest rates if it is confident the economic recovery is on solid footing.
Receive this report electronically and eliminate paper mailings.
To enroll, go to
us.allianzgi.com/ edelivery.
With respect to the US economy, an important factor going forward will be consumer spending, as it comprises in excess of two-thirds of GDP. The US Commerce Department reported that retail sales rose for the fourth consecutive month in July 2013. In addition, there were signs that consumers have their balance sheets in order. While the global financial crisis of 2008-2009 has had a significant impact on consumers’ mindset, it appears that as the employment situation improves, consumer confidence will likely rise with spending to follow. This could help drive the economy during the remainder of the year and into 2014.
While the European Central Bank (“ECB”) had its benchmark rate on hold during its last meeting, the central bank’s President Mario Draghi left open the possibility for future cuts, saying he was “very, very cautious” about the prospects for growth and that “these shoots are still very, very green.” The ECB now forecasts that GDP growth in the region will be 1.0% in 2014. We expect to see a gradual normalization of private sector private investment going forward in the euro zone, assuming ongoing progress on financing conditions in the region.
For specific information on the Fund and its performance, please review the following pages. If you have any questions regarding the information provided, we encourage you to contact your financial advisor or call the Fund’s shareholder servicing agent at (800) 254-5197. In addition, a wide range of information and resources is available on our website, us.allianzgi.com/closedendfunds.
Together with Allianz Global Investors Fund Management LLC, the Fund’s investment manager, and Pacific Investment Management Company LLC (“PIMCO”), the Fund’s subadviser, we thank you for investing with us.
We remain dedicated to serving your investment needs.
Sincerely,
| | |
 | |  |
| Hans W. Kertess | | Brian S. Shlissel |
| Chairman of the Board of Directors | | President & Chief Executive Officer |
| | | | | | |
| Semiannual Report | | | July 31, 2013 | | | 3 | |
Fund Insights
PIMCO Strategic Global Government Fund, Inc.
July 31, 2013 (unaudited)
For the six-month period ended July 31, 2013, PIMCO Strategic Global Government Fund, Inc. (the “Fund”) returned 1.79% on net asset value (“NAV”) and -6.75% on market price. On a NAV basis, the Fund outperformed the unmanaged Barclays US Aggregate Bond and Barclays US Intermediate Aggregate Bond Indices which declined 1.62% and 1.06%, respectively, during the reporting period.
The US fixed income market experienced periods of volatility during the period. This was triggered by a number of factors, including moderating global growth, uncertainties regarding sequestration and the ongoing European sovereign debt crisis. The Federal Reserve (the “Fed”) and other developed country central banks maintained their accommodative monetary policies during the reporting period. However, following its meeting on June 19, 2013, Fed Chairman Bernanke said “…the Committee currently anticipates that it would be appropriate to moderate the monthly pace of purchases later this year; and if the subsequent data remain broadly aligned with our current expectations for the economy, we would continue to reduce the pace of purchases in measured steps through the first half of next year, ending purchases around midyear.” This triggered a sharp rise in Treasury yields and falling bond prices. The benchmark 10-year Treasury bond began the six month reporting period yielding 2.02% and ended the period at 2.60%.
International developed fixed income markets were also impacted by the rising interest rate environment in the US. Also impacting non-US fixed income markets was generally accommodative monetary policy by central banks, including the ECB and Bank of Japan, as they looked to support their economies.
Sector positioning drives the Fund’s outperformance
The Fund’s overweight exposure to non-agency mortgage-backed securities (“MBS”) and European residential MBS contributed to performance. These securities benefited from stabilizing economic conditions and a gradual healing of US and select European residential real estate markets. The Fund’s tactical exposure to US agency MBS also added to results. Despite underperforming the broader market, the Fund actively managed its agency MBS exposure and added to its position when the sector reached its cheapest level, during June 2013. Elsewhere, the Fund’s allocation to investment grade corporate bonds was additive for performance. The Fund’s focus on real estate and financial corporate bonds were among the largest contributors to performance during the six-month reporting period
On the downside, the Fund’s duration exposure detracted from performance, as interest rates moved sharply higher during the period.
| | | | |
| 4 | | July 31, 2013 | | | Semiannual Report |
Performance and Statistics
PIMCO Strategic Global Government Fund, Inc.
July 31, 2013 (unaudited)
| | | | | | | | |
| Total Return(1): | | Market Price | | | NAV | |
Six Months | | | –6.75% | | | | 1.79% | |
1 Year | | | –0.18% | | | | 13.96% | |
5 Year | | | 15.64% | | | | 16.42% | |
10 Year | | | 9.62% | | | | 10.52% | |
Commencement of Operations (2/24/94) to 7/31/13 | | | 9.47% | | | | 8.96% | |
| | |
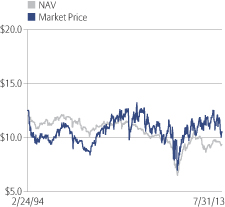
| Market Price/NAV Performance: | | |
Commencement of Operations (2/24/94) to 7/31/13
| | | | |
| Market Price/NAV: | | | |
Market Price | | | $10.55 | |
NAV | | | $9.35 | |
Premium to NAV | | | 12.83% | |
Market Price Yield(2) | | | 9.10% | |
Levarage Ratio(3) | | | 53.35% | |
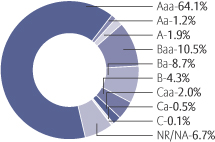
Moody’s Ratings
(as a % of total investments, before securities sold short)
(1) Past performance is no guarantee of future results. Total return is calculated by determining the percentage change in NAV or market price (as applicable) in the specified period. The calculation assumes that all dividends and capital gain and return of capital distributions, if any, have been reinvested. Total return does not reflect broker commissions or sales charges in connection with the purchase or sale of Fund stock. Total return for a period of more than one year represents the average annual total return. Total return for a period of less than one year is not annualized.
Performance at market price will differ from results at NAV. Although market price returns typically reflect investment results over time, during shorter periods returns at market price can also be influenced by factors such as changing views about the Fund, market conditions, supply and demand for the Fund’s stock, or changes in the Fund’s dividends.
An investment in the Fund involves risk, including the loss of principal. Total return, market price, market price yield and NAV will fluctuate with changes in market conditions. This data is provided for information purposes only and is not intended for trading purposes. Closed-end funds, unlike open-end funds, are not continuously offered. There is a onetime public offering and, once issued, shares of closed-end funds are traded in the open market through a stock exchange. NAV is equal to total assets less total liabilities divided by the number of shares outstanding. Holdings are subject to change daily.
(2) Market Price Yield is determined by dividing the annualized current monthly dividend per share (comprised of net investment income) by the market price per share at July 31, 2013.
(3) Represents Reverse Repurchase Agreements (“Leverage”) outstanding, as a percentage of total managed assets. Total managed assets refer to total assets (including assets attributable to Leverage) minus liabilities (other than liabilities representing Leverage).
| | | | | | |
| Semiannual Report | | | July 31, 2013 | | | 5 | |
Schedule of Investments
PIMCO Strategic Global Government Fund, Inc.
July 31, 2013 (unaudited)
| | | | | | | | | | |
Principal
Amount
(000s) | | | | | | | Value | |
| | U.S. Government Agency Securities – 174.4% | | | | | | |
| | | | Fannie Mae, | | | | | | |
| $ | 206 | | | 2.065%, 12/1/30, MBS (i)(k) | | | | $ | 208,501 | |
| | 2 | | | 2.20%, 4/1/30, MBS (k) | | | | | 1,873 | |
| | 13 | | | 2.25%, 9/1/28, MBS (k) | | | | | 13,605 | |
| | 9 | | | 2.415%, 2/1/32, MBS (k) | | | | | 8,591 | |
| | 80 | | | 2.445%, 12/1/28, MBS (i)(k) | | | | | 85,861 | |
| | 92 | | | 2.446%, 3/1/32, MBS (i)(k) | | | | | 93,209 | |
| | 63 | | | 2.45%, 11/1/27, MBS (i)(k) | | | | | 66,919 | |
| | 9,318 | | | 2.50%, 12/25/27, CMO, IO (i) | | | | | 994,622 | |
| | 5 | | | 2.722%, 12/1/25, MBS (k) | | | | | 4,860 | |
| | 74 | | | 2.75%, 3/1/31, MBS (i)(k) | | | | | 78,750 | |
| | 35,000 | | | 3.00%, MBS, TBA, 30 Year (e) | | | | | 33,977,345 | |
| | 104,000 | | | 3.50%, MBS, TBA, 30 Year (e) | | | | | 104,901,877 | |
| | 129,000 | | | 4.00%, MBS, TBA, 30 Year (e) | | | | | 134,139,838 | |
| | 408 | | | 4.00%, 6/1/39, MBS | | | | | 419,232 | |
| | 478 | | | 4.25%, 11/25/24, CMO (i) | | | | | 529,092 | |
| | 3 | | | 4.25%, 3/25/33, CMO | | | | | 3,037 | |
| | 55,535 | | | 4.50%, 9/1/23-10/1/41, MBS (i) | | | | | 58,938,633 | |
| | 61 | | | 4.50%, 7/1/39-6/1/41, MBS | | | | | 64,249 | |
| | 4,824 | | | 4.50%, 7/25/40, CMO (i) | | | | | 5,080,610 | |
| | 6 | | | 5.00%, 12/1/18, MBS | | | | | 6,272 | |
| | 12,674 | | | 5.00%, 7/1/35, MBS (i) | | | | | 13,705,641 | |
| | 30,487 | | | 5.00%, 1/25/38-7/25/38, CMO (i) | | | | | 33,319,961 | |
| | 7 | | | 5.50%, 12/25/16, CMO | | | | | 7,331 | |
| | 16,246 | | | 5.50%, 7/25/24-4/25/35, CMO (i) | | | | | 18,061,375 | |
| | 80 | | | 5.75%, 6/25/33, CMO (i) | | | | | 87,870 | |
| | 2,500 | | | 5.807%, 8/25/43, CMO (i) | | | | | 2,736,315 | |
| | 35 | | | 6.00%, 2/25/17-4/25/17, CMO | | | | | 37,240 | |
| | 3,745 | | | 6.00%, 4/25/17-1/25/44, CMO (i) | | | | | 4,025,467 | |
| | 26,781 | | | 6.00%, 12/1/32-6/1/40, MBS (i) | | | | | 29,388,478 | |
| | 60 | | | 6.039%, 12/25/42, CMO (i)(k) | | | | | 67,033 | |
| | 34 | | | 6.439%, 10/25/42, CMO (i)(k) | | | | | 36,011 | |
| | 1,750 | | | 6.50%, 10/1/13-11/1/47, MBS | | | | | 1,936,385 | |
| | 8,999 | | | 6.50%, 6/25/23-6/25/44, CMO (i) | | | | | 10,323,858 | |
| | 7,349 | | | 6.50%, 9/1/28-7/1/39, MBS (i) | | | | | 8,304,234 | |
| | 1,004 | | | 6.756%, 2/25/42, CMO (i)(k) | | | | | 1,199,117 | |
| | 36 | | | 6.85%, 12/18/27, CMO (i) | | | | | 41,064 | |
| | 1,460 | | | 7.00%, 2/1/15-1/1/47, MBS | | | | | 1,647,388 | |
| | 5,513 | | | 7.00%, 3/1/16-7/1/36, MBS (i) | | | | | 6,320,923 | |
| | 24 | | | 7.00%, 6/18/27, CMO | | | | | 27,662 | |
| | 2,606 | | | 7.00%, 9/25/32-3/25/45, CMO (i) | | | | | 3,099,601 | |
| | 1,145 | | | 7.00%, 9/25/41, CMO (i)(k) | | | | | 1,316,773 | |
| | 832 | | | 7.141%, 10/25/42, CMO (i)(k) | | | | | 979,443 | |
| | 398 | | | 7.50%, 6/1/17-5/1/22, MBS (i) | | | | | 435,041 | |
| | 200 | | | 7.50%, 12/1/17-5/1/32, MBS | | | | | 213,729 | |
| | | | |
| 6 | | July 31, 2013 | | | Semiannual Report |
Schedule of Investments
PIMCO Strategic Global Government Fund, Inc.
July 31, 2013 (unaudited) (continued)
| | | | | | | | | | |
Principal
Amount
(000s) | | | | | | | Value | |
| $ | 3,269 | | | 7.50%, 10/25/22-6/25/44, CMO (i) | | | | $ | 3,861,560 | |
| | 165 | | | 7.50%, 6/19/30, CMO (i)(k) | | | | | 195,795 | |
| | 8 | | | 7.50%, 7/25/42-8/25/42, CMO | | | | | 9,352 | |
| | 49 | | | 7.70%, 3/25/23, CMO (i) | | | | | 55,818 | |
| | 1,398 | | | 7.94%, 7/19/30, CMO (i)(k) | | | | | 1,562,904 | |
| | 167 | | | 8.00%, 9/25/21, CMO (i) | | | | | 198,109 | |
| | 458 | | | 8.00%, 1/1/22-1/1/35, MBS | | | | | 514,814 | |
| | 453 | | | 8.00%, 5/1/30-11/1/31, MBS (i) | | | | | 537,904 | |
| | 20 | | | 8.50%, 4/1/16, MBS | | | | | 19,982 | |
| | 1,722 | | | 8.50%, 9/25/21-6/25/30, CMO (i) | | | | | 1,989,991 | |
| | 425 | | | 9.409%, 5/15/21, MBS (i) | | | | | 489,934 | |
| | 139 | | | 9.992%, 7/15/27, MBS | | | | | 151,274 | |
| | | | Freddie Mac, | | | | | | |
| | 8 | | | 2.262%, 12/1/26, MBS (k) | | | | | 8,347 | |
| | 41 | | | 2.499%, 9/1/31, MBS (i)(k) | | | | | 41,717 | |
| | 6 | | | 2.639%, 4/1/33, MBS (k) | | | | | 6,790 | |
| | 3,000 | | | 4.00%, MBS, TBA, 30 Year (e) | | | | | 3,112,383 | |
| | 30,713 | | | 4.50%, 5/1/39, MBS (i) | | | | | 32,407,193 | |
| | 25 | | | 5.00%, 2/15/24, CMO | | | | | 26,727 | |
| | 14,789 | | | 5.00%, 7/1/35, MBS (i) | | | | | 15,905,289 | |
| | 7,385 | | | 5.50%, 4/1/39, MBS (i) | | | | | 8,198,858 | |
| | 6,000 | | | 5.50%, 6/15/41, CMO (i) | | | | | 6,875,265 | |
| | 16 | | | 6.00%, 9/15/16-3/15/17, CMO | | | | | 16,942 | |
| | 8,407 | | | 6.00%, 9/15/16-3/15/35, CMO (i) | | | | | 9,378,674 | |
| | 1,049 | | | 6.00%, 4/1/17-3/1/33, MBS (i) | | | | | 1,125,753 | |
| | 22 | | | 6.00%, 2/1/33-2/1/34, MBS | | | | | 24,405 | |
| | 808 | | | 6.386%, 7/25/32, CMO (i)(k) | | | | | 927,588 | |
| | 619 | | | 6.50%, 11/1/16-9/1/48, MBS (i) | | | | | 666,800 | |
| | 1,125 | | | 6.50%, 8/1/21-9/1/47, MBS | | | | | 1,249,015 | |
| | 18,651 | | | 6.50%, 9/15/23-3/25/44, CMO (i) | | | | | 21,111,808 | |
| | 88 | | | 6.50%, 9/25/43, CMO (i)(k) | | | | | 103,008 | |
| | 196 | | | 6.70%, 7/25/32, CMO (i)(k) | | | | | 230,421 | |
| | 754 | | | 6.90%, 9/15/23, CMO (i) | | | | | 857,255 | |
| | 377 | | | 6.95%, 7/15/21, CMO (i) | | | | | 432,731 | |
| | 3,495 | | | 7.00%, 1/1/14-1/1/37, MBS | | | | | 3,903,472 | |
| | 1,921 | | | 7.00%, 9/1/14-11/1/36, MBS (i) | | | | | 2,152,470 | |
| | 8,415 | | | 7.00%, 5/15/23-10/25/43, CMO (i) | | | | | 9,783,353 | |
| | 523 | | | 7.50%, 1/1/16-3/1/37, MBS | | | | | 578,717 | |
| | 1,239 | | | 7.50%, 5/15/24-2/25/42, CMO (i) | | | | | 1,427,225 | |
| | 3,783 | | | 7.50%, 8/1/24-5/1/32, MBS (i) | | | | | 4,410,384 | |
| | 156 | | | 8.00%, 8/15/22-4/15/30, CMO (i) | | | | | 185,475 | |
| | 26 | | | 8.00%, 7/1/24, MBS | | | | | 26,857 | |
| | 429 | | | 8.00%, 8/1/24-12/1/26, MBS (i) | | | | | 492,416 | |
| | | | Ginnie Mae, | | | | | | |
| | 24,451 | | | 4.00%, 10/15/40, MBS (i) | | | | | 25,736,226 | |
| | | | | | |
| Semiannual Report | | | July 31, 2013 | | | 7 | |
Schedule of Investments
PIMCO Strategic Global Government Fund, Inc.
July 31, 2013 (unaudited) (continued)
| | | | | | | | | | |
Principal
Amount
(000s) | | | | | | | Value | |
| $ | 7,000 | | | 4.50%, MBS, TBA, 30 Year (e) | | | | $ | 7,430,937 | |
| | 5,036 | | | 6.00%, 4/15/29-12/15/38, MBS | | | | | 5,590,556 | |
| | 1,395 | | | 6.50%, 11/20/24-10/20/38, MBS | | | | | 1,573,505 | |
| | 36 | | | 6.50%, 6/20/32, CMO (i) | | | | | 42,044 | |
| | 100 | | | 7.00%, 4/15/24-6/15/26, MBS | | | | | 113,856 | |
| | 2,363 | | | 7.00%, 3/20/31, CMO (i) | | | | | 2,769,590 | |
| | 1,479 | | | 7.50%, 1/15/17-3/15/29, MBS | | | | | 1,626,764 | |
| | 99 | | | 7.50%, 6/20/26, CMO (i) | | | | | 115,245 | |
| | 43 | | | 8.00%, 6/15/16-11/15/22, MBS | | | | | 45,426 | |
| | 14 | | | 8.50%, 10/15/16-2/15/31, MBS | | | | | 15,572 | |
| | 356 | | | 9.00%, 6/15/16-1/15/20, MBS | | | | | 377,233 | |
| | | | Small Business Administration Participation Certificates, ABS, | | | | | | |
| | 406 | | | 4.625%, 2/1/25 | | | | | 434,813 | |
| | 174 | | | 4.754%, 8/10/14 | | | | | 177,452 | |
| | 171 | | | 5.038%, 3/10/15 | | | | | 179,704 | |
| | 1,014 | | | 5.51%, 11/1/27 | | | | | 1,129,004 | |
| | 106 | | | 5.78%, 8/1/27 | | | | | 119,150 | |
| | 92 | | | 5.82%, 7/1/27 | | | | | 104,290 | |
| | 115 | | | 6.30%, 6/1/18 | | | | | 124,386 | |
| | 10 | | | 6.40%, 8/1/13 | | | | | 9,972 | |
| | 16 | | | 7.20%, 6/1/17 | | | | | 17,168 | |
| | 9 | | | 7.70%, 7/1/16 | | | | | 9,173 | |
| | | | Vendee Mortgage Trust, CMO, | | | | | | |
| | 326 | | | 6.50%, 3/15/29 | | | | | 379,395 | |
| | 220 | | | 6.75%, 2/15/26-6/15/26 (i) | | | | | 256,328 | |
| | 4,259 | | | 7.50%, 9/15/30 (i) | | | | | 4,905,741 | |
| | | | | Total U.S. Government Agency Securities (cost-$655,639,707) | | | | | 665,473,221 | |
| | | | | | | | | | |
| | Corporate Bonds & Notes – 54.9% | | | | | | |
| | | | Airlines – 2.6% | | | | | | |
| | 3,000 | | | American Airlines, Inc., 10.50%, 10/15/12 (f) | | | | | 3,645,000 | |
| | 451 | | | Northwest Airlines, Inc., 1.024%, 11/20/15 (MBIA) (k) | | | | | 445,745 | |
| | | | United Air Lines Pass-Through Trust, | | | | | | |
| | 2,151 | | | 6.636%, 1/2/24 | | | | | 2,258,737 | |
| | 658 | | | 9.75%, 7/15/18 (i) | | | | | 751,725 | |
| | 2,465 | | | 10.40%, 5/1/18 (i) | | | | | 2,804,229 | |
| | | | | | | | | | 9,905,436 | |
| | | | Banking – 21.9% | | | | | | |
| | | | Ally Financial, Inc., | | | | | | |
| | 3,000 | | | 6.75%, 12/1/14 (i) | | | | | 3,172,500 | |
| | 6,100 | | | 8.30%, 2/12/15 | | | | | 6,595,625 | |
| £ | 1,300 | | | Barclays Bank PLC, 14.00%, 6/15/19 (g) | | | | | 2,654,725 | |
| | | | BPCE S.A. (g), | | | | | | |
| € | 50 | | | 9.00%, 3/17/15 | | | | | 70,841 | |
| | 300 | | | 9.25%, 4/22/15 | | | | | 426,045 | |
| | | | |
| 8 | | July 31, 2013 | | | Semiannual Report |
Schedule of Investments
PIMCO Strategic Global Government Fund, Inc.
July 31, 2013 (unaudited) (continued)
| | | | | | | | | | |
Principal
Amount
(000s) | | | | | | | Value | |
| | | | Banking (continued) | | | | | | |
| $ | 3,900 | | | CIT Group, Inc., 5.25%, 4/1/14 (a)(d) | | | | $ | 3,987,750 | |
| | 9,000 | | | Citigroup, Inc., 5.00%, 9/15/14 (i) | | | | | 9,357,084 | |
| | | | Cooperatieve Centrale Raiffeisen-Boerenleenbank BA, | | | | | | |
| € | 2,000 | | | 6.875%, 3/19/20 | | | | | 2,908,251 | |
| $ | 5,900 | | | 11.00%, 6/30/19 (a)(d)(g)(i) | | | | | 7,659,120 | |
| £ | 800 | | | Credit Agricole S.A., 8.125%, 10/26/19 (g) | | | | | 1,287,069 | |
| $ | 7,700 | | | Discover Bank, 7.00%, 4/15/20 (i) | | | | | 9,100,414 | |
| £ | 800 | | | DnB NOR Bank ASA, 6.012%, 3/29/17 (g) | | | | | 1,255,944 | |
| $ | 5,000 | | | ICICI Bank Ltd., 5.75%, 11/16/20 (a)(d) | | | | | 5,149,310 | |
| € | 300 | | | LBG Capital No. 1 PLC, 7.625%, 10/14/20 | | | | | 411,078 | |
| £ | 300 | | | LBG Capital No. 2 PLC, 15.00%, 12/21/19 | | | | | 649,194 | |
| | | | Morgan Stanley, | | | | | | |
| $ | 8,000 | | | 0.716%, 10/18/16 (i)(k) | | | | | 7,804,216 | |
| | 1,000 | | | 6.625%, 4/1/18 | | | | | 1,154,650 | |
| | 13,000 | | | Regions Financial Corp., 7.75%, 11/10/14 (i) | | | | | 14,032,980 | |
| | | | Royal Bank of Scotland PLC (k), | | | | | | |
| | 2,000 | | | 0.969%, 4/11/16 | | | | | 1,850,000 | |
| | 3,000 | | | 1.016%, 9/29/15 | | | | | 2,851,500 | |
| | 1,046 | | | UBS AG, 5.875%, 12/20/17 | | | | | 1,210,370 | |
| | | | | | | | | | 83,588,666 | |
| | | | Coal – 0.7% | | | | | | |
| | 2,100 | | | Berau Coal Energy Tbk PT, 7.25%, 3/13/17 (a)(d) | | | | | 1,953,000 | |
| | 625 | | | CONSOL Energy, Inc., 8.25%, 4/1/20 | | | | | 676,563 | |
| | | | | | | | | | 2,629,563 | |
| | | | Diversified Financial Services – 13.9% | | | | | | |
| | 1,800 | | | C10 Capital SPV Ltd., 6.722%, 12/31/16 | | | | | 1,566,000 | |
| | 3,000 | | | Cantor Fitzgerald L.P., 6.375%, 6/26/15 (a)(d)(i) | | | | | 3,150,000 | |
| | | | Ford Motor Credit Co. LLC, | | | | | | |
| | 1,000 | | | 6.625%, 8/15/17 | | | | | 1,141,593 | |
| | 10,000 | | | 8.70%, 10/1/14 (i) | | | | | 10,875,930 | |
| £ | 3,000 | | | General Electric Capital Corp., 6.50%, 9/15/67 (converts to FRN on 9/15/17) | | | | | 4,782,811 | |
| $ | 4,000 | | | HSBC Finance Corp., 6.676%, 1/15/21 (i) | | | | | 4,532,620 | |
| | | | International Lease Finance Corp. (a)(d), | | | | | | |
| | 2,000 | | | 6.75%, 9/1/16 | | | | | 2,210,000 | |
| | 7,000 | | | 7.125%, 9/1/18 (i) | | | | | 7,927,500 | |
| | 1,417 | | | Jefferies LoanCore LLC, 6.875%, 6/1/20 (a)(b)(d)(j) (acquisition cost-$1,432,255; purchased 5/16/13-5/17/13) | | | | | 1,424,085 | |
| | 4,000 | | | Merrill Lynch & Co., Inc., 0.728%, 1/15/15 (i)(k) | | | | | 3,991,776 | |
| | | | SLM Corp., | | | | | | |
| | 150 | | | 0.566%, 1/27/14 (k) | | | | | 148,887 | |
| | 570 | | | 3.804%, 2/1/14 (k) | | | | | 567,703 | |
| | 1,050 | | | 5.00%, 10/1/13 | | | | | 1,056,563 | |
| | 1,000 | | | 5.375%, 5/15/14 | | | | | 1,023,750 | |
| | 1,000 | | | 8.00%, 3/25/20 | | | | | 1,118,750 | |
| | 2,500 | | | 8.45%, 6/15/18 | | | | | 2,887,800 | |
| | | | | | |
| Semiannual Report | | | July 31, 2013 | | | 9 | |
Schedule of Investments
PIMCO Strategic Global Government Fund, Inc.
July 31, 2013 (unaudited) (continued)
| | | | | | | | | | |
Principal
Amount
(000s) | | | | | | | Value | |
| | | | Diversified Financial Services (continued) | | | | | | |
| | | | Springleaf Finance Corp., | | | | | | |
| $ | 500 | | | 6.50%, 9/15/17 | | | | $ | 502,500 | |
| | 500 | | | 6.90%, 12/15/17 | | | | | 505,000 | |
| | 3,500 | | | Waha Aerospace BV, 3.925%, 7/28/20 (a)(d) | | | | | 3,657,500 | |
| | | | | | | | | | 53,070,768 | |
| | | | Electric Utilities – 0.6% | | | | | | |
| | 2,000 | | | Energy Future Intermediate Holding Co. LLC, 10.00%, 12/1/20 (a)(d) | | | | | 2,170,000 | |
| | | | Engineering & Construction – 1.1% | | | | | | |
| | 4,115 | | | Alion Science and Technology Corp., 12.00%, 11/1/14, PIK | | | | | 4,238,568 | |
| | | | Healthcare-Services – 0.4% | | | | | | |
| | 1,500 | | | HCA, Inc., 9.00%, 12/15/14 | | | | | 1,631,250 | |
| | | | Household Products/Wares – 0.0% | | | | | | |
| | 100 | | | Armored Autogroup, Inc., 9.25%, 11/1/18 | | | | | 92,500 | |
| | | | Insurance – 4.9% | | | | | | |
| | | | American International Group, Inc., | | | | | | |
| | 6,300 | | | 5.85%, 1/16/18 (i) | | | | | 7,188,250 | |
| | 3,600 | | | 6.40%, 12/15/20 (i) | | | | | 4,257,551 | |
| £ | 819 | | | 6.765%, 11/15/17 | | | | | 1,468,759 | |
| $ | 3,400 | | | 8.25%, 8/15/18 (i) | | | | | 4,264,919 | |
| £ | 850 | | | 8.625%, 5/22/68 (converts to FRN on 5/22/18) | | | | | 1,519,995 | |
| | | | | | | | | | 18,699,474 | |
| | | | Oil & Gas – 5.2% | | | | | | |
| | | | Anadarko Petroleum Corp., | | | | | | |
| $ | 600 | | | 6.20%, 3/15/40 | | | | | 688,955 | |
| | 4,500 | | | 6.45%, 9/15/36 (i) | | | | | 5,293,008 | |
| | 7,000 | | | BP Capital Markets PLC, 4.75%, 3/10/19 (i) | | | | | 7,803,614 | |
| | | | Gaz Capital S.A. for Gazprom, | | | | | | |
| € | 1,000 | | | 5.875%, 6/1/15 (a)(d) | | | | | 1,427,598 | |
| $ | 2,600 | | | 8.625%, 4/28/34 | | | | | 3,113,500 | |
| | 1,250 | | | Ras Laffan Liquefied Natural Gas Co., Ltd. III, 6.332%, 9/30/27 (b) | | | | | 1,431,586 | |
| | | | | | | | | | 19,758,261 | |
| | | | Paper & Forest Products – 0.0% | | | | | | |
| | 50 | | | Millar Western Forest Products Ltd., 8.50%, 4/1/21 | | | | | 50,000 | |
| | | | Pipelines – 0.3% | | | | | | |
| | 300 | | | NGPL PipeCo LLC, 7.768%, 12/15/37 (a)(d) | | | | | 268,500 | |
| | 1,200 | | | Rockies Express Pipeline LLC, 6.875%, 4/15/40 (a)(d) | | | | | 1,002,000 | |
| | | | | | | | | | 1,270,500 | |
| | | | Real Estate Investment Trust – 2.2% | | | | | | |
| | 3,000 | | | Columbia Property Trust Operating Partnership L.P., 5.875%, 4/1/18 (i) | | | | | 3,157,620 | |
| | 4,500 | | | SL Green Realty Corp., 7.75%, 3/15/20 | | | | | 5,340,190 | |
| | | | | | | | | | 8,497,810 | |
| | | | Retail – 0.5% | | | | | | |
| £ | 400 | | | Aston Martin Capital Ltd., 9.25%, 7/15/18 | | | �� | | 655,659 | |
| $ | 929 | | | CVS Pass-Through Trust, 7.507%, 1/10/32 (a)(d) | | | | | 1,127,015 | |
| | | | | | | | | | 1,782,674 | |
| | | | |
| 10 | | July 31, 2013 | | | Semiannual Report |
Schedule of Investments
PIMCO Strategic Global Government Fund, Inc.
July 31, 2013 (unaudited) (continued)
| | | | | | | | | | |
Principal
Amount
(000s) | | | | | | | Value | |
| | | | Transportation – 0.6% | | | | | | |
| $ | 2,000 | | | Aeropuertos Dominicanos Siglo XXI S.A., 9.25%, 11/13/19 (a)(d) | | | | $ | 2,055,000 | |
| | 120 | | | Western Express, Inc., 12.50%, 4/15/15 (a)(d) | | | | | 81,000 | |
| | | | | | | | | | 2,136,000 | |
| | | | | Total Corporate Bonds & Notes (cost-$181,862,704) | | | | | 209,521,470 | |
| | | | | | | | | | |
| | Mortgage-Backed Securities – 46.6% | | | | | | |
| | | | Adjustable Rate Mortgage Trust, CMO (k), | | | | | | |
| | 1,377 | | | 2.646%, 7/25/35 | | | | | 1,234,901 | |
| | 3,460 | | | 2.934%, 8/25/35 | | | | | 3,152,916 | |
| | 4,897 | | | Banc of America Large Loan Trust, 2.491%, 11/15/15, CMO (a)(d)(k) | | | | | 4,932,091 | |
| | 55 | | | Banc of America Mortgage Trust, 2.97%, 2/25/35, CMO (k) | | | | | 53,508 | |
| | 2,833 | | | Banc of America Re-Remic Trust, 5.686%, 4/24/49, CMO (a)(d)(k) | | | | | 3,112,383 | |
| | | | BCAP LLC Trust, CMO (a)(d)(k), | | | | | | |
| | 211 | | | 0.389%, 7/26/36 | | | | | 88,962 | |
| | 43 | | | 2.705%, 6/26/35 | | | | | 31,007 | |
| | 130 | | | 2.717%, 10/26/33 | | | | | 89,564 | |
| | 574 | | | 5.005%, 3/26/36 | | | | | 548,946 | |
| | 625 | | | Bear Stearns ALT-A Trust, 3.396%, 8/25/36, CMO (k) | | | | | 423,517 | |
| | 3,276 | | | Bear Stearns Commercial Mortgage Securities Trust, 7.00%, 5/20/30, CMO (k) | | | | | 3,731,309 | |
| € | 7,644 | | | Celtic Residential Irish Mortgage Securitisation No. 9 PLC,
0.363%, 11/13/47, CMO (k) | | | | | 8,556,764 | |
| £ | 7,022 | | | Celtic Residential Irish Mortgage Securitisation No. 11 PLC,
0.766%, 12/14/48, CMO (k) | | | | | 8,918,729 | |
| $ | 16 | | | Citigroup Mortgage Loan Trust, Inc., 7.00%, 9/25/33, CMO | | | | | 16,488 | |
| | | | Countrywide Alternative Loan Trust, CMO, | | | | | | |
| | 201 | | | 5.50%, 5/25/22 | | | | | 192,301 | |
| | 1,243 | | | 6.25%, 8/25/37 | | | | | 988,846 | |
| | 2,062 | | | 6.50%, 7/25/35 | | | | | 1,218,110 | |
| | | | Countrywide Home Loan Mortgage Pass-Through Trust, CMO, | | | | | | |
| | 1,215 | | | 3.292%, 8/25/34 (k) | | | | | 1,032,071 | |
| | 3,071 | | | 7.50%, 11/25/34 (a)(d) | | | | | 3,330,102 | |
| | 466 | | | 7.50%, 6/25/35 (a)(d) | | | | | 485,569 | |
| | | | Credit Suisse First Boston Mortgage Securities Corp., CMO, | | | | | | |
| | 312 | | | 1.34%, 3/25/34 (k) | | | | | 275,063 | |
| | 997 | | | 7.00%, 2/25/34 | | | | | 1,063,817 | |
| | | | Credit Suisse Mortgage Capital Certificates Mortgage-Backed Trust, CMO, | | | | | | |
| | 2,338 | | | 0.361%, 10/15/21 (a)(d)(k) | | | | | 2,316,634 | |
| | 2,306 | | | 5.695%, 9/15/40 (k) | | | | | 2,584,522 | |
| | 2,021 | | | 6.50%, 3/25/36 | | | | | 1,346,968 | |
| € | 432 | | | DECO 14-Pan Europe 5BV, 0.385%, 10/27/20, CMO (k) | | | | | 562,082 | |
| | | | Deutsche Mortgage Securities, Inc. Re-Remic Trust Certificates, | | | | | | |
| $ | 6,770 | | | 5.00%, 6/26/35, CMO (a)(d)(k) | | | | | 6,403,936 | |
| € | 4,057 | | | Emerald Mortgages No. 4 PLC, 0.243%, 7/15/48, CMO (k) | | | | | 4,084,474 | |
| $ | 305 | | | GMACM Mortgage Loan Trust, 5.352%, 8/19/34, CMO (k) | | | | | 282,810 | |
| | 1,850 | | | GSAA Trust, 6.00%, 4/1/34, CMO | | | | | 1,906,093 | |
| | | | | | |
| Semiannual Report | | | July 31, 2013 | | | 11 | |
Schedule of Investments
PIMCO Strategic Global Government Fund, Inc.
July 31, 2013 (unaudited) (continued)
| | | | | | | | | | |
Principal
Amount
(000s) | | | | | | | Value | |
| | | | GSMPS Mortgage Loan Trust, CMO (a)(d), | | | | | | |
| $ | 5,312 | | | 7.00%, 6/25/43 | | | | $ | 5,441,544 | |
| | 80 | | | 7.50%, 6/19/27 (k) | | | | | 81,442 | |
| | 1,240 | | | 8.00%, 9/19/27 (k) | | | | | 1,283,876 | |
| | | | GSR Mortgage Loan Trust, CMO, | | | | | | |
| | 1,030 | | | 0.52%, 12/25/34 (k) | | | | | 931,465 | |
| | 477 | | | 0.53%, 12/25/34 (k) | | | | | 440,832 | |
| | 3,682 | | | 5.084%, 11/25/35 (k) | | | | | 3,592,383 | |
| | 4,152 | | | 5.50%, 11/25/35 | | | | | 3,939,964 | |
| | 603 | | | 6.50%, 1/25/34 | | | | | 631,216 | |
| | | | Harborview Mortgage Loan Trust, CMO (k),
| | | | | | |
| | 2,641 | | | 0.562%, 10/19/33 | | | | | 2,398,243 | |
| | 2,262 | | | 5.368%, 6/19/36 | | | | | 1,607,639 | |
| | | | JPMorgan Chase Commercial Mortgage Securities Trust, CMO (a)(d)(k),
| | | | | | |
| | 5,000 | | | 0.641%, 7/15/19 | | | | | 4,855,963 | |
| | 4,000 | | | 5.636%, 3/18/51 | | | | | 4,338,740 | |
| | | | JPMorgan Mortgage Trust, CMO,
| | | | | | |
| | 5,164 | | | 2.693%, 10/25/36 (k) | | | | | 4,476,644 | |
| | 172 | | | 5.50%, 8/25/22 | | | | | 168,537 | |
| | 1,015 | | | 5.50%, 6/25/37 | | | | | 939,082 | |
| | 384 | | | Lehman Mortgage Trust, 5.00%, 8/25/21, CMO | | | | | 383,953 | |
| | 3,430 | | | Luminent Mortgage Trust, 0.36%, 12/25/36, CMO (k) | | | | | 2,474,451 | |
| | 1,498 | | | MASTR Adjustable Rate Mortgages Trust, 3.134%, 10/25/34, CMO (k) | | | | | 1,286,901 | |
| | | | MASTR Alternative Loans Trust, CMO, | | | | | | |
| | 940 | | | 6.25%, 7/25/36 | | | | | 784,924 | |
| | 1,178 | | | 6.50%, 3/25/34 | | | | | 1,239,013 | |
| | 88 | | | 7.00%, 4/25/34 | | | | | 89,051 | |
| | | | MASTR Reperforming Loan Trust, CMO (a)(d), | | | | | | |
| | 6,907 | | | 7.00%, 5/25/35 | | | | | 6,590,292 | |
| | 3,661 | | | 7.50%, 7/25/35 | | | | | 3,709,703 | |
| | 39 | | | Merrill Lynch Mortgage Investors Trust, 5.25%, 8/25/36, CMO (k) | | | | | 38,617 | |
| | 1 | | | Morgan Stanley Dean Witter Capital I, Inc. Trust, 5.50%, 4/25/17, CMO | | | | | 708 | |
| | | | Newgate Funding, CMO (k), | | | | | | |
| € | 3,050 | | | 1.46%, 12/15/50 | | | | | 3,159,830 | |
| £ | 4,200 | | | 1.509%, 12/15/50 | | | | | 5,471,835 | |
| € | 3,050 | | | 1.71%, 12/15/50 | | | | | 3,033,031 | |
| £ | 3,450 | | | 1.759%, 12/15/50 | | | | | 4,194,090 | |
| | | | Nomura Asset Acceptance Corp., CMO (a)(d), | | | | | | |
| $ | 1,863 | | | 7.00%, 10/25/34 | | | | | 1,964,812 | |
| | 4,948 | | | 7.50%, 3/25/34 | | | | | 5,346,880 | |
| | 5,588 | | | 7.50%, 10/25/34 | | | | | 6,036,090 | |
| | | | Residential Accredit Loans, Inc., CMO, | | | | | | |
| | 2,956 | | | 0.37%, 6/25/46 (k) | | | | | 1,207,818 | |
| | 3,585 | | | 6.00%, 8/25/35 | | | | | 3,120,521 | |
| | | | |
| 12 | | July 31, 2013 | | | Semiannual Report |
Schedule of Investments
PIMCO Strategic Global Government Fund, Inc.
July 31, 2013 (unaudited) (continued)
| | | | | | | | | | |
Principal
Amount
(000s) | | | | | | | Value | |
| | | | Residential Asset Mortgage Products, Inc., CMO, | | | | | | |
| $ | 8 | | | 6.50%, 4/25/34 | | | | $ | 8,529 | |
| | 208 | | | 7.00%, 8/25/16 | | | | | 209,411 | |
| | 893 | | | 8.50%, 10/25/31 | | | | | 973,409 | |
| | 1,479 | | | 8.50%, 11/25/31 | | | | | 1,543,398 | |
| | 489 | | | Structured Adjustable Rate Mortgage Loan Trust, 2.614%, 3/25/34, CMO (k) | | | | | 483,275 | |
| | 4,981 | | | Structured Asset Mortgage Investments II Trust, 1.662%, 8/25/47, CMO (k) | | | | | 3,830,295 | |
| | 4,473 | | | Structured Asset Securities Corp. Mortgage Loan Trust,
7.50%, 10/25/36, CMO (a)(d) | | | | | 4,238,328 | |
| | 2,839 | | | UBS Commercial Mortgage Trust, 0.766%, 7/15/24, CMO (a)(d)(k) | | | | | 2,795,639 | |
| | 2,137 | | | Wachovia Bank Commercial Mortgage Trust, 0.312%, 9/15/21, CMO (a)(d)(k) | | | | | 2,131,159 | |
| | 575 | | | WaMu Mortgage Pass-Through Certificates, 2.427%, 5/25/35, CMO (k) | | | | | 537,642 | |
| | | | Washington Mutual MSC Mortgage Pass-Through Certificates Trust, CMO, | | | | | | |
| | 1,066 | | | 6.50%, 8/25/34 | | | | | 1,108,069 | |
| | 423 | | | 7.00%, 3/25/34 | | | | | 447,525 | |
| | 974 | | | 7.50%, 4/25/33 | | | | | 1,073,437 | |
| | | | Wells Fargo Mortgage-Backed Securities Trust, CMO (k), | | | | | | |
| | 843 | | | 2.636%, 6/25/35 | | | | | 835,125 | |
| | 1,824 | | | 2.71%, 4/25/36 | | | | | 1,659,923 | |
| | 100 | | | 2.72%, 4/25/36 | | | | | 93,846 | |
| | 2,409 | | | 5.616%, 10/25/36 | | | | | 2,260,067 | |
| | 5,500 | | | WFDB Commercial Mortgage Trust, 6.403%, 7/5/24, CMO (a)(d) | | | | | 5,615,055 | |
| | | | | Total Mortgage-Backed Securities (cost-$160,515,128) | | | | | 178,068,705 | |
| | | | | | | | | | |
| | U.S. Treasury Obligations – 13.1% | | | | | | |
| | | | U.S. Treasury Notes, | | | | | | |
| | 75 | | | 0.25%, 3/31/14 (h) | | | | | 75,075 | |
| | 50,000 | | | 0.375%, 6/30/15 | | | | | 50,073,250 | |
| | | | | Total U.S. Treasury Obligations (cost-$50,092,297) | | | | | 50,148,325 | |
| | | | | | | | | | |
| | Asset-Backed Securities – 3.0% | | | | | | |
| | 405 | | | Access Financial Manufactured Housing Contract Trust, 7.65%, 5/15/21 | | | | | 407,026 | |
| | 1,022 | | | Ameriquest Mortgage Securities, Inc. Asset-Backed Pass-Through Certificates (k), 3.715%, 11/25/32 | | | | | 82,057 | |
| | 164 | | | 5.815%, 2/25/33 | | | | | 8,272 | |
| | 1,160 | | | Bear Stearns Asset-Backed Securities I Trust, 0.69%, 9/25/34 (k) | | | | | 1,037,505 | |
| | | | Conseco Finance Securitizations Corp., | | | | | | |
| | 2,001 | | | 7.96%, 5/1/31 | | | | | 1,642,648 | |
| | 299 | | | 7.97%, 5/1/32 | | | | | 215,567 | |
| | | | Conseco Financial Corp., | | | | | | |
| | 219 | | | 6.53%, 2/1/31 (k) | | | | | 223,486 | |
| | 461 | | | 7.05%, 1/15/27 | | | | | 475,333 | |
| | 1,128 | | | Credit-Based Asset Servicing and Securitization LLC, 6.02%, 12/25/37 (a)(d) | | | | | 1,182,986 | |
| | 3,876 | | | Green Tree, 8.97%, 4/25/38 (a)(d)(k) | | | | | 4,279,413 | |
| | 1,000 | | | Greenpoint Manufactured Housing, 8.30%, 10/15/26 (k) | | | | | 1,091,645 | |
| | 745 | | | Morgan Stanley Capital I, Inc. Trust, 0.37%, 1/25/36 (k) | | | | | 733,222 | |
| | | | | | |
| Semiannual Report | | | July 31, 2013 | | | 13 | |
Schedule of Investments
PIMCO Strategic Global Government Fund, Inc.
July 31, 2013 (unaudited) (continued)
| | | | | | | | | | |
Principal
Amount
(000s) | | | | | | | Value | |
| $ | 34 | | | Oakwood Mortgage Investors, Inc., 0.421%, 5/15/13 | | | | $ | 28,250 | |
| | 27 | | | Residential Asset Mortgage Products, Inc., 8.50%, 12/25/31 | | | | | 26,049 | |
| | | | | Total Asset-Backed Securities (cost-$11,127,604) | | | | | 11,433,459 | |
| | Senior Loans – 2.3% | | | | |
| | | | Electric Utilities – 0.1% | | | | | | |
| $ | 654 | | | Texas Competitive Electric Holdings Co. LLC, 4.695%-4.775%, 10/10/17 (a)(c) | | | | $ | 460,201 | |
| | | | Financial Services – 1.6% | | | | | | |
| | 6,000 | | | Springleaf Finance Corp., 5.50%, 5/10/17 (a)(c) | | | | | 6,017,250 | |
| | | | Healthcare-Services – 0.5% | | | | | | |
| | 1,775 | | | HCA, Inc., 2.686%, 5/2/16, Term A2 (a)(c) | | | | | 1,778,697 | |
| | | | Hotels/Gaming – 0.1% | | | | | | |
| | 500 | | | Stockbridge SBE Holdings LLC, 13.00%, 5/2/17, Term B (a)(b)(c)(j)
(acquisition cost-$495,625; purchased 7/10/12) | | | | | 530,000 | |
| | | | | Total Senior Loans (cost-$8,689,988) | | | | | 8,786,148 | |
| | | | | | | | | | |
| | Municipal Bonds – 0.4% | | | | |
| | | | West Virginia – 0.4% | | | | | | |
| | 1,780 | | | Tobacco Settlement Finance Auth. Rev., 7.467%, 6/1/47, Ser. A (cost-$1,676,150) | | | | | 1,495,129 | |
| | | |
| Shares | | | | | | | | |
| | Common Stock – 0.1% | | | | |
| | | | Oil, Gas & Consumable Fuels – 0.1% | | | | | | |
| | 3,881 | | | SemGroup Corp., Class A (cost-$100,912) | | | | | 219,058 | |
| | | |
Principal
Amount
(000s) | | | | | | | | |
| | Sovereign Debt Obligations – 0.1% | | | | |
| | | | Ireland – 0.1% | | | | | | |
| $ | 200 | | | VEB Finance PLC for Vnesheconombank, 5.375%, 2/13/17 (a)(d) (cost-$200,000) | | | | | 213,500 | |
| | | |
| Units | | | | | | | | |
| | Warrants – 0.0% | | | | |
| | | | Engineering & Construction – 0.0% | | | | | | |
| | 3,675 | | | Alion Science and Technology Corp., expires 11/1/14 (a)(d)(m) | | | | | 37 | |
| | | | Oil, Gas & Consumable Fuels – 0.0% | | | | | | |
| | 4,086 | | | SemGroup Corp., expires 11/30/14 (m) | | | | | 133,024 | |
| | | | | Total Warrants (cost-$18,422) | | | | | 133,061 | |
| | | |
Principal
Amount
(000s) | | | | | | | | |
| | Short-Term Investments – 1.2% | | | | |
| | | | Repurchase Agreements – 0.7% | | | | | | |
| $ | 700 | | | Banc of America Securities LLC, dated 7/31/13, 0.09%, due 8/1/13, proceeds $700,002; collateralized by U.S. Treasury Bills, zero coupon, due 7/24/14, valued at $714,238 | | | | | 700,000 | |
| | 1,200 | | | Citigroup Global Markets, Inc., dated 7/31/13, 0.10%, due 8/1/13, proceeds $1,200,003; collateralized by U.S. Treasury Notes, 0.25%, due 6/30/14, valued at $1,226,582 including accrued interest | | | | | 1,200,000 | |
| | | | |
| 14 | | July 31, 2013 | | | Semiannual Report |
Schedule of Investments
PIMCO Strategic Global Government Fund, Inc.
July 31, 2013 (unaudited) (continued)
| | | | | | | | | | |
Principal
Amount
(000s) | | | | | | | Value | |
| | | | Repurchase Agreements (continued) | | | | | | |
| $ | 671 | | | State Street Bank and Trust Co., dated 7/31/13, 0.01%, due 8/1/13, proceeds $671,000; collateralized by Fannie Mae, 2.20%, due 10/17/22, valued at $685,332 including accrued interest | | | | $ | 671,000 | |
| | | | | Total Repurchase Agreements (cost-$2,571,000) | | | | | 2,571,000 | |
| | | | U.S. Treasury Obligations (h) – 0.5% | | | | | | |
| | 1,286 | | | U.S. Treasury Bills, 0.011%-0.137%, 8/1/13-5/29/14 (l) | | | | | 1,285,333 | |
| | | | U.S. Treasury Notes, | | | | | | |
| | 100 | | | 0.25%, 4/30/14 | | | | | 100,104 | |
| | 400 | | | 0.75%, 6/15/14 | | | | | 402,148 | |
| | | | | Total U.S. Treasury Obligations (cost-$1,787,457) | | | | | 1,787,585 | |
| | | | | Total Short-Term Investments (cost-$4,358,457) | | | | | 4,358,585 | |
| | | |
Notional
Amount
(000s) | | | | | | | | |
| | Options Purchased (m) – 0.0% | | | | | | |
| | | | Put Options – 0.0% | | | | | | |
| | 19,000 | | | Fannie Mae, 3.00%, TBA, 15 Year (OTC), strike price $94.50, expires 8/7/13 | | | | | — | (n) |
| | | | Fannie Mae, 3.00%-4.50%, TBA, 30 Year (OTC), | | | | | | |
| | 32,000 | | | strike price $90.00, expires 9/5/13 | | | | | 131 | |
| | 38,000 | | | strike price $96.00, expires 9/5/13 | | | | | — | (n) |
| | 25,000 | | | strike price $79.00, expires 10/3/13 | | | | | 18 | |
| | 29,000 | | | strike price $80.00, expires 10/3/13 | | | | | 171 | |
| | 79,000 | | | strike price $81.00, expires 10/3/13 | | | | | 276 | |
| | 59,000 | | | strike price $81.50, expires 10/3/13 | | | | | 65 | |
| | 19,000 | | | strike price $83.00, expires 10/3/13 | | | | | 59 | |
| | 3,000 | | | Freddie Mac, 4.00%, TBA, 30 Year (OTC), strike price $82.00, expires 10/3/13 | | | | | 6 | |
| | | | Ginnie Mae, 4.00%-4.50%, TBA, 30 Year (OTC), | | | | | | |
| | 24,500 | | | strike price $80.50, expires 10/15/13 | | | | | 37 | |
| | 7,000 | | | strike price $87.50, expires 10/15/13 | | | | | — | (n) |
| | | | | Total Options Purchased (cost-$39,199) | | | | | 763 | |
| | | | | Total Investments, before securities sold short
(cost-$1,074,320,568) – 296.1% | | | | | 1,129,851,424 | |
| | | |
Principal
Amount
(000s) | | | | | | | | |
| | Securities Sold Short – (13.1)% | | | | | | |
| | | | U.S. Government Agency Securities – (13.1)% | | | | | | |
| $ | 47,000 | | | Fannie Mae, 4.50%, MBS, TBA, 30 Year (proceeds received-$49,340,625) | | | | | (49,827,346 | ) |
| | | | | Total Investments, net of securities sold short
(cost-$1,024,979,943) – 283.0% | | | | | 1,080,024,078 | |
| | | | | Other liabilities in excess of other assets – (183.0)% | | | | | (698,434,504 | ) |
| | | | | Net Assets – 100.0% | | | | $ | 381,589,574 | |
Notes to Schedule of Investments:
| (a) | | Private Placement – Restricted as to resale and may not have a readily available market. Securities with an aggregate value of $135,480,179, representing 35.5% of net assets. | |
| | | | | | |
| Semiannual Report | | | July 31, 2013 | | | 15 | |
Schedule of Investments
PIMCO Strategic Global Government Fund, Inc.
July 31, 2013 (unaudited) (continued)
| (c) | | These securities generally pay interest at rates which are periodically pre-determined by reference to a base lending rate plus a premium. These base lending rates are generally either the lending rate offered by one or more major European banks, such as the “LIBOR” or the prime rate offered by one or more major United States banks, or the certificate of deposit rate. These securities are generally considered to be restricted as the Fund is ordinarily contractually obligated to receive approval from the Agent bank and/or borrower prior to disposition. Remaining maturities of senior loans may be less than the stated maturities shown as a result of contractual or optional payments by the borrower. Such prepayments cannot be predicted with certainty. The interest rate disclosed reflects the rate in effect on July 31, 2013. | |
| (d) | | 144A – Exempt from registration under Rule 144A of the Securities Act of 1933. These securities may be resold in transactions exempt from registration, typically only to qualified institutional buyers. Unless otherwise indicated, these securities are not considered to be illiquid. | |
| (e) | | When-issued or delayed-delivery. To be settled/delivered after July 31, 2013. | |
| (g) | | Perpetual maturity. The date shown, if any, is the next call date. For Corporate Bonds & Notes the interest rate is fixed until the first call date and variable thereafter. | |
| (h) | | All or partial amount segregated for the benefit of the counterparty as collateral for derivatives, securities sold short and/or when-issued or delayed-delivery securities. | |
| (i) | | All or partial amount transferred for the benefit of the counterparty as collateral for reverse repurchase agreements. | |
| (j) | | Restricted. The aggregate acquisition cost of such securities is $1,927,880. The aggregate value is $1,954,085, representing 0.5% of net assets. | |
| (k) | | Variable or Floating Rate Security – Securities with an interest rate that changes periodically. The interest rate disclosed reflects the rate in effect on July 31, 2013. | |
| (l) | | Rates reflect the effective yields at purchase date. | |
| (m) | | Non-income producing. | |
| (o) | | Credit default swap agreements outstanding at July 31, 2013: | |
OTC sell protection swap agreements:
| | | | | | | | | | | | | | | | | | | | | | | | | | | | |
Swap Counterparty/
Referenced Debt Issuer | | Notional
Amount
(000s)(1) | | | Credit
Spread | | | Termination
Date | | | Payments
Received | | | Value(2) | | | Upfront
Premiums
Paid
(Received) | | | Unrealized
Appreciation
(Depreciation) | |
Bank of America: | | | | | | | | | | | | | | | | | | | | | | | | | | | | |
American Express | | $ | 8,000 | | | | 0.10 | % | | | 12/20/13 | | | | 4.10 | % | | $ | 164,182 | | | $ | — | | | $ | 164,182 | |
SLM | | | 5,000 | | | | 0.49 | % | | | 12/20/13 | | | | 5.00 | % | | | 117,811 | | | | (612,500 | ) | | | 730,311 | |
Citigroup: | | | | | | | | | | | | | | | | | | | | | | | | | | | | |
American Express | | | 500 | | | | 0.10 | % | | | 12/20/13 | | | | 4.30 | % | | | 10,772 | | | | — | | | | 10,772 | |
SLM | | | 6,000 | | | | 0.49 | % | | | 12/20/13 | | | | 5.00 | % | | | 141,373 | | | | 518,648 | | | | (377,275 | ) |
SLM | | | 1,300 | | | | 0.49 | % | | | 12/20/13 | | | | 5.00 | % | | | 30,631 | | | | (156,000 | ) | | | 186,631 | |
Credit Suisse First Boston: | | | | | | | | | | | | | | | | | | | | | | | | | | | | |
Nokia Oyj | | € | 1,900 | | | | 4.15 | % | | | 6/20/17 | | | | 5.00 | % | | | 91,364 | | | | (359,813 | ) | | | 451,177 | |
Deutsche Bank: | | | | | | | | | | | | | | | | | | | | | | | | | | | | |
SLM | | $ | 2,600 | | | | 0.49 | % | | | 12/20/13 | | | | 5.00 | % | | | 61,262 | | | | (318,500 | ) | | | 379,762 | |
Morgan Stanley: | | | | | | | | | | | | | | | | | | | | | | | | | | | | |
Merrill Lynch & Co. | | | 5,000 | | | | 0.66 | % | | | 9/20/16 | | | | 1.00 | % | | | 58,202 | | | | (741,653 | ) | | | 799,855 | |
| | | | | | | | | | | | | | | | | | | | | | | | | | | | |
| | | | | | | | | | | | | | | | | | $ | 675,597 | | | $ | (1,669,818 | ) | | $ | 2,345,415 | |
| | | | | | | | | | | | | | | | | | | | | | | | | | | | |
| (1) | | This represents the maximum potential amount the Fund could be required to make available as a seller of credit protection or receive as a buyer of credit protection if a credit event occurs as defined under the terms of that particular swap agreement. | |
| (2) | | The quoted market prices and resulting values for credit default swap agreements serve as an indicator of the status at July 31, 2013 of the payment/performance risk and represent the likelihood of an expected liability (or profit) for the credit derivative should the notional amount of the swap agreement have been | |
| | | | |
| 16 | | July 31, 2013 | | | Semiannual Report |
Schedule of Investments
PIMCO Strategic Global Government Fund, Inc.
July 31, 2013 (unaudited) (continued)
| | closed/sold as of the period end. Increasing market values, in absolute terms when compared to the notional amount of the swap, represent a deterioration of the referenced entity’s credit soundness and a greater likelihood or risk of default or other credit event occurring as defined under the terms of the agreement. | |
| (p) | | Interest rate swap agreements outstanding at July 31, 2013: | |
Centrally cleared swap agreements:
| | | | | | | | | | | | | | | | | | | | | | | | |
| | | Notional
Amount
(000s) | | | Termination
Date | | | Rate Type | | | Value | | | Unrealized
Appreciation | |
| Broker (Exchange) | | | | Payments
Made | | | Payments
Received | | | |
Goldman Sachs (CME) | | $ | 170,000 | | | | 12/19/22 | | | | 1.75 | % | | | 3-Month USD-LIBOR | | | $ | 13,463,663 | | | $ | 11,182,785 | |
| | | | | | | | | | | | | | | | | | | | | | | | |
| (q) | | Forward foreign currency contracts outstanding at July 31, 2013: | |
| | | | | | | | | | | | | | |
| | | Counterparty | | U.S.$ Value
on
Origination
Date | | | U.S.$ Value
July 31,
2013 | | | Unrealized
Appreciation
(Depreciation) | |
Purchased: | | | | | | | | | | | | | | |
341,000 British Pound settling 9/12/13 | | Barclays Bank | | $ | 535,218 | | | $ | 518,600 | | | $ | (16,618 | ) |
859,362 Euro settling 9/17/13 | | Barclays Bank | | | 1,120,000 | | | | 1,143,430 | | | | 23,430 | |
19,217,000 Euro settling 8/2/13 | | Goldman Sachs | | | 25,339,536 | | | | 25,565,332 | | | | 225,796 | |
568,000 Euro settling 9/3/13 | | HSBC Bank | | | 752,509 | | | | 755,718 | | | | 3,209 | |
Sold: | | | | | | | | | | | | | | |
182,221 British Pound settling 9/12/13 | | Citigroup | | | 279,000 | | | | 277,126 | | | | 1,874 | |
21,736,000 British Pound settling 9/12/13 | | HSBC Bank | | | 33,356,740 | | | | 33,056,536 | | | | 300,204 | |
282,000 British Pound settling 9/12/13 | | UBS | | | 429,092 | | | | 428,871 | | | | 221 | |
18,571,000 Euro settling 8/2/13 | | Citigroup | | | 24,284,479 | | | | 24,705,926 | | | | (421,447 | ) |
19,217,000 Euro settling 9/3/13 | | Goldman Sachs | | | 25,342,439 | | | | 25,568,023 | | | | (225,584 | ) |
873,990 Euro settling 9/17/13 | | JPMorgan Chase | | | 1,140,000 | | | | 1,162,894 | | | | (22,894 | ) |
646,000 Euro settling 8/2/13 | | UBS | | | 843,834 | | | | 859,406 | | | | (15,572 | ) |
| | | | | | | | | | | | | | |
| | | | | | | | | | | | $ | (147,381 | ) |
| | | | | | | | | | | | | | |
| (r) | | At July 31, 2013, the Fund held $1,119,000 in cash as collateral and pledged cash collateral of $6,316,000 for derivative contracts. Cash collateral held may be invested in accordance with the Fund’s investment strategy. | |
| (s) | | Open reverse repurchase agreements at July 31, 2013: | |
| | | | | | | | | | | | | | | | | | | | |
| Counterparty | | Rate | | | Trade Date | | | Due Date | | | Principal & Interest | | | Principal | |
Barclays Bank | | | 0.42 | % | | | 7/15/13 | | | | 8/12/13 | | | $ | 81,064,075 | | | $ | 81,048,000 | |
| | | 0.625 | | | | 2/25/13 | | | | 8/26/13 | | | | 1,604,361 | | | | 1,600,000 | |
| | | 0.692 | | | | 7/15/13 | | | | 8/12/13 | | | | 765,250 | | | | 765,000 | |
Citigroup | | | 0.33 | | | | 7/15/13 | | | | 8/12/13 | | | | 549,086 | | | | 549,000 | |
| | | 0.43 | | | | 7/15/13 | | | | 8/12/13 | | | | 11,750,386 | | | | 11,748,000 | |
Credit Suisse First Boston | | | 0.45 | | | | 6/14/13 | | | | 9/16/13 | | | | 2,961,776 | | | | 2,960,000 | |
Deutsche Bank | | | 0.20 | | | | 7/22/13 | | | | 8/20/13 | | | | 24,964,887 | | | | 24,963,500 | |
| | | 0.43 | | | | 5/22/13 | | | | 8/20/13 | | | | 3,843,257 | | | | 3,840,000 | |
| | | 0.50 | | | | 5/20/13 | | | | 8/20/13 | | | | 13,306,478 | | | | 13,293,000 | |
| | | 0.50 | | | | 5/22/13 | | | | 8/20/13 | | | | 905,898 | | | | 905,000 | |
| | | 0.52 | | | | 7/11/13 | | | | 10/7/13 | | | | 4,645,409 | | | | 4,644,000 | |
| | | 0.52 | | | | 7/12/13 | | | | 10/7/13 | | | | 3,205,926 | | | | 3,205,000 | |
Goldman Sachs | | | 0.23 | | | | 7/15/13 | | | | 8/12/13 | | | | 173,748,869 | | | | 173,730,000 | |
| | | 0.23 | | | | 7/16/13 | | | | 8/12/13 | | | | 3,754,384 | | | | 3,754,000 | |
JPMorgan Chase | | | 0.55 | | | | 7/15/13 | | | | 8/12/13 | | | | 43,362,259 | | | | 43,351,000 | |
Royal Bank of Canada | | | 0.45 | | | | 5/22/13 | | | | 8/19/13 | | | | 2,474,194 | | | | 2,472,000 | |
| | | 0.45 | | | | 6/14/13 | | | | 9/17/13 | | | | 23,742,237 | | | | 23,728,000 | |
| | | 0.45 | | | | 7/11/13 | | | | 10/3/13 | | | | 6,171,620 | | | | 6,170,000 | |
| | | | | | |
| Semiannual Report | | | July 31, 2013 | | | 17 | |
Schedule of Investments
PIMCO Strategic Global Government Fund, Inc.
July 31, 2013 (unaudited) (continued)
| | | | | | | | | | | | | | | | | | | | |
| Counterparty | | Rate | | | Trade Date | | | Due Date | | | Principal & Interest | | | Principal | |
Royal Bank of Scotland | | | 0.43 | % | | | 7/11/13 | | | | 9/6/13 | | | $ | 2,956,741 | | | $ | 2,956,000 | |
| | | 0.48 | | | | 5/17/13 | | | | 8/20/13 | | | | 12,752,910 | | | | 12,740,000 | |
UBS | | | 0.61 | | | | 2/22/13 | | | | 8/22/13 | | | | 18,051,808 | | | | 18,003,000 | |
| | | | | | | | | | | | | | | | | | | | |
| | | | | | | | | | | | | | | | | | $ | 436,424,500 | |
| | | | | | | | | | | | | | | | | | | | |
| (t) | | The weighted average daily balance of reverse repurchase agreements during the six months ended July 31, 2013 was $435,671,539, at a weighted average interest rate of 0.41%. Total value of underlying collateral (refer to the Schedule of Investments for positions transferred for the benefit of the counterparty as collateral) for open reverse repurchase agreements at July 31, 2013 was $458,090,971. | |
| | | At July 31, 2013, the Fund held $1,511,000 in cash as collateral and pledged cash collateral of $410,000 for open reverse repurchase agreements. Cash collateral held may be invested in accordance with the Fund’s investment strategy. | |
| (u) | | Sale-buybacks for the six months ended July 31, 2013: The weighted average borrowing for sale-buybacks during the six months ended July 31, 2013 was $42,712,669 at a weighted average interest rate of 0.03%. | |
| (v) | | Fair Value Measurements – See Note 1(b) in the Notes to Financial Statements. | |
| | | | | | | | | | | | | | | | |
| | | Level 1 –
Quoted
Prices | | | Level 2 –
Other Significant
Observable
Inputs | | | Level 3 –
Significant
Unobservable
Inputs | | | Value at
7/31/13 | |
| Investments in Securities – Assets | | | | | | | | | |
U.S. Government Agency Securities | | $ | — | | | $ | 665,473,221 | | | $ | — | | | $ | 665,473,221 | |
Corporate Bonds & Notes: | | | | | | | | | | | | | | | | |
Airlines | | | — | | | | 4,090,745 | | | | 5,814,691 | | | | 9,905,436 | |
All Other | | | — | | | | 199,616,034 | | | | — | | | | 199,616,034 | |
Mortgage-Backed Securities | | | — | | | | 178,068,705 | | | | — | | | | 178,068,705 | |
U.S. Treasury Obligations | | | — | | | | 50,148,325 | | | | — | | | | 50,148,325 | |
Asset-Backed Securities | | | — | | | | 11,433,459 | | | | — | | | | 11,433,459 | |
Senior Loans: | | | | | | | | | | | | | | | | |
Hotels/Gaming | | | — | | | | — | | | | 530,000 | | | | 530,000 | |
All Other | | | — | | | | 8,256,148 | | | | — | | | | 8,256,148 | |
Municipal Bonds | | | — | | | | 1,495,129 | | | | — | | | | 1,495,129 | |
Common Stock | | | 219,058 | | | | — | | | | — | | | | 219,058 | |
Sovereign Debt Obligations | | | — | | | | 213,500 | | | | — | | | | 213,500 | |
Warrants: | | | | | | | | | | | | | | | | |
Engineering & Construction | | | — | | | | 37 | | | | — | | | | 37 | |
Oil, Gas & Consumable Fuels | | | 133,024 | | | | — | | | | — | | | | 133,024 | |
Short-Term Investments | | | — | | | | 4,358,585 | | | | — | | | | 4,358,585 | |
Options Purchased: | | | | | | | | | | | | | | | | |
Interest Rate Contracts | | | — | | | | 763 | | | | — | | | | 763 | |
| | | | 352,082 | | | | 1,123,154,651 | | | | 6,344,691 | | | | 1,129,851,424 | |
| Investment in Securities – Liabilities | | | | | | | | | | | | | | | | |
Securities Sold Short, at value | | | — | | | | (49,827,346 | ) | | | — | | | | (49,827,346 | ) |
| Other Financial Instruments* – Assets | | | | | | | | | | | | | | | | |
Credit Contracts | | | — | | | | 2,722,690 | | | | — | | | | 2,722,690 | |
Foreign Exchange Contracts | | | — | | | | 554,734 | | | | — | | | | 554,734 | |
Interest Rate Contracts | | | — | | | | 11,182,785 | | | | — | | | | 11,182,785 | |
| | | | — | | | | 14,460,209 | | | | — | | | | 14,460,209 | |
| | | | |
| 18 | | July 31, 2013 | | | Semiannual Report |
Schedule of Investments
PIMCO Strategic Global Government Fund, Inc.
July 31, 2013 (unaudited) (continued)
| | | | | | | | | | | | | | | | |
| | | Level 1 –
Quoted
Prices | | | Level 2 –
Other Significant
Observable
Inputs | | | Level 3 –
Significant
Unobservable
Inputs | | | Value at
7/31/13 | |
| Other Financial Instruments* – Liabilities | | | | | | | | | | | | | | | | |
Credit Contracts | | $ | — | | | $ | (377,275 | ) | | $ | — | | | $ | (377,275 | ) |
Foreign Exchange Contracts | | | — | | | | (702,115 | ) | | | — | | | | (702,115 | ) |
| | | | — | | | | (1,079,390 | ) | | | — | | | | (1,079,390 | ) |
Totals | | $ | 352,082 | | | $ | 1,086,708,124 | | | $ | 6,344,691 | | | $ | 1,093,404,897 | |
At July 31, 2013, a security valued at $113,024 was transferred from Level 2 to Level 1 due to the availability of a closing price traded on an exchange.
A roll forward of fair value measurements using significant unobservable inputs (Level 3) for the six months ended July 31, 2013, was as follows:
| | | | | | | | | | | | | | | | | | | | | | | | | | | | | | | | | | | | |
| | | Beginning
Balance
1/31/13 | | | Purchases | | | Sales | | | Accrued
Discount
(Premiums) | | | Net
Realized
Gain (Loss) | | | Net Change
in Unrealized
Appreciation/
Depreciation | | | Transfers
into
Level 3 | | | Transfers
out of
Level 3** | | | Ending
Balance
7/31/13 | |
Investments in Securities – Assets | | | | | | | | | | | | | | | | | | | | | | | | | | | | | |
Corporate Bonds & Notes: | | | | | | | | | | | | | | | | | | | | | | | | | | | | | | | | | | | | |
Airlines | | $ | 6,578,826 | | | $ | — | | | $ | (541,662 | ) | | $ | (4,544 | ) | | $ | (8,519 | ) | | $ | (209,410 | ) | | $ | — | | | $ | — | | | $ | 5,814,691 | |
Mortgage-Backed Securities | | | 4,365,337 | | | | — | | | | — | | | | 2,134 | | | | — | | | | (28,731 | ) | | | — | | | | (4,338,740 | ) | | | — | |
Senior Loans: | | | | | | | | | | | | | | | | | | | | | | | | | | | | | | | | | | | | |
Hotels/Gaming | | | 538,750 | | | | — | | | | — | | | | 454 | | | | — | | | | (9,204 | ) | | | — | | | | — | | | | 530,000 | |
Totals | | $ | 11,482,913 | | | $ | — | | | $ | (541,662 | ) | | $ | (1,956 | ) | | $ | (8,519 | ) | | $ | (247,345 | ) | | $ | — | | | $ | (4,338,740 | ) | | $ | 6,344,691 | |
The following table presents additional information about valuation techniques and inputs used for investments that are measured at fair value and categorized within Level 3 at July 31, 2013.
| | | | | | | | | | | | |
| | | Ending
Balance at
7/31/13 | | | Valuation
Technique Used | | Unobservable
Inputs | | Input Values | |
| Investments in Securities – Assets | | | | | | |
Corporate Bonds & Notes | | $ | 5,814,691 | | | Third-Party pricing vendor | | Single Broker Quote | | $ | 105.00-$114.25 | |
Senior Loans | | | 530,000 | | | Third-Party pricing vendor | | Single Broker Quote | | | $106.00 | |
| * | | Other financial instruments are derivatives, such as swap agreements and forward foreign currency contracts, which are valued at the unrealized appreciation (depreciation) of the instrument. | |
| ** | | Transferred out of Level 3 into Level 2 because an evaluated price with observable inputs from a third-party pricing vendor became available. | |
The net change in unrealized appreciation/depreciation of Level 3 investments held at July 31, 2013, was $(107,192). Net realized gain (loss) and net change in unrealized appreciation/depreciation are reflected on the Statement of Operations.
| | | | | | |
| Semiannual Report | | | July 31, 2013 | | | 19 | |
Schedule of Investments
PIMCO Strategic Global Government Fund, Inc.
July 31, 2013 (unaudited) (continued)
| (w) | | The following is a summary of the derivative instruments categorized by risk exposure: | |
The effect of derivatives on the Statement of Assets and Liabilities at July 31, 2013:
| | | | | | | | | | | | | | | | |
| Location | | Interest
Rate
Contracts | | | Credit
Contracts | | | Foreign
Exchange
Contracts | | | Total | |
| | | | |
| Asset derivatives: | | | | | | | | | | | | | | | | |
Investments, at value (options purchased) | | $ | 763 | | | $ | — | | | $ | — | | | $ | 763 | |
Unrealized appreciation of OTC swaps | | | — | | | | 2,722,690 | | | | — | | | | 2,722,690 | |
Unrealized appreciation of forward foreign currency contracts | | | — | | | | — | | | | 554,734 | | | | 554,734 | |
| Total asset derivatives | | $ | 763 | | | $ | 2,722,690 | | | $ | 554,734 | | | $ | 3,278,187 | |
| | | | |
| Liability derivatives: | | | | | | | | | | | | | | | | |
Unrealized depreciation of OTC swaps | | $ | — | | | $ | (377,275 | ) | | $ | — | | | $ | (377,275 | ) |
Payable for variation margin on centrally cleared swaps* | | | (125,094 | ) | | | — | | | | — | | | | (125,094 | ) |
Unrealized depreciation of forward foreign currency contracts | | | — | | | | — | | | | (702,115 | ) | | | (702,115 | ) |
| Total liability derivatives | | $ | (125,094 | ) | | $ | (377,275 | ) | | $ | (702,115 | ) | | $ | (1,204,484 | ) |
| * | | Included in net unrealized appreciation of $11,182,785 on centrally cleared swaps as reported in note (p) of the Notes to Schedule of Investments. | |
The effect of derivatives on the Statement of Operations for the six months ended July 31, 2013:
| | | | | | | | | | | | | | | | |
| Location | | Interest
Rate
Contracts | | | Credit
Contracts | | | Foreign
Exchange
Contracts | | | Total | |
| | | | |
| Net realized gain (loss) on: | | | | | | | | | | | | | | | | |
Investments (options purchased) | | $ | (61,914 | ) | | $ | — | | | $ | — | | | $ | (61,914 | ) |
Swaps | | | (1,237,055 | ) | | | 1,270,447 | | | | — | | | | 33,392 | |
Foreign currency transactions (forward foreign currency contracts) | | | — | | | | — | | | | 1,214,399 | | | | 1,214,399 | |
| Total net realized gain (loss) | | $ | (1,298,969 | ) | | $ | 1,270,447 | | | $ | 1,214,399 | | | $ | 1,185,877 | |
| | | | |
| Net change in unrealized appreciation/depreciation of: | | | | | | | | | | | | | | | | |
Investments (options purchased) | | $ | (9,406 | ) | | $ | — | | | $ | — | | | $ | (9,406 | ) |
Swaps | | | 9,200,656 | | | | (1,002,420 | ) | | | — | | | | 8,198,236 | |
Foreign currency transactions (forward foreign currency contracts) | | | — | | | | — | | | | 491,839 | | | | 491,839 | |
| Total net change in unrealized appreciation/depreciation | | $ | 9,191,250 | | | $ | (1,002,420 | ) | | $ | 491,839 | | | $ | 8,680,669 | |
The average volume (measured at each fiscal quarter-end) of derivative activity during the six months ended July 31, 2013:
| | | | | | | | | | | | | | | | | | | | |
| Options Purchased(2) | | Forward Foreign
Currency Contracts(1) | | | Credit
Default Swap
Agreements(2) | | | Interest Rate
Swap
Agreements(2) | |
| | | Purchased | | | Sold | | | Sell | | | Sell | | | | |
| $296,833 | | $ | 27,686,916 | | | $ | 84,826,559 | | | $ | 32,700 | | | € | 1,967 | | | $ | 170,000 | |
| (1) | | U.S. $ Value on origination date | |
| (2) | | Notional Amount (in thousands) | |
| | | | |
| 20 | | July 31, 2013 | | | Semiannual Report |
Schedule of Investments
PIMCO Strategic Global Government Fund, Inc.
July 31, 2013 (unaudited) (continued)
Financial Assets and Derivative Assets, and Collateral Received as of July 31, 2013:
| | | | | | | | | | | | | | | | |
| Gross Amounts Not Offset in the Statement of Assets and Liabilities | |
| Counterparty | | Gross Asset Derivatives
Presented in Statement of
Assets and Liabilities | | | Financial
Instrument | | | Collateral
Received | | | Net Amount
(not less than $0) | |
Bank of America | | $ | 894,493 | | | $ | — | | | $ | (280,000 | ) | | $ | 614,493 | |
Barclays Bank plc | | | 23,430 | | | | (23,430 | ) | | | — | | | | — | |
Citigroup | | | 199,277 | | | | (199,277 | ) | | | — | | | | — | |
Credit Suisse First Boston | | | 451,177 | | | | (451,177 | ) | | | — | | | | — | |
Deutsche Bank | | | 379,762 | | | | (379,762 | ) | | | — | | | | — | |
Goldman Sachs | | | 225,796 | | | | (225,796 | ) | | | — | | | | — | |
HSBC Bank | | | 303,413 | | | | — | | | | — | | | | 303,413 | |
Morgan Stanley | | | 799,855 | | | | — | | | | (142,000 | ) | | | 657,855 | |
UBS AG | | | 221 | | | | (221 | ) | | | — | | | | — | |
Totals | | $ | 3,277,424 | | | $ | (1,279,663 | ) | | $ | (422,000 | ) | | $ | 1,575,761 | |
Financial Liabilities and Derivative Liabilities, and Collateral Pledged as of July 31, 2013:
| | | | | | | | | | | | | | | | |
| Gross Amounts Not Offset in the Statement of Assets and Liabilities | |
| Counterparty | | Gross Liability Derivatives
Presented in Statement of
Assets and Liabilities | | | Financial
Instrument | | | Collateral
Pledged | | | Net Amount
(not less than $0) | |
Barclays Bank plc | | $ | 83,429,618 | | | $ | (23,430 | ) | | $ | (83,406,188 | ) | | $ | — | |
Citigroup | | | 13,095,722 | | | | (199,277 | ) | | | (12,896,445 | ) | | | — | |
Credit Suisse First Boston | | | 2,960,000 | | | | (451,177 | ) | | | (2,508,823 | ) | | | — | |
Deutsche Bank | | | 50,850,500 | | | | (379,762 | ) | | | (50,470,738 | ) | | | — | |
Goldman Sachs | | | 177,709,584 | | | | (225,796 | ) | | | (177,483,788 | ) | | | — | |
JPMorgan Chase | | | 43,373,894 | | | | — | | | | (43,373,894 | ) | | | — | |
Royal Bank of Canada | | | 32,370,000 | | | | — | | | | (32,370,000 | ) | | | — | |
Royal Bank of Scotland | | | 15,696,000 | | | | — | | | | (15,696,000 | ) | | | — | |
UBS AG | | | 18,018,572 | | | | (221 | ) | | | (18,018,351 | ) | | | — | |
Totals | | $ | 437,503,890 | | | $ | (1,279,663 | ) | | $ | (436,224,227 | ) | | $ | — | |
Glossary:
| | | | |
| ABS | | - | | Asset-Backed Securities |
| £ | | - | | British Pound |
| CME | | - | | Chicago Mercantile Exchange |
| CMO | | - | | Collateralized Mortgage Obligation |
| € | | - | | Euro |
| FRN | | - | | Floating Rate Note |
| IO | | - | | Interest Only |
| LIBOR | | - | | London Inter-Bank Offered Rate |
| MBIA | | - | | insured by MBIA Insurance Corp. |
| MBS | | - | | Mortgage-Backed Securities |
| OTC | | - | | Over-the-Counter |
| PIK | | - | | Payment-in-Kind |
| TBA | | - | | To Be Announced |
| | | | | | | | |
| See accompanying Notes to Financial Statements | | | July 31, 2013 | | | Semiannual Report | | | 21 | |
Statement of Assets and Liabilities
PIMCO Strategic Global Government Fund, Inc.
July 31, 2013 (unaudited)
| | | | | | |
| | |
| Assets: | | | | | | |
Investments, at value (cost-$1,074,320,568) | | | | | $1,129,851,424 | |
Cash | | | | | 193,264 | |
Foreign currency, at value (cost-$62,271) | | | | | 62,262 | |
Receivable for investments sold | | | | | 99,189,510 | |
Deposits with brokers for swaps collateral | | | | | 6,316,000 | |
Interest receivable | | | | | 5,719,268 | |
Unrealized appreciation of OTC swaps | | | | | 2,722,690 | |
Unrealized appreciation of forward foreign currency contracts | | | | | 554,734 | |
Swap premiums paid | | | | | 518,648 | |
Receivable for principal paydowns | | | | | 342 | |
Deposits with brokers for reverse repurchase agreements | | | | | 410,000 | |
Prepaid expenses | | | | | 16,421 | |
Total Assets | | | | | 1,245,554,563 | |
| | |
| Liabilities: | | | | | | |
Payable for investments purchased | | | | | 333,210,898 | |
Payable for reverse repurchase agreements | | | | | 436,424,500 | |
Payable to brokers for cash collateral received | | | | | 2,630,000 | |
Payable for variation margin on centrally cleared swaps | | | | | 125,094 | |
Payable to broker | | | | | 13,594 | |
Payable for sale-buyback financing transactions | | | | | 34,364,308 | |
Securities sold short, at value (proceeds received-$49,340,625) | | | | | 49,827,346 | |
Dividends payable to stockholders | | | | | 3,265,374 | |
Swap premiums received | | | | | 2,188,466 | |
Unrealized depreciation of forward foreign currency contracts | | | | | 702,115 | |
Unrealized depreciation of OTC swaps | | | | | 377,275 | |
Investment management fees payable | | | | | 274,211 | |
Interest payable for reverse repurchase agreements | | | | | 157,311 | |
Accrued expenses and other liabilities | | | | | 404,497 | |
Total Liabilities | | | | | 863,964,989 | |
| Net Assets | | | | | $381,589,574 | |
| | |
| Composition of Net Assets: | | | | | | |
Common Stock: | | | | | | |
Par value ($0.00001 per share, applicable to 40,817,476 shares issued and outstanding) | | | | | $408 | |
Paid-in-capital in excess of par | | | | | 431,155,058 | |
Dividends in excess of net investment income | | | | | (1,116,671) | |
Accumulated net realized loss | | | | | (116,872,890) | |
Net unrealized appreciation | | | | | 68,423,669 | |
| Net Assets | | | | | $381,589,574 | |
| Net Asset Value Per Share | | | | | $9.35 | |
| | | | | | |
| 22 | | Semiannual Report | | | July 31, 2013 | | | See accompanying Notes to Financial Statements |
Statement of Operations
PIMCO Strategic Global Government Fund, Inc.
Six Months ended July 31, 2013 (unaudited)
| | | | | | |
| | |
| Investment Income: | | | | | | |
Interest | | | | | $21,762,036 | |
Dividends | | | | | 65,338 | |
Total Investment Income | | | | | 21,827,374 | |
| | |
| Expenses: | | | | | | |
Investment management | | | | | 1,636,204 | |
Interest | | | | | 908,550 | |
Custodian and accounting agent | | | | | 120,194 | |
Audit and tax services | | | | | 51,918 | |
Stockholder communications | | | | | 36,986 | |
New York Stock Exchange listing | | | | | 17,494 | |
Directors | | | | | 12,926 | |
Transfer agent | | | | | 12,612 | |
Legal | | | | | 10,166 | |
Insurance | | | | | 5,828 | |
Miscellaneous | | | | | 1,628 | |
Total Expenses | | | | | 2,814,506 | |
| | |
| Net Investment Income | | | | | 19,012,868 | |
| | |
| Realized and Change in Unrealized Gain (Loss): | | | | | | |
Net realized gain (loss) on: | | | | | | |
Investments | | | | | (4,665,850) | |
Swaps | | | | | 33,392 | |
Foreign currency transactions | | | | | 1,190,662 | |
Net change in unrealized appreciation/depreciation of: | | | | | | |
Investments | | | | | (17,027,711) | |
Securities sold short | | | | | (486,721) | |
Swaps | | | | | 8,198,236 | |
Foreign currency transactions | | | | | 478,286 | |
Net realized and change in unrealized loss | | | | | (12,279,706) | |
| Net Increase in Net Assets Resulting from Investment Operations | | | | | $6,733,162 | |
| | | | | | | | |
| See accompanying Notes to Financial Statements | | | July 31, 2013 | | | Semiannual Report | | | 23 | |
Statement of Changes in Net Assets
PIMCO Strategic Global Government Fund, Inc.
| | | | | | | | | | | | |
| | | | | Six Months
ended
July 31, 2013
(unaudited) | | | | | Year ended
January 31, 2013 | |
| Investment Operations: | | | | | | | | | | | | |
Net investment income | | | | | $19,012,868 | | | | | | $42,319,971 | |
Net realized gain (loss) | | | | | (3,441,796) | | | | | | 9,509,836 | |
Net change in unrealized appreciation/depreciation | | | | | (8,837,910) | | | | | | 27,574,028 | |
Net increase in net assets resulting from investment operations | | | | | 6,733,162 | | | | | | 79,403,835 | |
| Dividends to Stockholders from Net Investment Income | | | | | (19,552,357) | | | | | | (50,259,028) | |
| | | | |
| Capital Stock Transactions: | | | | | | | | | | | | |
Reinvestment of dividends | | | | | 2,092,103 | | | | | | 5,459,764 | |
Total increase (decrease) in net assets | | | | | (10,727,092) | | | | | | 34,604,571 | |
| | | | |
| Net Assets: | | | | | | | | | | | | |
Beginning of period | | | | | 392,316,666 | | | | | | 357,712,095 | |
End of period* | | | | | $381,589,574 | | | | | | $392,316,666 | |
* Including dividends in excess of net investment income of: | | | | | $(1,116,671) | | | | | | $(577,182) | |
| | | | |
| Shares Issued in Reinvestment of Dividends | | | | | 195,425 | | | | | | 493,060 | |
| | | | | | |
| 24 | | Semiannual Report | | | July 31, 2013 | | | See accompanying Notes to Financial Statements |
Statement of Cash Flows
PIMCO Strategic Global Government Fund, Inc.
Six Months ended July 31, 2013 (unaudited)
| | | | | | |
| | |
| Increase in Cash and Foreign Currency from: | | | | | | |
| | |
| Cash Flows used for Operating Activities: | | | | | | |
Net increase in net assets resulting from investment operations | | | | | $6,733,162 | |
| | | | | | |
| Adjustments to Reconcile Net Increase in Net Assets Resulting from Investment Operations to Net Cash used for Operating Activities: | | | | | | |
Purchases of long-term investments | | | | | (1,631,867,063) | |
Proceeds from sales of long-term investments | | | | | 1,602,643,922 | |
Sales of short-term portfolio investments, net | | | | | 14,199,334 | |
Net change in unrealized appreciation/depreciation | | | | | 8,837,910 | |
Net realized loss | | | | | 3,441,796 | |
Net amortization/accretion on investments | | | | | (1,243,084) | |
Proceeds for securities sold short | | | | | 49,340,625 | |
Decrease in receivable for investments sold | | | | | 77,372,248 | |
Decrease in interest and dividends receivable | | | | | 302,433 | |
Increase in receivable for principal paydown | | | | | (17) | |
Increase in deposits with brokers for swaps collateral | | | | | (1,993,000) | |
Increase in deposits with brokers for reverse repurchase agreements | | | | | (410,000) | |
Increase in prepaid expenses | | | | | (10,593) | |
Decrease in payable for investments purchased | | | | | (156,338,773) | |
Increase in payable to brokers for cash collateral received | | | | | 10,000 | |
Net cash provided by swap transactions | | | | | 8,963,024 | |
Net cash provided by foreign currency transactions | | | | | 1,177,109 | |
Decrease in investment management fees payable | | | | | (6,302) | |
Decrease in interest payable on cash collateral | | | | | (115) | |
Decrease in accrued expenses and other liabilities | | | | | (79,051) | |
| Net cash used for operating activities | | | | | (18,926,435) | |
| | |
| Cash Flows provided by Financing Activities: | | | | | | |
Payments for reverse repurchase agreements | | | | | (2,280,292,605) | |
Proceeds on reverse repurchase agreements | | | | | 2,282,188,105 | |
Decrease in interest payable for reverse repurchase agreements | | | | | (27,359) | |
Cash dividends paid (excluding reinvestment of dividends of $2,092,103) | | | | | (17,436,420) | |
Payments from mortgage dollar rolls | | | | | (1,541,903,965) | |
Proceeds on mortgage dollar rolls | | | | | 1,542,117,441 | |
Increase in payable for sale-buyback financing transactions | | | | | 34,364,308 | |
| Net cash provided by financing activities | | | | | 19,009,505 | |
| Net increase in cash and foreign currency | | | | | 83,070 | |
| Cash and foreign currency, at beginning of period | | | | | 172,456 | |
| Cash and foreign currency, at end of period | | | | | $255,526 | |
Cash paid for interest primarily related to participation in reverse repurchase agreement transactions was $936,024.
| | | | | | | | |
| See accompanying Notes to Financial Statements | | | July 31, 2013 | | | Semiannual Report | | | 25 | |
Notes to Financial Statements
PIMCO Strategic Global Government Fund, Inc.
July 31, 2013 (unaudited)
1. Organization and Significant Accounting Policies
PIMCO Strategic Global Government Fund, Inc. (the “Fund”) commenced operations on February 24, 1994. The Fund is organized as a Maryland corporation and registered under the Investment Company Act of 1940, as amended, as a non-diversified, closed-end management investment company. Allianz Global Investors Fund Management LLC (the “Investment Manager”) and Pacific Investment Management Company LLC (“PIMCO” or the “Sub-Adviser”) serve as the Fund’s investment manager and sub-adviser, respectively, and are indirect, wholly-owned subsidiaries of Allianz Asset Management of America L.P. (“AAM”). AAM is an indirect, wholly-owned subsidiary of Allianz SE, a publicly traded European insurance and financial services company. The Fund has authorized 500 million common shares with $0.00001 par value.
The Fund’s primary investment objective is to generate a high level of income that is higher than that generated by high-quality, intermediate-term U.S. debt securities. As a secondary objective, the Fund seeks to maintain volatility in the net asset value of the shares of the Fund comparable to that of high-quality, intermediate-term U.S. debt securities. There can be no assurance that the Fund will meet its stated objectives.
The preparation of the Fund’s financial statements in accordance with accounting principles generally accepted in the United States of America requires the Fund’s management to make estimates and assumptions that affect the reported amounts and disclosures in the Fund’s financial statements. Actual results could differ from those estimates.
In the normal course of business, the Fund enters into contracts that contain a variety of
representations that provide general indemnifications. The Fund’s maximum exposure under these arrangements is unknown as this would involve future claims that may be made against the Fund that have not yet occurred.
In June 2013, the Financial Accounting Standards Board issued guidance that creates a two tiered approach to assess whether an entity is an investment company. The guidance will also require an investment company to measure noncontrolling ownership interests in other investment companies at fair value and will require additional disclosures relating to investment company status, any changes thereto and information about financial support provided or contractually required to be provided to any of the investment company’s investees. The guidance is effective for financial statements with fiscal years beginning on or after December 15, 2013 and interim periods within those fiscal years. The Fund’s management is evaluating the impact of this guidance on the Fund’s financial statement disclosures.
The following is a summary of significant accounting policies consistently followed by the Fund:
(a) Valuation of Investments
Portfolio securities and other financial instruments for which market quotations are readily available are stated at market value. Market value is generally determined on the basis of last reported sales prices, or if no sales are reported, on the basis of quotes obtained from a quotation reporting system, established market makers, or independent pricing services. The Fund’s investments are valued daily using prices supplied by an independent pricing service or dealer quotations, or by using the last sale price on the exchange that is the primary market for such securities, or the mean
| | | | |
| 26 | | July 31, 2013 | | | Semiannual Report |
Notes to Financial Statements
PIMCO Strategic Global Government Fund, Inc.
July 31, 2013 (unaudited)
1. Organization and Significant Accounting Policies (continued)
between the last quoted bid and ask price. Independent pricing services use information provided by market makers or estimates of market values obtained from yield data relating to investments or securities with similar characteristics. Centrally cleared swaps are valued at the price determined by the relevant exchange. Securities purchased on a when-issued or delayed-delivery basis are marked to market daily until settlement at the forward settlement date.
The Board of Directors (the “Board”) has adopted procedures for valuing portfolio securities and other financial derivative instruments in circumstances where market quotes are not readily available, and has delegated the responsibility for applying the valuation methods to the Investment Manager and Sub-Adviser. The Fund’s Valuation Committee was established by the Board to oversee the implementation of the Fund’s valuation methods and to make fair value determinations on behalf of the Board, as instructed. The Sub-Adviser monitors the continued appropriateness of methods applied and determines if adjustments should be made in light of market changes, events affecting the issuer, or other factors. If the Sub-Adviser determines that a valuation method may no longer be appropriate, another valuation method may be selected, or the Valuation Committee will be convened to consider the matter and take any appropriate action in accordance with procedures set forth by the Board. The Board shall review the appropriateness of the valuation methods and these methods may be amended or supplemented from time to time by the Valuation Committee.
Benchmark pricing procedures are used as the basis for setting the base price of a
fixed-income security and for subsequently adjusting the price proportionally to market value changes of a pre-determined security deemed to be comparable in duration, generally a U.S. Treasury or sovereign note based on country of issuance. The base price may be a broker-dealer quote, transaction price, or an internal value as derived by analysis of market data. The base price of the security may be reset on a periodic basis based on the availability of market data and procedures approved by the Valuation Committee. The validity of the fair value is reviewed by the Sub-Adviser on a periodic basis and may be amended as the availability of market data indicates a material change.
Short-term securities maturing in 60 days or less are valued at amortized cost, if their original term to maturity was 60 days or less, or by amortizing their value on the 61st day prior to maturity, if the original term to maturity exceeded 60 days.
Investments initially valued in currencies other than the U.S. dollar are converted to the U.S. dollar using exchange rates obtained from pricing services. As a result, the net asset value (“NAV”) of the Fund’s shares may be affected by changes in the value of currencies in relation to the U.S. dollar. The value of securities traded in markets outside the United States or denominated in currencies other than the U.S. dollar may be affected significantly on a day that the New York Stock Exchange (“NYSE”) is closed.
The prices used by the Fund to value investments may differ from the value that would be realized if the investments were sold, and these differences could be material to the Fund’s financial statements. The Fund’s NAV is normally determined as of the close of regular trading (normally, 4:00 p.m. Eastern time) on the NYSE on each day the NYSE is open for business.
| | | | | | |
| Semiannual Report | | | July 31, 2013 | | | 27 | |
Notes to Financial Statements
PIMCO Strategic Global Government Fund, Inc.
July 31, 2013 (unaudited)
1. Organization and Significant Accounting Policies (continued)
(b) Fair Value Measurements
Fair value is defined as the price that would be received to sell an asset or paid to transfer a liability (i.e. the “exit price”) in an orderly transaction between market participants. The three levels of the fair value hierarchy are described below:
| n | | Level 1 – quoted prices in active markets for identical investments that the Fund has the ability to access |
| n | | Level 2 – valuations based on other significant observable inputs, which may include, but are not limited to, quoted prices for similar assets or liabilities, interest rates, yield curves, volatilities, prepayment speeds, loss severities, credit risks and default rates or other market corroborated inputs |
| n | | Level 3 – valuations based on significant unobservable inputs (including the Sub-Adviser’s or Valuation Committee’s own assumptions and securities whose price was determined by using a single broker’s quote) |
The inputs or methodology used for valuing securities are not necessarily an indication of the risk associated with investing in those securities. The following are certain inputs and techniques that the Fund generally uses to evaluate how to classify each major category of assets and liabilities for Level 2 and Level 3, in accordance with Generally Accepted Accounting Principles (“GAAP”).
Equity Securities (Common and Preferred Stock) – Equity securities traded in inactive markets are valued using inputs which include broker-dealer quotes, recently executed transactions adjusted for changes in the benchmark index, or evaluated price quotes received from independent pricing services that take into account the integrity of the market sector and issuer, the individual characteristics
of the security, and information received from broker-dealers and other market sources pertaining to the issuer or security. To the extent that these inputs are observable, the values of equity securities are categorized as Level 2. To the extent that these inputs are unobservable, the values are categorized as Level 3.
U.S. Treasury Obligations – U.S. Treasury obligations are valued by independent pricing services based on pricing models that evaluate the mean between the most recently quoted bid and ask price. The models also take into consideration data received from active market makers and broker-dealers, yield curves, and the spread over comparable U.S. Treasury issues. The spreads change daily in response to market conditions and are generally obtained from the new issue market and broker-dealer sources. To the extent that these inputs are observable, the values of U.S. Treasury obligations are categorized as Level 2. To the extent that these inputs are unobservable, the values are categorized as Level 3.
Government Sponsored Enterprise and Mortgage-Backed Securities – Government sponsored enterprise and mortgage-backed securities are valued by independent pricing services using pricing models based on inputs that include issuer type, coupon, cash flows, mortgage prepayment projection tables and Adjustable Rate Mortgage evaluations that incorporate index data, periodic and life caps, the next coupon reset date, and the convertibility of the bond. To the extent that these inputs are observable, the values of government sponsored enterprise and mortgage-backed securities are categorized as Level 2. To the extent that these inputs are unobservable, the values are categorized as Level 3.
Municipal Bonds – Municipal bonds are valued by independent pricing services based on
| | | | |
| 28 | | July 31, 2013 | | | Semiannual Report |
Notes to Financial Statements
PIMCO Strategic Global Government Fund, Inc.
July 31, 2013 (unaudited)
1. Organization and Significant Accounting Policies (continued)
pricing models that take into account, among other factors, information received from market makers and broker-dealers, current trades, bid-want lists, offerings, market movements, the callability of the bond, state of issuance, benchmark yield curves, and bond insurance. To the extent that these inputs are observable, the values of municipal bonds are categorized as Level 2. To the extent that these inputs are unobservable, the values are categorized as Level 3.
Sovereign Debt Obligations – Sovereign debt obligations are valued by independent pricing services based on discounted cash flow models that incorporate option adjusted spreads along with benchmark curves and credit spreads. In addition, international bond markets are monitored regularly for information pertaining to the issuer and/or the specific issue. To the extent that these inputs are observable, the values of sovereign debt obligations are categorized as Level 2. To the extent that these inputs are unobservable, the values are categorized as Level 3.
Corporate Bonds & Notes – Corporate bonds & notes are generally comprised of two main categories: investment grade bonds and high yield bonds. Investment grade bonds are valued by independent pricing services using various inputs and techniques, which include broker-dealer quotations, live trading levels, recently executed transactions in securities of the issuer or comparable issuers, and option adjusted spread models that include base curve and spread curve inputs. Adjustments to individual bonds can be applied to recognize trading differences compared to other bonds issued by the same issuer. High yield bonds are valued by independent pricing services based primarily on broker-dealer quotations from relevant market makers and recently executed transactions in
securities of the issuer or comparable issuers. The broker-dealer quotations received are supported by credit analysis of the issuer that takes into consideration credit quality assessments, daily trading activity, and the activity of the underlying equities, listed bonds and sector-specific trends. To the extent that these inputs are observable, the values of corporate bonds & notes are categorized as Level 2. To the extent that these inputs are unobservable, the values are categorized as Level 3.
Asset-Backed Securities and Collateralized Mortgage Obligations – Asset-backed securities and collateralized mortgage obligations are valued by independent pricing services using pricing models based on a security’s average life volatility. The models also take into account tranche characteristics such as coupon, average life, collateral types, ratings, the issuer and tranche type, underlying collateral and performance of the collateral, and discount margin for certain floating rate issues. To the extent that these inputs are observable, the values of asset-backed securities and collateralized mortgage obligations are categorized as Level 2. To the extent that these inputs are unobservable, the values are categorized as Level 3.
Option Contracts – Option contracts traded over-the-counter (“OTC”) and FLexible EXchange (“FLEX”) options are valued by independent pricing services based on pricing models that incorporate various inputs such as interest rates, credit spreads, currency exchange rates and volatility measurements for in-the-money, at-the-money, and out-of-the-money contracts based on a given strike price. To the extent that these inputs are observable, the values of OTC and FLEX option contracts are categorized as Level 2. To the extent that these inputs are unobservable, the values are categorized as Level 3.
| | | | | | |
| Semiannual Report | | | July 31, 2013 | | | 29 | |
Notes to Financial Statements
PIMCO Strategic Global Government Fund, Inc.
July 31, 2013 (unaudited)
1. Organization and Significant Accounting Policies (continued)
Forward Foreign Currency Contracts – Forward foreign currency contracts are valued by independent pricing services using various inputs and techniques, which include broker-dealer quotations, actual trading information and foreign currency exchange rates gathered from leading market makers and foreign currency exchange trading centers throughout the world. To the extent that these inputs are observable, the values of forward foreign currency contracts are categorized as Level 2. To the extent that these inputs are unobservable, the values are categorized as Level 3.
Credit Default Swaps – OTC credit default swaps are valued by independent pricing services using pricing models that take into account, among other factors, information received from market makers and broker-dealers, default probabilities from index specific credit spread curves, recovery rates, and cash flows. To the extent that these inputs are observable, the values of credit default swaps are categorized as Level 2. To the extent that these inputs are unobservable, the values are categorized as Level 3.
Interest Rate Swaps – OTC interest rate swaps are valued by independent pricing services using pricing models that are based on real-time intraday snapshots of relevant interest rate curves that are built using the most actively traded securities for a given maturity. The pricing models also incorporate cash and money market rates. In addition, market data pertaining to interest rate swaps is monitored regularly to ensure that interest rates are properly depicting the current market rate. Centrally cleared interest rate swaps are valued at the price determined by the relevant exchange. To the extent that these inputs are observable, the values of interest rate swaps are
categorized as Level 2. To the extent that these inputs are unobservable, the values are categorized as Level 3.
Senior Loans – Senior Loans are valued by independent pricing services based on the average of quoted prices received from multiple dealers or valued relative to other benchmark securities when broker-dealer quotes are unavailable. These quoted prices are based on interest rates, yield curves, option adjusted spreads and credit spreads. To the extent that these inputs are observable, the values of Senior Loans are categorized as Level 2. To the extent that these inputs are unobservable, the values are categorized as Level 3.
The valuation techniques used by the Fund to measure fair value during the six months ended July 31, 2013 were intended to maximize the use of observable inputs and to minimize the use of unobservable inputs.
The Fund’s policy is to recognize transfers between levels at the end of the reporting period. An investment asset’s or liability’s level within the fair value hierarchy is based on the lowest level input, individually or in aggregate, that is significant to the fair value measurement. The objective of fair value measurement remains the same even when there is a significant decrease in the volume and level of activity for an asset or liability and regardless of the valuation techniques used. Investments categorized as Level 1 or 2 as of period end may have been transferred between Levels 1 and 2 since the prior period due to changes in the valuation method utilized in valuing the investments.
(c) Investment Transactions and Investment Income
Investment transactions are accounted for on the trade date. Securities purchased and sold on a when-issued or delayed-delivery basis may be
| | | | |
| 30 | | July 31, 2013 | | | Semiannual Report |
Notes to Financial Statements
PIMCO Strategic Global Government Fund, Inc.
July 31, 2013 (unaudited)
1. Organization and Significant Accounting Policies (continued)
settled a month or more after the trade date. Realized gains and losses on investments are determined on an identified cost basis. Interest income adjusted for the accretion of discount and amortization of premiums is recorded on an accrual basis. Discounts or premiums on debt securities purchased are accreted or amortized, respectively, to interest income. Dividend income is recorded on the ex-dividend date. Paydown gains and losses are netted and recorded as interest income on the Statement of Operations.
(d) Federal Income Taxes
The Fund intends to distribute all of its taxable income and to comply with the other requirements of Subchapter M of the U.S. Internal Revenue Code of 1986, as amended, applicable to regulated investment companies. Accordingly, no provision for U.S. federal income taxes is required.
Accounting for uncertainty in income taxes establishes for all entities, including pass-through entities such as the Fund, a minimum threshold for financial statement recognition of the benefit of positions taken in filing tax returns (including whether an entity is taxable in a particular jurisdiction), and requires certain expanded tax disclosures. Fund’s management has determined that its evaluation of the positions taken in the tax returns has resulted in no material impact to the Fund’s financial statements at July 31, 2013. The federal income tax returns for the prior three years remain subject to examination by the Internal Revenue Service.
(e) Dividends and Distributions
The Fund declares dividends from net investment income to stockholders monthly. Distributions of net realized capital gains, if any, are paid at least annually. The Fund records dividends and distributions on the ex-dividend
date. The amount of dividends from net investment income and distributions from net realized capital gains is determined in accordance with federal income tax regulations, which may differ from GAAP. These “book-tax” differences are considered either temporary or permanent in nature. To the extent these differences are permanent in nature, such amounts are reclassified within the capital accounts based on their federal income tax treatment; temporary differences do not require reclassification. To the extent dividends and/or distributions exceed current and accumulated earnings and profits for federal income tax purposes, they are reported as dividends and/or distributions to stockholders from return of capital.
(f) Foreign Currency Translation
The Fund’s accounting records are maintained in U.S. dollars as follows: (1) the foreign currency market value of investments and other assets and liabilities denominated in foreign currencies are translated at the prevailing exchange rate at the end of the period; and (2) purchases and sales, income and expenses are translated at the prevailing exchange rate on the respective dates of such transactions. The resulting net foreign currency gain (loss) is included in the Fund’s Statement of Operations.
The Fund does not generally isolate that portion of the results of operations arising as a result of changes in foreign currency exchange rates from the fluctuations arising from changes in the market prices of securities. Accordingly, such foreign currency gain (loss) is included in net realized and unrealized gain (loss) on investments. However, the Fund does isolate the effect of fluctuations in foreign currency exchange rates when determining the gain (loss) upon the sale or maturity of foreign currency denominated debt obligations pursuant to U.S. federal income tax regulations; such amount is categorized as foreign currency
| | | | | | |
| Semiannual Report | | | July 31, 2013 | | | 31 | |
Notes to Financial Statements
PIMCO Strategic Global Government Fund, Inc.
July 31, 2013 (unaudited)
1. Organization and Significant Accounting Policies (continued)
gain (loss) for both financial reporting and income tax reporting purposes.
(g) Senior Loans
The Fund may purchase assignments of, and participations in, Senior Loans originated, negotiated and structured by a U.S. or foreign commercial bank, insurance company, finance company or other financial institution (the “Agent”) for a lending syndicate of financial institutions (the “Lender”). When purchasing an assignment, the Fund succeeds to all the rights and obligations under the loan agreement with the same rights and obligations as the assigning Lender. Assignments may, however, be arranged through private negotiations between potential assignees and potential assignors, and the rights and obligations acquired by the purchaser of an assignment may differ from, and be more limited than, those held by the assigning Lender.
(h) Mortgage Dollar Rolls
Mortgage dollar rolls involve the Fund selling securities for delivery in the current month and simultaneously contracting to repurchase substantially similar (same type, same or similar interest and maturity) securities on a specified future date. The difference between the selling price and future purchase price is an adjustment to interest income on the Statement of Operations. During the roll period, the Fund forgoes principal and interest paid on the securities. The Fund accounts for rolls as financing transactions. The Fund’s dollar roll transactions are intended to enhance the Fund’s yield by earning a spread between the yield on the underlying mortgage securities and short-term interest rates. At July 31, 2013, $281,556 in dollar roll commitments were outstanding. This balance is included in accrued expenses and other liabilities on the Fund’s Statement of Assets and Liabilities.
(i) Repurchase Agreements
The Fund is a party to Master Repurchase Agreements (“Master Repo Agreements”) with select counterparties. The Master Repo Agreements maintain provisions for initiation, income payments, events of default, and maintenance of collateral.
The Fund enters into transactions, under the Master Repo Agreements, with its custodian bank or securities brokerage firms whereby it purchases securities under agreements to resell such securities at an agreed upon price and date (“repurchase agreements”). The Fund, through its custodian, takes possession of securities collateralizing the repurchase agreement. Such agreements are carried at the contract amount in the financial statements, which is considered to represent fair value. Collateral pledged (the securities received), which consists primarily of U.S. government obligations and asset-backed securities, is held by the custodian bank for the benefit of the Fund until maturity of the repurchase agreement. Provisions of the repurchase agreements and the procedures adopted by the Fund require that the market value of the collateral, including accrued interest thereon, be sufficient in the event of default by the counterparty. If the counterparty defaults under the Master Repo Agreements and the value of the collateral declines or if the counterparty enters an insolvency proceeding, realization of the collateral by the Fund may be delayed or limited. At July 31, 2013, the Fund had investments in repurchase agreements with a gross value of $2,571,000 on the Statements of Assets and Liabilities. The value of the related collateral exceeded the value of the repurchase agreements at July 31, 2013.
(j) Reverse Repurchase Agreements
In a reverse repurchase agreement, the Fund sells securities to a bank or broker-dealer and agrees to repurchase the securities at a
| | | | |
| 32 | | July 31, 2013 | | | Semiannual Report |
Notes to Financial Statements
PIMCO Strategic Global Government Fund, Inc.
July 31, 2013 (unaudited)
1. Organization and Significant Accounting Policies (continued)
mutually agreed upon date and price. Generally, the effect of such a transaction is that the Fund can recover and reinvest all or most of the cash invested in portfolio securities involved during the term of the reverse repurchase agreement and still be entitled to the returns associated with those portfolio securities. Such transactions are advantageous if the interest cost to the Fund of the reverse repurchase transaction is less than the returns it obtains on investments purchased with the cash. To the extent the Fund does not cover its positions in reverse repurchase agreements (by segregating liquid assets at least equal in amount to the forward purchase commitment), the Fund’s uncovered obligations under the agreements will be subject to the Fund’s limitations on borrowings. Reverse repurchase agreements involve leverage risk and also the risk that the market value of the securities that the Fund is obligated to repurchase under the agreements may decline below the repurchase price. In the event the buyer of securities under a reverse repurchase agreement files for bankruptcy or becomes insolvent, the Fund’s use of the proceeds of the agreement may be restricted pending determination by the other party, or its trustee or receiver, whether to enforce the Fund’s obligation to repurchase the securities.
(k) Sale-Buybacks
A Fund may enter into financing transactions referred to as ‘sale-buybacks’. A sale-buyback transaction consists of a sale of a security by a Fund to a financial institution, the counterparty, with a simultaneous agreement to repurchase the same or substantially the same security at an agreed-upon price and date. A Fund is not entitled to receive principal and interest payments, if any, made on the security sold to the counterparty during the term of the agreement. The agreed-upon proceeds for
securities to be repurchased by a Fund are reflected as a liability on the Statements of Assets and Liabilities. A Fund will recognize net income represented by the price differential between the price received for the transferred security and the agreed-upon repurchase price. This is commonly referred to as the ‘price drop’. A price drop consists of (i) the foregone interest and inflationary income adjustments, if any, a Fund would have otherwise received had the security not been sold and (ii) the negotiated financing terms between a Fund and the counterparty. Foregone interest and inflationary income adjustments, if any, are recorded as components of interest income on the Statements of Operations. Interest payments based upon negotiated financing terms made by a Fund to counterparties are recorded as a component of interest expense on the Statements of Operations. In periods of increased demand for the security, a Fund may receive a fee for use of the security by the counterparty, which may result in interest income to the Fund. A Fund will segregate assets determined to be liquid by the Investment Manager or otherwise cover its obligations under sale-buyback transactions.
(l) When-Issued/Delayed-Delivery Transactions
When-issued or delayed-delivery transactions involve a commitment to purchase or sell securities for a predetermined price or yield, with payment and delivery taking place beyond the customary settlement period. When delayed-delivery purchases are outstanding, the Fund will set aside and maintain until the settlement date in a designated account, liquid assets in an amount sufficient to meet the purchase price. When purchasing a security on a delayed-delivery basis, the Fund assumes the rights and risks of ownership of the security, including the risk of price and yield fluctuations; consequently, such fluctuations are taken into account when determining the net asset value.
| | | | | | |
| Semiannual Report | | | July 31, 2013 | | | 33 | |
Notes to Financial Statements
PIMCO Strategic Global Government Fund, Inc.
July 31, 2013 (unaudited)
1. Organization and Significant Accounting Policies (continued)
The Fund may dispose of or renegotiate a delayed-delivery transaction after it is entered into, and may sell when-issued securities before they are delivered, which may result in a realized gain or loss. When a security is sold on a delayed-delivery basis, the Fund does not participate in future gains and losses with respect to the security.
(m) Mortgage-Related and Other Asset-Backed Securities
Investments in mortgage-related or other asset-backed securities include mortgage pass-through securities, collateralized mortgage obligations (“CMOs”), commercial mortgage-backed securities, mortgage dollar rolls, CMO residuals, stripped mortgage-backed securities (“SMBSs”) and other securities that directly or indirectly represent a participation in, or are secured by and payable from, mortgage loans on real property. The value of some mortgage-related or asset-backed securities may be particularly sensitive to changes in prevailing interest rates. Early repayment of principal on some mortgage-related securities may expose the Fund to a lower rate of return upon reinvestment of principal. The value of these securities may fluctuate in response to the market’s perception of the creditworthiness of the issuers. The decline in liquidity and prices of these types of securities may make it more difficult to determine fair market value. Additionally, although mortgages and mortgage-related securities are generally supported by some form of government or private guarantee and/or insurance, there is no assurance that private guarantors or insurers will meet their obligations.
(n) U.S. Government Agencies or Government-Sponsored Enterprises
Securities issued by U.S. Government agencies or government-sponsored enterprises may not
be guaranteed by the U.S. Treasury. The Government National Mortgage Association (“GNMA” or “Ginnie Mae”), a wholly-owned U.S. Government corporation, is authorized to guarantee, with the full faith and credit of the U.S. Government, the timely payment of principal and interest on securities issued by institutions approved by GNMA and backed by pools of mortgages insured by the Federal Housing Administration or guaranteed by the Department of Veterans Affairs. Government-related guarantors not backed by the full faith and credit of the U.S. Government include the Federal National Mortgage Association (“FNMA” or “Fannie Mae”) and the Federal Home Loan Mortgage Corporation (“FHLMC” or “Freddie Mac”). Pass-through securities issued by FNMA are guaranteed as to timely payment of principal and interest by FNMA, but are not backed by the full faith and credit of the U.S. Government. FHLMC guarantees the timely payment of interest and ultimate collection of principal, but its participation certificates are not backed by the full faith and credit of the U.S. Government.
(o) Short Sales
Short sale transactions involve the Fund selling securities it does not own in anticipation of a decline in the market price of the securities. The Fund is obligated to deliver securities at the market price at the time the short position is closed. Possible losses from short sales may be unlimited, whereas losses from purchases cannot exceed the total amount invested.
(p) Restricted Securities
The Fund is permitted to invest in securities that are subject to legal or contractual restrictions on resale. These securities generally may be resold in transactions exempt from registration or to the public if the securities are registered. Disposal of these securities may involve time-consuming negotiations and expenses, and prompt sale at an acceptable price may be difficult.
| | | | |
| 34 | | July 31, 2013 | | | Semiannual Report |
Notes to Financial Statements
PIMCO Strategic Global Government Fund, Inc.
July 31, 2013 (unaudited)
1. Organization and Significant Accounting Policies (continued)
(q) Interest Expense
Interest expense primarily relates to the Fund’s participation in reverse repurchase agreement transactions. Interest expense is recorded as it is incurred.
(r) Custody Credits on Cash Balances
The Fund may benefit from an expense offset arrangement with its custodian bank, whereby uninvested cash balances may earn credits that reduce monthly custodian and accounting agent expenses. Had these cash balances been invested in income-producing securities, they would have generated income for the Fund. Cash overdraft charges, if any, are included in custodian and accounting agent fees.
(s) Securities traded on to-be-announced basis
The Portfolios may from time to time purchase securities on a to-be-announced (“TBA”) basis. In a TBA transaction, the Portfolio commits to purchasing or selling securities for which all specific information is not yet known at the time of the trade, particularly the face amount and maturity date of the underlying security transactions. Securities purchased on a TBA basis are not settled until they are delivered to the Portfolio, normally 15 to 45 days later. Beginning on the date the Portfolio enters into a TBA transaction, cash, U.S. government securities or other liquid securities are segregated in an amount equal in value to the purchase price of the TBA security. These transactions are subject to market fluctuations, and their current value is determined in the same manner as for other securities.
2. Principal Risks
In the normal course of business, the Fund trades financial instruments and enters into financial transactions where risk of potential loss exists due to, among other things, changes
in the market (market risk) or failure of the other party to a transaction to perform (counterparty risk). The Fund is also exposed to other risks such as, but not limited to, interest rate, foreign currency, credit and leverage risks.
Interest rate risk is the risk that fixed income securities will decline in value because of changes in interest rates. As nominal interest rates rise, the values of certain fixed income securities held by the Fund is likely to decrease. A nominal interest rate can be described as the sum of a real interest rate and an expected inflation rate. Fixed income securities with longer durations tend to be more sensitive to changes in interest rates, usually making them more volatile than securities with shorter durations. Duration is used primarily as a measure of the sensitivity of a fixed income security’s market price to interest rate (i.e. yield) movements.
Variable and floating rate securities generally are less sensitive to interest rate changes but may decline in value if their interest rates do not rise as much, or as quickly, as interest rates in general. Conversely, floating rate securities will not generally increase in value if interest rates decline. Inverse floating rate securities may decrease in value if interest rates increase. Inverse floating rate securities may also exhibit greater price volatility than a fixed rate obligation with similar credit quality. When the Fund holds variable or floating rate securities, a decrease (or, in the case of inverse floating rate securities, an increase) in market interest rates will adversely affect the income received from such securities and the NAV of the Fund’s shares.
Mortgage-related and other asset-backed securities often involve risks that are different from or more acute than risks associated with other types of debt instruments. Generally, rising interest rates tend to extend the duration of fixed rate mortgage-related securities,
| | | | | | |
| Semiannual Report | | | July 31, 2013 | | | 35 | |
Notes to Financial Statements
PIMCO Strategic Global Government Fund, Inc.
July 31, 2013 (unaudited)
2. Principal Risks (continued)
making them more sensitive to changes in interest rates. As a result, in a period of rising interest rates, if the Fund holds mortgage-related securities, it may exhibit additional volatility. This is known as extension risk. In addition, adjustable and fixed rate mortgage-related securities are subject to prepayment risk. When interest rates decline, borrowers may pay off their mortgages sooner than expected. This can reduce the returns of the Fund because the Fund may have to reinvest that money at the lower prevailing interest rates. The Fund’s investments in other asset-backed securities are subject to risks similar to those associated with mortgage-related securities, as well as additional risks associated with the nature of the assets and the servicing of those assets.
The Fund is exposed to credit risk, which is the risk of losing money if the issuer or guarantor of a fixed income security is unable or unwilling, or is perceived (whether by market participants, rating agencies, pricing services or otherwise) as unable or unwilling, to make timely principal and/or interest payments, or to otherwise honor its obligations. Securities are subject to varying degrees of credit risk, which are often reflected in credit ratings.
To the extent the Fund directly invests in foreign currencies or in securities that trade in, and receive revenues in, foreign currencies, or in derivatives that provide exposure to foreign currencies, it will be subject to the risk that those currencies will decline in value relative to the U.S. dollar, or, in the case of hedging positions, that the U.S. dollar will decline in value relative to the currency being hedged. Currency rates in foreign countries may fluctuate significantly over short periods of time for a number of reasons, including economic growth, inflation, changes in interest rates, intervention (or the failure to intervene) by U.S. or foreign governments, central banks or
supranational entities such as the International Monetary Fund, or the imposition of currency controls or other political developments in the United States or abroad. As a result, the Fund’s investments in foreign currency-denominated securities may reduce the returns of the Fund.
The Fund is subject to elements of risk not typically associated with investments in the U.S., due to concentrated investments in foreign issuers located in a specific country or region. Such concentrations will subject the Fund to additional risks resulting from future political or economic conditions in such country or region and the possible imposition of adverse governmental laws or currency exchange restrictions affecting such country or region, which could cause the securities and their markets to be less liquid and prices more volatile than those of comparable U.S. companies.
The market values of securities may decline due to general market conditions (market risk) which are not specifically related to a particular company, such as real or perceived adverse economic conditions, changes in the general outlook for corporate earnings, changes in interest or currency rates or adverse investor sentiment. They may also decline due to factors that affect a particular industry or industries, such as labor shortages or increased production costs and competitive conditions within an industry. Equity securities and equity-related investments generally have greater market price volatility than fixed income securities.
The Fund is exposed to counterparty risk, or the risk that an institution or other entity with which the Fund has unsettled or open transactions will default. The potential loss to the Fund could exceed the value of the financial assets recorded in the Fund’s financial statements. Financial assets, which potentially expose the Fund to counterparty risk, consist principally of cash due from counterparties and investments.
| | | | |
| 36 | | July 31, 2013 | | | Semiannual Report |
Notes to Financial Statements
PIMCO Strategic Global Government Fund, Inc.
July 31, 2013 (unaudited)
2. Principal Risks (continued)
The Sub-Adviser seeks to minimize the Fund’s counterparty risk by performing reviews of each counterparty and by minimizing concentration of counterparty risk by undertaking transactions with multiple customers and counterparties on recognized and reputable exchanges. Delivery of securities sold is only made once the Fund has received payment. Payment is made on a purchase once the securities have been delivered by the counterparty. The trade will fail if either party fails to meet its obligation.
The Fund is exposed to risks associated with leverage. Leverage may cause the value of the Fund’s stock to be more volatile than if the Fund did not use leverage. This is because leverage tends to exaggerate the effect of any increase or decrease in the value of the Fund’s portfolio securities. The Fund may engage in transactions or purchase instruments that give rise to forms of leverage. Obligations to settle reverse repurchase agreements may be detrimental to the Fund’s performance. In addition, to the extent the Fund employs leverage, dividend and interest costs may not be recovered by any appreciation of the securities purchased with the leverage proceeds and could exceed the Fund’s investment returns, resulting in greater losses.
The Fund is party to International Swaps and Derivatives Association, Inc. Master Agreements (“ISDA Master Agreements”) with select counterparties that govern transactions, over-the-counter derivatives and foreign exchange contracts entered into by the Fund and those counterparties. The ISDA Master Agreements contain provisions for general obligations, representations, agreements, collateral and events of default or termination. Events of termination include conditions that may entitle counterparties to elect to terminate early and cause settlement of all outstanding transactions under the applicable ISDA Master Agreement.
Any election to terminate early could be material to the financial statements of the Fund.
The considerations and factors surrounding the settlement of certain purchases and sales made on a delayed-delivery basis are governed by Master Securities Forward Transaction Agreements (“Master Forward Agreements”) between the Fund and select counterparties. The Master Forward Agreements maintain provisions for, among other things, initiation and confirmation, payment and transfer, events of default, termination, and maintenance of collateral.
The counterparty risk associated with certain contracts may be reduced by master netting arrangements to the extent that if an event of default occurs, all amounts with the counterparty are terminated and settled on a net basis. The Fund’s overall exposure to counterparty risk with respect to transactions subject to master netting arrangements can change substantially within a short period, as it is affected by each transaction subject to the arrangement.
The Fund had credit default swap agreements and securities transactions outstanding with Lehman Brothers entities as issuer, referenced entity, counterparty or guarantor at the time the relevant Lehman Brothers entity filed for protection or was placed in administration. The balance shown under payable to broker on the Statement of Assets and Liabilities represents the amount due to Lehman Brothers, Inc.
3. Financial Derivative Instruments
Disclosure about derivatives and hedging activities requires qualitative disclosure regarding objectives and strategies for using derivatives, quantitative disclosure about fair value amounts of gains and losses on derivatives, and disclosure about credit-risk-related contingent features in derivative agreements. The disclosure requirements
| | | | | | |
| Semiannual Report | | | July 31, 2013 | | | 37 | |
Notes to Financial Statements
PIMCO Strategic Global Government Fund, Inc.
July 31, 2013 (unaudited)
3. Financial Derivative Instruments (continued)
distinguish between derivatives, which are accounted for as “hedges”, and those that do not qualify for such accounting. Although the Fund at times uses derivatives for hedging purposes, the Fund reflects derivatives at fair value and recognizes changes in fair value through the Fund’s Statement of Operations, and such derivatives do not qualify for hedge accounting treatment.
(a) Option Transactions
The Fund purchases put and call options on securities and indices for hedging purposes, risk management purposes or otherwise as part of its investment strategies. The risks associated with purchasing an option include the risk that the Fund pays a premium whether or not the option is exercised. Additionally, the Fund bears the risk of loss of premiums and changes in market value should the counterparty not perform under the contract. Put and call options purchased are accounted for in the same manner as portfolio securities. The cost of securities acquired through the exercise of call options is increased by the premiums paid. The proceeds from securities sold through the exercise of put options are decreased by the premiums paid.
(b) Swap Agreements
Swap agreements are bilaterally negotiated agreements between the Fund and a counterparty to exchange or swap investment cash flows, assets, foreign currencies or market or event-linked returns at specified, future intervals. Swap agreements may be privately negotiated in the over-the-counter market (“OTC swaps”) or may be executed in a multilateral or other trade facility platform, such as a registered commodities exchange (“centrally cleared swaps”). The Fund may enter into credit default, cross-currency, interest rate, total return, variance and other forms of swap agreements in order to, among other things,
manage its exposure to credit, currency and interest rate risk. In connection with these agreements, securities may be identified as collateral or margin in accordance with the terms of the respective swap agreements to provide assets of value and recourse in the event of default or bankruptcy/insolvency.
OTC swap payments received or made at the beginning of the measurement period are reflected as such on the Fund’s Statement of Assets and Liabilities and represent payments made or received upon entering into the swap agreement to compensate for differences between the stated terms of the swap agreement and prevailing market conditions (credit spreads, currency exchange rates, interest rates, and other relevant factors). These upfront payments are recorded as realized gains or losses on the Fund’s Statement of Operations upon termination or maturity of the swap. A liquidation payment received or made at the termination of the swap is recorded as realized gain or loss on the Fund’s Statement of Operations. Net periodic payments received or paid by the Fund are included as part of realized gains or losses on the Fund’s Statement of Operations. Changes in market value, if any, are reflected as a component of net changes in unrealized appreciation/depreciation on the Fund’s Statement of Operations. Daily changes in valuation of centrally cleared swaps, if any, are recorded as a receivable or payable, as applicable, for variation margin on centrally cleared swaps on the Fund’s Statement of Assets and Liabilities.
Entering into these agreements involves, to varying degrees, elements of credit, legal, market and documentation risk in excess of the amounts recognized on the Fund’s Statement of Assets and Liabilities. Such risks include the possibility that there will be no liquid market for these agreements, that the counterparties to
| | | | |
| 38 | | July 31, 2013 | | | Semiannual Report |
Notes to Financial Statements
PIMCO Strategic Global Government Fund, Inc.
July 31, 2013 (unaudited)
3. Financial Derivative Instruments (continued)
the agreements may default on their obligation to perform or disagree as to the meaning of contractual terms in the agreements and that there may be unfavorable changes in interest rates.
Credit Default Swap Agreements – Credit default swap agreements involve one party (referred to as the buyer of protection) making a stream of payments to another party (the seller of protection) in exchange for the right to receive a specified return in the event of a default or other credit event for the referenced entity, obligation or index. As a seller of protection on credit default swap agreements, the Fund will generally receive from the buyer of protection a fixed rate of income throughout the term of the swap provided that there is no credit event. As the seller, the Fund would effectively add leverage to its investment portfolio because, in addition to its total net assets, the Fund would be subject to investment exposure on the notional amount of the swap.
If the Fund is a seller of protection and a credit event occurs, as defined under the terms of that particular swap agreement, the Fund will either (i) pay to the buyer of protection an amount equal to the notional amount of the swap and take delivery of the referenced obligation, other deliverable obligations or underlying securities comprising the referenced index or (ii) pay a net settlement amount in the form of cash or securities equal to the notional amount of the swap less the recovery value of the referenced obligation or underlying securities comprising the referenced index. If the Fund is a buyer of protection and a credit event occurs, as defined under the terms of that particular swap agreement, the Fund will either (i) receive from the seller of protection an amount equal to the notional amount of the swap and deliver the referenced obligation, other deliverable obligations or underlying securities comprising
the referenced index or (ii) receive a net settlement amount in the form of cash or securities equal to the notional amount of the swap less the recovery value of the referenced obligation or underlying securities comprising the referenced index. Recovery values are assumed by market makers considering either industry standard recovery rates or entity specific factors and considerations until a credit event occurs. If a credit event has occurred, the recovery value is determined by a facilitated auction whereby a minimum number of allowable broker bids, together with a specified valuation method, are used to calculate the settlement value.
Credit default swap agreements on corporate or sovereign issues involve one party making a stream of payments to another party in exchange for the right to receive a specified return in the event of a default or other credit event. If a credit event occurs and cash settlement is not elected, a variety of other deliverable obligations may be delivered in lieu of the specific referenced obligation. The ability to deliver other obligations may result in a cheapest-to-deliver option (the buyer of protection’s right to choose the deliverable obligation with the lowest value following a credit event). The Fund uses credit default swaps on corporate or sovereign issues to provide a measure of protection against defaults of the issuers (i.e., to reduce risk where the Fund owns or has exposure to the referenced obligation) or to take an active long or short position with respect to the likelihood of a particular issuer’s default.
Credit default swap agreements on asset-backed securities involve one party making a stream of payments to another party in exchange for the right to receive a specified return in the event of a default or other credit events. Unlike credit default swaps on corporate
| | | | | | |
| Semiannual Report | | | July 31, 2013 | | | 39 | |
Notes to Financial Statements
PIMCO Strategic Global Government Fund, Inc.
July 31, 2013 (unaudited)
3. Financial Derivative Instruments (continued)
or sovereign issues, deliverable obligations in most instances would be limited to the specific referenced obligation as performance for asset-backed securities can vary across deals. Prepayments, principal paydowns, and other writedown or loss events on the underlying mortgage loans will reduce the outstanding principal balance of the referenced obligation. These reductions may be temporary or permanent as defined under the terms of the swap agreement and the notional amount of the swap agreement will be adjusted by corresponding amounts. The Fund uses credit default swaps on asset-backed securities to provide a measure of protection against defaults of the referenced obligation or to take an active long or short position with respect to the likelihood of a particular referenced obligation’s default.
Credit default swap agreements on credit indices involve one party making a stream of payments to another party in exchange for the right to receive a specified return in the event of a write-down, principal shortfall, interest shortfall or default of all or part of the referenced entities comprising the credit index. A credit index is a basket of credit instruments or exposures designed to be representative of some part of the credit market as a whole. These indices are made up of reference credits that are judged by a poll of dealers to be the most liquid entities in the credit default swap market based on the sector of the index. Components of the indices may include, but are not limited to, investment grade securities, high yield securities, asset backed securities, emerging markets, and/or various credit ratings within each sector. Credit indices are traded using credit default swaps with standardized terms including a fixed spread and standard maturity dates. An index credit default swap references all the names in the index, and if there is a default, the credit event is settled
based on that name’s weight in the index, or in the case of a tranched index credit default swap, the credit event is settled based on the name’s weight in the index that falls within the tranche for which the Fund bears exposure. The composition of the indices changes periodically, usually every six months, and for most indices, each name has an equal weight in the index. The Fund uses credit default swaps on credit indices to hedge a portfolio of credit default swaps or bonds, which is less expensive than it would be to buy many credit default swaps to achieve a similar effect. Credit-default swaps on indices are benchmarks for protecting investors owning bonds against default, and traders use them to speculate on changes in credit quality.
Implied credit spreads, represented in absolute terms, utilized in determining the market value of credit default swap agreements on corporate or sovereign issues as of period end are disclosed in the Notes to Schedule of Investments, serve as an indicator of the current status of the payment/performance risk, and represent the likelihood or risk of default for the credit derivative. The implied credit spread of a particular referenced entity reflects the cost of buying/selling protection and may include upfront payments required to be made to enter into the agreement. For credit default swap agreements on asset-backed securities and credit indices, the quoted market prices and resulting values serve as the indicator of the current status of the payment/performance risk. Wider credit spreads and increasing market values, in absolute terms when compared to the notional amount of the swap, represent a deterioration of the referenced entity’s credit soundness and a greater likelihood or risk of default or other credit event occurring as defined under the terms of the agreement.
| | | | |
| 40 | | July 31, 2013 | | | Semiannual Report |
Notes to Financial Statements
PIMCO Strategic Global Government Fund, Inc.
July 31, 2013 (unaudited)
3. Financial Derivative Instruments (continued)
The maximum potential amount of future payments (undiscounted) that the Fund as a seller of protection could be required to make under a credit default swap agreement would be an amount equal to the notional amount of the agreement. Notional amounts of all credit default swap agreements outstanding as of July 31, 2013 for which the Fund is the seller of protection are disclosed in the Notes to Schedule of Investments. These potential amounts would be partially offset by any recovery values of the respective referenced obligations, upfront payments received upon entering into the agreement, or net amounts received from the settlement of buy protection credit default swap agreements entered into by the Fund for the same referenced entity or entities.
Interest Rate Swap Agreements – Interest rate swap agreements involve the exchange by the Fund with a counterparty of its respective commitments to pay or receive interest, e.g., an exchange of floating rate payments for fixed rate payments, with respect to the notional amount of principal. Certain forms of interest rate swap agreements may include: (i) interest rate caps, under which, in return for a premium, one party agrees to make payments to the other to the extent that interest rates exceed a specified rate, or “cap”, (ii) interest rate floors, under which, in return for a premium, one party agrees to make payments to the other to the extent that interest rates fall below a specified rate, or “floor”, (iii) interest rate collars, under which a party sells a cap and purchases a floor or vice versa in an attempt to protect itself against interest rate movements exceeding given minimum or maximum levels, (iv) callable interest rate swaps, under which the counterparty may terminate the swap transaction in whole at zero cost by a predetermined date and time prior to the maturity date, (v) spreadlocks, which allow the
interest rate swap users to lock in the forward differential (or spread) between the interest rate swap rate and a specified benchmark, or (vi) basis swaps, under which two parties can exchange variable interest rates based on different money markets.
(c) Forward Foreign Currency Contracts
A forward foreign currency contract is an agreement between two parties to buy and sell a currency at a set exchange rate on a future date. The Fund enters into forward foreign currency contracts for the purpose of hedging against foreign currency risk arising from the investment or anticipated investment in securities denominated in foreign currencies. The Fund also enters into these contracts for purposes of increasing exposure to a foreign currency or shifting exposure to foreign currency fluctuations from one country to another. The market value of a forward foreign currency contract fluctuates with changes in foreign currency exchange rates. All commitments are marked to market daily at the applicable exchange rates and any resulting unrealized appreciation or depreciation is recorded. Realized gains or losses are recorded at the time the forward contract matures or by delivery of the currency. Risks may arise upon entering into these contracts from the potential inability of counterparties to meet the terms of their contracts and from unanticipated movements in the value of a foreign currency relative to the U.S. dollar. In addition, these contracts may involve market risk in excess of the unrealized appreciation (depreciation) reflected in the Fund’s Statement of Assets and Liabilities.
4. Investment Manager/Sub-Adviser
The Fund has an Investment Management Agreement (the “Agreement”) with the Investment Manager. Subject to the supervision of the Fund’s Board, the Investment Manager is
| | | | | | |
| Semiannual Report | | | July 31, 2013 | | | 41 | |
Notes to Financial Statements
PIMCO Strategic Global Government Fund, Inc.
July 31, 2013 (unaudited)
4. Investment Manager/Sub-Adviser (continued)
responsible for managing, either directly or through others selected by it, the Fund’s investment activities, business affairs and administrative matters. Pursuant to the Agreement, the Investment Manager receives an annual fee, payable monthly, at an annual rate of 0.85% of the Fund’s average daily net assets.
The Investment Manager has retained the Sub-Adviser to manage the Fund’s investments. Subject to the supervision of the Investment Manager, the Sub-Adviser is responsible for making all of the Fund’s investment decisions. The Investment Manager, not the Fund, pays a portion of the fees it receives as Investment Manager to the Sub-Adviser in return for its services.
5. Investments in Securities
For the six months ended July 31, 2013, purchases and sales of investments, other than short-term securities and U.S. government obligations, were $2,939,936 and $38,023,388, respectively. Purchases and sales in U.S. government obligations were $1,628,241,180 and $1,562,296,802, respectively.
6. Income Tax Information
At July 31, 2013, the cost basis of portfolio securities (before securities sold short) for
federal income tax purposes was $1,074,642,403. Gross unrealized appreciation was $63,504,849; gross unrealized depreciation was $8,295,828; and net unrealized appreciation was $55,209,021. Differences between book and tax cost basis were attributable to wash sale loss deferrals and sale-buyback adjustments.
7. Subsequent Events
In preparing these financial statements, Fund management has evaluated events and transactions for potential recognition or disclosure through the date the financial statements were issued.
On August 1, 2013, a dividend of $0.08 per share was declared to common stockholders payable September 3, 2013 to stockholders of record on August 12, 2013.
On September 3, 2013, a dividend of $0.08 per share was declared to common stockholders payable October 1, 2013 to stockholders of record on September 13, 2013.
There were no other subsequent events identified that require recognition or disclosure.
| | | | |
| 42 | | July 31, 2013 | | | Semiannual Report |
Financial Highlights
PIMCO Strategic Global Government Fund, Inc.
For a share of common stock outstanding throughout each period:
| | | | | | | | | | | | | | | | | | | | | | | | | | | | | | | | | | | | |
| | | | | Six Months
ended
July 31, 2013
(unaudited) | | | | | Year ended January 31, | |
| | | | | | | | 2013 | | | | | 2012 | | | | | 2011 | | | | | 2010 | | | | | 2009 | |
| Net asset value, beginning of period | | | | | $9.66 | | | | | | $8.91 | | | | | | $9.97 | | | | | | $9.08 | | | | | | $7.46 | | | | | | $9.84 | |
| | | | | | | | | | | | |
Investment Operations: | | | | | | | | | | | | | | | | | | | | | | | | | | | | | | | | | | | | |
| Net investment income | | | | | 0.47 | | | | | | 1.05 | | | | | | 1.36 | | | | | | 1.27 | | | | | | 1.13 | | | | | | 0.89 | |
| Net realized and change in unrealized gain (loss) | | | | | (0.30 | ) | | | | | 0.95 | | | | | | (1.03 | ) | | | | | 1.04 | | | | | | 1.83 | | | | | | (2.05 | ) |
| Total from investment operations | | | | | 0.17 | | | | | | 2.00 | | | | | | 0.33 | | | | | | 2.31 | | | | | | 2.96 | | | | | | (1.16 | ) |
| | | | | | | | | | | | |
| Dividends to Stockholders from Net Investment Income | | | | | (0.48 | ) | | | | | (1.25 | ) | | | | | (1.39 | ) | | | | | (1.42 | ) | | | | | (1.34 | ) | | | | | (1.22 | ) |
| Net asset value, end of period | | | | | $9.35 | | | | | | $9.66 | | | | | | $8.91 | | | | | | $9.97 | | | | | | $9.08 | | | | | | $7.46 | |
| Market price, end of period | | | | | $10.55 | | | | | | $11.84 | | | | | | $11.80 | | | | | | $10.44 | | | | | | $10.73 | | | | | | $9.51 | |
| Total Investment Return (1) | | | | | (6.75 | )% | | | | | 12.21 | % | | | | | 28.34 | % | | | | | 11.82 | % | | | | | 29.83 | % | | | | | 4.63 | % |
| RATIOS/SUPPLEMENTAL DATA: | | | | | | | | | | | | | | | | | | | | | | | | | | | | | | | | | | | | |
| Net assets, end of period (000s) | | | | | $381,590 | | | | | | $392,317 | | | | | | $357,712 | | | | | | $394,695 | | | | | | $354,117 | | | | | | $286,061 | |
| Ratio of expenses to average net assets, including interest expense (2) | | | | | 1.46 | %(4) | | | | | 1.55 | % | | | | | 1.48 | % | | | | | 1.43 | % | | | | | 1.63 | % | | | | | 3.01 | %(3) |
| Ratio of expenses to average net assets, excluding interest expense | | | | | 0.99 | %(4) | | | | | 1.00 | % | | | | | 1.01 | % | | | | | 1.04 | % | | | | | 1.05 | % | | | | | 1.18 | %(3) |
| Ratio of net investment income to average net assets | | | | | 9.88 | %(4) | | | | | 11.14 | % | | | | | 14.27 | % | | | | | 12.98 | % | | | | | 13.84 | % | | | | | 9.96 | % |
| Portfolio turnover rate | | | | | 137 | % | | | | | 293 | % | | | | | 147 | % | | | | | 168 | % | | | | | 241 | % | | | | | 110 | % |
| (1) | | Total investment return is calculated assuming a purchase of a share of common stock at the market price on the first day and a sale of a share of common stock at the market price on the last day of each period reported. Dividends and distributions, if any, are assumed, for purposes of this calculation, to be reinvested at prices obtained under the Fund’s dividend reinvestment plan. Total investment return does not reflect brokerage commissions or sales charges in connection with the purchase or sale of Fund stock. Total investment return for a period less than one year is not annualized. | |
| (2) | | Interest expense primarily relates to participation in reverse repurchase agreement transactions. | |
| (3) | | Inclusive of expenses offset by custody credits earned on cash balances at the custodian bank (See note 1(r) in Notes to Financial Statements). | |
| | | | | | | | |
| See accompanying Notes to Financial Statements | | | July 31, 2013 | | | Semiannual Report | | | 43 | |
Annual Stockholder Meeting Results/
Proxy Voting Policies & Procedures (unaudited)
PIMCO Strategic Global Government Fund, Inc.
Annual Stockholder Meeting Results:
The Fund held a meeting of stockholders on July 17, 2013. Stockholders voted as indicated below:
| | | | | | | | |
| | | Affirmative | | | Withheld Authority | |
Re-election of James A. Jacobson — Class I to serve until the annual meeting for the 2016 — 2017 fiscal year | | | 34,798,646 | | | | 1,043,203 | |
Re-election of William B. Ogden, IV — Class I to serve until the annual meeting for the 2016 — 2017 fiscal year | | | 34,790,961 | | | | 1,050,888 | |
The other members of the Board of Directors at the time of the meeting, namely, Ms. Deborah A. DeCotis and Messrs. Bradford K. Gallagher, Hans W. Kertess, John C. Maney* and Alan Rappaport continued to serve as Directors of the Fund.
Proxy Voting Policies & Procedures:
A description of the policies and procedures that the Fund has adopted to determine how to vote proxies relating to portfolio securities and information about how the Fund voted proxies relating to portfolio securities held during the most recent twelve month period ended June 30 is available (i) without charge, upon request, by calling the Fund’s stockholder servicing agent at (800) 254-5197; (ii) on the Fund’s website at us.allianzgi.com/closedendfunds; and (iii) on the Securities and Exchange Commission website at www.sec.gov.
| | | | |
| 44 | | July 31, 2013 | | | Semiannual Report |
Matters Relating to the Directors’ Consideration of the Investment Management &
Portfolio Management Agreements (unaudited)
PIMCO Strategic Global Government Fund, Inc.
The Investment Company Act of 1940, as amended, requires that both the full Board of Directors (the “Directors”) and a majority of the non-interested Directors (the “Independent Directors”), voting separately, approve the Fund’s Management Agreement with the Investment Manager (the “Advisory Agreement”) and Portfolio Management Agreement between the Investment Manager and the Sub-Adviser (the “Sub-Advisory Agreement,” and together with the Advisory Agreement, the “Agreements”). The Directors met telephonically on June 10, 2013 and in person on June 25, 2013 (the “contract review meetings”) for the specific purpose of considering whether to approve the continuation of the Advisory Agreement and the Sub-Advisory Agreement. The Independent Directors were assisted in their evaluation of the Agreements by independent legal counsel, from whom they received separate legal advice and with whom they met separately from Fund management during the contract review meetings.
In connection with their deliberations regarding the continuation of the Agreements, the Directors, including the Independent Directors, considered such information and factors as they believed, in light of the legal advice furnished to them and their own business judgment, to be relevant. As described below, the Directors considered the nature, quality, and extent of the various investment management, administrative and other services performed by the Investment Manager or the Sub-Adviser under the applicable Agreement.
In connection with their contract review meetings, the Directors received and relied upon materials provided by the Investment Manager which included, among other items: (i) information provided by Lipper Inc. (“Lipper”), an independent third party, on the total return investment performance (based on net assets) of the Fund for various time periods
and the investment performance of a group of funds with investment classifications/objectives comparable to those of the Fund identified by Lipper (the “Lipper performance universe”) and the performance of an applicable benchmark index, (ii) information provided by Lipper on the Fund’s management fees and other expenses and the management fees and other expenses of comparable funds identified by Lipper, (iii) information regarding the investment performance and fees for other funds and accounts managed by the Investment Manager and the Sub-Adviser with strategies that have similarities (but are not substantially similar) to those of the Fund, (iv) the estimated profitability to the Investment Manager from its relationship with the Fund for the one year period ended December 31, 2012, (v) descriptions of various functions performed by the Investment Manager and the Sub-Adviser for the Fund, such as portfolio management, compliance monitoring and portfolio trading practices, and (vi) information regarding the overall organization of the Investment Manager and the Sub-Adviser, including information regarding senior management, portfolio managers and other personnel providing investment management, administrative and other services to the Fund.
The Directors’ conclusions as to the continuation of the Agreements were based on a comprehensive consideration of all information provided to the Directors and were not the result of any single factor. Some of the factors that figured particularly in the Directors’ deliberations are described below, although individual Directors may have evaluated the information presented differently from one another, attributing different weights to various factors. The Directors recognized that the fee arrangement for the Fund is the result of review and discussion in prior years between the Independent Directors and the Investment Manager, that certain aspects of such arrangement may receive greater scrutiny in
| | | | | | |
| Semiannual Report | | | July 31, 2013 | | | 45 | |
Matters Relating to the Directors’ Consideration of the Investment Management &
Portfolio Management Agreements (unaudited) (continued)
PIMCO Strategic Global Government Fund, Inc.
some years than in others, and that the Directors’ conclusions may be based, in part, on their consideration of this same arrangement during the course of the year and in prior years.
Fund-specific performance results reviewed by the Directors are discussed below. The comparative performance information was prepared and provided by Lipper and was not independently verified by the Directors. Due to the passage of time, these performance results may differ from the performance results for more recent periods, including those shown elsewhere in this report. The Directors reviewed, among other information, comparative information showing performance of the Fund against its Lipper performance universe for the one-year, three-year, five-year and ten-year periods ended March 31, 2013.
In addition, it was noted that the Directors considered matters bearing on the Fund and its advisory arrangements at their meetings throughout the year, including a review of performance data at each regular meeting.
As part of their review, the Directors examined the Investment Manager’s and the Sub-Adviser’s abilities to provide high quality investment management and other services to the Fund. Among other information, the Directors considered the investment philosophy and research and decision-making processes of the Sub-Adviser; the experience of key advisory personnel of the Sub-Adviser responsible for portfolio management of the Fund; the ability of the Investment Manager and the Sub-Adviser to attract and retain capable personnel; and the capability of the senior management and staff of the Investment Manager and the Sub-Adviser. In addition, the Directors reviewed the quality of the Investment Manager’s and the Sub-Adviser’s services with respect to regulatory compliance and compliance with the investment policies of the Fund; the nature and quality of certain administrative services the
Investment Manager is responsible for providing to the Fund; and conditions that might affect the Investment Manager’s or the Sub-Adviser’s ability to provide high quality services to the Fund in the future under the Agreements, including each organization’s respective financial condition and operational stability. Based on the foregoing, the Directors concluded that the Sub-Adviser’s investment process, research capabilities and philosophy were well suited to the Fund given its investment objective and policies, and that the Investment Manager and the Sub-Adviser would be able to continue to meet any reasonably foreseeable obligations under the Agreements.
In assessing the reasonableness of the Fund’s fees under the Agreements, the Directors considered, among other information, the Fund’s management fee and its total expense ratio as a percentage of average net assets attributable to common shares and the management fee and total expense ratios of a peer expense group of funds based on information provided by Lipper. The Fund-specific fee and expense results discussed below were prepared and provided by Lipper and were not independently verified by the Directors.
The Directors specifically took note of how the Fund compared to its Lipper peers as to performance, management fee expense and total net expenses. The Directors noted that while the Fund is not charged a separate administration fee (recognizing that the management fee includes a component for administrative services), it was not clear in all cases whether the peer funds in the Lipper category were separately charged such a fee by their investment managers, so that the total expense ratio (rather than any individual expense component) represented the most relevant comparison. It was noted that the total expense ratio comparisons reflects the effect of
| | | | |
| 46 | | July 31, 2013 | | | Semiannual Report |
Matters Relating to the Directors’ Consideration of the Investment Management &
Portfolio Management Agreements (unaudited) (continued)
PIMCO Strategic Global Government Fund, Inc.
expense waivers/reimbursements (although none exist for the Fund).
The Directors noted that the expense group for the Fund provided by Lipper consisted of a total of five closed-end funds, including the Fund. The Directors noted that only leveraged closed-end funds were considered for inclusion in the group. The Directors also noted that average net assets of the common shares of the five funds in the expense group ranged from $123.8 million to $379.8 million, and that no other fund was larger in asset size than the Fund. The Directors also noted that the Fund was ranked second out of five funds in the expense group for total expense ratio based on common share assets, third out of five funds in the expense group for total expense ratio based on common share and leveraged assets combined, first out of five funds in actual management fees based on common share assets and fourth out of five funds in actual management fees based on common share and leveraged assets combined (with funds ranked first having the lowest fees/expenses and ranked fifth having the highest fees/expenses in the expense group).
With respect to Fund total return performance relative to its Lipper performance universe (based on net asset value), the Directors noted that the Fund had second quintile performance for the one-year period and first quintile performance for the three-year and five-year periods and was ranked second out of three funds for the ten-year period ended March 31, 2013.
In addition to their review of Fund performance based on net asset value, the Directors also considered the market value performance of the Fund’s common shares and related share price premium and/or discount information based on the materials provided by Lipper and management.
The Directors were advised that the Sub-Adviser does not manage any funds or accounts, including institutional or separate accounts, with an investment strategy and return profile similar to those of the Fund. However, the Directors considered the management fees charged by the Sub-Adviser to other funds and accounts with strategies that have similarities (but are not substantially similar) to those of the Fund, including open-end funds and separate accounts advised by the Sub-Adviser. The Directors noted that the management fee paid by the Fund is generally higher than the fees paid by such separate account clients. However, the Directors were advised by the Sub-Adviser that it generally provides broader and more extensive services to the Fund in comparison to separate accounts, and incurs additional expenses in connection with the more extensive regulatory regime to which the Fund is subject in comparison to separate accounts generally. The Directors noted that the management fee paid by the Fund is generally higher than the fees paid by the open-end funds offered for comparison but were advised by the Sub-Adviser that there are additional portfolio management challenges in managing the Fund, such as those associated with the use of leverage and attempting to meet a regular dividend.
Based on a profitability analysis provided by the Investment Manager, the Directors also considered the estimated profitability to the Investment Manager from its relationship with the Fund and determined that such profitability did not appear to be excessive.
The Directors also took into account that, as a closed-end investment company, the Fund does not currently intend to raise additional assets, so the assets of the Fund will grow (if at all) only through the investment performance of the Fund. Therefore, the Directors did not consider potential economies of scale as a
| | | | | | |
| Semiannual Report | | | July 31, 2013 | | | 47 | |
Matters Relating to the Directors’ Consideration of the Investment Management &
Portfolio Management Agreements (unaudited) (continued)
PIMCO Strategic Global Government Fund, Inc.
principal factor in assessing the fee rates payable under the Agreements.
Additionally, the Directors considered so-called “fall-out benefits” to the Investment Manager and the Sub-Adviser, such as reputational value derived from serving as Investment Manager and Sub-Adviser to the Fund.
After reviewing these and other factors described herein, the Directors concluded with respect to the Fund, within the context of their overall conclusions regarding the Agreements and based on the information provided and related representations made by management, that they were satisfied with the Investment
Manager’s and the Sub-Adviser’s responses and efforts relating to the investment performance of the Fund. The Directors also concluded that the fees payable under each Agreement represent reasonable compensation in light of the nature, extent and quality of services provided by the Investment Manager or Sub-Adviser, as the case may be. Based on their evaluation of factors that they deemed to be material, including those factors described above, the Directors, including the Independent Directors, unanimously concluded that the continuation of the Agreements was in the interests of the Fund and its shareholders, and should be approved.
| | | | |
| 48 | | July 31, 2013 | | | Semiannual Report |
Directors
Hans W. Kertess
Chairman of the Board of Directors
Deborah A. DeCotis
Bradford K. Gallagher
James A. Jacobson
John C. Maney
William B. Ogden, IV
Alan Rappaport
Fund Officers
Brian S. Shlissel
President & Chief Executive Officer
Lawrence G. Altadonna
Treasurer, Principal Financial & Accounting Officer
Thomas J. Fuccillo
Vice President, Secretary & Chief Legal Officer
Scott Whisten
Assistant Treasurer
Richard J. Cochran
Assistant Treasurer
Orhan Dzemaili
Assistant Treasurer
Thomas L. Harter
Chief Compliance Officer
Lagan Srivastava
Assistant Secretary
Investment Manager
Allianz Global Investors Fund Management LLC
1633 Broadway
New York, NY 10019
Sub-Adviser
Pacific Investment Management Company LLC
840 Newport Center Drive
Newport Beach, CA 92660
Custodian & Accounting Agent
State Street Bank & Trust Co.
801 Pennsylvania Avenue
Kansas City, MO 64105-1307
Transfer Agent, Dividend Paying Agent and Registrar
American Stock Transfer & Trust Company, LLC
6201 15th Avenue
Brooklyn, NY 11219
Independent Registered Public Accounting Firm
PricewaterhouseCoopers LLP
1100 Walnut Street, Suite 1300
Kansas City, MO 64106
Legal Counsel
Ropes & Gray LLP
Prudential Tower
800 Boylston Street
Boston, MA 02199
This report, including the financial information herein, is transmitted to the stockholders of PIMCO Strategic Global Government Fund, Inc. for its information. It is not a prospectus, circular or representation intended for use in the purchase of stock of the Fund or any securities mentioned in this report.
The financial information included herein is taken from the records of the Fund without examination by an independent registered public accounting firm, who did not express an opinion herein.
Notice is hereby given in accordance with Section 23(c) of the Investment Company Act of 1940, as amended, that from time to time the Fund may purchase its common shares in the open market.
The Fund files its complete schedule of portfolio holdings with the Securities and Exchange Commission (“SEC”) for the first and third quarters of its fiscal year on Form N-Q. The Fund’s Form N-Q is available on the SEC’s website at www.sec.gov and may be reviewed and copied at the SEC’s Public Reference Room in Washington, D.C. Information on the operation of the Public Reference Room may be obtained by calling (800) SEC-0330. The information on Form N-Q is also available on the Fund’s website at us.allianzgi.com/closedendfunds.
Information on the Fund is available at us.allianzgi.com/closedendfunds or by calling the Fund’s stockholder servicing agent at (800) 254-5197.
us.allianzgi.com
Receive this report electronically and eliminate paper mailings.
To enroll, go to us.allianzgi.com/edelivery.
| | |
| ©Allianz Global Investors Distributors LLC | | AZ602SA_073113 |
AGI-2013-08-07-7534
Not required in this filing.
| ITEM 3. | AUDIT COMMITTEE FINANCIAL EXPERT |
Not required in this filing.
| ITEM 4. | PRINCIPAL ACCOUNTANT FEES AND SERVICES |
Not required in this filing.
| ITEM 5. | AUDIT COMMITTEE OF LISTED REGISTRANT |
Not required in this filing.
| ITEM 6. | SCHEDULE OF INVESTMENTS |
| (a) | The registrant’s Schedule of Investments is included as part of the report to shareholders filed under Item 1 of this form. |
| (b) | Not applicable due to no such divestments during the semi-annual period covered since the previous Form N-CSR filing. |
| ITEM 7. | DISCLOSURE OF PROXY VOTING POLICIES AND PROCEDURES FOR CLOSED-END MANAGEMENT INVESTMENT COMPANIES |
Not required in this filing.
| ITEM 8. | PORTFOLIO MANAGERS OF CLOSED-END MANAGEMENT INVESTMENT COMPANIES |
Not required in this filing.
| ITEM 9. | PURCHASES OF EQUITY SECURITIES BY CLOSED-END MANAGEMENT INVESTMENT COMPANY AND AFFILIATED COMPANIES |
None
| ITEM 10. | SUBMISSION OF MATTERS TO A VOTE OF SECURITY HOLDERS |
There have been no material changes to the procedures by which shareholders may recommend nominees to the Fund’s Board of Trustees since the Fund last provided disclosure in response to this item.
| ITEM 11. | CONTROLS AND PROCEDURES |
| (a) | The registrant’s President and Treasurer, Principal Financial & Accounting Officer have concluded that the registrant’s disclosure controls and procedures (as defined in Rule 30a-3(c) under the Act (17 CFR 270.30a-3(c))) are effective based on their evaluation of these controls and procedures as of a date within 90 days of the filing date of this document. |
| (b) | There were no significant changes in the registrant’s internal control over financial reporting (as defined in Rule 30a-3(d) under the Act (17 CFR 270.30a-3(d))) that occurred during the second fiscal quarter of the period covered by this report that has materially affected, or is reasonably likely to materially affect, the registrant’s internal control over financial reporting. |
| (a) | (1) Not required in this filing. |
| (a) | (2) Exhibit 99.302 Cert. — Certification pursuant to Section 302 of the Sarbanes-Oxley Act of 2002 |
| (b) | Exhibit 99.906 Cert. — Certification pursuant to Section 906 of the Sarbanes-Oxley Act of 2002 |
A-1
Signatures
Pursuant to the requirements of the Securities Exchange Act of 1934 and the Investment Company Act of 1940, the registrant has duly caused this report to be signed on its behalf by the undersigned, thereunto duly authorized.
(Registrant) PIMCO Strategic Global Government Fund, Inc.
| | |
| |
| By | | /s/ Brian S. Shlissel |
| | Brian S. Shlissel, President & Chief Executive Officer |
|
| Date: October 1, 2013 |
| |
| By | | /s/ Lawrence G. Altadonna |
| | Lawrence G. Altadonna, Treasurer, Principal Financial & Accounting Officer |
|
| Date: October 1, 2013 |
Pursuant to the requirements of the Securities Exchange Act of 1934 and the Investment Company Act of 1940, this report has been signed below by the following persons on behalf of the registrant and in the capacities and on the dates indicated.
| | |
| By | | /s/ Brian S. Shlissel |
| | Brian S. Shlissel, President & Chief Executive Officer |
|
| Date: October 1, 2013 |
| |
| By | | /s/ Lawrence G. Altadonna |
| | Lawrence G. Altadonna, Treasurer, Principal Financial & Accounting Officer |
|
| Date: October 1, 2013 |