Exhibit 99.1
| Imperial Capital’s Global Opportunities Conference November 18, 2008 New York, NY Richard Ginsburg, CEO Darius G. Nevin, CFO |
| Forward-looking Statements Certain statements in this presentation may contain forward-looking statements regarding Protection One, Inc. that are intended to qualify for the safe harbor from liability established by the Private Securities Litigation Reform Act of 1995. Statements that are not historical fact are forward-looking statements. These forward-looking statements generally can be identified by, among other things, the use of forward-looking language such as the words “estimate,” “project,” “intend,” “believe,” “expect,” “anticipate,” “may,” “will,” “would,” “should,” “could,” “seeks,” “plans,” “intends,” or other words of similar import or their negatives. Similarly, statements in this presentation that describe Protection One’s objectives, plans or goals are forward-looking statements. Such statements include those made on matters such as Protection One’s earnings and financial condition, liquidity, debt maturities and covenants, business strategy, cash flows per subscriber and capital available for future plans. The forward-looking statements included in this presentation are based upon the current beliefs and expectations of the management of Protection One and are subject to certain risks and uncertainties that could cause actual results to differ materially from those in the forward-looking statements. Certain factors that could cause actual results to differ from those set forth in this presentation include: Protection One’s history of losses, which are likely to continue; difficulties in integrating the business of Integrated Alarm Services Group, Inc.; principal and interest payment requirements of Protection One’s indebtedness; competition, including competition from companies that are larger than Protection One and have greater resources; losses of customers over time and difficulty acquiring new customers; termination of the marketing alliance with BellSouth; changes in technology that may make Protection One’s services less attractive or obsolete or require significant expenditures to upgrade; the development of new services or service innovations by Protection One’s competitors; potential liability for failure to respond adequately to alarm activations; changes in management; the potential for environmental or man-made catastrophes in areas of high customer concentration; continued deterioration in conditions affecting the economy or security alarm monitoring service providers generally; and changes in federal, state or local government or other regulations or standards affecting Protection One’s operations. New factors emerge from time to time, and it is not possible for Protection One to predict all of such factors or the impact of each such factor on its business or the extent to which any factor, or combination of factors, may cause actual results to differ materially from those contained in any forward-looking statement. Additional risks and factors are identified in Protection One’s filings with the Securities and Exchange Commission, including Protection One’s Annual Report on Form 10-K for the year ended December 31, 2007, and its 2008 quarterly reports on Form 10-Q, which are available on Protection One’s website (http://www.protectionone.com). The forward-looking statements included in this presentation are made only as of the date of this presentation and Protection One undertakes no obligation to publicly update such forward-looking statements to reflect subsequent events or circumstances. |
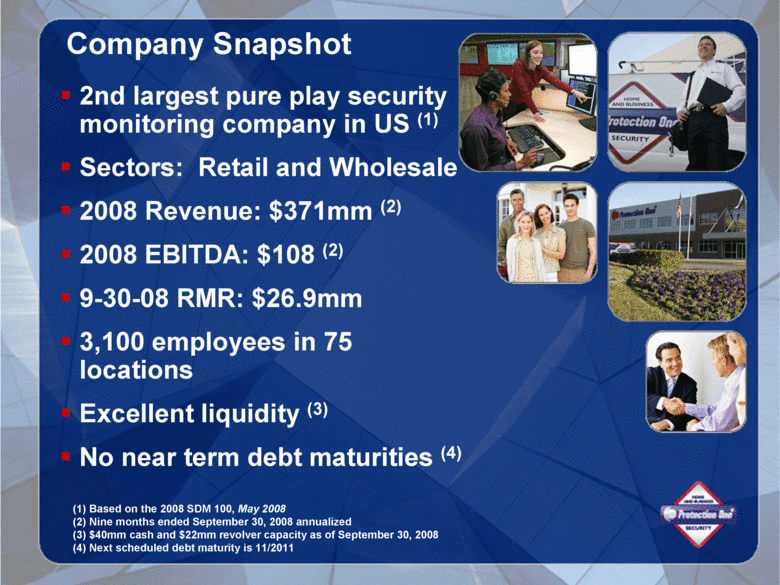
| Company Snapshot 2nd largest pure play security monitoring company in US (1) Sectors: Retail and Wholesale 2008 Revenue: $371mm (2) 2008 EBITDA: $108 (2) 9-30-08 RMR: $26.9mm 3,100 employees in 75 locations Excellent liquidity (3) No near term debt maturities (4) (1) Based on the 2008 SDM 100, May 2008 (2) Nine months ended September 30, 2008 annualized (3) $40mm cash and $22mm revolver capacity as of September 30, 2008 (4) Next scheduled debt maturity is 11/2011 |
| Protection One Executive Leadership Richard Ginsburg President and Chief Executive Officer 21 years in industry Darius G. Nevin EVP & Chief Financial Officer 20 years in industry Peter J. Pefanis EVP and Chief Operating Officer 23 years in industry With a deep team of professionals in each operating and staff group Kim Lessner EVP and Chief Marketing Officer Former VP Strategy & Target Marketing, Verizon |
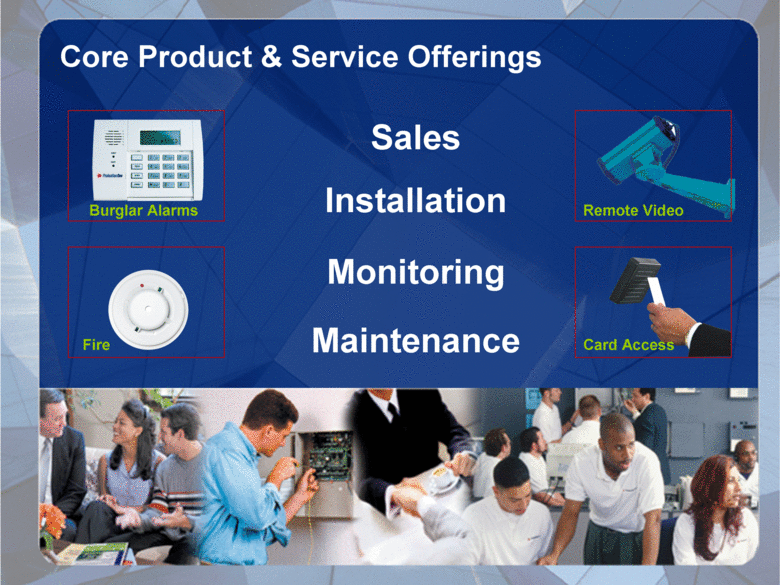
| Core Product & Service Offerings Installation Sales Maintenance Monitoring Burglar Alarms Card Access Remote Video Fire |
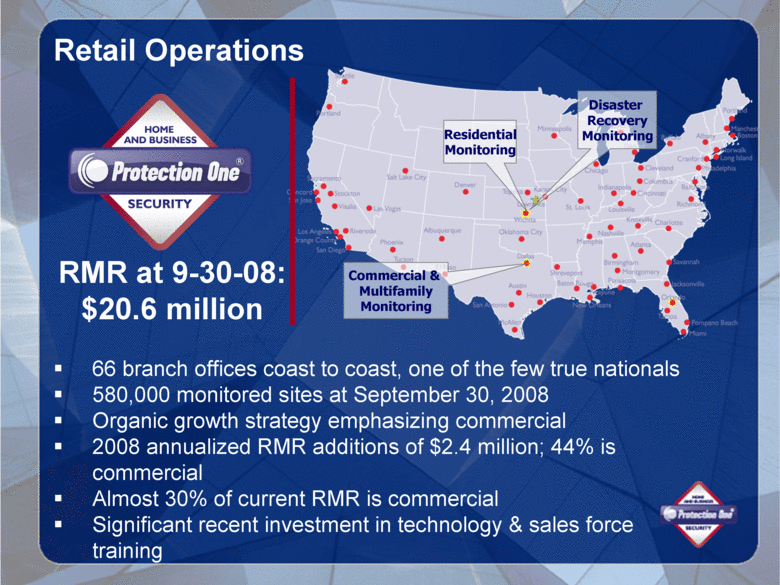
| Retail Operations 66 branch offices coast to coast, one of the few true nationals 580,000 monitored sites at September 30, 2008 Organic growth strategy emphasizing commercial 2008 annualized RMR additions of $2.4 million; 44% is commercial Almost 30% of current RMR is commercial Significant recent investment in technology & sales force training Market Position: #3 Residential Monitoring Commercial & Multifamily Monitoring Disaster Recovery Monitoring RMR at 9-30-08: $20.6 million |
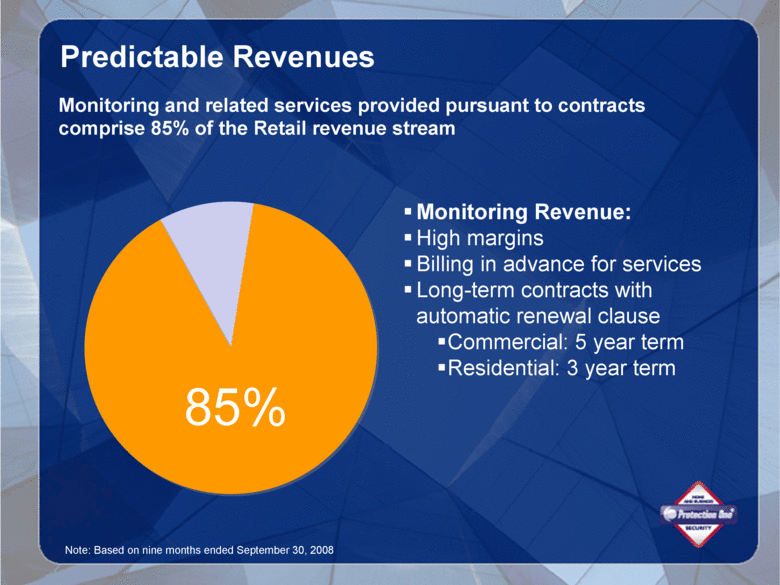
| Note: Based on nine months ended September 30, 2008 Predictable Revenues Monitoring and related services provided pursuant to contracts comprise 85% of the Retail revenue stream Monitoring Revenue: High margins Billing in advance for services Long-term contracts with automatic renewal clause Commercial: 5 year term Residential: 3 year term 85% |
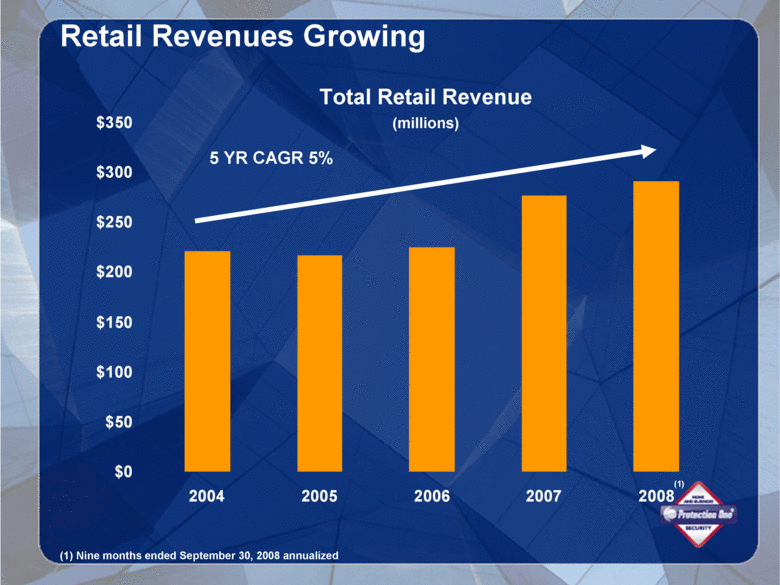
| Retail Revenues Growing $0 $50 $100 $150 $200 $250 $300 $350 2004 2005 2006 2007 2008 Total Retail Revenue (millions) (1) (1) Nine months ended September 30, 2008 annualized 5 YR CAGR 5% |
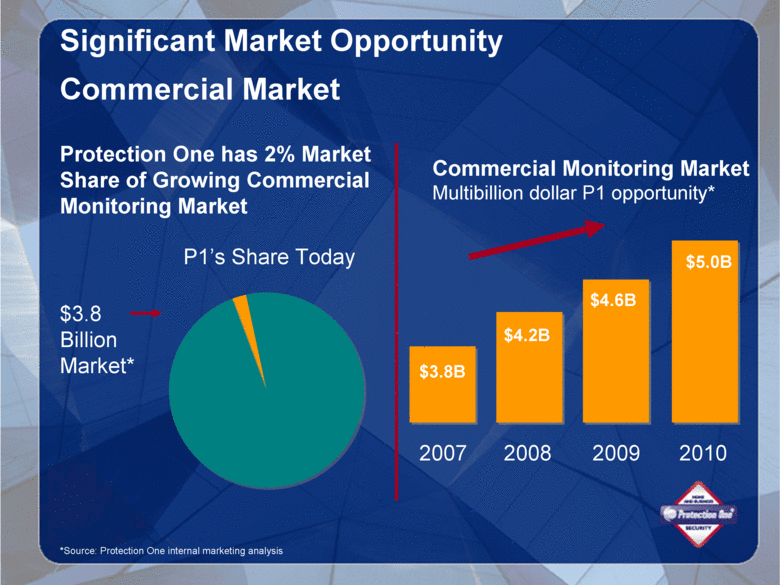
| Significant Market Opportunity Commercial Market Protection One has 2% Market Share of Growing Commercial Monitoring Market $3.8 Billion Market* P1’s Share Today 2007 2008 2009 2010 $3.8B $4.2B $4.6B $5.0B *Source: Protection One internal marketing analysis Commercial Monitoring Market Multibillion dollar P1 opportunity* |
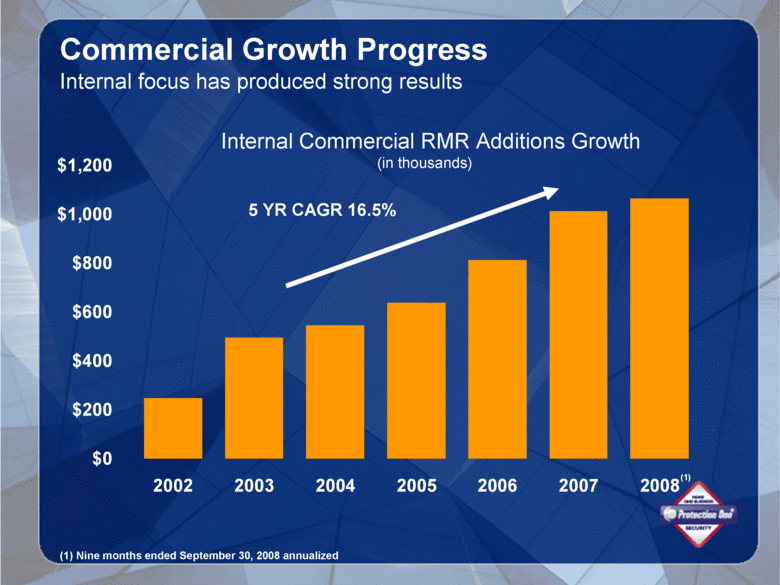
| $0 $200 $400 $600 $800 $1,000 $1,200 2002 2003 2004 2005 2006 2007 2008 Internal Commercial RMR Additions Growth (in thousands) Internal focus has produced strong results (1) Commercial Growth Progress (1) Nine months ended September 30, 2008 annualized 5 YR CAGR 16.5% |
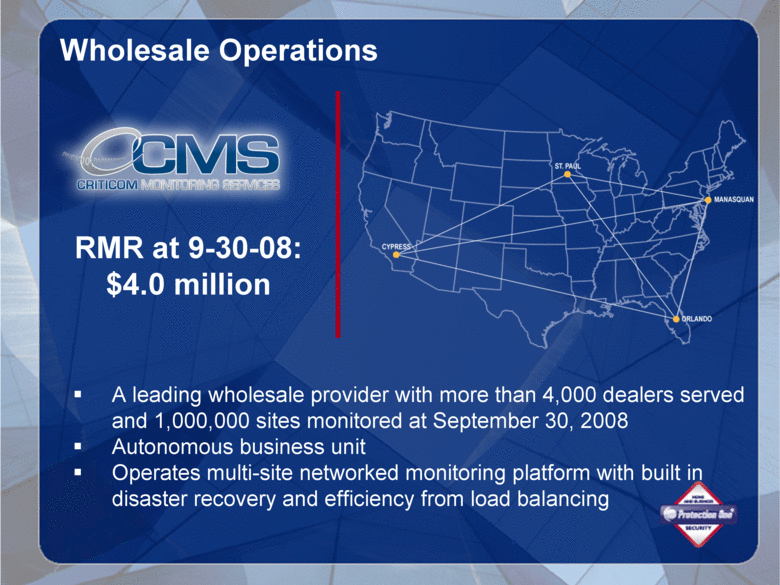
| Wholesale Operations A leading wholesale provider with more than 4,000 dealers served and 1,000,000 sites monitored at September 30, 2008 Autonomous business unit Operates multi-site networked monitoring platform with built in disaster recovery and efficiency from load balancing RMR at 9-30-08: $4.0 million |
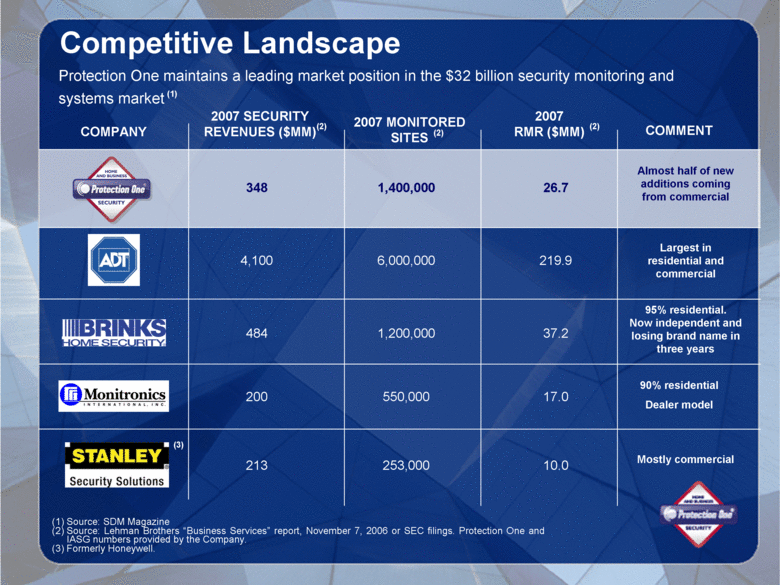
| Competitive Landscape Protection One maintains a leading market position in the $32 billion security monitoring and systems market (1) Source: SDM Magazine (2) Source: Lehman Brothers “Business Services” report, November 7, 2006 or SEC filings. Protection One and IASG numbers provided by the Company. (3) Formerly Honeywell. COMPANY 2007 SECURITY REVENUES ($MM) 2007 MONITORED SITES 2007 RMR ($MM) COMMENT 348 1,400,000 26.7 Almost half of new additions coming from commercial 4,100 6,000,000 219.9 Largest in residential and commercial 484 1,200,000 37.2 95% residential. Now independent and losing brand name in three years 200 550,000 17.0 90% residential Dealer model 213 253,000 10.0 Mostly commercial (2) (2) (2) (3) (1) |
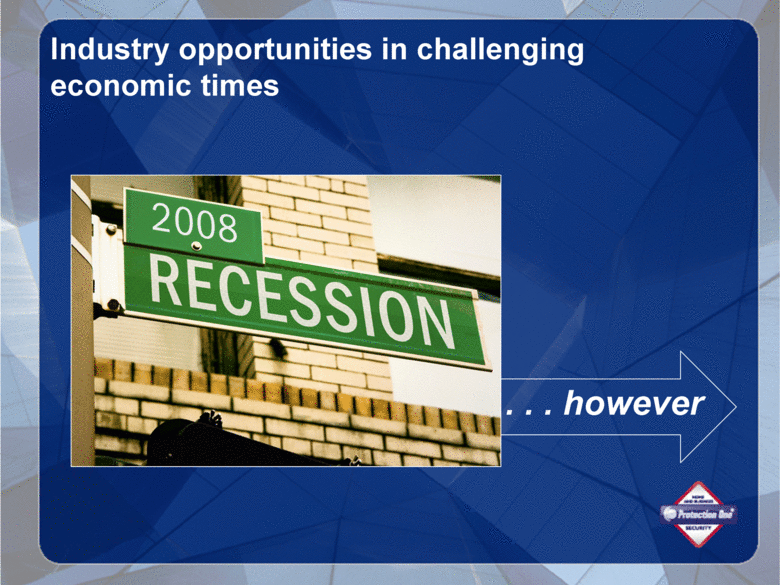
| Industry opportunities in challenging economic times . . . however |
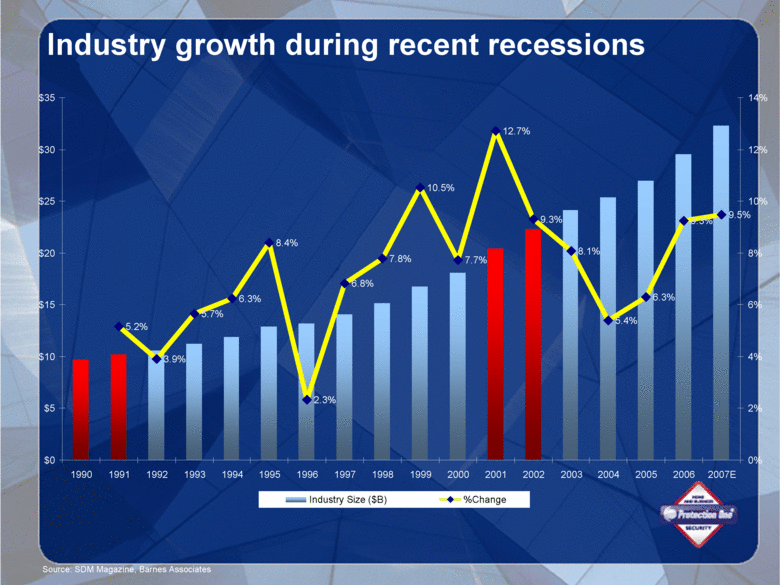
| Source: SDM Magazine, Barnes Associates Industry growth during recent recessions 5.2% 3.9% 5.7% 6.3% 8.4% 2.3% 6.8% 7.8% 10.5% 7.7% 12.7% 9.3% 8.1% 5.4% 6.3% 9.3% 9.5% $0 $5 $10 $15 $20 $25 $30 $35 1990 1991 1992 1993 1994 1995 1996 1997 1998 1999 2000 2001 2002 2003 2004 2005 2006 2007E 0% 2% 4% 6% 8% 10% 12% 14% Industry Size ($B) %Change |
| Impact on crime and police budgets “ burglaries up 3.6% as the state’s economy slowed” Florida Department of Law Enforcement October 14, 2008 “Crime has increased during every recession since the late 1950s.” Richard Rosenfeld, sociologist, University of Missouri-St Louis October 21, 2008 “The collapse of U.S. financial markets is forcing deep cuts in local police agencies and stoking fears among police chiefs that mass home foreclosures are bringing more crime to suburbs. Problems created by the financial meltdown are starting to touch everything from police response times to unsolved crimes. ” – USA TODAY October 17, 2008 “Declining property values lead to less revenue for law enforcement agencies, meaning they have to decrease their budgets and tighten their belts at the same time crime is expected to increase. ” Naples Daily News October 11, 2008 “ police agencies are dramatically reducing their forces as local governments struggle to allocate shrinking revenue from property and sales taxes to fund basic services.” USA TODAY October 17, 2008 “U.S. police departments are streamlining patrols, reducing training and cutting back on some preventative programs as their budgets fall victim to the struggling economy.” CNN.com October 23, 2008 |
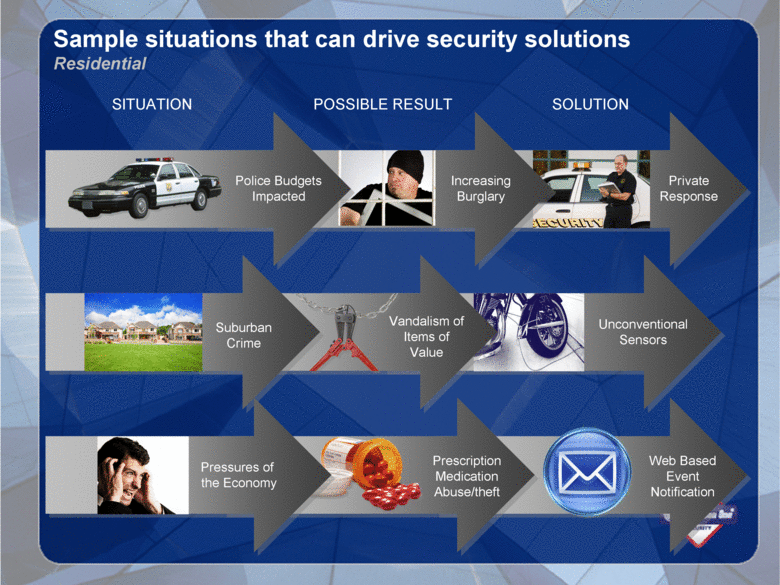
| Sample situations that can drive security solutions Residential Private Response Police Budgets Impacted Increasing Burglary Unconventional Sensors Vandalism of Items of Value Suburban Crime Web Based Event Notification Prescription Medication Abuse/theft Pressures of the Economy SOLUTION POSSIBLE RESULT SITUATION |
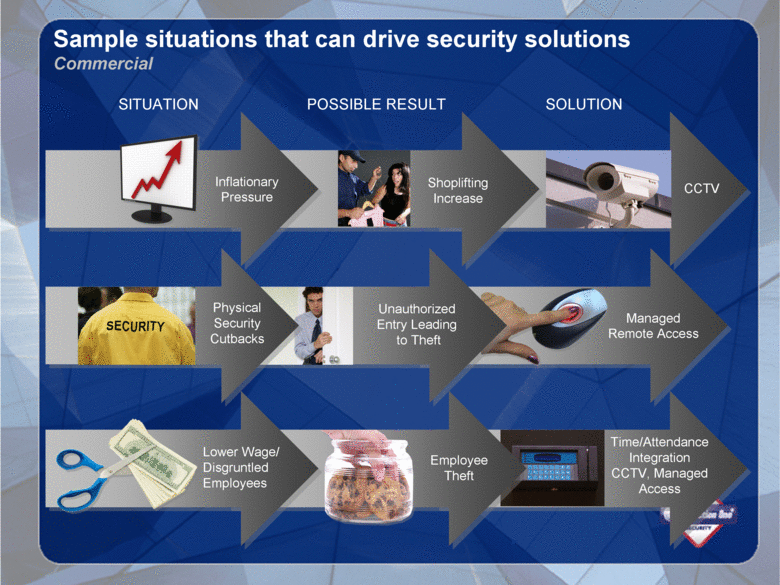
| Sample situations that can drive security solutions Commercial Managed Remote Access CCTV Shoplifting Increase Unauthorized Entry Leading to Theft Physical Security Cutbacks Time/Attendance Integration CCTV, Managed Access SOLUTION POSSIBLE RESULT SITUATION Inflationary Pressure Employee Theft Lower Wage/ Disgruntled Employees |
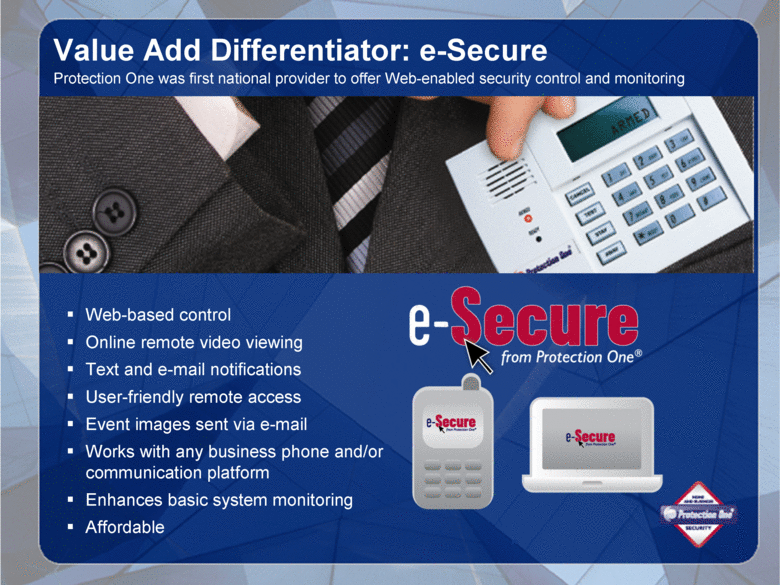
| Value Add Differentiator: e-Secure Web-based control Online remote video viewing Text and e-mail notifications User-friendly remote access Event images sent via e-mail Works with any business phone and/or communication platform Enhances basic system monitoring Affordable Protection One was first national provider to offer Web-enabled security control and monitoring |
| Darius G. Nevin, CFO |
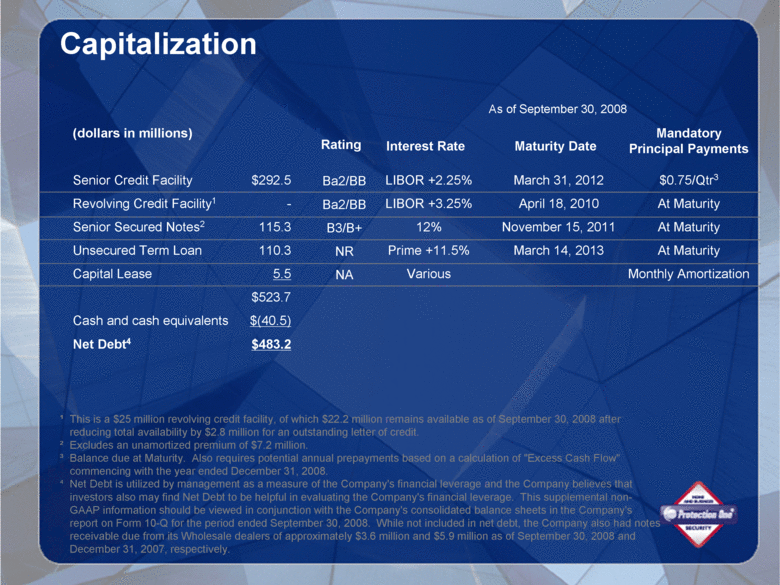
| Capitalization (dollars in millions) Maturity Date Mandatory Principal Payments Senior Credit Facility Revolving Credit Facility1 Senior Secured Notes2 Unsecured Term Loan Capital Lease Cash and cash equivalents Net Debt4 March 31, 2012 April 18, 2010 November 15, 2011 March 14, 2013 As of September 30, 2008 Interest Rate LIBOR +2.25% LIBOR +3.25% 12% Prime +11.5% Various $0.75/Qtr3 At Maturity At Maturity At Maturity Monthly Amortization ¹ This is a $25 million revolving credit facility, of which $22.2 million remains available as of September 30, 2008 after reducing total availability by $2.8 million for an outstanding letter of credit. ² Excludes an unamortized premium of $7.2 million. ³ Balance due at Maturity. Also requires potential annual prepayments based on a calculation of "Excess Cash Flow" commencing with the year ended December 31, 2008. 4 Net Debt is utilized by management as a measure of the Company's financial leverage and the Company believes that investors also may find Net Debt to be helpful in evaluating the Company's financial leverage. This supplemental non- GAAP information should be viewed in conjunction with the Company's consolidated balance sheets in the Company's report on Form 10-Q for the period ended September 30, 2008. While not included in net debt, the Company also had notes receivable due from its Wholesale dealers of approximately $3.6 million and $5.9 million as of September 30, 2008 and December 31, 2007, respectively. $292.5 - 115.3 110.3 5.5 $523.7 $(40.5) $483.2 Rating Ba2/BB Ba2/BB B3/B+ NR NA |
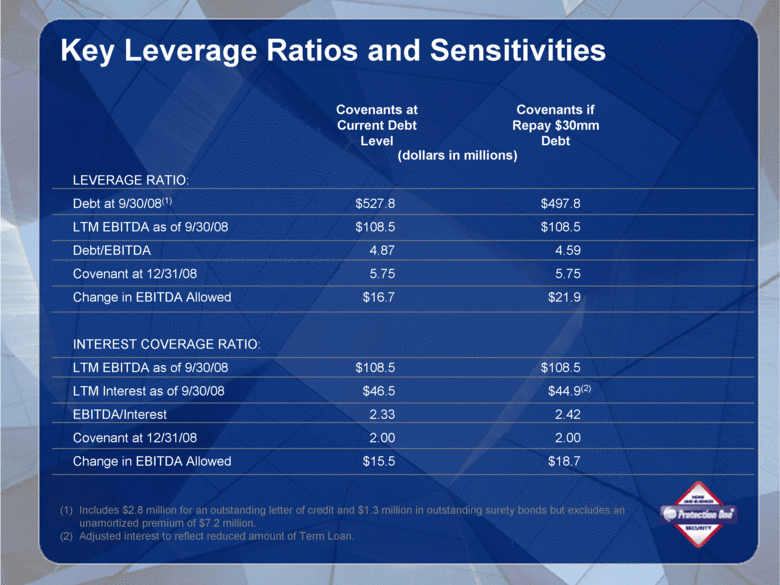
| Key Leverage Ratios and Sensitivities (dollars in millions) LEVERAGE RATIO: Debt at 9/30/08(1) LTM EBITDA as of 9/30/08 Debt/EBITDA Covenant at 12/31/08 Change in EBITDA Allowed INTEREST COVERAGE RATIO: LTM EBITDA as of 9/30/08 LTM Interest as of 9/30/08 EBITDA/Interest Covenant at 12/31/08 Change in EBITDA Allowed Covenants if Repay $30mm Debt $497.8 $108.5 4.59 5.75 $21.9 $108.5 $44.9(2) 2.42 2.00 $18.7 (1) Includes $2.8 million for an outstanding letter of credit and $1.3 million in outstanding surety bonds but excludes an unamortized premium of $7.2 million. (2) Adjusted interest to reflect reduced amount of Term Loan. $527.8 $108.5 4.87 5.75 $16.7 $108.5 $46.5 2.33 2.00 $15.5 Covenants at Current Debt Level |
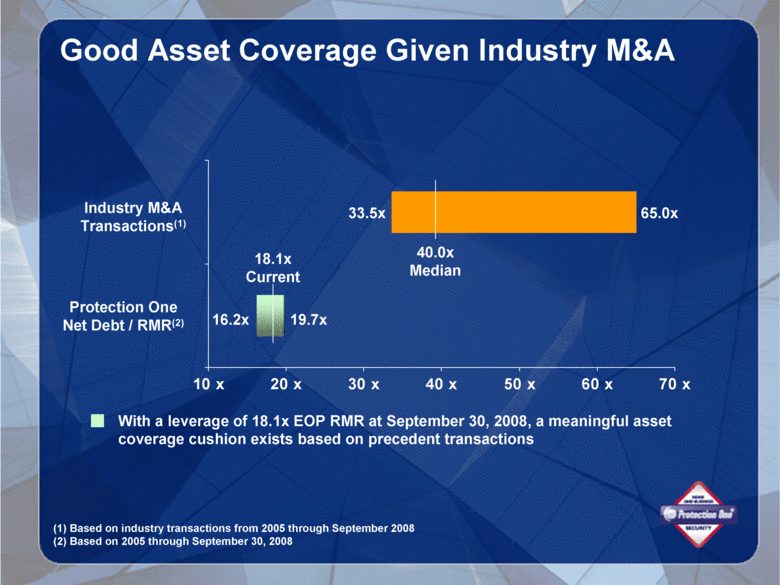
| 10x 20x 30x 40x 50x 60x 70x Industry M&A Transactions(1) Protection One Net Debt / RMR(2) 40.0x Median 18.1x Current 33.5x 65.0x 19.7x 16.2x With a leverage of 18.1x EOP RMR at September 30, 2008, a meaningful asset coverage cushion exists based on precedent transactions (1) Based on industry transactions from 2005 through September 2008 (2) Based on 2005 through September 30, 2008 Good Asset Coverage Given Industry M&A |
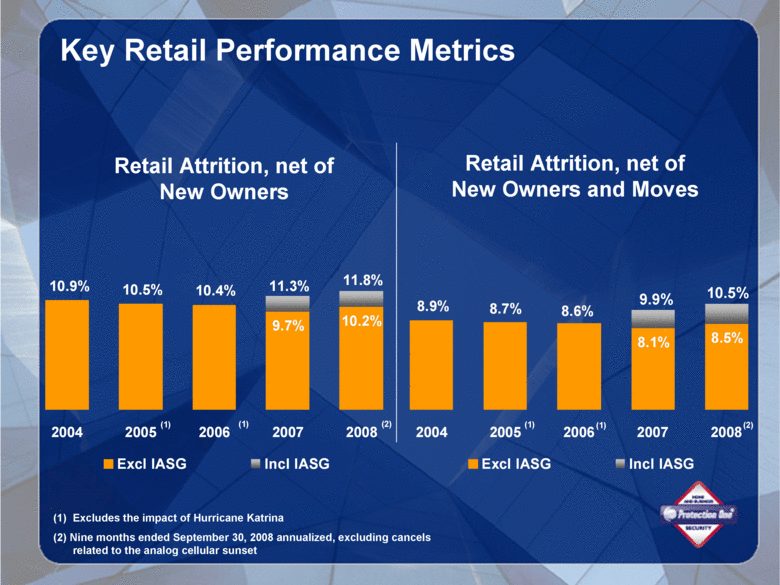
| Key Retail Performance Metrics 8.1% 8.9% 8.7% 8.6% 8.5% 2004 2005 2006 2007 2008 Excl IASG Incl IASG Retail Attrition, net of New Owners 10.2% 10.4% 10.5% 10.9% 9.7% 11.8% 11.3% 2004 2005 2006 2007 2008 Excl IASG Incl IASG (1) (1) (2) (2) (1) (1) 9.9% 10.5% (1) Excludes the impact of Hurricane Katrina (2) Nine months ended September 30, 2008 annualized, excluding cancels related to the analog cellular sunset Retail Attrition, net of New Owners and Moves |
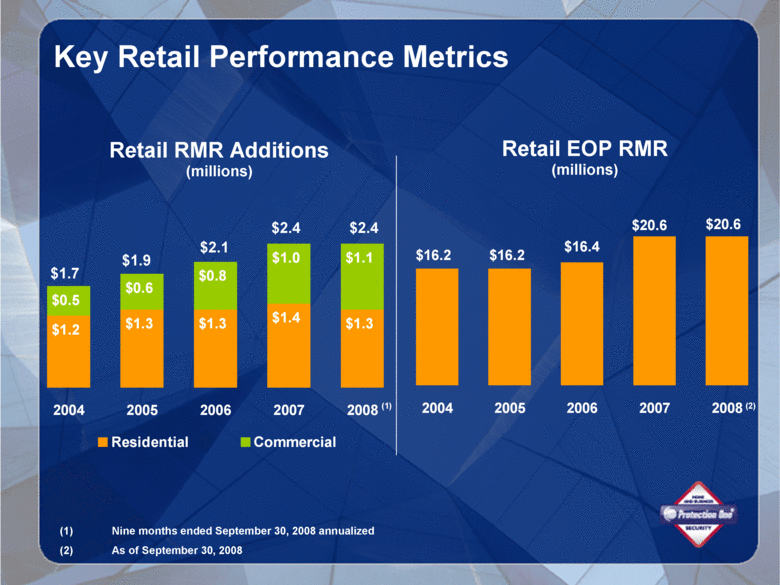
| Key Retail Performance Metrics $20.6 $20.6 $16.4 $16.2 $16.2 2004 2005 2006 2007 2008 Retail EOP RMR (millions) Retail RMR Additions (millions) $1.2 $1.3 $1.3 $1.4 $1.3 $0.5 $0.6 $0.8 $1.0 $1.1 2004 2005 2006 2007 2008 Residential Commercial $1.7 $1.9 $2.1 $2.4 $2.4 (1) (2) (1) Nine months ended September 30, 2008 annualized (2) As of September 30, 2008 |
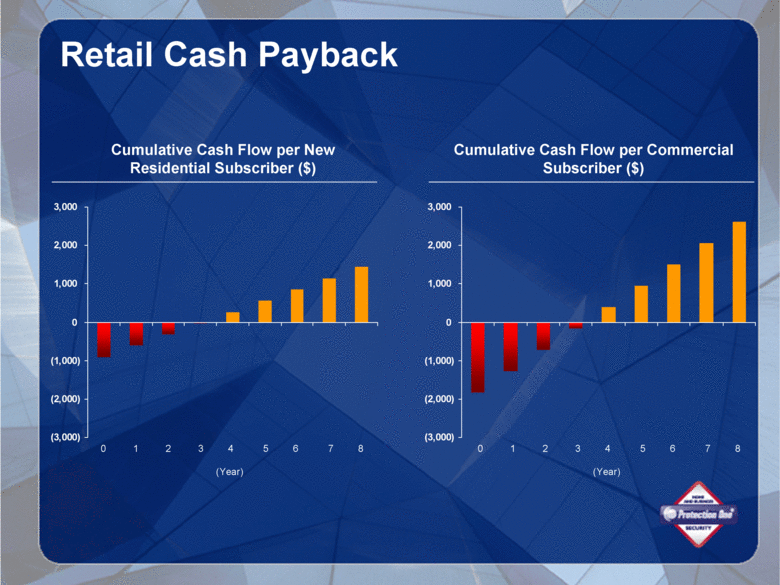
| Retail Cash Payback (3,000) (2,000) (1,000) 0 1,000 2,000 3,000 (3,000) (2,000) (1,000) 0 1,000 2,000 3,000 Cumulative Cash Flow per New Residential Subscriber ($) Cumulative Cash Flow per Commercial Subscriber ($) 0 1 2 3 4 5 6 7 8 0 1 2 3 4 5 6 7 8 (Year) (Year) |
| Summary |
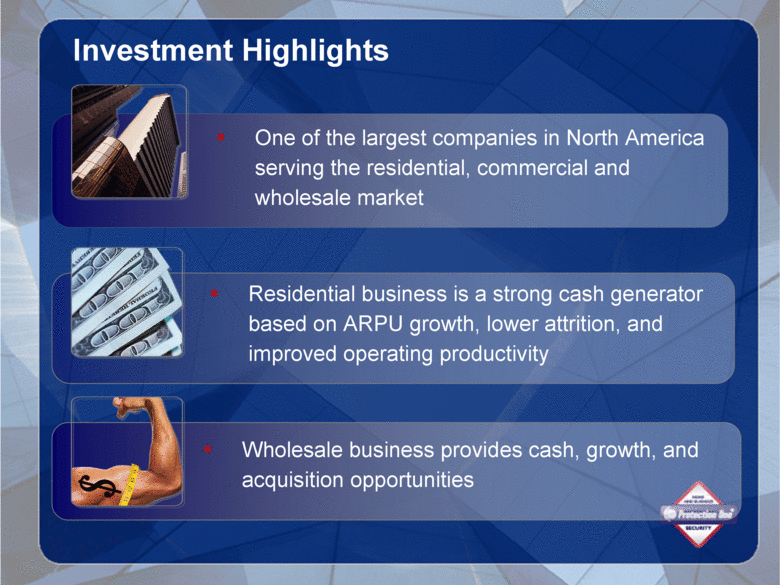
| Investment Highlights One of the largest companies in North America serving the residential, commercial and wholesale market Residential business is a strong cash generator based on ARPU growth, lower attrition, and improved operating productivity Wholesale business provides cash, growth, and acquisition opportunities |
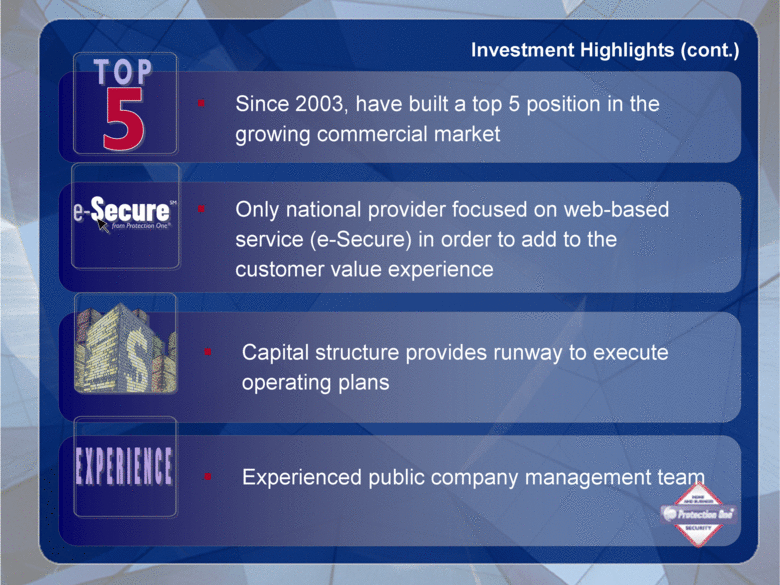
| Investment Highlights (cont.) Capital structure provides runway to execute operating plans Only national provider focused on web-based service (e-Secure) in order to add to the customer value experience Since 2003, have built a top 5 position in the growing commercial market Experienced public company management team |
| [LOGO] |
| Appendices |
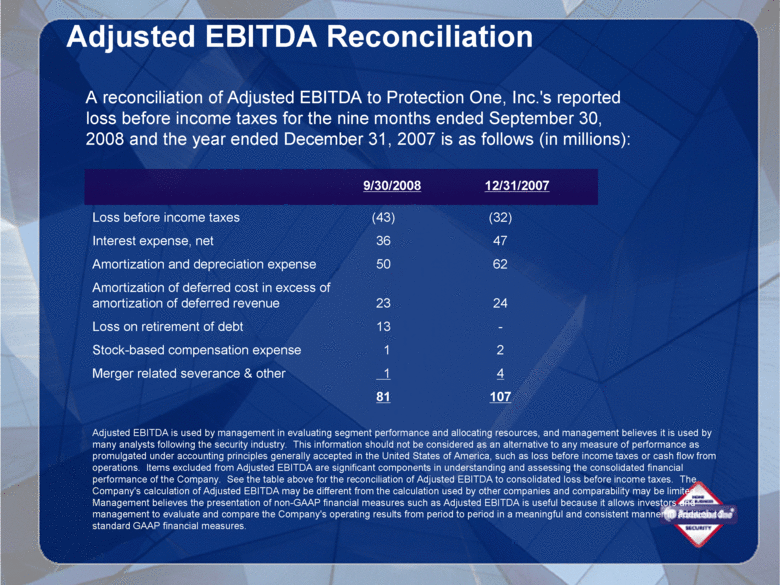
| Adjusted EBITDA Reconciliation A reconciliation of Adjusted EBITDA to Protection One, Inc.'s reported loss before income taxes for the nine months ended September 30, 2008 and the year ended December 31, 2007 is as follows (in millions): 9/30/2008 12/31/2007 Loss before income taxes Interest expense, net Amortization and depreciation expense Amortization of deferred cost in excess of amortization of deferred revenue Loss on retirement of debt Stock-based compensation expense Merger related severance & other (43) 36 50 23 13 1 1 81 (32) 47 62 24 - 2 4 107 Adjusted EBITDA is used by management in ev aluating segment performance and allocating resources, and management believes it is used by many analysts f ollowing the security industry. This information should not be considered as an alternativ e to any measure of performance as promulgated under accounting principles generally accepted in the United States of America, such as loss before income taxes or cash f low from operations. Items excluded from Adjusted EBITDA are significant components in understanding and assessing the consolidated f inancial perf ormance of the Company. See the table above for the reconciliation of Adjusted EBITDA to consolidated loss before income taxes. The Company's calculation of Adjusted EBITDA may be different from the calculation used by other companies and comparability may be limited. Management believ es the presentation of non-GAAP f inancial measures such as Adjusted EBITDA is usef ul because it allows inv estors and management to ev aluate and compare the Company's operating results from period to period in a meaningful and consistent manner in addition to standard GAAP f inancial measures. |
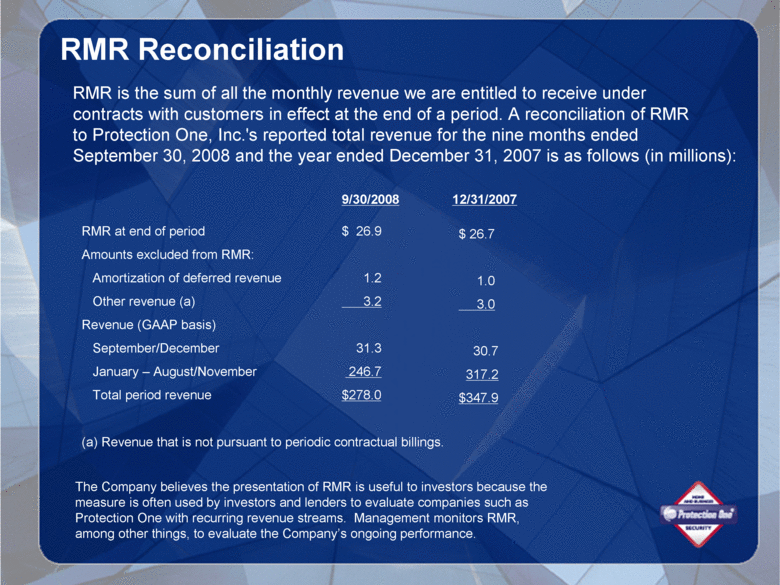
| RMR Reconciliation RMR is the sum of all the monthly revenue we are entitled to receive under contracts with customers in effect at the end of a period. A reconciliation of RMR to Protection One, Inc.'s reported total revenue for the nine months ended September 30, 2008 and the year ended December 31, 2007 is as follows (in millions): The Company believes the presentation of RMR is useful to investors because the measure is often used by investors and lenders to evaluate companies such as Protection One with recurring revenue streams. Management monitors RMR, among other things, to evaluate the Company’s ongoing performance. 9/30/2008 12/31/2007 RMR at end of period Amounts excluded from RMR: Amortization of deferred revenue Other revenue (a) Revenue (GAAP basis) September/December January – August/November Total period revenue (a) Revenue that is not pursuant to periodic contractual billings. $ 26.9 1.2 3.2 31.3 246.7 $278.0 $ 26.7 1.0 3.0 30.7 317.2 $347.9 |

