 Copyright ® 2010 Rovi Corporation. Company Confidential. Rovi 2011Analyst Day Filed by: Rovi Corporation pursuant to Rule 425 under the Securities Act of 1933, as amended, and deemed filed pursuant to Rule 14d-2 under the Securities Exchange Act of 1934, as amended Subject Company: Sonic Solutions Commission File No. 000-23190 |
 Copyright ® 2010 Rovi Corporation. Safe Harbor Statement All statements contained herein, as well as oral statements that may be made by the Company or by officers, directors or employees of the Company acting on the Company’s behalf, that are not statements of historical fact, including but not limited to any description of the Company’s or its management’s future plans, objectives, or goals, constitute “forward-looking statements” and are made pursuant to the Safe-Harbour provisions of the Private Securities Litigation Reform Act of 1995. Such forward-looking statements involve known and unknown risks, uncertainties and other factors that could cause the actual results of the Company to be materially different from the historical results and/or from any future results or outcomes expressed or implied by such forward-looking statements. Such factors include, among others, the Company’s estimates of future revenues, earnings and growth rates, business strategies, the Company’s assumptions and estimates relating to guide advertising, the Company’ ability to pay down its debt, whether markets materialize as anticipated and customer demand for the Company’s technologies and integrated offerings. Such factors also include the expected timetable and structure of the transaction between the Company and Sonic Solutions, the transaction’s anticipated strategic and financial benefits; and the potential impacts of the transaction on both the Company’s and Sonic’s organizations. The statements made by the Company in this document are based upon current expectations and are subject to certain risks and uncertainties that could cause actual results to differ materially from those described in the forward-looking statements. These risks and uncertainties include the satisfaction of closing conditions for the acquisition, including clearance under the Hart-Scott-Rodino Antitrust Improvements Act and the tender of a majority of the outstanding shares of common stock of Sonic Solutions; market conditions; the effect of the announcement of the transaction on the Company’s and Sonic’s respective businesses; the impact of any failure to complete the exchange offer and the merger; the risk that the Company will not realize the anticipated benefits of the acquisition; the potential inability to successfully operate or integrate Sonic’s business and expand product as a result thereof; general industry and economic conditions; and other factors beyond the companies’ control. Such factors are further addressed in the Company’s Report on Form 10-Q for the period ended September 30, 2010 and other documents as are filed with the Securities and Exchange Commission from time to time (available at www.sec.gov). The Company assumes no obligation, except as required by law, to update any forward-looking statements in order to reflect events or circumstances that may arise after the date of this presentation. Page 2 |
 Copyright ® 2010 Rovi Corporation. Additional Information Additional Information and Where to Find It The exchange offer for the outstanding common stock of Sonic Solutions has not yet commenced. This announcement is neither an offer to purchase nor a solicitation of an offer to sell shares of Sonic Solutions. Sonic Solutions shareholders are urged to read the relevant exchange offer documents when they become available because they will contain important information that shareholders should consider before making any decision regarding tendering their shares. At the time the offer is commenced, Rovi will file exchange offer materials with the U.S. Securities and Exchange Commission and Sonic Solutions will file a Solicitation/Recommendation Statement with respect to the offer. The exchange offer materials (including a Prospectus and certain other offer documents) and the Solicitation/Recommendation Statement will contain important information, which should be read carefully before any decision is made with respect to the exchange offer. The Prospectus and certain other offer documents, as well as the Solicitation/Recommendation Statement, will be made available to all shareholders of Sonic Solutions at no expense to them. The exchange offer materials and the Solicitation/Recommendation Statement will be made available for free at the Commission’s web site at www.sec.gov. Free copies of the Offer to Purchase, the related Letter of Transmittal and certain other offering documents will be made available by Rovi by mail to Rovi Corporation, 2830 De La Cruz Blvd, Santa Clara, CA 95050, attention: Investor Relations, and free copies of the Solicitation/Recommendation Statement will be made available by Sonic Solutions by mail to Sonic Solutions, 7250 Redwood Blvd., Suite 300 Novato, CA 94945, attention: Investor Relations. Interests of Certain Persons in the Offer and the Merger Rovi will be, and certain other persons may be, soliciting Sonic Solutions shareholders to tender their shares into the exchange offer. The directors and executive officers of Rovi and the directors and executive officers of Sonic Solutions may be deemed to be participants in Rovi’s solicitation of Sonic Solutions’s shareholders to tender their shares into the exchange offer. Investors and shareholders may obtain more detailed information regarding the names, affiliations and interests of the directors and officers of Rovi and Sonic Solutions in the exchange offer by reading the Prospectus and certain other offer documents, as well as the Solicitation/Recommendation Statement, when they become available. Page 3 |
 Copyright ® 2010 Rovi Corporation. Agenda Time Presentation Speaker 12:00 pm Lunch 12:30 pm Business & Strategic Update Fred Amoroso - President and CEO 1:00 pm Markets & Products Corey Ferengul - EVP Product Management & Marketing 1:45 pm Financials James Budge – CFO 2:15 pm Q&A 2:30 pm Wrap Up Fred Amoroso - President and CEO Page 4 |
 Copyright ® 2010 Rovi Corporation. Page 5 • Who we were - Copy protection licensed to studios, games publishers & hardware vendors - License management and installation software sold to ISV’s and enterprises • Who we have become - A leading digital media technology solutions provider: Products, services, metadata & patent • Major activities on our transformation - Acquired key digital media technology assets - Completed divestitures of non-core assets - Fully integrated all companies after transactions closed Our Transformation Mediabolic acquisition; yields Connected Platform AMG acquisition; yields metadata plus Media Recognition technology Gemstar- TV Guide acquisition Sale of Software & Games Protection businesses Sale of TV Guide Magazine Sale of TV Guide Network & TV Guide Online Sale of TVG Network 1/1/07 12/31/08 9/30/08 3/31/08 12/31/07 9/30/07 6/30/07 3/31/07 Sale of eMeta Muze acquisition 3/31/09 Rovi Rebranding 6/30/09 Exit Guidework s JV Sale of Norpak Sonic Acquisition Announced 12/22/10 2/1/10 9/15/10 Introduction of Rovi Media Cloud 1/5/11 Devices w/initial TotalGuide capability begin to ship |
 Copyright ® 2010 Rovi Corporation. Page 6 Connect •Connected Platform •Software Update Service Rovi Products & Solutions Rovi products connect devices and connect consumers to the entertainment they love. Guide •TotalGuide for CE •TotalGuide for SP •TV Guide OnScreen •Guide + Protect •BD+ Blu Ray protection •RipGuard •CopyBlock •ACP (VOD & DVD) Enhance Data Access Search Recommendations Profile Media Recognition Advertising •Passport Guide •Passport Guide DVR •G-Guide •i-Guide Insight TV Data Movie Data Music Data Games Data Book Data |
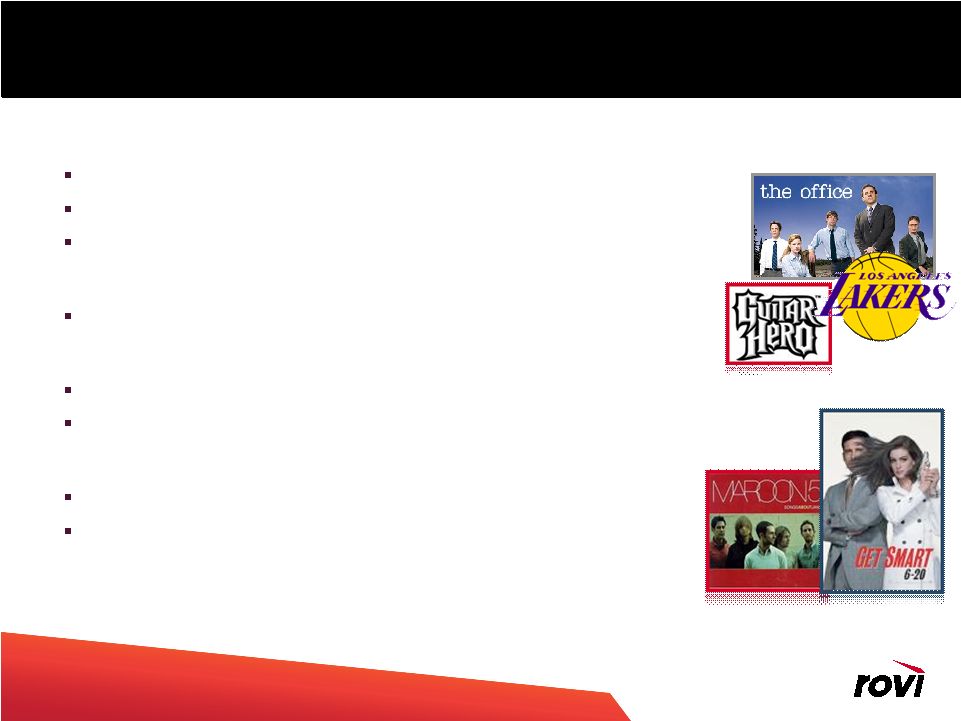 Copyright ® 2010 Rovi Corporation. Entertainment Metadata • Data on more than: 3 million programs since 1954 from nearly 18,000 sources 2 million music album releases and 21 million tracks 460,000 movie titles • Entertainment Metadata is core to our solutions Software + Metadata + IP = Compelling Offering • The stand alone data opportunity is growing New interaction models, devices, and web locations all require entertainment metadata Service provider and international opportunities are underpenetrated • Rovi well positioned Accumulated Metadata portfolio is compelling, global & growing Upgraded infrastructure to improve automation and flexibility Page 7 Page 7 |
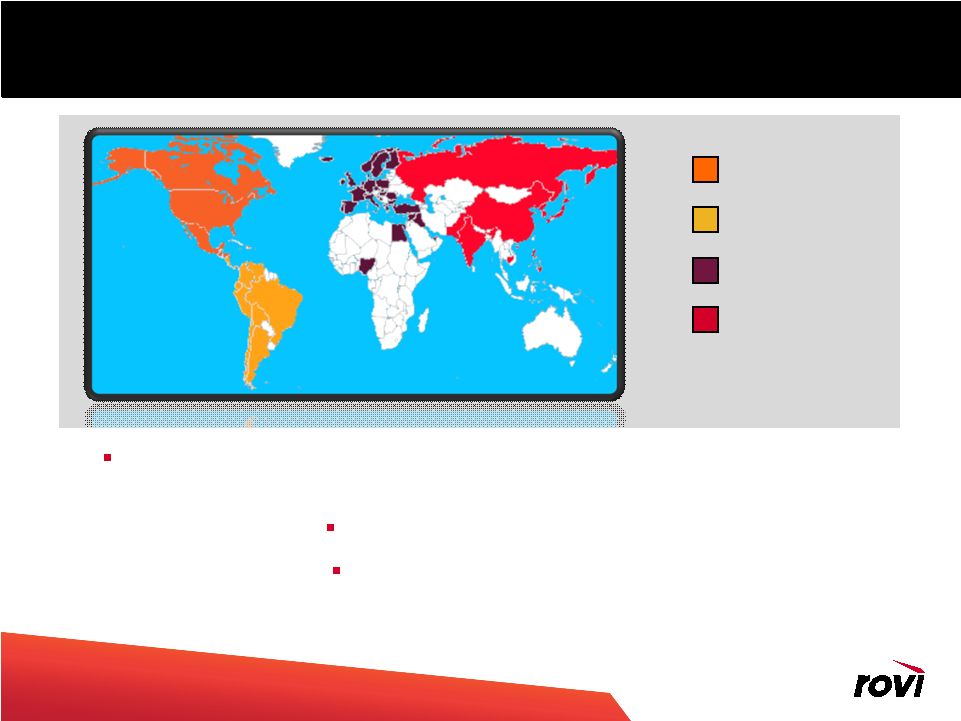 Copyright ® 2010 Rovi Corporation. Page 8 Rovi metadata around the world North America Latin America EMEA APAC 16,000 sources of video content in North America, 660 European TV channels, 450 Latin American TV channels, and 500 Asian TV channels Movies from 160 countries Music from 180 countries |
 Copyright ® 2010 Rovi Corporation. Page 9 Backed by Strong Patent Portfolio • Over 4,700 patents & patent applications worldwide covering: Display of and interaction with TV program schedule data - Basic Guidance Features - Digital Recording including embedded DVR & Network DVR - Online Guidance & Video Search - Cross-Platform Functionality - Interactive Advertising Content Protection • Guidance patents are generally “platform agnostic” Applicable to video guidance on STBs, TVs, DVRs, PCs, Blu-ray players, & mobile phones • Early priority dates & staggered expiration dates extending beyond 2028 • Guidance Portfolio demonstrating healthy growth Europe - grown to over 950 patents (majority granted after 2001) & patent applications APAC – portfolio has grown by over 820 patents & patent applications since 1998 Includes Australia, China, Hong Kong, Japan, Singapore, South Korea, and Taiwan |
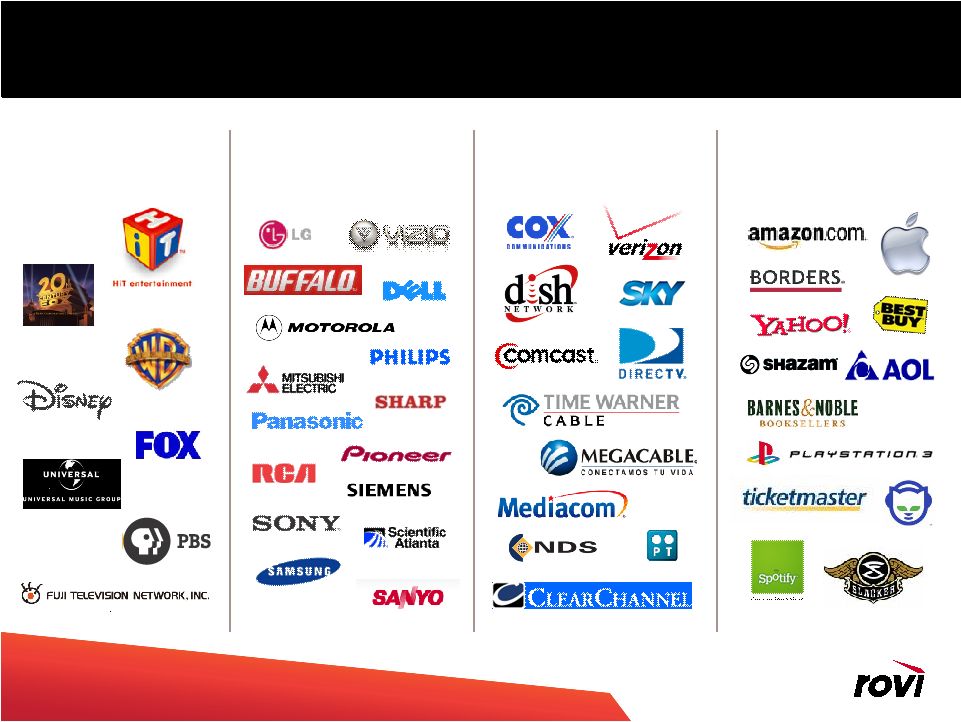 Copyright ® 2010 Rovi Corporation. Entertainment 10 Rovi Customer Highlights Consumer Electronics Service Providers Retailers/ Portals Page 10 |
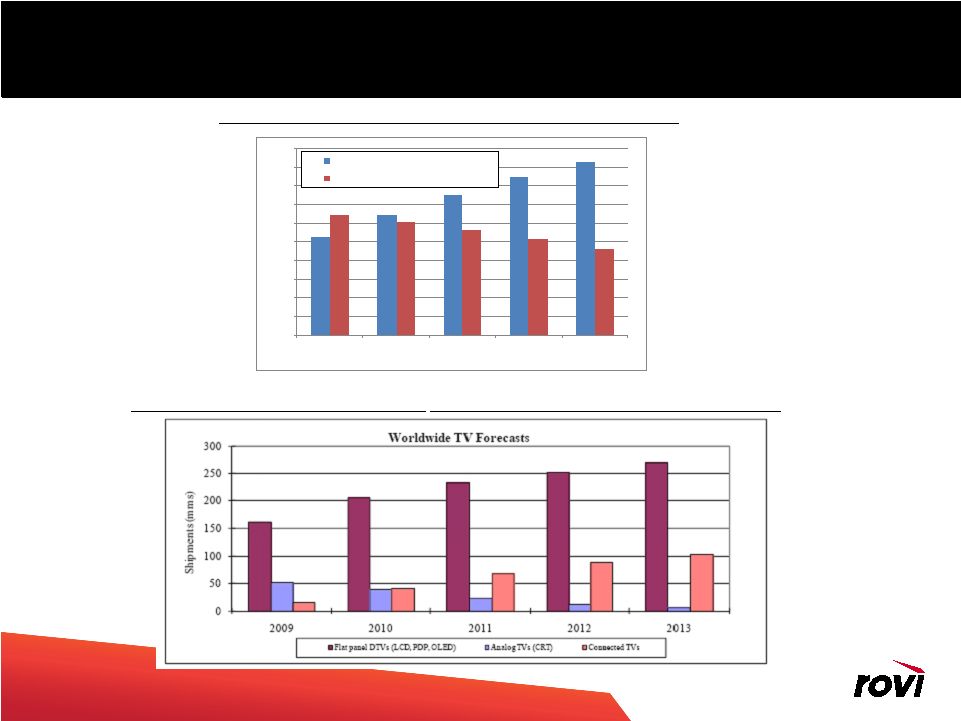 Copyright ® 2010 Rovi Corporation. Fundamental Business Drivers - Digital & Connectivity Driving Growth Digital Pay TV Subscribers Growing at 11% CAGR 2010-2012 Sources: DisplaySearch. Sources: SNL Kagan, Screen Digest. Page 11 DTV Shipments to Grow at 14% CAGR; Connected TVs to Grow from 15mm to 104mm 0 50 100 150 200 250 300 350 400 450 500 2008 2009 2010 2011 2012 Total WW Digital Pay-TV Subs (TAM) WW Analog Pay-TV Subs |
 Copyright ® 2010 Rovi Corporation. The Industry is Moving Fast COULD THIS FINALLY BE COULD THIS FINALLY BE THE SEASON FOR WEB TV? THE SEASON FOR WEB TV? -USA Today Microsoft in talks for new TV service -reuters Amazon Web Services sees $500M revenues -Venturebeat Netflix Streaming Comes to Sony Bravia TVs, Blu-ray -PC Magazine Sears, Kmart Launch Movie Download Service Via Sonic -Cable360 Time Warner Cable to Test Cheaper TV Package - New York Times The 'Next Big Thing in TV' is Online from Cable Operators - Medicaster All the changes result in continued consumer confusion Can Google Be a TV STAR? -Multichannel news Page 12 |
 Copyright ® 2010 Rovi Corporation. Trends Facing The Industry • Market Speed - The transformation is occurring faster than we expected - Connected devices usage increasing • Consumers spreading their entertainment dollars - Connected devices or Over The Top - Cable operators actively seeking “connected” features • Advertising models still emerging - Future in video advertising to support premium content • Consumers demanding “mobility of experience” - Increasing mobility of their content enjoyment • New market entrants and new business models are being explored • Social media will shape how consumers interact with their entertainment Page 13 |
 Copyright ® 2010 Rovi Corporation. Shifts in Digital Entertainment Distribution Current Service Providers Broadening of the distribution channels expands the total available market Rovi can target |
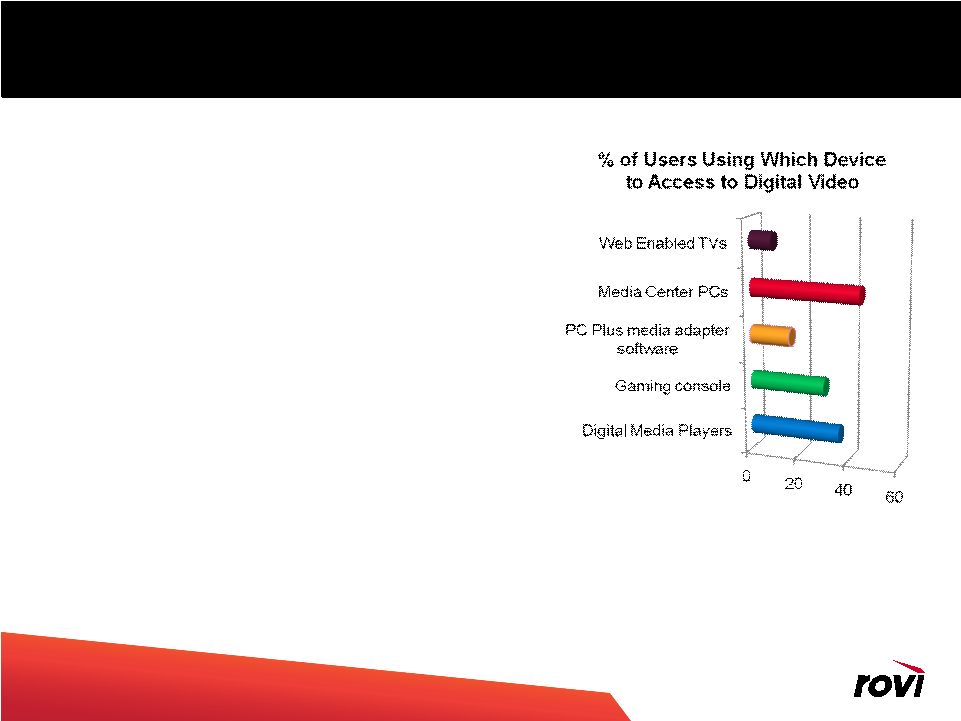 Copyright ® 2010 Rovi Corporation. Increased Adoption of Connected Media • Connection of devices - Sony – expects one trillion yen in sales of 3D-related products in the year ending March 2013 - Connected TVs expected to grow to 69MM by 2012 (Source: DisplaySearch) - DLNA device types continue to grow with now over 7,000 devices certified (Source: DLNA) • Specialty UI’s from CE Manufacturers - Samsung, Sony, Panasonic, Vizio, etc… • Adoption of specialty devices & services - Apple TV and Roku each reporting sales now exceed 1 million units (source:CNET 12/21/10) • Apple is a Rovi IP licensee - Hulu at 30M users with 260M content streams (source: GigaOMs NewTeeVee Conference 11/10/10) • MSO’s not being left behind - Comcast testing STB that does cable and internet (source: Gizmodo 12/14/10) - Rovi provides Data/IP for Over-the-Top (OTT) to Comcast Page 15 Source: InStat 10/2010 Digital Entertainment Update |
 Copyright ® 2010 Rovi Corporation. Industry Seeking The Road To Revenue Page 16 • Device sales - Added features increase adoption • Content - Revenue share on content sales - Charging “placement” on UI • Advertising - Targeted advertising getting traction - According to Nielsen, the ads on Hulu are 55% more effective than ads on traditional media [in terms of recall]. This allows them to charge more for their ads. • Increased services - TV Everywhere Revenue opportunities exist in powering these experiences from the UI through advertising and now the purchase of content |
   Copyright ® 2010 Rovi Corporation. A New Digital Experience Is Coming Integrated Content Discovery and Access • Power the user experience via TotalGuide embedded UI - Enabling unified access to broadcast, OTT (UGC and premium content,) and personal media • Embedded middleware for content access and sharing Flexible Approach • Deliver a la carte services to power a home grown user experience - Data, search, recommendations, etc… • Custom build UI for customers on top of our “web services” - a.k.a. the Rovi Media Cloud Power Advertising • Extend the advertising option beyond just a Rovi powered UI, into any connected UI • New revenue source for manufacturers Rovi’s Approach To Securing Business: Page 17 |
 Copyright ® 2010 Rovi Corporation. Sonic • Signed definitive agreement to acquire Sonic in a cash and stock transaction - Announced December 22, 2010 and valued at ~$720M - 55/45 - cash/stock transaction with a close targeted in Q1 • Employees:~1,000 • Key products - RoxioNow – video delivery platform • Movie and TV library of over 10K titles • Power digital movie delivery for a number of leading companies including Blockbuster, Best Buy, Sears/Kmart, Cineplex, Warner Bros., Dell and Lionsgate • Expected to power entertainment services on 30M connected devices by June 2011 - DivX codec, DRM and certification – embedded in CE devices • 100M downloads per year of player software (500M total) • 12M+ unique website visits/month • Technology residing on over 350M CE devices Page 18 |
 Copyright ® 2010 Rovi Corporation. Expanding the Rovi Value Proposition • Expanded addressable marketplace - Rovi: Service providers, CE makers, content owners - Sonic: Retail partners, content owners, mobile carriers, consumers • Envision bringing each company’s products to each others targets • Expand solution offering for services capability to power digital entertainment, growing the Media Cloud - Rovi: Content guidance, discovery, recommendations, meta data - Sonic: Premium content distribution (RoxioNow), retailer storefront management • RoxioNow customers, Blockbuster and Best Buy are already integrated with TotalGuide • Envision expansion of Rovi services into the RoxioNow storefronts (data, search, recommendations, advertising) • Expanded offerings for CE Manufacturers - Rovi: TotalGuide, content discovery - Sonic: streaming content delivery, decoding, protection solutions (DRM) • Expand offerings for Service Providers - Combination of TotalGuide for SP and RoxioNow Page 19 |
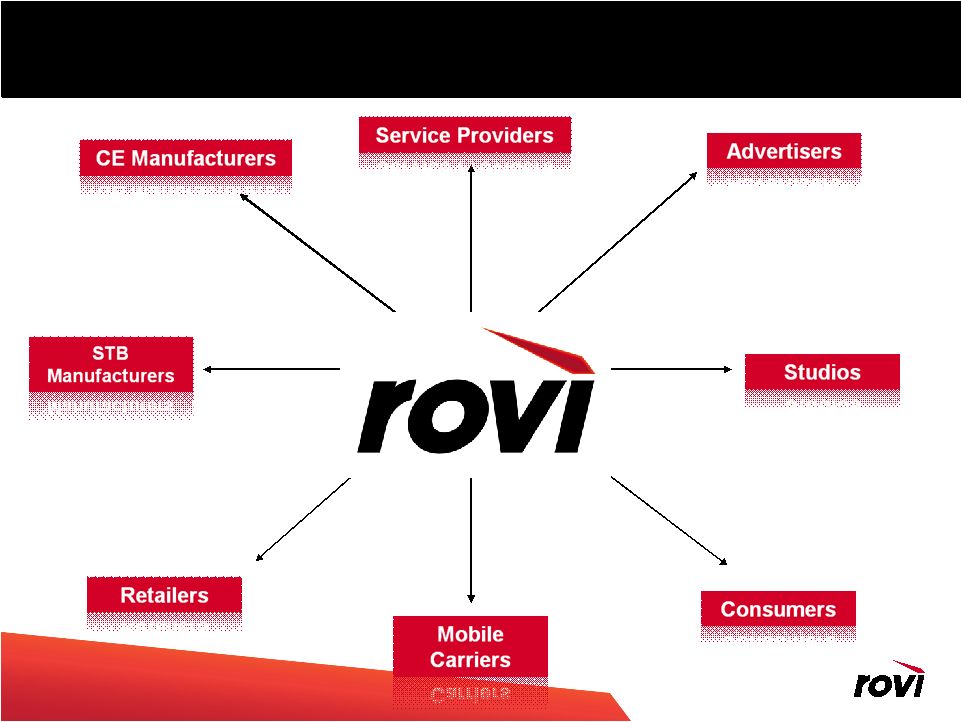 Copyright ® 2010 Rovi Corporation. Rovi Key to The Ecosystem Page 20 |
 Copyright ® 2010 Rovi Corporation. Page 21 Page 21 Summary Investment Highlights • Compelling strategic combination of complementary solutions - Guidance + Connectivity + Metadata + Security - Independent purveyor of key pillars of Digital Media technology requirements • Strong competitive position - Proven and growing patent portfolio with long remaining life - Platform agnostic, highly extensible, addressing key growth areas - Proprietary metadata databases inform consumer amid sea of digital choices - Must-have technologies, essential to offering complete solutions - Integrated product offering • Broad customer footprint • Well positioned to address growth opportunity from digitization of content - Targeting 15-20% CAGR stand-alone growth long-term, 20-25% including Sonic - Long term growth drivers include new solutions for new markets, increased penetration & advertising • Attractive financial profile - High operating margins and low capex drive FCF growth - High percentage of royalty-based, recurring revenue streams - Responsible stewards of capital • Track record of debt repayment, accretive financings (inc. securities repurchases, hedging activities) & acquisitions • Experienced, proven team, with successful track record |
 Copyright ® 2010 Rovi Corporation. Company Confidential. New Solutions * * * * * |
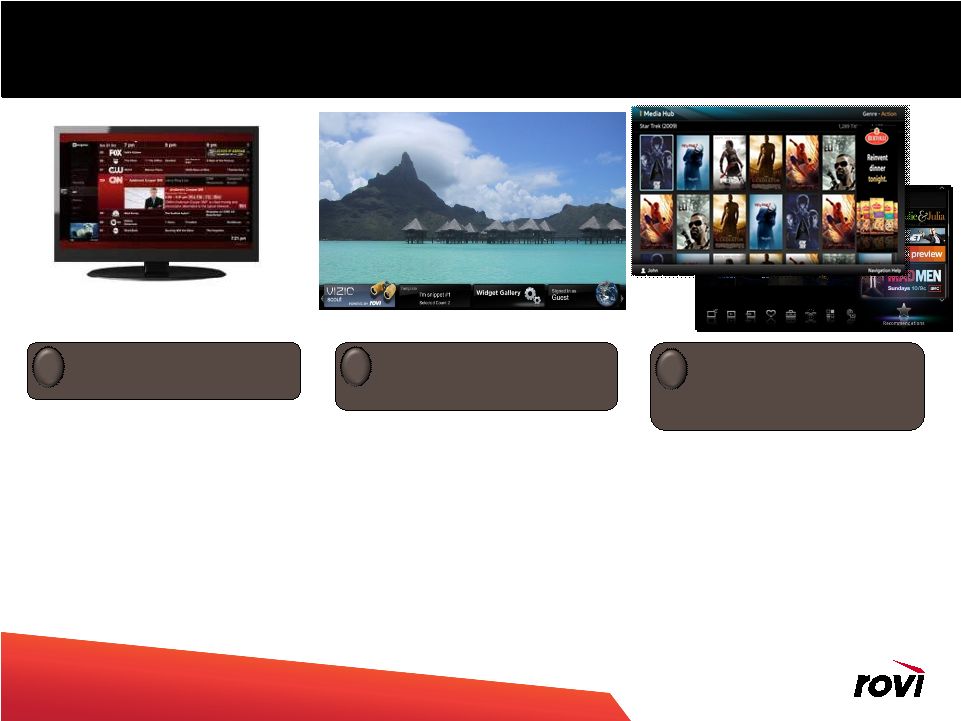
 Copyright ® 2010 Rovi Corporation. Rovi at CES • Key PR - Introducing the Rovi Media Cloud • Set of Web services customers can use to build their own entertainment applications. • Not limited to any single customer type, can span CE, Service providers, application developers and even studios and retailers looking to build their own experience • Several applications already built using these services - Samsung using Rovi capability to power its MediaHub - New customer of Rovi automotive solution: Denso • Inclusion of new features: voice recognition and automated playlisting - Trident supporting TotalGuide in its DTV solution • Other key relationships - Rovi web services powering tier 1 Japanese manufactures new UI - Partnering with Panasonic on custom TG implementation - New Rovi application custom built for Vizio - Multiple consumers of the Rovi Media Cloud, e.g., Match.com Page 23 |
 Copyright ® 2010 Rovi Corporation. Key New Offering: The Rovi Media Cloud Page 24 Media Cloud Metadata Search Recommendations Advertising User/Device Management |
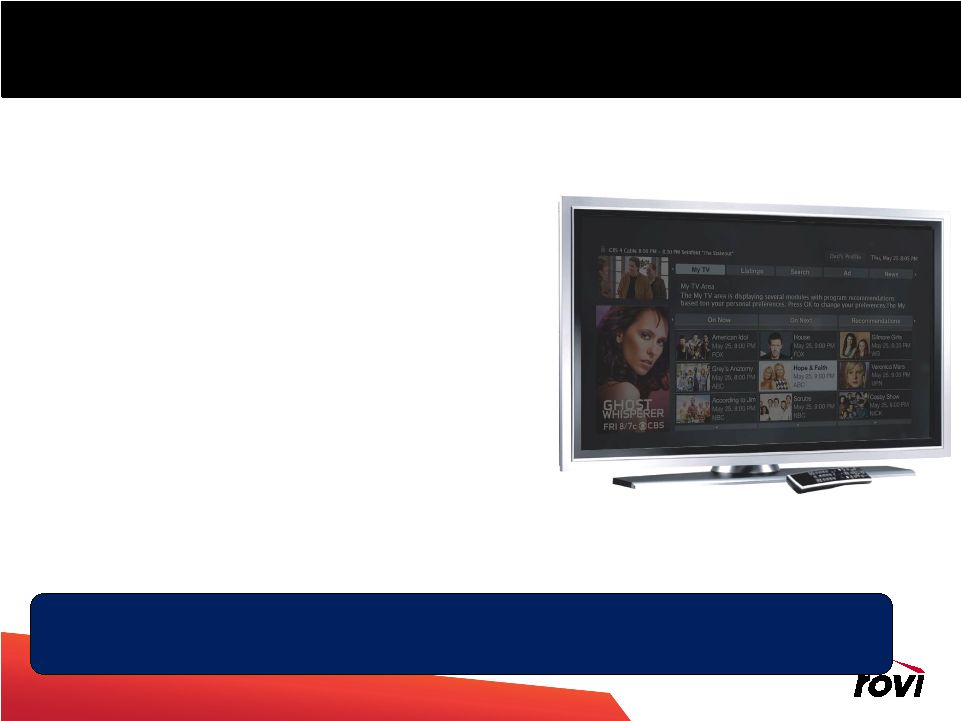
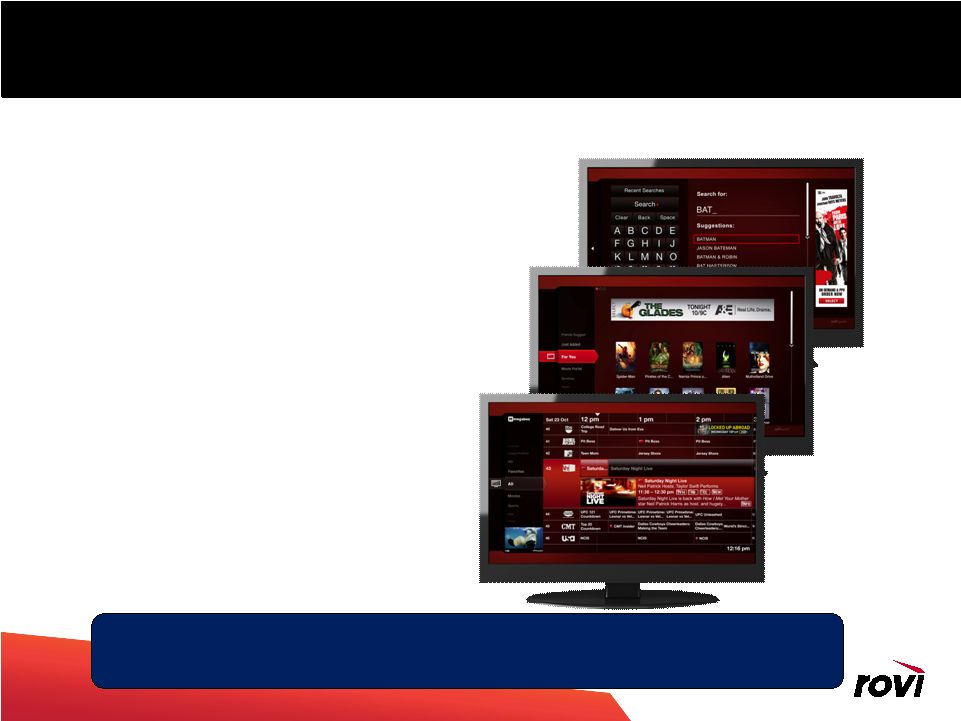 Copyright ® 2010 Rovi Corporation. TotalGuide Advanced media guide that enables consumers to discover television, broadband and personal content from one user interface. Can be used in connected living room devices, such as Digital TVs, Blu-ray players, media players and other set-top boxes Key Features •Access to Over the Top content providers •Advertising •Data •Recommendations •Search •Personalization Extracting the web services that power TotalGuide to offer customers stand alone access – the Rovi Media Cloud |
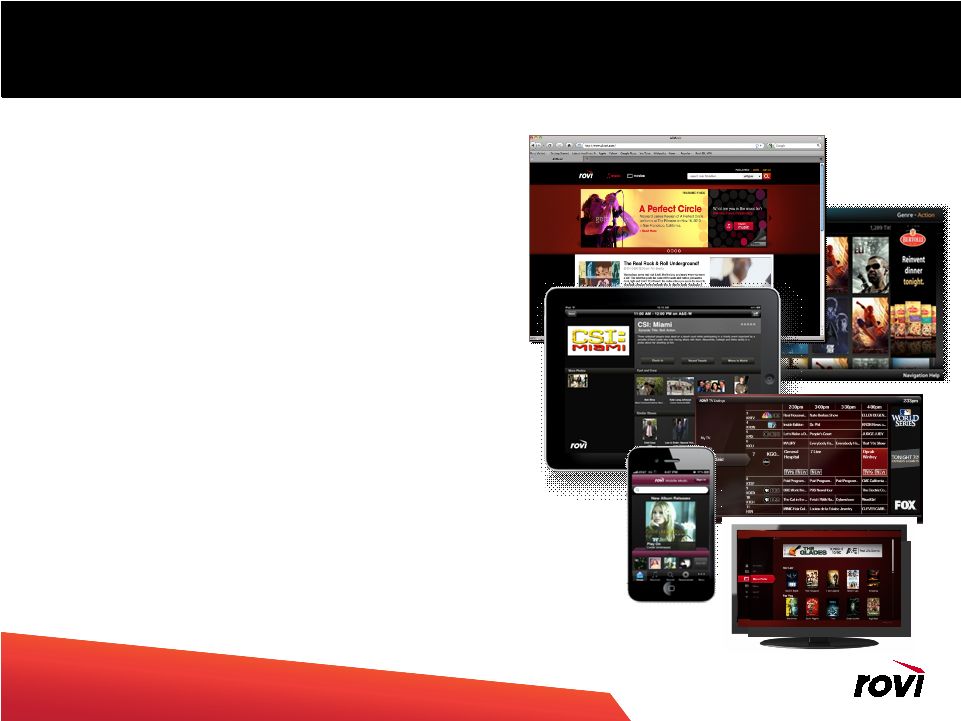
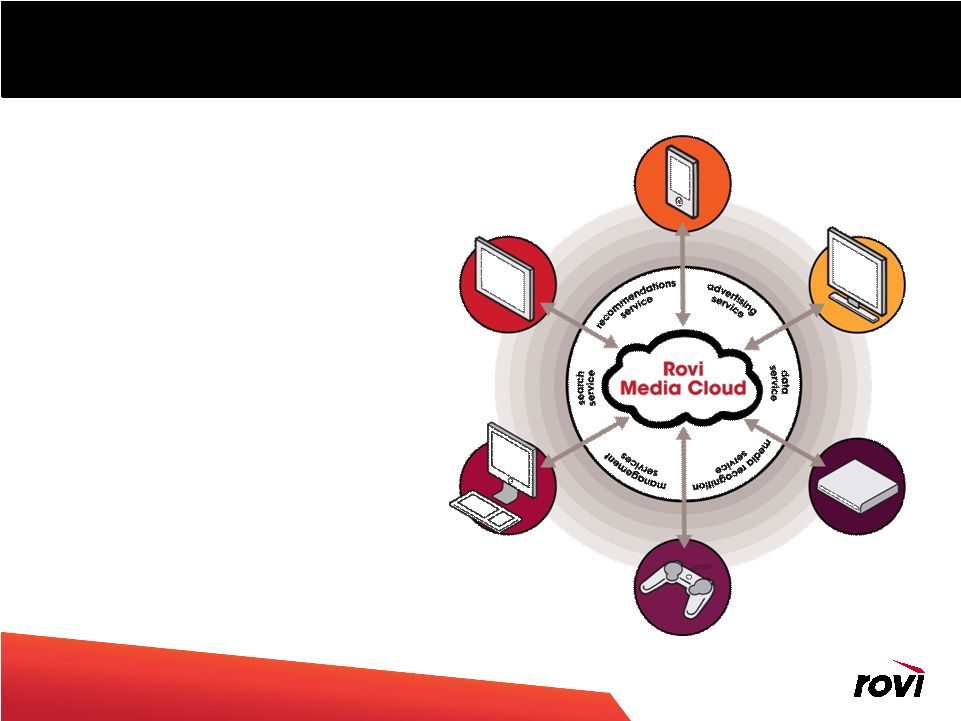 Copyright ® 2010 Rovi Corporation. Rovi Media Cloud Services Page 26 Rovi Media Cloud Web services that enables customers to build entertainment products on multiple platforms and devices. Can be used in any Internet connected product, including Digital TVs, Blu-ray players, media players and other set-top boxes and mobile, PC, online and other portable devices. Services • Rovi Advertising Service • Rovi Data Service • Rovi Recommendations Service • Rovi Search Service • Rovi Management Services • Rovi Media Recognition Service |
 Copyright ® 2010 Rovi Corporation. TotalGuide Services = Rovi Media Cloud + More TotalGuide Advanced media guide that enables consumers to discover television, broadband and personal content from one user interface. Can be used in connected living room devices, such as Digital TVs, Blu-ray players, media players and other set- top boxes Features • Advertising • Data • Recommendations • Search • Personalization Rovi Media Cloud Web services that enables customers to build entertainment products on multiple platforms and devices. Can be used in any Internet-connected product, such as Digital TVs, Blu-ray players, media players and other set-top boxes and mobile, PC, online and other portable devices. Services • Rovi Advertising Service • Rovi Data Service • Rovi Recommendations Service • Rovi Search Service • Rovi Management Services • Rovi Media Recognition Service |
 Copyright ® 2010 Rovi Corporation. TotalGuide + Media Cloud Go-To-Market Page 28 1 Customer embeds TotalGuide into their devices 2 Rovi builds custom UI for customer using Media Cloud and TotalGuide concepts 3 Customer incorporates Rovi web services into their own UI (e.g., Rovi supplied ads in custom UI) Revenue Model: • CE: Per unit fee and advertising revenue share • Service Providers: Per subscriber per month fee and advertising revenue share Revenue Model: • CE: Per unit fee (or per access fee), advertising revenue share, and consulting • Service Providers: Per subscriber per month fee, advertising revenue share, and consulting Revenue Model: • CE: Service access fee, advertising revenue share, and consulting • Service Providers: Per subscriber per month fee, advertising revenue share, and consulting |
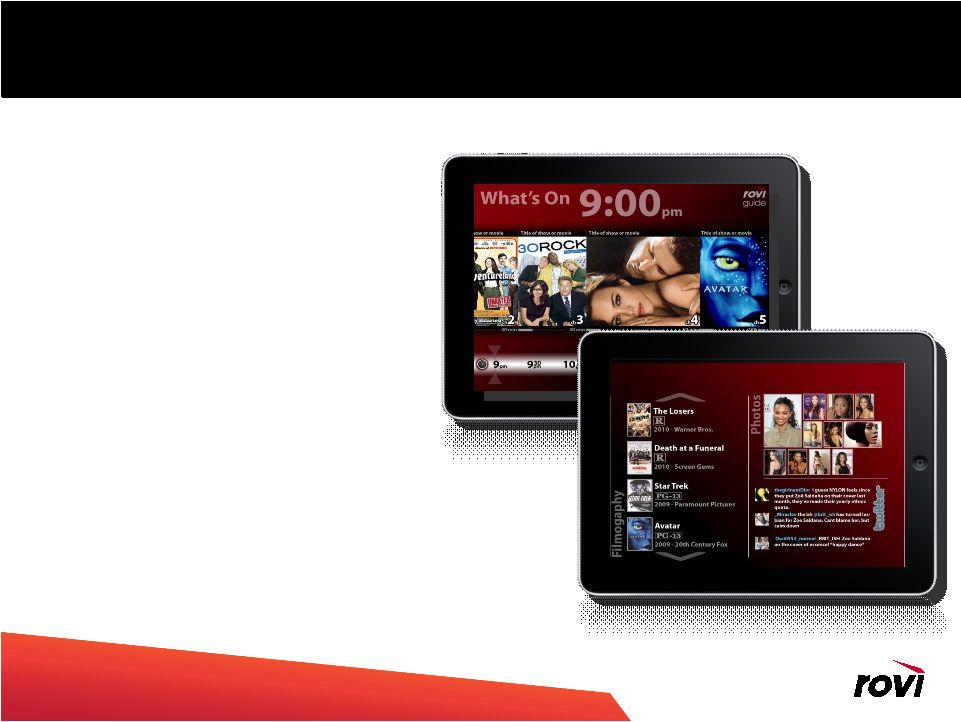
 Copyright ® 2010 Rovi Corporation. Rovi Media Cloud and TotalGuide for Service Providers • Targeting initial customers signing up 1 st half 2011 • Solution encompasses - TotalGuide – for advanced set top boxes • Targeting initial deployments late 2011 - TotalGuide lite – for older, non IP connected set top boxes • Targeting initial deployments late 2011 - TotalGuide xD – for iPad • Targeting initial deployments first half 2011 • Rovi Media Cloud also available for use in custom built user interfaces and applications • Revenue model for all products based on per subscriber per month and advertising revenue share Page 29 |
 Copyright ® 2010 Rovi Corporation. SP Roadmap 2010 30 Rovi Rovi Media Cloud Media Cloud PC Tablet/ Phones w/in MSO Website Portable In the Home Solution: TotalGuide “lite” Solution: TotalGuide & Rovi Media Cloud Solution: TotalGuide PC (Personal Media Manager) & Rovi Media Cloud Solution: TotalGuide xD & Rovi Media Cloud Solution: Rovi Remote Record & Rovi Media Cloud TotalGuide for Service Providers PC Tablet/ Phones w/in MSO Website Primary Viewing Room (AKA advanced STB) Secondary Room (e.g., bedroom AKA legacy STB) |
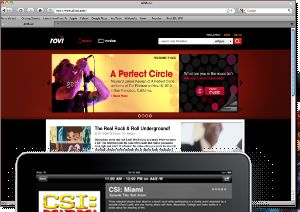
 Copyright ® 2010 Rovi Corporation. Rovi and the Consumer • Reaching out to consumers directly with entertainment oriented applications • Generates awareness of Rovi capability - which generates B2B demand • Demonstrates to the market the “art of the possible” • Increased ad footprint Page 31 |
 Advertising Update * * * * |
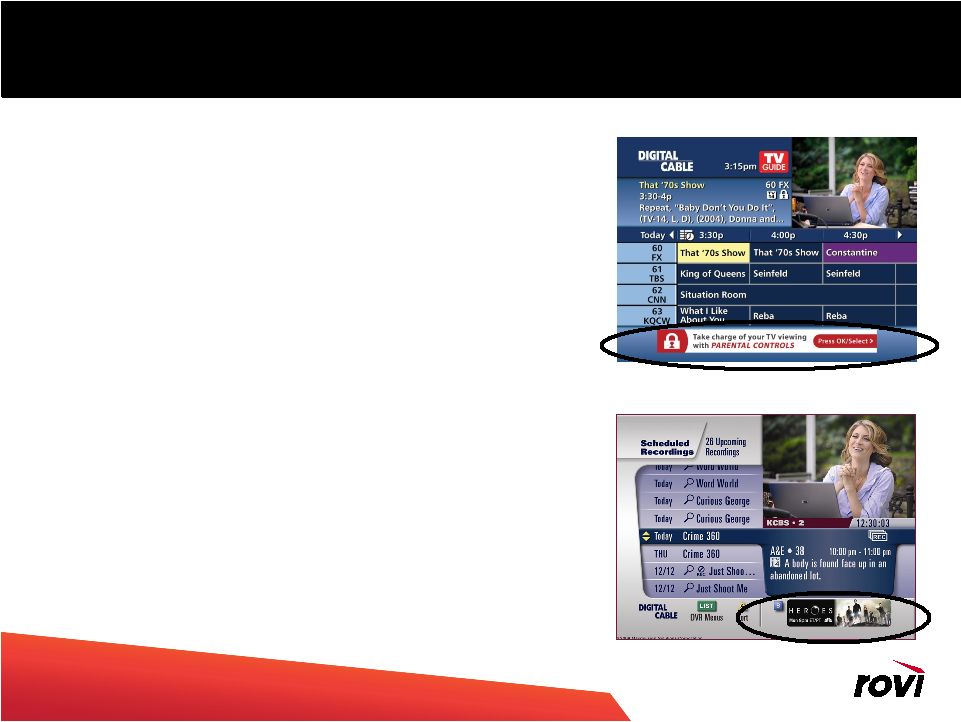 Copyright ® 2010 Rovi Corporation. Rovi Advertising Capability Today • EPG based advertising • Revenue-sharing arrangements with MSO and CE partners - IPG ad rev share rights in place with ~145M EPGs WW • ~70M EPG’s currently active with EPG ads - ~24M SP homes and ~46M CE device homes WW • Rovi operates ad lifecycle - Ad engine (often EPGs) - Ad sales - Ad creation - Ad trafficking - Measurement Page 33 Rovi Confidential |
 Copyright ® 2010 Rovi Corporation. Page 34 Rovi Confidential Rovi IPG Advertisers |
 Copyright ® 2010 Rovi Corporation. Key Success Factors • Measurement - To prove the impact of our ad platform to advertisers • Rich, interactive ad experiences - To deliver an engaging consumer experience - To provide a powerful messaging platform for advertisers • New products & distribution - To lead the market in interactive TV ad capabilities - To influence more consumers • Expanded client base - To extend the business we do with TV and studio clients - To expand into more traditional ad segments (retail, auto, financial, etc.) Page 35 |
 Copyright ® 2010 Rovi Corporation. Expanding Ad Footprint in 2011 • Rovi Ad Network - Aggregate the EPG advertising footprint from Pay TV providers that do not effectively sell it on their own • The Rovi Ad Platform (component of Rovi Media Cloud) - Enable Rovi supplied ads to be embedded into non-Rovi user interfaces - Both in SP and CE environments - Early wins with Tier 1 CE manufacturers • Rovi Guides deployed with advanced ad capability - Passport, TotalGuide CE and TotalGuide SP Page 36 |
 Copyright ® 2010 Rovi Corporation. Company Confidential. Financials * * * * ** |
 Copyright ® 2010 Rovi Corporation. Page 38 • On track to exceed initial 2010 APF estimates: • APF Preliminary revenue of $540mm, up 12% y/y • APF Preliminary EBITDA of $272.6mm (50.5% margin), up 25% y/y • APF Preliminary Net Income of $224.7mm, up 43% y/y - In addition to higher revenues, lower interest expense and tax rate • Q4 Preliminary Cash & Investments of $694mm, Debt of $594mm • Repaid remainder of $550mm term loan, repurchased $105mm of convert & $109mm of stock Adjusted Pro Forma (APF) Highlights Preliminary 2010 Highlights Revenue EPS Midpoint Midpoint Current (a/o 12/22/10) $540 2.10 $ Initial (a/o 12/10/09) $515 1.90 $ Variance vs. Initial $25 0.20 $ |
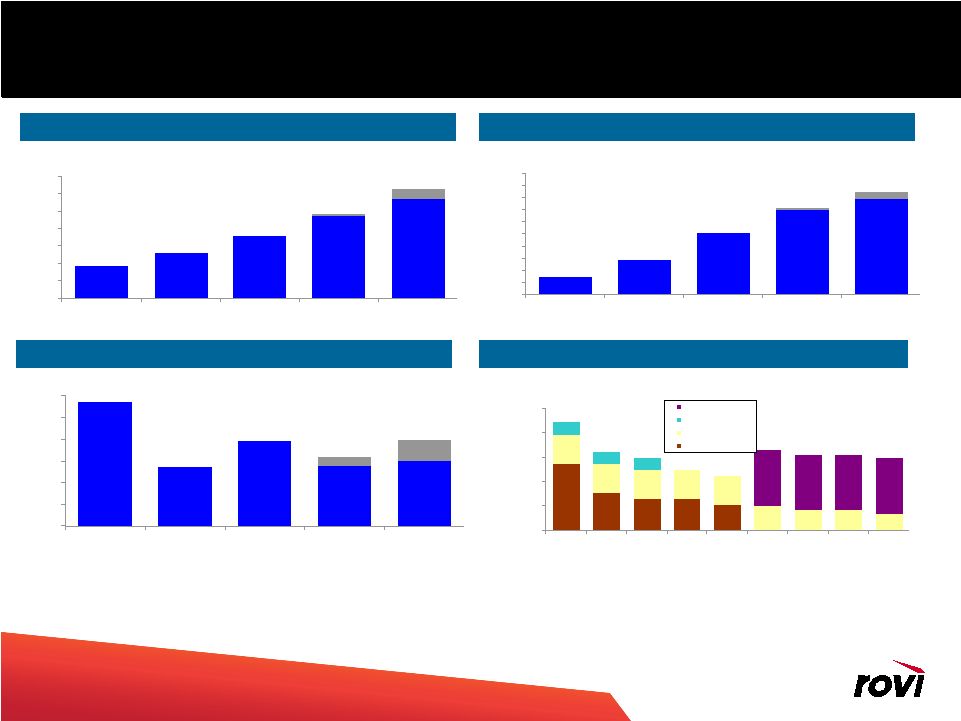 Copyright ® 2010 Rovi Corporation. Page 39 Page 39 Adjusted Pro Forma Information 1,2 Notes: 1. Blue areas equal low end of estimates, which, when combined with grey areas, equals high end of estimates. 2. 2010 and 2011 figures are estimates. 3. Convertible debt is shown at par. ASC Topic 470 requires the liability and equity component to be separated. Debt has been grossed up to reflect the equity component of the convertible debt. Adjusted Pro Forma Revenue ($ in millions) Adjusted Pro Forma EPS $0.45 $0.87 $1.52 $2.08 $2.35 $0.04 $0.20 $0.00 $0.30 $0.60 $0.90 $1.20 $1.50 $1.80 $2.10 $2.40 $2.70 $3.00 CY07 CY08 CY09 CY10 Est CY11 Est $392 $428 $480 $538 $585 $4 $30 $300 $350 $400 $450 $500 $550 $600 $650 CY07 CY08 CY09 CY10 Est CY11 Est Adjusted Pro Forma Capex ($ in millions) $29 $14 $20 $14 $15 $2 $5 $0 $5 $10 $15 $20 $25 $30 CY07 CY08 CY09 CY10 Est CY11 Est $547 $307 $257 $257 $207 $240 $240 $240 $240 $240 $199 $163 $163 $135 $100 $100 $100 $460 $460 $460 $460 $0 $200 $400 $600 $800 $1,000 Q408 Q109 Q209 Q309 Q409 Q110 Q210 Q310 Q410 2040 Convertible High Yield 2011 Convertible Term Loan Debt (ex. Leases) ($ in millions) (3) |
 Copyright ® 2010 Rovi Corporation. Page 40 Page 40 (4) GAAP basis pro forma to Adjusted Pro Forma Reconciliation - 2007 Adjusted Pro Forma Rovi Corporation Year ended December 31, 2007 (in thousands) (1) Eliminate discontinued Hawkeye product line (2) Eliminate non-cash interest expense such as the amortization of debt issuance costs and the convertible note discount recorded under ASC 470-20 (formerly FSP APB 14-1) (3) Tax effect pro forma adjustments at 28% (4) Additional shares needed for dilutive calculation due to positive income from continuing operations (2) (3) GAAP Adjusted Pro Forma Adjustments Pro Forma Revenues 394,633 $ $ (2,841) $ 391,792 Operating income 7,405 $ $ - $ - Equity-based compensation 12,402 Transaction costs 7,395 Restructuring and impairment charges 4,546 Discontinued product line (Hawkeye) 4,359 Non-recurring accrued expense reversal (10,700) Amortization 82,992 Adjusted Pro Forma Operating Income 108,399 Interest (expense) income and other, net (49,113) 13,557 (35,556) Impairment loss on strategic investments (5,000) 5,000 - (Loss) income before income taxes (46,708) 119,551 72,843 Income tax (benefit) expense (7,609) 34,055 26,446 (Loss) income from continuing operations $ (39,099) 85,496 $ 46,397 Shares used in computing diluted net earnings per share 101,135 783 101,918 Diluted (loss) income per share from continuing operations $ 0.38 $ 0.45 (1) |
 Copyright ® 2010 Rovi Corporation. Page 41 Page 41 (2) GAAP basis pro forma to Adjusted Pro Forma Reconciliation - 2008 Adjusted Pro Forma Rovi Corporation Year ended December 31, 2008 (in thousands) (1) Eliminate non-cash interest expense such as amortization of note issuance costs and the convertible note discount recorded under ASC 470-20 (formerly FSP APB14-1) (2) Tax effect pro forma adjustments at 34% and eliminate discrete tax benefit of $11.5 million. (1) GAAP Adjusted Pro Forma Adjustments Pro Forma Revenues 428,020 $ $ - $ 428,020 Operating income 70,952 $ $ - $ - Equity-based compensation 14,573 Transaction costs 681 Transition and integration costs 9,186 Insurance settlement (32,500) Amortization 82,258 Adjusted Pro Forma Operating Income 145,150 Interest (expense) income and other, net (45,049) 14,126 (30,923) Gain on sale of strategic investments 5,238 (5,238) - (Loss) income before income taxes 31,141 83,086 114,227 Income tax (benefit) expense (14,248) 39,378 25,130 (Loss) income from continuing operations $ 45,389 43,708 $ 89,097 Shares used in computing diluted net earnings per share 101,646 - 101,646 Diluted (loss) income per share from continuing operations $ 0.44 $ 0.87 |
 Copyright ® 2010 Rovi Corporation. Page 42 Page 42 GAAP Adjusted Pro Forma (1) Adjustments Pro Forma Revenues 480,450 $ $ - $ 480,450 Operating income 36,348 $ $ - $ - Equity-based compensation 22,346 Transaction costs 617 Transition and integration costs 1,657 Court awarded fees 3,372 Restructuring and asset impairment charges 53,619 Amortization 81,934 Adjusted Pro Forma Operating Income 199,893 Interest (expense) income and other, net (40,876) 17,037 (23,839) Loss on debt redemption (8,687) 8,687 - (Loss) income before income taxes (13,215) 189,269 176,054 Income tax expense 801 18,565 19,366 (Loss) income from continuing operations $ (14,016) 170,704 $ 156,688 Shares used in computing diluted net earnings per share 100,860 1,254 102,114 Diluted (loss) income per share from continuing operations $ (0.14) $ 1.52 GAAP basis pro forma to Adjusted Pro Forma Reconciliation - 2009 Adjusted Pro Forma Rovi Corporation Year ended December 31, 2009 (in thousands) (1) GAAP Pro Forma information is necessary in 2009 to provide comparative operating results. GAAP Pro Forma assumes $275 million of net proceeds from the sale of the Media Properties reduced the debt issued in conjunction with acquiring Gemstar. As such, GAAP Pro Forma includes a $1.1 million reduction in interest expense and a $0.4 million reduction in tax benefit. (2) Eliminate non-cash interest expense such as amortization of note issuance costs and the convertible note discount recorded under ASC 470-20 (formerly FSP APB14-1) (3) Utilization of net operating losses resulted in an adjusted pro forma tax rate of 11% (4) Adjusted to include dilutive potential common shares as adjustments to pro forma loss from continuing operations resulted in Adjusted Pro Forma Net Income (2) (3) (4) |
 Copyright ® 2010 Rovi Corporation. Page 43 CY09-CY11E Revenue Bridge CE $200 CE $218 CE $219 SP $231 SP $266 SP $323 Other $50 Other $57 Other $58 $18 $35 $7 $1 $58 $1 2009 APF Revenue CE SP Other 2010 Revenue CE SP Other 2011 Revenue $480 $540 $600 9% growth 33% growth 14% growth 1% growth 22% growth 2% growth Conversion of analog-to- digital and international penetration, conversion of patent to product, licensing TV listings metadata, online/mobile (TV- Everywhere), IPG advertising New products, e.g., Total Guide, continued growth in shipments of IPG enabled devices and Media Recognition largely offset by significant declines in legacy analog (VCR+, ACP) •Growth in data licensing driven by new customers and expansion in EMEA •Offset by reduced DVD volumes Note: 2010 and 2011 Adjusted Pro Forma revenue assumes midpoint of range. Sum of vertical revenue may not equal total revenue due to rounding. New products, e.g., Media Recognition, atop continued growth in shipments of IPG enabled devices, offset by significant declines in legacy analog (VCR+, ACP) Conversion of analog-to- digital and international penetration, conversion of patent to product, licensing TV listings metadata, online/mobile, IPG advertising •Growth in data licensing driven by new customers and annual price increases •Strong DVD volumes for Independent studios and stable MPAA business |
 Copyright ® 2010 Rovi Corporation. Page 44 Page 44 Business Models • Verticals include subscription/fixed fee license options as well as variable pricing • Service Provider – primarily license operators guidance products and/or patents - Includes Digital Pay-TV operators & Online portals - Patent portfolio licenses (including IPG, DVR, interactive advertising, etc.) - Digital Pay-TV IPG licensees pay money/sub/month - Advertising - revenue share basis - Some services fees for development and installation of IPGs • CE – license to products, patents and services - IPG, Connected Platform, Media Recognition - Advertising - revenue share basis - ACP (includes annual DVD license fees & set-top-box volume based royalties) • Other - Data licensing • Subscriber-based fees for data feeds through Service Providers • Term-based subscription fees for portals - Entertainment – per disc copy protection royalties plus authoring fees for BD+ Primarily Royalty-Based Recurring Revenues |
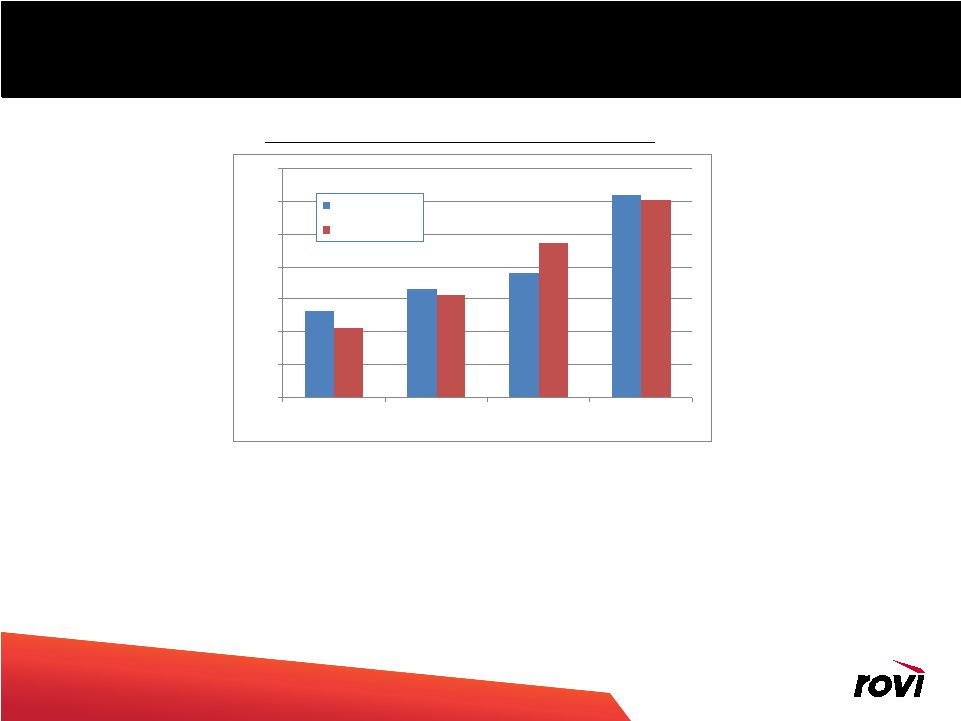
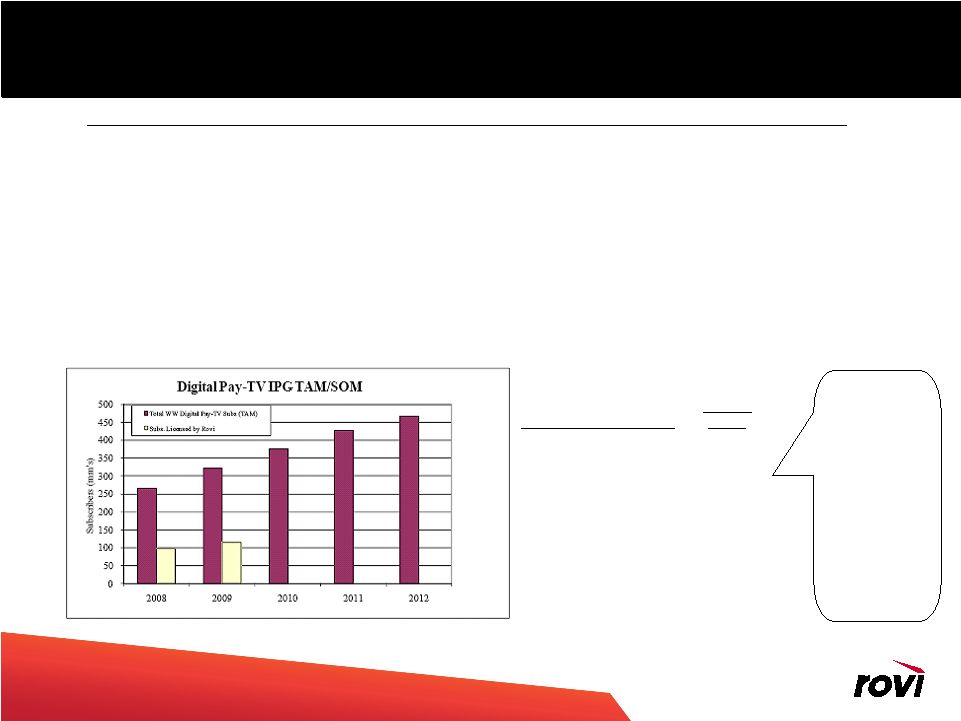 Copyright ® 2010 Rovi Corporation. Page 45 Page 45 Service Provider IPG Drivers • Growth will be driven by analog-to-digital conversion & international opportunities - Rovi has licensed most NA Digital Pay-TV providers; growth should track industry - Of the ~128mm NA TVHHs, ~93mm are Digital Pay-TV (Source: SNL Kagan) - We believe our penetration will rise in a growing market - BSkyB, Sky Italia, Portugal Telecom, UPC, NDS, CANAL Plus, Unitymedia – Key European deals - Of the 165mm Western European TVHHs, ~70mm are Digital Pay-TV (Source: SNL Kagan) - Rovi European patents primarily apply to Western Europe - Asia, South America have even less Digital Pay-TV percentage share (Source: SNL Kagan) - Upgrades from patent to product licenses plus Interactive advertising lead to additional opportunity International IPG Licensing is Emerging While Domestic Growth Continues Sources: SNL Kagan, Screen Digest, Rovi. Sources: SNL Kagan, Screen Digest. While primary market segments are slower growing (North America & Europe), European penetration is low. Asia and Latin America are more nascent and include product licensing opportunities. (10-12E) Digital Pay-TV Subscribers CAGR North America 5% Latin America 21% EMEA 12% APAC 14% |
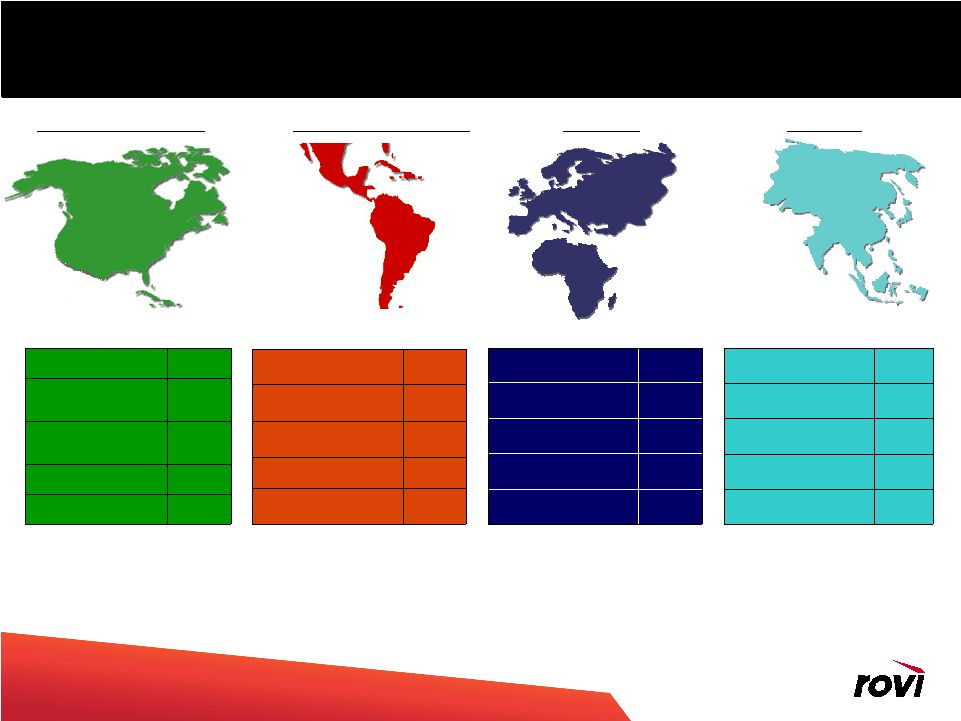 Copyright ® 2010 Rovi Corporation. Page 46 Video Subs By Territory Numbers in Millions EMEA APAC US & Canada Latin America TV HHs 129 Pay TV HHs Pay TV HHs 112 112 Analog Only HHs 19 Digital HHs 93 ROVI Subs ROVI Subs 90 90 TV HHs 319 Pay TV HHs Pay TV HHs 160 160 Analog Only HHs 50 Digital HHs 110 ROVI Subs ROVI Subs 30 30 TV HHs 653 Pay TV HHs Pay TV HHs 342 342 Analog Only HHs 199 Digital HHs 143 ROVI Subs ROVI Subs 2 2 TV HHs 138 Pay TV HHs Pay TV HHs 35 35 Analog Only HHs 19 Digital HHs 16 ROVI Subs ROVI Subs 2 2 Approximately 124mm subscribers licensed worldwide Sources: SNL Kagan and Screen Digest market data as of Q3:10. Rovi Subs are as of Q3:10. Note: Rovi’s subscribers by geography may not equal total Rovi subscribers due to rounding. Page 46 |
 Copyright ® 2010 Rovi Corporation. Page 47 SP Growth Drivers • SP Product - Grow SP product revenue through • SARA to Passport conversions • Increase Data sales • Introduction of a new “TotalGuide-like” UI for Passport • Digital expansion in LTAM - Introduce TotalGuide for Service Provider • Increase demand from tier 1 customers for customized guide and web services • Increase demand from tier 2 & 3 customers for off the shelf, multi device, guide - Improve value through the introduction of TotalGuide and via renewals • SP Licensing - Short-term growth drivers • Web and mobile IP Licensing • Digital conversions • International penetration - Longer-term drivers (beyond 3 year plan) • Improve value at renewal • Drive new revenue from Comcast and Echostar at expiration of current agreements |
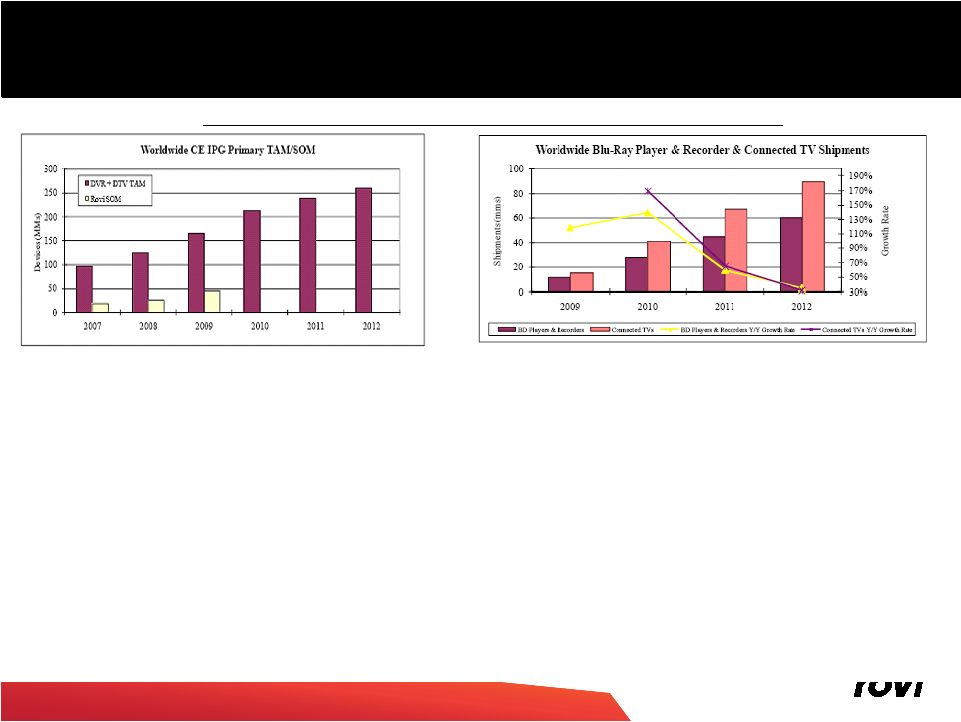 Copyright ® 2010 Rovi Corporation. Page 48 Page 48 CE IPG Opportunity • Total Addressable Market (TAM) = total number of DTVs & DVRs shipped - Market research forecasts TV & DVR TAM unit volume CAGR of 16% from 2009 to 2012 • Flat panel shipments to benefit from “2 room” TV replacements, 3D, connectivity for Over-the-Top (OTT) applications, e.g., movie streaming • Share of Market (SOM) = devices shipped with Rovi IPG or patent license • Many DTVs today do not include IPGs, creating opportunity for above trend growth - Connected TVs, which should increase IPG adoption, are projected to grow from 15mm to 89mm (2009 to 2012): • North America - OTT/movie download services are gaining broad support • International - standards are emerging requiring connectivity • Additional opportunity with emergence of connected Blu-ray players & recorders - BD devices have the memory, processing power, and connectivity prerequisites for a rich IPG experience • Connected TV & Blu-ray device growth creates opportunity for TotalGuide revenue in 2011 - 2011 growth to be driven primarily by end-market shipments of existing product & patent licensed platforms CE IPG Growth Driven by Increased TAM and Penetration Sources: In-Stat, DisplaySearch, Rovi. Sources: Futuresource, DisplaySearch. nd |
 Copyright ® 2010 Rovi Corporation. Page 49 CE Growth Drivers & Assumptions • CE Product - CE Guides • TotalGuide off-the-shelf for sub tier 1 manufacturers • TotalGuide web services/RMC and data for tier 1 manufacturers • Increase in number of devices shipped & revenue per device - ACP & VCR+ • VCR+ goes to $0 by 2011 • Analog copy protection dropping to $15M by 2013 • CE Licensing - IPG licensing. Growth driven by increased penetration and end market shipments |
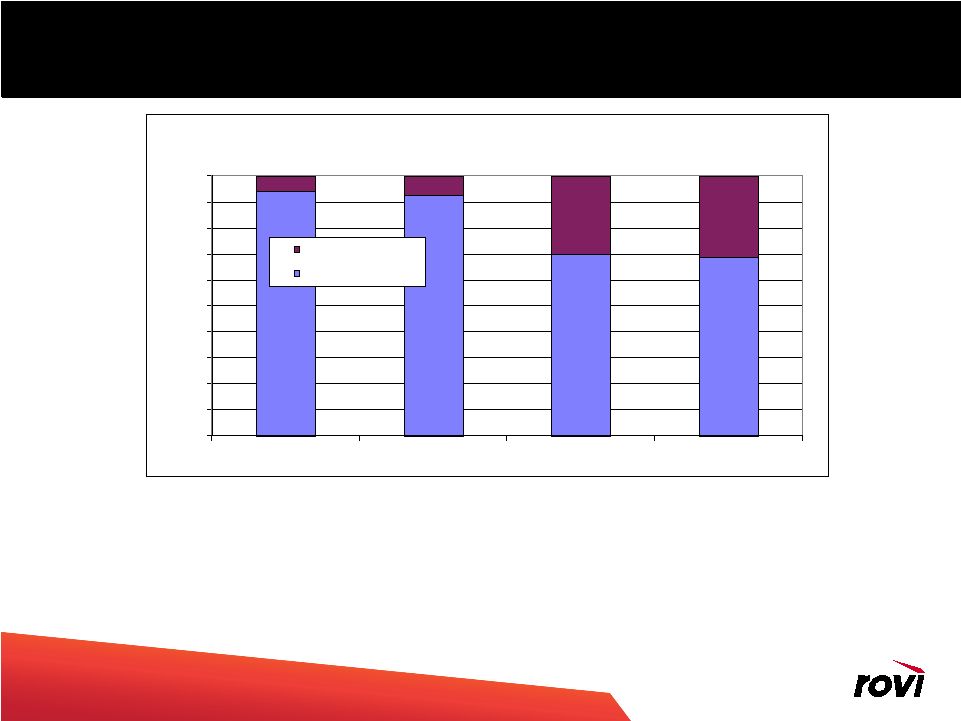 Copyright ® 2010 Rovi Corporation. Page 50 • Service provider – ~70% of subs currently covered by license agreements are contracted through 2013 - 48% of Q3:10 revenue was attributable to Service Providers • CE: As long as our IPG patents remain, we would expect to be able to continue licensing • Other: Data licensing stickiness primarily a function of our ability to maintain our database competitiveness - Over $130mm in acquisition capital (excluding TV listings) and Capex invested; monetized across verticals Page 50 Page 50 Visibility is Largely a Function of Patent Duration & Inclusion in Standards Sources: Rovi. Data as of Q3:10. 0% 10% 20% 30% 40% 50% 60% 70% 80% 90% 100% 2010 2011 2012 2013 % of Current Subscribers Under Contract % Subject to Renewal % Under Contract |
 Copyright ® 2010 Rovi Corporation. Page 51 Revenue Split to Resemble Prior Years • Expect total revenue quarterly skew to resemble prior years • Vertical quarterly revenue trends - CE – ACP to weigh on first half results, new products to boost second half results - SP – Expect linear sequential quarterly growth - Other – Expect year-over-year gains each quarter • Any given quarter could be affected by large licensing transactions Percent of Annual Revenue by Quarter 24% 24% 25% 27% 21% 22% 23% 24% 25% 26% 27% 28% Q1 Q2 Q3 Q4 2008-2010 Avg. 2011 Forecast |
 Copyright ® 2010 Rovi Corporation. Key DD Findings & Variances to Sonic Plan Page 52 Business Unit Opportunity (industry problems being addressed by BU) & Investment Highlights Strengths Challenges Potential Synergies Rovi’s View vs. Sonic’s Internal CY2011 Plan RoxioNow (RN) • High growth area – OTT • “Digital Locker” enables consumer choice • Tool for content providers to manage rental and Electronic Sell-Through (EST) • Early leadership position • Neutral third party • Flexible business terms • Workflow ubiquity – sticky • Economics of small company • Economic assumptions in analyst models could be optimistic • Large walled garden alternatives • Significant variability could occur • Better guidance begets more transactions, which create more advertising, all of which generate demand for Rovi solutions (a.k.a., the Positive Feedback Loop) • Tighter integration of RN into TG helps TG sales • Slightly Below DivX • CE industry needs certification authority to ensure playability, a role that DivX has begun to fill, which has added value to its brand • MPEG standard does not guarantee playability of high performance features such as subtitling, multiple video & audio tracks, & smooth trick- play mode • Industry lacks independent but well- resourced solution • Fragmented OTT video environment • High growth end markets • Increasing penetration • Executing on shift away from DVD, towards emerging device categories • DivX Ecosystem (community, brand, certification, tools, support, installed base) • Visibility • Open standards • Large competitors • Lack premium content • Lack streaming DRM • Ability to monetize DivX TV • Feedback loop creates potential for increased demand for individual components • Ability to boost technology development & IP • Ability to monetize advertising potential • Premium content relationships through RN & TotalGuide • Slightly Above |
 Copyright ® 2010 Rovi Corporation. • Financial Due Diligence (FDD) Process • DivX and RoxioNow • Top-Down - used TAM analysis to determine opportunity • Bottoms-up penetration forecast - performed bottoms-up, contract-level revenue build • “Booked” all contracted and identified revenue opportunities • Used probability weighted pipeline including timing of deal signings • Assumed very little unnamed/unsigned (“Blue bird”) revenue opportunities • • Result Result – – 5 5 to to ten ten cents cents accretive accretive • APF EBT accretion - ~$20mm of APF EBITDA plus $15mm in synergies • Deferred revenue purchase accounting adjustment (~$5mm-$10mm range) • Cost synergies annualizing at $32mm, but anticipate $15mm realizable in 2011 • $3mm of depreciation, ~$8mm of interest expense • ~6mm additional shares • Rovi expects Term Loan to be EPS neutral after use of proceeds, which includes convert repurchases Sonic Financial Due Diligence Summary Page 53 |
 Copyright ® 2010 Rovi Corporation. • Deal valued at announcement at $14.17/share ($764mm equity value/$720mm enterprise value) • 38% premium to 30-day avg. Sonic closing price as of Dec. 21, 2010 • Structure – 55% Cash, 45% Stock exchange offer, with election feature, followed by a back-end merger • Mechanics of election feature • Each Sonic share may be exchanged for $14 cash or 0.2489 shares of Rovi (stock subject to proration – see filings for details) • Exchange offer dynamics • If the initial exchange offer and related actions permitted by the agreement do not result in Rovi owning at least 90 percent of the outstanding shares of Sonic common stock, the consideration paid to Sonic shareholders in the second-step/back-end merger may consist entirely of Rovi common stock at an exchange ratio of 0.2489 shares of Rovi common stock. • However, we have no plans for that happening because we may, and are permitted to: • Extend the exchange offer • Seek a permit from the CA Department of Corporations to use the same 55%/45% mix in the back-end merger • Close on 49.9% and do a long-form merger with the same 55%/45% mix in the back-end merger • But Sonic shares have traded at a premium to as-if-converted value • Thus, arbs betting on getting all stock should consider the losses that may be incurred using this strategy • Background of merger (see upcoming filings for further details) • Sonic is the recently formed combination of Sonic and DivX • DivX noted that it had performed a market check prior to the Sonic combination • Sonic reported that it performed a market check prior to signing exclusivity with Rovi • Timing – file TO week of Jan. 10, close initial tender offer week of Feb. 10th, close deal in Q1 • Assumes successful exchange and satisfaction of other closing conditions (including anticipated HSR clearance) • HSR filing already made Deal Update Page 54 |
 Copyright ® 2010 Rovi Corporation. Page 55 Page 55 Target Model – Rovi + Sonic Operating Margin Expansion Derived Through Low Variable Costs • 15-20% long-term revenue growth (standalone) driven by industry trends and new licenses • Sonic to add to growth as RoxioNow accelerates • High operating margins - minimal variable costs, non-capital intensive - Low COGS – patent defense & applications, data, & implementation services supporting launches (primarily IPG & CP) - Low recurring R&D requirement inherent in patent licensing model - But making sufficient R&D investments to drive new solutions, e.g., TotalGuide & new patent development - Long technology lifecycles/high ROI - Patents generally last 20 years from filing - RoxioNow to suppress margins due to gross revenue recognition and overall lower margin profile - But potential synergies could eventually return margins to Rovi-standalone levels 2008A 2009A 2010E 2011E % of Revenue Growth % of Revenue Growth Revenue 100% 100% 100% 100% 100% 15-20% 100% 20-25% Cost of Goods Sold 13% 13% 13% 12% 10% 20% Gross Margin 87% 87% 87% 88% 90% 80% R&D 19% 18% 16% 17% 13% 13% SG&A 30% 24% 21% 20% 19% 19% Depreciation 4% 4% 4% 4% 3% 3% Total Opex 53% 45% 41% 41% 35% 35% Operating Margin 34% 42% 46% 47% 55% 20-25% 45% 25-30% Long-Term Targets Adjusted Pro Forma Rovi + Sonic Rovi-Standalone Long-Term Targets Notes: Line items may not equal totals due to rounding. |
 Copyright ® 2010 Rovi Corporation. Page 56 Page 56 Summary Investment Highlights • Compelling strategic combination of complementary solutions - Guidance + Connectivity + Metadata + Security - Independent purveyor of key pillars of Digital Media technology requirements • Strong competitive position - Proven and growing patent portfolio with long remaining life - Platform agnostic, highly extensible, addressing key growth areas - Proprietary metadata databases inform consumer amid sea of digital choices - Must-have technologies, essential to offering complete solutions - Integrated product offering • Broad customer footprint • Well positioned to address growth opportunity from digitization of content - Targeting 15-20% CAGR stand-alone growth long-term, 20-25% including Sonic - Long term growth drivers include new solutions for new markets, increased penetration & advertising • Attractive financial profile - High operating margins and low capex drive FCF growth - High percentage of royalty-based, recurring revenue streams - Responsible stewards of capital • Track record of debt repayment, accretive financings (inc. securities repurchases, hedging activities) & acquisitions • Experienced, proven team, with successful track record |