EXHIBIT 99.1
CONTACTS: 408-995-5115
Media Relations: Bill Highlander, Ext. 1244
Investor Relations: Rick Barraza, Ext. 1125
Calpine Reports Second Quarter 2004 Financial and Operating Results
(SAN JOSE, CALIF.) /PR NEWSWIRE — First Call/ Aug. 5, 2004 — Calpine Corporation [NYSE:CPN], one of North America’s leading power companies, today announced financial and operating results for the three and six months ended June 30, 2004. A conference call, set for 8:30 a.m. PDT today, will be accompanied by a comprehensive presentation of the financial and operating results for the quarter. The presentation will be located on Calpine’s investor relations page at www.calpine.com.
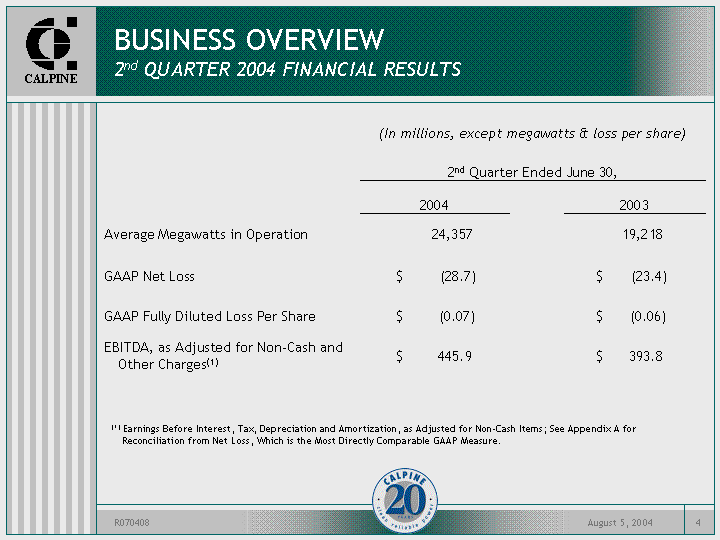
For the three months ended June 30, 2004, the company reported a loss per share of $0.07, or $28.7 million of net loss, compared to a loss per share of $0.06, or $23.4 million of net loss for the quarter ended June 30, 2003. The results for the second quarter of 2004 include a gain of approximately $0.25 per share associated with the restructuring and sale of power purchase agreements for two of the company’s New Jersey power plants, net of transaction costs and the write-off of unamortized deferred financing costs; $0.02 per share from the restructuring of a long-term gas supply contract, net of transaction costs; and $0.02 per share from the King City restructuring transaction, which gave rise to a gain from the sale of the company’s collateral debt securities, net of transaction costs and write-off of deferred financing costs. This gain was offset by non-cash charges including losses of $0.02 per share from the expensing of deferred financing costs in connection with refinancing activities; $0.03 per share from mark-to-market activities, net; and $0.01 per share from foreign exchange transaction losses. The results for the three months ended June 30, 2003, included a gain of approximately $0.10 per share, or $52.8 million, in connection with terminating a tolling arrangement with a unit of Aquila on the Acadia facility.
For the six months ended June 30, 2004, the company reported a $0.24 loss per share, or a $99.9 million of net loss, compared with a $0.20 loss per share, or a $75.4 million of net loss for the six months ended June 30, 2003.
| | | | | | | | | | | | | |
| | | Second Quarter
|
| | | (unaudited) |
| | | 2004
| | 2003
| | % Chg
|
Megawatt-hours Generated (millions)(a) | | | 22.1 | | | | 17.5 | | | | 26 | % |
| Megawatts in Operation at June 30 | | | 26,285 | | | | 22,351 | | | | 18 | % |
| Revenue (millions) | | $ | 2,314.6 | | | $ | 2,165.3 | | | | 7 | % |
| Net Loss (millions) | | $ | (28.7 | ) | | $ | (23.4 | ) | | | 23 | % |
| Diluted Loss Per Share | | $ | (0.07 | ) | | $ | (0.06 | ) | | | 17 | % |
| Operating Cash Flow (millions) | | $ | 185.2 | | | $ | (52.1 | ) | | | 455 | % |
EBITDA, as adjusted (millions)(b) | | $ | 388.5 | | | $ | 344.4 | | | | 13 | % |
EBITDA, as adjusted, for non-cash and other charges (millions)(c) | | $ | 445.9 | | | $ | 393.8 | | | | 13 | % |
| Total Assets (billions) | | $ | 27 | | | $ | 26 | | | | 4 | % |
| (a) | | From continuing operations. |
| |
| (b) | | Earnings Before Interest, Tax, Depreciation and Amortization, as adjusted; see attachedSupplemental Datafor reconciliation from net income. |
| |
| (c) | | SeeSupplemental Datafor reconciliation from EBITDA, as adjusted. |
- more -
CALPINE REPORTS SECOND QUARTER 2004 FINANCIAL AND OPERATING RESULTS
Page 2
Aug. 5, 2004
“During the second quarter, power plant performance remained strong, and we continued to execute on our liquidity-enhancing and financing programs,” stated Calpine Chief Executive Officer and President Peter Cartwright. “Calpine’s earnings, however, were impacted by weak spark spreads across North America as well as additional operating, depreciation and interest costs associated with new plants coming on line.
“For the quarter, Calpine added five plants to our power portfolio, representing more than 3,100 net megawatts of new capacity. Consistent with our long-term strategy, several of these new facilities are now serving major wholesale customers under long-term power and steam sales contracts. On the liquidity and financing front, we completed approximately $506 million in financing and liquidity transactions, and repurchased $181.6 million of debt and preferred securities.
“During the quarter, we continued to see promising signals that point to a positive market shift,” continued Cartwright. “Sparks spreads, while weak overall, rose quarter-over-quarter in all major markets, except for ERCOT. Power consumption in North America increased by about 2.4%, and we experienced record peak demand in two of Calpine’s major power markets. Moving forward, Calpine will continue our program to enhance liquidity, increase our revenue-generating capabilities, lower operating and overhead costs, and strengthen our balance sheet.”
2004 Second Quarter Results
Calpine recorded a net loss of $28.7 million for the three months ended June 30, 2004, compared to a net loss of $23.4 million for the same period in 2003, as gross profit decreased by $107.9 million, or 61%, to $67.7 million. The gross profit decrease is the result of lower per megawatt-hour spark spreads realized during the three months ended June 30, 2004, and additional costs associated with new power plants coming on line. For the three months ended June 30, 2004, Calpine generated 22.1 million megawatt-hours, which equated to a baseload capacity factor of 47%, and realized an average spark spread of $21.91 per megawatt-hour. For the same period in 2003, Calpine generated 17.5 million megawatt-hours, which equated to a capacity factor of 48%, and realized an average spark spread of $26.93 per megawatt-hour. In the quarter ended June 30, 2004, the company netted approximately $322 million of sales of purchased power for hedging and optimization with purchased power expense. This was due to the adoption on October 1, 2003, on a prospective basis, of new accounting rules related to presentation of non-trading derivative activity. Without this netting from sales of purchased power for hedging and optimization, total revenue would have grown by approximately 22% versus 7% as reported. Additional increases in power plant costs for the three months ended June 30, 2004, as compared to the three months ended June 30, 2003, include a $22.8 million increase in depreciation expense and a $64.0 million increase in plant operating expense. Also, during the three months ended June 30, 2004, financial results were affected by a $115.1 million increase in interest expense and distributions on trust preferred securities, as compared to the same period in 2003. This occurred as a result of higher debt balances, higher average interest rates and lower capitalization of interest expense as new plants entered commercial operation. The results for the three months ended June 30, 2003, included a gain of approximately $0.10 per share, or $52.8 million, in connection with terminating a tolling arrangement with a unit of Aquila on the Acadia facility.
- more -
CALPINE REPORTS SECOND QUARTER 2004 FINANCIAL AND OPERATING RESULTS
Page 3
Aug. 5, 2004
Other income was $206.0 million higher in the three months ended June 30, 2004, compared to the prior year primarily due to pre-tax income in the amount of $171.5 million associated with the restructuring and sale of power purchase agreements for two of the company’s New Jersey plants, net of transaction costs and the write-off of unamortized deferred financing costs; an $11.7 million pre-tax gain from the restructuring of a long-term gas supply contract, net of transaction costs; and a $12.6 million pre-tax gain from the King City restructuring transaction related to the sale of the company’s collateral debt securities, net of transaction costs.
2004 Six-Month Results
Calpine recorded a net loss of $99.9 million for the six months ended June 30, 2004, compared to a net loss of $75.4 million for the six months ended June 30, 2003. Gross profit decreased by $152.5 million, or 45%, to $188.2 million. This decrease is the result of lower per megawatt-hour spark spreads realized during the six months ended June 30, 2004, and additional costs associated with new power plants coming on line. For the six months ended June 30, 2004, Calpine generated 43.1 million megawatt-hours, which equated to a capacity factor of 48%, and realized an average spark spread of $21.49 per megawatt-hour. For the same period in 2003, Calpine generated 36.6 million megawatt-hours, which equated to a capacity factor of 52%, and realized an average spark spread of $24.83 per megawatt-hour. Additional increases in power plant costs for the six months ended June 30, 2004 as compared to the six months ended June 30, 2003, include a $38.4 million increase in depreciation expense, a $77.9 million increase in plant operating expense and a $10.9 million increase in transmission purchase expense. Also, during the six months ended June 30, 2004, financial results were affected by a $211.3 million increase in interest expense and distributions on trust preferred securities, as compared to the first six months of 2003. This occurred as a result of higher debt balances, higher average interest rates and lower capitalization of interest expense as new plants entered commercial operation.
Other income increased by $259.1 million during the six months ended June 30, 2004, as compared to the same period in 2003, primarily as a result of the factors indicated in the three-month discussion found above, and because during the six months ended June 30, 2004, the company recorded a foreign currency transaction gain of $4.8 million compared to a loss of $44.3 million in the corresponding period in 2003.
Finance Program Highlights
During the past several months, Calpine continued to focus on enhancing liquidity and addressing near-term financing obligations with a number of transactions, including:
| | • | | The refinancing of its Rocky Mountain and Riverside Energy Centers with the issuance of $633.4 million of floating rate secured institutional term loans due 2011. After repayment of amounts outstanding under existing non-recourse project financing facilities, the refinancing returned approximately $160 million to Calpine for general corporate purposes. |
- more -
CALPINE REPORTS SECOND QUARTER 2004 FINANCIAL AND OPERATING RESULTS
Page 4
Aug. 5, 2004
| | • | | The restructuring and sale of its power contracts related to two of its plants in New Jersey, the 118-megawatt Parlin and 58-megawatt Newark Power Plants. Calpine raised approximately $101 million after transaction costs and the repayment of approximately $79 million of non-recourse project debt associated with the projects. |
| |
| | • | | In transactions initiated during the second quarter, Calpine has repurchased $181.6 million of the principal amount of its outstanding debt and its High Tides preferred securities as listed below: |
| | | | | | | | | |
| - | | 8 1/4% Senior Notes Due 2005 | | $ | 38,950,000 | |
| - | | 7 3/4% Senior Notes Due 2009 | | $ | 11,000,000 | |
| - | | 8 1/2% Senior Notes Due 2011 | | $ | 9,000,000 | |
| - | | 10 1/2% Senior Notes Due 2006 | | $ | 7,650,000 | |
| - | | 5 3/4% High Tides I | | $ | 40,000,000 | |
| - | | 5 1/2% High Tides II | | $ | 75,000,000 | |
| | | | The securities were repurchased in exchange for approximately $56.2 million in cash and approximately 24.3 million shares of Calpine common stock valued at approximately $112.5 million. |
| |
| | • | | Calpine created a new entity, Calpine Energy Management (CEM), and implemented a new credit enhancement structure that it expects will increase working capital and improve margins. CEM has entered into a $250 million letter of credit facility with Deutsche Bank (rated Aa3/AA-) that expires in October 2005. Deutsche Bank will guarantee CEM’s short-term power and gas obligations by issuing letters of credit. CEM will provide Deutsche Bank with collateral in the form of receivables from its power sales. |
| |
| | • | | The company continued to reduce capital requirements for Calpine Energy Services (CES), the company’s commodity transaction and risk management subsidiary. Compared to the first quarter of 2004, CES’s total collateral requirements decreased by 11% to $288 million from $323 million. |
The company has identified a number of potential liquidity-enhancing opportunities that could raise in excess of $2 billion through transactions that include the issuance of additional First Priority Secured Debt, previously announced sale of the company’s Canadian gas reserves and certain of its U.S. gas reserves, the monetization of power contracts, construction financing and the sale of a preferred interest in certain projects.
Power Plant and Natural Gas Operations
Calpine is a leading North American power company. Together, its 91 gas-fired and geothermal power plants currently in operation are capable of delivering up to 26,200 net megawatts of electricity for wholesale and industrial customers in 21 states, three Canadian provinces and the United Kingdom. In addition, Calpine is nearing completion of its merchant construction program and is selectively moving forward with construction on projects with long-term contracts in place. During the quarter, Calpine:
- more -
CALPINE REPORTS SECOND QUARTER 2004 FINANCIAL AND OPERATING RESULTS
Page 5
Aug. 5, 2004
| | • | | Operated its natural gas-fired and geothermal power plants with an average plant availability factor of 89%, compared to an 87% average availability for the same period a year ago; |
| |
| | • | | Generated 22.1 million megawatt-hours, a 26% increase over the second quarter of 2003. Through hedging and optimization activity at its Calpine Energy Services subsidiary, the company delivered an additional 20.9 million megawatt-hours; |
| |
| | • | | Achieved an average heat rate of 7,203 British thermal units per kilowatt-hour, compared to 7,234 for the second quarter in 2003; |
| |
| | • | | Maintained a $5.49 average operating expense per megawatt-hour (assuming a 70% capacity factor) for the trailing twelve-month period ending June 30, 2004, up slightly from $5.44 in 2003 due to seasonal major maintenance costs incurred during the quarter; |
| |
| | • | | Completed construction of five new, highly efficient power plants, totaling more than 3,100 megawatts. These modern, gas-fired facilities supply major wholesale and industrial customers under long-term power and steam sales contracts. |
| |
| | • | | Managed the production of approximately 204 million cubic feet equivalent per day of natural gas — representing about 14% of Calpine’s total North American fuel consumption. |
New Power Contract Opportunities
Calpine continued to execute its strategy of entering into long-term contracts and providing customers with a wide range of customized energy products and services. The company serves more than 100 wholesale and large retail customers through approximately 150 contracts. Today, Calpine is pursuing nearly 21,000 megawatts of contract opportunities.
During the quarter, the company entered into 24 new power contracts, totaling more than 2,300 megawatts.
Through June 30, 2004, the company has signed 42 power contracts — representing approximately 4,300 megawatts of capacity and approximately 133 million megawatt-hours. The average on-peak spark spread for these contracts is approximately $17.00 per megawatt-hour, with a five-year weighted average life.
Recent power contracts include:
| | • | | An expanded, long-term contract with Wisconsin Public Service Corporation. The new 235-megawatt, ten-year power sales commitment for capacity, energy and ancillary services is scheduled to begin on June 1, 2006, subject to approval by the Public Service Commission of Wisconsin. The additional commitment will be supported through an expansion of the Fox Energy Center, currently under construction in Kaukauna, Wis. |
- more -
CALPINE REPORTS SECOND QUARTER 2004 FINANCIAL AND OPERATING RESULTS
Page 6
Aug. 5, 2004
| | • | | A five-year agreement for 200 megawatts of capacity and energy for Snapping Shoals Electric Membership Corporation. Electricity will be delivered from Calpine’s Hog Bayou Energy Center located in Mobile, Ala. beginning January 1, 2005. |
| |
| | • | | A 25-year agreement with The Dow Chemical Company (Dow) for the sale of up to 200 megawatts of electricity commencing in 2006 and one million pounds per hour of steam beginning in 2005 to Dow’s Freeport, Texas facility. |
| |
| | • | | A proposed 20-year, 79.9-megawatt power contract for capacity and related energy and ancillary services to the Long Island Power Authority (LIPA) beginning in June 2005. The contract remains subject to review and approval by the State of New York’s Comptroller and Attorney General. |
Included in theSupplemental Datawith this news release is an updated report summarizing Calpine’s total estimated generation capacity and capacity currently under contract through 2009. A full detailed report is available on the company’s website on its investor relations page at www.calpine.com.
2004 Earnings and Cash Flow Guidance
The company is reaffirming its breakeven GAAP earnings guidance for the year ending December 31, 2004. The company is also reaffirming that EBITDA, as adjusted, is anticipated to be approximately $1.7 billion for 2004.
Conference Call Information
Calpine will host a conference call to discuss its financial and operating results for the three and six months ended June 30, 2004 this morning, Thursday, August 5, 2004, at 8:30 a.m. PDT. To participate via the teleconference (in listen-only mode), dial 1-888-603-6685 at least five minutes before the start of the call. In addition, Calpine will simulcast the conference call and a PowerPoint presentation live via the Internet. The web cast and presentation will be available for 30 days on Calpine’s investor relations page at www.calpine.com.
About Calpine
Calpine Corporation, celebrating its 20th year in power, is a leading North American power company dedicated to providing electric power to customers from clean, efficient, natural gas-fired and geothermal power plants. The company generates power at plants it owns or leases in 21 states in the United States, three provinces in Canada and in the United Kingdom. Calpine also owns or controls approximately one trillion cubic feet equivalent of proved natural gas reserves in the United States and Canada. The company is listed on the S&P 500 and was namedFORTUNE’sMost Admired Energy Company in America for 2004. Calpine was founded in 1984 and is publicly traded on the New York Stock Exchange under the symbol CPN. For more information, visit www.calpine.com.
- more -
CALPINE REPORTS SECOND QUARTER 2004 FINANCIAL AND OPERATING RESULTS
Page 7
Aug. 5, 2004
This news release discusses certain matters that may be considered “forward-looking” statements within the meaning of Section 27A of the Securities Act of 1933, as amended, and Section 21E of the Securities Exchange Act of 1934, as amended, including statements regarding the intent, belief or current expectations of Calpine Corporation (“the Company”) and its management. Prospective investors are cautioned that any such forward-looking statements are not guarantees of future performance and involve a number of risks and uncertainties that could materially affect actual results such as, but not limited to, (i) changes in legislation and regulation of energy markets and the rules and regulations adopted from time to time with respect thereto; (ii) the timing and extent of changes in commodity prices for energy, particularly natural gas and electricity; (iii) commercial operations of new plants that may be delayed or prevented because of various development and construction risks, such as a failure to obtain the necessary permits to operate, failure of third-party contractors to perform their contractual obligations or failure to obtain financing on acceptable terms; (iv) unscheduled outages of operating plants; (v) a competitor’s development of lower cost generating gas-fired power plants; (vi) risks associated with marketing and selling power from power plants in dynamic energy markets; (vii) the successful exploitation of an oil or gas resource that ultimately depends upon the geology of the resource, the total amount and costs to develop recoverable reserves and operations factors relating to the extraction of natural gas; (viii) the effects on the Company’s business resulting from reduced liquidity in the trading and power industry; (ix) the Company’s ability to access the capital markets or obtain bank financing on attractive terms; (x) the direct or indirect effects on the Company’s business of a lowering of its credit rating (or actions it may take in response to changing credit rating criteria), including, increased collateral requirements, refusal by the Company’s current or potential counterparties to enter into transactions with it and its inability to obtain credit or capital in desired amounts or on favorable terms; and (xi) other risks identified from time-to-time in the Company’s reports and registration statements filed with the SEC, including its Annual Report onForm 10-K for the year ended Dec. 31, 2003, and its Quarterly Report onForm 10-Q for the quarter ended March 31, 2004, which can also be found on the Company’s website at www.calpine.com. This news release includes certain non-GAAP financial measures as defined under SEC rules. As required by SEC rules, we have provided a reconciliation of those measures to the most directly comparable GAAP measures, which can be found in the Supplemental Data tables in this release. All information set forth in this news release is as of today’s date, and the Company undertakes no duty to update this information.
- table follows -
CALPINE CORPORATION AND SUBSIDIARIES
Consolidated Condensed Statements of Operations
For the Three and Six Months Ended June 30, 2004 and 2003
(In thousands, except per share amounts)
(unaudited)
| | | | | | | | | | | | | | | | | |
| | | Three Months Ended | | Six Months Ended |
| | | June 30,
| | June 30,
|
| | | 2004
| | 2003
| | 2004
| | 2003
|
| Revenue: | | | | | | | | | | | | | | | | |
| Electric generation and marketing revenue | | | | | | | | | | | | | | | | |
| Electricity and steam revenue | | $ | 1,312,792 | | | $ | 1,046,260 | | | $ | 2,558,678 | | | $ | 2,146,328 | |
| Sales of purchased power for hedging and optimization | | | 496,652 | | | | 744,805 | | | | 876,680 | | | | 1,426,089 | |
| | | |
| | | |
| | | |
| | | |
| |
| Total electric generation and marketing revenue | | | 1,809,444 | | | | 1,791,065 | | | | 3,435,358 | | | | 3,572,417 | |
| Oil and gas production and marketing revenue | | | | | | | | | | | | | | | | |
| Oil and gas sales | | | 26,069 | | | | 29,299 | | | | 50,651 | | | | 55,210 | |
| Sales of purchased gas for hedging and optimization | | | 481,971 | | | | 328,478 | | | | 834,708 | | | | 655,945 | |
| | | |
| | | |
| | | |
| | | |
| |
| Total oil and gas production and marketing revenue | | | 508,040 | | | | 357,777 | | | | 885,359 | | | | 711,155 | |
| Mark-to-market activities, net | | | (22,605 | ) | | | 1,839 | | | | (10,086 | ) | | | 22,282 | |
| Other revenue | | | 19,755 | | | | 14,627 | | | | 46,741 | | | | 25,386 | |
| | | |
| | | |
| | | |
| | | |
| |
| Total revenue | | | 2,314,634 | | | | 2,165,308 | | | | 4,357,372 | | | | 4,331,240 | |
| | | |
| | | |
| | | |
| | | |
| |
| Cost of revenue: | | | | | | | | | | | | | | | | |
| Electric generation and marketing expense | | | | | | | | | | | | | | | | |
| Plant operating expense | | | 223,664 | | | | 159,646 | | | | 399,498 | | | | 321,574 | |
| Transmission purchase expense | | | 14,651 | | | | 11,330 | | | | 31,078 | | | | 20,156 | |
| Royalty expense | | | 6,951 | | | | 6,461 | | | | 12,833 | | | | 11,818 | |
| Purchased power expense for hedging and optimization | | | 445,169 | | | | 738,719 | | | | 820,108 | | | | 1,418,668 | |
| | | |
| | | |
| | | |
| | | |
| |
| Total electric generation and marketing expense | | | 690,435 | | | | 916,156 | | | | 1,263,517 | | | | 1,772,216 | |
| Oil and gas operating and marketing expense | | | | | | | | | | | | | | | | |
| Oil and gas operating expense | | | 23,443 | | | | 29,033 | | | | 45,770 | | | | 54,694 | |
| Purchased gas expense for hedging and optimization | | | 453,922 | | | | 331,122 | | | | 814,409 | | | | 648,070 | |
| | | |
| | | |
| | | |
| | | |
| |
| Total oil and gas operating and marketing expense | | | 477,365 | | | | 360,155 | | | | 860,179 | | | | 702,764 | |
| Fuel expense | | | 867,785 | | | | 539,409 | | | | 1,630,490 | | | | 1,174,778 | |
| Depreciation, depletion and amortization expense | | | 161,789 | | | | 138,957 | | | | 311,203 | | | | 272,771 | |
| Operating lease expense | | | 26,963 | | | | 28,168 | | | | 54,762 | | | | 55,860 | |
| Other cost of revenue | | | 22,607 | | | | 6,870 | | | | 48,988 | | | | 12,121 | |
| | | |
| | | |
| | | |
| | | |
| |
| Total cost of revenue | | | 2,246,944 | | | | 1,989,715 | | | | 4,169,139 | | | | 3,990,510 | |
| | | |
| | | |
| | | |
| | | |
| |
| Gross profit | | | 67,690 | | | | 175,593 | | | | 188,233 | | | | 340,730 | |
| Loss (income) from unconsolidated investments in power projects and oil and gas properties | | | 718 | | | | (59,351 | ) | | | (1,788 | ) | | | (64,475 | ) |
| Equipment cancellation and impairment cost | | | 7 | | | | 19,222 | | | | 2,367 | | | | 19,309 | |
| Project development expense | | | 4,030 | | | | 6,072 | | | | 11,748 | | | | 11,158 | |
| Research and development expense | | | 5,124 | | | | 2,469 | | | | 8,939 | | | | 4,860 | |
| Sales, general and administrative expense | | | 60,978 | | | | 53,710 | | | | 118,225 | | | | 97,367 | |
| | | |
| | | |
| | | |
| | | |
| |
| Income (loss) from operations | | | (3,167 | ) | | | 153,471 | | | | 48,742 | | | | 272,511 | |
| Interest expense | | | 279,659 | | | | 148,879 | | | | 534,452 | | | | 291,840 | |
| Distributions on trust preferred securities | | | — | | | | 15,656 | | | | — | | | | 31,313 | |
| Interest (income) | | | (9,920 | ) | | | (9,003 | ) | | | (21,981 | ) | | | (17,037 | ) |
| Minority interest expense | | | 4,724 | | | | 5,335 | | | | 13,159 | | | | 7,612 | |
| (Income) from repurchase of various issuances of debt | | | (2,559 | ) | | | (6,763 | ) | | | (3,394 | ) | | | (6,763 | ) |
| Other expense (income) | | | (185,571 | ) | | | 20,467 | | | | (203,996 | ) | | | 55,056 | |
| | | |
| | | |
| | | |
| | | |
| |
| Loss before (benefit) for income taxes | | | (89,500 | ) | | | (21,100 | ) | | | (269,498 | ) | | | (89,510 | ) |
| (Benefit) for income taxes | | | (60,604 | ) | | | (4,725 | ) | | | (146,553 | ) | | | (21,596 | ) |
| | | |
| | | |
| | | |
| | | |
| |
| Loss before discontinued operations and cumulative effect of a change in accounting principle | | | (28,896 | ) | | | (16,375 | ) | | | (122,945 | ) | | | (67,914 | ) |
| Discontinued operations, net of tax provision (benefit) of $126, $(4,484), $12,452 and $(5,275) | | | 198 | | | | (6,991 | ) | | | 23,055 | | | | (7,997 | ) |
Cumulative effect of a change in accounting principle, net of tax provision of
$—, $—, $— and $450 | | | — | | | | — | | | | — | | | | 529 | |
| | | |
| | | |
| | | |
| | | |
| |
| Net loss | | $ | (28,698 | ) | | $ | (23,366 | ) | | $ | (99,890 | ) | | $ | (75,382 | ) |
| | | |
| | | |
| | | |
| | | |
| |
- table continues -
| | | | | | | | | | | | | | | | | |
| | | Three Months Ended | | Six Months Ended |
| | | June 30,
| | June 30,
|
| | | 2004
| | 2003
| | 2004
| | 2003
|
| Basic and diluted loss per common share: | | | | | | | | | | | | | | | | |
| Weighted average shares of common stock outstanding | | | 417,357 | | | | 381,219 | | | | 416,332 | | | | 381,089 | |
| Loss before discontinued operations and cumulative effect of a change in accounting principle | | $ | (0.07 | ) | | $ | (0.04 | ) | | $ | (0.30 | ) | | $ | (0.18 | ) |
| Discontinued operations, net of tax | | $ | — | | | $ | (0.02 | ) | | $ | 0.06 | | | $ | (0.02 | ) |
| Cumulative affect of a change in accounting principle, net of tax | | $ | — | | | $ | — | | | $ | — | | | $ | — | |
| | | |
| | | |
| | | |
| | | |
| |
| Net loss | | $ | (0.07 | ) | | $ | (0.06 | ) | | $ | (0.24 | ) | | $ | (0.20 | ) |
| | | |
| | | |
| | | |
| | | |
| |
| The financial information presented above and in the Supplemental Data is subject to adjustment until the company files its Form 10-Q with the United States Securities and Exchange Commission for the three and six months ended June 30, 2004. | | |
- table continues -
CALPINE CORPORATION AND SUBSIDIARIES
Supplemental Data
(unaudited)
CASH FLOW DATA
| | | | | | | | | | | | | | | | | |
| | | Three Months Ended | | Six Months Ended |
| | | June 30,
| | June 30,
|
| | | 2004
| | 2003
| | 2004
| | 2003
|
| (in thousands) | | | | | | | | | | | | | | | | |
| Cash (used in) provided by operating activities | | $ | 185,223 | | | $ | (52,063 | ) | | $ | 11,993 | | | $ | 113,304 | |
| Cash used in investing activities | | | (96,020 | ) | | | (814,174 | ) | | | (167,391 | ) | | | (1,297,803 | ) |
| Cash (used in) provided by financing activities | | | 180,860 | | | | 904,771 | | | | 20,769 | | | | 1,017,314 | |
| Effect of exchange rate changes on cash and cash equivalents | | | (8,836 | ) | | | 1,382 | | | | (13,146 | ) | | | 5,672 | |
| | | |
| | | |
| | | |
| | | |
| |
| Net decrease in cash and cash equivalents | | $ | 261,227 | | | $ | 39,916 | | | $ | (147,775 | ) | | $ | (161,513 | ) |
| | | |
| | | |
| | | |
| | | |
| |
RECONCILIATION OF GAAP CASH PROVIDED BY (USED IN) OPERATING ACTIVITIES TO
EBITDA, AS ADJUSTED (1)
| | | | | | | | | | | | | | | | | |
| | | Three Months Ended | | Six Months Ended |
| | | June 30,
| | June 30,
|
| | | 2004
| | 2003
| | 2004
| | 2003
|
| (in thousands) | | | | | | | | | | | | | | | | |
| Cash provided by (used in) operating activities | | $ | 185,223 | | | $ | (52,063 | ) | | $ | 11,993 | | | $ | 113,304 | |
| Less: Changes in operating assets and liabilities, excluding the effects of acquisitions | | | 87,811 | | | | (682,335 | ) | | | (49,934 | ) | | | (408,312 | ) |
| Less: Additional adjustments to reconcile net income to net cash provided by (used in) operating activities, net | | | 126,110 | | | | 653,638 | | | | 161,817 | | | | 596,998 | |
| | | |
| | | |
| | | |
| | | |
| |
| GAAP net loss | | | (28,698 | ) | | | (23,366 | ) | | | (99,890 | ) | | | (75,382 | ) |
| (Income) loss from unconsolidated investments in power projects and oil and gas properties | | | 718 | | | | (59,351 | ) | | | (1,788 | ) | | | (64,475 | ) |
| Distributions from unconsolidated investments in power projects and oil and gas properties | | | 9,474 | | | | 111,613 | | | | 14,614 | | | | 121,015 | |
| | | |
| | | |
| | | |
| | | |
| |
| Subtotal | | | (18,506 | ) | | | 28,896 | | | | (87,064 | ) | | | (18,842 | ) |
| Interest expense | | | 279,659 | | | | 148,879 | | | | 534,452 | | | | 291,840 | |
| 1/3 of operating lease expense | | | 8,988 | | | | 9,389 | | | | 18,254 | | | | 18,620 | |
| Distributions on trust preferred securities | | | — | | | | 15,656 | | | | — | | | | 31,313 | |
| (Benefit) for income taxes | | | (60,604 | ) | | | (4,725 | ) | | | (146,553 | ) | | | (21,596 | ) |
| Depreciation, depletion and amortization expense | | | 179,009 | | | | 145,204 | | | | 350,413 | | | | 285,503 | |
| Interest expense, provision (benefit) for income taxes and depreciation, depletion and amortization from discontinued operations | | | — | | | | 1,077 | | | | 12,338 | | | | 1,184 | |
| | | |
| | | |
| | | |
| | | |
| |
| EBITDA, as adjusted | | $ | 388,546 | | | $ | 344,376 | | | $ | 681,840 | | | $ | 588,022 | |
| | | |
| | | |
| | | |
| | | |
| |
RECONCILIATION OF EBITDA, AS ADJUSTED TO EBITDA, AS ADJUSTED FOR NON-CASH AND OTHER
CHARGES (2)
| | | | | | | | | | | | | | | | | |
| | | Three Months Ended | | Six Months Ended |
| | | June 30,
| | June 30,
|
| | | 2004
| | 2003
| | 2004
| | 2003
|
| (in thousands) | | | | | | | | | | | | | | | | |
| EBITDA, as adjusted | | $ | 388,546 | | | $ | 344,376 | | | $ | 681,840 | | | $ | 588,022 | |
| Equipment cancellation and impairment cost | | | 7 | | | | 17,179 | | | | 2,367 | | | | 17,179 | |
| Foreign currency transaction (gain) loss | | | 5,152 | | | | 19,095 | | | | (4,832 | ) | | | 44,304 | |
| Unrealized mark-to-market activity loss | | | 28,913 | | | | 7,221 | | | | 33,858 | | | | 7,992 | |
| (Income) from repurchases of various issuances of debt | | | (2,559 | ) | | | (6,763 | ) | | | (3,394 | ) | | | (6,763 | ) |
| SFAS No. 123 (stock-based compensation expense) | | | 5,190 | | | | 3,931 | | | | 9,290 | | | | 8,423 | |
| Minority interest expense | | | 4,724 | | | | 5,335 | | | | 13,159 | | | | 7,612 | |
| Write-off of deferred financing costs (not related to bonds repurchased) | | | 19,376 | | | | — | | | | 19,376 | | | | — | |
| Other non-cash and other charges | | | (3,487 | ) | | | 3,400 | | | | (1,041 | ) | | | 3,929 | |
| | | |
| | | |
| | | |
| | | |
| |
| EBITDA, as adjusted, for non-cash and other charges | | $ | 445,862 | | | $ | 393,774 | | | $ | 750,623 | | | $ | 670,698 | |
| | | |
| | | |
| | | |
| | | |
| |
- table continues -
SUPPLEMENTARY POWER DATA
| | | | | | | | | | | | | | | | | |
| | | Three Months Ended | | Six Months Ended |
| | | June 30,
| | June 30,
|
| | | 2004
| | 2003
| | 2004
| | 2003
|
| Generation (in MWh, in thousands) (3) | | | 22,083 | | | | 17,519 | | | | 43,132 | | | | 36,620 | |
| Average electric price realized (per MWh) | | $ | 61.78 | | | $ | 60.07 | | | $ | 60.63 | | | $ | 58.81 | |
Average spark spread adjusted for benefits of equity gas
production (per MWh) | | $ | 21.91 | | | $ | 26.93 | | | $ | 21.49 | | | $ | 24.83 | |
SUPPLEMENTARY EQUIVALENT NATURAL GAS PRODUCTION DATA (4)
| | | | | | | | | | | | | | | | | |
| | | Three Months Ended | | Six Months Ended |
| | | June 30,
| | June 30,
|
| | | 2004
| | 2003
| | 2004
| | 2003
|
| (in Bcfe) | | | | | | | | | | | | | | | | |
| Natural Gas Production | | | | | | | | | | | | | | | | |
| United States | | | 12.6 | | | | 14.6 | | | | 25.1 | | | | 30.3 | |
| Canada | | | 5.9 | | | | 9.9 | | | | 12.6 | | | | 20.4 | |
| | | |
| | | |
| | | |
| | | |
| |
| Total | | | 18.5 | | | | 24.5 | | | | 37.7 | | | | 50.7 | |
| Average daily production rate | | | 204 | | | | 269 | | | | 207 | | | | 280 | |
| Average realized price per Mcfe | | $ | 6.10 | | | $ | 5.14 | | | $ | 5.78 | | | $ | 5.49 | |
| Average unit cost per Mcfe (excluding interest expense) | | | 3.60 | | | | 2.76 | | | | 3.42 | | | | 2.62 | |
CALPINE CONTRACTUAL PORTFOLIO — AS OF MARCH 31, 2004
| | | | | | | | | | | | | | | | | | | | | |
| | | 2005
| | 2006
| | 2007
| | 2008
| | 2009
|
| Estimated Generation Capacity (in millions of MWh) | | | | | | | | | | | | | | | | | | | | |
| - Baseload | | | 185.3 | | | | 207.6 | | | | 215.3 | | | | 215.9 | | | | 215.3 | |
| - Peaking | | | 25.5 | | | | 26.6 | | | | 27.0 | | | | 27.0 | | | | 27.0 | |
| | | |
| | | |
| | | |
| | | |
| | | |
| |
| Total | | | 210.8 | | | | 234.2 | | | | 242.3 | | | | 242.9 | | | | 242.3 | |
| | | |
| | | |
| | | |
| | | |
| | | |
| |
| Contractual Generation (in millions of MWh) | | | | | | | | | | | | | | | | | | | | |
| - Baseload | | | 77.9 | | | | 62.7 | | | | 51.9 | | | | 49.8 | | | | 47.1 | |
| - Peaking | | | 19.2 | | | | 18.9 | | | | 18.7 | | | | 18.1 | | | | 15.0 | |
| | | |
| | | |
| | | |
| | | |
| | | |
| |
| Total | | | 97.1 | | | | 81.6 | | | | 70.6 | | | | 67.9 | | | | 62.1 | |
| | | |
| | | |
| | | |
| | | |
| | | |
| |
| % Sold | | | | | | | | | | | | | | | | | | | | |
| - Baseload | | | 42 | % | | | 30 | % | | | 24 | % | | | 23 | % | | | 22 | % |
| - Peaking | | | 77 | % | | | 71 | % | | | 69 | % | | | 67 | % | | | 56 | % |
| Total | | | 46 | % | | | 35 | % | | | 29 | % | | | 28 | % | | | 26 | % |
| Contractual Spark Spread | | $ | 2,025 | | | $ | 1,866 | | | $ | 1,600 | | | $ | 1,540 | | | $ | 1,446 | |
| (in millions) | | | | | | | | | | | | | | | | | | | | |
- table continues -
| | | | | | | | | |
| | | As of | | As of |
| CAPITALIZATION | | June 30, 2004
| | December 31, 2003
|
| Cash and cash equivalents (in billions) | | $ | 0.8 | | | $ | 1.0 | |
| Total debt (in billions) | | | 18.1 | | | $ | 17.7 | |
| Debt to capitalization ratio | | | 78 | % | | | 78 | % |
| Present value of operating leases (in billions) | | $ | 1.3 | | | $ | 1.3 | |
| Unconsolidated debt of equity method investments (estimated, in billions)(5) | | $ | 0.1 | | | $ | 0.1 | |
| (in thousands): | | | | | | | | |
| Short-term debt | | | | | | | | |
| Notes payable and borrowings under lines of credit, current portion | | $ | 239,289 | | | $ | 254,292 | |
| Preferred interests, current portion | | | 8,758 | | | | 11,220 | |
| Capital lease obligation, current portion | | | 8,466 | | | | 4,008 | |
| CCFC I financing, current portion | | | 3,208 | | | | 3,208 | |
| Construction/project financing, current portion | | | 57,256 | | | | 61,900 | |
| Senior notes, current portion | | | 14,500 | | | | 14,500 | |
| | | |
| | | |
| |
| Total short-term debt | | | 331,477 | | | | 349,128 | |
| | | |
| | | |
| |
| Long-term debt | | | | | | | | |
| Notes payable and borrowings under lines of credit, net of current portion | | | 861,424 | | | | 873,572 | |
| Notes payable to Calpine Capital Trusts | | | 1,153,500 | | | | 1,153,500 | |
| Preferred interests, net of current portion | | | 142,064 | | | | 232,412 | |
| Capital lease obligation, net of current portion | | | 283,005 | | | | 193,741 | |
| CCFC I financing, net of current portion | | | 784,661 | | | | 785,781 | |
| CalGen/CCFC II financing | | | 2,448,907 | | | | 2,200,358 | |
| Construction/project financing, net of current portion | | | 1,723,040 | | | | 1,209,505 | |
| Convertible Senior Notes Due 2006 | | | 72,126 | | | | 660,059 | |
| Convertible Senior Notes Due 2023 | | | 900,000 | | | | 650,000 | |
| Senior notes, net of current portion | | | 9,370,936 | | | | 9,369,253 | |
| | | |
| | | |
| |
| Total long-term debt | | | 17,739,663 | | | | 17,328,181 | |
| | | |
| | | |
| |
| Total debt | | $ | 18,071,140 | | | $ | 17,677,309 | |
| Minority interests | | $ | 350,561 | | | $ | 410,892 | |
| Total stockholders’ equity (6) | | $ | 4,600,891 | | | $ | 4,621,253 | |
| | | |
| | | |
| |
| Total capitalization | | $ | 23,022,592 | | | $ | 22,709,454 | |
| | | |
| | | |
| |
| Debt to capitalization ratio | | | | | | | | |
| Total debt | | $ | 18,071,140 | | | $ | 17,677,309 | |
| Total capitalization | | $ | 23,022,592 | | | $ | 22,709,454 | |
| Debt to capitalization | | | 78 | % | | | 78 | % |
| (1) | | This non-GAAP measure is presented not as a measure of operating results, but rather as a measure of our ability to service debt and to raise additional funds. It should not be construed as an alternative to either (i) income from operations or (ii) cash flows from operating activities. It is defined as net income less income from unconsolidated investments, plus cash received from unconsolidated investments, plus provision for tax, plus interest expense (including distributions on trust preferred securities and one-third of operating lease expense, which is management’s estimate of the component of operating lease expense that constitutes interest expense,) plus depreciation, depletion and amortization. The interest, tax and depreciation and amortization components of discontinued operations are added back in calculating EBITDA, as adjusted. |
| |
| (2) | | This non-GAAP measure is presented as a further refinement of EBITDA, as adjusted, to reflect the company’s ability to service debt with cash. |
| |
| (3) | | Does not include MWh generated by unconsolidated investments in power projects. |
| |
| (4) | | From continuing operations. |
| |
| (5) | | Amounts based on Calpine’s ownership percentage. |
| |
| (6) | | Includes accumulated other comprehensive income (“AOCI”) of $22,054 at June 30, 2004, and $56,594 at December 31, 2003. Excluding AOCI from stockholders’ equity would change the debt to capitalization ratio to 79% at June 30, 2004, but would not change the debt to capitalization ratio at December 31, 2003. |
###
| CALPINE CORPORATION EARNINGS CONFERENCE CALL 2nd QUARTER ENDED JUNE 30, 2004 |
| FORWARD-LOOKING STATEMENT This presentation discusses certain matters that may be considered "forward-looking" statements within the meaning of Section 27A of the Securities Act of 1933, as amended, and Section 21E of the Securities Exchange Act of 1934, as amended, including statements regarding our expected financial performance, our strategic and operational plans, as well as all assumptions, expectations, predictions, intentions, or beliefs about future events. Investors are cautioned that any forward-looking statements are not guarantees of future performance and involve a number of risks and uncertainties that could cause actual results to differ materially from the forward-looking statements. We refer you to the documents we file from time to time with the Securities and Exchange Commission, including our Annual Report on Form 10-K for the year ended December 31, 2003 and our Quarterly Report on Form 10-Q for the quarter ended March 31, 2004, which can also be found on our website at www.calpine.com. We undertake no duty to update any forward- looking statements. This presentation also includes certain non-GAAP financial measures as defined under SEC rules. As required by SEC rules, we have provided a reconciliation of those financial measures to the most directly comparable GAAP measures, which can be found in Appendix A of this presentation. The financial information presented is subject to adjustment until we file our Form 10-Q with the United States Securities and Exchange Commission for the three months ended June 30, 2004. |

| CALPINE PARTICIPANTS PETER CARTWRIGHT Chairman, Chief Executive Officer and President BOB KELLY Executive Vice President and Chief Financial Officer LISA BODENSTEINER Executive Vice President and General Counsel CHUCK CLARK Senior Vice President, Corporate Controller and Chief Accounting Officer RICK BARRAZA Senior Vice President, Investor Relations |
| BUSINESS OVERVIEW Peter Cartwright Chairman, Chief Executive Officer and President |
| BUSINESS OVERVIEW 2nd QUARTER 2004 FINANCIAL RESULTS (In millions, except megawatts & loss per share) (In millions, except megawatts & loss per share) (In millions, except megawatts & loss per share) 2nd Quarter Ended June 30, 2nd Quarter Ended June 30, 2nd Quarter Ended June 30, 2004 2003 Average Megawatts in Operation 24,357 19,218 GAAP Net Loss $ (28.7) $ (23.4) GAAP Fully Diluted Loss Per Share $ (0.07) $ (0.06) EBITDA, as Adjusted for Non-Cash and Other Charges(1) $ 445.9 $ 393.8 (1) Earnings Before Interest, Tax, Depreciation and Amortization, as Adjusted for Non-Cash Items; See Appendix A for Reconciliation from Net Loss, Which is the Most Directly Comparable GAAP Measure. |
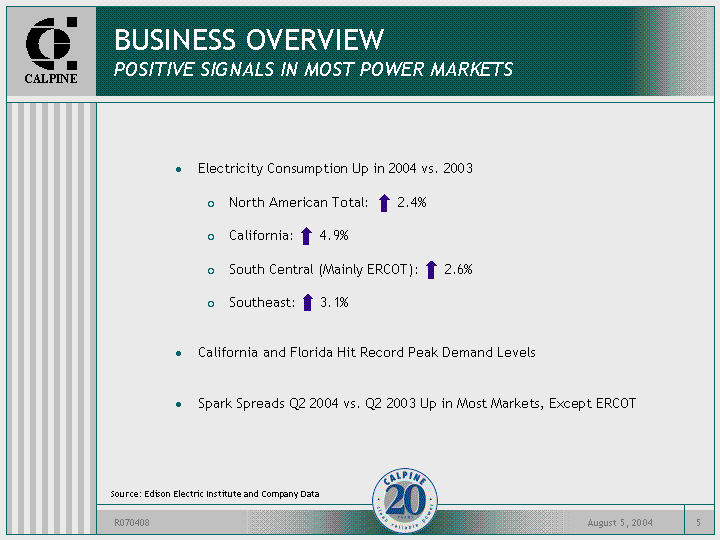
| BUSINESS OVERVIEW POSITIVE SIGNALS IN MOST POWER MARKETS Electricity Consumption Up in 2004 vs. 2003 North American Total: 2.4% California: 4.9% South Central (Mainly ERCOT): 2.6% Southeast: 3.1% California and Florida Hit Record Peak Demand Levels Spark Spreads Q2 2004 vs. Q2 2003 Up in Most Markets, Except ERCOT Source: Edison Electric Institute and Company Data |
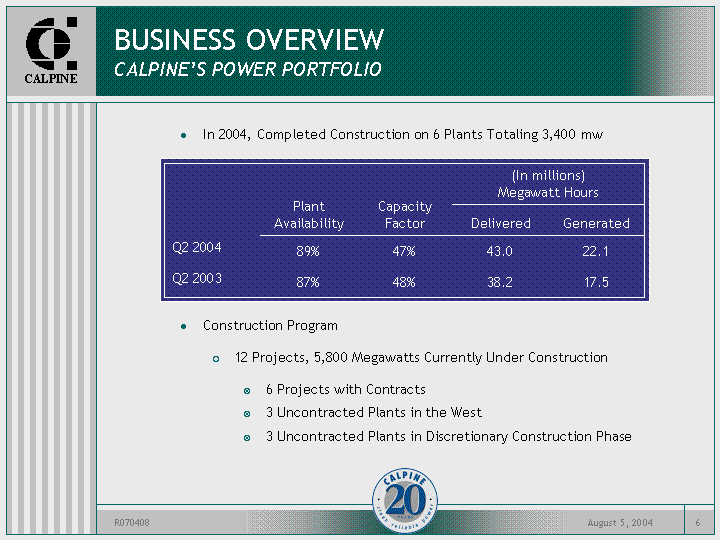
| BUSINESS OVERVIEW CALPINE'S POWER PORTFOLIO In 2004, Completed Construction on 6 Plants Totaling 3,400 mw Construction Program 12 Projects, 5,800 Megawatts Currently Under Construction 6 Projects with Contracts 3 Uncontracted Plants in the West 3 Uncontracted Plants in Discretionary Construction Phase Plant Availability Capacity Factor (In millions) Megawatt Hours (In millions) Megawatt Hours Plant Availability Capacity Factor Delivered Generated Q2 2004 89% 47% 43.0 22.1 Q2 2003 87% 48% 38.2 17.5 |
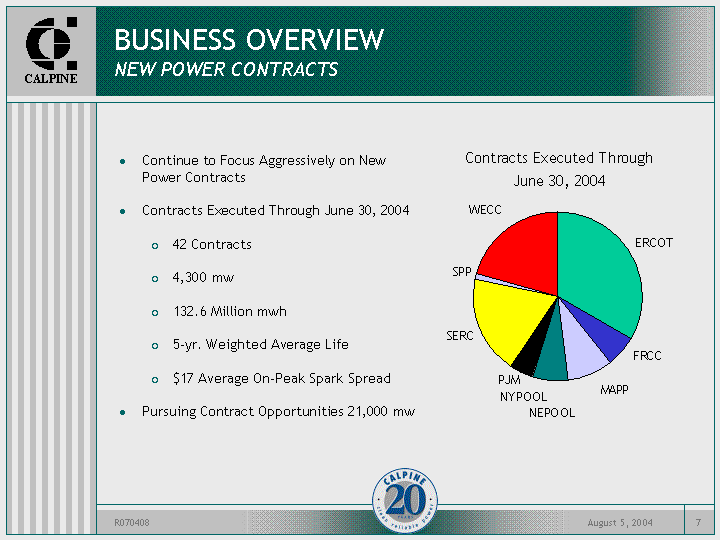
| BUSINESS OVERVIEW NEW POWER CONTRACTS Continue to Focus Aggressively on New Power Contracts Contracts Executed Through June 30, 2004 42 Contracts 4,300 mw 132.6 Million mwh 5-yr. Weighted Average Life $17 Average On-Peak Spark Spread Pursuing Contract Opportunities 21,000 mw ERCOT FRCC MAPP NEPOOL NYPOOL PJM SERC SPP WECC 33.2 6.3 8.5 6.6 0.5 4.4 18.7 1.2 20.6 |
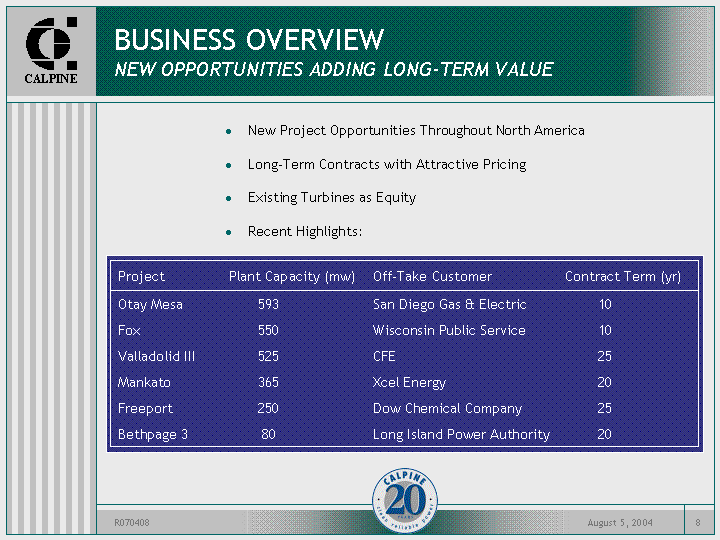
| BUSINESS OVERVIEW NEW OPPORTUNITIES ADDING LONG-TERM VALUE New Project Opportunities Throughout North America Long-Term Contracts with Attractive Pricing Existing Turbines as Equity Recent Highlights: Project Plant Capacity (mw) Off-Take Customer Contract Term (yr) Otay Mesa 593 San Diego Gas & Electric 10 Fox 550 Wisconsin Public Service 10 Valladolid III 525 CFE 25 Mankato 365 Xcel Energy 20 Freeport 250 Dow Chemical Company 25 Bethpage 3 80 Long Island Power Authority 20 |
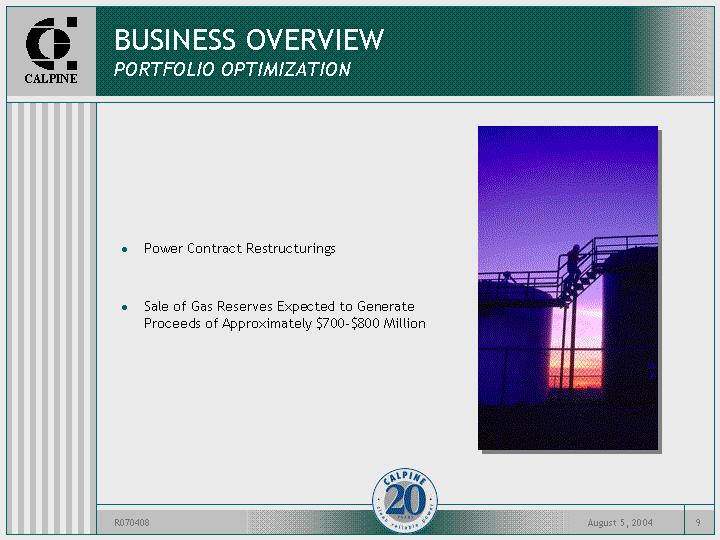
| BUSINESS OVERVIEW PORTFOLIO OPTIMIZATION Power Contract Restructurings Sale of Gas Reserves Expected to Generate Proceeds of Approximately $700-$800 Million |
| FINANCIAL & OPERATING RESULTS 2ND QUARTER 2004 Bob Kelly Executive Vice President and Chief Financial Officer |

| 2nd QTR 2004 FINANCIAL RESULTS KEY FINANCIAL HIGHLIGHTS (In millions, except EPS) (In millions, except EPS) (In millions, except EPS) 2nd Quarter Ended June 30, 2004 6 Months Ended June 30, 2004 Revenue $ 2,314.6 $ 4,357.4 GAAP Net Loss $ (28.7) $ (99.9) GAAP Fully Diluted Earnings Per Share $ (0.07) $ (0.24) Operating Cash Flow $ 185.2 $ 12.0 EBITDA, as Adjusted for Non-Cash and Other Charges(1) $ 445.9 $ 750.6 EBITDA, as Adjusted for Non-Cash and Other Charges to Interest Expense(2) 1.54X 1.36X (1) Earnings Before Interest, Tax, Depreciation and Amortization, as Adjusted for Non-Cash Items; See Appendix A for Reconciliation from Net Loss, Which is the Most Directly Comparable GAAP Measure. (2) Interest Expense Includes One-Third of Operating Lease Expense and Distributions on Trust Preferred Securities. |
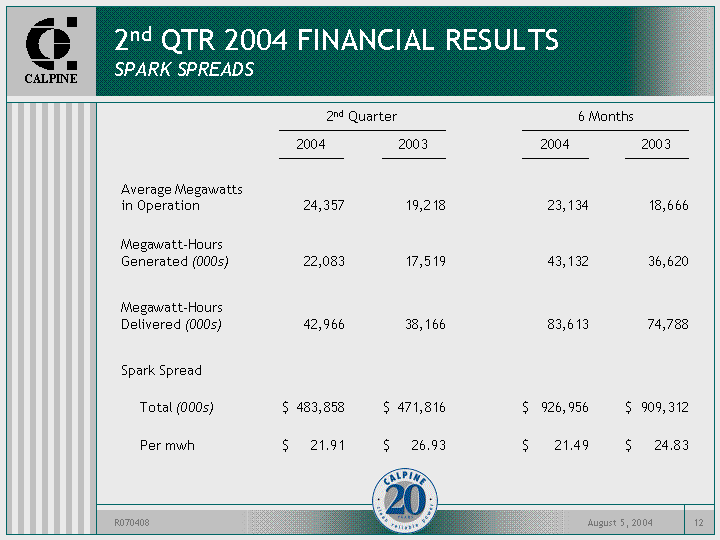
| 2nd QTR 2004 FINANCIAL RESULTS SPARK SPREADS 2nd Quarter 2nd Quarter 2nd Quarter 6 Months 6 Months 6 Months 2004 2003 2004 2003 Average Megawatts in Operation Average Megawatts in Operation 24,357 19,218 23,134 18,666 Megawatt-Hours Generated (000s) Megawatt-Hours Generated (000s) 22,083 17,519 43,132 36,620 Megawatt-Hours Delivered (000s) Megawatt-Hours Delivered (000s) 42,966 38,166 83,613 74,788 Spark Spread Spark Spread Total (000s) $ 483,858 $ 471,816 $ 926,956 $ 909,312 Per mwh $ 21.91 $ 26.93 $ 21.49 $ 24.83 |
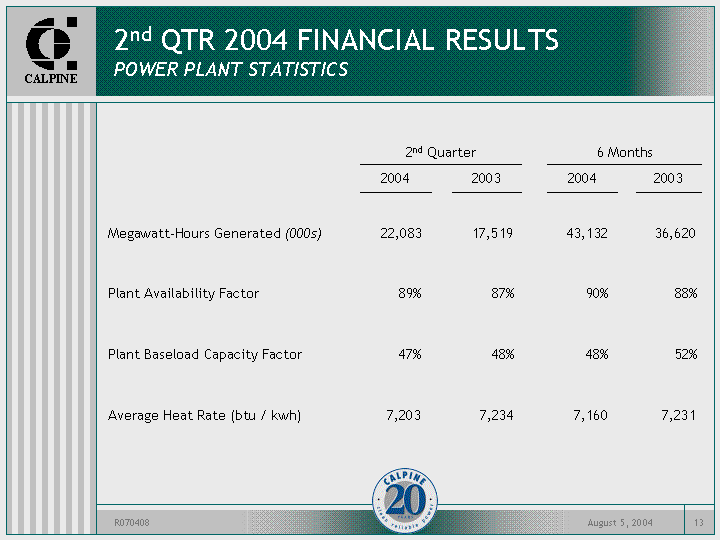
| 2nd QTR 2004 FINANCIAL RESULTS POWER PLANT STATISTICS 2nd Quarter 2nd Quarter 2nd Quarter 6 Months 6 Months 6 Months 2004 2003 2004 2003 Megawatt-Hours Generated (000s) Megawatt-Hours Generated (000s) 22,083 17,519 43,132 36,620 Plant Availability Factor Plant Availability Factor 89% 87% 90% 88% Plant Baseload Capacity Factor Plant Baseload Capacity Factor 47% 48% 48% 52% Average Heat Rate (btu / kwh) Average Heat Rate (btu / kwh) 7,203 7,234 7,160 7,231 |
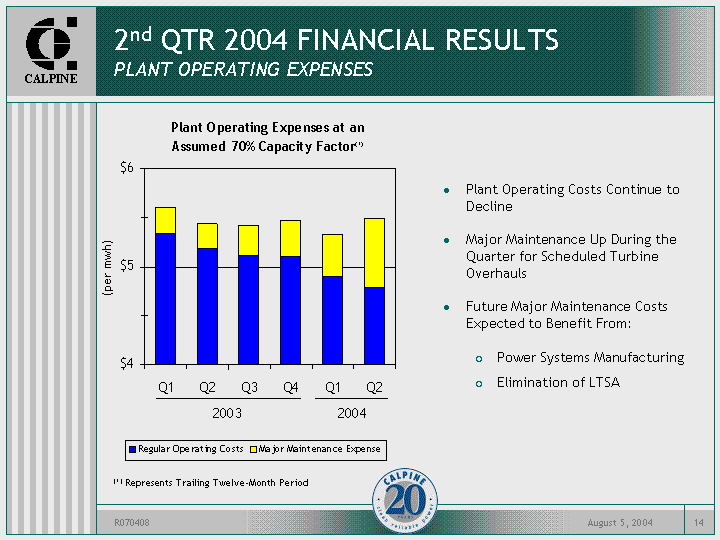
| Q1 Q2 Q3 Q4 Q1 Q2 Regular Operating Costs 5.34 5.19 5.11 5.1 4.9 4.79 Major Maintenance Expense 0.27 0.25 0.31 0.38 0.43 0.7 Plant Operating Costs Continue to Decline Major Maintenance Up During the Quarter for Scheduled Turbine Overhauls Future Major Maintenance Costs Expected to Benefit From: Power Systems Manufacturing Elimination of LTSA 2nd QTR 2004 FINANCIAL RESULTS PLANT OPERATING EXPENSES 2003 2004 (1) Represents Trailing Twelve-Month Period (per mwh) |
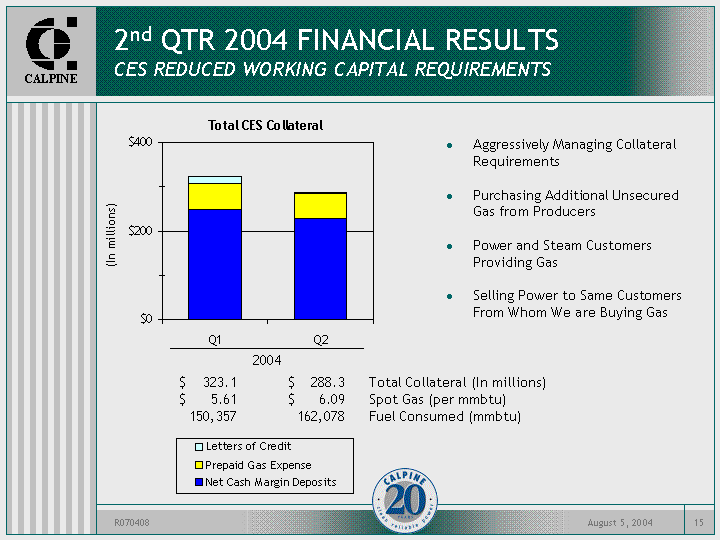
| Q1 Q2 Net Cash Margin Deposits 249.2 227.9 Prepaid 59.4 56.8 Letters of Credit 14.5 3.5 2nd QTR 2004 FINANCIAL RESULTS CES REDUCED WORKING CAPITAL REQUIREMENTS Aggressively Managing Collateral Requirements Purchasing Additional Unsecured Gas from Producers Power and Steam Customers Providing Gas Selling Power to Same Customers From Whom We are Buying Gas 2004 Q2 Q1 Q2 Net Cash Margin Deposits 171.7 249.2 227.9 Prepaid Gas Expense 277.1 59.4 41.2 Letters of Credit 18.6 14.5 4.5 $ 323.1 $ 288.3 Total Collateral (In millions) $ 5.61 $ 6.09 Spot Gas (per mmbtu) 150,357 162,078 Fuel Consumed (mmbtu) (In millions) |
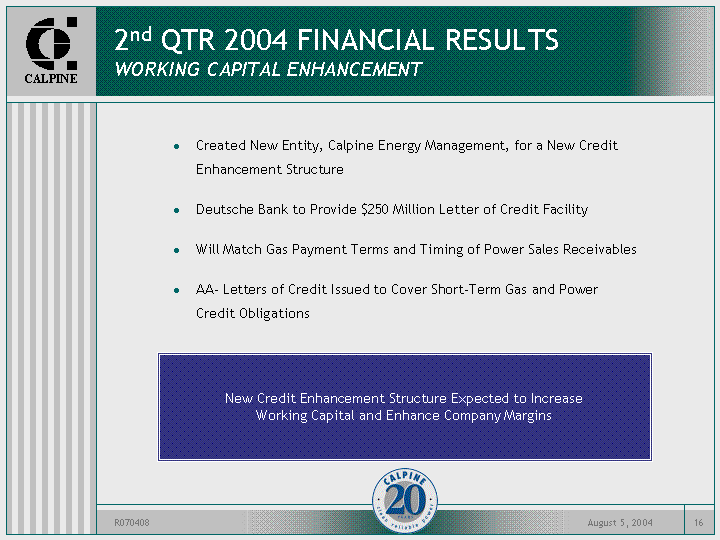
| 2nd QTR 2004 FINANCIAL RESULTS WORKING CAPITAL ENHANCEMENT Created New Entity, Calpine Energy Management, for a New Credit Enhancement Structure Deutsche Bank to Provide $250 Million Letter of Credit Facility Will Match Gas Payment Terms and Timing of Power Sales Receivables AA- Letters of Credit Issued to Cover Short-Term Gas and Power Credit Obligations New Credit Enhancement Structure Expected to Increase Working Capital and Enhance Company Margins |

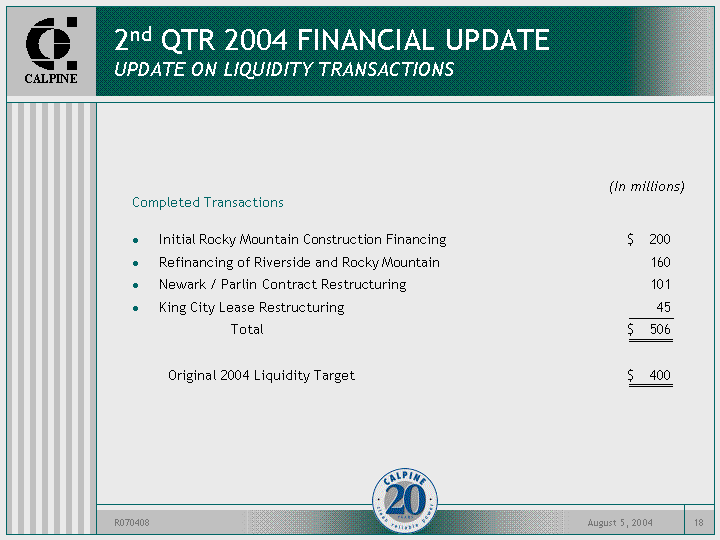
| Completed Transactions Initial Rocky Mountain Construction Financing $ 200 Refinancing of Riverside and Rocky Mountain 160 Newark / Parlin Contract Restructuring 101 King City Lease Restructuring 45 Total $ 506 Original 2004 Liquidity Target $ 400 2nd QTR 2004 FINANCIAL UPDATE UPDATE ON LIQUIDITY TRANSACTIONS (In millions) |
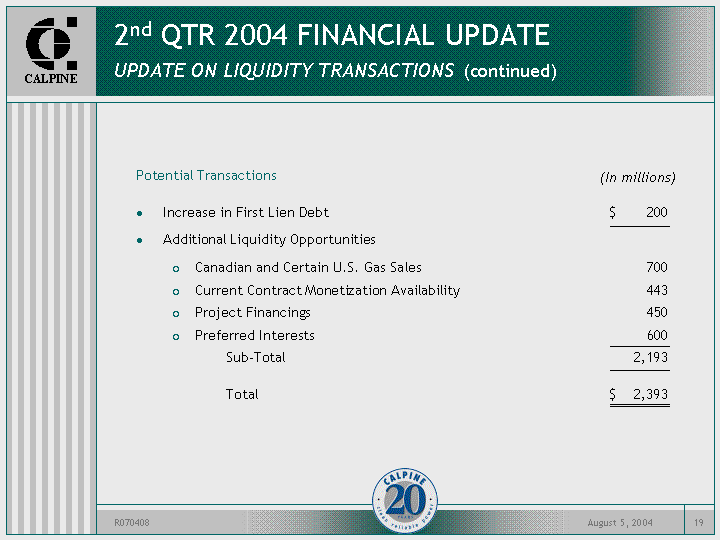
| Potential Transactions Increase in First Lien Debt $ 200 Additional Liquidity Opportunities Canadian and Certain U.S. Gas Sales 700 Current Contract Monetization Availability 443 Project Financings 450 Preferred Interests 600 Sub-Total 2,193 Total $ 2,393 2nd QTR 2004 FINANCIAL UPDATE UPDATE ON LIQUIDITY TRANSACTIONS (continued) (In millions) |
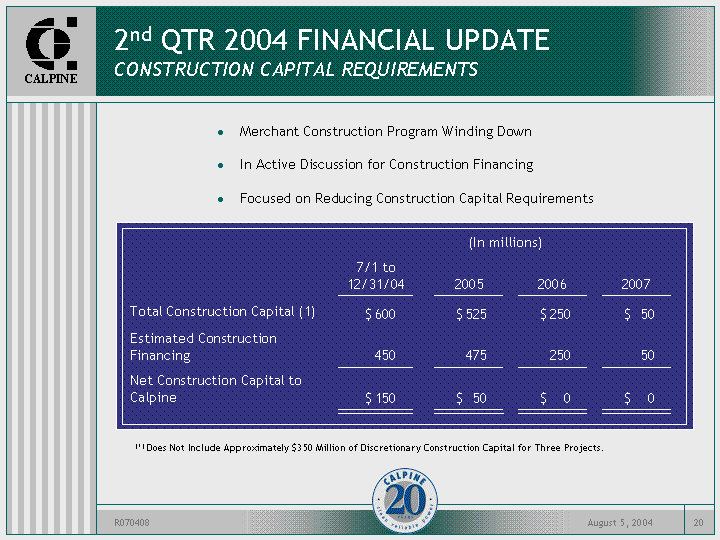
| 2nd QTR 2004 FINANCIAL UPDATE CONSTRUCTION CAPITAL REQUIREMENTS Merchant Construction Program Winding Down In Active Discussion for Construction Financing Focused on Reducing Construction Capital Requirements (In millions) (In millions) (In millions) (In millions) (In millions) (In millions) (In millions) 7/1 to 12/31/04 2005 2006 2007 Total Construction Capital (1) $ 600 $ 525 $ 250 $ 50 Estimated Construction Financing 450 475 250 50 Net Construction Capital to Calpine $ 150 $ 50 $ 0 $ 0 (1) Does Not Include Approximately $350 Million of Discretionary Construction Capital for Three Projects. |
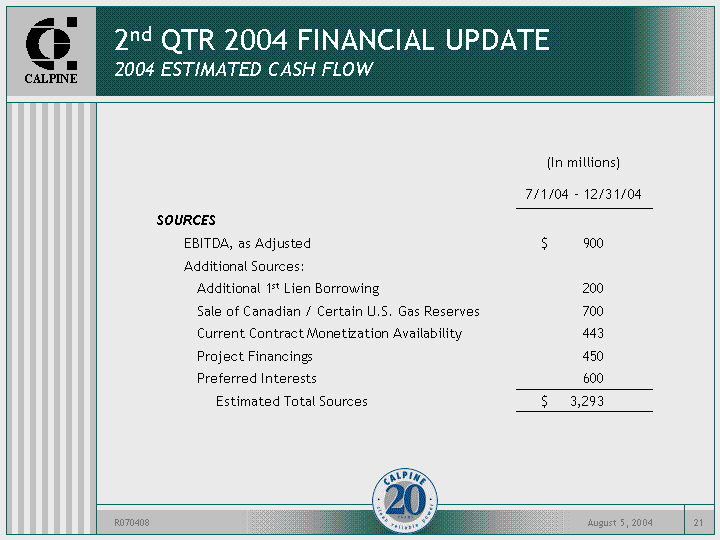
| 2nd QTR 2004 FINANCIAL UPDATE 2004 ESTIMATED CASH FLOW (In millions) 7/1/04 - 12/31/04 SOURCES EBITDA, as Adjusted $ 900 Additional Sources: Additional 1st Lien Borrowing 200 Sale of Canadian / Certain U.S. Gas Reserves 700 Current Contract Monetization Availability 443 Project Financings 450 Preferred Interests 600 Estimated Total Sources $ 3,293 |
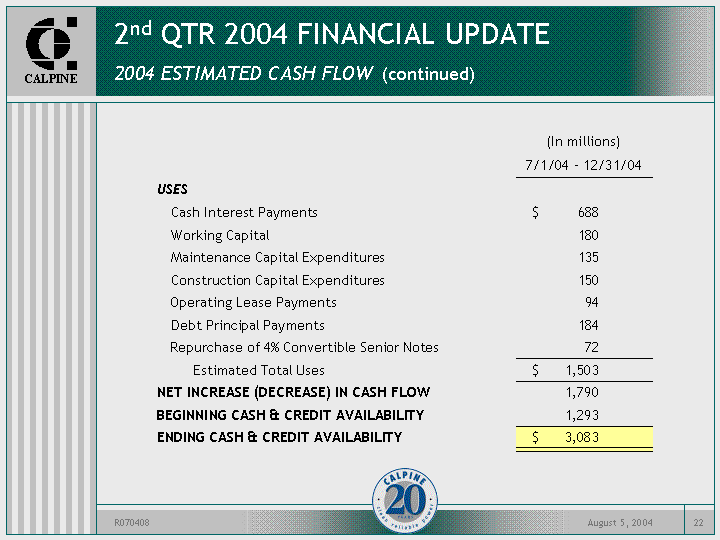
| 2nd QTR 2004 FINANCIAL UPDATE 2004 ESTIMATED CASH FLOW (continued) (In millions) 7/1/04 - 12/31/04 USES Cash Interest Payments $ 688 Working Capital 180 Maintenance Capital Expenditures 135 Construction Capital Expenditures 150 Operating Lease Payments 94 Debt Principal Payments 184 Repurchase of 4% Convertible Senior Notes 72 Estimated Total Uses $ 1,503 NET INCREASE (DECREASE) IN CASH FLOW 1,790 BEGINNING CASH & CREDIT AVAILABILITY 1,293 ENDING CASH & CREDIT AVAILABILITY $ 3,083 |
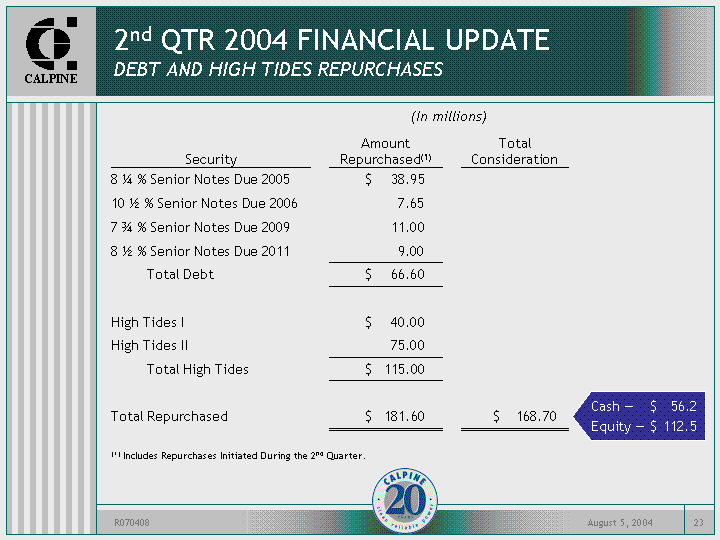
| (In millions) (In millions) (In millions) Security Amount Repurchased(1) Total Consideration 8 1/4 % Senior Notes Due 2005 $ 38.95 10 1/2 % Senior Notes Due 2006 7.65 7 3/4 % Senior Notes Due 2009 11.00 8 1/2 % Senior Notes Due 2011 9.00 Total Debt $ 66.60 High Tides I $ 40.00 High Tides II 75.00 Total High Tides $ 115.00 Total Repurchased $ 181.60 $ 168.70 2nd QTR 2004 FINANCIAL UPDATE DEBT AND HIGH TIDES REPURCHASES Cash - $ 56.2 Equity - $ 112.5 (1) Includes Repurchases Initiated During the 2nd Quarter. |
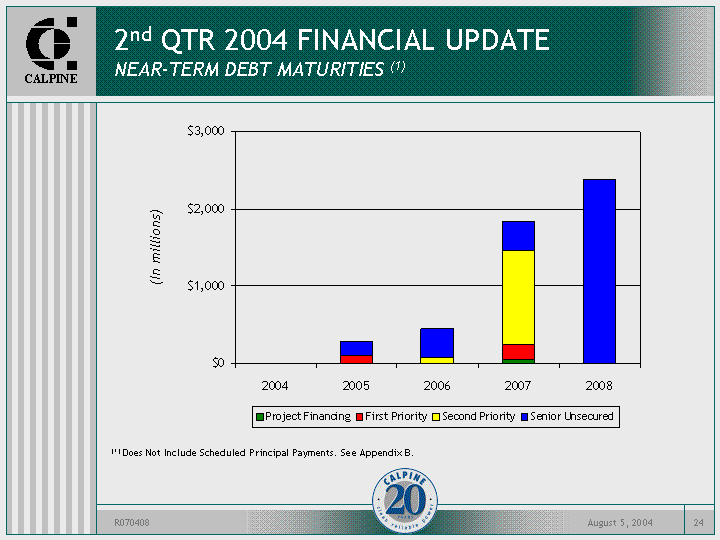
| 2nd QTR 2004 FINANCIAL UPDATE NEAR-TERM DEBT MATURITIES (1) 2004 2005 2006 2007 2008 Project Financing 54.5 First Priority 100 193.5 Second Priority 72.1 1209.3 Senior Unsecured 186.1 373.6 374.8 2379.9 (In millions) (1) Does Not Include Scheduled Principal Payments. See Appendix B. |
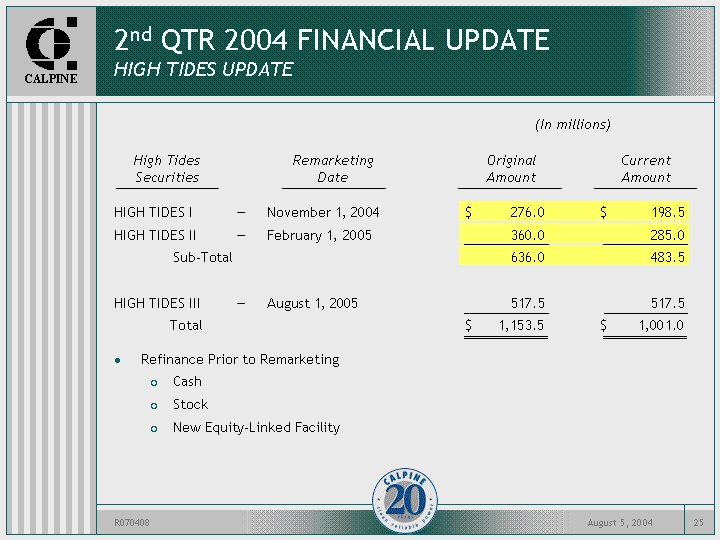
| HIGH TIDES I - November 1, 2004 $ 276.0 $ 198.5 HIGH TIDES II - February 1, 2005 360.0 285.0 Sub-Total 636.0 483.5 HIGH TIDES III - August 1, 2005 517.5 517.5 Total $ 1,153.5 $ 1,001.0 Refinance Prior to Remarketing Cash Stock New Equity-Linked Facility 2nd QTR 2004 FINANCIAL UPDATE HIGH TIDES UPDATE (In millions) High Tides Securities Remarketing Date Original Amount Current Amount |
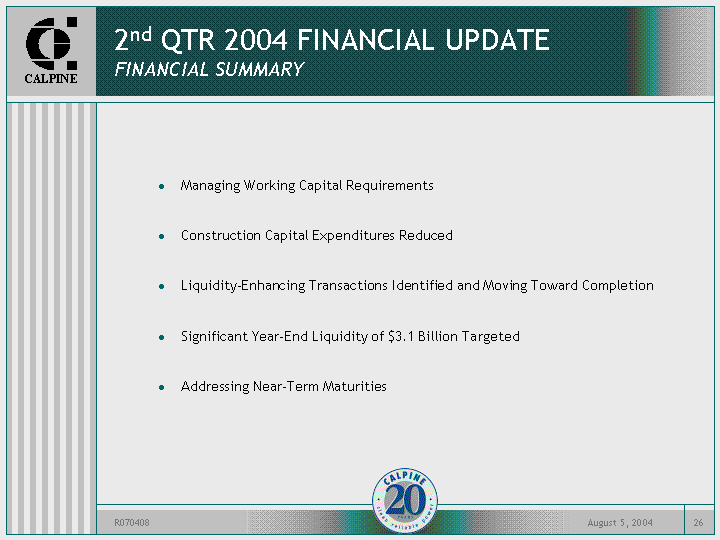
| Managing Working Capital Requirements Construction Capital Expenditures Reduced Liquidity-Enhancing Transactions Identified and Moving Toward Completion Significant Year-End Liquidity of $3.1 Billion Targeted Addressing Near-Term Maturities 2nd QTR 2004 FINANCIAL UPDATE FINANCIAL SUMMARY |

| QUESTION AND ANSWER SESSION |
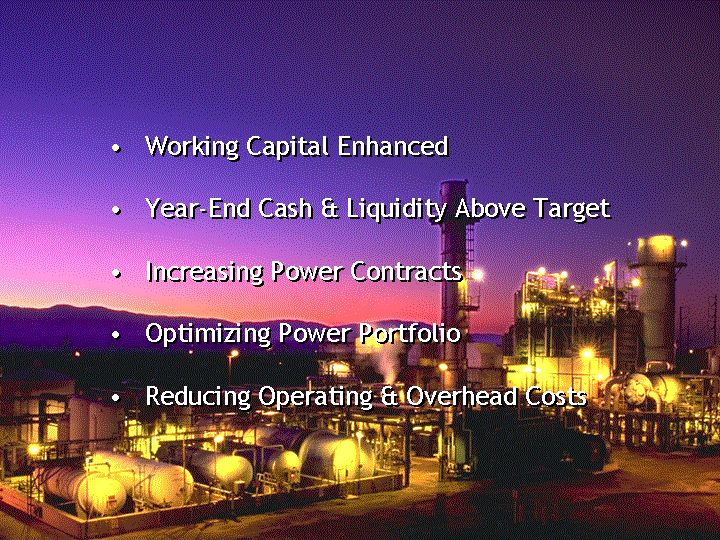
| Working Capital Enhanced Year-End Cash & Liquidity Above Target Increasing Power Contracts Optimizing Power Portfolio Reducing Operating & Overhead Costs |

| APPENDIX A: GAAP NET INCOME TO EBITDA, AS ADJUSTED FOR NON-CASH AND OTHER CHARGES |
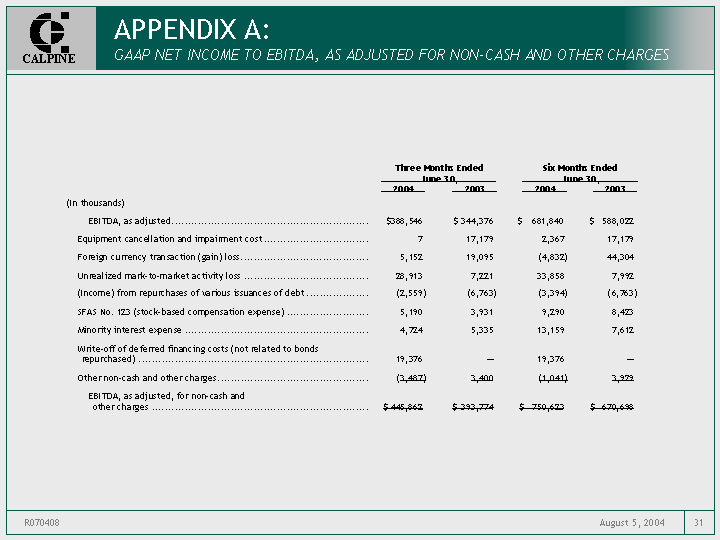
| APPENDIX A: GAAP NET INCOME TO EBITDA, AS ADJUSTED FOR NON-CASH AND OTHER CHARGES |
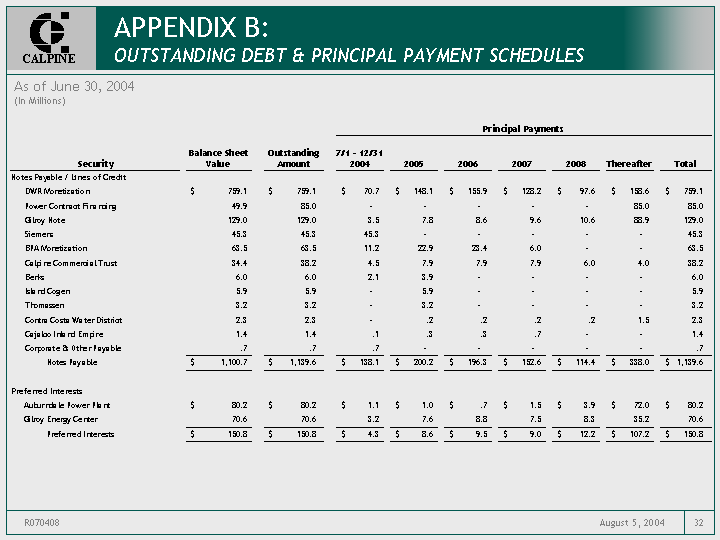
| APPENDIX B: OUTSTANDING DEBT & PRINCIPAL PAYMENT SCHEDULES As of June 30, 2004 (In Millions) Principal Payments Principal Payments Principal Payments Principal Payments Principal Payments Principal Payments Principal Payments Principal Payments Principal Payments Principal Payments Principal Payments Principal Payments Principal Payments Security Balance Sheet Value Outstanding Amount 7/1 - 12/31 2004 2005 2006 2007 2008 Thereafter Total Notes Payable / Lines of Credit DWR Monetization $ 759.1 $ 759.1 $ 70.7 $ 148.1 $ 155.9 $ 128.2 $ 97.6 $ 158.6 $ 759.1 Power Contract Financing 49.9 85.0 - - - - - 85.0 85.0 Gilroy Note 129.0 129.0 3.5 7.8 8.6 9.6 10.6 88.9 129.0 Siemens 45.3 45.3 45.3 - - - - - 45.3 BPA Monetization 63.5 63.5 11.2 22.9 23.4 6.0 - - 63.5 Calpine Commercial Trust 34.4 38.2 4.5 7.9 7.9 7.9 6.0 4.0 38.2 Berks 6.0 6.0 2.1 3.9 - - - - 6.0 Island Cogen 5.9 5.9 - 5.9 - - - - 5.9 Thomassen 3.2 3.2 - 3.2 - - - - 3.2 Contra Costa Water District 2.3 2.3 - .2 .2 .2 .2 1.5 2.3 Cajalco Inland Empire 1.4 1.4 .1 .3 .3 .7 - - 1.4 Corporate & Other Payable .7 .7 .7 - - - - - .7 Notes Payable $ 1,100.7 $ 1,139.6 $ 138.1 $ 200.2 $ 196.3 $ 152.6 $ 114.4 $ 338.0 $ 1,139.6 Preferred Interests Auburndale Power Plant $ 80.2 $ 80.2 $ 1.1 $ 1.0 $ .7 $ 1.5 $ 3.9 $ 72.0 $ 80.2 Gilroy Energy Center 70.6 70.6 3.2 7.6 8.8 7.5 8.3 35.2 70.6 Preferred Interests $ 150.8 $ 150.8 $ 4.3 $ 8.6 $ 9.5 $ 9.0 $ 12.2 $ 107.2 $ 150.8 |
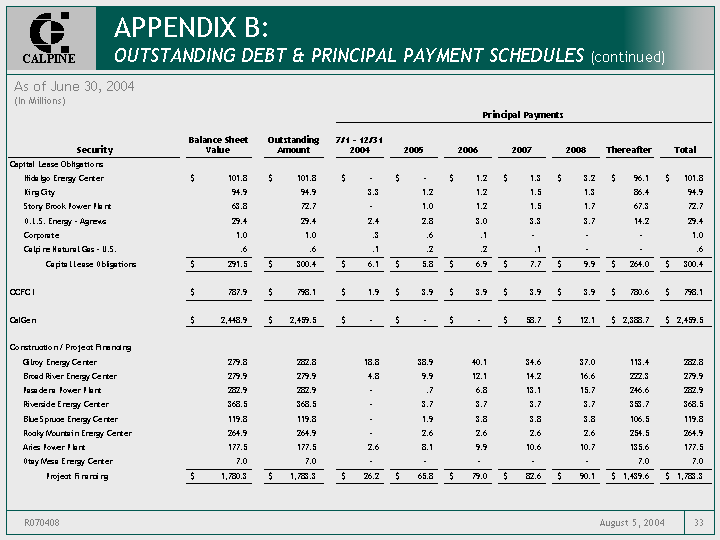
| APPENDIX B: OUTSTANDING DEBT & PRINCIPAL PAYMENT SCHEDULES (continued) As of June 30, 2004 (In Millions) Principal Payments Principal Payments Principal Payments Principal Payments Principal Payments Principal Payments Principal Payments Principal Payments Principal Payments Principal Payments Principal Payments Principal Payments Principal Payments Security Balance Sheet Value Outstanding Amount 7/1 - 12/31 2004 2005 2006 2007 2008 Thereafter Total Capital Lease Obligations Hidalgo Energy Center $ 101.8 $ 101.8 $ - $ - $ 1.2 $ 1.3 $ 3.2 $ 96.1 $ 101.8 King City 94.9 94.9 3.3 1.2 1.2 1.5 1.3 86.4 94.9 Stony Brook Power Plant 63.8 72.7 - 1.0 1.2 1.5 1.7 67.3 72.7 O.L.S. Energy - Agnews 29.4 29.4 2.4 2.8 3.0 3.3 3.7 14.2 29.4 Corporate 1.0 1.0 .3 .6 .1 - - - 1.0 Calpine Natural Gas - U.S. .6 .6 .1 .2 .2 .1 - - .6 Capital Lease Obligations $ 291.5 $ 300.4 $ 6.1 $ 5.8 $ 6.9 $ 7.7 $ 9.9 $ 264.0 $ 300.4 CCFC I $ 787.9 $ 798.1 $ 1.9 $ 3.9 $ 3.9 $ 3.9 $ 3.9 $ 780.6 $ 798.1 CalGen $ 2,448.9 $ 2,459.5 $ - $ - $ - $ 58.7 $ 12.1 $ 2,388.7 $ 2,459.5 Construction / Project Financing Gilroy Energy Center 279.8 282.8 18.8 38.9 40.1 34.6 37.0 113.4 282.8 Broad River Energy Center 279.9 279.9 4.8 9.9 12.1 14.2 16.6 222.3 279.9 Pasadena Power Plant 282.9 282.9 - .7 6.8 13.1 15.7 246.6 282.9 Riverside Energy Center 368.5 368.5 - 3.7 3.7 3.7 3.7 353.7 368.5 Blue Spruce Energy Center 119.8 119.8 - 1.9 3.8 3.8 3.8 106.5 119.8 Rocky Mountain Energy Center 264.9 264.9 - 2.6 2.6 2.6 2.6 254.5 264.9 Aries Power Plant 177.5 177.5 2.6 8.1 9.9 10.6 10.7 135.6 177.5 Otay Mesa Energy Center 7.0 7.0 - - - - - 7.0 7.0 Project Financing $ 1,780.3 $ 1,783.3 $ 26.2 $ 65.8 $ 79.0 $ 82.6 $ 90.1 $ 1,439.6 $ 1,783.3 |
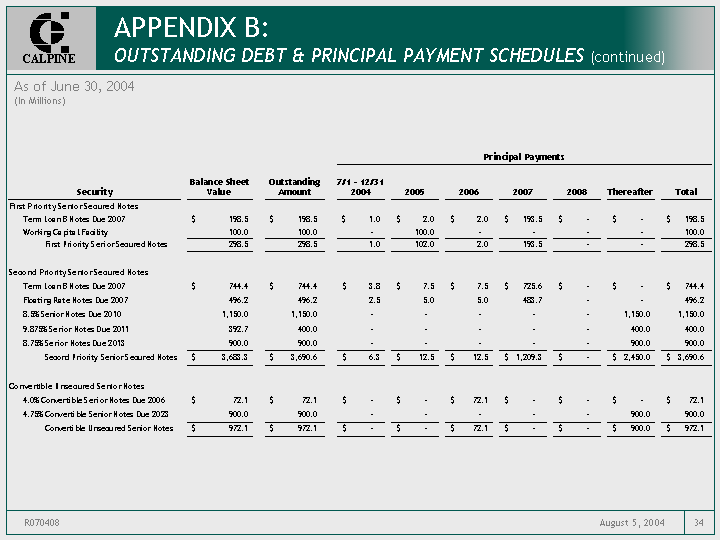
| As of June 30, 2004 (In Millions) Principal Payments Principal Payments Principal Payments Principal Payments Principal Payments Principal Payments Principal Payments Principal Payments Principal Payments Principal Payments Principal Payments Principal Payments Principal Payments Security Balance Sheet Value Outstanding Amount 7/1 - 12/31 2004 2005 2006 2007 2008 Thereafter Total First Priority Senior Secured Notes Term Loan B Notes Due 2007 $ 198.5 $ 198.5 $ 1.0 $ 2.0 $ 2.0 $ 193.5 $ - $ - $ 198.5 Working Capital Facility 100.0 100.0 - 100.0 - - - - 100.0 First Priority Senior Secured Notes 298.5 298.5 1.0 102.0 2.0 193.5 - - 298.5 Second Priority Senior Secured Notes Term Loan B Notes Due 2007 $ 744.4 $ 744.4 $ 3.8 $ 7.5 $ 7.5 $ 725.6 $ - $ - $ 744.4 Floating Rate Notes Due 2007 496.2 496.2 2.5 5.0 5.0 483.7 - - 496.2 8.5% Senior Notes Due 2010 1,150.0 1,150.0 - - - - - 1,150.0 1,150.0 9.875% Senior Notes Due 2011 392.7 400.0 - - - - - 400.0 400.0 8.75% Senior Notes Due 2013 900.0 900.0 - - - - - 900.0 900.0 Second Priority Senior Secured Notes $ 3,683.3 $ 3,690.6 $ 6.3 $ 12.5 $ 12.5 $ 1,209.3 $ - $ 2,450.0 $ 3,690.6 Convertible Unsecured Senior Notes 4.0% Convertible Senior Notes Due 2006 $ 72.1 $ 72.1 $ - $ - $ 72.1 $ - $ - $ - $ 72.1 4.75% Convertible Senior Notes Due 2023 900.0 900.0 - - - - - 900.0 900.0 Convertible Unsecured Senior Notes $ 972.1 $ 972.1 $ - $ - $ 72.1 $ - $ - $ 900.0 $ 972.1 APPENDIX B: OUTSTANDING DEBT & PRINCIPAL PAYMENT SCHEDULES (continued) |

| As of June 30, 2004 (In Millions) Principal Payments Principal Payments Principal Payments Principal Payments Principal Payments Principal Payments Principal Payments Principal Payments Principal Payments Principal Payments Principal Payments Principal Payments Principal Payments Security Balance Sheet Value Outstanding Amount 7/1 - 12/31 2004 2005 2006 2007 2008 Thereafter Total Unsecured Senior Notes 8.25% Senior Notes Due 2005 $ 185.9 $ 186.1 $ - $ 186.1 $ - $ - $ - $ - $ 186.1 7.625% Senior Notes Due 2006 214.6 214.7 - - 214.7 - - - 214.7 10.5% Senior Notes Due 2006 158.9 158.9 - - 158.9 - - - 158.9 8.75% Senior Notes Due 2007 148.1 148.7 - - - 148.7 - - 148.7 8.75% Senior Notes Due 2007 226.1 226.1 - - - 226.1 - - 226.1 7.875% Senior Notes Due 2008 305.4 305.7 - - - - 305.7 - 305.7 8.375% Senior Notes Due 2008 147.5 147.5 - - - - 147.5 - 147.5 8.5% Senior Notes Due 2008 1,925.3 1,926.7 - - - - 1,926.7 - 1,926.7 7.75% Senior Notes Due 2009 221.5 221.6 - - - - - 221.6 221.6 8.625% Senior Notes Due 2010 496.9 497.3 - - - - - 497.3 497.3 8.5% Senior Notes Due 2011 1,155.3 1,196.5 - - - - - 1,196.5 1,196.5 8.875% Senior Notes Due 2011 218.1 219.5 - - - - - 219.5 219.5 Unsecured Senior Notes $ 5,403.6 $ 5,449.3 $ - $ 186.1 $ 373.6 $ 374.8 $ 2,379.9 $ 2,134.9 $ 5,449.3 Notes Payable to Calpine Capital Trust(1) $ 1,153.5 $ 1,001.0 $ - $ - $ - $ - $ - $ 1,001.0 $ 1,001.0 Total Debt $ 18,071.1 $ 18,043.2 $ 183.9 $ 584.9 $ 755.8 $ 2,092.1 $ 2,622.5 $ 11,804.0 $ 18,043.2 Scheduled Principal Payments $ 183.9 $ 298.8 $ 310.1 $ 260.0 $ 242.6 Final Principal Payments 0.0 286.1 445.7 1,832.1 2,379.9 Total $ 183.9 $ 584.9 $ 755.8 $ 2,092.1 $ 2,622.5 (1) Repurchased High Tides are Reflected on Balance Sheet in Other Assets as Available for Sale Securities. APPENDIX B: OUTSTANDING DEBT & PRINCIPAL PAYMENT SCHEDULES (continued) |
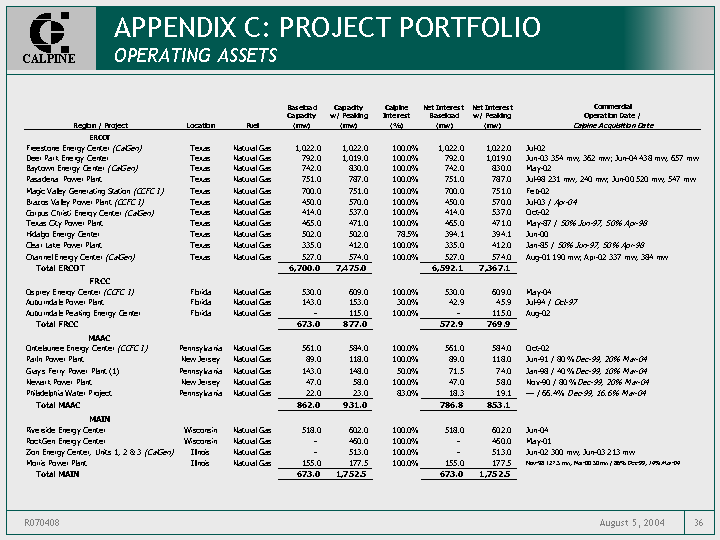
| APPENDIX C: PROJECT PORTFOLIO OPERATING ASSETS |
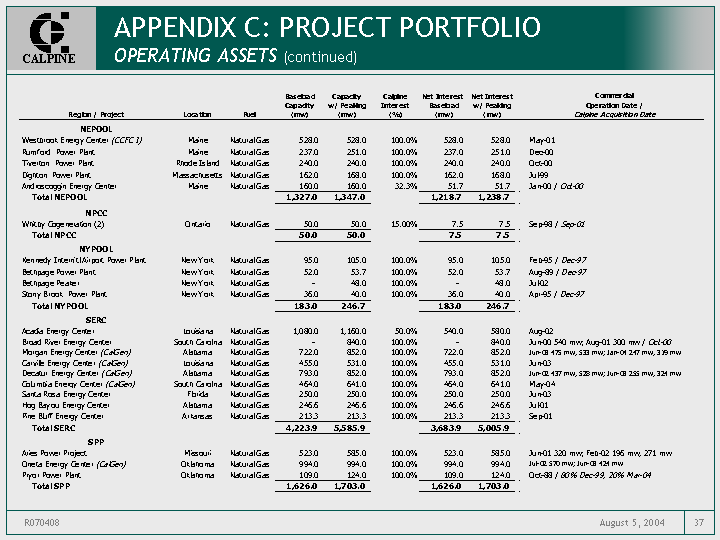
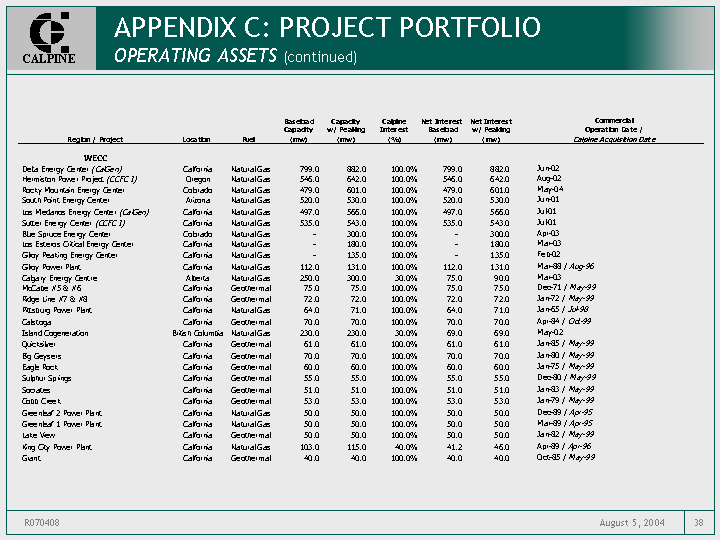
| APPENDIX C: PROJECT PORTFOLIO OPERATING ASSETS (continued) |
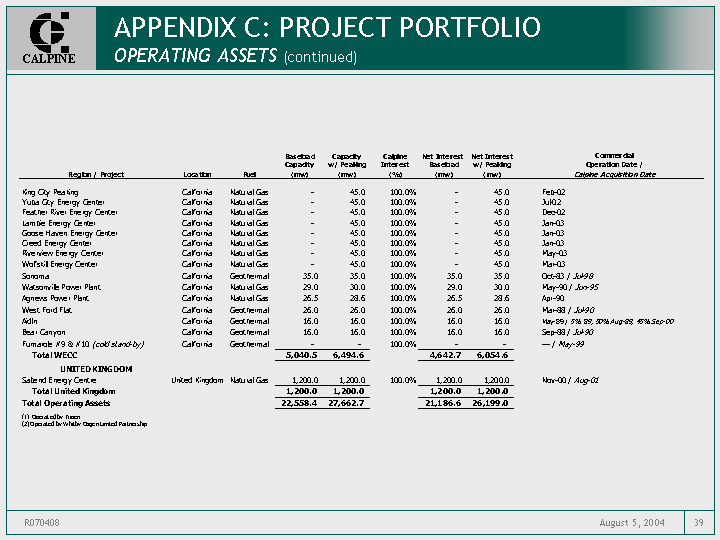
| APPENDIX C: PROJECT PORTFOLIO OPERATING ASSETS (continued) |
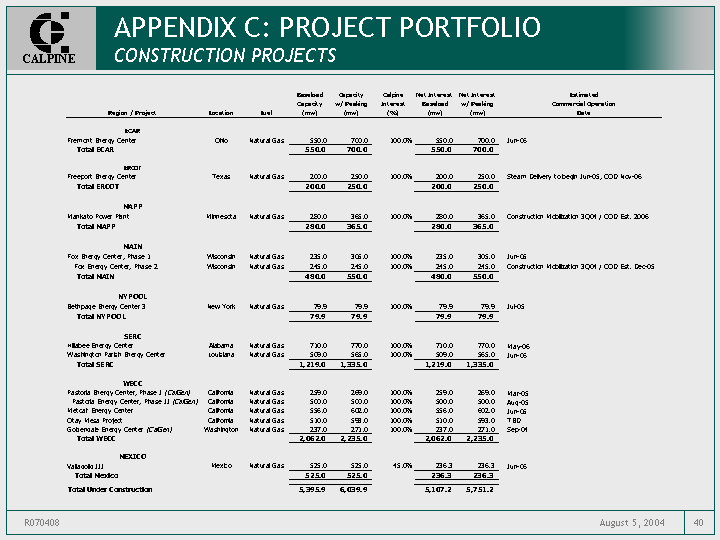
| APPENDIX C: PROJECT PORTFOLIO OPERATING ASSETS (continued) |
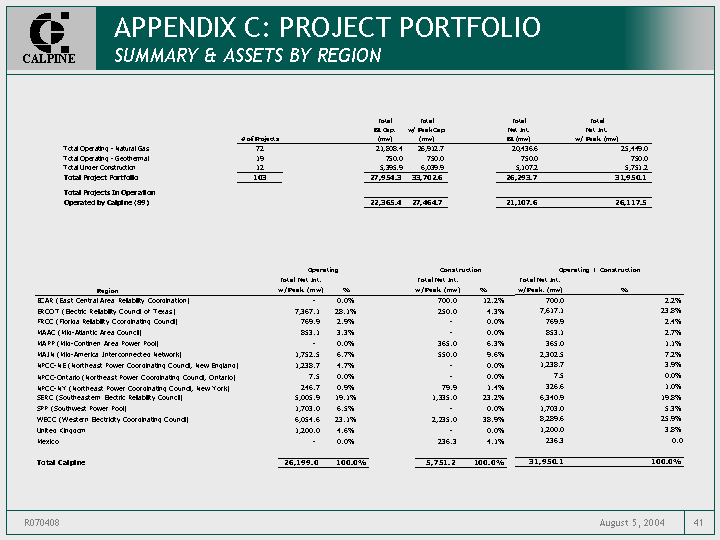
| APPENDIX C: PROJECT PORTFOLIO CONSTRUCTION PROJECTS |
| APPENDIX C: PROJECT PORTFOLIO SUMMARY & ASSETS BY REGION |
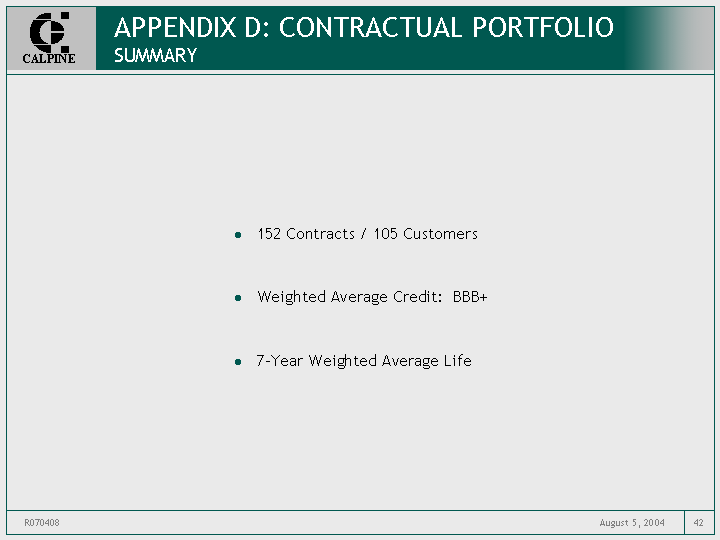
| APPENDIX D: CONTRACTUAL PORTFOLIO SUMMARY 152 Contracts / 105 Customers Weighted Average Credit: BBB+ 7-Year Weighted Average Life |
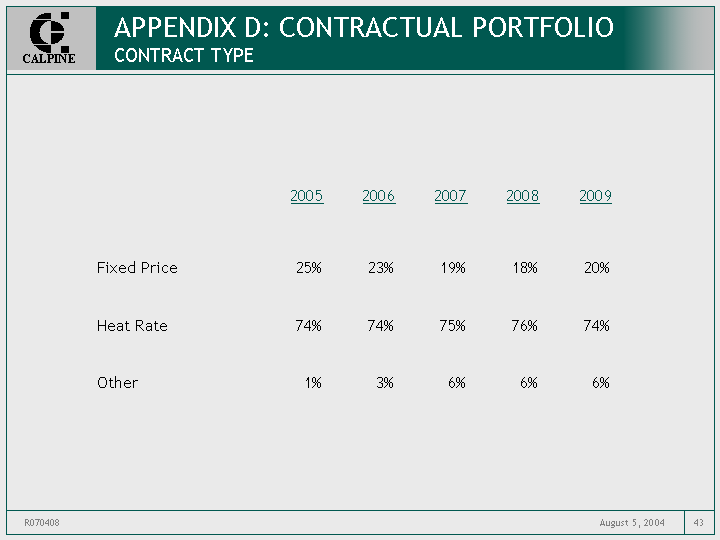
| APPENDIX D: CONTRACTUAL PORTFOLIO CONTRACT TYPE 2005 2006 2007 2008 2009 Fixed Price 25% 23% 19% 18% 20% Heat Rate 74% 74% 75% 76% 74% Other 1% 3% 6% 6% 6% |
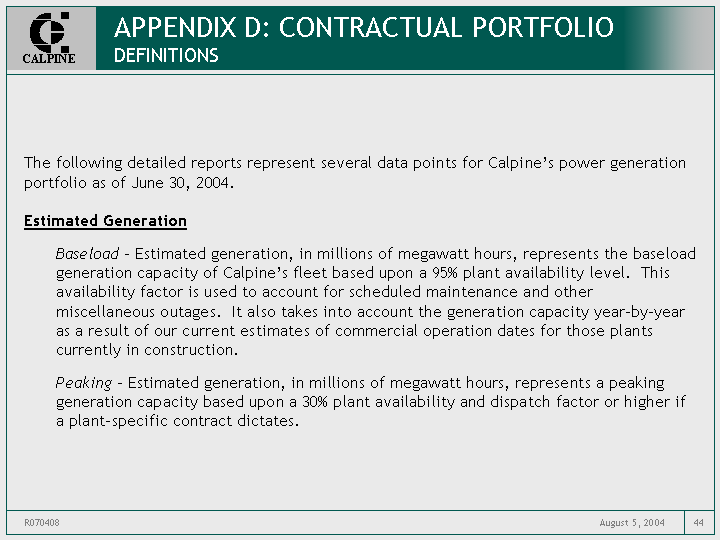
| APPENDIX D: CONTRACTUAL PORTFOLIO DEFINITIONS The following detailed reports represent several data points for Calpine's power generation portfolio as of June 30, 2004. Estimated Generation Baseload - Estimated generation, in millions of megawatt hours, represents the baseload generation capacity of Calpine's fleet based upon a 95% plant availability level. This availability factor is used to account for scheduled maintenance and other miscellaneous outages. It also takes into account the generation capacity year-by-year as a result of our current estimates of commercial operation dates for those plants currently in construction. Peaking - Estimated generation, in millions of megawatt hours, represents a peaking generation capacity based upon a 30% plant availability and dispatch factor or higher if a plant-specific contract dictates. |
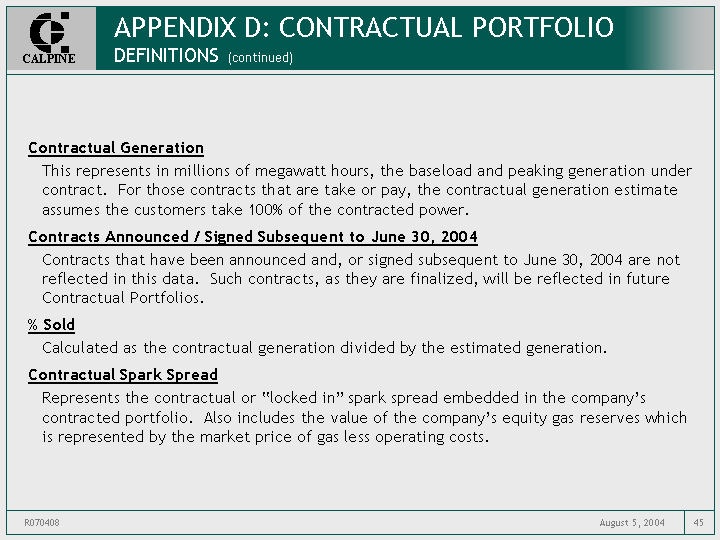
| APPENDIX D: CONTRACTUAL PORTFOLIO DEFINITIONS (continued) Contractual Generation This represents in millions of megawatt hours, the baseload and peaking generation under contract. For those contracts that are take or pay, the contractual generation estimate assumes the customers take 100% of the contracted power. Contracts Announced / Signed Subsequent to June 30, 2004 Contracts that have been announced and, or signed subsequent to June 30, 2004 are not reflected in this data. Such contracts, as they are finalized, will be reflected in future Contractual Portfolios. % Sold Calculated as the contractual generation divided by the estimated generation. Contractual Spark Spread Represents the contractual or "locked in" spark spread embedded in the company's contracted portfolio. Also includes the value of the company's equity gas reserves which is represented by the market price of gas less operating costs. |

| APPENDIX D: CONTRACTUAL PORTFOLIO TOTAL 2005 2006 2007 2008 2009 Estimated Generation (In Millions of mwh) - Baseload 185.3 207.6 215.3 215.9 215.3 - Peaking 25.5 26.6 27.0 27.0 27.0 Total 210.8 234.2 242.3 242.9 242.3 Contractual Generation (In Millions of mwh) - Baseload 77.9 62.7 51.9 49.8 47.1 - Peaking 19.2 18.9 18.7 18.1 15.0 Total 97.1 81.6 70.6 67.9 62.1 % Sold - Baseload 42% 30% 24% 23% 22% - Peaking 77% 71% 69% 67% 56% Total 46% 35% 29% 28% 26% Contractual Spark Spread $2,025 $1,866 $1,600 $1,540 $1,446 (In Millions) Data as of 6/30/04 |

| APPENDIX D: CONTRACTUAL PORTFOLIO WECC Estimated Generation (In Millions of mwh) - Baseload 49.5 56.0 58.1 58.2 58.1 - Peaking 6.7 6.9 7.0 7.0 7.0 Total 56.2 62.9 65.1 65.2 65.1 Contractual Generation (In Millions of mwh) - Baseload 28.6 26.1 24.1 24.2 23.3 - Peaking 4.9 4.2 4.1 4.1 4.1 Total 33.5 30.3 28.2 28.3 27.4 % Sold - Baseload 58% 47% 42% 42% 40% - Peaking 74% 61% 58% 58% 58% Total 60% 48% 43% 43% 42% 2005 2006 2007 2008 2009 Data as of 6/30/04 |
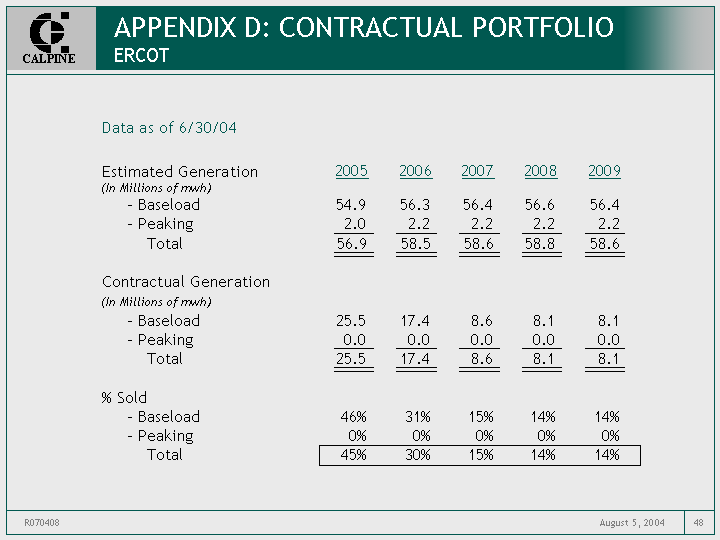
| APPENDIX D: CONTRACTUAL PORTFOLIO ERCOT Estimated Generation (In Millions of mwh) - Baseload 54.9 56.3 56.4 56.6 56.4 - Peaking 2.0 2.2 2.2 2.2 2.2 Total 56.9 58.5 58.6 58.8 58.6 Contractual Generation (In Millions of mwh) - Baseload 25.5 17.4 8.6 8.1 8.1 - Peaking 0.0 0.0 0.0 0.0 0.0 Total 25.5 17.4 8.6 8.1 8.1 % Sold - Baseload 46% 31% 15% 14% 14% - Peaking 0% 0% 0% 0% 0% Total 45% 30% 15% 14% 14% 2005 2006 2007 2008 2009 Data as of 6/30/04 |
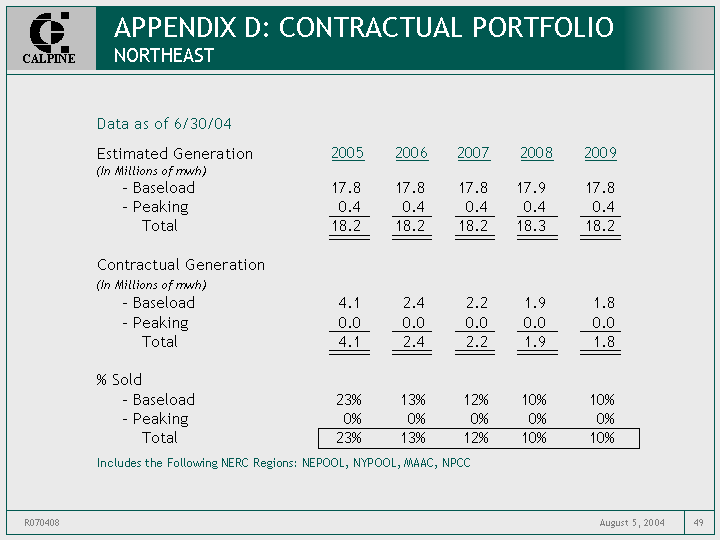
| APPENDIX D: CONTRACTUAL PORTFOLIO NORTHEAST Estimated Generation (In Millions of mwh) - Baseload 17.8 17.8 17.8 17.9 17.8 - Peaking 0.4 0.4 0.4 0.4 0.4 Total 18.2 18.2 18.2 18.3 18.2 Contractual Generation (In Millions of mwh) - Baseload 4.1 2.4 2.2 1.9 1.8 - Peaking 0.0 0.0 0.0 0.0 0.0 Total 4.1 2.4 2.2 1.9 1.8 % Sold - Baseload 23% 13% 12% 10% 10% - Peaking 0% 0% 0% 0% 0% Total 23% 13% 12% 10% 10% 2005 2006 2007 2008 2009 Data as of 6/30/04 Includes the Following NERC Regions: NEPOOL, NYPOOL, MAAC, NPCC |
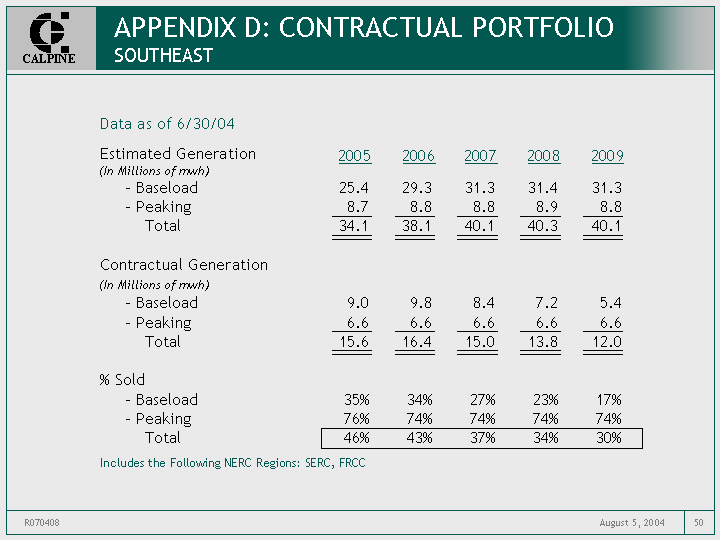
| APPENDIX D: CONTRACTUAL PORTFOLIO SOUTHEAST Estimated Generation (In Millions of mwh) - Baseload 25.4 29.3 31.3 31.4 31.3 - Peaking 8.7 8.8 8.8 8.9 8.8 Total 34.1 38.1 40.1 40.3 40.1 Contractual Generation (In Millions of mwh) - Baseload 9.0 9.8 8.4 7.2 5.4 - Peaking 6.6 6.6 6.6 6.6 6.6 Total 15.6 16.4 15.0 13.8 12.0 % Sold - Baseload 35% 34% 27% 23% 17% - Peaking 76% 74% 74% 74% 74% Total 46% 43% 37% 34% 30% 2005 2006 2007 2008 2009 Data as of 6/30/04 Includes the Following NERC Regions: SERC, FRCC |
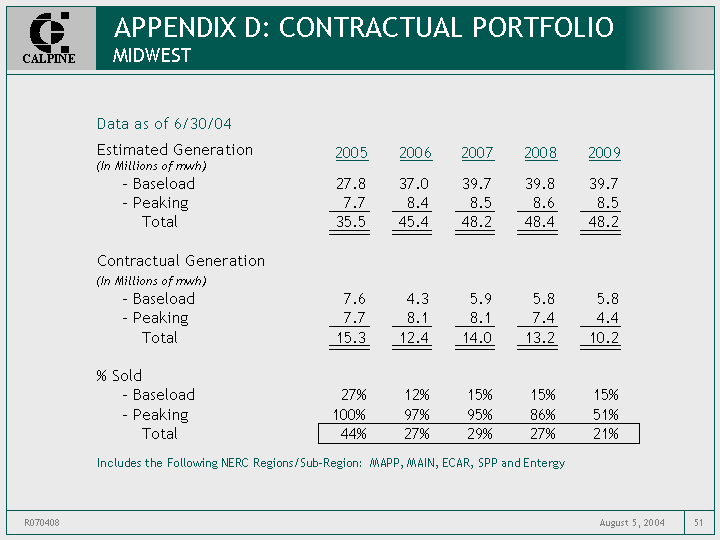
| APPENDIX D: CONTRACTUAL PORTFOLIO MIDWEST Estimated Generation (In Millions of mwh) - Baseload 27.8 37.0 39.7 39.8 39.7 - Peaking 7.7 8.4 8.5 8.6 8.5 Total 35.5 45.4 48.2 48.4 48.2 Contractual Generation (In Millions of mwh) - Baseload 7.6 4.3 5.9 5.8 5.8 - Peaking 7.7 8.1 8.1 7.4 4.4 Total 15.3 12.4 14.0 13.2 10.2 % Sold - Baseload 27% 12% 15% 15% 15% - Peaking 100% 97% 95% 86% 51% Total 44% 27% 29% 27% 21% 2005 2006 2007 2008 2009 Data as of 6/30/04 Includes the Following NERC Regions/Sub-Region: MAPP, MAIN, ECAR, SPP and Entergy |

| APPENDIX D: CONTRACTUAL PORTFOLIO UNITED KINGDOM Estimated Generation (In Millions of mwh) - Baseload 10.0 10.0 10.0 10.0 10.0 - Peaking 0.0 0.0 0.0 0.0 0.0 Total 10.0 10.0 10.0 10.0 10.0 Contractual Generation (In Millions of mwh) - Baseload 3.2 1.6 0.7 0.7 0.7 - Peaking 0.0 0.0 0.0 0.0 0.0 Total 3.2 1.6 0.7 0.7 0.7 % Sold - Baseload 32% 16% 7% 7% 7% - Peaking 0% 0% 0% 0% 0% Total 32% 16% 7% 7% 7% 2005 2006 2007 2008 2009 Data as of 6/30/04 Includes the Saltend Energy Centre |
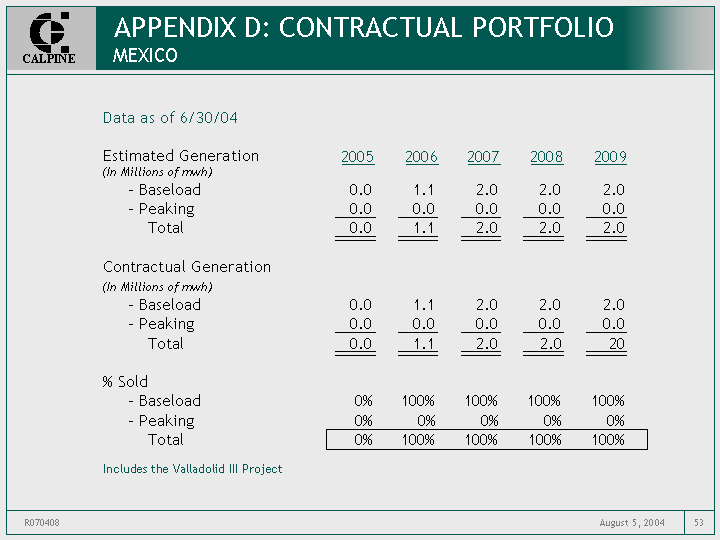
| APPENDIX D: CONTRACTUAL PORTFOLIO MEXICO Estimated Generation (In Millions of mwh) - Baseload 0.0 1.1 2.0 2.0 2.0 - Peaking 0.0 0.0 0.0 0.0 0.0 Total 0.0 1.1 2.0 2.0 2.0 Contractual Generation (In Millions of mwh) - Baseload 0.0 1.1 2.0 2.0 2.0 - Peaking 0.0 0.0 0.0 0.0 0.0 Total 0.0 1.1 2.0 2.0 20 % Sold - Baseload 0% 100% 100% 100% 100% - Peaking 0% 0% 0% 0% 0% Total 0% 100% 100% 100% 100% 2005 2006 2007 2008 2009 Data as of 6/30/04 Includes the Valladolid III Project |


