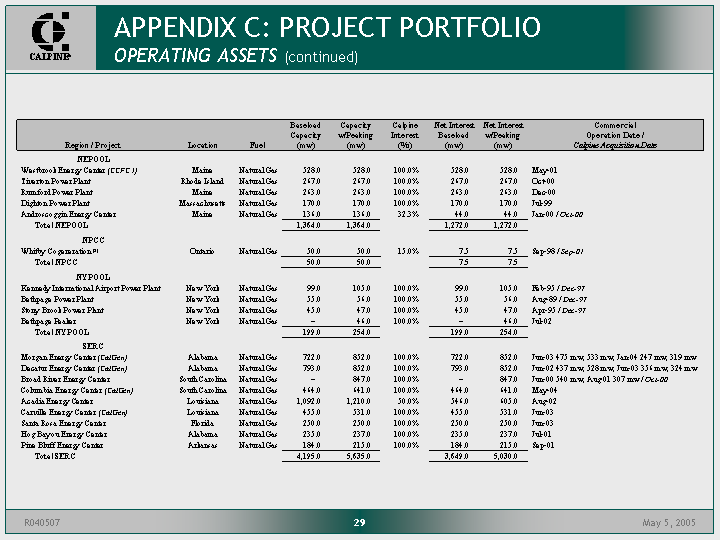
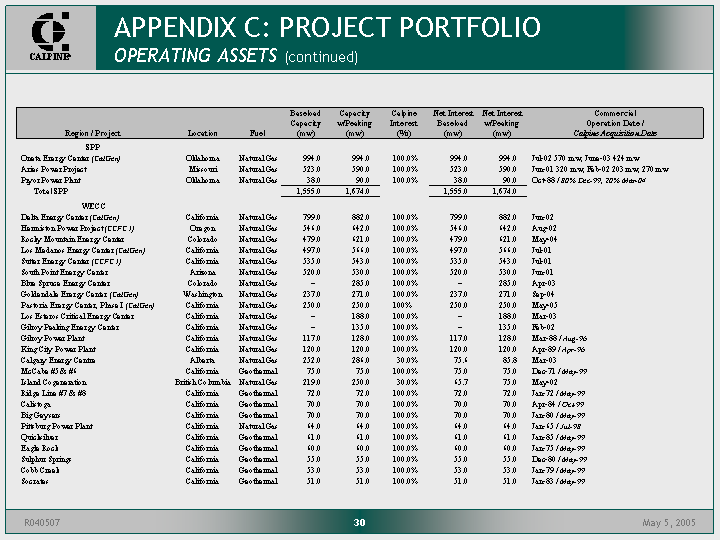
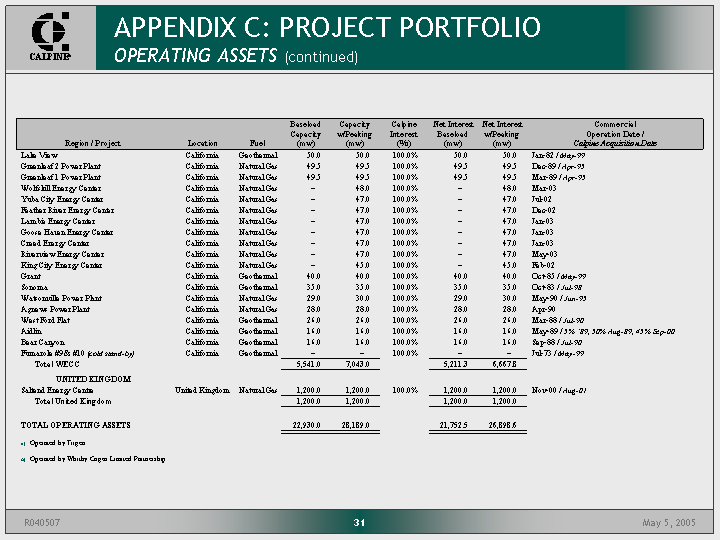
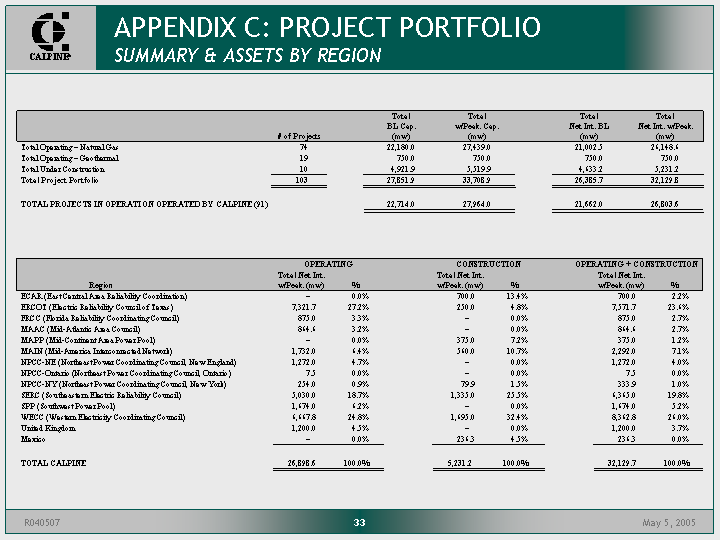
| APPENDIX C: PROJECT PORTFOLIO SUMMARY & ASSETS BY REGION OPERATING OPERATING CONSTRUCTION CONSTRUCTION OPERATING + CONSTRUCTION OPERATING + CONSTRUCTION OPERATING + CONSTRUCTION Region Total Net Int. w/Peak. (mw) % Total Net Int. w/Peak. (mw) % Total Net Int. w/Peak. (mw) % ECAR (East Central Area Reliability Coordination) ECAR (East Central Area Reliability Coordination) ECAR (East Central Area Reliability Coordination) - 0.0% 700.0 13.4% 700.0 2.2% ERCOT (Electric Reliability Council of Texas) ERCOT (Electric Reliability Council of Texas) ERCOT (Electric Reliability Council of Texas) 7,321.7 27.2% 250.0 4.8% 7,571.7 23.6% FRCC (Florida Reliability Coordinating Council) FRCC (Florida Reliability Coordinating Council) FRCC (Florida Reliability Coordinating Council) 875.0 3.3% - 0.0% 875.0 2.7% MAAC (Mid-Atlantic Area Council) MAAC (Mid-Atlantic Area Council) MAAC (Mid-Atlantic Area Council) 864.6 3.2% - 0.0% 864.6 2.7% MAPP (Mid-Continent Area Power Pool) MAPP (Mid-Continent Area Power Pool) MAPP (Mid-Continent Area Power Pool) - 0.0% 375.0 7.2% 375.0 1.2% MAIN (Mid-America Interconnected Network) MAIN (Mid-America Interconnected Network) MAIN (Mid-America Interconnected Network) 1,732.0 6.4% 560.0 10.7% 2,292.0 7.1% NPCC-NE (Northeast Power Coordinating Council, New England) NPCC-NE (Northeast Power Coordinating Council, New England) NPCC-NE (Northeast Power Coordinating Council, New England) 1,272.0 4.7% - 0.0% 1,272.0 4.0% NPCC-Ontario (Northeast Power Coordinating Council, Ontario) NPCC-Ontario (Northeast Power Coordinating Council, Ontario) NPCC-Ontario (Northeast Power Coordinating Council, Ontario) 7.5 0.0% - 0.0% 7.5 0.0% NPCC-NY (Northeast Power Coordinating Council, New York) NPCC-NY (Northeast Power Coordinating Council, New York) NPCC-NY (Northeast Power Coordinating Council, New York) 254.0 0.9% 79.9 1.5% 333.9 1.0% SERC (Southeastern Electric Reliability Council) SERC (Southeastern Electric Reliability Council) SERC (Southeastern Electric Reliability Council) 5,030.0 18.7% 1,335.0 25.5% 6,365.0 19.8% SPP (Southwest Power Pool) SPP (Southwest Power Pool) SPP (Southwest Power Pool) 1,674.0 6.2% - 0.0% 1,674.0 5.2% WECC (Western Electricity Coordinating Council) WECC (Western Electricity Coordinating Council) WECC (Western Electricity Coordinating Council) 6,667.8 24.8% 1,695.0 32.4% 8,362.8 26.0% United Kingdom United Kingdom United Kingdom 1,200.0 4.5% - 0.0% 1,200.0 3.7% Mexico Mexico Mexico - 0.0% 236.3 4.5% 236.3 0.0% TOTAL CALPINE 26,898.6 100.0% 5,231.2 100.0% 32,129.7 100.0% # of Projects Total BL Cap. (mw) Total w/Peak. Cap. (mw) Total Net Int. BL (mw) Total Net Int. w/Peak. (mw) Total Operating - Natural Gas Total Operating - Natural Gas Total Operating - Natural Gas 74 22,180.0 27,439.0 21,002.5 26,148.6 Total Operating - Geothermal Total Operating - Geothermal Total Operating - Geothermal 19 750.0 750.0 750.0 750.0 Total Under Construction Total Under Construction Total Under Construction 10 4,921.9 5,519.9 4,633.2 5,231.2 Total Project Portfolio 103 27,851.9 33,708.9 26,385.7 32,129.8 TOTAL PROJECTS IN OPERATION OPERATED BY CALPINE (91) TOTAL PROJECTS IN OPERATION OPERATED BY CALPINE (91) TOTAL PROJECTS IN OPERATION OPERATED BY CALPINE (91) TOTAL PROJECTS IN OPERATION OPERATED BY CALPINE (91) 22,714.0 27,964.0 21,662.0 26,803.6 |