 SPECIAL NOTICE REGARDING PUBLICLY AVAILABLE INFORMATION CALPINE CORPORATION (THE “COMPANY”) HAS REPRESENTED THAT THE INFORMATION CONTAINED IN THIS PRESENTATION IS EITHER PUBLICLY AVAILABLE OR DOES NOT CONSTITUTE MATERIAL NON-PUBLIC INFORMATION WITH RESPECT TO THE COMPANY (AS DEFINED HEREIN) OR ITS SECURITIES. THE RECIPIENT OF THIS PRESENTATION ACKNOWLEDGES THAT OTHER LENDERS HAVE RECEIVED A CONFIDENTIAL PRESENTATION THAT CONTAINS ADDITIONAL INFORMATION WITH RESPECT TO THE COMPANY OR ITS SECURITIES THAT MAY BE MATERIAL. NEITHER THE COMP ANY NOR THE LEAD ARRANGERS TAKES ANY RESPONSIBILITY FOR THE RECIPIENT'S DECISION TO LIMIT THE SCOPE OF THE INFORMATION IT HAS OBTAINED IN CONNECTION WITH ITS EVALUATION OF THE COMPANY AND THE FACILITY. CALPINE EXIT FACILITY LENDERS’ PRESENTATION PUBLIC INFORMATION JANUARY 8, 2008 Exhibit 99.2 |
 1 FORWARD-LOOKING STATEMENT The Evaluation Material may include certain matters that may be considered "forward-looking" statements within the meaning of Section 27A of the Securities Act of 1933, as amended, and Section 21E of the Securities Exchange Act of 1934, as amended, including statements regarding the intent, belief or current expectations of Calpine Corporation and its subsidiaries (the “Company” and its management). Recipients are cautioned that any such forward-looking statements are not guarantees of future performance and involve a number of risks and uncertainties that could materially affect actual results such as, but not limited to: (i) the Company's ability to continue as a going concern; (ii) the ability of the Company to operate pursuant to the terms of the Facilities; (iii) the ability of the Company to develop, prosecute, confirm and consummate one or more plans of reorganization with respect to the Chapter 11 cases; (iv) the ability of the Company to obtain and maintain normal terms with vendors and service providers; (v) the Company's ability to maintain contracts that are critical to its operations; (vi) the potential adverse impact of the Chapter 11 cases on the Company's liquidity or results of operations; (vii) the ability of the Company to fund and execute its business plan; (viii) the ability of the Company to attract, motivate and/or retain key executives and associates; (ix) the ability of the Company to attract and retain customers; and (x) other risks identified from time-to-time in the Company's reports and registration statements filed with the SEC, including the risk factors identified in its Annual Report on Form 10-K for the year ended December 31, 2006, and its Quarterly Report on Form 10-Q for the quarter ended September 30, 2007, which can also be found on the Company's website at www.calpine.com. The Company undertakes no duty to update this Evaluation Material. |
 2 Transaction and Introduction . . . . . . . . . . . . . . Vivek Bantwal, Managing Director, Goldman Sachs Calpine Overview. . . . . . . . . . . . . . . . . . . . . . Robert P. May, CEO Restructuring Accomplishments. . . . . . . . . . . . . Gregory L. Doody, Exec. VP, General Counsel & Secretary Operations Overview. . . . . . . . . . . . . . . . . . . . Todd Filsinger, Managing Partner, PA Consulting Financial Results and Business Plan Overview. . . . Lisa J. Donahue, SVP, CFO Transaction Overview . . . . . . . . . . . . . . . . . . . Zamir Rauf, SVP Finance and Treasurer Process and Timeline. . . . . . . . . . . . . . . . . . . . David Lischer, Managing Director, Goldman Sachs AGENDA |
 3 TRANSACTION & INTRODUCTION |
 4 TRANSACTION OVERVIEW • The Existing Exit Facility comprised of: — $1.0 billion First Lien Exit Revolving Facility — $4.0 billion First Lien Exit Term Loan • Additional $2.6 billion of Exit Term Loan Facilities consisting of: — $2.3 billion Additional First Lien Exit Term Loan — $300 million First Lien Bridge Facility • The additional loans will be used principally for the repayment of Calpine’s pre- petition existing Second Lien Debt Calpine is launching an amendment to the Existing DIP Facility (the “Amendment”) in order to modify the $5.0 billion existing senior secured exit financing (the “Existing Exit Facility”) into exit financing that, together with additional exit financing described below, will constitute a $7.6 billion New Exit Facility |
 5 COMPANY OVERVIEW |
 6 COMPANY OVERVIEW • Founded in 1984, Calpine is a major U.S. power company, capable of delivering nearly 24,000 megawatts (“MW”) of clean, cost-effective, reliable and fuel-efficient electricity to customers and communities in 18 states in the U.S. • Calpine owns or leases interests in 80 1 power plants with nearly 24,000 MW of generating capacity — Fleet is primarily natural gas-fired, with the exception of the Company’s geothermal plants • Since its founding more than two decades ago, Calpine has led the power industry in its unwavering commitment to clean, energy-efficient and renewable power generation • Today, Calpine is the nation’s largest combined heat and power (cogeneration) and renewable geothermal power provider ___________________________________ (1) Excludes Calpine’s 3 development or construction plants, Otay Mesa, Russell City and Greenfield |
 7 CALPINE SOURCES OF VALUE Commercial Operations • Calpine’s scale and concentration in certain markets enables Calpine to effectively manage risk and optimize fleet dispatch Power Operations • Calpine's scale in gas-fired and geothermal generation and associated expertise in capital projects and efficiency improvements provides an advantage in the marketplace Asset Portfolio • Calpine owns valuable, competitive assets in key North American markets • Calpine continues to have a growth pipeline • Calpine’s fleet is environmentally friendly |
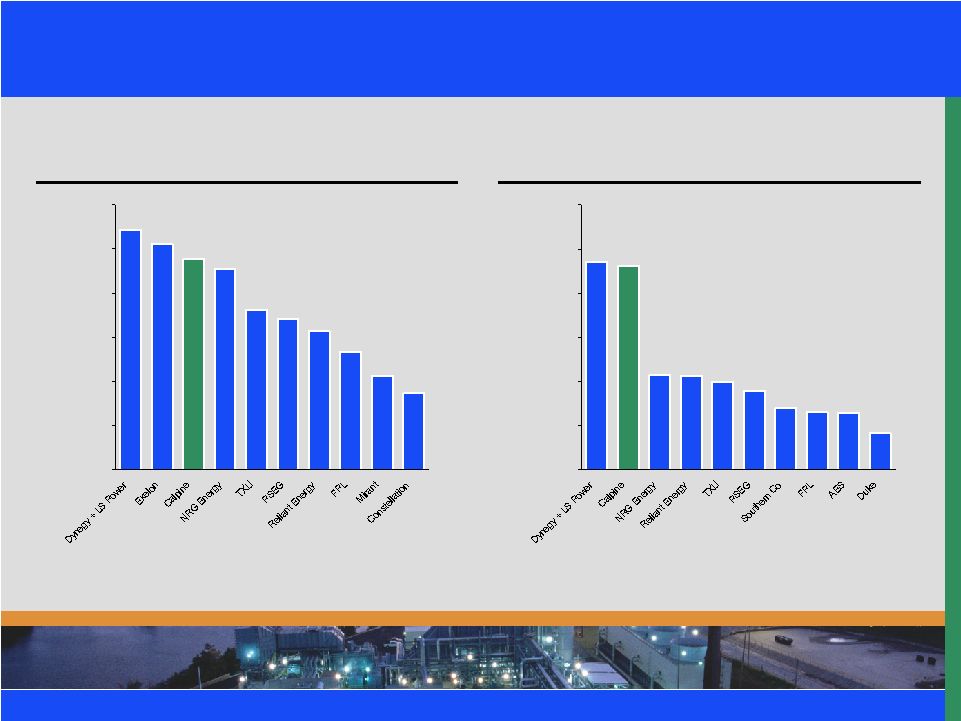 8 CALPINE — A MAJOR POWER COMPANY Top Ten U.S. Merchants by Total Capacity¹ Top Ten U.S. Merchants by Gas Fired Capacity¹ ___________________________________ Source: Company websites and public filings (1) Operating capacity excludes Goldendale, Aries, Parlin, Newark, Pryor, Acadia, Hillabee, Fremont, Washington Parish, Otay Mesa, Russell City and Greenfield. Included in the operating capacity is the non operational plant Philadelphia Water. Total generating capacity including Calpine’s net ownership in development and construction/development plants (Otay Mesa, Russell City and Greenfield) is 25,335 MW. 10,677 10,711 23,126 23,554 4,166 6,473 6,538 6,970 8,946 10,000 0 5,000 10,000 15,000 20,000 25,000 30,000 27,184 25,543 23,851 22,790 18,100 17,035 15,702 13,343 10,650 8,677 0 5,000 10,000 15,000 20,000 25,000 30,000 |
 9 • Capitalizing on Calpine’s strong foundation and rich heritage — Dedicated and skilled workforce — High-quality portfolio of assets, well diversified geographically — Focused on clean, cost-effective, fuel-efficient generation o Low-carbon, natural gas-fired power plants o World’s largest renewable fleet of geothermal power plants — Maximize value of existing power plant portfolio — Identify and pursue new growth opportunities THE NEW CALPINE |
 10 Calpine’s Vision Statement To be recognized as the leading power company by providing clean, efficient and reliable energy products and related services to our customers and appropriate financial returns to our stakeholders THE NEW CALPINE Continued |
 11 RESTRUCTURING ACCOMPLISHMENTS |
 12 RESTRUCTURING ACCOMPLISHMENTS Overview • December 20, 2005 - Filed for Chapter 11 protection • June 20, 2007 - Filed Joint Plan of Reorganization and Disclosure Statement • September 26, 2007 – Fourth Amended Joint Plan of Reorganization and Disclosure Statement approved • December 19, 2007 – Sixth Amended Joint Plan of Reorganization confirmed • Key restructuring accomplishments — Stabilized and streamlined our business — Strengthened our organization and leadership team — Improved results and capital structure |
 13 RESTRUCTURING ACCOMPLISHMENTS continued Stabilized and Streamlined Our Business • Re-oriented our operations to focus on core power assets and markets — Divested or turned-over nine plants or businesses — Hillabee and Fremont divestitures are in progress — Texas City and Clear Lake are being actively marketed — Reduced project debt by approximately $684 million and reduced lease obligations — Refocused development and construction activities • Contract restructuring — Reviewed approximately 6,000 leases and executory contracts — Rejected approximately 57 executory contracts and 29 unexpired leases — Will reject an additional 212 executory contracts through the Plan — Eight below-market PPAs were either terminated or restructured • Cost management — Reduce overhead costs by $180 million annually — Reduction in workforce of approximately 1,096 employees — Closed 19 non-core office locations |
 14 RESTRUCTURING ACCOMPLISHMENTS continued Strengthened Our Organization • Restructured our organization around seven functional groups • Restructured and simplified our corporate structures • Improved monitoring and reporting capabilities • Improved risk management organization • Enhanced our governance platform Improved Results and Capital Structure • Lowered operating and overhead costs through restructuring efforts • Reduced interest expense, including through the repayment of the CalGen indebtedness • Maintained strong liquidity and raised significant proceeds from non-core asset divestitures • Improved our hedging programs — Currently, approximately 75% of gross margin is hedged for 2008 • Total debt will be reduced by approximately $7 billion |
 15 PLAN OF REORGANIZATION Sixth Amended Joint Plan of Reorganization • Broad-based support — All ten classes of creditors entitled to vote on the Plan voted overwhelmingly in favor of the Plan • Plan provides for: — Calpine Corporation to continue as a going concern — Total Enterprise Value of $18.95 billion — Total funded indebtedness of approximately $10.7 billion, including $7.3 billion exit facility — Unsecured creditors to receive between 82.1% and 100% of allowed claims — — Issuance of warrants to holders of former equity interests in Class E-1 — Right to purchase up to approximately 10% of the common stock — Exercise price has not yet been determined, but is expected to be based upon a reorganized equity value of $11.942 billion — Expiration on the later of August 25, 2008 or a date six months after the Effective Date of the Plan — Re-listing on New York Stock Exchange |
 16 OPERATIONS OVERVIEW |
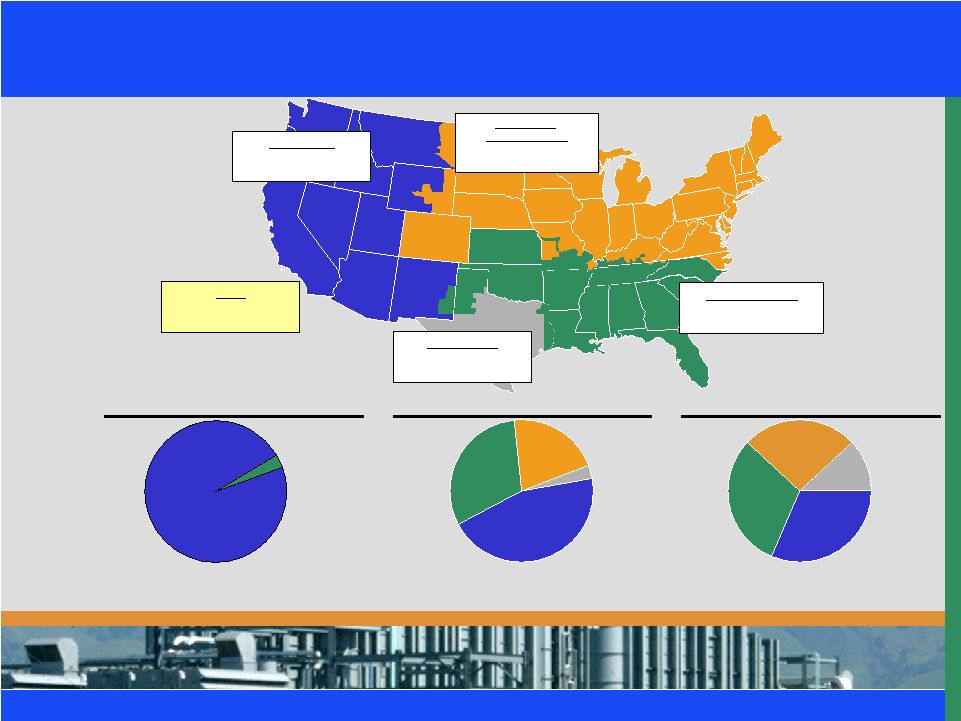 17 CALPINE CURRENT PORTFOLIO OVERVIEW Fuel Type (MW) Region (MW) Dispatch Type (MW) West Region 45 Plants 7,246 MW Northeast & Midwest Region 11 Plants 2,841 MW Southeast Region 12 Plants 6,254 MW Texas Region 12 Plants 7,510 MW Total¹ 80 Plants 23,851 MW Gas 23,126 MW 97% Geysers 725 MW 3% Texas 7,510 MW 31% West 7,246 MW 30% Southeast 6,254 MW 26% Northeast and Midwest 2,841 MW 12% Intermediate 10,755 MW 45% Intermediate (Cogeneration) 7,394 MW 31% Peaking 4,977 MW 21% Baseload (Geothermal) 725 MW 3% ___________________________________ (1) Operating capacity excludes Goldendale, Aries, Parlin, Newark, Pryor, Acadia, Hillabee, Fremont, Washington Parish, Otay Mesa, Russell City and Greenfield. Included in the operating capacity is the non operational plant Philadelphia Water. Total generating capacity including Calpine’s net ownership in development and construction plants (Otay Mesa, Russell City and Greenfield) is 25,335 MW. |
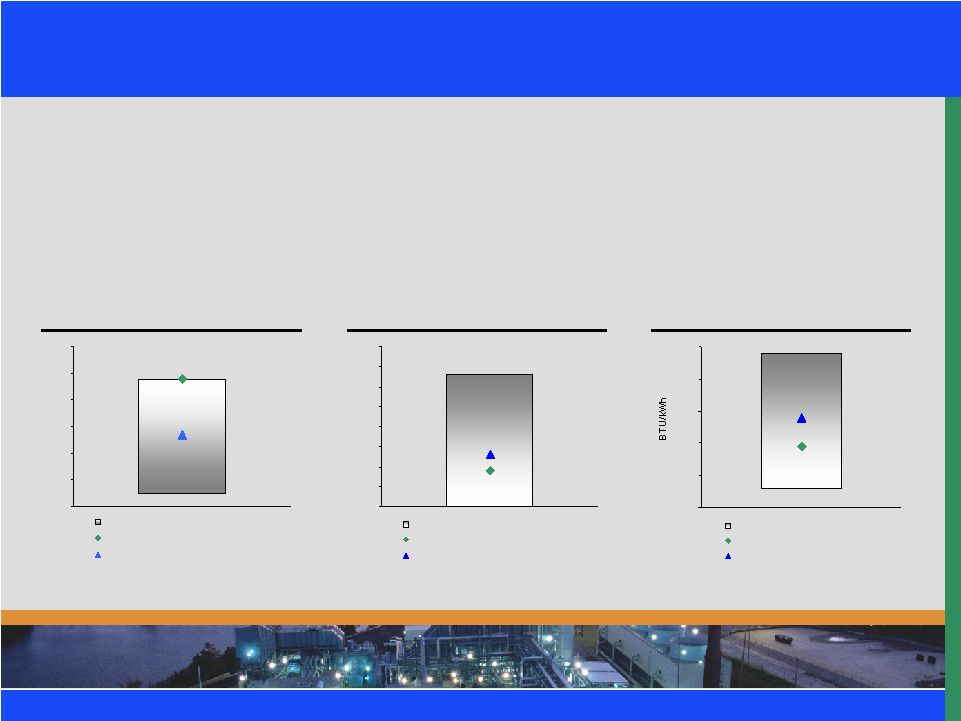 18 RELATIVE FLEET CHARACTERISTICS • Calpine’s assets are more reliable and fuel-efficient — Higher availability and lower outages than national average — Operate at lower heat rates • Calpine’s fleet efficiency permits the Company to economically dispatch its assets when it is uneconomic for other similar assets to operate ___________________________________ Sources: Calpine combined cycle data (excludes cogens): NERC Generating Availability Data System (GADS). National combined cycle data: NCF and EFOR plant data from NERC; NHR plant data from Energy Velocity and PA Consulting Group 27 48 0% 10% 20% 30% 40% 50% 60% National Average +/- 1 St Dev Calpine Average - 2005 National Average - 2005 Net Capacity Factor 13 9 0% 5% 10% 15% 20% 25% 30% 35% 40% National Average +/- 1 St Dev Calpine Average - 2005 National Average - 2005 Equiv. Forced Outage Rate 7,896 7,444 6,500 7,000 7,500 8,000 8,500 9,000 National Average +/- 1 St Dev Calpine Average - 2005 National Average - 2005 Net Heat Rate |
 19 STRONG ENVIRONMENTAL POSITION • Environmental regulations slated for implementation in the next few years include — NO x and SO 2 regulations starting in 2009 and 2010, respectively, under the Clean Air Interstate Rule (“CAIR”) with advantages to Calpine’s gas fleet — Clean Air Mercury Rule (“CAMR”), creating a mercury cap-and-trade program, starting in 2010 which is an advantage to a gas based fleet like Calpine’s • Coal based portfolios will need to have significant Capex to meet these future regulations, while Calpine’s gas fleet environmental Capex will be minimal • As Renewable Portfolio Standards (“RPS”) increase and green prices increase- the Geysers generation will benefit |
 20 CONTINUING FLEET WIDE INITIATIVES • Power Operations manages Calpine’s fleet of assets and focuses on continuous operational improvement, including: — Performance Optimization Program (“POP”) focused on enhancing the total efficiency of Calpine’s plants through implementation of best practices gathered from across the fleet — Calpine Engine Optimization (“CEO”) designed to reduce heat rates and increase power output of gas turbines through implementation of optimized parts and components — Other engineering initiatives designed to optimize operations and processes related to management of the power assets • Calpine is able to leverage lessons learned across the fleets for maximum optimization |
 21 EXPANDING COMMERCIAL CAPABILITIES • Calpine’s commercial objective is to enhance the expected gross margin of its portfolio of assets while stabilizing cash flows — Optimization of the assets through trading, dispatch and operations — Specific optimization targets are set annually — Active risk management through trading and hedging around the assets — New PPAs: part of commercial operations new focus — Hedging targets are set for a 3 year period — 2008 hedging targets have been reached — 2009 hedging is on target • Commercial operations is optimizing the use of collateral through netting arrangements and through first lien collateral program |
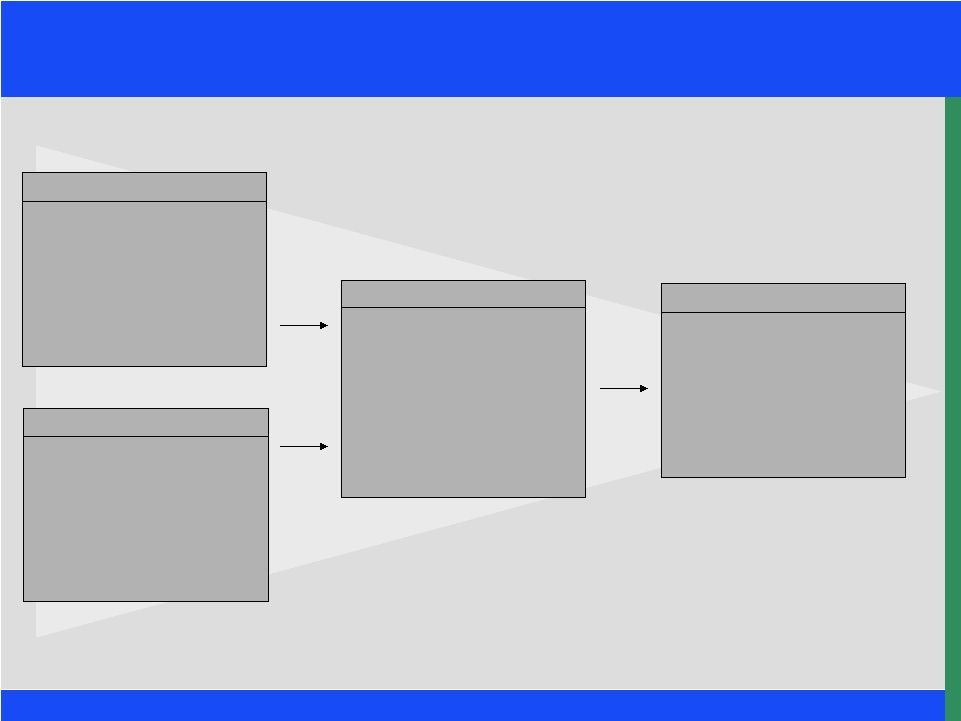 22 INCREMENTAL MARGIN RESULTS FROM OUR COMMERCIAL OPERATIONS Portfolio Attributes • Regional diversity • Efficient & flexible assets • Gas/Power integration • Gas supply flexibility • Large renewable position Capabilities • Active real-time dispatch • Asset & valuation modeling • Spark spread management • Specialized personnel • Integrated process (“One Calpine”) Leveragable Advantages • Detailed market insight • Flexible networked position • Natural customer relationships • Scalable infrastructure Incremental Value • Optimizing the asset base through arbitrage and dispatch • Marketing & origination of customized products • Leveraging market knowledge to time the execution of transactions |
 23 DEVELOPMENT EFFORTS INCLUDE OFF TAKE AGREEMENTS • Calpine’s development program includes power purchase agreements for off take of power • Calpine has three projects where contractual agreements with counterparties have been completed, totaling 2,198 MW: — Greenfield – Ontario, Canada – 1,005 MW NG, Target COD –2008 — Otay Mesa – San Diego, CA – 593 MW NG, Target COD –2009 — Russell City – Hayward, CA – 600 MW NG, Target COD –2010 • Calpine is actively pursuing off-take agreements with counterparties, totaling 790 MW: — Deer Park Expansion - Deer Park, Texas – 230 MW NG CC, Cogeneration — Fontana – Fontana, CA – 300 MW NG Peaker — Mankato Expansion - Mankato, MN – 260 MW Peaker |
 24 MARKET BASED COMMODITY AND PLANT ASSUMPTIONS • The Nov 2007 Business Plan updates were prepared using a bottom-up approach in conjunction with Calpine’s outside advisors and with extensive organizational input • The updated projections reflect forward prices as of June 29, 2007, and recent fundamental fuel forecasts released by EIA, SEER and Global Insight — All three fundamental forecasts increased, due in part to upward gas price pressure from LNG development delays and higher LNG costs • Key changes from the previous Business Plan include: — Higher gas and power prices and lower projected load growth impacted by higher cost of new build and earlier carbon legislation — Updated plant characteristics and new long-term contracts ___________________________________ (1) Sources: EIA Annual Energy Outlook 2007 Early Release, Dec 2006, US Energy Outlook 2006 Price Update, Global Insight, March 2007, SEER Natural Gas Report (Reference Case) April 2007. Includes PA adder for carbon in 2012 and 2013. (2) Source: Bloomberg Natural Gas Price Assumptions ($/MMBtu) 2008 2009 2010 2011 2012 2013 Consensus Forecast¹ $7.89 $7.66 $7.40 $7.25 $7.38 $7.45 Forward as of 06/29/2007² 8.41 8.55 8.36 8.08 7.81 n/a Updated Business Plan Forecast $8.41 $8.55 $8.14 $7.75 $7.38 $7.45 |
 25 FINANCIAL PERFORMANCE AND BUSINESS PLAN OVERVIEW |
 26 PRELIMINARY CALPINE CORPORATION CONSOLIDATED 2007 FORECASTED PERFORMANCE ___________________________________ Note: Results presented on an accrual basis. (1) Financial close for Q4 2007 is not complete and Reorganization items and Income taxes in particular are subject to adjustment. Q4 2007 and FY 2007 forecasts are thus preliminary, unaudited and subject to adjustment until the Company files its 2007 Form 10-K Report. Calpine Corporation Unaudited YTD 2007 Financial Results Actuals at Q4 2007 Full Year Variance (in $ millions) 30-Sep-2007 Forecast¹ 2007 Forecast Actuals 2006 2007 vs. 2006 Total Revenue 5,829 1,736 7,565 6,706 859 less Total Cost of Revenue 5,097 1,538 6,635 5,958 (677) Gross Profit 732 198 930 748 182 Sales, general and administrative expense 112 34 146 175 29 Interest expense, net of interest income 1,128 314 1,442 1,183 (259) Other (income) / expense (110) (6) (116) 119 235 Net income before reorganization expense and taxes (398) (144) (542) (729) 187 Reorganization items (3,366) 184 (3,182) 972 4,154 Net income before taxes 2,968 (328) 2,640 (1,701) 4,341 Income taxes 133 18 151 64 (87) GAAP Net income $ 2,835 $(346) $ 2,489 $(1,765) $ 4,254 Adjustments to reconcile GAAP Income to Adjusted EBITDA: Interest expense, net of interest income 1,128 314 1,442 1,183 259 Depreciation and amortization expense 383 126 509 522 (13) Income tax provision (benefit) 133 18 151 64 87 Reorganization item (3,366) 184 (3,182) 972 (4,154) Other (32) 7 (25) 53 (78) Adjusted EBITDA $ 1,081 $ 303 $ 1,384 $ 1,029 $ 355 |
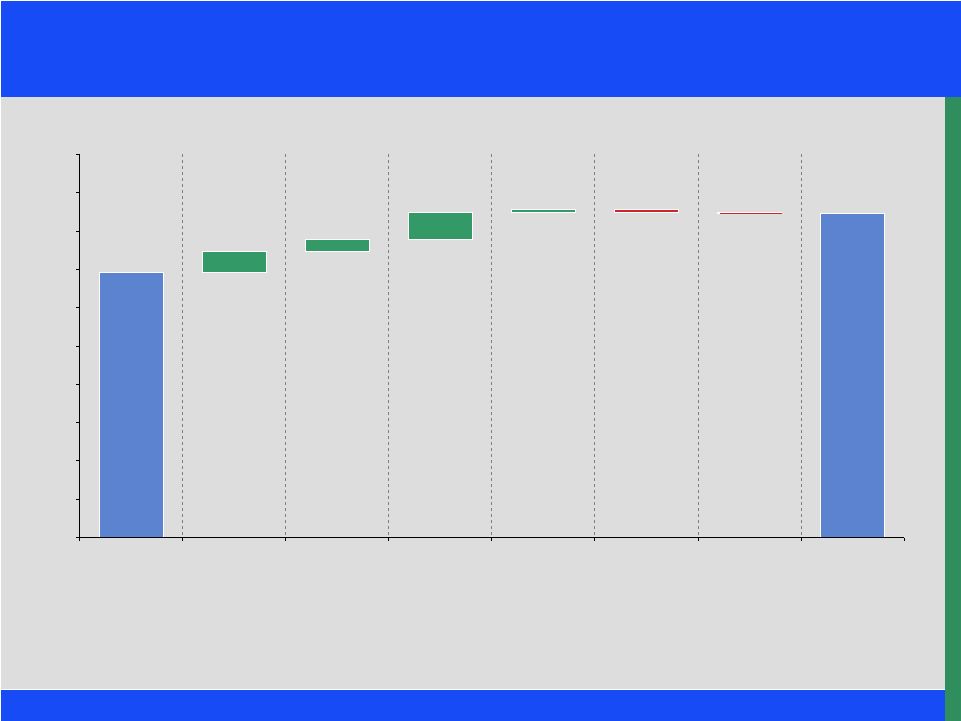 27 ___________________________________ (1) 2007 preliminary forecasted EBITDAR is accrual-based (equivalent to Accrual EBITDAR). 2008 Accrual EBITDAR is based on the November Business Plan. 2008 Accrual EBITDAR is calculated per the definition in the Exit Facility. EBITDAR BRIDGE: 2007 PRELIMINARY ACCRUAL FORECAST TO 2008 ACCRUAL FORECAST $111 $1,694 $142 $12 ($4) ($13) $1,384 $62 $0 $200 $400 $600 $800 $1,000 $1,200 $1,400 $1,600 $1,800 $2,000 2007 Accrual EBITDAR¹ Increase in Regional Spark Spread New/Restructured Contracts Increase in Mark- to-Market (net of unrealized/equity MTM), Trading and Other revenue Decrease in Plant Operating Cost (excluding MM Exp), SG&A Costs and Other Operating Costs Increase in Transmission & Royalties Other 2008 Accrual EBITDAR¹ ($ millions) |
 28 BUSINESS PLAN OVERVIEW • In November 2007, Calpine management presented a Business Plan update including key developments since the April Business Plan — The financial presentation focuses on cash EBITDAR 1 • The Business Plan financial forecast was prepared using a bottom-up approach in conjunction with the Company’s outside advisors and with extensive organizational input • Certain items that impact the forecast since April 2007 are: — Higher spark spreads in 2009 and higher long-term gas prices (at 29-Jun-07) — Benefits from new carbon regulations now expected in 2012 — Upward pressure on cost of new builds, which influence longer-term market pricing — Renegotiated and received CPUC approval for the SCE contract — Entered into contracts for power from Santa Rosa, Hog Bayou, The Geysers and Pastoria — RockGen, Santa Rosa, and Hog Bayou no longer assumed divested — Greenfield and Otay Mesa not consolidated, instead accounted for as equity investments ___________________________________ (1) Earnings before interest, tax, depreciation, amortization, major maintenance expense and certain other adjustments, rent and reorganization items, as adjusted to reflect the impact from equity investments in Greenfield and Otay Mesa and minority interest in Russell City. |
 29 FINANCIAL PERFORMANCE DRIVERS • Calpine is forecasting improved financial performance through 2013. There are numerous factors contributing to the improved performance, including: — Forecasted diminishing reserve margins across the U.S. — Significant impact on Calpine’s key markets, ERCOT and California — Owners of CCGT and peaking plants will be the main beneficiaries — Development of regional capacity markets — Environmental pressures are anticipated to increase with carbon legislation looming and rising replacement costs, particularly in California — Calpine’s low-carbon, cost-effective natural gas-fired generation portfolio is well positioned as this trend continues — The Geysers’ value will be further enhanced as the renewable energy credit market develops — Power sector fundamental forecasts increased, due in part to upper gas price pressure from LNG development delays and higher LNG costs — Positive relationship expected to exist between natural gas prices and Calpine’s margins due to Calpine’s relative fuel efficiency |
 30 NOVEMBER 2007 BUSINESS PLAN EBITDAR FORECAST ___________________________________ Note: Forecast excludes cash flows from assets sold, in process of being sold, or under evaluation, including Goldendale, Aries, Parlin, Newark, Pryor, Acadia, Hillabee, Fremont and Washington Parish. RockGen is no longer considered for divestiture. Cash EBITDAR is after minority interest for Russell City and including income from equity investments in Otay Mesa and Greenfield. Reporting for Otay Mesa changed in Q2 2007 from full consolidation to equity accounting due to terms of contractual arrangements with SDG&E. Further details are included in Calpine's recent SEC quarterly report. For reconciliation to net income, please see the appendix slide “NET INCOME TO EBITDAR RECONCILIATION”. $ millions 2008 2009 2010 2011 2012 2013 Total Revenue Receipts $ 7,201 $ 7,577 $ 7,813 $ 8,413 $ 9,177 $ 9,758 Fuel Cost Disbursements (4,623) (4,836) (4,969) (5,151) (5,138) (5,483) Gross Margin $ 2,578 $ 2,741 $ 2,844 $ 3,261 $ 4,039 $ 4,275 O&M and SG&A $(299) $(301) $(313) $(326) $(816) $(935) Overhead and Other Miscellaneous (259) (265) (271) (277) (284) (290) Labor (162) (164) (166) (170) (174) (178) Insurance (71) (87) (90) (93) (95) (97) Property Tax (104) (131) (227) (230) (234) (242) Consolidated EBITDAR $ 1,682 $ 1,794 $ 1,777 $ 2,164 $ 2,437 $ 2,533 Minority Interest/Equity Income EBITDAR Adjustment 19 98 75 67 73 72 Cash EBITDAR $ 1,702 $ 1,892 $ 1,852 $ 2,231 $ 2,510 $ 2,605 GAAP, Mark-to-Market, Working Cap., and Other Adjustments (8) (203) (50) (111) (76) (67) Accrual EBITDAR $ 1,694 $ 1,689 $ 1,802 $ 2,121 $ 2,435 $ 2,538 |
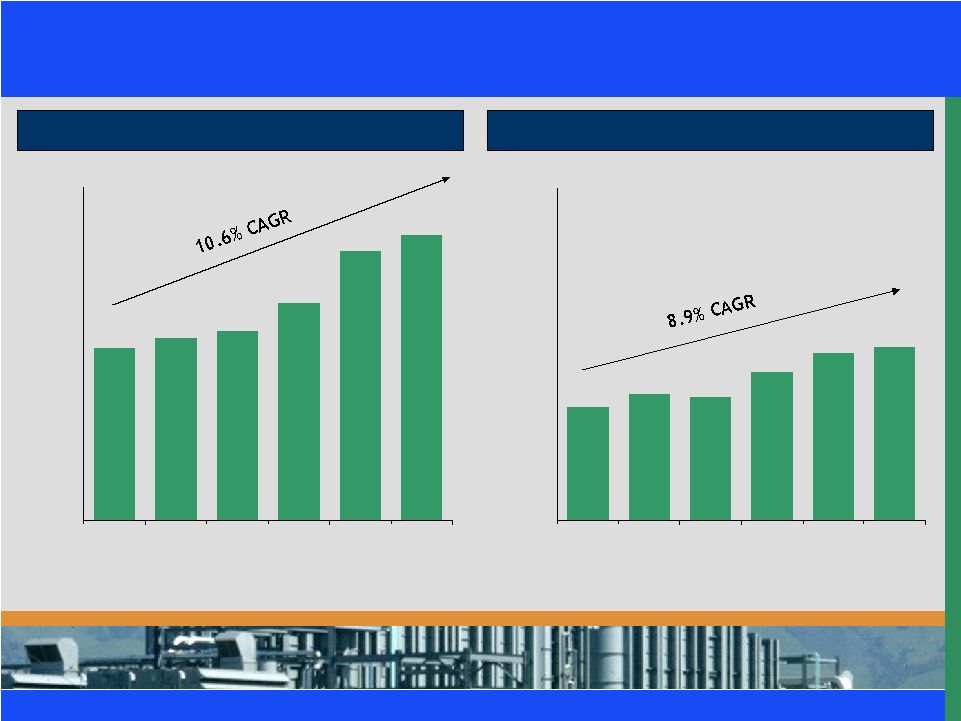 31 2008E-2013E CASH EBITDAR BUILD UP ($ in millions) $2,578 $2,741 $2,844 $3,261 $4,039 $4,275 $0 $1,000 $2,000 $3,000 $4,000 $5,000 2008 2009 2010 2011 2012 2013 Gross Margin Cash EBITDAR $1,702 $1,892 $1,852 $2,231 $2,510 $2,605 $0 $1,000 $2,000 $3,000 $4,000 $5,000 2008 2009 2010 2011 2012 2013 ___________________________________ Note: Gross Margin differs from Gross Profit. Excludes non-commodity cost of revenue items such as depreciation, plant operating costs, royalties and operating leases. Gross Margin is reflected on a cash basis. |
 32 KEY TAKEAWAYS • Cash EBITDAR is forecasted to be $1,702 million in 2008 on a gross margin of $2,578 million 1 • Year-over-year growth is driven by three primary drivers — Fundamental market growth: Growth in all regions and pending carbon legislation drive commodity prices which in turn improves earnings — Cost cutting initiatives: Decreased expenses, optimized operations and increased profitability — Contribution from new projects: Major contributor to future earnings ___________________________________ (1) Gross Margin differs from Gross Profit. Excludes non-commodity cost of revenue items such as depreciation, plant operating costs, royalties and operating leases. Gross Margin is reflected on a cash basis. |
 33 TRANSACTION OVERVIEW |
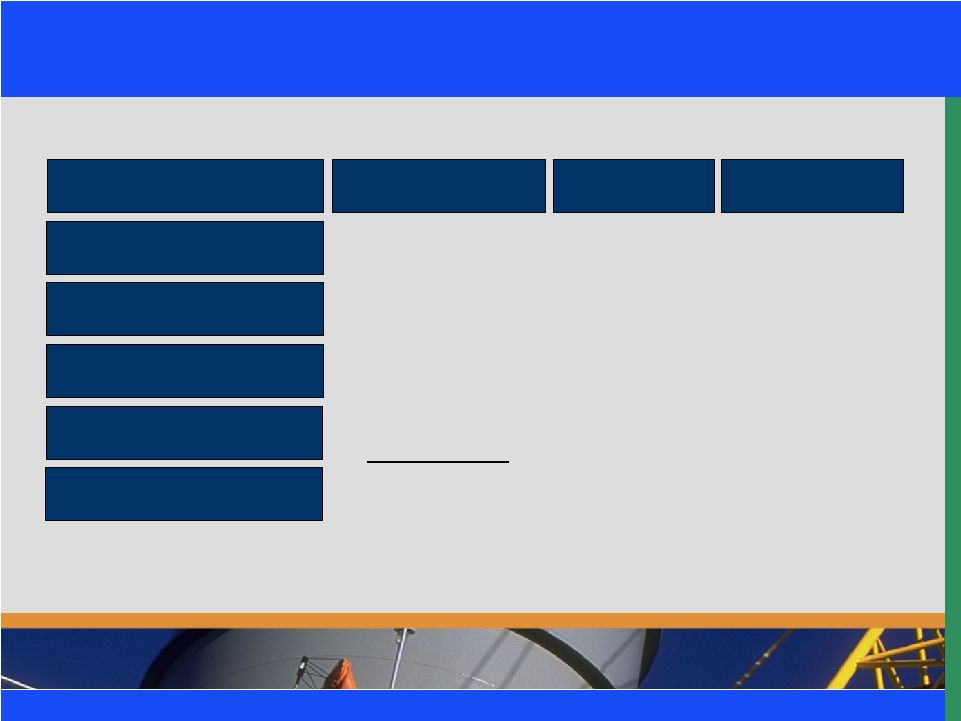 34 OVERVIEW OF NEW EXIT FACILITIES $7,600 None 366 days from closing date $300 1% per annum March 29, 2014 $2,456 1% per annum March 29, 2014 $3,844 None March 29, 2014 $1,000 Amount (in $ mm) Amortization Existing First Lien Term Loan Existing First Lien Revolver Maturity Facilities Additional First Lien Term Loan First Lien Asset Sale Bridge Total Facilities |
 35 FIRST LIEN SECURED BRIDGE FACILITY “Asset Sale Bridge” • $300 million First Lien Asset Sale Bridge facility • This facility matures in 366 days, and will be retired with proceeds from the sale of certain non-strategic assets, that currently do not generate any EBITDA, as well as certain tax refunds — Provides an opportunity to deleverage with no impact on operating cash flow going forward $336.5 Total Refunds of withholding tax previously paid $70 mm due in Apr 08 with remainder due Dec 08 $90.0 Tax Refunds Partially constructed natural gas-fired electricity generating facility Signed agreement, with closing expected in mid March 2008 $122.5 Hillabee Other natural-gas fired electricity generating assets No agreements yet. Closing expected in May 2008 timeframe $200.0 plus Other Asset Sales Partially constructed natural gas-fired electricity generating facility Signed agreement, with closing expected in mid Feb 08 $124.0 Fremont Energy Ctr Description Status Approx. Proceeds Source |
 36 SOURCES AND USES Sources Amount ($mm) Uses Amount ($mm) First Lien Exit Revolving Facility 1 $ 0 Rollover First Lien DIP Revolving Facility $ 0 First Lien Exit Term Loans² 6,300 Rollover First Lien DIP Term Loan 3 3,844 Asset Sale Bridge Loan 300 Repayment of Existing Second Lien Debt and Claims 4 3,964 Other Cash and Refinancings 5 238 Other Claims 6 141 Cash on Balance Sheet 1,349 Estimated Transaction Expenses 166 Professional Fees - Escrow 72 Total Sources $ 8,187 Total Uses $ 8,187 1 $300 million of posted letters of credit expected at close of the transaction against the $1,000 million revolving credit portion of the New Credit Facilities. 2 First Lien Exit Term Loans are subject to reduction pursuant to the December 13, 2007 Commitment Letter. 3 September 30, 2007 balance adjusted to reflect anticipated prepayment from proceeds of ULC bonds and scheduled amortization offset by interest expense accrual. 4 Repayment of second lien debt includes $3,672mm of second lien principal and $292mm of accrued interest and certain other second lien claims. 5 Includes cash returns, change in restricted cash balances and certain refinancings. 6 Other Claims include the additional claims required to be paid upon exit. |
 37 CORPORATE CAPITALIZATION ___________________________________ Note: Total existing debt excludes all ULC Notes due to Canada deconsolidation in December 2005. Unsecured debt does not include accrued pre-petition interest. (1) Based on 2007E Accrual EBITDAR of $1,384 million. (2) $45 million increase attributable to Blue Spruce and MetCalf refinancing. (3) $300 million of posted letters of credit expected at close of the transaction against the $1,000 million revolving credit portion of the New Credit Facilities. (4) Does not include $292 million of accrued pre-petition interest expense and claims. (5) Total pro forma debt assumes equitization of the unsecured debt. (6) Total short term and restricted cash per September 30, 2007 10Q. Pro forma cash excludes $1,349 million used in the sources and uses for this transaction. As of September 30, 2007 CCFC $ 1,079 - $ 1,079 0.8 x 0.8 x Other Project Debt² 2,945 45 2,990 2.9 2.9 First Lien Revolving Facility³ - - - 2.9 2.9 First Lien Term Loan 3,980 2,320 6,300 5.8 7.5 Asset Sale Bridge Loan - 300 300 5.8 7.7 Existing Second Lien Debt 4 3,672 (3,672) - 8.4 7.7 Convertible Unsecured Senior Notes 5 1,824 (1,824) - 9.8 7.7 Unsecured Senior Notes 5 1,880 (1,880) - 11.1 7.7 Total Debt $ 15,380 $ 10,669 11.1 x 7.7 x Cash 6 2,264 (1,349) 915 1.6 0.7 Total Net Debt $ 13,116 $ 9,754 9.5 x 7.0 x Pro-forma Cumul. Multiple of 2007E EBITDAR¹ Outstanding Amount ($mm) Exit Financing Adjustments Pro-forma for Exit Financing ($mm) Current Cumul. Multiple of 2007E EBITDAR¹ |
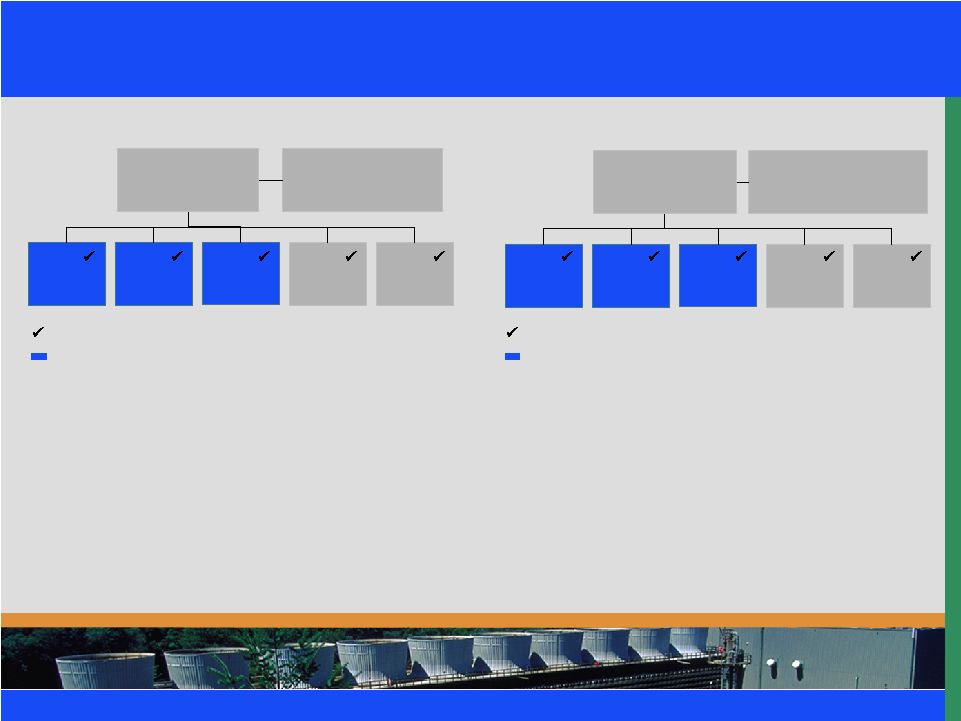 38 NEW CREDIT FACILITIES COLLATERAL STRUCTURE • Existing DIP Facility is secured by first liens on all unencumbered assets and junior liens on all encumbered assets • Existing DIP Facility benefits from super priority administrative expense claim at each debtor entity • Collateral for the Existing DIP Facility does not prime the collateral of the secured corporate bonds • First Lien Exit Facilities will be secured by first liens on substantially all assets (including equity in subsidiaries) of the Borrower and the guarantors to the extent permitted by existing contractual arrangements and legal requirements CalGen Existing DIP Facility New Exit Facilities Equity Pledge Liens/Guarantees The Geysers CCFC Other Projects Equity Pledge Liens/Guarantees Calpine Corporation First Lien Exit Facilities Other Projects CalGen The Geysers CCFC Other Projects Calpine Corporation Existing Second Lien Debt Existing DIP Facility Other Projects |
 39 COLLATERAL SUMMARY • First lien term loan and asset sale bridge loan share a first lien on substantially all assets (including equity in direct or indirect subsidiaries) to the extent permitted by existing contracts and requirements of law • Direct lien on The Geysers and CalGen — 32 plants with generation capacity of 10,205 MW • Lien on equity investments held by Guarantors in CCFC, Rocky Mountain / Riverside and Calpine Energy Services¹ — 8 plants with 4,840 MW of generation capacity • Equity liens on remaining 43 plants with 10,290 MW of generation capacity to the extent the terms of the existing contractual arrangements and requirements of law, if reinstated, permit² • To the extent other projects are unencumbered, Lenders will receive a direct lien at the entity level to the fullest extent permitted ___________________________________ (1) Equity lien is on the residual value of the subsidiaries after project debt obligations. (2) Consists of 371 MW of Calpine Eastern and Cogen, 2,615 MW of Unrestricted Holdings, 3,024 MW of Calpine Central, 1,553 MW of Calpine Development Holdings (excluding Rocky Mountain and Riverside) and 2,727 MW of other holdings. |
 40 TRANSACTION HIGHLIGHTS Transaction highlights include: • Permanent financing structure with long-term maturity: March 2014 for the First Lien Exit Term Loan, Additional First Lien Exit Term Loan, and First Lien Exit Revolving Facility • Sufficient cash availability in 2008 via asset sales and tax refunds to pay down the First Lien Bridge Facility to reduce leverage levels with no prepayment penalty • Provides necessary liquidity to fund distributions under Plan of Reorganization (“POR”), to pay related fees and expenses, and for working capital and general corporate purposes — Repayment of approximately $3.7 billion pre-petition existing Second Lien Debt plus accrued interest Terms and Conditions of the New Exit Facility will remain substantially similar to the Existing Exit Facility, but will include the following amendments and such other amendments as are set forth in the Term Sheets and as GSCP may agree to: • Adjustment to leverage covenants to allow for the Additional First Lien Exit Term Loan Facilities and First Lien Bridge Facility • Greater flexibility to operate the businesses and develop and finance new projects • Revised permitted annual capital expenditures • Enhancement of Calpine’s ability to manage commodity exposure going forward |
 41 SUMMARY INVESTMENT CONSIDERATIONS • Direct Lien on the 19 Geysers facilities (17 active) and 13 Calgen facilities • Equity lien on subsidiaries in CCFC (6 facilities) and CES if permitted • Equity interests in value of remaining 45 plants Strong Asset and Collateral Coverage Unencumbered Geysers Key Restructuring Benefits Achieved Through Reorganization Strong Position in Key Deregulated Markets Competitive Portfolio • Strong free cash flow generation • Long lived geothermal reserves with high operational flexibility • Largest supplier of baseload green power in California • Optimize capital structure through leverage reduction • Identify and reject certain unprofitable contracts • Complete asset rationalization plans and cost reduction measures • Calpine portfolio comprises 7% and 10% of generating capacity in CA and TX, respectively, where gas is on the margin 90+% of the time • 53 plants, 54% of net Calpine capacity, is in CA and TX, 2 of the largest and most attractive power markets • Geographic, dispatch and fuel diversity limits power market exposure • Lower than market heat rate and superior operational performance compared to national average • Superior environmental record and compliance |
 42 PROCESS & TIMELINE |
 43 SUMMARY OF KEY TERMS • Revolver: $1.0 bn • Term Loan: $6.3 bn Size / Structure Mandatory Prepayments Financial Covenants • March 29, 2014 • Max Total Leverage and Max Senior Leverage • Minimum Interest Coverage • Maximum Capex • Debt issuances, Equity issuances, Excess Cash Flow, Asset Sales, Extraordinary Receipts (all subject to specified carveouts/exceptions) Maturity First Lien Long-Term Facility First Lien Bridge Facility • Bridge: $300 mm • 366 days after closing date • 1% p.a., Bullet at maturity Amortization • None • 102, 101, par thereafter Call Protection • None • TBD Interest Rate • TBD • Identical to those set forth in the First Lien Long-Term Facilities • Priority with respect to proceeds from tax refunds, 100% of proceeds from sale of Fremont and Hillabee assets and other similar assets; other prepayments mirror First Lien Term Loan and Revolver other than from excess cash flow sweep |
 44 EXIT FINANCING PROCESS TIMETABLE January 2008 S M T W T F S 1 2 3 4 5 6 7 8 9 10 11 12 13 14 15 16 17 18 19 20 21 22 23 24 25 26 27 28 29 30 31 Dates Close and fund January 31 Amendment signature pages due January 18 Comments due on amendment documentation Week of January 14 Lenders meeting Amendment documentation posted to Syndtrak Week of January 7 |
 45 PUBLIC Q&A |
 46 APPENDIX |
 47 THE GEYSERS COLLATERAL • One of the world’s largest geothermal operations producing renewable green power, located approximately 72 miles north of San Francisco • Calpine owns the leasehold interest in The Geysers through a wholly owned subsidiary Geysers Power Company LLC which also owns the gathering system associated with the steam fields where The Geysers are located • 19 units (17 active) which operate as a baseload unit (average capacity of 95%) and benefit from a substantial spread between its fixed operating costs and California’s electricity prices PURPA STATUS ACQUISITION DATE COD CURRENT CAPACITY (MW) INSTALLED CAPACITY (MW) COUNTY UNIT # FACILITY QF 10/88-09/00 Jun-89 17 20 Sonoma 1 Aidlin QF Jul-90 Sep-88 14 20 Lake 2 Bear Canyon QF/EWG Jul-98 Dec-83 42 72 Lake 3 Sonoma QF Jul-90 Mar-89 24 27 Lake 4 West Ford Flat EWG May-99 Dec-71 78 106 Sonoma 5 & 6 McCabe EWG May-99 Nov-72 69 106 Sonoma 7 & 8 Ridge Line EWG May-99 Nov-73 – – Sonoma 9 & 10 Fumarole 725 1,302 Total EWG May-99 Oct-85 43 113 Sonoma 20 Grant Calistoga Socrates Lake View Quicksilver Sulphur Springs Big Geysers Cobb Creek Eagle Rock 19 18 17 16 14 13 12 11 Lake Sonoma Sonoma Lake Sonoma Lake Sonoma Sonoma 80 113 113 113 109 98 106 106 QF/EWG May-99 Oct-85 53 QF/EWG May-99 Sep-80 51 QF/EWG May-99 May-80 48 QF Oct-99 Apr-84 66 EWG May-99 Feb-83 50 QF/EWG May-99 Dec-82 52 QF/EWG May-99 Mar-79 52 EWG May-99 May-75 66 Facilities Overview |
 48 THE GEYSERS COLLATERAL continued Strong Free Cash Flow Long Life Resource Operational Flexibility Largest Baseload “Green Power” in California • Baseload generating facilities that continue to benefit from attractive electricity prices in California • Steam fuel supply creates a highly competitive cost structure • Strong performance with an avg. availability of 96% to 98% • Projected to be economically feasible through 2050 • Capacity today is approximately 725 MW • Steam pressure and flow rate declines have been significantly reduced through the implementation of resource management programs • Geothermal plants can operate 24 hours per day versus intermittent power generation from solar and wind • The Geysers comprise 19 units (17 active) lowering the amount of plant specific risk and providing operational flexibility • The Geysers are the largest supplier of renewable power, on a baseload basis, to the California market • California’s RPS requires utilities to provide 20% of electricity sales from renewable resources by 2010 |
 49 BUSINESS RATIONALIZATION Refocused resources through asset evaluation and sales program Launched a rationalization of generating fleet through restructuring and sales • Initially identified 14 non-core or idle assets with marginal or negative cash flow for restructuring and/or divestiture • Company will continue to evaluate holdings in all assets Assets Status Aries Divested Dighton Divested Fox Divested Valladolid III Divested Goldendale Divested Power Systems Manufacturing Divested Thomassen Turbine Systems Divested Parlin Divested Acadia Divested Rumford/Tiverton Turned Over Fremont Pending Sale Hillabee Pending Sale Pryor Under Evaluation Washington Parish Under Evaluation Newark Under Evaluation Texas City Restructured/Actively Marketing for Sale Clear Lake Restructured/Actively Marketing for Sale Pine Bluff Restructured RockGen Restructured Santa Rosa Restructured Hog Bayou Restructured |
 50 NET INCOME TO EBITDAR RECONCILIATION ___________________________________ (1) Interest expense is computed on the basis of the 3-month LIBOR (annual average) forward curve as of December 27, 2007. To the extent that actual interest rates in the future differ from the rates depicted in the forward curve, Calpine's realized interest expense will differ from the amounts presented in this forecast. (2) Other includes Minority Interest Expense, Operating Lease Expense, GAAP and other adjustments. $ millions 2008 2009 2010 2011 2012 2013 Net Income/(Loss) $ 73 $ 191 $ 327 $ 638 $ 1,038 $ 1,235 Add Back: Interest Expense net of Interest Income¹ 808 757 728 696 611 507 Depreciation and Amortization 461 474 484 492 492 492 Major maintenance 174 92 125 138 127 132 Reorganization Items 46 - - - - - Other² 132 175 138 157 167 172 Accrual EBITDAR $ 1,694 $ 1,689 $ 1,802 $ 2,121 $ 2,435 $ 2,538 |
 50 CALPINE ® CALPINE ® CONFIDENTIAL AND PROPRIETARY |