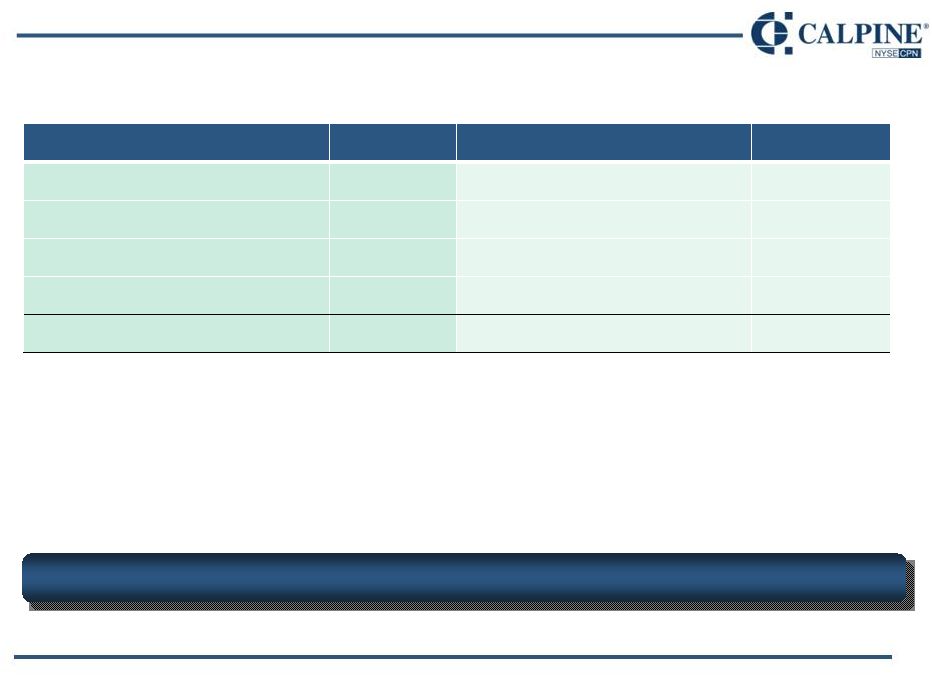
Reg G Reconciliations: 2010 and 2011 Guidance Adjusted EBITDA represents net income (loss) before interest, taxes, depreciation and amortization, adjusted for certain non-cash or non-recurring items as detailed in the following reconciliation. Adjusted EBITDA is presented because our management uses Adjusted EBITDA (i) as a measure of operating performance to assist in comparing performance from period to period on a consistent basis and to readily view operating trends; (ii) as a measure for planning and forecasting overall expectations and for evaluating actual results against such expectations; and (iii) in communications with our Board of Directors, shareholders, creditors, analysts and investors concerning our financial performance. We believe Adjusted EBITDA is also used by and is useful to investors and other users of our financial statements in evaluating our operating performance because it provides them with an additional tool to compare business performance across companies and across periods. Adjusted EBITDA is not a measure calculated in accordance with GAAP, and should be viewed as a supplement to and not a substitute for our results of operations presented in accordance with GAAP. Adjusted EBITDA is not intended to represent cash flows from operations or net income (loss) as defined by GAAP as an indicator of operating performance. Furthermore, Adjusted EBITDA is not necessarily comparable to similarly- titled measures reported by other companies. Adjusted Free Cash Flow represents net income before interest, taxes, depreciation and amortization, as adjusted, less operating lease payments, major maintenance expense and maintenance capital expenditures, net cash interest, cash taxes, working capital and other adjustments. Adjusted Free Cash Flow is presented because our management uses this measure, among others, to make decisions about capital allocation. Adjusted Free Cash Flow is not intended to represent cash flows from operations as defined by GAAP as an indicator of operating performance and is not necessarily comparable to similarly-titled measures reported by other companies. __________ Full Year 2010 Range: Low High (in millions) GAAP Net Income (Loss) $ (30) $ 70 Plus: Interest expense, net of interest income 710 710 465 465 Major maintenance expense 180 180 Operating lease expense 50 50 Other (1) 125 125 Adjusted EBITDA $ 1,500 $ 1,600 Less: Operating lease payments 50 50 290 290 (3) 750 750 Cash taxes 10 10 Adjusted Free Cash Flow $ 400 $ 500 Full Year 2011 Range: Low High (in millions) GAAP Net Income $ 30 $ 230 Plus: Interest expense, net of interest income 695 695 460 460 Major maintenance expense 210 210 45 45 Other (1) 85 85 Adjusted EBITDA $ 1,525 $ 1,725 Less: Operating lease payments 100 100 (2) 375 375 Cash interest, net (3) 735 735 15 15 Adjusted Free Cash Flow $ 300 $ 500 (2) (1) Other includes stock-based compensation expense, adjustments to reflect Adjusted EBITDA from unconsolidated investments and other items. (2) Includes projected Major Maintenance Expense of $178 million and $205 million in 2010 and 2011, respectively and maintenance Capital Expenditures of $112 million and $170 million in 2010 and 2011, respectively. Capital expenditures exclude major construction and development projects. (3) Includes fees for letters of credit, net of interest income. Cash interest, net Cash taxes Depreciation and amortization expense Depreciation and amortization expense Operating lease expense Major maintenance expense and maintenance capital expenditures Major maintenance expense and maintenance capital expenditures 27 | 