Exhibit 99.2

Gardner Denver
2011 Analyst Day
November 7, 2011
Gardner
Denver
Safe Harbor Disclosure
All of the statements made by Gardner Denver in this presentation or made orally in connection with it, other than historical facts, are forward-looking statements. As a general matter, forward-looking statements are those focused upon anticipated events or trends, expectations, and beliefs relating to matters that are not historical in nature. The Private Securities Litigation Reform Act of 1995 provides a “safe harbor” for these forward-looking statements. In order to comply with the terms of the safe harbor, the Company notes that forward-looking statements are subject to known and unknown risks, uncertainties, and other factors relating to the Company’s operations and business environment, all of which are difficult to predict and many of which are beyond the control of the Company. These known and unknown risks, uncertainties, and other factors could cause actual results to differ materially from those matters expressed in, anticipated by or implied by such forward-looking statements.
Factors that could cause or contribute to such differences include, but are not limited to: changing economic conditions; pricing of the Company’s products and other competitive market pressures; the costs and availability of raw materials; fluctuations in foreign currency rates and energy prices; risks associated with the Company’s current and future litigation; and the other risks detailed from time to time in the Company’s SEC filings, including but not limited to, its annual report on Form 10-K for the fiscal year ending December 31, 2010, and its quarterly reports on Form 10-Q.
These statements reflect the current views and assumptions of management with respect to future events. The Company does not undertake, and hereby disclaims, any duty to update these forward-looking statements, although its situation and circumstances may change in the future. The inclusion of any statement in this presentation does not constitute admission by the Company or any other person that the events or circumstances described in such statement are material.
Gardner
Denver
2
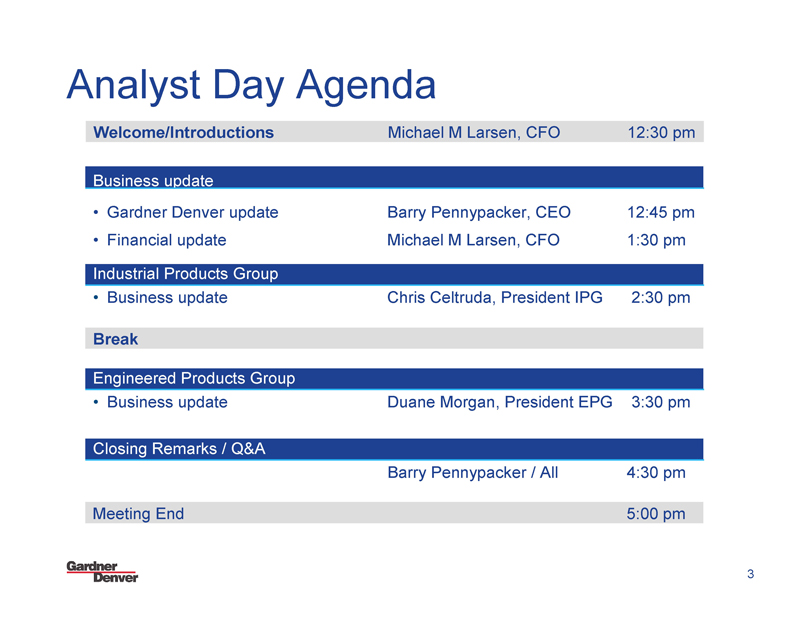
Analyst Day Agenda
Welcome/Introductions
Business update
• Gardner Denver update
• Financial update
Industrial Products Group
• Business update
Break
Engineered Products Group
• Business update
Closing Remarks / Q&A
Meeting End
Michael M Larsen, CFO
Barry Pennypacker, CEO
Michael M Larsen, CFO
Chris Celtruda, President IPG
Duane Morgan, President EPG
Barry Pennypacker / All
12:30 pm
12:45 pm
1:30 pm
2:30 pm
3:30 pm
4:30 pm
5:00 pm
Gardner
Denver
3

Gardner Denver Video
Strategic update
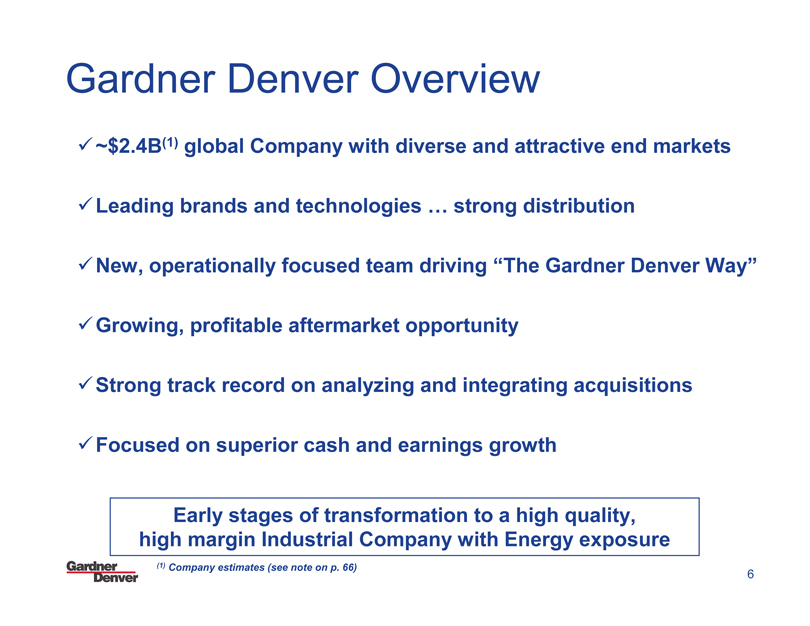
Gardner Denver Overview
~$2.4B(1) global Company with diverse and attractive end markets
Leading brands and technologies ... strong distribution
New, operationally focused team driving “The Gardner Denver Way”
Growing, profitable aftermarket opportunity
Strong track record on analyzing and integrating acquisitions
Focused on superior cash and earnings growth
Early stages of transformation to a high quality, high margin Industrial Company with Energy exposure
(1) Company estimates (see note on p. 66)
Gardner
Denver
6
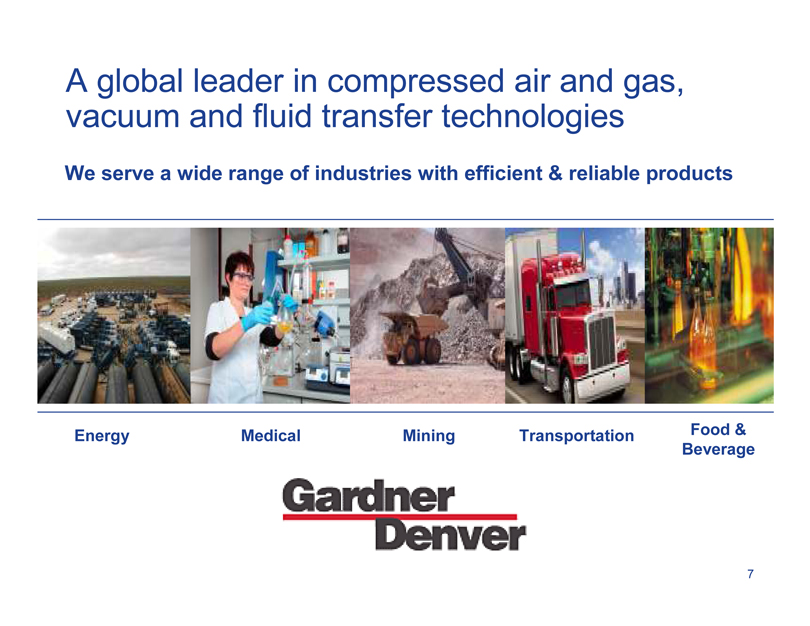
A global leader in compressed air and gas, vacuum and fluid transfer technologies
We serve a wide range of industries with efficient & reliable products
Energy Medical Mining Transportation Food & Beverage
Gardner Denver
7
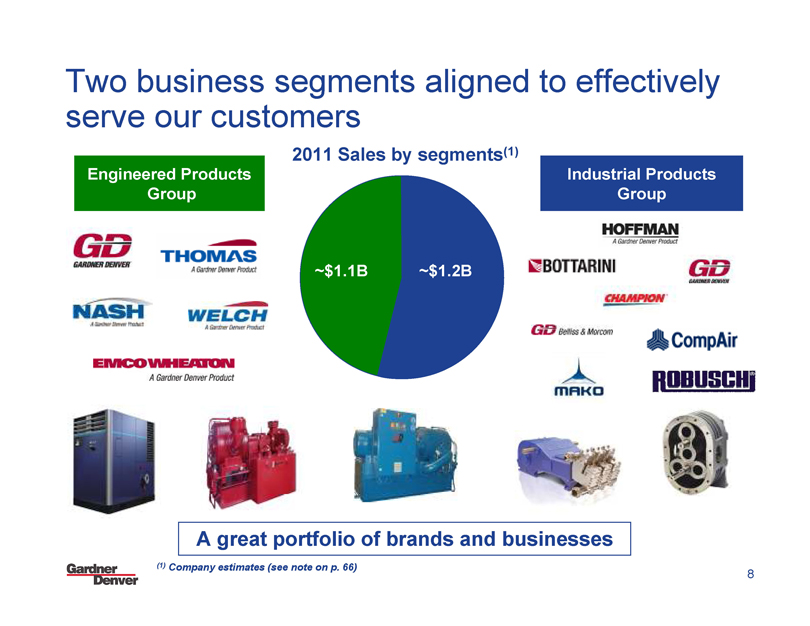
Two business segments aligned to effectively serve our customers
2011 Sales by segments(1)
Engineered Products Group
GD
GARDNER DENVER
THOMAS
A Gardner Denver Product
NASH
A Gardner Denver Product
WELCH
A Gardner Denver Product
EMCO WHEATON
A Gardner Denver Product
~$1.1B
~$1.2B
Industrial Products Group
HOFFMAN
A Gardner Denver Product
BOTTARINI
GD
GARDNER DENVER
CHAMPION
GD Belliss & Morcom
CompAir
MAKO
ROBUSCHI®
A great portfolio of brands and businesses
(1) Company estimates (see note on p. 66)
Gardner
Denver
8
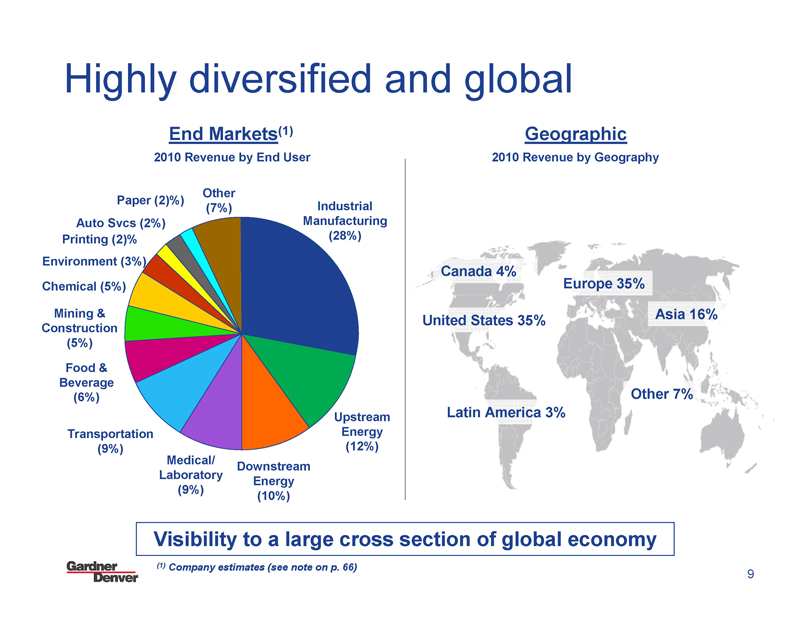
Highly diversified and global
End Markets(1)
2010 Revenue by End User
Other (7%)
Paper (2)%)
Auto Svcs (2%)
Printing (2)%
Environment (3%)
Chemical (5%)
Mining & Construction (5%)
Food & Beverage (6%)
Transportation (9%)
Medical/ Laboratory (9%)
Industrial Manufacturing (28%)
Upstream Energy (12%)
Downstream Energy (10%)
Geographic
2010 Revenue by Geography
Canada 4%
United States 35%
Latin America 3%
Europe 35%
Asia 16%
Other 7%
Visibility to a large cross section of global economy
(1) Company estimates (see note on p. 66)
Gardner
Denver
9
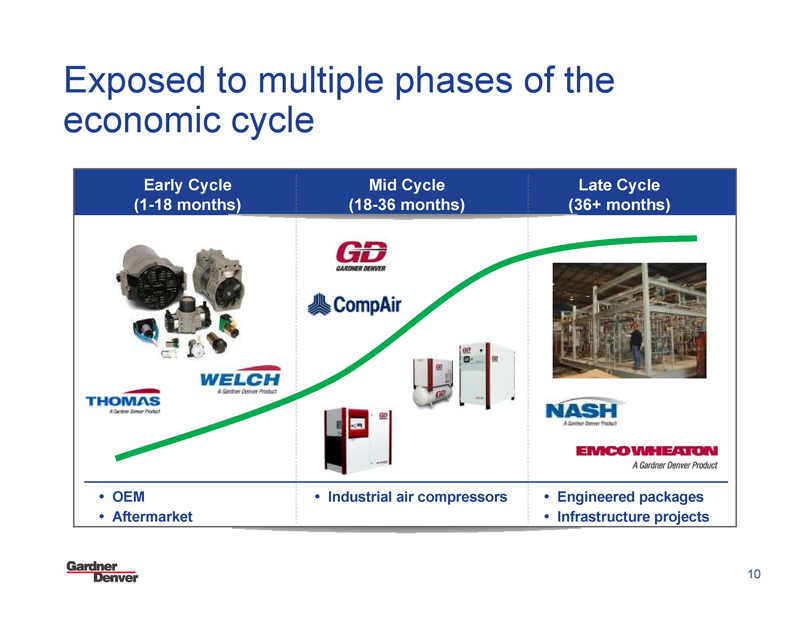
Exposed to multiple phases of the economic cycle
Early Cycle
(1-18 months)
THOMAS
A Gardner Denver Product
WELCH
A Gardner Denver Product
Mid Cycle (18-36 months)
GD
GARDNER DENVER
CompAir
Late Cycle (36+ months)
NASH
A Gardner Denver Product
EMCO WHEATON
A Gardner Denver Product
• OEM
• Aftermarket
• Industrial air compressors
• Engineered packages
• Infrastructure projects
Gardner
Denver
10
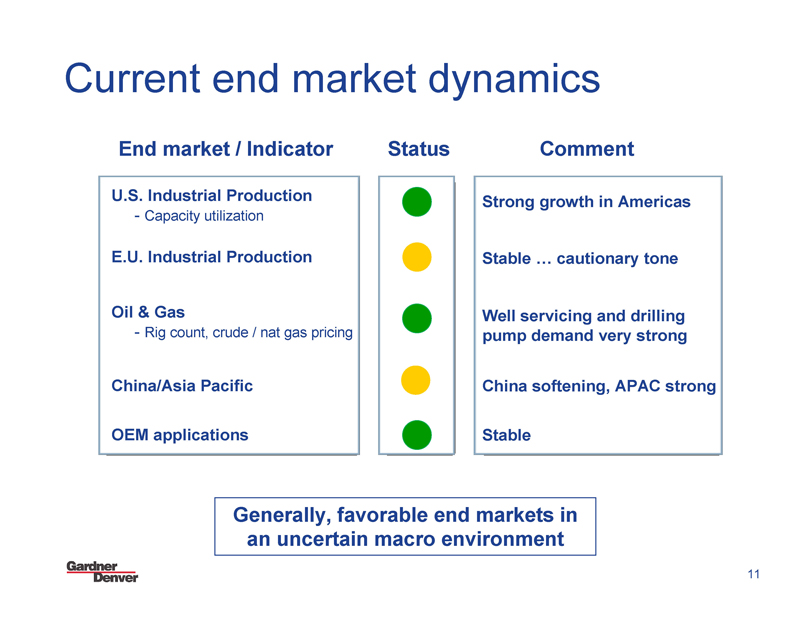
Current end market dynamics
End market / Indicator Status Comment
U.S. Industrial Production
- Capacity utilization
E.U. Industrial Production
Oil & Gas
- Rig count, crude / nat gas pricing
China/Asia Pacific
OEM applications
Strong growth in Americas
Stable ... cautionary tone
Well servicing and drilling pump demand very strong
China softening, APAC strong
Stable
Generally, favorable end markets in an uncertain macro environment
Gardner
Denver
11
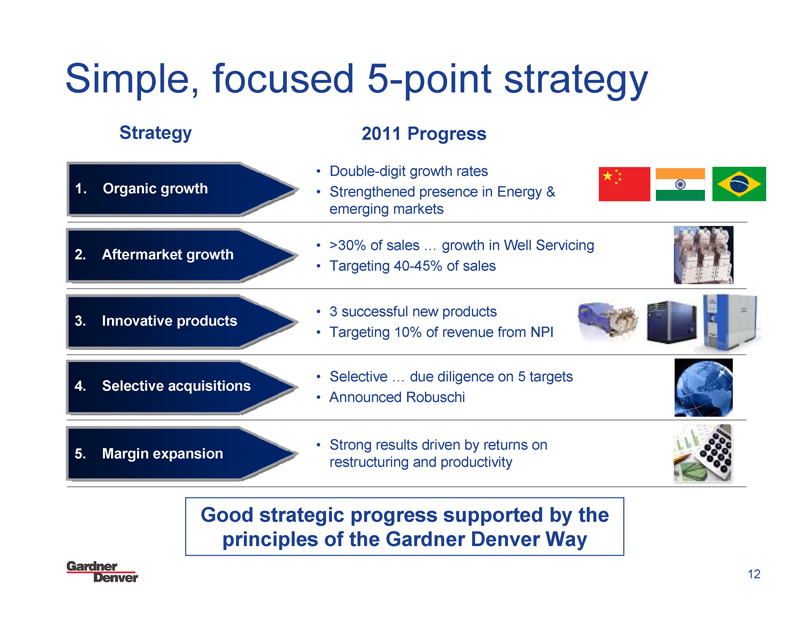
Simple, focused 5-point strategy
Strategy
1. Organic growth
2. Aftermarket growth
3. Innovative products
4. Selective acquisitions
5. Margin expansion
2011 Progress
• Double-digit growth rates
• Strengthened presence in Energy & emerging markets
• >30% of sales ... growth in Well Servicing
• Targeting 40-45% of sales
• 3 successful new products
• Targeting 10% of revenue from NPI
• Selective … due diligence on 5 targets
• Announced Robuschi
• Strong results driven by returns on restructuring and productivity
Good strategic progress supported by the principles of the Gardner Denver Way
Gardner
Denver
12
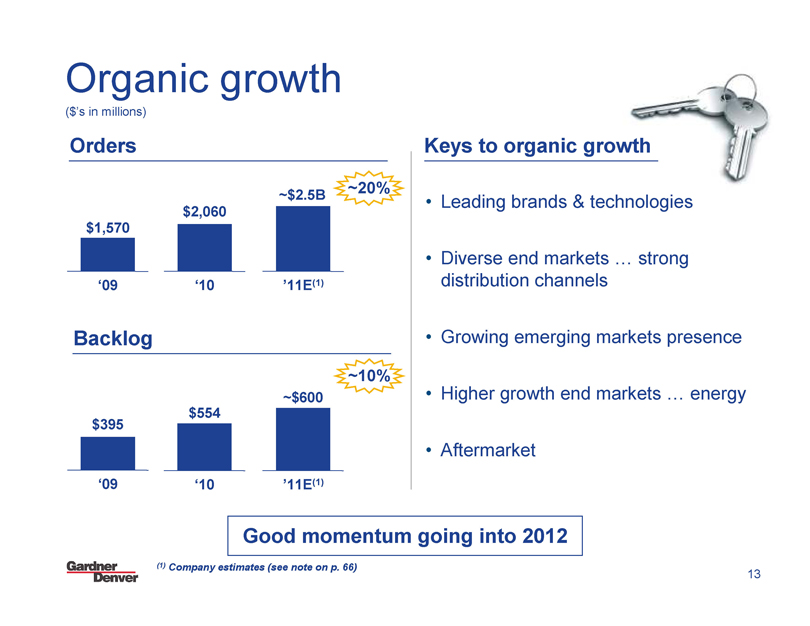
Organic growth
($’s in millions)
Orders
$1,570
‘09
$2,060
‘10
~$2.5B
’11E(1)
~20%
Backlog
$395
‘09
$554
‘10
~$600
’11E(1)
~10%
Keys to organic growth
• Leading brands & technologies
• Diverse end markets ... strong distribution channels
• Growing emerging markets presence
• Higher growth end markets … energy
• Aftermarket
Good momentum going into 2012
(1) Company estimates (see note on p. 66)
Gardner
Denver
13

Expanding presence in emerging markets
Real GDP growth (%)
‘10 ‘11 ‘12
2%
2%
2%
3%
3%
3%
4%
0%
3%
10%
9%
9%
9%
8%
8%
4%
4%
4%
8%
4%
4%
5%
4%
4%
Eurozone U.S. Japan China India Russia Brazil World
Key points regarding 2012+ outlook
• Advanced industrial countries will experience slow growth
• Emerging economies will continue to outperform industrial countries
Source: The World Bank, The Global Outlook in Summary
Gardner
Denver
14
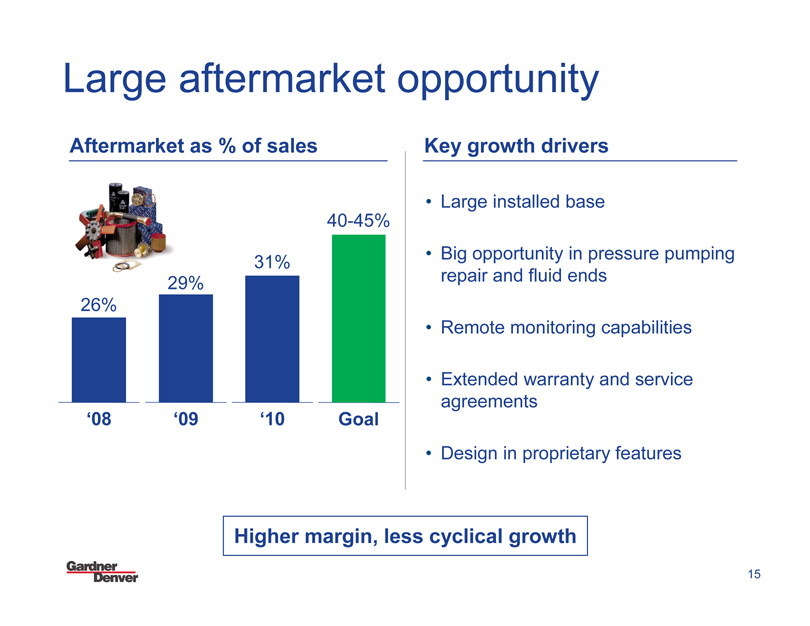
Large aftermarket opportunity
Aftermarket as % of sales
26%
‘08
29%
‘09
31%
‘10
40-45%
Goal
Key growth drivers
• Large installed base
• Big opportunity in pressure pumping repair and fluid ends
• Remote monitoring capabilities
• Extended warranty and service agreements
• Design in proprietary features
Higher margin, less cyclical growth
Gardner
Denver
15
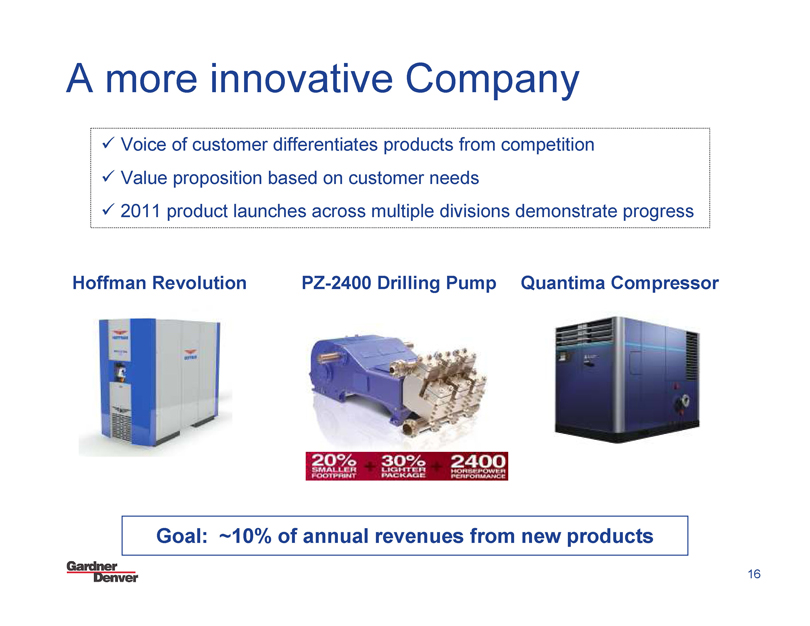
A more innovative Company
Voice of customer differentiates products from competition
Value proposition based on customer needs
2011 product launches across multiple divisions demonstrate progress
Hoffman Revolution
PZ-2400 Drilling Pump
Quantima Compressor
20%
SMALLER
FOOTPRINT
30%
LIGHTER
PACKAGE
2400
HORSEPOWER
PERFORMANCE
Goal: ~10% of annual revenues from new products
Gardner
Denver
16
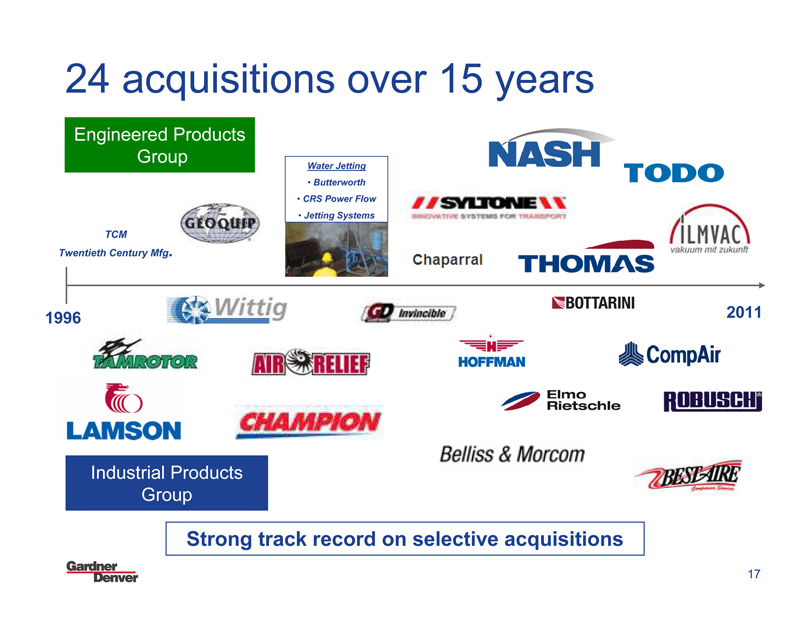
24 acquisitions over 15 years
Engineered Products Group
TCM
Twentieth Century Mfg.
GEOQUIP
Water Jetting
• Butterworth
• CRS Power Flow
• Jetting Systems
NASH
SYLTONE
INNOVATIVE SYSTEMS FOR TRANSPORT
TODO
ILMVAC
vakuum mit zukunft
Chaparral
THOMAS
1996
Wittig
BOTTARINI
2011
TAMROTOR
AIR RELIEF
HOFFMAN
CompAir
LAMSON
CHAMPION
Invincible
Elmo Rietschle
ROBUSCH
Industrial Products Group
Bellis & Morcom
BEST AIRE
Strong track record on selective acquisitions
Gardner
Denver
17
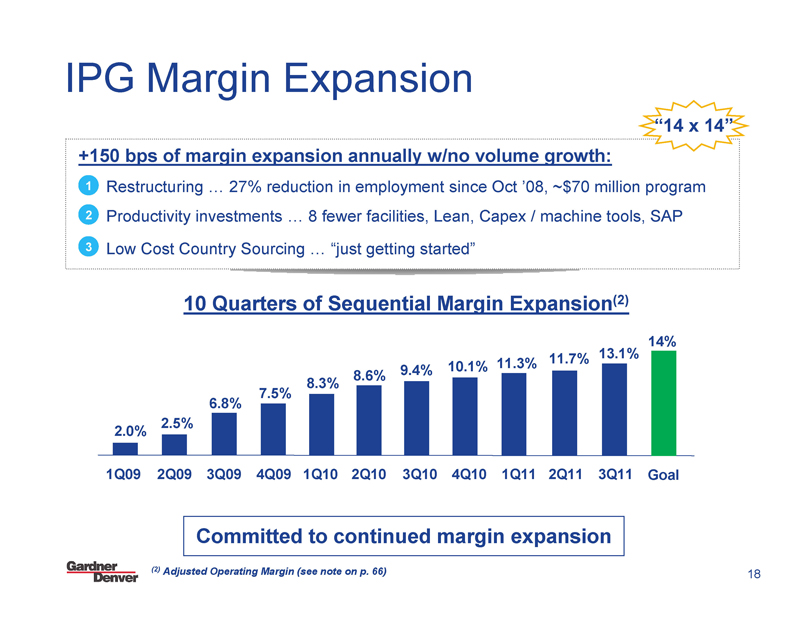
IPG Margin Expansion
“14 x 14”
+150 bps of margin expansion annually w/no volume growth:
1 Restructuring ... 27% reduction in employment since Oct ’08, ~$70 million program
2 Productivity investments ... 8 fewer facilities, Lean, Capex / machine tools, SAP
3 Low Cost Country Sourcing ... “just getting started”
10 Quarters of Sequential Margin Expansion(2)
2.0%
1Q09
2.5%
2Q09
6.8%
3Q09
7.5%
4Q09
8.3%
1Q10
8.6%
2Q10
9.4%
3Q10
10.1%
4Q10
11.3%
1Q11
11.7%
2Q11
13.1%
3Q11
14%
Goal
Committed to continued margin expansion
(2) Adjusted Operating Margin (see note on p. 66)
Gardner
Denver
18
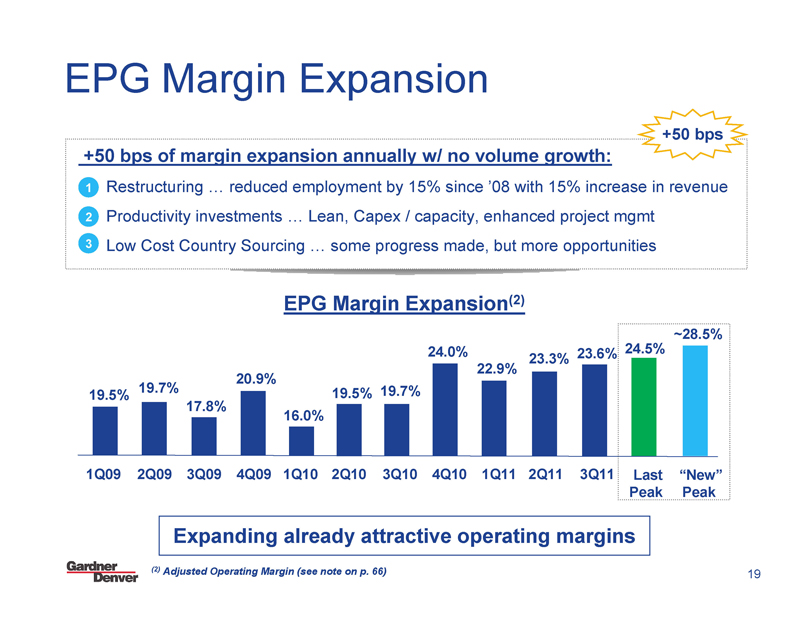
EPG Margin Expansion
+50 bps
+50 bps of margin expansion annually w/ no volume growth:
1 Restructuring ... reduced employment by 15% since ’08 with 15% increase in revenue
2 Productivity investments ... Lean, Capex / capacity, enhanced project mgmt
3 Low Cost Country Sourcing ... some progress made, but more opportunities
EPG Margin Expansion(2)
19.5%
1Q09
19.7%
2Q09
17.8%
3Q09
20.9%
4Q09
16.0%
1Q10
19.5%
2Q10
19.7%
3Q10
24.0%
4Q10
22.9%
1Q11
23.3%
2Q11
23.6%
3Q11
24.5%
Last Peak
~28.5%
“New” Peak
Expanding already attractive operating margins
(2) Adjusted Operating Margin (see note on p. 66)
Gardner
Denver
19
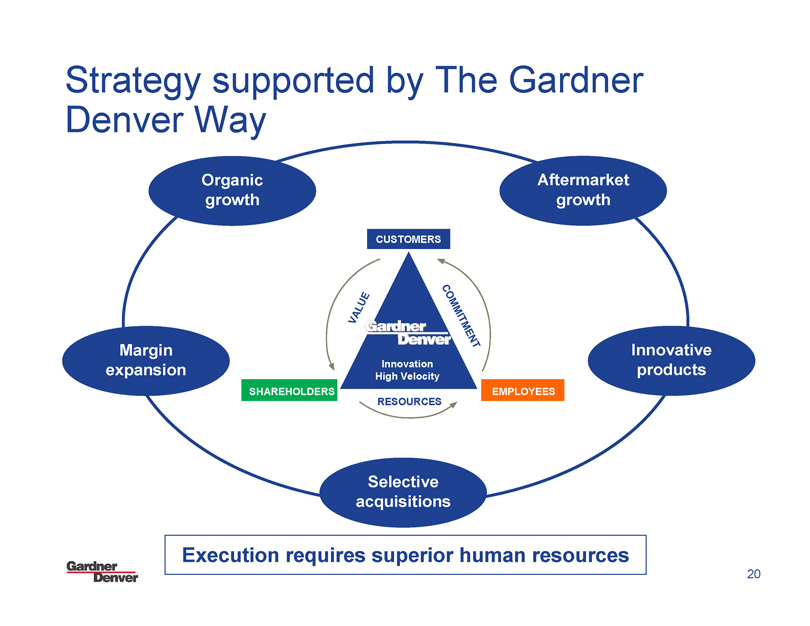
Strategy supported by The Gardner Denver Way
Organic growth
Margin expansion
Selective acquisitions
Innovative products
Aftermarket growth
CUSTOMERS
SHAREHOLDERS
EMPLOYEES
VALUE
COMMITMENT
RESOURCES
Gardner
Denver
Innovation
High Velocity
Execution requires superior human resources
Gardner
Denver
20
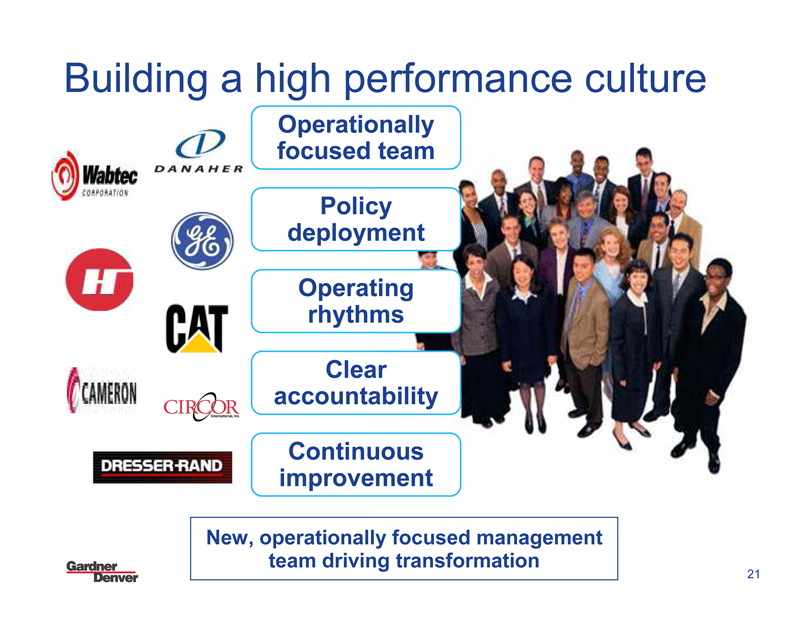
Building a high performance culture
Operationally focused team
Policy deployment
Operating rhythms
Clear accountability
Continuous improvement
New, operationally focused management
SF
team driving transformation
21

Financial Update
Track record of financial results
Favorable dynamics in diverse end markets support future growth
Margin expansion goals within reach ... “The Gardner Denver Way”
Ability to manage through uncertain times ... contingency planning
Strong cash generation and balance sheet ... disciplined deployment
Track record on accretive M&A ... active pipeline
Focused on delivering superior cash and earnings growth
Gardner
Denver
23
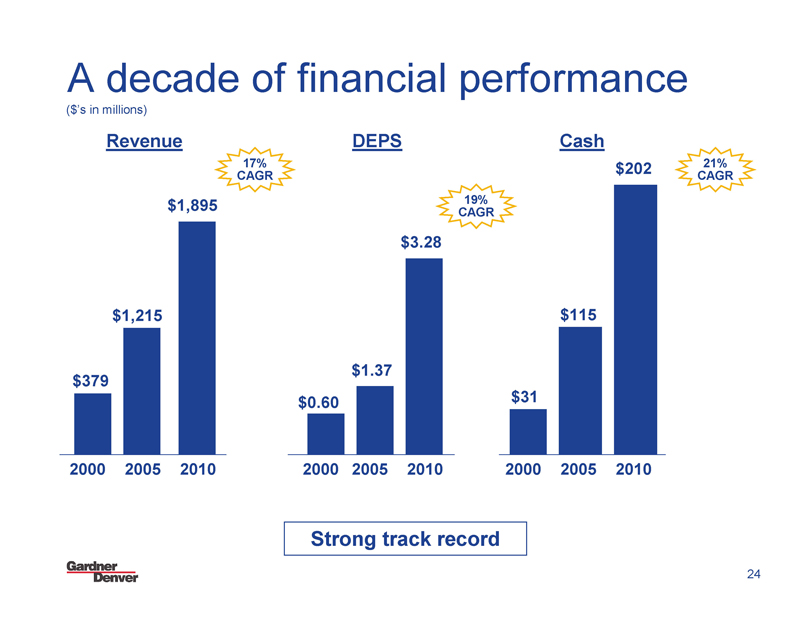
A decade of financial performance
($’s in millions)
Revenue DEPS Cash
$379
2000
$1,215
2005
$1,895
2010
17% CAGR
$0.60
2000
$1.37
2005
$3.28
2010
19% CAGR
$31
2000
$115
2005
$202
2010
21% CAGR
Strong track record
Gardner
Denver
24
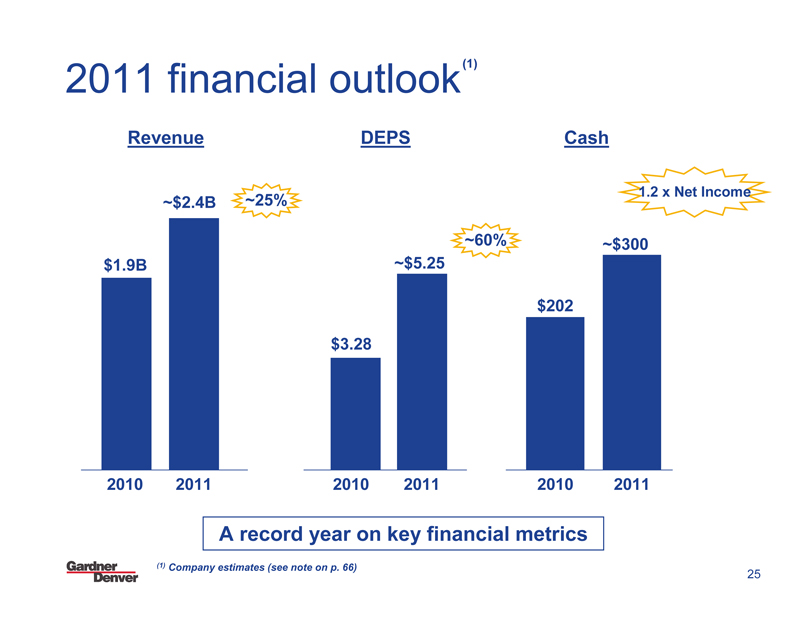
2011 financial outlook (1)
Revenue DEPS Cash
~400 bps
~25%
~$2.4B
$1.9B
2010
2011
$3.28
~$5.25
~60%
$202
~$300
2010
2011
2010
2011
1.2 x Net Income
A record year on key financial metrics
(1) Company estimates (see note on p. 66)
Gardner
Denver
25
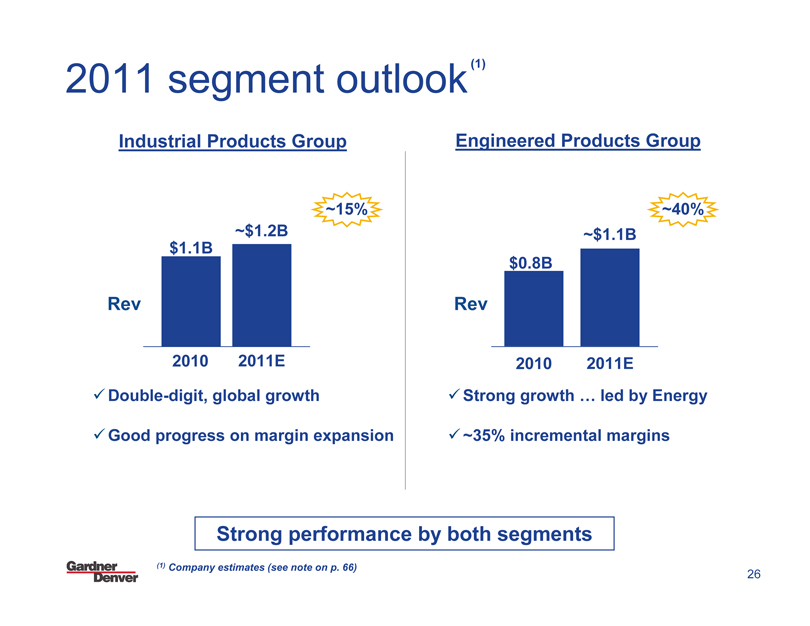
2011 segment outlook (1)
Industrial Products Group Engineered Products Group
Rev
$1.1B
~$1.2B
~15%
2010
2011E
Double-digit, global growth
Good progress on margin expansion
Rev
$0.8B
~$1.1B
~40%
2010
2011E
Strong growth ... led by Energy
~35% incremental margins
Strong performance by both segments
(1) Company estimates (see note on p. 66)
Gardner
Denver
26
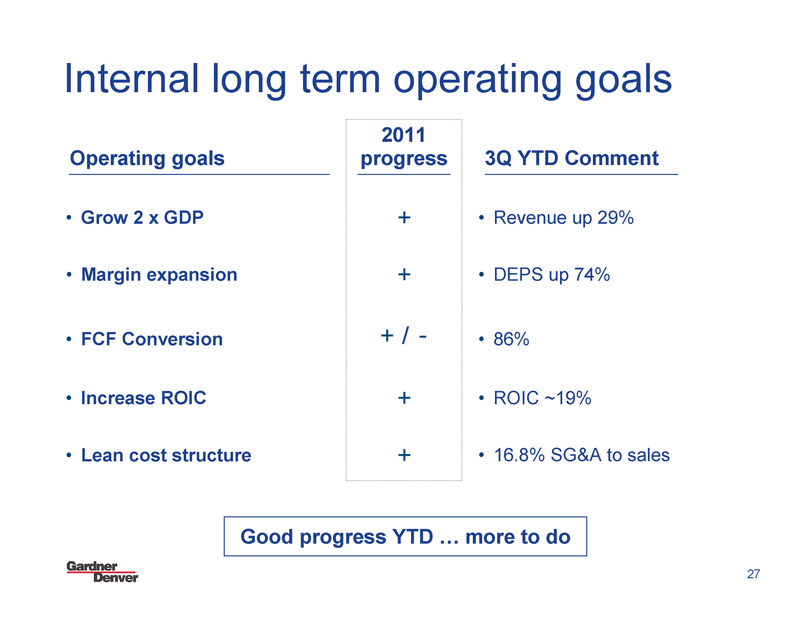
Internal long term operating goals
Operating goals
2011 progress
3Q YTD Comment
• Grow 2 x GDP + • Revenue up 29%
• Margin expansion + • DEPS up 74%
• FCF Conversion + / - • 86%
• Increase ROIC + • ROIC ~19%
• Lean cost structure + • 16.8% SG&A to sales
Good progress YTD ... more to do
Gardner
Denver
27
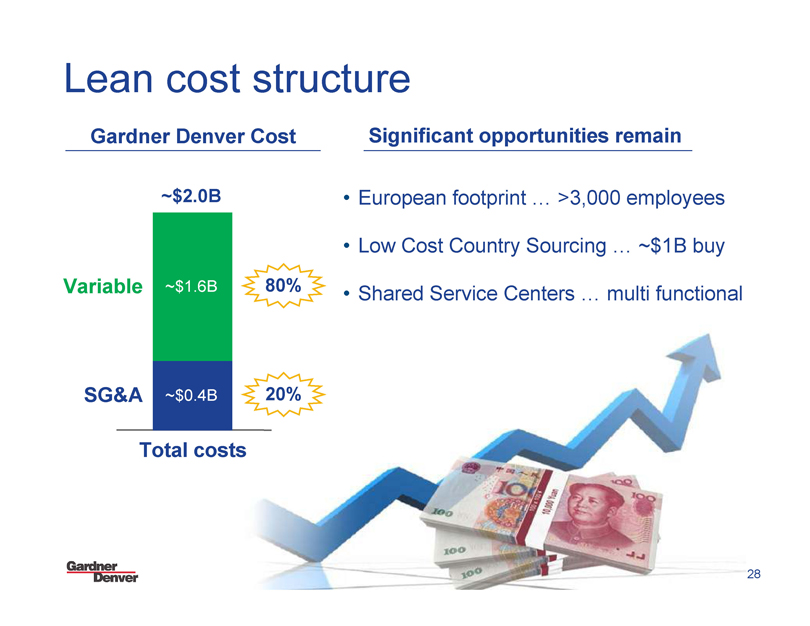
Lean cost structure
Gardner Denver Cost
~$2.0B
Variable ~$1.6B 80%
SG&A ~$0.4B 20%
Total costs
Significant opportunities remain
• European footprint ... >3,000 employees
• Low Cost Country Sourcing ... ~$1B buy
• Shared Service Centers ... multi functional
Gardner
Denver
28
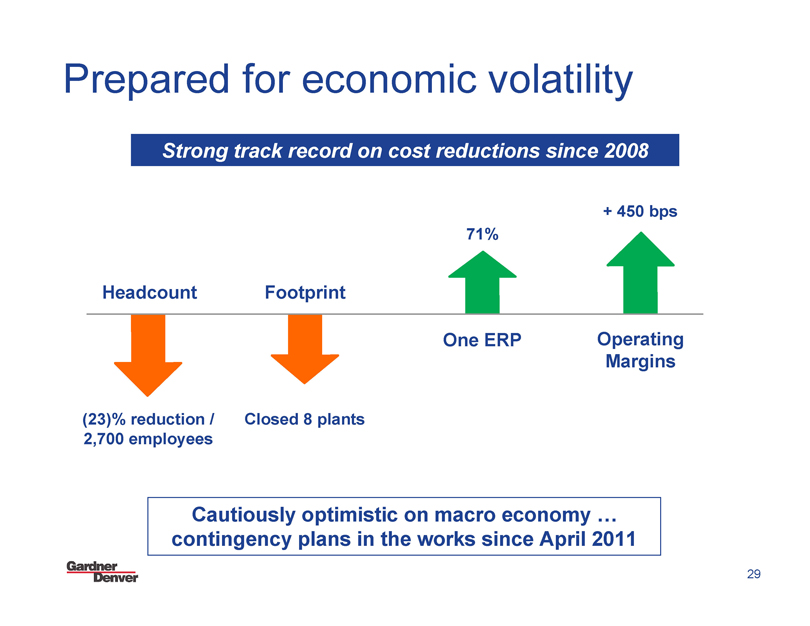
Prepared for economic volatility
Strong track record on cost reductions since 2008
Headcount
(23)% reduction / 2,700 employees
Footprint
Closed 8 plants
71%
One ERP
+ 450 bps
Operating Margins
Cautiously optimistic on macro economy ... contingency plans in the works since April 2011
Gardner
Denver
29
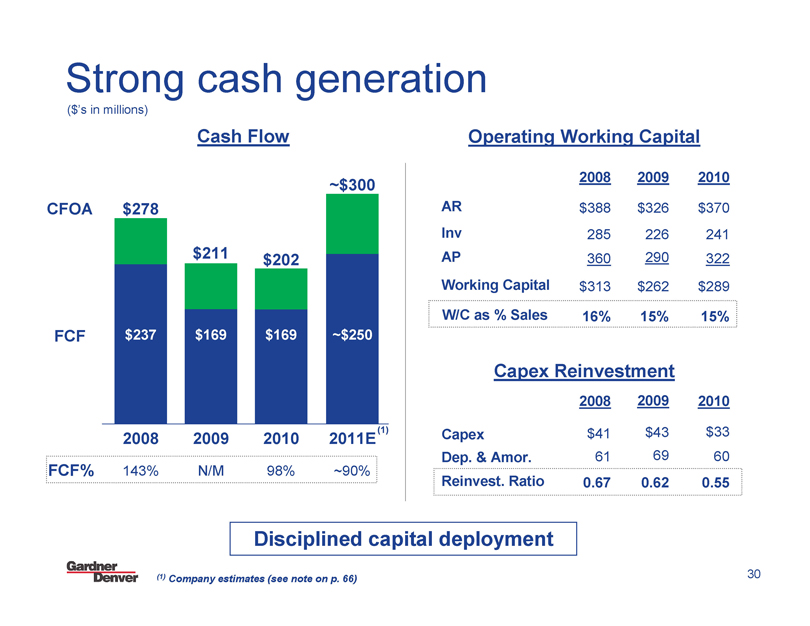
Strong cash generation
($’s in millions)
Cash Flow
CFOA
FCF
$278 $237 2008
$211 $169 2009
$202 $169 2010
~$300
~$250
(1)
2011E
FCF% 143% N/M 98% ~90%
Operating Working Capital
2008 2009 2010
AR $388 $326 $370
Inv 285 226 241
AP 360 290 322
Working Capital $313 $262 $289
W/C as % Sales 16% 15% 15%
Capex Reinvestment
2008 2009 2010
Capex $41 $43 $33
Dep. & Amor. 61 69 60
Reinvest. Ratio 0.67 0.62 0.55
Disciplined capital deployment
(1) Company estimates (see note on p. 66)
Gardner
Denver
30
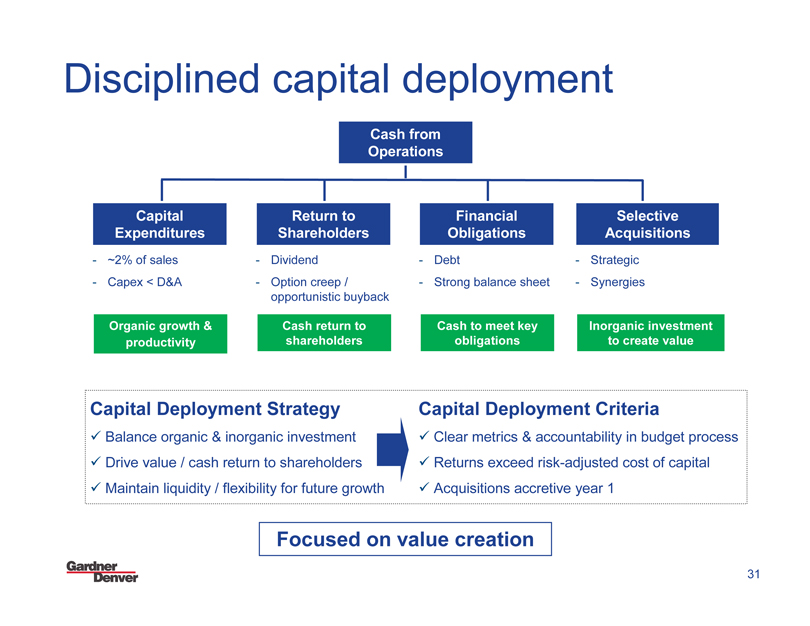
Disciplined capital deployment
Cash from Operations
Capital Expenditures
- ~2% of sales
- Capex < D&A
Organic growth & productivity
Return to Shareholders
- Dividend
Option creep/ opportunistic buyback
Cash return to shareholders
Financial Obligations
- Debt
- Strong balance sheet
Cash to meet key obligations
Selective Acquisitions
- Strategic
- Synergies
Inorganic investment to create value
Capital Deployment Strategy
Balance organic & inorganic investment
Drive value / cash return to shareholders
Maintain liquidity / flexibility for future growth
Capital Deployment Criteria
Clear metrics & accountability in budget process
Returns exceed risk-adjusted cost of capital
Acquisitions accretive year 1
Focused on value creation
Gardner
Denver
31
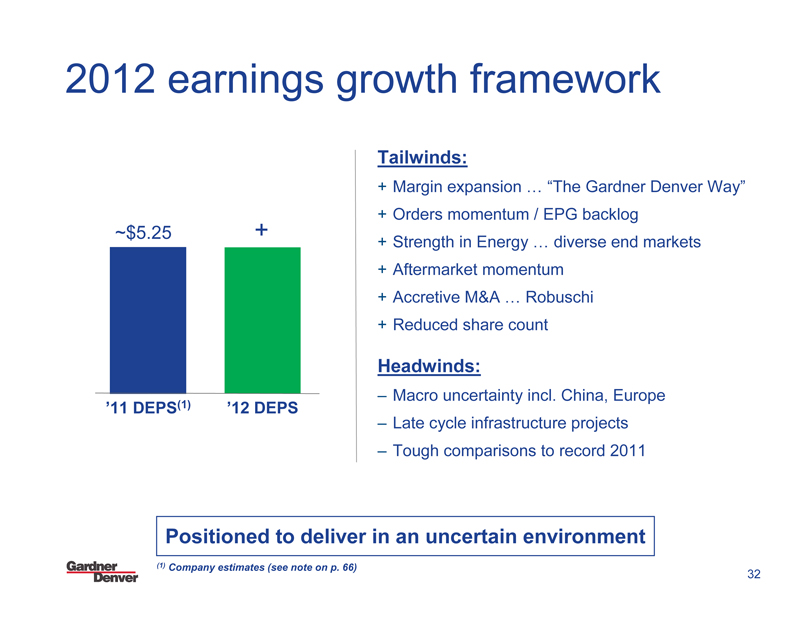
2012 earnings growth framework
~$5.25
’11 DEPS(1)
+
’12 DEPS
Tailwinds:
+ Margin expansion ... “The Gardner Denver Way”
+ Orders momentum / EPG backlog
+ Strength in Energy ... diverse end markets
+ Aftermarket momentum
+ Accretive M&A ... Robuschi
+ Reduced share count
Headwinds:
– Macro uncertainty incl. China, Europe
– Late cycle infrastructure projects
– Tough comparisons to record 2011
Positioned to deliver in an uncertain environment
(1) Company estimates (see note on p. 66)
Gardner
Denver
32
Industrial Products Group
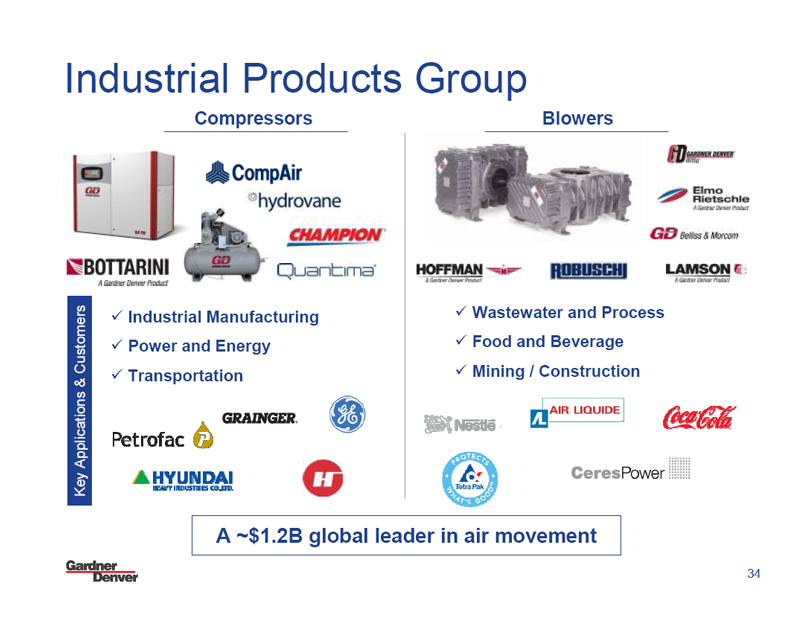
Industrial Products Group
Compressors
CompAir
hydrovane
CHAMPION
Quantima
BOTTARINI A Gardner Denver Product
Key Applications & Customers
Industrial Manufacturing
Power and Energy
Transportation
Petrofac
P
GRAINGER
GE
HYUNDAI HEAVY INDUSTRIES CO.,LTD.
H
Blowers
GARDNER DENVER
Elmo Rietschle A Gardner Denver Product
GD Belliss & Morcom
HOFFMAN A Gardner Denver Product
H
ROBUSCHI
LAMSON A Gardner Denver Product
Wastewater and Process
Food and Beverage
Mining / Construction
Nestle
AIR LIQUIDE
Coca-Cola
CeresPower
PROTECTS WHAT’S GOODTM Tetra Pak
A ~$1.2B global leader in air movement
Gardner Denver
34
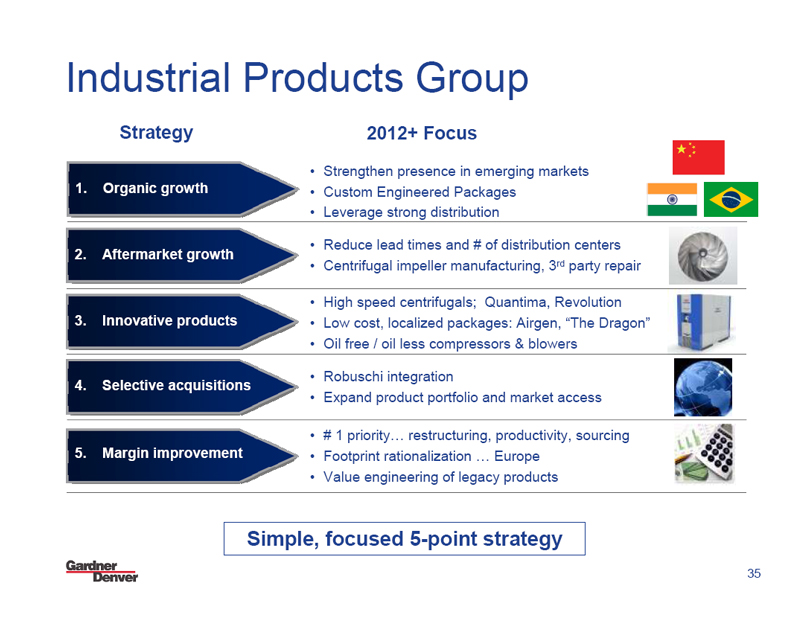
Industrial Products Group
Strategy 2012+ Focus
1. Organic growth
• Strengthen presence in emerging markets
• Custom Engineered Packages
• Leverage strong distribution
2. Aftermarket growth
• Reduce lead times and # of distribution centers
• Centrifugal impeller manufacturing, 3rd party repair
3. Innovative products
• High speed centrifugals; Quantima, Revolution
• Low cost, localized packages: Airgen, “The Dragon”
• Oil free / oil less compressors & blowers
4. Selective acquisitions
• Robuschi integration
• Expand product portfolio and market access
5. Margin improvement
• # 1 priority ... restructuring, productivity, sourcing
• Footprint rationalization ... Europe
• Value engineering of legacy products
Simple, focused 5-point strategy
Gardner Denver
35
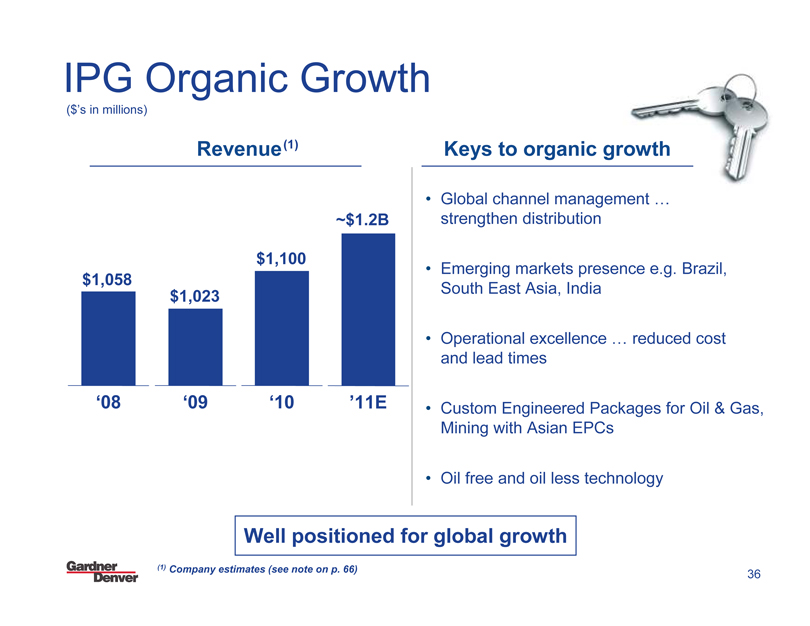
IPG Organic Growth
($’s in millions)
Revenue (1)
$1,058 $1,023 $1,100 ~$1.2B
Rev
‘08 ‘09 ‘10 ’11E
Keys to organic growth
• Global channel management ... strengthen distribution
• Emerging markets presence e.g. Brazil, South East Asia, India
• Operational excellence ... reduced cost and lead times
• Custom Engineered Packages for Oil & Gas, Mining with Asian EPCs
• Oil free and oil less technology
Well positioned for global growth
(1) Company estimates (see note on p. 66)
Gardner Denver
36
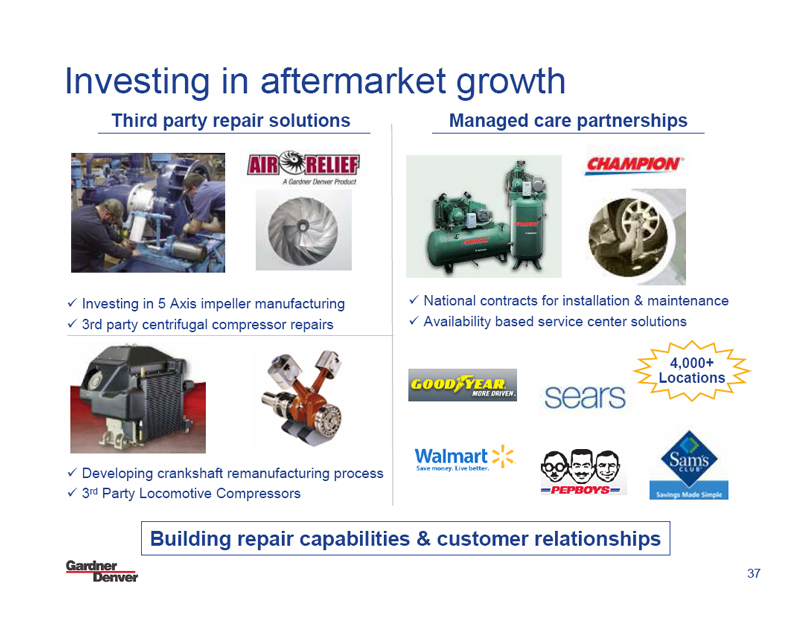
Investing in aftermarket growth
Third party repair solutions
AIR RELIEF
A Gardner Denver Product
Investing in 5 Axis impeller manufacturing
3rd party centrifugal compressor repairs
Developing crankshaft remanufacturing process
3rd Party Locomotive Compressors
Managed care partnerships
CHAMPION
National contracts for installation & maintenance
Availability based service center solutions
4,000+
Locations
GOOD YEAR MORE DRIVEN.
sears
Walmart Save money. Live better.
PEPBOYS
Sam’s CLUB
Savings Made Simple
Building repair capabilities & customer relationships
Gardner Denver
37

Custom Engineered Packages
~$500MM Market
Global growth
Adapting and integrating core compressor and blower technology
Attractive global infrastructure build in Oil, Gas, Mining and Manufacturing
Investing in regional relationships with Engineering Project Companies
~2 x increase in Asia Pacific orders
Repositioning and reorganizing team to focus on global opportunity
Winning in a high value, high growth market
38
Gardner Denver
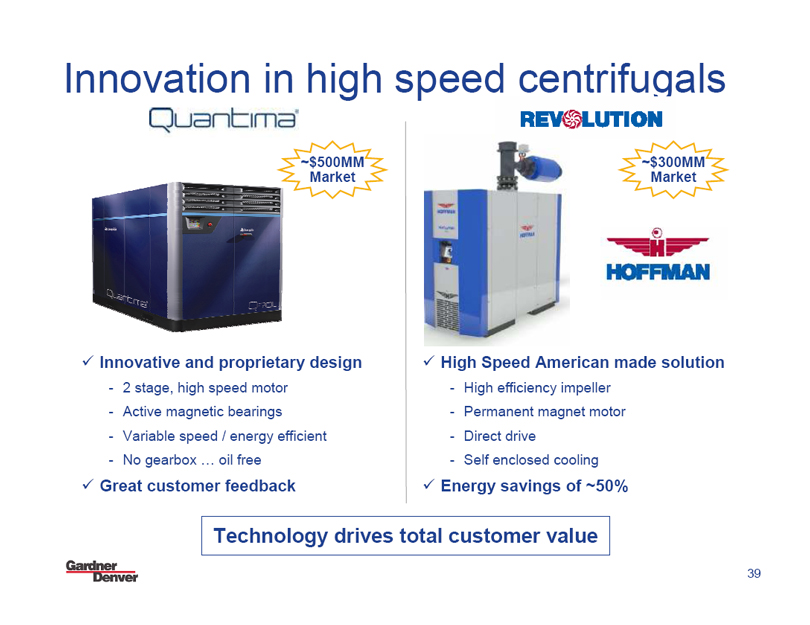
Innovation in high speed centrifugals
Quantima
~$500MM Market
Innovative and proprietary design
- 2 stage, high speed motor
- Active magnetic bearings
- Variable speed / energy efficient
- No gearbox ... oil free
Great customer feedback
REVOLUTION
~$300MM Market
H HOFFMAN
High Speed American made solution
- High efficiency impeller
- Permanent magnet motor
- Direct drive
- Self enclosed cooling
Energy savings of ~50%
Technology drives total customer value
Gardner Denver
39

Video
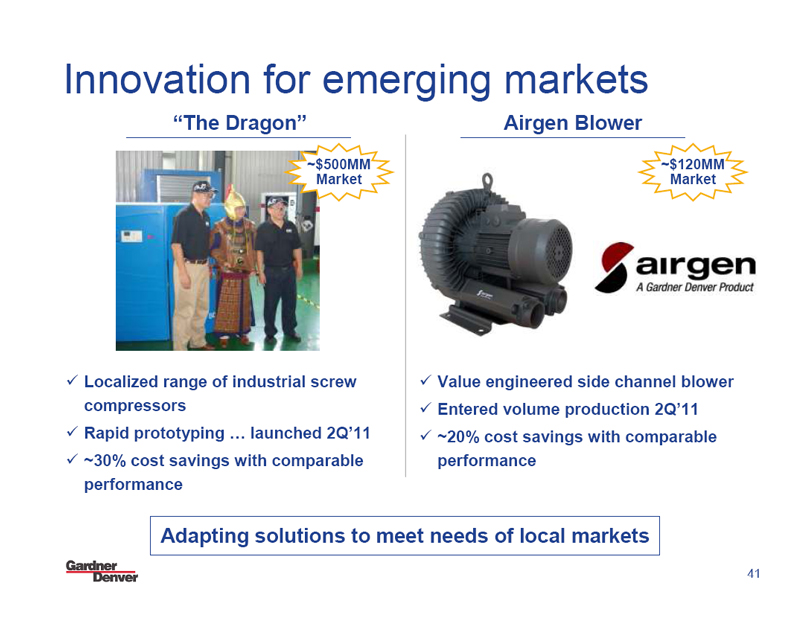
Innovation for emerging markets
“The Dragon”
~$500MM Market
Localized range of industrial screw compressors
Rapid prototyping ... launched 2Q’11
~30% cost savings with comparable performance
Airgen Blower
Value engineered side channel blower Entered volume production 2Q’11 ~20% cost savings with comparable performance
Adapting solutions to meet needs of local markets
~$120MM Market
airgen A Gardner Denver Product
Gardner Denver
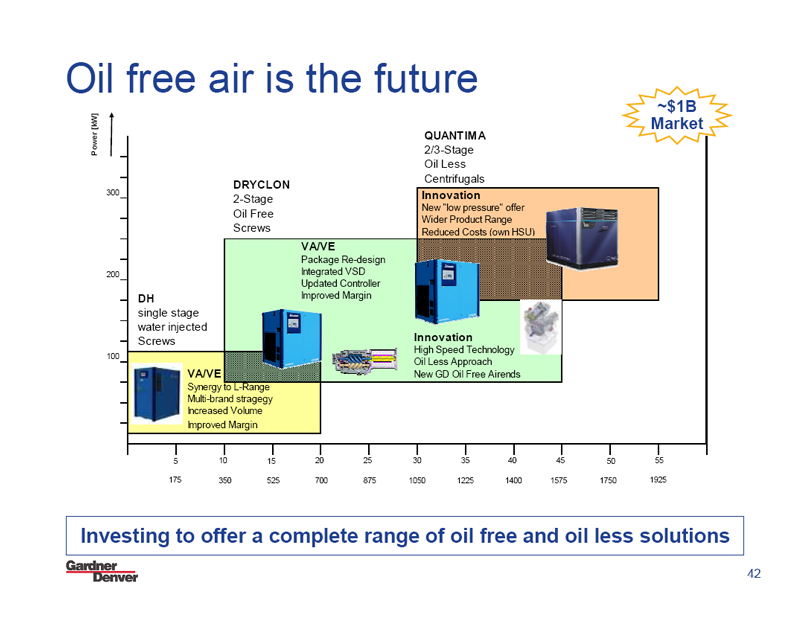
Oil free air is the future
~$1B
Market
Power [kW]
300 200 100
DH single stage water injected Screws
DRYCLON
2-Stage Oil Free Screws
QUANTIMA
2/3-Stage Oil Less Centrifugals
VA/VE
Synergy to L-Range Multi-brand stragegy Increased Volume Improved Margin
VA/VE
Package Re-design Integrated VSD Updated Controller Improved Margin
Innovation
New “low pressure” offer Wider Product Range Reduced Costs (own HSU)
Innovation
High Speed Technology Oil Less Approach New GD Oil Free Airends
5 10 15 20 25 30 35 40 45 50 55
175 350 525 700 875 1050 1225 1400 1575 1750 1925
Investing to offer a complete range of oil free and oil less solutions 42
Gardner Denver
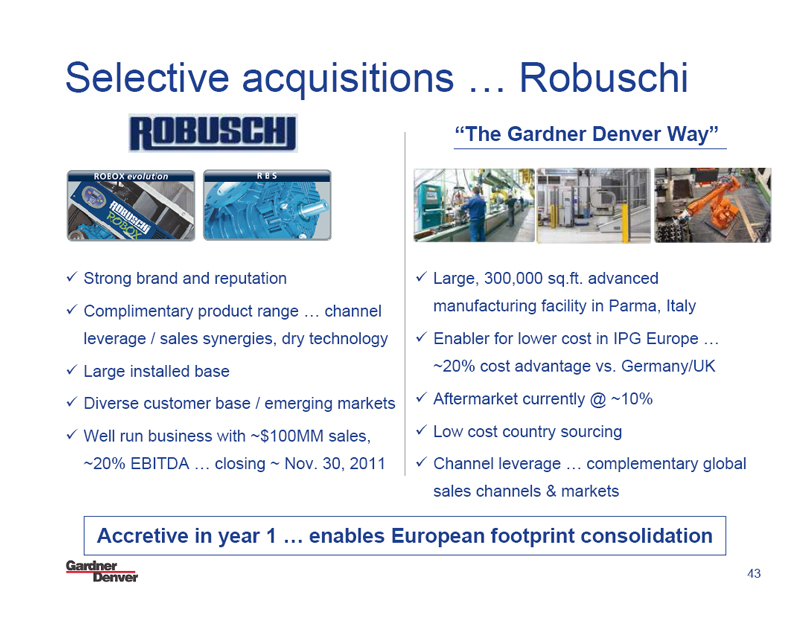
Selective acquisitions ... Robuschi
Strong brand and reputation
Robox evolution RBS
ROBUSCHI ROBOX
Complimentary product range ... channel leverage / sales synergies, dry technology
Large installed base
Diverse customer base / emerging markets
Well run business with ~$100MM sales, ~20% EBITDA ... closing ~ Nov. 30, 2011
“The Gardner Denver Way”
Large, 300,000 sq.ft. advanced manufacturing facility in Parma, Italy
Enabler for lower cost in IPG Europe ... ~20% cost advantage vs. Germany/UK
Aftermarket currently @ ~10%
Low cost country sourcing
Channel leverage ... complementary global sales channels & markets
Accretive in year 1 ... enables European footprint consolidation
Gardner Denver
43
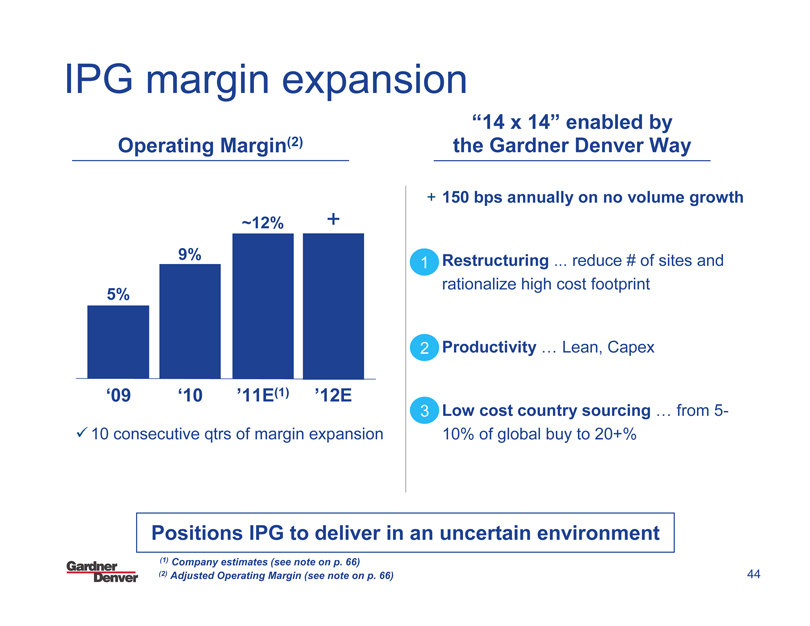
IPG margin expansion
Operating Margin(2)
+
~12%
9%
5%
‘09 ‘10 ’11E(1) ’12E
10 consecutive qtrs of margin expansion
“14 x 14” enabled by the Gardner Denver Way
+ 150 bps annually on no volume growth
1 Restructuring . reduce # of sites and rationalize high cost footprint
2 Productivity ... Lean, Capex
3 Low cost country sourcing ... from 5-10% of global buy to 20+%
Positions IPG to deliver in an uncertain environment
(1) Company estimates (see note on p. 66) (2) Adjusted Operating Margin (see note on p. 66)
Gardner Denver
44
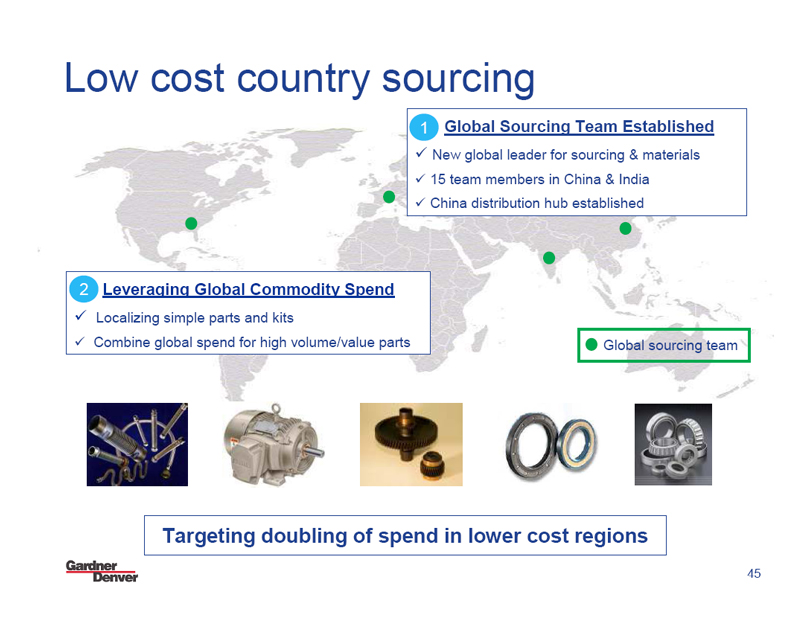
Low cost country sourcing
1 Global Sourcing Team Established
New global leader for sourcing & materials
15 team members in China & India
China distribution hub established
2 Leveraging Global Commodity Spend
Localizing simple parts and kits
Combine global spend for high volume/value parts
Global sourcing team
Targeting doubling of spend in lower cost regions
Gardner Denver
45
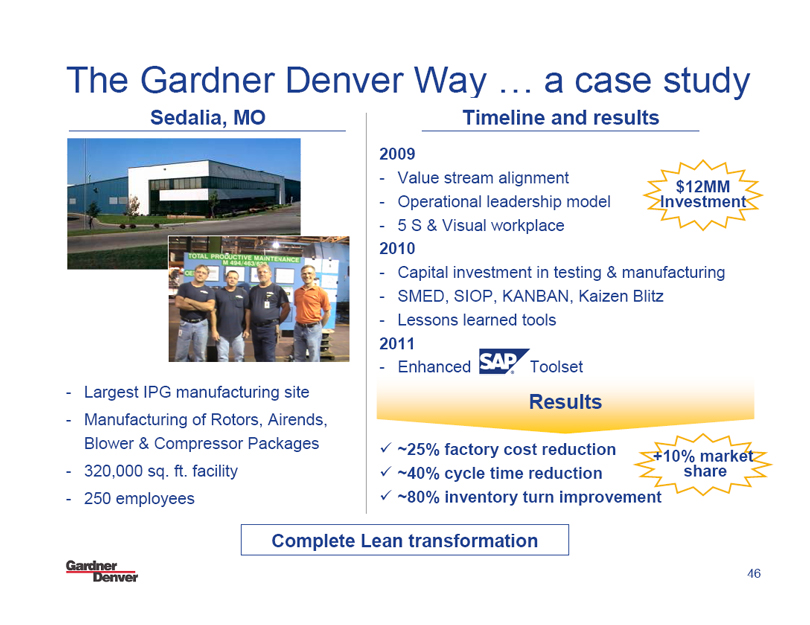
The Gardner Denver Way ... a case study
Sedalia, MO
- Largest IPG manufacturing site
- Manufacturing of Rotors, Airends,
Blower & Compressor Packages
- 320,000 sq. ft. facility
- 250 employees
Timeline and results
$12MM
Investment
2009
- Value stream alignment
- Operational leadership model
- 5 S & Visual workplace
2010
- Capital investment in testing & manufacturing
- SMED, SIOP, KANBAN, Kaizen Blitz
- Lessons learned tools
2011
- Enhanced SAP® Toolset
Results
+10% market
share
~25% factory cost reduction
~40% cycle time reduction
~80% inventory turn improvement
Complete Lean transformation
Gardner Denver
46
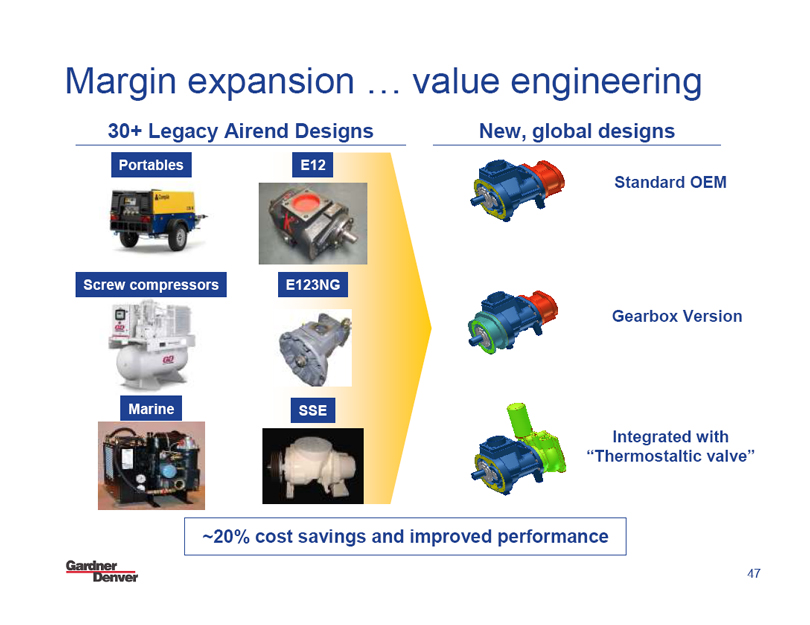
Margin expansion ... value engineering
30+ Legacy Airend Designs
Portables
Screw compressors
Marine
E12
E123NG
SSE
New, global designs
Standard OEM
Gearbox Version
Integrated with
“Thermostaltic valve”
~20% cost savings and improved performance
Gardner Denver
47

Break
Engineered Products Group
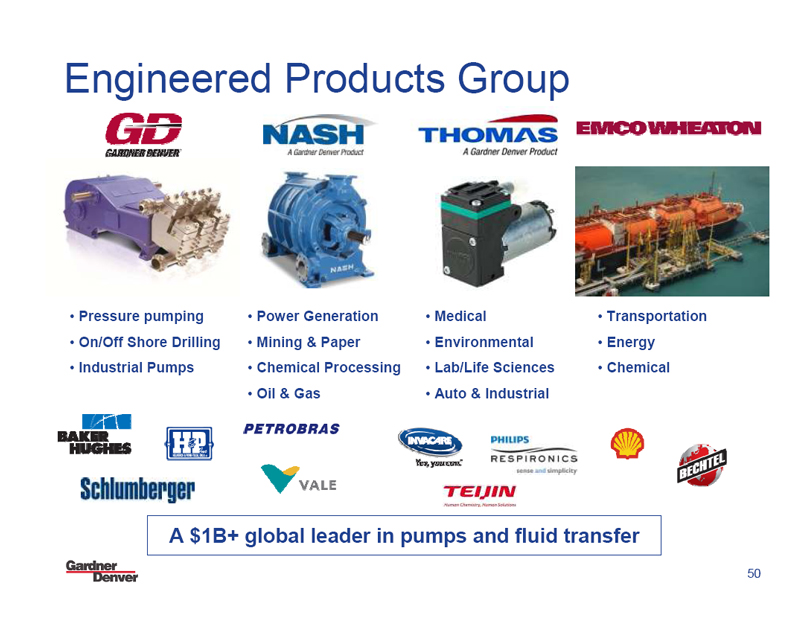
Engineered Products Group
GD GARDNER DENVER NASH A Gardner Denver Product THOMAS A Gardner Denver Product EMCO WHEATON
• Pressure pumping • Power Generation • Medical • Transportation
• On/Off Shore Drilling • Mining & Paper • Environmental • Energy
• Industrial Pumps • Chemical Processing • Lab/Life Sciences • Chemical
• Oil & Gas • Auto & Industrial
BAKER HUGHES H&P Inc PETROBRAS INVACARE Yes, you can: PHILIPS RESPIRONICS sense and simplicity BECHTEL
Schlumberger VALE TEIJIN
A $1B+ global leader in pumps and fluid transfer
Gardner Denver
50
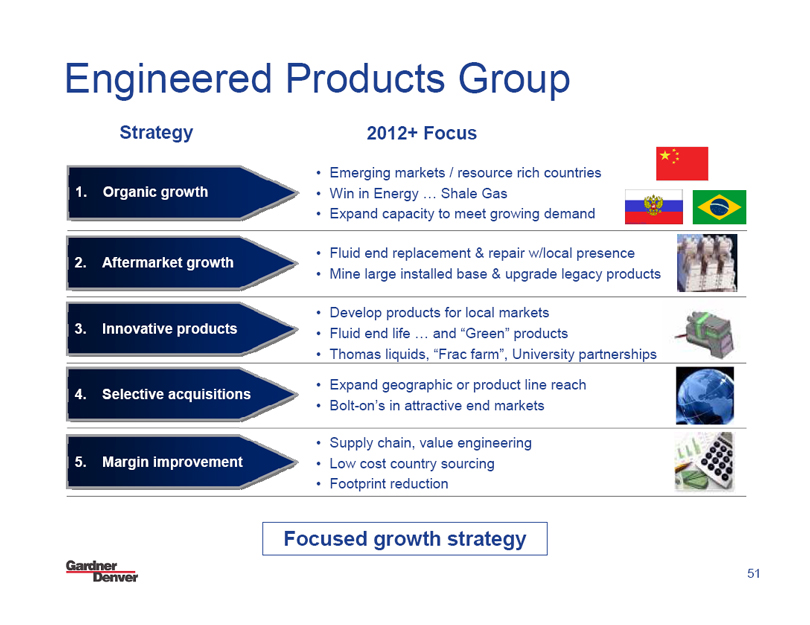
Engineered Products Group
Strategy 2012+ Focus
• Emerging markets / resource rich countries
1. Organic growth • Win in Energy ... Shale Gas
• Expand capacity to meet growing demand
• Fluid end replacement & repair w/local presence
2. Aftermarket growth • Mine large installed base & upgrade legacy products
• Develop products for local markets
3. Innovative products • Fluid end life … and “Green” products
• Thomas liquids, “Frac farm”, University partnerships
• Expand geographic or product line reach
4. Selective acquisitions • Bolt-on’s in attractive end markets
• Supply chain, value engineering
5. Margin improvement • Low cost country sourcing
• Footprint reduction
Focused growth strategy
Gardner Denver
51
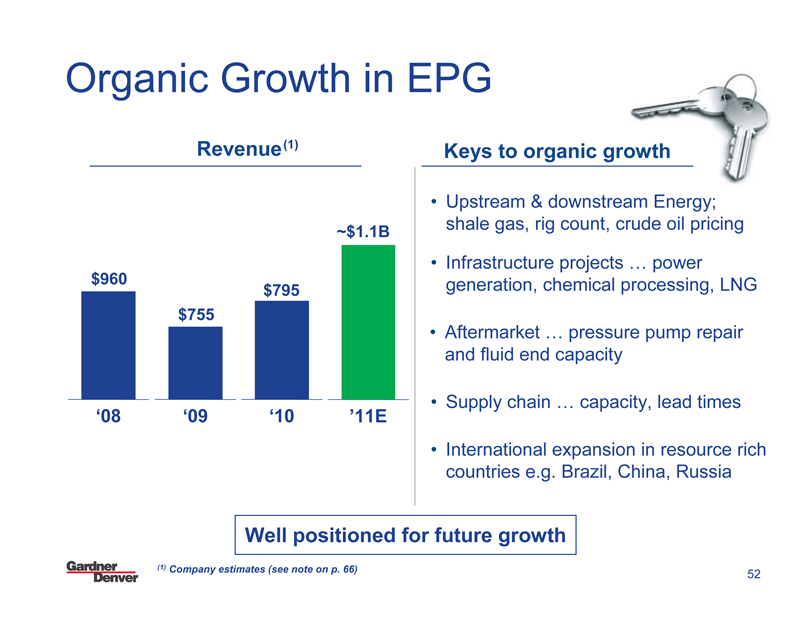
Organic Growth in EPG
Revenue(1)
~$1.1B
$960 $795 $755
Rev
‘08 ‘09 ‘10 ’11E
Keys to organic growth
• Upstream & downstream Energy; shale gas, rig count, crude oil pricing
• Infrastructure projects ... power generation, chemical processing, LNG
• Aftermarket ... pressure pump repair and fluid end capacity
• Supply chain ... capacity, lead times
• International expansion in resource rich countries e.g. Brazil, China, Russia
Well positioned for future growth
(1) Company estimates (see note on p. 66)
Gardner Denver
52
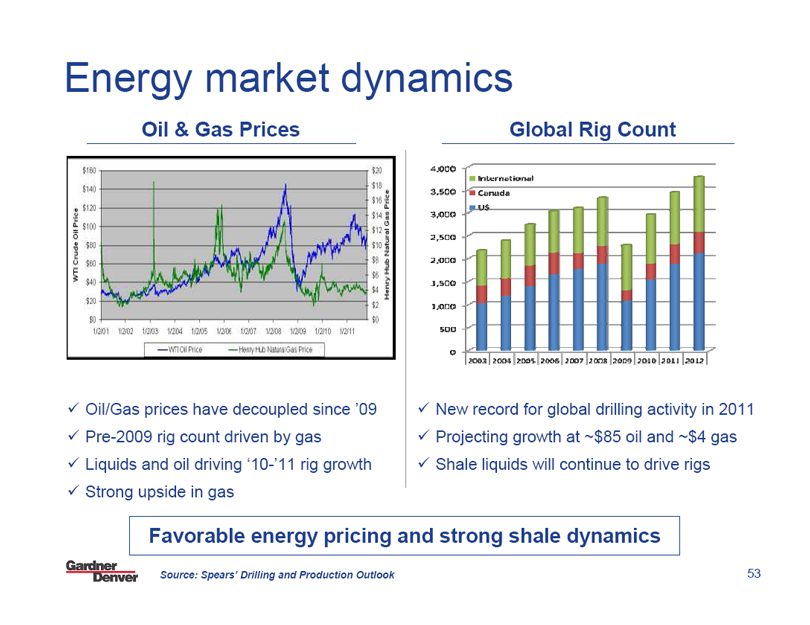
Energy market dynamics
Oil & Gas Prices
WTI Crude Oil Price
$150 $140 $120 $100 $80 $60 $40 $20 $0
$20 $18 $16 $14 $12 $10 $8 $6 $4 $2 $0
Henry Hub Natural Gas Price
1/2/01 1/2/02 1/2/03 1/2/04 1/2/05 1/2/06 1/2/07 1/2/08 1/2/09 1/2/10 1/2/11
WTI Oil Price Henry Hub Natural Gas Price
Oil/Gas prices have decoupled since ’09
Pre-2009 rig count driven by gas
Liquids and oil driving ‘10-’11 rig growth
Strong upside in gas
Global Rig Count
International
Canada
US
4,000 3,500 3,000 2,500 2,000 1,500 1,000 500 0
2003 2004 2005 2006 2007 2008 2009 2010 2011 2012
New record for global drilling activity in 2011
Projecting growth at ~$85 oil and ~$4 gas
Shale liquids will continue to drive rigs
Favorable energy pricing and strong shale dynamics
Source: Spears’ Drilling and Production Outlook
Gardner Denver
53
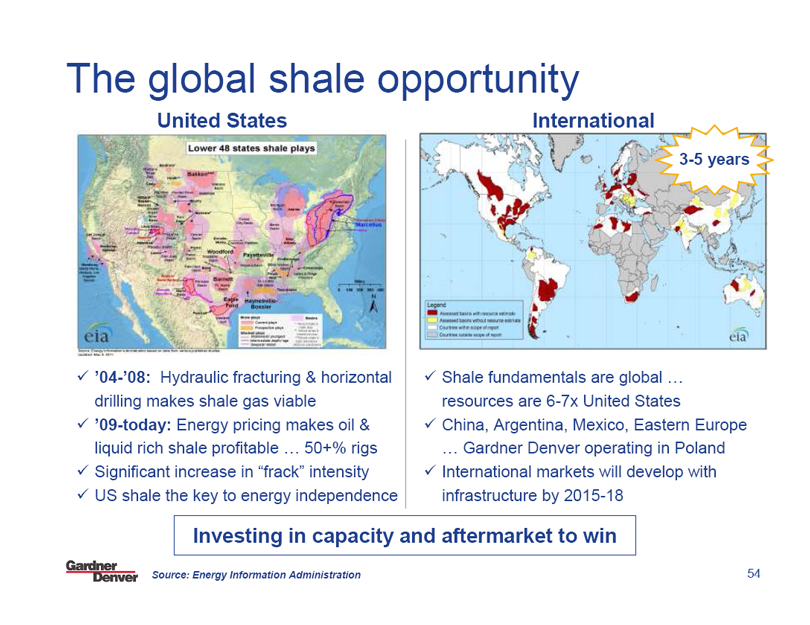
The global shale opportunity
United States
Lower 48 states shale plays
’04-’08: Hydraulic fracturing & horizontal drilling makes shale gas viable
’09-today: Energy pricing makes oil & liquid rich shale profitable ... 50+% rigs
Significant increase in “frack” intensity
US shale the key to energy independence
International
3-5 years
Shale fundamentals are global ... resources are 6-7x United States
China, Argentina, Mexico, Eastern Europe ... Gardner Denver operating in Poland
International markets will develop with infrastructure by 2015-18
Investing in capacity and aftermarket to win
Source: Energy Information Administration
Gardner Denver
54
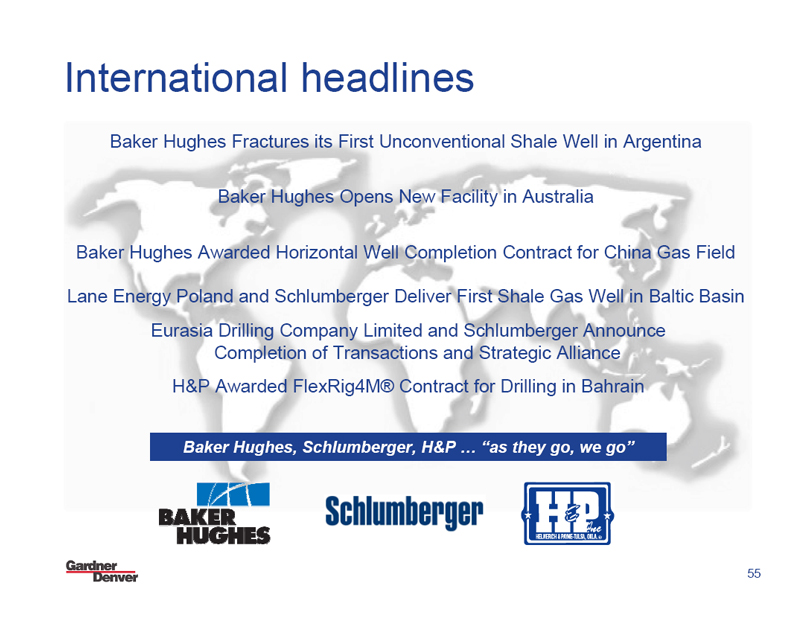
International headlines
Baker Hughes Fractures its First Unconventional Shale Well in Argentina Baker Hughes Opens New Facility in Australia Baker Hughes Awarded Horizontal Well Completion Contract for China Gas Field
Lane Energy Poland and Schlumberger Deliver First Shale Gas Well in Baltic Basin
Eurasia Drilling Company Limited and Schlumberger Announce Completion of Transactions and Strategic Alliance
H&P Awarded FlexRig4M® Contract for Drilling in Bahrain
Baker Hughes, Schlumberger, H&P ... “as they go, we go”
BAKER HUGHES Schlumberger H&P Inc
Gardner Denver
55
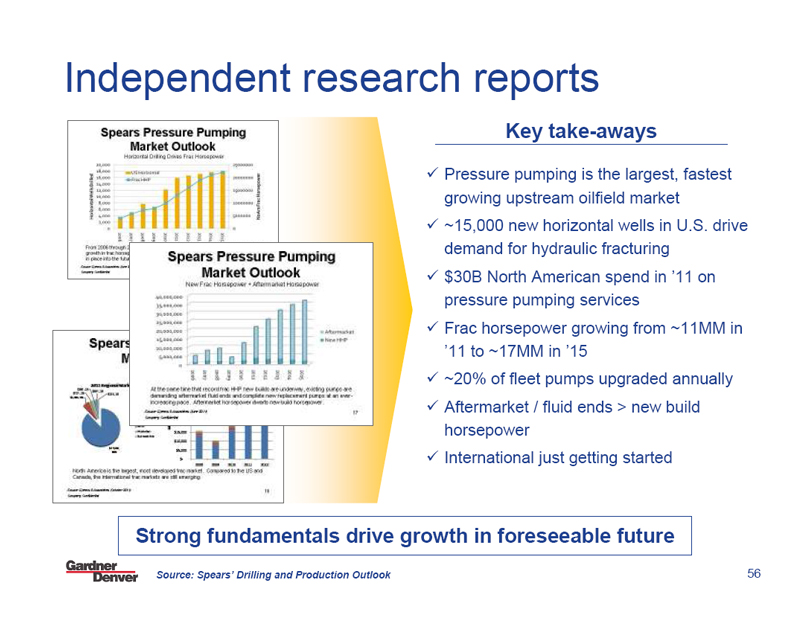
Independent research reports
Spears Pressure Pumping Market Outlook
Spears Pressure Pumping Market Outlook
Key take-aways
Pressure pumping is the largest, fastest growing upstream oilfield market
~15,000 new horizontal wells in U.S. drive demand for hydraulic fracturing
$30B North American spend in ’11 on pressure pumping services
Frac horsepower growing from ~11MM in ’11 to ~17MM in ’15
~20% of fleet pumps upgraded annually
Aftermarket / fluid ends > new build horsepower
International just getting started
Strong fundamentals drive growth in foreseeable future
Source: Spears’ Drilling and Production Outlook
Gardner Denver
56
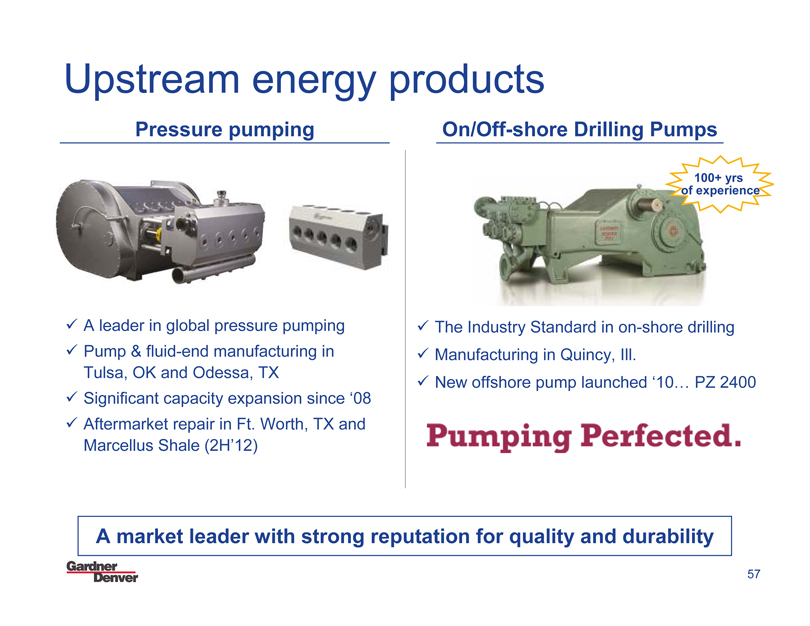
Upstream energy products
Pressure pumping
A leader in global pressure pumping
Pump & fluid-end manufacturing in Tulsa, OK and Odessa, TX
Significant capacity expansion since ‘08
Aftermarket repair in Ft. Worth, TX and Marcellus Shale (2H’12)
On/Off-shore Drilling Pumps
100+ yrs of experience
The Industry standard in onshore drilling.
Manufacturing in Quincy, III.
New offshore pump launched ‘10... PZ 2400
Pumping Perfected.
A market leader with strong reputation for quality and durability
Gardner Denver
57
Video
THE TULSA TRANSFORMATION
Gardner Denver
58
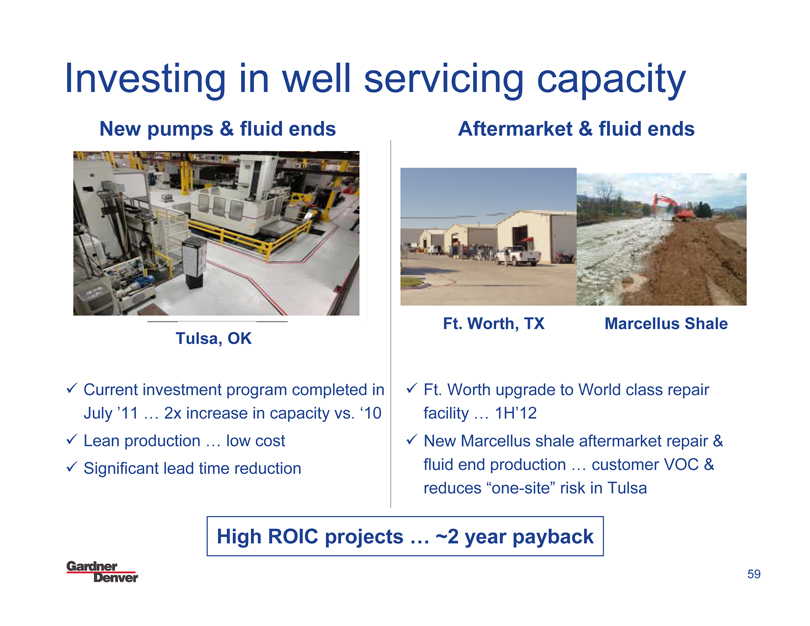
Investing in well servicing capacity
New pumps & fluid ends
Tulsa, OK
Current investment program completed in July ’11 ... 2x increase in capacity vs. ‘10
Lean production ... low cost
Significant lead time reduction
Aftermarket & fluid ends
Ft. Worth, TX Marcellus Shale
Ft. Worth upgrade to World class repair facility ... 1H’12
New Marcellus shale aftermarket repair & fluid end production ... customer VOC & reduces “one-site” risk in Tulsa
High ROIC projects ... ~2 year payback
Gardner Denver
59
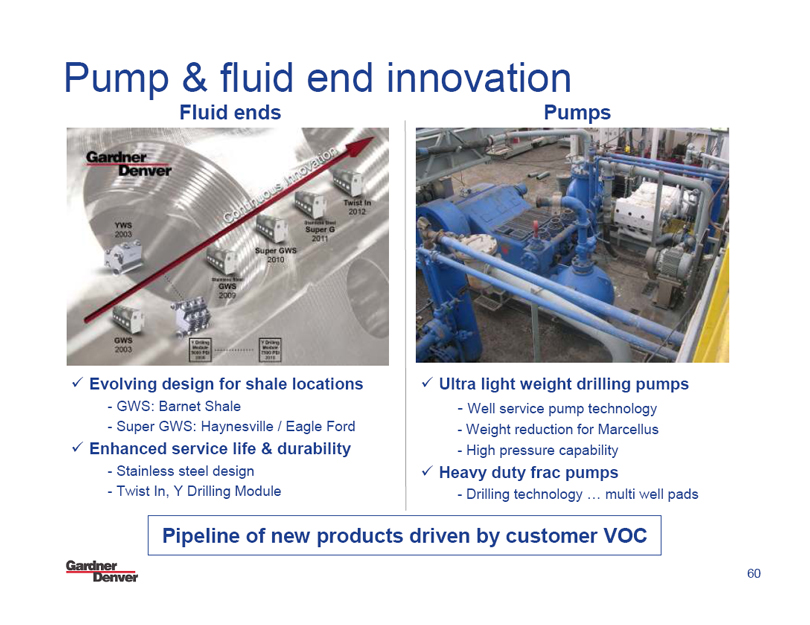
Pump & fluid end innovation
Fluid ends
Gardner Denver
Continuous Innovation
YWS 2003 GWS 2003 GWS 2009 Super GWS 2010 Super G 2011 Twist in 2012
Evolving design for shale locations
- GWS: Barnet Shale
- Super GWS: Haynesville / Eagle Ford
Enhanced service life & durability
- Stainless steel design
- Twist In, Y Drilling Module
Pumps
Ultra light weight drilling pumps
- Well service pump technology
- Weight reduction for Marcellus
- High pressure capability
Heavy duty frac pumps
- Drilling technology ... multi well pads
Pipeline of new products driven by customer VOC
Gardner Denver
60
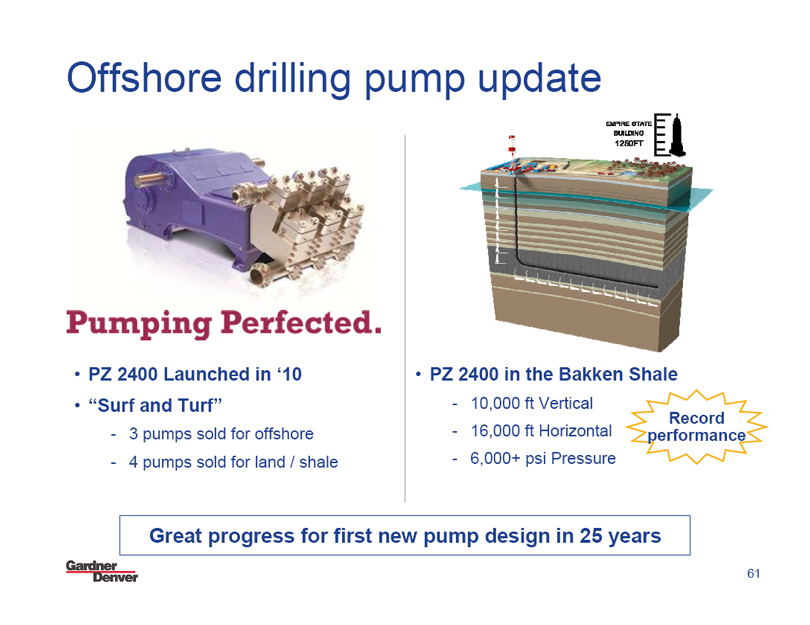
Offshore drilling pump update
Pumping Perfected.
• PZ 2400 Launched in ‘10
• “Surf and Turf”
- 3 pumps sold for offshore
- 4 pumps sold for land / shale
EMPIRE STATE
BUILDING
1250FT
• PZ 2400 in the Bakken Shale
- 10,000 ft Vertical
- 16,000 ft Horizontal
- 6,000+ psi Pressure
Record performance
Great progress for first new pump design in 25 years
Gardner Denver
61
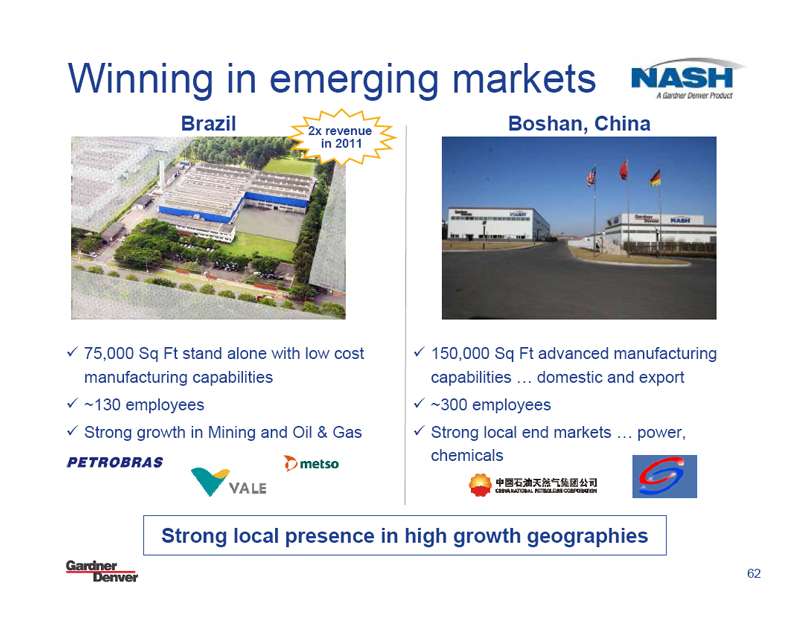
Winning in emerging markets
Brazil
2x revenue in 2011
75,000 Sq Ft stand alone with low cost manufacturing capabilities
~130 employees
Strong growth in Mining and Oil & Gas
PETROBRAS
VALE
metso
NASH A Gardner Denver Product
Boshan, China
150,000 Sq Ft advanced manufacturing capabilities ... domestic and export
~300 employees
Strong local end markets ... power, chemicals
CHINA NATIONAL PETROLEUM CORPORATION
Strong local presence in high growth geographies
Gardner Denver
62
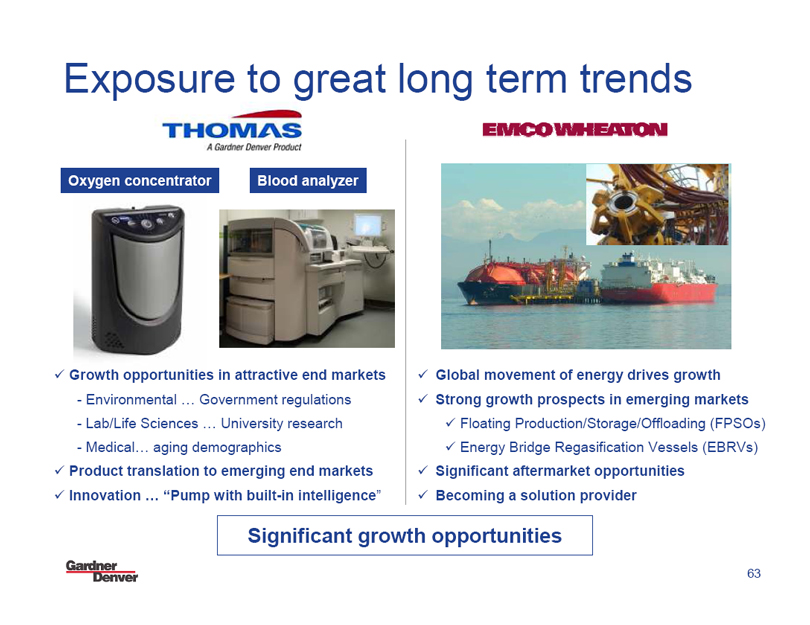
Exposure to great long term trends
THOMAS
A Gardner Denver Product
Oxygen concentrator
Blood analyzer
Growth opportunities in attractive end markets
- Environmental ... Government regulations
- Lab/Life Sciences ... University research
- Medical... aging demographics
Product translation to emerging end markets
Innovation ... “Pump with built-in intelligence”
EMCO WHEATON
Global movement of energy drives growth
Strong growth prospects in emerging markets
Floating Production/Storage/Offloading (FPSOs)
Energy Bridge Regasification Vessels (EBRVs)
Significant aftermarket opportunities
Becoming a solution provider
Significant growth opportunities
Gardner Denver
63
Closing Remarks/ Q&A
Gardner Denver
2011 Analyst Day
November 7, 2011
Gardner Denver
Presentation notes
• Note 1: Company estimates
• Note 2: Adjusted Operating Income, Adjusted Operating Margins, Adjusted Net Income and Adjusted DEPS are financial measures that are not in accordance with US GAAP. Adjusted Operating Income, Adjusted Operating Margins and Adjusted DEPS exclude the impact of expenses incurred for profit improvement initiatives, non-recurring items and impairment charges.
Adjusted net income is net income excluding non-cash impairment charges, net of related changes in deferred tax assets and liabilities.
Gardner Denver believes the non-GAAP financial measure of Adjusted Operating Income, Adjusted Operating Margins, Adjusted Net Income and Adjusted DEPS provide important supplemental information to both management and investors regarding financial and business trends used in assessing its results of operations. Gardner Denver believes excluding the specified items from the aforementioned financial measures provides a more meaningful comparison to the corresponding prior year periods and internal budgets and forecasts, assists investors in performing analysis that is consistent with financial models developed by investors in performing and research analysts, provides management with a more relevant measurement of operating performance, and is more useful in assessing management performance.
Gardner Denver
66