Exhibit 99.2
SF PowerPoint Template 03-27-08/1
1 |
Gardner Denver
Investor Presentation
May 2012
SF PowerPoint Template 03-27-08/2
2 |
All of the statements made by Gardner Denver in this presentation or made orally in connection with it,
other than historical facts, are forward-looking statements. As a general matter, forward-looking
statements are those focused upon anticipated events or trends, expectations, and beliefs relating to
matters that are not historical in nature. The Private Securities Litigation Reform Act of 1995 provides
a “safe harbor” for these forward-looking statements. In order to comply with the terms of the safe
harbor, the Company notes that forward-looking statements are subject to known and unknown risks,
uncertainties, and other factors relating to the Company’s operations and business environment, all of
which are difficult to predict and many of which are beyond the control of the Company. These known
and unknown risks, uncertainties, and other factors could cause actual results to differ materially from
those matters expressed in, anticipated by or implied by such forward-looking statements.
Factors that could cause or contribute to such differences include, but are not limited to: pricing of the
Company’s products and other competitive market pressures; changing economic conditions; the
costs and availability of raw materials; fluctuations in foreign currency rates and energy prices; risks
associated with the Company’s current and future litigation; and the other risks detailed from time to
time in the Company’s SEC filings, including but not limited to, its annual report on Form 10-K for the
fiscal year ending December 31, 2011, and its quarterly reports on Form 10-Q.
These statements reflect the current views and assumptions of management with respect to future
events. The Company does not undertake, and hereby disclaims, any duty to update these forwardlooking
statements, although its situation and circumstances may change in the future. The inclusion
of any statement in this presentation does not constitute admission by the Company or any other
person that the events or circumstances described in such statement are material.
Safe Harbor Disclosure
2

SF PowerPoint Template 03-27-08/3
3 |
Gardner Denver
Overview
SF PowerPoint Template 03-27-08/4
4 |
Gardner Denver Overview
Early stages of transformation to a high quality,
high margin Industrial Company with Energy exposure
?Leading brands and technologies … strong distribution
?New, operationally focused team driving “The Gardner Denver Way”
?$2.4B global Company with diverse and attractive end markets
?Growing, profitable aftermarket opportunity
?Focused on superior cash and earnings growth
?Strong track record on analyzing and integrating acquisitions
4
SF PowerPoint Template 03-27-08/5
5 |
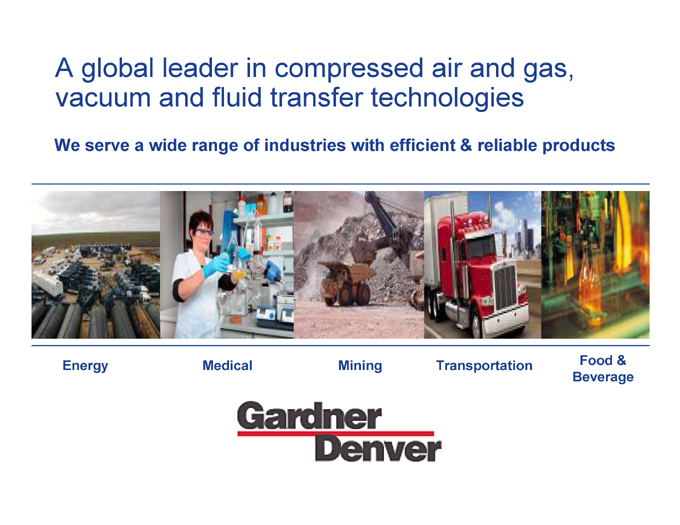
A global leader in compressed air and gas,
vacuum and fluid transfer technologies
We serve a wide range of industries with efficient & reliable products
Energy Medical Mining Transportation Food &
Beverage
5
SF PowerPoint Template 03-27-08/6
6 |
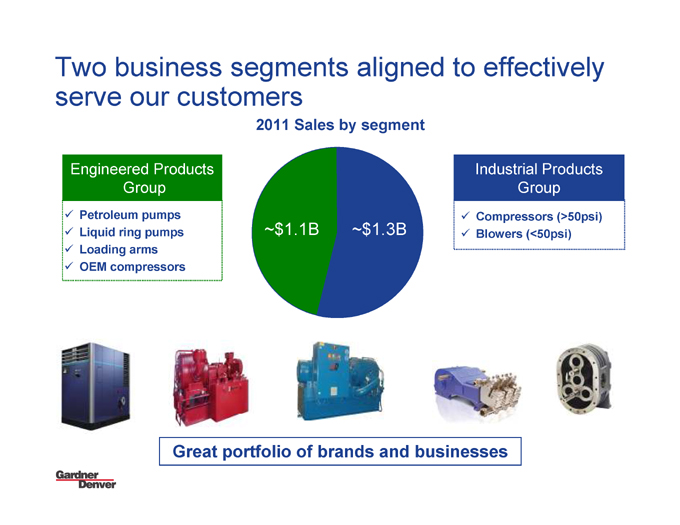
Two business segments aligned to effectively
serve our customers
Engineered Products
Group
Industrial Products
Group
2011 Sales by segment
~$1.3~$1.1B B
Great portfolio of brands and businesses
??Petroleum pumps
??Liquid ring pumps
??Loading arms
??OEM compressors
??Compressors (>50psi)
??Blowers (<50psi)
6
SF PowerPoint Template 03-27-08/7
7 |
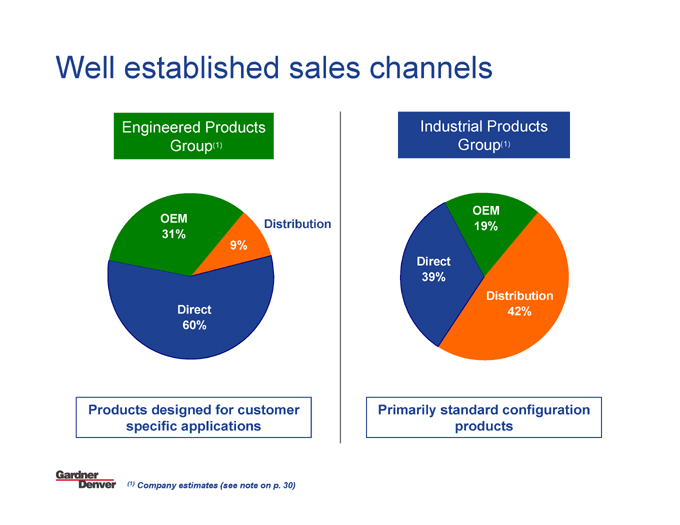
Well established sales channels
Distribution
9%
Direct
60%
OEM
31%
Engineered Products
Group(1)
Industrial Products
Group(1)
Distribution
42%
Direct
39%
OEM
19%
Products designed for customer
specific applications
Primarily standard configuration
products
(1) | Company estimates (see note on p. 30) |
7
SF PowerPoint Template 03-27-08/8
8 |
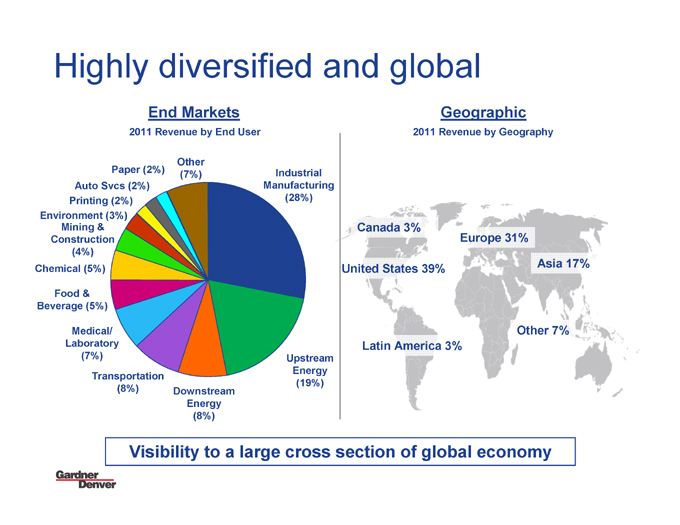
Highly diversified and global
End Markets Geographic
2011 Revenue by End User
Canada 3%
United States 39%
Latin America 3%
Europe 31%
Other 7%
Asia 17%
2011 Revenue by Geography
Visibility to a large cross section of global economy
Industrial
Manufacturing
(28%)
Upstream
Energy
(19%)
Downstream
Energy
(8%)
Medical/
Laboratory
(7%)
Transportation
(8%)
Food &
Beverage (5%)
Mining &
Construction
(4%)
Chemical (5%)
Environment (3%)
Printing (2%)
Auto Svcs (2%)
Paper (2%)
Other
(7%)
8
SF PowerPoint Template 03-27-08/9
9
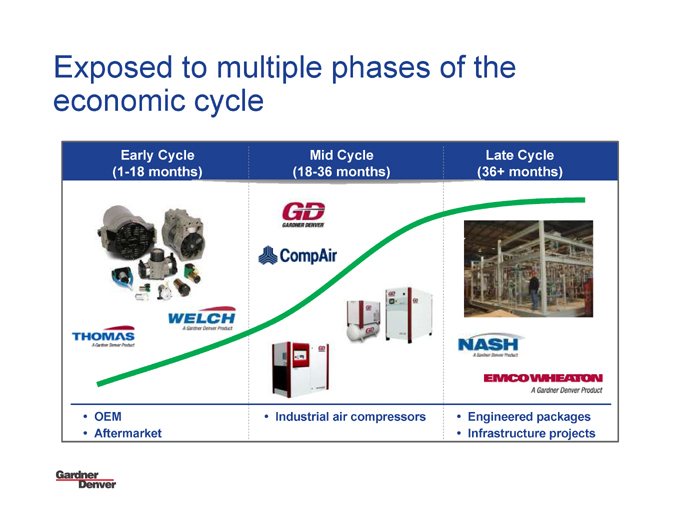
Exposed to multiple phases of the
economic cycle
Early Cycle
(1-18 months)
Late Cycle
(36+ months)
Mid Cycle
(18-36 months)
??Engineered packages
??Infrastructure projects
??Industrial air compressor??OEM s
??Aftermarket
9
SF PowerPoint Template 03-27-08/10
10
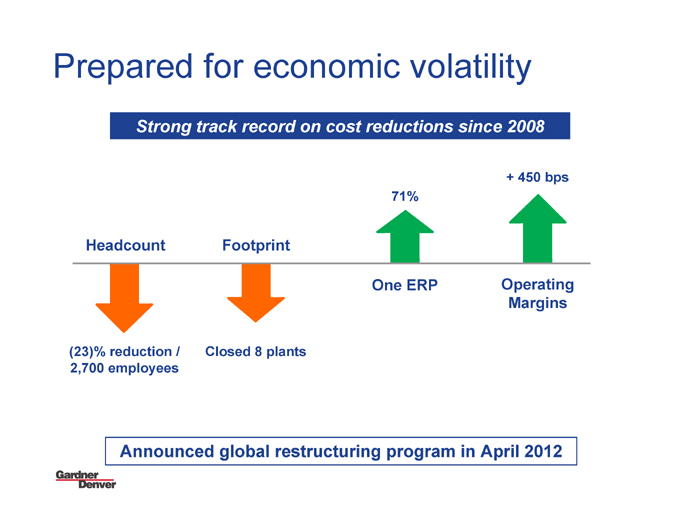
Prepared for economic volatility
Announced global restructuring program in April 2012
Strong track record on cost reductions since 2008
Headcount
(23)% reduction /
2,700 employees
Footprint
Closed 8 plants
One ERP
71%
+ 450 bps
Operating
Margins
10

SF PowerPoint Template 03-27-08/11
11
Growth Strategy
SF PowerPoint Template 03-27-08/12
12
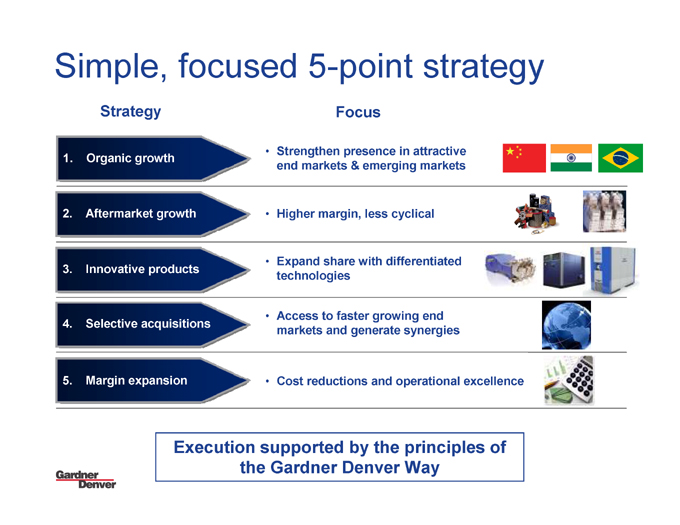
• Strengthen presence in attractive
end markets & emerging markets
4. Selective acquisitions
• Access to faster growing end
markets and generate synergies
Strategy Focus
2. Aftermarket growth • Higher margin, less cyclical
5. Margin expansion • Cost reductions and operational excellence
3. Innovative products
• Expand share with differentiated
technologies
Simple, focused 5-point strategy
Execution supported by the principles of
the Gardner Denver Way
1. Organic growth
12
SF PowerPoint Template 03-27-08/13
13
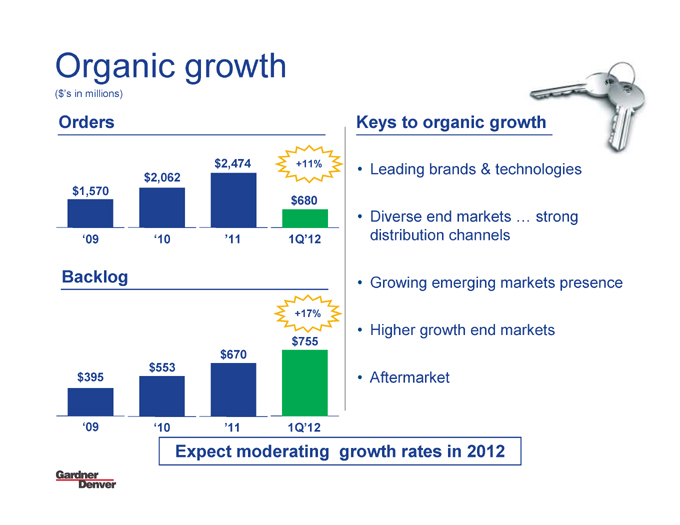
’11
$670
Organic growth
Keys to organic growth
• Leading brands & technologies
Orders
• Diverse end markets … strong
distribution channels
‘10
$553
Backlog
’11
$2,474
‘10
$2,062
‘09
$1,570
‘09
$395
• Growing emerging markets presence
• Higher growth end markets
• Aftermarket
($’s in millions)
1Q’12
$755
1Q’12
$680
Expect moderating growth rates in 2012
+11%
+17%
13
SF PowerPoint Template 03-27-08/14
14
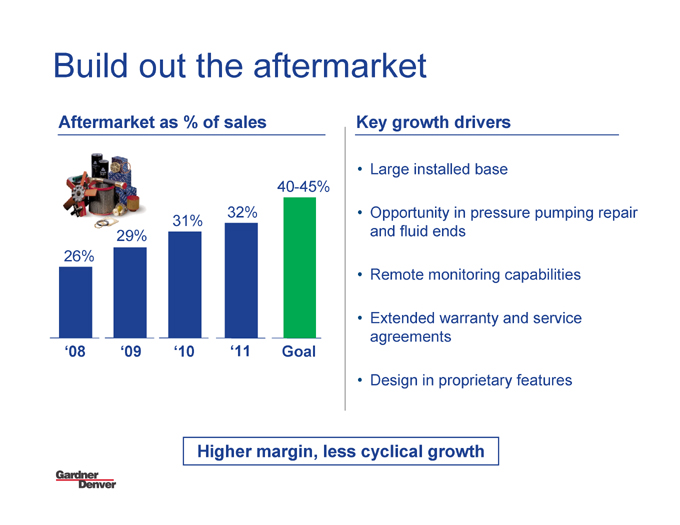
Build out the aftermarket
Key growth drivers
• Large installed base
Aftermarket as % of sales
• Opportunity in pressure pumping repair
and fluid ends
‘10
31%
‘09
29%
‘08
26%
• Remote monitoring capabilities
• Design in proprietary features
Goal
40-45%
• Extended warranty and service
agreements
‘11
32%
Higher margin, less cyclical growth
14
SF PowerPoint Template 03-27-08/15
15
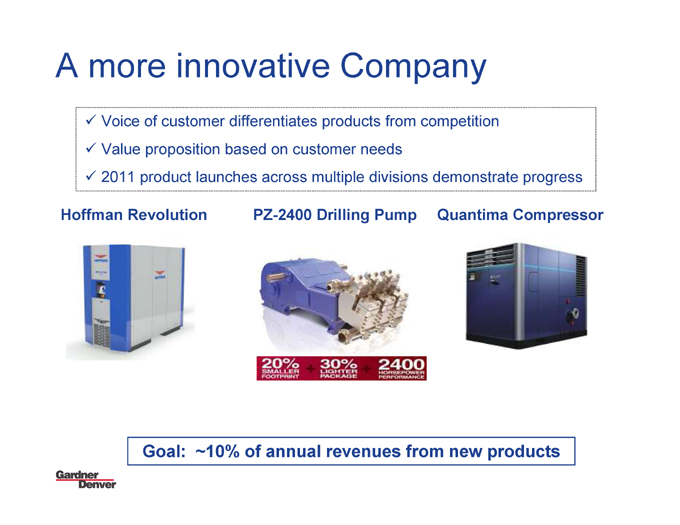
A more innovative Company
??Voice of customer differentiates products from competition
??Value proposition based on customer needs
??2011 product launches across multiple divisions demonstrate progress
PZ-2400 Drilling PumHoffman Revolution p Quantima Compressor
Goal: ~10% of annual revenues from new products
15
SF PowerPoint Template 03-27-08/16
16
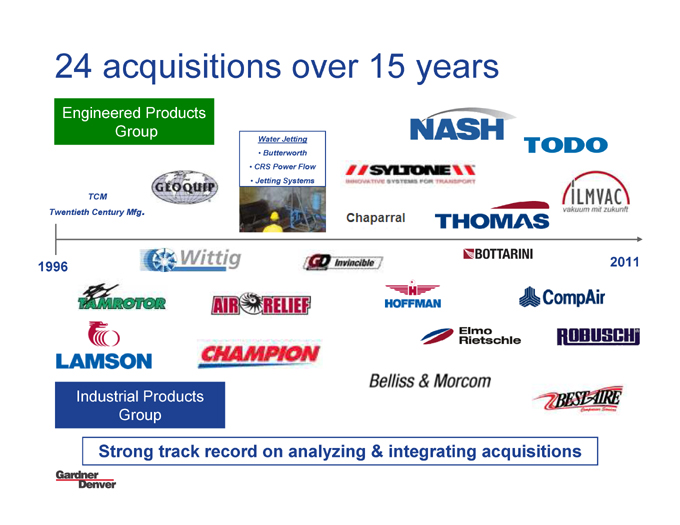
24 acquisitions over 15 years
Strong track record on analyzing & integrating acquisitions
1996 2011
Engineered Products
Group
Industrial Products
Group
TCM
Twentieth Century Mfg.
Water Jetting
• Butterworth
• CRS Power Flow
• Jetting Systems
16
SF PowerPoint Template 03-27-08/17
17
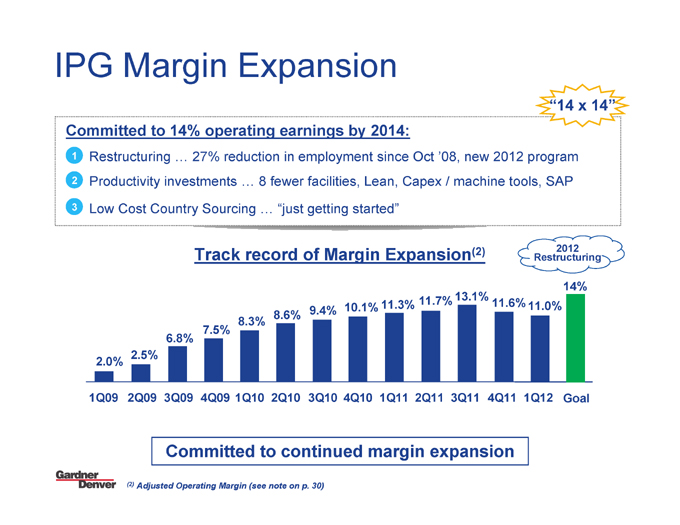
IPG Margin Expansion
1Q09 1Q10
2.0%
2Q09 3Q09 4Q09
Track record of Margin Expansion(2)
2Q10 2Q13Q10 4Q10 1Q11 1 3Q11
2.5%
6.8%
7.5%
8.3%
8.6% 9.4% 10.1%11.3% 11.7%13.1%
Goal
14%
Committed to 14% operating earnings by 2014:
Restructuring … 27% reduction in employment since Oct ’08, new 2012 program
Productivity investments … 8 fewer facilities, Lean, Capex / machine tools, SAP
Low Cost Country Sourcing … “just getting started”
1 |
2 |
3 |
“14 x 14”
(2) | Adjusted Operating Margin (see note on p. 30) |
2012
Restructuring
4Q11
11.6%
1Q12
11.0%
Committed to continued margin expansion
17
SF PowerPoint Template 03-27-08/18
18
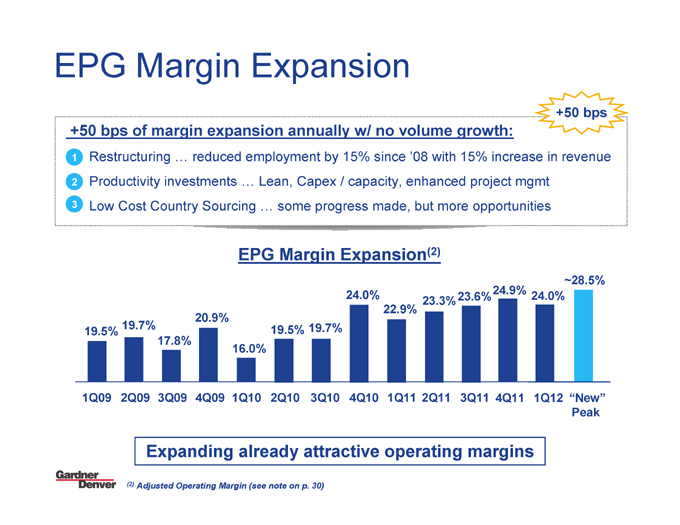
EPG Margin Expansion
1Q09 1Q10
19.5%
2Q09 3Q09 4Q09
EPG Margin Expansion(2)
2Q10 2Q13Q10 4Q10 1Q11 1 3Q11
19.7%
17.8%
20.9%
16.0%
19.5% 19.7%
24.0%
22.9%
23.3%23.6%
+50 bps of margin expansion annually w/ no volume growth:
Restructuring … reduced employment by 15% since ’08 with 15% increase in revenue
Productivity investments … Lean, Capex / capacity, enhanced project mgmt
Low Cost Country Sourcing … some progress made, but more opportunities
1 |
2 |
3 |
+50 bps
“New”
Peak
~28.5%
(2) | Adjusted Operating Margin (see note on p. 30) |
4Q11 1Q12
24.9% 24.0%
Expanding already attractive operating margins
18

SF POWERPOINT TEMPLATE 03-27-08/19
19
FINANCIAL RESULTS
SF PowerPoint Template 03-27-08/20
20
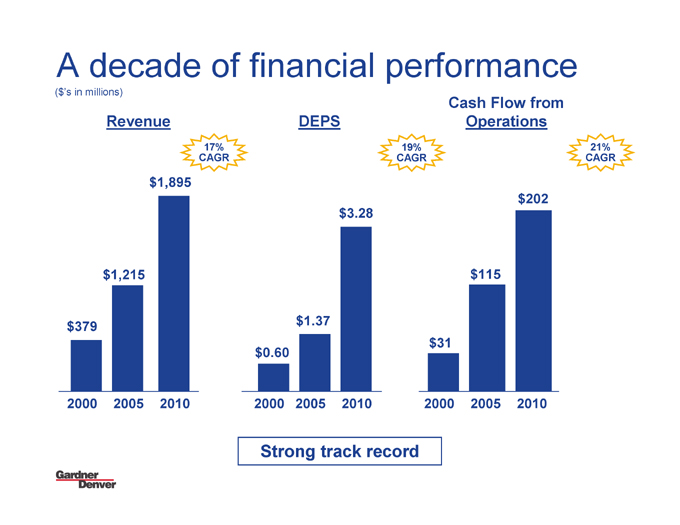
2000
$379
$1,215
2005
$1,895
2010
Revenue
$3.28
2012005 0
$1.37
$0.60
2000 2000
$31
2005
$115
2010
$202
Cash Flow from
Operations
A decade of financial performance
17%
CAGR
Strong track record
19%
CAGR
21%
CAGR
($’s in millions)
DEPS
20
SF PowerPoint Template 03-27-08/21
21
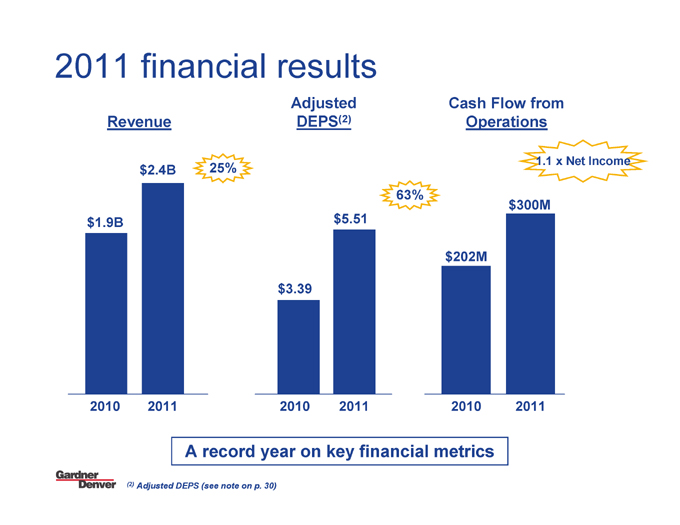
$1.9B
2010
$2.4B
2011
Revenue
$5.51
2012010 1
$3.39
Adjusted
DEPS(2)
2010
$202M
2011
$300M
2011 financial results
25%
63%
1.1 x Net Income
A record year on key financial metrics
Cash Flow from
Operations
(2) | Adjusted DEPS (see note on p. 30) |
21
SF PowerPoint Template 03-27-08/22
22
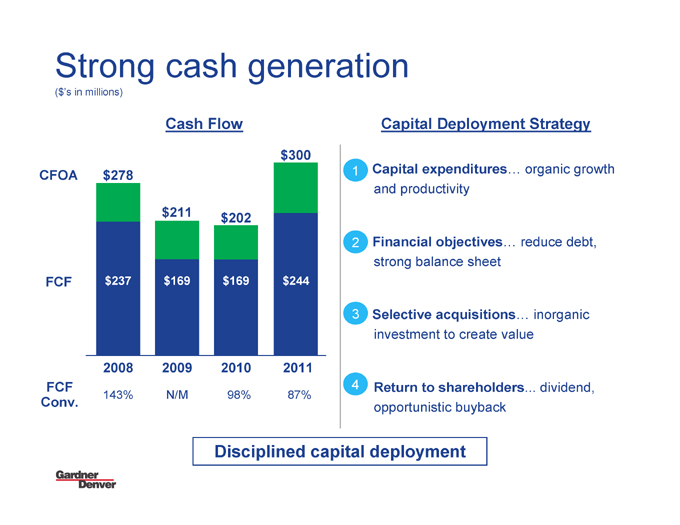
Strong cash generation
2008
$237 $169
2009
$169
2010
Cash Flow
Disciplined capital deployment
FCF
CFOA
2011
$278
$211 $202
$300
$244
FCF
Conv.
143% N/M 98% 87%
($’s in millions)
Capital expenditures… organic growth
and productivity
Financial objectives… reduce debt,
strong balance sheet
Selective acquisitions… inorganic
investment to create value
Return to shareholders. dividend,
opportunistic buyback
1 |
2 |
3 |
4 |
Capital Deployment Strategy
22
SF PowerPoint Template 03-27-08/23
23
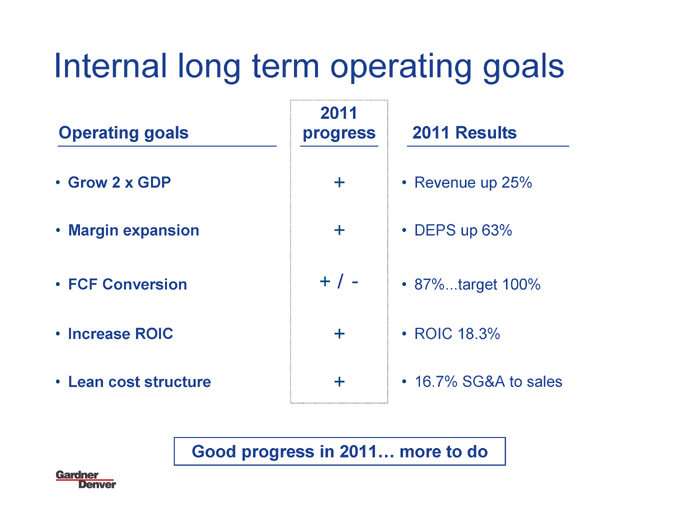
Internal long term operating goals
2011
progress
• Grow 2 x GDP
Operating goals 2011 Results
• Margin expansion
• FCF Conversion
• Increase ROIC
• Lean cost structure
+
+
+ /
+
+
• Revenue up 25%
• DEPS up 63%
• 87%.target 100%
• ROIC 18.3%
• 16.7% SG&A to sales
Good progress in 2011… more to do
23
SF PowerPoint Template 03-27-08/24
24
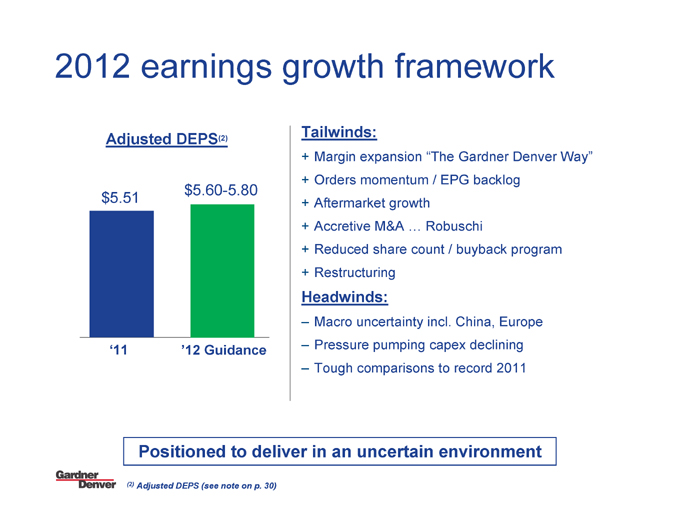
2012 earnings growth framework
Tailwinds:
+ Margin expansion “The Gardner Denver Way”
+ Orders momentum / EPG backlog
+ Aftermarket growth
+ Accretive M&A … Robuschi
+ Reduced share count / buyback program
+ Restructuring
Headwinds:
– Macro uncertainty incl. China, Europe
– Pressure pumping capex declining
– Tough comparisons to record 2011
‘11
$5.51
’12 Guidance
(2) | Adjusted DEPS (see note on p. 30) |
$5.60-5.80
Positioned to deliver in an uncertain environment
Adjusted DEPS(2)
24

SF PowerPoint Template 03-27-08/25
25
The Gardner Denver Way
SF PowerPoint Template 03-27-08/26
26
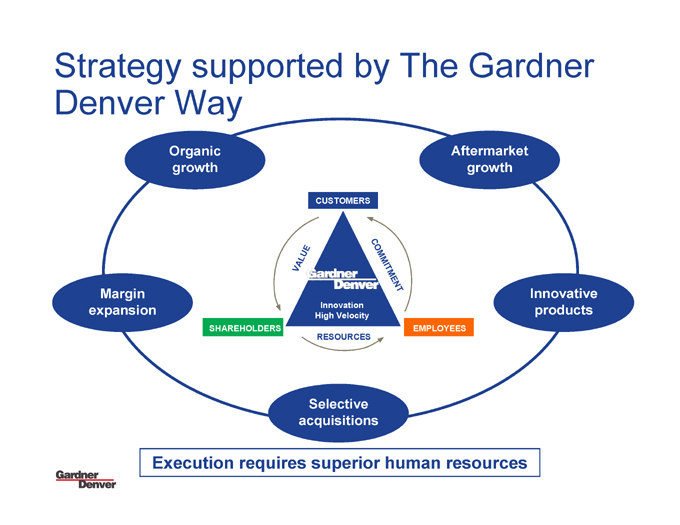
Aftermarket
growth
Innovative
products
Selective
acquisitions
Margin
expansion
Organic
growth
CUSTOMERS
Innovation
High Velocity
VALUE
COMMITMENT
RESOURCES
Strategy supported by The Gardner
Denver Way
SHAREHOLDERS EMPLOYEES
Execution requires superior human resources
26
SF PowerPoint Template 03-27-08/27
27
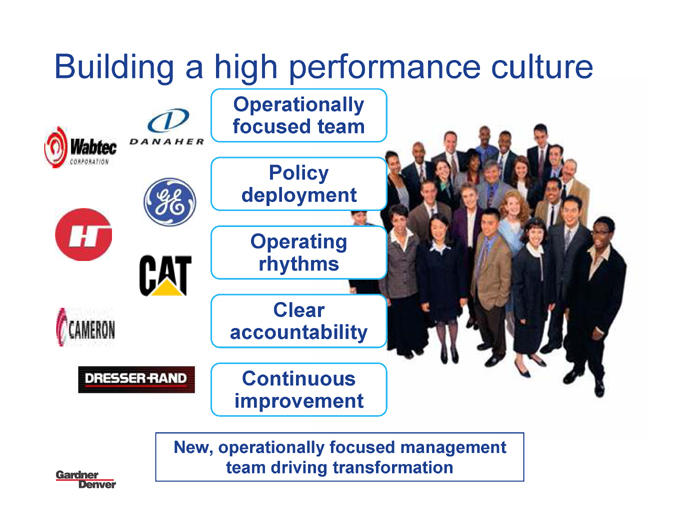
Building a high performance culture
Operationally
focused team
Policy
deployment
Operating
rhythms
Clear
accountability
Continuous
improvement
New, operationally focused management
team driving transformation
27
SF PowerPoint Template 03-27-08/28
28
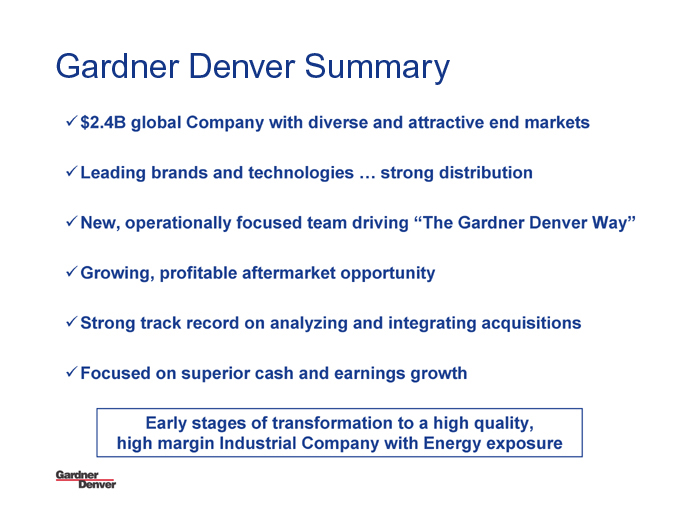
Gardner Denver Summary
Early stages of transformation to a high quality,
high margin Industrial Company with Energy exposure
?Leading brands and technologies … strong distribution
?New, operationally focused team driving “The Gardner Denver Way”
?$2.4B global Company with diverse and attractive end markets
?Growing, profitable aftermarket opportunity
?Focused on superior cash and earnings growth
?Strong track record on analyzing & integrating acquisitions
28

SF PowerPoint Template 03-27-08/29
29
Gardner Denver
Investor Presentation
May, 2012
SF PowerPoint Template 03-27-08/30
30
Presentation notes
• Note 1: Company estimates
• Note 2: Adjusted Operating Income, Adjusted Operating Margins, Adjusted Net Income and Adjusted
DEPS are financial measures that are not in accordance with US GAAP. Adjusted Operating Income,
Adjusted Operating Margins and Adjusted DEPS exclude the impact of expenses incurred for profit
improvement initiatives, non-recurring items and impairment charges.
Adjusted net income is net income excluding non-cash impairment charges, net of related changes in
deferred tax assets and liabilities.
Gardner Denver believes the non-GAAP financial measure of Adjusted Operating Income, Adjusted
Operating Margins, Adjusted Net Income and Adjusted DEPS provide important supplemental
information to both management and investors regarding financial and business trends used in
assessing its results of operations. Gardner Denver believes excluding the specified items from the
aforementioned financial measures provides a more meaningful comparison to the corresponding prior
year periods and internal budgets and forecasts, assists investors in performing analysis that is
consistent with financial models developed by investors and research analysts, provides management
with a more relevant measurement of operating performance, and is more useful in assessing
management performance.
30