UNITED STATES
SECURITIES AND EXCHANGE COMMISSION
Washington, DC 20549
FORM N-CSR
CERTIFIED SHAREHOLDER REPORT OF REGISTERED
MANAGEMENT INVESTMENT COMPANIES
Investment Company Act file number 811-08226
Templeton Global Investment Trust
(Exact name of registrant as specified in charter)
300 S.E. 2nd Street, Fort Lauderdale, FL 33301-1923
(Address of principal executive offices) (Zip code)
Alison Baur, One Franklin Parkway, San Mateo, CA 94403-1906
(Name and address of agent for service)
Registrant’s telephone number, including area code: 954 527-7500
Date of fiscal year end: 8/31
Date of reporting period: 8/31/24
Item 1. Reports to Stockholders.
| a.) | The following is a copy of the report transmitted to shareholders pursuant to Rule 30e-1 under the Investment Company Act of 1940, as amended (the “1940 Act”) (17 CFR 270.30e-1). |
| | |
| b.) | A copy of the notice transmitted to shareholders in reliance on Rule 30e-3 under the 1940 Act that contains disclosures specified by paragraph (c)(3) of that rule is included in the Annual Report. |
Not Applicable.
| | |
Templeton Emerging Markets Small Cap Fund | |
| Class A [TEMMX] |
| Annual Shareholder Report | August 31, 2024 |
|
This annual shareholder report contains important information about Templeton Emerging Markets Small Cap Fund for the period September 1, 2023, to August 31, 2024.
You can find additional information about the Fund at https://www.franklintempleton.com/regulatory-fund-documents. You can also request this information by contacting us at (800) DIAL BEN/342-5236.
WHAT WERE THE FUND COSTS FOR THE LAST YEAR? (based on a hypothetical $10,000 investment)
| | |
Class Name | Costs of a $10,000 investment | Costs paid as a percentage of a $10,000 investment* |
| Class A | $191 | 1.75% |
| * | Reflects fee waivers and/or expense reimbursements, without which expenses would have been higher. |
HOW DID THE FUND PERFORM LAST YEAR AND WHAT AFFECTED ITS PERFORMANCE?
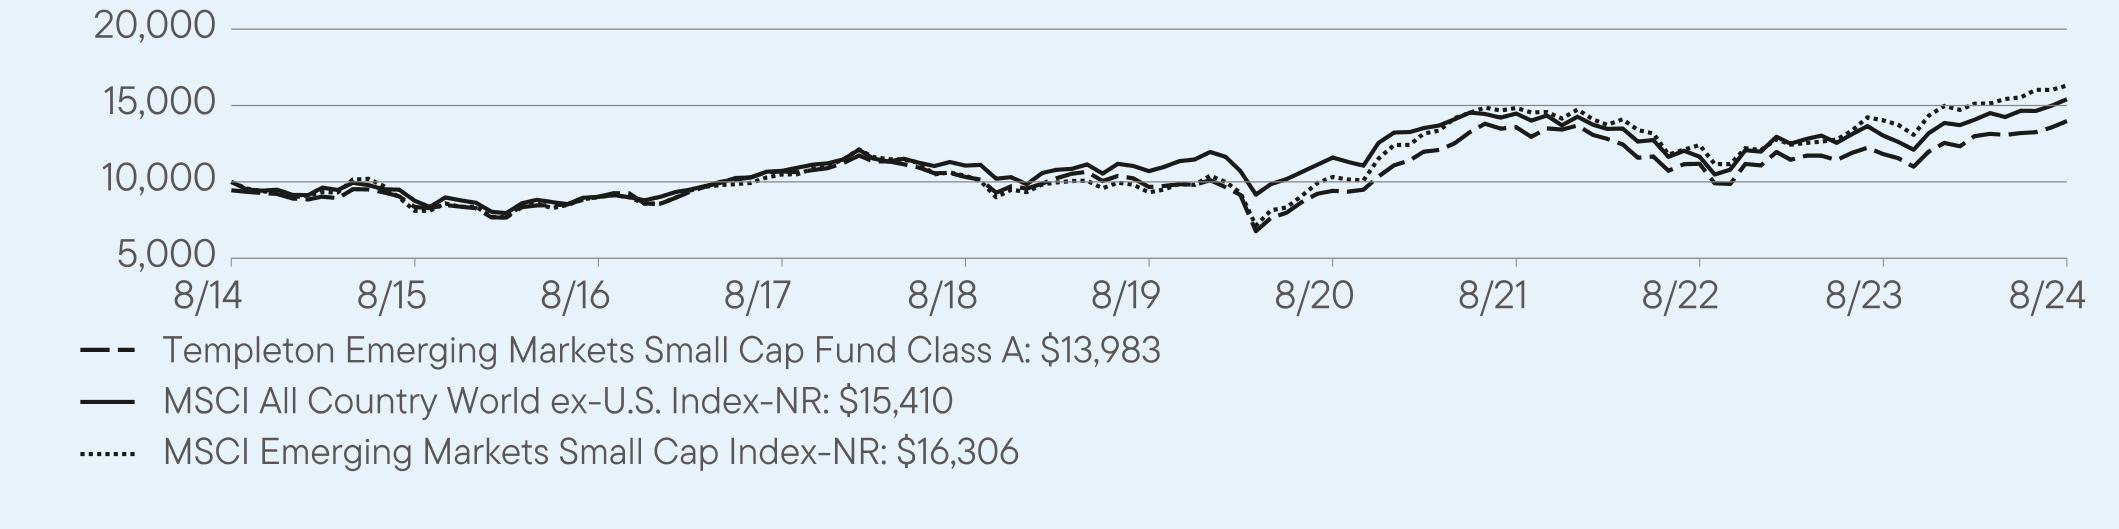
For the twelve months ended August 31, 2024, Class A shares of Templeton Emerging Markets Small Cap Fund returned 18.29%. The Fund compares its performance to the MSCI Emerging Markets Small Cap Index-NR, which returned 16.20% for the same period.
| |
Top contributors to performance: |
| ↑ | By sector, consumer discretionary, financials and health care contributed to absolute returns. |
| ↑ | By country, India, Taiwan and the Philippines were the largest absolute contributors. |
| ↑ | Shares of Zomato, India’s largest online food delivery platform, performed on strong results for several quarters. |
| |
Top detractors from performance: |
| ↓ | By sector, real estate, materials and utilities were the largest detractors from absolute performance. |
| ↓ | By country, China, Brazil and the United Arab Emirates were absolute detractors. |
| ↓ | Daqo New Energy, a Chinese polysilicon producer, detracted as a decline in polysilicon prices weighed on its share price. |
| Templeton Emerging Markets Small Cap Fund | PAGE 1 | 426-ATSR-1024 |
HOW DID THE FUND PERFORM OVER THE LAST 10 YEARS?
The Fund’s past performance is not necessarily an indication of how the Fund will perform in the future. The graph and table do not reflect the deduction of taxes that a shareholder would pay on Fund distributions or redemption of Fund shares.
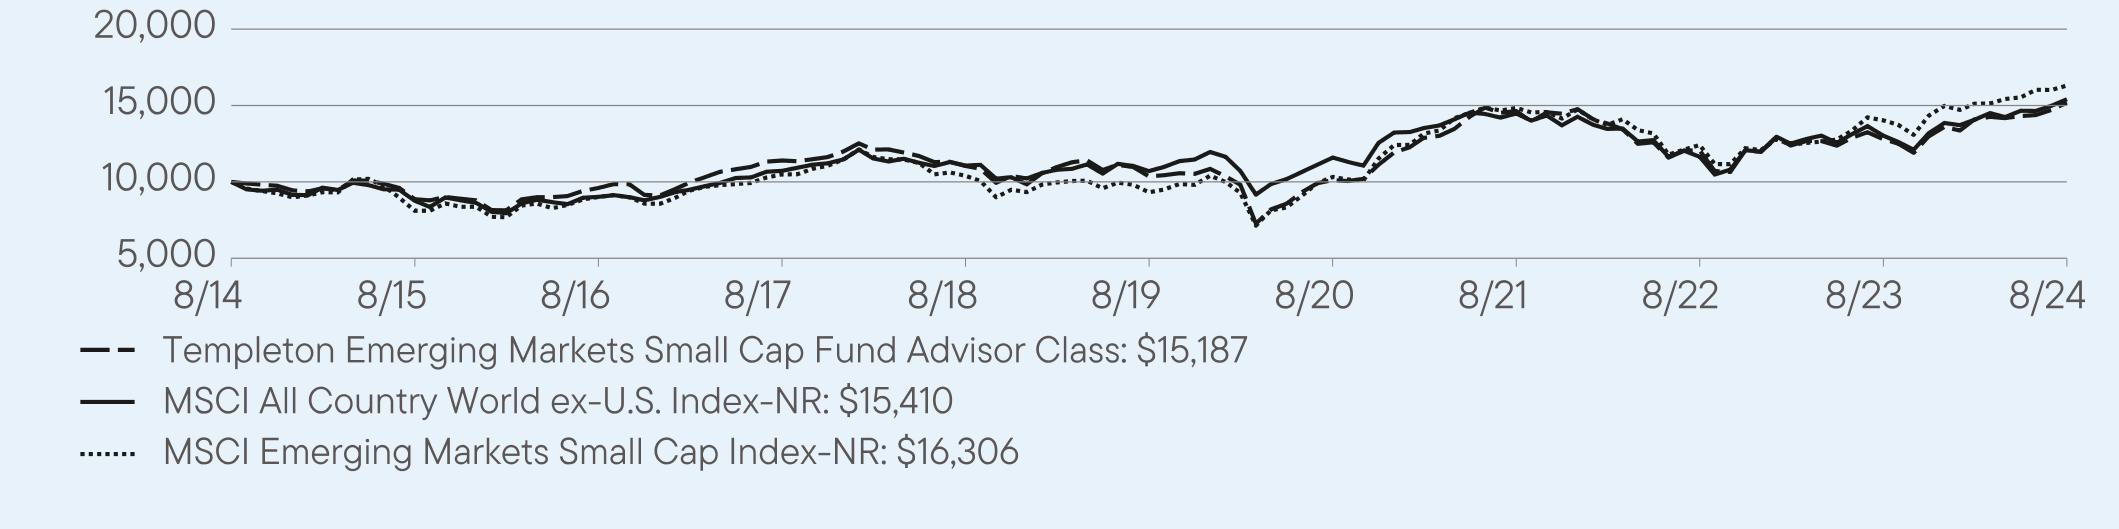
VALUE OF A $10,000 INVESTMENT ($9,450 AFTER MAXIMUM APPLICABLE SALES CHARGE) –
Class A 8/31/2014 — 8/31/2024
AVERAGE ANNUAL TOTAL RETURNS (%) Period Ended August 31, 2024
| | | |
| | 1 Year | 5 Year | 10 Year |
Class A | 18.29 | 7.67 | 4.00 |
Class A (with sales charge) | 11.75 | 6.45 | 3.41 |
MSCI All Country World ex-U.S. Index-NR | 18.21 | 7.56 | 4.42 |
MSCI Emerging Markets Small Cap Index-NR | 16.20 | 11.84 | 5.01 |
Fund performance figures may reflect fee waivers and/or expense reimbursements, without which the performance would have been lower.
Performance for periods prior to September 10, 2018, has been restated to reflect the current maximum sales charge, which is lower than the maximum sales charge prior to that date.
For current month-end performance, please call Franklin Templeton at (800) DIAL BEN/342-5236 or visit https://www.franklintempleton.com/investments/options/mutual-funds.
Important data provider notices and terms available at www.franklintempletondatasources.com.
KEY FUND STATISTICS (as of August 31, 2024)
| |
Total Net Assets | $353,832,397 |
Total Number of Portfolio Holdings* | 88 |
Total Management Fee Paid | $4,328,251 |
Portfolio Turnover Rate | 20.02% |
| * | Does not include derivatives, except purchased options, if any. |
| Templeton Emerging Markets Small Cap Fund | PAGE 2 | 426-ATSR-1024 |
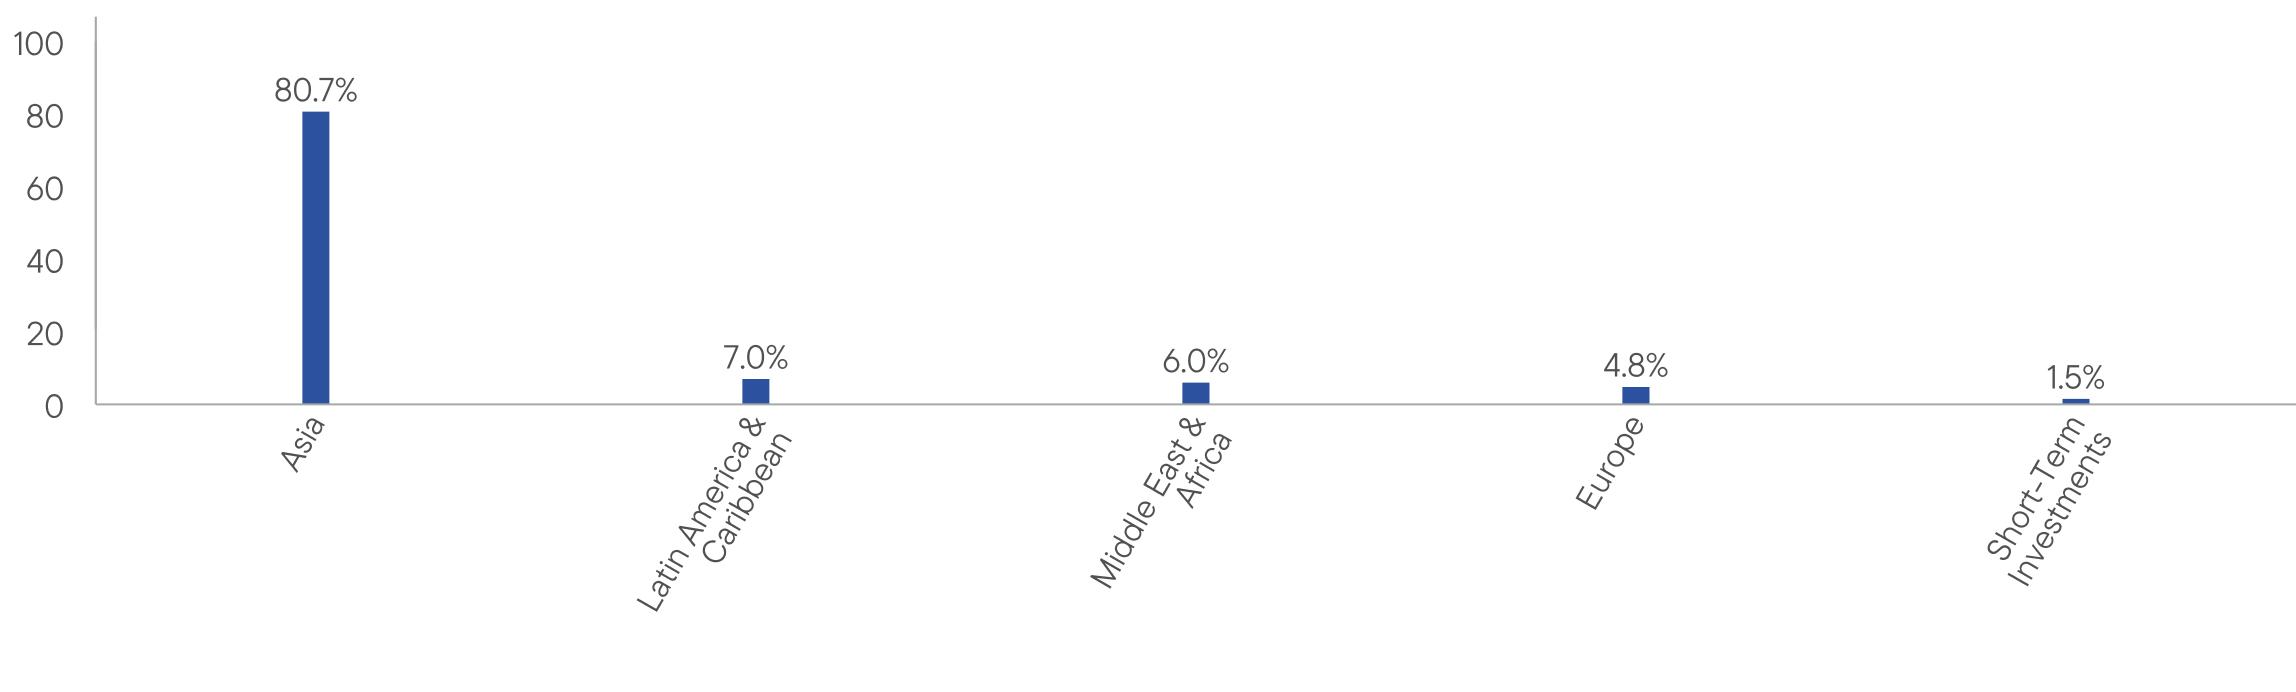
WHAT DID THE FUND INVEST IN? (as of August 31, 2024)
Portfolio Composition* (% of Total Investments)
| * | Does not include derivatives, except purchased options, if any. |
| |
| WHERE CAN I FIND ADDITIONAL INFORMATION ABOUT THE FUND? |
Additional information is available on https://www.franklintempleton.com/regulatory-fund-documents, including its: |
| • prospectus • proxy voting information • financial information • holdings • tax information |
HOUSEHOLDING
You will receive the Fund’s shareholder reports every six months. In addition, you will receive an annual updated summary prospectus (detail prospectus available upon request). To reduce Fund expenses, we try to identify related shareholders in a household and send only one copy of the shareholder reports and summary prospectus. This process, called “householding,” will continue indefinitely unless you instruct us otherwise. If you prefer not to have these documents householded, please call us at (800) DIAL BEN/342-5236. At any time, you may view current prospectuses/summary prospectuses and shareholder reports on our website. If you choose, you may receive these documents through electronic delivery.
| Templeton Emerging Markets Small Cap Fund | PAGE 3 | 426-ATSR-1024 |
9450835690301068910324966794161358411182118241398310000876590211072411065107041159314477116511303615410100008109901610491103999319103261484312413140331630680.77.06.04.81.5
| | |
Templeton Emerging Markets Small Cap Fund | |
| Class C [TCEMX] |
| Annual Shareholder Report | August 31, 2024 |
|
This annual shareholder report contains important information about Templeton Emerging Markets Small Cap Fund for the period September 1, 2023, to August 31, 2024.
You can find additional information about the Fund at https://www.franklintempleton.com/regulatory-fund-documents. You can also request this information by contacting us at (800) DIAL BEN/342-5236.
WHAT WERE THE FUND COSTS FOR THE LAST YEAR? (based on a hypothetical $10,000 investment)
| | |
Class Name | Costs of a $10,000 investment | Costs paid as a percentage of a $10,000 investment* |
| Class C | $272 | 2.50% |
| * | Reflects fee waivers and/or expense reimbursements, without which expenses would have been higher. |
HOW DID THE FUND PERFORM LAST YEAR AND WHAT AFFECTED ITS PERFORMANCE?
For the twelve months ended August 31, 2024, Class C shares of Templeton Emerging Markets Small Cap Fund returned 17.31%. The Fund compares its performance to the MSCI Emerging Markets Small Cap Index-NR, which returned 16.20% for the same period.
| |
Top contributors to performance: |
| ↑ | By sector, consumer discretionary, financials and health care contributed to absolute returns. |
| ↑ | By country, India, Taiwan and the Philippines were the largest absolute contributors. |
| ↑ | Shares of Zomato, India’s largest online food delivery platform, performed on strong results for several quarters. |
| |
Top detractors from performance: |
| ↓ | By sector, real estate, materials and utilities were the largest detractors from absolute performance. |
| ↓ | By country, China, Brazil and the United Arab Emirates were absolute detractors. |
| ↓ | Daqo New Energy, a Chinese polysilicon producer, detracted as a decline in polysilicon prices weighed on its share price. |
| Templeton Emerging Markets Small Cap Fund | PAGE 1 | 526-ATSR-1024 |
HOW DID THE FUND PERFORM OVER THE LAST 10 YEARS?
The Fund’s past performance is not necessarily an indication of how the Fund will perform in the future. The graph and table do not reflect the deduction of taxes that a shareholder would pay on Fund distributions or redemption of Fund shares.
VALUE OF A $10,000 INVESTMENT – Class C 8/31/2014 — 8/31/2024
AVERAGE ANNUAL TOTAL RETURNS (%) Period Ended August 31, 2024
| | | |
| | 1 Year | 5 Year | 10 Year |
Class C | 17.31 | 6.85 | 3.23 |
Class C (with sales charge) | 16.31 | 6.85 | 3.23 |
MSCI All Country World ex-U.S. Index-NR | 18.21 | 7.56 | 4.42 |
MSCI Emerging Markets Small Cap Index-NR | 16.20 | 11.84 | 5.01 |
Fund performance figures may reflect fee waivers and/or expense reimbursements, without which the performance would have been lower.
For current month-end performance, please call Franklin Templeton at (800) DIAL BEN/342-5236 or visit https://www.franklintempleton.com/investments/options/mutual-funds.
Important data provider notices and terms available at www.franklintempletondatasources.com.
KEY FUND STATISTICS (as of August 31, 2024)
| |
Total Net Assets | $353,832,397 |
Total Number of Portfolio Holdings* | 88 |
Total Management Fee Paid | $4,328,251 |
Portfolio Turnover Rate | 20.02% |
| * | Does not include derivatives, except purchased options, if any. |
| Templeton Emerging Markets Small Cap Fund | PAGE 2 | 526-ATSR-1024 |
WHAT DID THE FUND INVEST IN? (as of August 31, 2024)
Portfolio Composition* (% of Total Investments)
| * | Does not include derivatives, except purchased options, if any. |
| |
| WHERE CAN I FIND ADDITIONAL INFORMATION ABOUT THE FUND? |
Additional information is available on https://www.franklintempleton.com/regulatory-fund-documents, including its: |
| • prospectus • proxy voting information • financial information • holdings • tax information |
HOUSEHOLDING
You will receive the Fund’s shareholder reports every six months. In addition, you will receive an annual updated summary prospectus (detail prospectus available upon request). To reduce Fund expenses, we try to identify related shareholders in a household and send only one copy of the shareholder reports and summary prospectus. This process, called “householding,” will continue indefinitely unless you instruct us otherwise. If you prefer not to have these documents householded, please call us at (800) DIAL BEN/342-5236. At any time, you may view current prospectuses/summary prospectuses and shareholder reports on our website. If you choose, you may receive these documents through electronic delivery.
| Templeton Emerging Markets Small Cap Fund | PAGE 3 | 526-ATSR-1024 |
10000878294191106610615986395371364811144117111373910000876590211072411065107041159314477116511303615410100008109901610491103999319103261484312413140331630680.77.06.04.81.5
| | |
Templeton Emerging Markets Small Cap Fund | |
| Class R [FTESX] |
| Annual Shareholder Report | August 31, 2024 |
|
This annual shareholder report contains important information about Templeton Emerging Markets Small Cap Fund for the period September 1, 2023, to August 31, 2024.
You can find additional information about the Fund at https://www.franklintempleton.com/regulatory-fund-documents. You can also request this information by contacting us at (800) DIAL BEN/342-5236.
WHAT WERE THE FUND COSTS FOR THE LAST YEAR? (based on a hypothetical $10,000 investment)
| | |
Class Name | Costs of a $10,000 investment | Costs paid as a percentage of a $10,000 investment* |
| Class R | $218 | 2.00% |
| * | Reflects fee waivers and/or expense reimbursements, without which expenses would have been higher. |
HOW DID THE FUND PERFORM LAST YEAR AND WHAT AFFECTED ITS PERFORMANCE?
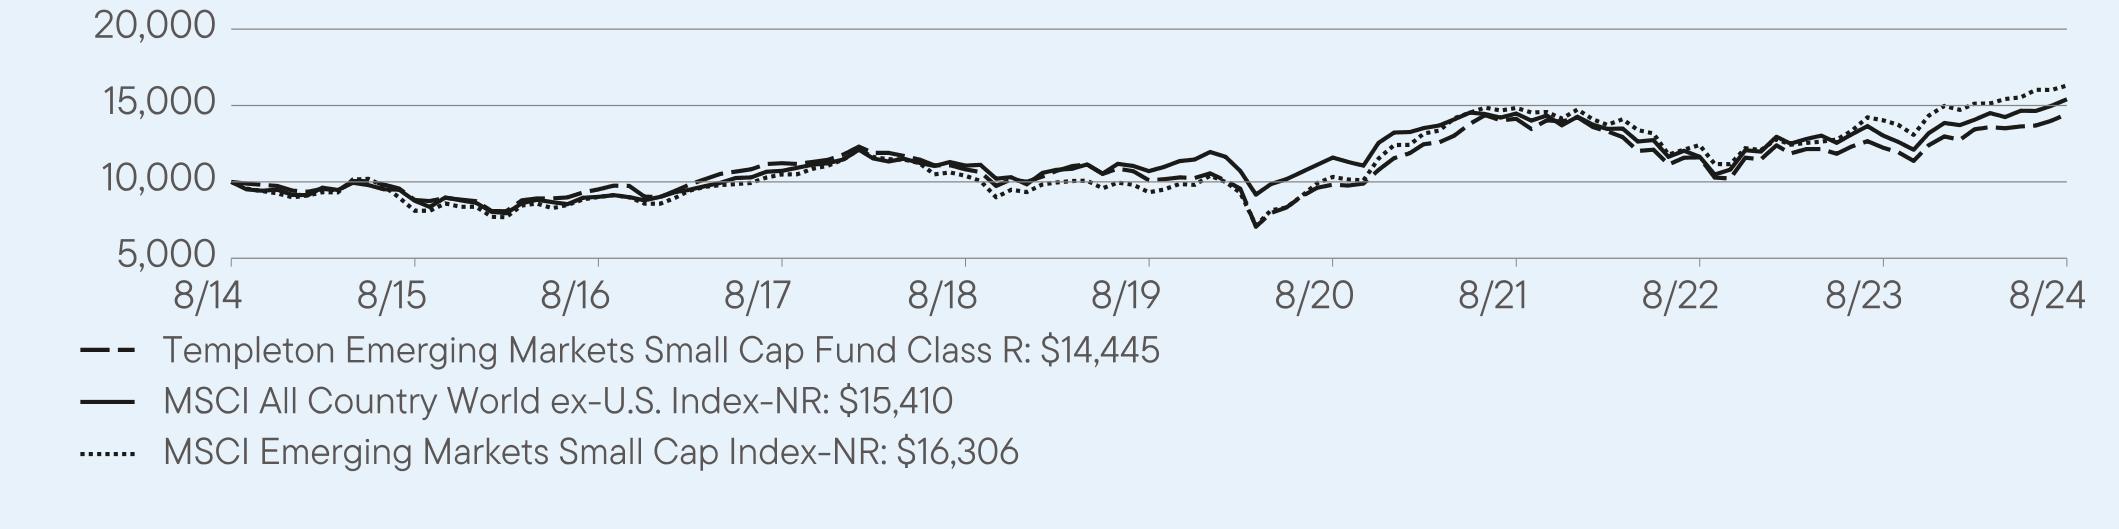
For the twelve months ended August 31, 2024, Class R shares of Templeton Emerging Markets Small Cap Fund returned 18.02%. The Fund compares its performance to the MSCI Emerging Markets Small Cap Index-NR, which returned 16.20% for the same period.
| |
Top contributors to performance: |
| ↑ | By sector, consumer discretionary, financials and health care contributed to absolute returns. |
| ↑ | By country, India, Taiwan and the Philippines were the largest absolute contributors. |
| ↑ | Shares of Zomato, India’s largest online food delivery platform, performed on strong results for several quarters. |
| |
Top detractors from performance: |
| ↓ | By sector, real estate, materials and utilities were the largest detractors from absolute performance. |
| ↓ | By country, China, Brazil and the United Arab Emirates were absolute detractors. |
| ↓ | Daqo New Energy, a Chinese polysilicon producer, detracted as a decline in polysilicon prices weighed on its share price. |
| Templeton Emerging Markets Small Cap Fund | PAGE 1 | 826-ATSR-1024 |
HOW DID THE FUND PERFORM OVER THE LAST 10 YEARS?
The Fund’s past performance is not necessarily an indication of how the Fund will perform in the future. The graph and table do not reflect the deduction of taxes that a shareholder would pay on Fund distributions or redemption of Fund shares.
VALUE OF A $10,000 INVESTMENT – Class R 8/31/2014 — 8/31/2024
AVERAGE ANNUAL TOTAL RETURNS (%) Period Ended August 31, 2024
| | | |
| | 1 Year | 5 Year | 10 Year |
Class R | 18.02 | 7.40 | 3.75 |
MSCI All Country World ex-U.S. Index-NR | 18.21 | 7.56 | 4.42 |
MSCI Emerging Markets Small Cap Index-NR | 16.20 | 11.84 | 5.01 |
Fund performance figures may reflect fee waivers and/or expense reimbursements, without which the performance would have been lower.
For current month-end performance, please call Franklin Templeton at (800) DIAL BEN/342-5236 or visit https://www.franklintempleton.com/investments/options/mutual-funds.
Important data provider notices and terms available at www.franklintempletondatasources.com.
KEY FUND STATISTICS (as of August 31, 2024)
| |
Total Net Assets | $353,832,397 |
Total Number of Portfolio Holdings* | 88 |
Total Management Fee Paid | $4,328,251 |
Portfolio Turnover Rate | 20.02% |
| * | Does not include derivatives, except purchased options, if any. |
WHAT DID THE FUND INVEST IN? (as of August 31, 2024)
Portfolio Composition* (% of Total Investments)
| * | Does not include derivatives, except purchased options, if any. |
| Templeton Emerging Markets Small Cap Fund | PAGE 2 | 826-ATSR-1024 |
| |
| WHERE CAN I FIND ADDITIONAL INFORMATION ABOUT THE FUND? |
Additional information is available on https://www.franklintempleton.com/regulatory-fund-documents, including its: |
| • prospectus • proxy voting information • financial information • holdings • tax information |
HOUSEHOLDING
You will receive the Fund’s shareholder reports every six months. In addition, you will receive an annual updated summary prospectus (detail prospectus available upon request). To reduce Fund expenses, we try to identify related shareholders in a household and send only one copy of the shareholder reports and summary prospectus. This process, called “householding,” will continue indefinitely unless you instruct us otherwise. If you prefer not to have these documents householded, please call us at (800) DIAL BEN/342-5236. At any time, you may view current prospectuses/summary prospectuses and shareholder reports on our website. If you choose, you may receive these documents through electronic delivery.
| Templeton Emerging Markets Small Cap Fund | PAGE 3 | 826-ATSR-1024 |
100008821951211223108211010998231412911601122391444510000876590211072411065107041159314477116511303615410100008109901610491103999319103261484312413140331630680.77.06.04.81.5
| | |
Templeton Emerging Markets Small Cap Fund | |
| Class R6 [FTEQX] |
| Annual Shareholder Report | August 31, 2024 |
|
This annual shareholder report contains important information about Templeton Emerging Markets Small Cap Fund for the period September 1, 2023, to August 31, 2024.
You can find additional information about the Fund at https://www.franklintempleton.com/regulatory-fund-documents. You can also request this information by contacting us at (800) DIAL BEN/342-5236.
WHAT WERE THE FUND COSTS FOR THE LAST YEAR? (based on a hypothetical $10,000 investment)
| | |
Class Name | Costs of a $10,000 investment | Costs paid as a percentage of a $10,000 investment* |
| Class R6 | $161 | 1.47% |
| * | Reflects fee waivers and/or expense reimbursements, without which expenses would have been higher. |
HOW DID THE FUND PERFORM LAST YEAR AND WHAT AFFECTED ITS PERFORMANCE?
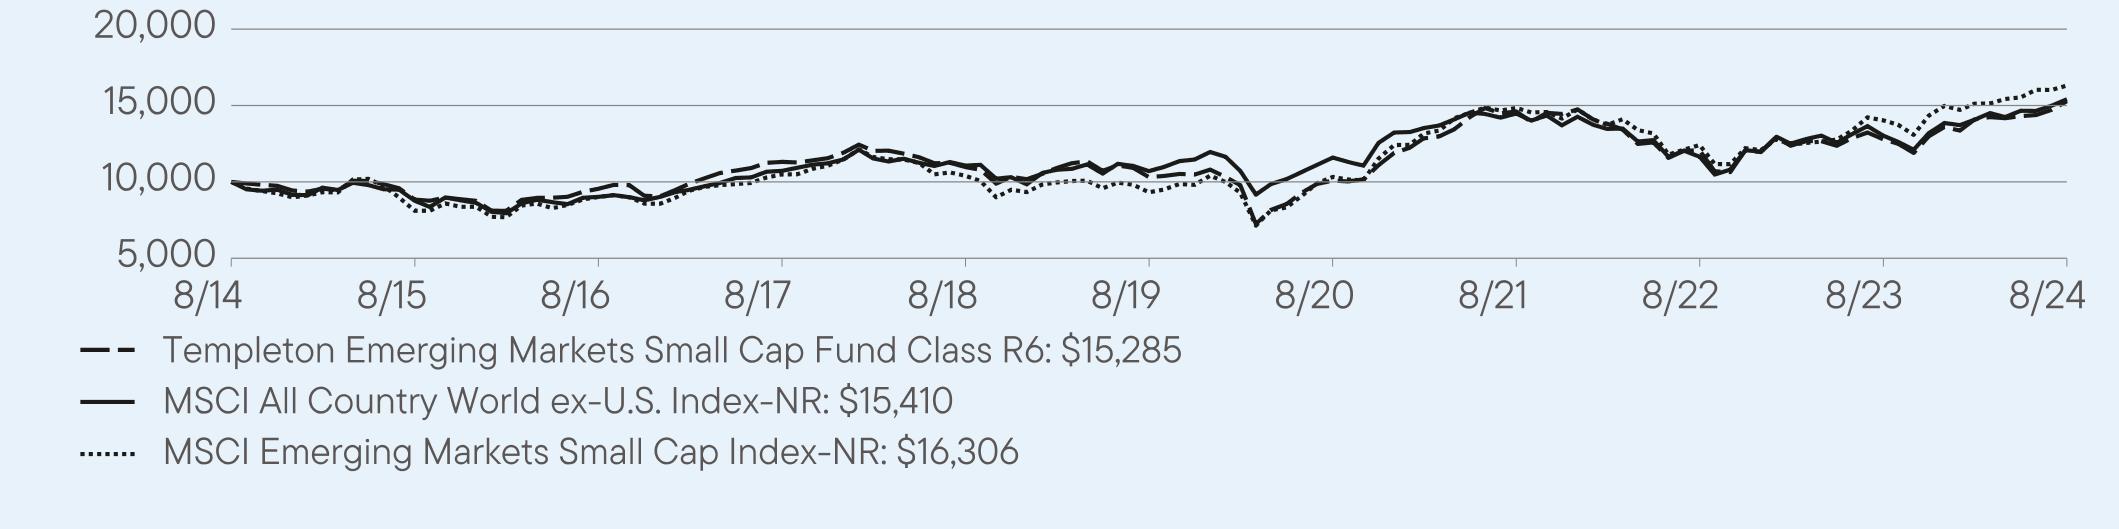
For the twelve months ended August 31, 2024, Class R6 shares of Templeton Emerging Markets Small Cap Fund returned 18.60%. The Fund compares its performance to the MSCI Emerging Markets Small Cap Index-NR, which returned 16.20% for the same period.
| |
Top contributors to performance: |
| ↑ | By sector, consumer discretionary, financials and health care contributed to absolute returns. |
| ↑ | By country, India, Taiwan and the Philippines were the largest absolute contributors. |
| ↑ | Shares of Zomato, India’s largest online food delivery platform, performed on strong results for several quarters. |
| |
Top detractors from performance: |
| ↓ | By sector, real estate, materials and utilities were the largest detractors from absolute performance. |
| ↓ | By country, China, Brazil and the United Arab Emirates were absolute detractors. |
| ↓ | Daqo New Energy, a Chinese polysilicon producer, detracted as a decline in polysilicon prices weighed on its share price. |
| Templeton Emerging Markets Small Cap Fund | PAGE 1 | 8426-ATSR-1024 |
HOW DID THE FUND PERFORM OVER THE LAST 10 YEARS?
The Fund’s past performance is not necessarily an indication of how the Fund will perform in the future. The graph and table do not reflect the deduction of taxes that a shareholder would pay on Fund distributions or redemption of Fund shares.
VALUE OF A $10,000 INVESTMENT – Class R6 8/31/2014 — 8/31/2024
AVERAGE ANNUAL TOTAL RETURNS (%) Period Ended August 31, 2024
| | | |
| | 1 Year | 5 Year | 10 Year |
Class R6 | 18.60 | 8.02 | 4.33 |
MSCI All Country World ex-U.S. Index-NR | 18.21 | 7.56 | 4.42 |
MSCI Emerging Markets Small Cap Index-NR | 16.20 | 11.84 | 5.01 |
Fund performance figures may reflect fee waivers and/or expense reimbursements, without which the performance would have been lower.
The Fund began offering Class R6 shares on 8/1/2017. Returns for periods before 8/1/2017 are based on the Fund’s Advisor Class performance, which has been adjusted to take into account differences in class-specific operating expenses and maximum sales charges. For periods after the share class offering, performance for the specific share class is used, reflecting the applicable expenses and maximum sales charges.
For current month-end performance, please call Franklin Templeton at (800) DIAL BEN/342-5236 or visit https://www.franklintempleton.com/investments/options/mutual-funds.
Important data provider notices and terms available at www.franklintempletondatasources.com.
KEY FUND STATISTICS (as of August 31, 2024)
| |
Total Net Assets | $353,832,397 |
Total Number of Portfolio Holdings* | 88 |
Total Management Fee Paid | $4,328,251 |
Portfolio Turnover Rate | 20.02% |
| * | Does not include derivatives, except purchased options, if any. |
| Templeton Emerging Markets Small Cap Fund | PAGE 2 | 8426-ATSR-1024 |
WHAT DID THE FUND INVEST IN? (as of August 31, 2024)
Portfolio Composition* (% of Total Investments)
| * | Does not include derivatives, except purchased options, if any. |
| |
| WHERE CAN I FIND ADDITIONAL INFORMATION ABOUT THE FUND? |
Additional information is available on https://www.franklintempleton.com/regulatory-fund-documents, including its: |
| • prospectus • proxy voting information • financial information • holdings • tax information |
HOUSEHOLDING
You will receive the Fund’s shareholder reports every six months. In addition, you will receive an annual updated summary prospectus (detail prospectus available upon request). To reduce Fund expenses, we try to identify related shareholders in a household and send only one copy of the shareholder reports and summary prospectus. This process, called “householding,” will continue indefinitely unless you instruct us otherwise. If you prefer not to have these documents householded, please call us at (800) DIAL BEN/342-5236. At any time, you may view current prospectuses/summary prospectuses and shareholder reports on our website. If you choose, you may receive these documents through electronic delivery.
| Templeton Emerging Markets Small Cap Fund | PAGE 3 | 8426-ATSR-1024 |
1000088439555113111097210317100871460912063127941528510000876590211072411065107041159314477116511303615410100008109901610491103999319103261484312413140331630680.77.06.04.81.5
| | |
Templeton Emerging Markets Small Cap Fund | |
| Advisor Class [TEMZX] |
| Annual Shareholder Report | August 31, 2024 |
|
This annual shareholder report contains important information about Templeton Emerging Markets Small Cap Fund for the period September 1, 2023, to August 31, 2024.
You can find additional information about the Fund at https://www.franklintempleton.com/regulatory-fund-documents. You can also request this information by contacting us at (800) DIAL BEN/342-5236.
WHAT WERE THE FUND COSTS FOR THE LAST YEAR? (based on a hypothetical $10,000 investment)
| | |
Class Name | Costs of a $10,000 investment | Costs paid as a percentage of a $10,000 investment* |
| Advisor Class | $164 | 1.50% |
| * | Reflects fee waivers and/or expense reimbursements, without which expenses would have been higher. |
HOW DID THE FUND PERFORM LAST YEAR AND WHAT AFFECTED ITS PERFORMANCE?
For the twelve months ended August 31, 2024, Advisor Class shares of Templeton Emerging Markets Small Cap Fund returned 18.62%. The Fund compares its performance to the MSCI Emerging Markets Small Cap Index-NR, which returned 16.20% for the same period.
| |
Top contributors to performance: |
| ↑ | By sector, consumer discretionary, financials and health care contributed to absolute returns. |
| ↑ | By country, India, Taiwan and the Philippines were the largest absolute contributors. |
| ↑ | Shares of Zomato, India’s largest online food delivery platform, performed on strong results for several quarters. |
| |
Top detractors from performance: |
| ↓ | By sector, real estate, materials and utilities were the largest detractors from absolute performance. |
| ↓ | By country, China, Brazil and the United Arab Emirates were absolute detractors. |
| ↓ | Daqo New Energy, a Chinese polysilicon producer, detracted as a decline in polysilicon prices weighed on its share price. |
| Templeton Emerging Markets Small Cap Fund | PAGE 1 | 626-ATSR-1024 |
HOW DID THE FUND PERFORM OVER THE LAST 10 YEARS?
The Fund’s past performance is not necessarily an indication of how the Fund will perform in the future. The graph and table do not reflect the deduction of taxes that a shareholder would pay on Fund distributions or redemption of Fund shares.
VALUE OF A $10,000 INVESTMENT – Advisor Class 8/31/2014 — 8/31/2024
AVERAGE ANNUAL TOTAL RETURNS (%) Period Ended August 31, 2024
| | | |
| | 1 Year | 5 Year | 10 Year |
Advisor Class | 18.62 | 7.94 | 4.27 |
MSCI All Country World ex-U.S. Index-NR | 18.21 | 7.56 | 4.42 |
MSCI Emerging Markets Small Cap Index-NR | 16.20 | 11.84 | 5.01 |
Fund performance figures may reflect fee waivers and/or expense reimbursements, without which the performance would have been lower.
For current month-end performance, please call Franklin Templeton at (800) DIAL BEN/342-5236 or visit https://www.franklintempleton.com/investments/options/mutual-funds.
Important data provider notices and terms available at www.franklintempletondatasources.com.
KEY FUND STATISTICS (as of August 31, 2024)
| |
Total Net Assets | $353,832,397 |
Total Number of Portfolio Holdings* | 88 |
Total Management Fee Paid | $4,328,251 |
Portfolio Turnover Rate | 20.02% |
| * | Does not include derivatives, except purchased options, if any. |
WHAT DID THE FUND INVEST IN? (as of August 31, 2024)
Portfolio Composition* (% of Total Investments)
| * | Does not include derivatives, except purchased options, if any. |
| Templeton Emerging Markets Small Cap Fund | PAGE 2 | 626-ATSR-1024 |
| |
| WHERE CAN I FIND ADDITIONAL INFORMATION ABOUT THE FUND? |
Additional information is available on https://www.franklintempleton.com/regulatory-fund-documents, including its: |
| • prospectus • proxy voting information • financial information • holdings • tax information |
HOUSEHOLDING
You will receive the Fund’s shareholder reports every six months. In addition, you will receive an annual updated summary prospectus (detail prospectus available upon request). To reduce Fund expenses, we try to identify related shareholders in a household and send only one copy of the shareholder reports and summary prospectus. This process, called “householding,” will continue indefinitely unless you instruct us otherwise. If you prefer not to have these documents householded, please call us at (800) DIAL BEN/342-5236. At any time, you may view current prospectuses/summary prospectuses and shareholder reports on our website. If you choose, you may receive these documents through electronic delivery.
| Templeton Emerging Markets Small Cap Fund | PAGE 3 | 626-ATSR-1024 |
1000088679609114011104610364101231463612069128031518710000876590211072411065107041159314477116511303615410100008109901610491103999319103261484312413140331630680.77.06.04.81.5
| | |
Franklin Templeton SMACS: Series EM true | |
| Annual Shareholder Report | August 31, 2024 |
|
This annual shareholder report contains important information about Franklin Templeton SMACS: Series EM for the period September 1, 2023, to August 31, 2024.
You can find additional information about the Fund at https://www.franklintempleton.com/regulatory-fund-documents. You can also request this information by contacting us at (800) DIAL BEN/342-5236.
WHAT WERE THE FUND COSTS FOR THE LAST YEAR? (based on a hypothetical $10,000 investment)
| | |
Fund Name | Costs of a $10,000 investment | Costs paid as a percentage of a $10,000 investment* |
Franklin Templeton SMACS: Series EM1 | $0 | 0.00% |
| * | Reflects fee waivers and/or expense reimbursements, without which expenses would have been higher. |
| 1 | Does not reflect the effect of fees and expenses associated with a separately managed account, or a management fee or other operating expenses of the Fund. |
HOW DID THE FUND PERFORM LAST YEAR AND WHAT AFFECTED ITS PERFORMANCE?
For the twelve months ended August 31, 2024, Franklin Templeton SMACS: Series EM returned 20.33%. The Fund compares its performance to the MSCI Emerging Markets Index-NR, which returned 15.07% for the same period.
| |
Top contributors to performance: |
| ↑ | Information technology, financials and consumer discretionary sectors contributed to absolute returns |
| ↑ | By country, Taiwan, South Korea and India were the largest absolute contributors |
| ↑ | Taiwan Semiconductor Manufacturing contributed with solid results and an optimistic outlook over the period |
| |
Top detractors from performance: |
| ↓ | Materials, communication services and industrials sectors were the largest detractors |
| ↓ | By country, Brazil, Indonesia and Mexico were absolute detractors |
| ↓ | Samsung SDI, a South Korea-based lithium-ion battery manufacturer, detracted on investor concerns of weaker-than-expected growth in end-market demand for its products |
| Franklin Templeton SMACS: Series EM | PAGE 1 | 3010-ATSR-1024 |
HOW DID THE FUND PERFORM OVER THE LAST 10 YEARS?
The Fund’s past performance is not necessarily an indication of how the Fund will perform in the future. The graph and table do not reflect the deduction of taxes that a shareholder would pay on Fund distributions or redemption of Fund shares, or the effect of fees and expenses borne by investors at the separately managed account level.
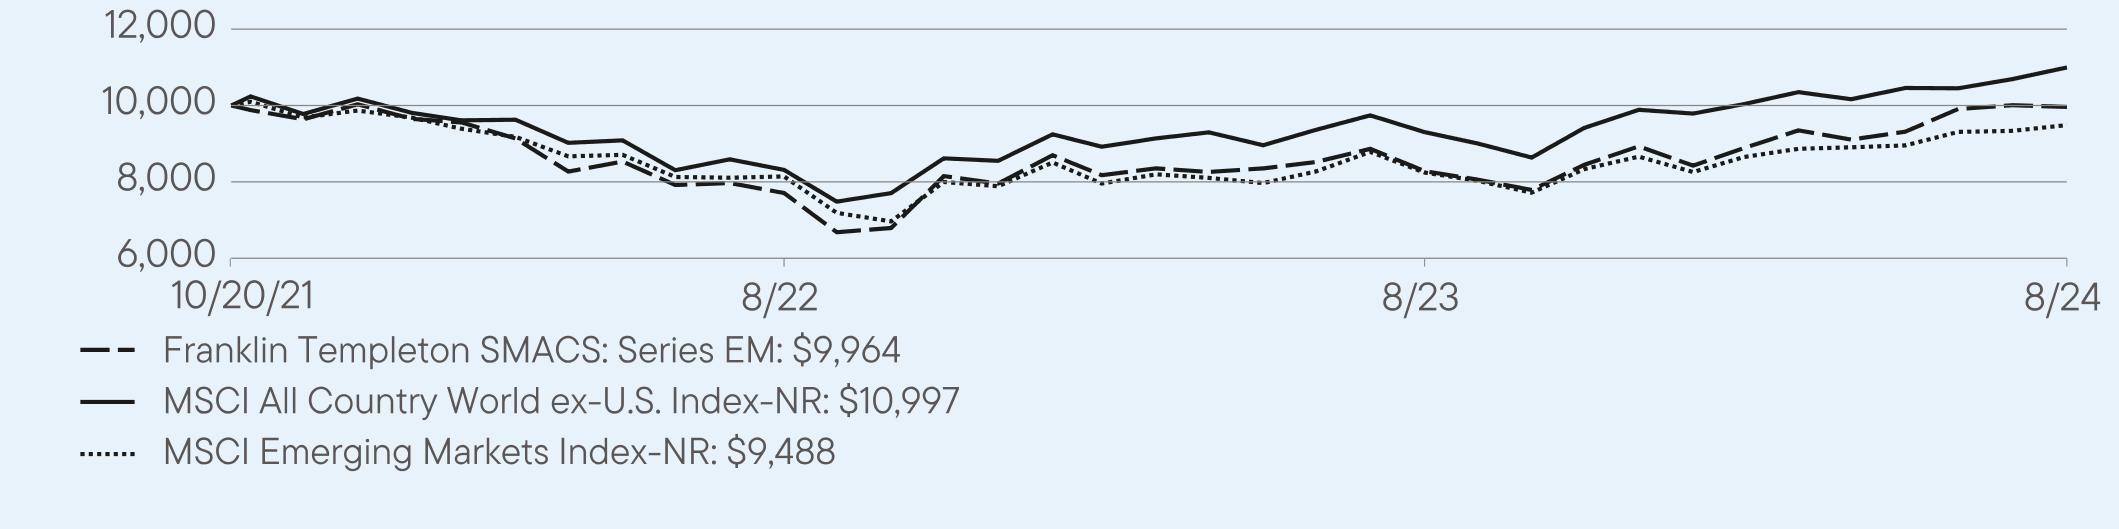
VALUE OF A $10,000 INVESTMENT – Franklin Templeton SMACS: Series EM 10/20/2021 — 8/31/2024
AVERAGE ANNUAL TOTAL RETURNS (%) Period Ended August 31, 2024
| | |
| | 1 Year | Since Inception
(10/20/2021) |
Franklin Templeton SMACS: Series EM | 20.33 | -0.13 |
MSCI All Country World ex-U.S. Index-NR | 18.21 | 2.18 |
MSCI Emerging Markets Index-NR | 15.07 | -3.11 |
Performance figures do not reflect the effect of fees and expenses associated with a separately managed account or a management fee or other operating expenses of the Fund, which if reflected, would reduce performance of the Fund.
Fund performance figures may reflect fee waivers and/or expense reimbursements, without which the performance would have been lower.
For current month-end performance, please call Franklin Templeton at (800) DIAL BEN/342-5236 or visit https://www.franklintempleton.com/investments/options/mutual-funds.
Important data provider notices and terms available at www.franklintempletondatasources.com.
KEY FUND STATISTICS (as of August 31, 2024)
| |
Total Net Assets | $1,023,163 |
Total Number of Portfolio Holdings* | 51 |
Total Management Fee Paid | $0 |
Portfolio Turnover Rate | 34.19% |
| * | Does not include derivatives, except purchased options, if any. |
| Franklin Templeton SMACS: Series EM | PAGE 2 | 3010-ATSR-1024 |
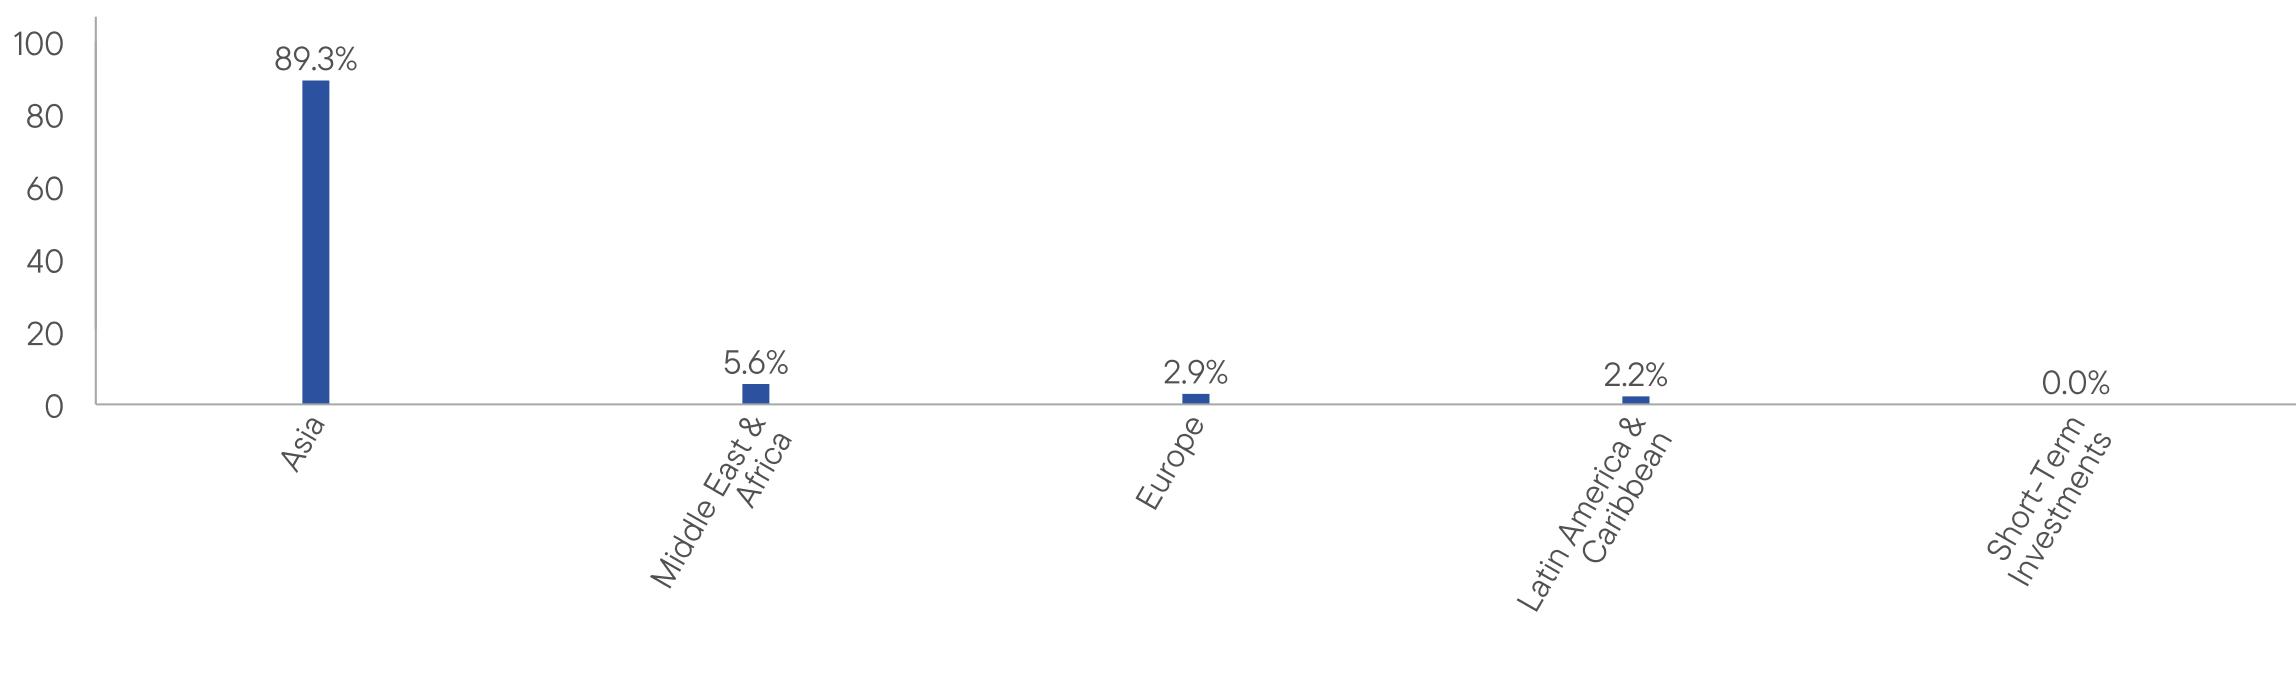
WHAT DID THE FUND INVEST IN? (as of August 31, 2024)
Portfolio Composition*,† (% of Total Investments)
| * | Does not include derivatives, except purchased options, if any. |
| † | Certain categories may represent less than 0.1%. |
| |
| WHERE CAN I FIND ADDITIONAL INFORMATION ABOUT THE FUND? |
Additional information is available on https://www.franklintempleton.com/regulatory-fund-documents, including its: |
| • prospectus • proxy voting information • financial information • holdings • tax information |
| Franklin Templeton SMACS: Series EM | PAGE 3 | 3010-ATSR-1024 |
770882819964831493031099781438245948889.35.62.92.20.0
Item 2. Code of Ethics.
(a) The Registrant has adopted a code of ethics that applies to its principal executive officers and principal financial and accounting officer .
(c) N/A
(d) N/A
(f) Pursuant to Item 19(a) (1), the Registrant is attaching as an exhibit a copy of its code of ethics that applies to its principal executive officers and principal financial and accounting officer.
Item 3. Audit Committee Financial Expert.
(a) (1) The Registrant has an audit committee financial expert serving on its audit committee.
(2) The audit committee financial experts are Ann Torre Bates and David W. Niemiec, and they are "independent" as defined under the relevant Securities and Exchange Commission Rules and Releases
Item 4. Principal Accountant Fees and Services.
(a) Audit Fees
The aggregate fees paid to the principal accountant for professional services rendered by the principal accountant for the audit of the registrant’s annual financial statements or for services that are normally provided by the principal accountant in connection with statutory and regulatory filings or engagements were $90,453 for the fiscal year ended August 31, 2024 and $85,745 for the fiscal year ended August 31, 2023.
(b) Audit-Related Fees
There were no fees paid to the principal accountant for assurance and related services rendered by the principal accountant to the registrant that are reasonably related to the performance of the audit of the registrant's financial statements and are not reported under paragraph (a) of Item 4.
There were no fees paid to the principal accountant for assurance and related services rendered by the principal accountant to the registrant's investment adviser and any entity controlling, controlled by or under common control with the investment adviser that provides ongoing services to the registrant that are reasonably related to the performance of the audit of their financial statements.
(c) Tax Fees
There were no fees paid to the principal accountant for professional services rendered by the principal accountant to the registrant for tax compliance, tax advice and tax planning.
The aggregate fees paid to the principal accountant for professional services rendered by the principal accountant to the registrant’s investment adviser and any entity controlling, controlled by or under common control with the investment adviser that provides ongoing services to the registrant for tax compliance, tax advice and tax planning were $140,000 for the fiscal year ended August 31, 2024, and $70,000 for the fiscal year ended August 31, 2023. The services for which these fees were paid included global access to tax platform International Tax View.
(d) All Other Fees
The aggregate fees paid to the principal accountant for products and services rendered by the principal accountant to the registrant not reported in paragraphs (a)-(c) of Item 4 were $0 for the fiscal year ended August 31, 2024, and $176 for the fiscal year ended August 31, 2023. The services for which these fees were paid included review of materials provided to the fund Board in connection with the investment management contract renewal process.
The aggregate fees paid to the principal accountant for products and services rendered by the principal accountant to the registrant’s investment adviser and any entity controlling, controlled by or under common control with the investment adviser that provides ongoing services to the registrant not reported in paragraphs (a)-(c) of Item 4 were $47,804 for the fiscal year ended August 31, 2024 and $37,215 for the fiscal year ended August 31, 2023. The services for which these fees were paid included professional fees in connection with SOC 1 Reports and fees in connection with license for accounting and business knowledge platform Viewpoint.
(e) (1) The registrant’s audit committee is directly responsible for approving the services to be provided by the auditors, including:
(i) pre-approval of all audit and audit related services;
(ii) pre-approval of all non-audit related services to be provided to the Fund by the auditors;
(iii) pre-approval of all non-audit related services to be provided to the registrant by the auditors to the registrant’s investment adviser or to any entity that controls, is controlled by or is under common control with the registrant’s investment adviser and that provides ongoing services to the registrant where the non-audit services relate directly to the operations or financial reporting of the registrant; and
(iv) establishment by the audit committee, if deemed necessary or appropriate, as an alternative to committee pre-approval of services to be provided by the auditors, as required by paragraphs (ii) and (iii) above, of policies and procedures to permit such services to be pre-approved by other means, such as through establishment of guidelines or by action of a designated member or members of the committee; provided the policies and procedures are detailed as to the particular service and the committee is informed of each service and such policies and procedures do not include delegation of audit committee responsibilities, as contemplated under the Securities Exchange Act of 1934, to management; subject, in the case of (ii) through (iv), to any waivers, exceptions or exemptions that may be available under applicable law or rules.
(e) (2) None of the services provided to the registrant described in paragraphs (b)-(d) of Item 4 were approved by the audit committee pursuant to paragraph (c)(7)(i)(C) of Rule 2-01 of regulation S-X.
(f) No disclosures are required by this Item 4(f).
(g) The aggregate non-audit fees paid to the principal accountant for services rendered by the principal accountant to the registrant and the registrant’s investment adviser and any entity controlling, controlled by or under common control with the investment adviser that provides ongoing services to the registrant were $187,804 for the fiscal year ended August 31, 2024 and $107,391 for the fiscal year ended August 31, 2023.
(h) The registrant’s audit committee of the board has considered whether the provision of non-audit services that were rendered to the registrant’s investment adviser (not including any sub-adviser whose role is primarily portfolio management and is subcontracted with or overseen by another investment adviser), and any entity controlling, controlled by, or under common control with the investment adviser that provides ongoing services to the registrant that were not pre-approved pursuant to paragraph (c)(7)(ii) of Rule 2-01 of Regulation S-X is compatible with maintaining the principal accountant’s independence.
(i) N/A
(j) N/A
Item 5. Audit Committee of Listed Registrants. N/A
Item 6. Schedule of Investments.
(a) Please see schedule of investments contained in the Financial Statements and Financial Highlights included under Item 7 of this Form N-CSR.
(b) N/A
Item 7. Financial Statements and Financial Highlights for Open-End Management Investment Companies.
Franklin
Templeton
SMACS:
Series
EM
Financial
Statements
and
Other
Important
Information
Annual
|
August
31,
2024
Financial
Statements
and
Other
Important
Information—Annual
Financial
Highlights
and
Schedule
of
Investments
2
Financial
Statements
6
Notes
to
Financial
Statements
9
Report
of
Independent
Registered
Public
Accounting
Firm
16
Tax
Information
17
Changes
In
and
Disagreements
with
Accountants
18
Results
of
Meeting(s)
of
Shareholders
18
Remuneration
Paid
to
Directors,
Officers
and
Others
18
Board
Approval
of
Management
and
Subadvisory
Agreements
18
TEMPLETON
GLOBAL
INVESTMENT
TRUST
Financial
Highlights
Franklin
Templeton
SMACS:
Series
EM
Annual
Report
The
accompanying
notes
are
an
integral
part
of
these
financial
statements.
a
Year
Ended
August
31,
Year
Ended
August
31,
2022
a
2024
2023
Per
share
operating
performance
(for
a
share
outstanding
throughout
the
year)
Net
asset
value,
beginning
of
year
............................................
$7.92
$7.66
$10.00
Income
from
investment
operations
b
:
Net
investment
income
c
..................................................
0.27
0.34
d
0.19
Net
realized
and
unrealized
gains
(losses)
....................................
1.27
0.22
(2.47)
Total
from
investment
operations
.............................................
1.54
0.56
(2.28)
Less
distributions
from:
Net
investment
income
...................................................
(0.39)
(0.30)
(0.06)
Net
asset
value,
end
of
year
................................................
$9.07
$7.92
$7.66
Total
return
e
............................................................
20.33%
7.43%
(22.92)%
Ratios
to
average
net
assets
f
Expenses
before
waiver
and
payments
by
affiliates
...............................
13.34%
15.23%
17.93%
Expenses
net
of
waiver
and
payments
by
affiliates
................................
—%
—%
—%
Net
investment
income
....................................................
3.26%
4.37%
d
2.48%
Supplemental
data
Net
assets,
end
of
year
(000’s)
..............................................
$1,023
$894
$849
Portfolio
turnover
rate
.....................................................
34.19%
35.74%
31.11%
a
For
the
period
October
20,
2021
(commencement
of
operations)
to
August
31,
2022.
b
The
amount
shown
for
a
share
outstanding
throughout
the
period
may
not
correlate
with
the
Statement
of
Operations
for
the
period
due
to
the
timing
of
sales
and
repurchases
of
the
Fund’s
shares
in
relation
to
income
earned
and/or
fluctuating
fair
value
of
the
investments
of
the
Fund.
c
Based
on
average
daily
shares
outstanding.
d
Net
investment
income
per
share
includes
approximately
$0.12
per
share
related
to
income
received
in
the
form
of
special
dividends
in
connection
with
certain
Fund
holdings.
Excluding
this
amount,
the
ratio
of
net
investment
income
to
average
net
assets
would
have
been
2.85%.
e
Total
return
is
not
annualized
for
periods
less
than
one
year.
f
Ratios
are
annualized
for
periods
less
than
one
year,
except
for
non-recurring
expenses,
if
any.
Templeton
Global
Investment
Trust
Schedule
of
Investments,
August
31,
2024
Franklin
Templeton
SMACS:
Series
EM
The
accompanying
notes
are
an
integral
part
of
these
financial
statements.
Annual
Report
a
a
Industry
Shares
a
Value
a
Common
Stocks
96.3%
Brazil
1.9%
a
Hypera
SA
.....................
Pharmaceuticals
1,198
$
6,067
a
Oncoclinicas
do
Brasil
Servicos
Medicos
SA
..........................
Health
Care
Providers
&
Services
6,292
7,436
TOTVS
SA
.....................
Software
1,256
6,680
20,183
Cambodia
0.4%
a
NagaCorp
Ltd.
..................
Hotels,
Restaurants
&
Leisure
8,440
3,585
China
9.7%
Beijing
Oriental
Yuhong
Waterproof
Technology
Co.
Ltd.
,
A
...........
Construction
Materials
2,601
3,985
Brilliance
China
Automotive
Holdings
Ltd.
.........................
Automobiles
2,034
848
b
Budweiser
Brewing
Co.
APAC
Ltd.
,
144A
,
Reg
S
..................
Beverages
21,340
24,320
China
Resources
Building
Materials
Technology
Holdings
Ltd.
.........
Construction
Materials
21,612
4,247
COSCO
SHIPPING
Ports
Ltd.
.......
Transportation
Infrastructure
8,558
5,073
b
Greentown
Service
Group
Co.
Ltd.
,
Reg
S
...........................
Real
Estate
Management
&
Development
5,063
2,343
Guangzhou
Tinci
Materials
Technology
Co.
Ltd.
,
A
....................
Chemicals
2,860
5,786
Haier
Smart
Home
Co.
Ltd.
,
D
.......
Household
Durables
6,507
10,989
Health
&
Happiness
H&H
International
Holdings
Ltd.
..................
Food
Products
4,317
4,612
a,b,c
Kuaishou
Technology
,
144A
,
Reg
S
...
Interactive
Media
&
Services
2,096
10,698
Uni-President
China
Holdings
Ltd.
....
Food
Products
19,729
17,432
a,b
Wuxi
Biologics
Cayman,
Inc.
,
144A
,
Reg
S
...........................
Life
Sciences
Tools
&
Services
5,963
8,487
98,820
Hungary
2.4%
Richter
Gedeon
Nyrt.
.............
Pharmaceuticals
819
24,818
India
6.0%
ACC
Ltd.
.......................
Construction
Materials
404
11,225
Bajaj
Holdings
&
Investment
Ltd.
.....
Financial
Services
134
16,078
Federal
Bank
Ltd.
................
Banks
6,232
14,467
a
One
97
Communications
Ltd.
.......
Financial
Services
451
3,351
a
Zomato
Ltd.
....................
Hotels,
Restaurants
&
Leisure
5,550
16,568
61,689
Indonesia
1.0%
Astra
International
Tbk.
PT
.........
Industrial
Conglomerates
30,783
10,152
Italy
0.4%
a,b
Wizz
Air
Holdings
plc
,
144A
,
Reg
S
...
Passenger
Airlines
222
3,907
Mexico
0.2%
a,b
Nemak
SAB
de
CV
,
144A
,
Reg
S
....
Automobile
Components
15,599
1,759
Philippines
1.0%
BDO
Unibank,
Inc.
...............
Banks
3,907
10,625
South
Africa
3.9%
Discovery
Ltd.
...................
Insurance
2,884
24,681
Netcare
Ltd.
....................
Health
Care
Providers
&
Services
19,801
15,072
39,753
Templeton
Global
Investment
Trust
Schedule
of
Investments
Franklin
Templeton
SMACS:
Series
EM
(continued)
Annual
Report
The
accompanying
notes
are
an
integral
part
of
these
financial
statements.
a
a
Industry
Shares
a
Value
a
Common
Stocks
(continued)
South
Korea
36.1%
Doosan
Bobcat,
Inc.
..............
Machinery
437
$
13,025
Fila
Holdings
Corp.
...............
Textiles,
Apparel
&
Luxury
Goods
327
10,363
Hankook
Tire
&
Technology
Co.
Ltd.
..
Automobile
Components
103
3,348
LG
Corp.
.......................
Industrial
Conglomerates
611
36,234
a
LigaChem
Biosciences,
Inc.
........
Life
Sciences
Tools
&
Services
65
4,695
NAVER
Corp.
...................
Interactive
Media
&
Services
386
48,906
Samsung
Electronics
Co.
Ltd.
.......
Technology
Hardware,
Storage
&
Peripherals
1,962
108,828
Samsung
Life
Insurance
Co.
Ltd.
.....
Insurance
780
56,901
Samsung
SDI
Co.
Ltd.
............
Electronic
Equipment,
Instruments
&
Components
105
27,910
SK
Hynix,
Inc.
...................
Semiconductors
&
Semiconductor
Equipment
372
48,686
Soulbrain
Co.
Ltd.
................
Chemicals
61
10,831
369,727
Taiwan
26.7%
Hon
Hai
Precision
Industry
Co.
Ltd.
...
Electronic
Equipment,
Instruments
&
Components
7,844
45,242
Lite-On
Technology
Corp.
..........
Technology
Hardware,
Storage
&
Peripherals
1,772
5,940
MediaTek,
Inc.
..................
Semiconductors
&
Semiconductor
Equipment
1,270
49,254
Taiwan
Semiconductor
Manufacturing
Co.
Ltd.
......................
Semiconductors
&
Semiconductor
Equipment
5,503
162,776
Yageo
Corp.
....................
Electronic
Equipment,
Instruments
&
Components
473
9,728
272,940
Thailand
5.0%
Kasikornbank
PCL
...............
Banks
6,728
28,285
Minor
International
PCL
............
Hotels,
Restaurants
&
Leisure
12,735
10,090
Star
Petroleum
Refining
PCL
........
Oil,
Gas
&
Consumable
Fuels
25,454
5,315
Thai
Beverage
PCL
...............
Beverages
18,151
7,379
51,069
United
Arab
Emirates
1.6%
Emirates
Central
Cooling
Systems
Corp.
Water
Utilities
21,605
10,118
Spinneys
1961
Holding
plc
.........
Consumer
Staples
Distribution
&
Retail
14,094
5,718
15,836
Total
Common
Stocks
(Cost
$
950,923
)
.........................................
984,863
Short
Term
Investments
0.0%
†
a
a
Industry
Shares
a
Value
a
a
a
a
a
a
Money
Market
Funds
0.0%
†
United
States
0.0%
†
d,e
Institutional
Fiduciary
Trust
-
Money
Market
Portfolio
,
4.982
%
.........
175
175
Total
Money
Market
Funds
(Cost
$
175
)
.........................................
175
a
a
a
a
a
Total
Short
Term
Investments
(Cost
$
175
)
......................................
175
a
a
a
Total
Investments
(Cost
$
951,098
)
96.3
%
.......................................
$985,038
Other
Assets,
less
Liabilities
3.7
%
.............................................
38,125
Net
Assets
100.0%
...........................................................
$1,023,163
a
a
a
Templeton
Global
Investment
Trust
Schedule
of
Investments
Franklin
Templeton
SMACS:
Series
EM
(continued)
The
accompanying
notes
are
an
integral
part
of
these
financial
statements.
Annual
Report
†
Rounds
to
less
than
0.1%
of
net
assets.
a
Non-income
producing.
b
Security
was
purchased
pursuant
to
Rule
144A
or
Regulation
S
under
the
Securities
Act
of
1933.
144A
securities
may
be
sold
in
transactions
exempt
from
registration
only
to
qualified
institutional
buyers
or
in
a
public
offering
registered
under
the
Securities
Act
of
1933.
Regulation
S
securities
cannot
be
sold
in
the
United
States
without
either
an
effective
registration
statement
filed
pursuant
to
the
Securities
Act
of
1933,
or
pursuant
to
an
exemption
from
registration.
At
August
31,
2024,
the
aggregate
value
of
these
securities
was
$51,514,
representing
5.0%
of
net
assets.
c
Variable
interest
entity
(VIE).
See
Note
6
regarding
investments
made
through
a
VIE
structure.
At
August
31,
2024,
the
value
of
this
security
was
$10,698,
representing
1.0%
of
net
assets.
d
See
Note
3(d)
regarding
investments
in
affiliated
management
investment
companies.
e
The
rate
shown
is
the
annualized
seven-day
effective
yield
at
period
end.
Templeton
Global
Investment
Trust
Financial
Statements
Statement
of
Assets
and
Liabilities
August
31,
2024
Annual
Report
The
accompanying
notes
are
an
integral
part
of
these
financial
statements.
Franklin
Templeton
SMACS:
Series
EM
Assets:
Investments
in
securities:
Cost
-
Unaffiliated
issuers
...................................................................
$950,923
Cost
-
Non-controlled
affiliates
(Note
3
d
)
........................................................
175
Value
-
Unaffiliated
issuers
..................................................................
$984,863
Value
-
Non-controlled
affiliates
(Note
3
d
)
.......................................................
175
Receivables:
Investment
securities
sold
...................................................................
2,695
Dividends
...............................................................................
481
Affiliates
................................................................................
42,407
Other
assets
..............................................................................
2,882
Total
assets
..........................................................................
1,033,503
Liabilities:
Payables:
Investment
securities
purchased
..............................................................
445
Custodian
fees
...........................................................................
521
Transfer
agent
fees
........................................................................
19
Reports
to
shareholders
fees
................................................................
842
Registration
and
filing
fees
..................................................................
953
Trustees'
fees
and
expenses
.................................................................
1
Funds
advanced
by
custodian
.................................................................
2,267
Deferred
tax
...............................................................................
4,090
Accrued
expenses
and
other
liabilities
...........................................................
1,202
Total
liabilities
.........................................................................
10,340
Net
assets,
at
value
.................................................................
$1,023,163
Net
assets
consist
of:
Paid-in
capital
.............................................................................
$1,125,111
Total
distributable
earnings
(losses)
.............................................................
(101,948)
Net
assets,
at
value
.................................................................
$1,023,163
Shares
outstanding
.........................................................................
112,809
Net
asset
value
per
share
a
....................................................................
$9.07
a
Net
asset
value
per
share
may
not
recalculate
due
to
rounding.
Templeton
Global
Investment
Trust
Financial
Statements
Statement
of
Operations
for
the
year
ended
August
31,
2024
The
accompanying
notes
are
an
integral
part
of
these
financial
statements.
Annual
Report
Franklin
Templeton
SMACS:
Series
EM
Investment
income:
Dividends:
(net
of
foreign
taxes
of
$3,496)
Unaffiliated
issuers
........................................................................
$28,860
Non-controlled
affiliates
(Note
3
d
)
.............................................................
1,760
Other
income
a
.............................................................................
126
Total
investment
income
...................................................................
30,746
Expenses:
Transfer
agent
fees
(Note
3
c
)
..................................................................
150
Custodian
fees
............................................................................
104
Reports
to
shareholders
fees
..................................................................
1,170
Registration
and
filing
fees
....................................................................
32,985
Professional
fees
...........................................................................
75,947
Trustees'
fees
and
expenses
..................................................................
1,411
Other
....................................................................................
13,958
Total
expenses
.........................................................................
125,725
Expenses
waived/paid
by
affiliates
(Note
3
d
and
3
e
)
..............................................
(125,725)
Net
expenses
.........................................................................
—
Net
investment
income
................................................................
30,746
Realized
and
unrealized
gains
(losses):
Net
realized
gain
(loss)
from:
Investments:
(net
of
foreign
taxes
of
$2,027)
Unaffiliated
issuers
......................................................................
(37,904)
Foreign
currency
transactions
................................................................
(252)
Net
realized
gain
(loss)
..................................................................
(38,156)
Net
change
in
unrealized
appreciation
(depreciation)
on:
Investments:
Unaffiliated
issuers
......................................................................
182,494
Translation
of
other
assets
and
liabilities
denominated
in
foreign
currencies
..............................
(21)
Change
in
deferred
taxes
on
unrealized
appreciation
...............................................
(278)
Net
change
in
unrealized
appreciation
(depreciation)
............................................
182,195
Net
realized
and
unrealized
gain
(loss)
............................................................
144,039
Net
increase
(decrease)
in
net
assets
resulting
from
operations
..........................................
$174,785
a
Other
income
includes
payments
by
Asset
Management
for
acquired
fund
fees
and
expenses
(See
Note
3e).
Templeton
Global
Investment
Trust
Financial
Statements
Statements
of
Changes
in
Net
Assets
Annual
Report
The
accompanying
notes
are
an
integral
part
of
these
financial
statements.
Franklin
Templeton
SMACS:
Series
EM
Year
Ended
August
31,
2024
Year
Ended
August
31,
2023
Increase
(decrease)
in
net
assets:
Operations:
Net
investment
income
.................................................
$30,746
$38,218
Net
realized
gain
(loss)
.................................................
(38,156)
(85,631)
Net
change
in
unrealized
appreciation
(depreciation)
...........................
182,195
109,647
Net
increase
(decrease)
in
net
assets
resulting
from
operations
................
174,785
62,234
Distributions
to
shareholders
..............................................
(44,430)
(33,406)
Capital
share
transactions
(Note
2
)
..........................................
(851)
15,973
Net
increase
(decrease)
in
net
assets
...................................
129,504
44,801
Net
assets:
Beginning
of
year
.......................................................
893,659
848,858
End
of
year
...........................................................
$1,023,163
$893,659
Templeton
Global
Investment
Trust
Notes
to
Financial
Statements
Franklin
Templeton
SMACS:
Series
EM
1.
Organization
and
Significant
Accounting
Policies
Templeton
Global
Investment
Trust (Trust)
is
registered
under
the
Investment
Company
Act
of
1940
(1940
Act)
as
an
open-end
management
investment
company,
consisting
of three separate
funds.
The
Trust
follows
the
accounting
and
reporting
guidance
in
Financial
Accounting
Standards
Board
(FASB)
Accounting
Standards
Codification
Topic
946,
Financial
Services
–
Investment
Companies
(ASC
946)
and applies
the
specialized
accounting
and
reporting
guidance
in
U.S.
Generally
Accepted
Accounting
Principles
(U.S.
GAAP),
including,
but
not
limited
to,
ASC
946.
Franklin
Templeton
SMACS:
Series
EM
(Fund)
is
included
in
this
report.
The
following
summarizes
the Fund's
significant
accounting
policies.
a.
Financial
Instrument
Valuation
The
Fund's
investments
in
financial
instruments
are
carried
at
fair
value
daily.
Fair
value
is
the
price
that
would
be
received
to
sell
an
asset
or
paid
to
transfer
a
liability
in
an
orderly
transaction
between
market
participants
on
the
measurement
date.
The
Fund
calculates
the
net
asset
value
(NAV)
per
share
each business
day as
of
4
p.m.
Eastern
time
or
the
regularly
scheduled
close
of
the
New
York
Stock
Exchange
(NYSE),
whichever
is
earlier.
Under
compliance
policies
and
procedures
approved
by
the Trust's
Board
of
Trustees
(the
Board),
the
Board
has
designated
the
Fund’s
investment
manager
as
the
valuation
designee
and
has
responsibility
for
oversight
of
valuation.
The
investment
manager
is
assisted
by
the
Fund’s
administrator
in
performing
this
responsibility,
including
leading
the
cross-
functional
Valuation
Committee
(VC).
The
Fund
may
utilize
independent
pricing
services,
quotations
from
securities
and
financial
instrument
dealers,
and
other
market
sources
to
determine
fair
value.
Equity
securities
listed
on
an
exchange
or
on
the
NASDAQ
National
Market
System
are
valued
at
the
last
quoted
sale
price
or
the
official
closing
price of
the
day,
respectively.
Foreign
equity
securities
are
valued
as
of
the
close
of
trading
on
the
foreign
stock
exchange
on
which
the
security
is
primarily
traded,
or
as
of
4
p.m.
Eastern
time.
The
value
is
then
converted
into
its
U.S.
dollar
equivalent
at
the
foreign
exchange
rate
in
effect
at
4
p.m.
Eastern
time
on
the
day
that
the
value
of
the
security
is
determined.
Over-the-counter
(OTC)
securities
are
valued
within
the
range
of
the
most
recent
quoted
bid
and
ask
prices.
Securities
that
trade
in
multiple
markets
or
on
multiple
exchanges
are
valued
according
to
the
broadest
and
most
representative
market.
Certain
equity
securities
are
valued
based
upon
fundamental
characteristics
or
relationships
to
similar
securities.
Investments
in open-end mutual
funds
are
valued
at
the
closing
NAV.
The
Fund
has
procedures
to
determine
the
fair
value
of
financial
instruments
for
which
market
prices
are
not
reliable
or
readily
available.
Under
these
procedures,
the Fund
primarily
employs
a
market-based
approach
which
may
use
related
or
comparable
assets
or
liabilities,
recent
transactions,
market
multiples,
and
other
relevant
information
for
the
investment
to
determine
the
fair
value
of
the
investment.
An
income-based
valuation
approach
may
also
be
used
in
which
the
anticipated
future
cash
flows
of
the
investment
are
discounted
to
calculate
fair
value.
Discounts
may
also
be
applied
due
to
the
nature
or
duration
of
any
restrictions
on
the
disposition
of
the
investments.
Due
to
the
inherent
uncertainty
of
valuations
of
such
investments,
the
fair
values
may
differ
significantly
from
the
values
that
would
have
been
used
had
an
active
market
existed.
Trading
in
securities
on
foreign
securities
stock
exchanges
and
OTC
markets
may
be
completed
before
4
p.m.
Eastern
time.
In
addition,
trading
in
certain
foreign
markets
may
not
take
place
on
every
Fund's
business
day. Events
can occur
between
the
time
at
which
trading
in
a
foreign
security
is
completed
and
4
p.m.
Eastern
time
that
might
call
into
question
the
reliability
of
the
value
of
a
portfolio
security
held
by
the
Fund.
As
a
result,
differences
may
arise
between
the
value
of
the
Fund's
portfolio
securities
as
determined
at
the
foreign
market
close
and
the
latest
indications
of
value
at
4
p.m.
Eastern
time. In
order
to
minimize
the
potential
for
these
differences,
an
independent
pricing
service
may
be
used
to
adjust
the
value
of
the
Fund's
portfolio
securities
to
the
latest
indications
of
fair
value
at
4
p.m.
Eastern
time.
At
August
31,
2024,
certain
securities
may
have
been
fair
valued
using
these
procedures,
in
which
case
the
securities
were
categorized
as
Level
2
within
the
fair
value
hierarchy
(referred
to
as
“market
level
fair
value”).
See
the
Fair
Value
Measurements
note
for
more
information.
When
the
last
day
of
the
reporting
period
is
a
non-business
day,
certain
foreign
markets
may
be
open
on
those
days
that
the
Fund's
NAV
is
not
calculated,
which
could
result
in
differences
between
the
value
of
the
Fund's
portfolio
securities
on
the
last
business
day
and
the
last
calendar
day
Templeton
Global
Investment
Trust
Notes
to
Financial
Statements
Franklin
Templeton
SMACS:
Series
EM
(continued)
of
the
reporting
period.
Any
security
valuation
changes
due
to
an
open
foreign
market
are
adjusted
and
reflected
by
the
Fund
for
financial
reporting
purposes.
b.
Foreign
Currency
Translation
Portfolio
securities
and
other
assets
and
liabilities
denominated
in
foreign
currencies
are
translated
into
U.S.
dollars
based
on
the
exchange
rate
of
such
currencies
against
U.S.
dollars
on
the
date
of
valuation.
The
Fund
may
enter
into
foreign
currency
exchange
contracts
to
facilitate
transactions
denominated
in
a
foreign
currency.
Purchases
and
sales
of
securities,
income
and
expense
items
denominated
in
foreign
currencies
are
translated
into
U.S.
dollars
at
the
exchange
rate
in
effect
on
the
transaction
date.
Portfolio
securities
and
assets
and
liabilities
denominated
in
foreign
currencies
contain
risks
that
those
currencies
will
decline
in
value
relative
to
the
U.S.
dollar.
Occasionally,
events
may
impact
the
availability
or
reliability
of
foreign
exchange
rates
used
to
convert
the
U.S.
dollar
equivalent
value.
If
such
an
event
occurs,
the
foreign
exchange
rate
will
be
valued
at
fair
value
using
procedures
established
and
approved
by
the
Board.
The
Fund
does
not
separately
report
the
effect
of
changes
in
foreign
exchange
rates
from
changes
in
market
prices
on
securities
held.
Such
changes
are
included
in
net
realized
and
unrealized
gain
or
loss
from
investments
in
the
Statement of
Operations.
Realized
foreign
exchange
gains
or
losses
arise
from
sales
of
foreign
currencies,
currency
gains
or
losses
realized
between
the
trade
and
settlement
dates
on
securities
transactions
and
the
difference
between
the
recorded
amounts
of
dividends,
interest,
and
foreign
withholding
taxes
and
the
U.S.
dollar
equivalent
of
the
amounts
actually
received
or
paid.
Net
unrealized
foreign
exchange
gains
and
losses
arise
from
changes
in
foreign
exchange
rates
on
foreign
denominated
assets
and
liabilities
other
than
investments
in
securities
held
at
the
end
of
the
reporting
period.
c.
Income
and
Deferred
Taxes
It
is the Fund's
policy
to
qualify
as
a
regulated
investment
company
under
the
Internal
Revenue
Code. The Fund
intends
to
distribute
to
shareholders
substantially
all
of
its income
and
net
realized
gains
to
relieve
it
from
federal
income
and excise
taxes.
As
a
result,
no
provision
for
U.S.
federal
income
taxes
is
required.
The Fund
may
be
subject
to
foreign
taxation
related
to
income
received,
capital
gains
on
the
sale
of
securities
and
certain
foreign
currency
transactions
in
the
foreign
jurisdictions
in
which
it
invests.
Foreign
taxes,
if
any,
are
recorded
based
on
the
tax
regulations
and
rates
that
exist
in
the
foreign
markets
in
which
the
Fund
invests.
When
a
capital
gain
tax
is
determined
to
apply,
the
Fund
records
an
estimated
deferred
tax
liability
in
an
amount
that
would
be
payable
if
the
securities
were
disposed
of
on
the
valuation
date.
The Fund
may
recognize
an
income
tax
liability
related
to
its
uncertain
tax
positions
under
U.S.
GAAP
when
the
uncertain
tax
position
has
a
less
than
50%
probability
that
it
will
be
sustained
upon
examination
by
the
tax
authorities
based
on
its
technical
merits.
As
of
August
31,
2024, the Fund
has
determined
that
no
tax
liability
is
required
in
its
financial
statements
related
to
uncertain
tax
positions
for
any
open
tax
years
(or
expected
to
be
taken
in
future
tax
years).
Open
tax
years
are
those
that
remain
subject
to
examination
and
are
based
on
the
statute
of
limitations
in
each
jurisdiction
in
which
the Fund
invests.
d.
Security
Transactions,
Investment
Income,
Expenses
and
Distributions
Security
transactions
are
accounted
for
on
trade
date.
Realized
gains
and
losses
on
security
transactions
are
determined
on
a
specific
identification
basis. Estimated
expenses
are
accrued
daily.
Dividend
income
is
recorded
on
the
ex-dividend
date
except
for
certain
dividends
from
securities
where
the
dividend
rate
is
not
available.
In
such cases,
the
dividend
is
recorded
as
soon
as
the
information
is
received
by
the
Fund. Distributions
to
shareholders
are recorded
on
the
ex-dividend
date.
Distributable
earnings
are
determined
according
to
income
tax
regulations
(tax
basis)
and
may
differ
from
earnings
recorded
in
accordance
with
U.S.
GAAP.
These
differences
may
be
permanent
or
temporary.
Permanent
differences
are
reclassified
among
capital
accounts
to
reflect
their
tax
character.
These
reclassifications
have
no
impact
on
net
1.
Organization
and
Significant
Accounting
Policies
(continued)
a.
Financial
Instrument
Valuation
(continued)
Templeton
Global
Investment
Trust
Notes
to
Financial
Statements
Franklin
Templeton
SMACS:
Series
EM
(continued)
assets
or
the
results
of
operations.
Temporary
differences
are
not
reclassified,
as
they
may
reverse
in
subsequent
periods.
Common
expenses
incurred
by
the
Trust
are
allocated
among
the
Funds
based
on
the
ratio
of
net
assets
of
each
Fund
to
the
combined
net
assets
of
the
Trust
or
based
on
the
ratio
of
number
of
shareholders
of
each
Fund
to
the
combined
number
of
shareholders
of
the
Trust.
Fund
specific
expenses
are
charged
directly
to
the
Fund
that
incurred
the
expense.
e.
Accounting
Estimates
The
preparation
of
financial
statements
in
accordance
with
U.S.
GAAP
requires
management
to
make
estimates
and
assumptions
that
affect
the
reported
amounts
of
assets
and
liabilities
at
the
date
of
the
financial
statements
and
the
amounts
of
income
and
expenses
during
the
reporting
period.
Actual
results
could
differ
from
those
estimates.
f.
Guarantees
and
Indemnifications
Under
the Trust's
organizational
documents,
its
officers
and trustees
are
indemnified
by
the Trust against
certain
liabilities
arising
out
of
the
performance
of
their
duties
to
the
Trust.
Additionally,
in
the
normal
course
of
business,
the Trust,
on
behalf
of
the
Fund, enters
into
contracts
with
service
providers
that
contain
general
indemnification
clauses.
The Trust's
maximum
exposure
under
these
arrangements
is
unknown
as
this
would
involve
future
claims
that
may
be
made
against
the Trust
that
have
not
yet
occurred.
Currently,
the Trust
expects
the
risk
of
loss
to
be
remote.
2.
Shares
of
Beneficial
Interest
At
August
31,
2024,
there
were
an
unlimited
number
of
shares
authorized
(without
par
value).
Transactions
in
the
Fund's
shares
were
as
follows:
3.
Transactions
with
Affiliates
Franklin
Resources,
Inc.
is
the
holding
company
for
various
subsidiaries
that
together
are
referred
to
as
Franklin
Templeton.
Certain
officers
and
trustees
of
the Trust are
also
officers
and/or
directors
of
the
following
subsidiaries:
a.
Management
Fees
Asset
Management provides
investment
management
services
to
the
Fund.
The
Fund
does
not
pay
a
fee
for
these
services.
Year
Ended
August
31,
2024
Year
Ended
August
31,
2023
Shares
Amount
Shares
Amount
Shares
sold
...................................
1,926
$16,145
1,980
$15,973
Shares
redeemed
...............................
(1,921)
(16,996)
—
—
Net
increase
(decrease)
..........................
5
$(851)
1,980
$15,973
Subsidiary
Affiliation
Templeton
Asset
Management
Ltd.
(Asset
Management)
Investment
manager
Franklin
Templeton
Investment
Management
Ltd.
(FTIML)
Investment
manager
Franklin
Templeton
Services,
LLC
(FT
Services)
Administrative
manager
Franklin
Distributors,
LLC
(Distributors)
Principal
underwriter
Franklin
Templeton
Investor
Services,
LLC
(Investor
Services)
Transfer
agent
1.
Organization
and
Significant
Accounting
Policies
(continued)
d.
Security
Transactions,
Investment
Income,
Expenses
and
Distributions
(continued)
Templeton
Global
Investment
Trust
Notes
to
Financial
Statements
Franklin
Templeton
SMACS:
Series
EM
(continued)
Under
a
subadvisory
agreement, FTIML,
an
affiliate of
Asset Management, provides
subadvisory
services
to
the
Fund.
The
Fund
does
not
pay
a
fee
for
these
services.
b.
Administrative
Fees
Under
an
agreement
with
Asset
Management,
FT
Services
provides
administrative
services
to
the Fund
and
is
not
paid
by
the
Fund
for
the
services.
c.
Transfer
Agent
Fees
The
Fund pays
transfer
agent
fees,
calculated
monthly
and
paid
monthly, to
Investor
Services
for
its
performance
of
shareholder
servicing
obligations. Effective
October
1,
2023,
the
fees
are based
on
a
fixed
margin
earned
by
Investor
Services
and
are allocated
to
the Fund
based
upon
relative
assets
and
relative
transactions.
Prior
to
October
1,
2023,
the
fees
were
based
on
an
annualized
asset
based
fee
of
0.016%
plus
a
transaction
based
fee. In
addition,
the
Fund reimburses
Investor
Services
for
out
of
pocket
expenses
incurred
and reimburses
shareholder
servicing
fees
paid
to
third
parties.
For
the
year
ended
August
31,
2024,
the Fund
paid
transfer
agent
fees
as
noted
in
the
Statement of
Operations,
of
which
$150
was
retained
by
Investor
Services.
d.
Investments
in
Affiliated
Management
Investment
Companies
The
Fund invests
in
one
or
more
affiliated
management
investment
companies.
As
defined
in
the
1940
Act,
an
investment
is
deemed
to
be
a
“Controlled
Affiliate”
of
a
fund
when
a
fund
owns,
either
directly
or
indirectly,
25%
or
more
of
the
affiliated
fund’s
outstanding
shares
or
has
the
power
to
exercise
control
over
management
or
policies
of
such
fund.
The
Fund
does
not
invest
for
purposes
of
exercising
a
controlling
influence
over
the
management
or
policies. Asset
Management has
contractually
agreed
to
reimburse
expenses
of
the
Fund
in
an
amount
equal
to
fees
indirectly
borne
by
the
Fund
on
assets
invested
in
the
affiliated
management
investment
companies,
as
noted
in
the
Statement
of
Operations.
During
the year
ended
August
31,
2024,
investments
in
affiliated
management
investment
companies
were
as
follows:
e.
Waiver
and
Expense
Reimbursements
Asset
Management
has
contractually
agreed
in
advance
to
waive
or
limit
its fees
and
to
assume
as
its
own
expense
certain
expenses
otherwise
payable
by
the
Fund
so
that
the
operating expenses
(excluding
certain
non-routine
expenses
or
costs,
including
those
relating
to
litigation,
indemnification,
reorganizations,
and
liquidations),
interest
expense
and
acquired
fund
fees
and
expenses
of
the
Fund
do not
exceed
0.00%
based
on
the
average
net
assets
until
December
31,
2024.
Total
expenses
waived
or
paid
are
not
subject
to
recapture
subsequent
to
the
Fund's
fiscal
year
end.
aa
Value
at
Beginning
of
Year
Purchases
Sales
Realized
Gain
(Loss)
Net
Change
in
Unrealized
Appreciation
(Depreciation)
Value
at
End
of
Year
Number
of
Shares
Held
at
End
of
Year
Investment
Income
a
a
a
a
a
a
a
a
Franklin
Templeton
SMACS:
Series
EM
Non-Controlled
Affiliates
Dividends
Institutional
Fiduciary
Trust
-
Money
Market
Portfolio,
4.982%
$33,791
$324,225
$(357,841)
$—
$—
$175
175
$1,760
Total
Affiliated
Securities
...
$33,791
$324,225
$(357,841)
$—
$—
$175
$1,760
3.
Transactions
with
Affiliates
(continued)
a.
Management
Fees
(continued)
Templeton
Global
Investment
Trust
Notes
to
Financial
Statements
Franklin
Templeton
SMACS:
Series
EM
(continued)
Acquired
fund
fees
and
expenses
are
indirect
expenses,
and
therefore Asset
Management may
make
payments,
if
necessary,
to
the
Fund
to
offset
these
estimated
indirect
expenses.
Payments
by Asset
Management for
the year
ended
August
31,
2024,
are
reflected
as
other
income
in
the
Statement
of
Operations.
f.
Other
Affiliated
Transactions
At
August
31,
2024, Templeton
International,
Inc.
owned
100%
of
the
Fund's
outstanding
shares.
Investment
activities
of
this
shareholder
could
have
a
material
impact
on
the
Fund.
4.
Income
Taxes
For
tax
purposes,
capital
losses
may
be
carried
over
to
offset
future
capital
gains.
At
August
31,
2024,
the
capital
loss
carryforwards
were
as
follows:
During
the
year
ended
August
31,
2024,
the
Fund
utilized
$6,952
of
capital
loss
carryforwards.
The
tax
character
of
distributions
paid
during
the
years
ended
August
31,
2024
and
2023,
was
as
follows:
At
August
31,
2024,
the
cost
of
investments,
net
unrealized
appreciation
(depreciation)
and
undistributed
ordinary
income for
income
tax
purposes
were
as
follows:
Differences
between
income
and/or
capital
gains
as
determined
on
a
book
basis
and
a
tax
basis
are
primarily
due
to
differing
treatments
of
wash
sales,
passive
foreign
investment
company
shares
and
foreign
capital
gains
tax.
5.
Investment
Transactions
Purchases
and
sales
of
investments (excluding
short
term
securities) for
the
year
ended
August
31,
2024,
aggregated
$319,393 and
$397,018,
respectively.
Capital
loss
carryforwards
not
subject
to
expiration:
Short
term
................................................................................
$7,229
Long
term
................................................................................
131,772
Total
capital
loss
carryforwards
...............................................................
$139,001
2024
2023
Distributions
paid
from:
Ordinary
income
..........................................................
$44,430
$33,406
Cost
of
investments
..........................................................................
$971,067
Unrealized
appreciation
........................................................................
$167,348
Unrealized
depreciation
........................................................................
(153,377)
Net
unrealized
appreciation
(depreciation)
..........................................................
$13,971
Distributable
earnings:
Undistributed
ordinary
income
...................................................................
$28,327
3.
Transactions
with
Affiliates
(continued)
e.
Waiver
and
Expense
Reimbursements
(continued)
Templeton
Global
Investment
Trust
Notes
to
Financial
Statements
Franklin
Templeton
SMACS:
Series
EM
(continued)
6.
Concentration
of
Risk
Investing
in
foreign
securities
may
include
certain
risks
and
considerations
not
typically
associated
with
investing
in
U.S.
securities,
such
as
fluctuating
currency
values
and
changing
local,
regional
and
global
economic,
political
and
social
conditions,
which
may
result
in
greater
market
volatility.
Political
and
financial
uncertainty
in
many
foreign
regions
may
increase
market
volatility
and
the
economic
risk
of
investing
in
foreign
securities.
In
addition,
certain
foreign
securities
may
not
be
as
liquid
as
U.S.
securities.
Certain
investments
in
Chinese
companies
are
made
through
a
special
structure
known
as
a
VIE.
In
a
VIE
structure,
foreign
investors,
such
as
the
Fund,
will
only
own
stock
in
a
shell
company
rather
than
directly
in
the
VIE,
which
must
be
owned
by
Chinese
nationals
(and/or
Chinese
companies)
to
obtain
the
licenses
and/or
assets
required
to
operate
in
a
restricted
or
prohibited
sector
in
China.
The
value
of
the
shell
company
is
derived
from
its
ability
to
consolidate
the
VIE
into
its
financials
pursuant
to
contractual
arrangements
that
allow
the
shell
company
to
exert
a
degree
of
control
over,
and
obtain
economic
benefits
arising
from,
the
VIE
without
formal
legal
ownership.
While
VIEs
are
a
longstanding
industry
practice
and
are
well
known
by
Chinese
officials
and
regulators,
the
structure
historically
has
not
been
formally
recognized
under
Chinese
law
and
it
is
uncertain
whether
Chinese
officials
or
regulators
will
withdraw
their
implicit
acceptance
of
the
structure.
It
is
also
uncertain
whether
the
contractual
arrangements,
which
may
be
subject
to
conflicts
of
interest
between
the
legal
owners
of
the
VIE
and
foreign
investors,
would
be
enforced
by
Chinese
courts
or
arbitration
bodies.
Prohibitions
of
these
structures
by
the
Chinese
government,
or
the
inability
to
enforce
such
contracts,
from
which
the
shell
company
derives
its
value,
would
likely
cause
the
VIE-structured
holding(s)
to
suffer
significant,
detrimental,
and
possibly
permanent
losses,
and
in
turn,
adversely
affect
the
Fund’s
returns
and
net
asset
value.
7.
Credit
Facility
The
Fund,
together
with
other
U.S.
registered
and
foreign
investment
funds
(collectively,
Borrowers),
managed
by
Franklin
Templeton,
are
borrowers
in
a
joint
syndicated
senior
unsecured
credit
facility
totaling
$2.675
billion
(Global
Credit
Facility)
which
matures
on
January
31,
2025.
This
Global
Credit
Facility
provides
a
source
of
funds
to
the
Borrowers
for
temporary
and
emergency
purposes,
including
the
ability
to
meet
future
unanticipated
or
unusually
large
redemption
requests.
Under
the
terms
of
the
Global
Credit
Facility,
the
Fund
shall,
in
addition
to
interest
charged
on
any
borrowings
made
by
the
Fund
and
other
costs
incurred
by
the
Fund,
pay
its
share
of
fees
and
expenses
incurred
in
connection
with
the
implementation
and
maintenance
of
the
Global
Credit
Facility,
based
upon
its
relative
share
of
the
aggregate
net
assets
of
all
of
the
Borrowers,
including
an
annual
commitment
fee
of
0.15%
based
upon
the
unused
portion
of
the
Global
Credit
Facility.
These
fees
are
reflected
in
other
expenses
in
the
Statement
of
Operations.
During
the
year
ended
August
31,
2024,
the Fund
did
not
use
the
Global
Credit
Facility.
8.
Fair
Value
Measurements
The
Fund
follows
a
fair
value
hierarchy
that
distinguishes
between
market
data
obtained
from
independent
sources
(observable
inputs)
and
the Fund's
own
market
assumptions
(unobservable
inputs).
These
inputs
are
used
in
determining
the
value
of
the
Fund's financial
instruments
and
are
summarized
in
the
following
fair
value
hierarchy:
Level
1
–
quoted
prices
in
active
markets
for
identical
financial
instruments
Level
2
–
other
significant
observable
inputs
(including
quoted
prices
for
similar
financial
instruments,
interest
rates,
prepayment
speed,
credit
risk,
etc.)
Level
3
–
significant
unobservable
inputs
(including
the
Fund's
own
assumptions
in
determining
the
fair
value
of
financial
instruments)
Templeton
Global
Investment
Trust
Notes
to
Financial
Statements
Franklin
Templeton
SMACS:
Series
EM
(continued)
The
input
levels
are
not
necessarily
an
indication
of
the
risk
or
liquidity
associated
with
financial
instruments
at
that
level.
A
summary
of
inputs
used
as
of August
31,
2024,
in
valuing
the
Fund's
assets
carried
at
fair
value,
is
as
follows:
9.
Subsequent
Events
The
Fund
has
evaluated
subsequent
events
through
the
issuance
of
the
financial
statements
and
determined
that
no
events
have
occurred
that
require
disclosure.
Level
1
Level
2
Level
3
Total
Franklin
Templeton
SMACS:
Series
EM
Assets:
Investments
in
Securities:
Common
Stocks
:
Brazil
................................
$
20,183
$
—
$
—
$
20,183
Cambodia
............................
—
3,585
—
3,585
China
...............................
33,033
65,787
—
98,820
Hungary
.............................
24,818
—
—
24,818
India
................................
—
61,689
—
61,689
Indonesia
............................
—
10,152
—
10,152
Italy
.................................
—
3,907
—
3,907
Mexico
..............................
1,759
—
—
1,759
Philippines
............................
—
10,625
—
10,625
South
Africa
...........................
—
39,753
—
39,753
South
Korea
..........................
—
369,727
—
369,727
Taiwan
...............................
—
272,940
—
272,940
Thailand
.............................
—
51,069
—
51,069
United
Arab
Emirates
....................
15,836
—
—
15,836
Short
Term
Investments
...................
175
—
—
175
Total
Investments
in
Securities
...........
$95,804
$889,234
a
$—
$985,038
a
Includes
foreign
securities
valued
at
$889,234,
which
were
categorized
as
Level
2
as
a
result
of
the
application
of
market
level
fair
value
procedures.
See
the
Financial
Instrument
Valuation
note
for
more
information.
8.
Fair
Value
Measurements
(continued)
Templeton
Global
Investment
Trust
Report
of
Independent
Registered
Public
Accounting
Firm
To
the
Board
of
Trustees
of
Templeton
Global
Investment
Trust
and
Shareholders
of
Franklin
Templeton
SMACS:
Series
EM
Opinion
on
the
Financial
Statements
We
have
audited
the
accompanying
statement
of
assets
and
liabilities,
including
the
schedule
of
investments,
of
Franklin
Templeton
SMACS:
Series
EM
(one
of
the
funds
constituting
Templeton
Global
Investment
Trust,
referred
to
hereafter
as
the
"Fund")
as
of
August
31,
2024,
the
related
statement
of
operations
for
the
year
ended
August
31,
2024,
the
statement
of
changes
in
net
assets
for
each
of
the
two
years
in
the
period
ended
August
31,
2024,
including
the
related
notes,
and
the
financial
highlights
for
each
of
the
two
years
in
the
period
ended
August
31,
2024
and
the
period
October
20,
2021
(commencement
of
operations)
to
August
31,
2022
(collectively
referred
to
as
the
“financial
statements”).
In
our
opinion,
the
financial
statements
present
fairly,
in
all
material
respects,
the
financial
position
of
the
Fund
as
of
August
31,
2024,
the
results
of
its
operations
for
the
year
then
ended,
the
changes
in
its
net
assets
for
each
of
the
two
years
in
the
period
ended
August
31,
2024
and
the
financial
highlights
for
each
of
the
two
years
in
the
period
ended
August
31,
2024
and
the
period
October
20,
2021
(commencement
of
operations)
to
August
31,
2022
in
conformity
with
accounting
principles
generally
accepted
in
the
United
States
of
America.
Basis
for
Opinion
These
financial
statements
are
the
responsibility
of
the
Fund’s
management.
Our
responsibility
is
to
express
an
opinion
on
the
Fund’s
financial
statements
based
on
our
audits.
We
are
a
public
accounting
firm
registered
with
the
Public
Company
Accounting
Oversight
Board
(United
States)
(PCAOB)
and
are
required
to
be
independent
with
respect
to
the
Fund
in
accordance
with
the
U.S.
federal
securities
laws
and
the
applicable
rules
and
regulations
of
the
Securities
and
Exchange
Commission
and
the
PCAOB.
We
conducted
our
audits
of
these
financial
statements
in
accordance
with
the
standards
of
the
PCAOB.
Those
standards
require
that
we
plan
and
perform
the
audit
to
obtain
reasonable
assurance
about
whether
the
financial
statements
are
free
of
material
misstatement,
whether
due
to
error
or
fraud.
Our
audits
included
performing
procedures
to
assess
the
risks
of
material
misstatement
of
the
financial
statements,
whether
due
to
error
or
fraud,
and
performing
procedures
that
respond
to
those
risks.
Such
procedures
included
examining,
on
a
test
basis,
evidence
regarding
the
amounts
and
disclosures
in
the
financial
statements.
Our
audits
also
included
evaluating
the
accounting
principles
used
and
significant
estimates
made
by
management,
as
well
as
evaluating
the
overall
presentation
of
the
financial
statements.
Our
procedures
included
confirmation
of
securities
owned
as
of
August
31,
2024
by
correspondence
with
the
custodian,
transfer
agent
and
brokers.
We
believe
that
our
audits
provide
a
reasonable
basis
for
our
opinion.
/s/PricewaterhouseCoopers
LLP
San
Francisco,
California
October
22,
2024
We
have
served
as
the
auditor
of
one
or
more
investment
companies
in
the
Franklin
Templeton
Group
of
Funds
since
1948.
Templeton
Global
Investment
Trust
Tax
Information
(unaudited)
Franklin
Templeton
SMACS:
Series
EM
By
mid-February,
tax
information
related
to
a
shareholder's
proportionate
share
of
distributions
paid
during
the
preceding
calendar
year
will
be
received,
if
applicable.
Please
also
refer
to
www.franklintempleton.com
for
per
share
tax
information
related
to
any
distributions
paid
during
the
preceding
calendar
year.
Shareholders
are
advised
to
consult
with
their
tax
advisors
for
further
information
on
the
treatment
of
these
amounts
on
their
tax
returns.
The
following
tax
information
for
the
Fund
is
required
to
be
furnished
to
shareholders
with
respect
to
income
earned
and
distributions
paid
during
its
fiscal
year.
The
Fund
hereby
reports
the
following
amount,
or
if
subsequently
determined
to
be
different,
the
maximum
allowable
amount,
for
the
fiscal
year
ended
August
31,
2024:
Under
Section
853
of
the
Internal
Revenue
Code,
the
Fund
intends
to
elect
to
pass
through
to
its
shareholders
the
following
amounts,
or
amounts
as
finally
determined,
of
foreign
taxes
paid
and
foreign
source
income
earned
by
the
Fund
during
the
fiscal
year
ended
August
31,
2024:
Pursuant
to:
Amount
Reported
Qualified
Dividend
Income
Earned
(QDI)
§854(b)(1)(B)
$15,457
Amount
Reported
Foreign
Taxes
Paid
$5,474
Foreign
Source
Income
Earned
$32,308
Templeton
Global
Investment
Trust
TEMPLETON
GLOBAL
INVESTMENT
TRUST
Franklin
Templeton
SMACS:
Series
EM
Fund
(Fund)
At
an
in-person
meeting
held
on
May
22,
2024
(Meeting),
the
Board
of
Trustees
(Board)
of
Templeton
Global
Investment
Trust
(Trust),
including
a
majority
of
the
trustees
who
are
not
“interested
persons”
as
defined
in
the
Investment
Company
Act
of
1940
(Independent
Trustees),
reviewed
and
approved
the
continuance
of
the
investment
management
agreement
between
Templeton
Asset
Management
Ltd.
(TAML)
and
the
Trust,
on
behalf
of
the
Fund,
and
the
investment
sub-advisory
agreement
between
TAML
and
Franklin
Templeton
Investment
Management
Limited
(Sub-Adviser),
an
affiliate
of
TAML
(each
a
Management
Agreement),
for
an
additional
one-year
period.
The
Independent
Trustees
received
advice
from
and
met
separately
with
Independent
Trustee
counsel
in
considering
whether
to
approve
the
continuation
of
the
Management
Agreements.
TAML
and
the
Sub-Adviser
are
each
referred
to
herein
as
a
Manager.
In
considering
the
continuation
of
the
Management
Agreements,
the
Board
reviewed
and
considered
information
provided
by
each
Manager
at
the
Meeting
and
throughout
the
year
at
meetings
of
the
Board
and
its
committees.
The
Board
also
reviewed
and
considered
information
provided
in
response
to
a
detailed
set
of
requests
for
information
submitted
to
the
Managers
by
Independent
Trustee
counsel
on
behalf
of
the
Independent
Trustees
in
connection
with
the
annual
contract
renewal
process.
In
addition,
prior
to
the
Meeting,
the
Independent
Trustees
held
a
virtual
contract
renewal
meeting
at
which
the
Independent
Trustees
first
conferred
amongst
themselves
and
Independent
Trustee
counsel
about
contract
renewal
matters,
and
then
met
with
management
to
request
additional
information
that
the
Independent
Trustees
reviewed
and
considered
prior
to
and
at
the
Meeting.
The
Board
reviewed
and
considered
all
of
the
factors
it
deemed
relevant
in
approving
the
continuance
of
the
Management
Agreements,
including,
but
not
limited
to:
(i)
the
nature,
extent
and
quality
of
the
services
provided
by
each
Manager;
(ii)
the
investment
performance
of
the
Fund;
(iii)
the
costs
of
the
services
provided
and
profits
realized
by
each
Manager
and
its
affiliates
from
the
relationship
with
the
Fund;
(iv)
the
extent
to
which
economies
of
scale
are
realized
as
the
Fund
grows;
and
(v)
whether
fee
levels
reflect
these
economies
of
scale
for
the
benefit
of
Fund
investors.
Changes
In
and
Disagreements
with
Accountants
For
the
period
covered
by
this
report
Not
applicable.
Results
of
Meeting(s)
of
Shareholders
For
the
period
covered
by
this
report
Not
applicable.
Remuneration
Paid
to
Directors,
Officers
and
Others
For
the
period
covered
by
this
report
Refer
to
the
financial
statements
included
herein.
Board
Approval
of
Management
and
Subadvisory
Agreements
For
the
period
covered
by
this
report
Templeton
Global
Investment
Trust
In
approving
the
continuance
of
the
Management
Agreements,
the
Board,
including
a
majority
of
the
Independent
Trustees,
determined,
through
the
exercise
of
its
business
judgment,
that
the
terms
of
the
Management
Agreements
are
fair
and
reasonable
and
that
the
continuance
of
the
Management
Agreements
are
in
the
best
interests
of
the
Fund
and
its
shareholders.
While
attention
was
given
to
all
information
furnished,
the
following
discusses
some
primary
factors
relevant
to
the
Board’s
determination.
Nature,
Extent
and
Quality
of
Services
The
Board
reviewed
and
considered
information
regarding
the
nature,
extent
and
quality
of
investment
management
services
provided
by
each
Manager
and
its
affiliates
to
the
Fund
and
its
shareholders.
This
information
included,
among
other
things,
the
qualifications,
background
and
experience
of
the
senior
management
and
investment
personnel
of
each
Manager,
as
well
as
information
on
succession
planning
where
appropriate;
the
structure
of
investment
personnel
compensation;
oversight
of
third-party
service
providers;
investment
performance
reports
and
related
financial
information
for
the
Fund;
reports
on
expenses
and
shareholder
services;
legal
and
compliance
matters;
risk
controls;
pricing
and
other
services
provided
by
each
Manager
and
its
affiliates;
and
management
fees
charged
by
each
Manager
and
its
affiliates
to
US
funds
and
other
accounts,
including
management’s
explanation
of
differences
among
accounts
where
relevant.
The
Board
also
reviewed
and
considered
an
annual
report
on
payments
made
by
Franklin
Templeton
(FT)
or
the
Fund
to
financial
intermediaries,
as
well
as
a
memorandum
relating
to
third-party
servicing
arrangements.
The
Board
acknowledged
the
ongoing
integration
of
the
Putnam
family
of
funds
into
the
FT
family
of
funds
and
management’s
continued
development
of
strategies
to
address
areas
of
heightened
concern
in
the
mutual
fund
industry,
including
various
regulatory
initiatives
and
continuing
geopolitical
concerns.
The
Board
also
reviewed
and
considered
the
benefits
provided
to
Fund
shareholders
of
investing
in
a
fund
that
is
part
of
the
FT
family
of
funds.
The
Board
noted
the
financial
position
of
Franklin
Resources,
Inc.
(FRI),
the
Managers’
parent,
and
its
commitment
to
the
mutual
fund
business
as
evidenced
by
its
continued
reassessment
of
the
fund
offerings
in
response
to
FT
acquisitions
and
the
market
environment,
as
well
as
project
initiatives
and
capital
investments
relating
to
the
services
provided
to
the
Fund
by
the
FT
organization.
The
Board
specifically
noted
FT’s
commitment
to
technological
innovation
and
advancement,
including
its
initiative
to
create
a
new
enterprise-wide
artificial
intelligence
platform.
Following
consideration
of
such
information,
the
Board
was
satisfied
with
the
nature,
extent
and
quality
of
services
provided
by
each
Manager
and
its
affiliates
to
the
Fund
and
its
shareholders.
Fund
Performance
The
Board
reviewed
and
considered
the
performance
results
of
the
Fund
over
various
time
periods
ended
December
31,
2023.
The
Board
considered
the
performance
returns
for
the
Fund
in
comparison
to
the
performance
returns
of
mutual
funds
deemed
comparable
to
the
Fund
included
in
a
universe
(Performance
Universe)
selected
by
Broadridge
Financial
Solutions,
Inc.
(Broadridge),
an
independent
provider
of
investment
company
data.
The
Board
received
a
description
of
the
methodology
used
by
Broadridge
to
select
the
mutual
funds
included
in
a
Performance
Universe.
The
Board
also
reviewed
and
considered
Fund
performance
reports
provided
and
discussions
that
occurred
with
portfolio
managers
at
Board
meetings
throughout
the
year.
A
summary
of
the
Fund’s
performance
results
is
below.
The
Performance
Universe
for
the
Fund
included
the
Fund
and
all
retail
and
institutional
emerging
markets
funds.
The
Fund
commenced
operations
in
2021,
so
it
does
not
have
three
years
of
performance
history.
The
Board
noted
that
the
Fund’s
annualized
total
return
for
the
one-year
period
was
above
the
median
of
its
Performance
Universe.
The
Board
further
noted
the
Fund’s
short
operating
history.
The
Board
concluded
that
the
Fund’s
performance
was
satisfactory.
Comparative
Fees
and
Expenses
The
Board
reviewed
and
considered
information
regarding
the
Fund’s
actual
total
expense
ratio
and
its
various
components,
including,
as
applicable,
management
fees;
transfer
agent
expenses;
underlying
fund
expenses;
Rule
12b-1
and
non-Rule
12b-1
service
fees;
and
other
non-management
fees.
The
Board
also
noted
the
quarterly
and
annual
reports
it
receives
on
all
marketing
support
payments
made
by
FT
to
financial
intermediaries.
The
Board
considered
the
actual
total
expense
ratio
and,
separately,
the
contractual
management
fee
rate,
without
the
effect
of
fee
waivers,
if
any
(Management
Rate)
of
the
Templeton
Global
Investment
Trust
Fund
in
comparison
to
the
median
expense
ratio
and
median
Management
Rate,
respectively,
of
other
mutual
funds
deemed
comparable
to
and
with
a
similar
expense
structure
to
the
Fund
selected
by
Broadridge
(Expense
Group).
Broadridge
fee
and
expense
data
is
based
upon
information
taken
from
each
fund’s
most
recent
annual
or
semi-annual
report,
which
reflects
historical
asset
levels
that
may
be
quite
different
from
those
currently
existing,
particularly
in
a
period
of
market
volatility.
While
recognizing
such
inherent
limitation
and
the
fact
that
expense
ratios
and
Management
Rates
generally
increase
as
assets
decline
and
decrease
as
assets
grow,
the
Board
believed
the
independent
analysis
conducted
by
Broadridge
to
be
an
appropriate
measure
of
comparative
fees
and
expenses.
The
Broadridge
Management
Rate
includes
administrative
charges,
and
the
actual
total
expense
ratio,
for
comparative
consistency,
was
shown
for
Investor
Class,
Open
Class,
Retail
Class,
Service
Class
and
Class
F
shares
for
the
other
funds
in
the
Expense
Group
with
multiple
classes
of
shares.
The
Board
received
a
description
of
the
methodology
used
by
Broadridge
to
select
the
mutual
funds
included
in
an
Expense
Group.
The
Expense
Group
for
the
Fund
included
the
Fund
and
14
other
emerging
markets
funds.
The
Board
noted
that
the
actual
total
expense
ratio
for
the
Fund
was
below
the
median
and
in
the
first
quintile
(least
expensive)
of
its
Expense
Group.
The
Board
also
noted
that
the
Manager
provides
general
investment
management
and
administrative
services
to
the
Fund
for
a
zero
management
fee.
The
Board
further
noted
that
the
Manager
assumes
certain
expenses
incurred
by
the
Fund
(including
acquired
fund
fees
and
expenses,
but
excluding
certain
non-routine
expenses,
such
as
those
relating
to
litigation,
indemnification,
reorganizations
and
liquidations)
so
that
total
annual
fund
operating
expenses
do
not
exceed
0.00%.
The
Board
also
noted
that
the
Sub-Adviser
provides
investment
sub-advisory
services
to
the
Fund
for
a
zero
sub-advisory
fee.
The
Board
concluded
that
the
Fund’s
zero
contractual
management
fee
and
zero
contractual
sub-advisory
fee
are
reasonable.
Profitability
The
Board
reviewed
and
considered
information
regarding
the
profits
realized
by
each
Manager
and
its
affiliates
in
connection
with
the
operation
of
the
Fund.
In
this
respect,
the
Board
considered
the
Fund
profitability
analysis
provided
by
the
Manager
that
addresses
the
overall
profitability
of
FT’s
US
fund
business,
as
well
as
its
profits
in
providing
investment
management
and
other
services
to
each
of
the
individual
funds
during
the
12-month
period
ended
September
30,
2023,
being
the
most
recent
fiscal
year-end
for
FRI.
The
Board
noted
that
although
management
continually
makes
refinements
to
its
methodologies
used
in
calculating
profitability
in
response
to
organizational
and
product-related
changes,
the
overall
methodology
has
remained
consistent
with
that
used
in
the
Fund’s
profitability
report
presentations
from
prior
years.
The
Board
also
noted
that
an
independent
registered
public
accounting
firm
has
been
engaged
by
the
Managers
to
periodically
review
and
assess
the
allocation
methodologies
to
be
used
solely
by
the
Fund’s
Board
with
respect
to
the
profitability
analysis.
The
Board
noted
management’s
belief
that
costs
incurred
in
establishing
the
infrastructure
necessary
for
the
type
of
mutual
fund
operations
conducted
by
each
Manager
and
its
affiliates
may
not
be
fully
reflected
in
the
expenses
allocated
to
the
Fund
in
determining
its
profitability,
as
well
as
the
fact
that
the
level
of
profits,
to
a
certain
extent,
reflected
operational
cost
savings
and
efficiencies
initiated
by
management.
As
part
of
this
evaluation,
the
Board
considered
management’s
outsourcing
of
certain
operations,
which
effort
has
required
considerable
up-front
expenditures
by
each
Manager
but,
over
the
long
run
is
expected
to
result
in
greater
efficiencies.
The
Board
also
noted
management’s
expenditures
in
improving
shareholder
services
provided
to
the
Fund,
as
well
as
the
need
to
implement
systems
and
meet
additional
regulatory
and
compliance
requirements
resulting
from
recent
US
Securities
and
Exchange
Commission
and
other
regulatory
requirements.
The
Board
also
considered
the
extent
to
which
each
Manager
and
its
affiliates
might
derive
ancillary
benefits
from
fund
operations,
including
revenues
generated
from
transfer
agent
services,
potential
benefits
resulting
from
personnel
and
systems
enhancements
necessitated
by
fund
growth,
as
well
as
increased
leverage
with
service
providers
and
counterparties.
Based
upon
its
consideration
of
all
these
factors,
the
Board
concluded
that
the
level
of
profits
realized
by
each
Manager
and
its
affiliates
from
providing
services
to
the
Fund
was
not
excessive
in
view
of
the
nature,
extent
and
quality
of
services
provided
to
the
Fund.
Templeton
Global
Investment
Trust
Economies
of
Scale
The
Board
noted
that
the
Fund
was
omitted
from
an
economies
of
scale
analysis
because
it
has
less
than
three
years
of
data
since
inception.
The
Board
further
noted
that
because
the
Fund
pays
a
zero
management
fee,
the
consideration
of
possible
economies
of
scale
in
the
future
was
not
relevant.
Conclusion
Based
on
its
review,
consideration
and
evaluation
of
all
factors
it
believed
relevant,
including
the
above-described
factors
and
conclusions,
the
Board
unanimously
approved
the
continuation
of
the
Management
Agreements
for
an
additional
one-year
period.
©
2024
Franklin
Templeton.
All
rights
reserved.
Templeton
Emerging
Markets
Small
Cap
Fund
Financial
Statements
and
Other
Important
Information
Annual
|
August
31,
2024
Financial
Statements
and
Other
Important
Information—Annual
Financial
Highlights
and
Schedule
of
Investments
2
Financial
Statements
11
Notes
to
Financial
Statements
15
Report
of
Independent
Registered
Public
Accounting
Firm
25
Tax
Information
26
Changes
In
and
Disagreements
with
Accountants
27
Results
of
Meeting(s)
of
Shareholders
27
Remuneration
Paid
to
Directors,
Officers
and
Others
27
Board
Approval
of
Management
and
Subadvisory
Agreements
27
Templeton
Global
Investment
Trust
Financial
Highlights
Templeton
Emerging
Markets
Small
Cap
Fund
Annual
Report
The
accompanying
notes
are
an
integral
part
of
these
financial
statements.
a
Year
Ended
August
31,
Year
Ended
August
31,
2022
a
Year
Ended
March
31,
2024
2023
2022
2021
2020
Class
A
Per
share
operating
performance
(for
a
share
outstanding
throughout
the
year)
Net
asset
value,
beginning
of
year
.......
$12.29
$12.55
$13.98
$15.08
$8.68
$13.78
Income
from
investment
operations
b
:
Net
investment
income
c
.............
0.12
0.19
0.26
0.07
0.02
0.10
Net
realized
and
unrealized
gains
(losses)
2.07
0.47
(1.69)
0.50
6.77
(4.96)
Total
from
investment
operations
........
2.19
0.66
(1.43)
0.57
6.79
(4.86)
Less
distributions
from:
Net
investment
income
..............
(0.37)
(0.29)
—
(0.66)
(0.39)
(—)
d
Net
realized
gains
.................
—
(0.63)
—
(1.01)
—
(0.24)
Total
distributions
...................
(0.37)
(0.92)
—
(1.67)
(0.39)
(0.24)
Net
asset
value,
end
of
year
...........
$14.11
$12.29
$12.55
$13.98
$15.08
$8.68
Total
return
e
.......................
18.29%
5.74%
(10.23)%
3.01%
78.52%
(35.73)%
Ratios
to
average
net
assets
f
Expenses
before
waiver
and
payments
by
affiliates
..........................
1.94%
1.95%
2.00%
1.91%
1.99%
1.93%
Expenses
net
of
waiver
and
payments
by
affiliates
..........................
1.75%
1.75%
1.75%
1.73%
1.80%
1.91%
Net
investment
income
...............
0.90%
1.54%
4.83%
0.47%
0.16%
0.94%
Supplemental
data
Net
assets,
end
of
year
(000’s)
.........
$186,634
$176,763
$187,525
$215,598
$210,269
$143,312
Portfolio
turnover
rate
................
20.02%
23.06%
8.13%
31.72%
31.70%
4.72%
a
For
the
period
April
1,
2022
to
August
31,
2022.
b
The
amount
shown
for
a
share
outstanding
throughout
the
period
may
not
correlate
with
the
Statement
of
Operations
for
the
period
due
to
the
timing
of
sales
and
repurchases
of
the
Fund’s
shares
in
relation
to
income
earned
and/or
fluctuating
fair
value
of
the
investments
of
the
Fund.
c
Based
on
average
daily
shares
outstanding.
d
Amount
rounds
to
less
than
$0.01
per
share.
e
Total
return
does
not
reflect
sales
commissions
or
contingent
deferred
sales
charges,
if
applicable,
and
is
not
annualized
for
periods
less
than
one
year.
f
Ratios
are
annualized
for
periods
less
than
one
year.
Templeton
Global
Investment
Trust
Financial
Highlights
Templeton
Emerging
Markets
Small
Cap
Fund
(continued)
The
accompanying
notes
are
an
integral
part
of
these
financial
statements.
Annual
Report
a
Year
Ended
August
31,
Year
Ended
August
31,
2022
a
Year
Ended
March
31,
2024
2023
2022
2021
2020
Class
C
Per
share
operating
performance
(for
a
share
outstanding
throughout
the
year)
Net
asset
value,
beginning
of
year
.......
$11.27
$11.57
$12.94
$14.03
$8.14
$13.02
Income
from
investment
operations
b
:
Net
investment
income
(loss)
c
........
0.01
0.08
0.20
(0.02)
(0.06)
0.02
Net
realized
and
unrealized
gains
(losses)
1.90
0.46
(1.57)
0.44
6.31
(4.66)
Total
from
investment
operations
........
1.91
0.54
(1.37)
0.42
6.25
(4.64)
Less
distributions
from:
Net
investment
income
..............
(0.26)
(0.21)
—
(0.50)
(0.36)
—
Net
realized
gains
.................
—
(0.63)
—
(1.01)
—
(0.24)
Total
distributions
...................
(0.26)
(0.84)
—
(1.51)
(0.36)
(0.24)
Net
asset
value,
end
of
year
...........
$12.92
$11.27
$11.57
$12.94
$14.03
$8.14
Total
return
d
.......................
17.31%
5.09%
(10.59)%
2.26%
77.25%
(36.23)%
Ratios
to
average
net
assets
e
Expenses
before
waiver
and
payments
by
affiliates
..........................
2.69%
2.70%
2.74%
2.66%
2.73%
2.68%
Expenses
net
of
waiver
and
payments
by
affiliates
..........................
2.50%
2.50%
2.50%
2.48%
2.54%
2.66%
Net
investment
income
(loss)
..........
0.09%
0.70%
4.06%
(0.15)%
(0.51)%
0.19%
Supplemental
data
Net
assets,
end
of
year
(000’s)
.........
$8,569
$9,836
$13,645
$17,588
$27,434
$23,168
Portfolio
turnover
rate
................
20.02%
23.06%
8.13%
31.72%
31.70%
4.72%
a
For
the
period
April
1,
2022
to
August
31,
2022.
b
The
amount
shown
for
a
share
outstanding
throughout
the
period
may
not
correlate
with
the
Statement
of
Operations
for
the
period
due
to
the
timing
of
sales
and
repurchases
of
the
Fund’s
shares
in
relation
to
income
earned
and/or
fluctuating
fair
value
of
the
investments
of
the
Fund.
c
Based
on
average
daily
shares
outstanding.
d
Total
return
does
not
reflect
sales
commissions
or
contingent
deferred
sales
charges,
if
applicable,
and
is
not
annualized
for
periods
less
than
one
year.
e
Ratios
are
annualized
for
periods
less
than
one
year.
Templeton
Global
Investment
Trust
Financial
Highlights
Templeton
Emerging
Markets
Small
Cap
Fund
(continued)
Annual
Report
The
accompanying
notes
are
an
integral
part
of
these
financial
statements.
a
Year
Ended
August
31,
Year
Ended
August
31,
2022
a
Year
Ended
March
31,
2024
2023
2022
2021
2020
Class
R
Per
share
operating
performance
(for
a
share
outstanding
throughout
the
year)
Net
asset
value,
beginning
of
year
.......
$12.02
$12.30
$13.71
$14.82
$8.56
$13.62
Income
from
investment
operations
b
:
Net
investment
income
(loss)
c
........
0.08
0.15
0.24
0.04
(0.03)
0.04
Net
realized
and
unrealized
gains
(losses)
2.03
0.47
(1.65)
0.47
6.68
(4.86)
Total
from
investment
operations
........
2.11
0.62
(1.41)
0.51
6.65
(4.82)
Less
distributions
from:
Net
investment
income
..............
(0.34)
(0.27)
—
(0.61)
(0.39)
—
Net
realized
gains
.................
—
(0.63)
—
(1.01)
—
(0.24)
Total
distributions
...................
(0.34)
(0.90)
—
(1.62)
(0.39)
(0.24)
Net
asset
value,
end
of
year
...........
$13.79
$12.02
$12.30
$13.71
$14.82
$8.56
Total
return
d
.......................
18.02%
5.50%
(10.28)%
2.71%
78.18%
(35.95)%
Ratios
to
average
net
assets
e
Expenses
before
waiver
and
payments
by
affiliates
..........................
2.19%
2.20%
2.25%
2.16%
2.24%
2.18%
Expenses
net
of
waiver
and
payments
by
affiliates
..........................
2.00%
2.00%
2.00%
1.98%
2.05%
2.16%
Net
investment
income
(loss)
..........
0.62%
1.29%
4.59%
0.26%
(0.20)%
0.69%
Supplemental
data
Net
assets,
end
of
year
(000’s)
.........
$2,147
$2,082
$2,109
$2,444
$2,966
$1,365
Portfolio
turnover
rate
................
20.02%
23.06%
8.13%
31.72%
31.70%
4.72%
a
For
the
period
April
1,
2022
to
August
31,
2022.
b
The
amount
shown
for
a
share
outstanding
throughout
the
period
may
not
correlate
with
the
Statement
of
Operations
for
the
period
due
to
the
timing
of
sales
and
repurchases
of
the
Fund’s
shares
in
relation
to
income
earned
and/or
fluctuating
fair
value
of
the
investments
of
the
Fund.
c
Based
on
average
daily
shares
outstanding.
d
Total
return
is
not
annualized
for
periods
less
than
one
year.
e
Ratios
are
annualized
for
periods
less
than
one
year.
Templeton
Global
Investment
Trust
Financial
Highlights
Templeton
Emerging
Markets
Small
Cap
Fund
(continued)
The
accompanying
notes
are
an
integral
part
of
these
financial
statements.
Annual
Report
a
Year
Ended
August
31,
Year
Ended
August
31,
2022
a
Year
Ended
March
31,
2024
2023
2022
2021
2020
Class
R6
Per
share
operating
performance
(for
a
share
outstanding
throughout
the
year)
Net
asset
value,
beginning
of
year
.......
$12.53
$12.77
$14.21
$15.30
$8.79
$13.94
Income
from
investment
operations
b
:
Net
investment
income
c
.............
0.15
0.22
0.28
0.14
0.08
0.22
Net
realized
and
unrealized
gains
(losses)
2.12
0.49
(1.72)
0.50
6.83
(5.07)
Total
from
investment
operations
........
2.27
0.71
(1.44)
0.64
6.91
(4.85)
Less
distributions
from:
Net
investment
income
..............
(0.41)
(0.32)
—
(0.72)
(0.40)
(0.06)
Net
realized
gains
.................
—
(0.63)
—
(1.01)
—
(0.24)
Total
distributions
...................
(0.41)
(0.95)
—
(1.73)
(0.40)
(0.30)
Net
asset
value,
end
of
year
...........
$14.39
$12.53
$12.77
$14.21
$15.30
$8.79
Total
return
d
.......................
18.60%
6.06%
(10.13)%
3.41%
79.19%
(35.48)%
Ratios
to
average
net
assets
e
Expenses
before
waiver
and
payments
by
affiliates
..........................
1.57%
1.56%
1.59%
1.54%
1.60%
1.53%
Expenses
net
of
waiver
and
payments
by
affiliates
..........................
1.47%
1.47%
1.47%
1.35%
1.40%
1.51%
Net
investment
income
...............
1.15%
1.79%
5.10%
0.88%
0.61%
1.34%
Supplemental
data
Net
assets,
end
of
year
(000’s)
.........
$26,408
$27,134
$31,790
$39,782
$46,062
$47,904
Portfolio
turnover
rate
................
20.02%
23.06%
8.13%
31.72%
31.70%
4.72%
a
For
the
period
April
1,
2022
to
August
31,
2022.
b
The
amount
shown
for
a
share
outstanding
throughout
the
period
may
not
correlate
with
the
Statement
of
Operations
for
the
period
due
to
the
timing
of
sales
and
repurchases
of
the
Fund’s
shares
in
relation
to
income
earned
and/or
fluctuating
fair
value
of
the
investments
of
the
Fund.
c
Based
on
average
daily
shares
outstanding.
d
Total
return
is
not
annualized
for
periods
less
than
one
year.
e
Ratios
are
annualized
for
periods
less
than
one
year.
Templeton
Global
Investment
Trust
Financial
Highlights
Templeton
Emerging
Markets
Small
Cap
Fund
(continued)
Annual
Report
The
accompanying
notes
are
an
integral
part
of
these
financial
statements.
a
Year
Ended
August
31,
Year
Ended
August
31,
2022
a
Year
Ended
March
31,
2024
2023
2022
2021
2020
Advisor
Class
Per
share
operating
performance
(for
a
share
outstanding
throughout
the
year)
Net
asset
value,
beginning
of
year
.......
$12.55
$12.78
$14.23
$15.32
$8.80
$13.96
Income
from
investment
operations
b
:
Net
investment
income
c
.............
0.14
0.23
0.28
0.12
0.07
0.15
Net
realized
and
unrealized
gains
(losses)
2.13
0.48
(1.73)
0.50
6.84
(5.03)
Total
from
investment
operations
........
2.27
0.71
(1.45)
0.62
6.91
(4.88)
Less
distributions
from:
Net
investment
income
..............
(0.40)
(0.31)
—
(0.70)
(0.39)
(0.04)
Net
realized
gains
.................
—
(0.63)
—
(1.01)
—
(0.24)
Total
distributions
...................
(0.40)
(0.94)
—
(1.71)
(0.39)
(0.28)
Net
asset
value,
end
of
year
...........
$14.42
$12.55
$12.78
$14.23
$15.32
$8.80
Total
return
d
.......................
18.62%
6.08%
(10.19)%
3.26%
79.10%
(35.61)%
Ratios
to
average
net
assets
e
Expenses
before
waiver
and
payments
by
affiliates
..........................
1.69%
1.71%
1.75%
1.66%
1.74%
1.68%
Expenses
net
of
waiver
and
payments
by
affiliates
..........................
1.50%
1.50%
1.50%
1.48%
1.54%
1.66%
Net
investment
income
...............
1.03%
1.86%
5.08%
0.75%
0.53%
1.19%
Supplemental
data
Net
assets,
end
of
year
(000’s)
.........
$130,075
$182,079
$146,484
$172,459
$177,989
$168,808
Portfolio
turnover
rate
................
20.02%
23.06%
8.13%
31.72%
31.70%
4.72%
a
For
the
period
April
1,
2022
to
August
31,
2022.
b
The
amount
shown
for
a
share
outstanding
throughout
the
period
may
not
correlate
with
the
Statement
of
Operations
for
the
period
due
to
the
timing
of
sales
and
repurchases
of
the
Fund’s
shares
in
relation
to
income
earned
and/or
fluctuating
fair
value
of
the
investments
of
the
Fund.
c
Based
on
average
daily
shares
outstanding.
d
Total
return
is
not
annualized
for
periods
less
than
one
year.
e
Ratios
are
annualized
for
periods
less
than
one
year.
Templeton
Global
Investment
Trust
Schedule
of
Investments,
August
31,
2024
Templeton
Emerging
Markets
Small
Cap
Fund
The
accompanying
notes
are
an
integral
part
of
these
financial
statements.
Annual
Report
a
a
Industry
Shares
a
Value
a
Common
Stocks
98.6%
Brazil
2.4%
Azzas
2154
SA
..................
Textiles,
Apparel
&
Luxury
Goods
372,378
$
3,237,926
a
Grupo
Mateus
SA
................
Consumer
Staples
Distribution
&
Retail
2,247,901
3,143,332
a
Hypera
SA
.....................
Pharmaceuticals
128,439
650,485
a
Oncoclinicas
do
Brasil
Servicos
Medicos
SA
..........................
Health
Care
Providers
&
Services
1,122,677
1,326,832
8,358,575
Cambodia
0.4%
a,b
NagaCorp
Ltd.
..................
Hotels,
Restaurants
&
Leisure
3,253,765
1,382,302
Chile
0.4%
Aguas
Andinas
SA
,
A
.............
Water
Utilities
4,267,311
1,293,662
China
4.7%
Asia
Cement
China
Holdings
Corp.
...
Construction
Materials
1,364,069
370,847
b
Chervon
Holdings
Ltd.
.............
Household
Durables
647,586
1,588,800
c,d
China
Education
Group
Holdings
Ltd.
,
Reg
S
.......................
Diversified
Consumer
Services
2,906,803
1,635,761
a,b
Daqo
New
Energy
Corp.
,
ADR
......
Semiconductors
&
Semiconductor
Equipment
150,350
2,214,655
Health
&
Happiness
H&H
International
Holdings
Ltd.
..................
Food
Products
2,202,619
2,352,918
b
Huaxin
Cement
Co.
Ltd.
,
H
.........
Construction
Materials
1,117,830
974,781
c
JNBY
Design
Ltd.
,
Reg
S
..........
Textiles,
Apparel
&
Luxury
Goods
1,428,758
2,460,526
d
Noah
Holdings
Ltd.
,
ADR
..........
Capital
Markets
233,374
1,932,337
Uni-President
China
Holdings
Ltd.
....
Food
Products
3,645,351
3,220,927
16,751,552
Georgia
0.8%
a
Georgia
Capital
plc
...............
Capital
Markets
224,199
3,009,297
Greece
0.7%
Piraeus
Financial
Holdings
SA
.......
Banks
553,544
2,387,858
Hong
Kong
1.0%
Luk
Fook
Holdings
International
Ltd.
..
Specialty
Retail
564,051
1,044,829
Pacific
Basin
Shipping
Ltd.
.........
Marine
Transportation
9,317,323
2,556,472
3,601,301
Hungary
2.2%
Richter
Gedeon
Nyrt.
.............
Pharmaceuticals
253,782
7,690,147
India
35.4%
a
Affle
India
Ltd.
...................
Media
312,183
6,079,642
Ajanta
Pharma
Ltd.
...............
Pharmaceuticals
122,833
4,751,087
c
Aster
DM
Healthcare
Ltd.
,
144A
,
Reg
S
Health
Care
Providers
&
Services
827,927
4,022,169
Bajaj
Holdings
&
Investment
Ltd.
.....
Financial
Services
209,557
25,144,002
City
Union
Bank
Ltd.
..............
Banks
2,634,434
5,368,878
Coforge
Ltd.
....................
IT
Services
55,675
4,219,374
Crompton
Greaves
Consumer
Electricals
Ltd.
.................
Household
Durables
311,456
1,771,598
Dalmia
Bharat
Ltd.
...............
Construction
Materials
290,056
6,539,305
a
Electronics
Mart
India
Ltd.
..........
Specialty
Retail
824,168
2,207,455
EPL
Ltd.
.......................
Containers
&
Packaging
896,215
2,663,786
a,c
Eris
Lifesciences
Ltd.
,
144A
,
Reg
S
...
Pharmaceuticals
346,989
5,751,966
Federal
Bank
Ltd.
................
Banks
4,860,117
11,282,024
a
Honasa
Consumer
Ltd.
............
Personal
Care
Products
848,333
5,118,894
a
MakeMyTrip
Ltd.
.................
Hotels,
Restaurants
&
Leisure
73,121
7,032,046
a
Max
Financial
Services
Ltd.
.........
Insurance
440,080
5,639,881
a
Ola
Electric
Mobility
Ltd.
...........
Automobiles
1,142,895
1,607,701
a
PB
Fintech
Ltd.
..................
Insurance
343,999
7,259,604
Templeton
Global
Investment
Trust
Schedule
of
Investments
Templeton
Emerging
Markets
Small
Cap
Fund
(continued)
Annual
Report
The
accompanying
notes
are
an
integral
part
of
these
financial
statements.
a
a
Industry
Shares
a
Value
a
Common
Stocks
(continued)
India
(continued)
Redington
Ltd.
..................
Electronic
Equipment,
Instruments
&
Components
1,896,792
$
4,573,218
a
Restaurant
Brands
Asia
Ltd.
........
Hotels,
Restaurants
&
Leisure
2,002,427
2,626,676
Tata
Consumer
Products
Ltd.
.......
Food
Products
158,241
2,266,283
a
Zomato
Ltd.
....................
Hotels,
Restaurants
&
Leisure
3,085,755
9,211,702
125,137,291
Indonesia
1.4%
Avia
Avian
Tbk.
PT
...............
Chemicals
109,085,200
3,317,376
a
GoTo
Gojek
Tokopedia
Tbk.
PT
,
A
....
Broadline
Retail
547,222,007
1,841,965
5,159,341
Italy
1.2%
a,b,c
Wizz
Air
Holdings
plc
,
144A
,
Reg
S
...
Passenger
Airlines
243,919
4,292,576
Kazakhstan
1.0%
c
Halyk
Savings
Bank
of
Kazakhstan
JSC
,
GDR
,
Reg
S
..................
Banks
213,908
3,743,390
Mexico
1.3%
Bolsa
Mexicana
de
Valores
SAB
de
CV
Capital
Markets
2,840,643
4,371,885
Grupo
Aeroportuario
del
Centro
Norte
SAB
de
CV
,
B
.................
Transportation
Infrastructure
51,274
410,635
4,782,520
Peru
0.9%
Intercorp
Financial
Services,
Inc.
.....
Banks
121,117
3,076,372
Philippines
5.8%
a
Bloomberry
Resorts
Corp.
..........
Hotels,
Restaurants
&
Leisure
19,513,000
2,731,008
Century
Pacific
Food,
Inc.
..........
Food
Products
7,174,166
4,675,947
International
Container
Terminal
Services,
Inc.
..................
Transportation
Infrastructure
1,850,915
13,041,428
20,448,383
Saudi
Arabia
2.0%
a
Jahez
International
Co.
............
Hotels,
Restaurants
&
Leisure
470,300
3,120,628
Mouwasat
Medical
Services
Co.
.....
Health
Care
Providers
&
Services
137,726
3,809,234
6,929,862
South
Africa
1.0%
Netcare
Ltd.
....................
Health
Care
Providers
&
Services
4,874,221
3,710,130
South
Korea
7.8%
Fila
Holdings
Corp.
...............
Textiles,
Apparel
&
Luxury
Goods
159,163
5,043,979
a
Hugel,
Inc.
.....................
Biotechnology
41,804
8,508,012
LEENO
Industrial,
Inc.
.............
Semiconductors
&
Semiconductor
Equipment
36,012
5,275,303
LX
Semicon
Co.
Ltd.
..............
Semiconductors
&
Semiconductor
Equipment
55,258
2,841,967
Shin
Heung
Energy
&
Electronics
Co.
Ltd.
.........................
Electrical
Equipment
219,215
1,435,713
Soulbrain
Co.
Ltd.
................
Chemicals
16,365
2,905,774
Vieworks
Co.
Ltd.
................
Health
Care
Equipment
&
Supplies
81,147
1,601,522
27,612,270
Taiwan
13.8%
Eclat
Textile
Co.
Ltd.
..............
Textiles,
Apparel
&
Luxury
Goods
223,590
3,740,997
Kinsus
Interconnect
Technology
Corp.
.
Semiconductors
&
Semiconductor
Equipment
1,124,850
4,163,935
Merida
Industry
Co.
Ltd.
...........
Leisure
Products
715,459
5,394,202
momo.com,
Inc.
.................
Broadline
Retail
339,429
4,141,565
Novatek
Microelectronics
Corp.
......
Semiconductors
&
Semiconductor
Equipment
586,366
9,895,108
Templeton
Global
Investment
Trust
Schedule
of
Investments
Templeton
Emerging
Markets
Small
Cap
Fund
(continued)
The
accompanying
notes
are
an
integral
part
of
these
financial
statements.
Annual
Report
a
a
Industry
Shares
a
Value
a
Common
Stocks
(continued)
Taiwan
(continued)
Poya
International
Co.
Ltd.
.........
Broadline
Retail
417,548
$
6,557,504
Primax
Electronics
Ltd.
............
Electronic
Equipment,
Instruments
&
Components
1,190,975
3,343,380
Shin
Zu
Shing
Co.
Ltd.
............
Machinery
49,747
352,018
Synnex
Technology
International
Corp.
Electronic
Equipment,
Instruments
&
Components
4,154,424
9,345,083
Visual
Photonics
Epitaxy
Co.
Ltd.
....
Semiconductors
&
Semiconductor
Equipment
418,128
1,859,943
48,793,735
Thailand
2.5%
Dynasty
Ceramic
PCL
.............
Building
Products
21,251,897
1,252,250
Major
Cineplex
Group
PCL
.........
Entertainment
6,519,860
2,737,975
Tisco
Financial
Group
PCL
.........
Banks
1,718,326
4,826,493
8,816,718
United
Arab
Emirates
3.2%
Americana
Restaurants
International
plc
Hotels,
Restaurants
&
Leisure
2,641,274
2,015,031
Burjeel
Holdings
plc
..............
Health
Care
Providers
&
Services
3,757,924
2,518,950
Emirates
Central
Cooling
Systems
Corp.
Water
Utilities
4,786,580
2,241,561
Spinneys
1961
Holding
plc
.........
Consumer
Staples
Distribution
&
Retail
5,684,491
2,306,082
Taaleem
Holdings
PJSC
...........
Diversified
Consumer
Services
2,133,071
2,113,993
11,195,617
Vietnam
8.7%
Asia
Commercial
Bank
JSC
........
Banks
3,097,525
3,089,784
FPT
Corp.
......................
IT
Services
2,872,600
15,592,468
Military
Commercial
Joint
Stock
Bank
.
Banks
2,980,000
2,982,207
Mobile
World
Investment
Corp.
......
Specialty
Retail
3,248,849
9,120,750
30,785,209
Total
Common
Stocks
(Cost
$
250,640,699
)
.....................................
348,958,108
a
Preferred
Stocks
2.3%
Brazil
1.0%
e
Bradespar
SA
,
9.18
%
.............
Metals
&
Mining
978,972
3,382,385
Chile
1.3%
e
Embotelladora
Andina
SA
,
A
,
6.67
%
..
Beverages
603,894
1,506,298
e
Embotelladora
Andina
SA
,
B
,
5.76
%
..
Beverages
963,231
3,058,194
4,564,492
Total
Preferred
Stocks
(Cost
$
9,524,705
)
.......................................
7,946,877
Total
Long
Term
Investments
(Cost
$
260,165,404
)
...............................
356,904,985
Short
Term
Investments
1.5%
a
a
Industry
Shares
a
Value
a
a
a
a
a
a
Money
Market
Funds
1.5%
United
States
1.5%
f,g
Institutional
Fiduciary
Trust
-
Money
Market
Portfolio
,
4.982
%
.........
5,120,684
5,120,684
Total
Money
Market
Funds
(Cost
$
5,120,684
)
...................................
5,120,684
Templeton
Global
Investment
Trust
Schedule
of
Investments
Templeton
Emerging
Markets
Small
Cap
Fund
(continued)
Annual
Report
The
accompanying
notes
are
an
integral
part
of
these
financial
statements.
Short
Term
Investments
(continued)
a
a
Industry
Shares
a
Value
a
a
a
a
a
a
h
Investments
from
Cash
Collateral
Received
for
Loaned
Securities
0.0%
†
Money
Market
Funds
0.0%
†
f,g
Institutional
Fiduciary
Trust
-
Money
Market
Portfolio
,
4.982
%
.........
134,633
$
134,633
Total
Investments
from
Cash
Collateral
Received
for
Loaned
Securities
(Cost
$
134,633
)
...................................................................
134,633
a
a
a
a
a
Total
Short
Term
Investments
(Cost
$
5,255,317
)
.................................
5,255,317
a
a
a
Total
Investments
(Cost
$
265,420,721
)
102.4
%
..................................
$362,160,302
Other
Assets,
less
Liabilities
(
2.4
)
%
...........................................
(8,327,905)
Net
Assets
100.0%
...........................................................
$353,832,397
a
a
a
See
A
bbreviations
on
page
24
.
†
Rounds
to
less
than
0.1%
of
net
assets.
a
Non-income
producing.
b
A
portion
or
all
of
the
security
is
on
loan
at
August
31,
2024.
See
Note
1(c).
c
Security
was
purchased
pursuant
to
Rule
144A
or
Regulation
S
under
the
Securities
Act
of
1933.
144A
securities
may
be
sold
in
transactions
exempt
from
registration
only
to
qualified
institutional
buyers
or
in
a
public
offering
registered
under
the
Securities
Act
of
1933.
Regulation
S
securities
cannot
be
sold
in
the
United
States
without
either
an
effective
registration
statement
filed
pursuant
to
the
Securities
Act
of
1933,
or
pursuant
to
an
exemption
from
registration.
At
August
31,
2024,
the
aggregate
value
of
these
securities
was
$21,906,388,
representing
6.2%
of
net
assets.
d
Variable
interest
entity
(VIE).
See
Note
6
regarding
investments
made
through
a
VIE
structure.
At
August
31,
2024,
the
aggregate
value
of
these
securities
was
$3,568,098,
representing
1.0%
of
net
assets.
e
Variable
rate
security.
The
rate
shown
represents
the
yield
at
period
end.
f
See
Note
3(f)
regarding
investments
in
affiliated
management
investment
companies.
g
The
rate
shown
is
the
annualized
seven-day
effective
yield
at
period
end.
h
See
Note
1(c)
regarding
securities
on
loan.
Templeton
Global
Investment
Trust
Financial
Statements
Statement
of
Assets
and
Liabilities
August
31,
2024
The
accompanying
notes
are
an
integral
part
of
these
financial
statements.
Annual
Report
Templeton
Emerging
Markets
Small
Cap
Fund
Assets:
Investments
in
securities:
Cost
-
Unaffiliated
issuers
...................................................................
$260,165,404
Cost
-
Non-controlled
affiliates
(Note
3
f
)
........................................................
5,255,317
Value
-
Unaffiliated
issuers
(Includes
securities
loaned
of
$
3,039,267
)
..................................
$356,904,985
Value
-
Non-controlled
affiliates
(Note
3
f
)
........................................................
5,255,317
Foreign
currency,
at
value
(cost
$
171,482
)
........................................................
171,556
Receivables:
Investment
securities
sold
...................................................................
264,221
Capital
shares
sold
........................................................................
82,319
Dividends
...............................................................................
383,185
European
Union
tax
reclaims
(Note
1
d
)
.........................................................
101,769
Total
assets
..........................................................................
363,163,352
Liabilities:
Payables:
Investment
securities
purchased
..............................................................
433,257
Capital
shares
redeemed
...................................................................
252,615
Management
fees
.........................................................................
397,398
Distribution
fees
..........................................................................
46,556
Transfer
agent
fees
........................................................................
119,113
Trustees'
fees
and
expenses
.................................................................
382
Payable
upon
return
of
securities
loaned
(Note
1
c
)
..................................................
134,633
Deferred
tax
...............................................................................
7,797,645
Accrued
expenses
and
other
liabilities
...........................................................
149,356
Total
liabilities
.........................................................................
9,330,955
Net
assets,
at
value
.................................................................
$353,832,397
Net
assets
consist
of:
Paid-in
capital
.............................................................................
$313,378,827
Total
distributable
earnings
(losses)
.............................................................
40,453,570
Net
assets,
at
value
.................................................................
$353,832,397
Templeton
Global
Investment
Trust
Financial
Statements
Statement
of
Assets
and
Liabilities
(continued)
August
31,
2024
Annual
Report
The
accompanying
notes
are
an
integral
part
of
these
financial
statements.
Templeton
Emerging
Markets
Small
Cap
Fund
Class
A:
Net
assets,
at
value
.......................................................................
$186,633,850
Shares
outstanding
........................................................................
13,226,238
Net
asset
value
per
share
a
,b
..................................................................
$14.11
Maximum
offering
price
per
share
(net
asset
value
per
share
÷
94
.50
%
)
b
................................
$14.93
Class
C:
Net
assets,
at
value
.......................................................................
$8,569,238
Shares
outstanding
........................................................................
663,052
Net
asset
value
and
maximum
offering
price
per
share
a
,b
............................................
$12.92
Class
R:
Net
assets,
at
value
.......................................................................
$2,146,520
Shares
outstanding
........................................................................
155,692
Net
asset
value
and
maximum
offering
price
per
share
b
.............................................
$13.79
Class
R6:
Net
assets,
at
value
.......................................................................
$26,407,726
Shares
outstanding
........................................................................
1,834,746
Net
asset
value
and
maximum
offering
price
per
share
b
.............................................
$14.39
Advisor
Class:
Net
assets,
at
value
.......................................................................
$130,075,063
Shares
outstanding
........................................................................
9,023,010
Net
asset
value
and
maximum
offering
price
per
share
b
.............................................
$14.42
a
Redemption
price
is
equal
to
net
asset
value
less
contingent
deferred
sales
charges,
if
applicable.
b
Net
asset
value
per
share
may
not
recalculate
due
to
rounding.
Templeton
Global
Investment
Trust
Financial
Statements
Statement
of
Operations
for
the
year
ended
August
31,
2024
The
accompanying
notes
are
an
integral
part
of
these
financial
statements.
Annual
Report
Templeton
Emerging
Markets
Small
Cap
Fund
Investment
income:
Dividends:
(net
of
foreign
taxes
of
$1,138,769)
Unaffiliated
issuers
........................................................................
$8,887,389
Non-controlled
affiliates
(Note
3
f
)
.............................................................
337,271
Income
from
securities
loaned:
Unaffiliated
entities
(net
of
fees
and
rebates)
.....................................................
4,018
Non-controlled
affiliates
(Note
3
f
)
.............................................................
3,150
Total
investment
income
...................................................................
9,231,828
Expenses:
Management
fees
(Note
3
a
)
...................................................................
4,974,227
Distribution
fees:
(Note
3c
)
Class
A
................................................................................
444,201
Class
C
................................................................................
89,292
Class
R
................................................................................
10,393
Transfer
agent
fees:
(Note
3e
)
Class
A
................................................................................
304,438
Class
C
................................................................................
15,201
Class
R
................................................................................
3,555
Class
R6
...............................................................................
13,388
Advisor
Class
............................................................................
236,846
Custodian
fees
............................................................................
109,624
Reports
to
shareholders
fees
..................................................................
34,095
Registration
and
filing
fees
....................................................................
116,015
Professional
fees
...........................................................................
61,588
Trustees'
fees
and
expenses
..................................................................
43,254
Other
....................................................................................
60,763
Total
expenses
.........................................................................
6,516,880
Expenses
waived/paid
by
affiliates
(Note
3
f
and
3
g
)
..............................................
(651,390)
Net
expenses
.........................................................................
5,865,490
Net
investment
income
................................................................
3,366,338
Realized
and
unrealized
gains
(losses):
Net
realized
gain
(loss)
from:
Investments:
(net
of
foreign
taxes
of
$2,282,966)
Unaffiliated
issuers
......................................................................
(6,225,570)
Foreign
currency
transactions
................................................................
(57,017)
Net
realized
gain
(loss)
..................................................................
(6,282,587)
Net
change
in
unrealized
appreciation
(depreciation)
on:
Investments:
Unaffiliated
issuers
......................................................................
63,448,382
Translation
of
other
assets
and
liabilities
denominated
in
foreign
currencies
..............................
(12,998)
Change
in
deferred
taxes
on
unrealized
appreciation
...............................................
(3,607,169)
Net
change
in
unrealized
appreciation
(depreciation)
............................................
59,828,215
Net
realized
and
unrealized
gain
(loss)
............................................................
53,545,628
Net
increase
(decrease)
in
net
assets
resulting
from
operations
..........................................
$56,911,966
Templeton
Global
Investment
Trust
Financial
Statements
Statements
of
Changes
in
Net
Assets
Annual
Report
The
accompanying
notes
are
an
integral
part
of
these
financial
statements.
Templeton
Emerging
Markets
Small
Cap
Fund
Year
Ended
August
31,
2024
Year
Ended
August
31,
2023
Increase
(decrease)
in
net
assets:
Operations:
Net
investment
income
.................................................
$3,366,338
$6,115,027
Net
realized
gain
(loss)
.................................................
(6,282,587)
(18,622,465)
Net
change
in
unrealized
appreciation
(depreciation)
...........................
59,828,215
32,093,822
Net
increase
(decrease)
in
net
assets
resulting
from
operations
................
56,911,966
19,586,384
Distributions
to
shareholders:
Class
A
.............................................................
(5,154,505)
(13,458,092)
Class
C
.............................................................
(208,350)
(867,935)
Class
R
.............................................................
(58,515)
(154,143)
Class
R6
............................................................
(845,772)
(2,136,443)
Advisor
Class
........................................................
(4,785,158)
(10,460,496)
Total
distributions
to
shareholders
..........................................
(11,052,300)
(27,077,109)
Capital
share
transactions:
(Note
2
)
Class
A
.............................................................
(14,843,790)
(6,802,414)
Class
C
.............................................................
(2,468,722)
(3,373,063)
Class
R
.............................................................
(222,112)
17,445
Class
R6
............................................................
(4,418,953)
(3,846,473)
Advisor
Class
........................................................
(67,967,274)
37,836,258
Total
capital
share
transactions
............................................
(89,920,851)
23,831,753
Net
increase
(decrease)
in
net
assets
...................................
(44,061,185)
16,341,028
Net
assets:
Beginning
of
year
.......................................................
397,893,582
381,552,554
End
of
year
...........................................................
$353,832,397
$397,893,582
Templeton
Global
Investment
Trust
Notes
to
Financial
Statements
Templeton
Emerging
Markets
Small
Cap
Fund
1.
Organization
and
Significant
Accounting
Policies
Templeton
Global
Investment
Trust (Trust)
is
registered
under
the
Investment
Company
Act
of
1940
(1940
Act)
as
an
open-end
management
investment
company,
consisting
of three separate
funds.
The
Trust
follows
the
accounting
and
reporting
guidance
in
Financial
Accounting
Standards
Board
(FASB)
Accounting
Standards
Codification
Topic
946,
Financial
Services
–
Investment
Companies
(ASC
946)
and applies
the
specialized
accounting
and
reporting
guidance
in
U.S.
Generally
Accepted
Accounting
Principles
(U.S.
GAAP),
including,
but
not
limited
to,
ASC
946.
Templeton
Emerging
Markets
Small
Cap
Fund
(Fund)
is
included
in
this
report.
The
Fund
offers
five classes
of
shares:
Class
A,
Class
C,
Class
R,
Class
R6
and
Advisor
Class. Class
C
shares
automatically
convert
to
Class
A
shares
on
a
monthly
basis,
after
they
have
been
held
for
8
years.
Each
class
of
shares
may
differ
by
its
initial
sales
load,
contingent
deferred
sales
charges,
voting
rights
on
matters
affecting
a
single
class,
its
exchange
privilege
and
fees
due
to
differing
arrangements
for
distribution
and
transfer
agent
fees.
The
following
summarizes
the Fund's
significant
accounting
policies.
a.
Financial
Instrument
Valuation
The
Fund's
investments
in
financial
instruments
are
carried
at
fair
value
daily.
Fair
value
is
the
price
that
would
be
received
to
sell
an
asset
or
paid
to
transfer
a
liability
in
an
orderly
transaction
between
market
participants
on
the
measurement
date.
The
Fund
calculates
the
net
asset
value
(NAV)
per
share
each business
day as
of
4
p.m.
Eastern
time
or
the
regularly
scheduled
close
of
the
New
York
Stock
Exchange
(NYSE),
whichever
is
earlier.
Under
compliance
policies
and
procedures
approved
by
the Fund's
Board
of
Trustees
(the
Board),
the
Board
has
designated
the
Fund’s
investment
manager
as
the
valuation
designee
and
has
responsibility
for
oversight
of
valuation.
The
investment
manager
is
assisted
by
the
Fund’s
administrator
in
performing
this
responsibility,
including
leading
the
cross-
functional
Valuation
Committee
(VC).
The
Fund
may
utilize
independent
pricing
services,
quotations
from
securities
and
financial
instrument
dealers,
and
other
market
sources
to
determine
fair
value.
Equity
securities
listed
on
an
exchange
or
on
the
NASDAQ
National
Market
System
are
valued
at
the
last
quoted
sale
price
or
the
official
closing
price of
the
day,
respectively.
Foreign
equity
securities
are
valued
as
of
the
close
of
trading
on
the
foreign
stock
exchange
on
which
the
security
is
primarily
traded,
or
as
of
4
p.m.
Eastern
time.
The
value
is
then
converted
into
its
U.S.
dollar
equivalent
at
the
foreign
exchange
rate
in
effect
at
4
p.m.
Eastern
time
on
the
day
that
the
value
of
the
security
is
determined.
Over-the-counter
(OTC)
securities
are
valued
within
the
range
of
the
most
recent
quoted
bid
and
ask
prices.
Securities
that
trade
in
multiple
markets
or
on
multiple
exchanges
are
valued
according
to
the
broadest
and
most
representative
market.
Certain
equity
securities
are
valued
based
upon
fundamental
characteristics
or
relationships
to
similar
securities.
Investments
in open-end mutual
funds
are
valued
at
the
closing
NAV.
The
Fund
has
procedures
to
determine
the
fair
value
of
financial
instruments
for
which
market
prices
are
not
reliable
or
readily
available.
Under
these
procedures,
the Fund
primarily
employs
a
market-based
approach
which
may
use
related
or
comparable
assets
or
liabilities,
recent
transactions,
market
multiples,
and
other
relevant
information
for
the
investment
to
determine
the
fair
value
of
the
investment.
An
income-based
valuation
approach
may
also
be
used
in
which
the
anticipated
future
cash
flows
of
the
investment
are
discounted
to
calculate
fair
value.
Discounts
may
also
be
applied
due
to
the
nature
or
duration
of
any
restrictions
on
the
disposition
of
the
investments.
Due
to
the
inherent
uncertainty
of
valuations
of
such
investments,
the
fair
values
may
differ
significantly
from
the
values
that
would
have
been
used
had
an
active
market
existed.
Trading
in
securities
on
foreign
securities
stock
exchanges
and
OTC
markets
may
be
completed
before
4
p.m.
Eastern
time.
In
addition,
trading
in
certain
foreign
markets
may
not
take
place
on
every
Fund's
business
day. Events
can occur
between
the
time
at
which
trading
in
a
foreign
security
is
completed
and
4
p.m.
Eastern
time
that
might
call
into
question
the
reliability
of
the
value
of
a
portfolio
security
held
by
the
Fund.
As
a
result,
differences
may
arise
between
the
value
of
the
Fund's
portfolio
securities
as
determined
at
the
foreign
market
close
and
the
latest
indications
of
value
at
4
p.m.
Eastern
time. In
order
to
minimize
the
potential
for
these
differences,
an
independent
pricing
service
may
be
used
to
adjust
the
value
of
the
Fund's
portfolio
securities
to
the
latest
indications
of
fair
value
at
4
p.m.
Eastern
time.
At
August
31,
2024,
certain
securities
may
have
been
fair
valued
using
these
procedures,
in
which
case
the
securities
Templeton
Global
Investment
Trust
Notes
to
Financial
Statements
Templeton
Emerging
Markets
Small
Cap
Fund
(continued)
were
categorized
as
Level
2
within
the
fair
value
hierarchy
(referred
to
as
“market
level
fair
value”).
See
the
Fair
Value
Measurements
note
for
more
information.
When
the
last
day
of
the
reporting
period
is
a
non-business
day,
certain
foreign
markets
may
be
open
on
those
days
that
the
Fund's
NAV
is
not
calculated,
which
could
result
in
differences
between
the
value
of
the
Fund's
portfolio
securities
on
the
last
business
day
and
the
last
calendar
day
of
the
reporting
period.
Any
security
valuation
changes
due
to
an
open
foreign
market
are
adjusted
and
reflected
by
the
Fund
for
financial
reporting
purposes.
b.
Foreign
Currency
Translation
Portfolio
securities
and
other
assets
and
liabilities
denominated
in
foreign
currencies
are
translated
into
U.S.
dollars
based
on
the
exchange
rate
of
such
currencies
against
U.S.
dollars
on
the
date
of
valuation.
The
Fund
may
enter
into
foreign
currency
exchange
contracts
to
facilitate
transactions
denominated
in
a
foreign
currency.
Purchases
and
sales
of
securities,
income
and
expense
items
denominated
in
foreign
currencies
are
translated
into
U.S.
dollars
at
the
exchange
rate
in
effect
on
the
transaction
date.
Portfolio
securities
and
assets
and
liabilities
denominated
in
foreign
currencies
contain
risks
that
those
currencies
will
decline
in
value
relative
to
the
U.S.
dollar.
Occasionally,
events
may
impact
the
availability
or
reliability
of
foreign
exchange
rates
used
to
convert
the
U.S.
dollar
equivalent
value.
If
such
an
event
occurs,
the
foreign
exchange
rate
will
be
valued
at
fair
value
using
procedures
established
and
approved
by
the
Board.
The
Fund
does
not
separately
report
the
effect
of
changes
in
foreign
exchange
rates
from
changes
in
market
prices
on
securities
held.
Such
changes
are
included
in
net
realized
and
unrealized
gain
or
loss
from
investments
in
the
Statement of
Operations.
Realized
foreign
exchange
gains
or
losses
arise
from
sales
of
foreign
currencies,
currency
gains
or
losses
realized
between
the
trade
and
settlement
dates
on
securities
transactions
and
the
difference
between
the
recorded
amounts
of
dividends,
interest,
and
foreign
withholding
taxes
and
the
U.S.
dollar
equivalent
of
the
amounts
actually
received
or
paid.
Net
unrealized
foreign
exchange
gains
and
losses
arise
from
changes
in
foreign
exchange
rates
on
foreign
denominated
assets
and
liabilities
other
than
investments
in
securities
held
at
the
end
of
the
reporting
period.
c.
Securities
Lending
The
Fund
participates
in
an
agency
based
securities
lending
program
to
earn
additional
income.
The
Fund
receives
collateral
in
the
form
of
cash
and/or
U.S.
Government
and
Agency
securities
against
the
loaned
securities
in
an
amount
equal
to
at
least
102%
of
the
fair
value
of
the
loaned
securities.
Collateral
is
maintained
over
the
life
of
the
loan
in
an
amount
not
less
than
100%
of
the
fair
value
of
loaned
securities,
as
determined
at
the
close
of
Fund
business
each
day;
any
additional
collateral
required
due
to
changes
in
security
values
is
delivered
to
the
Fund
on
the
next
business
day.
Any
cash
collateral
received
is
deposited
into
a
joint
cash
account
with
other
funds
and
is
used
to
invest
in
a
money
market
fund
managed
by
Franklin
Advisers,
Inc.,
an
affiliate
of
the
Fund.
Additionally,
at
August
31,
2024,
the
Fund
held
$3,109,317
in
U.S.
Government
and
Agency
securities
as
collateral.
These
securities
are
held
as
collateral
in
segregated
accounts
with
the
Fund's
custodian.
The
Fund
cannot
repledge
or
resell
these
securities
held
as
collateral.
As
such,
the
non-cash
collateral
is
excluded
from
the
Statement
of
Assets
and
Liabilities. The
Fund
may
receive
income
from
the
investment
of
cash
collateral,
in
addition
to
lending
fees paid
by
the
borrower.
Income
from
securities
loaned,
net
of
fees
paid
to
the
securities
lending
agent
and/or
third-party
vendor,
is
reported
separately
in
the Statement of
Operations.
The
Fund
bears
the
market
risk
with
respect
to
any
cash
collateral
investment,
securities
loaned,
and
the
risk
that
the
agent
may
default
on
its
obligations
to
the
Fund.
If
the
borrower
defaults
on
its
obligation
to
return
the
securities
loaned,
the
Fund
has
the
right
to
repurchase
the
securities
in
the
open
market
using
the
collateral
received.
The
securities
lending
agent
has
agreed
to
indemnify
the
Fund
in
the
event
of
default
by
a
third
party
borrower.
d.
Income
and
Deferred
Taxes
It
is the Fund's
policy
to
qualify
as
a
regulated
investment
company
under
the
Internal
Revenue
Code. The Fund
intends
to
distribute
to
shareholders
substantially
all
of
its
taxable
income
and
net
realized
gains
to
relieve
it
from
federal
income
and
excise
taxes.
As
a
result,
no
provision
for
U.S.
federal
income
taxes
is
required.
1.
Organization
and
Significant
Accounting
Policies
(continued)
a.
Financial
Instrument
Valuation
(continued)
Templeton
Global
Investment
Trust
Notes
to
Financial
Statements
Templeton
Emerging
Markets
Small
Cap
Fund
(continued)
The
Fund
may
be
subject
to
foreign
taxation
related
to
income
received,
capital
gains
on
the
sale
of
securities
and
certain
foreign
currency
transactions
in
the
foreign
jurisdictions
in
which it
invests.
Foreign
taxes,
if
any,
are
recorded
based
on
the
tax
regulations
and
rates
that
exist
in
the
foreign
markets
in
which
the
Fund
invests.
When
a
capital
gain
tax
is
determined
to
apply,
the
Fund
records
an
estimated
deferred
tax
liability
in
an
amount
that
would
be
payable
if
the
securities
were
disposed
of
on
the
valuation
date.
As
a
result
of
several
court
cases,
in
certain
countries
across
the
European
Union, the
Fund
filed
additional
tax
reclaims
for
previously
withheld
taxes
on
dividends
earned
in
those
countries
(EU
reclaims). Income
recognized,
if
any,
for
EU
reclaims
is
reflected
as
other
income
in
the
Statement
of
Operations
and
any
related
receivable,
if
any,
is
reflected
as
European
Union
tax
reclaims
in
the
Statement
of
Assets
and
Liabilities.
Any
fees
associated
with
these
filings
are
reflected
in
other
expenses
in
the
Statement
of
Operations.
When
uncertainty
exists
as
to
the
ultimate
resolution
of
these
proceedings,
the
likelihood
of
receipt
of
these
EU
reclaims,
and
the
potential
timing
of
payment,
no
amounts
are
reflected
in
the
financial
statements.
For
U.S.
income
tax
purposes,
EU
reclaims
received
by
the
Fund,
if
any,
reduce
the
amount
of
foreign
taxes
Fund
shareholders
can
use
as
tax
deductions
or credits
on
their
income
tax
returns.
The Fund
may
recognize
an
income
tax
liability
related
to
its
uncertain
tax
positions
under
U.S.
GAAP
when
the
uncertain
tax
position
has
a
less
than
50%
probability
that
it
will
be
sustained
upon
examination
by
the
tax
authorities
based
on
its
technical
merits.
As
of
August
31,
2024, the Fund
has
determined
that
no
tax
liability
is
required
in
its
financial
statements
related
to
uncertain
tax
positions
for
any
open
tax
years
(or
expected
to
be
taken
in
future
tax
years).
Open
tax
years
are
those
that
remain
subject
to
examination
and
are
based
on
the
statute
of
limitations
in
each
jurisdiction
in
which
the Fund
invests.
e.
Security
Transactions,
Investment
Income,
Expenses
and
Distributions
Security
transactions
are
accounted
for
on
trade
date.
Realized
gains
and
losses
on
security
transactions
are
determined
on
a
specific
identification
basis.
Estimated
expenses
are
accrued
daily.
Dividend
income
is
recorded
on
the
ex-dividend
date
except
for
certain
dividends
from
securities
where
the
dividend
rate
is
not
available.
In
such
cases,
the
dividend
is
recorded
as
soon
as
the
information
is
received
by
the
Fund.
Distributions
to
shareholders
are
recorded
on
the
ex-dividend
date.
Distributable
earnings
are
determined
according
to
income
tax
regulations
(tax
basis)
and
may
differ
from
earnings
recorded
in
accordance
with
U.S.
GAAP.
These
differences
may
be
permanent
or
temporary.
Permanent
differences
are
reclassified
among
capital
accounts
to
reflect
their
tax
character.
These
reclassifications
have
no
impact
on
net
assets
or
the
results
of
operations.
Temporary
differences
are
not
reclassified,
as
they
may
reverse
in
subsequent
periods.
Common
expenses
incurred
by
the
Trust
are
allocated
among
the
Funds
based
on
the
ratio
of
net
assets
of
each
Fund
to
the
combined
net
assets
of
the
Trust
or
based
on
the
ratio
of
number
of
shareholders
of
each
Fund
to
the
combined
number
of
shareholders
of
the
Trust.
Fund
specific
expenses
are
charged
directly
to
the
Fund
that
incurred
the
expense.
Realized
and
unrealized
gains
and
losses
and
net
investment
income,
excluding
class
specific
expenses,
are
allocated
daily
to
each
class
of
shares
based
upon
the
relative
proportion
of
net
assets
of
each
class.
Differences
in
per
share
distributions
by
class
are
generally
due
to
differences
in
class
specific
expenses.
f.
Accounting
Estimates
The
preparation
of
financial
statements
in
accordance
with
U.S.
GAAP
requires
management
to
make
estimates
and
assumptions
that
affect
the
reported
amounts
of
assets
and
liabilities
at
the
date
of
the
financial
statements
and
the
amounts
of
income
and
expenses
during
the
reporting
period.
Actual
results
could
differ
from
those
estimates.
1.
Organization
and
Significant
Accounting
Policies
(continued)
d.
Income
and
Deferred
Taxes
(continued)
Templeton
Global
Investment
Trust
Notes
to
Financial
Statements
Templeton
Emerging
Markets
Small
Cap
Fund
(continued)
g.
Guarantees
and
Indemnifications
Under
the Trust's
organizational
documents,
its
officers
and trustees
are
indemnified
by
the Trust against
certain
liabilities
arising
out
of
the
performance
of
their
duties
to
the
Trust.
Additionally,
in
the
normal
course
of
business,
the Trust,
on
behalf
of
the
Fund, enters
into
contracts
with
service
providers
that
contain
general
indemnification
clauses.
The Trust's
maximum
exposure
under
these
arrangements
is
unknown
as
this
would
involve
future
claims
that
may
be
made
against
the Trust
that
have
not
yet
occurred.
Currently,
the Trust
expects
the
risk
of
loss
to
be
remote.
2.
Shares
of
Beneficial
Interest
At
August
31,
2024,
there
were
an
unlimited
number
of
shares
authorized
($0.01
par
value).
Transactions
in
the
Fund's
shares
were
as
follows:
Year
Ended
August
31,
2024
Year
Ended
August
31,
2023
Shares
Amount
Shares
Amount
Class
A
Shares:
Shares
sold
a
...................................
1,258,523
$16,274,121
2,038,516
$24,548,864
Shares
issued
in
reinvestment
of
distributions
..........
361,112
4,427,211
988,332
11,590,825
Shares
redeemed
...............................
(2,772,976)
(35,545,122)
(3,594,802)
(42,942,103)
Net
increase
(decrease)
..........................
(1,153,341)
$(14,843,790)
(567,954)
$(6,802,414)
Class
C
Shares:
Shares
sold
...................................
90,234
$1,063,959
145,663
$1,609,366
Shares
issued
in
reinvestment
of
distributions
..........
18,240
205,927
79,727
859,170
Shares
redeemed
a
..............................
(318,497)
(3,738,608)
(531,185)
(5,841,599)
Net
increase
(decrease)
..........................
(210,023)
$(2,468,722)
(305,795)
$(3,373,063)
Class
R
Shares:
Shares
sold
...................................
12,345
$155,269
17,998
$213,368
Shares
issued
in
reinvestment
of
distributions
..........
4,876
58,515
13,430
154,143
Shares
redeemed
...............................
(34,724)
(435,896)
(29,764)
(350,066)
Net
increase
(decrease)
..........................
(17,503)
$(222,112)
1,664
$17,445
Class
R6
Shares:
Shares
sold
...................................
365,384
$4,779,314
607,304
$7,495,714
Shares
issued
in
reinvestment
of
distributions
..........
45,170
563,720
89,455
1,068,229
Shares
redeemed
...............................
(740,978)
(9,761,987)
(1,021,519)
(12,410,416)
Net
increase
(decrease)
..........................
(330,424)
$(4,418,953)
(324,760)
$(3,846,473)
Advisor
Class
Shares:
Shares
sold
...................................
1,849,902
$24,099,899
7,384,346
$92,218,229
Shares
issued
in
reinvestment
of
distributions
..........
347,372
4,342,154
792,266
9,472,682
Shares
redeemed
...............................
(7,679,792)
(96,409,327)
(5,130,704)
(63,854,653)
Net
increase
(decrease)
..........................
(5,482,518)
$(67,967,274)
3,045,908
$37,836,258
a
May
include
a
portion
of
Class
C
shares
that
were
automatically
converted
to
Class
A.
1.
Organization
and
Significant
Accounting
Policies
(continued)
Templeton
Global
Investment
Trust
Notes
to
Financial
Statements
Templeton
Emerging
Markets
Small
Cap
Fund
(continued)
3.
Transactions
with
Affiliates
Franklin
Resources,
Inc.
is
the
holding
company
for
various
subsidiaries
that
together
are
referred
to
as
Franklin
Templeton.
Certain
officers
and
trustees
of
the Trust are
also
officers
and/or
directors
of
the
following
subsidiaries:
a.
Management
Fees
The
Fund
pays
an
investment
management fee,
calculated
daily and
paid
monthly,
to
Asset
Management based
on the
average
daily
net
assets
of
the
Fund
as
follows:
For
the
year
ended
August
31,
2024,
the
gross
effective
investment
management
fee
rate
was 1.400%
of
the
Fund’s
average daily
net
assets.
b.
Administrative
Fees
Under
an
agreement
with
Asset
Management,
FT
Services
provides
administrative
services
to
the
Fund.
The
fee
is
paid
by
Asset
Management
based
on
the
Fund's
average
daily
net
assets,
and
is
not
an
additional
expense
of
the
Fund.
c.
Distribution
Fees
The
Board
has
adopted
distribution
plans
for
each
share
class,
with
the
exception
of
Class
R6
and
Advisor
Class
shares,
pursuant
to
Rule
12b-1
under
the
1940
Act.
Under
the
Fund's
Class
A
reimbursement
distribution
plan,
the
Fund
reimburses
Distributors
for
costs
incurred
in
connection
with
the
servicing,
sale
and
distribution
of the
Fund's
shares
up
to
the
maximum
annual
plan
rate.
Under
the
Class
A
reimbursement
distribution
plan,
costs
exceeding
the
maximum
for
the
current
plan
year
cannot
be
reimbursed
in
subsequent
periods.
In
addition,
under
the
Fund's
Class
C
and
R compensation
distribution
plans,
the
Fund
pays
Distributors
for
costs
incurred
in
connection
with
the
servicing,
sale
and
distribution
of
the
Fund's
shares
up
to
the
maximum
annual
plan
rate
for
each
class.
The
plan
year,
for
purposes
of
monitoring
compliance
with
the
maximum
annual
plan
rates,
is
February
1
through
January
31.
The
maximum
annual
plan
rates,
based
on
the
average
daily
net
assets,
for
each
class,
are
as
follows:
The
Board
has
set
the
current
rate
at
0.25%
per
year
for
Class
A
shares
until
further
notice
and
approval
by
the
Board.
Subsidiary
Affiliation
Templeton
Asset
Management
Ltd.
(Asset
Management)
Investment
manager
Franklin
Templeton
Services,
LLC
(FT
Services)
Administrative
manager
Franklin
Distributors,
LLC
(Distributors)
Principal
underwriter
Franklin
Templeton
Investor
Services,
LLC
(Investor
Services)
Transfer
agent
Annualized
Fee
Rate
Net
Assets
1.400%
Up
to
and
including
$500
million
1.300%
Over
$500
million,
up
to
and
including
$1
billion
1.200%
In
excess
of
$1
billion
Class
A
....................................................................................
0.35%
Class
C
....................................................................................
1.00%
Class
R
....................................................................................
0.50%
Templeton
Global
Investment
Trust
Notes
to
Financial
Statements
Templeton
Emerging
Markets
Small
Cap
Fund
(continued)
d.
Sales
Charges/Underwriting
Agreements
Front-end
sales
charges
and
contingent
deferred
sales
charges
(CDSC)
do
not
represent
expenses
of
the
Fund.
These
charges
are
deducted
from
the
proceeds
of
sales
of
fund
shares
prior
to
investment
or
from
redemption
proceeds
prior
to
remittance,
as
applicable.
Distributors
has
advised
the
Fund
of
the
following
commission
transactions
related
to
the
sales
and
redemptions
of
the
Fund's
shares
for
the
year:
e.
Transfer
Agent
Fees
Each
class
of
shares pays
transfer
agent
fees,
calculated
monthly
and
paid
monthly, to
Investor
Services
for
its
performance
of
shareholder
servicing
obligations. Effective
October
1,
2023,
the
fees
are based
on
a
fixed
margin
earned
by
Investor
Services
and
are allocated
to
the Fund
based
upon
relative
assets
and
relative
transactions.
Prior
to
October
1,
2023,
the
fees
were
based
on
an
annualized
asset
based
fee
of
0.016%
plus
a
transaction
based
fee. In
addition,
each
class reimburses
Investor
Services
for
out
of
pocket
expenses
incurred
and,
except
for
Class
R6, reimburses
shareholder
servicing
fees
paid
to
third
parties.
These
fees
paid
to
third
parties
are
accrued
and
allocated
daily
based
upon
their
relative
proportion
of
such
classes'
aggregate
net
assets.
Class
R6
pays
Investor
Services
transfer
agent
fees
allocated
specifically
to
that
class
based
upon
its
relative
assets
and
relative
transactions.
For
the
year
ended
August
31,
2024,
the Fund
paid
transfer
agent
fees
as
noted
in
the
Statement of
Operations,
of
which
$148,479
was
retained
by
Investor
Services.
f.
Investments
in
Affiliated
Management
Investment
Companies
The
Fund
invests
in
one
or
more
affiliated
management
investment
companies.
As
defined
in
the
1940
Act,
an
investment
is
deemed
to
be
a
“Controlled
Affiliate”
of
a
fund
when
a
fund
owns,
either
directly
or
indirectly,
25%
or
more
of
the
affiliated
fund’s
outstanding
shares
or
has
the
power
to
exercise
control
over
management
or
policies
of
such
fund.
The
Fund
does
not
invest
for
purposes
of
exercising
a
controlling
influence
over
the
management
or
policies.
Management
fees
paid
by
the
Fund
are
waived
on
assets
invested
in
the
affiliated
management
investment
companies,
as
noted
in
the
Statement
of
Operations,
in
an
amount
not
to
exceed
the
management
and
administrative
fees
paid
directly
or
indirectly
by
each
affiliate.
During
the
year
ended
August
31,
2024,
the
Fund
held
investments
in
affiliated
management
investment
companies
as
follows:
Sales
charges
retained
net
of
commissions
paid
to
unaffiliated
brokers/dealers
..............................
$6,909
CDSC
retained
..............................................................................
$549
aa
Value
at
Beginning
of
Year
Purchases
Sales
Realized
Gain
(Loss)
Net
Change
in
Unrealized
Appreciation
(Depreciation)
Value
at
End
of
Year
Number
of
Shares
Held
at
End
of
Year
Investment
Income
a
a
a
a
a
a
a
a
Templeton
Emerging
Markets
Small
Cap
Fund
Non-Controlled
Affiliates
Dividends
Institutional
Fiduciary
Trust
-
Money
Market
Portfolio
,
4.982
%
$13,955,515
$91,014,297
$(99,849,128)
$—
$—
$5,120,684
5,120,684
$337,271
Non-Controlled
Affiliates
Income
from
securities
loaned
Institutional
Fiduciary
Trust
-
Money
Market
Portfolio
,
4.982
%
$—
$7,340,408
$(7,205,775)
$—
$—
$134,633
134,633
$3,150
Total
Affiliated
Securities
...
$13,955,515
$98,354,705
$(107,054,903)
$—
$—
$5,255,317
$340,421
3.
Transactions
with
Affiliates
(continued)
Templeton
Global
Investment
Trust
Notes
to
Financial
Statements
Templeton
Emerging
Markets
Small
Cap
Fund
(continued)
g.
Waiver
and
Expense
Reimbursements
Asset
Management
has
contractually
agreed
in
advance
to
waive
or
limit
its
fees
and
to
assume
as
its
own
expense
certain
expenses
otherwise
payable
by
the
Fund
so
that
the
operating
expenses
(excluding
distribution
fees,
acquired
fund
fees
and
expenses,
and
certain
non-routine
expenses
or
costs,
including
those
relating
to
litigation,
indemnification,
reorganizations,
and
liquidations)
for
each
class
of
the
Fund
do
not
exceed
1.50%
based
on
the
average
net
assets
of
each
class
until
December
31,
2024.
Total
expenses
waived
or
paid
are
not
subject
to
recapture
subsequent
to
the
Fund’s
fiscal
year
end.
Transfer
agent
fees
on
Class
R6
shares
of
the
Fund have
been
capped
so
that
transfer
agent
fees
for
that
class
do
not
exceed
0.03%
based
on
the
average
net
assets
of
the
class
until
December
31,
2024.
4.
Income
Taxes
For
tax
purposes,
capital
losses
may
be
carried
over
to
offset
future
capital
gains.
At
August
31,
2024,
the
capital
loss
carryforwards
were
as
follows:
During
the
year
ended
August
31,
2024,
the
Fund
utilized
$3,431,793
of
capital
loss
carryforwards.
The
tax
character
of
distributions
paid
during
the
years
ended
August
31,
2024
and
2023,
was
as
follows:
At
August
31,
2024,
the
cost
of
investments,
net
unrealized
appreciation
(depreciation)
and
undistributed
ordinary
income for
income
tax
purposes
were
as
follows:
Differences
between
income
and/or
capital
gains
as
determined
on
a
book
basis
and
a
tax
basis
are
primarily
due
to
differing
treatments
of
wash
sales,
passive
foreign
investment
company
shares,
foreign
capital
gains
tax
and
corporate
actions.
Capital
loss
carryforwards
not
subject
to
expiration:
Short
term
................................................................................
$927,092
Long
term
................................................................................
29,781,973
Total
capital
loss
carryforwards
...............................................................
$30,709,065
2024
2023
Distributions
paid
from:
Ordinary
income
..........................................................
$11,052,300
$8,928,587
Long
term
capital
gain
......................................................
—
18,148,522
$11,052,300
$27,077,109
Cost
of
investments
..........................................................................
$283,513,964
Unrealized
appreciation
........................................................................
$131,019,935
Unrealized
depreciation
........................................................................
(52,373,597)
Net
unrealized
appreciation
(depreciation)
..........................................................
$78,646,338
Distributable
earnings:
Undistributed
ordinary
income
...................................................................
$1,248,683
3.
Transactions
with
Affiliates
(continued)
Templeton
Global
Investment
Trust
Notes
to
Financial
Statements
Templeton
Emerging
Markets
Small
Cap
Fund
(continued)
5.
Investment
Transactions
Purchases
and
sales
of
investments (excluding
short
term
securities) for
the
year
ended
August
31,
2024,
aggregated
$70,379,682 and
$159,564,198,
respectively.
At
August
31,
2024,
in
connection
with
securities
lending
transactions,
the
Fund
loaned
equity
investments
and
received
$134,633
of
cash
collateral.
The
gross
amount
of
recognized
liability
for
such
transactions
is
included
in
payable
upon
return
of
securities
loaned
in
the
Statement
of
Assets
and
Liabilities.
The
agreements
can
be
terminated
at
any
time.
6.
Concentration
of
Risk
Investing
in
foreign
securities
may
include
certain
risks
and
considerations
not
typically
associated
with
investing
in
U.S.
securities,
such
as
fluctuating
currency
values
and
changing
local,
regional
and
global
economic,
political
and
social
conditions,
which
may
result
in
greater
market
volatility.
Political
and
financial
uncertainty
in
many
foreign
regions
may
increase
market
volatility
and
the
economic
risk
of
investing
in
foreign
securities.
In
addition,
certain
foreign
securities
may
not
be
as
liquid
as
U.S.
securities.
Certain
investments
in
Chinese
companies
are
made
through
a
special
structure
known
as
a
VIE.
In
a
VIE
structure,
foreign
investors,
such
as
the
Fund,
will
only
own
stock
in
a
shell
company
rather
than
directly
in
the
VIE,
which
must
be
owned
by
Chinese
nationals
(and/or
Chinese
companies)
to
obtain
the
licenses
and/or
assets
required
to
operate
in
a
restricted
or
prohibited
sector
in
China.
The
value
of
the
shell
company
is
derived
from
its
ability
to
consolidate
the
VIE
into
its
financials
pursuant
to
contractual
arrangements
that
allow
the
shell
company
to
exert
a
degree
of
control
over,
and
obtain
economic
benefits
arising
from,
the
VIE
without
formal
legal
ownership.
While
VIEs
are
a
longstanding
industry
practice
and
are
well
known
by
Chinese
officials
and
regulators,
the
structure
historically
has
not
been
formally
recognized
under
Chinese
law
and
it
is
uncertain
whether
Chinese
officials
or
regulators
will
withdraw
their
implicit
acceptance
of
the
structure.
It
is
also
uncertain
whether
the
contractual
arrangements,
which
may
be
subject
to
conflicts
of
interest
between
the
legal
owners
of
the
VIE
and
foreign
investors,
would
be
enforced
by
Chinese
courts
or
arbitration
bodies.
Prohibitions
of
these
structures
by
the
Chinese
government,
or
the
inability
to
enforce
such
contracts,
from
which
the
shell
company
derives
its
value,
would
likely
cause
the
VIE-structured
holding(s)
to
suffer
significant,
detrimental,
and
possibly
permanent
losses,
and
in
turn,
adversely
affect
the
Fund’s
returns
and
net
asset
value.
7.
Credit
Facility
The
Fund,
together
with
other
U.S.
registered
and
foreign
investment
funds
(collectively,
Borrowers),
managed
by
Franklin
Templeton,
are
borrowers
in
a
joint
syndicated
senior
unsecured
credit
facility
totaling
$2.675
billion
(Global
Credit
Facility)
which
matures
on
January
31,
2025.
This
Global
Credit
Facility
provides
a
source
of
funds
to
the
Borrowers
for
temporary
and
emergency
purposes,
including
the
ability
to
meet
future
unanticipated
or
unusually
large
redemption
requests.
Under
the
terms
of
the
Global
Credit
Facility,
the
Fund
shall,
in
addition
to
interest
charged
on
any
borrowings
made
by
the
Fund
and
other
costs
incurred
by
the
Fund,
pay
its
share
of
fees
and
expenses
incurred
in
connection
with
the
implementation
and
maintenance
of
the
Global
Credit
Facility,
based
upon
its
relative
share
of
the
aggregate
net
assets
of
all
of
the
Borrowers,
including
an
annual
commitment
fee
of
0.15%
based
upon
the
unused
portion
of
the
Global
Credit
Facility.
These
fees
are
reflected
in
other
expenses
in
the
Statement
of
Operations.
During
the
year
ended
August
31,
2024,
the Fund
did
not
use
the
Global
Credit
Facility.
8.
Fair
Value
Measurements
The
Fund
follows
a
fair
value
hierarchy
that
distinguishes
between
market
data
obtained
from
independent
sources
(observable
inputs)
and
the Fund's
own
market
assumptions
(unobservable
inputs).
These
inputs
are
used
in
determining
the
value
of
the
Fund's financial
instruments
and
are
summarized
in
the
following
fair
value
hierarchy:
Templeton
Global
Investment
Trust
Notes
to
Financial
Statements
Templeton
Emerging
Markets
Small
Cap
Fund
(continued)
Level
1
–
quoted
prices
in
active
markets
for
identical
financial
instruments
Level
2
–
other
significant
observable
inputs
(including
quoted
prices
for
similar
financial
instruments,
interest
rates,
prepayment
speed,
credit
risk,
etc.)
Level
3
–
significant
unobservable
inputs
(including
the
Fund's
own
assumptions
in
determining
the
fair
value
of
financial
instruments)
The
input
levels
are
not
necessarily
an
indication
of
the
risk
or
liquidity
associated
with
financial
instruments
at
that
level.
A
summary
of
inputs
used
as
of August
31,
2024,
in
valuing
the
Fund's
assets
carried
at
fair
value,
is
as
follows:
9.
Subsequent
Events
The
Fund
has
evaluated
subsequent
events
through
the
issuance
of
the
financial
statements
and
determined
that
no
events
have
occurred
that
require
disclosure.
Level
1
Level
2
Level
3
Total
Templeton
Emerging
Markets
Small
Cap
Fund
Assets:
Investments
in
Securities:
Common
Stocks
:
Brazil
................................
$
8,358,575
$
—
$
—
$
8,358,575
Cambodia
............................
—
1,382,302
—
1,382,302
Chile
................................
1,293,662
—
—
1,293,662
China
...............................
11,066,465
5,685,087
—
16,751,552
Georgia
..............................
3,009,297
—
—
3,009,297
Greece
..............................
—
2,387,858
—
2,387,858
Hong
Kong
...........................
—
3,601,301
—
3,601,301
Hungary
.............................
7,690,147
—
—
7,690,147
India
................................
8,639,747
116,497,544
—
125,137,291
Indonesia
............................
3,317,376
1,841,965
—
5,159,341
Italy
.................................
—
4,292,576
—
4,292,576
Kazakhstan
...........................
3,743,390
—
—
3,743,390
Mexico
..............................
4,782,520
—
—
4,782,520
Peru
................................
3,076,372
—
—
3,076,372
Philippines
............................
20,448,383
—
—
20,448,383
Saudi
Arabia
..........................
3,120,628
3,809,234
—
6,929,862
South
Africa
...........................
—
3,710,130
—
3,710,130
South
Korea
..........................
—
27,612,270
—
27,612,270
Taiwan
...............................
—
48,793,735
—
48,793,735
Thailand
.............................
—
8,816,718
—
8,816,718
United
Arab
Emirates
....................
6,661,636
4,533,981
—
11,195,617
Vietnam
..............................
—
30,785,209
—
30,785,209
Preferred
Stocks
........................
7,946,877
—
—
7,946,877
Short
Term
Investments
...................
5,255,317
—
—
5,255,317
Total
Investments
in
Securities
...........
$98,410,392
$263,749,910
a
$—
$362,160,302
a
Includes
foreign
securities
valued
at
$263,749,910,
which
were
categorized
as
Level
2
as
a
result
of
the
application
of
market
level
fair
value
procedures.
See
the
Financial
Instrument
Valuation
note
for
more
information.
8.
Fair
Value
Measurements
(continued)
Templeton
Global
Investment
Trust
Notes
to
Financial
Statements
Templeton
Emerging
Markets
Small
Cap
Fund
(continued)
Abbreviations
Selected
Portfolio
ADR
American
Depositary
Receipt
GDR
Global
Depositary
Receipt
PJSC
Public
Joint
Stock
Company
Templeton
Global
Investment
Trust
Report
of
Independent
Registered
Public
Accounting
Firm
To
the
Board
of
Trustees
of
Templeton
Global
Investment
Trust
and
Shareholders
of
Templeton
Emerging
Markets
Small
Cap
Fund
Opinion
on
the
Financial
Statements
We
have
audited
the
accompanying
statement
of
assets
and
liabilities,
including
the
schedule
of
investments,
of
Templeton
Emerging
Markets
Small
Cap
Fund
(one
of
the
funds
constituting
Templeton
Global
Investment
Trust,
referred
to
hereafter
as
the
"Fund")
as
of
August
31,
2024,
the
related
statement
of
operations
for
the
year
ended
August
31,
2024,
the
statements
of
changes
in
net
assets
for
each
of
the
two
years
in
the
period
ended
August
31,
2024,
including
the
related
notes,
and
the
financial
highlights
for
each
of
the
two
years
in
the
period
ended
August
31,
2024,
the
period
April
1,
2022
to
August
31,
2022
and
each
of
the
three
years
in
the
period
ended
March
31,
2022
(collectively
referred
to
as
the
“financial
statements”).
In
our
opinion,
the
financial
statements
present
fairly,
in
all
material
respects,
the
financial
position
of
the
Fund
as
of
August
31,
2024,
the
results
of
its
operations
for
the
year
then
ended,
the
changes
in
its
net
assets
for
each
of
the
two
years
in
the
period
ended
August
31,
2024,
and
the
financial
highlights
for
each
of
the
two
years
in
the
period
ended
August
31,
2024,
the
period
April
1,
2022
to
August
31,
2022
and
each
of
the
three
years
in
the
period
ended
March
31,
2022
in
conformity
with
accounting
principles
generally
accepted
in
the
United
States
of
America.
Basis
for
Opinion
These
financial
statements
are
the
responsibility
of
the
Fund’s
management.
Our
responsibility
is
to
express
an
opinion
on
the
Fund’s
financial
statements
based
on
our
audits.
We
are
a
public
accounting
firm
registered
with
the
Public
Company
Accounting
Oversight
Board
(United
States)
(“PCAOB”)
and
are
required
to
be
independent
with
respect
to
the
Fund
in
accordance
with
the
U.S.
federal
securities
laws
and
the
applicable
rules
and
regulations
of
the
Securities
and
Exchange
Commission
and
the
PCAOB.
We
conducted
our
audits
of
these
financial
statements
in
accordance
with
the
standards
of
the
PCAOB.
Those
standards
require
that
we
plan
and
perform
the
audit
to
obtain
reasonable
assurance
about
whether
the
financial
statements
are
free
of
material
misstatement,
whether
due
to
error
or
fraud.
Our
audits
included
performing
procedures
to
assess
the
risks
of
material
misstatement
of
the
financial
statements,
whether
due
to
error
or
fraud,
and
performing
procedures
that
respond
to
those
risks.
Such
procedures
included
examining,
on
a
test
basis,
evidence
regarding
the
amounts
and
disclosures
in
the
financial
statements.
Our
audits
also
included
evaluating
the
accounting
principles
used
and
significant
estimates
made
by
management,
as
well
as
evaluating
the
overall
presentation
of
the
financial
statements.
Our
procedures
included
confirmation
of
securities
owned
as
of
August
31,
2024
by
correspondence
with
the
custodian,
transfer
agent
and
brokers;
when
replies
were
not
received
from
the
brokers,
we
performed
other
auditing
procedures.
We
believe
that
our
audits
provide
a
reasonable
basis
for
our
opinion.
/s/PricewaterhouseCoopers
LLP
San
Francisco,
California
October
22,
2024
We
have
served
as
the
auditor
of
one
or
more
investment
companies
in
the
Franklin
Templeton
Group
of
Funds
since
1948.
Templeton
Global
Investment
Trust
Tax
Information
(unaudited)
Templeton
Emerging
Markets
Small
Cap
Fund
By
mid-February,
tax
information
related
to
a
shareholder's
proportionate
share
of
distributions
paid
during
the
preceding
calendar
year
will
be
received,
if
applicable.
Please
also
refer
to
www.franklintempleton.com
for
per
share
tax
information
related
to
any
distributions
paid
during
the
preceding
calendar
year.
Shareholders
are
advised
to
consult
with
their
tax
advisors
for
further
information
on
the
treatment
of
these
amounts
on
their
tax
returns.
The
following
tax
information
for
the
Fund
is
required
to
be
furnished
to
shareholders
with
respect
to
income
earned
and
distributions
paid
during
its
fiscal
year.
The
Fund
hereby
reports
the
following
amounts,
or
if
subsequently
determined
to
be
different,
the
maximum
allowable
amounts,
for
the
fiscal
year
ended
August
31,
2024:
Under
Section
853
of
the
Internal
Revenue
Code,
the
Fund
intends
to
elect
to
pass
through
to
its
shareholders
the
following
amounts,
or
amounts
as
finally
determined,
of
foreign
taxes
paid
and
foreign
source
income
earned
by
the
Fund
during
the
fiscal
year
ended
August
31,
2024
:
Pursuant
to:
Amount
Reported
Qualified
Dividend
Income
Earned
(QDI)
§854(b)(1)(B)
$4,037,949
Section
163(j)
Interest
Earned
§163(j)
$132,857
Amount
Reported
Foreign
Taxes
Paid
$3,303,026
Foreign
Source
Income
Earned
$4,389,672
Templeton
Global
Investment
Trust
TEMPLETON
GLOBAL
INVESTMENT
TRUST
Templeton
Emerging
Markets
Small
Cap
Fund
(Fund)
At
an
in-person
meeting
held
on
May
22,
2024
(Meeting),
the
Board
of
Trustees
(Board)
of
Templeton
Global
Investment
Trust
(Trust),
including
a
majority
of
the
trustees
who
are
not
“interested
persons”
as
defined
in
the
Investment
Company
Act
of
1940
(Independent
Trustees),
reviewed
and
approved
the
continuance
of
the
investment
management
agreement
between
Templeton
Asset
Management
Ltd.
(Manager)
and
the
Trust,
on
behalf
of
the
Fund
(Management
Agreement)
for
an
additional
one-year
period.
The
Independent
Trustees
received
advice
from
and
met
separately
with
Independent
Trustee
counsel
in
considering
whether
to
approve
the
continuation
of
the
Management
Agreement.
In
considering
the
continuation
of
the
Management
Agreement,
the
Board
reviewed
and
considered
information
provided
by
the
Manager
at
the
Meeting
and
throughout
the
year
at
meetings
of
the
Board
and
its
committees.
The
Board
also
reviewed
and
considered
information
provided
in
response
to
a
detailed
set
of
requests
for
information
submitted
to
the
Manager
by
Independent
Trustee
counsel
on
behalf
of
the
Independent
Trustees
in
connection
with
the
annual
contract
renewal
process.
In
addition,
prior
to
the
Meeting,
the
Independent
Trustees
held
a
virtual
contract
renewal
meeting
at
which
the
Independent
Trustees
first
conferred
amongst
themselves
and
Independent
Trustee
counsel
about
contract
renewal
matters,
and
then
met
with
management
to
request
additional
information
that
the
Independent
Trustees
reviewed
and
considered
prior
to
and
at
the
Meeting.
The
Board
reviewed
and
considered
all
of
the
factors
it
deemed
relevant
in
approving
the
continuance
of
the
Management
Agreement,
including,
but
not
limited
to:
(i)
the
nature,
extent
and
quality
of
the
services
provided
by
the
Manager;
(ii)
the
investment
performance
of
the
Fund;
(iii)
the
costs
of
the
services
provided
and
profits
realized
by
the
Manager
and
its
affiliates
from
the
relationship
with
the
Fund;
(iv)
the
extent
to
which
economies
of
scale
are
realized
as
the
Fund
grows;
and
(v)
whether
fee
levels
reflect
these
economies
of
scale
for
the
benefit
of
Fund
investors.
In
approving
the
continuance
of
the
Management
Agreement,
the
Board,
including
a
majority
of
the
Independent
Trustees,
determined,
through
the
exercise
of
its
business
judgment,
that
the
terms
of
the
Management
Agreement
are
fair
and
reasonable
and
that
the
continuance
of
the
Management
Agreement
is
in
the
best
interests
of
the
Fund
and
its
shareholders.
Changes
In
and
Disagreements
with
Accountants
For
the
period
covered
by
this
report
Not
applicable.
Results
of
Meeting(s)
of
Shareholders
For
the
period
covered
by
this
report
Not
applicable.
Remuneration
Paid
to
Directors,
Officers
and
Others
For
the
period
covered
by
this
report
Refer
to
the
financial
statements
included
herein.
Board
Approval
of
Management
and
Subadvisory
Agreements
For
the
period
covered
by
this
report
Templeton
Global
Investment
Trust
While
attention
was
given
to
all
information
furnished,
the
following
discusses
some
primary
factors
relevant
to
the
Board’s
determination.
Nature,
Extent
and
Quality
of
Services
The
Board
reviewed
and
considered
information
regarding
the
nature,
extent
and
quality
of
investment
management
services
provided
by
the
Manager
and
its
affiliates
to
the
Fund
and
its
shareholders.
This
information
included,
among
other
things,
the
qualifications,
background
and
experience
of
the
senior
management
and
investment
personnel
of
the
Manager,
as
well
as
information
on
succession
planning
where
appropriate;
the
structure
of
investment
personnel
compensation;
oversight
of
third-
party
service
providers;
investment
performance
reports
and
related
financial
information
for
the
Fund;
reports
on
expenses
and
shareholder
services;
legal
and
compliance
matters;
risk
controls;
pricing
and
other
services
provided
by
the
Manager
and
its
affiliates;
and
management
fees
charged
by
the
Manager
and
its
affiliates
to
US
funds
and
other
accounts,
including
management’s
explanation
of
differences
among
accounts
where
relevant.
The
Board
also
reviewed
and
considered
an
annual
report
on
payments
made
by
Franklin
Templeton
(FT)
or
the
Fund
to
financial
intermediaries,
as
well
as
a
memorandum
relating
to
third-party
servicing
arrangements.
The
Board
acknowledged
the
ongoing
integration
of
the
Putnam
family
of
funds
into
the
FT
family
of
funds
and
management’s
continued
development
of
strategies
to
address
areas
of
heightened
concern
in
the
mutual
fund
industry,
including
various
regulatory
initiatives
and
continuing
geopolitical
concerns.
The
Board
also
reviewed
and
considered
the
benefits
provided
to
Fund
shareholders
of
investing
in
a
fund
that
is
part
of
the
FT
family
of
funds.
The
Board
noted
the
financial
position
of
Franklin
Resources,
Inc.
(FRI),
the
Manager’s
parent,
and
its
commitment
to
the
mutual
fund
business
as
evidenced
by
its
continued
reassessment
of
the
fund
offerings
in
response
to
FT
acquisitions
and
the
market
environment,
as
well
as
project
initiatives
and
capital
investments
relating
to
the
services
provided
to
the
Fund
by
the
FT
organization.
The
Board
specifically
noted
FT’s
commitment
to
technological
innovation
and
advancement,
including
its
initiative
to
create
a
new
enterprise-wide
artificial
intelligence
platform.
Following
consideration
of
such
information,
the
Board
was
satisfied
with
the
nature,
extent
and
quality
of
services
provided
by
the
Manager
and
its
affiliates
to
the
Fund
and
its
shareholders.
Fund
Performance
The
Board
reviewed
and
considered
the
performance
results
of
the
Fund
over
various
time
periods
ended
December
31,
2023.
The
Board
considered
the
performance
returns
for
the
Fund
in
comparison
to
the
performance
returns
of
mutual
funds
deemed
comparable
to
the
Fund
included
in
a
universe
(Performance
Universe)
selected
by
Broadridge
Financial
Solutions,
Inc.
(Broadridge),
an
independent
provider
of
investment
company
data.
The
Board
received
a
description
of
the
methodology
used
by
Broadridge
to
select
the
mutual
funds
included
in
a
Performance
Universe.
The
Board
also
considered
the
performance
returns
for
the
Fund
in
comparison
to
the
performance
returns
of
a
customized
peer
group
(Performance
Customized
Peer
Group)
selected
by
the
Manager.
The
Board
further
reviewed
and
considered
Fund
performance
reports
provided
and
discussions
that
occurred
with
portfolio
managers
at
Board
meetings
throughout
the
year.
A
summary
of
the
Fund’s
performance
results
is
below.
The
Performance
Universe
for
the
Fund
included
the
Fund
and
all
retail
and
institutional
emerging
markets
funds.
The
Performance
Customized
Peer
Group
for
the
Fund
included
only
emerging
markets
funds
that
are
benchmarked
to
MSCI
Emerging
Markets
Small
Cap
Index
at
the
time
of
purchase.
The
Board
noted
that
the
Fund’s
annualized
total
return
for
the
one-,
three-,
five-
and
10-year
periods
was
above
the
median
of
its
Performance
Universe.
The
Board
also
noted
that
the
Fund’s
annualized
total
return
was
above
the
median
and
in
the
first
(best)
quintile
of
its
Performance
Customized
Peer
Group
for
the
three-year
period,
but
below
the
median
of
its
Performance
Customized
Peer
Group
for
the
one-,
five-
and
10-year
periods.
The
Board
further
noted
that
no
quintile
information
was
provided
for
the
Fund’s
Performance
Customized
Peer
Group
for
the
10-year
period
due
to
its
small
size.
The
Board
discussed
with
management
the
Fund’s
underperformance
versus
its
Performance
Customized
Peer
Group
and
management
explained
that
the
Fund
follows
a
bottom-up,
fundamental
approach
which
can
detract
from
performance
when
the
overall
economic
picture
rather
than
company
fundamentals
are
driving
investments,
as
was
the
case
during
the
COVID-19
period
which
is
reflected
in
the
Fund’s
five-year
relative
performance.
The
Templeton
Global
Investment
Trust
Board
also
noted
management’s
representation
that
the
Fund
had
recently
outperformed
many
of
its
peers
over
the
three-
and
six-month
periods
ended
March
31,
2024.
The
Board
concluded
that
the
Fund’s
performance
was
satisfactory.
Comparative
Fees
and
Expenses
The
Board
reviewed
and
considered
information
regarding
the
Fund’s
actual
total
expense
ratio
and
its
various
components,
including,
as
applicable,
management
fees;
transfer
agent
expenses;
underlying
fund
expenses;
Rule
12b-1
and
non-Rule
12b-1
service
fees;
and
other
non-management
fees.
The
Board
also
noted
the
quarterly
and
annual
reports
it
receives
on
all
marketing
support
payments
made
by
FT
to
financial
intermediaries.
The
Board
considered
the
actual
total
expense
ratio
and,
separately,
the
contractual
management
fee
rate,
without
the
effect
of
fee
waivers,
if
any
(Management
Rate)
of
the
Fund
in
comparison
to
the
median
expense
ratio
and
median
Management
Rate,
respectively,
of
other
mutual
funds
deemed
comparable
to
and
with
a
similar
expense
structure
to
the
Fund
selected
by
Broadridge
(Expense
Group).
Broadridge
fee
and
expense
data
is
based
upon
information
taken
from
each
fund’s
most
recent
annual
or
semi-annual
report,
which
reflects
historical
asset
levels
that
may
be
quite
different
from
those
currently
existing,
particularly
in
a
period
of
market
volatility.
While
recognizing
such
inherent
limitation
and
the
fact
that
expense
ratios
and
Management
Rates
generally
increase
as
assets
decline
and
decrease
as
assets
grow,
the
Board
believed
the
independent
analysis
conducted
by
Broadridge
to
be
an
appropriate
measure
of
comparative
fees
and
expenses.
The
Broadridge
Management
Rate
includes
administrative
charges,
and
the
actual
total
expense
ratio,
for
comparative
consistency,
was
shown
for
Class
A
shares
for
the
Fund
and
for
each
other
fund
in
the
Expense
Group.
The
Board
received
a
description
of
the
methodology
used
by
Broadridge
to
select
the
mutual
funds
included
in
an
Expense
Group.
The
Expense
Group
for
the
Fund
included
the
Fund
and
13
other
emerging
markets
funds.
The
Board
noted
that
the
Management
Rate
and
actual
total
expense
ratio
for
the
Fund
were
above
the
medians
and
in
the
fifth
quintile
(most
expensive)
of
its
Expense
Group.
The
Board
discussed
the
expenses
of
this
Fund
with
management
and
management
explained
that
the
Expense
Group
was
not
directly
comparable
to
the
Fund
as
the
Expense
Group
was
comprised
of
funds
that
had
a
significantly
lower
average
allocation
of
their
investments
to
small-
and
mid-capitalization
companies
in
comparison
to
the
Fund.
Management
further
explained
that
when
the
Fund
is
compared
to
the
subset
of
funds
in
the
Expense
Group
that
invests
principally
in
emerging
markets
mid-
and
small-cap
companies,
the
Fund’s
Management
Rate
and
actual
total
expense
ratio
are
more
in
line
with
peers.
The
Board
then
noted
that
the
Fund’s
actual
total
expense
ratio
reflected
an
expense
cap
on
operating
expenses.
After
consideration
of
the
above,
the
Board
concluded
that
the
Management
Rate
charged
to
the
Fund
is
reasonable.
Profitability
The
Board
reviewed
and
considered
information
regarding
the
profits
realized
by
the
Manager
and
its
affiliates
in
connection
with
the
operation
of
the
Fund.
In
this
respect,
the
Board
considered
the
Fund
profitability
analysis
provided
by
the
Manager
that
addresses
the
overall
profitability
of
FT’s
US
fund
business,
as
well
as
its
profits
in
providing
investment
management
and
other
services
to
each
of
the
individual
funds
during
the
12-month
period
ended
September
30,
2023,
being
the
most
recent
fiscal
year-end
for
FRI.
The
Board
noted
that
although
management
continually
makes
refinements
to
its
methodologies
used
in
calculating
profitability
in
response
to
organizational
and
product-related
changes,
the
overall
methodology
has
remained
consistent
with
that
used
in
the
Fund’s
profitability
report
presentations
from
prior
years.
The
Board
also
noted
that
an
independent
registered
public
accounting
firm
has
been
engaged
by
the
Manager
to
periodically
review
and
assess
the
allocation
methodologies
to
be
used
solely
by
the
Fund’s
Board
with
respect
to
the
profitability
analysis.
The
Board
noted
management’s
belief
that
costs
incurred
in
establishing
the
infrastructure
necessary
for
the
type
of
mutual
fund
operations
conducted
by
the
Manager
and
its
affiliates
may
not
be
fully
reflected
in
the
expenses
allocated
to
the
Fund
in
determining
its
profitability,
as
well
as
the
fact
that
the
level
of
profits,
to
a
certain
extent,
reflected
operational
cost
savings
and
efficiencies
initiated
by
management.
As
part
of
this
evaluation,
the
Board
considered
management’s
outsourcing
of
certain
operations,
which
effort
has
required
considerable
up-front
expenditures
by
the
Manager
but,
over
the
long
run
is
expected
to
result
in
greater
efficiencies.
The
Board
also
noted
management’s
expenditures
in
improving
shareholder
services
provided
to
the
Fund,
as
well
as
the
need
to
implement
systems
and
meet
additional
regulatory
and
compliance
requirements
resulting
from
recent
US
Securities
and
Exchange
Commission
and
other
regulatory
requirements.
Templeton
Global
Investment
Trust
The
Board
also
considered
the
extent
to
which
the
Manager
and
its
affiliates
might
derive
ancillary
benefits
from
fund
operations,
including
revenues
generated
from
transfer
agent
services,
potential
benefits
resulting
from
personnel
and
systems
enhancements
necessitated
by
fund
growth,
as
well
as
increased
leverage
with
service
providers
and
counterparties.
Based
upon
its
consideration
of
all
these
factors,
the
Board
concluded
that
the
level
of
profits
realized
by
the
Manager
and
its
affiliates
from
providing
services
to
the
Fund
was
not
excessive
in
view
of
the
nature,
extent
and
quality
of
services
provided
to
the
Fund.
Economies
of
Scale
The
Board
reviewed
and
considered
the
extent
to
which
the
Manager
may
realize
economies
of
scale,
if
any,
as
the
Fund
grows
larger
and
whether
the
Fund’s
management
fee
structure
reflects
any
economies
of
scale
for
the
benefit
of
shareholders.
With
respect
to
possible
economies
of
scale,
the
Board
noted
the
existence
of
management
fee
breakpoints,
which
operate
generally
to
share
any
economies
of
scale
with
the
Fund’s
shareholders
by
reducing
the
Fund’s
effective
management
fees
as
the
Fund
grows
in
size.
The
Board
considered
the
Manager’s
view
that
any
analyses
of
potential
economies
of
scale
in
managing
a
particular
fund
are
inherently
limited
in
light
of
the
joint
and
common
costs
and
investments
the
Manager
incurs
across
the
FT
family
of
funds
as
a
whole.
The
Board
concluded
that
to
the
extent
economies
of
scale
may
be
realized
by
the
Manager
and
its
affiliates,
the
Fund’s
management
fee
structure
provided
a
sharing
of
benefits
with
the
Fund
and
its
shareholders
as
the
Fund
grows.
Conclusion
Based
on
its
review,
consideration
and
evaluation
of
all
factors
it
believed
relevant,
including
the
above-described
factors
and
conclusions,
the
Board
unanimously
approved
the
continuation
of
the
Management
Agreement
for
an
additional
one-year
period.
©
2024
Franklin
Templeton.
All
rights
reserved.
Item 8. Changes in and Disagreements with Accountants for Open-End Management Investment Companies.
The information is disclosed as part of the Financial Statements included in Item 7 of this Form N-CSR.
Item 9. Proxy Disclosures for Open-End Management Investment Companies.
The information is disclosed as part of the Financial Statements included in Item 7 of this Form N-CSR.
Item 10. Remuneration Paid to Directors, Officers, and Others of Open-End Management Investment Companies.
The information is disclosed as part of the Financial Statements included in Item 7 of this Form N-CSR.
Item 11. Statement Regarding Basis for Approval of Investment Advisory Contract.
The information is disclosed as part of the Financial Statements included in Item 7 of this Form N-CSR.
Item 12. Disclosure of Proxy Voting Policies and Procedures for Closed-End Management Investment Companies. N/A
Item 13. Portfolio Managers of Closed-End Management Investment Companies. N/A
Item 14. Purchases of Equity Securities by Closed-End Management Investment Company and Affiliated Purchasers. N/A
Item 15. Submission of Matters to a Vote of Security Holders.
There have been no changes to the procedures by which shareholders may recommend nominees to the Registrant’s Board of Trustees that would require disclosure herein.
Item 16. Controls and Procedures.
(a) Evaluation of Disclosure Controls and Procedures. The Registrant maintains disclosure controls and procedures that are designed to provide reasonable assurance that information required to be disclosed in the Registrant’s filings under the Securities Exchange Act of 1934, as amended, and the Investment Company Act of 1940 is recorded, processed, summarized and reported within the periods specified in the rules and forms of the Securities and Exchange Commission. Such information is accumulated and communicated to the Registrant’s management, including its principal executive officer and principal financial officer, as appropriate, to allow timely decisions regarding required disclosure. The Registrant’s management, including the principal executive officer and the principal financial officer, recognizes that any set of controls and procedures, no matter how well designed and operated, can provide only reasonable assurance of achieving the desired control objectives.
Within 90 days prior to the filing date of this Shareholder Report on Form N-CSR, the Registrant had carried out an evaluation, under the supervision and with the participation of the Registrant’s management, including the Registrant’s principal executive officer and the Registrant’s principal financial officer, of the effectiveness of the design and operation of the Registrant’s disclosure controls and procedures. Based on such evaluation, the Registrant’s principal executive officer and principal financial officer concluded that the Registrant’s disclosure controls and procedures are effective.
(b) Changes in Internal Controls. There have been no changes in the Registrant’s internal control over financial reporting that occurred during the period covered by this report that has materially affected or is reasonably likely to materially affect the internal control over financial reporting.
Item 17. Disclosure of Securities Lending Activities for Closed-End Management Investment Company N/A
Item 18. Recovery of Erroneously Awarded Compensation.
(a) N/A
(b) N/A
Item 19. Exhibits.
(a) (1) Code of Ethics
(a) (2) Certifications pursuant to Section 302 of the Sarbanes-Oxley Act of 2002 of Christopher Kings, Chief Executive Officer - Finance and Administration, and Jeffrey White, Chief Financial Officer, Chief Accounting Officer and Treasurer
(b) Certifications pursuant to Section 906 of the Sarbanes-Oxley Act of 2002 of Christopher Kings, Chief Executive Officer - Finance and Administration, and Jeffrey White, Chief Financial Officer, Chief Accounting Officer and Treasurer
SIGNATURES
Pursuant to the requirements of the Securities Exchange Act of 1934 and the Investment Company Act of 1940, the registrant has duly caused this report to be signed on its behalf by the undersigned, thereunto duly authorized.
TEMPLETON GLOBAL INVESTMENT TRUST
| By | /s/ CHRISTOPHER KINGS | |
| | Christopher Kings | |
| | Chief Executive Officer - Finance and Administration |
|
| | | |
| Date | October 31, 2024 | |
Pursuant to the requirements of the Securities Exchange Act of 1934 and the Investment Company Act of 1940, this report has been signed below by the following persons on behalf of the registrant and in the capacities and on the dates indicated.
| By | /s/ CHRISTOPHER KINGS | |
| | Christopher Kings | |
| | Chief Executive Officer - Finance and Administration | |
| | | |
| Date | October 31, 2024 | |
| By | /s/ JEFFREY WHITE | |
| | Jeffrey White | |
| | Chief Financial Officer, Chief Accounting Officer and Treasurer | |
| | | |
| Date | October 31, 2024 | |